UNITED STATES
SECURITIES AND EXCHANGE COMMISSION
WASHINGTON, D.C. 20549
FORM N-CSR
CERTIFIED SHAREHOLDER REPORT OF REGISTERED
MANAGEMENT INVESTMENT COMPANIES
Investment Company Act File Number: 811-22811
Bridge Builder Trust
(Exact name of registrant as specified in charter)
Bridge Builder Trust
12555 Manchester Road
Des Peres, MO, 63131
(Address of principal executive offices)
Helge Lee, Secretary
Bridge Builder Trust
c/o 12555 Manchester Road
Des Peres, MO 63131
(Name and address of Agent for service)
Registrant’s telephone number, including area code: (314) 515-5242
Date of fiscal year end: June 30
Date of reporting period: June 30, 2020
Form N-CSR is to be used by management investment companies to file reports with the Commission not later than 10 days after the transmission to stockholders of any report that is required to be transmitted to stockholders under Rule 30e-1 under the Investment Company Act of 1940 (17 CFR 270.30e-1). The Commission may use the information provided on Form N-CSR in its regulatory, disclosure review, inspection, and policymaking roles.
A registrant is required to disclose the information specified by Form N-CSR, and the Commission will make this information public. A registrant is not required to respond to the collection of information contained in Form N-CSR unless the Form displays a currently valid Office of Management and Budget (“OMB”) control number. Please direct comments concerning the accuracy of the information collection burden estimate and any suggestions for reducing the burden to Secretary, Securities and Exchange Commission, 450 Fifth Street, NW, Washington, DC 20549-0609. The OMB has reviewed this collection of information under the clearance requirements of 44 U.S.C. § 3507.
ITEM 1. REPORT TO SHAREHOLDERS
The following is a copy of the Registrant’s annual report transmitted to shareholders pursuant to Rule 30e-1 under the Investment Company Act of 1940, as amended (the “1940 Act”)(17 CFR 270.30e-1).
| Page | ||||
| 1 | ||||
Management’s Discussion of Fund Performance | ||||
| 2 | ||||
| 4 | ||||
| 7 | ||||
| 10 | ||||
| 12 | ||||
| 14 | ||||
| 16 | ||||
| 18 | ||||
| 21 | ||||
| 23 | ||||
| 24 | ||||
| 28 | ||||
| 38 | ||||
| 41 | ||||
| 43 | ||||
| 45 | ||||
| 47 | ||||
| 49 | ||||
| 52 | ||||
| 54 | ||||
| 56 | ||||
| 60 | ||||
| 62 | ||||
| 90 | ||||
| 91 | ||||
Board Considerations of Investment Advisory Agreement and Sub-advisory Agreements | 94 | |||
| 105 | ||||
| 107 | ||||
| 109 | ||||
| Annual Report • June 30, 2020 |
Bridge Builder Mutual Funds
Letter to Shareholders (Unaudited)
Dear Shareholder,
It is our pleasure to provide you with the Bridge Builder Mutual Funds (“Funds,” or individually a “Fund”), annual report for the fiscal year ended June 30, 2020. In this report you will find fund performance information, summaries of portfolio holdings, financial statements and other important information about each of the Funds.
For details about individual fund performance and market commentary, please refer to the Management’s Discussion of Fund Performance section of this report for each Fund.
The Funds are available exclusively through Edward Jones Advisory Solutions®, an asset allocation program providing investment advisory services. Each Fund uses a multi-manager sub-advised structure, where several leading asset management firms are selected to invest a portion of a fund’s assets. Each manager within a Fund brings a unique perspective and investment approach. The Funds are managed according to the key tenets of our investment philosophy: diversification, high quality and a long-term approach.
All of the Funds’ sub-advisers are selected by Olive Street Investment Advisers, LLC (“Olive Street” or “Adviser”), an affiliate of Edward Jones, and approved by the Funds’ Board of Trustees. Olive Street strives to combine complementary investment styles, performance patterns and portfolio characteristics that have generally demonstrated a track record of success.
Since the inception of the Funds in 2013, they have provided investors in Edward Jones Advisory Solutions® with several important benefits. Benefits of the Funds include: manager selection with oversight by Edward Jones’ Portfolio Solutions and Investment Management Research teams, access to certain institutional managers and investment strategies that are not available in the retail mutual fund marketplace, the ability to make changes among managers within the Funds in a cost-efficient manner, and lower net expense ratios compared to Morningstar® category medians. As a result, your ownership of the Funds as part of the Edward Jones Advisory Solutions® has played an important role in the performance of your account.
Over the course of the past 12-months, there have been certain changes to the Funds’ lineup of sub-advisers.
In October 2019, Manning & Napier Advisors, LLC was removed as a sub-adviser to the Bridge Builder
International Equity Fund. In May of 2020, T. Rowe Price Associates, Inc. and LSV Asset Management were added as sub-advisers to the Bridge Builder Large Cap Value Fund, and Advisory Research, Inc. was removed as sub-adviser to the Bridge Builder Small/Mid Cap Value Fund. In June 2020, Artisan Partners Limited Partnership replaced ClearBridge Investments, LLC as a sub-adviser to the Bridge Builder Small/Mid Cap Growth Fund.
For additional information about the Funds, visit www.bridgebuildermutualfunds.com.
We look forward to continuing to play an important role in helping you pursue your financial goals.
Sincerely,
 | ||
William Fiala
Chairman, Bridge Builder Trust | ||
| ||
Tom Kersting
President, Olive Street Investment Advisers, LLC
Principal, Edward Jones Investment Advisory | ||

| Annual Report • June 30, 2020 | 1 |
Management’s Discussion of Fund Performance (Unaudited)
Investment Objective
The investment objective of the Bridge Builder Core Bond Fund (the “Fund”) is to provide total return (capital appreciation plus income).
Summary of the Investment Strategy
The Fund’s assets are allocated across different fixed-income market sectors and maturities. Most of the Fund’s investments are fixed-income securities issued or guaranteed by the U.S. government or its agencies, municipalities or U.S. corporate issuers. The Fund also invests in asset-backed securities, privately-issued securities, floating rate securities and mortgage-related and mortgage-backed securities. The Fund employs a multi-manager sub-advised structure.
Investment Commentary
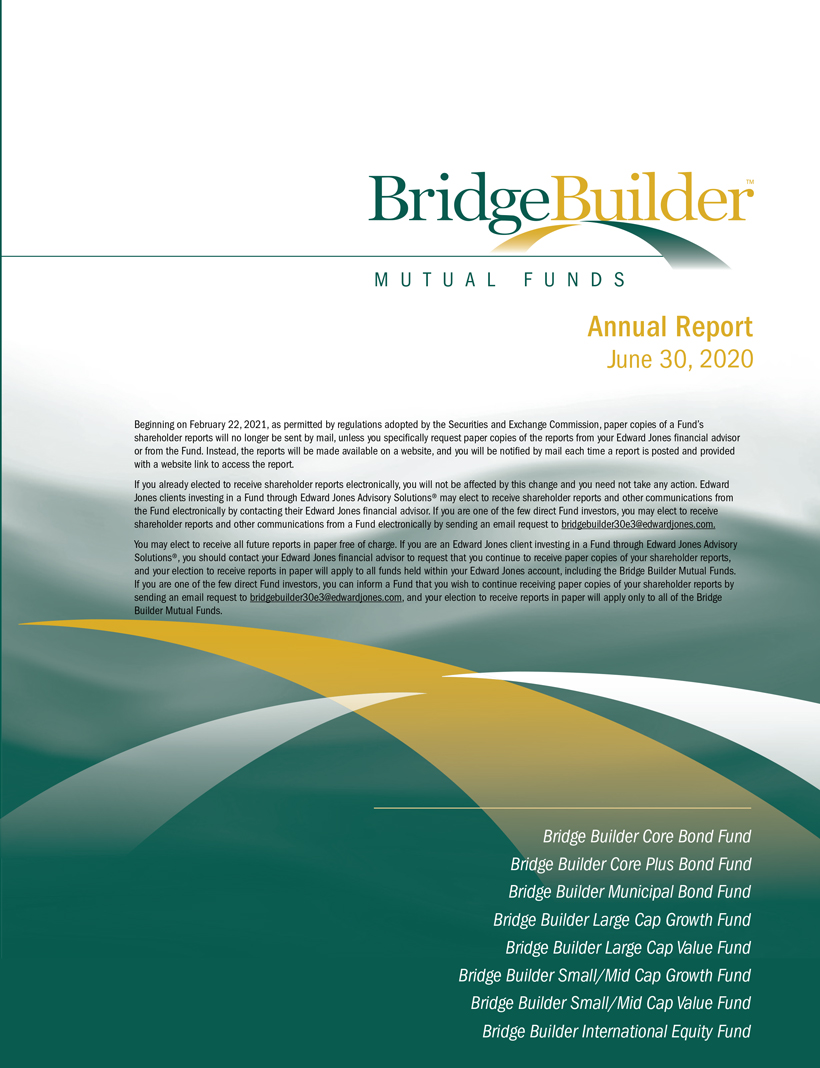
The Fund returned 9.01% during the fiscal year ended June 30, 2020. The Fund outperformed its benchmark, the Bloomberg Barclays U.S. Aggregate Bond Index, which returned 8.74% during the same period.
The second half of 2019 saw lingering uncertainty about the direction of global growth as the U.S. and other major economies experienced moderation in the rates of their economic expansion. In order to address the risks of further slowdown, the U.S. Federal Reserve (the “Federal Reserve”) lowered short-term interest rates three times in the second half of 2019. The shift from a pause in tightening to an outright loosening of monetary policy was anticipated. As the U.S. economy began showing signs of growth stabilization, the COVID-19 pandemic shocked global markets in the first quarter of 2020. To stabilize the economy and financial markets, the Federal Reserve took short-term interest rates to zero. This drove a significant rally in high-quality, interest-rate sensitive bonds, particularly U.S. Treasuries. At the same time, fears of widespread defaults and credit rating downgrades of companies caused credit-sensitive segments of the market, including investment grade corporates and securitized bonds, to underperform during the first quarter. Responding to the deteriorating economic environment, both the United States Congress and the Federal Reserve implemented a variety of fiscal and monetary measures in order to stabilize markets and rout prospects of a prolonged economic recession. These programs were focused on restoring consumer confidence, improving market liquidity and reducing overall volatility. Consequently, the markets experienced significant price stabilization, followed by a large and rapid rebound in most fixed-income assets during the second quarter of 2020. The strong rebound in the second quarter of the year suggests that the worst of the turbulence is behind us, but uncertainty about economic prospects will likely persist into the foreseeable future.
Despite market uncertainty and price volatility, most fixed-income sectors posted positive returns during the fiscal year. However, only a handful of sectors were able to beat the performance of the Bloomberg Barclays U.S. Aggregate Bond Index. Sectors that did outperform the index were typically higher-quality bonds with longer maturity such as longer-dated U.S. Treasury bonds and investment grade corporate bonds. Foreign bonds underperformed U.S. corporate bonds as the U.S. dollar modestly appreciated relative to most other developed-markets currencies during the period. In addition, high-quality securitized bonds such as agency mortgage-backed securities performed better than some other segments of the securitized markets that do not have implicit government guarantee such as asset-backed securities and non-agency mortgage backed securities.
The Fund’s outperformance compared to the benchmark was primarily driven by an overweight to investment grade bonds. Additionally, security selection within the investment grade bond universe added to performance, while within the securitized markets it was a moderate detractor from return. Yield curve positioning also detracted as the Fund had lower interest-rate sensitivity compared to the benchmark throughout the fiscal year amid a rally in interest-rate sensitive assets.
| 2 | Annual Report • June 30, 2020 |
Bridge Builder Core Bond Fund
Management’s Discussion of Fund Performance (Unaudited) (Continued)
Investment Sub-advisers
Robert W. Baird & Co. Inc. utilizes a structured, risk-controlled philosophy with a disciplined duration approach to invest its allocated portion of the Fund’s assets. | J.P. Morgan Investment Management, Inc. incorporates a bottom-up, value-oriented approach in managing its allocated portion of the Fund’s assets. | Loomis, Sayles & Company, L.P. employs an investment philosophy that focuses on relative value investing on a risk-adjusted basis, seeking to add value for clients primarily through security selection while managing risk in the portfolio. | PGIM, Inc. uses a team approach to attempt to add value by tilting toward fixed-income sectors that it believes are attractive and by utilizing its extensive research capabilities to choose attractive fixed-income securities within sectors. |
The following chart compares the value of a hypothetical $10,000 investment in the Bridge Builder Core Bond Fund
from its inception (October 28, 2013) to June 30, 2020 as compared with the Bloomberg Barclays U.S. Aggregate
Bond Index.
Growth of a Hypothetical $10,000 Investment as of June 30, 2020
vs.
Bloomberg Barclays U.S. Aggregate Bond Index
Average Annual Total Returns as of June 30, 2020
| 1 Year | 5 Years | Since Inception (10/28/2013) | ||||||||||
Bridge Builder Core Bond Fund | 9.01 | % | 4.70 | % | 4.26 | % | ||||||
Bloomberg Barclays U.S. Aggregate Bond Index | 8.74 | % | 4.30 | % | 3.93 | % | ||||||
Performance data quoted represents past performance; past performance does not guarantee future results. The investment return and principal value of an investment will fluctuate so that an investor’s shares, when redeemed, may be worth more or less than their original cost. Current performance of the Fund may be lower or higher than the performance quoted. As of the latest prospectus, the gross and net expense ratios of the Fund were 0.34%(1) and 0.14%(2), respectively. Performance data current to the most recent month end may be obtained by calling 1.855.823.3611.
The performance table does not reflect the deduction of taxes that a shareholder may pay on Fund distributions or the redemption of Fund shares. Returns shown for the Fund include the reinvestment of all dividends, if any. Total return calculations reflect the effect of the Adviser’s fee waiver agreement for the Fund. If such fee waivers had not occurred, the quoted performance would be lower.
Portfolio Characteristics (3)
| Security Type Breakdown | (% of Investments) | |||
Mortgage-Backed Obligations | 36.2 | % | ||
Corporate Bonds | 32.5 | |||
Government Related | 14.1 | |||
Asset-Backed Obligations | 11.3 | |||
Short-Term Investments | 5.9 | |||
Preferred Stocks | 0.0 | * | ||
| * | Amount less than 0.05%. |
| Annual Report • June 30, 2020 | 3 |
Bridge Builder Core Plus Bond Fund
Management’s Discussion of Fund Performance (Unaudited)
Investment Objective
The investment objective of the Bridge Builder Core Plus Bond Fund (the “Fund”) is to provide total return (capital appreciation plus income).
Summary of the Investment Strategy
The Fund’s assets are allocated across different fixed-income market sectors and maturities. Most of the Fund’s investments are fixed-income securities issued or guaranteed by the U.S. government or its agencies, municipalities or U.S. corporate issuers. The Fund also invests in asset-backed securities, privately-issued securities, floating rate securities, and mortgage-related and mortgage-backed securities. The Fund may invest in high-yield securities deemed below investment grade, and securities issued by foreign entities, including emerging market securities. The Fund employs a multi-manager sub-advised structure.
Investment Commentary
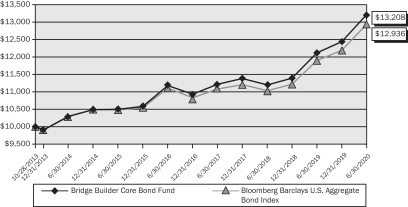
The Fund returned 7.94% during the fiscal year ended June 30, 2020. The Fund underperformed its benchmark, the Bloomberg Barclays U.S. Aggregate Bond Index, which returned 8.74% during the same period.
The second half of 2019 saw lingering uncertainty about the direction of global growth as the U.S. and other major economies experienced moderation in the rates of their economic expansion. In order to address the risks of further slowdown, the Federal Reserve lowered short-term interest rates three times in the second half of 2019. The shift from a pause in tightening to an outright loosening of monetary policy was anticipated. As the U.S. economy began showing signs of growth stabilization, the COVID-19 pandemic shocked global markets in the first quarter of 2020. To stabilize the economy and financial markets, the Federal Reserve took short-term interest rates to zero. This drove a significant rally in high-quality, interest-rate sensitive bonds, particularly U.S. Treasuries. At the same time, fears of widespread defaults and credit rating downgrades of companies caused credit-sensitive segments of the market, including investment-grade corporates and securitized bonds, to underperform during the first quarter. Responding to the deteriorating economic environment, both the United States Congress and the Federal Reserve implemented a variety of fiscal and monetary measures in order to stabilize markets and rout prospects of a prolonged economic recession. These programs were focused on restoring consumer confidence, improving market liquidity, and reducing overall volatility. Consequently, the markets experienced significant price stabilization, followed by a large and rapid rebound in most fixed-income assets during the second quarter of 2020. The strong rebound in the second quarter of the year suggests that the worst of the turbulence is behind us, but uncertainty about economic prospects will likely persist into the foreseeable future.
Despite market uncertainty and price volatility, most fixed-income sectors posted positive returns during the fiscal year. However, only a handful of sectors were able to beat the performance of the Bloomberg Barclays U.S. Aggregate Bond Index. Sectors that did outperform the index were typically higher-quality bonds with longer maturity such as longer-dated U.S. Treasury bonds and investment-grade corporate bonds. Lower-quality sectors such as below-investment-grade bonds and loans as well as emerging-market bonds underperformed the index by a meaningful margin. Foreign bonds underperformed U.S. corporate bonds as the U.S. dollar modestly appreciated relative to most other developed-markets currencies during the period. In addition, high-quality securitized bonds such as agency mortgage-backed securities performed better than some other segments of the securitized markets that do not have implicit government guarantee such as asset-backed securities, and non-agency mortgage backed securities.
The Fund’s overweight to more credit sensitive sectors in the securitized space such as asset-backed securities, and non-agency mortgage-backed securities detracted from performance during the fiscal year. In addition, overweights to below investment-grade bonds and loans, as well as emerging-market bonds were also a modest negative. Nonetheless, within the corporate credit sector, security selection contributed positively to performance. Also, the Fund’s lower interest-rate sensitivity compared to the benchmark throughout most of the period modestly detracted from the overall performance as interest rates fell and more interest-rate sensitive instruments rallied.
| 4 | Annual Report • June 30, 2020 |
Bridge Builder Core Plus Bond Fund
Management’s Discussion of Fund Performance (Unaudited) (Continued)
Investment Sub-advisers
| Pacific Investment Management Company LLC seeks to achieve the Fund’s investment objective by investing in a multi-sector portfolio of fixed-income instruments of varying maturities, which may be represented by derivatives such as futures, forward foreign currency exchange contracts or swap contracts. | Loomis, Sayles & Company, L.P. generally seeks fixed-income securities of issuers whose credit profiles it believes are improving. Loomis Sayles relies primarily on issue selection as the key driver to investment performance. Loomis Sayles also analyzes different sectors of the economy and differences in the yields of various fixed-income securities in an effort to find securities that it believes may produce attractive returns in comparison to these securities’ risks. | Metropolitan West Asset Management, LLC employs a value-oriented fixed-income management philosophy and an investment process predicated on a long-term economic outlook. | T. Rowe Price Associates, Inc. emphasizes the value of in-depth fundamental research, diversification and risk management practices. T. Rowe Price’s strategy integrates top-down sector allocation with bottom-up security selection in pursuit of the Fund’s investment objective. |
The following chart compares the value of a hypothetical $10,000 investment in the Bridge Builder Core Plus Bond
Fund from its inception (July 13, 2015) to June 30, 2020 as compared with the Bloomberg Barclays U.S. Aggregate Bond Index.
Growth of a Hypothetical $10,000 Investment as of June 30, 2020
vs.
Bloomberg Barclays U.S. Aggregate Bond Index
Average Annual Total Returns of June 30, 2020
| 1 Year | Since Inception (7/13/2015) | |||||||
Bridge Builder Core Plus Bond Fund | 7.94 | % | 4.59 | % | ||||
Bloomberg Barclays U.S. Aggregate Bond Index | 8.74 | % | 4.40 | % | ||||
Performance data quoted represents past performance; past performance does not guarantee future results. The investment return and principal value of an investment will fluctuate so that an investor’s shares, when redeemed, may be worth more or less than their original cost. Current performance of the Fund may be lower or higher than the performance quoted. As of the latest prospectus, the gross and net expense ratios of the Fund were 0.47%(1) and 0.24%(2), respectively. Performance data current to the most recent month end may be obtained by calling 1.855.823.3611.
The performance table does not reflect the deduction of taxes that a shareholder may pay on Fund distributions or the redemption of Fund shares. Returns shown for the Fund include the reinvestment of all dividends, if any. Total return calculations reflect the effect of the Adviser’s fee waiver agreement for the Fund. If such fee waivers had not occurred, the quoted performance would be lower.
| Annual Report • June 30, 2020 | 5 |
Bridge Builder Core Plus Bond Fund
Management’s Discussion of Fund Performance (Unaudited) (Continued)
Portfolio Characteristics (3)
| Security Type Breakdown | (% of Investments) | |||
Corporate Bonds | 36.0 | % | ||
Mortgage-Backed Obligations | 29.8 | |||
Government Related | 12.3 | |||
Asset-Backed Obligations | 11.2 | |||
Short-Term Investments | 7.9 | |||
Bank Loans | 2.6 | |||
Convertible Securities | 0.1 | |||
Convertible Preferred Stocks | 0.1 | |||
Common Stocks | 0.0 | * | ||
Warrants | 0.0 | * | ||
| * | Amount less than 0.05%. |
| 6 | Annual Report • June 30, 2020 |
Bridge Builder Municipal Bond Fund
Management’s Discussion of Fund Performance (Unaudited)
Investment Objective
The investment objective of the Bridge Builder Municipal Bond Fund (the “Fund”) is to provide current income exempt from federal tax, with a secondary goal of preservation of investment principal.
Summary of the Investment Strategy
The Fund invests, under normal conditions, at least 80% of its net assets in municipal securities of any maturity or duration whose interest is exempt from federal income tax. These municipal securities include debt obligations issued by or on behalf of a governmental entity or other qualifying issuer that pay interest that is generally excludable from gross income for federal income tax purposes. Interest may be includable in taxable income for certain non-corporate taxpayers subject to the federal alternative minimum tax. The Fund employs a multi-manager sub-advised structure.
Investment Commentary
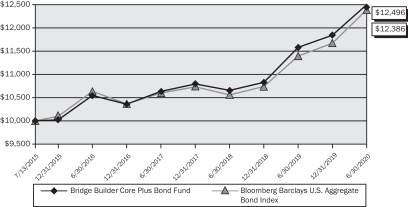
The Fund returned 2.80% during the fiscal year ended June 30, 2020. The Fund underperformed its benchmark, the Bloomberg Barclays Municipal 1-15 Year Index, which returned 4.18% during the same period.
The second half of 2019 saw lingering uncertainty about the direction of global growth as the U.S. and other major economies experienced moderation in the rates of their economic expansion. In order to address the risks of further slowdown, the Federal Reserve lowered short-term interest rates three times in the second half of 2019. The shift from a pause in tightening to an outright loosening of monetary policy was anticipated. As the U.S. economy began showing signs of growth stabilization, the COVID-19 pandemic shocked global markets in the first quarter of 2020. To stabilize the economy and financial markets, the Federal Reserve took short-term interest rates to zero. This drove a significant rally in high-quality, interest-rate sensitive bonds, particularly U.S. Treasuries. At the same time, fears of widespread defaults and credit rating downgrades of companies caused credit-sensitive segments of the market, including investment-grade corporates and securitized bonds, to underperform during the first quarter. This trend prevailed across the municipal bond markets as well, as investment grade municipal bonds fared much better than high-yield issues, and liquidity conditions worsened significantly. Responding to the deteriorating economic environment, both the United States Congress and the Federal Reserve implemented a variety of fiscal and monetary measures in order to stabilize markets and rout prospects of a prolonged economic recession. These programs were focused on restoring consumer confidence, improving market liquidity, and reducing overall volatility. Consequently, the markets experienced significant price stabilization, followed by a large and rapid rebound in most fixed-income assets during the second quarter of 2020. The strong rebound in the second quarter of the year suggests that the worst of the turbulence is behind us, but uncertainty about economic prospects will likely persist into the foreseeable future.
The two key drivers of the Fund’s underperformance over the last one-year period were its higher exposure to lower credit quality bonds and unfavorable security selection. In the first half of the reporting period, the Fund’s exposure to riskier credit issuers within the high-yield sleeve contributed to relative performance versus the index, but those gains were swiftly erased during the market turmoil that occurred in first quarter of 2020 which led high-yield municipal bonds to significantly lag investment-grade issues, especially the AAA-rated segment of the market. Security selection across municipal bond sectors also detracted from relative performance. Selection was particularly negative in general obligation bonds as well as revenue bond sectors including hospital and education. Sector allocation positioning posed a modest headwind in the first quarter of 2020, due to the Fund’s overweight positions in sectors such as healthcare and transportation which lagged due to the uncertainty of the economic impact of the COVID-19 pandemic and how it will affect the fundamental outlook. The Fund’s interest rate positioning was a small contributor to performance over the year, as the longer duration profile of the Fund benefitted from the lower interest rate environment brought on by the Federal Reserve’s interest rate-cuts in the first quarter of 2020.
| Annual Report • June 30, 2020 | 7 |
Bridge Builder Municipal Bond Fund
Management’s Discussion of Fund Performance (Unaudited) (Continued)
Investment Sub-advisers
| FlAM LLC allocates assets across different market sectors and maturities, normally investing in investment-grade municipal securities. When selecting investments, FlAM analyzes issuer credit quality, security-specific features, current and potential future valuation and trading opportunities. | T. Rowe Price Associates Inc. uses an active investment management approach that emphasizes the value of in-depth fundamental credit research, diversification and risk management practices. By using fundamental research, T. Rowe Price seeks to add value through sector weights and issue selection over a full market cycle. | Wells Capital Management, Inc. starts its investment process with a top-down, macroeconomic outlook. Wells Capital Management’s security selection is based on several factors including improving financial trends, positive industry and sector dynamics, improving economic conditions, specific demographic trends and value relative to other securities. | BlackRock Investment Management, LLC takes a top-down, bottom-up approach with a flexible investment framework. Their security selection process is based on the relative value outlook and the quantitative assessment of the security and portfolio. BlackRock seeks total return derived primarily from coupon interest, and secondarily, capital appreciation. |
The following chart compares the value of a hypothetical $10,000 investment in the Bridge Builder Municipal Bond
Fund from its inception (September 14, 2015) to June 30, 2020 as compared with the Bloomberg Barclays Municipal 1-15 Year Index.
Growth of a Hypothetical $10,000 Investment as of June 30, 2020
vs.
Bloomberg Barclays Municipal 1-15 Year Index
Average Annual Total Returns as of June 30, 2020
| 1 Year | Since Inception (9/14/2015) | |||||||
Bridge Builder Municipal Bond Fund | 2.80 | % | 3.30 | % | ||||
Bloomberg Barclays Municipal 1-15 Year Index | 4.18 | % | 3.43 | % | ||||
Performance data quoted represents past performance; past performance does not guarantee future results. The investment return and principal value of an investment will fluctuate so that an investor’s shares, when redeemed, may be worth more or less than their original cost. Current performance of the Fund may be lower or higher than the performance quoted. As of the latest prospectus, the gross and net expense ratios of the Fund were 0.39%(1) and 0.17%(2), respectively. Performance data current to the most recent month end may be obtained by calling 1.855.823.3611.
The performance table does not reflect the deduction of taxes that a shareholder may pay on Fund distributions or the redemption of Fund shares. Returns shown for the Fund include the reinvestment of all dividends, if any. Total return calculations reflect the effect of the Adviser’s fee waiver agreement for the Fund. If such fee waivers had not occurred, the quoted performance would be lower.
| 8 | Annual Report • June 30, 2020 |
Bridge Builder Municipal Bond Fund
Management’s Discussion of Fund Performance (Unaudited) (Continued)
Portfolio Characteristics (3)
| Security Type Breakdown | (% of Investments) | |||
General Revenue | 26.4 | % | ||
General Obligation | 16.7 | |||
Healthcare | 15.7 | |||
Transportation | 15.6 | |||
Education | 8.8 | |||
Utilities | 8.7 | |||
Housing | 4.7 | |||
Short-Term Investments | 3.4 | |||
| Breakdown by State | (% of Long-Term Investments) | |||
Illinois | 9.4 | % | ||
Texas | 9.3 | |||
New York | 7.8 | |||
Florida | 7.3 | |||
Pennsylvania | 5.5 | |||
California | 3.8 | |||
New Jersey | 3.5 | |||
Washington | 3.4 | |||
Arizona | 3.0 | |||
Ohio | 3.0 | |||
Other | 44.0 | |||
| Annual Report • June 30, 2020 | 9 |
Bridge Builder Large Cap Growth Fund
Management’s Discussion of Fund Performance (Unaudited)
Investment Objective
The investment objective of the Bridge Builder Large Cap Growth Fund (the “Fund”) is to provide capital appreciation.
Summary of the Investment Strategy
The Fund primarily invests in equity securities of large-capitalization companies, which are defined as those companies whose market capitalizations at the time of purchase typically fall within the range of the Russell 1000® Index. The Fund follows an investing style that favors growth investments and employs a multi-manager sub-advised structure.
Investment Commentary
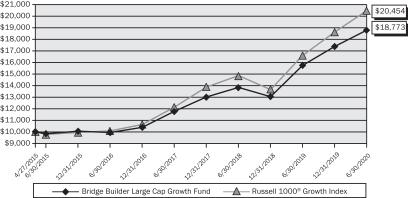
For the fiscal year ended June 30, 2020, the Fund returned 19.28%, underperforming its benchmark, the Russell 1000® Growth Index, which returned 23.28%. Underperformance was driven predominantly by the underweight allocation to, and stock selection within, the information technology sector. Given strong equity performance over the trailing year, the cash exposure was a meaningful headwind to relative performance versus the index.
For the year within large-capitalization growth stocks, information technology and consumer discretionary led the broad market. As a result of the disparity in absolute return and size of the information technology sector versus all other sectors, it accounted for over 60% of the trailing one-year returns within the benchmark. Conversely, energy and industrials were the worst-performing sectors with negative returns over the trailing year, while all other sectors were positive. In addition, within the overall large-capitalization portion of the market, growth stocks outperformed value stocks for the one-year period.
Investment Sub-advisers
| Lazard Asset Management LLC invests primarily in equity securities of U.S. companies that have strong and/or improving financial productivity and are undervalued based on their earnings, cash flow or asset values. | Sustainable Growth Advisers, LP seeks to identify large-capitalization companies that exhibit characteristics such as pricing power, repeat revenue streams and global reach that seem to have the potential for long-term earnings growth within the context of low business risk. | Jennison Associates LLC invests in companies that have strong capital appreciation potential. It follows a highly disciplined investment selection and management process of identifying companies that show superior absolute and relative earnings growth and are believed to be attractively valued. | BlackRock Investment Management, LLC invests in equity securities with the objective of approximating the capitalization weighted total rate of return of the segment of the United States market for publicly traded equity securities represented by the Russell 1000® Growth Index. |
The following chart compares the value of a hypothetical $10,000 investment in the Bridge Builder Large Cap Growth Fund from its inception (April 27, 2015) to June 30, 2020 as compared with the Russell 1000® Growth Index.
Growth of a Hypothetical $10,000 Investment as of June 30, 2020
vs.
Russell 1000® Growth Index
| 10 | Annual Report • June 30, 2020 |
Bridge Builder Large Cap Growth Fund
Management’s Discussion of Fund Performance (Unaudited) (Continued)
Average Annual Total Returns as of June 30, 2020
| 1 Year | 5 Years | Since Inception (4/27/2015) | ||||||||||
Bridge Builder Large Cap Growth Fund | 19.28 | % | 13.81 | % | 12.94 | % | ||||||
Russell 1000® Growth Index | 23.28 | % | 15.89 | % | 14.83 | % | ||||||
Performance data quoted represents past performance; past performance does not guarantee future results. The investment return and principal value of an investment will fluctuate so that an investor’s shares, when redeemed, may be worth more or less than their original cost. Current performance of the Fund may be lower or higher than the performance quoted. As of the latest prospectus, the gross and net expense ratios of the Fund were 0.46%(1) and 0.22%(2), respectively. Performance data current to the most recent month end may be obtained by calling 1.855.823.3611.
The performance table does not reflect the deduction of taxes that a shareholder may pay on Fund distributions or the redemption of Fund shares. Returns shown for the Fund include the reinvestment of all dividends, if any. Total return calculations reflect the effect of the Adviser’s fee waiver agreement for the Fund. If such fee waivers had not occurred, the quoted performance would be lower.
Portfolio Characteristics (3)
| Sector Breakdown | (% of Investments) | |||
Information Technology | 35.1 | % | ||
Healthcare | 17.8 | |||
Consumer Discretionary | 14.9 | |||
Communication Services | 11.0 | |||
Industrials | 4.8 | |||
Financials | 4.7 | |||
Consumer Staples | 3.4 | |||
Materials | 3.2 | |||
Real Estate | 2.3 | |||
Short-Term Investments | 2.1 | |||
Energy | 0.7 | |||
Utilities | 0.0 | * | ||
| * | Amount less than 0.05%. |
| Top Ten Equity Holdings | (% of Net Assets) | |||
Microsoft Corp. | 7.2 | % | ||
Amazon.com, Inc. | 4.2 | |||
Apple, Inc. | 4.1 | |||
Visa, Inc. – Class A | 3.1 | |||
Alphabet, Inc. – Class A | 2.7 | |||
Facebook, Inc. – Class A | 2.6 | |||
Alphabet, Inc. – Class C | 2.4 | |||
Salesforce.com, Inc. | 2.4 | |||
PayPal Holdings, Inc. | 2.0 | |||
Danaher Corp. | 1.9 | |||
| Annual Report • June 30, 2020 | 11 |
Bridge Builder Large Cap Value Fund
Management’s Discussion of Fund Performance (Unaudited)
Investment Objective
The investment objective of the Bridge Builder Large Cap Value Fund (the “Fund”) is to provide capital appreciation.
Summary of the Investment Strategy
The Fund primarily invests in equity securities of large-capitalization companies, which are defined as those companies whose market capitalizations at the time of purchase typically fall within the range of the Russell 1000® Index. The Fund follows an investing style that favors value investments and employs a multi-manager sub-advised structure.
Investment Commentary
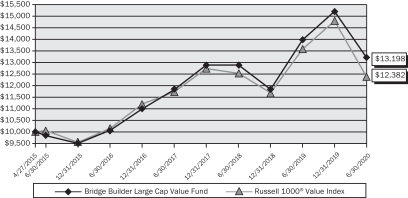
For the fiscal year ended June 30, 2020, the Fund returned -5.55%, outperforming its benchmark, the Russell 1000® Value Index, which returned -8.84%. Compared to the benchmark, tailwinds for the Fund’s relative performance were driven by strong stock selection in information technology, financials and real estate as well as an overweight to information technology and underweights to financials and real estate. Performance detractors for the year included poor stock selection within consumer staples and materials.
For the year, within large-capitalization value stocks, information technology, health care and consumer staples were the only sectors with positive returns over the trailing year. Conversely, energy and financials were the worst-performing sectors, significantly underperforming the broad market. In addition, within the overall large-capitalization portion of the market, growth stocks outperformed value stocks for the one-year period.
Investment Sub-advisers
| Artisan Partners Limited Partnership employs a fundamental investment process to construct a diversified portfolio of equity securities that are undervalued, in solid financial condition and have attractive business economics. | Barrow, Hanley, Mewhinney & Strauss, LLC believes that market inefficiencies can best be exploited through adherence to a value-oriented investment process dedicated to the selection of securities on a bottom-up basis. Barrow Hanley implements this strategy by seeking to construct portfolios of individual stocks that reflect three value characteristics: price/earnings and price/book ratios below the market and dividend yields above the market (as measured by the S&P 500 Index). | Wellington Management Company, LLP uses substantial proprietary, fundamental research resources to identify companies with superior prospects for dividend growth and capital appreciation that sell at reasonable valuation levels. Wellington Management believes that above-average growth in dividends is an effective and often overlooked indicator of higher quality, shareholder-oriented companies that have the ability to produce consistent, above-average returns over the long-term. | BlackRock Investment Management, LLC invests in equity securities with the objective of approximating the capitalization weighted total rate of return of the segment of the United States market for publicly traded equity securities represented by the Russell 1000® Value Index. | |||
| LSV Asset Management primarily invests in large and medium capitalization U.S. companies and uses a bottom-up investment style, seeking to identify companies that are trading at prices substantially below their intrinsic value. LSV follows an active investment strategy, focusing on using data and financial information and combining such information with the rigor of a quantitative model. | T. Rowe Price Associates, Inc. active investment approach emphasizes the value of large-capitalization stocks that have a strong track record of paying dividends or that are believed to be undervalued. T. Rowe Price’s in-house research team seeks companies that appear to be undervalued by various measures and may be temporarily out of favor but have good prospects for capital appreciation and dividend growth. |
| 12 | Annual Report • June 30, 2020 |
Bridge Builder Large Cap Value Fund
Management’s Discussion of Fund Performance (Unaudited) (Continued)
The following chart compares the value of a hypothetical $10,000 investment in the Bridge Builder Large Cap Value Fund from its inception (April 27, 2015) to June 30, 2020 as compared with the Russell 1000® Value Index.
Growth of a Hypothetical $10,000 Investment as of June 30, 2020
vs.
Russell 1000® Value Index
Average Annual Total Returns as of June 30, 2020
| 1 Year | 5 Years | Since Inception (4/27/2015) | ||||||||||
Bridge Builder Large Cap Value Fund | -5.55 | % | 6.05 | % | 5.51 | % | ||||||
Russell 1000® Value Index | -8.84 | % | 4.64 | % | 4.22 | % | ||||||
Performance data quoted represents past performance; past performance does not guarantee future results. The investment return and principal value of an investment will fluctuate so that an investor’s shares, when redeemed, may be worth more or less than their original cost. Current performance of the Fund may be lower or higher than the performance quoted. As of the latest prospectus, the gross and net expense ratios of the Fund were 0.46%(1) and 0.25%(2), respectively. Performance data current to the most recent month end may be obtained by calling 1.855.823.3611.
The performance table does not reflect the deduction of taxes that a shareholder may pay on Fund distributions or the redemption of Fund shares. Returns shown for the Fund include the reinvestment of all dividends, if any. Total return calculations reflect the effect of the Adviser’s fee waiver agreement for the Fund. If such fee waivers had not occurred, the quoted performance would be lower.
Portfolio Characteristics (3)
| Sector Breakdown | (% of Investments) | |||
Financials | 18.0 | % | ||
Industrials | 15.2 | |||
Healthcare | 13.2 | |||
Information Technology | 11.2 | |||
Consumer Discretionary | 10.8 | |||
Consumer Staples | 8.1 | |||
Communication Services | 5.8 | |||
Materials | 5.2 | |||
Energy | 3.5 | |||
Short-Term Investments | 3.4 | |||
Real Estate | 2.9 | |||
Utilities | 2.7 | |||
| Top Ten Equity Holdings | (% of Net Assets) | |||
Comcast Corp. – Class A | 1.8 | % | ||
Medtronic Plc | 1.6 | |||
Chubb Ltd. | 1.5 | |||
Berkshire Hathaway, Inc. – Class B | 1.3 | |||
UnitedHealth Group, Inc. | 1.3 | |||
Alphabet, Inc. – Class C | 1.3 | |||
Raytheon Technologies Corp. | 1.3 | |||
Johnson & Johnson | 1.2 | |||
Citigroup, Inc. | 1.2 | |||
Cisco Systems, Inc. | 1.1 | |||
| Annual Report • June 30, 2020 | 13 |
Bridge Builder Small/Mid Cap Growth Fund
Management’s Discussion of Fund Performance (Unaudited)
Investment Objective
The investment objective of the Bridge Builder Small/Mid Cap Growth Fund (the “Fund”) is to provide capital appreciation.
Summary of the Investment Strategy
The Fund primarily invests in equity securities of small- and mid-capitalization companies, which are defined as those companies whose market capitalizations at the time of purchase typically fall within the range of the Russell MidCap® Index and the Russell 2000® Index. The Fund follows an investing style that favors growth investments and employs a multi-manager sub-advised structure.
Investment Commentary
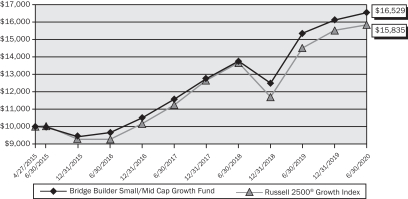
For the fiscal year ended June 30, 2020, the Fund returned 7.63%, underperforming its benchmark, the Russell 2500® Growth Index, which returned 9.21% for the period. Compared to its benchmark, underperformance was driven by challenging sector allocation and stock selection within health care, consumer staples and financials. An underweight in healthcare and overweights in consumer staples and financials detracted from Fund performance. The largest contributor to performance was an underweight, and strong stock selection in, industrials.
During the reporting period, small-capitalization stocks underperformed mid-capitalization stocks. Strongest contributors to returns included information technology and healthcare sectors. The energy and financials sectors were headwinds to performance. Within both mid-capitalization and small-capitalization segments of the market, growth stocks outperformed value stocks.
Investment Sub-advisers
| Eagle Asset Management, Inc. invests primarily in small-capitalization companies. The team generally focuses on investing in small-capitalization companies that demonstrate growth potential at a price that does not appear to reflect the company’s true underlying value. The portfolio managers use a three-pronged investment philosophy: quality, valuation and balance. | Champlain Investment Partners, LLC seeks capital appreciation by investing mainly in common stocks of medium-sized companies that it believes have strong long-term fundamentals, superior capital appreciation potential and attractive valuations. Champlain expects to identify a diversified universe of medium-sized companies that trade at a discount to their estimated or intrinsic fair values. | BlackRock Investment Management, LLC invests in equity securities with the objective of approximating the capitalization-weighted total rate of return of the segment of the United States market for publicly traded equity securities represented by the Russell Midcap® Growth Index, which tracks the performance of mid-capitalization companies, and the Russell 2000® Growth Index, which tracks the performance of small-capitalization companies. | Stephens Investment Management Group, LLC employs a disciplined, bottom-up investment selection process that combines rigorous fundamental analysis with quantitative screening in an effort to identify companies that exhibit potential for superior earnings growth that is unrecognized by the markets. | Artisan Partners Limited Partnership invests primarily in U.S. mid capitalization growth companies. The team seeks to identify companies that possess franchise characteristics, are benefiting from an accelerating profit cycle and are trading at a discount to its estimate of private market value. |
| 14 | Annual Report • June 30, 2020 |
Bridge Builder Small/Mid Cap Growth Fund
Management’s Discussion of Fund Performance (Unaudited) (Continued)
The following chart compares the value of a hypothetical $10,000 investment in the Bridge Builder Small/Mid Cap Growth Fund from its inception (April 27, 2015) to June 30, 2020 as compared with the Russell 2500® Growth Index.
Growth of a Hypothetical $10,000 Investment as of June 30, 2020
vs.
Russell 2500® Growth Index
Average Annual Total Returns as of June 30, 2020
| 1 Year | 5 Years | Since Inception (4/27/2015) | ||||||||||
Bridge Builder Small/Mid Cap Growth Fund | 7.63 | % | 10.66 | % | 10.20 | % | ||||||
Russell 2500® Growth Index | 9.21 | % | 9.57 | % | 9.29 | % | ||||||
Performance data quoted represents past performance; past performance does not guarantee future results. The investment return and principal value of an investment will fluctuate so that an investor’s shares, when redeemed, may be worth more or less than their original cost. Current performance of the Fund may be lower or higher than the performance quoted. As of the latest prospectus, the gross and net expense ratios of the Fund were 0.67%(1) and 0.39%(2), respectively. Performance data current to the most recent month end may be obtained by calling 1.855.823.3611.
The performance table does not reflect the deduction of taxes that a shareholder may pay on Fund distributions or the redemption of Fund shares. Returns shown for the Fund include the reinvestment of all dividends, if any. Total return calculations reflect the effect of the Adviser’s fee waiver agreement for the Fund. If such fee waivers had not occurred, the quoted performance would be lower.
Portfolio Characteristics (3)
| Sector Breakdown | (% of Investments) | |||
Information Technology | 27.2 | % | ||
Healthcare | 25.5 | |||
Industrials | 14.0 | |||
Consumer Discretionary | 9.8 | |||
Financials | 8.2 | |||
Communication Services | 4.3 | |||
Consumer Staples | 4.1 | |||
Short-Term Investments | 2.2 | |||
Materials | 2.1 | |||
Real Estate | 1.3 | |||
Utilities | 1.0 | |||
Energy | 0.3 | |||
| Top Ten Equity Holdings | (% of Net Assets) | |||
Veeva Systems, Inc. – Class A | 2.1 | % | ||
Catalent, Inc. | 1.9 | |||
Fortive Corp. | 1.4 | |||
Global Payments, Inc. | 1.3 | |||
DexCom, Inc. | 1.2 | |||
West Pharmaceutical Services, Inc. | 1.2 | |||
Bio-Techne Corp. | 1.1 | |||
Zscaler, Inc. | 1.1 | |||
Atlassian Corp. Plc – Class A | 1.1 | |||
Ollie’s Bargain Outlet Holdings, Inc. | 1.0 | |||
| Annual Report • June 30, 2020 | 15 |
Bridge Builder Small/Mid Cap Value Fund
Management’s Discussion of Fund Performance (Unaudited)
Investment Objective
The investment objective of the Bridge Builder Small/Mid Cap Value Fund (the “Fund”) is to provide capital appreciation.
Summary of the Investment Strategy
The Fund primarily invests in equity securities of small-and mid-capitalization companies, which are defined as those companies whose market capitalizations at the time of purchase typically fall within the range of the Russell MidCap® Index and the Russell 2000® Index. The Fund follows an investing style that favors value investments and employs a multi-manager sub-advised structure.
Investment Commentary
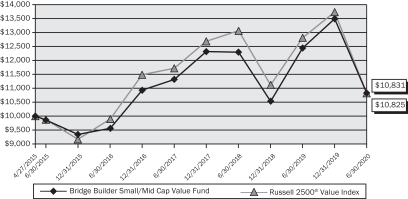
For the fiscal year ended June 30, 2020, the Fund returned -12.98%, outperforming its benchmark, the Russell 2500® Value Index, which returned -15.50% for the period. Compared to its benchmark, outperformance was driven by an underweight to REITs, an overweight to information technology, stock selection in financials and energy, as well as the Fund’s relative overweight to mid-cap stocks. Stock selection within healthcare was the largest detractor from Fund performance.
For the year, small-capitalization stocks underperformed mid-capitalization stocks. Strongest contributors to returns included information technology and healthcare sectors. The energy and financials sectors were headwinds to performance. Within both mid-capitalization and small-capitalization segments of the market, growth stocks outperformed value stocks.
Investment Sub-advisers
| Vaughan Nelson Investment Management, L.P. uses a bottom-up value-oriented investment process. Vaughan Nelson seeks companies than typically possess one or more of the following attributes: companies earning a positive return on capital with stable-to-improving returns, valued at a discount to their asset value and/or having an attractive and sustainable dividend level. | Boston Partners Global Investors, Inc. primarily invests in medium-capitalization companies and uses bottom-up fundamental analysis to make investment decisions. Boston Partners’ strategy seeks to add value through bottom-up stock selection. The strategy is designed to identify companies with attractive valuation, sound business fundamentals and improving business momentum. | Silvercrest Asset Management Group LLC invests in small-capitalization companies that typically possess one or more of the following attributes: business that results in relatively consistent longer-term earnings and cash flow growth, franchise/asset value that may make the company attractive to potential acquirers, cyclically depressed earnings and/or cash flow that has potential for improvement, or a catalyst that will promote recognition of the company’s undervalued status. | BlackRock Investment Management, LLC invests in equity securities with the objective of approximating the capitalization-weighted total rate of return of the segment of the United States market for publicly traded equity securities represented by the Russell Midcap® Value Index, which tracks the performance of mid-capitalization companies, and the Russell 2000® Value Index, which tracks the performance of small-capitalization companies. | |||
LSV Asset Management primarily invests in medium-capitalization companies. LSV uses a bottom-up investment style, seeking to identify companies that are trading at prices substantially below their intrinsic value. | Diamond Hill Capital Management, Inc. typically invests in U.S. equity securities of small to medium market capitalization companies measured at the time of purchase. Diamond Hill’s objective with respect to its allocated portion is to seek long-term capital appreciation by investing in companies selling for less than Diamond Hill’s estimate of intrinsic value. | MFS Investment Management primary invests in securities of companies with small-capitalizations. MFS focuses on investing in the stocks of companies that it believes are undervalued compared to their perceived worth (value companies). MFS uses an active bottom-up investment approach to buying and selling investments. Investments are selected primarily based on fundamental analysis of individual issuers and their potential in light of their Financial condition, and market, economic, political, and regulatory conditions. |
| 16 | Annual Report • June 30, 2020 |
Bridge Builder Small/Mid Cap Value Fund
Management’s Discussion of Fund Performance (Unaudited) (Continued)
The following chart compares the value of a hypothetical $10,000 investment in the Bridge Builder Small/Mid Cap Value Fund from its inception (April 27, 2015) to June 30, 2020 as compared with the Russell 2500® Value Index.
Growth of a Hypothetical $10,000 Investment as of June 30, 2020
vs.
Russell 2500® Value Index
Average Annual Total Returns as of June 30, 2020
| 1 Year | 5 Years | Since Inception (4/27/2015) | ||||||||||
Bridge Builder Small/Mid Cap Value Fund | -12.98 | % | 1.87 | % | 1.55 | % | ||||||
Russell 2500® Value Index | -15.50 | % | 1.85 | % | 1.54 | % | ||||||
Performance data quoted represents past performance; past performance does not guarantee future results. The investment return and principal value of an investment will fluctuate so that an investor’s shares, when redeemed, may be worth more or less than their original cost. Current performance of the Fund may be lower or higher than the performance quoted. As of the latest prospectus, the gross and net expense ratios of the Fund were 0.70%(1) and 0.46%(2), respectively. Performance data current to the most recent month end may be obtained by calling 1.855.823.3611.
The performance table does not reflect the deduction of taxes that a shareholder may pay on Fund distributions or the redemption of Fund shares. Returns shown for the Fund include the reinvestment of all dividends, if any. Total return calculations reflect the effect of the Adviser’s fee waiver agreement for the Fund. If such fee waivers had not occurred, the quoted performance would be lower.
Portfolio Characteristics (3)
| Sector Breakdown | (% of Investments) | |||
Financials | 19.9 | % | ||
Industrials | 17.9 | |||
Information Technology | 12.2 | |||
Consumer Discretionary | 10.7 | |||
Real Estate | 7.5 | |||
Healthcare | 7.3 | |||
Materials | 6.9 | |||
Utilities | 6.3 | |||
Consumer Staples | 4.3 | |||
Energy | 3.2 | |||
Short-Term Investments | 2.2 | |||
Communication Services | 1.6 | |||
| Top Ten Equity Holdings | (% of Net Assets) | |||
AMETEK, Inc. | 0.7 | % | ||
FMC Corp. | 0.7 | |||
Vistra Energy Corp. | 0.6 | |||
TCF Financial Corp. | 0.6 | |||
Evergy, Inc. | 0.6 | |||
Ameriprise Financial, Inc. | 0.6 | |||
Oshkosh Corp. | 0.6 | |||
Nexstar Media Group, Inc. – Class A | 0.5 | |||
IQVIA Holdings, Inc. | 0.5 | |||
Allstate Corp. | 0.5 | |||
| Annual Report • June 30, 2020 | 17 |
Bridge Builder International Equity Fund
Management’s Discussion of Fund Performance (Unaudited)
Investment Objective
The investment objective of the Bridge Builder International Equity Fund (the “Fund”) is to provide capital appreciation.
Summary of the Investment Strategy
The Fund primarily invests in non-U.S. dollar denominated securities of large-capitalization companies that derive a majority of their revenues or profits from a country or countries other than the United States. The Fund employs a multi-manager sub-advised structure.
Investment Commentary
For the fiscal year ended June 30, 2020, the Fund returned -1.40%, while its benchmark, the MSCI EAFE Index, returned -5.13%, which resulted in relative outperformance of 3.73%.
International markets faced a material headwind during the fiscal year as the COVID-19 pandemic increased global uncertainty and countries implemented plans to slow the spread of the coronavirus. While the rebound off the lows has been strong, the economic uncertainty remains. Select European countries such as France and the U.K. underperformed the broader market, while Japan and Germany held up better. The U.S. dollar generally appreciated versus the currencies of other developed regions, detracting from returns of international securities for U.S. investors. Emerging markets performed marginally better than developed markets. In developed markets, growth stocks outperformed value stocks, and small-capitalization stocks outperformed large-capitalization stocks. Energy and financials struggled as oil and interest rates fell. Information technology and health care were the strongest performing sectors as much of the world became more isolated, many moved to remote work arrangements, and potential treatments for the coronavirus became more critical.
Compared to its benchmark, the Fund’s relative return was aided by underweights to financials and real estate, overweights to health care and information technology, and an allocation to emerging markets. An overweight to energy was a headwind to performance for the year. Positive stock selection, particularly in consumer discretionary, industrials, and information technology supported relative returns and offset negative stock selection in the financials and health care sectors.
Investment Sub-advisers
| Baillie Gifford Overseas Limited aims to add value through active management, by making long-term investments in well managed, quality businesses that enjoy sustainable competitive advantages in their marketplace. | BlackRock Investment Management, LLC’s equity index strategies invest in portfolios of international equity securities with the objective of approximating as closely as practicable the capitalization weighted total rates of return of the markets in certain countries for value and growth equity securities traded outside the United States, as represented by the MSCI EAFE Growth and MSCI EAFE Value Indices. | Edinburgh Partners Limited employs a disciplined, value-oriented, global investment strategy to select stocks. Edinburgh Partners aims to identify and buy undervalued non-U.S. companies, including those in the emerging markets, and hold them until share prices reflect their long. term earnings potential. | ||
| Pzena Investment Management, LLC focuses on deep value investing, seeking to identify international securities that are trading at prices substantially below their intrinsic value but have solid long term prospects. | Mondrian Investment Partners Limited employs a long-only, value investment philosophy. Portfolio construction is primarily driven by detailed bottom-up stock selection, based on rigorous dividend discount valuation analysis. | WCM Investment Management uses a bottom-up approach that seeks to identify companies with attractive fundamentals, such as long-term growth in revenue and earnings, and that show a high probability for superior future growth. WCM’s investment process focuses on seeking industry-leading companies that WCM believes possess growing competitive advantages; corporate cultures emphasizing strong, quality and experienced management; low or no debt; and attractive relative valuations. |
| 18 | Annual Report • June 30, 2020 |
Bridge Builder International Equity Fund
Management’s Discussion of Fund Performance (Unaudited) (Continued)
The following chart compares the value of a hypothetical $10,000 investment in the Bridge Builder International Fund from its inception (July 6, 2015) to June 30, 2020 as compared with the MSCI EAFE Index.
Growth of a Hypothetical $10,000 Investment as of June 30, 2020
vs.
MSCI EAFE Index

Average Annual Total Returns as of June 30, 2020
| 1 Year | Since Inception (7/06/2015) | |||||||
Bridge Builder International Equity Fund | -1.40 | % | 3.84 | % | ||||
MSCI EAFE Index | -5.13 | % | 2.31 | % | ||||
Performance data quoted represents past performance; past performance does not guarantee future results. The investment return and principal value of an investment will fluctuate so that an investor’s shares, when redeemed, may be worth more or less than their original cost. Current performance of the Fund may be lower or higher than the performance quoted. As of the latest prospectus, the gross and net expense ratios of the Fund were 0.64%(1) and 0.36%(2), respectively. Performance data current to the most recent month end may be obtained by calling 1.855.823.3611.
The performance table does not reflect the deduction of taxes that a shareholder may pay on Fund distributions or the redemption of Fund shares. Returns shown for the Fund include the reinvestment of all dividends, if any. Total return calculations reflect the effect of the Adviser’s fee waiver agreement for the Fund. If such fee waivers had not occurred, the quoted performance would be lower.
Portfolio Characteristics (3)
| Sector Breakdown | (% of Investments) | |||
Healthcare | 15.5 | % | ||
Consumer Discretionary | 14.5 | |||
Information Technology | 14.2 | |||
Industrials | 13.1 | |||
Financials | 12.0 | |||
Communication Services | 9.5 | |||
Consumer Staples | 7.6 | |||
Energy | 4.0 | |||
Short-Term Investments | 3.5 | |||
Materials | 2.8 | |||
Utilities | 2.5 | |||
Real Estate | 0.8 | |||
| Top Ten Equity Holdings | (% of Net Assets) | |||
Shopify, Inc. – Class A | 2.3 | % | ||
Taiwan Semiconductor Manufacturing Co. Ltd. – ADR | 1.8 | |||
Sanofi SA | 1.8 | |||
Tesco Plc | 1.8 | |||
Novartis AG | 1.6 | |||
Roche Holding AG | 1.3 | |||
China Mobile Ltd. | 1.1 | |||
Samsung SDI Co. Ltd. | 1.1 | |||
Sony Corp. | 1.0 | |||
CK Hutchison Holdings Ltd. | 1.0 | |||
| Annual Report • June 30, 2020 | 19 |
Bridge Builder International Equity Fund
Management’s Discussion of Fund Performance (Unaudited) (Continued)
| Country Breakdown | (% of Long-Term Investments) | |||
Japan | 19.5 | % | ||
United Kingdom | 13.0 | |||
France | 8.7 | |||
Germany | 7.0 | |||
Switzerland | 6.8 | |||
Hong Kong | 4.9 | |||
Canada | 4.0 | |||
Netherlands | 3.6 | |||
China | 3.5 | |||
Sweden | 3.2 | |||
Other | 25.8 | |||
ADR - American Depositary Receipt
| 20 | Annual Report • June 30, 2020 |
Management’s Discussion of Fund Performance (Unaudited)
Disclosures
| (1) | The Gross Expense Ratio, per the Fund’s prospectus, includes all categories of expenses before any expense reductions or fee waivers. |
| (2) | Olive Street has contractually agreed, until at least October 28, 2021, to waive its management fees to the extent management fees to be paid to the Adviser exceed the management fees the Fund is required to pay the Fund’s sub-advisers. This contractual agreement may only be changed or eliminated with the approval of the Board of Trustees. Such waivers are not subject to recoupment by Olive Street. |
| (3) | Fund holdings, sector and portfolio characteristics are subject to change at any time and are not recommendations to buy or sell any security. |
Mutual fund investing involves risk. The value of your investment in a Fund could go down as well as up. Investing in the bond market is subject to certain risks including market, credit, interest-rate and liquidity. Investments in asset-backed, mortgage-related and mortgage-backed securities may be more sensitive to changes in interest rates, prepayments and impairment of the value of the collateral underlying the security.
Investments in lower-rated and non-rated securities presents a greater risk of loss to principal and interest than higher-rated securities. The risks to the municipal bond market can include unusual volatility, liquidity issues, the inability of the issuer to repay the obligation and a tax risk to the investor if the municipal obligation fails to meet requirements. There is no guarantee that all of the municipal bond income will remain exempt from federal or state income taxes. Investments in municipal securities may be adversely affected by unfavorable legislative or political developments and economic developments that impact the financial condition of municipal issuers. Investments in large cap companies may be unable to respond quickly to new competitive challenges, such as changes in technology. They may also not be able to attain the high growth rate of successful smaller companies. Investments in small-and mid-cap companies may involve additional risks such as limited liquidity and greater volatility than larger companies. Investments in non-U.S. dollar-denominated foreign securities (including emerging market securities) may be more sensitive to currency fluctuations, political and economic instability, differing government regulations and liquidity risk. Multi-manager and multi-style management may lead to overlapping securities transactions and higher transaction expenses compared to single investment management styles. Outcomes depend on the skill of the sub-advisers and adviser and the allocation of assets amongst them.
You cannot invest directly in an index.
DEFINITIONS
Bloomberg Barclays U.S. Aggregate Bond Index measures the performance of the U.S. dollar-denominated investment grade, fixed-rate taxable bond market.
Bloomberg Barclays Municipal 1-15 Year Index (1-17) is a subset of the Bloomberg Barclays Municipal Bond Index covering only maturities between 1 and 17 years. The Bloomberg Barclays Municipal Bond Index is an unmanaged index composed of tax-exempt bonds with maturities greater than one year and a minimum credit rating of Baa.
Duration is a measure of the sensitivity of the price of a fixed-income security (or a portfolio of fixed-income securities) to changes in interest rates.
Free Cash Flow is a measure of financial performance calculated as operating cash flow minus capital expenditures. Free cash flow represents the cash that a company is able to generate after laying out the money required to maintain or expand its asset base. Free cash flow is important because it allows a company to pursue opportunities that enhance shareholder value. Without cash, it’s tough to develop new products, make acquisitions, pay dividends and reduce debt.
The Morgan Stanley Capital International (MSCI) Europe, Australasia, Far East (EAFE) Index is an unmanaged index of over 900 companies, and is a generally accepted benchmark for major overseas markets.
Price to Earnings Ratio is a valuation ratio of a company’s current share price compared to its per-share earnings. It is calculated by dividing the current closing price of the stock by the earnings per share of the last four quarters.
Price to Book Ratio is a ratio used to compare a stock’s market value to its book value. It is calculated by dividing the current closing price of the stock by the latest quarter’s book value per share.
The Russell 1000® Index consists of the largest 1,000 companies in a group of 3,000 U.S. companies in the Russell 3000® Index, as ranked by market capitalization.
The Russell 1000® Growth Index measures the performance of the large-cap growth segment of the U.S. equity universe. It includes those Russell 1000® companies with higher price-to-book ratios and higher forecasted growth values.
The Russell 1000® Value Index measures the performance of the large-cap value segment of the U.S. equity universe. It includes those Russell 1000® companies with lower price-to-book ratios and lower expected growth values.
The Russell 2000® Index consists of the smallest 2,000 companies in a group of 3,000 U.S. companies in the Russell 3000® Index, as ranked by market capitalization.
| Annual Report • June 30, 2020 | 21 |
Bridge Builder Mutual Funds
Management’s Discussion of Fund Performance (Unaudited) (Continued)
The Russell 2000® Growth Index measures the performance of the small-cap growth segment of the U.S. equity universe. It includes those Russell 2000® companies with higher price-to-book ratios and higher forecasted growth values.
The Russell 2000® Value Index measures the performance of the small-cap value segment of the U.S. equity universe. It includes those Russell 2000® companies with lower price-to-book ratios and lower forecasted growth values.
The Russell 2500® Growth Index measures the performance of the small-to mid-cap growth segment of the U.S. equity universe. It includes those Russell 2500® Index companies with higher price-to-book ratios and higher forecasted growth values.
The Russell 2500® Value Index measures the performance of the small-to mid-cap value segment of the U.S. equity universe. It includes those Russell 2500® Index companies with lower price-to-book and lower forecasted growth values.
The Russell 3000® Index measures the performance of the 3,000 largest publicly held companies incorporated in the U.S. based on market capitalization.
The Russell Midcap® Index measures the performance of the mid-cap segment of the U.S. equity universe.
The Russell Midcap® Growth Index measures the performance of the mid-cap growth segment of the U.S. equity universe. It includes those Russell 1000® companies with higher price-to-book ratios and higher forecasted growth values.
The Russell Midcap® Value Index measures the performance of the mid-cap value segment of the U.S. equity universe. It includes those Russell 1000® companies with lower price-to-book ratios and lower forecasted growth values.
The S&P 500 Index, an unmanaged index, consists of 500 stocks chosen for market size, liquidity, and industry group representation. It is a market-value weighted index (stock price times number of shares outstanding), with each stock’s weight in the Index proportionate to its market value.
| 22 | Annual Report • June 30, 2020 |
Fund Expense Examples (Unaudited)
As a shareholder of the Funds, you incur two types of costs: (1) ongoing costs, including management fees and other Fund expenses; and (2) Edward Jones Advisory Solutions® program and administrative fees, which are charged outside of the Funds. This Example is intended to help you understand your ongoing costs (in dollars) of investing in the Funds and to compare these costs with the ongoing costs of investing in other mutual funds.
Actual Expenses
The Examples are based on $1,000 invested at the beginning of the period and held for the entire period from January 1, 2020 to June 30, 2020.
The first line of the table below provides information about actual account values and actual expenses. You may use the information in this line, together with the amount you invested, to estimate the expenses you paid over the period. Simply divide your account value by $1,000 (for example, an $8,600 account value divided by $1,000 equals 8.6), then multiply the result by the number in the applicable line under the heading titled “Expenses paid during the period” to estimate the expenses you paid on your account during the period.
Hypothetical Example for Comparison Purposes
The second line of the table below provides information about hypothetical account values and hypothetical expenses based on the Funds’ actual expense ratio and an assumed rate of return of 5% per year before expenses, which is not the Funds’ actual return. The hypothetical account values and expenses may not be used to estimate the actual ending account balance or expenses you paid for the period. You may use this information to compare the ongoing costs of investing in the Funds with other funds. To do so, compare this 5% hypothetical example with the 5% hypothetical examples that appear in the shareholder reports of other funds.
Please note that the expenses shown in the table are meant to highlight your ongoing costs of owning shares of a Fund only and do not reflect annual Edward Jones Advisory Solutions® program and administrative fees. If fees of Edward Jones Advisory Solutions® had been included, your costs would have been higher. The second line of the table for each Fund is useful in comparing ongoing costs only, and will not help you determine the relative total costs of owning different funds.
| Beginning account value | Ending account value | Annualized Expense Ratio | Expenses paid during the period* | |||||||||||||||||
Bridge Builder Core Bond Fund | ||||||||||||||||||||
| Actual | $ | 1,000.00 | $ | 1,062.20 | 0.13 | % | $ | 0.67 | ||||||||||||
| Hypothetical | 1,000.00 | 1,024.22 | 0.65 | |||||||||||||||||
Bridge Builder Core Plus Bond Fund | ||||||||||||||||||||
| Actual | 1,000.00 | 1,055.10 | 0.15 | 0.77 | ||||||||||||||||
| Hypothetical | 1,000.00 | 1,024.12 | 0.75 | |||||||||||||||||
Bridge Builder Municipal Bond Fund | ||||||||||||||||||||
| Actual | 1,000.00 | 1,006.50 | 0.16 | 0.80 | ||||||||||||||||
| Hypothetical | 1,000.00 | 1,024.07 | 0.81 | |||||||||||||||||
Bridge Builder Large Cap Growth Fund | ||||||||||||||||||||
| Actual | 1,000.00 | 1,080.90 | 0.22 | 1.14 | ||||||||||||||||
| Hypothetical | 1,000.00 | 1,023.77 | 1.11 | |||||||||||||||||
Bridge Builder Large Cap Value Fund | ||||||||||||||||||||
| Actual | 1,000.00 | 867.70 | 0.24 | 1.11 | ||||||||||||||||
| Hypothetical | 1,000.00 | 1,023.67 | 1.21 | |||||||||||||||||
Bridge Builder Small/Mid Cap Growth Fund | ||||||||||||||||||||
| Actual | 1,000.00 | 1,026.50 | 0.37 | 1.86 | ||||||||||||||||
| Hypothetical | 1,000.00 | 1,023.02 | 1.86 | |||||||||||||||||
Bridge Builder Small/Mid Cap Value Fund | ||||||||||||||||||||
| Actual | 1,000.00 | 802.60 | 0.41 | 1.84 | ||||||||||||||||
| Hypothetical | 1,000.00 | 1,022.82 | 2.06 | |||||||||||||||||
Bridge Builder International Equity Fund | ||||||||||||||||||||
| Actual | 1,000.00 | 914.90 | 0.33 | 1.57 | ||||||||||||||||
| Hypothetical | 1,000.00 | 1,023.22 | 1.66 | |||||||||||||||||
| * | Expenses are equal to the Funds’ annualized expense ratio, multiplied by the average account value over the period, multiplied by 182/366 (to reflect the six-month period). Expenses do not include Edward Jones Advisory Solutions® program and administrative fees, which are charged outside of the Funds. |
| Annual Report • June 30, 2020 | 23 |
Summary Schedule of Investments
June 30, 2020
| Principal Amount | Value | |||||||
BONDS & NOTES – 96.93% | ||||||||
Asset-Backed Obligations – 11.67% | ||||||||
Ford Credit Auto Owner Trust 2018-REV1, 3.19%, Jul. 2031 (1) | $ | 24,024,000 | $ | 25,725,286 | ||||
KVK CLO 2018-1 Ltd., 1.31%, (3 Month LIBOR USD + 0.93%), May 2029 (1)(2) | 25,000,000 | 24,454,250 | ||||||
Zais CLO 8 Ltd., 2.17%, (3 Month LIBOR USD + 0.95%), Apr. 2029 (1)(2) | 39,562,018 | 37,868,961 | ||||||
Other Securities (1)(2)(3)(4)(12) | 1,562,500,259 | 1,562,415,497 | ||||||
|
| |||||||
Total Asset-Backed Obligations | 1,650,463,994 | |||||||
|
| |||||||
Corporate Bonds – 33.46% | ||||||||
| Basic Materials – 1.07% | ||||||||
Various Securities (1)(2)(5) | 136,201,000 | 151,826,077 | ||||||
|
| |||||||
Total Basic Materials | 151,826,077 | |||||||
|
| |||||||
| Communications – 2.74% | ||||||||
Various Securities (1) | 327,718,000 | 386,825,170 | ||||||
|
| |||||||
Total Communications | 386,825,170 | |||||||
|
| |||||||
| Consumer, Cyclical – 1.46% | ||||||||
Various Securities (1)(2) | 205,012,094 | 206,177,677 | ||||||
|
| |||||||
Total Consumer, Cyclical | 206,177,677 | |||||||
|
| |||||||
| Consumer, Non-cyclical – 5.10% | ||||||||
Cigna Corp., 4.38%, Oct. 2028 | 30,325,000 | 35,887,572 | ||||||
Other Securities (1)(2) | 610,504,612 | 685,170,051 | ||||||
|
| |||||||
Total Consumer, Non-cyclical | 721,057,623 | |||||||
|
| |||||||
| Diversified – 0.03% | ||||||||
Various Securities (1) | 3,638,244 | 3,790,678 | ||||||
|
| |||||||
Total Diversified | 3,790,678 | |||||||
|
| |||||||
| Energy – 3.76% | ||||||||
Various Securities (1)(2) | 507,990,000 | 532,078,862 | ||||||
|
| |||||||
Total Energy | 532,078,862 | |||||||
|
| |||||||
| Financials – 12.58% | ||||||||
Bank of America Corp., 2.37%-7.75%, Apr. 2021-Jul. 2168 (2) | 148,949,000 | 162,647,014 | ||||||
Other Securities (1)(2) | 1,498,097,000 | 1,616,124,227 | ||||||
|
| |||||||
Total Financials | 1,778,771,241 | |||||||
|
| |||||||
| Industrials – 1.60% | ||||||||
Various Securities (1)(3) | 209,593,000 | 225,978,191 | ||||||
|
| |||||||
Total Industrials | 225,978,191 | |||||||
|
| |||||||
| Technology – 1.31% | ||||||||
Various Securities (1) | 169,995,000 | 185,382,283 | ||||||
|
| |||||||
Total Technology | 185,382,283 | |||||||
|
| |||||||
| Utilities – 3.81% | ||||||||
Various Securities (1)(5) | 479,664,875 | 539,368,816 | ||||||
|
| |||||||
Total Utilities | 539,368,816 | |||||||
|
| |||||||
Total Corporate Bonds | 4,731,256,618 | |||||||
|
| |||||||
Government Related – 14.50% | ||||||||
| Other Government Related – 2.23% | ||||||||
Various Securities (1)(2)(4)(6)(7) | 275,845,000 | 315,568,248 | ||||||
|
| |||||||
Total Other Government Related | 315,568,248 | |||||||
|
| |||||||
| U.S. Treasury Obligations – 12.27% | ||||||||
U.S. Treasury Bond, 3.00%, Nov. 2044 | 34,590,000 | 46,296,553 | ||||||
U.S. Treasury Note, 1.75%, Dec. 2024 | 36,232,800 | 38,657,284 | ||||||
U.S. Treasury Note/Bond, 0.25%, Jun. 2025 | 24,120,000 | 24,072,891 | ||||||
The accompanying notes are an integral part of these financial statements.
| 24 | Annual Report • June 30, 2020 |
Bridge Builder Core Bond Fund
Summary Schedule of Investments
June 30, 2020 (Continued)
| Principal Amount | Value | |||||||
| U.S. Treasury Obligations – 12.27% – (continued) | ||||||||
U.S. Treasury Note/Bond, 1.63%, Oct. 2023 | $ | 25,000,000 | $ | 26,192,383 | ||||
U.S. Treasury Note/Bond, 1.63%, Aug. 2029 | 58,230,000 | 63,525,291 | ||||||
U.S. Treasury Note/Bond, 1.75%, Feb. 2022 | 37,900,000 | 38,890,433 | ||||||
U.S. Treasury Note/Bond, 1.75%, Mar. 2022 | 53,000,000 | 54,461,640 | ||||||
U.S. Treasury Note/Bond, 2.00%, Feb. 2050 | 50,376,000 | 57,660,842 | ||||||
U.S. Treasury Note/Bond, 2.13%, Dec. 2022 | 55,000,000 | 57,674,805 | ||||||
U.S. Treasury Note/Bond, 2.25%, Nov. 2025 | 33,746,000 | 37,179,919 | ||||||
U.S. Treasury Note/Bond, 2.25%, Aug. 2046 | 26,502,100 | 31,418,446 | ||||||
U.S. Treasury Note/Bond, 2.50%, May 2024 | 41,538,000 | 45,196,914 | ||||||
U.S. Treasury Note/Bond, 2.50%, Feb. 2045 | 87,800,000 | 108,264,946 | ||||||
U.S. Treasury Note/Bond, 2.88%, May 2043 | 90,925,000 | 118,756,574 | ||||||
U.S. Treasury Note/Bond, 2.88%, May 2049 | 42,836,000 | 57,918,957 | ||||||
U.S. Treasury Note/Bond, 3.13%, Nov. 2028 | 58,300,000 | 70,479,234 | ||||||
U.S. Treasury Note/Bond, 3.13%, Feb. 2043 | 27,100,000 | 36,733,203 | ||||||
U.S. Treasury Note/Bond, 3.13%, May 2048 | 24,938,000 | 34,931,709 | ||||||
U.S. Treasury Note/Bond, 3.38%, Nov. 2048 | 30,280,000 | 44,470,201 | ||||||
U.S. Treasury Note/Bond, 3.63%, Aug. 2043 | 16,350,000 | 23,874,832 | ||||||
U.S. Treasury Note/Bond, 3.63%, Feb. 2044 | 32,750,000 | 47,925,020 | ||||||
U.S. Treasury Note/Bond, 3.75%, Nov. 2043 | 48,150,000 | 71,640,053 | ||||||
U.S. Treasury Note/Bond, 4.75%, Feb. 2037 | 37,619,000 | 59,981,732 | ||||||
U.S. Treasury Strip Coupon, 0.00%, Feb. 2022 | 25,367,000 | 25,293,184 | ||||||
U.S. Treasury Strip Coupon, 0.00%, Nov. 2022 | 25,950,000 | 25,837,067 | ||||||
U.S. Treasury Bond, 1.13%, May 2040 | 3,444,000 | 3,411,443 | ||||||
U.S. Treasury Note, 0.13%-1.88%, Nov. 2021-May 2027 | 50,438,000 | 50,923,847 | ||||||
U.S. Treasury Note/Bond, 0.13%-8.75%, Aug. 2020-May 2050 | 262,886,900 | 297,060,351 | ||||||
U.S. Treasury Strip Coupon, 0.00%, Aug. 2021-Nov. 2043 (6) | 133,505,000 | 127,357,567 | ||||||
Other Securities (8) | 8,232,903 | 9,125,524 | ||||||
|
| |||||||
Total U.S. Treasury Obligations | 1,735,212,845 | |||||||
|
| |||||||
Total Government Related | 2,050,781,093 | |||||||
|
| |||||||
Mortgage-Backed Obligations – 37.30% | ||||||||
BBCMS Mortgage Trust 2018-C2, 4.05%, Dec. 2051 | 20,000,000 | 23,182,176 | ||||||
Benchmark 2018-B1 Mortgage Trust, 2.67%, Dec. 2072 | 30,000,000 | 32,142,633 | ||||||
Citigroup Commercial Mortgage Trust 2017-P8, 3.20%, Sep. 2050 | 21,000,000 | 22,747,704 | ||||||
Citigroup Commercial Mortgage Trust 2018-B2, 3.74%, Mar. 2051 | 22,000,000 | 25,055,081 | ||||||
Fannie Mae, 2.00%, Aug. 2050 (9) | 43,640,000 | 44,540,535 | ||||||
Fannie Mae, 2.50%, Jul. 2050 (9) | 66,220,000 | 69,005,896 | ||||||
Fannie Mae, 3.00%, Sep. 2050 (9) | 35,205,000 | 36,949,846 | ||||||
Fannie Mae Pool, 3.50%, Jul. 2042 | 22,447,931 | 24,485,452 | ||||||
Fannie Mae REMICS SER 2019 CL BA, 1.99%, Dec. 2029 | 25,611,310 | 26,736,245 | ||||||
Fannie Mae-Aces, 3.06%, May 2027 (4) | 29,130,000 | 32,559,816 | ||||||
Fannie Mae-Aces, 3.09%, Apr. 2027 (4) | 23,211,000 | 25,825,898 | ||||||
Fannie Mae-Aces, 3.50%, Jul. 2028 (4) | 40,373,282 | 46,216,587 | ||||||
Freddie Mac Gold Pool, 3.00%, Oct. 2046 | 27,278,640 | 29,382,282 | ||||||
Freddie Mac Multifamily Structured Pass Through Certificates, 3.19%, Sep. 2027 (4) | 25,150,000 | 28,760,818 | ||||||
Freddie Mac Multifamily Structured Pass Through Certificates, 3.36%, Dec. 2026 (4) | 27,000,000 | 30,493,446 | ||||||
Freddie Mac Multifamily Structured Pass Through Certificates, 3.51%, Jan. 2027 (4) | 23,250,000 | 26,733,782 | ||||||
G2ST 30YR TBA 3.0% SEP 19, 3.00%, Sep. 2050 (9) | 45,810,000 | 48,338,497 | ||||||
Ginnie Mae, 2.50%, Jul. 2050 (9) | 22,000,000 | 23,148,984 | ||||||
Ginnie Mae, 3.50%, Jul. 2049 (9) | 25,720,000 | 27,140,628 | ||||||
GS Mortgage Securities Corp. II, 4.26%, Jul. 2051 (4) | 28,521,000 | 31,898,303 | ||||||
UBS Commercial Mortgage Trust 2017-C5, 3.21%, Nov. 2050 | 21,500,000 | 23,300,462 | ||||||
Fannie Mae, 2.00%-4.50%, Jul. 2034-Aug. 2050 (9) | 62,015,000 | 65,076,408 | ||||||
Fannie Mae Pool, 0.53%-8.50%, Aug. 2020-Jun. 2050 (2)(4) | 1,335,339,009 | 1,457,543,880 | ||||||
Fannie Mae-Aces, 1.65%-3.78%, Nov. 2020-Aug. 2030 (2)(4) | 124,426,116 | 137,678,099 | ||||||
Freddie Mac Gold Pool, 2.00%-10.00%, Aug. 2020-Oct. 2048 | 447,652,092 | 485,170,242 | ||||||
Freddie Mac Multifamily Structured Pass Through Certificates, 0.88%-4.03%, May 2022-Oct. 2033 (2)(4) | 391,854,420 | 337,299,069 | ||||||
Freddie Mac Pool, 3.00%-5.00%, Dec. 2034-Jun. 2050 | 138,217,549 | 149,302,334 | ||||||
Ginnie Mae,0.00%-8.05%, Feb. 2029-Aug. 2067 | 184,079,925 | 156,246,544 | ||||||
Ginnie Mae II Pool, 2.50%-8.50%, Mar. 2025-May 2063 (4)(6) | 400,923,032 | 432,821,464 | ||||||
The accompanying notes are an integral part of these financial statements.
| Annual Report • June 30, 2020 | 25 |
Bridge Builder Core Bond Fund
Summary Schedule of Investments
June 30, 2020 (Continued)
| Principal Amount | Value | |||||||
Mortgage-Backed Obligations – 37.30% – (continued) | ||||||||
Ginnie Mae TBA 30 YR, 2.50%, Aug. 2050 (9) | $ | 8,825,000 | $ | 9,266,939 | ||||
Other Securities (1)(2)(3)(4)(7)(9)(12) | 1,359,911,416 | 1,364,642,444 | ||||||
|
| |||||||
Total Mortgage-Backed Obligations | 5,273,692,494 | |||||||
|
| |||||||
Total Bonds & Notes | 13,706,194,199 | |||||||
|
| |||||||
| Shares | Value | |||||||
PREFERRED STOCKS – 0.02% | ||||||||
| Financials – 0.02% | ||||||||
State Street Corp., 5.35% (2) | 95,000 | 2,489,000 | ||||||
|
| |||||||
Total Preferred Stocks | 2,489,000 | |||||||
|
| |||||||
SHORT-TERM INVESTMENTS – 6.12% | ||||||||
| Money Market Funds – 6.09% | ||||||||
Fidelity Institutional Money Market Government Fund – Class I, 0.10% (10)(11) | 861,649,237 | 861,649,237 | ||||||
|
| |||||||
Total Money Market Funds | 861,649,237 | |||||||
|
| |||||||
| Principal Amount | Value | |||||||
| U.S. Treasury Bills – 0.02% | ||||||||
U.S. Treasury Bill, 1.45%, Jan. 2021 | $ | 2,000,000 | 1,998,184 | |||||
|
| |||||||
Total U.S. Treasury Bills | 1,998,184 | |||||||
|
| |||||||
| Time Deposits – 0.01% | ||||||||
BNP Paribas, Paris, 0.01% due 07/01/2020 | 327,746 | 327,746 | ||||||
China Construction Bank, New York, 0.01% due 07/01/2020 | 1,769,198 | 1,769,198 | ||||||
|
| |||||||
Total Time Deposits | 2,096,944 | |||||||
|
| |||||||
Total Short-Term Investments | 865,744,365 | |||||||
|
| |||||||
TOTAL INVESTMENTS IN SECURITIES – 103.07% | 14,574,427,564 | |||||||
LIABILITIES IN EXCESS OF OTHER ASSETS – (3.07)% | (434,296,820 | ) | ||||||
|
| |||||||
TOTAL NET ASSETS – 100.00% | $ | 14,140,130,744 | ||||||
|
| |||||||
Percentages are stated as a percent of net assets.
| (1) | Security or includes securities purchased exempt from registration in the U.S. pursuant to Rule 144(A) under the Securities Act of 1933. The value of these securities totals $2,777,138,233, which represents 19.64% of total net assets. |
| (2) | Variable rate security or includes variable rate securities based on a reference index and spread. The rate reported is the rate in effect as of June 30, 2020. |
| (3) | Step-up bond or includes step-up bonds that pays an initial coupon rate for the first period and then a higher coupon rate for the following periods. The rate reported is the rate in effect as of June 30, 2020. |
| (4) | Variable rate security or includes variable rate securities. The coupon is based on an underlying pool of assets. The rate reported is the rate in effect as of June 30, 2020. |
| (5) | Security in default or includes securities in default as of June 30, 2020. The value of these securities total $2,395,873, which represents 0.02% of total net assets. |
| (6) | Partially assigned as collateral for certain future and swap contracts. The value of these pledged issues totals $14,566,201, which represents 0.10% of total net assets. |
The accompanying notes are an integral part of these financial statements.
| 26 | Annual Report • June 30, 2020 |
Bridge Builder Core Bond Fund
Summary Schedule of Investments
June 30, 2020 (Continued)
| (7) | Inverse floating rate security or includes inverse floating rate securities whose interest rate moves in the opposite direction of reference interest rates. Reference interest rates are typically based on a negative multiplier or slope. |
| (8) | Includes inflation protected securities. The value of these securities total $6,288,752, which represents 0.04% of total net assets. |
| (9) | Delayed delivery purchase commitment security or includes delayed delivery purchase commitment securities. The value of these securities total $330,869,022, which represents 2.34% of total net assets. |
| (10) | Represents annualized seven-day yield as of the close of the reporting period. |
| (11) | Partially assigned as collateral for certain delayed delivery securities. |
| (12) | Security or includes securities categorized as Level 3 per the Trust’s fair value hierarchy. The value of these securities total $82,060,788, which represents 0.58% of total net assets. |
Open Futures Contracts
| Number of Contracts Purchased | Reference Entity | Counterparty | Expiration Date | Notional Amount | Value | Unrealized Appreciation/ (Depreciation) | ||||||||||||||||
| 1,733 | U.S. 2 Year Note Future | J.P. Morgan | Sep. 2020 | $ | 382,637,889 | $ | 382,695,142 | $ | 57,253 | |||||||||||||
| 1,475 | U.S. 5 Year Note Future | J.P. Morgan | Sep. 2020 | 185,096,727 | 185,469,727 | 373,000 | ||||||||||||||||
| 1,349 | U.S. Ultra Bond Future | J.P. Morgan | Sep. 2020 | 294,053,264 | 294,292,781 | 239,517 | ||||||||||||||||
|
| |||||||||||||||||||||
| 669,770 | ||||||||||||||||||||||
|
| |||||||||||||||||||||
| Number of Contracts Sold | Reference Entity | Counterparty | Expiration Date | Notional Amount | Value | Unrealized Appreciation/ (Depreciation) | ||||||||||||||||
| (1,272) | U.S. 10 Year Note Future | J.P. Morgan | Sep. 2020 | $ | (176,194,638 | ) | $ | (177,026,625 | ) | $ | (831,987 | ) | ||||||||||
| (3) | U.S. Long Bond Future | J.P. Morgan | Sep. 2020 | (528,472 | ) | (535,688 | ) | (7,216 | ) | |||||||||||||
| (72) | U.S. Ultra 10 Year Note Future | J.P. Morgan | Sep. 2020 | (11,268,969 | ) | (11,338,875 | ) | (69,906 | ) | |||||||||||||
|
| |||||||||||||||||||||
| (909,109 | ) | |||||||||||||||||||||
|
| |||||||||||||||||||||
| $ | (239,339 | ) | ||||||||||||||||||||
|
| |||||||||||||||||||||
Centrally Cleared Interest Rate Swaps
| Fixed Annual Rate | Floating Rate Index | Floating Rate Paid or Received | Payment Frequency | Maturity Date | Notional Amount | Upfront Premium Paid/ (Received) | Unrealized Appreciation/ (Depreciation) | Value | ||||||||||||||||||||||
| 1.38% | 3 Month USD LIBOR | Paid | Quarterly | 9/15/2021 | $ | 14,385,000 | $ | (1,342 | ) | $ | 253,485 | $ | 252,143 | |||||||||||||||||
| 1.48 | 3 Month USD LIBOR | Paid | Quarterly | 9/15/2021 | 7,490,000 | 4,536 | 137,766 | 142,302 | ||||||||||||||||||||||
| 1.60 | 3 Month USD LIBOR | Paid | Quarterly | 9/15/2021 | 5,370,000 | 15,786 | 96,258 | 112,044 | ||||||||||||||||||||||
|
|
|
|
|
| |||||||||||||||||||||||||
| $ | 18,980 | $ | 487,509 | $ | 506,489 | |||||||||||||||||||||||||
|
|
|
|
|
| |||||||||||||||||||||||||
The accompanying notes are an integral part of these financial statements.
| Annual Report • June 30, 2020 | 27 |
Bridge Builder Core Plus Bond Fund
Summary Schedule of Investments
June 30, 2020
| Principal Amount | Value | |||||||
BONDS & NOTES – 91.67% | ||||||||
Asset-Backed Obligations – 11.46% | ||||||||
Countrywide Asset-Backed Certificates, 0.36%, (1 Month LIBOR USD + 0.18%, 0.18% Floor), Jun. 2047 (1) | $ | 40,053,819 | $ | 36,914,849 | ||||
OAK Hill European Credit Partners V Designated Activity Co, 0.72%, (3 Month EURIBOR + 0.72%, 0.72% Floor), Feb. 2030 (1)(2) | EUR | 34,900,000 | 38,778,760 | |||||
St Paul’s CLO VI DAC, 0.85%, (3 Month EURIBOR + 0.85%, 0.85% Floor), Aug. 2030 (1)(2) | 38,000,000 | 42,139,058 | ||||||
Other Securities *(1)(2)(3)(4) | 2,233,980,246 | 2,108,264,543 | ||||||
|
| |||||||
Total Asset-Backed Obligations | 2,226,097,210 | |||||||
|
| |||||||
Corporate Bonds – 36.94% | ||||||||
| Basic Materials – 0.92% | ||||||||
Various Securities *(2) | 165,932,000 | 177,832,403 | ||||||
|
| |||||||
Total Basic Materials | 177,832,403 | |||||||
|
| |||||||
| Communications – 5.17% | ||||||||
AT&T, Inc., 2.75%, Jun. 2031 | $ | 34,109,000 | 35,285,294 | |||||
AT&T, Inc., 4.50%, Mar. 2048 | 34,524,000 | 40,512,172 | ||||||
T-Mobile USA, Inc., 3.88%, Apr. 2030 (2) | 46,138,000 | 51,424,031 | ||||||
AT&T, Inc., 2.30%-5.25%, Feb. 2027-Jun. 2060 | 122,985,000 | 140,356,196 | ||||||
Other Securities *(1)(2)(5) | 690,004,688 | 736,507,204 | ||||||
|
| |||||||
Total Communications | 1,004,084,897 | |||||||
|
| |||||||
| Consumer, Cyclical – 2.97% | ||||||||
Various Securities *(1)(2)(6) | 584,596,527 | 578,127,833 | ||||||
|
| |||||||
Total Consumer, Cyclical | 578,127,833 | |||||||
|
| |||||||
| Consumer, Non-cyclical – 6.27% | ||||||||
CVS Health Corp., 5.05%, Mar. 2048 | 38,380,000 | 49,923,481 | ||||||
Other Securities *(1)(2)(16) | 1,064,356,340 | 1,168,337,233 | ||||||
|
| |||||||
Total Consumer, Non-cyclical | 1,218,260,714 | |||||||
|
| |||||||
| Diversified – 0.02% | ||||||||
CVS Pass-Through Trust Series 2013, 4.70%, Jan. 2036 (2) | 4,262,027 | 4,559,327 | ||||||
|
| |||||||
Total Diversified | 4,559,327 | |||||||
|
| |||||||
| Energy – 3.23% | ||||||||
Various Securities *(1)(2)(5)(15) | 864,756,115 | 628,244,604 | ||||||
|
| |||||||
Total Energy | 628,244,604 | |||||||
|
| |||||||
| Financials – 12.39% | ||||||||
GE Capital International Funding Co. Unlimited Co., 4.42%, Nov. 2035 | 40,925,000 | 41,548,949 | ||||||
Other Securities *(1)(2)(3)(6)(16) | 2,229,230,740 | 2,365,573,007 | ||||||
|
| |||||||
Total Financials | 2,407,121,956 | |||||||
|
| |||||||
| Industrials – 2.22% | ||||||||
Various Securities *(1)(2) | 417,419,000 | 431,128,175 | ||||||
|
| |||||||
Total Industrials | 431,128,175 | |||||||
|
| |||||||
| Technology – 1.62% | ||||||||
Various Securities *(1)(2) | 289,728,000 | 315,073,012 | ||||||
|
| |||||||
Total Technology | 315,073,012 | |||||||
|
| |||||||
| Utilities – 2.13% | ||||||||
Various Securities (1)(2)(5) | 383,525,000 | 414,445,088 | ||||||
|
| |||||||
Total Utilities | 414,445,088 | |||||||
|
| |||||||
Total Corporate Bonds | 7,178,878,009 | |||||||
|
| |||||||
The accompanying notes are an integral part of these financial statements.
| 28 | Annual Report • June 30, 2020 |
Bridge Builder Core Plus Bond Fund
Summary Schedule of Investments
June 30, 2020 (Continued)
| Principal Amount | Value | |||||||
Convertible Securities – 0.13% | ||||||||
| Communications – 0.06% | ||||||||
Various Securities | $ | 11,905,000 | $ | 10,757,371 | ||||
|
| |||||||
Total Communications | 10,757,371 | |||||||
|
| |||||||
| Consumer, Cyclical – 0.01% | ||||||||
Caesars Entertainment Corp., 5.00%, Oct. 2024 | 1,634,430 | 2,747,001 | ||||||
|
| |||||||
Total Consumer, Cyclical | 2,747,001 | |||||||
|
| |||||||
| Consumer, Non-cyclical – 0.04% | ||||||||
Various Securities (2) | 7,285,000 | 8,776,800 | ||||||
|
| |||||||
Total Consumer, Non-cyclical | 8,776,800 | |||||||
|
| |||||||
| Energy – 0.01% | ||||||||
Various Securities (2)(5)(7) | 5,845,000 | 2,061,378 | ||||||
|
| |||||||
Total Energy | 2,061,378 | |||||||
|
| |||||||
| Industrials – 0.01% | ||||||||
Greenbrier Cos, Inc., 2.88%, Feb. 2024 | 1,993,000 | 1,640,183 | ||||||
|
| |||||||
Total Industrials | 1,640,183 | |||||||
|
| |||||||
Total Convertible Securities | 25,982,733 | |||||||
|
| |||||||
Government Related – 12.63% | ||||||||
| Other Government Related – 1.75% | ||||||||
Various Securities *(1)(2)(5)(16) | 3,369,018,605 | 340,170,963 | ||||||
|
| |||||||
Total Other Government Related | 340,170,963 | |||||||
|
| |||||||
| U.S. Treasury Obligations – 10.88% | ||||||||
U.S. Treasury Inflation Indexed Bonds, 0.25%, Jul. 2029 (8)(9) | 115,248,906 | 126,155,403 | ||||||
U.S. Treasury Inflation Indexed Bonds, 0.25%, Feb. 2050 (8) | 78,878,486 | 88,559,588 | ||||||
U.S. Treasury Inflation Indexed Note, 0.13%, Apr. 2025 (8) | 52,339,798 | 54,881,998 | ||||||
U.S. Treasury Note/Bond, 0.13%, Apr. 2022 | 140,350,000 | 140,251,317 | ||||||
U.S. Treasury Note/Bond, 0.13%, May 2022 | 57,150,000 | 57,107,584 | ||||||
U.S. Treasury Note/Bond, 0.25%, May 2025 | 71,700,000 | 71,607,574 | ||||||
U.S. Treasury Note/Bond, 0.25%, Jun. 2025 | 75,470,000 | 75,322,598 | ||||||
U.S. Treasury Note/Bond, 0.38%, Mar. 2022 | 83,370,000 | 83,669,611 | ||||||
U.S. Treasury Note/Bond, 0.63%, May 2030 | 61,240,000 | 61,053,409 | ||||||
U.S. Treasury Note/Bond, 1.25%, May 2050 | 97,004,000 | 93,127,629 | ||||||
U.S. Treasury Note/Bond, 1.50%, Nov. 2021 | 43,085,000 | 43,894,527 | ||||||
U.S. Treasury Note/Bond, 1.50%, Sep. 2022 (9) | 34,990,000 | 36,024,665 | ||||||
U.S. Treasury Note/Bond, 1.50%, Jan. 2023 | 229,835,000 | 237,538,062 | ||||||
U.S. Treasury Note/Bond, 1.63%, Nov. 2022 | 205,170,000 | 212,230,733 | ||||||
U.S. Treasury Note/Bond, 1.63%, Dec. 2022 | 44,950,000 | 46,554,855 | ||||||
U.S. Treasury Note/Bond, 2.00%, Feb. 2050 | 64,231,000 | 73,519,405 | ||||||
U.S. Treasury Note/Bond, 2.25%, Aug. 2049 (10) | 170,215,000 | 204,603,749 | ||||||
U.S. Treasury Note/Bond, 2.38%, Nov. 2049 | 53,640,000 | 66,218,161 | ||||||
U.S. Treasury Note/Bond, 2.50%, Feb. 2045 | 62,700,000 | 77,314,488 | ||||||
U.S. Treasury Note/Bond, 3.00%, May 2045 | 30,000,000 | 40,266,797 | ||||||
U.S. Treasury Note/Bond, 3.00%, Feb. 2049 | 82,878,400 | 114,356,005 | ||||||
U.S. Treasury Note/Bond, 2.75%-3.63%, Aug. 2028-May 2049 (9) | 81,515,000 | 109,442,301 | ||||||
|
| |||||||
Total U.S. Treasury Obligations | 2,113,700,459 | |||||||
|
| |||||||
Total Government Related | 2,453,871,422 | |||||||
|
| |||||||
Mortgage-Backed Obligations – 30.51% | ||||||||
Fannie Mae, 2.00%, Aug. 2050 (11) | 184,100,000 | 187,899,001 | ||||||
Fannie Mae, 2.50%, Jul. 2050 (11) | 164,650,000 | 171,458,905 | ||||||
Fannie Mae, 3.00%, Sep. 2050 (11) | 71,285,000 | 74,818,060 | ||||||
Fannie Mae Pool, 2.00%, Jun. 2050 | 237,029,148 | 241,610,205 | ||||||
Fannie Mae Pool, 2.50%, Mar. 2050 | 187,837,662 | 195,829,831 | ||||||
Fannie Mae Pool, 2.50%, Apr. 2050 | 178,203,238 | 185,632,548 | ||||||
The accompanying notes are an integral part of these financial statements.
| Annual Report • June 30, 2020 | 29 |
Bridge Builder Core Plus Bond Fund
Summary Schedule of Investments
June 30, 2020 (Continued)
| Principal Amount | Value | |||||||
Mortgage-Backed Obligations – 30.51% – (continued) | ||||||||
Freddie Mac Gold Pool, 3.50%, Dec. 2047 | $ | 34,705,003 | $ | 37,926,805 | ||||
Freddie Mac Gold Pool, 3.50%, Mar. 2048 | 102,255,486 | 111,000,736 | ||||||
Freddie Mac Gold Pool, 4.00%, Nov. 2048 | 43,084,309 | 47,152,871 | ||||||
Freddie Mac Pool, 2.50%, Apr. 2035 | 93,777,108 | 98,223,450 | ||||||
Freddie Mac Pool, 2.50%, Mar. 2050 | 257,253,113 | 268,300,869 | ||||||
Freddie Mac Strips, 3.00%, Sep. 2044 | 80,654,306 | 87,902,080 | ||||||
Ginnie Mae, 2.50%, Jul. 2050 (11) | 41,500,000 | 43,667,402 | ||||||
Ginnie Mae II Pool, 3.00%, Oct. 2049 | 34,838,132 | 36,081,008 | ||||||
New Residential Mortgage Loan Trust 2019-RPL3, 2.75%, Jul. 2059 (2)(4) | 35,498,400 | 37,217,708 | ||||||
Towd Point Mortgage Funding, 1.39%, (3 Month Sterling Overnight Interbank Average Rate + 0.90%), Jul. 2045 (1)(2) | GBP | 93,749,895 | 115,356,051 | |||||
Towd Point Mortgage Funding 2019-Granite4 Plc, 1.68%, (3 Month LIBOR GBP + 1.03%), Oct. 2051 (1)(2) | 28,446,965 | 35,171,182 | ||||||
Towd Point Mortgage Trust 2019-4, 2.90%, Oct. 2059 (2)(4) | $ | 104,890,095 | 110,335,579 | |||||
Fannie Mae, 2.00%-5.00%, Jul. 2035-Jul. 2050 (11) | 119,390,000 | 124,152,764 | ||||||
Fannie Mae Pool, 2.46%-6.50%, Jan. 2027-Jul. 2050 | 728,671,270 | 785,445,737 | ||||||
Freddie Mac Gold Pool, 2.50%-8.00%, Jul. 2030-Nov. 2048 | 398,844,818 | 427,694,149 | ||||||
Freddie Mac Pool, 2.50%-5.00%, May 2031-May 2050 | 170,322,101 | 181,239,168 | ||||||
Ginnie Mae, 3.00%-4.50%, Jul. 2050 (11) | 34,505,000 | 36,588,639 | ||||||
Ginnie Mae II Pool, 2.50%-5.50%, Jul. 2036-May 2050 | 396,707,064 | 424,368,401 | ||||||
Other Securities *(1)(2)(3)(4) | 2,181,257,100 | 1,864,873,860 | ||||||
|
| |||||||
Total Mortgage-Backed Obligations | 5,929,947,009 | |||||||
|
| |||||||
Total Bonds & Notes | 17,814,776,383 | |||||||
|
| |||||||
BANK LOANS – 2.66% | ||||||||
PetSmart, Inc. 5.00% (LIBOR + 4.00%) Mar. 2022 (1) | 36,090,447 | 35,561,361 | ||||||
Other Securities *(1)(6)(15)(16) | 516,330,015 | 481,029,036 | ||||||
|
| |||||||
Total Bank Loans | 516,590,397 | |||||||
|
| |||||||
| Shares | Value | |||||||
COMMON STOCKS – 0.04% | ||||||||
| Communications – 0.02% | ||||||||
Various Securities (12)(15) | 2,206,286 | 3,326,240 | ||||||
|
| |||||||
Total Communications | 3,326,240 | |||||||
|
| |||||||
| Consumer, Cyclical – 0.02% | ||||||||
Caesars Entertainment Corp. (12) | 338,983 | 4,111,864 | ||||||
|
| |||||||
Total Consumer, Cyclical | 4,111,864 | |||||||
|
| |||||||
Total Common Stocks | 7,438,104 | |||||||
|
| |||||||
CONVERTIBLE PREFERRED STOCKS – 0.08% | ||||||||
| Consumer, Non-cyclical – 0.04% | ||||||||
Bunge Ltd., 4.88% | 82,720 | 7,609,413 | ||||||
|
| |||||||
Total Consumer, Non-cyclical | 7,609,413 | |||||||
|
| |||||||
| Financials – 0.03% | ||||||||
Bank of America Corp., 7.25% | 4,556 | 6,115,063 | ||||||
|
| |||||||
Total Financials | 6,115,063 | |||||||
|
| |||||||
| Utilities – 0.01% | ||||||||
NextEra Energy, Inc., 5.28% | 34,441 | 1,462,020 | ||||||
|
| |||||||
Total Utilities | 1,462,020 | |||||||
|
| |||||||
Total Convertible Preferred Stocks | 15,186,496 | |||||||
|
| |||||||
The accompanying notes are an integral part of these financial statements.
| 30 | Annual Report • June 30, 2020 |
Bridge Builder Core Plus Bond Fund
Summary Schedule of Investments
June 30, 2020 (Continued)
| Shares | Value | |||||||
WARRANTS – 0.03% | ||||||||
iHeartMedia, Inc., expires 05/01/2039 (12)(15) | 723,037 | $ | 6,037,359 | |||||
|
| |||||||
Total Warrants | 6,037,359 | |||||||
|
| |||||||
SHORT-TERM INVESTMENTS – 8.09% | ||||||||
| Money Market Funds – 2.09% | ||||||||
Fidelity Institutional Money Market Government Fund-Class I, 0.10% (13)(14) | 405,307,655 | 405,307,655 | ||||||
|
| |||||||
Total Money Market Funds | 405,307,655 | |||||||
|
| |||||||
| Principal Amount | Value | |||||||
| Government Related – 0.04% | ||||||||
Various Securities | ARS | 557,991,000 | 8,105,648 | |||||
|
| |||||||
Total Government Related | 8,105,648 | |||||||
|
| |||||||
| Commercial Paper – 0.09% | ||||||||
Ford Motor Credit Co. LLC, 3.20%, Oct. 2020 (16) | $ | 17,380,000 | 17,189,374 | |||||
|
| |||||||
Total Commercial Paper | 17,189,374 | |||||||
|
| |||||||
| Repurchase Agreements – 1.07% | ||||||||
Bank of America Securities, Inc., 0.12% dated 06/29/2020, due 07/01/2020, repurchase price $62,800,419 (collateralized by U.S. Treasury Note, value $64,043,973, 0.25%, 06/15/2023) | 62,800,000 | 62,800,000 | ||||||
Bank of America Securities, Inc., 0.13% dated 06/24/2020, due 07/02/2020, repurchase price $12,882,279 (collateralized by U.S. Treasury Bond, value $13,197,220, 3.50%, 02/15/2039) | 12,882,000 | 12,882,000 | ||||||
Bank of America Securities, Inc., 0.13% dated 06/24/2020, due 07/02/2020, repurchase price $47,119,021 (collateralized by U.S. Treasury Bond, value $48,327,901, 2.75%, 08/15/2047) | 47,118,000 | 47,118,000 | ||||||
Bank of America Securities, Inc., 0.13% dated 06/30/2020, due 07/01/2020, repurchase price $29,100,105 (collateralized by U.S. Treasury Note, value $29,676,427, 0.25%, 06/15/2023) | 29,100,000 | 29,100,000 | ||||||
J.P. Morgan Securities, 0.12% dated 06/30/2020, due 07/02/2020, repurchase price $56,600,377 (collateralized by U.S. Treasury Bond, value $57,609,027, 3.00%, 11/15/2044) | 56,600,000 | 56,600,000 | ||||||
|
| |||||||
Total Repurchase Agreements | 208,500,000 | |||||||
|
| |||||||
| U.S. Treasury Bills – 4.51% | ||||||||
U.S. Cash Management Bill, 0.00%, Oct. 2020-Nov. 2020 | 373,160,000 | 372,976,887 | ||||||
U.S. Treasury Bill, 0.00%, Jul. 2020-Jan. 2021 (9) | 504,065,000 | 503,821,437 | ||||||
|
| |||||||
Total U.S. Treasury Bills | 876,798,324 | |||||||
|
| |||||||
| Time Deposits – 0.29% | ||||||||
ANZ, London, -0.10% due 07/01/2020 | AUD | 2,134,184 | 1,472,801 | |||||
BNP Paribas, Paris, -1.53% due 07/01/2020 | CHF | 119,967 | 126,621 | |||||
BNP Paribas, Paris, 0.01% due 07/01/2020 | $ | 42,593,851 | 42,593,851 | |||||
Brown Brothers Harriman, -0.68% due 07/01/2020 | EUR | 500 | 562 | |||||
Brown Brothers Harriman, -0.25% due 07/01/2020 | SEK | 387 | 42 | |||||
Brown Brothers Harriman, -0.25% due 07/01/2020 | JPY | 84,863 | 786 | |||||
Brown Brothers Harriman, 0.00% due 07/01/2020 | NZD | 295 | 190 | |||||
Brown Brothers Harriman, 0.02% due 07/02/2020 | CAD | 300 | 221 | |||||
Citibank, London, -0.68% due 07/01/2020 | EUR | 555,348 | 623,934 | |||||
Citibank, London, 0.01% due 07/01/2020 | GBP | 671,291 | 831,796 | |||||
Citibank, New York, 0.01% due 07/01/2020 | $ | 188,038 | 188,038 | |||||
JP Morgan, New York, 0.01% due 07/01/2020 | 9,645,495 | 9,645,495 | ||||||
Royal Bank of Canada, Toronto, 0.02% due 07/02/2020 | CAD | 1,270,304 | 935,698 | |||||
|
| |||||||
Total Time Deposits | 56,420,035 | |||||||
|
| |||||||
Total Short-Term Investments | 1,572,321,036 | |||||||
|
| |||||||
TOTAL INVESTMENTS IN SECURITIES – 102.57% | 19,932,349,775 | |||||||
LIABILITIES IN EXCESS OF OTHER ASSETS – (2.57)% | (498,683,950 | ) | ||||||
|
| |||||||
TOTAL NET ASSETS – 100.00% | $ | 19,433,665,825 | ||||||
|
| |||||||
The accompanying notes are an integral part of these financial statements.
| Annual Report • June 30, 2020 | 31 |
Bridge Builder Core Plus Bond Fund
Summary Schedule of Investments
June 30, 2020 (Continued)
Percentages are stated as a percent of net assets.
Principal amounts are denominated in the currency in which the security was purchased.
| * | Includes securities whose principal amounts are denominated in a currency other than the U.S. dollar. |
| ARS | Argentine Peso |
| AUD | Australian Dollar |
| CAD | Canadian Dollar |
| CHF | Swiss Franc |
| EUR | Euro |
| GBP | British Pound |
| JPY | Japanese Yen |
| NZD | New Zealand Dollar |
| SEK | Swedish Krona |
| (1) | Variable rate security or includes variable rate securities based on a reference index and spread. The rate reported is the rate in effect as of June 30, 2020. |
| (2) | Security or includes securities purchased exempt from registration in the U.S. pursuant to Rule 144(A) under the Securities Act of 1933. The value of these securities total $4,891,203,490, which represents 25.17% of total net assets. |
| (3) | Includes step-up bonds that pay an initial coupon rate for the first period and then a higher coupon rate for the following periods. The rate reported is the rate in effect as of June 30, 2020. |
| (4) | Variable rate security or includes variable rate securities. The coupon is based on an underlying pool of assets. The rate reported is the rate in effect as of June 30, 2020. |
| (5) | Includes securities in default as of June 30, 2020. The value of these securities total $107,349,298, which represents 0.55% of total net assets. |
| (6) | Security or includes inverse floating rate securities whose interest rate moves in the opposite direction of reference interest rates. Reference interest rates are typically based on a negative multiplier or slope. |
| (7) | Includes payment in-kind security for which part of the income earned may be paid as additional principal. |
| (8) | Inflation protected security. The value of these securities total $269,596,989, which represents 1.39% of total net assets. |
| (9) | Partially assigned as collateral for certain futures contracts, swap contracts and repurchase agreements. The value of these pledged issues totals $108,052,378, which represents 0.56% of total net assets. |
| (10) | All or a portion of U.S. Treasuries purchased in a sale-buyback transaction. The value of these securities total $121,128,696, which represents 0.62% of total net assets. |
| (11) | Delayed delivery purchase commitment security. The value of these securities total $638,584,771, which represents 3.29% of total net assets. |
| (12) | Non-income producing security or includes securities that are non-income producing. |
| (13) | Represents annualized seven-day yield as of the close of the reporting period. |
| (14) | Partially assigned as collateral for certain delayed delivery securities. |
| (15) | Security or includes securities that are categorized as Level 3 per the Trust’s fair value hierarchy. These securities represent $9,861,931 or 0.05% of the Fund’s net assets. |
| (16) | Security that is restricted or includes securities restricted at June 30, 2020. The value of the restricted security totals $42,014,140, which represents 0.22% of total net assets. |
Open Futures Contracts
| Number of Contracts Purchased | Reference Entity | Counterparty | Expiration Date | Notional Amount | Value | Unrealized Appreciation/ (Depreciation) | ||||||||||||
| 275 | Australian 10 Year Bond Future | Goldman Sachs | Sep. 2020 | AUD | 40,267,893 | $ | 28,236,682 | $ | 447,812 | |||||||||
| 219 | Euro-Btp Future | Goldman Sachs | Sep. 2020 | EUR | 30,827,600 | 35,401,170 | 766,362 | |||||||||||
The accompanying notes are an integral part of these financial statements.
| 32 | Annual Report • June 30, 2020 |
Bridge Builder Core Plus Bond Fund
Summary Schedule of Investments
June 30, 2020 (Continued)
Open Futures Contracts (Continued)
| Number of Contracts Purchased | Reference Entity | Counterparty | Expiration Date | Notional Amount | Value | Unrealized Appreciation/ (Depreciation) | ||||||||||||||||
| 10,062 | U.S. 10 Year Note Future | Goldman Sachs | Sep. 2020 | $ | 1,396,492,911 | $ | 1,400,347,406 | $ | 3,854,495 | |||||||||||||
| 4,474 | U.S. 5 Year Note Future | Citigroup Global Markets | Sep. 2020 | 561,173,844 | 562,570,549 | 1,396,705 | ||||||||||||||||
| 2,113 | U.S. 5 Year Note Future | Goldman Sachs | Sep. 2020 | 264,561,533 | 265,693,243 | 1,131,710 | ||||||||||||||||
| 489 | U.S. Long Bond Future | Goldman Sachs | Sep. 2020 | 87,126,547 | 87,317,063 | 190,516 | ||||||||||||||||
| 2,593 | U.S. 2-Year Note Future | Goldman Sachs | Sep. 2020 | 572,218,936 | 572,607,331 | 388,395 | ||||||||||||||||
| 44 | U.S. Ultra Long-Term Bond Future | Citigroup Global Markets | Sep. 2020 | 9,631,480 | 9,598,875 | (32,605 | ) | |||||||||||||||
| 1,009 | U.S. Ultra Long-Term Bond Future | Goldman Sachs | Sep. 2020 | 220,506,133 | 220,119,656 | (386,477 | ) | |||||||||||||||
|
| |||||||||||||||||||||
| 7,756,913 | ||||||||||||||||||||||
|
| |||||||||||||||||||||
| Number of Contracts Sold | Reference Entity | Counterparty | Expiration Date | Notional Amount | Value | Unrealized Appreciation/ (Depreciation) | ||||||||||||||||
| (127) | U.S. Ultra 10-Year Note Future | Citigroup Global Markets | Sep. 2020 | $ | 19,862,853 | $ | (20,000,516 | ) | $ | (137,663 | ) | |||||||||||
| (2,526) | U.S. Ultra 10-Year Note Future | Goldman Sachs | Sep. 2020 | 394,748,517 | (397,805,531 | ) | (3,057,014 | ) | ||||||||||||||
|
| |||||||||||||||||||||
| (3,194,677 | ) | |||||||||||||||||||||
|
| |||||||||||||||||||||
| $ | 4,562,236 | |||||||||||||||||||||
|
| |||||||||||||||||||||
Over-the-Counter Forward Foreign Currency Exchange Contracts
| Currency Purchased | Currency Sold | Settlement Date | Counterparty | Unrealized Appreciation/ (Depreciation) | ||||||||||||||
| BRL* | 156,049,575 | USD | 28,497,001 | 07/02/20 | Deutsche Bank | $ | 198,605 | |||||||||||
| BRL* | 33,000,000 | USD | 6,026,297 | 07/02/20 | J.P. Morgan | 41,999 | ||||||||||||
| EUR | 5,081,000 | USD | 5,704,334 | 07/02/20 | BNP Paribas | 4,168 | ||||||||||||
| EUR | 1,124,000 | USD | 1,256,229 | 07/02/20 | Goldman Sachs | 6,584 | ||||||||||||
| IDR* | 402,636,139,000 | USD | 26,550,355 | 09/16/20 | Morgan Stanley | 761,842 | ||||||||||||
| INR* | 2,063,547,450 | USD | 27,046,955 | 09/16/20 | Morgan Stanley | 42,489 | ||||||||||||
| RUB* | 201,849,664 | USD | 2,596,939 | 07/17/20 | Bank Of America | 233,615 | ||||||||||||
| RUB* | 455,846,087 | USD | 5,958,024 | 07/17/20 | Goldman Sachs | 434,341 | ||||||||||||
| RUB* | 826,637,832 | USD | 11,125,827 | 07/27/20 | Goldman Sachs | 448,868 | ||||||||||||
| USD | 5,538,300 | EUR | 4,887,000 | 07/02/20 | Bank Of America | 47,758 | ||||||||||||
| USD | 29,582,858 | BRL* | 156,049,575 | 07/02/20 | Deutsche Bank | 887,252 | ||||||||||||
| USD | 2,224,072 | GBP | 1,758,000 | 07/02/20 | Goldman Sachs | 45,734 | ||||||||||||
| USD | 136,526 | JPY | 14,700,000 | 07/02/20 | Goldman Sachs | 383 | ||||||||||||
| USD | 7,907,790 | BRL* | 33,000,000 | 07/02/20 | J.P. Morgan | 1,839,494 | ||||||||||||
| USD | 5,965,761 | EUR | 5,276,000 | 07/02/20 | J.P. Morgan | 38,177 | ||||||||||||
| USD | 3,853,003 | GBP | 3,049,000 | 07/02/20 | J.P. Morgan | 74,986 | ||||||||||||
| USD | 1,022,315 | AUD | 1,479,000 | 07/02/20 | Morgan Stanley | 1,657 | ||||||||||||
| USD | 3,798,651 | EUR | 3,364,000 | 07/02/20 | Morgan Stanley | 19,198 | ||||||||||||
| USD | 8,541,557 | PEN* | 28,785,047 | 09/04/20 | BNP Paribas | 423,656 | ||||||||||||
| USD | 13,158,715 | CAD | 17,615,000 | 09/16/20 | BNP Paribas | 181,586 | ||||||||||||
|
| |||||||||||||||||
| Total Unrealized Appreciation | 5,732,392 | |||||||||||||||||
|
| |||||||||||||||||
| BRL* | 33,000,000 | USD | 6,343,104 | 07/02/20 | BNP Paribas | (274,808 | ) | |||||||||||
| BRL* | 156,049,575 | USD | 29,122,148 | 07/02/20 | BNP Paribas | (426,542 | ) | |||||||||||
| BRL* | 156,049,575 | USD | 29,551,486 | 08/04/20 | Deutsche Bank | (905,422 | ) | |||||||||||
| GBP | 827,000 | USD | 1,025,877 | 07/02/20 | BNP Paribas | (1,140 | ) | |||||||||||
| GBP | 7,327,000 | USD | 9,133,919 | 07/02/20 | J.P. Morgan | (55,029 | ) | |||||||||||
The accompanying notes are an integral part of these financial statements.
| Annual Report • June 30, 2020 | 33 |
Bridge Builder Core Plus Bond Fund
Summary Schedule of Investments
June 30, 2020 (Continued)
Over-the-Counter Forward Foreign Currency Exchange Contracts (Continued)
| Currency Purchased | Currency Sold | Settlement Date | Counterparty | Unrealized Appreciation/ (Depreciation) | ||||||||||||||||||
| MXN | 33,876,000 | USD | 1,492,494 | 07/24/20 | Goldman Sachs | $ | (23,206 | ) | ||||||||||||||
| MXN | 142,098,000 | USD | 6,374,708 | 12/09/20 | BNP Paribas | (316,785 | ) | |||||||||||||||
| MXN | 931,395,152 | USD | 42,125,516 | 12/09/20 | Goldman Sachs | (2,418,273 | ) | |||||||||||||||
| RUB* | 1,832,559,666 | USD | 25,973,429 | 07/17/20 | BNP Paribas | (275,302 | ) | |||||||||||||||
| TRY | 4,051,749 | USD | 594,534 | 07/13/20 | J.P. Morgan | (4,715 | ) | |||||||||||||||
| TRY | 4,286,011 | USD | 629,918 | 07/14/20 | Bank Of America | (6,181 | ) | |||||||||||||||
| TRY | 1,167,392 | USD | 169,829 | 07/21/20 | Bank Of America | (291 | ) | |||||||||||||||
| TRY | 1,392,510 | USD | 202,654 | 07/21/20 | BNP Paribas | (422 | ) | |||||||||||||||
| USD | 34,523,297 | BRL* | 189,049,575 | 07/02/20 | BNP Paribas | (240,605 | ) | |||||||||||||||
| USD | 285,806,314 | EUR | 257,329,000 | 07/02/20 | BNP Paribas | (3,302,706 | ) | |||||||||||||||
| USD | 17,138,860 | EUR | 15,256,000 | 07/02/20 | J.P. Morgan | (1,249 | ) | |||||||||||||||
| USD | 401,464,699 | GBP | 326,424,000 | 07/02/20 | J.P. Morgan | (3,007,462 | ) | |||||||||||||||
| USD | 314,600,496 | EUR | 279,907,000 | 08/04/20 | BNP Paribas | (113,918 | ) | |||||||||||||||
| USD | 396,364,594 | GBP | 323,077,000 | 08/04/20 | Morgan Stanley | (4,050,102 | ) | |||||||||||||||
| USD | 9,940,602 | CAD | 13,986,000 | 08/17/20 | Bank Of America | (362,555 | ) | |||||||||||||||
| USD | 19,830,150 | NZD | 33,217,000 | 08/17/20 | J.P. Morgan | (1,605,123 | ) | |||||||||||||||
| USD | 6,805,373 | EUR | 6,271,713 | 08/21/20 | Goldman Sachs | (248,859 | ) | |||||||||||||||
| USD | 6,801,641 | EUR | 6,271,713 | 08/21/20 | Morgan Stanley | (252,591 | ) | |||||||||||||||
| USD | 5,840,622 | EUR | 5,375,754 | 08/21/20 | State Street | (205,862 | ) | |||||||||||||||
|
| |||||||||||||||||||||
| Total Unrealized Depreciation | (18,099,148 | ) | ||||||||||||||||||||
|
| |||||||||||||||||||||
| Net Unrealized Depreciation | $ | (12,366,756 | ) | |||||||||||||||||||
|
| |||||||||||||||||||||
| * | Non-deliverable forward |
| AUD | Australian Dollar |
| BRL | Brazilian Real |
| CAD | Canadian Dollar |
| EUR | Euro |
| GBP | British Pound |
| IDR | Indonesian Rupiah |
| INR | Indian Rupee |
| JPY | Japanese Yen |
| MXN | Mexican Peso |
| NZD | New Zealand Dollar |
| PEN | Peruvian Sol |
| RUB | Russian Ruble |
| TRY | Turkish Lira |
| USD | United States Dollar |
Centrally Cleared Credit Default Swaps – Sell Protection
| Reference Entity | Fixed Annual | Maturity Date | Implied Credit Spread at June 30, 2020 | Notional Amount | Upfront Premium Paid/ (Received) | Unrealized Appreciation/ (Depreciation) | Value | |||||||||||||||||||
| AT&T Inc. | 1.00% | 12/20/2020 | 0.61% | $ | 34,600,000 | $ | 22,648 | $ | 52,482 | $ | 75,130 | |||||||||||||||
| AT&T Inc. | 1.00 | 12/20/2024 | 1.00 | 12,100,000 | 102,371 | (96,632 | ) | 5,739 | ||||||||||||||||||
| CDX.EM.28 | 1.00 | 12/20/2022 | 1.58 | 9,588,000 | (237,472 | ) | 105,266 | (132,206 | ) | |||||||||||||||||
| CDX.EM.29 | 1.00 | 6/20/2023 | 1.64 | 1,880,000 | (31,920 | ) | (2,697 | ) | (34,617 | ) | ||||||||||||||||
| CDX.EM.30 | 1.00 | 12/20/2023 | 1.80 | 7,708,000 | (274,167 | ) | 70,195 | (203,972 | ) | |||||||||||||||||
| CDX.EM.31 | 1.00 | 6/20/2024 | 1.76 | 8,178,000 | (291,531 | ) | 55,031 | (236,500 | ) | |||||||||||||||||
| CDX.EM.32 | 1.00 | 12/20/2024 | 1.84 | 12,090,000 | (572,907 | ) | 142,473 | (430,434 | ) | |||||||||||||||||
| CDX.EM.33 | 1.00 | 6/20/2025 | 2.00 | 7,505,000 | (806,689 | ) | 456,941 | (349,748 | ) | |||||||||||||||||
| CDX.NA.HY.34 | 5.00 | 6/20/2025 | 5.17 | 64,885,000 | (3,828,215 | ) | 3,454,679 | | (373,536 | ) | ||||||||||||||||
| CDX.NA.HY.34 | 5.00 | 6/20/2025 | 5.17 | 46,455,000 | (530,366 | ) | 248,358 | (282,008 | ) | |||||||||||||||||
| CDX.NA.HY.34 | 5.00 | 6/20/2025 | 5.17 | 54,815,000 | (2,411,861 | ) | 2,081,068 | (330,793 | ) | |||||||||||||||||
| CDX.NA.IG.34 | 1.00 | 6/20/2025 | 0.76 | 284,052,000 | (597,066 | ) | 3,917,046 | 3,319,980 | ||||||||||||||||||
| General Electric Co. | 1.00 | 12/20/2023 | 1.48 | 700,000 | (23,753 | ) | 12,713 | (11,040 | ) | |||||||||||||||||
|
|
|
|
|
| |||||||||||||||||||||
| $ | (9,480,928 | ) | $ | 10,496,923 | $ | 1,015,995 | ||||||||||||||||||||
|
|
|
|
|
| |||||||||||||||||||||
The accompanying notes are an integral part of these financial statements.
| 34 | Annual Report • June 30, 2020 |
Bridge Builder Core Plus Bond Fund
Summary Schedule of Investments
June 30, 2020 (Continued)
Over-the-Counter Credit Default Swaps – Sell Protection
| Counterparty | Reference Entity | Fixed | Payment Frequency | Maturity Date | Implied Credit Spread at June 30, 2020 | Notional Amount | Upfront Premium Paid/ (Received) | Unrealized Appreciation/ (Depreciation) | Value | |||||||||||||||||||||
| Deutsche Bank | CMBX.NA.AAA.10 | 0.50% | Monthly | 11/17/2059 | 0.00% | $ | 16,450,000 | $ | (269,224 | ) | $ | 392,072 | $ | 122,848 | ||||||||||||||||
| J.P. Morgan | Barclays Bank Plc | 1.00 | Quarterly | 6/20/2024 | 0.69 | EUR | 1,000,000 | 10,163 | 4,154 | 14,317 | ||||||||||||||||||||
| Bank of America | Boeing Co. | 1.00 | Quarterly | 12/20/2021 | 2.42 | $ | 12,300,000 | 60,829 | (309,845 | ) | (249,016 | ) | ||||||||||||||||||
| Goldman Sachs | Brazilian Government International | 1.00 | Quarterly | 12/20/2024 | 2.40 | 3,200,000 | (42,762 | ) | (147,252 | ) | (190,014 | ) | ||||||||||||||||||
| Barclays Bank | Colombia Government International | 1.00 | Quarterly | 6/20/2025 | 1.60 | 12,895,000 | (752,522 | ) | 385,891 | (366,631 | ) | |||||||||||||||||||
| Morgan Stanley | Colombia Government International | 1.00 | Quarterly | 6/20/2025 | 1.60 | 11,000,000 | (1,044,868 | ) | 732,727 | (312,141 | ) | |||||||||||||||||||
| Barclays Bank | Devon Energy Corp. | 1.00 | Quarterly | 12/20/2024 | 1.49 | 455,000 | 186 | (9,686 | ) | (9,500 | ) | |||||||||||||||||||
| Morgan Stanley | Devon Energy Corp. | 1.00 | Quarterly | 12/20/2024 | 1.49 | 525,000 | — | (10,961 | ) | (10,961 | ) | |||||||||||||||||||
| Morgan Stanley | Devon Energy Corp. | 1.00 | Quarterly | 12/20/2024 | 1.49 | 1,170,000 | (6,219 | ) | (18,209 | ) | (24,428 | ) | ||||||||||||||||||
| Goldman Sachs | Federative Republic of Brazil | 1.00 | Quarterly | 6/20/2024 | 2.24 | 300,000 | (7,505 | ) | (6,646 | ) | (14,151 | ) | ||||||||||||||||||
| Barclays Bank | General Electric Co. | 1.00 | Quarterly | 12/20/2020 | 0.88 | 1,860,000 | 181 | 1,378 | 1,559 | |||||||||||||||||||||
| Barclays Bank | General Electric Co. | 1.00 | Quarterly | 12/20/2020 | 0.88 | 3,415,000 | (930 | ) | 3,794 | 2,864 | ||||||||||||||||||||
| Goldman Sachs | General Electric Co. | 1.00 | Quarterly | 12/20/2020 | 0.88 | 2,640,000 | 261 | 1,952 | 2,213 | |||||||||||||||||||||
| Goldman Sachs | General Electric Co. | 1.00 | Quarterly | 12/20/2020 | 0.88 | 1,685,000 | (444 | ) | 1,857 | 1,413 | ||||||||||||||||||||
| Barclays Bank | Indonesia Government International | 1.00 | Quarterly | 6/20/2025 | 1.32 | 9,796,000 | (383,282 | ) | 234,788 | (148,494 | ) | |||||||||||||||||||
| Goldman Sachs | Indonesia Government International | 1.00 | Quarterly | 6/20/2025 | 1.32 | 18,365,000 | (902,508 | ) | 623,100 | (279,408 | ) | |||||||||||||||||||
| Morgan Stanley | Indonesia Government International | 1.00 | Quarterly | 6/20/2025 | 1.32 | 17,615,000 | (663,042 | ) | 395,044 | (267,998 | ) | |||||||||||||||||||
| Morgan Stanley | Mexico Government International | 1.00 | Quarterly | 12/20/2024 | 1.44 | 2,800,000 | (18,934 | ) | (34,663 | ) | (53,597 | ) | ||||||||||||||||||
| Goldman Sachs | Republic of South Africa | 1.00 | Quarterly | 6/20/2024 | 2.79 | 4,700,000 | (154,393 | ) | (159,881 | ) | (314,274 | ) | ||||||||||||||||||
| J.P. Morgan | Republic of South Africa | 1.00 | Quarterly | 6/20/2023 | 2.51 | 9,400,000 | (412,143 | ) | 7,041 | (405,102 | ) | |||||||||||||||||||
| Goldman Sachs | Russia Emerging Markets SPMYC | 1.00 | Quarterly | 12/20/2022 | 0.66 | 1,500,000 | (17,737 | ) | 30,916 | 13,179 | ||||||||||||||||||||
| J.P. Morgan | Russia Emerging Markets SPMYC | 1.00 | Quarterly | 6/20/2023 | 0.72 | 18,200,000 | (336,204 | ) | 491,046 | 154,842 | ||||||||||||||||||||
| Goldman Sachs | Russian Foreign Bond-Eurobon | 1.00 | Quarterly | 12/20/2024 | 1.02 | 16,400,000 | 84,457 | (94,704 | ) | (10,247 | ) | |||||||||||||||||||
| Goldman Sachs | Teva Pharmaceutical Finance Ne | 1.00 | Quarterly | 6/20/2022 | 2.50 | 210,000 | (9,437 | ) | 3,436 | (6,001 | ) | |||||||||||||||||||
| Goldman Sachs | United Mexican States | 1.00 | Quarterly | 6/20/2023 | 1.06 | 29,900,000 | (150,396 | ) | 107,407 | (42,989 | ) | |||||||||||||||||||
| Goldman Sachs | United Mexican States | 1.00 | Quarterly | 12/20/2023 | 1.19 | 9,100,000 | (136,435 | ) | 79,562 | (56,873 | ) | |||||||||||||||||||
| J.P. Morgan | United Mexican States | 1.00 | Quarterly | 12/20/2023 | 1.19 | 5,400,000 | (81,799 | ) | 48,050 | (33,749 | ) | |||||||||||||||||||
| J.P. Morgan | United Mexican States | 1.00 | Quarterly | 6/20/2024 | 1.29 | 300,000 | (3,739 | ) | 442 | (3,297 | ) | |||||||||||||||||||
| Morgan Stanley | United Mexican States | 1.00 | Quarterly | 12/20/2022 | 0.96 | 3,800,000 | 2,499 | 2,615 | 5,114 | |||||||||||||||||||||
|
|
|
|
|
| |||||||||||||||||||||||||
| $ | (5,235,947 | ) | $ | 2,755,425 | $ | (2,480,522 | ) | |||||||||||||||||||||||
|
|
|
|
|
| |||||||||||||||||||||||||
Centrally Cleared Interest Rate Swaps
| Fixed Annual Rate | Floating Rate Index | Floating Rate Paid or Received | Payment Frequency | Maturity Date | Notional Amount | Upfront Premium Paid/ (Received) | Unrealized Appreciation/ (Depreciation) | Value | ||||||||||||||||||||||
| 1.25% | 3 Month USD LIBOR | Paid | Quarterly | 6/17/2027 | $ | 444,300,000 | $ | (5,266,611 | ) | $ | 29,526,130 | $ | 24,259,519 | |||||||||||||||||
| 1.25 | 3 Month USD LIBOR | Received | Quarterly | 6/17/2030 | 112,100,000 | 4,810,974 | (11,586,173 | ) | (6,775,199 | ) | ||||||||||||||||||||
| 1.50 | 3 Month USD LIBOR | Received | Quarterly | 6/17/2050 | 81,200,000 | (15,012,714 | ) | 2,327,481 | (12,685,233 | ) | ||||||||||||||||||||
| 2.25 | 3 Month USD LIBOR | Received | Quarterly | 3/12/2050 | 3,200,000 | (9,885 | ) | (1,137,501 | ) | (1,147,386 | ) | |||||||||||||||||||
The accompanying notes are an integral part of these financial statements.
| Annual Report • June 30, 2020 | 35 |
Bridge Builder Core Plus Bond Fund
Summary Schedule of Investments
June 30, 2020 (Continued)
Centrally Cleared Interest Rate Swaps (Continued)
Fixed Annual | Floating Rate Index | Floating Rate Paid or Received | Payment Frequency | Maturity Date | Notional Amount | Upfront Premium Paid/ (Received) | Unrealized Appreciation/ (Depreciation) | Value | ||||||||||||||||||||||||
| 2.50 % | 3 Month USD LIBOR | Paid | Quarterly | 12/20/2027 | $ | 107,900,000 | $ | (1,107,549 | ) | $ | 17,130,367 | $ | 16,022,818 | |||||||||||||||||||
| 2.50 | 3 Month USD LIBOR | Paid | Quarterly | 12/20/2027 | 94,300,000 | 1,744,029 | 12,259,231 | 14,003,260 | ||||||||||||||||||||||||
| 3.00 | 3 Month USD LIBOR | Paid | Quarterly | 6/19/2029 | 47,200,000 | 3,382,167 | 6,704,153 | 10,086,320 | ||||||||||||||||||||||||
| 3.00 | | 6 Month Australian Bank Bill | | Paid | Semi-Annual | 3/21/2027 | AUD | 109,400,000 | 625,604 | 11,867,046 | 12,492,650 | |||||||||||||||||||||
| (0.15) | 6 Month EURIBOR | Received | Semi-Annual | 3/18/2030 | EUR | 16,100,000 | 274,419 | (345,064 | ) | (70,645 | ) | |||||||||||||||||||||
| 0.50 | 6 Month EURIBOR | Received | Semi-Annual | 6/17/2050 | 9,000,000 | (283,674 | ) | (1,212,994 | ) | (1,496,668 | ) | |||||||||||||||||||||
| 0.75 | 6 Month GBP LIBOR | Received | Semi-Annual | 3/18/2030 | GBP | 18,700,000 | 179,861 | (1,052,466 | ) | (872,605 | ) | |||||||||||||||||||||
| 0.75 | 6 Month GBP LIBOR | Received | Semi-Annual | 3/18/2050 | 6,000,000 | 142,394 | (840,265 | ) | (697,871 | ) | ||||||||||||||||||||||
| 4.58 | | Mexico Interbank TIIE 28 Day | | Received | Lunar | 6/10/2022 | MXN | 4,000,000 | — | (474 | ) | (474 | ) | |||||||||||||||||||
| 4.65 | | Mexico Interbank TIIE 28 Day | | Received | Lunar | 5/10/2022 | 15,400,000 | 208 | (2,820 | ) | (2,612 | ) | ||||||||||||||||||||
| 4.74 | | Mexico Interbank TIIE 28 Day | | Received | Lunar | 6/3/2022 | 3,900,000 | — | (959 | ) | (959 | ) | ||||||||||||||||||||
| 4.83 | | Mexico Interbank TIIE 28 Day | | Received | Lunar | 5/27/2022 | 1,600,000 | — | (530 | ) | (530 | ) | ||||||||||||||||||||
| 5.12 | | Mexico Interbank TIIE 28 Day | | Paid | Lunar | 5/6/2025 | 2,000,000 | (134 | ) | 1,309 | 1,175 | |||||||||||||||||||||
| 5.16 | | Mexico Interbank TIIE 28 Day | | Paid | Lunar | 6/6/2025 | 1,700,000 | — | 1,102 | 1,102 | ||||||||||||||||||||||
| 5.28 | | Mexico Interbank TIIE 28 Day | | Paid | Lunar | 5/23/2025 | 700,000 | — | 627 | 627 | ||||||||||||||||||||||
| 5.28 | | Mexico Interbank TIIE 28 Day | | Paid | Lunar | 5/30/2025 | 1,600,000 | — | 1,421 | 1,421 | ||||||||||||||||||||||
| 5.54 | | Mexico Interbank TIIE 28 Day | | Paid | Lunar | 5/4/2027 | 3,400,000 | 1 | 2,796 | 2,797 | ||||||||||||||||||||||
| 7.15 | | Mexico Interbank TIIE 28 Day | | Paid | Lunar | 6/11/2027 | 25,800,000 | (17,507 | ) | 147,982 | 130,475 | |||||||||||||||||||||
| 7.36 | | Mexico Interbank TIIE 28 Day | | Received | Lunar | 8/21/2037 | 900,000 | 3,247 | (8,304 | ) | (5,057 | ) | ||||||||||||||||||||
| 7.37 | | Mexico Interbank TIIE 28 Day | | Paid | Lunar | 10/11/2027 | 40,300,000 | (1,906 | ) | 231,433 | 229,527 | |||||||||||||||||||||
| 7.38 | | Mexico Interbank TIIE 28 Day | | Received | Lunar | 8/14/2037 | 1,300,000 | 4,578 | (12,036 | ) | (7,458 | ) | ||||||||||||||||||||
| 7.61 | | Mexico Interbank TIIE 28 Day | | Received | Lunar | 1/23/2023 | 222,400,000 | 126,021 | (885,415 | ) | (759,394 | ) | ||||||||||||||||||||
| 7.75 | | Mexico Interbank TIIE 28 Day | | Paid | Lunar | 1/5/2023 | 1,400,000 | — | 4,864 | 4,864 | ||||||||||||||||||||||
| 7.81 | | Mexico Interbank TIIE 28 Day | | Paid | Lunar | 2/6/2023 | 2,800,000 | — | 10,204 | 10,204 | ||||||||||||||||||||||
| 7.82 | | Mexico Interbank TIIE 28 Day | | Paid | Lunar | 2/6/2023 | 2,800,000 | (341 | ) | 10,591 | 10,250 | |||||||||||||||||||||
| 7.87 | | Mexico Interbank TIIE 28 Day | | Paid | Lunar | 12/27/2022 | 3,400,000 | — | 12,233 | 12,233 | ||||||||||||||||||||||
| 7.88 | | Mexico Interbank TIIE 28 Day | | Paid | Lunar | 12/16/2022 | 2,000,000 | — | 7,206 | 7,206 | ||||||||||||||||||||||
| 7.88 | | Mexico Interbank TIIE 28 Day | | Paid | Lunar | 12/27/2022 | 36,000,000 | 9,174 | 120,922 | 130,096 | ||||||||||||||||||||||
| 7.91 | | Mexico Interbank TIIE 28 Day | | Received | Lunar | 12/30/2027 | 800,000 | — | (5,799 | ) | (5,799 | ) | ||||||||||||||||||||
| 7.98 | | Mexico Interbank TIIE 28 Day | | Received | Lunar | 12/10/2027 | 3,300,000 | (21 | ) | (24,727 | ) | (24,748 | ) | |||||||||||||||||||
| 7.99 | | Mexico Interbank TIIE 28 Day | | Received | Lunar | 12/21/2027 | 100,000 | — | (749 | ) | (749 | ) | ||||||||||||||||||||
| 8.01 | | Mexico Interbank TIIE 28 Day | | Received | Lunar | 12/21/2027 | 20,200,000 | (8,874 | ) | (143,343 | ) | (152,217 | ) | |||||||||||||||||||
| 8.03 | | Mexico Interbank TIIE 28 Day | | Received | Lunar | 1/31/2028 | 1,600,000 | 12 | (12,200 | ) | (12,188 | ) | ||||||||||||||||||||
| 8.05 | | Mexico Interbank TIIE 28 Day | | Received | Lunar | 1/31/2028 | 2,400,000 | 585 | (19,003 | ) | (18,418 | ) | ||||||||||||||||||||
|
|
|
|
|
| |||||||||||||||||||||||||||
| $ | (10,405,942 | ) | $ | 63,076,276 | $ | 52,670,334 | ||||||||||||||||||||||||||
|
|
|
|
|
| |||||||||||||||||||||||||||
| Lunar | - payment frequency equal periods of 28 days (a lunar month). |
The accompanying notes are an integral part of these financial statements.
| 36 | Annual Report • June 30, 2020 |
Bridge Builder Core Plus Bond Fund
Summary Schedule of Investments
June 30, 2020 (Continued)
Sale-Buyback Transactions
| Counterparty | Borrowing Date | Maturity Date | Borrowing Rate | Amount Borrowed | ||||||||||||||
| BNP Paribas | 6/30/2020 | 7/2/2020 | 0.18% | $ | 121,128,696 | |||||||||||||
|
| |||||||||||||||||
| $ | 121,128,696 | |||||||||||||||||
|
| |||||||||||||||||
The accompanying notes are an integral part of these financial statements.
| Annual Report • June 30, 2020 | 37 |
Bridge Builder Municipal Bond Fund
Summary Schedule of Investments
June 30, 2020
| Principal Amount | Value | |||||||
MUNICIPAL BONDS – 96.57% | ||||||||
| Education – 8.79% | ||||||||
Tennessee State School Bond Authority, 5.00%, Nov. 2040 | $ | 25,000,000 | $ | 29,543,250 | ||||
Illinois Finance Authority, 5.00%, Aug. 2021-Aug. 2049 (1) | 6,500,000 | 7,608,279 | ||||||
New Jersey Economic Development Authority, 5.00%-5.50%, Jun. 2024-Jun. 2054 (1)(2) | 26,290,000 | 29,100,051 | ||||||
New York State Dormitory Authority, 5.00%, Oct. 2028-Oct. 2030 (1) | 5,075,000 | 6,298,867 | ||||||
Other Securities (2)(3) | 441,085,000 | 500,852,905 | ||||||
|
| |||||||
Total Education | 573,403,352 | |||||||
|
| |||||||
| General Obligation – 16.73% | ||||||||
Commonwealth of Massachusetts, 5.00%, Jul. 2036 | 12,630,000 | 14,951,899 | ||||||
Commonwealth of Pennsylvania, 4.00%, Apr. 2033 | 20,000,000 | 21,404,000 | ||||||
Northside Independent School District, 1.60%, Aug. 2049 (3) | 15,135,000 | 15,592,228 | ||||||
State of Hawaii, 5.00%, Jan. 2032 | 12,800,000 | 16,651,520 | ||||||
State of Illinois, 5.00%, Nov. 2021 (1) | 12,555,000 | 12,927,758 | ||||||
State of Illinois, 5.00%, Nov. 2025 (1) | 15,740,000 | 17,033,356 | ||||||
State of Illinois, 5.25%, Dec. 2030 (1) | 11,685,000 | 12,693,883 | ||||||
Illinois Finance Authority, 3.00%, Jul. 2035 (1) | 2,250,000 | 2,409,570 | ||||||
State of Illinois, 4.00%-5.50%, Nov. 2020-Jul. 2038 (1) | 76,655,000 | 80,820,847 | ||||||
Other Securities (2)(3)(4)(5) | 783,980,000 | 896,042,246 | ||||||
|
| |||||||
Total General Obligation | 1,090,527,307 | |||||||
|
| |||||||
| General Revenue – 26.41% | ||||||||
Buckeye Tobacco Settlement Financing Authority, 5.00%, Jun. 2055 | 23,350,000 | 24,587,316 | ||||||
Central Plains Energy Project, 4.00%, Dec. 2049 (3) | 32,420,000 | 36,799,294 | ||||||
Chandler Industrial Development Authority, 5.00%, Jun. 2049 (3) | 18,960,000 | 21,835,284 | ||||||
City of Phoenix Civic Improvement Corp., 5.00%, Jul. 2029 | 12,865,000 | 14,194,340 | ||||||
City of Whiting IN, 5.00%, Dec. 2044 (3) | 19,260,000 | 22,768,209 | ||||||
Kentucky Public Energy Authority, 4.00%, Jan. 2049 (3) | 12,500,000 | 13,768,000 | ||||||
Kentucky Public Energy Authority, 4.00%, Dec. 2049 (3) | 21,270,000 | 23,895,315 | ||||||
Kentucky Public Energy Authority, 4.00%, Dec. 2050 (3) | 16,560,000 | 18,697,896 | ||||||
Lower Alabama Gas District, 4.00%, Dec. 2050 (3) | 15,610,000 | 17,761,995 | ||||||
Main Street Natural Gas, Inc., 4.00%, Aug. 2049 (3) | 17,670,000 | 19,940,418 | ||||||
Main Street Natural Gas, Inc., 4.00%, Mar. 2050 (3) | 20,000,000 | 22,963,400 | ||||||
Metropolitan Pier & Exposition Authority, 5.00%, Jun. 2050 | 17,060,000 | 18,170,265 | ||||||
New York State Dormitory Authority, 5.00%, Mar. 2021 (1) | 13,750,000 | 14,233,725 | ||||||
Ohio Air Quality Development Authority, 2.10%, Jul. 2028 (3) | 12,500,000 | 12,602,625 | ||||||
Patriots Energy Group Financing Agency, 4.00%, Oct. 2048 (3) | 31,075,000 | 34,133,091 | ||||||
PEFA, Inc., 5.00%, Sep. 2049 (3) | 13,000,000 | 15,688,140 | ||||||
Port of Port Arthur Navigation District, 1.95%, Nov. 2040 (3) | 15,000,000 | 15,000,000 | ||||||
Puerto Rico Sales Tax Financing Corp. Sales Tax Revenue, 5.00%, Jul. 2058 | 19,980,000 | 20,890,089 | ||||||
State of Ohio, 0.40%, Nov. 2035 (3) | 22,000,000 | 21,997,580 | ||||||
Tennergy Corp., 5.00%, Feb. 2050 (3) | 11,590,000 | 13,399,547 | ||||||
Illinois Finance Authority, 4.00%-5.25%, May 2023-May 2047 (1) | 1,535,000 | 1,561,265 | ||||||
Kentucky Public Energy Authority, 4.00%, Apr. 2048-Feb. 2050 (3) | 11,500,000 | 13,085,130 | ||||||
Main Street Natural Gas, Inc., 0.87%-5.00%, May 2027-Aug. 2048 (3)(5) | 29,695,000 | 32,534,521 | ||||||
Metropolitan Transportation Authority, 0.58% (SIFMA Municipal Swap Index Yield + 0.45%), Nov. 2026 (1)(5) | 2,530,000 | 2,455,314 | ||||||
New Jersey Economic Development Authority, 3.13%-5.63%, Jan. 2023-Jan. 2052 (1) | 33,790,000 | 36,551,573 | ||||||
New Jersey Transportation Trust Fund Authority, 0.00%-5.50%, Dec. 2022-Jun. 2043 (1) | 59,570,000 | 61,698,983 | ||||||
New York State Dormitory Authority, 4.00%-5.25%, Dec. 2023-Mar. 2038 (1) | 32,440,000 | 37,337,467 | ||||||
State of Illinois, 5.00%, Jun. 2024-Jun. 2025 (1) | 6,495,000 | 6,914,167 | ||||||
Other Securities (2)(3)(5)(7) | 1,081,258,000 | 1,126,712,402 | ||||||
|
| |||||||
Total General Revenue | 1,722,177,351 | |||||||
|
| |||||||
| Healthcare – 15.66% | ||||||||
Arizona Health Facilities Authority, 4.00%, Jan. 2043 | 24,000,000 | 24,400,080 | ||||||
County of Franklin OH, 5.00%, Nov. 2033 (3) | 12,780,000 | 14,327,275 | ||||||
Illinois Finance Authority, 5.00%, May 2028 (1) | 12,620,000 | 15,434,134 | ||||||
The accompanying notes are an integral part of these financial statements.
| 38 | Annual Report • June 30, 2020 |
Bridge Builder Municipal Bond Fund
Summary Schedule of Investments
June 30, 2020 (Continued)
| Principal Amount | Value | |||||||
| Healthcare – 15.66% – (continued) | ||||||||
Illinois Finance Authority, 5.00%, Jul. 2057 (1)(3) | $ | 11,305,000 | $ | 12,513,844 | ||||
Michigan State Hospital Finance Authority, 4.00%, Nov. 2047 (3) | 14,255,000 | 15,763,478 | ||||||
North Carolina Medical Care Commission, 0.17%, Nov. 2034 (3) | 25,000,000 | 25,000,000 | ||||||
Washington Health Care Facilities Authority, 5.00%, Oct. 2038 | 11,320,000 | 12,715,077 | ||||||
Illinois Finance Authority, 1.75%-5.25%, Feb. 2022-May 2054 (1)(3) | 71,265,000 | 82,113,168 | ||||||
New Jersey Economic Development Authority, 5.00%, Oct. 2039-Jan. 2040 (1)(2) | 795,000 | 648,567 | ||||||
New York State Dormitory Authority, 5.00%, Dec. 2022-May 2048 (1)(2)(3) | 14,510,000 | 16,381,627 | ||||||
Other Securities (2)(3)(5) | 727,351,958 | 801,639,362 | ||||||
|
| |||||||
Total Healthcare | 1,020,936,612 | |||||||
|
| |||||||
| Housing – 4.67% | ||||||||
Alamito Public Facility Corp., 2.50%, Nov. 2021 (3) | 15,000,000 | 15,203,850 | ||||||
District of Columbia Housing Finance Agency, 2.45%, Nov. 2021 (3) | 13,750,000 | 13,829,887 | ||||||
New Jersey Economic Development Authority, 5.00%, Jun. 2026 (1) | 900,000 | 1,082,223 | ||||||
Other Securities (2)(3)(5) | 262,524,959 | 274,545,449 | ||||||
|
| |||||||
Total Housing | 304,661,409 | |||||||
|
| |||||||
| Transportation – 15.60% | ||||||||
California Municipal Finance Authority, 5.00%, Dec. 2043 | 10,835,000 | 12,285,698 | ||||||
Chicago O’Hare International Airport, 5.00%, Jan. 2032 | 13,995,000 | 16,017,805 | ||||||
Commonwealth of Massachusetts Transportation Fund Revenue, 3.75%, Jun. 2040 | 45,000,000 | 45,734,400 | ||||||
Hillsborough County Aviation Authority, 5.00%, Oct. 2040 | 12,500,000 | 13,980,750 | ||||||
Metropolitan Transportation Authority, 5.00%, Sep. 2021 (1) | 25,000,000 | 25,696,500 | ||||||
State of Connecticut Special Tax Revenue, 5.00%, Oct. 2031 | 26,000,000 | 29,239,080 | ||||||
Triborough Bridge & Tunnel Authority, 0.55% (Secured Overnight Financing Rate + 0.50%), Nov. 2038 (5) | 20,000,000 | 19,977,000 | ||||||
Metropolitan Transportation Authority, 0.00%-5.25%, Sep. 2020-Nov. 2045 (1)(3)(5) | 52,245,000 | 54,895,726 | ||||||
New Jersey Transportation Trust Fund Authority, 0.00%-5.00%, Jun. 2029-Jun. 2032 (1) | 3,305,000 | 3,205,152 | ||||||
Other Securities (2)(3)(5) | 721,862,537 | 796,271,408 | ||||||
|
| |||||||
Total Transportation | 1,017,303,519 | |||||||
|
| |||||||
| Utilities – 8.71% | ||||||||
Boston Water & Sewer Commission, 3.75%, Nov. 2037 | 13,450,000 | 14,094,389 | ||||||
City of Atlanta GA Water & Wastewater Revenue, 5.00%, Nov. 2040 | 14,595,000 | 17,036,743 | ||||||
Energy Northwest, 5.00%, Jul. 2028 | 15,000,000 | 19,765,500 | ||||||
Illinois Finance Authority, 5.25%, Jul. 2035 (1) | 20,085,000 | 26,142,234 | ||||||
Indiana Finance Authority, 5.25%, Oct. 2038 | 15,010,000 | 15,873,225 | ||||||
Louisville & Jefferson County Metropolitan Government, 1.85%, Oct. 2033 (3) | 15,900,000 | 16,018,137 | ||||||
Illinois Finance Authority, 5.00%, Jul. 2022-Jul. 2031 (1) | 4,070,000 | 4,925,935 | ||||||
New Jersey Economic Development Authority, 1.15%-5.00%, Jun. 2023-Aug. 2059 (1)(3) | 8,305,000 | 8,604,654 | ||||||
Other Securities (2)(3)(4)(5) | 399,340,000 | 445,104,252 | ||||||
|
| |||||||
Total Utilities | 567,565,069 | |||||||
|
| |||||||
Total Municipal Bonds | 6,296,574,619 | |||||||
|
| |||||||
| Shares | Value | |||||||
SHORT-TERM INVESTMENTS – 3.34% | ||||||||
| Money Market Funds – 3.27% | ||||||||
Fidelity Institutional Money Market Government Fund-Class I, 0.10% (6) | 213,054,213 | 213,054,213 | ||||||
|
| |||||||
Total Money Market Funds | 213,054,213 | |||||||
|
| |||||||
| Principal Amount | Value | |||||||
| Time Deposits – 0.07% | ||||||||
BNP Paribas, Paris, 0.01% due 07/01/2020 | $ | 184,875 | 184,875 | |||||
The accompanying notes are an integral part of these financial statements.
| Annual Report • June 30, 2020 | 39 |
Bridge Builder Municipal Bond Fund
Summary Schedule of Investments
June 30, 2020 (Continued)
| Principal Amount | Value | |||||||
| Time Deposits – 0.07% – (Continued) | ||||||||
Citibank, New York, 0.01% due 07/01/2020 | $ | 4,800,976 | $ | 4,800,976 | ||||
|
| |||||||
Total Time Deposits | 4,985,851 | |||||||
|
| |||||||
Total Short-Term Investments | 218,040,064 | |||||||
|
| |||||||
TOTAL INVESTMENTS IN SECURITIES – 99.91% | 6,514,614,683 | |||||||
OTHER ASSETS IN EXCESS OF LIABILITIES – 0.09% | 5,826,662 | |||||||
|
| |||||||
TOTAL NET ASSETS – 100.00% | $ | 6,520,441,345 | ||||||
|
| |||||||
Percentages are stated as a percent of net assets.
| (1) | Issuer includes securities in multiple categories. The market value of the issuer as a whole is greater than 1% of the Fund’s total net assets. |
| (2) | Security or includes securities purchased exempt from registration in the U.S. pursuant to Rule 144(A) under the Securities Act of 1933. The value of these securities totals $202,146,973, which represents 3.10% of total net assets. |
| (3) | Adjustable rate security or includes adjustable rate securities. The rate reported is the rate in effect as of June 30, 2020. |
| (4) | Includes securities in default as of June 30, 2020. The value of these securities totals $16,913,532, which represents 0.26% of total net assets. |
| (5) | Variable rate security or includes variable rate securities based on a reference index and spread. The rate reported is the rate in effect as of June 30, 2020. |
| (6) | Represents annualized seven-day yield as of the close of the reporting period. |
| (7) | Includes a security that is restricted at June 30, 2020. The value of the restricted security totals $5,832,250, which represents 0.09% of total net assets. |
State/U.S. Territory | Percentage of Net Assets | |||
Alabama | 1.54 | % | ||
Alaska | 0.09 | |||
Arizona | 2.89 | |||
Arkansas | 0.12 | |||
California | 3.67 | |||
Colorado | 2.74 | |||
Connecticut | 2.66 | |||
Delaware | 0.33 | |||
District of Columbia | 1.68 | |||
Florida | 7.08 | |||
Georgia | 2.69 | |||
Guam | 0.06 | |||
Hawaii | 0.64 | |||
Idaho | 0.06 | |||
Illinois | 9.06 | |||
Indiana | 1.86 | |||
Iowa | 0.53 | |||
Kansas | 0.14 | |||
Kentucky | 2.40 | |||
Louisiana | 1.60 | |||
Maine | 0.10 | |||
Maryland | 2.01 | |||
Massachusetts | 2.83 | |||
Michigan | 2.85 | |||
Minnesota | 0.46 | |||
Mississippi | 0.31 | |||
Missouri | 0.69 | |||
Montana | 0.03 | |||
Nebraska | 0.80 | |||
Nevada | 1.47 | |||
State/U.S. Territory (Continued) | Percentage of Net Assets | |||
New Hampshire | 0.45 | % | ||
New Jersey | 3.43 | |||
New Mexico | 0.49 | |||
New York | 7.54 | |||
North Carolina | 1.34 | |||
North Dakota | 0.00 | * | ||
Ohio | 2.86 | |||
Oklahoma | 0.86 | |||
Oregon | 0.62 | |||
Pennsylvania | 5.31 | |||
Puerto Rico | 1.27 | |||
Rhode Island | 0.18 | |||
South Carolina | 1.30 | |||
South Dakota | 0.12 | |||
Tennessee | 1.37 | |||
Texas | 8.95 | |||
Utah | 0.28 | |||
Vermont | 0.07 | |||
Virgin Islands | 0.05 | |||
Virginia | 1.49 | |||
Washington | 3.26 | |||
West Virginia | 0.20 | |||
Wisconsin | 1.74 | |||
|
| |||
Total Municipal Bonds | 96.57 | |||
|
| |||
SHORT-TERM INVESTMENTS | 3.34 | |||
|
| |||
TOTAL INVESTMENTS IN SECURITIES | 99.91 | |||
OTHER ASSETS IN EXCESS OF LIABILITIES | 0.09 | |||
|
| |||
TOTAL NET ASSETS | 100.00 | % | ||
|
| |||
| * | Amount calculated is less than 0.005%. |
The accompanying notes are an integral part of these financial statements.
| 40 | Annual Report • June 30, 2020 |
Bridge Builder Large Cap Growth Fund
Summary Schedule of Investments
June 30, 2020
| Shares | Value | |||||||
COMMON STOCKS – 97.99% |
| |||||||
| Communication Services – 11.03% |
| |||||||
Alphabet, Inc. – Class A (1) | 259,545 | $ | 368,047,787 | |||||
Alphabet, Inc. – Class C (1) | 228,204 | 322,591,456 | ||||||
Facebook, Inc. – Class A (1) | 1,566,067 | 355,606,834 | ||||||
Match Group, Inc. (1) | 1,009,473 | 108,064,085 | ||||||
Netflix, Inc. (1) | 290,016 | 131,968,881 | ||||||
Other Securities (1) | 1,965,851 | 198,310,630 | ||||||
|
| |||||||
Total Communication Services |
| 1,484,589,673 | ||||||
|
| |||||||
| Consumer Discretionary – 14.86% |
| |||||||
Amazon.com, Inc. (1) | 205,582 | 567,163,733 | ||||||
Home Depot, Inc. | 512,258 | 128,325,752 | ||||||
Lowes Companies, Inc. | 971,737 | 131,301,103 | ||||||
McDonald’s Corp. | 742,304 | 136,932,819 | ||||||
NIKE, Inc. – Class B | 2,413,363 | 236,630,242 | ||||||
Tesla, Inc. (1) | 127,481 | 137,655,259 | ||||||
Yum! Brands, Inc. | 1,773,793 | 154,160,350 | ||||||
Other Securities (1) | 3,531,403 | 509,002,388 | ||||||
|
| |||||||
Total Consumer Discretionary |
| 2,001,171,646 | ||||||
|
| |||||||
| Consumer Staples – 3.40% | ||||||||
Coca-Cola Co. | 2,835,586 | 126,693,983 | ||||||
Procter & Gamble Co. | 1,311,734 | 156,844,034 | ||||||
Other Securities (1) | 2,275,343 | 174,150,033 | ||||||
|
| |||||||
Total Consumer Staples |
| 457,688,050 | ||||||
|
| |||||||
| Energy – 0.72% | ||||||||
Various Securities (1) | 2,232,266 | 96,471,695 | ||||||
|
| |||||||
Total Energy |
| 96,471,695 | ||||||
|
| |||||||
| Financials – 4.72% | ||||||||
Bank of America Corp. | 5,715,715 | 135,748,231 | ||||||
Intercontinental Exchange, Inc. | 1,959,543 | 179,494,139 | ||||||
Other Securities (1) | 2,977,236 | 320,669,730 | ||||||
|
| |||||||
Total Financials |
| 635,912,100 | ||||||
|
| |||||||
| Healthcare – 17.81% | ||||||||
Abbott Laboratories | 2,147,247 | 196,322,793 | ||||||
Becton Dickinson & Co. | 593,487 | 142,003,634 | ||||||
Danaher Corp. | 1,459,378 | 258,061,812 | ||||||
Illumina, Inc. (1) | 467,203 | 173,028,631 | ||||||
Intuitive Surgical, Inc. (1) | 305,021 | 173,810,116 | ||||||
Johnson & Johnson | 1,481,593 | 208,356,424 | ||||||
Medtronic Plc | 1,508,144 | 138,296,805 | ||||||
Pfizer, Inc. | 2,886,935 | 94,402,774 | ||||||
Regeneron Pharmaceuticals, Inc. (1) | 203,903 | 127,164,106 | ||||||
Thermo Fisher Scientific, Inc. | 281,365 | 101,949,794 | ||||||
UnitedHealth Group, Inc. | 697,530 | 205,736,473 | ||||||
Zoetis, Inc. – Class A | 710,178 | 97,322,793 | ||||||
Other Securities (1) | 5,309,329 | 480,887,348 | ||||||
|
| |||||||
Total Healthcare |
| 2,397,343,503 | ||||||
|
| |||||||
| Industrials – 4.80% | ||||||||
Honeywell International, Inc. | 942,436 | 136,266,821 | ||||||
IHS Markit Ltd. | 2,301,475 | 173,761,362 | ||||||
Union Pacific Corp. | 737,243 | 124,645,674 | ||||||
Other Securities (1) | 2,374,827 | 211,431,189 | ||||||
|
| |||||||
Total Industrials |
| 646,105,046 | ||||||
|
| |||||||
| Shares | Value | |||||||
| Information Technology – 35.18% |
| |||||||
Adobe Systems, Inc. (1) | 500,734 | $ | 217,974,518 | |||||
Analog Devices, Inc. | 931,772 | 114,272,518 | ||||||
Apple, Inc. | 1,502,470 | 548,101,056 | ||||||
Autodesk, Inc. (1) | 608,709 | 145,597,106 | ||||||
FleetCor Technologies, Inc. (1) | 725,346 | 182,446,279 | ||||||
Intuit, Inc. | 348,509 | 103,224,881 | ||||||
Mastercard, Inc. – Class A | 386,430 | 114,267,351 | ||||||
Microsoft Corp. | 4,754,455 | 967,579,137 | ||||||
NVIDIA Corp. | 268,442 | 101,983,800 | ||||||
PayPal Holdings, Inc. (1) | 1,575,186 | 274,444,657 | ||||||
Salesforce.com, Inc. (1) | 1,702,097 | 318,853,831 | ||||||
Shopify, Inc. – Class A (1) | 125,533 | 119,155,924 | ||||||
Visa, Inc. – Class A | 2,184,709 | 422,020,238 | ||||||
Workday, Inc. – Class A (1) | 1,184,675 | 221,960,708 | ||||||
Xilinx, Inc. | 1,286,684 | 126,596,839 | ||||||
Other Securities (1)(2) | 5,907,329 | 757,811,826 | ||||||
|
| |||||||
Total Information Technology |
| 4,736,290,669 | ||||||
|
| |||||||
| Materials – 3.16% | ||||||||
Ecolab, Inc. | 636,478 | 126,627,298 | ||||||
Linde Plc | 664,312 | 140,907,218 | ||||||
Other Securities (1) | 1,905,886 | 158,535,391 | ||||||
|
| |||||||
Total Materials |
| 426,069,907 | ||||||
|
| |||||||
| Real Estate – 2.31% | ||||||||
Equinix, Inc. | 217,088 | 152,460,902 | ||||||
Prologis, Inc. | 1,108,055 | 103,414,773 | ||||||
Other Securities | 346,147 | 55,362,699 | ||||||
|
| |||||||
Total Real Estate |
| 311,238,374 | ||||||
|
| |||||||
| Utilities – 0.00% (3) | ||||||||
NRG Energy, Inc. | 7,713 | 251,135 | ||||||
|
| |||||||
Total Utilities |
| 251,135 | ||||||
|
| |||||||
Total Common Stocks |
| 13,193,131,798 | ||||||
|
| |||||||
RIGHTS – 0.00% (3) | ||||||||
| Communication Services – 0.00% (3) |
| |||||||
T-Mobile US, Inc., expires 07/31/2020 (1) | 13,210 | 2,219 | ||||||
|
| |||||||
Total Communication Services |
| 2,219 | ||||||
|
| |||||||
Total Rights |
| 2,219 | ||||||
|
| |||||||
SHORT-TERM INVESTMENTS – 2.12% |
| |||||||
| Money Market Funds – 2.08% | ||||||||
Goldman Sachs Financial Square Government Fund – Class I, 0.15% (4) | 279,781,923 | 279,781,923 | ||||||
|
| |||||||
Total Money Market Funds |
| 279,781,923 | ||||||
|
| |||||||
| Principal Amount | Value | |||||||
| Time Deposits – 0.04% | ||||||||
JP Morgan, New York, 0.01% due 07/01/2020 | $ | 5,226,969 | 5,226,969 | |||||
The accompanying notes are an integral part of these financial statements.
| Annual Report • June 30, 2020 | 41 |
Bridge Builder Large Cap Growth Fund
Summary Schedule of Investments
June 30, 2020 (Continued)
| Principal Amount | Value | |||||||
National Australia Bank, London, 0.01% due 07/01/2020 | $ | 487,675 | $ | 487,675 | ||||
|
| |||||||
Total Time Deposits |
| 5,714,644 | ||||||
|
| |||||||
Total Short-Term Investments |
| 285,496,567 | ||||||
|
| |||||||
| TOTAL INVESTMENTS IN SECURITIES – 100.11% (Cost: $10,520,437,088) |
| 13,478,630,584 | ||||||
| LIABILITIES IN EXCESS OF OTHER ASSETS – (0.11)% |
| (14,345,696 | ) | |||||
|
| |||||||
| TOTAL NET ASSETS – 100.00% |
| $ | 13,464,284,888 | |||||
|
| |||||||
Percentages are stated as a percent of net assets.
| (1) | Non-income producing security or includes securities that are non-income producing. |
| (2) | Includes securities purchased exempt from registration in the U.S. pursuant to Rule 144(A) under the Securities Act of 1933. The value of these securities totals $63,274,701, which represents 0.47% of total net assets. |
| (3) | Amount calculated is less than 0.005%. |
| (4) | Represents annualized seven-day yield as of the close of the reporting period. |
The accompanying notes are an integral part of these financial statements.
| 42 | Annual Report • June 30, 2020 |
Bridge Builder Large Cap Value Fund
Summary Schedule of Investments
June 30, 2020
| Shares | Value | |||||||
COMMON STOCKS – 95.97% |
| |||||||
| Communication Services – 5.82% |
| |||||||
Alphabet, Inc. – Class A (1) | 2,408 | $ | 3,414,664 | |||||
Alphabet, Inc. – Class C (1) | 115,954 | 163,913,734 | ||||||
Comcast Corp. – Class A | 5,851,206 | 228,080,010 | ||||||
Facebook, Inc. – Class A (1) | 338,712 | 76,911,334 | ||||||
Other Securities (1) | 8,116,660 | 254,848,919 | ||||||
|
| |||||||
Total Communication Services |
| 727,168,661 | ||||||
|
| |||||||
| Consumer Discretionary – 10.73% |
| |||||||
Booking Holdings, Inc. (1) | 66,361 | 105,669,275 | ||||||
Marriott International, Inc. – Class A | 1,020,661 | 87,501,268 | ||||||
McDonald’s Corp. | 657,378 | 121,266,520 | ||||||
NIKE, Inc. – Class B | 933,125 | 91,492,906 | ||||||
TJX Companies, Inc. | 1,632,848 | 82,556,795 | ||||||
Other Securities (1) | 24,074,267 | 852,640,736 | ||||||
|
| |||||||
Total Consumer Discretionary |
| 1,341,127,500 | ||||||
|
| |||||||
| Consumer Staples – 8.02% | ||||||||
Altria Group, Inc. | 1,994,506 | 78,284,360 | ||||||
Coca-Cola Co. | 2,299,145 | 102,725,799 | ||||||
Colgate-Palmolive Co. | 1,290,637 | 94,552,067 | ||||||
PepsiCo, Inc. | 583,378 | 77,157,574 | ||||||
Philip Morris International, Inc. | 1,662,817 | 116,496,959 | ||||||
Procter & Gamble Co. | 833,486 | 99,659,921 | ||||||
Other Securities (1) | 7,481,492 | 433,744,646 | ||||||
|
| |||||||
Total Consumer Staples |
| 1,002,621,326 | ||||||
|
| |||||||
| Energy – 3.43% | ||||||||
Various Securities (1) | 10,285,698 | 429,113,789 | ||||||
|
| |||||||
Total Energy |
| 429,113,789 | ||||||
|
| |||||||
| Financials – 17.94% | ||||||||
American Express Co. | 1,370,445 | 130,466,364 | ||||||
American International Group, Inc. | 3,190,712 | 99,486,400 | ||||||
Berkshire Hathaway, Inc. – Class B (1) | 936,854 | 167,237,808 | ||||||
Chubb Ltd. | 1,520,237 | 192,492,409 | ||||||
Citigroup, Inc. | 2,892,450 | 147,804,195 | ||||||
Goldman Sachs Group, Inc. | 648,823 | 128,220,401 | ||||||
JPMorgan Chase & Co. | 982,505 | 92,414,420 | ||||||
Marsh & McLennan Companies, Inc. | 799,415 | 85,833,189 | ||||||
Wells Fargo & Co. | 4,521,942 | 115,761,715 | ||||||
Other Securities (1) | 41,254,858 | 1,083,024,474 | ||||||
|
| |||||||
Total Financials |
| 2,242,741,375 | ||||||
|
| |||||||
| Healthcare – 13.10% | ||||||||
AbbVie, Inc. | 842,157 | 82,682,974 | ||||||
Anthem, Inc. | 343,738 | 90,396,219 | ||||||
CVS Health Corp. | 1,635,323 | 106,246,935 | ||||||
Danaher Corp. | 414,685 | 73,328,749 | ||||||
Fresenius Medical Care AG & Co. KGaA | 986,393 | 84,859,270 | ||||||
Johnson & Johnson | 1,086,610 | 152,809,964 | ||||||
Medtronic Plc | 2,185,903 | 200,447,305 | ||||||
Merck & Co., Inc. | 1,334,791 | 103,219,388 | ||||||
Sanofi – ADR | 1,466,656 | 74,872,789 | ||||||
UnitedHealth Group, Inc. | 561,930 | 165,741,254 | ||||||
| Shares | Value | |||||||
Other Securities (1) | 8,013,405 | $ | 502,383,380 | |||||
|
| |||||||
Total Healthcare |
| 1,636,988,227 | ||||||
|
| |||||||
| Industrials – 15.19% | ||||||||
Deere & Co. | 682,751 | 107,294,320 | ||||||
FedEx Corp. | 631,196 | 88,506,303 | ||||||
General Dynamics Corp. | 892,347 | 133,370,183 | ||||||
Raytheon Technologies Corp. | 2,541,666 | 156,617,459 | ||||||
Stanley Black & Decker, Inc. | 524,895 | 73,159,865 | ||||||
Union Pacific Corp. | 530,376 | 89,670,670 | ||||||
United Parcel Service, Inc. – Class B | 921,861 | 102,492,506 | ||||||
Other Securities (1) | 25,683,495 | 1,147,409,681 | ||||||
|
| |||||||
Total Industrials |
| 1,898,520,987 | ||||||
|
| |||||||
| Information Technology – 11.18% |
| |||||||
Apple, Inc. | 202,879 | 74,010,259 | ||||||
Cisco Systems, Inc. | 2,936,023 | 136,936,113 | ||||||
Marvell Technology Group Ltd. | 2,126,487 | 74,554,634 | ||||||
Microsoft Corp. | 667,073 | 135,756,026 | ||||||
Oracle Corp. | 1,879,573 | 103,884,000 | ||||||
QUALCOMM, Inc. | 1,265,974 | 115,469,489 | ||||||
Texas Instruments, Inc. | 667,538 | 84,757,300 | ||||||
Other Securities (1) | 8,489,871 | 671,497,371 | ||||||
|
| |||||||
Total Information Technology |
| 1,396,865,192 | ||||||
|
| |||||||
| Materials – 5.20% |
| |||||||
DowDuPont, Inc. | 2,396,490 | 127,325,514 | ||||||
Ecolab, Inc. | 401,813 | 79,940,696 | ||||||
Linde Plc | 554,134 | 117,537,363 | ||||||
Other Securities (1) | 11,162,217 | 324,738,013 | ||||||
|
| |||||||
Total Materials |
| 649,541,586 | ||||||
|
| |||||||
| Real Estate – 2.89% |
| |||||||
Various Securities (1) | 9,399,420 | 361,539,493 | ||||||
|
| |||||||
Total Real Estate |
| 361,539,493 | ||||||
|
| |||||||
| Utilities – 2.47% |
| |||||||
Various Securities (1) | 7,493,369 | 308,153,192 | ||||||
|
| |||||||
Total Utilities |
| 308,153,192 | ||||||
|
| |||||||
Total Common Stocks |
| 11,994,381,328 | ||||||
|
| |||||||
PREFERRED STOCKS – 0.39% |
| |||||||
| Consumer Discretionary – 0.07% |
| |||||||
Volkswagen AG | 54,351 | 8,261,360 | ||||||
|
| |||||||
Total Consumer Discretionary |
| 8,261,360 | ||||||
|
| |||||||
| Healthcare – 0.08% |
| |||||||
Becton Dickinson & Co., 6.00% (1) | 183,415 | 9,757,678 | ||||||
|
| |||||||
Total Healthcare |
| 9,757,678 | ||||||
|
| |||||||
| Utilities – 0.24% |
| |||||||
Various Securities | 513,140 | 30,717,862 | ||||||
|
| |||||||
Total Utilities |
| 30,717,862 | ||||||
|
| |||||||
Total Preferred Stocks |
| 48,736,900 | ||||||
|
| |||||||
The accompanying notes are an integral part of these financial statements.
| Annual Report • June 30, 2020 | 43 |
Bridge Builder Large Cap Value Fund
Summary Schedule of Investments
June 30, 2020 (Continued)
| Shares | Value | |||||||
RIGHTS – 0.00% (2) |
| |||||||
| Communication Services – 0.00% (2) |
| |||||||
T-Mobile US, Inc., expires 07/31/2020 (1) | 8,854 | $ | 1,487 | |||||
|
| |||||||
Total Communication Services |
| 1,487 | ||||||
|
| |||||||
Total Rights |
| 1,487 | ||||||
|
| |||||||
| Principal Amount | Value | |||||||
BONDS & NOTES – 0.04% |
| |||||||
Convertible Securities – 0.04% |
| |||||||
| Financials – 0.04% |
| |||||||
AXA S.A., 7.25%, May 2021 (3) | $ | 5,500,000 | 5,022,187 | |||||
|
| |||||||
Total Financials |
| 5,022,187 | ||||||
|
| |||||||
Total Convertible Securities |
| 5,022,187 | ||||||
|
| |||||||
Total Bonds & Notes |
| 5,022,187 | ||||||
|
| |||||||
| Shares | Value | |||||||
SHORT-TERM INVESTMENTS – 3.40% |
| |||||||
| Exchange Traded Funds – 0.13% |
| |||||||
SPDR S&P 500 ETF Trust | 52,989 | 16,339,688 | ||||||
|
| |||||||
Total Exchange Traded Funds |
| 16,339,688 | ||||||
|
| |||||||
| Money Market Funds – 3.10% |
| |||||||
Goldman Sachs Financial Square Government Fund – Class I, 0.15% (4) | 387,792,134 | 387,792,134 | ||||||
|
| |||||||
Total Money Market Funds |
| 387,792,134 | ||||||
|
| |||||||
| Principal Amount | Value | |||||||
| Time Deposits – 0.17% |
| |||||||
BBVA, Madrid, 0.01% due 07/01/2020 | $ | 2,237,072 | $ | 2,237,072 | ||||
BNP Paribas, Paris, 0.01% due 07/01/2020 | 15,151,307 | 15,151,307 | ||||||
Brown Brothers Harriman, -0.68% due 07/01/2020 | EUR | 387 | 435 | |||||
JP Morgan, New York, 0.01% due 07/01/2020 | $ | 299,365 | 299,365 | |||||
Sumitomo, Tokyo, 0.01% due 07/01/2020 | 3,388,492 | 3,388,492 | ||||||
|
| |||||||
Total Time Deposits |
| 21,076,671 | ||||||
|
| |||||||
Total Short-Term Investments |
| 425,208,493 | ||||||
|
| |||||||
| TOTAL INVESTMENTS IN SECURITIES – 99.80% (Cost: $11,403,260,466) |
| 12,473,350,395 | ||||||
| OTHER ASSETS IN EXCESS OF LIABILITIES – 0.20% |
| 25,270,538 | ||||||
|
| |||||||
| TOTAL NET ASSETS – 100.00% |
| $ | 12,498,620,933 | |||||
|
| |||||||
Percentages are stated as a percent of net assets.
Principal amounts are denominated in the currency in which the security was purchased.
| ADR | American Depositary Receipt |
| EUR | Euro |
| (1) | Non-income producing security or includes securities that are non-income producing. |
| (2) | Amount calculated is less than 0.005%. |
| (3) | Security was purchased exempt from registration in the U.S. pursuant to Rule 144(A) under the Securities Act of 1933. The value of these securities totals $5,022,187, which represents 0.04% of total net assets. |
| (4) | Represents annualized seven-day yield as of the close of the reporting period. |
The accompanying notes are an integral part of these financial statements.
| 44 | Annual Report • June 30, 2020 |
Bridge Builder Small/Mid Cap Growth Fund
Summary Schedule of Investments
June 30, 2020
| Shares | Value | |||||||
COMMON STOCKS – 98.08% |
| |||||||
| Communication Services – 4.27% |
| |||||||
John Wiley & Sons, Inc. – Class A | 663,680 | $ | 25,883,520 | |||||
Zynga, Inc. – Class A (1) | 4,351,496 | 41,513,272 | ||||||
Other Securities (1) | 2,219,955 | 137,445,044 | ||||||
|
| |||||||
Total Communication Services |
| 204,841,836 | ||||||
|
| |||||||
| Consumer Discretionary – 9.83% |
| |||||||
Advance Auto Parts, Inc. | 232,000 | 33,048,400 | ||||||
Burlington Stores, Inc. (1) | 130,299 | 25,659,782 | ||||||
Chipotle Mexican Grill, Inc. – Class A (1) | 24,145 | 25,409,232 | ||||||
Ollie’s Bargain Outlet Holdings, Inc. (1) | 493,923 | 48,231,581 | ||||||
Tractor Supply Co. | 330,469 | 43,552,509 | ||||||
Ulta Beauty, Inc. (1) | 158,051 | 32,150,734 | ||||||
Other Securities (1) | 4,856,569 | 263,423,462 | ||||||
|
| |||||||
Total Consumer Discretionary |
| 471,475,700 | ||||||
|
| |||||||
| Consumer Staples – 4.08% |
| |||||||
Lamb Weston Holdings, Inc. | 472,297 | 30,193,947 | ||||||
The J.M. Smucker Co. | 316,000 | 33,435,960 | ||||||
Other Securities (1) | 2,103,092 | 132,048,827 | ||||||
|
| |||||||
Total Consumer Staples |
| 195,678,734 | ||||||
|
| |||||||
| Energy – 0.27% |
| |||||||
Various Securities (1) | 968,341 | 12,930,103 | ||||||
|
| |||||||
Total Energy |
| 12,930,103 | ||||||
|
| |||||||
| Financials – 8.25% |
| |||||||
Arthur J. Gallagher & Co. | 395,000 | 38,508,550 | ||||||
Everest Re Group Ltd. | 191,000 | 39,384,200 | ||||||
Tradeweb Markets, Inc. – Class A | 815,700 | 47,424,798 | ||||||
Other Securities (1) | 5,080,261 | 270,077,353 | ||||||
|
| |||||||
Total Financials |
| 395,394,901 | ||||||
|
| |||||||
| Healthcare – 25.60% |
| |||||||
Align Technology, Inc. (1) | 102,335 | 28,084,817 | ||||||
Argenx SE – ADR (1) | 115,896 | 26,103,256 | ||||||
Ascendis Pharma – ADR (1) | 227,442 | 33,638,672 | ||||||
Bio-Techne Corp. | 207,864 | 54,890,646 | ||||||
Catalent, Inc. (1) | 1,224,719 | 89,771,903 | ||||||
Dentsply Sirona, Inc. | 640,000 | 28,198,400 | ||||||
DexCom, Inc. (1) | 137,985 | 55,939,119 | ||||||
Edwards Lifesciences Corp. (1) | 455,000 | 31,445,050 | ||||||
Genmab – ADR (1) | 1,031,889 | 34,970,718 | ||||||
Integra LifeSciences Holdings Corp. (1) | 828,258 | 38,919,843 | ||||||
Veeva Systems, Inc. – Class A (1) | 422,092 | 98,946,807 | ||||||
West Pharmaceutical Services, Inc. | 243,653 | 55,350,652 | ||||||
Other Securities (1)(3) | 14,816,898 | 651,115,351 | ||||||
|
| |||||||
Total Healthcare |
| 1,227,375,234 | ||||||
|
| |||||||
| Industrials – 14.05% |
| |||||||
AMETEK, Inc. | 473,000 | 42,272,010 | ||||||
Clarivate Plc (1) | 1,222,000 | 27,287,260 | ||||||
Fortive Corp. | 976,176 | 66,048,068 | ||||||
IDEX Corp. | 263,593 | 41,658,238 | ||||||
IHS Markit Ltd. | 497,447 | 37,557,249 | ||||||
L3Harris Technologies, Inc. | 176,904 | 30,015,302 | ||||||
Rockwell Automation, Inc. | 176,730 | 37,643,490 | ||||||
Roper Technologies, Inc. | 67,781 | 26,316,651 | ||||||
| Shares | Value | |||||||
Toro Co. | 386,512 | $ | 25,641,206 | |||||
Verisk Analytics, Inc. – Class A | 169,099 | 28,780,650 | ||||||
Other Securities (1) | 5,831,710 | 310,288,830 | ||||||
|
| |||||||
Total Industrials |
| 673,508,954 | ||||||
|
| |||||||
| Information Technology – 27.33% |
| |||||||
Atlassian Corp. Plc – Class A (1) | 284,352 | 51,260,135 | ||||||
Fidelity National Information Services, Inc. | 218,438 | 29,290,351 | ||||||
Global Payments, Inc. | 366,197 | 62,114,335 | ||||||
Guidewire Software, Inc. (1) | 375,421 | 41,615,418 | ||||||
HubSpot, Inc. (1) | 123,910 | 27,799,208 | ||||||
Okta, Inc. – Class A (1) | 157,370 | 31,510,195 | ||||||
Palo Alto Networks, Inc. (1) | 160,974 | 36,970,899 | ||||||
Pure Storage, Inc. – Class A (1) | 1,609,740 | 27,896,794 | ||||||
ServiceNow, Inc. (1) | 102,000 | 41,316,120 | ||||||
Splunk, Inc. (1) | 210,717 | 41,869,468 | ||||||
Synopsys, Inc. (1) | 154,245 | 30,077,775 | ||||||
Workday, Inc. – Class A (1) | 241,000 | 45,153,760 | ||||||
Zoom Video Communications, Inc. – Class A (1) | 175,948 | 44,609,856 | ||||||
Zscaler, Inc. (1) | 473,164 | 51,811,458 | ||||||
Other Securities (1) | 13,229,557 | 746,986,275 | ||||||
|
| |||||||
Total Information Technology |
| 1,310,282,047 | ||||||
|
| |||||||
| Materials – 2.13% |
| |||||||
AptarGroup, Inc. | 357,172 | 39,996,121 | ||||||
Other Securities (1) | 1,995,054 | 62,314,724 | ||||||
|
| |||||||
Total Materials |
| 102,310,845 | ||||||
|
| |||||||
| Real Estate – 1.28% |
| |||||||
Various Securities (1) | 1,412,112 | 61,484,997 | ||||||
|
| |||||||
Total Real Estate |
| 61,484,997 | ||||||
|
| |||||||
| Utilities – 0.99% |
| |||||||
Various Securities (1) | 812,619 | 47,236,847 | ||||||
|
| |||||||
Total Utilities |
| 47,236,847 | ||||||
|
| |||||||
Total Common Stocks |
| 4,702,520,198 | ||||||
|
| |||||||
SHORT-TERM INVESTMENTS – 2.18% |
| |||||||
| Money Market Funds – 2.01% |
| |||||||
Goldman Sachs Financial Square Government Fund – Class I, 0.15% (2) | 96,213,135 | 96,213,135 | ||||||
|
| |||||||
Total Money Market Funds |
| 96,213,135 | ||||||
|
| |||||||
| Principal Amount | Value | |||||||
| Time Deposits – 0.17% |
| |||||||
BNP Paribas, Paris, 0.01% due 07/01/2020 | $ | 7,527,114 | 7,527,114 | |||||
National Australia Bank, London, 0.01% due 07/01/2020 | 188,364 | 188,364 | ||||||
Sumitomo, Tokyo, 0.01% due 07/01/2020 | 357,392 | 357,392 | ||||||
|
| |||||||
Total Time Deposits |
| 8,072,870 | ||||||
|
| |||||||
The accompanying notes are an integral part of these financial statements.
| Annual Report • June 30, 2020 | 45 |
Bridge Builder Small/Mid Cap Growth Fund
Summary Schedule of Investments
June 30, 2020 (Continued)
| Value | ||||||
Total Short-Term Investments | $ | 104,286,005 | ||||
|
| |||||
| TOTAL INVESTMENTS IN SECURITIES – 100.26% (Cost: $3,981,602,653) | 4,806,806,203 | |||||
|
| |||||
| LIABILITIES IN EXCESS OF OTHER ASSETS – (0.26)% | (12,659,106 | ) | ||||
|
| |||||
| TOTAL NET ASSETS – 100.00% | $ | 4,794,147,097 | ||||
|
| |||||
Percentages are stated as a percent of net assets.
| ADR | American Depositary Receipt |
| (1) | Non-income producing security or includes securities that are non-income producing. |
| (2) | Represents annualized seven-day yield as of the close of the reporting period. |
| (3) | Security or includes securities categorized as Level 3 per the Trust’s fair value hierarchy. The value of these securities total $382, which represents 0.00% of total net assets. |
The accompanying notes are an integral part of these financial statements.
| 46 | Annual Report • June 30, 2020 |
Bridge Builder Small/Mid Cap Value Fund
Summary Schedule of Investments
June 30, 2020
| Shares | Value | |||||||
COMMON STOCKS – 97.97% |
| |||||||
| Communication Services – 1.67% |
| |||||||
Nexstar Media Group, Inc. – Class A | 317,058 | $ | 26,534,584 | |||||
Other Securities (1) | 3,023,862 | 58,419,305 | ||||||
|
| |||||||
Total Communication Services |
| 84,953,889 | ||||||
|
| |||||||
| Consumer Discretionary – 10.69% |
| |||||||
Brunswick Corp. | 322,027 | 20,612,948 | ||||||
Grand Canyon Education, Inc. (1) | 198,359 | 17,957,440 | ||||||
ServiceMaster Global Holdings, Inc. (1) | 506,762 | 18,086,336 | ||||||
Other Securities (1) | 17,164,648 | 488,562,613 | ||||||
|
| |||||||
Total Consumer Discretionary |
| 545,219,337 | ||||||
|
| |||||||
| Consumer Staples – 4.35% |
| |||||||
Constellation Brands, Inc. – Class A | 105,460 | 18,450,227 | ||||||
Post Holdings, Inc. (1) | 206,792 | 18,119,115 | ||||||
Other Securities (1) | 5,842,735 | 185,345,740 | ||||||
|
| |||||||
Total Consumer Staples |
| 221,915,082 | ||||||
|
| |||||||
| Energy – 3.20% |
| |||||||
Various Securities (1) | 17,053,186 | 163,369,571 | ||||||
|
| |||||||
Total Energy |
| 163,369,571 | ||||||
|
| |||||||
| Financials – 19.90% |
| |||||||
Allstate Corp. | 260,005 | 25,217,885 | ||||||
Ameriprise Financial, Inc. | 192,563 | 28,892,153 | ||||||
BancorpSouth Bank | 871,984 | 19,828,916 | ||||||
CVB Financial Corp. | 946,907 | 17,745,037 | ||||||
Discover Financial Services | 374,497 | 18,758,555 | ||||||
Fifth Third Bancorp | 1,090,435 | 21,023,587 | ||||||
Glacier Bancorp, Inc. | 564,598 | 19,924,663 | ||||||
Huntington Bancshares, Inc. | 1,966,757 | 17,769,649 | ||||||
Independent Bank Corp. | 315,597 | 21,173,403 | ||||||
KeyCorp | 1,429,397 | 17,410,055 | ||||||
Lakeland Financial Corp. | 480,152 | 22,370,282 | ||||||
Loews Corp. | 622,425 | 21,342,953 | ||||||
Reinsurance Group of America, Inc. – Class A | 299,870 | 23,521,803 | ||||||
Selective Insurance Group, Inc. | 360,466 | 19,010,977 | ||||||
TCF Financial Corp. | 1,038,674 | 30,557,789 | ||||||
Other Securities (1)(4) | 29,059,539 | 690,541,725 | ||||||
|
| |||||||
Total Financials |
| 1,015,089,432 | ||||||
|
| |||||||
| Healthcare – 7.28% |
| |||||||
Centene Corp. (1) | 346,486 | 22,019,185 | ||||||
IQVIA Holdings, Inc. (1) | 181,410 | 25,738,451 | ||||||
Other Securities (1) | 8,161,652 | 323,784,618 | ||||||
|
| |||||||
Total Healthcare |
| 371,542,254 | ||||||
| �� | |||||||
| Industrials – 17.93% |
| |||||||
Altra Industrial Motion Corp. | 545,998 | 17,395,496 | ||||||
AMETEK, Inc. | 380,889 | 34,040,050 | ||||||
Crane Co. | 336,105 | 19,984,803 | ||||||
Cummins, Inc. | 121,464 | 21,044,853 | ||||||
ESCO Technologies, Inc. | 208,553 | 17,628,985 | ||||||
HD Supply Holdings, Inc. (1) | 572,250 | 19,828,462 | ||||||
Oshkosh Corp. | 393,928 | 28,213,123 | ||||||
Owens Corning | 338,143 | 18,854,854 | ||||||
Parker-Hannifin Corp. | 116,605 | 21,370,198 | ||||||
Timken Co. | 441,502 | 20,083,926 | ||||||
| Shares | Value | |||||||
Other Securities (1)(2) | 21,479,642 | $ | 696,151,066 | |||||
|
| |||||||
Total Industrials |
| 914,595,816 | ||||||
|
| |||||||
| Information Technology – 12.24% |
| |||||||
Brooks Automation, Inc. | 505,228 | 22,351,287 | ||||||
CACI International, Inc. – Class A (1) | 109,740 | 23,800,411 | ||||||
Fidelity National Information Services, Inc. | 132,450 | 17,760,221 | ||||||
Fiserv, Inc. (1) | 178,275 | 17,403,206 | ||||||
KBR, Inc. | 773,698 | 17,446,890 | ||||||
Methode Electronics, Inc. | 652,357 | 20,392,680 | ||||||
NXP Semiconductors NV | 156,208 | 17,813,960 | ||||||
Plexus Corp. (1) | 320,436 | 22,609,964 | ||||||
Other Securities (1) | 12,833,595 | 464,761,421 | ||||||
|
| |||||||
Total Information Technology |
| 624,340,040 | ||||||
|
| |||||||
| Materials – 6.91% |
| |||||||
Crown Holdings, Inc. (1) | 279,647 | 18,213,409 | ||||||
FMC Corp. | 339,872 | 33,858,049 | ||||||
Graphic Packaging Holding Co. | 1,319,794 | 18,463,918 | ||||||
Other Securities (1) | 12,644,428 | 281,972,943 | ||||||
|
| |||||||
Total Materials |
| 352,508,319 | ||||||
|
| |||||||
| Real Estate – 7.49% |
| |||||||
QTS Realty Trust, Inc. – Class A | 334,765 | 21,455,089 | ||||||
Other Securities (1) | 17,841,576 | 360,407,894 | ||||||
|
| |||||||
Total Real Estate |
| 381,862,983 | ||||||
|
| |||||||
| Utilities – 6.31% |
| |||||||
Ameren Corp. | 258,177 | 18,165,334 | ||||||
Evergy, Inc. | 509,803 | 30,226,220 | ||||||
FirstEnergy Corp. | 450,186 | 17,458,213 | ||||||
ONE Gas, Inc. | 225,492 | 17,374,159 | ||||||
Vistra Energy Corp. | 1,722,059 | 32,064,739 | ||||||
Other Securities (1) | 5,293,086 | 206,442,099 | ||||||
|
| |||||||
Total Utilities |
| 321,730,764 | ||||||
|
| |||||||
Total Common Stocks |
| 4,997,127,487 | ||||||
|
| |||||||
SHORT-TERM INVESTMENTS – 2.22% |
| |||||||
| Money Market Funds – 1.94% |
| |||||||
Goldman Sachs Financial Square Government Fund – Class I, 0.15% (3) | 99,271,966 | 99,271,966 | ||||||
|
| |||||||
Total Money Market Funds |
| 99,271,966 | ||||||
|
| |||||||
| Principal Amount | Value | |||||||
| Time Deposits – 0.28% |
| |||||||
Banco Santander, Frankfurt, 0.01% due 07/01/2020 | $ | 5,666,959 | 5,666,959 | |||||
BBVA, Madrid, 0.01% due 07/01/2020 | 922,424 | 922,424 | ||||||
BNP Paribas, Paris, 0.01% due 07/01/2020 | 4,577,510 | 4,577,510 | ||||||
Brown Brothers Harriman, 0.01% due 07/01/2020 | 35 | 35 | ||||||
Brown Brothers Harriman, 0.02% due 07/02/2020 | CAD | 17 | 12 | |||||
The accompanying notes are an integral part of these financial statements.
| Annual Report • June 30, 2020 | 47 |
Bridge Builder Small/Mid Cap Value Fund
Summary Schedule of Investments
June 30, 2020 (Continued)
| Principal Amount | Value | |||||||
China Construction Bank, New York, 0.01% due 07/01/2020 | $ | 157,799 | $ | 157,799 | ||||
JP Morgan, New York, 0.01% due 07/01/2020 | 2,823,908 | 2,823,908 | ||||||
|
| |||||||
Total Time Deposits |
| 14,148,647 | ||||||
|
| |||||||
Total Short-Term Investments |
| 113,420,613 | ||||||
|
| |||||||
| TOTAL INVESTMENTS IN SECURITIES – 100.19% (Cost: $5,037,210,725) |
| 5,110,548,100 | ||||||
| LIABILITIES IN EXCESS OF OTHER ASSETS – (0.19)% |
| (9,549,318 | ) | |||||
|
| |||||||
| TOTAL NET ASSETS – 100.00% |
| $ | 5,100,998,782 | |||||
|
| |||||||
Percentages are stated as a percent of net assets.
Principal amounts are denominated in the currency in which the security was purchased.
| CAD | Canadian Dollar |
| (1) | Non-income producing security or includes securities that are non-income producing. |
| (2) | Includes security purchased exempt from registration in the U.S. pursuant to Rule 144(A) under the Securities Act of 1933. The value of these security totals $684,507, which represents 0.01% of total net assets. |
| (3) | Represents annualized seven-day yield as of the close of the reporting period. |
| (4) | Security or includes securities categorized as Level 3 per the Trust’s fair value hierarchy. The value of these securities total $0, which represents 0.00% of total net assets. |
The accompanying notes are an integral part of these financial statements.
| 48 | Annual Report • June 30, 2020 |
Bridge Builder International Equity Fund
Summary Schedule of Investments
June 30, 2020
| Shares | Value | |||||||
COMMON STOCKS – 95.92% |
| |||||||
| Communication Services – 9.43% |
| |||||||
China Mobile Ltd. | 18,860,500 | $ | 127,347,237 | |||||
Singapore Telecommunications Ltd. | 46,398,900 | 82,538,902 | ||||||
Tencent Holdings Ltd. | 1,127,956 | 72,277,066 | ||||||
Vodafone Group Plc | 67,143,248 | 106,741,670 | ||||||
Other Securities (1)(2) | 71,913,346 | 681,132,463 | ||||||
|
| |||||||
Total Communication Services |
| 1,070,037,338 | ||||||
|
| |||||||
| Consumer Discretionary – 14.21% |
| |||||||
Alibaba Group Holding Ltd. – ADR (2) | 377,300 | 81,383,610 | ||||||
Continental AG (2) | 877,779 | 86,295,625 | ||||||
Honda Motor Co. Ltd. | 3,951,199 | 101,125,677 | ||||||
Lululemon Athletica, Inc. (2) | 317,701 | 99,125,889 | ||||||
LVMH Moet Hennessy Louis Vuitton SE | 197,574 | 87,227,990 | ||||||
MercadoLibre, Inc. (2) | 99,636 | 98,218,180 | ||||||
Panasonic Corp. | 12,120,700 | 106,287,007 | ||||||
Sony Corp. | 1,711,800 | 118,165,862 | ||||||
Zalando SE (1)(2) | 990,121 | 70,239,725 | ||||||
Other Securities (1)(2) | 49,499,010 | 763,949,281 | ||||||
|
| |||||||
Total Consumer Discretionary |
| 1,612,018,846 | ||||||
|
| |||||||
| Consumer Staples – 7.62% |
| |||||||
Nestle SA | 651,611 | 72,244,519 | ||||||
Tesco Plc | 72,413,070 | 203,673,635 | ||||||
Other Securities (1)(2) | 148,152,137 | 587,354,158 | ||||||
|
| |||||||
Total Consumer Staples |
| 863,272,312 | ||||||
|
| |||||||
| Energy – 3.96% |
| |||||||
BP Plc | 29,628,305 | 113,507,313 | ||||||
ENI SpA | 11,307,017 | 108,389,239 | ||||||
Other Securities (2) | 29,443,736 | 226,942,978 | ||||||
|
| |||||||
Total Energy |
| 448,839,530 | ||||||
|
| |||||||
| Financials – 11.95% |
| |||||||
AIA Group Ltd. | 10,913,284 | 102,122,202 | ||||||
Allianz SE | 340,347 | 69,547,351 | ||||||
ING Groep NV | 13,708,542 | 95,561,007 | ||||||
United Overseas Bank Ltd. | 7,298,206 | 106,640,421 | ||||||
Other Securities (1)(2) | 260,643,243 | 981,746,911 | ||||||
|
| |||||||
Total Financials |
| 1,355,617,892 | ||||||
|
| |||||||
| Healthcare – 15.42% |
| |||||||
Astellas Pharma, Inc. | 4,260,300 | 71,145,143 | ||||||
AstraZeneca Plc | 982,097 | 102,211,143 | ||||||
CSL Ltd. | 425,526 | 84,632,426 | ||||||
Fresenius Medical Care AG & Co. KGaA | 861,023 | 74,073,704 | ||||||
GlaxoSmithKline Plc | 3,676,997 | 74,274,204 | ||||||
Mettler-Toledo International, Inc. (2) | 110,170 | 88,747,443 | ||||||
Novartis AG | 2,100,490 | 182,996,930 | ||||||
ResMed, Inc. | 371,999 | 71,423,808 | ||||||
Roche Holding AG | 411,477 | 142,556,017 | ||||||
Sanofi SA | 2,031,812 | 207,213,718 | ||||||
Takeda Pharmaceutical Co. Ltd. | 2,355,700 | 84,635,514 | ||||||
Other Securities (1)(2) | 28,463,348 | 565,538,370 | ||||||
|
| |||||||
Total Healthcare |
| 1,749,448,420 | ||||||
|
| |||||||
| Shares | Value | |||||||
| Industrials – 13.04% |
| |||||||
ABB Ltd. | 3,566,407 | $ | 80,896,583 | |||||
Atlas Copco AB – Class A | 2,397,257 | 102,088,259 | ||||||
Cie de Saint-Gobain | 2,613,666 | 94,303,609 | ||||||
CK Hutchison Holdings Ltd. | 17,544,500 | 113,610,938 | ||||||
Experian Plc | 2,021,660 | 70,957,948 | ||||||
Mitsubishi Electric Corp. | 6,047,500 | 78,988,027 | ||||||
Other Securities (1)(2) | 42,366,294 | 938,585,806 | ||||||
|
| |||||||
Total Industrials |
| 1,479,431,170 | ||||||
|
| |||||||
| Information Technology – 14.11% |
| |||||||
Accenture Plc – Class A | 326,834 | 70,177,796 | ||||||
ASML Holding NV | 211,464 | 77,356,321 | ||||||
ASML Holding NV – Class REG | 170,445 | 62,728,873 | ||||||
FUJIFILM Holdings Corp. | 1,635,300 | 69,993,640 | ||||||
Keyence Corp. | 232,208 | 97,309,443 | ||||||
Kyocera Corp. | 1,316,000 | 71,833,302 | ||||||
Nokia OYJ | 21,055,018 | 92,007,646 | ||||||
Samsung SDI Co. Ltd. | 405,864 | 124,097,637 | ||||||
Shopify, Inc. – Class A (2) | 269,447 | 255,759,092 | ||||||
Taiwan Semiconductor Manufacturing Co. Ltd. | 7,472,860 | 79,806,560 | ||||||
Taiwan Semiconductor Manufacturing Co. Ltd. – ADR | 3,683,703 | 209,123,819 | ||||||
Other Securities (1)(2) | 40,009,891 | 390,506,180 | ||||||
|
| |||||||
Total Information Technology |
| 1,600,700,309 | ||||||
|
| |||||||
| Materials – 2.84% |
| |||||||
Various Securities (1)(2) | 14,392,075 | 322,587,369 | ||||||
|
| |||||||
Total Materials |
| 322,587,369 | ||||||
|
| |||||||
| Real Estate – 0.85% |
| |||||||
Various Securities (2) | 9,849,335 | 96,394,294 | ||||||
|
| |||||||
Total Real Estate |
| 96,394,294 | ||||||
|
| |||||||
| Utilities – 2.49% |
| |||||||
Enel SpA | 11,537,068 | 99,777,719 | ||||||
SSE Plc | 4,851,823 | 82,156,496 | ||||||
Other Securities (1)(2) | 24,702,260 | 101,055,467 | ||||||
|
| |||||||
Total Utilities |
| 282,989,682 | ||||||
|
| |||||||
Total Common Stocks |
| 10,881,337,162 | ||||||
|
| |||||||
PREFERRED STOCKS – 0.23% |
| |||||||
| Consumer Discretionary – 0.22% |
| |||||||
Various Securities (2) | 168,045 | 24,715,644 | ||||||
|
| |||||||
Total Consumer Discretionary |
| 24,715,644 | ||||||
|
| |||||||
| Consumer Staples – 0.01% |
| |||||||
Henkel AG & Co. KGaA | 7,336 | 684,403 | ||||||
|
| |||||||
Total Consumer Staples |
| 684,403 | ||||||
|
| |||||||
| Healthcare – 0.00% (3) |
| |||||||
Sartorius AG | 1,517 | 500,683 | ||||||
|
| |||||||
Total Healthcare |
| 500,683 | ||||||
|
| |||||||
| Materials – 0.00% (3) |
| |||||||
Fuchs Petrolub SE | 2,928 | 117,687 | ||||||
|
| |||||||
Total Materials |
| 117,687 | ||||||
|
| |||||||
Total Preferred Stocks |
| 26,018,417 | ||||||
|
| |||||||
The accompanying notes are an integral part of these financial statements.
| Annual Report • June 30, 2020 | 49 |
Bridge Builder International Equity Fund
Summary Schedule of Investments
June 30, 2020 (Continued)
| Shares | Value | |||||||
RIGHTS – 0.02% |
| |||||||
| Communication Services – 0.02% |
| |||||||
Telefonica SA, expires 07/07/2020 (2) | 13,011,834 | $ | 2,559,751 | |||||
|
| |||||||
Total Communication Services |
| 2,559,751 | ||||||
|
| |||||||
| Energy – 0.00% (3) |
| |||||||
Repsol SA, expires 07/27/2020 (2) | 58,034 | 28,252 | ||||||
|
| |||||||
Total Energy |
| 28,252 | ||||||
|
| |||||||
| Industrials – 0.00% (3) |
| |||||||
ACS Actividades de Construccion y Servicios SA, expires 07/10/2020 (2) | 10,439 | 16,284 | ||||||
|
| |||||||
Total Industrials |
| 16,284 | ||||||
|
| |||||||
Total Rights |
| 2,604,287 | ||||||
|
| |||||||
SHORT-TERM INVESTMENTS – 3.45% |
| |||||||
| Money Market Funds – 3.26% |
| |||||||
Goldman Sachs Financial Square Government Fund – Class I, 0.15% (4) | 370,088,795 | 370,088,795 | ||||||
|
| |||||||
Total Money Market Funds |
| 370,088,795 | ||||||
|
| |||||||
| Principal Amount | Value | |||||||
| Time Deposits – 0.19% |
| |||||||
ANZ, London, -0.10% due 07/01/2020 | AUD | 1,198,958 | 827,401 | |||||
BBVA, Madrid, 0.01% due 07/01/2020 | $ | 126,977 | 126,977 | |||||
BNP Paribas, Paris, -1.53% due 07/01/2020 | CHF | 133,407 | 140,806 | |||||
Brown Brothers Harriman, -0.30% due 07/01/2020 | NOK | 38,596 | 4,010 | |||||
Brown Brothers Harriman, -0.25% due 07/01/2020 | SEK | 38,027 | 4,081 | |||||
Brown Brothers Harriman, -0.16% due 07/01/2020 | DKK | 317,936 | 47,936 | |||||
Brown Brothers Harriman, -0.10% due 07/01/2020 | AUD | 10,731 | 7,405 | |||||
Brown Brothers Harriman, 0.00% due 07/01/2020 | NZD | 49,927 | 32,218 | |||||
Brown Brothers Harriman, 0.00% due 07/01/2020 | SGD | 55 | 39 | |||||
Brown Brothers Harriman, 0.01% due 07/01/2020 | GBP | 7,116 | 8,817 | |||||
Brown Brothers Harriman, 0.04% due 07/02/2020 | HKD | 2,098 | 271 | |||||
China Construction Bank, New York, 0.01% due 07/01/2020 | $ | 1,763,037 | 1,763,037 | |||||
Citibank, London, -0.68% due 07/01/2020 | EUR | 371,449 | 417,323 | |||||
Citibank, London, 0.01% due 07/01/2020 | GBP | 26,025 | 32,248 | |||||
HSBC, Hong Kong, 0.04% due 07/02/2020 | HKD | 1,790,408 | 231,005 | |||||
| Principal Amount | Value | |||||||
HSBC, Singapore, 0.00% due 07/01/2020 | SGD | 5,581,984 | 4,005,442 | |||||
JP Morgan, New York, 0.01% due 07/01/2020 | $ | 1,619,672 | 1,619,672 | |||||
National Australia Bank, London, 0.01% due 07/01/2020 | 3,737,128 | 3,737,128 | ||||||
Nordea Bank ABP, Oslo, -0.30% due 07/01/2020 | NOK | 254,969 | 26,490 | |||||
Skandinaviska Enskilda Banken AB, Stockholm, -0.25% due 07/01/2020 | SEK | 473,894 | 50,857 | |||||
Sumitomo, Tokyo, -0.25% due 07/01/2020 | JPY | 886,660,344 | 8,211,719 | |||||
|
| |||||||
Total Time Deposits |
| 21,294,882 | ||||||
|
| |||||||
Total Short-Term Investments |
| 391,383,677 | ||||||
|
| |||||||
| TOTAL INVESTMENTS IN SECURITIES – 99.62% (Cost: $10,726,734,933) |
| 11,301,343,543 | ||||||
| OTHER ASSETS IN EXCESS OF LIABILITIES – 0.38% |
| 43,161,119 | ||||||
|
| |||||||
| TOTAL NET ASSETS – 100.00% |
| $ | 11,344,504,662 | |||||
|
| |||||||
Percentages are stated as a percent of net assets.
Principal amounts are denominated in the currency in which the security was purchased.
| ADR | American Depositary Receipt |
| AUD | Australian Dollar |
| CHF | Swiss Franc |
| DKK | Danish Krone |
| EUR | Euro |
| GBP | British Pound |
| HKD | Hong Kong Dollar |
| JPY | Japanese Yen |
| NOK | Norwegian Krone |
| NZD | New Zealand Dollar |
| SEK | Swedish Krona |
| SGD | Singapore Dollar |
| (1) | Security or includes securities purchased exempt from registration in the U.S. pursuant to Rule 144(A) under the Securities Act of 1933. The value of these securities totals $285,674,808, which represents 2.52% of total net assets. |
| (2) | Non-income producing security or includes securities that are non-income producing. |
| (3) | Amount calculated is less than 0.005%. |
| (4) | Represents annualized seven-day yield as of the close of the reporting period. |
The accompanying notes are an integral part of these financial statements.
| 50 | Annual Report • June 30, 2020 |
Bridge Builder International Equity Fund
Summary Schedule of Investments
June 30, 2020 (Continued)
Country | Percentage of Net Assets | |||
Argentina | 0.87 | % | ||
Australia | 2.12 | |||
Austria | 0.01 | |||
Belgium | 0.12 | |||
Brazil | 0.29 | |||
Canada | 3.86 | |||
Chile | 0.52 | |||
China | 3.41 | |||
Denmark | 1.12 | |||
Finland | 1.20 | |||
France | 8.39 | |||
Germany | 6.76 | |||
Hong Kong | 4.67 | |||
India | 1.43 | |||
Ireland | 1.91 | |||
Israel | 0.03 | |||
Italy | 2.28 | |||
Japan | 18.76 | |||
Luxembourg | 0.04 | |||
Mexico | 0.38 | |||
Netherlands | 3.47 | |||
New Zealand | 0.32 | |||
Country (Continued) | Percentage of Net Assets | |||
Norway | 0.03 | % | ||
Peru | 0.44 | |||
Portugal | 0.32 | |||
Singapore | 2.06 | |||
South Africa | 0.47 | |||
South Korea | 2.11 | |||
Spain | 1.79 | |||
Sweden | 3.10 | |||
Switzerland | 6.51 | |||
Taiwan | 2.87 | |||
Thailand | 0.10 | |||
United Kingdom | 12.46 | |||
United States | 1.95 | |||
Other (individually each country is less than 0.005%) | 0.00 | |||
|
| |||
Total Country | 96.17 | |||
|
| |||
SHORT-TERM INVESTMENTS | 3.45 | |||
|
| |||
TOTAL INVESTMENTS IN SECURITIES | 99.62 | |||
OTHER ASSETS IN EXCESS OF LIABILITIES | 0.38 | |||
|
| |||
TOTAL NET ASSETS | 100.00 | % | ||
|
| |||
The accompanying notes are an integral part of these financial statements.
| Annual Report • June 30, 2020 | 51 |
Statements of Assets and Liabilities
June 30, 2020
| Bridge Builder Core Bond Fund | Bridge Builder Core Plus Bond Fund | Bridge Builder Municipal Bond Fund | Bridge Builder Large Cap Growth Fund | |||||||||||||
Assets | ||||||||||||||||
Investments, at value (1) | $ | 14,574,427,564 | $ | 19,932,349,775 | $ | 6,514,614,683 | $ | 13,478,630,584 | ||||||||
Foreign currency, at value (2) | — | 10,095,521 | — | — | ||||||||||||
Cash | 40 | 2,725,388 | 42 | 20,495 | ||||||||||||
Over-the-counter credit default swap contracts, at value | — | 318,349 | — | — | ||||||||||||
Receivable for sale-buyback transactions | — | 121,128,091 | — | — | ||||||||||||
Receivable for foreign currency transactions | — | 4,136,417 | — | — | ||||||||||||
Receivable for investments sold | 329,178,033 | 635,956,454 | 3,789 | — | ||||||||||||
Receivable for fund shares sold | 18,906,360 | 33,743,512 | 16,192,374 | 14,781,107 | ||||||||||||
Unrealized appreciation on forward foreign currency exchange contracts | — | 5,732,392 | — | — | ||||||||||||
Unrealized appreciation on unfunded loan commitments | — | 53,724 | — | — | ||||||||||||
Dividend and interest receivable | 66,247,830 | 106,068,012 | 64,356,635 | 4,259,569 | ||||||||||||
Tax reclaim receivable | — | 42,061 | — | 987,771 | ||||||||||||
Deposits at broker for futures contracts | — | 772,000 | — | — | ||||||||||||
Variation margin on futures contracts | — | 599,801 | — | — | ||||||||||||
Deposits at broker for centrally cleared swap contracts | — | 603,000 | — | — | ||||||||||||
Variation margin on centrally cleared swap contracts | 1,222 | 22,920,602 | — | — | ||||||||||||
Prepaid expenses and other assets | 151,472 | 236,936 | 83,508 | 108,276 | ||||||||||||
Total Assets | 14,988,912,521 | 20,877,482,035 | 6,595,251,031 | 13,498,787,802 | ||||||||||||
Liabilities | ||||||||||||||||
Over-the-counter credit default swap contracts, at value | — | 2,798,871 | — | — | ||||||||||||
Variation margin on futures contracts | 1,112,122 | — | — | — | ||||||||||||
Due to broker for swap contracts | — | 1,957,000 | — | — | ||||||||||||
Due to broker for TBA commitments | 29,000 | — | — | — | ||||||||||||
Due to Bank | 384,876 | 11,711,445 | 14,346 | 10,240 | ||||||||||||
Payable for investments purchased | 833,392,042 | 1,267,272,352 | 65,897,131 | 15,851,033 | ||||||||||||
Payable for fund shares redeemed | 11,908,759 | 15,264,432 | 7,714,546 | 15,471,985 | ||||||||||||
Interest payable | — | 1,679,084 | — | — | ||||||||||||
Payable for sale-buyback transactions | — | 121,128,696 | — | — | ||||||||||||
Unrealized depreciation on forward foreign currency exchange contracts | — | 18,099,148 | — | — | ||||||||||||
Payable to Custodian | 70,324 | 107,564 | 16,779 | 20,411 | ||||||||||||
Payable to Sub-advisers for Investment Advisory Fee | 1,562,875 | 3,294,449 | 867,676 | 2,408,201 | ||||||||||||
Payable to Trustees | 6,657 | 9,054 | 2,999 | 4,791 | ||||||||||||
Accrued expenses and other liabilities | 315,122 | 494,115 | 296,209 | 736,253 | ||||||||||||
Total Liabilities | 848,781,777 | 1,443,816,210 | 74,809,686 | 34,502,914 | ||||||||||||
Net Assets | $ | 14,140,130,744 | $ | 19,433,665,825 | $ | 6,520,441,345 | $ | 13,464,284,888 | ||||||||
Net Assets Consist of | ||||||||||||||||
Paid in capital ($0.00 par value common stock unlimited authorized shares) | $ | 12,992,359,253 | $ | 18,524,063,003 | $ | 6,368,421,297 | $ | 10,340,794,491 | ||||||||
Total distributable earnings/(loss) | 1,147,771,491 | 909,602,822 | 152,020,048 | 3,123,490,397 | ||||||||||||
Net Assets | $ | 14,140,130,744 | $ | 19,433,665,825 | $ | 6,520,441,345 | $ | 13,464,284,888 | ||||||||
Net Assets | $ | 14,140,130,744 | $ | 19,433,665,825 | $ | 6,520,441,345 | $ | 13,464,284,888 | ||||||||
Shares Outstanding | 1,295,679,187 | 1,840,216,577 | 621,864,946 | 786,808,843 | ||||||||||||
Net Asset Value | $ | 10.91 | $ | 10.56 | $ | 10.49 | $ | 17.11 | ||||||||
(1) Cost of investments | $ | 13,679,913,040 | $ | 19,452,175,502 | $ | 6,332,791,821 | $ | 10,520,437,088 | ||||||||
(2) Cost of foreign currency | — | 11,147,847 | — | — | ||||||||||||
The accompanying notes are an integral part of these financial statements.
| 52 | Annual Report • June 30, 2020 |
Bridge Builder Mutual Funds
Statements of Assets and Liabilities
June 30, 2020 (Continued)
| Bridge Builder Large Cap Value Fund | Bridge Builder Small/Mid Cap Growth Fund | Bridge Builder Small/Mid Cap Value Fund | Bridge Builder International Equity Fund | |||||||||||||
Assets | ||||||||||||||||
Investments, at value (1) | $ | 12,473,350,395 | $ | 4,806,806,203 | $ | 5,110,548,100 | $ | 11,301,343,543 | ||||||||
Foreign currency, at value (2) | — | — | — | 61,853 | ||||||||||||
Cash | 281 | 34 | 85 | 25 | ||||||||||||
Receivable for foreign currency transactions | — | — | — | 13,709 | ||||||||||||
Receivable for investments sold | 20,063,976 | 7,099,416 | 10,016,436 | 6,939,186 | ||||||||||||
Receivable for fund shares sold | 15,775,209 | 5,238,092 | 6,390,620 | 15,122,879 | ||||||||||||
Dividend and interest receivable | 20,107,311 | 1,397,220 | 6,649,002 | 22,946,651 | ||||||||||||
Tax reclaim receivable | 1,045,885 | 8,046 | 25,077 | 23,725,511 | ||||||||||||
Prepaid expenses and other assets | 160,580 | 81,418 | 79,927 | 182,332 | ||||||||||||
Total Assets | 12,530,503,637 | 4,820,630,429 | 5,133,709,247 | 11,370,335,689 | ||||||||||||
Liabilities | ||||||||||||||||
Due to Bank | 436,390 | 215,286 | 3,312,377 | 17,792 | ||||||||||||
Payable for investments purchased | 16,279,580 | 16,898,102 | 21,994,431 | 5,502,848 | ||||||||||||
Payable for fund shares redeemed | 11,388,394 | 7,986,071 | 5,143,292 | 14,612,295 | ||||||||||||
Payable to Custodian | 36,561 | 29,606 | 47,458 | 278,615 | ||||||||||||
Foreign withholding tax payable | — | — | — | 655,968 | ||||||||||||
Payable to Sub-advisers for Investment Advisory Fee | 3,079,449 | 1,206,245 | 2,024,714 | 4,411,045 | ||||||||||||
Payable to Trustees | 5,801 | 2,335 | 2,590 | 5,741 | ||||||||||||
Accrued expenses and other liabilities | 656,529 | 145,687 | 185,603 | 346,723 | ||||||||||||
Total Liabilities | 31,882,704 | 26,483,332 | 32,710,465 | 25,831,027 | ||||||||||||
Net Assets | $ | 12,498,620,933 | $ | 4,794,147,097 | $ | 5,100,998,782 | $ | 11,344,504,662 | ||||||||
Net Assets Consist of | ||||||||||||||||
Paid in capital ($0.00 par value common stock unlimited authorized shares) | $ | 11,773,908,728 | $ | 3,499,226,562 | $ | 5,205,296,595 | $ | 11,073,454,164 | ||||||||
Total distributable earnings/(loss) | 724,712,205 | 1,294,920,535 | (104,297,813 | ) | 271,050,498 | |||||||||||
Net Assets | $ | 12,498,620,933 | $ | 4,794,147,097 | $ | 5,100,998,782 | $ | 11,344,504,662 | ||||||||
Net Assets | $ | 12,498,620,933 | $ | 4,794,147,097 | $ | 5,100,998,782 | $ | 11,344,504,662 | ||||||||
Shares Outstanding | 1,061,950,724 | 325,517,622 | 514,012,905 | 1,034,339,075 | ||||||||||||
Net Asset Value | $ | 11.77 | $ | 14.73 | $ | 9.92 | $ | 10.97 | ||||||||
(1) Cost of investments | $ | 11,403,260,466 | $ | 3,981,602,653 | $ | 5,037,210,725 | $ | 10,726,734,933 | ||||||||
(2) Cost of foreign currency | — | — | — | 117,662 | ||||||||||||
The accompanying notes are an integral part of these financial statements.
| Annual Report • June 30, 2020 | 53 |
Bridge Builder Mutual Funds
Year Ended June 30, 2020
| Bridge Builder Core Bond Fund | Bridge Builder Core Plus Bond Fund | Bridge Builder Municipal Bond Fund | Bridge Builder Large Cap Growth Fund | |||||||||||||
Investment Income | ||||||||||||||||
Dividend income | $ | 7,999,021 | $ | 7,370,278 | $ | 1,509,868 | $ | 87,840,716 | ||||||||
Less: Foreign taxes withheld and issuance fees | — | (12,431 | ) | — | (160,399 | ) | ||||||||||
Interest | 450,636,847 | 602,626,095 | 155,419,218 | 56,806 | ||||||||||||
Less: Foreign taxes withheld | — | (20 | ) | — | — | |||||||||||
Other Income | 210,174 | 11,867 | 600 | — | ||||||||||||
Total investment income | 458,846,042 | 609,995,789 | 156,929,686 | 87,737,123 | ||||||||||||
Expenses | ||||||||||||||||
Investment advisory fee | 48,358,196 | 67,722,240 | 21,458,496 | 34,600,282 | ||||||||||||
Professional fees | 302,863 | 334,767 | 151,924 | 163,707 | ||||||||||||
Administration fee | 12,219 | 16,278 | 13,791 | 11,924 | ||||||||||||
Fund accounting fees | 1,104,592 | 1,334,237 | 529,430 | 303,859 | ||||||||||||
Transfer agent fees and expenses | 46,899 | 58,009 | 25,747 | 28,565 | ||||||||||||
Trustee fees and expenses | 279,753 | 300,558 | 112,460 | 143,371 | ||||||||||||
Printing and mailing expense | 43,705 | 27,978 | 8,333 | 22,297 | ||||||||||||
Custody fees | 382,053 | 534,379 | 111,578 | 107,358 | ||||||||||||
Insurance expenses | 62,390 | 72,606 | 22,886 | 30,603 | ||||||||||||
Interest expense | 10,734 | 1,594,552 | — | — | ||||||||||||
Registration fees | 286,149 | 478,508 | 336,222 | 815,776 | ||||||||||||
Other expenses | 175,227 | 313,552 | 62,477 | 75,863 | ||||||||||||
Total expenses before fee waivers | 51,064,780 | 72,787,664 | 22,833,344 | 36,303,605 | ||||||||||||
Fee waivers by Adviser | (31,247,469 | ) | (43,177,822 | ) | (13,055,766 | ) | (19,023,486 | ) | ||||||||
Net expenses | 19,817,311 | 29,609,842 | 9,777,578 | 17,280,119 | ||||||||||||
Net Investment Income | 439,028,731 | 580,385,947 | 147,152,108 | 70,457,004 | ||||||||||||
Realized Gain/(Loss) and Change in Unrealized Appreciation/(Depreciation) |
| |||||||||||||||
Net realized gain/(loss) on: | ||||||||||||||||
Investments | 326,711,782 | 484,374,557 | (8,178,029 | ) | 240,710,885 | |||||||||||
TBA sales commitments | (275,195 | ) | — | — | — | |||||||||||
Forward foreign currency exchange contracts | — | 8,278,447 | — | — | ||||||||||||
Foreign currency transactions | — | (11,221,574 | ) | — | (202,547 | ) | ||||||||||
Futures contracts | 91,652,763 | 225,104,564 | (7,541,154 | ) | — | |||||||||||
Swap contracts | (32,515,771 | ) | (61,408,092 | ) | — | — | ||||||||||
Net realized gain/(loss) | 385,573,579 | 645,127,902 | (15,719,183 | ) | 240,508,338 | |||||||||||
Net change in net unrealized appreciation/(depreciation) on: | ||||||||||||||||
Investments | 393,122,184 | 45,931,976 | (5,340,855 | ) | 1,138,679,415 | |||||||||||
Forward foreign currency exchange contracts | — | (4,076,793 | ) | — | — | |||||||||||
Foreign currency transactions | — | 3,042,378 | — | 1,835 | ||||||||||||
Futures contracts | (14,385,233 | ) | (35,361,994 | ) | 985,937 | — | ||||||||||
Swap contracts | 13,539,963 | 66,438,865 | — | — | ||||||||||||
Unfunded loan commitments | — | 34,170 | — | — | ||||||||||||
Net change in unrealized appreciation/(depreciation) | 392,276,914 | 76,008,602 | (4,354,918 | ) | 1,138,681,250 | |||||||||||
Net realized gain/(loss) and net change in unrealized appreciation/(depreciation) | 777,850,493 | 721,136,504 | (20,074,101 | ) | 1,379,189,588 | |||||||||||
Net Increase/(Decrease) in Net Assets Resulting from Operations | $ | 1,216,879,224 | $ | 1,301,522,451 | $ | 127,078,007 | $ | 1,449,646,592 | ||||||||
The accompanying notes are an integral part of these financial statements.
| 54 | Annual Report • June 30, 2020 |
Bridge Builder Mutual Funds
Statements of Operations
Year Ended June 30, 2020 (Continued)
| Bridge Builder Large Cap Value Fund | Bridge Builder Small/Mid Cap Growth Fund | Bridge Builder Small/Mid Cap Value Fund | Bridge Builder International Equity Fund | |||||||||||||
Investment Income | ||||||||||||||||
Dividend income | $ | 212,615,131 | $ | 29,796,093 | $ | 92,079,339 | $ | 301,894,132 | ||||||||
Less: Foreign taxes withheld and issuance fees | (1,591,138 | ) | (44,946 | ) | (109,503 | ) | (24,737,049 | ) | ||||||||
Interest | 167,202 | 52,517 | 74,927 | 99,158 | ||||||||||||
Less: Foreign taxes withheld | (120,793 | ) | – | – | (167,624 | ) | ||||||||||
Other Income | 152 | – | 606 | 71 | ||||||||||||
Total investment income | 211,070,554 | 29,803,664 | 92,045,369 | 277,088,688 | ||||||||||||
Expenses | ||||||||||||||||
Investment advisory fee | 42,510,968 | 26,577,251 | 31,687,745 | 68,365,123 | ||||||||||||
Professional fees | 198,025 | 104,200 | 145,992 | 243,618 | ||||||||||||
Administration fee | 11,893 | 12,082 | 16,246 | 17,171 | ||||||||||||
Fund accounting fees | 372,529 | 179,842 | 211,367 | 607,026 | ||||||||||||
Transfer agent fees and expenses | 33,731 | 20,290 | 22,281 | 39,135 | ||||||||||||
Trustee fees and expenses | 185,057 | 80,872 | 95,928 | 216,659 | ||||||||||||
Printing and mailing expense | 23,161 | 1,033 | 37,810 | 57,062 | ||||||||||||
Custody fees | 114,727 | 115,290 | 177,528 | 1,410,781 | ||||||||||||
Insurance expenses | 38,880 | 16,677 | 20,554 | 45,898 | ||||||||||||
Registration fees | 744,266 | 207,279 | 255,775 | 459,891 | ||||||||||||
Other expenses | 128,903 | 41,664 | 51,181 | 189,563 | ||||||||||||
Total expenses before fee waivers | 44,362,140 | 27,356,480 | 32,722,407 | 71,651,927 | ||||||||||||
Fee waivers by Adviser | (20,994,013 | ) | (11,728,675 | ) | (11,935,192 | ) | (33,928,594 | ) | ||||||||
Net expenses | 23,368,127 | 15,627,805 | 20,787,215 | 37,723,333 | ||||||||||||
Net Investment Income | 187,702,427 | 14,175,859 | 71,258,154 | 239,365,355 | ||||||||||||
Realized Gain/(Loss) and Change in Unrealized Appreciation/(Depreciation) |
| |||||||||||||||
Net realized gain/(loss) on: | ||||||||||||||||
Investments | (269,221,438 | ) | 509,573,835 | (114,048,494 | ) | (299,003,092 | ) | |||||||||
Foreign currency transactions | (494,903 | ) | – | (17,012 | ) | (2,320,045 | ) | |||||||||
Net realized gain/(loss) | (269,716,341 | ) | 509,573,835 | (114,065,506 | ) | (301,323,137 | ) | |||||||||
Net change in net unrealized appreciation/(depreciation) on: | ||||||||||||||||
Investments | (194,544,068 | ) | (97,483,766 | ) | (426,336,162 | ) | 9,226,623 | |||||||||
Foreign currency transactions | (6,627 | ) | – | (2,023 | ) | 243,634 | ||||||||||
Net change in unrealized appreciation/(depreciation) | (194,550,695 | ) | (97,483,766 | ) | (426,338,185 | ) | 9,470,257 | |||||||||
Net realized gain/(loss) and net change in unrealized appreciation/(depreciation) | (464,267,036 | ) | 412,090,069 | (540,403,691 | ) | (291,852,880 | ) | |||||||||
Net Increase/(Decrease) in Net Assets Resulting from Operations | $ | (276,564,609 | ) | $ | 426,265,928 | $ | (469,145,537 | ) | $ | (52,487,525 | ) | |||||
The accompanying notes are an integral part of these financial statements.
| Annual Report • June 30, 2020 | 55 |
Bridge Builder Mutual Funds
Statements of Changes in Net Assets
| Bridge Builder Core Bond Fund | Bridge Builder Core Plus Bond Fund | |||||||||||||||
| Year Ended June 30, 2020 | Year Ended June 30, 2019 | Year Ended June 30, 2020 | Year Ended June 30, 2019 | |||||||||||||
Operations | ||||||||||||||||
Net investment income | $ | 439,028,731 | $ | 495,644,448 | $ | 580,385,947 | $ | 535,072,634 | ||||||||
Net realized gain/(loss) | 385,573,579 | 39,087,207 | 645,127,902 | 202,673,715 | ||||||||||||
Net change in unrealized appreciation/(depreciation) | 392,276,914 | 683,327,007 | 76,008,602 | 588,531,291 | ||||||||||||
Net increase/(decrease) in net assets resulting from operations | 1,216,879,224 | 1,218,058,662 | 1,301,522,451 | 1,326,277,640 | ||||||||||||
Distributions to Shareholders | ||||||||||||||||
From distributable earnings | (496,869,340 | ) | (507,218,573 | ) | (916,052,109 | ) | (570,931,619 | ) | ||||||||
Total distributions | (496,869,340 | ) | (507,218,573 | ) | (916,052,109 | ) | (570,931,619 | ) | ||||||||
Capital Transactions | ||||||||||||||||
Proceeds from shares sold | 2,639,120,415 | 2,324,777,474 | 5,657,499,290 | 8,247,855,226 | ||||||||||||
Reinvestment of dividends | 496,869,340 | 507,218,573 | 916,052,109 | 570,931,619 | ||||||||||||
Cost of shares redeemed | (4,875,422,962 | ) | (4,188,593,514 | ) | (5,488,699,292 | ) | (2,673,327,221 | ) | ||||||||
Net increase/(decrease) from capital transactions | (1,739,433,207 | ) | (1,356,597,467 | ) | 1,084,852,107 | 6,145,459,624 | ||||||||||
Net increase/(decrease) in net assets | (1,019,423,323 | ) | (645,757,378 | ) | 1,470,322,449 | 6,900,805,645 | ||||||||||
Net Assets | ||||||||||||||||
Beginning of period | 15,159,554,067 | 15,805,311,445 | 17,963,343,376 | 11,062,537,731 | ||||||||||||
End of period | $ | 14,140,130,744 | $ | 15,159,554,067 | $ | 19,433,665,825 | $ | 17,963,343,376 | ||||||||
Change in Shares Outstanding | ||||||||||||||||
Shares outstanding, beginning of period | 1,465,655,895 | 1,601,019,411 | 1,749,665,169 | 1,127,345,265 | ||||||||||||
Shares sold | 249,438,083 | 234,039,906 | 545,952,764 | 835,453,422 | ||||||||||||
Shares issued to holders in reinvestments of dividends | 46,958,823 | 50,835,229 | 88,969,424 | 57,581,068 | ||||||||||||
Shares redeemed | (466,373,614 | ) | (420,238,651 | ) | (544,370,780 | ) | (270,714,586 | ) | ||||||||
Shares outstanding, end of period | 1,295,679,187 | 1,465,655,895 | 1,840,216,577 | 1,749,665,169 | ||||||||||||
The accompanying notes are an integral part of these financial statements.
| 56 | Annual Report • June 30, 2020 |
Bridge Builder Mutual Funds
Statements of Changes in Net Assets (Continued)
| Bridge Builder Municipal Bond Fund | Bridge Builder Large Cap Growth Fund | |||||||||||||||
| Year Ended June 30, 2020 | Year Ended June 30, 2019 | Year Ended June 30, 2020 | Year Ended June 30, 2019 | |||||||||||||
Operations | ||||||||||||||||
Net investment income | $ | 147,152,108 | $ | 113,899,837 | $ | 70,457,004 | $ | 68,895,560 | ||||||||
Net realized gain/(loss) | (15,719,183 | ) | (6,646,797 | ) | 240,508,338 | 40,340,543 | ||||||||||
Net change in unrealized appreciation/(depreciation) | (4,354,918 | ) | 186,942,977 | 1,138,681,250 | 740,238,399 | |||||||||||
Net increase/(decrease) in net assets resulting from operations | 127,078,007 | 294,196,017 | 1,449,646,592 | 849,474,502 | ||||||||||||
Distributions to Shareholders | ||||||||||||||||
From distributable earnings | (147,458,539 | ) | (114,260,331 | ) | (159,430,743 | ) | (292,945,669 | ) | ||||||||
Total distributions | (147,458,539 | ) | (114,260,331 | ) | (159,430,743 | ) | (292,945,669 | ) | ||||||||
Capital Transactions | ||||||||||||||||
Proceeds from shares sold | 2,765,141,283 | 2,213,263,379 | 6,817,284,482 | 1,671,695,810 | ||||||||||||
Reinvestment of dividends | 147,458,539 | 114,260,331 | 159,430,743 | 292,945,669 | ||||||||||||
Cost of shares redeemed | (1,624,533,291 | ) | (729,020,439 | ) | (1,801,076,796 | ) | (1,658,826,246 | ) | ||||||||
Net increase/(decrease) from capital transactions | 1,288,066,531 | 1,598,503,271 | 5,175,638,429 | 305,815,233 | ||||||||||||
Net increase/(decrease) in net assets | 1,267,685,999 | 1,778,438,957 | 6,465,854,278 | 862,344,066 | ||||||||||||
Net Assets | ||||||||||||||||
Beginning of period | 5,252,755,346 | 3,474,316,389 | 6,998,430,610 | 6,136,086,544 | ||||||||||||
End of period | $ | 6,520,441,345 | $ | 5,252,755,346 | $ | 13,464,284,888 | $ | 6,998,430,610 | ||||||||
Change in Shares Outstanding | ||||||||||||||||
Shares outstanding, beginning of period | 502,003,522 | 344,193,751 | 478,108,620 | 453,379,922 | ||||||||||||
Shares sold | 264,228,716 | 218,300,194 | 418,654,012 | 120,575,375 | ||||||||||||
Shares issued to holders in reinvestments of dividends | 14,041,244 | 11,172,557 | 10,118,058 | 23,452,719 | ||||||||||||
Shares redeemed | (158,408,536 | ) | (71,662,980 | ) | (120,071,847 | ) | (119,299,396 | ) | ||||||||
Shares outstanding, end of period | 621,864,946 | 502,003,522 | 786,808,843 | 478,108,620 | ||||||||||||
The accompanying notes are an integral part of these financial statements.
| Annual Report • June 30, 2020 | 57 |
Bridge Builder Mutual Funds
Statements of Changes in Net Assets (Continued)
| Bridge Builder Large Cap Value Fund | Bridge Builder Small/Mid Cap Growth Fund | |||||||||||||||
| Year Ended June 30, 2020 | Year Ended June 30, 2019 | Year Ended June 30, 2020 | Year Ended June 30, 2019 | |||||||||||||
Operations | ||||||||||||||||
Net investment income | $ | 187,702,427 | $ | 154,781,494 | $ | 14,175,859 | $ | 15,012,715 | ||||||||
Net realized gain/(loss) | (269,716,341 | ) | 41,929,115 | 509,573,835 | 157,518,302 | |||||||||||
Net change in unrealized appreciation/(depreciation) | (194,550,695 | ) | 464,405,374 | (97,483,766 | ) | 252,730,487 | ||||||||||
Net increase/(decrease) in net assets resulting from operations | (276,564,609 | ) | 661,115,983 | 426,265,928 | 425,261,504 | |||||||||||
Distributions to Shareholders | ||||||||||||||||
From distributable earnings | (194,762,192 | ) | (261,262,694 | ) | (167,829,927 | ) | (188,711,939 | ) | ||||||||
Total distributions | (194,762,192 | ) | (261,262,694 | ) | (167,829,927 | ) | (188,711,939 | ) | ||||||||
Capital Transactions | ||||||||||||||||
Proceeds from shares sold | 5,698,545,768 | 2,113,925,665 | 1,163,185,513 | 712,366,764 | ||||||||||||
Reinvestment of dividends | 194,762,192 | 261,262,694 | 167,829,927 | 188,711,939 | ||||||||||||
Cost of shares redeemed | (1,654,436,523 | ) | (1,146,111,437 | ) | (819,377,264 | ) | (735,635,960 | ) | ||||||||
Net increase/(decrease) from capital transactions | 4,238,871,437 | 1,229,076,922 | 511,638,176 | 165,442,743 | ||||||||||||
Net increase/(decrease) in net assets | 3,767,544,636 | 1,628,930,211 | 770,074,177 | 401,992,308 | ||||||||||||
Net Assets | ||||||||||||||||
Beginning of period | 8,731,076,297 | 7,102,146,086 | 4,024,072,920 | 3,622,080,612 | ||||||||||||
End of period | $ | 12,498,620,933 | $ | 8,731,076,297 | $ | 4,794,147,097 | $ | 4,024,072,920 | ||||||||
Change in Shares Outstanding | ||||||||||||||||
Shares outstanding, beginning of period | 686,911,070 | 585,931,695 | 282,304,411 | 267,895,333 | ||||||||||||
Shares sold | 493,237,676 | 172,651,795 | 91,152,877 | 52,748,730 | ||||||||||||
Shares issued to holders in reinvestments of dividends | 16,294,653 | 22,201,836 | 11,804,558 | 15,753,297 | ||||||||||||
Shares redeemed | (134,492,675 | ) | (93,874,256 | ) | (59,744,224 | ) | (54,092,949 | ) | ||||||||
Shares outstanding, end of period | 1,061,950,724 | 686,911,070 | 325,517,622 | 282,304,411 | ||||||||||||
The accompanying notes are an integral part of these financial statements.
| 58 | Annual Report • June 30, 2020 |
Bridge Builder Mutual Funds
Statements of Changes in Net Assets (Continued)
| Bridge Builder Small/Mid Cap Value Fund | Bridge Builder International Equity Fund | |||||||||||||||
| Year Ended June 30, 2020 | Year Ended June 30, 2019 | Year Ended June 30, 2020 | Year Ended June 30, 2019 | |||||||||||||
Operations | ||||||||||||||||
Net investment income | $ | 71,258,154 | $ | 65,487,081 | $ | 239,365,355 | $ | 220,008,848 | ||||||||
Net realized gain/(loss) | (114,065,506 | ) | (35,001,216 | ) | (301,323,137 | ) | (70,817,356 | ) | ||||||||
Net change in unrealized appreciation/(depreciation) | (426,338,185 | ) | 30,937,304 | 9,470,257 | 51,604,056 | |||||||||||
Net increase/(decrease) in net assets resulting from operations | (469,145,537 | ) | 61,423,169 | (52,487,525 | ) | 200,795,548 | ||||||||||
Distributions to Shareholders | ||||||||||||||||
From distributable earnings | (69,918,972 | ) | (188,494,227 | ) | (282,965,029 | ) | (274,598,118 | ) | ||||||||
Total distributions | (69,918,972 | ) | (188,494,227 | ) | (282,965,029 | ) | (274,598,118 | ) | ||||||||
Capital Transactions | ||||||||||||||||
Proceeds from shares sold | 1,667,232,200 | 1,169,018,286 | 4,289,090,074 | 3,914,930,395 | ||||||||||||
Reinvestment of dividends | 69,918,972 | 188,494,227 | 282,965,029 | 274,598,118 | ||||||||||||
Cost of shares redeemed | (906,731,888 | ) | (606,616,491 | ) | (3,537,454,257 | ) | (1,005,677,864 | ) | ||||||||
Net increase/(decrease) from capital transactions | 830,419,284 | 750,896,022 | 1,034,600,846 | 3,183,850,649 | ||||||||||||
Net increase/(decrease) in net assets | 291,354,775 | 623,824,964 | 699,148,292 | 3,110,048,079 | ||||||||||||
Net Assets | ||||||||||||||||
Beginning of period | 4,809,644,007 | 4,185,819,043 | 10,645,356,370 | 7,535,308,291 | ||||||||||||
End of period | $ | 5,100,998,782 | $ | 4,809,644,007 | $ | 11,344,504,662 | $ | 10,645,356,370 | ||||||||
Change in Shares Outstanding | ||||||||||||||||
Shares outstanding, beginning of period | 416,449,124 | 349,571,673 | 935,579,086 | 649,332,631 | ||||||||||||
Shares sold | 178,358,173 | 101,075,626 | 402,936,047 | 350,104,118 | ||||||||||||
Shares issued to holders in reinvestments of dividends | 5,661,455 | 18,620,999 | 23,521,615 | 27,294,795 | ||||||||||||
Shares redeemed | (86,455,847 | ) | (52,819,174 | ) | (327,697,673 | ) | (91,152,458 | ) | ||||||||
Shares outstanding, end of period | 514,012,905 | 416,449,124 | 1,034,339,075 | 935,579,086 | ||||||||||||
The accompanying notes are an integral part of these financial statements.
| Annual Report • June 30, 2020 | 59 |
Bridge Builder Mutual Funds
| Per Share Operating Performance | ||||||||||||||||||||||||||||
| Change in Net Assets Resulting from Operations | Less Distributions | |||||||||||||||||||||||||||
| Net asset value, beginning of period | Net investment income | Net realized and unrealized gain/(loss) | Net increase/ (decrease) in net asset value from operations | Distributions from net investment income | Distributions from net realized gains | Total Distributions | ||||||||||||||||||||||
Bridge Builder Core Bond Fund | ||||||||||||||||||||||||||||
For the year ended June 30, 2020(8) | $ | 10.34 | 0.31 | 0.61 | 0.92 | (0.32 | ) | (0.03 | ) | (0.35 | ) | |||||||||||||||||
For the year ended June 30, 2019(8) | $ | 9.87 | 0.31 | 0.48 | 0.79 | (0.32 | ) | — | (0.32 | ) | ||||||||||||||||||
For the year ended June 30, 2018 | $ | 10.17 | 0.27 | (0.28 | ) | (0.01 | ) | (0.29 | ) | — | (0.29 | ) | ||||||||||||||||
For the year ended June 30, 2017 | $ | 10.47 | 0.25 | (0.22 | ) | 0.03 | (0.26 | ) | (0.07 | ) | (0.33 | ) | ||||||||||||||||
For the year ended June 30, 2016 | $ | 10.10 | 0.24 | 0.41 | 0.65 | (0.26 | ) | (0.02 | ) | (0.28 | ) | |||||||||||||||||
Bridge Builder Core Plus Bond Fund | ||||||||||||||||||||||||||||
For the year ended June 30, 2020(8) | $ | 10.27 | 0.32 | 0.47 | 0.79 | (0.36 | ) | (0.14 | ) | (0.50 | ) | |||||||||||||||||
For the year ended June 30, 2019(8) | $ | 9.81 | 0.35 | 0.48 | 0.83 | (0.37 | ) | — | (0.37 | ) | ||||||||||||||||||
For the year ended June 30, 2018 | $ | 10.09 | 0.29 | (0.27 | ) | 0.02 | (0.30 | ) | — | (0.30 | ) | |||||||||||||||||
For the year ended June 30, 2017 | $ | 10.28 | 0.24 | (0.15 | ) | 0.09 | (0.25 | ) | (0.03 | ) | (0.28 | ) | ||||||||||||||||
For the period 7/13/15(6) - 6/30/16 | $ | 10.00 | 0.22 | 0.31 | 0.53 | (0.23 | ) | (0.02 | ) | (0.25 | ) | |||||||||||||||||
Bridge Builder Municipal Bond Fund | ||||||||||||||||||||||||||||
For the year ended June 30, 2020(8) | $ | 10.46 | 0.26 | 0.03 | 0.29 | (0.26 | ) | — | (0.26 | ) | ||||||||||||||||||
For the year ended June 30, 2019(8) | $ | 10.09 | 0.27 | 0.37 | 0.64 | (0.27 | ) | — | (0.27 | ) | ||||||||||||||||||
For the year ended June 30, 2018 | $ | 10.14 | 0.21 | (0.05 | ) | 0.16 | (0.21 | ) | — | (0.21 | ) | |||||||||||||||||
For the year ended June 30, 2017 | $ | 10.38 | 0.19 | (0.23 | ) | (0.04 | ) | (0.19 | ) | (0.01 | ) | (0.20 | ) | |||||||||||||||
For the period 9/14/15(6) - 6/30/16 | $ | 10.00 | 0.16 | 0.38 | 0.54 | (0.15 | ) | (0.01 | ) | (0.16 | ) | |||||||||||||||||
Bridge Builder Large Cap Growth Fund | ||||||||||||||||||||||||||||
For the year ended June 30, 2020(8) | $ | 14.64 | 0.14 | 2.65 | 2.79 | (0.14 | ) | (0.18 | ) | (0.32 | ) | |||||||||||||||||
For the year ended June 30, 2019(8) | $ | 13.53 | 0.15 | 1.60 | 1.75 | (0.14 | ) | (0.50 | ) | (0.64 | ) | |||||||||||||||||
For the year ended June 30, 2018 | $ | 11.59 | 0.12 | 1.92 | 2.04 | (0.10 | ) | — | (0.10 | ) | ||||||||||||||||||
For the year ended June 30, 2017 | $ | 9.89 | 0.10 | 1.69 | 1.79 | (0.09 | ) | — | (0.09 | ) | ||||||||||||||||||
For the year ended June 30, 2016 | $ | 9.83 | 0.09 | 0.02 | 0.11 | (0.05 | ) | — | (0.05 | ) | ||||||||||||||||||
Bridge Builder Large Cap Value Fund | ||||||||||||||||||||||||||||
For the year ended June 30, 2020(8) | $ | 12.71 | 0.24 | (0.94 | ) | (0.70 | ) | (0.23 | ) | (0.01 | ) | (0.24 | ) | |||||||||||||||
For the year ended June 30, 2019(8) | $ | 12.12 | 0.24 | 0.74 | 0.98 | (0.23 | ) | (0.16 | ) | (0.39 | ) | |||||||||||||||||
For the year ended June 30, 2018 | $ | 11.38 | 0.20 | 0.82 | 1.02 | (0.19 | ) | (0.09 | ) | (0.28 | ) | |||||||||||||||||
For the year ended June 30, 2017 | $ | 9.86 | 0.18 | 1.52 | 1.70 | (0.18 | ) | — | (0.18 | ) | ||||||||||||||||||
For the year ended June 30, 2016 | $ | 9.81 | 0.17 | 0.05 | 0.22 | (0.17 | ) | 0.00 | (7) | (0.17 | ) | |||||||||||||||||
Bridge Builder Small/Mid Cap Growth Fund | ||||||||||||||||||||||||||||
For the year ended June 30, 2020(8) | $ | 14.25 | 0.05 | 1.01 | 1.06 | (0.05 | ) | (0.53 | ) | (0.58 | ) | |||||||||||||||||
For the year ended June 30, 2019(8) | $ | 13.52 | 0.05 | 1.39 | 1.44 | (0.05 | ) | (0.66 | ) | (0.71 | ) | |||||||||||||||||
For the year ended June 30, 2018 | $ | 11.49 | 0.05 | 2.12 | 2.17 | (0.04 | ) | (0.10 | ) | (0.14 | ) | |||||||||||||||||
For the year ended June 30, 2017 | $ | 9.62 | 0.03 | 1.88 | 1.91 | (0.04 | ) | — | (0.04 | ) | ||||||||||||||||||
For the year ended June 30, 2016 | $ | 9.96 | 0.03 | (0.35 | ) | (0.32 | ) | (0.02 | ) | — | (0.02 | ) | ||||||||||||||||
Bridge Builder Small/Mid Cap Value Fund | ||||||||||||||||||||||||||||
For the year ended June 30, 2020(8) | $ | 11.55 | 0.16 | (1.63 | ) | (1.47 | ) | (0.16 | ) | — | (0.16 | ) | ||||||||||||||||
For the year ended June 30, 2019(8) | $ | 11.97 | 0.17 | (0.10 | ) | 0.07 | (0.14 | ) | (0.35 | ) | (0.49 | ) | ||||||||||||||||
For the year ended June 30, 2018 | $ | 11.15 | 0.15 | 0.81 | 0.96 | (0.13 | ) | (0.01 | ) | (0.14 | ) | |||||||||||||||||
For the year ended June 30, 2017 | $ | 9.50 | 0.11 | 1.63 | 1.74 | (0.09 | ) | — | (0.09 | ) | ||||||||||||||||||
For the year ended June 30, 2016 | $ | 9.87 | 0.08 | (0.38 | ) | (0.30 | ) | (0.06 | ) | (0.01 | ) | (0.07 | ) | |||||||||||||||
Bridge Builder International Equity Fund | ||||||||||||||||||||||||||||
For the year ended June 30, 2020(8) | $ | 11.38 | 0.23 | (0.36 | ) | (0.13 | ) | (0.28 | ) | — | (0.28 | ) | ||||||||||||||||
For the year ended June 30, 2019(8) | $ | 11.60 | 0.28 | (0.14 | ) | 0.14 | (0.22 | ) | (0.14 | ) | (0.36 | ) | ||||||||||||||||
For the year ended June 30, 2018 | $ | 11.07 | 0.21 | 0.56 | 0.77 | (0.19 | ) | (0.05 | ) | (0.24 | ) | |||||||||||||||||
For the year ended June 30, 2017 | $ | 9.45 | 0.15 | 1.60 | 1.75 | (0.13 | ) | — | (0.13 | ) | ||||||||||||||||||
For the period 7/6/15(6) - 6/30/16 | $ | 10.00 | 0.16 | (0.67 | ) | (0.51 | ) | (0.04 | ) | — | (0.04 | ) | ||||||||||||||||
| (1) | Annualized for periods less than one year. |
| (2) | Total return is calculated assuming an initial investment made at the net asset value at the beginning of the period, reinvestment of all dividends and distributions at net asset value during the period and redemption on the last day of the period and is not annualized. |
| (3) | Includes adjustments in accordance with accounting principles generally accepted in the United States of America and as such, the net asset value for financial reporting purposes and the returns based upon those net asset values may differ from the net asset value and returns for shareholder transactions. |
| (4) | Ratios do not include the impact of the expenses of the underlying funds in which the fund invests. |
| (5) | Portfolio turnover is not annualized for periods less than one year. |
| (6) | Inception Date. |
| (7) | Less than $0.005. |
| (8) | Per share amounts based on average number of shares outstanding during the year |
| (9) | Portfolio turnover rate does not include securities received as part of an in-kind capital contribution. Please see Note 8 for additional details. |
The accompanying notes are an integral part of these financial statements.
| 60 | Annual Report • June 30, 2020 |
| Ratios/Supplement Data | ||||||||||||||||||||||||||
| Ratios to Average Net Assets of:(1) | ||||||||||||||||||||||||||
Net asset | Total return(2)(3) | Net assets, end of period (millions) | Expenses, before waivers(4) | Expenses, net of waivers(4) | Net��investment income/ (loss) | Portfolio turnover rate(5) | ||||||||||||||||||||
| $ | 10.91 | 9.01 | % | $ | 14,140 | 0.34 | % | 0.13 | % | 2.91 | % | 137 | % | |||||||||||||
| $ | 10.34 | 8.18 | % | $ | 15,160 | 0.34 | % | 0.14 | % | 3.15 | % | 153 | % | |||||||||||||
| $ | 9.87 | (0.15 | )% | $ | 15,805 | 0.35 | % | 0.14 | % | 2.71 | % | 236 | % | |||||||||||||
| $ | 10.17 | 0.33 | % | $ | 13,596 | 0.35 | % | 0.15 | % | 2.44 | % | 232 | % | |||||||||||||
| $ | 10.47 | 6.51 | % | $ | 10,762 | 0.36 | % | 0.16 | % | 2.32 | % | 238 | % | |||||||||||||
| $ | 10.56 | 7.94 | % | $ | 19,434 | 0.39 | % | 0.16 | % | 3.08 | % | 164 | % | |||||||||||||
| $ | 10.27 | 8.66 | % | $ | 17,963 | 0.47 | % | 0.24 | % | 3.50 | % | 242 | % | |||||||||||||
| $ | 9.81 | 0.18 | % | $ | 11,063 | 0.41 | % | 0.18 | % | 2.93 | % | 193 | % | |||||||||||||
| $ | 10.09 | 0.87 | % | $ | 6,423 | 0.40 | % | 0.18 | % | 2.34 | % | 198 | % | |||||||||||||
| $ | 10.28 | 5.43 | % | $ | 4,410 | 0.43 | % | 0.23 | % | 2.23 | % | 197 | % | |||||||||||||
| $ | 10.49 | 2.80 | % | $ | 6,520 | 0.38 | % | 0.16 | % | 2.47 | % | 41 | % | |||||||||||||
| $ | 10.46 | 6.42 | % | $ | 5,253 | 0.39 | % | 0.17 | % | 2.64 | % | 42 | % | |||||||||||||
| $ | 10.09 | 1.62 | % | $ | 3,474 | 0.39 | % | 0.19 | % | 2.11 | % | 27 | % | |||||||||||||
| $ | 10.14 | (0.36 | )% | $ | 2,565 | 0.40 | % | 0.21 | % | 1.88 | % | 23 | % | |||||||||||||
| $ | 10.38 | 5.46 | % | $ | 1,972 | 0.43 | % | 0.25 | % | 1.76 | % | 21 | % | |||||||||||||
| $ | 17.11 | 19.28 | % | $ | 13,464 | 0.46 | % | 0.22 | % | 0.90 | % | 42 | % | |||||||||||||
| $ | 14.64 | 13.76 | % | $ | 6,998 | 0.46 | % | 0.22 | % | 1.07 | % | 31 | % | |||||||||||||
| $ | 13.53 | 17.66 | % | $ | 6,136 | 0.47 | % | 0.24 | % | 1.01 | % | 54 | % | |||||||||||||
| $ | 11.59 | 18.26 | % | $ | 4,202 | 0.47 | % | 0.28 | % | 1.11 | % | 44 | % | |||||||||||||
| $ | 9.89 | 1.14 | % | $ | 2,323 | 0.49 | % | 0.31 | % | 0.89 | % | 45 | % | |||||||||||||
| $ | 11.77 | (5.55 | )% | $ | 12,499 | 0.46 | % | 0.24 | % | 1.94 | % | 36 | %(9) | |||||||||||||
| $ | 12.71 | 8.46 | % | $ | 8,731 | 0.46 | % | 0.25 | % | 1.95 | % | 24 | % | |||||||||||||
| $ | 12.12 | 9.01 | % | $ | 7,102 | 0.47 | % | 0.27 | % | 1.72 | % | 23 | % | |||||||||||||
| $ | 11.38 | 17.38 | % | $ | 5,039 | 0.47 | % | 0.30 | % | 1.82 | % | 23 | % | |||||||||||||
| $ | 9.86 | 2.35 | % | $ | 2,595 | 0.49 | % | 0.34 | % | 1.83 | % | 33 | % | |||||||||||||
| $ | 14.73 | 7.63 | % | $ | 4,794 | 0.66 | % | 0.38 | % | 0.34 | % | 65 | % | |||||||||||||
| $ | 14.25 | 11.66 | % | $ | 4,024 | 0.67 | % | 0.39 | % | 0.41 | % | 23 | % | |||||||||||||
| $ | 13.52 | 18.96 | % | $ | 3,622 | 0.67 | % | 0.41 | % | 0.38 | % | 26 | % | |||||||||||||
| $ | 11.49 | 19.87 | % | $ | 2,530 | 0.68 | % | 0.43 | % | 0.34 | % | 27 | % | |||||||||||||
| $ | 9.62 | (3.16 | )% | $ | 1,647 | 0.71 | % | 0.47 | % | 0.41 | % | 49 | % | |||||||||||||
| $ | 9.92 | (12.98 | )% | $ | 5,101 | 0.66 | % | 0.42 | % | 1.44 | % | 50 | % | |||||||||||||
| $ | 11.55 | 1.22 | % | $ | 4,810 | 0.67 | % | 0.43 | % | 1.47 | % | 38 | % | |||||||||||||
| $ | 11.97 | 8.62 | % | $ | 4,186 | 0.67 | % | 0.45 | % | 1.32 | % | 38 | % | |||||||||||||
| $ | 11.15 | 18.33 | % | $ | 3,245 | 0.69 | % | 0.47 | % | 1.10 | % | 48 | % | |||||||||||||
| $ | 9.50 | (3.08 | )% | $ | 1,877 | 0.73 | % | 0.54 | % | 1.19 | % | 49 | % | |||||||||||||
| $ | 10.97 | (1.40 | )% | $ | 11,345 | 0.63 | % | 0.33 | % | 2.10 | % | 36 | % | |||||||||||||
| $ | 11.38 | 1.57 | % | $ | 10,645 | 0.64 | % | 0.36 | % | 2.49 | % | 16 | % | |||||||||||||
| $ | 11.60 | 6.85 | % | $ | 7,535 | 0.65 | % | 0.38 | % | 2.15 | % | 20 | % | |||||||||||||
| $ | 11.07 | 18.78 | % | $ | 5,164 | 0.67 | % | 0.42 | % | 2.17 | % | 22 | % | |||||||||||||
| $ | 9.45 | (5.06 | )% | $ | 2,466 | 0.69 | % | 0.46 | % | 1.99 | % | 18 | % | |||||||||||||
The accompanying notes are an integral part of these financial statements.
| Annual Report • June 30, 2020 | 61 |
Bridge Builder Mutual Funds
1. ORGANIZATION
The Bridge Builder Trust (the “Trust”) is a Delaware statutory trust organized under the laws of the State of Delaware on December 19, 2012, and is registered with the Securities and Exchange Commission (the “SEC”) as an open-end management investment company under the Investment Company Act of 1940, as amended (the “1940 Act”). As of June 30, 2020, the Trust consisted of nine series, of which the eight active series identified below are presented in this report (each a “Fund,” and collectively, the “Funds”). The one remaining series is inactive and currently not available for purchase.
Olive Street Investment Advisers, LLC (the “Adviser”) acts as investment adviser to the Funds.
| Fund | Investment Objective | |
Bridge Builder Core Bond Fund (“Core Bond Fund”) | To provide total return (capital appreciation plus income) | |
Bridge Builder Core Plus Bond Fund (“Core Plus Bond Fund”) | To provide total return (capital appreciation plus income) | |
Bridge Builder Municipal Bond Fund (“Municipal Bond Fund”) | To provide current income exempt from federal tax, with a secondary goal of preservation of investment principal | |
Bridge Builder Large Cap Growth Fund (“Large Cap Growth Fund”) | To provide capital appreciation | |
Bridge Builder Large Cap Value Fund (“Large Cap Value Fund”) | To provide capital appreciation | |
Bridge Builder Small/Mid Cap Growth Fund (“Small/Mid Cap Growth Fund”) | To provide capital appreciation | |
Bridge Builder Small/Mid Cap Value Fund (“Small/Mid Cap Value Fund”) | To provide capital appreciation | |
Bridge Builder International Equity Fund (“International Equity Fund”) | To provide capital appreciation |
The Funds are diversified and each currently offers a single class of shares. The Funds are available for investment exclusively through Edward Jones Advisory Solutions®.
2. SIGNIFICANT ACCOUNTING POLICIES
The following is a summary of significant accounting policies consistently followed by the Trust in the preparation of its financial statements. These policies are in conformity with generally accepted accounting principles (“GAAP”) in the United States of America.
The Funds are investment companies and, accordingly, follow the investment company accounting and reporting guidance of the Financial Accounting Standards Board (“FASB”) Accounting Standards Codification Topic 946 – Investment Companies, which is part of GAAP.
a) Use of Estimates – The presentation of financial statements in conformity with GAAP requires management to make estimates and assumptions that affect the reported amounts of assets and liabilities at the date of the financial statements and the reported amounts of revenues and expenses during the reporting period. Actual results could differ from those estimates and assumptions.
b) Investment Valuation – All securities and other investments are recorded at their estimated fair value, as described in Note 4.
c) Federal Income Taxes – Each Fund is treated as a separate taxable entity for federal income tax purposes. The Funds intend to comply with the requirements of Subchapter M of the Internal Revenue Code of 1986, as amended (the “Internal Revenue Code”), applicable to regulated investment companies and to distribute substantially all of their net investment income and capital gains to shareholders. As a result, no provision for federal income tax is recorded in the financial statements.
| 62 | Annual Report • June 30, 2020 |
Bridge Builder Mutual Funds
Notes to Financial Statements (Continued)
The Adviser has reviewed the Funds’ tax positions for all open tax years (the prior three years of tax filings or since inception, if shorter, are considered open for examination) and has concluded that there is no tax liability/benefit resulting from uncertain income tax positions taken or expected to be taken in future tax returns. The Funds are also not aware of any tax position for which it is reasonably possible that the total amounts of unrecognized tax expense will significantly change in the next twelve months.
As of June 30, 2020, the Funds had no tax examinations or audits in progress.
d) Distributions to Shareholders – Distributions to shareholders are recorded on the ex-dividend date. Distributions of net investment income for the Core Bond, Core Plus Bond and Municipal Bond Funds are generally declared daily and paid monthly. The Large Cap Value Fund will generally declare and pay distributions of net investment income quarterly. The Large Cap Growth, Small/Mid Cap Growth, Small/Mid Cap Value and International Equity Funds will generally declare and pay distributions of net investment income annually, as necessary. Realized capital gains, if any, are distributed by each Fund at least annually, as necessary. The amount and timing of distributions are determined in accordance with federal income tax regulations, which may differ from GAAP. To the extent these “book/tax” differences are permanent in nature, these amounts are reclassified within the capital accounts in the financial statements to reflect their tax character.
e) Indemnifications – In the normal course of business, the Trust may enter into contracts with service providers that contain general indemnification clauses. The Trust’s maximum exposure under these arrangements is unknown, as this would involve future claims against the Trust that have not yet occurred.
f) Investment Transactions, Income and Expense Allocation – Investment transactions are recorded on trade date. Securities gains and losses, net of foreign taxes withheld, if any, are calculated on the basis of identified cost. Dividend income (expense), net of foreign taxes withheld, if any, is recognized on ex-dividend date except in the case of foreign securities, in which case dividends are recorded as soon as the information becomes available, which may be after the published ex-dividend date. Non-cash dividend income received in the form of securities in-lieu of cash are recorded at the fair value of the securities received. Issuance fees, if any, are custodial fees on American Depositary Receipts (“ADRs”) charged by ADR agents on ADR dividends and are recorded when paid. Interest income is recognized on an accrual basis, while discounts and premiums on securities purchased are amortized or accreted, respectively, using the constant yield method over the life of the security. Expenses common to multiple Funds are allocated among the respective Funds based upon their relative net asset values or other reasonable allocation methods.
g) Foreign Currency Translation and Transactions – The books and records of the Funds are maintained in U.S. dollars. The Funds’ assets and liabilities in foreign currencies are translated into U.S. dollars at the prevailing exchange rate on the valuation date. Transactions denominated in foreign currencies are translated into U.S. dollars at the prevailing exchange rate on the date of the transaction. The Funds’ income earned and expense incurred in foreign denominated currencies are translated into U.S. dollars at the prevailing exchange rate on the date of such activity.
The Funds do not isolate that portion of the results of operations arising from changes in the foreign exchange rates on investments and derivatives from the fluctuations that result from changes in the market prices of investments and derivatives held or sold during the period. Accordingly, such foreign currency gains/(losses) are included in the reported net realized gains/(losses) on investments in securities and derivatives and net change in unrealized appreciation/(depreciation) on investment securities and derivatives on the Statements of Operations.
| Annual Report • June 30, 2020 | 63 |
Bridge Builder Mutual Funds
Notes to Financial Statements (Continued)
3. SECURITIES AND OTHER INVESTMENTS
a) Delayed Delivery Securities – Certain Funds may enter into contracts to purchase mortgage securities for a fixed price at a future date beyond customary settlement time if the Fund sets aside on its books liquid assets in an amount sufficient to meet the purchase price, or if the Fund enters into offsetting contracts for the forward sale of other securities it owns. In the case of delayed delivery mortgage purchase commitments, the unit price and the
estimated principal amount are established when the Fund enters into a contract, with the actual principal amount being within a specified range of the estimate. For these obligations, the Fund will earmark liquid assets in an amount sufficient to cover its obligations. Forward commitments may be considered securities in themselves, and involve a risk of loss if the value of the security to be purchased declines prior to the settlement date. This risk is in addition to the risk of decline in the value of the Fund’s other assets. Where such purchases are made through dealers, the Fund relies on the dealer to consummate the sale. The dealer’s failure to do so may result in a loss to the Fund of an advantageous yield or price. Although the Fund will generally enter into forward commitments with the intention of acquiring securities for its portfolio, the Fund may dispose of a commitment prior to settlement if it deems it appropriate to do so.
A Fund may enter into delayed delivery sale commitments to hedge its portfolio positions or to sell securities it owns under delayed delivery arrangements. Proceeds of the sale commitments are not received until the contractual settlement date. Unsettled sale commitments are valued at current market value of the underlying securities. If the sale commitment is closed through the acquisition of an offsetting purchase commitment, the Fund realizes a gain or (loss) on the commitment without regard to any unrealized appreciation/(depreciation) on the underlying security. If the Fund delivers securities under the commitment, the Fund realizes a gain or (loss) from the sale of the securities based upon the unit price established at the date the commitment was entered into.
b) Derivatives – The Funds invest in derivatives as permitted by their investment strategies and policies. Derivatives are financial instruments whose value is based on the value of another underlying asset, interest rate, index or financial instrument.
Futures Contracts – Certain Funds may enter into futures contracts, which are agreements between two parties to buy or sell a specified underlying instrument for a fixed price on a specified future date. The Funds buy and sell futures contracts to gain or hedge exposure to certain risk factors. Upon entering into a futures contract, the Funds are required to deposit with the broker cash or securities, which are referred to as initial margin. Securities deposited as initial margin are designated on the Summary Schedule of Investments, and cash deposited is recorded as Deposits at broker for futures contracts on the Statements of Assets and Liabilities. Exchange traded futures are marked to market daily based on the price movement of the contract. This change in value creates either a payable or receivable for the Fund as either more or less margin is required by the clearing agent. This change in value, known as variation margin, is moved daily between the Fund and its counterparty. A change in the market value of an open futures contract is recorded as unrealized appreciation/(depreciation) until the contract is closed. When a contract is closed, the Fund will record a realized gain or (loss) equal to the difference between the proceeds of the closing transaction and the Fund’s basis in the contract. Futures contracts outstanding at period end, if any, are listed within each Fund’s Summary Schedule of Investments.
Forward Foreign Currency Exchange Contracts – Certain Funds buy and sell forward foreign currency exchange contracts, which are agreements between two parties to buy and sell currencies at a set price on a future date. These contracts are used to protect against a decline in value relative to the U.S. dollar of the currencies in which portfolio securities are denominated or quoted (or an increase in the value of a currency in which securities that a Fund intends to buy are denominated, when a Fund holds cash reserves and short-term investments), or for other investment purposes. The market value of the contract will fluctuate with changes in currency exchange rates. The contract is marked to market daily and the change in market value is recorded as unrealized appreciation/ (depreciation). When the contract is closed in its foreign currency, the Funds record a realized gain or (loss) equal to the difference between the value of the contract at the time it was opened and the value at the time it was closed.
| 64 | Annual Report • June 30, 2020 |
Bridge Builder Mutual Funds
Notes to Financial Statements (Continued)
Non-deliverable forward foreign currency exchange contracts are settled with the counterparty in U.S. dollars without the delivery of foreign currency. The Funds could be exposed to risk if the value of the currency changes unfavorably, if the counterparties to the contracts are unable to meet the terms of their contracts or if the Funds are unable to enter into a closing position. Forward foreign currency exchange contracts outstanding at period end, if any, are listed within each Fund’s Summary Schedule of Investments.
Repurchase Agreements – In a repurchase agreement, a Fund buys a security from another party (the counterparty), usually a financial institution, with the agreement that it be sold back in the future. Repurchase agreements subject a Fund to counterparty risk, meaning that the Fund could lose money if the other party fails to perform under the terms of the agreement. A Fund mitigates this risk by ensuring that the Fund’s repurchase agreements are collateralized by cash and/or U.S. government securities. All collateral is held by a Fund’s custodian (or, with multiparty agreements, the agent’s bank) and is monitored daily to ensure that its market value is at least equal to the repurchase price under the agreement. In the event of a default by the counterparty, realization of the collateral proceeds could be delayed or limited and the value of the collateral may decline. Investments in repurchase agreements are also based on a review of the credit quality of the repurchase agreement counterparty. Certain Funds may enter into repurchase agreements in which eligible securities are transferred into joint trading accounts maintained by the custodian or sub-custodian under a Master Repurchase Agreement for investment companies and other clients advised by the Sub-adviser (as defined below) and its affiliates. A Fund may participate with the other investment companies and clients in its share of the securities transferred under such repurchase agreements and in its share of proceeds from any repurchase or other disposition of such securities. Repurchase agreements are subject to master netting agreements, which are agreements between a Fund and its counterparties that provide for the net settlement of all transactions and collateral with the Fund through a single payment, in the event of default or termination. Repurchase agreement amounts, if any, presented on the Summary Schedule of Investments are gross settlement amounts.
Swap Contracts – Certain Funds may invest in swap contracts. Swap contracts are bilaterally negotiated agreements between a Fund and a counterparty to exchange or swap investment cash flows, assets, or market-linked returns at specified, future intervals. Swap contracts may be privately negotiated in the over-the-counter market (“OTC Swaps”) or may be cleared through a third-party, known as a central counterparty or derivatives clearing organization (“Centrally Cleared Swaps”). A Fund may enter into credit default, interest rate and/or total return swap contracts to manage the Fund’s exposure to credit, interest rate and equity risk. Securities or cash may be used as collateral or margin in accordance with the terms of the swap contract in order to provide assets in the event of a default or bankruptcy.
Centrally Cleared Swaps are marked to market daily and the change, if any, is recorded as variation margin on centrally cleared swap contracts on the Statements of Assets and Liabilities. OTC Swaps are marked to market daily and the change, if any, is included in the over-the-counter swap contracts, at value line item on the Statements of Assets and Liabilities. Both OTC and Centrally Cleared Swaps show this component as change in unrealized appreciation/(depreciation) on the Statements of Operations. Swap variation margin is accounted for as unrealized appreciation/(depreciation) until the contract is closed, at which time the gains or (losses) are realized. Upfront premiums received/(paid) represent cash payments made upon the opening of the swap contract to compensate for differences between the stated terms of the contract and the current market value contract. These upfront payments are recorded as assets/(liabilities) and are included within the market value of the swap contract. Upon liquidation or termination of the swap contract, these payments are recorded as realized gain/(loss) on the Statements of Operations. Net periodic payments received/(paid) by the Fund are also included in the realized gain/ (loss) on swap contracts on the Statements of Operations. Swap contracts outstanding, including their respective notional amounts at period end, if any, are listed within each Fund’s Summary Schedule of Investments.
Interest Rate Swaps – Certain Funds may enter into interest rate swap contracts to manage fund exposure to interest rates or to either preserve or generate a return on a particular investment or portion of its portfolio. These
| Annual Report • June 30, 2020 | 65 |
Bridge Builder Mutual Funds
Notes to Financial Statements (Continued)
are agreements between counterparties to exchange periodic interest payments based on interest rates. One cash flow stream will typically be a floating rate payment based upon a specified interest rate while the other is typically a fixed interest rate.
Credit Default Swap Contracts – Certain Funds may enter into credit default swap contracts to provide a measure of protection against risk of loss following a default, or other credit event in respect of issuers within an underlying index or a single issuer, or to gain credit exposure to an underlying index or issuer. In a credit default swap contract, the protection buyer typically makes an upfront payment and a periodic stream of payments to the protection seller, in exchange for the right to receive a contingent payment upon the occurrence of a credit event on the reference obligation or other equally ranked obligations of the reference entity. As a seller of protection on a credit default swap contract, the Fund will generally receive from the protection buyer a fixed rate of income throughout the term of the swap provided there is no credit event. Credit events are contract specific but may include bankruptcy, failure to pay, restructuring and obligation acceleration. Upon the occurrence of a credit event, the difference between the par value and market value of the reference obligation, net of any proportional amount of the upfront payment, is recorded as a realized gain or (loss).
Implied credit spreads are used to determine the value of credit default swap contracts and reflect the cost of buying/selling protection, which may include upfront payments made to enter into the contract. Therefore, higher spreads indicate a greater likelihood that a seller will be obligated to perform (i.e. make payment) under the swap contract. Implied credit spreads for credit default swaps on credit indexes are linked to the weighted average spread across the underlying reference obligations included in a particular index.
Risks of loss may exceed amounts recognized on the Summary Schedule of Investments. A Fund’s maximum risk of loss from counterparty risk, either as the protection seller or as the protection buyer, is the fair value of the contract. This risk may be mitigated by having a master netting arrangement between the specific Fund and the counterparty. Where a Fund is a seller of protection, the maximum potential amount of future payments the Fund may be required to make is equal to the notional amount of the relevant credit default contract. The Fund’s risk of loss associated with these instruments may exceed their value, as recorded in the Summary Schedule of Investments.
Total Return Swap Contracts – Certain Funds may enter into total return swaps to obtain exposure to the underlying referenced instruments, obtain leverage or attain the returns from ownership without actually owning the underlying position. Total return swaps are two-party contracts that generally obligate one party to pay the positive return and the other party to pay the negative return on a specified reference security, security index or index component during the period of the swap. Total return swap contracts are marked to market daily and the change, if any, is recorded as net change in unrealized appreciation/(depreciation) on swap contracts in the Statements of Operations. Total return swaps normally do not involve the delivery of securities or other underlying assets. If the counterparty to a total return swap contract defaults, a Fund’s risk of loss consists of the net amount of payments the Fund is contractually entitled to receive, if any. The use of long total return swap contracts subject the Funds to risk of loss in excess of the amounts shown on the Statements of Assets and Liabilities. The use of short total return swaps subject the Funds to unlimited loss. Periodic payments received (paid) by the Funds are recorded as net realized gain/(loss) on swap contracts in the Statements of Operations. Total return swap contracts outstanding at period end, if any, are listed after each Fund’s Summary Schedule of Investments.
c) Loan Participation, Assignments and Unfunded Commitments – Certain Funds may enter into loan participations and assignments. When one of the Funds purchases a loan participation, the Fund typically enters into a contractual relationship with the lender or a third party selling such participations (“Selling Participant”), but not the borrower. In this case, the Fund assumes the credit risk of the borrower and the Selling Participant and any other persons inter-positioned between the Fund and the borrower (“Intermediate Participants”). In contrast, when one of the Funds purchases an assignment, the contractual relationship is with the borrower and the credit risk assumed by the Fund
| 66 | Annual Report • June 30, 2020 |
Bridge Builder Mutual Funds
Notes to Financial Statements (Continued)
is only with the borrower. Although certain loan participations or assignments are secured by collateral, the Fund could experience delays or limitations in realizing such collateral or have its interest subordinated to other indebtedness of the obligor.
The Funds may also enter into unfunded loan commitments, which are contractual obligations for future funding. These unfunded commitments represent a future obligation in full, even though a percentage of the loan may not be utilized by the borrower. These types of investments may include standby financing commitments, such as revolving credit facilities, which obligate the Fund to supply additional cash to the borrower on demand. The value of the unfunded portion of the investment is determined using pro-rata allocation, based on its par value relative to the par value of the entire investment. The unfunded loan commitments are marked daily and any unrealized appreciation/ (depreciation) from unfunded commitments is reported in the Statements of Assets and Liabilities as well as the Statements of Operations. When investing in loan participations, the Fund has the right to receive payments of principal, interest and any fees to which it is entitled only from the lender selling the loan participation and only upon receipt of payments by the lender from the borrower. The Fund may receive a commitment fee based on the undrawn portion of the underlying line of credit portion of the loan. In certain circumstances, the Fund may receive a penalty fee upon the prepayment of a loan by a borrower. Fees earned or paid are recorded as a component of interest income or interest expense, respectively, on the Statements of Operations. In addition, loan participations and assignments are vulnerable to market conditions such that economic conditions or other events may reduce the demand for loan participations and assignments, and certain loan participations and assignments which were liquid, when purchased, may become illiquid. The following table summarizes the Fund’s unfunded loan positions as of June 30, 2020.
Fund | Borrower | Unfunded Bank Loan Commitment | Value of Underlying Bank Loan Commitment | Unrealized Appreciation/ (Depreciation) | ||||||||||
Core Plus Bond Fund | Intelsat Jackson Holdings SA | $ | 2,630,760 | $ | 2,665,302 | $34,542 | ||||||||
Core Plus Bond Fund | Neiman Marcus Group LLC Ltd. | 959,082 | 978,264 | 19,182 | ||||||||||
|
| |||||||||||||
| $53,724 | ||||||||||||||
|
| |||||||||||||
d) Restricted Securities – The Funds may own investment securities that are unregistered or have other legal or contractual limitations, and thus are restricted as to resale. These securities are valued after giving due consideration to pertinent factors, including recent private sales, market conditions and the issuer’s financial performance. Where future disposition of these securities requires registration under the Securities Act of 1933, a Fund may have the right to include these securities in such registration, generally without cost to the Fund. A Fund generally has no right to require registration of the unregistered securities it holds. The Adviser has determined as of June 30, 2020, the restricted securities held by the following Funds, to be liquid pursuant to the Funds liquidity risk management program.
Bridge Builder Core Plus Bond Fund
Issuer Description | Acquisition Date | Acquisition Cost | Market Value at June 30, 2020 | % of Net Assets at June 30, 2020 | ||||||||||||
AI Alpine U.S. Bidco, Inc. | 3/26/2019 - 9/26/2019 | $ | 2,514,950 | $ | 1,817,582 | 0.01 | % | |||||||||
Export-Import Bank of India | 12/19/2019 | 9,520,416 | 9,598,368 | 0.05 | ||||||||||||
Ford Motor Credit Co. LLC | 10/15/2019 | 16,835,234 | 17,189,374 | 0.09 | ||||||||||||
General Motors Co. | 5/7/2020 | 514,839 | 601,201 | 0.00 | * | |||||||||||
Morgan Stanley | 2/11/2020 | 12,557,800 | 12,807,615 | 0.07 | ||||||||||||
|
|
|
|
|
| |||||||||||
| $ | 41,943,239 | $ | 42,014,140 | 0.22 | % | |||||||||||
|
|
|
|
|
| |||||||||||
| * | Amount less than 0.005% |
Bridge Builder Municipal Bond Fund
Issuer Description | Acquisition Date | Acquisition Cost | Market Value at June 30, 2020 | % of Net Assets at June 30, 2020 | ||||||||||||
Public Finance Authority | 5/19/2016 - 4/14/2020 | $ | 6,174,620 | $ | 5,832,250 | 0.09 | % | |||||||||
| Annual Report • June 30, 2020 | 67 |
Bridge Builder Mutual Funds
Notes to Financial Statements (Continued)
e) Defaulted Securities – Certain Funds may hold defaulted securities or other securities which were placed in non-accrual status as the collection of a portion or all of the interest has been deemed to be uncollectible. Debt obligations may be placed on non-accrual status and the related interest income, amortization or accretion may be reduced or stopped entirely. Additionally, current income accruals and interest receivables may be written off when the collection of the interest income has become doubtful. A debt obligation is removed from non-accrual status when the issuer resumes interest payments or when collectability of interest is probable.
f) Sale-buyback and Buy-saleback Transactions – A sale-buyback financing transaction consists of a sale of a security by a Fund to a counterparty, with a simultaneous agreement to repurchase the same or substantially the same security at an agreed-upon price and date. The Fund will segregate assets determined to be liquid by the Sub-adviser or will otherwise cover its obligations under sale-buyback transactions.
As of June 30, 2020, the Core Plus Bond Fund participated in sale-buyback transactions. The payable for investments purchased related to sale-buyback transactions were $121,128,696, with an average amount borrowed of $91,016,839 and incurred interest expense of $1,382,571 with a weighted average interest rate of 2.97%. The receivable related to sale-buyback transactions which will be settled in next period is $121,128,091.
A buy-saleback lending transaction consists of a purchase of a security by a Fund from a counterparty, with a simultaneous agreement to sell the same or substantially the same security at an agreed-upon price and date. The party who sold the security is not entitled to receive principal and interest payments, if any, made on the security during the term of the agreement. The Fund will segregate assets determined to be liquid by the Sub-adviser or will otherwise cover its obligations under buy-saleback transactions.
During the period, the Core Plus Bond Fund participated in buy-saleback transactions. As of June 30, 2020, there were no outstanding buy-saleback transactions. The average amount loaned was $3,596,142 and the received interest income was $90,408 with a weighted average interest rate of 1.85%.
Sale-buyback and buy-saleback transactions are governed by Master Securities Forward Transaction Agreements (“Master Forward Agreements”), which are agreements between the Fund and select counterparties. The Master Forward Agreements maintain provisions for, among other things, transaction initiation and confirmation, payment and transfer, events of default, termination and maintenance of collateral. The market value of any pending sale-buyback and buy-saleback transactions as of period end is disclosed in each Fund’s Summary Schedule of Investments.
4. INVESTMENT VALUATION AND FAIR VALUE MEASUREMENTS
a) Investment Valuation Policies – The Net Asset Value (“NAV”) of the Funds’ shares are generally valued as of the close of the regular trading on the New York Stock Exchange (“NYSE”), normally 4:00 p.m. Eastern time, on each day the NYSE is open. The NAV per share of each Fund is computed by dividing the total net assets of the Fund by the total number of shares outstanding. For purposes of calculating the NAV, portfolio securities and derivative instruments are valued using valuation methods adopted by the Trust’s Board of Trustees (the “Board”).
The Board has delegated responsibility for applying approved valuation policies to the Adviser. The Adviser monitors the continual appropriateness of valuation methods applied and determines if adjustments should be made in light of market factor changes and events affecting issuers. The Adviser performs a series of activities to provide reasonable assurance of the accuracy of the prices utilized including: periodic vendor due diligence meetings and reviewing the results of back testing on a monthly basis. The Adviser provides the Board with reporting on the results of the back testing as well as positions which were fair valued during the period.
The Board has approved a Valuation Committee whose function is to monitor the valuation of portfolio securities and derivative instruments and determine in good faith the fair value of the Funds’ holdings after considering all
| 68 | Annual Report • June 30, 2020 |
Bridge Builder Mutual Funds
Notes to Financial Statements (Continued)
relevant factors. The Valuation Committee is generally responsible for overseeing the day-to-day valuation processes and is authorized to make all necessary determinations to fair value the portfolio securities and other assets for which market quotations are not readily available or if it is deemed that the prices obtained from brokers, dealers or independent pricing services are unreliable.
Additionally, the Board has adopted valuation procedures that allow for the use of fair value pricing in appropriate circumstances. For example, such circumstances may arise when trading in a security has been halted or suspended, when a security has been delisted from a national exchange, when a security has not been traded for an extended period of time, or when a significant event with respect to a security occurs after the close of the market or exchange on which the security principally trades and before the time a Fund calculates its own share price. If there is no price, or in the Adviser’s determination the price provided for a security by an independent pricing agent or broker does not represent fair value, then the security will be fair valued in accordance with procedures adopted by the Board. Thinly traded securities and certain foreign securities may be impacted more by the use of fair valuations than other securities. In using fair value pricing, a Fund attempts to establish the price that it might reasonably have expected to receive upon a sale of the security at 4:00 p.m. Eastern time. Valuing securities at fair value involves greater reliance on judgment than valuation of securities based on readily available market quotations. When using fair value to price securities, a Fund may value those securities higher or lower than another fund using market quotations or fair value to price the same securities. Further, there can be no assurance that the Fund could obtain the fair value assigned to a security if it were to sell the security at approximately the same time at which the Fund determines its net asset value.
b) Fair Value Hierarchy – The Funds have performed an analysis of all existing investments to determine the significance and character of all inputs to their fair value determination. Various inputs are used in determining the value of each Fund’s investments. These inputs are summarized in the following three broad categories:
| • | Level 1 – Inputs using unadjusted quoted prices in active markets or exchanges for identical assets and liabilities. |
| • | Level 2 – Inputs other than quoted prices included within Level 1 that are observable for the asset or liability. Other significant observable market inputs include, but are not limited to, quoted prices for similar instruments in active markets, quoted adjusted prices in active markets, quoted prices for identical or similar instruments in markets that are not active, and model-derived valuations in which the majority of significant inputs and significant value drivers are observable in active markets. |
| • | Level 3 – Significant unobservable inputs (including the Fund’s own assumptions). |
c) Valuation Techniques – Fixed-income securities, including corporate, convertible and municipal bonds and notes, U.S. government agencies, U.S. Treasury obligations, sovereign issues, bank loans, convertible preferred securities and non-U.S. bonds (other than short-term securities) are valued using that day’s bid price provided by an independent pricing service. Fixed-income securities are normally valued on the basis of quotes obtained from independent pricing services in accordance with procedures adopted by the Board. Independent pricing services typically use information provided by market makers or estimates of market values obtained from yields and other relevant data relating to investments or securities with similar characteristics. The independent pricing service’s internal models use inputs that are observable such as, among other things, issuer details, interest rates, yield curves, prepayment speeds, trade information, market color, credit risks/spreads, default rates and quoted prices for similar assets and the securities’ terms and conditions. Securities that use similar valuation techniques and inputs as described above are generally categorized as Level 2 of the fair value hierarchy.
Mortgage- and asset-backed securities are usually issued as separate tranches, or classes, of securities within each package of underlying securities. These securities are also normally valued by pricing service providers that use broker-dealer quotations or valuation estimates from their internal pricing models. The pricing models for these securities usually consider tranche level attributes, estimated cash flows and market-based yield spreads for each
| Annual Report • June 30, 2020 | 69 |
Bridge Builder Mutual Funds
Notes to Financial Statements (Continued)
tranche and current market data and packaged collateral performance, as available. Mortgage- and asset-backed securities that use such valuation techniques and inputs are typically categorized as Level 2.
Short-term securities without a vendor price and with 60 days or less remaining to maturity when acquired by a Fund are generally valued on an amortized cost basis, which approximates fair value. These securities are typically categorized as Level 2 in the fair value hierarchy.
Equity securities traded on a national securities exchange are valued at the last reported sale price at the close of regular trading on each day the exchange is open for trading. Securities listed on the NASDAQ National Market System for which market quotations are readily available are valued using the NASDAQ Official Closing Price. These valuations are typically categorized as Level 1 in the fair value hierarchy. Securities traded on an exchange for which there have been no sales are valued at the mean between the last bid and ask price on such day. Securities and financial instruments for which prices are not available from an independent pricing service may be valued using market quotations obtained from one or more dealers that make markets in the respective securities in accordance with procedures adopted by the Board and are classified as Level 2 or Level 3 depending on the observability of inputs.
Foreign securities, currencies and other assets denominated in currencies other than U.S. dollars are translated to U.S. dollars using exchange rates obtained from independent pricing services. All assets denominated in foreign currencies are converted to U.S. dollars using the applicable currency exchange rates as of the close of the NYSE, generally 4:00 p.m. Eastern time.
Valuation adjustments may be applied to certain common and preferred stocks that are solely traded on a foreign exchange to account for the market movement between the close of the foreign market and the close of the NYSE. These securities are generally valued using pricing service providers that consider the correlation of the trading patterns of the foreign securities to the intraday trading in the U.S. markets for investments. Securities using these valuation adjustments are categorized as Level 2 of the fair value hierarchy.
Open-ended mutual funds (including money market funds) are valued at the end of the day’s net asset value and are categorized as Level 1 of the fair value hierarchy.
Exchange traded financial derivative instruments, such as futures contracts or options contracts that are traded on a national securities or commodities exchange, are valued at the last reported sales or settlement price. To the extent these securities are actively traded and valuation adjustments are not applied, they are categorized as Level 1 of the fair value hierarchy. If there was no sale activity, the financial derivative is valued at the mean between the highest bid and lowest ask price on the relevant exchange closest to the close of the NYSE and are categorized as Level 2 of the fair value hierarchy.
OTC derivatives, including forward foreign currency exchange contracts and swap contracts, are valued by the Funds on a daily basis using observable inputs, such as quotations provided by an independent pricing service, the counterparty, dealers or brokers, whenever available and considered reliable. These securities are typically categorized as Level 2 of the fair value hierarchy.
The U.S. dollar value of forward foreign currency exchange contracts is determined using current forward currency exchange rates supplied by an independent pricing service.
Centrally cleared credit default and interest rate swap contracts are valued daily based on quotations as provided by an independent pricing service. The independent pricing services aggregate valuation information from various market participants to create a single reference value for each credit default swap contract and interest rate swap contract. These securities are typically categorized as Level 2 of the fair value hierarchy.
The Funds value the repurchase agreements they have entered based on the respective contract amounts, which approximate fair value. As such, repurchase agreements are carried at the amount of cash paid plus accrued interest receivable (or interest payable in periods of increased demand for collateral). These securities are typically categorized as Level 2 of the fair value hierarchy.
| 70 | Annual Report • June 30, 2020 |
Bridge Builder Mutual Funds
Notes to Financial Statements (Continued)
Quantitative Information
The following tables represent each Fund’s valuation inputs as presented in the Summary Schedule of Investments as of June 30, 2020.
Core Bond Fund
| Level 1 | Level 2 | Level 3 | Total | |||||||||||||
Assets | ||||||||||||||||
Asset-Backed Obligations | $ | — | $ | 1,597,065,700 | $ | 53,398,294 | $ | 1,650,463,994 | ||||||||
Corporate Bonds | ||||||||||||||||
Basic Materials | — | 151,826,077 | — | 151,826,077 | ||||||||||||
Communications | — | 386,825,170 | — | 386,825,170 | ||||||||||||
Consumer, Cyclical | — | 206,177,677 | — | 206,177,677 | ||||||||||||
Consumer, Non-cyclical | — | 721,057,623 | — | 721,057,623 | ||||||||||||
Diversified | — | 3,790,678 | — | 3,790,678 | ||||||||||||
Energy | — | 532,078,862 | — | 532,078,862 | ||||||||||||
Financials | — | 1,778,771,241 | — | 1,778,771,241 | ||||||||||||
Industrials | — | 225,978,191 | — | 225,978,191 | ||||||||||||
Technology | — | 185,382,283 | — | 185,382,283 | ||||||||||||
Utilities | — | 539,368,816 | — | 539,368,816 | ||||||||||||
Government Related | — | 315,568,248 | — | 315,568,248 | ||||||||||||
U.S. Treasury Obligations | — | 1,735,212,845 | — | 1,735,212,845 | ||||||||||||
Mortgage-Backed Obligations | — | 5,245,030,000 | 28,662,494 | 5,273,692,494 | ||||||||||||
Preferred Stocks | ||||||||||||||||
Financials | 2,489,000 | — | — | 2,489,000 | ||||||||||||
Short-Term Investments | ||||||||||||||||
Money Market Funds | 861,649,237 | — | — | 861,649,237 | ||||||||||||
U.S. Treasury Bills | — | 1,998,184 | — | 1,998,184 | ||||||||||||
Time Deposits | — | 2,096,944 | — | 2,096,944 | ||||||||||||
Futures Contracts (1) | 669,770 | — | — | 669,770 | ||||||||||||
Swap Contracts (1) | — | 506,489 | — | 506,489 | ||||||||||||
Total Assets | $ | 864,808,007 | $ | 13,628,735,028 | $ | 82,060,788 | $ | 14,575,603,823 | ||||||||
Liabilities | ||||||||||||||||
Futures Contracts (1) | $ | (909,109 | ) | $ | — | $ | — | $ | (909,109 | ) | ||||||
Total Liabilities | $ | (909,109 | ) | $ | — | $ | — | $ | (909,109 | ) | ||||||
| Annual Report • June 30, 2020 | 71 |
Bridge Builder Mutual Funds
Notes to Financial Statements (Continued)
| Core Plus Bond Fund | ||||||||||||||||
| Level 1 | Level 2 | Level 3 | Total | |||||||||||||
Assets | ||||||||||||||||
Asset-Backed Obligations | $ | — | $ | 2,226,097,210 | $ | — | $ | 2,226,097,210 | ||||||||
Corporate Bonds | ||||||||||||||||
Basic Materials | — | 177,832,403 | — | 177,832,403 | ||||||||||||
Communications | — | 1,004,084,897 | — | 1,004,084,897 | ||||||||||||
Consumer, Cyclical | — | 578,127,833 | — | 578,127,833 | ||||||||||||
Consumer, Non-cyclical | — | 1,218,260,714 | — | 1,218,260,714 | ||||||||||||
Diversified | — | 4,559,327 | — | 4,559,327 | ||||||||||||
Energy | — | 627,076,836 | 1,167,768 | 628,244,604 | ||||||||||||
Financials | — | 2,407,121,956 | — | 2,407,121,956 | ||||||||||||
Industrials | — | 431,128,175 | — | 431,128,175 | ||||||||||||
Technology | — | 315,073,012 | — | 315,073,012 | ||||||||||||
Utilities | — | 414,445,088 | — | 414,445,088 | ||||||||||||
Convertible Securities | ||||||||||||||||
Communications | — | 10,757,371 | — | 10,757,371 | ||||||||||||
Consumer, Cyclical | — | 2,747,001 | — | 2,747,001 | ||||||||||||
Consumer, Non-cyclical | — | 8,776,800 | — | 8,776,800 | ||||||||||||
Energy | — | 2,061,378 | — | 2,061,378 | ||||||||||||
Industrials | — | 1,640,183 | — | 1,640,183 | ||||||||||||
Government Related | — | 340,170,963 | — | 340,170,963 | ||||||||||||
U.S. Treasury Obligations | — | 2,113,700,459 | — | 2,113,700,459 | ||||||||||||
Mortgage-Backed Obligations | — | 5,929,947,009 | — | 5,929,947,009 | ||||||||||||
Bank Loans | — | 513,947,022 | 2,643,375 | 516,590,397 | ||||||||||||
Common Stocks | ||||||||||||||||
Communications | 3,312,811 | — | 13,429 | 3,326,240 | ||||||||||||
Consumer, Cyclical | 4,111,864 | — | — | 4,111,864 | ||||||||||||
Convertible Preferred Stocks | ||||||||||||||||
Consumer, Non-cyclical | 7,609,413 | — | — | 7,609,413 | ||||||||||||
Financials | 6,115,063 | — | — | 6,115,063 | ||||||||||||
Utilities | 1,462,020 | — | — | 1,462,020 | ||||||||||||
Warrants | — | — | 6,037,359 | 6,037,359 | ||||||||||||
Short-Term Investments | ||||||||||||||||
Money Market Funds | 405,307,655 | — | — | 405,307,655 | ||||||||||||
Government Related | — | 8,105,648 | — | 8,105,648 | ||||||||||||
Commercial Paper | — | 17,189,374 | — | 17,189,374 | ||||||||||||
Repurchase Agreements | — | 208,500,000 | — | 208,500,000 | ||||||||||||
U.S. Treasury Bills | — | 876,798,324 | — | 876,798,324 | ||||||||||||
Time Deposits | — | 56,420,035 | — | 56,420,035 | ||||||||||||
Futures Contracts (1) | 8,175,995 | — | — | 8,175,995 | ||||||||||||
Forward Foreign Currency Exchange Contracts (1) | — | 5,732,392 | — | 5,732,392 | ||||||||||||
Swap Contracts (1) | — | 81,125,742 | — | 81,125,742 | ||||||||||||
Total Assets | $ | 436,094,821 | $ | 19,581,427,152 | $ | 9,861,931 | $ | 20,027,383,904 | ||||||||
Liabilities | ||||||||||||||||
Futures Contracts (1) | $ | (3,613,759 | ) | $ | — | $ | — | $ | (3,613,759 | ) | ||||||
Forward Foreign Currency Exchange Contracts (1) | — | (18,099,148 | ) | — | (18,099,148 | ) | ||||||||||
Swap Contracts (1) | — | (29,919,935 | ) | — | (29,919,935 | ) | ||||||||||
Total Liabilities | $ | (3,613,759 | ) | $ | (48,019,083 | ) | $ | — | $ | (51,632,842 | ) | |||||
| 72 | Annual Report • June 30, 2020 |
Bridge Builder Mutual Funds
Notes to Financial Statements (Continued)
| Municipal Bond Fund | ||||||||||||||||
| Level 1 | Level 2 | Level 3 | Total | |||||||||||||
Assets | ||||||||||||||||
Municipal Bonds | ||||||||||||||||
Education | $ | — | $ | 573,403,352 | $ | — | $ | 573,403,352 | ||||||||
General Obligation | — | 1,090,527,307 | — | 1,090,527,307 | ||||||||||||
General Revenue | — | 1,722,177,351 | — | 1,722,177,351 | ||||||||||||
Healthcare | — | 1,020,936,612 | — | 1,020,936,612 | ||||||||||||
Housing | — | 304,661,409 | — | 304,661,409 | ||||||||||||
Transportation | — | 1,017,303,519 | — | 1,017,303,519 | ||||||||||||
Utilities | — | 567,565,069 | — | 567,565,069 | ||||||||||||
Short-Term Investments | ||||||||||||||||
Money Market Funds | 213,054,213 | — | — | 213,054,213 | ||||||||||||
Time Deposits | — | 4,985,851 | — | 4,985,851 | ||||||||||||
Total Assets | $ | 213,054,213 | $ | 6,301,560,470 | $ | — | $ | 6,514,614,683 | ||||||||
| Large Cap Growth Fund | ||||||||||||||||
| Level 1 | Level 2 | Level 3 | Total | |||||||||||||
Assets | ||||||||||||||||
Common Stocks | ||||||||||||||||
Communication Services | $ | 1,437,070,518 | $ | 47,519,155 | $ | — | $ | 1,484,589,673 | ||||||||
Consumer Discretionary | 1,974,520,175 | 26,651,471 | — | 2,001,171,646 | ||||||||||||
Consumer Staples | 457,688,050 | — | — | 457,688,050 | ||||||||||||
Energy | 96,471,695 | — | — | 96,471,695 | ||||||||||||
Financials | 635,912,100 | — | — | 635,912,100 | ||||||||||||
Healthcare | 2,397,343,503 | — | — | 2,397,343,503 | ||||||||||||
Industrials | 646,105,046 | — | — | 646,105,046 | ||||||||||||
Information Technology | 4,736,290,669 | — | — | 4,736,290,669 | ||||||||||||
Materials | 426,069,907 | — | — | 426,069,907 | ||||||||||||
Real Estate | 311,238,374 | — | — | 311,238,374 | ||||||||||||
Utilities | 251,135 | — | — | 251,135 | ||||||||||||
Rights | ||||||||||||||||
Communication Services | 2,219 | — | — | 2,219 | ||||||||||||
Short-Term Investments | ||||||||||||||||
Money Market Funds | 279,781,923 | — | — | 279,781,923 | ||||||||||||
Time Deposits | — | 5,714,644 | — | 5,714,644 | ||||||||||||
Total Assets | $ | 13,398,745,314 | $ | 79,885,270 | $ | — | $ | 13,478,630,584 | ||||||||
| Annual Report • June 30, 2020 | 73 |
Bridge Builder Mutual Funds
Notes to Financial Statements (Continued)
| Large Cap Value Fund | ||||||||||||||||
| Level 1 | Level 2 | Level 3 | Total | |||||||||||||
Assets | ||||||||||||||||
Common Stocks | ||||||||||||||||
Communication Services | $ | 727,168,661 | $ | — | $ | — | $ | 727,168,661 | ||||||||
Consumer Discretionary | 1,283,669,193 | 57,458,307 | — | 1,341,127,500 | ||||||||||||
Consumer Staples | 981,609,642 | 21,011,684 | — | 1,002,621,326 | ||||||||||||
Energy | 387,514,528 | 41,599,261 | — | 429,113,789 | ||||||||||||
Financials | 2,242,741,375 | — | — | 2,242,741,375 | ||||||||||||
Healthcare | 1,543,492,902 | 93,495,325 | — | 1,636,988,227 | ||||||||||||
Industrials | 1,890,160,849 | 8,360,138 | — | 1,898,520,987 | ||||||||||||
Information Technology | 1,326,157,432 | 70,707,760 | — | 1,396,865,192 | ||||||||||||
Materials | 645,452,130 | 4,089,456 | — | 649,541,586 | ||||||||||||
Real Estate | 361,539,493 | — | — | 361,539,493 | ||||||||||||
Utilities | 308,153,192 | — | — | 308,153,192 | ||||||||||||
Preferred Stocks | ||||||||||||||||
Consumer Discretionary | — | 8,261,360 | — | 8,261,360 | ||||||||||||
Healthcare | 9,757,678 | — | — | 9,757,678 | ||||||||||||
Utilities | 30,717,862 | — | — | 30,717,862 | ||||||||||||
Rights | ||||||||||||||||
Communication Services | 1,487 | — | — | 1,487 | ||||||||||||
Convertible Securities | ||||||||||||||||
Financials | — | 5,022,187 | — | 5,022,187 | ||||||||||||
Short-Term Investments | ||||||||||||||||
Exchange Traded Funds | 16,339,688 | — | — | 16,339,688 | ||||||||||||
Money Market Funds | 387,792,134 | — | — | 387,792,134 | ||||||||||||
Time Deposits | — | 21,076,671 | — | 21,076,671 | ||||||||||||
Total Assets | $ | 12,142,268,246 | $ | 331,082,149 | $ | — | $ | 12,473,350,395 | ||||||||
| Small/Mid Cap Growth Fund |
| |||||||||||||||
| Level 1 | Level 2 | Level 3 | Total | |||||||||||||
Assets | ||||||||||||||||
Common Stocks | ||||||||||||||||
Communication Services | $ | 204,841,836 | $ | — | $ | — | $ | 204,841,836 | ||||||||
Consumer Discretionary | 471,475,700 | — | — | 471,475,700 | ||||||||||||
Consumer Staples | 195,678,734 | — | — | 195,678,734 | ||||||||||||
Energy | 12,930,103 | — | — | 12,930,103 | ||||||||||||
Financials | 395,394,901 | — | — | 395,394,901 | ||||||||||||
Healthcare | 1,227,374,852 | — | 382 | 1,227,375,234 | ||||||||||||
Industrials | 673,508,954 | — | — | 673,508,954 | ||||||||||||
Information Technology | 1,310,282,047 | — | — | 1,310,282,047 | ||||||||||||
Materials | 102,310,845 | — | — | 102,310,845 | ||||||||||||
Real Estate | 61,484,997 | — | — | 61,484,997 | ||||||||||||
Utilities | 47,236,847 | — | — | 47,236,847 | ||||||||||||
Short-Term Investments | ||||||||||||||||
Money Market Funds | 96,213,135 | — | — | 96,213,135 | ||||||||||||
Time Deposits | — | 8,072,870 | — | 8,072,870 | ||||||||||||
Total Assets | $ | 4,798,732,951 | $ | 8,072,870 | $ | 382 | $ | 4,806,806,203 | ||||||||
| 74 | Annual Report • June 30, 2020 |
Bridge Builder Mutual Funds
Notes to Financial Statements (Continued)
| Small/Mid Cap Value Fund |
| |||||||||||||||
| Level 1 | Level 2 | Level 3 | Total | |||||||||||||
Assets | ||||||||||||||||
Common Stocks | ||||||||||||||||
Communication Services | $ | 84,953,889 | $ | — | $ | — | $ | 84,953,889 | ||||||||
Consumer Discretionary | 545,219,337 | — | — | 545,219,337 | ||||||||||||
Consumer Staples | 221,915,082 | — | — | 221,915,082 | ||||||||||||
Energy | 163,369,571 | — | — | 163,369,571 | ||||||||||||
Financials | 1,015,089,432 | — | — | (2) | 1,015,089,432 | |||||||||||
Healthcare | 371,542,254 | — | — | 371,542,254 | ||||||||||||
Industrials | 914,595,816 | — | — | 914,595,816 | ||||||||||||
Information Technology | 624,340,040 | — | — | 624,340,040 | ||||||||||||
Materials | 352,508,319 | — | — | 352,508,319 | ||||||||||||
Real Estate | 381,862,983 | — | — | 381,862,983 | ||||||||||||
Utilities | 321,730,764 | — | — | 321,730,764 | ||||||||||||
Short-Term Investments | ||||||||||||||||
Money Market Funds | 99,271,966 | — | — | 99,271,966 | ||||||||||||
Time Deposits | — | 14,148,647 | — | 14,148,647 | ||||||||||||
Total Assets | $ | 5,096,399,453 | $ | 14,148,647 | $ | — | $ | 5,110,548,100 | ||||||||
| International Equity Fund | ||||||||||||||||
| Level 1 | Level 2 | Level 3 | Total | |||||||||||||
Assets | ||||||||||||||||
Common Stocks | ||||||||||||||||
Communication Services | $ | 73,283,665 | $ | 996,753,673 | $ | — | $ | 1,070,037,338 | ||||||||
Consumer Discretionary | 303,668,795 | 1,308,350,051 | — | 1,612,018,846 | ||||||||||||
Consumer Staples | 77,611,567 | 785,660,745 | — | 863,272,312 | ||||||||||||
Energy | 16,213,262 | 432,626,268 | — | 448,839,530 | ||||||||||||
Financials | 105,946,357 | 1,249,671,535 | — | 1,355,617,892 | ||||||||||||
Healthcare | 249,300,203 | 1,500,148,217 | — | 1,749,448,420 | ||||||||||||
Industrials | 67,721,265 | 1,411,709,905 | — | 1,479,431,170 | ||||||||||||
Information Technology | 600,227,542 | 1,000,472,767 | — | 1,600,700,309 | ||||||||||||
Materials | — | 322,587,369 | — | 322,587,369 | ||||||||||||
Real Estate | 298,431 | 96,095,863 | — | 96,394,294 | ||||||||||||
Utilities | 928,058 | 282,061,624 | — | 282,989,682 | ||||||||||||
Preferred Stocks | ||||||||||||||||
Consumer Discretionary | — | 24,715,644 | — | 24,715,644 | ||||||||||||
Consumer Staples | — | 684,403 | — | 684,403 | ||||||||||||
Healthcare | — | 500,683 | — | 500,683 | ||||||||||||
Materials | — | 117,687 | — | 117,687 | ||||||||||||
Rights | ||||||||||||||||
Communication Services | 2,559,751 | — | — | 2,559,751 | ||||||||||||
Energy | 28,252 | — | — | 28,252 | ||||||||||||
Industrials | 16,284 | — | — | 16,284 | ||||||||||||
Short-Term Investments | ||||||||||||||||
Money Market Funds | 370,088,795 | — | — | 370,088,795 | ||||||||||||
Time Deposits | — | 21,294,882 | — | 21,294,882 | ||||||||||||
Total Assets | $ | 1,867,892,227 | $ | 9,433,451,316 | $ | — | $ | 11,301,343,543 | ||||||||
| (1) | Derivative instruments, including futures, total return swap contracts and forward foreign currency exchange contracts are reported at the cumulative unrealized appreciation/(depreciation) of the instrument within the Funds’ Summary Schedule of Investments. Credit default swaps and interest rate swaps are reported at market value. Only current day’s variation margin is reported within the Statements of Assets and Liabilities for exchange-traded and centrally cleared derivatives. |
| (2) | Includes a security valued at $0. |
| Annual Report • June 30, 2020 | 75 |
Bridge Builder Mutual Funds
Notes to Financial Statements (Continued)
The Core Bond, Core Plus Bond, Small/Mid Cap Growth, and Small/Mid Cap Value all held Level 3 securities at the end of the period. In the aggregate, securities classified as Level 3 in the Core Plus Bond, Small/Mid Cap Growth, and Small/Mid Cap Value have been deemed immaterial.
Quantitative Information about Level 3 Fair Value Measurements*
Core Bond Fund
| Investment Type | Fair Value at 06/30/20 | Valuation Methodology | Unobservable Inputs | Input Value/Range | Weighted Average | |||||||||
Asset-Backed Obligations | $ | 5,700,000 | Cost Basis | Purchase Price | $100.00 | $ | 100.00 | |||||||
Mortgage-Backed Obligations | $ | 6,417,752 | Cost Basis | Purchase Price | $99.90 | $99.90 | ||||||||
*The table above does not include Level 3 securities that were valued by brokers. At June 30, 2020, the value of these securities was $69,943,036 for the Core Bond Fund. The inputs for these securities are not readily available or cannot be reasonably estimated and are generally those inputs described in Note 4. The appropriateness of fair values for these securities is monitored on an ongoing basis which may include results of back testing, results of pricing vendor and/or broker due diligence, unchanged price review and consideration of macro or security specific events.
The realized and unrealized gains/(losses) from Level 3 transactions are included with the net realized gain/(loss) on investments and net change in unrealized appreciation/(depreciation) on investments on the Statements of Operations, respectively.
The following is a reconciliation of assets for which significant unobservable inputs (Level 3) were used in determining fair value during the period July 1, 2019 through June 30, 2020:
| Core Bond Fund | ||||||||||||||||
| Total | Asset-Backed Obligations | Corporate Bonds | Mortgage-Backed Obligations | |||||||||||||
Balance as of June 30, 2019 | $ | 60,573,172 | $ | 44,679,358 | $ | 22,048 | $ | 15,871,766 | ||||||||
Total realized gain/(loss) | 19,464 | 610 | — | 18,854 | ||||||||||||
Accrued discounts/(premiums) | 14,060 | (11 | ) | — | 14,071 | |||||||||||
Paydown | (14,515,439 | ) | (9,741,460 | ) | — | (4,773,979 | ) | |||||||||
Change in unrealized appreciation/(depreciation) | (2,492,981 | ) | (2,326,736 | ) | 223 | (166,468 | ) | |||||||||
Purchases | 58,971,785 | 34,025,800 | — | 24,945,985 | ||||||||||||
Sales | (20,509,273 | ) | (13,239,267 | ) | (22,271 | ) | (7,247,735 | ) | ||||||||
Transfers in | — | — | — | — | ||||||||||||
Transfers out | — | — | — | — | ||||||||||||
|
|
|
|
|
|
|
| |||||||||
Balance as of June 30, 2020 | $ | 82,060,788 | $ | 53,398,294 | $ | — | $ | 28,662,494 | ||||||||
|
|
|
|
|
|
|
| |||||||||
Change in unrealized appreciation/(depreciation) from Investments held as of June 30, 2020 | $ | (2,492,605 | ) | $ | (2,326,137 | ) | $ | — | $ | (166,468 | ) | |||||
|
|
|
|
|
|
|
| |||||||||
5. DERIVATIVE INSTRUMENTS
Certain Funds use derivative instruments as part of their investment strategy to achieve their stated investment objective. The Funds’ derivative contracts held at period end are not accounted for as hedging instruments under GAAP. For financial reporting purposes, the Funds do not offset derivative assets and derivative liabilities across derivative types that are subject to master netting arrangements in the Statements of Assets and Liabilities. There were no financial instruments subject to a netting agreement for which the Funds are not currently netting.
| 76 | Annual Report • June 30, 2020 |
Bridge Builder Mutual Funds
Notes to Financial Statements (Continued)
The following table lists the fair value of derivative instruments held by the Funds, by primary underlying risk and contract type, as included in the Statements of Assets and Liabilities at period end.
| Assets | Liabilities | |||||||||||||||||||||||
| Unrealized Appreciation on Futures Contracts* | Swaps at Value* | Unrealized Appreciation on Forward Foreign Currency Exchange Contracts | Unrealized Depreciation on Futures Contracts* | Swaps at Value* | Unrealized Depreciation on Forward Foreign Currency Exchange Contracts | |||||||||||||||||||
Interest Rate Risk: | ||||||||||||||||||||||||
Core Bond Fund | $ | 669,770 | $ | 506,489 | $ | — | $ | (909,109 | ) | $ | — | $ | — | |||||||||||
Core Plus Bond Fund | 8,175,995 | 77,406,544 | (3,613,759 | ) | (24,736,210 | ) | — | |||||||||||||||||
Foreign Exchange Risk: | ||||||||||||||||||||||||
Core Plus Bond Fund | — | — | 5,732,392 | — | — | (18,099,148 | ) | |||||||||||||||||
Credit Risk: | ||||||||||||||||||||||||
Core Plus Bond Fund | — | 3,719,198 | — | — | (5,183,725 | ) | — | |||||||||||||||||
| * | May include cumulative unrealized appreciation/(deprecation) as reported on the Summary Schedule of Investments. Only current day’s variation margin is reported on the Statements of Assets and Liabilities for exchange traded derivatives and centrally-cleared derivatives. |
The following table lists the effect of derivative instruments held by the Funds, by primary underlying risk and contract type, on the Statements of Operations for the year ended June 30, 2020.
| Realized Gain/(Loss) on Derivatives recognized as a result of Operations | Net Change in Unrealized Appreciation / (Depreciation) on Derivatives recognized as a result of Operations | |||||||||||||||||||||||
| Futures Contracts | Forward Foreign Currency Exchange Contracts | Swaps | Futures Contracts | Forward Foreign Currency Exchange Contracts | Swaps | |||||||||||||||||||
Interest Rate Risk: | ||||||||||||||||||||||||
Core Bond Fund | $ | 91,652,763 | $ | — | $ | (32,515,771 | ) | $ | (14,385,233 | ) | $ | — | $ | 13,539,963 | ||||||||||
Core Plus Bond Fund | 225,104,564 | — | (21,248,590 | ) | (35,361,994 | ) | — | 58,285,002 | ||||||||||||||||
Municipal Bond Fund | (7,541,154 | ) | — | 2,396 | 985,937 | — | — | |||||||||||||||||
Foreign Exchange Risk: | ||||||||||||||||||||||||
Core Plus Bond Fund | — | 8,278,447 | — | — | (4,076,793 | ) | — | |||||||||||||||||
Credit Risk: | ||||||||||||||||||||||||
Core Plus Bond Fund | — | — | (40,159,502 | ) | — | — | 8,153,863 | |||||||||||||||||
| Annual Report • June 30, 2020 | 77 |
Bridge Builder Mutual Funds
Notes to Financial Statements (Continued)
The following tables present the Funds’ gross OTC derivative assets and liabilities by counterparty and contract type, net of amounts available for offset under a master netting agreement and the related collateral received or pledged by the Funds as of June 30, 2020:
| Core Plus Bond Fund | ||||||||||||||||||||||||||||
| Investment Type | Gross Amounts of Recognized Assets Presented in the Statements of Assets & Liabilities | Gross Amounts Available for Offset | Net Amounts | Gross Amounts not offset in the Statements of Assets & Liabilities | Net Amount | |||||||||||||||||||||||
| Counterparty | Financial Instruments | Collateral Received | ||||||||||||||||||||||||||
Bank of America | | Forward Foreign Currency Exchange Contracts | | $ | 281,373 | $ | (281,373 | ) | $ | — | $ | — | $ | — | $ | — | ||||||||||||
Barclays Bank | | Credit Default Swap Contracts | | 4,423 | (4,423 | ) | — | — | — | — | ||||||||||||||||||
BNP Paribas | | Forward Foreign Currency Exchange Contracts | | 609,410 | (609,410 | ) | — | — | — | — | ||||||||||||||||||
Deutsche Bank | | Credit Default Swap Contracts | | 122,848 | — | 122,848 | — | (80,000 | ) | 42,848 | ||||||||||||||||||
Deutsche Bank | | Forward Foreign Currency Exchange Contracts | | 1,085,857 | (905,422 | ) | 180,435 | — | — | 180,435 | ||||||||||||||||||
Goldman Sachs | | Credit Default Swap Contracts | | 16,805 | (16,805 | ) | — | — | — | — | ||||||||||||||||||
Goldman Sachs | | Forward Foreign Currency Exchange Contracts | | 935,910 | (935,910 | ) | — | — | — | — | ||||||||||||||||||
J.P. Morgan | | Credit Default Swap Contracts | | 169,159 | (169,159 | ) | — | — | — | — | ||||||||||||||||||
J.P. Morgan | | Forward Foreign Currency Exchange Contracts | | 1,994,656 | (1,994,656 | ) | — | — | — | — | ||||||||||||||||||
Morgan Stanley | | Credit Default Swap Contracts | | 5,114 | (5,114 | ) | — | — | — | — | ||||||||||||||||||
Morgan Stanley | | Forward Foreign Currency Exchange Contracts | | 825,186 | (825,186 | ) | — | — | — | — | ||||||||||||||||||
Total Financial Instruments Subject to a Master Netting Arrangement or Similar Arrangement | 6,050,741 | (5,747,458 | ) | 303,283 | — | (80,000 | ) | 223,283 | ||||||||||||||||||||
| 78 | Annual Report • June 30, 2020 |
Bridge Builder Mutual Funds
Notes to Financial Statements (Continued)
| Core Plus Bond Fund (Continued) | ||||||||||||||||||||||||||||
| Investment Type | Gross Amounts of Recognized Liabilities Presented in the Statements of Assets & Liabilities | Gross Amounts Available for Offset | Net Amounts | Gross Amounts not offset in the Statements of Assets & Liabilities | Net Amount | |||||||||||||||||||||||
| Counterparty | Financial Instruments | Collateral Pledged (1) | ||||||||||||||||||||||||||
Bank Of America | | Credit Default Swap Contracts | | $ | 249,016 | $ | — | $ | 249,016 | $ | — | $ | — | $ | 249,016 | |||||||||||||
Bank Of America | | Forward Foreign Currency Exchange Contracts | | 369,027 | (281,373 | ) | 87,654 | — | — | 87,654 | ||||||||||||||||||
Barclays Bank | | Credit Default Swap Contracts | | 524,625 | (4,423 | ) | 520,202 | — | — | 520,202 | ||||||||||||||||||
BNP Paribas | | Forward Foreign Currency Exchange Contracts | | 4,952,228 | (609,410 | ) | 4,342,818 | — | — | 4,342,818 | ||||||||||||||||||
Deutsche Bank | | Forward Foreign Currency Exchange Contracts | | 905,422 | (905,422 | ) | — | — | — | — | ||||||||||||||||||
Goldman Sachs | | Credit Default Swap Contracts | | 913,957 | (16,805 | ) | 897,152 | — | — | 897,152 | ||||||||||||||||||
Goldman Sachs | | Forward Foreign Currency Exchange Contracts | | 2,690,338 | (935,910 | ) | 1,754,428 | — | — | 1,754,428 | ||||||||||||||||||
J.P. Morgan | | Credit Default Swap Contracts | | 442,148 | (169,159 | ) | 272,989 | — | — | 272,989 | ||||||||||||||||||
J.P. Morgan | | Forward Foreign Currency Exchange Contracts | | 4,673,578 | (1,994,656 | ) | 2,678,922 | — | — | 2,678,922 | ||||||||||||||||||
Morgan Stanley | | Credit Default Swap Contracts | | 669,125 | (5,114 | ) | 664,011 | — | — | 664,011 | ||||||||||||||||||
Morgan Stanley | | Forward Foreign Currency Exchange Contracts | | 4,302,693 | (825,186 | ) | 3,477,507 | — | — | 3,477,507 | ||||||||||||||||||
State Street | | Forward Foreign Currency Exchange Contracts | | 205,862 | — | 205,862 | — | — | 205,862 | |||||||||||||||||||
Total Financial Instruments Subject to a Master Netting Arrangement or Similar Arrangement | 20,898,019 | (5,747,458 | ) | 15,150,561 | — | — | 15,150,561 | |||||||||||||||||||||
| (1) | In accordance with GAAP disclosure requirements, the table above does not include the additional collateral pledged to the counterparty. |
| Annual Report • June 30, 2020 | 79 |
Bridge Builder Mutual Funds
Notes to Financial Statements (Continued)
The Funds’ average monthly notional amount of derivatives during the year ended June 30, 2020 were as follows:
| Core Bond Fund | Core Plus Bond Fund* | Municipal Bond Fund | ||||||||||
Futures Contracts | ||||||||||||
Average Notional Balance – Long | $ | 798,525,038 | $ | 3,301,778,710 | $ | — | ||||||
Average Notional Balance – Short | (81,297,529 | ) | (362,812,144 | ) | (48,054,826 | ) | ||||||
Forward Foreign Currency Exchange Contracts |
| |||||||||||
Average Amounts – Purchased | — | 1,253,395,627 | — | |||||||||
Average Amounts – Sold | — | (578,572,147 | ) | — | ||||||||
Credit Default Swaps | ||||||||||||
Average Amounts – Buy Protection | — | 14,027,846 | — | |||||||||
Average Amounts – Sell Protection | — | (684,611,349 | ) | — | ||||||||
Interest Rate Swaps | ||||||||||||
Average Amounts – Pays Fixed Rate | 193,250,538 | 208,304,381 | — | |||||||||
Average Amounts – Receives Fixed Rate | (18,861,923 | ) | (518,908,854 | ) | — | |||||||
Total Return Swaps | ||||||||||||
Average Amounts – Long | — | 1,246,154 | — | |||||||||
Average Amounts – Short | — | — | — | |||||||||
| * | Notional amounts shown have been converted to USD. |
6. FEES AND OTHER TRANSACTIONS WITH AFFILIATES
The Adviser acts as investment adviser to the Funds pursuant to an investment advisory agreement (the “Advisory Agreement”) with the Trust. The Adviser is a wholly owned subsidiary of The Jones Financial Companies, L.L.L.P. Under the Advisory Agreement, the Adviser furnishes, at its own expense, all services, facilities and personnel necessary in connection with managing the Funds’ investments.
The Adviser provides the Trust with such investment research, advice and investment supervision as the Trust may from time to time consider necessary for the proper management of the assets of the Funds, and furnishes continuously an investment program for the Funds. In fulfilling this obligation, the Adviser, among other things, recommends the hiring and termination, and monitors the ongoing performance, of one or more investment advisers (the “Sub-advisers”) and allocates Fund assets among the Sub-advisers.
In consideration of the services provided by the Adviser pursuant to the Advisory Agreement, the Funds pay the Adviser an investment advisory fee at an annual rate based on a percentage of each Fund’s average daily net assets. In an effort to pass along lower fund expenses to shareholders, the Adviser does not retain any portion of the advisory fees. The Adviser has contractually agreed to waive its advisory fees for each Fund to the extent advisory fees paid to the Adviser exceed the aggregate advisory fees the Fund is required to pay its Sub-advisers. The annual advisory fee and amounts of advisory fees waived by the Adviser during the period ended June 30, 2020 are noted in the table below:
Fund | Annual Management Fee | Management Fees Waived by Adviser | ||||||
Core Bond Fund | 0.32 | % | $ | (31,247,469 | ) | |||
Core Plus Bond Fund | 0.36 | (43,177,822 | ) | |||||
Municipal Bond Fund | 0.36 | (13,055,766 | ) | |||||
Large Cap Growth Fund | 0.44 | (19,023,486 | ) | |||||
Large Cap Value Fund | 0.44 | (20,994,013 | ) | |||||
Small/Mid Cap Growth Fund | 0.64 | (11,728,675 | ) | |||||
Small/Mid Cap Value Fund | 0.64 | (11,935,192 | ) | |||||
International Equity Fund | 0.60 | (33,928,594 | ) | |||||
None of the advisory fees waived by the Adviser pursuant to the agreement described above are subject to recoupment by the Adviser.
| 80 | Annual Report • June 30, 2020 |
Bridge Builder Mutual Funds
Notes to Financial Statements (Continued)
The Adviser has selected and the Board has approved the following Sub-advisers to sub-advise discrete portions of each of the Fund’s assets:
| Fund | Sub-advisers | |
| Core Bond Fund | Robert W. Baird & Co., Inc. J.P. Morgan Investment Management, Inc. Loomis, Sayles & Company, L.P. PGIM, Inc. | |
| Core Plus Bond Fund | Pacific Investment Management Company LLC Loomis Sayles & Company, L.P. Metropolitan West Asset Management, LLC T. Rowe Price Associates, Inc. | |
| Municipal Bond Fund | FIAM, LLC T. Rowe Price Associates, Inc. Wells Capital Management, Inc. BlackRock Investment Management, LLC | |
| Large Cap Growth Fund | Lazard Asset Management LLC Sustainable Growth Advisers, LP Jennison Associates LLC BlackRock Investment Management, LLC | |
| Large Cap Value Fund | Barrow, Hanley, Mewhinney & Strauss LLC Wellington Management Company LLP Artisan Partners Limited Partnership BlackRock Investment Management, LLC T. Rowe Price Associates, Inc. LSV Asset Management | |
| Small/Mid Cap Growth Fund | Champlain Investment Partners, LLC Eagle Asset Management, Inc. Stephens Investment Management Group, LLC BlackRock Investment Management, LLC Artisan Partners Limited Partnership | |
| Small/Mid Cap Value Fund | Boston Partners Global Investors, Inc. Vaughan Nelson Investment Management, L.P. Silvercrest Asset Management Group LLC BlackRock Investment Management, LLC LSV Asset Management MFS Investment Management Diamond Hill Capital Management, Inc. | |
| International Equity Fund | Baillie Gifford Overseas Limited Edinburgh Partners Limited Mondrian Investment Partners Limited WCM Investment Management BlackRock Investment Management, LLC Pzena Investment Management, LLC |
Subject to the supervision of the Adviser, the Sub-advisers provide the Funds, among other services, a continuous investment program and determine from time to time which securities or other investments shall be purchased, sold or exchanged for the Funds, including providing or obtaining such services as may be necessary in managing, acquiring or disposing of securities, cash or other investments. For their services as Sub-advisers to the Funds, each Sub-adviser is entitled to receive fees directly from each Fund it serves.
Pursuant to an operating expense limitation agreement between the Adviser and the Funds, effective until October 28, 2021, the Adviser has contractually agreed to waive its fees and/or reimburse Fund expenses (excluding acquired fund fees and expenses, portfolio transaction expenses, interest expense in connection with
| Annual Report • June 30, 2020 | 81 |
Bridge Builder Mutual Funds
Notes to Financial Statements (Continued)
investment activities, taxes and non-routine expenses) to limit total annual fund operating expenses after fee waivers and/or expense reimbursements to each of the amounts listed below (each an “Expense Cap”).
| Fund | Expense Cap | |
| Core Bond Fund | 0.48% | |
| Core Plus Bond Fund | 0.42 | |
| Municipal Bond Fund | 0.48 | |
| Large Cap Growth Fund | 0.51 | |
| Large Cap Value Fund | 0.51 | |
| Small/Mid Cap Growth Fund | 0.73 | |
| Small/Mid Cap Value Fund | 0.73 | |
| International Equity Fund | 0.67 |
The Trust has agreed to repay the expense reimbursement to the Adviser. However, the repayment of previously waived expenses is limited to amounts that do not cause the aggregate operating expenses of the Fund to exceed the current expense cap or the expense cap in place at the time the waiver was generated. The Adviser has up to three fiscal years from the time the expenses were reimbursed to request reimbursement from a Fund. During the year ended June 30, 2020, the Funds did not exceed the Expense Cap, and there are no expense reimbursements currently available for recoupment in future periods.
Administrator – Brown Brothers Harriman & Co. (“BBH”) acts as Administrator to the Trust pursuant to an Administrative Agency Agreement. As Administrator, BBH provides certain services to the Trust, including, among other responsibilities, administrative, tax, legal, accounting services, portfolio compliance monitoring, and financial reporting for the maintenance and operations of the Funds. In addition, BBH makes available the personnel and facilities to provide such services. In its capacity as Administrator, BBH does not have any responsibility or authority for the portfolio management of the Funds, the determination of investment policy, or for any matter pertaining to the distribution of Fund shares. Pursuant to the Administrative Agency Agreement, the Trust has agreed to pay such compensation as is mutually agreed from time to time and such out-of-pocket expenses as incurred by BBH in the performance of its duties. The amounts paid directly to the Administrator by the Funds for administrative services are included in the Administration fee in the Statements of Operations.
Custodian – BBH also acts as Custodian to the Trust. In this capacity, BBH holds all cash and, directly or through a book entry system or an agent, securities of each Fund, delivers and receives payment for securities sold by such Fund, collects income from investments of each Fund and performs other duties as set forth in the Custodian Agreement between the Trust, on behalf of the Funds, and BBH. Custodian fees are paid monthly and based on assets held in custody, investment purchases and sales activity and account maintenance fees, plus reimbursement for certain out-of-pocket expenses. The amounts paid directly to the Custodian by the Funds for custody services are included in Custody fees in the Statements of Operations.
Trustees – Trustee fees and expenses displayed in the Statements of Operations include amounts accrued by the Funds to pay remuneration to each Trustee who is not an “interested person” as defined by the 1940 Act (an “Independent Trustee”) of the Trust. The Trustees who are not Independent Trustees of the Trust are not compensated by the Trust.
Affiliated Transactions – The Funds may participate in purchase and sale transactions with other Funds or accounts that have a common investment adviser or Sub-adviser, commonly referred to as “cross trades.” These cross trades are executed in accordance with procedures adopted by the Trust’s Board and comply with Rule 17a-7 of the 1940 Act, which require, among other things, that such cross trades be effected at the independent current market price
| 82 | Annual Report • June 30, 2020 |
Bridge Builder Mutual Funds
Notes to Financial Statements (Continued)
of the security. During the year ended June 30, 2020, the aggregate value of purchases and sales cross trades with other Funds or accounts were as follows:
| Purchases | Sales | Realized Gain/(Loss) | ||||||||||
Large Cap Growth Fund | $ | 37,529,640 | $ | 9,612,933 | $ | (720,961 | ) | |||||
Large Cap Value Fund | 44,724,012 | 2,526,394 | (1,096,893 | ) | ||||||||
Small/Mid Cap Growth Fund | 1,974,008 | 20,872,406 | (7,463,107 | ) | ||||||||
Small/Mid Cap Value Fund | 8,729,401 | 10,450,285 | (2,921,498 | ) | ||||||||
International Equity Fund | 2,086,298 | 147,531 | 6,137 | |||||||||
7. INTERFUND LENDING AGREEMENT
On June 1, 2016, the Funds received exemptive relief from the SEC to enter into a master interfund lending agreement with each other that permits each Fund to lend money directly to and borrow money directly from other Funds for temporary purposes. Each Fund may lend to another Fund, in aggregate, up to 15% of its current net assets at the time of the loan and a Fund’s loans, in aggregate, to any one Fund under the agreement may not exceed 5% of the lending Fund’s net assets. A loan under the agreement will not exceed duration of seven days and interest is charged on borrowings at a rate determined based on current short-term market interest rates and short-term lending rates available to the Funds. As of June 30, 2020, the Funds have yet to lend under this agreement.
8. INVESTMENT TRANSACTIONS
For the year ended June 30, 2020, purchases and sales of investment securities, other than short-term investments, were as follows:
| Core Bond Fund | Core Plus Bond Fund | Municipal Bond Fund | Large Cap Growth Fund | Large Cap Value Fund | Small/Mid Cap Growth Fund | Small/Mid Cap Value Fund | International Equity Fund | |||||||||||||||||||||||||
Purchases: | ||||||||||||||||||||||||||||||||
U.S. Government | $ | 15,012,301,528 | $ | 24,050,881,973 | $ | 4,270 | $ | — | $ | — | $ | — | $ | — | $ | — | ||||||||||||||||
Other | 5,131,703,121 | 7,026,415,901 | 3,547,370,833 | 8,279,609,864 | 6,489,465,034 | 2,960,951,745 | 3,346,247,565 | 4,910,356,010 | ||||||||||||||||||||||||
Sales: | ||||||||||||||||||||||||||||||||
U.S. Government | 16,475,231,220 | 25,563,826,963 | 9,196 | — | — | — | — | — | ||||||||||||||||||||||||
Other | 5,526,698,831 | 5,217,111,634 | 2,360,360,303 | 3,286,710,676 | 3,403,287,231 | 2,592,991,821 | 2,442,087,499 | 3,949,737,252 | ||||||||||||||||||||||||
On May 13, 2020, as part of a capital contribution in-kind, the Large Cap Value Fund received securities with a fair value of $1,117,108,672 in exchange for 103,149,462 shares of the Fund. The received securities are not included in the table above or part of the portfolio turnover rate included in the Financial Highlights.
9. FEDERAL INCOME TAX INFORMATION
GAAP requires that certain components of net assets be reclassified between financial and tax reporting. Temporary differences do not require reclassification. Temporary differences and permanent reclassifications have no effect on net assets. For the year ended June 30, 2020, the Funds made permanent book-to-tax reclassifications primarily related to the treatment of foreign currency, partnership taxable income, passive foreign investment company sales adjustments, paydowns, dividend re-designations and difference between book and tax accretion methods for market premium.
For the fiscal year ended June 30, 2020, the Funds made the following reclassifications between total distributable earnings and paid-in capital:
| Total Distributable Earnings/(Loss) | Paid-in Capital | |||||||
Core Bond Fund | $ | 1,191,929 | $ | (1,191,929 | ) | |||
Core Plus Bond Fund | 1 | (1 | ) | |||||
Municipal Bond Fund | 301,693 | (301,693 | ) | |||||
Large Cap Growth Fund | — | — | ||||||
Large Cap Value Fund | 149,693 | (149,693 | ) | |||||
Small/Mid Cap Growth Fund | — | — | ||||||
Small/Mid Cap Value Fund | — | — | ||||||
International Equity Fund | 988 | (988 | ) | |||||
| Annual Report • June 30, 2020 | 83 |
Bridge Builder Mutual Funds
Notes to Financial Statements (Continued)
At June 30, 2020, gross unrealized appreciation and (depreciation) of investments and derivative contracts based on cost for federal income tax purposes were as follows:
| Core Bond Fund | Core Plus Bond Fund | Municipal Bond Fund | Large Cap Growth Fund | Large Cap Value Fund | Small/Mid Cap Growth Fund | Small/Mid Cap Value Fund | International Equity Fund | |||||||||||||||||||||||||
Tax Cost of Portfolio | $ | 13,693,941,682 | $ | 19,456,099,518 | $ | 6,333,257,178 | $ | 10,575,202,057 | $ | 11,582,853,193 | $ | 4,010,291,505 | $ | 5,154,632,793 | $ | 10,851,874,748 | ||||||||||||||||
|
|
|
|
|
|
|
|
|
|
|
|
|
|
|
| |||||||||||||||||
Gross Unrealized App | $ | 947,551,943 | $ | 974,523,153 | $ | 216,565,988 | $ | 3,032,888,906 | $ | 1,592,711,758 | $ | 1,009,378,754 | $ | 582,214,445 | $ | 1,975,004,635 | ||||||||||||||||
Gross Unrealized Dep | (66,798,911 | ) | (454,871,609 | ) | (35,208,483 | ) | (129,460,379 | ) | (702,214,556 | ) | (212,864,056 | ) | (626,299,138 | ) | (1,525,535,840 | ) | ||||||||||||||||
|
|
|
|
|
|
|
|
|
|
|
|
|
|
|
| |||||||||||||||||
Net Unrealized App/(Dep) | $ | 880,753,032 | $ | 519,651,544 | $ | 181,357,505 | $ | 2,903,428,527 | $ | 890,497,202 | $ | 796,514,698 | $ | (44,084,693 | ) | $ | 449,468,795 | |||||||||||||||
|
|
|
|
|
|
|
|
|
|
|
|
|
|
|
| |||||||||||||||||
The differences between book basis and tax basis appreciation/(depreciation) on investments is primarily attributable to wash sale loss deferrals, and differences in the tax treatment of mark to market on passive foreign investment companies, mark to market on derivatives, non-REIT return of capital, outstanding partnership basis and the amortization of premiums.
As of June 30, 2020, the components of total distributable earnings/(losses) on a tax basis were as follows:
| Core Bond Fund | Core Plus Bond Fund | Municipal Bond Fund | Large Cap Growth Fund | Large Cap Value Fund | Small/Mid Cap Growth Fund | Small/Mid Cap Value Fund | International Equity Fund | |||||||||||||||||||||||||
Accumulated Capital and Losses (1) | $ | — | $ | — | $ | (29,317,119 | ) | $ | — | $ | (165,774,871 | ) | $ | — | $ | (94,228,917 | ) | $ | (331,665,290 | ) | ||||||||||||
Other (2) | (7,535,202 | ) | (22,008,137 | ) | (20,338 | ) | (3,343 | ) | (2,111 | ) | (206 | ) | — | (15,500 | ) | |||||||||||||||||
Undistributed Ordinary Income | 96,490,127 | 226,882,543 | — | 34,983,159 | — | 78,641,386 | 34,015,572 | 153,817,231 | ||||||||||||||||||||||||
Undistributed Tax Exempt Income | — | — | — | — | — | — | — | — | ||||||||||||||||||||||||
Undistributed Long Term Capital Gain | 178,063,534 | 181,979,038 | — | 185,081,832 | — | 419,764,657 | — | — | ||||||||||||||||||||||||
Unrealized Appreciation/ (Depreciation) | 880,753,032 | 522,749,378 | 181,357,505 | 2,903,428,749 | 890,489,187 | 796,514,698 | (44,084,468 | ) | 448,914,057 | |||||||||||||||||||||||
|
|
|
|
|
|
|
|
|
|
|
|
|
|
|
| |||||||||||||||||
Total Accumulated Gain/ (Loss) | $ | 1,147,771,491 | $ | 909,602,822 | $ | 152,020,048 | $ | 3,123,490,397 | $ | 724,712,205 | $ | 1,294,920,535 | $ | (104,297,813 | ) | $ | 271,050,498 | |||||||||||||||
|
|
|
|
|
|
|
|
|
|
|
|
|
|
|
| |||||||||||||||||
| (1) | Includes capital loss carryforwards and late year loss deferrals. |
| (2) | Includes straddle loss deferrals and organizational costs. |
The differences between book basis and tax basis components of net assets are primarily attributable to wash sale loss deferrals and other book and tax differences including paydowns, organizational costs, straddle loss deferrals, and capital loss carryforwards.
At June 30, 2020, the Funds had the following capital loss carryforwards. The capital loss carryforwards do not have an expiration date and will retain their character as either short-term or long-term capital losses. The ability to utilize capital loss carryforwards in the future may be limited under the Internal Revenue Code and related regulations based on the results of future transactions.
| 84 | Annual Report • June 30, 2020 |
Bridge Builder Mutual Funds
Notes to Financial Statements (Continued)
As of June 30, 2020, the Funds had the following net capital loss carryforwards remaining:
| Core Bond Fund | Core Plus Bond Fund | Municipal Bond Fund | Large Cap Growth Fund | Large Cap Value Fund | Small/Mid Cap Growth Fund | Small/Mid Cap Value Fund | International Equity Fund | |||||||||||||||||||||||||
Short-Term | $ | — | $ | — | $ | 19,716,201 | $ | — | $ | — | $ | — | $ | 72,793,070 | $ | 18,576,620 | ||||||||||||||||
Long-Term | — | — | 9,600,918 | — | — | — | 21,435,847 | 313,088,670 | ||||||||||||||||||||||||
|
|
|
|
|
|
|
|
|
|
|
|
|
|
|
| |||||||||||||||||
| $ | — | $ | — | $ | 29,317,119 | $ | — | $ | — | $ | — | $ | 94,228,917 | $ | 331,665,290 | |||||||||||||||||
|
|
|
|
|
|
|
|
|
|
|
|
|
|
|
| |||||||||||||||||
At June 30, 2020, the Large Cap Value Fund deferred, on a tax basis, qualified late-year ordinary losses of $441,692 and post-October capital losses of $165,333,179. Under the current tax law, qualified late-year losses may be deferred and treated as occurring on the first day of a Fund’s next taxable year.
The tax character of distributions paid by the Funds during the fiscal periods ended June 30, 2020 and June 30, 2019 were as follows:
| Core Bond Fund | Core Plus Bond Fund | Municipal Bond Fund | Large Cap Growth Fund | |||||||||||||||||||||||||||||
| 2020 | 2019 | 2020 | 2019 | 2020 | 2019 | 2020 | 2019 | |||||||||||||||||||||||||
Distributions paid from: | ||||||||||||||||||||||||||||||||
Ordinary Income (1) | $ | 488,061,643 | $ | 507,218,573 | $ | 873,942,340 | $ | 570,931,619 | $ | 1,934,488 | $ | 1,838,066 | $ | 69,786,448 | $ | 89,835,036 | ||||||||||||||||
Tax Exempt Income | — | — | — | — | 145,524,051 | 112,422,265 | — | — | ||||||||||||||||||||||||
Long-term Capital Gains | 8,807,697 | — | 42,109,769 | — | — | — | 89,644,295 | 203,110,633 | ||||||||||||||||||||||||
Return of Capital | — | — | — | — | — | — | — | — | ||||||||||||||||||||||||
|
|
|
|
|
|
|
|
|
|
|
|
|
|
|
| |||||||||||||||||
Total Distributions Paid | $ | 496,869,340 | $ | 507,218,573 | $ | 916,052,109 | $ | 570,931,619 | $ | 147,458,539 | $ | 114,260,331 | $ | 159,430,743 | $ | 292,945,669 | ||||||||||||||||
|
|
|
|
|
|
|
|
|
|
|
|
|
|
|
| |||||||||||||||||
| Large Cap Value Fund | Small/Mid Cap Growth Fund | Small/Mid Cap Value Fund | International Equity Fund | |||||||||||||||||||||||||||||
| 2020 | 2019 | 2020 | 2019 | 2020 | 2019 | 2020 | 2019 | |||||||||||||||||||||||||
Distributions paid from: | ||||||||||||||||||||||||||||||||
Ordinary Income (1) | $ | 194,762,192 | $ | 162,988,789 | $ | 30,673,688 | $ | 53,634,791 | $ | 69,918,972 | $ | 64,175,282 | $ | 282,965,029 | $ | 199,914,003 | ||||||||||||||||
Tax Exempt Income | — | — | — | — | — | — | — | — | ||||||||||||||||||||||||
Long-term Capital Gains | — | 98,273,905 | 137,156,239 | 135,077,148 | — | 124,318,945 | — | 74,684,115 | ||||||||||||||||||||||||
Return of Capital | — | — | — | — | — | — | — | — | ||||||||||||||||||||||||
|
|
|
|
|
|
|
|
|
|
|
|
|
|
|
| |||||||||||||||||
Total Distributions Paid | $ | 194,762,192 | $ | 261,262,694 | $ | 167,829,927 | $ | 188,711,939 | $ | 69,918,972 | $ | 188,494,227 | $ | 282,965,029 | $ | 274,598,118 | ||||||||||||||||
|
|
|
|
|
|
|
|
|
|
|
|
|
|
|
| |||||||||||||||||
| (1) | Ordinary Income includes net short-term capital gains, if any. |
10. RISKS
Investing in the Funds may involve certain risks including, but not limited to, those described below. Please refer to the Funds’ prospectus and statement of additional information for more information on risks associated with investing in the Funds.
a) Interest Rate Risk – Certain Funds invest in fixed-income securities that change in value based on changes in interest rates. If rates increase, the value of these investments generally declines. Alternatively, if rates fall, the value of these investments generally increases. Such Funds may be subject to a greater risk of rising interest rates than would normally be the case due to the current period of historically low rates and the effect of potential
| Annual Report • June 30, 2020 | 85 |
Bridge Builder Mutual Funds
Notes to Financial Statements (Continued)
government fiscal policy initiatives and resulting market reaction to those initiatives. A rise in interest rates may, in turn, increase volatility and reduce liquidity in the fixed-income markets and result in a decline in the value of the fixed-income investments held by the Funds. The value of a fixed-income security with greater duration will be more sensitive to changes in interest rates than a similar security with shorter duration. Duration is a measure of the sensitivity of the price of a fixed-income security (or a portfolio of fixed-income securities) to changes in interest rates. The prices of fixed-income securities with shorter duration generally will be less affected by changes in interest rates than the prices of fixed-income securities with greater duration. For example, a five-year duration means the fixed-income security is expected to decrease in value by 5% if interest rates rise 1% and increase in value by 5% if interest rates fall 1%, holding other factors constant. Usually, the changes in the value of fixed-income securities will not affect cash income generated, but may affect the value of an investment in the Fund. Floating rate instruments also react to interest rate changes in a similar manner although generally to a lesser degree (depending, however, on the characteristics of the reset terms, including the benchmark rate chosen, frequency of reset and reset caps or floors, among other things). Zero coupon bonds have longer durations than coupon-bearing bonds with comparable maturities and generally experience greater volatility in response to changing interest rates. In certain interest rate environments, such as when real interest rates are rising faster than nominal interest rates, inflation-indexed bonds may experience greater losses than other fixed-income securities with similar durations.
The U.K. Financial Conduct Authority has announced that it intends to stop compelling or inducing banks to submit London Inter-Bank Offered Rate (“LIBOR”) rates after 2021. The elimination of LIBOR may adversely affect the interest rates on, and value of, certain investments for which the value is tied to LIBOR. However, it remains unclear if LIBOR will continue to exist in its current, or a modified, form. Alternatives to LIBOR are established or in development in most major currencies, including the Secured Overnight Financing Rate, which is intended to replace U.S. dollar LIBOR. Markets are slowly developing in response to these new rates. Questions around liquidity impacted by these rates, and how to appropriately adjust these rates at the time of transition, remain a concern for the Funds. Accordingly, it is difficult to predict the full impact of the transition away from LIBOR on the Funds until new reference rates and fallbacks for both legacy and new products, instruments and contracts are commercially accepted.
b) Liquidity Risk – Low trading volume, a lack of a market maker, or contractual or legal restrictions may limit or prevent a Fund from selling securities or closing derivative positions at desirable times or prices. During times of significant market or economic turmoil, usually liquid markets for certain of a Fund’s investments may experience extreme reductions in buy-side demand, which may result in values of a Fund’s portfolio securities declining significantly over short or extended periods of time. These reductions in value may occur regardless of whether there has been a change in interest rates or a change in the credit rating of the issuer of the security. Under certain adverse market or economic conditions, Fund investments previously determined to be liquid may be deemed to be illiquid, and, because of regulatory limitations on investments in illiquid securities, a Fund may not be able to make or gain the desired level of exposure to certain investments that it otherwise would.
c) Redemption Risk – A Fund may experience losses when selling securities to meet redemption requests. This risk is greater for larger redemption requests or redemption requests during adverse market conditions. Because the Funds currently are available only to participants in a single asset allocation program, a reduction in the allocation of program assets to the Funds could result in one or more large redemption requests. Moreover, as a result of the requirement that a Fund satisfy redemption requests even during times of significant market or economic turmoil, a Fund may be forced to sell portfolio securities during periods of reduced liquidity when prices are rapidly declining. This may require a Fund to realize investment losses at times that a Sub-adviser believes that it would have been advisable to hold a particular investment until a more orderly sale could occur or the market recovers.
d) Credit Risk – There is a risk that issuers and counterparties will not make payments on securities, repurchase agreements or other investments held by a Fund. Such defaults could result in losses to a Fund. In addition, the
| 86 | Annual Report • June 30, 2020 |
Bridge Builder Mutual Funds
Notes to Financial Statements (Continued)
credit quality of securities held by a Fund may be lowered if an issuer’s financial condition changes. Lower credit quality may lead to greater volatility in the price of a security and in shares of a Fund. Lower credit quality also may affect liquidity and make it difficult for the Fund to sell the security. A Fund may invest in securities that are rated in the lowest investment grade category. Such securities may exhibit speculative characteristics similar to high yield securities, and issuers of such securities may be more vulnerable to changes in economic conditions than issuers of higher grade securities.
e) Counterparty Risk – When a Fund enters into an investment contract, such as a derivative or a repurchase agreement, the Fund is exposed to the risk that the other party will not fulfill its contractual obligations. For example, in a repurchase agreement, there exists the risk that a Fund buys a security from a seller (counterparty) that agrees to repurchase the security at an agreed upon price and time, but the counterparty later fails to repurchase the security.
f) Market Risk – Various market risks can affect the price or liquidity of an issuer’s securities in which a Fund may invest. Returns from the securities in which a Fund invests may underperform returns from the various general securities markets or different asset classes. Different types of securities tend to go through cycles of outperformance and underperformance in comparison to the general securities markets. Adverse events occurring with respect to an issuer’s performance or financial position can depress the value of the issuer’s securities. The liquidity in a market for a particular security will affect its value and may be affected by factors relating to the issuer, as well as the depth of the market for that security. Declines in dealer market-making capacity as a result of structural or regulatory changes could decrease liquidity and/or increase volatility in the fixed-income markets. As a result, a Fund’s value may fluctuate and/or a Fund may experience increased redemptions from shareholders, which may impact the Fund’s liquidity or force the Fund to sell securities into a declining or illiquid market. The interconnection of international markets means that events in one country or region may affect the markets in other countries and regions, increasing the likelihood that inflation, interest rates, wars, natural disasters, acts of terrorism, infectious illness or other public health issues and recessions could affect the securities market. Other market risks that can affect value include a market’s current attitudes about types of securities, market reactions to political or economic events, including litigation, and tax and regulatory effects (including lack of adequate regulations for a market or particular type of instrument).
g) Equity Risk – Since certain Funds purchase equity securities, those Funds are subject to equity risk. This is the risk that stock prices will fall over short or extended periods of time. Although the stock market has historically outperformed other asset classes over the long term, the stock market tends to move in cycles. Individual stock prices may fluctuate drastically from day-to-day and may underperform other asset classes over an extended period of time. Individual companies may report poor results or be negatively affected by industry and/or economic trends and developments. The prices of securities issued by such companies may suffer a decline in response. These price movements may result from factors affecting individual companies, industries or the securities market as a whole.
h) Multi-Manager and Multi-Style Management Risk – Fund performance is dependent upon the success of the Adviser and the Sub-advisers in implementing a Fund’s investment strategies in pursuit of its objective. To a significant extent, a Fund’s performance will depend on the success of the Adviser’s methodology in allocating the Fund’s assets to Sub-advisers and its selection and oversight of the Sub-advisers and on a Sub-adviser’s skill in executing the relevant strategy and selecting investments for the Fund. There can be no assurance that the Adviser or Sub-advisers will be successful in this regard. In addition, because portions of each Fund’s assets are managed by different Sub-advisers using different styles/strategies, a Fund could experience overlapping security transactions. Certain Sub-advisers may be purchasing securities at the same time that other Sub-advisers may be selling those same securities, which may lead to higher transaction expenses compared to a fund using a single investment management style. The Adviser’s and the Sub-advisers’ judgments about the attractiveness, value and potential appreciation of a particular asset class or individual security in which a Fund invests may prove to be incorrect, and there is no guarantee that the Adviser’s or a Sub-adviser’s judgment will produce the desired results.
| Annual Report • June 30, 2020 | 87 |
Bridge Builder Mutual Funds
Notes to Financial Statements (Continued)
In addition, a Fund may allocate its assets so as to under- or over-emphasize certain strategies or investments under market conditions that are not optimal, in which case a Fund’s value may be adversely affected.
i) Foreign Securities Risk – The securities of foreign issuers, including ADRs and GDRs, may be less liquid and more volatile than securities of comparable U.S. issuers. The costs associated with securities transactions are often higher in foreign countries than the United States. Additionally, investments in securities of foreign issuers, even those publicly traded in the United States, may involve risks which are in addition to those inherent in domestic investments. Foreign companies may not be subject to the same regulatory requirements of U.S. companies, and as a consequence, there may be less publicly available information about such companies. Also, foreign companies may not be subject to uniform accounting, and financial reporting standards and requirements comparable to those applicable to U.S. companies. Foreign governments and foreign economies, particularly in emerging markets, may be less stable than the U.S. Government and the U.S. economy.
j) Currency Risk – While the Funds’ net assets are valued in U.S. dollars, the securities of foreign companies are frequently denominated in foreign currencies. Thus, a change in the value of a foreign currency against the U.S. dollar will result in a corresponding change in value of securities denominated in that currency. Some of the factors that may impair the investments denominated in a foreign currency are: (1) it may be expensive to convert foreign currencies into U.S. dollars and vice versa; (2) complex political and economic factors may significantly affect the values of various currencies, including U.S. dollars, and their exchange rates; (3) government intervention may increase risks involved in purchasing or selling foreign currency options, forward foreign currency exchange contracts and futures contracts, since exchange rates may not be free to fluctuate in response to other market forces; (4) there may be no systematic reporting of last sale information for foreign currencies or regulatory requirement that quotations available through dealers or other market sources be firm or revised on a timely basis; (5) available quotation information is generally representative of very large round-lot transactions in the inter-bank market and thus may not reflect exchange rates for smaller odd-lot transactions (less than $1 million) where rates may be less favorable; and (6) the inter-bank market in foreign currencies is a global, around-the-clock market. To the extent that a market is closed while the markets for the underlying currencies remain open, certain markets may not always reflect significant price and rate movements.
k) Geographic Focus Risk – To the extent that a significant portion of a Fund’s portfolio is invested in the securities of companies in a particular country or region, a Fund may be more susceptible to economic, political, regulatory or other events or conditions affecting issuers within that country or region. As a result, a Fund may be subject to greater price volatility and risk of loss than a fund holding more geographically diverse investments.
l) High Yield Securities Risk – High yield, or “junk,” securities involve greater risks of default or downgrade and are more volatile than investment grade securities. Junk bonds involve greater risk of price declines than investment grade securities due to actual or perceived changes in the issuer’s credit worthiness.
m) Cybersecurity Risk – The Funds and their service providers may be susceptible to operational, information, security and related risks. While the Funds’ service providers have established business continuity plans in the event of such cyber incidents, there are inherent limitations in such plans and systems. Additionally, the Funds cannot control the cybersecurity plans and systems put in place by their service providers or any other third parties whose operations may affect the Funds or their shareholders.
11. NEW ACCOUNTING PRONOUNCEMENTS – In March 2020, FASB issued Accounting Standards Update (“ASU”) 2020-04, Reference Rate Reform: Facilitation of the Effects of Reference Rate Reform on Financial Reporting. The main objective of the new guidance is to provide relief to companies that will be impacted by the expected change in benchmark interest rates at the end of 2021, when participating banks will no longer be required to submit London Interbank Offered Rate (LIBOR) quotes by the UK Financial Conduct Authority (FCA). The new guidance allows companies to, provided the only change to existing contracts are a change to an approved benchmark interest rate, account for modifications as a continuance of the existing contract without additional analysis. In addition,
| 88 | Annual Report • June 30, 2020 |
Bridge Builder Mutual Funds
Notes to Financial Statements (Continued)
derivative contracts that qualified for hedge accounting prior to modification, will be allowed to continue to receive such treatment, even if critical terms change due to a change in the benchmark interest rate. For new and existing contracts, the Funds may elect to apply the amendments as of March 12, 2020 through December 31, 2022. Management is currently assessing the impact of the ASU’s adoption to the Funds’ financial statements and various filings.
12. SUBSEQUENT EVENTS – Recently, the spread of coronavirus (COVID-19) has adversely affected global business activities and has resulted in significant uncertainty in the global economy and volatility in financial markets. The impact of COVID-19 continues to evolve and has been marked by rapid changes and developments. The impact of the outbreak may be short term or may last for an extended period of time and may have a material adverse impact on the Funds.
| Annual Report • June 30, 2020 | 89 |
Bridge Builder Mutual Funds
Report of Independent Registered Public Accounting Firm
To the Board of Trustees of Bridge Builder Trust and Shareholders of Bridge Builder Core Bond Fund, Bridge Builder Core Plus Bond Fund, Bridge Builder Municipal Bond Fund, Bridge Builder Large Cap Growth Fund, Bridge Builder Large Cap Value Fund, Bridge Builder Small/Mid Cap Growth Fund, Bridge Builder Small/Mid Cap Value Fund and Bridge Builder International Equity Fund
Opinions on the Financial Statements
We have audited the accompanying statements of assets and liabilities, including the summary schedules of investments, of Bridge Builder Core Bond Fund, Bridge Builder Core Plus Bond Fund, Bridge Builder Municipal Bond Fund, Bridge Builder Large Cap Growth Fund, Bridge Builder Large Cap Value Fund, Bridge Builder Small/Mid Cap Growth Fund, Bridge Builder Small/Mid Cap Value Fund and Bridge Builder International Equity Fund (eight of the funds constituting Bridge Builder Trust, hereafter collectively referred to as the “Funds”) as of June 30, 2020, the related statements of operations for the year ended June 30, 2020, the statements of changes in net assets for each of the two years in the period ended June 30, 2020, including the related notes, and the financial highlights for each of the periods indicated therein (collectively referred to as the “financial statements”). In our opinion, the financial statements present fairly, in all material respects, the financial position of each of the Funds as of June 30, 2020, the results of each of their operations for the year then ended, the changes in each of their net assets for each of the two years in the period ended June 30, 2020 and each of the financial highlights for each of the periods indicated therein, in conformity with accounting principles generally accepted in the United States of America.
Basis for Opinions
These financial statements are the responsibility of the Funds’ management. Our responsibility is to express an opinion on the Funds’ financial statements based on our audits. We are a public accounting firm registered with the Public Company Accounting Oversight Board (United States) (“PCAOB”) and are required to be independent with respect to the Funds in accordance with the U.S. federal securities laws and the applicable rules and regulations of the Securities and Exchange Commission and the PCAOB.
We conducted our audits of these financial statements in accordance with the standards of the PCAOB. Those standards require that we plan and perform the audit to obtain reasonable assurance about whether the financial statements are free of material misstatement, whether due to error or fraud.
Our audits included performing procedures to assess the risks of material misstatement of the financial statements, whether due to error or fraud, and performing procedures that respond to those risks. Such procedures included examining, on a test basis, evidence regarding the amounts and disclosures in the financial statements. Our audits also included evaluating the accounting principles used and significant estimates made by management, as well as evaluating the overall presentation of the financial statements. Our procedures included confirmation of securities owned as of June 30, 2020 by correspondence with the custodian, brokers and agent banks; when replies were not received from brokers and agent banks, we performed other auditing procedures. We believe that our audits provide a reasonable basis for our opinions.
/s/ PricewaterhouseCoopers LLP
Chicago, Illinois
August 26, 2020
We have served as the auditor of one or more investment companies in the Bridge Builder Trust since 2013.
| 90 | Annual Report • June 30, 2020 |
Bridge Builder Mutual Funds
Trustees and Officers (Unaudited)
Independent Trustees of the Trust (1)
| Name | Role | Term | Principal Occupation | Number of in Fund Complex (3) by Trustees | Other Past Five Years | |||||
Jean E. Carter (Born: 1957) | Trustee | Indefinite Term; Since Inception | Retired; Director of Investment Management Group for Russell Investment Group (1982-2005) | 9 | Trustee, Brandes U.S. registered mutual funds (2008-2020), eight funds as of December 31, 2019. | |||||
Janice L. Innis-Thompson (Born: 1966) | Trustee, Chair of the Governance and Nominating Committee | Indefinite Term; Since Inception | Chief Compliance & Ethics Officer, Samsung Electronics America (since 2017); Retired (2016-2017); Senior Vice President, Chief Compliance & Ethics Officer, TIAA-CREF (2006-2016) | 9 | None. | |||||
Michelle M. Keeley (Born: 1964) | Trustee | Indefinite Term; Since August 2015 | Retired; Executive Vice President, Ameriprise Financial Services, Inc. (2002-2010) | 9 | Independent Director, Federal Home Loan Bank of Des Moines. Independent Director, American Equity Life. | |||||
William N. Scheffel (Born: 1953) | Trustee, Chair of the Audit Committee | Indefinite Term; Since Inception | Retired; Executive Vice President, Chief Financial Officer and Treasurer, Centene Corporation (2003-2016) | 9 | None. | |||||
John M. Tesoro (Born: 1952) | Lead Independent Trustee | Indefinite Term; Since Inception | Retired; Partner, KPMG LLP (2002-2012) | 9 | Director; Teton Advisors, Inc. (registered investment adviser). Independent Trustee, BBH Trust (seven funds). |
| Annual Report • June 30, 2020 | 91 |
Bridge Builder Mutual Funds
Trustees and Officers (Unaudited) (Continued)
Interested Trustees of the Trust (2)
| Name | Role | Term | Principal Occupation | Number of in Fund Complex (3) Overseen by Trustees | Other Past Five Years | |||||
William E. Fiala* (Born: 1967) | Trustee, Chairman | Indefinite Term; Since Inception | Principal, Edward Jones and General Partner, The Jones Financial Companies, LLLP (1994-Present) Client Strategies Group (1994-Present) | 9 | None. | |||||
Merry Mosbacher* (Born: 1958) | Trustee | Indefinite Term; Since January 2020 | Subordinated Limited Partner, The Jones Financial Companies, LLLP (since 2020); Principal, Edward Jones, and General Partner, The Jones Financial Companies, LLLP (1986-2019); Associate, Edward Jones (1982-1985). | 9 | None. |
Officers of the Trust
| Name | Role | Term | Principal Occupation | |||
Julius A. Drelick, III (Born: 1966) | President | Indefinite Term; Since August 2019 | Director of Fund Administration and Strategic Products, Edward Jones (since 2016); Previously, Vice President of the Trust (2017-2019); Senior Vice President and Chief Compliance Officer at Voya Investment Management, LLC (2013-2016); Vice President, Head of Mutual Fund Product Development and Strategic Planning, Voya Investment Management, LLC (2007-2013) | |||
Aaron J. Masek (Born: 1974) | Treasurer | Indefinite Term; Since July 2016 | Director, Finance, Edward Jones (since 2015); Vice President and Treasurer, AQR Funds (2010-2015) | |||
Paul Felsch** (Born: 1982) | Chief Compliance Officer and Vice President | Indefinite Term; Since January 2020 | Senior Compliance Counsel, Edward Jones (since December 2016); Associate Compliance Counsel, Edward Jones (December 2013-November 2016). | |||
Helge K. Lee (Born: 1946) | Secretary | Indefinite Term; Since July 2016 | Associate General Counsel, Edward Jones (since 2014); Special Counsel, Godfrey & Kahn (2005-2014) | |||
Evan S. Posner (Born: 1979) | Assistant Secretary | Indefinite Term; Since February 2019 | Associate General Counsel at Edward Jones (since October 2018); Previously, Vice President, Counsel at Voya Investment Management (March 2012-September 2018) |
| (1) | The Trustees of the Trust who are not “interested persons” of the Trust as defined under the 1940 Act (“Independent Trustees”). |
| (2) | Mr. Fiala and Ms. Mosbacher are “interested persons” of the Trust as defined by the 1940 Act by virtue of the fact that they are affiliated persons of the Adviser’s parent company, The Jones Financial Companies, L.L.L.P. |
| (3) | The “Fund Complex” is comprised of each Fund offered by the Trust, one of which is not included in this Annual Report, and the Edward Jones Money Market Fund. No Trustee oversees, nor receives compensation from, the Edward Jones Money Market Fund, which is advised by Passport Research, Ltd., an affiliate of the Adviser. |
| 92 | Annual Report • June 30, 2020 |
Bridge Builder Mutual Funds
Trustees and Officers (Unaudited) (Continued)
| * | Effective December 31, 2019, the Board accepted the retirement of William H. Broderick III as a Trustee of the Trust. Effective January 1, 2020 the Board appointed William E. Fiala as Chair of the Board. Additionally, effective January 1, 2020, the Board appointed Merry L. Mosbacher as a Trustee of the Trust. |
| ** | Effective December 31, 2019, the Board accepted the resignation of Alan J. Herzog as the Chief Compliance Officer and Vice President of the Trust. Effective January 1, 2020, the Board appointed Paul W. Felsch as Chief Compliance Officer and Vice President of the Trust. |
The business address of the Trustees and Officers is the address of the Trust: 12555 Manchester Road, St. Louis, MO 63131.
The Statement of Additional Information includes additional information about the Trustees and is available upon request, without charge, by calling 1-855-823-3611.
| Annual Report • June 30, 2020 | 93 |
Bridge Builder Mutual Funds
Board Considerations of the Investment Advisory Agreement and Sub-advisory Agreements (Unaudited)
Board Considerations of the Investment Advisory Agreement and Investment Sub-advisory Agreements
Pursuant to Section 15 of the Investment Company Act of 1940 (the “1940 Act”), the Board of Trustees (the “Board” or the “Trustees”) of the Bridge Builder Trust (the “Trust”), including a majority of the Trustees who are not parties to the agreements or “interested persons” of any party, as defined in the 1940 Act (the “Independent Trustees”), must determine annually whether to approve the continuation of the Trust’s investment advisory and sub-advisory agreements.
At a meeting held on May 19-20, 2020 via teleconference (the “May Renewal Meeting”) in reliance on and in compliance with the conditions of an SEC order granting relief from the in-person meeting requirement, the Trustees, including the Independent Trustees, considered and approved the continuance of an investment advisory agreement (the “Advisory Agreement”) with Olive Street Investment Advisers, LLC (“Olive Street” or the “Adviser”) for the Bridge Builder Core Bond Fund (the “Core Bond Fund”), the Bridge Builder Core Plus Bond Fund (the “Core Plus Bond Fund”), the Bridge Builder Municipal Bond Fund (the “Municipal Bond Fund”), the Bridge Builder Large Cap Growth Fund (the “Large Cap Growth Fund”), the Bridge Builder Large Cap Value Fund (the “Large Cap Value Fund”), the Bridge Builder Small/Mid Cap Growth Fund (the “Small/Mid Cap Growth Fund”), the Bridge Builder Small/Mid Cap Value Fund (the “Small/Mid Cap Value Fund”), and the Bridge Builder International Equity Fund (the “International Equity Fund”) (collectively, the “Funds”). The Trustees, including the Independent Trustees, also considered and approved the continuance of an investment sub-advisory agreement (each, a “Sub-advisory Agreement and collectively, the “Sub-advisory Agreements”) with each of the following Fund subadvisers whose Sub-advisory Agreements were subject to renewal at the May Renewal Meeting (listed next to the Fund(s) for which it serves as subadviser (each a “Subadviser” and collectively, the “Subadvisers”):
| Fund | Subadviser* | |
| Core Bond Fund | J.P. Morgan Investment Management, Inc. (“J.P. Morgan”) Loomis, Sayles & Company, L.P. (“Loomis”) PGIM, Inc. (“PGIM”) Robert W. Baird & Co. Inc. (“Baird”) | |
| Core Plus Bond Fund | Loomis Metropolitan West Asset Management, LLC (“MetWest”) Pacific Investment Management Company LLC (“PIMCO”) T. Rowe Price Associates, Inc. (“T. Rowe Price”) | |
| Municipal Bond Fund | BlackRock Investment Management, LLC (BlackRock”) Fidelity Institutional Asset Management LLC (FIAM”) T. Rowe Price Wells Capital Management Incorporated (“Wells Cap”) | |
| Large Cap Growth Fund | Jennison Associates LLC (“Jennison”) Lazard Asset Management, LLC (“Lazard”) Sustainable Growth Advisers, LP (“SGA”) BlackRock | |
| Large Cap Value Fund | Artisan Partners Limited Partnership (“Artisan Partners”) Barrow, Hanley, Mewhinney & Strauss, LLC (“Barrow Hanley”) Wellington Management Company, LLP (“Wellington”) BlackRock | |
| Small/Mid Cap Growth Fund | Eagle Asset Management, Inc. (“Eagle”) Champlain Investment Partners, LLC (“Champlain”) ClearBridge Investments, LLC (“ClearBridge”) Stephens Investment Management Group, LLC (“Stephens”) BlackRock | |
| Small/Mid Cap Value Fund | Boston Partners Global Investors, Inc. (f/k/a Robeco Investment Management Inc.) (“Boston Partners”) Diamond Hill Capital Management, Inc. (“Diamond Hill”) LSV Asset Management (“LSV”) Massachusetts Financial Services Company (d/b/a MFS Investment Management) (“MFS”) Silvercrest Asset Management Group LLC (“Silvercrest”) Vaughan Nelson Investment Management, LP (“Vaughan Nelson”) BlackRock |
| 94 | Annual Report • June 30, 2020 |
Bridge Builder Mutual Funds
Board Considerations of the Investment Advisory Agreement and Sub-advisory Agreements (Unaudited) (Continued)
| Fund | Subadviser* | |
| International Equity Fund | Baillie Gifford Overseas Limited (“Baillie Gifford”) Edinburgh Partners Limited (“Edinburgh”) Mondrian Investment Partners Limited (“Mondrian”) Pzena Investment Management, LLC (“Pzena”) WCM Investment Management (“WCM”) BlackRock |
| * | Note, not all of the Funds’ Sub-advisory Agreements were subject to renewal at the May Renewal Meeting and, therefore, the above is not a complete list of the Funds’ Sub-advisers. |
In connection with the annual review process and in advance of the May Renewal Meeting, the Adviser and the Subadvisers provided information to the Board in response to requests for information by the Independent Trustees to facilitate the Board’s evaluation of the Advisory Agreement and Sub-advisory Agreements (collectively, the “Agreements”). The information furnished by the Adviser included materials describing, among other matters: (i) the nature, extent, and quality of the services provided by the Adviser and the Subadvisers; (ii) each Fund’s historical investment performance and the historical investment performance of each Subadviser; (iii) the Adviser’s and the Subadvisers’ personnel, including portfolio managers; (iv) the investment practices and techniques used by the Adviser and the Subadvisers in managing the Funds; (v) the advisory fees payable by the Funds to the Adviser and the Funds’ overall fees and operating expenses, compared with those of a category and a peer group of mutual funds; (vi) the sub-advisory fees payable to each Subadviser; (vii) the Adviser’s and the Subadvisers’ compliance policies and procedures; (viii) the Adviser’s and the Subadvisers’ financial health; and (ix) other “fall-out” benefits the Adviser and/or its affiliates and the Subadvisers may receive based on their relationships with the Funds. At a meeting held via teleconference on May 5, 2020 and at the May Renewal Meeting (collectively, the “May Meetings”), representatives of the Adviser made presentations and responded to questions regarding services, fees, and other aspects of the Agreements.
In addition to the May Meetings, the Board met periodically over the course of the year since the most recent annual renewal of the Agreements. At these meetings, representatives of the Adviser and the Subadvisers furnished reports and other information to the Board regarding the performance of the Funds, the services provided to the Funds by the Adviser and the Subadvisers, and compliance and operations matters related to the Trust, the Funds, the Adviser, and the Subadvisers.
At the May Meetings, the Trustees received advice from Fund counsel, and the Independent Trustees received additional advice from their independent legal counsel, including advice regarding the legal standards applicable to the consideration of the approval of advisory arrangements. The Independent Trustees met in executive session, outside the presence of the interested Trustees, Trust officers, and representatives of the Adviser and the Subadvisers, to discuss the Agreements and the services provided by the Adviser and the Subadvisers.
In considering and approving the Agreements, the Trustees considered information that they deemed relevant, including, but not limited to, the information discussed in further detail below. The Board considered not only the specific information presented in connection with the May Meetings, but also the knowledge gained over time through previous interactions with the Adviser and the Subadvisers. The Board did not identify any particular information or consideration that was all-important or controlling, and each individual Trustee may have attributed different weights to various factors and information.
1. The nature, extent and quality of the services provided by the Adviser and the Subadvisers. The Trustees considered the nature, extent and quality of the services provided to the Funds by the Adviser and each Subadviser, including their respective responsibilities for management of the Funds. In this regard, the Board considered the Adviser’s oversight role and responsibilities with regard to the Subadvisers, and the Subadvisers’ roles in the day-to-day management of each Fund’s portfolio. The Board considered the Adviser’s assumption of business, entrepreneurial and overall managerial risks by advising the Funds. The Board also evaluated the Adviser’s oversight of the Subadvisers, which includes continuous analysis of, and regular discussions with each Subadviser about, the
| Annual Report • June 30, 2020 | 95 |
Bridge Builder Mutual Funds
Board Considerations of the Investment Advisory Agreement and Sub-advisory Agreements (Unaudited) (Continued)
investment strategies and performance of the portion of a Fund’s assets allocated to a particular Subadviser, and periodic on-site and other meetings with the Subadvisers. The Board also considered the enhanced oversight of the Subadvisers that the Adviser is performing in connection with the novel coronavirus disease (“COVID-19”) pandemic. The Board further considered the Adviser’s processes relating to Subadviser selection, monitoring, termination and allocation adjustments and the impact of the Adviser’s services on each Fund’s investment performance. The Board also took into account the Adviser’s oversight of the Funds’ other service providers, including the enhanced oversight the Adviser is performing in response to the COVID-19 pandemic.
The Board considered the Adviser’s and each Subadviser’s operations, including resources devoted to supporting such operations, including how the Adviser and each Subadviser continue to service the Funds during the COVID-19 pandemic with no material disruptions. The Board noted key additions to the Adviser’s and certain Subadviser’s personnel. The Board considered the Adviser’s and each Subadviser’s ability to attract and retain qualified investment professionals and the experience and skills of management and investment personnel of the Adviser and the Subadvisers. The Board also noted the compliance programs and compliance experience of the Adviser and the Subadvisers. In addition, the Board considered the administrative and other services that are provided to the Funds by the Adviser, including analytical tools the Adviser employs to help mitigate the Funds’ risks.
Based on the above factors, as well as those discussed below, the Board concluded, within the context of its full deliberations, that the Adviser and the Subadvisers are capable of continuing to provide services of the nature, extent and quality contemplated by the terms of the Agreements.
2. Fees and Other Expenses. The Board received and reviewed reports prepared by Broadridge Financial Solutions (“Broadridge”), an independent provider of mutual fund industry data, comparing each Fund’s advisory fees and gross and net expense ratios (net of fee and expense waivers and reimbursements) to those paid by an independently-selected category and peer group of mutual funds. The Board noted that each of the Funds’ gross and net expenses were below their respective peer group medians. The Board also noted that, except for Core Plus Bond Fund, each Fund’s advisory fee was below its respective peer group median. The Board noted that the advisory fee before waivers for the Core Plus Bond Fund was higher than the peer group median, but the net expenses were lower than its peer group median. The Board observed that the Adviser had no similarly managed accounts for purposes of comparison. The Board reviewed the information provided by certain of the Subadvisers regarding fees charged to other similarly managed accounts, if any. To the extent provided, the Board reviewed information about structural, operational and other differences, including the amount of assets being managed and the range of services provided, between such similarly managed accounts and the portion of the Fund’s assets allocated to the particular Subadviser.
The Board noted that the Adviser has contractually agreed to waive its advisory fees to the extent advisory fees payable to the Adviser exceed the sub-advisory fees paid to a Subadviser for management of its allocated portion of a Fund or Funds. The Board noted that the Adviser may terminate this waiver arrangement without Board approval effective upon the end of the then current one-year period, by providing the Board written notice of such termination by April 15. The Board further noted that the Adviser has irrevocably agreed not to exercise its right to terminate the waiver arrangement upon the end of the current one-year period, resulting in the arrangement continuing until at least October 28, 2021.
Based on the above factors, as well as those discussed below, the Board concluded, within the context of its full deliberations, that the advisory and sub-advisory fees payable under the Agreements are reasonable in light of the nature, extent and quality of the services rendered by the Adviser and the Subadvisers.
3. The Funds’ Investment Performance Record. The Board reviewed the investment performance of each Fund on an absolute basis and in comparison to appropriate benchmarks and each Fund’s respective Morningstar category and peer group as independently selected by Broadridge. Each performance time period referenced below ended as of March 31, 2020.
| 96 | Annual Report • June 30, 2020 |
Bridge Builder Mutual Funds
Board Considerations of the Investment Advisory Agreement and Sub-advisory Agreements (Unaudited) (Continued)
The Board observed that the Core Bond Fund outperformed its peer group median but underperformed its benchmark index for the one- and three-year periods and outperformed its peer group median and benchmark index for the five-year period. The Board also reviewed the investment performance of each Subadviser of the Core Bond Fund. In so doing, the Board observed that J.P. Morgan underperformed its benchmark index over the one- and three-year periods but outperformed its benchmark index for the five-year period. The Board also noted that PGIM underperformed its benchmark index for the one, three, and five-year periods and that Baird underperformed its benchmark index for the one-year period but outperformed its benchmark index for the three- and five-year periods. Finally, the Board noted that Loomis underperformed its benchmark index for the one- and three-year periods and noted that Loomis’s performance information for the five-year period was unavailable as Loomis had not been managing its sleeve of the Fund for five years.
The Board observed that the Core Plus Bond Fund outperformed its peer group median but underperformed its benchmark index for the one- and three-year periods. The Board also reviewed the investment performance of each Subadviser of the Core Plus Bond Fund, noting that T. Rowe Price and Loomis underperformed their benchmark indices for the one- and three-year periods and MetWest underperformed its benchmark index for the one-year period, but outperformed its benchmark index for the three-year period. Finally, the Board observed that PIMCO underperformed its benchmark index for the one-year period and noted that PIMCO’s performance information for the three-year period was unavailable as PIMCO had not been managing its sleeve of the Fund for three years.
The Board reviewed the performance of the Municipal Bond Fund. The Board observed that the Municipal Bond Fund underperformed its peer group median and benchmark index for the one- and three-year periods. In reviewing the investment performance of each Subadviser of the Municipal Bond Fund, the Board observed that each of FIAM, Wells Cap and T. Rowe Price underperformed its benchmark index for the one- and three-year periods. The Board also observed that BlackRock underperformed its benchmark index for the one-year period, and observed that BlackRock’s performance information for the three-year period was unavailable as BlackRock had not been managing its sleeve of the Fund for three years.
In reviewing the investment performance of the Large Cap Growth Fund, the Board observed that the Fund underperformed its peer group median and benchmark index for the one- and three-year periods. In reviewing the investment performance of each Subadviser of the Large Cap Growth Fund, the Board noted that SGA underperformed its benchmark index for the one-year period but outperformed its benchmark index for the three-year period. The Board also noted that Lazard and BlackRock outperformed their benchmark indices for the one-year period but underperformed their benchmark indices for the three-year period. Finally, the Board observed that Jennison outperformed its benchmark index for the one- and three-year periods.
The Board considered the performance of the Large Cap Value Fund. The Board noted that the Large Cap Value Fund outperformed its peer group median and benchmark index for the one- and three-year periods. In reviewing the investment performance of each Subadviser of the Large Cap Value Fund, the Board noted that Barrow Hanley and Artisan Partners underperformed their benchmark indices for the one- and three-year periods and that Wellington and BlackRock outperformed their benchmark indices for the one- and three-year periods.
In reviewing the investment performance of the Small/Mid Cap Growth Fund, the Board observed that the Fund outperformed its benchmark index but underperformed its peer group median for the one-year period. For the three-year period, the Board noted that the Small/Mid Cap Growth Fund outperformed its peer group median and benchmark index. In reviewing the investment performance of each Subadviser of the Small/Mid Cap Growth Fund, the Board observed that Champlain and Eagle outperformed their benchmark indices for the one- and three-year periods. The Board also observed that ClearBridge and both BlackRock sleeves underperformed their benchmark indices for the one- and three-year periods. Finally, the Board noted that Stephens underperformed its benchmark index for the one-year period but outperformed its benchmark index for the three-year period. With respect to ClearBridge, the Board noted that it approved the continuation of the ClearBridge sub-advisory agreement through
| Annual Report • June 30, 2020 | 97 |
Bridge Builder Mutual Funds
Board Considerations of the Investment Advisory Agreement and Sub-advisory Agreements (Unaudited) (Continued)
the transition of the Small/Mid Cap Growth Fund’s ClearBridge allocation to Artisan Partners, which is currently planned for early-June, and also approved the termination of the ClearBridge sub-advisory agreement on a date to be determined by an officer of the Trust after that transition.
The Board reviewed the performance of the Small/Mid Cap Value Fund, observing that it outperformed its peer group median and benchmark index for the one-year period. For the three-year period, the Board noted that the Small/Mid Cap Value Fund outperformed its benchmark index but underperformed its peer group median. The Board reviewed the performance of each Subadviser as well, noting that Boston Partners, Silvercrest and Vaughan Nelson outperformed their benchmark indices over the one- and three-year periods, and LSV and both BlackRock sleeves underperformed their benchmark indices over for the one- and three-year periods. The Board also noted that MFS outperformed its benchmark index and Diamond Hill underperformed its benchmark index for the one-year period and observed that the three-year performance information for MFS and Diamond Hill was unavailable as MFS and Diamond Hill had not been managing their respective sleeves of the Fund for three years.
The Board observed that the International Equity Fund outperformed its peer group median and its benchmark index for the one- and three-year periods. In reviewing the performance of each Subadviser of the International Equity Fund, the Board noted that each of WCM, Edinburgh and Mondrian outperformed its benchmark index for the one- and three-year periods and Pzena and both BlackRock sleeves underperformed their benchmark indices for the one-year period. The Board also observed that Baillie Gifford outperformed its benchmark index for the one-year period but underperformed its benchmark index for the three-year period.
Taking into account the performance information above and other performance information deemed relevant by the Board, the Board concluded that the investment performance generated by each Subadviser was generally satisfactory, or that any steps being taken by the Adviser and Subadvisers to address any performance issues were satisfactory.
4. Profitability and Economies of Scale. The Board considered that the Adviser has contractually agreed to waive its advisory fees to the extent advisory fees to be paid to the Adviser exceed the sub-advisory fees to be paid to a Subadviser for management of its allocated portion of a Fund or Funds. Therefore, the Adviser does not profit or receive any differential compensation from allocating assets in any particular manner among the Subadvisers. In addition, the Board did not consider the profitability of the Subadvisers to be a material factor in their determination, given that the Subadvisers are not affiliated with the Adviser and, therefore, the sub-advisory fees are the result of an arms’ length negotiation. Further, the Board was satisfied that the Adviser employed a rigorous sub-advisory fee negotiation process. The Board also considered whether the Funds’ fee structure is designed to share economies of scale with shareholders as the Funds’ assets grow. In this regard, the Board noted that most of the Subadvisers have agreed to contractual breakpoints in their sub-advisory fee schedules, which accrue to the benefit of Fund shareholders in light of the Adviser’s contractual fee waiver.
5. Indirect Benefits. The Board noted that Fund shares are available exclusively to investors participating in Edward Jones Advisory Solutions®, an investment advisory program (asset-based fee program) sponsored by Edward D. Jones & Co., L.P. (“Edward Jones”), an affiliate of the Adviser. Accordingly, the Board received and considered information about asset-based fees received by Edward Jones from participants in Edward Jones Advisory Solutions® in connection with their investments in the Funds as an indirect or “fall-out” benefit. In addition, the Board considered that the Adviser, Edward Jones and each Subadviser may derive a benefit to their reputations and standing in the investment community from their relationship with the Funds. The Board also noted that certain Subadvisers use soft dollars generated from executing Fund portfolio trades to purchase research, which could be viewed as a fall-out benefit to such Subadvisers to the extent they use the research generated from such trading activities across their client base.
Based on the Board’s deliberations and its evaluation of the information described above and other information it believed relevant, the Board, including all of the Independent Trustees, unanimously approved the continuation of the Agreements for an additional year.
| 98 | Annual Report • June 30, 2020 |
Bridge Builder Mutual Funds
Board Considerations of the Investment Advisory Agreement and Sub-advisory Agreements (Unaudited) (Continued)
Board Considerations of Amended and Restated Sub-Advisory Agreements with T. Rowe Price Associates, Inc. and LSV Asset Management for the Bridge Builder Large Cap Value Fund
Pursuant to Section 15 of the 1940 Act, as amended, a fund’s advisory and sub-advisory agreements must be approved: (i) by a vote of a majority of the shareholders of the fund; and (ii) by a vote of a majority of the members of the board who are not parties to the agreements or “interested persons” of any party, as defined in the 1940 Act (the “Independent Trustees”), cast in person at a meeting called for the purpose of voting on such approval.
At an in-person meeting held on February 25-26, 2020 (the “February 2020 In-Person Meeting”), the Board of Trustees of the Bridge Builder Trust (the “Board”), including a majority of the Independent Trustees, considered and approved a proposed Amended and Restated Investment Sub-Advisory Agreement among Olive Street Investment Advisers, LLC (the “Adviser” or “Olive Street”), T. Rowe Price Associates, Inc., (“T. Rowe Price”) and the Trust, on behalf of the Bridge Builder Large Cap Value Fund (the “Fund”) (the “T. Rowe Price A&R Sub-Advisory Agreement”) for an initial two-year term.
Also at the February 2020 In-Person Meeting, the Board, including a majority of the Independent Trustees, considered and approved a proposed Amended and Restated Investment Sub-Advisory Agreement among Olive Street, LSV Asset Management (“LSV”, and, together with T. Rowe Price, the “Subadvisers”) and the Trust, on behalf of the Fund (the “LSV A&R Sub-Advisory Agreement”, and, together with the T. Rowe Price A&R Sub-Advisory Agreement, the “A&R Sub-Advisory Agreements”) for an initial two-year term.
Pursuant to an exemptive order obtained by the Adviser and the Trust from the SEC, the Adviser is permitted, subject to certain conditions, to select new sub-advisers for the Fund with the approval of the Board but without obtaining shareholder approval.
In advance of the February 2020 In-Person Meeting, at a telephonic meeting held on February 18, 2020 (the “February 2020 Telephonic Meeting”, and, together with the February 2020 In-Person Meeting, the “February 2020 Board Meetings”), the Adviser and the Subadvisers furnished information to the Board reasonably necessary for the Board to evaluate the terms of the A&R Sub-Advisory Agreements. The Board had the opportunity to ask questions and request further information in connection with its consideration.
In addition, at the February 2020 Meetings, representatives of the Adviser and the Subadvisers (with respect to the February 2020 In-Person Meeting) made presentations and responded to questions regarding the Subadvisers’ services, fees and other aspects of the proposed sub-advisory relationship. The information provided to the Board in connection with the February 2020 Board Meetings included materials describing, among other matters: (i) the nature, extent and quality of the services proposed to be provided by the Subadvisers; (ii) the Subadvisers’ investment management personnel; (iii) the Subadvisers’ operations; (iv) the Subadvisers’ investment philosophy and investment process; (v) the sub-advisory fees proposed to be payable to each Subadviser; (vi) the Subadvisers’ policies and compliance procedures; and (vii) the investment performance of accounts managed by the Subadvisers employing a large cap value strategy similar to the portion of the Fund proposed to be managed by each Subadviser.
The Board observed that T. Rowe Price is currently a subadviser to the Bridge Builder Core Plus Bond Fund (the “Core Plus Bond Fund”) and the Bridge Builder Municipal Bond Fund (the “Municipal Bond Fund”). The Board also observed that LSV is currently a subadviser to Bridge Builder Small/Mid Cap Value Fund (the “SMID Cap Value Fund”). As such, the Board determined that it was reasonable to consider certain information that the Board received regarding the Subadvisers in connection with evaluating the most recent renewal of the sub-advisory agreements relating to the Subadvisers with respect to such other Bridge Builder Funds which occurred at a telephonic meeting held on May 7, 2019 and an in-person meeting held on May 14-15, 2019 (together, the “May 2019 Meetings”).
The Independent Trustees received advice from Fund counsel and from their independent legal counsel, including advice regarding the legal standards applicable to the consideration of sub-advisory arrangements, and met in
| Annual Report • June 30, 2020 | 99 |
Bridge Builder Mutual Funds
Board Considerations of the Investment Advisory Agreement and Sub-advisory Agreements (Unaudited) (Continued)
executive session outside the presence of the interested Trustees, Fund management and representatives of the Adviser and the Subadvisers to discuss the A&R Sub-Advisory Agreements and the services to be provided by each Subadviser.
In considering the approval of the A&R Sub-Advisory Agreements, the Board considered various factors, as discussed in further detail below:
1. The nature, extent and quality of the services to be provided by the Subadvisers. The Board reviewed the portfolio management services and investment process proposed to be provided by the Subadvisers, including how each Subadviser’s investment philosophy and process complement those of the other subadvisers that manage the Fund. The Board also reviewed the background and experience of the Subadvisers’ portfolio management personnel. The Board considered the Subadvisers’ ability to attract and retain qualified investment professionals, and the experience and skills of management and investment personnel of the Subadviser. The Board also considered other services proposed to be provided to the Fund by the Subadvisers under the Adviser’s supervision, such as monitoring adherence to the Fund’s investment restrictions, monitoring compliance with various Fund policies and procedures and with applicable securities laws and regulations, monitoring valuation and liquidity and selecting broker-dealers to execute portfolio transactions.
The Board reviewed the terms of the proposed A&R Sub-advisory Agreements. In so doing, the Board observed that T. Rowe Price serves as a subadviser to the Core Plus Bond Fund and the Municipal Bond Fund pursuant to a sub-advisory agreement dated June 30, 2015, as amended on May 18, 2016, June 9, 2017, September 28, 2018 and November 28, 2018 (the “Prior T. Rowe Price Sub-Advisory Agreement”) and LSV serves as a subadviser to the SMID Cap Value Fund pursuant to a sub-advisory agreement dated October 15, 2016, as amended on June 9, 2017 and November 28, 2018 (the “Prior LSV Sub-Advisory Agreement”, and, together with the Prior T. Rowe Price Sub-Advisory Agreement the “Prior Sub-Advisory Agreements”). The Board further observed that the A&R Sub-Advisory Agreements incorporated the previously approved amendments to the Prior Sub-Advisory Agreements and that there were no material changes to the Prior Sub-Advisory Agreements other than the addition of the Fund.
Based on the factors above, as well as those discussed below, the Board concluded, within the context of its full deliberations, that each Subadviser is capable of providing services of the type and nature contemplated by the terms of the A&R Sub-Advisory Agreements.
2. Fees and Other Expenses. The Board reviewed the sub-advisory fees proposed to be payable to the Subadvisers. The Board considered the potential impact of each Subadviser’s fee to the Fund’s overall expenses, given the Adviser’s contractual agreement to waive its advisory fees to the extent advisory fees to be paid to the Adviser exceed the sub-advisory fees to be paid to the Fund’s subadvisers. The Board noted that the Adviser may terminate this waiver arrangement without Board approval effective upon the end of the then current one-year period, by providing the Board written notice of such termination by April 15. The Board further noted that the Adviser has irrevocably agreed not to exercise its right to terminate the waiver arrangement upon the end of the current one-year period, resulting in the arrangement continuing until at least October 28, 2021. In addition, with respect to the T. Rowe Price A&R Sub-Advisory Agreement, the Board considered that the Fund’s assets allocated to T. Rowe Price will apply toward the breakpoints of the T. Rowe Price relationship pricing discount. The Board also observed the additional discounts that T. Rowe Price added to its relationship pricing discount in connection with adding the Fund to the T. Rowe Price A&R Sub-Advisory Agreement.
Based on the factors above, as well as those discussed below, the Board concluded, within the context of its full deliberations, that the sub-advisory fees were reasonable in light of the nature and quality of the services expected to be rendered by each Subadviser.
3. The Subadvisers’ Investment Performance Record. Because the Subadvisers are new to the Fund, the Board was not able to evaluate an investment performance record for the portion of the Fund to be managed by the
| 100 | Annual Report • June 30, 2020 |
Bridge Builder Mutual Funds
Board Considerations of the Investment Advisory Agreement and Sub-advisory Agreements (Unaudited) (Continued)
Subadvisers. The Board did consider each Subadviser’s performance history with respect to similarly-managed investment accounts. While there was no historical Subadviser performance information with respect to the Fund for review, the Board noted that it would have an opportunity to review such information in connection with future annual reviews of advisory and sub-advisory agreements
4. Profitability and Economies of Scale. The Board did not consider profitability of the Subadvisers to be a material factor, given that the Subadvisers are not affiliated with the Adviser and, therefore, the fees were negotiated at arm’s length.
5. Indirect Benefits. The Board noted that Fund shares are currently available exclusively to investors participating in Edward Jones Advisory Solutions®, an investment advisory program (asset-based fee program) sponsored by Edward D. Jones & Co., L.P. (“Edward Jones”), an affiliate of the Adviser. Accordingly, the Board received and considered information about asset-based fees received by Edward Jones from participants in Edward Jones Advisory Solutions in connection with their investments in the Fund as an indirect or “fall-out” benefit. In addition, the Board considered that the Adviser, Edward Jones and the Subadvisers may derive a benefit to their reputations and standing in the investment community from their relationship with the Fund. The Board also noted that the Subadviser may use soft dollars generated from executing Fund portfolio trades to purchase research, which could be viewed as a fall-out benefit to the Subadviser to the extent the Subadviser uses the research generated from such trading activities across its client base.
CONCLUSION
Based on the Board’s deliberations and its evaluation of the information described above and other factors and information it believed relevant, the Board concluded, in the exercise of its reasonable judgment, that the terms of the A&R Sub-Advisory Agreements were reasonable in relation to the services expected to be provided by the Subadvisers to the Fund and that the approval of the A&R Sub-Advisory Agreements would be in the best interests of the Fund and its shareholders. Based on the Board’s deliberations and its evaluation of the information described above and other factors and information it believed relevant, the full Board, and all of the Independent Trustees voting separately, unanimously approved the A&R Sub-Advisory Agreements. In considering the approval of the A&R Sub-Advisory Agreements, the Board considered not only the specific information presented in connection with the February 2020 Meetings but also information from the May 2019 Meetings. The Board did not identify any particular information or consideration that was all important or controlling, and each individual Trustee may have attributed different weights to various factors and information.
| Annual Report • June 30, 2020 | 101 |
Bridge Builder Mutual Funds
Board Considerations of the Investment Advisory Agreement and Sub-advisory Agreements (Unaudited) (Continued)
Board Considerations of Amended Sub-Advisory Agreement with Artisan Partners for the Bridge Builder Small/Mid Cap Growth Fund
Pursuant to Section 15 of the 1940 Act, as amended, a fund’s advisory and sub-advisory agreements must be approved: (i) by a vote of a majority of the shareholders of the fund; and (ii) by a vote of a majority of the members of the board who are not parties to the agreements or “interested persons” of any party, as defined in the 1940 Act (the “Independent Trustees”), cast at a meeting called for the purpose of voting on such approval.
The Board of Trustees of the Bridge Builder Trust (the “Board”), including a majority of the Independent Trustees, previously approved a sub-advisory agreement among Olive Street Investment Advisers, LLC (the “Adviser” or “Olive Street”), the Trust, and Artisan Partners, L.P. (“Artisan Partners” or the “Subadviser”) dated February 19, 2015, and amended June 9, 2017 and November 29, 2017 (the “Existing Sub-advisory Agreement”).
At a meeting held on May 19-20, 2020 via teleconference (the “May Renewal Meeting”) in reliance on and in compliance with the conditions of an SEC order granting relief from the in-person meeting requirement, Olive Street proposed, and the Board, including a majority of the Independent Trustees, considered and approved, an amendment to the Existing Sub-advisory Agreement (the “Amended Sub-advisory Agreement”) to add Artisan Partners as a subadviser to the Small/Mid Cap Growth Fund (the “Fund”). At the May Renewal Meeting, Olive Street also proposed, and the Board, including a majority of the Independent Trustees, considered and approved, the annual continuance of the Existing Sub-advisory Agreement with respect to Artisan Partners’ services to the Large Cap Value Fund.
Pursuant to an exemptive order obtained by the Adviser and the Trust from the SEC, the Adviser is permitted, subject to certain conditions, to select new subadvisers for the Trust’s funds with the approval of the Board but without obtaining shareholder approval.
In advance of the May Renewal Meeting, at a meeting held via teleconference on May 7, 2020 (the “May 7, 2020 Telephonic Meeting”), the Adviser furnished information to the Board reasonably necessary for the Board to evaluate the terms of the Amended Sub-Advisory Agreement. The Board had the opportunity to ask questions and request further information in connection with its consideration.
In addition, at the May 7, 2020 Telephonic Meeting and the May Renewal Meeting, representatives of the Adviser made presentations and responded to questions regarding the Subadviser’s services, fees and other aspects of the proposed sub-advisory relationship. Further, at the May Renewal Meeting, representatives of the Subadviser made a presentation and responded to questions regarding the Subadviser’s services and other aspects of the proposed sub-advisory relationship. Collectively, the information provided to the Board in connection with the May 7, 2020 Telephonic Meeting and the May Renewal Meeting included materials describing, among other matters: (i) the nature, extent and quality of the services proposed to be provided by the Subadviser; (ii) the Subadviser’s investment management personnel; (iii) the Subadviser’s operations; (iv) the Subadviser’s investment philosophy and investment process; (v) the sub-advisory fees proposed to be payable to the Subadviser; (vi) the Subadviser’s policies and compliance procedures; (vii) the Subadviser’s financial health; and (vii) the investment performance of accounts managed by the Subadviser employing a mid-cap growth strategy similar to the portion of the Fund proposed to be managed by the Subadviser.
The Board observed that Artisan Partners is currently a subadviser to the Large Cap Value Fund pursuant to the Existing Sub-Advisory Agreement. As such, the Board determined that it was reasonable to consider certain information that the Board received from the Adviser and Artisan Partners regarding Artisan Partners in connection with its annual evaluation of the Existing Sub-Advisory Agreement which occurred at a meeting held via teleconference on May 5, 2020 and the May Renewal Meeting (collectively, with the May 7, 2020 Telephonic Meeting, the “May Meetings”).
The Independent Trustees received advice from Fund counsel and from their independent legal counsel, including advice regarding the legal standards applicable to the consideration of sub-advisory arrangements, and met in
| 102 | Annual Report • June 30, 2020 |
Bridge Builder Mutual Funds
Board Considerations of the Investment Advisory Agreement and Sub-advisory Agreements (Unaudited) (Continued)
executive session outside the presence of the Interested Trustees, Fund management and representatives of the Adviser and the Subadviser to discuss the Amended Sub-Advisory Agreement and the services to be provided by the Subadviser.
In considering whether to approve the Amended Sub-Advisory Agreement the Board considered not only the specific information presented in connection with the May Meetings, but also the knowledge gained regarding the Subadviser over time through previous interactions with the Adviser and the Subadviser. The Board did not identify any particular information or consideration that was all important or controlling, and each individual Trustee may have attributed different weights to various factors and information.
In considering the approval of the Amended Sub-Advisory Agreement, the Board considered various factors, as discussed in further detail below:
1. The nature, extent and quality of the services to be provided by the Subadviser. The Board reviewed the portfolio management services and investment process proposed to be provided by the Subadviser, including how the Subadviser’s investment philosophy and process complement those of the other subadvisers that manage the Fund. The Board also reviewed the background and experience of the Subadviser’s portfolio management personnel. The Board considered the Subadviser’s ability to attract and retain qualified investment professionals, and the experience and skills of management and investment personnel of the Subadviser. The Board also considered other services proposed to be provided to the Fund by the Subadviser under the Adviser’s supervision, such as monitoring adherence to the Fund’s investment restrictions, monitoring compliance with various Fund policies and procedures and with applicable securities laws and regulations, monitoring valuation and liquidity and selecting broker-dealers to execute portfolio transactions.
The Board reviewed the terms of the Existing Sub-Advisory Agreement and proposed amendment. In so doing, the Board observed that Artisan Partners serves as a subadviser to the Large Cap Value Fund pursuant to the Existing Sub-advisory Agreement. The Board further observed that the amendment to the Existing Sub-advisory Agreement incorporates the proposed fee rate schedule for Artisan Partners’ sleeve of the Fund and that there were no other changes to the Existing Sub-advisory Agreement outside of the addition of the Fund.
Based on the factors above, as well as those discussed below, the Board concluded, within the context of its full deliberations, that the Subadviser is capable of providing services of the type and nature contemplated by the terms of the Amended Sub-Advisory Agreement.
2. Fees and Other Expenses. The Board reviewed the sub-advisory fees proposed to be payable to the Subadviser. The Board considered the potential impact of the Subadviser’s fee to the Fund’s overall expenses, given the Adviser’s contractual agreement to waive its advisory fees to the extent advisory fees to be paid to the Adviser exceed the sub-advisory fees to be paid to the Fund’s subadvisers. The Board noted that the Adviser may terminate this waiver arrangement without Board approval effective upon the end of the then current one-year period, by providing the Board written notice of such termination by April 15. The Board further noted that the Adviser has irrevocably agreed not to exercise its right to terminate the waiver arrangement upon the end of the current one-year period, resulting in the arrangement continuing until at least October 28, 2021.
Based on the factors above, as well as those discussed below, the Board concluded, within the context of its full deliberations, that the sub-advisory fees were reasonable in light of the nature and quality of the services expected to be rendered by the Subadviser.
3. The Subadviser’s Investment Performance Record. Because the Subadviser is new to the Fund, the Board was not able to evaluate an investment performance record for the portion of the Fund to be managed by the Subadviser. The Board did consider the Subadviser’s performance history with respect to similarly-managed
| Annual Report • June 30, 2020 | 103 |
Bridge Builder Mutual Funds
Board Considerations of the Investment Advisory Agreement and Sub-advisory Agreements (Unaudited) (Continued)
investment accounts. While there was no historical Subadviser performance information with respect to the Fund for review, the Board noted that it would have an opportunity to review such information in connection with future annual reviews of advisory and sub-advisory agreements
4. Profitability and Economies of Scale. The Board did not consider profitability of the Subadviser to be a material factor, given that the Subadviser is not affiliated with the Adviser and, therefore, the fees were negotiated at arm’s length.
5. Indirect Benefits. The Board noted that Fund shares are currently available exclusively to investors participating in Edward Jones Advisory Solutions®, an investment advisory program (asset-based fee program) sponsored by Edward D. Jones & Co., L.P. (“Edward Jones”), an affiliate of the Adviser. Accordingly, the Board received and considered information about asset-based fees received by Edward Jones from participants in Edward Jones Advisory Solutions in connection with their investments in the Fund as an indirect or “fall-out” benefit. In addition, the Board considered that the Adviser, Edward Jones and the Subadvisers may derive a benefit to their reputations and standing in the investment community from their relationship with the Fund. The Board also noted that the Subadviser may use soft dollars generated from executing Fund portfolio trades to purchase research, which could be viewed as a fall-out benefit to the Subadviser to the extent the Subadviser uses the research generated from such trading activities across its client base.
CONCLUSION
Based on the Board’s deliberations and its evaluation of the information described above and other factors and information it believed relevant, the Board concluded, in the exercise of its reasonable judgment, that the terms of the Amended Sub-Advisory Agreement were reasonable in relation to the services expected to be provided by the Subadviser to the Fund. Based on the Board’s deliberations and its evaluation of the information described above and other factors and information it believed relevant, the full Board, and all of the Independent Trustees voting separately, unanimously approved the Amended Sub-Advisory Agreement.
| 104 | Annual Report • June 30, 2020 |
Bridge Builder Mutual Funds
Liquidity Risk Management Program (Unaudited)
As required by Rule 22e-4 (the “Liquidity Rule”) under the Investment Company Act of 1940, as amended, each of the Bridge Builder mutual funds (the “Funds”) has adopted and implemented a written liquidity risk management program (“LRMP”) including policies and procedures reasonably designed to assess and manage the risk that a Fund may not be able to meet shareholder redemption requests without significantly diluting the interest of shareholders remaining in the Fund.
The Bridge Builder Board of Trustees (the “Board”) designated the Fund’s Investment Adviser, Olive Street Investment Advisers, LLC (the “Adviser”), as the LRMP Administrator (the “Administrator”) for the Funds. The Administrator established a committee made up of representatives from relevant departments within the Adviser and its affiliates (the “Liquidity Committee”) to assist in the implementation and day-to-day administration of the LRMP, and to carry out its liquidity risk management responsibilities.
During the period December 1, 2018 through November 30, 2019 (the “Period”), as required by the LRMP, each Fund classified each of its investments into one of four liquidity categories based on the number of days reasonably needed to sell and convert a reasonably anticipated sized trade of each investment into cash without significantly impacting the price of the investment. The Administrator relied on a third-party data provider to facilitate the classification of each Fund’s investments based on criteria in each Fund’s LRMP. During the Period, the Funds primarily held assets that are classified as highly liquid investments and thus were not required to establish highly liquid investment minimums. During the Period, no Fund held more than 15% of its net assets in illiquid investments that are assets.
During the Period, the Liquidity Committee met monthly or more frequently, as necessary or appropriate in response to relevant market, trading or investment-specific considerations, to, among other things, review and determine liquidity classifications for portfolio investments and monitor the Funds’ liquidity risk.
As required by the LRMP, the Administrator assessed, managed and reviewed each Fund’s liquidity risk (the “Review”) for the Period. As part of this Review, the Administrator considered each Fund’s investment strategy; the liquidity of its investments; long-term cash flow projections during both normal and reasonably foreseeable stressed conditions; and its holdings of cash and cash equivalents, borrowing arrangements and other funding sources, as set forth in more detail below.
A. A Fund’s investment strategy and liquidity of portfolio investments during both normal and reasonably foreseeable stressed conditions: The Liquidity Committee reviewed whether each Fund’s strategy is appropriate for an open-end fund structure. During the Period, none of the Funds changed their strategy, allowed concentrated investments, or relied extensively upon borrowing or derivatives.
B. Short-term and long-term cash flow projections during both normal and reasonably foreseeable stressed conditions: The Liquidity Committee reviewed historical shareholder activity. The Liquidity Committee also considered each Fund’s shareholder ownership, and the degree of confidence associated with a Fund’s short-term and long-term cash flow projections.
Further, the Liquidity Committee considered that each Fund may, under highly unusual circumstances, pay all or part of redemption proceeds in securities with a market value equal to the redemption price (redemption in kind) in order to protect the Fund’s remaining shareholders.
C. Holdings of cash and cash equivalents, as well as borrowing arrangements: The Liquidity Committee considered the average and lowest daily cash holdings of each Fund measured against the highest net redemptions during the Period. The Committee also considered other types of borrowing available to the Funds, such as the ability to use interfund lending, as applicable.
| Annual Report • June 30, 2020 | 105 |
Bridge Builder Mutual Funds
Liquidity Risk Management Program (Unaudited) (Continued)
The Administrator reflected the results of its Review in a written report to the Board, which addressed the operation, adequacy and effectiveness of the implementation of the LRMP and described any material changes made to the LRMP (the “Report”). At its meeting on May 20, 2020, the Board received the Report covering the Period. The Report concluded that each Fund’s LRMP is operating as intended and is effective in implementing the requirements of the Liquidity Rule. At that meeting, the Board also received reporting covering each Fund’s first quarter, which fell outside the Period. The quarterly reporting discussed recent market disruption and volatility caused by the pandemic spread of the novel coronavirus known as COVID-19 and related implications for the operation of the Fund’s LRMP.
There can be no assurance that the LRMP will achieve its objectives in the future. Please refer to the prospectus for more information regarding a Fund’s exposure to liquidity risk and other principal risks to which an investment in the Fund may be subject.
| 106 | Annual Report • June 30, 2020 |
Bridge Builder Mutual Funds
General Information (Unaudited)
Proxy Voting Procedures and Proxy Voting Record
A description of the policies and procedures that the Funds use to determine how to vote proxies relating to portfolio securities is available, free of charge, by calling 1-855-823-3611. This information is also available through the Securities and Exchange Commission’s website at http://www.sec.gov. Information regarding how the Trust voted proxies relating to portfolio securities during the 12-month period ending June 30 is available without charge, upon request, by calling 1-855-823-3611. This information is also available through the Securities and Exchange Commission’s website at http://www.sec.gov.
Form N-PORT Disclosure
The Trust files its complete schedule of portfolio holdings with the Securities and Exchange Commission for the first and third quarters of each fiscal year as an exhibit to its reports on Form N-PORT. The Trust’s Form N-PORT filings are available on the Securities and Exchange Commission’s website at http://www.sec.gov. Information regarding the Trust’s Form N-PORT filings is also available, without charge, by calling, 1-855-823-3611.
Household Delivery of Shareholder Documents
To reduce expenses the Funds may mail only one copy of the prospectus, Statement of Additional Information and each annual and semiannual report to those addresses shared by two or more accounts. If you wish to receive individual copies of these documents, please call the Trust at 1-855-823-3611. You will begin receiving individual copies thirty days after your request is received.
Schedule of Investments
Each Fund’s complete schedule of investments in securities of unaffiliated issuers is available without charge, upon request, by calling 1-855-823-3611, and on the Securities and Exchange Commission website at http://www.sec.gov as a part of Form N-CSR.
Tax Notice
The following table lists the percentages of dividend income distributed by the Funds for the period ended June 30, 2020, that were designated as qualified dividend income under the Jobs and Growth Tax Relief Reconciliation Act of 2003 and qualify for the corporate dividends received deduction, respectively.
| % of Dividend Income Distributed | ||||
| Fund | Qualified Dividend Income | Corporate Dividends Received Deduction | ||
| Core Bond Fund | — % | — % | ||
| Core Plus Bond Fund | — | — | ||
| Municipal Bond Fund | — | — | ||
| Large Cap Growth Fund | 93.66 | 91.13 | ||
| Large Cap Value Fund | 95.66 | 84.91 | ||
| Small/Mid Cap Growth Fund | 43.94 | 40.63 | ||
| Small/Mid Cap Value Fund | 96.85 | 94.34 | ||
| International Equity Fund | 83.83 | 1.34 | ||
| Annual Report • June 30, 2020 | 107 |
Bridge Builder Mutual Funds
General Information (Unaudited) (Continued)
The following table lists the percentages of ordinary income distributions paid by the Funds, for the period ended June 30, 2020, that were designated as short-term capital gain distributions under Internal Revenue Code Section 871(k)(2)(c) and qualify as interest related dividends under Internal Revenue Code Section 871(k)(2)(c), respectively.
| % of Ordinary Income Distributions | ||
| Fund | Short-Term Capital Gain Distributions | |
| Core Bond Fund | 7.23% | |
| Core Plus Bond Fund | 27.66 | |
| Municipal Bond Fund | — | |
| Large Cap Growth Fund | — | |
| Large Cap Value Fund | 1.61 | |
| Small/Mid Cap Growth Fund | 49.33 | |
| Small/Mid Cap Value Fund | — | |
| International Equity Fund | — |
For the Fiscal Year Ended June 30, 2020, the International Equity Fund earned foreign source income of $296,569,141 which amounts to $0.29 per share, and paid foreign taxes of $24,571,884 which amounts to $0.02 per share, which it intends to pass through to its shareholders pursuant Section 853 of the Internal Revenue Code.
| 108 | Annual Report • June 30, 2020 |
Bridge Builder Mutual Funds
Revised August 2019
FACTS | What Does the Bridge Builder Trust (“Bridge Builder”) Do with Your Personal Information? | |||
Why? | Financial companies choose how they share your personal information. Federal law gives consumers the right to limit some but not all sharing. Federal law also requires us to tell you how we collect, share and protect your personal information. Please read this notice carefully to understand what we do. | |||
What? | The types of personal information we collect and share depend on the product or service you have with us. This information can include: | |||
| * Social Security number | * Investment experience | |||
| * Account balances | * Income and risk tolerance | |||
| * Transaction history | * Assets and account transactions | |||
| When you are no longer our customer, we continue to share your information as described in this notice. | ||||
How? | All financial companies need to share customers’ personal information to run their everyday business. In the section below, we list the reasons financial companies can share their customers’ personal information; the reasons Bridge Builder chooses to share; and whether you can limit this sharing. | |||
| REASONS WE CAN SHARE YOUR PERSONAL INFORMATION | DOES BRIDGE BUILDER SHARE? | CAN YOU LIMIT THIS SHARING? | ||
| For our everyday business purposes – such as to process your transactions, maintain your account(s), respond to court orders and legal investigations, or report to credit bureaus | Yes | No | ||
| For our marketing purposes – to offer our products and services to you | No | We don’t share | ||
| For joint marketing with other financial companies | No | We don’t share | ||
| For our affiliates’ everyday business purposes – information about your transactions and experiences | Yes | No | ||
| For our affiliates’ everyday business purposes – information about your creditworthiness | No | We don’t share | ||
| For nonaffiliates to market to you | No | We don’t share | ||
WHO WE ARE | ||
Who is providing this notice? | Bridge Builder Trust | |
WHAT WE DO | ||
How does Bridge Builder protect my personal information? | To protect your personal information from unauthorized access and use, we use security measures that comply with federal law. These measures include computer safeguards and secured files and buildings. | |
How does Bridge Builder collect my personal information? | We collect your personal information, for example, when you deposit money with us, if you ever were to give us your contact information, open an account with us, provide us account information or make a wire transfer. We also collect your personal information from others, such as credit bureaus, affiliates or other companies. | |
Why can’t I limit all sharing? | Federal law gives you the right to limit only:
* Sharing for affiliates’ everyday business purposes – information about your creditworthiness * Affiliates from using your information to market to you * Sharing for nonaffiliates to market to you
State laws and individual companies may give you additional rights to limit sharing. See the Other Important Information section for your rights under state law. | |
DEFINITIONS | ||
Affiliates | Companies related by common ownership or control. They can be financial and nonfinancial companies.
* Olive Street Investment Advisers, LLC (“Olive Street”), our investment adviser, may be deemed to be affiliated with us. Olive Street is a wholly owned subsidiary of The Jones Financial Companies, L.L.L.P. (“JFC”), and is affiliated with other subsidiaries of JFC, including Edward D. Jones & Co., L.P. and Edward Jones Trust Company. | |
Nonaffiliates | Companies not related by common ownership or control. They can be financial and nonfinancial companies.
* Bridge Builder does not share with non-affiliates so they can market to you. | |
Joint Marketing | A formal agreement between nonaffiliated financial companies that together market financial products or services to you.
Bridge Builder does not currently engage in joint marketing efforts. | |
OTHER IMPORTANT INFORMATION | ||
| California residents | We will not share information we collect about you with companies outside of Bridge Builder, unless permitted by law. We also limit sharing among Bridge Builder and our affiliate companies to the extent required by California law. | |
| Nevada residents | We are providing this notice to you pursuant to state law. Nevada law requires us to disclose that you may request to be placed on our internal “Do Not Call” list at any time by calling 800-441-2357, and that you may obtain further information by contacting the Nevada Attorney General, 555 E. Washington Ave., Suite 3900, Las Vegas, NV 89101; phone 702-486-3132; email BCPINFO@ag.state.nv.us. | |
| Questions? Call 855-823-3611 or go to www.bridgebuildermutualfunds.com |
| Annual Report • June 30, 2020 | 109 |
Investment Adviser
Olive Street Investment Advisers, LLC
12555 Manchester Road
St. Louis, MO 63131
Administrator & Fund Accountant
Brown Brothers Harriman & Co.
50 Post Office Square
Boston, MA 02110
Transfer Agent
ALPS Fund Services, Inc.
1290 Broadway, Suite 1100
Denver, CO 80203
Distributor
ALPS Distributors, Inc.
1290 Broadway, Suite 1100
Denver, CO 80203
Custodian
Brown Brothers Harriman & Co.
140 Broadway
New York, NY 10005
Legal Counsel
Morgan Lewis & Bockius, LLP
1701 Market Street
Philadelphia, PA 19103
Independent Registered Public Accounting Firm
PricewaterhouseCoopers LLP
One North Wacker
Chicago, IL 60606

ITEM 2. CODE OF ETHICS.
The registrant has adopted a code of ethics that applies to the registrant’s principal executive officer and principal financial officer. The registrant has not made any amendments to its code of ethics during the period covered by this report. The registrant has not granted any waivers from any provisions of the code of ethics during the period covered by this report.
Incorporated by reference to the Registrant’s Form N-CSR filed December 16, 2015.
ITEM 3. AUDIT COMMITTEE FINANCIAL EXPERT.
The registrant’s board of trustees has determined that John Tesoro and William Scheffel are the “audit committee financial experts” and are considered to be “independent” as each term is defined in Item 3 of Form N-CSR.
ITEM 4. PRINCIPAL ACCOUNTANT FEES AND SERVICES.
The registrant has engaged its principal accountant to perform audit services, audit-related services, and tax services during the past two fiscal years. “Audit fees” refer to performing an audit of the registrant’s annual financial statements or services that are normally provided by the accountant in connection with statutory and regulatory filings or engagements for those fiscal years. “Audit-related fees” refer to the assurance and related services by the principal accountant that are reasonably related to the performance of the audit. “Tax fees” refer to professional services rendered by the principal accountant for tax compliance, tax advice, and tax planning. The following table details the aggregate fees billed or expected to be billed for the last two fiscal years for audit fees, audit-related fees, tax fees and other fees by the principal accountant.
| FYE 6/30/2020 | FYE 6/30/2019 | |||||||
Audit Fees | $ | 535,300 | $ | 525,300 | ||||
Audit-Related Fees | ||||||||
Tax Fees | $ | 62,675 | $ | 59,574 | ||||
All Other Fees | ||||||||
The audit committee has adopted pre-approval policies and procedures that require the audit committee to pre-approve all audit and non-audit services of the registrant, including services provided to any entity affiliated with the registrant.
The percentage of services described in each of paragraphs (b) through (d) of this Item that were approved by the audit committee pursuant to paragraph (c)(7)(i)(C) of Rule 2-01 of Regulation S-X were as follows:
| FYE 6/30/2020 | FYE 6/30/2019 | |||||||
Audit-Related Fees | 0 | % | 0 | % | ||||
Tax Fees | 0 | % | 0 | % | ||||
All Other Fees | 0 | % | 0 | % | ||||
All of the principal accountant’s hours spent on auditing the registrant’s financial statements were attributed to work performed by full-time permanent employees of the principal accountant. The following table indicates the non-audit fees billed or expected to be billed by the registrant’s accountant for services to the registrant and to the registrant’s investment adviser (and any entity controlling, controlled by, or under common control with the investment adviser) for the last two years.
Non-Audit Related Fees | FYE 6/30/2020 | FYE 6/30/2019 | ||||||
Registrant | $ | 62,675 | $ | 59,574 | ||||
Registrant’s Investment Adviser | $ | 0 | $ | 0 | ||||
ITEM 5. AUDIT COMMITTEE OF LISTED REGISTRANTS.
Not applicable to registrants who are not listed issuers (as defined in Rule 10A-3 under the Securities Exchange Act of 1934).
ITEM 6. INVESTMENTS.
Bridge Builder Core Bond Fund
Schedule of Investments
June 30, 2020
| Principal Amount | Value | |||||||
BONDS & NOTES – 96.93% | ||||||||
Asset-Backed Obligations – 11.67% | ||||||||
ABFC 2005-AQ1 Trust | ||||||||
4.63%, 01/25/2034(1) | $ | 144,080 | $ | 146,333 | ||||
ABFC 2006-OPT1 Trust | ||||||||
0.33% (1 Month LIBOR USD + 0.15%, 0.15% Floor), 09/25/2036(2) | 2,782,334 | 2,714,372 | ||||||
Academic Loan Funding Trust 2013-1 | ||||||||
0.98% (1 Month LIBOR USD + 0.80%), 12/26/2044(2)(3) | 749,135 | 716,666 | ||||||
Allegro CLO VII Ltd. | ||||||||
2.32% (3 Month LIBOR USD + 1.10%, 1.10% Floor), 06/13/2031(2)(3) | �� | 12,000,000 | 11,528,220 | |||||
Ally Auto Receivables Trust 2019-4 | ||||||||
1.84%, 06/17/2024 | 6,027,000 | 6,144,451 | ||||||
1.92%, 01/15/2025 | 1,987,000 | 2,036,314 | ||||||
1.93%, 10/17/2022 | 7,143,376 | 7,181,449 | ||||||
American Credit Acceptance Receivables Trust 2017-2 | ||||||||
3.69%, 06/12/2023(3) | 3,074,867 | 3,096,436 | ||||||
American Credit Acceptance Receivables Trust 2019-2 | ||||||||
2.85%, 07/12/2022(3) | 675,274 | 676,477 | ||||||
American Credit Acceptance Receivables Trust 2019-4 | ||||||||
2.18%, 02/13/2023(3) | 7,365,722 | 7,400,259 | ||||||
American Credit Acceptance Receivables Trust 2020-2 SER 2020-2 | ||||||||
1.65%, 12/13/2023(3) | 3,546,589 | 3,564,449 | ||||||
American Express Credit Account Master Trust | ||||||||
0.42% (1 Month LIBOR USD + 0.24%), 04/15/2024(2) | 8,760,000 | 8,772,238 | ||||||
American Homes 4 Rent 2014-SFR2 Trust | ||||||||
3.79%, 10/17/2036(3) | 3,738,830 | 4,015,652 | ||||||
4.29%, 10/17/2036(3) | 300,000 | 326,719 | ||||||
6.23%, 10/17/2036(3) | 1,000,000 | 1,111,509 | ||||||
American Homes 4 Rent 2014-SFR3 Trust | ||||||||
4.60%, 12/17/2036(3) | 600,000 | 648,417 | ||||||
6.42%, 12/17/2036(3) | 1,000,000 | 1,118,510 | ||||||
American Homes 4 Rent 2015-SFR1 | ||||||||
3.47%, 04/17/2052(3) | 2,037,995 | 2,181,439 | ||||||
5.64%, 04/17/2052(3) | 3,900,000 | 4,301,546 | ||||||
American Homes 4 Rent 2015-SFR2 Trust | ||||||||
3.73%, 10/17/2052(3) | 1,773,170 | 1,921,617 | ||||||
AmeriCredit Automobile Receivables Trust 2017-1 | ||||||||
2.30%, 02/18/2022 | 294,944 | 295,382 | ||||||
2.71%, 08/18/2022 | 618,000 | 624,729 | ||||||
3.13%, 01/18/2023 | 1,387,000 | 1,408,127 | ||||||
AmeriCredit Automobile Receivables Trust 2017-2 | ||||||||
3.42%, 04/18/2023 | 6,000,000 | 6,152,806 | ||||||
AmeriCredit Automobile Receivables Trust 2017-4 | ||||||||
2.36%, 12/19/2022 | 5,355,000 | 5,412,326 | ||||||
AmeriCredit Automobile Receivables Trust 2018-1 | ||||||||
3.50%, 01/18/2024 | 6,000,000 | 6,242,732 | ||||||
AmeriCredit Automobile Receivables Trust 2018-2 | ||||||||
3.45%, 06/18/2024 | 7,636,000 | 7,899,269 | ||||||
AmeriCredit Automobile Receivables Trust 2019-1 | ||||||||
3.13%, 02/18/2025 | 3,400,000 | 3,530,594 | ||||||
3.36%, 02/18/2025 | 3,500,000 | 3,637,242 | ||||||
AmeriCredit Automobile Receivables Trust 2019-2 | ||||||||
2.43%, 09/19/2022 | 1,423,736 | 1,431,361 | ||||||
AmeriCredit Automobile Receivables Trust 2019-3 | ||||||||
2.17%, 01/18/2023 | 1,252,551 | 1,261,746 | ||||||
AmeriCredit Automobile Receivables Trust 2020-1 | ||||||||
1.48%, 01/21/2025 | 6,100,000 | 6,104,218 | ||||||
Amortizing Residential Collateral Trust 2002-BC5 | ||||||||
1.22% (1 Month LIBOR USD + 1.04%, 0.69% Floor), 07/25/2032(2) | 1,671,955 | 1,644,199 | ||||||
Anchorage Capital CLO 2013-1 Ltd. | ||||||||
2.56% (3 Month LIBOR USD + 1.25%), 10/13/2030(2)(3) | 2,500,000 | 2,447,677 | ||||||
Argent Securities, Inc. Asset-Backed Pass-Through Certificates Series 2005-W3 | ||||||||
0.52% (1 Month LIBOR USD + 0.34%, 0.34% Floor), 11/25/2035(2) | 1,218,042 | 1,212,535 | ||||||
Asset Backed Securities Corp. Home Equity Loan Trust Series 2003-HE6 | ||||||||
0.86% (1 Month LIBOR USD + 0.68%, 0.34% Floor), 11/25/2033(2) | 1,862,969 | 1,750,913 | ||||||
Asset Backed Securities Corp. Home Equity Loan Trust Series AEG 2006-HE1 | ||||||||
0.40% (1 Month LIBOR USD + 0.22%, 0.22% Floor), 01/25/2036(2) | 1,878,586 | 1,863,566 | ||||||
Asset-Backed Pass-Through Certificates Series 2004-R2 | ||||||||
0.96% (1 Month LIBOR USD + 0.78%, 0.39% Floor), 04/25/2034(2) | 170,161 | 169,273 | ||||||
Atlas Senior Loan Fund III Ltd. | ||||||||
1.22% (3 Month LIBOR USD + 0.83%), 11/17/2027(2)(3) | 5,925,236 | 5,817,420 | ||||||
Avis Budget Rental Car Funding AESOP LLC | ||||||||
2.33%, 08/20/2026(3) | 6,100,000 | 5,899,586 | ||||||
2.36%, 03/20/2026(3) | 12,000,000 | 11,831,965 | ||||||
3.70%, 09/20/2024(3) | 6,200,000 | 6,243,034 | ||||||
4.00%, 03/20/2025(3) | 5,800,000 | 5,853,414 | ||||||
B2R Mortgage Trust 2015-2 | ||||||||
3.34%, 11/15/2048(3) | 305,745 | 305,612 | ||||||
Bayview Financial Mortgage Pass-Through Trust 2007-B | ||||||||
6.83%, 08/28/2047(1) | 155,701 | 153,609 | ||||||
Bear Stearns Asset Backed Securities Trust 2003-2 | ||||||||
1.68% (1 Month LIBOR USD + 1.50%, 0.75% Floor, 11.00% Cap), 03/25/2043(2) | 3,604,745 | 3,510,767 | ||||||
BMW Floorplan Master Owner Trust | ||||||||
0.50% (1 Month LIBOR USD + 0.32%), 05/15/2023(2)(3) | 6,407,000 | 6,373,469 | ||||||
Business Jet Securities 2019-1 LLC | ||||||||
4.21%, 07/15/2034(3) | 9,346,795 | 9,082,595 | ||||||
Business Jet Securities LLC | ||||||||
4.34%, 02/15/2033(3) | 2,346,451 | 2,358,335 | ||||||
Business Jet Securities LLC 2018-2 | ||||||||
4.45%, 06/15/2033(3) | 5,395,697 | 5,353,684 | ||||||
BXG Receivables Note Trust 2012-A | ||||||||
2.66%, 12/02/2027(3) | 68,791 | 68,406 | ||||||
Camillo Issuer LLC 2016-SFR1 A | ||||||||
5.00%, 12/05/2023(3)(12) | 4,935,427 | 4,924,631 | ||||||
Capital Auto Receivables Asset Trust 2018-1 | ||||||||
2.79%, 01/20/2022(3) | 2,312,598 | 2,321,687 | ||||||
Capital One Multi-Asset Execution Trust | ||||||||
1.72%, 08/15/2024 | 2,808,000 | 2,886,308 | ||||||
Capital One Prime Auto Receivables Trust 2019-2 | ||||||||
1.92%, 05/15/2024 | 3,455,000 | 3,533,617 | ||||||
Carlyle US Clo 2017-1 Ltd. | ||||||||
2.37% (3 Month LIBOR USD + 1.23%), 04/20/2031(2)(3) | 5,496,412 | 5,299,514 | ||||||
Carlyle US Clo 2017-2 Ltd. | ||||||||
2.36% (3 Month LIBOR USD + 1.22%), 07/20/2031(2)(3) | 3,000,000 | 2,886,165 | ||||||
CarMax Auto Owner Trust | ||||||||
1.89%, 12/16/2024 | 3,601,000 | 3,705,163 | ||||||
2.03%, 06/16/2025 | 2,415,000 | 2,516,320 | ||||||
CarMax Auto Owner Trust 2018-2 | ||||||||
3.16%, 07/17/2023 | 2,635,000 | 2,742,604 | ||||||
CarMax Auto Owner Trust 2019-1 | ||||||||
3.26%, 08/15/2024 | 1,614,000 | 1,695,931 | ||||||
Carnow Auto Receivables Trust 2019-1 | ||||||||
3.36%, 06/17/2024(3) | 3,710,000 | 3,720,481 | ||||||
Carvana Auto Receivables Trust 2019-3 | ||||||||
3.04%, 04/15/2025(3) | 11,005,000 | 11,092,721 | ||||||
Catamaran CLO 2014-2 Ltd. | ||||||||
2.54% (3 Month LIBOR USD + 1.40%), 10/18/2026(2)(3) | 311,388 | 310,066 | ||||||
CBAM 2019-11 Ltd. | ||||||||
2.50% (3 Month LIBOR USD + 1.36%, 1.36% Floor), 10/20/2032(2)(3) | 22,000,000 | 21,483,495 | ||||||
Chase Funding Trust Series 2003-4 | ||||||||
5.11%, 05/25/2033(1) | 118,684 | 123,404 | ||||||
Chase Funding Trust Series 2003-6 | ||||||||
5.00%, 11/25/2034(1) | 152,894 | 160,046 | ||||||
5.00%, 11/25/2034(1) | 260,322 | 271,372 | ||||||
CIFC Funding 2018-II Ltd. | ||||||||
2.18% (3 Month LIBOR USD + 1.04%), 04/20/2031(2)(3) | 10,000,000 | 9,683,100 | ||||||
CLUB Credit Trust | ||||||||
3.82%, 01/15/2026(3) | 1,796,385 | 1,807,793 | ||||||
Colony American Finance 2016-2 Ltd. | ||||||||
2.55%, 11/15/2048(3) | 793,135 | 795,006 | ||||||
Commonbond Student Loan Trust 2017-B-GS | ||||||||
2.68%, 09/25/2042(3) | 5,991,707 | 6,090,056 | ||||||
Commonbond Student Loan Trust 2018-A-GS | ||||||||
3.21%, 02/25/2044(3) | 5,045,807 | 5,187,816 | ||||||
Commonbond Student Loan Trust 2018-C-GS | ||||||||
3.87%, 02/25/2046(3) | 1,817,195 | 1,888,815 | ||||||
Conseco Finance Corp. | ||||||||
6.18%, 04/01/2030 | 9,305 | 9,468 | ||||||
6.22%, 03/01/2030 | 24,525 | 25,027 |
Consumer Loan Underlying Bond Club Certificate Issuer Trust I Series 2019-HP1 | ||||||||
2.59%, 12/15/2026(3) | 3,328,246 | 3,341,723 | ||||||
Consumer Loan Underlying Bond Credit Trust 2019-P1 | ||||||||
2.94%, 07/15/2026(3) | 1,822,829 | 1,829,057 | ||||||
COOF Securitization Trust 2014-1 Ltd. | ||||||||
2.91%, 06/25/2040(3)(4) | 685,275 | 63,186 | ||||||
Corevest American Finance 2019-1 Trust | ||||||||
3.88%, 03/15/2052(3) | 4,860,000 | 5,030,445 | ||||||
Corevest American Finance 2019-3 Trust | ||||||||
2.71%, 10/15/2052(3) | 5,558,016 | 5,701,516 | ||||||
3.16%, 10/15/2052(3) | 2,250,000 | 2,218,468 | ||||||
3.27%, 10/15/2052(3) | 5,862,000 | 5,432,149 | ||||||
Countrywide Asset-Backed Certificates | ||||||||
4.30%, 02/25/2036(4) | 43,643 | 44,856 | ||||||
5.12%, 02/25/2035(1) | 15,744 | 15,721 | ||||||
5.43%, 02/25/2033(4) | 39,545 | 36,970 | ||||||
5.97%, 09/25/2046(4) | 52,411 | 49,774 | ||||||
CPS Auto Receivables Trust 2015-B | ||||||||
4.20%, 05/17/2021(3) | 469,634 | 471,342 | ||||||
CPS Auto Receivables Trust 2015-C | ||||||||
4.63%, 08/16/2021(3) | 511,117 | 513,715 | ||||||
CPS Auto Receivables Trust 2017-B | ||||||||
2.92%, 02/15/2022(3) | 247,765 | 248,082 | ||||||
3.95%, 03/15/2023(3) | 3,485,000 | 3,518,189 | ||||||
CPS Auto Receivables Trust 2017-C | ||||||||
2.86%, 06/15/2023(3) | 644,198 | 645,672 | ||||||
3.79%, 06/15/2023(3) | 791,000 | 803,148 | ||||||
CPS Auto Receivables Trust 2019-A | ||||||||
3.18%, 06/15/2022(3) | 1,335,756 | 1,340,356 | ||||||
CPS Auto Receivables Trust 2019-B | ||||||||
2.89%, 05/16/2022(3) | 427,016 | 428,482 | ||||||
CPS Auto Receivables Trust 2019-C | ||||||||
2.55%, 09/15/2022(3) | 2,776,964 | 2,793,037 | ||||||
CPS Auto Receivables Trust 2019-D | ||||||||
2.17%, 12/15/2022(3) | 2,198,883 | 2,211,404 | ||||||
CPS Auto Receivables Trust 2020-A | ||||||||
2.09%, 05/15/2023(3) | 7,495,917 | 7,558,212 | ||||||
CPS Auto Receivables Trust 2020-B | ||||||||
1.15%, 07/17/2023(3) | 2,177,947 | 2,181,628 | ||||||
2.11%, 04/15/2026(3) | 1,303,000 | 1,314,312 | ||||||
Credit Acceptance Auto Loan Trust 2017-2 | ||||||||
3.35%, 06/15/2026(3) | 811,000 | 815,550 | ||||||
Credit Acceptance Auto Loan Trust 2018-1 | ||||||||
3.01%, 02/16/2027(3) | 3,961,057 | 3,985,557 | ||||||
Credit Acceptance Auto Loan Trust 2018-3 | ||||||||
3.55%, 08/15/2027(3) | 3,090,000 | 3,142,217 | ||||||
Credit Acceptance Auto Loan Trust 2019-1 | ||||||||
3.33%, 02/15/2028(3) | 7,351,000 | 7,523,045 | ||||||
Credit Acceptance Auto Loan Trust 2020-1 | ||||||||
2.39%, 04/16/2029(3) | 6,680,000 | 6,760,259 | ||||||
CSMC 2018-RPL8 Trust | ||||||||
4.13%, 07/25/2058(3)(4) | 6,031,568 | 6,174,579 | ||||||
CWABS Asset-Backed Certificates Trust 2004-15 | ||||||||
4.61%, 04/25/2035(4) | 1,303 | 1,313 | ||||||
CWABS Asset-Backed Certificates Trust 2005-1 | ||||||||
5.03%, 07/25/2035(4) | 3,196 | 3,244 | ||||||
CWABS Asset-Backed Certificates Trust 2005-17 | ||||||||
5.56%, 05/25/2036(4) | 17,126 | 17,540 | ||||||
CWABS, Inc. Asset-Backed Certificates Series 2004-1 | ||||||||
0.74% (1 Month LIBOR USD + 0.56%, 0.28% Floor), 04/25/2034(2) | 1,112 | 960 | ||||||
0.93% (1 Month LIBOR USD + 0.75%, 0.50% Floor), 03/25/2034(2) | 20,287 | 20,096 | ||||||
1.01% (1 Month LIBOR USD + 0.83%, 0.55% Floor), 03/25/2034(2) | 6,477 | 6,372 | ||||||
CWABS, Inc. Asset-Backed Certificates Trust 2004-6 | ||||||||
0.96% (1 Month LIBOR USD + 0.78%, 0.39% Floor), 11/25/2034(2) | 639,595 | 595,370 | ||||||
1.08% (1 Month LIBOR USD + 0.90%, 0.60% Floor), 10/25/2034(2) | 9,424 | 8,672 | ||||||
Delta Air Lines 2015-1 Class AA Pass Through Trust | ||||||||
3.63%, 07/30/2027 | 1,046,329 | 1,034,725 | ||||||
Diamond Resorts Owner Trust | ||||||||
3.27%, 10/22/2029(3) | 1,177,348 | 1,175,735 | ||||||
Diamond Resorts Owner Trust 2018-1 | ||||||||
3.70%, 01/21/2031(3) | 2,745,480 | 2,799,966 |
Diamond Resorts Owner Trust 2019-1 | ||||||||
3.53%, 02/20/2032(3) | 6,613,792 | 6,341,941 | ||||||
Discover Card Execution Note Trust | ||||||||
0.45% (1 Month LIBOR USD + 0.27%), 12/15/2023(2) | 4,368,000 | 4,373,635 | ||||||
3.04%, 07/15/2024 | 3,302,000 | 3,436,708 | ||||||
Drive Auto Receivables Trust | ||||||||
3.66%, 11/15/2024 | 6,470,702 | 6,529,804 | ||||||
Drive Auto Receivables Trust 2016-C | ||||||||
4.18%, 03/15/2024(3) | 2,023,752 | 2,052,120 | ||||||
Drive Auto Receivables Trust 2017-1 | ||||||||
3.84%, 03/15/2023 | 3,504,319 | 3,557,211 | ||||||
Drive Auto Receivables Trust 2017-3 | ||||||||
3.53%, 12/15/2023(3) | 9,564,738 | 9,699,931 | ||||||
Drive Auto Receivables Trust 2017-A | ||||||||
4.16%, 05/15/2024(3) | 1,315,773 | 1,333,346 | ||||||
Drive Auto Receivables Trust 2017-B | ||||||||
3.72%, 10/17/2022(3) | 852,432 | 858,536 | ||||||
Drive Auto Receivables Trust 2019-1 | ||||||||
4.09%, 06/15/2026 | 2,645,000 | 2,696,334 | ||||||
Drive Auto Receivables Trust 2019-2 | ||||||||
3.17%, 11/15/2023 | 4,747,000 | 4,799,426 | ||||||
Drive Auto Receivables Trust 2019-3 | ||||||||
2.65%, 02/15/2024 | 4,200,000 | 4,237,194 | ||||||
Drive Auto Receivables Trust 2019-4 | ||||||||
2.23%, 01/16/2024 | 6,016,000 | 6,094,317 | ||||||
Drive Auto Receivables Trust 2020-1 | ||||||||
1.99%, 12/15/2022 | 5,024,762 | 5,046,626 | ||||||
2.02%, 11/15/2023 | 7,361,000 | 7,464,487 | ||||||
Drive Auto Receivables Trust 2020-2 | ||||||||
1.42%, 03/17/2025 | 2,260,000 | 2,266,735 | ||||||
2.28%, 08/17/2026 | 1,611,000 | 1,627,146 | ||||||
DT Auto Owner Trust 2017-1 | ||||||||
3.55%, 11/15/2022(3) | 1,738,603 | 1,748,160 | ||||||
DT Auto Owner Trust 2017-3 | ||||||||
3.58%, 05/15/2023(3) | 1,187,409 | 1,197,940 | ||||||
DT Auto Owner Trust 2018-2 | ||||||||
3.67%, 03/15/2024(3) | 6,131,052 | 6,181,753 | ||||||
DT Auto Owner Trust 2018-3 | ||||||||
3.02%, 02/15/2022(3) | 93,322 | 93,410 | ||||||
DT Auto Owner Trust 2019-1 | ||||||||
3.08%, 09/15/2022(3) | 1,585,528 | 1,589,665 | ||||||
DT Auto Owner Trust 2019-2 | ||||||||
2.85%, 09/15/2022(3) | 1,010,458 | 1,015,549 | ||||||
DT Auto Owner Trust 2019-3 | ||||||||
2.55%, 08/15/2022(3) | 1,352,967 | 1,359,932 | ||||||
DT Auto Owner Trust 2019-4 | ||||||||
2.17%, 05/15/2023(3) | 5,093,035 | 5,123,583 | ||||||
2.73%, 07/15/2025(3) | 7,080,000 | 7,156,252 | ||||||
DT Auto Owner Trust 2020-1 | ||||||||
1.94%, 09/15/2023(3) | 4,849,437 | 4,879,292 | ||||||
DT Auto Owner Trust 2020-2 | ||||||||
1.14%, 01/16/2024(3) | 3,998,000 | 4,005,034 | ||||||
2.08%, 03/16/2026(3) | 951,000 | 959,183 | ||||||
DTAT Asset Trust 2017-B | ||||||||
5.84%, 12/16/2020(3)(12) | 3,400,000 | 3,390,922 | ||||||
Engs Commercial Finance Trust 2016-1 | ||||||||
2.63%, 02/22/2022(3) | 4,345 | 4,348 | ||||||
Exeter Automobile Receivables Trust 2017-1 | ||||||||
3.95%, 12/15/2022(3) | 549,323 | 553,035 | ||||||
Exeter Automobile Receivables Trust 2017-2 | ||||||||
2.82%, 05/16/2022(3) | 258,541 | 258,765 | ||||||
Exeter Automobile Receivables Trust 2017-3 | ||||||||
3.68%, 07/17/2023(3) | 3,836,000 | 3,905,305 | ||||||
Exeter Automobile Receivables Trust 2018-4 | ||||||||
3.64%, 11/15/2022(3) | 1,168,125 | 1,173,108 | ||||||
Exeter Automobile Receivables Trust 2019-2 | ||||||||
2.93%, 07/15/2022(3) | 502,684 | 503,771 | ||||||
Exeter Automobile Receivables Trust 2019-4 | ||||||||
2.18%, 01/17/2023(3) | 2,898,763 | 2,911,090 | ||||||
Exeter Automobile Receivables Trust 2020-1 | ||||||||
2.05%, 06/15/2023(3) | 8,186,097 | 8,235,243 | ||||||
Exeter Automobile Receivables Trust 2020-2 | ||||||||
1.13%, 08/15/2023(3) | 10,260,000 | 10,274,083 | ||||||
2.08%, 07/15/2024(3) | 2,615,000 | 2,638,150 |
First Investors Auto Owner Trust 2015-2 | ||||||||
4.22%, 12/15/2021(3) | 152,052 | 152,262 | ||||||
First Investors Auto Owner Trust 2017-1 | ||||||||
2.67%, 04/17/2023(3) | 1,331,674 | 1,333,587 | ||||||
3.60%, 04/17/2023(3) | 2,847,000 | 2,893,989 | ||||||
First Investors Auto Owner Trust 2019-2 | ||||||||
2.21%, 09/16/2024(3) | 4,319,302 | 4,375,011 | ||||||
Flagship Credit Auto Trust 2015-3 | ||||||||
4.65%, 03/15/2022(3) | 277,753 | 278,892 | ||||||
Flagship Credit Auto Trust 2016-1 | ||||||||
6.22%, 06/15/2022(3) | 2,353,794 | 2,389,104 | ||||||
Flagship Credit Auto Trust 2016-4 | ||||||||
2.71%, 11/15/2022(3) | 1,027,716 | 1,032,630 | ||||||
Flagship Credit Auto Trust 2017-2 | ||||||||
2.96%, 07/15/2023(3) | 5,195,000 | 5,253,339 | ||||||
3.62%, 07/15/2023(3) | 2,995,000 | 3,056,505 | ||||||
Flagship Credit Auto Trust 2018-3 | ||||||||
3.79%, 12/16/2024(3) | 7,710,000 | 7,931,497 | ||||||
Flagship Credit Auto Trust 2019-1 | ||||||||
3.11%, 08/15/2023(3) | 4,677,923 | 4,743,227 | ||||||
Flagship Credit Auto Trust 2019-2 | ||||||||
2.83%, 10/16/2023(3) | 7,903,599 | 8,022,765 | ||||||
Flagship Credit Auto Trust 2019-4 | ||||||||
2.17%, 06/17/2024(3) | 10,526,743 | 10,664,180 | ||||||
3.12%, 01/15/2026(3) | 9,275,000 | 9,382,670 | ||||||
Flagship Credit Auto Trust 2020-1 | ||||||||
1.90%, 08/15/2024(3) | 10,273,966 | 10,380,269 | ||||||
Flagship Credit Auto Trust 2020-2 SER 2020-2 CL A REGD 144A P/P | ||||||||
1.49%, 07/15/2024(3) | 5,201,452 | 5,232,038 | ||||||
Ford Credit Auto Owner Trust 2016-REV1 | ||||||||
2.31%, 08/15/2027(3) | 7,000,000 | 7,065,228 | ||||||
Ford Credit Auto Owner Trust 2016-REV2 | ||||||||
2.03%, 12/15/2027(3) | 10,000,000 | 10,115,867 | ||||||
Ford Credit Auto Owner Trust 2017-C | ||||||||
2.01%, 03/15/2022 | 1,443,472 | 1,450,459 | ||||||
Ford Credit Auto Owner Trust 2018-REV1 | ||||||||
3.19%, 07/15/2031(3) | 24,024,000 | 25,725,286 | ||||||
Ford Credit Auto Owner Trust 2019-REV1 | ||||||||
3.52%, 07/15/2030(3) | 2,150,000 | 2,299,999 | ||||||
Ford Credit Auto Owner Trust 2020-A SER 2020-A CL A2 REGD | ||||||||
1.03%, 10/15/2022 | 360,000 | 361,617 | ||||||
Ford Credit Auto Owner Trust 2020-A SER 2020-A CL A3 REGD | ||||||||
1.04%, 08/15/2024 | 3,124,000 | 3,156,504 | ||||||
Ford Credit Auto Owner Trust 2020-A SER 2020-A CL A4 REGD | ||||||||
1.35%, 07/15/2025 | 2,163,000 | 2,206,770 | ||||||
Ford Credit Auto Owner Trust 2020-B | ||||||||
0.79%, 11/15/2025 | 3,711,000 | 3,715,490 | ||||||
Ford Credit Auto Owner Trust 2020-REV1 | ||||||||
2.04%, 08/15/2031(3) | 12,300,000 | 12,498,310 | ||||||
FORT CRE 2018-1 LLC | ||||||||
3.02% (1 Month LIBOR USD + 2.83%, 2.83% Floor), 11/16/2035(2)(3) | 11,800,000 | 10,764,267 | ||||||
Foundation Finance Trust 2017-1 | ||||||||
3.30%, 07/15/2033(3) | 1,520,097 | 1,532,608 | ||||||
Foundation Finance Trust 2019-1 | ||||||||
3.86%, 11/15/2034(3) | 2,950,998 | 2,978,284 | ||||||
Foursight Capital Automobile Receivables Trust 2017-1 | ||||||||
3.05%, 12/15/2022(3) | 4,000,000 | 4,022,731 | ||||||
FREED ABS TRUST 2018-1 | ||||||||
3.61%, 07/18/2024(3) | 512,387 | 510,722 | ||||||
FREED ABS TRUST 2018-2 | ||||||||
3.99%, 10/20/2025(3) | 1,444,703 | 1,444,138 | ||||||
FREED ABS TRUST 2019-2 | ||||||||
2.62%, 11/18/2026(3) | 2,801,134 | 2,800,583 | ||||||
FTF 2019-1 A FRN | ||||||||
5.50%, 08/15/2020(4)(12) | 4,768,029 | 3,337,853 | ||||||
Galaxy XXIX CLO Ltd. | ||||||||
1.18% (3 Month LIBOR USD + 0.79%), 11/15/2026(2)(3) | 4,540,774 | 4,464,875 | ||||||
GE Capital Mortgage Services, Inc. 1999-HE1 Trust | ||||||||
6.27%, 04/25/2029 | 13 | 13 | ||||||
6.71%, 04/25/2029(4) | 18,001 | 15,867 |
GM Financial Automobile Leasing Trust 2020-2 | ||||||||
0.80%, 07/20/2023 | 3,688,000 | 3,693,996 | ||||||
1.01%, 07/22/2024 | 1,000,000 | 1,004,281 | ||||||
GM Financial Consumer Automobile 2017-1 | ||||||||
1.78%, 10/18/2021(3) | 535,276 | 535,926 | ||||||
GM Financial Consumer Automobile Receivables Trust 2018-1 | ||||||||
2.32%, 07/18/2022 | 2,993,502 | 3,018,756 | ||||||
GM Financial Consumer Automobile Receivables Trust 2018-4 | ||||||||
3.62%, 06/17/2024 | 1,400,000 | 1,477,278 | ||||||
GM Financial Consumer Automobile Receivables Trust 2020-1 | ||||||||
1.84%, 09/16/2024 | 8,369,000 | 8,565,109 | ||||||
GM Financial Consumer Automobile Receivables Trust 2020-2 SER 2020-2 CL A3 REGD | ||||||||
1.49%, 12/16/2024 | 3,095,000 | 3,163,714 | ||||||
GM Financial Consumer Automobile Receivables Trust 2020-2 SER 2020-2 CL A4 REGD | ||||||||
1.74%, 08/18/2025 | 1,486,000 | 1,535,527 | ||||||
GMF Floorplan Owner Revolving Trust | ||||||||
2.90%, 04/15/2026(3) | 17,200,000 | 17,922,962 | ||||||
Gold Key Resorts 2014-A LLC | ||||||||
3.22%, 03/17/2031(3) | 230,709 | 230,691 | ||||||
Golden Bear 2016-R LLC | ||||||||
5.65%, 09/20/2047(3) | 1,121,408 | 1,102,251 | ||||||
Goodgreen 2017-1 Trust | ||||||||
3.74%, 10/15/2052(3) | 1,275,885 | 1,333,229 | ||||||
Goodgreen 2017-2 Trust | ||||||||
3.26%, 10/15/2053(3) | 3,498,946 | 3,564,625 | ||||||
Goodgreen 2017-R1 Trust | ||||||||
5.00%, 10/20/2051(3)(4) | 5,957,941 | 6,001,199 | ||||||
Goodgreen 2019-2 Trust | ||||||||
2.76%, 10/15/2054(3) | 5,161,322 | 5,113,772 | ||||||
Greenwood Park CLO Ltd. | ||||||||
2.23% (3 Month LIBOR USD + 1.01%), 04/15/2031(2)(3) | 23,000,000 | 22,435,350 | ||||||
GSAMP Trust 2005-WMC2 | ||||||||
0.80% (1 Month LIBOR USD + 0.62%, 0.31% Floor), 11/25/2035(2) | 854,436 | 852,350 | ||||||
GSAMP Trust 2006-HE7 | ||||||||
0.41% (1 Month LIBOR USD + 0.23%, 0.23% Floor), 10/25/2046(2) | 874,333 | 853,033 | ||||||
Headlands Residential 2018-RPL1 LLC | ||||||||
4.25%, 06/25/2023(1)(3) | 8,245,000 | 8,376,941 | ||||||
HERO Funding 2017-3 | ||||||||
3.95%, 09/20/2048(3) | 2,962,967 | 3,107,138 | ||||||
HERO Funding II 2016-3B | ||||||||
5.24%, 09/20/2042(3) | 577,108 | 582,352 | ||||||
HERO Funding Trust 2016-2 | ||||||||
3.75%, 09/20/2041(3) | 1,705,181 | 1,777,460 | ||||||
HERO Funding Trust 2016-3 | ||||||||
3.08%, 09/20/2042(3) | 746,437 | 761,734 | ||||||
HERO Funding Trust 2016-4A | ||||||||
3.57%, 09/20/2047(3) | 2,319,341 | 2,428,461 | ||||||
HERO Funding Trust 2017-1A | ||||||||
4.46%, 09/20/2047(3) | 4,050,117 | 4,304,157 | ||||||
HERO Funding Trust 2017-2 | ||||||||
3.28%, 09/20/2048(3) | 3,752,127 | 3,875,280 | ||||||
Hilton Grand Vacations Trust 2017-A | ||||||||
2.66%, 12/26/2028(3) | 1,080,675 | 1,066,486 | ||||||
Home Equity Mortgage Loan Asset-Backed Trust Series INABS 2006-A | ||||||||
0.38% (1 Month LIBOR USD + 0.20%, 0.20% Floor), 03/25/2036(2) | 22,802 | 22,441 | ||||||
Honda Auto Receivables 2017-4 Owner Trust | ||||||||
2.05%, 11/22/2021 | 1,359,335 | 1,365,578 | ||||||
Honda Auto Receivables 2020-2 Owner Trust SER 2020-2 CL A2 REGD | ||||||||
0.74%, 11/15/2022 | 1,140,000 | 1,143,443 | ||||||
Honda Auto Receivables 2020-2 Owner Trust SER 2020-2 CL A3 REGD | ||||||||
0.82%, 07/15/2024 | 3,810,000 | 3,835,804 | ||||||
Honda Auto Receivables 2020-2 Owner Trust SER 2020-2 CL A4 REGD | ||||||||
1.09%, 10/15/2026 | 1,022,000 | 1,035,852 | ||||||
Hyundai Auto Receivables Trust 2019-A | ||||||||
2.66%, 06/15/2023 | 3,452,000 | 3,539,153 | ||||||
Hyundai Auto Receivables Trust 2020-A SER 2020-A CL A3 REGD | ||||||||
1.41%, 11/15/2024 | 4,157,000 | 4,247,764 | ||||||
Hyundai Auto Receivables Trust 2020-A SER 2020-A CL A4 REGD | ||||||||
1.72%, 06/15/2026 | 3,308,000 | 3,412,198 | ||||||
Imc Home Equity Loan Trust 1997-5 | ||||||||
6.88%, 11/20/2028 | 30 | 30 | ||||||
Kabbage Funding LLC | ||||||||
3.83%, 03/15/2024(3) | 8,851,521 | 8,737,578 | ||||||
4.07%, 03/15/2024(3) | 7,519,000 | 6,393,031 |
KGS-Alpha SBA COOF Trust | ||||||||
0.63%, 05/25/2039(3)(4) | 2,118,425 | 31,901 | ||||||
KGS-Alpha SBA COOF Trust 2012-2 | ||||||||
0.98%, 08/25/2038(3)(4) | 2,361,571 | 47,687 | ||||||
KGS-Alpha SBA COOF Trust 2014-2 | ||||||||
2.76%, 04/25/2040(3)(4) | 740,659 | 63,659 | ||||||
KKR CLO 11 Ltd. | ||||||||
2.40% (3 Month LIBOR USD + 1.18%), 01/15/2031(2)(3) | 6,250,000 | 6,060,769 | ||||||
KVK CLO 2018-1 Ltd. | ||||||||
1.31% (3 Month LIBOR USD + 0.93%), 05/20/2029(2)(3) | 25,000,000 | 24,454,250 | ||||||
Laurel Road Prime Student Loan Trust 2017-C | ||||||||
2.81%, 11/25/2042(3) | 3,705,177 | 3,792,493 | ||||||
Laurel Road Prime Student Loan Trust 2018-B | ||||||||
3.54%, 05/26/2043(3) | 7,296,711 | 7,385,657 | ||||||
Legacy Mortgage Asset Trust 2019-GS4 | ||||||||
3.44%, 05/25/2059(1)(3) | 4,102,113 | 4,094,466 | ||||||
Lendingpoint 2019-2 Asset Securitization Trust | ||||||||
3.07%, 11/10/2025(3) | 4,067,606 | 4,078,512 | ||||||
Lendmark Funding Trust 2018-1 | ||||||||
5.03%, 12/21/2026(3) | 1,900,000 | 1,847,297 | ||||||
LL ABS Trust 2019-1 | ||||||||
2.87%, 03/15/2027(3) | 3,285,269 | 3,301,309 | ||||||
Long Beach Mortgage Loan Trust 2004-1 | ||||||||
0.93% (1 Month LIBOR USD + 0.75%, 0.50% Floor), 02/25/2034(2) | 142,534 | 137,012 | ||||||
Long Beach Mortgage Loan Trust 2004-3 | ||||||||
1.04% (1 Month LIBOR USD + 0.86%, 0.57% Floor), 07/25/2034(2) | 35,464 | 33,186 | ||||||
LV Tower 52 Issuer 2013-1 | ||||||||
5.75%, 02/15/2023(3)(12) | 2,651,169 | 2,673,943 | ||||||
7.75%, 02/15/2023(3)(12) | 990,199 | 998,705 | ||||||
Man GLG US CLO 2018-2 Ltd. | ||||||||
2.46% (3 Month LIBOR USD + 1.24%, 1.24% Floor), 10/15/2028(2)(3) | 8,000,000 | 7,860,808 | ||||||
Mariner Finance Issuance Trust 2019-A | ||||||||
3.51%, 07/20/2032(3) | 5,235,000 | 5,052,377 | ||||||
MASTR Asset Backed Securities Trust 2006-NC1 | ||||||||
0.78% (1 Month LIBOR USD + 0.60%, 0.30% Floor), 01/25/2036(2) | 550,325 | 549,460 | ||||||
MidOcean Credit CLO III | ||||||||
2.23% (3 Month LIBOR USD + 1.12%, 1.12% Floor), 04/21/2031(2)(3) | 15,345,798 | 15,008,513 | ||||||
MidOcean Credit CLO IX | ||||||||
2.29% (3 Month LIBOR USD + 1.15%, 1.15% Floor), 07/20/2031(2)(3) | 4,000,000 | 3,912,808 | ||||||
Mid-State Capital Corp. 2006-1 Trust | ||||||||
6.08%, 10/15/2040(3) | 649,059 | 696,508 | ||||||
Mid-State Capital Trust 2010-1 | ||||||||
3.50%, 12/15/2045(3) | 149,771 | 152,630 | ||||||
5.25%, 12/15/2045(3) | 269,507 | 278,742 | ||||||
MMAF Equipment Finance LLC 2019-B | ||||||||
2.29%, 11/12/2041(3) | 7,200,000 | 7,623,721 | ||||||
Mountain View CLO 2015-9 Ltd. | ||||||||
2.34% (3 Month LIBOR USD + 1.12%), 07/15/2031(2)(3) | 20,000,000 | 19,206,620 | ||||||
MRA Issuance Trust 2019-3 REGD | ||||||||
2.03% (1 Month LIBOR USD + 1.85%), 07/10/2020(2)(3)(12) | 3,900,000 | 3,900,000 | ||||||
MRA Issuance Trust 2019-3 SER 2019-3 CL A2 V/R REGD 144A P/P | ||||||||
2.03% (1 Month LIBOR USD + 1.85%), 07/10/2020(2)(3)(12) | 7,525,800 | 7,525,800 | ||||||
Navient Private Education Refi Loan Trust 2018-A | ||||||||
3.19%, 02/18/2042(3) | 14,956,813 | 15,308,644 | ||||||
Navient Private Education Refi Loan Trust 2018-C | ||||||||
3.52%, 06/16/2042(3) | 5,700,000 | 5,881,937 | ||||||
Navient Private Education Refi Loan Trust 2019-C | ||||||||
3.13%, 02/15/2068(3) | 6,600,000 | 6,809,204 | ||||||
Navient Private Education Refi Loan Trust 2020-B | ||||||||
2.12%, 01/15/2069(3) | 5,400,000 | 5,485,207 | ||||||
Navient Student Loan Trust 2018-EA | ||||||||
4.00%, 12/15/2059(3) | 6,200,000 | 6,458,204 | ||||||
New Century Home Equity Loan Trust Series 2003-5 | ||||||||
5.04%, 11/25/2033(1) | 149,781 | 154,619 | ||||||
New Residential Mortgage Loan Trust 2018-1 | ||||||||
4.00%, 12/25/2057(3)(4) | 7,561,649 | 8,013,185 | ||||||
Nissan Auto Receivables 2019-A Owner Trust | ||||||||
2.82%, 01/18/2022 | 3,101,179 | 3,116,739 | ||||||
Nissan Auto Receivables 2020-A Owner Trust SER 2020-A CL A3 REGD | ||||||||
1.38%, 12/16/2024 | 3,974,000 | 4,052,034 |
Nomura Home Equity Loan, Inc. Home Equity Loan Trust Series 2006-FM1 | ||||||||
0.41% (1 Month LIBOR USD + 0.23%, 0.23% Floor), 11/25/2035(2) | 7,777,878 | 7,662,137 | ||||||
Oakwood Mortgage Investors, Inc. | ||||||||
6.45%, 12/15/2023 | 1,261 | 1,281 | ||||||
OL SP 2018-B LLC | ||||||||
4.16%, 02/09/2030 | 2,308,682 | 2,336,462 | ||||||
4.61%, 02/09/2030 | 501,888 | 463,167 | ||||||
OnDeck Asset Securitization Trust LLC | ||||||||
3.50%, 04/18/2022(3) | 3,647,248 | 3,617,270 | ||||||
OneMain Direct Auto Receivables Trust 2017-2 | ||||||||
2.55%, 11/14/2023(3) | 4,325,597 | 4,329,322 | ||||||
OneMain Direct Auto Receivables Trust 2018-1 | ||||||||
3.43%, 12/16/2024(3) | 19,400,000 | 19,676,495 | ||||||
OneMain Financial Issuance Trust 2016-1 | ||||||||
6.00%, 02/20/2029(3) | 1,900,000 | 1,907,438 | ||||||
OneMain Financial Issuance Trust 2017-1 | ||||||||
0.98% (1 Month LIBOR USD + 0.80%), 09/14/2032(2)(3) | 5,059,073 | 5,044,856 | ||||||
Oportun Funding VII LLC | ||||||||
3.22%, 10/10/2023(3) | 1,691,000 | 1,685,476 | ||||||
Oportun Funding VIII LLC | ||||||||
3.61%, 03/08/2024(3) | 2,978,000 | 2,982,829 | ||||||
Oportun Funding X LLC | ||||||||
4.10%, 10/08/2024(3) | 5,900,000 | 5,922,849 | ||||||
Oportun Funding XII LLC | ||||||||
4.15%, 12/09/2024(3) | 4,200,000 | 4,196,768 | ||||||
Option One Mortgage Loan Trust 2004-3 | ||||||||
1.08% (1 Month LIBOR USD + 0.90%, 0.45% Floor), 11/25/2034(2) | 1,691,802 | 1,501,503 | ||||||
OZLM Funding IV Ltd. | ||||||||
2.35% (3 Month LIBOR USD + 1.25%), 10/22/2030(2)(3) | 9,915,324 | 9,673,985 | ||||||
OZLM XXII Ltd. | ||||||||
2.20% (3 Month LIBOR USD + 1.07%), 01/17/2031(2)(3) | 6,991,130 | 6,706,361 | ||||||
P4 SFR 2019-STL A 7.5 11 OCT 2026 | ||||||||
7.50%, 10/11/2022(12) | 5,700,000 | 5,700,000 | ||||||
Palmer Square CLO 2014-1 Ltd. | ||||||||
2.26% (3 Month LIBOR USD + 1.13%, 1.13% Floor), 01/17/2031(2)(3) | 4,000,000 | 3,888,724 | ||||||
Palmer Square CLO 2018-2 Ltd. | ||||||||
2.28% (3 Month LIBOR USD + 1.10%), 07/16/2031(2)(3) | 20,000,000 | 19,360,680 | ||||||
Park Avenue Institutional Advisers CLO Ltd. 2018-1 | ||||||||
2.42% (3 Month LIBOR USD + 1.28%, 1.28% Floor), 10/20/2031(2)(3) | 21,500,000 | 21,006,166 | ||||||
Progress Residential 2017-SFR1 Trust | ||||||||
3.02%, 08/17/2034(3) | 2,000,000 | 2,026,642 | ||||||
Progress Residential 2018-SFR2 Trust | ||||||||
4.34%, 08/17/2035(3) | 2,390,000 | 2,458,120 | ||||||
4.66%, 08/17/2035(3) | 3,853,000 | 3,947,206 | ||||||
PRPM 2019-4 LLC | ||||||||
3.35%, 11/25/2024(1)(3) | 6,037,171 | 6,042,441 | ||||||
PRPM 2020-1 LLC | ||||||||
2.98%, 02/25/2025(1)(3) | 5,600,071 | 5,564,947 | ||||||
Purchasing Power Funding 2018-A LLC | ||||||||
3.34%, 08/15/2022(3) | 5,630,032 | 5,639,389 | ||||||
RAMP Series 2005-RS1 Trust | ||||||||
4.71%, 11/25/2034 | 423 | 426 | ||||||
Regional Management Issuance Trust 2018-1 | ||||||||
4.28%, 07/15/2027(3) | 3,100,000 | 3,001,387 | ||||||
Renaissance Home Equity Loan Trust | ||||||||
5.61%, 04/25/2037(1) | 298,832 | 116,803 | ||||||
Renew 2017-1 | ||||||||
3.67%, 09/20/2052(3) | 1,647,349 | 1,700,090 | ||||||
Rice Park Financing Trust 2016-A | ||||||||
4.63%, 10/31/2041(3) | 2,406,402 | 2,358,843 | ||||||
Santander Drive Auto Receivables Trust 2017-1 | ||||||||
2.58%, 05/16/2022 | 78,477 | 78,550 | ||||||
3.17%, 04/17/2023 | 5,074,000 | 5,137,538 | ||||||
Santander Drive Auto Receivables Trust 2017-2 | ||||||||
2.79%, 08/15/2022 | 1,727,313 | 1,729,893 | ||||||
3.49%, 07/17/2023 | 1,633,000 | 1,660,903 | ||||||
Santander Drive Auto Receivables Trust 2019-1 | ||||||||
3.21%, 09/15/2023 | 5,212,000 | 5,265,453 | ||||||
Santander Drive Auto Receivables Trust 2019-3 | ||||||||
2.49%, 10/15/2025 | 5,800,000 | 5,861,569 | ||||||
Santander Drive Auto Receivables Trust 2020-1 SER 2020-1 CL A2A REGD | ||||||||
2.07%, 01/17/2023 | 6,225,000 | 6,275,872 |
Santander Drive Auto Receivables Trust 2020-1 SER 2020-1 CL A3 REGD | ||||||||
2.03%, 02/15/2024 | 2,239,000 | 2,280,312 | ||||||
Santander Retail Auto Lease Trust 2018-A | ||||||||
2.93%, 05/20/2021(3) | 1,343,305 | 1,346,098 | ||||||
SART 2017-1 | ||||||||
4.75%, 07/15/2024(12) | 6,832,205 | 6,763,883 | ||||||
SART 2018-1 | ||||||||
4.76%, 06/15/2025(12) | 7,974,512 | 7,974,512 | ||||||
Securitized Asset Backed Receivables LLC Trust 2006-CB1 | ||||||||
3.20%, 01/25/2036(1) | 56,974 | 53,179 | ||||||
Sierra Timeshare 2019-3 Receivables Funding LLC | ||||||||
2.75%, 08/20/2036(3) | 3,753,575 | 3,529,914 | ||||||
SoFi Consumer Loan Program 2016-2 LLC | ||||||||
3.09%, 10/27/2025(3) | 40,499 | 40,572 | ||||||
SoFi Consumer Loan Program 2018-1 Trust | ||||||||
3.14%, 02/25/2027(3) | 4,258,256 | 4,290,974 | ||||||
SoFi Consumer Loan Program 2019-3 Trust | ||||||||
2.90%, 05/25/2028(3) | 3,042,988 | 3,085,215 | ||||||
SoFi Consumer Loan Program 2020-1 Trust | ||||||||
2.02%, 01/25/2029(3) | 10,212,435 | 10,320,720 | ||||||
SoFi Professional Loan Program 2017-F LLC | ||||||||
2.84%, 01/25/2041(3) | 16,272,444 | 16,634,010 | ||||||
SoFi Professional Loan Program 2018-B Trust | ||||||||
3.34%, 08/25/2047(3) | 6,200,000 | 6,410,838 | ||||||
SoFi Professional Loan Program 2019-C LLC | ||||||||
2.37%, 11/16/2048(3) | 7,800,000 | 7,962,596 | ||||||
SoFi Professional Loan Program 2020-ATrust | ||||||||
2.54%, 05/15/2046(3) | 7,800,000 | 8,082,400 | ||||||
Sound Point CLO II Ltd. | ||||||||
2.06% (3 Month LIBOR USD + 1.07%, 1.07% Floor), 01/26/2031(2)(3) | 9,000,000 | 8,681,301 | ||||||
Specialty Underwriting & Residential Finance Trust Series 2004-BC4 | ||||||||
0.85% (1 Month LIBOR USD + 0.67%, 0.34% Floor), 10/25/2035(2) | 137,697 | 136,720 | ||||||
Springleaf Funding Trust 2017-A | ||||||||
2.68%, 07/15/2030(3) | 9,900,000 | 9,891,044 | ||||||
Structured Asset Securities Corp. Mortgage Loan Trust 2005-7XS | ||||||||
5.44%, 04/25/2035(1) | 862 | 885 | ||||||
Structured Asset Securities Corp. Mortgage Pass-Through Ctfs Series 2004-6XS | ||||||||
6.03%, 03/25/2034(1) | 71,797 | 73,013 | ||||||
6.05%, 03/25/2034(1) | 57,419 | 58,391 | ||||||
Structured Asset Securities Corp. Pass-Through Certificates Series 2002-AL1 | ||||||||
3.45%, 02/25/2032 | 19,574 | 18,810 | ||||||
3.45%, 02/25/2032 | 50,920 | 49,456 | ||||||
Synchrony Card Funding LLC | ||||||||
2.95%, 03/15/2025 | 12,384,000 | 12,830,000 | ||||||
Synchrony Card Issuance Trust | ||||||||
3.38%, 09/15/2024 | 5,500,000 | 5,663,111 | ||||||
Towd Point Mortgage Trust 2017-2 | ||||||||
2.75%, 04/25/2057(3)(4) | 4,938,309 | 5,025,262 | ||||||
Towd Point Mortgage Trust 2017-6 | ||||||||
2.75%, 10/25/2057(3)(4) | 4,613,887 | 4,779,643 | ||||||
Towd Point Mortgage Trust 2018-1 | ||||||||
3.00%, 01/25/2058(3)(4) | 6,558,535 | 6,794,337 | ||||||
Towd Point Mortgage Trust 2019-1 | ||||||||
3.75%, 03/25/2058(3)(4) | 7,729,745 | 8,320,985 | ||||||
Towd Point Mortgage Trust 2019-HY3 | ||||||||
1.18% (1 Month LIBOR USD + 1.00%, 1.00% Floor), 10/25/2059(2)(3) | 2,264,863 | 2,256,190 | ||||||
Towd Point Mortgage Trust 2020-MH1 | ||||||||
2.25%, 02/25/2060(3)(4) | 8,513,525 | 8,635,230 | ||||||
Toyota Auto Loan Extended Note Trust 2019-1 | ||||||||
2.56%, 11/25/2031(3) | 15,275,000 | 16,257,890 | ||||||
Toyota Auto Loan Extended Note Trust 2020-1 | ||||||||
1.35%, 05/25/2033(3) | 12,248,000 | 12,431,092 | ||||||
Toyota Auto Receivables 2020-A Owner Trust | ||||||||
1.68%, 05/15/2025 | 1,196,000 | 1,233,189 | ||||||
Toyota Auto Receivables 2020-B Owner Trust SER 2020-B CL A3 REGD | ||||||||
1.36%, 08/15/2024 | 3,481,000 | 3,546,244 | ||||||
Toyota Auto Receivables 2020-B Owner Trust SER 2020-B CL A4 REGD | ||||||||
1.66%, 09/15/2025 | 3,189,000 | 3,284,771 | ||||||
Trafigura Securitisation Finance Plc 2018-1 | ||||||||
3.73%, 03/15/2022(3) | 12,666,667 | 12,816,011 | ||||||
Tricolor Auto Securitization Trust 2018-1 | ||||||||
5.05%, 12/15/2020(3) | 764,152 | 760,621 |
Trinitas CLO IV Ltd. | ||||||||
2.32% (3 Month LIBOR USD + 1.18%), 10/18/2031(2)(3) | 7,500,000 | 7,312,935 | ||||||
US Auto Funding 2018-1 LLC | ||||||||
5.50%, 07/15/2023(3) | 2,328,161 | 2,374,977 | ||||||
USAA Auto Owner Trust 2019-1 | ||||||||
2.14%, 11/15/2024 | 4,004,000 | 4,116,982 | ||||||
Venture 32 CLO Ltd. | ||||||||
2.24% (3 Month LIBOR USD + 1.10%, 1.10% Floor), 07/18/2031(2)(3) | 6,000,000 | 5,802,666 | ||||||
Vericrest Opportunity Loan Trust 2019-NPL5 | ||||||||
3.35%, 09/25/2049(1)(3) | 5,079,597 | 5,081,434 | ||||||
Vericrest Opportunity Loan Trust 2019-NPL8 | ||||||||
3.28%, 11/25/2049(1)(3) | 14,190,658 | 14,174,801 | ||||||
Vericrest Opportunity Loan Trust 2020-NPL2 | ||||||||
2.98%, 02/25/2050(1)(3) | 6,973,206 | 6,906,709 | ||||||
Verizon Owner Trust 2017-2 | ||||||||
1.92%, 12/20/2021(3) | 343,190 | 343,511 | ||||||
Verizon Owner Trust 2017-3 | ||||||||
2.06%, 04/20/2022(3) | 1,577,792 | 1,583,030 | ||||||
Verizon Owner Trust 2018-A SER 2018-A CL A1A REGD | ||||||||
3.23%, 04/20/2023 | 9,117,000 | 9,317,760 | ||||||
Verizon Owner Trust 2019-A | ||||||||
2.93%, 09/20/2023 | 5,473,000 | 5,633,427 | ||||||
Verizon Owner Trust 2019-B | ||||||||
2.33%, 12/20/2023 | 10,525,000 | 10,802,584 | ||||||
Verizon Owner Trust 2020-A | ||||||||
1.85%, 07/22/2024 | 9,704,000 | 9,959,312 | ||||||
VM DEBT 2019-1 TR | ||||||||
7.50%, 06/15/2024(12) | 6,598,828 | 6,208,045 | ||||||
Volkswagen Auto Loan Enhanced Trust 2020-1 SER 2020-1 CL A3 REGD | ||||||||
0.98%, 11/20/2024 | 5,114,000 | 5,164,458 | ||||||
Volkswagen Auto Loan Enhanced Trust 2020-1 SER 2020-1 CL A4 REGD | ||||||||
1.26%, 08/20/2026 | 1,923,000 | 1,956,227 | ||||||
Volt LXIV LLC | ||||||||
3.38%, 10/25/2047(1)(3) | 2,567,530 | 2,565,985 | ||||||
VOLT LXXXIII LLC | ||||||||
3.33%, 11/26/2049(1)(3) | 11,020,442 | 11,001,135 | ||||||
VOLT LXXXV LLC | ||||||||
3.23%, 01/25/2050(1)(3) | 8,917,394 | 8,862,146 | ||||||
VOLT LXXXVII LLC | ||||||||
2.98%, 02/25/2050(1)(3) | 15,858,732 | 15,713,152 | ||||||
VOLT LXXXVIII LLC | ||||||||
2.98%, 03/25/2050(1)(3) | 8,323,360 | 8,207,231 | ||||||
Voya CLO 2015-1 Ltd. | ||||||||
2.04% (3 Month LIBOR USD + 0.90%, 0.90% Floor), 01/18/2029(2)(3) | 6,000,000 | 5,894,946 | ||||||
VSE 2018-A Voi Mortgage LLC | ||||||||
3.56%, 02/20/2036(3) | 2,107,538 | 2,150,305 | ||||||
Westgate Resorts 2017-1 LLC | ||||||||
3.05%, 12/20/2030(3) | 651,792 | 650,682 | ||||||
4.05%, 12/20/2030(3) | 1,160,047 | 1,125,953 | ||||||
Westlake Automobile Receivables Trust 2017-1 | ||||||||
3.46%, 10/17/2022(3) | 759,041 | 761,240 | ||||||
Westlake Automobile Receivables Trust 2017-2 | ||||||||
2.59%, 12/15/2022(3) | 105,728 | 105,850 | ||||||
Westlake Automobile Receivables Trust 2019-1 | ||||||||
3.06%, 05/16/2022(3) | 4,111,988 | 4,133,334 | ||||||
Westlake Automobile Receivables Trust 2019-3 | ||||||||
2.15%, 02/15/2023(3) | 8,875,065 | 8,932,767 | ||||||
World Financial Network Credit Card Master Trust | ||||||||
3.14%, 12/15/2025 | 5,660,000 | 5,838,943 | ||||||
World Omni Auto Receivables Trust 2018-D | ||||||||
3.33%, 04/15/2024 | 15,916,000 | 16,425,853 | ||||||
World Omni Auto Receivables Trust 2019-B | ||||||||
2.59%, 07/15/2024 | 6,018,000 | 6,183,036 | ||||||
World Omni Auto Receivables Trust 2019-C | ||||||||
1.96%, 12/16/2024 | 5,525,000 | 5,677,965 | ||||||
World Omni Auto Receivables Trust 2020-B | ||||||||
0.82%, 01/15/2026 | 3,296,000 | 3,301,865 | ||||||
Zais CLO 7 Ltd. | ||||||||
2.51% (3 Month LIBOR USD + 1.29%), 04/15/2030(2)(3) | 9,529,086 | 9,285,571 | ||||||
Zais CLO 8 Ltd. | ||||||||
2.17% (3 Month LIBOR USD + 0.95%), 04/15/2029(2)(3) | 39,562,018 | 37,868,961 | ||||||
|
| |||||||
Total Asset-Backed Obligations (Cost: $1,646,246,827) | 1,650,463,994 | |||||||
|
|
Corporate Bonds – 33.46% | ||||||||
Basic Materials – 1.07% | ||||||||
Air Liquide Finance SA | ||||||||
2.25%, 09/27/2023(3) | 550,000 | 573,817 | ||||||
Albemarle Corp. | ||||||||
5.45%, 12/01/2044 | 600,000 | 630,352 | ||||||
Anglo American Capital Plc | ||||||||
3.63%, 09/11/2024(3) | 630,000 | 661,048 | ||||||
4.00%, 09/11/2027(3) | 1,020,000 | 1,090,309 | ||||||
Barrick Gold Corp. | ||||||||
6.45%, 10/15/2035 | 203,000 | 273,633 | ||||||
Barrick North America Finance LLC | ||||||||
5.75%, 05/01/2043 | 4,480,000 | 6,267,792 | ||||||
BHP Billiton Finance USA Ltd. | ||||||||
6.25% (5 Year Swap Rate USD + 4.97%), 10/19/2075(2)(3) | 985,000 | 989,876 | ||||||
Braskem Netherlands Finance BV | ||||||||
5.88%, 01/31/2050(3) | 1,575,000 | 1,386,000 | ||||||
CF Industries, Inc. | ||||||||
5.38%, 03/15/2044 | 2,040,000 | 2,205,852 | ||||||
Chevron Phillips Chemical Co. LLC | ||||||||
5.13%, 04/01/2025(3) | 1,705,000 | 1,954,262 | ||||||
CNAC HK Finbridge Co. Ltd. | ||||||||
4.13%, 03/14/2021 | 4,255,000 | 4,311,719 | ||||||
Dow Chemical Co. | ||||||||
4.55%, 11/30/2025 | 6,660,000 | 7,592,564 | ||||||
5.55%, 11/30/2048 | 3,005,000 | 3,940,663 | ||||||
DuPont de Nemours, Inc. | ||||||||
5.32%, 11/15/2038 | 5,665,000 | 7,149,566 | ||||||
5.42%, 11/15/2048 | 1,200,000 | 1,591,426 | ||||||
Eastman Chemical Co. | ||||||||
4.50%, 01/15/2021 | 352,000 | 354,338 | ||||||
Ecolab, Inc. | ||||||||
3.25%, 01/14/2023 | 452,000 | 479,984 | ||||||
FMC Corp. | ||||||||
3.95%, 02/01/2022 | 1,725,000 | 1,789,205 | ||||||
Freeport-McMoRan, Inc. | ||||||||
3.55%, 03/01/2022 | 4,971,000 | 4,971,000 | ||||||
Glencore Finance Canada Ltd. | ||||||||
4.25%, 10/25/2022(3) | 5,000,000 | 5,285,750 | ||||||
Glencore Funding LLC | ||||||||
3.88%, 10/27/2027(3) | 875,000 | 930,055 | ||||||
4.00%, 03/27/2027(3) | 6,300,000 | 6,751,119 | ||||||
4.13%, 05/30/2023(3) | 54,000 | 57,728 | ||||||
4.63%, 04/29/2024(3) | 1,500,000 | 1,641,912 | ||||||
Indonesia Asahan Alumini | ||||||||
4.75%, 05/15/2025(3) | 2,727,000 | 2,910,763 | ||||||
5.45%, 05/15/2030(3) | 1,966,000 | 2,192,483 | ||||||
International Flavors & Fragrances, Inc. | ||||||||
4.45%, 09/26/2028 | 720,000 | 819,185 | ||||||
International Paper Co. | ||||||||
6.00%, 11/15/2041 | 3,150,000 | 4,147,468 | ||||||
8.70%, 06/15/2038 | 350,000 | 536,439 | ||||||
LYB International Finance BV | ||||||||
4.88%, 03/15/2044 | 610,000 | 719,533 | ||||||
LYB International Finance III REGD | ||||||||
4.20%, 05/01/2050 | 2,829,000 | 3,046,765 | ||||||
LyondellBasell Industries NV | ||||||||
5.75%, 04/15/2024 | 2,550,000 | 2,939,208 | ||||||
6.00%, 11/15/2021 | 2,628,000 | 2,774,488 | ||||||
Mosaic Co. | ||||||||
4.25%, 11/15/2023 | 8,533,000 | 8,945,130 | ||||||
5.63%, 11/15/2043 | 2,055,000 | 2,199,021 | ||||||
Newmont Goldcorp Corp. | ||||||||
3.63%, 06/09/2021 | 1,810,000 | 1,847,539 | ||||||
Nucor Corp. | ||||||||
6.40%, 12/01/2037 | 800,000 | 1,110,250 | ||||||
Nutrien Ltd. | ||||||||
3.15%, 10/01/2022 | 875,000 | 906,944 | ||||||
4.13%, 03/15/2035 | 1,960,000 | 2,199,658 | ||||||
4.20%, 04/01/2029 | 420,000 | 487,293 | ||||||
5.25%, 01/15/2045 | 1,900,000 | 2,347,661 | ||||||
6.13%, 01/15/2041 | 2,850,000 | 3,661,555 |
Orbia Advance Corp. SAB de CV | ||||||||
4.88%, 09/19/2022(3) | 3,425,000 | 3,579,125 | ||||||
Rio Tinto Alcan, Inc. | ||||||||
5.75%, 06/01/2035 | 54,000 | 78,285 | ||||||
Samarco Mineracao SA | ||||||||
5.75%, 10/24/2023(3)(5) | 537,000 | 276,560 | ||||||
SASOL Financing USA LLC | ||||||||
5.88%, 03/27/2024 | 3,249,000 | 2,891,610 | ||||||
6.50%, 09/27/2028 | 1,555,000 | 1,374,869 | ||||||
Sherwin-Williams Co. | ||||||||
3.13%, 06/01/2024 | 401,000 | 430,853 | ||||||
Solvay Finance America LLC | ||||||||
4.45%, 12/03/2025(3) | 7,000,000 | 7,907,263 | ||||||
Southern Copper Corp. | ||||||||
5.25%, 11/08/2042 | 1,000,000 | 1,183,691 | ||||||
Steel Dynamics, Inc. | ||||||||
3.45%, 04/15/2030 | 823,000 | 860,140 | ||||||
Syngenta Finance NV | ||||||||
4.44%, 04/24/2023(3) | 3,561,000 | 3,737,458 | ||||||
4.89%, 04/24/2025(3) | 7,180,000 | 7,548,421 | ||||||
5.18%, 04/24/2028(3) | 1,721,000 | 1,835,455 | ||||||
Teck Resources Ltd. | ||||||||
3.90%, 07/15/2030(3) | 1,597,000 | 1,593,435 | ||||||
Union Carbide Corp. | ||||||||
7.50%, 06/01/2025 | 624,000 | 755,324 | ||||||
7.75%, 10/01/2096 | 681,000 | 874,313 | ||||||
Vale Overseas Ltd. | ||||||||
6.25%, 08/10/2026 | 5,000,000 | 5,881,250 | ||||||
6.88%, 11/21/2036 | 167,000 | 218,186 | ||||||
6.88%, 11/10/2039 | 2,107,000 | 2,749,656 | ||||||
8.25%, 01/17/2034 | 984,000 | 1,378,830 | ||||||
|
| |||||||
Total Basic Materials |
| 151,826,077 | ||||||
|
| |||||||
Communications – 2.74% | ||||||||
Amazon.com, Inc. | ||||||||
2.50%, 06/03/2050 | 3,245,000 | 3,281,914 | ||||||
2.70%, 06/03/2060 | 670,000 | 680,086 | ||||||
3.88%, 08/22/2037 | 1,700,000 | 2,104,309 | ||||||
America Movil SAB de CV | ||||||||
3.13%, 07/16/2022 | 374,000 | 386,888 | ||||||
3.63%, 04/22/2029 | 1,935,000 | 2,145,257 | ||||||
4.38%, 04/22/2049 | 1,214,000 | 1,477,535 | ||||||
AT&T, Inc. | ||||||||
2.30%, 06/01/2027 | 4,900,000 | 5,059,022 | ||||||
2.75%, 06/01/2031 | 10,271,000 | 10,625,209 | ||||||
2.95%, 07/15/2026 | 2,000,000 | 2,162,722 | ||||||
3.20%, 03/01/2022 | 4,022,000 | 4,196,938 | ||||||
3.40%, 05/15/2025 | 17,242,000 | 18,958,553 | ||||||
3.50%, 06/01/2041 | 2,821,000 | 2,962,563 | ||||||
3.55%, 06/01/2024 | 2,300,000 | 2,514,235 | ||||||
3.60%, 07/15/2025 | 7,353,000 | 8,166,484 | ||||||
3.80%, 02/15/2027 | 2,850,000 | 3,209,347 | ||||||
3.90%, 03/11/2024 | 3,750,000 | 4,140,184 | ||||||
3.95%, 01/15/2025 | 811,000 | 906,704 | ||||||
4.30%, 02/15/2030 | 1,702,000 | 1,988,464 | ||||||
4.30%, 12/15/2042 | 444,000 | 497,215 | ||||||
4.50%, 05/15/2035 | 6,175,000 | 7,325,572 | ||||||
4.55%, 03/09/2049 | 3,150,000 | 3,712,423 | ||||||
4.65%, 06/01/2044 | 2,145,000 | 2,451,888 | ||||||
4.80%, 06/15/2044 | 915,000 | 1,083,191 | ||||||
4.85%, 03/01/2039 | 13,085,000 | 15,777,359 | ||||||
4.90%, 08/15/2037 | 975,000 | 1,167,904 | ||||||
5.15%, 03/15/2042 | 40,000 | 49,912 | ||||||
5.15%, 11/15/2046 | 5,722,000 | 7,195,354 | ||||||
5.25%, 03/01/2037 | 1,908,000 | 2,358,502 | ||||||
5.38%, 10/15/2041 | 181,000 | 226,893 | ||||||
6.00%, 08/15/2040 | 3,095,000 | 4,162,163 | ||||||
6.38%, 03/01/2041 | 7,828,000 | 11,087,453 | ||||||
Booking Holdings, Inc. | ||||||||
2.75%, 03/15/2023 | 857,000 | 898,491 | ||||||
CBS Corp. | ||||||||
3.70%, 06/01/2028 | 870,000 | 945,998 | ||||||
4.00%, 01/15/2026 | 1,000,000 | 1,119,501 | ||||||
4.90%, 08/15/2044 | 315,000 | 341,968 | ||||||
Charter Communications Operating LLC | ||||||||
3.70%, 04/01/2051 | 2,580,000 | 2,509,717 | ||||||
4.91%, 07/23/2025 | 16,855,000 | 19,328,159 | ||||||
5.05%, 03/30/2029 | 560,000 | 660,571 | ||||||
5.38%, 04/01/2038 | 835,000 | 1,016,756 | ||||||
5.38%, 05/01/2047 | 4,610,000 | 5,441,626 | ||||||
6.38%, 10/23/2035 | 5,867,000 | 7,739,468 | ||||||
6.48%, 10/23/2045 | 1,275,000 | 1,694,019 | ||||||
6.83%, 10/23/2055 | 690,000 | 929,362 | ||||||
Comcast Cable Holdings LLC | ||||||||
10.13%, 04/15/2022 | 186,000 | 212,116 | ||||||
Comcast Corp. | ||||||||
1.95%, 01/15/2031 | 5,376,000 | 5,475,292 | ||||||
3.15%, 03/01/2026 | 1,716,000 | 1,920,106 | ||||||
3.15%, 02/15/2028 | 1,500,000 | 1,674,739 | ||||||
3.25%, 11/01/2039 | 1,595,000 | 1,769,543 | ||||||
3.45%, 02/01/2050 | 914,000 | 1,035,957 | ||||||
3.55%, 05/01/2028 | 886,000 | 1,022,098 | ||||||
3.60%, 03/01/2024 | 542,000 | 602,003 | ||||||
3.75%, 04/01/2040 | 2,195,000 | 2,581,892 | ||||||
3.90%, 03/01/2038 | 455,000 | 540,110 | ||||||
3.95%, 10/15/2025 | 1,614,000 | 1,849,560 | ||||||
3.97%, 11/01/2047 | 154,000 | 185,987 | ||||||
4.00%, 11/01/2049 | 638,000 | 770,139 | ||||||
4.05%, 11/01/2052 | 300,000 | 367,921 | ||||||
4.20%, 08/15/2034 | 555,000 | 675,200 | ||||||
4.25%, 01/15/2033 | 3,107,000 | 3,814,421 | ||||||
4.60%, 10/15/2038 | 4,314,000 | 5,493,826 | ||||||
4.70%, 10/15/2048 | 5,303,000 | 7,116,898 | ||||||
4.95%, 10/15/2058 | 2,000,000 | 2,843,181 | ||||||
Corning, Inc. | ||||||||
5.35%, 11/15/2048 | 960,000 | 1,267,654 | ||||||
Cox Communications, Inc. | ||||||||
3.25%, 12/15/2022(3) | 348,000 | 366,750 | ||||||
3.35%, 09/15/2026(3) | 369,000 | 407,995 | ||||||
3.50%, 08/15/2027(3) | 8,245,000 | 9,100,486 | ||||||
3.85%, 02/01/2025(3) | 1,250,000 | 1,364,619 | ||||||
4.60%, 08/15/2047(3) | 588,000 | 744,412 | ||||||
4.80%, 02/01/2035(3) | 6,000,000 | 7,544,551 | ||||||
8.38%, 03/01/2039(3) | 1,500,000 | 2,449,764 | ||||||
Crown Castle Towers LLC | ||||||||
3.22%, 05/15/2022(3) | 589,000 | 598,825 | ||||||
3.66%, 05/15/2025(3) | 955,000 | 1,018,730 | ||||||
Deutsche Telekom AG | ||||||||
3.63%, 01/21/2050(3) | 1,926,000 | 2,129,651 | ||||||
Deutsche Telekom International Finance BV | ||||||||
3.60%, 01/19/2027(3) | 508,000 | 568,516 | ||||||
4.88%, 03/06/2042(3) | 240,000 | 310,129 | ||||||
8.75%, 06/15/2030 | 49,000 | 76,320 | ||||||
Discovery Communications LLC | ||||||||
5.20%, 09/20/2047 | 1,375,000 | 1,599,119 | ||||||
Fox Corp. | ||||||||
5.58%, 01/25/2049 | 1,450,000 | 2,039,995 | ||||||
Grupo Televisa SAB | ||||||||
6.13%, 01/31/2046 | 382,000 | 486,503 | ||||||
Level 3 Financing, Inc. | ||||||||
3.40%, 03/01/2027(3) | 7,000,000 | 7,385,910 | ||||||
NBCUniversal Media LLC | ||||||||
4.45%, 01/15/2043 | 15,000 | 18,834 | ||||||
5.95%, 04/01/2041 | 527,000 | 781,830 | ||||||
Qwest Corp. | ||||||||
6.75%, 12/01/2021 | 3,866,000 | 4,085,613 | ||||||
Rogers Communications, Inc. | ||||||||
4.35%, 05/01/2049 | 1,335,000 | 1,634,810 | ||||||
Sky Ltd. | ||||||||
3.75%, 09/16/2024(3) | 287,000 | 319,580 | ||||||
TCI Communications, Inc. | ||||||||
7.13%, 02/15/2028 | 138,000 | 192,234 | ||||||
Telecom Italia Capital SA | ||||||||
7.20%, 07/18/2036 | 1,644,000 | 1,956,360 |
Telefonica Emisiones SA | ||||||||
4.10%, 03/08/2027 | 4,775,000 | 5,450,133 | ||||||
4.67%, 03/06/2038 | 1,175,000 | 1,402,291 | ||||||
4.90%, 03/06/2048 | 1,075,000 | 1,304,607 | ||||||
5.46%, 02/16/2021 | 233,000 | 239,876 | ||||||
Tencent Holdings Ltd. | ||||||||
1.81%, 01/26/2026(3) | 2,973,000 | 3,006,358 | ||||||
3.24%, 06/03/2050(3) | 950,000 | 951,663 | ||||||
Time Warner Cable LLC | ||||||||
5.50%, 09/01/2041 | 6,815,000 | 8,196,665 | ||||||
5.88%, 11/15/2040 | 1,275,000 | 1,570,289 | ||||||
6.55%, 05/01/2037 | 375,000 | 493,197 | ||||||
6.75%, 06/15/2039 | 539,000 | 716,024 | ||||||
7.30%, 07/01/2038 | 1,418,000 | 1,963,395 | ||||||
Time Warner Entertainment Co. LP | ||||||||
8.38%, 07/15/2033 | 529,000 | 796,539 | ||||||
T-Mobile USA, Inc. | ||||||||
1.50%, 02/15/2026(3) | 2,970,000 | 2,969,792 | ||||||
2.05%, 02/15/2028(3) | 3,330,000 | 3,331,565 | ||||||
3.50%, 04/15/2025(3) | 2,915,000 | 3,177,408 | ||||||
3.75%, 04/15/2027(3) | 3,500,000 | 3,883,250 | ||||||
3.88%, 04/15/2030(3) | 4,685,000 | 5,221,760 | ||||||
TWDC Enterprises 18 Corp. | ||||||||
3.00%, 07/30/2046 | 160,000 | 162,858 | ||||||
Verizon Communications, Inc. | ||||||||
3.15%, 03/22/2030 | 5,000,000 | 5,651,642 | ||||||
3.88%, 02/08/2029 | 765,000 | 905,326 | ||||||
4.02%, 12/03/2029 | 712,000 | 851,076 | ||||||
4.13%, 03/16/2027 | 2,800,000 | 3,300,635 | ||||||
4.27%, 01/15/2036 | 4,454,000 | 5,514,252 | ||||||
4.40%, 11/01/2034 | 4,843,000 | 6,017,891 | ||||||
4.50%, 08/10/2033 | 7,079,000 | 8,815,359 | ||||||
4.52%, 09/15/2048 | 1,065,000 | 1,407,359 | ||||||
4.81%, 03/15/2039 | 7,941,000 | 10,373,511 | ||||||
4.86%, 08/21/2046 | 10,285,000 | 13,981,431 | ||||||
5.25%, 03/16/2037 | 731,000 | 989,325 | ||||||
ViacomCBS, Inc. | ||||||||
3.70%, 08/15/2024 | 848,000 | 921,235 | ||||||
4.20%, 05/19/2032 | 1,804,000 | 2,001,395 | ||||||
4.38%, 03/15/2043 | 718,000 | 750,556 | ||||||
Vodafone Group Plc | ||||||||
4.88%, 06/19/2049 | 4,584,000 | 5,743,668 | ||||||
5.25%, 05/30/2048 | 938,000 | 1,234,193 | ||||||
6.15%, 02/27/2037 | 4,600,000 | 6,438,298 | ||||||
Walt Disney Co. | ||||||||
3.70%, 10/15/2025 | 380,000 | 429,166 | ||||||
6.20%, 12/15/2034 | 150,000 | 216,682 | ||||||
6.40%, 12/15/2035 | 1,703,000 | 2,555,819 | ||||||
7.63%, 11/30/2028 | 310,000 | 443,668 | ||||||
8.88%, 04/26/2023 | 108,000 | 129,963 | ||||||
9.50%, 07/15/2024 | 175,000 | 226,992 | ||||||
|
| |||||||
Total Communications |
| 386,825,170 | ||||||
|
| |||||||
Consumer, Cyclical – 1.46% | ||||||||
Air Canada 2013-1 Class A Pass Through Trust | ||||||||
4.13%, 05/15/2025(3) | 1,568,340 | 1,443,973 | ||||||
Air Canada 2015-1 Class A Pass Through Trust | ||||||||
3.60%, 03/15/2027(3) | 712,235 | 651,208 | ||||||
Air Canada 2015-2 Class AA Pass Through Trust | ||||||||
3.75%, 12/15/2027(3) | 1,150,136 | 1,087,944 | ||||||
Air Canada 2017-1 Class A Pass Through Trust | ||||||||
3.55%, 01/15/2030(3) | 2,726,210 | 2,249,699 | ||||||
Air Canada 2017-1 Class AA Pass Through Trust | ||||||||
3.30%, 01/15/2030(3) | 1,556,515 | 1,411,167 | ||||||
Alimentation Couche-Tard, Inc. | ||||||||
2.95%, 01/25/2030(3) | 1,100,000 | 1,140,271 | ||||||
American Airlines 2011-1 Class A Pass Through Trust | ||||||||
5.25%, 01/31/2021 | 56,304 | 49,621 | ||||||
American Airlines 2013-2 Class A Pass Through Trust | ||||||||
4.95%, 01/15/2023 | 2,217,533 | 1,796,224 | ||||||
American Airlines 2014-1 Class A Pass Through Trust | ||||||||
3.70%, 10/01/2026 | 350,786 | 297,628 | ||||||
American Airlines 2015-1 Class A Pass Through Trust | ||||||||
3.38%, 05/01/2027 | 3,186,320 | 2,666,146 | ||||||
American Airlines 2015-2 Class AA Pass Through Trust | ||||||||
3.60%, 09/22/2027 | 575,488 | 531,959 | ||||||
American Airlines 2016-2 Class A Pass Through Trust | ||||||||
3.65%, 06/15/2028 | 203,008 | 165,364 | ||||||
American Airlines 2016-2 Class AA Pass Through Trust | ||||||||
3.20%, 06/15/2028 | 1,264,640 | 1,191,049 | ||||||
American Airlines 2016-3 Class AA Pass Through Trust | ||||||||
3.00%, 10/15/2028 | 2,360,934 | 2,165,207 | ||||||
American Airlines 2017-1 Class AA Pass Through Trust | ||||||||
3.65%, 02/15/2029 | 1,983,768 | 1,899,513 | ||||||
American Honda Finance Corp. | ||||||||
2.30%, 09/09/2026 | 185,000 | 196,729 | ||||||
2.90%, 02/16/2024 | 300,000 | 319,464 | ||||||
BMW US Capital LLC | ||||||||
1.72% (3 Month LIBOR USD + 0.41%), 04/12/2021(2)(3) | 1,675,000 | 1,669,888 | ||||||
2.25%, 09/15/2023(3) | 894,000 | 926,441 | ||||||
British Airways 2018-1 Class A Pass Through Trust | ||||||||
4.13%, 09/20/2031(3) | 2,461,127 | 2,018,201 | ||||||
British Airways 2018-1 Class AA Pass Through Trust | ||||||||
3.80%, 09/20/2031(3) | 1,163,868 | 1,105,767 | ||||||
British Airways 2019-1 Class AA Pass Through Trust | ||||||||
3.30%, 12/15/2032(3) | 1,562,743 | 1,407,817 | ||||||
CK Hutchison International 19 Ltd. | ||||||||
3.63%, 04/11/2029(3) | 1,615,000 | 1,792,535 | ||||||
Continental Airlines 2007-1 Class A Pass Through Trust | ||||||||
5.98%, 04/19/2022 | 4,583,289 | 4,298,769 | ||||||
Continental Airlines 2012-1 Class A Pass Through Trust | ||||||||
4.15%, 04/11/2024 | 1,081,523 | 1,013,373 | ||||||
Continental Airlines 2012-2 Class A Pass Through Trust | ||||||||
4.00%, 10/29/2024 | 4,482,784 | 4,089,586 | ||||||
Daimler Finance North America LLC | ||||||||
2.88%, 03/10/2021(3) | 700,000 | 707,361 | ||||||
3.35%, 02/22/2023(3) | 1,000,000 | 1,047,228 | ||||||
8.50%, 01/18/2031 | 155,000 | 236,109 | ||||||
Delta Air Lines 2007-1 Class A Pass Through Trust | ||||||||
6.82%, 08/10/2022 | 3,444,813 | 3,377,384 | ||||||
Dollar General Corp. | ||||||||
4.13%, 05/01/2028 | 835,000 | 976,407 | ||||||
Dollar Tree, Inc. | ||||||||
4.20%, 05/15/2028 | 3,695,000 | 4,299,884 | ||||||
Ford Motor Co. | ||||||||
5.29%, 12/08/2046 | 280,000 | 230,241 | ||||||
Ford Motor Credit Co. LLC | ||||||||
3.16%, 08/04/2020 | 1,000,000 | 993,950 | ||||||
3.34%, 03/18/2021 | 4,321,000 | 4,276,537 | ||||||
3.34%, 03/28/2022 | 3,000,000 | 2,901,600 | ||||||
3.35%, 11/01/2022 | 620,000 | 593,824 | ||||||
3.81%, 10/12/2021 | 6,200,000 | 6,115,060 | ||||||
4.25%, 09/20/2022 | 3,800,000 | 3,724,798 | ||||||
5.88%, 08/02/2021 | 4,100,000 | 4,139,770 | ||||||
General Motors Co. | ||||||||
5.95%, 04/01/2049 | 1,872,000 | 1,963,219 | ||||||
6.60%, 04/01/2036 | 685,000 | 744,790 | ||||||
General Motors Financial Co., Inc. | ||||||||
2.17% (3 Month LIBOR USD + 0.85%), 04/09/2021(2) | 3,590,000 | 3,568,582 | ||||||
2.45%, 11/06/2020 | 9,004,000 | 9,018,089 | ||||||
3.15%, 06/30/2022 | 2,750,000 | 2,797,871 | ||||||
3.45%, 01/14/2022 | 6,500,000 | 6,606,675 | ||||||
3.45%, 04/10/2022 | 4,820,000 | 4,914,903 | ||||||
3.55%, 04/09/2021 | 2,725,000 | 2,757,897 | ||||||
3.70%, 05/09/2023 | 6,289,000 | 6,475,799 | ||||||
3.95%, 04/13/2024 | 5,535,000 | 5,725,968 | ||||||
4.30%, 07/13/2025 | 1,765,000 | 1,839,112 | ||||||
4.38%, 09/25/2021 | 5,000,000 | 5,135,271 | ||||||
Hasbro, Inc. | ||||||||
3.55%, 11/19/2026 | 8,949,000 | 9,456,716 | ||||||
Home Depot, Inc. | ||||||||
4.40%, 03/15/2045 | 268,000 | 339,183 | ||||||
Hyundai Capital America | ||||||||
2.75%, 09/18/2020(3) | 4,000,000 | 4,008,707 | ||||||
3.10%, 04/05/2022(3) | 2,500,000 | 2,550,877 | ||||||
3.40%, 06/20/2024(3) | 1,500,000 | 1,547,106 | ||||||
3.45%, 03/12/2021(3) | 4,170,000 | 4,218,735 |
Hyundai Capital Services, Inc. | ||||||||
3.00%, 03/06/2022(3) | 3,725,000 | 3,791,337 | ||||||
Lowe’s Cos, Inc. | ||||||||
3.65%, 04/05/2029 | 1,701,000 | 1,950,280 | ||||||
4.55%, 04/05/2049 | 1,450,000 | 1,835,922 | ||||||
4.65%, 04/15/2042 | 449,000 | 561,995 | ||||||
5.13%, 04/15/2050 | 2,942,000 | 4,061,058 | ||||||
Magna International, Inc. | ||||||||
3.63%, 06/15/2024 | 1,658,000 | 1,804,475 | ||||||
McDonald’s Corp. | ||||||||
4.45%, 03/01/2047 | 360,000 | 437,894 | ||||||
4.70%, 12/09/2035 | 216,000 | 271,027 | ||||||
6.30%, 10/15/2037 | 679,000 | 984,982 | ||||||
O’Reilly Automotive, Inc. | ||||||||
3.55%, 03/15/2026 | 500,000 | 566,004 | ||||||
3.60%, 09/01/2027 | 802,000 | 901,162 | ||||||
Spirit Airlines Pass Through Trust 2017-1AA | ||||||||
3.38%, 02/15/2030 | 878,011 | 821,618 | ||||||
Starbucks Corp | ||||||||
2.55%, 11/15/2030 | 1,480,000 | 1,552,045 | ||||||
TJX Cos, Inc. | ||||||||
3.88%, 04/15/2030 | 970,000 | 1,139,664 | ||||||
Toyota Motor Credit Corp | ||||||||
1.35%, 08/25/2023 | 1,938,000 | 1,977,037 | ||||||
1.80%, 02/13/2025 | 4,549,000 | 4,715,180 | ||||||
United Airlines 2013-1 Class A Pass Through Trust | ||||||||
4.30%, 08/15/2025 | 582,182 | 546,018 | ||||||
United Airlines 2014-1 Class A Pass Through Trust | ||||||||
4.00%, 04/11/2026 | 812,815 | 745,623 | ||||||
United Airlines 2016-1 Class AA Pass Through Trust | ||||||||
3.10%, 07/07/2028 | 6,935,992 | 6,660,209 | ||||||
United Airlines 2016-1 Class B Pass Through Trust | ||||||||
3.65%, 01/07/2026 | 407,722 | 300,858 | ||||||
United Airlines 2016-2 Class AA Pass Through Trust | ||||||||
2.88%, 10/07/2028 | 1,562,121 | 1,458,721 | ||||||
United Airlines 2018-1 Class AA Pass Through Trust | ||||||||
3.50%, 03/01/2030 | 2,358,691 | 2,206,144 | ||||||
United Airlines 2018-1 Class B Pass Through Trust | ||||||||
4.60%, 03/01/2026 | 511,367 | 383,120 | ||||||
United Airlines 2019-1 Class A Pass Through Trust | ||||||||
4.55%, 08/25/2031 | 2,045,758 | 1,690,091 | ||||||
United Airlines 2019-1 Class AA Pass Through Trust | ||||||||
4.15%, 08/25/2031 | 2,342,070 | 2,301,846 | ||||||
United Airlines 2019-2 Class AA Pass Through Trust | ||||||||
2.70%, 05/01/2032 | 2,904,000 | 2,606,340 | ||||||
Volkswagen Group of America Finance LLC | ||||||||
3.88%, 11/13/2020(3) | 3,795,000 | 3,830,988 | ||||||
4.00%, 11/12/2021(3) | 5,045,000 | 5,251,996 | ||||||
Walgreens Boots Alliance, Inc. | ||||||||
4.50%, 11/18/2034 | 5,323,000 | 5,948,847 | ||||||
|
| |||||||
Total Consumer, Cyclical |
| 206,177,677 | ||||||
|
| |||||||
Consumer, Non-cyclical – 5.10% | ||||||||
Abbott Laboratories | ||||||||
1.15%, 01/30/2028 | 1,390,000 | 1,388,696 | ||||||
1.40%, 06/30/2030 | 1,460,000 | 1,444,926 | ||||||
4.75%, 11/30/2036 | 5,000,000 | 6,725,557 | ||||||
4.90%, 11/30/2046 | 2,755,000 | 3,954,931 | ||||||
AbbVie, Inc. | ||||||||
2.60%, 11/21/2024(3) | 4,019,000 | 4,279,751 | ||||||
2.80%, 03/15/2023(3) | 971,000 | 1,007,583 | ||||||
2.85%, 05/14/2023 | 4,900,000 | 5,168,064 | ||||||
2.95%, 11/21/2026(3) | 6,991,000 | 7,649,662 | ||||||
3.25%, 10/01/2022(3) | 4,000,000 | 4,184,610 | ||||||
3.45%, 03/15/2022(3) | 1,238,000 | 1,286,173 | ||||||
3.60%, 05/14/2025 | 12,060,000 | 13,390,955 | ||||||
3.80%, 03/15/2025(3) | 3,000,000 | 3,345,111 | ||||||
3.85%, 06/15/2024(3) | 1,198,000 | 1,315,504 | ||||||
4.05%, 11/21/2039(3) | 6,137,000 | 7,117,736 | ||||||
4.25%, 11/21/2049(3) | 11,691,000 | 14,014,139 | ||||||
4.40%, 11/06/2042 | 1,700,000 | 2,049,588 | ||||||
4.45%, 05/14/2046 | 425,000 | 515,854 | ||||||
4.55%, 03/15/2035(3) | 6,025,000 | 7,419,279 | ||||||
4.70%, 05/14/2045 | 4,415,000 | 5,529,236 | ||||||
4.88%, 11/14/2048 | 2,641,000 | 3,378,729 | ||||||
5.00%, 12/15/2021(3) | 3,500,000 | 3,674,074 | ||||||
Advocate Health & Hospitals Corp. | ||||||||
3.39%, 10/15/2049 | 792,000 | 886,362 | ||||||
Aetna, Inc. | ||||||||
4.50%, 05/15/2042 | 4,205,000 | 5,000,306 | ||||||
4.75%, 03/15/2044 | 1,800,000 | 2,161,554 | ||||||
6.75%, 12/15/2037 | 341,000 | 485,475 | ||||||
Ahold Finance USA LLC | ||||||||
6.88%, 05/01/2029 | 3,280,000 | 4,543,636 | ||||||
AmerisourceBergen Corp. | ||||||||
4.30%, 12/15/2047 | 1,080,000 | 1,211,355 | ||||||
Amgen, Inc. | ||||||||
2.20%, 02/21/2027 | 4,631,000 | 4,883,248 | ||||||
2.70%, 05/01/2022 | 5,600,000 | 5,792,328 | ||||||
3.15%, 02/21/2040 | 2,000,000 | 2,125,906 | ||||||
Anheuser-Busch InBev Finance, Inc. | ||||||||
4.63%, 02/01/2044 | 455,000 | 522,067 | ||||||
Anheuser-Busch InBev Worldwide, Inc. | ||||||||
3.50%, 06/01/2030 | 2,620,000 | 2,945,311 | ||||||
4.35%, 06/01/2040 | 4,110,000 | 4,680,371 | ||||||
4.38%, 04/15/2038 | 2,240,000 | 2,572,521 | ||||||
4.44%, 10/06/2048 | 590,000 | 679,419 | ||||||
4.50%, 06/01/2050 | 5,390,000 | 6,426,984 | ||||||
4.60%, 04/15/2048 | 2,939,000 | 3,431,018 | ||||||
4.60%, 06/01/2060 | 1,910,000 | 2,283,265 | ||||||
4.70%, 02/01/2036 | 8,132,000 | 9,587,047 | ||||||
4.75%, 01/23/2029 | 2,345,000 | 2,832,877 | ||||||
4.75%, 04/15/2058 | 93,000 | 112,256 | ||||||
4.90%, 02/01/2046 | 9,237,000 | 11,298,063 | ||||||
4.95%, 01/15/2042 | 2,735,000 | 3,308,563 | ||||||
5.45%, 01/23/2039 | 7,035,000 | 8,886,031 | ||||||
Anthem, Inc. | ||||||||
2.38%, 01/15/2025 | 996,000 | 1,055,543 | ||||||
3.13%, 05/15/2022 | 484,000 | 506,975 | ||||||
3.30%, 01/15/2023 | 271,000 | 288,828 | ||||||
3.50%, 08/15/2024 | 694,000 | 759,433 | ||||||
4.10%, 03/01/2028 | 920,000 | 1,075,214 | ||||||
4.38%, 12/01/2047 | 4,500,000 | 5,605,922 | ||||||
4.63%, 05/15/2042 | 400,000 | 497,672 | ||||||
4.65%, 01/15/2043 | 391,000 | 490,864 | ||||||
4.65%, 08/15/2044 | 395,000 | 503,515 | ||||||
5.10%, 01/15/2044 | 1,690,000 | 2,226,459 | ||||||
Ascension Health | ||||||||
2.53%, 11/15/2029 | 1,740,000 | 1,865,721 | ||||||
3.11%, 11/15/2039 | 2,670,000 | 2,921,543 | ||||||
AstraZeneca Plc | ||||||||
4.00%, 09/18/2042 | 540,000 | 657,393 | ||||||
6.45%, 09/15/2037 | 500,000 | 755,290 | ||||||
BAT Capital Corp. | ||||||||
3.22%, 09/06/2026 | 9,224,000 | 9,901,675 | ||||||
3.22%, 08/15/2024 | 7,145,000 | 7,656,153 | ||||||
4.54%, 08/15/2047 | 635,000 | 691,204 | ||||||
Baxalta, Inc. | ||||||||
3.60%, 06/23/2022 | 110,000 | 115,822 | ||||||
5.25%, 06/23/2045 | 50,000 | 67,817 | ||||||
Bayer US Finance II LLC | ||||||||
0.93% (3 Month LIBOR USD + 0.63%), 06/25/2021(2)(3) | 4,135,000 | 4,130,151 | ||||||
3.50%, 06/25/2021(3) | 1,650,000 | 1,690,387 | ||||||
Becton Dickinson & Co. | ||||||||
3.73%, 12/15/2024 | 1,972,000 | 2,171,209 | ||||||
Biogen, Inc. | ||||||||
2.25%, 05/01/2030 | 1,397,000 | 1,409,779 | ||||||
3.15%, 05/01/2050 | 650,000 | 625,805 | ||||||
Bon Secours Mercy Health Inc | ||||||||
3.46%, 06/01/2030 | 2,220,000 | 2,451,303 | ||||||
Boston Scientific Corp. | ||||||||
3.75%, 03/01/2026 | 765,000 | 868,675 | ||||||
4.00%, 03/01/2029 | 1,545,000 | 1,767,467 | ||||||
4.55%, 03/01/2039 | 725,000 | 890,440 |
Bristol-Myers Squibb Co. | ||||||||
3.20%, 06/15/2026(3) | 2,246,000 | 2,520,537 | ||||||
3.25%, 02/20/2023(3) | 2,000,000 | 2,128,380 | ||||||
4.13%, 06/15/2039(3) | 5,151,000 | 6,577,967 | ||||||
4.25%, 10/26/2049(3) | 870,000 | 1,155,129 | ||||||
4.35%, 11/15/2047(3) | 7,950,000 | 10,559,309 | ||||||
4.55%, 02/20/2048(3) | 1,770,000 | 2,416,613 | ||||||
4.63%, 05/15/2044(3) | 2,640,000 | 3,533,393 | ||||||
5.00%, 08/15/2045(3) | 860,000 | 1,212,179 | ||||||
5.70%, 10/15/2040(3) | 302,000 | 446,448 | ||||||
Bunge Ltd. Finance Corp. | ||||||||
3.50%, 11/24/2020 | 283,000 | 285,674 | ||||||
Campbell Soup Co. | ||||||||
2.38%, 04/24/2030 | 895,000 | 926,778 | ||||||
4.80%, 03/15/2048 | 525,000 | 690,079 | ||||||
Cargill, Inc. | ||||||||
2.13%, 04/23/2030(3) | 2,783,000 | 2,916,610 | ||||||
3.25%, 03/01/2023(3) | 345,000 | 368,034 | ||||||
3.30%, 03/01/2022(3) | 800,000 | 829,304 | ||||||
Children’s Hospital Corp. | ||||||||
2.59%, 02/01/2050 | 1,290,000 | 1,301,994 | ||||||
Cigna Corp. | ||||||||
2.40%, 03/15/2030 | 8,334,000 | 8,646,436 | ||||||
3.05%, 11/30/2022(3) | 9,105,000 | 9,594,553 | ||||||
3.25%, 04/15/2025(3) | 970,000 | 1,058,960 | ||||||
3.40%, 09/17/2021 | 7,505,000 | 7,758,753 | ||||||
3.75%, 07/15/2023 | 1,850,000 | 2,008,486 | ||||||
4.38%, 10/15/2028 | 30,325,000 | 35,887,572 | ||||||
4.50%, 02/25/2026(3) | 755,000 | 878,336 | ||||||
4.80%, 07/15/2046(3) | 218,000 | 274,272 | ||||||
4.90%, 12/15/2048 | 753,000 | 995,300 | ||||||
Coca-Cola Femsa SAB de CV | ||||||||
2.75%, 01/22/2030 | 1,370,000 | 1,448,873 | ||||||
Conagra Brands, Inc. | ||||||||
4.95%, 08/15/2020 | 40,000 | 40,193 | ||||||
7.00%, 10/01/2028 | 3,250,000 | 4,347,139 | ||||||
9.75%, 03/01/2021 | 1,750,000 | 1,840,793 | ||||||
Constellation Brands, Inc. | ||||||||
2.88%, 05/01/2030 | 3,620,000 | 3,834,721 | ||||||
4.40%, 11/15/2025 | 760,000 | 878,452 | ||||||
4.65%, 11/15/2028 | 4,780,000 | 5,620,940 | ||||||
Cottage Health Obligated Group | ||||||||
3.30%, 11/01/2049 | 4,046,000 | 4,431,183 | ||||||
CVS Health Corp. | ||||||||
4.00%, 12/05/2023 | 6,000,000 | 6,581,533 | ||||||
4.30%, 03/25/2028 | 3,575,000 | 4,179,504 | ||||||
4.78%, 03/25/2038 | 550,000 | 683,230 | ||||||
4.88%, 07/20/2035 | 2,515,000 | 3,175,026 | ||||||
5.05%, 03/25/2048 | 4,000,000 | 5,203,073 | ||||||
5.13%, 07/20/2045 | 4,430,000 | 5,705,974 | ||||||
5.30%, 12/05/2043 | 3,260,000 | 4,261,858 | ||||||
CVS Pass-Through Trust | ||||||||
5.77%, 01/10/2033(3) | 759,558 | 854,683 | ||||||
5.93%, 01/10/2034(3) | 565,791 | 632,434 | ||||||
7.51%, 01/10/2032(3) | 842,610 | 1,049,966 | ||||||
CVS Pass-Through Trust Series 2009 | ||||||||
8.35%, 07/10/2031(3) | 850,769 | 1,099,259 | ||||||
CVS Pass-Through Trust Series 2014 | ||||||||
4.16%, 08/11/2036(3) | 2,576,047 | 2,722,546 | ||||||
DH Europe Finance II Sarl | ||||||||
3.25%, 11/15/2039 | 431,000 | 475,963 | ||||||
Diageo Investment Corp. | ||||||||
8.00%, 09/15/2022 | 516,000 | 598,426 | ||||||
Eli Lilly and Co | ||||||||
2.25%, 05/15/2050 | 1,075,000 | 1,030,650 | ||||||
Emory University | ||||||||
2.14%, 09/01/2030 | 2,220,000 | 2,310,307 | ||||||
ERAC USA Finance LLC | ||||||||
4.50%, 08/16/2021(3) | 400,000 | 412,810 | ||||||
4.50%, 02/15/2045(3) | 300,000 | 302,112 | ||||||
5.63%, 03/15/2042(3) | 357,000 | 414,873 |
Experian Finance Plc | ||||||||
2.75%, 03/08/2030(3) | 9,240,000 | 9,845,395 | ||||||
Fomento Economico Mexicano SAB de CV | ||||||||
3.50%, 01/16/2050 | 2,290,000 | 2,362,614 | ||||||
4.38%, 05/10/2043 | 526,000 | 635,225 | ||||||
Ford Foundation | ||||||||
2.82%, 06/01/2070 | 4,835,000 | 5,011,026 | ||||||
General Mills, Inc. | ||||||||
4.00%, 04/17/2025 | 925,000 | 1,046,546 | ||||||
4.55%, 04/17/2038 | 3,250,000 | 4,093,763 | ||||||
Gilead Sciences, Inc. | ||||||||
4.60%, 09/01/2035 | 4,225,000 | 5,513,030 | ||||||
Grupo Bimbo SAB de CV | ||||||||
3.88%, 06/27/2024(3) | 5,000,000 | 5,369,636 | ||||||
4.70%, 11/10/2047(3) | 4,500,000 | 4,965,795 | ||||||
Hartford HealthCare Corp. | ||||||||
3.45%, 07/01/2054 | 3,370,000 | 3,115,496 | ||||||
HCA, Inc. | ||||||||
5.13%, 06/15/2039 | 1,715,000 | 1,998,451 | ||||||
5.25%, 06/15/2026 | 2,000,000 | 2,302,020 | ||||||
Highmark, Inc. | ||||||||
4.75%, 05/15/2021(3) | 3,322,000 | 3,409,724 | ||||||
JM Smucker Co. | ||||||||
3.00%, 03/15/2022 | 4,750,000 | 4,925,676 | ||||||
Johnson & Johnson | ||||||||
4.38%, 12/05/2033 | 1,070,000 | 1,406,919 | ||||||
Kellogg Co. | ||||||||
2.10%, 06/01/2030 | 1,240,000 | 1,255,925 | ||||||
Keurig Dr Pepper, Inc. | ||||||||
3.13%, 12/15/2023 | 925,000 | 994,453 | ||||||
3.43%, 06/15/2027 | 1,802,000 | 1,986,842 | ||||||
4.06%, 05/25/2023 | 4,575,000 | 4,989,280 | ||||||
4.42%, 05/25/2025 | 447,000 | 515,410 | ||||||
4.42%, 12/15/2046 | 4,032,000 | 4,801,248 | ||||||
4.99%, 05/25/2038 | 646,000 | 826,194 | ||||||
5.09%, 05/25/2048 | 500,000 | 659,058 | ||||||
Kraft Heinz Foods Co. | ||||||||
2.80%, 07/02/2020 | 541,000 | 541,000 | ||||||
3.00%, 06/01/2026 | 3,625,000 | 3,664,392 | ||||||
4.38%, 06/01/2046 | 4,425,000 | 4,348,595 | ||||||
4.88%, 10/01/2049(3) | 3,375,000 | 3,435,544 | ||||||
Kroger Co. | ||||||||
3.95%, 01/15/2050 | 1,600,000 | 1,830,452 | ||||||
4.45%, 02/01/2047 | 1,010,000 | 1,223,310 | ||||||
5.40%, 07/15/2040 | 95,000 | 121,240 | ||||||
Laboratory Corp. of America Holdings | ||||||||
2.95%, 12/01/2029 | 7,795,000 | 8,273,235 | ||||||
3.20%, 02/01/2022 | 1,127,000 | 1,169,050 | ||||||
Leland Stanford Junior University | ||||||||
2.41%, 06/01/2050 | 1,527,000 | 1,554,605 | ||||||
Mars, Inc. | ||||||||
3.95%, 04/01/2049(3) | 5,320,000 | 6,707,460 | ||||||
Massachusetts Institute of Technology | ||||||||
3.89%, 07/01/2116 | 2,906,000 | 3,614,490 | ||||||
4.68%, 07/01/2114 | 1,645,000 | 2,399,439 | ||||||
Mead Johnson Nutrition Co. | ||||||||
4.13%, 11/15/2025 | 891,000 | 1,031,695 | ||||||
Medtronic, Inc. | ||||||||
3.50%, 03/15/2025 | 5,546,000 | 6,252,838 | ||||||
4.63%, 03/15/2045 | 205,000 | 275,985 | ||||||
Memorial Health Services | ||||||||
3.45%, 11/01/2049 | 3,040,000 | 3,190,786 | ||||||
Merck & Co., Inc. | ||||||||
2.35%, 06/24/2040 | 3,303,000 | 3,360,566 | ||||||
2.45%, 06/24/2050 | 1,950,000 | 1,957,041 | ||||||
Mondelez International, Inc. | ||||||||
1.50%, 05/04/2025 | 700,000 | 713,399 | ||||||
2.75%, 04/13/2030 | 1,296,000 | 1,397,852 | ||||||
Mount Sinai Hospitals Group, Inc. | ||||||||
3.98%, 07/01/2048 | 999,000 | 1,097,084 | ||||||
Mylan NV | ||||||||
3.95%, 06/15/2026 | 532,000 | 594,803 |
Mylan, Inc. | ||||||||
3.13%, 01/15/2023(3) | 5,000,000 | 5,254,918 | ||||||
4.55%, 04/15/2028 | 700,000 | 804,104 | ||||||
5.20%, 04/15/2048 | 5,965,000 | 7,335,013 | ||||||
New York & Presbyterian Hospital | ||||||||
4.02%, 08/01/2045 | 125,000 | 153,362 | ||||||
NYU Langone Hospitals | ||||||||
3.38%, 07/01/2055 | 1,270,000 | 1,225,016 | ||||||
Orlando Health Obligated Group | ||||||||
4.09%, 10/01/2048 | 2,605,000 | 2,923,812 | ||||||
Partners Healthcare System, Inc. | ||||||||
3.34%, 07/01/2060 | 5,470,000 | 5,878,080 | ||||||
PayPal Holdings, Inc. | ||||||||
1.65%, 06/01/2025 | 3,240,000 | 3,353,706 | ||||||
Pepperdine University | ||||||||
3.30%, 12/01/2059 | 1,440,000 | 1,478,097 | ||||||
Pfizer, Inc. | ||||||||
2.55%, 05/28/2040 | 4,650,000 | 4,826,033 | ||||||
2.70%, 05/28/2050 | 1,106,000 | 1,140,497 | ||||||
4.40%, 05/15/2044 | 2,345,000 | 3,047,288 | ||||||
5.80%, 08/12/2023 | 4,000,000 | 4,643,264 | ||||||
Philip Morris International, Inc. | ||||||||
2.50%, 11/02/2022 | 1,300,000 | 1,354,741 | ||||||
President & Fellows of Harvard College | ||||||||
2.52%, 10/15/2050 | 3,480,000 | 3,602,585 | ||||||
3.30%, 07/15/2056 | 5,599,000 | 6,798,964 | ||||||
Procter & Gamble - Esop | ||||||||
9.36%, 01/01/2021 | 35,838 | 36,446 | ||||||
Providence St Joseph Health Obligated Group | ||||||||
2.75%, 10/01/2026 | 1,200,000 | 1,283,275 | ||||||
Quest Diagnostics, Inc. | ||||||||
3.45%, 06/01/2026 | 223,000 | 250,814 | ||||||
3.50%, 03/30/2025 | 4,820,000 | 5,297,115 | ||||||
Reckitt Benckiser Treasury Services Plc | ||||||||
2.38%, 06/24/2022(3) | 1,200,000 | 1,236,393 | ||||||
Reynolds American, Inc. | ||||||||
4.45%, 06/12/2025 | 5,000,000 | 5,632,980 | ||||||
Rush Obligated Group | ||||||||
3.92%, 11/15/2029 | 2,316,000 | 2,597,371 | ||||||
Shire Acquisitions Investments Ireland DAC | ||||||||
2.40%, 09/23/2021 | 13,135,000 | 13,397,535 | ||||||
2.88%, 09/23/2023 | 668,000 | 707,525 | ||||||
3.20%, 09/23/2026 | 3,626,000 | 4,021,983 | ||||||
Smithfield Foods, Inc. | ||||||||
3.35%, 02/01/2022(3) | 14,000,000 | 13,892,417 | ||||||
Takeda Pharmaceutical Co. Ltd. | ||||||||
0.00%, 07/09/2040 | 1,785,000 | 1,785,000 | ||||||
3.18%, 07/09/2050 | 1,920,000 | 1,927,463 | ||||||
3.38%, 07/09/2060 | 1,210,000 | 1,210,091 | ||||||
Texas Health Resources | ||||||||
4.33%, 11/15/2055 | 1,000,000 | 1,293,039 | ||||||
Thermo Fisher Scientific, Inc. | ||||||||
2.95%, 09/19/2026 | 476,000 | 526,503 | ||||||
3.00%, 04/15/2023 | 227,000 | 240,417 | ||||||
Tyson Foods, Inc. | ||||||||
4.50%, 06/15/2022 | 2,485,000 | 2,642,162 | ||||||
4.88%, 08/15/2034 | 400,000 | 507,959 | ||||||
5.15%, 08/15/2044 | 588,000 | 728,331 | ||||||
Unilever Capital Corp. | ||||||||
3.38%, 03/22/2025 | 800,000 | 899,079 | ||||||
UnitedHealth Group, Inc. | ||||||||
2.00%, 05/15/2030 | 1,330,000 | 1,392,057 | ||||||
2.75%, 05/15/2040 | 4,421,000 | 4,688,465 | ||||||
3.10%, 03/15/2026 | 550,000 | 613,911 | ||||||
3.13%, 05/15/2060 | 2,286,000 | 2,441,660 | ||||||
3.50%, 08/15/2039 | 1,675,000 | 1,947,089 | ||||||
4.63%, 07/15/2035 | 427,000 | 561,697 | ||||||
University of Chicago | ||||||||
2.76%, 04/01/2045 | 1,575,000 | 1,636,628 | ||||||
University of Southern California | ||||||||
3.23%, 10/01/2120 | 1,370,000 | 1,423,601 |
Upjohn, Inc. | ||||||||
1.13%, 06/22/2022(3) | 2,253,000 | 2,265,096 | ||||||
2.30%, 06/22/2027(3) | 3,732,000 | 3,852,802 | ||||||
3.85%, 06/22/2040(3) | 8,693,000 | 9,323,069 | ||||||
4.00%, 06/22/2050(3) | 2,000,000 | 2,140,661 | ||||||
Verisk Analytics, Inc. | ||||||||
4.00%, 06/15/2025 | 7,000,000 | 7,921,897 | ||||||
Yale University | ||||||||
0.87%, 04/15/2025 | 7,538,000 | 7,596,153 | ||||||
1.48%, 04/15/2030 | 2,745,000 | 2,773,822 | ||||||
Zimmer Biomet Holdings, Inc. | ||||||||
3.38%, 11/30/2021 | 3,650,000 | 3,762,632 | ||||||
3.55%, 04/01/2025 | 6,000,000 | 6,523,412 | ||||||
3.70%, 03/19/2023 | 407,000 | 432,907 | ||||||
Zoetis, Inc. | ||||||||
2.00%, 05/15/2030 | 1,590,000 | 1,621,567 | ||||||
3.00%, 09/12/2027 | 4,685,000 | 5,168,535 | ||||||
|
| |||||||
Total Consumer, Non-cyclical |
| 721,057,623 | ||||||
|
| |||||||
Diversified – 0.03% | ||||||||
CK Hutchison International 16 Ltd. | ||||||||
1.88%, 10/03/2021(3) | 402,000 | 404,311 | ||||||
2.75%, 10/03/2026(3) | 600,000 | 632,151 | ||||||
CK Hutchison International 17 II Ltd. | ||||||||
2.75%, 03/29/2023(3) | 500,000 | 516,662 | ||||||
CK Hutchison International 17 Ltd. | ||||||||
2.88%, 04/05/2022(3) | 800,000 | 820,360 | ||||||
CVS Pass-Through Trust Series 2013 | ||||||||
4.70%, 01/10/2036(3) | 886,244 | 948,064 | ||||||
Hutchison Whampoa International 12 II Ltd. | ||||||||
3.25%, 11/08/2022(3) | 450,000 | 469,130 | ||||||
|
| |||||||
Total Diversified |
| 3,790,678 | ||||||
|
| |||||||
Energy – 3.76% | ||||||||
Abu Dhabi Crude Oil Pipeline LLC | ||||||||
4.60%, 11/02/2047(3) | 6,238,000 | 7,369,885 | ||||||
ANR Pipeline Co. | ||||||||
9.63%, 11/01/2021 | 337,000 | 376,606 | ||||||
Apache Corp. | ||||||||
3.25%, 04/15/2022 | 40,000 | 38,814 | ||||||
4.75%, 04/15/2043 | 416,000 | 334,815 | ||||||
5.10%, 09/01/2040 | 600,000 | 492,794 | ||||||
APT Pipelines Ltd. | ||||||||
4.20%, 03/23/2025(3) | 2,100,000 | 2,302,306 | ||||||
Baker Hughes a GE Co. LLC | ||||||||
4.49%, 05/01/2030 | 1,365,000 | 1,571,062 | ||||||
5.13%, 09/15/2040 | 600,000 | 722,615 | ||||||
Boardwalk Pipelines LP | ||||||||
4.80%, 05/03/2029 | 960,000 | 1,022,070 | ||||||
BP Capital Markets America, Inc. | ||||||||
3.02%, 01/16/2027 | 1,052,000 | 1,138,921 | ||||||
3.25%, 05/06/2022 | 262,000 | 274,691 | ||||||
3.79%, 02/06/2024 | 9,145,000 | 10,010,064 | ||||||
BP Capital Markets Plc | ||||||||
3.28%, 09/19/2027 | 2,309,000 | 2,521,697 | ||||||
3.51%, 03/17/2025 | 45,000 | 49,825 | ||||||
3.54%, 11/04/2024 | 700,000 | 772,115 | ||||||
Buckeye Partners LP | ||||||||
5.60%, 10/15/2044 | 2,000,000 | 1,600,000 | ||||||
5.85%, 11/15/2043 | 591,000 | 512,870 | ||||||
Canadian Natural Resources Ltd. | ||||||||
6.50%, 02/15/2037 | 118,000 | 142,774 | ||||||
Cenovus Energy, Inc. | ||||||||
5.25%, 06/15/2037 | 5,270,000 | 4,556,178 | ||||||
5.40%, 06/15/2047 | 322,000 | 276,343 | ||||||
Chevron Corp | ||||||||
2.24%, 05/11/2030 | 1,280,000 | 1,339,882 | ||||||
CNOOC Finance 2013 Ltd. | ||||||||
2.88%, 09/30/2029 | 6,325,000 | 6,708,519 | ||||||
3.00%, 05/09/2023 | 2,000,000 | 2,086,441 | ||||||
Columbia Pipeline Group, Inc. | ||||||||
5.80%, 06/01/2045 | 2,700,000 | 3,290,123 | ||||||
ConocoPhillips Co. | ||||||||
4.95%, 03/15/2026 | 598,000 | 717,172 | ||||||
Diamondback Energy, Inc. | ||||||||
4.75%, 05/31/2025 | 2,000,000 | 2,138,914 | ||||||
Ecopetrol SA | ||||||||
4.13%, 01/16/2025 | 383,000 | 383,961 | ||||||
5.38%, 06/26/2026 | 537,000 | 562,443 | ||||||
5.88%, 09/18/2023 | 395,000 | 422,650 | ||||||
Enable Midstream Partners LP | ||||||||
4.40%, 03/15/2027 | 900,000 | 829,224 | ||||||
4.95%, 05/15/2028 | 615,000 | 570,659 | ||||||
Enbridge Energy Partners LP | ||||||||
7.50%, 04/15/2038 | 1,000,000 | 1,373,557 | ||||||
Enbridge, Inc. | ||||||||
3.70%, 07/15/2027 | 538,000 | 593,523 | ||||||
4.50%, 06/10/2044 | 500,000 | 560,592 | ||||||
6.25% (3 Month LIBOR USD + 3.64%), 03/01/2078(2) | 950,000 | 935,750 | ||||||
Encana Corp. | ||||||||
6.50%, 08/15/2034 | 268,000 | 239,372 | ||||||
7.20%, 11/01/2031 | 500,000 | 453,511 | ||||||
7.38%, 11/01/2031 | 274,000 | 254,721 | ||||||
8.13%, 09/15/2030 | 400,000 | 374,175 | ||||||
Energy Transfer Operating LP | ||||||||
4.05%, 03/15/2025 | 2,250,000 | 2,394,499 | ||||||
4.75%, 01/15/2026 | 2,367,000 | 2,585,053 | ||||||
5.00%, 05/15/2050 | 5,545,000 | 5,239,001 | ||||||
5.25%, 04/15/2029 | 2,631,000 | 2,871,140 | ||||||
6.05%, 06/01/2041 | 500,000 | 515,125 | ||||||
6.13%, 12/15/2045 | 810,000 | 842,263 | ||||||
6.25%, 04/15/2049 | 1,903,000 | 2,016,739 | ||||||
6.50%, 02/01/2042 | 200,000 | 215,714 | ||||||
Energy Transfer Partners LP | ||||||||
5.00%, 10/01/2022 | 3,300,000 | 3,513,123 | ||||||
5.88%, 03/01/2022 | 5,000,000 | 5,278,316 | ||||||
ENI SpA | ||||||||
4.25%, 05/09/2029(3) | 2,825,000 | 3,056,264 | ||||||
5.70%, 10/01/2040(3) | 557,000 | 633,018 | ||||||
ENI USA, Inc. | ||||||||
7.30%, 11/15/2027 | 400,000 | 495,364 | ||||||
EnLink Midstream Partners LP | ||||||||
4.15%, 06/01/2025 | 1,000,000 | 770,000 | ||||||
Enterprise Products Operating LLC | ||||||||
3.70%, 02/15/2026 | 304,000 | 341,636 | ||||||
3.90%, 02/15/2024 | 3,400,000 | 3,720,582 | ||||||
3.95%, 01/31/2060 | 870,000 | 899,522 | ||||||
4.20%, 01/31/2050 | 1,335,000 | 1,477,112 | ||||||
4.85%, 08/15/2042 | 4,000,000 | 4,597,680 | ||||||
4.95%, 10/15/2054 | 177,000 | 197,300 | ||||||
5.75%, 03/01/2035 | 1,075,000 | 1,332,556 | ||||||
5.95%, 02/01/2041 | 201,000 | 257,044 | ||||||
EOG Resources, Inc. | ||||||||
2.63%, 03/15/2023 | 249,000 | 260,877 | ||||||
EQM Midstream Partners LP | ||||||||
4.00%, 08/01/2024 | 2,000,000 | 1,894,580 | ||||||
4.75%, 07/15/2023 | 5,000,000 | 5,043,750 | ||||||
EQT Corp. | ||||||||
3.90%, 10/01/2027 | 805,000 | 654,811 | ||||||
Equinor ASA | ||||||||
1.75%, 01/22/2026 | 11,628,000 | 11,910,501 | ||||||
2.88%, 04/06/2025 | 8,500,000 | 9,163,376 | ||||||
3.25%, 11/10/2024 | 508,000 | 563,770 | ||||||
Exxon Mobil Corp. | ||||||||
2.61%, 10/15/2030 | 6,143,000 | 6,548,993 | ||||||
2.99%, 03/19/2025 | 13,655,000 | 14,854,492 | ||||||
3.00%, 08/16/2039 | 2,035,000 | 2,152,379 | ||||||
3.10%, 08/16/2049 | 2,040,000 | 2,127,759 | ||||||
3.45%, 04/15/2051 | 4,750,000 | 5,270,913 | ||||||
3.48%, 03/19/2030 | 4,500,000 | 5,124,235 | ||||||
Gazprom OAO Via Gaz Capital SA | ||||||||
4.95%, 07/19/2022(3) | 610,000 | 642,644 | ||||||
6.51%, 03/07/2022(3) | 1,140,000 | 1,222,992 | ||||||
Halliburton Co. | ||||||||
3.25%, 11/15/2021 | 12,079,000 | 12,342,830 | ||||||
4.75%, 08/01/2043 | 565,000 | 557,813 | ||||||
4.85%, 11/15/2035 | 200,000 | 210,347 | ||||||
7.60%, 08/15/2096(3) | 258,000 | 264,469 |
Helmerich & Payne, Inc. | ||||||||
4.65%, 03/15/2025 | 4,710,000 | 5,020,658 | ||||||
Hess Corp. | ||||||||
4.30%, 04/01/2027 | 3,295,000 | 3,410,168 | ||||||
6.00%, 01/15/2040 | 513,000 | 549,451 | ||||||
7.88%, 10/01/2029 | 1,328,000 | 1,593,810 | ||||||
Husky Energy, Inc. | ||||||||
6.80%, 09/15/2037 | 2,100,000 | 2,384,121 | ||||||
KazMunayGas National Co. JSC | ||||||||
4.75%, 04/24/2025(3) | 1,590,000 | 1,710,045 | ||||||
Kinder Morgan Energy Partners LP | ||||||||
4.30%, 05/01/2024 | 3,700,000 | 4,040,881 | ||||||
5.00%, 10/01/2021 | 4,875,000 | 5,067,099 | ||||||
6.95%, 01/15/2038 | 2,242,000 | 2,968,162 | ||||||
7.30%, 08/15/2033 | 1,650,000 | 2,171,839 | ||||||
7.50%, 11/15/2040 | 483,000 | 673,433 | ||||||
Kinder Morgan, Inc. | ||||||||
5.20%, 03/01/2048 | 600,000 | 728,437 | ||||||
7.80%, 08/01/2031 | 4,600,000 | 6,243,517 | ||||||
Magellan Midstream Partners LP | ||||||||
3.20%, 03/15/2025 | 386,000 | 390,975 | ||||||
4.20%, 12/01/2042 | 417,000 | 401,359 | ||||||
4.20%, 03/15/2045 | 5,725,000 | 5,558,890 | ||||||
4.20%, 10/03/2047 | 1,050,000 | 1,085,978 | ||||||
5.15%, 10/15/2043 | 441,000 | 487,588 | ||||||
Marathon Oil Corp. | ||||||||
2.80%, 11/01/2022 | 700,000 | 700,735 | ||||||
Marathon Petroleum Corp. | ||||||||
3.40%, 12/15/2020 | 2,544,000 | 2,567,863 | ||||||
3.63%, 09/15/2024 | 1,241,000 | 1,323,219 | ||||||
4.50%, 04/01/2048 | 3,000,000 | 3,076,121 | ||||||
4.70%, 05/01/2025 | 6,698,000 | 7,498,136 | ||||||
4.75%, 12/15/2023 | 7,890,000 | 8,658,279 | ||||||
5.13%, 12/15/2026 | 5,379,000 | 6,189,291 | ||||||
5.38%, 10/01/2022 | 4,640,000 | 4,668,421 | ||||||
MPLX LP | ||||||||
4.13%, 03/01/2027 | 622,000 | 663,564 | ||||||
4.50%, 04/15/2038 | 8,016,000 | 8,013,250 | ||||||
4.70%, 04/15/2048 | 210,000 | 215,293 | ||||||
4.80%, 02/15/2029 | 743,000 | 826,402 | ||||||
4.88%, 06/01/2025 | 3,000,000 | 3,347,176 | ||||||
5.20%, 03/01/2047 | 1,573,000 | 1,688,580 | ||||||
5.25%, 01/15/2025 | 5,103,000 | 5,306,247 | ||||||
5.50%, 02/15/2049 | 1,665,000 | 1,889,165 | ||||||
Newfield Exploration Co. | ||||||||
5.75%, 01/30/2022 | 1,320,000 | 1,322,556 | ||||||
Noble Energy, Inc. | ||||||||
3.25%, 10/15/2029 | 5,991,000 | 5,409,952 | ||||||
5.05%, 11/15/2044 | 3,740,000 | 3,398,538 | ||||||
5.25%, 11/15/2043 | 3,975,000 | 3,644,177 | ||||||
6.00%, 03/01/2041 | 1,240,000 | 1,189,965 | ||||||
Occidental Petroleum Corp. | ||||||||
0.00%, 10/10/2036 | 4,000,000 | 1,680,000 | ||||||
3.20%, 08/15/2026 | 3,000,000 | 2,421,690 | ||||||
4.85%, 03/15/2021 | 2,064,000 | 2,048,520 | ||||||
6.45%, 09/15/2036 | 2,685,000 | 2,298,118 | ||||||
Oleoducto Central SA | ||||||||
4.00%, 05/07/2021(3) | 225,000 | 227,250 | ||||||
ONEOK Partners LP | ||||||||
3.38%, 10/01/2022 | 151,000 | 156,345 | ||||||
5.00%, 09/15/2023 | 3,923,000 | 4,226,954 | ||||||
6.20%, 09/15/2043 | 2,500,000 | 2,663,011 | ||||||
6.65%, 10/01/2036 | 1,050,000 | 1,174,829 | ||||||
ONEOK, Inc. | ||||||||
2.20%, 09/15/2025 | 3,035,000 | 2,978,794 | ||||||
3.10%, 03/15/2030 | 13,970,000 | 13,362,714 | ||||||
3.40%, 09/01/2029 | 925,000 | 899,541 | ||||||
4.50%, 03/15/2050 | 915,000 | 851,454 | ||||||
4.95%, 07/13/2047 | 1,850,000 | 1,781,249 | ||||||
5.20%, 07/15/2048 | 1,400,000 | 1,394,259 | ||||||
7.15%, 01/15/2051 | 1,578,000 | 1,916,313 |
Petroleos Mexicanos | ||||||||
5.50%, 01/21/2021 | 810,000 | 807,975 | ||||||
6.35%, 02/12/2048 | 5,187,000 | 3,852,126 | ||||||
6.49%, 01/23/2027(3) | 1,185,000 | 1,081,775 | ||||||
6.50%, 03/13/2027 | 1,090,000 | 983,747 | ||||||
6.50%, 01/23/2029 | 970,000 | 846,083 | ||||||
6.75%, 09/21/2047 | 9,337,000 | 7,178,752 | ||||||
6.88%, 08/04/2026 | 2,390,000 | 2,260,486 | ||||||
7.69%, 01/23/2050(3) | 4,534,000 | 3,758,233 | ||||||
Phillips 66 | ||||||||
4.88%, 11/15/2044 | 70,000 | 86,632 | ||||||
5.88%, 05/01/2042 | 3,000,000 | 4,056,458 | ||||||
Phillips 66 Partners LP | ||||||||
3.15%, 12/15/2029 | 655,000 | 670,447 | ||||||
3.55%, 10/01/2026 | 190,000 | 205,906 | ||||||
3.61%, 02/15/2025 | 560,000 | 599,169 | ||||||
4.90%, 10/01/2046 | 412,000 | 446,073 | ||||||
Plains All American Pipeline | ||||||||
3.65%, 06/01/2022 | 5,672,000 | 5,798,113 | ||||||
Plains All American Pipeline LP | ||||||||
3.55%, 12/15/2029 | 2,800,000 | 2,722,268 | ||||||
3.80%, 09/15/2030 | 838,000 | 825,207 | ||||||
4.65%, 10/15/2025 | 13,141,000 | 14,033,246 | ||||||
4.70%, 06/15/2044 | 3,880,000 | 3,500,822 | ||||||
5.15%, 06/01/2042 | 1,540,000 | 1,490,466 | ||||||
Reliance Holding USA, Inc. | ||||||||
5.40%, 02/14/2022(3) | 1,115,000 | 1,174,545 | ||||||
Sabal Trail Transmission LLC | ||||||||
4.68%, 05/01/2038(3) | 10,000,000 | 11,061,229 | ||||||
Sabine Pass Liquefaction LLC | ||||||||
5.88%, 06/30/2026 | 10,000,000 | 11,750,000 | ||||||
Schlumberger Holdings Corp. | ||||||||
3.75%, 05/01/2024(3) | 780,000 | 839,654 | ||||||
3.90%, 05/17/2028(3) | 852,000 | 919,310 | ||||||
Shell International Finance BV | ||||||||
2.75%, 04/06/2030 | 3,300,000 | 3,577,036 | ||||||
Sinopec Group Overseas Development 2016 Ltd. | ||||||||
3.50%, 05/03/2026(3) | 2,000,000 | 2,196,448 | ||||||
Sinopec Group Overseas Development 2018 Ltd. | ||||||||
3.68%, 08/08/2049(3) | 4,318,000 | 4,904,740 | ||||||
Southern Natural Gas Co. LLC | ||||||||
4.80%, 03/15/2047(3) | 428,000 | 476,182 | ||||||
8.00%, 03/01/2032 | 446,000 | 646,473 | ||||||
Spectra Energy Partners LP | ||||||||
3.50%, 03/15/2025 | 787,000 | 860,966 | ||||||
4.50%, 03/15/2045 | 3,000,000 | 3,392,832 | ||||||
5.95%, 09/25/2043 | 207,000 | 258,718 | ||||||
Suncor Energy, Inc. | ||||||||
5.95%, 12/01/2034 | 1,048,000 | 1,271,159 | ||||||
5.95%, 05/15/2035 | 350,000 | 414,872 | ||||||
6.80%, 05/15/2038 | 423,000 | 547,631 | ||||||
7.88%, 06/15/2026 | 543,000 | 653,488 | ||||||
Sunoco Logistics Partners Operations LP | ||||||||
4.95%, 01/15/2043 | 1,482,000 | 1,343,267 | ||||||
5.30%, 04/01/2044 | 200,000 | 192,906 | ||||||
5.40%, 10/01/2047 | 1,500,000 | 1,475,531 | ||||||
TC PipeLines LP | ||||||||
3.90%, 05/25/2027 | 5,457,000 | 5,738,606 | ||||||
4.38%, 03/13/2025 | 8,465,000 | 9,070,224 | ||||||
Tennessee Gas Pipeline Co. LLC | ||||||||
2.90%, 03/01/2030(3) | 1,705,000 | 1,746,946 | ||||||
Texas Eastern Transmission LP | ||||||||
2.80%, 10/15/2022(3) | 714,000 | 726,712 | ||||||
3.50%, 01/15/2028(3) | 450,000 | 478,771 | ||||||
Total Capital International SA | ||||||||
2.99%, 06/29/2041 | 2,600,000 | 2,649,789 | ||||||
3.13%, 05/29/2050 | 8,468,000 | 8,643,704 | ||||||
3.46%, 07/12/2049 | 1,905,000 | 2,056,392 | ||||||
TransCanada PipeLines Ltd. | ||||||||
4.75%, 05/15/2038 | 1,000,000 | 1,175,088 | ||||||
4.88%, 01/15/2026 | 792,000 | 934,605 | ||||||
6.20%, 10/15/2037 | 573,000 | 765,552 |
Valero Energy Corp. | ||||||||
2.70%, 04/15/2023 | 1,455,000 | 1,509,602 | ||||||
3.40%, 09/15/2026 | 12,496,000 | 13,677,000 | ||||||
6.63%, 06/15/2037 | 5,000,000 | 6,615,779 | ||||||
7.50%, 04/15/2032 | 175,000 | 240,823 | ||||||
Williams Cos, Inc. | ||||||||
3.50%, 11/15/2030 | 5,039,000 | 5,300,603 | ||||||
3.90%, 01/15/2025 | 700,000 | 765,938 | ||||||
4.30%, 03/04/2024 | 2,500,000 | 2,716,093 | ||||||
4.85%, 03/01/2048 | 3,000,000 | 3,280,343 | ||||||
4.90%, 01/15/2045 | 7,000,000 | 7,384,129 | ||||||
5.40%, 03/04/2044 | 2,750,000 | 3,056,502 | ||||||
5.75%, 06/24/2044 | 2,500,000 | 2,883,163 | ||||||
6.30%, 04/15/2040 | 333,000 | 399,090 | ||||||
8.75%, 03/15/2032 | 2,359,000 | 3,497,216 | ||||||
Woodside Finance Ltd. | ||||||||
3.65%, 03/05/2025(3) | 3,300,000 | 3,458,623 | ||||||
|
| |||||||
Total Energy |
| 532,078,862 | ||||||
|
| |||||||
Financials – 12.58% | ||||||||
ABN AMRO Bank NV | ||||||||
2.65%, 01/19/2021(3) | 1,000,000 | 1,008,660 | ||||||
4.75%, 07/28/2025(3) | 6,031,000 | 6,646,632 | ||||||
AerCap Ireland Capital DAC | ||||||||
3.30%, 01/23/2023 | 701,000 | 688,284 | ||||||
3.50%, 01/15/2025 | 1,500,000 | 1,407,879 | ||||||
4.45%, 12/16/2021 | 1,260,000 | 1,272,527 | ||||||
4.50%, 09/15/2023 | 3,610,000 | 3,610,423 | ||||||
6.50%, 07/15/2025 | 770,000 | 806,677 | ||||||
AIA Group Ltd. | ||||||||
3.20%, 03/11/2025(3) | 5,545,000 | 5,914,215 | ||||||
3.60%, 04/09/2029(3) | 795,000 | 877,560 | ||||||
3.90%, 04/06/2028(3) | 1,000,000 | 1,115,520 | ||||||
AIB Group Plc | ||||||||
4.75%, 10/12/2023(3) | 3,500,000 | 3,773,551 | ||||||
AIG Global Funding | ||||||||
0.80%, 07/07/2023(3) | 1,499,000 | 1,499,106 | ||||||
AIG SunAmerica Global Financing X | ||||||||
6.90%, 03/15/2032(3) | 955,000 | 1,424,863 | ||||||
Air Lease Corp. | ||||||||
3.25%, 03/01/2025 | 710,000 | 709,465 | ||||||
3.25%, 10/01/2029 | 3,950,000 | 3,760,701 | ||||||
3.38%, 07/01/2025 | 2,430,000 | 2,429,373 | ||||||
3.88%, 07/03/2023 | 2,500,000 | 2,532,291 | ||||||
Alexandria Real Estate Equities, Inc. | ||||||||
3.80%, 04/15/2026 | 338,000 | 379,160 | ||||||
4.00%, 02/01/2050 | 1,451,000 | 1,770,908 | ||||||
American Express Co. | ||||||||
4.20%, 11/06/2025 | 1,400,000 | 1,628,739 | ||||||
American Financial Group, Inc. | ||||||||
3.50%, 08/15/2026 | 1,435,000 | 1,529,454 | ||||||
American International Group, Inc. | ||||||||
3.38%, 08/15/2020 | 4,639,000 | 4,654,744 | ||||||
3.40%, 06/30/2030 | 4,791,000 | 5,189,758 | ||||||
3.88%, 01/15/2035 | 376,000 | 430,835 | ||||||
3.90%, 04/01/2026 | 1,370,000 | 1,547,411 | ||||||
4.13%, 02/15/2024 | 107,000 | 119,380 | ||||||
6.40%, 12/15/2020 | 4,009,000 | 4,115,854 | ||||||
American Tower Corp. | ||||||||
2.10%, 06/15/2030 | 1,300,000 | 1,302,703 | ||||||
2.25%, 01/15/2022 | 600,000 | 614,973 | ||||||
2.90%, 01/15/2030 | 120,000 | 128,051 | ||||||
3.38%, 10/15/2026 | 506,000 | 562,783 | ||||||
3.70%, 10/15/2049 | 2,065,000 | 2,262,474 | ||||||
3.80%, 08/15/2029 | 2,500,000 | 2,840,771 | ||||||
American Tower Trust | ||||||||
3.07%, 03/15/2023(3) | 2,900,000 | 2,967,165 | ||||||
AmSouth Bancorp | ||||||||
6.75%, 11/01/2025 | 527,000 | 639,724 | ||||||
ANZ New Zealand Int’l Ltd. | ||||||||
3.45%, 01/21/2028(3) | 500,000 | 568,618 | ||||||
Aon Corp. | ||||||||
2.80%, 05/15/2030 | 4,451,000 | 4,757,851 | ||||||
Aon Plc | ||||||||
3.50%, 06/14/2024 | 815,000 | 887,940 | ||||||
4.00%, 11/27/2023 | 5,000,000 | 5,469,961 | ||||||
ASB Bank Ltd. | ||||||||
3.13%, 05/23/2024(3) | 2,050,000 | 2,199,036 | ||||||
Assurant, Inc. | ||||||||
4.20%, 09/27/2023 | 1,210,000 | 1,282,606 | ||||||
Athene Global Funding | ||||||||
2.95%, 11/12/2026(3) | 8,370,000 | 8,398,721 | ||||||
Australia & New Zealand Banking Group Ltd. | ||||||||
4.40%, 05/19/2026(3) | 226,000 | 251,301 | ||||||
4.50%, 03/19/2024(3) | 9,000,000 | 9,773,002 | ||||||
Avolon Holdings Funding Ltd. | ||||||||
2.88%, 02/15/2025(3) | 1,000,000 | 839,157 | ||||||
4.38%, 05/01/2026(3) | 790,000 | 664,258 | ||||||
5.25%, 05/15/2024(3) | 2,790,000 | 2,547,384 | ||||||
Banco del Estado de Chile | ||||||||
2.67%, 01/08/2021(3) | 6,202,000 | 6,233,063 | ||||||
Banco Santander SA | ||||||||
2.43% (3 Month LIBOR USD + 1.12%), 04/12/2023(2) | 1,000,000 | 985,050 | ||||||
2.75%, 05/28/2025 | 1,600,000 | 1,657,312 | ||||||
3.13%, 02/23/2023 | 2,200,000 | 2,294,336 | ||||||
3.49%, 05/28/2030 | 2,137,000 | 2,287,324 | ||||||
3.50%, 04/11/2022 | 5,000,000 | 5,200,332 | ||||||
3.85%, 04/12/2023 | 2,400,000 | 2,552,978 | ||||||
5.18%, 11/19/2025 | 1,500,000 | 1,686,773 | ||||||
Bank of America Corp. | ||||||||
2.37% (3 Month LIBOR USD + 0.66%), 07/21/2021(2) | 2,500,000 | 2,502,309 | ||||||
2.46% (3 Month LIBOR USD + 0.87%), 10/22/2025(2) | 2,000,000 | 2,104,054 | ||||||
2.50% (3 Month LIBOR USD + 0.99%), 02/13/2031(2) | 2,965,000 | 3,107,879 | ||||||
2.59% (Secured Overnight Financing Rate + 2.15%), 04/29/2031(2) | 11,321,000 | 11,974,806 | ||||||
2.63%, 04/19/2021 | 2,500,000 | 2,544,246 | ||||||
2.68% (Secured Overnight Financing Rate + 1.93%), 06/19/2041(2) | 9,170,000 | 9,416,560 | ||||||
2.88% (3 Month LIBOR USD + 1.02%), 04/24/2023(2) | 1,640,000 | 1,700,055 | ||||||
2.88% (3 Month LIBOR USD + 1.19%), 10/22/2030(2) | 5,130,000 | 5,549,746 | ||||||
3.00% (3 Month LIBOR USD + 0.79%), 12/20/2023(2) | 18,031,000 | 18,964,271 | ||||||
3.09% (3 Month LIBOR USD + 1.09%), 10/01/2025(2) | 5,000,000 | 5,397,730 | ||||||
3.12% (3 Month LIBOR USD + 1.16%), 01/20/2023(2) | 951,000 | 985,041 | ||||||
3.25%, 10/21/2027 | 5,800,000 | 6,396,668 | ||||||
3.30%, 01/11/2023 | 3,800,000 | 4,046,544 | ||||||
3.37% (3 Month LIBOR USD + 0.81%), 01/23/2026(2) | 1,500,000 | 1,638,290 | ||||||
3.55% (3 Month LIBOR USD + 0.78%), 03/05/2024(2) | 1,985,000 | 2,121,058 | ||||||
3.56% (3 Month LIBOR USD + 1.06%), 04/23/2027(2) | 11,240,000 | 12,544,751 | ||||||
3.59% (3 Month LIBOR USD + 1.37%), 07/21/2028(2) | 7,800,000 | 8,762,256 | ||||||
3.71% (3 Month LIBOR USD + 1.51%), 04/24/2028(2) | 4,500,000 | 5,085,757 | ||||||
3.82% (3 Month LIBOR USD + 1.58%), 01/20/2028(2) | 10,000,000 | 11,373,025 | ||||||
3.86% (3 Month LIBOR USD + 0.94%), 07/23/2024(2) | 8,174,000 | 8,881,378 | ||||||
3.95%, 04/21/2025 | 5,201,000 | 5,754,951 | ||||||
3.97% (3 Month LIBOR USD + 1.21%), 02/07/2030(2) | 2,820,000 | 3,281,093 | ||||||
4.00%, 01/22/2025 | 5,349,000 | 5,903,448 | ||||||
4.20%, 08/26/2024 | 4,140,000 | 4,593,939 | ||||||
4.27% (3 Month LIBOR USD + 1.31%), 07/23/2029(2) | 1,500,000 | 1,765,485 | ||||||
4.30% (3 Month LIBOR USD + 2.66%), 07/28/2168(2) | 3,075,000 | 2,745,360 | ||||||
4.45%, 03/03/2026 | 7,140,000 | 8,198,182 | ||||||
6.11%, 01/29/2037 | 3,580,000 | 5,083,608 | ||||||
7.75%, 05/14/2038 | 137,000 | 224,524 | ||||||
Bank of Montreal | ||||||||
1.85%, 05/01/2025 | 1,950,000 | 2,018,830 | ||||||
3.30%, 02/05/2024 | 1,200,000 | 1,302,000 | ||||||
3.80% (5 Year Swap Rate USD + 1.43%), 12/15/2032(2) | 7,167,000 | 7,713,914 | ||||||
Bank of New York Mellon Corp. | ||||||||
2.95%, 01/29/2023 | 1,000,000 | 1,063,248 | ||||||
3.00%, 02/24/2025 | 5,360,000 | 5,864,552 | ||||||
3.25%, 09/11/2024 | 650,000 | 713,821 | ||||||
Bank of New Zealand | ||||||||
3.50%, 02/20/2024(3) | 950,000 | 1,030,578 | ||||||
Bank of Nova Scotia | ||||||||
1.30%, 06/11/2025 | 7,032,000 | 7,087,586 | ||||||
1.63%, 05/01/2023 | 6,570,000 | 6,725,114 | ||||||
Banque Federative du Credit Mutuel SA | ||||||||
3.75%, 07/20/2023(3) | 1,650,000 | 1,783,360 |
Barclays Plc | ||||||||
2.65% (1 Year CMT Index + 1.90%), 06/24/2031(2) | 3,220,000 | 3,197,650 | ||||||
3.65%, 03/16/2025 | 2,522,000 | 2,734,125 | ||||||
3.68%, 01/10/2023 | 10,650,000 | 11,052,884 | ||||||
3.93% (3 Month LIBOR USD + 1.61%), 05/07/2025(2) | 4,500,000 | 4,861,658 | ||||||
4.34%, 01/10/2028 | 2,360,000 | 2,619,572 | ||||||
4.61% (3 Month LIBOR USD + 1.40%), 02/15/2023(2) | 2,300,000 | 2,421,768 | ||||||
4.97% (3 Month LIBOR USD + 1.90%), 05/16/2029(2) | 2,450,000 | 2,869,974 | ||||||
5.20%, 05/12/2026 | 500,000 | 556,200 | ||||||
BB&T Corp. | ||||||||
2.85%, 10/26/2024 | 1,000,000 | 1,079,419 | ||||||
Berkshire Hathaway Finance Corp. | ||||||||
4.30%, 05/15/2043 | 322,000 | 420,145 | ||||||
4.40%, 05/15/2042 | 1,524,000 | 1,984,976 | ||||||
Berkshire Hathaway, Inc. | ||||||||
3.13%, 03/15/2026 | 8,130,000 | 9,107,741 | ||||||
BlackRock, Inc. | ||||||||
1.90%, 01/28/2031 | 2,800,000 | 2,860,629 | ||||||
Blackstone Holdings Finance Co. LLC | ||||||||
4.45%, 07/15/2045(3) | 170,000 | 196,728 | ||||||
BNP Paribas SA | ||||||||
2.22% (Secured Overnight Financing Rate + 2.07%), 06/09/2026(3) | 1,400,000 | 1,430,298 | ||||||
2.82% (3 Month LIBOR USD + 1.11%), 11/19/2025(2)(3) | 12,232,000 | 12,810,422 | ||||||
3.38%, 01/09/2025(3) | 10,725,000 | 11,592,001 | ||||||
3.50%, 03/01/2023(3) | 430,000 | 455,143 | ||||||
3.80%, 01/10/2024(3) | 1,600,000 | 1,732,196 | ||||||
4.40%, 08/14/2028(3) | 725,000 | 835,541 | ||||||
BNZ International Funding Ltd. | ||||||||
2.10%, 09/14/2021(3) | 400,000 | 406,886 | ||||||
2.65%, 11/03/2022(3) | 10,091,000 | 10,518,017 | ||||||
3.38%, 03/01/2023(3) | 6,000,000 | 6,398,913 | ||||||
BOC Aviation Ltd. | ||||||||
2.38%, 09/15/2021(3) | 3,550,000 | 3,548,473 | ||||||
2.75%, 09/18/2022(3) | 780,000 | 784,899 | ||||||
Boston Properties LP | ||||||||
3.13%, 09/01/2023 | 300,000 | 317,863 | ||||||
3.20%, 01/15/2025 | 1,139,000 | 1,225,985 | ||||||
3.65%, 02/01/2026 | 557,000 | 616,936 | ||||||
BPCE SA | ||||||||
2.75%, 01/11/2023(3) | 1,000,000 | 1,047,964 | ||||||
3.25%, 01/11/2028(3) | 7,815,000 | 8,530,318 | ||||||
4.50%, 03/15/2025(3) | 2,000,000 | 2,183,637 | ||||||
4.63%, 07/11/2024(3) | 1,300,000 | 1,417,875 | ||||||
5.15%, 07/21/2024(3) | 2,800,000 | 3,124,753 | ||||||
5.70%, 10/22/2023(3) | 3,645,000 | 4,061,784 | ||||||
Brixmor Operating Partnership LP | ||||||||
3.85%, 02/01/2025 | 1,100,000 | 1,135,939 | ||||||
4.05%, 07/01/2030 | 5,956,000 | 6,083,668 | ||||||
Brookfield Finance, Inc. | ||||||||
3.90%, 01/25/2028 | 770,000 | 845,082 | ||||||
4.70%, 09/20/2047 | 769,000 | 885,887 | ||||||
4.85%, 03/29/2029 | 875,000 | 1,029,709 | ||||||
Capital One Bank USA N.A. | ||||||||
3.38%, 02/15/2023 | 6,000,000 | 6,317,510 | ||||||
Capital One Financial Corp. | ||||||||
2.60%, 05/11/2023 | 4,546,000 | 4,747,187 | ||||||
3.20%, 02/05/2025 | 726,000 | 776,877 | ||||||
3.75%, 04/24/2024 | 824,000 | 892,838 | ||||||
3.75%, 07/28/2026 | 960,000 | 1,047,557 | ||||||
3.90%, 01/29/2024 | 3,600,000 | 3,914,943 | ||||||
4.20%, 10/29/2025 | 400,000 | 443,873 | ||||||
Charles Schwab Corp. | ||||||||
3.20%, 03/02/2027 | 1,700,000 | 1,897,465 | ||||||
3.23%, 09/01/2022 | 165,000 | 174,531 | ||||||
Citigroup, Inc. | ||||||||
2.57% (Secured Overnight Financing Rate + 2.11%), 06/03/2031(2) | 5,149,000 | 5,321,377 | ||||||
2.75%, 04/25/2022 | 13,420,000 | 13,912,111 | ||||||
2.88% (3 Month LIBOR USD + 0.95%), 07/24/2023(2) | 12,352,000 | 12,855,152 | ||||||
3.14% (3 Month LIBOR USD + 0.72%), 01/24/2023(2) | 3,387,000 | 3,502,907 | ||||||
3.20%, 10/21/2026 | 905,000 | 992,493 | ||||||
3.40%, 05/01/2026 | 1,000,000 | 1,108,806 | ||||||
3.52% (3 Month LIBOR USD + 1.15%), 10/27/2028(2) | 7,000,000 | 7,712,905 | ||||||
3.67% (3 Month LIBOR USD + 1.39%), 07/24/2028(2) | 4,625,000 | 5,155,643 |
3.70%, 01/12/2026 | 9,150,000 | 10,218,842 | ||||||
3.89% (3 Month LIBOR USD + 1.56%), 01/10/2028(2) | 4,100,000 | 4,620,758 | ||||||
4.30%, 11/20/2026 | 5,442,000 | 6,176,768 | ||||||
4.40%, 06/10/2025 | 12,181,000 | 13,641,011 | ||||||
4.41% (Secured Overnight Financing Rate + 3.91%), 03/31/2031(2) | 3,600,000 | 4,257,676 | ||||||
4.45%, 09/29/2027 | 7,467,000 | 8,509,364 | ||||||
6.63%, 01/15/2028 | 387,000 | 504,351 | ||||||
Citizens Bank N.A. | ||||||||
3.70%, 03/29/2023 | 1,370,000 | 1,468,219 | ||||||
Citizens Financial Group, Inc. | ||||||||
2.38%, 07/28/2021 | 188,000 | 190,384 | ||||||
3.25%, 04/30/2030 | 5,000,000 | 5,402,451 | ||||||
4.30%, 12/03/2025 | 343,000 | 383,788 | ||||||
CNA Financial Corp. | ||||||||
3.45%, 08/15/2027 | 820,000 | 874,532 | ||||||
3.95%, 05/15/2024 | 303,000 | 329,400 | ||||||
7.25%, 11/15/2023 | 7,470,000 | 8,708,167 | ||||||
Comerica, Inc. | ||||||||
4.00%, 02/01/2029 | 1,900,000 | 2,134,426 | ||||||
Commonwealth Bank of Australia | ||||||||
2.00%, 09/06/2021(3) | 450,000 | 458,403 | ||||||
2.50%, 09/18/2022(3) | 800,000 | 834,512 | ||||||
2.85%, 05/18/2026(3) | 1,300,000 | 1,423,831 | ||||||
3.45%, 03/16/2023(3) | 1,300,000 | 1,397,839 | ||||||
3.74%, 09/12/2039(3) | 6,585,000 | 7,071,239 | ||||||
4.50%, 12/09/2025(3) | 778,000 | 878,201 | ||||||
Compass Bank | ||||||||
3.88%, 04/10/2025 | 7,840,000 | 8,282,227 | ||||||
Cooperatieve Rabobank UA | ||||||||
3.88%, 02/08/2022 | 5,323,000 | 5,619,566 | ||||||
4.38%, 08/04/2025 | 570,000 | 643,113 | ||||||
4.63%, 12/01/2023 | 5,927,000 | 6,535,940 | ||||||
5.80%, 09/30/2110(3) | 361,000 | 585,666 | ||||||
Credit Agricole SA | ||||||||
1.91% (Secured Overnight Financing Rate + 1.68%), 06/16/2026(2)(3) | 1,450,000 | 1,469,936 | ||||||
3.75%, 04/24/2023(3) | 575,000 | 615,329 | ||||||
4.00% (5 Year Swap Rate USD + 1.64%), 01/10/2033(2)(3) | 5,000,000 | 5,504,007 | ||||||
4.38%, 03/17/2025(3) | 305,000 | 337,029 | ||||||
Credit Suisse AG/New York | ||||||||
1.00%, 05/05/2023 | 20,152,000 | 20,262,712 | ||||||
2.80%, 04/08/2022 | 3,000,000 | 3,115,636 | ||||||
Credit Suisse Group AG | ||||||||
2.19% (Secured Overnight Financing Rate + 2.04%), 06/05/2026(2)(3) | 1,020,000 | 1,032,747 | ||||||
2.59% (Secured Overnight Financing Rate + 1.56%), 09/11/2025(2)(3) | 1,450,000 | 1,499,559 | ||||||
3.57%, 01/09/2023(3) | 3,216,000 | 3,335,995 | ||||||
3.87% (3 Month LIBOR USD + 1.41%), 01/12/2029(2)(3) | 2,000,000 | 2,207,735 | ||||||
4.28%, 01/09/2028(3) | 3,973,000 | 4,449,063 | ||||||
Credit Suisse Group Funding Guernsey Ltd. | ||||||||
3.80%, 06/09/2023 | 8,500,000 | 9,152,800 | ||||||
4.55%, 04/17/2026 | 1,500,000 | 1,724,789 | ||||||
Crown Castle International Corp. | ||||||||
2.25%, 01/15/2031 | 2,585,000 | 2,603,660 | ||||||
4.00%, 03/01/2027 | 261,000 | 296,601 | ||||||
4.88%, 04/15/2022 | 1,112,000 | 1,187,974 | ||||||
5.25%, 01/15/2023 | 400,000 | 445,104 | ||||||
Dai-ichi Life Insurance Co. Ltd. | ||||||||
4.00% (3 Month LIBOR USD + 3.66%), 01/24/2168(2)(3) | 1,179,000 | 1,249,740 | ||||||
Daiwa Securities Group, Inc. | ||||||||
3.13%, 04/19/2022(3) | 854,000 | 879,909 | ||||||
Danske Bank | ||||||||
2.00%, 09/08/2021(3) | 558,000 | 566,560 | ||||||
2.70%, 03/02/2022(3) | 542,000 | 559,439 | ||||||
Deutsche Bank AG | ||||||||
3.15%, 01/22/2021 | 5,000,000 | 5,023,436 | ||||||
3.30%, 11/16/2022 | 3,000,000 | 3,068,515 | ||||||
3.70%, 05/30/2024 | 850,000 | 885,867 | ||||||
3.70%, 05/30/2024 | 2,063,000 | 2,156,263 | ||||||
4.25%, 10/14/2021 | 4,165,000 | 4,273,893 | ||||||
Deutsche Bank AG/New York NY | ||||||||
3.95%, 02/27/2023 | 5,000,000 | 5,192,377 | ||||||
Dexia Credit Local SA | ||||||||
3.25%, 09/26/2023(3) | 500,000 | 543,246 |
Digital Realty Trust LP | ||||||||
3.70%, 08/15/2027 | 462,000 | 526,961 | ||||||
Discover Bank | ||||||||
3.35%, 02/06/2023 | 2,000,000 | 2,109,752 | ||||||
3.45%, 07/27/2026 | 1,951,000 | 2,109,261 | ||||||
4.20%, 08/08/2023 | 7,156,000 | 7,815,324 | ||||||
4.65%, 09/13/2028 | 4,000,000 | 4,593,071 | ||||||
Discover Financial Services | ||||||||
3.75%, 03/04/2025 | 2,920,000 | 3,143,023 | ||||||
Duke Realty LP | ||||||||
2.88%, 11/15/2029 | 800,000 | 872,464 | ||||||
3.25%, 06/30/2026 | 203,000 | 222,610 | ||||||
3.63%, 04/15/2023 | 7,744,000 | 8,226,029 | ||||||
Equinix, Inc. | ||||||||
1.80%, 07/15/2027 | 1,823,000 | 1,824,878 | ||||||
Essex Portfolio LP | ||||||||
2.65%, 03/15/2032 | 1,740,000 | 1,834,723 | ||||||
Federal Realty Investment Trust | ||||||||
3.50%, 06/01/2030 | 2,753,000 | 2,899,690 | ||||||
3.95%, 01/15/2024 | 6,671,000 | 7,099,220 | ||||||
Federation des Caisses Desjardins du Quebec | ||||||||
2.05%, 02/10/2025(3) | 5,000,000 | 5,145,376 | ||||||
Fifth Third Bancorp | ||||||||
3.65%, 01/25/2024 | 1,420,000 | 1,548,923 | ||||||
FMR LLC | ||||||||
4.95%, 02/01/2033(3) | 250,000 | 326,573 | ||||||
6.45%, 11/15/2039(3) | 258,000 | 383,977 | ||||||
GAIF Bond Issuer Pty Ltd. | ||||||||
3.40%, 09/30/2026(3) | 1,000,000 | 1,045,919 | ||||||
GE Capital Funding LLC | ||||||||
3.45%, 05/15/2025(3) | 5,894,000 | 6,175,107 | ||||||
4.05%, 05/15/2027(3) | 4,000,000 | 4,222,098 | ||||||
4.40%, 05/15/2030(3) | 2,473,000 | 2,571,391 | ||||||
GE Capital International Funding Co. Unlimited Co. | ||||||||
4.42%, 11/15/2035 | 12,928,000 | 13,125,102 | ||||||
Globe Life, Inc. | ||||||||
4.55%, 09/15/2028 | 3,000,000 | 3,467,894 | ||||||
Goldman Sachs Capital I | ||||||||
6.35%, 02/15/2034 | 127,000 | 174,558 | ||||||
Goldman Sachs Group, Inc. | ||||||||
2.88% (3 Month LIBOR USD + 0.82%), 10/31/2022(2) | 8,784,000 | 9,005,744 | ||||||
2.91% (3 Month LIBOR USD + 0.99%), 07/24/2023(2) | 8,773,000 | 9,117,795 | ||||||
2.91% (3 Month LIBOR USD + 1.05%), 06/05/2023(2) | 3,076,000 | 3,188,803 | ||||||
3.00%, 04/26/2022 | 1,653,000 | 1,685,035 | ||||||
3.27% (3 Month LIBOR USD + 1.20%), 09/29/2025(2) | 5,590,000 | 6,026,346 | ||||||
3.50%, 01/23/2025 | 6,509,000 | 7,086,064 | ||||||
3.50%, 11/16/2026 | 1,700,000 | 1,869,590 | ||||||
3.69% (3 Month LIBOR USD + 1.51%), 06/05/2028(2) | 3,488,000 | 3,906,605 | ||||||
3.75%, 05/22/2025 | 1,305,000 | 1,445,908 | ||||||
3.75%, 02/25/2026 | 9,005,000 | 10,043,271 | ||||||
4.22% (3 Month LIBOR USD + 1.30%), 05/01/2029(2) | 5,000,000 | 5,816,664 | ||||||
4.41% (3 Month LIBOR USD + 1.43%), 04/23/2039(2) | 6,303,000 | 7,686,446 | ||||||
5.15%, 05/22/2045 | 4,000,000 | 5,287,181 | ||||||
6.75%, 10/01/2037 | 2,170,000 | 3,129,030 | ||||||
Goodman US Finance Four LLC | ||||||||
4.50%, 10/15/2037(3) | 200,000 | 228,229 | ||||||
Goodman US Finance Three LLC | ||||||||
3.70%, 03/15/2028(3) | 862,000 | 932,008 | ||||||
Great-West Lifeco Finance 2018 LP | ||||||||
4.58%, 05/17/2048(3) | 650,000 | 796,809 | ||||||
GTP Acquisition Partners I LLC | ||||||||
3.48%, 06/16/2025(3) | 1,824,000 | 1,910,491 | ||||||
Guardian Life Global Funding | ||||||||
1.10%, 06/23/2025(3) | 3,122,000 | 3,133,377 | ||||||
Guardian Life Insurance Co. of America | ||||||||
4.85%, 01/24/2077(3) | 5,610,000 | 7,134,062 | ||||||
Hartford Financial Services Group, Inc. | ||||||||
3.60%, 08/19/2049 | 1,000,000 | 1,053,935 | ||||||
4.30%, 04/15/2043 | 1,080,000 | 1,241,943 | ||||||
HCP, Inc. | ||||||||
3.40%, 02/01/2025 | 662,000 | 713,436 | ||||||
3.50%, 07/15/2029 | 1,742,000 | 1,896,789 | ||||||
3.88%, 08/15/2024 | 1,981,000 | 2,177,413 | ||||||
4.20%, 03/01/2024 | 241,000 | 262,618 |
Healthcare Trust of America Holdings LP | ||||||||
3.75%, 07/01/2027 | 1,734,000 | 1,829,384 | ||||||
HSBC Holdings Plc | ||||||||
2.65%, 01/05/2022 | 2,618,000 | 2,698,949 | ||||||
3.03% (3 Month LIBOR USD + 0.92%), 11/22/2023(2) | 1,784,000 | 1,863,895 | ||||||
3.60%, 05/25/2023 | 1,000,000 | 1,073,940 | ||||||
3.80% (3 Month LIBOR USD + 1.21%), 03/11/2025(2) | 1,795,000 | 1,939,353 | ||||||
3.95% (3 Month LIBOR USD + 0.99%), 05/18/2024(2) | 1,301,000 | 1,398,192 | ||||||
3.97% (3 Month LIBOR USD + 1.61%), 05/22/2030(2) | 1,000,000 | 1,109,853 | ||||||
4.00%, 03/30/2022 | 780,000 | 824,487 | ||||||
4.04% (3 Month LIBOR USD + 1.55%), 03/13/2028(2) | 1,533,000 | 1,694,045 | ||||||
4.25%, 03/14/2024 | 1,000,000 | 1,076,275 | ||||||
4.25%, 08/18/2025 | 1,009,000 | 1,100,781 | ||||||
4.29% (3 Month LIBOR USD + 1.35%), 09/12/2026(2) | 7,000,000 | 7,786,650 | ||||||
4.30%, 03/08/2026 | 1,000,000 | 1,128,803 | ||||||
6.10%, 01/14/2042 | 1,060,000 | 1,507,763 | ||||||
HSBC USA, Inc. | ||||||||
5.00%, 09/27/2020 | 3,000,000 | 3,031,306 | ||||||
9.13%, 05/15/2021 | 75,000 | 80,220 | ||||||
Huntington Bancshares, Inc. | ||||||||
2.30%, 01/14/2022 | 3,000,000 | 3,077,359 | ||||||
2.55%, 02/04/2030 | 1,650,000 | 1,705,251 | ||||||
Huntington National Bank | ||||||||
2.88%, 08/20/2020 | 4,000,000 | 4,007,491 | ||||||
Industrial & Commercial Bank of China Ltd. | ||||||||
2.45%, 10/20/2021 | 1,150,000 | 1,167,491 | ||||||
ING Bank NV | ||||||||
5.80%, 09/25/2023(3) | 503,000 | 564,418 | ||||||
ING Groep NV | ||||||||
1.40% (1 Year CMT Index + 1.10%), 07/01/2026(2)(3) | 1,940,000 | 1,944,527 | ||||||
3.15%, 03/29/2022 | 4,000,000 | 4,158,576 | ||||||
4.10%, 10/02/2023 | 3,175,000 | 3,482,188 | ||||||
International Lease Finance Corp. | ||||||||
5.88%, 08/15/2022 | 438,000 | 460,810 | ||||||
8.63%, 01/15/2022 | 1,200,000 | 1,289,184 | ||||||
Intesa Sanpaolo SpA | ||||||||
4.00%, 09/23/2029(3) | 10,590,000 | 11,198,040 | ||||||
Invesco Finance Plc | ||||||||
3.75%, 01/15/2026 | 4,249,000 | 4,652,503 | ||||||
4.00%, 01/30/2024 | 2,889,000 | 3,143,501 | ||||||
Jackson National Life Global Funding | ||||||||
2.50%, 06/27/2022(3) | 800,000 | 825,328 | ||||||
3.05%, 04/29/2026(3) | 473,000 | 510,365 | ||||||
3.25%, 01/30/2024(3) | 460,000 | 491,109 | ||||||
Jefferies Group LLC | ||||||||
5.13%, 01/20/2023 | 2,600,000 | 2,821,573 | ||||||
6.25%, 01/15/2036 | 155,000 | 177,538 | ||||||
6.45%, 06/08/2027 | 428,000 | 502,164 | ||||||
John Hancock Life Insurance Co. | ||||||||
7.38%, 02/15/2024(3) | 731,000 | 848,570 | ||||||
JPMorgan Chase & Co. | ||||||||
2.18% (Secured Overnight Financing Rate + 1.89%), 06/01/2028(2) | 18,322,000 | 18,952,310 | ||||||
2.30%, 08/15/2021 | 3,600,000 | 3,607,596 | ||||||
2.95%, 10/01/2026 | 5,000,000 | 5,491,526 | ||||||
3.11% (Secured Overnight Financing Rate + 2.44%), 04/22/2051(2) | 1,474,000 | 1,586,358 | ||||||
3.13%, 01/23/2025 | 4,000,000 | 4,359,553 | ||||||
3.20%, 06/15/2026 | 11,090,000 | 12,309,399 | ||||||
3.30%, 04/01/2026 | 1,870,000 | 2,090,161 | ||||||
3.38%, 05/01/2023 | 3,800,000 | 4,065,401 | ||||||
3.56% (3 Month LIBOR USD + 0.73%), 04/23/2024(2) | 8,000,000 | 8,577,602 | ||||||
3.96% (3 Month LIBOR USD + 1.38%), 11/15/2048(2) | 5,796,000 | 7,080,915 | ||||||
4.00% (Secured Overnight Financing Rate + 2.75%), 10/01/2168(2) | 4,275,000 | 3,741,822 | ||||||
4.01% (3 Month LIBOR USD + 1.12%), 04/23/2029(2) | 2,320,000 | 2,680,706 | ||||||
4.02% (3 Month LIBOR USD + 1.00%), 12/05/2024(2) | 1,742,000 | 1,919,498 | ||||||
4.26% (3 Month LIBOR USD + 1.58%), 02/22/2048(2) | 5,140,000 | 6,473,278 | ||||||
4.45% (3 Month LIBOR USD + 1.33%), 12/05/2029(2) | 9,660,000 | 11,580,674 | ||||||
4.60% (Secured Overnight Financing Rate + 3.13%), 08/01/2168(2) | 1,985,000 | 1,769,826 | ||||||
5.00% (Secured Overnight Financing Rate + 3.38%), 02/01/2168(2) | 5,010,000 | 4,818,643 | ||||||
KeyBank N.A. | ||||||||
3.18%, 05/22/2022 | 567,000 | 587,853 |
KeyCorp | ||||||||
4.15%, 10/29/2025 | 950,000 | 1,089,217 | ||||||
Liberty Mutual Group, Inc. | ||||||||
3.95%, 10/15/2050(3) | 6,769,000 | 7,149,413 | ||||||
4.25%, 06/15/2023(3) | 72,000 | 78,150 | ||||||
4.57%, 02/01/2029(3) | 2,301,000 | 2,694,678 | ||||||
Liberty Mutual Insurance Co. | ||||||||
7.70%, 10/15/2097(3) | 100,000 | 152,449 | ||||||
8.50%, 05/15/2025(3) | 700,000 | 900,959 | ||||||
Life Storage LP | ||||||||
4.00%, 06/15/2029 | 1,831,000 | 2,027,110 | ||||||
Lincoln National Corp. | ||||||||
3.05%, 01/15/2030 | 4,101,000 | 4,316,752 | ||||||
4.20%, 03/15/2022 | 873,000 | 924,555 | ||||||
7.00%, 06/15/2040 | 1,715,000 | 2,448,983 | ||||||
Lloyds Banking Group Plc | ||||||||
2.91% (3 Month LIBOR USD + 0.81%), 11/07/2023(2) | 8,950,000 | 9,318,126 | ||||||
3.57% (3 Month LIBOR USD + 1.21%), 11/07/2028(2) | 1,000,000 | 1,086,575 | ||||||
3.75%, 01/11/2027 | 2,000,000 | 2,213,600 | ||||||
4.05%, 08/16/2023 | 3,000,000 | 3,261,189 | ||||||
4.38%, 03/22/2028 | 949,000 | 1,101,125 | ||||||
4.45%, 05/08/2025 | 855,000 | 969,594 | ||||||
4.58%, 12/10/2025 | 550,000 | 610,404 | ||||||
Macquarie Bank Ltd. | ||||||||
4.00%, 07/29/2025(3) | 500,000 | 563,920 | ||||||
Macquarie Group Ltd. | ||||||||
3.19% (3 Month LIBOR USD + 1.02%), 11/28/2023(2)(3) | 6,000,000 | 6,233,293 | ||||||
3.76% (3 Month LIBOR USD + 1.37%), 11/28/2028(2)(3) | 2,565,000 | 2,763,505 | ||||||
4.15% (3 Month LIBOR USD + 1.33%), 03/27/2024(2)(3) | 2,000,000 | 2,146,991 | ||||||
5.03% (3 Month LIBOR USD + 1.75%), 01/15/2030(2)(3) | 4,445,000 | 5,263,649 | ||||||
6.25%, 01/14/2021(3) | 1,111,000 | 1,142,673 | ||||||
Manulife Financial Corp. | ||||||||
4.06% (5 Year 1100 Run ICE Swap Rate USD + 1.65%), 02/24/2032(2) | 1,910,000 | 2,024,103 | ||||||
Markel Corp. | ||||||||
3.63%, 03/30/2023 | 400,000 | 426,286 | ||||||
4.15%, 09/17/2050 | 655,000 | 720,245 | ||||||
5.00%, 04/05/2046 | 1,265,000 | 1,553,554 | ||||||
Marsh & McLennan Cos, Inc. | ||||||||
4.80%, 07/15/2021 | 5,000,000 | 5,158,238 | ||||||
Massachusetts Mutual Life Insurance Co. | ||||||||
3.73%, 10/15/2070(3) | 2,690,000 | 2,763,044 | ||||||
4.90%, 04/01/2077(3) | 5,000,000 | 6,458,378 | ||||||
7.63%, 11/15/2023(3) | 550,000 | 629,490 | ||||||
MassMutual Global Funding II | ||||||||
2.35%, 01/14/2027(3) | 3,843,000 | 4,054,718 | ||||||
2.75%, 06/22/2024(3) | 700,000 | 748,771 | ||||||
Mastercard, Inc. | ||||||||
3.85%, 03/26/2050 | 3,349,000 | 4,178,120 | ||||||
MBIA Insurance Corp. | ||||||||
12.48% (3 Month LIBOR USD + 11.26%), 01/15/2033(3) | 86,000 | 34,400 | ||||||
MetLife, Inc. | ||||||||
4.88%, 11/13/2043 | 3,000,000 | 3,882,857 | ||||||
6.40%, 12/15/2036 | 3,530,000 | 4,166,565 | ||||||
Metropolitan Life Global Funding I | ||||||||
0.90%, 06/08/2023(3) | 3,106,000 | 3,124,583 | ||||||
3.00%, 01/10/2023(3) | 407,000 | 431,029 | ||||||
3.00%, 09/19/2027(3) | 1,180,000 | 1,289,978 | ||||||
3.88%, 04/11/2022(3) | 1,480,000 | 1,567,256 | ||||||
Mid-America Apartments LP | ||||||||
4.00%, 11/15/2025 | 1,500,000 | 1,666,195 | ||||||
Mitsubishi UFJ Financial Group, Inc. | ||||||||
2.19%, 02/25/2025 | 5,000,000 | 5,166,530 | ||||||
2.53%, 09/13/2023 | 481,000 | 504,833 | ||||||
2.67%, 07/25/2022 | 800,000 | 830,844 | ||||||
2.95%, 03/01/2021 | 330,000 | 335,302 | ||||||
3.00%, 02/22/2022 | 206,000 | 213,450 | ||||||
3.41%, 03/07/2024 | 2,520,000 | 2,720,979 | ||||||
3.46%, 03/02/2023 | 4,000,000 | 4,269,627 | ||||||
3.75%, 07/18/2039 | 1,615,000 | 1,832,442 | ||||||
Mitsubishi UFJ Lease & Finance Co. Ltd. | ||||||||
2.65%, 09/19/2022(3) | 764,000 | 784,040 | ||||||
3.96%, 09/19/2023(3) | 2,730,000 | 2,920,496 |
Mizuho Bank Ltd. | ||||||||
3.60%, 09/25/2024(3) | 1,250,000 | 1,361,022 | ||||||
Mizuho Financial Group, Inc. | ||||||||
2.23% (3 Month LIBOR USD + 0.83%), 05/25/2026(2) | 1,740,000 | 1,782,833 | ||||||
2.60%, 09/11/2022 | 3,500,000 | 3,638,952 | ||||||
2.87% (3 Month LIBOR USD + 1.31%), 09/13/2030(2) | 1,620,000 | 1,710,192 | ||||||
2.95%, 02/28/2022 | 2,000,000 | 2,074,174 | ||||||
Morgan Stanley | ||||||||
2.19% (Secured Overnight Financing Rate + 1.99%), 04/28/2026(2) | 16,054,000 | 16,696,334 | ||||||
2.50%, 04/21/2021 | 2,000,000 | 2,033,487 | ||||||
2.63%, 11/17/2021 | 3,860,000 | 3,966,065 | ||||||
2.75%, 05/19/2022 | 8,390,000 | 8,722,941 | ||||||
3.13%, 01/23/2023 | 1,735,000 | 1,839,630 | ||||||
3.59% (3 Month LIBOR USD + 1.34%), 07/22/2028(2) | 5,882,000 | 6,615,061 | ||||||
3.63%, 01/20/2027 | 9,804,000 | 11,067,248 | ||||||
3.70%, 10/23/2024 | 1,167,000 | 1,294,366 | ||||||
3.74% (3 Month LIBOR USD + 0.85%), 04/24/2024(2) | 1,468,000 | 1,582,596 | ||||||
3.75%, 02/25/2023 | 1,882,000 | 2,032,114 | ||||||
3.77% (3 Month LIBOR USD + 1.14%), 01/24/2029(2) | 4,371,000 | 4,975,422 | ||||||
3.88%, 04/29/2024 | 2,050,000 | 2,266,842 | ||||||
3.88%, 01/27/2026 | 3,125,000 | 3,535,015 | ||||||
3.95%, 04/23/2027 | 14,190,000 | 15,971,447 | ||||||
4.10%, 05/22/2023 | 3,460,000 | 3,739,531 | ||||||
4.35%, 09/08/2026 | 930,000 | 1,072,425 | ||||||
5.00%, 11/24/2025 | 4,959,000 | 5,792,156 | ||||||
5.50%, 07/28/2021 | 1,437,000 | 1,513,204 | ||||||
MUFG Bank Ltd. | ||||||||
3.75%, 03/10/2024(3) | 3,215,000 | 3,524,970 | ||||||
4.10%, 09/09/2023(3) | 239,000 | 262,678 | ||||||
National Australia Bank Ltd. | ||||||||
3.93% (5 Year CMT Index + 1.88%), 08/02/2034(2)(3) | 2,330,000 | 2,538,812 | ||||||
National Retail Properties, Inc. | ||||||||
3.50%, 10/15/2027 | 400,000 | 417,848 | ||||||
3.60%, 12/15/2026 | 700,000 | 736,613 | ||||||
3.90%, 06/15/2024 | 1,310,000 | 1,394,112 | ||||||
Nationwide Building Society | ||||||||
4.00%, 09/14/2026(3) | 7,250,000 | 7,833,966 | ||||||
Nationwide Financial Services, Inc. | ||||||||
5.38%, 03/25/2021(3) | 2,000,000 | 2,056,910 | ||||||
Nationwide Mutual Insurance Co. | ||||||||
9.38%, 08/15/2039(3) | 7,150,000 | 11,495,666 | ||||||
NatWest Markets Plc | ||||||||
2.38%, 05/21/2023(3) | 4,188,000 | 4,287,449 | ||||||
3.63%, 09/29/2022(3) | 3,360,000 | 3,521,501 | ||||||
New York Life Global Funding | ||||||||
3.00%, 01/10/2028(3) | 2,022,000 | 2,239,283 | ||||||
New York Life Insurance Co. | ||||||||
4.45%, 05/15/2069(3) | 4,225,000 | 5,159,548 | ||||||
Nomura Holdings, Inc. | ||||||||
2.65%, 01/16/2025 | 2,597,000 | 2,708,387 | ||||||
Nordea Bank Abp | ||||||||
3.75%, 08/30/2023(3) | 4,000,000 | 4,288,939 | ||||||
4.25%, 09/21/2022(3) | 12,865,000 | 13,655,756 | ||||||
Northern Trust Corp. | ||||||||
1.95%, 05/01/2030 | 3,650,000 | 3,751,962 | ||||||
3.38% (3 Month LIBOR USD + 1.13%), 05/08/2032(2) | 411,000 | 440,324 | ||||||
Office Properties Income Trust | ||||||||
4.00%, 07/15/2022 | 1,255,000 | 1,250,124 | ||||||
OneBeacon US Holdings, Inc. | ||||||||
4.60%, 11/09/2022 | 1,500,000 | 1,558,986 | ||||||
Ontario Teachers’ Cadillac Fairview Properties Trust | ||||||||
3.13%, 03/20/2022(3) | 1,003,000 | 1,026,442 | ||||||
3.88%, 03/20/2027(3) | 1,044,000 | 1,119,668 | ||||||
ORIX Corp. | ||||||||
3.25%, 12/04/2024 | 1,500,000 | 1,618,071 | ||||||
Pacific Life Global Funding II | ||||||||
1.20%, 06/24/2025(3) | 5,771,000 | 5,801,149 | ||||||
Pacific Life Insurance Co. | ||||||||
4.30% (3 Month LIBOR USD + 2.80%), 10/24/2067(2)(3) | 743,000 | 773,384 | ||||||
Park Aerospace Holdings Ltd. | ||||||||
5.25%, 08/15/2022(3) | 1,480,000 | 1,389,289 | ||||||
People’s United Bank N.A. | ||||||||
4.00%, 07/15/2024 | 4,350,000 | 4,615,069 |
PNC Bank N.A. | ||||||||
2.95%, 01/30/2023 | 6,500,000 | 6,839,055 | ||||||
4.20%, 11/01/2025 | 322,000 | 374,441 | ||||||
Principal Life Global Funding II | ||||||||
1.25%, 06/23/2025(3) | 2,711,000 | 2,719,255 | ||||||
3.00%, 04/18/2026(3) | 2,000,000 | 2,206,465 | ||||||
Private Export Funding Corp. | ||||||||
2.65%, 02/16/2021(3) | 6,750,000 | 6,849,571 | ||||||
2.80%, 05/15/2022 | 1,200,000 | 1,251,286 | ||||||
3.25%, 06/15/2025 | 1,280,000 | 1,436,229 | ||||||
3.55%, 01/15/2024 | 2,489,000 | 2,712,244 | ||||||
Progressive Corp. | ||||||||
5.38% (3 Month LIBOR USD + 2.54%), 09/15/2167(2) | 780,000 | 775,336 | ||||||
Prologis LP | ||||||||
3.25%, 10/01/2026 | 303,000 | 339,865 | ||||||
Protective Life Corp. | ||||||||
4.30%, 09/30/2028(3) | 4,500,000 | 4,884,226 | ||||||
Prudential Financial, Inc. | ||||||||
3.91%, 12/07/2047 | 1,231,000 | 1,398,888 | ||||||
6.63%, 06/21/2040 | 5,995,000 | 9,090,999 | ||||||
Prudential Insurance Co. of America | ||||||||
8.30%, 07/01/2025(3) | 1,691,000 | 2,194,544 | ||||||
Realty Income Corp. | ||||||||
3.25%, 10/15/2022 | 1,490,000 | 1,560,700 | ||||||
Regency Centers LP | ||||||||
2.95%, 09/15/2029 | 2,200,000 | 2,232,559 | ||||||
Regions Financial Corp. | ||||||||
2.75%, 08/14/2022 | 326,000 | 339,539 | ||||||
Royal Bank of Canada | ||||||||
1.15%, 06/10/2025 | 12,789,000 | 12,806,295 | ||||||
2.25%, 11/01/2024 | 10,288,000 | 10,837,559 | ||||||
Royal Bank of Scotland Group Plc | ||||||||
3.75% (5 Year CMT Index + 2.10%), 11/01/2029(2) | 1,833,000 | 1,899,782 | ||||||
4.45% (3 Month LIBOR USD + 1.87%), 05/08/2030(2) | 1,500,000 | 1,741,119 | ||||||
4.52% (3 Month LIBOR USD + 1.55%), 06/25/2024(2) | 555,000 | 602,952 | ||||||
4.89% (3 Month LIBOR USD + 1.75%), 05/18/2029(2) | 2,490,000 | 2,934,780 | ||||||
5.08% (3 Month LIBOR USD + 1.91%), 01/27/2030(2) | 7,000,000 | 8,409,312 | ||||||
Santander Holdings USA, Inc. | ||||||||
3.45%, 06/02/2025 | 7,762,000 | 8,090,209 | ||||||
Santander UK Group Holdings Plc | ||||||||
3.82% (3 Month LIBOR USD + 1.40%), 11/03/2028(2) | 800,000 | 881,505 | ||||||
4.75%, 09/15/2025(3) | 1,810,000 | 1,961,207 | ||||||
Santander UK Plc | ||||||||
5.00%, 11/07/2023(3) | 4,150,000 | 4,520,595 | ||||||
Scentre Group Trust 1 | ||||||||
3.50%, 02/12/2025(3) | 1,390,000 | 1,447,719 | ||||||
SITE Centers Corp. | ||||||||
4.70%, 06/01/2027 | 368,000 | 374,387 | ||||||
Societe Generale SA | ||||||||
2.63%, 01/22/2025(3) | 7,054,000 | 7,202,330 | ||||||
3.00%, 01/22/2030(3) | 4,062,000 | 4,131,082 | ||||||
3.25%, 01/12/2022(3) | 7,000,000 | 7,207,841 | ||||||
3.88%, 03/28/2024(3) | 1,000,000 | 1,068,430 | ||||||
4.25%, 04/14/2025(3) | 800,000 | 846,552 | ||||||
SouthTrust Bank | ||||||||
7.69%, 05/15/2025 | 253,000 | 308,355 | ||||||
Standard Chartered Plc | ||||||||
2.74% (3 Month LIBOR USD + 1.20%), 09/10/2022(2)(3) | 800,000 | 809,237 | ||||||
2.82% (3 Month LIBOR USD + 1.21%), 01/30/2026(2)(3) | 1,360,000 | 1,388,990 | ||||||
4.25% (3 Month LIBOR USD + 1.15%), 01/20/2023(2)(3) | 3,230,000 | 3,353,063 | ||||||
4.31% (3 Month LIBOR USD + 1.91%), 05/21/2030(2)(3) | 700,000 | 770,956 | ||||||
4.87% (5 Year 1100 Run ICE Swap Rate USD + 1.97%), 03/15/2033(2)(3) | 800,000 | 872,797 | ||||||
5.20%, 01/26/2024(3) | 609,000 | 660,726 | ||||||
State Bank of India | ||||||||
4.38%, 01/24/2024(3) | 6,475,000 | 6,874,143 | ||||||
State Street Corp. | ||||||||
2.90% (Secured Overnight Financing Rate + 2.60%), 03/30/2026(2)(3) | 2,274,000 | 2,467,168 | ||||||
3.78% (3 Month LIBOR USD + 0.77%), 12/03/2024(2) | 1,000,000 | 1,102,526 | ||||||
Stifel Financial Corp. | ||||||||
3.50%, 12/01/2020 | 5,000,000 | 5,024,717 | ||||||
Sumitomo Life Insurance Co. | ||||||||
4.00% (3 Month LIBOR USD + 2.99%), 09/14/2077(2)(3) | 1,000,000 | 1,070,000 |
Sumitomo Mitsui Banking Corp. | ||||||||
3.95%, 07/19/2023 | 250,000 | 272,643 | ||||||
Sumitomo Mitsui Financial Group, Inc. | ||||||||
1.47%, 07/08/2025 | 10,975,000 | 10,973,000 | ||||||
2.13%, 07/08/2030 | 7,797,000 | 7,813,509 | ||||||
2.44%, 10/19/2021 | 531,000 | 543,837 | ||||||
2.63%, 07/14/2026 | 644,000 | 685,886 | ||||||
2.78%, 10/18/2022 | 6,718,000 | 7,021,795 | ||||||
2.78%, 07/12/2022 | 1,500,000 | 1,562,570 | ||||||
2.85%, 01/11/2022 | 1,100,000 | 1,136,641 | ||||||
3.04%, 07/16/2029 | 5,005,000 | 5,393,248 | ||||||
3.10%, 01/17/2023 | 1,033,000 | 1,092,470 | ||||||
SunTrust Bank | ||||||||
3.30%, 05/15/2026 | 1,000,000 | 1,102,759 | ||||||
SunTrust Banks, Inc. | ||||||||
2.70%, 01/27/2022 | 4,210,000 | 4,342,241 | ||||||
4.00%, 05/01/2025 | 424,000 | 482,718 | ||||||
Synchrony Financial | ||||||||
3.75%, 08/15/2021 | 6,000,000 | 6,134,609 | ||||||
3.95%, 12/01/2027 | 1,500,000 | 1,567,620 | ||||||
4.50%, 07/23/2025 | 4,000,000 | 4,250,010 | ||||||
Teachers Insurance & Annuity Association of America | ||||||||
4.27%, 05/15/2047(3) | 3,360,000 | 3,986,414 | ||||||
4.90%, 09/15/2044(3) | 200,000 | 256,872 | ||||||
6.85%, 12/16/2039(3) | 218,000 | 327,649 | ||||||
Trinity Acquisition Plc | ||||||||
4.40%, 03/15/2026 | 2,300,000 | 2,620,117 | ||||||
6.13%, 08/15/2043 | 5,000,000 | 6,818,942 | ||||||
Truist Financial Corp. | ||||||||
1.95%, 06/05/2030 | 7,588,000 | 7,701,186 | ||||||
4.80% (5 Year CMT Index + 3.00%), 12/31/2099(2) | 5,630,000 | 5,185,680 | ||||||
UBS AG | ||||||||
1.75%, 04/21/2022(3) | 1,710,000 | 1,742,285 | ||||||
UBS Group Funding Switzerland AG | ||||||||
2.86% (3 Month LIBOR USD + 0.95%), 08/15/2023(2)(3) | 7,367,000 | 7,630,750 | ||||||
2.95%, 09/24/2020(3) | 1,250,000 | 1,257,017 | ||||||
3.49%, 05/23/2023(3) | 9,790,000 | 10,254,851 | ||||||
4.13%, 09/24/2025(3) | 800,000 | 906,764 | ||||||
4.25%, 03/23/2028(3) | 3,000,000 | 3,403,947 | ||||||
UDR, Inc. | ||||||||
2.95%, 09/01/2026 | 276,000 | 292,307 | ||||||
3.00%, 08/15/2031 | 415,000 | 442,319 | ||||||
3.20%, 01/15/2030 | 1,565,000 | 1,705,245 | ||||||
United Overseas Bank Ltd. | ||||||||
3.20%, 04/23/2021(3) | 765,000 | 779,962 | ||||||
Ventas Realty LP | ||||||||
3.10%, 01/15/2023 | 13,500,000 | 13,819,315 | ||||||
3.50%, 02/01/2025 | 251,000 | 259,063 | ||||||
3.75%, 05/01/2024 | 382,000 | 398,021 | ||||||
3.85%, 04/01/2027 | 677,000 | 708,291 | ||||||
4.13%, 01/15/2026 | 449,000 | 481,839 | ||||||
Vornado Realty LP | ||||||||
3.50%, 01/15/2025 | 800,000 | 800,750 | ||||||
WEA Finance LLC | ||||||||
3.15%, 04/05/2022(3) | 1,243,000 | 1,261,186 | ||||||
WEA Finance LLC / Westfield UK & Europe Finance Plc | ||||||||
3.25%, 10/05/2020(3) | 7,331,000 | 7,340,374 | ||||||
Wells Fargo & Co. | ||||||||
1.65% (Secured Overnight Financing Rate + 1.60%), 06/02/2024(2) | 521,000 | 529,437 | ||||||
2.16% (3 Month LIBOR USD + 0.75%), 02/11/2026(2) | 17,945,000 | 18,520,860 | ||||||
2.19% (Secured Overnight Financing Rate + 2.00%), 04/30/2026(2) | 2,207,000 | 2,281,966 | ||||||
2.39% (Secured Overnight Financing Rate + 2.10%), 06/02/2028(2) | 2,342,000 | 2,419,350 | ||||||
2.57% (3 Month LIBOR USD + 1.00%), 02/11/2031(2) | 12,110,000 | 12,668,176 | ||||||
2.63%, 07/22/2022 | 11,315,000 | 11,788,542 | ||||||
3.00%, 04/22/2026 | 5,000,000 | 5,460,011 | ||||||
3.07% (Secured Overnight Financing Rate + 2.53%), 04/30/2041(2) | 3,900,000 | 4,058,058 | ||||||
3.07%, 01/24/2023 | 2,655,000 | 2,750,118 | ||||||
3.20% (3 Month LIBOR USD + 1.17%), 06/17/2027(2) | 3,145,000 | 3,410,112 | ||||||
3.30%, 09/09/2024 | 1,900,000 | 2,077,061 | ||||||
3.50%, 03/08/2022 | 1,929,000 | 2,020,519 | ||||||
3.55%, 09/29/2025 | 700,000 | 781,714 |
3.75%, 01/24/2024 | 1,690,000 | 1,846,576 | ||||||
4.10%, 06/03/2026 | 3,749,000 | 4,225,689 | ||||||
4.30%, 07/22/2027 | 729,000 | 836,179 | ||||||
4.40%, 06/14/2046 | 626,000 | 756,554 | ||||||
4.65%, 11/04/2044 | 675,000 | 836,082 | ||||||
4.75%, 12/07/2046 | 1,343,000 | 1,716,748 | ||||||
4.90%, 11/17/2045 | 1,457,000 | 1,869,716 | ||||||
5.38%, 11/02/2043 | 317,000 | 430,411 | ||||||
Welltower, Inc. | ||||||||
2.70%, 02/15/2027 | 497,000 | 516,407 | ||||||
3.10%, 01/15/2030 | 1,085,000 | 1,125,145 | ||||||
6.50%, 03/15/2041 | 700,000 | 889,812 | ||||||
Western Union Co. | ||||||||
3.60%, 03/15/2022 | 1,300,000 | 1,348,981 | ||||||
Westpac Banking Corp. | ||||||||
4.42%, 07/24/2039 | 1,010,000 | 1,192,281 | ||||||
Weyerhaeuser Co. | ||||||||
7.38%, 03/15/2032 | 500,000 | 691,479 | ||||||
Willis North America, Inc. | ||||||||
5.05%, 09/15/2048 | 7,500,000 | 9,600,043 | ||||||
WP Carey, Inc. | ||||||||
4.25%, 10/01/2026 | 800,000 | 873,352 | ||||||
WR Berkley Corp. | ||||||||
4.75%, 08/01/2044 | 3,445,000 | 4,037,938 | ||||||
XLIT Ltd. | ||||||||
5.25%, 12/15/2043 | 2,700,000 | 3,617,879 | ||||||
|
| |||||||
Total Financials |
| 1,778,771,241 | ||||||
|
| |||||||
Industrials – 1.60% | ||||||||
Airbus Finance BV | ||||||||
2.70%, 04/17/2023(3) | 376,000 | 389,746 | ||||||
Airbus SE | ||||||||
3.15%, 04/10/2027(3) | 736,000 | 759,579 | ||||||
3.95%, 04/10/2047(3) | 150,000 | 161,061 | ||||||
Allegion US Holding Co., Inc. | ||||||||
3.20%, 10/01/2024 | 2,000,000 | 2,086,442 | ||||||
Amphenol Corp. | ||||||||
3.20%, 04/01/2024 | 8,135,000 | 8,722,413 | ||||||
Arrow Electronics, Inc. | ||||||||
3.25%, 09/08/2024 | 219,000 | 232,151 | ||||||
3.50%, 04/01/2022 | 965,000 | 990,839 | ||||||
3.88%, 01/12/2028 | 221,000 | 231,558 | ||||||
4.50%, 03/01/2023 | 183,000 | 194,324 | ||||||
Aviation Capital Group LLC | ||||||||
3.50%, 11/01/2027(3) | 700,000 | 576,976 | ||||||
3.88%, 05/01/2023(3) | 780,000 | 742,084 | ||||||
BAE Systems Plc | ||||||||
5.80%, 10/11/2041(3) | 400,000 | 542,772 | ||||||
Boeing Co. | ||||||||
3.30%, 03/01/2035 | 1,410,000 | 1,284,281 | ||||||
3.95%, 08/01/2059 | 4,825,000 | 4,226,376 | ||||||
4.51%, 05/01/2023 | 9,846,000 | 10,396,490 | ||||||
4.88%, 05/01/2025 | 3,038,000 | 3,307,934 | ||||||
5.15%, 05/01/2030 | 6,670,000 | 7,441,619 | ||||||
5.71%, 05/01/2040 | 1,555,000 | 1,758,594 | ||||||
5.81%, 05/01/2050 | 1,226,000 | 1,446,562 | ||||||
Burlington Northern Santa Fe LLC | ||||||||
3.55%, 02/15/2050 | 725,000 | 840,398 | ||||||
4.38%, 09/01/2042 | 462,000 | 582,653 | ||||||
5.15%, 09/01/2043 | 389,000 | 537,476 | ||||||
5.40%, 06/01/2041 | 542,000 | 743,447 | ||||||
5.75%, 05/01/2040 | 373,000 | 526,029 | ||||||
6.15%, 05/01/2037 | 320,000 | 467,323 | ||||||
7.29%, 06/01/2036 | 134,000 | 203,716 | ||||||
Canadian Pacific Railway Co. | ||||||||
2.90%, 02/01/2025 | 644,000 | 697,861 | ||||||
Carlisle Cos, Inc. | ||||||||
3.50%, 12/01/2024 | 3,025,000 | 3,273,313 | ||||||
Carrier Global Corp. | ||||||||
2.70%, 02/15/2031(3) | 2,039,000 | 2,027,105 | ||||||
3.38%, 04/05/2040(3) | 1,921,000 | 1,868,232 | ||||||
Caterpillar Financial Services Corp. | ||||||||
2.75%, 08/20/2021 | 420,000 | 431,397 | ||||||
2.85%, 06/01/2022 | 446,000 | 465,135 | ||||||
3.25%, 12/01/2024 | 1,429,000 | 1,582,749 | ||||||
3.45%, 05/15/2023 | 650,000 | 703,963 | ||||||
3.75%, 11/24/2023 | 2,175,000 | 2,405,547 | ||||||
Caterpillar, Inc. | ||||||||
2.60%, 06/26/2022 | 220,000 | 227,451 | ||||||
CH Robinson Worldwide, Inc. | ||||||||
4.20%, 04/15/2028 | 6,000,000 | 6,834,528 | ||||||
CNH Industrial Capital LLC | ||||||||
1.95%, 07/02/2023 | 5,287,000 | 5,322,767 | ||||||
CRH America Finance, Inc. | ||||||||
3.40%, 05/09/2027(3) | 200,000 | 210,820 | ||||||
CRH America, Inc. | ||||||||
3.88%, 05/18/2025(3) | 354,000 | 390,446 | ||||||
5.13%, 05/18/2045(3) | 230,000 | 267,997 | ||||||
CSX Corp. | ||||||||
3.35%, 09/15/2049 | 305,000 | 335,269 | ||||||
4.65%, 03/01/2068 | 2,000,000 | 2,606,024 | ||||||
4.75%, 05/30/2042 | 175,000 | 223,384 | ||||||
4.75%, 11/15/2048 | 1,280,000 | 1,698,692 | ||||||
5.50%, 04/15/2041 | 402,000 | 553,027 | ||||||
Deere & Co. | ||||||||
2.88%, 09/07/2049 | 3,745,000 | 3,990,382 | ||||||
Eaton Corp. | ||||||||
4.00%, 11/02/2032 | 143,000 | 169,044 | ||||||
5.80%, 03/15/2037 | 500,000 | 669,824 | ||||||
7.63%, 04/01/2024 | 206,000 | 243,271 | ||||||
Embraer Netherlands Finance BV | ||||||||
5.05%, 06/15/2025 | 2,202,000 | 1,948,792 | ||||||
Embraer Overseas Ltd. | ||||||||
5.70%, 09/16/2023(3) | 4,000,000 | 3,810,040 | ||||||
Empresa de Transporte de Pasajeros Metro SA | ||||||||
4.70%, 05/07/2050(3) | 2,263,000 | 2,595,435 | ||||||
FedEx Corp. | ||||||||
4.95%, 10/17/2048 | 3,000,000 | 3,479,323 | ||||||
FLIR Systems, Inc. | ||||||||
3.13%, 06/15/2021 | 3,025,000 | 3,078,034 | ||||||
General Electric Co. | ||||||||
3.15%, 09/07/2022 | 7,800,000 | 8,161,531 | ||||||
3.45%, 05/01/2027 | 1,000,000 | 1,025,769 | ||||||
3.63%, 05/01/2030 | 1,535,000 | 1,536,374 | ||||||
5.55%, 01/05/2026 | 1,384,000 | 1,606,575 | ||||||
5.88%, 01/14/2038 | 289,000 | 323,317 | ||||||
Honeywell International Inc | ||||||||
1.95%, 06/01/2030 | 2,000,000 | 2,089,642 | ||||||
JB Hunt Transport Services, Inc. | ||||||||
3.85%, 03/15/2024 | 650,000 | 692,403 | ||||||
3.88%, 03/01/2026 | 1,380,000 | 1,577,811 | ||||||
John Deere Capital Corp. | ||||||||
2.25%, 09/14/2026 | 970,000 | 1,049,155 | ||||||
2.80%, 09/08/2027 | 700,000 | 782,927 | ||||||
Johnson Controls International Plc | ||||||||
3.75%, 12/01/2021 | 12,000 | 12,273 | ||||||
4.95%, 07/02/2064(1) | 928,000 | 1,100,955 | ||||||
Keysight Technologies, Inc. | ||||||||
4.60%, 04/06/2027 | 8,000,000 | 9,414,421 | ||||||
L3Harris Technologies, Inc. | ||||||||
3.83%, 04/27/2025 | 1,820,000 | 2,031,224 | ||||||
4.85%, 04/27/2035 | 1,000,000 | 1,274,571 | ||||||
Lockheed Martin Corp. | ||||||||
3.10%, 01/15/2023 | 346,000 | 367,966 | ||||||
Martin Marietta Materials, Inc. | ||||||||
3.45%, 06/01/2027 | 811,000 | 872,641 | ||||||
3.50%, 12/15/2027 | 6,165,000 | 6,787,564 | ||||||
4.25%, 07/02/2024 | 1,705,000 | 1,857,870 | ||||||
6.25%, 05/01/2037 | 107,000 | 133,842 | ||||||
Masco Corp. | ||||||||
6.50%, 08/15/2032 | 1,240,000 | 1,506,394 | ||||||
Mexico City Airport Trust | ||||||||
3.88%, 04/30/2028(3) | 3,950,000 | 3,580,714 | ||||||
5.50%, 07/31/2047(3) | 3,902,000 | 3,429,000 |
Norfolk Southern Corp. | ||||||||
2.90%, 02/15/2023 | 294,000 | 310,213 | ||||||
3.95%, 10/01/2042 | 332,000 | 386,648 | ||||||
4.05%, 08/15/2052 | 1,100,000 | 1,322,654 | ||||||
4.80%, 08/15/2043 | 1,273,000 | 1,611,664 | ||||||
5.59%, 05/17/2025 | 6,000 | 7,172 | ||||||
7.80%, 05/15/2027 | 1,705,000 | 2,348,072 | ||||||
Northrop Grumman Corp. | ||||||||
3.20%, 02/01/2027 | 849,000 | 940,574 | ||||||
3.25%, 01/15/2028 | 250,000 | 279,316 | ||||||
3.85%, 04/15/2045 | 195,000 | 229,078 | ||||||
nVent Finance Sarl | ||||||||
4.55%, 04/15/2028 | 3,625,000 | 3,877,087 | ||||||
Otis Worldwide Corp. | ||||||||
2.57%, 02/15/2030(3) | 3,430,000 | 3,596,843 | ||||||
Pactiv LLC | ||||||||
7.95%, 12/15/2025 | 34,000 | 36,210 | ||||||
Parker-Hannifin Corp. | ||||||||
4.10%, 03/01/2047 | 583,000 | 661,874 | ||||||
4.45%, 11/21/2044 | 333,000 | 397,170 | ||||||
Penske Truck Leasing Co. LP | ||||||||
2.70%, 03/14/2023(3) | 220,000 | 225,160 | ||||||
3.95%, 03/10/2025(3) | 7,000,000 | 7,587,556 | ||||||
Precision Castparts Corp. | ||||||||
4.20%, 06/15/2035 | 75,000 | 88,494 | ||||||
4.38%, 06/15/2045 | 415,000 | 501,589 | ||||||
Raytheon Technologies Corp. | ||||||||
3.20%, 03/15/2024(3) | 409,000 | 439,999 | ||||||
4.35%, 04/15/2047(3) | 970,000 | 1,183,134 | ||||||
Roper Technologies, Inc. | ||||||||
2.00%, 06/30/2030 | 1,150,000 | 1,150,567 | ||||||
3.00%, 12/15/2020 | 208,000 | 209,881 | ||||||
Ryder System, Inc. | ||||||||
2.88%, 09/01/2020 | 345,000 | 345,449 | ||||||
Siemens Financieringsmaatschappij NV | ||||||||
2.35%, 10/15/2026(3) | 700,000 | 749,673 | ||||||
2.90%, 05/27/2022(3) | 553,000 | 578,067 | ||||||
3.13%, 03/16/2024(3) | 800,000 | 864,878 | ||||||
3.30%, 09/15/2046(3) | 980,000 | 1,128,372 | ||||||
4.40%, 05/27/2045(3) | 513,000 | 687,622 | ||||||
Textron, Inc. | ||||||||
3.65%, 03/01/2021 | 11,600,000 | 11,734,566 | ||||||
3.65%, 03/15/2027 | 4,975,000 | 5,152,491 | ||||||
Timken Co. | ||||||||
3.88%, 09/01/2024 | 1,000,000 | 1,049,179 | ||||||
TTX Co. | ||||||||
3.60%, 01/15/2025(3) | 2,000,000 | 2,198,330 | ||||||
Union Pacific Corp. | ||||||||
4.10%, 09/15/2067 | 200,000 | 239,648 | ||||||
United Technologies Corp. | ||||||||
3.75%, 11/01/2046 | 1,130,000 | 1,292,485 | ||||||
4.15%, 05/15/2045 | 785,000 | 937,238 | ||||||
4.50%, 06/01/2042 | 1,823,000 | 2,257,275 | ||||||
4.63%, 11/16/2048 | 898,000 | 1,162,797 | ||||||
Vulcan Materials Co. | ||||||||
4.70%, 03/01/2048 | 2,054,000 | 2,367,108 | ||||||
Wabtec Corp. | ||||||||
3.45%, 11/15/2026 | 5,000,000 | 5,146,903 | ||||||
4.38%, 08/15/2023 | 322,000 | 337,449 | ||||||
Waste Management, Inc. | ||||||||
3.45%, 06/15/2029 | 940,000 | 972,661 | ||||||
WestRock MWV LLC | ||||||||
8.20%, 01/15/2030 | 537,000 | 756,769 | ||||||
WRKCo, Inc. | ||||||||
3.75%, 03/15/2025 | 1,300,000 | 1,440,919 | ||||||
Xylem, Inc. | ||||||||
3.25%, 11/01/2026 | 1,192,000 | 1,315,761 | ||||||
Xylem, Inc./NY | ||||||||
1.95%, 01/30/2028 | 2,170,000 | 2,188,179 | ||||||
2.25%, 01/30/2031 | 960,000 | 965,783 | ||||||
|
| |||||||
Total Industrials |
| 225,978,191 | ||||||
|
| |||||||
Technology – 1.31% | ||||||||
Analog Devices, Inc. | ||||||||
3.13%, 12/05/2023 | 476,000 | 511,396 | ||||||
4.50%, 12/05/2036 | 1,020,000 | 1,192,289 | ||||||
Apple, Inc. | ||||||||
1.65%, 05/11/2030 | 3,030,000 | 3,128,514 | ||||||
2.45%, 08/04/2026 | 1,111,000 | 1,207,098 | ||||||
2.90%, 09/12/2027 | 1,643,000 | 1,841,575 | ||||||
3.00%, 06/20/2027 | 1,462,000 | 1,632,930 | ||||||
3.20%, 05/13/2025 | 1,010,000 | 1,127,887 | ||||||
3.20%, 05/11/2027 | 743,000 | 842,152 | ||||||
3.45%, 02/09/2045 | 1,357,000 | 1,583,078 | ||||||
3.85%, 05/04/2043 | 4,000,000 | 4,961,035 | ||||||
3.85%, 08/04/2046 | 776,000 | 966,678 | ||||||
Broadcom Cayman Finance Ltd. | ||||||||
3.13%, 01/15/2025 | 7,000,000 | 7,477,365 | ||||||
Broadcom, Inc. | ||||||||
3.15%, 11/15/2025(3) | 6,325,000 | 6,715,284 | ||||||
3.46%, 09/15/2026(3) | 4,111,000 | 4,412,670 | ||||||
4.11%, 09/15/2028(3) | 2,092,000 | 2,288,136 | ||||||
4.15%, 11/15/2030(3) | 4,034,000 | 4,389,171 | ||||||
4.75%, 04/15/2029(3) | 3,340,000 | 3,790,577 | ||||||
Dell International LLC / EMC Corp. | ||||||||
5.45%, 06/15/2023(3) | 5,000,000 | 5,469,061 | ||||||
6.02%, 06/15/2026(3) | 8,302,000 | 9,518,038 | ||||||
DXC Technology Co. | ||||||||
4.25%, 04/15/2024 | 9,435,000 | 10,144,933 | ||||||
4.75%, 04/15/2027 | 1,500,000 | 1,644,392 | ||||||
Fidelity National Information Services, Inc. | ||||||||
3.00%, 08/15/2026 | 1,300,000 | 1,440,405 | ||||||
3.50%, 04/15/2023 | 1,281,000 | 1,371,458 | ||||||
3.88%, 06/05/2024 | 582,000 | 642,366 | ||||||
Fiserv, Inc. | ||||||||
3.20%, 07/01/2026 | 890,000 | 985,061 | ||||||
3.85%, 06/01/2025 | 5,000,000 | 5,644,629 | ||||||
4.40%, 07/01/2049 | 2,850,000 | 3,466,761 | ||||||
4.75%, 06/15/2021 | 5,231,000 | 5,438,856 | ||||||
Genpact Luxembourg Sarl | ||||||||
3.38%, 12/01/2024 | 2,000,000 | 2,063,879 | ||||||
Hewlett Packard Enterprise Co. | ||||||||
4.40%, 10/15/2022 | 7,500,000 | 8,029,301 | ||||||
HP, Inc. | ||||||||
3.00%, 06/17/2027 | 1,380,000 | 1,446,478 | ||||||
IBM Corp | ||||||||
1.70%, 05/15/2027 | 5,180,000 | 5,289,369 | ||||||
International Business Machines Corp. | ||||||||
3.30%, 05/15/2026 | 3,690,000 | 4,152,217 | ||||||
6.50%, 01/15/2028 | 120,000 | 160,431 | ||||||
Lam Research Corp | ||||||||
3.13%, 06/15/2060 | 4,670,000 | 4,927,026 | ||||||
Leidos, Inc. | ||||||||
3.63%, 05/15/2025(3) | 3,500,000 | 3,814,125 | ||||||
Microchip Technology, Inc. | ||||||||
2.67%, 09/01/2023(3) | 12,286,000 | 12,643,000 | ||||||
Microsoft Corp. | ||||||||
2.40%, 08/08/2026 | 600,000 | 655,022 | ||||||
2.53%, 06/01/2050 | 9,330,000 | 9,653,844 | ||||||
2.68%, 06/01/2060 | 1,637,000 | 1,708,259 | ||||||
3.50%, 02/12/2035 | 318,000 | 389,100 | ||||||
3.95%, 08/08/2056 | 589,000 | 756,646 | ||||||
4.20%, 11/03/2035 | 231,000 | 300,554 | ||||||
NXP BV | ||||||||
4.30%, 06/18/2029(3) | 2,265,000 | 2,569,444 | ||||||
5.35%, 03/01/2026(3) | 3,542,000 | 4,210,081 | ||||||
Oracle Corp. | ||||||||
2.40%, 09/15/2023 | 757,000 | 791,557 | ||||||
2.80%, 07/08/2021 | 766,000 | 785,837 | ||||||
2.95%, 11/15/2024 | 1,500,000 | 1,625,906 | ||||||
3.60%, 04/01/2040 | 2,500,000 | 2,837,659 | ||||||
3.60%, 04/01/2050 | 8,287,000 | 9,339,559 | ||||||
3.80%, 11/15/2037 | 600,000 | 692,118 | ||||||
3.85%, 07/15/2036 | 1,065,000 | 1,242,437 | ||||||
3.90%, 05/15/2035 | 936,000 | 1,131,876 | ||||||
4.30%, 07/08/2034 | 221,000 | 273,985 | ||||||
4.38%, 05/15/2055 | 400,000 | 507,227 |
QUALCOMM, Inc. | ||||||||
2.15%, 05/20/2030 | 4,135,000 | 4,303,841 | ||||||
Seagate HDD Cayman | ||||||||
4.75%, 06/01/2023 | 1,500,000 | 1,581,930 | ||||||
VMware, Inc. | ||||||||
2.95%, 08/21/2022 | 2,321,000 | 2,400,950 | ||||||
Xerox Corp. | ||||||||
2.75%, 09/01/2020 | 1,268,000 | 1,264,830 | ||||||
|
| |||||||
Total Technology |
| 185,382,283 | ||||||
|
| |||||||
Utilities – 3.81% | ||||||||
AEP Texas, Inc. | ||||||||
3.80%, 10/01/2047 | 3,715,000 | 4,195,891 | ||||||
AEP Transmission Co. LLC | ||||||||
3.15%, 09/15/2049 | 580,000 | 624,003 | ||||||
3.75%, 12/01/2047 | 2,600,000 | 2,981,808 | ||||||
4.00%, 12/01/2046 | 2,020,000 | 2,424,585 | ||||||
4.25%, 09/15/2048 | 4,790,000 | 5,938,750 | ||||||
Alabama Power Co. | ||||||||
2.80%, 04/01/2025 | 2,025,000 | 2,182,942 | ||||||
3.75%, 03/01/2045 | 182,000 | 206,383 | ||||||
4.10%, 01/15/2042 | 233,000 | 263,853 | ||||||
4.15%, 08/15/2044 | 205,000 | 245,038 | ||||||
6.13%, 05/15/2038 | 219,000 | 315,090 | ||||||
Ameren Corp. | ||||||||
2.50%, 09/15/2024 | 3,468,000 | 3,674,850 | ||||||
Ameren Illinois Co. | ||||||||
3.25%, 03/15/2050 | 2,007,000 | 2,214,663 | ||||||
American Water Capital Corp. | ||||||||
3.45%, 06/01/2029 | 590,000 | 675,617 | ||||||
3.85%, 03/01/2024 | 500,000 | 554,054 | ||||||
4.00%, 12/01/2046 | 2,350,000 | 2,832,893 | ||||||
6.59%, 10/15/2037 | 386,000 | 575,224 | ||||||
Appalachian Power Co. | ||||||||
6.70%, 08/15/2037 | 430,000 | 595,852 | ||||||
APT Pipelines Ltd. | ||||||||
4.25%, 07/15/2027(3) | 1,098,000 | 1,225,540 | ||||||
Arizona Public Service Co. | ||||||||
3.35%, 06/15/2024 | 676,000 | 725,757 | ||||||
3.75%, 05/15/2046 | 2,290,000 | 2,588,353 | ||||||
5.05%, 09/01/2041 | 349,000 | 440,814 | ||||||
Atmos Energy Corp. | ||||||||
4.13%, 10/15/2044 | 1,860,000 | 2,292,523 | ||||||
4.15%, 01/15/2043 | 830,000 | 1,007,795 | ||||||
Ausgrid Finance Pty Ltd. | ||||||||
4.35%, 08/01/2028(3) | 10,275,000 | 11,424,109 | ||||||
Avangrid, Inc. | ||||||||
3.15%, 12/01/2024 | 610,000 | 658,552 | ||||||
Baltimore Gas & Electric Co. | ||||||||
2.80%, 08/15/2022 | 509,000 | 529,596 | ||||||
2.90%, 06/15/2050 | 950,000 | 968,934 | ||||||
3.20%, 09/15/2049 | 1,105,000 | 1,172,111 | ||||||
3.50%, 08/15/2046 | 375,000 | 420,051 | ||||||
Berkshire Hathaway Energy Co. | ||||||||
3.50%, 02/01/2025 | 625,000 | 696,977 | ||||||
6.13%, 04/01/2036 | 366,000 | 527,642 | ||||||
Boston Gas Co. | ||||||||
4.49%, 02/15/2042(3) | 253,000 | 312,840 | ||||||
Brooklyn Union Gas Co. | ||||||||
3.87%, 03/04/2029(3) | 1,125,000 | 1,290,931 | ||||||
4.27%, 03/15/2048(3) | 1,100,000 | 1,355,856 | ||||||
4.50%, 03/10/2046(3) | 2,000,000 | 2,459,726 | ||||||
CenterPoint Energy Houston Electric LLC | ||||||||
3.95%, 03/01/2048 | 151,000 | 183,026 | ||||||
CenterPoint Energy Resources Corp. | ||||||||
4.50%, 01/15/2021 | 158,000 | 159,815 | ||||||
China Southern Power Grid International Finance BVI Co. Ltd. | ||||||||
3.50%, 05/08/2027(3) | 1,910,000 | 2,085,276 | ||||||
Cleveland Electric Illuminating Co. | ||||||||
3.50%, 04/01/2028(3) | 1,333,000 | 1,459,938 | ||||||
CMS Energy Corp. | ||||||||
2.95%, 02/15/2027 | 348,000 | 362,263 | ||||||
3.00%, 05/15/2026 | 110,000 | 119,308 | ||||||
3.45%, 08/15/2027 | 350,000 | 384,424 | ||||||
Comision Federal de Electricidad | ||||||||
4.88%, 05/26/2021(3) | 551,000 | 559,954 | ||||||
4.88%, 01/15/2024(3) | 322,000 | 338,905 | ||||||
Commonwealth Edison Co. | ||||||||
3.65%, 06/15/2046 | 364,000 | 426,284 | ||||||
3.75%, 08/15/2047 | 1,000,000 | 1,188,580 | ||||||
4.00%, 03/01/2048 | 4,615,000 | 5,694,708 | ||||||
Connecticut Light & Power Co. | ||||||||
3.20%, 03/15/2027 | 600,000 | 660,895 | ||||||
Consolidated Edison Co. of New York, Inc. | ||||||||
3.85%, 06/15/2046 | 2,940,000 | 3,379,595 | ||||||
4.30%, 12/01/2056 | 3,050,000 | 3,627,387 | ||||||
4.50%, 05/15/2058 | 538,000 | 676,738 | ||||||
4.65%, 12/01/2048 | 5,900,000 | 7,570,795 | ||||||
5.70%, 06/15/2040 | 318,000 | 440,232 | ||||||
Consumers Energy Co. | ||||||||
3.25%, 08/15/2046 | 190,000 | 211,950 | ||||||
4.35%, 08/31/2064 | 191,000 | 243,451 | ||||||
Delmarva Power & Light Co. | ||||||||
4.00%, 06/01/2042 | 170,000 | 197,278 | ||||||
Dominion Energy Gas Holdings LLC | ||||||||
2.80%, 11/15/2020 | 264,000 | 265,812 | ||||||
4.60%, 12/15/2044 | 1,300,000 | 1,482,932 | ||||||
Dominion Energy Inc. | ||||||||
2.85%, 08/15/2026 | 304,000 | 326,196 | ||||||
4.90%, 08/01/2041 | 212,000 | 264,227 | ||||||
5.25%, 08/01/2033 | 1,161,000 | 1,405,563 | ||||||
5.95%, 06/15/2035 | 3,389,000 | 4,462,542 | ||||||
7.00%, 06/15/2038 | 124,000 | 176,287 | ||||||
Dominion Energy, Inc. | ||||||||
2.45%, 01/15/2023(3) | 7,054,000 | 7,279,240 | ||||||
DTE Electric Co. | ||||||||
2.65%, 06/15/2022 | 194,000 | 200,646 | ||||||
DTE Energy Co. | ||||||||
2.53%, 10/01/2024 | 6,316,000 | 6,608,985 | ||||||
Duke Energy Carolinas LLC | ||||||||
4.25%, 12/15/2041 | 141,000 | 173,687 | ||||||
6.00%, 12/01/2028 | 235,000 | 310,526 | ||||||
Duke Energy Corp. | ||||||||
3.55%, 09/15/2021 | 306,000 | 314,626 | ||||||
3.75%, 09/01/2046 | 10,300,000 | 11,663,810 | ||||||
3.95%, 08/15/2047 | 1,740,000 | 2,031,378 | ||||||
Duke Energy Florida LLC | ||||||||
1.75%, 06/15/2030 | 4,909,000 | 4,959,634 | ||||||
4.20%, 07/15/2048 | 3,396,000 | 4,287,406 | ||||||
Duke Energy Indiana LLC | ||||||||
3.75%, 05/15/2046 | 600,000 | 696,410 | ||||||
Duke Energy Progress LLC | ||||||||
3.70%, 10/15/2046 | 506,000 | 591,078 | ||||||
4.10%, 05/15/2042 | 217,000 | 261,422 | ||||||
4.10%, 03/15/2043 | 181,000 | 217,932 | ||||||
4.15%, 12/01/2044 | 129,000 | 157,517 | ||||||
4.20%, 08/15/2045 | 325,000 | 402,014 | ||||||
4.38%, 03/30/2044 | 132,000 | 165,878 | ||||||
Duquesne Light Holdings, Inc. | ||||||||
3.62%, 08/01/2027(3) | 1,675,000 | 1,708,404 | ||||||
East Ohio Gas Co. | ||||||||
3.00%, 06/15/2050(3) | 730,000 | 728,790 | ||||||
Edison International | ||||||||
3.55%, 11/15/2024 | 3,606,000 | 3,807,522 | ||||||
5.75%, 06/15/2027 | 7,787,000 | 8,939,665 | ||||||
EDP Finance BV | ||||||||
3.63%, 07/15/2024(3) | 700,000 | 751,636 | ||||||
Electricite de France SA | ||||||||
4.75%, 10/13/2035(3) | 5,000,000 | 6,036,011 | ||||||
Emera US Finance LP | ||||||||
2.70%, 06/15/2021 | 3,799,000 | 3,868,446 | ||||||
3.55%, 06/15/2026 | 3,895,000 | 4,370,907 | ||||||
4.75%, 06/15/2046 | 900,000 | 1,066,727 |
Enel Finance International NV | ||||||||
2.65%, 09/10/2024(3) | 1,440,000 | 1,504,174 | ||||||
3.50%, 04/06/2028(3) | 5,845,000 | 6,286,067 | ||||||
3.63%, 05/25/2027(3) | 12,505,000 | 13,650,593 | ||||||
4.63%, 09/14/2025(3) | 1,787,000 | 2,035,089 | ||||||
4.75%, 05/25/2047(3) | 5,575,000 | 6,650,122 | ||||||
4.88%, 06/14/2029(3) | 215,000 | 253,904 | ||||||
6.00%, 10/07/2039(3) | 307,000 | 408,657 | ||||||
Engie Energia Chile SA | ||||||||
3.40%, 01/28/2030(3) | 1,600,000 | 1,666,400 | ||||||
Entergy Arkansas LLC | ||||||||
3.50%, 04/01/2026 | 307,000 | 345,496 | ||||||
Entergy Corp. | ||||||||
2.95%, 09/01/2026 | 310,000 | 342,080 | ||||||
Entergy Louisiana LLC | ||||||||
2.40%, 10/01/2026 | 650,000 | 696,578 | ||||||
3.05%, 06/01/2031 | 440,000 | 486,994 | ||||||
3.12%, 09/01/2027 | 370,000 | 406,496 | ||||||
4.00%, 03/15/2033 | 2,610,000 | 3,205,133 | ||||||
Entergy Texas, Inc. | ||||||||
4.50%, 03/30/2039 | 11,000,000 | 13,582,368 | ||||||
Evergy, Inc. | ||||||||
2.90%, 09/15/2029 | 2,190,000 | 2,346,206 | ||||||
Eversource Energy | ||||||||
2.75%, 03/15/2022 | 8,915,000 | 9,237,031 | ||||||
Exelon Corp. | ||||||||
3.50%, 06/01/2022 | 10,180,000 | 10,626,873 | ||||||
4.95%, 06/15/2035 | 1,500,000 | 1,848,562 | ||||||
Exelon Generation Co. LLC | ||||||||
3.40%, 03/15/2022 | 1,180,000 | 1,226,352 | ||||||
4.25%, 06/15/2022 | 313,000 | 331,601 | ||||||
5.75%, 10/01/2041 | 192,000 | 214,122 | ||||||
6.25%, 10/01/2039 | 300,000 | 356,153 | ||||||
FirstEnergy Corp. | ||||||||
2.85%, 07/15/2022 | 1,124,000 | 1,165,693 | ||||||
3.40%, 03/01/2050 | 3,305,000 | 3,523,700 | ||||||
3.90%, 07/15/2027 | 4,137,000 | 4,679,264 | ||||||
4.25%, 03/15/2023 | 3,893,000 | 4,209,390 | ||||||
4.85%, 07/15/2047 | 263,000 | 333,159 | ||||||
FirstEnergy Transmission LLC | ||||||||
4.55%, 04/01/2049(3) | 2,482,000 | 3,014,582 | ||||||
5.45%, 07/15/2044(3) | 4,430,000 | 5,722,500 | ||||||
Florida Power & Light Co. | ||||||||
3.70%, 12/01/2047 | 2,598,000 | 3,117,806 | ||||||
5.40%, 09/01/2035 | 700,000 | 986,548 | ||||||
Fortis, Inc. | ||||||||
3.06%, 10/04/2026 | 2,291,000 | 2,471,956 | ||||||
Indiana Michigan Power Co. | ||||||||
3.20%, 03/15/2023 | 991,000 | 1,045,406 | ||||||
Interstate Power and Light Co | ||||||||
2.30%, 06/01/2030 | 2,975,000 | 3,037,601 | ||||||
Israel Electric Corp. Ltd. | ||||||||
5.00%, 11/12/2024(3) | 3,288,000 | 3,682,955 | ||||||
6.88%, 06/21/2023(3) | 2,340,000 | 2,678,555 | ||||||
ITC Holdings Corp. | ||||||||
2.70%, 11/15/2022 | 10,512,000 | 10,959,173 | ||||||
2.95%, 05/14/2030(3) | 890,000 | 944,486 | ||||||
Jersey Central Power & Light Co. | ||||||||
4.30%, 01/15/2026(3) | 740,000 | 855,657 | ||||||
6.15%, 06/01/2037 | 400,000 | 514,339 | ||||||
John Sevier Combined Cycle Generation LLC | ||||||||
4.63%, 01/15/2042 | 428,663 | 541,281 | ||||||
Kansas City Power & Light Co. | ||||||||
3.15%, 03/15/2023 | 375,000 | 396,576 | ||||||
4.20%, 03/15/2048 | 500,000 | 624,039 | ||||||
5.30%, 10/01/2041 | 1,032,000 | 1,376,294 | ||||||
KeySpan Gas East Corp. | ||||||||
2.74%, 08/15/2026(3) | 538,000 | 575,094 | ||||||
Massachusetts Electric Co. | ||||||||
4.00%, 08/15/2046(3) | 624,000 | 709,627 | ||||||
Mega Advance Investments Ltd. | ||||||||
5.00%, 05/12/2021(3) | 591,000 | 605,267 | ||||||
MidAmerican Energy Co. | ||||||||
3.50%, 10/15/2024 | 317,000 | 351,913 |
Mid-Atlantic Interstate Transmission LLC | ||||||||
4.10%, 05/15/2028(3) | 9,900,000 | 11,283,553 | ||||||
National Rural Utilities Cooperative Finance Corp. | ||||||||
2.95%, 02/07/2024 | 341,000 | 364,913 | ||||||
3.05%, 04/25/2027 | 462,000 | 504,817 | ||||||
8.00%, 03/01/2032 | 791,000 | 1,243,860 | ||||||
Nevada Power Co. | ||||||||
2.40%, 05/01/2030 | 3,306,000 | 3,513,749 | ||||||
5.38%, 09/15/2040 | 261,000 | 334,266 | ||||||
5.45%, 05/15/2041 | 386,000 | 500,065 | ||||||
New England Power Co. | ||||||||
3.80%, 12/05/2047(3) | 6,995,000 | 8,071,254 | ||||||
New York State Electric & Gas Corp. | ||||||||
3.25%, 12/01/2026(3) | 804,000 | 890,051 | ||||||
NextEra Energy Capital Holdings, Inc. | ||||||||
2.25%, 06/01/2030 | 10,761,000 | 11,054,476 | ||||||
2.80%, 01/15/2023 | 3,671,000 | 3,858,842 | ||||||
3.34%, 09/01/2020 | 15,940,000 | 16,019,515 | ||||||
Niagara Mohawk Power Corp. | ||||||||
1.96%, 06/27/2030(3) | 2,150,000 | 2,171,128 | ||||||
3.51%, 10/01/2024(3) | 258,000 | 283,257 | ||||||
NiSource, Inc. | ||||||||
2.65%, 11/17/2022 | 11,730,000 | 12,249,404 | ||||||
2.95%, 09/01/2029 | 1,520,000 | 1,655,968 | ||||||
3.60%, 05/01/2030 | 5,934,000 | 6,780,111 | ||||||
3.85%, 02/15/2023 | 283,000 | 300,414 | ||||||
3.95%, 03/30/2048 | 4,480,000 | 5,180,230 | ||||||
5.80%, 02/01/2042 | 774,000 | 1,035,273 | ||||||
6.25%, 12/15/2040 | 550,000 | 762,717 | ||||||
Northern States Power Co. | ||||||||
3.60%, 09/15/2047 | 2,395,000 | 2,802,913 | ||||||
4.13%, 05/15/2044 | 1,480,000 | 1,860,988 | ||||||
NRG Energy, Inc. | ||||||||
4.45%, 06/15/2029(3) | 1,155,000 | 1,215,695 | ||||||
Ohio Power Co. | ||||||||
4.15%, 04/01/2048 | 1,190,000 | 1,464,958 | ||||||
Oncor Electric Delivery Co. LLC | ||||||||
3.10%, 09/15/2049 | 1,895,000 | 2,088,200 | ||||||
5.75%, 03/15/2029 | 124,000 | 162,642 | ||||||
Pacific Gas & Electric Co. | ||||||||
1.75%, 06/16/2022 | 8,056,000 | 8,068,567 | ||||||
4.45%, 04/15/2042(5) | 1,905,000 | 2,119,313 | ||||||
PECO Energy Co. | ||||||||
2.38%, 09/15/2022 | 578,000 | 598,445 | ||||||
2.80%, 06/15/2050 | 860,000 | 887,381 | ||||||
3.70%, 09/15/2047 | 2,120,000 | 2,509,458 | ||||||
3.90%, 03/01/2048 | 5,235,000 | 6,415,478 | ||||||
4.15%, 10/01/2044 | 353,000 | 435,765 | ||||||
Pennsylvania Electric Co. | ||||||||
3.25%, 03/15/2028(3) | 2,386,000 | 2,593,253 | ||||||
Pepco Holdings LLC | ||||||||
7.45%, 08/15/2032 | 222,000 | 317,620 | ||||||
Perusahaan Listrik Negara PT | ||||||||
4.88%, 07/17/2049(3) | 1,541,000 | 1,675,838 | ||||||
5.50%, 11/22/2021(3) | 1,959,000 | 2,045,196 | ||||||
PNM Resources, Inc. | ||||||||
3.25%, 03/09/2021 | 165,000 | 167,453 | ||||||
Potomac Electric Power Co. | ||||||||
6.50%, 11/15/2037 | 136,000 | 203,167 | ||||||
PPL Capital Funding, Inc. | ||||||||
4.00%, 09/15/2047 | 200,000 | 215,733 | ||||||
4.20%, 06/15/2022 | 1,082,000 | 1,145,563 | ||||||
PPL Electric Utilities Corp. | ||||||||
2.50%, 09/01/2022 | 178,000 | 182,705 | ||||||
3.00%, 10/01/2049 | 2,105,000 | 2,229,829 | ||||||
4.13%, 06/15/2044 | 208,000 | 252,519 | ||||||
Progress Energy, Inc. | ||||||||
3.15%, 04/01/2022 | 389,000 | 403,809 | ||||||
4.40%, 01/15/2021 | 390,000 | 394,451 | ||||||
7.75%, 03/01/2031 | 3,031,000 | 4,411,140 | ||||||
PSEG Power LLC | ||||||||
3.00%, 06/15/2021 | 2,310,000 | 2,356,955 |
Public Service Co. of Colorado | ||||||||
3.55%, 06/15/2046 | 353,000 | 392,739 | ||||||
4.10%, 06/15/2048 | 2,515,000 | 3,158,948 | ||||||
Public Service Co. of Oklahoma | ||||||||
4.40%, 02/01/2021 | 203,000 | 207,608 | ||||||
6.63%, 11/15/2037 | 649,000 | 885,410 | ||||||
Public Service Electric & Gas Co. | ||||||||
3.15%, 08/15/2024 | 1,000,000 | 1,077,238 | ||||||
3.60%, 12/01/2047 | 1,605,000 | 1,857,808 | ||||||
5.38%, 11/01/2039 | 117,000 | 162,654 | ||||||
Puget Energy, Inc. | ||||||||
3.65%, 05/15/2025 | 1,200,000 | 1,282,087 | ||||||
Puget Sound Energy, Inc. | ||||||||
3.25%, 09/15/2049 | 3,890,000 | 4,167,768 | ||||||
RGS I&M Funding Corp. | ||||||||
9.82%, 06/07/2022 | 63,213 | 65,828 | ||||||
San Diego Gas & Electric Co. | ||||||||
3.75%, 06/01/2047 | 1,737,000 | 2,003,273 | ||||||
3.95%, 11/15/2041 | 310,000 | 348,561 | ||||||
4.15%, 05/15/2048 | 1,693,000 | 2,042,767 | ||||||
5.35%, 05/15/2040 | 3,430,000 | 4,542,448 | ||||||
6.00%, 06/01/2026 | 213,000 | 261,228 | ||||||
Sempra Energy | ||||||||
4.05%, 12/01/2023 | 10,325,000 | 11,251,511 | ||||||
6.00%, 10/15/2039 | 752,000 | 1,040,906 | ||||||
Southern California Edison Co. | ||||||||
1.85%, 02/01/2022 | 96,000 | 96,081 | ||||||
3.50%, 10/01/2023 | 328,000 | 352,144 | ||||||
3.65%, 03/01/2028 | 1,200,000 | 1,346,677 | ||||||
3.65%, 02/01/2050 | 2,793,000 | 3,067,949 | ||||||
3.70%, 08/01/2025 | 5,547,000 | 6,136,224 | ||||||
3.90%, 12/01/2041 | 392,000 | 426,026 | ||||||
4.05%, 03/15/2042 | 800,000 | 911,580 | ||||||
4.13%, 03/01/2048 | 1,880,000 | 2,194,959 | ||||||
6.05%, 03/15/2039 | 253,000 | 341,035 | ||||||
Southern California Gas Co. | ||||||||
2.55%, 02/01/2030 | 2,621,000 | 2,820,244 | ||||||
Southern Co. | ||||||||
3.25%, 07/01/2026 | 218,000 | 241,585 | ||||||
Southern Co. Gas Capital Corp. | ||||||||
2.45%, 10/01/2023 | 230,000 | 241,256 | ||||||
3.25%, 06/15/2026 | 225,000 | 240,667 | ||||||
3.50%, 09/15/2021 | 530,000 | 544,587 | ||||||
3.95%, 10/01/2046 | 282,000 | 311,129 | ||||||
4.40%, 06/01/2043 | 160,000 | 180,603 | ||||||
5.88%, 03/15/2041 | 1,210,000 | 1,606,235 | ||||||
Southern Power Co. | ||||||||
5.15%, 09/15/2041 | 746,000 | 848,197 | ||||||
Southwest Gas Corp. | ||||||||
3.80%, 09/29/2046 | 508,000 | 552,326 | ||||||
Southwestern Public Service Co. | ||||||||
4.50%, 08/15/2041 | 350,000 | 431,830 | ||||||
Talent Yield Investments Ltd. | ||||||||
4.50%, 04/25/2022(3) | 715,000 | 745,128 | ||||||
Toledo Edison Co. | ||||||||
6.15%, 05/15/2037 | 680,000 | 973,338 | ||||||
Tri-State Generation & Transmission Association, Inc. | ||||||||
4.25%, 06/01/2046 | 371,000 | 435,092 | ||||||
Union Electric Co. | ||||||||
2.95%, 06/15/2027 | 715,000 | 785,609 | ||||||
3.65%, 04/15/2045 | 1,370,000 | 1,559,408 | ||||||
Virginia Electric & Power Co. | ||||||||
3.45%, 02/15/2024 | 191,000 | 207,149 | ||||||
3.50%, 03/15/2027 | 4,955,000 | 5,618,275 | ||||||
4.45%, 02/15/2044 | 126,000 | 156,963 | ||||||
4.60%, 12/01/2048 | 1,705,000 | 2,244,587 | ||||||
4.65%, 08/15/2043 | 3,500,000 | 4,454,673 | ||||||
Vistra Operations Co. LLC | ||||||||
3.55%, 07/15/2024(3) | 8,460,000 | 8,731,355 | ||||||
WEC Energy Group, Inc. | ||||||||
3.55%, 06/15/2025 | 865,000 | 963,429 |
Westar Energy, Inc. | ||||||||
4.13%, 03/01/2042 | 4,175,000 | 4,902,025 | ||||||
Wisconsin Electric Power Co. | ||||||||
3.10%, 06/01/2025 | 285,000 | 310,311 | ||||||
Xcel Energy, Inc. | ||||||||
2.40%, 03/15/2021 | 250,000 | 252,712 | ||||||
3.35%, 12/01/2026 | 5,105,000 | 5,721,576 | ||||||
|
| |||||||
Total Utilities |
| 539,368,816 | ||||||
|
| |||||||
Total Corporate Bonds (Cost: $4,380,143,747) | 4,731,256,618 | |||||||
|
| |||||||
Government Related – 14.50% | ||||||||
Other Government Related – 2.23% | ||||||||
Alabama Economic Settlement Authority | ||||||||
4.26%, 09/15/2032 | 610,000 | 728,981 | ||||||
American Municipal Power, Inc. | ||||||||
7.50%, 02/15/2050 | 1,350,000 | 2,191,725 | ||||||
Atlanta Independent School System | ||||||||
5.56%, 03/01/2026 | 535,000 | 645,515 | ||||||
Bay Area Toll Authority | ||||||||
2.57%, 04/01/2031 | 6,700,000 | 7,207,927 | ||||||
6.26%, 04/01/2049 | 1,650,000 | 2,878,244 | ||||||
California Qualified School Bond Joint Powers Authority | ||||||||
7.16%, 03/01/2027 | 805,000 | 968,938 | ||||||
City of Houston TX Combined Utility System Revenue | ||||||||
3.83%, 05/15/2028 | 1,850,000 | 2,111,165 | ||||||
City of Los Angeles Department of Airports | ||||||||
6.58%, 05/15/2039 | 1,650,000 | 2,207,090 | ||||||
Clark County School District | ||||||||
5.51%, 06/15/2024 | 3,000,000 | 3,227,340 | ||||||
Colombia Government International Bond | ||||||||
4.00%, 02/26/2024 | 737,000 | 772,929 | ||||||
4.13%, 05/15/2051 | 2,548,000 | 2,560,740 | ||||||
4.38%, 07/12/2021 | 1,000,000 | 1,023,750 | ||||||
4.50%, 01/28/2026 | 1,192,000 | 1,290,352 | ||||||
5.00%, 06/15/2045 | 2,872,000 | 3,223,820 | ||||||
5.63%, 02/26/2044 | 200,000 | 238,500 | ||||||
7.38%, 09/18/2037 | 2,150,000 | 2,924,000 | ||||||
Corp. Andina de Fomento | ||||||||
2.13%, 09/27/2021 | 2,740,000 | 2,757,152 | ||||||
2.75%, 01/06/2023 | 1,125,000 | 1,164,409 | ||||||
3.25%, 02/11/2022 | 1,230,000 | 1,261,980 | ||||||
4.38%, 06/15/2022 | 2,735,000 | 2,893,603 | ||||||
County of Cuyahoga OH | ||||||||
9.13%, 10/01/2023 | 105,000 | 117,336 | ||||||
District of Columbia Water & Sewer Authority | ||||||||
4.81%, 10/01/2114 | 875,000 | 1,254,776 | ||||||
Eaton Community City School District | ||||||||
5.39%, 08/25/2027 | 275,000 | 275,572 | ||||||
Export-Import Bank of India | ||||||||
3.88%, 02/01/2028(3) | 3,480,000 | 3,605,692 | ||||||
Fannie Mae | ||||||||
1.63%, 01/07/2025 | 6,247,000 | 6,581,422 | ||||||
1.88%, 09/24/2026 | 725,000 | 780,683 | ||||||
2.25%, 04/12/2022 | 6,542,000 | 6,781,454 | ||||||
2.63%, 09/06/2024 | 5,221,000 | 5,716,258 | ||||||
6.25%, 05/15/2029 | 630,000 | 912,629 | ||||||
6.63%, 11/15/2030(6) | 2,300,000 | 3,557,203 | ||||||
7.13%, 01/15/2030(4)(6) | 1,500,000 | 2,325,595 | ||||||
Fannie Mae Principal Strip | ||||||||
0.00%, 05/15/2030 | 929,000 | 815,555 | ||||||
Federal Home Loan Banks | ||||||||
4.00%, 10/24/2029(4)(6) | 2,000,000 | 2,541,825 | ||||||
Federal Home Loan Mortgage Corp. | ||||||||
6.25%, 07/15/2032 | 3,709,000 | 5,825,937 | ||||||
6.75%, 09/15/2029 | 625,000 | 942,091 | ||||||
Finnvera OYJ | ||||||||
2.38%, 06/04/2025(3) | 600,000 | 651,502 | ||||||
Hydro-Quebec | ||||||||
8.05%, 07/07/2024 | 638,000 | 816,051 | ||||||
8.40%, 01/15/2022 | 826,000 | 924,555 | ||||||
9.40%, 02/01/2021 | 186,000 | 195,669 | ||||||
Indonesia Government International Bond | ||||||||
4.13%, 01/15/2025(3) | 1,325,000 | 1,438,456 | ||||||
4.45%, 02/11/2024 | 1,130,000 | 1,225,366 | ||||||
5.88%, 01/15/2024(3) | 1,300,000 | 1,473,468 | ||||||
Iowa Tobacco Settlement Authority | ||||||||
6.50%, 06/01/2023 | 645,000 | 645,432 | ||||||
Israel Government AID Bond | ||||||||
0.00%, 09/15/2023 | 1,837,000 | 1,794,062 | ||||||
0.00%, 11/01/2023 | 413,000 | 403,038 | ||||||
0.00%, 11/01/2024 | 1,000,000 | 965,091 | ||||||
0.00%, 11/01/2024 | 17,739,000 | 17,134,760 | ||||||
5.50%, 09/18/2033 | 619,000 | 923,499 | ||||||
Japan Finance Organization for Municipalities | ||||||||
1.75%, 09/05/2024(3) | 200,000 | 208,457 | ||||||
2.00%, 09/08/2020(3) | 1,600,000 | 1,603,952 | ||||||
2.13%, 04/13/2021(3) | 400,000 | 404,914 | ||||||
2.13%, 10/25/2023(3) | 3,400,000 | 3,561,616 | ||||||
2.63%, 04/20/2022(3) | 6,000,000 | 6,219,022 | ||||||
3.25%, 04/24/2023(3) | 1,000,000 | 1,072,411 | ||||||
Korea Gas Corp. | ||||||||
4.25%, 11/02/2020(3) | 279,000 | 282,144 | ||||||
Los Angeles Department of Water & Power Power System Revenue | ||||||||
6.60%, 07/01/2050 | 2,400,000 | 4,290,672 | ||||||
Mexico Government International Bond | ||||||||
3.60%, 01/30/2025 | 868,000 | 920,340 | ||||||
3.75%, 01/11/2028 | 3,517,000 | 3,659,931 | ||||||
4.13%, 01/21/2026 | 1,014,000 | 1,095,130 | ||||||
4.35%, 01/15/2047 | 42,000 | 42,063 | ||||||
4.50%, 01/31/2050 | 1,275,000 | 1,311,338 | ||||||
4.60%, 01/23/2046 | 1,494,000 | 1,541,778 | ||||||
4.60%, 02/10/2048 | 1,482,000 | 1,537,575 | ||||||
4.75%, 03/08/2044 | 450,000 | 472,500 | ||||||
5.00%, 04/27/2051 | 6,081,000 | 6,552,278 | ||||||
5.75%, 10/12/2110 | 588,000 | 651,210 | ||||||
New Hampshire Housing Finance Authority | ||||||||
3.05%, 01/01/2021 | 95,000 | 95,758 | ||||||
3.75%, 07/01/2034 | 80,000 | 81,587 | ||||||
New Jersey Transportation Trust Fund Authority | ||||||||
4.13%, 06/15/2042 | 2,830,000 | 2,635,862 | ||||||
5.75%, 12/15/2028 | 5,100,000 | 5,555,685 | ||||||
New Jersey Turnpike Authority | ||||||||
7.10%, 01/01/2041 | 5,870,000 | 9,698,355 | ||||||
New York State Dormitory Authority | ||||||||
3.19%, 02/15/2043 | 6,730,000 | 7,323,721 | ||||||
5.60%, 03/15/2040 | 260,000 | 370,456 | ||||||
New York State Urban Development Corp. | ||||||||
5.84%, 03/15/2040 | 2,000,000 | 2,718,300 | ||||||
North American Development Bank | ||||||||
2.40%, 10/26/2022 | 684,000 | 707,799 | ||||||
North Carolina Housing Finance Agency | ||||||||
3.00%, 01/01/2033 | 1,555,000 | 1,571,903 | ||||||
North Carolina State Education Assistance Authority | ||||||||
0.00% (3 Month LIBOR USD + 0.80%), 07/25/2036(2)(7) | 8,600,000 | 8,180,750 | ||||||
Ohio State University | ||||||||
4.05%, 12/01/2056 | 406,000 | 538,998 | ||||||
4.80%, 06/01/2111 | 1,102,000 | 1,678,280 | ||||||
Panama Government International Bond | ||||||||
4.50%, 04/16/2050 | 1,610,000 | 1,969,030 | ||||||
Peruvian Government International Bond | ||||||||
2.39%, 01/23/2026 | 3,967,000 | 4,119,730 | ||||||
4.13%, 08/25/2027 | 2,008,000 | 2,307,212 | ||||||
5.63%, 11/18/2050 | 190,000 | 299,725 | ||||||
Port Authority of New York & New Jersey | ||||||||
4.46%, 10/01/2062 | 2,065,000 | 2,741,349 | ||||||
5.65%, 11/01/2040 | 435,000 | 620,841 | ||||||
5.65%, 11/01/2040 | 1,260,000 | 1,798,297 | ||||||
Province of Manitoba Canada | ||||||||
2.13%, 06/22/2026 | 400,000 | 429,221 | ||||||
2.60%, 04/16/2024 | 110,000 | 117,816 | ||||||
Qatar Government International Bond | ||||||||
2.38%, 06/02/2021(3) | 829,000 | 838,948 | ||||||
3.40%, 04/16/2025(3) | 6,388,000 | 6,947,001 | ||||||
4.40%, 04/16/2050(3) | 1,130,000 | 1,398,601 | ||||||
4.82%, 03/14/2049(3) | 1,200,000 | 1,577,076 | ||||||
5.10%, 04/23/2048(3) | 3,140,000 | 4,267,517 |
Regents of the University of California Medical Center Pooled Revenue | ||||||||
3.71%, 05/15/2120 | 3,270,000 | 3,389,126 | ||||||
Republic of South Africa Government International Bond | ||||||||
5.88%, 09/16/2025 | 403,000 | 427,180 | ||||||
Resolution Funding Corp. Interest Strip | ||||||||
0.00%, 10/15/2027 | 1,295,000 | 1,204,455 | ||||||
Rhode Island Housing & Mortgage Finance Corp. | ||||||||
4.00%, 10/01/2023 | 2,865,000 | 2,961,493 | ||||||
Romanian Government International Bond | ||||||||
5.13%, 06/15/2048(3) | 5,000,000 | 5,900,000 | ||||||
6.75%, 02/07/2022 | 250,000 | 268,675 | ||||||
Saudi Government International Bond | ||||||||
2.88%, 03/04/2023(3) | 5,560,000 | 5,796,500 | ||||||
4.00%, 04/17/2025(3) | 3,200,000 | 3,547,680 | ||||||
State of California | ||||||||
7.30%, 10/01/2039 | 275,000 | 459,756 | ||||||
7.50%, 04/01/2034 | 5,540,000 | 9,034,300 | ||||||
State of Illinois | ||||||||
5.00%, 10/01/2022 | 685,000 | 715,750 | ||||||
5.00%, 11/01/2022 | 10,340,000 | 10,819,673 | ||||||
5.10%, 06/01/2033 | 5,015,000 | 5,087,467 | ||||||
Tennessee Valley Authority | ||||||||
0.75%, 05/15/2025 | 5,562,000 | 5,634,822 | ||||||
2.88%, 02/01/2027 | 1,000,000 | 1,133,207 | ||||||
4.25%, 09/15/2065 | 1,720,000 | 2,587,316 | ||||||
4.63%, 09/15/2060 | 1,308,000 | 2,042,524 | ||||||
5.50%, 06/15/2038 | 57,000 | 87,055 | ||||||
5.88%, 04/01/2036 | 2,967,000 | 4,627,192 | ||||||
7.13%, 05/01/2030 | 1,615,000 | 2,510,102 | ||||||
Tennessee Valley Authority Generic Strip | ||||||||
0.00%, 07/15/2028 | 2,000,000 | 1,811,254 | ||||||
0.00%, 03/15/2032 | 1,514,000 | 1,259,724 | ||||||
Tennessee Valley Authority Principal Strip | ||||||||
0.00%, 11/01/2025 | 1,847,000 | 1,755,962 | ||||||
0.00%, 06/15/2035 | 258,000 | 191,106 | ||||||
Texas Private Activity Bond Surface Transportation Corp. | ||||||||
3.92%, 12/31/2049 | 1,810,000 | 1,863,250 | ||||||
Three Rivers Local School District | ||||||||
5.21%, 09/15/2027 | 285,000 | 289,187 | ||||||
Tokyo Metropolitan Government | ||||||||
2.00%, 05/17/2021(3) | 2,400,000 | 2,427,072 | ||||||
2.50%, 06/08/2022(3) | 5,000,000 | 5,172,569 | ||||||
3.25%, 06/01/2023(3) | 1,200,000 | 1,287,022 | ||||||
University of Missouri | ||||||||
5.96%, 11/01/2039 | 3,445,000 | 4,723,198 | ||||||
University of Virginia | ||||||||
4.18%, 09/01/2117 | 1,540,000 | 2,097,218 | ||||||
Uruguay Government International Bond | ||||||||
4.98%, 04/20/2055 | 2,590,000 | 3,318,463 | ||||||
5.10%, 06/18/2050 | 1,150,000 | 1,483,512 | ||||||
West Contra Costa Unified School District | ||||||||
6.25%, 08/01/2030 | 215,000 | 298,596 | ||||||
Westlake City School District | ||||||||
5.23%, 12/01/2026 | 430,000 | 435,556 | ||||||
|
| |||||||
Total Other Government Related |
| 315,568,248 | ||||||
|
| |||||||
U.S. Treasury Obligations – 12.27% | ||||||||
U.S. Treasury Bond | ||||||||
1.13%, 05/15/2040 | 3,444,000 | 3,411,443 | ||||||
3.00%, 11/15/2044 | 34,590,000 | 46,296,553 | ||||||
U.S. Treasury Inflation Indexed Bonds | ||||||||
0.13%, 01/15/2022(8) | 2,517,059 | 2,553,521 | ||||||
1.75%, 01/15/2028(8) | 734,298 | 876,499 | ||||||
2.50%, 01/15/2029(8) | 493,192 | 632,557 | ||||||
3.63%, 04/15/2028(8) | 1,653,353 | 2,226,175 | ||||||
U.S. Treasury Note | ||||||||
0.13%, 06/30/2022 | 14,172,000 | 14,163,696 | ||||||
0.25%, 06/15/2023 | 7,191,000 | 7,206,169 | ||||||
0.50%, 05/31/2027 | 15,345,000 | 15,361,184 | ||||||
1.75%, 12/31/2024 | 36,232,800 | 38,657,284 | ||||||
1.75%, 12/31/2026 | 2,230,000 | 2,415,630 | ||||||
1.88%, 11/30/2021 | 11,500,000 | 11,777,168 | ||||||
U.S. Treasury Note/Bond | ||||||||
0.13%, 05/31/2022 | 18,922,000 | 18,907,956 | ||||||
0.25%, 05/31/2025 | 3,089,000 | 3,085,018 | ||||||
0.25%, 06/30/2025 | 24,120,000 | 24,072,891 | ||||||
0.50%, 06/30/2027 | 2,835,000 | 2,836,772 | ||||||
0.63%, 05/15/2030 | 9,047,000 | 9,019,435 | ||||||
1.13%, 02/28/2021 | 8,000,000 | 8,049,687 | ||||||
1.25%, 05/15/2050 | 5,000,000 | 4,800,195 | ||||||
1.38%, 08/31/2020 | 10,000,000 | 10,019,789 | ||||||
1.38%, 10/31/2020 | 1,050,000 | 1,054,121 | ||||||
1.38%, 08/31/2023 | 12,000,000 | 12,452,344 | ||||||
1.50%, 01/31/2022 | 1,250,000 | 1,276,123 | ||||||
1.63%, 10/31/2023 | 25,000,000 | 26,192,383 | ||||||
1.63%, 08/15/2029 | 58,230,000 | 63,525,291 | ||||||
1.75%, 02/28/2022 | 37,900,000 | 38,890,433 | ||||||
1.75%, 03/31/2022 | 53,000,000 | 54,461,640 | ||||||
1.75%, 01/31/2023 | 12,000,000 | 12,485,156 | ||||||
1.75%, 05/15/2023 | 17,221,000 | 17,996,618 | ||||||
1.88%, 04/30/2022 | 2,000,000 | 2,062,266 | ||||||
2.00%, 11/30/2020 | 1,000,000 | 1,007,539 | ||||||
2.00%, 06/30/2024 | 543,000 | 581,349 | ||||||
2.00%, 08/15/2025 | 150,100 | 162,964 | ||||||
2.00%, 02/15/2050 | 50,376,000 | 57,660,842 | ||||||
2.13%, 08/15/2021 | 2,805,000 | 2,865,921 | ||||||
2.13%, 12/31/2022 | 55,000,000 | 57,674,805 | ||||||
2.13%, 02/29/2024 | 10,842,000 | 11,602,211 | ||||||
2.13%, 05/15/2025 | 17,000,000 | 18,510,078 | ||||||
2.25%, 04/30/2021 | 1,800,000 | 1,831,008 | ||||||
2.25%, 11/15/2024 | 20,529,000 | 22,318,070 | ||||||
2.25%, 11/15/2025 | 33,746,000 | 37,179,919 | ||||||
2.25%, 08/15/2046 | 26,502,100 | 31,418,446 | ||||||
2.25%, 08/15/2049 | 9,259,000 | 11,129,607 | ||||||
2.38%, 11/15/2049 | 8,832,000 | 10,903,035 | ||||||
2.50%, 05/15/2024 | 41,538,000 | 45,196,914 | ||||||
2.50%, 02/15/2045 | 87,800,000 | 108,264,946 | ||||||
2.63%, 08/15/2020 | 3,709,000 | 3,720,200 | ||||||
2.63%, 11/15/2020 | 4,596,000 | 4,637,831 | ||||||
2.63%, 05/15/2021 | 5,277,800 | 5,390,778 | ||||||
2.75%, 05/31/2023 | 1,737,000 | 1,866,732 | ||||||
2.75%, 02/15/2024 | 1,000,000 | 1,091,836 | ||||||
2.75%, 11/15/2042 | 1,200,000 | 1,536,656 | ||||||
2.75%, 08/15/2047 | 6,887,000 | 8,994,261 | ||||||
2.75%, 11/15/2047 | 6,648,000 | 8,693,558 | ||||||
2.88%, 04/30/2025 | 840,000 | 944,541 | ||||||
2.88%, 05/31/2025 | 5,392,000 | 6,071,476 | ||||||
2.88%, 05/15/2043 | 90,925,000 | 118,756,574 | ||||||
2.88%, 08/15/2045 | 7,800,000 | 10,278,023 | ||||||
2.88%, 05/15/2049 | 42,836,000 | 57,918,957 | ||||||
3.00%, 05/15/2047 | 3,861,000 | 5,260,009 | ||||||
3.00%, 02/15/2048 | 870,000 | 1,190,507 | ||||||
3.00%, 02/15/2049 | 2,144,000 | 2,958,301 | ||||||
3.13%, 05/15/2021 | 4,592,000 | 4,710,029 | ||||||
3.13%, 11/15/2028 | 58,300,000 | 70,479,234 | ||||||
3.13%, 02/15/2043 | 27,100,000 | 36,733,203 | ||||||
3.13%, 05/15/2048 | 24,938,000 | 34,931,709 | ||||||
3.38%, 11/15/2048 | 30,280,000 | 44,470,201 | ||||||
3.63%, 08/15/2043 | 16,350,000 | 23,874,832 | ||||||
3.63%, 02/15/2044 | 32,750,000 | 47,925,020 | ||||||
3.75%, 11/15/2043 | 48,150,000 | 71,640,053 | ||||||
4.38%, 11/15/2039 | 11,454,000 | 18,006,493 | ||||||
4.38%, 05/15/2041 | 1,500,000 | 2,385,059 | ||||||
4.75%, 02/15/2037 | 37,619,000 | 59,981,732 | ||||||
5.00%, 05/15/2037 | 8,604,000 | 14,107,535 | ||||||
8.00%, 11/15/2021 | 4,414,000 | 4,887,988 | ||||||
8.13%, 05/15/2021 | 1,718,000 | 1,837,320 | ||||||
8.75%, 08/15/2020 | 6,304,000 | 6,370,728 | ||||||
U.S. Treasury Strip Coupon | ||||||||
0.00%, 08/15/2021 | 9,469,000 | 9,453,136 | ||||||
0.00%, 11/15/2021 | 4,679,000 | 4,669,176 | ||||||
0.00%, 02/15/2022 | 25,367,000 | 25,293,184 | ||||||
0.00%, 05/15/2022 | 18,154,000 | 18,097,950 |
0.00%, 08/15/2022 | 4,975,000 | 4,956,788 | ||||||
0.00%, 11/15/2022 | 25,950,000 | 25,837,067 | ||||||
0.00%, 08/15/2023 | 22,550,000 | 22,386,097 | ||||||
0.00%, 11/15/2023 | 3,218,000 | 3,190,015 | ||||||
0.00%, 02/15/2024 | 12,206,000 | 12,082,275 | ||||||
0.00%, 05/15/2024 | 1,322,000 | 1,306,919 | ||||||
0.00%, 08/15/2024 | 1,834,000 | 1,809,761 | ||||||
0.00%, 11/15/2024 | 6,105,000 | 6,014,607 | ||||||
0.00%, 02/15/2025 | 799,000 | 785,556 | ||||||
0.00%, 05/15/2025 | 3,279,000 | 3,217,480 | ||||||
0.00%, 08/15/2027 | 4,314,000 | 4,135,719 | ||||||
0.00%, 11/15/2027 | 4,607,000 | 4,401,169 | ||||||
0.00%, 02/15/2031(6) | 12,590,000 | 11,483,333 | ||||||
0.00%, 08/15/2033 | 4,212,000 | 3,695,706 | ||||||
0.00%, 08/15/2034 | 6,895,000 | 5,949,362 | ||||||
0.00%, 11/15/2034 | 2,487,000 | 2,138,812 | ||||||
0.00%, 02/15/2035 | 1,824,000 | 1,562,148 | ||||||
0.00%, 05/15/2035 | 1,920,000 | 1,637,158 | ||||||
0.00%, 08/15/2035 | 175,000 | 148,714 | ||||||
0.00%, 05/15/2036 | 121,000 | 101,376 | ||||||
0.00%, 05/15/2039(6) | 455,000 | 356,563 | ||||||
0.00%, 08/15/2041 | 1,225,000 | 909,336 | ||||||
0.00%, 11/15/2043(6) | 4,090,000 | 2,868,411 | ||||||
|
| |||||||
Total U.S. Treasury Obligations |
| 1,735,212,845 | ||||||
|
| |||||||
Total Government Related (Cost: $1,812,116,141) | 2,050,781,093 | |||||||
|
| |||||||
Mortgage-Backed Obligations – 37.30% | ||||||||
20 Times Square Trust 2018-20TS | ||||||||
3.20%, 05/15/2035(3)(4) | 5,204,000 | 4,779,698 | ||||||
ACRC Holdings LLC | ||||||||
7.08% (1 Month LIBOR USD + 4.60%), 12/22/2021(2)(12) | 6,515,000 | 6,515,000 | ||||||
Alternative Loan Trust 2003-22CB | ||||||||
6.00%, 12/25/2033 | 1,930,221 | 1,987,564 | ||||||
Alternative Loan Trust 2004-2CB | ||||||||
5.75%, 03/25/2034 | 495,514 | 501,146 | ||||||
Alternative Loan Trust 2004-8CB | ||||||||
0.45% (1 Month LIBOR USD + 0.27%, 0.27% Floor), 06/25/2034(2) | 308,177 | 306,759 | ||||||
Alternative Loan Trust 2005-1CB | ||||||||
6.92% (1 Month LIBOR USD + 7.10%, 7.10% Cap), 03/25/2035(2)(7) | 146,406 | 24,682 | ||||||
Alternative Loan Trust 2005-20CB | ||||||||
4.57% (1 Month LIBOR USD + 4.75%, 4.75% Cap), 07/25/2035(2)(7) | 490,948 | 75,331 | ||||||
Alternative Loan Trust 2005-22T1 | ||||||||
4.89% (1 Month LIBOR USD + 5.07%, 5.07% Cap), 06/25/2035(2)(7) | 574,321 | 101,547 | ||||||
Alternative Loan Trust 2005-28CB | ||||||||
5.50%, 08/25/2035 | 206,737 | 202,769 | ||||||
6.00%, 08/25/2035 | 7,291 | 4,910 | ||||||
Alternative Loan Trust 2005-37T1 | ||||||||
4.87% (1 Month LIBOR USD + 5.05%, 5.05% Cap), 09/25/2035(2)(7) | 1,933,971 | 330,794 | ||||||
Alternative Loan Trust 2005-50CB | ||||||||
5.00%, 11/25/2020 | 4,286 | 4,257 | ||||||
Alternative Loan Trust 2005-54CB | ||||||||
4.67% (1 Month LIBOR USD + 4.85%, 4.85% Cap), 11/25/2035(2)(7) | 771,801 | 131,337 | ||||||
5.50%, 11/25/2035 | 2,730 | 2,683 | ||||||
5.50%, 11/25/2035 | 195,352 | 175,069 | ||||||
Alternative Loan Trust 2005-64CB | ||||||||
5.50%, 12/25/2035 | 80,820 | 78,084 | ||||||
Alternative Loan Trust 2005-J1 | ||||||||
4.92% (1 Month LIBOR USD + 5.10%, 5.10% Cap), 02/25/2035(2)(7) | 11,121 | 188 | ||||||
Alternative Loan Trust 2006-28CB | ||||||||
6.00%, 10/25/2036 | 65,342 | 47,903 | ||||||
Alternative Loan Trust 2006-43CB | ||||||||
6.00%, 02/25/2022 | 4,100 | 4,088 | ||||||
Alternative Loan Trust 2006-7CB | ||||||||
5.25%, 05/25/2021 | 34,581 | 34,176 | ||||||
Alternative Loan Trust 2006-J5 | ||||||||
3.98%, 07/25/2021(4) | 13,487 | 13,343 | ||||||
American General Mortgage Loan Trust 2006-1 | ||||||||
5.75%, 12/25/2035(3)(4) | 2,711 | 2,817 | ||||||
Antler Mortgage Trust 2018-RTL1 | ||||||||
4.34%, 07/25/2022(3) | 12,518,767 | 12,545,266 | ||||||
ASG Resecuritization Trust 2011-1 | ||||||||
6.00%, 09/28/2036(3) | 159,886 | 154,720 | ||||||
Assurant Commercial Mortgage Trust 2016-1 | ||||||||
3.17%, 05/15/2049(3) | 9,100,000 | 9,332,886 | ||||||
BAMLL Commercial Mortgage Securities Trust 2012-PARK | ||||||||
2.96%, 12/10/2030(3) | 809,000 | 846,894 | ||||||
BAMLL Commercial Mortgage Securities Trust 2014-520M | ||||||||
4.35%, 08/15/2046(3)(4) | 1,200,000 | 1,287,458 | ||||||
BAMLL Re-REMIC Trust 2013-FRR2 | ||||||||
0.00%, 09/26/2022(3) | 4,000,000 | 3,657,393 | ||||||
BAMLL Re-REMIC Trust 2014-FRR5 | ||||||||
0.00%, 06/27/2045(3) | 6,300,000 | 5,765,099 | ||||||
Banc of America Alternative Loan Trust 2004-6 | ||||||||
0.00%, 07/25/2049 | 974 | 771 | ||||||
Banc of America Alternative Loan Trust 2005-10 | ||||||||
5.25%, 11/25/2020 | 461 | 460 | ||||||
Banc of America Alternative Loan Trust 2005-11 | ||||||||
5.50%, 12/25/2035 | 8,815 | 8,357 | ||||||
Banc of America Alternative Loan Trust 2005-5 | ||||||||
5.50%, 06/25/2035 | 31,776 | 31,716 | ||||||
Banc of America Alternative Loan Trust 2005-9 | ||||||||
5.50%, 10/25/2035 | 14,172 | 13,828 | ||||||
Banc of America Alternative Loan Trust 2006-5 | ||||||||
6.00%, 06/25/2046 | 31,552 | 30,034 | ||||||
Banc of America Alternative Loan Trust 2007-1 | ||||||||
4.95%, 04/25/2022(4) | 18,419 | 17,467 | ||||||
Banc of America Commercial Mortgage Trust 2006-5 | ||||||||
0.88%, 09/10/2047(3)(4) | 115,523 | 327 | ||||||
Banc of America Funding 2004-1 Trust | ||||||||
0.00%, 03/25/2034 | 25,148 | 20,035 | ||||||
Banc of America Funding 2004-2 Trust | ||||||||
5.75%, 09/20/2034 | 1,689,778 | 1,807,018 | ||||||
Banc of America Funding 2004-C Trust | ||||||||
4.41%, 12/20/2034(4) | 34,281 | 33,120 | ||||||
Banc of America Funding 2005-6 Trust | ||||||||
5.50%, 10/25/2035 | 23,618 | 22,583 | ||||||
Banc of America Funding 2005-7 Trust | ||||||||
0.00%, 11/25/2035 | 22,614 | 20,017 | ||||||
Banc of America Funding 2005-8 Trust | ||||||||
0.00%, 01/25/2036 | 8,853 | 6,624 | ||||||
Banc of America Funding 2005-C Trust | ||||||||
0.43% (1 Month LIBOR USD + 0.24%, 0.24% Floor, 11.00% Cap), 05/20/2035(2) | 1,648,014 | 1,626,747 | ||||||
Banc of America Funding 2005-E Trust | ||||||||
4.44%, 03/20/2035(4) | 7,056 | 7,110 | ||||||
Banc of America Funding 2006-1 Trust | ||||||||
0.00%, 01/25/2036 | 12,471 | 9,029 | ||||||
Banc of America Mortgage 2003-C Trust | ||||||||
4.00%, 04/25/2033(4) | 11,395 | 10,976 | ||||||
BANK 2017-BNK4 | ||||||||
3.63%, 05/15/2050 | 6,790,000 | 7,633,252 | ||||||
BANK 2017-BNK8 | ||||||||
3.49%, 11/15/2050 | 12,745,000 | 14,321,022 | ||||||
BANK 2017-BNK9 | ||||||||
3.54%, 11/15/2054 | 6,100,000 | 6,863,334 | ||||||
BANK 2019-BNK21 | ||||||||
2.85%, 10/17/2052 | 2,742,000 | 2,999,764 | ||||||
BANK 2020-BNK27 | ||||||||
2.14%, 04/15/2063 | 1,538,000 | 1,590,156 | ||||||
BBCMS Mortgage Trust 2018-C2 | ||||||||
4.05%, 12/15/2051 | 20,000,000 | 23,182,176 | ||||||
BB-UBS Trust | ||||||||
2.89%, 06/05/2030(3) | 568,000 | 518,667 | ||||||
BB-UBS Trust 2012-SHOW | ||||||||
3.43%, 11/05/2036(3) | 4,602,000 | 4,424,516 | ||||||
BCAP LLC 2009-RR5 Trust | ||||||||
5.50%, 11/26/2034(3)(4) | 31,313 | 31,463 | ||||||
Bear Stearns ALT-A Trust 2005-7 | ||||||||
0.72% (1 Month LIBOR USD + 0.54%, 0.27% Floor, 11.50% Cap), 08/25/2035(2) | 386,235 | 383,625 | ||||||
Bear Stearns ARM Trust 2003-2 | ||||||||
4.01%, 01/25/2033(3)(4) | 101,790 | 98,600 | ||||||
Bear Stearns ARM Trust 2003-7 | ||||||||
3.31%, 10/25/2033(4) | 5,661 | 5,335 | ||||||
Bear Stearns ARM Trust 2004-2 | ||||||||
3.76%, 05/25/2034(4) | 43,321 | 40,486 |
Bear Stearns ARM Trust 2006-1 | ||||||||
3.84% (1 Year CMT Index + 2.25%, 2.25% Floor, 9.90% Cap), 02/25/2036(2) | 140,881 | 139,269 | ||||||
Bear Stearns Asset Backed Securities I Trust 2004-AC2 | ||||||||
5.00%, 05/25/2034 | 19,074 | 18,973 | ||||||
Bear Stearns Commercial Mortgage Securities Trust 2006-PWR14 | ||||||||
0.50%, 12/11/2038(3)(4) | 590,563 | 5 | ||||||
Bear Stearns Commercial Mortgage Securities Trust 2007-TOP26 | ||||||||
0.01%, 01/12/2045(3)(4) | 10,625,694 | 4,076 | ||||||
Bellemeade Re 2018-1 Ltd. | ||||||||
1.78% (1 Month LIBOR USD + 1.60%), 04/25/2028(2)(3) | 1,650,270 | 1,633,576 | ||||||
Bellemeade Re 2018-2 Ltd. | ||||||||
1.53% (1 Month LIBOR USD + 1.35%), 08/25/2028(2)(3) | 809,400 | 804,510 | ||||||
1.78% (1 Month LIBOR USD + 1.60%), 08/25/2028(2)(3) | 1,350,000 | 1,224,582 | ||||||
Bellemeade Re 2018-3 Ltd. | ||||||||
2.03% (1 Month LIBOR USD + 1.85%, 1.85% Floor), 10/25/2028(2)(3) | 1,833,624 | 1,816,036 | ||||||
Bellemeade Re 2019-3 Ltd. | ||||||||
1.28% (1 Month LIBOR USD + 1.10%, 1.10% Floor), 07/25/2029(2)(3) | 1,211,147 | 1,206,681 | ||||||
1.78% (1 Month LIBOR USD + 1.60%, 1.60% Floor), 07/25/2029(2)(3) | 3,600,000 | 3,487,837 | ||||||
Bellemeade Re 2020-1 Ltd. | ||||||||
2.85% (1 Month LIBOR USD + 2.65%), 06/25/2030(2)(3) | 2,650,000 | 2,650,464 | ||||||
3.60% (1 Month LIBOR USD + 3.40%), 06/25/2030(2)(3) | 690,000 | 690,000 | ||||||
Benchmark 2018-B1 Mortgage Trust | ||||||||
2.67%, 12/15/2072 | 30,000,000 | 32,142,633 | ||||||
Benchmark 2020-B16 Mortgage Trust | ||||||||
2.73%, 02/15/2053 | 511,000 | 554,985 | ||||||
Benchmark 2020-B17 Mortgage Trust | ||||||||
2.29%, 03/15/2053 | 3,637,000 | 3,809,973 | ||||||
BX Commercial Mortgage Trust 2020-BXLP | ||||||||
0.98% (1 Month LIBOR USD + 0.80%, 0.80% Floor), 12/15/2036(2)(3) | 13,500,000 | 13,393,084 | ||||||
CD 2006-CD3 Mortgage Trust | ||||||||
0.86%, 10/15/2048(3)(4) | 2,065,645 | 10,208 | ||||||
CD 2007-CD4 Commercial Mortgage Trust | ||||||||
1.51%, 12/11/2049(3)(4) | 15,966 | 581 | ||||||
CD 2019-CD8 Mortgage Trust | ||||||||
2.66%, 08/15/2057 | 20,000,000 | 21,384,366 | ||||||
Chase Mortgage Finance Trust Series 2006-A1 | ||||||||
4.01%, 09/25/2036(4) | 108,508 | 95,302 | ||||||
Chase Mortgage Finance Trust Series 2007-A1 | ||||||||
3.51%, 02/25/2037(4) | 56,062 | 54,693 | ||||||
3.66%, 02/25/2037(4) | 9,259 | 8,963 | ||||||
3.77%, 02/25/2037(4) | 28,106 | 27,207 | ||||||
3.99%, 02/25/2037(4) | 33,235 | 32,403 | ||||||
Chase Mortgage Finance Trust Series 2007-A2 | ||||||||
3.51%, 06/25/2035(4) | 29,520 | 27,988 | ||||||
4.14%, 06/25/2035(4) | 46,127 | 44,759 | ||||||
CHL Mortgage Pass-Through Trust 2002-18 | ||||||||
0.00%, 11/25/2032 | 10,251 | 9,301 | ||||||
CHL Mortgage Pass-Through Trust 2004-3 | ||||||||
5.50%, 04/25/2034 | 28,031 | 29,152 | ||||||
5.75%, 04/25/2034 | 19,098 | 19,926 | ||||||
CHL Mortgage Pass-Through Trust 2004-5 | ||||||||
5.50%, 06/25/2034 | 110,201 | 112,627 | ||||||
CHL Mortgage Pass-Through Trust 2004-7 | ||||||||
3.57%, 06/25/2034(4) | 6,366 | 6,416 | ||||||
CHL Mortgage Pass-Through Trust 2004-8 | ||||||||
4.50%, 06/25/2021 | 1,517 | 1,549 | ||||||
CHL Mortgage Pass-Through Trust 2004-HYB1 | ||||||||
3.43%, 05/20/2034(4) | 8,932 | 8,532 | ||||||
CHL Mortgage Pass-Through Trust 2004-HYB3 | ||||||||
3.00%, 06/20/2034(4) | 58,045 | 55,288 | ||||||
CHL Mortgage Pass-Through Trust 2004-HYB6 | ||||||||
3.89%, 11/20/2034(4) | 34,714 | 33,714 | ||||||
CHL Mortgage Pass-Through Trust 2005-14 | ||||||||
5.50%, 07/25/2035 | 21,026 | 17,954 | ||||||
CHL Mortgage Pass-Through Trust 2005-16 | ||||||||
5.50%, 09/25/2035 | 9,204 | 8,064 | ||||||
CHL Mortgage Pass-Through Trust 2005-22 | ||||||||
3.56%, 11/25/2035(4) | 142,313 | 127,204 | ||||||
CIM Trust 2017-6 | ||||||||
3.02%, 06/25/2057(3)(4) | 4,048,581 | 4,069,296 | ||||||
CIM Trust 2017-8 | ||||||||
3.00%, 12/25/2065(3)(4) | 7,315,078 | 7,287,363 |
Citicorp Mortgage Securities Trust Series 2006-1 | ||||||||
5.00%, 02/25/2021 | 1,656 | 1,663 | ||||||
Citicorp Mortgage Securities Trust Series 2006-4 | ||||||||
6.00%, 08/25/2036 | 47,572 | 48,282 | ||||||
Citigroup Commercial Mortgage Trust 2014-GC19 | ||||||||
3.75%, 03/10/2047 | 3,833,033 | 4,100,160 | ||||||
Citigroup Commercial Mortgage Trust 2014-GC21 | ||||||||
3.58%, 05/10/2047 | 3,225,515 | 3,437,202 | ||||||
Citigroup Commercial Mortgage Trust 2014-GC23 | ||||||||
3.36%, 07/10/2047 | 9,634,692 | 10,251,734 | ||||||
Citigroup Commercial Mortgage Trust 2015-GC29 | ||||||||
2.94%, 04/10/2048 | 10,000,000 | 10,442,121 | ||||||
Citigroup Commercial Mortgage Trust 2015-GC33 | ||||||||
3.78%, 09/10/2058 | 717,000 | 793,845 | ||||||
Citigroup Commercial Mortgage Trust 2016-C1 | ||||||||
2.94%, 05/10/2049 | 10,100,000 | 10,787,844 | ||||||
Citigroup Commercial Mortgage Trust 2016-C3 | ||||||||
3.15%, 11/15/2049 | 2,764,000 | 3,012,643 | ||||||
Citigroup Commercial Mortgage Trust 2016-GC37 | ||||||||
3.05%, 04/10/2049 | 13,750,000 | 14,439,127 | ||||||
Citigroup Commercial Mortgage Trust 2016-P6 | ||||||||
3.72%, 12/10/2049(4) | 2,783,000 | 3,136,449 | ||||||
Citigroup Commercial Mortgage Trust 2017-P7 | ||||||||
3.44%, 04/14/2050 | 16,000,000 | 17,632,267 | ||||||
Citigroup Commercial Mortgage Trust 2017-P8 | ||||||||
3.20%, 09/15/2050 | 21,000,000 | 22,747,704 | ||||||
Citigroup Commercial Mortgage Trust 2018-B2 | ||||||||
3.74%, 03/10/2051 | 22,000,000 | 25,055,081 | ||||||
Citigroup Commercial Mortgage Trust 2019-C7 | ||||||||
2.86%, 12/15/2072 | 10,000,000 | 10,946,608 | ||||||
3.10%, 12/15/2072 | 5,196,000 | 5,789,120 | ||||||
Citigroup Commercial Mortgage Trust 2020-GC46 | ||||||||
2.72%, 02/15/2053 | 13,520,000 | 14,581,110 | ||||||
Citigroup Global Markets Mortgage Securities VII, Inc. | ||||||||
0.00%, 06/25/2033 | 143 | 130 | ||||||
4.24%, 09/25/2033(4) | 54,332 | 52,791 | ||||||
7.00%, 06/25/2033(1) | 13,350 | 13,855 | ||||||
Citigroup Mortgage Loan Trust 2009-10 | ||||||||
4.28%, 09/25/2033(3)(4) | 168,352 | 164,299 | ||||||
Citigroup Mortgage Loan Trust 2015-A | ||||||||
4.50%, 06/25/2058(3)(4) | 426,057 | 428,788 | ||||||
Citigroup Mortgage Loan Trust 2018-A | ||||||||
4.00%, 01/25/2068(3)(4) | 2,252,096 | 2,268,271 | ||||||
Citigroup Mortgage Loan Trust, Inc. | ||||||||
0.00%, 09/25/2033 | 4,153 | 3,809 | ||||||
0.00%, 10/25/2033 | 3,156 | 2,742 | ||||||
2.51%, 02/25/2035(4) | 21,891 | 17,954 | ||||||
3.16%, 08/25/2034(4) | 13,958 | 12,889 | ||||||
3.50%, 08/25/2035(4) | 62,408 | 48,288 | ||||||
5.25%, 10/25/2033 | 19,689 | 20,198 | ||||||
5.50%, 05/25/2035 | 99,746 | 103,401 | ||||||
5.50%, 11/25/2035 | 1,488 | 1,483 | ||||||
6.00%, 11/25/2035 | 2,115,141 | 2,138,402 | ||||||
7.00%, 09/25/2033 | 2,973 | 3,014 | ||||||
COBALT CMBS Commercial Mortgage Trust 2006-C1 | ||||||||
1.09%, 08/15/2048(4) | 449,938 | 391 | ||||||
COMM 2012-CCRE1 Mortgage Trust | ||||||||
3.39%, 05/15/2045 | 3,783,014 | 3,863,780 | ||||||
COMM 2012-CCRE2 Mortgage Trust | ||||||||
1.79%, 08/15/2045(4) | 2,657,754 | 69,891 | ||||||
3.15%, 08/15/2045 | 9,614,464 | 9,885,475 | ||||||
COMM 2013-300P Mortgage Trust | ||||||||
4.35%, 08/10/2030(3) | 516,000 | 553,197 | ||||||
COMM 2013-CCRE10 Mortgage Trust | ||||||||
3.92%, 08/10/2046 | 4,113,981 | 4,405,218 | ||||||
COMM 2013-CCRE11 Mortgage Trust | ||||||||
4.26%, 08/10/2050 | 8,100,000 | 8,799,034 | ||||||
COMM 2013-CCRE12 Mortgage Trust | ||||||||
3.77%, 10/10/2046 | 9,308,032 | 9,916,163 | ||||||
COMM 2013-CCRE7 Mortgage Trust | ||||||||
3.21%, 03/10/2046 | 1,225,913 | 1,276,830 | ||||||
COMM 2013-CCRE9 Mortgage Trust | ||||||||
4.02%, 07/10/2045 | 3,059,736 | 3,242,637 |
COMM 2013-SFS Mortgage Trust | ||||||||
3.09%, 04/12/2035(3)(4) | 708,000 | 690,791 | ||||||
COMM 2014-CCRE15 Mortgage Trust | ||||||||
2.93%, 02/10/2047 | 1,799,555 | 1,804,921 | ||||||
COMM 2014-CCRE19 Mortgage Trust | ||||||||
3.80%, 08/10/2047 | 17,769,300 | 19,350,220 | ||||||
COMM 2014-CCRE20 Mortgage Trust | ||||||||
3.33%, 11/10/2047 | 12,000,000 | 12,726,143 | ||||||
COMM 2014-UBS4 Mortgage Trust | ||||||||
2.96%, 08/10/2047 | 417,521 | 423,491 | ||||||
COMM 2015-CCRE24 Mortgage Trust | ||||||||
3.43%, 08/10/2048 | 7,258,719 | 7,880,536 | ||||||
3.70%, 08/10/2048 | 770,833 | 850,399 | ||||||
COMM 2015-CCRE25 Mortgage Trust | ||||||||
3.51%, 08/10/2048 | 10,754,847 | 11,573,358 | ||||||
3.76%, 08/10/2048 | 2,437,000 | 2,673,111 | ||||||
COMM 2015-LC23 Mortgage Trust | ||||||||
3.77%, 10/10/2048 | 4,039,090 | 4,470,407 | ||||||
COMM 2018-HOME Mortgage Trust | ||||||||
3.94%, 04/10/2033(3)(4) | 10,975,000 | 12,390,107 | ||||||
COMM 2020-CBM Mortgage Trust | ||||||||
3.40%, 02/10/2037(3) | 6,090,000 | 5,547,270 | ||||||
Credit Suisse Commercial Mortgage Trust Series 2007-C2 | ||||||||
0.04%, 01/15/2049(3)(4) | 1,916,471 | 1 | ||||||
Credit Suisse First Boston Mortgage Securities Corp. | ||||||||
0.00%, 10/25/2033 | 39,832 | 33,377 | ||||||
3.72%, 06/25/2033(4) | 23,046 | 22,272 | ||||||
3.82%, 03/25/2034(4) | 1,000,079 | 1,035,661 | ||||||
5.25%, 07/25/2033 | 991,259 | 1,013,681 | ||||||
5.25%, 09/25/2033 | 43,966 | 45,400 | ||||||
5.25%, 09/25/2034 | 9,388 | 8,605 | ||||||
6.73%, 02/25/2033(4) | 66,420 | 68,477 | ||||||
CSAIL 2015-C4 Commercial Mortgage Trust | ||||||||
3.54%, 11/15/2048 | 7,500,000 | 8,149,112 | ||||||
CSAIL 2016-C7 Commercial Mortgage Trust | ||||||||
3.50%, 11/15/2049 | 1,882,000 | 2,066,158 | ||||||
CSAIL 2017-C8 Commercial Mortgage Trust | ||||||||
3.13%, 06/15/2050 | 15,525,000 | 16,780,274 | ||||||
CSAIL 2019-C16 Commercial Mortgage Trust | ||||||||
3.33%, 06/15/2052 | 1,299,000 | 1,441,355 | ||||||
CSFB Mortgage-Backed Pass-Through Certificates Series 2003-27 | ||||||||
5.25%, 11/25/2033 | 26,894 | 27,659 | ||||||
5.25%, 11/25/2033 | 34,838 | 35,399 | ||||||
5.75%, 11/25/2033 | 233,996 | 244,403 | ||||||
CSFB Mortgage-Backed Pass-Through Certificates Series 2004-4 | ||||||||
5.50%, 09/25/2034 | 33,156 | 34,168 | ||||||
CSFB Mortgage-Backed Pass-Through Certificates Series 2004-8 | ||||||||
5.50%, 12/25/2034 | 80,506 | 82,857 | ||||||
CSFB Mortgage-Backed Pass-Through Certificates Series 2005-9 | ||||||||
0.00%, 10/25/2035 | 14,694 | 11,236 | ||||||
5.50%, 10/25/2035 | 177,987 | 2,097 | ||||||
CSFB Mortgage-Backed Pass-Through Certificates Series 2005-10 | ||||||||
0.00%, 11/25/2035 | 7,944 | 5,523 | ||||||
CSMA SFR Holdings II A-1 | ||||||||
3.50%, 07/25/2023(12) | 6,424,177 | 6,417,752 | ||||||
CSMC 2014-USA OA LLC | ||||||||
4.37%, 09/15/2037(3) | 3,000,000 | 2,315,935 | ||||||
CSMC 2018-RPL7 Trust | ||||||||
4.00%, 08/26/2058(3) | 3,378,374 | 3,405,751 | ||||||
CSMC 2018-RPL9 Trust | ||||||||
3.85%, 09/25/2057(3)(4) | 11,822,350 | 12,546,989 | ||||||
CSMC 2020-WL1 TR VARIABLE REGD 144A | ||||||||
2.35% (1 Month LIBOR USD + 1.40%), 12/26/2059(2)(3)(12) | 12,916,539 | 12,755,082 | ||||||
CSMC Series 2010-17R | ||||||||
3.80%, 06/26/2036(3)(4) | 4,422 | 4,421 | ||||||
CSMC Series 2019-11R | ||||||||
1.53% (1 Month LIBOR USD + 1.35%, 1.35% Floor), 09/25/2045(2)(3) | 6,558,744 | 6,500,738 | ||||||
CSMCM 2018-RPL4 Trust | ||||||||
3.75%, 05/25/2058(3) | 3,522,389 | 3,584,213 | ||||||
CSMCM 2018-RPL9 Trust | ||||||||
3.86%, 09/25/2057(3)(12) | 3,074,222 | 2,974,660 |
DBJPM 16-C1 Mortgage Trust | ||||||||
3.02%, 05/10/2049 | 15,000,000 | 16,068,079 | ||||||
DBUBS 2011-LC2 Mortgage Trust | ||||||||
1.20%, 07/10/2044(3)(4) | 2,219,883 | 10,142 | ||||||
Deephaven Residential Mortgage Trust 2017-1 | ||||||||
3.49%, 12/26/2046(3)(4) | 208,231 | 208,609 | ||||||
Deutsche Alternative-A Securities, Inc. Mortgage Loan Trust Series 2005-1 | ||||||||
4.98%, 02/25/2021(4) | 11,255 | 11,182 | ||||||
Deutsche Mortgage Securities, Inc. Mortgage Loan Trust 2004-4 | ||||||||
6.15%, 04/25/2034(1) | 115 | 117 | ||||||
Eagle RE 2018-1 Ltd. | ||||||||
1.88% (1 Month LIBOR USD + 1.70%, 1.70% Floor), 11/25/2028(2)(3) | 1,514,166 | 1,465,154 | ||||||
Eagle RE 2019-1 Ltd. | ||||||||
1.98% (1 Month LIBOR USD + 1.80%), 04/25/2029(2)(3) | 866,253 | 859,093 | ||||||
Fannie Mae | ||||||||
2.00%, 07/01/2050(9) | 10,075,000 | 10,305,229 | ||||||
2.00%, 08/01/2050(9) | 43,640,000 | 44,540,535 | ||||||
2.50%, 07/01/2034(9) | 12,410,000 | 12,989,295 | ||||||
2.50%, 07/01/2050(9) | 66,220,000 | 69,005,896 | ||||||
3.00%, 07/01/2034(9) | 12,800,000 | 13,450,500 | ||||||
3.00%, 08/01/2050(9) | 7,000,000 | 7,359,875 | ||||||
3.00%, 09/01/2050(9) | 35,205,000 | 36,949,846 | ||||||
3.50%, 07/01/2034(9) | 2,575,000 | 2,705,259 | ||||||
3.50%, 07/01/2049(9) | 3,835,000 | 4,033,042 | ||||||
4.00%, 07/01/2049(9) | 5,275,000 | 5,589,233 | ||||||
4.50%, 07/01/2050(9) | 8,045,000 | 8,643,975 | ||||||
Fannie Mae Grantor Trust 1999-T2 | ||||||||
7.50%, 01/19/2039(4) | 60,752 | 66,669 | ||||||
Fannie Mae Grantor Trust 2001-T3 | ||||||||
7.50%, 11/25/2040 | 97,565 | 111,143 | ||||||
Fannie Mae Grantor Trust 2002-T16 | ||||||||
7.00%, 07/25/2042 | 111,909 | 136,108 | ||||||
Fannie Mae Grantor Trust 2004-T1 | ||||||||
6.50%, 01/25/2044 | 21,662 | 25,589 | ||||||
Fannie Mae Grantor Trust 2004-T2 | ||||||||
4.25%, 07/25/2043(4) | 99,690 | 105,724 | ||||||
7.50%, 11/25/2043 | 182,801 | 217,393 | ||||||
Fannie Mae Grantor Trust 2004-T3 | ||||||||
10.18%, 01/25/2044(4) | 22,432 | 27,399 | ||||||
6.50%, 02/25/2044 | 276,948 | 328,312 | ||||||
7.00%, 02/25/2044 | 115,653 | 139,093 | ||||||
Fannie Mae Grantor Trust 2017-T1 | ||||||||
2.90%, 06/25/2027 | 6,528,784 | 7,185,974 | ||||||
Fannie Mae Interest Strip | ||||||||
0.00%, 09/25/2024 | 36,248 | 35,253 | ||||||
0.00%, 01/25/2033 | 7,745 | 7,320 | ||||||
0.68% (1 Month LIBOR USD + 0.50%, 0.50% Floor, 6.50% Cap), 08/25/2042(2) | 594,080 | 600,401 | ||||||
0.73% (1 Month LIBOR USD + 0.55%, 0.55% Floor, 6.50% Cap), 08/25/2042(2) | 1,431,087 | 1,440,415 | ||||||
4.50%, 11/25/2020 | 5 | 0 | ||||||
5.00%, 12/25/2033(4) | 10,374 | 1,559 | ||||||
5.50%, 05/25/2036 | 39,997 | 8,457 | ||||||
5.50%, 08/25/2036 | 26,611 | 4,996 | ||||||
5.50%, 04/25/2037 | 11,638 | 1,871 | ||||||
6.00%, 01/25/2038 | 26,696 | 5,349 | ||||||
7.50%, 04/25/2023 | 403 | 32 | ||||||
9.00%, 03/25/2024 | 331 | 366 | ||||||
Fannie Mae Pool | ||||||||
0.53% (1 Month LIBOR USD + 0.35%, 0.35% Floor, 97.76% Cap), 01/01/2023(2) | 1,406,329 | 1,404,076 | ||||||
0.66% (1 Month LIBOR USD + 0.48%, 0.48% Floor, 98.56% Cap), 09/01/2024(2) | 3,441,193 | 3,446,389 | ||||||
0.98% (1 Month LIBOR USD + 0.80%, 0.80% Floor, 98.04% Cap), 03/01/2022(2) | 862,024 | 860,450 | ||||||
2.00%, 12/01/2020 | 1,548,000 | 1,547,279 | ||||||
2.00%, 08/01/2031 | 2,436,037 | 2,532,171 | ||||||
2.14% (1 Year LIBOR USD + 1.26%, 1.26% Floor, 9.86% Cap), 05/01/2035(2) | 11,252 | 11,298 | ||||||
2.28%, 12/01/2022 | 948,241 | 978,283 | ||||||
2.29%, 10/01/2026 | 10,004,550 | 10,691,380 | ||||||
2.32%, 12/01/2022 | 347,194 | 358,286 | ||||||
2.34%, 12/01/2022 | 2,188,827 | 2,260,917 | ||||||
2.34%, 01/01/2023 | 1,263,698 | 1,306,932 | ||||||
2.37%, 11/01/2022 | 437,803 | 451,654 | ||||||
2.37%, 01/01/2023 | 1,008,155 | 1,042,239 | ||||||
2.38%, 11/01/2022 | 797,978 | 823,416 | ||||||
2.41%, 11/01/2022 | 143,901 | 148,566 |
2.42%, 12/01/2022 | 1,082,708 | 1,119,270 | ||||||
2.42%, 06/01/2023 | 829,219 | 862,420 | ||||||
2.42% (1 Year LIBOR USD + 1.55%, 1.55% Floor, 11.17% Cap), 06/01/2036(2) | 7,404 | 7,432 | ||||||
2.45%, 11/01/2022 | 1,385,186 | 1,432,490 | ||||||
2.45%, 01/01/2023 | 678,875 | 702,962 | ||||||
2.45%, 02/01/2023 | 1,290,000 | 1,338,970 | ||||||
2.49%, 03/01/2023 | 744,484 | 775,942 | ||||||
2.50%, 04/01/2023 | 1,445,000 | 1,505,128 | ||||||
2.50%, 09/01/2027 | 347,240 | 364,302 | ||||||
2.50%, 04/01/2028 | 3,295,352 | 3,454,195 | ||||||
2.50%, 04/01/2030 | 1,736,515 | 1,849,845 | ||||||
2.50%, 05/01/2030 | 2,181,035 | 2,311,426 | ||||||
2.50%, 11/01/2031 | 2,952,632 | 3,129,497 | ||||||
2.50%, 12/01/2034 | 17,822,402 | 18,749,074 | ||||||
2.50%, 12/01/2036 | 3,778,768 | 3,958,656 | ||||||
2.50%, 01/01/2043 | 2,361,632 | 2,500,257 | ||||||
2.50%, 02/01/2043 | 1,045,505 | 1,106,876 | ||||||
2.50%, 10/01/2043 | 2,181,275 | 2,309,322 | ||||||
2.50%, 05/01/2046 | 1,284,010 | 1,351,110 | ||||||
2.50%, 07/01/2046 | 2,724,591 | 2,866,975 | ||||||
2.50%, 10/01/2046 | 1,005,296 | 1,064,347 | ||||||
2.52%, 05/01/2023 | 3,302,000 | 3,445,256 | ||||||
2.52%, 11/01/2029 | 14,750,000 | 15,925,814 | ||||||
2.55%, 11/01/2022 | 369,560 | 382,525 | ||||||
2.55%, 11/01/2022 | 1,156,920 | 1,197,508 | ||||||
2.55%, 10/01/2028 | 9,300,000 | 10,177,512 | ||||||
2.57%, 08/01/2028 | 5,400,000 | 5,912,023 | ||||||
2.58%, 09/01/2028 | 3,830,000 | 4,200,838 | ||||||
2.59%, 09/01/2028 | 7,552,000 | 8,292,889 | ||||||
2.60%, 06/01/2022 | 765,605 | 787,104 | ||||||
2.62%, 10/01/2028 | 9,306,382 | 10,209,254 | ||||||
2.64%, 04/01/2023 | 330,400 | 344,908 | ||||||
2.64%, 07/01/2023 | 413,000 | 433,416 | ||||||
2.64%, 08/01/2028 | 3,398,841 | 3,741,425 | ||||||
2.65%, 08/01/2022 | 1,032,000 | 1,065,960 | ||||||
2.67%, 07/01/2022 | 624,000 | 643,770 | ||||||
2.68%, 05/01/2025 | 1,818,306 | 1,951,422 | ||||||
2.69%, 12/01/2028 | 4,567,000 | 5,062,485 | ||||||
2.70%, 04/01/2023(4) | 497,000 | 519,594 | ||||||
2.70%, 04/01/2025 | 4,797,348 | 5,154,382 | ||||||
2.70% (11th District Cost of Funds Index + 1.25%, 1.91% Floor, 12.66% Cap), 09/01/2027(2) | 2,818 | 2,833 | ||||||
2.75%, 03/01/2022 | 157,419 | 162,201 | ||||||
2.76%, 06/01/2022 | 1,575,691 | 1,607,827 | ||||||
2.77%, 06/01/2023 | 898,292 | 944,212 | ||||||
2.79%, 05/01/2027 | 1,997,249 | 2,204,819 | ||||||
2.79%, 06/01/2023(4) | 1,439,091 | 1,508,747 | ||||||
2.81%, 04/01/2025 | 2,900,000 | 3,138,111 | ||||||
2.81%, 05/01/2027 | 1,925,176 | 2,123,127 | ||||||
2.82%, 07/01/2022 | 987,720 | 1,020,489 | ||||||
2.83%, 05/01/2027 | 8,000,000 | 8,863,347 | ||||||
2.88% (1 Year LIBOR USD + 1.60%, 1.60% Floor, 10.89% Cap), 05/01/2035(2) | 5,683 | 5,771 | ||||||
2.90%, 12/01/2024 | 2,000,000 | 2,162,612 | ||||||
2.90%, 10/01/2029 | 3,425,113 | 3,844,616 | ||||||
2.90% (1 Year CMT Index + 2.30%, 2.30% Floor, 9.20% Cap), 06/01/2034(2) | 32,422 | 33,909 | ||||||
2.91%, 03/01/2027 | 9,786,170 | 10,849,347 | ||||||
2.91%, 12/01/2027 | 9,323,918 | 10,417,589 | ||||||
2.92%, 12/01/2024 | 991,634 | 1,072,338 | ||||||
2.92%, 05/01/2030 | 4,000,000 | 4,400,099 | ||||||
2.93%, 01/01/2025 | 1,857,171 | 2,007,467 | ||||||
2.94%, 05/01/2022 | 961,425 | 991,511 | ||||||
2.94%, 05/01/2030 | 2,500,000 | 2,813,694 | ||||||
2.96%, 06/01/2030 | 1,867,749 | 2,095,822 | ||||||
2.97%, 01/01/2022 | 690,655 | 707,293 | ||||||
2.97%, 06/01/2028 | 3,064,891 | 3,411,912 | ||||||
2.99%, 07/01/2029 | 9,677,000 | 10,912,833 | ||||||
2.99%, 08/01/2029 | 7,240,000 | 8,163,986 | ||||||
3.00%, 06/01/2027 | 2,000,000 | 2,239,195 | ||||||
3.00%, 08/01/2028 | 1,071,776 | 1,128,087 | ||||||
3.00%, 09/01/2028 | 1,710,499 | 1,812,109 | ||||||
3.00%, 12/01/2028 | 641,265 | 674,512 | ||||||
3.00%, 05/01/2030 | 1,690,774 | 1,787,233 | ||||||
3.00%, 09/01/2030 | 6,927,781 | 7,340,282 |
3.00%, 03/01/2033 | 5,743,545 | 6,038,783 | ||||||
3.00%, 05/01/2042 | 509,440 | 545,724 | ||||||
3.00%, 09/01/2042 | 12,129,779 | 12,649,290 | ||||||
3.00%, 10/01/2042 | 417,952 | 435,817 | ||||||
3.00%, 10/01/2042 | 4,758,267 | 5,097,547 | ||||||
3.00%, 11/01/2042 | 1,977,583 | 2,118,604 | ||||||
3.00%, 12/01/2042 | 101,972 | 109,244 | ||||||
3.00%, 12/01/2042 | 1,097,600 | 1,175,803 | ||||||
3.00%, 01/01/2043 | 957,078 | 1,025,326 | ||||||
3.00%, 01/01/2043 | 1,427,659 | 1,525,324 | ||||||
3.00%, 01/01/2043 | 1,482,711 | 1,588,439 | ||||||
3.00%, 01/01/2043 | 1,631,957 | 1,748,330 | ||||||
3.00%, 02/01/2043 | 784,399 | 837,877 | ||||||
3.00%, 04/01/2043 | 1,982,227 | 2,123,683 | ||||||
3.00%, 04/01/2043 | 2,035,102 | 2,186,737 | ||||||
3.00%, 04/01/2043 | 3,315,795 | 3,552,406 | ||||||
3.00%, 05/01/2043 | 104,550 | 111,820 | ||||||
3.00%, 05/01/2043 | 327,999 | 351,302 | ||||||
3.00%, 05/01/2043 | 755,525 | 810,104 | ||||||
3.00%, 05/01/2043 | 9,600,626 | 10,284,789 | ||||||
3.00%, 06/01/2043 | 94,383 | 101,118 | ||||||
3.00%, 06/01/2043 | 275,415 | 295,071 | ||||||
3.00%, 06/01/2043 | 620,770 | 665,066 | ||||||
3.00%, 06/01/2043 | 2,362,337 | 2,563,868 | ||||||
3.00%, 06/01/2043 | 6,571,918 | 7,037,870 | ||||||
3.00%, 07/01/2043 | 78,361 | 83,953 | ||||||
3.00%, 07/01/2043 | 341,675 | 365,641 | ||||||
3.00%, 07/01/2043 | 358,050 | 383,601 | ||||||
3.00%, 07/01/2043 | 838,743 | 887,583 | ||||||
3.00%, 07/01/2043 | 1,388,307 | 1,485,687 | ||||||
3.00%, 07/01/2043 | 7,224,239 | 7,761,890 | ||||||
3.00%, 08/01/2043 | 951,478 | 1,019,377 | ||||||
3.00%, 08/01/2043 | 3,573,798 | 3,828,802 | ||||||
3.00%, 08/01/2043 | 6,060,071 | 6,490,446 | ||||||
3.00%, 10/01/2043 | 89,122 | 95,346 | ||||||
3.00%, 10/01/2043 | 12,269,238 | 13,092,312 | ||||||
3.00%, 02/01/2044 | 6,484,795 | 6,944,661 | ||||||
3.00%, 04/01/2045 | 7,092,226 | 7,578,193 | ||||||
3.00%, 05/01/2046 | 8,471,646 | 8,971,476 | ||||||
3.00%, 09/01/2046 | 972,696 | 1,032,906 | ||||||
3.00%, 11/01/2046 | 6,417,711 | 6,872,110 | ||||||
3.00%, 11/01/2046 | 9,165,930 | 9,680,731 | ||||||
3.00%, 01/01/2047 | 5,312,342 | 5,619,710 | ||||||
3.00%, 02/01/2047 | 1,766,342 | 1,891,392 | ||||||
3.00%, 03/01/2047 | 824,125 | 871,644 | ||||||
3.00%, 10/01/2047 | 2,444,456 | 2,530,562 | ||||||
3.00%, 02/01/2049 | 10,232,206 | 10,913,362 | ||||||
3.00%, 09/01/2049 | 2,782,150 | 2,991,113 | ||||||
3.00%, 11/01/2049 | 4,330,712 | 4,663,992 | ||||||
3.00%, 11/01/2049 | 6,735,605 | 7,253,952 | ||||||
3.00%, 12/01/2049 | 1,288,216 | 1,354,352 | ||||||
3.00%, 12/01/2049 | 1,420,678 | 1,508,388 | ||||||
3.00%, 12/01/2049 | 1,860,211 | 2,003,368 | ||||||
3.00%, 12/01/2049 | 9,435,658 | 9,955,085 | ||||||
3.00%, 01/01/2050 | 3,224,614 | 3,389,452 | ||||||
3.00%, 02/01/2050 | 902,653 | 948,075 | ||||||
3.00%, 02/01/2050 | 1,719,502 | 1,805,549 | ||||||
3.00%, 02/01/2050 | 2,727,622 | 2,939,262 | ||||||
3.00%, 02/01/2050 | 3,722,358 | 3,999,659 | ||||||
3.00%, 03/01/2050 | 805,030 | 863,997 | ||||||
3.00%, 03/01/2050 | 1,189,962 | 1,282,297 | ||||||
3.00%, 03/01/2050 | 5,081,116 | 5,379,677 | ||||||
3.02%, 05/01/2022 | 611,908 | 631,772 | ||||||
3.02%, 07/01/2029 | 8,200,000 | 9,268,361 | ||||||
3.03% (6 Month LIBOR USD + 1.52%, 1.51% Floor, 10.84% Cap), 01/01/2035(2) | 150,100 | 154,120 | ||||||
3.03%, 12/01/2021 | 859,823 | 879,379 | ||||||
3.03%, 01/01/2022 | 758,785 | 777,390 | ||||||
3.03%, 04/01/2027 | 1,495,973 | 1,673,356 | ||||||
3.03%, 04/01/2030 | 3,500,000 | 3,970,639 | ||||||
3.07%, 02/01/2025 | 4,995,000 | 5,461,233 | ||||||
3.07% (6 Month LIBOR USD + 1.20%, 1.20% Floor, 10.38% Cap), 08/01/2034(2) | 28,075 | 28,398 | ||||||
3.07% (6 Month LIBOR USD + 1.45%, 1.45% Floor, 12.56% Cap), 01/01/2037(2) | 39,964 | 40,981 |
3.08%, 04/01/2022 | 940,825 | 970,565 | ||||||
3.08%, 12/01/2024 | 1,844,660 | 2,001,973 | ||||||
3.08%, 01/01/2028 | 8,000,000 | 8,886,001 | ||||||
3.08%, 04/01/2030 | 1,924,325 | 2,184,693 | ||||||
3.09%, 01/01/2022 | 1,208,196 | 1,238,869 | ||||||
3.09%, 09/01/2029 | 7,484,000 | 8,527,696 | ||||||
3.10% (6 Month LIBOR USD + 1.31%, 1.31% Floor, 12.81% Cap), 09/01/2036(2) | 113,123 | 115,494 | ||||||
3.10%, 09/01/2025 | 4,869,872 | 5,369,504 | ||||||
3.10%, 01/01/2028 | 6,750,000 | 7,620,823 | ||||||
3.10% (6 Month LIBOR USD + 1.29%, 1.30% Floor, 11.97% Cap), 07/01/2037(2) | 49,442 | 50,381 | ||||||
3.11%, 12/01/2024 | 2,479,287 | 2,701,481 | ||||||
3.12%, 11/01/2026 | 956,992 | 1,067,733 | ||||||
3.12%, 06/01/2035 | 3,400,000 | 3,968,899 | ||||||
3.13%, 03/01/2027 | 6,835,000 | 7,673,971 | ||||||
3.13%, 06/01/2030 | 1,000,000 | 1,120,696 | ||||||
3.14%, 02/01/2022 | 433,702 | 445,851 | ||||||
3.14%, 03/01/2022 | 270,453 | 278,572 | ||||||
3.14%, 12/01/2026 | 1,794,172 | 1,995,580 | ||||||
3.19%, 01/01/2033 | 4,484,523 | 5,007,278 | ||||||
3.19%, 03/01/2036 | 2,521,543 | 2,887,994 | ||||||
3.20%, 01/01/2022 | 779,130 | 799,986 | ||||||
3.20%, 06/01/2029 | 3,446,094 | 3,961,491 | ||||||
3.20%, 06/01/2030 | 983,859 | 1,121,891 | ||||||
3.21%, 03/01/2022 | 310,000 | 319,765 | ||||||
3.21%, 03/01/2029 | 10,000,000 | 11,502,744 | ||||||
3.22%, 02/01/2029 | 8,956,378 | 10,292,049 | ||||||
3.22%, 09/01/2032 | 6,000,000 | 6,758,567 | ||||||
3.23%, 01/01/2030 | 4,466,624 | 5,112,173 | ||||||
3.23%, 01/01/2030 | 7,590,000 | 8,767,998 | ||||||
3.24%, 10/01/2026 | 1,797,030 | 2,005,085 | ||||||
3.24%, 12/01/2026 | 1,500,000 | 1,689,628 | ||||||
3.25%, 09/01/2026 | 1,455,009 | 1,628,483 | ||||||
3.25%, 02/01/2027 | 5,642,545 | 6,315,138 | ||||||
3.26%, 12/01/2026 | 940,048 | 1,049,905 | ||||||
3.26%, 04/01/2029 | 13,520,000 | 15,635,553 | ||||||
3.26%, 10/01/2030 | 4,812,627 | 5,491,899 | ||||||
3.28% (6 Month LIBOR USD + 1.41%, 1.41% Floor, 9.28% Cap), 09/01/2033(2) | 28,882 | 29,105 | ||||||
3.28%, 02/01/2029 | 8,159,947 | 9,415,337 | ||||||
3.29%, 08/01/2026 | 3,000,000 | 3,349,974 | ||||||
3.30%, 03/01/2029 | 4,000,000 | 4,625,142 | ||||||
3.30%, 07/01/2030 | 1,005,000 | 1,157,549 | ||||||
3.31%, 12/01/2021 | 351,955 | 360,957 | ||||||
3.32%, 03/01/2029 | 2,844,989 | 3,263,460 | ||||||
3.34%, 02/01/2027 | 1,500,000 | 1,684,044 | ||||||
3.34%, 07/01/2030 | 1,500,000 | 1,725,791 | ||||||
3.35% (6 Month LIBOR USD + 1.60%, 1.60% Floor, 10.27% Cap), 09/01/2036(2) | 27,723 | 28,668 | ||||||
3.36% (6 Month LIBOR USD + 1.48%, 1.48% Floor, 12.68% Cap), 02/01/2037(2) | 46,498 | 47,751 | ||||||
3.38%, 12/01/2023 | 2,398,554 | 2,583,593 | ||||||
3.39%, 09/01/2030 | 1,835,432 | 2,097,427 | ||||||
3.40%, 10/01/2021 | 317,570 | 324,533 | ||||||
3.42% (6 Month LIBOR USD + 1.54%, 1.54% Floor, 10.94% Cap), 02/01/2035(2) | 4,461 | 4,574 | ||||||
3.43%, 11/01/2021 | 912,115 | 934,567 | ||||||
3.45%, 01/01/2024 | 1,703,634 | 1,835,891 | ||||||
3.45%, 04/01/2035 | 1,832,821 | 2,155,568 | ||||||
3.49% (1 Year LIBOR USD + 1.49%, 1.49% Floor, 10.29% Cap), 11/01/2033(2) | 29,890 | 30,171 | ||||||
3.49% (1 Year CMT Index + 2.22%, 2.22% Floor, 9.61% Cap), 04/01/2035(2) | 27,744 | 28,233 | ||||||
3.50% (1 Year LIBOR USD + 1.50%, 1.50% Floor, 10.35% Cap), 01/01/2035(2) | 9,649 | 9,712 | ||||||
3.50%, 12/01/2023 | 2,185,427 | 2,357,713 | ||||||
3.50%, 03/01/2027 | 1,240,597 | 1,312,224 | ||||||
3.50%, 12/01/2029 | 2,828,683 | 3,024,531 | ||||||
3.50%, 05/01/2030 | 494,586 | 523,670 | ||||||
3.50%, 12/01/2030 | 1,682,855 | 1,778,701 | ||||||
3.50%, 07/01/2032 | 115,044 | 123,092 | ||||||
3.50%, 09/01/2032 | 3,805,121 | 4,001,358 | ||||||
3.50%, 11/01/2032 | 834,485 | 898,486 | ||||||
3.50%, 12/01/2032 | 261,286 | 280,220 | ||||||
3.50%, 12/01/2032 | 11,832,584 | 12,772,044 | ||||||
3.50%, 02/01/2033 | 478,964 | 513,639 | ||||||
3.50%, 02/01/2033 | 534,660 | 563,924 | ||||||
3.50%, 03/01/2033 | 2,717,631 | 2,896,984 | ||||||
3.50%, 04/01/2033 | 2,653,385 | 2,792,948 | ||||||
3.50%, 06/01/2033 | 191,256 | 205,116 |
3.50%, 10/01/2033 | 8,690,229 | 9,298,636 | ||||||
3.50%, 06/01/2040 | 2,947,429 | 3,188,953 | ||||||
3.50%, 12/01/2040 | 98,506 | 106,550 | ||||||
3.50%, 02/01/2041 | 8,134,043 | 8,799,788 | ||||||
3.50%, 11/01/2041 | 340,042 | 367,903 | ||||||
3.50%, 11/01/2041 | 3,324,422 | 3,596,421 | ||||||
3.50%, 12/01/2041 | 237,894 | 257,085 | ||||||
3.50%, 12/01/2041 | 645,951 | 698,503 | ||||||
3.50%, 12/01/2041 | 6,439,056 | 6,962,721 | ||||||
3.50%, 02/01/2042 | 8,560 | 9,262 | ||||||
3.50%, 02/01/2042 | 243,906 | 266,688 | ||||||
3.50%, 02/01/2042 | 417,613 | 451,597 | ||||||
3.50%, 04/01/2042 | 244,454 | 264,209 | ||||||
3.50%, 05/01/2042 | 6,858,786 | 7,422,666 | ||||||
3.50%, 06/01/2042 | 1,546,672 | 1,673,667 | ||||||
3.50%, 07/01/2042 | 603,377 | 653,038 | ||||||
3.50%, 07/01/2042 | 1,135,710 | 1,229,193 | ||||||
3.50%, 07/01/2042 | 3,554,846 | 3,847,037 | ||||||
3.50%, 07/01/2042 | 17,153,998 | 18,756,184 | ||||||
3.50%, 08/01/2042 | 644,753 | 697,883 | ||||||
3.50%, 09/01/2042 | 597,878 | 646,974 | ||||||
3.50%, 09/01/2042 | 793,915 | 857,000 | ||||||
3.50%, 09/01/2042 | 797,069 | 862,328 | ||||||
3.50%, 09/01/2042 | 4,718,615 | 5,103,668 | ||||||
3.50%, 10/01/2042 | 355,421 | 384,683 | ||||||
3.50%, 10/01/2042 | 412,501 | 446,493 | ||||||
3.50%, 10/01/2042 | 586,022 | 634,316 | ||||||
3.50%, 10/01/2042 | 1,174,577 | 1,270,796 | ||||||
3.50%, 11/01/2042 | 2,537,099 | 2,746,180 | ||||||
3.50%, 11/01/2042 | 6,784,345 | 7,343,427 | ||||||
3.50%, 01/01/2043 | 663,592 | 716,363 | ||||||
3.50%, 01/01/2043 | 908,634 | 980,302 | ||||||
3.50%, 02/01/2043 | 52,626 | 56,963 | ||||||
3.50%, 02/01/2043 | 64,717 | 70,052 | ||||||
3.50%, 03/01/2043 | 491,535 | 530,756 | ||||||
3.50%, 03/01/2043 | 1,380,458 | 1,501,009 | ||||||
3.50%, 03/01/2043 | 3,896,642 | 4,217,196 | ||||||
3.50%, 04/01/2043 | 1,624,720 | 1,751,451 | ||||||
3.50%, 04/01/2043 | 3,780,967 | 4,092,642 | ||||||
3.50%, 05/01/2043 | 73,860 | 80,762 | ||||||
3.50%, 05/01/2043 | 348,161 | 376,464 | ||||||
3.50%, 05/01/2043 | 624,141 | 674,087 | ||||||
3.50%, 05/01/2043 | 1,330,579 | 1,437,237 | ||||||
3.50%, 05/01/2043 | 1,740,679 | 1,879,752 | ||||||
3.50%, 07/01/2043 | 8,005,619 | 8,704,738 | ||||||
3.50%, 06/01/2044 | 5,279,950 | 5,700,977 | ||||||
3.50%, 06/01/2044 | 6,959,973 | 7,524,040 | ||||||
3.50%, 02/01/2045 | 7,107,257 | 7,690,529 | ||||||
3.50%, 04/01/2045 | 11,249,697 | 12,048,661 | ||||||
3.50%, 06/01/2045 | 2,351,324 | 2,508,916 | ||||||
3.50%, 06/01/2045 | 8,726,877 | 9,328,894 | ||||||
3.50%, 08/01/2045 | 459,825 | 490,975 | ||||||
3.50%, 11/01/2045 | 2,987,346 | 3,198,945 | ||||||
3.50%, 12/01/2045 | 349,632 | 374,326 | ||||||
3.50%, 12/01/2045 | 628,759 | 671,935 | ||||||
3.50%, 01/01/2046 | 9,568,102 | 10,248,178 | ||||||
3.50%, 04/01/2046 | 1,124,323 | 1,240,294 | ||||||
3.50%, 05/01/2046 | 487,556 | 516,922 | ||||||
3.50%, 08/01/2046 | 6,038,449 | 6,448,252 | ||||||
3.50%, 09/01/2046 | 2,933,341 | 3,155,498 | ||||||
3.50%, 11/01/2046 | 894,641 | 961,839 | ||||||
3.50%, 11/01/2046 | 12,802,536 | 13,706,547 | ||||||
3.50%, 12/01/2046 | 3,692,794 | 3,925,513 | ||||||
3.50%, 12/01/2046 | 7,784,703 | 8,417,184 | ||||||
3.50%, 01/01/2047 | 4,488,862 | 4,761,862 | ||||||
3.50%, 02/01/2047 | 7,594,293 | 8,168,013 | ||||||
3.50%, 02/01/2047 | 8,804,643 | 9,419,084 | ||||||
3.50%, 06/01/2047 | 705,330 | 757,428 | ||||||
3.50%, 07/01/2047 | 2,238,746 | 2,389,397 | ||||||
3.50%, 10/01/2048 | 5,768,976 | 6,187,329 | ||||||
3.50%, 08/01/2049 | 4,096,465 | 4,344,380 | ||||||
3.50%, 09/01/2049 | 6,131,849 | 6,499,395 |
3.50%, 11/01/2049 | 3,081,025 | 3,346,512 | ||||||
3.50%, 12/01/2049 | 2,692,038 | 2,892,314 | ||||||
3.50%, 01/01/2050 | 14,580,091 | 15,836,440 | ||||||
3.51%, 12/01/2020(4) | 78,144 | 79,032 | ||||||
3.53%, 08/01/2028 | 4,700,000 | 5,436,592 | ||||||
3.55% (1 Year LIBOR USD + 1.80%, 1.80% Floor, 11.11% Cap), 05/01/2036(2) | 10,616 | 10,777 | ||||||
3.55%, 02/01/2030 | 1,500,000 | 1,724,917 | ||||||
3.56%, 01/01/2021(4) | 575,616 | 581,137 | ||||||
3.57%, 06/01/2028 | 8,361,000 | 9,694,174 | ||||||
3.57% (1 Year LIBOR USD + 1.92%, 1.92% Floor, 10.50% Cap), 06/01/2036(2) | 25,312 | 25,915 | ||||||
3.57% (1 Year LIBOR USD + 1.51%, 1.51% Floor, 9.70% Cap), 03/01/2035(2) | 15,318 | 15,424 | ||||||
3.58% (1 Year CMT Index + 1.89%, 1.89% Floor, 10.04% Cap), 07/01/2035(2) | 7,761 | 7,788 | ||||||
3.59%, 08/01/2023 | 1,135,000 | 1,220,342 | ||||||
3.59%, 06/01/2028 | 8,000,000 | 9,287,729 | ||||||
3.61% (1 Year LIBOR USD + 1.73%, 1.73% Floor, 9.88% Cap), 11/01/2034(2) | 5,907 | 5,943 | ||||||
3.61%, 04/01/2028 | 2,960,525 | 3,409,256 | ||||||
3.63%, 10/01/2029 | 1,370,704 | 1,576,865 | ||||||
3.63% (1 Year LIBOR USD + 1.63%, 1.63% Floor, 11.04% Cap), 04/01/2037(2) | 38,407 | 39,031 | ||||||
3.64% (1 Year LIBOR USD + 1.62%, 1.61% Floor, 9.37% Cap), 08/01/2033(2) | 23,705 | 24,728 | ||||||
3.64%, 01/01/2025 | 535,084 | 588,919 | ||||||
3.66% (12 Month U.S. Treasury Average + 1.98%, 1.98% Floor, 8.60% Cap), | 86,510 | 89,306 | ||||||
3.66%, 03/01/2027 | 2,292,532 | 2,588,659 | ||||||
3.67%, 07/01/2023 | 4,850,000 | 5,209,119 | ||||||
3.68%, 09/01/2026 | 3,417,938 | 3,856,543 | ||||||
3.69% (1 Year LIBOR USD + 1.48%, 1.48% Floor, 9.96% Cap), 10/01/2034(2) | 8,260 | 8,567 | ||||||
3.70%, 12/01/2020 | 338,890 | 338,748 | ||||||
3.71% (1 Year LIBOR USD + 1.65%, 1.65% Floor, 8.85% Cap), 01/01/2034(2) | 9,606 | 9,807 | ||||||
3.71% (1 Year LIBOR USD + 1.46%, 1.46% Floor, 10.61% Cap), 09/01/2037(2) | 24,229 | 24,674 | ||||||
3.72%, 12/01/2020(4) | 462,473 | 462,599 | ||||||
3.72%, 07/01/2033 | 11,178,000 | 13,083,910 | ||||||
3.73% (1 Year LIBOR USD + 1.58%, 1.60% Floor, 10.57% Cap), 09/01/2035(2) | 17,958 | 18,346 | ||||||
3.74% (1 Year LIBOR USD + 1.49%, 1.49% Floor, 11.86% Cap), 09/01/2037(2) | 3,570 | 3,555 | ||||||
3.74% (1 Year LIBOR USD + 1.61%, 1.61% Floor, 9.97% Cap), 08/01/2034(2) | 12,949 | 13,172 | ||||||
3.74%, 07/01/2023 | 536,806 | 576,741 | ||||||
3.75% (1 Year LIBOR USD + 1.86%, 1.86% Floor, 12.47% Cap), 11/01/2036(2) | 6,675 | 6,714 | ||||||
3.76%, 03/01/2024 | 1,265,000 | 1,372,706 | ||||||
3.77%, 12/01/2025 | 3,417,903 | 3,847,590 | ||||||
3.77% (1 Year LIBOR USD + 1.41%, 1.41% Floor, 11.31% Cap), 11/01/2037(2) | 97,938 | 101,511 | ||||||
3.79% (1 Year LIBOR USD + 1.79%, 1.79% Floor, 10.19% Cap), 01/01/2038(2) | 17,518 | 17,634 | ||||||
3.80% (1 Year CMT Index + 2.05%, 2.05% Floor, 9.06% Cap), 07/01/2034(2) | 1,486 | 1,492 | ||||||
3.81%, 12/01/2028 | 7,000,000 | 8,208,921 | ||||||
3.81% (1 Year CMT Index + 2.00%, 2.00% Floor, 9.12% Cap), 11/01/2034(2) | 4,387 | 4,407 | ||||||
3.83% (1 Year CMT Index + 2.23%, 2.23% Floor, 9.66% Cap), 01/01/2036(2) | 25,906 | 27,094 | ||||||
3.84% (1 Year LIBOR USD + 1.64%, 1.64% Floor, 10.97% Cap), 09/01/2034(2) | 796 | 802 | ||||||
3.85%, 09/01/2021 | 788,367 | 806,579 | ||||||
3.85%, 07/01/2030 | 13,900,000 | 16,432,374 | ||||||
3.86% (1 Year LIBOR USD + 1.79%, 1.79% Floor, 10.98% Cap), 12/01/2036(2) | 51,481 | 52,494 | ||||||
3.86%, 07/01/2021 | 872,878 | 888,710 | ||||||
3.88% (1 Year LIBOR USD + 1.63%, 1.63% Floor, 11.27% Cap), 09/01/2036(2) | 36,952 | 38,655 | ||||||
3.92%, 09/01/2021 | 602,797 | 617,048 | ||||||
3.92% (6 Month LIBOR USD + 2.03%, 2.03% Floor, 10.81% Cap), 02/01/2037(2) | 41,697 | 43,739 | ||||||
3.94%, 07/01/2021 | 1,032,000 | 1,059,636 | ||||||
3.94% (1 Year LIBOR USD + 1.94%, 1.94% Floor, 10.72% Cap), 12/01/2036(2) | 21,783 | 21,966 | ||||||
3.95% (1 Year LIBOR USD + 1.67%, 1.68% Floor, 11.09% Cap), 09/01/2036(2) | 89,249 | 93,301 | ||||||
3.97%, 06/01/2021 | 583,422 | 592,788 | ||||||
3.97% (1 Year LIBOR USD + 1.77%, 1.77% Floor, 11.62% Cap), 10/01/2036(2) | 28,289 | 28,445 | ||||||
3.99% (1 Year CMT Index + 2.12%, 2.12% Floor, 10.49% Cap), 08/01/2036(2) | 10,456 | 10,516 | ||||||
4.00%, 11/01/2031 | 3,896,098 | 4,194,694 | ||||||
4.00%, 06/01/2033 | 1,025,953 | 1,087,310 | ||||||
4.00%, 12/01/2033 | 46,557 | 49,740 | ||||||
4.00% (1 Year LIBOR USD + 1.96%, 1.95% Floor, 10.96% Cap), 01/01/2037(2) | 24,643 | 25,135 | ||||||
4.00%, 05/01/2037 | 9,311,099 | 10,012,885 | ||||||
4.00% (1 Year LIBOR USD + 1.64%, 1.64% Floor, 11.01% Cap), 07/01/2037(2) | 124,034 | 129,910 | ||||||
4.00%, 10/01/2037 | 1,808,332 | 1,943,930 | ||||||
4.00%, 08/01/2039 | 364,941 | 400,333 | ||||||
4.00%, 10/01/2039 | 522,990 | 573,862 | ||||||
4.00%, 07/01/2040 | 4,355,956 | 4,777,176 | ||||||
4.00%, 08/01/2040 | 146,766 | 161,067 | ||||||
4.00%, 09/01/2040 | 1,104,772 | 1,212,345 | ||||||
4.00%, 10/01/2040 | 1,255,095 | 1,376,957 | ||||||
4.00%, 12/01/2040 | 235,647 | 258,738 | ||||||
4.00%, 12/01/2040 | 297,121 | 326,085 |
4.00%, 12/01/2040 | 342,678 | 373,949 | ||||||
4.00%, 12/01/2040 | 571,678 | 627,547 | ||||||
4.00%, 12/01/2040 | 1,144,827 | 1,256,642 | ||||||
4.00%, 01/01/2041 | 223,427 | 245,242 | ||||||
4.00%, 01/01/2041 | 462,585 | 507,810 | ||||||
4.00%, 01/01/2041 | 678,961 | 745,290 | ||||||
4.00%, 01/01/2041 | 897,150 | 984,583 | ||||||
4.00%, 01/01/2041 | 1,350,907 | 1,482,034 | ||||||
4.00%, 01/01/2041 | 1,515,567 | 1,663,993 | ||||||
4.00%, 01/01/2041 | 1,535,700 | 1,686,198 | ||||||
4.00%, 02/01/2041 | 57,902 | 63,522 | ||||||
4.00%, 02/01/2041 | 1,252,037 | 1,373,909 | ||||||
4.00%, 02/01/2041 | 2,034,698 | 2,233,979 | ||||||
4.00%, 03/01/2041 | 6,720,671 | 7,378,697 | ||||||
4.00%, 09/01/2041 | 225,322 | 247,104 | ||||||
4.00%, 10/01/2041 | 67,201 | 73,756 | ||||||
4.00%, 10/01/2041 | 471,853 | 518,135 | ||||||
4.00%, 10/01/2041 | 992,936 | 1,090,092 | ||||||
4.00%, 12/01/2041 | 1,289,395 | 1,416,062 | ||||||
4.00%, 12/01/2041 | 1,906,147 | 2,091,788 | ||||||
4.00%, 01/01/2042 | 1,442,577 | 1,581,636 | ||||||
4.00%, 01/01/2042 | 2,566,192 | 2,818,621 | ||||||
4.00%, 03/01/2042 | 89,206 | 92,915 | ||||||
4.00%, 07/01/2042 | 365,726 | 398,342 | ||||||
4.00%, 07/01/2042 | 389,059 | 423,754 | ||||||
4.00%, 07/01/2042 | 398,928 | 434,503 | ||||||
4.00%, 07/01/2042 | 586,767 | 638,589 | ||||||
4.00%, 08/01/2042 | 5,854,566 | 6,430,476 | ||||||
4.00%, 11/01/2042 | 722,955 | 793,276 | ||||||
4.00%, 12/01/2042 | 456,104 | 500,976 | ||||||
4.00%, 04/01/2043 | 5,924,971 | 6,701,740 | ||||||
4.00%, 07/01/2043 | 917,227 | 999,705 | ||||||
4.00%, 08/01/2043 | 70,722 | 77,103 | ||||||
4.00%, 10/01/2043 | 97,138 | 107,443 | ||||||
4.00%, 11/01/2043 | 3,140,939 | 3,434,449 | ||||||
4.00%, 12/01/2043 | 133,796 | 146,255 | ||||||
4.00%, 12/01/2043 | 1,489,033 | 1,647,006 | ||||||
4.00%, 02/01/2044 | 760,062 | 831,813 | ||||||
4.00%, 05/01/2044 | 556,911 | 612,784 | ||||||
4.00%, 06/01/2044 | 4,032,184 | 4,422,592 | ||||||
4.00%, 07/01/2044 | 2,121,187 | 2,320,691 | ||||||
4.00%, 08/01/2044 | 4,386,887 | 4,814,509 | ||||||
4.00%, 09/01/2044 | 1,179,579 | 1,287,397 | ||||||
4.00%, 01/01/2045 | 8,384,894 | 9,107,951 | ||||||
4.00%, 07/01/2045 | 6,631,089 | 7,203,353 | ||||||
4.00%, 10/01/2045 | 857,368 | 927,886 | ||||||
4.00%, 11/01/2045 | 1,597,006 | 1,727,713 | ||||||
4.00%, 12/01/2045 | 1,208,400 | 1,302,149 | ||||||
4.00%, 12/01/2045 | 5,494,600 | 5,924,365 | ||||||
4.00%, 01/01/2046 | 3,311,793 | 3,567,151 | ||||||
4.00%, 03/01/2046 | 2,168,873 | 2,388,791 | ||||||
4.00%, 05/01/2046 | 130,519 | 142,567 | ||||||
4.00%, 08/01/2046 | 5,220,489 | 5,583,763 | ||||||
4.00%, 09/01/2046 | 2,381,886 | 2,612,390 | ||||||
4.00%, 03/01/2047 | 784,538 | 851,779 | ||||||
4.00%, 03/01/2047 | 7,383,650 | 8,063,516 | ||||||
4.00%, 03/01/2047 | 7,576,711 | 8,172,947 | ||||||
4.00%, 05/01/2047 | 902,222 | 979,601 | ||||||
4.00%, 05/01/2047 | 1,541,573 | 1,674,164 | ||||||
4.00%, 05/01/2047 | 2,913,042 | 3,167,077 | ||||||
4.00%, 06/01/2047 | 2,972,724 | 3,246,477 | ||||||
4.00%, 08/01/2047 | 9,308,383 | 10,015,879 | ||||||
4.00%, 11/01/2047 | 8,773,853 | 9,358,829 | ||||||
4.00%, 01/01/2048 | 7,400,694 | 7,880,006 | ||||||
4.00%, 01/01/2048 | 7,993,329 | 8,724,210 | ||||||
4.00%, 02/01/2048 | 1,273,622 | 1,385,458 | ||||||
4.00%, 03/01/2048 | 3,154,172 | 3,350,128 | ||||||
4.00%, 03/01/2048 | 9,671,152 | 10,726,559 | ||||||
4.00%, 04/01/2048 | 1,953,453 | 2,120,256 | ||||||
4.00%, 06/01/2048 | 2,139,170 | 2,321,869 | ||||||
4.00%, 09/01/2048 | 1,917,762 | 2,068,845 | ||||||
4.00%, 10/01/2048 | 2,653,304 | 2,892,036 |
4.00%, 07/01/2049 | 4,034,628 | 4,318,311 | ||||||
4.00%, 10/01/2049 | 7,693,999 | 8,271,402 | ||||||
4.02%, 06/01/2021 | 691,000 | 702,349 | ||||||
4.03%, 09/01/2022 | 1,143,648 | 1,208,224 | ||||||
4.04% (1 Year CMT Index + 2.47%, 2.47% Floor, 10.46% Cap), 10/01/2035(2) | 43,470 | 43,902 | ||||||
4.05% (11th District Cost of Funds Index + 1.25%, 3.88% Floor, 13.49% Cap), | 1,927 | 1,949 | ||||||
4.05%, 08/01/2021 | 153,787 | 157,133 | ||||||
4.06%, 07/01/2021 | 936,567 | 954,610 | ||||||
4.06%, 09/01/2021(4) | 603,857 | 616,202 | ||||||
4.06% (1 Year LIBOR USD + 1.81%, 1.81% Floor, 9.15% Cap), 09/01/2033(2) | 9,166 | 9,600 | ||||||
4.07% (1 Year LIBOR USD + 1.82%, 1.82% Floor, 10.99% Cap), 09/01/2036(2) | 30,632 | 30,894 | ||||||
4.09% (1 Year LIBOR USD + 1.47%, 1.47% Floor, 10.72% Cap), 07/01/2037(2) | 7,885 | 7,920 | ||||||
4.10%, 06/01/2021 | 623,129 | 633,538 | ||||||
4.10% (1 Year LIBOR USD + 1.85%, 1.85% Floor, 12.02% Cap), 09/01/2037(2) | 12,193 | 12,281 | ||||||
4.11% (1 Year LIBOR USD + 1.86%, 1.86% Floor, 10.76% Cap), 08/01/2036(2) | 54,724 | 57,677 | ||||||
4.14% (1 Year LIBOR USD + 1.75%, 1.75% Floor, 10.00% Cap), 08/01/2034(2) | 6,133 | 6,169 | ||||||
4.15% (1 Year LIBOR USD + 2.28%, 2.28% Floor, 10.53% Cap), 11/01/2036(2) | 8,589 | 8,714 | ||||||
4.17% (1 Year CMT Index + 2.26%, 2.26% Floor, 10.74% Cap), 12/01/2037(2) | 80,085 | 84,164 | ||||||
4.19%, 06/01/2021 | 504,690 | 512,938 | ||||||
4.21%, 07/01/2021(4) | 520,476 | 535,174 | ||||||
4.21% (1 Year CMT Index + 2.08%, 2.08% Floor, 10.66% Cap), 11/01/2037(2) | 51,265 | 53,471 | ||||||
4.22% (1 Year LIBOR USD + 1.83%, 1.84% Floor, 11.14% Cap), 06/01/2036(2) | 107,147 | 112,737 | ||||||
4.22% (1 Year LIBOR USD + 1.88%, 1.88% Floor, 11.53% Cap), 08/01/2036(2) | 16,503 | 16,573 | ||||||
4.26%, 07/01/2021 | 2,121,349 | 2,162,949 | ||||||
4.26% (6 Month LIBOR USD + 2.50%, 2.50% Floor, 11.26% Cap), 03/01/2036(2) | 241,661 | 256,304 | ||||||
4.26%, 06/01/2021(4) | 450,321 | 464,268 | ||||||
4.27% (1 Year LIBOR USD + 2.08%, 2.08% Floor, 10.94% Cap), 10/01/2036(2) | 62,680 | 66,701 | ||||||
4.29% (1 Year CMT Index + 2.32%, 2.32% Floor, 11.02% Cap), 09/01/2037(2) | 14,599 | 15,396 | ||||||
4.30%, 06/01/2021 | 1,159,635 | 1,188,891 | ||||||
4.32%, 01/01/2021(4) | 353,747 | 355,737 | ||||||
4.33% (1 Year LIBOR USD + 2.08%, 2.08% Floor, 11.39% Cap), 10/01/2036(2) | 63,464 | 64,931 | ||||||
4.34%, 06/01/2021 | 1,858,000 | 1,889,967 | ||||||
4.34% (1 Year LIBOR USD + 1.80%, 1.80% Floor, 10.21% Cap), 07/01/2037(2) | 33,536 | 33,856 | ||||||
4.35% (6 Month LIBOR USD + 2.50%, 2.50% Floor, 10.93% Cap), 02/01/2036(2) | 7,898 | 7,975 | ||||||
4.40% (1 Year LIBOR USD + 1.77%, 1.77% Floor, 11.03% Cap), 07/01/2036(2) | 30,154 | 30,756 | ||||||
4.44% (1 Year CMT Index + 2.38%, 2.38% Floor, 10.17% Cap), 10/01/2034(2) | 29,850 | 31,286 | ||||||
4.50%, 08/01/2029 | 124,283 | 133,803 | ||||||
4.50%, 09/01/2029 | 144,167 | 155,572 | ||||||
4.50%, 01/01/2030 | 220,060 | 239,311 | ||||||
4.50%, 10/01/2033 | 3,855,275 | 4,215,542 | ||||||
4.50%, 11/01/2033 | 12,441 | 13,594 | ||||||
4.50%, 09/01/2034 | 24,166 | 26,380 | ||||||
4.50%, 04/01/2039 | 5,776,086 | 6,422,960 | ||||||
4.50%, 11/01/2039 | 20,073 | 22,319 | ||||||
4.50%, 08/01/2040 | 3,087,958 | 3,436,792 | ||||||
4.50%, 08/01/2040 | 3,160,488 | 3,515,952 | ||||||
4.50%, 12/01/2040 | 1,417,513 | 1,578,069 | ||||||
4.50%, 12/01/2040 | 4,604,833 | 5,124,650 | ||||||
4.50%, 02/01/2041 | 498,869 | 555,030 | ||||||
4.50%, 02/01/2041 | 3,738,835 | 4,159,986 | ||||||
4.50%, 03/01/2041 | 1,133,383 | 1,261,692 | ||||||
4.50%, 04/01/2041 | 837,217 | 931,393 | ||||||
4.50%, 05/01/2041 | 1,588,816 | 1,768,007 | ||||||
4.50%, 05/01/2041 | 5,658,679 | 6,294,173 | ||||||
4.50%, 07/01/2041 | 349,672 | 389,290 | ||||||
4.50%, 08/01/2041 | 2,186,937 | 2,433,964 | ||||||
4.50%, 01/01/2042 | 2,141,090 | 2,382,799 | ||||||
4.50%, 11/01/2042 | 7,125,263 | 7,926,486 | ||||||
4.50%, 02/01/2046 | 7,533,814 | 8,375,463 | ||||||
4.50%, 08/01/2047 | 1,121,951 | 1,209,898 | ||||||
4.50%, 05/01/2048 | 3,635,877 | 3,938,139 | ||||||
4.50%, 07/01/2048 | 70,200 | 75,378 | ||||||
4.50%, 07/01/2048 | 599,877 | 644,064 | ||||||
4.50%, 08/01/2048 | 6,301,247 | 6,765,412 | ||||||
4.50%, 03/01/2049 | 6,917,023 | 7,610,214 | ||||||
4.50%, 07/01/2049 | 10,864,253 | 11,892,069 | ||||||
4.55%, 08/01/2026 | 855,896 | 976,071 | ||||||
4.66%, 12/01/2026(4) | 1,061,737 | 1,238,765 | ||||||
4.76%, 08/01/2026 | 974,873 | 1,128,043 | ||||||
4.76% (1 Year LIBOR USD + 2.37%, 2.37% Floor, 11.23% Cap), 08/01/2037(2) | 51,110 | 52,329 | ||||||
4.77%, 08/01/2026 | 620,198 | 717,701 | ||||||
5.00%, 11/01/2021 | 96 | 100 |
5.00%, 05/01/2023 | 4,143 | 4,354 | ||||||
5.00%, 08/01/2024 | 19,719 | 20,748 | ||||||
5.00%, 05/01/2028 | 15,365 | 16,749 | ||||||
5.00%, 04/01/2031 | 109,603 | 120,384 | ||||||
5.00%, 12/01/2032 | 584 | 605 | ||||||
5.00%, 06/01/2033 | 12,297 | 13,854 | ||||||
5.00%, 07/01/2033 | 13,398 | 15,227 | ||||||
5.00%, 07/01/2033 | 15,386 | 17,593 | ||||||
5.00%, 11/01/2033 | 4,179 | 4,793 | ||||||
5.00%, 11/01/2033 | 35,506 | 40,724 | ||||||
5.00%, 11/01/2033 | 2,814,086 | 3,228,083 | ||||||
5.00%, 04/01/2034 | 90,118 | 103,456 | ||||||
5.00%, 05/01/2034 | 28,771 | 33,034 | ||||||
5.00%, 12/01/2034 | 23,080 | 26,472 | ||||||
5.00%, 01/01/2035 | 16,607 | 18,281 | ||||||
5.00%, 02/01/2035 | 518,242 | 594,501 | ||||||
5.00%, 02/01/2035 | 2,488,922 | 2,855,024 | ||||||
5.00%, 06/01/2035 | 435,362 | 499,457 | ||||||
5.00%, 07/01/2035 | 12,136 | 13,636 | ||||||
5.00%, 07/01/2035 | 2,068,008 | 2,371,824 | ||||||
5.00%, 07/01/2035 | 2,350,658 | 2,696,646 | ||||||
5.00%, 09/01/2035 | 50,870 | 58,358 | ||||||
5.00%, 10/01/2035 | 210,793 | 241,929 | ||||||
5.00%, 11/01/2035 | 474,989 | 545,162 | ||||||
5.00%, 01/01/2036 | 40,671 | 46,712 | ||||||
5.00%, 02/01/2036 | 32,123 | 36,873 | ||||||
5.00%, 07/01/2037 | 613,528 | 703,597 | ||||||
5.00%, 01/01/2039 | 1,920,366 | 2,196,127 | ||||||
5.00%, 09/01/2039 | 107,264 | 123,126 | ||||||
5.00%, 04/01/2040 | 242,870 | 279,104 | ||||||
5.00%, 08/01/2040 | 264,534 | 304,007 | ||||||
5.00%, 05/01/2041 | 116,131 | 133,465 | ||||||
5.00%, 05/01/2042 | 1,884,206 | 2,161,394 | ||||||
5.00%, 09/01/2043 | 1,095,735 | 1,218,256 | ||||||
5.00%, 01/01/2048 | 1,158,760 | 1,267,807 | ||||||
5.00%, 05/01/2048 | 3,626,725 | 3,965,714 | ||||||
5.00%, 01/01/2049 | 8,699,327 | 9,864,919 | ||||||
5.50%, 07/01/2025 | 29,113 | 32,004 | ||||||
5.50%, 11/01/2032 | 48,160 | 55,039 | ||||||
5.50%, 02/01/2033 | 1,517 | 1,722 | ||||||
5.50%, 03/01/2033 | 64,630 | 74,204 | ||||||
5.50%, 04/01/2033 | 43,988 | 50,167 | ||||||
5.50%, 07/01/2033 | 8,657 | 9,729 | ||||||
5.50%, 09/01/2033 | 168,573 | 189,476 | ||||||
5.50%, 11/01/2033 | 3,383 | 3,821 | ||||||
5.50%, 12/01/2033 | 73,416 | 85,048 | ||||||
5.50%, 01/01/2034 | 6,807 | 7,878 | ||||||
5.50%, 03/01/2034 | 6,482 | 7,244 | ||||||
5.50%, 09/01/2034 | 15,065 | 17,278 | ||||||
5.50%, 10/01/2034 | 13,296 | 13,824 | ||||||
5.50%, 02/01/2035 | 51,124 | 58,667 | ||||||
5.50%, 12/01/2035 | 22,598 | 25,888 | ||||||
5.50%, 04/01/2036 | 57,367 | 65,923 | ||||||
5.50%, 05/01/2036 | 48,579 | 55,835 | ||||||
5.50%, 05/01/2036 | 76,463 | 87,882 | ||||||
5.50%, 11/01/2036 | 19,009 | 21,842 | ||||||
5.50%, 03/01/2037 | 368,147 | 422,334 | ||||||
5.50%, 04/01/2037 | 124,430 | 141,977 | ||||||
5.50%, 05/01/2037 | 164,855 | 189,069 | ||||||
5.50%, 01/01/2038 | 107,545 | 123,035 | ||||||
5.50%, 05/01/2038 | 15,142 | 17,398 | ||||||
5.50%, 06/01/2038 | 1,464 | 1,680 | ||||||
5.50%, 06/01/2038 | 110,175 | 126,472 | ||||||
5.50%, 06/01/2038 | 786,504 | 902,291 | ||||||
5.50%, 09/01/2038 | 670,650 | 770,854 | ||||||
5.50%, 06/01/2039 | 17,538 | 18,909 | ||||||
5.50%, 09/01/2039 | 92,670 | 104,715 | ||||||
5.50%, 12/01/2039 | 73,807 | 83,380 | ||||||
5.50%, 01/01/2040 | 519,995 | 589,228 | ||||||
6.00%, 03/01/2021 | 1,233 | 1,244 | ||||||
6.00%, 04/01/2021 | 448 | 450 | ||||||
6.00%, 04/01/2021 | 466 | 471 |
6.00%, 07/01/2021 | 57 | 57 | ||||||
6.00%, 08/01/2021 | 4,611 | 4,687 | ||||||
6.00%, 12/01/2021 | 1,907 | 1,938 | ||||||
6.00%, 02/01/2023 | 51,500 | 53,326 | ||||||
6.00%, 01/01/2024 | 17,766 | 18,653 | ||||||
6.00%, 01/01/2024 | 48,518 | 50,725 | ||||||
6.00%, 07/01/2024 | 13,227 | 13,948 | ||||||
6.00%, 07/01/2026 | 22,273 | 24,768 | ||||||
6.00%, 07/01/2027 | 31,453 | 34,983 | ||||||
6.00%, 11/01/2027 | 14,066 | 15,646 | ||||||
6.00%, 12/01/2027 | 43,771 | 48,690 | ||||||
6.00%, 01/01/2028 | 75,551 | 84,040 | ||||||
6.00%, 10/01/2028 | 55,040 | 61,218 | ||||||
6.00%, 12/01/2028 | 2,271 | 2,525 | ||||||
6.00%, 01/01/2029 | 2,812 | 3,179 | ||||||
6.00%, 09/01/2029 | 37,601 | 41,821 | ||||||
6.00%, 12/01/2032 | 20,415 | 23,023 | ||||||
6.00%, 12/01/2032 | 121,769 | 141,462 | ||||||
6.00%, 03/01/2033 | 970 | 1,079 | ||||||
6.00%, 03/01/2033 | 2,331 | 2,598 | ||||||
6.00%, 03/01/2033 | 3,218 | 3,630 | ||||||
6.00%, 03/01/2033 | 4,201 | 4,878 | ||||||
6.00%, 03/01/2033 | 5,465 | 6,085 | ||||||
6.00%, 05/01/2033 | 16,512 | 19,248 | ||||||
6.00%, 08/01/2033 | 4,152 | 4,639 | ||||||
6.00%, 09/01/2033 | 8,239 | 9,379 | ||||||
6.00%, 09/01/2033 | 13,518 | 15,063 | ||||||
6.00%, 11/01/2034 | 4,134 | 4,822 | ||||||
6.00%, 04/01/2035 | 77,221 | 90,067 | ||||||
6.00%, 02/01/2036 | 4,621 | 5,279 | ||||||
6.00%, 09/01/2036 | 271,281 | 316,241 | ||||||
6.00%, 11/01/2036 | 49,335 | 57,440 | ||||||
6.00%, 03/01/2037 | 80,198 | 93,416 | ||||||
6.00%, 09/01/2037 | 64,500 | 75,165 | ||||||
6.00%, 04/01/2038 | 10,600 | 11,773 | ||||||
6.00%, 05/01/2038 | 190,851 | 222,740 | ||||||
6.00%, 11/01/2038 | 52,507 | 61,199 | ||||||
6.00%, 12/01/2039 | 942,462 | 1,099,931 | ||||||
6.00%, 10/01/2040 | 1,260,603 | 1,471,234 | ||||||
6.00%, 07/01/2041 | 3,319,199 | 3,873,661 | ||||||
6.00%, 11/01/2048 | 32,207 | 34,711 | ||||||
6.50%, 08/01/2020 | 15 | 15 | ||||||
6.50%, 04/01/2022 | 3,010 | 3,057 | ||||||
6.50%, 05/01/2022 | 1,115 | 1,240 | ||||||
6.50%, 12/01/2022 | 3,635 | 4,042 | ||||||
6.50%, 02/01/2024 | 26,314 | 27,763 | ||||||
6.50%, 07/01/2024 | 9,170 | 10,199 | ||||||
6.50%, 04/01/2025 | 1,344 | 1,495 | ||||||
6.50%, 08/01/2026 | 40,635 | 45,191 | ||||||
6.50%, 03/01/2029 | 11,596 | 13,014 | ||||||
6.50%, 11/01/2029 | 382,399 | 429,073 | ||||||
6.50%, 08/01/2031 | 9,499 | 11,382 | ||||||
6.50%, 02/01/2032 | 50,523 | 56,188 | ||||||
6.50%, 01/01/2036 | 231,486 | 263,194 | ||||||
6.50%, 04/01/2036 | 963 | 974 | ||||||
6.50%, 07/01/2036 | 4,168 | 4,872 | ||||||
6.50%, 08/01/2036 | 141,231 | 161,533 | ||||||
6.50%, 10/01/2036 | 31,644 | 36,918 | ||||||
6.50%, 01/01/2037 | 84,845 | 102,264 | ||||||
6.50%, 08/01/2037 | 25,686 | 29,834 | ||||||
6.50%, 08/01/2037 | 27,946 | 32,138 | ||||||
6.50%, 10/01/2037 | 55,654 | 65,273 | ||||||
6.50%, 10/01/2038 | 69,393 | 79,883 | ||||||
6.50%, 10/01/2038 | 269,620 | 311,137 | ||||||
7.00%, 01/01/2024 | 180 | 194 | ||||||
7.00%, 04/01/2026 | 3,962 | 4,116 | ||||||
7.00%, 09/01/2027 | 535 | 599 | ||||||
7.00%, 01/01/2029 | 926 | 927 | ||||||
7.00%, 06/01/2032 | 4,725 | 5,113 | ||||||
7.00%, 02/01/2033 | 1,298 | 1,382 | ||||||
7.00%, 06/01/2033 | 73,878 | 87,914 | ||||||
7.00%, 02/01/2036 | 41,907 | 50,645 |
7.00%, 03/01/2036 | 1,506 | 1,720 | ||||||
7.00%, 12/01/2036 | 7,422 | 8,514 | ||||||
7.00%, 03/01/2037 | 5,250 | 5,808 | ||||||
7.00%, 04/01/2037 | 8,929 | 10,298 | ||||||
7.00%, 09/01/2037 | 43,707 | 52,877 | ||||||
7.00%, 09/01/2038 | 45,415 | 56,300 | ||||||
7.00%, 10/01/2038 | 69,459 | 87,547 | ||||||
7.00%, 11/01/2038 | 48,477 | 58,158 | ||||||
7.00%, 12/01/2038 | 144,176 | 171,083 | ||||||
7.00%, 01/01/2039 | 221,532 | 265,463 | ||||||
7.50%, 11/01/2022 | 402 | 407 | ||||||
7.50%, 10/01/2024 | 268 | 288 | ||||||
7.50%, 01/01/2035 | 32,893 | 38,908 | ||||||
7.50%, 03/01/2035 | 35,584 | 43,254 | ||||||
7.50%, 05/01/2037 | 27,391 | 34,756 | ||||||
7.50%, 10/01/2037 | 135,028 | 162,247 | ||||||
7.50%, 11/01/2037 | 46,768 | 55,210 | ||||||
7.50%, 11/01/2038 | 40,442 | 49,404 | ||||||
7.50%, 04/01/2039 | 146,436 | 195,880 | ||||||
8.00%, 03/01/2021 | 9 | 9 | ||||||
8.00%, 05/01/2024 | 151 | 164 | ||||||
8.00%, 03/01/2027 | 5,276 | 5,872 | ||||||
8.00%, 06/01/2027 | 4,455 | 4,982 | ||||||
8.00%, 06/01/2028 | 2,178 | 2,386 | ||||||
8.00%, 09/01/2028 | 8,806 | 10,071 | ||||||
8.00%, 11/01/2028 | 18,379 | 21,323 | ||||||
8.00%, 11/01/2037 | 9,295 | 10,246 | ||||||
8.00%, 01/01/2038 | 4,093 | 4,951 | ||||||
8.50%, 07/01/2024 | 670 | 731 | ||||||
8.50%, 05/01/2025 | 52 | 52 | ||||||
Fannie Mae REMIC Trust 2003-W1 | ||||||||
5.24%, 12/25/2042(4) | 93,967 | 103,792 | ||||||
5.75%, 12/25/2042(4) | 24,922 | 27,923 | ||||||
Fannie Mae REMIC Trust 2003-W4 | ||||||||
5.77%, 10/25/2042(4) | 12,523 | 14,422 | ||||||
Fannie Mae REMIC Trust 2004-W10 | ||||||||
5.75%, 08/25/2034 | 513,013 | 589,587 | ||||||
Fannie Mae REMIC Trust 2004-W11 | ||||||||
6.00%, 05/25/2044 | 72,198 | 87,525 | ||||||
Fannie Mae REMIC Trust 2005-W1 | ||||||||
6.50%, 10/25/2044 | 133,569 | 160,717 | ||||||
Fannie Mae REMIC Trust 2006-W3 | ||||||||
6.00%, 09/25/2046 | 104,096 | 118,564 | ||||||
Fannie Mae REMIC Trust 2007-W1 | ||||||||
6.29%, 08/25/2047(4) | 12,163 | 14,031 | ||||||
Fannie Mae REMIC Trust 2007-W3 | ||||||||
6.75%, 04/25/2037 | 26,676 | 30,100 | ||||||
Fannie Mae REMIC Trust 2007-W5 | ||||||||
0.00%, 06/25/2037 | 20,732 | 19,564 | ||||||
Fannie Mae REMIC Trust 2007-W7 | ||||||||
38.07% (1 Month LIBOR USD + 39.18%, 39.18% Cap), 07/25/2037(2)(7) | 17,914 | 38,244 | ||||||
Fannie Mae REMIC Trust 2009-W1 | ||||||||
6.00%, 12/25/2049 | 461,056 | 534,016 | ||||||
Fannie Mae REMICS | ||||||||
0.00%, 03/25/2022 | 5,162 | 5,137 | ||||||
0.00%, 10/25/2022 | 527 | 524 | ||||||
0.00%, 04/25/2023 | 614 | 608 | ||||||
0.00%, 09/25/2023 | 376 | 374 | ||||||
0.00%, 09/25/2023 | 1,242 | 1,226 | ||||||
0.00%, 11/25/2023 | 131 | 130 | ||||||
0.00%, 01/25/2032 | 1,685 | 1,646 | ||||||
0.00%, 04/25/2032 | 1,477 | 1,431 | ||||||
0.00%, 12/25/2032 | 9,359 | 8,885 | ||||||
0.00%, 05/25/2033 | 5,141 | 4,856 | ||||||
0.00%, 08/25/2033 | 3,343 | 3,250 | ||||||
0.00%, 12/25/2033 | 75,788 | 71,980 | ||||||
0.00%, 03/25/2034 | 79,748 | 78,641 | ||||||
0.00%, 04/25/2035 | 6,730 | 6,721 | ||||||
0.00%, 09/25/2035 | 9,479 | 9,369 | ||||||
0.00%, 10/25/2035 | 20,152 | 19,666 | ||||||
0.00%, 01/25/2036 | 761 | 760 | ||||||
0.00%, 03/25/2036 | 16,190 | 15,333 |
0.00%, 03/25/2036 | 160,355 | 146,898 | ||||||
0.00%, 04/25/2036 | 19,414 | 18,817 | ||||||
0.00%, 04/25/2036 | 38,166 | 36,311 | ||||||
0.00%, 04/25/2036 | 53,663 | 51,032 | ||||||
0.00%, 06/25/2036 | 14,476 | 14,178 | ||||||
0.00%, 06/25/2036 | 28,552 | 26,918 | ||||||
0.00%, 06/25/2036 | 44,784 | 41,839 | ||||||
0.00%, 06/25/2036 | 101,461 | 95,315 | ||||||
0.00%, 06/25/2036 | 122,271 | 119,595 | ||||||
0.00%, 07/25/2036 | 5,894 | 5,874 | ||||||
0.00%, 07/25/2036 | 9,379 | 8,782 | ||||||
0.00%, 07/25/2036 | 16,965 | 16,093 | ||||||
0.00%, 07/25/2036 | 33,301 | 31,603 | ||||||
0.00%, 08/25/2036 | 11,786 | 10,950 | ||||||
0.00%, 08/25/2036 | 23,665 | 23,151 | ||||||
0.00%, 08/25/2036 | 34,632 | 32,190 | ||||||
0.00%, 08/25/2036 | 59,183 | 57,489 | ||||||
0.00%, 09/25/2036 | 12,731 | 11,891 | ||||||
0.00%, 09/25/2036 | 26,809 | 25,634 | ||||||
0.00%, 09/25/2036 | 33,338 | 31,759 | ||||||
0.00%, 11/25/2036 | 8,347 | 7,852 | ||||||
0.00%, 11/25/2036 | 23,259 | 21,599 | ||||||
0.00%, 11/25/2036 | 51,724 | 48,750 | ||||||
0.00%, 12/25/2036 | 12,296 | 11,803 | ||||||
0.00%, 12/25/2036 | 28,979 | 27,056 | ||||||
0.00%, 01/25/2037 | 30,026 | 28,298 | ||||||
0.00%, 01/25/2037 | 76,664 | 71,428 | ||||||
0.00%, 03/25/2037 | 22,809 | 21,895 | ||||||
0.00%, 04/25/2037 | 76,168 | 71,040 | ||||||
0.00%, 05/25/2037 | 7,904 | 7,388 | ||||||
0.00%, 07/25/2037 | 53,684 | 50,286 | ||||||
0.00%, 10/25/2037 | 487,125 | 453,381 | ||||||
0.00%, 05/25/2038 | 1,715 | 1,562 | ||||||
0.00%, 01/25/2040 | 41,857 | 37,853 | ||||||
0.00%, 06/25/2040 | 69,080 | 64,835 | ||||||
0.00%, 09/25/2043 | 1,172,462 | 1,083,611 | ||||||
0.00%, 10/25/2043 | 861,200 | 753,045 | ||||||
0.00%, 12/25/2043 | 2,249,911 | 1,985,159 | ||||||
0.19% (1 Month LIBOR USD + 0.02%, 0.02% Floor, 9.32% Cap), 09/25/2022(2) | 281 | 279 | ||||||
0.23% (1 Month LIBOR USD + 0.06%, 0.06% Floor), 12/25/2036(2) | 53,101 | 52,787 | ||||||
0.23% (1 Month LIBOR USD + 0.06%, 0.06% Floor), 12/25/2036(2) | 233,319 | 231,126 | ||||||
0.43% (1 Month LIBOR USD + 0.25%, 0.25% Floor, 7.00% Cap), 08/25/2034(2) | 41,092 | 41,143 | ||||||
0.43% (1 Month LIBOR USD + 0.25%, 0.25% Floor, 7.00% Cap), 04/25/2036(2) | 80,319 | 79,765 | ||||||
0.43% (1 Month LIBOR USD + 0.25%, 0.25% Floor, 6.50% Cap), 02/25/2037(2) | 67,803 | 67,546 | ||||||
0.45% (1 Month LIBOR USD + 0.25%, 0.25% Floor), 06/27/2036(2) | 329,827 | 324,615 | ||||||
0.47% (1 Month LIBOR USD + 0.29%, 0.29% Floor, 7.50% Cap), 07/25/2036(2) | 270,570 | 269,845 | ||||||
0.48% (1 Month LIBOR USD + 0.30%, 0.30% Floor, 6.75% Cap), 05/25/2037(2) | 40,109 | 39,899 | ||||||
0.53% (1 Month LIBOR USD + 0.35%, 0.35% Floor, 6.75% Cap), 04/25/2035(2) | 94,575 | 94,411 | ||||||
0.53% (1 Month LIBOR USD + 0.35%, 0.35% Floor, 7.50% Cap), 08/25/2036(2) | 99,840 | 99,657 | ||||||
0.55% (1 Month LIBOR USD + 0.37%, 0.37% Floor, 7.50% Cap), 07/25/2037(2) | 52,742 | 52,945 | ||||||
0.58% (1 Month LIBOR USD + 0.40%, 0.40% Floor, 7.50% Cap), 03/25/2034(2) | 73,144 | 73,161 | ||||||
0.58% (1 Month LIBOR USD + 0.40%, 0.40% Floor, 7.50% Cap), 05/25/2034(2) | 205,923 | 206,005 | ||||||
0.58% (1 Month LIBOR USD + 0.40%, 0.40% Floor, 7.00% Cap), 06/25/2036(2) | 32,366 | 32,262 | ||||||
0.58% (1 Month LIBOR USD + 0.40%, 0.40% Floor, 7.00% Cap), 06/25/2037(2) | 204,423 | 205,264 | ||||||
0.63% (1 Month LIBOR USD + 0.45%, 6.50% Cap), 06/25/2037(2) | 20,248 | 21,152 | ||||||
0.63% (1 Month LIBOR USD + 0.45%, 0.45% Floor, 7.00% Cap), 08/25/2037(2) | 31,032 | 31,061 | ||||||
0.63% (1 Month LIBOR USD + 0.45%, 0.45% Floor, 6.50% Cap), 09/25/2037(2) | 425,296 | 425,862 | ||||||
0.63% (1 Month LIBOR USD + 0.45%, 0.45% Floor, 6.50% Cap), 04/25/2039(2) | 150,466 | 150,682 | ||||||
0.63% (1 Month LIBOR USD + 0.45%, 0.45% Floor, 6.50% Cap), 09/25/2042(2) | 362,859 | 362,852 | ||||||
0.64% (1 Month LIBOR USD + 0.46%, 0.46% Floor, 7.00% Cap), 07/25/2036(2) | 27,389 | 27,458 | ||||||
0.68% (1 Month LIBOR USD + 0.50%, 0.50% Floor, 7.00% Cap), 03/25/2037(2) | 58,536 | 58,800 | ||||||
0.68% (1 Month LIBOR USD + 0.50%, 0.50% Floor, 7.00% Cap), 07/25/2037(2) | 30,678 | 30,824 | ||||||
0.68% (1 Month LIBOR USD + 0.50%, 0.50% Floor, 6.50% Cap), 07/25/2041(2) | 56,274 | 56,438 | ||||||
0.68% (1 Month LIBOR USD + 0.50%, 0.50% Floor, 6.50% Cap), 11/25/2041(2) | 216,681 | 217,364 | ||||||
0.68% (1 Month LIBOR USD + 0.50%, 0.50% Floor, 6.50% Cap), 09/25/2042(2) | 168,327 | 166,446 | ||||||
0.68% (1 Month LIBOR USD + 0.50%, 0.50% Floor, 6.50% Cap), 09/25/2042(2) | 1,291,066 | 1,295,775 | ||||||
0.68% (1 Month LIBOR USD + 0.50%, 0.50% Floor, 6.50% Cap), 10/25/2042(2) | 493,968 | 494,783 | ||||||
0.73% (1 Month LIBOR USD + 0.55%, 0.55% Floor, 7.00% Cap), 01/25/2041(2) | 90,608 | 91,098 | ||||||
0.73% (1 Month LIBOR USD + 0.55%, 0.55% Floor, 6.50% Cap), 08/25/2041(2) | 135,602 | 136,112 | ||||||
0.77% (1 Month LIBOR USD + 0.60%, 0.60% Floor, 9.00% Cap), 12/25/2023(2) | 740 | 735 | ||||||
0.78% (1 Month LIBOR USD + 0.60%, 0.60% Floor, 7.00% Cap), 04/25/2040(2) | 45,619 | 45,836 | ||||||
0.78% (1 Month LIBOR USD + 0.60%, 0.60% Floor, 7.00% Cap), 05/25/2040(2) | 71,119 | 71,670 |
0.93% (1 Month LIBOR USD + 0.75%, 0.75% Floor, 8.00% Cap), 01/25/2034(2) | 114,866 | 116,196 | ||||||
0.93% (1 Month LIBOR USD + 0.75%, 6.50% Cap), 03/25/2037(2) | 37,184 | 38,699 | ||||||
0.98% (1 Month LIBOR USD + 0.80%, 0.80% Floor, 8.00% Cap), 11/25/2032(2) | 233,184 | 235,848 | ||||||
1.06% (1 Month LIBOR USD + 0.88%, 0.88% Floor, 9.50% Cap), 08/25/2023(2) | 1,642 | 1,638 | ||||||
1.08% (1 Month LIBOR USD + 0.90%, 0.90% Floor, 6.75% Cap), 03/25/2038(2) | 36,328 | 36,931 | ||||||
1.18% (1 Month LIBOR USD + 1.00%, 1.00% Floor, 9.50% Cap), 12/25/2023(2) | 1,835 | 1,847 | ||||||
1.44% (11th District Cost of Funds Index + 0.70%, 0.70% Floor, 10.00% Cap), 10/25/2022(2) | 242 | 242 | ||||||
1.60% (1 Month LIBOR USD + 8.10%, 1.60% Cap), 03/25/2032(2)(7) | 42,868 | 1,577 | ||||||
1.84%, 03/25/2027(4) | 2,041 | 44 | ||||||
1.84%, 03/25/2027(4) | 5,519 | 117 | ||||||
2.50%, 11/25/2045 | 4,356,866 | 4,547,968 | ||||||
2.76%, 01/25/2038(4) | 313,519 | 13,147 | ||||||
2.88%, 04/25/2041(4) | 558,225 | 36,018 | ||||||
3.00%, 12/25/2028 | 1,237,521 | 1,329,031 | ||||||
3.00%, 10/25/2033 | 908,000 | 999,592 | ||||||
3.00%, 02/25/2043 | 1,000,000 | 1,060,668 | ||||||
3.00%, 06/25/2045 | 1,809,066 | 1,873,957 | ||||||
3.00%, 01/25/2046 | 1,780,055 | 1,911,757 | ||||||
3.00%, 04/25/2046 | 3,681,389 | 3,833,427 | ||||||
3.00%, 06/25/2046 | 3,582,771 | 3,737,504 | ||||||
3.00%, 02/25/2047 | 2,207,107 | 2,348,213 | ||||||
3.23%, 06/25/2038(4) | 122,292 | 7,318 | ||||||
3.50%, 04/25/2031 | 852,005 | 920,700 | ||||||
3.50%, 09/25/2033 | 1,500,000 | 1,748,716 | ||||||
3.50%, 03/25/2042 | 1,000,000 | 1,112,583 | ||||||
3.50%, 02/25/2043 | 353,756 | 393,172 | ||||||
3.50%, 06/25/2044 | 2,635,957 | 2,694,778 | ||||||
3.66%, 12/25/2039(4) | 169,666 | 176,459 | ||||||
4.00%, 04/25/2033 | 181,035 | 201,576 | ||||||
4.00%, 05/25/2033 | 9,977 | 11,138 | ||||||
4.00%, 02/25/2039 | 31,776 | 31,920 | ||||||
4.26% (1 Month LIBOR USD + 4.44%, 4.44% Cap), 11/25/2040(2)(7) | 559,634 | 72,257 | ||||||
4.50%, 07/25/2023 | 36,582 | 37,870 | ||||||
4.50%, 10/25/2036 | 149,629 | 169,059 | ||||||
4.50%, 02/25/2039 | 5,526 | 6,117 | ||||||
4.50%, 12/25/2040 | 5,359,402 | 6,372,560 | ||||||
4.50%, 01/25/2042 | 2,483,000 | 2,790,864 | ||||||
4.50%, 04/25/2042 | 1,500,000 | 1,754,853 | ||||||
5.00%, 03/25/2021 | 26 | 26 | ||||||
5.00%, 02/25/2024 | 212 | 1 | ||||||
5.00%, 03/25/2024 | 67 | 0 | ||||||
5.00%, 03/25/2024 | 7 | 0 | ||||||
5.00%, 11/25/2024 | 120,022 | 126,554 | ||||||
5.00%, 03/25/2029 | 148,000 | 157,727 | ||||||
5.00%, 11/25/2032 | 11,414 | 12,602 | ||||||
5.00%, 03/25/2033 | 18,507 | 1,409 | ||||||
5.00%, 03/25/2037 | 4,848 | 5,482 | ||||||
5.00%, 07/25/2038 | 35,940 | 40,579 | ||||||
5.00%, 07/25/2038 | 43,133 | 49,445 | ||||||
5.00%, 07/25/2039 | 75,858 | 12,442 | ||||||
5.00%, 08/25/2039 | 277,204 | 316,219 | ||||||
5.00%, 09/25/2039 | 161,561 | 175,576 | ||||||
5.00%, 06/25/2040 | 489,442 | 552,872 | ||||||
5.00%, 09/25/2040 | 206,000 | 239,313 | ||||||
5.43%, 07/25/2051(4) | 30,233 | 34,960 | ||||||
5.50%, 09/25/2022 | 389 | 401 | ||||||
5.50%, 03/25/2023 | 54,688 | 57,098 | ||||||
5.50%, 04/25/2023 | 3,555 | 3,708 | ||||||
5.50%, 04/25/2023 | 104,904 | 109,650 | ||||||
5.50%, 05/25/2023 | 24,948 | 26,001 | ||||||
5.50%, 07/25/2024 | 6,946 | 7,294 | ||||||
5.50%, 08/25/2024 | 75,599 | 79,708 | ||||||
5.50%, 08/25/2025 | 86,969 | 93,829 | ||||||
5.50%, 01/25/2026 | 53,332 | 57,044 | ||||||
5.50%, 04/18/2029 | 7,758 | 8,463 | ||||||
5.50%, 12/25/2032 | 104,035 | 120,891 | ||||||
5.50%, 08/25/2033 | 191,652 | 35,196 | ||||||
5.50%, 08/25/2033 | 87,386 | 101,790 | ||||||
5.50%, 10/25/2033 | 643,761 | 749,822 | ||||||
5.50%, 04/25/2034 | 199,405 | 235,392 | ||||||
5.50%, 07/25/2034 | 330,820 | 378,596 | ||||||
5.50%, 08/25/2035 | 83,991 | 95,916 |
5.50%, 08/25/2035 | 573,407 | 666,784 | ||||||
5.50%, 12/25/2035 | 38,101 | 41,248 | ||||||
5.50%, 12/25/2035 | 435,504 | 509,296 | ||||||
5.50%, 01/25/2036 | 24,281 | 26,502 | ||||||
5.50%, 03/25/2036 | 55,070 | 63,714 | ||||||
5.50%, 03/25/2036 | 195,409 | 223,408 | ||||||
5.50%, 03/25/2036 | 221,672 | 262,059 | ||||||
5.50%, 01/25/2037 | 18,415 | 20,120 | ||||||
5.50%, 07/25/2037 | 138,026 | 157,865 | ||||||
5.50%, 08/25/2037 | 36,494 | 41,448 | ||||||
5.50%, 07/25/2038 | 162,945 | 189,097 | ||||||
5.50%, 10/25/2039 | 172,582 | 31,083 | ||||||
5.50%, 06/25/2040 | 804,308 | 913,907 | ||||||
5.50%, 07/25/2040 | 320,553 | 375,228 | ||||||
5.50%, 10/25/2040 | 1,183,670 | 1,413,416 | ||||||
5.60% (1 Month LIBOR USD + 5.78%, 5.78% Cap), 06/25/2037(2)(7) | 39,509 | 6,309 | ||||||
5.67% (1 Month LIBOR USD + 5.85%, 5.85% Cap), 09/25/2038(2)(7) | 127,707 | 21,648 | ||||||
5.67% (1 Month LIBOR USD + 5.85%, 5.85% Cap), 09/25/2038(2)(7) | 163,460 | 31,275 | ||||||
5.72% (1 Month LIBOR USD + 5.90%, 5.90% Cap), 10/25/2039(2)(7) | 40,412 | 6,211 | ||||||
5.73% (1 Month LIBOR USD + 5.91%, 5.91% Cap), 02/25/2038(2)(7) | 145,960 | 28,151 | ||||||
5.75%, 06/25/2033 | 50,868 | 60,237 | ||||||
5.75%, 07/25/2035 | 1,465,969 | 1,773,422 | ||||||
5.75%, 10/25/2035 | 71,449 | 81,070 | ||||||
5.82% (1 Month LIBOR USD + 6.00%, 6.00% Cap), 02/25/2038(2)(7) | 362,354 | 67,831 | ||||||
5.85%, 02/25/2051(4) | 92,808 | 106,636 | ||||||
5.90% (1 Month LIBOR USD + 6.08%, 6.08% Cap), 03/25/2037(2)(7) | 3,718 | 157 | ||||||
5.92% (1 Month LIBOR USD + 6.10%, 6.10% Cap), 04/25/2037(2)(7) | 53,687 | 5,888 | ||||||
5.92% (1 Month LIBOR USD + 6.10%, 6.10% Cap), 06/25/2037(2)(7) | 46,536 | 9,670 | ||||||
5.92% (1 Month LIBOR USD + 6.10%, 6.10% Cap), 06/25/2037(2)(7) | 116,333 | 20,102 | ||||||
5.92% (1 Month LIBOR USD + 6.10%, 6.10% Cap), 11/25/2049(2)(7) | 77,783 | 7,781 | ||||||
6.00% (1 Month LIBOR USD + 6.18%, 6.18% Cap), 12/25/2039(2)(7) | 52,993 | 8,237 | ||||||
6.00%, 02/25/2022 | 15,803 | 16,209 | ||||||
6.00%, 08/25/2022 | 820 | 853 | ||||||
6.00%, 09/25/2022 | 28,498 | 29,496 | ||||||
6.00% (1 Month LIBOR USD + 28.70%, 6.00% Cap), 04/25/2023(2)(7) | 2,106 | 2,243 | ||||||
6.00%, 07/25/2023(4) | 14,549 | 15,463 | ||||||
6.00%, 07/18/2028 | 6,632 | 7,467 | ||||||
6.00%, 12/25/2028 | 2,915 | 3,097 | ||||||
6.00%, 07/25/2031 | 24,776 | 4,233 | ||||||
6.00%, 11/25/2031 | 45,919 | 53,414 | ||||||
6.00%, 04/25/2032 | 112,817 | 126,707 | ||||||
6.00%, 11/25/2032 | 331,627 | 386,111 | ||||||
6.00%, 05/25/2033(4) | 8,242 | 1,524 | ||||||
6.00%, 05/25/2033 | 32,714 | 38,593 | ||||||
6.00%, 05/25/2033 | 68,976 | 79,251 | ||||||
6.00%, 05/25/2033 | 145,504 | 170,810 | ||||||
6.00%, 12/25/2035 | 12,472 | 14,035 | ||||||
6.00%, 12/25/2035 | 262,137 | 270,338 | ||||||
6.00%, 07/25/2036 | 374,699 | 442,149 | ||||||
6.00%, 03/25/2037 | 266,875 | 302,212 | ||||||
6.00%, 05/25/2037 | 118,856 | 138,895 | ||||||
6.00%, 08/25/2037 | 11,648 | 13,717 | ||||||
6.00%, 08/25/2037 | 49,895 | 58,378 | ||||||
6.00%, 08/25/2037 | 55,475 | 64,411 | ||||||
6.00%, 08/25/2037 | 61,645 | 70,563 | ||||||
6.00%, 08/25/2039 | 347,146 | 411,764 | ||||||
6.02% (1 Month LIBOR USD + 6.20%, 6.20% Cap), 03/25/2038(2)(7) | 42,930 | 6,755 | ||||||
6.04%, 09/25/2039(4) | 132,078 | 151,455 | ||||||
6.05% (1 Month LIBOR USD + 6.23%, 6.23% Cap), 03/25/2038(2)(7) | 54,830 | 10,517 | ||||||
6.07% (1 Month LIBOR USD + 6.25%, 6.25% Cap), 01/25/2040(2)(7) | 124,486 | 27,209 | ||||||
6.18% (1 Month LIBOR USD + 6.36%, 6.36% Cap), 12/25/2037(2)(7) | 6,590 | 1,084 | ||||||
6.20%, 03/25/2040(4) | 196,136 | 227,471 | ||||||
6.20%, 10/25/2037(4) | 52,182 | 60,073 | ||||||
6.22% (1 Month LIBOR USD + 6.40%, 6.40% Cap), 07/25/2037(2)(7) | 341,471 | 70,356 | ||||||
6.22% (1 Month LIBOR USD + 6.40%, 6.40% Cap), 12/25/2037(2)(7) | 164,828 | 26,143 | ||||||
6.22% (1 Month LIBOR USD + 6.40%, 6.40% Cap), 05/25/2040(2)(7) | 54,197 | 11,261 | ||||||
6.22%, 02/25/2040(4) | 56,146 | 64,324 | ||||||
6.24% (1 Month LIBOR USD + 6.42%, 6.42% Cap), 04/25/2040(2)(7) | 88,307 | 15,394 | ||||||
6.26% (1 Month LIBOR USD + 6.44%, 6.44% Cap), 03/25/2037(2)(7) | 209,938 | 40,407 | ||||||
6.27% (1 Month LIBOR USD + 6.45%, 6.45% Cap), 10/25/2037(2)(7) | 142,057 | 28,176 | ||||||
6.27% (1 Month LIBOR USD + 6.45%, 6.45% Cap), 12/25/2037(2)(7) | 179,944 | 42,265 | ||||||
6.28% (1 Month LIBOR USD + 6.46%, 6.46% Cap), 10/25/2037(2)(7) | 197,310 | 44,393 |
6.30%, 12/25/2039(4) | 279,307 | 322,826 | ||||||
6.32% (1 Month LIBOR USD + 6.50%, 6.50% Cap), 06/25/2023(2)(7) | 6,364 | 180 | ||||||
6.32% (1 Month LIBOR USD + 6.50%, 6.50% Cap), 08/25/2036(2)(7) | 93,197 | 32,980 | ||||||
6.34% (1 Month LIBOR USD + 6.52%, 6.52% Cap), 07/25/2036(2)(7) | 51,368 | 9,341 | ||||||
6.35% (1 Month LIBOR USD + 6.53%, 6.53% Cap), 01/25/2041(2)(7) | 603,143 | 143,679 | ||||||
6.35%, 04/25/2029 | 4,029 | 4,528 | ||||||
6.36% (1 Month LIBOR USD + 6.54%, 6.54% Cap), 09/25/2037(2)(7) | 172,687 | 38,222 | ||||||
6.37% (1 Month LIBOR USD + 6.55%, 6.55% Cap), 02/25/2039(2)(7) | 118,635 | 24,882 | ||||||
6.40% (1 Month LIBOR USD + 6.58%, 6.58% Cap), 06/25/2036(2)(7) | 122,739 | 24,609 | ||||||
6.44% (1 Month LIBOR USD + 6.62%, 6.62% Cap), 07/25/2037(2)(7) | 133,491 | 22,178 | ||||||
6.44%, 03/25/2040(4) | 200,479 | 230,084 | ||||||
6.47% (1 Month LIBOR USD + 6.65%, 6.65% Cap), 12/25/2036(2)(7) | 95,876 | 20,727 | ||||||
6.47% (1 Month LIBOR USD + 6.65%, 6.65% Cap), 03/25/2039(2)(7) | 42,634 | 7,727 | ||||||
6.50%, 08/25/2020 | 32 | 32 | ||||||
6.50%, 09/25/2020 | 11 | 11 | ||||||
6.50%, 07/25/2021 | 156 | 160 | ||||||
6.50%, 09/25/2021 | 12,859 | 13,111 | ||||||
6.50%, 02/25/2022 | 2,658 | 2,722 | ||||||
6.50%, 08/25/2022 | 887 | 925 | ||||||
6.50%, 02/25/2023 | 1,359 | 1,425 | ||||||
6.50%, 03/25/2023 | 946 | 992 | ||||||
6.50%, 07/25/2023 | 698 | 741 | ||||||
6.50%, 09/25/2023 | 1,477 | 1,576 | ||||||
6.50%, 10/25/2023 | 8,068 | 8,616 | ||||||
6.50%, 10/25/2023 | 22,366 | 23,920 | ||||||
6.50%, 11/25/2023 | 8,554 | 9,103 | ||||||
6.50%, 12/25/2023 | 2,345 | 2,520 | ||||||
6.50%, 03/25/2024 | 6,920 | 7,415 | ||||||
6.50%, 03/25/2024 | 44,338 | 47,814 | ||||||
6.50%, 04/25/2027 | 12,533 | 13,943 | ||||||
6.50%, 07/18/2027 | 1,035 | 1,160 | ||||||
6.50%, 09/25/2031 | 5,946 | 6,971 | ||||||
6.50%, 10/25/2031 | 4,431 | 5,050 | ||||||
6.50%, 04/25/2032 | 20,086 | 23,633 | ||||||
6.50%, 05/25/2032 | 41,258 | 48,457 | ||||||
6.50%, 06/25/2032 | 17,963 | 20,421 | ||||||
6.50%, 07/25/2032 | 76,222 | 13,219 | ||||||
6.50%, 08/25/2032 | 52,097 | 62,243 | ||||||
6.50%, 02/25/2033 | 18,604 | 21,607 | ||||||
6.50%, 05/25/2033 | 75,194 | 16,754 | ||||||
6.50%, 07/25/2036 | 162,620 | 194,429 | ||||||
6.50%, 07/25/2036 | 215,539 | 261,334 | ||||||
6.50%, 08/25/2036 | 23,995 | 28,144 | ||||||
6.50%, 08/25/2036 | 102,559 | 117,989 | ||||||
6.50%, 09/25/2036 | 10,532 | 12,315 | ||||||
6.50%, 06/25/2037 | 23,698 | 27,642 | ||||||
6.50%, 12/25/2037 | 140,471 | 170,298 | ||||||
6.50%, 04/25/2038 | 16,025 | 16,300 | ||||||
6.50%, 06/25/2042 | 53,407 | 63,098 | ||||||
6.52% (1 Month LIBOR USD + 6.70%, 6.70% Cap), 03/25/2036(2)(7) | 587,969 | 143,459 | ||||||
6.53% (1 Month LIBOR USD + 6.71%, 6.71% Cap), 07/25/2035(2)(7) | 61,193 | 14,457 | ||||||
6.67% (1 Month LIBOR USD + 6.85%, 6.85% Cap), 04/25/2038(2)(7) | 39,765 | 4,860 | ||||||
6.72% (1 Month LIBOR USD + 6.90%, 6.90% Cap), 04/25/2038(2)(7) | 65,029 | 13,070 | ||||||
6.81% (1 Month LIBOR USD + 6.99%, 6.99% Cap), 03/25/2038(2)(7) | 81,359 | 17,979 | ||||||
6.88%, 08/25/2023 | 15,613 | 16,533 | ||||||
6.92% (1 Month LIBOR USD + 7.10%, 7.10% Cap), 06/25/2033(2)(7) | 38,320 | 2,255 | ||||||
6.97% (1 Month LIBOR USD + 7.15%, 7.15% Cap), 07/25/2037(2)(7) | 555,693 | 143,384 | ||||||
7.00%, 09/25/2020 | 2 | 2 | ||||||
7.00%, 01/25/2021 | 18 | 18 | ||||||
7.00%, 03/25/2021 | 771 | 777 | ||||||
7.00%, 07/25/2022 | 191 | 196 | ||||||
7.00%, 10/25/2022 | 600 | 626 | ||||||
7.00%, 02/25/2023 | 13,378 | 14,085 | ||||||
7.00%, 03/25/2023 | 9,439 | 9,910 | ||||||
7.00%, 04/25/2023 | 2,874 | 3,019 | ||||||
7.00%, 05/25/2023 | 32,285 | 34,349 | ||||||
7.00%, 07/25/2023 | 10,914 | 11,548 | ||||||
7.00%, 07/25/2023 | 16,406 | 17,418 | ||||||
7.00%, 08/25/2023 | 26,635 | 28,261 | ||||||
7.00%, 04/25/2024 | 28,154 | 30,514 | ||||||
7.00%, 04/25/2024 | 64,864 | 69,395 | ||||||
7.00%, 11/25/2026 | 17,166 | 18,769 |
7.00%, 12/18/2027 | 5,722 | 529 | ||||||
7.00%, 03/25/2031 | 4,061 | 4,870 | ||||||
7.00%, 07/25/2031 | 14,625 | 17,616 | ||||||
7.00%, 08/25/2031 | 27,176 | 32,210 | ||||||
7.00%, 09/25/2031 | 4,193 | 5,037 | ||||||
7.00%, 09/25/2031 | 7,105 | 8,457 | ||||||
7.00%, 09/25/2031 | 35,963 | 43,181 | ||||||
7.00%, 11/25/2031 | 48,600 | 58,485 | ||||||
7.00%, 05/25/2033 | 135,256 | 15,908 | ||||||
7.00%, 07/25/2039 | 2,339 | 2,762 | ||||||
7.00%, 11/25/2041 | 924,708 | 1,141,235 | ||||||
7.00%, 11/25/2041 | 961,409 | 1,151,664 | ||||||
7.00%, 11/25/2041 | 1,098,133 | 1,348,441 | ||||||
7.02% (1 Month LIBOR USD + 7.20%, 7.20% Cap), 07/25/2038(2)(7) | 45,578 | 8,357 | ||||||
7.24% (1 Month LIBOR USD + 7.47%, 7.47% Cap), 08/25/2033(2)(7) | 82,257 | 98,070 | ||||||
7.42% (1 Month LIBOR USD + 7.60%, 7.60% Cap), 07/25/2028(2)(7) | 192,994 | 25,822 | ||||||
7.42% (1 Month LIBOR USD + 7.60%, 7.60% Cap), 11/25/2033(2)(7) | 95,958 | 20,553 | ||||||
7.50%, 06/25/2022 | 40 | 42 | ||||||
7.50%, 07/25/2022 | 2,689 | 2,797 | ||||||
7.50%, 09/25/2022 | 1,540 | 1,591 | ||||||
7.50%, 10/25/2022 | 2,950 | 3,105 | ||||||
7.50%, 03/25/2023 | 2,943 | 3,127 | ||||||
7.50%, 04/18/2027 | 3,758 | 4,362 | ||||||
7.50%, 04/20/2027 | 5,531 | 6,412 | ||||||
7.50%, 05/20/2027 | 22,516 | 25,785 | ||||||
7.50%, 12/18/2029 | 6,391 | 7,403 | ||||||
7.50%, 02/25/2030 | 33,213 | 39,006 | ||||||
7.70%, 03/25/2023 | 1,359 | 1,441 | ||||||
7.75%, 09/25/2022 | 1,345 | 1,416 | ||||||
7.87% (1 Month LIBOR USD + 8.05%, 8.05% Cap), 08/25/2023(2)(7) | 524 | 40 | ||||||
7.90%, 01/25/2023 | 2,446 | 2,588 | ||||||
7.97% (1 Month LIBOR USD + 8.15%, 8.15% Cap), 12/25/2028(2)(7) | 3,704 | 254 | ||||||
8.00%, 07/25/2022 | 166 | 171 | ||||||
8.00%, 07/25/2022 | 4,461 | 4,698 | ||||||
8.00%, 09/25/2022 | 4,890 | 5,144 | ||||||
8.50%, 06/25/2021 | 11 | 11 | ||||||
8.50%, 01/25/2025 | 1,533 | 1,715 | ||||||
8.50%, 01/25/2031 | 1,801 | 371 | ||||||
8.50% (1 Month LIBOR USD + 51.00%, 8.50% Cap), 11/25/2032(2)(7) | 15,225 | 18,422 | ||||||
8.75%, 06/25/2021 | 38 | 38 | ||||||
8.80%, 01/25/2025 | 2,629 | 2,992 | ||||||
8.92% (1 Month LIBOR USD + 9.10%, 9.10% Cap), 07/25/2030(2)(7) | 10,357 | 1,455 | ||||||
9.84% (1 Month LIBOR USD + 10.17%, 10.17% Cap), 08/25/2033(2)(7) | 9,385 | 11,923 | ||||||
10.00% (10 year CMT Index + 10.75%, 10.00% Cap), 08/25/2023(2)(7) | 14,178 | 1,567 | ||||||
10.00% (1 Month LIBOR USD + 54.00%, 10.00% Cap), 03/25/2032(2)(7) | 603 | 761 | ||||||
10.50% (11th District Cost of Funds Index + 63.39%, 10.50% Cap), | 469 | 530 | ||||||
11.24% (1 Month LIBOR USD + 11.52%, 11.52% Cap), 01/25/2034(2)(7) | 2,826 | 3,320 | ||||||
12.19% (1 Month LIBOR USD + 12.50%, 12.50% Cap), 09/25/2033(2)(7) | 13,208 | 16,910 | ||||||
12.21% (11th District Cost of Funds Index + 12.95%, 4.00% Floor, 12.95% Cap), 12/25/2023(2)(7) | 854 | 960 | ||||||
12.29% (1 Month LIBOR USD + 12.66%, 12.66% Cap), 03/25/2040(2)(7) | 257,300 | 348,521 | ||||||
13.29% (11th District Cost of Funds Index + 14.86%, 14.86% Cap), | 821 | 899 | ||||||
13.32% (1 Month LIBOR USD + 13.75%, 13.75% Cap), 07/25/2033(2)(7) | 20,635 | 26,773 | ||||||
13.63% (1 Month LIBOR USD + 14.00%, 14.00% Cap), 03/25/2038(2)(7) | 20,281 | 26,090 | ||||||
13.73% (1 Month LIBOR USD + 14.10%, 14.10% Cap), 12/25/2033(2)(7) | 1,390 | 1,436 | ||||||
13.83% (1 Month LIBOR USD + 14.20%, 14.20% Cap), 06/25/2033(2)(7) | 28,505 | 31,760 | ||||||
13.87% (1 Month LIBOR USD + 14.24%, 14.24% Cap), 07/25/2034(2)(7) | 12,590 | 16,246 | ||||||
14.15% (1 Month LIBOR USD + 14.48%, 14.48% Cap), 12/25/2032(2)(7) | 7,683 | 10,355 | ||||||
15.11% (1 Month LIBOR USD + 15.50%, 15.50% Cap), 11/25/2031(2)(7) | 14,126 | 19,971 | ||||||
15.50% (1 Month LIBOR USD + 58.37%, 15.50% Cap), 02/25/2023(2)(7) | 471 | 560 | ||||||
15.69% (1 Month LIBOR USD + 16.15%, 16.15% Cap), 09/25/2037(2)(7) | 11,488 | 16,232 | ||||||
15.83% (1 Month LIBOR USD + 16.20%, 16.20% Cap), 01/25/2034(2)(7) | 8,834 | 10,458 | ||||||
15.99% (1 Month LIBOR USD + 16.50%, 16.50% Cap), 05/25/2034(2)(7) | 11,084 | 15,463 | ||||||
16.04% (1 Month LIBOR USD + 16.50%, 16.50% Cap), 07/25/2037(2)(7) | 30,679 | 41,370 | ||||||
16.24% (1 Month LIBOR USD + 16.70%, 16.70% Cap), 08/25/2035(2)(7) | 31,878 | 44,806 | ||||||
16.41% (1 Month LIBOR USD + 16.88%, 16.88% Cap), 08/25/2035(2)(7) | 28,238 | 39,517 | ||||||
16.41% (1 Month LIBOR USD + 16.88%, 16.88% Cap), 10/25/2035(2)(7) | 34,331 | 49,141 | ||||||
16.54% (1 Month LIBOR USD + 17.00%, 17.00% Cap), 05/25/2035(2)(7) | 4,750 | 6,184 | ||||||
16.91% (1 Month LIBOR USD + 17.38%, 17.38% Cap), 07/25/2035(2)(7) | 26,060 | 39,330 | ||||||
17.04% (1 Month LIBOR USD + 17.47%, 17.47% Cap), 12/25/2031(2)(7) | 1,375 | 1,956 | ||||||
17.05% (1 Month LIBOR USD + 17.67%, 17.67% Cap), 04/25/2040(2)(7) | 123,205 | 173,901 | ||||||
17.35% (1 Month LIBOR USD + 17.68%, 17.68% Cap), 05/25/2021(2)(7) | 21 | 22 | ||||||
17.60% (1 Month LIBOR USD + 18.15%, 18.15% Cap), 08/25/2033(2)(7) | 25,373 | 31,878 |
18.81% (11th District Cost of Funds Index + 20.53%, 20.53% Cap), | 1,379 | 1,586 | ||||||
19.02% (1 Month LIBOR USD + 19.53%, 19.53% Cap), 04/25/2034(2)(7) | 40,683 | 61,288 | ||||||
19.02% (1 Month LIBOR USD + 19.53%, 19.53% Cap), 05/25/2034(2)(7) | 88,043 | 137,370 | ||||||
19.29% (1 Month LIBOR USD + 19.80%, 19.80% Cap), 11/25/2034(2)(7) | 5,222 | 5,486 | ||||||
19.51% (1 Month LIBOR USD + 20.02%, 20.02% Cap), 05/25/2035(2)(7) | 82,374 | 108,191 | ||||||
19.62% (1 Month LIBOR USD + 20.13%, 20.13% Cap), 05/25/2035(2)(7) | 56,629 | 74,772 | ||||||
20.15% (1 Month LIBOR USD + 20.70%, 20.70% Cap), 04/25/2038(2)(7) | 24,151 | 38,018 | ||||||
21.04% (7 year CMT Index + 22.30%, 21.83% Cap), 04/25/2023(2)(7) | 2,604 | 535 | ||||||
21.32% (1 Month LIBOR USD + 21.60%, 4.50% Floor, 21.60% Cap), 11/25/2020(2)(7) | 3 | 3 | ||||||
22.05% (1 Month LIBOR USD + 22.67%, 22.67% Cap), 04/25/2037(2)(7) | 38,693 | 65,278 | ||||||
22.40% (1 Month LIBOR USD + 22.95%, 22.95% Cap), 10/25/2031(2)(7) | 11,365 | 18,958 | ||||||
22.86% (1 Month LIBOR USD + 23.38%, 23.38% Cap), 10/25/2023(2)(7) | 1,308 | 1,686 | ||||||
23.26% (1 Month LIBOR USD + 24.00%, 24.00% Cap), 05/25/2034(2)(7) | 17,288 | 27,653 | ||||||
23.34% (1 Month LIBOR USD + 24.02%, 24.02% Cap), 08/25/2037(2)(7) | 48,344 | 79,209 | ||||||
23.46% (1 Month LIBOR USD + 24.20%, 24.20% Cap), 09/25/2035(2)(7) | 7,633 | 11,665 | ||||||
23.52% (1 Month LIBOR USD + 24.20%, 24.20% Cap), 06/25/2036(2)(7) | 5,169 | 8,497 | ||||||
23.85% (1 Month LIBOR USD + 24.50%, 24.50% Cap), 12/25/2023(2)(7) | 1,835 | 2,389 | ||||||
23.85% (1 Month LIBOR USD + 24.50%, 24.50% Cap), 09/25/2031(2)(7) | 18,210 | 27,843 | ||||||
23.89% (1 Month LIBOR USD + 24.57%, 24.57% Cap), 11/25/2035(2)(7) | 155,094 | 239,193 | ||||||
23.89% (1 Month LIBOR USD + 24.57%, 24.57% Cap), 03/25/2036(2)(7) | 15,365 | 25,748 | ||||||
24.07% (1 Month LIBOR USD + 24.75%, 24.75% Cap), 05/25/2035(2)(7) | 18,909 | 25,473 | ||||||
24.58% (1 Month LIBOR USD + 25.50%, 25.50% Cap), 06/25/2035(2)(7) | 26,783 | 46,251 | ||||||
24.59% (1 Month LIBOR USD + 25.19%, 25.19% Cap), 02/25/2032(2)(7) | 3,385 | 5,066 | ||||||
25.46% (1 Month LIBOR USD + 26.20%, 26.20% Cap), 10/25/2036(2)(7) | 19,230 | 32,263 | ||||||
25.82% (1 Month LIBOR USD + 26.56%, 26.56% Cap), 12/25/2036(2)(7) | 4,154 | 6,749 | ||||||
26.51% (11th District Cost of Funds Index + 29.75%, 29.75% Cap), | 704 | 845 | ||||||
27.73% (11th District Cost of Funds Index + 31.01%, 31.01% Cap), | 2,255 | 2,736 | ||||||
28.06% (1 Month LIBOR USD + 28.80%, 28.80% Cap), 07/25/2036(2)(7) | 16,826 | 27,495 | ||||||
28.55% (7 year CMT Index + 30.01%, 29.59% Cap), 12/25/2021(2)(7) | 11 | 13 | ||||||
29.32% (1 Month LIBOR USD + 30.15%, 30.15% Cap), 05/25/2036(2)(7) | 17,143 | 30,365 | ||||||
32.33% (1 Month LIBOR USD + 33.25%, 33.25% Cap), 10/25/2026(2)(7) | 11,907 | 18,329 | ||||||
37.89% (1 Month LIBOR USD + 39.00%, 39.00% Cap), 02/25/2037(2)(7) | 8,374 | 30,754 | ||||||
38.79% (1 Month LIBOR USD + 39.90%, 39.90% Cap), 07/25/2036(2)(7) | 12,705 | 27,981 | ||||||
Fannie Mae REMICS SER 1990-140 CL K | ||||||||
652.15%, 12/25/2020 | 3 | 6 | ||||||
Fannie Mae REMICS SER 1993-165 CL SK V/R | ||||||||
12.50% (1 Month LIBOR USD + 77.31%, 12.50% Cap), 09/25/2023(2)(7) | 1,019 | 1,109 | ||||||
Fannie Mae REMICS SER 2019 CL BA | ||||||||
1.99%, 12/25/2029 | 25,611,310 | 26,736,245 | ||||||
Fannie Mae REMICS SER G92-35 CL G | ||||||||
1184.78%, 07/25/2022 | 2 | 17 | ||||||
Fannie Mae Trust 2003-W2 | ||||||||
5.90%, 07/25/2042 | 50,264 | 58,683 | ||||||
6.50%, 07/25/2042 | 84,490 | 99,867 | ||||||
Fannie Mae Trust 2003-W6 | ||||||||
5.20%, 09/25/2042 | 319,454 | 362,837 | ||||||
6.50%, 09/25/2042 | 116,239 | 136,962 | ||||||
Fannie Mae Trust 2003-W8 | ||||||||
0.58% (1 Month LIBOR USD + 0.40%, 0.40% Floor, 8.00% Cap), 05/25/2042(2) | 27,353 | 27,270 | ||||||
7.00%, 10/25/2042 | 129,591 | 155,500 | ||||||
Fannie Mae Trust 2004-W1 | ||||||||
7.00%, 12/25/2033 | 201,246 | 238,824 | ||||||
Fannie Mae Trust 2004-W15 | ||||||||
0.43% (1 Month LIBOR USD + 0.25%, 0.25% Floor), 08/25/2044(2) | 124,072 | 123,358 | ||||||
Fannie Mae Trust 2004-W2 | ||||||||
7.00%, 02/25/2044 | 41,818 | 49,337 | ||||||
Fannie Mae Trust 2004-W8 | ||||||||
7.50%, 06/25/2044 | 41,181 | 49,470 | ||||||
Fannie Mae Trust 2005-W3 | ||||||||
0.40% (1 Month LIBOR USD + 0.22%, 0.22% Floor, 9.50% Cap), 03/25/2045(2) | 985,299 | 981,502 | ||||||
Fannie Mae Trust 2005-W4 | ||||||||
6.00%, 08/25/2045 | 53,340 | 61,888 | ||||||
Fannie Mae Trust 2006-W2 | ||||||||
0.40% (1 Month LIBOR USD + 0.22%, 0.22% Floor, 9.50% Cap), 02/25/2046(2) | 438,431 | 438,410 | ||||||
3.72%, 11/25/2045(4) | 133,753 | 143,323 | ||||||
Fannie Mae Whole Loan | ||||||||
0.44% (1 Month LIBOR USD + 0.26%, 0.26% Floor, 9.50% Cap), 11/25/2046(2) | 1,043,424 | 1,030,488 | ||||||
Fannie Mae-Aces | ||||||||
1.65% (1 Month LIBOR USD + 0.93%), 11/25/2022(2) | 591,520 | 592,028 | ||||||
2.10%, 08/25/2029 | 20,416,090 | 21,454,497 | ||||||
2.28%, 12/27/2022 | 737,095 | 760,561 | ||||||
2.39%, 01/25/2023(4) | 641,861 | 663,921 |
2.50%, 10/25/2026(4) | 5,335,000 | 5,753,882 | ||||||
2.53%, 09/25/2024 | 1,390,000 | 1,482,070 | ||||||
2.57%, 12/25/2026(4) | 1,512,023 | 1,639,883 | ||||||
2.59%, 12/25/2024 | 1,421,558 | 1,520,902 | ||||||
2.67%, 12/25/2026(4) | 9,307,000 | 10,159,125 | ||||||
2.83%, 01/25/2025(4) | 629,838 | 675,789 | ||||||
2.90%, 01/25/2025(4) | 2,000,000 | 2,137,201 | ||||||
2.92%, 08/25/2021 | 406,911 | 413,203 | ||||||
2.96%, 02/25/2027(4) | 3,535,000 | 3,916,407 | ||||||
2.98%, 08/25/2029 | 2,200,000 | 2,472,199 | ||||||
3.02%, 11/25/2025(4) | 8,556,251 | 9,352,622 | ||||||
3.02%, 08/25/2024(4) | 1,212,652 | 1,311,049 | ||||||
3.06%, 05/25/2027(4) | 29,130,000 | 32,559,816 | ||||||
3.09%, 04/25/2027(4) | 23,211,000 | 25,825,898 | ||||||
3.10%, 07/25/2024(4) | 1,038,118 | 1,126,647 | ||||||
3.15%, 03/25/2028(4) | 3,891,000 | 4,389,802 | ||||||
3.18%, 06/25/2027(4) | 5,513,000 | 6,136,962 | ||||||
3.19%, 02/25/2030(4) | 2,791,000 | 3,178,524 | ||||||
3.30%, 04/25/2029(4) | 4,540,000 | 5,194,989 | ||||||
3.44%, 06/25/2028(4) | 5,160,000 | 5,886,158 | ||||||
3.50%, 07/25/2028(4) | 4,896,282 | 5,399,919 | ||||||
3.50%, 07/25/2028(4) | 35,477,000 | 40,816,668 | ||||||
3.50%, 01/25/2024(4) | 11,566,467 | 12,536,076 | ||||||
3.51%, 12/25/2023(4) | 2,076,141 | 2,229,425 | ||||||
3.66%, 11/25/2020 | 31,497 | 31,604 | ||||||
3.67%, 09/25/2028(4) | 7,310,000 | 8,561,454 | ||||||
3.75%, 11/25/2028(4) | 12,600,000 | 14,580,163 | ||||||
3.76%, 06/25/2021 | 404,755 | 411,279 | ||||||
3.78%, 08/25/2030(4) | 7,611,341 | 9,109,677 | ||||||
FHLMC-Ginnie Mae | ||||||||
6.25%, 11/25/2023 | 3,501 | 3,732 | ||||||
7.00%, 03/25/2023 | 4,011 | 4,182 | ||||||
7.50%, 04/25/2024 | 24,065 | 25,973 | ||||||
First Horizon Alternative Mortgage Securities Trust 2005-FA8 | ||||||||
5.50%, 11/25/2035 | 85,254 | 64,871 | ||||||
First Horizon Alternative Mortgage Securities Trust 2006-FA6 | ||||||||
5.75%, 11/25/2021 | 3,574 | 3,412 | ||||||
First Horizon Alternative Mortgage Securities Trust 2006-FA8 | ||||||||
5.75%, 02/25/2037 | 16,082 | 12,053 | ||||||
First Horizon Alternative Mortgage Securities Trust 2007-FA4 | ||||||||
5.47% (1 Month LIBOR USD + 5.65%, 5.65% Cap), 08/25/2037(2)(7) | 739,488 | 196,056 | ||||||
Freddie Mac Gold Pool | ||||||||
2.00%, 01/01/2032 | 5,305,049 | 5,515,323 | ||||||
2.50%, 04/01/2028 | 1,713,371 | 1,798,191 | ||||||
2.50%, 06/01/2028 | 632,173 | 672,521 | ||||||
2.50%, 03/01/2030 | 1,349,185 | 1,434,146 | ||||||
2.50%, 07/01/2030 | 2,974,587 | 3,162,119 | ||||||
2.50%, 07/01/2031 | 2,672,170 | 2,835,792 | ||||||
2.50%, 08/01/2031 | 1,608,678 | 1,707,076 | ||||||
3.00%, 07/01/2028 | 1,295,188 | 1,370,230 | ||||||
3.00%, 08/01/2028 | 777,799 | 827,453 | ||||||
3.00%, 09/01/2028 | 2,692,898 | 2,852,140 | ||||||
3.00%, 10/01/2028 | 1,122,404 | 1,195,689 | ||||||
3.00%, 05/01/2029 | 1,108,628 | 1,183,416 | ||||||
3.00%, 04/01/2031 | 5,204,037 | 5,527,743 | ||||||
3.00%, 09/01/2031 | 1,075,407 | 1,141,870 | ||||||
3.00%, 02/01/2032 | 5,604,625 | 5,953,438 | ||||||
3.00%, 02/01/2032 | 8,235,415 | 8,779,505 | ||||||
3.00%, 08/01/2042 | 1,720,315 | 1,842,772 | ||||||
3.00%, 10/01/2042 | 4,369,925 | 4,681,576 | ||||||
3.00%, 11/01/2042 | 639,309 | 684,900 | ||||||
3.00%, 11/01/2042 | 5,540,692 | 5,990,982 | ||||||
3.00%, 02/01/2043 | 373,454 | 400,169 | ||||||
3.00%, 03/01/2043 | 2,383,199 | 2,553,929 | ||||||
3.00%, 03/01/2043 | 4,817,337 | 5,162,446 | ||||||
3.00%, 04/01/2043 | 87,369 | 93,616 | ||||||
3.00%, 04/01/2043 | 11,175,069 | 11,971,305 | ||||||
3.00%, 06/01/2043 | 31,939 | 34,188 | ||||||
3.00%, 07/01/2043 | 25,180 | 26,984 | ||||||
3.00%, 07/01/2043 | 331,127 | 354,665 | ||||||
3.00%, 08/01/2043 | 476,239 | 509,922 | ||||||
3.00%, 08/01/2043 | 6,385,881 | 6,840,034 |
3.00%, 01/01/2045 | 218,450 | 227,660 | ||||||
3.00%, 05/01/2045 | 1,032,664 | 1,120,595 | ||||||
3.00%, 05/01/2045 | 2,273,047 | 2,456,892 | ||||||
3.00%, 06/01/2045 | 575,020 | 612,009 | ||||||
3.00%, 10/01/2045 | 4,490,686 | 4,809,045 | ||||||
3.00%, 10/01/2046 | 7,684,798 | 8,136,582 | ||||||
3.00%, 10/01/2046 | 19,593,842 | 21,245,700 | ||||||
3.00%, 03/01/2047 | 1,468,154 | 1,551,400 | ||||||
3.00%, 05/01/2047 | 14,891,523 | 15,916,653 | ||||||
3.50%, 01/01/2027 | 140,062 | 147,399 | ||||||
3.50%, 01/01/2032 | 466,980 | 499,677 | ||||||
3.50%, 03/01/2032 | 190,161 | 203,477 | ||||||
3.50%, 02/01/2033 | 151,176 | 162,173 | ||||||
3.50%, 05/01/2033 | 198,947 | 213,392 | ||||||
3.50%, 05/01/2033 | 616,409 | 661,247 | ||||||
3.50%, 01/01/2034 | 6,905,233 | 7,385,327 | ||||||
3.50%, 11/01/2037 | 2,523,578 | 2,677,317 | ||||||
3.50%, 05/01/2042 | 844,600 | 914,491 | ||||||
3.50%, 06/01/2042 | 398,746 | 431,586 | ||||||
3.50%, 06/01/2042 | 2,465,485 | 2,661,297 | ||||||
3.50%, 08/01/2042 | 730,656 | 790,921 | ||||||
3.50%, 09/01/2042 | 2,857,024 | 3,093,458 | ||||||
3.50%, 09/01/2042 | 5,099,489 | 5,520,131 | ||||||
3.50%, 10/01/2042 | 2,358,550 | 2,553,532 | ||||||
3.50%, 10/01/2042 | 10,182,430 | 11,074,847 | ||||||
3.50%, 11/01/2042 | 92,483 | 99,912 | ||||||
3.50%, 11/01/2042 | 1,007,349 | 1,090,464 | ||||||
3.50%, 11/01/2042 | 2,735,368 | 2,961,731 | ||||||
3.50%, 12/01/2042 | 3,073,021 | 3,325,546 | ||||||
3.50%, 01/01/2043 | 7,079,315 | 7,664,796 | ||||||
3.50%, 03/01/2043 | 734,110 | 794,882 | ||||||
3.50%, 05/01/2043 | 281,292 | 303,809 | ||||||
3.50%, 05/01/2043 | 3,982,867 | 4,309,742 | ||||||
3.50%, 06/01/2043 | 862,703 | 931,624 | ||||||
3.50%, 06/01/2043 | 1,453,898 | 1,574,028 | ||||||
3.50%, 07/01/2043 | 508,227 | 550,171 | ||||||
3.50%, 10/01/2043 | 211,190 | 227,962 | ||||||
3.50%, 05/01/2044 | 13,590,731 | 14,858,883 | ||||||
3.50%, 01/01/2045 | 11,616,277 | 12,623,630 | ||||||
3.50%, 06/01/2045 | 1,358,055 | 1,460,387 | ||||||
3.50%, 08/01/2045 | 4,279,821 | 4,576,460 | ||||||
3.50%, 12/01/2045 | 4,682,205 | 4,993,425 | ||||||
3.50%, 01/01/2046 | 756,057 | 812,805 | ||||||
3.50%, 01/01/2046 | 8,429,980 | 9,165,997 | ||||||
3.50%, 05/01/2046 | 3,002,833 | 3,204,508 | ||||||
3.50%, 07/01/2046 | 1,932,075 | 2,062,286 | ||||||
3.50%, 07/01/2046 | 3,708,237 | 3,949,117 | ||||||
3.50%, 08/01/2046 | 6,790,825 | 7,417,040 | ||||||
3.50%, 08/01/2046 | 8,664,098 | 9,366,850 | ||||||
3.50%, 12/01/2046 | 513,405 | 545,502 | ||||||
3.50%, 12/01/2046 | 7,523,851 | 8,091,565 | ||||||
3.50%, 01/01/2047 | 3,444,708 | 3,664,556 | ||||||
3.50%, 10/01/2047 | 11,349,221 | 12,028,603 | ||||||
3.50%, 01/01/2048 | 5,775,656 | 6,156,639 | ||||||
3.50%, 03/01/2048 | 6,091,926 | 6,487,476 | ||||||
4.00%, 08/01/2040 | 511,077 | 560,051 | ||||||
4.00%, 09/01/2040 | 611,828 | 668,273 | ||||||
4.00%, 11/01/2040 | 33,852 | 37,134 | ||||||
4.00%, 11/01/2040 | 1,781,135 | 1,935,406 | ||||||
4.00%, 12/01/2040 | 372,614 | 408,716 | ||||||
4.00%, 12/01/2040 | 802,254 | 880,083 | ||||||
4.00%, 12/01/2040 | 984,704 | 1,079,770 | ||||||
4.00%, 12/01/2040 | 1,174,818 | 1,287,899 | ||||||
4.00%, 12/01/2040 | 1,204,276 | 1,319,752 | ||||||
4.00%, 01/01/2041 | 708,137 | 773,012 | ||||||
4.00%, 01/01/2041 | 1,333,483 | 1,461,699 | ||||||
4.00%, 10/01/2041 | 3,800,800 | 4,169,831 | ||||||
4.00%, 11/01/2041 | 11,104 | 12,177 | ||||||
4.00%, 01/01/2042 | 206,847 | 227,053 | ||||||
4.00%, 05/01/2042 | 13,452 | 14,780 | ||||||
4.00%, 06/01/2042 | 1,835,112 | 2,000,401 | ||||||
4.00%, 10/01/2042 | 79,591 | 83,085 |
4.00%, 01/01/2043 | 227,716 | 248,095 | ||||||
4.00%, 06/01/2043 | 15,707 | 16,738 | ||||||
4.00%, 09/01/2043 | 133,312 | 146,437 | ||||||
4.00%, 09/01/2043 | 6,135,500 | 6,732,729 | ||||||
4.00%, 11/01/2043 | 74,825 | 82,101 | ||||||
4.00%, 11/01/2043 | 152,499 | 167,380 | ||||||
4.00%, 12/01/2043 | 210,500 | 231,225 | ||||||
4.00%, 12/01/2043 | 897,876 | 983,140 | ||||||
4.00%, 12/01/2043 | 1,477,649 | 1,622,116 | ||||||
4.00%, 01/01/2044 | 121,545 | 131,642 | ||||||
4.00%, 01/01/2044 | 452,242 | 496,289 | ||||||
4.00%, 03/01/2044 | 2,434,104 | 2,661,669 | ||||||
4.00%, 05/01/2044 | 101,595 | 110,878 | ||||||
4.00%, 10/01/2044 | 6,672,006 | 7,315,702 | ||||||
4.00%, 01/01/2045 | 392,151 | 426,010 | ||||||
4.00%, 10/01/2045 | 554,159 | 597,141 | ||||||
4.00%, 10/01/2045 | 7,318,732 | 7,904,723 | ||||||
4.00%, 11/01/2045 | 10,891,445 | 11,761,369 | ||||||
4.00%, 12/01/2045 | 1,255,886 | 1,364,626 | ||||||
4.00%, 01/01/2046 | 3,342,261 | 3,641,814 | ||||||
4.00%, 02/01/2046 | 2,128,866 | 2,326,052 | ||||||
4.00%, 05/01/2046 | 288,502 | 311,410 | ||||||
4.00%, 06/01/2046 | 9,644,782 | 10,437,976 | ||||||
4.00%, 08/01/2046 | 2,382,607 | 2,576,484 | ||||||
4.00%, 01/01/2047 | 12,274,886 | 13,572,709 | ||||||
4.00%, 06/01/2047 | 4,840,778 | 5,162,349 | ||||||
4.00%, 09/01/2047 | 6,792,678 | 7,420,264 | ||||||
4.00%, 07/01/2048 | 248,453 | 272,073 | ||||||
4.00%, 07/01/2048 | 7,571,048 | 8,263,472 | ||||||
4.00%, 10/01/2048 | 6,523,248 | 7,089,862 | ||||||
4.50%, 11/01/2035 | 10,363 | 11,408 | ||||||
4.50%, 07/01/2039 | 186,728 | 207,605 | ||||||
4.50%, 10/01/2039 | 1,391,674 | 1,547,749 | ||||||
4.50%, 11/01/2039 | 1,588,266 | 1,765,555 | ||||||
4.50%, 11/01/2039 | 2,160,620 | 2,402,373 | ||||||
4.50%, 05/01/2040 | 751,510 | 835,735 | ||||||
4.50%, 08/01/2040 | 342,609 | 380,902 | ||||||
4.50%, 09/01/2040 | 272,735 | 303,320 | ||||||
4.50%, 09/01/2040 | 1,125,371 | 1,250,287 | ||||||
4.50%, 03/01/2041 | 220,066 | 244,660 | ||||||
4.50%, 05/01/2041 | 1,609,141 | 1,790,030 | ||||||
4.50%, 08/01/2041 | 559,134 | 622,191 | ||||||
4.50%, 12/01/2043 | 6,206,560 | 6,938,670 | ||||||
4.50%, 03/01/2044 | 542,598 | 604,108 | ||||||
4.50%, 05/01/2044 | 834,206 | 927,164 | ||||||
4.50%, 07/01/2044 | 23,586 | 25,397 | ||||||
4.50%, 07/01/2044 | 254,294 | 281,004 | ||||||
4.50%, 09/01/2044 | 1,630,560 | 1,804,439 | ||||||
4.50%, 09/01/2046 | 3,546,696 | 3,857,748 | ||||||
4.50%, 10/01/2046 | 2,833,879 | 3,076,323 | ||||||
4.50%, 11/01/2046 | 11,281,461 | 12,543,066 | ||||||
4.50%, 03/01/2047 | 983,264 | 1,084,841 | ||||||
4.50%, 07/01/2047 | 1,499,054 | 1,619,079 | ||||||
4.50%, 07/01/2047 | 3,181,104 | 3,458,381 | ||||||
4.50%, 11/01/2047 | 1,159,469 | 1,252,256 | ||||||
4.50%, 09/01/2048 | 337,157 | 362,766 | ||||||
5.00%, 01/01/2034 | 24,234 | 27,795 | ||||||
5.00%, 06/01/2034 | 69,748 | 79,920 | ||||||
5.00%, 09/01/2034 | 72,769 | 83,655 | ||||||
5.00%, 03/01/2035 | 26,754 | 29,597 | ||||||
5.00%, 08/01/2035 | 1,050,554 | 1,195,801 | ||||||
5.00%, 03/01/2036 | 2,278,165 | 2,614,516 | ||||||
5.00%, 07/01/2036 | 2,163 | 2,482 | ||||||
5.00%, 11/01/2036 | 63,380 | 72,709 | ||||||
5.00%, 03/01/2037 | 169,617 | 194,317 | ||||||
5.00%, 06/01/2037 | 189,436 | 217,258 | ||||||
5.00%, 08/01/2037 | 178,942 | 205,346 | ||||||
5.00%, 02/01/2038 | 222,454 | 254,509 | ||||||
5.00%, 03/01/2038 | 56,547 | 64,853 | ||||||
5.00%, 03/01/2038 | 199,762 | 229,449 | ||||||
5.00%, 03/01/2038 | 215,741 | 247,244 | ||||||
5.00%, 03/01/2038 | 248,169 | 284,483 |
5.00%, 04/01/2038 | 144,698 | 165,609 | ||||||
5.00%, 09/01/2038 | 27,236 | 31,224 | ||||||
5.00%, 09/01/2038 | 157,646 | 180,720 | ||||||
5.00%, 11/01/2038 | 1,163 | 1,334 | ||||||
5.00%, 11/01/2038 | 58,222 | 66,593 | ||||||
5.00%, 12/01/2038 | 597 | 680 | ||||||
5.00%, 12/01/2038 | 186,947 | 214,323 | ||||||
5.00%, 02/01/2039 | 387,084 | 443,837 | ||||||
5.00%, 05/01/2039 | 7,167 | 8,267 | ||||||
5.00%, 10/01/2039 | 427,220 | 489,755 | ||||||
5.00%, 01/01/2040 | 107,242 | 123,176 | ||||||
5.00%, 03/01/2040 | 174,567 | 199,832 | ||||||
5.00%, 03/01/2040 | 2,026,667 | 2,329,934 | ||||||
5.00%, 08/01/2040 | 278,012 | 318,047 | ||||||
5.00%, 04/01/2041 | 780,149 | 896,235 | ||||||
5.00%, 06/01/2041 | 341,932 | 391,995 | ||||||
5.00%, 12/01/2047 | 5,195,070 | 5,689,574 | ||||||
5.00%, 02/01/2048 | 1,800,763 | 1,971,488 | ||||||
5.50%, 02/01/2024 | 3,201 | 3,317 | ||||||
5.50%, 01/01/2033 | 50,127 | 57,171 | ||||||
5.50%, 10/01/2033 | 35,120 | 40,651 | ||||||
5.50%, 07/01/2035 | 71,400 | 81,318 | ||||||
5.50%, 01/01/2036 | 15,985 | 18,326 | ||||||
5.50%, 12/01/2036 | 31,119 | 35,776 | ||||||
5.50%, 05/01/2038 | 50,086 | 57,379 | ||||||
5.50%, 08/01/2038 | 63,746 | 73,250 | ||||||
5.50%, 01/01/2039 | 2,378,255 | 2,725,910 | ||||||
5.50%, 03/01/2040 | 23,259 | 26,584 | ||||||
5.50%, 05/01/2040 | 1,586,689 | 1,819,238 | ||||||
5.50%, 08/01/2040 | 648,302 | 742,405 | ||||||
6.00%, 08/01/2020 | 5 | 5 | ||||||
6.00%, 07/01/2021 | 17 | 17 | ||||||
6.00%, 07/01/2021 | 420 | 422 | ||||||
6.00%, 03/01/2022 | 12 | 12 | ||||||
6.00%, 10/01/2029 | 9,901 | 11,080 | ||||||
6.00%, 12/01/2033 | 11,279 | 12,581 | ||||||
6.00%, 01/01/2034 | 6,196 | 6,521 | ||||||
6.00%, 01/01/2034 | 24,939 | 29,117 | ||||||
6.00%, 11/01/2036 | 8,835 | 9,841 | ||||||
6.00%, 12/01/2036 | 5,987 | 6,901 | ||||||
6.00%, 12/01/2036 | 14,764 | 17,228 | ||||||
6.50%, 03/01/2022 | 488 | 492 | ||||||
6.50%, 01/01/2028 | 31,255 | 35,008 | ||||||
6.50%, 06/01/2029 | 10,194 | 11,436 | ||||||
6.50%, 08/01/2029 | 78,139 | 90,778 | ||||||
6.50%, 11/01/2034 | 6,128 | 7,264 | ||||||
6.50%, 01/01/2035 | 84,364 | 95,341 | ||||||
6.50%, 12/01/2035 | 17,481 | 19,595 | ||||||
6.50%, 12/01/2035 | 52,540 | 60,497 | ||||||
6.50%, 11/01/2036 | 16,693 | 19,328 | ||||||
6.50%, 11/01/2036 | 106,075 | 119,967 | ||||||
6.50%, 11/01/2036 | 173,332 | 202,468 | ||||||
6.50%, 12/01/2036 | 95,468 | 114,171 | ||||||
6.50%, 12/01/2036 | 216,151 | 251,244 | ||||||
6.50%, 01/01/2037 | 6,085 | 6,303 | ||||||
6.50%, 01/01/2037 | 16,776 | 19,032 | ||||||
6.50%, 02/01/2037 | 8,364 | 8,705 | ||||||
6.50%, 06/01/2037 | 5,404 | 5,645 | ||||||
6.50%, 11/01/2037 | 40,445 | 49,490 | ||||||
6.50%, 03/01/2038 | 46,040 | 53,895 | ||||||
7.00%, 04/01/2026 | 918 | 1,023 | ||||||
7.00%, 12/01/2028 | 34,220 | 39,010 | ||||||
7.00%, 07/01/2029 | 863 | 970 | ||||||
7.00%, 01/01/2031 | 28,608 | 32,585 | ||||||
7.00%, 07/01/2032 | 3,044 | 3,488 | ||||||
7.00%, 08/01/2032 | 4,155 | 4,876 | ||||||
7.00%, 02/01/2037 | 6,806 | 8,129 | ||||||
7.50%, 08/01/2025 | 739 | 809 | ||||||
7.50%, 01/01/2032 | 81,194 | 93,689 | ||||||
7.50%, 12/01/2036 | 243,182 | 278,088 | ||||||
7.50%, 01/01/2038 | 34,449 | 42,533 | ||||||
7.50%, 01/01/2038 | 59,717 | 69,197 |
7.50%, 09/01/2038 | 26,530 | 31,277 | ||||||
8.00%, 08/01/2024 | 381 | 418 | ||||||
8.00%, 11/01/2024 | 261 | 283 | ||||||
8.50%, 07/01/2028 | 2,008 | 2,301 | ||||||
10.00%, 03/17/2026 | 168 | 167 | ||||||
10.00%, 10/01/2030 | 8,720 | 9,417 | ||||||
Freddie Mac Multifamily Structured Pass Through Certificates | ||||||||
0.88% (1 Month LIBOR USD + 0.70%, 0.70% Floor), 09/25/2022(2) | 129,357 | 129,643 | ||||||
0.93%, 10/25/2022(4) | 20,784,509 | 324,425 | ||||||
1.50%, 03/25/2026(4) | 27,337,755 | 1,806,678 | ||||||
1.50%, 05/25/2022(4) | 49,128,075 | 1,039,717 | ||||||
1.64%, 01/25/2030 | 1,890,000 | 1,981,584 | ||||||
2.31%, 12/25/2022 | 4,201,431 | 4,376,676 | ||||||
2.36%, 08/25/2022 | 1,775,249 | 1,814,805 | ||||||
2.52%, 01/25/2023 | 1,903,466 | 1,971,566 | ||||||
2.57%, 07/25/2026 | 10,075,000 | 10,970,437 | ||||||
2.77%, 05/25/2025 | 4,250,000 | 4,619,433 | ||||||
2.81%, 09/25/2024 | 6,287,000 | 6,766,583 | ||||||
2.84%, 09/25/2022 | 1,672,054 | 1,748,138 | ||||||
2.86%, 08/25/2022 | 4,567,822 | 4,730,750 | ||||||
2.91%, 04/25/2024 | 9,235,739 | 9,859,414 | ||||||
3.04%, 07/25/2024 | 10,000,000 | 10,636,230 | ||||||
3.07%, 08/25/2022 | 1,811,963 | 1,882,826 | ||||||
3.08%, 01/25/2031 | 4,126,000 | 4,794,269 | ||||||
3.10%, 02/25/2024(4) | 11,250,000 | 12,116,095 | ||||||
3.11%, 02/25/2023 | 13,450,000 | 14,222,121 | ||||||
3.12%, 06/25/2027 | 4,263,000 | 4,838,980 | ||||||
3.17%, 09/25/2026(4) | 9,915,000 | 11,158,879 | ||||||
3.19%, 09/25/2027(4) | 25,150,000 | 28,760,818 | ||||||
3.22%, 03/25/2027 | 8,625,000 | 9,807,601 | ||||||
3.24%, 04/25/2027 | 7,030,000 | 8,030,045 | ||||||
3.24%, 08/25/2027 | 2,846,000 | 3,264,678 | ||||||
3.25%, 09/25/2027(4) | 4,900,000 | 5,575,523 | ||||||
3.30%, 11/25/2027(4) | 4,589,000 | 5,289,950 | ||||||
3.32%, 02/25/2023 | 5,550,000 | 5,902,638 | ||||||
3.33%, 05/25/2027 | 1,779,000 | 2,036,776 | ||||||
3.33%, 08/25/2025(4) | 10,000,000 | 11,194,138 | ||||||
3.34%, 04/25/2028(4) | 3,315,000 | 3,765,792 | ||||||
3.35%, 01/25/2028 | 5,167,000 | 5,980,619 | ||||||
3.36%, 11/25/2027(4) | 18,922,000 | 21,804,239 | ||||||
3.36%, 12/25/2026(4) | 27,000,000 | 30,493,446 | ||||||
3.39%, 03/25/2024 | 4,286,000 | 4,685,416 | ||||||
3.41%, 12/25/2026 | 15,125,000 | 17,344,426 | ||||||
3.49%, 01/25/2024 | 18,300,000 | 19,971,970 | ||||||
3.51%, 03/25/2029 | 2,527,000 | 2,988,537 | ||||||
3.51%, 01/25/2027(4) | 23,250,000 | 26,733,782 | ||||||
3.76%, 01/25/2029(4) | 11,600,000 | 13,866,411 | ||||||
3.85%, 05/25/2028(4) | 3,550,000 | 4,229,998 | ||||||
3.85%, 05/25/2028(4) | 6,340,000 | 7,558,835 | ||||||
3.85%, 06/25/2028 | 7,875,000 | 9,389,748 | ||||||
3.90%, 04/25/2028 | 8,575,000 | 10,221,892 | ||||||
3.90%, 10/25/2033(4) | 6,500,000 | 8,205,212 | ||||||
3.92%, 12/25/2028(4) | 4,100,000 | 4,947,854 | ||||||
3.92%, 09/25/2028(4) | 10,000,000 | 12,013,976 | ||||||
3.99%, 05/25/2033(4) | 16,700,000 | 20,660,245 | ||||||
4.03%, 10/25/2028(4) | 5,600,000 | 6,773,301 | ||||||
Freddie Mac Non Gold Pool | ||||||||
3.01% (6 Month LIBOR USD + 1.54%, 1.54% Floor, 11.81% Cap), 05/01/2037(2) | 61,446 | 63,321 | ||||||
3.04% (6 Month LIBOR USD + 1.67%, 1.67% Floor, 10.68% Cap), 01/01/2037(2) | 14,286 | 14,415 | ||||||
3.16% (1 Year LIBOR USD + 1.87%, 1.87% Floor, 11.71% Cap), 07/01/2037(2) | 12,035 | 12,121 | ||||||
3.23% (1 Year CMT Index + 2.25%, 2.25% Floor, 10.66% Cap), 05/01/2036(2) | 46,896 | 49,263 | ||||||
3.25% (6 Month LIBOR USD + 1.81%, 1.81% Floor, 12.46% Cap), 10/01/2036(2) | 35,234 | 36,678 | ||||||
3.36% (6 Month LIBOR USD + 1.73%, 1.73% Floor, 13.09% Cap), 10/01/2036(2) | 76,778 | 79,653 | ||||||
3.37% (6 Month LIBOR USD + 2.01%, 2.01% Floor, 12.46% Cap), 05/01/2037(2) | 48,618 | 49,121 | ||||||
3.47% (6 Month LIBOR USD + 2.01%, 2.01% Floor, 12.17% Cap), 05/01/2037(2) | 21,684 | 22,764 | ||||||
3.48% (6 Month LIBOR USD + 1.75%, 1.75% Floor, 12.56% Cap), 07/01/2036(2) | 34,081 | 35,356 | ||||||
3.50% (6 Month LIBOR USD + 1.63%, 1.63% Floor, 11.75% Cap), 08/01/2036(2) | 1,836 | 1,850 | ||||||
3.51% (6 Month LIBOR USD + 1.70%, 1.70% Floor, 12.34% Cap), 10/01/2036(2) | 40,224 | 40,996 | ||||||
3.55% (6 Month LIBOR USD + 1.68%, 1.68% Floor, 13.13% Cap), 08/01/2036(2) | 125,638 | 129,919 | ||||||
3.57% (6 Month LIBOR USD + 1.70%, 1.70% Floor, 12.82% Cap), 08/01/2036(2) | 42,889 | 44,415 | ||||||
3.57% (1 Year LIBOR USD + 1.99%, 1.99% Floor, 10.91% Cap), 06/01/2036(2) | 72,681 | 73,416 | ||||||
3.60% (1 Year LIBOR USD + 1.94%, 1.94% Floor, 10.93% Cap), 06/01/2036(2) | 168,077 | 178,428 |
3.61% (1 Year LIBOR USD + 1.58%, 1.58% Floor, 11.12% Cap), 12/01/2036(2) | 160,540 | 167,524 | ||||||
3.64% (1 Year LIBOR USD + 1.75%, 1.75% Floor, 9.14% Cap), 04/01/2034(2) | 16,540 | 16,980 | ||||||
3.65% (1 Year LIBOR USD + 1.67%, 1.67% Floor, 11.06% Cap), 11/01/2036(2) | 15,958 | 16,289 | ||||||
3.70% (1 Year CMT Index + 2.24%, 2.24% Floor, 10.24% Cap), 05/01/2033(2) | 101,478 | 106,062 | ||||||
3.70% (1 Year LIBOR USD + 1.70%, 1.70% Floor, 11.06% Cap), 02/01/2037(2) | 9,132 | 9,604 | ||||||
3.71% (6 Month LIBOR USD + 2.12%, 2.12% Floor, 10.89% Cap), 05/01/2037(2) | 3,336 | 3,375 | ||||||
3.72% (6 Month LIBOR USD + 1.90%, 1.91% Floor, 12.43% Cap), 03/01/2037(2) | 103,811 | 108,273 | ||||||
3.75% (1 Year CMT Index + 2.25%, 2.25% Floor, 10.59% Cap), 05/01/2036(2) | 39,134 | 41,239 | ||||||
3.77% (1 Year LIBOR USD + 1.64%, 1.64% Floor, 10.95% Cap), 11/01/2036(2) | 43,714 | 45,824 | ||||||
3.77% (1 Year CMT Index + 2.11%, 2.11% Floor, 12.17% Cap), 01/01/2027(2) | 3,105 | 3,125 | ||||||
3.82% (1 Year LIBOR USD + 1.69%, 1.69% Floor, 11.32% Cap), 12/01/2036(2) | 4,289 | 4,322 | ||||||
3.83% (1 Year LIBOR USD + 1.90%, 1.90% Floor, 10.71% Cap), 05/01/2038(2) | 21,386 | 21,507 | ||||||
3.84% (1 Year LIBOR USD + 1.71%, 1.71% Floor, 10.09% Cap), 02/01/2036(2) | 11,458 | 12,050 | ||||||
3.85% (1 Year LIBOR USD + 1.60%, 1.60% Floor, 11.32% Cap), 10/01/2036(2) | 13,708 | 13,795 | ||||||
3.85% (1 Year CMT Index + 2.25%, 2.25% Floor, 10.19% Cap), 07/01/2036(2) | 30,739 | 32,201 | ||||||
3.88% (1 Year CMT Index + 2.25%, 2.25% Floor, 10.03% Cap), 01/01/2035(2) | 39,232 | 41,159 | ||||||
3.88% (1 Year CMT Index + 2.25%, 2.25% Floor, 10.09% Cap), 01/01/2035(2) | 104,686 | 109,845 | ||||||
3.88% (1 Year LIBOR USD + 1.88%, 1.88% Floor, 10.80% Cap), 02/01/2037(2) | 4,443 | 4,481 | ||||||
3.89% (1 Year LIBOR USD + 1.89%, 1.89% Floor, 10.97% Cap), 02/01/2037(2) | 31,606 | 31,855 | ||||||
3.91% (1 Year LIBOR USD + 1.91%, 1.91% Floor, 10.91% Cap), 04/01/2037(2) | 1,719 | 1,731 | ||||||
3.92% (1 Year LIBOR USD + 1.67%, 1.67% Floor, 11.29% Cap), 08/01/2035(2) | 5,874 | 5,902 | ||||||
3.92% (1 Year LIBOR USD + 1.92%, 1.92% Floor, 10.89% Cap), 01/01/2037(2) | 31,864 | 32,617 | ||||||
3.93% (1 Year LIBOR USD + 2.18%, 2.18% Floor, 11.07% Cap), 05/01/2037(2) | 38,684 | 41,504 | ||||||
3.93% (1 Year LIBOR USD + 1.94%, 1.92% Floor, 11.12% Cap), 12/01/2036(2) | 50,802 | 53,911 | ||||||
3.95% (1 Year LIBOR USD + 2.06%, 2.06% Floor, 10.98% Cap), 04/01/2038(2) | 38,489 | 41,051 | ||||||
3.97% (1 Year CMT Index + 2.26%, 2.26% Floor, 11.82% Cap), 04/01/2030(2) | 1,048 | 1,054 | ||||||
3.98% (1 Year LIBOR USD + 1.98%, 1.98% Floor, 10.62% Cap), 04/01/2037(2) | 27,616 | 27,966 | ||||||
3.98% (1 Year CMT Index + 2.23%, 2.23% Floor, 9.36% Cap), 12/01/2033(2) | 20,670 | 21,139 | ||||||
3.99% (6 Month LIBOR USD + 2.11%, 2.11% Floor, 12.44% Cap), 02/01/2037(2) | 36,052 | 36,916 | ||||||
4.00% (1 Year LIBOR USD + 1.75%, 1.75% Floor, 11.75% Cap), 11/01/2037(2) | 5,300 | 5,323 | ||||||
4.01% (6 Month LIBOR USD + 2.13%, 2.13% Floor, 11.64% Cap), 12/01/2035(2) | 27,917 | 28,485 | ||||||
4.03% (1 Year CMT Index + 2.24%, 2.24% Floor, 9.83% Cap), 11/01/2036(2) | 31,891 | 33,405 | ||||||
4.03% (1 Year LIBOR USD + 2.04%, 2.04% Floor, 11.02% Cap), 05/01/2037(2) | 71,323 | 72,681 | ||||||
4.04% (1 Year LIBOR USD + 2.04%, 2.04% Floor, 10.71% Cap), 03/01/2036(2) | 56,049 | 59,831 | ||||||
4.07% (1 Year LIBOR USD + 1.77%, 1.77% Floor, 11.42% Cap), 11/01/2036(2) | 36,883 | 37,580 | ||||||
4.07% (1 Year LIBOR USD + 1.67%, 1.67% Floor, 11.98% Cap), 12/01/2036(2) | 149,002 | 156,275 | ||||||
4.07% (1 Year LIBOR USD + 1.85%, 1.85% Floor, 9.07% Cap), 07/01/2040(2) | 35,783 | 37,408 | ||||||
4.10% (1 Year LIBOR USD + 2.13%, 2.13% Floor, 11.19% Cap), 12/01/2036(2) | 1,924 | 1,944 | ||||||
4.12% (1 Year CMT Index + 2.37%, 2.37% Floor, 10.60% Cap), 09/01/2034(2) | 78,926 | 82,857 | ||||||
4.12% (1 Year LIBOR USD + 2.33%, 2.33% Floor, 10.88% Cap), 05/01/2036(2) | 11,318 | 12,187 | ||||||
4.13% (1 Year CMT Index + 2.25%, 2.25% Floor, 10.00% Cap), 02/01/2036(2) | 47,900 | 50,115 | ||||||
4.14% (1 Year LIBOR USD + 1.88%, 1.88% Floor, 11.04% Cap), 09/01/2036(2) | 103,208 | 109,325 | ||||||
4.21% (1 Year LIBOR USD + 2.20%, 2.20% Floor, 10.78% Cap), 10/01/2036(2) | 24,184 | 24,427 | ||||||
4.22% (1 Year LIBOR USD + 1.74%, 1.75% Floor, 11.41% Cap), 09/01/2036(2) | 54,405 | 57,086 | ||||||
4.33% (1 Year LIBOR USD + 2.29%, 2.29% Floor, 11.32% Cap), 03/01/2037(2) | 12,669 | 12,793 | ||||||
4.34% (1 Year CMT Index + 2.25%, 2.25% Floor, 11.16% Cap), 11/01/2036(2) | 97,070 | 101,680 | ||||||
4.35% (1 Year LIBOR USD + 2.35%, 2.35% Floor, 10.85% Cap), 03/01/2037(2) | 12,194 | 12,264 | ||||||
4.36% (1 Year CMT Index + 2.36%, 2.36% Floor, 11.18% Cap), 10/01/2036(2) | 40,621 | 41,305 | ||||||
4.36% (1 Year LIBOR USD + 2.36%, 2.36% Floor, 10.67% Cap), 02/01/2037(2) | 5,594 | 5,627 | ||||||
4.37% (1 Year CMT Index + 2.37%, 2.37% Floor, 10.25% Cap), 09/01/2032(2) | 3,562 | 3,584 | ||||||
4.42% (1 Year CMT Index + 2.25%, 2.25% Floor, 10.83% Cap), 07/01/2036(2) | 19,967 | 20,883 | ||||||
4.50% (1 Year CMT Index + 2.13%, 2.13% Floor, 12.13% Cap), 07/01/2026(2) | 3,012 | 3,028 | ||||||
4.62% (1 Year LIBOR USD + 2.47%, 2.47% Floor, 11.84% Cap), 03/01/2036(2) | 39,467 | 42,182 | ||||||
Freddie Mac Pool | ||||||||
3.00%, 12/01/2034 | 314,663 | 334,348 | ||||||
3.00%, 01/01/2046 | 12,783,906 | 13,886,698 | ||||||
3.00%, 02/01/2046 | 1,097,389 | 1,165,421 | ||||||
3.00%, 02/01/2047 | 2,221,573 | 2,392,771 | ||||||
3.00%, 08/01/2048 | 4,147,659 | 4,394,760 | ||||||
3.00%, 10/01/2049 | 3,481,902 | 3,689,450 | ||||||
3.00%, 12/01/2049 | 825,234 | 876,182 | ||||||
3.00%, 01/01/2050 | 2,247,589 | 2,387,493 | ||||||
3.00%, 01/01/2050 | 4,018,036 | 4,259,507 | ||||||
3.00%, 02/01/2050 | 2,015,610 | 2,120,011 | ||||||
3.00%, 03/01/2050 | 6,197,512 | 6,518,672 | ||||||
3.00%, 03/01/2050 | 6,432,448 | 6,931,545 | ||||||
3.00%, 06/01/2050 | 1,218,027 | 1,283,325 | ||||||
3.50%, 02/01/2042 | 2,317,803 | 2,506,084 | ||||||
3.50%, 08/01/2042 | 1,856,299 | 2,008,298 | ||||||
3.50%, 07/01/2045 | 9,722,803 | 10,512,850 | ||||||
3.50%, 10/01/2046 | 10,652,007 | 11,452,087 | ||||||
3.50%, 06/01/2047 | 467,594 | 502,485 |
3.50%, 01/01/2048 | 1,535,202 | 1,635,998 | ||||||
3.50%, 03/01/2048 | 441,637 | 474,102 | ||||||
3.50%, 03/01/2048 | 8,988,020 | 9,568,863 | ||||||
3.50%, 10/01/2049 | 3,518,894 | 3,698,866 | ||||||
4.00%, 12/01/2044 | 3,815,041 | 4,178,378 | ||||||
4.00%, 12/01/2045 | 424,780 | 461,442 | ||||||
4.00%, 02/01/2046 | 9,764,976 | 10,709,247 | ||||||
4.00%, 05/01/2047 | 5,060,434 | 5,493,460 | ||||||
4.00%, 01/01/2048 | 294,662 | 317,933 | ||||||
4.00%, 06/01/2048 | 220,110 | 240,234 | ||||||
4.00%, 01/01/2049 | 6,475,493 | 7,032,556 | ||||||
4.50%, 12/01/2045 | 1,114,725 | 1,239,651 | ||||||
4.50%, 06/01/2048 | 7,288,775 | 8,054,673 | ||||||
4.50%, 09/01/2048 | 366,526 | 394,231 | ||||||
4.50%, 11/01/2048 | 5,609,695 | 6,029,656 | ||||||
5.00%, 08/01/2049 | 5,801,217 | 6,337,570 | ||||||
5.00%, 12/01/2049 | 5,479,308 | 6,213,487 | ||||||
Freddie Mac Reference REMIC | ||||||||
6.00%, 04/15/2036 | 279,756 | 335,524 | ||||||
6.00%, 05/15/2036 | 369,637 | 441,630 | ||||||
Freddie Mac REMICS | ||||||||
0.00% (10 year CMT Index + -0.70%, 10.00% Cap), 07/15/2023(2) | 3,532 | 3,474 | ||||||
0.00%, 02/15/2024 | 1,655 | 1,629 | ||||||
0.00%, 02/15/2024 | 5,959 | 5,900 | ||||||
0.00% (10 year CMT Index + -0.85%, 10.00% Cap), 03/15/2024(2) | 252 | 248 | ||||||
0.00%, 05/15/2024 | 2,692 | 2,666 | ||||||
0.00%, 09/15/2032 | 953,645 | 896,383 | ||||||
0.00%, 12/15/2032 | 18,155 | 17,222 | ||||||
0.00%, 07/15/2034 | 97,489 | 93,088 | ||||||
0.00%, 02/15/2035 | 30,524 | 28,428 | ||||||
0.00%, 04/15/2035 | 41,843 | 40,723 | ||||||
0.00%, 08/15/2035 | 6,796 | 6,169 | ||||||
0.00%, 09/15/2035 | 18,287 | 17,901 | ||||||
0.00%, 02/15/2036 | 21,081 | 20,060 | ||||||
0.00%, 02/15/2036 | 22,206 | 21,054 | ||||||
0.00%, 02/15/2036 | 25,429 | 23,995 | ||||||
0.00%, 02/15/2036 | 66,836 | 65,001 | ||||||
0.00%, 03/15/2036 | 5,974 | 5,779 | ||||||
0.00%, 03/15/2036 | 37,749 | 36,699 | ||||||
0.00%, 03/15/2036 | 40,615 | 38,272 | ||||||
0.00%, 04/15/2036 | 30,926 | 29,591 | ||||||
0.00%, 04/15/2036 | 60,521 | 55,942 | ||||||
0.00%, 04/15/2036 | 80,175 | 78,022 | ||||||
0.00%, 04/15/2036 | 111,041 | 105,761 | ||||||
0.00%, 05/15/2036 | 8,795 | 8,274 | ||||||
0.00%, 05/15/2036 | 13,692 | 11,727 | ||||||
0.00%, 05/15/2036 | 32,920 | 31,209 | ||||||
0.00%, 05/15/2036 | 47,194 | 43,524 | ||||||
0.00%, 06/15/2036 | 80,839 | 78,264 | ||||||
0.00%, 07/15/2036 | 22,125 | 21,101 | ||||||
0.00%, 08/15/2036 | 31,515 | 30,195 | ||||||
0.00%, 09/15/2036 | 14,480 | 12,560 | ||||||
0.00%, 09/15/2036 | 17,806 | 16,461 | ||||||
0.00%, 10/15/2036 | 36,839 | 35,064 | ||||||
0.00%, 12/15/2036 | 18,548 | 17,455 | ||||||
0.00%, 01/15/2037 | 20,008 | 18,771 | ||||||
0.00%, 02/15/2037 | 5,919 | 5,724 | ||||||
0.00%, 02/15/2037 | 53,899 | 51,839 | ||||||
0.00%, 03/15/2037 | 7,512 | 7,002 | ||||||
0.00%, 04/15/2037 | 21,932 | 20,505 | ||||||
0.00%, 05/15/2037 | 1,355 | 1,288 | ||||||
0.00%, 05/15/2037 | 35,651 | 32,704 | ||||||
0.00%, 05/15/2037 | 204,972 | 192,294 | ||||||
0.00%, 06/15/2037 | 3,949 | 3,685 | ||||||
0.00%, 06/15/2037 | 20,059 | 19,181 | ||||||
0.00%, 07/15/2037 | 281,695 | 258,714 | ||||||
0.00%, 09/15/2037 | 28,611 | 26,476 | ||||||
0.00%, 10/15/2039 | 99,434 | 92,913 | ||||||
0.00%, 01/15/2040 | 89,795 | 85,421 | ||||||
0.00%, 10/15/2049 | 320,112 | 311,973 | ||||||
0.48% (1 Month LIBOR USD + 0.30%, 0.30% Floor, 6.50% Cap), 06/15/2035(2) | 66,381 | 66,070 | ||||||
0.58% (1 Month LIBOR USD + 0.40%, 0.40% Floor, 6.50% Cap), 05/15/2035(2) | 50,477 | 50,526 |
0.58% (1 Month LIBOR USD + 0.40%, 0.40% Floor, 6.50% Cap), 04/15/2039(2) | 255,145 | 255,439 | ||||||
0.58% (1 Month LIBOR USD + 0.40%, 0.40% Floor, 7.00% Cap), 10/15/2041(2) | 587,035 | 586,582 | ||||||
0.58% (1 Month LIBOR USD + 0.40%, 0.40% Floor, 7.00% Cap), 09/15/2042(2) | 648,238 | 644,860 | ||||||
0.62% (1 Month LIBOR USD + 0.44%, 0.44% Floor, 6.50% Cap), 02/15/2037(2) | 37,364 | 37,379 | ||||||
0.63% (1 Month LIBOR USD + 0.45%, 0.45% Floor, 7.00% Cap), 05/15/2036(2) | 287,813 | 288,315 | ||||||
0.63% (1 Month LIBOR USD + 0.45%, 0.45% Floor, 6.50% Cap), 05/15/2039(2) | 191,679 | 191,872 | ||||||
0.63% (1 Month LIBOR USD + 0.45%, 0.45% Floor, 6.50% Cap), 08/15/2039(2) | 55,653 | 55,750 | ||||||
0.63% (1 Month LIBOR USD + 0.45%, 0.45% Floor, 7.00% Cap), 08/15/2042(2) | 1,837,019 | 1,838,346 | ||||||
0.68% (1 Month LIBOR USD + 0.50%, 0.50% Floor, 6.50% Cap), 05/15/2036(2) | 7,675 | 7,676 | ||||||
0.68% (1 Month LIBOR USD + 0.50%, 0.50% Floor, 7.00% Cap), 10/15/2040(2) | 106,127 | 106,327 | ||||||
0.68% (1 Month LIBOR USD + 0.50%, 0.50% Floor, 7.00% Cap), 03/15/2042(2) | 728,839 | 730,240 | ||||||
0.68% (1 Month LIBOR USD + 0.50%, 0.50% Floor, 6.50% Cap), 07/15/2042(2) | 346,269 | 347,180 | ||||||
0.73% (1 Month LIBOR USD + 0.55%, 0.55% Floor, 6.50% Cap), 12/15/2040(2) | 1,069,145 | 1,071,522 | ||||||
0.73% (1 Month LIBOR USD + 0.55%, 0.55% Floor, 6.50% Cap), 03/15/2041(2) | 858,863 | 861,094 | ||||||
0.77% (1 Month LIBOR USD + 0.40%, 0.40% Floor, 9999.00% Cap), 07/15/2037(2) | 636,096 | 636,105 | ||||||
0.78% (1 Month LIBOR USD + 0.60%, 0.60% Floor, 9.00% Cap), 03/15/2024(2) | 612 | 613 | ||||||
0.78% (1 Month LIBOR USD + 0.60%, 0.60% Floor, 8.50% Cap), 01/15/2029(2) | 11,119 | 11,159 | ||||||
0.78% (1 Month LIBOR USD + 0.60%, 0.60% Floor, 9.50% Cap), 12/15/2033(2) | 153,591 | 153,400 | ||||||
0.78% (1 Month LIBOR USD + 0.60%, 0.60% Floor, 7.00% Cap), 09/15/2037(2) | 14,323 | 14,406 | ||||||
0.86% (1 Month LIBOR USD + 0.68%, 0.68% Floor, 7.00% Cap), 11/15/2037(2) | 558,701 | 564,986 | ||||||
0.88% (1 Month LIBOR USD + 0.70%, 0.70% Floor, 9.00% Cap), 02/15/2027(2) | 393 | 394 | ||||||
0.93% (1 Month LIBOR USD + 0.75%, 0.75% Floor, 8.50% Cap), 12/15/2032(2) | 36,552 | 37,029 | ||||||
0.98% (1 Month LIBOR USD + 0.80%, 0.80% Floor, 7.50% Cap), 08/15/2035(2) | 49,097 | 49,723 | ||||||
1.08% (1 Month LIBOR USD + 0.90%, 0.90% Floor, 9.00% Cap), 02/15/2032(2) | 56,531 | 57,058 | ||||||
1.13% (1 Month LIBOR USD + 0.95%, 0.95% Floor, 11.00% Cap), 05/15/2021(2) | 6 | 6 | ||||||
1.33% (1 Month LIBOR USD + 1.15%, 1.15% Floor, 10.00% Cap), 09/15/2022(2) | 773 | 773 | ||||||
1.33% (1 Month LIBOR USD + 1.15%, 1.15% Floor, 10.00% Cap), 04/15/2023(2) | 5,023 | 5,062 | ||||||
1.38% (1 Month LIBOR USD + 1.20%, 1.20% Floor, 7.00% Cap), 07/15/2039(2) | 25,129 | 25,449 | ||||||
1.88% (11th District Cost of Funds Index + 1.00%, 1.00% Floor, 10.00% Cap), 02/15/2023(2) | 135 | 135 | ||||||
2.24% (11th District Cost of Funds Index + 1.50%, 1.50% Floor, 9.00% Cap), 08/15/2023(2) | 196 | 199 | ||||||
2.40% (1 Month LIBOR USD + 2.22%, 8.32% Cap), 07/15/2034(2) | 38,404 | 41,497 | ||||||
3.00%, 08/15/2033 | 495,000 | 539,903 | ||||||
3.00%, 06/15/2043 | 206,000 | 229,308 | ||||||
3.00%, 04/15/2045 | 2,162,862 | 2,257,490 | ||||||
3.00%, 12/15/2047 | 2,817,137 | 2,970,861 | ||||||
3.20%, 01/15/2040(4) | 556,841 | 30,253 | ||||||
3.50%, 01/15/2026 | 1,339,978 | 1,407,620 | ||||||
3.50%, 08/15/2039 | 292,103 | 299,539 | ||||||
3.50%, 01/15/2042 | 1,700,000 | 1,903,564 | ||||||
3.50%, 06/15/2048 | 2,906,957 | 2,969,534 | ||||||
3.50%, 10/15/2053 | 5,579,085 | 5,905,375 | ||||||
3.64%, 02/15/2039(4) | 55,909 | 57,624 | ||||||
3.75%, 02/15/2046(1) | 178,264 | 179,271 | ||||||
4.00%, 12/15/2024 | 136,605 | 143,365 | ||||||
4.00%, 11/15/2029 | 57,488 | 1,071 | ||||||
4.00%, 12/15/2030 | 2,851,663 | 3,125,194 | ||||||
4.00%, 11/15/2041 | 488,200 | 541,583 | ||||||
4.00%, 12/15/2041 | 288,290 | 321,826 | ||||||
4.00%, 12/15/2043 | 1,500,000 | 1,539,264 | ||||||
4.50%, 06/15/2025 | 469,046 | 497,935 | ||||||
4.50%, 07/15/2039 | 371,997 | 394,848 | ||||||
4.50%, 12/15/2039 | 2,860,708 | 3,199,779 | ||||||
4.50%, 05/15/2041 | 927,793 | 1,041,713 | ||||||
4.50%, 09/15/2043 | 1,000,000 | 1,279,358 | ||||||
4.58% (1 Month LIBOR USD + 4.68%, 4.68% Cap), 12/15/2022(2)(7) | 859 | 894 | ||||||
5.00%, 03/15/2022 | 1,138 | 1,139 | ||||||
5.00%, 05/15/2023 | 7,654 | 7,951 | ||||||
5.00%, 11/15/2023 | 106,518 | 111,726 | ||||||
5.00%, 12/15/2023 | 11,144 | 11,684 | ||||||
5.00%, 12/15/2024 | 32,774 | 35,073 | ||||||
5.00%, 04/15/2030 | 702,000 | 818,442 | ||||||
5.00%, 07/15/2033 | 399,847 | 444,962 | ||||||
5.00%, 01/15/2034 | 240,707 | 278,406 | ||||||
5.00%, 10/15/2039 | 201,124 | 15,582 | ||||||
5.00%, 12/15/2040 | 1,110,382 | 1,231,390 | ||||||
5.00%, 05/15/2041 | 1,335,796 | 1,622,834 | ||||||
5.50%, 10/15/2022 | 20,675 | 21,467 | ||||||
5.50%, 12/15/2022 | 6,414 | 6,602 | ||||||
5.50%, 03/15/2023 | 77,845 | 81,584 | ||||||
5.50%, 04/15/2023 | 95,341 | 100,103 | ||||||
5.50%, 11/15/2023 | 22,222 | 23,124 | ||||||
5.50%, 02/15/2034 | 2,724 | 2,892 |
5.50%, 08/15/2036 | 50,570 | 58,961 | ||||||
5.50%, 08/15/2036 | 141,829 | 165,940 | ||||||
5.50%, 03/15/2038 | 379,699 | 442,621 | ||||||
5.50%, 05/15/2038 | 27,862 | 31,723 | ||||||
5.50%, 01/15/2039 | 160,476 | 186,827 | ||||||
5.50% (1 Month LIBOR USD + 27.21%, 5.50% Cap), 05/15/2041(2)(7) | 213,791 | 239,981 | ||||||
5.50% (1 Month LIBOR USD + 27.50%, 5.50% Cap), 05/15/2041(2)(7) | 598,243 | 665,664 | ||||||
5.60%, 06/15/2023 | 17,207 | 18,049 | ||||||
5.67% (1 Month LIBOR USD + 5.85%, 5.85% Cap), 08/15/2038(2)(7) | 207,163 | 40,378 | ||||||
5.70%, 10/15/2038(4) | 99,298 | 112,610 | ||||||
5.82% (1 Month LIBOR USD + 6.00%, 6.00% Cap), 01/15/2038(2)(7) | 281,191 | 58,234 | ||||||
5.82% (1 Month LIBOR USD + 6.00%, 6.00% Cap), 02/15/2039(2)(7) | 82,048 | 15,941 | ||||||
5.82% (1 Month LIBOR USD + 6.00%, 6.00% Cap), 10/15/2040(2)(7) | 290,286 | 53,321 | ||||||
5.82% (1 Month LIBOR USD + 6.00%, 6.00% Cap), 10/15/2040(2)(7) | 386,355 | 73,169 | ||||||
5.92% (1 Month LIBOR USD + 6.10%, 6.10% Cap), 05/15/2039(2)(7) | 17,038 | 2,645 | ||||||
5.96% (1 Month LIBOR USD + 6.14%, 6.14% Cap), 01/15/2037(2)(7) | 31,615 | 6,389 | ||||||
6.00%, 11/15/2023 | 9,383 | 9,952 | ||||||
6.00%, 06/15/2024 | 11,753 | 12,633 | ||||||
6.00%, 05/15/2027 | 11,900 | 13,024 | ||||||
6.00%, 07/15/2028 | 7,638 | 8,602 | ||||||
6.00%, 09/15/2028 | 5,204 | 5,896 | ||||||
6.00%, 11/15/2028 | 24,626 | 27,865 | ||||||
6.00%, 12/15/2028 | 46,917 | 53,153 | ||||||
6.00%, 01/15/2029 | 64,134 | 72,951 | ||||||
6.00%, 02/15/2029 | 14,413 | 15,761 | ||||||
6.00%, 07/15/2031 | 9,165 | 10,685 | ||||||
6.00%, 09/15/2032 | 38,031 | 44,578 | ||||||
6.00%, 12/15/2032 | 35,787 | 41,418 | ||||||
6.00%, 12/15/2032 | 70,370 | 80,557 | ||||||
6.00%, 01/15/2033 | 44,846 | 52,900 | ||||||
6.00%, 02/15/2033 | 39,111 | 46,297 | ||||||
6.00%, 02/15/2033 | 170,865 | 199,258 | ||||||
6.00%, 03/15/2033 | 29,228 | 32,834 | ||||||
6.00%, 05/15/2034 | 118,975 | 133,556 | ||||||
6.00%, 04/15/2035 | 1,057,000 | 1,230,627 | ||||||
6.00%, 01/15/2036 | 114,759 | 137,863 | ||||||
6.00%, 03/15/2036 | 2,624 | 4,027 | ||||||
6.00%, 04/15/2036 | 59,740 | 12,797 | ||||||
6.00%, 04/15/2036 | 72,521 | 86,349 | ||||||
6.00%, 04/15/2036 | 607,085 | 723,418 | ||||||
6.00%, 06/15/2036 | 13,951 | 15,225 | ||||||
6.00%, 02/15/2037 | 42,732 | 48,197 | ||||||
6.00%, 04/15/2037 | 53,626 | 63,335 | ||||||
6.00%, 05/15/2037 | 57,620 | 65,844 | ||||||
6.00%, 06/15/2038 | 13,160 | 15,371 | ||||||
6.00%, 06/15/2038 | 323,945 | 374,407 | ||||||
6.02% (1 Month LIBOR USD + 6.20%, 6.20% Cap), 06/15/2038(2)(7) | 114,730 | 20,070 | ||||||
6.07% (1 Month LIBOR USD + 6.25%, 6.25% Cap), 12/15/2039(2)(7) | 81,460 | 16,223 | ||||||
6.12% (1 Month LIBOR USD + 6.30%, 6.30% Cap), 05/15/2039(2)(7) | 96,784 | 9,110 | ||||||
6.24% (1 Month LIBOR USD + 6.42%, 6.42% Cap), 11/15/2037(2)(7) | 217,635 | 42,471 | ||||||
6.25%, 10/15/2023 | 3,407 | 3,623 | ||||||
6.25%, 08/15/2028 | 29,105 | 32,550 | ||||||
6.25%, 02/15/2029 | 70,347 | 78,794 | ||||||
6.27% (1 Month LIBOR USD + 6.45%, 6.45% Cap), 03/15/2037(2)(7) | 53,033 | 10,846 | ||||||
6.27% (1 Month LIBOR USD + 6.45%, 6.45% Cap), 11/15/2037(2)(7) | 149,211 | 30,720 | ||||||
6.38%, 02/15/2032 | 13,803 | 15,148 | ||||||
6.42% (1 Month LIBOR USD + 6.60%, 6.60% Cap), 07/15/2037(2)(7) | 41,012 | 7,715 | ||||||
6.47% (1 Month LIBOR USD + 6.65%, 6.65% Cap), 08/15/2036(2)(7) | 475,703 | 104,929 | ||||||
6.50%, 09/15/2023 | 23,638 | 25,354 | ||||||
6.50%, 12/15/2023 | 5,900 | 6,327 | ||||||
6.50%, 12/15/2023 | 7,278 | 7,759 | ||||||
6.50%, 03/15/2026 | 1,548 | 1,660 | ||||||
6.50%, 07/15/2026 | 11,808 | 12,657 | ||||||
6.50%, 01/15/2027 | 9,265 | 10,302 | ||||||
6.50%, 12/15/2027 | 6,983 | 7,884 | ||||||
6.50%, 06/15/2028 | 13,938 | 15,714 | ||||||
6.50%, 08/15/2028 | 27,187 | 31,094 | ||||||
6.50%, 05/15/2031 | 4,427 | 5,111 | ||||||
6.50%, 08/15/2031 | 10,455 | 12,314 | ||||||
6.50%, 08/15/2031 | 12,791 | 14,607 | ||||||
6.50%, 08/15/2031 | 16,693 | 19,854 | ||||||
6.50%, 08/15/2031 | 146,274 | 170,259 |
6.50%, 10/15/2031 | 13,615 | 15,286 | ||||||
6.50%, 01/15/2032 | 17,976 | 21,156 | ||||||
6.50%, 01/15/2032 | 20,826 | 24,547 | ||||||
6.50%, 02/15/2032 | 24,433 | 28,816 | ||||||
6.50%, 02/15/2032 | 29,134 | 34,327 | ||||||
6.50%, 03/15/2032 | 38,409 | 43,437 | ||||||
6.50%, 03/15/2032 | 37,478 | 44,636 | ||||||
6.50%, 04/15/2032 | 8,978 | 10,588 | ||||||
6.50%, 04/15/2032 | 64,161 | 75,509 | ||||||
6.50%, 04/15/2032 | 81,607 | 91,921 | ||||||
6.50%, 05/15/2032 | 27,306 | 32,039 | ||||||
6.50%, 06/15/2032 | 16,615 | 18,692 | ||||||
6.50%, 06/15/2032 | 24,337 | 27,745 | ||||||
6.50%, 06/15/2032 | 30,907 | 36,405 | ||||||
6.50%, 07/15/2032 | 30,790 | 35,026 | ||||||
6.50%, 07/15/2032 | 37,740 | 45,511 | ||||||
6.50%, 03/15/2033 | 18,554 | 3,703 | ||||||
6.50%, 07/15/2036 | 64,296 | 74,600 | ||||||
6.50%, 07/15/2036 | 88,661 | 103,962 | ||||||
6.52% (1 Month LIBOR USD + 6.70%, 6.70% Cap), 10/15/2036(2)(7) | 50,263 | 10,001 | ||||||
6.62% (1 Month LIBOR USD + 6.80%, 6.80% Cap), 04/15/2038(2)(7) | 124,513 | 20,777 | ||||||
6.71% (1 Month LIBOR USD + 6.80%, 4.00% Floor, 6.80% Cap), 07/15/2033(2)(7) | 462 | 559 | ||||||
6.92% (1 Month LIBOR USD + 7.10%, 7.10% Cap), 07/15/2036(2)(7) | 7,274 | 1,327 | ||||||
6.96%, 11/15/2021(4) | 6,189 | 6,275 | ||||||
7.00%, 05/15/2021 | 516 | 523 | ||||||
7.00%, 03/15/2022 | 194 | 200 | ||||||
7.00%, 05/15/2022 | 316 | 328 | ||||||
7.00%, 04/15/2023 | 7,775 | 8,226 | ||||||
7.00%, 05/15/2023 | 887 | 944 | ||||||
7.00%, 09/15/2023 | 5,941 | 6,361 | ||||||
7.00%, 01/15/2024 | 3,364 | 3,615 | ||||||
7.00%, 02/15/2024 | 1,655 | 1,766 | ||||||
7.00%, 03/15/2024 | 3,013 | 3,235 | ||||||
7.00%, 03/15/2024 | 17,940 | 19,250 | ||||||
7.00%, 03/15/2028 | 8,581 | 1,320 | ||||||
7.00%, 06/15/2028 | 1,654 | 1,924 | ||||||
7.00%, 10/15/2028 | 10,943 | 1,124 | ||||||
7.00%, 04/15/2029 | 938 | 94 | ||||||
7.00%, 06/15/2029 | 56,351 | 65,355 | ||||||
7.00%, 07/15/2029 | 31,627 | 37,253 | ||||||
7.00%, 08/15/2029 | 14,312 | 16,805 | ||||||
7.00%, 01/15/2030 | 28,106 | 33,322 | ||||||
7.00%, 10/15/2030 | 20,006 | 23,772 | ||||||
7.00%, 03/15/2031 | 11,905 | 14,132 | ||||||
7.00%, 06/15/2031 | 10,034 | 12,002 | ||||||
7.00%, 07/15/2031 | 23,551 | 28,085 | ||||||
7.00%, 03/15/2032 | 22,044 | 26,330 | ||||||
7.00%, 03/15/2032 | 26,935 | 32,330 | ||||||
7.00%, 04/15/2032 | 13,567 | 15,629 | ||||||
7.00%, 04/15/2032 | 46,540 | 55,462 | ||||||
7.00%, 05/15/2032 | 25,317 | 30,625 | ||||||
7.00%, 12/15/2036 | 1,123,010 | 1,370,022 | ||||||
7.25%, 07/15/2027 | 656 | 754 | ||||||
7.25%, 09/15/2030 | 15,412 | 18,558 | ||||||
7.25%, 12/15/2030 | 20,102 | 24,018 | ||||||
7.38%, 11/15/2046(4) | 542,135 | 643,894 | ||||||
7.50%, 08/15/2022 | 466 | 490 | ||||||
7.50%, 02/15/2023 | 7,434 | 7,879 | ||||||
7.50%, 04/15/2023 | 1,542 | 1,640 | ||||||
7.50%, 04/15/2024 | 10,464 | 11,223 | ||||||
7.50%, 08/15/2024 | 4,006 | 4,406 | ||||||
7.50%, 09/15/2026 | 2,153 | 2,437 | ||||||
7.50%, 01/15/2027 | 5,575 | 6,431 | ||||||
7.50%, 01/15/2027 | 15,131 | 17,348 | ||||||
7.50%, 09/15/2027 | 4,931 | 5,788 | ||||||
7.50%, 03/15/2028 | 26,448 | 30,904 | ||||||
7.50%, 05/15/2028 | 9,306 | 10,791 | ||||||
7.50%, 06/15/2029 | 4,588 | 499 | ||||||
7.50%, 11/15/2029 | 77 | 92 | ||||||
7.50%, 05/15/2030 | 6,662 | 8,010 | ||||||
7.50%, 08/15/2030 | 6,530 | 7,746 | ||||||
7.50%, 10/15/2030 | 2,051 | 2,488 |
7.50%, 11/15/2036 | 475,788 | 584,617 | ||||||
7.50%, 12/15/2036 | 401,403 | 499,688 | ||||||
7.77% (1 Month LIBOR USD + 7.95%, 7.95% Cap), 03/15/2032(2)(7) | 24,887 | 5,160 | ||||||
7.82% (1 Month LIBOR USD + 8.00%, 8.00% Cap), 02/15/2032(2)(7) | 59,028 | 12,067 | ||||||
7.82% (1 Month LIBOR USD + 8.00%, 8.00% Cap), 03/15/2032(2)(7) | 16,235 | 3,340 | ||||||
7.84% (1 Month LIBOR USD + 8.01%, 8.01% Cap), 10/15/2033(2)(7) | 511,973 | 608,734 | ||||||
8.00%, 08/15/2022 | 1,168 | 1,231 | ||||||
8.00%, 09/15/2026 | 5,611 | 6,511 | ||||||
8.00%, 11/15/2029 | 11,746 | 13,560 | ||||||
8.00%, 01/15/2030 | 7,648 | 9,161 | ||||||
8.00%, 01/15/2030 | 28,428 | 34,526 | ||||||
8.00%, 03/15/2030 | 6,446 | 7,808 | ||||||
8.00%, 04/15/2030 | 8,901 | 10,672 | ||||||
8.42% (1 Month LIBOR USD + 8.60%, 3.00% Floor, 8.60% Cap), 07/15/2023(2)(7) | 5,590 | 5,943 | ||||||
8.47% (1 Month LIBOR USD + 8.65%, 8.65% Cap), 02/15/2032(2)(7) | 12,368 | 2,768 | ||||||
8.50%, 09/15/2021 | 506 | 525 | ||||||
8.50%, 06/15/2031 | 24,041 | 29,500 | ||||||
8.73% (3 Months CMT Index + 8.90%, 8.90% Cap), 05/15/2023(2)(7) | 3,390 | 3,684 | ||||||
9.00%, 10/15/2020 | 2 | 2 | ||||||
9.00%, 04/15/2021 | 22 | 22 | ||||||
9.93% (10 year CMT Index + 10.60%, 10.00% Cap), 05/15/2024(2)(7) | 6,445 | 873 | ||||||
10.00% (11th District Cost of Funds Index + 44.15%, 10.00% Cap), 02/15/2024(2)(7) | 2,165 | 2,464 | ||||||
12.92% (1 Month LIBOR USD + 13.29%, 13.29% Cap), 07/15/2033(2)(7) | 22,931 | 30,978 | ||||||
14.42% (1 Month LIBOR USD + 14.76%, 14.76% Cap), 09/15/2033(2)(7) | 17,740 | 25,232 | ||||||
14.51% (1 Month LIBOR USD + 14.85%, 14.85% Cap), 06/15/2033(2)(7) | 65,206 | 88,586 | ||||||
15.73% (1 Month LIBOR USD + 16.10%, 16.10% Cap), 02/15/2032(2)(7) | 34,968 | 47,941 | ||||||
16.09% (1 Month LIBOR USD + 16.50%, 16.50% Cap), 11/15/2033(2)(7) | 9,070 | 12,816 | ||||||
16.41% (1 Month LIBOR USD + 16.88%, 16.88% Cap), 08/15/2025(2)(7) | 4,272 | 5,304 | ||||||
16.55% (1 Month LIBOR USD + 17.03%, 17.03% Cap), 06/15/2035(2)(7) | 1,435 | 1,985 | ||||||
16.88% (1 Month LIBOR USD + 17.50%, 17.50% Cap), 02/15/2040(2)(7) | 290,857 | 430,834 | ||||||
16.99% (1 Month LIBOR USD + 17.45%, 17.45% Cap), 02/15/2038(2)(7) | 10,412 | 13,754 | ||||||
18.16% (1 Month LIBOR USD + 18.60%, 18.60% Cap), 12/15/2032(2)(7) | 21,549 | 32,004 | ||||||
18.82% (1 Month LIBOR USD + 10.13%, 19.24% Cap), 02/15/2024(2) | 387 | 468 | ||||||
19.02% (1 Month LIBOR USD + 19.50%, 19.50% Cap), 02/15/2032(2)(7) | 30,072 | 48,238 | ||||||
19.15% (1 Month LIBOR USD + 19.66%, 19.66% Cap), 06/15/2036(2)(7) | 18,289 | 26,169 | ||||||
19.38% (1 Month LIBOR USD + 20.00%, 20.00% Cap), 11/15/2035(2)(7) | 30,229 | 47,424 | ||||||
22.15% (1 Month LIBOR USD + 22.75%, 22.75% Cap), 10/15/2023(2)(7) | 2,921 | 3,615 | ||||||
23.82% (1 Month LIBOR USD + 24.49%, 24.49% Cap), 06/15/2034(2)(7) | 35,431 | 45,676 | ||||||
23.89% (1 Month LIBOR USD + 24.57%, 24.57% Cap), 01/15/2036(2)(7) | 6,599 | 9,934 | ||||||
24.00% (11th District Cost of Funds Index + 27.47%, 27.47% Cap), 07/15/2023(2)(7) | 742 | 879 | ||||||
27.22% (1 Month LIBOR USD + 28.03%, 28.03% Cap), 10/15/2025(2)(7) | 12,833 | 18,429 | ||||||
27.35% (1 Month LIBOR USD + 28.16%, 28.16% Cap), 02/15/2035(2)(7) | 37,906 | 58,865 | ||||||
28.11% (11th District Cost of Funds Index + 31.43%, 31.43% Cap), 03/15/2024(2)(7) | 1,974 | 374 | ||||||
29.80% (1 Month LIBOR USD + 30.55%, 30.55% Cap), 03/15/2029(2)(7) | 1,737 | 2,906 | ||||||
32.81% (1 Month LIBOR USD + 33.83%, 33.83% Cap), 04/15/2025(2)(7) | 9,990 | 13,340 | ||||||
33.70% (1 Month LIBOR USD + 34.50%, 34.50% Cap), 09/15/2023(2)(7) | 2,622 | 3,644 | ||||||
44.39% (1 Month LIBOR USD + 45.23%, 45.23% Cap), 05/15/2021(2)(7) | 4 | 4 | ||||||
Freddie Mac REMICS SER 3443 CL SY V/R | ||||||||
9.00% (1 Month LIBOR USD + 70.64%, 9.00% Cap), 03/15/2037(2)(7) | 18,098 | 22,744 | ||||||
Freddie Mac STACR Trust 2019-HRP1 | ||||||||
0.93% (1 Month LIBOR USD + 0.75%), 02/25/2049(2)(3) | 404,283 | 403,607 | ||||||
Freddie Mac Strips | ||||||||
0.00%, 04/01/2028 | 48,625 | 47,207 | ||||||
0.00%, 09/15/2043 | 784,773 | 742,258 | ||||||
0.68% (1 Month LIBOR USD + 0.50%, 0.50% Floor, 6.50% Cap), 08/15/2042(2) | 1,222,366 | 1,240,470 | ||||||
0.73% (1 Month LIBOR USD + 0.55%, 0.55% Floor, 6.50% Cap), 07/15/2042(2) | 1,962,822 | 1,975,661 | ||||||
0.73% (1 Month LIBOR USD + 0.55%, 0.55% Floor, 6.50% Cap), 08/15/2042(2) | 1,055,079 | 1,073,288 | ||||||
3.00%, 08/15/2042 | 1,521,999 | 1,628,361 | ||||||
3.00%, 01/15/2043 | 378,722 | 410,513 | ||||||
3.50%, 07/15/2042 | 4,918,022 | 5,508,929 | ||||||
4.50%, 11/15/2020 | 67 | 0 | ||||||
4.50%, 12/15/2020 | 20 | — | ||||||
5.00%, 09/15/2035 | 91,285 | 17,345 | ||||||
5.00%, 09/15/2035 | 107,956 | 18,950 | ||||||
5.00%, 09/15/2035 | 173,388 | 30,093 | ||||||
7.52% (1 Month LIBOR USD + 7.70%, 7.70% Cap), 08/15/2036(2)(7) | 313,152 | 78,467 | ||||||
Freddie Mac Structured Pass-Through Certificates | ||||||||
0.00%, 07/25/2043 | 18,705 | 16,519 | ||||||
0.00%, 09/25/2043 | 20,365 | 17,852 | ||||||
0.00%, 10/25/2043 | 24,242 | 19,520 | ||||||
2.24%, 10/25/2037(4) | 1,083,244 | 1,205,993 | ||||||
2.70% (12 Month U.S. Treasury Average + 1.20%, 1.20% Floor), 10/25/2044(2) | 431,722 | 436,052 |
4.85%, 07/25/2033(4) | 156,777 | 175,713 | ||||||
5.23%, 05/25/2043 | 498,961 | 575,376 | ||||||
5.29%, 07/25/2032(4) | 52,607 | 59,641 | ||||||
6.50%, 02/25/2043 | 221,235 | 271,275 | ||||||
7.00%, 02/25/2043 | 71,841 | 88,765 | ||||||
7.00%, 10/25/2043 | 279,571 | 350,506 | ||||||
7.50%, 02/25/2042 | 212,429 | 261,541 | ||||||
7.50%, 08/25/2042(4) | 37,026 | 49,683 | ||||||
7.50%, 07/25/2043 | 49,106 | 63,029 | ||||||
7.50%, 09/25/2043 | 275,269 | 329,485 | ||||||
FREMF 2013-K25 Mortgage Trust | ||||||||
3.74%, 11/25/2045(3)(4) | 2,000,000 | 2,042,629 | ||||||
FREMF 2013-K35 Mortgage Trust | ||||||||
4.07%, 12/25/2046(3)(4) | 2,951,000 | 3,058,160 | ||||||
FREMF 2014-K40 Mortgage Trust | ||||||||
4.21%, 11/25/2047(3)(4) | 2,273,000 | 2,385,721 | ||||||
FREMF 2014-K41 Mortgage Trust | ||||||||
3.96%, 11/25/2047(3)(4) | 6,000,000 | 6,199,824 | ||||||
FREMF 2015-K44 Mortgage Trust | ||||||||
3.81%, 01/25/2048(3)(4) | 3,510,000 | 3,736,314 | ||||||
FREMF 2015-K45 Mortgage Trust | ||||||||
3.71%, 04/25/2048(3)(4) | 2,135,000 | 2,265,402 | ||||||
FREMF 2015-K49 Mortgage Trust | ||||||||
3.85%, 10/25/2048(3)(4) | 4,000,000 | 4,076,986 | ||||||
FREMF 2015-K51 Mortgage Trust | ||||||||
4.09%, 10/25/2048(3)(4) | 1,500,000 | 1,546,540 | ||||||
FREMF 2015-K720 Mortgage Trust | ||||||||
3.51%, 07/25/2022(3)(4) | 4,000,000 | 4,050,072 | ||||||
FREMF 2016-K52 Mortgage Trust | ||||||||
4.06%, 01/25/2049(3)(4) | 4,750,000 | 5,048,001 | ||||||
FREMF 2016-K59 Mortgage Trust | ||||||||
3.70%, 11/25/2049(3)(4) | 2,450,000 | 2,610,774 | ||||||
FREMF 2016-K722 Mortgage Trust | ||||||||
3.97%, 07/25/2049(3)(4) | 1,845,000 | 1,931,125 | ||||||
G2ST 30YR TBA 3.0% SEP 19 | ||||||||
3.00%, 09/01/2050(9) | 45,810,000 | 48,338,497 | ||||||
GCAT 2020-1 LLC | ||||||||
2.98%, 01/26/2060(1)(3) | 2,300,519 | 2,224,169 | ||||||
Ginnie Mae | ||||||||
0.00%, 12/20/2032 | 12,575 | 12,546 | ||||||
0.00%, 02/17/2033 | 8,807 | 8,784 | ||||||
0.00%, 03/16/2033 | 6,425 | 6,344 | ||||||
0.00%, 06/16/2033 | 35,131 | 33,402 | ||||||
0.00%, 10/20/2033 | 5,185 | 5,023 | ||||||
0.00%, 06/20/2034 | 59,478 | 58,544 | ||||||
0.00%, 08/20/2035 | 142,368 | 134,933 | ||||||
0.00%, 10/20/2035 | 31,668 | 28,759 | ||||||
0.00%, 11/20/2035 | 44,801 | 42,627 | ||||||
0.00%, 03/20/2036 | 38,460 | 36,083 | ||||||
0.00%, 05/20/2036 | 54,638 | 53,956 | ||||||
0.00%, 07/20/2036 | 7,611 | 7,388 | ||||||
0.00%, 03/20/2037 | 122,656 | 118,204 | ||||||
0.00%, 04/16/2037 | 72,018 | 65,816 | ||||||
0.00%, 05/20/2037 | 11,167 | 10,536 | ||||||
0.00%, 06/16/2037 | 20,393 | 19,003 | ||||||
0.00%, 06/16/2037 | 197,177 | 188,781 | ||||||
0.00%, 09/20/2037 | 15,071 | 14,980 | ||||||
0.00%, 11/16/2037 | 209,645 | 200,712 | ||||||
0.00%, 01/20/2038 | 7,821 | 7,397 | ||||||
0.00%, 12/20/2040 | 526,408 | 502,992 | ||||||
0.50% (1 Month LIBOR USD + 0.30%, 0.30% Floor, 6.50% Cap), 05/16/2037(2) | 53,479 | 53,228 | ||||||
0.60% (1 Month LIBOR USD + 0.30%, 0.30% Floor, 5.59% Cap), 08/20/2060(2) | 1,447 | 1,439 | ||||||
0.60% (1 Month LIBOR USD + 0.30%, 0.30% Floor), 11/20/2062(2) | 4,823 | 4,792 | ||||||
0.62% (1 Month LIBOR USD + 0.32%, 0.32% Floor, 10.50% Cap), 01/20/2063(2) | 959,166 | 954,657 | ||||||
0.64% (1 Month LIBOR USD + 0.34%, 0.34% Floor, 11.00% Cap), 12/20/2062(2) | 1,830,117 | 1,820,653 | ||||||
0.71% (1 Month LIBOR USD + 0.41%, 0.41% Floor, 11.00% Cap), 03/20/2063(2) | 805,576 | 803,208 | ||||||
0.72% (1 Month LIBOR USD + 0.42%, 0.42% Floor, 10.50% Cap), 02/20/2063(2) | 217,466 | 216,585 | ||||||
0.73% (1 Month LIBOR USD + 0.43%, 0.43% Floor, 5.59% Cap), 04/20/2060(2) | 13,161 | 13,118 | ||||||
0.74% (1 Month LIBOR USD + 0.44%, 0.44% Floor, 11.00% Cap), 07/20/2065(2) | 3,167,658 | 3,156,142 | ||||||
0.75% (1 Month LIBOR USD + 0.45%, 0.45% Floor, 5.50% Cap), 03/20/2060(2) | 19,001 | 18,922 | ||||||
0.75% (1 Month LIBOR USD + 0.45%, 0.45% Floor, 5.50% Cap), 05/20/2062(2) | 382 | 381 | ||||||
0.75% (1 Month LIBOR USD + 0.45%, 0.45% Floor, 11.00% Cap), 06/20/2065(2) | 1,421,138 | 1,417,818 |
0.75% (1 Month LIBOR USD + 0.45%, 0.45% Floor, 11.00% Cap), 08/20/2067(2) | 2,844,211 | 2,839,626 | ||||||
0.77% (1 Month LIBOR USD + 0.47%, 0.47% Floor), 08/20/2061(2) | 462,904 | 462,221 | ||||||
0.77% (1 Month LIBOR USD + 0.47%, 0.47% Floor, 10.50% Cap), 03/20/2063(2) | 244,167 | 243,813 | ||||||
0.77% (1 Month LIBOR USD + 0.47%, 0.47% Floor, 11.00% Cap), 06/20/2063(2) | 2,059,196 | 2,056,454 | ||||||
0.77% (1 Month LIBOR USD + 0.47%, 0.47% Floor, 11.00% Cap), 07/20/2064(2) | 3,002,335 | 2,997,859 | ||||||
0.77% (1 Month LIBOR USD + 0.47%, 0.47% Floor, 11.00% Cap), 09/20/2064(2) | 3,624,985 | 3,616,876 | ||||||
0.77% (1 Month LIBOR USD + 0.47%, 0.47% Floor, 11.00% Cap), 08/20/2065(2) | 517,279 | 515,988 | ||||||
0.78% (1 Month LIBOR USD + 0.48%, 0.48% Floor, 11.00% Cap), 02/20/2065(2) | 3,388,548 | 3,382,887 | ||||||
0.78% (1 Month LIBOR USD + 0.48%, 0.48% Floor, 11.00% Cap), 03/20/2065(2) | 6,782,944 | 6,769,447 | ||||||
0.78% (1 Month LIBOR USD + 0.48%, 11.00% Cap), 04/20/2065(2) | 4,994,720 | 4,984,201 | ||||||
0.80% (1 Month LIBOR USD + 0.50%, 0.50% Floor, 10.66% Cap), 03/20/2061(2) | 1,517,103 | 1,515,800 | ||||||
0.80% (1 Month LIBOR USD + 0.50%, 0.50% Floor), 01/20/2063(2) | 18,267 | 18,259 | ||||||
0.80% (1 Month LIBOR USD + 0.50%, 0.50% Floor, 11.00% Cap), 06/20/2064(2) | 2,118,165 | 2,115,245 | ||||||
0.80% (1 Month LIBOR USD + 0.50%, 0.50% Floor, 11.00% Cap), 07/20/2064(2) | 1,657,465 | 1,655,229 | ||||||
0.80% (1 Month LIBOR USD + 0.50%, 0.50% Floor, 11.00% Cap), 07/20/2064(2) | 2,133,881 | 2,130,981 | ||||||
0.80% (1 Month LIBOR USD + 0.50%, 0.50% Floor, 11.00% Cap), 12/20/2064(2) | 2,613,147 | 2,611,170 | ||||||
0.80% (1 Month LIBOR USD + 0.50%, 0.50% Floor, 11.00% Cap), 06/20/2067(2) | 5,663,948 | 5,656,693 | ||||||
0.81% (1 Year LIBOR USD + 0.00%), 06/20/2067(2) | 13,420,217 | 1,159,507 | ||||||
0.82% (1 Month LIBOR USD + 0.52%, 0.52% Floor, 11.50% Cap), 10/20/2062(2) | 1,774,214 | 1,773,566 | ||||||
0.85% (1 Month LIBOR USD + 0.55%, 0.55% Floor), 10/20/2061(2) | 5,897 | 5,899 | ||||||
0.85% (1 Month LIBOR USD + 0.55%, 0.55% Floor), 04/20/2062(2) | 1,313 | 1,314 | ||||||
0.85% (1 Month LIBOR USD + 0.55%, 0.55% Floor), 07/20/2062(2) | 31,147 | 31,153 | ||||||
0.86% (1 Month LIBOR USD + 0.56%, 0.56% Floor, 11.00% Cap), 03/20/2067(2) | 5,739,929 | 5,745,502 | ||||||
0.88% (1 Month LIBOR USD + 0.58%, 0.58% Floor), 09/20/2062(2) | 52,685 | 52,708 | ||||||
0.90% (1 Month LIBOR USD + 0.60%, 0.60% Floor, 4.60% Cap), 10/20/2062(2) | 12,628 | 12,647 | ||||||
0.90% (1 Month LIBOR USD + 0.60%, 0.60% Floor), 04/20/2064(2) | 2,685,429 | 2,691,986 | ||||||
0.90% (1 Month LIBOR USD + 0.60%, 0.60% Floor, 11.00% Cap), 04/20/2064(2) | 3,097,119 | 3,102,156 | ||||||
0.90% (1 Month LIBOR USD + 0.60%, 0.60% Floor, 11.00% Cap), 05/20/2064(2) | 4,919,605 | 4,931,880 | ||||||
0.90% (1 Month LIBOR USD + 0.60%, 0.60% Floor, 7.00% Cap), 10/20/2064(2) | 1,253,159 | 1,254,376 | ||||||
0.95% (1 Month LIBOR USD + 0.65%, 0.65% Floor), 05/20/2061(2) | 39,784 | 39,869 | ||||||
0.95% (1 Month LIBOR USD + 0.65%, 0.65% Floor, 11.00% Cap), 01/20/2064(2) | 2,481,232 | 2,488,245 | ||||||
0.95% (1 Month LIBOR USD + 0.65%, 0.65% Floor, 11.00% Cap), 02/20/2064(2) | 4,946,950 | 4,961,670 | ||||||
0.95% (1 Month LIBOR USD + 0.65%, 0.65% Floor, 11.00% Cap), 03/20/2064(2) | 2,137,799 | 2,143,689 | ||||||
0.99% (1 Month LIBOR USD + 0.69%, 0.69% Floor, 11.00% Cap), 02/20/2064(2) | 2,509,853 | 2,524,496 | ||||||
1.00% (1 Month LIBOR USD + 0.70%, 0.70% Floor), 05/20/2061(2) | 39,015 | 39,132 | ||||||
1.00% (1 Month LIBOR USD + 0.70%, 0.70% Floor, 11.00% Cap), 04/20/2062(2) | 835,033 | 839,475 | ||||||
1.01% (1 Month LIBOR USD + 0.82%, 0.82% Floor, 7.00% Cap), 07/20/2038(2) | 333,207 | 337,898 | ||||||
1.49% (1 Month LIBOR USD + 0.47%, 11.00% Cap), 02/20/2065(2) | 1,657,690 | 1,655,318 | ||||||
1.65%, 01/20/2063 | 486,616 | 487,478 | ||||||
1.65%, 02/20/2063 | 501,528 | 502,399 | ||||||
1.65%, 04/20/2063 | 282,700 | 283,619 | ||||||
2.35% (1 Year LIBOR USD + 0.00%), 05/20/2067(2) | 13,604,723 | 1,803,152 | ||||||
2.50%, 07/20/2047 | 4,070,389 | 4,275,559 | ||||||
2.50%, 07/01/2050(9) | 22,000,000 | 23,148,984 | ||||||
3.00%, 12/20/2041 | 1,000,000 | 1,101,178 | ||||||
3.00%, 10/20/2045 | 1,246,144 | 1,334,425 | ||||||
3.00%, 02/20/2047 | 3,446,205 | 3,564,501 | ||||||
3.00%, 09/20/2047 | 2,048,815 | 2,200,530 | ||||||
3.00%, 11/20/2047 | 7,333,457 | 7,742,403 | ||||||
3.00%, 08/01/2049(9) | 6,500,000 | 6,871,211 | ||||||
3.50%, 07/20/2046 | 4,148,595 | 4,329,864 | ||||||
3.50%, 09/20/2046 | 1,266,381 | 1,383,191 | ||||||
3.50%, 07/01/2049(9) | 25,720,000 | 27,140,628 | ||||||
3.69%, 01/20/2042(4) | 321,856 | 357,912 | ||||||
3.97%, 09/16/2042(4) | 208,022 | 234,073 | ||||||
4.00%, 07/01/2049(9) | 500,000 | 530,078 | ||||||
4.48%, 04/20/2043(4) | 194,060 | 214,397 | ||||||
4.53%, 11/16/2041(4) | 313,795 | 347,021 | ||||||
4.59%, 10/20/2041(4) | 571,107 | 646,031 | ||||||
4.66%, 10/20/2042(4) | 1,085,833 | 1,220,522 | ||||||
4.67%, 09/20/2041(4) | 323,024 | 369,158 | ||||||
4.76%, 03/20/2048(4) | 11,930,892 | 13,552,391 | ||||||
4.79%, 11/20/2042(4) | 183,189 | 209,137 | ||||||
5.15%, 06/20/2040(4) | 139,324 | 160,495 | ||||||
5.30%, 07/20/2060(4) | 43,848 | 46,174 | ||||||
5.41%, 01/20/2039(4) | 649,903 | 749,649 | ||||||
5.49%, 01/20/2038(4) | 597,560 | 707,616 | ||||||
5.50%, 01/16/2033 | 330,509 | 361,234 | ||||||
5.50%, 04/20/2033 | 183,145 | 199,151 | ||||||
5.50%, 03/16/2034 | 2,733,793 | 3,034,512 | ||||||
5.50%, 07/20/2035 | 24,228 | 4,353 | ||||||
5.50%, 09/20/2035 | 134,500 | 152,440 |
5.50%, 10/16/2037 | 133,833 | 9,550 | ||||||
5.50%, 02/20/2038 | 27,156 | 2,656 | ||||||
5.50%, 05/20/2039 | 31,169 | 4,608 | ||||||
5.50%, 09/20/2039 | 317,000 | 396,212 | ||||||
5.50%, 10/20/2039 | 778,716 | 901,634 | ||||||
5.51% (1 Month LIBOR USD + 5.70%, 5.70% Cap), 12/20/2038(2)(7) | 187,509 | 26,081 | ||||||
5.56%, 08/20/2038(4) | 206,480 | 240,792 | ||||||
5.56%, 10/20/2036 | 135,889 | 151,557 | ||||||
5.57%, 07/20/2040(4) | 216,181 | 255,664 | ||||||
5.71%, 08/20/2034(4) | 67,356 | 78,136 | ||||||
5.71% (1 Month LIBOR USD + 5.90%, 5.90% Cap), 09/20/2038(2)(7) | 177,583 | 33,692 | ||||||
5.75%, 02/20/2036 | 22,041 | 23,522 | ||||||
5.75%, 07/20/2038 | 127,725 | 138,645 | ||||||
5.76% (1 Month LIBOR USD + 5.95%, 5.95% Cap), 02/20/2039(2)(7) | 145,441 | 21,799 | ||||||
5.76% (1 Month LIBOR USD + 5.95%, 5.95% Cap), 06/20/2039(2)(7) | 140,402 | 20,883 | ||||||
5.81% (1 Month LIBOR USD + 6.00%, 6.00% Cap), 11/20/2037(2)(7) | 128,732 | 17,423 | ||||||
5.81% (1 Month LIBOR USD + 6.00%, 6.00% Cap), 02/20/2038(2)(7) | 1,099,918 | 203,837 | ||||||
5.81% (1 Month LIBOR USD + 6.00%, 6.00% Cap), 08/20/2038(2)(7) | 52,181 | 7,774 | ||||||
5.81% (1 Month LIBOR USD + 6.00%, 6.00% Cap), 12/20/2038(2)(7) | 104,401 | 9,879 | ||||||
5.82%, 10/20/2033(4) | 127,244 | 144,169 | ||||||
5.85% (1 Month LIBOR USD + 6.04%, 6.04% Cap), 02/20/2039(2)(7) | 89,177 | 10,683 | ||||||
5.87%, 12/20/2038(4) | 482,744 | 565,980 | ||||||
5.87%, 02/20/2037(4) | 43,926 | 51,194 | ||||||
5.89% (1 Month LIBOR USD + 6.08%, 6.08% Cap), 11/20/2034(2)(7) | 182,848 | 2,267 | ||||||
5.89% (1 Month LIBOR USD + 6.08%, 6.08% Cap), 06/20/2039(2)(7) | 199,037 | 30,006 | ||||||
5.90% (1 Month LIBOR USD + 6.09%, 6.09% Cap), 09/20/2039(2)(7) | 356,917 | 74,773 | ||||||
5.90% (1 Month LIBOR USD + 6.10%, 6.10% Cap), 02/16/2039(2)(7) | 88,177 | 11,841 | ||||||
5.90% (1 Month LIBOR USD + 6.10%, 6.10% Cap), 07/16/2039(2)(7) | 226,809 | 34,758 | ||||||
5.91% (1 Month LIBOR USD + 6.10%, 6.10% Cap), 10/20/2034(2)(7) | 350,395 | 61,044 | ||||||
5.95% (1 Month LIBOR USD + 6.15%, 6.15% Cap), 02/16/2039(2)(7) | 121,872 | 12,087 | ||||||
5.96%, 04/20/2037(4) | 86,017 | 99,564 | ||||||
5.96% (1 Month LIBOR USD + 6.15%, 6.15% Cap), 07/20/2038(2)(7) | 146,527 | 19,898 | ||||||
6.00%, 02/20/2029 | 74,708 | 74,698 | ||||||
6.00%, 11/20/2032 | 118,072 | 124,326 | ||||||
6.00%, 09/16/2033 | 102,113 | 117,836 | ||||||
6.00%, 06/20/2034 | 224,567 | 259,011 | ||||||
6.00%, 12/20/2035 | 47,576 | 7,727 | ||||||
6.00%, 06/20/2038 | 86,889 | 102,613 | ||||||
6.00%, 12/20/2038 | 30,804 | 1,789 | ||||||
6.00%, 05/20/2039 | 42,550 | 8,366 | ||||||
6.01% (1 Month LIBOR USD + 6.20%, 6.20% Cap), 03/20/2037(2)(7) | 128,284 | 22,644 | ||||||
6.01% (1 Month LIBOR USD + 6.20%, 6.20% Cap), 04/20/2037(2)(7) | 72,502 | 7,649 | ||||||
6.01% (1 Month LIBOR USD + 6.20%, 6.20% Cap), 05/20/2037(2)(7) | 133,242 | 23,936 | ||||||
6.01% (1 Month LIBOR USD + 6.20%, 6.20% Cap), 05/20/2037(2)(7) | 146,106 | 24,090 | ||||||
6.01% (1 Month LIBOR USD + 6.20%, 6.20% Cap), 06/20/2038(2)(7) | 41,695 | 7,307 | ||||||
6.01% (1 Month LIBOR USD + 6.20%, 6.20% Cap), 09/20/2038(2)(7) | 365,194 | 36,497 | ||||||
6.05% (1 Month LIBOR USD + 6.25%, 6.25% Cap), 08/16/2039(2)(7) | 216,802 | 44,476 | ||||||
6.06% (1 Month LIBOR USD + 6.25%, 6.25% Cap), 06/20/2037(2)(7) | 111,923 | 11,997 | ||||||
6.08% (1 Month LIBOR USD + 6.27%, 6.27% Cap), 04/20/2039(2)(7) | 257,070 | 42,997 | ||||||
6.11% (1 Month LIBOR USD + 6.30%, 6.30% Cap), 09/20/2035(2)(7) | 490,692 | 108,493 | ||||||
6.11% (1 Month LIBOR USD + 6.30%, 6.30% Cap), 04/20/2038(2)(7) | 173,117 | 586 | ||||||
6.11% (1 Month LIBOR USD + 6.30%, 6.30% Cap), 03/20/2039(2)(7) | 132,011 | 10,012 | ||||||
6.12%, 11/20/2038(4) | 143,925 | 169,558 | ||||||
6.20% (1 Month LIBOR USD + 6.40%, 6.40% Cap), 05/16/2038(2)(7) | 568,342 | 107,746 | ||||||
6.20% (1 Month LIBOR USD + 6.40%, 6.40% Cap), 06/16/2039(2)(7) | 29,994 | 410 | ||||||
6.20% (1 Month LIBOR USD + 6.40%, 6.40% Cap), 11/16/2039(2)(7) | 276,442 | 52,801 | ||||||
6.27% (1 Month LIBOR USD + 6.47%, 6.47% Cap), 06/16/2037(2)(7) | 87,447 | 13,231 | ||||||
6.31% (1 Month LIBOR USD + 6.50%, 6.50% Cap), 06/20/2036(2)(7) | 5,901 | 451 | ||||||
6.31% (1 Month LIBOR USD + 6.50%, 6.50% Cap), 11/20/2037(2)(7) | 247,918 | 27,671 | ||||||
6.32% (1 Month LIBOR USD + 6.51%, 6.51% Cap), 11/20/2037(2)(7) | 141,485 | 29,484 | ||||||
6.34% (1 Month LIBOR USD + 6.54%, 6.54% Cap), 11/16/2037(2)(7) | 122,367 | 17,874 | ||||||
6.35% (1 Month LIBOR USD + 6.55%, 6.55% Cap), 11/16/2033(2)(7) | 67,480 | 7,526 | ||||||
6.35% (1 Month LIBOR USD + 6.55%, 6.55% Cap), 12/16/2033(2)(7) | 67,325 | 8,723 | ||||||
6.35% (1 Month LIBOR USD + 6.55%, 6.55% Cap), 09/16/2034(2)(7) | 239,430 | 50,357 | ||||||
6.36% (1 Month LIBOR USD + 6.55%, 6.55% Cap), 09/20/2037(2)(7) | 113,998 | 16,916 | ||||||
6.36% (1 Month LIBOR USD + 6.55%, 6.55% Cap), 11/20/2037(2)(7) | 112,453 | 16,443 | ||||||
6.36% (1 Month LIBOR USD + 6.55%, 6.55% Cap), 12/20/2037(2)(7) | 169,841 | 26,061 | ||||||
6.41% (1 Month LIBOR USD + 6.60%, 6.60% Cap), 05/20/2041(2)(7) | 284,953 | 53,644 | ||||||
6.45% (1 Month LIBOR USD + 6.64%, 6.64% Cap), 07/20/2037(2)(7) | 161,742 | 25,109 | ||||||
6.49% (1 Month LIBOR USD + 6.68%, 6.68% Cap), 07/20/2037(2)(7) | 160,599 | 34,817 | ||||||
6.50%, 07/20/2032 | 60,713 | 60,705 | ||||||
6.50%, 01/20/2033 | 86,475 | 95,362 |
6.50%, 03/20/2033 | 48,805 | 54,863 | ||||||
6.50%, 03/20/2033 | 166,320 | 183,939 | ||||||
6.50%, 05/20/2033 | 64,997 | 74,852 | ||||||
6.50%, 07/20/2036 | 230,478 | 272,107 | ||||||
6.50%, 08/20/2036 | 307,171 | 355,055 | ||||||
6.50%, 03/20/2039 | 47,347 | 8,456 | ||||||
6.50%, 03/20/2039 | 106,240 | 23,697 | ||||||
6.51% (1 Month LIBOR USD + 6.70%, 6.70% Cap), 10/20/2036(2)(7) | 76,421 | 15,092 | ||||||
6.56% (1 Month LIBOR USD + 6.75%, 6.75% Cap), 01/20/2035(2)(7) | 234,809 | 58,087 | ||||||
6.56% (1 Month LIBOR USD + 6.75%, 6.75% Cap), 07/20/2037(2)(7) | 109,852 | 19,609 | ||||||
6.59% (1 Month LIBOR USD + 6.78%, 6.78% Cap), 08/20/2037(2)(7) | 39,157 | 5,854 | ||||||
6.61% (1 Month LIBOR USD + 6.80%, 6.80% Cap), 06/20/2035(2)(7) | 122,682 | 136,252 | ||||||
6.61% (1 Month LIBOR USD + 6.80%, 6.80% Cap), 11/20/2036(2)(7) | 117,151 | 17,463 | ||||||
6.61% (1 Month LIBOR USD + 6.81%, 6.81% Cap), 04/16/2037(2)(7) | 185,602 | 42,426 | ||||||
7.00% (1 Month LIBOR USD + 44.50%, 7.00% Cap), 09/20/2034(2)(7) | 25,997 | 28,479 | ||||||
7.00%, 08/16/2039 | 109,366 | 123,363 | ||||||
7.00%, 10/16/2040 | 398,746 | 484,076 | ||||||
7.11% (1 Month LIBOR USD + 7.30%, 7.30% Cap), 12/20/2038(2)(7) | 326,930 | 69,444 | ||||||
7.41% (1 Month LIBOR USD + 7.60%, 7.60% Cap), 09/20/2038(2)(7) | 76,699 | 13,087 | ||||||
7.50% (1 Month LIBOR USD + 7.70%, 7.70% Cap), 02/16/2033(2)(7) | 29,366 | 98 | ||||||
7.50% (1 Month LIBOR USD + 7.70%, 7.70% Cap), 04/16/2038(2)(7) | 67,036 | 12,904 | ||||||
7.51% (1 Month LIBOR USD + 7.70%, 7.70% Cap), 02/20/2033(2)(7) | 19,458 | 2,814 | ||||||
8.05% (1 Month LIBOR USD + 8.25%, 8.25% Cap), 08/16/2031(2)(7) | 12,980 | 46 | ||||||
11.82% (1 Month LIBOR USD + 12.20%, 12.20% Cap), 10/20/2034(2)(7) | 196 | 197 | ||||||
13.02% (1 Month LIBOR USD + 13.40%, 13.40% Cap), 10/20/2037(2)(7) | 19,746 | 23,322 | ||||||
13.83% (1 Month LIBOR USD + 14.26%, 14.26% Cap), 10/16/2034(2)(7) | 2,025 | 2,299 | ||||||
14.35% (1 Month LIBOR USD + 14.70%, 14.70% Cap), 11/17/2032(2)(7) | 10,609 | 12,037 | ||||||
14.45% (1 Month LIBOR USD + 14.86%, 14.86% Cap), 08/17/2034(2)(7) | 15,439 | 16,647 | ||||||
15.96% (1 Month LIBOR USD + 16.43%, 16.43% Cap), 06/17/2035(2)(7) | 76,246 | 99,810 | ||||||
16.29% (1 Month LIBOR USD + 16.72%, 16.72% Cap), 05/18/2034(2)(7) | 2,327 | 2,931 | ||||||
19.13% (1 Month LIBOR USD + 19.66%, 19.66% Cap), 04/16/2034(2)(7) | 33,818 | 51,924 | ||||||
19.38% (1 Month LIBOR USD + 19.95%, 19.95% Cap), 11/20/2037(2)(7) | 13,816 | 18,409 | ||||||
19.64% (1 Month LIBOR USD + 20.21%, 20.21% Cap), 09/20/2037(2)(7) | 27,555 | 37,435 | ||||||
20.18% (1 Month LIBOR USD + 20.83%, 20.83% Cap), 08/16/2035(2)(7) | 13,693 | 22,450 | ||||||
22.01% (1 Month LIBOR USD + 22.73%, 22.73% Cap), 08/20/2035(2)(7) | 3,093 | 5,823 | ||||||
23.67% (1 Month LIBOR USD + 24.38%, 24.38% Cap), 10/16/2034(2)(7) | 21,375 | 35,520 | ||||||
28.53% (1 Month LIBOR USD + 29.46%, 29.46% Cap), 09/20/2034(2)(7) | 25,997 | 42,288 | ||||||
Ginnie Mae I Pool | ||||||||
3.00%, 05/15/2043 | 479,125 | 512,525 | ||||||
3.00%, 07/15/2045 | 1,518,693 | 1,605,560 | ||||||
3.50%, 01/15/2042 | 4,280,431 | 4,571,528 | ||||||
3.50%, 03/15/2043 | 1,156,010 | 1,269,919 | ||||||
3.50%, 04/15/2043 | 3,697,059 | 3,946,487 | ||||||
3.50%, 06/15/2043 | 1,464,854 | 1,565,177 | ||||||
3.50%, 07/15/2043 | 587,535 | 645,415 | ||||||
4.00%, 06/15/2039 | 375,377 | 404,127 | ||||||
4.00%, 10/15/2040 | 201,731 | 218,386 | ||||||
4.50%, 04/15/2040 | 1,861,961 | 2,072,886 | ||||||
5.50%, 04/15/2033 | 242,784 | 283,535 | ||||||
5.50%, 06/15/2033 | 2,632 | 3,045 | ||||||
5.50%, 12/15/2033 | 9,645 | 11,248 | ||||||
5.50%, 07/15/2034 | 2,872 | 3,161 | ||||||
5.50%, 09/15/2034 | 14,487 | 16,210 | ||||||
6.00%, 11/15/2028 | 8,605 | 9,568 | ||||||
6.50%, 01/15/2024 | 2,215 | 2,438 | ||||||
6.50%, 03/15/2028 | 6,512 | 7,196 | ||||||
6.50%, 09/15/2028 | 13,836 | 15,350 | ||||||
6.50%, 10/15/2028 | 739 | 824 | ||||||
6.50%, 01/15/2032 | 53,528 | 62,572 | ||||||
6.50%, 07/15/2032 | 2,212 | 2,434 | ||||||
6.50%, 02/15/2033 | 8,925 | 10,169 | ||||||
6.50%, 04/15/2033 | 5,764 | 6,606 | ||||||
6.50%, 12/15/2035 | 58,590 | 69,660 | ||||||
7.00%, 08/15/2023 | 149 | 151 | ||||||
7.00%, 09/15/2023 | 6,294 | 6,637 | ||||||
7.00%, 11/15/2023 | 319 | 337 | ||||||
7.00%, 02/15/2024 | 1,754 | 1,775 | ||||||
7.00%, 09/15/2031 | 66,428 | 80,295 | ||||||
7.00%, 02/15/2033 | 5,405 | 6,251 | ||||||
7.00%, 06/15/2033 | 16,635 | 20,528 | ||||||
7.00%, 06/15/2035 | 168,922 | 200,791 | ||||||
7.00%, 04/15/2037 | 26,521 | 31,234 |
7.50%, 11/15/2022 | 11 | 11 | ||||||
7.50%, 03/15/2023 | 138 | 140 | ||||||
7.50%, 11/15/2026 | 780 | 795 | ||||||
7.50%, 07/15/2027 | 794 | 798 | ||||||
7.50%, 07/15/2028 | 584 | 594 | ||||||
7.50%, 09/15/2028 | 2,495 | 2,751 | ||||||
7.50%, 10/15/2037 | 30,456 | 36,005 | ||||||
8.00%, 08/15/2028 | 977 | 981 | ||||||
9.00%, 11/15/2024 | 69 | 69 | ||||||
9.50%, 10/15/2024 | 1,051 | 1,085 | ||||||
9.50%, 12/15/2025 | 303 | 304 | ||||||
Ginnie Mae II Pool | ||||||||
2.50%, 12/20/2046 | 2,737,691 | 2,901,650 | ||||||
3.00%, 06/20/2042 | 295,672 | 316,384 | ||||||
3.00%, 08/20/2042 | 4,010,628 | 4,290,531 | ||||||
3.00%, 11/20/2042 | 2,218,520 | 2,372,685 | ||||||
3.00%, 12/20/2042 | 1,135,832 | 1,214,982 | ||||||
3.00%, 01/20/2043 | 1,146,424 | 1,226,154 | ||||||
3.00%, 04/20/2043 | 2,870,766 | 3,070,720 | ||||||
3.00%, 09/20/2043 | 882,991 | 944,434 | ||||||
3.00%, 10/20/2043 | 133,625 | 142,933 | ||||||
3.00%, 01/20/2044 | 762,415 | 815,755 | ||||||
3.00%, 07/20/2044 | 332,183 | 355,328 | ||||||
3.00%, 12/20/2044 | 638,941 | 683,117 | ||||||
3.00%, 04/20/2045 | 5,934,713 | 6,315,013 | ||||||
3.00%, 05/20/2045 | 1,040,330 | 1,109,719 | ||||||
3.00%, 07/20/2045 | 2,410,687 | 2,573,658 | ||||||
3.00%, 10/20/2045 | 2,701,631 | 2,879,839 | ||||||
3.00%, 11/20/2045 | 644,076 | 686,258 | ||||||
3.00%, 02/20/2046 | 936,772 | 997,573 | ||||||
3.00%, 04/20/2046 | 6,356,872 | 6,764,269 | ||||||
3.00%, 05/20/2046 | 265,252 | 281,717 | ||||||
3.00%, 07/20/2046 | 5,133,661 | 5,460,475 | ||||||
3.00%, 08/20/2046 | 5,943,804 | 6,323,690 | ||||||
3.00%, 09/20/2046 | 1,751,946 | 1,862,394 | ||||||
3.00%, 01/20/2047 | 3,960,867 | 4,208,578 | ||||||
3.00%, 02/20/2047 | 5,524,810 | 5,866,404 | ||||||
3.00%, 03/20/2047 | 599,812 | 637,174 | ||||||
3.50%, 10/20/2042 | 4,503,356 | 4,896,382 | ||||||
3.50%, 11/20/2042 | 1,552,774 | 1,688,291 | ||||||
3.50%, 05/20/2043 | 1,050,809 | 1,143,820 | ||||||
3.50%, 03/20/2045 | 1,410,602 | 1,510,258 | ||||||
3.50%, 04/20/2045 | 11,110,636 | 11,894,114 | ||||||
3.50%, 10/20/2045 | 9,273,869 | 9,951,913 | ||||||
3.50%, 03/20/2046 | 854,264 | 914,797 | ||||||
3.50%, 04/20/2046 | 19,466,353 | 20,877,641 | ||||||
3.50%, 05/20/2046 | 10,639,676 | 11,399,348 | ||||||
3.50%, 06/20/2046 | 3,810,218 | 4,078,411 | ||||||
3.50%, 07/20/2046(6) | 10,793,408 | 11,548,443 | ||||||
3.50%, 09/20/2046 | 1,208,248 | 1,294,486 | ||||||
3.50%, 12/20/2046 | 7,702,803 | 8,205,073 | ||||||
3.50%, 01/20/2047 | 601,918 | 640,172 | ||||||
3.50%, 02/20/2047 | 6,854,603 | 7,319,766 | ||||||
3.50%, 03/20/2047 | 5,518,630 | 5,871,127 | ||||||
3.50%, 05/20/2047 | 4,966,863 | 5,297,420 | ||||||
3.50%, 06/20/2047 | 5,192,757 | 5,534,468 | ||||||
3.50%, 11/20/2047 | 15,285,636 | 16,261,807 | ||||||
3.50%, 12/20/2047 | 2,963,859 | 3,149,709 | ||||||
3.50%, 11/20/2049 | 6,161,972 | 6,572,715 | ||||||
4.00%, 10/20/2040 | 1,987,534 | 2,190,953 | ||||||
4.00%, 06/20/2042 | 2,545,388 | 2,803,447 | ||||||
4.00%, 10/20/2042 | 5,450,421 | 6,006,490 | ||||||
4.00%, 12/20/2042 | 2,658,766 | 2,930,279 | ||||||
4.00%, 02/20/2043 | 1,175,647 | 1,295,787 | ||||||
4.00%, 10/20/2043 | 3,816,624 | 4,184,272 | ||||||
4.00%, 11/20/2044 | 2,098,416 | 2,285,133 | ||||||
4.00%, 12/20/2044 | 1,492,458 | 1,624,997 | ||||||
4.00%, 03/20/2045 | 386,188 | 420,589 | ||||||
4.00%, 05/20/2045 | 4,923,706 | 5,339,116 | ||||||
4.00%, 06/20/2045 | 993,823 | 1,080,762 | ||||||
4.00%, 08/20/2045 | 12,999,567 | 14,088,950 | ||||||
4.00%, 11/20/2045 | 4,821,885 | 5,220,307 |
4.00%, 01/20/2046 | 1,580,851 | 1,709,605 | ||||||
4.00%, 03/20/2046 | 1,024,102 | 1,108,170 | ||||||
4.00%, 04/20/2046 | 2,731,809 | 2,952,723 | ||||||
4.00%, 05/20/2046 | 4,601,997 | 4,974,209 | ||||||
4.00%, 06/20/2046 | 2,148,463 | 2,322,042 | ||||||
4.00%, 11/20/2046 | 1,977,957 | 2,129,798 | ||||||
4.00%, 02/20/2047 | 3,401,814 | 3,658,546 | ||||||
4.00%, 03/20/2047 | 7,176,775 | 7,710,162 | ||||||
4.00%, 05/20/2047 | 609,022 | 654,416 | ||||||
4.00%, 06/20/2047 | 2,205,684 | 2,369,412 | ||||||
4.00%, 07/20/2047 | 8,841,944 | 9,510,637 | ||||||
4.00%, 09/20/2047 | 3,337,409 | 3,577,530 | ||||||
4.00%, 12/20/2047 | 4,732,422 | 5,069,305 | ||||||
4.00%, 01/20/2048 | 1,810,989 | 1,941,071 | ||||||
4.25%, 05/20/2063(4) | 112,641 | 114,023 | ||||||
4.25%, 12/20/2047 | 1,546,045 | 1,710,312 | ||||||
4.50%, 06/20/2040 | 672,999 | 738,810 | ||||||
4.50%, 01/20/2041 | 552,898 | 617,805 | ||||||
4.50%, 03/20/2041 | 513,516 | 563,666 | ||||||
4.50%, 05/20/2041 | 256,183 | 281,238 | ||||||
4.50%, 06/20/2041 | 1,797,591 | 1,973,194 | ||||||
4.50%, 09/20/2041 | 575,141 | 631,438 | ||||||
4.50%, 09/20/2043 | 1,462,975 | 1,602,986 | ||||||
4.50%, 10/20/2043 | 2,786,283 | 3,052,781 | ||||||
4.50%, 12/20/2043 | 1,480,829 | 1,622,441 | ||||||
4.50%, 01/20/2046 | 2,339,152 | 2,562,576 | ||||||
4.50%, 07/20/2046 | 1,226,912 | 1,343,919 | ||||||
4.50%, 09/20/2046 | 2,090,345 | 2,274,617 | ||||||
4.50%, 11/20/2046 | 3,602,996 | 3,944,741 | ||||||
4.50%, 03/20/2047 | 764,131 | 834,411 | ||||||
4.50%, 07/20/2047 | 7,764,582 | 8,458,778 | ||||||
4.50%, 08/20/2047 | 2,051,275 | 2,234,891 | ||||||
4.50%, 09/20/2047 | 10,563,183 | 11,520,157 | ||||||
4.50%, 01/20/2048 | 1,587,369 | 1,708,998 | ||||||
4.50%, 02/20/2048 | 7,523,897 | 8,164,557 | ||||||
4.50%, 03/20/2048 | 831,499 | 892,367 | ||||||
4.50%, 04/20/2048 | 764,134 | 824,647 | ||||||
4.50%, 04/20/2048 | 1,980,069 | 2,154,564 | ||||||
4.50%, 04/20/2048 | 2,831,363 | 3,054,093 | ||||||
4.50%, 04/20/2048 | 3,903,231 | 4,307,651 | ||||||
4.50%, 05/20/2048 | 2,414,400 | 2,588,524 | ||||||
4.50%, 05/20/2048 | 5,687,583 | 6,276,216 | ||||||
4.50%, 05/20/2048 | 8,366,243 | 9,001,374 | ||||||
4.50%, 09/20/2048 | 1,934,140 | 2,082,937 | ||||||
4.50%, 11/20/2049 | 10,796,083 | 11,818,013 | ||||||
5.00%, 10/20/2037 | 256,923 | 290,193 | ||||||
5.00%, 07/20/2040 | 171,455 | 193,489 | ||||||
5.00%, 06/20/2044 | 711,149 | 802,457 | ||||||
5.00%, 07/20/2044 | 609,684 | 685,293 | ||||||
5.00%, 08/20/2045 | 816,958 | 909,572 | ||||||
5.00%, 09/20/2046 | 1,902,376 | 2,145,912 | ||||||
5.00%, 10/20/2047 | 382,210 | 422,670 | ||||||
5.00%, 11/20/2047 | 1,817,430 | 2,009,852 | ||||||
5.00%, 06/20/2048 | 3,331,345 | 3,669,663 | ||||||
5.00%, 07/20/2048 | 1,321,298 | 1,473,321 | ||||||
5.00%, 07/20/2048 | 4,645,353 | 5,074,360 | ||||||
5.00%, 07/20/2049 | 1,677,893 | 1,882,826 | ||||||
5.00%, 08/20/2049 | 8,868,405 | 9,872,833 | ||||||
5.50%, 09/20/2039 | 104,396 | 119,259 | ||||||
6.00%, 03/20/2028 | 4,992 | 5,613 | ||||||
6.00%, 11/20/2033 | 4,023 | 4,621 | ||||||
6.00%, 09/20/2038 | 398,622 | 457,816 | ||||||
6.00%, 11/20/2038 | 4,030 | 4,487 | ||||||
6.00%, 08/20/2039 | 194,840 | 222,094 | ||||||
6.50%, 07/20/2029 | 58,342 | 67,310 | ||||||
7.00%, 08/20/2038 | 19,305 | 22,354 | ||||||
7.50%, 02/20/2028 | 1,022 | 1,150 | ||||||
7.50%, 09/20/2028 | 3,038 | 3,446 | ||||||
8.00%, 12/20/2025 | 422 | 466 | ||||||
8.00%, 06/20/2026 | 982 | 1,094 | ||||||
8.00%, 08/20/2026 | 754 | 870 | ||||||
8.00%, 09/20/2026 | 870 | 1,011 |
8.00%, 11/20/2026 | 708 | 812 | ||||||
8.00%, 10/20/2027 | 1,743 | 1,977 | ||||||
8.00%, 11/20/2027 | 1,678 | 1,893 | ||||||
8.00%, 12/20/2027 | 848 | 964 | ||||||
8.00%, 06/20/2028 | 476 | 483 | ||||||
8.00%, 08/20/2028 | 108 | 112 | ||||||
8.00%, 09/20/2028 | 261 | 267 | ||||||
8.50%, 03/20/2025 | 186 | 191 | ||||||
8.50%, 04/20/2025 | 1,036 | 1,139 | ||||||
8.50%, 05/20/2025 | 2,347 | 2,566 | ||||||
Ginnie Mae TBA 30 YR | ||||||||
2.50%, 08/01/2050(9) | 8,825,000 | 9,266,939 | ||||||
GMACM Mortgage Loan Trust 2005-AR3 | ||||||||
3.58%, 06/19/2035(4) | 62,221 | 57,933 | ||||||
GS Mortgage Securities Corp. II | ||||||||
4.26%, 07/10/2051(4) | 28,521,000 | 31,898,303 | ||||||
GS Mortgage Securities Corp. Trust 2012-ALOHA | ||||||||
3.55%, 04/10/2034(3) | 4,200,000 | 4,248,833 | ||||||
GS Mortgage Securities Trust 2006-GG8 | ||||||||
1.27%, 11/10/2039(3)(4) | 1,200,464 | 3,936 | ||||||
GS Mortgage Securities Trust 2012-GCJ9 | ||||||||
2.77%, 11/10/2045 | 12,926,324 | 13,143,087 | ||||||
GS Mortgage Securities Trust 2013-GC13 | ||||||||
3.87%, 07/10/2046(4) | 5,880,000 | 6,195,152 | ||||||
GS Mortgage Securities Trust 2013-GC16 | ||||||||
1.21%, 11/10/2046(4) | 16,491,680 | 471,134 | ||||||
GS Mortgage Securities Trust 2013-GCJ12 | ||||||||
3.14%, 06/10/2046 | 1,260,000 | 1,314,641 | ||||||
GS Mortgage Securities Trust 2014-GC18 | ||||||||
3.80%, 01/10/2047 | 4,458,693 | 4,749,273 | ||||||
4.07%, 01/10/2047 | 4,338,000 | 4,687,629 | ||||||
GS Mortgage Securities Trust 2014-GC26 | ||||||||
3.36%, 11/10/2047 | 8,000,000 | 8,510,698 | ||||||
GS Mortgage Securities Trust 2015-GC28 | ||||||||
3.14%, 02/10/2048 | 9,000,000 | 9,566,052 | ||||||
GS Mortgage Securities Trust 2016-GS4 | ||||||||
3.18%, 11/10/2049 | 12,000,000 | 13,039,312 | ||||||
3.44%, 11/10/2049(4) | 1,317,000 | 1,452,370 | ||||||
GS Mortgage Securities Trust 2020-GC45 | ||||||||
2.91%, 02/13/2053 | 2,550,000 | 2,790,421 | ||||||
GSMPS Mortgage Loan Trust 2004-4 | ||||||||
0.58% (1 Month LIBOR USD + 0.40%, 0.40% Floor), 06/25/2034(2)(3) | 50,992 | 42,558 | ||||||
GSMPS Mortgage Loan Trust 2005-RP2 | ||||||||
0.53% (1 Month LIBOR USD + 0.35%, 0.35% Floor), 03/25/2035(2)(3) | 88,637 | 78,916 | ||||||
GSMPS Mortgage Loan Trust 2005-RP3 | ||||||||
0.53% (1 Month LIBOR USD + 0.35%, 0.35% Floor, 9.50% Cap), 09/25/2035(2)(3) | 573,472 | 482,851 | ||||||
4.26%, 09/25/2035(3)(4) | 422,801 | 61,477 | ||||||
GSR Mortgage Loan Trust 2003-3F | ||||||||
5.75%, 04/25/2033 | 19,689 | 20,576 | ||||||
GSR Mortgage Loan Trust 2003-6F | ||||||||
0.58% (1 Month LIBOR USD + 0.40%, 0.40% Floor, 7.50% Cap), 09/25/2032(2) | 4,264 | 4,195 | ||||||
GSR Mortgage Loan Trust 2004-13F | ||||||||
6.00%, 11/25/2034 | 57,919 | 60,672 | ||||||
GSR Mortgage Loan Trust 2004-6F | ||||||||
5.50%, 05/25/2034 | 64,294 | 66,121 | ||||||
6.50%, 05/25/2034 | 44,729 | 47,849 | ||||||
GSR Mortgage Loan Trust 2005-5F | ||||||||
0.68% (1 Month LIBOR USD + 0.50%, 0.50% Floor, 5.50% Cap), 06/25/2035(2) | 18,918 | 17,535 | ||||||
GSR Mortgage Loan Trust 2005-7F | ||||||||
6.00%, 09/25/2035 | 90,103 | 93,015 | ||||||
GSR Mortgage Loan Trust 2005-AR6 | ||||||||
3.65%, 09/25/2035(4) | 5,287 | 5,152 | ||||||
GSR Mortgage Loan Trust 2006-1F | ||||||||
5.50%, 02/25/2036 | 47,352 | 59,570 | ||||||
6.00%, 02/25/2036 | 279,609 | 209,952 | ||||||
Headlands Residential LLC | ||||||||
3.88%, 08/25/2022(1)(3) | 6,170,000 | 6,101,891 | ||||||
3.97%, 06/25/2024(1)(3) | 9,000,000 | 8,970,691 | ||||||
Home Re 2018-1 Ltd. | ||||||||
1.78% (1 Month LIBOR USD + 1.60%), 10/25/2028(2)(3) | 556,358 | 554,746 | ||||||
Home RE 2019-1 Ltd. | ||||||||
1.83% (1 Month LIBOR USD + 1.65%), 05/25/2029(2)(3) | 513,119 | 505,451 |
HomeBanc Mortgage Trust 2005-3 | ||||||||
0.42% (1 Month LIBOR USD + 0.24%, 0.24% Floor, 11.50% Cap), 07/25/2035(2) | 229,977 | 228,827 | ||||||
Impac CMB Trust Series 2004-4 | ||||||||
4.88%, 09/25/2034(1) | 8,240 | 8,813 | ||||||
Impac CMB Trust Series 2004-7 | ||||||||
0.92% (1 Month LIBOR USD + 0.74%, 11.25% Cap), 11/25/2034(2) | 695,948 | 670,719 | ||||||
Impac CMB Trust Series 2005-4 | ||||||||
0.78% (1 Month LIBOR USD + 0.60%, 0.30% Floor, 10.25% Cap), 05/25/2035(2) | 91,975 | 83,316 | ||||||
Impac Secured Assets CMN Owner Trust | ||||||||
5.50%, 08/25/2033 | 62,180 | 62,340 | ||||||
Impac Secured Assets Trust 2006-1 | ||||||||
0.53% (1 Month LIBOR USD + 0.35%, 0.35% Floor, 11.50% Cap), 05/25/2036(2) | 211,932 | 195,219 | ||||||
Impac Secured Assets Trust 2006-2 | ||||||||
0.53% (1 Month LIBOR USD + 0.35%, 0.35% Floor, 11.50% Cap), 08/25/2036(2) | 114,317 | 112,853 | ||||||
Independence Plaza Trust 2018-INDP | ||||||||
3.76%, 07/10/2035(3) | 5,445,000 | 5,800,322 | ||||||
JP Morgan Alternative Loan Trust | ||||||||
3.80%, 03/25/2036(4) | 26,584 | 23,970 | ||||||
JP Morgan Chase Commercial Mortgage Securities Corp. | ||||||||
1.18% (1 Month LIBOR USD + 1.00%, 1.00% Floor), 09/15/2029(2)(3) | 9,200,000 | 8,923,552 | ||||||
JP Morgan Chase Commercial Mortgage Securities Trust 2005-CIBC11 | ||||||||
0.18%, 08/12/2037(3)(4) | 1,001,832 | 156 | ||||||
JP Morgan Chase Commercial Mortgage Securities Trust 2006-CIBC15 | ||||||||
0.40%, 06/12/2043(4) | 1,829,873 | 2,098 | ||||||
JP Morgan Chase Commercial Mortgage Securities Trust 2007-LDP12 | ||||||||
0.00%, 02/15/2051(4) | 929,771 | 9 | ||||||
JP Morgan Chase Commercial Mortgage Securities Trust 2013-LC11 | ||||||||
2.96%, 04/15/2046 | 7,152,087 | 7,409,463 | ||||||
JP Morgan Mortgage Trust 2004-A3 | ||||||||
3.26%, 07/25/2034(4) | 4,309 | 4,359 | ||||||
JP Morgan Mortgage Trust 2004-A4 | ||||||||
3.37%, 09/25/2034(4) | 25,924 | 24,837 | ||||||
JP Morgan Mortgage Trust 2004-S1 | ||||||||
5.00%, 09/25/2034 | 4,197 | 4,251 | ||||||
JP Morgan Mortgage Trust 2005-A1 | ||||||||
3.99%, 02/25/2035(4) | 65,108 | 62,291 | ||||||
JP Morgan Mortgage Trust 2005-A4 | ||||||||
3.19%, 07/25/2035(4) | 62,662 | 62,830 | ||||||
JP Morgan Mortgage Trust 2006-A2 | ||||||||
3.60%, 08/25/2034(4) | 363,575 | 365,775 | ||||||
4.10%, 11/25/2033(4) | 218,148 | 216,187 | ||||||
JP Morgan Mortgage Trust 2006-A3 | ||||||||
3.64%, 08/25/2034(4) | 54,733 | 51,422 | ||||||
JP Morgan Mortgage Trust 2006-A7 | ||||||||
3.79%, 01/25/2037(4) | 54,504 | 48,785 | ||||||
3.79%, 01/25/2037(4) | 95,609 | 85,575 | ||||||
JP Morgan Mortgage Trust 2007-A1 | ||||||||
3.97%, 07/25/2035(4) | 47,823 | 46,142 | ||||||
3.97%, 07/25/2035(4) | 729,507 | 704,566 | ||||||
JP Morgan Mortgage Trust 2007-A2 | ||||||||
3.94%, 04/25/2037(4) | 193,635 | 169,773 | ||||||
JPMBB Commercial Mortgage Securities Trust 2013-C17 | ||||||||
3.93%, 01/15/2047 | 2,288,937 | 2,457,381 | ||||||
JPMBB Commercial Mortgage Securities Trust 2014-C19 | ||||||||
3.67%, 04/15/2047 | 2,010,000 | 2,041,039 | ||||||
JPMBB Commercial Mortgage Securities Trust 2014-C25 | ||||||||
3.41%, 11/15/2047 | 8,240,000 | 8,821,503 | ||||||
JPMCC Commercial Mortgage Securities Trust 2017-JP5 | ||||||||
3.46%, 03/15/2050 | 12,460,000 | 13,798,370 | ||||||
JPMCC Commercial Mortgage Securities Trust 2017-JP7 | ||||||||
3.19%, 09/15/2050 | 20,000,000 | 21,940,588 | ||||||
Ladder Capital Commercial Mortgage 2013-GCP Mortgage Trust | ||||||||
3.99%, 02/15/2036(3) | 1,027,000 | 1,120,780 | ||||||
LB-UBS Commercial Mortgage Trust 2007-C2 | ||||||||
0.36%, 02/15/2040(4) | 307,700 | 16 | ||||||
LCCM 2017-LC26 | ||||||||
3.29%, 07/12/2050(3) | 20,300,000 | 21,636,448 | ||||||
Legacy Mortgage Asset Trust 2019-GS6 | ||||||||
3.00%, 06/25/2059(1)(3) | 930,148 | 929,425 | ||||||
Legacy Mortgage Asset Trust 2019-PR1 | ||||||||
3.86%, 09/25/2059(1)(3) | 9,030,442 | 9,475,254 | ||||||
Legacy Mortgage Asset Trust 2020-GS1 | ||||||||
2.88%, 10/25/2059(1)(3) | 5,725,742 | 5,670,888 |
Lehman Mortgage Trust 2006-2 | ||||||||
5.96%, 04/25/2036(4) | 48,019 | 41,823 | ||||||
Lehman Mortgage Trust 2007-6 | ||||||||
6.00%, 07/25/2037 | 27,785 | 26,179 | ||||||
Lehman Mortgage Trust 2008-2 | ||||||||
6.00%, 03/25/2038 | 275,506 | 162,503 | ||||||
LHOME Mortgage Trust 2019-RTL3 | ||||||||
3.87%, 07/25/2024(3) | 9,210,000 | 9,253,478 | ||||||
Luminent Mortgage Trust 2005-1 | ||||||||
0.44% (1 Month LIBOR USD + 0.26%, 0.26% Floor, 11.50% Cap), 11/25/2035(2) | 1,258,068 | 1,156,258 | ||||||
MASTR Adjustable Rate Mortgages Trust 2004-13 | ||||||||
4.33%, 04/21/2034(4) | 99,080 | 97,396 | ||||||
MASTR Adjustable Rate Mortgages Trust 2004-15 | ||||||||
4.16%, 12/25/2034(4) | 26,627 | 24,175 | ||||||
MASTR Adjustable Rate Mortgages Trust 2004-3 | ||||||||
3.44%, 04/25/2034(4) | 24,848 | 21,797 | ||||||
MASTR Alternative Loan Trust 2003-9 | ||||||||
6.00%, 12/25/2033 | 24,804 | 25,882 | ||||||
6.00%, 01/25/2034 | 18,914 | 19,705 | ||||||
MASTR Alternative Loan Trust 2004-10 | ||||||||
4.50%, 09/25/2020 | 953 | 953 | ||||||
MASTR Alternative Loan Trust 2004-13 | ||||||||
5.50%, 01/25/2025 | 20,779 | 21,477 | ||||||
MASTR Alternative Loan Trust 2004-3 | ||||||||
6.00%, 04/25/2034 | 174,698 | 178,616 | ||||||
6.25%, 04/25/2034 | 38,203 | 39,149 | ||||||
MASTR Alternative Loan Trust 2004-6 | ||||||||
0.00%, 07/25/2034 | 24,222 | 20,630 | ||||||
6.00%, 07/25/2034 | 16,297 | 17,288 | ||||||
MASTR Alternative Loan Trust 2004-7 | ||||||||
0.00%, 08/25/2034 | 17,226 | 14,510 | ||||||
MASTR Alternative Loan Trust 2004-8 | ||||||||
5.50%, 09/25/2020 | 314 | 323 | ||||||
MASTR Alternative Loan Trust 2005-6 | ||||||||
5.50%, 11/25/2020 | 14,148 | 13,526 | ||||||
MASTR Asset Securitization Trust 2003-12 | ||||||||
0.00%, 12/25/2033 | 2,982 | 2,678 | ||||||
5.00%, 12/25/2033 | 9,857 | 9,962 | ||||||
MASTR Asset Securitization Trust 2004-1 | ||||||||
0.00%, 02/25/2034 | 2,058 | 1,697 | ||||||
MASTR Asset Securitization Trust 2004-4 | ||||||||
5.25%, 12/26/2033 | 48,955 | 49,485 | ||||||
MASTR Asset Securitization Trust 2004-6 | ||||||||
0.00%, 07/25/2020 | 37 | 37 | ||||||
MASTR Asset Securitization Trust 2004-8 | ||||||||
4.75%, 08/25/2020 | 163 | 163 | ||||||
MASTR Reperforming Loan Trust 2005-2 | ||||||||
0.53% (1 Month LIBOR USD + 0.35%, 0.35% Floor, 9.50% Cap), 05/25/2035(2)(3) | 811,220 | 374,735 | ||||||
MASTR Reperforming Loan Trust 2006-2 | ||||||||
4.35%, 05/25/2036(3)(4) | 95,976 | 89,617 | ||||||
MASTR Resecuritization Trust 2005-PO | ||||||||
0.00%, 05/28/2035(3) | 19,884 | 14,546 | ||||||
Merrill Lynch Mortgage Backed Securities Trust Series 2007-3 | ||||||||
2.16%, 06/25/2037(4) | 65,336 | 59,811 | ||||||
Merrill Lynch Mortgage Investors Trust Series 2003-A5 | ||||||||
3.55%, 08/25/2033(4) | 32,977 | 31,759 | ||||||
Merrill Lynch Mortgage Investors Trust Series MLCC 2003-E | ||||||||
0.80% (1 Month LIBOR USD + 0.62%, 0.31% Floor, 11.75% Cap), 10/25/2028(2) | 66,104 | 64,334 | ||||||
Merrill Lynch Mortgage Investors Trust Series MLCC 2003-F | ||||||||
0.82% (1 Month LIBOR USD + 0.64%, 0.32% Floor, 11.75% Cap), 10/25/2028(2) | 86,126 | 83,255 | ||||||
Merrill Lynch Mortgage Investors Trust Series MLCC 2004-1 | ||||||||
3.41%, 12/25/2034(4) | 62,626 | 60,903 | ||||||
Merrill Lynch Mortgage Investors Trust Series MLCC 2004-A | ||||||||
0.64% (1 Month LIBOR USD + 0.46%, 0.23% Floor, 11.75% Cap), 04/25/2029(2) | 26,178 | 24,641 | ||||||
Merrill Lynch Mortgage Investors Trust Series MLCC 2004-C | ||||||||
0.98% (6 Month LIBOR USD + 0.60%, 0.30% Floor, 11.75% Cap), 07/25/2029(2) | 51,137 | 48,492 | ||||||
Merrill Lynch Mortgage Investors Trust Series MLMI 2004-A4 | ||||||||
3.83%, 08/25/2034(4) | 58,646 | 58,730 | ||||||
Merrill Lynch Mortgage Investors Trust Series MLMI 2005-A2 | ||||||||
3.74%, 02/25/2035(4) | 102,396 | 102,634 | ||||||
Metlife Securitization Trust 2018-1 | ||||||||
3.75%, 03/25/2057(3)(4) | 1,788,683 | 1,905,787 |
Mill City Mortgage Loan Trust 2019-1 | ||||||||
3.25%, 10/25/2069(3)(4) | 3,020,836 | 3,180,442 | ||||||
ML-CFC Commercial Mortgage Trust 2006-4 | ||||||||
0.55%, 12/12/2049(3)(4) | 568,990 | 8 | ||||||
Morgan Stanley Bank of America Merrill Lynch Trust 2012-C6 | ||||||||
2.86%, 11/15/2045 | 7,483,114 | 7,687,071 | ||||||
Morgan Stanley Bank of America Merrill Lynch Trust 2014-C14 | ||||||||
3.67%, 02/15/2047 | 1,860,212 | 1,875,078 | ||||||
Morgan Stanley Bank of America Merrill Lynch Trust 2015-C20 | ||||||||
3.25%, 02/15/2048 | 3,652,000 | 3,876,603 | ||||||
Morgan Stanley Bank of America Merrill Lynch Trust 2015-C23 | ||||||||
3.45%, 07/15/2050 | 18,100,000 | 19,501,769 | ||||||
Morgan Stanley Bank of America Merrill Lynch Trust 2015-C24 | ||||||||
3.48%, 05/15/2048 | 5,000,000 | 5,417,499 | ||||||
3.73%, 05/15/2048 | 6,507,000 | 7,143,712 | ||||||
Morgan Stanley Capital I Trust 2006-IQ12 | ||||||||
0.63%, 12/15/2043(3)(4) | 248,118 | 4 | ||||||
Morgan Stanley Capital I Trust 2007-HQ11 | ||||||||
0.17%, 02/12/2044(3)(4) | 216,464 | 63 | ||||||
Morgan Stanley Capital I Trust 2007-HQ13 | ||||||||
0.00%, 12/15/2044(3)(4) | 167,419 | 2 | ||||||
Morgan Stanley Capital I Trust 2007-IQ13 | ||||||||
0.66%, 03/15/2044(3)(4) | 455,925 | 1,319 | ||||||
Morgan Stanley Capital I Trust 2012-C4 | ||||||||
2.99%, 03/15/2045 | 137,556 | 138,172 | ||||||
Morgan Stanley Capital I Trust 2014-CPT | ||||||||
3.35%, 07/13/2029(3) | 4,241,000 | 4,321,973 | ||||||
Morgan Stanley Capital I Trust 2016-UB11 | ||||||||
2.53%, 08/15/2049 | 20,000,000 | 21,042,078 | ||||||
Morgan Stanley Capital I Trust 2018-H4 | ||||||||
4.31%, 12/15/2051 | 2,552,000 | 3,031,757 | ||||||
Morgan Stanley Capital I Trust 2019-H7 | ||||||||
3.01%, 07/15/2052 | 1,372,854 | 1,507,958 | ||||||
Morgan Stanley Mortgage Loan Trust 2004-3 | ||||||||
5.62%, 04/25/2034(4) | 158,350 | 170,131 | ||||||
Morgan Stanley Mortgage Loan Trust 2004-9 | ||||||||
3.44%, 10/25/2020(4) | 13,121 | 12,871 | ||||||
Mortgage Insurance-Linked Notes Series 2020-1 | ||||||||
1.13% (1 Month LIBOR USD + 0.95%, 0.95% Floor), 02/25/2030(2)(3) | 1,100,000 | 1,087,234 | ||||||
MortgageIT Trust 2005-2 | ||||||||
0.70% (1 Month LIBOR USD + 0.52%, 0.26% Floor, 11.50% Cap), 05/25/2035(2) | 528,854 | 521,643 | ||||||
MRA Issuance Trust 2020-1 | ||||||||
1.57% (1 Month LIBOR USD + 1.40%), 12/08/2020(2)(3) | 22,414,680 | 22,437,142 | ||||||
MRCD 2019-MARK Mortgage Trust | ||||||||
2.72%, 12/15/2036(3) | 6,108,000 | 5,887,943 | ||||||
2.72%, 12/15/2036(3) | 9,990,000 | 10,121,147 | ||||||
MRFC Mortgage Pass-Through Trust Series 1999-TBC2 | ||||||||
0.66% (1 Month LIBOR USD + 0.48%, 0.24% Floor, 10.00% Cap), 06/15/2030(2) | 164,042 | 159,171 | ||||||
MRFC Mortgage Pass-Through Trust Series 2000-TBC3 | ||||||||
0.62% (1 Month LIBOR USD + 0.44%, 0.22% Floor, 10.00% Cap), 12/15/2030(2) | 38,923 | 37,159 | ||||||
NACC Reperforming Loan REMIC Trust 2004-R2 | ||||||||
6.50%, 10/25/2034(3)(4) | 50,329 | 49,431 | ||||||
NCUA Guaranteed Notes Trust 2010-R3 | ||||||||
0.73% (1 Month LIBOR USD + 0.56%, 0.56% Floor, 8.00% Cap), 12/08/2020(2) | 1,022,906 | 1,021,051 | ||||||
2.40%, 12/08/2020 | 11,102 | 11,124 | ||||||
New Residential Mortgage Loan Trust 2017-2 | ||||||||
4.00%, 03/25/2057(3)(4) | 3,062,176 | 3,289,997 | ||||||
New Residential Mortgage Loan Trust 2017-3 | ||||||||
4.00%, 04/25/2057(3)(4) | 5,025,292 | 5,366,892 | ||||||
New Residential Mortgage Loan Trust 2017-4 | ||||||||
4.00%, 05/25/2057(3)(4) | 3,349,640 | 3,594,119 | ||||||
New Residential Mortgage Loan Trust 2018-RPL1 | ||||||||
3.50%, 12/25/2057(3)(4) | 19,727,993 | 21,046,726 | ||||||
Nomura Asset Acceptance Corp. Alternative Loan Trust Series 2003-A1 | ||||||||
5.50%, 05/25/2033 | 8,938 | 9,207 | ||||||
6.00%, 05/25/2033 | 14,120 | 14,422 | ||||||
7.00%, 04/25/2033 | 7,954 | 8,216 | ||||||
Oaktown Re II Ltd. | ||||||||
1.73% (1 Month LIBOR USD + 1.55%), 07/25/2028(2)(3) | 547,366 | 544,597 | ||||||
Oaktown Re III Ltd. | ||||||||
1.58% (1 Month LIBOR USD + 1.40%, 1.40% Floor), 07/25/2029(2)(3) | 145,680 | 145,680 |
Park Avenue Funding Trust 2020-2 | ||||||||
2.18% (1 Month LIBOR USD + 2.00%, 2.00% Floor), 06/02/2022(2)(3) | 19,910,000 | 19,910,000 | ||||||
Prime Mortgage Trust 2004-CL1 | ||||||||
6.00%, 02/25/2034 | 55,371 | 58,656 | ||||||
Radnor Re 2018-1 Ltd. | ||||||||
1.58% (1 Month LIBOR USD + 1.40%), 03/25/2028(2)(3) | 191,943 | 191,461 | ||||||
RALI Series 2002-QS16 Trust | ||||||||
16.24% (1 Month LIBOR USD + 16.62%, 16.62% Cap), 10/25/2049(2)(7) | 118 | 78 | ||||||
RALI Series 2003-QS14 Trust | ||||||||
5.00%, 07/25/2020 | 1,015 | 1,010 | ||||||
RALI Series 2003-QS9 Trust | ||||||||
7.37% (1 Month LIBOR USD + 7.55%, 7.55% Cap), 05/25/2049(2)(7) | 1,019 | 0 | ||||||
RALI Series 2004-QS6 Trust | ||||||||
5.00%, 05/25/2023 | 956 | 922 | ||||||
RALI Series 2005-QA6 Trust | ||||||||
4.41%, 05/25/2035(4) | 101,918 | 69,602 | ||||||
RALI Series 2007-QS1 Trust | ||||||||
6.00%, 01/25/2037 | 14,322 | 12,790 | ||||||
RBS Commercial Funding, Inc. 2013-SMV Trust | ||||||||
3.26%, 03/11/2031(3) | 512,000 | 501,605 | ||||||
RBSSP Resecuritization Trust 2009-1 | ||||||||
6.50%, 02/26/2036(3)(4) | 124,331 | 127,383 | ||||||
RBSSP Resecuritization Trust 2009-12 | ||||||||
5.33%, 11/25/2033(3)(4) | 126,049 | 125,874 | ||||||
Reperforming Loan REMIC Trust 2005-R1 | ||||||||
0.00%, 03/25/2035(3) | 6,018 | 4,484 | ||||||
Residential Asset Securitization Trust 2003-A8 | ||||||||
4.25%, 10/25/2021 | 1,399 | 1,423 | ||||||
Residential Asset Securitization Trust 2004-A7 | ||||||||
5.50%, 10/25/2034 | 1,783,508 | 1,845,785 | ||||||
Residential Asset Securitization Trust 2005-A2 | ||||||||
4.87% (1 Month LIBOR USD + 5.05%, 5.05% Cap), 03/25/2035(2)(7) | 627,218 | 64,880 | ||||||
Residential Asset Securitization Trust 2006-A4IP | ||||||||
6.00%, 05/25/2036 | 54,689 | 52,979 | ||||||
RFMSI Series 2005-SA4 Trust | ||||||||
3.66%, 09/25/2035(4) | 32,497 | 28,345 | ||||||
Seasoned Credit Risk Transfer Trust 2017-4 | ||||||||
3.50%, 06/25/2057 | 4,262,786 | 4,808,691 | ||||||
Seasoned Credit Risk Transfer Trust Series 2018-4 | ||||||||
3.50%, 03/25/2058 | 8,479,826 | 10,329,227 | ||||||
Seasoned Credit Risk Transfer Trust Series 2019-1 | ||||||||
3.50%, 07/25/2058 | 10,588,404 | 11,974,461 | ||||||
Seasoned Credit Risk Transfer Trust Series 2019-3 | ||||||||
3.50%, 10/25/2058 | 3,880,000 | 4,607,502 | ||||||
Seasoned Credit Risk Transfer Trust Series 2019-4 | ||||||||
4.00%, 02/25/2059 | 7,922,636 | 8,818,001 | ||||||
Seasoned Credit Risk Transfer Trust Series 2020-1 | ||||||||
3.00%, 08/25/2059 | 8,999,006 | 9,639,447 | ||||||
Sequoia Mortgage Trust 2004-10 | ||||||||
0.81% (1 Month LIBOR USD + 0.62%, 0.31% Floor, 11.50% Cap), 11/20/2034(2) | 35,791 | 33,135 | ||||||
Sequoia Mortgage Trust 2004-11 | ||||||||
0.79% (1 Month LIBOR USD + 0.60%, 0.30% Floor, 11.50% Cap), 12/20/2034(2) | 107,900 | 102,927 | ||||||
Sequoia Mortgage Trust 2004-12 | ||||||||
0.74% (6 Month LIBOR USD + 0.32%, 0.32% Floor, 11.50% Cap), 01/20/2035(2) | 93,198 | 83,950 | ||||||
Sequoia Mortgage Trust 2004-8 | ||||||||
0.89% (1 Month LIBOR USD + 0.70%, 0.35% Floor, 11.50% Cap), 09/20/2034(2) | 694,914 | 668,307 | ||||||
2.45% (6 Month LIBOR USD + 0.74%, 0.37% Floor, 11.50% Cap), 09/20/2034(2) | 99,846 | 95,704 | ||||||
Series RR 2014-1 Trust | ||||||||
0.00%, 05/25/2047(3) | 1,603,000 | 1,455,720 | ||||||
Structured Asset Mortgage Investments II Trust 2004-AR5 | ||||||||
0.85% (1 Month LIBOR USD + 0.66%, 0.33% Floor, 11.00% Cap), 10/19/2034(2) | 103,269 | 99,680 | ||||||
Structured Asset Mortgage Investments II Trust 2005-AR5 | ||||||||
0.44% (1 Month LIBOR USD + 0.25%, 0.25% Floor, 11.00% Cap), 07/19/2035(2) | 354,556 | 335,012 | ||||||
Structured Asset Mortgage Investments Trust 2003-CL1 | ||||||||
0.58% (1 Month LIBOR USD + 0.40%, 0.40% Floor, 8.00% Cap), 07/25/2032(2) | 226,031 | 217,950 | ||||||
Structured Asset Securities Corp. | ||||||||
0.53% (1 Month LIBOR USD + 0.35%, 0.35% Floor), 06/25/2035(2)(3) | 66,131 | 56,449 | ||||||
3.82%, 12/25/2033(4) | 114,930 | 109,328 | ||||||
3.87%, 12/25/2033(4) | 1,070,987 | 1,022,784 | ||||||
5.15%, 02/25/2034(1) | 174,035 | 182,243 | ||||||
Structured Asset Securities Corp. Mortgage Pass-Through Ctfs Series 2003-34A | ||||||||
3.74%, 11/25/2033(4) | 24,883 | 24,344 |
Thornburg Mortgage Securities Trust 2003-4 | ||||||||
0.82% (1 Month LIBOR USD + 0.64%, 0.32% Floor, 11.50% Cap), 09/25/2043(2) | 423,220 | 410,373 | ||||||
Thornburg Mortgage Securities Trust 2003-5 | ||||||||
3.86%, 10/25/2043(4) | 2,033,751 | 1,963,415 | ||||||
Thornburg Mortgage Securities Trust 2004-4 | ||||||||
3.47%, 12/25/2044(4) | 205,627 | 200,036 | ||||||
Thornburg Mortgage Securities Trust 2005-1 | ||||||||
3.65%, 04/25/2045(4) | 578,675 | 546,831 | ||||||
Toorak Mortgage Corp. 2019-2 Ltd. | ||||||||
3.72%, 09/25/2022(1) | 6,665,000 | 6,648,793 | ||||||
UBS Commercial Mortgage Trust 2012-C1 | ||||||||
2.25%, 05/10/2045(3)(4) | 1,452,718 | 37,542 | ||||||
UBS Commercial Mortgage Trust 2017-C2 | ||||||||
3.26%, 08/15/2050 | 10,114,000 | 10,864,145 | ||||||
UBS Commercial Mortgage Trust 2017-C5 | ||||||||
3.21%, 11/15/2050 | 21,500,000 | 23,300,462 | ||||||
UBS Commercial Mortgage Trust 2018-C9 | ||||||||
3.85%, 03/15/2051 | 9,650,000 | 10,816,329 | ||||||
UBS-BAMLL Trust | ||||||||
3.66%, 06/10/2030(3) | 1,787,000 | 1,807,946 | ||||||
UBS-Barclays Commercial Mortgage Trust 2012-C2 | ||||||||
1.46%, 05/10/2063(3)(4) | 5,161,517 | 111,483 | ||||||
3.53%, 05/10/2063 | 1,073,000 | 1,110,085 | ||||||
UBS-Barclays Commercial Mortgage Trust 2013-C6 | ||||||||
3.24%, 04/10/2046 | 271,000 | 281,265 | ||||||
Vendee Mortgage Trust 1993-1 | ||||||||
7.25%, 02/15/2023 | 113,059 | 120,290 | ||||||
Vendee Mortgage Trust 1994-1 | ||||||||
5.29%, 02/15/2024(4) | 36,255 | 38,536 | ||||||
6.50%, 02/15/2024 | 108,054 | 116,316 | ||||||
Vendee Mortgage Trust 1996-1 | ||||||||
6.75%, 02/15/2026 | 76,229 | 86,999 | ||||||
Vendee Mortgage Trust 1996-2 | ||||||||
6.75%, 06/15/2026 | 34,305 | 38,964 | ||||||
Vendee Mortgage Trust 1997-1 | ||||||||
7.50%, 02/15/2027 | 114,858 | 131,786 | ||||||
Vendee Mortgage Trust 1998-1 | ||||||||
7.00%, 03/15/2028 | 78,053 | 87,983 | ||||||
VNDO 2012-6AVE Mortgage Trust | ||||||||
3.00%, 11/15/2030(3) | 2,283,000 | 2,348,134 | ||||||
VNDO 2013-PENN Mortgage Trust | ||||||||
3.81%, 12/13/2029(3) | 2,500,000 | 2,504,292 | ||||||
Wachovia Bank Commercial Mortgage Trust Series 2006-C24 | ||||||||
0.00%, 03/15/2045(3)(4) | 358,635 | 4 | ||||||
WaMu Mortgage Pass-Through Certificates Series 2003-AR7 Trust | ||||||||
4.12%, 08/25/2033(4) | 49,223 | 47,525 | ||||||
WaMu Mortgage Pass-Through Certificates Series 2003-AR9 Trust | ||||||||
4.28%, 09/25/2033(4) | 326,750 | 312,700 | ||||||
4.35%, 09/25/2033(4) | 50,210 | 47,050 | ||||||
WaMu Mortgage Pass-Through Certificates Series 2003-AR11 Trust | ||||||||
4.13%, 10/25/2033(4) | 184,286 | 175,509 | ||||||
WaMu Mortgage Pass-Through Certificates Series 2003-S1 Trust | ||||||||
5.50%, 04/25/2033 | 54,826 | 56,503 | ||||||
WaMu Mortgage Pass-Through Certificates Series 2003-S4 | ||||||||
16.96% (1 Month LIBOR USD + 17.46%, 17.46% Cap), 06/25/2033(2)(7) | 20,513 | 26,960 | ||||||
WaMu Mortgage Pass-Through Certificates Series 2003-S9 Trust | ||||||||
0.00%, 10/25/2033 | 3,024 | 2,665 | ||||||
5.25%, 10/25/2033 | 221,216 | 227,956 | ||||||
WaMu Mortgage Pass-Through Certificates Series 2004-AR3 Trust | ||||||||
3.66%, 06/25/2034(4) | 100,590 | 96,968 | ||||||
3.66%, 06/25/2034(4) | 1,785,137 | 1,724,906 | ||||||
WaMu Mortgage Pass-Through Certificates Series 2004-AR14 Trust | ||||||||
3.82%, 01/25/2035(4) | 1,750,455 | 1,731,046 | ||||||
WaMu Mortgage Pass-Through Certificates Series 2004-CB2 Trust | ||||||||
6.00%, 08/25/2034 | 634,631 | 683,793 | ||||||
WaMu Mortgage Pass-Through Certificates Series 2004-CB3 Trust | ||||||||
6.50%, 10/25/2034 | 1,899,997 | 1,972,533 | ||||||
WaMu Mortgage Pass-Through Certificates Series 2004-RS2 | ||||||||
5.00%, 11/25/2033 | 38,850 | 40,310 | ||||||
WaMu Mortgage Pass-Through Certificates Series 2004-S2 Trust | ||||||||
5.50%, 06/25/2034 | 240,767 | 248,997 | ||||||
WaMu Mortgage Pass-Through Certificates Series 2004-S3 Trust | ||||||||
5.00%, 07/25/2034 | 27,700 | 28,049 |
WaMu Mortgage Pass-Through Certificates Series 2006-AR10 Trust | ||||||||
3.82%, 09/25/2036(4) | 6,412 | 5,341 | ||||||
WaMu Mortgage Pass-Through Certificates Series 2006-AR8 Trust | ||||||||
3.91%, 08/25/2046(4) | 47,532 | 43,550 | ||||||
Washington Mutual Mortgage Pass-Through Certificates WMALT Series 2005-1 Trust | ||||||||
0.00%, 03/25/2035 | 9,455 | 7,485 | ||||||
5.50%, 03/25/2035 | 78,998 | 79,071 | ||||||
Washington Mutual Mortgage Pass-Through Certificates WMALT Series 2005-2 Trust | ||||||||
4.82% (1 Month LIBOR USD + 5.00%, 5.00% Cap), 04/25/2035(2)(7) | 198,984 | 33,983 | ||||||
4.87% (1 Month LIBOR USD + 5.05%, 5.05% Cap), 04/25/2035(2)(7) | 599,812 | 91,271 | ||||||
Washington Mutual Mortgage Pass-Through Certificates WMALT Series 2005-4 Trust | ||||||||
5.50%, 06/25/2035 | 209,999 | 37,970 | ||||||
5.50%, 06/25/2035 | 212,311 | 199,136 | ||||||
Washington Mutual Mortgage Pass-Through Certificates WMALT Series 2005-6 Trust | ||||||||
5.50%, 08/25/2035 | 34,603 | 33,471 | ||||||
Washington Mutual Mortgage Pass-Through Certificates WMALT Series 2006-1 Trust | ||||||||
5.75%, 02/25/2036 | 16,017 | 14,594 | ||||||
Washington Mutual MSC Mortgage Pass-Through Certificates Series 2003-MS7 Trust | ||||||||
0.00%, 03/25/2033 | 99 | 87 | ||||||
Wells Fargo Alternative Loan 2003-1 Trust | ||||||||
0.00%, 09/25/2033 | 4,265 | 3,643 | ||||||
Wells Fargo Alternative Loan 2007-PA3 Trust | ||||||||
5.75%, 07/25/2037 | 17,166 | 16,075 | ||||||
Wells Fargo Commercial Mortgage Trust 2015-C26 | ||||||||
2.99%, 02/15/2048 | 8,710,402 | 9,006,138 | ||||||
Wells Fargo Commercial Mortgage Trust 2015-C29 | ||||||||
3.37%, 06/15/2048 | 9,838,948 | 10,570,068 | ||||||
Wells Fargo Commercial Mortgage Trust 2015-C30 | ||||||||
3.66%, 09/15/2058 | 729,000 | 801,775 | ||||||
Wells Fargo Commercial Mortgage Trust 2015-C31 | ||||||||
3.70%, 11/15/2048 | 3,280,000 | 3,556,734 | ||||||
Wells Fargo Commercial Mortgage Trust 2015-NXS2 | ||||||||
3.50%, 07/15/2058 | 15,000,000 | 15,985,332 | ||||||
Wells Fargo Commercial Mortgage Trust 2015-P2 | ||||||||
3.81%, 12/15/2048 | 7,272,631 | 8,103,910 | ||||||
Wells Fargo Commercial Mortgage Trust 2016-C34 | ||||||||
3.10%, 06/15/2049 | 3,698,000 | 3,944,851 | ||||||
Wells Fargo Commercial Mortgage Trust 2016-NXS6 | ||||||||
2.64%, 11/15/2049 | 20,000,000 | 20,961,164 | ||||||
Wells Fargo Commercial Mortgage Trust 2017-C38 | ||||||||
3.19%, 07/15/2050 | 13,800,000 | 15,154,480 | ||||||
Wells Fargo Commercial Mortgage Trust 2017-RC1 | ||||||||
3.63%, 01/15/2060 | 10,000,000 | 11,120,704 | ||||||
Wells Fargo Commercial Mortgage Trust 2019-C49 | ||||||||
3.76%, 03/15/2052 | 1,085,000 | 1,242,354 | ||||||
Wells Fargo Commercial Mortgage Trust 2019-C54 | ||||||||
3.15%, 12/15/2052 | 3,079,000 | 3,423,516 | ||||||
Wells Fargo Commercial Mortgage Trust 2020-C55 | ||||||||
2.73%, 02/15/2053 | 3,380,000 | 3,650,696 | ||||||
Wells Fargo Mortgage Backed Securities 2007-7 Trust | ||||||||
6.00%, 06/25/2037 | 14,173 | 13,218 | ||||||
WFRBS Commercial Mortgage Trust 2011-C3 | ||||||||
4.38%, 03/15/2044(3) | 1,010,584 | 1,020,755 | ||||||
WFRBS Commercial Mortgage Trust 2012-C6 | ||||||||
3.44%, 04/15/2045 | 9,139,716 | 9,287,639 | ||||||
WFRBS Commercial Mortgage Trust 2013-C11 | ||||||||
4.40%, 03/15/2045(3)(4) | 300,000 | 252,223 | ||||||
WFRBS Commercial Mortgage Trust 2013-C14 | ||||||||
3.34%, 06/15/2046 | 229,750 | 241,416 | ||||||
WFRBS Commercial Mortgage Trust 2014-C21 | ||||||||
3.68%, 08/15/2047 | 7,000,000 | 7,554,649 | ||||||
WFRBS Commercial Mortgage Trust 2014-C23 | ||||||||
3.64%, 10/15/2057 | 3,048,051 | 3,191,716 | ||||||
WFRBS Commercial Mortgage Trust 2014-C25 | ||||||||
3.63%, 11/15/2047 | 3,846,000 | 4,144,338 | ||||||
WFRBS Commercial Mortgage Trust 2014-LC14 | ||||||||
3.77%, 03/15/2047 | 10,000,000 | 10,630,579 | ||||||
|
| |||||||
Total Mortgage-Backed Obligations (Cost: $4,973,301,906) | 5,273,692,494 | |||||||
|
| |||||||
Total Bonds & Notes (Cost: $12,811,808,621) |
| 13,706,194,199 | ||||||
|
| |||||||
| Shares | Value | |||||||
PREFERRED STOCKS – 0.02% | ||||||||
Financials – 0.02% | ||||||||
State Street Corp., 5.35%(2) | 95,000 | $ | 2,489,000 | |||||
|
| |||||||
Total Financials |
| 2,489,000 | ||||||
|
| |||||||
Total Preferred Stocks (Cost: $2,375,000) |
| 2,489,000 | ||||||
|
| |||||||
SHORT-TERM INVESTMENTS – 6.12% | ||||||||
Money Market Funds – 6.09% | ||||||||
Fidelity Institutional Money Market Government Fund - Class I, | 861,649,237 | 861,649,237 | ||||||
|
| |||||||
Total Money Market Funds (Cost: $861,649,237) | 861,649,237 | |||||||
|
| |||||||
| Principal Amount | Value | |||||||
U.S. Treasury Bills – 0.02% | ||||||||
U.S. Treasury Bill, 1.45%, 01/28/2021 | $ | 2,000,000 | $ | 1,998,184 | ||||
|
| |||||||
Total U.S. Treasury Bills (Cost: $1,983,238) | 1,998,184 | |||||||
|
| |||||||
Time Deposits – 0.01% | ||||||||
BNP Paribas, Paris, 0.01% due 07/01/2020 | 327,746 | 327,746 | ||||||
China Construction Bank, New York, 0.01% due 07/01/2020 | 1,769,198 | 1,769,198 | ||||||
|
| |||||||
Total Time Deposits (Cost: $2,096,944) | 2,096,944 | |||||||
|
| |||||||
Total Short-Term Investments (Cost: $865,729,419) |
| 865,744,365 | ||||||
|
| |||||||
TOTAL INVESTMENTS IN SECURITIES – 103.07% | 14,574,427,564 | |||||||
|
| |||||||
LIABILITIES IN EXCESS OF OTHER ASSETS – (3.07)% | (434,296,820 | ) | ||||||
|
| |||||||
TOTAL NET ASSETS – 100.00% | $ | 14,140,130,744 | ||||||
|
| |||||||
Percentages are stated as a percent of net assets.
| (1) | Step-up bond that pays an initial coupon rate for the first period and then a higher coupon rate for the following periods. The rate reported is the rate in effect as of June 30, 2020. |
| (2) | Variable rate security based on a reference index and spread. The rate reported is the rate in effect as of June 30, 2020. |
| (3) | Security was purchased exempt from registration in the U.S. pursuant to Rule 144(A) under the Securities Act of 1933. The value of these securities total $2,777,138,233, which represents 19.64% of total net assets. |
| (4) | Variable rate security. The coupon is based on an underlying pool of assets. The rate reported is the rate in effect as of June 30, 2020. |
| (5) | Security in default as of June 30, 2020. The value of these securities total $2,395,873, which represents 0.02% of total net assets. |
| (6) | Partially assigned as collateral for certain future and swap contracts. The value of these pledged issues totals $14,566,201, which represents 0.10% of total net assets. |
| (7) | Inverse floating rate security whose interest rate moves in the opposite direction of reference interest rates. Reference interest rates are typically based on a negative multiplier or slope. |
| (8) | Inflation protected security. The value of these securities total $6,288,752, which represents 0.04% of total net assets. |
| (9) | Delayed delivery purchase commitment security. The value of these securities total $330,869,022, which represents 2.34% of total net assets. |
| (10) | Represents annualized seven-day yield as of the close of the reporting period. |
| (11) | Partially assigned as collateral for certain delayed delivery securities. |
| (12) | Security categorized as Level 3 per the Trust’s fair value hierarchy. The value of these securities total $82,060,788, which represents 0.58% of total net assets. |
The accompanying notes are an integral part of this Schedule of Investments.
Open Futures Contracts
Number of Contracts | Reference Entity | Counterparty | Expiration Date | Notional Amount | Value | Unrealized Appreciation/ (Depreciation) | ||||||||||||
| 1,733 | U.S. 2 Year Note Future | J.P. Morgan | Sep. 2020 | $ | 382,637,889 | $ | 382,695,142 | $ | 57,253 | |||||||||
| 1,475 | U.S. 5 Year Note Future | J.P. Morgan | Sep. 2020 | 185,096,727 | 185,469,727 | 373,000 | ||||||||||||
| 1,349 | U.S. Ultra Bond Future | J.P. Morgan | Sep. 2020 | 294,053,264 | 294,292,781 | 239,517 | ||||||||||||
|
| |||||||||||||||||
| 669,770 | ||||||||||||||||||
|
| |||||||||||||||||
Number of Contracts | Reference Entity | Counterparty | Expiration Date | Notional Amount | Value | Unrealized Appreciation/ (Depreciation) | ||||||||||||
| (1,272) | U.S. 10 Year Note Future | J.P. Morgan | Sep. 2020 | $ | (176,194,638 | ) | $ | (177,026,625 | ) | $ | (831,987 | ) | ||||||
| (3) | U.S. Long Bond Future | J.P. Morgan | Sep. 2020 | (528,472 | ) | (535,688 | ) | (7,216 | ) | |||||||||
| (72) | U.S. Ultra 10 Year Note Future | J.P. Morgan | Sep. 2020 | (11,268,969 | ) | (11,338,875 | ) | (69,906 | ) | |||||||||
|
| |||||||||||||||||
| (909,109 | ) | |||||||||||||||||
|
| |||||||||||||||||
| $ | (239,339 | ) | ||||||||||||||||
|
| |||||||||||||||||
Centrally Cleared Interest Rate Swaps
Fixed Annual | Floating Rate Index | Floating Rate | Payment | Maturity Date | Notional Amount | Upfront Premium Paid/(Received) | Unrealized Appreciation/ (Depreciation) | Value | ||||||||||||||||
| 1.38% | 3 Month USD LIBOR | Paid | Quarterly | 9/15/2021 | $ | 14,385,000 | $ | (1,342 | ) | $ | 253,485 | $ | 252,143 | |||||||||||
| 1.48 | 3 Month USD LIBOR | Paid | Quarterly | 9/15/2021 | 7,490,000 | 4,536 | 137,766 | 142,302 | ||||||||||||||||
| 1.60 | 3 Month USD LIBOR | Paid | Quarterly | 9/15/2021 | 5,370,000 | 15,786 | 96,258 | 112,044 | ||||||||||||||||
|
|
|
|
|
| |||||||||||||||||||
| $ | 18,980 | $ | 487,509 | $ | 506,489 | |||||||||||||||||||
|
|
|
|
|
| |||||||||||||||||||
Bridge Builder Core Plus Bond Fund
Schedule of Investments
June 30, 2020
| Principal Amount | Value | |||||||
BONDS & NOTES – 91.67% | ||||||||
Asset-Backed Obligations – 11.46% | ||||||||
ABFC 2005-WMC1 Trust | ||||||||
0.92% (1 Month LIBOR USD + 0.74%, 0.49% Floor), 06/25/2035(1) | $ | 7,005,761 | $ | 6,645,536 | ||||
ABFC 2007-NC1 Trust | ||||||||
0.48% (1 Month LIBOR USD + 0.30%, 0.30% Floor), 05/25/2037(1)(2) | 6,544,009 | 6,115,087 | ||||||
Accredited Mortgage Loan Trust 2003-2 | ||||||||
0.88% (1 Month LIBOR USD + 0.70%, 0.35% Floor, 13.00% Cap), 10/25/2033(1) | 1,411,758 | 1,385,347 | ||||||
Accredited Mortgage Loan Trust 2006-2 | ||||||||
0.44% (1 Month LIBOR USD + 0.26%, 0.26% Floor), 09/25/2036(1) | 536,165 | 512,116 | ||||||
ACE Securities Corp. Home Equity Loan Trust Series 2004-HE3 | ||||||||
1.11% (1 Month LIBOR USD + 0.93%, 0.62% Floor), 11/25/2034(1) | 2,948,773 | 2,882,211 | ||||||
ACE Securities Corp. Home Equity Loan Trust Series 2005-HE3 | ||||||||
0.89% (1 Month LIBOR USD + 0.71%, 0.47% Floor), 05/25/2035(1) | 7,185,000 | 7,016,291 | ||||||
Adams Outdoor Advertising LP | ||||||||
5.65%, 11/15/2048(2) | 1,475,000 | 1,466,314 | ||||||
Aegis Asset Backed Securities Trust 2005-5 | ||||||||
0.43% (1 Month LIBOR USD + 0.25%, 0.25% Floor), 12/25/2035(1) | 1,967,968 | 1,959,835 | ||||||
Ajax Mortgage Loan Trust 2019-F | ||||||||
2.86%, 07/25/2059(2)(3) | 26,120,414 | 26,542,384 | ||||||
Ally Auto Receivables Trust 2018-2 | ||||||||
2.92%, 11/15/2022 | 3,580,826 | 3,626,470 | ||||||
Ally Auto Receivables Trust 2019-2 | ||||||||
2.23%, 01/16/2024 | 10,000,000 | 10,227,202 | ||||||
ALME Loan Funding II DAC | ||||||||
0.75% (3 Month EURIBOR + 0.75%, 0.75% Floor), 01/15/2031(1)(2) | EUR | 23,900,000 | 26,573,064 | |||||
Ambac LSNI LLC | ||||||||
6.00% (3 Month LIBOR USD + 5.00%), 02/12/2023(1)(2) | $ | 4,313,907 | 4,259,983 | |||||
American Credit Acceptance Receivables Trust 2019-3 | ||||||||
2.89%, 09/12/2025(2) | 3,810,000 | 3,825,668 | ||||||
American Express Credit Account Master Trust | ||||||||
2.04%, 05/15/2023 | 100,000 | 100,481 | ||||||
American Homes 4 Rent 2014-SFR2 Trust | ||||||||
6.23%, 10/17/2036(2) | 515,000 | 572,427 | ||||||
American Homes 4 Rent 2015-SFR1 | ||||||||
5.64%, 04/17/2052(2) | 6,400,000 | 7,058,947 | ||||||
5.89%, 04/17/2052(2) | 2,378,000 | 2,385,793 | ||||||
AmeriCredit Automobile Receivables 2016-1 | ||||||||
3.59%, 02/08/2022 | 891,697 | 894,088 | ||||||
AmeriCredit Automobile Receivables Trust 2016-2 | ||||||||
3.65%, 05/09/2022 | 605,000 | 609,448 | ||||||
AmeriCredit Automobile Receivables Trust 2016-3 | ||||||||
2.24%, 04/08/2022 | 1,262,671 | 1,267,662 | ||||||
Americredit Automobile Receivables Trust 2016-4 | ||||||||
2.74%, 12/08/2022 | 1,795,000 | 1,820,292 | ||||||
Americredit Automobile Receivables Trust 2018-2 | ||||||||
3.59%, 06/18/2024 | 5,970,000 | 6,259,828 | ||||||
4.01%, 07/18/2024 | 2,940,000 | 3,058,284 | ||||||
Americredit Automobile Receivables Trust 2018-3 | ||||||||
4.04%, 11/18/2024 | 4,310,000 | 4,469,172 | ||||||
AmeriCredit Automobile Receivables Trust 2019-3 | ||||||||
2.58%, 09/18/2025 | 1,330,000 | 1,321,339 | ||||||
AmeriCredit Automobile Receivables Trust 2020-1 | ||||||||
1.59%, 10/20/2025 | 5,410,000 | 5,341,336 | ||||||
1.80%, 12/18/2025 | 5,410,000 | 5,230,623 | ||||||
Ameriquest Mortgage Securities, Inc. Asset-Backed Pass-Through Ctfs Series 2004-R9 | ||||||||
1.16% (1 Month LIBOR USD + 0.98%, 0.65% Floor), 10/25/2034(1) | 64,738 | 64,719 | ||||||
Ameriquest Mortgage Securities, Inc. Asset-Backed Pass-Through Ctfs Series 2005-R5 | ||||||||
0.92% (1 Month LIBOR USD + 0.74%, 0.49% Floor), 07/25/2035(1) | 3,635,639 | 3,607,937 | ||||||
Ammc Clo 19 Ltd. | ||||||||
2.36% (3 Month LIBOR USD + 1.14%, 1.14% Floor), 10/16/2028(1)(2) | 7,275,000 | 7,152,809 | ||||||
Applebee’s Funding LLC / IHOP Funding LLC | ||||||||
4.19%, 06/07/2049(2) | 6,740,000 | 5,973,864 | ||||||
Arbor Realty Commercial Real Estate Notes 2019-FL1 Ltd. | ||||||||
1.33% (1 Month LIBOR USD + 1.15%), 05/15/2037(1)(2) | 5,000,000 | 4,867,000 | ||||||
Arbour CLO IV DAC | ||||||||
0.87% (3 Month EURIBOR + 0.87%, 0.87% Floor), 01/15/2030(1)(2) | EUR | 2,400,000 | 2,667,492 | |||||
Asset Backed Securities Corp. Home Equity Loan Trust Series OOMC 2006-HE3 | ||||||||
0.35% (1 Month LIBOR USD + 0.17%, 0.17% Floor), 03/25/2036(1) | $ | 1,267,122 | 1,259,048 | |||||
Atrium XII | ||||||||
1.93% (3 Month LIBOR USD + 0.83%), 04/22/2027(1)(2) | 2,871,259 | 2,820,854 | ||||||
Aurium CLO III DAC | ||||||||
0.67% (3 Month EURIBOR + 0.67%, 0.67% Floor), 04/16/2030(1)(2) | EUR | 900,000 | 993,544 | |||||
Avis Budget Rental Car Funding AESOP LLC | ||||||||
2.33%, 08/20/2026(2) | $ | 2,585,000 | 2,500,070 | |||||
2.72%, 11/20/2022(2) | 1,545,000 | 1,542,947 | ||||||
2.97%, 03/20/2024(2) | 19,773,000 | 19,836,938 | ||||||
Ayresome CDO I Ltd. | ||||||||
0.59% (3 Month LIBOR USD + 0.27%), 12/08/2045(1)(2) | 499,514 | 491,022 | ||||||
Barings BDC Static CLO Ltd. 2019-1 | ||||||||
2.24% (3 Month LIBOR USD + 1.02%, 1.02% Floor), 04/15/2027(1)(2) | 7,173,641 | 7,110,628 | ||||||
Barings CLO Ltd. 2013-I | ||||||||
1.94% (3 Month LIBOR USD + 0.80%, 0.80% Floor), 01/20/2028(1)(2) | 4,850,533 | 4,776,543 | ||||||
Barings CLO Ltd. 2016-II | ||||||||
2.22% (3 Month LIBOR USD + 1.08%, 1.08% Floor), 07/20/2028(1)(2) | 3,710,000 | 3,665,487 | ||||||
Bayview Opportunity Master Fund IVa Trust 2017-RT1 | ||||||||
3.00%, 03/28/2057(2)(4) | 133,850 | 136,848 | ||||||
Bayview Opportunity Master Fund IVb Trust 2017-RT2 | ||||||||
3.50%, 08/28/2057(2)(4) | 873,025 | 889,956 | ||||||
Bayview Opportunity Master Fund IVb Trust 2017-SPL4 | ||||||||
4.75%, 01/28/2055(2)(4) | 655,000 | 693,379 | ||||||
Bayview Opportunity Master Fund IVb Trust 2019-RN4 | ||||||||
3.28%, 10/28/2034(2)(3) | 1,450,790 | 1,437,298 | ||||||
BCMSC Trust 1999-B | ||||||||
6.61%, 12/15/2029(4) | 3,594,315 | 839,285 | ||||||
Bear Stearns Asset Backed Securities I Trust 2005-EC1 | ||||||||
0.96% (1 Month LIBOR USD + 0.78%, 0.52% Floor), 11/25/2035(1) | 12,157,000 | 11,961,637 | ||||||
Bear Stearns Asset Backed Securities I Trust 2007-HE2 | ||||||||
0.34% (1 Month LIBOR USD + 0.16%, 0.16% Floor), 02/25/2037(1) | 16,556,030 | 16,688,544 | ||||||
Benefit Street Partners CLO IV Ltd. | ||||||||
2.89% (3 Month LIBOR USD + 1.75%, 1.75% Floor), 01/20/2029(1)(2) | 4,280,000 | 4,140,763 | ||||||
Betony CLO 2 Ltd. | ||||||||
1.84% (3 Month LIBOR USD + 1.08%), 04/30/2031(1)(2) | 1,000,000 | 969,716 | ||||||
Blackbird Capital Aircraft Lease Securitization Ltd. 2016-1 | ||||||||
4.21%, 12/16/2041(2)(3) | 1,180,291 | 990,707 | ||||||
BlueMountain CLO 2012-2 Ltd. | ||||||||
1.43% (3 Month LIBOR USD + 1.05%, 1.05% Floor), 11/20/2028(1)(2) | 6,900,000 | 6,750,860 | ||||||
BlueMountain CLO 2013-1 Ltd. | ||||||||
2.37% (3 Month LIBOR USD + 1.23%, 1.23% Floor), 01/20/2029(1)(2) | 3,487,257 | 3,447,805 | ||||||
BlueMountain CLO 2015-2 Ltd. | ||||||||
2.07% (3 Month LIBOR USD + 0.93%, 0.93% Floor), 07/18/2027(1)(2) | 3,373,063 | 3,290,426 | ||||||
2.64% (3 Month LIBOR USD + 1.50%, 1.50% Floor), 07/18/2027(1)(2) | 1,915,000 | 1,860,101 | ||||||
BMW Canada Auto Trust | ||||||||
2.15%, 10/20/2021(2) | CAD | 939,177 | 694,166 | |||||
BRE Grand Islander Timeshare Issuer 2019-A LLC | ||||||||
3.28%, 09/26/2033(2) | $ | 2,608,915 | 2,596,608 | |||||
California Republic Auto Receivables Trust 2017-1 | ||||||||
3.76%, 12/15/2023 | 1,300,000 | 1,312,147 | ||||||
California Republic Auto Receivables Trust 2018-1 | ||||||||
4.33%, 04/15/2025 | 2,050,000 | 2,096,611 | ||||||
Capital One Multi-Asset Execution Trust | ||||||||
1.99%, 07/17/2023 | 3,135,000 | 3,145,287 | ||||||
2.43%, 01/15/2025 | 8,440,000 | 8,730,580 | ||||||
Capitalsource Real Estate Loan Trust | ||||||||
2.24% (3 Month LIBOR USD + 0.39%), 01/20/2037(1)(2) | 247,082 | 245,682 | ||||||
2.50% (3 Month LIBOR USD + 0.65%), 01/20/2037(1)(2) | 3,400,000 | 3,223,846 | ||||||
2.60% (3 Month LIBOR USD + 0.75%), 01/20/2037(1)(2) | 1,200,000 | 1,112,508 | ||||||
2.70% (3 Month LIBOR USD + 0.85%), 01/20/2037(1)(2) | 700,000 | 649,827 | ||||||
Carlyle Global Market Strategies CLO 2015-3 Ltd. | ||||||||
1.89% (3 Month LIBOR USD + 1.00%), 07/28/2028(1)(2) | 11,615,000 | 11,381,318 | ||||||
Carlyle Global Market Strategies Euro CLO 2016-2 DAC | ||||||||
0.87% (3 Month EURIBOR + 0.87%, 0.87% Floor), 01/18/2030(1)(2) | EUR | 3,900,000 | 4,319,610 | |||||
Carmax Auto Owner Trust 2019-2 | ||||||||
3.41%, 10/15/2025 | $ | 2,055,000 | 2,050,208 | |||||
Carmax Auto Owner Trust 2019-3 | ||||||||
2.85%, 01/15/2026 | 1,120,000 | 1,131,361 | ||||||
Carmax Auto Owner Trust 2020-1 | ||||||||
2.64%, 07/15/2026 | 2,380,000 | 2,335,780 | ||||||
Castlelake Aircraft Securitization Trust | ||||||||
3.97%, 07/15/2042 | 824,683 | 743,000 | ||||||
Castlelake Aircraft Securitization Trust 2018-1 | ||||||||
4.13%, 06/15/2043(2) | 5,878,963 | 5,459,115 | ||||||
CBAM 2019-9 Ltd. | ||||||||
2.50% (3 Month LIBOR USD + 1.28%, 1.28% Floor), 02/12/2030(1)(2) | 9,410,000 | 9,257,087 | ||||||
Cent CLO 24 Ltd. | ||||||||
2.29% (3 Month LIBOR USD + 1.07%), 10/15/2026(1)(2) | 19,150,000 | 18,927,611 | ||||||
Centex Home Equity Loan Trust 2005-B | ||||||||
0.83% (1 Month LIBOR USD + 0.65%, 0.43% Floor), 03/25/2035(1) | 5,182,714 | 4,962,278 | ||||||
CHEC Loan Trust 2004-2 | ||||||||
0.82% (1 Month LIBOR USD + 0.64%, 0.64% Floor), 06/25/2034(1) | 1,144,705 | 1,084,090 | ||||||
CIFC Funding 2015-IV Ltd. | ||||||||
2.29% (3 Month LIBOR USD + 1.15%, 1.15% Floor), 10/20/2027(1)(2) | 3,920,000 | 3,862,454 | ||||||
CIFC Funding 2015-V Ltd. | ||||||||
1.85% (3 Month LIBOR USD + 0.86%), 10/25/2027(1)(2) | 2,990,000 | 2,937,209 | ||||||
Citibank Credit Card Issuance Trust | ||||||||
1.86%, 08/08/2022 | 2,060,000 | 2,062,890 | ||||||
Citigroup Mortgage Loan Trust 2007-AHL1 | ||||||||
0.32% (1 Month LIBOR USD + 0.14%, 0.14% Floor), 12/25/2036(1) | 2,510,349 | 2,478,888 | ||||||
Citigroup Mortgage Loan Trust, Inc. | ||||||||
0.78% (1 Month LIBOR USD + 0.60%, 0.60% Floor), 10/25/2035(1) | 14,327,000 | 12,075,138 | ||||||
0.81% (1 Month LIBOR USD + 0.63%, 0.42% Floor), 02/25/2035(1) | 2,520,098 | 2,387,664 | ||||||
1.08% (1 Month LIBOR USD + 0.90%, 0.60% Floor), 09/25/2035(1) | 7,900,000 | 7,198,452 | ||||||
CNH Equipment Trust 2017-C | ||||||||
2.54%, 05/15/2025 | 60,000 | 60,568 | ||||||
Coinstar Funding LLC Series 2017-1 | ||||||||
5.22%, 04/25/2047(2) | 11,276,250 | 10,786,836 | ||||||
Cole Park CLO Ltd. 2015-1 | ||||||||
2.19% (3 Month LIBOR USD + 1.05%), 10/20/2028(1)(2) | 6,820,000 | 6,732,131 |
College Avenue Student Loans 2018-A LLC | ||||||||
1.38% (1 Month LIBOR USD + 1.20%), 12/26/2047(1)(2) | 2,149,974 | 2,094,323 | ||||||
4.13%, 12/26/2047(2) | 2,931,783 | 3,183,610 | ||||||
College Avenue Student Loans LLC | ||||||||
1.83% (1 Month LIBOR USD + 1.65%, 1.65% Floor), 11/26/2046(1)(2) | 4,379,924 | 4,345,612 | ||||||
Colony American Finance 2015-1 Ltd. | ||||||||
4.83%, 10/15/2047(2) | 725,000 | 726,526 | ||||||
Conseco Finance Securitizations Corp. | ||||||||
7.97%, 05/01/2032 | 733,953 | 247,916 | ||||||
8.06%, 09/01/2029(4) | 13,034,752 | 4,756,087 | ||||||
8.31%, 05/01/2032(4) | 8,504,715 | 2,995,291 | ||||||
Conseco Financial Corp. | ||||||||
7.70%, 05/15/2027(4) | 6,434,955 | 6,225,250 | ||||||
Continental Airlines 2000-1 Class A-1 Pass Through Trust | ||||||||
8.05%, 11/01/2020 | 43 | 40 | ||||||
CoreVest American Finance 2018-1 Trust | ||||||||
3.80%, 06/15/2051(2) | 1,518,878 | 1,565,383 | ||||||
Corevest American Finance 2019-3 Trust | ||||||||
2.71%, 10/15/2052(2) | 2,746,780 | 2,817,698 | ||||||
3.16%, 10/15/2052(2) | 1,470,000 | 1,449,399 | ||||||
Countrywide Asset-Backed Certificates | ||||||||
0.32% (1 Month LIBOR USD + 0.14%, 0.14% Floor), 08/25/2037(1) | 285,688 | 253,249 | ||||||
0.35% (1 Month LIBOR USD + 0.17%, 0.17% Floor), 03/25/2037(1) | 3,305,827 | 3,119,859 | ||||||
0.36% (1 Month LIBOR USD + 0.18%, 0.18% Floor), 06/25/2047(1) | 40,053,819 | 36,914,849 | ||||||
0.40% (1 Month LIBOR USD + 0.22%, 0.22% Floor), 05/25/2047(1) | 10,884,730 | 9,588,692 | ||||||
0.42% (1 Month LIBOR USD + 0.24%, 0.24% Floor), 03/25/2036(1) | 2,624,550 | 2,335,391 | ||||||
0.43% (1 Month LIBOR USD + 0.25%, 0.25% Floor), 02/25/2036(1) | 990,000 | 872,615 | ||||||
0.47% (1 Month LIBOR USD + 0.29%, 0.29% Floor), 06/25/2037(1) | 8,448,500 | 7,695,273 | ||||||
0.57% (1 Month LIBOR USD + 0.39%, 0.39% Floor), 04/25/2036(1) | 1,000,000 | 751,731 | ||||||
0.60% (1 Month LIBOR USD + 0.42%, 0.42% Floor), 06/25/2036(1) | 2,000,000 | 1,718,595 | ||||||
0.67% (1 Month LIBOR USD + 0.49%, 0.49% Floor), 02/25/2036(1) | 5,099,569 | 5,056,341 | ||||||
1.61% (1 Month LIBOR USD + 1.43%, 0.95% Floor), 06/25/2035(1) | 6,788,429 | 6,664,426 | ||||||
CPS Auto Receivables Trust 2016-C | ||||||||
5.92%, 06/15/2022(2) | 1,638,874 | 1,660,355 | ||||||
CPS Auto Receivables Trust 2017-C | ||||||||
3.79%, 06/15/2023(2) | 1,530,000 | 1,553,497 | ||||||
CPS Auto Receivables Trust 2017-D | ||||||||
3.73%, 09/15/2023(2) | 645,000 | 654,960 | ||||||
CPS Auto Receivables Trust 2018-B | ||||||||
4.26%, 03/15/2024(2) | 1,715,000 | 1,748,603 | ||||||
CPS Auto Trust | ||||||||
4.53%, 01/17/2023(2) | 1,465,000 | 1,483,442 | ||||||
Credit Acceptance Auto Loan Trust 2017-3 | ||||||||
3.48%, 10/15/2026(2) | 1,980,000 | 1,980,966 | ||||||
Credit Acceptance Auto Loan Trust 2018-1 | ||||||||
3.77%, 06/15/2027(2) | 2,255,000 | 2,280,800 | ||||||
Credit Acceptance Auto Loan Trust 2018-2 | ||||||||
4.16%, 09/15/2027(2) | 3,045,000 | 3,144,282 | ||||||
Credit Acceptance Auto Loan Trust 2018-3 | ||||||||
4.04%, 12/15/2027(2) | 3,110,000 | 3,192,906 | ||||||
Credit Acceptance Auto Loan Trust 2019-1 | ||||||||
3.94%, 06/15/2028(2) | 9,810,000 | 10,092,313 | ||||||
CVS Pass-Through Trust | ||||||||
6.94%, 01/10/2030 | 985,857 | 1,128,819 | ||||||
CWABS Asset-Backed Certificates Trust 2005-7 | ||||||||
0.88% (1 Month LIBOR USD + 0.70%, 0.70% Floor), 11/25/2035(1) | 678,216 | 673,291 | ||||||
CWABS Asset-Backed Certificates Trust 2007-12 | ||||||||
0.92% (1 Month LIBOR USD + 0.74%, 0.74% Floor), 08/25/2047(1) | 5,721,112 | 5,427,357 | ||||||
CWABS Revolving Home Equity Loan Trust Series 2004-T | ||||||||
0.42% (1 Month LIBOR USD + 0.24%, 0.24% Floor, 16.00% Cap), 02/15/2030(1) | 7,270,026 | 7,089,124 | ||||||
DB Master Finance LLC | ||||||||
4.03%, 11/20/2047(2) | 1,578,663 | 1,670,509 | ||||||
4.35%, 05/20/2049(2) | 3,295,100 | 3,563,090 | ||||||
Delta Air Lines 2002-1 Class G-1 Pass Through Trust | ||||||||
6.72%, 01/02/2023 | 1,400,259 | 1,371,557 | ||||||
Denali Capital CLO X LLC | ||||||||
2.04% (3 Month LIBOR USD + 1.05%), 10/26/2027(1)(2) | 6,500,000 | 6,412,029 | ||||||
Domino’s Pizza Master Issuer LLC | ||||||||
3.67%, 10/25/2049(2) | 2,014,875 | 2,110,763 | ||||||
4.12%, 07/25/2048(2) | 1,630,950 | 1,736,211 | ||||||
4.12%, 07/25/2047(2) | 3,451,500 | 3,722,443 | ||||||
4.33%, 07/25/2048(2) | 2,446,425 | 2,660,732 | ||||||
Drive Auto Receivables Trust | ||||||||
4.30%, 09/16/2024 | 3,195,000 | 3,288,250 | ||||||
Drive Auto Receivables Trust 2018-2 | ||||||||
4.14%, 08/15/2024 | 1,715,000 | 1,759,409 | ||||||
Drive Auto Receivables Trust 2018-5 | ||||||||
4.30%, 04/15/2026 | 2,685,000 | 2,799,041 | ||||||
Drive Auto Receivables Trust 2019-1 | ||||||||
4.09%, 06/15/2026 | 3,590,000 | 3,659,674 | ||||||
Driven Brands Funding LLC | ||||||||
4.64%, 04/20/2049(2) | 3,727,813 | 3,943,951 | ||||||
4.74%, 04/20/2048(2) | 739,900 | 783,044 | ||||||
Dryden 30 Senior Loan Fund | ||||||||
1.21% (3 Month LIBOR USD + 0.82%), 11/15/2028(1)(2) | 1,200,000 | 1,177,910 | ||||||
Dryden 46 Euro CLO 2016 BV | ||||||||
0.88% (3 Month EURIBOR + 0.88%, 0.88% Floor), 01/15/2030(1)(2) | EUR | 3,700,000 | 4,098,773 |
Dryden XXVI Senior Loan Fund | ||||||||
2.12% (3 Month LIBOR USD + 0.90%), 04/15/2029(1)(2) | $ | 4,500,000 | 4,416,480 | |||||
DT Auto Owner Trust 2017-2 | ||||||||
3.89%, 01/15/2023(2) | 2,197,300 | 2,214,248 | ||||||
DT Auto Owner Trust 2018-2 | ||||||||
4.15%, 03/15/2024(2) | 1,435,000 | 1,467,165 | ||||||
DT Auto Owner Trust 2019-3 | ||||||||
2.96%, 04/15/2025(2) | 1,635,000 | 1,642,619 | ||||||
Earnest Student Loan Program 2017-A LLC | ||||||||
2.65%, 01/25/2041(2) | 2,768,259 | 2,801,566 | ||||||
Eaton Vance CLO 2013-1 Ltd. | ||||||||
3.07% (3 Month LIBOR USD + 1.85%), 01/15/2028(1)(2) | 6,855,000 | 6,730,493 | ||||||
ECAF I Ltd. | ||||||||
3.47%, 06/15/2040(2) | 476,914 | 430,040 | ||||||
ECMC Group Student Loan Trust | ||||||||
1.18% (1 Month LIBOR USD + 1.00%), 07/25/2069(1)(2) | 1,099,020 | 1,066,106 | ||||||
ECMC Group Student Loan Trust 2017-2 | ||||||||
1.23% (1 Month LIBOR USD + 1.05%), 05/25/2067(1)(2) | 8,029,610 | 7,917,059 | ||||||
ELFI Graduate Loan Program 2019-A LLC | ||||||||
2.54%, 03/25/2044(2) | 4,616,778 | 4,731,799 | ||||||
Ellington Loan Acquisition Trust 2007-1 | ||||||||
1.28% (1 Month LIBOR USD + 1.10%, 1.10% Floor), 05/25/2037(1)(2) | 970,402 | 936,937 | ||||||
Euro Galaxy III CLO BV | ||||||||
0.75% (3 Month EURIBOR + 0.75%, 0.75% Floor), 01/17/2031(1)(2) | EUR | 600,000 | 667,810 | |||||
Exeter Automobile Receivables Trust 2018-1 | ||||||||
3.53%, 11/15/2023(2) | $ | 3,640,000 | 3,676,015 | |||||
Fairstone Financial Issuance Trust I | ||||||||
3.95%, 03/21/2033(2) | CAD | 9,840,000 | 7,114,793 | |||||
Fieldstone Mortgage Investment Trust Series 2005-1 | ||||||||
1.31% (1 Month LIBOR USD + 1.13%, 0.75% Floor, 12.25% Cap), 03/25/2035(1) | $ | 3,044,452 | 3,013,635 | |||||
Fieldstone Mortgage Investment Trust Series 2006-3 | ||||||||
0.45% (1 Month LIBOR USD + 0.14%, 0.14% Floor, 12.25% Cap), 11/25/2036(1) | 7,386,663 | 6,600,678 | ||||||
First Franklin Mortgage Loan Trust 2004-FF7 | ||||||||
2.36% (1 Month LIBOR USD + 2.18%, 1.45% Floor), 09/25/2034(1) | 854,074 | 822,427 | ||||||
First Franklin Mortgage Loan Trust 2006-FF16 | ||||||||
0.39% (1 Month LIBOR USD + 0.21%, 0.21% Floor), 12/25/2036(1) | 6,598,929 | 3,816,125 | ||||||
First Franklin Mortgage Loan Trust 2006-FF17 | ||||||||
0.33% (1 Month LIBOR USD + 0.15%, 0.15% Floor), 12/25/2036(1) | 4,961,431 | 4,364,626 | ||||||
First Investors Auto Owner Trust 2016-2 | ||||||||
3.35%, 11/15/2022(2) | 850,000 | 859,908 | ||||||
First Investors Auto Owner Trust 2017-2 | ||||||||
3.56%, 09/15/2023(2) | 975,000 | 991,247 | ||||||
First Investors Auto Owner Trust 2018-1 | ||||||||
4.11%, 06/17/2024(2) | 605,000 | 624,418 | ||||||
First Investors Auto Owner Trust 2019-2 | ||||||||
2.71%, 12/15/2025(2) | 1,254,000 | 1,275,532 | ||||||
Flagship Credit Auto Trust 2016-3 | ||||||||
3.89%, 11/15/2022(2) | 810,000 | 823,884 | ||||||
Flagship Credit Auto Trust 2017-1 | ||||||||
4.23%, 05/15/2023(2) | 260,000 | 266,136 | ||||||
Flagship Credit Auto Trust 2018-1 | ||||||||
3.86%, 04/15/2024(2) | 1,285,000 | 1,312,830 | ||||||
Flagship Credit Auto Trust 2018-2 | ||||||||
4.23%, 09/16/2024(2) | 1,580,000 | 1,629,573 | ||||||
Flagship Credit Auto Trust 2019-3 | ||||||||
2.86%, 12/15/2025(2) | 2,235,000 | 2,244,601 | ||||||
Flatiron CLO 2015-1 Ltd. | ||||||||
2.11% (3 Month LIBOR USD + 0.89%), 04/15/2027(1)(2) | 3,266,360 | 3,231,717 | ||||||
Ford Auto Securitization Trust | ||||||||
2.47%, 02/15/2025(2) | CAD | 4,925,000 | 3,649,492 | |||||
2.55%, 09/15/2024(2) | 5,725,000 | 4,248,080 | ||||||
Ford Credit Auto Owner Trust 2017-B | ||||||||
1.69%, 11/15/2021 | $ | 784,688 | 786,802 | |||||
Ford Credit Auto Owner Trust 2017-C | ||||||||
2.01%, 03/15/2022 | 520,092 | 522,610 | ||||||
Ford Credit Auto Owner Trust 2018-A | ||||||||
3.16%, 10/15/2023 | 8,225,000 | 8,528,873 | ||||||
Ford Credit Auto Owner Trust 2019-REV1 | ||||||||
3.52%, 07/15/2030(2) | 9,385,000 | 10,039,764 | ||||||
Ford Credit Auto Owner Trust 2020-B | ||||||||
0.56%, 10/15/2024 | 10,520,000 | 10,546,300 | ||||||
Fremont Home Loan Trust 2004-C | ||||||||
1.16% (1 Month LIBOR USD + 0.98%, 0.65% Floor), 08/25/2034(1) | 4,924,418 | 4,457,666 | ||||||
Fremont Home Loan Trust 2005-2 | ||||||||
0.93% (1 Month LIBOR USD + 0.75%, 0.50% Floor), 06/25/2035(1) | 4,870,441 | 4,754,664 | ||||||
Fremont Home Loan Trust 2005-C | ||||||||
1.11% (1 Month LIBOR USD + 0.93%, 0.62% Floor), 07/25/2035(1) | 6,220,773 | 4,632,550 | ||||||
Gallatin CLO IX 2018-1 Ltd. | ||||||||
2.16% (3 Month LIBOR USD + 1.05%, 1.05% Floor), 01/21/2028(1)(2) | 11,863,077 | 11,704,468 | ||||||
GCAT 2019-3 LLC | ||||||||
3.35%, 10/25/2049(2)(3) | 1,954,074 | 1,904,115 | ||||||
GLS Auto Receivables Issuer Trust 2019-3 | ||||||||
2.58%, 07/17/2023(2) | 10,371,537 | 10,483,685 | ||||||
GLS Auto Receivables Issuer Trust 2020-1 | ||||||||
2.17%, 02/15/2024(2) | 10,901,211 | 11,024,058 | ||||||
GM Financial Automobile Leasing Trust 2018-1 | ||||||||
3.11%, 12/20/2021 | 3,500,000 | 3,519,364 |
GM Financial Consumer Automobile 2017-1 | ||||||||
2.45%, 07/17/2023(2) | 100,000 | 100,797 | ||||||
GM Financial Consumer Automobile Receivables Trust 2017-3 | ||||||||
1.97%, 05/16/2022(2) | 2,780,466 | 2,793,878 | ||||||
2.33%, 03/16/2023(2) | 155,000 | 156,657 | ||||||
GM Financial Consumer Automobile Receivables Trust 2018-2 | ||||||||
3.31%, 12/18/2023 | 1,615,000 | 1,657,800 | ||||||
GM Financial Consumer Automobile Receivables Trust 2019-4 | ||||||||
1.75%, 07/16/2024 | 5,540,000 | 5,652,369 | ||||||
2.04%, 02/18/2025 | 2,645,000 | 2,684,748 | ||||||
GMF Floorplan Owner Revolving Trust | ||||||||
3.06%, 04/15/2024(2) | 3,180,000 | 3,153,593 | ||||||
3.30%, 04/15/2026(2) | 6,875,000 | 6,832,902 | ||||||
GoldenTree Loan Opportunities IX Ltd. | ||||||||
1.95% (3 Month LIBOR USD + 1.11%, 1.11% Floor), 10/29/2029(1)(2) | 11,000,000 | 10,836,023 | ||||||
GoldentTree Loan Management US CLO 1 Ltd. | ||||||||
2.09% (3 Month LIBOR USD + 0.95%, 0.95% Floor), 04/20/2029(1)(2) | 9,600,000 | 9,451,354 | ||||||
Golub Capital Partners CLO 39B Ltd. | ||||||||
2.29% (3 Month LIBOR USD + 1.15%, 1.15% Floor), 10/20/2028(1)(2) | 5,295,000 | 5,219,202 | ||||||
GreatAmerica Leasing Receivables Funding LLC Series 2018-1 | ||||||||
2.99%, 06/17/2024(2) | 1,685,000 | 1,702,270 | ||||||
Greystone Commercial Real Estate Notes 2019-FL2 Ltd. | ||||||||
1.36% (1 Month LIBOR USD + 1.18%, 1.18% Floor), 09/15/2037(1)(2) | 1,900,000 | 1,843,000 | ||||||
GSAMP Trust 2005-AHL | ||||||||
1.16% (1 Month LIBOR USD + 0.98%, 0.65% Floor), 04/25/2035(1) | 5,971,078 | 5,652,102 | ||||||
GSAMP Trust 2007-FM2 | ||||||||
0.24% (1 Month LIBOR USD + 0.06%, 0.06% Floor), 01/25/2037(1) | 2,000,290 | 1,243,802 | ||||||
Halcyon Loan Advisors Funding 2014-3 Ltd. | ||||||||
2.20% (3 Month LIBOR USD + 1.10%), 10/22/2025(1)(2) | 348,892 | 346,783 | ||||||
Hardee’s Funding LLC | ||||||||
4.25%, 06/20/2048(2) | 8,238,263 | 8,372,464 | ||||||
4.96%, 06/20/2048(2) | 4,234,575 | 4,191,975 | ||||||
Harley Marine Financing LLC | ||||||||
5.68%, 05/15/2043(2) | 931,973 | 839,885 | ||||||
Harvest SBA Loan Trust 2018-1 | ||||||||
2.42% (1 Month LIBOR USD + 2.25%), 08/25/2044(1)(2) | 7,966,235 | 7,631,312 | ||||||
Hilton Grand Vacations Trust 2017-A | ||||||||
2.66%, 12/26/2028(2) | 158,499 | 156,418 | ||||||
2.96%, 12/26/2028(2) | 72,045 | 66,562 | ||||||
Home Equity Asset Trust 2006-3 | ||||||||
0.38% (1 Month LIBOR USD + 0.20%, 0.20% Floor), 07/25/2036(1) | 1,143,772 | 1,141,622 | ||||||
Home Equity Asset Trust 2007-1 | ||||||||
0.29% (1 Month LIBOR USD + 0.11%, 0.11% Floor), 05/25/2037(1) | 2,591,852 | 2,582,009 | ||||||
Home Partners of America 2019-1 Trust | ||||||||
3.41%, 09/17/2039(2) | 1,374,279 | 1,357,276 | ||||||
Home Partners of America 2019-2 Trust | ||||||||
3.12%, 10/19/2039(2) | 1,273,805 | 1,224,980 | ||||||
Honda Auto Receivables 2017-4 Owner Trust | ||||||||
2.05%, 11/22/2021 | 2,688,494 | 2,700,841 | ||||||
Honda Auto Receivables 2018-1 Owner Trust | ||||||||
2.64%, 02/15/2022 | 2,494,599 | 2,516,207 | ||||||
Honda Auto Receivables 2020-1 Owner Trust | ||||||||
1.61%, 04/22/2024 | 9,675,000 | 9,910,205 | ||||||
Horizon Aircraft Finance I Ltd. | ||||||||
4.46%, 12/15/2038(2) | 4,969,600 | 4,483,722 | ||||||
Horizon Aircraft Finance II Ltd. | ||||||||
3.72%, 07/15/2039(2) | 1,356,204 | 1,192,947 | ||||||
HPEFS Equipment Trust | ||||||||
2.00%, 07/22/2030(2) | 1,030,000 | 1,029,794 | ||||||
HPEFS Equipment Trust 2019-1 | ||||||||
2.49%, 09/20/2029(2) | 970,000 | 967,953 | ||||||
HPEFS Equipment Trust 2020-1 | ||||||||
2.26%, 02/20/2030(2) | 1,900,000 | 1,833,661 | ||||||
Invitation Homes 2018-SFR1 Trust | ||||||||
2.19% (1 Month LIBOR USD + 2.00%), 03/17/2037(1)(2) | 2,811,616 | 2,721,497 | ||||||
Invitation Homes 2018-SFR2 Trust | ||||||||
2.18% (1 Month LIBOR USD + 2.00%, 2.10% Floor), 06/17/2037(1)(2) | 5,355,000 | 5,177,119 | ||||||
Invitation Homes 2018-SFR3 Trust | ||||||||
2.19% (1 Month LIBOR USD + 2.00%, 2.00% Floor), 07/17/2037(1)(2) | 2,645,000 | 2,514,370 | ||||||
Invitation Homes 2018-SFR4 Trust | ||||||||
1.84% (1 Month LIBOR USD + 1.65%, 1.60% Floor), 01/17/2038(1)(2) | 615,000 | 600,426 | ||||||
Jack In The Box Funding LLC | ||||||||
3.98%, 08/25/2049(2) | 5,004,850 | 5,157,348 | ||||||
Jamestown CLO IV Ltd. | ||||||||
1.91% (3 Month LIBOR USD + 0.69%), 07/15/2026(1)(2) | 2,785,043 | 2,767,425 | ||||||
Jimmy Johns Funding LLC | ||||||||
3.61%, 07/30/2047(2) | 393,863 | 386,312 | ||||||
JP Morgan Mortgage Acquisition Corp. 2005-FRE1 | ||||||||
0.61% (1 Month LIBOR USD + 0.43%, 0.43% Floor), 10/25/2035(1) | 7,044,106 | 5,529,306 | ||||||
JP Morgan Mortgage Acquisition Corp. 2006-FRE2 | ||||||||
0.54% (1 Month LIBOR USD + 0.36%, 0.36% Floor), 02/25/2036(1) | 8,467,499 | 6,536,873 | ||||||
JP Morgan Mortgage Acquisition Trust 2006-CW1 | ||||||||
0.47% (1 Month LIBOR USD + 0.29%, 0.29% Floor), 05/25/2036(1) | 11,322,000 | 8,412,483 | ||||||
JP Morgan Mortgage Acquisition Trust 2006-WMC4 | ||||||||
0.30% (1 Month LIBOR USD + 0.12%, 0.12% Floor), 12/25/2036(1) | 23,892,487 | 13,452,197 | ||||||
0.33% (1 Month LIBOR USD + 0.15%, 0.15% Floor), 12/25/2036(1) | 21,760,007 | 12,333,607 |
JP Morgan Mortgage Acquisition Trust 2007-CH3 | ||||||||
0.44% (1 Month LIBOR USD + 0.26%, 0.26% Floor), 03/25/2037(1) | 29,750,000 | 28,766,757 | ||||||
Kestrel Aircraft Funding Ltd. | ||||||||
4.25%, 12/15/2038(2) | 3,203,364 | 2,674,888 | ||||||
KKR CLO 13 Ltd. | ||||||||
1.98% (3 Month LIBOR USD + 0.80%, 0.80% Floor), 01/16/2028(1)(2) | 2,691,828 | 2,639,973 | ||||||
Legacy Mortgage Asset Trust 2019-GS3 | ||||||||
3.75%, 04/25/2059(2)(3) | 2,617,433 | 2,657,227 | ||||||
Legacy Mortgage Asset Trust 2019-GS4 | ||||||||
3.44%, 05/25/2059(2)(3) | 222,941 | 222,525 | ||||||
Lehman XS Trust 2007-6 | ||||||||
0.39% (1 Month LIBOR USD + 0.21%, 0.21% Floor), 05/25/2037(1) | 11,891,016 | 9,700,026 | ||||||
Lendmark Funding Trust 2018-1 | ||||||||
3.81%, 12/21/2026(2) | 1,655,000 | 1,656,164 | ||||||
LoanCore 2019-CRE2 Issuer Ltd. | ||||||||
1.31% (1 Month LIBOR USD + 1.13%, 1.13% Floor), 05/15/2036(1)(2) | 3,600,000 | 3,612,136 | ||||||
Long Beach Mortgage Loan Trust 2005-WL2 | ||||||||
0.96% (1 Month LIBOR USD + 0.78%, 0.52% Floor), 08/25/2035(1) | 10,000,000 | 9,227,847 | ||||||
Long Beach Mortgage Loan Trust 2006-WL1 | ||||||||
0.81% (1 Month LIBOR USD + 0.63%, 0.42% Floor), 01/25/2046(1) | 15,000,000 | 13,547,304 | ||||||
LP Credit Card ABS Master Trust | ||||||||
2.32% (1 Month LIBOR USD + 1.55%), 08/20/2024(1)(2) | 4,349,425 | 4,420,412 | ||||||
Madison Park Funding XVIII Ltd. | ||||||||
2.30% (3 Month LIBOR USD + 1.19%), 10/21/2030(1)(2) | 4,815,000 | 4,705,988 | ||||||
Madison Park Funding XXXIII Ltd. | ||||||||
2.55% (3 Month LIBOR USD + 1.33%, 1.33% Floor), 10/15/2032(1)(2) | 4,180,000 | 4,075,550 | ||||||
Madison Park Funding XXXVII Ltd. | ||||||||
2.52% (3 Month LIBOR USD + 1.30%), 07/15/2032(1)(2) | 2,965,000 | 2,889,819 | ||||||
Magnetite XVI Ltd. | ||||||||
2.34% (3 Month LIBOR USD + 1.20%), 01/18/2028(1)(2) | 2,760,000 | 2,650,213 | ||||||
Magnetite XXI Ltd. | ||||||||
2.42% (3 Month LIBOR USD + 1.28%, 1.28% Floor), 04/20/2030(1)(2) | 6,500,000 | 6,424,229 | ||||||
Magnetite XXIII Ltd. | ||||||||
2.29% (3 Month LIBOR USD + 1.30%, 1.30% Floor), 10/25/2032(1)(2) | 1,255,000 | 1,234,841 | ||||||
MAPS 2018-1 Ltd. | ||||||||
4.21%, 05/15/2043(2) | 6,542,769 | 5,719,293 | ||||||
MAPS 2019-1 Ltd. | ||||||||
4.46%, 03/15/2044(2) | 1,678,805 | 1,477,104 | ||||||
Mariner Finance Issuance Trust 2018-A | ||||||||
4.20%, 11/20/2030(2) | 5,575,000 | 5,580,759 | ||||||
Marlette Funding Trust 2019-4 | ||||||||
2.39%, 12/17/2029(2) | 2,353,704 | 2,362,812 | ||||||
MASTR Asset Backed Securities Trust 2004-WMC1 | ||||||||
0.96% (1 Month LIBOR USD + 0.78%, 0.52% Floor), 02/25/2034(1) | 1,574,388 | 1,548,162 | ||||||
MASTR Specialized Loan Trust | ||||||||
0.44% (1 Month LIBOR USD + 0.26%, 0.26% Floor), 02/25/2036(1)(2) | 847,412 | 799,576 | ||||||
Merlin Aviation Holdings DAC | ||||||||
4.50%, 12/15/2032(2)(3) | 236,496 | 202,597 | ||||||
Merrill Lynch First Franklin Mortgage Loan Trust Series 2007-2 | ||||||||
0.42% (1 Month LIBOR USD + 0.24%, 0.24% Floor), 05/25/2037(1) | 2,708,062 | 1,870,164 | ||||||
METAL 2017-1 LLC | ||||||||
4.58%, 10/15/2042(2) | 3,212,691 | 2,328,708 | ||||||
Mill City Mortgage Loan Trust 2016-1 | ||||||||
2.50%, 04/25/2057(2)(4) | 172,683 | 174,680 | ||||||
Mill City Mortgage Loan Trust 2017-2 | ||||||||
2.75%, 07/25/2059(2)(4) | 409,496 | 419,505 | ||||||
Mill City Mortgage Loan Trust 2018-1 | ||||||||
3.25%, 05/25/2062(2)(4) | 4,606,647 | 4,795,516 | ||||||
Mill City Mortgage Loan Trust 2018-2 | ||||||||
3.75%, 05/25/2058(2)(4) | 494,254 | 518,590 | ||||||
Mill City Mortgage Loan Trust 2018-3 | ||||||||
3.50%, 08/25/2058(2)(4) | 2,394,064 | 2,528,552 | ||||||
MMAF Equipment Finance LLC 2018-A | ||||||||
3.39%, 01/10/2025(2) | 1,180,000 | 1,232,759 | ||||||
Morgan Stanley ABS Capital I, Inc. Trust 2005-WMC2 | ||||||||
1.11% (1 Month LIBOR USD + 0.93%, 0.62% Floor), 02/25/2035(1) | 1,568,504 | 1,400,319 | ||||||
Morgan Stanley ABS Capital I, Inc. Trust 2006-HE8 | ||||||||
0.31% (1 Month LIBOR USD + 0.13%, 0.13% Floor), 10/25/2036(1) | 651,383 | 557,340 | ||||||
Morgan Stanley Capital I, Inc. Trust 2006-HE1 | ||||||||
0.47% (1 Month LIBOR USD + 0.29%, 0.29% Floor), 01/25/2036(1) | 10,417,583 | 10,050,348 | ||||||
Morgan Stanley Mortgage Loan Trust 2006-15XS | ||||||||
6.20%, 11/25/2036(3) | 13,900,295 | 5,258,626 | ||||||
Morgan Stanley Mortgage Loan Trust 2007-8XS | ||||||||
0.71% (1 Month LIBOR USD + 0.53%, 0.53% Floor, 6.25% Cap), 04/25/2037(1) | 23,542,162 | 10,452,353 | ||||||
0.72% (1 Month LIBOR USD + 0.54%, 0.54% Floor, 6.26% Cap), 04/25/2037(1) | 2,273,331 | 1,010,150 | ||||||
Mountain View CLO 2014-1 Ltd. | ||||||||
2.02% (3 Month LIBOR USD + 0.80%, 0.80% Floor), 10/15/2026(1)(2) | 5,298,209 | 5,227,345 | ||||||
Mountain View CLO 2017-1 LLC | ||||||||
2.27% (3 Month LIBOR USD + 1.09%, 1.09% Floor), 10/16/2029(1)(2) | 11,100,000 | 10,778,000 | ||||||
Mountain View CLO X Ltd. | ||||||||
2.13% (3 Month LIBOR USD + 0.82%, 0.82% Floor), 10/13/2027(1)(2) | 1,186,268 | 1,165,025 | ||||||
MVW Owner Trust 2015-1 | ||||||||
2.52%, 12/20/2032(2) | 339,801 | 336,828 | ||||||
MVW Owner Trust 2017-1 | ||||||||
2.75%, 12/20/2034(2) | 88,493 | 85,947 | ||||||
Nassau 2017-I Ltd. | ||||||||
2.37% (3 Month LIBOR USD + 1.15%), 10/15/2029(1)(2) | 15,200,000 | 14,911,610 |
National Collegiate Student Loan Trust 2004-2 | ||||||||
0.66% (1 Month LIBOR USD + 0.48%), 12/26/2033(1) | 6,611,170 | 6,035,074 | ||||||
National Collegiate Student Loan Trust 2005-3 | ||||||||
0.55% (1 Month LIBOR USD + 0.29%), 10/25/2033(1)(2) | 11,032,941 | 10,056,808 | ||||||
Navient Private Education Loan Trust 2017-A | ||||||||
2.88%, 12/16/2058(2) | 555,972 | 564,584 | ||||||
3.91%, 12/16/2058(2) | 440,000 | 447,991 | ||||||
Navient Private Education Loan Trust 2018-B | ||||||||
3.61%, 12/15/2059(2) | 2,112,127 | 2,159,770 | ||||||
Navient Private Education Refi Loan Trust 2018-A | ||||||||
3.19%, 02/18/2042(2) | 4,231,204 | 4,330,735 | ||||||
Navient Private Education Refi Loan Trust 2018-C | ||||||||
3.52%, 06/16/2042(2) | 1,300,000 | 1,341,494 | ||||||
Navient Private Education Refi Loan Trust 2019-F | ||||||||
2.60%, 08/15/2068(2) | 6,965,000 | 7,156,349 | ||||||
Navient Private Education Refi Loan Trust 2019-G | ||||||||
2.40%, 10/15/2068(2) | 2,070,913 | 2,111,440 | ||||||
Navient Private Education Refi Loan Trust 2020-B | ||||||||
2.12%, 01/15/2069(2) | 5,635,000 | 5,723,915 | ||||||
Navient Private Education Refi Loan Trust 2020-C | ||||||||
2.15%, 11/15/2068(2) | 4,795,000 | 4,852,472 | ||||||
2.83%, 11/15/2068(2) | 4,665,000 | 4,512,834 | ||||||
Navient Private Education Refi Loan Trust 2020-D | ||||||||
1.69%, 05/15/2069(2) | 16,300,000 | 16,362,033 | ||||||
Navient Student Loan Trust 2014-2 | ||||||||
0.82% (1 Month LIBOR USD + 0.64%), 03/25/2083(1) | 728,787 | 697,748 | ||||||
Navient Student Loan Trust 2014-3 | ||||||||
0.80% (1 Month LIBOR USD + 0.62%), 03/25/2083(1) | 285,559 | 272,557 | ||||||
Navient Student Loan Trust 2016-1 | ||||||||
0.88% (1 Month LIBOR USD + 0.70%), 02/25/2070(1)(2) | 2,915,766 | 2,762,694 | ||||||
Navient Student Loan Trust 2016-2 | ||||||||
1.68% (1 Month LIBOR USD + 1.50%), 06/25/2065(1)(2) | 6,200,000 | 6,169,942 | ||||||
Navient Student Loan Trust 2017-1 | ||||||||
1.33% (1 Month LIBOR USD + 1.15%), 07/26/2066(1)(2) | 4,730,000 | 4,606,545 | ||||||
Navient Student Loan Trust 2017-3 | ||||||||
1.23% (1 Month LIBOR USD + 1.05%), 07/26/2066(1)(2) | 5,000,000 | 4,827,485 | ||||||
Navient Student Loan Trust 2018-2 | ||||||||
0.93% (1 Month LIBOR USD + 0.75%), 03/25/2067(1)(2) | 15,000,000 | 14,198,901 | ||||||
Navient Student Loan Trust 2018-4 | ||||||||
0.43% (1 Month LIBOR USD + 0.25%), 06/27/2067(1)(2) | 587,638 | 586,945 | ||||||
Navient Student Loan Trust 2018-EA | ||||||||
4.00%, 12/15/2059(2) | 2,790,000 | 2,906,192 | ||||||
Nelnet Student Loan Trust 2014-2 | ||||||||
1.03% (1 Month LIBOR USD + 0.85%), 07/27/2037(1)(2) | 4,250,000 | 3,942,442 | ||||||
Nelnet Student Loan Trust 2020-1 | ||||||||
0.92% (1 Month LIBOR USD + 0.74%, 0.74% Floor), 03/26/2068(1)(2) | 2,529,133 | 2,489,979 | ||||||
Neuberger Berman CLO XIX Ltd. | ||||||||
2.37% (3 Month LIBOR USD + 1.15%, 1.15% Floor), 07/15/2027(1)(2) | 3,010,000 | 2,895,638 | ||||||
New Century Home Equity Loan Trust 2005-1 | ||||||||
0.86% (1 Month LIBOR USD + 0.68%, 0.45% Floor, 12.50% Cap), 03/25/2035(1) | 12,349,373 | 12,037,839 | ||||||
New Century Home Equity Loan Trust 2005-3 | ||||||||
0.95% (1 Month LIBOR USD + 0.77%, 0.51% Floor, 12.50% Cap), 07/25/2035(1) | 3,381,793 | 3,373,366 | ||||||
Nissan Auto Receivables 2017-B Owner Trust | ||||||||
1.75%, 10/15/2021 | 677,680 | 679,340 | ||||||
Nissan Auto Receivables 2017-C Owner Trust | ||||||||
2.12%, 04/18/2022 | 3,454,001 | 3,476,174 | ||||||
Nissan Auto Receivables 2018-A Owner Trust | ||||||||
2.65%, 05/16/2022 | 1,897,484 | 1,913,621 | ||||||
Nissan Auto Receivables 2018-B Owner Trust | ||||||||
3.06%, 03/15/2023 | 5,354,034 | 5,464,243 | ||||||
Nissan Auto Receivables 2019-C Owner Trust | ||||||||
1.93%, 07/15/2024 | 3,320,000 | 3,412,615 | ||||||
Nissan Auto Receivables 2020-B Owner Trust | ||||||||
0.55%, 07/15/2024 | 5,470,000 | 5,468,906 | ||||||
Nomura Home Equity Loan, Inc. Home Equity Loan Trust Series 2006-HE1 | ||||||||
0.59% (1 Month LIBOR USD + 0.41%, 0.41% Floor), 02/25/2036(1) | 3,677,828 | 3,633,003 | ||||||
OAK Hill European Credit Partners V Designated Activity Co | ||||||||
0.72% (3 Month EURIBOR + 0.72%, 0.72% Floor), 02/21/2030(1)(2) | EUR | 34,900,000 | 38,778,760 | |||||
Ocean Trails CLO VI | ||||||||
2.37% (3 Month LIBOR USD + 1.15%, 1.15% Floor), 07/15/2028(1)(2) | $ | 497,004 | 489,175 | |||||
OCP CLO 2014-7 Ltd. | ||||||||
2.26% (3 Month LIBOR USD + 1.12%), 07/20/2029(1)(2) | 14,635,000 | 14,393,991 | ||||||
OCP CLO 2020-19 Ltd. | ||||||||
2.07% (3 Month LIBOR USD + 1.75%, 1.75% Floor), 07/20/2031(1)(2) | 3,735,000 | 3,734,526 | ||||||
Octagon Investment Partners 29 Ltd. | ||||||||
2.20% (3 Month LIBOR USD + 1.18%), 01/24/2033(1)(2) | 7,880,000 | 7,720,012 | ||||||
Octagon Investment Partners XXIII Ltd. | ||||||||
2.07% (3 Month LIBOR USD + 0.85%), 07/15/2027(1)(2) | 3,231,997 | 3,188,162 | ||||||
2.42% (3 Month LIBOR USD + 1.20%), 07/15/2027(1)(2) | 1,685,000 | 1,613,276 | ||||||
OFSI Fund VII Ltd. | ||||||||
2.04% (3 Month LIBOR USD + 0.90%), 10/18/2026(1)(2) | 524,900 | 522,529 | ||||||
OneMain Financial Issuance Trust 2015-3 | ||||||||
4.16%, 11/20/2028(2) | 710,000 | 707,516 | ||||||
OneMain Financial Issuance Trust 2016-1 | ||||||||
4.57%, 02/20/2029(2) | 498,855 | 499,476 | ||||||
OneMain Financial Issuance Trust 2017-1 | ||||||||
3.35%, 09/14/2032(2) | 1,645,000 | 1,621,262 | ||||||
Onemain Financial Issuance Trust 2018-1 | ||||||||
4.08%, 03/14/2029(2) | 1,220,000 | 1,148,554 |
OneMain Financial Issuance Trust 2019-1 | ||||||||
4.22%, 02/14/2031(2) | 3,360,000 | 3,184,251 | ||||||
OneMain Financial Issuance Trust 2020-A | ||||||||
4.83%, 05/14/2032(2) | 3,780,000 | 3,939,951 | ||||||
Option One Mortgage Loan Trust 2005-2 | ||||||||
0.84% (1 Month LIBOR USD + 0.66%, 0.44% Floor), 05/25/2035(1) | 500,853 | 497,521 | ||||||
Option One Mortgage Loan Trust 2005-4 Asset-Backed Certificates Series 2005-4 | ||||||||
0.84% (1 Month LIBOR USD + 0.66%, 0.44% Floor), 11/25/2035(1) | 2,321,407 | 2,314,278 | ||||||
Option One Mortgage Loan Trust 2006-1 | ||||||||
0.40% (1 Month LIBOR USD + 0.22%, 0.22% Floor), 01/25/2036(1) | 5,623,486 | 5,552,010 | ||||||
0.48% (1 Month LIBOR USD + 0.30%, 0.30% Floor), 01/25/2036(1) | 16,603,582 | 16,184,372 | ||||||
Option One Mortgage Loan Trust 2006-3 | ||||||||
0.32% (1 Month LIBOR USD + 0.14%, 0.14% Floor), 02/25/2037(1) | 20,948,152 | 15,142,801 | ||||||
OSAT 2020-RPL1 Trust | ||||||||
3.07%, 12/26/2059(2)(3) | 2,955,139 | 2,984,752 | ||||||
OSCAR US Funding Trust V | ||||||||
2.99%, 12/15/2023(2) | 289,948 | 291,975 | ||||||
Oscar US Funding XI LLC | ||||||||
2.49%, 08/10/2022(2) | 525,728 | 529,342 | ||||||
OZLM VII Ltd. | ||||||||
2.14% (3 Month LIBOR USD + 1.01%, 1.01% Floor), 07/17/2029(1)(2) | 7,303,928 | 7,087,542 | ||||||
OZLM VIII Ltd. | ||||||||
2.30% (3 Month LIBOR USD + 1.17%, 1.17% Floor), 10/17/2029(1)(2) | 2,900,702 | 2,836,982 | ||||||
2.93% (3 Month LIBOR USD + 1.80%, 1.80% Floor), 10/17/2029(1)(2) | 2,955,000 | 2,792,723 | ||||||
Ozlme BV | ||||||||
0.82% (3 Month EURIBOR + 0.82%, 0.82% Floor), 01/18/2030(1)(2) | EUR | 1,200,000 | 1,303,151 | |||||
Palmer Square CLO 2015-1 Ltd. | ||||||||
2.62% (3 Month LIBOR USD + 2.25%), 05/21/2029(1)(2) | $ | 4,975,000 | 4,866,789 | |||||
Palmer Square Loan Funding 2019-4 Ltd. | ||||||||
1.92% (3 Month LIBOR USD + 0.90%, 0.90% Floor), 10/24/2027(1)(2) | 1,562,624 | 1,533,661 | ||||||
Penarth Master Issuer Plc | ||||||||
0.64% (1 Month LIBOR USD + 0.45%), 09/18/2022(1)(2) | 4,725,000 | 4,714,535 | ||||||
Planet Fitness Master Issuer LLC | ||||||||
3.86%, 12/05/2049(2) | 388,050 | 334,290 | ||||||
4.26%, 09/05/2048(2) | 10,139,400 | 10,183,608 | ||||||
Prestige Auto Receivables Trust 2018-1 | ||||||||
3.75%, 10/15/2024(2) | 2,765,000 | 2,824,920 | ||||||
Progress Residential 2018-SFR3 Trust | ||||||||
4.43%, 10/17/2035(2) | 2,430,000 | 2,502,345 | ||||||
Progress Residential 2019-SFR1 Trust | ||||||||
4.17%, 08/17/2035(2) | 1,190,000 | 1,231,195 | ||||||
Progress Residential 2019-SFR2 Trust | ||||||||
3.79%, 05/17/2036(2) | 2,165,000 | 2,224,710 | ||||||
Progress Residential 2019-SFR4 Trust | ||||||||
3.14%, 10/17/2036(2) | 1,915,000 | 1,947,786 | ||||||
PRPM 2019-3 LLC | ||||||||
3.35%, 07/25/2024(2)(3) | 1,470,886 | 1,478,611 | ||||||
PRPM 2019-4 LLC | ||||||||
3.35%, 11/25/2024(2)(3) | 2,641,203 | 2,643,509 | ||||||
PRPM 2020-1 LLC | ||||||||
2.98%, 02/25/2025(2)(3) | 1,866,690 | 1,854,982 | ||||||
RASC Series 2005-KS10 Trust | ||||||||
0.62% (1 Month LIBOR USD + 0.44%, 0.44% Floor, 14.00% Cap), 11/25/2035(1) | 9,749,801 | 9,634,318 | ||||||
RASC Series 2006-KS9 Trust | ||||||||
0.34% (1 Month LIBOR USD + 0.16%, 0.16% Floor, 14.00% Cap), 11/25/2036(1) | 3,819,877 | 3,771,114 | ||||||
RASC Series 2007-KS3 Trust | ||||||||
0.52% (1 Month LIBOR USD + 0.34%, 0.34% Floor, 14.00% Cap), 04/25/2037(1) | 31,155,046 | 28,155,884 | ||||||
Rockford Tower CLO 2019-2 Ltd. | ||||||||
1.71% (3 Month LIBOR USD + 1.33%, 1.33% Floor), 08/20/2032(1)(2) | 13,850,000 | 13,501,848 | ||||||
Santander Drive Auto Receivables Trust 2017-1 | ||||||||
2.58%, 05/16/2022 | 6,049 | 6,055 | ||||||
Santander Drive Auto Receivables Trust 2018-2 | ||||||||
3.88%, 02/15/2024 | 1,160,000 | 1,183,213 | ||||||
Santander Drive Auto Receivables Trust 2018-3 | ||||||||
4.07%, 08/15/2024 | 3,770,000 | 3,858,435 | ||||||
Santander Drive Auto Receivables Trust 2018-4 | ||||||||
3.98%, 12/15/2025 | 3,390,000 | 3,480,638 | ||||||
Santander Drive Auto Receivables Trust 2018-5 | ||||||||
4.19%, 12/16/2024 | 3,070,000 | 3,160,929 | ||||||
Santander Drive Auto Receivables Trust 2019-1 | ||||||||
3.65%, 04/15/2025 | 11,435,000 | 11,761,920 | ||||||
Santander Drive Auto Receivables Trust 2019-3 | ||||||||
2.68%, 10/15/2025 | 4,095,000 | 4,087,190 | ||||||
Santander Drive Auto Receivables Trust 2020-1 | ||||||||
5.35%, 03/15/2028 | 6,795,000 | 7,211,373 | ||||||
Santander Retail Auto Lease Trust 2017-A | ||||||||
2.96%, 11/21/2022(2) | 1,000,000 | 1,002,142 | ||||||
Santander Retail Auto Lease Trust 2019-B | ||||||||
3.31%, 06/20/2024(2) | 6,610,000 | 6,647,143 | ||||||
Santander Retail Auto Lease Trust 2019-C | ||||||||
2.88%, 06/20/2024(2) | 10,280,000 | 10,236,417 | ||||||
Saxon Asset Securities Trust 2006-1 | ||||||||
0.65% (1 Month LIBOR USD + 0.47%, 0.31% Floor, 12.25% Cap), 03/25/2036(1) | 1,938,873 | 1,852,692 | ||||||
Saxon Asset Securities Trust 2007-2 | ||||||||
0.38% (1 Month LIBOR USD + 0.20%, 0.20% Floor), 05/25/2047(1) | 26,055,127 | 23,087,255 | ||||||
Saxon Asset Securities Trust 2007-3 | ||||||||
0.49% (1 Month LIBOR USD + 0.31%, 0.31% Floor), 09/25/2037(1) | 27,473,834 | 25,672,902 |
Securitized Asset Backed Receivables LLC Trust 2004-OP1 | ||||||||
0.95% (1 Month LIBOR USD + 0.77%, 0.51% Floor), 02/25/2034(1) | 5,549,754 | 5,366,122 | ||||||
Securitized Asset Backed Receivables LLC Trust 2006-CB5 | ||||||||
0.32% (1 Month LIBOR USD + 0.14%, 0.14% Floor), 06/25/2036(1) | 5,262,862 | 3,828,667 | ||||||
Shackleton 2016-IX CLO Ltd. | ||||||||
2.27% (3 Month LIBOR USD + 1.13%, 1.13% Floor), 10/20/2028(1)(2) | 1,497,605 | 1,474,746 | ||||||
Sierra Timeshare 2016-2 Receivables Funding LLC | ||||||||
2.33%, 07/20/2033(2) | 134,882 | 134,840 | ||||||
Sierra Timeshare 2019-1 Receivables Funding LLC | ||||||||
3.20%, 01/20/2036(2) | 1,714,766 | 1,748,192 | ||||||
Sierra Timeshare Conduit Receivables Funding LLC | ||||||||
2.91%, 03/20/2034(2) | 94,136 | 93,503 | ||||||
S-Jets 2017-1 Ltd. | ||||||||
3.97%, 08/15/2042(2) | 14,048,489 | 12,429,676 | ||||||
SLC Student Loan Trust 2005-2 | ||||||||
0.47% (3 Month LIBOR USD + 0.16%), 12/15/2039(1) | 4,900,000 | 4,600,292 | ||||||
SLC Student Loan Trust 2005-3 | ||||||||
0.46% (3 Month LIBOR USD + 0.15%), 12/15/2039(1) | 5,000,000 | 4,535,640 | ||||||
SLM Private Credit Student Loan Trust 2003-B | ||||||||
0.00%, 03/15/2033(4) | 2,554,000 | 2,447,904 | ||||||
SLM Student Loan Trust 2003-7 | ||||||||
1.51% (3 Month LIBOR USD + 1.20%, 1.20% Floor), 12/15/2033(1)(2) | 9,111,384 | 8,792,419 | ||||||
SLM Student Loan Trust 2004-3 | ||||||||
1.54% (3 Month LIBOR USD + 0.55%, 0.55% Floor), 10/25/2064(1)(2) | 16,685,361 | 15,853,721 | ||||||
SLM Student Loan Trust 2005-4 | ||||||||
1.16% (3 Month LIBOR USD + 0.17%), 07/25/2040(1) | 11,000,000 | 10,121,189 | ||||||
SLM Student Loan Trust 2006-2 | ||||||||
1.16% (3 Month LIBOR USD + 0.17%), 01/25/2041(1) | 3,605,600 | 3,329,533 | ||||||
SLM Student Loan Trust 2006-10 | ||||||||
1.21% (3 Month LIBOR USD + 0.22%), 03/25/2044(1) | 2,040,893 | 1,777,183 | ||||||
SLM Student Loan Trust 2007-2 | ||||||||
1.16% (3 Month LIBOR USD + 0.17%), 07/25/2025(1) | 6,950,000 | 5,415,892 | ||||||
SLM Student Loan Trust 2007-3 | ||||||||
1.05% (3 Month LIBOR USD + 0.06%), 01/25/2022(1) | 3,418,104 | 3,293,983 | ||||||
SLM Student Loan Trust 2007-7 | ||||||||
1.32% (3 Month LIBOR USD + 0.33%), 01/25/2022(1) | 2,497,870 | 2,360,517 | ||||||
SLM Student Loan Trust 2008-2 | ||||||||
1.74% (3 Month LIBOR USD + 0.75%), 04/25/2023(1) | 8,207,673 | 7,657,968 | ||||||
SLM Student Loan Trust 2008-5 | ||||||||
2.69% (3 Month LIBOR USD + 1.70%, 1.70% Floor), 07/25/2023(1) | 4,257,024 | 4,187,693 | ||||||
2.84% (3 Month LIBOR USD + 1.85%, 1.85% Floor), 07/25/2073(1) | 7,350,000 | 6,656,701 | ||||||
SLM Student Loan Trust 2008-6 | ||||||||
2.09% (3 Month LIBOR USD + 1.10%), 07/25/2023(1) | 12,610,620 | 11,997,566 | ||||||
SLM Student Loan Trust 2008-7 | ||||||||
1.89% (3 Month LIBOR USD + 0.90%), 07/25/2023(1) | 9,872,250 | 9,334,433 | ||||||
SLM Student Loan Trust 2012-1 | ||||||||
1.13% (1 Month LIBOR USD + 0.95%, 0.95% Floor), 09/25/2028(1) | 12,060,518 | 11,431,449 | ||||||
SLM Student Loan Trust 2012-2 | ||||||||
0.88% (1 Month LIBOR USD + 0.70%), 01/25/2029(1) | 14,074,116 | 13,074,186 | ||||||
SLM Student Loan Trust 2012-7 | ||||||||
0.83% (1 Month LIBOR USD + 0.65%, 0.65% Floor), 05/26/2026(1) | 4,742,991 | 4,337,265 | ||||||
1.98% (1 Month LIBOR USD + 1.80%, 1.80% Floor), 09/25/2043(1) | 2,220,000 | 1,843,252 | ||||||
SLM Student Loan Trust 2014-1 | ||||||||
0.78% (1 Month LIBOR USD + 0.60%), 02/26/2029(1) | 2,961,151 | 2,710,168 | ||||||
SMART ABS Series 2016-2US Trust | ||||||||
2.05%, 12/14/2022 | 1,830,549 | 1,834,321 | ||||||
SMB Private Education Loan Trust 2014-A | ||||||||
3.05%, 05/15/2026(2) | 145,013 | 146,378 | ||||||
SMB Private Education Loan Trust 2015-B | ||||||||
1.93% (1 Month LIBOR USD + 1.75%), 05/17/2032(1)(2) | 1,685,000 | 1,699,691 | ||||||
2.98%, 07/15/2027(2) | 117,708 | 119,682 | ||||||
SMB Private Education Loan Trust 2015-C | ||||||||
3.50%, 09/15/2043(2) | 1,295,000 | 1,346,715 | ||||||
SMB Private Education Loan Trust 2016-A | ||||||||
2.70%, 05/15/2031(2) | 274,878 | 281,097 | ||||||
SMB Private Education Loan Trust 2016-B | ||||||||
2.43%, 02/17/2032(2) | 1,548,165 | 1,582,086 | ||||||
SMB Private Education Loan Trust 2016-C | ||||||||
2.34%, 09/15/2034(2) | 481,101 | 488,688 | ||||||
SMB Private Education Loan Trust 2017-A | ||||||||
2.88%, 09/15/2034(2) | 1,349,903 | 1,396,376 | ||||||
SMB Private Education Loan Trust 2017-B | ||||||||
2.82%, 10/15/2035(2) | 2,653,744 | 2,732,647 | ||||||
SMB Private Education Loan Trust 2018-B | ||||||||
0.90% (1 Month LIBOR USD + 0.72%), 01/15/2037(1)(2) | 1,846,052 | 1,802,658 | ||||||
3.60%, 01/15/2037(2) | 5,597,265 | 5,817,063 | ||||||
4.00%, 07/15/2042(2) | 285,000 | 281,813 | ||||||
SMB Private Education Loan Trust 2018-C | ||||||||
3.63%, 11/15/2035(2) | 6,696,575 | 7,016,287 | ||||||
4.00%, 11/17/2042(2) | 770,000 | 778,223 | ||||||
SMB Private Education Loan Trust 2019-A | ||||||||
3.44%, 07/15/2036(2) | 2,190,000 | 2,289,077 | ||||||
SMB Private Education Loan Trust 2019-B | ||||||||
2.84%, 06/15/2037(2) | 7,675,000 | 7,926,847 | ||||||
SMB Private Education Loan Trust 2020-A | ||||||||
2.23%, 09/15/2037(2) | 3,090,000 | 3,147,415 |
SoFi Consumer Loan Program 2017-3 LLC | ||||||||
2.77%, 05/25/2026(2) | 1,833,735 | 1,844,530 | ||||||
SoFi Consumer Loan Program 2017-4 LLC | ||||||||
2.50%, 05/26/2026(2) | 2,358,192 | 2,380,778 | ||||||
SoFi Consumer Loan Program 2017-6 LLC | ||||||||
3.52%, 11/25/2026(2) | 1,765,000 | 1,768,478 | ||||||
SoFi Consumer Loan Program 2018-2 Trust | ||||||||
3.79%, 04/26/2027(2) | 2,210,000 | 2,277,358 | ||||||
SoFi Consumer Loan Program 2018-3 Trust | ||||||||
4.02%, 08/25/2027(2) | 1,375,000 | 1,395,055 | ||||||
SoFi Consumer Loan Program 2018-4 Trust | ||||||||
4.17%, 11/26/2027(2) | 2,745,000 | 2,717,607 | ||||||
SoFi Consumer Loan Program 2019-1 Trust | ||||||||
3.73%, 02/25/2028(2) | 5,690,000 | 5,655,589 | ||||||
SoFi Consumer Loan Program 2019-2 Trust | ||||||||
3.01%, 04/25/2028(2) | 4,931,613 | 4,996,310 | ||||||
3.46%, 04/25/2028(2) | 3,145,000 | 3,152,212 | ||||||
SoFi Consumer Loan Program 2019-3 Trust | ||||||||
3.35%, 05/25/2028(2) | 5,965,000 | 5,920,863 | ||||||
SoFi Consumer Loan Program 2020-1 Trust | ||||||||
2.02%, 01/25/2029(2) | 6,491,626 | 6,560,458 | ||||||
SoFi Professional Loan Program 2015-B LLC | ||||||||
3.52%, 03/25/2036(2) | 229,731 | 232,864 | ||||||
SoFi Professional Loan Program 2015-C LLC | ||||||||
2.51%, 08/25/2033(2) | 300,341 | 302,767 | ||||||
3.58%, 08/25/2036(2) | 248,257 | 250,683 | ||||||
SoFi Professional Loan Program 2015-D LLC | ||||||||
3.59%, 10/26/2037(2) | 555,356 | 563,114 | ||||||
SoFi Professional Loan Program 2016-B LLC | ||||||||
3.80%, 04/25/2037(2) | 195,000 | 199,761 | ||||||
SoFi Professional Loan Program 2016-C LLC | ||||||||
3.35%, 05/25/2037(2)(4) | 310,000 | 316,453 | ||||||
SoFi Professional Loan Program 2016-D LLC | ||||||||
3.23%, 01/25/2039(2)(4) | 490,000 | 492,685 | ||||||
SoFi Professional Loan Program 2016-E LLC | ||||||||
3.44%, 07/25/2040(2)(4) | 1,600,000 | 1,649,542 | ||||||
SoFi Professional Loan Program 2017-A LLC | ||||||||
4.43%, 03/26/2040(2)(4) | 165,000 | 172,316 | ||||||
SoFi Professional Loan Program 2017-C LLC | ||||||||
0.78% (1 Month LIBOR USD + 0.60%), 07/25/2040(1)(2) | 2,140,197 | 2,130,003 | ||||||
SoFi Professional Loan Program 2017-D LLC | ||||||||
2.65%, 09/25/2040(2) | 3,319,669 | 3,403,297 | ||||||
SoFi Professional Loan Program 2017-E LLC | ||||||||
4.16%, 11/26/2040(2) | 695,000 | 728,907 | ||||||
SoFi Professional Loan Program 2017-F LLC | ||||||||
3.62%, 01/25/2041(2) | 1,405,000 | 1,465,246 | ||||||
SoFi Professional Loan Program 2018-C Trust | ||||||||
4.13%, 01/25/2048(2) | 1,875,000 | 1,927,496 | ||||||
SoFi Professional Loan Program 2018-D Trust | ||||||||
3.12%, 02/25/2048(2) | 2,715,139 | 2,733,822 | ||||||
Sofi Professional Loan Program 2019-B LLC | ||||||||
2.78%, 08/17/2048(2) | 486,662 | 489,816 | ||||||
Sound Point Clo XIV Ltd. | ||||||||
2.19% (3 Month LIBOR USD + 1.15%), 01/23/2029(1)(2) | 3,400,000 | 3,323,571 | ||||||
Southwick Park CLO LLC | ||||||||
2.44% (3 Month LIBOR USD + 1.30%), 07/20/2032(1)(2) | 11,400,000 | 11,195,324 | ||||||
SpringCastle Funding Asset-Backed Notes 2019-A | ||||||||
3.20%, 05/27/2036(2) | 10,070,967 | 10,179,750 | ||||||
Springleaf Funding Trust 2017-A | ||||||||
2.68%, 07/15/2030(2) | 7,900,000 | 7,892,854 | ||||||
3.86%, 07/15/2030(2) | 1,270,000 | 1,230,523 | ||||||
Sprite 2017-1 Ltd. | ||||||||
4.25%, 12/15/2037(2) | 922,618 | 759,503 | ||||||
St Paul’s CLO VI DAC | ||||||||
0.85% (3 Month EURIBOR + 0.85%, 0.85% Floor), 08/20/2030(1)(2) | EUR | 38,000,000 | 42,139,058 | |||||
Stack Infrastructure Issuer LLC Series 2019-1 | ||||||||
4.54%, 02/25/2044(2) | $ | 7,345,733 | 7,691,446 | |||||
Structured Adjustable Rate Mortgage Loan Trust | ||||||||
3.68%, 02/25/2035(4) | 6,305,502 | 6,056,017 | ||||||
Structured Asset Investment Loan Trust 2004-8 | ||||||||
1.08% (1 Month LIBOR USD + 0.90%, 0.60% Floor), 09/25/2034(1) | 865,360 | 818,601 | ||||||
Structured Asset Mortgage Investments II Trust 2007-AR3 | ||||||||
0.37% (1 Month LIBOR USD + 0.19%, 0.19% Floor, 10.50% Cap), 09/25/2047(1) | 26,134,312 | 23,722,071 | ||||||
Structured Asset Securities Corp. Mortgage Loan Trust 2007-WF2 | ||||||||
1.18% (1 Month LIBOR USD + 1.00%, 1.00% Floor), 08/25/2037(1) | 533,531 | 528,503 | ||||||
STWD 2019-FL1 Ltd. | ||||||||
1.26% (1 Month LIBOR USD + 1.08%, 1.08% Floor), 07/15/2038(1)(2) | 3,600,000 | 3,512,250 | ||||||
Symphony CLO XVII Ltd. | ||||||||
2.10% (3 Month LIBOR USD + 0.88%), 04/15/2028(1)(2) | 4,030,000 | 3,977,263 | ||||||
Synchrony Credit Card Master Note Trust | ||||||||
2.62%, 09/15/2023 | 650,000 | 650,605 | ||||||
3.36%, 03/15/2024 | 2,835,000 | 2,853,043 | ||||||
Taco Bell Funding LLC | ||||||||
4.32%, 11/25/2048(2) | 11,312,725 | 11,553,460 | ||||||
TCI-Flatiron CLO 2016-1 Ltd. | ||||||||
2.35% (3 Month LIBOR USD + 1.22%, 1.22% Floor), 07/17/2028(1)(2) | 1,800,000 | 1,778,549 | ||||||
THL Credit Wind River 2016-1 CLO Ltd. | ||||||||
2.87% (3 Month LIBOR USD + 1.65%), 07/15/2028(1)(2) | 1,320,000 | 1,291,265 | ||||||
3.32% (3 Month LIBOR USD + 2.10%), 07/15/2028(1)(2) | 1,395,000 | 1,321,440 |
Tikehau CLO II BV | ||||||||
0.88% (3 Month EURIBOR + 0.88%, 0.88% Floor), 12/07/2029(1)(2) | EUR | 2,300,000 | 2,544,209 | |||||
Towd Point Mortgage Trust 2015-2 | ||||||||
2.50%, 11/25/2060(2)(4) | $ | 1,378,408 | 1,388,410 | |||||
Towd Point Mortgage Trust 2015-3 | ||||||||
3.00%, 03/25/2054(2)(4) | 85,462 | 86,106 | ||||||
Towd Point Mortgage Trust 2015-4 | ||||||||
2.75%, 04/25/2055(2)(4) | 120,134 | 121,067 | ||||||
3.75%, 04/25/2055(2)(4) | 960,000 | 1,018,744 | ||||||
Towd Point Mortgage Trust 2015-5 | ||||||||
2.75%, 05/25/2055(2)(4) | 128,134 | 128,993 | ||||||
Towd Point Mortgage Trust 2016-1 | ||||||||
2.75%, 02/25/2055(2)(4) | 618,132 | 625,471 | ||||||
3.00%, 02/25/2055(2)(4) | 197,267 | 201,783 | ||||||
Towd Point Mortgage Trust 2016-2 | ||||||||
2.75%, 08/25/2055(2)(4) | 136,354 | 139,497 | ||||||
Towd Point Mortgage Trust 2016-3 | ||||||||
2.25%, 04/25/2056(2)(4) | 191,711 | 192,804 | ||||||
Towd Point Mortgage Trust 2016-4 | ||||||||
2.25%, 07/25/2056(2)(4) | 422,232 | 426,041 | ||||||
Towd Point Mortgage Trust 2017-1 | ||||||||
2.75%, 10/25/2056(2)(4) | 368,608 | 377,180 | ||||||
3.75%, 10/25/2056(2)(4) | 6,315,000 | 6,731,600 | ||||||
Towd Point Mortgage Trust 2017-2 | ||||||||
2.75%, 04/25/2057(2)(4) | 170,985 | 173,995 | ||||||
Towd Point Mortgage Trust 2017-4 | ||||||||
3.25%, 06/25/2057(2)(4) | 2,465,000 | 2,511,891 | ||||||
Towd Point Mortgage Trust 2017-5 | ||||||||
0.78% (1 Month LIBOR USD + 0.60%), 02/25/2057(1)(2) | 508,628 | 504,059 | ||||||
1.68% (1 Month LIBOR USD + 1.50%), 02/25/2057(1)(2) | 3,310,000 | 3,043,868 | ||||||
Towd Point Mortgage Trust 2018-3 | ||||||||
3.75%, 05/25/2058(2)(4) | 6,257,940 | 6,718,250 | ||||||
Towd Point Mortgage Trust 2018-4 | ||||||||
3.00%, 06/25/2058(2)(4) | 1,015,000 | 1,025,551 | ||||||
Towd Point Mortgage Trust 2018-SJ1 | ||||||||
4.00%, 10/25/2058(2)(4) | 2,231,671 | 2,251,792 | ||||||
Towd Point Mortgage Trust 2019-1 | ||||||||
3.75%, 03/25/2058(2)(4) | 11,130,032 | 11,981,356 | ||||||
Towd Point Mortgage Trust 2019-2 | ||||||||
3.75%, 12/25/2058(2)(4) | 6,860,000 | 6,958,984 | ||||||
Towd Point Mortgage Trust 2019-MH1 | ||||||||
3.00%, 11/25/2058(2)(4) | 552,207 | 562,649 | ||||||
Towd Point Mortgage Trust 2019-SJ1 | ||||||||
4.17%, 11/25/2058(2)(4) | 6,100,000 | 6,199,690 | ||||||
Towd Point Mortgage Trust 2019-SJ2 | ||||||||
4.50%, 11/25/2058(2)(4) | 12,971,000 | 13,084,234 | ||||||
Towd Point Mortgage Trust 2019-SJ3 | ||||||||
3.00%, 11/25/2059(2)(4) | 5,925,877 | 6,019,498 | ||||||
Toyota Auto Receivables 2017-B Owner Trust | ||||||||
1.76%, 07/15/2021 | 1,871,524 | 1,874,253 | ||||||
Toyota Auto Receivables 2017-C Owner Trust | ||||||||
1.78%, 11/15/2021 | 1,497,060 | 1,502,087 | ||||||
Tralee CLO V Ltd. | ||||||||
2.25% (3 Month LIBOR USD + 1.11%, 1.11% Floor), 10/20/2028(1)(2) | 2,000,000 | 1,968,268 | ||||||
Tricon American Homes 2019-SFR1 Trust | ||||||||
3.20%, 03/17/2038(2) | 1,270,000 | 1,269,856 | ||||||
Upstart Securitization Trust 2019-2 | ||||||||
2.90%, 09/20/2029(2) | 337,387 | 338,758 | ||||||
Upstart Securitization Trust 2019-3 | ||||||||
2.68%, 01/21/2030(2) | 5,215,500 | 5,251,669 | ||||||
Upstart Securitization Trust 2020-1 | ||||||||
2.32%, 04/22/2030(2) | 2,840,311 | 2,842,440 | ||||||
Venture XIV CLO Ltd. | ||||||||
1.40% (3 Month LIBOR USD + 1.03%, 1.03% Floor), 08/28/2029(1)(2) | 15,300,000 | 14,986,717 | ||||||
Venture Xxv Clo Ltd. | ||||||||
2.37% (3 Month LIBOR USD + 1.23%), 04/20/2029(1)(2) | 25,570,000 | 25,158,118 | ||||||
Vericrest Opportunity Loan Trust 2019-NPL5 | ||||||||
3.35%, 09/25/2049(2)(3) | 5,689,968 | 5,692,026 | ||||||
Vericrest Opportunity Loan Trust 2019-NPL8 | ||||||||
3.28%, 11/25/2049(2)(3) | 5,668,948 | 5,662,614 | ||||||
Vericrest Opportunity Loan Trust 2020-NPL2 | ||||||||
2.98%, 02/25/2050(2)(3) | 2,991,103 | 2,962,579 | ||||||
Verizon Owner Trust 2017-3 | ||||||||
2.53%, 04/20/2022(2) | 1,360,000 | 1,368,479 | ||||||
Verizon Owner Trust 2018-1 | ||||||||
3.20%, 09/20/2022(2) | 1,105,000 | 1,121,930 | ||||||
VOLT LXXXIII LLC | ||||||||
3.33%, 11/26/2049(2)(3) | 2,209,807 | 2,205,936 | ||||||
VOLT LXXXV LLC | ||||||||
3.23%, 01/25/2050(2)(3) | 5,009,154 | 4,978,119 | ||||||
WaMu Mortgage Pass-Through Certificates Series 2007-HY1 Trust | ||||||||
3.59%, 02/25/2037(4) | 9,282,332 | 8,623,958 | ||||||
WAVE 2017-1 Trust | ||||||||
3.84%, 11/15/2042(2) | 2,185,759 | 1,904,299 |
Wellfleet CLO 2017-2A Ltd. | ||||||||
2.20% (3 Month LIBOR USD + 1.06%), 10/20/2029(1)(2) | 6,900,000 | 6,718,357 | ||||||
Westlake Automobile Receivables Trust 2018-2 | ||||||||
4.00%, 01/16/2024(2) | 1,540,000 | 1,565,418 | ||||||
Westlake Automobile Receivables Trust 2018-3 | ||||||||
4.00%, 10/16/2023(2) | 1,215,000 | 1,239,583 | ||||||
Westlake Automobile Receivables Trust 2019-1 | ||||||||
3.67%, 03/15/2024(2) | 6,545,000 | 6,737,666 | ||||||
Wingstop Funding 2018-1 LLC | ||||||||
4.97%, 12/05/2048(2) | 945,450 | 985,537 | ||||||
World Omni Auto Receivables Trust | ||||||||
1.64%, 08/17/2026 | 3,190,000 | 3,176,711 | ||||||
World Omni Select Auto Trust 2019-A | ||||||||
2.17%, 12/15/2025 | 4,785,000 | 4,855,021 | ||||||
Zais CLO 1 Ltd. | ||||||||
2.37% (3 Month LIBOR USD + 1.15%), 04/15/2028(1)(2) | 14,720,375 | 14,530,983 | ||||||
|
| |||||||
Total Asset-Backed Obligations (Cost: $2,282,680,338) | 2,226,097,210 | |||||||
|
| |||||||
Corporate Bonds – 36.94% | ||||||||
Basic Materials – 0.92% | ||||||||
ABJA Investment Co. Pte Ltd. | ||||||||
5.45%, 01/24/2028 | 4,800,000 | 4,430,356 | ||||||
Anglo American Capital Plc | ||||||||
4.00%, 09/11/2027(2) | 1,000,000 | 1,068,930 | ||||||
4.13%, 09/27/2022(2) | 3,883,000 | 4,048,600 | ||||||
4.50%, 03/15/2028(2) | 19,220,000 | 21,076,520 | ||||||
5.38%, 04/01/2025(2) | 450,000 | 508,250 | ||||||
ArcelorMittal SA | ||||||||
4.55%, 03/11/2026 | 5,950,000 | 6,009,028 | ||||||
6.13%, 06/01/2025 | 565,000 | 613,159 | ||||||
Arconic Corp. | ||||||||
6.00%, 05/15/2025(2) | 463,000 | 476,311 | ||||||
6.13%, 02/15/2028(2) | 1,275,000 | 1,274,681 | ||||||
Ashland Services BV | ||||||||
2.00%, 01/30/2028(2) | EUR | 625,000 | 651,279 | |||||
Braskem Netherlands Finance BV | ||||||||
4.50%, 01/31/2030(2) | $ | 3,735,000 | 3,417,525 | |||||
Celulosa Arauco y Constitucion SA | ||||||||
3.88%, 11/02/2027 | 860,000 | 877,200 | ||||||
CF Industries, Inc. | ||||||||
4.50%, 12/01/2026(2) | 5,145,000 | 5,657,728 | ||||||
Corp. Nacional del Cobre de Chile | ||||||||
3.15%, 01/14/2030 | 2,456,000 | 2,553,110 | ||||||
3.63%, 08/01/2027 | 300,000 | 321,106 | ||||||
DuPont de Nemours, Inc. | ||||||||
3.77%, 11/15/2020 | 6,165,000 | 6,235,263 | ||||||
Equate Petrochemical BV | ||||||||
4.25%, 11/03/2026 | 6,910,000 | 7,285,420 | ||||||
First Quantum Minerals Ltd. | ||||||||
6.50%, 03/01/2024(2) | 200,000 | 188,500 | ||||||
6.88%, 03/01/2026(2) | 200,000 | 189,500 | ||||||
FMC Corp. | ||||||||
3.45%, 10/01/2029 | 1,850,000 | 2,005,570 | ||||||
4.50%, 10/01/2049 | 1,025,000 | 1,217,149 | ||||||
Glencore Finance Canada Ltd. | ||||||||
4.95%, 11/15/2021(2) | 1,170,000 | 1,221,106 | ||||||
Glencore Funding LLC | ||||||||
3.88%, 10/27/2027(2) | 11,555,000 | 12,282,037 | ||||||
4.00%, 04/16/2025(2) | 4,450,000 | 4,835,719 | ||||||
4.00%, 03/27/2027(2) | 1,000,000 | 1,071,606 | ||||||
4.13%, 03/12/2024(2) | 4,920,000 | 5,273,021 | ||||||
4.88%, 03/12/2029(2) | 8,160,000 | 9,253,953 | ||||||
Huntsman International LLC | ||||||||
5.13%, 11/15/2022 | 1,797,000 | 1,903,639 | ||||||
ICL Group Ltd. | ||||||||
6.38%, 05/31/2038(2) | 10,200,000 | 12,099,045 | ||||||
Indonesia Asahan Aluminium Persero PT | ||||||||
6.53%, 11/15/2028 | 200,000 | 236,006 | ||||||
6.53%, 11/15/2028(2) | 1,200,000 | 1,416,037 | ||||||
6.76%, 11/15/2048 | 834,000 | 1,013,447 | ||||||
International Flavors & Fragrances, Inc. | ||||||||
5.00%, 09/26/2048 | 7,265,000 | 8,472,844 | ||||||
LYB International Finance III LLC | ||||||||
4.20%, 10/15/2049 | 4,050,000 | 4,375,591 | ||||||
Minmetals Bounteous Finance BVI Ltd. | ||||||||
3.50%, 07/30/2020 | 3,400,000 | 3,404,610 | ||||||
Newcrest Finance Pty Ltd. | ||||||||
3.25%, 05/13/2030(2) | 2,260,000 | 2,412,976 | ||||||
Newmont Corp. | ||||||||
3.70%, 03/15/2023 | 430,000 | 445,338 | ||||||
Orbia Advance Corp. SAB de CV | ||||||||
4.00%, 10/04/2027(2) | 1,255,000 | 1,287,956 | ||||||
Steel Dynamics, Inc. | ||||||||
3.25%, 01/15/2031 | 200,000 | 203,256 | ||||||
3.45%, 04/15/2030 | 7,590,000 | 7,932,519 | ||||||
Suzano Austria GmbH | ||||||||
5.00%, 01/15/2030 | 3,465,000 | 3,510,045 | ||||||
6.00%, 01/15/2029 | 5,035,000 | 5,431,557 |
Syngenta Finance NV | ||||||||
3.93%, 04/23/2021(2) | 7,942,000 | 8,019,307 | ||||||
4.44%, 04/24/2023(2) | 200,000 | 209,911 | ||||||
4.89%, 04/24/2025(2) | 550,000 | 578,222 | ||||||
5.18%, 04/24/2028(2) | 500,000 | 533,252 | ||||||
Vale Overseas Ltd. | ||||||||
6.25%, 08/10/2026 | 1,299,000 | 1,527,949 | ||||||
6.88%, 11/21/2036 | 1,132,000 | 1,478,958 | ||||||
6.88%, 11/10/2039 | 316,000 | 412,383 | ||||||
Vale SA | ||||||||
3.75%, 01/10/2023 | EUR | 400,000 | 462,886 | |||||
Westlake Chemical Corp. | ||||||||
1.63%, 07/17/2029 | 2,025,000 | 2,171,016 | ||||||
3.60%, 08/15/2026 | $ | 1,925,000 | 2,036,683 | |||||
Yara International ASA | ||||||||
3.15%, 06/04/2030(2) | 2,130,000 | 2,214,343 | ||||||
|
| |||||||
Total Basic Materials |
| 177,832,403 | ||||||
|
| |||||||
Communications – 5.17% | ||||||||
Altice Financing SA | ||||||||
2.25%, 01/15/2025(2) | EUR | 2,700,000 | 2,836,276 | |||||
3.00%, 01/15/2028 | 4,700,000 | 4,844,813 | ||||||
5.00%, 01/15/2028(2) | $ | 2,700,000 | 2,682,072 | |||||
Altice France SA | ||||||||
5.50%, 01/15/2028(2) | 4,815,000 | 4,863,150 | ||||||
7.38%, 05/01/2026(2) | 1,400,000 | 1,461,516 | ||||||
8.13%, 02/01/2027(2) | 700,000 | 766,500 | ||||||
Amazon.com, Inc. | ||||||||
2.50%, 06/03/2050 | 10,675,000 | 10,796,436 | ||||||
AT&T, Inc. | ||||||||
2.30%, 06/01/2027 | 13,163,000 | 13,590,185 | ||||||
2.75%, 06/01/2031 | 34,109,000 | 35,285,294 | ||||||
3.50%, 06/01/2041 | 6,608,000 | 6,939,601 | ||||||
3.65%, 06/01/2051 | 10,820,000 | 11,287,304 | ||||||
3.80%, 02/15/2027 | 2,235,000 | 2,516,803 | ||||||
3.85%, 06/01/2060 | 5,797,000 | 6,143,647 | ||||||
4.30%, 02/15/2030 | 9,820,000 | 11,472,807 | ||||||
4.35%, 03/01/2029 | 14,507,000 | 16,911,067 | ||||||
4.35%, 06/15/2045 | 10,531,000 | 11,846,533 | ||||||
4.50%, 05/15/2035 | 1,637,000 | 1,942,018 | ||||||
4.50%, 03/09/2048 | 34,524,000 | 40,512,172 | ||||||
4.55%, 03/09/2049 | 4,090,000 | 4,820,257 | ||||||
4.75%, 05/15/2046 | 9,050,000 | 10,717,047 | ||||||
4.80%, 06/15/2044 | 9,060,000 | 10,725,369 | ||||||
4.85%, 03/01/2039 | 10,680,000 | 12,877,508 | ||||||
4.90%, 08/15/2037 | 650,000 | 778,603 | ||||||
5.15%, 11/15/2046 | 3,055,000 | 3,841,630 | ||||||
5.25%, 03/01/2037 | 11,282,000 | 13,945,817 | ||||||
Baidu, Inc. | ||||||||
2.88%, 07/06/2022 | 5,105,000 | 5,228,792 | ||||||
3.88%, 09/29/2023 | 11,655,000 | 12,403,406 | ||||||
Bharti Airtel Ltd. | ||||||||
4.38%, 06/10/2025 | 225,000 | 232,199 | ||||||
Booking Holdings, Inc. | ||||||||
4.10%, 04/13/2025 | 1,940,000 | 2,179,749 | ||||||
4.50%, 04/13/2027 | 7,250,000 | 8,322,716 | ||||||
4.63%, 04/13/2030 | 10,865,000 | 12,706,777 | ||||||
British Telecommunications Plc | ||||||||
3.25%, 11/08/2029(2) | 4,870,000 | 5,308,830 | ||||||
C&W Senior Financing DAC | ||||||||
6.88%, 09/15/2027(2) | 200,000 | 198,098 | ||||||
CCO Holdings LLC / CCO Holdings Capital Corp. | ||||||||
4.50%, 08/15/2030(2) | 12,407,000 | 12,661,343 | ||||||
4.50%, 05/01/2032(2) | 185,000 | 187,312 | ||||||
5.38%, 06/01/2029(2) | 2,466,000 | 2,601,630 | ||||||
CenturyLink, Inc. | ||||||||
4.00%, 02/15/2027(2) | 1,158,000 | 1,120,863 | ||||||
Charter Communications Operating LLC | ||||||||
3.70%, 04/01/2051 | 7,915,000 | 7,699,383 | ||||||
4.91%, 07/23/2025 | 11,097,000 | 12,725,279 | ||||||
5.38%, 04/01/2038 | 980,000 | 1,193,318 | ||||||
6.48%, 10/23/2045 | 1,515,000 | 2,012,893 | ||||||
Charter Communications Operating LLC / Charter Communications Operating Capital | ||||||||
2.34% (3 Month LIBOR USD + 1.65%), 02/01/2024(1) | 402,000 | 403,292 | ||||||
2.80%, 04/01/2031 | 6,185,000 | 6,266,826 | ||||||
3.75%, 02/15/2028 | 30,000 | 32,697 | ||||||
4.46%, 07/23/2022 | 8,518,000 | 9,081,706 | ||||||
4.50%, 02/01/2024 | 3,510,000 | 3,883,507 | ||||||
4.80%, 03/01/2050 | 7,125,000 | 8,075,511 | ||||||
5.75%, 04/01/2048 | 4,240,000 | 5,276,256 | ||||||
Clear Channel Worldwide Holdings, Inc. | ||||||||
9.25%, 02/15/2024 | 1,730,000 | 1,604,800 | ||||||
Comcast Corp. | ||||||||
2.80%, 01/15/2051 | 9,160,000 | 9,361,691 | ||||||
3.15%, 03/01/2026 | 4,440,000 | 4,968,106 | ||||||
3.25%, 11/01/2039 | 4,650,000 | 5,158,857 | ||||||
3.30%, 02/01/2027 | 12,230,000 | 13,712,027 | ||||||
3.38%, 08/15/2025 | 4,345,000 | 4,837,940 | ||||||
4.70%, 10/15/2048 | 9,000,000 | 12,078,461 | ||||||
CommScope, Inc. | ||||||||
6.00%, 03/01/2026(2) | 2,205,000 | 2,260,125 | ||||||
7.13%, 07/01/2028(2) | 1,940,000 | 1,935,344 | ||||||
Connect Finco SARL / Connect US Finco LLC | ||||||||
6.75%, 10/01/2026(2) | 646,000 | 610,470 | ||||||
Cox Communications, Inc. | ||||||||
3.15%, 08/15/2024(2) | 3,400,000 | 3,658,285 | ||||||
4.50%, 06/30/2043(2) | 950,000 | 1,122,121 | ||||||
4.70%, 12/15/2042(2) | 810,000 | 999,771 | ||||||
4.80%, 02/01/2035(2) | 8,725,000 | 10,971,035 | ||||||
Crown Castle Towers LLC | ||||||||
3.22%, 05/15/2022(2) | 700,000 | 711,677 | ||||||
3.66%, 05/15/2025(2) | 1,300,000 | 1,386,754 | ||||||
CSC Holdings LLC | ||||||||
4.13%, 12/01/2030(2) | 200,000 | 198,262 | ||||||
4.63%, 12/01/2030(2) | 200,000 | 194,272 | ||||||
5.38%, 02/01/2028(2) | 530,000 | 553,850 | ||||||
5.50%, 04/15/2027(2) | 2,300,000 | 2,393,150 | ||||||
6.50%, 02/01/2029(2) | 1,316,000 | 1,437,730 | ||||||
Discovery Communications LLC | ||||||||
3.95%, 03/20/2028 | 8,250,000 | 9,217,218 | ||||||
5.00%, 09/20/2037 | 5,630,000 | 6,661,671 | ||||||
DISH DBS Corp. | ||||||||
6.75%, 06/01/2021 | 4,250,000 | 4,329,687 | ||||||
eBay, Inc. | ||||||||
2.60%, 07/15/2022 | 2,279,000 | 2,356,311 | ||||||
2.70%, 03/11/2030 | 2,400,000 | 2,522,551 | ||||||
4.00%, 07/15/2042 | 720,000 | 783,389 | ||||||
Expedia Group, Inc. | ||||||||
3.25%, 02/15/2030 | 7,960,000 | 7,418,511 | ||||||
5.00%, 02/15/2026 | 4,395,000 | 4,523,508 | ||||||
6.25%, 05/01/2025(2) | 5,885,000 | 6,283,952 | ||||||
7.00%, 05/01/2025(2) | 2,729,000 | 2,836,666 | ||||||
Fox Corp. | ||||||||
3.05%, 04/07/2025 | 2,085,000 | 2,256,199 | ||||||
3.50%, 04/08/2030 | 2,805,000 | 3,131,584 | ||||||
4.71%, 01/25/2029 | 2,585,000 | 3,104,625 | ||||||
Frontier Communications Corp. | ||||||||
8.00%, 04/01/2027(2)(5) | 864,000 | 876,960 | ||||||
Globo Comunicacao e Participacoes SA | ||||||||
4.88%, 01/22/2030(2) | 5,800,000 | 5,234,500 | ||||||
iHeartCommunications, Inc. | ||||||||
5.25%, 08/15/2027(2) | 1,710,000 | 1,637,325 | ||||||
6.38%, 05/01/2026 | 5,266,000 | 5,213,340 | ||||||
8.38%, 05/01/2027 | 6,299,000 | 5,772,215 | ||||||
Intelsat Connect Finance SA | ||||||||
9.50%, 02/15/2023(2)(5) | 710,000 | 177,500 | ||||||
Intelsat Jackson Holdings SA | ||||||||
5.50%, 08/01/2023(5) | 960,000 | 546,912 | ||||||
8.00%, 02/15/2024(2)(5) | 10,156,000 | 10,300,012 | ||||||
8.50%, 10/15/2024(2)(5) | 11,280,000 | 6,782,100 | ||||||
9.75%, 07/15/2025(2)(5) | 15,687,000 | 9,636,524 | ||||||
Intelsat Luxembourg SA | ||||||||
7.75%, 06/01/2021(5) | 8,455,000 | 549,575 | ||||||
Interpublic Group of Cos, Inc. | ||||||||
3.50%, 10/01/2020 | 1,130,000 | 1,137,485 | ||||||
3.75%, 10/01/2021 | 200,000 | 207,359 | ||||||
4.00%, 03/15/2022 | 216,000 | 225,236 | ||||||
Koninklijke KPN NV | ||||||||
8.38%, 10/01/2030 | 2,750,000 | 4,022,432 | ||||||
Level 3 Financing, Inc. | ||||||||
4.63%, 09/15/2027(2) | 2,216,000 | 2,232,620 | ||||||
5.38%, 08/15/2022 | 820,000 | 820,394 | ||||||
5.38%, 01/15/2024 | 600,000 | 604,500 | ||||||
5.38%, 05/01/2025 | 1,474,000 | 1,505,322 | ||||||
Netflix, Inc. | ||||||||
4.63%, 05/15/2029 | EUR | 4,100,000 | 5,105,162 | |||||
4.88%, 04/15/2028 | $ | 145,000 | 155,044 | |||||
4.88%, 06/15/2030(2) | 1,005,000 | 1,073,712 | ||||||
5.38%, 11/15/2029(2) | 481,000 | 528,302 | ||||||
5.50%, 02/15/2022 | 300,000 | 312,825 | ||||||
Nokia OYJ | ||||||||
3.38%, 06/12/2022 | 280,000 | 285,589 | ||||||
4.38%, 06/12/2027 | 4,255,000 | 4,495,918 | ||||||
Radiate Holdco LLC / Radiate Finance, Inc. | �� | |||||||
6.88%, 02/15/2023(2) | 20,000 | 20,250 | ||||||
Sirius XM Radio, Inc. | ||||||||
4.63%, 07/15/2024(2) | 275,000 | 282,310 | ||||||
5.00%, 08/01/2027(2) | 1,385,000 | 1,420,761 | ||||||
5.38%, 04/15/2025(2) | 265,000 | 272,155 | ||||||
5.38%, 07/15/2026(2) | 510,000 | 526,697 | ||||||
5.50%, 07/01/2029(2) | 115,000 | 121,644 | ||||||
Sprint Capital Corp. | ||||||||
6.88%, 11/15/2028 | 150,000 | 182,805 | ||||||
Sprint Communications, Inc. | ||||||||
6.00%, 11/15/2022 | 4,570,000 | 4,820,116 |
7.00%, 08/15/2020 | 12,097,000 | 12,148,896 | ||||||
11.50%, 11/15/2021 | 700,000 | 775,250 | ||||||
Sprint Corp. | ||||||||
7.13%, 06/15/2024 | 200,000 | 225,828 | ||||||
7.25%, 09/15/2021 | 19,338,000 | 20,272,992 | ||||||
7.63%, 03/01/2026 | 137,000 | 161,711 | ||||||
7.88%, 09/15/2023 | 701,000 | 789,501 | ||||||
Sprint Spectrum Co. LLC / Sprint Spectrum Co. II LLC / Sprint Spectrum Co. III LLC | ||||||||
3.36%, 09/20/2021(2) | 5,564,688 | 5,632,465 | ||||||
4.74%, 03/20/2025(2) | 27,610,000 | 29,887,825 | ||||||
5.15%, 03/20/2028(2) | 17,736,000 | 20,396,400 | ||||||
Telefonica Emisiones SA | ||||||||
5.46%, 02/16/2021 | 168,000 | 172,958 | ||||||
5.52%, 03/01/2049 | 21,095,000 | 27,732,190 | ||||||
Time Warner Cable LLC | ||||||||
4.00%, 09/01/2021 | 370,000 | 379,853 | ||||||
4.50%, 09/15/2042 | 13,975,000 | 15,008,890 | ||||||
5.50%, 09/01/2041 | 11,204,000 | 13,475,486 | ||||||
5.88%, 11/15/2040 | 6,491,000 | 7,994,313 | ||||||
T-Mobile USA, Inc. | ||||||||
2.05%, 02/15/2028(2) | 2,720,000 | 2,721,278 | ||||||
2.55%, 02/15/2031(2) | 22,825,000 | 22,905,344 | ||||||
3.50%, 04/15/2025(2) | 2,640,000 | 2,877,653 | ||||||
3.75%, 04/15/2027(2) | 13,155,000 | 14,595,473 | ||||||
3.88%, 04/15/2030(2) | 46,138,000 | 51,424,031 | ||||||
4.50%, 02/01/2026 | 1,238,000 | 1,252,806 | ||||||
4.50%, 04/15/2050(2) | 2,560,000 | 3,015,552 | ||||||
4.75%, 02/01/2028 | 3,143,000 | 3,319,102 | ||||||
6.00%, 03/01/2023 | 876,000 | 879,539 | ||||||
6.00%, 04/15/2024 | 329,000 | 336,139 | ||||||
6.50%, 01/15/2024 | 1,045,000 | 1,067,677 | ||||||
Tower Bersama Infrastructure Tbk PT | ||||||||
4.25%, 01/21/2025 | 2,900,000 | 2,884,994 | ||||||
Turk Telekomunikasyon AS | ||||||||
6.88%, 02/28/2025(2) | 8,000,000 | 8,412,640 | ||||||
United Group BV | ||||||||
4.88%, 07/01/2024(2) | EUR | 200,000 | 222,435 | |||||
4.88%, 07/01/2024 | 8,300,000 | 9,231,053 | ||||||
Univision Communications, Inc. | ||||||||
5.13%, 05/15/2023(2) | $ | 6,215,000 | 6,271,308 | |||||
5.13%, 02/15/2025(2) | 7,686,000 | 7,239,290 | ||||||
6.63%, 06/01/2027(2) | 6,678,000 | 6,377,490 | ||||||
Verizon Communications, Inc. | ||||||||
4.52%, 09/15/2048 | 8,235,000 | 10,882,256 | ||||||
4.67%, 03/15/2055 | 1,494,000 | 2,029,964 | ||||||
4.75%, 11/01/2041 | 685,000 | 905,347 | ||||||
5.01%, 04/15/2049 | 2,985,000 | 4,161,435 | ||||||
ViacomCBS, Inc. | ||||||||
3.70%, 08/15/2024 | 1,500,000 | 1,629,542 | ||||||
4.20%, 05/19/2032 | 3,375,000 | 3,744,294 | ||||||
4.38%, 03/15/2043 | 1,650,000 | 1,724,815 | ||||||
4.95%, 01/15/2031 | 10,430,000 | 12,196,949 | ||||||
ViaSat, Inc. | ||||||||
5.63%, 09/15/2025(2) | 175,000 | 167,563 | ||||||
5.63%, 04/15/2027(2) | 105,000 | 107,494 | ||||||
Virgin Media Secured Finance Plc | ||||||||
5.50%, 08/15/2026(2) | 1,285,000 | 1,314,478 | ||||||
5.50%, 05/15/2029(2) | 6,899,000 | 7,270,787 | ||||||
Vodafone Group Plc | ||||||||
4.25%, 09/17/2050 | 6,885,000 | 8,066,389 | ||||||
4.38%, 05/30/2028 | 8,820,000 | 10,487,618 | ||||||
4.88%, 06/19/2049 | 6,963,000 | 8,724,512 | ||||||
5.00%, 05/30/2038 | 5,045,000 | 6,338,740 | ||||||
5.25%, 05/30/2048 | 15,065,000 | 19,822,079 | ||||||
VTR Comunicaciones SpA | ||||||||
5.13%, 01/15/2028(2) | 2,810,000 | 2,867,605 | ||||||
Walt Disney Co. | ||||||||
2.65%, 01/13/2031 | 5,465,000 | 5,791,558 | ||||||
3.60%, 01/13/2051 | 11,500,000 | 12,787,280 | ||||||
Ziggo BV | ||||||||
5.50%, 01/15/2027(2) | 6,005,000 | 6,102,821 | ||||||
|
| |||||||
Total Communications |
| 1,004,084,897 | ||||||
|
| |||||||
Consumer, Cyclical – 2.97% | ||||||||
1011778 BC ULC / New Red Finance, Inc. | ||||||||
4.25%, 05/15/2024(2) | 132,000 | 132,234 | ||||||
5.75%, 04/15/2025(2) | 690,000 | 724,500 | ||||||
Air Canada 2013-1 Class B Pass Through Trust | ||||||||
5.38%, 05/15/2021(2) | 212,770 | 191,775 | ||||||
Air Canada 2015-2 Class B Pass Through Trust | ||||||||
5.00%, 12/15/2023(2) | 1,538,467 | 1,286,704 | ||||||
Air Canada 2017-1 Class B Pass Through Trust | ||||||||
3.70%, 01/15/2026(2) | 12,618,452 | 9,988,156 | ||||||
Alaska Airlines 2020-1 Class A Pass Through Trust | ||||||||
4.80%, 08/15/2027(2) | 1,545,000 | 1,564,312 | ||||||
Alimentation Couche-Tard, Inc. | ||||||||
2.70%, 07/26/2022(2) | 995,000 | 1,018,583 | ||||||
3.55%, 07/26/2027(2) | 3,000,000 | 3,218,927 | ||||||
3.80%, 01/25/2050(2) | 4,513,000 | 4,676,342 | ||||||
America West Airlines 2001-1 Pass Through Trust | ||||||||
7.10%, 04/02/2021 | 742,423 | 622,955 | ||||||
American Airlines 2013-1 Class A Pass Through Trust | ||||||||
4.00%, 07/15/2025 | 1,352,176 | 1,032,277 | ||||||
American Airlines 2015-2 Class B Pass Through Trust | ||||||||
4.40%, 09/22/2023 | 8,224,355 | 5,849,750 | ||||||
American Airlines 2016-1 Class AA Pass Through Trust | ||||||||
3.58%, 01/15/2028 | 508,203 | 491,683 | ||||||
American Airlines 2016-1 Class B Pass Through Trust | ||||||||
5.25%, 01/15/2024 | 424,217 | 280,626 | ||||||
American Airlines 2016-2 Class B Pass Through Trust | ||||||||
4.38%, 06/15/2024(2) | 3,329,100 | 2,315,206 | ||||||
American Airlines 2016-3 Class B Pass Through Trust | ||||||||
3.75%, 10/15/2025 | 6,547,841 | 4,632,908 | ||||||
American Airlines 2017-2 Class AA Pass Through Trust | ||||||||
3.35%, 10/15/2029 | 731,240 | 685,466 | ||||||
American Airlines 2017-2 Class B Pass Through Trust | ||||||||
3.70%, 10/15/2025 | 7,060,420 | 4,904,271 | ||||||
American Airlines 2019-1 Class B Pass Through Trust | ||||||||
3.85%, 02/15/2028 | 11,350,702 | 7,946,276 | ||||||
Aramark Services, Inc. | ||||||||
6.38%, 05/01/2025(2) | 85,000 | 87,774 | ||||||
AutoNation, Inc. | ||||||||
3.35%, 01/15/2021 | 770,000 | 773,343 | ||||||
4.75%, 06/01/2030 | 1,030,000 | 1,115,893 | ||||||
AutoZone, Inc. | ||||||||
3.63%, 04/15/2025 | 5,645,000 | 6,307,847 | ||||||
4.00%, 04/15/2030 | 8,465,000 | 9,782,025 | ||||||
BMW Finance NV | ||||||||
2.25%, 08/12/2022(2) | 7,300,000 | 7,531,981 | ||||||
BMW US Capital LLC | ||||||||
3.10%, 04/12/2021(2) | 5,495,000 | 5,584,097 | ||||||
3.25%, 08/14/2020(2) | 14,250,000 | 14,297,450 | ||||||
British Airways 2019-1 Class A Pass Through Trust | ||||||||
3.35%, 06/15/2029(2) | 3,281,335 | 2,707,038 | ||||||
CD&R Smokey Buyer, Inc. | ||||||||
6.75%, 07/15/2025(2) | 385,000 | 400,361 | ||||||
Choice Hotels International, Inc. | ||||||||
5.75%, 07/01/2022 | 3,000,000 | 3,191,820 | ||||||
Churchill Downs, Inc. | ||||||||
4.75%, 01/15/2028(2) | 2,652,000 | 2,559,180 | ||||||
5.50%, 04/01/2027(2) | 4,997,000 | 4,860,082 | ||||||
Colt Merger Sub, Inc. | ||||||||
6.25%, 07/01/2025(2) | 7,328,000 | 7,270,842 | ||||||
Continental Airlines 2007-1 Class A Pass Through Trust | ||||||||
5.98%, 04/19/2022 | 3,760,009 | 3,526,596 | ||||||
Continental Airlines 2012-2 Class A Pass Through Trust | ||||||||
4.00%, 10/29/2024 | 1,547,997 | 1,412,218 | ||||||
Daimler Finance North America LLC | ||||||||
1.29% (3 Month LIBOR USD + 0.90%), 02/15/2022(1)(2) | 8,420,000 | 8,320,013 | ||||||
2.55%, 08/15/2022(2) | 4,700,000 | 4,820,848 | ||||||
2.70%, 06/14/2024(2) | 500,000 | 516,840 | ||||||
3.00%, 02/22/2021(2) | 2,210,000 | 2,236,572 | ||||||
3.88%, 09/15/2021(2) | 850,000 | 876,102 | ||||||
Delta Air Lines 2007-1 Class A Pass Through Trust | ||||||||
6.82%, 08/10/2022 | 23,787 | 23,322 | ||||||
Delta Air Lines, Inc. | ||||||||
3.40%, 04/19/2021 | 350,000 | 340,371 | ||||||
3.63%, 03/15/2022 | 3,757,000 | 3,558,630 | ||||||
7.00%, 05/01/2025(2) | 6,960,000 | 7,184,586 | ||||||
Diamond Resorts International, Inc. | ||||||||
7.75%, 09/01/2023(2) | 4,234,000 | 4,054,055 | ||||||
Dillard’s, Inc. | ||||||||
7.00%, 12/01/2028 | 380,000 | 379,259 | ||||||
7.75%, 07/15/2026 | 135,000 | 143,513 | ||||||
7.75%, 05/15/2027 | 85,000 | 89,699 | ||||||
Dollar General Corp. | ||||||||
3.50%, 04/03/2030 | 3,125,000 | 3,500,437 | ||||||
DR Horton, Inc. | ||||||||
4.38%, 09/15/2022 | 10,658,000 | 11,322,207 | ||||||
Emirates Airline | ||||||||
4.50%, 02/06/2025 | 2,857,080 | 2,735,751 | ||||||
FCE Bank Plc | ||||||||
1.88%, 06/24/2021 | EUR | 300,000 | 329,278 | |||||
Ferguson Finance Plc | ||||||||
3.25%, 06/02/2030(2) | $ | 5,220,000 | 5,346,623 | |||||
Ford Motor Credit Co. LLC | ||||||||
0.08% (3 Month EURIBOR + 0.37%), 12/01/2021(1)(6) | EUR | 610,000 | 642,060 | |||||
0.19% (3 Month EURIBOR + 0.43%), 05/14/2021(1)(6) | 220,000 | 237,998 | ||||||
0.99% (3 Month LIBOR USD + 0.43%), 11/02/2020(1) | $ | 3,110,000 | 3,076,465 | |||||
1.58% (3 Month LIBOR USD + 1.27%), 03/28/2022(1) | 350,000 | 327,269 | ||||||
1.63% (3 Month LIBOR USD + 1.24%), 02/15/2023(1) | 500,000 | 443,816 | ||||||
1.74%, 07/19/2024 | EUR | 1,200,000 | 1,212,531 | |||||
2.18% (3 Month LIBOR USD + 0.81%), 04/05/2021(1) | $ | 400,000 | 383,907 | |||||
2.19% (3 Month LIBOR USD + 0.88%), 10/12/2021(1) | 3,390,000 | 3,216,764 | ||||||
2.34%, 11/02/2020 | 7,795,000 | 7,736,537 |
3.16%, 08/04/2020 | 2,420,000 | 2,405,359 | ||||||
3.20%, 01/15/2021 | 3,750,000 | 3,693,750 | ||||||
3.22%, 01/09/2022 | 3,950,000 | 3,842,204 | ||||||
3.34%, 03/18/2021 | 12,400,000 | 12,272,404 | ||||||
3.34%, 03/28/2022 | 4,740,000 | 4,584,528 | ||||||
3.35%, 11/01/2022 | 845,000 | 809,324 | ||||||
3.55%, 10/07/2022 | 4,200,000 | 4,074,840 | ||||||
3.81%, 10/12/2021 | 4,810,000 | 4,744,103 | ||||||
5.09%, 01/07/2021 | 315,000 | 314,701 | ||||||
5.75%, 02/01/2021 | 2,865,000 | 2,878,408 | ||||||
Gap, Inc. | ||||||||
8.38%, 05/15/2023(2) | 1,225,000 | 1,333,719 | ||||||
8.63%, 05/15/2025(2) | 5,413,000 | 5,731,014 | ||||||
8.88%, 05/15/2027(2) | 2,759,000 | 2,959,028 | ||||||
General Motors Co. | ||||||||
1.21% (3 Month LIBOR USD + 0.90%), 09/10/2021(1) | 3,000,000 | 2,967,000 | ||||||
5.20%, 04/01/2045 | 3,485,000 | 3,370,258 | ||||||
6.25%, 10/02/2043 | 65,000 | 69,053 | ||||||
6.60%, 04/01/2036 | 975,000 | 1,060,102 | ||||||
6.80%, 10/01/2027(16) | 516,000 | 601,201 | ||||||
General Motors Financial Co., Inc. | ||||||||
0.15% (3 Month EURIBOR + 0.55%), 03/26/2022(1)(6) | EUR | 450,000 | 482,300 | |||||
2.17% (3 Month LIBOR USD + 0.85%), 04/09/2021(1) | $ | 10,375,000 | 10,313,103 | |||||
3.15%, 06/30/2022 | 3,715,000 | 3,779,670 | ||||||
3.20%, 07/13/2020 | 6,992,000 | 6,995,291 | ||||||
3.20%, 07/06/2021 | 3,525,000 | 3,565,642 | ||||||
3.45%, 04/10/2022 | 1,470,000 | 1,498,943 | ||||||
3.55%, 04/09/2021 | 32,590,000 | 32,983,434 | ||||||
4.00%, 10/06/2026 | 1,900,000 | 1,972,321 | ||||||
4.20%, 03/01/2021 | 1,655,000 | 1,677,005 | ||||||
4.20%, 11/06/2021 | 2,110,000 | 2,163,906 | ||||||
4.30%, 07/13/2025 | 540,000 | 562,675 | ||||||
4.35%, 04/09/2025 | 1,530,000 | 1,614,786 | ||||||
4.38%, 09/25/2021 | 8,020,000 | 8,236,974 | ||||||
5.10%, 01/17/2024 | 13,185,000 | 14,093,387 | ||||||
Harley-Davidson Financial Services, Inc. | ||||||||
2.85%, 01/15/2021(2) | 3,287,000 | 3,304,169 | ||||||
Hasbro, Inc. | ||||||||
3.00%, 11/19/2024 | 4,910,000 | 5,141,505 | ||||||
3.55%, 11/19/2026 | 2,270,000 | 2,398,787 | ||||||
Hyundai Capital America | ||||||||
1.11% (3 Month LIBOR USD + 0.80%), 09/18/2020(1)(2) | 1,170,000 | 1,167,504 | ||||||
2.38%, 02/10/2023(2) | 4,575,000 | 4,621,395 | ||||||
InterContinental Hotels Group Plc | ||||||||
2.13%, 08/24/2026 | GBP | 400,000 | 469,686 | |||||
2.13%, 05/15/2027 | EUR | 200,000 | 216,085 | |||||
Las Vegas Sands Corp. | ||||||||
3.20%, 08/08/2024 | $ | 1,200,000 | 1,194,853 | |||||
3.50%, 08/18/2026 | 1,965,000 | 1,959,433 | ||||||
Latam Airlines 2015-1 Pass Through Trust A | ||||||||
4.20%, 11/15/2027 | 2,647,488 | 2,263,603 | ||||||
Latam Airlines 2015-1 Pass Through Trust B | ||||||||
4.50%, 11/15/2023 | 384,001 | 194,880 | ||||||
Lennar Corp. | ||||||||
4.75%, 11/29/2027 | 4,275,000 | 4,638,375 | ||||||
4.88%, 12/15/2023 | 510,000 | 538,050 | ||||||
Live Nation Entertainment, Inc. | ||||||||
4.75%, 10/15/2027(2) | 1,819,000 | 1,564,722 | ||||||
Magna International, Inc. | ||||||||
4.15%, 10/01/2025 | 665,000 | 746,504 | ||||||
Marriott International, Inc. | ||||||||
4.63%, 06/15/2030 | 1,174,000 | 1,220,608 | ||||||
Marriott Ownership Resorts, Inc. | ||||||||
6.13%, 09/15/2025(2) | 590,000 | 603,275 | ||||||
McDonald’s Corp. | ||||||||
3.63%, 09/01/2049 | 3,335,000 | 3,695,970 | ||||||
Melco Resorts Finance Ltd. | ||||||||
5.38%, 12/04/2029(2) | 2,900,000 | 2,884,457 | ||||||
5.63%, 07/17/2027(2) | 400,000 | 403,984 | ||||||
MGM China Holdings Ltd. | ||||||||
5.25%, 06/18/2025(2) | 2,100,000 | 2,142,000 | ||||||
5.88%, 05/15/2026(2) | 700,000 | 720,790 | ||||||
Mileage Plus Holdings LLC / Mileage Plus Intellectual Property Assets Ltd. | ||||||||
6.50%, 06/20/2027(2) | 4,860,000 | 4,872,150 | ||||||
Mitchells & Butlers Finance Plc | ||||||||
0.76% (3 Month LIBOR USD + 0.45%), 12/15/2030(1) | 9,104,550 | 8,014,414 | ||||||
6.01%, 12/15/2028 | GBP | 309,723 | 407,304 | |||||
Mitsubishi Corp. | ||||||||
2.63%, 07/14/2022 | $ | 200,000 | 205,911 | |||||
Nissan Motor Acceptance Corp. | ||||||||
1.90%, 09/14/2021(2) | 650,000 | 638,259 | ||||||
2.20% (3 Month LIBOR USD + 0.89%), 01/13/2022(1)(2) | 791,000 | 760,270 | ||||||
3.15%, 03/15/2021(2) | 400,000 | 398,813 | ||||||
3.65%, 09/21/2021(2) | 300,000 | 300,728 | ||||||
NVR, Inc. | ||||||||
3.00%, 05/15/2030 | 527,000 | 550,691 | ||||||
Panasonic Corp. | ||||||||
2.54%, 07/19/2022(2) | 985,000 | 1,013,452 |
PetSmart, Inc. | ||||||||
5.88%, 06/01/2025(2) | 172,000 | 172,323 | ||||||
QVC, Inc. | ||||||||
4.38%, 03/15/2023 | 4,322,000 | 4,321,568 | ||||||
4.45%, 02/15/2025 | 482,000 | 472,505 | ||||||
4.85%, 04/01/2024 | 3,107,000 | 3,127,506 | ||||||
5.13%, 07/02/2022 | 4,255,000 | 4,296,699 | ||||||
Rite Aid Corp. | ||||||||
6.13%, 04/01/2023(2) | 1,911,000 | 1,858,448 | ||||||
Royal Caribbean Cruises Ltd. | ||||||||
10.88%, 06/01/2023(2) | 3,439,000 | 3,533,785 | ||||||
11.50%, 06/01/2025(2) | 5,306,000 | 5,531,097 | ||||||
Sands China Ltd. | ||||||||
3.80%, 01/08/2026(2) | 1,200,000 | 1,233,012 | ||||||
4.38%, 06/18/2030(2) | 1,000,000 | 1,040,320 | ||||||
4.60%, 08/08/2023 | 4,200,000 | 4,421,760 | ||||||
5.13%, 08/08/2025 | 1,600,000 | 1,733,296 | ||||||
5.40%, 08/08/2028 | 2,000,000 | 2,207,560 | ||||||
Southwest Airlines Co. | ||||||||
4.75%, 05/04/2023 | 611,000 | 630,896 | ||||||
5.13%, 06/15/2027 | 1,458,000 | 1,511,571 | ||||||
5.25%, 05/04/2025 | 516,000 | 544,318 | ||||||
Southwest Airlines Co. 2007-1 Pass Through Trust | ||||||||
6.65%, 08/01/2022 | 68,160 | 67,306 | ||||||
Staples, Inc. | ||||||||
7.50%, 04/15/2026(2) | 111,000 | 87,218 | ||||||
Starbucks Corp. | ||||||||
2.25%, 03/12/2030 | 310,000 | 322,003 | ||||||
3.80%, 08/15/2025 | 5,465,000 | 6,159,071 | ||||||
Toyota Motor Credit Corp. | ||||||||
2.65%, 04/12/2022 | 17,580,000 | 18,212,001 | ||||||
2.95%, 04/13/2021 | 14,545,000 | 14,826,521 | ||||||
Toyota Motor Finance Netherlands BV | ||||||||
2.76%, 04/26/2021 | 1,500,000 | 1,515,353 | ||||||
United Airlines 2018-1 Class A Pass Through Trust | ||||||||
3.70%, 03/01/2030 | 597,137 | 476,111 | ||||||
United Airlines 2018-1 Class B Pass Through Trust | ||||||||
4.60%, 03/01/2026 | 5,932,557 | 4,444,710 | ||||||
United Airlines 2019-2 Class A Pass Through Trust | ||||||||
2.90%, 05/01/2028 | 1,495,000 | 1,230,415 | ||||||
United Airlines 2019-2 Class AA Pass Through Trust | ||||||||
2.70%, 05/01/2032 | 930,000 | 834,675 | ||||||
US Airways 2011-1 Class A Pass Through Trust | ||||||||
7.13%, 10/22/2023 | 1,408,374 | 1,173,974 | ||||||
US Airways 2013-1 Class A Pass Through Trust | ||||||||
3.95%, 11/15/2025 | 1,396,963 | 1,155,620 | ||||||
Vail Resorts, Inc. | ||||||||
6.25%, 05/15/2025(2) | 330,000 | 345,263 | ||||||
Volkswagen Bank GmbH | ||||||||
0.06% (3 Month EURIBOR + 0.42%), 06/15/2021(1)(6) | EUR | 1,400,000 | 1,561,056 | |||||
0.63%, 09/08/2021 | 7,500,000 | 8,401,393 | ||||||
1.88%, 01/31/2024 | 300,000 | 344,827 | ||||||
Volkswagen Group of America Finance LLC | ||||||||
1.16% (3 Month LIBOR USD + 0.86%), 09/24/2021(1)(2) | $ | 4,300,000 | 4,284,729 | |||||
1.20% (3 Month LIBOR USD + 0.77%), 11/13/2020(1)(2) | 8,300,000 | 8,304,881 | ||||||
1.37% (3 Month LIBOR USD + 0.94%), 11/12/2021(1)(2) | 8,300,000 | 8,274,360 | ||||||
2.50%, 09/24/2021(2) | 2,350,000 | 2,387,496 | ||||||
2.70%, 09/26/2022(2) | 6,040,000 | 6,239,564 | ||||||
2.85%, 09/26/2024(2) | 2,640,000 | 2,777,764 | ||||||
3.20%, 09/26/2026(2) | 2,970,000 | 3,179,573 | ||||||
3.35%, 05/13/2025(2) | 1,455,000 | 1,562,237 | ||||||
4.00%, 11/12/2021(2) | 8,800,000 | 9,161,064 | ||||||
4.63%, 11/13/2025(2) | 6,525,000 | 7,418,237 | ||||||
Volkswagen Leasing GmbH | ||||||||
0.11% (3 Month EURIBOR + 0.45%), 07/06/2021(1)(6) | EUR | 400,000 | 445,826 | |||||
1.63%, 08/15/2025 | 3,095,000 | 3,508,229 | ||||||
Walgreens Boots Alliance, Inc. | ||||||||
3.80%, 11/18/2024 | $ | 2,550,000 | 2,807,256 | |||||
4.80%, 11/18/2044 | 926,000 | 1,002,358 | ||||||
Wyndham Destinations, Inc. | ||||||||
3.90%, 03/01/2023 | 1,170,000 | 1,092,254 | ||||||
4.25%, 03/01/2022 | 40,000 | 39,308 | ||||||
5.40%, 04/01/2024 | 72,000 | 69,480 | ||||||
5.75%, 04/01/2027 | 6,035,000 | 5,808,688 | ||||||
6.35%, 10/01/2025 | 1,120,000 | 1,131,570 | ||||||
Wynn Macau Ltd. | ||||||||
5.13%, 12/15/2029(2) | 600,000 | 582,000 | ||||||
5.50%, 01/15/2026(2) | 2,600,000 | 2,568,254 | ||||||
5.50%, 10/01/2027(2) | 2,000,000 | 1,980,000 | ||||||
Yum! Brands, Inc. | ||||||||
4.75%, 01/15/2030(2) | 750,000 | 761,250 | ||||||
7.75%, 04/01/2025(2) | 1,870,000 | 2,017,263 | ||||||
|
| |||||||
Total Consumer, Cyclical |
| 578,127,833 | ||||||
|
| |||||||
Consumer, Non-cyclical – 6.27% | ||||||||
AA Bond Co. Ltd. | ||||||||
2.88%, 01/31/2022 | GBP | 5,547,000 | 6,659,597 | |||||
4.25%, 07/31/2020 | 10,080,000 | 12,466,996 | ||||||
AbbVie, Inc. | ||||||||
2.85%, 05/14/2023 | $ | 1,000,000 | 1,054,707 | |||||
2.95%, 11/21/2026(2) | 7,020,000 | 7,681,395 | ||||||
3.20%, 11/21/2029(2) | 715,000 | 795,150 | ||||||
3.25%, 10/01/2022(2) | 9,250,000 | 9,676,911 | ||||||
3.45%, 03/15/2022(2) | 380,000 | 394,787 | ||||||
3.60%, 05/14/2025 | 7,845,000 | 8,710,783 | ||||||
3.80%, 03/15/2025(2) | 3,618,000 | 4,034,203 | ||||||
4.05%, 11/21/2039(2) | 6,934,000 | 8,042,102 | ||||||
4.25%, 11/14/2028 | 4,500,000 | 5,310,541 | ||||||
4.25%, 11/21/2049(2) | 11,625,000 | 13,935,024 | ||||||
4.40%, 11/06/2042 | 1,994,000 | 2,404,046 | ||||||
4.45%, 05/14/2046 | 5,880,000 | 7,136,986 | ||||||
4.70%, 05/14/2045 | 5,020,000 | 6,286,923 | ||||||
4.88%, 11/14/2048 | 10,355,000 | 13,247,533 | ||||||
Aetna, Inc. | ||||||||
2.80%, 06/15/2023 | 3,388,000 | 3,569,352 | ||||||
3.50%, 11/15/2024 | 3,370,000 | 3,668,493 | ||||||
Albertsons Cos, Inc. / Safeway, Inc. / New Albertsons LP / Albertsons LLC | ||||||||
5.75%, 03/15/2025 | 2,320,000 | 2,370,762 | ||||||
7.50%, 03/15/2026(2) | 1,640,000 | 1,776,546 | ||||||
Alcon Finance Corp. | ||||||||
2.60%, 05/27/2030(2) | 3,200,000 | 3,288,862 | ||||||
Altria Group, Inc. | ||||||||
2.35%, 05/06/2025 | 785,000 | 825,993 | ||||||
3.40%, 05/06/2030 | 650,000 | 699,202 | ||||||
5.80%, 02/14/2039 | 11,870,000 | 14,799,436 | ||||||
5.95%, 02/14/2049 | 400,000 | 524,444 | ||||||
Amgen, Inc. | ||||||||
2.60%, 08/19/2026 | 3,200,000 | 3,485,421 | ||||||
4.40%, 05/01/2045 | 6,151,000 | 7,631,371 | ||||||
4.66%, 06/15/2051 | 1,315,000 | 1,743,898 | ||||||
Anheuser-Busch InBev Worldwide, Inc. | ||||||||
4.50%, 06/01/2050 | 20,535,000 | 24,485,737 | ||||||
4.60%, 04/15/2048 | 5,200,000 | 6,070,532 | ||||||
4.90%, 02/01/2046 | 2,455,000 | 3,002,787 | ||||||
5.55%, 01/23/2049 | 7,095,000 | 9,496,810 | ||||||
Anthem, Inc. | ||||||||
2.25%, 05/15/2030 | 2,945,000 | 3,029,817 | ||||||
2.50%, 11/21/2020 | 15,420,000 | 15,542,256 | ||||||
3.65%, 12/01/2027 | 2,580,000 | 2,939,541 | ||||||
4.38%, 12/01/2047 | 1,000,000 | 1,245,760 | ||||||
4.63%, 05/15/2042 | 1,838,000 | 2,286,803 | ||||||
4.65%, 01/15/2043 | 2,562,000 | 3,216,354 | ||||||
Ascension Health | ||||||||
3.95%, 11/15/2046 | 825,000 | 1,030,884 | ||||||
Ashtead Capital, Inc. | ||||||||
5.25%, 08/01/2026(2) | 4,585,000 | 4,819,981 | ||||||
Avon International Capital Plc | ||||||||
6.50%, 08/15/2022(2) | 184,000 | 180,320 | ||||||
B&G Foods, Inc. | ||||||||
5.25%, 09/15/2027 | 1,390,000 | 1,393,475 | ||||||
Bacardi Ltd. | ||||||||
4.70%, 05/15/2028(2) | 2,047,000 | 2,314,860 | ||||||
5.30%, 05/15/2048(2) | 2,730,000 | 3,370,511 | ||||||
Banner Health | ||||||||
2.34%, 01/01/2030 | 781,000 | 803,217 | ||||||
3.18%, 01/01/2050 | 543,000 | 583,599 | ||||||
BAT Capital Corp. | ||||||||
2.76%, 08/15/2022 | 3,124,000 | 3,235,423 | ||||||
3.56%, 08/15/2027 | 7,240,000 | 7,833,732 | ||||||
4.54%, 08/15/2047 | 10,555,000 | 11,489,223 | ||||||
BAT International Finance Plc | ||||||||
3.25%, 06/07/2022(2) | 2,978,000 | 3,102,022 | ||||||
3.50%, 06/15/2022(2) | 326,000 | 341,780 | ||||||
Bausch Health Americas, Inc. | ||||||||
8.50%, 01/31/2027(2) | 1,395,000 | 1,480,444 | ||||||
Bausch Health Cos, Inc. | ||||||||
5.75%, 08/15/2027(2) | 1,080,000 | 1,144,800 | ||||||
Bayer US Finance II LLC | ||||||||
0.93% (3 Month LIBOR USD + 0.63%), 06/25/2021(1)(2) | 1,500,000 | 1,498,241 | ||||||
2.75%, 07/15/2021(2) | 5,312,000 | 5,402,544 | ||||||
3.38%, 07/15/2024(2) | 915,000 | 991,235 | ||||||
3.50%, 06/25/2021(2) | 800,000 | 819,582 | ||||||
3.88%, 12/15/2023(2) | 10,865,000 | 11,913,784 | ||||||
4.25%, 12/15/2025(2) | 5,060,000 | 5,809,433 | ||||||
4.38%, 12/15/2028(2) | 12,685,000 | 14,821,489 | ||||||
4.40%, 07/15/2044(2) | 4,200,000 | 4,769,809 | ||||||
4.88%, 06/25/2048(2) | 11,025,000 | 14,131,572 | ||||||
Bayer US Finance LLC | ||||||||
3.00%, 10/08/2021(2) | 900,000 | 923,749 | ||||||
3.38%, 10/08/2024(2) | 5,000,000 | 5,453,436 | ||||||
Becton Dickinson & Co. | ||||||||
2.82%, 05/20/2030 | 5,090,000 | 5,395,392 | ||||||
2.89%, 06/06/2022 | 6,000,000 | 6,208,782 | ||||||
3.25%, 11/12/2020 | 590,000 | 594,686 |
3.36%, 06/06/2024 | 10,060,000 | 10,847,022 | ||||||
3.70%, 06/06/2027 | 13,027,000 | 14,574,586 | ||||||
3.73%, 12/15/2024 | 1,560,000 | 1,717,589 | ||||||
3.79%, 05/20/2050 | 5,285,000 | 5,882,077 | ||||||
4.67%, 06/06/2047 | 3,490,000 | 4,319,701 | ||||||
7.00%, 08/01/2027 | 361,000 | 452,624 | ||||||
Boston Scientific Corp. | ||||||||
3.38%, 05/15/2022 | 600,000 | 627,317 | ||||||
BRF GmbH | ||||||||
4.35%, 09/29/2026 | 4,643,000 | 4,480,495 | ||||||
BRF SA | ||||||||
4.88%, 01/24/2030 | 6,857,000 | 6,462,723 | ||||||
Bristol-Myers Squibb Co. | ||||||||
3.55%, 08/15/2022(2) | 975,000 | 1,036,264 | ||||||
5.25%, 08/15/2043(2) | 1,940,000 | 2,867,029 | ||||||
Bunge Ltd. Finance Corp. | ||||||||
3.75%, 09/25/2027 | 2,410,000 | 2,514,269 | ||||||
Campbell Soup Co. | ||||||||
0.94% (3 Month LIBOR USD + 0.63%), 03/15/2021(1) | 1,324,000 | 1,325,345 | ||||||
3.30%, 03/15/2021 | 100,000 | 101,690 | ||||||
Cardinal Health, Inc. | ||||||||
3.75%, 09/15/2025 | 3,935,000 | 4,392,279 | ||||||
4.50%, 11/15/2044 | 905,000 | 988,173 | ||||||
4.90%, 09/15/2045 | 960,000 | 1,110,620 | ||||||
Centene Corp. | ||||||||
3.38%, 02/15/2030 | 14,295,000 | 14,433,804 | ||||||
4.25%, 12/15/2027 | 4,575,000 | 4,720,988 | ||||||
4.63%, 12/15/2029 | 4,275,000 | 4,526,242 | ||||||
4.75%, 05/15/2022 | 383,000 | 388,282 | ||||||
5.38%, 06/01/2026(2) | 3,100,000 | 3,213,646 | ||||||
5.38%, 08/15/2026(2) | 5,000,000 | 5,201,050 | ||||||
China Merchants Finance Co. Ltd. | ||||||||
3.50%, 08/03/2020 | 700,000 | 701,106 | ||||||
CHS/Community Health Systems, Inc. | ||||||||
6.25%, 03/31/2023 | 28,091,000 | 26,460,598 | ||||||
6.63%, 02/15/2025(2) | 3,869,000 | 3,636,860 | ||||||
8.00%, 03/15/2026(2) | 4,312,000 | 4,075,702 | ||||||
8.63%, 01/15/2024(2) | 8,172,000 | 7,991,235 | ||||||
Cigna Corp. | ||||||||
2.40%, 03/15/2030 | 6,755,000 | 7,008,241 | ||||||
3.05%, 11/30/2022(2) | 800,000 | 843,014 | ||||||
3.20%, 09/17/2020 | 11,060,000 | 11,121,804 | ||||||
3.40%, 03/01/2027(2) | 6,858,000 | 7,553,925 | ||||||
4.38%, 10/15/2028 | 15,030,000 | 17,786,981 | ||||||
4.50%, 02/25/2026(2) | 16,415,000 | 19,096,539 | ||||||
4.80%, 08/15/2038 | 3,350,000 | 4,243,532 | ||||||
4.90%, 12/15/2048 | 13,030,000 | 17,222,793 | ||||||
Cintas Corp. No 2 | ||||||||
4.30%, 06/01/2021 | 165,000 | 170,149 | ||||||
Constellation Brands, Inc. | ||||||||
3.75%, 05/01/2050 | 5,000,000 | 5,430,581 | ||||||
CoStar Group, Inc. | ||||||||
2.80%, 07/15/2030(2) | 1,000,000 | 1,023,116 | ||||||
CVS Health Corp. | ||||||||
3.25%, 08/15/2029 | 6,270,000 | 6,926,046 | ||||||
3.70%, 03/09/2023 | 900,000 | 967,044 | ||||||
4.10%, 03/25/2025 | 8,335,000 | 9,422,055 | ||||||
4.75%, 12/01/2022(2) | 56,000 | 60,580 | ||||||
5.05%, 03/25/2048 | 38,380,000 | 49,923,481 | ||||||
5.13%, 07/20/2045 | 3,735,000 | 4,810,793 | ||||||
CVS Pass-Through Trust | ||||||||
5.77%, 01/10/2033(2) | 64,491 | 72,567 | ||||||
5.77%, 01/10/2033 | 2,368,244 | 2,664,838 | ||||||
6.04%, 12/10/2028 | 1,318,668 | 1,490,380 | ||||||
CVS Pass-Through Trust Series 2014 | ||||||||
4.16%, 08/11/2036(2) | 10,455,240 | 11,049,826 | ||||||
Danone SA | ||||||||
2.08%, 11/02/2021(2) | 1,549,000 | 1,576,589 | ||||||
3.00%, 06/15/2022(2) | 11,845,000 | 12,345,684 | ||||||
DP World Crescent Ltd. | ||||||||
4.85%, 09/26/2028 | 1,050,000 | 1,104,747 | ||||||
DP World Plc | ||||||||
2.38%, 09/25/2026(2) | EUR | 400,000 | 434,909 | |||||
4.25%, 09/25/2030(2) | GBP | 200,000 | 241,624 | |||||
Duke University | ||||||||
2.68%, 10/01/2044 | $ | 3,000,000 | 3,148,476 | |||||
2.83%, 10/01/2055 | 3,000,000 | 3,154,344 | ||||||
Elanco Animal Health, Inc. | ||||||||
5.02%, 08/28/2023 | 2,840,000 | 2,982,000 | ||||||
5.65%, 08/28/2028 | 4,195,000 | 4,651,416 | ||||||
Emory University | ||||||||
2.97%, 09/01/2050 | 5,470,000 | 5,869,676 | ||||||
Encompass Health Corp. | ||||||||
4.75%, 02/01/2030 | 2,977,000 | 2,843,035 | ||||||
Equifax, Inc. | ||||||||
3.10%, 05/15/2030 | 1,380,000 | 1,466,929 | ||||||
3.60%, 08/15/2021 | 4,485,000 | 4,628,264 |
ERAC USA Finance LLC | ||||||||
2.60%, 12/01/2021(2) | 1,180,000 | 1,196,347 | ||||||
3.80%, 11/01/2025(2) | 4,605,000 | 4,872,055 | ||||||
Fomento Economico Mexicano SAB de CV | ||||||||
3.50%, 01/16/2050 | 8,105,000 | 8,362,002 | ||||||
Ford Foundation | ||||||||
2.82%, 06/01/2070 | 880,000 | 912,038 | ||||||
Fresenius Medical Care US Finance II, Inc. | ||||||||
4.13%, 10/15/2020(2) | 114,000 | 114,138 | ||||||
Fresenius Medical Care US Finance, Inc. | ||||||||
5.75%, 02/15/2021(2) | 570,000 | 586,133 | ||||||
G4S International Finance Plc | ||||||||
1.50%, 01/09/2023 | EUR | 100,000 | 111,366 | |||||
General Mills, Inc. | ||||||||
3.20%, 04/16/2021 | $ | 1,645,000 | 1,680,992 | |||||
George Washington University | ||||||||
3.55%, 09/15/2046 | 740,000 | 791,729 | ||||||
Gilead Sciences, Inc. | ||||||||
4.60%, 09/01/2035 | 3,961,000 | 5,168,547 | ||||||
4.75%, 03/01/2046 | 375,000 | 506,561 | ||||||
Global Payments, Inc. | ||||||||
2.65%, 02/15/2025 | 319,000 | 338,566 | ||||||
Greene King Finance Plc | ||||||||
4.06%, 03/15/2035 | GBP | 3,703,500 | 4,720,528 | |||||
5.11%, 03/15/2034 | 450,000 | 610,839 | ||||||
HCA, Inc. | ||||||||
3.50%, 09/01/2030 | $ | 1,098,000 | 1,057,307 | |||||
4.13%, 06/15/2029 | 1,540,000 | 1,698,396 | ||||||
5.00%, 03/15/2024 | 7,416,000 | 8,247,112 | ||||||
5.13%, 06/15/2039 | 3,000,000 | 3,495,833 | ||||||
5.25%, 04/15/2025 | 5,314,000 | 6,107,066 | ||||||
5.25%, 06/15/2049 | 29,105,000 | 35,041,718 | ||||||
5.88%, 05/01/2023 | 844,000 | 913,630 | ||||||
5.88%, 02/01/2029 | 939,000 | 1,062,563 | ||||||
7.50%, 11/06/2033 | 1,035,000 | 1,257,525 | ||||||
Hill-Rom Holdings, Inc. | ||||||||
4.38%, 09/15/2027(2) | 835,000 | 854,831 | ||||||
Hologic, Inc. | ||||||||
4.63%, 02/01/2028(2) | 3,215,000 | 3,335,563 | ||||||
Humana, Inc. | ||||||||
3.15%, 12/01/2022 | 3,503,000 | 3,671,201 | ||||||
3.85%, 10/01/2024 | 4,014,000 | 4,407,453 | ||||||
3.95%, 08/15/2049 | 520,000 | 612,464 | ||||||
4.50%, 04/01/2025 | 2,085,000 | 2,384,162 | ||||||
4.88%, 04/01/2030 | 7,665,000 | 9,452,146 | ||||||
IHS Markit Ltd. | ||||||||
4.00%, 03/01/2026(2) | 500,000 | 553,005 | ||||||
4.25%, 05/01/2029 | 2,585,000 | 2,957,524 | ||||||
4.75%, 02/15/2025(2) | 3,900,000 | 4,368,000 | ||||||
4.75%, 08/01/2028 | 3,425,000 | 4,018,998 | ||||||
5.00%, 11/01/2022(2) | 5,186,000 | 5,561,035 | ||||||
Imperial Brands Finance Plc | ||||||||
3.75%, 07/21/2022(2) | 3,710,000 | 3,872,157 | ||||||
IQVIA, Inc. | ||||||||
2.88%, 09/15/2025(2) | EUR | 100,000 | 112,687 | |||||
2.88%, 06/15/2028(2) | 4,000,000 | 4,465,912 | ||||||
Japan Tobacco, Inc. | ||||||||
2.00%, 04/13/2021 | $ | 5,230,000 | 5,264,228 | |||||
JBS USA LUX SA / JBS USA Finance, Inc. | ||||||||
5.75%, 06/15/2025(2) | 3,530,000 | 3,574,125 | ||||||
6.75%, 02/15/2028(2) | 2,130,000 | 2,249,834 | ||||||
JBS USA LUX SA / JBS USA Food Co. / JBS USA Finance, Inc. | ||||||||
5.50%, 01/15/2030(2) | 5,675,000 | 5,816,875 | ||||||
6.50%, 04/15/2029(2) | 735,000 | 780,019 | ||||||
Keurig Dr Pepper, Inc. | ||||||||
3.20%, 11/15/2021 | 500,000 | 513,847 | ||||||
Kimberly-Clark de Mexico SAB de CV | ||||||||
2.43%, 07/01/2031(2) | 2,380,000 | 2,390,710 | ||||||
Kraft Heinz Foods Co. | ||||||||
2.80%, 07/02/2020 | 132,000 | 132,000 | ||||||
3.00%, 06/01/2026 | 2,108,000 | 2,130,907 | ||||||
3.88%, 05/15/2027(2) | 16,583,000 | 17,326,172 | ||||||
3.95%, 07/15/2025 | 64,000 | 68,383 | ||||||
4.25%, 03/01/2031(2) | 11,316,000 | 11,995,375 | ||||||
4.38%, 06/01/2046 | 20,816,000 | 20,456,579 | ||||||
4.88%, 10/01/2049(2) | 15,875,000 | 16,159,781 | ||||||
5.00%, 07/15/2035 | 1,000,000 | 1,099,953 | ||||||
5.00%, 06/04/2042 | 8,171,000 | 8,606,732 | ||||||
5.20%, 07/15/2045 | 5,605,000 | 6,076,389 | ||||||
5.50%, 06/01/2050(2) | 1,086,000 | 1,157,219 | ||||||
Kroger Co. | ||||||||
5.40%, 01/15/2049 | 3,561,000 | 4,979,897 | ||||||
Lamb Weston Holdings, Inc. | ||||||||
4.88%, 05/15/2028(2) | 785,000 | 831,715 | ||||||
Merck & Co., Inc. | ||||||||
2.45%, 06/24/2050 | 4,355,000 | 4,370,726 | ||||||
Molina Healthcare, Inc. | ||||||||
5.38%, 11/15/2022 | 1,913,000 | 1,951,260 |
Moody’s Corp. | ||||||||
3.25%, 05/20/2050 | 52,000 | 55,743 | ||||||
Mylan NV | ||||||||
5.25%, 06/15/2046 | 5,065,000 | 6,278,122 | ||||||
Mylan, Inc. | ||||||||
5.20%, 04/15/2048 | 1,145,000 | 1,407,978 | ||||||
5.40%, 11/29/2043 | 1,290,000 | 1,623,207 | ||||||
NBM US Holdings, Inc. | ||||||||
7.00%, 05/14/2026(2) | 4,955,000 | 4,963,969 | ||||||
New York & Presbyterian Hospital | ||||||||
3.56%, 08/01/2036 | 2,630,000 | 2,851,121 | ||||||
NYU Langone Hospitals | ||||||||
4.43%, 07/01/2042 | 2,000,000 | 2,268,689 | ||||||
Ortho-Clinical Diagnostics, Inc. / Ortho-Clinical Diagnostics SA | ||||||||
7.25%, 02/01/2028(2) | 944,000 | 959,557 | ||||||
7.38%, 06/01/2025(2) | 386,000 | 392,273 | ||||||
Par Pharmaceutical, Inc. | ||||||||
7.50%, 04/01/2027(2) | 879,000 | 902,030 | ||||||
Partners Healthcare System, Inc. | ||||||||
3.34%, 07/01/2060 | 4,375,000 | 4,701,390 | ||||||
Pernod Ricard SA | ||||||||
4.25%, 07/15/2022(2) | 1,600,000 | 1,707,634 | ||||||
4.45%, 01/15/2022(2) | 2,700,000 | 2,851,080 | ||||||
Perrigo Finance Unlimited Co. | ||||||||
3.15%, 06/15/2030 | 9,205,000 | 9,282,044 | ||||||
3.90%, 12/15/2024 | 3,800,000 | 4,041,038 | ||||||
4.38%, 03/15/2026 | 5,490,000 | 5,987,101 | ||||||
Pilgrim’s Pride Corp. | ||||||||
5.88%, 09/30/2027(2) | 530,000 | 530,106 | ||||||
Post Holdings, Inc. | ||||||||
4.63%, 04/15/2030(2) | 505,000 | 495,557 | ||||||
5.00%, 08/15/2026(2) | 1,570,000 | 1,575,888 | ||||||
5.75%, 03/01/2027(2) | 4,806,000 | 4,974,210 | ||||||
Reckitt Benckiser Treasury Services Plc | ||||||||
2.38%, 06/24/2022(2) | 6,030,000 | 6,212,875 | ||||||
Rede D’or Finance SARL | ||||||||
4.50%, 01/22/2030(2) | 3,395,000 | 2,996,088 | ||||||
Refinitiv US Holdings, Inc. | ||||||||
4.50%, 05/15/2026 | EUR | 1,200,000 | 1,403,374 | |||||
RELX Capital, Inc. | ||||||||
3.00%, 05/22/2030 | $ | 1,142,000 | 1,236,630 | |||||
3.50%, 03/16/2023 | 1,153,000 | 1,229,537 | ||||||
Reynolds American, Inc. | ||||||||
3.25%, 11/01/2022 | 1,215,000 | 1,250,512 | ||||||
4.00%, 06/12/2022 | 900,000 | 950,876 | ||||||
4.45%, 06/12/2025 | 10,905,000 | 12,285,529 | ||||||
5.70%, 08/15/2035 | 3,650,000 | 4,552,328 | ||||||
5.85%, 08/15/2045 | 9,235,000 | 11,548,104 | ||||||
Sigma Alimentos SA de CV | ||||||||
4.13%, 05/02/2026 | 3,300,000 | 3,455,100 | ||||||
Sigma Finance Netherlands BV | ||||||||
4.88%, 03/27/2028 | 2,500,000 | 2,687,500 | ||||||
Smithfield Foods, Inc. | ||||||||
4.25%, 02/01/2027(2) | 1,290,000 | 1,317,050 | ||||||
Spectrum Brands, Inc. | ||||||||
5.75%, 07/15/2025 | 2,142,000 | 2,198,270 | ||||||
6.13%, 12/15/2024 | 500,000 | 513,750 | ||||||
Suntory Holdings Ltd. | ||||||||
2.55%, 06/28/2022(2) | 810,000 | 832,982 | ||||||
Teleflex, Inc. | ||||||||
4.63%, 11/15/2027 | 2,272,000 | 2,401,981 | ||||||
Tenet Healthcare Corp. | ||||||||
4.63%, 07/15/2024 | 718,000 | 703,590 | ||||||
4.63%, 09/01/2024(2) | 4,500,000 | 4,398,750 | ||||||
4.88%, 01/01/2026(2) | 4,987,000 | 4,884,567 | ||||||
7.50%, 04/01/2025(2) | 2,325,000 | 2,470,313 | ||||||
Teva Pharmaceutical Finance Co. BV | ||||||||
2.95%, 12/18/2022 | 1,350,000 | 1,302,750 | ||||||
Teva Pharmaceutical Finance Netherlands II BV | ||||||||
0.38%, 07/25/2020 | EUR | 5,215,197 | 5,832,555 | |||||
1.25%, 03/31/2023 | 300,000 | 312,614 | ||||||
3.25%, 04/15/2022 | 1,300,000 | 1,452,721 | ||||||
Teva Pharmaceutical Finance Netherlands III BV | ||||||||
2.20%, 07/21/2021 | $ | 11,174,000 | 10,946,497 | |||||
2.80%, 07/21/2023 | 4,490,000 | 4,243,050 | ||||||
3.15%, 10/01/2026 | 5,805,000 | 5,183,168 | ||||||
4.10%, 10/01/2046 | 1,385,000 | 1,163,400 | ||||||
Thermo Fisher Scientific, Inc. | ||||||||
0.13%, 03/01/2025 | EUR | 1,290,000 | 1,427,862 | |||||
Transurban Finance Co. Pty Ltd. | ||||||||
3.38%, 03/22/2027(2) | $ | 2,635,000 | 2,776,357 | |||||
Unilever Capital Corp. | ||||||||
3.00%, 03/07/2022 | 5,625,000 | 5,868,980 | ||||||
UnitedHealth Group, Inc. | ||||||||
2.00%, 05/15/2030 | 2,695,000 | 2,820,747 | ||||||
2.75%, 05/15/2040 | 5,320,000 | 5,641,854 |
2.90%, 05/15/2050 | 10,100,000 | 10,755,187 | ||||||
3.13%, 05/15/2060 | 6,890,000 | 7,359,160 | ||||||
3.50%, 08/15/2039 | 1,430,000 | 1,662,291 | ||||||
3.70%, 08/15/2049 | 475,000 | 561,707 | ||||||
3.88%, 12/15/2028 | 1,070,000 | 1,280,943 | ||||||
3.88%, 08/15/2059 | 1,367,000 | 1,673,839 | ||||||
4.20%, 01/15/2047 | 1,288,000 | 1,633,286 | ||||||
4.25%, 06/15/2048 | 5,000,000 | 6,388,600 | ||||||
4.75%, 07/15/2045 | 1,712,000 | 2,305,016 | ||||||
Universal Health Services, Inc. | ||||||||
4.75%, 08/01/2022(2) | 7,595,000 | 7,595,000 | ||||||
5.00%, 06/01/2026(2) | 7,497,000 | 7,682,176 | ||||||
University of Chicago | ||||||||
2.76%, 04/01/2045 | 3,170,000 | 3,294,039 | ||||||
Upjohn, Inc. | ||||||||
4.00%, 06/22/2050(2) | 8,745,000 | 9,360,041 | ||||||
US Renal Care, Inc. | ||||||||
10.63%, 07/15/2027(2) | 558,000 | 574,740 | ||||||
Verisk Analytics, Inc. | ||||||||
4.13%, 03/15/2029 | 3,835,000 | 4,479,857 | ||||||
William Marsh Rice University | ||||||||
3.77%, 05/15/2055 | 3,000,000 | 3,672,930 | ||||||
Zimmer Biomet Holdings, Inc. | ||||||||
1.07% (3 Month LIBOR USD + 0.75%), 03/19/2021(1) | 970,000 | 969,831 | ||||||
3.15%, 04/01/2022 | 640,000 | 664,333 | ||||||
3.55%, 03/20/2030 | 790,000 | 852,334 | ||||||
3.70%, 03/19/2023 | 3,145,000 | 3,345,190 | ||||||
Zoetis, Inc. | ||||||||
3.45%, 11/13/2020 | 600,000 | 605,201 | ||||||
|
| |||||||
Total Consumer, Non-cyclical |
| 1,218,260,714 | ||||||
|
| |||||||
Diversified – 0.02% | ||||||||
CVS Pass-Through Trust Series 2013 | ||||||||
4.70%, 01/10/2036(2) | 4,262,027 | 4,559,327 | ||||||
|
| |||||||
Total Diversified |
| 4,559,327 | ||||||
|
| |||||||
Energy – 3.23% | ||||||||
Aker BP ASA | ||||||||
3.00%, 01/15/2025(2) | 1,645,000 | 1,602,089 | ||||||
3.75%, 01/15/2030(2) | 5,720,000 | 5,371,147 | ||||||
5.88%, 03/31/2025(2) | 4,870,000 | 4,949,628 | ||||||
Antero Resources Corp. | ||||||||
5.00%, 03/01/2025 | 5,461,000 | 3,221,990 | ||||||
5.13%, 12/01/2022 | 1,893,000 | 1,367,692 | ||||||
5.63%, 06/01/2023 | 1,250,000 | 800,000 | ||||||
BG Energy Capital Plc | ||||||||
4.00%, 10/15/2021(2) | 1,100,000 | 1,140,549 | ||||||
Boardwalk Pipelines LP | ||||||||
3.38%, 02/01/2023 | 330,000 | 331,082 | ||||||
4.95%, 12/15/2024 | 2,655,000 | 2,842,966 | ||||||
5.95%, 06/01/2026 | 8,415,000 | 9,465,334 | ||||||
BP Capital Markets America, Inc. | ||||||||
2.11%, 09/16/2021 | 5,210,000 | 5,303,874 | ||||||
3.00%, 02/24/2050 | 1,280,000 | 1,260,319 | ||||||
3.63%, 04/06/2030 | 11,060,000 | 12,491,008 | ||||||
4.74%, 03/11/2021 | 3,025,000 | 3,116,776 | ||||||
Cameron LNG LLC | ||||||||
2.90%, 07/15/2031(2) | 1,630,000 | 1,744,709 | ||||||
3.30%, 01/15/2035(2) | 1,785,000 | 1,967,378 | ||||||
3.70%, 01/15/2039(2) | 1,330,000 | 1,427,202 | ||||||
Canadian Natural Resources Ltd. | ||||||||
3.45%, 11/15/2021 | 1,320,000 | 1,351,738 | ||||||
3.85%, 06/01/2027 | 890,000 | 951,014 | ||||||
6.25%, 03/15/2038 | 1,345,000 | 1,603,734 | ||||||
Cheniere Corpus Christi Holdings LLC | ||||||||
3.70%, 11/15/2029(2) | 16,815,000 | 17,217,749 | ||||||
5.13%, 06/30/2027 | 1,300,000 | 1,426,392 | ||||||
5.88%, 03/31/2025 | 3,220,000 | 3,613,721 | ||||||
Cheniere Energy Partners LP | ||||||||
5.25%, 10/01/2025 | 510,000 | 508,317 | ||||||
Chevron Corp. | ||||||||
2.42%, 11/17/2020 | 1,550,000 | 1,559,429 | ||||||
Continental Resources, Inc. | ||||||||
3.80%, 06/01/2024 | 4,910,000 | 4,632,143 | ||||||
DCP Midstream Operating LP | ||||||||
6.75%, 09/15/2037(2) | 1,830,000 | 1,642,041 | ||||||
8.13%, 08/16/2030 | 205,000 | 215,250 | ||||||
Diamondback Energy, Inc. | ||||||||
2.88%, 12/01/2024 | 4,750,000 | 4,757,847 | ||||||
3.25%, 12/01/2026 | 4,940,000 | 4,966,869 | ||||||
3.50%, 12/01/2029 | 17,645,000 | 17,046,276 | ||||||
5.38%, 05/31/2025 | 7,025,000 | 7,231,345 | ||||||
Energy Transfer Operating LP | ||||||||
2.90%, 05/15/2025 | 6,950,000 | 7,116,607 | ||||||
4.05%, 03/15/2025 | 415,000 | 441,652 | ||||||
4.50%, 04/15/2024 | 985,000 | 1,067,846 | ||||||
4.65%, 06/01/2021 | 860,000 | 878,389 | ||||||
4.75%, 01/15/2026 | 4,720,000 | 5,154,816 | ||||||
4.95%, 06/15/2028 | 2,235,000 | 2,399,712 | ||||||
5.00%, 05/15/2050 | 10,120,000 | 9,561,532 | ||||||
5.15%, 03/15/2045 | 700,000 | 663,813 | ||||||
5.25%, 04/15/2029 | 2,155,000 | 2,351,694 | ||||||
5.50%, 06/01/2027 | 5,105,000 | 5,693,502 | ||||||
5.88%, 01/15/2024 | 4,196,000 | 4,692,875 | ||||||
6.00%, 06/15/2048 | 3,990,000 | 4,138,884 | ||||||
6.25%, 04/15/2049 | 5,275,000 | 5,590,276 | ||||||
6.50%, 02/01/2042 | 1,000,000 | 1,078,571 | ||||||
Energy Transfer Partners LP | ||||||||
4.50%, 11/01/2023 | 2,385,000 | 2,560,827 | ||||||
5.00%, 10/01/2022 | 1,600,000 | 1,703,332 | ||||||
5.88%, 03/01/2022 | 1,521,000 | 1,605,664 | ||||||
ENI SpA | ||||||||
4.75%, 09/12/2028(2) | 4,075,000 | 4,540,417 | ||||||
EnLink Midstream Partners LP | ||||||||
4.15%, 06/01/2025 | 3,885,000 | 2,991,450 | ||||||
5.05%, 04/01/2045 | 3,141,000 | 1,956,215 | ||||||
5.45%, 06/01/2047 | 6,725,000 | 4,168,155 | ||||||
5.60%, 04/01/2044 | 7,983,000 | 4,869,630 | ||||||
EQT Corp. | ||||||||
3.90%, 10/01/2027 | 2,023,000 | 1,645,569 | ||||||
6.13%, 02/01/2025 | 2,525,000 | 2,516,213 | ||||||
7.00%, 02/01/2030 | 1,175,000 | 1,210,285 | ||||||
Equinor ASA | ||||||||
3.70%, 04/06/2050 | 4,490,000 | 5,161,416 | ||||||
Exxon Mobil Corp. | ||||||||
2.61%, 10/15/2030 | 2,895,000 | 3,086,332 | ||||||
3.48%, 03/19/2030 | 2,765,000 | 3,148,557 | ||||||
4.23%, 03/19/2040 | 2,505,000 | 3,027,397 | ||||||
4.33%, 03/19/2050 | 12,045,000 | 15,090,147 | ||||||
Gazprom Neft OAO Via GPN Capital SA | ||||||||
4.38%, 09/19/2022 | 3,400,000 | 3,541,358 | ||||||
Gazprom PJSC Via Gaz Capital SA | ||||||||
4.95%, 07/19/2022 | 3,000,000 | 3,160,542 | ||||||
6.51%, 03/07/2022 | 4,045,000 | 4,339,476 | ||||||
Gulfport Energy Corp. | ||||||||
6.38%, 05/15/2025 | 215,000 | 107,243 | ||||||
Hess Corp. | ||||||||
4.30%, 04/01/2027 | 4,305,000 | 4,455,469 | ||||||
5.60%, 02/15/2041 | 4,660,000 | 4,888,411 | ||||||
KazMunayGas National Co. JSC | ||||||||
5.38%, 04/24/2030 | 1,367,000 | 1,546,419 | ||||||
5.75%, 04/19/2047 | 1,187,000 | 1,382,271 | ||||||
Kinder Morgan Energy Partners LP | ||||||||
4.25%, 09/01/2024 | 150,000 | 164,467 | ||||||
5.00%, 08/15/2042 | 30,000 | 33,241 | ||||||
Kinder Morgan, Inc. | ||||||||
4.30%, 06/01/2025 | 14,500,000 | 16,164,782 | ||||||
5.05%, 02/15/2046 | 150,000 | 172,510 | ||||||
5.30%, 12/01/2034 | 2,450,000 | 2,849,351 | ||||||
5.63%, 11/15/2023(2) | 2,935,000 | 3,313,946 | ||||||
Marathon Petroleum Corp. | ||||||||
3.80%, 04/01/2028 | 2,245,000 | 2,379,497 | ||||||
4.75%, 12/15/2023 | 1,580,000 | 1,733,851 | ||||||
5.13%, 12/15/2026 | 14,440,000 | 16,615,238 | ||||||
MPLX LP | ||||||||
4.25%, 12/01/2027 | 5,655,000 | 6,129,872 | ||||||
5.25%, 01/15/2025 | 390,000 | 405,533 | ||||||
Newfield Exploration Co. | ||||||||
5.63%, 07/01/2024 | 6,745,000 | 6,407,927 | ||||||
NGL Energy Partners LP / NGL Energy Finance Corp. | ||||||||
7.50%, 04/15/2026 | 1,850,000 | 1,406,000 | ||||||
Noble Holding International Ltd. | ||||||||
7.88%, 02/01/2026(2) | 306,000 | 79,560 | ||||||
Occidental Petroleum Corp. | ||||||||
1.84% (3 Month LIBOR USD + 1.45%), 08/15/2022(1) | 313,000 | 288,021 | ||||||
2.90%, 08/15/2024 | 8,795,000 | 7,519,725 | ||||||
5.55%, 03/15/2026 | 2,820,000 | 2,573,842 | ||||||
Odebrecht Drilling Norbe VIII/IX Ltd. | ||||||||
6.35%, 12/01/2021 | 105,009 | 89,258 | ||||||
Odebrecht Offshore Drilling Finance Ltd. | ||||||||
6.72%, 12/01/2022 | 41,893 | 34,352 | ||||||
ONEOK Partners LP | ||||||||
3.38%, 10/01/2022 | 1,100,000 | 1,138,936 | ||||||
ONEOK, Inc. | ||||||||
4.25%, 02/01/2022 | 470,000 | 486,013 | ||||||
Pan American Energy LLC/Argentina | ||||||||
28.13% (Argentina Deposit Rates Badlar Private Banks ARS 30 to 35 Days + 0.00%), 11/20/2020(1) | ARS | 94,653,000 | 1,310,795 | |||||
Pertamina Persero PT | ||||||||
3.10%, 08/25/2030(2) | $ | 3,063,000 | 3,069,951 | |||||
6.00%, 05/03/2042 | 480,000 | 568,718 | ||||||
Petrobras Global Finance BV | ||||||||
5.09%, 01/15/2030(2) | 7,528,000 | 7,497,888 | ||||||
6.13%, 01/17/2022 | 7,341,000 | 7,689,697 | ||||||
6.25%, 12/14/2026 | GBP | 4,359,000 | 5,713,212 | |||||
6.90%, 03/19/2049 | $ | 1,445,000 | 1,520,862 | |||||
7.38%, 01/17/2027 | 13,450,000 | 14,975,095 |
Petroleos de Venezuela SA | ||||||||
5.38%, 04/12/2027(5) | 2,052,000 | 49,248 | ||||||
5.50%, 04/12/2037(5) | 2,500,000 | 60,000 | ||||||
6.00%, 05/16/2024(5) | 2,312,000 | 55,488 | ||||||
6.00%, 11/15/2026(5) | 4,600,000 | 110,400 | ||||||
9.00%, 11/17/2021(5) | 200,000 | 4,800 | ||||||
9.75%, 05/17/2035(5) | 830,000 | 20,750 | ||||||
Petroleos del Peru SA | ||||||||
4.75%, 06/19/2032 | 2,378,000 | 2,639,580 | ||||||
Petroleos Mexicanos | ||||||||
5.35%, 02/12/2028 | 274,000 | 230,160 | ||||||
5.95%, 01/28/2031(2) | 8,650,000 | 7,137,547 | ||||||
6.49%, 01/23/2027(2) | 1,540,000 | 1,405,851 | ||||||
6.50%, 03/13/2027 | 1,566,000 | 1,413,346 | ||||||
6.50%, 01/23/2029 | 21,083,000 | 18,389,647 | ||||||
6.63%, 06/15/2035 | 940,000 | 764,878 | ||||||
6.75%, 09/21/2047 | 13,741,000 | 10,564,768 | ||||||
6.84%, 01/23/2030(2) | 7,010,000 | 6,147,069 | ||||||
6.95%, 01/28/2060(2) | 3,895,000 | 2,994,242 | ||||||
7.69%, 01/23/2050(2) | 3,502,000 | 2,902,808 | ||||||
Petronas Capital Ltd. | ||||||||
3.50%, 04/21/2030(2) | 2,000,000 | 2,222,342 | ||||||
4.55%, 04/21/2050(2) | 1,400,000 | 1,772,223 | ||||||
4.80%, 04/21/2060(2) | 1,200,000 | 1,646,867 | ||||||
Plains All American Pipeline LP | ||||||||
3.55%, 12/15/2029 | 800,000 | 777,791 | ||||||
4.65%, 10/15/2025 | 1,500,000 | 1,601,847 | ||||||
Plains All American Pipeline LP / PAA Finance Corp. | ||||||||
4.50%, 12/15/2026 | 1,168,000 | 1,237,132 | ||||||
Range Resources Corp. | ||||||||
4.88%, 05/15/2025 | 1,008,000 | 756,353 | ||||||
Rio Oil Finance Trust Series 2014-1 | ||||||||
9.25%, 07/06/2024 | 267,106 | 272,448 | ||||||
Rio Oil Finance Trust Series 2014-3 | ||||||||
9.75%, 01/06/2027 | 230,491 | 238,270 | ||||||
Rio Oil Finance Trust Series 2018-1 | ||||||||
8.20%, 04/06/2028(2) | 500,000 | 501,875 | ||||||
Rockies Express Pipeline LLC | ||||||||
4.95%, 07/15/2029(2) | 2,700,000 | 2,511,810 | ||||||
6.88%, 04/15/2040(2) | 2,535,000 | 2,402,166 | ||||||
Ruby Pipeline LLC | ||||||||
7.00%, 04/01/2022(2) | 3,409,091 | 3,172,309 | ||||||
Sabine Pass Liquefaction LLC | ||||||||
4.50%, 05/15/2030(2) | 10,555,000 | 11,654,600 | ||||||
5.00%, 03/15/2027 | 6,865,000 | 7,680,014 | ||||||
5.63%, 03/01/2025 | 5,739,000 | 6,559,269 | ||||||
5.75%, 05/15/2024 | 2,982,000 | 3,358,179 | ||||||
5.88%, 06/30/2026 | 6,040,000 | 7,097,000 | ||||||
6.25%, 03/15/2022 | 3,725,000 | 3,969,734 | ||||||
Saudi Arabian Oil Co. | ||||||||
3.50%, 04/16/2029(2) | 6,300,000 | 6,794,586 | ||||||
4.25%, 04/16/2039 | 200,000 | 222,418 | ||||||
4.38%, 04/16/2049(2) | 4,200,000 | 4,748,665 | ||||||
Seven Generations Energy Ltd. | ||||||||
5.38%, 09/30/2025(2) | 3,110,000 | 2,736,800 | ||||||
Shell International Finance BV | ||||||||
4.38%, 05/11/2045 | 1,000,000 | 1,239,171 | ||||||
Southern Gas Corridor CJSC | ||||||||
6.88%, 03/24/2026 | 1,684,000 | 1,936,357 | ||||||
Southern Natural Gas Co. LLC | ||||||||
4.80%, 03/15/2047(2) | 1,000,000 | 1,112,574 | ||||||
Suncor Energy, Inc. | ||||||||
2.80%, 05/15/2023 | 650,000 | 678,876 | ||||||
3.10%, 05/15/2025 | 1,040,000 | 1,110,810 | ||||||
Sunoco Logistics Partners Operations LP | ||||||||
4.00%, 10/01/2027 | 16,730,000 | 17,139,521 | ||||||
5.40%, 10/01/2047 | 9,919,000 | 9,757,193 | ||||||
Targa Resources Partners LP / Targa Resources Partners Finance Corp. | ||||||||
6.88%, 01/15/2029 | 3,163,000 | 3,313,242 | ||||||
TC PipeLines LP | ||||||||
3.90%, 05/25/2027 | 3,325,000 | 3,496,585 | ||||||
4.38%, 03/13/2025 | 6,000,000 | 6,428,984 | ||||||
Texas Eastern Transmission LP | ||||||||
2.80%, 10/15/2022(2) | 6,320,000 | 6,432,517 | ||||||
Topaz Solar Farms LLC | ||||||||
4.88%, 09/30/2039(2) | 493,551 | 543,728 | ||||||
5.75%, 09/30/2039(2) | 3,756,964 | 4,436,116 | ||||||
Transcontinental Gas Pipe Line Co. LLC | ||||||||
3.25%, 05/15/2030(2) | 1,610,000 | 1,719,339 | ||||||
4.00%, 03/15/2028 | 5,410,000 | 6,056,934 | ||||||
4.60%, 03/15/2048 | 3,995,000 | 4,542,349 | ||||||
TransMontaigne Partners LP / TLP Finance Corp. | ||||||||
6.13%, 02/15/2026 | 540,000 | 521,100 | ||||||
Transocean Phoenix 2 Ltd. | ||||||||
7.75%, 10/15/2024(2) | 1,361,100 | 1,276,031 | ||||||
Transocean Pontus Ltd. | ||||||||
6.13%, 08/01/2025(2) | 2,075,810 | 1,805,955 |
Transocean Poseidon Ltd. | ||||||||
6.88%, 02/01/2027(2) | 2,280,000 | 1,938,000 | ||||||
Transocean Proteus Ltd. | ||||||||
6.25%, 12/01/2024(2) | 503,100 | 457,821 | ||||||
Transocean Sentry Ltd. | ||||||||
5.38%, 05/15/2023(2) | 500,000 | 422,500 | ||||||
Transocean, Inc. | ||||||||
7.25%, 11/01/2025(2) | 100,000 | 54,500 | ||||||
8.00%, 02/01/2027(2) | 70,000 | 38,631 | ||||||
USA Compression Partners LP / USA Compression Finance Corp. | ||||||||
6.88%, 04/01/2026 | 495,000 | 478,294 | ||||||
6.88%, 09/01/2027 | 1,310,000 | 1,244,238 | ||||||
Valero Energy Corp. | ||||||||
2.85%, 04/15/2025 | 465,000 | 490,452 | ||||||
Valero Energy Partners LP | ||||||||
4.50%, 03/15/2028 | 5,370,000 | 6,161,675 | ||||||
Viper Energy Partners LP | ||||||||
5.38%, 11/01/2027(2) | 940,000 | 922,065 | ||||||
Williams Cos, Inc. | ||||||||
3.35%, 08/15/2022 | 1,000,000 | 1,039,438 | ||||||
3.70%, 01/15/2023 | 1,728,000 | 1,826,271 | ||||||
3.90%, 01/15/2025 | 3,071,000 | 3,360,279 | ||||||
4.00%, 09/15/2025 | 420,000 | 465,102 | ||||||
4.30%, 03/04/2024 | 175,000 | 190,127 | ||||||
4.50%, 11/15/2023 | 2,595,000 | 2,842,006 | ||||||
4.55%, 06/24/2024 | 3,490,000 | 3,872,532 | ||||||
4.85%, 03/01/2048 | 5,975,000 | 6,533,351 | ||||||
5.10%, 09/15/2045 | 960,000 | 1,049,679 | ||||||
6.30%, 04/15/2040 | 1,323,000 | 1,585,574 | ||||||
Woodside Finance Ltd. | ||||||||
3.65%, 03/05/2025(2) | 5,610,000 | 5,879,659 | ||||||
3.70%, 09/15/2026(2) | 2,885,000 | 3,050,266 | ||||||
3.70%, 03/15/2028(2) | 2,659,000 | 2,714,459 | ||||||
4.50%, 03/04/2029(2) | 3,845,000 | 4,142,895 | ||||||
YPF Sociedad Anonima | ||||||||
30.83% (Argentina Deposit Rates Badlar Private Banks ARS 30 to 35 Days + 4.00%), 09/24/2020(1)(15) | ARS | 80,240,000 | 1,167,768 | |||||
33.02% (Argentina Deposit Rates Badlar Private Banks ARS 30 to 35 Days + 6.00%), 03/04/2021(1) | 62,240,000 | 951,648 | ||||||
|
| |||||||
Total Energy |
| 628,244,604 | ||||||
|
| |||||||
Financials – 12.39% | ||||||||
ABN AMRO Bank NV | ||||||||
5.75% (5 Year Swap Rate EUR + 5.45%), 03/22/2169(1) | EUR | 500,000 | 559,157 | |||||
AerCap Ireland Capital DAC / AerCap Global Aviation Trust | ||||||||
3.50%, 05/26/2022 | $ | 2,440,000 | 2,414,188 | |||||
3.50%, 01/15/2025 | 2,837,000 | 2,662,769 | ||||||
3.65%, 07/21/2027 | 4,920,000 | 4,352,735 | ||||||
3.88%, 01/23/2028 | 925,000 | 835,066 | ||||||
3.95%, 02/01/2022 | 15,362,000 | 15,367,147 | ||||||
4.13%, 07/03/2023 | 8,300,000 | 8,115,951 | ||||||
4.50%, 05/15/2021 | 8,325,000 | 8,377,120 | ||||||
4.63%, 10/30/2020 | 1,880,000 | 1,888,174 | ||||||
4.63%, 07/01/2022 | 450,000 | 454,514 | ||||||
4.88%, 01/16/2024 | 3,800,000 | 3,774,910 | ||||||
5.00%, 10/01/2021 | 2,200,000 | 2,224,871 | ||||||
6.50%, 07/15/2025 | 740,000 | 775,248 | ||||||
Aflac, Inc. | ||||||||
3.60%, 04/01/2030 | 1,615,000 | 1,885,295 | ||||||
AIA Group Ltd. | ||||||||
3.90%, 04/06/2028(2) | 2,945,000 | 3,285,207 | ||||||
AIB Group Plc | ||||||||
4.26% (3 Month LIBOR USD + 1.87%), 04/10/2025(1)(2) | 8,720,000 | 9,290,025 | ||||||
4.75%, 10/12/2023(2) | 2,219,000 | 2,392,432 | ||||||
Air Lease Corp. | ||||||||
2.25%, 01/15/2023 | 735,000 | 723,958 | ||||||
2.50%, 03/01/2021 | 648,000 | 648,092 | ||||||
3.00%, 02/01/2030 | 2,655,000 | 2,460,329 | ||||||
3.25%, 10/01/2029 | 475,000 | 452,236 | ||||||
3.38%, 07/01/2025 | 5,360,000 | 5,358,617 | ||||||
3.50%, 01/15/2022 | 6,690,000 | 6,759,777 | ||||||
3.88%, 04/01/2021 | 2,540,000 | 2,554,618 | ||||||
3.88%, 07/03/2023 | 4,000,000 | 4,051,666 | ||||||
4.63%, 10/01/2028 | 30,000 | 30,855 | ||||||
Aircastle Ltd. | ||||||||
4.13%, 05/01/2024 | 5,440,000 | 5,141,584 | ||||||
5.00%, 04/01/2023 | 5,090,000 | 4,959,308 | ||||||
5.13%, 03/15/2021 | 1,060,000 | 1,064,253 | ||||||
Alexandria Real Estate Equities, Inc. | ||||||||
3.38%, 08/15/2031 | 7,175,000 | 8,001,420 | ||||||
3.45%, 04/30/2025 | 2,115,000 | 2,354,279 | ||||||
3.80%, 04/15/2026 | 2,215,000 | 2,484,730 | ||||||
3.95%, 01/15/2027 | 3,440,000 | 3,856,178 | ||||||
4.30%, 01/15/2026 | 5,995,000 | 6,823,277 | ||||||
Allied World Assurance Co. Holdings Ltd. | ||||||||
4.35%, 10/29/2025 | 2,490,000 | 2,605,813 | ||||||
Allstate Corp. | ||||||||
4.20%, 12/15/2046 | 1,430,000 | 1,766,908 | ||||||
Ally Financial, Inc. | ||||||||
3.88%, 05/21/2024 | 15,000 | 15,510 | ||||||
4.13%, 02/13/2022 | 105,000 | 107,964 | ||||||
4.25%, 04/15/2021 | 568,000 | 578,238 | ||||||
4.63%, 05/19/2022 | 100,000 | 104,071 | ||||||
4.63%, 03/30/2025 | 16,915,000 | 18,053,696 | ||||||
5.13%, 09/30/2024 | 400,000 | 431,976 | ||||||
5.75%, 11/20/2025 | 1,315,000 | 1,404,835 | ||||||
5.80%, 05/01/2025 | 2,990,000 | 3,338,262 | ||||||
7.50%, 09/15/2020 | 100,000 | 100,985 | ||||||
8.00%, 11/01/2031 | 5,000 | 6,346 | ||||||
8.00%, 11/01/2031 | 2,663,000 | 3,435,350 | ||||||
American Campus Communities Operating Partnership LP | ||||||||
2.85%, 02/01/2030 | 7,225,000 | 6,976,869 | ||||||
3.30%, 07/15/2026 | 2,950,000 | 3,025,221 | ||||||
3.63%, 11/15/2027 | 3,733,000 | 3,834,327 | ||||||
3.75%, 04/15/2023 | 2,000,000 | 2,053,662 | ||||||
American Homes 4 Rent LP | ||||||||
4.25%, 02/15/2028 | 73,000 | 78,056 | ||||||
American International Group, Inc. | ||||||||
3.90%, 04/01/2026 | 5,715,000 | 6,455,076 | ||||||
4.20%, 04/01/2028 | 2,522,000 | 2,869,397 | ||||||
American Tower Corp. | ||||||||
2.10%, 06/15/2030 | 4,100,000 | 4,108,525 | ||||||
3.00%, 06/15/2023 | 4,000,000 | 4,265,800 | ||||||
3.50%, 01/31/2023 | 717,000 | 766,089 | ||||||
Aon Corp. | ||||||||
2.80%, 05/15/2030 | 8,104,000 | 8,662,688 | ||||||
Ardonagh Midco 3 Plc | ||||||||
8.38%, 07/15/2023(2) | GBP | 1,200,000 | 1,538,837 | |||||
8.38%, 07/15/2023 | 1,490,000 | 1,910,723 | ||||||
Athene Holding Ltd. | ||||||||
4.13%, 01/12/2028 | $ | 11,630,000 | 11,997,144 | |||||
Avolon Holdings Funding Ltd. | ||||||||
2.88%, 02/15/2025(2) | 8,154,000 | 6,842,490 | ||||||
3.95%, 07/01/2024(2) | 3,119,000 | 2,728,789 | ||||||
4.38%, 05/01/2026(2) | 3,202,000 | 2,692,348 | ||||||
5.13%, 10/01/2023(2) | 19,938,000 | 18,439,808 | ||||||
5.25%, 05/15/2024(2) | 480,000 | 438,260 | ||||||
5.50%, 01/15/2023(2) | 6,425,000 | 6,049,457 | ||||||
Banco Bilbao Vizcaya Argentaria SA | ||||||||
8.88% (5 Year Swap Rate EUR + 9.18%), 07/14/2168(1)(6) | EUR | 4,000,000 | 4,634,437 | |||||
Banco Bradesco SA | ||||||||
3.20%, 01/27/2025(2) | $ | 1,600,000 | 1,572,320 | |||||
Banco de Bogota SA | ||||||||
4.38%, 08/03/2027 | 4,700,000 | 4,767,022 | ||||||
Banco Nacional de Comercio Exterior SNC/Cayman Islands | ||||||||
3.80% (5 Year CMT Index + 3.00%), 08/11/2026(1)(2) | 500,000 | 487,505 | ||||||
Banco Santander Mexico SA Institucion de Banca Multiple Grupo Financiero Santand | ||||||||
5.38%, 04/17/2025(2) | 5,395,000 | 5,904,288 | ||||||
Banco Santander SA | ||||||||
3.49%, 05/28/2030 | 2,000,000 | 2,140,687 | ||||||
3.85%, 04/12/2023 | 200,000 | 212,748 | ||||||
5.18%, 11/19/2025 | 2,400,000 | 2,698,836 | ||||||
6.75% (5 Year Swap Rate EUR + 6.80%), 07/25/2168(1)(6) | EUR | 500,000 | 575,445 | |||||
Bangkok Bank PCL/Hong Kong | ||||||||
3.73% (5 Year CMT Index + 1.90%), 09/25/2034(1) | $ | 5,000,000 | 4,767,737 | |||||
Bank of America Corp. | ||||||||
0.95% (3 Month LIBOR USD + 0.65%), 06/25/2022(1) | 240,000 | 240,165 | ||||||
1.32% (Secured Overnight Financing Rate + 1.15%), 06/19/2026(1) | 5,000,000 | 5,011,821 | ||||||
2.50% (3 Month LIBOR USD + 0.99%), 02/13/2031(1) | 19,520,000 | 20,460,639 | ||||||
2.59% (Secured Overnight Financing Rate + 2.15%), 04/29/2031(1) | 6,285,000 | 6,647,969 | ||||||
2.68% (Secured Overnight Financing Rate + 1.93%), 06/19/2041(1) | 4,370,000 | 4,487,499 | ||||||
2.88% (3 Month LIBOR USD + 1.19%), 10/22/2030(1) | 2,600,000 | 2,812,737 | ||||||
3.00% (3 Month LIBOR USD + 0.79%), 12/20/2023(1) | 18,670,000 | 19,636,345 | ||||||
3.50% (3 Month LIBOR USD + 0.63%), 05/17/2022(1) | 7,500,000 | 7,678,180 | ||||||
3.55% (3 Month LIBOR USD + 0.78%), 03/05/2024(1) | 3,800,000 | 4,060,463 | ||||||
4.08% (3 Month LIBOR USD + 3.15%), 03/20/2051(1) | 14,495,000 | 18,086,926 | ||||||
4.18%, 11/25/2027 | 3,509,000 | 4,002,541 | ||||||
4.25%, 10/22/2026 | 17,295,000 | 19,825,647 | ||||||
4.27% (3 Month LIBOR USD + 1.31%), 07/23/2029(1) | 7,470,000 | 8,792,115 | ||||||
4.45%, 03/03/2026 | 855,000 | 981,715 | ||||||
Bank of Ireland Group Plc | ||||||||
4.50%, 11/25/2023(2) | 19,613,000 | 20,979,656 | ||||||
Bank of New York Mellon Corp. | ||||||||
4.70% (5 Year CMT Index + 4.36%), 09/20/2168(1) | 451,000 | 469,040 | ||||||
Barclays Bank Plc | ||||||||
5.14%, 10/14/2020 | 665,000 | 672,254 | ||||||
7.63%, 11/21/2022 | 13,576,000 | 14,781,162 | ||||||
Barclays Plc | ||||||||
1.77% (3 Month LIBOR USD + 1.38%), 05/16/2024(1) | 200,000 | 198,171 | ||||||
1.82% (3 Month LIBOR USD + 1.43%), 02/15/2023(1) | 1,000,000 | 997,041 | ||||||
2.85% (3 Month LIBOR USD + 2.45%), 05/07/2026(1) | 5,450,000 | 5,673,608 | ||||||
3.20%, 08/10/2021 | 1,500,000 | 1,533,360 | ||||||
3.25%, 02/12/2027 | GBP | 6,200,000 | 8,151,293 | |||||
3.25%, 01/17/2033 | 600,000 | 782,672 | ||||||
3.65%, 03/16/2025 | $ | 700,000 | 758,877 | |||||
3.68%, 01/10/2023 | 4,200,000 | 4,358,884 | ||||||
3.93% (3 Month LIBOR USD + 1.61%), 05/07/2025(1) | 3,815,000 | 4,121,606 |
4.38%, 01/12/2026 | 3,170,000 | 3,569,483 | ||||||
4.61% (3 Month LIBOR USD + 1.40%), 02/15/2023(1) | 7,045,000 | 7,417,979 | ||||||
4.97% (3 Month LIBOR USD + 1.90%), 05/16/2029(1) | 3,700,000 | 4,334,247 | ||||||
5.09% (3 Month LIBOR USD + 3.05%), 06/20/2030(1) | 1,570,000 | 1,789,651 | ||||||
5.88% (5 Year Swap Rate GBP + 4.91%), 12/15/2168(1) | GBP | 2,400,000 | 2,687,608 | |||||
7.13% (UK Government Bonds 5 Year Note Generic Bid Yield + 6.58%), 09/15/2168(1) | 900,000 | 1,099,856 | ||||||
7.25% (5 Year Swap Rate GBP + 6.46%), 06/15/2169(1) | 14,283,000 | 17,543,207 | ||||||
7.75% (5 Year Swap Rate USD + 4.84%), 12/15/2168(1) | $ | 4,450,000 | 4,522,312 | |||||
7.88% (5 Year Swap Rate USD + 6.77%), 12/15/2168(1) | 600,000 | 609,000 | ||||||
7.88% (5 Year Swap Rate GBP + 6.10%), 12/15/2168(1) | GBP | 1,200,000 | 1,487,039 | |||||
8.00% (5 Year Swap Rate EUR + 6.75%), 03/15/2169(1) | EUR | 12,100,000 | 13,607,265 | |||||
BBVA Bancomer SA | ||||||||
4.38%, 04/10/2024(2) | $ | 2,800,000 | 2,981,160 | |||||
5.13% (5 Year CMT Index + 2.65%), 01/18/2033(1) | 10,200,000 | 9,493,038 | ||||||
Berkshire Hathaway Finance Corp. | ||||||||
4.20%, 08/15/2048 | 2,000,000 | 2,537,255 | ||||||
4.25%, 01/15/2049 | 2,595,000 | 3,324,539 | ||||||
4.40%, 05/15/2042 | 1,000,000 | 1,302,478 | ||||||
BGC Partners, Inc. | ||||||||
5.38%, 07/24/2023 | 380,000 | 395,362 | ||||||
BNP Paribas SA | ||||||||
4.40%, 08/14/2028(2) | 400,000 | 460,988 | ||||||
7.63% (5 Year Swap Rate USD + 6.31%), 09/30/2168(1)(2) | 200,000 | 203,000 | ||||||
BOC Aviation Ltd. | ||||||||
1.41% (3 Month LIBOR USD + 1.13%), 09/26/2023(1)(2) | 500,000 | 484,245 | ||||||
1.61% (3 Month LIBOR USD + 1.05%), 05/02/2021(1)(2) | 600,000 | 594,414 | ||||||
2.75%, 09/18/2022(2) | 300,000 | 301,884 | ||||||
Boston Properties LP | ||||||||
2.75%, 10/01/2026 | 2,660,000 | 2,850,098 | ||||||
3.20%, 01/15/2025 | 5,555,000 | 5,979,235 | ||||||
3.25%, 01/30/2031 | 2,245,000 | 2,414,890 | ||||||
3.85%, 02/01/2023 | 3,245,000 | 3,464,927 | ||||||
Brixmor Operating Partnership LP | ||||||||
1.74% (3 Month LIBOR USD + 1.05%), 02/01/2022(1) | 4,860,000 | 4,769,459 | ||||||
3.65%, 06/15/2024 | 3,624,000 | 3,754,546 | ||||||
3.85%, 02/01/2025 | 1,680,000 | 1,734,889 | ||||||
3.90%, 03/15/2027 | 7,198,000 | 7,399,014 | ||||||
4.05%, 07/01/2030 | 2,410,000 | 2,461,659 | ||||||
4.13%, 06/15/2026 | 2,980,000 | 3,116,476 | ||||||
4.13%, 05/15/2029 | 10,235,000 | 10,624,826 | ||||||
Brookfield Finance, Inc. | ||||||||
3.90%, 01/25/2028 | 38,000 | 41,705 | ||||||
4.70%, 09/20/2047 | 408,000 | 470,016 | ||||||
Capital One Bank USA N.A. | ||||||||
3.38%, 02/15/2023 | 7,443,000 | 7,836,871 | ||||||
Capital One Financial Corp. | ||||||||
0.80%, 06/12/2024 | EUR | 2,940,000 | 3,215,653 | |||||
3.20%, 01/30/2023 | $ | 820,000 | 863,599 | |||||
3.65%, 05/11/2027 | 9,310,000 | 10,178,824 | ||||||
3.80%, 01/31/2028 | 8,795,000 | 9,778,545 | ||||||
3.90%, 01/29/2024 | 2,845,000 | 3,093,892 | ||||||
4.20%, 10/29/2025 | 195,000 | 216,388 | ||||||
4.25%, 04/30/2025 | 2,880,000 | 3,236,153 | ||||||
Carlyle Holdings Finance LLC | ||||||||
3.88%, 02/01/2023(2) | 428,000 | 455,539 | ||||||
CBL & Associates LP | ||||||||
5.95%, 12/15/2026 | 708,000 | 203,550 | ||||||
CBRE Services, Inc. | ||||||||
4.88%, 03/01/2026 | 445,000 | 506,459 | ||||||
CC Holdings GS V LLC / Crown Castle GS III Corp. | ||||||||
3.85%, 04/15/2023 | 3,705,000 | 4,001,502 | ||||||
CDBL Funding 2 | ||||||||
3.00%, 08/01/2022 | 1,700,000 | 1,737,941 | ||||||
Charles Schwab Corp. | ||||||||
5.38% (5 Year CMT Index + 4.97%), 09/01/2168(1) | 1,049,000 | 1,120,668 | ||||||
China Construction Bank New Zealand Ltd. | ||||||||
1.06% (3 Month LIBOR USD + 0.75%), 12/20/2021(1) | 7,100,000 | 7,087,171 | ||||||
CIT Bank N.A. | ||||||||
2.97% (Secured Overnight Financing Rate + 1.72%), 09/27/2025(1) | 1,700,000 | 1,589,500 | ||||||
CIT Group, Inc. | ||||||||
4.13%, 03/09/2021 | 148,000 | 148,255 | ||||||
5.00%, 08/15/2022 | 250,000 | 255,312 | ||||||
Citigroup, Inc. | ||||||||
2.57% (Secured Overnight Financing Rate + 2.11%), 06/03/2031(1) | 8,975,000 | 9,275,462 | ||||||
2.88% (3 Month LIBOR USD + 0.95%), 07/24/2023(1) | 1,290,000 | 1,342,547 | ||||||
3.11% (Secured Overnight Financing Rate + 2.75%), 04/08/2026(1) | 5,200,000 | 5,575,205 | ||||||
3.14% (3 Month LIBOR USD + 0.72%), 01/24/2023(1) | 4,000,000 | 4,136,884 | ||||||
4.13%, 07/25/2028 | 1,675,000 | 1,893,079 | ||||||
4.41% (Secured Overnight Financing Rate + 3.91%), 03/31/2031(1) | 6,395,000 | 7,563,289 | ||||||
CNO Financial Group, Inc. | ||||||||
5.25%, 05/30/2025 | 6,110,000 | 6,753,058 | ||||||
5.25%, 05/30/2029 | 3,840,000 | 4,114,615 | ||||||
Cooperatieve Rabobank UA | ||||||||
4.38%, 08/04/2025 | 1,225,000 | 1,382,128 | ||||||
6.63% (5 Year Swap Rate EUR + 6.70%), 06/29/2169(1)(6) | EUR | 6,000,000 | 6,917,951 | |||||
CPI Property Group SA | ||||||||
1.63%, 04/23/2027 | 100,000 | 106,375 |
Credit Agricole SA | ||||||||
1.91% (Secured Overnight Financing Rate + 1.68%), 06/16/2026(1)(2) | $ | 24,700,000 | 25,039,604 | |||||
2.04% (3 Month LIBOR USD + 1.02%), 04/24/2023(1)(2) | 250,000 | 250,269 | ||||||
3.75%, 04/24/2023(2) | 250,000 | 267,535 | ||||||
4.00% (5 Year Swap Rate USD + 1.64%), 01/10/2033(1)(2) | 21,168,000 | 23,301,763 | ||||||
4.38%, 03/17/2025(2) | 1,717,000 | 1,897,307 | ||||||
Credit Suisse AG | ||||||||
5.75% (5 Year Swap Rate EUR + 4.00%), 09/18/2025(1) | EUR | 922,000 | 1,041,046 | |||||
6.50%, 08/08/2023(2) | $ | 1,400,000 | 1,526,364 | |||||
Credit Suisse AG/New York NY | ||||||||
2.95%, 04/09/2025 | 3,020,000 | 3,275,924 | ||||||
Credit Suisse Group AG | ||||||||
2.19% (Secured Overnight Financing Rate + 2.04%), 06/05/2026(1)(2) | 4,700,000 | 4,758,736 | ||||||
2.59% (Secured Overnight Financing Rate + 1.56%), 09/11/2025(1)(2) | 8,255,000 | 8,537,143 | ||||||
4.19% (Secured Overnight Financing Rate + 3.73%), 04/01/2031(1)(2) | 20,955,000 | 23,894,106 | ||||||
6.25% (5 Year Swap Rate USD + 3.46%), 12/18/2168(1)(2) | 700,000 | 729,176 | ||||||
7.13% (5 Year Swap Rate USD + 5.11%), 07/29/2168(1) | 900,000 | 927,405 | ||||||
7.25% (5 Year CMT Index + 4.33%), 03/12/2169(1)(2) | 400,000 | 411,000 | ||||||
7.50% (5 Year Swap Rate USD + 4.60%), 01/17/2169(1)(2) | 1,400,000 | 1,454,474 | ||||||
7.50% (5 Year Swap Rate USD + 4.60%), 06/11/2169(1)(2) | 800,000 | 860,000 | ||||||
7.50% (5 Year Swap Rate USD + 4.60%), 06/11/2169(1) | 1,400,000 | 1,505,000 | ||||||
Credit Suisse Group Funding Guernsey Ltd. | ||||||||
3.75%, 03/26/2025 | 5,500,000 | 6,061,946 | ||||||
Crown Castle International Corp. | ||||||||
1.35%, 07/15/2025 | 1,810,000 | 1,816,324 | ||||||
2.25%, 09/01/2021 | 1,510,000 | 1,522,642 | ||||||
2.25%, 01/15/2031 | 5,780,000 | 5,821,723 | ||||||
3.30%, 07/01/2030 | 2,940,000 | 3,209,914 | ||||||
3.40%, 02/15/2021 | 100,000 | 101,567 | ||||||
3.65%, 09/01/2027 | 7,580,000 | 8,442,538 | ||||||
3.80%, 02/15/2028 | 3,220,000 | 3,618,595 | ||||||
4.15%, 07/01/2050 | 215,000 | 247,126 | ||||||
4.30%, 02/15/2029 | 11,875,000 | 13,777,757 | ||||||
4.45%, 02/15/2026 | 7,275,000 | 8,339,223 | ||||||
4.88%, 04/15/2022 | 1,815,000 | 1,939,004 | ||||||
5.25%, 01/15/2023 | 200,000 | 222,552 | ||||||
CTR Partnership LP / CareTrust Capital Corp. | ||||||||
5.25%, 06/01/2025 | 194,000 | 195,940 | ||||||
CubeSmart LP | ||||||||
4.80%, 07/15/2022 | 1,783,000 | 1,881,755 | ||||||
Danske Bank | ||||||||
1.23%, 06/22/2024(2) | 4,160,000 | 4,175,314 | ||||||
2.00%, 09/08/2021(2) | 5,705,000 | 5,792,522 | ||||||
2.70%, 03/02/2022(2) | 2,224,000 | 2,295,559 | ||||||
3.00% (3 Month LIBOR USD + 1.25%), 09/20/2022(1)(2) | 8,535,000 | 8,667,908 | ||||||
3.24% (3 Month LIBOR USD + 1.59%), 12/20/2025(1)(2) | 4,210,000 | 4,376,834 | ||||||
3.88%, 09/12/2023(2) | 2,003,000 | 2,123,187 | ||||||
5.00%, 01/12/2022(2) | 7,540,000 | 7,929,326 | ||||||
5.38%, 01/12/2024(2) | 9,455,000 | 10,521,737 | ||||||
Deutsche Bank AG | ||||||||
0.15% (3 Month EURIBOR + 0.50%), 12/07/2020(1)(6) | EUR | 4,600,000 | 5,151,128 | |||||
0.29% (3 Month EURIBOR + 0.65%), 09/10/2021(1)(6) | 2,800,000 | 3,103,458 | ||||||
0.54% (3 Month EURIBOR + 0.80%), 05/16/2022(1)(6) | 700,000 | 765,724 | ||||||
4.25%, 10/14/2021 | $ | 3,000,000 | 3,078,435 | |||||
Deutsche Bank AG/New York NY | ||||||||
1.58% (3 Month LIBOR USD + 1.19%), 11/16/2022(1) | 100,000 | 96,772 | ||||||
1.85% (3 Month LIBOR USD + 1.29%), 02/04/2021(1) | 31,460,000 | 31,296,531 | ||||||
1.91% (3 Month LIBOR USD + 0.82%), 01/22/2021(1) | 21,400,000 | 21,243,193 | ||||||
2.28% (3 Month LIBOR USD + 0.97%), 07/13/2020(1) | 46,000 | 46,008 | ||||||
3.95%, 02/27/2023 | 200,000 | 207,695 | ||||||
3.96% (Secured Overnight Financing Rate + 2.58%), 11/26/2025(1) | 15,420,000 | 16,176,771 | ||||||
Digital Realty Trust LP | ||||||||
2.75%, 02/01/2023 | 1,445,000 | 1,514,483 | ||||||
3.63%, 10/01/2022 | 4,000,000 | 4,221,918 | ||||||
4.75%, 10/01/2025 | 1,640,000 | 1,892,167 | ||||||
Discover Financial Services | ||||||||
3.75%, 03/04/2025 | 8,845,000 | 9,520,561 | ||||||
4.10%, 02/09/2027 | 2,625,000 | 2,868,635 | ||||||
Doric Nimrod Air Finance Alpha Ltd. 2012-1 Class A Pass Through Trust | ||||||||
5.13%, 11/30/2022(2) | 2,468,092 | 2,283,378 | ||||||
Duke Realty LP | ||||||||
2.88%, 11/15/2029 | 400,000 | 436,232 | ||||||
EPR Properties | ||||||||
4.75%, 12/15/2026 | 140,000 | 133,694 | ||||||
4.95%, 04/15/2028 | 414,000 | 395,237 | ||||||
Equinix, Inc. | ||||||||
2.15%, 07/15/2030 | 5,445,000 | 5,378,734 | ||||||
2.88%, 02/01/2026 | EUR | 200,000 | 228,264 | |||||
2.90%, 11/18/2026 | $ | 3,500,000 | 3,772,720 | |||||
3.20%, 11/18/2029 | 8,645,000 | 9,383,975 | ||||||
Equitable Holdings, Inc. | ||||||||
3.90%, 04/20/2023 | 6,474,000 | 6,929,746 | ||||||
4.35%, 04/20/2028 | 1,820,000 | 2,038,134 | ||||||
5.00%, 04/20/2048 | 30,000 | 34,163 | ||||||
Erste Group Bank AG | ||||||||
8.88% (5 Year Swap Rate EUR + 9.02%), 10/15/2168(1)(6) | EUR | 1,000,000 | 1,171,217 | |||||
ESH Hospitality, Inc. | ||||||||
4.63%, 10/01/2027(2) | $ | 223,000 | 209,620 |
Essex Portfolio LP | ||||||||
3.63%, 05/01/2027 | 2,785,000 | 3,090,518 | ||||||
3.88%, 05/01/2024 | 4,200,000 | 4,570,392 | ||||||
Fairfax Financial Holdings Ltd. | ||||||||
4.63%, 04/29/2030(2) | 3,361,000 | 3,621,023 | ||||||
4.85%, 04/17/2028 | 138,000 | 147,790 | ||||||
Farmers Exchange Capital II | ||||||||
6.15% (3 Month LIBOR USD + 3.74%), 11/01/2053(1)(2) | 280,000 | 345,886 | ||||||
Farmers Exchange Capital III | ||||||||
5.45% (3 Month LIBOR USD + 3.45%), 10/15/2054(1)(2) | 4,000,000 | 4,633,320 | ||||||
Farmers Insurance Exchange | ||||||||
4.75% (3 Month LIBOR USD + 3.23%), 11/01/2057(1)(2) | 3,000,000 | 3,029,213 | ||||||
Fidelity & Guaranty Life Holdings, Inc. | ||||||||
5.50%, 05/01/2025(2) | 2,360,000 | 2,551,113 | ||||||
Fidelity National Financial, Inc. | ||||||||
3.40%, 06/15/2030 | 2,030,000 | 2,112,818 | ||||||
4.50%, 08/15/2028 | 15,455,000 | 17,393,769 | ||||||
Fifth Third Bancorp | ||||||||
2.55%, 05/05/2027 | 8,760,000 | 9,364,923 | ||||||
GE Capital European Funding Unlimited Co. | ||||||||
2.63%, 03/15/2023 | EUR | 100,000 | 117,406 | |||||
GE Capital Funding LLC | ||||||||
4.40%, 05/15/2030(2) | $ | 16,570,000 | 17,229,257 | |||||
GE Capital International Funding Co. Unlimited Co. | ||||||||
3.37%, 11/15/2025 | 8,985,000 | 9,427,707 | ||||||
4.42%, 11/15/2035 | 40,925,000 | 41,548,949 | ||||||
GE Capital UK Funding Unlimited Co. | ||||||||
4.13%, 09/13/2023 | GBP | 200,000 | 260,214 | |||||
Genworth Holdings, Inc. | ||||||||
7.20%, 02/15/2021 | $ | 2,535,000 | 2,370,225 | |||||
Global Bank Corp. | ||||||||
5.25% (3 Month LIBOR USD + 3.30%), 04/16/2029(1) | 550,000 | 563,750 | ||||||
GLP Capital LP / GLP Financing II, Inc. | ||||||||
3.35%, 09/01/2024 | 3,795,000 | 3,791,964 | ||||||
4.00%, 01/15/2030 | 2,100,000 | 2,088,135 | ||||||
4.00%, 01/15/2031 | 565,000 | 558,271 | ||||||
5.25%, 06/01/2025 | 2,239,000 | 2,434,711 | ||||||
5.30%, 01/15/2029 | 5,325,000 | 5,762,076 | ||||||
5.38%, 04/15/2026 | 3,545,000 | 3,874,260 | ||||||
5.75%, 06/01/2028 | 4,034,000 | 4,444,258 | ||||||
Goldman Sachs Group, Inc. | ||||||||
2.60%, 02/07/2030 | 5,525,000 | 5,767,840 | ||||||
2.88% (3 Month LIBOR USD + 0.82%), 10/31/2022(1) | 11,078,000 | 11,357,654 | ||||||
2.91% (3 Month LIBOR USD + 0.99%), 07/24/2023(1) | 1,235,000 | 1,283,538 | ||||||
3.80%, 03/15/2030 | 4,862,000 | 5,546,170 | ||||||
Goodman US Finance Three LLC | ||||||||
3.70%, 03/15/2028(2) | 463,000 | 500,603 | ||||||
Growthpoint Properties International Pty Ltd. | ||||||||
5.87%, 05/02/2023(2) | 200,000 | 196,000 | ||||||
HCP, Inc. | ||||||||
3.25%, 07/15/2026 | 610,000 | 666,646 | ||||||
3.40%, 02/01/2025 | 2,625,000 | 2,828,959 | ||||||
3.50%, 07/15/2029 | 685,000 | 745,867 | ||||||
4.00%, 06/01/2025 | 4,375,000 | 4,845,354 | ||||||
4.20%, 03/01/2024 | 1,175,000 | 1,280,400 | ||||||
4.25%, 11/15/2023 | 16,000 | 17,416 | ||||||
Healthcare Realty Trust, Inc. | ||||||||
3.63%, 01/15/2028 | 4,375,000 | 4,606,902 | ||||||
3.75%, 04/15/2023 | 3,356,000 | 3,493,887 | ||||||
Healthcare Trust of America Holdings LP | ||||||||
3.70%, 04/15/2023 | 3,425,000 | 3,583,150 | ||||||
Healthpeak Properties, Inc. | ||||||||
2.88%, 01/15/2031 | 5,865,000 | 6,021,036 | ||||||
3.00%, 01/15/2030 | 70,000 | 73,227 | ||||||
Highwoods Realty LP | ||||||||
3.05%, 02/15/2030 | 200,000 | 199,043 | ||||||
4.13%, 03/15/2028 | 4,875,000 | 5,213,059 | ||||||
4.20%, 04/15/2029 | 1,148,000 | 1,233,423 | ||||||
Host Hotels & Resorts LP | ||||||||
3.75%, 10/15/2023 | 2,175,000 | 2,219,877 | ||||||
4.50%, 02/01/2026 | 1,600,000 | 1,656,320 | ||||||
Howard Hughes Corp. | ||||||||
5.38%, 03/15/2025(2) | 1,777,000 | 1,653,676 | ||||||
HSBC Holdings Plc | ||||||||
1.39% (3 Month LIBOR USD + 1.00%), 05/18/2024(1) | 400,000 | 396,767 | ||||||
2.10% (Secured Overnight Financing Rate + 1.93%), 06/04/2026(1) | 12,870,000 | 12,997,755 | ||||||
2.85% (Secured Overnight Financing Rate + 2.39%), 06/04/2031(1) | 20,300,000 | 20,758,826 | ||||||
3.00% (1 Year Swap Rate GBP + 1.77%), 05/29/2030(1) | GBP | 2,400,000 | 3,145,011 | |||||
3.26% (3 Month LIBOR USD + 1.06%), 03/13/2023(1) | $ | 1,585,000 | 1,642,047 | |||||
3.95% (3 Month LIBOR USD + 0.99%), 05/18/2024(1) | 7,615,000 | 8,183,881 | ||||||
3.97% (3 Month LIBOR USD + 1.61%), 05/22/2030(1) | 2,600,000 | 2,885,618 | ||||||
4.29% (3 Month LIBOR USD + 1.35%), 09/12/2026(1) | 10,000,000 | 11,123,785 | ||||||
4.58% (3 Month LIBOR USD + 1.53%), 06/19/2029(1) | 3,200,000 | 3,696,308 | ||||||
5.88% (5 Year Swap Rate GBP + 4.28%), 03/28/2169(1) | GBP | 6,400,000 | 7,752,793 | |||||
6.00% (5 Year Swap Rate EUR + 5.34%), 03/29/2169(1) | EUR | 600,000 | 699,573 | |||||
6.50% (5 Year 1100 Run ICE Swap Rate USD + 3.61%), 09/23/2168(1) | $ | 1,820,000 | 1,867,775 | |||||
6.88% (5 Year 1100 Run ICE Swap Rate USD + 5.51%), 12/01/2168(1) | 200,000 | 202,928 |
Hudson Pacific Properties LP | ||||||||
3.95%, 11/01/2027 | 2,399,000 | 2,485,870 | ||||||
Hunt Companies, Inc. | ||||||||
6.25%, 02/15/2026(2) | 82,000 | 74,620 | ||||||
Icahn Enterprises LP / Icahn Enterprises Finance Corp. | ||||||||
5.25%, 05/15/2027 | 1,870,000 | 1,804,550 | ||||||
ICICI Bank Ltd./Hong Kong | ||||||||
5.75%, 11/16/2020(2) | 200,000 | 202,388 | ||||||
5.75%, 11/16/2020 | 200,000 | 202,388 | ||||||
Industrial & Commercial Bank of China Ltd. | ||||||||
1.06% (3 Month LIBOR USD + 0.75%), 12/21/2021(1) | 3,500,000 | 3,490,272 | ||||||
1.20% (3 Month LIBOR USD + 0.75%), 11/08/2020(1) | 25,826,000 | 25,837,789 | ||||||
ING Bank NV | ||||||||
5.80%, 09/25/2023(2) | 1,026,000 | 1,151,278 | ||||||
ING Groep NV | ||||||||
1.30% (3 Month LIBOR USD + 1.00%), 10/02/2023(1) | 1,300,000 | 1,305,736 | ||||||
4.10%, 10/02/2023 | 2,200,000 | 2,412,855 | ||||||
6.88% (5 Year Swap Rate USD + 5.12%), 04/16/2169(1) | 300,000 | 309,750 | ||||||
International Lease Finance Corp. | ||||||||
8.25%, 12/15/2020 | 2,500,000 | 2,558,644 | ||||||
8.63%, 01/15/2022 | 1,056,000 | 1,134,482 | ||||||
Intesa Sanpaolo SpA | ||||||||
7.00% (5 Year Swap Rate EUR + 6.88%), 07/19/2168(1) | EUR | 5,570,000 | 6,216,343 | |||||
Itau Unibanco Holding SA | ||||||||
2.90%, 01/24/2023(2) | $ | 5,500,000 | 5,438,180 | |||||
3.25%, 01/24/2025(2) | 3,800,000 | 3,738,250 | ||||||
Jefferies Group LLC | ||||||||
5.13%, 01/20/2023 | 6,335,000 | 6,874,871 | ||||||
6.25%, 01/15/2036 | 1,430,000 | 1,637,929 | ||||||
6.45%, 06/08/2027 | 3,660,000 | 4,294,202 | ||||||
Jefferies Group LLC / Jefferies Group Capital Finance, Inc. | ||||||||
4.15%, 01/23/2030 | 7,180,000 | 7,795,070 | ||||||
4.85%, 01/15/2027 | 1,500,000 | 1,651,778 | ||||||
Jones Lang LaSalle, Inc. | ||||||||
4.40%, 11/15/2022 | 1,270,000 | 1,331,197 | ||||||
JPMorgan Chase & Co. | ||||||||
2.08% (Secured Overnight Financing Rate + 1.85%), 04/22/2026(1) | 11,770,000 | 12,211,748 | ||||||
2.18% (Secured Overnight Financing Rate + 1.89%), 06/01/2028(1) | 7,115,000 | 7,359,769 | ||||||
2.52% (Secured Overnight Financing Rate + 2.04%), 04/22/2031(1) | 14,415,000 | 15,223,820 | ||||||
2.74% (Secured Overnight Financing Rate + 1.51%), 10/15/2030(1) | 4,350,000 | 4,665,981 | ||||||
2.95%, 10/01/2026 | 2,340,000 | 2,570,034 | ||||||
2.96% (Secured Overnight Financing Rate + 2.52%), 05/13/2031(1) | 10,330,000 | 10,984,702 | ||||||
3.11% (Secured Overnight Financing Rate + 2.44%), 04/22/2051(1) | 13,945,000 | 15,007,979 | ||||||
3.20%, 06/15/2026 | 6,585,000 | 7,309,052 | ||||||
4.49% (Secured Overnight Financing Rate + 3.79%), 03/24/2031(1) | 13,825,000 | 16,889,255 | ||||||
Kennedy-Wilson, Inc. | ||||||||
5.88%, 04/01/2024 | 224,000 | 222,880 | ||||||
Kilroy Realty LP | ||||||||
3.05%, 02/15/2030 | 200,000 | 198,411 | ||||||
3.45%, 12/15/2024 | 1,845,000 | 1,934,129 | ||||||
4.38%, 10/01/2025 | 2,345,000 | 2,518,396 | ||||||
Ladder Capital Finance Holdings LLLP / Ladder Capital Finance Corp. | ||||||||
4.25%, 02/01/2027(2) | 6,245,000 | 4,996,000 | ||||||
5.25%, 10/01/2025(2) | 4,265,000 | 3,679,458 | ||||||
5.88%, 08/01/2021(2) | 1,025,000 | 1,014,750 | ||||||
LeasePlan Corp. NV | ||||||||
2.88%, 10/24/2024(2) | 300,000 | 308,297 | ||||||
Lloyds Banking Group Plc | ||||||||
2.86% (3 Month LIBOR USD + 1.25%), 03/17/2023(1) | 15,365,000 | 15,826,056 | ||||||
2.91% (3 Month LIBOR USD + 0.81%), 11/07/2023(1) | 12,390,000 | 12,899,618 | ||||||
3.57% (3 Month LIBOR USD + 1.21%), 11/07/2028(1) | 420,000 | 456,361 | ||||||
3.87% (1 Year CMT Index + 3.50%), 07/09/2025(1) | 1,675,000 | 1,821,612 | ||||||
4.05%, 08/16/2023 | 2,000,000 | 2,174,126 | ||||||
4.38%, 03/22/2028 | 400,000 | 464,120 | ||||||
4.45%, 05/08/2025 | 4,265,000 | 4,836,630 | ||||||
4.55%, 08/16/2028 | 1,600,000 | 1,874,665 | ||||||
4.95% (CMS 5 Year Rate EUR + 5.29%), 06/27/2169(1)(6) | EUR | 5,281,000 | 5,747,791 | |||||
7.50% (5 Year Swap Rate USD + 4.50%), 12/27/2168(1) | $ | 3,100,000 | 3,216,870 | |||||
7.63% (5 Year Swap Rate GBP + 5.01%), 06/27/2169(1) | GBP | 1,900,000 | 2,397,543 | |||||
7.88% (5 Year Swap Rate GBP + 4.83%), 06/27/2169(1) | 900,000 | 1,235,630 | ||||||
Logicor Financing SARL | ||||||||
3.25%, 11/13/2028 | EUR | 265,000 | 324,394 | |||||
Marsh & McLennan Cos, Inc. | ||||||||
2.25%, 11/15/2030 | $ | 1,965,000 | 2,041,533 | |||||
Massachusetts Mutual Life Insurance Co. | ||||||||
3.38%, 04/15/2050(2) | 5,745,000 | 5,910,213 | ||||||
Metropolitan Life Global Funding I | ||||||||
2.95%, 04/09/2030(2) | 1,175,000 | 1,287,346 | ||||||
MGM Growth Properties Operating Partnership LP / MGP Finance Co.-Issuer, Inc. | ||||||||
5.63%, 05/01/2024 | 1,079,000 | 1,122,236 | ||||||
Mid-America Apartments LP | ||||||||
3.95%, 03/15/2029 | 700,000 | 807,114 | ||||||
Mitsubishi UFJ Lease & Finance Co. Ltd. | ||||||||
2.65%, 09/19/2022(2) | 600,000 | 615,738 | ||||||
3.41%, 02/28/2022(2) | 200,000 | 206,218 | ||||||
3.96%, 09/19/2023(2) | 300,000 | 320,934 |
Morgan Stanley | ||||||||
2.70% (Secured Overnight Financing Rate + 1.14%), 01/22/2031(1) | 10,000,000 | 10,621,380 | ||||||
3.13%, 07/27/2026 | 2,030,000 | 2,239,560 | ||||||
3.88%, 04/29/2024 | 14,850,000 | 16,420,781 | ||||||
3.95%, 04/23/2027 | 10,130,000 | 11,401,745 | ||||||
4.00%, 07/23/2025 | 8,000,000 | 9,070,309 | ||||||
4.35%, 09/08/2026 | 8,350,000 | 9,628,762 | ||||||
5.00%, 11/24/2025 | 10,320,000 | 12,053,852 | ||||||
7.50%, 04/02/2032(3)(16) | 14,800,000 | 12,807,615 | ||||||
National Retail Properties, Inc. | ||||||||
2.50%, 04/15/2030 | 200,000 | 190,959 | ||||||
Nationwide Building Society | ||||||||
3.62% (3 Month LIBOR USD + 1.18%), 04/26/2023(1)(2) | 4,250,000 | 4,416,064 | ||||||
3.77% (3 Month LIBOR USD + 1.06%), 03/08/2024(1)(2) | 6,600,000 | 6,953,769 | ||||||
3.96% (3 Month LIBOR USD + 1.86%), 07/18/2030(1)(2) | 5,650,000 | 6,359,454 | ||||||
4.30% (3 Month LIBOR USD + 1.45%), 03/08/2029(1)(2) | 8,600,000 | 9,747,453 | ||||||
4.36% (3 Month LIBOR USD + 1.39%), 08/01/2024(1)(2) | 4,600,000 | 4,976,439 | ||||||
Nationwide Mutual Insurance Co. | ||||||||
2.60% (3 Month LIBOR USD + 2.29%), 12/15/2024(1)(2) | 1,790,000 | 1,782,163 | ||||||
NatWest Markets Plc | ||||||||
0.63%, 03/02/2022 | EUR | 4,750,000 | 5,315,225 | |||||
3.63%, 09/29/2022(2) | $ | 12,800,000 | 13,415,242 | |||||
Navient Corp. | ||||||||
5.00%, 10/26/2020 | 300,000 | 298,761 | ||||||
5.00%, 03/15/2027 | 1,997,000 | 1,677,480 | ||||||
5.50%, 01/25/2023 | 3,000,000 | 2,876,250 | ||||||
5.88%, 03/25/2021 | 9,693,000 | 9,523,372 | ||||||
5.88%, 10/25/2024 | 30,000 | 28,181 | ||||||
6.13%, 03/25/2024 | 14,000 | 13,300 | ||||||
6.50%, 06/15/2022 | 3,941,000 | 3,872,033 | ||||||
6.63%, 07/26/2021 | 2,969,000 | 2,909,620 | ||||||
6.75%, 06/15/2026 | 89,000 | 82,770 | ||||||
7.25%, 01/25/2022 | 15,500,000 | 15,538,750 | ||||||
7.25%, 09/25/2023 | 221,000 | 216,003 | ||||||
New York Life Global Funding | ||||||||
1.70%, 09/14/2021(2) | 6,775,000 | 6,878,443 | ||||||
2.35%, 07/14/2026(2) | 1,000,000 | 1,072,699 | ||||||
New York Life Insurance Co. | ||||||||
3.75%, 05/15/2050(2) | 9,600,000 | 10,818,223 | ||||||
Newmark Group, Inc. | ||||||||
6.13%, 11/15/2023 | 602,000 | 602,331 | ||||||
Old Republic International Corp. | ||||||||
3.88%, 08/26/2026 | 5,155,000 | 5,510,447 | ||||||
4.88%, 10/01/2024 | 335,000 | 362,303 | ||||||
Omega Healthcare Investors, Inc. | ||||||||
4.50%, 01/15/2025 | 5,050,000 | 5,212,505 | ||||||
Oppenheimer Holdings, Inc. | ||||||||
6.75%, 07/01/2022 | 84,000 | 85,418 | ||||||
Park Aerospace Holdings Ltd. | ||||||||
3.63%, 03/15/2021(2) | 451,000 | 445,050 | ||||||
4.50%, 03/15/2023(2) | 9,484,000 | 8,652,397 | ||||||
5.25%, 08/15/2022(2) | 14,261,000 | 13,386,927 | ||||||
5.50%, 02/15/2024(2) | 4,459,000 | 4,079,268 | ||||||
Physicians Realty LP | ||||||||
3.95%, 01/15/2028 | 177,000 | 180,436 | ||||||
Prologis LP | ||||||||
3.75%, 11/01/2025 | 1,325,000 | 1,521,766 | ||||||
QNB Finance Ltd. | ||||||||
1.90% (3 Month LIBOR USD + 1.45%), 08/11/2021(1) | 3,400,000 | 3,399,978 | ||||||
2.71% (3 Month LIBOR USD + 1.57%), 07/18/2021(1) | 2,400,000 | 2,405,993 | ||||||
Quicken Loans LLC | ||||||||
5.25%, 01/15/2028(2) | 3,595,000 | 3,738,800 | ||||||
5.75%, 05/01/2025(2) | 3,985,000 | 4,073,826 | ||||||
Raymond James Financial, Inc. | ||||||||
4.65%, 04/01/2030 | 2,505,000 | 2,994,706 | ||||||
4.95%, 07/15/2046 | 4,420,000 | 5,344,831 | ||||||
5.63%, 04/01/2024 | 1,617,000 | 1,842,605 | ||||||
Realty Income Corp. | ||||||||
3.25%, 06/15/2029 | 300,000 | 324,176 | ||||||
Regency Centers LP | ||||||||
2.95%, 09/15/2029 | 200,000 | 202,960 | ||||||
3.60%, 02/01/2027 | 4,271,000 | 4,545,333 | ||||||
3.70%, 06/15/2030 | 4,801,000 | 5,160,780 | ||||||
4.13%, 03/15/2028 | 970,000 | 1,058,152 | ||||||
Retail Opportunity Investments Partnership LP | ||||||||
4.00%, 12/15/2024 | 895,000 | 868,696 | ||||||
Royal Bank of Scotland Group Plc | ||||||||
1.85% (3 Month LIBOR USD + 1.55%), 06/25/2024(1) | 5,845,000 | 5,848,399 | ||||||
1.86% (3 Month LIBOR USD + 1.47%), 05/15/2023(1) | 3,217,000 | 3,218,995 | ||||||
2.00% (3 Month EURIBOR + 2.04%), 03/08/2023(1)(6) | EUR | 1,100,000 | 1,256,227 | |||||
2.00% (3 Month EURIBOR + 1.74%), 03/04/2025(1) | 400,000 | 462,895 | ||||||
2.50%, 03/22/2023 | 3,600,000 | 4,206,958 | ||||||
3.50% (3 Month LIBOR USD + 1.48%), 05/15/2023(1) | $ | 855,000 | 887,696 | |||||
3.88%, 09/12/2023 | 10,543,000 | 11,366,875 | ||||||
4.27% (3 Month LIBOR USD + 1.76%), 03/22/2025(1) | 16,200,000 | 17,614,021 | ||||||
4.45% (3 Month LIBOR USD + 1.87%), 05/08/2030(1) | 4,390,000 | 5,095,674 | ||||||
4.52% (3 Month LIBOR USD + 1.55%), 06/25/2024(1) | 1,600,000 | 1,738,240 |
4.80%, 04/05/2026 | 200,000 | 231,403 | ||||||
4.89% (3 Month LIBOR USD + 1.75%), 05/18/2029(1) | 2,900,000 | 3,418,017 | ||||||
5.08% (3 Month LIBOR USD + 1.91%), 01/27/2030(1) | 6,600,000 | 7,928,780 | ||||||
5.13%, 05/28/2024 | 3,650,000 | 3,992,655 | ||||||
6.00% (5 Year CMT Index + 5.63%), 09/29/2168(1) | 8,300,000 | 8,407,900 | ||||||
6.10%, 06/10/2023 | 500,000 | 553,615 | ||||||
6.13%, 12/15/2022 | 120,000 | 130,995 | ||||||
7.50% (5 Year Swap Rate USD + 5.80%), 09/30/2168(1) | 4,060,000 | 4,074,210 | ||||||
8.00% (5 Year Swap Rate USD + 5.72%), 09/30/2168(1) | 7,151,000 | 7,893,703 | ||||||
8.63% (5 Year Swap Rate USD + 7.60%), 09/30/2168(1) | 3,500,000 | 3,639,125 | ||||||
Sabra Health Care LP | ||||||||
3.90%, 10/15/2029 | 200,000 | 181,761 | ||||||
Santander Holdings USA, Inc. | ||||||||
3.24%, 10/05/2026 | 6,342,000 | 6,588,837 | ||||||
3.40%, 01/18/2023 | 184,000 | 191,530 | ||||||
3.50%, 06/07/2024 | 50,000 | 52,593 | ||||||
4.40%, 07/13/2027 | 153,000 | 165,783 | ||||||
Santander UK Group Holdings Plc | ||||||||
0.45% (3 Month EURIBOR + 0.85%), 03/27/2024(1)(6) | EUR | 1,200,000 | 1,315,735 | |||||
0.52% (3 Month EURIBOR + 0.78%), 05/18/2023(1)(6) | 200,000 | 221,080 | ||||||
1.13%, 09/08/2023 | 400,000 | 451,607 | ||||||
2.88%, 10/16/2020 | $ | 2,800,000 | 2,819,381 | |||||
2.92% (1 Year Swap Rate GBP + 1.38%), 05/08/2026(1) | GBP | 520,000 | 670,262 | |||||
3.37% (3 Month LIBOR USD + 1.08%), 01/05/2024(1) | $ | 1,000,000 | 1,048,060 | |||||
3.57%, 01/10/2023 | 6,395,000 | 6,637,228 | ||||||
3.82% (3 Month LIBOR USD + 1.40%), 11/03/2028(1) | 4,990,000 | 5,498,389 | ||||||
4.75%, 09/15/2025(2) | 1,025,000 | 1,110,629 | ||||||
4.80% (3 Month LIBOR USD + 1.57%), 11/15/2024(1) | 18,285,000 | 20,227,227 | ||||||
6.75% (5 Year Swap Rate GBP + 5.79%), 06/24/2169(1) | GBP | 5,800,000 | 7,303,565 | |||||
7.38% (5 Year Swap Rate GBP + 5.54%), 09/24/2168(1) | 5,647,000 | 7,119,648 | ||||||
Santander UK Plc | ||||||||
2.13%, 11/03/2020 | $ | 370,000 | 372,053 | |||||
3.40%, 06/01/2021 | 600,000 | 615,973 | ||||||
SBA Tower Trust | ||||||||
2.84%, 01/15/2025(2) | 3,250,000 | 3,350,793 | ||||||
2.88%, 07/09/2021(2) | 3,000,000 | 3,004,950 | ||||||
3.17%, 04/11/2022(2) | 2,825,000 | 2,853,516 | ||||||
3.45%, 03/15/2023(2) | 600,000 | 624,164 | ||||||
3.72%, 04/11/2023(2) | 3,515,000 | 3,647,557 | ||||||
3.87%, 10/08/2024(2) | 10,376,000 | 10,957,341 | ||||||
Sberbank of Russia Via SB Capital SA | ||||||||
5.13%, 10/29/2022 | 1,300,000 | 1,365,468 | ||||||
5.72%, 06/16/2021 | 3,720,000 | 3,862,476 | ||||||
Service Properties Trust | ||||||||
3.95%, 01/15/2028 | 5,245,000 | 4,222,795 | ||||||
Shimao Group Holdings Ltd. | ||||||||
4.75%, 07/03/2022 | 8,900,000 | 9,066,537 | ||||||
Simon Property Group LP | ||||||||
3.30%, 01/15/2026 | 1,515,000 | 1,625,380 | ||||||
3.50%, 09/01/2025 | 2,305,000 | 2,490,273 | ||||||
Sirius International Group Ltd. | ||||||||
4.60%, 11/01/2026(2) | 2,520,000 | 2,274,300 | ||||||
SITE Centers Corp. | ||||||||
3.63%, 02/01/2025 | 1,914,000 | 1,928,607 | ||||||
4.25%, 02/01/2026 | 2,500,000 | 2,531,399 | ||||||
4.70%, 06/01/2027 | 8,000,000 | 8,138,842 | ||||||
SL Green Operating Partnership LP | ||||||||
3.25%, 10/15/2022 | 6,000,000 | 5,974,889 | ||||||
SL Green Realty Corp. | ||||||||
4.50%, 12/01/2022 | 850,000 | 867,608 | ||||||
Societe Generale SA | ||||||||
4.25%, 04/14/2025(2) | 2,340,000 | 2,476,165 | ||||||
4.75%, 11/24/2025(2) | 9,285,000 | 10,164,280 | ||||||
6.75% (5 Year Swap Rate USD + 3.93%), 10/06/2168(1)(2) | 400,000 | 398,000 | ||||||
6.75% (5 Year Swap Rate EUR + 5.54%), 10/07/2168(1) | EUR | 300,000 | 333,814 | |||||
7.38% (5 Year Swap Rate USD + 6.24%), 03/13/2169(1)(2) | $ | 2,100,000 | 2,118,270 | |||||
7.38% (5 Year Swap Rate USD + 4.30%), 04/04/2169(1)(2) | 3,700,000 | 3,727,750 | ||||||
Spirit Realty LP | ||||||||
3.40%, 01/15/2030 | 200,000 | 189,210 | ||||||
Springleaf Finance Corp. | ||||||||
5.63%, 03/15/2023 | 3,658,000 | 3,699,226 | ||||||
6.13%, 05/15/2022 | 3,548,000 | 3,613,212 | ||||||
6.13%, 03/15/2024 | 2,400,000 | 2,439,000 | ||||||
6.88%, 03/15/2025 | 363,000 | 372,415 | ||||||
7.75%, 10/01/2021 | 5,960,000 | 6,201,082 | ||||||
8.25%, 12/15/2020 | 8,210,000 | 8,480,930 | ||||||
Standard Chartered Plc | ||||||||
1.51% (3 Month LIBOR USD + 1.20%), 09/10/2022(1)(2) | 3,900,000 | 3,905,070 | ||||||
2.29% (3 Month LIBOR USD + 1.15%), 01/20/2023(1)(2) | 6,475,000 | 6,473,187 | ||||||
4.25% (3 Month LIBOR USD + 1.15%), 01/20/2023(1)(2) | 1,730,000 | 1,795,913 | ||||||
4.64% (5 Year CMT Index + 3.85%), 04/01/2031(1)(2) | 18,880,000 | 21,337,729 | ||||||
Starwood Property Trust, Inc. | ||||||||
4.75%, 03/15/2025 | 133,000 | 121,030 | ||||||
Stichting AK Rabobank Certificaten | ||||||||
0.00%, 03/29/2169 | EUR | 3,690,000 | 4,394,458 | |||||
STORE Capital Corp. | ||||||||
4.50%, 03/15/2028 | $ | 128,000 | 130,377 | |||||
4.63%, 03/15/2029 | 200,000 | 204,464 |
SVB Financial Group | ||||||||
3.13%, 06/05/2030 | 388,000 | 415,497 | ||||||
Synchrony Financial | ||||||||
2.85%, 07/25/2022 | 3,720,000 | 3,783,696 | ||||||
4.25%, 08/15/2024 | 955,000 | 1,004,359 | ||||||
4.38%, 03/19/2024 | 2,923,000 | 3,061,924 | ||||||
4.50%, 07/23/2025 | 2,778,000 | 2,951,632 | ||||||
Teachers Insurance & Annuity Association of America | ||||||||
3.30%, 05/15/2050(2) | 5,765,000 | 5,938,923 | ||||||
4.38% (3 Month LIBOR USD + 2.66%), 09/15/2054(1)(2) | 4,500,000 | 4,790,251 | ||||||
TP ICAP Plc | ||||||||
5.25%, 01/26/2024 | GBP | 100,000 | 132,909 | |||||
Travelers Cos, Inc. | ||||||||
2.55%, 04/27/2050 | $ | 850,000 | 839,847 | |||||
UBS AG | ||||||||
4.75% (5 Year Swap Rate EUR + 3.40%), 02/12/2026(1) | EUR | 5,400,000 | 6,171,141 | |||||
5.13%, 05/15/2024 | $ | 200,000 | 216,605 | |||||
UBS Group AG | ||||||||
5.75% (5 Year Swap Rate EUR + 5.29%), 02/19/2169(1) | EUR | 600,000 | 689,870 | |||||
6.88% (5 Year Swap Rate USD + 5.50%), 03/22/2169(1) | $ | 300,000 | 303,375 | |||||
7.00% (5 Year Swap Rate USD + 4.87%), 02/19/2169(1) | 200,000 | 219,790 | ||||||
7.13% (5 Year Swap Rate USD + 5.88%), 08/10/2168(1) | 300,000 | 305,216 | ||||||
UniCredit SpA | ||||||||
6.75% (5 Year Swap Rate EUR + 6.10%), 03/10/2169(1) | EUR | 4,200,000 | 4,612,529 | |||||
7.83%, 12/04/2023(2) | $ | 13,400,000 | 15,442,951 | |||||
Unique Pub Finance Co. Plc | ||||||||
5.66%, 06/30/2027 | GBP | 3,214,648 | 4,042,132 | |||||
7.40%, 03/28/2024 | 3,107,000 | 3,991,255 | ||||||
Ventas Realty LP | ||||||||
3.00%, 01/15/2030 | $ | 1,765,000 | 1,748,292 | |||||
3.25%, 10/15/2026 | 7,052,000 | 7,255,443 | ||||||
3.85%, 04/01/2027 | 1,485,000 | 1,553,637 | ||||||
4.40%, 01/15/2029 | 3,000,000 | 3,270,594 | ||||||
VEREIT Operating Partnership LP | ||||||||
3.40%, 01/15/2028 | 2,855,000 | 2,872,262 | ||||||
3.95%, 08/15/2027 | 4,155,000 | 4,323,317 | ||||||
4.60%, 02/06/2024 | 6,215,000 | 6,611,027 | ||||||
4.63%, 11/01/2025 | 10,265,000 | 11,109,104 | ||||||
4.88%, 06/01/2026 | 4,800,000 | 5,321,772 | ||||||
VIVAT NV | ||||||||
2.38%, 05/17/2024 | EUR | 500,000 | 580,248 | |||||
Voyager Aviation Holdings LLC / Voyager Finance Co. | ||||||||
8.50%, 08/15/2021(2) | $ | 186,000 | 135,780 | |||||
WEA Finance LLC | ||||||||
3.15%, 04/05/2022(2) | 3,000,000 | 3,043,892 | ||||||
Weingarten Realty Investors | ||||||||
3.25%, 08/15/2026 | 1,665,000 | 1,661,351 | ||||||
Wells Fargo & Co. | ||||||||
1.65% (Secured Overnight Financing Rate + 1.60%), 06/02/2024(1) | 7,275,000 | 7,392,811 | ||||||
2.19% (Secured Overnight Financing Rate + 2.00%), 04/30/2026(1) | 3,600,000 | 3,722,282 | ||||||
2.39% (Secured Overnight Financing Rate + 2.10%), 06/02/2028(1) | 10,650,000 | 11,001,742 | ||||||
2.57% (3 Month LIBOR USD + 1.00%), 02/11/2031(1) | 12,285,000 | 12,851,242 | ||||||
2.60%, 07/22/2020 | 310,000 | 310,378 | ||||||
2.88% (3 Month LIBOR USD + 1.17%), 10/30/2030(1) | 30,992,000 | 33,120,664 | ||||||
3.07% (Secured Overnight Financing Rate + 2.53%), 04/30/2041(1) | 17,550,000 | 18,261,262 | ||||||
3.58% (3 Month LIBOR USD + 1.31%), 05/22/2028(1) | 9,455,000 | 10,493,386 | ||||||
Welltower, Inc. | ||||||||
3.95%, 09/01/2023 | 13,500,000 | 14,533,727 | ||||||
4.00%, 06/01/2025 | 4,690,000 | 5,184,271 | ||||||
4.25%, 04/15/2028 | 111,000 | 124,029 | ||||||
4.50%, 01/15/2024 | 650,000 | 711,944 | ||||||
Weyerhaeuser Co. | ||||||||
4.00%, 04/15/2030 | 9,630,000 | 10,877,246 | ||||||
Willis North America, Inc. | ||||||||
3.60%, 05/15/2024 | 9,380,000 | 10,151,855 | ||||||
WPC Eurobond BV | ||||||||
1.35%, 04/15/2028 | EUR | 3,425,000 | 3,782,487 | |||||
2.13%, 04/15/2027 | 400,000 | 464,772 | ||||||
2.25%, 04/09/2026 | 1,300,000 | 1,528,262 | ||||||
|
| |||||||
Total Financials |
| 2,407,121,956 | ||||||
|
| |||||||
Industrials – 2.22% | ||||||||
Amcor Finance USA, Inc. | ||||||||
3.63%, 04/28/2026 | $ | 2,990,000 | 3,239,137 | |||||
4.50%, 05/15/2028 | 4,100,000 | 4,713,460 | ||||||
Arrow Electronics, Inc. | ||||||||
3.50%, 04/01/2022 | 480,000 | 492,852 | ||||||
4.00%, 04/01/2025 | 3,622,000 | 3,915,535 | ||||||
4.50%, 03/01/2023 | 380,000 | 403,515 | ||||||
Associated Materials LLC / AMH New Finance, Inc. | ||||||||
9.00%, 01/01/2024(2) | 1,400,000 | 1,191,386 | ||||||
Aviation Capital Group LLC | ||||||||
2.88%, 01/20/2022(2) | 8,869,000 | 8,476,377 | ||||||
3.88%, 05/01/2023(2) | 100,000 | 95,139 | ||||||
4.13%, 08/01/2025(2) | 168,000 | 151,249 | ||||||
4.88%, 10/01/2025(2) | 3,007,000 | 2,754,489 | ||||||
Avnet, Inc. | ||||||||
3.75%, 12/01/2021 | 2,210,000 | 2,267,751 | ||||||
4.63%, 04/15/2026 | 10,485,000 | 11,868,055 | ||||||
4.88%, 12/01/2022 | 5,855,000 | 6,263,348 | ||||||
BAE Systems Plc | ||||||||
3.40%, 04/15/2030(2) | 10,975,000 | 11,969,140 | ||||||
Ball Corp. | ||||||||
4.00%, 11/15/2023 | 750,000 | 776,250 | ||||||
Boeing Co. | ||||||||
2.25%, 06/15/2026 | 2,170,000 | 2,097,628 | ||||||
2.95%, 02/01/2030 | 2,790,000 | 2,724,583 | ||||||
3.10%, 05/01/2026 | 370,000 | 377,091 | ||||||
3.20%, 03/01/2029 | 1,855,000 | 1,834,756 | ||||||
3.25%, 02/01/2035 | 315,000 | 287,124 | ||||||
3.38%, 06/15/2046 | 905,000 | 749,975 | ||||||
3.50%, 03/01/2039 | 735,000 | 646,844 | ||||||
3.55%, 03/01/2038 | 375,000 | 341,408 | ||||||
3.63%, 03/01/2048 | 410,000 | 359,968 | ||||||
3.65%, 03/01/2047 | 80,000 | 69,571 | ||||||
3.75%, 02/01/2050 | 1,585,000 | 1,430,916 | ||||||
3.85%, 11/01/2048 | 1,695,000 | 1,515,032 | ||||||
3.95%, 08/01/2059 | 2,715,000 | 2,378,158 | ||||||
4.51%, 05/01/2023 | 1,439,000 | 1,519,454 | ||||||
4.88%, 05/01/2025 | 1,977,000 | 2,152,662 | ||||||
5.04%, 05/01/2027 | 2,860,000 | 3,153,522 | ||||||
5.15%, 05/01/2030 | 8,833,000 | 9,854,845 | ||||||
5.71%, 05/01/2040 | 7,091,000 | 8,019,416 | ||||||
5.81%, 05/01/2050 | 9,748,000 | 11,501,703 | ||||||
5.93%, 05/01/2060 | 8,416,000 | 9,944,632 | ||||||
Bombardier, Inc. | ||||||||
6.00%, 10/15/2022(2) | 248,000 | 172,360 | ||||||
6.13%, 01/15/2023(2) | 100,000 | 68,780 | ||||||
7.88%, 04/15/2027(2) | 1,492,000 | 977,260 | ||||||
Boral Finance Pty Ltd. | ||||||||
3.00%, 11/01/2022(2) | 4,439,000 | 4,474,211 | ||||||
3.75%, 05/01/2028(2) | 3,520,000 | 3,450,262 | ||||||
Canadian Pacific Railway Co. | ||||||||
4.50%, 01/15/2022 | 110,000 | 115,511 | ||||||
Carrier Global Corp. | ||||||||
2.72%, 02/15/2030(2) | 8,695,000 | 8,715,373 | ||||||
3.58%, 04/05/2050(2) | 5,710,000 | 5,571,188 | ||||||
Caterpillar, Inc. | ||||||||
3.90%, 05/27/2021 | 3,110,000 | 3,208,706 | ||||||
CEMEX Finance LLC | ||||||||
6.00%, 04/01/2024(2) | 450,000 | 445,365 | ||||||
Cemex SAB de CV | ||||||||
5.45%, 11/19/2029(2) | 3,460,000 | 3,196,002 | ||||||
5.70%, 01/11/2025(2) | 900,000 | 879,750 | ||||||
7.75%, 04/16/2026(2) | 250,000 | 255,237 | ||||||
Clean Harbors, Inc. | ||||||||
4.88%, 07/15/2027(2) | 1,639,000 | 1,684,072 | ||||||
5.13%, 07/15/2029(2) | 680,000 | 705,269 | ||||||
DAE Funding LLC | ||||||||
4.00%, 08/01/2020(2) | 3,924,000 | 3,894,570 | ||||||
4.50%, 08/01/2022(2) | 183,000 | 174,307 | ||||||
5.00%, 08/01/2024(2) | 8,307,000 | 7,787,812 | ||||||
5.25%, 11/15/2021(2) | 6,844,000 | 6,707,120 | ||||||
5.75%, 11/15/2023(2) | 2,501,000 | 2,382,202 | ||||||
Embraer Netherlands Finance BV | ||||||||
5.05%, 06/15/2025 | 2,405,000 | 2,128,449 | ||||||
5.40%, 02/01/2027 | 1,190,000 | 1,053,150 | ||||||
Embraer Overseas Ltd. | ||||||||
5.70%, 09/16/2023(2) | 3,575,000 | 3,405,223 | ||||||
Empresa de Transporte de Pasajeros Metro SA | ||||||||
3.65%, 05/07/2030(2) | 600,000 | 647,250 | ||||||
4.70%, 05/07/2050(2) | 1,400,000 | 1,605,660 | ||||||
Fortress Transportation & Infrastructure Investors LLC | ||||||||
6.50%, 10/01/2025(2) | 1,561,000 | 1,405,228 | ||||||
6.75%, 03/15/2022(2) | 4,576,000 | 4,395,065 | ||||||
General Dynamics Corp. | ||||||||
3.00%, 05/11/2021 | 5,585,000 | 5,713,943 | ||||||
General Electric Co. | ||||||||
3.45%, 05/15/2024 | 915,000 | 975,102 | ||||||
3.63%, 05/01/2030 | 3,370,000 | 3,373,016 | ||||||
4.35%, 05/01/2050 | 13,905,000 | 13,780,445 | ||||||
5.00% (3 Month LIBOR USD + 3.33%), 06/15/2169(1) | 7,944,000 | 6,236,834 | ||||||
5.50%, 06/07/2021 | GBP | 100,000 | 127,459 | |||||
5.55%, 01/05/2026 | $ | 4,748,000 | 5,511,573 | |||||
6.15%, 08/07/2037 | 36,000 | 41,686 | ||||||
6.25%, 09/29/2020 | GBP | 160,000 | 200,351 | |||||
6.75%, 03/15/2032 | $ | 5,231,000 | 6,404,327 | |||||
6.88%, 01/10/2039 | 27,000 | 33,185 | ||||||
Graphic Packaging International LLC | ||||||||
4.13%, 08/15/2024 | 50,000 | 51,625 | ||||||
4.75%, 07/15/2027(2) | 1,500,000 | 1,582,500 | ||||||
Heathrow Funding Ltd. | ||||||||
4.88%, 07/15/2021(2) | 7,220,000 | 7,364,973 |
Huntington Ingalls Industries, Inc. | ||||||||
3.84%, 05/01/2025(2) | 3,995,000 | 4,337,870 | ||||||
4.20%, 05/01/2030(2) | 2,465,000 | 2,746,085 | ||||||
Jabil, Inc. | ||||||||
4.70%, 09/15/2022 | 3,685,000 | 3,914,184 | ||||||
John Deere Capital Corp. | ||||||||
0.80% (3 Month LIBOR USD + 0.48%), 09/08/2022(1) | 10,000,000 | 10,042,200 | ||||||
2.95%, 04/01/2022 | 7,475,000 | 7,801,322 | ||||||
Keysight Technologies, Inc. | ||||||||
3.00%, 10/30/2029 | 5,800,000 | 6,273,602 | ||||||
4.55%, 10/30/2024 | 1,374,000 | 1,534,414 | ||||||
4.60%, 04/06/2027 | 1,695,000 | 1,994,680 | ||||||
Komatsu Finance America, Inc. | ||||||||
2.12%, 09/11/2020 | 200,000 | 200,393 | ||||||
2.44%, 09/11/2022 | 860,000 | 879,215 | ||||||
Masco Corp. | ||||||||
3.50%, 04/01/2021 | 7,044,000 | 7,141,101 | ||||||
Matthews International Corp. | ||||||||
5.25%, 12/01/2025(2) | 1,064,000 | 957,600 | ||||||
Mauser Packaging Solutions Holding Co. | ||||||||
5.50%, 04/15/2024(2) | 510,000 | 500,916 | ||||||
NTT Finance Corp. | ||||||||
1.90%, 07/21/2021 | 5,400,000 | 5,461,834 | ||||||
OI European Group BV | ||||||||
4.00%, 03/15/2023(2) | 216,000 | 212,745 | ||||||
Pelabuhan Indonesia III Persero PT | ||||||||
4.50%, 05/02/2023 | 200,000 | 208,750 | ||||||
Penske Truck Leasing Co. LP / PTL Finance Corp. | ||||||||
3.38%, 02/01/2022(2) | 2,781,000 | 2,852,906 | ||||||
4.88%, 07/11/2022(2) | 5,762,000 | 6,137,798 | ||||||
PerkinElmer, Inc. | ||||||||
3.30%, 09/15/2029 | 4,910,000 | 5,261,408 | ||||||
PowerTeam Services LLC | ||||||||
9.03%, 12/04/2025(2) | 5,121,000 | 5,223,420 | ||||||
Republic Services, Inc. | ||||||||
2.90%, 07/01/2026 | 3,000,000 | 3,277,159 | ||||||
Reynolds Group Issuer, Inc. / Reynolds Group Issuer LLC / Reynolds Group Issuer Lu | ||||||||
4.72% (3 Month LIBOR USD + 3.50%), 07/15/2021(1)(2) | 1,200,000 | 1,191,000 | ||||||
Roper Technologies, Inc. | ||||||||
2.00%, 06/30/2030 | 1,015,000 | 1,015,500 | ||||||
2.35%, 09/15/2024 | 1,215,000 | 1,280,557 | ||||||
2.95%, 09/15/2029 | 1,930,000 | 2,107,703 | ||||||
Sealed Air Corp. | ||||||||
4.00%, 12/01/2027(2) | 505,000 | 505,000 | ||||||
5.25%, 04/01/2023(2) | 1,000,000 | 1,045,460 | ||||||
5.50%, 09/15/2025(2) | 1,545,000 | 1,660,875 | ||||||
Sensata Technologies, Inc. | ||||||||
4.38%, 02/15/2030(2) | 208,000 | 205,920 | ||||||
Siemens Financieringsmaatschappij NV | ||||||||
0.93% (3 Month LIBOR USD + 0.61%), 03/16/2022(1)(2) | 13,690,000 | 13,742,433 | ||||||
SIG Combibloc PurchaseCo SARL | ||||||||
1.88%, 06/18/2023(2) | EUR | 9,357,000 | 10,670,068 | |||||
2.13%, 06/18/2025(2) | 7,592,000 | 8,650,050 | ||||||
SMBC Aviation Capital Finance DAC | ||||||||
2.65%, 07/15/2021(2) | $ | 200,000 | 200,841 | |||||
4.13%, 07/15/2023(2) | 13,215,000 | 13,715,291 | ||||||
Spirit AeroSystems, Inc. | ||||||||
1.11% (3 Month LIBOR USD + 0.80%), 06/15/2021(1) | 3,080,000 | 2,868,515 | ||||||
4.60%, 06/15/2028 | 695,000 | 557,738 | ||||||
Textron, Inc. | ||||||||
1.00% (3 Month LIBOR USD + 0.55%), 11/10/2020(1) | 830,000 | 827,489 | ||||||
3.00%, 06/01/2030 | 16,485,000 | 16,408,001 | ||||||
TransDigm, Inc. | ||||||||
5.50%, 11/15/2027 | 25,000 | 21,824 | ||||||
6.25%, 03/15/2026(2) | 2,490,000 | 2,488,444 | ||||||
7.50%, 03/15/2027 | 860,000 | 826,529 | ||||||
8.00%, 12/15/2025(2) | 2,410,000 | 2,532,886 | ||||||
Trident TPI Holdings, Inc. | ||||||||
9.25%, 08/01/2024(2) | 207,000 | 212,175 | ||||||
Triumph Group, Inc. | ||||||||
5.25%, 06/01/2022 | 482,000 | 412,110 | ||||||
6.25%, 09/15/2024(2) | 751,000 | 638,350 | ||||||
Trivium Packaging Finance BV | ||||||||
3.75%, 08/15/2026(2) | EUR | 340,000 | 374,896 | |||||
5.50%, 08/15/2026(2) | $ | 7,454,000 | 7,519,223 | |||||
Union Pacific Corp. | ||||||||
3.95%, 09/10/2028 | 4,640,000 | 5,507,973 | ||||||
Vertical US Newco, Inc. | ||||||||
5.25%, 07/15/2027(2) | 2,045,000 | 2,045,000 | ||||||
Vulcan Materials Co. | ||||||||
3.50%, 06/01/2030 | 1,400,000 | 1,520,290 | ||||||
Waste Pro USA, Inc. | ||||||||
5.50%, 02/15/2026(2) | 2,121,000 | 2,024,473 | ||||||
Westinghouse Air Brake Technologies Corp. | ||||||||
3.20%, 06/15/2025 | 4,200,000 | 4,287,651 | ||||||
WRKCo, Inc. | ||||||||
3.00%, 09/15/2024 | 4,000,000 | 4,253,170 | ||||||
3.00%, 06/15/2033 | 1,445,000 | 1,508,421 |
3.75%, 03/15/2025 | 815,000 | 903,345 | ||||||
|
| |||||||
Total Industrials |
| 431,128,175 | ||||||
|
| |||||||
Technology – 1.62% | ||||||||
Activision Blizzard, Inc. | ||||||||
2.60%, 06/15/2022 | 100,000 | 103,751 | ||||||
Amdocs Ltd. | ||||||||
2.54%, 06/15/2030 | 15,503,000 | 15,439,517 | ||||||
Apple, Inc. | ||||||||
1.65%, 05/11/2030 | 4,685,000 | 4,837,322 | ||||||
2.65%, 05/11/2050 | 2,570,000 | 2,649,483 | ||||||
3.85%, 05/04/2043 | 2,805,000 | 3,478,926 | ||||||
4.65%, 02/23/2046 | 1,250,000 | 1,711,536 | ||||||
Broadcom Corp. / Broadcom Cayman Finance Ltd. | ||||||||
2.65%, 01/15/2023 | 200,000 | 207,443 | ||||||
3.50%, 01/15/2028 | 685,000 | 723,458 | ||||||
3.63%, 01/15/2024 | 8,815,000 | 9,480,248 | ||||||
3.88%, 01/15/2027 | 15,260,000 | 16,497,010 | ||||||
Broadcom, Inc. | ||||||||
3.13%, 10/15/2022(2) | 3,000,000 | 3,125,096 | ||||||
3.15%, 11/15/2025(2) | 1,721,000 | 1,827,194 | ||||||
3.46%, 09/15/2026(2) | 21,327,000 | 22,892,002 | ||||||
3.63%, 10/15/2024(2) | 4,875,000 | 5,297,631 | ||||||
4.11%, 09/15/2028(2) | 3,068,000 | 3,355,641 | ||||||
4.15%, 11/15/2030(2) | 2,607,000 | 2,836,532 | ||||||
4.25%, 04/15/2026(2) | 2,625,000 | 2,922,912 | ||||||
4.30%, 11/15/2032(2) | 11,277,000 | 12,448,949 | ||||||
4.75%, 04/15/2029(2) | 16,122,000 | 18,296,909 | ||||||
5.00%, 04/15/2030(2) | 6,767,000 | 7,776,082 | ||||||
Change Healthcare Holdings LLC / Change Healthcare Finance, Inc. | ||||||||
5.75%, 03/01/2025(2) | 510,000 | 503,625 | ||||||
Dell International LLC / EMC Corp. | ||||||||
4.42%, 06/15/2021(2) | 7,590,000 | 7,801,477 | ||||||
5.30%, 10/01/2029(2) | 1,395,000 | 1,544,325 | ||||||
5.85%, 07/15/2025(2) | 3,100,000 | 3,561,406 | ||||||
Exela Intermediate LLC / Exela Finance, Inc. | ||||||||
10.00%, 07/15/2023(2) | 300,000 | 72,750 | ||||||
Fidelity National Information Services, Inc. | ||||||||
0.75%, 05/21/2023 | EUR | 1,870,000 | 2,114,685 | |||||
Fiserv, Inc. | ||||||||
1.13%, 07/01/2027 | 1,465,000 | 1,663,565 | ||||||
2.65%, 06/01/2030 | $ | 5,465,000 | 5,765,323 | |||||
3.20%, 07/01/2026 | 2,995,000 | 3,314,896 | ||||||
Hewlett Packard Enterprise Co. | ||||||||
2.09% (3 Month LIBOR USD + 0.72%), 10/05/2021(1) | 2,500,000 | 2,495,142 | ||||||
Leidos, Inc. | ||||||||
3.63%, 05/15/2025(2) | 120,000 | 130,770 | ||||||
4.38%, 05/15/2030(2) | 212,000 | 238,807 | ||||||
Microchip Technology, Inc. | ||||||||
3.92%, 06/01/2021 | 1,670,000 | 1,702,545 | ||||||
4.33%, 06/01/2023 | 15,130,000 | 16,321,638 | ||||||
Micron Technology, Inc. | ||||||||
4.19%, 02/15/2027 | 3,800,000 | 4,208,787 | ||||||
4.64%, 02/06/2024 | 6,512,000 | 7,198,319 | ||||||
4.66%, 02/15/2030 | 8,880,000 | 10,350,955 | ||||||
5.33%, 02/06/2029 | 7,324,000 | 8,760,784 | ||||||
NetApp, Inc. | ||||||||
1.88%, 06/22/2025 | 1,000,000 | 1,013,003 | ||||||
2.38%, 06/22/2027 | 2,000,000 | 2,023,340 | ||||||
2.70%, 06/22/2030 | 2,500,000 | 2,503,643 | ||||||
NXP BV | ||||||||
4.30%, 06/18/2029(2) | �� | 566,000 | 642,077 | |||||
5.35%, 03/01/2026(2) | 1,945,000 | 2,311,860 | ||||||
NXP BV / NXP Funding LLC | ||||||||
3.88%, 09/01/2022(2) | 6,840,000 | 7,231,092 | ||||||
4.13%, 06/01/2021(2) | 19,112,000 | 19,682,178 | ||||||
4.63%, 06/01/2023(2) | 460,000 | 504,550 | ||||||
4.88%, 03/01/2024(2) | 5,935,000 | 6,628,415 | ||||||
NXP BV / NXP Funding LLC / NXP USA, Inc. | ||||||||
2.70%, 05/01/2025(2) | 606,000 | 636,572 | ||||||
3.15%, 05/01/2027(2) | 1,178,000 | 1,249,764 | ||||||
3.40%, 05/01/2030(2) | 212,000 | 228,123 | ||||||
Open Text Corp. | ||||||||
3.88%, 02/15/2028(2) | 445,000 | 428,450 | ||||||
Oracle Corp. | ||||||||
2.80%, 04/01/2027 | 4,565,000 | 4,984,603 | ||||||
2.95%, 04/01/2030 | 7,480,000 | 8,333,040 | ||||||
3.60%, 04/01/2050 | 23,830,000 | 26,856,726 | ||||||
3.85%, 04/01/2060 | 833,000 | 974,616 | ||||||
4.00%, 07/15/2046 | 1,909,000 | 2,259,438 | ||||||
Seagate HDD Cayman | ||||||||
4.09%, 06/01/2029(2) | 4,079,000 | 4,266,068 | ||||||
4.13%, 01/15/2031(2) | 1,400,000 | 1,466,741 | ||||||
4.88%, 06/01/2027 | 431,000 | 467,353 | ||||||
5.75%, 12/01/2034 | 1,022,000 | 1,126,696 | ||||||
VMware, Inc. | ||||||||
2.95%, 08/21/2022 | 2,540,000 | 2,627,494 | ||||||
3.90%, 08/21/2027 | 160,000 | 169,490 | ||||||
4.65%, 05/15/2027 | 1,290,000 | 1,426,682 | ||||||
4.70%, 05/15/2030 | 546,000 | 603,517 | ||||||
Western Digital Corp. | ||||||||
4.75%, 02/15/2026 | 744,000 | 770,040 | ||||||
|
| |||||||
Total Technology |
| 315,073,012 | ||||||
|
| |||||||
Utilities – 2.13% | ||||||||
AEP Texas, Inc. | ||||||||
3.85%, 10/01/2025(2) | 1,500,000 | 1,662,875 | ||||||
AEP Transmission Co. LLC | ||||||||
3.10%, 12/01/2026 | 1,575,000 | 1,762,393 | ||||||
AES Corp. | ||||||||
3.95%, 07/15/2030(2) | 2,040,000 | 2,157,300 | ||||||
5.13%, 09/01/2027 | 60,000 | 62,260 | ||||||
5.50%, 04/15/2025 | 345,000 | 354,073 | ||||||
6.00%, 05/15/2026 | 120,000 | 125,400 | ||||||
AES Gener SA | ||||||||
7.13% (5 Year Swap Rate USD + 4.64%), 03/26/2079(1) | 4,500,000 | 4,644,204 | ||||||
American Electric Power Co., Inc. | ||||||||
2.15%, 11/13/2020 | 330,000 | 332,071 | ||||||
2.95%, 12/15/2022 | 400,000 | 420,342 | ||||||
American Transmission Systems, Inc. | ||||||||
5.25%, 01/15/2022(2) | 100,000 | 105,919 | ||||||
American Water Capital Corp. | ||||||||
4.15%, 06/01/2049 | 1,425,000 | 1,765,193 | ||||||
APT Pipelines Ltd. | ||||||||
3.88%, 10/11/2022(2) | 1,360,000 | 1,424,303 | ||||||
4.25%, 07/15/2027(2) | 11,420,000 | 12,746,511 | ||||||
Ausgrid Finance Pty Ltd. | ||||||||
3.85%, 05/01/2023(2) | 9,410,000 | 9,894,154 | ||||||
Baltimore Gas & Electric Co. | ||||||||
2.80%, 08/15/2022 | 570,000 | 593,065 | ||||||
Black Hills Corp. | ||||||||
4.35%, 05/01/2033 | 6,250,000 | 7,109,919 | ||||||
British Transco International Finance BV | ||||||||
0.00%, 11/04/2021 | 400,000 | 393,963 | ||||||
Cleco Power LLC | ||||||||
6.00%, 12/01/2040 | 1,000,000 | 1,260,088 | ||||||
Dominion Energy, Inc. | ||||||||
2.45%, 01/15/2023(2) | 13,500,000 | 13,931,066 | ||||||
DPL, Inc. | ||||||||
4.13%, 07/01/2025(2) | 1,525,000 | 1,525,427 | ||||||
Duke Energy Carolinas LLC | ||||||||
3.70%, 12/01/2047 | 2,500,000 | 2,949,569 | ||||||
3.88%, 03/15/2046 | 2,750,000 | 3,282,008 | ||||||
4.25%, 12/15/2041 | 1,650,000 | 2,032,511 | ||||||
Duke Energy Progress LLC | ||||||||
3.25%, 08/15/2025 | 2,613,000 | 2,911,137 | ||||||
3.70%, 09/01/2028 | 4,050,000 | 4,706,610 | ||||||
4.10%, 03/15/2043 | 900,000 | 1,083,639 | ||||||
4.20%, 08/15/2045 | 1,000,000 | 1,236,965 | ||||||
Duquesne Light Holdings, Inc. | ||||||||
5.90%, 12/01/2021(2) | 1,500,000 | 1,582,361 | ||||||
Edison International | ||||||||
4.95%, 04/15/2025 | 315,000 | 346,150 | ||||||
Emera US Finance LP | ||||||||
2.70%, 06/15/2021 | 338,000 | 344,179 | ||||||
Enel Americas SA | ||||||||
4.00%, 10/25/2026 | 1,832,000 | 1,941,938 | ||||||
Enel Finance International NV | ||||||||
2.75%, 04/06/2023(2) | 8,060,000 | 8,364,007 | ||||||
3.63%, 05/25/2027(2) | 3,175,000 | 3,465,864 | ||||||
Evergy Metro, Inc. | ||||||||
3.65%, 08/15/2025 | 3,550,000 | 4,000,540 | ||||||
FirstEnergy Corp. | ||||||||
1.60%, 01/15/2026 | 1,385,000 | 1,397,215 | ||||||
2.25%, 09/01/2030 | 1,090,000 | 1,092,192 | ||||||
2.85%, 07/15/2022 | 2,075,000 | 2,151,969 | ||||||
3.40%, 03/01/2050 | 10,950,000 | 11,674,589 | ||||||
3.90%, 07/15/2027 | 5,035,000 | 5,694,971 | ||||||
FirstEnergy Transmission LLC | ||||||||
4.35%, 01/15/2025(2) | 7,535,000 | 8,521,838 | ||||||
IPALCO Enterprises, Inc. | ||||||||
4.25%, 05/01/2030(2) | 1,245,000 | 1,348,590 | ||||||
ITC Holdings Corp. | ||||||||
2.70%, 11/15/2022 | 610,000 | 635,949 | ||||||
3.25%, 06/30/2026 | 2,000,000 | 2,190,661 | ||||||
4.05%, 07/01/2023 | 3,812,000 | 4,079,145 | ||||||
Jersey Central Power & Light Co. | ||||||||
4.30%, 01/15/2026(2) | 1,000,000 | 1,156,293 | ||||||
4.70%, 04/01/2024(2) | 150,000 | 168,202 | ||||||
KeySpan Gas East Corp. | ||||||||
2.74%, 08/15/2026(2) | 4,500,000 | 4,810,267 | ||||||
LG&E & KU Energy LLC | ||||||||
4.38%, 10/01/2021 | 700,000 | 723,716 | ||||||
Metropolitan Edison Co. | ||||||||
4.00%, 04/15/2025(2) | 4,000,000 | 4,473,861 | ||||||
4.30%, 01/15/2029(2) | 5,000,000 | 5,843,761 | ||||||
Mong Duong Finance Holdings BV | ||||||||
5.13%, 05/07/2029 | 1,150,000 | 1,153,658 | ||||||
NextEra Energy Capital Holdings, Inc. | ||||||||
0.92% (3 Month LIBOR USD + 0.55%), 08/28/2021(1) | 4,000,000 | 4,001,399 | ||||||
3.34%, 09/01/2020 | 3,400,000 | 3,416,961 | ||||||
NiSource, Inc. | ||||||||
2.65%, 11/17/2022 | 750,000 | 783,210 | ||||||
3.60%, 05/01/2030 | 3,820,000 | 4,364,682 | ||||||
Northern States Power Co. | ||||||||
3.60%, 09/15/2047 | 1,800,000 | 2,106,574 | ||||||
4.00%, 08/15/2045 | 1,000,000 | 1,213,972 | ||||||
NRG Energy, Inc. | ||||||||
3.75%, 06/15/2024(2) | 700,000 | 739,001 | ||||||
4.45%, 06/15/2029(2) | 7,405,000 | 7,794,133 | ||||||
5.25%, 06/15/2029(2) | 850,000 | 894,446 | ||||||
5.75%, 01/15/2028 | 1,990,000 | 2,099,450 | ||||||
Pacific Gas & Electric Co. | ||||||||
1.75%, 06/16/2022 | 10,000,000 | 10,015,600 | ||||||
2.10%, 08/01/2027 | 5,180,000 | 5,115,613 | ||||||
2.45%, 08/15/2022(5) | 1,944,000 | 2,118,960 | ||||||
2.50%, 02/01/2031 | 5,950,000 | 5,816,720 | ||||||
2.95%, 03/01/2026(5) | 3,053,000 | 3,289,608 | ||||||
3.25%, 09/15/2021(5) | 959,000 | 1,045,310 | ||||||
3.25%, 06/15/2023(5) | 2,644,000 | 2,868,740 | ||||||
3.30%, 03/15/2027(5) | 1,252,000 | 1,358,420 | ||||||
3.30%, 12/01/2027(5) | 3,700,000 | 4,000,403 | ||||||
3.30%, 08/01/2040 | 4,970,000 | 4,836,059 | ||||||
3.40%, 08/15/2024(5) | 2,476,000 | 2,723,600 | ||||||
3.50%, 10/01/2020(5) | 5,979,000 | 6,517,110 | ||||||
3.50%, 06/15/2025(5) | 3,850,000 | 4,244,625 | ||||||
3.50%, 08/01/2050 | 10,580,000 | 10,213,720 | ||||||
3.75%, 02/15/2024(5) | 2,384,000 | 2,640,781 | ||||||
3.75%, 08/15/2042(5) | 166,000 | 171,810 | ||||||
3.85%, 11/15/2023(5) | 318,000 | 352,980 | ||||||
3.95%, 12/01/2047(5) | 3,365,000 | 3,519,790 | ||||||
4.00%, 12/01/2046(5) | 16,000 | 16,840 | ||||||
4.25%, 05/15/2021(5) | 6,273,000 | 6,837,570 | ||||||
4.25%, 08/01/2023(5) | 14,900,000 | 16,985,895 | ||||||
4.30%, 03/15/2045(5) | 475,000 | 523,688 | ||||||
4.45%, 04/15/2042(5) | 941,000 | 1,046,863 | ||||||
4.50%, 12/15/2041(5) | 203,000 | 223,808 | ||||||
4.60%, 06/15/2043(5) | 488,000 | 550,220 | ||||||
4.65%, 08/01/2028(5) | 100,000 | 119,151 | ||||||
4.75%, 02/15/2044(5) | 423,000 | 498,083 | ||||||
5.13%, 11/15/2043(5) | 1,132,000 | 1,332,930 | ||||||
5.40%, 01/15/2040(5) | 4,186,000 | 4,991,805 | ||||||
5.80%, 03/01/2037(5) | 795,000 | 948,037 | ||||||
6.05%, 03/01/2034(5) | 1,003,000 | 1,196,077 | ||||||
6.25%, 03/01/2039(5) | 615,000 | 733,387 | ||||||
6.35%, 02/15/2038(5) | 444,000 | 530,580 | ||||||
Perusahaan Perseroan Persero PT Perusahaan Listrik Negara | ||||||||
5.45%, 05/21/2028(2) | 11,800,000 | 13,584,750 | ||||||
PPL WEM Ltd. / Western Power Distribution Plc | ||||||||
5.38%, 05/01/2021(2) | 2,615,000 | 2,678,530 | ||||||
Public Service Co. of New Mexico | ||||||||
3.85%, 08/01/2025 | 7,000,000 | 7,699,522 | ||||||
San Diego Gas & Electric Co. | ||||||||
3.75%, 06/01/2047 | 24,000 | 27,679 | ||||||
Sempra Energy | ||||||||
3.25%, 06/15/2027 | 8,634,000 | 9,498,776 | ||||||
3.40%, 02/01/2028 | 3,037,000 | 3,336,713 | ||||||
4.05%, 12/01/2023 | 1,250,000 | 1,362,168 | ||||||
Southern California Edison Co. | ||||||||
3.65%, 03/01/2028 | 40,000 | 44,889 | ||||||
5.75%, 04/01/2035 | 70,000 | 94,805 | ||||||
6.00%, 01/15/2034 | 20,000 | 26,846 | ||||||
6.65%, 04/01/2029 | 192,000 | 238,072 | ||||||
Southern California Gas Co. | ||||||||
5.13%, 11/15/2040 | 12,000 | 15,581 | ||||||
Southern Co. | ||||||||
3.25%, 07/01/2026 | 8,000,000 | 8,865,496 | ||||||
Southern Co. Gas Capital Corp. | ||||||||
3.50%, 09/15/2021 | 3,250,000 | 3,339,450 | ||||||
4.40%, 05/30/2047 | 1,915,000 | 2,273,310 | ||||||
5.88%, 03/15/2041 | 1,920,000 | 2,548,737 | ||||||
Southern Power Co. | ||||||||
0.86% (3 Month LIBOR USD + 0.55%), 12/20/2020(1)(2) | 600,000 | 600,030 | ||||||
Southwestern Electric Power Co. | ||||||||
4.10%, 09/15/2028 | 10,000,000 | 11,361,710 | ||||||
Spire, Inc. | ||||||||
3.54%, 02/27/2024 | 5,000,000 | 5,258,393 | ||||||
State Grid Overseas Investment 2016 Ltd. | ||||||||
2.75%, 05/04/2022(2) | 404,000 | 413,845 | ||||||
3.75%, 05/02/2023(2) | 4,235,000 | 4,503,931 | ||||||
Talen Energy Supply LLC | ||||||||
6.63%, 01/15/2028(2) | 250,000 | 244,688 |
Tucson Electric Power Co. | ||||||||
3.05%, 03/15/2025 | 3,000,000 | 3,226,777 | ||||||
5.15%, 11/15/2021 | 678,000 | 710,790 | ||||||
Vistra Operations Co. LLC | ||||||||
3.55%, 07/15/2024(2) | 8,385,000 | 8,653,949 | ||||||
3.70%, 01/30/2027(2) | 26,455,000 | 27,239,681 | ||||||
4.30%, 07/15/2029(2) | 3,960,000 | 4,162,478 | ||||||
|
| |||||||
Total Utilities |
| 414,445,088 | ||||||
|
| |||||||
Total Corporate Bonds (Cost: $6,851,797,100) | 7,178,878,009 | |||||||
|
| |||||||
Convertible Securities – 0.13% | ||||||||
Communications – 0.06% | ||||||||
DISH Network Corp. | ||||||||
2.38%, 03/15/2024 | 7,520,000 | 6,729,246 | ||||||
3.38%, 08/15/2026 | 4,385,000 | 4,028,125 | ||||||
|
| |||||||
Total Communications |
| 10,757,371 | ||||||
|
| |||||||
Consumer, Cyclical – 0.01% | ||||||||
Caesars Entertainment Corp. | ||||||||
5.00%, 10/01/2024 | 1,634,430 | 2,747,001 | ||||||
|
| |||||||
Total Consumer, Cyclical |
| 2,747,001 | ||||||
|
| |||||||
Consumer, Non-cyclical – 0.04% | ||||||||
BioMarin Pharmaceutical, Inc. | ||||||||
0.60%, 08/01/2024 | 5,125,000 | 6,263,052 | ||||||
1.25%, 05/15/2027(2) | 2,160,000 | 2,513,748 | ||||||
|
| |||||||
Total Consumer, Non-cyclical |
| 8,776,800 | ||||||
|
| |||||||
Energy – 0.01% | ||||||||
Cheniere Energy, Inc. | ||||||||
4.88%, 05/28/2021(2)(7) | 1,905,000 | 1,923,478 | ||||||
Chesapeake Energy Corp. | ||||||||
5.50%, 09/15/2026(5) | 3,940,000 | 137,900 | ||||||
|
| |||||||
Total Energy |
| 2,061,378 | ||||||
|
| |||||||
Industrials – 0.01% | ||||||||
Greenbrier Cos, Inc. | ||||||||
2.88%, 02/01/2024 | 1,993,000 | 1,640,183 | ||||||
|
| |||||||
Total Industrials |
| 1,640,183 | ||||||
|
| |||||||
Total Convertible Securities (Cost: $28,173,734) | 25,982,733 | |||||||
|
| |||||||
Government Related – 12.63% | ||||||||
Other Government Related – 1.75% | ||||||||
Abu Dhabi Government International Bond | ||||||||
2.50%, 09/30/2029 | 1,891,000 | 1,980,823 | ||||||
3.13%, 10/11/2027(2) | 1,200,000 | 1,311,000 | ||||||
3.88%, 04/16/2050 | 200,000 | 236,150 | ||||||
3.88%, 04/16/2050(2) | 5,400,000 | 6,376,050 | ||||||
Africa Finance Corp. | ||||||||
3.88%, 04/13/2024(2) | 1,085,000 | 1,128,400 | ||||||
Argentina Bocon | ||||||||
30.02% (Argentina Deposit Rates Badlar Private Banks ARS 30 to 35 Days + 0.00%), 10/04/2022(1) | ARS | 3,900,000 | 77,493 | |||||
Argentina Treasury Bond BONCER | ||||||||
1.00%, 08/05/2021 | 8,690,000 | 135,547 | ||||||
1.50%, 03/25/2024 | 9,677,000 | 115,782 | ||||||
Argentine Bonos del Tesoro | ||||||||
15.50%, 10/17/2026 | 110,804,000 | 655,002 | ||||||
Argentine Republic Government International Bond | ||||||||
3.38%, 01/15/2023 | EUR | 1,100,000 | 468,041 | |||||
3.38%, 12/31/2038 | 179,000 | 74,876 | ||||||
3.75%, 12/31/2038 | $ | 8,696,000 | 3,413,180 | |||||
3.88%, 01/15/2022 | EUR | 16,200,000 | 6,965,408 | |||||
4.63%, 01/11/2023 | $ | 8,716,000 | 3,647,646 | |||||
5.00%, 01/15/2027 | EUR | 2,000,000 | 824,424 | |||||
5.25%, 01/15/2028 | 500,000 | 205,320 | ||||||
5.63%, 01/26/2022 | $ | 445,000 | 184,452 | |||||
6.25%, 11/09/2047 | EUR | 100,000 | 41,064 | |||||
6.88%, 01/26/2027 | $ | 300,000 | 120,600 | |||||
6.88%, 01/11/2048 | 1,200,000 | 467,400 | ||||||
7.13%, 07/06/2036 | 200,000 | 77,702 | ||||||
7.50%, 04/22/2026 | 150,000 | 60,750 | ||||||
7.82%, 12/31/2033 | EUR | 220,177 | 103,573 | |||||
Autonomous Community of Catalonia | ||||||||
4.90%, 09/15/2021 | 50,000 | 59,215 | ||||||
Bonos del Tesoro Nacional en Pesos Badlar | ||||||||
31.71% (Argentina Deposit Rates Badlar Private Banks ARS 30 to 35 Days + 2.00%), 04/03/2022(1) | ARS | 211,153,000 | 3,056,818 | |||||
Chile Government International Bond | ||||||||
3.24%, 02/06/2028 | $ | 11,500,000 | 12,615,500 | |||||
City of New York NY | ||||||||
3.55%, 12/01/2028 | 3,645,000 | 4,008,990 | ||||||
Ciudad Autonoma de Buenos Aires/Government Bonds | ||||||||
29.85% (Argentina Deposit Rates Badlar Private Banks ARS 30 to 35 Days + 5.00%), 01/23/2022(1) | ARS | 566,081,000 | | 8,436,067 | ||||
32.30% (Argentina Deposit Rates Badlar Private Banks ARS 30 to 35 Days + 3.75%), 02/22/2028(1) | 401,380,000 | 4,813,762 | ||||||
32.96% (Argentina Deposit Rates Badlar Private Banks ARS 30 to 35 Days + 3.25%), 03/29/2024(1) | 314,346,000 | 3,926,113 | ||||||
Colombia Government International Bond | ||||||||
3.00%, 01/30/2030 | $ | 1,400,000 | 1,382,500 | |||||
3.88%, 04/25/2027 | 364,000 | 384,024 | ||||||
4.50%, 01/28/2026 | 525,000 | 568,318 | ||||||
5.00%, 06/15/2045 | 874,000 | 981,065 | ||||||
5.20%, 05/15/2049 | 700,000 | 820,351 | ||||||
Commonwealth of Massachusetts | ||||||||
3.00%, 03/01/2049 | 10,015,000 | 10,601,879 | ||||||
Commonwealth of Puerto Rico | ||||||||
4.13%, 07/01/2022(5) | 100,000 | 63,375 | ||||||
5.00%, 07/01/2021(5) | 240,000 | 156,000 | ||||||
5.00%, 07/01/2028(5) | 20,000 | 14,025 | ||||||
5.00%, 07/01/2041(5) | 395,000 | 247,862 | ||||||
5.13%, 07/01/2028(5) | 30,000 | 20,813 | ||||||
5.13%, 07/01/2031(5) | 2,590,000 | 1,806,525 | ||||||
5.13%, 07/01/2037(5) | 190,000 | 121,837 | ||||||
5.25%, 07/01/2026(5) | 200,000 | 140,500 | ||||||
5.25%, 07/01/2037(5) | 100,000 | 70,250 | ||||||
5.38%, 07/01/2030(5) | 165,000 | 104,775 | ||||||
5.50%, 07/01/2032(5) | 1,610,000 | 1,120,963 | ||||||
5.50%, 07/01/2039(5) | 520,000 | 339,950 | ||||||
5.70%, 07/01/2023(5) | 170,000 | 111,775 | ||||||
5.75%, 07/01/2038(5) | 80,000 | 55,000 | ||||||
5.75%, 07/01/2041(5) | 100,000 | 63,500 | ||||||
6.00%, 07/01/2038(5) | 610,000 | 432,338 | ||||||
6.00%, 07/01/2039(5) | 55,000 | 38,088 | ||||||
6.50%, 07/01/2040(5) | 30,000 | 21,038 | ||||||
8.00%, 07/01/2035(5) | 800,000 | 480,000 | ||||||
Croatia Government International Bond | ||||||||
6.00%, 01/26/2024 | 1,253,000 | 1,433,119 | ||||||
Dominican Republic International Bond | ||||||||
4.50%, 01/30/2030(2) | 300,000 | 271,350 | ||||||
5.50%, 01/27/2025 | 1,250,000 | 1,264,375 | ||||||
6.00%, 07/19/2028 | 1,665,000 | 1,674,990 | ||||||
Egypt Government International Bond | ||||||||
5.58%, 02/21/2023(2) | 400,000 | 408,500 | ||||||
7.60%, 03/01/2029(2) | 250,000 | 254,375 | ||||||
Export Credit Bank of Turkey | ||||||||
8.25%, 01/24/2024(2) | 1,000,000 | 1,041,546 | ||||||
Export-Import Bank of India | ||||||||
1.33% (3 Month LIBOR USD + 1.02%), 03/28/2022(1)(16) | 9,600,000 | 9,598,368 | ||||||
Guatemala Government Bond | ||||||||
5.38%, 04/24/2032(2) | 600,000 | 662,700 | ||||||
6.13%, 06/01/2050(2) | 800,000 | 925,200 | ||||||
Hazine Mustesarligi Varlik Kiralama AS | ||||||||
5.80%, 02/21/2022(2) | 7,960,000 | 8,051,540 | ||||||
Health & Educational Facilities Authority of the State of Missouri | ||||||||
3.65%, 08/15/2057 | 2,735,000 | 3,380,788 | ||||||
Hungary Government International Bond | ||||||||
5.38%, 03/25/2024 | 1,596,000 | 1,810,502 | ||||||
Indonesia Government International Bond | ||||||||
2.85%, 02/14/2030 | 1,200,000 | 1,224,986 | ||||||
4.20%, 10/15/2050 | 200,000 | 223,243 | ||||||
Los Angeles Department of Water | ||||||||
6.01%, 07/01/2039 | 675,000 | 926,883 | ||||||
Metropolitan Transportation Authority | ||||||||
5.18%, 11/15/2049 | 2,720,000 | 3,172,934 | ||||||
Mexico Government International Bond | ||||||||
3.25%, 04/16/2030 | 3,731,000 | 3,697,458 | ||||||
3.75%, 01/11/2028 | 726,000 | 755,505 | ||||||
3.90%, 04/27/2025 | 900,000 | 963,900 | ||||||
4.50%, 04/22/2029 | 773,000 | 840,638 | ||||||
4.60%, 01/23/2046 | 713,000 | 735,802 | ||||||
4.75%, 04/27/2032 | 2,400,000 | 2,646,000 | ||||||
4.75%, 03/08/2044 | 1,000,000 | 1,050,000 | ||||||
5.00%, 04/27/2051 | 2,400,000 | 2,586,000 | ||||||
New York City Transitional Finance Authority Future Tax Secured Revenue | ||||||||
2.80%, 02/01/2026 | 1,850,000 | 2,007,638 | ||||||
3.95%, 08/01/2032 | 1,900,000 | 2,174,075 | ||||||
5.27%, 05/01/2027 | 3,500,000 | 4,330,935 | ||||||
New York City Water & Sewer System | ||||||||
5.75%, 06/15/2041 | 240,000 | 368,153 | ||||||
New York State Dormitory Authority | ||||||||
4.00%, 07/01/2050 | 1,855,000 | 2,075,040 | ||||||
5.05%, 09/15/2027 | 1,800,000 | 2,181,510 | ||||||
Panama Government International Bond | ||||||||
3.16%, 01/23/2030 | 5,109,000 | 5,499,838 | ||||||
3.88%, 03/17/2028 | 600,000 | 673,500 | ||||||
Paraguay Government International Bond | ||||||||
4.70%, 03/27/2027 | 1,380,000 | 1,507,664 | ||||||
4.95%, 04/28/2031(2) | 932,000 | 1,039,180 | ||||||
Peru Government Bond | ||||||||
5.94%, 02/12/2029(2) | PEN | 21,282,000 | 6,936,234 | |||||
6.15%, 08/12/2032(2) | 17,826,000 | 5,751,294 | ||||||
6.95%, 08/12/2031 | 5,192,000 | 1,784,454 | ||||||
Perusahaan Penerbit SBSN Indonesia III | ||||||||
2.30%, 06/23/2025(2) | $ | 4,200,000 | 4,205,250 | |||||
2.80%, 06/23/2030(2) | 4,800,000 | 4,806,000 | ||||||
3.80%, 06/23/2050(2) | 3,100,000 | 3,186,800 | ||||||
Peruvian Government International Bond | ||||||||
2.39%, 01/23/2026 | 758,000 | 787,183 | ||||||
2.78%, 01/23/2031 | 1,503,000 | 1,602,949 | ||||||
2.84%, 06/20/2030 | 1,270,000 | 1,362,075 | ||||||
4.13%, 08/25/2027 | 2,141,000 | 2,460,030 | ||||||
5.94%, 02/12/2029 | PEN | 11,140,000 | 3,623,272 |
5.94%, 02/12/2029(2) | 11,637,000 | 3,792,734 | ||||||
6.15%, 08/12/2032(2) | 2,151,000 | 703,811 | ||||||
6.35%, 08/12/2028(2) | 12,544,000 | 4,194,256 | ||||||
6.90%, 08/12/2037(2) | 879,000 | 298,131 | ||||||
6.95%, 08/12/2031 | 1,183,000 | 406,589 | ||||||
6.95%, 08/12/2031(2) | 11,230,000 | 3,859,673 | ||||||
8.20%, 08/12/2026(2) | 15,908,000 | 5,807,224 | ||||||
Provincia de Buenos Aires/Government Bonds | ||||||||
28.19% (Argentina Deposit Rates Badlar Private Banks ARS 30 to 35 Days + 3.75%), 04/12/2025(1)(2) | ARS | 1,284,476,000 | 15,355,535 | |||||
32.81% (Argentina Deposit Rates Badlar Private Banks ARS 30 to 35 Days + 3.83%), 05/31/2022(1) | 51,870,000 | 644,164 | ||||||
Puerto Rico Electric Power Authority | ||||||||
6.05%, 07/01/2032(5) | $ | 100,000 | 69,375 | |||||
Qatar Government International Bond | ||||||||
3.88%, 04/23/2023 | 700,000 | 750,652 | ||||||
4.50%, 04/23/2028 | 2,059,000 | 2,426,408 | ||||||
4.63%, 06/02/2046 | 1,257,000 | 1,616,816 | ||||||
5.10%, 04/23/2048 | 600,000 | 815,449 | ||||||
Regents of the University of California Medical Center Pooled Revenue | ||||||||
3.01%, 05/15/2050 | 1,395,000 | 1,412,507 | ||||||
3.26%, 05/15/2060 | 15,790,000 | 16,414,495 | ||||||
Republic of South Africa Government International Bond | ||||||||
4.30%, 10/12/2028 | 3,234,000 | 2,997,465 | ||||||
4.85%, 09/30/2029 | 7,600,000 | 7,185,344 | ||||||
4.88%, 04/14/2026 | 700,000 | 699,006 | ||||||
5.75%, 09/30/2049 | 5,200,000 | 4,511,614 | ||||||
Russian Foreign Bond - Eurobond | ||||||||
4.25%, 06/23/2027 | 400,000 | 447,000 | ||||||
4.38%, 03/21/2029 | 1,200,000 | 1,363,500 | ||||||
4.75%, 05/27/2026 | 600,000 | 683,222 | ||||||
Saudi Government International Bond | ||||||||
2.75%, 02/03/2032(2) | 300,000 | 307,818 | ||||||
3.63%, 03/04/2028 | 2,500,000 | 2,744,750 | ||||||
3.75%, 01/21/2055(2) | 200,000 | 203,842 | ||||||
4.00%, 04/17/2025 | 16,200,000 | 17,960,130 | ||||||
4.50%, 10/26/2046 | 1,450,000 | 1,665,369 | ||||||
4.63%, 10/04/2047 | 800,000 | 932,768 | ||||||
5.00%, 04/17/2049 | 1,400,000 | 1,730,288 | ||||||
Serbia International Bond | ||||||||
3.13%, 05/15/2027(2) | EUR | 1,998,000 | 2,348,348 | |||||
State of California | ||||||||
7.95%, 03/01/2036 | $ | 428 | 413 | |||||
State of Illinois | ||||||||
5.10%, 06/01/2033 | 225,000 | 228,251 | ||||||
6.73%, 04/01/2035 | 70,000 | 76,978 | ||||||
7.35%, 07/01/2035 | 55,000 | 62,395 | ||||||
State of Israel | ||||||||
3.80%, 05/13/2060 | 3,300,000 | 3,823,875 | ||||||
Texas Public Finance Authority | ||||||||
8.25%, 07/01/2024 | 3,960,000 | 3,975,206 | ||||||
Turkey Government International Bond | ||||||||
4.63%, 03/31/2025 | EUR | 6,300,000 | 7,051,012 | |||||
5.63%, 03/30/2021 | $ | 800,000 | 813,240 | |||||
5.75%, 03/22/2024 | 600,000 | 595,135 | ||||||
5.75%, 05/11/2047 | 2,800,000 | 2,279,609 | ||||||
6.35%, 08/10/2024 | 1,782,000 | 1,799,820 | ||||||
7.25%, 12/23/2023 | 4,000,000 | 4,157,616 | ||||||
7.63%, 04/26/2029 | 11,900,000 | 12,514,730 | ||||||
Uruguay Government International Bond | ||||||||
4.38%, 10/27/2027 | 2,000,000 | 2,285,020 | ||||||
4.38%, 01/23/2031 | 1,100,000 | 1,285,636 | ||||||
Venezuela Government International Bond | ||||||||
6.00%, 12/09/2020(5) | 30,000 | 1,725 | ||||||
7.00%, 03/31/2038(5) | 187,000 | 10,753 | ||||||
7.65%, 04/21/2025(5) | 534,000 | 30,705 | ||||||
7.75%, 04/13/2022(5) | 100,000 | 6,000 | ||||||
8.25%, 10/13/2024(5) | 7,294,000 | 419,405 | ||||||
9.00%, 05/07/2023(5) | 110,000 | 6,325 | ||||||
9.00%, 05/07/2023(5) | 7,405,000 | 425,788 | ||||||
9.25%, 09/15/2027(5) | 1,049,000 | 60,318 | ||||||
9.25%, 05/07/2028(5) | 420,000 | 24,150 | ||||||
11.75%, 10/21/2026(5) | 120,000 | 6,900 | ||||||
11.95%, 08/05/2031(5) | 3,200,000 | 184,000 | ||||||
|
| |||||||
Total Other Government Related |
| 340,170,963 | ||||||
|
| |||||||
U.S. Treasury Obligations – 10.88% | ||||||||
U.S. Treasury Inflation Indexed Bonds | ||||||||
0.25%, 07/15/2029(8)(9) | 115,248,906 | 126,155,403 | ||||||
0.25%, 02/15/2050(8) | 78,878,486 | 88,559,588 | ||||||
U.S. Treasury Inflation Indexed Note | ||||||||
0.13%, 04/15/2025(8) | 52,339,798 | 54,881,998 | ||||||
U.S. Treasury Note/Bond | ||||||||
0.13%, 04/30/2022 | 140,350,000 | 140,251,317 | ||||||
0.13%, 05/31/2022 | 57,150,000 | 57,107,584 | ||||||
0.25%, 05/31/2025 | 71,700,000 | 71,607,574 | ||||||
0.25%, 06/30/2025 | 75,470,000 | 75,322,598 | ||||||
0.38%, 03/31/2022 | 83,370,000 | 83,669,611 | ||||||
0.63%, 05/15/2030 | 61,240,000 | 61,053,409 | ||||||
1.25%, 05/15/2050 | 97,004,000 | 93,127,629 | ||||||
1.50%, 11/30/2021 | 43,085,000 | 43,894,527 | ||||||
1.50%, 09/15/2022(9) | 34,990,000 | 36,024,665 | ||||||
1.50%, 01/15/2023 | 229,835,000 | 237,538,062 | ||||||
1.63%, 11/15/2022 | 205,170,000 | 212,230,733 | ||||||
1.63%, 12/15/2022 | 44,950,000 | 46,554,855 | ||||||
2.00%, 02/15/2050 | 64,231,000 | 73,519,405 | ||||||
2.25%, 08/15/2049(10) | 170,215,000 | 204,603,749 | ||||||
2.38%, 11/15/2049 | 53,640,000 | 66,218,161 | ||||||
2.50%, 02/15/2045 | 62,700,000 | 77,314,488 | ||||||
2.75%, 11/15/2047 | 250,000 | 326,924 | ||||||
2.88%, 08/15/2028(9) | 7,800,000 | 9,236,297 | ||||||
2.88%, 05/15/2049 | 20,980,000 | 28,367,255 | ||||||
3.00%, 05/15/2045 | 30,000,000 | 40,266,797 | ||||||
3.00%, 02/15/2048(9) | 15,800,000 | 21,620,695 | ||||||
3.00%, 08/15/2048(9) | 10,405,000 | 14,301,185 | ||||||
3.00%, 02/15/2049 | 82,878,400 | 114,356,005 | ||||||
3.13%, 11/15/2028(9) | 7,500,000 | 9,066,797 | ||||||
3.13%, 05/15/2048(9) | 12,780,000 | 17,901,485 | ||||||
3.38%, 05/15/2044(9) | 3,210,000 | 4,538,890 | ||||||
3.63%, 02/15/2044(9) | 2,790,000 | 4,082,773 | ||||||
|
| |||||||
Total U.S. Treasury Obligations |
| 2,113,700,459 | ||||||
|
| |||||||
Total Government Related (Cost: $2,305,270,115) | 2,453,871,422 | |||||||
|
| |||||||
Mortgage-Backed Obligations – 30.51% | ||||||||
280 Park Avenue 2017-280P Mortgage Trust | ||||||||
1.06% (1 Month LIBOR USD + 0.88%, 0.88% Floor), 09/15/2034(1)(2) | 1,315,633 | 1,305,161 | ||||||
Alternative Loan Trust 2003-22CB | ||||||||
5.75%, 12/25/2033 | 580,982 | 604,424 | ||||||
6.00%, 12/25/2033 | 174,708 | 179,898 | ||||||
Alternative Loan Trust 2004-16CB | ||||||||
5.50%, 07/25/2034 | 368,794 | 381,117 | ||||||
5.50%, 08/25/2034 | 404,770 | 418,748 | ||||||
Alternative Loan Trust 2005-56 | ||||||||
0.91% (1 Month LIBOR USD + 0.73%, 0.73% Floor), 11/25/2035(1) | 4,864,299 | 4,664,544 | ||||||
Alternative Loan Trust 2005-74T1 | ||||||||
6.00%, 01/25/2036 | 11,599,493 | 9,160,052 | ||||||
Alternative Loan Trust 2006-HY12 | ||||||||
3.57%, 08/25/2036(4) | 266,345 | 267,656 | ||||||
Alternative Loan Trust 2006-OA3 | ||||||||
0.38% (1 Month LIBOR USD + 0.20%, 0.20% Floor), 05/25/2036(1) | 6,039,546 | 4,934,723 | ||||||
Alternative Loan Trust 2006-OA7 | ||||||||
2.44% (12 Month U.S. Treasury Average + 0.94%, 0.94% Floor), 06/25/2046(1) | 11,585,460 | 9,754,578 | ||||||
Alternative Loan Trust 2006-OA17 | ||||||||
0.39% (1 Month LIBOR USD + 0.20%, 0.20% Floor), 12/20/2046(1) | 16,053,695 | 12,862,659 | ||||||
Alternative Loan Trust 2006-OA22 | ||||||||
0.39% (1 Month LIBOR USD + 0.21%, 0.21% Floor), 02/25/2047(1) | 14,695,169 | 12,761,657 | ||||||
Alternative Loan Trust 2006-OC5 | ||||||||
0.44% (1 Month LIBOR USD + 0.26%, 0.26% Floor), 06/25/2046(1) | 8,085,080 | 6,775,018 | ||||||
Alternative Loan Trust 2007-HY7C | ||||||||
0.32% (1 Month LIBOR USD + 0.14%, 0.14% Floor), 08/25/2037(1) | 2,971,132 | 2,521,451 | ||||||
Alternative Loan Trust 2007-OA2 | ||||||||
0.31% (1 Month LIBOR USD + 0.13%, 0.13% Floor), 03/25/2047(1) | 12,514,904 | 9,039,553 | ||||||
2.34% (12 Month U.S. Treasury Average + 0.84%, 0.84% Floor), 03/25/2047(1) | 27,290,523 | 21,748,415 | ||||||
Alternative Loan Trust 2007-OA4 | ||||||||
0.35% (1 Month LIBOR USD + 0.17%, 0.17% Floor), 05/25/2047(1) | 2,007,040 | 1,782,197 | ||||||
Angel Oak Mortgage Trust 2019-3 | ||||||||
3.24%, 05/25/2059(2)(4) | 3,817,253 | 3,852,988 | ||||||
Angel Oak Mortgage Trust I LLC 2019-1 | ||||||||
3.92%, 11/25/2048(2)(4) | 5,856,385 | 5,977,563 | ||||||
4.02%, 11/25/2048(2)(4) | 1,316,344 | 1,342,213 | ||||||
Angel Oak Mortgage Trust I LLC 2019-2 | ||||||||
3.63%, 03/25/2049(2)(4) | 2,258,239 | 2,313,875 | ||||||
3.78%, 03/25/2049(2)(4) | 2,456,278 | 2,515,304 | ||||||
4.07%, 03/25/2049(2)(4) | 3,460,000 | 3,456,193 | ||||||
Angel Oak Mortgage Trust LLC | ||||||||
1.69%, 04/25/2065(2)(4) | 5,420,000 | 5,419,972 | ||||||
Ashford Hospitality Trust 2018-ASHF | ||||||||
1.08% (1 Month LIBOR USD + 0.90%, 0.90% Floor), 04/15/2035(1)(2) | 1,061,043 | 983,971 | ||||||
1.43% (1 Month LIBOR USD + 1.25%, 1.25% Floor), 04/15/2035(1)(2) | 1,530,000 | 1,388,688 | ||||||
1.58% (1 Month LIBOR USD + 1.40%, 1.40% Floor), 04/15/2035(1)(2) | 715,000 | 643,369 | ||||||
Atrium Hotel Portfolio Trust 2017-ATRM | ||||||||
1.11% (1 Month LIBOR USD + 0.93%, 0.93% Floor), 12/15/2036(1)(2) | 3,120,000 | 2,898,213 | ||||||
1.68% (1 Month LIBOR USD + 1.50%, 1.50% Floor), 12/15/2036(1)(2) | 1,095,000 | 993,216 | ||||||
Austin Fairmont Hotel Trust 2019-FAIR | ||||||||
1.43% (1 Month LIBOR USD + 1.25%, 1.25% Floor), 09/15/2032(1)(2) | 2,155,000 | 2,020,152 | ||||||
1.63% (1 Month LIBOR USD + 1.45%, 1.45% Floor), 09/15/2032(1)(2) | 5,500,000 | 5,100,769 | ||||||
Aventura Mall Trust | ||||||||
4.25%, 07/05/2040(2)(4) | 5,325,000 | 5,597,407 | ||||||
BAMLL Commercial Mortgage Securities Trust 2018-PARK | ||||||||
4.23%, 08/10/2038(2)(4) | 6,575,000 | 7,612,298 | ||||||
BAMLL Re-REMIC Trust 2016-RRLD11 | ||||||||
6.01%, 06/17/2050(2)(4) | 100,000 | 47,000 | ||||||
6.01%, 06/17/2050(2)(4) | 231,753 | 231,793 | ||||||
Banc of America Commercial Mortgage Trust 2007-5 | ||||||||
6.02%, 02/10/2051(4) | 5,929,669 | 6,324,170 | ||||||
Banc of America Funding 2015-R7 Trust | ||||||||
2.54% (12 Month U.S. Treasury Average + 0.92%), 09/26/2046(1)(2) | 1,106,754 | 1,095,872 | ||||||
Banc of America Funding 2015-R8 Trust | ||||||||
2.53%, 11/26/2046(2)(4) | 1,589,362 | 1,585,297 | ||||||
Banc of America Funding 2015-R9 Trust | ||||||||
0.39% (1 Month LIBOR USD + 0.21%, 0.21% Floor), 02/26/2037(1)(2) | 13,303,021 | 12,873,623 | ||||||
Bank 2017-BNK4 | ||||||||
4.00%, 05/15/2050 | 960,000 | 978,717 | ||||||
Bank 2017-BNK5 | ||||||||
3.90%, 06/15/2060(4) | 1,167,000 | 1,180,578 | ||||||
Bank 2019-BNK18 | ||||||||
3.98%, 05/15/2062 | 4,550,000 | 4,777,184 | ||||||
Bank 2019-BNK21 | ||||||||
3.52%, 10/17/2052 | 1,960,000 | 1,667,662 | ||||||
Bank 2019-BNK22 | ||||||||
2.50%, 11/15/2062(2) | 3,945,000 | 2,831,986 | ||||||
Bank 2020-BNK25 | ||||||||
2.84%, 01/15/2063 | 1,890,000 | 1,976,590 | ||||||
Bank 2020-BNK26 | ||||||||
2.91%, 03/15/2063(4) | 10,120,000 | 9,821,375 | ||||||
BBCCRE Trust 2015-GTP | ||||||||
4.70%, 08/10/2033(2)(4) | 2,715,000 | 2,693,912 | ||||||
BBCMS 2019-BWAY Mortgage Trust | ||||||||
2.34% (1 Month LIBOR USD + 2.16%, 2.16% Floor), 11/25/2034(1)(2) | 2,025,000 | 1,908,702 | ||||||
BBCMS Mortgage Trust 2020-C6 | ||||||||
2.84%, 02/15/2053 | 1,880,000 | 1,876,811 | ||||||
BBCMS Trust 2018-CBM | ||||||||
1.18% (1 Month LIBOR USD + 1.00%, 1.00% Floor), 07/15/2037(1)(2) | 2,945,000 | 2,650,842 | ||||||
BCAP LLC 2014-RR2 | ||||||||
0.41% (1 Month LIBOR USD + 0.24%, 0.24% Floor), 10/26/2036(1)(2) | 16,396,614 | 15,358,485 | ||||||
Bear Stearns ALT-A Trust 2005-1 | ||||||||
1.31% (1 Month LIBOR USD + 1.13%, 0.75% Floor, 11.50% Cap), | 6,167,557 | 5,719,566 | ||||||
Bear Stearns ARM Trust 2003-3 | ||||||||
4.08%, 05/25/2033(4) | 508,140 | 493,809 | ||||||
Bear Stearns Commercial Mortgage Securities Trust 2006-TOP24 | ||||||||
5.66%, 10/12/2041(2)(4) | 8,796,533 | 8,984,778 | ||||||
Benchmark 2018-B1 Mortgage Trust | ||||||||
3.88%, 01/15/2051(4) | 3,095,000 | 3,424,373 | ||||||
Benchmark 2019-B13 Mortgage Trust | ||||||||
2.70%, 08/15/2057 | 7,750,000 | 8,360,772 | ||||||
3.18%, 08/15/2057 | 2,902,000 | 3,137,557 | ||||||
Benchmark 2020-B16 Mortgage Trust | ||||||||
3.66%, 02/15/2053(4) | 3,051,000 | 2,747,883 | ||||||
BFLD 2019-DPLO | ||||||||
1.72% (1 Month LIBOR USD + 1.54%, 1.54% Floor), 10/15/2034(1)(2) | 4,650,000 | 4,254,280 | ||||||
Brass NO 8 Plc | ||||||||
1.09% (3 Month LIBOR USD + 0.70%), 11/16/2066(1)(2) | 2,588,207 | 2,537,161 | ||||||
Brunel Residential Mortgage Securitisation No 1 Plc | ||||||||
0.89% (3 Month LIBOR GBP + 0.22%), 01/13/2039(1) | GBP | 1,003,846 | 1,243,760 | |||||
BX Commercial Mortgage Trust 2019-IMC | ||||||||
1.48% (1 Month LIBOR USD + 1.30%, 1.30% Floor), 04/15/2034(1)(2) | $ | 4,870,000 | 4,479,664 | |||||
2.33% (1 Month LIBOR USD + 2.15%, 2.15% Floor), 04/15/2034(1)(2) | 4,215,000 | 3,687,174 | ||||||
BX Trust 2019-OC11 | ||||||||
3.20%, 12/09/2041(2) | 2,755,000 | 2,882,782 | ||||||
BXP Trust 2017-GM | ||||||||
3.38%, 06/13/2039(2) | 3,800,000 | 4,161,007 | ||||||
CALI Mortgage Trust 2019-101C | ||||||||
3.96%, 03/10/2039(2) | 5,010,000 | 5,718,353 | ||||||
Cantor Commercial Real Estate Lending 2019-CF1 | ||||||||
4.18%, 05/15/2052(4) | 3,445,000 | 3,479,489 | ||||||
4.35%, 05/15/2052(4) | 3,220,000 | 2,709,455 | ||||||
Cantor Commercial Real Estate Lending 2019-CF2 | ||||||||
2.50%, 11/15/2052(2) | 7,935,000 | 5,463,873 | ||||||
3.27%, 11/15/2052(4) | 2,780,000 | 2,621,027 | ||||||
CD 2018-CD7 Mortgage Trust | ||||||||
5.01%, 08/15/2051(4) | 8,190,000 | 7,999,530 | ||||||
Century Plaza Towers 2019-CPT | ||||||||
2.87%, 11/13/2039(2) | 5,185,000 | 5,642,497 | ||||||
CHL Mortgage Pass-Through Trust Resecuritization 2008-3R | ||||||||
6.00%, 08/25/2037(2) | 6,508,342 | 5,206,692 | ||||||
CIM Trust 2018-R4 | ||||||||
4.07%, 12/26/2057(2)(4) | 16,949,563 | 17,415,781 | ||||||
CIM Trust 2018-R5 | ||||||||
3.75%, 07/25/2058(2)(4) | 12,641,918 | 12,808,255 | ||||||
CIM Trust 2018-R6 | ||||||||
1.25% (1 Month LIBOR USD + 1.08%, 1.08% Floor), 09/25/2058(1)(2) | 15,529,292 | 15,160,012 | ||||||
CIM Trust 2019-R3 | ||||||||
2.63%, 06/25/2058(2)(4) | 22,173,916 | 21,778,486 | ||||||
CIM Trust 2019-R4 | ||||||||
3.00%, 10/25/2059(2)(4) | 25,721,525 | 23,937,048 | ||||||
CIM Trust 2020-R1 | ||||||||
2.85%, 10/27/2059(2)(4) | 30,101,561 | 26,185,916 | ||||||
Citigroup Commercial Mortgage Trust 2013-375P | ||||||||
3.63%, 05/10/2035(2)(4) | 3,120,000 | 3,036,075 | ||||||
Citigroup Commercial Mortgage Trust 2015-GC27 | ||||||||
2.69%, 02/10/2048 | 91,997 | 91,968 | ||||||
3.57%, 02/10/2048 | 430,000 | 452,097 | ||||||
Citigroup Commercial Mortgage Trust 2015-GC33 | ||||||||
4.11%, 09/10/2058 | 1,350,000 | 1,449,560 |
Citigroup Commercial Mortgage Trust 2016-P3 | ||||||||
3.06%, 04/15/2049 | 1,225,000 | 1,308,630 | ||||||
Citigroup Commercial Mortgage Trust 2017-P7 | ||||||||
3.92%, 04/14/2050 | 2,140,000 | 2,299,375 | ||||||
Citigroup Commercial Mortgage Trust 2018-B2 | ||||||||
4.83%, 03/10/2051(4) | 1,195,000 | 1,054,530 | ||||||
Citigroup Commercial Mortgage Trust 2020-555 | ||||||||
2.83%, 12/10/2041(2) | 2,150,000 | 2,146,111 | ||||||
3.03%, 12/10/2041(2) | 1,530,000 | 1,491,089 | ||||||
Citigroup Mortgage Loan Trust 2018-A | ||||||||
4.00%, 01/25/2068(2)(4) | 1,466,487 | 1,477,019 | ||||||
Citigroup Mortgage Loan Trust 2018-C | ||||||||
4.13%, 03/25/2059(2)(3) | 4,370,662 | 4,382,210 | ||||||
Citigroup Mortgage Loan Trust 2019-B | ||||||||
3.26%, 04/25/2066(2)(4) | 3,242,231 | 3,232,853 | ||||||
Citigroup Mortgage Loan Trust 2019-RP1 | ||||||||
3.50%, 01/25/2066(2)(4) | 3,330,288 | 3,524,015 | ||||||
Clavis Securities Plc | ||||||||
0.36% (3 Month LIBOR GBP + 0.17%), 12/15/2032(1) | GBP | 1,019,057 | 1,214,517 | |||||
COLT 2018-2 Mortgage Loan Trust | ||||||||
3.47%, 07/27/2048(2)(4) | $ | 1,286,224 | 1,297,978 | |||||
4.19%, 07/27/2048(2)(4) | 1,095,000 | 1,087,293 | ||||||
COLT 2018-3 Mortgage Loan Trust | ||||||||
3.87%, 10/26/2048(2)(4) | 1,131,506 | 1,153,752 | ||||||
COLT 2018-4 Mortgage Loan Trust | ||||||||
4.01%, 12/28/2048(2)(4) | 1,891,094 | 1,921,381 | ||||||
4.11%, 12/28/2048(2)(4) | 1,568,640 | 1,593,948 | ||||||
COLT 2019-1 Mortgage Loan Trust | ||||||||
3.71%, 03/25/2049(2)(4) | 4,915,993 | 4,965,821 | ||||||
COLT 2019-2 Mortgage Loan Trust | ||||||||
3.34%, 05/25/2049(2)(4) | 4,040,755 | 4,088,808 | ||||||
3.54%, 05/25/2049(2)(4) | 2,773,260 | 2,789,737 | ||||||
COLT 2019-3 Mortgage Loan Trust | ||||||||
2.76%, 08/25/2049(2)(4) | 2,279,559 | 2,306,900 | ||||||
COLT 2020-3 Mortgage Loan Trust | ||||||||
1.51%, 04/27/2065(2)(4) | 3,285,000 | 3,290,735 | ||||||
COMM 2014-CCRE20 Mortgage Trust | ||||||||
3.94%, 11/10/2047 | 1,115,000 | 1,177,955 | ||||||
COMM 2014-CR14 Mortgage Trust | ||||||||
4.77%, 02/10/2047(4) | 6,770,000 | 6,481,490 | ||||||
COMM 2014-UBS2 Mortgage Trust | ||||||||
5.14%, 03/10/2047(4) | 800,000 | 763,190 | ||||||
COMM 2015-CCRE24 Mortgage Trust | ||||||||
3.70%, 08/10/2048 | 1,990,000 | 2,195,409 | ||||||
COMM 2015-DC1 Mortgage Trust | ||||||||
3.72%, 02/10/2048 | 2,495,000 | 2,619,524 | ||||||
COMM 2015-PC1 Mortgage Trust | ||||||||
3.90%, 07/10/2050 | 515,000 | 566,901 | ||||||
4.58%, 07/10/2050(4) | 440,000 | 453,073 | ||||||
COMM 2017-COR2 Mortgage Trust | ||||||||
3.51%, 09/10/2050 | 3,110,000 | 3,445,627 | ||||||
COMM 2017-PANW Mortgage Trust | ||||||||
3.53%, 10/10/2029(2)(4) | 1,285,000 | 1,318,435 | ||||||
COMM 2020-CBM Mortgage Trust | ||||||||
3.40%, 02/10/2037(2) | 5,150,000 | 4,691,041 | ||||||
Connecticut Avenue Securities Trust 2019-R04 | ||||||||
2.28% (1 Month LIBOR USD + 2.10%), 06/25/2039(1)(2) | 1,185,497 | 1,150,866 | ||||||
Connecticut Avenue Securities Trust 2019-R06 | ||||||||
0.93% (1 Month LIBOR USD + 0.75%), 09/25/2039(1)(2) | 610,119 | 609,222 | ||||||
Connecticut Avenue Securities Trust 2020-R02 | ||||||||
0.93% (1 Month LIBOR USD + 0.75%), 01/25/2040(1)(2) | 2,499,440 | 2,472,648 | ||||||
Credit Suisse Mortgage Capital Certificates 19-RPL4 | ||||||||
3.52%, 08/26/2058(2) | 702,081 | 716,837 | ||||||
Credit Suisse Mortgage Capital Certificates 2019-ICE4 | ||||||||
1.78% (1 Month LIBOR USD + 1.60%, 1.60% Floor), 05/15/2036(1)(2) | 5,465,000 | 5,294,287 | ||||||
2.33% (1 Month LIBOR USD + 2.15%, 2.15% Floor), 05/15/2036(1)(2) | 2,375,000 | 2,267,997 | ||||||
Csail 2015-C2 Commercial Mortgage Trust | ||||||||
3.85%, 06/15/2057(4) | 8,560,000 | 9,048,468 | ||||||
CSAIL 2016-C6 Commercial Mortgage Trust | ||||||||
3.09%, 01/15/2049 | 840,000 | 901,306 | ||||||
CSAIL 2016-C7 Commercial Mortgage Trust | ||||||||
3.96%, 11/15/2049(4) | 6,160,000 | 6,617,272 | ||||||
CSAIL 2019-C16 Commercial Mortgage Trust | ||||||||
3.33%, 06/15/2052 | 10,970,000 | 12,172,185 | ||||||
CSAIL 2019-C17 Commercial Mortgage Trust | ||||||||
2.76%, 09/15/2052 | 6,050,000 | 6,472,574 | ||||||
3.28%, 09/15/2052 | 2,625,000 | 2,716,793 | ||||||
3.48%, 09/15/2052 | 3,015,000 | 2,880,580 | ||||||
CSFB Mortgage-Backed Pass-Through Certificates Series 2003-27 | ||||||||
5.75%, 11/25/2033 | 102,746 | 107,316 | ||||||
CSMC 2014-USA OA LLC | ||||||||
4.37%, 09/15/2037(2) | 6,175,000 | 4,766,967 | ||||||
CSMC 2018-RPL2 Trust | ||||||||
4.30%, 08/25/2062(2)(3) | 2,448,366 | 2,482,045 | ||||||
CSMC 2018-RPL7 Trust | ||||||||
4.00%, 08/26/2058(2) | 1,597,702 | 1,610,649 |
CSMC Trust 2013-5R | ||||||||
0.69% (1 Month LIBOR USD + 0.25%, 0.25% Floor), 02/27/2036(1)(2) | 5,605,292 | 5,613,818 | ||||||
DBCG 2017-BBG Mortgage Trust | ||||||||
0.88% (1 Month LIBOR USD + 0.70%, 0.70% Floor), 06/15/2034(1)(2) | 2,645,000 | 2,582,173 | ||||||
DBJPM 17-C6 Mortgage Trust | ||||||||
3.79%, 06/10/2050(4) | 2,750,000 | 2,764,488 | ||||||
DBUBS 2017-BRBK Mortgage Trust | ||||||||
3.65%, 10/10/2034(2)(4) | 2,540,000 | 2,585,476 | ||||||
DC Office Trust 2019-MTC | ||||||||
2.97%, 09/15/2045(2) | 5,545,000 | 5,970,997 | ||||||
3.17%, 09/15/2045(2)(4) | 4,450,000 | 4,037,917 | ||||||
Deephaven Residential Mortgage Trust 2018-1 | ||||||||
2.98%, 12/25/2057(2)(4) | 250,397 | 252,806 | ||||||
Deephaven Residential Mortgage Trust 2018-2 | ||||||||
3.48%, 04/25/2058(2)(4) | 1,560,116 | 1,587,138 | ||||||
Deephaven Residential Mortgage Trust 2019-1 | ||||||||
3.74%, 01/25/2059(2)(4) | 2,216,481 | 2,226,020 | ||||||
Deephaven Residential Mortgage Trust 2019-2 | ||||||||
3.56%, 04/25/2059(2)(4) | 2,711,428 | 2,721,260 | ||||||
Deutsche Alternative-A Securities, Inc. Mortgage Loan Trust Series 2005-2 | ||||||||
0.58% (1 Month LIBOR USD + 0.40%, 0.40% Floor), 04/25/2035(1) | 4,761,267 | 4,357,335 | ||||||
Durham Mortgages Plc | ||||||||
0.81% (3 Month LIBOR GBP + 0.55%), 03/31/2053(1) | GBP | 24,169,913 | 29,802,878 | |||||
0.86% (3 Month LIBOR GBP + 0.60%), 03/31/2054(1) | 20,435,351 | 25,084,840 | ||||||
Eleven Madison Trust 2015-11MD Mortgage Trust | ||||||||
3.67%, 09/10/2035(2)(4) | $ | 3,110,000 | 3,364,873 | |||||
Ellington Financial Mortgage Trust 2019-2 | ||||||||
2.74%, 11/25/2059(2)(4) | 5,359,916 | 5,379,422 | ||||||
EOS European Loan Conduit No 35 DAC | ||||||||
1.00% (3 Month EURIBOR + 1.00%, 1.00% Floor, 6.00% Cap), 04/23/2029(1)(2) | EUR | 883,150 | 976,110 | |||||
Eurosail-UK 2007-5np Plc | ||||||||
0.96% (3 Month LIBOR GBP + 0.77%), 09/13/2045(1) | GBP | 9,887,954 | 11,323,854 | |||||
Eurosail-UK 2007-6nc Plc | ||||||||
0.89% (3 Month LIBOR GBP + 0.70%, 0.70% Floor), 09/13/2045(1) | 247,471 | 298,180 | ||||||
Fannie Mae | ||||||||
2.00%, 07/01/2035(11) | $ | 28,150,000 | 29,114,358 | |||||
2.00%, 08/01/2035(11) | 14,075,000 | 14,534,637 | ||||||
2.00%, 07/01/2050(11) | 31,920,000 | 32,649,422 | ||||||
2.00%, 08/01/2050(11) | 184,100,000 | 187,899,001 | ||||||
2.50%, 08/01/2035(11) | 27,250,000 | 28,478,379 | ||||||
2.50%, 07/01/2050(11) | 61,975,000 | 64,464,336 | ||||||
2.50%, 07/01/2050(11) | 102,675,000 | 106,994,569 | ||||||
3.00%, 09/01/2050(11) | 71,285,000 | 74,818,060 | ||||||
4.00%, 06/01/2050(11) | 3,280,000 | 3,477,184 | ||||||
4.50%, 07/01/2050(11) | 9,890,000 | 10,626,341 | ||||||
5.00%, 07/01/2050(11) | 4,825,000 | 5,272,443 | ||||||
Fannie Mae Connecticut Avenue Securities | ||||||||
1.03% (1 Month LIBOR USD + 0.85%, 0.85% Floor), 07/25/2030(1) | 9,238,421 | 8,895,860 | ||||||
1.08% (1 Month LIBOR USD + 0.90%, 0.90% Floor), 08/25/2030(1) | 3,070,000 | 2,930,032 | ||||||
1.18% (1 Month LIBOR USD + 1.00%, 1.00% Floor), 02/25/2030(1) | 5,122,951 | 4,990,638 | ||||||
1.28% (1 Month LIBOR USD + 1.10%), 11/25/2029(1) | 8,093,653 | 7,884,121 | ||||||
1.53% (1 Month LIBOR USD + 1.35%), 09/25/2029(1) | 8,249,308 | 8,082,960 | ||||||
3.73% (1 Month LIBOR USD + 3.55%), 07/25/2029(1) | 2,877,991 | 2,925,968 | ||||||
4.73% (1 Month LIBOR USD + 4.55%), 02/25/2025(1) | 640,250 | 641,015 | ||||||
Fannie Mae Pool | ||||||||
2.00%, 06/01/2050 | 237,029,148 | 241,610,205 | ||||||
2.46%, 04/01/2040 | 8,775,000 | 8,889,898 | ||||||
2.50%, 07/01/2030 | 524,817 | 557,145 | ||||||
2.50%, 07/01/2030 | 699,426 | 742,529 | ||||||
2.50%, 08/01/2030 | 1,261,496 | 1,339,122 | ||||||
2.50%, 11/01/2031 | 1,694,322 | 1,797,875 | ||||||
2.50%, 01/01/2032 | 2,034,454 | 2,133,784 | ||||||
2.50%, 04/01/2035 | 5,085,596 | 5,326,724 | ||||||
2.50%, 05/01/2040 | 25,890,818 | 27,005,996 | ||||||
2.50%, 03/01/2050 | 187,837,662 | 195,829,831 | ||||||
2.50%, 04/01/2050 | 178,203,238 | 185,632,548 | ||||||
2.50%, 05/01/2050 | 10,971,073 | 11,430,601 | ||||||
2.50%, 07/01/2050 | 18,147,320 | 18,914,561 | ||||||
3.00%, 10/01/2028 | 306,445 | 322,476 | ||||||
3.00%, 02/01/2030 | 9,308,717 | 9,778,189 | ||||||
3.00%, 03/01/2030 | 9,518,822 | 10,003,383 | ||||||
3.00%, 05/01/2030 | 168,670 | 177,656 | ||||||
3.00%, 09/01/2030 | 1,862,820 | 1,979,271 | ||||||
3.00%, 12/01/2030 | 765,354 | 805,919 | ||||||
3.00%, 09/01/2031 | 653,976 | 688,560 | ||||||
3.00%, 06/01/2032 | 1,512,536 | 1,588,936 | ||||||
3.00%, 09/01/2032 | 3,019,534 | 3,176,005 | ||||||
3.00%, 06/01/2033 | 12,060 | 12,757 | ||||||
3.00%, 10/01/2033 | 1,934,406 | 2,061,427 | ||||||
3.00%, 11/01/2033 | 1,244,722 | 1,326,382 | ||||||
3.00%, 12/01/2034 | 5,232,793 | 5,611,187 | ||||||
3.00%, 01/01/2035 | 1,668,684 | 1,779,155 | ||||||
3.00%, 01/01/2035 | 3,728,100 | 3,974,722 | ||||||
3.00%, 02/01/2035 | 2,793,305 | 2,995,374 | ||||||
3.00%, 11/01/2036 | 221,922 | 237,390 | ||||||
3.00%, 11/01/2036 | 1,492,121 | 1,585,211 | ||||||
3.00%, 11/01/2036 | 1,736,057 | 1,855,028 | ||||||
3.00%, 12/01/2036 | 261,603 | 279,837 |
3.00%, 12/01/2036 | 1,953,158 | 2,075,017 | ||||||
3.00%, 10/01/2037 | 38,554 | 40,621 | ||||||
3.00%, 03/01/2038 | 2,987,122 | 3,154,095 | ||||||
3.00%, 04/01/2040 | 4,293,060 | 4,594,119 | ||||||
3.00%, 04/01/2040 | 4,736,580 | 5,051,320 | ||||||
3.00%, 04/01/2040 | 5,488,972 | 5,833,524 | ||||||
3.00%, 01/01/2043 | 2,435,474 | 2,607,247 | ||||||
3.00%, 02/01/2043 | 3,710,009 | 3,972,675 | ||||||
3.00%, 04/01/2043 | 2,485,259 | 2,662,604 | ||||||
3.00%, 05/01/2043 | 1,293,200 | 1,385,398 | ||||||
3.00%, 06/01/2043 | 3,018,990 | 3,234,443 | ||||||
3.00%, 07/01/2043 | 305,383 | 328,110 | ||||||
3.00%, 08/01/2043 | 151,183 | 159,977 | ||||||
3.00%, 08/01/2043 | 7,598,831 | 8,141,094 | ||||||
3.00%, 09/01/2043 | 1,191,268 | 1,295,275 | ||||||
3.00%, 02/01/2044 | 37,251 | 39,419 | ||||||
3.00%, 05/01/2045 | 588,560 | 630,301 | ||||||
3.00%, 05/01/2045 | 1,168,825 | 1,248,916 | ||||||
3.00%, 07/01/2045 | 5,501,259 | 5,967,929 | ||||||
3.00%, 05/01/2046 | 11,475,421 | 12,150,476 | ||||||
3.00%, 06/01/2046 | 358,537 | 383,136 | ||||||
3.00%, 07/01/2046 | 2,443,030 | 2,582,606 | ||||||
3.00%, 08/01/2046 | 115,061 | 121,740 | ||||||
3.00%, 11/01/2046 | 496,473 | 536,523 | ||||||
3.00%, 11/01/2046 | 577,418 | 609,848 | ||||||
3.00%, 11/01/2046 | 820,861 | 877,183 | ||||||
3.00%, 11/01/2046 | 1,666,986 | 1,763,565 | ||||||
3.00%, 11/01/2046 | 1,831,406 | 1,944,769 | ||||||
3.00%, 11/01/2046 | 1,879,423 | 2,002,473 | ||||||
3.00%, 11/01/2046 | 2,073,217 | 2,215,472 | ||||||
3.00%, 11/01/2046 | 4,848,256 | 5,148,362 | ||||||
3.00%, 12/01/2046 | 46,851 | 49,572 | ||||||
3.00%, 01/01/2047 | 3,539,757 | 3,743,746 | ||||||
3.00%, 01/01/2047 | 19,512,585 | 20,641,570 | ||||||
3.00%, 06/01/2047 | 2,254,014 | 2,448,562 | ||||||
3.00%, 08/01/2047 | 11,354,427 | 12,263,920 | ||||||
3.00%, 10/01/2047 | 3,779,076 | 3,987,693 | ||||||
3.00%, 09/01/2048 | 1,063,230 | 1,124,047 | ||||||
3.00%, 09/01/2048 | 1,964,218 | 2,079,333 | ||||||
3.00%, 08/01/2049 | 1,852,437 | 2,013,044 | ||||||
3.00%, 10/01/2049 | 3,859,358 | 4,066,257 | ||||||
3.00%, 02/01/2050 | 6,814,682 | 7,180,015 | ||||||
3.00%, 03/01/2050 | 2,695,153 | 2,878,732 | ||||||
3.21%, 11/01/2037 | 11,050,322 | 12,918,530 | ||||||
3.22%, 01/01/2027 | 3,565,000 | 4,015,612 | ||||||
3.45%, 05/01/2034 | 10,464,000 | 12,529,981 | ||||||
3.48%, 07/01/2042 | 4,057,071 | 4,788,242 | ||||||
3.50%, 04/01/2031 | 1,383,594 | 1,462,549 | ||||||
3.50%, 11/01/2031 | 2,195,303 | 2,320,157 | ||||||
3.50%, 11/01/2032 | 1,570,092 | 1,680,186 | ||||||
3.50%, 12/01/2033 | 2,765,000 | 2,932,933 | ||||||
3.50%, 02/01/2035 | 131,058 | 139,998 | ||||||
3.50%, 01/01/2036 | 1,228,266 | 1,312,948 | ||||||
3.50%, 01/01/2038 | 6,323,971 | 6,676,351 | ||||||
3.50%, 12/01/2041 | 66,360 | 73,230 | ||||||
3.50%, 06/01/2042 | 55,441 | 59,877 | ||||||
3.50%, 06/01/2042 | 92,425 | 99,820 | ||||||
3.50%, 07/01/2042 | 73,003 | 78,792 | ||||||
3.50%, 07/01/2042 | 537,149 | 579,761 | ||||||
3.50%, 08/01/2042 | 150,824 | 162,850 | ||||||
3.50%, 09/01/2042 | 166,722 | 179,970 | ||||||
3.50%, 09/01/2042 | 224,257 | 242,145 | ||||||
3.50%, 12/01/2042 | 1,078,522 | 1,164,478 | ||||||
3.50%, 12/01/2042 | 1,822,593 | 1,968,411 | ||||||
3.50%, 01/01/2043 | 96,228 | 103,879 | ||||||
3.50%, 01/01/2043 | 248,939 | 268,858 | ||||||
3.50%, 03/01/2043 | 1,044,035 | 1,127,342 | ||||||
3.50%, 04/01/2043 | 92,993 | 100,518 | ||||||
3.50%, 06/01/2043 | 133,563 | 146,617 | ||||||
3.50%, 06/01/2043 | 861,552 | 932,579 | ||||||
3.50%, 06/01/2043 | 1,584,667 | 1,715,300 | ||||||
3.50%, 06/01/2043 | 2,191,730 | 2,367,006 | ||||||
3.50%, 07/01/2043 | 104,628 | 112,934 | ||||||
3.50%, 07/01/2043 | 165,936 | 182,153 | ||||||
3.50%, 08/01/2043 | 100,206 | 108,211 | ||||||
3.50%, 08/01/2043 | 111,581 | 120,436 | ||||||
3.50%, 09/01/2043 | 464,327 | 507,528 | ||||||
3.50%, 01/01/2044 | 499,656 | 539,157 | ||||||
3.50%, 01/01/2044 | 687,483 | 742,398 | ||||||
3.50%, 01/01/2044 | 1,006,318 | 1,099,332 | ||||||
3.50%, 01/01/2044 | 5,139,189 | 5,549,181 | ||||||
3.50%, 03/01/2044 | 210,907 | 232,650 | ||||||
3.50%, 07/01/2044 | 707,730 | 765,463 | ||||||
3.50%, 12/01/2044 | 359,597 | 388,285 | ||||||
3.50%, 02/01/2045 | 442,077 | 477,143 | ||||||
3.50%, 04/01/2045 | 56,954 | 61,902 | ||||||
3.50%, 04/01/2045 | 1,378,181 | 1,475,927 |
3.50%, 05/01/2045 | 1,779,152 | 1,905,150 | ||||||
3.50%, 06/01/2045 | 2,089,398 | 2,270,923 | ||||||
3.50%, 06/01/2045 | 2,333,229 | 2,491,722 | ||||||
3.50%, 07/01/2045 | 2,490,129 | 2,676,913 | ||||||
3.50%, 08/01/2045 | 52,583 | 56,521 | ||||||
3.50%, 09/01/2045 | 4,298,635 | 4,647,494 | ||||||
3.50%, 10/01/2045 | 344,937 | 371,022 | ||||||
3.50%, 11/01/2045 | 352,915 | 379,373 | ||||||
3.50%, 11/01/2045 | 6,236,344 | 6,664,287 | ||||||
3.50%, 12/01/2045 | 1,231,919 | 1,315,167 | ||||||
3.50%, 01/01/2046 | 30,935 | 33,626 | ||||||
3.50%, 01/01/2046 | 84,313 | 90,276 | ||||||
3.50%, 04/01/2046 | 536,539 | 572,358 | ||||||
3.50%, 05/01/2046 | 589,021 | 636,066 | ||||||
3.50%, 06/01/2046 | 648,985 | 688,420 | ||||||
3.50%, 06/01/2046 | 1,388,310 | 1,474,173 | ||||||
3.50%, 06/01/2046 | 2,427,515 | 2,663,828 | ||||||
3.50%, 06/01/2046 | 3,142,456 | 3,415,818 | ||||||
3.50%, 06/01/2046 | 4,564,659 | 4,884,645 | ||||||
3.50%, 07/01/2046 | 1,290,840 | 1,368,014 | ||||||
3.50%, 09/01/2046 | 5,797,775 | 6,177,523 | ||||||
3.50%, 12/01/2046 | 1,843,709 | 1,959,847 | ||||||
3.50%, 01/01/2047 | 901,346 | 956,390 | ||||||
3.50%, 01/01/2047 | 1,442,285 | 1,530,000 | ||||||
3.50%, 01/01/2047 | 4,242,622 | 4,611,707 | ||||||
3.50%, 01/01/2047 | 20,756,119 | 22,047,622 | ||||||
3.50%, 02/01/2047 | 992,522 | 1,051,681 | ||||||
3.50%, 02/01/2047 | 1,333,490 | 1,415,911 | ||||||
3.50%, 03/01/2047 | 187,615 | 198,648 | ||||||
3.50%, 08/01/2047 | 13,836,242 | 15,028,475 | ||||||
3.50%, 11/01/2047 | 10,408,941 | 10,997,105 | ||||||
3.50%, 12/01/2047 | 3,984,998 | 4,329,456 | ||||||
3.50%, 12/01/2047 | 4,408,866 | 4,788,837 | ||||||
3.50%, 12/01/2047 | 4,849,990 | 5,120,879 | ||||||
3.50%, 01/01/2048 | 3,500,838 | 3,823,707 | ||||||
3.50%, 01/01/2048 | 8,287,629 | 9,012,750 | ||||||
3.50%, 02/01/2048 | 2,147,817 | 2,292,886 | ||||||
3.50%, 06/01/2049 | 12,222,342 | 13,349,282 | ||||||
3.50%, 08/01/2049 | 623,942 | 655,862 | ||||||
3.50%, 09/01/2049 | 4,861,240 | 5,109,893 | ||||||
3.50%, 09/01/2049 | 5,328,853 | 5,793,277 | ||||||
3.50%, 10/01/2049 | 2,886,423 | 3,034,066 | ||||||
3.50%, 10/01/2049 | 4,616,839 | 4,852,993 | ||||||
3.50%, 02/01/2050 | 911,523 | 958,358 | ||||||
4.00%, 11/01/2040 | 84,477 | 92,704 | ||||||
4.00%, 11/01/2040 | 314,748 | 345,495 | ||||||
4.00%, 11/01/2040 | 2,486,616 | 2,694,863 | ||||||
4.00%, 12/01/2040 | 211,145 | 231,779 | ||||||
4.00%, 01/01/2041 | 155,808 | 170,992 | ||||||
4.00%, 02/01/2041 | 158,375 | 173,903 | ||||||
4.00%, 02/01/2041 | 498,534 | 547,245 | ||||||
4.00%, 02/01/2041 | 685,456 | 752,178 | ||||||
4.00%, 09/01/2041 | 308,071 | 338,185 | ||||||
4.00%, 01/01/2042 | 45,238 | 49,633 | ||||||
4.00%, 01/01/2042 | 2,836,208 | 3,114,323 | ||||||
4.00%, 02/01/2042 | 73,040 | 80,155 | ||||||
4.00%, 03/01/2042 | 2,822,490 | 3,139,242 | ||||||
4.00%, 08/01/2042 | 2,738,971 | 2,983,104 | ||||||
4.00%, 09/01/2043 | 1,553,410 | 1,704,291 | ||||||
4.00%, 12/01/2043 | 3,055,621 | 3,354,589 | ||||||
4.00%, 06/01/2045 | 6,171,811 | 6,712,346 | ||||||
4.00%, 07/01/2045 | 871,717 | 941,744 | ||||||
4.00%, 09/01/2045 | 100,637 | 108,692 | ||||||
4.00%, 09/01/2045 | 136,109 | 147,691 | ||||||
4.00%, 10/01/2045 | 2,809,720 | 3,041,947 | ||||||
4.00%, 12/01/2045 | 475,568 | 509,576 | ||||||
4.00%, 12/01/2045 | 4,916,288 | 5,319,399 | ||||||
4.00%, 03/01/2046 | 1,347,018 | 1,454,660 | ||||||
4.00%, 09/01/2046 | 76,302 | 82,426 | ||||||
4.00%, 09/01/2046 | 1,844,447 | 1,982,635 | ||||||
4.00%, 12/01/2046 | 4,866,359 | 5,232,450 | ||||||
4.00%, 02/01/2047 | 1,994,112 | 2,136,183 | ||||||
4.00%, 02/01/2047 | 4,270,748 | 4,602,295 | ||||||
4.00%, 03/01/2047 | 2,246,845 | 2,398,570 | ||||||
4.00%, 04/01/2047 | 2,376,300 | 2,535,534 | ||||||
4.00%, 05/01/2047 | 3,146,974 | 3,349,434 | ||||||
4.00%, 06/01/2047 | 1,346,788 | 1,436,960 | ||||||
4.00%, 06/01/2047 | 3,602,986 | 3,833,859 | ||||||
4.00%, 07/01/2047 | 3,106,924 | 3,305,916 | ||||||
4.00%, 08/01/2047 | 2,396,472 | 2,567,520 | ||||||
4.00%, 08/01/2047 | 3,237,484 | 3,483,553 | ||||||
4.00%, 06/01/2048 | 2,432,142 | 2,574,076 | ||||||
4.00%, 09/01/2048 | 23,590,338 | 26,245,000 | ||||||
4.00%, 10/01/2048 | 380,043 | 418,919 | ||||||
4.00%, 12/01/2048 | 2,785,776 | 2,948,500 | ||||||
4.00%, 01/01/2049 | 8,615,776 | 9,514,422 | ||||||
4.00%, 02/01/2049 | 1,237,604 | 1,310,798 |
4.00%, 02/01/2049 | 9,328,382 | 10,129,548 | ||||||
4.00%, 11/01/2049 | 2,509,348 | 2,684,713 | ||||||
4.00%, 12/01/2049 | 472,109 | 499,970 | ||||||
4.00%, 01/01/2050 | 11,842,982 | 12,541,881 | ||||||
4.50%, 11/01/2035 | 307,065 | 335,369 | ||||||
4.50%, 08/01/2040 | 86,370 | 96,056 | ||||||
4.50%, 09/01/2040 | 33,983 | 37,812 | ||||||
4.50%, 11/01/2040 | 2,233,239 | 2,484,001 | ||||||
4.50%, 01/01/2041 | 23,922 | 26,628 | ||||||
4.50%, 02/01/2041 | 299,713 | 333,451 | ||||||
4.50%, 08/01/2041 | 37,740 | 41,991 | ||||||
4.50%, 11/01/2041 | 620,605 | 690,713 | ||||||
4.50%, 02/01/2045 | 492,122 | 547,322 | ||||||
4.50%, 06/01/2045 | 333,967 | 370,364 | ||||||
4.50%, 02/01/2046 | 2,277,816 | 2,493,144 | ||||||
4.50%, 03/01/2046 | 1,745,623 | 1,942,007 | ||||||
4.50%, 09/01/2046 | 2,065,428 | 2,292,866 | ||||||
4.50%, 11/01/2047 | 2,974,326 | 3,331,236 | ||||||
4.50%, 04/01/2048 | 3,741,333 | 4,016,992 | ||||||
4.50%, 05/01/2048 | 6,923,663 | 7,446,987 | ||||||
4.50%, 05/01/2048 | 16,258,547 | 17,456,151 | ||||||
4.50%, 08/01/2048 | 1,227,791 | 1,318,275 | ||||||
4.50%, 08/01/2048 | 2,326,687 | 2,498,073 | ||||||
4.50%, 08/01/2048 | 12,171,916 | 13,078,360 | ||||||
4.50%, 09/01/2048 | 4,785,253 | 5,143,015 | ||||||
4.50%, 11/01/2048 | 2,588,617 | 2,782,507 | ||||||
4.50%, 12/01/2048 | 6,410,873 | 6,882,472 | ||||||
4.50%, 05/01/2049 | 8,011,924 | 8,688,392 | ||||||
4.50%, 01/01/2050 | 964,108 | 1,035,596 | ||||||
4.50%, 05/01/2050 | 3,526,806 | 3,816,008 | ||||||
5.00%, 07/01/2035 | 732,112 | 839,998 | ||||||
5.00%, 02/01/2036 | 1,166,344 | 1,338,795 | ||||||
5.00%, 05/01/2040 | 27,223 | 31,217 | ||||||
5.00%, 06/01/2040 | 9,255 | 10,616 | ||||||
5.00%, 06/01/2040 | 789,338 | 900,570 | ||||||
5.00%, 02/01/2041 | 670,905 | 770,852 | ||||||
5.00%, 07/01/2041 | 857,040 | 982,310 | ||||||
5.00%, 08/01/2041 | 277,936 | 319,268 | ||||||
5.00%, 03/01/2042 | 463,897 | 529,542 | ||||||
5.00%, 11/01/2044 | 2,843,897 | 3,261,450 | ||||||
5.00%, 02/01/2045 | 1,063,297 | 1,178,213 | ||||||
5.00%, 07/01/2045 | 581,679 | 667,263 | ||||||
5.50%, 05/01/2034 | 1,490,532 | 1,709,770 | ||||||
5.50%, 07/01/2034 | 361,226 | 414,107 | ||||||
5.50%, 07/01/2036 | 140,121 | 160,767 | ||||||
5.50%, 12/01/2039 | 309,256 | 353,896 | ||||||
5.50%, 03/01/2040 | 1,689,968 | 1,937,755 | ||||||
5.50%, 06/01/2041 | 323,028 | 371,853 | ||||||
5.50%, 02/01/2042 | 735,642 | 838,093 | ||||||
5.50%, 02/01/2042 | 1,175,568 | 1,330,405 | ||||||
5.50%, 10/01/2043 | 567,750 | 659,145 | ||||||
5.50%, 05/01/2044 | 395,696 | 454,206 | ||||||
5.50%, 05/01/2044 | 6,077,622 | 6,976,924 | ||||||
6.00%, 03/01/2034 | 1,763,622 | 2,039,563 | ||||||
6.00%, 06/01/2036 | 11,643 | 13,584 | ||||||
6.00%, 07/01/2038 | 1,200,915 | 1,401,412 | ||||||
6.00%, 10/01/2038 | 66,463 | 77,524 | ||||||
6.00%, 07/01/2041 | 5,632,645 | 6,571,183 | ||||||
6.50%, 05/01/2040 | 404,882 | 469,371 | ||||||
Fannie Mae REMICS | ||||||||
0.68% (1 Month LIBOR USD + 0.50%, 0.50% Floor, 6.50% Cap), 01/25/2050(1) | 4,872,092 | 4,889,607 | ||||||
3.00%, 09/25/2049 | 2,078,737 | 2,134,319 | ||||||
3.50%, 03/25/2042 | 4,335,407 | 4,753,360 | ||||||
3.50%, 01/25/2047 | 15,546,577 | 15,986,845 | ||||||
3.50%, 06/25/2047 | 14,441,966 | 15,143,764 | ||||||
4.00%, 06/25/2044 | 1,108,645 | 1,136,101 | ||||||
4.00%, 05/25/2047 | 6,558,770 | 6,867,353 | ||||||
Fannie Mae-Aces | ||||||||
3.50%, 07/25/2028(4) | 5,305,000 | 6,103,459 | ||||||
Feldspar 2016-1 Plc | ||||||||
0.89% (3 Month LIBOR GBP + 0.70%), 09/15/2045(1) | | GBP 819,508 | | 1,012,915 | ||||
Finsbury Square 2017-2 Plc | ||||||||
0.88% (3 Month LIBOR GBP + 0.68%), 09/12/2065(1) | 1,865,018 | 2,309,021 | ||||||
Finsbury Square 2018-2 Plc | ||||||||
1.15% (3 Month LIBOR GBP + 0.95%), 09/12/2068(1) | 2,351,075 | 2,906,735 | ||||||
Finsbury Square 2019-1 Plc | ||||||||
1.17% (3 Month LIBOR GBP + 0.97%), 06/16/2069(1) | 4,216,218 | 5,218,433 | ||||||
Flagstar Mortgage Trust 2017-2 | ||||||||
4.11%, 10/25/2047(2)(4) | $ | 1,289,019 | 1,348,423 | |||||
Flagstar Mortgage Trust 2018-6RR | ||||||||
4.00%, 09/25/2048(2)(4) | 1,518,986 | 1,621,014 | ||||||
Flagstar Mortgage Trust 2020-1NV | ||||||||
1.03% (1 Month LIBOR USD + 0.85%), 03/25/2050(1)(2) | 2,398,137 | 2,294,613 | ||||||
Fontainebleau Miami Beach Trust 2019-FBLU | ||||||||
3.75%, 12/10/2036(2) | 7,500,000 | 7,066,118 | ||||||
Freddie Mac Gold Pool | ||||||||
2.50%, 07/01/2030 | 1,095,844 | 1,150,000 |
2.50%, 09/01/2031 | 3,896,027 | 4,141,912 | ||||||
2.50%, 12/01/2031 | 5,524,151 | 5,862,641 | ||||||
2.50%, 12/01/2031 | 11,001,358 | 11,545,816 | ||||||
2.50%, 02/01/2032 | 7,665,188 | 8,168,003 | ||||||
3.00%, 03/01/2031 | 660,225 | 695,517 | ||||||
3.00%, 12/01/2032 | 2,436,006 | 2,560,621 | ||||||
3.00%, 06/01/2033 | 1,137,252 | 1,195,436 | ||||||
3.00%, 02/01/2038 | 4,177,624 | 4,402,601 | ||||||
3.00%, 02/01/2043 | 704,674 | 755,184 | ||||||
3.00%, 04/01/2046 | 186,890 | 197,951 | ||||||
3.00%, 06/01/2046 | 6,557,721 | 6,948,737 | ||||||
3.00%, 08/01/2046 | 7,863,680 | 8,320,766 | ||||||
3.00%, 09/01/2046 | 23,968,402 | 25,388,611 | ||||||
3.00%, 10/01/2046 | 7,716,989 | 8,169,748 | ||||||
3.00%, 11/01/2046 | 8,410,719 | 8,901,620 | ||||||
3.00%, 12/01/2046 | 4,972,937 | 5,254,851 | ||||||
3.00%, 12/01/2046 | 5,155,968 | 5,455,370 | ||||||
3.00%, 01/01/2047 | 9,730,583 | 10,282,198 | ||||||
3.00%, 02/01/2047 | 9,018,491 | 9,536,876 | ||||||
3.00%, 03/01/2047 | 5,368,959 | 5,673,384 | ||||||
3.00%, 04/01/2047 | 3,304,263 | 3,487,003 | ||||||
3.00%, 08/01/2047 | 21,967,211 | 23,187,074 | ||||||
3.00%, 12/01/2047 | 5,717,771 | 6,033,300 | ||||||
3.00%, 01/01/2048 | 282,219 | 297,429 | ||||||
3.50%, 05/01/2033 | 535,162 | 564,115 | ||||||
3.50%, 08/01/2033 | 5,344,621 | 5,618,802 | ||||||
3.50%, 08/01/2033 | 14,564,136 | 15,325,120 | ||||||
3.50%, 11/01/2033 | 10,293,522 | 10,815,221 | ||||||
3.50%, 09/01/2042 | 372,286 | 401,899 | ||||||
3.50%, 11/01/2042 | 41,314 | 44,646 | ||||||
3.50%, 07/01/2043 | 343,186 | 370,548 | ||||||
3.50%, 10/01/2043 | 736,820 | 795,867 | ||||||
3.50%, 01/01/2044 | 919,943 | 995,677 | ||||||
3.50%, 10/01/2045 | 10,330,641 | 11,294,655 | ||||||
3.50%, 03/01/2046 | 942,327 | 1,030,366 | ||||||
3.50%, 06/01/2046 | 6,130,833 | 6,544,182 | ||||||
3.50%, 08/01/2046 | 9,556,863 | 10,201,128 | ||||||
3.50%, 08/01/2046 | 18,134,416 | 19,806,677 | ||||||
3.50%, 11/01/2046 | 2,134,907 | 2,273,144 | ||||||
3.50%, 02/01/2047 | 1,117,302 | 1,186,153 | ||||||
3.50%, 04/01/2047 | 5,132,650 | 5,423,470 | ||||||
3.50%, 04/01/2047 | 14,063,048 | 15,368,506 | ||||||
3.50%, 09/01/2047 | 18,278,698 | 19,284,454 | ||||||
3.50%, 10/01/2047 | 3,970,500 | 4,186,094 | ||||||
3.50%, 11/01/2047 | 2,774,434 | 2,935,026 | ||||||
3.50%, 11/01/2047 | 3,902,193 | 4,120,703 | ||||||
3.50%, 12/01/2047 | 34,705,003 | 37,926,805 | ||||||
3.50%, 01/01/2048 | 3,216,035 | 3,400,843 | ||||||
3.50%, 01/01/2048 | 20,791,067 | 22,922,762 | ||||||
3.50%, 02/01/2048 | 2,956,221 | 3,112,724 | ||||||
3.50%, 03/01/2048 | 32,951,764 | 35,912,960 | ||||||
3.50%, 03/01/2048 | 33,744,428 | 36,236,681 | ||||||
3.50%, 03/01/2048 | 35,559,294 | 38,851,095 | ||||||
4.00%, 01/01/2045 | 1,741,366 | 1,939,886 | ||||||
4.00%, 07/01/2045 | 510,304 | 551,453 | ||||||
4.00%, 12/01/2045 | 3,655,167 | 4,033,016 | ||||||
4.00%, 03/01/2048 | 9,087,664 | 10,041,817 | ||||||
4.00%, 06/01/2048 | 20,995,448 | 22,832,440 | ||||||
4.00%, 07/01/2048 | 10,872,318 | 11,905,924 | ||||||
4.00%, 11/01/2048 | 43,084,309 | 47,152,871 | ||||||
4.50%, 07/01/2042 | 581,624 | 646,172 | ||||||
4.50%, 05/01/2044 | 354,669 | 393,729 | ||||||
4.50%, 06/01/2045 | 657,220 | 756,326 | ||||||
4.50%, 02/01/2046 | 691,200 | 794,952 | ||||||
4.50%, 05/01/2046 | 723,549 | 832,161 | ||||||
4.50%, 06/01/2046 | 848,053 | 962,964 | ||||||
4.50%, 02/01/2047 | 645,362 | 741,872 | ||||||
4.50%, 12/01/2047 | 3,663,581 | 3,949,145 | ||||||
4.50%, 10/01/2048 | 10,550,726 | 11,347,190 | ||||||
5.00%, 11/01/2041 | 905,606 | 1,038,179 | ||||||
5.00%, 07/01/2048 | 2,065,810 | 2,259,126 | ||||||
5.00%, 08/01/2048 | 1,073,374 | 1,172,393 | ||||||
5.00%, 09/01/2048 | 583,916 | 638,453 | ||||||
5.00%, 10/01/2048 | 2,909,999 | 3,181,192 | ||||||
5.00%, 11/01/2048 | 4,508,521 | 4,923,609 | ||||||
5.50%, 08/01/2041 | 5,930,832 | 6,888,249 | ||||||
8.00%, 04/01/2032 | 184,232 | 228,470 | ||||||
Freddie Mac Multifamily Structured Pass Through Certificates | ||||||||
0.86%, 01/25/2031(4) | 293,889,515 | 10,263,121 | ||||||
1.06%, 04/25/2034(4) | 18,970,338 | 1,615,895 | ||||||
2.73%, 05/25/2029 | 15,705,000 | 17,637,018 | ||||||
2.86%, 10/25/2034 | 22,150,000 | 25,623,368 | ||||||
3.00%, 12/25/2047(4) | 550,261 | 579,130 | ||||||
3.03%, 10/25/2046(4) | 514,224 | 561,592 | ||||||
3.75%, 04/25/2033 | 5,505,000 | 6,823,343 | ||||||
Freddie Mac Pool | ||||||||
2.50%, 04/01/2035 | 93,777,108 | 98,223,450 |
2.50%, 05/01/2040 | 25,989,542 | 27,100,695 | ||||||
2.50%, 06/01/2040 | 26,094,458 | 27,218,418 | ||||||
2.50%, 03/01/2050 | 257,253,113 | 268,300,869 | ||||||
3.00%, 05/01/2031 | 7,467,658 | 7,958,282 | ||||||
3.00%, 11/01/2034 | 1,874,636 | 2,010,449 | ||||||
3.00%, 09/01/2049 | 2,064,452 | 2,243,436 | ||||||
3.00%, 01/01/2050 | 12,701,077 | 13,449,250 | ||||||
3.00%, 02/01/2050 | 21,627,731 | 22,435,432 | ||||||
3.00%, 03/01/2050 | 2,607,928 | 2,748,654 | ||||||
3.00%, 04/01/2050 | 11,429,774 | 12,046,734 | ||||||
3.50%, 06/01/2033 | 1,313,694 | 1,387,012 | ||||||
3.50%, 06/01/2046 | 778,592 | 837,072 | ||||||
3.50%, 12/01/2047 | 705,938 | 745,415 | ||||||
3.50%, 01/01/2050 | 25,166,397 | 27,238,634 | ||||||
3.98%, 04/01/2034 | 9,234,156 | 10,933,126 | ||||||
4.00%, 12/01/2049 | 3,850,029 | 4,179,546 | ||||||
4.00%, 01/01/2050 | 9,027,717 | 9,564,840 | ||||||
4.00%, 02/01/2050 | 4,269,406 | 4,564,065 | ||||||
4.50%, 05/01/2050 | 2,389,692 | 2,585,646 | ||||||
5.00%, 12/01/2041 | 1,390,781 | 1,595,393 | ||||||
5.00%, 03/01/2042 | 338,443 | 397,069 | ||||||
Freddie Mac REMICS | ||||||||
3.00%, 01/15/2049 | 3,194,428 | 3,353,459 | ||||||
3.00%, 04/15/2049 | 14,212,633 | 14,591,139 | ||||||
4.50%, 05/25/2050 | 5,421,973 | 848,232 | ||||||
Freddie Mac STACR Remic Trust 2019-HQA4 | ||||||||
0.95% (1 Month LIBOR USD + 0.77%), 11/25/2049(1)(2) | 324,419 | 322,924 | ||||||
2.23% (1 Month LIBOR USD + 2.05%), 11/25/2049(1)(2) | 1,215,000 | 1,178,483 | ||||||
Freddie Mac STACR Remic Trust 2020-DNA3 | ||||||||
1.67% (1 Month LIBOR USD + 1.50%), 06/25/2050(1)(2) | 3,260,000 | 3,260,000 | ||||||
Freddie Mac STACR Remic Trust 2020-HQA2 | ||||||||
1.28% (1 Month LIBOR USD + 1.10%), 03/25/2050(1)(2) | 11,437,582 | 11,390,269 | ||||||
Freddie Mac STACR Trust 2018-HQA2 | ||||||||
0.93% (1 Month LIBOR USD + 0.75%), 10/25/2048(1)(2) | 257,540 | 257,139 | ||||||
Freddie Mac STACR Trust 2019-HQA2 | ||||||||
2.23% (1 Month LIBOR USD + 2.05%), 04/25/2049(1)(2) | 1,039,799 | 1,018,439 | ||||||
Freddie Mac STACR Trust 2019-HRP1 | ||||||||
1.58% (1 Month LIBOR USD + 1.40%), 02/25/2049(1)(2) | 3,740,000 | 3,562,255 | ||||||
Freddie Mac Strips | ||||||||
3.00%, 09/15/2044 | 80,654,306 | 87,902,080 | ||||||
Freddie Mac Structured Agency Credit Risk Debt Notes | ||||||||
0.93% (1 Month LIBOR USD + 0.75%), 03/25/2030(1) | 244,866 | 244,866 | ||||||
1.23% (1 Month LIBOR USD + 1.05%), 07/25/2030(1) | 4,517,832 | 4,437,517 | ||||||
1.38% (1 Month LIBOR USD + 1.20%, 1.20% Floor), 07/25/2029(1) | 22,958 | 22,953 | ||||||
1.38% (1 Month LIBOR USD + 1.20%), 10/25/2029(1) | 1,633,378 | 1,634,804 | ||||||
2.03% (1 Month LIBOR USD + 1.85%), 10/25/2027(1) | 201,710 | 201,420 | ||||||
3.03% (1 Month LIBOR USD + 2.85%), 04/25/2028(1) | 384,428 | 384,987 | ||||||
3.81%, 05/25/2048(2)(4) | 445,000 | 433,634 | ||||||
4.14%, 08/25/2048(2)(4) | 3,752,879 | 3,699,097 | ||||||
Freddie Mac Whole Loan Securities Trust | ||||||||
3.59%, 12/25/2046(2)(4) | 2,636,149 | 2,625,979 | ||||||
FREMF 2018-K731 Mortgage Trust | ||||||||
4.06%, 02/25/2025(2)(4) | 4,525,000 | 4,831,028 | ||||||
FREMF 2019-K94 Mortgage Trust | ||||||||
4.10%, 07/25/2052(2)(4) | 2,800,000 | 3,036,806 | ||||||
FREMF 2019-K98 Mortgage Trust | ||||||||
3.86%, 10/25/2052(2)(4) | 2,895,000 | 3,087,876 | ||||||
FREMF 2019-K736 Mortgage Trust | ||||||||
3.88%, 07/25/2026(2)(4) | 5,440,000 | 5,783,275 | ||||||
FREMF K-100 Mortgage Trust | ||||||||
3.61%, 11/25/2052(2)(4) | 6,980,000 | 7,308,468 | ||||||
Galton Funding Mortgage Trust 2017-1 | ||||||||
3.50%, 11/25/2057(2)(4) | 1,537,884 | 1,582,038 | ||||||
Galton Funding Mortgage Trust 2018-2 | ||||||||
4.00%, 10/25/2058(2)(4) | 3,607,087 | 3,726,728 | ||||||
Galton Funding Mortgage Trust 2019-1 | ||||||||
4.00%, 02/25/2059(2)(4) | 744,321 | 753,971 | ||||||
4.00%, 02/25/2059(2)(4) | 968,455 | 998,450 | ||||||
Galton Funding Mortgage Trust 2019-2 | ||||||||
3.50%, 06/25/2059(2)(4) | 1,916,320 | 1,936,881 | ||||||
Galton Funding Mortgage Trust 2019-H1 | ||||||||
2.66%, 10/25/2059(2)(4) | 4,880,330 | 4,987,714 | ||||||
2.96%, 10/25/2059(2)(4) | 4,332,573 | 4,427,343 | ||||||
Galton Funding Mortgage Trust 2020-H1 | ||||||||
2.31%, 01/25/2060(2)(4) | 5,982,668 | 6,004,430 | ||||||
GCAT 2019-RPL1 Trust | ||||||||
2.65%, 10/25/2068(2)(4) | 4,065,585 | 4,205,700 | ||||||
GCAT 2020-1 LLC | ||||||||
2.98%, 01/26/2060(2)(3) | 2,225,268 | 2,151,416 | ||||||
Ginnie Mae | ||||||||
0.49% (1 Month LIBOR USD + 0.30%, 0.30% Floor, 6.50% Cap), 09/20/2048(1) | 2,164,068 | 2,157,122 | ||||||
2.50%, 07/01/2050(11) | 41,500,000 | 43,667,402 | ||||||
3.00%, 11/20/2047 | 707,548 | 745,261 | ||||||
3.00%, 12/20/2047 | 528,573 | 547,713 | ||||||
3.00%, 07/20/2049 | 1,001,993 | 1,045,724 | ||||||
3.00%, 09/20/2049 | 10,820,554 | 11,255,795 | ||||||
3.00%, 07/01/2050(11) | 29,500,000 | 31,245,801 |
3.50%, 03/20/2039 | 311,219 | 3,635 | ||||||
3.50%, 05/20/2043 | 237,807 | 33,938 | ||||||
3.50%, 08/20/2048 | 7,362,131 | 7,841,223 | ||||||
3.50%, 09/20/2048 | 4,540,776 | 4,897,342 | ||||||
3.50%, 12/20/2048 | 940,628 | 984,216 | ||||||
4.50%, 07/01/2050(11) | 5,005,000 | 5,342,838 | ||||||
Ginnie Mae I Pool | ||||||||
3.00%, 10/15/2042 | 155,941 | 165,509 | ||||||
3.00%, 12/15/2042 | 29,077 | 31,033 | ||||||
3.00%, 05/15/2043 | 91,592 | 97,751 | ||||||
3.00%, 06/15/2043 | 7,902 | 8,379 | ||||||
3.00%, 06/15/2043 | 7,905 | 8,382 | ||||||
3.50%, 12/15/2042 | 8,845 | 9,599 | ||||||
3.50%, 01/15/2043 | 12,716 | 13,800 | ||||||
3.50%, 10/15/2043 | 63,127 | 68,518 | ||||||
4.50%, 05/15/2041 | 471,390 | 525,906 | ||||||
4.50%, 09/15/2045 | 173,858 | 193,750 | ||||||
5.00%, 09/15/2039 | 35,389 | 40,456 | ||||||
5.00%, 10/15/2039 | 246,848 | 277,435 | ||||||
5.00%, 12/15/2039 | 437,129 | 499,412 | ||||||
5.00%, 02/15/2040 | 62,281 | 71,225 | ||||||
5.00%, 02/15/2040 | 62,281 | 71,225 | ||||||
5.00%, 06/15/2040 | 172,816 | 197,426 | ||||||
5.00%, 09/15/2041 | 149,615 | 171,196 | ||||||
5.00%, 07/15/2044 | 153,223 | 170,476 | ||||||
7.50%, 08/15/2033 | 228,549 | 264,950 | ||||||
Ginnie Mae II Pool | ||||||||
2.50%, 04/20/2050 | 3,997,452 | 4,128,454 | ||||||
3.00%, 12/20/2044 | 528,192 | 564,710 | ||||||
3.00%, 06/20/2045 | 23,668,001 | 25,238,652 | ||||||
3.00%, 05/20/2046 | 30,139 | 32,440 | ||||||
3.00%, 05/20/2046 | 80,908 | 87,386 | ||||||
3.00%, 06/20/2046 | 178,804 | 192,122 | ||||||
3.00%, 07/20/2046 | 49,791 | 53,593 | ||||||
3.00%, 07/20/2046 | 80,731 | 87,196 | ||||||
3.00%, 07/20/2046 | 123,398 | 132,615 | ||||||
3.00%, 07/20/2046 | 152,813 | 164,518 | ||||||
3.00%, 07/20/2046 | 216,830 | 233,145 | ||||||
3.00%, 07/20/2046 | 271,392 | 292,117 | ||||||
3.00%, 08/20/2046 | 71,755 | 76,955 | ||||||
3.00%, 08/20/2046 | 103,729 | 111,521 | ||||||
3.00%, 08/20/2046 | 117,266 | 126,685 | ||||||
3.00%, 09/20/2046 | 59,625 | 63,925 | ||||||
3.00%, 09/20/2046 | 68,542 | 73,702 | ||||||
3.00%, 10/20/2046 | 2,353,037 | 2,502,820 | ||||||
3.00%, 12/20/2046 | 5,617,628 | 5,967,492 | ||||||
3.00%, 03/20/2047 | 1,434,984 | 1,524,367 | ||||||
3.00%, 09/20/2047 | 16,080,521 | 17,057,140 | ||||||
3.00%, 11/20/2047 | 5,995,892 | 6,360,478 | ||||||
3.00%, 01/20/2048 | 7,461,677 | 7,914,847 | ||||||
3.00%, 09/20/2049 | 1,082,004 | 1,120,210 | ||||||
3.00%, 10/20/2049 | 34,838,132 | 36,081,008 | ||||||
3.00%, 03/20/2050 | 13,829,558 | 14,346,874 | ||||||
3.00%, 05/20/2050 | 4,520,535 | 4,795,081 | ||||||
3.50%, 08/20/2042 | 16,613 | 18,062 | ||||||
3.50%, 12/20/2042 | 7,021 | 7,634 | ||||||
3.50%, 02/20/2043 | 19,298 | 20,983 | ||||||
3.50%, 05/20/2043 | 9,035 | 9,835 | ||||||
3.50%, 06/20/2043 | 2,585,580 | 2,810,259 | ||||||
3.50%, 07/20/2043 | 1,748,240 | 1,900,203 | ||||||
3.50%, 09/20/2043 | 124,183 | 134,696 | ||||||
3.50%, 10/20/2044 | 61,421 | 67,593 | ||||||
3.50%, 10/20/2044 | 399,141 | 429,155 | ||||||
3.50%, 12/20/2044 | 9,172 | 9,824 | ||||||
3.50%, 01/20/2045 | 2,228,007 | 2,399,672 | ||||||
3.50%, 03/20/2045 | 368,802 | 394,857 | ||||||
3.50%, 05/20/2045 | 13,489 | 14,534 | ||||||
3.50%, 07/20/2045 | 499,285 | 534,628 | ||||||
3.50%, 10/20/2045 | 78,766 | 84,641 | ||||||
3.50%, 10/20/2045 | 108,729 | 116,845 | ||||||
3.50%, 12/20/2045 | 2,635,986 | 2,822,625 | ||||||
3.50%, 01/20/2046 | 1,872,852 | 2,005,123 | ||||||
3.50%, 02/20/2046 | 616,696 | 660,221 | ||||||
3.50%, 03/20/2046 | 7,042,767 | 7,541,815 | ||||||
3.50%, 04/20/2046 | 4,729,598 | 5,072,488 | ||||||
3.50%, 05/20/2046 | 7,365 | 7,866 | ||||||
3.50%, 05/20/2046 | 22,091 | 23,804 | ||||||
3.50%, 05/20/2046 | 82,357 | 88,729 | ||||||
3.50%, 05/20/2046 | 3,235,458 | 3,466,469 | ||||||
3.50%, 06/20/2046 | 85,376 | 91,955 | ||||||
3.50%, 06/20/2046 | 2,010,853 | 2,151,654 | ||||||
3.50%, 07/20/2046 | 661,454 | 707,725 | ||||||
3.50%, 09/20/2046 | 1,199,871 | 1,285,510 | ||||||
3.50%, 12/20/2046 | 4,475,993 | 4,767,855 | ||||||
3.50%, 01/20/2047 | 5,945,878 | 6,323,761 | ||||||
3.50%, 04/20/2047 | 8,779,277 | 9,369,290 | ||||||
3.50%, 05/20/2047 | 389,895 | 415,844 |
3.50%, 06/20/2047 | 13,436,224 | 14,320,398 | ||||||
3.50%, 08/20/2047 | 6,168,066 | 6,566,924 | ||||||
3.50%, 09/20/2047 | 16,358,128 | 17,409,017 | ||||||
3.50%, 10/20/2047 | 1,282,847 | 1,364,624 | ||||||
3.50%, 11/20/2047 | 21,695,478 | 23,080,995 | ||||||
3.50%, 01/20/2048 | 22,025,272 | 23,412,912 | ||||||
3.50%, 02/20/2048 | 3,126,390 | 3,362,547 | ||||||
3.50%, 02/20/2048 | 7,701,256 | 8,280,369 | ||||||
3.50%, 04/20/2048 | 425,098 | 458,508 | ||||||
3.50%, 06/20/2049 | 3,360,340 | 3,475,756 | ||||||
3.50%, 07/20/2049 | 15,361,361 | 15,887,274 | ||||||
4.00%, 09/20/2045 | 2,008,524 | 2,175,414 | ||||||
4.00%, 05/20/2046 | 1,029,206 | 1,112,449 | ||||||
4.00%, 03/20/2047 | 2,695,562 | 2,895,900 | ||||||
4.00%, 04/20/2047 | 5,749,011 | 6,192,826 | ||||||
4.00%, 05/20/2047 | 4,511,681 | 4,847,962 | ||||||
4.00%, 06/20/2047 | 2,194,287 | 2,357,168 | ||||||
4.00%, 07/20/2047 | 1,104,181 | 1,187,687 | ||||||
4.00%, 08/20/2047 | 919,910 | 989,539 | ||||||
4.00%, 09/20/2047 | 4,733,394 | 5,073,954 | ||||||
4.00%, 11/20/2047 | 3,355,467 | 3,604,597 | ||||||
4.00%, 12/20/2047 | 3,211,322 | 3,439,924 | ||||||
4.00%, 01/20/2048 | 841,515 | 909,370 | ||||||
4.00%, 01/20/2048 | 4,596,716 | 4,926,894 | ||||||
4.00%, 06/20/2048 | 2,897,710 | 3,098,184 | ||||||
4.00%, 08/20/2048 | 7,469,229 | 7,961,400 | ||||||
4.00%, 09/20/2048 | 4,152,049 | 4,436,169 | ||||||
4.00%, 10/20/2048 | 2,017,899 | 2,149,085 | ||||||
4.50%, 07/20/2045 | 3,736,675 | 4,093,710 | ||||||
4.50%, 12/20/2045 | 70,955 | 77,735 | ||||||
4.50%, 01/20/2046 | 601,599 | 659,060 | ||||||
4.50%, 01/20/2047 | 3,116,943 | 3,406,720 | ||||||
4.50%, 05/20/2047 | 6,700,495 | 7,321,899 | ||||||
4.50%, 06/20/2047 | 9,234,395 | 10,084,318 | ||||||
4.50%, 07/20/2047 | 1,082,273 | 1,179,034 | ||||||
4.50%, 09/20/2047 | 2,746,918 | 2,995,776 | ||||||
4.50%, 11/20/2047 | 1,010,985 | 1,101,730 | ||||||
4.50%, 01/20/2048 | 334,428 | 360,053 | ||||||
4.50%, 08/20/2048 | 14,302,744 | 15,301,391 | ||||||
4.50%, 09/20/2048 | 1,581,646 | 1,703,325 | ||||||
4.50%, 09/20/2048 | 1,611,952 | 1,729,151 | ||||||
5.00%, 05/20/2040 | 163,605 | 184,587 | ||||||
5.00%, 06/20/2040 | 88,426 | 99,793 | ||||||
5.00%, 08/20/2040 | 68,451 | 77,220 | ||||||
5.00%, 09/20/2040 | 59,824 | 67,497 | ||||||
5.00%, 12/20/2044 | 271,326 | 302,604 | ||||||
5.00%, 06/20/2047 | 4,620,645 | 5,110,629 | ||||||
5.00%, 07/20/2047 | 676,827 | 748,412 | ||||||
5.00%, 08/20/2047 | 453,723 | 501,814 | ||||||
5.00%, 09/20/2047 | 4,463,316 | 4,936,059 | ||||||
5.00%, 10/20/2047 | 418,743 | 463,070 | ||||||
5.00%, 11/20/2047 | 901,194 | 996,609 | ||||||
5.00%, 12/20/2047 | 1,726,486 | 1,908,819 | ||||||
5.00%, 01/20/2048 | 2,226,882 | 2,440,685 | ||||||
5.00%, 02/20/2048 | 2,012,679 | 2,203,297 | ||||||
5.00%, 06/20/2048 | 2,047,437 | 2,250,303 | ||||||
5.00%, 08/20/2048 | 5,477,535 | 5,967,793 | ||||||
5.00%, 10/20/2048 | 4,970,109 | 5,435,619 | ||||||
5.00%, 11/20/2048 | 5,972,389 | 6,508,944 | ||||||
5.50%, 07/20/2036 | 86,777 | 99,970 | ||||||
5.50%, 01/20/2040 | 186,051 | 212,826 | ||||||
5.50%, 06/20/2045 | 223,466 | 257,206 | ||||||
5.50%, 10/20/2047 | 768,225 | 859,841 | ||||||
5.50%, 05/20/2048 | 2,657,341 | 2,911,810 | ||||||
5.50%, 12/20/2048 | 1,768,151 | 1,921,828 | ||||||
5.50%, 01/20/2049 | 504,786 | 549,838 | ||||||
5.50%, 03/20/2049 | 3,086,786 | 3,354,380 | ||||||
Gosforth Funding 2018-1 Plc | ||||||||
0.81% (3 Month LIBOR USD + 0.45%), 08/25/2060(1)(2) | 1,426,614 | 1,385,618 | ||||||
Grand Avenue Mortgage Loan Trust 2017-RPL1 | ||||||||
3.25%, 08/25/2064(2) | 2,373,356 | 2,306,951 | ||||||
Great Wolf Trust 2019-WOLF | ||||||||
1.22% (1 Month LIBOR USD + 1.03%, 1.03% Floor), 12/15/2036(1)(2) | 5,000,000 | 4,801,625 | ||||||
2.12% (1 Month LIBOR USD + 1.93%, 1.93% Floor), 12/15/2036(1)(2) | 3,400,000 | 3,111,167 | ||||||
GS Mortgage Securities Corp. Trust 2013-PEMB | ||||||||
3.67%, 03/05/2033(2)(4) | 4,860,000 | 3,808,365 | ||||||
GS Mortgage Securities Corp. Trust 2019-SOHO | ||||||||
1.48% (1 Month LIBOR USD + 1.30%, 1.30% Floor), 06/15/2036(1)(2) | 7,090,000 | 6,683,350 | ||||||
GS Mortgage Securities Trust 2011-GC3 | ||||||||
5.82%, 03/10/2044(2)(4) | 340,000 | 330,240 | ||||||
GS Mortgage Securities Trust 2011-GC5 | ||||||||
5.56%, 08/10/2044(2)(4) | 220,000 | 163,202 | ||||||
GS Mortgage Securities Trust 2013-GC16 | ||||||||
5.16%, 11/10/2046(4) | 7,561,000 | 8,078,204 | ||||||
GS Mortgage Securities Trust 2014-GC18 | ||||||||
4.38%, 01/10/2047 | 905,000 | 961,889 | ||||||
GS Mortgage Securities Trust 2015-GC34 | ||||||||
3.51%, 10/10/2048 | 540,000 | 589,871 |
GS Mortgage Securities Trust 2017-GS8 | ||||||||
4.48%, 11/10/2050(4) | 5,365,000 | 5,193,589 | ||||||
GS Mortgage Securities Trust 2019-GC40 | ||||||||
3.16%, 07/10/2052 | 9,560,000 | 10,575,406 | ||||||
GS Mortgage-Backed Securities Corp. Trust 2019-PJ1 | ||||||||
4.00%, 08/25/2049(2)(4) | 3,855,000 | 3,989,917 | ||||||
GS Mortgage-Backed Securities Trust 2020-INV1 | ||||||||
3.00%, 08/25/2050(2)(4) | 12,050,000 | 12,424,680 | ||||||
HarborView Mortgage Loan Trust 2005-9 | ||||||||
0.64% (1 Month LIBOR USD + 0.45%, 0.45% Floor, 11.00% Cap), | 7,300,531 | 6,770,412 | ||||||
HarborView Mortgage Loan Trust 2006-7 | ||||||||
0.39% (1 Month LIBOR USD + 0.20%, 0.20% Floor), 09/19/2046(1) | 4,433,731 | 3,808,065 | ||||||
HarborView Mortgage Loan Trust 2006-10 | ||||||||
0.39% (1 Month LIBOR USD + 0.20%, 0.20% Floor), 11/19/2036(1) | 9,907,702 | 8,329,363 | ||||||
HarborView Mortgage Loan Trust 2006-12 | ||||||||
0.40% (1 Month LIBOR USD + 0.21%, 0.21% Floor), 12/19/2036(1) | 32,877,784 | 26,248,137 | ||||||
HarborView Mortgage Loan Trust 2007-6 | ||||||||
0.39% (1 Month LIBOR USD + 0.20%, 10.50% Cap), 08/19/2037(1) | 9,120,297 | 7,639,819 | ||||||
Harvest Commercial Capital Loan Trust 2019-1 | ||||||||
3.29%, 09/25/2046(2)(4) | 9,771,391 | 9,857,511 | ||||||
Hawksmoor Mortgages | ||||||||
1.29% (3 Month Sterling Overnight Interbank Average Rate + 1.05%), 05/25/2053(1)(2) | GBP | 20,921,026 | 25,915,958 | |||||
Hilton Orlando Trust 2018-ORL | ||||||||
0.95% (1 Month LIBOR USD + 0.77%, 0.77% Floor), 12/15/2034(1)(2) | $ | 2,085,000 | 1,985,832 | |||||
1.23% (1 Month LIBOR USD + 1.05%, 1.05% Floor), 12/15/2034(1)(2) | 350,000 | 330,725 | ||||||
Homeward Opportunities Fund I Trust 2018-1 | ||||||||
3.77%, 06/25/2048(2)(4) | 4,288,666 | 4,370,773 | ||||||
4.00%, 06/25/2048(2)(4) | 3,743,314 | 3,804,481 | ||||||
Homeward Opportunities Fund I Trust 2019-1 | ||||||||
3.45%, 01/25/2059(2)(4) | 2,534,885 | 2,578,592 | ||||||
3.61%, 01/25/2059(2)(4) | 3,539,839 | 3,588,232 | ||||||
3.95%, 01/25/2059(2)(4) | 4,495,000 | 4,327,526 | ||||||
Homeward Opportunities Fund I Trust 2019-2 | ||||||||
2.70%, 09/25/2059(2)(4) | 6,313,256 | 6,390,961 | ||||||
Homeward Opportunities Fund I Trust 2019-3 | ||||||||
2.68%, 11/25/2059(2)(4) | 3,209,054 | 3,240,050 | ||||||
3.03%, 11/25/2059(2)(4) | 3,414,983 | 3,432,527 | ||||||
HSI Asset Securitization Corp. Trust 2005-NC1 | ||||||||
1.14% (1 Month LIBOR USD + 0.96%, 0.64% Floor), 07/25/2035(1) | 6,336,000 | 5,766,249 | ||||||
Hudson Yards 2019-30HY Mortgage Trust | ||||||||
3.23%, 07/10/2039(2) | 6,570,000 | 7,339,141 | ||||||
3.38%, 07/10/2039(2)(4) | 3,905,000 | 4,170,925 | ||||||
3.56%, 07/10/2039(2)(4) | 4,500,000 | 4,506,429 | ||||||
Hudson Yards 2019-55HY Mortgage Trust | ||||||||
3.04%, 12/10/2041(2)(4) | 5,545,000 | 6,095,411 | ||||||
Hudsons Bay Simon JV Trust 2015-HBS | ||||||||
4.15%, 08/05/2034(2) | 3,540,000 | 2,935,535 | ||||||
ILPT Trust 2019-SURF | ||||||||
4.15%, 02/11/2041(2) | 7,575,000 | 8,517,782 | ||||||
Impac CMB Trust Series 2004-7 | ||||||||
0.82% (1 Month LIBOR USD + 0.64%, 11.25% Cap), 11/25/2034(1) | 5,393,679 | 5,251,619 | ||||||
Independence Plaza Trust 2018-INDP | ||||||||
3.76%, 07/10/2035(2) | 3,265,000 | 3,478,063 | ||||||
3.91%, 07/10/2035(2) | 2,780,000 | 2,920,583 | ||||||
IndyMac INDX Mortgage Loan Trust 2006-AR19 | ||||||||
3.74%, 08/25/2036(4) | 10,649,953 | 9,118,976 | ||||||
IndyMac INDX Mortgage Loan Trust 2007-AR15 | ||||||||
3.49%, 08/25/2037(4) | 4,786,316 | 3,892,566 | ||||||
InTown Hotel Portfolio Trust 2018-STAY | ||||||||
1.23% (1 Month LIBOR USD + 1.05%, 1.05% Floor), 01/15/2033(1)(2) | 430,000 | 400,047 | ||||||
JP Morgan Chase Commercial Mortgage Securities Trust 2015-UES | ||||||||
3.74%, 09/05/2032(2)(4) | 590,000 | 581,015 | ||||||
JP Morgan Chase Commercial Mortgage Securities Trust 2016-JP2 | ||||||||
3.06%, 08/15/2049 | 1,993,000 | 2,037,739 | ||||||
JP Morgan Chase Commercial Mortgage Securities Trust 2016-JP3 | ||||||||
3.40%, 08/15/2049(4) | 565,000 | 535,335 | ||||||
JP Morgan Chase Commercial Mortgage Securities Trust 2016-NINE | ||||||||
2.95%, 09/06/2038(2)(4) | 910,000 | 939,032 | ||||||
2.95%, 09/06/2038(2)(4) | 3,597,500 | 3,783,929 | ||||||
JP Morgan Chase Commercial Mortgage Securities Trust 2018-WPT | ||||||||
4.25%, 07/05/2033(2) | 965,000 | 1,022,629 | ||||||
JP Morgan Chase Commercial Mortgage Securities Trust 2019-OSB | ||||||||
3.40%, 06/05/2039(2) | 8,012,500 | 8,928,096 | ||||||
JP Morgan Mortgage Trust 2019-INV3 | ||||||||
3.50%, 05/25/2050(2)(4) | 3,737,693 | 3,814,319 | ||||||
3.50%, 05/25/2050(2)(4) | 4,374,908 | 4,463,259 | ||||||
JP Morgan Mortgage Trust 2020-INV1 | ||||||||
1.00% (1 Month LIBOR USD + 0.83%, 6.00% Cap), 08/25/2050(1)(2) | 2,226,056 | 2,203,435 | ||||||
3.50%, 08/25/2050(2)(4) | 3,702,935 | 3,844,786 | ||||||
JP Morgan Resecuritization Trust Series 2014-6 | ||||||||
0.38% (1 Month LIBOR USD + 0.21%, 0.21% Floor), 07/27/2046(1)(2) | 426,995 | 424,992 | ||||||
JP Morgan Seasoned Mortgage Trust 2010-1 | ||||||||
0.00%, 03/25/2050(2)(4) | 12,762,372 | 11,250,955 | ||||||
JPMBB Commercial Mortgage Securities Trust 2014-C24 | ||||||||
2.94%, 11/15/2047 | 678,262 | 677,849 |
JPMBB Commercial Mortgage Securities Trust 2015-C30 | ||||||||
3.82%, 07/15/2048 | 2,780,000 | 3,066,039 | ||||||
JPMBB Commercial Mortgage Securities Trust 2015-C31 | ||||||||
3.80%, 08/15/2048 | 5,065,000 | 5,586,298 | ||||||
JPMCC Commercial Mortgage Securities Trust 2017-JP5 | ||||||||
3.88%, 03/15/2050(4) | 4,990,000 | 5,424,386 | ||||||
JPMDB Commercial Mortgage Securities Trust 2016-C4 | ||||||||
3.38%, 12/15/2049 | 4,040,000 | 4,206,686 | ||||||
JPMDB Commercial Mortgage Securities Trust 2018-C8 | ||||||||
4.90%, 06/15/2051(4) | 3,474,000 | 3,221,671 | ||||||
Lanark Master Issuer Plc | ||||||||
1.13% (3 Month LIBOR USD + 0.77%), 12/22/2069(1)(2) | 8,436,000 | 8,368,759 | ||||||
2.28%, 12/22/2069(2)(4) | 695,000 | 702,246 | ||||||
2.71%, 12/22/2069(2)(3) | 3,285,000 | 3,264,790 | ||||||
Legacy Mortgage Asset Trust 2019-GS7 | ||||||||
3.25%, 11/25/2059(2)(3) | 5,709,316 | 5,678,394 | ||||||
Legacy Mortgage Asset Trust 2020-GS1 | ||||||||
2.88%, 10/25/2059(2)(3) | 4,279,749 | 4,238,749 | ||||||
Mansard Mortgages 2007-1 Plc | ||||||||
0.97% (3 Month LIBOR GBP + 0.30%), 04/15/2049(1) | GBP | 5,966,221 | 6,673,637 | |||||
Merrill Lynch Mortgage Investors Trust Series MLCC 2004-HB1 | ||||||||
3.17%, 04/25/2029(4) | $ | 709,382 | 674,666 | |||||
Metlife Securitization Trust 2018-1 | ||||||||
3.75%, 03/25/2057(2)(4) | 15,136,726 | 16,127,726 | ||||||
Mill City Mortgage Loan Trust 2019-1 | ||||||||
3.25%, 10/25/2069(2)(4) | 2,164,243 | 2,278,591 | ||||||
3.50%, 10/25/2069(2)(4) | 1,187,812 | 1,235,871 | ||||||
Mill City Mortgage Loan Trust 2019-GS1 | ||||||||
2.75%, 07/25/2059(2)(4) | 5,705,491 | 5,971,179 | ||||||
Mill City Mortgage Loan Trust 2019-GS2 | ||||||||
2.75%, 08/25/2059(2)(4) | 13,947,855 | 14,584,363 | ||||||
Morgan Stanley Bank of America Merrill Lynch Trust 2013-C9 | ||||||||
3.46%, 05/15/2046 | 3,750,000 | 3,855,106 | ||||||
Morgan Stanley Bank of America Merrill Lynch Trust 2014-C15 | ||||||||
4.26%, 04/15/2047 | 1,940,000 | 2,055,296 | ||||||
Morgan Stanley Bank of America Merrill Lynch Trust 2014-C17 | ||||||||
3.74%, 08/15/2047 | 974,000 | 1,050,779 | ||||||
4.46%, 08/15/2047(4) | 1,655,000 | 1,707,549 | ||||||
Morgan Stanley Bank of America Merrill Lynch Trust 2014-C18 | ||||||||
4.00%, 08/15/2031 | 310,000 | 322,318 | ||||||
Morgan Stanley Bank of America Merrill Lynch Trust 2015-C24 | ||||||||
3.73%, 05/15/2048 | 6,000,000 | 6,587,102 | ||||||
4.04%, 05/15/2048(4) | 190,000 | 202,914 | ||||||
Morgan Stanley Bank of America Merrill Lynch Trust 2016-C30 | ||||||||
2.86%, 09/15/2049 | 3,220,000 | 3,434,275 | ||||||
Morgan Stanley Bank of America Merrill Lynch Trust 2017-C34 | ||||||||
4.32%, 11/15/2052(4) | 845,000 | 730,730 | ||||||
Morgan Stanley Capital I Trust 2011-C2 | ||||||||
5.66%, 06/15/2044(2)(4) | 1,415,000 | 845,837 | ||||||
Morgan Stanley Capital I Trust 2017-H1 | ||||||||
4.28%, 06/15/2050(4) | 1,490,089 | 1,347,574 | ||||||
Morgan Stanley Capital I Trust 2018-H4 | ||||||||
4.31%, 12/15/2051 | 4,030,000 | 4,787,611 | ||||||
Morgan Stanley Resecuritization Trust 2013-R7 | ||||||||
0.71% (1 Month LIBOR USD + 0.27%, 0.27% Floor, 11.50% Cap), 12/26/2046(1)(2) | 8,127,514 | 7,918,808 | ||||||
Motel 6 Trust 2017-MTL6 | ||||||||
1.10% (1 Month LIBOR USD + 0.92%, 0.92% Floor), 08/15/2034(1)(2) | 2,618,477 | 2,566,758 | ||||||
1.37% (1 Month LIBOR USD + 1.19%, 1.19% Floor), 08/15/2034(1)(2) | 6,178,848 | 5,931,395 | ||||||
2.33% (1 Month LIBOR USD + 2.15%, 2.15% Floor), 08/15/2034(1)(2) | 641,958 | 603,395 | ||||||
MSCG Trust 2018-SELF | ||||||||
1.08% (1 Month LIBOR USD + 0.90%, 0.90% Floor), 10/15/2037(1)(2) | 4,110,000 | 4,048,343 | ||||||
Natixis Commercial Mortgage Securities Trust 2020-2PAC | ||||||||
2.97%, 12/15/2038(2) | 6,668,500 | 6,943,139 | ||||||
New Orleans Hotel Trust 2019-HNLA | ||||||||
1.17% (1 Month LIBOR USD + 0.99%, 0.99% Floor), 04/15/2032(1)(2) | 5,000,000 | 4,736,998 | ||||||
1.47% (1 Month LIBOR USD + 1.29%, 1.29% Floor), 04/15/2032(1)(2) | 6,425,000 | 5,910,030 | ||||||
New Residential Mortgage Loan Trust 2019-NQM1 | ||||||||
3.67%, 01/25/2049(2)(4) | 3,399,194 | 3,411,483 | ||||||
3.93%, 01/25/2049(2)(4) | 3,212,469 | 3,163,658 | ||||||
New Residential Mortgage Loan Trust 2019-NQM2 | ||||||||
3.60%, 04/25/2049(2)(4) | 4,577,375 | 4,667,947 | ||||||
3.70%, 04/25/2049(2)(4) | 1,533,267 | 1,555,632 | ||||||
New Residential Mortgage Loan Trust 2019-NQM3 | ||||||||
2.80%, 07/25/2049(2)(4) | 6,000,638 | 6,088,762 | ||||||
3.09%, 07/25/2049(2)(4) | 2,438,269 | 2,472,638 | ||||||
New Residential Mortgage Loan Trust 2019-NQM5 | ||||||||
2.71%, 11/25/2059(2)(4) | 3,550,654 | 3,605,183 | ||||||
New Residential Mortgage Loan Trust 2019-RPL3 | ||||||||
2.75%, 07/25/2059(2)(4) | 35,498,400 | 37,217,708 | ||||||
New Residential Mortgage Loan Trust 2020-NQM1 | ||||||||
2.46%, 01/26/2060(2)(4) | 4,524,210 | 4,601,094 | ||||||
Nomura Resecuritization Trust 2015-7R | ||||||||
3.50%, 08/26/2036(2)(4) | 315,229 | 316,061 | ||||||
OBX 2018-EXP1 Trust | ||||||||
1.03% (1 Month LIBOR USD + 0.85%, 0.85% Floor), 04/25/2048(1)(2) | 2,356,295 | 2,417,144 | ||||||
4.00%, 04/25/2048(2)(4) | 1,314,493 | 1,367,293 | ||||||
OBX 2019-EXP2 Trust | ||||||||
4.00%, 06/25/2059(2)(4) | 3,444,462 | 3,584,594 |
OBX 2019-EXP3 Trust | ||||||||
3.50%, 10/25/2059(2)(4) | 2,503,541 | 2,567,461 | ||||||
OBX 2020-EXP1 Trust | ||||||||
0.93% (1 Month LIBOR USD + 0.75%), 02/25/2060(1)(2) | 1,146,076 | 1,147,438 | ||||||
3.50%, 02/25/2060(2)(4) | 3,212,528 | 3,303,390 | ||||||
OBX 2020-INV1 Trust | ||||||||
3.50%, 12/25/2049(2)(4) | 5,859,256 | 6,046,777 | ||||||
One Bryant Park Trust 2019-OBP | ||||||||
2.52%, 09/15/2054(2) | 7,390,000 | 7,818,437 | ||||||
Palisades Center Trust 2016-PLSD | ||||||||
2.71%, 04/13/2033(2) | 640,000 | 624,701 | ||||||
Precise Mortgage Funding 2018-2B Plc | ||||||||
0.88% (3 Month LIBOR GBP + 0.68%), 03/12/2055(1) | GBP | 3,776,363 | 4,614,530 | |||||
Queens Center Mortgage Trust 2013-QC | ||||||||
3.28%, 01/11/2037(2) | $ | 3,915,000 | 3,855,002 | |||||
RALI Series 2006-QS9 Trust | ||||||||
6.00%, 07/25/2036 | 4,428,742 | 4,185,215 | ||||||
RALI Series 2007-QH8 Trust | ||||||||
2.62%, 10/25/2037(4) | 1,329,811 | 1,162,499 | ||||||
RBS Commercial Funding, Inc. 2013-GSP Trust | ||||||||
3.96%, 01/15/2032(2)(4) | 1,565,000 | 1,590,368 | ||||||
RCO V Mortgage LLC 2019-1 | ||||||||
3.72%, 05/24/2024(2)(3) | 2,654,910 | 2,660,851 | ||||||
Real Estate Asset Liquidity Trust | ||||||||
2.42%, 06/12/2054(2)(4) | CAD | 11,814,073 | 8,720,189 | |||||
RESIMAC Bastille Trust Series 2018-1NC | ||||||||
1.02% (1 Month LIBOR USD + 0.85%), 12/05/2059(1)(2) | $ | 1,560,001 | 1,540,952 | |||||
RETL 2019-RVP | ||||||||
1.33% (1 Month LIBOR USD + 1.15%, 1.15% Floor), 03/15/2036(1)(2) | 603,048 | 573,689 | ||||||
Rosslyn Portfolio Trust 2017-ROSS | ||||||||
1.94% (1 Month LIBOR USD + 0.95%, 1.94% Floor), 06/15/2033(1)(2) | 15,800,000 | 15,484,003 | ||||||
Seasoned Credit Risk Transfer Trust Series 2016-1 | ||||||||
3.00%, 09/25/2055(2)(4) | 375,000 | 370,466 | ||||||
Seasoned Credit Risk Transfer Trust Series 2017-2 | ||||||||
4.00%, 08/25/2056(2)(4) | 910,000 | 896,166 | ||||||
Sequoia Mortgage Trust 2003-2 | ||||||||
0.85% (1 Month LIBOR USD + 0.66%, 0.33% Floor, 11.50% Cap), 06/20/2033(1) | 496,203 | 472,598 | ||||||
Sequoia Mortgage Trust 2004-9 | ||||||||
1.67% (6 Month LIBOR USD + 0.72%, 0.36% Floor, 11.50% Cap), 10/20/2034(1) | 1,069,876 | 1,029,596 | ||||||
Sequoia Mortgage Trust 2013-4 | ||||||||
3.49%, 04/25/2043(4) | 2,374,295 | 2,381,519 | ||||||
Sequoia Mortgage Trust 2017-CH2 | ||||||||
4.00%, 12/25/2047(2)(4) | 1,290,121 | 1,339,039 | ||||||
4.00%, 12/25/2047(2)(4) | 1,336,988 | 1,375,988 | ||||||
Sequoia Mortgage Trust 2018-CH1 | ||||||||
3.50%, 02/25/2048(2)(4) | 411,361 | 420,893 | ||||||
Sequoia Mortgage Trust 2018-CH2 | ||||||||
4.00%, 06/25/2048(2)(4) | 1,273,172 | 1,302,339 | ||||||
Sequoia Mortgage Trust 2018-CH3 | ||||||||
4.00%, 08/25/2048(2)(4) | 3,925,694 | 4,033,844 | ||||||
4.50%, 08/25/2048(2)(4) | 1,645,127 | 1,716,161 | ||||||
4.50%, 08/25/2048(2)(4) | 5,000,000 | 5,219,192 | ||||||
Sequoia Mortgage Trust 2018-CH4 | ||||||||
4.00%, 10/25/2048(2)(4) | 1,330,985 | 1,370,173 | ||||||
Sequoia Mortgage Trust 2019-CH2 | ||||||||
4.50%, 08/25/2049(2)(4) | 2,304,121 | 2,368,291 | ||||||
SFAVE Commercial Mortgage Securities Trust 2015-5AVE | ||||||||
4.14%, 01/05/2043(2)(4) | 780,000 | 702,195 | ||||||
SG Residential Mortgage Trust 2019-3 | ||||||||
2.70%, 09/25/2059(2)(4) | 3,487,279 | 3,516,194 | ||||||
SLIDE 2018-FUN | ||||||||
2.48% (1 Month LIBOR USD + 2.30%, 2.30% Floor), 06/15/2031(1)(2) | 5,070,067 | 4,359,417 | ||||||
SLM Student Loan Trust 2008-9 | ||||||||
2.49% (3 Month LIBOR USD + 1.50%), 04/25/2023(1) | 7,870,989 | 7,701,241 | ||||||
Southern Pacific Securities 06-1 Plc | ||||||||
0.50% (3 Month LIBOR GBP + 0.30%), 03/10/2044(1) | GBP | 1,683,461 | 2,078,569 | |||||
STACR Trust 2018-DNA2 | ||||||||
0.98% (1 Month LIBOR USD + 0.80%), 12/25/2030(1)(2) | $ | 497,685 | 496,408 | |||||
1.13% (1 Month LIBOR USD + 0.95%), 12/25/2030(1)(2) | 6,800,000 | 6,834,677 | ||||||
STACR Trust 2018-DNA3 | ||||||||
1.08% (1 Month LIBOR USD + 0.90%), 09/25/2048(1)(2) | 4,965,000 | 4,899,192 | ||||||
STACR Trust 2018-HRP2 | ||||||||
1.43% (1 Month LIBOR USD + 1.25%), 02/25/2047(1)(2) | 3,044,952 | 2,998,772 | ||||||
Starwood Mortgage Residential Trust 2018-IMC2 | ||||||||
4.12%, 10/25/2048(2)(4) | 4,469,955 | 4,610,306 | ||||||
Starwood Mortgage Residential Trust 2019-1 | ||||||||
2.94%, 06/25/2049(2)(4) | 5,863,026 | 5,885,068 | ||||||
Starwood Mortgage Residential Trust 2019-IMC1 | ||||||||
3.47%, 02/25/2049(2)(4) | 2,549,323 | 2,614,139 | ||||||
3.75%, 02/25/2049(2)(4) | 1,431,289 | 1,421,350 | ||||||
4.09%, 02/25/2049(2)(4) | 2,160,000 | 1,878,554 | ||||||
Starwood Mortgage Residential Trust 2019-INV1 | ||||||||
2.61%, 09/27/2049(2)(4) | 5,085,284 | 5,101,454 | ||||||
Sutherland Commercial Mortgage Loans 2017-SBC6 | ||||||||
3.19%, 05/25/2037(2)(4) | 3,442,310 | 3,415,429 | ||||||
Towd Point Mortgage Funding | ||||||||
1.39% (3 Month Sterling Overnight Interbank Average Rate + 0.90%), 07/20/2045(1)(2) | GBP | 93,749,895 | 115,356,051 |
Towd Point Mortgage Funding 2018 - Auburn 12 Plc | ||||||||
1.06% (3 Month LIBOR GBP + 0.80%), 02/20/2045(1) | 2,586,526 | 3,170,177 | ||||||
Towd Point Mortgage Funding 2019 - Granite4 Plc | ||||||||
1.68% (3 Month LIBOR GBP + 1.03%), 10/20/2051(1)(2) | 28,446,965 | 35,171,182 | ||||||
Towd Point Mortgage Trust 2019-4 | ||||||||
2.90%, 10/25/2059(2)(4) | $ | 104,890,095 | 110,335,579 | |||||
UBS Commercial Mortgage Trust 2018-C9 | ||||||||
4.32%, 03/15/2051(4) | 1,718,000 | 1,902,857 | ||||||
UBS-Barclays Commercial Mortgage Trust 2012-C2 | ||||||||
5.05%, 05/10/2063(2)(4) | 1,135,000 | 614,954 | ||||||
5.05%, 05/10/2063(2)(4) | 2,750,000 | 1,026,048 | ||||||
Verus Securitization Trust 2018-2 | ||||||||
3.68%, 06/01/2058(2)(4) | 1,322,346 | 1,338,315 | ||||||
3.78%, 06/01/2058(2)(4) | 721,915 | 726,370 | ||||||
Verus Securitization Trust 2018-3 | ||||||||
4.11%, 10/25/2058(2)(4) | 3,541,966 | 3,622,500 | ||||||
4.18%, 10/25/2058(2)(4) | 2,739,915 | 2,741,331 | ||||||
Verus Securitization Trust 2018-INV1 | ||||||||
3.63%, 03/25/2058(2)(4) | 655,917 | 656,858 | ||||||
Verus Securitization Trust 2018-INV2 | ||||||||
4.15%, 10/25/2058(2)(4) | 3,336,864 | 3,375,297 | ||||||
Verus Securitization Trust 2019-1 | ||||||||
3.84%, 02/25/2059(2)(4) | 4,619,265 | 4,709,015 | ||||||
Verus Securitization Trust 2019-2 | ||||||||
3.78%, 05/25/2059(2)(4) | 12,360,000 | 10,684,136 | ||||||
Verus Securitization Trust 2019-3 | ||||||||
3.04%, 07/25/2059(2)(3) | 2,302,370 | 2,286,860 | ||||||
Verus Securitization Trust 2019-4 | ||||||||
2.64%, 11/25/2059(2)(3) | 4,048,077 | 4,114,116 | ||||||
Verus Securitization Trust 2019-INV1 | ||||||||
3.40%, 12/25/2059(2)(4) | 4,561,667 | 4,665,691 | ||||||
3.66%, 12/25/2059(2)(4) | 1,286,394 | 1,306,875 | ||||||
Verus Securitization Trust 2019-INV2 | ||||||||
3.12%, 07/25/2059(2)(4) | 5,055,108 | 5,143,340 | ||||||
Verus Securitization Trust 2019-INV3 | ||||||||
2.69%, 11/25/2059(2)(4) | 8,280,157 | 8,379,388 | ||||||
Verus Securitization Trust 2020-1 | ||||||||
2.72%, 01/25/2060(2)(4) | 4,383,330 | 4,359,433 | ||||||
Verus Securitization Trust 2020-INV1 | ||||||||
3.89%, 04/25/2060(2) | 805,000 | 807,116 | ||||||
Vista Point Securitization Trust 2020-1 | ||||||||
1.76%, 03/25/2065(2)(4) | 4,010,000 | 4,009,944 | ||||||
3.20%, 03/25/2065(2)(4) | 3,765,000 | 3,764,937 | ||||||
Wachovia Bank Commercial Mortgage Trust Series 2006-C29 | ||||||||
5.44%, 11/15/2048(4) | 2,173,631 | 2,159,318 | ||||||
Wachovia Bank Commercial Mortgage Trust Series 2007-C33 | ||||||||
5.84%, 02/15/2051(4) | 3,228,566 | 2,528,936 | ||||||
WaMu Mortgage Pass-Through Certificates Series 2005-AR2 Trust | ||||||||
0.51% (1 Month LIBOR USD + 0.33%, 0.33% Floor, 10.50% Cap), 01/25/2045(1) | 5,167,695 | 4,791,266 | ||||||
WaMu Mortgage Pass-Through Certificates Series 2005-AR11 Trust | ||||||||
0.50% (1 Month LIBOR USD + 0.32%, 0.32% Floor, 10.50% Cap), 08/25/2045(1) | 2,669,890 | 2,678,342 | ||||||
WaMu Mortgage Pass-Through Certificates Series 2005-AR13 Trust | ||||||||
0.47% (1 Month LIBOR USD + 0.29%, 0.29% Floor, 10.50% Cap), 10/25/2045(1) | 4,090,145 | 3,948,748 | ||||||
WaMu Mortgage Pass-Through Certificates Series 2005-AR15 Trust | ||||||||
0.44% (1 Month LIBOR USD + 0.26%, 0.26% Floor, 10.50% Cap), 11/25/2045(1) | 5,342,824 | 5,034,992 | ||||||
WaMu Mortgage Pass-Through Certificates Series 2007-OA5 Trust | ||||||||
2.25% (12 Month U.S. Treasury Average + 0.75%, 0.75% Floor), | 12,669,514 | 11,298,798 | ||||||
Warwick Finance Residential Mortgages No One Plc | ||||||||
1.68% (3 Month LIBOR GBP + 1.50%), 09/21/2049(1) | GBP | 14,169,991 | 17,547,378 | |||||
Washington Mutual Mortgage Pass-Through Certificates WMALT Series 2007-2 Trust | ||||||||
5.50%, 04/25/2037 | $ | 9,944,740 | 10,246,437 | |||||
Wells Fargo Commercial Mortgage Trust 2015-C30 | ||||||||
3.66%, 09/15/2058 | 1,280,000 | 1,407,780 | ||||||
Wells Fargo Commercial Mortgage Trust 2016-C33 | ||||||||
3.16%, 03/15/2059 | 1,225,000 | 1,297,861 | ||||||
4.51%, 03/15/2059(4) | 4,317,000 | 4,526,739 | ||||||
Wells Fargo Commercial Mortgage Trust 2016-C35 | ||||||||
3.18%, 07/15/2048 | 3,155,000 | 3,248,090 | ||||||
Wells Fargo Commercial Mortgage Trust 2016-LC24 | ||||||||
3.37%, 10/15/2049 | 6,000,000 | 6,239,435 | ||||||
Wells Fargo Commercial Mortgage Trust 2017-C38 | ||||||||
3.45%, 07/15/2050 | 1,695,000 | 1,892,915 | ||||||
3.67%, 07/15/2050(4) | 1,315,000 | 1,444,416 | ||||||
Wells Fargo Commercial Mortgage Trust 2017-HSDB | ||||||||
1.03% (1 Month LIBOR USD + 0.85%, 0.85% Floor), 12/13/2031(1)(2) | 8,100,000 | 7,672,838 | ||||||
1.28% (1 Month LIBOR USD + 1.10%, 1.10% Floor), 12/13/2031(1)(2) | 6,700,000 | 6,114,455 | ||||||
2.03% (1 Month LIBOR USD + 1.84%, 1.85% Floor), 12/13/2031(1)(2) | 100,000 | 81,396 | ||||||
Wells Fargo Commercial Mortgage Trust 2019-C50 | ||||||||
4.19%, 05/15/2052 | 2,085,000 | 2,129,469 | ||||||
Wells Fargo Commercial Mortgage Trust 2019-C51 | ||||||||
3.31%, 06/15/2052 | 10,905,000 | 12,234,258 | ||||||
Wells Fargo Commercial Mortgage Trust 2019-C53 | ||||||||
3.51%, 10/15/2052(4) | 3,290,000 | 3,363,109 | ||||||
Wells Fargo Commercial Mortgage Trust 2019-C54 | ||||||||
3.67%, 12/15/2052 | 4,420,000 | 4,534,007 | ||||||
Wells Fargo Commercial Mortgage Trust 2019-JWDR | ||||||||
2.58%, 09/15/2031(2)(4) | 6,560,000 | 6,458,620 | ||||||
2.79%, 09/15/2031(2)(4) | 1,880,000 | 1,784,659 |
Wells Fargo Commercial Mortgage Trust 2020-C55 | ||||||||
2.73%, 02/15/2053 | 11,075,000 | 11,961,969 | ||||||
3.14%, 02/15/2053 | 2,375,000 | 2,240,371 | ||||||
WFRBS Commercial Mortgage Trust 2011-C2 | ||||||||
5.85%, 02/15/2044(2)(4) | 3,500,000 | 3,431,361 | ||||||
WFRBS Commercial Mortgage Trust 2011-C5 | ||||||||
5.84%, 11/15/2044(2)(4) | 115,000 | 105,547 | ||||||
WFRBS Commercial Mortgage Trust 2012-C7 | ||||||||
4.97%, 06/15/2045(2)(4) | 690,000 | 286,721 | ||||||
WFRBS Commercial Mortgage Trust 2014-C19 | ||||||||
4.72%, 03/15/2047(4) | 329,000 | 339,150 | ||||||
WFRBS Commercial Mortgage Trust 2014-C22 | ||||||||
4.07%, 09/15/2057(4) | 4,250,000 | 4,506,568 | ||||||
Worldwide Plaza Trust 2017-WWP | ||||||||
3.53%, 11/10/2036(2) | 1,740,000 | 1,917,859 | ||||||
3.72%, 11/10/2036(2)(4) | 320,000 | 324,008 | ||||||
|
| |||||||
Total Mortgage-Backed Obligations (Cost: $5,817,461,051) | 5,929,947,009 | |||||||
|
| |||||||
Total Bonds & Notes (Cost: $17,285,382,338) |
| 17,814,776,383 | ||||||
|
| |||||||
BANK LOANS – 2.66% | ||||||||
1011778 BC ULC | ||||||||
1.93% (LIBOR + 1.75%), 11/19/2026(1) | 1,583,358 | 1,497,858 | ||||||
ABG Intermediate Holdings 2 LLC | ||||||||
3.68% (LIBOR + 3.50%), 09/27/2024(1) | 2,348,839 | 2,188,531 | ||||||
Acrisure LLC | ||||||||
3.68% (LIBOR + 3.50%), 02/15/2027(1) | 2,493,749 | 2,350,359 | ||||||
Advanced Drainage Systems, Inc. | ||||||||
2.44% (LIBOR + 2.25%), 07/31/2026(1) | 480,256 | 466,450 | ||||||
Advanz Pharma Corp. | ||||||||
6.57% (LIBOR + 5.50%), 09/06/2024(1) | 1,760,023 | 1,626,261 | ||||||
AI Alpine U.S. Bidco, Inc. | ||||||||
4.21% (LIBOR + 3.00%), 10/31/2025(1)(16) | 2,019,535 | 1,817,582 | ||||||
AI Convoy SARL | ||||||||
3.75% (EURIBOR + 3.75%), 01/18/2027(1) | EUR | 1,000,000 | 1,068,381 | |||||
Aldevron LLC | ||||||||
5.25% (LIBOR + 4.25%), 10/12/2026(1) | $ | 3,715,688 | 3,655,308 | |||||
Alliant Holdings Intermediate LLC | ||||||||
2.93% (LIBOR + 2.75%), 05/09/2025(1) | 5,448,800 | 5,152,876 | ||||||
Alphabet Holding Company, Inc. | ||||||||
3.68% (LIBOR + 3.50%), 09/26/2024(1) | 97,250 | 91,324 | ||||||
Altice France SA | ||||||||
4.18% (LIBOR + 4.00%), 08/14/2026(1) | 1,379,000 | 1,323,095 | ||||||
American Airlines, Inc. | ||||||||
0.00%, 01/29/2027 | 500,000 | 375,750 | ||||||
Applied Systems, Inc. | ||||||||
4.25% (LIBOR + 3.25%), 09/19/2024(1) | 4,312,212 | 4,184,312 | ||||||
Aramark Intermediate HoldCo Corp. | ||||||||
1.93% (LIBOR + 1.75%), 03/28/2024(1) | 1,631,808 | 1,539,610 | ||||||
1.93% (LIBOR + 1.75%), 03/11/2025(1) | 186,533 | 175,807 | ||||||
Ascend Learning LLC | ||||||||
4.00% (LIBOR + 3.00%), 07/12/2024(1) | 4,588,809 | 4,356,524 | ||||||
Asurion LLC | ||||||||
3.18% (LIBOR + 3.00%), 11/03/2023(1) | 437,638 | 422,684 | ||||||
3.18% (LIBOR + 3.00%), 11/03/2024(1) | 6,810,390 | 6,559,291 | ||||||
6.68% (LIBOR + 6.50%), 08/04/2025(1) | 860,000 | 853,550 | ||||||
Avantor Funding, Inc. | ||||||||
3.25% (LIBOR + 2.25%), 11/21/2024(1) | 2,467,421 | 2,399,567 | ||||||
Avolon TLB Borrower 1 U.S. LLC | ||||||||
2.25% (LIBOR + 1.50%), 02/12/2027(1) | 4,255,335 | 3,863,504 | ||||||
2.50% (LIBOR + 1.75%), 01/15/2025(1) | 281,300 | 261,116 | ||||||
Axalta Coating Systems U.S. Holdings, Inc. | ||||||||
2.06% (LIBOR + 1.75%), 06/01/2024(1) | 68,323 | 65,292 | ||||||
Azalea TopCo, Inc. | ||||||||
4.26% (LIBOR + 3.50%), 07/24/2026(1) | 5,769,403 | 5,581,897 | ||||||
B&G Foods, Inc. | ||||||||
2.68% (LIBOR + 2.50%), 10/10/2026(1) | 759,263 | 747,874 | ||||||
Bausch Health Companies, Inc. | ||||||||
2.94% (LIBOR + 2.75%), 11/27/2025(1) | 1,359,579 | 1,312,184 | ||||||
3.19% (LIBOR + 3.00%), 06/02/2025(1) | 7,835,143 | 7,603,067 | ||||||
Beacon Roofing Supply, Inc. | ||||||||
2.43% (LIBOR + 2.25%), 01/02/2025(1) | 117,300 | 111,372 | ||||||
Berry Global, Inc. | ||||||||
2.18% (LIBOR + 2.00%), 07/01/2026(1) | 1,606,269 | 1,531,979 | ||||||
Brookfield WEC Holdings, Inc. | ||||||||
3.75% (LIBOR + 3.00%), 08/01/2025(1) | 3,024,051 | 2,913,794 | ||||||
Buckeye Partners, LP | ||||||||
2.92% (LIBOR + 2.75%), 11/01/2026(1) | 3,605,963 | 3,449,103 | ||||||
Caesars Resort Collection LLC | ||||||||
0.00%, 06/19/2025 | 3,485,000 | 3,269,383 | ||||||
2.93% (LIBOR + 2.75%), 12/23/2024(1) | 6,360,015 | 5,638,535 | ||||||
Calpine Corp. | ||||||||
2.43% (LIBOR + 2.25%), 04/05/2026(1) | 4,554,000 | 4,384,500 | ||||||
Camelot U.S. Acquisition 1 Co. | ||||||||
3.18% (LIBOR + 3.00%), 10/30/2026(1) | 3,930,250 | 3,800,080 | ||||||
Carnival Corp. | ||||||||
0.00%, 06/30/2025 | EUR | 5,000,000 | 5,377,015 | |||||
0.00%, 06/30/2025 | $ | 10,800,000 | 10,395,000 | |||||
Catalent Pharma Solutions, Inc. | ||||||||
3.25% (LIBOR + 2.25%), 05/18/2026(1) | 3,861,125 | 3,809,656 | ||||||
CCC Information Services, Inc. | ||||||||
4.00% (LIBOR + 3.00%), 04/29/2024(1) | 5,427,444 | 5,235,204 | ||||||
CenturyLink, Inc. | ||||||||
2.18% (LIBOR + 2.00%), 01/31/2025(1) | 1,462,500 | 1,393,031 | ||||||
2.43% (LIBOR + 2.25%), 03/15/2027(1) | 2,082,435 | 1,958,655 | ||||||
CEOC LLC | ||||||||
2.18% (LIBOR + 2.00%), 10/07/2024(1) | 504,835 | 502,155 | ||||||
Ceridian HCM Holding, Inc. | ||||||||
2.61% (LIBOR + 2.50%), 04/30/2025(1) | 2,932,290 | 2,798,519 | ||||||
Change Healthcare Holdings, Inc. | ||||||||
3.50% (LIBOR + 2.50%), 03/01/2024(1) | 1,967,248 | 1,885,548 | ||||||
Charter Communications Operating LLC | ||||||||
1.93% (LIBOR + 1.75%), 02/01/2027(1) | 7,459,051 | 7,161,659 | ||||||
Charter NEX US, Inc. | ||||||||
3.43% (LIBOR + 3.25%), 05/16/2024(1) | 6,426,828 | 6,134,408 | ||||||
Churchill Downs, Inc. | ||||||||
2.18% (LIBOR + 2.00%), 12/27/2024(1) | 489,950 | 470,352 | ||||||
Clean Harbors, Inc. | ||||||||
1.93% (LIBOR + 1.75%), 06/28/2024(1) | 489,899 | 478,470 | ||||||
Clear Channel Outdoor Holdings, Inc. | ||||||||
4.26% (LIBOR + 3.50%), 08/21/2026(1) | 3,278,675 | 2,963,922 | ||||||
CommScope, Inc. | ||||||||
3.43% (LIBOR + 3.25%), 04/06/2026(1) | 2,878,250 | 2,719,946 | ||||||
Core & Main, LP | ||||||||
3.75% (LIBOR + 2.75%), 08/01/2024(1) | 97,500 | 92,655 | ||||||
CPI Holdco LLC | ||||||||
4.43% (LIBOR + 4.25%), 11/04/2026(1) | 5,209,935 | 5,001,537 | ||||||
CSC Holdings LLC | ||||||||
2.43% (LIBOR + 2.25%), 01/15/2026(1) | 5,827,188 | 5,501,506 | ||||||
2.43% (LIBOR + 2.25%), 07/17/2025(1) | 3,930,217 | 3,709,142 | ||||||
2.68% (LIBOR + 2.50%), 04/15/2027(1) | 3,433,884 | 3,250,549 | ||||||
Dell International LLC | ||||||||
2.75% (LIBOR + 2.00%), 09/19/2025(1) | 93,813 | 91,266 | ||||||
Delos Finance SARL | ||||||||
2.06% (LIBOR + 1.75%), 10/06/2023(1) | 1,690,000 | 1,610,249 | ||||||
Delta Air Lines, Inc. | ||||||||
5.75% (LIBOR + 4.75%), 04/29/2023(1) | 1,913,000 | 1,873,554 | ||||||
Diamond Resorts International, Inc. | ||||||||
4.75% (LIBOR + 3.75%), 09/02/2023(1) | 6,318,895 | 5,529,033 | ||||||
Dun & Bradstreet Corp. | ||||||||
4.18% (LIBOR + 4.00%), 02/06/2026(1) | 2,693,250 | 2,619,186 | ||||||
Dynasty Acquisition Co., Inc. | ||||||||
3.81% (LIBOR + 3.50%), 04/06/2026(1) | 2,580,123 | 2,196,329 | ||||||
3.81% (LIBOR + 3.50%), 04/06/2026(1) | 4,799,028 | 4,085,172 | ||||||
Eastern Power LLC | ||||||||
4.75% (LIBOR + 3.75%), 10/02/2025(1) | 4,821,331 | 4,665,843 | ||||||
Elanco Animal Health, Inc. | ||||||||
0.00%, 02/04/2027 | 11,185,000 | 10,644,429 | ||||||
Envision Healthcare Corp. | ||||||||
3.93% (LIBOR + 3.75%), 10/10/2025(1) | 4,719,042 | 3,079,175 | ||||||
ExamWorks Group, Inc. | ||||||||
4.32% (LIBOR + 3.25%), 07/27/2023(1) | 2,403,934 | 2,343,836 | ||||||
Filtration Group Corp. | ||||||||
3.18% (LIBOR + 3.00%), 03/31/2025(1) | 6,958,638 | 6,610,706 | ||||||
Forest City Enterprises, LP | ||||||||
3.68% (LIBOR + 3.50%), 12/08/2025(1) | 788,000 | 736,780 | ||||||
Four Seasons Holdings, Inc. | ||||||||
2.18% (LIBOR + 2.00%), 11/30/2023(1) | 626,753 | 592,281 | ||||||
Frontier Communications Corp. | ||||||||
5.35% (LIBOR + 3.75%), 06/15/2024(1) | 3,233,376 | 3,142,712 | ||||||
Gentiva Health Services, Inc. | ||||||||
3.44% (LIBOR + 3.25%), 07/02/2025(1) | 315,210 | 304,572 | ||||||
GFL Environmental, Inc. | ||||||||
4.00% (LIBOR + 3.00%), 05/30/2025(1) | 4,142,559 | 4,019,152 | ||||||
Gray Television, Inc. | ||||||||
2.67% (LIBOR + 2.50%), 01/02/2026(1) | 509,786 | 492,326 | ||||||
Grifols Worldwide Operations Ltd. | ||||||||
2.11% (LIBOR + 2.00%), 11/15/2027(1) | 497,500 | 478,162 | ||||||
HCA, Inc. | ||||||||
1.93% (LIBOR + 1.75%), 03/13/2025(1) | 3,187,648 | 3,118,189 | ||||||
Hilton Worldwide Finance LLC | ||||||||
1.93% (LIBOR + 1.75%), 06/22/2026(1) | 7,631,741 | 7,191,542 | ||||||
Hostess Brands LLC | ||||||||
3.01% (LIBOR + 2.25%), 08/03/2025(1) | 1,691,479 | 1,628,894 | ||||||
HUB International Ltd. | ||||||||
4.02% (LIBOR + 3.00%), 04/25/2025(1) | 5,310,738 | 5,040,793 | ||||||
5.00% (LIBOR + 4.00%), 04/25/2025(1) | 2,373,075 | 2,327,987 | ||||||
Hyland Software, Inc. | ||||||||
4.00% (LIBOR + 3.25%), 07/01/2024(1) | 1,252,517 | 1,214,353 | ||||||
Ineos Finance Plc | ||||||||
2.50% (EURIBOR + 2.00%), 04/01/2024(1) | EUR | 5,954,198 | 6,453,334 | |||||
Intelsat Jackson Holdings SA | ||||||||
4.70% (LIBOR + 5.50%), 07/14/2021(1)(6) | $ | 2,630,760 | 2,665,301 | |||||
8.00% (LIBOR + 5.75%), 11/27/2023(1) | 13,900,000 | 13,804,507 |
IPS Acquisition LLC | ||||||||
4.25% (LIBOR + 3.25%), 11/07/2024(1) | 542,016 | 517,625 | ||||||
IQVIA, Inc. | ||||||||
1.93% (LIBOR + 1.75%), 01/17/2025(1) | 734,887 | 709,629 | ||||||
2.06% (LIBOR + 1.75%), 06/11/2025(1) | 1,243,655 | 1,203,497 | ||||||
IRB Holding Corp. | ||||||||
3.75% (LIBOR + 2.75%), 02/05/2025(1) | 97,750 | 90,035 | ||||||
Iridium Satellite LLC | ||||||||
4.75% (LIBOR + 3.75%), 11/04/2026(1) | 3,765,563 | 3,686,486 | ||||||
Jaguar Holding Co. I LLC | ||||||||
3.50% (LIBOR + 2.50%), 08/18/2022(1) | 2,530,970 | 2,496,953 | ||||||
KAR Auction Services, Inc. | ||||||||
2.50% (LIBOR + 2.25%), 09/19/2026(1) | 545,875 | 516,534 | ||||||
KFC Holding Co. | ||||||||
1.94% (LIBOR + 1.75%), 04/03/2025(1) | 13,811,831 | 13,207,564 | ||||||
Kronos, Inc. | ||||||||
3.18% (LIBOR + 3.00%), 11/01/2023(1) | 9,188,148 | 9,168,026 | ||||||
9.25% (LIBOR + 8.25%), 11/01/2024(1) | 450,000 | 449,721 | ||||||
Lake Road Generating Company, LP | ||||||||
0.00%, 02/22/2049 | 4,550,000 | 4,931,062 | ||||||
Lamar Media Corp. | ||||||||
1.67% (LIBOR + 1.50%), 02/05/2027(1) | 3,160,000 | 3,081,000 | ||||||
Level 3 Financing, Inc. | ||||||||
1.98% (LIBOR + 1.75%), 03/01/2027(1) | 11,790,353 | 11,129,268 | ||||||
LifePoint Health, Inc. | ||||||||
3.93% (LIBOR + 3.75%), 11/16/2025(1) | 5,851,741 | 5,470,617 | ||||||
Marriott Ownership Resorts, Inc. | ||||||||
1.93% (LIBOR + 1.75%), 08/29/2025(1) | 2,634,511 | 2,466,561 | ||||||
McDermott International, Inc. | ||||||||
9.25% (LIBOR + 7.00%), 05/09/2025(1) | 3,621,017 | 1,242,480 | ||||||
Meredith Corp. | ||||||||
3.26% (LIBOR + 2.50%), 01/31/2025(1) | 57,874 | 53,316 | ||||||
Messer Industries GmbH | ||||||||
2.81% (LIBOR + 2.50%), 03/02/2026(1) | 2,681,664 | 2,550,933 | ||||||
Micro Holdings Corp. | ||||||||
4.57% (LIBOR + 3.50%), 09/13/2024(1) | 301,475 | 289,588 | ||||||
Mission Broadcasting, Inc. | ||||||||
2.42% (LIBOR + 2.25%), 01/17/2024(1) | 297,568 | 282,318 | ||||||
MPH Acquisition Holdings LLC | ||||||||
3.75% (LIBOR + 2.75%), 06/07/2023(1) | 1,242,681 | 1,178,993 | ||||||
Nascar Holdings, Inc. | ||||||||
2.93% (LIBOR + 2.75%), 10/19/2026(1) | 728,425 | 695,514 | ||||||
Neiman Marcus Group LLC Ltd. | ||||||||
0.00%, 10/25/2023 | 3,384,213 | 856,206 | ||||||
0.00%, 10/25/2023 | 12,926,406 | 2,617,597 | ||||||
0.00%, 05/08/2025 | 710,421 | 717,525 | ||||||
12.31% (LIBOR + 12.75%), 10/07/2020(1)(6) | 3,356,787 | 3,423,922 | ||||||
Nexstar Broadcasting, Inc. | ||||||||
2.43% (LIBOR + 2.25%), 01/17/2024(1) | 1,156,689 | 1,097,409 | ||||||
Nouryon Finance BV | ||||||||
3.19% (LIBOR + 3.00%), 10/01/2025(1) | 1,548,852 | 1,449,462 | ||||||
Pacific Gas & Electric Co. | ||||||||
2.44% (LIBOR + 2.25%), 12/31/2020(1) | 20,028,922 | 19,928,778 | ||||||
Panther BF Aggregator 2, LP | ||||||||
3.68% (LIBOR + 3.50%), 04/30/2026(1) | 4,701,956 | 4,466,858 | ||||||
PAREXEL International Corp. | ||||||||
2.93% (LIBOR + 2.75%), 09/27/2024(1) | 10,288,065 | 9,728,703 | ||||||
Penn National Gaming, Inc. | ||||||||
3.00% (LIBOR + 2.25%), 10/15/2025(1) | 492,500 | 457,887 | ||||||
PetSmart, Inc. | ||||||||
5.00% (LIBOR + 4.00%), 03/11/2022(1) | 36,090,447 | 35,561,361 | ||||||
Pike Corp. | ||||||||
4.25% (LIBOR + 3.25%), 07/24/2026(1) | 2,699,335 | 2,615,412 | ||||||
Ply Gem Midco, Inc. | ||||||||
3.94% (LIBOR + 3.75%), 04/12/2025(1) | 1,147,553 | 1,088,741 | ||||||
PODS LLC | ||||||||
3.75% (LIBOR + 2.75%), 12/06/2024(1) | 738,162 | 704,487 | ||||||
PQ Corp. | ||||||||
2.43% (LIBOR + 2.25%), 02/07/2027(1) | 3,314,926 | 3,187,865 | ||||||
Qatar National Bank SAQ | ||||||||
1.28% (LIBOR + 0.90%), 12/22/2020(1)(15) | 2,650,000 | 2,643,375 | ||||||
Refinitiv U.S. Holdings, Inc. | ||||||||
3.43% (LIBOR + 3.25%), 10/01/2025(1) | 9,079,285 | 8,859,112 | ||||||
Reynolds Consumer Products LLC | ||||||||
1.93% (LIBOR + 1.75%), 02/04/2027(1) | 4,887,750 | 4,701,820 | ||||||
Reynolds Group Holdings, Inc. | ||||||||
2.93% (LIBOR + 2.75%), 02/05/2023(1) | 3,748,512 | 3,571,957 | ||||||
SBA Senior Finance II LLC | ||||||||
1.93% (LIBOR + 1.75%), 04/11/2025(1) | 1,568,000 | 1,505,939 | ||||||
Sequa Mezzanine Holdings LLC | ||||||||
6.00% (LIBOR + 5.00%), 11/28/2021(1) | 8,629,844 | 7,853,158 | ||||||
10.00% (LIBOR + 9.00%), 04/28/2022(1) | 660,000 | 468,600 | ||||||
Servicemaster Company LLC | ||||||||
1.93% (LIBOR + 1.75%), 11/05/2026(1) | 1,288,525 | 1,250,333 | ||||||
Sigma Holdco BV | ||||||||
3.50% (EURIBOR + 3.50%), 07/02/2025(1) | EUR | 7,690,000 | 8,225,441 |
Simply Good Foods USA, Inc. | ||||||||
4.75% (LIBOR + 3.75%), 07/07/2024(1) | $ | 1,153,692 | 1,121,965 | |||||
Sinclair Television Group, Inc. | ||||||||
2.69% (LIBOR + 2.50%), 09/30/2026(1) | 632,223 | 600,611 | ||||||
Solera LLC | ||||||||
2.93% (LIBOR + 2.75%), 03/03/2023(1) | 4,552,455 | 4,385,380 | ||||||
SS&C Technologies Holdings, Inc. | ||||||||
1.93% (LIBOR + 1.75%), 04/16/2025(1) | 414,814 | 396,276 | ||||||
1.93% (LIBOR + 1.75%), 04/16/2025(1) | 580,137 | 554,211 | ||||||
Stars Group Holdings BV | ||||||||
3.81% (LIBOR + 3.50%), 07/10/2025(1) | 1,215,303 | 1,206,747 | ||||||
Sunshine Luxembourg VII SARL | ||||||||
0.00%, 10/01/2026 | 5,186,967 | 4,955,732 | ||||||
3.75% (EURIBOR + 3.75%), 10/01/2026(1) | EUR | 1,000,000 | 1,071,156 | |||||
Syniverse Holdings, Inc. | ||||||||
6.87% (LIBOR + 5.00%), 03/09/2023(1) | $ | 460,999 | 326,240 | |||||
Telenet Financing USD LLC | ||||||||
2.18% (LIBOR + 2.00%), 04/30/2028(1) | 1,250,000 | 1,176,563 | ||||||
T-Mobile USA, Inc. | ||||||||
3.18% (LIBOR + 3.00%), 04/01/2027(1) | 6,650,000 | 6,635,636 | ||||||
Trans Union LLC | ||||||||
1.93% (LIBOR + 1.75%), 11/16/2026(1) | 2,356,570 | 2,249,794 | ||||||
TransDigm, Inc. | ||||||||
2.43% (LIBOR + 2.25%), 05/30/2025(1) | 1,236,231 | 1,107,206 | ||||||
Tronox Finance LLC | ||||||||
2.98% (LIBOR + 2.75%), 09/23/2024(1) | 126,482 | 121,142 | ||||||
Uber Technologies, Inc. | ||||||||
5.00% (LIBOR + 4.00%), 04/04/2025(1) | 2,796,118 | 2,676,025 | ||||||
UFC Holdings LLC | ||||||||
4.25% (LIBOR + 3.25%), 04/29/2026(1) | 7,227,965 | 6,890,636 | ||||||
Ultimate Software Group, Inc. | ||||||||
0.00%, 05/04/2026 | 9,185,000 | 9,060,176 | ||||||
0.00%, 05/03/2027 | 450,000 | 456,750 | ||||||
Univision Communications, Inc. | ||||||||
3.75% (LIBOR + 2.75%), 03/15/2024(1) | 4,009,813 | 3,699,052 | ||||||
USI, Inc. | ||||||||
4.31% (LIBOR + 4.00%), 12/02/2026(1) | 606,950 | 588,238 | ||||||
Vertical Midco GmbH | ||||||||
0.00%, 06/30/2027 | 1,715,000 | 1,689,275 | ||||||
VICI Properties 1 LLC | ||||||||
0.00%, 12/20/2024 | 500,000 | 464,940 | ||||||
Wand Newco 3, Inc. | ||||||||
4.07% (LIBOR + 3.00%), 02/05/2026(1) | 1,856,670 | 1,759,195 | ||||||
Weight Watchers International, Inc. | ||||||||
5.50% (LIBOR + 4.75%), 11/29/2024(1) | 874,516 | 856,484 | ||||||
Western Digital Corp. | ||||||||
1.67% (LIBOR + 1.50%), 02/27/2023(1) | 4,126,923 | 4,005,715 | ||||||
1.92% (LIBOR + 1.75%), 04/29/2023(1) | 3,272,535 | 3,177,435 | ||||||
Whatabrands LLC | ||||||||
2.93% (LIBOR + 2.75%), 07/31/2026(1) | 231,255 | 220,995 | ||||||
Windstream Services LLC | ||||||||
7.50% (LIBOR + 5.25%), 02/17/2024(1) | 48,000 | 28,640 | ||||||
8.25% (LIBOR + 6.00%), 03/29/2021(1) | 405,000 | 243,810 | ||||||
Wink Holdco, Inc. | ||||||||
4.00% (LIBOR + 3.00%), 12/02/2024(1) | 1,965,589 | 1,878,376 | ||||||
Wyndham Hotels & Resorts, Inc. | ||||||||
1.93% (LIBOR + 1.75%), 05/30/2025(1) | 196,500 | 185,103 | ||||||
Zayo Group Holdings, Inc. | ||||||||
3.18% (LIBOR + 3.00%), 03/09/2027(1) | 4,608,450 | 4,363,833 | ||||||
|
| |||||||
Total Bank Loans (Cost: $548,071,499) |
| 516,590,397 | ||||||
|
| |||||||
| Shares | Value | |||||||
COMMON STOCKS – 0.04% | ||||||||
Communications – 0.02% | ||||||||
Clear Channel Outdoor Holdings, Inc. - Class A(12) | 2,064,946 | 2,147,544 | ||||||
iHeartMedia, Inc. - Class A(12) | 139,553 | 1,165,267 | ||||||
iHeartMedia, Inc. - Class B(12)(15) | 1,787 | 13,429 | ||||||
|
| |||||||
Total Communications |
| 3,326,240 | ||||||
|
| |||||||
Consumer, Cyclical – 0.02% | ||||||||
Caesars Entertainment Corp.(12) | 338,983 | 4,111,864 | ||||||
|
| |||||||
Total Consumer, Cyclical |
| 4,111,864 | ||||||
|
| |||||||
Total Common Stocks (Cost: $15,794,687) |
| 7,438,104 | ||||||
|
| |||||||
CONVERTIBLE PREFERRED STOCKS – 0.08% | ||||||||
Consumer, Non-cyclical – 0.04% | ||||||||
Bunge Ltd., 4.88% | 82,720 | 7,609,413 | ||||||
|
| |||||||
Total Consumer, Non-cyclical |
| 7,609,413 | ||||||
|
| |||||||
Financials – 0.03% | ||||||||
Bank of America Corp., 7.25% | 4,556 | 6,115,063 | ||||||
|
| |||||||
Total Financials |
| 6,115,063 | ||||||
|
| |||||||
Utilities – 0.01% | ||||||||
NextEra Energy, Inc., 5.28% | 34,441 | 1,462,020 | ||||||
|
| |||||||
Total Utilities |
| 1,462,020 | ||||||
|
| |||||||
Total Convertible Preferred Stocks (Cost: $16,057,115) |
| 15,186,496 | ||||||
|
| |||||||
WARRANTS – 0.03% | ||||||||
Communications – 0.03% | ||||||||
iHeartMedia, Inc., expires 05/01/2039(12)(15) | 723,037 | 6,037,359 | ||||||
|
| |||||||
Total Communications |
| 6,037,359 | ||||||
|
| |||||||
Total Warrants (Cost: $14,531,679) |
| 6,037,359 | ||||||
|
| |||||||
SHORT-TERM INVESTMENTS – 8.09% | ||||||||
Money Market Funds – 2.09% | ||||||||
Fidelity Institutional Money Market Government Fund - Class I, 0.10%(13)(14) | 405,307,655 | 405,307,655 | ||||||
|
| |||||||
Total Money Market Funds | 405,307,655 | |||||||
|
| |||||||
| Principal Amount | Value | |||||||
Government Related – 0.04% | ||||||||
Argentina Treasury Bond BONCER, 1.10%, 04/17/2021 | ARS | 86,830,000 | 1,284,748 | |||||
Republic of Argentina, 0.00%, 10/13/2020 | 471,161,000 | 6,820,900 | ||||||
|
| |||||||
Total Government Related (Cost: $8,219,667) | 8,105,648 | |||||||
|
| |||||||
Commercial Paper – 0.09% | ||||||||
Ford Motor Credit Co. LLC, 3.20%, 10/14/2020(16) | $ | 17,380,000 | 17,189,374 | |||||
|
| |||||||
Total Commercial Paper (Cost: $17,222,856) | 17,189,374 | |||||||
|
| |||||||
Repurchase Agreements – 1.07% | ||||||||
Bank of America Securities, Inc., 0.12% dated 06/29/2020, due 07/01/2020, repurchase price $62,800,419 (collateralized by U.S. Treasury Note, value $64,043,973, 0.25%, 06/15/2023) | 62,800,000 | 62,800,000 | ||||||
Bank of America Securities, Inc., 0.13% dated 06/24/2020, due 07/02/2020, repurchase price $12,882,279 (collateralized by U.S. Treasury Bond, value $13,197,220, 3.50%, 02/15/2039) | 12,882,000 | 12,882,000 | ||||||
Bank of America Securities, Inc., 0.13% dated 06/24/2020, due 07/02/2020, repurchase price $47,119,021 (collateralized by U.S. Treasury Bond, value $48,327,901, 2.75%, 08/15/2047) | 47,118,000 | 47,118,000 | ||||||
Bank of America Securities, Inc., 0.13% dated 06/30/2020, due 07/01/2020, repurchase price $29,100,105 (collateralized by U.S. Treasury Note, value $29,676,427, 0.25%, 06/15/2023) | 29,100,000 | 29,100,000 | ||||||
J.P. Morgan Securities, 0.12% dated 06/30/2020, due 07/02/2020, repurchase price $56,600,377 (collateralized by U.S. Treasury Bond, value $57,609,027, 3.00%, 11/15/2044) | 56,600,000 | 56,600,000 | ||||||
|
| |||||||
Total Repurchase Agreements (Cost: $208,500,000) |
| 208,500,000 | ||||||
|
| |||||||
U.S. Treasury Bills – 4.51% | ||||||||
U.S. Cash Management Bill, 0.00%, 10/27/2020 | $ | 289,380,000 | $ | 289,247,206 | ||||
U.S. Cash Management Bill, 0.00%, 11/03/2020 | 53,685,000 | 53,652,379 | ||||||
U.S. Cash Management Bill, 0.00%, 11/24/2020 | 30,095,000 | 30,077,302 | ||||||
U.S. Treasury Bill, 0.00%, 07/16/2020 | 80,250,000 | 80,246,196 | ||||||
U.S. Treasury Bill, 0.00%, 07/23/2020 | 69,730,000 | 69,724,887 | ||||||
U.S. Treasury Bill, 0.00%, 09/10/2020(9) | 24,255,000 | 24,248,662 | ||||||
U.S. Treasury Bill, 0.00%, 11/27/2020 | 250,000,000 | 249,834,445 | ||||||
U.S. Treasury Bill, 0.00%, 12/03/2020 | 37,200,000 | 37,175,975 | ||||||
U.S. Treasury Bill, 0.00%, 01/28/2021 | 42,630,000 | 42,591,272 | ||||||
|
| |||||||
Total U.S. Treasury Bills (Cost: $876,667,971) | 876,798,324 | |||||||
|
| |||||||
Time Deposits – 0.29% | ||||||||
ANZ, London, -0.10% due 07/01/2020 | AUD | 2,134,184 | 1,472,801 | |||||
BNP Paribas, Paris, -1.53% due 07/01/2020 | CHF | 119,967 | 126,621 | |||||
BNP Paribas, Paris, 0.01% due 07/01/2020 | $ | 42,593,851 | 42,593,851 | |||||
Brown Brothers Harriman, -0.68% due 07/01/2020 | EUR | 500 | 562 | |||||
Brown Brothers Harriman, -0.25% due 07/01/2020 | SEK | 387 | 42 | |||||
Brown Brothers Harriman, -0.25% due 07/01/2020 | JPY | 84,863 | 786 | |||||
Brown Brothers Harriman, 0.00% due 07/01/2020 | NZD | 295 | 190 | |||||
Brown Brothers Harriman, 0.02% due 07/02/2020 | CAD | 300 | 221 | |||||
Citibank, London, - 0.68% due 07/01/2020 | EUR | 555,348 | 623,934 | |||||
Citibank, London, 0.01% due 07/01/2020 | GBP | 671,291 | 831,796 | |||||
Citibank, New York, 0.01% due 07/01/2020 | $ | 188,038 | 188,038 | |||||
JP Morgan, New York, 0.01% due 07/01/2020 | 9,645,495 | 9,645,495 | ||||||
Royal Bank of Canada, Toronto, 0.02% due 07/02/2020 | CAD | 1,270,304 | 935,698 | |||||
|
| |||||||
Total Time Deposits (Cost: $56,420,035) | 56,420,035 | |||||||
|
| |||||||
Total Short-Term Investments (Cost: $1,572,338,184) |
| 1,572,321,036 | ||||||
|
| |||||||
TOTAL INVESTMENTS IN SECURITIES – 102.57% |
| 19,932,349,775 | ||||||
|
| |||||||
LIABILITIES IN EXCESS OF OTHER ASSETS – (2.57)% | (498,683,950 | ) | ||||||
|
| |||||||
TOTAL NET ASSETS – 100.00% | $ | 19,433,665,825 | ||||||
|
| |||||||
Percentages are stated as a percent of net assets.
Principal amounts are denominated in the currency in which the security was purchased.
ARS Argentine Peso
AUD Australian Dollar
CAD Canadian Dollar
CHF Swiss Franc
EUR Euro
GBP British Pound
JPY Japanese Yen
NZD New Zealand Dollar
PEN Peruvian Sol
SEK Swedish Krona
| (1) | Variable rate security based on a reference index and spread. The rate reported is the rate in effect as of June 30, 2020. |
| (2) | Security was purchased exempt from registration in the U.S. pursuant to Rule 144(A) under the Securities Act of 1933. The value of these securities total $4,891,203,490, which represents 25.17% of total net assets. |
| (3) | Step-up bond that pays an initial coupon rate for the first period and then a higher coupon rate for the following periods. The rate reported is the rate in effect as of June 30, 2020. |
| (4) | Variable rate security. The coupon is based on an underlying pool of assets. The rate reported is the rate in effect as of June 30, 2020. |
| (5) | Security in default as of June 30, 2020. The value of these securities total $107,349,298, which represents 0.55% of total net assets. |
| (6) | Inverse floating rate security whose interest rate moves in the opposite direction of reference interest rates. Reference interest rates are typically based on a negative multiplier or slope. |
| (7) | Payment in-kind security for which part of the income earned may be paid as additional principal. |
| (8) | Inflation protected security. The value of these securities total $269,596,989, which represents 1.39% of total net assets. |
| (9) | Partially assigned as collateral for certain futures contracts, swap contracts and repurchase agreements. The value of these pledged issues totals $108,052,378, which represents 0.56% of total net assets. |
| (10) | All or a portion of U.S. Treasuries purchased in a sale-buyback transaction. The value of these securities total $121,128,696, which represents 0.62% of total net assets. |
| (11) | Delayed delivery purchase commitment security. The value of these securities total $638,584,771, which represents 3.29% of total net assets. |
| (12) | Non-income producing security. |
| (13) | Represents annualized seven-day yield as of the close of the reporting period. |
| (14) | Partially assigned as collateral for certain delayed delivery securities. |
| (15) | Security categorized as Level 3 per the Trust’s fair value hierarchy. These securities represent $9,861,931 or 0.05% of the Fund’s net assets. |
| (16) | Security that is restricted at June 30, 2020. The value of the restricted security totals $42,014,140, which represents 0.22% of total net assets. |
The accompanying notes are an integral part of this Schedule of Investments.
Open Futures Contracts
Number of Contracts | Reference Entity | Counterparty | Expiration Date | Notional | Value | Unrealized Appreciation/ (Depreciation) | ||||||||||
| 275 | Australian 10 Year Bond Future | Goldman Sachs | Sep. 2020 | AUD 40,267,893 | $ | 28,236,682 | $ | 447,812 | ||||||||
| 219 | Euro-Btp Future | Goldman Sachs | Sep. 2020 | EUR 30,827,600 | 35,401,170 | 766,362 | ||||||||||
| 10,062 | U.S. 10 Year Note Future | Goldman Sachs | Sep. 2020 | $ 1,396,492,911 | 1,400,347,406 | 3,854,495 | ||||||||||
| 4,474 | U.S. 5 Year Note Future | Citigroup Global Markets | Sep. 2020 | 561,173,844 | 562,570,549 | 1,396,705 | ||||||||||
| 2,113 | U.S. 5 Year Note Future | Goldman Sachs | Sep. 2020 | 264,561,533 | 265,693,243 | 1,131,710 | ||||||||||
| 489 | U.S. Long Bond Future | Goldman Sachs | Sep. 2020 | 87,126,547 | 87,317,063 | 190,516 | ||||||||||
| 2,593 | U.S. 2-Year Note Future | Goldman Sachs | Sep. 2020 | 572,218,936 | 572,607,331 | 388,395 | ||||||||||
| 44 | U.S. Ultra Long-Term Bond Future | Citigroup Global Markets | Sep. 2020 | 9,631,480 | 9,598,875 | (32,605 | ) | |||||||||
| 1,009 | U.S. Ultra Long-Term Bond Future | Goldman Sachs | Sep. 2020 | 220,506,133 | 220,119,656 | (386,477 | ) | |||||||||
|
| |||||||||||||||
| 7,756,913 | ||||||||||||||||
|
| |||||||||||||||
Number of Contracts | Reference Entity | Counterparty | Expiration Date | Notional | Value | Unrealized Appreciation/ (Depreciation) | ||||||||||
| (127) | U.S. Ultra 10-Year Note Future | Citigroup Global Markets | Sep. 2020 | $ 19,862,853 | $ | (20,000,516 | ) | $ | (137,663 | ) | ||||||
| (2,526) | U.S. Ultra 10-Year Note Future | Goldman Sachs | Sep. 2020 | 394,748,517 | (397,805,531 | ) | (3,057,014 | ) | ||||||||
|
| |||||||||||||||
| (3,194,677 | ) | |||||||||||||||
|
| |||||||||||||||
| $ | 4,562,236 | |||||||||||||||
|
| |||||||||||||||
Over-the-Counter Forward Foreign Currency Exchange Contracts
Currency Purchased | Currency Sold | Settlement Date | Counterparty | Unrealized Appreciation/ (Depreciation) | ||||||||||||||
BRL* | 156,049,575 | USD | 28,497,001 | 07/02/20 | Deutsche Bank | $ | 198,605 | |||||||||||
BRL* | 33,000,000 | USD | 6,026,297 | 07/02/20 | J.P. Morgan | 41,999 | ||||||||||||
EUR | 5,081,000 | USD | 5,704,334 | 07/02/20 | BNP Paribas | 4,168 | ||||||||||||
EUR | 1,124,000 | USD | 1,256,229 | 07/02/20 | Goldman Sachs | 6,584 | ||||||||||||
IDR* | 402,636,139,000 | USD | 26,550,355 | 09/16/20 | Morgan Stanley | 761,842 | ||||||||||||
INR* | 2,063,547,450 | USD | 27,046,955 | 09/16/20 | Morgan Stanley | 42,489 | ||||||||||||
RUB* | 201,849,664 | USD | 2,596,939 | 07/17/20 | Bank Of America | 233,615 | ||||||||||||
RUB* | 455,846,087 | USD | 5,958,024 | 07/17/20 | Goldman Sachs | 434,341 | ||||||||||||
RUB* | 826,637,832 | USD | 11,125,827 | 07/27/20 | Goldman Sachs | 448,868 | ||||||||||||
USD | 5,538,300 | EUR | 4,887,000 | 07/02/20 | Bank Of America | 47,758 | ||||||||||||
USD | 29,582,858 | BRL* | 156,049,575 | 07/02/20 | Deutsche Bank | 887,252 | ||||||||||||
USD | 2,224,072 | GBP | 1,758,000 | 07/02/20 | Goldman Sachs | 45,734 | ||||||||||||
USD | 136,526 | JPY | 14,700,000 | 07/02/20 | Goldman Sachs | 383 | ||||||||||||
USD | 7,907,790 | BRL* | 33,000,000 | 07/02/20 | J.P. Morgan | 1,839,494 | ||||||||||||
USD | 5,965,761 | EUR | 5,276,000 | 07/02/20 | J.P. Morgan | 38,177 | ||||||||||||
USD | 3,853,003 | GBP | 3,049,000 | 07/02/20 | J.P. Morgan | 74,986 | ||||||||||||
USD | 1,022,315 | AUD | 1,479,000 | 07/02/20 | Morgan Stanley | 1,657 | ||||||||||||
USD | 3,798,651 | EUR | 3,364,000 | 07/02/20 | Morgan Stanley | 19,198 | ||||||||||||
USD | 8,541,557 | PEN* | 28,785,047 | 09/04/20 | BNP Paribas | 423,656 | ||||||||||||
USD | 13,158,715 | CAD | 17,615,000 | 09/16/20 | BNP Paribas | 181,586 | ||||||||||||
|
| |||||||||||||||||
| Total Unrealized Appreciation | 5,732,392 | |||||||||||||||||
|
| |||||||||||||||||
BRL* | 33,000,000 | USD | 6,343,104 | 07/02/20 | BNP Paribas | $ | (274,808 | ) | ||||||||||
BRL* | 156,049,575 | USD | 29,122,148 | 07/02/20 | BNP Paribas | (426,542 | ) | |||||||||||
BRL* | 156,049,575 | USD | 29,551,486 | 08/04/20 | Deutsche Bank | (905,422 | ) | |||||||||||
GBP | 827,000 | USD | 1,025,877 | 07/02/20 | BNP Paribas | (1,140 | ) | |||||||||||
GBP | 7,327,000 | USD | 9,133,919 | 07/02/20 | J.P. Morgan | (55,029 | ) | |||||||||||
MXN | 33,876,000 | USD | 1,492,494 | 07/24/20 | Goldman Sachs | (23,206 | ) | |||||||||||
MXN | 142,098,000 | USD | 6,374,708 | 12/09/20 | BNP Paribas | (316,785 | ) | |||||||||||
MXN | 931,395,152 | USD | 42,125,516 | 12/09/20 | Goldman Sachs | (2,418,273 | ) | |||||||||||
RUB* | 1,832,559,666 | USD | 25,973,429 | 07/17/20 | BNP Paribas | (275,302 | ) | |||||||||||
TRY | 4,051,749 | USD | 594,534 | 07/13/20 | J.P. Morgan | (4,715 | ) | |||||||||||
TRY | 4,286,011 | USD | 629,918 | 07/14/20 | Bank Of America | (6,181 | ) | |||||||||||
TRY | 1,167,392 | USD | 169,829 | 07/21/20 | Bank Of America | (291 | ) | |||||||||||
TRY | 1,392,510 | USD | 202,654 | 07/21/20 | BNP Paribas | (422 | ) | |||||||||||
USD | 34,523,297 | BRL* | 189,049,575 | 07/02/20 | BNP Paribas | (240,605 | ) | |||||||||||
USD | 285,806,314 | EUR | 257,329,000 | 07/02/20 | BNP Paribas | (3,302,706 | ) | |||||||||||
USD | 17,138,860 | EUR | 15,256,000 | 07/02/20 | J.P. Morgan | (1,249 | ) | |||||||||||
USD | 401,464,699 | GBP | 326,424,000 | 07/02/20 | J.P. Morgan | (3,007,462 | ) | |||||||||||
USD | 314,600,496 | EUR | 279,907,000 | 08/04/20 | BNP Paribas | (113,918 | ) | |||||||||||
USD | 396,364,594 | GBP | 323,077,000 | 08/04/20 | Morgan Stanley | (4,050,102 | ) | |||||||||||
USD | 9,940,602 | CAD | 13,986,000 | 08/17/20 | Bank Of America | (362,555 | ) | |||||||||||
USD | 19,830,150 | NZD | 33,217,000 | 08/17/20 | J.P. Morgan | (1,605,123 | ) | |||||||||||
USD | 6,805,373 | EUR | 6,271,713 | 08/21/20 | Goldman Sachs | (248,859 | ) | |||||||||||
USD | 6,801,641 | EUR | 6,271,713 | 08/21/20 | Morgan Stanley | (252,591 | ) | |||||||||||
USD | 5,840,622 | EUR | 5,375,754 | 08/21/20 | State Street | (205,862 | ) | |||||||||||
|
| |||||||||||||||||
| Total Unrealized Depreciation | (18,099,148 | ) | ||||||||||||||||
|
| |||||||||||||||||
| Net Unrealized Depreciation | $ | (12,366,756 | ) | |||||||||||||||
|
| |||||||||||||||||
* Non-deliverable forward | ||||||||||||||
AUD | Australian Dollar | |||||||||||||
BRL | Brazilian Real | |||||||||||||
CAD | Canadian Dollar | |||||||||||||
EUR | Euro | |||||||||||||
GBP | British Pound | |||||||||||||
IDR | Indonesian Rupiah | |||||||||||||
INR | Indian Rupee | |||||||||||||
JPY | Japanese Yen | |||||||||||||
MXN | Mexican Peso | |||||||||||||
NZD | New Zealand Dollar | |||||||||||||
PEN | Peruvian Sol | |||||||||||||
RUB | Russian Ruble | |||||||||||||
TRY | Turkish Lira | |||||||||||||
USD | United States Dollar | |||||||||||||
Centrally Cleared Interest Rate Swaps
Fixed Annual | Floating | Floating Rate | Payment | Maturity | Notional | Upfront Premium Paid/ (Received) | Unrealized Appreciation/ (Depreciation) | Value | ||||||||||||||
| 1.25% | 3 Month USD LIBOR | Paid | Quarterly | 6/17/2027 | $ 444,300,000 | $ | (5,266,611 | ) | $ | 29,526,130 | $ | 24,259,519 | ||||||||||
| 1.25 | 3 Month USD LIBOR | Received | Quarterly | 6/17/2030 | 112,100,000 | 4,810,974 | (11,586,173 | ) | (6,775,199 | ) | ||||||||||||
| 1.50 | 3 Month USD LIBOR | Received | Quarterly | 6/17/2050 | 81,200,000 | (15,012,714 | ) | 2,327,481 | (12,685,233 | ) | ||||||||||||
| 2.25 | 3 Month USD LIBOR | Received | Quarterly | 3/12/2050 | 3,200,000 | (9,885 | ) | (1,137,501 | ) | (1,147,386 | ) | |||||||||||
| 2.50 | 3 Month USD LIBOR | Paid | Quarterly | 12/20/2027 | 107,900,000 | (1,107,549 | ) | 17,130,367 | 16,022,818 | |||||||||||||
| 2.50 | 3 Month USD LIBOR | Paid | Quarterly | 12/20/2027 | 94,300,000 | 1,744,029 | 12,259,231 | 14,003,260 | ||||||||||||||
| 3.00 | 3 Month USD LIBOR | Paid | Quarterly | 6/19/2029 | 47,200,000 | 3,382,167 | 6,704,153 | 10,086,320 | ||||||||||||||
| 3.00 | 6 Month Australian Bank Bill | Paid | Semi-Annual | 3/21/2027 | AUD 109,400,000 | 625,604 | 11,867,046 | 12,492,650 | ||||||||||||||
| (0.15) | 6 Month EURIBOR | Received | Semi-Annual | 3/18/2030 | EUR 16,100,000 | 274,419 | (345,064 | ) | (70,645 | ) | ||||||||||||
| 0.50 | 6 Month EURIBOR | Received | Semi-Annual | 6/17/2050 | 9,000,000 | (283,674 | ) | (1,212,994 | ) | (1,496,668 | ) | |||||||||||
| 0.75 | 6 Month GBP LIBOR | Received | Semi-Annual | 3/18/2030 | GBP 18,700,000 | 179,861 | (1,052,466 | ) | (872,605 | ) | ||||||||||||
| 0.75 | 6 Month GBP LIBOR | Received | Semi-Annual | 3/18/2050 | 6,000,000 | 142,394 | (840,265 | ) | (697,871 | ) | ||||||||||||
| 4.58 | Mexico Interbank TIIE 28 Day | Received | Lunar | 6/10/2022 | MXN 4,000,000 | — | (474 | ) | (474 | ) | ||||||||||||
| 4.65 | Mexico Interbank TIIE 28 Day | Received | Lunar | 5/10/2022 | 15,400,000 | | 208 | | (2,820 | ) | (2,612 | ) | ||||||||||
| 4.74 | Mexico Interbank TIIE 28 Day | Received | Lunar | 6/3/2022 | 3,900,000 | — | (959 | ) | (959 | ) | ||||||||||||
| 4.83 | Mexico Interbank TIIE 28 Day | Received | Lunar | 5/27/2022 | 1,600,000 | — | (530 | ) | (530 | ) | ||||||||||||
| 5.12 | Mexico Interbank TIIE 28 Day | Paid | Lunar | 5/6/2025 | 2,000,000 | (134 | ) | 1,309 | 1,175 | |||||||||||||
| 5.16 | Mexico Interbank TIIE 28 Day | Paid | Lunar | 6/6/2025 | 1,700,000 | — | 1,102 | 1,102 | ||||||||||||||
| 5.28 | Mexico Interbank TIIE 28 Day | Paid | Lunar | 5/23/2025 | 700,000 | — | 627 | 627 | ||||||||||||||
| 5.28 | Mexico Interbank TIIE 28 Day | Paid | Lunar | 5/30/2025 | 1,600,000 | — | 1,421 | 1,421 | ||||||||||||||
| 5.54 | Mexico Interbank TIIE 28 Day | Paid | Lunar | 5/4/2027 | 3,400,000 | 1 | 2,796 | 2,797 | ||||||||||||||
| 7.15 | Mexico Interbank TIIE 28 Day | Paid | Lunar | 6/11/2027 | 25,800,000 | (17,507 | ) | 147,982 | 130,475 | |||||||||||||
| 7.36 | Mexico Interbank TIIE 28 Day | Received | Lunar | 8/21/2037 | 900,000 | 3,247 | (8,304 | ) | (5,057 | ) | ||||||||||||
| 7.37 | Mexico Interbank TIIE 28 Day | Paid | Lunar | 10/11/2027 | 40,300,000 | (1,906 | ) | 231,433 | 229,527 | |||||||||||||
| 7.38 | Mexico Interbank TIIE 28 Day | Received | Lunar | 8/14/2037 | 1,300,000 | 4,578 | (12,036 | ) | (7,458 | ) | ||||||||||||
| 7.61 | Mexico Interbank TIIE 28 Day | Received | Lunar | 1/23/2023 | 222,400,000 | 126,021 | (885,415 | ) | (759,394 | ) | ||||||||||||
| 7.75 | Mexico Interbank TIIE 28 Day | Paid | Lunar | 1/5/2023 | 1,400,000 | | — | | 4,864 | 4,864 | ||||||||||||
| 7.81 | Mexico Interbank TIIE 28 Day | Paid | Lunar | 2/6/2023 | 2,800,000 | — | 10,204 | 10,204 | ||||||||||||||
| 7.82 | Mexico Interbank TIIE 28 Day | Paid | Lunar | 2/6/2023 | 2,800,000 | (341 | ) | 10,591 | 10,250 | |||||||||||||
| 7.87 | Mexico Interbank TIIE 28 Day | Paid | Lunar | 12/27/2022 | 3,400,000 | — | 12,233 | 12,233 | ||||||||||||||
| 7.88 | Mexico Interbank TIIE 28 Day | Paid | Lunar | 12/16/2022 | 2,000,000 | — | 7,206 | 7,206 | ||||||||||||||
| 7.88 | Mexico Interbank TIIE 28 Day | Paid | Lunar | 12/27/2022 | 36,000,000 | 9,174 | 120,922 | 130,096 | ||||||||||||||
| 7.91 | Mexico Interbank TIIE 28 Day | Received | Lunar | 12/30/2027 | 800,000 | — | (5,799 | ) | (5,799 | ) | ||||||||||||
| 7.98 | Mexico Interbank TIIE 28 Day | Received | Lunar | 12/10/2027 | 3,300,000 | (21 | ) | (24,727 | ) | (24,748 | ) | |||||||||||
| 7.99 | Mexico Interbank TIIE 28 Day | Received | Lunar | 12/21/2027 | 100,000 | — | (749 | ) | (749 | ) | ||||||||||||
| 8.01 | Mexico Interbank TIIE 28 Day | Received | Lunar | 12/21/2027 | 20,200,000 | (8,874 | ) | (143,343 | ) | (152,217 | ) | |||||||||||
| 8.03 | Mexico Interbank TIIE 28 Day | Received | Lunar | 1/31/2028 | 1,600,000 | 12 | (12,200 | ) | (12,188 | ) | ||||||||||||
| 8.05 | Mexico Interbank TIIE 28 Day | Received | Lunar | 1/31/2028 | 2,400,000 | 585 | (19,003 | ) | (18,418 | ) | ||||||||||||
|
|
|
|
|
| |||||||||||||||||
| $ | (10,405,942 | ) | $ | 63,076,276 | $ | 52,670,334 | ||||||||||||||||
|
|
|
|
|
| |||||||||||||||||
Lunar - payment frequency equal periods of 28 days (a lunar month). |
| |||||||||||||||||||||
Centrally Cleared Credit Default Swaps – Sell Protection
Reference Entity | Fixed Annual | Maturity Date | Implied Credit | Notional Amount | Upfront Premium Paid/ (Received) | Unrealized Appreciation/ (Depreciation) | Value | |||||||||||||||
| AT&T Inc. | 1.00% | 12/20/2020 | 0.61% | $ | 34,600,000 | $ | 22,648 | $ | 52,482 | $ | 75,130 | |||||||||||
| AT&T Inc. | 1.00 | 12/20/2024 | 1.00 | 12,100,000 | 102,371 | (96,632 | ) | 5,739 | ||||||||||||||
| CDX.EM.28 | 1.00 | 12/20/2022 | 1.58 | 9,588,000 | (237,472 | ) | 105,266 | (132,206 | ) | |||||||||||||
| CDX.EM.29 | 1.00 | 6/20/2023 | 1.64 | 1,880,000 | (31,920 | ) | (2,697 | ) | (34,617 | ) | ||||||||||||
| CDX.EM.30 | 1.00 | 12/20/2023 | 1.80 | 7,708,000 | (274,167 | ) | 70,195 | (203,972 | ) | |||||||||||||
| CDX.EM.31 | 1.00 | 6/20/2024 | 1.76 | 8,178,000 | (291,531 | ) | 55,031 | (236,500 | ) | |||||||||||||
| CDX.EM.32 | 1.00 | 12/20/2024 | 1.84 | 12,090,000 | (572,907 | ) | 142,473 | (430,434 | ) | |||||||||||||
| CDX.EM.33 | 1.00 | 6/20/2025 | 2.00 | 7,505,000 | (806,689 | ) | 456,941 | (349,748 | ) | |||||||||||||
| CDX.NA.HY.34 | 5.00 | 6/20/2025 | 5.17 | 64,885,000 | (3,828,215 | ) | 3,454,679 | (373,536 | ) | |||||||||||||
| CDX.NA.HY.34 | 5.00 | 6/20/2025 | 5.17 | 46,455,000 | (530,366 | ) | 248,358 | (282,008 | ) | |||||||||||||
| CDX.NA.HY.34 | 5.00 | 6/20/2025 | 5.17 | 54,815,000 | (2,411,861 | ) | 2,081,068 | (330,793 | ) | |||||||||||||
| CDX.NA.IG.34 | 1.00 | 6/20/2025 | 0.76 | 284,052,000 | (597,066 | ) | 3,917,046 | 3,319,980 | ||||||||||||||
| General Electric Co. | 1.00 | 12/20/2023 | 1.48 | 700,000 | (23,753 | ) | 12,713 | (11,040 | ) | |||||||||||||
|
|
|
|
|
| |||||||||||||||||
| $ | (9,480,928 | ) | $ | 10,496,923 | $ | 1,015,995 | ||||||||||||||||
|
|
|
|
|
| |||||||||||||||||
Over-the-Counter Credit Default Swaps – Sell Protection
Counterparty | Reference | Fixed | Payment | Maturity | Implied | Notional | Upfront Premium Paid/ (Received) | Unrealized Appreciation/ (Depreciation) | Value | |||||||||||||||
| Deutsche Bank | CMBX.NA.AAA.10 | 0.50% | Monthly | 11/17/2059 | 0.00% | $ 16,450,000 | $ | (269,224 | ) | $ | 392,072 | $ | 122,848 | |||||||||||
| J.P. Morgan | Barclays Bank Plc | 1.00 | Quarterly | 6/20/2024 | 0.69 | EUR 1,000,000 | 10,163 | 4,154 | 14,317 | |||||||||||||||
| Bank of America | Boeing Co. | 1.00 | Quarterly | 12/20/2021 | 2.42 | $ 12,300,000 | 60,829 | (309,845 | ) | (249,016 | ) | |||||||||||||
| Goldman Sachs | Brazilian Government International | 1.00 | Quarterly | 12/20/2024 | 2.40 | 3,200,000 | (42,762 | ) | (147,252 | ) | (190,014 | ) | ||||||||||||
| Barclays Bank | Colombia Government International | 1.00 | Quarterly | 6/20/2025 | 1.60 | 12,895,000 | (752,522 | ) | 385,891 | (366,631 | ) | |||||||||||||
| Morgan Stanley | Colombia Government International | 1.00 | Quarterly | 6/20/2025 | 1.60 | 11,000,000 | (1,044,868 | ) | 732,727 | (312,141 | ) | |||||||||||||
| Barclays Bank | Devon Energy Corp. | 1.00 | Quarterly | 12/20/2024 | 1.49 | 455,000 | 186 | (9,686 | ) | (9,500 | ) | |||||||||||||
| Morgan Stanley | Devon Energy Corp. | 1.00 | Quarterly | 12/20/2024 | 1.49 | 525,000 | — | (10,961 | ) | (10,961 | ) | |||||||||||||
| Morgan Stanley | Devon Energy Corp. | 1.00 | Quarterly | 12/20/2024 | 1.49 | 1,170,000 | (6,219 | ) | (18,209 | ) | (24,428 | ) | ||||||||||||
| Goldman Sachs | Federative Republic of Brazil | 1.00 | Quarterly | 6/20/2024 | 2.24 | 300,000 | (7,505 | ) | (6,646 | ) | (14,151 | ) | ||||||||||||
| Barclays Bank | General Electric Co. | 1.00 | Quarterly | 12/20/2020 | 0.88 | 1,860,000 | 181 | 1,378 | 1,559 | |||||||||||||||
| Barclays Bank | General Electric Co. | 1.00 | Quarterly | 12/20/2020 | 0.88 | 3,415,000 | (930 | ) | 3,794 | 2,864 | ||||||||||||||
| Goldman Sachs | General Electric Co. | 1.00 | Quarterly | 12/20/2020 | 0.88 | 2,640,000 | 261 | 1,952 | 2,213 | |||||||||||||||
| Goldman Sachs | General Electric Co. | 1.00 | Quarterly | 12/20/2020 | 0.88 | 1,685,000 | (444 | ) | 1,857 | 1,413 | ||||||||||||||
| Barclays Bank | Indonesia Government International | 1.00 | Quarterly | 6/20/2025 | 1.32 | 9,796,000 | (383,282 | ) | 234,788 | (148,494 | ) | |||||||||||||
| Goldman Sachs | Indonesia Government International | 1.00 | Quarterly | 6/20/2025 | 1.32 | 18,365,000 | (902,508 | ) | 623,100 | (279,408 | ) | |||||||||||||
| Morgan Stanley | Indonesia Government International | 1.00 | Quarterly | 6/20/2025 | 1.32 | 17,615,000 | (663,042 | ) | 395,044 | (267,998 | ) | |||||||||||||
| Morgan Stanley | Mexico Government International | 1.00 | Quarterly | 12/20/2024 | 1.44 | 2,800,000 | (18,934 | ) | (34,663 | ) | (53,597 | ) | ||||||||||||
| Goldman Sachs | Republic of South Africa | 1.00 | Quarterly | 6/20/2024 | 2.79 | 4,700,000 | (154,393 | ) | (159,881 | ) | (314,274 | ) | ||||||||||||
| J.P. Morgan | Republic of South Africa | 1.00 | Quarterly | 6/20/2023 | 2.51 | 9,400,000 | (412,143 | ) | 7,041 | (405,102 | ) | |||||||||||||
| Goldman Sachs | Russia Emerging Markets SPMYC | 1.00 | Quarterly | 12/20/2022 | 0.66 | 1,500,000 | (17,737 | ) | 30,916 | 13,179 | ||||||||||||||
| J.P. Morgan | Russia Emerging Markets SPMYC | 1.00 | Quarterly | 6/20/2023 | 0.72 | 18,200,000 | (336,204 | ) | 491,046 | 154,842 | ||||||||||||||
| Goldman Sachs | Russian Foreign Bond-Eurobon | 1.00 | Quarterly | 12/20/2024 | 1.02 | 16,400,000 | 84,457 | (94,704 | ) | (10,247 | ) | |||||||||||||
| Goldman Sachs | Teva Pharmaceutical Finance Ne | 1.00 | Quarterly | 6/20/2022 | 2.50 | 210,000 | (9,437 | ) | 3,436 | (6,001 | ) | |||||||||||||
| Goldman Sachs | United Mexican States | 1.00 | Quarterly | 6/20/2023 | 1.06 | 29,900,000 | (150,396 | ) | 107,407 | (42,989 | ) | |||||||||||||
| Goldman Sachs | United Mexican States | 1.00 | Quarterly | 12/20/2023 | 1.19 | 9,100,000 | (136,435 | ) | 79,562 | (56,873 | ) | |||||||||||||
| J.P. Morgan | United Mexican States | 1.00 | Quarterly | 12/20/2023 | 1.19 | 5,400,000 | (81,799 | ) | 48,050 | (33,749 | ) | |||||||||||||
| J.P. Morgan | United Mexican States | 1.00 | Quarterly | 6/20/2024 | 1.29 | 300,000 | (3,739 | ) | 442 | (3,297 | ) | |||||||||||||
| Morgan Stanley | United Mexican States | 1.00 | Quarterly | 12/20/2022 | 0.96 | 3,800,000 | 2,499 | 2,615 | 5,114 | |||||||||||||||
|
|
|
|
|
| |||||||||||||||||||
| $ | (5,235,947 | ) | $ | 2,755,425 | $ | (2,480,522 | ) | |||||||||||||||||
|
|
|
|
|
| |||||||||||||||||||
Sale-Buyback Transactions
Counterparty | Borrowing Date | Maturity Date | Borrowing Rate | Amount Borrowed | ||||||||||||
BNP Paribas | 6/30/2020 | 7/2/2020 | 0.18% | $ | 121,128,696 | |||||||||||
|
| |||||||||||||||
| $ | 121,128,696 | |||||||||||||||
|
| |||||||||||||||
Bridge Builder Municipal Bond Fund
Schedule of Investments
June 30, 2020
| Principal Amount | Value | |||||||
MUNICIPAL BONDS – 96.57% | ||||||||
Alabama – 1.54% | ||||||||
Alabama Federal Aid Highway Finance Authority | ||||||||
5.00%, 09/01/2031 | $ | 4,845,000 | $ | 5,596,363 | ||||
5.00%, 09/01/2036 | 10,000,000 | 12,023,000 | ||||||
Alabama Public School & College Authority | ||||||||
5.00%, 06/01/2035 | 4,000,000 | 4,655,800 | ||||||
Birmingham Airport Authority | ||||||||
5.00%, 07/01/2028 | 700,000 | 875,938 | ||||||
5.00%, 07/01/2030 | 1,000,000 | 1,293,760 | ||||||
5.00%, 07/01/2031 | 350,000 | 450,530 | ||||||
5.00%, 07/01/2032 | 300,000 | 383,079 | ||||||
5.00%, 07/01/2034 | 800,000 | 1,011,672 | ||||||
Black Belt Energy Gas District | ||||||||
4.00%, 07/01/2046(1) | 1,705,000 | 1,749,705 | ||||||
4.00%, 10/01/2049(1) | 2,000,000 | 2,306,160 | ||||||
Columbia Industrial Development Board | ||||||||
0.12%, 06/01/2028(1) | 3,900,000 | 3,900,000 | ||||||
County of Jefferson AL | ||||||||
5.00%, 04/01/2021 | 1,085,000 | 1,121,282 | ||||||
5.00%, 04/01/2023 | 1,550,000 | 1,736,279 | ||||||
County of Jefferson AL Sewer Revenue | ||||||||
5.00%, 10/01/2044 | 1,500,000 | 1,659,810 | ||||||
5.25%, 10/01/2048 | 1,650,000 | 1,835,245 | ||||||
5.50%, 10/01/2053 | 715,000 | 799,334 | ||||||
Homewood Educational Building Authority | ||||||||
4.00%, 12/01/2038 | 1,385,000 | 1,504,124 | ||||||
Industrial Development Board of the City of Mobile Alabama | ||||||||
1.00%, 06/01/2034(1) | 3,870,000 | 3,870,000 | ||||||
Lower Alabama Gas District | ||||||||
4.00%, 12/01/2050(1) | 15,610,000 | 17,761,995 | ||||||
Mobile County Board of School Commissioners | ||||||||
5.00%, 03/01/2028 | 1,030,000 | 1,246,084 | ||||||
Mobile Downtown Redevelopment Authority | ||||||||
0.15%, 05/01/2041(1)(2) | 3,795,000 | 3,795,000 | ||||||
Montgomery Medical Clinic Board | ||||||||
5.00%, 03/01/2029 | 1,000,000 | 1,147,650 | ||||||
Selma Industrial Development Board | ||||||||
5.80%, 05/01/2034 | 2,900,000 | 2,903,538 | ||||||
Southeast Alabama Gas Supply District | ||||||||
0.97% (1 Month LIBOR USD + 0.85%), 06/01/2049(3) | 5,365,000 | 5,237,796 | ||||||
4.00%, 06/01/2049(1) | 11,010,000 | 12,127,625 | ||||||
Tuscaloosa County Industrial Development Authority | ||||||||
4.50%, 05/01/2032(2) | 500,000 | 537,285 | ||||||
5.25%, 05/01/2044(2) | 6,700,000 | 7,312,313 | ||||||
University of Alabama | ||||||||
4.00%, 06/01/2033 | 1,070,000 | 1,287,381 | ||||||
Water Works Board of the City of Birmingham | ||||||||
5.00%, 01/01/2023 | 430,000 | 477,696 | ||||||
|
| |||||||
Total Alabama |
| 100,606,444 | ||||||
|
| |||||||
Alaska – 0.09% | ||||||||
Alaska Industrial Development & Export Authority | ||||||||
5.00%, 10/01/2030 | 1,385,000 | 1,782,066 | ||||||
City of Valdez AK | ||||||||
5.00%, 01/01/2021 | 4,000,000 | 4,075,120 | ||||||
|
| |||||||
Total Alaska |
| 5,857,186 | ||||||
|
| |||||||
Arizona – 2.89% | ||||||||
Apache County Industrial Development Authority | ||||||||
4.50%, 03/01/2030 | 1,000,000 | 1,040,400 | ||||||
Arizona Health Facilities Authority | ||||||||
0.10%, 01/01/2029(1) | 5,625,000 | 5,625,000 | ||||||
4.00%, 01/01/2043 | 24,000,000 | 24,400,080 | ||||||
5.00%, 02/01/2042 | 2,000,000 | 2,084,920 | ||||||
Arizona Industrial Development Authority | ||||||||
5.00%, 07/01/2049(2) | 650,000 | 678,438 | ||||||
5.00%, 07/15/2049(2) | 500,000 | 506,500 | ||||||
5.50%, 07/01/2052(2) | 655,000 | 699,946 | ||||||
Chandler Industrial Development Authority | ||||||||
5.00%, 06/01/2049(1) | 18,960,000 | 21,835,284 | ||||||
City of Glendale AZ | ||||||||
5.00%, 07/01/2030 | 1,780,000 | 2,143,245 | ||||||
City of Mesa AZ | ||||||||
4.00%, 07/01/2028 | 1,265,000 | 1,522,971 | ||||||
City of Phoenix AZ | ||||||||
4.00%, 07/01/2022 | 900,000 | 966,447 | ||||||
City of Phoenix Civic Improvement Corp. | ||||||||
4.00%, 07/01/2045 | 5,000,000 | 5,192,000 | ||||||
5.00%, 07/01/2026 | 1,675,000 | 2,025,125 | ||||||
5.00%, 07/01/2027 | 3,000,000 | 3,701,730 | ||||||
5.00%, 07/01/2028 | 4,440,000 | 5,585,032 | ||||||
5.00%, 07/01/2029 | 12,865,000 | 14,194,340 | ||||||
5.00%, 07/01/2030 | 1,500,000 | 1,651,275 | ||||||
5.00%, 07/01/2032 | 800,000 | 958,608 | ||||||
5.00%, 07/01/2036 | 3,000,000 | 3,585,210 | ||||||
5.00%, 07/01/2042 | 540,000 | 629,132 | ||||||
County of Pima AZ Sewer System Revenue | ||||||||
5.00%, 07/01/2022 | 10,000,000 | 10,924,700 | ||||||
Glendale Industrial Development Authority | ||||||||
4.00%, 07/01/2028 | 300,000 | 291,786 | ||||||
5.00%, 07/01/2033 | 435,000 | 440,633 | ||||||
5.00%, 07/01/2038 | 450,000 | 448,943 | ||||||
5.00%, 07/01/2048 | 915,000 | 875,179 | ||||||
Industrial Development Authority of the City of Phoenix | ||||||||
5.00%, 07/01/2030 | 700,000 | 759,472 | ||||||
5.00%, 07/01/2033 | 415,000 | 445,129 | ||||||
5.00%, 07/01/2034 | 765,000 | 818,152 | ||||||
5.00%, 07/01/2037 | 4,750,000 | 4,979,568 | ||||||
5.00%, 07/01/2038 | 1,295,000 | 1,366,989 | ||||||
5.00%, 07/01/2049 | 525,000 | 543,065 | ||||||
Industrial Development Authority of the County of Pima | ||||||||
4.75%, 06/15/2037(2) | 2,250,000 | 2,203,763 | ||||||
Industrial Development Authority of the County of Yavapai | ||||||||
0.40%, 04/01/2029(1) | 11,000,000 | 10,998,790 | ||||||
2.20%, 03/01/2028(1) | 2,100,000 | 2,153,319 | ||||||
Maricopa County Industrial Development Authority | ||||||||
5.00%, 01/01/2046(1) | 3,175,000 | 3,798,443 | ||||||
5.00%, 07/01/2047 | 1,000,000 | 1,165,120 | ||||||
5.00%, 01/01/2048(1) | 1,000,000 | 1,155,130 | ||||||
5.00%, 01/01/2048(1) | 1,300,000 | 1,414,686 | ||||||
5.75%, 01/01/2036(2) | 500,000 | 491,950 | ||||||
6.00%, 01/01/2048(2) | 635,000 | 585,451 | ||||||
Maricopa County Special Health Care District | ||||||||
5.00%, 07/01/2025 | 5,000,000 | 5,993,300 | ||||||
5.00%, 07/01/2026 | 7,000,000 | 8,580,740 | ||||||
McAllister Academic Village LLC | ||||||||
5.00%, 07/01/2021 | 200,000 | 209,352 | ||||||
Salt River Project Agricultural Improvement & Power District | ||||||||
5.00%, 01/01/2022 | 1,200,000 | 1,284,192 | ||||||
5.00%, 01/01/2024 | 1,600,000 | 1,856,224 | ||||||
5.00%, 01/01/2033 | 1,000,000 | 1,276,150 | ||||||
Salt Verde Financial Corp. | ||||||||
5.00%, 12/01/2032 | 5,020,000 | 6,399,747 | ||||||
5.00%, 12/01/2037 | 3,500,000 | 4,636,765 | ||||||
State of Arizona | ||||||||
5.00%, 10/01/2020 | 840,000 | 850,004 | ||||||
5.00%, 10/01/2021 | 740,000 | 784,030 | ||||||
5.00%, 10/01/2024 | 1,075,000 | 1,270,510 | ||||||
Tempe Industrial Development Authority | ||||||||
4.00%, 10/01/2023(2) | 1,250,000 | 1,224,963 | ||||||
5.00%, 12/01/2050 | 500,000 | 461,865 | ||||||
5.00%, 12/01/2054 | 750,000 | 685,868 |
University of Arizona | ||||||||
5.00%, 06/01/2038 | 1,955,000 | 2,509,164 | ||||||
5.00%, 06/01/2039 | 860,000 | 1,100,757 | ||||||
Western Maricopa Education Center District No 402 | ||||||||
5.00%, 07/01/2022 | 2,000,000 | 2,185,360 | ||||||
5.00%, 07/01/2024 | 320,000 | 377,514 | ||||||
5.00%, 07/01/2025 | 1,410,000 | 1,716,294 | ||||||
|
| |||||||
Total Arizona |
| 188,288,750 | ||||||
|
| |||||||
Arkansas – 0.12% | ||||||||
Arkansas Development Finance Authority | ||||||||
1.20%, 03/01/2024(1) | 5,000,000 | 5,051,450 | ||||||
4.50%, 09/01/2049(2) | 2,900,000 | 2,876,539 | ||||||
|
| |||||||
Total Arkansas |
| 7,927,989 | ||||||
|
| |||||||
California – 3.67% | ||||||||
Abag Finance Authority for Nonprofit Corps | ||||||||
5.00%, 08/01/2033 | 1,300,000 | 1,441,869 | ||||||
Alameda Corridor Transportation Authority | ||||||||
5.00%, 10/01/2036 | 2,500,000 | 2,802,525 | ||||||
5.00%, 10/01/2037 | 2,000,000 | 2,238,080 | ||||||
Alisal Union School District | ||||||||
5.25%, 08/01/2042 | 740,000 | 901,653 | ||||||
Anaheim Public Financing Authority | ||||||||
5.00%, 09/01/2029 | 1,860,000 | 2,323,828 | ||||||
Bay Area Toll Authority | ||||||||
1.38% (SIFMA Municipal Swap Index Yield + 1.25%), 04/01/2036(3) | 1,000,000 | 980,130 | ||||||
2.10%, 04/01/2045(1) | 2,790,000 | 2,851,045 | ||||||
2.85%, 04/01/2047(1) | 1,000,000 | 1,058,250 | ||||||
2.95%, 04/01/2047(1) | 1,170,000 | 1,253,164 | ||||||
California County Tobacco Securitization Agency | ||||||||
4.00%, 06/01/2034 | 400,000 | 468,084 | ||||||
4.00%, 06/01/2036 | 275,000 | 318,387 | ||||||
4.00%, 06/01/2037 | 275,000 | 317,223 | ||||||
4.00%, 06/01/2038 | 275,000 | 316,228 | ||||||
California Health Facilities Financing Authority | ||||||||
1.25%, 10/01/2036(1) | 2,500,000 | 2,504,925 | ||||||
5.00%, 11/01/2032(1) | 1,400,000 | 1,540,742 | ||||||
5.00%, 07/01/2034(1) | 1,710,000 | 1,866,585 | ||||||
5.00%, 08/15/2034 | 125,000 | 150,967 | ||||||
5.63%, 07/01/2025 | 2,130,000 | 2,137,561 | ||||||
California Housing Finance | ||||||||
4.00%, 03/20/2033 | 3,473,849 | 3,723,515 | ||||||
4.25%, 01/15/2035 | 523,813 | 571,752 | ||||||
California Municipal Finance Authority | ||||||||
0.38%, 09/01/2021(1) | 10,700,000 | 10,700,000 | ||||||
4.00%, 08/15/2037 | 1,560,000 | 1,663,412 | ||||||
4.00%, 08/15/2042 | 1,635,000 | 1,721,900 | ||||||
5.00%, 08/15/2029 | 1,000,000 | 1,255,180 | ||||||
5.00%, 12/31/2029 | 2,300,000 | 2,755,952 | ||||||
5.00%, 08/15/2034 | 1,065,000 | 1,302,836 | ||||||
5.00%, 12/31/2043 | 10,835,000 | 12,285,698 | ||||||
5.00%, 12/31/2047 | 555,000 | 626,700 | ||||||
5.00%, 05/15/2049 | 1,000,000 | 1,132,470 | ||||||
5.00%, 10/01/2049(2) | 515,000 | 521,298 | ||||||
5.00%, 10/01/2057(2) | 1,000,000 | 1,007,180 | ||||||
California Public Finance Authority | ||||||||
5.00%, 07/01/2027(2) | 180,000 | 135,000 | ||||||
5.00%, 07/01/2047(2) | 140,000 | 105,000 | ||||||
5.00%, 10/15/2047 | 1,775,000 | 1,940,199 | ||||||
California State Public Works Board | ||||||||
5.00%, 03/01/2024 | 2,500,000 | 2,912,925 | ||||||
5.00%, 03/01/2025 | 3,280,000 | 3,949,284 | ||||||
5.00%, 11/01/2037 | 235,000 | 255,593 | ||||||
5.00%, 09/01/2039 | 10,705,000 | 12,158,953 | ||||||
California Statewide Communities Development Authority | ||||||||
4.00%, 09/02/2029 | 200,000 | 217,314 | ||||||
5.00%, 10/01/2028 | 1,100,000 | 1,155,517 | ||||||
5.00%, 11/01/2032(2) | 1,135,000 | 1,202,737 | ||||||
5.00%, 01/01/2038 | 750,000 | 882,960 | ||||||
5.00%, 09/02/2039 | 745,000 | 832,947 | ||||||
5.00%, 05/15/2040 | 400,000 | 432,452 | ||||||
5.00%, 11/01/2041(2) | 875,000 | 903,114 | ||||||
5.00%, 04/01/2042 | 2,000,000 | 2,114,020 | ||||||
5.00%, 01/01/2043 | 1,000,000 | 1,157,000 | ||||||
5.00%, 09/02/2044 | 500,000 | 548,955 | ||||||
5.00%, 09/02/2044 | 700,000 | 768,537 | ||||||
5.00%, 09/02/2044 | 1,430,000 | 1,633,217 | ||||||
5.00%, 02/01/2045 | 1,175,000 | 1,116,215 | ||||||
5.00%, 04/01/2046(1) | 4,300,000 | 5,720,118 | ||||||
5.00%, 01/01/2048 | 2,840,000 | 3,251,885 | ||||||
5.00%, 09/02/2049 | 700,000 | 765,142 | ||||||
5.25%, 12/01/2048(2) | 800,000 | 864,144 | ||||||
5.25%, 12/01/2056(2) | 1,000,000 | 1,076,010 | ||||||
5.38%, 11/01/2049(2) | 100,000 | 102,139 | ||||||
5.50%, 12/01/2054 | 1,960,000 | 2,101,865 | ||||||
5.50%, 12/01/2058(2) | 4,845,000 | 5,230,614 | ||||||
City of Long Beach CA Harbor Revenue | ||||||||
4.00%, 07/15/2021 | 6,000,000 | 6,207,240 | ||||||
City of Los Angeles Department of Airports | ||||||||
5.00%, 05/15/2033 | 1,265,000 | 1,553,850 | ||||||
5.00%, 05/15/2040 | 1,095,000 | 1,239,014 | ||||||
5.25%, 05/15/2031 | 4,805,000 | 6,062,036 | ||||||
5.25%, 05/15/2032 | 3,210,000 | 4,023,896 | ||||||
County of Sacramento CA Airport System Revenue | ||||||||
5.00%, 07/01/2034 | 3,000,000 | 3,634,050 | ||||||
Cucamonga Valley Water District | ||||||||
5.38%, 09/01/2035 | 3,320,000 | 3,504,692 | ||||||
Foothill-de Anza Community College District | ||||||||
5.00%, 04/01/2035 | 250,000 | 290,898 | ||||||
5.00%, 04/01/2036 | 200,000 | 232,176 | ||||||
Golden State Tobacco Securitization Corp. | ||||||||
0.00%, 06/01/2024 | 1,000,000 | 962,450 | ||||||
5.00%, 06/01/2021 | 285,000 | 296,249 | ||||||
5.00%, 06/01/2022 | 400,000 | 431,764 | ||||||
5.00%, 06/01/2023 | 455,000 | 508,390 | ||||||
5.00%, 06/01/2024 | 255,000 | 294,372 | ||||||
5.00%, 06/01/2047 | 925,000 | 936,248 | ||||||
5.25%, 06/01/2047 | 2,500,000 | 2,542,550 | ||||||
5.30%, 06/01/2037 | 1,000,000 | 1,030,000 | ||||||
Irvine Unified School District | ||||||||
5.00%, 03/01/2057 | 800,000 | 907,824 | ||||||
Los Angeles County Public Works Financing Authority | ||||||||
5.00%, 12/01/2029 | 1,200,000 | 1,452,648 | ||||||
5.00%, 12/01/2030 | 2,520,000 | 3,046,126 | ||||||
Los Angeles Unified School District | ||||||||
4.00%, 07/01/2037 | 3,000,000 | 3,582,600 | ||||||
Mendocino-Lake Community College District | ||||||||
5.00%, 08/01/2027 | 1,700,000 | 2,050,676 | ||||||
5.00%, 08/01/2028 | 1,000,000 | 1,204,620 | ||||||
5.00%, 08/01/2029 | 775,000 | 931,868 | ||||||
5.00%, 08/01/2030 | 2,530,000 | 3,036,531 | ||||||
Metropolitan Water District of Southern California | ||||||||
0.38% (SIFMA Municipal Swap Index Yield + 0.25%), 07/01/2037(3) | 3,000,000 | 3,000,000 | ||||||
0.38% (SIFMA Municipal Swap Index Yield + 0.25%), 07/01/2037(3) | 3,000,000 | 3,000,000 | ||||||
0.38% (SIFMA Municipal Swap Index Yield + 0.25%), 07/01/2047(3) | 3,000,000 | 3,000,000 | ||||||
Norman Y Mineta San Jose International Airport SJC | ||||||||
5.00%, 03/01/2022 | 1,675,000 | 1,778,951 | ||||||
5.00%, 03/01/2028 | 1,340,000 | 1,634,277 | ||||||
5.00%, 03/01/2030 | 1,700,000 | 2,048,721 | ||||||
Orange County Community Facilities District | ||||||||
5.25%, 08/15/2045 | 975,000 | 1,080,290 | ||||||
Orchard School District | ||||||||
0.00%, 08/01/2022 | 2,940,000 | 2,908,630 | ||||||
Port of Oakland | ||||||||
5.00%, 05/01/2026 | 4,450,000 | 4,704,540 |
Sacramento City Financing Authority | ||||||||
5.00%, 12/01/2033 | 875,000 | 1,055,635 | ||||||
San Diego County Regional Airport Authority | ||||||||
5.00%, 07/01/2030 | 205,000 | 265,764 | ||||||
San Francisco City & County Airport Comm-San Francisco International Airport | ||||||||
5.00%, 05/01/2027 | 3,000,000 | 3,199,500 | ||||||
5.00%, 05/01/2037 | 945,000 | 1,160,120 | ||||||
State of California | ||||||||
0.89% (1 Month LIBOR USD + 0.76%), 12/01/2031(3) | 750,000 | 749,580 | ||||||
4.00%, 03/01/2025 | 3,500,000 | 4,072,600 | ||||||
4.00%, 03/01/2026 | 375,000 | 445,733 | ||||||
5.00%, 08/01/2022 | 1,535,000 | 1,685,998 | ||||||
5.00%, 08/01/2023 | 3,000,000 | 3,431,970 | ||||||
5.00%, 09/01/2026 | 2,000,000 | 2,523,100 | ||||||
5.00%, 08/01/2027 | 620,000 | 752,023 | ||||||
5.00%, 08/01/2029 | 935,000 | 1,164,449 | ||||||
5.00%, 09/01/2029 | 370,000 | 461,841 | ||||||
5.00%, 11/01/2029 | 3,170,000 | 4,087,239 | ||||||
5.00%, 04/01/2030 | 5,130,000 | 7,045,850 | ||||||
5.00%, 08/01/2030 | 3,500,000 | 4,339,895 | ||||||
5.00%, 08/01/2030 | 3,910,000 | 4,985,289 | ||||||
Tender Option Bond Trust Receipts/Certificates | ||||||||
0.23%, 10/01/2049(1)(2) | 1,060,000 | 1,060,000 | ||||||
Tobacco Securitization Authority of Northern California | ||||||||
4.75%, 06/01/2023 | 3,910,000 | 3,915,943 | ||||||
Transbay Joint Powers Authority | ||||||||
5.00%, 10/01/2033 | 250,000 | 295,083 | ||||||
5.00%, 10/01/2034 | 250,000 | 294,560 | ||||||
5.00%, 10/01/2035 | 240,000 | 281,928 | ||||||
5.00%, 10/01/2038 | 600,000 | 694,104 | ||||||
|
| |||||||
Total California |
| 239,359,376 | ||||||
|
| |||||||
Colorado – 2.74% | ||||||||
Adams 12 Five Star Schools | ||||||||
5.00%, 12/15/2028 | 2,050,000 | 2,588,084 | ||||||
Amber Creek Metropolitan District | ||||||||
5.00%, 12/01/2037 | 750,000 | 749,100 | ||||||
5.13%, 12/01/2047 | 1,075,000 | 1,047,716 | ||||||
Arapahoe County School District No 6 Littleton | ||||||||
5.50%, 12/01/2033 | 1,150,000 | 1,533,548 | ||||||
Belleview Station Metropolitan District No 2 | ||||||||
5.00%, 12/01/2036 | 500,000 | 501,710 | ||||||
Berthoud-Heritage Metropolitan District No 1 | ||||||||
5.63%, 12/01/2048 | 1,400,000 | 1,432,480 | ||||||
Brighton Crossing Metropolitan District No 4 | ||||||||
5.00%, 12/01/2037 | 525,000 | 537,721 | ||||||
Broadway Station Metropolitan District No 2 | ||||||||
5.00%, 12/01/2035 | 730,000 | 732,183 | ||||||
5.13%, 12/01/2048 | 1,450,000 | 1,424,784 | ||||||
Canyons Metropolitan District No 5 | ||||||||
6.00%, 12/01/2037 | 500,000 | 514,600 | ||||||
City & County of Denver CO | ||||||||
5.00%, 10/01/2032 | 9,405,000 | 9,455,129 | ||||||
City & County of Denver CO Airport System Revenue | ||||||||
4.00%, 11/15/2023 | 4,465,000 | 4,896,006 | ||||||
5.00%, 11/15/2029 | 3,105,000 | 3,825,422 | ||||||
5.00%, 12/01/2031 | 7,045,000 | 8,725,021 | ||||||
5.00%, 12/01/2032 | 385,000 | 473,400 | ||||||
5.00%, 12/01/2035 | 5,520,000 | 6,707,849 | ||||||
Colorado Health Facilities Authority | ||||||||
0.00%, 07/15/2022 | 980,000 | 969,494 | ||||||
1.37% (1 Month LIBOR USD + 1.25%), 10/01/2039(3) | 2,000,000 | 1,983,520 | ||||||
2.80%, 05/15/2042(1) | 3,800,000 | 3,975,408 | ||||||
4.00%, 11/01/2039 | 3,775,000 | 4,187,381 | ||||||
5.00%, 12/01/2022 | 1,855,000 | 1,958,472 | ||||||
5.00%, 11/01/2023 | 1,350,000 | 1,520,681 | ||||||
5.00%, 11/01/2024 | 1,125,000 | 1,301,805 | ||||||
5.00%, 11/01/2025 | 1,715,000 | 2,034,419 | ||||||
5.00%, 11/01/2026 | 1,330,000 | 1,605,111 | ||||||
5.00%, 01/01/2031 | 100,000 | 100,860 | ||||||
5.00%, 11/15/2036(1) | 6,770,000 | 7,760,857 | ||||||
5.00%, 01/01/2037 | 250,000 | 243,697 | ||||||
5.00%, 10/01/2038(1) | 630,000 | 664,064 | ||||||
5.00%, 02/01/2041 | 500,000 | 513,590 | ||||||
5.00%, 08/01/2044 | 2,200,000 | 2,582,514 | ||||||
5.00%, 09/01/2046 | 1,000,000 | 1,122,900 | ||||||
5.00%, 08/01/2049(1) | 3,830,000 | 4,505,344 | ||||||
5.00%, 11/15/2049(1) | 2,585,000 | 3,184,772 | ||||||
5.25%, 02/01/2031 | 2,250,000 | 2,314,417 | ||||||
5.25%, 05/15/2037 | 475,000 | 481,802 | ||||||
5.25%, 01/01/2040 | 540,000 | 603,434 | ||||||
6.13%, 12/01/2045(2) | 375,000 | 381,615 | ||||||
6.25%, 12/01/2050(2) | 205,000 | 208,840 | ||||||
Colorado High Performance Transportation Enterprise | ||||||||
5.00%, 12/31/2047 | 645,000 | 690,305 | ||||||
5.00%, 12/31/2051 | 2,150,000 | 2,295,813 | ||||||
5.00%, 12/31/2056 | 4,790,000 | 5,096,847 | ||||||
Colorado Housing & Finance Authority | ||||||||
4.25%, 11/01/2049 | 565,000 | 630,551 | ||||||
4.25%, 11/01/2049 | 1,105,000 | 1,231,500 | ||||||
Colorado International Center Metropolitan District No 14 | ||||||||
5.88%, 12/01/2046 | 635,000 | 658,089 | ||||||
Copperleaf Metropolitan District No 4 | ||||||||
5.00%, 12/01/2039 | 775,000 | 773,535 | ||||||
5.00%, 12/01/2049 | 1,500,000 | 1,455,270 | ||||||
Cornerstar Metropolitan District | ||||||||
5.13%, 12/01/2037 | 500,000 | 503,030 | ||||||
Cottonwood Highlands Metropolitan District No 1 | ||||||||
5.00%, 12/01/2049 | 900,000 | 891,738 | ||||||
County of El Paso CO | ||||||||
4.00%, 12/01/2033 | 800,000 | 965,456 | ||||||
4.00%, 12/01/2035 | 910,000 | 1,084,738 | ||||||
5.00%, 12/01/2031 | 600,000 | 793,152 | ||||||
Denver City & County School District No 1 | ||||||||
5.25%, 12/01/2038 | 3,595,000 | 3,698,716 | ||||||
Denver Convention Center Hotel Authority | ||||||||
5.00%, 12/01/2022 | 4,950,000 | 5,210,667 | ||||||
Denver Gateway Center Metropolitan District | ||||||||
5.50%, 12/01/2038 | 1,360,000 | 1,381,189 | ||||||
5.63%, 12/01/2048 | 2,130,000 | 2,163,654 | ||||||
Denver Health & Hospital Authority | ||||||||
5.00%, 12/01/2048 | 1,800,000 | 2,028,096 | ||||||
Denver International Business Center Metropolitan District No 1 | ||||||||
6.00%, 12/01/2048 | 500,000 | 506,020 | ||||||
Denver Urban Renewal Authority | ||||||||
5.25%, 12/01/2039(2) | 1,000,000 | 1,005,360 | ||||||
E-470 Public Highway Authority | ||||||||
0.00%, 09/01/2020 | 730,000 | 729,328 | ||||||
1.17% (1 Month LIBOR USD + 1.05%), 09/01/2039(3) | 275,000 | 275,085 | ||||||
5.00%, 09/01/2040 | 5,165,000 | 5,869,919 | ||||||
Eagle County Airport Terminal Corp. | ||||||||
5.00%, 05/01/2033 | 2,000,000 | 2,271,340 | ||||||
Mesa County Valley School District No 51 Grand Junction CO | ||||||||
5.25%, 12/01/2033 | 2,000,000 | 2,613,900 | ||||||
Mirabelle Metropolitan District No 2 | ||||||||
5.00%, 12/01/2039 | 700,000 | 699,951 | ||||||
Painted Prairie Metropolitan District No 2 | ||||||||
5.25%, 12/01/2048 | 500,000 | 504,190 | ||||||
Park Creek Metropolitan District | ||||||||
5.00%, 12/01/2045 | 1,775,000 | 2,032,641 | ||||||
Rampart Range Metropolitan District No 1 | ||||||||
5.00%, 12/01/2047 | 650,000 | 777,433 | ||||||
Regional Transportation District | ||||||||
5.00%, 06/01/2031 | 1,315,000 | 1,710,473 | ||||||
Serenity Ridge Metropolitan District No 2 | ||||||||
5.13%, 12/01/2037 | 1,290,000 | 1,312,149 | ||||||
Sierra Ridge Metropolitan District No 2 | ||||||||
4.50%, 12/01/2031 | 750,000 | 753,548 | ||||||
5.50%, 12/01/2046 | 1,500,000 | 1,529,580 |
Solaris Metropolitan District No 3 | ||||||||
5.00%, 12/01/2036 | 850,000 | 865,785 | ||||||
5.00%, 12/01/2046 | 1,880,000 | 1,904,421 | ||||||
Southglenn Metropolitan District | ||||||||
5.00%, 12/01/2046 | 500,000 | 500,565 | ||||||
Southlands Metropolitan District No 1 | ||||||||
3.00%, 12/01/2022 | 232,000 | 231,998 | ||||||
3.50%, 12/01/2027 | 500,000 | 502,580 | ||||||
St Vrain Lakes Metropolitan District No 2 | ||||||||
5.00%, 12/01/2037 | 500,000 | 504,245 | ||||||
STC Metropolitan District No 2 | ||||||||
3.00%, 12/01/2025 | 555,000 | 531,096 | ||||||
5.00%, 12/01/2038 | 500,000 | 502,130 | ||||||
University of Colorado | ||||||||
2.00%, 06/01/2054(1) | 11,455,000 | 11,981,014 | ||||||
5.00%, 06/01/2047 | 500,000 | 631,950 | ||||||
University of Colorado Hospital Authority | ||||||||
5.00%, 11/15/2038(1) | 1,020,000 | 1,067,930 | ||||||
5.00%, 11/15/2047(1) | 9,495,000 | 11,036,323 | ||||||
Vauxmont Metropolitan District | ||||||||
5.00%, 12/15/2021 | 100,000 | 105,855 | ||||||
5.00%, 12/01/2024 | 200,000 | 229,876 | ||||||
5.00%, 12/15/2024 | 135,000 | 156,970 | ||||||
5.00%, 12/01/2025 | 180,000 | �� | 211,417 | |||||
5.00%, 12/15/2025 | 85,000 | 100,590 | ||||||
5.00%, 12/01/2026 | 195,000 | 233,842 | ||||||
5.00%, 12/01/2027 | 205,000 | 250,162 | ||||||
5.00%, 12/01/2028 | 210,000 | 261,192 | ||||||
5.00%, 12/15/2028 | 130,000 | 152,425 | ||||||
5.00%, 12/01/2029 | 210,000 | 265,425 | ||||||
5.00%, 12/15/2029 | 5,000 | 5,845 | ||||||
5.00%, 12/15/2030 | 500,000 | 582,580 | ||||||
5.00%, 12/01/2031 | 230,000 | 286,943 | ||||||
5.00%, 12/01/2032 | 250,000 | 309,718 | ||||||
5.00%, 12/01/2035 | 100,000 | 122,318 | ||||||
Willow Bend Metropolitan District | ||||||||
5.00%, 12/01/2039 | 600,000 | 604,632 | ||||||
5.00%, 12/01/2049 | 1,000,000 | 999,930 | ||||||
|
| |||||||
Total Colorado |
| 178,632,770 | ||||||
|
| |||||||
Connecticut – 2.66% | ||||||||
City of Bridgeport CT | ||||||||
4.00%, 06/01/2037 | 2,460,000 | 2,652,372 | ||||||
5.00%, 09/15/2029 | 2,600,000 | 3,300,024 | ||||||
5.00%, 09/15/2030 | 2,250,000 | 2,838,127 | ||||||
5.00%, 06/01/2033 | 1,985,000 | 2,383,588 | ||||||
City of Hartford CT | ||||||||
5.00%, 07/15/2021 | 3,300,000 | 3,440,976 | ||||||
5.00%, 07/15/2022 | 2,250,000 | 2,431,418 | ||||||
5.00%, 07/15/2023 | 2,000,000 | 2,239,460 | ||||||
5.00%, 07/15/2026 | 2,430,000 | 2,860,134 | ||||||
City of New Britain CT | ||||||||
5.00%, 03/01/2027 | 1,260,000 | 1,572,782 | ||||||
5.00%, 03/01/2028 | 1,490,000 | 1,860,027 | ||||||
5.00%, 03/01/2033 | 1,900,000 | 2,309,507 | ||||||
City of New Haven CT | ||||||||
5.00%, 08/15/2023 | 900,000 | 1,029,114 | ||||||
5.00%, 08/15/2029 | 2,000,000 | 2,305,460 | ||||||
5.00%, 08/15/2031 | 1,000,000 | 1,142,910 | ||||||
5.25%, 08/01/2023 | 1,115,000 | 1,229,734 | ||||||
City of West Haven CT | ||||||||
5.00%, 08/01/2021 | 2,495,000 | 2,605,005 | ||||||
Connecticut Housing Finance Authority | ||||||||
2.25%, 11/15/2023 | 1,250,000 | 1,300,575 | ||||||
3.40%, 11/15/2042 | 815,000 | 825,114 | ||||||
Connecticut State Health & Educational Facilities Authority | ||||||||
0.55%, 07/01/2037(1) | 4,500,000 | 4,506,435 | ||||||
1.10%, 07/01/2048(1) | 9,000,000 | 9,158,490 | ||||||
1.80%, 07/01/2049(1) | 2,005,000 | 2,079,265 | ||||||
1.80%, 07/01/2049(1) | 5,280,000 | 5,325,408 | ||||||
2.00%, 07/01/2042(1) | 4,370,000 | 4,668,821 | ||||||
2.05%, 07/01/2035(1) | 6,570,000 | 6,682,413 | ||||||
4.00%, 07/01/2021(2) | 875,000 | 893,594 | ||||||
4.00%, 07/01/2022(2) | 1,010,000 | 1,052,531 | ||||||
4.00%, 07/01/2044 | 710,000 | 709,539 | ||||||
4.00%, 07/01/2046 | 880,000 | 903,980 | ||||||
4.00%, 07/01/2049 | 645,000 | 637,866 | ||||||
5.00%, 11/01/2023 | 695,000 | 779,714 | ||||||
5.00%, 11/01/2024 | 475,000 | 547,917 | ||||||
5.00%, 07/01/2025(2) | 435,000 | 495,143 | ||||||
5.00%, 06/01/2027 | 200,000 | 249,178 | ||||||
5.00%, 06/01/2028 | 400,000 | 507,388 | ||||||
5.00%, 11/01/2028 | 1,245,000 | 1,559,599 | ||||||
5.00%, 06/01/2029 | 250,000 | 322,075 | ||||||
5.00%, 07/01/2029(2) | 440,000 | 532,734 | ||||||
5.00%, 07/01/2029 | 1,000,000 | 1,232,880 | ||||||
5.00%, 06/01/2031 | 600,000 | 776,166 | ||||||
5.00%, 07/01/2032 | 2,000,000 | 2,486,400 | ||||||
5.00%, 07/01/2043 | 1,750,000 | 1,691,970 | ||||||
5.00%, 07/01/2049(2) | 1,550,000 | 1,764,644 | ||||||
5.00%, 07/01/2053(1) | 2,625,000 | 3,259,331 | ||||||
5.00%, 07/01/2053(1) | 3,445,000 | 4,069,234 | ||||||
Mohegan Tribe of Indians of Connecticut | ||||||||
5.25%, 02/01/2022(2) | 955,000 | 969,898 | ||||||
State of Connecticut | ||||||||
5.00%, 09/01/2022 | 5,725,000 | 6,277,462 | ||||||
5.00%, 11/01/2022 | 315,000 | 333,667 | ||||||
5.00%, 04/15/2023 | 3,200,000 | 3,585,088 | ||||||
5.00%, 01/15/2026 | 850,000 | 1,030,566 | ||||||
5.00%, 04/15/2026 | 1,500,000 | 1,829,610 | ||||||
5.00%, 06/15/2027 | 1,680,000 | 1,997,066 | ||||||
5.00%, 09/15/2027 | 1,000,000 | 1,254,390 | ||||||
5.00%, 03/01/2029 | 1,500,000 | 1,705,350 | ||||||
5.00%, 04/15/2030 | 565,000 | 721,454 | ||||||
5.00%, 06/15/2032 | 710,000 | 830,011 | ||||||
5.00%, 11/15/2032 | 200,000 | 236,144 | ||||||
5.00%, 04/15/2034 | 645,000 | 805,134 | ||||||
5.00%, 04/15/2035 | 225,000 | 279,747 | ||||||
State of Connecticut Special Tax Revenue | ||||||||
4.00%, 05/01/2036 | 3,260,000 | 3,751,412 | ||||||
5.00%, 09/01/2023 | 900,000 | 1,020,645 | ||||||
5.00%, 05/01/2030 | 2,000,000 | 2,630,920 | ||||||
5.00%, 10/01/2031 | 26,000,000 | 29,239,080 | ||||||
5.00%, 05/01/2033 | 3,000,000 | 3,863,520 | ||||||
5.00%, 01/01/2038 | 4,400,000 | 5,307,324 | ||||||
Town of Hamden CT | ||||||||
5.00%, 08/15/2026 | 500,000 | 579,435 | ||||||
5.00%, 08/15/2026 | 1,335,000 | 1,623,854 | ||||||
5.00%, 01/01/2040 | 1,875,000 | 1,746,750 | ||||||
University of Connecticut | ||||||||
5.00%, 11/01/2028 | 1,290,000 | 1,664,539 | ||||||
5.25%, 11/15/2034 | 3,705,000 | 4,698,644 | ||||||
|
| |||||||
Total Connecticut |
| 173,200,752 | ||||||
|
| |||||||
Delaware – 0.33% | ||||||||
County of Kent DE | ||||||||
5.00%, 07/01/2040 | 645,000 | 616,723 | ||||||
5.00%, 07/01/2048 | 2,305,000 | 2,141,322 | ||||||
County of Sussex DE | ||||||||
5.00%, 01/01/2036 | 2,425,000 | 2,459,896 | ||||||
Delaware State Economic Development Authority | ||||||||
1.05%, 01/01/2031(1) | 4,630,000 | 4,651,344 | ||||||
4.00%, 09/01/2030 | 180,000 | 205,344 | ||||||
5.00%, 09/01/2036 | 1,225,000 | 1,372,429 | ||||||
5.00%, 08/01/2039 | 715,000 | 790,125 | ||||||
5.00%, 09/01/2040 | 250,000 | 293,312 | ||||||
5.00%, 09/01/2046 | 700,000 | 770,623 | ||||||
5.00%, 11/15/2048 | 2,000,000 | 2,238,480 | ||||||
5.00%, 08/01/2049 | 900,000 | 977,454 | ||||||
5.00%, 09/01/2050 | 250,000 | 287,980 | ||||||
5.00%, 08/01/2054 | 835,000 | 903,787 | ||||||
5.40%, 02/01/2031 | 500,000 | 501,425 | ||||||
Delaware State Health Facilities Authority | ||||||||
5.00%, 06/01/2037 | 1,385,000 | 1,608,761 | ||||||
5.00%, 06/01/2043 | 1,000,000 | 1,131,330 | ||||||
5.00%, 06/01/2048 | 500,000 | 558,640 | ||||||
|
| |||||||
Total Delaware |
| 21,508,975 | ||||||
|
| |||||||
District of Columbia – 1.68% | ||||||||
District of Columbia | ||||||||
5.00%, 10/01/2022 | 3,730,000 | 4,125,604 | ||||||
5.00%, 03/01/2024 | 400,000 | 467,660 | ||||||
5.00%, 10/01/2029 | 5,000,000 | 6,797,150 | ||||||
5.00%, 12/01/2033 | 5,000,000 | 6,535,100 | ||||||
5.00%, 06/01/2034 | 1,000,000 | 1,182,630 | ||||||
5.00%, 06/01/2034 | 2,100,000 | 2,619,939 | ||||||
5.00%, 06/01/2035 | 3,000,000 | 3,449,430 | ||||||
5.00%, 12/01/2036 | 670,000 | 708,545 | ||||||
5.00%, 07/01/2042 | 730,000 | 663,840 | ||||||
5.00%, 06/01/2046 | 3,370,000 | 3,645,093 | ||||||
5.00%, 07/01/2052 | 915,000 | 805,447 | ||||||
District of Columbia Housing Finance Agency | ||||||||
0.70%, 06/01/2024(1) | 10,000,000 | 9,991,300 | ||||||
2.45%, 11/01/2021(1) | 13,750,000 | 13,829,887 | ||||||
District of Columbia Tobacco Settlement Financing Corp. | ||||||||
0.00%, 06/15/2046 | 2,000,000 | 237,660 | ||||||
0.00%, 06/15/2046 | 5,000,000 | 1,011,000 | ||||||
District of Columbia Water & Sewer Authority | ||||||||
1.75%, 10/01/2054(1) | 9,340,000 | 9,659,521 | ||||||
Metropolitan Washington Airports Authority | ||||||||
5.00%, 10/01/2022 | 1,000,000 | 1,096,570 | ||||||
5.00%, 10/01/2023 | 850,000 | 961,716 | ||||||
5.00%, 10/01/2024 | 1,325,000 | 1,545,957 | ||||||
5.00%, 10/01/2024 | 1,500,000 | 1,762,470 | ||||||
5.00%, 10/01/2025 | 1,185,000 | 1,433,139 | ||||||
5.00%, 10/01/2027 | 500,000 | 626,690 | ||||||
5.00%, 10/01/2030 | 1,735,000 | 1,872,533 | ||||||
5.00%, 10/01/2030 | 5,250,000 | 6,472,830 | ||||||
5.00%, 10/01/2031 | 5,335,000 | 6,693,238 | ||||||
5.00%, 10/01/2037 | 1,000,000 | 1,198,300 | ||||||
Metropolitan Washington Airports Authority Dulles Toll Road Revenue | ||||||||
0.00%, 10/01/2037 | 1,000,000 | 599,170 | ||||||
4.00%, 10/01/2038 | 415,000 | 456,346 | ||||||
5.00%, 10/01/2033 | 1,250,000 | 1,519,675 | ||||||
5.00%, 10/01/2034 | 1,500,000 | 1,817,730 | ||||||
5.00%, 10/01/2053 | 4,890,000 | 5,075,820 | ||||||
6.50%, 10/01/2041 | 2,000,000 | 2,467,880 | ||||||
Tender Option Bond Trust Receipts/Certificates | ||||||||
0.38%, 07/01/2042(1)(2) | 1,765,000 | 1,765,000 | ||||||
Washington Convention & Sports Authority | ||||||||
5.00%, 10/01/2023 | 1,330,000 | 1,419,536 | ||||||
5.00%, 10/01/2024 | 1,030,000 | 1,115,758 | ||||||
Washington Metropolitan Area Transit Authority | ||||||||
5.00%, 07/01/2032 | 3,250,000 | 3,999,353 | ||||||
|
| |||||||
Total District of Columbia |
| 109,629,517 | ||||||
|
| |||||||
Florida – 7.08% | ||||||||
Alachua County Health Facilities Authority | ||||||||
4.00%, 12/01/2049 | 5,000,000 | 5,453,450 | ||||||
5.00%, 12/01/2036 | 1,000,000 | 1,119,520 | ||||||
5.00%, 12/01/2044 | 3,350,000 | 3,694,279 | ||||||
6.00%, 11/15/2034 | 35,000 | 29,212 | ||||||
6.38%, 11/15/2049 | 300,000 | 235,692 | ||||||
Alachua County School Board | ||||||||
5.00%, 07/01/2021 | 1,000,000 | 1,046,350 | ||||||
5.00%, 07/01/2027 | 1,155,000 | 1,441,706 | ||||||
5.00%, 07/01/2030 | 2,140,000 | 2,815,641 | ||||||
Brevard County Health Facilities Authority | ||||||||
5.00%, 04/01/2039 | 1,335,000 | 1,471,290 | ||||||
Celebration Pointe Community Development District | ||||||||
4.00%, 05/01/2022(2) | 170,000 | 172,105 | ||||||
Central Florida Expressway Authority | ||||||||
5.00%, 07/01/2035 | 5,000,000 | 6,163,650 | ||||||
Citizens Property Insurance Corp. | ||||||||
5.00%, 06/01/2021 | 355,000 | 368,912 | ||||||
5.00%, 06/01/2022 | 2,150,000 | 2,320,301 | ||||||
City of Jacksonville FL | ||||||||
5.00%, 08/15/2028 | 3,045,000 | 3,879,300 | ||||||
5.00%, 08/15/2029 | 2,500,000 | 3,247,225 | ||||||
5.00%, 08/15/2030 | 1,700,000 | 2,191,181 | ||||||
5.00%, 08/15/2031 | 2,250,000 | 2,881,642 | ||||||
5.00%, 08/15/2032 | 1,200,000 | 1,525,680 | ||||||
5.00%, 08/15/2033 | 1,200,000 | 1,516,860 | ||||||
5.00%, 06/01/2053(2) | 1,015,000 | 948,355 | ||||||
City of Miami Gardens FL | ||||||||
5.00%, 07/01/2034 | 1,725,000 | 1,941,436 | ||||||
City of Orlando FL | ||||||||
5.00%, 10/01/2031 | 1,120,000 | 1,472,654 | ||||||
5.00%, 10/01/2032 | 1,300,000 | 1,612,429 | ||||||
5.00%, 10/01/2032 | 1,680,000 | 2,188,234 | ||||||
5.00%, 10/01/2035 | 1,200,000 | 1,535,736 | ||||||
5.00%, 10/01/2036 | 1,000,000 | 1,275,020 | ||||||
City of Orlando FL Tourist Development Tax Revenue | ||||||||
5.00%, 11/01/2029 | 2,000,000 | 2,407,100 | ||||||
City Of South Miami Health Facilities Authority, Inc. | ||||||||
5.00%, 08/15/2023 | 250,000 | 280,603 | ||||||
5.00%, 08/15/2024 | 400,000 | 462,848 | ||||||
5.00%, 08/15/2025 | 700,000 | 826,392 | ||||||
City of Tallahassee FL | ||||||||
5.00%, 12/01/2026 | 1,380,000 | 1,592,727 | ||||||
City of Tampa FL | ||||||||
0.00%, 09/01/2036 | 800,000 | 465,808 | ||||||
0.00%, 09/01/2037 | 800,000 | 444,944 | ||||||
5.00%, 04/01/2040 | 1,115,000 | 1,243,593 | ||||||
County of Broward FL | ||||||||
5.00%, 04/01/2028 | 560,000 | 620,166 | ||||||
County of Broward FL Airport System Revenue | ||||||||
5.00%, 10/01/2022 | 1,185,000 | 1,289,410 | ||||||
5.00%, 10/01/2022 | 1,500,000 | 1,638,840 | ||||||
5.00%, 10/01/2023 | 3,620,000 | 4,069,749 | ||||||
5.00%, 10/01/2025 | 2,125,000 | 2,520,781 | ||||||
5.00%, 10/01/2026 | 1,000,000 | 1,212,660 | ||||||
5.00%, 10/01/2026 | 2,915,000 | 3,534,904 | ||||||
5.00%, 10/01/2027 | 1,650,000 | 2,041,066 | ||||||
5.00%, 10/01/2027 | 3,500,000 | 4,329,535 | ||||||
5.00%, 10/01/2028 | 1,500,000 | 1,888,035 | ||||||
5.00%, 10/01/2029 | 500,000 | 582,085 | ||||||
5.00%, 10/01/2029 | 1,150,000 | 1,468,504 | ||||||
5.00%, 10/01/2030 | 405,000 | 490,994 | ||||||
5.00%, 10/01/2031 | 1,525,000 | 1,915,186 | ||||||
5.00%, 10/01/2036 | 1,350,000 | 1,652,076 | ||||||
5.00%, 10/01/2036 | 1,500,000 | 1,768,920 | ||||||
5.00%, 10/01/2040 | 10,000,000 | 11,303,500 | ||||||
5.00%, 10/01/2042 | 110,000 | 121,570 | ||||||
County of Broward FL Port Facilities Revenue | ||||||||
4.00%, 09/01/2037 | 11,250,000 | 12,202,762 | ||||||
5.00%, 09/01/2030 | 310,000 | 384,924 | ||||||
5.00%, 09/01/2030 | 1,780,000 | 2,190,183 | ||||||
5.00%, 09/01/2032 | 265,000 | 324,585 | ||||||
5.00%, 09/01/2034 | 1,925,000 | 2,316,295 | ||||||
5.00%, 09/01/2035 | 2,000,000 | 2,395,980 | ||||||
County of Clay FL Sales Surtax Revenue | ||||||||
5.00%, 10/01/2026 | 1,170,000 | 1,467,297 | ||||||
5.00%, 10/01/2030 | 1,680,000 | 2,227,663 | ||||||
5.00%, 10/01/2031 | 1,375,000 | 1,802,790 | ||||||
5.00%, 10/01/2035 | 1,805,000 | 2,300,888 |
County of Hillsborough FL Community Investment Tax Revenue | ||||||||
5.00%, 11/01/2025 | 1,800,000 | 2,175,408 | ||||||
County of Lee FL Solid Waste System Revenue | ||||||||
5.00%, 10/01/2025 | 3,045,000 | 3,578,332 | ||||||
County of Miami-Dade FL | ||||||||
5.00%, 07/01/2023 | 1,000,000 | 1,138,400 | ||||||
5.00%, 07/01/2023 | 7,135,000 | 8,122,484 | ||||||
5.00%, 10/01/2024 | 1,785,000 | 2,072,974 | ||||||
County of Miami-Dade FL Aviation Revenue | ||||||||
5.00%, 10/01/2020 | 1,000,000 | 1,009,660 | ||||||
5.00%, 10/01/2021 | 690,000 | 723,141 | ||||||
5.00%, 10/01/2022 | 485,000 | 489,792 | ||||||
5.00%, 10/01/2029 | 200,000 | 225,690 | ||||||
5.00%, 10/01/2031 | 3,000,000 | 3,290,640 | ||||||
5.00%, 10/01/2031 | 7,500,000 | 8,401,425 | ||||||
5.00%, 10/01/2033 | 2,000,000 | 2,225,720 | ||||||
5.00%, 10/01/2034 | 5,520,000 | 6,133,493 | ||||||
5.00%, 10/01/2035 | 1,000,000 | 1,108,140 | ||||||
5.00%, 10/01/2037 | 2,990,000 | 3,336,451 | ||||||
County of Miami-Dade FL Transit System | ||||||||
4.00%, 07/01/2036 | 1,755,000 | 1,943,136 | ||||||
County of Miami-Dade FL Water & Sewer System Revenue | ||||||||
0.16%, 10/01/2033(1)(2) | 2,000,000 | 2,000,000 | ||||||
5.00%, 10/01/2031 | 4,000,000 | 4,778,640 | ||||||
5.00%, 10/01/2032 | 1,275,000 | 1,521,764 | ||||||
County of Miami-Dade Seaport Department | ||||||||
6.00%, 10/01/2038 | 7,000,000 | 7,903,000 | ||||||
6.25%, 10/01/2038 | 2,000,000 | 2,260,840 | ||||||
County of Palm Beach FL | ||||||||
5.00%, 05/01/2029 | 1,915,000 | 2,359,012 | ||||||
County of St Lucie FL | ||||||||
0.13%, 05/01/2024(1) | 2,500,000 | 2,500,000 | ||||||
0.13%, 09/01/2028(1) | 5,000,000 | 5,000,000 | ||||||
Crossings At Fleming Island Community Development District | ||||||||
4.50%, 05/01/2030 | 190,000 | 195,641 | ||||||
Escambia County Health Facilities Authority | ||||||||
4.00%, 08/15/2045 | 1,305,000 | 1,396,350 | ||||||
Esplanade Lake Club Community Development District | ||||||||
3.25%, 11/01/2025 | 250,000 | 250,075 | ||||||
3.25%, 11/01/2025 | 250,000 | 251,870 | ||||||
Florida Development Finance Corp. | ||||||||
5.00%, 04/01/2028 | 315,000 | 387,689 | ||||||
5.00%, 04/01/2029 | 250,000 | 311,562 | ||||||
5.00%, 05/01/2029(2) | 2,625,000 | 2,793,315 | ||||||
5.00%, 02/15/2031 | 750,000 | 816,967 | ||||||
5.00%, 02/15/2038 | 600,000 | 647,826 | ||||||
5.00%, 02/15/2048 | 1,600,000 | 1,718,016 | ||||||
Florida Higher Educational Facilities Financial Authority | ||||||||
5.00%, 10/01/2029 | 1,000,000 | 1,146,910 | ||||||
5.00%, 10/01/2033 | 1,000,000 | 1,120,920 | ||||||
5.00%, 06/01/2048(2) | 2,310,000 | 2,183,805 | ||||||
Florida Housing Finance Corp. | ||||||||
3.50%, 07/01/2051 | 2,750,000 | 3,041,665 | ||||||
Florida Municipal Power Agency | ||||||||
5.00%, 10/01/2025 | 3,475,000 | 4,186,819 | ||||||
Greater Orlando Aviation Authority | ||||||||
5.00%, 10/01/2022 | 1,000,000 | 1,090,690 | ||||||
5.00%, 10/01/2024 | 8,935,000 | 10,400,697 | ||||||
5.00%, 10/01/2030 | 1,000,000 | 1,218,380 | ||||||
5.00%, 10/01/2031 | 2,000,000 | 2,331,620 | ||||||
5.00%, 10/01/2033 | 2,020,000 | 2,337,342 | ||||||
5.00%, 10/01/2033 | 6,705,000 | 8,385,139 | ||||||
Halifax Hospital Medical Center | ||||||||
5.00%, 06/01/2036 | 3,000,000 | 3,439,320 | ||||||
Harbor Bay Community Development District | ||||||||
3.10%, 05/01/2024 | 95,000 | 95,798 | ||||||
3.10%, 05/01/2024 | 400,000 | 403,332 | ||||||
3.10%, 05/01/2024 | 455,000 | 458,817 |
Hernando County School District | ||||||||
5.00%, 07/01/2024 | 805,000 | 944,788 | ||||||
Hillsborough County Aviation Authority | ||||||||
5.00%, 10/01/2032 | 375,000 | 466,736 | ||||||
5.00%, 10/01/2033 | 465,000 | 575,912 | ||||||
5.00%, 10/01/2034 | 2,150,000 | 2,654,949 | ||||||
5.00%, 10/01/2035 | 2,275,000 | 2,797,977 | ||||||
5.00%, 10/01/2036 | 2,650,000 | 3,247,151 | ||||||
5.00%, 10/01/2040 | 12,500,000 | 13,980,750 | ||||||
Hillsborough County Port District | ||||||||
5.00%, 06/01/2038 | 900,000 | 1,046,700 | ||||||
Hillsborough County School Board | ||||||||
5.00%, 07/01/2029 | 1,795,000 | 2,376,257 | ||||||
JEA Electric System Revenue | ||||||||
5.00%, 10/01/2026 | 1,120,000 | 1,377,734 | ||||||
JEA Water & Sewer System Revenue | ||||||||
0.18%, 10/01/2036(1) | 530,000 | 530,000 | ||||||
Lakewood Ranch Stewardship District | ||||||||
3.13%, 05/01/2025 | 315,000 | 313,803 | ||||||
3.40%, 05/01/2030 | 370,000 | 366,252 | ||||||
3.50%, 05/01/2024 | 120,000 | 120,985 | ||||||
4.00%, 05/01/2022 | 260,000 | 263,557 | ||||||
4.00%, 05/01/2040 | 600,000 | 596,718 | ||||||
4.00%, 05/01/2050 | 1,000,000 | 967,770 | ||||||
4.35%, 05/01/2024 | 1,275,000 | 1,300,704 | ||||||
4.55%, 05/01/2024(2) | 775,000 | 790,539 | ||||||
Lee County Industrial Development Authority | ||||||||
5.00%, 11/15/2039 | 1,850,000 | 1,965,052 | ||||||
5.63%, 12/01/2037(2) | 250,000 | 227,863 | ||||||
5.75%, 12/01/2052(2) | 750,000 | 659,730 | ||||||
Lee County School Board | ||||||||
5.00%, 08/01/2028 | 3,275,000 | 4,250,197 | ||||||
Lee Memorial Health System | ||||||||
5.00%, 04/01/2033(1) | 2,850,000 | 3,278,982 | ||||||
5.00%, 04/01/2035 | 6,575,000 | 7,963,903 | ||||||
5.00%, 04/01/2037 | 2,060,000 | 2,476,429 | ||||||
LT Ranch Community Development District | ||||||||
3.00%, 05/01/2025 | 835,000 | 827,560 | ||||||
Manatee County School District | ||||||||
5.00%, 10/01/2025 | 520,000 | 621,811 | ||||||
Marion County School Board | ||||||||
5.00%, 06/01/2026 | 1,455,000 | 1,733,763 | ||||||
Martin County Health Facilities Authority | ||||||||
5.00%, 11/15/2023 | 800,000 | 921,000 | ||||||
Miami-Dade County Educational Facilities Authority | ||||||||
5.00%, 04/01/2040 | 2,855,000 | 3,153,233 | ||||||
5.00%, 04/01/2045 | 1,010,000 | 1,107,960 | ||||||
Miami-Dade County Expressway Authority | ||||||||
5.00%, 07/01/2030 | 1,225,000 | 1,426,537 | ||||||
Miami-Dade County Health Facilities Authority | ||||||||
5.00%, 08/01/2025 | 110,000 | 129,747 | ||||||
5.00%, 08/01/2026 | 155,000 | 186,057 | ||||||
5.00%, 08/01/2027 | 345,000 | 420,800 | ||||||
5.00%, 08/01/2028 | 400,000 | 486,120 | ||||||
5.00%, 08/01/2029 | 480,000 | 580,958 | ||||||
5.00%, 08/01/2030 | 680,000 | 819,958 | ||||||
5.00%, 08/01/2032 | 750,000 | 891,773 | ||||||
Miami-Dade County Industrial Development Authority | ||||||||
1.50%, 09/01/2027(1) | 6,500,000 | 6,509,685 | ||||||
Monroe County School District | ||||||||
5.00%, 06/01/2033 | 540,000 | 666,079 | ||||||
5.00%, 06/01/2035 | 500,000 | 612,770 | ||||||
Orange County Convention Center | ||||||||
5.00%, 10/01/2023 | 1,510,000 | 1,670,045 | ||||||
Orange County Health Facilities Authority | ||||||||
0.13%, 01/01/2037(1) | 900,000 | 900,000 | ||||||
5.00%, 10/01/2039 | 750,000 | 874,950 |
Orange County School Board | ||||||||
5.00%, 08/01/2029 | 1,000,000 | 1,211,270 | ||||||
Palm Beach County Health Facilities Authority | ||||||||
5.00%, 12/01/2023 | 50,000 | 57,754 | ||||||
5.00%, 05/15/2024 | 615,000 | 643,776 | ||||||
5.00%, 12/01/2024 | 105,000 | 125,856 | ||||||
7.50%, 06/01/2049 | 100,000 | 106,341 | ||||||
7.50%, 06/01/2049 | 1,875,000 | 1,994,456 | ||||||
Palm Beach County School District | ||||||||
5.00%, 08/01/2023 | 500,000 | 569,015 | ||||||
5.00%, 08/01/2024 | 220,000 | 259,789 | ||||||
5.00%, 08/01/2026 | 1,065,000 | 1,335,297 | ||||||
5.00%, 08/01/2026 | 3,750,000 | 4,701,750 | ||||||
5.00%, 08/01/2030 | 4,520,000 | 5,412,519 | ||||||
5.00%, 08/01/2032 | 3,000,000 | 3,572,700 | ||||||
Pasco County School Board | ||||||||
5.00%, 08/01/2030 | 450,000 | 596,768 | ||||||
5.00%, 08/01/2033 | 1,000,000 | 1,306,710 | ||||||
Pinellas County Industrial Development Authority | ||||||||
5.00%, 07/01/2039 | 375,000 | 415,958 | ||||||
Portico Community Development District | ||||||||
2.80%, 05/01/2025 | 1,000,000 | 985,690 | ||||||
Rib Floater Trust Various States | ||||||||
0.48%, 10/01/2054(1)(2) | 6,700,000 | 6,700,000 | ||||||
Sarasota County Health Facilities Authority | ||||||||
5.00%, 01/01/2042 | 750,000 | 760,373 | ||||||
5.00%, 01/01/2047 | 875,000 | 884,669 | ||||||
School Board of Miami-Dade County | ||||||||
5.00%, 05/01/2025 | 3,000,000 | 3,616,860 | ||||||
5.00%, 05/01/2026 | 1,000,000 | 1,196,140 | ||||||
5.00%, 05/01/2028 | 2,785,000 | 3,310,892 | ||||||
5.00%, 02/01/2030 | 500,000 | 603,260 | ||||||
5.00%, 05/01/2031(1) | 5,000,000 | 5,810,500 | ||||||
5.00%, 05/01/2031 | 5,000,000 | 5,936,350 | ||||||
School District of Broward County | ||||||||
5.00%, 07/01/2022 | 1,000,000 | 1,081,530 | ||||||
5.00%, 07/01/2028 | 1,500,000 | 1,870,320 | ||||||
5.00%, 07/01/2029 | 2,545,000 | 3,166,438 | ||||||
5.00%, 07/01/2030 | 3,955,000 | 5,238,042 | ||||||
5.00%, 07/01/2030 | 5,500,000 | 6,448,640 | ||||||
5.00%, 07/01/2033 | 5,000,000 | 6,401,800 | ||||||
Seminole County Industrial Development Authority | ||||||||
3.75%, 11/15/2025 | 2,690,000 | 2,468,855 | ||||||
St Johns County School Board | ||||||||
5.00%, 07/01/2029 | 1,250,000 | 1,648,538 | ||||||
5.00%, 07/01/2030 | 1,500,000 | 1,958,760 | ||||||
5.00%, 07/01/2031 | 1,000,000 | 1,297,820 | ||||||
State of Florida | ||||||||
5.00%, 06/01/2023 | 2,425,000 | 2,755,382 | ||||||
5.00%, 06/01/2024 | 2,415,000 | 2,848,009 | ||||||
5.00%, 07/01/2024 | 2,460,000 | 2,902,136 | ||||||
State of Florida Lottery Revenue | ||||||||
5.00%, 07/01/2024 | 1,400,000 | 1,656,508 | ||||||
5.00%, 07/01/2024 | 4,000,000 | 4,732,880 | ||||||
Sunshine Skyway Bridge | ||||||||
4.00%, 07/01/2037 | 2,355,000 | 2,772,447 | ||||||
Tampa Bay Water | ||||||||
5.50%, 10/01/2022 | 1,000,000 | 1,116,060 | ||||||
Tender Option Bond Trust Receipts/Certificates | ||||||||
0.28%, 01/01/2028(1)(2) | 6,300,000 | 6,300,000 | ||||||
0.46%, 10/01/2023(1)(2) | 2,700,000 | 2,700,000 | ||||||
Tolomato Community Development District | ||||||||
2.00%, 05/01/2021 | 580,000 | 586,519 | ||||||
2.00%, 05/01/2022 | 605,000 | 619,502 | ||||||
2.00%, 05/01/2023 | 1,250,000 | 1,295,575 | ||||||
2.00%, 05/01/2024 | 1,300,000 | 1,357,564 | ||||||
2.10%, 05/01/2025 | 1,345,000 | 1,416,083 | ||||||
3.50%, 05/01/2024 | 465,000 | 471,240 |
Town of Davie FL | ||||||||
5.00%, 04/01/2048 | 1,440,000 | �� | 1,648,080 | |||||
Village Community Development District No 13 | ||||||||
3.00%, 05/01/2029 | 1,000,000 | 999,490 | ||||||
3.38%, 05/01/2034 | 1,000,000 | 999,420 | ||||||
Volusia County Educational Facility Authority | ||||||||
4.00%, 10/15/2037 | 740,000 | 819,580 | ||||||
5.00%, 10/15/2044 | 390,000 | 459,319 | ||||||
5.00%, 10/15/2049 | 730,000 | 855,268 | ||||||
Volusia County School Board | ||||||||
5.00%, 08/01/2024 | 2,100,000 | 2,445,534 | ||||||
West Villages Improvement District | ||||||||
4.00%, 05/01/2024 | 400,000 | 407,148 | ||||||
Westside Community Development District | ||||||||
3.50%, 05/01/2024(2) | 470,000 | 471,476 | ||||||
|
| |||||||
Total Florida |
| 461,654,830 | ||||||
|
| |||||||
Georgia – 2.69% | ||||||||
Atlanta Development Authority | ||||||||
6.75%, 01/01/2035 | 2,200,000 | 1,823,580 | ||||||
7.00%, 01/01/2040 | 985,000 | 816,171 | ||||||
Augusta GA Airport Revenue | ||||||||
5.00%, 01/01/2027 | 370,000 | 401,572 | ||||||
Bartow County Development Authority | ||||||||
1.55%, 08/01/2043(1) | 3,000,000 | 3,003,840 | ||||||
Brookhaven Development Authority | ||||||||
5.00%, 07/01/2025 | 1,400,000 | 1,681,918 | ||||||
5.00%, 07/01/2031 | 650,000 | 842,309 | ||||||
5.00%, 07/01/2032 | 1,000,000 | 1,282,440 | ||||||
5.00%, 07/01/2033 | 1,135,000 | 1,443,379 | ||||||
5.00%, 07/01/2037 | 1,800,000 | 2,237,256 | ||||||
Burke County Development Authority | ||||||||
2.25%, 10/01/2032(1) | 2,800,000 | 2,858,548 | ||||||
2.93%, 11/01/2053(1) | 2,940,000 | 3,081,091 | ||||||
3.25%, 11/01/2045(1) | 3,000,000 | 3,205,110 | ||||||
City of Atlanta GA Water & Wastewater Revenue | ||||||||
5.00%, 11/01/2040 | 14,595,000 | 17,036,743 | ||||||
City of East Point GA | ||||||||
5.00%, 08/01/2020 | 415,000 | 416,457 | ||||||
5.00%, 08/01/2021 | 250,000 | 261,605 | ||||||
Cobb County Kennestone Hospital Authority | ||||||||
5.00%, 04/01/2047 | 1,150,000 | 1,289,644 | ||||||
Columbus Medical Center Hospital Authority | ||||||||
5.00%, 07/01/2054(1) | 2,700,000 | 3,259,629 | ||||||
5.00%, 07/01/2054(1) | 3,330,000 | 4,017,745 | ||||||
DeKalb County Hospital Authority | ||||||||
6.13%, 09/01/2040 | 550,000 | 555,225 | ||||||
DeKalb Private Hospital Authority | ||||||||
5.00%, 07/01/2027 | 1,235,000 | 1,556,631 | ||||||
Development Authority for Fulton County | ||||||||
5.00%, 04/01/2023 | 300,000 | 331,713 | ||||||
5.00%, 06/15/2044 | 580,000 | 712,750 | ||||||
5.00%, 04/01/2047 | 1,750,000 | 1,962,502 | ||||||
Development Authority of Burke County | ||||||||
1.70%, 12/01/2049(1) | 2,400,000 | 2,410,440 | ||||||
Development Authority of Monroe County | ||||||||
0.17%, 09/01/2037(1) | 3,000,000 | 3,000,000 | ||||||
Development Authority Of The City Of Marietta | ||||||||
5.00%, 11/01/2037(2) | 625,000 | 640,369 | ||||||
5.00%, 11/01/2047(2) | 500,000 | 503,015 | ||||||
Fayette County Hospital Authority | ||||||||
5.00%, 07/01/2054(1) | 1,300,000 | 1,489,605 | ||||||
Fulton County Residential Care Facilities for the Elderly Authority | ||||||||
5.00%, 04/01/2047(2) | 700,000 | 660,555 | ||||||
5.00%, 04/01/2054(2) | 550,000 | 510,345 | ||||||
Gainesville & Hall County Hospital Authority | ||||||||
5.50%, 02/15/2042 | 650,000 | 793,500 | ||||||
Griffin-Spalding County Hospital Authority | ||||||||
3.00%, 04/01/2027 | 635,000 | 688,683 | ||||||
LaGrange-Troup County Hospital Authority | ||||||||
5.00%, 04/01/2024 | 500,000 | 570,270 | ||||||
Macon-Bibb County Urban Development Authority | ||||||||
5.75%, 06/15/2037(2) | 1,000,000 | 1,018,870 | ||||||
Main Street Natural Gas, Inc. | ||||||||
0.87% (1 Month LIBOR USD + 0.75%), 04/01/2048(3) | 6,400,000 | 6,345,344 | ||||||
0.95% (1 Month LIBOR USD + 0.83%), 08/01/2048(3) | 1,700,000 | 1,687,828 | ||||||
4.00%, 04/01/2048(1) | 3,600,000 | 3,918,528 | ||||||
4.00%, 08/01/2048(1) | 7,975,000 | 8,727,361 | ||||||
4.00%, 08/01/2049(1) | 17,670,000 | 19,940,418 | ||||||
4.00%, 03/01/2050(1) | 20,000,000 | 22,963,400 | ||||||
5.00%, 05/15/2027 | 3,000,000 | 3,574,920 | ||||||
5.00%, 05/15/2028 | 2,500,000 | 3,025,000 | ||||||
5.00%, 05/15/2043 | 4,520,000 | 5,255,540 | ||||||
Monroe County Development Authority | ||||||||
2.35%, 10/01/2048(1) | 500,000 | 503,895 | ||||||
Municipal Electric Authority of Georgia | ||||||||
5.00%, 01/01/2024 | 830,000 | 934,190 | ||||||
5.00%, 01/01/2025 | 350,000 | 404,649 | ||||||
5.00%, 01/01/2025 | 900,000 | 1,040,526 | ||||||
5.00%, 01/01/2026 | 300,000 | 354,927 | ||||||
5.00%, 01/01/2026 | 320,000 | 378,589 | ||||||
5.00%, 01/01/2027 | 300,000 | 362,304 | ||||||
5.00%, 01/01/2028 | 25,000 | 30,816 | ||||||
5.00%, 01/01/2028 | 750,000 | 924,488 | ||||||
5.00%, 01/01/2030 | 1,000,000 | 1,236,180 | ||||||
5.00%, 01/01/2031 | 685,000 | 851,181 | ||||||
5.00%, 01/01/2049 | 3,610,000 | 4,210,271 | ||||||
Private Colleges & Universities Authority | ||||||||
4.00%, 09/01/2037 | 8,350,000 | 10,067,512 | ||||||
4.00%, 09/01/2038 | 4,665,000 | 5,600,939 | ||||||
5.00%, 09/01/2025 | 1,810,000 | 2,229,468 | ||||||
5.00%, 04/01/2027 | 1,900,000 | 2,137,709 | ||||||
5.00%, 04/01/2044 | 1,000,000 | 1,088,280 | ||||||
Savannah Economic Development Authority | ||||||||
7.25%, 01/01/2049 | 120,000 | 128,051 | ||||||
State of Georgia | ||||||||
5.00%, 07/01/2023 | 1,000,000 | 1,140,980 | ||||||
|
| |||||||
Total Georgia |
| 175,426,804 | ||||||
|
| |||||||
Guam – 0.06% | ||||||||
Guam Government Waterworks Authority | ||||||||
5.00%, 07/01/2035 | 1,550,000 | 1,706,938 | ||||||
Territory of Guam | ||||||||
5.00%, 11/15/2031 | 2,410,000 | 2,509,316 | ||||||
|
| |||||||
Total Guam |
| 4,216,254 | ||||||
|
| |||||||
Hawaii – 0.64% | ||||||||
City & County of Honolulu HI | ||||||||
5.00%, 09/01/2024 | 1,275,000 | 1,508,631 | ||||||
5.00%, 10/01/2029 | 2,000,000 | 2,422,240 | ||||||
State of Hawaii | ||||||||
5.00%, 08/01/2023 | 1,925,000 | 2,195,790 | ||||||
5.00%, 01/01/2030 | 2,330,000 | 3,068,773 | ||||||
5.00%, 01/01/2032 | 12,800,000 | 16,651,520 | ||||||
5.00%, 01/01/2033 | 9,500,000 | 12,278,655 | ||||||
State of Hawaii Airports System Revenue | ||||||||
5.00%, 07/01/2031 | 1,275,000 | 1,572,674 | ||||||
5.00%, 07/01/2032 | 1,500,000 | 1,836,675 | ||||||
|
| |||||||
Total Hawaii |
| 41,534,958 | ||||||
|
| |||||||
Idaho – 0.06% | ||||||||
Idaho Health Facilities Authority | ||||||||
5.00%, 03/01/2034 | 3,155,000 | 3,492,270 | ||||||
Idaho Housing & Finance Association | ||||||||
4.00%, 01/01/2050 | 280,000 | 309,534 | ||||||
|
| |||||||
Total Idaho |
| 3,801,804 | ||||||
|
| |||||||
Illinois – 9.06% | ||||||||
Champaign County Community Unit School District No 4 Champaign | ||||||||
0.00%, 01/01/2025 | 485,000 | 467,370 | ||||||
Chicago Board of Education | ||||||||
0.00%, 12/01/2025 | 265,000 | 226,323 | ||||||
0.00%, 12/01/2025 | 345,000 | 276,718 | ||||||
5.00%, 12/01/2021 | 1,000,000 | 1,023,890 | ||||||
5.00%, 12/01/2023 | 2,000,000 | 2,106,400 | ||||||
5.00%, 12/01/2024 | 130,000 | 138,342 | ||||||
5.00%, 12/01/2024 | 2,175,000 | 2,314,570 | ||||||
5.00%, 12/01/2025 | 475,000 | 509,152 | ||||||
5.00%, 12/01/2025 | 1,160,000 | 1,243,404 | ||||||
5.00%, 12/01/2025 | 2,500,000 | 2,838,225 | ||||||
5.00%, 12/01/2026 | 145,000 | 156,915 | ||||||
5.00%, 12/01/2026 | 3,660,000 | 3,960,742 | ||||||
5.00%, 12/01/2027 | 850,000 | 927,826 | ||||||
5.00%, 12/01/2028 | 310,000 | 340,358 | ||||||
5.00%, 12/01/2028 | 1,270,000 | 1,394,371 | ||||||
5.00%, 12/01/2029 | 385,000 | 425,102 | ||||||
5.00%, 12/01/2029 | 540,000 | 596,246 | ||||||
5.00%, 12/01/2030 | 2,000,000 | 2,204,740 | ||||||
5.00%, 12/01/2030 | 2,430,000 | 2,678,759 | ||||||
5.00%, 12/01/2031 | 2,185,000 | 2,396,115 | ||||||
5.00%, 12/01/2033 | 300,000 | 322,914 | ||||||
5.00%, 12/01/2034 | 250,000 | 284,972 | ||||||
5.00%, 12/01/2041 | 785,000 | 791,453 | ||||||
5.00%, 12/01/2042 | 200,000 | 202,758 | ||||||
5.00%, 12/01/2046 | 1,455,000 | 1,527,677 | ||||||
5.25%, 12/01/2041 | 3,000,000 | 3,034,860 | ||||||
6.50%, 12/01/2046 | 100,000 | 114,287 | ||||||
6.75%, 12/01/2030(2) | 1,500,000 | 1,816,830 | ||||||
7.00%, 12/01/2046(2) | 400,000 | 479,152 | ||||||
Chicago Midway International Airport | ||||||||
5.00%, 01/01/2021 | 5,000,000 | 5,095,150 | ||||||
5.00%, 01/01/2027 | 1,800,000 | 2,083,914 | ||||||
5.00%, 01/01/2032 | 2,000,000 | 2,186,420 | ||||||
5.00%, 01/01/2034 | 1,000,000 | 1,087,580 | ||||||
5.00%, 01/01/2041 | 835,000 | 934,674 | ||||||
5.00%, 01/01/2046 | 300,000 | 333,483 | ||||||
5.50%, 01/01/2028 | 5,000,000 | 5,455,750 | ||||||
Chicago O’Hare International Airport | ||||||||
5.00%, 01/01/2021 | 1,535,000 | 1,564,288 | ||||||
5.00%, 01/01/2022 | 520,000 | 549,552 | ||||||
5.00%, 01/01/2023 | 1,000,000 | 1,097,280 | ||||||
5.00%, 01/01/2024 | 1,865,000 | 2,103,888 | ||||||
5.00%, 01/01/2025 | 415,000 | 480,777 | ||||||
5.00%, 01/01/2027 | 385,000 | 465,750 | ||||||
5.00%, 01/01/2028 | 1,000,000 | 1,203,290 | ||||||
5.00%, 01/01/2030 | 520,000 | 648,066 | ||||||
5.00%, 01/01/2030 | 2,000,000 | 2,292,520 | ||||||
5.00%, 01/01/2030 | 3,105,000 | 3,530,199 | ||||||
5.00%, 01/01/2031 | 660,000 | 782,489 | ||||||
5.00%, 01/01/2031 | 700,000 | 792,946 | ||||||
5.00%, 01/01/2031 | 835,000 | 1,033,880 | ||||||
5.00%, 01/01/2032 | 1,140,000 | 1,402,485 | ||||||
5.00%, 01/01/2032 | 1,300,000 | 1,467,232 | ||||||
5.00%, 01/01/2032 | 11,555,000 | 13,148,088 | ||||||
5.00%, 01/01/2033 | 345,000 | 399,099 | ||||||
5.00%, 01/01/2033 | 1,200,000 | 1,466,844 | ||||||
5.00%, 01/01/2033 | 2,520,000 | 2,856,949 | ||||||
5.00%, 07/01/2033 | 550,000 | 635,024 | ||||||
5.00%, 01/01/2034 | 400,000 | 461,384 | ||||||
5.00%, 01/01/2035 | 1,285,000 | 1,558,808 | ||||||
5.00%, 01/01/2036 | 430,000 | 493,446 | ||||||
5.00%, 01/01/2042 | 500,000 | 573,665 | ||||||
5.00%, 01/01/2048 | 1,025,000 | 1,206,445 | ||||||
5.00%, 01/01/2053 | 615,000 | 728,062 | ||||||
Chicago Park District | ||||||||
4.00%, 01/01/2022 | 500,000 | 518,135 | ||||||
5.00%, 01/01/2025 | 500,000 | 507,770 | ||||||
5.00%, 01/01/2029 | 3,000,000 | 3,328,230 | ||||||
5.00%, 01/01/2036 | 480,000 | 493,594 |
Chicago Transit Authority | ||||||||
5.00%, 06/01/2022 | 265,000 | 282,898 | ||||||
5.00%, 06/01/2023 | 240,000 | 264,362 | ||||||
5.00%, 06/01/2024 | 200,000 | 226,426 | ||||||
5.00%, 06/01/2025 | 200,000 | 231,958 | ||||||
5.00%, 06/01/2026 | 160,000 | 189,304 | ||||||
5.00%, 06/01/2026 | 8,275,000 | 9,790,566 | ||||||
5.25%, 06/01/2024 | 2,000,000 | 2,069,100 | ||||||
City of Chicago IL | ||||||||
5.00%, 01/01/2022 | 460,000 | 491,841 | ||||||
5.00%, 01/01/2027 | 500,000 | 599,690 | ||||||
5.00%, 01/01/2027 | 2,000,000 | 2,173,000 | ||||||
5.00%, 01/01/2031 | 1,000,000 | 1,110,070 | ||||||
5.00%, 01/01/2035 | 750,000 | 797,797 | ||||||
5.00%, 01/01/2035 | 2,650,000 | 2,777,995 | ||||||
5.00%, 01/01/2039 | 1,200,000 | 1,294,692 | ||||||
5.25%, 01/01/2027 | 2,435,000 | 2,610,515 | ||||||
5.50%, 01/01/2035 | 1,000,000 | 1,071,100 | ||||||
5.75%, 01/01/2034 | 2,000,000 | 2,252,400 | ||||||
City of Chicago IL Motor Fuel Tax Revenue | ||||||||
5.00%, 01/01/2025 | 2,000,000 | 2,041,760 | ||||||
City of Chicago IL Wastewater Transmission Revenue | ||||||||
5.00%, 01/01/2023 | 450,000 | 488,191 | ||||||
5.00%, 01/01/2024 | 500,000 | 557,860 | ||||||
5.00%, 01/01/2028 | 3,000,000 | 3,149,550 | ||||||
5.00%, 01/01/2028 | 2,900,000 | 3,218,855 | ||||||
5.00%, 01/01/2029 | 1,300,000 | 1,442,467 | ||||||
5.00%, 01/01/2030 | 1,000,000 | 1,220,470 | ||||||
5.00%, 01/01/2030 | 1,310,000 | 1,494,265 | ||||||
5.00%, 01/01/2033 | 2,000,000 | 2,237,160 | ||||||
5.00%, 01/01/2039 | 1,000,000 | 1,105,040 | ||||||
City of Chicago IL Waterworks Revenue | ||||||||
4.00%, 11/01/2023 | 1,025,000 | 1,081,723 | ||||||
5.00%, 11/01/2020 | 1,030,000 | 1,041,917 | ||||||
5.00%, 11/01/2021 | 1,525,000 | 1,594,814 | ||||||
5.00%, 11/01/2022 | 1,000,000 | 1,079,450 | ||||||
5.00%, 11/01/2023 | 650,000 | 722,020 | ||||||
5.00%, 11/01/2024 | 250,000 | 284,755 | ||||||
5.00%, 11/01/2024 | 1,000,000 | 1,139,020 | ||||||
5.00%, 11/01/2024 | 1,150,000 | 1,309,873 | ||||||
5.00%, 11/01/2025 | 1,000,000 | 1,134,280 | ||||||
5.00%, 11/01/2026 | 1,000,000 | 1,129,330 | ||||||
5.00%, 11/01/2033 | 500,000 | 548,640 | ||||||
City of Springfield IL | ||||||||
5.00%, 12/01/2024 | 340,000 | 396,219 | ||||||
5.00%, 12/01/2025 | 395,000 | 472,175 | ||||||
5.00%, 12/01/2026 | 160,000 | 188,346 | ||||||
City of Waukegan IL | ||||||||
4.00%, 12/30/2024 | 540,000 | 610,394 | ||||||
Cook County Community College District No 508 | ||||||||
5.25%, 12/01/2028 | 1,150,000 | 1,181,130 | ||||||
Cook Kane Lake & McHenry Counties Community College District No 512 | ||||||||
5.00%, 12/01/2024 | 850,000 | 1,012,375 | ||||||
County of Cook IL | ||||||||
5.00%, 11/15/2023 | 3,090,000 | 3,517,780 | ||||||
5.00%, 11/15/2026 | 1,000,000 | 1,008,800 | ||||||
5.00%, 11/15/2026 | 1,450,000 | 1,651,260 | ||||||
5.00%, 11/15/2029 | 1,000,000 | 1,122,920 | ||||||
5.00%, 11/15/2030 | 500,000 | 558,950 | ||||||
5.00%, 11/15/2034 | 1,200,000 | 1,320,216 | ||||||
5.25%, 11/15/2022 | 405,000 | 409,475 | ||||||
5.25%, 11/15/2028 | 1,035,000 | 1,070,180 | ||||||
County of Cook IL Sales Tax Revenue | ||||||||
5.00%, 11/15/2029 | 1,085,000 | 1,185,341 | ||||||
5.00%, 11/15/2033 | 2,795,000 | 3,278,982 | ||||||
5.25%, 11/15/2035 | 3,000,000 | 3,555,690 | ||||||
County of Kankakee IL | ||||||||
4.00%, 12/01/2020 | 515,000 | 521,340 |
County of Kendall IL | ||||||||
5.00%, 12/15/2024 | 2,190,000 | 2,587,244 | ||||||
Illinois Finance Authority | ||||||||
1.75%, 11/15/2042(1) | 1,770,000 | 1,784,886 | ||||||
2.25%, 11/15/2042(1) | 500,000 | 514,305 | ||||||
3.00%, 07/01/2035 | 2,250,000 | 2,409,570 | ||||||
3.63%, 02/15/2032 | 355,000 | 390,181 | ||||||
3.75%, 02/15/2034 | 200,000 | 221,206 | ||||||
4.00%, 05/15/2023 | 35,000 | 38,517 | ||||||
4.00%, 05/15/2023 | 245,000 | 243,417 | ||||||
4.00%, 11/01/2030 | 2,500,000 | 2,856,550 | ||||||
4.00%, 09/01/2032 | 40,000 | 41,180 | ||||||
4.00%, 02/15/2036 | 800,000 | 895,680 | ||||||
4.00%, 02/15/2041 | 5,000 | 6,051 | ||||||
4.00%, 02/15/2041 | 130,000 | 157,327 | ||||||
4.13%, 08/15/2037 | 1,090,000 | 1,163,401 | ||||||
4.75%, 05/15/2033 | 125,000 | 140,230 | ||||||
4.75%, 05/15/2033 | 835,000 | 835,175 | ||||||
5.00%, 08/01/2021 | 445,000 | 461,625 | ||||||
5.00%, 02/15/2022 | 215,000 | 229,788 | ||||||
5.00%, 07/01/2022 | 1,000,000 | 1,092,050 | ||||||
5.00%, 12/01/2022 | 325,000 | 346,008 | ||||||
5.00%, 11/15/2023 | 1,680,000 | 1,867,488 | ||||||
5.00%, 12/01/2023 | 1,880,000 | 2,098,926 | ||||||
5.00%, 01/01/2024 | 250,000 | 282,758 | ||||||
5.00%, 02/15/2024 | 215,000 | 245,939 | ||||||
5.00%, 05/15/2024 | 350,000 | 394,377 | ||||||
5.00%, 02/15/2025 | 695,000 | 811,711 | ||||||
5.00%, 07/15/2025 | 230,000 | 276,603 | ||||||
5.00%, 08/01/2025 | 1,605,000 | 1,855,508 | ||||||
5.00%, 02/15/2026 | 360,000 | 435,380 | ||||||
5.00%, 02/15/2026 | 1,345,000 | 1,607,208 | ||||||
5.00%, 08/15/2026 | 1,500,000 | 1,821,600 | ||||||
5.00%, 08/15/2027 | 2,000,000 | 2,482,280 | ||||||
5.00%, 03/01/2028 | 15,000 | 18,211 | ||||||
5.00%, 05/15/2028 | 12,620,000 | 15,434,134 | ||||||
5.00%, 09/01/2028 | 500,000 | 574,840 | ||||||
5.00%, 01/01/2029 | 1,650,000 | 2,071,196 | ||||||
5.00%, 02/15/2029 | 1,445,000 | 1,780,052 | ||||||
5.00%, 10/01/2029 | 505,000 | 632,613 | ||||||
5.00%, 12/01/2029 | 340,000 | 395,852 | ||||||
5.00%, 02/15/2030 | 1,240,000 | 1,520,872 | ||||||
5.00%, 07/01/2030 | 275,000 | 323,540 | ||||||
5.00%, 07/15/2030 | 710,000 | 894,643 | ||||||
5.00%, 08/01/2030 | 870,000 | 1,021,337 | ||||||
5.00%, 09/01/2030 | 430,000 | 494,534 | ||||||
5.00%, 10/01/2030 | 565,000 | 698,035 | ||||||
5.00%, 11/15/2030 | 2,000,000 | 2,301,580 | ||||||
5.00%, 01/01/2031 | 3,545,000 | 4,195,791 | ||||||
5.00%, 02/15/2031 | 300,000 | 366,225 | ||||||
5.00%, 05/15/2031 | 5,000,000 | 6,087,800 | ||||||
5.00%, 07/01/2031 | 1,420,000 | 1,762,689 | ||||||
5.00%, 08/15/2031 | 1,525,000 | 1,984,681 | ||||||
5.00%, 05/15/2033 | 795,000 | 741,934 | ||||||
5.00%, 08/15/2033 | 250,000 | 315,650 | ||||||
5.00%, 10/01/2033 | 700,000 | 848,435 | ||||||
5.00%, 01/01/2034 | 605,000 | 706,434 | ||||||
5.00%, 02/15/2034 | 1,890,000 | 2,276,278 | ||||||
5.00%, 07/01/2034 | 300,000 | 347,433 | ||||||
5.00%, 08/15/2034 | 2,500,000 | 2,971,425 | ||||||
5.00%, 11/15/2034 | 300,000 | 340,872 | ||||||
5.00%, 11/15/2034 | 3,000,000 | 3,408,720 | ||||||
5.00%, 08/15/2035 | 100,000 | 111,893 | ||||||
5.00%, 08/15/2035 | 600,000 | 757,560 | ||||||
5.00%, 02/15/2036 | 905,000 | 1,083,213 | ||||||
5.00%, 07/01/2036 | 830,000 | 955,430 | ||||||
5.00%, 08/15/2036 | 1,000,000 | 1,262,600 | ||||||
5.00%, 10/01/2036 | 620,000 | 742,735 |
5.00%, 01/01/2037 | 2,785,000 | 3,276,942 | ||||||
5.00%, 05/15/2037 | 395,000 | 398,176 | ||||||
5.00%, 05/15/2037 | 1,050,000 | 1,044,025 | ||||||
5.00%, 08/15/2037 | 1,000,000 | 1,262,600 | ||||||
5.00%, 11/15/2038 | 3,795,000 | 4,276,434 | ||||||
5.00%, 02/15/2041 | 1,075,000 | 1,269,080 | ||||||
5.00%, 08/01/2042 | 120,000 | 129,143 | ||||||
5.00%, 01/01/2044 | 4,145,000 | 4,801,402 | ||||||
5.00%, 08/15/2044 | 200,000 | 218,376 | ||||||
5.00%, 12/01/2046 | 5,950,000 | 6,649,958 | ||||||
5.00%, 05/15/2047 | 100,000 | 97,824 | ||||||
5.00%, 08/01/2049 | 140,000 | 149,474 | ||||||
5.00%, 07/15/2057(1) | 11,305,000 | 12,513,844 | ||||||
5.13%, 05/15/2038 | 1,000,000 | 915,050 | ||||||
5.25%, 08/15/2031 | 500,000 | 638,795 | ||||||
5.25%, 07/01/2035 | 20,085,000 | 26,142,234 | ||||||
5.25%, 02/15/2037 | 380,000 | 342,125 | ||||||
5.25%, 05/15/2047 | 35,000 | 39,762 | ||||||
5.25%, 05/15/2047 | 245,000 | 245,953 | ||||||
5.25%, 05/15/2054 | 1,000,000 | 861,070 | ||||||
Illinois Municipal Electric Agency | ||||||||
5.00%, 02/01/2022 | 1,280,000 | 1,369,933 | ||||||
5.00%, 02/01/2023 | 275,000 | 306,487 | ||||||
5.00%, 02/01/2031 | 470,000 | 550,840 | ||||||
Illinois Sports Facilities Authority | ||||||||
5.25%, 06/15/2032 | 1,735,000 | 1,892,729 | ||||||
Illinois State Toll Highway Authority | ||||||||
5.00%, 01/01/2024 | 935,000 | 1,069,275 | ||||||
5.00%, 01/01/2028 | 3,000,000 | 3,757,920 | ||||||
5.00%, 12/01/2031 | 235,000 | 277,756 | ||||||
5.00%, 12/01/2032 | 425,000 | 498,164 | ||||||
5.00%, 01/01/2034 | 1,300,000 | 1,583,907 | ||||||
5.00%, 01/01/2037 | 1,260,000 | 1,454,922 | ||||||
Illinois State University | ||||||||
5.00%, 04/01/2032 | 1,745,000 | 2,025,125 | ||||||
Kane & DeKalb Counties Community Unit School District No 302 Kaneland | ||||||||
5.00%, 02/01/2025 | 4,125,000 | 4,875,503 | ||||||
5.00%, 02/01/2026 | 1,930,000 | 2,342,557 | ||||||
Lake County Community Unit School District No 60 Waukegan | ||||||||
5.00%, 01/01/2026 | 1,000,000 | 1,157,510 | ||||||
5.00%, 01/01/2027 | 100,000 | 119,938 | ||||||
5.00%, 01/01/2027 | 2,100,000 | 2,419,536 | ||||||
McHenry County Community Unit School District No 12 Johnsburg | ||||||||
5.00%, 01/01/2026 | 925,000 | 1,058,182 | ||||||
McHenry County Community Unit School District No 200 Woodstock | ||||||||
0.00%, 01/15/2024 | 1,000,000 | 964,360 | ||||||
0.00%, 01/15/2025 | 1,000,000 | 948,500 | ||||||
0.00%, 01/15/2026 | 1,000,000 | 928,670 | ||||||
Metropolitan Pier & Exposition Authority | ||||||||
0.00%, 12/15/2023 | 165,000 | 149,937 | ||||||
0.00%, 06/15/2028 | 14,270,000 | 11,012,016 | ||||||
0.00%, 06/15/2029 | 2,540,000 | 1,881,429 | ||||||
0.00%, 12/15/2030 | 11,000,000 | 7,613,210 | ||||||
0.00%, 12/15/2034 | 550,000 | 313,363 | ||||||
5.00%, 12/15/2026 | 2,000,000 | 2,056,680 | ||||||
5.00%, 12/15/2028 | 1,000,000 | 1,091,730 | ||||||
5.00%, 12/15/2028 | 2,815,000 | 2,888,162 | ||||||
5.00%, 12/15/2032 | 550,000 | 588,935 | ||||||
5.00%, 06/15/2050 | 17,060,000 | 18,170,265 | ||||||
5.00%, 06/15/2057 | 3,275,000 | 3,436,818 | ||||||
Metropolitan Water Reclamation District of Greater Chicago | ||||||||
5.00%, 12/01/2031 | 5,700,000 | 5,990,700 | ||||||
5.25%, 12/01/2032 | 1,800,000 | 2,549,718 | ||||||
Peoria Metropolitan Airport Authority | ||||||||
5.00%, 12/01/2026 | 1,375,000 | 1,656,765 | ||||||
Peoria Public Building Commission | ||||||||
5.00%, 12/01/2022 | 1,500,000 | 1,656,405 |
Railsplitter Tobacco Settlement Authority | ||||||||
5.00%, 06/01/2023 | 2,265,000 | 2,501,081 | ||||||
5.00%, 06/01/2024 | 5,275,000 | 5,989,182 | ||||||
5.50%, 06/01/2023 | 1,240,000 | 1,298,801 | ||||||
Regional Transportation Authority | ||||||||
5.00%, 07/01/2020 | 400,000 | 400,000 | ||||||
5.00%, 07/01/2021 | 400,000 | 415,920 | ||||||
Sales Tax Securitization Corp. | ||||||||
5.00%, 01/01/2025 | 1,000,000 | 1,135,560 | ||||||
5.00%, 01/01/2025 | 4,000,000 | 4,542,240 | ||||||
5.00%, 01/01/2026 | 2,000,000 | 2,315,840 | ||||||
5.00%, 01/01/2029 | 1,000,000 | 1,219,350 | ||||||
State of Illinois | ||||||||
4.00%, 01/01/2023 | 330,000 | 334,389 | ||||||
5.00%, 11/01/2020 | 610,000 | 614,776 | ||||||
5.00%, 02/01/2021 | 6,000,000 | 6,081,960 | ||||||
5.00%, 09/01/2021 | 1,365,000 | 1,400,681 | ||||||
5.00%, 10/01/2021 | 2,000,000 | 2,055,720 | ||||||
5.00%, 11/01/2021 | 12,555,000 | 12,927,758 | ||||||
5.00%, 08/01/2022 | 3,000,000 | 3,172,020 | ||||||
5.00%, 09/01/2022 | 1,340,000 | 1,398,129 | ||||||
5.00%, 11/01/2022 | 570,000 | 596,442 | ||||||
5.00%, 02/01/2023 | 200,000 | 209,720 | ||||||
5.00%, 02/01/2023 | 235,000 | 246,421 | ||||||
5.00%, 09/01/2023 | 1,365,000 | 1,444,307 | ||||||
5.00%, 11/01/2023 | 4,160,000 | 4,411,930 | ||||||
5.00%, 06/15/2024 | 2,305,000 | 2,457,683 | ||||||
5.00%, 09/01/2024 | 1,365,000 | 1,460,932 | ||||||
5.00%, 02/01/2025 | 455,000 | 482,123 | ||||||
5.00%, 05/01/2025 | 3,050,000 | 3,240,991 | ||||||
5.00%, 06/01/2025 | 880,000 | 949,186 | ||||||
5.00%, 06/15/2025 | 4,190,000 | 4,456,484 | ||||||
5.00%, 10/01/2025 | 355,000 | 383,936 | ||||||
5.00%, 11/01/2025 | 2,040,000 | 2,207,627 | ||||||
5.00%, 11/01/2025 | 13,700,000 | 14,825,729 | ||||||
5.00%, 06/01/2026 | 125,000 | 135,780 | ||||||
5.00%, 10/01/2026 | 2,270,000 | 2,471,553 | ||||||
5.00%, 11/01/2026 | 9,230,000 | 10,055,624 | ||||||
5.00%, 02/01/2027 | 1,635,000 | 1,784,406 | ||||||
5.00%, 02/01/2028 | 1,000,000 | 1,081,500 | ||||||
5.00%, 05/01/2028 | 265,000 | 278,062 | ||||||
5.00%, 11/01/2028 | 3,000,000 | 3,260,460 | ||||||
5.00%, 02/01/2029 | 1,000,000 | 1,075,550 | ||||||
5.00%, 04/01/2029 | 605,000 | 632,110 | ||||||
5.00%, 01/01/2031 | 11,000,000 | 11,178,640 | ||||||
5.00%, 10/01/2031 | 7,300,000 | 7,829,323 | ||||||
5.00%, 05/01/2032 | 800,000 | 830,416 | ||||||
5.00%, 05/01/2034 | 2,500,000 | 2,590,525 | ||||||
5.13%, 05/01/2022 | 325,000 | 337,964 | ||||||
5.25%, 02/01/2029 | 3,720,000 | 3,912,138 | ||||||
5.25%, 02/01/2030 | 100,000 | 104,707 | ||||||
5.25%, 12/01/2030 | 11,685,000 | 12,693,883 | ||||||
5.25%, 02/01/2031 | 760,000 | 794,481 | ||||||
5.50%, 07/01/2024 | 1,000,000 | 1,066,200 | ||||||
5.50%, 05/01/2025 | 840,000 | 923,933 | ||||||
5.50%, 07/01/2025 | 400,000 | 425,352 | ||||||
5.50%, 07/01/2038 | 1,500,000 | 1,568,460 | ||||||
University of Illinois | ||||||||
4.00%, 04/01/2036 | 1,500,000 | 1,665,945 | ||||||
Upper Illinois River Valley Development Authority | ||||||||
5.25%, 12/01/2037(2) | 2,005,000 | 2,030,684 | ||||||
Village of Bedford Park IL | ||||||||
4.00%, 12/01/2020 | 1,180,000 | 1,193,287 | ||||||
Village of Bolingbrook IL | ||||||||
4.00%, 03/01/2023 | 500,000 | 544,855 | ||||||
4.00%, 03/01/2025 | 500,000 | 571,840 | ||||||
4.00%, 03/01/2027 | 1,000,000 | 1,182,100 | ||||||
Village of Hillside IL | ||||||||
5.00%, 01/01/2024 | 725,000 | 737,970 |
Will County Community Unit School District No 365 Valley View | ||||||||
0.00%, 11/01/2025 | 1,520,000 | 1,424,194 | ||||||
0.00%, 11/01/2026 | 905,000 | 838,148 | ||||||
5.00%, 11/01/2023 | 420,000 | 479,472 | ||||||
5.00%, 11/01/2024 | 2,390,000 | 2,816,496 | ||||||
5.00%, 11/01/2026 | 1,800,000 | 2,236,104 | ||||||
|
| |||||||
Total Illinois |
| 590,967,054 | ||||||
|
| |||||||
Indiana – 1.86% | ||||||||
Ball State University | ||||||||
5.00%, 07/01/2033 | 955,000 | 1,175,061 | ||||||
City of Whiting IN | ||||||||
5.00%, 12/01/2044(1) | 19,260,000 | 22,768,209 | ||||||
5.00%, 11/01/2045(1) | 3,000,000 | 3,250,350 | ||||||
5.25%, 01/01/2021 | 1,745,000 | 1,779,935 | ||||||
County of St Joseph IN | ||||||||
5.00%, 04/01/2033 | 1,245,000 | 1,490,713 | ||||||
Indiana Finance Authority | ||||||||
0.65%, 05/01/2034(1) | 3,000,000 | 2,999,640 | ||||||
0.65%, 12/01/2037(1) | 2,500,000 | 2,499,700 | ||||||
1.65%, 12/01/2042(1) | 2,145,000 | 2,172,713 | ||||||
2.25%, 12/01/2058(1) | 1,285,000 | 1,348,967 | ||||||
5.00%, 12/01/2024 | 3,000,000 | 3,593,370 | ||||||
5.00%, 05/01/2026 | 1,100,000 | 1,335,521 | ||||||
5.00%, 11/01/2026 | 1,200,000 | 1,474,212 | ||||||
5.00%, 05/01/2027 | 700,000 | 867,377 | ||||||
5.00%, 05/01/2029 | 685,000 | 887,013 | ||||||
5.00%, 11/01/2029 | 2,350,000 | 2,882,228 | ||||||
5.00%, 09/01/2031 | 440,000 | 527,965 | ||||||
5.00%, 06/01/2032 | 2,750,000 | 2,866,270 | ||||||
5.00%, 03/01/2036 | 4,000,000 | 4,564,280 | ||||||
5.00%, 09/01/2036 | 1,000,000 | 1,179,100 | ||||||
5.00%, 06/01/2039 | 1,200,000 | 1,242,588 | ||||||
5.00%, 07/01/2048 | 3,600,000 | 3,811,536 | ||||||
5.25%, 02/01/2033 | 2,500,000 | 2,904,725 | ||||||
5.25%, 10/01/2038 | 15,010,000 | 15,873,225 | ||||||
5.25%, 01/01/2051 | 5,450,000 | 5,799,454 | ||||||
6.00%, 12/01/2026 | 2,035,000 | 1,906,551 | ||||||
Indiana Health & Educational Facilities Financing Authority | ||||||||
1.75%, 11/15/2031(1) | 45,000 | 45,795 | ||||||
1.75%, 11/15/2031(1) | 2,955,000 | 2,999,266 | ||||||
Indiana Health Facility Financing Authority | ||||||||
1.35%, 11/01/2027(1) | 1,075,000 | 1,075,881 | ||||||
2.00%, 11/15/2036(1) | 2,070,000 | 2,141,581 | ||||||
Indiana Housing & Community Development Authority | ||||||||
1.65%, 04/01/2022(1) | 7,500,000 | 7,548,525 | ||||||
3.50%, 01/01/2049 | 1,220,000 | 1,325,920 | ||||||
Indianapolis Local Public Improvement Bond Bank | ||||||||
5.00%, 01/01/2021 | 370,000 | 376,838 | ||||||
5.00%, 01/01/2022 | 755,000 | 796,517 | ||||||
5.00%, 01/01/2023 | 285,000 | 311,613 | ||||||
5.00%, 07/15/2023 | 300,000 | 341,142 | ||||||
5.00%, 07/15/2024 | 1,000,000 | 1,175,580 | ||||||
5.00%, 01/01/2025 | 1,195,000 | 1,384,408 | ||||||
5.00%, 07/15/2025 | 750,000 | 907,733 | ||||||
5.00%, 01/15/2026 | 720,000 | 882,511 | ||||||
5.00%, 01/15/2027 | 700,000 | 878,605 | ||||||
5.00%, 01/15/2028 | 500,000 | 640,835 | ||||||
5.00%, 01/01/2029 | 1,000,000 | 1,182,360 | ||||||
5.00%, 01/01/2031 | 1,000,000 | 1,170,270 | ||||||
Lebanon Middle School Building Corp. | ||||||||
5.00%, 01/10/2023 | 1,065,000 | 1,185,984 | ||||||
5.00%, 07/10/2023 | 1,740,000 | 1,973,665 | ||||||
Westfield-Washington Multi-School Building Corp. | ||||||||
5.00%, 01/15/2028 | 390,000 | 476,264 | ||||||
5.00%, 01/15/2029 | 540,000 | 658,222 | ||||||
5.00%, 01/15/2030 | 700,000 | 850,549 | ||||||
|
| |||||||
Total Indiana |
| 121,530,767 | ||||||
|
| |||||||
Iowa – 0.53% | ||||||||
City of Coralville IA | ||||||||
4.00%, 05/01/2030 | 1,005,000 | 1,044,366 | ||||||
Iowa Finance Authority | ||||||||
2.88%, 05/15/2049 | 895,000 | 868,025 | ||||||
3.13%, 12/01/2022 | 6,770,000 | 6,831,945 | ||||||
4.75%, 08/01/2042 | 980,000 | 991,182 | ||||||
5.00%, 05/15/2043 | 270,000 | 272,014 | ||||||
5.00%, 05/15/2048 | 335,000 | 335,559 | ||||||
5.25%, 12/01/2025 | 3,000,000 | 3,129,150 | ||||||
Iowa Student Loan Liquidity Corp. | ||||||||
5.00%, 12/01/2025 | 1,000,000 | 1,136,930 | ||||||
5.00%, 12/01/2025 | 1,775,000 | 2,018,051 | ||||||
5.00%, 12/01/2028 | 1,640,000 | 1,951,387 | ||||||
PEFA, Inc. | ||||||||
5.00%, 09/01/2049(1) | 13,000,000 | 15,688,140 | ||||||
|
| |||||||
Total Iowa |
| 34,266,749 | ||||||
|
| |||||||
Kansas – 0.14% | ||||||||
City of Lenexa KS | ||||||||
5.00%, 05/15/2021 | 500,000 | 507,165 | ||||||
5.00%, 05/15/2039 | 325,000 | 343,145 | ||||||
Johnson County Unified School District No 232 de Soto | ||||||||
5.00%, 09/01/2022 | 350,000 | 384,895 | ||||||
Kansas Development Finance Authority | ||||||||
5.00%, 11/15/2032 | 7,325,000 | 7,799,220 | ||||||
|
| |||||||
Total Kansas |
| 9,034,425 | ||||||
|
| |||||||
Kentucky – 2.40% | ||||||||
City of Ashland KY | ||||||||
4.00%, 02/01/2034 | 500,000 | 526,930 | ||||||
4.00%, 02/01/2038 | 620,000 | 644,254 | ||||||
5.00%, 02/01/2028 | 255,000 | 300,742 | ||||||
5.00%, 02/01/2032 | 395,000 | 470,366 | ||||||
City of Russell KY | ||||||||
5.00%, 11/01/2022 | 3,200,000 | 3,529,280 | ||||||
County of Carroll KY | ||||||||
1.55%, 09/01/2042(1) | 10,750,000 | 10,733,660 | ||||||
1.75%, 10/01/2034(1) | 1,000,000 | 999,510 | ||||||
County of Trimble KY | ||||||||
2.55%, 11/01/2027(1) | 6,730,000 | 6,822,807 | ||||||
Kentucky Asset Liability Commission | ||||||||
5.00%, 09/01/2024 | 1,000,000 | 1,150,210 | ||||||
5.00%, 09/01/2025 | 1,250,000 | 1,474,487 | ||||||
Kentucky Economic Development Finance Authority | ||||||||
0.40%, 04/01/2031(1) | 7,000,000 | 6,999,230 | ||||||
5.00%, 08/01/2030 | 2,160,000 | 2,671,078 | ||||||
5.00%, 05/15/2031 | 100,000 | 94,612 | ||||||
5.00%, 06/01/2037 | 325,000 | 348,949 | ||||||
5.00%, 06/01/2041 | 225,000 | 239,456 | ||||||
5.00%, 06/01/2045 | 1,000,000 | 1,057,570 | ||||||
5.00%, 12/01/2045 | 300,000 | 336,762 | ||||||
5.00%, 05/15/2046 | 500,000 | 430,590 | ||||||
5.00%, 12/01/2047 | 620,000 | 646,338 | ||||||
5.00%, 05/15/2051 | 325,000 | 272,792 | ||||||
5.25%, 06/01/2041 | 725,000 | 782,463 | ||||||
6.25%, 11/15/2046 | 750,000 | 492,120 | ||||||
Kentucky Higher Education Student Loan Corp. | ||||||||
5.00%, 06/01/2021 | 610,000 | 628,227 | ||||||
Kentucky Housing Corp. | ||||||||
1.16%, 02/01/2023(1) | 3,000,000 | 3,021,780 | ||||||
Kentucky Public Energy Authority | ||||||||
4.00%, 04/01/2048(1) | 5,000,000 | 5,490,400 | ||||||
4.00%, 01/01/2049(1) | 12,500,000 | 13,768,000 | ||||||
4.00%, 12/01/2049(1) | 10,000,000 | 11,229,300 | ||||||
4.00%, 12/01/2049(1) | 11,270,000 | 12,666,015 | ||||||
4.00%, 02/01/2050(1) | 6,500,000 | 7,594,730 | ||||||
4.00%, 12/01/2050(1) | 16,560,000 | 18,697,896 | ||||||
Kentucky Public Transportation Infrastructure Authority | ||||||||
5.75%, 07/01/2049 | 1,000,000 | 1,043,800 | ||||||
6.00%, 07/01/2053 | 530,000 | 556,150 | ||||||
Kentucky State Property & Building Commission | ||||||||
5.00%, 05/01/2021 | 500,000 | 517,470 | ||||||
5.00%, 11/01/2026 | 1,495,000 | 1,754,009 | ||||||
5.00%, 04/01/2027 | 1,000,000 | 1,178,090 | ||||||
5.00%, 11/01/2027 | 2,435,000 | 2,837,993 | ||||||
5.00%, 05/01/2029 | 1,000,000 | 1,165,440 | ||||||
5.00%, 05/01/2029 | 1,025,000 | 1,217,208 | ||||||
5.00%, 11/01/2031 | 1,685,000 | 1,990,373 | ||||||
5.00%, 05/01/2032 | 270,000 | 326,295 | ||||||
Louisville & Jefferson County Metropolitan Government | ||||||||
1.85%, 10/01/2033(1) | 15,900,000 | 16,018,137 | ||||||
5.00%, 10/01/2020 | 1,140,000 | 1,151,297 | ||||||
5.00%, 10/01/2023 | 1,565,000 | 1,758,371 | ||||||
5.00%, 12/01/2028 | 430,000 | 466,550 | ||||||
5.00%, 12/01/2029 | 1,250,000 | 1,356,250 | ||||||
5.00%, 10/01/2030 | 2,500,000 | 2,955,250 | ||||||
5.00%, 10/01/2032 | 430,000 | 503,319 | ||||||
Louisville/Jefferson County Metropolitan Government | ||||||||
5.00%, 10/01/2047(1) | 740,000 | 859,399 | ||||||
5.00%, 10/01/2047(1) | 1,100,000 | 1,326,380 | ||||||
5.00%, 10/01/2047(1) | 2,165,000 | 2,380,742 | ||||||
University of Louisville | ||||||||
3.00%, 09/01/2021 | 1,230,000 | 1,265,486 | ||||||
|
| |||||||
Total Kentucky |
| 156,748,563 | ||||||
|
| |||||||
Louisiana – 1.60% | ||||||||
Calcasieu Parish Memorial Hospital Service District | ||||||||
5.00%, 12/01/2025 | 285,000 | 330,634 | ||||||
5.00%, 12/01/2026 | 255,000 | 299,444 | ||||||
5.00%, 12/01/2027 | 300,000 | 358,758 | ||||||
5.00%, 12/01/2028 | 300,000 | 361,764 | ||||||
5.00%, 12/01/2029 | 1,015,000 | 1,229,764 | ||||||
Greater New Orleans Expressway Commission | ||||||||
5.00%, 11/01/2034 | 1,000,000 | 1,173,420 | ||||||
Greater Ouachita Water Co. | ||||||||
5.00%, 09/01/2027 | 1,000,000 | 1,257,130 | ||||||
5.00%, 09/01/2028 | 960,000 | 1,233,523 | ||||||
5.00%, 09/01/2029 | 365,000 | 477,745 | ||||||
Jefferson Parish Economic Development & Port District | ||||||||
5.50%, 06/15/2038(2) | 600,000 | 629,904 | ||||||
5.63%, 06/15/2048(2) | 700,000 | 727,937 | ||||||
Jefferson Parish Hospital Service District No 1 | ||||||||
5.50%, 01/01/2026 | 3,000,000 | 3,077,460 | ||||||
Louisiana Local Government Environmental Facilities & Community Development Auth | ||||||||
3.50%, 11/01/2032 | 5,500,000 | 5,716,370 | ||||||
5.00%, 10/01/2028 | 1,045,000 | 1,348,876 | ||||||
6.50%, 08/01/2029 | 2,200,000 | 2,207,106 | ||||||
Louisiana Offshore Terminal Authority | ||||||||
1.65%, 09/01/2027(1) | 2,500,000 | 2,465,675 | ||||||
1.65%, 09/01/2034(1) | 4,500,000 | 4,438,215 | ||||||
Louisiana Public Facilities Authority | ||||||||
0.00%, 10/01/2027 | 2,000,000 | 1,878,480 | ||||||
5.00%, 06/01/2021 | 7,695,000 | 8,015,343 | ||||||
5.00%, 12/15/2022 | 230,000 | 250,935 | ||||||
5.00%, 12/15/2023 | 335,000 | 376,935 | ||||||
5.00%, 12/15/2024 | 330,000 | 378,632 | ||||||
5.00%, 12/15/2025 | 275,000 | 322,525 | ||||||
5.00%, 12/15/2026 | 300,000 | 359,328 | ||||||
5.00%, 12/15/2028 | 250,000 | 303,080 | ||||||
5.00%, 12/15/2029 | 200,000 | 240,576 | ||||||
5.00%, 12/15/2030 | 150,000 | 179,499 | ||||||
5.00%, 05/15/2031 | 1,250,000 | 1,481,975 | ||||||
5.00%, 12/15/2031 | 390,000 | 464,053 | ||||||
5.00%, 05/15/2032 | 1,000,000 | 1,177,430 | ||||||
Louisiana State Citizens Property Insurance Corp. | ||||||||
5.00%, 06/01/2021 | 4,000,000 | 4,156,760 | ||||||
New Orleans Aviation Board | ||||||||
5.00%, 01/01/2023 | 50,000 | 54,760 | ||||||
5.00%, 01/01/2024 | 55,000 | 62,126 | ||||||
5.00%, 01/01/2024 | 1,400,000 | 1,581,384 | ||||||
5.00%, 01/01/2027 | 850,000 | 977,908 | ||||||
5.00%, 01/01/2028 | 155,000 | 186,510 | ||||||
5.00%, 01/01/2029 | 810,000 | 925,822 | ||||||
5.00%, 01/01/2030 | 275,000 | 327,357 | ||||||
5.00%, 01/01/2033 | 740,000 | 867,465 | ||||||
5.00%, 01/01/2033 | 2,600,000 | 3,151,486 | ||||||
5.00%, 01/01/2034 | 170,000 | 198,614 | ||||||
5.00%, 01/01/2034 | 750,000 | 876,240 | ||||||
5.00%, 01/01/2034 | 2,750,000 | 3,320,653 | ||||||
5.00%, 01/01/2036 | 500,000 | 580,695 | ||||||
5.00%, 01/01/2037 | 500,000 | 579,065 | ||||||
5.00%, 01/01/2040 | 1,000,000 | 1,114,500 | ||||||
5.00%, 01/01/2040 | 1,540,000 | 1,730,344 | ||||||
Parish of St James LA | ||||||||
0.31%, 11/01/2040(1) | 1,950,000 | 1,950,000 | ||||||
6.10%, 06/01/2038(1)(2) | 1,000,000 | 1,164,210 | ||||||
6.10%, 12/01/2040(1)(2) | 1,930,000 | 2,246,925 | ||||||
6.35%, 07/01/2040(2) | 3,015,000 | 3,530,746 | ||||||
6.35%, 10/01/2040(2) | 440,000 | 515,266 | ||||||
Parish of St John the Baptist LA | ||||||||
2.00%, 06/01/2037(1) | 3,835,000 | 3,800,447 | ||||||
2.10%, 06/01/2037(1) | 5,995,000 | 5,857,355 | ||||||
2.20%, 06/01/2037(1) | 2,475,000 | 2,369,689 | ||||||
State of Louisiana | ||||||||
4.00%, 05/01/2032 | 5,000,000 | 5,590,600 | ||||||
4.00%, 05/01/2034 | 10,685,000 | 11,899,991 | ||||||
5.00%, 07/15/2021 | 1,695,000 | 1,777,174 | ||||||
|
| |||||||
Total Louisiana |
| 104,156,608 | ||||||
|
| |||||||
Maine – 0.10% | ||||||||
Maine Health & Higher Educational Facilities Authority | ||||||||
4.00%, 07/01/2041 | 1,480,000 | 1,505,071 | ||||||
4.00%, 07/01/2046 | 330,000 | 332,940 | ||||||
5.00%, 07/01/2041 | 1,235,000 | 1,330,799 | ||||||
5.00%, 07/01/2043 | 610,000 | 637,968 | ||||||
5.00%, 07/01/2046 | 1,735,000 | 1,849,337 | ||||||
Maine Municipal Bond Bank | ||||||||
5.00%, 11/01/2033 | 650,000 | 813,560 | ||||||
|
| |||||||
Total Maine |
| 6,469,675 | ||||||
|
| |||||||
Maryland – 2.01% | ||||||||
City of Baltimore MD | ||||||||
5.00%, 09/01/2023 | 1,000,000 | 943,540 | ||||||
5.00%, 07/01/2026 | 720,000 | 896,782 | ||||||
5.00%, 07/01/2029 | 4,770,000 | 5,935,645 | ||||||
5.00%, 09/01/2030 | 3,000,000 | 2,761,440 | ||||||
5.00%, 09/01/2032 | 1,000,000 | 920,270 | ||||||
5.00%, 09/01/2036 | 1,770,000 | 1,626,789 | ||||||
5.00%, 09/01/2046 | 2,500,000 | 2,290,750 | ||||||
City of Gaithersburg MD | ||||||||
5.00%, 01/01/2027 | 1,335,000 | 1,455,604 | ||||||
5.00%, 01/01/2033 | 130,000 | 140,295 | ||||||
5.00%, 01/01/2036 | 85,000 | 91,497 | ||||||
City of Rockville MD | ||||||||
3.00%, 11/01/2025 | 440,000 | 408,615 | ||||||
4.00%, 11/01/2021 | 200,000 | 199,478 | ||||||
5.00%, 11/01/2042 | 1,250,000 | 1,157,987 | ||||||
5.00%, 11/01/2047 | 1,230,000 | 1,128,857 | ||||||
City of Westminster MD | ||||||||
6.25%, 07/01/2044 | 1,100,000 | 1,136,795 | ||||||
County of Anne Arundel MD | ||||||||
4.00%, 10/01/2033 | 2,325,000 | 2,837,244 | ||||||
County of Baltimore MD | ||||||||
5.00%, 10/01/2023 | 2,495,000 | 2,860,992 | ||||||
County of Howard MD | ||||||||
4.00%, 08/15/2031 | 1,665,000 | 2,040,724 | ||||||
County of Montgomery MD | ||||||||
5.00%, 10/01/2024 | 1,210,000 | 1,444,099 | ||||||
5.38%, 07/01/2048 | 625,000 | 590,087 | ||||||
County of Prince George’s MD | ||||||||
4.00%, 08/01/2029 | 4,035,000 | 4,489,825 | ||||||
5.13%, 07/01/2039(2) | 1,500,000 | 1,551,180 | ||||||
Maryland Community Development Administration | ||||||||
2.06%, 09/01/2021 | 3,000,000 | 3,031,020 | ||||||
2.60%, 09/01/2022 | 2,630,000 | 2,739,434 | ||||||
2.70%, 03/01/2023 | 3,195,000 | 3,360,725 | ||||||
2.75%, 09/01/2023 | 1,010,000 | 1,071,802 | ||||||
2.85%, 03/01/2024 | 2,560,000 | 2,739,558 | ||||||
2.95%, 03/01/2025 | 3,025,000 | 3,287,177 | ||||||
3.10%, 03/01/2026 | 1,445,000 | 1,598,473 | ||||||
3.25%, 03/01/2027 | 2,325,000 | 2,620,926 | ||||||
3.50%, 03/01/2050 | 1,300,000 | 1,414,296 | ||||||
4.00%, 09/01/2049 | 1,580,000 | 1,742,914 | ||||||
Maryland Community Development Administration Multi-Family Mortgage Revenue | ||||||||
2.34%, 04/01/2021(2) | 10,000,000 | 10,083,700 | ||||||
Maryland Economic Development Corp. | ||||||||
5.00%, 07/01/2020 | 250,000 | 250,000 | ||||||
5.00%, 07/01/2021 | 500,000 | 516,955 | ||||||
5.00%, 06/01/2023 | 215,000 | 230,134 | ||||||
5.00%, 03/31/2024 | 5,805,000 | 5,860,264 | ||||||
5.00%, 09/30/2027 | 50,000 | 51,080 | ||||||
5.00%, 06/01/2028 | 2,000,000 | 2,267,280 | ||||||
5.00%, 09/30/2030 | 905,000 | 923,209 | ||||||
5.00%, 06/01/2035 | 1,415,000 | 1,536,379 | ||||||
5.00%, 03/31/2046 | 1,680,000 | 1,701,252 | ||||||
5.00%, 06/01/2049 | 1,000,000 | 1,060,940 | ||||||
5.00%, 03/31/2051 | 2,535,000 | 2,558,854 | ||||||
5.00%, 06/01/2058 | 600,000 | 612,072 | ||||||
Maryland Health & Higher Educational Facilities Authority | ||||||||
4.00%, 07/01/2042 | 120,000 | 126,803 | ||||||
5.00%, 07/01/2024 | 535,000 | 630,160 | ||||||
5.00%, 07/01/2024 | 745,000 | 857,458 | ||||||
5.00%, 07/01/2030 | 600,000 | 664,638 | ||||||
5.00%, 07/01/2032 | 750,000 | 859,912 | ||||||
5.00%, 07/01/2035 | 75,000 | 85,193 | ||||||
5.00%, 08/15/2038 | 1,945,000 | 2,184,177 | ||||||
5.00%, 07/01/2043 | 500,000 | 541,775 | ||||||
5.00%, 07/01/2045 | 2,000,000 | 2,177,680 | ||||||
5.00%, 07/01/2048 | 1,000,000 | 1,079,720 | ||||||
5.50%, 01/01/2029 | 1,500,000 | 1,763,355 | ||||||
5.50%, 01/01/2030 | 1,750,000 | 2,045,435 | ||||||
5.50%, 01/01/2046 | 1,290,000 | 1,418,677 | ||||||
Maryland Stadium Authority | ||||||||
5.00%, 06/15/2021 | 900,000 | 940,212 | ||||||
5.00%, 05/01/2032 | 765,000 | 900,451 | ||||||
5.00%, 05/01/2041 | 5,000,000 | 5,754,400 | ||||||
Maryland State Transportation Authority | ||||||||
5.00%, 07/01/2030 | 4,655,000 | 5,901,516 | ||||||
5.00%, 07/01/2034 | 1,550,000 | 2,052,975 | ||||||
Prince George’s County Revenue Authority | ||||||||
5.00%, 05/01/2030 | 1,085,000 | 1,405,314 | ||||||
Rib Floater Trust Various States | ||||||||
0.48%, 02/01/2021(1)(2) | 4,400,000 | 4,400,000 | ||||||
State of Maryland | ||||||||
5.00%, 08/01/2024 | 1,450,000 | 1,720,642 | ||||||
Washington Suburban Sanitary Commission | ||||||||
3.00%, 06/01/2026 | 5,000,000 | 5,591,600 | ||||||
|
| |||||||
Total Maryland |
| 131,269,032 | ||||||
|
| |||||||
Massachusetts – 2.83% | ||||||||
Boston Water & Sewer Commission | ||||||||
3.75%, 11/01/2037 | 13,450,000 | 14,094,389 | ||||||
City of Boston MA | ||||||||
5.00%, 04/01/2023 | 2,095,000 | 2,366,428 | ||||||
City of Worcester MA | ||||||||
2.00%, 02/16/2021 | 4,000,000 | 4,038,160 | ||||||
Commonwealth of Massachusetts | ||||||||
1.05%, 08/01/2043(1) | 10,515,000 | 10,515,000 | ||||||
1.70%, 08/01/2043(1) | 1,750,000 | 1,793,173 | ||||||
5.00%, 07/01/2022 | 485,000 | 530,561 | ||||||
5.00%, 12/01/2030 | 1,500,000 | 1,881,525 | ||||||
5.00%, 07/01/2036 | 12,630,000 | 14,951,899 | ||||||
5.00%, 03/01/2046 | 205,000 | 230,342 | ||||||
5.25%, 09/01/2043 | 1,250,000 | 1,591,863 | ||||||
5.50%, 12/01/2022 | 1,195,000 | 1,345,271 | ||||||
Commonwealth of Massachusetts Transportation Fund Revenue | ||||||||
3.75%, 06/01/2040 | 45,000,000 | 45,734,400 | ||||||
Massachusetts Bay Transportation Authority | ||||||||
5.25%, 07/01/2031 | 5,440,000 | 7,768,048 | ||||||
Massachusetts Development Finance Agency | ||||||||
4.00%, 10/01/2038 | 495,000 | 513,508 | ||||||
5.00%, 07/15/2022 | 355,000 | 389,453 | ||||||
5.00%, 07/01/2023 | 900,000 | 1,011,906 | ||||||
5.00%, 10/01/2024 | 2,020,000 | 2,337,685 | ||||||
5.00%, 07/01/2025 | 1,090,000 | 1,283,192 | ||||||
5.00%, 10/01/2025 | 905,000 | 1,023,446 | ||||||
5.00%, 07/01/2026 | 1,140,000 | 1,371,739 | ||||||
5.00%, 10/01/2026 | 955,000 | 1,091,718 | ||||||
5.00%, 07/01/2030 | 590,000 | 730,042 | ||||||
5.00%, 01/01/2031 | 475,000 | 545,333 | ||||||
5.00%, 01/01/2032 | 635,000 | 723,716 | ||||||
5.00%, 07/01/2032 | 500,000 | 592,430 | ||||||
5.00%, 01/01/2033 | 540,000 | 610,961 | ||||||
5.00%, 01/01/2034 | 710,000 | 800,177 | ||||||
5.00%, 07/01/2034 | 500,000 | 585,060 | ||||||
5.00%, 01/01/2035 | 745,000 | 837,842 | ||||||
5.00%, 01/01/2036 | 1,100,000 | 1,234,475 | ||||||
5.00%, 10/01/2037(2) | 500,000 | 521,565 | ||||||
5.00%, 07/01/2038(1) | 8,525,000 | 9,861,635 | ||||||
5.00%, 01/01/2040 | 755,000 | 845,230 | ||||||
5.00%, 10/01/2047(2) | 1,375,000 | 1,407,629 | ||||||
5.00%, 10/01/2048 | 1,750,000 | 1,926,873 | ||||||
5.00%, 10/01/2057(2) | 1,000,000 | 1,014,490 | ||||||
5.13%, 11/15/2046(2) | 800,000 | 735,536 | ||||||
Massachusetts Educational Financing Authority | ||||||||
5.00%, 07/01/2024 | 2,190,000 | 2,453,063 | ||||||
5.00%, 07/01/2026 | 5,000,000 | 5,785,950 | ||||||
Massachusetts Housing Finance Agency | ||||||||
0.68% (SIFMA Municipal Swap Index Yield + 0.55%), 11/01/2048(3) | 9,800,000 | 9,800,000 | ||||||
Massachusetts Port Authority | ||||||||
5.00%, 07/01/2024 | 800,000 | 917,384 | ||||||
Massachusetts School Building Authority | ||||||||
5.00%, 01/15/2028 | 1,500,000 | 1,781,145 | ||||||
5.00%, 08/15/2030 | 2,000,000 | 2,175,820 | ||||||
5.00%, 10/15/2032 | 1,000,000 | 1,060,820 | ||||||
5.00%, 08/15/2037 | 10,000,000 | 11,801,100 | ||||||
Massachusetts Transportation Trust Fund Metropolitan Highway System Revenue | ||||||||
5.00%, 01/01/2039(1) | 4,055,000 | 4,491,967 | ||||||
Metropolitan Boston Transit Parking Corp. | ||||||||
5.00%, 07/01/2041 | 5,000,000 | 5,138,200 | ||||||
|
| |||||||
Total Massachusetts |
| 184,242,149 | ||||||
|
| |||||||
Michigan – 2.85% | ||||||||
Avondale School District | ||||||||
5.00%, 11/01/2022 | 600,000 | 664,602 | ||||||
5.00%, 11/01/2023 | 680,000 | 781,633 | ||||||
5.00%, 11/01/2024 | 800,000 | 951,784 | ||||||
5.00%, 11/01/2025 | 785,000 | 962,920 | ||||||
5.00%, 11/01/2026 | 765,000 | 964,237 | ||||||
Calhoun County Hospital Finance Authority | ||||||||
5.00%, 02/15/2037 | 1,695,000 | 1,884,620 | ||||||
City of Detroit MI | ||||||||
5.00%, 04/01/2021 | 1,000,000 | 1,011,140 | ||||||
5.00%, 04/01/2022 | 835,000 | 855,583 | ||||||
5.00%, 04/01/2023 | 750,000 | 776,925 | ||||||
5.00%, 04/01/2024 | 900,000 | 939,375 | ||||||
5.00%, 04/01/2025 | 900,000 | 946,494 | ||||||
5.00%, 04/01/2034 | 1,000,000 | 1,031,380 | ||||||
City of Detroit MI Sewage Disposal System Revenue | ||||||||
5.25%, 07/01/2039 | 4,050,000 | 4,445,482 | ||||||
City of Detroit MI Water Supply System Revenue | ||||||||
5.25%, 07/01/2041 | 1,000,000 | 1,049,660 | ||||||
City of Royal Oak MI | ||||||||
5.00%, 04/01/2029 | 500,000 | 651,895 | ||||||
5.00%, 04/01/2031 | 1,045,000 | 1,348,123 | ||||||
City of Wyandotte MI Electric System Revenue | ||||||||
5.00%, 10/01/2021 | 750,000 | 788,333 | ||||||
5.00%, 10/01/2022 | 800,000 | 873,864 | ||||||
5.00%, 10/01/2023 | 500,000 | 566,060 | ||||||
5.00%, 10/01/2024 | 765,000 | 890,491 | ||||||
Clarkston Community Schools | ||||||||
5.00%, 05/01/2022 | 445,000 | 482,037 | ||||||
County of Kent MI | ||||||||
5.00%, 06/01/2028 | 700,000 | 872,760 | ||||||
Detroit City School District | ||||||||
5.25%, 05/01/2030 | 3,345,000 | 4,512,539 | ||||||
Detroit Downtown Development Authority | ||||||||
5.00%, 07/01/2037 | 540,000 | 608,866 | ||||||
5.00%, 07/01/2038 | 1,000,000 | 1,125,880 | ||||||
Grand Rapids Public Schools | ||||||||
5.00%, 05/01/2025 | 1,075,000 | 1,297,751 | ||||||
5.00%, 11/01/2037 | 1,750,000 | 2,225,702 | ||||||
5.00%, 11/01/2038 | 1,000,000 | 1,268,210 | ||||||
Great Lakes Water Authority Sewage Disposal System Revenue | ||||||||
5.00%, 07/01/2030 | 3,000,000 | 3,654,090 | ||||||
5.00%, 07/01/2036 | 1,000,000 | 1,193,130 | ||||||
Great Lakes Water Authority Water Supply System Revenue | ||||||||
5.00%, 07/01/2023 | 1,000,000 | 1,133,580 | ||||||
Karegnondi Water Authority | ||||||||
5.25%, 11/01/2040 | 130,000 | 148,229 | ||||||
Lake Orion Community School District | ||||||||
5.00%, 05/01/2021 | 1,385,000 | 1,437,879 | ||||||
5.00%, 05/01/2025 | 3,275,000 | 3,958,820 | ||||||
Michigan Finance Authority | ||||||||
3.50%, 11/01/2023 | 5,500,000 | 5,685,350 | ||||||
3.75%, 11/01/2024 | 5,500,000 | 5,706,635 | ||||||
3.75%, 11/15/2049(1) | 3,600,000 | 4,107,096 | ||||||
4.00%, 12/01/2035 | 1,500,000 | 1,735,905 | ||||||
5.00%, 07/01/2022 | 1,235,000 | 1,348,336 | ||||||
5.00%, 11/15/2022 | 275,000 | 300,567 | ||||||
5.00%, 10/01/2023 | 1,000,000 | 1,101,270 | ||||||
5.00%, 10/01/2024 | 3,000,000 | 3,573,420 | ||||||
5.00%, 11/01/2024 | 750,000 | 889,470 | ||||||
5.00%, 11/01/2025 | 1,000,000 | 1,219,610 | ||||||
5.00%, 12/01/2026 | 1,190,000 | 1,461,522 | ||||||
5.00%, 12/01/2029 | 500,000 | 624,845 | ||||||
5.00%, 07/01/2030 | 600,000 | 701,274 | ||||||
5.00%, 10/01/2030 | 800,000 | 931,096 | ||||||
5.00%, 11/15/2032 | 1,445,000 | 1,713,900 | ||||||
5.00%, 07/01/2033 | 350,000 | 410,550 | ||||||
5.00%, 12/01/2044(1) | 2,550,000 | 3,016,471 | ||||||
Michigan State Building Authority | ||||||||
5.00%, 10/15/2021 | 1,750,000 | 1,855,017 | ||||||
5.00%, 04/15/2022 | 1,250,000 | 1,353,862 | ||||||
5.00%, 04/15/2035 | 1,250,000 | 1,630,412 | ||||||
Michigan State Hospital Finance Authority | ||||||||
1.90%, 11/15/2047(1) | 3,850,000 | 3,886,652 | ||||||
2.40%, 11/15/2047(1) | 850,000 | 889,746 | ||||||
4.00%, 11/15/2047(1) | 4,505,000 | 5,075,333 | ||||||
4.00%, 11/15/2047(1) | 9,750,000 | 10,688,145 | ||||||
5.00%, 12/01/2022 | 125,000 | 137,400 | ||||||
5.00%, 12/01/2023 | 1,150,000 | 1,307,389 | ||||||
5.00%, 12/01/2024 | 275,000 | 322,025 | ||||||
5.00%, 12/01/2025 | 700,000 | 840,833 | ||||||
5.00%, 12/01/2027 | 415,000 | 520,858 |
Michigan State Housing Development Authority | ||||||||
3.50%, 12/01/2050 | 8,100,000 | 8,894,367 | ||||||
Michigan Strategic Fund | ||||||||
1.45%, 09/01/2030(1) | 1,260,000 | 1,265,809 | ||||||
1.80%, 10/01/2049(1) | 2,075,000 | 2,149,161 | ||||||
5.00%, 06/30/2025 | 2,000,000 | 2,230,140 | ||||||
5.00%, 12/31/2025 | 2,595,000 | 2,914,081 | ||||||
5.00%, 06/30/2026 | 2,800,000 | 3,162,712 | ||||||
Michigan Tobacco Settlement Finance Authority | ||||||||
0.00%, 06/01/2052 | 10,050,000 | 782,493 | ||||||
6.00%, 06/01/2048 | 8,025,000 | 8,026,445 | ||||||
Oakland University | ||||||||
5.00%, 03/01/2041 | 2,190,000 | 2,493,665 | ||||||
Portage Public Schools | ||||||||
5.00%, 11/01/2028 | 1,000,000 | 1,216,630 | ||||||
Royal Oak Hospital Finance Authority | ||||||||
5.00%, 09/01/2039 | 10,320,000 | 11,383,786 | ||||||
Royal Oak School District | ||||||||
5.00%, 05/01/2023 | 600,000 | 676,392 | ||||||
5.00%, 05/01/2024 | 600,000 | 699,738 | ||||||
Saginaw Hospital Finance Authority | ||||||||
5.00%, 07/01/2027 | 825,000 | 1,019,832 | ||||||
5.00%, 07/01/2028 | 435,000 | 549,422 | ||||||
State of Michigan | ||||||||
5.00%, 03/15/2021 | 1,000,000 | 1,030,870 | ||||||
5.00%, 03/15/2022 | 1,170,000 | 1,256,662 | ||||||
5.00%, 03/15/2023 | 2,000,000 | 2,232,600 | ||||||
University of Michigan | ||||||||
5.00%, 04/01/2024 | 1,670,000 | 1,961,816 | ||||||
Wayne County Airport Authority | ||||||||
5.00%, 12/01/2022 | 200,000 | 218,730 | ||||||
5.00%, 12/01/2023 | 250,000 | 281,873 | ||||||
5.00%, 12/01/2023 | 400,000 | 451,716 | ||||||
5.00%, 12/01/2023 | 550,000 | 616,000 | ||||||
5.00%, 12/01/2024 | 375,000 | 435,604 | ||||||
5.00%, 12/01/2024 | 500,000 | 574,530 | ||||||
5.00%, 12/01/2025 | 600,000 | 704,514 | ||||||
5.00%, 12/01/2025 | 1,000,000 | 1,177,030 | ||||||
5.00%, 12/01/2027 | 4,055,000 | 4,724,724 | ||||||
5.00%, 12/01/2031 | 350,000 | 423,423 | ||||||
5.00%, 12/01/2032 | 1,400,000 | 1,571,710 | ||||||
5.00%, 12/01/2033 | 300,000 | 359,391 | ||||||
5.00%, 12/01/2040 | 4,000,000 | 4,530,280 | ||||||
5.00%, 12/01/2042 | 900,000 | 1,036,737 | ||||||
5.00%, 12/01/2042 | 1,000,000 | 1,080,430 | ||||||
5.00%, 12/01/2047 | 1,000,000 | 1,144,380 | ||||||
Wayne-Westland Community Schools | ||||||||
5.00%, 11/01/2022 | 190,000 | 209,754 | ||||||
5.00%, 11/01/2023 | 80,000 | 91,585 | ||||||
5.00%, 11/01/2024 | 185,000 | 218,359 | ||||||
5.00%, 11/01/2025 | 95,000 | 115,254 | ||||||
5.00%, 11/01/2026 | 1,000,000 | 1,244,360 | ||||||
5.00%, 11/01/2027 | 600,000 | 764,562 | ||||||
5.00%, 11/01/2029 | 585,000 | 769,550 | ||||||
|
| |||||||
Total Michigan |
| 186,030,180 | ||||||
|
| |||||||
Minnesota – 0.46% | ||||||||
City of Deephaven MN | ||||||||
5.00%, 10/01/2037 | 1,250,000 | 1,257,975 | ||||||
5.00%, 10/01/2049 | 2,200,000 | 2,179,782 | ||||||
City of Minneapolis MN/St Paul Housing & Redevelopment Authority | ||||||||
5.00%, 11/15/2022 | 1,100,000 | 1,209,901 | ||||||
City of Moorhead MN | ||||||||
5.00%, 12/01/2025 | 775,000 | 845,959 | ||||||
City of Rochester MN | ||||||||
0.10%, 11/15/2047(1) | 1,000,000 | 1,000,000 | ||||||
5.00%, 12/01/2025 | 900,000 | 905,472 | ||||||
5.25%, 12/01/2038 | 1,000,000 | 954,530 | ||||||
Duluth Economic Development Authority | ||||||||
5.00%, 02/15/2033 | 500,000 | 589,785 | ||||||
5.00%, 02/15/2034 | 750,000 | 882,750 | ||||||
5.00%, 02/15/2037 | 1,250,000 | 1,457,437 | ||||||
Rib Floater Trust Various States | ||||||||
0.48%, 11/01/2058(1)(2) | 3,700,000 | 3,700,000 | ||||||
Roseville Independent School District No 623 | ||||||||
5.00%, 02/01/2025 | 3,895,000 | 4,638,400 | ||||||
5.00%, 02/01/2026 | 2,315,000 | 2,835,180 | ||||||
Shakopee Independent School District No 720 | ||||||||
5.00%, 02/01/2024 | 3,185,000 | 3,653,482 | ||||||
State of Minnesota | ||||||||
5.00%, 08/01/2023 | 1,465,000 | 1,678,861 | ||||||
Tender Option Bond Trust Receipts/Certificates | ||||||||
0.38%, 11/15/2026(1)(2) | 2,025,000 | 2,025,000 | ||||||
|
| |||||||
Total Minnesota |
| 29,814,514 | ||||||
|
| |||||||
Mississippi – 0.31% | ||||||||
Mississippi Hospital Equipment & Facilities Authority | ||||||||
5.00%, 01/01/2021 | 350,000 | 356,944 | ||||||
5.00%, 01/01/2029 | 910,000 | 1,140,084 | ||||||
5.00%, 01/01/2033 | 1,750,000 | 2,177,122 | ||||||
5.00%, 10/01/2035 | 700,000 | 853,293 | ||||||
5.00%, 10/01/2036 | 2,000,000 | 2,428,120 | ||||||
5.00%, 10/01/2040(1) | 3,865,000 | 4,651,798 | ||||||
5.00%, 09/01/2044(1) | 2,000,000 | 2,252,700 | ||||||
State of Mississippi | ||||||||
5.00%, 10/15/2020 | 1,750,000 | 1,765,243 | ||||||
5.00%, 10/15/2021 | 1,300,000 | 1,349,907 | ||||||
5.00%, 10/15/2022 | 1,750,000 | 1,894,323 | ||||||
5.00%, 10/01/2030 | 1,000,000 | 1,273,740 | ||||||
|
| |||||||
Total Mississippi |
| 20,143,274 | ||||||
|
| |||||||
Missouri – 0.69% | ||||||||
Belton School District No 124 | ||||||||
5.00%, 03/01/2028 | 250,000 | 325,487 | ||||||
5.50%, 03/01/2030 | 500,000 | 648,905 | ||||||
5.50%, 03/01/2033 | 500,000 | 640,265 | ||||||
5.50%, 03/01/2036 | 500,000 | 635,455 | ||||||
Cape Girardeau County Industrial Development Authority | ||||||||
5.00%, 03/01/2032 | 500,000 | 547,265 | ||||||
City of Kansas City MO Sanitary Sewer System Revenue | ||||||||
5.00%, 01/01/2026 | 285,000 | 350,009 | ||||||
5.00%, 01/01/2031 | 135,000 | 172,395 | ||||||
City of St Louis MO Airport Revenue | ||||||||
5.00%, 07/01/2025 | 400,000 | 466,676 | ||||||
Hannibal Industrial Development Authority | ||||||||
5.00%, 10/01/2047 | 1,580,000 | 1,774,056 | ||||||
Health & Educational Facilities Authority of the State of Missouri | ||||||||
4.00%, 02/01/2040 | 100,000 | 108,468 | ||||||
5.00%, 06/01/2025 | 7,000,000 | 8,274,700 | ||||||
5.00%, 04/01/2027 | 1,705,000 | 1,853,147 | ||||||
5.00%, 02/01/2029 | 1,000,000 | 1,200,620 | ||||||
5.00%, 02/01/2035 | 1,000,000 | 1,043,950 | ||||||
5.00%, 02/01/2036 | 200,000 | 233,634 | ||||||
5.00%, 08/01/2040 | 1,145,000 | 1,156,725 | ||||||
5.00%, 10/01/2042 | 6,370,000 | 7,620,049 | ||||||
5.00%, 10/01/2046 | 6,000,000 | 7,169,580 | ||||||
Industrial Development Authority of the City of St Louis Missouri | ||||||||
3.88%, 11/15/2029 | 90,000 | 80,583 | ||||||
4.38%, 11/15/2035 | 230,000 | 193,623 | ||||||
4.75%, 11/15/2047 | 250,000 | 212,375 | ||||||
Kirkwood Industrial Development Authority | ||||||||
5.00%, 05/15/2021 | 1,500,000 | 1,510,575 | ||||||
Missouri Housing Development Commission | ||||||||
4.00%, 05/01/2050 | 325,000 | 359,762 | ||||||
St Louis County Industrial Development Authority | ||||||||
5.00%, 12/01/2025 | 875,000 | 884,109 | ||||||
5.00%, 09/01/2038 | 500,000 | 519,315 | ||||||
5.13%, 08/15/2045 | 200,000 | 194,078 | ||||||
5.13%, 09/01/2048 | 2,345,000 | 2,413,380 | ||||||
5.50%, 09/01/2033 | 1,000,000 | 1,045,320 | ||||||
St Louis Land Clearance for Redevelopment Authority | ||||||||
5.00%, 06/01/2029 | 1,000,000 | 1,137,250 | ||||||
5.38%, 06/01/2043 | 2,000,000 | 2,234,860 | ||||||
|
| |||||||
Total Missouri |
| 45,006,616 | ||||||
|
| |||||||
Montana – 0.03% | ||||||||
City of Kalispell MT | ||||||||
5.25%, 05/15/2037 | 765,000 | 754,849 | ||||||
5.25%, 05/15/2047 | 500,000 | 475,800 | ||||||
Montana Board of Housing | ||||||||
4.00%, 12/01/2047 | 375,000 | 396,251 | ||||||
4.00%, 06/01/2050 | 165,000 | 185,508 | ||||||
|
| |||||||
Total Montana |
| 1,812,408 | ||||||
|
| |||||||
Nebraska – 0.80% | ||||||||
Central Plains Energy Project | ||||||||
4.00%, 12/01/2049(1) | 32,420,000 | 36,799,294 | ||||||
5.00%, 09/01/2033 | 1,500,000 | 1,927,590 | ||||||
5.00%, 09/01/2035 | 930,000 | 1,209,326 | ||||||
5.00%, 03/01/2050(1) | 5,000,000 | 5,616,150 | ||||||
City of Omaha NE | ||||||||
5.00%, 01/15/2026 | 1,700,000 | 2,107,626 | ||||||
Douglas County Hospital Authority No 2 | ||||||||
4.00%, 11/15/2036 | 425,000 | 489,825 | ||||||
Nebraska Investment Finance Authority | ||||||||
3.50%, 09/01/2050 | 1,000,000 | 1,097,480 | ||||||
3.75%, 09/01/2049 | 1,115,000 | 1,199,171 | ||||||
4.00%, 09/01/2049 | 890,000 | 972,895 | ||||||
Omaha Airport Authority | ||||||||
5.00%, 12/15/2031 | 515,000 | 614,925 | ||||||
|
| |||||||
Total Nebraska |
| 52,034,282 | ||||||
|
| |||||||
Nevada – 1.47% | ||||||||
City of Carson City NV | ||||||||
5.00%, 09/01/2026 | 550,000 | 644,446 | ||||||
City of Henderson NV | ||||||||
4.00%, 06/01/2035 | 900,000 | 1,085,616 | ||||||
4.00%, 06/01/2036 | 925,000 | 1,110,481 | ||||||
4.00%, 06/01/2038 | 3,540,000 | 4,219,963 | ||||||
5.00%, 06/01/2036 | 1,755,000 | 2,284,255 | ||||||
5.00%, 06/01/2037 | 3,230,000 | 4,188,922 | ||||||
City of Las Vegas NV Special Improvement District No 814 | ||||||||
4.00%, 06/01/2039 | 450,000 | 448,335 | ||||||
4.00%, 06/01/2049 | 1,100,000 | 1,051,622 | ||||||
City of Las Vegas NV Special Improvement District No 815 | ||||||||
4.75%, 12/01/2040 | 900,000 | 929,052 | ||||||
City of Reno NV | ||||||||
0.00%, 07/01/2058(2) | 2,000,000 | 237,060 | ||||||
5.00%, 06/01/2038 | 150,000 | 176,817 | ||||||
City of Sparks NV | ||||||||
2.50%, 06/15/2024(2) | 1,700,000 | 1,668,533 | ||||||
Clark County School District | ||||||||
4.00%, 06/15/2034 | 5,000,000 | 5,673,100 | ||||||
4.00%, 06/15/2038 | 775,000 | 901,325 | ||||||
5.00%, 06/15/2021 | 420,000 | 437,367 | ||||||
5.00%, 06/15/2023 | 370,000 | 414,774 | ||||||
5.00%, 06/15/2023 | 1,665,000 | 1,866,482 | ||||||
5.00%, 06/15/2024 | 4,500,000 | 5,200,875 | ||||||
5.00%, 06/15/2025 | 25,000 | 29,662 | ||||||
5.00%, 06/15/2025 | 6,060,000 | 7,190,008 | ||||||
5.00%, 06/15/2026 | 3,670,000 | 4,446,866 | ||||||
5.00%, 06/15/2029 | 4,080,000 | 5,115,218 | ||||||
5.00%, 06/15/2035 | 500,000 | 641,005 | ||||||
County of Clark Department of Aviation | ||||||||
5.00%, 07/01/2021 | 830,000 | 862,860 | ||||||
5.00%, 07/01/2021 | 1,000,000 | 1,039,590 | ||||||
5.00%, 07/01/2024 | 3,320,000 | 3,795,955 | ||||||
County of Clark NV | ||||||||
1.65%, 01/01/2036(1) | 1,560,000 | 1,571,700 | ||||||
5.00%, 11/01/2028 | 3,000,000 | 3,712,320 | ||||||
5.00%, 06/01/2032 | 3,000,000 | 3,768,900 | ||||||
5.00%, 12/01/2032 | 5,385,000 | 6,802,063 | ||||||
County of Clark NV Passenger Facility Charge Revenue | ||||||||
5.00%, 07/01/2024 | 1,250,000 | 1,423,963 | ||||||
5.00%, 07/01/2025 | 2,220,000 | 2,591,228 | ||||||
County of Washoe NV | ||||||||
2.05%, 03/01/2036(1) | 4,500,000 | 4,564,170 | ||||||
2.05%, 03/01/2036(1) | 5,000,000 | 5,071,300 | ||||||
3.00%, 03/01/2036(1) | 700,000 | 724,437 | ||||||
Las Vegas Convention & Visitors Authority | ||||||||
5.00%, 07/01/2031 | 600,000 | 689,256 | ||||||
5.00%, 07/01/2033 | 1,140,000 | 1,232,579 | ||||||
Las Vegas Redevelopment Agency | ||||||||
5.00%, 06/15/2030 | 1,000,000 | 1,155,950 | ||||||
5.00%, 06/15/2040 | 685,000 | 768,282 | ||||||
Las Vegas Valley Water District | ||||||||
4.00%, 06/01/2028 | 1,000,000 | 1,144,860 | ||||||
5.00%, 06/01/2039 | 2,815,000 | 3,235,899 | ||||||
Nevada Housing Division | ||||||||
4.00%, 10/01/2049 | 525,000 | 580,556 | ||||||
State of Nevada Department of Business & Industry | ||||||||
0.88%, 12/01/2026(1)(2) | 1,300,000 | 1,299,623 | ||||||
|
| |||||||
Total Nevada |
| 95,997,275 | ||||||
|
| |||||||
New Hampshire – 0.45% | ||||||||
New Hampshire Business Finance Authority | ||||||||
0.88% (SIFMA Municipal Swap Index Yield + 0.75%), 10/01/2033(3) | 9,500,000 | 9,497,530 | ||||||
4.13%, 01/20/2034 | 5,092,142 | 5,457,961 | ||||||
5.00%, 01/01/2024 | 720,000 | 798,127 | ||||||
5.25%, 07/01/2039(2) | 240,000 | 224,398 | ||||||
5.63%, 07/01/2046(2) | 125,000 | 118,552 | ||||||
5.75%, 07/01/2054(2) | 315,000 | 299,269 | ||||||
New Hampshire Health & Education Facilities Authority Act | ||||||||
4.00%, 10/01/2038 | 115,000 | 122,986 | ||||||
4.13%, 07/01/2024(2) | 100,000 | 91,526 | ||||||
5.00%, 07/01/2023 | 500,000 | 562,170 | ||||||
5.00%, 08/01/2027 | 1,575,000 | 1,915,169 | ||||||
5.00%, 10/01/2028 | 1,580,000 | 1,871,889 | ||||||
5.00%, 07/01/2030 | 390,000 | 482,570 | ||||||
5.00%, 08/01/2030 | 305,000 | 369,504 | ||||||
5.00%, 10/01/2032 | 2,825,000 | 3,270,813 | ||||||
5.00%, 10/01/2038 | 425,000 | 485,269 | ||||||
5.00%, 07/01/2044 | 2,445,000 | 2,718,278 | ||||||
5.25%, 07/01/2027(2) | 550,000 | 505,159 | ||||||
6.13%, 07/01/2052(2) | 245,000 | 192,244 | ||||||
6.25%, 07/01/2042(2) | 700,000 | 589,953 | ||||||
|
| |||||||
Total New Hampshire |
| 29,573,367 | ||||||
|
| |||||||
New Jersey – 3.43% | ||||||||
Camden County Improvement Authority | ||||||||
5.00%, 01/15/2028 | 500,000 | 627,110 | ||||||
5.00%, 01/15/2029 | 1,000,000 | 1,247,220 | ||||||
5.00%, 01/15/2033 | 500,000 | 610,340 | ||||||
County of Union NJ | ||||||||
3.00%, 03/01/2026 | 3,000,000 | 3,332,070 | ||||||
Garden State Preservation Trust | ||||||||
5.75%, 11/01/2028 | 2,000,000 | 2,485,780 | ||||||
Hudson County Improvement Authority | ||||||||
4.00%, 01/01/2036 | 1,125,000 | 1,323,022 | ||||||
4.00%, 01/01/2037 | 855,000 | 1,001,829 | ||||||
New Brunswick Parking Authority | ||||||||
5.00%, 09/01/2039 | 2,000,000 | 2,319,540 | ||||||
New Jersey Economic Development Authority | ||||||||
1.15%, 06/01/2023 | 2,550,000 | 2,546,328 | ||||||
1.20%, 11/01/2034(1) | 3,000,000 | 2,995,680 | ||||||
2.20%, 10/01/2039(1) | 1,400,000 | 1,448,748 | ||||||
3.13%, 07/01/2029 | 725,000 | 721,752 | ||||||
4.00%, 11/01/2038 | 825,000 | 851,804 | ||||||
4.00%, 11/01/2044 | 1,000,000 | 1,016,960 | ||||||
4.00%, 08/01/2059 | 355,000 | 394,898 | ||||||
5.00%, 01/01/2023 | 400,000 | 433,060 | ||||||
5.00%, 03/01/2023 | 4,160,000 | 4,449,203 | ||||||
5.00%, 03/01/2024 | 2,405,000 | 2,536,241 | ||||||
5.00%, 06/15/2024 | 2,000,000 | 2,193,740 | ||||||
5.00%, 06/15/2025 | 5,190,000 | 5,786,487 | ||||||
5.00%, 06/01/2026 | 900,000 | 1,082,223 | ||||||
5.00%, 06/15/2028 | 605,000 | 620,645 | ||||||
5.00%, 06/15/2029 | 1,000,000 | 1,023,670 | ||||||
5.00%, 06/15/2030 | 4,000,000 | 4,612,600 | ||||||
5.00%, 01/01/2031 | 500,000 | 559,790 | ||||||
5.00%, 06/15/2033 | 5,000,000 | 5,714,900 | ||||||
5.00%, 06/15/2034 | 1,000,000 | 1,138,740 | ||||||
5.00%, 06/15/2035 | 1,595,000 | 1,791,153 | ||||||
5.00%, 10/01/2037 | 3,185,000 | 3,507,577 | ||||||
5.00%, 06/15/2038 | 10,200,000 | 11,251,620 | ||||||
5.00%, 10/01/2039(2) | 355,000 | 290,557 | ||||||
5.00%, 01/01/2040(2) | 440,000 | 358,010 | ||||||
5.00%, 10/01/2047 | 3,450,000 | 3,728,070 | ||||||
5.00%, 06/15/2054(2) | 2,900,000 | 2,956,724 | ||||||
5.00%, 08/01/2059 | 1,000,000 | 1,219,000 | ||||||
5.13%, 01/01/2034 | 705,000 | 770,953 | ||||||
5.13%, 06/15/2043 | 2,450,000 | 2,590,213 | ||||||
5.25%, 01/01/2044 | 190,000 | 173,506 | ||||||
5.50%, 01/01/2027 | 500,000 | 561,215 | ||||||
5.50%, 06/15/2030 | 2,000,000 | 2,298,880 | ||||||
5.63%, 11/15/2030 | 2,095,000 | 2,158,101 | ||||||
5.63%, 01/01/2052 | 2,000,000 | 2,204,020 | ||||||
New Jersey Educational Facilities Authority | ||||||||
5.00%, 06/01/2023 | 930,000 | 1,000,150 | ||||||
5.00%, 07/01/2023 | 3,390,000 | 3,713,067 | ||||||
5.00%, 07/01/2029 | 1,500,000 | 1,714,260 | ||||||
5.00%, 07/01/2032 | 4,920,000 | 5,557,435 | ||||||
New Jersey Health Care Facilities Financing Authority | ||||||||
5.00%, 07/01/2021 | 40,000 | 41,580 | ||||||
5.00%, 07/01/2022 | 540,000 | 582,687 | ||||||
5.00%, 07/01/2023 | 140,000 | 156,302 | ||||||
5.00%, 07/01/2023 | 530,000 | 593,383 | ||||||
5.00%, 07/01/2024 | 110,000 | 126,604 | ||||||
5.00%, 07/01/2024 | 2,500,000 | 2,693,250 | ||||||
5.00%, 07/01/2025 | 120,000 | 141,269 | ||||||
5.00%, 07/01/2026 | 40,000 | 48,131 | ||||||
5.00%, 07/01/2027 | 60,000 | 71,963 | ||||||
5.00%, 07/01/2028 | 155,000 | 188,407 | ||||||
5.00%, 07/01/2030 | 165,000 | 193,920 | ||||||
5.00%, 07/01/2033 | 500,000 | 581,715 | ||||||
5.00%, 07/01/2041 | 815,000 | 903,737 | ||||||
5.00%, 07/01/2042(1) | 2,755,000 | 3,279,993 | ||||||
5.00%, 07/01/2043(1) | 2,250,000 | 2,605,657 | ||||||
5.00%, 07/01/2045(1) | 2,795,000 | 3,405,065 | ||||||
5.00%, 07/01/2046 | 2,375,000 | 2,564,335 | ||||||
New Jersey Higher Education Student Assistance Authority | ||||||||
3.35%, 12/01/2029 | 3,720,000 | 3,827,657 | ||||||
5.00%, 12/01/2021 | 660,000 | 694,808 | ||||||
5.00%, 12/01/2023 | 460,000 | 516,506 | ||||||
5.00%, 12/01/2024 | 265,000 | 305,728 | ||||||
5.00%, 12/01/2024 | 1,000,000 | 1,114,600 | ||||||
5.00%, 12/01/2025 | 490,000 | 578,700 | ||||||
5.00%, 12/01/2025 | 2,600,000 | 2,960,282 | ||||||
5.00%, 12/01/2026 | 1,330,000 | 1,521,427 | ||||||
5.00%, 12/01/2026 | 1,550,000 | 1,784,964 | ||||||
5.00%, 12/01/2027 | 1,455,000 | 1,682,708 | ||||||
5.00%, 12/01/2027 | 1,470,000 | 1,712,962 | ||||||
5.00%, 12/01/2044 | 1,000,000 | 1,055,940 | ||||||
5.50%, 12/01/2021 | 2,260,000 | 2,387,419 | ||||||
New Jersey Housing & Mortgage Finance Agency | ||||||||
2.02%, 08/01/2021(1) | 3,000,000 | 3,003,270 | ||||||
2.41%, 10/01/2021(1) | 5,000,000 | 5,021,250 | ||||||
3.55%, 04/01/2027 | 2,045,000 | 2,311,668 | ||||||
3.65%, 04/01/2028 | 1,480,000 | 1,685,098 |
New Jersey Transportation Trust Fund Authority | ||||||||
0.00%, 12/15/2026 | 2,600,000 | 2,121,626 | ||||||
0.00%, 12/15/2027 | 3,260,000 | 2,557,763 | ||||||
0.00%, 12/15/2028 | 770,000 | 580,619 | ||||||
0.00%, 12/15/2028 | 780,000 | 588,159 | ||||||
0.00%, 12/15/2030 | 2,000,000 | 1,377,140 | ||||||
0.00%, 12/15/2030 | 2,000,000 | 1,388,500 | ||||||
4.00%, 12/15/2039 | 600,000 | 617,826 | ||||||
5.00%, 12/15/2023 | 2,720,000 | 2,958,354 | ||||||
5.00%, 12/15/2024 | 1,335,000 | 1,477,097 | ||||||
5.00%, 06/15/2025 | 450,000 | 481,599 | ||||||
5.00%, 12/15/2025 | 1,255,000 | 1,408,763 | ||||||
5.00%, 12/15/2026 | 2,000,000 | 2,272,400 | ||||||
5.00%, 06/15/2027 | 235,000 | 265,548 | ||||||
5.00%, 12/15/2028 | 5,510,000 | 6,410,169 | ||||||
5.00%, 06/15/2029 | 665,000 | 691,986 | ||||||
5.00%, 06/15/2029 | 1,200,000 | 1,340,976 | ||||||
5.00%, 12/15/2029 | 820,000 | 962,360 | ||||||
5.00%, 12/15/2030 | 2,000,000 | 2,299,700 | ||||||
5.00%, 06/15/2031 | 3,545,000 | 3,907,937 | ||||||
5.00%, 06/15/2032 | 235,000 | 253,027 | ||||||
5.00%, 06/15/2032 | 1,860,000 | 1,925,007 | ||||||
5.00%, 06/15/2032 | 2,725,000 | 3,098,679 | ||||||
5.00%, 12/15/2032 | 1,340,000 | 1,519,346 | ||||||
5.00%, 12/15/2033 | 2,200,000 | 2,483,734 | ||||||
5.00%, 12/15/2039 | 700,000 | 779,072 | ||||||
5.25%, 12/15/2022 | 1,760,000 | 1,883,922 | ||||||
5.25%, 12/15/2023 | 3,940,000 | 4,317,767 | ||||||
5.25%, 06/15/2036 | 10,180,000 | 10,355,096 | ||||||
5.25%, 06/15/2043 | 3,000,000 | 3,347,190 | ||||||
5.50%, 12/15/2023 | 190,000 | 209,783 | ||||||
5.50%, 06/15/2031 | 1,000,000 | 1,022,990 | ||||||
New Jersey Turnpike Authority | ||||||||
5.00%, 01/01/2033 | 5,000,000 | 5,712,600 | ||||||
Tobacco Settlement Financing Corp. | ||||||||
5.00%, 06/01/2023 | 570,000 | 636,183 | ||||||
Township of Montclair NJ | ||||||||
4.00%, 03/01/2023 | 800,000 | 878,920 | ||||||
4.00%, 03/01/2027 | 325,000 | 393,458 | ||||||
|
| |||||||
Total New Jersey |
| 223,787,172 | ||||||
|
| |||||||
New Mexico – 0.49% | ||||||||
Albuquerque Bernalillo County Water Utility Authority | ||||||||
5.00%, 07/01/2027 | 2,400,000 | 3,008,448 | ||||||
5.00%, 07/01/2028 | 1,700,000 | 2,124,184 | ||||||
Albuquerque Municipal School District No 12 | ||||||||
5.00%, 08/01/2025 | 800,000 | 969,904 | ||||||
City of Farmington NM | ||||||||
1.88%, 04/01/2033(1) | 10,500,000 | 10,474,380 | ||||||
City of Santa Fe NM | ||||||||
2.25%, 05/15/2024 | 555,000 | 523,920 | ||||||
2.63%, 05/15/2025 | 995,000 | 940,056 | ||||||
Farmington Municipal School District No 5 | ||||||||
5.00%, 09/01/2024 | 490,000 | 581,346 | ||||||
New Mexico Hospital Equipment Loan Council | ||||||||
5.00%, 08/01/2049(1) | 2,360,000 | 2,759,619 | ||||||
New Mexico Mortgage Finance Authority | ||||||||
3.75%, 01/01/2050 | 745,000 | 817,839 | ||||||
New Mexico Municipal Energy Acquisition Authority | ||||||||
5.00%, 11/01/2039(1) | 5,140,000 | 6,043,869 | ||||||
Town of Clayton NM | ||||||||
4.00%, 11/01/2020 | 3,545,000 | 3,581,513 | ||||||
|
| |||||||
Total New Mexico |
| 31,825,078 | ||||||
|
| |||||||
New York – 7.54% | ||||||||
Albany County Airport Authority | ||||||||
5.00%, 12/15/2021 | 800,000 | 841,624 | ||||||
Build NYC Resource Corp. | ||||||||
4.88%, 05/01/2031(2) | 750,000 | 782,430 | ||||||
5.00%, 08/01/2022 | 200,000 | 214,898 | ||||||
5.00%, 08/01/2023 | 485,000 | 536,672 | ||||||
5.00%, 01/01/2035(2) | 3,900,000 | 4,080,765 | ||||||
5.50%, 05/01/2048(2) | 1,350,000 | 1,407,402 | ||||||
City of New York NY | ||||||||
0.13%, 04/01/2042(1) | 900,000 | 900,000 | ||||||
5.00%, 08/01/2025 | 1,600,000 | 1,937,136 | ||||||
5.00%, 08/01/2027 | 400,000 | 469,828 | ||||||
5.00%, 08/01/2027 | 2,975,000 | 3,549,413 | ||||||
5.00%, 08/01/2028 | 400,000 | 483,572 | ||||||
5.00%, 08/01/2028 | 700,000 | 858,494 | ||||||
5.00%, 08/01/2028 | 3,975,000 | 4,733,827 | ||||||
5.00%, 08/01/2029 | 1,305,000 | 1,663,262 | ||||||
5.00%, 08/01/2029 | 1,500,000 | 1,911,795 | ||||||
5.00%, 08/01/2031 | 1,000,000 | 1,256,870 | ||||||
5.00%, 08/01/2032 | 1,745,000 | 2,150,974 | ||||||
City of Yonkers NY | ||||||||
5.00%, 09/01/2022 | 2,350,000 | 2,555,461 | ||||||
5.00%, 09/01/2025 | 1,015,000 | 1,202,288 | ||||||
County of Erie NY | ||||||||
5.00%, 09/15/2020 | 350,000 | 353,388 | ||||||
5.00%, 06/01/2021 | 750,000 | 782,497 | ||||||
5.00%, 09/15/2021 | 225,000 | 237,798 | ||||||
5.00%, 06/01/2025 | 1,000,000 | 1,211,380 | ||||||
County of Nassau NY | ||||||||
5.00%, 10/01/2024 | 3,000,000 | 3,497,580 | ||||||
County of Rockland NY | ||||||||
4.00%, 01/01/2021 | 1,100,000 | 1,120,537 | ||||||
County of Suffolk NY | ||||||||
2.50%, 07/23/2020 | 6,000,000 | 6,005,520 | ||||||
4.00%, 02/01/2028 | 1,865,000 | 2,140,591 | ||||||
5.00%, 03/19/2021 | 4,000,000 | 4,092,960 | ||||||
Erie County Fiscal Stability Authority | ||||||||
5.00%, 09/01/2033 | 525,000 | 664,319 | ||||||
Glen Cove Local Economic Assistance Corp. | ||||||||
0.00%, 01/01/2045 | 3,550,000 | 1,009,407 | ||||||
0.00%, 01/01/2055 | 710,000 | 632,752 | ||||||
5.00%, 01/01/2056 | 485,000 | 492,794 | ||||||
Hempstead Town Local Development Corp. | ||||||||
5.53%, 02/01/2040 | 3,500,000 | 3,507,560 | ||||||
5.89%, 02/01/2032 | 1,250,000 | 1,313,812 | ||||||
6.24%, 02/01/2047 | 1,000,000 | 1,042,580 | ||||||
6.47%, 02/01/2033 | 1,000,000 | 1,087,810 | ||||||
Hudson Yards Infrastructure Corp. | ||||||||
5.00%, 02/15/2035 | 1,700,000 | 2,022,762 | ||||||
Long Island Power Authority | ||||||||
1.65%, 09/01/2049(1) | 4,395,000 | 4,380,321 | ||||||
5.00%, 09/01/2023 | 550,000 | 622,803 | ||||||
5.00%, 09/01/2024 | 565,000 | 660,135 | ||||||
5.00%, 09/01/2025 | 1,000,000 | 1,201,140 | ||||||
5.00%, 09/01/2026 | 2,000,000 | 2,461,920 | ||||||
5.00%, 09/01/2027 | 6,500,000 | 8,196,760 | ||||||
5.00%, 09/01/2039 | 1,725,000 | 2,125,579 | ||||||
Metropolitan Transportation Authority | ||||||||
0.00%, 11/15/2033 | 1,600,000 | 977,424 | ||||||
0.58% (SIFMA Municipal Swap Index Yield + 0.45%), 11/01/2026(3) | 2,530,000 | 2,455,314 | ||||||
0.77% (1 Month LIBOR USD + 0.65%), 11/01/2035(3) | 8,305,000 | 8,098,455 | ||||||
4.00%, 09/01/2020 | 5,000,000 | 5,008,800 | ||||||
4.00%, 02/01/2022 | 4,370,000 | 4,478,726 | ||||||
5.00%, 09/01/2021 | 25,000,000 | 25,696,500 | ||||||
5.00%, 11/15/2021 | 500,000 | 518,405 | ||||||
5.00%, 11/15/2021 | 640,000 | 663,546 | ||||||
5.00%, 11/15/2022 | 1,430,000 | 1,508,936 | ||||||
5.00%, 11/15/2024 | 1,885,000 | 2,124,715 | ||||||
5.00%, 11/15/2025 | 1,155,000 | 1,291,267 | ||||||
5.00%, 11/15/2026 | 1,600,000 | 1,799,968 | ||||||
5.00%, 11/15/2026 | 2,350,000 | 2,643,703 | ||||||
5.00%, 11/15/2029 | 2,220,000 | 2,452,900 |
5.00%, 11/15/2033 | 1,025,000 | 1,126,157 | ||||||
5.00%, 11/15/2033 | 1,715,000 | 1,954,328 | ||||||
5.00%, 11/15/2033 | 3,645,000 | 4,153,660 | ||||||
5.00%, 11/15/2034 | 4,000,000 | 4,556,560 | ||||||
5.00%, 11/15/2035 | 1,750,000 | 1,921,412 | ||||||
5.00%, 11/15/2039 | 2,000,000 | 2,156,640 | ||||||
5.00%, 11/15/2045(1) | 4,470,000 | 4,492,037 | ||||||
5.25%, 11/15/2030 | 1,570,000 | 1,773,503 | ||||||
5.25%, 11/15/2036 | 1,015,000 | 1,194,584 | ||||||
MTA Hudson Rail Yards Trust Obligations | ||||||||
5.00%, 11/15/2051 | 1,500,000 | 1,560,555 | ||||||
5.00%, 11/15/2056 | 4,380,000 | 4,772,360 | ||||||
Nassau County Industrial Development Agency | ||||||||
6.50%, 01/01/2034 | 672,500 | 573,649 | ||||||
6.70%, 01/01/2049 | 793,750 | 625,475 | ||||||
New York City Housing Development Corp. | ||||||||
1.13%, 05/01/2060(1) | 7,500,000 | 7,501,800 | ||||||
2.75%, 05/01/2050(1) | 6,500,000 | 6,799,975 | ||||||
5.00%, 05/01/2026 | 110,000 | 133,000 | ||||||
5.00%, 05/01/2027 | 600,000 | 739,062 | ||||||
5.00%, 11/01/2027 | 855,000 | 1,063,611 | ||||||
5.00%, 05/01/2028 | 875,000 | 1,099,000 | ||||||
5.00%, 11/01/2028 | 600,000 | 760,662 | ||||||
5.00%, 05/01/2029 | 300,000 | 383,610 | ||||||
5.00%, 11/01/2029 | 875,000 | 1,127,464 | ||||||
5.00%, 11/01/2030 | 500,000 | 653,405 | ||||||
New York City Transitional Finance Authority Building Aid Revenue | ||||||||
5.00%, 07/15/2024 | 200,000 | 235,414 | ||||||
5.00%, 07/15/2032 | 2,000,000 | 2,473,600 | ||||||
New York City Transitional Finance Authority Future Tax Secured Revenue | ||||||||
5.00%, 11/01/2028 | 1,500,000 | 1,810,245 | ||||||
5.00%, 11/01/2029 | 2,000,000 | 2,370,380 | ||||||
5.00%, 02/01/2030 | 4,480,000 | 5,410,586 | ||||||
5.00%, 02/01/2031 | 2,720,000 | 2,999,643 | ||||||
5.00%, 05/01/2033 | 2,535,000 | 3,172,629 | ||||||
5.00%, 08/01/2034 | 700,000 | 878,003 | ||||||
5.00%, 08/01/2035 | 1,600,000 | 1,998,832 | ||||||
5.00%, 08/01/2038 | 1,975,000 | 2,444,142 | ||||||
5.00%, 02/01/2041 | 200,000 | 230,364 | ||||||
New York City Water & Sewer System | ||||||||
4.00%, 06/15/2039 | 5,290,000 | 6,268,862 | ||||||
5.00%, 06/15/2031 | 6,075,000 | 7,269,406 | ||||||
5.00%, 06/15/2032 | 5,000,000 | 5,200,350 | ||||||
5.00%, 06/15/2033 | 2,525,000 | 2,624,965 | ||||||
5.00%, 06/15/2034 | 4,800,000 | 5,179,824 | ||||||
5.00%, 06/15/2035 | 9,025,000 | 10,845,433 | ||||||
5.00%, 06/15/2036 | 5,000,000 | 5,993,900 | ||||||
5.00%, 06/15/2037 | 6,000,000 | 7,077,600 | ||||||
5.00%, 06/15/2039 | 8,320,000 | 9,783,571 | ||||||
5.00%, 06/15/2048 | 20,000 | 24,544 | ||||||
New York Convention Center Development Corp. | ||||||||
5.00%, 11/15/2033 | 3,000,000 | 3,255,030 | ||||||
New York Liberty Development Corp. | ||||||||
2.63%, 09/15/2069 | 400,000 | 396,848 | ||||||
2.80%, 09/15/2069 | 1,025,000 | 1,004,377 | ||||||
5.00%, 09/15/2031 | 4,000,000 | 4,274,400 | ||||||
5.00%, 11/15/2044(2) | 1,100,000 | 1,140,073 | ||||||
5.25%, 10/01/2035 | 2,285,000 | 3,082,191 | ||||||
5.38%, 11/15/2040(2) | 5,000,000 | 5,181,550 | ||||||
5.75%, 11/15/2051 | 2,000,000 | 2,097,840 | ||||||
New York State Dormitory Authority | ||||||||
4.00%, 02/15/2037 | 5,000,000 | 5,887,350 | ||||||
5.00%, 03/31/2021 | 13,750,000 | 14,233,725 | ||||||
5.00%, 12/01/2022(2) | 900,000 | 977,301 | ||||||
5.00%, 07/01/2023 | 5,000 | 5,677 | ||||||
5.00%, 07/01/2023 | 245,000 | 278,986 | ||||||
5.00%, 12/15/2023 | 1,000,000 | 1,107,450 | ||||||
5.00%, 03/15/2024 | 3,700,000 | 4,316,087 |
5.00%, 05/01/2024 | 4,870,000 | 5,554,186 | ||||||
5.00%, 07/01/2024 | 5,000 | 5,894 | ||||||
5.00%, 07/01/2024 | 345,000 | 407,007 | ||||||
5.00%, 07/01/2025 | 5,000 | 6,098 | ||||||
5.00%, 07/01/2025 | 255,000 | 310,253 | ||||||
5.00%, 03/15/2027 | 2,500,000 | 2,963,925 | ||||||
5.00%, 10/01/2028 | 1,735,000 | 2,167,501 | ||||||
5.00%, 03/15/2029 | 3,700,000 | 4,258,071 | ||||||
5.00%, 10/01/2029 | 1,430,000 | 1,776,489 | ||||||
5.00%, 10/01/2030 | 1,910,000 | 2,354,877 | ||||||
5.00%, 02/15/2032 | 8,610,000 | 9,143,390 | ||||||
5.00%, 05/01/2048(1) | 1,145,000 | 1,203,338 | ||||||
5.00%, 05/01/2048(1) | 1,040,000 | 1,227,834 | ||||||
5.00%, 05/01/2048(1) | 5,695,000 | 6,405,053 | ||||||
5.25%, 03/15/2033 | 6,000,000 | 7,212,120 | ||||||
5.25%, 03/15/2038 | 1,930,000 | 2,449,074 | ||||||
New York State Environmental Facilities Corp. | ||||||||
5.00%, 06/15/2033 | 500,000 | 662,155 | ||||||
New York State Thruway Authority | ||||||||
5.00%, 01/01/2032 | 2,835,000 | 3,270,966 | ||||||
New York State Urban Development Corp. | ||||||||
5.00%, 03/15/2022 | 360,000 | 388,138 | ||||||
5.00%, 03/15/2023 | 700,000 | 787,073 | ||||||
5.00%, 03/15/2024 | 400,000 | 466,764 | ||||||
5.00%, 03/15/2035 | 2,800,000 | 3,183,880 | ||||||
5.00%, 03/15/2035 | 3,000,000 | 3,954,900 | ||||||
New York Transportation Development Corp. | ||||||||
5.00%, 01/01/2023 | 270,000 | 279,779 | ||||||
5.00%, 08/01/2026 | 1,000,000 | 1,002,980 | ||||||
5.00%, 01/01/2031 | 1,015,000 | 1,087,136 | ||||||
5.00%, 08/01/2031 | 5,105,000 | 5,112,249 | ||||||
5.00%, 01/01/2033 | 5,500,000 | 5,887,145 | ||||||
5.00%, 07/01/2041 | 2,300,000 | 2,479,929 | ||||||
5.00%, 07/01/2046 | 800,000 | 861,024 | ||||||
5.25%, 08/01/2031 | 500,000 | 515,775 | ||||||
5.38%, 08/01/2036 | 800,000 | 826,056 | ||||||
Oneida County Local Development Corp. | ||||||||
5.00%, 12/01/2025 | 320,000 | 365,456 | ||||||
5.00%, 12/01/2027 | 1,425,000 | 1,618,928 | ||||||
5.00%, 12/01/2028 | 1,000,000 | 1,134,090 | ||||||
Onondaga Civic Development Corp. | ||||||||
5.00%, 12/01/2033 | 1,000,000 | 1,327,570 | ||||||
Port Authority of New York & New Jersey | ||||||||
5.00%, 09/15/2024 | 5,115,000 | 5,953,297 | ||||||
5.00%, 09/15/2025 | 1,000,000 | 1,026,350 | ||||||
5.00%, 09/15/2026 | 1,000,000 | 1,220,740 | ||||||
5.00%, 10/15/2028 | 4,000,000 | 4,704,480 | ||||||
5.00%, 07/15/2031 | 5,000,000 | 5,102,000 | ||||||
5.00%, 10/15/2033 | 3,500,000 | 3,948,315 | ||||||
5.25%, 07/15/2030 | 9,705,000 | 9,920,160 | ||||||
State of New York Mortgage Agency | ||||||||
2.20%, 10/01/2029 | 1,000,000 | 1,049,040 | ||||||
3.45%, 04/01/2026 | 2,185,000 | 2,442,065 | ||||||
Suffolk County Economic Development Corp. | ||||||||
5.00%, 07/01/2028 | 300,000 | 313,752 | ||||||
5.00%, 07/01/2028 | 1,750,000 | 1,810,970 | ||||||
Tender Option Bond Trust Receipts/Certificates | ||||||||
0.21%, 11/15/2044(1)(2) | 1,700,000 | 1,700,000 | ||||||
0.33%, 01/01/2028(1)(2) | 2,900,000 | 2,900,000 | ||||||
Tompkins County Development Corp. | ||||||||
5.00%, 07/01/2044 | 115,000 | 117,843 | ||||||
Town of Hempstead NY | ||||||||
4.00%, 06/15/2028 | 3,665,000 | 4,159,042 | ||||||
Triborough Bridge & Tunnel Authority | ||||||||
0.55% (Secured Overnight Financing Rate + 0.50%), 11/15/2038(3) | 20,000,000 | 19,977,000 | ||||||
5.00%, 11/15/2030 | 4,000,000 | 5,382,960 | ||||||
Utility Debt Securitization Authority | ||||||||
5.00%, 12/15/2032 | 640,000 | 729,901 | ||||||
5.00%, 12/15/2041 | 9,385,000 | 11,696,150 |
Westchester County Local Development Corp. | ||||||||
5.50%, 05/01/2042 | 150,000 | 162,921 | ||||||
|
| |||||||
Total New York |
| 491,747,851 | ||||||
|
| |||||||
North Carolina – 1.34% | ||||||||
Charlotte-Mecklenburg Hospital Authority | ||||||||
5.00%, 01/15/2031 | 1,500,000 | 1,586,055 | ||||||
5.00%, 01/15/2048(1) | 5,000,000 | 5,364,650 | ||||||
County of New Hanover NC | ||||||||
5.00%, 10/01/2023 | 1,125,000 | 1,267,841 | ||||||
5.00%, 10/01/2027 | 100,000 | 123,315 | ||||||
5.00%, 10/01/2034 | 1,000,000 | 1,194,850 | ||||||
5.00%, 10/01/2047 | 840,000 | 976,912 | ||||||
Mecklenburg County Public Facilities Corp. | ||||||||
5.00%, 02/01/2023 | 2,160,000 | 2,417,990 | ||||||
North Carolina Capital Facilities Finance Agency | ||||||||
0.40%, 07/01/2034(1) | 3,375,000 | 3,374,629 | ||||||
0.65%, 12/01/2020(1) | 200,000 | 199,976 | ||||||
0.70%, 06/01/2038(1) | 6,000,000 | 6,000,120 | ||||||
5.00%, 06/01/2021 | 500,000 | 519,970 | ||||||
North Carolina Eastern Municipal Power Agency | ||||||||
5.00%, 01/01/2021 | 1,965,000 | 2,011,354 | ||||||
North Carolina Medical Care Commission | ||||||||
0.17%, 11/01/2034(1) | 25,000,000 | 25,000,000 | ||||||
2.20%, 12/01/2048(1) | 2,285,000 | 2,316,282 | ||||||
2.55%, 06/01/2048(1) | 3,955,000 | 4,122,811 | ||||||
3.55%, 10/01/2024 | 1,110,000 | 1,103,040 | ||||||
4.88%, 07/01/2040 | 550,000 | 516,873 | ||||||
5.00%, 10/01/2023 | 110,000 | 115,086 | ||||||
5.00%, 10/01/2024 | 300,000 | 316,752 | ||||||
5.00%, 10/01/2025 | 250,000 | 257,855 | ||||||
5.00%, 10/01/2030 | 420,000 | 416,976 | ||||||
5.00%, 10/01/2030 | 2,100,000 | 2,185,491 | ||||||
5.00%, 10/01/2031 | 2,950,000 | 3,002,008 | ||||||
5.00%, 09/01/2037 | 3,000,000 | 3,005,370 | ||||||
5.00%, 10/01/2037 | 250,000 | 251,983 | ||||||
5.00%, 01/01/2039 | 1,225,000 | 1,249,133 | ||||||
5.00%, 07/01/2039 | 800,000 | 843,248 | ||||||
5.00%, 09/01/2041 | 440,000 | 433,752 | ||||||
5.00%, 10/01/2043 | 2,000,000 | 2,001,180 | ||||||
5.00%, 07/01/2049 | 900,000 | 933,669 | ||||||
6.25%, 07/01/2035 | 1,000,000 | 1,032,710 | ||||||
North Carolina Turnpike Authority | ||||||||
5.00%, 01/01/2027 | 530,000 | 641,162 | ||||||
5.00%, 01/01/2032 | 1,000,000 | 1,142,910 | ||||||
5.00%, 07/01/2051 | 1,700,000 | 1,828,095 | ||||||
Raleigh Durham Airport Authority | ||||||||
5.00%, 05/01/2024 | 2,000,000 | 2,289,860 | ||||||
5.00%, 05/01/2025 | 3,000,000 | 3,529,260 | ||||||
State of North Carolina | ||||||||
5.00%, 03/01/2022 | 1,000,000 | 1,076,200 | ||||||
5.00%, 03/01/2023 | 2,335,000 | 2,617,325 | ||||||
|
| |||||||
Total North Carolina |
| 87,266,693 | ||||||
|
| |||||||
North Dakota – 0.00%(4) | ||||||||
North Dakota Housing Finance Agency | ||||||||
1.55%, 07/01/2020 | 85,000 | 85,000 | ||||||
|
| |||||||
Total North Dakota |
| 85,000 | ||||||
|
| |||||||
Ohio – 2.86% | ||||||||
Akron Bath Copley Joint Township Hospital District | ||||||||
5.25%, 11/15/2031 | 530,000 | 631,013 | ||||||
5.25%, 11/15/2032 | 645,000 | 764,028 | ||||||
5.25%, 11/15/2033 | 1,770,000 | 2,089,113 | ||||||
5.25%, 11/15/2046 | 1,255,000 | 1,417,937 | ||||||
American Municipal Power, Inc. | ||||||||
2.30%, 02/15/2038(1) | 2,900,000 | 2,907,047 | ||||||
Buckeye Tobacco Settlement Financing Authority | ||||||||
3.00%, 06/01/2048 | 2,840,000 | 2,690,304 | ||||||
4.00%, 06/01/2038 | 1,000,000 | 1,146,100 | ||||||
5.00%, 06/01/2055 | 23,350,000 | 24,587,316 | ||||||
City of Cleveland OH Airport System Revenue | ||||||||
5.00%, 01/01/2024 | 2,450,000 | 2,768,328 | ||||||
5.00%, 01/01/2048 | 2,000,000 | 2,341,620 | ||||||
City of Columbus OH | ||||||||
5.00%, 04/01/2033 | 1,345,000 | 1,766,066 | ||||||
City of Dayton OH Airport Revenue | ||||||||
5.00%, 12/01/2021 | 1,050,000 | 1,105,608 | ||||||
City of Hamilton OH Electric System Revenue | ||||||||
4.00%, 10/01/2037 | 1,000,000 | 1,150,570 | ||||||
Clermont County Port Authority | ||||||||
5.00%, 12/01/2029 | 750,000 | 901,327 | ||||||
5.00%, 12/01/2030 | 850,000 | 1,020,017 | ||||||
5.00%, 12/01/2031 | 650,000 | 778,505 | ||||||
Cleveland-Cuyahoga County Port Authority | ||||||||
5.50%, 12/01/2043 | 125,000 | 127,780 | ||||||
5.50%, 12/01/2053 | 900,000 | 912,042 | ||||||
County of Allen OH Hospital Facilities Revenue | ||||||||
4.00%, 05/01/2033 | 9,620,000 | 9,977,479 | ||||||
5.00%, 12/01/2029 | 585,000 | 751,854 | ||||||
5.00%, 12/01/2030 | 585,000 | 759,289 | ||||||
5.00%, 08/01/2047(1) | 500,000 | 536,305 | ||||||
County of Cuyahoga OH | ||||||||
5.00%, 12/01/2026 | 2,500,000 | 2,746,275 | ||||||
5.00%, 02/15/2042 | 525,000 | 577,967 | ||||||
5.50%, 02/15/2052 | 1,790,000 | 2,019,156 | ||||||
5.50%, 02/15/2057 | 1,245,000 | 1,389,993 | ||||||
County of Fairfield OH | ||||||||
4.25%, 06/15/2024 | 1,470,000 | 1,569,004 | ||||||
County of Franklin OH | ||||||||
0.12%, 12/01/2028(1) | 900,000 | 900,000 | ||||||
5.00%, 11/15/2033(1) | 12,780,000 | 14,327,275 | ||||||
County of Hamilton OH | ||||||||
4.00%, 01/01/2021 | 450,000 | 451,476 | ||||||
5.00%, 01/01/2022 | 465,000 | 475,565 | ||||||
5.00%, 09/15/2034 | 1,050,000 | 1,306,011 | ||||||
5.25%, 06/01/2026 | 660,000 | 707,962 | ||||||
County of Marion OH | ||||||||
5.13%, 12/01/2049 | 575,000 | 564,265 | ||||||
County of Muskingum OH | ||||||||
4.00%, 02/15/2023 | 1,700,000 | 1,802,952 | ||||||
5.00%, 02/15/2048 | 2,080,000 | 2,120,206 | ||||||
County of Scioto OH | ||||||||
5.00%, 02/15/2029 | 1,500,000 | 1,699,470 | ||||||
County of Wood OH | ||||||||
5.00%, 12/01/2032 | 115,000 | 118,127 | ||||||
5.00%, 12/01/2042 | 145,000 | 146,494 | ||||||
Franklin County Convention Facilities Authority | ||||||||
5.00%, 12/01/2044 | 1,550,000 | 1,451,528 | ||||||
5.00%, 12/01/2051 | 2,135,000 | 1,995,328 | ||||||
Lancaster Port Authority | ||||||||
5.00%, 08/01/2049(1) | 2,000,000 | 2,333,820 | ||||||
Miami University | ||||||||
5.00%, 09/01/2030 | 475,000 | 642,395 | ||||||
5.00%, 09/01/2032 | 1,000,000 | 1,325,600 | ||||||
5.00%, 09/01/2034 | 700,000 | 847,273 | ||||||
Ohio Air Quality Development Authority | ||||||||
2.10%, 12/01/2027(1) | 5,000,000 | 5,046,700 | ||||||
2.10%, 07/01/2028(1) | 12,500,000 | 12,602,625 | ||||||
2.88%, 02/01/2026 | 5,400,000 | 5,463,558 | ||||||
3.25%, 09/01/2029 | 2,995,000 | 3,077,063 | ||||||
5.00%, 07/01/2049(2) | 2,800,000 | 2,816,128 | ||||||
Ohio Higher Educational Facility Commission | ||||||||
5.00%, 10/01/2032 | 1,000,000 | 1,213,030 | ||||||
Ohio Housing Finance Agency | ||||||||
2.45%, 11/01/2021(1) | 2,385,000 | 2,398,785 | ||||||
2.50%, 10/01/2021(1) | 2,850,000 | 2,862,454 | ||||||
4.50%, 03/01/2050 | 235,000 | 264,420 |
Ohio Water Development Authority Water Pollution Control Loan Fund | ||||||||
5.00%, 12/01/2037 | 3,000,000 | 3,987,090 | ||||||
Southeastern Ohio Port Authority | ||||||||
5.50%, 12/01/2043 | 1,000,000 | 1,039,450 | ||||||
5.75%, 12/01/2032 | 445,000 | 468,403 | ||||||
6.00%, 12/01/2042 | 550,000 | 571,417 | ||||||
State of Ohio | ||||||||
0.40%, 11/01/2035(1) | 22,000,000 | 21,997,580 | ||||||
4.00%, 01/15/2050 | 450,000 | 491,589 | ||||||
5.00%, 08/01/2024 | 2,500,000 | 2,962,175 | ||||||
5.00%, 01/01/2030 | 1,170,000 | 1,476,950 | ||||||
5.00%, 10/01/2035 | 1,410,000 | 1,737,162 | ||||||
5.00%, 01/15/2050 | 1,000,000 | 1,189,960 | ||||||
Tender Option Bond Trust Receipts/Certificates | ||||||||
0.21%, 12/01/2043(1)(2) | 600,000 | 600,000 | ||||||
University of Akron | ||||||||
4.00%, 01/01/2027 | 2,780,000 | 3,205,090 | ||||||
5.00%, 01/01/2037 | 6,675,000 | 7,683,125 | ||||||
University of Cincinnati | ||||||||
5.00%, 06/01/2028 | 250,000 | 314,668 | ||||||
5.00%, 06/01/2029 | 400,000 | 501,524 | ||||||
|
| |||||||
Total Ohio |
| 186,618,736 | ||||||
|
| |||||||
Oklahoma – 0.86% | ||||||||
Cache Educational Facilities Authority | ||||||||
5.00%, 09/01/2023 | 500,000 | 566,185 | ||||||
5.00%, 09/01/2026 | 3,220,000 | 3,974,510 | ||||||
Canadian County Educational Facilities Authority | ||||||||
4.00%, 09/01/2025 | 1,500,000 | 1,737,045 | ||||||
5.00%, 09/01/2026 | 1,725,000 | 2,132,686 | ||||||
5.00%, 09/01/2028 | 1,120,000 | 1,370,734 | ||||||
Cleveland County Educational Facilities Authority | ||||||||
5.00%, 09/01/2024 | 440,000 | 511,729 | ||||||
5.00%, 09/01/2025 | 300,000 | 358,671 | ||||||
5.00%, 09/01/2026 | 375,000 | 459,105 | ||||||
Dewey County Educational Facilities Authority | ||||||||
5.00%, 09/01/2030 | 2,470,000 | 2,913,637 | ||||||
Garvin County Educational Facilities Authority | ||||||||
5.00%, 12/01/2024 | 515,000 | 604,528 | ||||||
5.00%, 12/01/2025 | 545,000 | 656,551 | ||||||
5.00%, 12/01/2026 | 820,000 | 1,010,502 | ||||||
Grady County School Finance Authority | ||||||||
5.00%, 09/01/2028 | 375,000 | 484,196 | ||||||
5.00%, 09/01/2030 | 1,235,000 | 1,583,628 | ||||||
Grand River Dam Authority | ||||||||
5.00%, 06/01/2023 | 1,000,000 | 1,133,430 | ||||||
Muskogee Industrial Trust | ||||||||
4.00%, 09/01/2030 | 2,000,000 | 2,376,060 | ||||||
Norman Regional Hospital Authority | ||||||||
4.00%, 09/01/2045 | 750,000 | 788,107 | ||||||
Oklahoma City Airport Trust | ||||||||
5.00%, 07/01/2025 | 2,040,000 | 2,402,651 | ||||||
5.00%, 07/01/2026 | 2,195,000 | 2,641,200 | ||||||
5.00%, 07/01/2030 | 1,350,000 | 1,672,178 | ||||||
5.00%, 07/01/2032 | 2,960,000 | 3,617,031 | ||||||
5.00%, 07/01/2035 | 3,240,000 | 3,911,911 | ||||||
5.00%, 07/01/2043 | 1,065,000 | 1,258,724 | ||||||
Oklahoma County Finance Authority | ||||||||
5.13%, 04/01/2042 | 1,900,000 | 1,576,715 | ||||||
5.70%, 04/01/2025 | 410,000 | 410,049 | ||||||
Oklahoma Department of Transportation | ||||||||
5.00%, 09/01/2030 | 1,015,000 | 1,306,965 | ||||||
Oklahoma Development Finance Authority | ||||||||
3.00%, 06/01/2022 | 1,015,000 | 1,057,721 | ||||||
4.00%, 12/01/2022 | 530,000 | 569,538 | ||||||
4.00%, 06/01/2023 | 1,305,000 | 1,419,892 | ||||||
5.00%, 08/01/2023 | 515,000 | 558,502 | ||||||
5.00%, 08/01/2026 | 75,000 | 85,353 | ||||||
5.00%, 08/15/2029 | 420,000 | 499,653 | ||||||
5.00%, 08/01/2030 | 1,010,000 | 1,173,741 | ||||||
5.25%, 08/15/2048 | 1,500,000 | 1,721,790 | ||||||
5.50%, 08/15/2052 | 830,000 | 964,012 | ||||||
5.50%, 08/15/2057 | 1,000,000 | 1,154,610 | ||||||
Oklahoma State University | ||||||||
5.00%, 09/01/2031 | 1,500,000 | 2,021,250 | ||||||
Tulsa Airports Improvement Trust | ||||||||
5.00%, 06/01/2031 | 1,120,000 | 1,364,832 | ||||||
5.00%, 06/01/2033 | 1,240,000 | 1,491,906 | ||||||
Tulsa County Industrial Authority | ||||||||
5.00%, 11/15/2023 | 230,000 | 238,568 | ||||||
5.00%, 11/15/2029 | 400,000 | 420,340 | ||||||
|
| |||||||
Total Oklahoma |
| 56,200,436 | ||||||
|
| |||||||
Oregon – 0.62% | ||||||||
City of Eugene OR Electric Utility System Revenue | ||||||||
4.00%, 08/01/2036 | 300,000 | 367,017 | ||||||
Hillsboro School District No 1J | ||||||||
5.00%, 06/15/2028 | 1,525,000 | 1,957,841 | ||||||
Klamath Falls Intercommunity Hospital Authority | ||||||||
5.00%, 09/01/2031 | 200,000 | 234,340 | ||||||
5.00%, 09/01/2032 | 270,000 | 314,731 | ||||||
5.00%, 09/01/2046 | 1,000,000 | 1,128,940 | ||||||
Metro | ||||||||
4.00%, 06/01/2034 | 2,000,000 | 2,475,480 | ||||||
Oregon State Business Development Commission | ||||||||
5.00%, 03/01/2049(1) | 10,000,000 | 10,654,800 | ||||||
Oregon State Lottery | ||||||||
5.00%, 04/01/2036 | 2,500,000 | 3,082,050 | ||||||
Port of Portland OR Airport Revenue | ||||||||
5.00%, 07/01/2027 | 1,000,000 | 1,233,910 | ||||||
5.00%, 07/01/2028 | 2,190,000 | 2,754,779 | ||||||
5.00%, 07/01/2029 | 750,000 | 949,455 | ||||||
5.00%, 07/01/2031 | 1,000,000 | 1,191,580 | ||||||
5.00%, 07/01/2032 | 1,000,000 | 1,122,170 | ||||||
5.00%, 07/01/2033 | 3,485,000 | 3,899,331 | ||||||
State of Oregon | ||||||||
0.13%, 06/01/2039(1) | 1,000,000 | 1,000,000 | ||||||
State of Oregon Housing & Community Services Department | ||||||||
0.16%, 07/01/2037(1) | 5,500,000 | 5,500,000 | ||||||
3.50%, 01/01/2051 | 1,385,000 | 1,520,065 | ||||||
Yamhill County Hospital Authority | ||||||||
5.00%, 11/15/2051 | 1,005,000 | 1,016,407 | ||||||
|
| |||||||
Total Oregon |
| 40,402,896 | ||||||
|
| |||||||
Pennsylvania – 5.31% | ||||||||
Allegheny County Hospital Development Authority | ||||||||
5.00%, 07/15/2025 | 2,370,000 | 2,797,619 | ||||||
5.00%, 07/15/2034 | 5,100,000 | 6,261,525 | ||||||
Allentown City School District | ||||||||
2.38%, 03/31/2021 | 1,400,000 | 1,400,000 | ||||||
Allentown Neighborhood Improvement Zone Development Authority | ||||||||
5.00%, 05/01/2022(2) | 2,550,000 | 2,636,139 | ||||||
5.00%, 05/01/2025 | 1,000,000 | 1,058,330 | ||||||
5.00%, 05/01/2027(2) | 1,250,000 | 1,374,862 | ||||||
5.00%, 05/01/2032(2) | 2,025,000 | 2,101,950 | ||||||
5.00%, 05/01/2042(2) | 1,345,000 | 1,381,705 | ||||||
5.00%, 05/01/2042(2) | 1,750,000 | 1,803,602 | ||||||
Berks County Municipal Authority | ||||||||
5.00%, 02/01/2040(1) | 500,000 | 591,510 | ||||||
5.00%, 02/01/2040(1) | 875,000 | 1,002,522 | ||||||
5.00%, 02/01/2040(1) | 6,510,000 | 7,243,612 | ||||||
Butler County General Authority | ||||||||
0.11%, 09/01/2027(1) | 1,000,000 | 1,000,000 | ||||||
Capital Region Water Revenue | ||||||||
5.00%, 07/15/2023 | 1,750,000 | 1,975,820 | ||||||
5.00%, 07/15/2025 | 1,000,000 | 1,191,740 | ||||||
Capital Region Water Sewer Revenue | ||||||||
5.00%, 07/15/2024 | 430,000 | 498,219 | ||||||
5.00%, 07/15/2028 | 350,000 | 438,665 | ||||||
Chester County Industrial Development Authority | ||||||||
4.38%, 03/01/2028(2) | 175,000 | 172,916 | ||||||
5.00%, 03/01/2038(2) | 425,000 | 419,088 | ||||||
5.13%, 03/01/2048(2) | 1,049,000 | 1,015,044 | ||||||
City of Philadelphia PA | ||||||||
5.00%, 08/01/2022 | 2,940,000 | 3,196,397 | ||||||
5.00%, 08/01/2023 | 4,000,000 | 4,508,760 | ||||||
5.00%, 07/15/2026 | 2,475,000 | 2,850,854 | ||||||
5.00%, 08/01/2027 | 1,500,000 | 1,886,505 | ||||||
5.00%, 08/01/2028 | 6,000,000 | 7,184,760 | ||||||
5.00%, 02/01/2029 | 3,175,000 | 4,133,056 | ||||||
5.00%, 08/01/2031 | 500,000 | 679,585 | ||||||
5.00%, 08/01/2031 | 8,000,000 | 10,017,840 | ||||||
5.00%, 08/01/2033 | 2,000,000 | 2,441,540 | ||||||
City of Philadelphia PA Airport Revenue | ||||||||
5.00%, 06/15/2027 | 2,315,000 | 2,396,280 | ||||||
5.00%, 07/01/2030 | 1,000,000 | 1,190,340 | ||||||
5.00%, 07/01/2031 | 2,000,000 | 2,367,560 | ||||||
5.00%, 07/01/2032 | 1,745,000 | 2,053,499 | ||||||
5.00%, 07/01/2033 | 1,000,000 | 1,171,010 | ||||||
City of Philadelphia PA Water & Wastewater Revenue | ||||||||
5.00%, 11/01/2026 | 1,165,000 | 1,440,010 | ||||||
5.00%, 11/01/2027 | 1,540,000 | 1,949,979 | ||||||
5.00%, 11/01/2032 | 1,000,000 | 1,243,500 | ||||||
City of Reading PA | ||||||||
5.00%, 11/01/2027 | 2,330,000 | 2,905,813 | ||||||
Coatesville School District | ||||||||
5.00%, 08/01/2025 | 875,000 | 1,047,296 | ||||||
Commonwealth Financing Authority | ||||||||
5.00%, 06/01/2023 | 750,000 | 837,540 | ||||||
5.00%, 06/01/2027 | 750,000 | 944,025 | ||||||
5.00%, 06/01/2027 | 1,500,000 | 1,856,520 | ||||||
5.00%, 06/01/2027 | 2,165,000 | 2,725,085 | ||||||
5.00%, 06/01/2028 | 2,555,000 | 3,230,031 | ||||||
5.00%, 06/01/2030 | 1,750,000 | 2,350,862 | ||||||
Commonwealth of Pennsylvania | ||||||||
4.00%, 11/15/2028 | 6,325,000 | 6,594,572 | ||||||
4.00%, 04/01/2033 | 20,000,000 | 21,404,000 | ||||||
5.00%, 11/01/2020 | 2,800,000 | 2,840,964 | ||||||
5.00%, 08/15/2021 | 1,015,000 | 1,067,679 | ||||||
5.00%, 11/01/2021 | 2,000,000 | 2,116,440 | ||||||
5.00%, 02/01/2023 | 895,000 | 998,704 | ||||||
5.00%, 01/01/2024 | 5,800,000 | 6,691,576 | ||||||
5.00%, 01/01/2027 | 2,095,000 | 2,638,988 | ||||||
County of Lancaster PA | ||||||||
4.00%, 11/01/2029 | 625,000 | 760,600 | ||||||
4.00%, 11/01/2030 | 560,000 | 675,377 | ||||||
County of Luzerne PA | ||||||||
5.00%, 12/15/2029 | 750,000 | 938,610 | ||||||
Cumberland County Municipal Authority | ||||||||
4.00%, 01/01/2033 | 1,500,000 | 1,505,805 | ||||||
Dauphin County General Authority | ||||||||
5.00%, 06/01/2035 | 1,000,000 | 1,152,810 | ||||||
Delaware County Authority | ||||||||
5.00%, 08/01/2030 | 1,150,000 | 1,324,190 | ||||||
Delaware River Joint Toll Bridge Commission | ||||||||
5.00%, 07/01/2042 | 1,100,000 | 1,339,217 | ||||||
Doylestown Hospital Authority | ||||||||
4.00%, 07/01/2045 | 750,000 | 785,887 | ||||||
5.00%, 07/01/2046 | 3,700,000 | 4,003,659 | ||||||
5.00%, 07/01/2049 | 3,620,000 | 4,002,055 | ||||||
Easton Area School District | ||||||||
5.00%, 04/01/2029 | 1,000,000 | 1,230,550 | ||||||
5.00%, 04/01/2030 | 2,805,000 | 3,446,391 | ||||||
Franklin County Industrial Development Authority | ||||||||
5.00%, 12/01/2053 | 500,000 | 450,705 | ||||||
Geisinger Authority | ||||||||
5.00%, 04/01/2035 | 3,000,000 | 3,815,400 | ||||||
5.00%, 02/15/2039 | 1,500,000 | 1,783,335 |
General Authority of Southcentral Pennsylvania | ||||||||
5.00%, 06/01/2038 | 1,970,000 | 2,459,703 | ||||||
5.00%, 06/01/2044 | 1,085,000 | 1,329,537 | ||||||
Hospitals & Higher Education Facilities Authority of Philadelphia | ||||||||
5.00%, 07/01/2021 | 275,000 | 283,907 | ||||||
5.00%, 07/01/2023 | 325,000 | 354,777 | ||||||
5.00%, 07/01/2030 | 780,000 | 897,203 | ||||||
5.00%, 07/01/2034 | 2,000,000 | 2,257,020 | ||||||
Lancaster City Parking Authority | ||||||||
4.00%, 09/01/2035 | 1,100,000 | 1,250,722 | ||||||
Lancaster County Hospital Authority | ||||||||
5.00%, 07/01/2023 | 775,000 | 789,012 | ||||||
5.00%, 12/01/2032 | 250,000 | 255,260 | ||||||
5.00%, 12/01/2037 | 820,000 | 817,130 | ||||||
5.00%, 07/01/2045 | 1,970,000 | 1,931,427 | ||||||
5.00%, 12/01/2047 | 2,010,000 | 1,890,103 | ||||||
Lehigh County Industrial Development Authority | ||||||||
1.80%, 02/15/2027(1) | 1,000,000 | 1,010,630 | ||||||
1.80%, 09/01/2029(1) | 1,925,000 | 1,946,002 | ||||||
Luzerne County Industrial Development Authority | ||||||||
5.00%, 12/15/2027 | 1,000,000 | 1,202,290 | ||||||
Montgomery County Higher Education & Health Authority | ||||||||
5.00%, 09/01/2023 | 460,000 | 512,918 | ||||||
5.00%, 10/01/2023 | 50,000 | 54,999 | ||||||
5.00%, 09/01/2024 | 410,000 | 470,151 | ||||||
5.00%, 10/01/2028 | 1,000,000 | 1,157,250 | ||||||
5.00%, 09/01/2032 | 1,000,000 | 1,244,510 | ||||||
5.00%, 09/01/2033 | 305,000 | 377,434 | ||||||
5.00%, 10/01/2036 | 1,320,000 | 1,467,761 | ||||||
5.00%, 10/01/2040 | 1,595,000 | 1,749,524 | ||||||
Montgomery County Industrial Development Authority | ||||||||
5.25%, 01/15/2036 | 2,500,000 | 2,669,800 | ||||||
5.25%, 01/01/2040 | 1,510,000 | 1,502,707 | ||||||
5.38%, 01/01/2050 | 500,000 | 491,645 | ||||||
North Allegheny School District | ||||||||
4.00%, 05/01/2035 | 1,000,000 | 1,181,320 | ||||||
4.00%, 05/01/2036 | 705,000 | 829,242 | ||||||
Northampton County General Purpose Authority | ||||||||
1.16% (1 Month LIBOR USD + 1.04%), 08/15/2048(3) | 1,625,000 | 1,615,998 | ||||||
5.00%, 08/15/2036 | 455,000 | 523,505 | ||||||
Pennsylvania Economic Development Financing Authority | ||||||||
0.40%, 12/01/2030(1) | 1,800,000 | 1,800,000 | ||||||
1.70%, 08/01/2037(1) | 1,000,000 | 1,000,260 | ||||||
1.75%, 08/01/2038(1) | 10,000,000 | 10,081,500 | ||||||
2.15%, 11/01/2021(1) | 2,405,000 | 2,447,544 | ||||||
3.25%, 08/01/2039(2) | 625,000 | 548,331 | ||||||
4.00%, 04/15/2037 | 1,000,000 | 1,122,730 | ||||||
5.00%, 04/15/2026 | 2,500,000 | 2,993,450 | ||||||
5.00%, 04/15/2027 | 4,600,000 | 5,620,694 | ||||||
5.00%, 04/15/2031 | 2,095,000 | 2,659,728 | ||||||
Pennsylvania Higher Educational Facilities Authority | ||||||||
5.00%, 06/15/2022 | 2,000,000 | 2,157,140 | ||||||
5.00%, 06/15/2024 | 3,005,000 | 3,461,640 | ||||||
5.00%, 06/15/2025 | 1,855,000 | 2,196,969 | ||||||
5.00%, 08/15/2029 | 1,600,000 | 1,986,112 | ||||||
Pennsylvania Housing Finance Agency | ||||||||
3.50%, 04/01/2051 | 800,000 | 866,128 | ||||||
Pennsylvania State University | ||||||||
5.00%, 09/01/2020 | 2,440,000 | 2,458,959 | ||||||
5.00%, 09/01/2021 | 1,400,000 | 1,476,720 | ||||||
5.00%, 09/01/2022 | 2,295,000 | 2,525,372 | ||||||
Pennsylvania Turnpike Commission | ||||||||
0.12%, 12/01/2039(1) | 9,000,000 | 9,000,000 | ||||||
5.00%, 06/01/2028 | 2,085,000 | 2,467,493 | ||||||
5.00%, 06/01/2032 | 2,000,000 | 2,357,820 | ||||||
5.00%, 06/01/2033 | 3,155,000 | 3,701,004 | ||||||
5.00%, 12/01/2034 | 1,240,000 | 1,482,098 | ||||||
5.25%, 07/15/2029 | 410,000 | 556,112 |
Philadelphia Authority for Industrial Development | ||||||||
0.82%, 09/01/2050(1) | 1,500,000 | 1,500,000 | ||||||
5.00%, 07/01/2031 | 205,000 | 204,828 | ||||||
5.00%, 07/01/2032 | 600,000 | 595,728 | ||||||
5.00%, 07/01/2037 | 150,000 | 143,864 | ||||||
5.00%, 06/15/2039 | 500,000 | 507,975 | ||||||
5.00%, 06/15/2050 | 1,375,000 | 1,377,970 | ||||||
Philadelphia Gas Works Co. | ||||||||
5.00%, 08/01/2022 | 750,000 | 807,473 | ||||||
Pittsburgh Water & Sewer Authority | ||||||||
5.00%, 09/01/2038 | 1,000,000 | 1,271,350 | ||||||
Reading School District | ||||||||
5.00%, 02/01/2021 | 1,000,000 | 1,025,690 | ||||||
5.00%, 02/01/2022 | 1,920,000 | 2,053,325 | ||||||
5.00%, 03/01/2035 | 1,100,000 | 1,332,947 | ||||||
5.00%, 03/01/2036 | 1,250,000 | 1,503,588 | ||||||
Redevelopment Authority of the City of Philadelphia | ||||||||
5.00%, 04/15/2023 | 1,335,000 | 1,458,741 | ||||||
School District of Philadelphia | ||||||||
5.00%, 09/01/2026 | 1,625,000 | 1,985,133 | ||||||
5.00%, 09/01/2029 | 1,500,000 | 1,955,835 | ||||||
5.00%, 09/01/2030 | 15,000 | 19,019 | ||||||
5.00%, 09/01/2030 | 3,985,000 | 4,823,404 | ||||||
5.00%, 09/01/2031 | 1,000,000 | 1,204,500 | ||||||
5.00%, 09/01/2031 | 1,200,000 | 1,498,296 | ||||||
5.00%, 09/01/2032 | 1,200,000 | 1,488,420 | ||||||
5.00%, 09/01/2032 | 2,200,000 | 2,788,346 | ||||||
5.00%, 09/01/2033 | 960,000 | 1,237,853 | ||||||
5.00%, 09/01/2033 | 1,500,000 | 1,890,390 | ||||||
5.25%, 09/01/2023 | 1,750,000 | 1,763,003 | ||||||
Scranton School District | ||||||||
5.00%, 06/01/2033 | 530,000 | 658,106 | ||||||
5.00%, 06/01/2035 | 515,000 | 635,299 | ||||||
Southeastern Pennsylvania Transportation Authority | ||||||||
5.00%, 03/01/2026 | 875,000 | 1,079,348 | ||||||
St Mary Hospital Authority | ||||||||
5.00%, 11/15/2022 | 1,900,000 | 2,083,692 | ||||||
State Public School Building Authority | ||||||||
4.00%, 12/01/2020 | 1,590,000 | 1,612,705 | ||||||
5.00%, 12/01/2022 | 7,370,000 | 8,086,143 | ||||||
5.00%, 04/01/2023 | 2,500,000 | 2,696,825 | ||||||
5.00%, 12/01/2024 | 1,250,000 | 1,461,400 | ||||||
5.00%, 06/15/2025 | 3,000,000 | 3,466,920 | ||||||
5.00%, 12/01/2025 | 1,570,000 | 1,827,402 | ||||||
5.00%, 06/01/2026 | 180,000 | 212,495 | ||||||
5.00%, 12/01/2026 | 1,250,000 | 1,448,500 | ||||||
5.00%, 06/01/2029 | 605,000 | 784,685 | ||||||
5.00%, 12/01/2032 | 3,060,000 | 3,629,680 | ||||||
5.25%, 09/15/2030 | 1,000,000 | 1,252,650 | ||||||
Susquehanna Area Regional Airport Authority | ||||||||
5.00%, 01/01/2035 | 1,000,000 | 1,066,700 | ||||||
5.00%, 01/01/2038 | 2,125,000 | 2,245,700 | ||||||
Upper Merion Area School District | ||||||||
5.00%, 01/15/2030 | 600,000 | 732,882 | ||||||
Waverly Township Municipal Authority | ||||||||
4.00%, 02/15/2029 | 1,030,000 | 1,203,081 | ||||||
York County School of Technology Authority | ||||||||
5.00%, 02/15/2023 | 1,200,000 | 1,338,732 | ||||||
5.00%, 02/15/2028 | 400,000 | 465,128 | ||||||
|
| |||||||
Total Pennsylvania |
| 346,458,071 | ||||||
|
| |||||||
Puerto Rico – 1.27% | ||||||||
Commonwealth of Puerto Rico | ||||||||
5.50%, 07/01/2039(5) | 1,000,000 | 653,750 | ||||||
8.00%, 07/01/2035(5) | 8,750,000 | 5,250,000 | ||||||
Puerto Rico Commonwealth Aqueduct & Sewer Authority | ||||||||
4.00%, 07/01/2022 | 140,000 | 143,500 | ||||||
4.50%, 07/01/2027 | 1,195,000 | 1,192,012 | ||||||
5.00%, 07/01/2022 | 300,000 | 313,500 | ||||||
5.00%, 07/01/2030 | 260,000 | 267,150 | ||||||
5.00%, 07/01/2033 | 4,020,000 | 4,100,400 | ||||||
5.13%, 07/01/2037 | 1,770,000 | 1,805,400 | ||||||
5.13%, 07/01/2047 | 1,425,000 | 1,425,256 | ||||||
5.25%, 07/01/2042 | 3,040,000 | 3,100,800 | ||||||
5.75%, 07/01/2037 | 2,030,000 | 2,101,050 | ||||||
6.00%, 07/01/2044 | 2,005,000 | 2,035,075 | ||||||
6.13%, 07/01/2024 | 280,000 | 298,900 | ||||||
Puerto Rico Electric Power Authority | ||||||||
3.70%, 07/01/2050(5) | 20,000 | 13,300 | ||||||
5.00%, 07/01/2024(5) | 340,000 | 236,300 | ||||||
5.00%, 07/01/2026(5) | 30,000 | 20,850 | ||||||
5.00%, 07/01/2027(5) | 15,000 | 10,425 | ||||||
5.00%, 07/01/2027(5) | 25,000 | 17,375 | ||||||
5.00%, 07/01/2028(5) | 30,000 | 20,850 | ||||||
5.00%, 07/01/2028(5) | 50,000 | 34,750 | ||||||
5.00%, 07/01/2032(5) | 650,000 | 451,750 | ||||||
5.00%, 07/01/2037(5) | 3,105,000 | 2,157,975 | ||||||
5.05%, 07/01/2042(5) | 120,000 | 83,400 | ||||||
5.25%, 07/01/2023(5) | 3,495,000 | 2,433,394 | ||||||
5.25%, 07/01/2024(5) | 25,000 | 17,437 | ||||||
5.25%, 07/01/2026(5) | 555,000 | 387,113 | ||||||
5.25%, 07/01/2027(5) | 30,000 | 20,925 | ||||||
5.25%, 07/01/2027(5) | 650,000 | 453,375 | ||||||
5.25%, 07/01/2028(5) | 60,000 | 41,850 | ||||||
5.25%, 07/01/2033(5) | 95,000 | 66,263 | ||||||
5.25%, 07/01/2040(5) | 3,075,000 | 2,144,813 | ||||||
5.25%, 07/01/2050(5) | 270,000 | 187,312 | ||||||
5.75%, 07/01/2036(5) | 1,300,000 | 913,250 | ||||||
6.75%, 07/01/2036(5) | 1,560,000 | 1,107,600 | ||||||
7.25%, 07/01/2030(5) | 265,000 | 189,475 | ||||||
Puerto Rico Sales Tax Financing Corp. Sales Tax Revenue | ||||||||
0.00%, 07/01/2024 | 2,400,000 | 2,162,448 | ||||||
0.00%, 07/01/2024 | 6,650,000 | 5,991,783 | ||||||
0.00%, 07/01/2027 | 407,000 | 334,981 | ||||||
0.00%, 07/01/2027 | 2,061,000 | 1,696,306 | ||||||
0.00%, 07/01/2029 | 2,569,000 | 1,961,098 | ||||||
0.00%, 07/01/2031 | 4,300,000 | 3,027,415 | ||||||
0.00%, 07/01/2033 | 2,023,000 | 1,307,728 | ||||||
0.00%, 07/01/2046 | 8,706,000 | 2,455,527 | ||||||
4.33%, 07/01/2040 | 1,000,000 | 1,004,630 | ||||||
4.50%, 07/01/2034 | 2,582,000 | 2,689,334 | ||||||
4.75%, 07/01/2053 | 4,754,000 | 4,885,496 | ||||||
4.78%, 07/01/2058 | 500,000 | 515,525 | ||||||
5.00%, 07/01/2058 | 19,980,000 | 20,890,089 | ||||||
|
| |||||||
Total Puerto Rico |
| 82,618,935 | ||||||
|
| |||||||
Rhode Island – 0.18% | ||||||||
Providence Redevelopment Agency | ||||||||
5.00%, 04/01/2028 | 1,200,000 | 1,288,044 | ||||||
Rhode Island Health & Educational Building Corp. | ||||||||
5.00%, 09/01/2031 | 710,000 | 736,518 | ||||||
5.00%, 09/01/2036 | 100,000 | 101,444 | ||||||
5.00%, 05/15/2039 | 700,000 | 757,043 | ||||||
Rhode Island Housing & Mortgage Finance Corp. | ||||||||
3.50%, 10/01/2050 | 1,195,000 | 1,311,859 | ||||||
4.00%, 10/01/2049 | 610,000 | 672,513 | ||||||
Rhode Island Student Loan Authority | ||||||||
3.50%, 12/01/2034 | 585,000 | 596,039 | ||||||
5.00%, 12/01/2024 | 600,000 | 675,480 | ||||||
5.00%, 12/01/2025 | 750,000 | 859,687 | ||||||
5.00%, 12/01/2026 | 1,000,000 | 1,159,960 | ||||||
5.00%, 12/01/2027 | 800,000 | 941,088 | ||||||
5.00%, 12/01/2027 | 1,000,000 | 1,175,620 | ||||||
Tobacco Settlement Financing Corp. | ||||||||
5.00%, 06/01/2024 | 1,455,000 | 1,630,066 | ||||||
|
| |||||||
Total Rhode Island |
| 11,905,361 | ||||||
|
| |||||||
South Carolina – 1.30% | ||||||||
Aiken County Consolidated School District | ||||||||
4.00%, 04/01/2034 | 2,415,000 | 2,927,028 | ||||||
Connector 2000 Association, Inc. | ||||||||
0.00%, 01/01/2032 | 3,500,000 | 1,502,760 | ||||||
0.00%, 07/22/2051 | 19,902,537 | 1,544,636 | ||||||
Lancaster County School District | ||||||||
5.00%, 03/01/2023 | 445,000 | 500,069 | ||||||
Lexington County Health Services District, Inc. | ||||||||
5.00%, 11/01/2022 | 250,000 | 273,180 | ||||||
5.00%, 11/01/2023 | 300,000 | 338,979 | ||||||
5.00%, 11/01/2024 | 780,000 | 907,959 | ||||||
Patriots Energy Group Financing Agency | ||||||||
4.00%, 10/01/2048(1) | 31,075,000 | 34,133,091 | ||||||
Scago Educational Facilities Corp. for Sumter County School 17 | ||||||||
4.00%, 12/01/2021 | 1,895,000 | 1,965,077 | ||||||
Scago Educational Facilities Corp. for Union School District | ||||||||
5.00%, 12/01/2023 | 1,060,000 | 1,208,527 | ||||||
South Carolina Jobs-Economic Development Authority | ||||||||
5.00%, 11/01/2028 | 700,000 | 774,620 | ||||||
5.00%, 04/01/2031 | 510,000 | 613,785 | ||||||
5.00%, 05/01/2037 | 500,000 | 455,835 | ||||||
5.00%, 05/01/2042 | 500,000 | 437,350 | ||||||
5.00%, 11/15/2042 | 585,000 | 574,148 | ||||||
5.00%, 05/01/2043 | 4,675,000 | 5,353,202 | ||||||
5.00%, 04/01/2047 | 2,000,000 | 1,925,640 | ||||||
5.00%, 04/01/2052 | 1,750,000 | 1,667,050 | ||||||
5.00%, 11/15/2054 | 1,000,000 | 951,200 | ||||||
6.00%, 02/01/2035(2) | 525,000 | 439,509 | ||||||
6.25%, 02/01/2045(2) | 995,000 | 795,552 | ||||||
South Carolina Ports Authority | ||||||||
5.00%, 07/01/2026 | 1,940,000 | 2,303,692 | ||||||
5.00%, 07/01/2027 | 3,120,000 | 3,778,227 | ||||||
5.00%, 07/01/2028 | 1,100,000 | 1,358,533 | ||||||
South Carolina Public Service Authority | ||||||||
5.00%, 12/01/2022 | 1,185,000 | 1,298,357 | ||||||
5.00%, 12/01/2032 | 1,500,000 | 1,749,900 | ||||||
5.00%, 12/01/2035 | 1,500,000 | 1,753,275 | ||||||
5.00%, 12/01/2041 | 3,000,000 | 3,460,170 | ||||||
5.00%, 12/01/2049 | 1,900,000 | 2,078,068 | ||||||
5.75%, 12/01/2043 | 2,000,000 | 2,357,200 | ||||||
South Carolina State Housing Finance & Development Authority | ||||||||
4.00%, 01/01/2050 | 885,000 | 988,722 | ||||||
4.00%, 07/01/2050 | 775,000 | 870,922 | ||||||
South Carolina Transportation Infrastructure Bank | ||||||||
5.00%, 10/01/2025 | 305,000 | 359,433 | ||||||
Tender Option Bond Trust Receipts/Certificates | ||||||||
0.38%, 05/30/2022(1)(2) | 3,220,000 | 3,220,000 | ||||||
|
| |||||||
Total South Carolina |
| 84,865,696 | ||||||
|
| |||||||
South Dakota – 0.12% | ||||||||
City of Sioux Falls SD | ||||||||
5.00%, 11/01/2042 | 750,000 | 751,965 | ||||||
South Dakota Health & Educational Facilities Authority | ||||||||
5.00%, 11/01/2029 | 800,000 | 935,288 | ||||||
5.00%, 11/01/2030 | 1,000,000 | 1,164,600 | ||||||
5.00%, 07/01/2033(1) | 2,630,000 | 2,934,922 | ||||||
5.00%, 11/01/2042 | 145,000 | 154,100 | ||||||
5.00%, 11/01/2045 | 1,500,000 | 1,689,735 | ||||||
|
| |||||||
Total South Dakota |
| 7,630,610 | ||||||
|
| |||||||
Tennessee – 1.37% | ||||||||
Blount County Health & Educational Facilities Board | ||||||||
5.00%, 01/01/2037 | 1,240,000 | 907,928 | ||||||
Chattanooga Health Educational & Housing Facility Board | ||||||||
5.00%, 10/01/2021 | 1,000,000 | 1,021,050 | ||||||
5.00%, 10/01/2022 | 325,000 | 335,572 | ||||||
5.00%, 10/01/2030 | 500,000 | 516,490 | ||||||
5.00%, 10/01/2032 | 1,215,000 | 1,244,172 | ||||||
5.00%, 10/01/2035 | 2,260,000 | 2,295,233 | ||||||
Greeneville Health & Educational Facilities Board | ||||||||
5.00%, 07/01/2025 | 1,850,000 | 2,032,040 | ||||||
5.00%, 07/01/2035 | 1,275,000 | 1,493,433 | ||||||
Johnson City Health & Educational Facilities Board | ||||||||
5.00%, 08/15/2042 | 2,000,000 | 2,097,680 | ||||||
Knox County Health Educational & Housing Facility Board | ||||||||
5.00%, 04/01/2023 | 1,825,000 | 1,984,213 | ||||||
5.00%, 04/01/2024 | 1,000,000 | 1,115,180 | ||||||
5.00%, 04/01/2027 | 1,740,000 | 2,057,080 | ||||||
Memphis-Shelby County Industrial Development Board | ||||||||
4.75%, 07/01/2027 | 200,000 | 199,412 | ||||||
5.50%, 07/01/2037 | 600,000 | 589,608 | ||||||
Metropolitan Government Nashville & Davidson County Health & Educational Facs Bd | ||||||||
1.88%, 07/01/2021(1) | 2,400,000 | 2,400,000 | ||||||
Nashville Metropolitan Development & Housing Agency | ||||||||
4.50%, 06/01/2028(2) | 1,050,000 | 1,079,883 | ||||||
5.13%, 06/01/2036(2) | 3,290,000 | 3,388,305 | ||||||
Shelby County Health Educational & Housing Facilities Board | ||||||||
5.00%, 09/01/2037(2) | 1,590,000 | 1,177,411 | ||||||
Tennergy Corp. | ||||||||
5.00%, 02/01/2050(1) | 11,590,000 | 13,399,547 | ||||||
Tennessee Energy Acquisition Corp. | ||||||||
4.00%, 05/01/2048(1) | 8,885,000 | 9,563,281 | ||||||
4.00%, 11/01/2049(1) | 7,070,000 | 8,005,008 | ||||||
5.00%, 02/01/2027 | 2,725,000 | 3,199,831 | ||||||
Tennessee State School Bond Authority | ||||||||
5.00%, 11/01/2040 | 25,000,000 | 29,543,250 | ||||||
|
| |||||||
Total Tennessee |
| 89,645,607 | ||||||
|
| |||||||
Texas – 8.95% | ||||||||
Alamito Public Facility Corp. | ||||||||
1.51%, 05/01/2037(1) | 5,000,000 | 5,048,800 | ||||||
1.95%, 04/01/2036(1) | 7,000,000 | 7,004,060 | ||||||
2.50%, 11/01/2021(1) | 15,000,000 | 15,203,850 | ||||||
Alamo Community College District | ||||||||
4.00%, 02/15/2021 | 715,000 | 731,316 | ||||||
4.00%, 02/15/2022 | 665,000 | 704,381 | ||||||
4.00%, 02/15/2023 | 1,000,000 | 1,094,580 | ||||||
Atascosa County Industrial Development Corp. | ||||||||
5.00%, 12/15/2025 | 600,000 | 718,218 | ||||||
5.00%, 12/15/2026 | 600,000 | 731,334 | ||||||
5.00%, 12/15/2028 | 1,505,000 | 1,897,504 | ||||||
5.00%, 12/15/2030 | 1,550,000 | 2,006,661 | ||||||
5.00%, 12/15/2032 | 2,700,000 | 3,413,394 | ||||||
5.00%, 12/15/2034 | 2,600,000 | 3,254,290 | ||||||
5.00%, 12/15/2036 | 2,780,000 | 3,456,708 | ||||||
5.00%, 12/15/2037 | 1,435,000 | 1,784,078 | ||||||
Austin Community College District Public Facility Corp. | ||||||||
5.00%, 08/01/2024 | 430,000 | 507,004 | ||||||
5.00%, 08/01/2028 | 310,000 | 396,186 | ||||||
5.00%, 08/01/2031 | 300,000 | 377,985 | ||||||
5.00%, 08/01/2031 | 580,000 | 730,771 | ||||||
Austin Convention Enterprises, Inc. | ||||||||
5.00%, 01/01/2023 | 250,000 | 240,632 | ||||||
5.00%, 01/01/2025 | 150,000 | 143,112 | ||||||
5.00%, 01/01/2028 | 400,000 | 400,796 | ||||||
5.00%, 01/01/2029 | 425,000 | 425,922 | ||||||
5.00%, 01/01/2030 | 720,000 | 685,764 | ||||||
5.00%, 01/01/2032 | 1,700,000 | 1,704,165 | ||||||
5.00%, 01/01/2034 | 730,000 | 694,537 | ||||||
Austin-Bergstrom Landhost Enterprises, Inc. | ||||||||
5.00%, 10/01/2023 | 1,425,000 | 1,579,370 | ||||||
5.00%, 10/01/2025 | 1,780,000 | 2,049,047 | ||||||
5.00%, 10/01/2026 | 1,400,000 | 1,630,328 | ||||||
5.00%, 10/01/2028 | 1,925,000 | 2,242,952 | ||||||
5.00%, 10/01/2030 | 2,175,000 | 2,495,269 | ||||||
5.00%, 10/01/2033 | 2,000,000 | 2,242,680 | ||||||
5.00%, 10/01/2034 | 2,000,000 | 2,234,100 | ||||||
5.00%, 10/01/2036 | 1,000,000 | 1,109,440 | ||||||
Baytown Area Water Authority | ||||||||
5.00%, 05/01/2023 | 1,000,000 | 1,124,300 | ||||||
5.00%, 05/01/2024 | 1,000,000 | 1,164,580 | ||||||
5.00%, 05/01/2025 | 1,000,000 | 1,201,930 | ||||||
Board of Managers Joint Guadalupe County-City of Seguin Hospital | ||||||||
5.00%, 12/01/2045 | 290,000 | 299,355 | ||||||
5.25%, 12/01/2035 | 525,000 | 577,384 | ||||||
Central Texas Regional Mobility Authority | ||||||||
4.00%, 01/01/2022 | 5,000,000 | 5,080,350 | ||||||
5.00%, 01/01/2022 | 500,000 | 520,810 | ||||||
5.00%, 01/01/2024 | 175,000 | 190,388 | ||||||
5.00%, 01/01/2025 | 225,000 | 249,037 | ||||||
5.00%, 01/01/2028 | 300,000 | 336,435 | ||||||
5.00%, 01/01/2034 | 1,475,000 | 1,625,701 | ||||||
5.00%, 01/01/2040 | 2,250,000 | 2,463,975 | ||||||
5.00%, 01/01/2046 | 1,600,000 | 1,736,944 | ||||||
Central Texas Turnpike System | ||||||||
5.00%, 08/15/2037 | 2,500,000 | 2,716,875 | ||||||
5.00%, 08/15/2042 | 1,400,000 | 1,509,676 | ||||||
City of Arlington TX | ||||||||
4.00%, 08/15/2029 | 960,000 | 1,206,278 | ||||||
City of Arlington TX Special Tax Revenue | ||||||||
5.00%, 02/15/2045 | 530,000 | 542,619 | ||||||
City of Austin TX Airport System Revenue | ||||||||
5.00%, 11/15/2026 | 1,140,000 | 1,388,509 | ||||||
5.00%, 11/15/2044 | 255,000 | 281,747 | ||||||
City of Dallas TX | ||||||||
5.00%, 02/15/2023 | 1,000,000 | 1,070,490 | ||||||
5.00%, 02/15/2024 | 1,055,000 | 1,224,823 | ||||||
City of Dallas TX Waterworks & Sewer System Revenue | ||||||||
5.00%, 10/01/2027 | 530,000 | 645,625 | ||||||
5.00%, 10/01/2031 | 800,000 | 989,984 | ||||||
City of El Paso TX | ||||||||
5.00%, 08/15/2025 | 2,245,000 | 2,741,167 | ||||||
City of Fort Worth TX | ||||||||
5.00%, 03/01/2023 | 1,000,000 | 1,122,330 | ||||||
City of Garland TX Water & Sewer System Revenue | ||||||||
5.00%, 03/01/2028 | 700,000 | 875,875 | ||||||
City of Houston TX | ||||||||
5.00%, 03/01/2023 | 1,975,000 | 2,210,993 | ||||||
5.00%, 03/01/2025 | 750,000 | 897,682 | ||||||
5.00%, 03/01/2029 | 1,000,000 | 1,248,350 | ||||||
City of Houston TX Airport System Revenue | ||||||||
4.50%, 07/01/2020 | 1,500,000 | 1,500,000 | ||||||
4.75%, 07/01/2024 | 2,000,000 | 2,036,640 | ||||||
5.00%, 07/15/2020 | 1,000,000 | 1,001,640 | ||||||
5.00%, 07/01/2027 | 1,625,000 | 1,690,114 | ||||||
5.00%, 07/01/2027 | 3,000,000 | 3,731,040 | ||||||
5.00%, 07/15/2027 | 2,325,000 | 2,418,581 | ||||||
5.00%, 07/01/2029 | 1,000,000 | 1,246,340 | ||||||
5.00%, 07/01/2031 | 1,750,000 | 2,154,197 | ||||||
5.00%, 07/01/2032 | 1,750,000 | 2,138,447 | ||||||
5.00%, 07/15/2035 | 800,000 | 808,496 | ||||||
City of Houston TX Combined Utility System Revenue | ||||||||
5.00%, 11/15/2022 | 200,000 | 222,084 | ||||||
5.00%, 11/15/2023 | 225,000 | 259,810 | ||||||
5.00%, 05/15/2028 | 410,000 | 476,555 | ||||||
5.00%, 11/15/2030 | 2,005,000 | 2,642,610 | ||||||
5.00%, 11/15/2033 | 400,000 | 490,752 | ||||||
City of Houston TX Hotel Occupancy Tax & Special Revenue | ||||||||
5.00%, 09/01/2036 | 2,100,000 | 2,191,959 | ||||||
City of San Antonio TX Airport System | ||||||||
5.00%, 07/01/2027 | 2,000,000 | 2,394,300 | ||||||
5.00%, 07/01/2028 | 1,750,000 | 2,120,720 | ||||||
5.00%, 07/01/2030 | 1,000,000 | 1,217,900 | ||||||
City of San Antonio TX Electric & Gas Systems Revenue | ||||||||
1.75%, 02/01/2049(1) | 4,000,000 | 4,073,680 | ||||||
2.00%, 02/01/2033(1) | 1,115,000 | 1,130,019 | ||||||
3.00%, 12/01/2045(1) | 5,150,000 | 5,202,942 | ||||||
5.00%, 02/01/2030 | 1,000,000 | 1,276,630 |
City of Waco TX | ||||||||
5.00%, 02/01/2025 | 1,710,000 | 1,981,907 | ||||||
Clifton Higher Education Finance Corp. | ||||||||
6.13%, 08/15/2048 | 4,750,000 | 5,238,252 | ||||||
Coppell Independent School District | ||||||||
4.00%, 08/15/2034 | 2,310,000 | 2,761,397 | ||||||
4.00%, 08/15/2036 | 2,580,000 | 3,050,927 | ||||||
5.00%, 08/15/2033 | 2,985,000 | 3,833,068 | ||||||
County of Comal TX | ||||||||
4.00%, 02/01/2023 | 1,000,000 | 1,090,250 | ||||||
County of El Paso TX | ||||||||
5.00%, 02/15/2029 | 1,500,000 | 1,900,815 | ||||||
5.00%, 02/15/2031 | 1,280,000 | 1,565,197 | ||||||
County of Williamson TX | ||||||||
5.00%, 02/15/2021 | 1,000,000 | 1,029,440 | ||||||
Cypress-Fairbanks Independent School District | ||||||||
1.25%, 02/15/2036(1) | 390,000 | 394,025 | ||||||
1.25%, 02/15/2036(1) | 1,190,000 | 1,202,281 | ||||||
1.40%, 02/15/2040(1) | 1,000,000 | 1,001,080 | ||||||
1.40%, 02/15/2044(1) | 1,000,000 | 1,001,080 | ||||||
2.13%, 02/15/2040(1) | 10,000,000 | 10,178,200 | ||||||
5.00%, 02/15/2027 | 470,000 | 576,164 | ||||||
Dallas Area Rapid Transit | ||||||||
5.00%, 12/01/2024 | 550,000 | 656,128 | ||||||
Dallas County Utility & Reclamation District | ||||||||
5.00%, 02/15/2024 | 1,125,000 | 1,297,755 | ||||||
Dallas Independent School District | ||||||||
5.00%, 02/15/2036(1) | 85,000 | 91,434 | ||||||
5.00%, 02/15/2036 | 1,045,000 | 1,124,106 | ||||||
5.00%, 02/15/2036(1) | 2,180,000 | 2,330,311 | ||||||
5.00%, 02/15/2036(1) | 2,175,000 | 2,339,647 | ||||||
Dallas/Fort Worth International Airport | ||||||||
5.00%, 11/01/2032 | 1,600,000 | 1,765,216 | ||||||
5.00%, 11/01/2037 | 10,100,000 | 10,513,999 | ||||||
5.00%, 11/01/2038 | 3,110,000 | 3,237,075 | ||||||
5.00%, 11/01/2042 | 8,710,000 | 9,058,835 | ||||||
5.00%, 11/01/2044 | 300,000 | 321,831 | ||||||
Denton Independent School District | ||||||||
0.00%, 08/15/2025 | 500,000 | 483,200 | ||||||
2.00%, 08/01/2044(1) | 5,275,000 | 5,531,840 | ||||||
El Paso County Hospital District | ||||||||
5.00%, 08/15/2027 | 1,260,000 | 1,335,398 | ||||||
5.00%, 08/15/2029 | 50,000 | 52,797 | ||||||
Forney Independent School District | ||||||||
5.00%, 02/15/2030 | 710,000 | 945,741 | ||||||
5.00%, 02/15/2031 | 1,000,000 | 1,324,130 | ||||||
5.00%, 02/15/2032 | 1,345,000 | 1,769,025 | ||||||
Fort Bend Independent School District | ||||||||
1.35%, 08/01/2042(1) | 490,000 | 490,323 | ||||||
1.50%, 08/01/2042(1) | 960,000 | 970,022 | ||||||
Fort Worth Independent School District | ||||||||
5.00%, 02/15/2022 | 450,000 | 484,524 | ||||||
5.00%, 02/15/2026 | 1,365,000 | 1,683,441 | ||||||
Grand Parkway Transportation Corp. | ||||||||
5.00%, 02/01/2023 | 1,580,000 | 1,707,885 | ||||||
5.00%, 10/01/2031 | 2,630,000 | 3,362,534 | ||||||
5.00%, 10/01/2033 | 1,205,000 | 1,522,831 | ||||||
5.00%, 10/01/2034 | 1,500,000 | 1,889,055 | ||||||
5.00%, 10/01/2052(1) | 9,610,000 | 10,843,347 | ||||||
Gregg County Health Facilities Development Corp. | ||||||||
4.50%, 07/01/2032 | 635,000 | 685,546 | ||||||
5.00%, 07/01/2042 | 25,000 | 27,238 | ||||||
Gulf Coast Industrial Development Authority | ||||||||
4.88%, 05/01/2025 | 2,250,000 | 2,265,300 | ||||||
Harlandale Independent School District | ||||||||
5.00%, 08/01/2030 | 1,305,000 | 1,623,472 |
Harris County Cultural Education Facilities Finance Corp. | ||||||||
5.00%, 06/01/2021 | 1,100,000 | 1,141,668 | ||||||
5.00%, 01/01/2043 | 180,000 | 179,518 | ||||||
5.00%, 07/01/2049(1) | 1,290,000 | 1,403,752 | ||||||
5.00%, 07/01/2049(1) | 1,480,000 | 1,707,594 | ||||||
5.00%, 07/01/2049(1) | 5,000,000 | 6,008,950 | ||||||
Hays Consolidated Independent School District | ||||||||
2.70%, 08/15/2042(1) | 2,900,000 | 3,024,410 | ||||||
Houston Independent School District | ||||||||
2.25%, 06/01/2039(1) | 5,000,000 | 5,141,250 | ||||||
2.40%, 06/01/2030(1) | 7,000,000 | 7,119,140 | ||||||
4.00%, 06/01/2039(1) | 4,415,000 | 4,841,180 | ||||||
5.00%, 02/15/2030 | 1,000,000 | 1,221,580 | ||||||
Irving Hospital Authority | ||||||||
5.00%, 10/15/2035 | 625,000 | 728,550 | ||||||
Love Field Airport Modernization Corp. | ||||||||
5.00%, 11/01/2028 | 1,250,000 | 1,284,712 | ||||||
5.00%, 11/01/2035 | 1,000,000 | 1,137,900 | ||||||
5.25%, 11/01/2040 | 3,015,000 | 3,031,944 | ||||||
Lower Colorado River Authority | ||||||||
5.00%, 05/15/2021 | 800,000 | 831,544 | ||||||
5.00%, 05/15/2022 | 565,000 | 612,025 | ||||||
5.00%, 05/15/2022 | 1,025,000 | 1,110,311 | ||||||
5.00%, 05/15/2026 | 1,000,000 | 1,233,040 | ||||||
5.00%, 05/15/2036 | 1,425,000 | 1,798,350 | ||||||
Midlothian Independent School District | ||||||||
2.00%, 08/01/2051(1) | 1,065,000 | 1,116,855 | ||||||
2.50%, 08/01/2052(1) | 1,135,000 | 1,136,952 | ||||||
2.50%, 08/01/2052(1) | 7,145,000 | 7,156,289 | ||||||
Mission Economic Development Corp. | ||||||||
1.50%, 05/01/2050(1) | 2,100,000 | 2,099,853 | ||||||
2.50%, 08/01/2020 | 3,000,000 | 3,003,720 | ||||||
4.63%, 10/01/2031(2) | 3,955,000 | 4,145,868 | ||||||
Montgomery County Toll Road Authority | ||||||||
5.00%, 09/15/2032 | 50,000 | 54,525 | ||||||
5.00%, 09/15/2033 | 270,000 | 293,053 | ||||||
5.00%, 09/15/2034 | 55,000 | 59,527 | ||||||
5.00%, 09/15/2035 | 1,145,000 | 1,235,936 | ||||||
5.00%, 09/15/2036 | 75,000 | 80,757 | ||||||
5.00%, 09/15/2037 | 1,245,000 | 1,337,952 | ||||||
5.00%, 09/15/2038 | 125,000 | 134,030 | ||||||
5.00%, 09/15/2043 | 380,000 | 404,347 | ||||||
5.00%, 09/15/2048 | 1,070,000 | 1,132,563 | ||||||
New Hope Cultural Education Facilities Finance Corp. | ||||||||
5.00%, 08/15/2024 | 730,000 | 854,348 | ||||||
5.00%, 08/15/2026 | 200,000 | 246,584 | ||||||
5.00%, 08/15/2027 | 375,000 | 474,124 | ||||||
5.00%, 04/01/2029 | 1,000,000 | 998,450 | ||||||
5.00%, 08/15/2030 | 3,500,000 | 4,360,405 | ||||||
5.00%, 04/01/2031 | 335,000 | 327,891 | ||||||
5.00%, 10/01/2031 | 160,000 | 153,602 | ||||||
5.00%, 11/01/2031 | 1,750,000 | 1,870,033 | ||||||
5.00%, 10/01/2034 | 185,000 | 170,934 | ||||||
5.00%, 07/01/2035 | 2,100,000 | 1,777,440 | ||||||
5.00%, 04/01/2036 | 820,000 | 776,278 | ||||||
5.00%, 10/01/2039 | 250,000 | 221,405 | ||||||
5.00%, 11/01/2040 | 1,100,000 | 1,147,795 | ||||||
5.00%, 07/01/2047 | 1,075,000 | 880,403 | ||||||
5.00%, 04/01/2048 | 1,250,000 | 1,130,262 | ||||||
5.00%, 07/01/2058 | 275,000 | 309,260 | ||||||
5.25%, 10/01/2049 | 575,000 | 498,151 | ||||||
5.50%, 11/15/2052 | 250,000 | 187,073 | ||||||
Newark Higher Education Finance Corp. | ||||||||
5.00%, 04/01/2029 | 505,000 | 579,548 | ||||||
North East Independent School District | ||||||||
1.42%, 08/01/2040(1) | 460,000 | 460,327 | ||||||
North Texas Municipal Water District Upper East Fork Wastewater Interceptor Sys | ||||||||
5.00%, 06/01/2027 | 1,025,000 | 1,316,910 | ||||||
5.00%, 06/01/2028 | 1,050,000 | 1,341,690 | ||||||
5.00%, 06/01/2029 | 600,000 | 763,710 |
North Texas Tollway Authority | ||||||||
5.00%, 01/01/2023 | 235,000 | 259,952 | ||||||
5.00%, 01/01/2025 | 860,000 | 1,012,770 | ||||||
5.00%, 01/01/2030 | 75,000 | 89,308 | ||||||
5.00%, 01/01/2030 | 6,250,000 | 7,043,750 | ||||||
5.00%, 01/01/2031 | 105,000 | 124,655 | ||||||
5.00%, 01/01/2031 | 500,000 | 594,470 | ||||||
5.00%, 01/01/2031 | 1,100,000 | 1,344,508 | ||||||
5.00%, 01/01/2031 | 1,900,000 | 2,133,662 | ||||||
5.00%, 01/01/2032 | 1,100,000 | 1,336,764 | ||||||
5.00%, 01/01/2033 | 500,000 | 591,110 | ||||||
5.00%, 01/01/2033 | 1,250,000 | 1,510,300 | ||||||
5.00%, 01/01/2033 | 3,150,000 | 3,606,309 | ||||||
5.00%, 01/01/2034 | 1,400,000 | 1,685,110 | ||||||
5.00%, 01/01/2035 | 1,500,000 | 1,799,955 | ||||||
5.00%, 01/01/2036 | 550,000 | 641,394 | ||||||
5.00%, 01/01/2039 | 170,000 | 196,714 | ||||||
5.00%, 01/01/2040 | 2,000,000 | 2,145,780 | ||||||
5.50%, 09/01/2041 | 5,840,000 | 6,188,298 | ||||||
Northside Independent School District | ||||||||
1.60%, 08/01/2049(1) | 15,135,000 | 15,592,228 | ||||||
Old Spanish Trail-Alemda Corridors Redevelopment Authority | ||||||||
4.00%, 09/01/2033 | 1,360,000 | 1,591,513 | ||||||
Pasadena Independent School District | ||||||||
1.50%, 02/15/2044(1) | 4,295,000 | 4,422,046 | ||||||
Permanent University Fund - University of Texas System | ||||||||
5.00%, 07/01/2029 | 235,000 | 288,681 | ||||||
Pflugerville Independent School District | ||||||||
2.50%, 02/15/2039(1) | 7,500,000 | 7,912,425 | ||||||
Plano Independent School District | ||||||||
5.00%, 02/15/2022 | 1,000,000 | 1,076,720 | ||||||
Port Beaumont Navigation District | ||||||||
4.00%, 01/01/2050(2) | 1,035,000 | 986,707 | ||||||
Port of Port Arthur Navigation District | ||||||||
1.95%, 11/01/2040(1) | 15,000,000 | 15,000,000 | ||||||
Rockwall Independent School District | ||||||||
0.00%, 02/15/2024 | 1,005,000 | 979,684 | ||||||
San Antonio Water System | ||||||||
5.00%, 05/15/2032 | 3,000,000 | 3,359,580 | ||||||
Southwest Houston Redevelopment Authority | ||||||||
4.00%, 09/01/2031 | 400,000 | 468,084 | ||||||
4.00%, 09/01/2032 | 400,000 | 463,516 | ||||||
4.00%, 09/01/2033 | 425,000 | 487,739 | ||||||
4.00%, 09/01/2034 | 355,000 | 406,003 | ||||||
4.00%, 09/01/2035 | 225,000 | 256,064 | ||||||
4.00%, 09/01/2036 | 700,000 | 793,660 | ||||||
5.00%, 09/01/2028 | 350,000 | 433,745 | ||||||
5.00%, 09/01/2029 | 345,000 | 433,976 | ||||||
5.00%, 09/01/2030 | 300,000 | 381,858 | ||||||
State of Texas | ||||||||
1.85%, 08/01/2029(1) | 1,155,000 | 1,155,959 | ||||||
2.25%, 08/01/2029(1) | 4,295,000 | 4,301,485 | ||||||
4.00%, 08/27/2020 | 10,100,000 | 10,159,186 | ||||||
4.00%, 08/01/2021 | 1,240,000 | 1,287,393 | ||||||
4.00%, 10/01/2032 | 1,200,000 | 1,333,176 | ||||||
5.00%, 08/01/2025 | 2,035,000 | 2,316,563 | ||||||
5.00%, 08/01/2026 | 1,000,000 | 1,185,760 | ||||||
5.00%, 04/01/2027 | 5,000,000 | 6,187,550 | ||||||
5.00%, 04/01/2039 | 10,000,000 | 11,729,500 | ||||||
5.50%, 08/01/2026 | 1,000,000 | 1,266,470 | ||||||
5.50%, 08/01/2032 | 1,000,000 | 1,262,420 | ||||||
Tarrant County Cultural Education Facilities Finance Corp. | ||||||||
0.15%, 10/01/2041(1) | 1,000,000 | 1,000,000 | ||||||
5.00%, 11/15/2022 | 300,000 | 321,153 | ||||||
5.00%, 07/01/2026 | 1,775,000 | 2,143,739 | ||||||
5.00%, 11/15/2035 | 1,015,000 | 840,684 | ||||||
5.00%, 11/15/2035 | 1,750,000 | 1,792,910 |
5.00%, 11/15/2037 | 4,400,000 | 5,146,900 | ||||||
5.00%, 11/15/2040 | 1,800,000 | 1,826,118 | ||||||
5.00%, 11/15/2040 | 1,650,000 | 1,827,870 | ||||||
5.00%, 11/15/2045 | 1,175,000 | 879,934 | ||||||
5.00%, 11/15/2046 | 1,615,000 | 1,773,448 | ||||||
5.75%, 12/01/2054 | 530,708 | 501,174 | ||||||
Texas A&M University | ||||||||
3.00%, 05/15/2028 | 2,300,000 | 2,565,535 | ||||||
Texas Department of Housing & Community Affairs | ||||||||
2.95%, 07/01/2036 | 1,660,155 | 1,723,872 | ||||||
3.50%, 03/01/2051 | 6,765,000 | 7,488,043 | ||||||
4.00%, 03/01/2050 | 1,770,000 | 1,989,161 | ||||||
Texas Municipal Gas Acquisition & Supply Corp. I | ||||||||
5.25%, 12/15/2022 | 450,000 | 491,040 | ||||||
5.25%, 12/15/2025 | 3,000,000 | 3,547,110 | ||||||
6.25%, 12/15/2026 | 7,385,000 | 8,583,142 | ||||||
Texas Municipal Gas Acquisition & Supply Corp. III | ||||||||
5.00%, 12/15/2029 | 5,000,000 | 5,337,350 | ||||||
5.00%, 12/15/2032 | 3,000,000 | 3,180,840 | ||||||
Texas Municipal Power Agency | ||||||||
5.00%, 09/01/2033 | 920,000 | 926,256 | ||||||
5.00%, 09/01/2034 | 945,000 | 951,379 | ||||||
5.00%, 09/01/2035 | 1,200,000 | 1,208,016 | ||||||
Texas Private Activity Bond Surface Transportation Corp. | ||||||||
5.00%, 12/31/2050 | 2,410,000 | 2,506,521 | ||||||
5.00%, 12/31/2055 | 2,755,000 | 2,859,167 | ||||||
Texas Public Finance Authority | ||||||||
5.00%, 02/01/2028 | 2,300,000 | 2,991,886 | ||||||
Texas State University System | ||||||||
5.00%, 03/15/2026 | 800,000 | 990,856 | ||||||
5.00%, 03/15/2029 | 610,000 | 767,612 | ||||||
5.00%, 03/15/2032 | 1,325,000 | 1,638,137 | ||||||
Texas Transportation Commission | ||||||||
0.00%, 08/01/2034 | 1,060,000 | 617,418 | ||||||
0.00%, 08/01/2037 | 725,000 | 359,114 | ||||||
0.00%, 08/01/2038 | 800,000 | 374,856 | ||||||
0.00%, 08/01/2039 | 710,000 | 315,240 | ||||||
0.00%, 08/01/2040 | 1,500,000 | 629,415 | ||||||
5.00%, 08/01/2057 | 2,930,000 | 3,275,799 | ||||||
Texas Transportation Commission State Highway Fund | ||||||||
5.00%, 10/01/2023 | 5,020,000 | 5,765,169 | ||||||
Texas Water Development Board | ||||||||
4.00%, 08/01/2034 | 5,090,000 | 6,358,021 | ||||||
4.00%, 08/01/2035 | 5,400,000 | 6,705,882 | ||||||
Travis County Health Facilities Development Corp. | ||||||||
7.00%, 11/01/2030 | 55,000 | 55,716 | ||||||
University of Houston | ||||||||
5.00%, 02/15/2030 | 860,000 | 1,042,045 | ||||||
University of Texas Revenues | ||||||||
4.00%, 08/15/2036 | 10,785,000 | 11,824,458 | ||||||
University of Texas System | ||||||||
5.00%, 08/15/2021 | 505,000 | 531,856 | ||||||
Uptown Development Authority | ||||||||
5.00%, 09/01/2033 | 715,000 | 822,994 | ||||||
Viridian Municipal Management District | ||||||||
4.00%, 12/01/2029 | 520,000 | 577,502 | ||||||
4.00%, 12/01/2031 | 560,000 | 616,370 | ||||||
4.00%, 12/01/2032 | 580,000 | 633,459 | ||||||
4.00%, 12/01/2033 | 605,000 | 658,349 | ||||||
|
| |||||||
Total Texas |
| 583,731,255 | ||||||
|
| |||||||
Utah – 0.28% | ||||||||
Salt Lake City Corp. Airport Revenue | ||||||||
5.00%, 07/01/2025 | 1,000,000 | 1,185,220 | ||||||
5.00%, 07/01/2026 | 1,700,000 | 2,061,896 | ||||||
5.00%, 07/01/2026 | 3,000,000 | 3,638,640 | ||||||
5.00%, 07/01/2030 | 1,000,000 | 1,245,400 | ||||||
5.25%, 07/01/2048 | 3,000,000 | 3,592,830 | ||||||
State of Utah | ||||||||
5.00%, 07/01/2023 | 1,760,000 | 2,006,998 | ||||||
Utah Charter School Finance Authority | ||||||||
4.50%, 06/15/2027(2) | 1,000,000 | 1,068,870 | ||||||
Utah Transit Authority | ||||||||
4.00%, 12/15/2031 | 2,880,000 | 3,210,077 | ||||||
|
| |||||||
Total Utah |
| 18,009,931 | ||||||
|
| |||||||
Vermont – 0.07% | ||||||||
Vermont Educational & Health Buildings Financing Agency | ||||||||
5.00%, 10/15/2027 | 1,000,000 | 1,100,290 | ||||||
5.00%, 10/15/2029 | 890,000 | 965,383 | ||||||
Vermont Student Assistance Corp. | ||||||||
5.00%, 06/15/2025 | 800,000 | 905,800 | ||||||
5.00%, 06/15/2026 | 500,000 | 573,390 | ||||||
5.00%, 06/15/2027 | 700,000 | 796,782 | ||||||
|
| |||||||
Total Vermont |
| 4,341,645 | ||||||
|
| |||||||
Virgin Islands – 0.05% | ||||||||
Virgin Islands Public Finance Authority | ||||||||
5.00%, 10/01/2032 | 3,000,000 | 3,243,930 | ||||||
|
| |||||||
Total Virgin Islands |
| 3,243,930 | ||||||
|
| |||||||
Virginia – 1.49% | ||||||||
Arlington County Industrial Development Authority | ||||||||
5.00%, 07/01/2027 | 905,000 | 1,120,082 | ||||||
Chesapeake Bay Bridge & Tunnel District | ||||||||
5.00%, 11/01/2023 | 7,700,000 | 8,305,682 | ||||||
5.00%, 07/01/2046 | 3,985,000 | 4,321,015 | ||||||
5.00%, 07/01/2051 | 1,345,000 | 1,453,125 | ||||||
City of Norfolk VA Water Revenue | ||||||||
5.00%, 11/01/2022 | 1,645,000 | 1,825,785 | ||||||
County of Botetourt VA | ||||||||
4.75%, 07/01/2023 | 80,000 | 80,367 | ||||||
6.00%, 07/01/2034 | 1,500,000 | 1,540,095 | ||||||
County of Loudoun VA | ||||||||
5.00%, 12/01/2023 | 825,000 | 956,340 | ||||||
Fairfax County Economic Development Authority | ||||||||
5.00%, 12/01/2042 | 1,290,000 | 1,319,167 | ||||||
Fairfax County Industrial Development Authority | ||||||||
5.00%, 05/15/2035 | 1,175,000 | 1,245,923 | ||||||
5.00%, 05/15/2044 | 975,000 | 1,079,539 | ||||||
Franklin County Industrial Development Authority | ||||||||
3.00%, 10/15/2023 | 2,000,000 | 2,013,640 | ||||||
Fredericksburg Economic Development Authority | ||||||||
5.00%, 06/15/2031 | 500,000 | 556,675 | ||||||
Hanover County Economic Development Authority | ||||||||
5.00%, 07/01/2042 | 1,120,000 | 1,121,053 | ||||||
5.00%, 07/01/2047 | 2,080,000 | 2,079,896 | ||||||
Norfolk Redevelopment & Housing Authority | ||||||||
4.00%, 01/01/2025 | 3,870,000 | 3,847,980 | ||||||
5.00%, 01/01/2046 | 240,000 | 241,246 | ||||||
5.00%, 01/01/2049 | 500,000 | 503,105 | ||||||
Salem Economic Development Authority | ||||||||
5.00%, 04/01/2030 | 710,000 | 835,500 | ||||||
5.00%, 04/01/2031 | 400,000 | 466,212 | ||||||
5.00%, 04/01/2032 | 700,000 | �� | 808,563 | |||||
5.00%, 04/01/2033 | 350,000 | 401,236 | ||||||
5.00%, 04/01/2034 | 925,000 | 1,054,750 | ||||||
Stafford County Economic Development Authority | ||||||||
4.00%, 06/15/2037 | 50,000 | 54,325 | ||||||
5.00%, 06/15/2030 | 150,000 | 176,320 | ||||||
5.00%, 06/15/2033 | 150,000 | 173,465 | ||||||
5.00%, 06/15/2034 | 500,000 | 577,040 | ||||||
Tender Option Bond Trust Receipts/Certificates | ||||||||
0.48%, 10/01/2059(1)(2) | 3,400,000 | 3,400,000 | ||||||
Tobacco Settlement Financing Corp. | ||||||||
0.00%, 06/01/2047 | 3,000,000 | 550,530 | ||||||
Virginia College Building Authority | ||||||||
5.00%, 02/01/2023 | 700,000 | 784,189 | ||||||
5.00%, 09/01/2023 | 1,000,000 | 1,144,890 | ||||||
5.00%, 02/01/2024 | 2,475,000 | 2,875,257 | ||||||
5.00%, 02/01/2026 | 1,000,000 | 1,236,380 | ||||||
5.00%, 02/01/2030 | 1,500,000 | 1,939,395 | ||||||
5.00%, 07/01/2030(2) | 500,000 | 507,945 | ||||||
5.00%, 07/01/2045(2) | 500,000 | 492,980 | ||||||
5.00%, 07/01/2045(2) | 1,000,000 | 985,960 | ||||||
5.25%, 07/01/2035(2) | 1,000,000 | 1,022,010 | ||||||
Virginia Commonwealth Transportation Board | ||||||||
5.00%, 09/15/2022 | 1,000,000 | 1,080,480 | ||||||
5.00%, 09/15/2023 | 2,500,000 | 2,872,400 | ||||||
Virginia Port Authority | ||||||||
5.00%, 07/01/2023 | 1,000,000 | 1,127,830 | ||||||
Virginia Public Building Authority | ||||||||
5.00%, 08/01/2022 | 1,050,000 | 1,153,982 | ||||||
5.00%, 08/01/2022 | 1,490,000 | 1,637,555 | ||||||
Virginia Public School Authority | ||||||||
5.00%, 08/01/2022 | 2,505,000 | 2,748,661 | ||||||
5.00%, 08/01/2022 | 3,275,000 | 3,597,882 | ||||||
Virginia Small Business Financing Authority | ||||||||
5.00%, 07/01/2034 | 1,000,000 | 1,029,070 | ||||||
5.00%, 01/01/2040 | 3,540,000 | 3,642,908 | ||||||
5.00%, 01/01/2040 | 4,135,000 | 4,255,204 | ||||||
5.00%, 01/01/2048(1)(2) | 500,000 | 510,590 | ||||||
5.00%, 12/31/2049 | 3,105,000 | 3,436,366 | ||||||
5.00%, 12/31/2052 | 880,000 | 971,027 | ||||||
5.00%, 12/31/2056 | 4,455,000 | 4,898,317 | ||||||
5.50%, 01/01/2042 | 6,590,000 | 6,898,939 | ||||||
Wise County Industrial Development Authority | ||||||||
1.20%, 11/01/2040(1) | 3,285,000 | 3,293,114 | ||||||
York County Economic Development Authority | ||||||||
1.90%, 05/01/2033(1) | 600,000 | 619,092 | ||||||
|
| |||||||
Total Virginia |
| 96,871,079 | ||||||
|
| |||||||
Washington – 3.26% | ||||||||
Adams County Public Hospital District No 2 | ||||||||
5.13%, 12/01/2044 | 1,000,000 | 1,102,240 | ||||||
Auburn School District No 408 of King & Pierce Counties | ||||||||
5.00%, 12/01/2033 | 2,000,000 | 2,521,060 | ||||||
Central Puget Sound Regional Transit Authority | ||||||||
5.00%, 11/01/2035 | 960,000 | 1,145,338 | ||||||
Chelan County Public Utility District No 1 | ||||||||
4.00%, 07/01/2035 | 750,000 | 905,505 | ||||||
City of Kent WA | ||||||||
5.00%, 12/01/2027 | 695,000 | 866,526 | ||||||
City of Seattle WA Municipal Light & Power Revenue | ||||||||
0.62% (SIFMA Municipal Swap Index Yield + 0.49%), 11/01/2046(3) | 5,000,000 | 4,942,750 | ||||||
4.00%, 01/01/2032 | 3,385,000 | 4,007,874 | ||||||
City of Tacoma WA Electric System Revenue | ||||||||
5.00%, 01/01/2039 | 675,000 | 816,554 | ||||||
City of Tacoma WA Solid Waste Utility Revenue | ||||||||
5.00%, 12/01/2031 | 460,000 | 564,259 | ||||||
Clark County Public Utility District No 1 | ||||||||
5.00%, 01/01/2022 | 425,000 | 454,550 | ||||||
5.00%, 01/01/2023 | 375,000 | 418,087 | ||||||
5.00%, 01/01/2023 | 750,000 | 836,175 | ||||||
5.00%, 01/01/2024 | 395,000 | 457,509 | ||||||
East Pierce Fire & Rescue | ||||||||
5.00%, 12/01/2029 | 635,000 | 837,838 | ||||||
5.00%, 12/01/2031 | 925,000 | 1,205,737 | ||||||
Energy Northwest | ||||||||
4.00%, 07/01/2044 | 8,000,000 | 8,347,920 | ||||||
5.00%, 07/01/2028 | 15,000,000 | 19,765,500 | ||||||
5.00%, 07/01/2034 | 6,890,000 | 9,254,579 | ||||||
King & Snohomish Counties School District No 417 Northshore | ||||||||
4.00%, 12/01/2033 | 5,500,000 | 6,077,720 | ||||||
King County Housing Authority | ||||||||
4.00%, 06/01/2026 | 450,000 | 517,878 | ||||||
4.00%, 06/01/2027 | 620,000 | 722,610 | ||||||
4.00%, 06/01/2028 | 1,115,000 | 1,315,555 | ||||||
4.00%, 06/01/2029 | 840,000 | 1,003,926 | ||||||
4.00%, 06/01/2030 | 400,000 | 482,888 | ||||||
4.00%, 06/01/2031 | 650,000 | 776,080 | ||||||
4.00%, 11/01/2031 | 1,640,000 | 1,997,454 | ||||||
4.00%, 06/01/2032 | 625,000 | 740,200 | ||||||
4.00%, 11/01/2032 | 1,705,000 | 2,061,294 | ||||||
4.00%, 06/01/2033 | 500,000 | 588,050 | ||||||
4.00%, 06/01/2034 | 525,000 | 615,363 | ||||||
4.00%, 06/01/2035 | 735,000 | 857,429 | ||||||
5.00%, 11/01/2027 | 1,000,000 | 1,274,270 | ||||||
5.00%, 11/01/2028 | 1,430,000 | 1,866,193 | ||||||
5.00%, 11/01/2029 | 750,000 | 999,255 | ||||||
King County Public Hospital District No 1 | ||||||||
5.00%, 12/01/2032 | 4,500,000 | 5,223,870 | ||||||
King County School District No 414 Lake Washington | ||||||||
5.00%, 12/01/2035 | 1,600,000 | 2,029,248 | ||||||
5.00%, 12/01/2036 | 3,205,000 | 4,050,864 | ||||||
5.00%, 12/01/2037 | 1,425,000 | 1,796,027 | ||||||
5.00%, 12/01/2038 | 865,000 | 1,087,400 | ||||||
Pierce County School District No 10 Tacoma | ||||||||
5.00%, 12/01/2034 | 2,800,000 | 3,285,436 | ||||||
Port of Seattle WA | ||||||||
5.00%, 07/01/2024 | 595,000 | 658,326 | ||||||
5.00%, 04/01/2029 | 5,050,000 | 6,316,641 | ||||||
5.00%, 04/01/2030 | 2,000,000 | 2,247,320 | ||||||
5.00%, 04/01/2034 | 1,000,000 | 1,109,430 | ||||||
5.00%, 04/01/2036 | 3,130,000 | 3,775,469 | ||||||
5.00%, 01/01/2037 | 3,500,000 | 4,265,240 | ||||||
Skagit County Public Hospital District No 1 | ||||||||
5.00%, 12/01/2020 | 1,750,000 | 1,775,515 | ||||||
Snohomish County Housing Authority | ||||||||
5.00%, 04/01/2031 | 1,135,000 | 1,434,436 | ||||||
State of Washington | ||||||||
5.00%, 09/01/2021 | 2,670,000 | 2,816,983 | ||||||
5.00%, 08/01/2027 | 235,000 | 294,803 | ||||||
5.00%, 08/01/2027 | 550,000 | 671,110 | ||||||
5.00%, 08/01/2028 | 235,000 | 294,009 | ||||||
5.00%, 08/01/2030 | 235,000 | 291,170 | ||||||
5.00%, 08/01/2030 | 1,830,000 | 2,334,714 | ||||||
5.00%, 06/01/2034 | 660,000 | 844,760 | ||||||
5.00%, 07/01/2036 | 1,505,000 | 1,919,342 | ||||||
Thurston & Pierce Counties Community Schools | ||||||||
5.00%, 12/01/2029 | 675,000 | 893,808 | ||||||
5.00%, 12/01/2031 | 1,100,000 | 1,435,896 | ||||||
Tobacco Settlement Authority | ||||||||
5.00%, 06/01/2023 | 500,000 | 554,545 | ||||||
5.00%, 06/01/2024 | 1,000,000 | 1,106,360 | ||||||
Washington Health Care Facilities Authority | ||||||||
1.18% (SIFMA Municipal Swap Index Yield + 1.05%), 01/01/2042(3) | 5,000,000 | 5,013,950 | ||||||
5.00%, 08/15/2022 | 1,200,000 | 1,306,812 | ||||||
5.00%, 08/15/2023 | 650,000 | 733,850 | ||||||
5.00%, 10/01/2024 | 465,000 | 507,301 | ||||||
5.00%, 07/01/2025 | 360,000 | 423,806 | ||||||
5.00%, 08/01/2028 | 1,005,000 | 1,232,009 | ||||||
5.00%, 07/01/2029 | 115,000 | 140,220 | ||||||
5.00%, 07/01/2030 | 410,000 | 496,686 | ||||||
5.00%, 08/01/2030 | 3,500,000 | 4,328,135 | ||||||
5.00%, 08/15/2030 | 1,000,000 | 1,085,590 | ||||||
5.00%, 08/15/2031 | 845,000 | 912,710 | ||||||
5.00%, 09/01/2031 | 185,000 | 238,434 | ||||||
5.00%, 08/15/2032 | 385,000 | 413,448 | ||||||
5.00%, 09/01/2032 | 180,000 | 229,397 | ||||||
5.00%, 09/01/2033 | 225,000 | 284,517 | ||||||
5.00%, 07/01/2034 | 105,000 | 124,630 | ||||||
5.00%, 09/01/2034 | 450,000 | 568,062 | ||||||
5.00%, 09/01/2035 | 365,000 | 458,929 | ||||||
5.00%, 10/01/2038 | 11,320,000 | 12,715,077 | ||||||
5.00%, 07/01/2042 | 2,415,000 | 2,805,457 | ||||||
5.00%, 08/01/2049(1) | 10,000,000 | 11,526,100 |
Washington Higher Education Facilities Authority | ||||||||
4.00%, 05/01/2045 | 1,000,000 | 1,100,240 | ||||||
4.00%, 05/01/2050 | 950,000 | 1,035,453 | ||||||
5.00%, 05/01/2025 | 100,000 | 115,707 | ||||||
5.00%, 05/01/2026 | 375,000 | 442,770 | ||||||
5.00%, 05/01/2028 | 420,000 | 515,344 | ||||||
5.00%, 05/01/2029 | 180,000 | 224,624 | ||||||
5.00%, 10/01/2029 | 1,855,000 | 2,077,878 | ||||||
5.00%, 10/01/2033 | 735,000 | 804,296 | ||||||
Washington State Housing Finance Commission | ||||||||
0.68% (SIFMA Municipal Swap Index Yield + 0.55%), 12/01/2048(3) | 10,000,000 | 9,937,400 | ||||||
1.55%, 07/01/2022(1) | 10,000,000 | 10,172,000 | ||||||
2.38%, 01/01/2026(2) | 600,000 | 550,074 | ||||||
4.00%, 07/01/2026(2) | 1,155,000 | 1,126,125 | ||||||
5.00%, 01/01/2024(2) | 180,000 | 186,296 | ||||||
5.00%, 01/01/2025(2) | 375,000 | 390,765 | ||||||
5.00%, 01/01/2026(2) | 300,000 | 314,220 | ||||||
5.00%, 07/01/2031(2) | 1,000,000 | 1,007,720 | ||||||
5.00%, 07/01/2053(2) | 400,000 | 379,600 | ||||||
5.00%, 01/01/2055(2) | 775,000 | 741,892 | ||||||
Washington State University | ||||||||
5.00%, 04/01/2029 | 1,285,000 | 1,469,128 | ||||||
Yakima County School District No 208 West Valley | ||||||||
5.00%, 12/01/2030 | 1,000,000 | 1,316,480 | ||||||
|
| |||||||
Total Washington |
| 212,312,020 | ||||||
|
| |||||||
West Virginia – 0.20% | ||||||||
Monongalia County Commission Special District | ||||||||
5.50%, 06/01/2037(2) | 200,000 | 206,012 | ||||||
5.75%, 06/01/2043(2) | 200,000 | 206,426 | ||||||
Ohio County Board of Education | ||||||||
3.00%, 06/01/2028 | 2,150,000 | 2,449,409 | ||||||
State of West Virginia | ||||||||
5.00%, 12/01/2036 | 2,910,000 | 3,685,486 | ||||||
West Virginia Economic Development Authority | ||||||||
1.70%, 01/01/2041(1) | 1,515,000 | 1,515,803 | ||||||
5.00%, 07/01/2045(1) | 900,000 | 918,873 | ||||||
5.38%, 12/01/2038 | 885,000 | 897,346 | ||||||
West Virginia Hospital Finance Authority | ||||||||
5.00%, 01/01/2031 | 620,000 | 762,761 | ||||||
West Virginia State School Building Authority Lottery Revenue | ||||||||
5.00%, 07/01/2022 | 695,000 | 759,364 | ||||||
5.00%, 07/01/2024 | 500,000 | 588,775 | ||||||
5.00%, 07/01/2032 | 940,000 | 1,149,827 | ||||||
|
| |||||||
Total West Virginia |
| 13,140,082 | ||||||
|
| |||||||
Wisconsin – 1.74% | ||||||||
Milwaukee Redevelopment Authority | ||||||||
5.00%, 11/15/2031 | 570,000 | 696,979 | ||||||
5.00%, 11/15/2032 | 500,000 | 610,020 | ||||||
Public Finance Authority | ||||||||
3.00%, 04/01/2025(2) | 425,000 | 409,806 | ||||||
4.00%, 08/01/2035(7) | 6,250,000 | 5,832,250 | ||||||
4.13%, 05/01/2026(2) | 750,000 | 751,777 | ||||||
5.00%, 05/15/2021(2) | 185,000 | 185,313 | ||||||
5.00%, 12/01/2025 | 1,000,000 | 1,133,420 | ||||||
5.00%, 05/15/2028(2) | 200,000 | 211,900 | ||||||
5.00%, 05/01/2029(2) | 2,330,000 | 2,428,000 | ||||||
5.00%, 06/15/2034 | 500,000 | 583,890 | ||||||
5.00%, 07/01/2035 | 5,000,000 | 6,069,600 | ||||||
5.00%, 06/15/2037(2) | 1,130,000 | 1,147,368 | ||||||
5.00%, 07/01/2037 | 825,000 | 881,199 | ||||||
5.00%, 06/15/2039(2) | 410,000 | 416,736 | ||||||
5.00%, 06/15/2039 | 500,000 | 572,225 | ||||||
5.00%, 04/01/2040(2) | 400,000 | 406,140 | ||||||
5.00%, 01/01/2042 | 600,000 | 580,806 | ||||||
5.00%, 10/01/2043(2) | 170,000 | 169,524 | ||||||
5.00%, 10/01/2048(2) | 705,000 | 694,453 | ||||||
5.00%, 06/15/2049(2) | 420,000 | 421,705 | ||||||
5.00%, 06/15/2049(2) | 750,000 | 754,200 | ||||||
5.00%, 06/15/2049 | 1,100,000 | 1,238,050 | ||||||
5.00%, 04/01/2050(2) | 550,000 | 549,956 | ||||||
5.00%, 10/01/2053(2) | 1,175,000 | 1,147,000 | ||||||
5.00%, 06/15/2054(2) | 455,000 | 455,682 | ||||||
5.00%, 05/01/2055(2) | 2,000,000 | 1,959,440 | ||||||
5.20%, 06/01/2037 | 500,000 | 478,360 | ||||||
5.25%, 05/15/2037(2) | 500,000 | 523,725 | ||||||
5.25%, 05/15/2042(2) | 60,000 | 62,343 | ||||||
5.25%, 10/01/2043 | 2,105,000 | 2,229,363 | ||||||
5.25%, 05/15/2047(2) | 60,000 | 61,986 | ||||||
5.25%, 10/01/2048 | 2,105,000 | 2,218,249 | ||||||
5.25%, 05/15/2052(2) | 115,000 | 118,466 | ||||||
5.30%, 06/01/2047 | 500,000 | 463,560 | ||||||
State of Wisconsin | ||||||||
5.00%, 05/01/2023 | 2,000,000 | 2,265,540 | ||||||
5.00%, 05/01/2023 | 4,000,000 | 4,531,080 | ||||||
5.00%, 05/01/2024 | 7,470,000 | 8,786,363 | ||||||
5.00%, 05/01/2025 | 5,335,000 | 6,434,810 | ||||||
5.00%, 05/01/2034 | 2,400,000 | 2,913,864 | ||||||
Tender Option Bond Trust Receipts/Certificates | ||||||||
0.33%, 01/01/2026(1)(2) | 9,020,000 | 9,020,000 | ||||||
Village of Mukwonago WI Waterworks System & Sewer System Revenue | ||||||||
3.38%, 06/01/2021 | 3,190,000 | 3,197,305 | ||||||
Wisconsin Health & Educational Facilities Authority | ||||||||
0.78% (SIFMA Municipal Swap Index Yield + 0.65%), 08/15/2054(3) | 4,000,000 | 3,981,760 | ||||||
0.89%, 02/15/2053(1) | 3,500,000 | 3,500,000 | ||||||
2.55%, 11/01/2027 | 390,000 | 366,460 | ||||||
2.83%, 11/01/2028 | 605,000 | 571,913 | ||||||
4.00%, 02/15/2025 | 270,000 | 312,296 | ||||||
4.00%, 02/15/2026 | 510,000 | 598,414 | ||||||
4.00%, 02/15/2031 | 460,000 | 539,746 | ||||||
4.00%, 02/15/2033 | 550,000 | 645,348 | ||||||
5.00%, 05/01/2022 | 550,000 | 589,792 | ||||||
5.00%, 10/01/2022 | 330,000 | 355,855 | ||||||
5.00%, 12/01/2022 | 560,000 | 613,004 | ||||||
5.00%, 11/01/2024 | 155,000 | 160,850 | ||||||
5.00%, 04/01/2025 | 2,000,000 | 2,378,260 | ||||||
5.00%, 04/01/2026 | 1,000,000 | 1,220,510 | ||||||
5.00%, 02/15/2027 | 300,000 | 367,128 | ||||||
5.00%, 04/01/2027 | 1,700,000 | 2,127,499 | ||||||
5.00%, 10/01/2027 | 580,000 | 702,409 | ||||||
5.00%, 11/01/2027 | 100,000 | 104,420 | ||||||
5.00%, 04/01/2028 | 900,000 | 1,154,907 | ||||||
5.00%, 10/01/2028 | 700,000 | 863,457 | ||||||
5.00%, 11/01/2029 | 760,000 | 794,542 | ||||||
5.00%, 04/01/2030 | 1,670,000 | 2,128,599 | ||||||
5.00%, 12/15/2033 | 1,450,000 | 1,806,903 | ||||||
5.00%, 09/01/2036 | 335,000 | 380,989 | ||||||
5.00%, 09/15/2037 | 650,000 | 657,378 | ||||||
5.00%, 09/15/2050 | 645,000 | 650,076 | ||||||
5.00%, 08/15/2054(1) | 1,260,000 | 1,349,397 | ||||||
Wisconsin Housing & Economic Development Authority | ||||||||
1.55%, 11/01/2038(1) | 1,750,000 | 1,755,792 | ||||||
1.60%, 11/01/2048(1) | 6,000,000 | 6,066,060 | ||||||
3.50%, 09/01/2050 | 2,525,000 | 2,766,971 | ||||||
|
| |||||||
Total Wisconsin |
| 113,123,188 | ||||||
|
| |||||||
Total Municipal Bonds (Cost: $6,114,751,757) |
| 6,296,574,619 | ||||||
|
| |||||||
| Shares | Value | |||||||
SHORT-TERM INVESTMENTS – 3.34% | ||||||||
Money Market Funds – 3.27% | ||||||||
Fidelity Institutional Money Market Government Fund—Class I, 0.10%(6) | 213,054,213 | 213,054,213 | ||||||
|
| |||||||
Total Money Market Funds (Cost: $213,054,213) | 213,054,213 | |||||||
|
| |||||||
| Principal Amount | Value | |||||||
Time Deposits – 0.07% | ||||||||
BNP Paribas, Paris, 0.01% due 07/01/2020 | $ | 184,875 | 184,875 | |||||
Citibank, New York, 0.01% due 07/01/2020 | 4,800,976 | 4,800,976 | ||||||
|
| |||||||
Total Time Deposits (Cost: $4,985,851) | 4,985,851 | |||||||
|
| |||||||
Total Short-Term Investments (Cost: $218,040,064) |
| 218,040,064 | ||||||
|
| |||||||
TOTAL INVESTMENTS IN SECURITIES – 99.91% (Cost: $6,332,791,821) | 6,514,614,683 | |||||||
|
| |||||||
OTHER ASSETS IN EXCESS OF LIABILITIES – 0.09% | 5,826,662 | |||||||
|
| |||||||
TOTAL NET ASSETS – 100.00% | $ | 6,520,441,345 | ||||||
|
| |||||||
Percentages are stated as a percent of net assets.
| (1) | Adjustable rate security. The rate reported is the rate in effect as of June 30, 2020. |
| (2) | Security was purchased exempt from registration in the U.S. pursuant to Rule 144(A) under the Securities Act of 1933. The value of these securities total $202,146,973, which represents 3.10% of total net assets. |
| (3) | Variable rate security based on a reference index and spread. The rate reported is the rate in effect as of June 30, 2020. |
| (4) | Amount calculated is less than 0.005%. |
| (5) | Security in default as of June 30, 2020. The value of these securities total $16,913,532, which represents 0.26% of total net assets. |
| (6) | Represents annualized seven-day yield as of the close of the reporting period. |
| (7) | Security that is restricted at June 30, 2020. The value of the restricted security totals $5,832,250, which represents 0.09% of total net assets. |
The accompanying notes are an integral part of this Schedule of Investments.
| MUNICIPAL BONDS | Percentage of Net Assets | |||
Education | 8.79 | % | ||
General Obligation | 16.73 | % | ||
General Revenue | 26.41 | % | ||
Healthcare | 15.66 | % | ||
Housing | 4.67 | % | ||
Transportation | 15.60 | % | ||
Utilities | 8.71 | % | ||
|
| |||
Total Municipal Bonds | 96.57 | % | ||
|
| |||
SHORT-TERM INVESTMENTS | 3.34 | % | ||
|
| |||
TOTAL INVESTMENTS | 99.91 | % | ||
Other Assets In Excess Of Liabilities | 0.09 | % | ||
|
| |||
TOTAL NET ASSETS | 100 | % | ||
|
| |||
The accompanying notes are an integral part of this Schedule of Investments.
Bridge Builder Large Cap Growth Fund
Schedule of Investments
June 30, 2020
| Shares | Value | |||||||
COMMON STOCKS – 97.99% | ||||||||
Communication Services – 11.03% | ||||||||
Activision Blizzard, Inc. | 28,120 | $ | 2,134,308 | |||||
Alphabet, Inc. - Class A(1) | 259,545 | 368,047,787 | ||||||
Alphabet, Inc. - Class C(1) | 228,204 | 322,591,456 | ||||||
Altice USA, Inc. - Class A(1) | 29,573 | 666,575 | ||||||
Cable One, Inc. | 464 | 823,530 | ||||||
Charter Communications, Inc. - Class A(1) | 12,524 | 6,387,741 | ||||||
Electronic Arts, Inc.(1) | 452,927 | 59,809,010 | ||||||
Facebook, Inc. - Class A(1) | 1,566,067 | 355,606,834 | ||||||
InterActiveCorp(1) | 6,984 | 2,258,626 | ||||||
Liberty Media Corp.-Liberty SiriusXM - Class A(1) | 880 | 30,378 | ||||||
Liberty Media Corp.-Liberty SiriusXM - Class C(1) | 1,839 | 63,354 | ||||||
Live Nation Entertainment, Inc.(1) | 12,963 | 574,650 | ||||||
Match Group, Inc.(1) | 1,009,473 | 108,064,085 | ||||||
Netflix, Inc.(1) | 290,016 | 131,968,881 | ||||||
Nexstar Media Group, Inc. - Class A | 2,727 | 228,223 | ||||||
Pinterest, Inc. - Class A(1) | 30,483 | 675,808 | ||||||
Roku, Inc. - Class A(1) | 9,297 | 1,083,379 | ||||||
Sirius XM Holdings, Inc. | 64,873 | 380,805 | ||||||
Spotify Technology SA(1) | 129,353 | 33,397,651 | ||||||
Take-Two Interactive Software, Inc.(1) | 9,506 | 1,326,752 | ||||||
Tencent Holdings Ltd. | 741,584 | 47,519,155 | ||||||
Walt Disney Co. | 358,893 | 40,020,158 | ||||||
World Wrestling Entertainment, Inc. - Class A | 4,195 | 182,273 | ||||||
Zillow Group, Inc. - Class A(1) | 578 | 33,223 | ||||||
Zillow Group, Inc. - Class C(1) | 1,362 | 78,465 | ||||||
Zynga, Inc. - Class A(1) | 66,726 | 636,566 | ||||||
|
| |||||||
Total Communication Services |
| 1,484,589,673 | ||||||
|
| |||||||
Consumer Discretionary – 14.86% | ||||||||
Alibaba Group Holding Ltd. - ADR(1) | 246,778 | 53,230,015 | ||||||
Amazon.com, Inc.(1) | 205,582 | 567,163,733 | ||||||
Aptiv Plc | 361,412 | 28,161,223 | ||||||
AutoZone, Inc.(1) | 1,298 | 1,464,300 | ||||||
Best Buy Co., Inc. | 3,760 | 328,135 | ||||||
Booking Holdings, Inc.(1) | 3,783 | 6,023,822 | ||||||
Bright Horizons Family Solutions, Inc.(1) | 3,657 | 428,600 | ||||||
Burlington Stores, Inc.(1) | 5,315 | 1,046,683 | ||||||
CarMax, Inc.(1) | 1,115 | 99,848 | ||||||
Carvana Co. - Class A(1) | 4,996 | 600,519 | ||||||
Chegg, Inc.(1) | 11,065 | 744,232 | ||||||
Chipotle Mexican Grill, Inc. - Class A(1) | 2,597 | 2,732,979 | ||||||
Dollar General Corp. | 422,038 | 80,402,459 | ||||||
Dollar Tree, Inc.(1) | 410,281 | 38,024,843 | ||||||
Domino’s Pizza, Inc. | 3,561 | 1,315,576 | ||||||
Dunkin’ Brands Group, Inc. | 7,017 | 457,719 | ||||||
eBay, Inc. | 56,635 | 2,970,506 | ||||||
Etsy, Inc.(1) | 10,788 | 1,146,009 | ||||||
Expedia Group, Inc. | 1,384 | 113,765 | ||||||
Five Below, Inc.(1) | 4,989 | 533,374 | ||||||
Floor & Decor Holdings, Inc. - Class A(1) | 7,422 | 427,878 | ||||||
Frontdoor, Inc.(1) | 1,314 | 58,250 | ||||||
GrubHub, Inc.(1) | 807 | 56,732 | ||||||
H&R Block, Inc. | 12,395 | 177,001 | ||||||
Home Depot, Inc. | 512,258 | 128,325,752 | ||||||
Kering SA | 48,748 | 26,651,471 | ||||||
Las Vegas Sands Corp. | 13,213 | 601,720 | ||||||
Lowes Companies, Inc. | 971,737 | 131,301,103 | ||||||
Lululemon Athletica, Inc.(1) | 283,299 | 88,392,121 | ||||||
Mattel, Inc.(1) | 19,374 | 187,347 | ||||||
McDonald’s Corp. | 742,304 | 136,932,819 | ||||||
MercadoLibre, Inc.(1) | 51,499 | 50,766,169 | ||||||
NIKE, Inc. - Class B | 2,413,363 | 236,630,242 | ||||||
NVR, Inc.(1) | 31 | 101,021 | ||||||
Ollie’s Bargain Outlet Holdings, Inc.(1) | 4,272 | 417,161 | ||||||
O’Reilly Automotive, Inc.(1) | 6,796 | 2,865,669 | ||||||
Peloton Interactive, Inc. - Class A(1) | 2,171 | 125,419 | ||||||
Planet Fitness, Inc. - Class A(1) | 4,160 | 251,971 | ||||||
Polaris Industries, Inc. | 547 | 50,625 | ||||||
Pool Corp. | 3,543 | 963,235 | ||||||
Ross Stores, Inc. | 607,860 | 51,813,986 | ||||||
Starbucks Corp. | 763,145 | 56,159,841 | ||||||
Tempur Sealy International, Inc.(1) | 3,702 | 266,359 | ||||||
Tesla, Inc.(1) | 127,481 | 137,655,259 | ||||||
TJX Companies, Inc. | 89,849 | 4,542,765 | ||||||
Tractor Supply Co. | 10,565 | 1,392,361 | ||||||
Ulta Beauty, Inc.(1) | 4,578 | 931,257 | ||||||
Vail Resorts, Inc. | 292 | 53,188 | ||||||
VF Corp. | 1,732 | 105,548 | ||||||
Wayfair, Inc. - Class A(1) | 5,487 | 1,084,286 | ||||||
Wendy’s Co. | 16,386 | 356,887 | ||||||
Williams-Sonoma, Inc. | 1,263 | 103,579 | ||||||
Wynn Resorts Ltd. | 2,210 | 164,623 | ||||||
Yum China Holdings, Inc. | 2,274 | 109,311 | ||||||
Yum! Brands, Inc. | 1,773,793 | 154,160,350 | ||||||
|
| |||||||
Total Consumer Discretionary |
| 2,001,171,646 | ||||||
|
| |||||||
Consumer Staples – 3.40% | ||||||||
Altria Group, Inc. | 75,365 | 2,958,076 | ||||||
Beyond Meat Inc.(1) | 3,758 | 503,497 | ||||||
Boston Beer Inc. - Class A(1) | 792 | 425,027 | ||||||
Brown-Forman Corp. - Class A | 3,755 | 216,175 | ||||||
Brown-Forman Corp. - Class B | 14,067 | 895,505 | ||||||
Campbell Soup Co. | 7,800 | 387,114 | ||||||
Church & Dwight Co., Inc. | 22,994 | 1,777,436 | ||||||
Clorox Co. | 8,133 | 1,784,136 | ||||||
Coca-Cola Co. | 2,835,586 | 126,693,983 | ||||||
Costco Wholesale Corp. | 36,014 | 10,919,805 | ||||||
Energizer Holdings, Inc. | 4,499 | 213,658 | ||||||
Estee Lauder Companies, Inc. - Class A | 18,342 | 3,460,769 | ||||||
Grocery Outlet Holding Corp.(1) | 3,394 | 138,475 | ||||||
Herbalife Nutrition Ltd.(1) | 1,078 | 48,488 | ||||||
Hershey Co. | 10,413 | 1,349,733 | ||||||
Kellogg Co. | 7,932 | 523,988 | ||||||
Kimberly-Clark Corp. | 382,288 | 54,036,409 | ||||||
Lamb Weston Holdings, Inc. | 3,080 | 196,904 | ||||||
McCormick & Co., Inc. | 6,280 | 1,126,695 | ||||||
Mondelez International, Inc. - Class A | 1,491,845 | 76,278,035 | ||||||
Monster Beverage Corp.(1) | 34,343 | 2,380,657 | ||||||
PepsiCo, Inc. | 94,107 | 12,446,592 | ||||||
Pilgrim’s Pride Corp.(1) | 2,439 | 41,195 | ||||||
Procter & Gamble Co. | 1,311,734 | 156,844,034 | ||||||
Reynolds Consumer Products, Inc. | 1,218 | 42,313 | ||||||
Sprouts Farmers Market, Inc.(1) | 9,080 | 232,357 | ||||||
Sysco Corp. | 32,327 | 1,766,994 | ||||||
|
| |||||||
Total Consumer Staples |
| 457,688,050 | ||||||
|
| |||||||
Energy – 0.72% | ||||||||
Cheniere Energy, Inc.(1) | 21,149 | 1,021,920 | ||||||
ConocoPhillips | 1,896,721 | 79,700,217 | ||||||
EOG Resources, Inc. | 310,199 | 15,714,681 | ||||||
Equitrans Midstream Corp. | 4,197 | 34,877 | ||||||
|
| |||||||
Total Energy |
| 96,471,695 | ||||||
|
| |||||||
Financials – 4.72% | ||||||||
Alleghany Corp. | 142 | 69,458 | ||||||
American Express Co. | 325,031 | 30,942,951 | ||||||
AON Plc-CLASS A - Class A | 21,242 | 4,091,209 | ||||||
Apollo Global Management, Inc. - Class A | 7,733 | 386,031 | ||||||
Ares Management Corp. - Class A | 8,963 | 355,831 | ||||||
Axis Capital Holdings Ltd. | 1,024 | 41,533 | ||||||
Bank of America Corp. | 5,715,715 | 135,748,231 | ||||||
Brown & Brown, Inc. | 936 | 38,151 | ||||||
Carlyle Group, Inc. | 1,000 | 27,900 | ||||||
CBOE Global Markets, Inc. | 2,121 | 197,847 | ||||||
Commerce Bancshares, Inc. | 691,236 | 41,107,805 | ||||||
Credit Acceptance Corp.(1) | 61 | 25,560 | ||||||
Erie Indemnity Co. - Class A | 1,352 | 259,449 | ||||||
FactSet Research Systems, Inc. | 3,394 | 1,114,827 | ||||||
Goldman Sachs Group, Inc. | 143,123 | 28,283,967 | ||||||
Intercontinental Exchange, Inc. | 1,959,543 | 179,494,139 | ||||||
JPMorgan Chase & Co. | 902,893 | 84,926,116 | ||||||
LendingTree, Inc.(1) | 657 | 190,221 | ||||||
Lincoln National Corp. | 2,183 | 80,313 | ||||||
LPL Financial Holdings, Inc. | 567 | 44,453 | ||||||
MarketAxess Holdings, Inc. | 3,451 | 1,728,675 | ||||||
Marsh & McLennan Companies, Inc. | 648,592 | 69,639,323 | ||||||
Moody’s Corp. | 15,096 | 4,147,324 | ||||||
Morningstar, Inc. | 1,711 | 241,200 | ||||||
MSCI, Inc. - Class A | 7,687 | 2,566,074 | ||||||
Primerica, Inc. | 2,183 | 254,538 | ||||||
RenaissanceRe Holdings Ltd. | 1,224 | 209,341 | ||||||
S&P Global, Inc. | 143,427 | 47,256,328 | ||||||
SLM Corp. | 7,900 | 55,537 | ||||||
T Rowe Price Group, Inc. | 5,255 | 648,992 | ||||||
The Progressive Corp. | 15,574 | 1,247,633 | ||||||
Tradeweb Markets, Inc. - Class A | 6,377 | 370,759 | ||||||
Virtu Financial, Inc. - Class A | 5,101 | 120,384 | ||||||
|
| |||||||
Total Financials |
| 635,912,100 | ||||||
|
| |||||||
Healthcare – 17.81% | ||||||||
10X Genomics, Inc. - Class A(1) | 4,972 | 444,049 | ||||||
Abbott Laboratories | 2,147,247 | 196,322,793 | ||||||
AbbVie, Inc. | 153,249 | 15,045,987 | ||||||
ABIOMED, Inc.(1) | 4,047 | 977,593 | ||||||
ACADIA Pharmaceuticals, Inc.(1) | 9,995 | 484,458 | ||||||
Acceleron Pharma, Inc.(1) | 3,944 | 375,745 | ||||||
Adaptive Biotechnologies Corp.(1) | 6,500 | 314,470 | ||||||
Agilent Technologies, Inc. | 2,333 | 206,167 | ||||||
Agios Pharmaceuticals, Inc.(1) | 793 | 42,410 | ||||||
Alexion Pharmaceuticals, Inc.(1) | 2,995 | 336,159 | ||||||
Align Technology, Inc.(1) | 7,288 | 2,000,119 | ||||||
Alnylam Pharmaceuticals, Inc.(1) | 10,446 | 1,547,157 | ||||||
Amedisys, Inc.(1) | 2,888 | 573,384 | ||||||
AmerisourceBergen Corp. - Class A | 6,394 | 644,323 | ||||||
Amgen, Inc. | 54,496 | 12,853,427 | ||||||
Anthem, Inc. | 5,938 | 1,561,575 | ||||||
AstraZeneca Plc - ADR | 1,149,015 | 60,771,403 | ||||||
Avantor, Inc.(1) | 37,643 | 639,931 | ||||||
Baxter International, Inc. | 19,528 | 1,681,361 | ||||||
Becton Dickinson & Co. | 593,487 | 142,003,634 | ||||||
Biogen, Inc.(1) | 4,510 | 1,206,650 | ||||||
BioMarin Pharmaceutical, Inc.(1) | 324,156 | 39,981,401 | ||||||
Bio-Techne Corp. | 3,417 | 902,327 | ||||||
Bluebird Bio, Inc.(1) | 2,646 | 161,512 | ||||||
Boston Scientific Corp.(1) | 1,822,602 | 63,991,556 | ||||||
Bristol Myers Squibb Co. | 76,247 | 4,483,324 | ||||||
Bruker Corp. | 4,010 | 163,127 | ||||||
Cardinal Health, Inc. | 26,741 | 1,395,613 | ||||||
Centene Corp.(1) | 16,163 | 1,027,159 | ||||||
Cerner Corp. | 28,451 | 1,950,316 | ||||||
Change Healthcare, Inc.(1) | 16,279 | 182,325 | ||||||
Charles River Laboratories International, Inc.(1) | 3,972 | 692,518 | ||||||
Chemed Corp. | 1,416 | 638,715 | ||||||
Cigna Corp. | 9,239 | 1,733,698 | ||||||
Danaher Corp. | 1,459,378 | 258,061,812 | ||||||
DaVita, Inc.(1) | 1,265 | 100,112 | ||||||
DexCom, Inc.(1) | 8,522 | 3,454,819 | ||||||
Edwards Lifesciences Corp.(1) | 57,257 | 3,957,031 | ||||||
Eli Lilly & Co. | 77,955 | 12,798,652 | ||||||
Encompass Health Corp. | 4,218 | 261,221 | ||||||
Exact Sciences Corp.(1) | 11,807 | 1,026,501 | ||||||
Exelixis, Inc.(1) | 10,560 | 250,694 | ||||||
Global Blood Therapeutics, Inc.(1) | 5,349 | 337,682 | ||||||
Guardant Health, Inc.(1) | 6,788 | 550,710 | ||||||
Haemonetics Corp.(1) | 4,247 | 380,361 | ||||||
HCA Healthcare, Inc. | 12,708 | 1,233,438 | ||||||
Hill-Rom Holdings, Inc. | 713 | 78,273 | ||||||
Hologic, Inc.(1) | 16,361 | 932,577 | ||||||
Horizon Therapeutics Plc(1) | 15,545 | 863,991 | ||||||
Humana, Inc. | 167,177 | 64,822,882 | ||||||
ICU Medical, Inc.(1) | 532 | 98,053 | ||||||
IDEXX Laboratories, Inc.(1) | 7,838 | 2,587,794 | ||||||
Illumina, Inc.(1) | 467,203 | 173,028,631 | ||||||
Immunomedics, Inc.(1) | 18,822 | 667,052 | ||||||
Incyte Corp.(1) | 17,035 | 1,771,129 | ||||||
Insulet Corp.(1) | 5,761 | 1,119,132 | ||||||
Intuitive Surgical, Inc.(1) | 305,021 | 173,810,116 | ||||||
Ionis Pharmaceuticals, Inc.(1) | 5,874 | 346,331 | ||||||
Iovance Biotherapeutics, Inc.(1) | 12,362 | 339,337 | ||||||
IQVIA Holdings, Inc.(1) | 270,806 | 38,421,955 | ||||||
Johnson & Johnson | 1,481,593 | 208,356,424 | ||||||
Laboratory Corp. of America Holdings(1) | 201,474 | 33,466,846 | ||||||
Livongo Health, Inc.(1) | 4,924 | 370,236 | ||||||
Masimo Corp.(1) | 4,399 | 1,002,928 | ||||||
McKesson Corp. | 11,273 | 1,729,504 | ||||||
Medtronic Plc | 1,508,144 | 138,296,805 | ||||||
Merck & Co., Inc. | 204,226 | 15,792,797 | ||||||
Mettler-Toledo International, Inc.(1) | 2,078 | 1,673,933 | ||||||
Moderna, Inc.(1) | 24,558 | 1,576,869 | ||||||
Molina Healthcare, Inc.(1) | 2,896 | 515,430 | ||||||
Neurocrine Biosciences, Inc.(1) | 8,407 | 1,025,654 | ||||||
Novocure Ltd.(1) | 9,084 | 538,681 | ||||||
Penumbra, Inc.(1) | 2,926 | 523,227 | ||||||
PerkinElmer, Inc. | 1,923 | 188,627 | ||||||
Pfizer, Inc. | 2,886,935 | 94,402,774 | ||||||
PPD, Inc.(1) | 4,781 | 128,131 | ||||||
PRA Health Sciences, Inc.(1) | 4,969 | 483,434 | ||||||
Quidel Corp.(1) | 3,396 | 759,821 | ||||||
Reata Pharmaceuticals, Inc. - Class A(1) | 1,939 | 302,523 | ||||||
Regeneron Pharmaceuticals, Inc.(1) | 203,903 | 127,164,106 | ||||||
Repligen Corp.(1) | 4,773 | 589,991 | ||||||
ResMed, Inc. | 13,106 | 2,516,352 | ||||||
Sage Therapeutics, Inc.(1) | 346 | 14,387 | ||||||
Sarepta Therapeutics, Inc.(1) | 6,802 | 1,090,633 | ||||||
Seattle Genetics, Inc.(1) | 11,362 | 1,930,631 | ||||||
STERIS Plc | 364 | 55,852 | ||||||
Stryker Corp. | 10,339 | 1,862,984 | ||||||
Syneos Health, Inc. - Class A(1) | 612 | 35,649 | ||||||
Tandem Diabetes Care, Inc.(1) | 4,762 | 471,057 | ||||||
Teladoc Health, Inc.(1) | 6,102 | 1,164,506 | ||||||
Teleflex, Inc. | 2,670 | 971,827 | ||||||
The Cooper Companies, Inc. | 555 | 157,420 | ||||||
Thermo Fisher Scientific, Inc. | 281,365 | 101,949,794 | ||||||
UnitedHealth Group, Inc. | 697,530 | 205,736,473 | ||||||
Varian Medical Systems, Inc.(1) | 1,045 | 128,033 | ||||||
Veeva Systems, Inc. - Class A(1) | 12,403 | 2,907,511 | ||||||
Vertex Pharmaceuticals, Inc.(1) | 171,897 | 49,903,418 | ||||||
Waters Corp.(1) | 414 | 74,686 | ||||||
West Pharmaceutical Services, Inc. | 6,709 | 1,524,084 | ||||||
Zoetis, Inc. - Class A | 710,178 | 97,322,793 | ||||||
|
| |||||||
Total Healthcare |
| 2,397,343,503 | ||||||
|
| |||||||
Industrials – 4.80% | ||||||||
3M Co. | 34,278 | 5,347,025 | ||||||
Allegion Plc | 5,538 | 566,094 | ||||||
Allison Transmission Holdings, Inc. | 6,671 | 245,359 | ||||||
Armstrong World Industries, Inc. | 1,611 | 125,594 | ||||||
Axon Enterprise, Inc.(1) | 5,658 | 555,220 | ||||||
Boeing Co. | 151,182 | 27,711,661 | ||||||
BWX Technologies, Inc. | 5,492 | 311,067 | ||||||
Carrier Global Corp. | 28,506 | 633,403 | ||||||
Caterpillar, Inc. | 186,822 | 23,632,983 | ||||||
CH Robinson Worldwide, Inc. | 1,902 | 150,372 | ||||||
Cintas Corp. | 7,304 | 1,945,493 | ||||||
Copart, Inc.(1) | 18,572 | 1,546,490 | ||||||
CoreLogic, Inc. | 223 | 14,990 | ||||||
CoStar Group, Inc.(1) | 3,580 | 2,544,199 | ||||||
Donaldson Co., Inc. | 1,195 | 55,591 | ||||||
Equifax, Inc. | 8,234 | 1,415,260 | ||||||
Expeditors International of Washington, Inc. | 9,301 | 707,248 | ||||||
Fastenal Co. | 42,458 | 1,818,901 | ||||||
Generac Holdings, Inc.(1) | 5,428 | 661,836 | ||||||
Graco, Inc. | 7,546 | 362,133 | ||||||
HEICO Corp. | 3,573 | 356,049 | ||||||
HEICO Corp. - Class A | 5,714 | 464,205 | ||||||
Honeywell International, Inc. | 942,436 | 136,266,821 | ||||||
Huntington Ingalls Industries, Inc. | 344 | 60,025 | ||||||
IAA, Inc.(1) | 2,920 | 112,624 | ||||||
IHS Markit Ltd. | 2,301,475 | 173,761,362 | ||||||
Illinois Tool Works, Inc. | 13,001 | 2,273,225 | ||||||
JB Hunt Transport Services, Inc. | 2,045 | 246,095 | ||||||
Landstar System, Inc. | 2,893 | 324,913 | ||||||
Lincoln Electric Holdings, Inc. | 2,221 | 187,097 | ||||||
Lockheed Martin Corp. | 22,887 | 8,351,924 | ||||||
Mercury Systems, Inc.(1) | 4,062 | 319,517 | ||||||
MSA Safety, Inc. | 738 | 84,457 | ||||||
Nordson Corp. | 4,443 | 842,882 | ||||||
Norfolk Southern Corp. | 396,538 | 69,620,177 | ||||||
Northrop Grumman Corp. | 13,282 | 4,083,418 | ||||||
Old Dominion Freight Line, Inc. | 7,687 | 1,303,638 | ||||||
Quanta Services, Inc. | 3,205 | 125,732 | ||||||
Rockwell Automation, Inc. | 5,343 | 1,138,059 | ||||||
Rollins, Inc. | 12,026 | 509,782 | ||||||
Roper Technologies, Inc. | 1,333 | 517,551 | ||||||
Toro Co. | 8,912 | 591,222 | ||||||
TransDigm Group, Inc. | 1,060 | 468,573 | ||||||
TransUnion | 16,295 | 1,418,317 | ||||||
Trex Co., Inc.(1) | 5,285 | 687,420 | ||||||
Uber Technologies, Inc.(1) | 1,218,347 | 37,866,225 | ||||||
Union Pacific Corp. | 737,243 | 124,645,674 | ||||||
United Parcel Service, Inc. - Class B | 43,043 | 4,785,521 | ||||||
Verisk Analytics, Inc. - Class A | 14,800 | 2,518,960 | ||||||
Vertiv Holdings Co.(1) | 18,211 | 246,941 | ||||||
Virgin Galactic Holdings, Inc.(1) | 4,731 | 77,305 | ||||||
Waste Management, Inc. | 4,985 | 527,961 | ||||||
WW Grainger, Inc. | 2,987 | 938,396 | ||||||
XPO Logistics, Inc.(1) | 415 | 32,059 | ||||||
|
| |||||||
Total Industrials |
| 646,105,046 | ||||||
|
| |||||||
Information Technology – 35.18% | ||||||||
2U, Inc.(1) | 1,583 | 60,091 | ||||||
Accenture Plc - Class A | 287,093 | 61,644,609 | ||||||
Adobe Systems, Inc.(1) | 500,734 | 217,974,518 | ||||||
Advanced Micro Devices, Inc.(1) | 100,449 | 5,284,622 | ||||||
Adyen NV(1)(2) | 43,473 | 63,274,701 | ||||||
Akamai Technologies, Inc.(1) | 12,093 | 1,295,039 | ||||||
Alteryx, Inc. - Class A(1) | 4,814 | 790,844 | ||||||
Amphenol Corp. - Class A | 348,280 | 33,368,707 | ||||||
Analog Devices, Inc. | 931,772 | 114,272,518 | ||||||
Anaplan, Inc.(1) | 11,911 | 539,687 | ||||||
ANSYS, Inc.(1) | 7,833 | 2,285,121 | ||||||
Apple, Inc. | 1,502,470 | 548,101,056 | ||||||
Applied Materials, Inc. | 84,862 | 5,129,908 | ||||||
Arista Networks, Inc.(1) | 4,410 | 926,232 | ||||||
Aspen Technology, Inc.(1) | 5,758 | 596,586 | ||||||
Atlassian Corp. Plc - Class A(1) | 152,681 | 27,523,804 | ||||||
Autodesk, Inc.(1) | 608,709 | 145,597,106 | ||||||
Automatic Data Processing, Inc. | 34,265 | 5,101,716 | ||||||
Avalara, Inc.(1) | 7,030 | 935,623 | ||||||
Bill.Com Holdings, Inc.(1) | 1,469 | 132,518 | ||||||
Black Knight, Inc.(1) | 13,201 | 957,865 | ||||||
Booz Allen Hamilton Holding Corp. - Class A | 12,578 | 978,443 | ||||||
Broadcom, Inc. | 34,261 | 10,813,114 | ||||||
Broadridge Financial Solutions, Inc. | 10,460 | 1,319,947 | ||||||
CACI International, Inc. - Class A(1) | 365 | 79,161 | ||||||
Cadence Design Systems, Inc.(1) | 25,209 | 2,419,056 | ||||||
CDK Global, Inc. | 1,413 | 58,526 | ||||||
CDW Corp. | 222,082 | 25,801,487 | ||||||
Ceridian HCM Holding, Inc.(1) | 6,819 | 540,542 | ||||||
Cisco Systems, Inc. | 1,612,113 | 75,188,950 | ||||||
Citrix Systems, Inc. | 3,064 | 453,196 | ||||||
Cloudflare, Inc. - Class A(1) | 9,965 | 358,242 | ||||||
Cognex Corp. | 15,056 | 899,144 | ||||||
Cognizant Technology Solutions Corp. - Class A | 3,570 | 202,847 | ||||||
Coherent, Inc.(1) | 1,821 | 238,515 | ||||||
CommScope Holding Co., Inc.(1) | 2,956 | 24,623 | ||||||
Coupa Software, Inc.(1) | 238,961 | 66,201,755 | ||||||
Crowdstrike Holdings, Inc. - Class A(1) | 270,677 | 27,146,196 | ||||||
Datadog, Inc. - Class A(1) | 13,936 | 1,211,735 | ||||||
Dell Technologies, Inc. - Class C(1) | 853 | 46,864 | ||||||
DocuSign, Inc. - Class A(1) | 16,363 | 2,817,872 | ||||||
Dolby Laboratories, Inc. - Class A | 586 | 38,600 | ||||||
Dropbox, Inc. - Class A(1) | 22,430 | 488,301 | ||||||
Dynatrace, Inc.(1) | 13,879 | 563,487 | ||||||
Elastic NV(1) | 5,423 | 500,055 | ||||||
Enphase Energy, Inc.(1) | 9,656 | 459,336 | ||||||
Entegris, Inc. | 11,563 | 682,795 | ||||||
EPAM Systems, Inc.(1) | 4,858 | 1,224,265 | ||||||
Everbridge, Inc.(1) | 3,134 | 433,620 | ||||||
Fair Isaac Corp.(1) | 2,558 | 1,069,346 | ||||||
Fastly, Inc. - Class A(1) | 6,658 | 566,796 | ||||||
Fidelity National Information Services, Inc. | 200,755 | 26,919,238 | ||||||
FireEye, Inc.(1) | 4,526 | 55,104 | ||||||
Fiserv, Inc.(1) | 15,487 | 1,511,841 | ||||||
Five9, Inc.(1) | 5,641 | 624,289 | ||||||
FleetCor Technologies, Inc.(1) | 725,346 | 182,446,279 | ||||||
Fortinet, Inc.(1) | 12,448 | 1,708,737 | ||||||
Gartner, Inc.(1) | 7,909 | 959,599 | ||||||
Genpact Ltd. | 6,669 | 243,552 | ||||||
Globant SA(1) | 3,305 | 495,254 | ||||||
GoDaddy, Inc. - Class A(1) | 15,132 | 1,109,630 | ||||||
Guidewire Software, Inc.(1) | 1,442 | 159,846 | ||||||
HubSpot, Inc.(1) | 3,958 | 887,977 | ||||||
Inphi Corp.(1) | 4,369 | 513,357 | ||||||
Intuit, Inc. | 348,509 | 103,224,881 | ||||||
IPG Photonics Corp.(1) | 292 | 46,834 | ||||||
Jabil, Inc. | 2,260 | 72,501 | ||||||
Jack Henry & Associates, Inc. | 5,684 | 1,046,027 | ||||||
Keysight Technologies, Inc.(1) | 5,746 | 579,082 | ||||||
KLA-Tencor Corp. | 14,410 | 2,802,457 | ||||||
Lam Research Corp. | 13,432 | 4,344,715 | ||||||
Leidos Holdings, Inc. | 1,193 | 111,748 | ||||||
LogMeIn, Inc. | 368 | 31,195 | ||||||
Lumentum Holdings, Inc.(1) | 731 | 59,525 | ||||||
Manhattan Associates, Inc.(1) | 5,230 | 492,666 | ||||||
Mastercard, Inc. - Class A | 386,430 | 114,267,351 | ||||||
Maxim Integrated Products, Inc. | 8,151 | 494,032 | ||||||
Medallia, Inc.(1) | 7,484 | 188,896 | ||||||
Microchip Technology, Inc. | 16,100 | 1,695,491 | ||||||
Microsoft Corp. | 4,754,455 | 967,579,137 | ||||||
MKS Instruments, Inc. | 3,756 | 425,329 | ||||||
MongoDB, Inc. - Class A(1) | 3,820 | 864,619 | ||||||
Monolithic Power Systems, Inc. | 3,978 | 942,786 | ||||||
Motorola Solutions, Inc. | 1,586 | 222,246 | ||||||
NetApp, Inc. | 10,968 | 486,650 | ||||||
New Relic, Inc.(1) | 4,602 | 317,078 | ||||||
NortonLifeLock, Inc. | 53,045 | 1,051,882 | ||||||
Nutanix, Inc. - Class A(1) | 16,286 | 386,060 |
NVIDIA Corp. | 268,442 | 101,983,800 | ||||||
Okta, Inc. - Class A(1) | 10,711 | 2,144,664 | ||||||
Oracle Corp. | 160,625 | 8,877,744 | ||||||
Pagerduty, Inc.(1) | 6,260 | 179,161 | ||||||
Palo Alto Networks, Inc.(1) | 79,996 | 18,372,681 | ||||||
Paychex, Inc. | 23,181 | 1,755,961 | ||||||
Paycom Software, Inc.(1) | 4,504 | 1,395,024 | ||||||
Paylocity Holding Corp.(1) | 3,162 | 461,304 | ||||||
PayPal Holdings, Inc.(1) | 1,575,186 | 274,444,657 | ||||||
Pegasystems, Inc. | 3,370 | 340,943 | ||||||
Pluralsight, Inc. - Class A(1) | 8,581 | 154,887 | ||||||
Proofpoint, Inc.(1) | 5,175 | 575,046 | ||||||
PTC, Inc.(1) | 137,680 | 10,710,127 | ||||||
Pure Storage, Inc. - Class A(1) | 12,647 | 219,173 | ||||||
QUALCOMM, Inc. | 104,116 | 9,496,420 | ||||||
RealPage, Inc.(1) | 7,246 | 471,062 | ||||||
RingCentral, Inc. - Class A(1) | 112,666 | 32,110,937 | ||||||
Salesforce.com, Inc.(1) | 1,702,097 | 318,853,831 | ||||||
Science Applications International Corp. | 684 | 53,133 | ||||||
ServiceNow, Inc.(1) | 126,242 | 51,135,585 | ||||||
Shopify, Inc. - Class A(1) | 125,533 | 119,155,924 | ||||||
Slack Technologies, Inc. - Class A(1) | 34,275 | 1,065,610 | ||||||
Smartsheet, Inc. - Class A(1) | 10,094 | 513,986 | ||||||
SolarEdge Technologies, Inc.(1) | 4,465 | 619,653 | ||||||
Splunk, Inc.(1) | 14,765 | 2,933,806 | ||||||
Square, Inc. - Class A(1) | 33,451 | 3,510,348 | ||||||
SS&C Technologies Holdings, Inc. | 4,292 | 242,412 | ||||||
StoneCo Ltd. - Class A(1) | 14,185 | 549,811 | ||||||
Switch, Inc. - Class A | 8,068 | 143,772 | ||||||
Synopsys, Inc.(1) | 12,919 | 2,519,205 | ||||||
Teradata Corp.(1) | 7,242 | 150,634 | ||||||
Teradyne, Inc. | 15,120 | 1,277,791 | ||||||
Texas Instruments, Inc. | 632,935 | 80,363,757 | ||||||
Trade Desk, Inc. - Class A(1) | 68,042 | 27,659,073 | ||||||
Twilio, Inc. - Class A(1) | 9,924 | 2,177,524 | ||||||
Tyler Technologies, Inc.(1) | 3,581 | 1,242,177 | ||||||
Ubiquiti, Inc. | 582 | 101,594 | ||||||
Universal Display Corp. | 3,923 | 586,959 | ||||||
VeriSign, Inc.(1) | 5,543 | 1,146,459 | ||||||
Visa, Inc. - Class A | 2,184,709 | 422,020,238 | ||||||
VMware, Inc. - Class A(1) | 7,223 | 1,118,554 | ||||||
Western Union Co. | 7,233 | 156,377 | ||||||
WEX, Inc.(1) | 340 | 56,103 | ||||||
Workday, Inc. - Class A(1) | 1,184,675 | 221,960,708 | ||||||
Xilinx, Inc. | 1,286,684 | 126,596,839 | ||||||
Zebra Technologies Corp. - Class A(1) | 4,372 | 1,119,013 | ||||||
Zendesk, Inc.(1) | 10,786 | 954,885 | ||||||
Zoom Video Communications, Inc. - Class A(1) | 15,461 | 3,919,982 | ||||||
Zscaler, Inc.(1) | 6,427 | 703,757 | ||||||
|
| |||||||
Total Information Technology |
| 4,736,290,669 | ||||||
|
| |||||||
Materials – 3.16% | ||||||||
Air Products & Chemicals, Inc. | 2,576 | 622,001 | ||||||
Amcor Plc | 22,001 | �� | 224,630 | |||||
Avery Dennison Corp. | 322,938 | 36,843,996 | ||||||
Ball Corp. | 1,336,686 | 92,886,310 | ||||||
Berry Global Group, Inc.(1) | 4,169 | 184,770 | ||||||
Crown Holdings, Inc.(1) | 1,220 | 79,459 | ||||||
Ecolab, Inc. | 636,478 | 126,627,298 | ||||||
FMC Corp. | 2,332 | 232,314 | ||||||
Graphic Packaging Holding Co. | 5,537 | 77,463 | ||||||
Linde Plc | 664,312 | 140,907,218 | ||||||
NewMarket Corp. | 546 | 218,662 | ||||||
Royal Gold, Inc. | 4,289 | 533,209 | ||||||
RPM International, Inc. | 10,319 | 774,544 | ||||||
Scotts Miracle-Gro Co. | 3,470 | 466,611 | ||||||
Sherwin-Williams Co. | 7,624 | 4,405,528 | ||||||
Vulcan Materials Co. | 180,341 | 20,892,505 | ||||||
WR Grace & Co. | 1,838 | 93,389 | ||||||
|
| |||||||
Total Materials |
| 426,069,907 | ||||||
|
| |||||||
Real Estate – 2.31% | ||||||||
American Tower Corp. | 40,821 | 10,553,861 | ||||||
Americold Realty Trust | 1,812 | 65,776 | ||||||
Brookfield Property REIT, Inc. - Class A | 3,999 | 39,830 | ||||||
CoreSite Realty Corp. | 2,509 | 303,740 | ||||||
Crown Castle International Corp. | 233,969 | 39,154,712 | ||||||
Equinix, Inc. | 217,088 | 152,460,902 | ||||||
Equity LifeStyle Properties, Inc. | 7,151 | 446,794 | ||||||
Extra Space Storage, Inc. | 8,255 | 762,514 | ||||||
Iron Mountain, Inc. | 15,316 | 399,748 | ||||||
Prologis, Inc. | 1,108,055 | 103,414,773 | ||||||
Public Storage | 9,009 | 1,728,737 | ||||||
SBA Communications Corp. - Class A | 1,365 | 406,661 | ||||||
Simon Property Group, Inc. | 21,941 | 1,500,326 | ||||||
|
| |||||||
Total Real Estate |
| 311,238,374 | ||||||
|
| |||||||
Utilities – 0.00%(3) | ||||||||
NRG Energy, Inc. | 7,713 | 251,135 | ||||||
|
| |||||||
Total Utilities |
| 251,135 | ||||||
|
| |||||||
Total Common Stocks (Cost: $10,234,907,249) |
| 13,193,131,798 | ||||||
|
| |||||||
RIGHTS – 0.00%(3) | ||||||||
T-Mobile US, Inc., expires 07/31/2020(1) | 13,210 | 2,219 | ||||||
|
| |||||||
Total Rights (Cost: $33,272) |
| 2,219 | ||||||
|
| |||||||
SHORT-TERM INVESTMENTS – 2.12% | ||||||||
Money Market Funds – 2.08% | ||||||||
Goldman Sachs Financial Square Government Fund - Class I, 0.15%(4) | 279,781,923 | 279,781,923 | ||||||
|
| |||||||
Total Money Market Funds (Cost: $279,781,923) | 279,781,923 | |||||||
|
| |||||||
| Principal Amount | Value | |||||||
Time Deposits – 0.04% | ||||||||
JP Morgan, New York, 0.01% due 07/01/2020 | $ | 5,226,969 | 5,226,969 | |||||
National Australia Bank, London, 0.01% due 07/01/2020 | 487,675 | 487,675 | ||||||
|
| |||||||
Total Time Deposits (Cost: $5,714,644) | 5,714,644 | |||||||
|
| |||||||
Total Short-Term Investments (Cost: $285,496,567) |
| 285,496,567 | ||||||
|
| |||||||
TOTAL INVESTMENTS IN SECURITIES – 100.11% | 13,478,630,584 | |||||||
|
| |||||||
LIABILITIES IN EXCESS OF OTHER ASSETS – (0.11)% | (14,345,696 | ) | ||||||
|
| |||||||
TOTAL NET ASSETS – 100.00% | $ | 13,464,284,888 | ||||||
|
| |||||||
Percentages are stated as a percent of net assets.
ADR American Depositary Receipt
REIT Real Estate Investment Trust
| (1) | Non-income producing security. |
| (2) | Security was purchased exempt from registration in the U.S. pursuant to Rule 144(A) under the Securities Act of 1933. The value of the security totals $63,274,701, which represents 0.47% of total net assets. |
| (3) | Amount calculated is less than 0.005%. |
| (4) | Represents annualized seven-day yield as of the close of the reporting period. |
The accompanying notes are an integral part of this Schedule of Investments.
Bridge Builder Large Cap Value Fund
Schedule of Investments
June 30, 2020
| Shares | Value | |||||||
COMMON STOCKS – 95.97% | ||||||||
Communication Services – 5.82% | ||||||||
Activision Blizzard, Inc. | 16,534 | $ | 1,254,931 | |||||
Alphabet, Inc. - Class A(1) | 2,408 | 3,414,664 | ||||||
Alphabet, Inc. - Class C(1) | 115,954 | 163,913,734 | ||||||
AT&T, Inc. | 1,267,682 | 38,322,027 | ||||||
CenturyLink, Inc. | 480,992 | 4,824,350 | ||||||
Charter Communications, Inc. - Class A(1) | 519 | 264,711 | ||||||
Comcast Corp. - Class A | 5,851,206 | 228,080,010 | ||||||
Discovery, Inc. - Class A(1) | 5,577 | 117,675 | ||||||
Discovery, Inc. - Class C(1) | 11,638 | 224,148 | ||||||
DISH Network Corp. - Class A(1) | 8,782 | 303,067 | ||||||
Electronic Arts, Inc.(1) | 251,122 | 33,160,660 | ||||||
Facebook, Inc. - Class A(1) | 338,712 | 76,911,334 | ||||||
Fox Corp. - Class A | 219,393 | 5,884,120 | ||||||
Fox Corp. - Class B | 829,597 | 22,266,383 | ||||||
GCI Liberty, Inc. - Class A(1) | 85,473 | 6,078,840 | ||||||
Interpublic Group of Companies, Inc. | 13,886 | 238,284 | ||||||
John Wiley & Sons, Inc. - Class A | 1,542 | 60,138 | ||||||
Liberty Broadband Corp. - Class A(1) | 884 | 108,016 | ||||||
Liberty Broadband Corp. - Class C(1) | 3,752 | 465,098 | ||||||
Liberty Media Corp. - Liberty Formula One - Class A(1) | 893 | 26,058 | ||||||
Liberty Media Corp. - Liberty Formula One - Class C(1) | 7,083 | 224,602 | ||||||
Liberty Media Corp. - Liberty SiriusXM - Class A(1) | 2,621 | 90,477 | ||||||
Liberty Media Corp.-Liberty SiriusXM - Class C(1) | 5,481 | 188,820 | ||||||
Lions Gate Entertainment Corp. - Class A(1) | 2,180 | 16,154 | ||||||
Lions Gate Entertainment Corp. - Class B(1) | 4,090 | 27,935 | ||||||
Madison Square Garden Co. - Class A(1) | 670 | 98,416 | ||||||
Madison Square Garden Entertainment Corp.(1) | 730 | 54,750 | ||||||
New York Times Co. - Class A | 5,818 | 244,531 | ||||||
News Corp. - Class A | 1,700,732 | 20,170,681 | ||||||
News Corp. - Class B | 4,334 | 51,791 | ||||||
Nexstar Media Group, Inc. - Class A | 519 | 43,435 | ||||||
Omnicom Group, Inc. | 7,934 | 433,196 | ||||||
Pinterest, Inc. - Class A(1) | 2,442 | 54,139 | ||||||
Sirius XM Holdings, Inc. | 16,772 | 98,452 | ||||||
Take-Two Interactive Software, Inc.(1) | 301 | 42,011 | ||||||
TEGNA, Inc. | 274,622 | 3,059,289 | ||||||
Telephone & Data Systems, Inc. | 3,595 | 71,469 | ||||||
T-Mobile US, Inc.(1) | 18,503 | 1,927,087 | ||||||
TripAdvisor, Inc. | 3,592 | 68,284 | ||||||
Twitter, Inc.(1) | 27,503 | 819,314 | ||||||
United States Cellular Corp.(1) | 651 | 20,096 | ||||||
Verizon Communications, Inc. | 941,240 | 51,890,561 | ||||||
ViacomCBS, Inc. - Class A | 401 | 10,266 | ||||||
ViacomCBS, Inc. - Class B | 1,677,338 | 39,115,522 | ||||||
Walt Disney Co. | 197,490 | 22,022,110 | ||||||
Zillow Group, Inc. - Class A(1) | 1,830 | 105,188 | ||||||
Zillow Group, Inc. - Class C(1) | 4,310 | 248,299 | ||||||
Zynga, Inc. - Class A(1) | 5,612 | 53,538 | ||||||
|
| |||||||
Total Communication Services |
| 727,168,661 | ||||||
|
| |||||||
Consumer Discretionary – 10.73% | ||||||||
Aarons, Inc. | 1,208,275 | 54,855,685 | ||||||
Advance Auto Parts, Inc. | 334,912 | 47,708,214 | ||||||
Aptiv Plc | 9,578 | 746,318 | ||||||
Aramark | 2,036,706 | 45,968,454 | ||||||
AutoNation, Inc.(1) | 1,740,212 | 65,397,167 | ||||||
AutoZone, Inc.(1) | 341 | 384,689 | ||||||
Best Buy Co., Inc. | 54,443 | 4,751,241 | ||||||
Booking Holdings, Inc.(1) | 66,361 | 105,669,275 | ||||||
BorgWarner, Inc. | 151,209 | 5,337,678 | ||||||
Bright Horizons Family Solutions, Inc.(1) | 631 | 73,953 | ||||||
Brunswick Corp. | 2,819 | 180,444 | ||||||
Burlington Stores, Inc.(1) | 246 | 48,445 | ||||||
Caesars Entertainment Corp.(1) | 20,348 | 246,821 | ||||||
Capri Holdings Ltd.(1) | 5,071 | 79,260 | ||||||
CarMax, Inc.(1) | 5,378 | 481,600 | ||||||
Carnival Corp. | 16,822 | 276,217 | ||||||
Carter’s, Inc. | 1,531 | 123,552 | ||||||
Choice Hotels International, Inc. | 1,243 | 98,073 | ||||||
Cie Generale des Etablissements Michelin SCA | 441,218 | 45,989,520 | ||||||
Columbia Sportswear Co. | 1,029 | 82,917 | ||||||
Compass Group Plc | 833,581 | 11,468,787 | ||||||
Compass Group Plc - ADR | 3,423,264 | 46,932,949 | ||||||
Darden Restaurants, Inc. | 4,649 | 352,255 | ||||||
Dick’s Sporting Goods, Inc. | 94,334 | 3,892,221 | ||||||
Dollar General Corp. | 180,717 | 34,428,396 | ||||||
Dollar Tree, Inc.(1) | 4,380 | 405,938 | ||||||
DR Horton, Inc. | 12,154 | 673,939 | ||||||
Dunkin’ Brands Group, Inc. | 434 | 28,310 | ||||||
eBay, Inc. | 157,952 | 8,284,582 | ||||||
Expedia Group, Inc. | 4,291 | 352,720 | ||||||
Extended Stay America, Inc. | 6,323 | 70,754 | ||||||
Foot Locker, Inc. | 129,314 | 3,770,796 | ||||||
Ford Motor Co. | 139,463 | 847,935 | ||||||
Frontdoor, Inc.(1) | 2,545 | 112,820 | ||||||
Gap, Inc. | 6,523 | 82,320 | ||||||
Garmin Ltd. | 5,553 | 541,417 | ||||||
General Motors Co. | 487,322 | 12,329,247 | ||||||
Gentex Corp. | 8,766 | 225,900 | ||||||
Genuine Parts Co. | 5,220 | 453,931 | ||||||
Graham Holdings Co. - Class B | 148 | 50,715 | ||||||
Grand Canyon Education, Inc.(1) | 1,667 | 150,914 | ||||||
GrubHub, Inc.(1) | 2,971 | 208,861 | ||||||
H&R Block, Inc. | 2,048 | 29,245 | ||||||
Hanesbrands, Inc. | 458,974 | 5,181,816 | ||||||
Harley-Davidson, Inc. | 179,572 | 4,268,426 | ||||||
Hasbro, Inc. | 4,546 | 340,723 | ||||||
Hilton Worldwide Holdings, Inc. | 9,760 | 716,872 | ||||||
Home Depot, Inc. | 289,872 | 72,615,835 | ||||||
Hyatt Hotels Corp. - Class A | 1,249 | 62,812 | ||||||
Kohl’s Corp. | 477,274 | 9,912,981 | ||||||
L Brands, Inc. | 8,227 | 123,158 | ||||||
Las Vegas Sands Corp. | 1,102,632 | 50,213,861 | ||||||
La-Z-Boy, Inc. | 116,724 | 3,158,551 | ||||||
Lear Corp. | 41,379 | 4,511,139 | ||||||
Leggett & Platt, Inc. | 4,718 | 165,838 | ||||||
Lennar Corp. - Class A | 927,596 | 57,158,466 | ||||||
Lennar Corp. - Class B | 561 | 25,856 | ||||||
LKQ Corp.(1) | 10,824 | 283,589 | ||||||
Lowes Companies, Inc. | 391,124 | 52,848,675 | ||||||
Marriott International, Inc. - Class A | 1,020,661 | 87,501,268 | ||||||
Marriott Vacations Worldwide Corp. | 498,253 | 40,961,379 | ||||||
Mattel, Inc.(1) | 1,018,349 | 9,847,435 | ||||||
McDonald’s Corp. | 657,378 | 121,266,520 | ||||||
MGM Resorts International | 3,135,442 | 52,675,426 | ||||||
Mohawk Industries, Inc.(1) | 2,076 | 211,254 | ||||||
Newell Brands, Inc. | 355,066 | 5,638,448 | ||||||
NIKE, Inc. - Class B | 933,125 | 91,492,906 | ||||||
Nordstrom, Inc. | 93,300 | 1,445,217 | ||||||
Norwegian Cruise Line Holdings Ltd.(1) | 9,147 | 150,285 | ||||||
NVR, Inc.(1) | 107 | 348,686 | ||||||
Ollie’s Bargain Outlet Holdings, Inc.(1) | 218 | 21,288 | ||||||
Peloton Interactive, Inc. - Class A(1) | 2,645 | 152,802 | ||||||
Penske Automotive Group, Inc. | 92,211 | 3,569,488 | ||||||
Planet Fitness, Inc. - Class A(1) | 1,237 | 74,925 | ||||||
Polaris, Inc. | 1,862 | 172,328 | ||||||
PulteGroup, Inc. | 167,535 | 5,701,216 | ||||||
PVH Corp. | 50,957 | 2,448,484 | ||||||
Qurate Retail, Inc.(1) | 13,606 | 129,257 | ||||||
Ralph Lauren Corp. - Class A | 54,498 | 3,952,195 |
Ross Stores, Inc. | 2,386 | 203,383 | ||||||
Royal Caribbean Cruises Ltd. | 6,115 | 307,584 | ||||||
SeaWorld Entertainment, Inc.(1) | 2,696,382 | 39,933,417 | ||||||
Service Corp. International | 6,215 | 241,701 | ||||||
ServiceMaster Global Holdings, Inc.(1) | 4,727 | 168,707 | ||||||
Six Flags Entertainment Corp. | 2,728 | 52,405 | ||||||
Skechers USA, Inc. - Class A(1) | 4,779 | 149,965 | ||||||
Sleep Number Corp.(1) | 55,824 | 2,324,511 | ||||||
Starbucks Corp. | 17,704 | 1,302,837 | ||||||
Tapestry, Inc. | 9,882 | 131,233 | ||||||
Target Corp. | 72,763 | 8,726,467 | ||||||
Tempur Sealy International, Inc.(1) | 437 | 31,442 | ||||||
Thor Industries, Inc. | 1,971 | 209,971 | ||||||
Tiffany & Co. | 4,329 | 527,878 | ||||||
TJX Companies, Inc. | 1,632,848 | 82,556,795 | ||||||
Toll Brothers, Inc. | 4,137 | 134,825 | ||||||
Ulta Beauty, Inc.(1) | 135 | 27,462 | ||||||
Under Armour, Inc. - Class A(1) | 6,728 | 65,531 | ||||||
Under Armour, Inc. - Class C(1) | 6,773 | 59,873 | ||||||
Vail Resorts, Inc. | 1,313 | 239,163 | ||||||
VF Corp. | 11,000 | 670,340 | ||||||
Wayfair, Inc. - Class A(1) | 207 | 40,905 | ||||||
Whirlpool Corp. | 57,205 | 7,409,764 | ||||||
Williams-Sonoma, Inc. | 2,298 | 188,459 | ||||||
Wyndham Destinations, Inc. | 3,002 | 84,596 | ||||||
Wyndham Hotels & Resorts, Inc. | 3,277 | 139,666 | ||||||
Wynn Resorts Ltd. | 2,634 | 196,207 | ||||||
Yum China Holdings, Inc. | 11,998 | 576,744 | ||||||
Yum! Brands, Inc. | 10,146 | 881,789 | ||||||
|
| |||||||
Total Consumer Discretionary |
| 1,341,127,500 | ||||||
|
| |||||||
Consumer Staples – 8.02% | ||||||||
Altria Group, Inc. | 1,994,506 | 78,284,360 | ||||||
Archer-Daniels-Midland Co. | 20,290 | 809,571 | ||||||
Beyond Meat Inc.(1) | 372 | 49,841 | ||||||
Brown-Forman Corp. - Class A | 239 | 13,759 | ||||||
Brown-Forman Corp. - Class B | 956 | 60,859 | ||||||
Bunge Ltd. | 230,518 | 9,481,205 | ||||||
Campbell Soup Co. | 3,401 | 168,792 | ||||||
Casey’s General Stores, Inc. | 1,316 | 196,768 | ||||||
Clorox Co. | 1,313 | 288,033 | ||||||
Coca-Cola Co. | 2,299,145 | 102,725,799 | ||||||
Coca-Cola European Partners Plc | 1,525,770 | 57,613,075 | ||||||
Colgate-Palmolive Co. | 1,290,637 | 94,552,067 | ||||||
Conagra Brands, Inc. | 1,079,649 | 37,971,255 | ||||||
Constellation Brands, Inc. - Class A | 5,706 | 998,265 | ||||||
Costco Wholesale Corp. | 136,101 | 41,267,184 | ||||||
Coty, Inc. - Class A | 10,297 | 46,028 | ||||||
Diageo Plc - ADR | 518,103 | 69,627,862 | ||||||
Edgewell Personal Care Co.(1) | 88,016 | 2,742,579 | ||||||
Energizer Holdings, Inc. | 456 | 21,655 | ||||||
Estee Lauder Companies, Inc. - Class A | 841 | 158,680 | ||||||
Flowers Foods, Inc. | 6,964 | 155,715 | ||||||
General Mills, Inc. | 21,716 | 1,338,791 | ||||||
Grocery Outlet Holding Corp.(1) | 1,158 | 47,246 | ||||||
Hain Celestial Group, Inc.(1) | 2,907 | 91,600 | ||||||
Herbalife Nutrition Ltd.(1) | 3,138 | 141,147 | ||||||
Hershey Co. | 1,203 | 155,933 | ||||||
Hormel Foods Corp. | 9,977 | 481,590 | ||||||
Ingredion, Inc. | 70,709 | 5,868,847 | ||||||
J.M. Smucker Co. | 68,546 | 7,252,852 | ||||||
Kellogg Co. | 5,932 | 391,868 | ||||||
Keurig Dr Pepper, Inc. | 12,209 | 346,736 | ||||||
Kimberly-Clark Corp. | 263,573 | 37,256,044 | ||||||
Kraft Heinz Co. | 319,868 | 10,200,591 | ||||||
Kroger Co. | 308,741 | 10,450,883 | ||||||
Lamb Weston Holdings, Inc. | 4,021 | 257,063 | ||||||
McCormick & Co., Inc. | 1,955 | 350,747 | ||||||
Molson Coors Brewing Co. - Class B | 128,449 | 4,413,508 | ||||||
Mondelez International, Inc. - Class A | 79,094 | 4,044,076 | ||||||
Nu Skin Enterprises, Inc. - Class A | 1,833 | 70,076 | ||||||
PepsiCo, Inc. | 583,378 | 77,157,574 | ||||||
Philip Morris International, Inc. | 1,662,817 | 116,496,959 | ||||||
Pilgrim’s Pride Corp.(1) | 139,883 | 2,362,624 | ||||||
Post Holdings, Inc.(1) | 2,277 | 199,511 | ||||||
Procter & Gamble Co. | 833,486 | 99,659,921 | ||||||
Reynolds Consumer Products, Inc. | 1,202 | 41,757 | ||||||
Seaboard Corp. | 9 | 26,404 | ||||||
Spectrum Brands Holdings, Inc. | 1,515 | 69,538 | ||||||
Sprouts Farmers Market, Inc.(1) | 129,237 | 3,307,175 | ||||||
Swedish Match AB | 297,803 | 21,011,684 | ||||||
Swedish Match AB - ADR | 802,996 | 28,265,459 | ||||||
Sysco Corp. | 4,994 | 272,972 | ||||||
TreeHouse Foods, Inc.(1) | 1,975 | 86,505 | ||||||
Tyson Foods, Inc. - Class A | 709,650 | 42,373,201 | ||||||
US Foods Holding Corp.(1) | 7,851 | 154,822 | ||||||
Walgreens Boots Alliance, Inc. | 294,237 | 12,472,706 | ||||||
Walmart, Inc. | 152,526 | 18,269,564 | ||||||
|
| |||||||
Total Consumer Staples |
| 1,002,621,326 | ||||||
|
| |||||||
Energy – 3.43% | ||||||||
Antero Midstream Corp. | 10,356 | 52,816 | ||||||
Apache Corp. | 13,494 | 182,169 | ||||||
Baker Hughes a GE Co. - Class A | 23,464 | 361,111 | ||||||
Cabot Oil & Gas Corp. | 14,011 | 240,709 | ||||||
Chevron Corp. | 545,073 | 48,636,864 | ||||||
Cimarex Energy Co. | 3,589 | 98,662 | ||||||
Concho Resources, Inc. | 6,975 | 359,212 | ||||||
ConocoPhillips | 178,356 | 7,494,519 | ||||||
Continental Resources, Inc. | 2,672 | 46,840 | ||||||
Devon Energy Corp. | 13,644 | 154,723 | ||||||
Diamondback Energy, Inc. | 5,630 | 235,447 | ||||||
Enbridge, Inc. | 600,620 | 18,270,860 | ||||||
EOG Resources, Inc. | 725,577 | 36,757,731 | ||||||
EQT Corp. | 9,110 | 108,409 | ||||||
Equitrans Midstream Corp. | 13,240 | 110,024 | ||||||
Exxon Mobil Corp. | 600,821 | 26,868,715 | ||||||
Halliburton Co. | 963,895 | 12,511,357 | ||||||
Helmerich & Payne, Inc. | 3,733 | 72,831 | ||||||
Hess Corp. | 955,312 | 49,494,715 | ||||||
HollyFrontier Corp. | 128,019 | 3,738,155 | ||||||
Kinder Morgan, Inc. | 428,340 | 6,497,918 | ||||||
Marathon Oil Corp. | 28,159 | 172,333 | ||||||
Marathon Petroleum Corp. | 188,318 | 7,039,327 | ||||||
Murphy Oil Corp. | 5,195 | 71,691 | ||||||
National Oilwell Varco, Inc. | 13,866 | 169,858 | ||||||
Noble Energy, Inc. | 17,016 | 152,463 | ||||||
Occidental Petroleum Corp. | 467,010 | 8,546,283 | ||||||
ONEOK, Inc. | 15,682 | 520,956 | ||||||
Parsley Energy, Inc. - Class A | 10,755 | 114,863 | ||||||
Phillips 66 | 812,025 | 58,384,597 | ||||||
Pioneer Natural Resources Co. | 71,139 | 6,950,280 | ||||||
Schlumberger Ltd. | 50,993 | 937,761 | ||||||
Targa Resources Corp. | 657,942 | 13,204,896 | ||||||
TC Energy Corp. | 714,690 | 30,631,613 | ||||||
TOTAL SA | 1,078,863 | 41,599,261 | ||||||
TOTAL SA - ADR | 128,069 | 4,925,534 | ||||||
Valero Energy Corp. | 722,197 | 42,479,628 | ||||||
Williams Companies, Inc. | 43,480 | 826,990 | ||||||
WPX Energy, Inc.(1) | 14,368 | 91,668 | ||||||
|
| |||||||
Total Energy |
| 429,113,789 | ||||||
|
| |||||||
Financials – 17.94% | ||||||||
Affiliated Managers Group, Inc. | 36,397 | 2,713,760 | ||||||
Aflac, Inc. | 25,826 | 930,511 | ||||||
AGNC Investment Corp. | 20,294 | 261,793 | ||||||
Alleghany Corp. | 451 | 220,602 | ||||||
Allstate Corp. | 102,334 | 9,925,375 | ||||||
Ally Financial, Inc. | 13,353 | 264,790 | ||||||
American Express Co. | 1,370,445 | 130,466,364 | ||||||
American Financial Group, Inc. | 55,445 | 3,518,540 | ||||||
American International Group, Inc. | 3,190,712 | 99,486,400 | ||||||
American National Insurance Co. | 317 | 22,846 | ||||||
Ameriprise Financial, Inc. | 73,292 | 10,996,732 | ||||||
Annaly Capital Management, Inc. | 561,101 | 3,680,823 | ||||||
Apollo Global Management, Inc. - Class A | 3,073 | 153,404 | ||||||
Arch Capital Group Ltd.(1) | 1,615,977 | 46,297,741 | ||||||
Arthur J. Gallagher & Co. | 6,730 | 656,108 | ||||||
Associated Banc-Corp. | 5,416 | 74,091 | ||||||
Assurant, Inc. | 2,130 | 220,008 | ||||||
Assured Guaranty Ltd. | 101,243 | 2,471,342 | ||||||
Athene Holding Ltd. - Class A(1) | 4,128 | 128,752 | ||||||
Axis Capital Holdings Ltd. | 2,700 | 109,512 | ||||||
Bank of America Corp. | 1,432,345 | 34,018,194 | ||||||
Bank of Hawaii Corp. | 1,409 | 86,527 | ||||||
Bank of New York Mellon Corp. | 1,288,246 | 49,790,708 | ||||||
Bank OZK | 4,363 | 102,400 | ||||||
Berkshire Hathaway, Inc. - Class B(1) | 936,854 | 167,237,808 | ||||||
BlackRock, Inc. - Class A | 5,271 | 2,867,898 | ||||||
BOK Financial Corp. | 1,121 | 63,269 | ||||||
Brighthouse Financial, Inc.(1) | 3,513 | 97,732 | ||||||
Brown & Brown, Inc. | 7,977 | 325,142 | ||||||
Capital One Financial Corp. | 142,198 | 8,900,173 | ||||||
Carlyle Group, Inc. | 3,770 | 105,183 | ||||||
CBOE Global Markets, Inc. | 3,060 | 285,437 | ||||||
Charles Schwab Corp. | 41,351 | 1,395,183 | ||||||
Chubb Ltd. | 1,520,237 | 192,492,409 | ||||||
Cincinnati Financial Corp. | 5,352 | 342,689 | ||||||
Citigroup, Inc. | 2,892,450 | 147,804,195 | ||||||
Citizens Financial Group, Inc. | 389,563 | 9,832,570 | ||||||
CME Group, Inc. - Class A | 12,707 | 2,065,396 | ||||||
CNA Financial Corp. | 139,339 | 4,479,749 | ||||||
Comerica, Inc. | 4,972 | 189,433 | ||||||
Commerce Bancshares, Inc. | 3,594 | 213,735 | ||||||
Credit Acceptance Corp.(1) | 337 | 141,206 | ||||||
Cullen/Frost Bankers, Inc. | 2,001 | 149,495 | ||||||
Discover Financial Services | 126,535 | 6,338,138 | ||||||
E*TRADE Financial Corp. | 1,395,535 | 69,399,956 | ||||||
East West Bancorp, Inc. | 5,038 | 182,577 | ||||||
Eaton Vance Corp. | 3,957 | 152,740 | ||||||
Equitable Holdings, Inc. | 777,009 | 14,988,504 | ||||||
Erie Indemnity Co. - Class A | 384 | 73,690 | ||||||
Essent Group Ltd. | 99,290 | 3,601,248 | ||||||
Evercore, Inc. - Class A | 1,411 | 83,136 | ||||||
Everest Re Group Ltd. | 33,379 | 6,882,750 | ||||||
Fidelity National Financial, Inc. | 1,218,501 | 37,359,241 | ||||||
Fifth Third Bancorp | 1,834,601 | 35,371,107 | ||||||
First American Financial Corp. | 3,877 | 186,174 | ||||||
First Citizens BancShares, Inc. - Class A | 272 | 110,165 | ||||||
First Hawaiian, Inc. | 4,631 | 79,838 | ||||||
First Horizon National Corp. | 11,012 | 109,679 | ||||||
First Republic Bank | 6,088 | 645,267 | ||||||
FNB Corp. | 512,476 | 3,843,570 | ||||||
Franklin Resources, Inc. | 391,518 | 8,210,132 | ||||||
Globe Life, Inc. | 3,749 | 278,288 | ||||||
Goldman Sachs Group, Inc. | 648,823 | 128,220,401 | ||||||
Hanover Insurance Group, Inc. | 1,353 | 137,099 | ||||||
Hartford Financial Services Group, Inc. | 220,411 | 8,496,844 | ||||||
Huntington Bancshares, Inc. | 36,102 | 326,182 | ||||||
Interactive Brokers Group, Inc. - Class A | 2,577 | 107,641 | ||||||
Intercontinental Exchange, Inc. | 12,525 | 1,147,290 | ||||||
Invesco Ltd. | 13,475 | 144,991 | ||||||
Jefferies Financial Group, Inc. | 3,632,263 | 56,481,690 | ||||||
JPMorgan Chase & Co. | 982,505 | 92,414,420 | ||||||
Kemper Corp. | 2,192 | 158,964 | ||||||
KeyCorp | 631,138 | 7,687,261 | ||||||
KKR & Co., Inc. - Class Miscella | 19,048 | 588,202 |
Lazard Ltd. - Class A | 103,898 | 2,974,600 | ||||||
Legg Mason, Inc. | 2,971 | 147,807 | ||||||
Lincoln National Corp. | 147,565 | 5,428,916 | ||||||
Loews Corp. | 734,253 | 25,177,535 | ||||||
LPL Financial Holdings, Inc. | 2,584 | 202,586 | ||||||
M&T Bank Corp. | 4,577 | 475,871 | ||||||
Markel Corp.(1) | 483 | 445,891 | ||||||
Marsh & McLennan Companies, Inc. | 799,415 | 85,833,189 | ||||||
Mercury General Corp. | 976 | 39,772 | ||||||
MetLife, Inc. | 1,182,352 | 43,179,495 | ||||||
MGIC Investment Corp. | 12,068 | 98,837 | ||||||
Morgan Stanley | 1,130,475 | 54,601,942 | ||||||
Morningstar, Inc. | 124 | 17,480 | ||||||
Nasdaq, Inc. | 4,091 | 488,752 | ||||||
Navient Corp. | 2,658,289 | 18,687,772 | ||||||
New Residential Investment Corp. | 14,806 | 110,009 | ||||||
New York Community Bancorp, Inc. | 4,925,339 | 50,238,458 | ||||||
Northern Trust Corp. | 504,207 | 40,003,783 | ||||||
Old Republic International Corp. | 11,056 | 180,323 | ||||||
OneMain Holdings, Inc. - Class A | 2,322 | 56,982 | ||||||
PacWest Bancorp | 4,170 | 82,191 | ||||||
People’s United Financial, Inc. | 15,114 | 174,869 | ||||||
Pinnacle Financial Partners, Inc. | 2,640 | 110,854 | ||||||
PNC Financial Services Group, Inc. | 639,656 | 67,298,208 | ||||||
Popular, Inc. | 3,102 | 115,301 | ||||||
Primerica, Inc. | 539 | 62,847 | ||||||
Principal Financial Group, Inc. | 9,709 | 403,312 | ||||||
Progressive Corp. | 14,898 | 1,193,479 | ||||||
Prospect Capital Corp. | 522,995 | 2,672,504 | ||||||
Prosperity Bancshares, Inc. | 3,190 | 189,422 | ||||||
Prudential Financial, Inc. | 93,666 | 5,704,259 | ||||||
Radian Group, Inc. | 223,750 | 3,470,362 | ||||||
Raymond James Financial, Inc. | 179,435 | 12,350,511 | ||||||
Regions Financial Corp. | 670,018 | 7,450,600 | ||||||
Reinsurance Group of America, Inc. - Class A | 2,421 | 189,903 | ||||||
RenaissanceRe Holdings Ltd. | 1,154 | 197,369 | ||||||
S&P Global, Inc. | 3,621 | 1,193,047 | ||||||
Santander Consumer USA Holdings, Inc. | 2,697 | 49,652 | ||||||
SEI Investments Co. | 4,121 | 226,573 | ||||||
Signature Bank | 1,859 | 198,764 | ||||||
SLM Corp. | 4,322,164 | 30,384,813 | ||||||
Starwood Property Trust, Inc. | 292,848 | 4,381,006 | ||||||
State Street Corp. | 592,350 | 37,643,842 | ||||||
Sterling Bancorp | 6,907 | 80,950 | ||||||
SVB Financial Group(1) | 1,837 | 395,929 | ||||||
Synchrony Financial | 2,690,998 | 59,632,516 | ||||||
Synovus Financial Corp. | 5,225 | 107,269 | ||||||
T Rowe Price Group, Inc. | 6,035 | 745,322 | ||||||
TCF Financial Corp. | 5,391 | 158,603 | ||||||
TD Ameritrade Holding Corp. | 9,280 | 337,606 | ||||||
TFS Financial Corp. | 2,082 | 29,793 | ||||||
Tradeweb Markets, Inc. - Class A | 440 | 25,582 | ||||||
Travelers Companies, Inc. | 9,198 | 1,049,032 | ||||||
Truist Financial Corp. | 48,216 | 1,810,511 | ||||||
Umpqua Holdings Corp. | 7,860 | 83,630 | ||||||
Unum Group | 7,265 | 120,526 | ||||||
US Bancorp | 1,528,491 | 56,279,039 | ||||||
Virtu Financial, Inc. - Class A | 239 | 5,640 | ||||||
Voya Financial, Inc. | 72,047 | 3,360,993 | ||||||
Webster Financial Corp. | 3,199 | 91,523 | ||||||
Wells Fargo & Co. | 4,521,942 | 115,761,715 | ||||||
Western Alliance Bancorp | 130,633 | 4,947,072 | ||||||
White Mountains Insurance Group Ltd. | 108 | 95,901 | ||||||
Willis Towers Watson Plc | 339,578 | 66,879,887 | ||||||
Wintrust Financial Corp. | 2,040 | 88,985 | ||||||
WR Berkley Corp. | 4,976 | 285,075 | ||||||
Zions Bancorp N.A. | 201,217 | 6,841,378 | ||||||
|
| |||||||
Total Financials |
| 2,242,741,375 | ||||||
|
| |||||||
Healthcare – 13.10% | ||||||||
Abbott Laboratories | 38,348 | 3,506,158 | ||||||
AbbVie, Inc. | 842,157 | 82,682,974 | ||||||
Acadia Healthcare Co., Inc.(1) | 3,140 | 78,877 | ||||||
Acceleron Pharma, Inc.(1) | 98 | 9,336 | ||||||
Agilent Technologies, Inc. | 10,111 | 893,509 | ||||||
Agios Pharmaceuticals, Inc.(1) | 1,984 | 106,104 | ||||||
Alexion Pharmaceuticals, Inc.(1) | 116,739 | 13,102,785 | ||||||
Alkermes Plc(1) | 5,640 | 109,444 | ||||||
AmerisourceBergen Corp. - Class A | 2,709 | 272,986 | ||||||
Amgen, Inc. | 250,028 | 58,971,604 | ||||||
Anthem, Inc. | 343,738 | 90,396,219 | ||||||
Baxter International, Inc. | 692,109 | 59,590,585 | ||||||
Becton Dickinson & Co. | 117,686 | 28,158,729 | ||||||
Biogen, Inc.(1) | 24,158 | 6,463,473 | ||||||
BioMarin Pharmaceutical, Inc.(1) | 600 | 74,004 | ||||||
Bio-Rad Laboratories, Inc. - Class A(1) | 755 | 340,875 | ||||||
Bio-Techne Corp. | 81 | 21,390 | ||||||
Bluebird Bio, Inc.(1) | 1,275 | 77,826 | ||||||
Boston Scientific Corp.(1) | 50,032 | 1,756,624 | ||||||
Bristol Myers Squibb Co. | 457,774 | 26,917,111 | ||||||
Bruker Corp. | 2,122 | 86,323 | ||||||
Cardinal Health, Inc. | 106,452 | 5,555,730 | ||||||
Catalent, Inc.(1) | 5,488 | 402,270 | ||||||
Centene Corp.(1) | 14,490 | 920,840 | ||||||
Change Healthcare, Inc.(1) | 2,295 | 25,704 | ||||||
Charles River Laboratories International, Inc.(1) | 199 | 34,696 | ||||||
Cigna Corp. | 9,576 | 1,796,936 | ||||||
Cooper Companies, Inc. | 1,530 | 433,969 | ||||||
CVS Health Corp. | 1,635,323 | 106,246,935 | ||||||
Danaher Corp. | 414,685 | 73,328,749 | ||||||
DaVita, Inc.(1) | 66,050 | 5,227,197 | ||||||
Dentsply Sirona, Inc. | 7,814 | 344,285 | ||||||
Elanco Animal Health, Inc.(1) | 14,288 | 306,478 | ||||||
Encompass Health Corp. | 1,908 | 118,162 | ||||||
Envista Holdings Corp.(1) | 1,831,600 | 38,628,444 | ||||||
Exact Sciences Corp.(1) | 696 | 60,510 | ||||||
Exelixis, Inc.(1) | 6,916 | 164,186 | ||||||
Fresenius Medical Care AG & Co. KGaA | 986,393 | 84,859,270 | ||||||
Gilead Sciences, Inc. | 421,192 | 32,406,512 | ||||||
GlaxoSmithKline Plc | 427,534 | 8,636,055 | ||||||
GlaxoSmithKline Plc - ADR | 113,441 | 4,627,258 | ||||||
Globus Medical, Inc. - Class A(1) | 2,648 | 126,336 | ||||||
Haemonetics Corp.(1) | 119 | 10,658 | ||||||
HCA Healthcare, Inc. | 72,060 | 6,994,144 | ||||||
Henry Schein, Inc.(1) | 5,095 | 297,497 | ||||||
Hill-Rom Holdings, Inc. | 2,104 | 230,977 | ||||||
Hologic, Inc.(1) | 937,231 | 53,422,167 | ||||||
Horizon Therapeutics Plc(1) | 486 | 27,012 | ||||||
Humana, Inc. | 102,349 | 39,685,825 | ||||||
ICU Medical, Inc.(1) | 508 | 93,629 | ||||||
Integra LifeSciences Holdings Corp.(1) | 2,550 | 119,825 | ||||||
Ionis Pharmaceuticals, Inc.(1) | 2,372 | 139,853 | ||||||
IQVIA Holdings, Inc.(1) | 4,222 | 599,017 | ||||||
Jazz Pharmaceuticals Plc(1) | 76,503 | 8,441,341 | ||||||
Johnson & Johnson | 1,086,610 | 152,809,964 | ||||||
Laboratory Corp. of America Holdings(1) | 3,276 | 544,176 | ||||||
McKesson Corp. | 41,382 | 6,348,826 | ||||||
Medtronic Plc | 2,185,903 | 200,447,305 | ||||||
Merck & Co., Inc. | 1,334,791 | 103,219,388 | ||||||
Mettler-Toledo International, Inc.(1) | 51 | 41,083 | ||||||
Molina Healthcare, Inc.(1) | 576 | 102,516 | ||||||
Mylan NV(1) | 18,430 | 296,354 | ||||||
Nektar Therapeutics - Class A(1) | 6,087 | 140,975 | ||||||
PerkinElmer, Inc. | 3,207 | 314,575 | ||||||
Perrigo Co. Plc | 4,882 | 269,828 | ||||||
Pfizer, Inc. | 1,718,199 | 56,185,107 | ||||||
PPD, Inc.(1) | 340 | 9,112 |
PRA Health Sciences, Inc.(1) | 336 | 32,689 | ||||||
Premier, Inc. - Class A(1) | 2,199 | 75,382 | ||||||
QIAGEN NV(1) | 8,038 | 344,107 | ||||||
Quest Diagnostics, Inc. | 4,779 | 544,615 | ||||||
Reata Pharmaceuticals, Inc. - Class A(1) | 89 | 13,886 | ||||||
Regeneron Pharmaceuticals, Inc.(1) | 7,572 | 4,722,278 | ||||||
Sage Therapeutics, Inc.(1) | 1,693 | 70,395 | ||||||
Sanofi - ADR | 1,466,656 | 74,872,789 | ||||||
STERIS Plc | 2,845 | 436,537 | ||||||
Stryker Corp. | 8,444 | 1,521,524 | ||||||
Syneos Health, Inc. - Class A(1) | 1,996 | 116,267 | ||||||
Tandem Diabetes Care, Inc.(1) | 228 | 22,554 | ||||||
Teladoc Health, Inc.(1) | 253 | 48,283 | ||||||
Teleflex, Inc. | 616 | 224,212 | ||||||
Thermo Fisher Scientific, Inc. | 5,905 | 2,139,618 | ||||||
United Therapeutics Corp.(1) | 1,551 | 187,671 | ||||||
UnitedHealth Group, Inc. | 561,930 | 165,741,254 | ||||||
Universal Health Services, Inc. - Class B | 56,113 | 5,212,337 | ||||||
Varian Medical Systems, Inc.(1) | 2,835 | 347,344 | ||||||
Waters Corp.(1) | 2,025 | 365,310 | ||||||
Zimmer Biomet Holdings, Inc. | 92,736 | 11,068,969 | ||||||
Zoetis, Inc. - Class A | 1,617 | 221,594 | ||||||
|
| |||||||
Total Healthcare |
| 1,636,988,227 | ||||||
|
| |||||||
Industrials – 15.19% | ||||||||
3M Co. | 295,761 | 46,135,758 | ||||||
Acuity Brands, Inc. | 1,405 | 134,515 | ||||||
ADT, Inc. | 3,999 | 31,912 | ||||||
AECOM(1) | 1,371,427 | 51,538,227 | ||||||
AGCO Corp. | 84,953 | 4,711,493 | ||||||
Air Lease Corp. - Class A | 2,445,123 | 71,617,653 | ||||||
Airbus SE | 116,674 | 8,360,138 | ||||||
Airbus SE - ADR | 2,014,786 | 35,963,930 | ||||||
Alaska Air Group, Inc. | 166,098 | 6,022,713 | ||||||
Allegion Plc | 1,153 | 117,860 | ||||||
Allison Transmission Holdings, Inc. | 92,691 | 3,409,175 | ||||||
AMERCO | 319 | 96,399 | ||||||
American Airlines Group, Inc. | 17,986 | 235,077 | ||||||
AMETEK, Inc. | 8,392 | 749,993 | ||||||
AO Smith Corp. | 4,742 | 223,443 | ||||||
Armstrong World Industries, Inc. | 1,073 | 83,651 | ||||||
Atkore International Group, Inc.(1) | 113,180 | 3,095,473 | ||||||
Boeing Co. | 183,330 | 33,604,389 | ||||||
BWX Technologies, Inc. | 844,631 | 47,839,900 | ||||||
Canadian National Railway Co. | 806,151 | 71,400,794 | ||||||
Carlisle Companies, Inc. | 1,931 | 231,083 | ||||||
Carrier Global Corp. | 19,904 | 442,267 | ||||||
Caterpillar, Inc. | 19,388 | 2,452,582 | ||||||
CH Robinson Worldwide, Inc. | 3,994 | 315,766 | ||||||
Cintas Corp. | 360 | 95,890 | ||||||
Clean Harbors, Inc.(1) | 1,839 | 110,303 | ||||||
Colfax Corp.(1) | 3,540 | 98,766 | ||||||
Copa Holdings SA - Class A | 1,120 | 56,627 | ||||||
CoreLogic, Inc. | 2,685 | 180,486 | ||||||
Crane Co. | 89,028 | 5,293,605 | ||||||
CSX Corp. | 27,303 | 1,904,111 | ||||||
Cummins, Inc. | 39,864 | 6,906,837 | ||||||
Curtiss-Wright Corp. | 54,179 | 4,837,101 | ||||||
Deere & Co. | 682,751 | 107,294,320 | ||||||
Delta Air Lines, Inc. | 168,152 | 4,716,664 | ||||||
Donaldson Co., Inc. | 4,069 | 189,290 | ||||||
Dover Corp. | 5,354 | 516,982 | ||||||
Eaton Corp. Plc | 14,523 | 1,270,472 | ||||||
Emerson Electric Co. | 1,110,658 | 68,894,116 | ||||||
Equifax, Inc. | 1,116 | 191,818 | ||||||
Expeditors International of Washington, Inc. | 2,296 | 174,588 | ||||||
Fastenal Co. | 3,869 | 165,748 | ||||||
FedEx Corp. | 631,196 | 88,506,303 | ||||||
Flowserve Corp. | 83,269 | 2,374,832 | ||||||
Fortive Corp. | 10,636 | 719,632 | ||||||
Fortune Brands Home & Security, Inc. | 4,922 | 314,663 | ||||||
FTI Consulting, Inc.(1) | 1,305 | 149,488 | ||||||
Gates Industrial Corp. Plc(1) | 1,963 | 20,180 | ||||||
Generac Holdings, Inc.(1) | 192 | 23,411 | ||||||
General Dynamics Corp. | 892,347 | 133,370,183 | ||||||
General Electric Co. | 6,221,094 | 42,490,072 | ||||||
Graco, Inc. | 2,951 | 141,618 | ||||||
GrafTech International Ltd. | 2,442 | 19,487 | ||||||
Greenbrier Companies, Inc. | 88,286 | 2,008,506 | ||||||
HD Supply Holdings, Inc.(1) | 180,688 | 6,260,839 | ||||||
HEICO Corp. | 313 | 31,190 | ||||||
HEICO Corp. - Class A | 545 | 44,276 | ||||||
Hexcel Corp. | 2,979 | 134,710 | ||||||
Hillenbrand, Inc. | 94,708 | 2,563,746 | ||||||
Honeywell International, Inc. | 437,488 | 63,256,390 | ||||||
Howmet Aerospace, Inc. | 14,108 | 223,612 | ||||||
Hubbell, Inc. - Class B | 1,931 | 242,070 | ||||||
Huntington Ingalls Industries, Inc. | 35,680 | 6,225,803 | ||||||
IAA, Inc.(1) | 3,656 | 141,012 | ||||||
IDEX Corp. | 2,692 | 425,444 | ||||||
IHS Markit Ltd. | 6,458 | 487,579 | ||||||
Illinois Tool Works, Inc. | 6,276 | 1,097,359 | ||||||
Ingersoll Rand, Inc.(1) | 12,386 | 348,294 | ||||||
ITT, Inc. | 3,089 | 181,448 | ||||||
Jacobs Engineering Group, Inc. | 560,451 | 47,526,245 | ||||||
JB Hunt Transport Services, Inc. | 507,769 | 61,104,921 | ||||||
JetBlue Airways Corp.(1) | 380,885 | 4,151,646 | ||||||
Johnson Controls International Plc | 313,368 | 10,698,383 | ||||||
Kansas City Southern | 3,390 | 506,093 | ||||||
Kirby Corp.(1) | 2,129 | 114,029 | ||||||
Knight-Swift Transportation Holdings, Inc. - Class A | 4,467 | 186,319 | ||||||
L3Harris Technologies, Inc. | 165,285 | 28,043,906 | ||||||
Landstar System, Inc. | 256 | 28,751 | ||||||
Lennox International, Inc. | 1,236 | 287,976 | ||||||
Lincoln Electric Holdings, Inc. | 1,170 | 98,561 | ||||||
Lockheed Martin Corp. | 145,435 | 53,072,140 | ||||||
Lyft, Inc. - Class A(1) | 8,520 | 281,245 | ||||||
Macquarie Infrastructure Corp. | 2,624 | 80,531 | ||||||
ManpowerGroup, Inc. | 2,069 | 142,244 | ||||||
Masco Corp. | 9,394 | 471,673 | ||||||
MasTec, Inc.(1) | 69,111 | 3,101,011 | ||||||
Mercury Systems, Inc.(1) | 363 | 28,554 | ||||||
Middleby Corp.(1) | 1,968 | 155,354 | ||||||
Moog, Inc. - Class A | 49,588 | 2,627,172 | ||||||
MSA Safety, Inc. | 1,012 | 115,813 | ||||||
MSC Industrial Direct Co., Inc. - Class A | 1,596 | 116,205 | ||||||
Nielsen Holdings Plc | 965,179 | 14,342,560 | ||||||
Nordson Corp. | 376 | 71,331 | ||||||
Norfolk Southern Corp. | 9,268 | 1,627,183 | ||||||
Northrop Grumman Corp. | 163,576 | 50,289,805 | ||||||
nVent Electric Plc | 141,149 | 2,643,721 | ||||||
Old Dominion Freight Line, Inc. | 481 | 81,573 | ||||||
Oshkosh Corp. | 74,987 | 5,370,569 | ||||||
Otis Worldwide Corp. | 185,364 | 10,539,797 | ||||||
Owens Corning | 1,176,026 | 65,575,210 | ||||||
PACCAR, Inc. | 148,150 | 11,089,027 | ||||||
Parker-Hannifin Corp. | 4,578 | 839,010 | ||||||
Pentair Plc | 5,899 | 224,103 | ||||||
Quanta Services, Inc. | 1,345,605 | 52,788,084 | ||||||
Raytheon Technologies Corp. | 2,541,666 | 156,617,459 | ||||||
Regal Beloit Corp. | 1,622 | 141,633 | ||||||
Republic Services, Inc. - Class A | 7,505 | 615,785 | ||||||
Robert Half International, Inc. | 3,990 | 210,792 | ||||||
Rockwell Automation, Inc. | 2,131 | 453,903 | ||||||
Rollins, Inc. | 662 | 28,062 | ||||||
Roper Technologies, Inc. | 3,211 | 1,246,703 | ||||||
Ryder System, Inc. | 1,872 | 70,219 |
Schneider National, Inc. - Class B | 2,107 | 51,980 | ||||||
Sensata Technologies Holding Plc(1) | 5,514 | 205,286 | ||||||
Snap-on, Inc. | 112,974 | 15,648,029 | ||||||
Southwest Airlines Co. | 21,073 | 720,275 | ||||||
Spirit AeroSystems Holdings, Inc. - Class A | 3,746 | 89,679 | ||||||
Stanley Black & Decker, Inc. | 524,895 | 73,159,865 | ||||||
Stericycle, Inc.(1) | 288,647 | 16,158,459 | ||||||
Teledyne Technologies, Inc.(1) | 1,345 | 418,228 | ||||||
Textron, Inc. | 104,740 | 3,446,993 | ||||||
Timken Co. | 2,595 | 118,046 | ||||||
Toro Co. | 378 | 25,076 | ||||||
Trane Technologies Plc | 8,542 | 760,067 | ||||||
TransDigm Group, Inc. | 1,453 | 642,299 | ||||||
TransUnion | 604 | 52,572 | ||||||
Trinity Industries, Inc. | 138,127 | 2,940,724 | ||||||
Uber Technologies, Inc.(1) | 11,278 | 350,520 | ||||||
Union Pacific Corp. | 530,376 | 89,670,670 | ||||||
United Continental Holdings, Inc.(1) | 10,372 | 358,975 | ||||||
United Parcel Service, Inc. - Class B | 921,861 | 102,492,506 | ||||||
United Rentals, Inc.(1) | 42,090 | 6,273,094 | ||||||
Univar, Inc.(1) | 243,484 | 4,105,140 | ||||||
Valmont Industries, Inc. | 749 | 85,101 | ||||||
Virgin Galactic Holdings, Inc.(1) | 301 | 4,918 | ||||||
Wabtec Corp. | 814,341 | 46,881,611 | ||||||
Waste Management, Inc. | 13,163 | 1,394,093 | ||||||
Watsco, Inc. | 1,164 | 206,843 | ||||||
Woodward, Inc. | 1,988 | 154,169 | ||||||
WW Grainger, Inc. | 423 | 132,890 | ||||||
XPO Logistics, Inc.(1) | 3,083 | 238,162 | ||||||
Xylem, Inc. | 6,394 | 415,354 | ||||||
|
| |||||||
Total Industrials |
| 1,898,520,987 | ||||||
|
| |||||||
Information Technology – 11.18% | ||||||||
2U, Inc.(1) | 1,488 | 56,484 | ||||||
Accenture Plc - Class A | 319,996 | 68,709,541 | ||||||
Advanced Micro Devices, Inc.(1) | 2,923 | 153,779 | ||||||
Akamai Technologies, Inc.(1) | 1,006 | 107,733 | ||||||
Alliance Data Systems Corp. | 1,672 | 75,441 | ||||||
Amdocs Ltd. | 73,473 | 4,473,036 | ||||||
Amphenol Corp. - Class A | 4,202 | 402,594 | ||||||
Analog Devices, Inc. | 11,573 | 1,419,313 | ||||||
Apple, Inc. | 202,879 | 74,010,259 | ||||||
Applied Materials, Inc. | 524,113 | 31,682,631 | ||||||
Arista Networks, Inc.(1) | 373 | 78,341 | ||||||
Arrow Electronics, Inc.(1) | 62,096 | 4,265,374 | ||||||
Aspen Technology, Inc.(1) | 164 | 16,992 | ||||||
Autodesk, Inc.(1) | 2,622 | 627,156 | ||||||
Automatic Data Processing, Inc. | 320,454 | 47,712,396 | ||||||
Avnet, Inc. | 3,503 | 97,681 | ||||||
Broadcom, Inc. | 225,036 | 71,023,612 | ||||||
CACI International, Inc. - Class A(1) | 744 | 161,359 | ||||||
CDK Global, Inc. | 3,800 | 157,396 | ||||||
Ceridian HCM Holding, Inc.(1) | 1,127 | 89,337 | ||||||
Ciena Corp.(1) | 63,342 | 3,430,603 | ||||||
Cirrus Logic, Inc.(1) | 2,087 | 128,935 | ||||||
Cisco Systems, Inc. | 2,936,023 | 136,936,113 | ||||||
Citrix Systems, Inc. | 3,207 | 474,347 | ||||||
Cognizant Technology Solutions Corp. - Class A | 912,548 | 51,850,977 | ||||||
Coherent, Inc.(1) | 150 | 19,647 | ||||||
CommScope Holding Co., Inc.(1) | 6,476 | 53,945 | ||||||
Corning, Inc. | 193,786 | 5,019,057 | ||||||
Cree, Inc.(1) | 3,868 | 228,947 | ||||||
Crowdstrike Holdings, Inc. - Class A(1) | 1,130 | 113,328 | ||||||
Dell Technologies, Inc. - Class C(1) | 81,008 | 4,450,580 | ||||||
Dolby Laboratories, Inc. - Class A | 1,986 | 130,818 | ||||||
DXC Technology Co. | 175,886 | 2,902,119 | ||||||
EchoStar Corp. - Class A(1) | 1,718 | 48,035 | ||||||
Entegris, Inc. | 306 | 18,069 | ||||||
Euronet Worldwide, Inc.(1) | 1,796 | 172,093 | ||||||
F5 Networks, Inc.(1) | 2,178 | 303,787 | ||||||
Fidelity National Information Services, Inc. | 22,322 | 2,993,157 | ||||||
FireEye, Inc.(1) | 6,062 | 73,805 | ||||||
First Solar, Inc.(1) | 2,971 | 147,065 | ||||||
Fiserv, Inc.(1) | 14,281 | 1,394,111 | ||||||
FLIR Systems, Inc. | 4,661 | 189,097 | ||||||
Genpact Ltd. | 4,096 | 149,586 | ||||||
Global Payments, Inc. | 10,656 | 1,807,471 | ||||||
Guidewire Software, Inc.(1) | 2,404 | 266,483 | ||||||
Hewlett Packard Enterprise Co. | 518,137 | 5,041,473 | ||||||
HP, Inc. | 348,432 | 6,073,170 | ||||||
Intel Corp. | 614,793 | 36,783,065 | ||||||
International Business Machines Corp. | 75,741 | 9,147,241 | ||||||
IPG Photonics Corp.(1) | 1,185 | 190,062 | ||||||
Jabil, Inc. | 4,255 | 136,500 | ||||||
Jack Henry & Associates, Inc. | 591 | 108,762 | ||||||
Juniper Networks, Inc. | 11,749 | 268,582 | ||||||
Keysight Technologies, Inc.(1) | 4,441 | 447,564 | ||||||
Lam Research Corp. | 17,852 | 5,774,408 | ||||||
Leidos Holdings, Inc. | 4,343 | 406,809 | ||||||
Littelfuse, Inc. | 841 | 143,500 | ||||||
LogMeIn, Inc. | 1,589 | 134,700 | ||||||
Lumentum Holdings, Inc.(1) | 2,387 | 194,373 | ||||||
Manhattan Associates, Inc.(1) | 244 | 22,985 | ||||||
Marvell Technology Group Ltd. | 2,126,487 | 74,554,634 | ||||||
Maxim Integrated Products, Inc. | 6,341 | 384,328 | ||||||
Methode Electronics, Inc. | 96,320 | 3,010,963 | ||||||
Microchip Technology, Inc. | 570,036 | 60,030,491 | ||||||
Micron Technology, Inc.(1) | 40,147 | 2,068,373 | ||||||
Microsoft Corp. | 667,073 | 135,756,026 | ||||||
MKS Instruments, Inc. | 482 | 54,582 | ||||||
Motorola Solutions, Inc. | 5,461 | 765,250 | ||||||
National Instruments Corp. | 4,605 | 178,260 | ||||||
NCR Corp.(1) | 4,543 | 78,685 | ||||||
NetApp, Inc. | 3,624 | 160,797 | ||||||
Nuance Communications, Inc.(1) | 10,047 | 254,239 | ||||||
NXP Semiconductors NV | 576,593 | 65,754,666 | ||||||
ON Semiconductor Corp.(1) | 14,502 | 287,430 | ||||||
Oracle Corp. | 1,879,573 | 103,884,000 | ||||||
Paychex, Inc. | 2,410 | 182,558 | ||||||
Pegasystems, Inc. | 142 | 14,366 | ||||||
Pure Storage, Inc. - Class A(1) | 3,685 | 63,861 | ||||||
Qorvo, Inc.(1) | 4,270 | 471,963 | ||||||
QUALCOMM, Inc. | 1,265,974 | 115,469,489 | ||||||
RealPage, Inc.(1) | 396 | 25,744 | ||||||
Sabre Corp. | 9,856 | 79,439 | ||||||
Salesforce.com, Inc.(1) | 2,264 | 424,115 | ||||||
Samsung Electronics Co. Ltd. | 1,597,279 | 70,707,760 | ||||||
Science Applications International Corp. | 41,049 | 3,188,686 | ||||||
Seagate Technology Plc | 119,013 | 5,761,419 | ||||||
Skyworks Solutions, Inc. | 5,963 | 762,429 | ||||||
SolarWinds Corp.(1) | 1,664 | 29,403 | ||||||
SS&C Technologies Holdings, Inc. | 6,353 | 358,817 | ||||||
SYNNEX Corp. | 1,484 | 177,739 | ||||||
Synopsys, Inc.(1) | 385 | 75,075 | ||||||
TE Connectivity Ltd. | 40,800 | 3,327,240 | ||||||
Teradata Corp.(1) | 919 | 19,115 | ||||||
Texas Instruments, Inc. | 667,538 | 84,757,300 | ||||||
Trimble, Inc.(1) | 9,267 | 400,242 | ||||||
Twilio, Inc. - Class A(1) | 772 | 169,392 | ||||||
Ubiquiti, Inc. | 57 | 9,950 | ||||||
VeriSign, Inc.(1) | 1,488 | 307,763 | ||||||
ViaSat, Inc.(1) | 2,059 | 79,004 | ||||||
Visa, Inc. - Class A | 374,295 | 72,302,565 | ||||||
Western Digital Corp. | 65,488 | 2,891,295 | ||||||
Western Union Co. | 171,904 | 3,716,564 | ||||||
WEX, Inc.(1) | 1,414 | 233,324 | ||||||
Xerox Corp. | 6,463 | 98,819 | ||||||
Zebra Technologies Corp. - Class A(1) | 161 | 41,208 | ||||||
|
| |||||||
Total Information Technology |
| 1,396,865,192 | ||||||
|
| |||||||
Materials – 5.20% | ||||||||
Air Products & Chemicals, Inc. | 223,605 | 53,991,663 | ||||||
Akzo Nobel NV | 45,519 | 4,089,456 | ||||||
Albemarle Corp. | 3,772 | 291,236 | ||||||
Amcor Plc | 48,755 | 497,789 | ||||||
AptarGroup, Inc. | 2,295 | 256,994 | ||||||
Ardagh Group SA - Class A | 788 | 10,173 | ||||||
Ashland Global Holdings, Inc. | 1,977 | 136,611 | ||||||
Avery Dennison Corp. | 1,749 | 199,543 | ||||||
Axalta Coating Systems Ltd.(1) | 7,527 | 169,734 | ||||||
Ball Corp. | 730 | 50,728 | ||||||
Berry Global Group, Inc.(1) | 3,132 | 138,810 | ||||||
Cabot Corp. | 1,990 | 73,729 | ||||||
Celanese Corp. - Class A | 518,866 | 44,798,890 | ||||||
CF Industries Holdings, Inc. | 937,243 | 26,374,018 | ||||||
Chemours Co. | 5,836 | 89,583 | ||||||
Corteva, Inc. | 2,157,036 | 57,786,994 | ||||||
Crown Holdings, Inc.(1) | 4,156 | 270,680 | ||||||
Dow, Inc. | 26,552 | 1,082,259 | ||||||
DowDuPont, Inc. | 2,396,490 | 127,325,514 | ||||||
Eagle Materials, Inc. | 1,475 | 103,574 | ||||||
Eastman Chemical Co. | 102,067 | 7,107,946 | ||||||
Ecolab, Inc. | 401,813 | 79,940,696 | ||||||
Element Solutions, Inc.(1) | 4,916,089 | 53,339,566 | ||||||
FMC Corp. | 3,717 | 370,288 | ||||||
Freeport-McMoRan, Inc. | 51,844 | 599,835 | ||||||
Graphic Packaging Holding Co. | 456,714 | 6,389,429 | ||||||
Huntsman Corp. | 129,999 | 2,336,082 | ||||||
Ingevity Corp.(1) | 71,312 | 3,748,872 | ||||||
International Flavors & Fragrances, Inc. | 3,824 | 468,287 | ||||||
International Paper Co. | 792,600 | 27,907,446 | ||||||
Linde Plc | 554,134 | 117,537,363 | ||||||
LyondellBasell Industries NV - Class A | 125,983 | 8,279,603 | ||||||
Martin Marietta Materials, Inc. | 2,222 | 458,999 | ||||||
Mosaic Co. | 12,343 | 154,411 | ||||||
NewMarket Corp. | 42 | 16,820 | ||||||
Newmont Goldcorp Corp. | 28,736 | 1,774,161 | ||||||
Nucor Corp. | 10,772 | 446,069 | ||||||
Olin Corp. | 5,095 | 58,542 | ||||||
Packaging Corp. of America | 3,348 | 334,130 | ||||||
PPG Industries, Inc. | 44,384 | 4,707,367 | ||||||
Reliance Steel & Aluminum Co. | 47,507 | 4,509,839 | ||||||
Royal Gold, Inc. | 665 | 82,673 | ||||||
RPM International, Inc. | 749 | 56,220 | ||||||
Scotts Miracle-Gro Co. | 91 | 12,237 | ||||||
Sealed Air Corp. | 106,293 | 3,491,725 | ||||||
Silgan Holdings, Inc. | 2,810 | 91,016 | ||||||
Sonoco Products Co. | 3,579 | 187,146 | ||||||
Southern Copper Corp. | 2,948 | 117,242 | ||||||
Steel Dynamics, Inc. | 7,243 | 188,970 | ||||||
Valvoline, Inc. | 6,622 | 128,003 | ||||||
Vulcan Materials Co. | 4,725 | 547,391 | ||||||
Westlake Chemical Corp. | 1,211 | 64,970 | ||||||
Westrock Co. | 222,391 | 6,284,770 | ||||||
WR Grace & Co. | 1,289 | 65,494 | ||||||
|
| |||||||
Total Materials |
| 649,541,586 | ||||||
|
| |||||||
Real Estate – 2.89% | ||||||||
Alexandria Real Estate Equities, Inc. | 4,477 | 726,393 | ||||||
American Campus Communities, Inc. | 1,340,615 | 46,867,900 | ||||||
American Homes 4 Rent - Class A | 9,276 | 249,524 | ||||||
American Tower Corp. | 217,886 | 56,332,246 | ||||||
Americold Realty Trust | 6,448 | 234,062 | ||||||
Apartment Investment & Management Co. - Class A | 5,290 | 199,116 | ||||||
Apple Hospitality REIT, Inc. | 7,490 | 72,353 | ||||||
AvalonBay Communities, Inc. | 5,032 | 778,148 | ||||||
Boston Properties, Inc. | 5,728 | 517,697 | ||||||
Brandywine Realty Trust | 336,440 | 3,663,832 | ||||||
Brixmor Property Group, Inc. | 10,586 | 135,713 | ||||||
Camden Property Trust | 3,372 | 307,594 | ||||||
CBRE Group, Inc. - Class A(1) | 11,926 | 539,294 | ||||||
CoreSite Realty Corp. | 468 | 56,656 | ||||||
Corporate Office Properties Trust | 4,012 | 101,664 | ||||||
Cousins Properties, Inc. | 89,775 | 2,677,988 | ||||||
Crown Castle International Corp. | 997 | 166,848 | ||||||
CubeSmart | 6,903 | 186,312 | ||||||
CyrusOne, Inc. | 4,109 | 298,930 | ||||||
Digital Realty Trust, Inc. | 9,561 | 1,358,714 | ||||||
Douglas Emmett, Inc. | 6,486 | 198,861 | ||||||
Duke Realty Corp. | 13,168 | 466,016 | ||||||
Empire State Realty Trust, Inc. - Class A | 5,226 | 36,582 | ||||||
EPR Properties | 2,785 | 92,267 | ||||||
Equity Commonwealth | 4,170 | 134,274 | ||||||
Equity LifeStyle Properties, Inc. | 3,667 | 229,114 | ||||||
Equity Residential | 407,584 | 23,974,091 | ||||||
Essex Property Trust, Inc. | 2,397 | 549,320 | ||||||
Extra Space Storage, Inc. | 1,334 | 123,222 | ||||||
Federal Realty Investment Trust | 2,689 | 229,130 | ||||||
First Industrial Realty Trust, Inc. | 4,510 | 173,364 | ||||||
Gaming & Leisure Properties, Inc. | 90,010 | 3,114,346 | ||||||
Healthcare Trust of America, Inc. - Class A | 7,767 | 205,981 | ||||||
Healthpeak Properties, Inc. | 20,083 | 553,487 | ||||||
Highwoods Properties, Inc. | 4,140 | 154,546 | ||||||
Host Hotels & Resorts, Inc. | 247,163 | 2,666,889 | ||||||
Howard Hughes Corp.(1) | 1,394 | 72,418 | ||||||
Hudson Pacific Properties, Inc. | 5,367 | 135,034 | ||||||
Invitation Homes, Inc. | 19,457 | 535,651 | ||||||
Iron Mountain, Inc. | 139,685 | 3,645,779 | ||||||
JBG SMITH Properties | 4,352 | 128,689 | ||||||
Jones Lang LaSalle, Inc. | 1,840 | 190,366 | ||||||
Kilroy Realty Corp. | 4,105 | 240,964 | ||||||
Kimco Realty Corp. | 14,760 | 189,518 | ||||||
Lamar Advertising Co. - Class A | 3,071 | 205,020 | ||||||
Life Storage, Inc. | 1,666 | 158,187 | ||||||
Medical Properties Trust, Inc. | 224,396 | 4,218,645 | ||||||
MGM Growth Properties LLC - Class A | 2,672,893 | 72,729,419 | ||||||
Mid-America Apartment Communities, Inc. | 4,071 | 466,822 | ||||||
National Retail Properties, Inc. | 6,120 | 217,138 | ||||||
Office Properties Income Trust | 104,183 | 2,705,633 | ||||||
Omega Healthcare Investors, Inc. | 8,040 | 239,029 | ||||||
Outfront Media, Inc. | 5,166 | 73,202 | ||||||
Paramount Group, Inc. | 6,761 | 52,127 | ||||||
Park Hotels & Resorts, Inc. | 8,555 | 84,609 | ||||||
Prologis, Inc. | 26,353 | 2,459,525 | ||||||
Public Storage | 284,756 | 54,641,829 | ||||||
Rayonier, Inc. | 646,775 | 16,033,552 | ||||||
Realty Income Corp. | 12,297 | 731,672 | ||||||
Regency Centers Corp. | 6,022 | 276,350 | ||||||
Rexford Industrial Realty, Inc. | 4,147 | 171,810 | ||||||
SBA Communications Corp. - Class A | 3,420 | 1,018,886 | ||||||
Simon Property Group, Inc. | 2,317 | 158,436 | ||||||
SL Green Realty Corp. | 284,169 | 14,006,690 | ||||||
Spirit Realty Capital, Inc. | 3,675 | 128,111 | ||||||
STORE Capital Corp. | 8,032 | 191,242 | ||||||
Sun Communities, Inc. | 3,455 | 468,774 | ||||||
Taubman Centers, Inc. | 2,144 | 80,957 | ||||||
UDR, Inc. | 11,037 | 412,563 | ||||||
Ventas, Inc. | 13,344 | 488,657 | ||||||
VEREIT, Inc. | 556,061 | 3,575,472 | ||||||
VICI Properties, Inc. | 16,780 | 338,788 | ||||||
Vornado Realty Trust | 6,270 | 239,577 | ||||||
Weingarten Realty Investors | 4,334 | 82,043 | ||||||
Welltower, Inc. | 14,951 | 773,714 | ||||||
Weyerhaeuser Co. | 1,343,268 | 30,169,799 | ||||||
WP Carey, Inc. | 6,361 | 430,322 | ||||||
|
| |||||||
Total Real Estate |
| 361,539,493 | ||||||
|
| |||||||
Utilities – 2.47% | ||||||||
AES Corp. | 23,631 | 342,413 | ||||||
Alliant Energy Corp. | 8,929 | 427,163 | ||||||
Ameren Corp. | 71,529 | 5,032,780 | ||||||
American Electric Power Co., Inc. | 17,770 | 1,415,203 | ||||||
American Water Works Co., Inc. | 6,479 | 833,588 | ||||||
Atmos Energy Corp. | 4,332 | 431,381 | ||||||
Avangrid, Inc. | 2,025 | 85,010 | ||||||
CenterPoint Energy, Inc. | 408,655 | 7,629,589 | ||||||
CMS Energy Corp. | 10,213 | 596,643 | ||||||
Consolidated Edison, Inc. | 11,980 | 861,721 | ||||||
Dominion Energy, Inc. | 30,020 | 2,437,024 | ||||||
DTE Energy Co. | 7,125 | 765,938 | ||||||
Duke Energy Corp. | 26,300 | 2,101,107 | ||||||
Edison International | 1,193,952 | 64,843,533 | ||||||
Entergy Corp. | 7,182 | 673,743 | ||||||
Essential Utilities, Inc. | 7,994 | 337,667 | ||||||
Evergy, Inc. | 8,091 | 479,715 | ||||||
Eversource Energy | 12,055 | 1,003,820 | ||||||
Exelon Corp. | 1,450,632 | 52,643,435 | ||||||
FirstEnergy Corp. | 19,379 | 751,518 | ||||||
Hawaiian Electric Industries, Inc. | 3,823 | 137,857 | ||||||
IDACORP, Inc. | 1,800 | 157,266 | ||||||
MDU Resources Group, Inc. | 240,495 | 5,334,179 | ||||||
National Fuel Gas Co. | 101,968 | 4,275,518 | ||||||
NextEra Energy, Inc. | 85,488 | 20,531,653 | ||||||
NiSource, Inc. | 1,675,497 | 38,100,802 | ||||||
NRG Energy, Inc. | 191,624 | 6,239,277 | ||||||
OGE Energy Corp. | 7,141 | 216,801 | ||||||
PG&E Corp.(1) | 22,705 | 201,393 | ||||||
Pinnacle West Capital Corp. | 4,022 | 294,772 | ||||||
PPL Corp. | 254,352 | 6,572,456 | ||||||
Public Service Enterprise Group, Inc. | 114,410 | 5,624,396 | ||||||
Sempra Energy | 132,214 | 15,499,447 | ||||||
Southern Co. | 1,047,716 | 54,324,075 | ||||||
UGI Corp. | 7,433 | 236,369 | ||||||
Vistra Energy Corp. | 244,317 | 4,549,183 | ||||||
WEC Energy Group, Inc. | 11,295 | 990,007 | ||||||
Xcel Energy, Inc. | 18,796 | 1,174,750 | ||||||
|
| |||||||
Total Utilities |
| 308,153,192 | ||||||
|
| |||||||
Total Common Stocks (Cost: $10,923,577,379) |
| 11,994,381,328 | ||||||
|
| |||||||
PREFERRED STOCKS – 0.39% | ||||||||
Consumer Discretionary – 0.07% | ||||||||
Volkswagen AG | 54,351 | 8,261,360 | ||||||
|
| |||||||
Total Consumer Discretionary |
| 8,261,360 | ||||||
|
| |||||||
Healthcare – 0.08% | ||||||||
Becton Dickinson & Co., 6.00%(1) | 183,415 | 9,757,678 | ||||||
|
| |||||||
Total Healthcare |
| 9,757,678 | ||||||
|
| |||||||
Utilities – 0.24% | ||||||||
NextEra Energy, Inc., 5.28% | 152,671 | 6,480,884 | ||||||
Sempra Energy, 6.00% | 120,261 | 11,753,107 | ||||||
Sempra Energy, 6.75% | 35,061 | 3,445,094 | ||||||
Southern Co., 6.75% | 205,147 | 9,038,777 | ||||||
|
| |||||||
Total Utilities |
| 30,717,862 | ||||||
|
| |||||||
Total Preferred Stocks (Cost: $49,764,602) |
| 48,736,900 | ||||||
|
| |||||||
RIGHTS – 0.00%(2) | ||||||||
Communication Services – 0.00%(2) | ||||||||
T-Mobile US, Inc., expires 07/31/2020(1) | 8,854 | 1,487 | ||||||
|
| |||||||
Total Communication Services |
| 1,487 | ||||||
|
| |||||||
Total Rights (Cost: $22,301) |
| 1,487 | ||||||
|
| |||||||
| Principal Amount | Value | |||||||
BONDS & NOTES – 0.04% | ||||||||
Convertible Securities – 0.04% | ||||||||
Financials – 0.04% | ||||||||
AXA SA, 7.25%, May 2021(3) | 5,500,000 | 5,022,187 | ||||||
|
| |||||||
Total Financials |
| 5,022,187 | ||||||
|
| |||||||
Total Convertible Securities (Cost: $5,034,875) | 5,022,187 | |||||||
|
| |||||||
Total Bonds & Notes (Cost: $5,034,875) |
| 5,022,187 | ||||||
|
| |||||||
| Shares | Value | |||||||
SHORT-TERM INVESTMENTS – 3.40% | ||||||||
Exchange Traded Funds – 0.13% | ||||||||
SPDR S&P 500 ETF Trust | 52,989 | 16,339,688 | ||||||
|
| |||||||
Total Exchange Traded Funds (Cost: $15,992,504) | 16,339,688 | |||||||
|
| |||||||
Money Market Funds – 3.10% | ||||||||
Goldman Sachs Financial Square Government Fund - Class I, 0.15%(4) | 387,792,134 | 387,792,134 | ||||||
|
| |||||||
Total Money Market Funds (Cost: $387,792,134) | 387,792,134 | |||||||
|
| |||||||
| Principal Amount | Value | |||||||
Time Deposits – 0.17% | ||||||||
BBVA, Madrid, 0.01% due 07/01/2020 | $ | 2,237,072 | 2,237,072 | |||||
BNP Paribas, Paris, 0.01% due 07/01/2020 | 15,151,307 | 15,151,307 | ||||||
Brown Brothers Harriman, -0.68% due 07/01/2020 | EUR | 387 | 435 | |||||
JP Morgan, New York, 0.01% due 07/01/2020 | $ | 299,365 | 299,365 | |||||
Sumitomo, Tokyo, 0.01% due 07/01/2020 | 3,388,492 | 3,388,492 | ||||||
|
| |||||||
Total Time Deposits (Cost: $21,076,671) | 21,076,671 | |||||||
|
| |||||||
Total Short-Term Investments (Cost: $424,861,309) |
| 425,208,493 | ||||||
|
| |||||||
TOTAL INVESTMENTS IN SECURITIES – 99.80% | 12,473,350,395 | |||||||
|
| |||||||
OTHER ASSETS IN EXCESS OF LIABILITIES – 0.20% | 25,270,538 | |||||||
|
| |||||||
TOTAL NET ASSETS – 100.00% | $ | 12,498,620,933 | ||||||
|
| |||||||
Percentages are stated as a percent of net assets.
Principal amounts are denominated in the currency in which the security was purchased.
ADR American Depositary Receipt
REIT Real Estate Investment Trust
EUR Euro
| (1) | Non-income producing security. |
| (2) | Amount calculated is less than 0.005%. |
| (3) | Security was purchased exempt from registration in the U.S. pursuant to Rule 144(A) under the Securities Act of 1933. The value of the security totals $5,022,187, which represents 0.04% of total net assets. |
| (4) | Represents annualized seven-day yield as of the close of the reporting period. |
The accompanying notes are an integral part of this Schedule of Investments.
Bridge Builder Small/Mid Cap Growth Fund
Schedule of Investments
June 30, 2020
| Shares | Value | |||||||
COMMON STOCKS – 98.08% | ||||||||
Communication Services – 4.27% | ||||||||
Altice USA, Inc. - Class A(1) | 32,005 | $ | 721,393 | |||||
AMC Networks, Inc. - Class A(1) | 8,350 | 195,306 | ||||||
Anterix, Inc.(1) | 7,258 | 329,078 | ||||||
ATN International, Inc. | 325 | 19,685 | ||||||
Bandwidth, Inc. - Class A(1) | 10,533 | 1,337,691 | ||||||
Boingo Wireless, Inc.(1) | 23,661 | 315,165 | ||||||
Cable One, Inc. | 503 | 892,750 | ||||||
Cardlytics, Inc.(1) | 14,252 | 997,355 | ||||||
Cargurus, Inc. - Class A(1) | 47,400 | 1,201,590 | ||||||
Central European Media Enterprises Ltd. - Class A(1) | 23,625 | 83,632 | ||||||
Cincinnati Bell, Inc.(1) | 8,461 | 125,646 | ||||||
Cogent Communications Holdings, Inc. | 23,258 | 1,799,239 | ||||||
Consolidated Communications Holdings, Inc.(1) | 3,750 | 25,387 | ||||||
Daily Journal Corp.(1) | 487 | 131,490 | ||||||
Electronic Arts, Inc.(1) | 41,173 | 5,436,895 | ||||||
Eventbrite, Inc. - Class A(1) | 34,321 | 294,131 | ||||||
EverQuote, Inc. - Class A(1) | 7,678 | 446,552 | ||||||
Glu Mobile, Inc.(1) | 71,944 | 666,921 | ||||||
Gogo, Inc.(1) | 29,970 | 94,705 | ||||||
Gray Television, Inc.(1) | 14,737 | 205,581 | ||||||
IDT Corp. - Class B(1) | 5,336 | 34,844 | ||||||
InterActiveCorp(1) | 40,034 | 12,946,996 | ||||||
Iridium Communications, Inc.(1) | 296,678 | 7,547,488 | ||||||
John Wiley & Sons, Inc. - Class A | 663,680 | 25,883,520 | ||||||
Liberty Media Corp.-Liberty Braves - Class A(1) | 3,206 | 64,376 | ||||||
Liberty Media Corp.-Liberty Braves - Class C(1) | 11,830 | 233,524 | ||||||
Liberty Media Corp.-Liberty SiriusXM - Class A(1) | 934 | 32,242 | ||||||
Liberty Media Corp.-Liberty SiriusXM - Class C(1) | 1,972 | 67,935 | ||||||
Live Nation Entertainment, Inc.(1) | 125,828 | 5,577,955 | ||||||
LiveXLive Media, Inc.(1) | 2,538 | 9,188 | ||||||
Loral Space & Communications, Inc. | 1,637 | 31,954 | ||||||
Match Group, Inc.(1) | 165,964 | 17,766,446 | ||||||
Meet Group, Inc.(1) | 17,540 | 109,450 | ||||||
Meredith Corp. | 10,729 | 156,107 | ||||||
New York Times Co. - Class A | 547,336 | 23,004,532 | ||||||
Nexstar Media Group, Inc. - Class A | 2,893 | 242,115 | ||||||
Ooma, Inc.(1) | 11,314 | 186,455 | ||||||
ORBCOMM, Inc.(1) | 5,267 | 20,278 | ||||||
Pinterest, Inc. - Class A(1) | 32,926 | 729,969 | ||||||
QuinStreet, Inc.(1) | 8,412 | 87,990 | ||||||
Roku, Inc. - Class A(1) | 81,893 | 9,542,991 | ||||||
Shenandoah Telecommunications Co. | 26,442 | 1,303,326 | ||||||
Sirius XM Holdings, Inc. | 70,392 | 413,201 | ||||||
Spotify Technology SA(1) | 69,354 | 17,906,509 | ||||||
Take-Two Interactive Software, Inc.(1) | 160,707 | 22,429,876 | ||||||
TechTarget, Inc.(1) | 12,795 | 384,234 | ||||||
Vonage Holdings Corp.(1) | 72,046 | 724,783 | ||||||
WideOpenWest, Inc.(1) | 16,477 | 86,834 | ||||||
World Wrestling Entertainment, Inc. - Class A | 4,529 | 196,785 | ||||||
Yelp, Inc. - Class A(1) | 7,153 | 165,449 | ||||||
Zillow Group, Inc. - Class A(1) | 588 | 33,798 | ||||||
Zillow Group, Inc. - Class C(1) | 1,514 | 87,222 | ||||||
Zynga, Inc. - Class A(1) | 4,351,496 | 41,513,272 | ||||||
|
| |||||||
Total Communication Services |
| 204,841,836 | ||||||
|
| |||||||
Consumer Discretionary – 9.83% | ||||||||
1-800-Flowers.com, Inc. - Class A(1) | 13,454 | 269,349 | ||||||
Aaron’s, Inc. | 148,014 | 6,719,836 | ||||||
Accel Entertainment, Inc.(1) | 24,263 | 233,653 | ||||||
Acushnet Holdings Corp. | 4,342 | 151,058 | ||||||
Advance Auto Parts, Inc. | 232,000 | 33,048,400 | ||||||
America’s Car-Mart, Inc.(1) | 2,529 | 222,223 | ||||||
Aptiv Plc | 185,609 | 14,462,653 | ||||||
Asbury Automotive Group, Inc.(1) | 4,261 | 329,503 | ||||||
Aspen Group, Inc.(1) | 10,338 | 93,559 | ||||||
AutoZone, Inc.(1) | 1,367 | 1,542,140 | ||||||
Best Buy Co., Inc. | 4,101 | 357,894 | ||||||
Big Lots, Inc. | 1,657 | 69,594 | ||||||
Bloomin’ Brands, Inc. | 48,769 | 519,878 | ||||||
Boot Barn Holdings, Inc.(1) | 14,083 | 303,629 | ||||||
Bright Horizons Family Solutions, Inc.(1) | 33,995 | 3,984,214 | ||||||
Brinker International, Inc. | 16,325 | 391,800 | ||||||
Burlington Stores, Inc.(1) | 130,299 | 25,659,782 | ||||||
Camping World Holdings, Inc. - Class A | 17,798 | 483,394 | ||||||
CarMax, Inc.(1) | 1,234 | 110,505 | ||||||
Carvana Co. - Class A(1) | 5,401 | 649,200 | ||||||
Casper Sleep, Inc.(1) | 1,336 | 11,984 | ||||||
Cavco Industries, Inc.(1) | 4,783 | 922,402 | ||||||
Chegg, Inc.(1) | 212,311 | 14,280,038 | ||||||
Children’s Place, Inc. | 5,741 | 214,828 | ||||||
Chipotle Mexican Grill, Inc. - Class A(1) | 24,145 | 25,409,232 | ||||||
Churchill Downs, Inc. | 20,785 | 2,767,523 | ||||||
Clarus Corp. | 983 | 11,383 | ||||||
Collectors Universe, Inc. | 4,556 | 156,180 | ||||||
Core-Mark Holding Co., Inc. | 23,042 | 575,013 | ||||||
Cracker Barrel Old Country Store, Inc. | 5,527 | 613,000 | ||||||
Crocs, Inc.(1) | 36,645 | 1,349,269 | ||||||
Dave & Buster’s Entertainment, Inc. | 9,060 | 120,770 | ||||||
Deckers Outdoor Corp.(1) | 15,299 | 3,004,571 | ||||||
Denny’s Corp.(1) | 19,107 | 192,981 | ||||||
Dine Brands Global, Inc. | 527 | 22,187 | ||||||
Dollar Tree, Inc.(1) | 65,131 | 6,036,341 | ||||||
Domino’s Pizza, Inc. | 26,013 | 9,610,243 | ||||||
Dorman Products, Inc.(1) | 14,624 | 980,832 | ||||||
Dunkin’ Brands Group, Inc. | 296,910 | 19,367,439 | ||||||
El Pollo Loco Holdings, Inc.(1) | 747 | 11,026 | ||||||
Eldorado Resorts, Inc.(1) | 43,656 | 1,748,859 | ||||||
Envela Corp.(1) | 3,890 | 23,729 | ||||||
Etsy, Inc.(1) | 11,665 | 1,239,173 | ||||||
Everi Holdings, Inc.(1) | 15,452 | 79,732 | ||||||
Expedia Group, Inc. | 1,494 | 122,807 | ||||||
Five Below, Inc.(1) | 5,393 | 576,566 | ||||||
Floor & Decor Holdings, Inc. - Class A(1) | 100,436 | 5,790,135 | ||||||
Fox Factory Holding Corp.(1) | 98,285 | 8,119,324 | ||||||
Franchise Group, Inc. | 1,301 | 28,466 | ||||||
Frontdoor, Inc.(1) | 1,463 | 64,855 | ||||||
GAN Ltd.(1) | 3,331 | 84,774 | ||||||
Gentherm, Inc.(1) | 230,328 | 8,959,759 | ||||||
Golden Entertainment, Inc.(1) | 3,413 | 30,444 | ||||||
GoPro, Inc. - Class A(1) | 65,330 | 310,971 | ||||||
Greenlane Holdings, Inc. - Class A(1) | 4,966 | 19,765 | ||||||
GrowGeneration Corp.(1) | 15,964 | 109,194 | ||||||
GrubHub, Inc.(1) | 871 | 61,231 | ||||||
H&R Block, Inc. | 13,519 | 193,051 | ||||||
Hamilton Beach Brands Holding Co. - Class A | 1,122 | 13,352 | ||||||
Helen of Troy Ltd.(1) | 98,375 | 18,549,590 | ||||||
Hilton Grand Vacations, Inc.(1) | 46,604 | 911,108 | ||||||
Hooker Furniture Corp. | 331 | 6,438 | ||||||
Hudson Ltd. - Class A(1) | 651,495 | 3,172,781 | ||||||
Installed Building Products, Inc.(1) | 12,404 | 853,147 | ||||||
iRobot Corp.(1) | 15,112 | 1,267,897 | ||||||
Jack in the Box, Inc. | 1,380 | 102,244 | ||||||
Johnson Outdoors, Inc. - Class A | 1,422 | 129,430 | ||||||
KB Home | 7,111 | 218,165 | ||||||
LCI Industries | 13,473 | 1,549,126 | ||||||
Legacy Housing Corp.(1) | 842 | 11,973 | ||||||
LGI Homes, Inc.(1) | 12,113 | 1,066,307 | ||||||
Lindblad Expeditions Holdings, Inc.(1) | 13,738 | 106,057 | ||||||
Lithia Motors, Inc. - Class A | 5,839 | 883,616 | ||||||
Lovesac Co.(1) | 4,798 | 125,852 |
Lululemon Athletica, Inc.(1) | 45,258 | 14,120,949 | ||||||
Lumber Liquidators Holdings, Inc.(1) | 3,060 | 42,412 | ||||||
Malibu Boats, Inc. - Class A(1) | 11,140 | 578,723 | ||||||
Marine Products Corp. | 3,829 | 53,032 | ||||||
Marriott Vacations Worldwide Corp. | 2,848 | 234,134 | ||||||
MasterCraft Boat Holdings, Inc.(1) | 10,002 | 190,538 | ||||||
Mattel, Inc.(1) | 20,141 | 194,763 | ||||||
MercadoLibre, Inc.(1) | 6,548 | 6,454,822 | ||||||
Meritage Homes Corp.(1) | 1,141 | 86,853 | ||||||
Monarch Casino & Resort, Inc.(1) | 4,872 | 166,038 | ||||||
Monro, Inc. | 8,749 | 480,670 | ||||||
Motorcar Parts of America, Inc.(1) | 1,214 | 21,451 | ||||||
Murphy USA, Inc.(1) | 15,083 | 1,698,195 | ||||||
National Vision Holdings, Inc.(1) | 241,491 | 7,370,305 | ||||||
Noodles & Co. - Class A(1) | 8,427 | 50,983 | ||||||
NVR, Inc.(1) | 33 | 107,539 | ||||||
Ollie’s Bargain Outlet Holdings, Inc.(1) | 493,923 | 48,231,581 | ||||||
OneWater Marine, Inc. - Class A(1) | 2,501 | 60,724 | ||||||
O’Reilly Automotive, Inc.(1) | 7,242 | 3,053,734 | ||||||
Overstock.com, Inc.(1) | 18,461 | 524,846 | ||||||
Papa John’s International, Inc. | 14,976 | 1,189,244 | ||||||
Peloton Interactive, Inc. - Class A(1) | 232,478 | 13,430,254 | ||||||
Penn National Gaming, Inc.(1) | 36,896 | 1,126,804 | ||||||
Perdoceo Education Corp.(1) | 37,680 | 600,242 | ||||||
PetMed Express, Inc. | 10,643 | 379,316 | ||||||
Planet Fitness, Inc. - Class A(1) | 4,530 | 274,382 | ||||||
PlayAGS, Inc.(1) | 3,057 | 10,333 | ||||||
Polaris Industries, Inc. | 601 | 55,623 | ||||||
Pool Corp. | 11,758 | 3,196,647 | ||||||
Purple Innovation, Inc. - Class A(1) | 7,840 | 141,120 | ||||||
Quotient Technology, Inc.(1) | 25,717 | 188,248 | ||||||
RealReal, Inc.(1) | 34,505 | 441,319 | ||||||
Red Rock Resorts, Inc. - Class A | 26,663 | 290,893 | ||||||
Rent-A-Center, Inc. | 23,856 | 663,674 | ||||||
RH(1) | 9,154 | 2,278,431 | ||||||
Rubicon Project, Inc.(1) | 33,745 | 225,079 | ||||||
Ruth’s Hospitality Group, Inc. | 14,080 | 114,893 | ||||||
Scientific Games Corp.(1) | 22,173 | 342,795 | ||||||
SeaWorld Entertainment, Inc.(1) | 13,025 | 192,900 | ||||||
Shake Shack, Inc. - Class A(1) | 19,294 | 1,022,196 | ||||||
Shutterstock, Inc. | 10,587 | 370,227 | ||||||
Skyline Champion Corp.(1) | 30,134 | 733,462 | ||||||
Sleep Number Corp.(1) | 5,651 | 235,308 | ||||||
Sonos, Inc.(1) | 44,023 | 644,056 | ||||||
Sportsman’s Warehouse Holdings, Inc.(1) | 23,295 | 331,954 | ||||||
Stamps.com, Inc.(1) | 9,068 | 1,665,701 | ||||||
Standard Motor Products, Inc. | 1,742 | 71,770 | ||||||
Steven Madden Ltd. | 322,437 | 7,960,970 | ||||||
Stitch Fix, Inc. - Class A(1) | 26,394 | 658,266 | ||||||
Strategic Education, Inc. | 12,027 | 1,847,949 | ||||||
Sturm Ruger & Co., Inc. | 8,052 | 611,952 | ||||||
Superior Group of Companies, Inc. | 1,138 | 15,249 | ||||||
Taylor Morrison Home Corp. - Class A(1) | 6,937 | 133,815 | ||||||
Tempur Sealy International, Inc.(1) | 3,468 | 249,523 | ||||||
Texas Roadhouse, Inc. - Class A | 205,912 | 10,824,794 | ||||||
TopBuild Corp.(1) | 17,946 | 2,041,716 | ||||||
Tractor Supply Co. | 330,469 | 43,552,509 | ||||||
Twin River Worldwide Holdings, Inc. | 9,835 | 219,222 | ||||||
Ulta Beauty, Inc.(1) | 158,051 | 32,150,734 | ||||||
Universal Electronics, Inc.(1) | 6,664 | 312,008 | ||||||
Universal Technical Institute, Inc.(1) | 14,968 | 104,028 | ||||||
US Auto Parts Network, Inc.(1) | 10,815 | 93,658 | ||||||
Vail Resorts, Inc. | 324 | 59,017 | ||||||
VF Corp. | 1,867 | 113,775 | ||||||
Visteon Corp.(1) | 15,209 | 1,041,816 | ||||||
Vivint Smart Home, Inc.(1) | 8,091 | 140,217 | ||||||
Waitr Holdings, Inc.(1) | 40,841 | 107,412 | ||||||
Wayfair, Inc. - Class A(1) | 50,788 | 10,036,217 |
Wendy’s Co. | 17,738 | 386,334 | ||||||
Williams-Sonoma, Inc. | 1,244 | 102,020 | ||||||
Wingstop, Inc. | 67,764 | 9,417,163 | ||||||
Winmark Corp. | 467 | 79,969 | ||||||
Winnebago Industries, Inc. | 17,113 | 1,140,068 | ||||||
WW International, Inc.(1) | 6,188 | 157,051 | ||||||
Wynn Resorts Ltd. | 2,388 | 177,882 | ||||||
XPEL, Inc.(1) | 10,076 | 157,589 | ||||||
YETI Holdings, Inc.(1) | 40,610 | 1,735,265 | ||||||
Yum China Holdings, Inc. | 2,474 | 118,925 | ||||||
|
| |||||||
Total Consumer Discretionary |
| 471,475,700 | ||||||
|
| |||||||
Consumer Staples – 4.08% | ||||||||
B&G Foods, Inc. | 30,349 | 739,909 | ||||||
Beyond Meat, Inc.(1) | 41,694 | 5,586,162 | ||||||
BJ’s Wholesale Club Holdings, Inc.(1) | 74,920 | 2,792,268 | ||||||
Boston Beer, Inc. - Class A(1) | 860 | 461,519 | ||||||
Bridgford Foods Corp.(1) | 749 | 12,403 | ||||||
Brown-Forman Corp. - Class A | 3,721 | 214,218 | ||||||
Brown-Forman Corp. - Class B | 166,330 | 10,588,568 | ||||||
Calavo Growers, Inc. | 180,180 | 11,335,124 | ||||||
Cal-Maine Foods, Inc.(1) | 5,783 | 257,228 | ||||||
Campbell Soup Co. | 220,283 | 10,932,645 | ||||||
Celsius Holdings, Inc.(1) | 18,848 | 221,841 | ||||||
Central Garden & Pet Co. - Class A(1) | 1,508 | 54,273 | ||||||
Central Garden & Pet Co. - Class A(1) | 6,968 | 235,449 | ||||||
Church & Dwight Co., Inc. | 119,276 | 9,220,035 | ||||||
Clorox Co. | 8,842 | 1,939,670 | ||||||
Coca-Cola Consolidated, Inc. | 2,609 | 597,957 | ||||||
Craft Brew Alliance, Inc.(1) | 363 | 5,587 | ||||||
elf Beauty, Inc.(1) | 14,244 | 271,633 | ||||||
Energizer Holdings, Inc. | 4,854 | 230,516 | ||||||
Freshpet, Inc.(1) | 21,244 | 1,777,273 | ||||||
Grocery Outlet Holding Corp.(1) | 3,676 | 149,981 | ||||||
Herbalife Nutrition Ltd.(1) | 1,341 | 60,318 | ||||||
Hershey Co. | 181,252 | 23,493,884 | ||||||
Hostess Brands, Inc. - Class A(1) | 29,295 | 357,985 | ||||||
Inter Parfums, Inc. | 9,553 | 459,977 | ||||||
J&J Snack Foods Corp. | 2,161 | 274,728 | ||||||
John B Sanfilippo & Son, Inc. | 4,778 | 407,707 | ||||||
Kellogg Co. | 8,394 | 554,508 | ||||||
Lamb Weston Holdings, Inc. | 472,297 | 30,193,947 | ||||||
Lancaster Colony Corp. | 10,344 | 1,603,217 | ||||||
LifeVantage Corp.(1) | 7,506 | 101,481 | ||||||
Limoneira Co. | 1,961 | 28,415 | ||||||
McCormick & Co., Inc. | 6,849 | 1,228,779 | ||||||
Medifast, Inc. | 6,124 | 849,827 | ||||||
MGP Ingredients, Inc. | 5,230 | 191,967 | ||||||
Molson Coors Brewing Co. - Class B | 330,000 | 11,338,800 | ||||||
Monster Beverage Corp.(1) | 66,919 | 4,638,825 | ||||||
National Beverage Corp.(1) | 6,413 | 391,321 | ||||||
Natural Grocers by Vitamin Cottage, Inc. | 3,085 | 45,905 | ||||||
New Age Beverages Corp.(1) | 20,811 | 31,841 | ||||||
Pilgrim’s Pride Corp.(1) | 1,609 | 27,176 | ||||||
PriceSmart, Inc. | 746 | 45,006 | ||||||
Revlon, Inc. - Class A(1) | 114 | 1,129 | ||||||
Reynolds Consumer Products, Inc. | 1,327 | 46,100 | ||||||
Sanderson Farms, Inc. | 8,587 | 995,147 | ||||||
Sprouts Farmers Market, Inc.(1) | 9,858 | 252,266 | ||||||
The J.M. Smucker Co. | 316,000 | 33,435,960 | ||||||
Tootsie Roll Industries, Inc. | 7,268 | 249,074 | ||||||
TreeHouse Foods, Inc.(1) | 341,795 | 14,970,621 | ||||||
Turning Point Brands, Inc. | 4,615 | 114,960 | ||||||
USANA Health Sciences, Inc.(1) | 6,468 | 474,945 | ||||||
Vector Group Ltd. | 8,671 | 87,230 | ||||||
Veru, Inc.(1) | 27,192 | 90,821 | ||||||
WD-40 Co. | 55,525 | 11,010,608 | ||||||
|
| |||||||
Total Consumer Staples |
| 195,678,734 | ||||||
|
| |||||||
Energy – 0.27% | ||||||||
Ardmore Shipping Corp. | 2,471 | 10,724 | ||||||
Aspen Aerogels, Inc.(1) | 1,296 | 8,528 | ||||||
Cabot Oil & Gas Corp. | 157,221 | 2,701,057 | ||||||
Cactus, Inc. - Class A | 11,982 | 247,189 | ||||||
ChampionX Corp.(1) | 237,211 | 2,315,179 | ||||||
Cheniere Energy, Inc.(1) | 22,871 | 1,105,127 | ||||||
Contango Oil & Gas Co.(1) | 8,334 | 19,085 | ||||||
Core Laboratories NV | 123,238 | 2,504,196 | ||||||
DMC Global, Inc. | 3,664 | 101,127 | ||||||
Dorian LPG Ltd.(1) | 2,643 | 20,457 | ||||||
Equitrans Midstream Corp. | 3,669 | 30,489 | ||||||
Goodrich Petroleum Corp.(1) | 2,717 | 19,562 | ||||||
Magnolia Oil & Gas Corp. - Class A(1) | 63,623 | 385,555 | ||||||
NextDecade Corp.(1) | 828 | 1,789 | ||||||
Parsley Energy, Inc. - Class A | 104,918 | 1,120,524 | ||||||
PDC Energy, Inc.(1) | 185,514 | 2,307,794 | ||||||
Uranium Energy Corp.(1) | 36,141 | 31,721 | ||||||
|
| |||||||
Total Energy |
| 12,930,103 | ||||||
|
| |||||||
Financials – 8.25% | ||||||||
Alleghany Corp. | 142 | 69,458 | ||||||
Apollo Global Management, Inc. - Class A | 8,371 | 417,880 | ||||||
Ares Management Corp. - Class A | 9,686 | 384,534 | ||||||
Argo Group International Holdings Ltd. | 280,511 | 9,770,198 | ||||||
Arthur J. Gallagher & Co. | 395,000 | 38,508,550 | ||||||
Artisan Partners Asset Management, Inc. - Class A | 12,364 | 401,830 | ||||||
Assetmark Financial Holdings, Inc.(1) | 3,750 | 102,337 | ||||||
Atlanticus Holdings Corp.(1) | 2,795 | 28,900 | ||||||
Axis Capital Holdings Ltd. | 750 | 30,420 | ||||||
Axos Financial, Inc.(1) | 2,662 | 58,777 | ||||||
Bank First Corp. | 3,142 | 201,402 | ||||||
Bank7 Corp. | 211 | 2,290 | ||||||
Baycom Corp.(1) | 1,580 | 20,398 | ||||||
Benefytt Technologies, Inc. - Class A(1) | 5,686 | 116,336 | ||||||
Brightsphere Investment Group, Inc. | 33,949 | 423,005 | ||||||
Brown & Brown, Inc. | 1,384 | 56,412 | ||||||
BRP Group, Inc. - Class A(1) | 10,819 | 186,844 | ||||||
Bryn Mawr Bank Corp. | 139,378 | 3,855,195 | ||||||
Cambridge Bancorp | 736 | 43,601 | ||||||
Camden National Corp. | 134,069 | 4,630,743 | ||||||
Carlyle Group, Inc. | 1,113 | 31,053 | ||||||
CBOE Global Markets, Inc. | 2,367 | 220,794 | ||||||
Century Bancorp, Inc. - Class A | 205 | 15,933 | ||||||
Coastal Financial Corp.(1) | 735 | 10,672 | ||||||
Cohen & Steers, Inc. | 205,484 | 13,983,186 | ||||||
Columbia Banking System, Inc. | 631,961 | 17,912,935 | ||||||
Columbia Financial, Inc.(1) | 7,117 | 99,318 | ||||||
Commerce Bancshares, Inc. | 160,000 | 9,515,200 | ||||||
Cowen, Inc. - Class A | 5,199 | 84,276 | ||||||
Crawford & Co. - Class A | 1,328 | 10,478 | ||||||
Credit Acceptance Corp.(1) | 67 | 28,074 | ||||||
Cullen/Frost Bankers, Inc. | 267,000 | 19,947,570 | ||||||
Curo Group Holdings Corp. | 9,794 | 80,017 | ||||||
Customers Bancorp, Inc.(1) | 863 | 10,373 | ||||||
eHealth, Inc.(1) | 13,988 | 1,374,181 | ||||||
Encore Capital Group, Inc.(1) | 136,948 | 4,680,883 | ||||||
Erie Indemnity Co. - Class A | 1,423 | 273,074 | ||||||
Esquire Financial Holdings, Inc.(1) | 1,131 | 19,114 | ||||||
Everest Re Group Ltd. | 191,000 | 39,384,200 | ||||||
FactSet Research Systems, Inc. | 3,673 | 1,206,470 | ||||||
Federal Agricultural Mortgage Corp. - Class C | 1,177 | 75,340 | ||||||
Federated Hermes, Inc. - Class B | 15,369 | 364,245 | ||||||
FedNat Holding Co. | 546 | 6,044 | ||||||
First Financial Bankshares, Inc. | 70,364 | 2,032,816 | ||||||
First Foundation, Inc. | 5,532 | 90,393 | ||||||
First Merchants Corp. | 209,575 | 5,777,983 | ||||||
FirstCash, Inc. | 106,466 | 7,184,326 | ||||||
Focus Financial Partners, Inc. - Class A(1) | 17,052 | 563,569 | ||||||
Franklin Financial Network, Inc. | 438 | 11,278 | ||||||
FS Bancorp, Inc. | 161 | 6,210 | ||||||
GAMCO Investors, Inc. - Class A | 2,999 | 39,917 | ||||||
Glacier Bancorp, Inc. | 5,411 | 190,954 | ||||||
Global Indemnity Ltd. | 1,013 | 24,251 | ||||||
Goosehead Insurance, Inc. - Class A(1) | 976 | 73,356 | ||||||
Great Western Bancorp, Inc. | 321,571 | 4,424,817 | ||||||
Green Dot Corp. - Class A(1) | 2,404 | 117,988 | ||||||
Greene County Bancorp, Inc. | 312 | 6,958 | ||||||
Greenhill & Co., Inc. | 8,004 | 79,960 | ||||||
GWG Holdings, Inc.(1) | 1,722 | 13,208 | ||||||
Hamilton Lane, Inc. - Class A | 12,247 | 825,080 | ||||||
Hanmi Financial Corp. | 645 | 6,263 | ||||||
Hannon Armstrong Sustainable Infrastructure Capital, Inc. | 2,010 | 57,205 | ||||||
HCI Group, Inc. | 1,206 | 55,693 | ||||||
Heritage Insurance Holdings, Inc. | 1,110 | 14,530 | ||||||
Hingham Institution for Savings | 63 | 10,570 | ||||||
Houlihan Lokey, Inc. - Class A | 316,923 | 17,633,596 | ||||||
Independent Bank Corp. | 1,207 | 80,978 | ||||||
INTL. FCStone, Inc.(1) | 662 | 36,410 | ||||||
Investors Bancorp, Inc. | 35,494 | 301,699 | ||||||
Investors Title Co. | 86 | 10,434 | ||||||
James River Group Holdings Ltd. | 14,160 | 637,200 | ||||||
Kearny Financial Corp. | 8,923 | 72,990 | ||||||
Kinsale Capital Group, Inc. | 11,468 | 1,779,948 | ||||||
Lakeland Financial Corp. | 927 | 43,189 | ||||||
LendingTree, Inc.(1) | 740 | 214,252 | ||||||
Lincoln National Corp. | 2,368 | 87,119 | ||||||
LPL Financial Holdings, Inc. | 640 | 50,176 | ||||||
MarketAxess Holdings, Inc. | 21,801 | 10,920,557 | ||||||
Meridian Corp.(1) | 567 | 8,987 | ||||||
Moelis & Co. - Class A | 29,087 | 906,351 | ||||||
Morningstar, Inc. | 49,800 | 7,020,306 | ||||||
MSCI, Inc. - Class A | 51,990 | 17,355,302 | ||||||
National Bank Holdings Corp. - Class A | 3,835 | 103,545 | ||||||
National General Holdings Corp. | 17,655 | 381,525 | ||||||
NMI Holdings, Inc. - Class A(1) | 2,093 | 33,655 | ||||||
Northeast Bank | 244 | 4,282 | ||||||
Northern Trust Corp. | 308,000 | 24,436,720 | ||||||
PacWest Bancorp | 169,889 | 3,348,512 | ||||||
Palomar Holdings, Inc. - Class A(1) | 76,846 | 6,590,313 | ||||||
PennyMac Financial Services, Inc. | 2,850 | 119,101 | ||||||
People’s Utah Bancorp | 548 | 12,314 | ||||||
Piper Sandler Companies | 45,830 | 2,711,303 | ||||||
PJT Partners, Inc. - Class A | 12,762 | 655,201 | ||||||
PRA Group, Inc.(1) | 169,955 | 6,570,460 | ||||||
Primerica, Inc. | 2,479 | 289,051 | ||||||
Prosperity Bancshares, Inc. | 242,000 | 14,369,960 | ||||||
Pzena Investment Management, Inc. - Class A | 9,129 | 49,662 | ||||||
Reliant Bancorp, Inc. | 377 | 6,141 | ||||||
RenaissanceRe Holdings Ltd. | 1,269 | 217,037 | ||||||
RLI Corp. | 18,962 | 1,556,780 | ||||||
ServisFirst Bancshares, Inc. | 20,055 | 717,167 | ||||||
Siebert Financial Corp.(1) | 7,417 | 37,530 | ||||||
Silvercrest Asset Management Group, Inc. - Class A | 2,614 | 33,224 | ||||||
SLM Corp. | 8,617 | 60,577 | ||||||
Stock Yards Bancorp, Inc. | 1,898 | 76,300 | ||||||
SVB Financial Group(1) | 92,392 | 19,913,248 | ||||||
T Rowe Price Group, Inc. | 5,701 | 704,073 | ||||||
Texas Capital Bancshares, Inc.(1) | 170,814 | 5,273,028 | ||||||
Tradeweb Markets, Inc. - Class A | 815,700 | 47,424,798 | ||||||
Trupanion, Inc.(1) | 16,157 | 689,742 | ||||||
UMB Financial Corp. | 215,615 | 11,114,953 | ||||||
Unity Bancorp, Inc. | 290 | 4,147 | ||||||
Universal Insurance Holdings, Inc. | 3,934 | 69,828 | ||||||
Value Line, Inc. | 923 | 24,912 | ||||||
Virtu Financial, Inc. - Class A | 5,522 | 130,319 | ||||||
Virtus Investment Partners, Inc. | 341 | 39,655 | ||||||
Walker & Dunlop, Inc. | 1,344 | 68,289 |
Waterstone Financial, Inc. | 950 | 14,088 | ||||||
West Bancorporation, Inc. | 1,469 | 25,693 | ||||||
Westamerica Bancorporation | 1,888 | 108,409 | ||||||
|
| |||||||
Total Financials |
| 395,394,901 | ||||||
|
| |||||||
Healthcare – 25.60% | ||||||||
10X Genomics, Inc. - Class A(1) | 5,379 | 480,398 | ||||||
1Life Healthcare, Inc.(1) | 11,596 | 421,167 | ||||||
89bio, Inc.(1) | 1,597 | 31,828 | ||||||
Abeona Therapeutics, Inc.(1) | 9,872 | 28,777 | ||||||
ABIOMED, Inc.(1) | 4,376 | 1,057,067 | ||||||
Acadia Healthcare Co., Inc.(1) | 154,489 | 3,880,764 | ||||||
ACADIA Pharmaceuticals, Inc.(1) | 10,814 | 524,155 | ||||||
Accelerate Diagnostics, Inc.(1) | 16,489 | 249,973 | ||||||
Acceleron Pharma, Inc.(1) | 4,267 | 406,517 | ||||||
Accuray, Inc.(1) | 47,820 | 97,075 | ||||||
AcelRx Pharmaceuticals, Inc.(1) | 11,414 | 13,811 | ||||||
AdaptHealth Corp.(1) | 4,375 | 70,437 | ||||||
Adaptive Biotechnologies Corp.(1) | 141,898 | 6,865,025 | ||||||
Addus HomeCare Corp.(1) | 7,507 | 694,848 | ||||||
ADMA Biologics, Inc.(1) | 28,749 | 84,235 | ||||||
Aduro Biotech, Inc.(1) | 31,606 | 73,010 | ||||||
Adverum Biotechnologies, Inc.(1) | 34,146 | 712,968 | ||||||
Aeglea BioTherapeutics, Inc.(1) | 20,853 | 192,890 | ||||||
Aerie Pharmaceuticals, Inc.(1) | 19,921 | 294,034 | ||||||
Affimed NV(1) | 39,833 | 183,829 | ||||||
Agenus, Inc.(1) | 75,081 | 295,068 | ||||||
Agile Therapeutics, Inc.(1) | 34,571 | 96,107 | ||||||
Agilent Technologies, Inc. | 165,064 | 14,586,706 | ||||||
Agios Pharmaceuticals, Inc.(1) | 632 | 33,799 | ||||||
Aimmune Therapeutics, Inc.(1) | 25,167 | 420,541 | ||||||
Akcea Therapeutics, Inc.(1) | 3,969 | 54,375 | ||||||
Akebia Therapeutics, Inc.(1) | 71,796 | 974,990 | ||||||
Akero Therapeutics, Inc.(1) | 6,086 | 151,663 | ||||||
Albireo Pharma, Inc.(1) | 5,060 | 134,039 | ||||||
Alector, Inc.(1) | 25,694 | 627,961 | ||||||
Alexion Pharmaceuticals, Inc.(1) | 3,248 | 364,556 | ||||||
Align Technology, Inc.(1) | 102,335 | 28,084,817 | ||||||
Allakos, Inc.(1) | 13,391 | 962,277 | ||||||
Allogene Therapeutics, Inc.(1) | 26,632 | 1,140,382 | ||||||
Allscripts Healthcare Solutions, Inc.(1) | 4,173 | 28,251 | ||||||
Alnylam Pharmaceuticals, Inc.(1) | 11,299 | 1,673,495 | ||||||
Alphatec Holdings, Inc.(1) | 21,031 | 98,846 | ||||||
Amedisys, Inc.(1) | 3,132 | 621,827 | ||||||
American Renal Associates Holdings, Inc.(1) | 2,395 | 15,615 | ||||||
AmerisourceBergen Corp. - Class A | 6,944 | 699,747 | ||||||
Amicus Therapeutics, Inc.(1) | 139,003 | 2,096,165 | ||||||
AMN Healthcare Services, Inc.(1) | 25,592 | 1,157,782 | ||||||
Amneal Pharmaceuticals, Inc.(1) | 53,696 | 255,593 | ||||||
Amphastar Pharmaceuticals, Inc.(1) | 19,287 | 433,186 | ||||||
Anavex Life Sciences Corp.(1) | 30,720 | 151,142 | ||||||
ANI Pharmaceuticals, Inc.(1) | 2,641 | 85,410 | ||||||
Antares Pharma, Inc.(1) | 89,094 | 245,008 | ||||||
Apellis Pharmaceuticals, Inc.(1) | 32,551 | 1,063,116 | ||||||
Apollo Medical Holdings, Inc.(1) | 5,452 | 89,958 | ||||||
Applied Therapeutics, Inc.(1) | 7,227 | 261,256 | ||||||
Aprea Therapeutics, Inc.(1) | 3,895 | 151,048 | ||||||
Apyx Medical Corp.(1) | 1,864 | 10,345 | ||||||
Aquestive Therapeutics, Inc.(1) | 10,848 | 52,721 | ||||||
Aravive, Inc.(1) | 6,586 | 76,661 | ||||||
Arcturus Therapeutics Holdings, Inc.(1) | 7,064 | 330,171 | ||||||
Arcus Biosciences, Inc.(1) | 17,890 | 442,599 | ||||||
Arcutis Biotherapeutics, Inc.(1) | 5,162 | 156,099 | ||||||
Ardelyx, Inc.(1) | 39,571 | 273,831 | ||||||
Arena Pharmaceuticals, Inc.(1) | 2,555 | 160,837 | ||||||
Argenx SE - ADR(1) | 115,896 | 26,103,256 | ||||||
Arrowhead Pharmaceuticals, Inc.(1) | 54,892 | 2,370,785 | ||||||
Arvinas, Inc.(1) | 15,892 | 533,018 | ||||||
Ascendis Pharma - ADR(1) | 227,442 | 33,638,672 | ||||||
Aspira Women’s Health, Inc.(1) | 24,832 | 95,355 | ||||||
Assembly Biosciences, Inc.(1) | 8,687 | 202,581 | ||||||
Atara Biotherapeutics, Inc.(1) | 23,025 | 335,474 | ||||||
Athenex, Inc.(1) | 40,937 | 563,293 | ||||||
Athersys, Inc.(1) | 93,947 | 259,294 | ||||||
Atreca, Inc. - Class A(1) | 10,711 | 227,930 | ||||||
AtriCure, Inc.(1) | 21,220 | 953,839 | ||||||
Atrion Corp. | 764 | 486,676 | ||||||
Avalon GloboCare Corp.(1) | 7,063 | 13,420 | ||||||
Avantor, Inc.(1) | 40,725 | 692,325 | ||||||
Avenue Therapeutics, Inc.(1) | 3,695 | 39,795 | ||||||
AVEO Pharmaceuticals, Inc.(1) | 4,221 | 21,738 | ||||||
Avid Bioservices, Inc.(1) | 27,808 | 182,560 | ||||||
Avrobio, Inc.(1) | 16,727 | 291,886 | ||||||
Axcella Health, Inc.(1) | 5,041 | 27,877 | ||||||
Axogen, Inc.(1) | 19,612 | 181,215 | ||||||
Axonics Modulation Technologies, Inc.(1) | 16,533 | 580,474 | ||||||
Axsome Therapeutics, Inc.(1) | 15,200 | 1,250,656 | ||||||
Beam Therapeutics, Inc.(1) | 6,697 | 187,516 | ||||||
Bellerophon Therapeutics, Inc.(1) | 1,876 | 23,544 | ||||||
Beyond Air, Inc.(1) | 9,211 | 66,780 | ||||||
BeyondSpring, Inc.(1) | 6,825 | 102,921 | ||||||
BioCryst Pharmaceuticals, Inc.(1) | 67,039 | 319,441 | ||||||
BioDelivery Sciences International, Inc.(1) | 48,226 | 210,265 | ||||||
Biohaven Pharmaceutical Holding Co. Ltd.(1) | 25,830 | 1,888,431 | ||||||
BioLife Solutions, Inc.(1) | 4,002 | 65,433 | ||||||
BioMarin Pharmaceutical, Inc.(1) | 16,195 | 1,997,491 | ||||||
BioNTech SE - ADR(1) | 146,072 | 9,748,845 | ||||||
Bio-Rad Laboratories, Inc. - Class A(1) | 32,000 | 14,447,680 | ||||||
BioSig Technologies, Inc.(1) | 11,591 | 83,455 | ||||||
BioSpecifics Technologies Corp.(1) | 3,360 | 205,901 | ||||||
Bio-Techne Corp. | 207,864 | 54,890,646 | ||||||
BioTelemetry, Inc.(1) | 110,971 | 5,014,779 | ||||||
BioXcel Therapeutics, Inc.(1) | 5,734 | 303,959 | ||||||
Black Diamond Therapeutics, Inc.(1) | 6,658 | 280,701 | ||||||
Bluebird Bio, Inc.(1) | 2,850 | 173,964 | ||||||
Blueprint Medicines Corp.(1) | 29,629 | 2,311,062 | ||||||
BrainStorm Cell Therapeutics, Inc.(1) | 14,446 | 161,940 | ||||||
Bridgebio Pharma, Inc.(1) | 39,908 | 1,301,400 | ||||||
Bruker Corp. | 4,398 | 178,911 | ||||||
Calithera Biosciences, Inc.(1) | 35,497 | 187,424 | ||||||
Calyxt, Inc.(1) | 6,803 | 33,539 | ||||||
Cantel Medical Corp. | 341,874 | 15,121,087 | ||||||
Cara Therapeutics, Inc.(1) | 22,300 | 381,330 | ||||||
Cardinal Health, Inc. | 28,910 | 1,508,813 | ||||||
Cardiovascular Systems, Inc.(1) | 211,155 | 6,661,940 | ||||||
CareDx, Inc.(1) | 23,216 | 822,543 | ||||||
CASI Pharmaceuticals, Inc.(1) | 30,438 | 76,095 | ||||||
Cassava Sciences, Inc.(1) | 4,469 | 13,765 | ||||||
Castle Biosciences, Inc.(1) | 5,553 | 209,293 | ||||||
Catabasis Pharmaceuticals, Inc.(1) | 6,881 | 44,245 | ||||||
Catalent, Inc.(1) | 1,224,719 | 89,771,903 | ||||||
Catalyst Pharmaceuticals, Inc.(1) | 52,621 | 243,109 | ||||||
Catasys, Inc.(1) | 4,336 | 107,273 | ||||||
Cellular Biomedicine Group, Inc.(1) | 4,345 | 65,045 | ||||||
CEL-SCI Corp.(1) | 15,207 | 226,888 | ||||||
Centene Corp.(1) | 376,743 | 23,942,018 | ||||||
Centogene NV(1) | 2,203 | 50,405 | ||||||
Cerecor, Inc.(1) | 14,964 | 38,906 | ||||||
Cerner Corp. | 95,294 | 6,532,404 | ||||||
Cerus Corp.(1) | 90,175 | 595,155 | ||||||
Champions Oncology, Inc.(1) | 3,813 | 36,452 | ||||||
Change Healthcare, Inc.(1) | 17,592 | 197,030 | ||||||
Charles River Laboratories International, Inc.(1) | 4,282 | 746,567 | ||||||
Checkpoint Therapeutics, Inc.(1) | 21,080 | 41,738 | ||||||
Chembio Diagnostics, Inc.(1) | 9,494 | 30,855 | ||||||
Chemed Corp. | 1,545 | 696,903 | ||||||
ChemoCentryx, Inc.(1) | 24,395 | 1,403,688 |
Chiasma, Inc.(1) | 19,896 | 107,040 | ||||||
ChromaDex Corp.(1) | 23,070 | 105,891 | ||||||
Cidara Therapeutics, Inc.(1) | 14,276 | 52,678 | ||||||
Clovis Oncology, Inc.(1) | 40,959 | 276,473 | ||||||
Co.-Diagnostics, Inc.(1) | 14,173 | 274,248 | ||||||
Codexis, Inc.(1) | 28,851 | 328,901 | ||||||
Cohbar, Inc.(1) | 12,590 | 19,514 | ||||||
Coherus Biosciences, Inc.(1) | 32,088 | 573,092 | ||||||
Collegium Pharmaceutical, Inc.(1) | 18,644 | 326,270 | ||||||
CONMED Corp. | 195,000 | 14,038,050 | ||||||
Constellation Pharmaceuticals, Inc.(1) | 14,644 | 440,052 | ||||||
ContraFect Corp.(1) | 7,222 | 46,149 | ||||||
Corbus Pharmaceuticals Holdings, Inc.(1) | 37,809 | 317,218 | ||||||
Corcept Therapeutics, Inc.(1) | 52,146 | 877,096 | ||||||
CorMedix, Inc.(1) | 13,644 | 85,957 | ||||||
Cortexyme, Inc.(1) | 8,253 | 382,114 | ||||||
CorVel Corp.(1) | 4,803 | 340,485 | ||||||
Crinetics Pharmaceuticals, Inc.(1) | 15,412 | 270,018 | ||||||
Cross Country Healthcare, Inc.(1) | 2,265 | 13,952 | ||||||
CryoLife, Inc.(1) | 16,177 | 310,113 | ||||||
CryoPort, Inc.(1) | 18,815 | 569,154 | ||||||
Cue Biopharma, Inc.(1) | 15,021 | 368,165 | ||||||
Cutera, Inc.(1) | 8,990 | 109,408 | ||||||
Cytokinetics, Inc.(1) | 26,728 | 629,979 | ||||||
CytomX Therapeutics, Inc.(1) | 24,379 | 203,077 | ||||||
CytoSorbents Corp.(1) | 18,842 | 186,536 | ||||||
DaVita, Inc.(1) | 1,409 | 111,508 | ||||||
Deciphera Pharmaceuticals, Inc.(1) | 20,541 | 1,226,709 | ||||||
Denali Therapeutics, Inc.(1) | 34,672 | 838,369 | ||||||
Dentsply Sirona, Inc. | 640,000 | 28,198,400 | ||||||
DermTech, Inc.(1) | 4,398 | 58,186 | ||||||
DexCom, Inc.(1) | 137,985 | 55,939,119 | ||||||
Dicerna Pharmaceuticals, Inc.(1) | 35,270 | 895,858 | ||||||
Durect Corp.(1) | 107,134 | 248,551 | ||||||
Dyadic International, Inc.(1) | 8,688 | 75,238 | ||||||
Dynavax Technologies Corp. - Class A(1) | 41,096 | 364,522 | ||||||
Eagle Pharmaceuticals, Inc.(1) | 6,184 | 296,708 | ||||||
Editas Medicine, Inc.(1) | 30,598 | 905,089 | ||||||
Edwards Lifesciences Corp.(1) | 455,000 | 31,445,050 | ||||||
Eidos Therapeutics, Inc.(1) | 5,959 | 284,066 | ||||||
Eiger Biopharmaceuticals, Inc.(1) | 12,744 | 122,342 | ||||||
Electromed, Inc.(1) | 3,923 | 60,375 | ||||||
Eloxx Pharmaceuticals, Inc.(1) | 13,495 | 40,890 | ||||||
Emergent BioSolutions, Inc.(1) | 24,434 | 1,932,241 | ||||||
Enanta Pharmaceuticals, Inc.(1) | 880 | 44,185 | ||||||
Encompass Health Corp. | 4,454 | 275,836 | ||||||
Endo International Plc(1) | 56,308 | 193,136 | ||||||
Ensign Group, Inc. | 28,022 | 1,172,721 | ||||||
Envista Holdings Corp.(1) | 406,000 | 8,562,540 | ||||||
Epizyme, Inc.(1) | 31,391 | 504,139 | ||||||
Esperion Therapeutics, Inc.(1) | 14,342 | 735,888 | ||||||
Eton Pharmaceuticals, Inc.(1) | 7,765 | 42,319 | ||||||
Evelo Biosciences, Inc.(1) | 9,760 | 47,824 | ||||||
Evofem Biosciences, Inc.(1) | 23,412 | 66,256 | ||||||
Evolent Health, Inc. - Class A(1) | 6,696 | 47,676 | ||||||
Evolus, Inc.(1) | 4,856 | 25,737 | ||||||
Exact Sciences Corp.(1) | 277,865 | 24,157,583 | ||||||
Exagen, Inc.(1) | 3,818 | 47,381 | ||||||
Exelixis, Inc.(1) | 151,633 | 3,599,767 | ||||||
Exicure, Inc.(1) | 27,191 | 66,346 | ||||||
Fate Therapeutics, Inc.(1) | 34,405 | 1,180,436 | ||||||
Fennec Pharmaceuticals, Inc.(1) | 11,701 | 97,703 | ||||||
FibroGen, Inc.(1) | 38,952 | 1,578,725 | ||||||
Flexion Therapeutics, Inc.(1) | 18,550 | 243,932 | ||||||
Fluidigm Corp.(1) | 3,124 | 12,527 | ||||||
Fortress Biotech, Inc.(1) | 31,394 | 84,136 | ||||||
Frequency Therapeutics, Inc.(1) | 15,281 | 355,283 | ||||||
Fulcrum Therapeutics, Inc.(1) | 6,788 | 124,153 |
Fulgent Genetics, Inc.(1) | 5,400 | 86,400 | ||||||
G1 Therapeutics, Inc.(1) | 8,679 | 210,553 | ||||||
Galectin Therapeutics, Inc.(1) | 20,571 | 62,947 | ||||||
Galera Therapeutics, Inc.(1) | 4,635 | 33,094 | ||||||
Genmab - ADR(1) | 1,031,889 | 34,970,718 | ||||||
GenMark Diagnostics, Inc.(1) | 36,879 | 542,490 | ||||||
Genprex, Inc.(1) | 15,406 | 48,375 | ||||||
Glaukos Corp.(1) | 23,264 | 893,803 | ||||||
Global Blood Therapeutics, Inc.(1) | 5,784 | 365,144 | ||||||
Globus Medical, Inc. - Class A(1) | 255,912 | 12,209,562 | ||||||
Gossamer Bio, Inc.(1) | 11,970 | 155,610 | ||||||
Gritstone Oncology, Inc.(1) | 2,299 | 15,265 | ||||||
Guardant Health, Inc.(1) | 7,344 | 595,819 | ||||||
Haemonetics Corp.(1) | 67,725 | 6,065,451 | ||||||
Halozyme Therapeutics, Inc.(1) | 700,068 | 18,768,823 | ||||||
Hanger, Inc.(1) | 2,401 | 39,761 | ||||||
Harpoon Therapeutics, Inc.(1) | 5,775 | 95,865 | ||||||
Harrow Health, Inc.(1) | 11,922 | 62,114 | ||||||
Health Catalyst, Inc.(1) | 17,994 | 524,885 | ||||||
HealthEquity, Inc.(1) | 112,719 | 6,613,224 | ||||||
Heron Therapeutics, Inc.(1) | 48,200 | 709,022 | ||||||
Heska Corp.(1) | 1,385 | 129,040 | ||||||
Hill-Rom Holdings, Inc. | 783 | 85,958 | ||||||
HMS Holdings Corp.(1) | 196,538 | 6,365,866 | ||||||
Hologic, Inc.(1) | 120,590 | 6,873,630 | ||||||
Homology Medicines, Inc.(1) | 18,356 | 278,828 | ||||||
Hookipa Pharma, Inc.(1) | 6,369 | 74,008 | ||||||
Horizon Therapeutics Plc(1) | 16,835 | 935,689 | ||||||
iBio, Inc.(1) | 22,839 | 50,703 | ||||||
iCAD, Inc.(1) | 11,006 | 109,950 | ||||||
ICON Plc(1) | 47,110 | 7,936,151 | ||||||
ICU Medical, Inc.(1) | 75,742 | 13,960,008 | ||||||
Ideaya Biosciences, Inc.(1) | 1,205 | 17,123 | ||||||
IDEXX Laboratories, Inc.(1) | 39,569 | 13,064,101 | ||||||
IGM Biosciences, Inc.(1) | 3,845 | 280,685 | ||||||
Illumina, Inc.(1) | 11,480 | 4,251,618 | ||||||
IMARA, Inc.(1) | 2,679 | 74,021 | ||||||
Immunic, Inc.(1) | 1,154 | 13,986 | ||||||
ImmunoGen, Inc.(1) | 40,441 | 186,029 | ||||||
Immunomedics, Inc.(1) | 20,359 | 721,523 | ||||||
Immunovant, Inc.(1) | 10,352 | 252,071 | ||||||
Incyte Corp.(1) | 18,005 | 1,871,980 | ||||||
InfuSystem Holdings, Inc.(1) | 7,992 | 92,228 | ||||||
Innoviva, Inc.(1) | 34,428 | 481,303 | ||||||
Inogen, Inc.(1) | 6,660 | 236,563 | ||||||
Inovalon Holdings, Inc. - Class A(1) | 40,892 | 787,580 | ||||||
Inovio Pharmaceuticals, Inc.(1) | 78,688 | 2,120,642 | ||||||
Insmed, Inc.(1) | 55,379 | 1,525,138 | ||||||
Inspire Medical Systems, Inc.(1) | 14,372 | 1,250,651 | ||||||
Insulet Corp.(1) | 6,235 | 1,211,211 | ||||||
Integer Holdings Corp.(1) | 11,194 | 817,722 | ||||||
Integra LifeSciences Holdings Corp.(1) | 828,258 | 38,919,843 | ||||||
Intellia Therapeutics, Inc.(1) | 23,798 | 500,234 | ||||||
Intercept Pharmaceuticals, Inc.(1) | 14,225 | 681,520 | ||||||
Intersect ENT, Inc.(1) | 17,523 | 237,261 | ||||||
Intra-Cellular Therapies, Inc.(1) | 11,392 | 292,433 | ||||||
Intuitive Surgical, Inc.(1) | 4,542 | 2,588,168 | ||||||
Invitae Corp.(1) | 63,087 | 1,910,905 | ||||||
Ionis Pharmaceuticals, Inc.(1) | 6,377 | 375,988 | ||||||
Iovance Biotherapeutics, Inc.(1) | 13,371 | 367,034 | ||||||
IQVIA Holdings, Inc.(1) | 7,131 | 1,011,746 | ||||||
iRadimed Corp.(1) | 3,183 | 73,877 | ||||||
iRhythm Technologies, Inc.(1) | 14,839 | 1,719,692 | ||||||
Ironwood Pharmaceuticals, Inc. - Class A(1) | 87,577 | 903,795 | ||||||
Kadmon Holdings, Inc.(1) | 87,380 | 447,386 | ||||||
Kala Pharmaceuticals, Inc.(1) | 21,440 | 225,334 | ||||||
Kaleido BioSciences, Inc.(1) | 5,096 | 37,863 | ||||||
KalVista Pharmaceuticals, Inc.(1) | 1,416 | 17,134 |
Karuna Therapeutics, Inc.(1) | 8,401 | 936,375 | ||||||
Karyopharm Therapeutics, Inc.(1) | 38,840 | 735,630 | ||||||
Keros Therapeutics, Inc.(1) | 3,528 | 132,335 | ||||||
Kindred Biosciences, Inc.(1) | 18,972 | 85,184 | ||||||
Kiniksa Pharmaceuticals Ltd. - Class A(1) | 9,517 | 242,493 | ||||||
Kodiak Sciences, Inc.(1) | 15,658 | 847,411 | ||||||
Krystal Biotech, Inc.(1) | 6,831 | 282,940 | ||||||
Kura Oncology, Inc.(1) | 28,745 | 468,543 | ||||||
La Jolla Pharmaceutical Co.(1) | 11,949 | 50,903 | ||||||
Laboratory Corp. of America Holdings(1) | 542 | 90,032 | ||||||
Lantheus Holdings, Inc.(1) | 25,603 | 366,123 | ||||||
LeMaitre Vascular, Inc. | 7,200 | 190,080 | ||||||
Lexicon Pharmaceuticals, Inc.(1) | 22,770 | 45,426 | ||||||
LHC Group, Inc.(1) | 91,042 | 15,870,441 | ||||||
Ligand Pharmaceuticals, Inc.(1) | 70,815 | 7,920,658 | ||||||
Liquidia Technologies, Inc.(1) | 11,082 | 93,310 | ||||||
LivaNova Plc(1) | 18,966 | 912,834 | ||||||
Livongo Health, Inc.(1) | 5,326 | 400,462 | ||||||
LogicBio Therapeutics, Inc.(1) | 6,353 | 53,746 | ||||||
Luminex Corp. | 23,078 | 750,727 | ||||||
Lyra Therapeutics, Inc.(1) | 2,035 | 23,077 | ||||||
MacroGenics, Inc.(1) | 9,281 | 259,126 | ||||||
Madrigal Pharmaceuticals, Inc.(1) | 4,739 | 536,692 | ||||||
Magellan Health, Inc.(1) | 5,532 | 403,725 | ||||||
Magenta Therapeutics, Inc.(1) | 7,588 | 56,986 | ||||||
MannKind Corp.(1) | 124,088 | 217,154 | ||||||
Marinus Pharmaceuticals, Inc.(1) | 45,866 | 116,500 | ||||||
Marker Therapeutics, Inc.(1) | 10,772 | 22,298 | ||||||
Masimo Corp.(1) | 87,770 | 20,010,682 | ||||||
McKesson Corp. | 11,915 | 1,827,999 | ||||||
MediciNova, Inc.(1) | 22,442 | 121,636 | ||||||
Medpace Holdings, Inc.(1) | 117,297 | 10,910,967 | ||||||
MEI Pharma, Inc.(1) | 47,106 | 194,548 | ||||||
MeiraGTx Holdings Plc(1) | 11,142 | 139,498 | ||||||
Menlo Therapeutics, Inc.(1) | 7,090 | 12,266 | ||||||
Meridian Bioscience, Inc.(1) | 20,055 | 467,081 | ||||||
Merit Medical Systems, Inc.(1) | 29,677 | 1,354,755 | ||||||
Mersana Therapeutics, Inc.(1) | 24,845 | 581,373 | ||||||
Mesa Laboratories, Inc. | 48,937 | 10,609,542 | ||||||
Mettler-Toledo International, Inc.(1) | 2,190 | 1,764,154 | ||||||
Milestone Scientific, Inc.(1) | 17,952 | 35,006 | ||||||
Minerva Neurosciences, Inc.(1) | 18,030 | 65,088 | ||||||
Mirati Therapeutics, Inc.(1) | 20,112 | 2,296,187 | ||||||
Mirum Pharmaceuticals, Inc.(1) | 1,187 | 23,099 | ||||||
Misonix, Inc.(1) | 3,477 | 47,183 | ||||||
Moderna, Inc.(1) | 26,564 | 1,705,674 | ||||||
Molecular Templates, Inc.(1) | 13,132 | 181,090 | ||||||
Molina Healthcare, Inc.(1) | 3,460 | 615,811 | ||||||
Momenta Pharmaceuticals, Inc.(1) | 60,572 | 2,015,230 | ||||||
Morphic Holding, Inc.(1) | 7,494 | 202,713 | ||||||
Mustang Bio, Inc.(1) | 15,174 | 48,253 | ||||||
MyoKardia, Inc.(1) | 23,805 | 2,300,039 | ||||||
NanoString Technologies, Inc.(1) | 17,810 | 522,724 | ||||||
NantHealth, Inc.(1) | 15,099 | 69,153 | ||||||
NantKwest, Inc.(1) | 13,287 | 163,164 | ||||||
Natera, Inc.(1) | 35,922 | 1,791,071 | ||||||
National Research Corp. | 7,297 | 424,758 | ||||||
Natus Medical, Inc.(1) | 5,949 | 129,807 | ||||||
Nemaura Medical, Inc.(1) | 3,576 | 33,078 | ||||||
Neogen Corp.(1) | 82,528 | 6,404,173 | ||||||
NeoGenomics, Inc.(1) | 56,738 | 1,757,743 | ||||||
Neoleukin Therapeutics, Inc.(1) | 16,086 | 267,028 | ||||||
Neubase Therapeutics, Inc.(1) | 9,352 | 82,111 | ||||||
NeuroBo Pharmaceuticals, Inc.(1) | 2,001 | 16,108 | ||||||
Neurocrine Biosciences, Inc.(1) | 9,100 | 1,110,200 | ||||||
Nevro Corp.(1) | 18,397 | 2,197,890 | ||||||
NextCure, Inc.(1) | 9,015 | 193,282 | ||||||
NGM Biopharmaceuticals, Inc.(1) | 11,948 | 235,854 |
Novavax, Inc.(1) | 8,524 | 710,475 | ||||||
Novocure Ltd.(1) | 9,828 | 582,800 | ||||||
NuVasive, Inc.(1) | 77,393 | 4,307,694 | ||||||
Nymox Pharmaceutical Corp.(1) | 18,620 | 66,101 | ||||||
Ocular Therapeutix, Inc.(1) | 29,753 | 247,842 | ||||||
Odonate Therapeutics, Inc.(1) | 7,476 | 316,534 | ||||||
Omeros Corp.(1) | 28,391 | 417,916 | ||||||
Omnicell, Inc.(1) | 209,261 | 14,778,012 | ||||||
OncoCyte Corp.(1) | 23,268 | 44,442 | ||||||
Oncternal Therapeutics, Inc. CVR(1)(3) | 207 | 382 | ||||||
OptimizeRx Corp.(1) | 7,989 | 104,097 | ||||||
Optinose, Inc.(1) | 16,668 | 124,010 | ||||||
Option Care Health, Inc.(1) | 17,261 | 239,583 | ||||||
OraSure Technologies, Inc.(1) | 20,577 | 239,311 | ||||||
Organogenesis Holdings, Inc. - Class A(1) | 10,557 | 40,539 | ||||||
Orgenesis, Inc.(1) | 1,862 | 11,321 | ||||||
ORIC Pharmaceuticals, Inc.(1) | 4,411 | 148,783 | ||||||
OrthoPediatrics Corp.(1) | 6,915 | 302,600 | ||||||
Osmotica Pharmaceuticals Plc(1) | 4,695 | 31,597 | ||||||
Ovid therapeutics, Inc.(1) | 23,191 | 170,918 | ||||||
Oyster Point Pharma, Inc.(1) | 2,747 | 79,333 | ||||||
Pacific Biosciences of California, Inc.(1) | 68,562 | 236,539 | ||||||
Pacira BioSciences, Inc.(1) | 118,650 | 6,225,566 | ||||||
Paratek Pharmaceuticals, Inc.(1) | 20,584 | 107,448 | ||||||
Passage Bio, Inc.(1) | 4,539 | 124,051 | ||||||
PAVmed, Inc.(1) | 20,137 | 42,489 | ||||||
Pennant Group, Inc.(1) | 14,756 | 333,486 | ||||||
Penumbra, Inc.(1) | 32,350 | 5,784,827 | ||||||
PerkinElmer, Inc. | 2,147 | 210,599 | ||||||
Personalis, Inc.(1) | 10,469 | 135,783 | ||||||
PetIQ, Inc. - Class A(1) | 11,177 | 389,407 | ||||||
Pfenex, Inc.(1) | 20,500 | 171,175 | ||||||
PhaseBio Pharmaceuticals, Inc.(1) | 7,924 | 36,450 | ||||||
Phathom Pharmaceuticals, Inc.(1) | 5,841 | 192,227 | ||||||
Phibro Animal Health Corp. - Class A | 10,790 | 283,453 | ||||||
Phreesia, Inc.(1) | 15,554 | 439,867 | ||||||
Pieris Pharmaceuticals, Inc.(1) | 27,347 | 84,776 | ||||||
Portola Pharmaceuticals, Inc.(1) | 42,486 | 764,323 | ||||||
PPD, Inc.(1) | 5,175 | 138,690 | ||||||
PRA Health Sciences, Inc.(1) | 54,108 | 5,264,167 | ||||||
Precigen, Inc.(1) | 28,253 | 140,982 | ||||||
Precision BioSciences, Inc.(1) | 23,173 | 193,031 | ||||||
Prestige Consumer Healthcare, Inc.(1) | 285,290 | 10,715,492 | ||||||
Prevail Therapeutics, Inc.(1) | 8,724 | 129,988 | ||||||
Principia Biopharma, Inc.(1) | 14,581 | 871,798 | ||||||
Progyny, Inc.(1) | 14,895 | 384,440 | ||||||
Protagonist Therapeutics, Inc.(1) | 12,270 | 216,688 | ||||||
Protara Therapeutics, Inc.(1) | 1,092 | 32,017 | ||||||
Provention Bio, Inc.(1) | 22,956 | 323,909 | ||||||
PTC Therapeutics, Inc.(1) | 33,820 | 1,716,027 | ||||||
Pulse Biosciences, Inc.(1) | 7,514 | 78,596 | ||||||
Puma Biotechnology, Inc.(1) | 16,436 | 171,427 | ||||||
Quanterix Corp.(1) | 10,777 | 295,182 | ||||||
Quidel Corp.(1) | 14,807 | 3,312,918 | ||||||
Quotient Ltd.(1) | 32,768 | 242,483 | ||||||
R1 RCM, Inc.(1) | 59,295 | 661,139 | ||||||
Radius Health, Inc.(1) | 24,497 | 333,894 | ||||||
RadNet, Inc.(1) | 24,165 | 383,499 | ||||||
RAPT Therapeutics, Inc.(1) | 5,932 | 172,147 | ||||||
Reata Pharmaceuticals, Inc. - Class A(1) | 2,097 | 327,174 | ||||||
Recro Pharma, Inc.(1) | 10,915 | 49,663 | ||||||
REGENXBIO, Inc.(1) | 18,789 | 691,999 | ||||||
Relmada Therapeutics, Inc.(1) | 7,616 | 340,816 | ||||||
Repligen Corp.(1) | 74,701 | 9,233,791 | ||||||
Replimune Group, Inc.(1) | 9,394 | 233,441 | ||||||
Repro-Med Systems, Inc.(1) | 13,466 | 120,925 | ||||||
ResMed, Inc. | 53,873 | 10,343,616 | ||||||
Retractable Technologies, Inc.(1) | 7,160 | 50,263 |
Retrophin, Inc.(1) | 22,413 | 457,449 | ||||||
Revance Therapeutics, Inc.(1) | 24,241 | 591,965 | ||||||
REVOLUTION Medicines, Inc.(1) | 7,939 | 250,634 | ||||||
Rhythm Pharmaceuticals, Inc.(1) | 18,235 | 406,641 | ||||||
Rigel Pharmaceuticals, Inc.(1) | 99,058 | 181,276 | ||||||
Rocket Pharmaceuticals, Inc.(1) | 18,495 | 387,100 | ||||||
Rockwell Medical, Inc.(1) | 38,598 | 75,266 | ||||||
Rubius Therapeutics, Inc.(1) | 3,449 | 20,625 | ||||||
Sage Therapeutics, Inc.(1) | 100,782 | 4,190,516 | ||||||
Sangamo Therapeutics, Inc.(1) | 63,972 | 573,189 | ||||||
Sarepta Therapeutics, Inc.(1) | 60,894 | 9,763,744 | ||||||
Satsuma Pharmaceuticals, Inc.(1) | 4,997 | 143,714 | ||||||
Scholar Rock Holding Corp.(1) | 12,357 | 225,021 | ||||||
Schrodinger, Inc./United States(1) | 7,524 | 688,973 | ||||||
scPharmaceuticals, Inc.(1) | 2,912 | 21,432 | ||||||
Seattle Genetics, Inc.(1) | 12,034 | 2,044,817 | ||||||
Select Medical Holdings Corp.(1) | 59,689 | 879,219 | ||||||
Selecta Biosciences, Inc.(1) | 17,338 | 49,240 | ||||||
Seres Therapeutics, Inc.(1) | 23,951 | 114,007 | ||||||
Sharps Compliance Corp.(1) | 7,902 | 55,551 | ||||||
Shockwave Medical, Inc.(1) | 14,462 | 685,065 | ||||||
SI-BONE, Inc.(1) | 13,721 | 218,713 | ||||||
Sientra, Inc.(1) | 19,836 | 76,765 | ||||||
SIGA Technologies, Inc.(1) | 32,072 | 189,546 | ||||||
Silk Road Medical, Inc.(1) | 17,241 | 722,225 | ||||||
Simulations Plus, Inc. | 6,896 | 412,519 | ||||||
Soleno Therapeutics, Inc.(1) | 15,216 | 33,780 | ||||||
Solid Biosciences, Inc.(1) | 1,265 | 3,706 | ||||||
Soliton, Inc.(1) | 3,215 | 25,013 | ||||||
Sorrento Therapeutics, Inc.(1) | 97,471 | 612,118 | ||||||
Spero Therapeutics, Inc.(1) | 6,967 | 94,264 | ||||||
SpringWorks Therapeutics, Inc.(1) | 11,489 | 482,538 | ||||||
STAAR Surgical Co.(1) | 24,731 | 1,521,946 | ||||||
Stereotaxis, Inc.(1) | 24,211 | 107,981 | ||||||
STERIS Plc | 453 | 69,508 | ||||||
Stoke Therapeutics, Inc.(1) | 6,573 | 156,635 | ||||||
Strongbridge Biopharma Plc(1) | 17,653 | 66,728 | ||||||
Supernus Pharmaceuticals, Inc.(1) | 5,918 | 140,553 | ||||||
Surgery Partners, Inc.(1) | 12,132 | 140,367 | ||||||
Surmodics, Inc.(1) | 7,189 | 310,852 | ||||||
Sutro Biopharma, Inc.(1) | 7,540 | 58,510 | ||||||
Syndax Pharmaceuticals, Inc.(1) | 14,663 | 217,306 | ||||||
Syneos Health, Inc. - Class A(1) | 670 | 39,028 | ||||||
Syros Pharmaceuticals, Inc.(1) | 22,583 | 240,735 | ||||||
Tabula Rasa HealthCare, Inc.(1) | 11,123 | 608,762 | ||||||
Tactile Systems Technology, Inc.(1) | 10,290 | 426,315 | ||||||
Tandem Diabetes Care, Inc.(1) | 71,032 | 7,026,485 | ||||||
TCR2 Therapeutics, Inc.(1) | 469 | 7,204 | ||||||
Tela Bio, Inc.(1) | 2,958 | 38,336 | ||||||
Teladoc Health, Inc.(1) | 17,119 | 3,266,990 | ||||||
Teleflex, Inc. | 2,897 | 1,054,450 | ||||||
Tenet Healthcare Corp.(1) | 5,654 | 102,394 | ||||||
TG Therapeutics, Inc.(1) | 44,773 | 872,178 | ||||||
The Cooper Companies, Inc. | 86,592 | 24,560,955 | ||||||
The Joint Corp.(1) | 7,185 | 109,715 | ||||||
The Providence Service Corp.(1) | 6,751 | 532,721 | ||||||
TherapeuticsMD, Inc.(1) | 107,412 | 134,265 | ||||||
Theravance Biopharma, Inc.(1) | 21,524 | 451,789 | ||||||
Tivity Health, Inc.(1) | 10,846 | 122,885 | ||||||
Translate Bio, Inc.(1) | 27,494 | 492,692 | ||||||
TransMedics Group, Inc.(1) | 10,679 | 191,368 | ||||||
Tricida, Inc.(1) | 15,280 | 419,894 | ||||||
Triple-S Management Corp. - Class B(1) | 987 | 18,773 | ||||||
Turning Point Therapeutics, Inc.(1) | 14,111 | 911,429 | ||||||
Twist Bioscience Corp.(1) | 16,239 | 735,627 | ||||||
Tyme Technologies, Inc.(1) | 44,657 | 59,394 | ||||||
Ultragenyx Pharmaceutical, Inc.(1) | 31,009 | 2,425,524 | ||||||
UNITY Biotechnology, Inc.(1) | 17,790 | 154,417 |
UroGen Pharma Ltd.(1) | 6,435 | 168,082 | ||||||
US Physical Therapy, Inc. | 6,862 | 555,959 | ||||||
Utah Medical Products, Inc. | 1,478 | 130,980 | ||||||
Vapotherm, Inc.(1) | 10,463 | 428,878 | ||||||
Varian Medical Systems, Inc.(1) | 1,155 | 141,511 | ||||||
Vaxart, Inc.(1) | 20,504 | 181,460 | ||||||
VBI Vaccines, Inc.(1) | 76,395 | 236,825 | ||||||
Veeva Systems, Inc. - Class A(1) | 422,092 | 98,946,807 | ||||||
Venus Concept, Inc.(1) | 5,753 | 20,078 | ||||||
Veracyte, Inc.(1) | 27,087 | 701,553 | ||||||
Verastem, Inc.(1) | 36,284 | 62,408 | ||||||
Vericel Corp.(1) | 21,369 | 295,320 | ||||||
Verrica Pharmaceuticals, Inc.(1) | 7,745 | 85,272 | ||||||
Viela Bio, Inc.(1) | 11,181 | 484,361 | ||||||
Viemed Healthcare, Inc.(1) | 18,766 | 180,154 | ||||||
ViewRay, Inc.(1) | 22,573 | 50,564 | ||||||
Viking Therapeutics, Inc.(1) | 2,397 | 17,282 | ||||||
Vir Biotechnology, Inc.(1) | 25,476 | 1,043,752 | ||||||
Vocera Communications, Inc.(1) | 18,087 | 383,444 | ||||||
VolitionRX Ltd.(1) | 12,133 | 47,197 | ||||||
Voyager Therapeutics, Inc.(1) | 13,859 | 174,901 | ||||||
vTv Therapeutics, Inc. - Class A(1) | 4,994 | 11,237 | ||||||
Waters Corp.(1) | 134,464 | 24,257,306 | ||||||
WaVe Life Sciences Ltd.(1) | 11,073 | 115,270 | ||||||
West Pharmaceutical Services, Inc. | 243,653 | 55,350,652 | ||||||
Wright Medical Group NV(1) | 70,341 | 2,090,535 | ||||||
Xencor, Inc.(1) | 28,347 | 918,159 | ||||||
Xeris Pharmaceuticals, Inc.(1) | 18,515 | 49,250 | ||||||
XOMA Corp.(1) | 2,712 | 53,589 | ||||||
Y-mAbs Therapeutics, Inc.(1) | 16,280 | 703,296 | ||||||
Zentalis Pharmaceuticals, Inc.(1) | 5,236 | 251,433 | ||||||
ZIOPHARM Oncology, Inc.(1) | 77,831 | 255,286 | ||||||
Zogenix, Inc.(1) | 30,644 | 827,694 | ||||||
Zynex, Inc.(1) | 9,111 | 226,591 | ||||||
|
| |||||||
Total Healthcare |
| 1,227,375,234 | ||||||
|
| |||||||
Industrials – 14.05% | ||||||||
AAON, Inc. | 171,451 | 9,308,075 | ||||||
Advanced Disposal Services, Inc.(1) | 37,233 | 1,123,320 | ||||||
Advanced Drainage Systems, Inc. | 27,151 | 1,341,259 | ||||||
Aerojet Rocketdyne Holdings, Inc.(1) | 40,116 | 1,590,198 | ||||||
Aerovironment, Inc.(1) | 11,758 | 936,290 | ||||||
Air Transport Services Group, Inc.(1) | 32,503 | 723,842 | ||||||
Akerna Corp.(1) | 4,586 | 40,357 | ||||||
Alamo Group, Inc. | 4,340 | 445,458 | ||||||
Albany International Corp. - Class A | 153,190 | 8,993,785 | ||||||
Allegiant Travel Co. - Class A | 864 | 94,357 | ||||||
Allegion Plc | 5,905 | 603,609 | ||||||
Allied Motion Technologies, Inc. | 3,650 | 128,845 | ||||||
Allison Transmission Holdings, Inc. | 7,297 | 268,384 | ||||||
Alpha Pro Tech Ltd.(1) | 7,584 | 134,237 | ||||||
Altra Industrial Motion Corp. | 390,492 | 12,441,075 | ||||||
Ameresco, Inc. - Class A(1) | 13,864 | 385,142 | ||||||
AMETEK, Inc. | 473,000 | 42,272,010 | ||||||
Apogee Enterprises, Inc. | 2,041 | 47,025 | ||||||
Applied Industrial Technologies, Inc. | 8,408 | 524,575 | ||||||
Armstrong World Industries, Inc. | 1,757 | 136,976 | ||||||
ASGN, Inc.(1) | 23,026 | 1,535,374 | ||||||
Atkore International Group, Inc.(1) | 25,620 | 700,707 | ||||||
Atlas Air Worldwide Holdings, Inc.(1) | 894 | 38,469 | ||||||
Avis Budget Group, Inc.(1) | 29,164 | 667,564 | ||||||
Axon Enterprise, Inc.(1) | 66,253 | 6,501,407 | ||||||
AZEK Co., Inc. - Class A(1) | 43,693 | 1,392,059 | ||||||
Barrett Business Services, Inc. | 320 | 17,002 | ||||||
Beacon Roofing Supply, Inc.(1) | 259,235 | 6,836,027 | ||||||
Bloom Energy Corp. - Class A(1) | 43,242 | 470,473 | ||||||
Blue Bird Corp.(1) | 3,220 | 48,268 | ||||||
Brady Corp. - Class A | 19,973 | 935,136 | ||||||
Brink’s Co. | 27,445 | 1,249,022 | ||||||
Builders FirstSource, Inc.(1) | 57,559 | 1,191,471 | ||||||
BWX Technologies, Inc. | 6,039 | 342,049 | ||||||
CAI International, Inc.(1) | 1,408 | 23,457 | ||||||
Carrier Global Corp. | 30,832 | 685,087 | ||||||
Casella Waste Systems, Inc. - Class A(1) | 21,888 | 1,140,803 | ||||||
CBIZ, Inc.(1) | 4,625 | 110,861 | ||||||
CH Robinson Worldwide, Inc. | 2,059 | 162,785 | ||||||
Cimpress Plc(1) | 3,141 | 239,784 | ||||||
Cintas Corp. | 49,949 | 13,304,416 | ||||||
Clarivate Plc(1) | 1,222,000 | 27,287,260 | ||||||
Comfort Systems USA, Inc. | 5,709 | 232,642 | ||||||
Construction Partners, Inc. - Class A(1) | 4,647 | 82,531 | ||||||
Copart, Inc.(1) | 20,088 | 1,672,728 | ||||||
CoreLogic, Inc. | 404 | 27,157 | ||||||
Cornerstone Building Brands, Inc.(1) | 9,295 | 56,328 | ||||||
CoStar Group, Inc.(1) | 11,099 | 7,887,726 | ||||||
Covanta Holding Corp. | 25,261 | 242,253 | ||||||
CRA International, Inc. | 3,435 | 135,682 | ||||||
CSW Industrials, Inc. | 7,662 | 529,521 | ||||||
Cubic Corp. | 1,953 | 93,803 | ||||||
Daseke, Inc.(1) | 27,867 | 109,517 | ||||||
Donaldson Co., Inc. | 1,374 | 63,918 | ||||||
Douglas Dynamics, Inc. | 11,253 | 395,205 | ||||||
Dycom Industries, Inc.(1) | 12,001 | 490,721 | ||||||
EMCOR Group, Inc. | 2,430 | 160,720 | ||||||
Energy Recovery, Inc.(1) | 20,345 | 154,520 | ||||||
Enerpac Tool Group Corp. - Class A | 10,958 | 192,861 | ||||||
EnerSys | 2,159 | 138,996 | ||||||
Equifax, Inc. | 8,875 | 1,525,435 | ||||||
ESCO Technologies, Inc. | 12,933 | 1,093,226 | ||||||
EVI Industries, Inc.(1) | 2,506 | 54,405 | ||||||
Evoqua Water Technologies Corp.(1) | 46,456 | 864,082 | ||||||
ExOne Co.(1) | 4,670 | 39,928 | ||||||
Expeditors International of Washington, Inc. | 10,042 | 763,594 | ||||||
Exponent, Inc. | 28,047 | 2,269,844 | ||||||
Fastenal Co. | 45,891 | 1,965,970 | ||||||
Federal Signal Corp. | 30,422 | 904,446 | ||||||
Forrester Research, Inc.(1) | 5,824 | 186,601 | ||||||
Fortive Corp. | 976,176 | 66,048,068 | ||||||
Forward Air Corp. | 9,316 | 464,123 | ||||||
Foundation Building Materials, Inc.(1) | 2,403 | 37,511 | ||||||
Franklin Covey Co.(1) | 6,754 | 144,536 | ||||||
Franklin Electric Co., Inc. | 23,161 | 1,216,416 | ||||||
FuelCell Energy, Inc.(1) | 76,818 | 173,609 | ||||||
Gencor Industries, Inc.(1) | 565 | 7,142 | ||||||
Generac Holdings, Inc.(1) | 5,509 | 671,712 | ||||||
Gibraltar Industries, Inc.(1) | 3,985 | 191,320 | ||||||
Gorman-Rupp Co. | 1,479 | 45,967 | ||||||
Graco, Inc. | 8,207 | 393,854 | ||||||
Granite Construction, Inc. | 2,652 | 50,759 | ||||||
HC2 Holdings, Inc.(1) | 23,423 | 78,233 | ||||||
Healthcare Services Group, Inc. | 40,979 | 1,002,346 | ||||||
HEICO Corp. | 3,542 | 352,960 | ||||||
HEICO Corp. - Class A | 60,131 | 4,885,042 | ||||||
Helios Technologies, Inc. | 7,082 | 263,804 | ||||||
Herc Holdings, Inc.(1) | 764 | 23,478 | ||||||
Huntington Ingalls Industries, Inc. | 380 | 66,306 | ||||||
Huron Consulting Group, Inc.(1) | 1,118 | 49,471 | ||||||
IAA, Inc.(1) | 3,171 | 122,305 | ||||||
ICF International, Inc. | 4,910 | 318,315 | ||||||
IDEX Corp. | 263,593 | 41,658,238 | ||||||
IES Holdings, Inc.(1) | 1,603 | 37,142 | ||||||
IHS Markit Ltd. | 497,447 | 37,557,249 | ||||||
Ingersoll Rand, Inc.(1) | 537,628 | 15,118,099 | ||||||
Insperity, Inc. | 10,023 | 648,789 | ||||||
Interface, Inc. - Class A | 5,361 | 43,639 | ||||||
JB Hunt Transport Services, Inc. | 26,169 | 3,149,177 | ||||||
John Bean Technologies Corp. | 17,107 | 1,471,544 |
Kadant, Inc. | 6,202 | 618,091 | ||||||
Kaman Corp. | 1,426 | 59,322 | ||||||
Kforce, Inc. | 10,493 | 306,920 | ||||||
Kornit Digital Ltd.(1) | 107,537 | 5,740,325 | ||||||
Kratos Defense & Security Solutions, Inc.(1) | 418,133 | 6,535,419 | ||||||
L3Harris Technologies, Inc. | 176,904 | 30,015,302 | ||||||
Landstar System, Inc. | 75,621 | 8,492,995 | ||||||
Lawson Products, Inc.(1) | 1,527 | 49,261 | ||||||
Lincoln Electric Holdings, Inc. | 2,429 | 204,619 | ||||||
Lindsay Corp. | 6,032 | 556,211 | ||||||
Luxfer Holdings Plc | 913 | 12,919 | ||||||
Marten Transport Ltd. | 10,464 | 263,274 | ||||||
Masonite International Corp.(1) | 13,400 | 1,042,252 | ||||||
MasTec, Inc.(1) | 2,082 | 93,419 | ||||||
Mastech Digital, Inc.(1) | 2,236 | 57,979 | ||||||
McGrath RentCorp | 7,429 | 401,240 | ||||||
Mercury Systems, Inc.(1) | 74,945 | 5,895,174 | ||||||
Meritor, Inc.(1) | 28,482 | 563,944 | ||||||
Mobile Mini, Inc. | 5,855 | 172,722 | ||||||
MSA Safety, Inc. | 803 | 91,895 | ||||||
MSC Industrial Direct Co., Inc. - Class A | 125,413 | 9,131,321 | ||||||
Mueller Water Products, Inc. - Class A | 5,607 | 52,874 | ||||||
MYR Group, Inc.(1) | 5,655 | 180,451 | ||||||
National Presto Industries, Inc. | 207 | 18,090 | ||||||
Nordson Corp. | 79,641 | 15,108,694 | ||||||
NV5 Global, Inc.(1) | 5,294 | 269,094 | ||||||
Old Dominion Freight Line, Inc. | 8,304 | 1,408,275 | ||||||
Omega Flex, Inc. | 1,582 | 167,376 | ||||||
Orion Energy Systems, Inc.(1) | 14,374 | 49,734 | ||||||
PAE, Inc.(1) | 33,567 | 320,901 | ||||||
PAM Transportation Services, Inc.(1) | 135 | 4,151 | ||||||
Parsons Corp.(1) | 9,030 | 327,247 | ||||||
Patrick Industries, Inc. | 11,689 | 715,951 | ||||||
PGT Innovations, Inc.(1) | 11,828 | 185,463 | ||||||
Pitney Bowes, Inc. | 35,824 | 93,142 | ||||||
Plug Power, Inc.(1) | 177,978 | 1,461,199 | ||||||
Primoris Services Corp. | 400,338 | 7,110,003 | ||||||
Proto Labs, Inc.(1) | 64,502 | 7,254,540 | ||||||
Quanta Services, Inc. | 2,779 | 109,020 | ||||||
Raven Industries, Inc. | 1,660 | 35,707 | ||||||
RBC Bearings, Inc.(1) | 127,851 | 17,137,148 | ||||||
Red Violet, Inc.(1) | 3,589 | 63,310 | ||||||
REV Group, Inc. | 1,792 | 10,931 | ||||||
Rexnord Corp. | 4,446 | 129,601 | ||||||
Rockwell Automation, Inc. | 176,730 | 37,643,490 | ||||||
Rollins, Inc. | 12,822 | 543,525 | ||||||
Roper Technologies, Inc. | 67,781 | 26,316,651 | ||||||
Saia, Inc.(1) | 14,400 | 1,600,992 | ||||||
Shyft Group, Inc. | 18,536 | 312,146 | ||||||
Simpson Manufacturing Co., Inc. | 137,822 | 11,626,664 | ||||||
SiteOne Landscape Supply, Inc.(1) | 79,984 | 9,115,776 | ||||||
SPX Corp.(1) | 17,674 | 727,285 | ||||||
Sterling Construction Co., Inc.(1) | 2,318 | 24,269 | ||||||
Sunrun, Inc.(1) | 63,758 | 1,257,308 | ||||||
Systemax, Inc. | 4,299 | 88,301 | ||||||
Teledyne Technologies, Inc.(1) | 26,183 | 8,141,604 | ||||||
Tennant Co. | 10,118 | 657,771 | ||||||
Tetra Tech, Inc. | 29,392 | 2,325,495 | ||||||
Toro Co. | 386,512 | 25,641,206 | ||||||
TPI Composites, Inc.(1) | 16,421 | 383,759 | ||||||
Transcat, Inc.(1) | 3,731 | 96,484 | ||||||
TransDigm Group, Inc. | 1,147 | 507,031 | ||||||
TransUnion | 172,035 | 14,973,926 | ||||||
Trex Co., Inc.(1) | 42,432 | 5,519,130 | ||||||
TriNet Group, Inc.(1) | 22,538 | 1,373,466 | ||||||
UFP Industries, Inc. | 27,639 | 1,368,407 | ||||||
UniFirst Corp. | 67,120 | 12,011,124 | ||||||
Universal Logistics Holdings, Inc. | 2,948 | 51,236 |
Upwork, Inc.(1) | 51,241 | 739,920 | ||||||
Vectrus, Inc.(1) | 2,327 | 114,326 | ||||||
Verisk Analytics, Inc. - Class A | 169,099 | 28,780,650 | ||||||
Vertiv Holdings Co.(1) | 19,650 | 266,454 | ||||||
Vicor Corp.(1) | 9,712 | 698,778 | ||||||
Virgin Galactic Holdings, Inc.(1) | 5,099 | 83,318 | ||||||
Vivint Solar, Inc.(1) | 26,733 | 264,657 | ||||||
Watsco, Inc. | 52,886 | 9,397,842 | ||||||
Watts Water Technologies, Inc. - Class A | 6,574 | 532,494 | ||||||
Welbilt, Inc.(1) | 19,704 | 119,997 | ||||||
Werner Enterprises, Inc. | 29,608 | 1,288,836 | ||||||
Willdan Group, Inc.(1) | 3,943 | 98,614 | ||||||
WillScot Corp. - Class A(1) | 16,506 | 202,859 | ||||||
WW Grainger, Inc. | 3,235 | 1,016,308 | ||||||
XPO Logistics, Inc.(1) | 460 | 35,535 | ||||||
|
| |||||||
Total Industrials |
| 673,508,954 | ||||||
|
| |||||||
Information Technology – 27.33% | ||||||||
2U, Inc.(1) | 1,967 | 74,667 | ||||||
8x8, Inc.(1) | 183,505 | 2,936,080 | ||||||
A10 Networks, Inc.(1) | 35,744 | 243,417 | ||||||
Acacia Communications, Inc.(1) | 21,410 | 1,438,538 | ||||||
ACI Worldwide, Inc.(1) | 62,524 | 1,687,523 | ||||||
Advanced Energy Industries, Inc.(1) | 20,816 | 1,411,117 | ||||||
Advanced Micro Devices, Inc.(1) | 205,295 | 10,800,570 | ||||||
Agilysys, Inc.(1) | 10,458 | 187,617 | ||||||
Akamai Technologies, Inc.(1) | 13,029 | 1,395,276 | ||||||
Akoustis Technologies, Inc.(1) | 16,913 | 140,209 | ||||||
Alarm.com Holdings, Inc.(1) | 24,797 | 1,607,094 | ||||||
Altair Engineering, Inc. - Class A(1) | 234,687 | 9,328,808 | ||||||
Alteryx, Inc. - Class A(1) | 5,205 | 855,077 | ||||||
Ambarella, Inc.(1) | 5,423 | 248,373 | ||||||
American Software, Inc. - Class A | 16,246 | 256,037 | ||||||
Amkor Technology, Inc.(1) | 8,973 | 110,458 | ||||||
Amphenol Corp. - Class A | 16,917 | 1,620,818 | ||||||
Anaplan, Inc.(1) | 12,871 | 583,185 | ||||||
ANSYS, Inc.(1) | 22,816 | 6,656,112 | ||||||
Appfolio, Inc. - Class A(1) | 8,683 | 1,412,811 | ||||||
Appian Corp. - Class A(1) | 17,829 | 913,736 | ||||||
Arista Networks, Inc.(1) | 98,052 | 20,593,862 | ||||||
Aspen Technology, Inc.(1) | 45,289 | 4,692,393 | ||||||
Atlassian Corp. Plc - Class A(1) | 284,352 | 51,260,135 | ||||||
Atomera, Inc.(1) | 7,948 | 71,532 | ||||||
Avalara, Inc.(1) | 7,598 | 1,011,218 | ||||||
Avaya Holdings Corp.(1) | 51,430 | 635,675 | ||||||
Avid Technology, Inc.(1) | 16,979 | 123,437 | ||||||
Axcelis Technologies, Inc.(1) | 16,904 | 470,776 | ||||||
Badger Meter, Inc. | 111,488 | 7,014,825 | ||||||
Benefitfocus, Inc.(1) | 15,505 | 166,834 | ||||||
Bill.Com Holdings, Inc.(1) | 1,587 | 143,163 | ||||||
Black Knight, Inc.(1) | 14,275 | 1,035,794 | ||||||
Blackbaud, Inc. | 181,560 | 10,363,445 | ||||||
Blackline, Inc.(1) | 27,542 | 2,283,507 | ||||||
Booz Allen Hamilton Holding Corp. - Class A | 13,612 | 1,058,877 | ||||||
Bottomline Technologies DE, Inc.(1) | 23,802 | 1,208,428 | ||||||
Box, Inc. - Class A(1) | 80,775 | 1,676,889 | ||||||
Brightcove, Inc.(1) | 21,374 | 168,427 | ||||||
Broadridge Financial Solutions, Inc. | 11,314 | 1,427,714 | ||||||
Brooks Automation, Inc. | 39,678 | 1,755,355 | ||||||
Cabot Microelectronics Corp. | 88,740 | 12,382,780 | ||||||
CACI International, Inc. - Class A(1) | 403 | 87,403 | ||||||
Cadence Design Systems, Inc.(1) | 123,740 | 11,874,090 | ||||||
CalAmp Corp.(1) | 11,661 | 93,405 | ||||||
Calix, Inc.(1) | 26,575 | 395,967 | ||||||
Cambium Networks Corp.(1) | 3,057 | 22,500 | ||||||
Cardtronics Plc - Class A(1) | 14,051 | 336,943 | ||||||
Casa Systems, Inc.(1) | 17,538 | 72,958 | ||||||
Cass Information Systems, Inc. | 8,098 | 316,065 | ||||||
CDK Global, Inc. | 1,534 | 63,538 | ||||||
CDW Corp. | 14,028 | 1,629,773 | ||||||
Ceridian HCM Holding, Inc.(1) | 283,515 | 22,474,234 | ||||||
CEVA, Inc.(1) | 12,236 | 457,871 | ||||||
ChannelAdvisor Corp.(1) | 14,967 | 237,077 | ||||||
Ciena Corp.(1) | 51,977 | 2,815,074 | ||||||
Citrix Systems, Inc. | 3,315 | 490,322 | ||||||
Clearfield, Inc.(1) | 6,661 | 92,988 | ||||||
Cloudera, Inc.(1) | 55,302 | 703,441 | ||||||
Cloudflare, Inc. - Class A(1) | 10,766 | 387,038 | ||||||
Cognex Corp. | 385,367 | 23,014,117 | ||||||
Coherent, Inc.(1) | 1,956 | 256,197 | ||||||
Cohu, Inc. | 1,383 | 23,981 | ||||||
CommScope Holding Co., Inc.(1) | 1,075 | 8,955 | ||||||
CommVault Systems, Inc.(1) | 22,597 | 874,504 | ||||||
Cornerstone OnDemand, Inc.(1) | 33,170 | 1,279,035 | ||||||
Coupa Software, Inc.(1) | 17,197 | 4,764,257 | ||||||
Crowdstrike Holdings, Inc. - Class A(1) | 8,275 | 829,900 | ||||||
CSG Systems International, Inc. | 17,724 | 733,596 | ||||||
CyberArk Software Ltd.(1) | 30,584 | 3,036,074 | ||||||
CyberOptics Corp.(1) | 3,905 | 125,780 | ||||||
Datadog, Inc. - Class A(1) | 261,957 | 22,777,161 | ||||||
Diebold Nixdorf, Inc.(1) | 15,345 | 92,991 | ||||||
Digimarc Corp.(1) | 5,915 | 94,581 | ||||||
Digital Turbine, Inc.(1) | 46,056 | 578,924 | ||||||
Diodes, Inc.(1) | 4,085 | 207,109 | ||||||
DocuSign, Inc. - Class A(1) | 79,440 | 13,680,362 | ||||||
Dolby Laboratories, Inc. - Class A | 102,088 | 6,724,537 | ||||||
Domo, Inc. - Class B(1) | 13,850 | 445,554 | ||||||
Dropbox, Inc. - Class A(1) | 24,223 | 527,335 | ||||||
DSP Group, Inc.(1) | 10,769 | 171,012 | ||||||
Dynatrace, Inc.(1) | 14,997 | 608,878 | ||||||
Ebix, Inc. | 7,856 | 175,660 | ||||||
eGain Corp.(1) | 4,433 | 49,251 | ||||||
Elastic NV(1) | 5,395 | 497,473 | ||||||
Endava Plc - ADR(1) | 112,874 | 5,451,814 | ||||||
Endurance International Group Holdings, Inc.(1) | 35,668 | 143,742 | ||||||
Enphase Energy, Inc.(1) | 10,446 | 496,916 | ||||||
Entegris, Inc. | 12,413 | 732,988 | ||||||
Envestnet, Inc.(1) | 129,818 | 9,546,816 | ||||||
EPAM Systems, Inc.(1) | 5,255 | 1,324,313 | ||||||
ePlus, Inc.(1) | 6,006 | 424,504 | ||||||
Everbridge, Inc.(1) | 3,390 | 469,040 | ||||||
EVERTEC, Inc. | 33,124 | 930,784 | ||||||
Evo Payments, Inc. - Class A(1) | 22,100 | 504,543 | ||||||
ExlService Holdings, Inc.(1) | 214,231 | 13,582,245 | ||||||
Extreme Networks, Inc.(1) | 63,447 | 275,360 | ||||||
Fabrinet(1) | 20,148 | 1,257,638 | ||||||
Fair Isaac Corp.(1) | 2,765 | 1,155,881 | ||||||
FARO Technologies, Inc.(1) | 9,160 | 490,976 | ||||||
Fastly, Inc. - Class A(1) | 7,200 | 612,936 | ||||||
Fidelity National Information Services, Inc. | 218,438 | 29,290,351 | ||||||
FireEye, Inc.(1) | 4,813 | 58,598 | ||||||
Fitbit, Inc. - Class A(1) | 89,351 | 577,207 | ||||||
Five9, Inc.(1) | 36,311 | 4,018,538 | ||||||
FleetCor Technologies, Inc.(1) | 8,151 | 2,050,221 | ||||||
FLIR Systems, Inc. | 86,292 | 3,500,866 | ||||||
ForeScout Technologies, Inc.(1) | 26,701 | 566,061 | ||||||
FormFactor, Inc.(1) | 42,066 | 1,233,796 | ||||||
Fortinet, Inc.(1) | 46,610 | 6,398,155 | ||||||
Gartner, Inc.(1) | 8,546 | 1,036,886 | ||||||
Genasys, Inc.(1) | 18,506 | 89,939 | ||||||
Genpact Ltd. | 7,253 | 264,880 | ||||||
Global Payments, Inc. | 366,197 | 62,114,335 | ||||||
GlobalSCAPE, Inc. | 9,192 | 89,622 | ||||||
Globant SA(1) | 3,577 | 536,013 | ||||||
GoDaddy, Inc. - Class A(1) | 16,365 | 1,200,045 | ||||||
GreenSky, Inc. - Class A(1) | 33,303 | 163,185 | ||||||
Grid Dynamics Holdings, Inc.(1) | 11,573 | 79,854 |
GTT Communications, Inc.(1) | 17,518 | 142,947 | ||||||
Guidewire Software, Inc.(1) | 375,421 | 41,615,418 | ||||||
Hackett Group, Inc. | 11,694 | 158,337 | ||||||
HubSpot, Inc.(1) | 123,910 | 27,799,208 | ||||||
I3 Verticals, Inc. - Class A(1) | 8,074 | 244,239 | ||||||
Ichor Holdings Ltd.(1) | 11,942 | 317,418 | ||||||
II-VI, Inc.(1) | 43,401 | 2,049,395 | ||||||
Immersion Corp.(1) | 7,154 | 44,569 | ||||||
Impinj, Inc.(1) | 9,701 | 266,486 | ||||||
Infinera Corp.(1) | 42,666 | 252,583 | ||||||
Inphi Corp.(1) | 4,729 | 555,657 | ||||||
Inseego Corp.(1) | 16,998 | 197,177 | ||||||
Insight Enterprises, Inc.(1) | 5,137 | 252,740 | ||||||
Intellicheck, Inc.(1) | 8,787 | 66,342 | ||||||
Intelligent Systems Corp.(1) | 3,929 | 133,900 | ||||||
InterDigital, Inc. | 5,390 | 305,236 | ||||||
International Money Express, Inc.(1) | 7,408 | 92,304 | ||||||
Intevac, Inc.(1) | 2,791 | 15,239 | ||||||
IPG Photonics Corp.(1) | 39,844 | 6,390,579 | ||||||
Iteris, Inc.(1) | 22,630 | 107,606 | ||||||
Itron, Inc.(1) | 21,941 | 1,453,591 | ||||||
J2 Global, Inc.(1) | 25,380 | 1,604,270 | ||||||
Jabil, Inc. | 2,770 | 88,862 | ||||||
Jack Henry & Associates, Inc. | 5,904 | 1,086,513 | ||||||
KBR, Inc. | 9,466 | 213,458 | ||||||
Keysight Technologies, Inc.(1) | 6,217 | 626,549 | ||||||
KLA-Tencor Corp. | 15,352 | 2,985,657 | ||||||
Lattice Semiconductor Corp.(1) | 496,017 | 14,081,923 | ||||||
Leidos Holdings, Inc. | 1,301 | 121,865 | ||||||
Limelight Networks, Inc.(1) | 63,190 | 465,078 | ||||||
Littelfuse, Inc. | 57,716 | 9,848,081 | ||||||
LivePerson, Inc.(1) | 33,406 | 1,384,011 | ||||||
LiveRamp Holdings, Inc.(1) | 28,991 | 1,231,248 | ||||||
LogMeIn, Inc. | 404 | 34,247 | ||||||
Lumentum Holdings, Inc.(1) | 800 | 65,144 | ||||||
Luna Innovations, Inc.(1) | 18,251 | 106,586 | ||||||
MACOM Technology Solutions Holdings, Inc.(1) | 26,000 | 893,100 | ||||||
Majesco(1) | 4,535 | 35,645 | ||||||
Manhattan Associates, Inc.(1) | 222,868 | 20,994,166 | ||||||
ManTech International Corp. - Class A | 6,468 | 442,993 | ||||||
Maxim Integrated Products, Inc. | 8,690 | 526,701 | ||||||
MAXIMUS, Inc. | 33,290 | 2,345,281 | ||||||
MaxLinear, Inc. - Class A(1) | 21,761 | 466,991 | ||||||
Medallia, Inc.(1) | 942,522 | 23,789,255 | ||||||
Methode Electronics, Inc. | 3,413 | 106,690 | ||||||
Microchip Technology, Inc. | 82,139 | 8,650,058 | ||||||
MicroStrategy, Inc. - Class A(1) | 2,667 | 315,479 | ||||||
Mimecast Ltd.(1) | 30,947 | 1,289,252 | ||||||
Mitek Systems, Inc.(1) | 10,557 | 101,453 | ||||||
MKS Instruments, Inc. | 4,057 | 459,415 | ||||||
MobileIron, Inc.(1) | 52,353 | 258,100 | ||||||
Model N, Inc.(1) | 18,637 | 647,822 | ||||||
MongoDB, Inc. - Class A(1) | 4,132 | 935,237 | ||||||
Monolithic Power Systems, Inc. | 4,301 | 1,019,337 | ||||||
Motorola Solutions, Inc. | 1,723 | 241,444 | ||||||
Napco Security Technologies, Inc.(1) | 6,419 | 150,140 | ||||||
National Instruments Corp. | 76,171 | 2,948,579 | ||||||
NeoPhotonics Corp.(1) | 18,193 | 161,554 | ||||||
NetApp, Inc. | 11,881 | 527,160 | ||||||
New Relic, Inc.(1) | 274,283 | 18,898,099 | ||||||
NIC, Inc. | 36,371 | 835,078 | ||||||
Nice Ltd. - ADR(1) | 83,198 | 15,744,390 | ||||||
nLight, Inc.(1) | 18,712 | 416,529 | ||||||
NortonLifeLock, Inc. | 55,139 | 1,093,406 | ||||||
Novanta, Inc.(1) | 18,705 | 1,997,133 | ||||||
Nutanix, Inc. - Class A(1) | 523,587 | 12,411,630 | ||||||
NVE Corp. | 2,308 | 142,704 | ||||||
Okta, Inc. - Class A(1) | 157,370 | 31,510,195 |
OneSpan, Inc.(1) | 18,178 | 507,712 | ||||||
Onto Innovation, Inc.(1) | 130,022 | 4,425,949 | ||||||
OSI Systems, Inc.(1) | 9,099 | 679,149 | ||||||
Pagerduty, Inc.(1) | 6,744 | 193,013 | ||||||
Pagseguro Digital Ltd. - Class A(1) | 500,587 | 17,690,745 | ||||||
Palo Alto Networks, Inc.(1) | 160,974 | 36,970,899 | ||||||
PAR Technology Corp.(1) | 8,739 | 261,558 | ||||||
Park City Group, Inc.(1) | 1,887 | 7,982 | ||||||
Paychex, Inc. | 25,051 | 1,897,613 | ||||||
Paycom Software, Inc.(1) | 4,868 | 1,507,766 | ||||||
Paylocity Holding Corp.(1) | 3,416 | 498,360 | ||||||
PaySign, Inc.(1) | 16,739 | 162,536 | ||||||
PC Connection, Inc. | 467 | 21,650 | ||||||
PDF Solutions, Inc.(1) | 14,549 | 284,578 | ||||||
Pegasystems, Inc. | 3,496 | 353,690 | ||||||
Perficient, Inc.(1) | 17,694 | 633,091 | ||||||
Perspecta, Inc. | 63,028 | 1,464,140 | ||||||
PFSweb, Inc.(1) | 7,708 | 51,489 | ||||||
Ping Identity Holding Corp.(1) | 8,736 | 280,338 | ||||||
Pixelworks, Inc.(1) | 22,355 | 72,207 | ||||||
Plantronics, Inc. | 6,049 | 88,799 | ||||||
Plexus Corp.(1) | 12,848 | 906,555 | ||||||
Pluralsight, Inc. - Class A(1) | 9,239 | 166,764 | ||||||
Power Integrations, Inc. | 58,227 | 6,878,356 | ||||||
Priority Technology Holdings, Inc.(1) | 2,478 | 6,418 | ||||||
Progress Software Corp. | 24,332 | 942,865 | ||||||
Proofpoint, Inc.(1) | 183,989 | 20,444,858 | ||||||
PROS Holdings, Inc.(1) | 108,917 | 4,839,182 | ||||||
PTC, Inc.(1) | 67,970 | 5,287,386 | ||||||
Pure Storage, Inc. - Class A(1) | 1,609,740 | 27,896,794 | ||||||
Q2 Holdings, Inc.(1) | 166,431 | 14,278,115 | ||||||
QAD, Inc. - Class A | 6,633 | 273,810 | ||||||
Qualys, Inc.(1) | 170,578 | 17,743,524 | ||||||
Quantum Corp.(1) | 3,251 | 12,549 | ||||||
Rapid7, Inc.(1) | 76,863 | 3,921,550 | ||||||
RealPage, Inc.(1) | 7,581 | 492,841 | ||||||
Repay Holdings Corp. - Class A(1) | 20,087 | 494,743 | ||||||
Research Frontiers, Inc.(1) | 14,527 | 58,980 | ||||||
Resonant, Inc.(1) | 27,140 | 63,236 | ||||||
Rimini Street, Inc.(1) | 11,078 | 57,052 | ||||||
RingCentral, Inc. - Class A(1) | 35,889 | 10,228,724 | ||||||
Rogers Corp.(1) | 1,769 | 220,417 | ||||||
Rosetta Stone, Inc.(1) | 1,518 | 25,593 | ||||||
SailPoint Technologies Holding, Inc.(1) | 48,367 | 1,280,274 | ||||||
Sapiens International Corp. NV | 14,027 | 392,475 | ||||||
Science Applications International Corp. | 750 | 58,260 | ||||||
SecureWorks Corp. - Class A(1) | 391 | 4,469 | ||||||
Semtech Corp.(1) | 164,808 | 8,606,274 | ||||||
ServiceNow, Inc.(1) | 102,000 | 41,316,120 | ||||||
Shopify, Inc. - Class A(1) | 3,265 | 3,099,138 | ||||||
ShotSpotter, Inc.(1) | 4,342 | 109,418 | ||||||
Silicon Laboratories, Inc.(1) | 161,399 | 16,183,478 | ||||||
SiTime Corp.(1) | 2,761 | 130,899 | ||||||
Skyworks Solutions, Inc. | 162,917 | 20,830,568 | ||||||
Slack Technologies, Inc. - Class A(1) | 478,466 | 14,875,508 | ||||||
SMART Global Holdings, Inc.(1) | 7,285 | 198,006 | ||||||
Smartsheet, Inc. - Class A(1) | 310,912 | 15,831,639 | ||||||
Smith Micro Software, Inc.(1) | 18,201 | 81,176 | ||||||
SolarEdge Technologies, Inc.(1) | 4,829 | 670,169 | ||||||
Splunk, Inc.(1) | 210,717 | 41,869,468 | ||||||
Sprout Social, Inc. - Class A(1) | 4,377 | 118,179 | ||||||
SPS Commerce, Inc.(1) | 270,413 | 20,313,425 | ||||||
SS&C Technologies Holdings, Inc. | 4,653 | 262,801 | ||||||
StoneCo Ltd. - Class A(1) | 15,327 | 594,075 | ||||||
SunPower Corp. - Class A(1) | 30,569 | 234,159 | ||||||
Super Micro Computer, Inc.(1) | 7,659 | 217,439 | ||||||
SVMK, Inc.(1) | 65,367 | 1,538,739 | ||||||
Switch, Inc. - Class A | 8,743 | 155,800 |
Sykes Enterprises, Inc.(1) | 1,160 | 32,086 | ||||||
Synaptics, Inc.(1) | 17,465 | 1,049,996 | ||||||
Synopsys, Inc.(1) | 154,245 | 30,077,775 | ||||||
Telenav, Inc.(1) | 7,175 | 39,391 | ||||||
Tenable Holdings, Inc.(1) | 33,620 | 1,002,212 | ||||||
Teradata Corp.(1) | 8,305 | 172,744 | ||||||
Teradyne, Inc. | 16,347 | 1,381,485 | ||||||
Trade Desk, Inc. - Class A(1) | 4,003 | 1,627,220 | ||||||
Trimble, Inc.(1) | 429,856 | 18,565,481 | ||||||
TTEC Holdings, Inc. | 10,214 | 475,564 | ||||||
Tucows, Inc. - Class A(1) | 5,098 | 292,217 | ||||||
Twilio, Inc. - Class A(1) | 10,567 | 2,318,611 | ||||||
Tyler Technologies, Inc.(1) | 36,257 | 12,576,828 | ||||||
Ubiquiti, Inc. | 690 | 120,446 | ||||||
Ultra Clean Holdings, Inc.(1) | 21,510 | 486,771 | ||||||
Unisys Corp.(1) | 3,392 | 37,007 | ||||||
Universal Display Corp. | 4,238 | 634,090 | ||||||
Upland Software, Inc.(1) | 12,397 | 430,920 | ||||||
Varonis Systems, Inc.(1) | 17,123 | 1,515,043 | ||||||
Verint Systems, Inc.(1) | 15,593 | 704,492 | ||||||
VeriSign, Inc.(1) | 5,998 | 1,240,566 | ||||||
Veritone, Inc.(1) | 12,546 | 186,434 | ||||||
Verra Mobility Corp. - Class A(1) | 74,030 | 761,028 | ||||||
Viavi Solutions, Inc.(1) | 125,702 | 1,601,443 | ||||||
VirnetX Holding Corp. | 18,164 | 118,066 | ||||||
Virtusa Corp.(1) | 15,555 | 505,071 | ||||||
Western Union Co. | 7,881 | 170,387 | ||||||
WEX, Inc.(1) | 24,168 | 3,987,962 | ||||||
Wix.com Ltd.(1) | 6,454 | 1,653,644 | ||||||
Workday, Inc. - Class A(1) | 241,000 | 45,153,760 | ||||||
Workiva, Inc. - Class A(1) | 21,148 | 1,131,207 | ||||||
Wrap Technologies, Inc.(1) | 6,337 | 66,412 | ||||||
Xilinx, Inc. | 24,139 | 2,375,036 | ||||||
Xperi Holding Corp. | 3,933 | 58,051 | ||||||
Yext, Inc.(1) | 55,752 | 926,041 | ||||||
Zebra Technologies Corp. - Class A(1) | 4,739 | 1,212,947 | ||||||
Zendesk, Inc.(1) | 11,153 | 987,375 | ||||||
Zix Corp.(1) | 31,940 | 220,386 | ||||||
Zoom Video Communications, Inc. - Class A(1) | 175,948 | 44,609,856 | ||||||
Zscaler, Inc.(1) | 473,164 | 51,811,458 | ||||||
Zuora, Inc. - Class A(1) | 54,116 | 689,979 | ||||||
|
| |||||||
Total Information Technology |
| 1,310,282,047 | ||||||
|
| |||||||
Materials – 2.13% | ||||||||
Amcor Plc | 23,718 | 242,161 | ||||||
American Vanguard Corp. | 2,821 | 38,817 | ||||||
Amyris, Inc.(1) | 4,190 | 17,891 | ||||||
AptarGroup, Inc. | 357,172 | 39,996,121 | ||||||
Avery Dennison Corp. | 3,405 | 388,476 | ||||||
Balchem Corp. | 46,509 | 4,411,844 | ||||||
Ball Corp. | 29,514 | 2,050,928 | ||||||
Berry Global Group, Inc.(1) | 114,640 | 5,080,845 | ||||||
Boise Cascade Co. | 3,718 | 139,834 | ||||||
Caledonia Mining Corp. Plc | 3,070 | 53,172 | ||||||
Chase Corp. | 50,349 | 5,160,772 | ||||||
Compass Minerals International, Inc. | 18,735 | 913,331 | ||||||
Crown Holdings, Inc.(1) | 1,375 | 89,554 | ||||||
Ferro Corp.(1) | 32,674 | 390,128 | ||||||
FMC Corp. | 2,510 | 250,046 | ||||||
Forterra, Inc.(1) | 11,907 | 132,882 | ||||||
GCP Applied Technologies, Inc.(1) | 20,627 | 383,250 | ||||||
Graphic Packaging Holding Co. | 923,978 | 12,926,452 | ||||||
Hawkins, Inc. | 3,151 | 134,170 | ||||||
HB Fuller Co. | 18,429 | 821,933 | ||||||
Ingevity Corp.(1) | 138,628 | 7,287,674 | ||||||
Innospec, Inc. | 105,149 | 8,122,760 | ||||||
Koppers Holdings, Inc.(1) | 6,856 | 129,167 | ||||||
Louisiana-Pacific Corp. | 61,622 | 1,580,604 | ||||||
Marrone Bio Innovations, Inc.(1) | 33,065 | 38,686 | ||||||
Materion Corp. | 3,339 | 205,315 | ||||||
Myers Industries, Inc. | 7,290 | 106,070 | ||||||
NewMarket Corp. | 564 | 225,871 | ||||||
Novagold Resources, Inc.(1) | 121,689 | 1,117,105 | ||||||
O-I Glass, Inc. | 66,827 | 600,106 | ||||||
Orion Engineered Carbons SA | 18,177 | 192,494 | ||||||
PQ Group Holdings, Inc.(1) | 3,195 | 42,302 | ||||||
Quaker Chemical Corp. | 7,201 | 1,336,866 | ||||||
Reliance Steel & Aluminum Co. | 51,270 | 4,867,061 | ||||||
Royal Gold, Inc. | 4,627 | 575,229 | ||||||
RPM International, Inc. | 10,538 | 790,982 | ||||||
Scotts Miracle-Gro Co. | 3,757 | 505,204 | ||||||
Sensient Technologies Corp. | 9,382 | 489,365 | ||||||
Stepan Co. | 946 | 91,857 | ||||||
Trinseo SA | 6,405 | 141,935 | ||||||
Tronox Holdings Plc - Class A | 16,839 | 121,578 | ||||||
UFP Technologies, Inc.(1) | 320 | 14,099 | ||||||
United States Lime & Minerals, Inc. | 55 | 4,644 | ||||||
WR Grace & Co. | 1,993 | 101,264 | ||||||
|
| |||||||
Total Materials |
| 102,310,845 | ||||||
|
| |||||||
Real Estate – 1.28% | ||||||||
Alexander’s, Inc. | 1,078 | 259,690 | ||||||
Altisource Portfolio Solutions SA(1) | 222 | 3,272 | ||||||
Americold Realty Trust | 1,980 | 71,874 | ||||||
Bluerock Residential Growth REIT, Inc. - Class A | 4,504 | 36,392 | ||||||
Brookfield Property REIT, Inc. - Class A | 5,060 | 50,398 | ||||||
CareTrust REIT, Inc. | 7,220 | 123,895 | ||||||
CatchMark Timber Trust, Inc. - Class A | 2,592 | 22,939 | ||||||
CIM Commercial Trust Corp. | 5,597 | 60,336 | ||||||
Clipper Realty, Inc. | 6,363 | 51,540 | ||||||
Community Healthcare Trust, Inc. | 11,817 | 483,315 | ||||||
CoreSite Realty Corp. | 73,842 | 8,939,313 | ||||||
Corporate Office Properties Trust | 191,618 | 4,855,600 | ||||||
Cushman & Wakefield Plc(1) | 20,301 | 252,951 | ||||||
Easterly Government Properties, Inc. | 41,539 | 960,382 | ||||||
EastGroup Properties, Inc. | 20,007 | 2,373,030 | ||||||
Equity LifeStyle Properties, Inc. | 7,127 | 445,295 | ||||||
eXp World Holdings, Inc.(1) | 12,985 | 221,394 | ||||||
Extra Space Storage, Inc. | 8,783 | 811,286 | ||||||
FirstService Corp. | 88,111 | 8,877,183 | ||||||
Four Corners Property Trust, Inc. | 38,736 | 945,158 | ||||||
Gladstone Commercial Corp. | 3,920 | 73,500 | ||||||
Gladstone Land Corp. | 5,088 | 80,696 | ||||||
Griffin Industrial Realty, Inc. | 946 | 51,245 | ||||||
Hudson Pacific Properties, Inc. | 177,059 | 4,454,804 | ||||||
Innovative Industrial Properties, Inc. - Class A | 3,768 | 331,659 | ||||||
Iron Mountain, Inc. | 16,572 | 432,529 | ||||||
LTC Properties, Inc. | 7,996 | 301,209 | ||||||
Marcus & Millichap, Inc.(1) | 1,219 | 35,180 | ||||||
Maui Land & Pineapple Co., Inc.(1) | 1,513 | 16,794 | ||||||
Monmouth Real Estate Investment Corp. | 46,400 | 672,336 | ||||||
National Health Investors, Inc. | 7,621 | 462,747 | ||||||
National Storage Affiliates Trust | 34,104 | 977,421 | ||||||
NexPoint Residential Trust, Inc. | 1,917 | 67,766 | ||||||
Plymouth Industrial REIT, Inc. | 8,986 | 115,021 | ||||||
PS Business Parks, Inc. | 10,945 | 1,449,118 | ||||||
QTS Realty Trust, Inc. - Class A | 31,040 | 1,989,354 | ||||||
Redfin Corp.(1) | 52,538 | 2,201,868 | ||||||
RMR Group, Inc. - Class A | 7,453 | 219,640 | ||||||
Ryman Hospitality Properties, Inc. | 24,040 | 831,784 | ||||||
Safehold, Inc. | 5,158 | 296,533 | ||||||
Saul Centers, Inc. | 5,478 | 176,775 | ||||||
Simon Property Group, Inc. | 23,668 | 1,618,418 | ||||||
St Joe Co.(1) | 8,766 | 170,236 | ||||||
STAG Industrial, Inc. | 6,564 | 192,457 | ||||||
Terreno Realty Corp. | 242,150 | 12,746,776 | ||||||
UMH Properties, Inc. | 15,402 | 199,148 | ||||||
Uniti Group, Inc. | 106,266 | 993,587 | ||||||
Universal Health Realty Income Trust | 6,053 | 481,153 | ||||||
|
| |||||||
Total Real Estate |
| 61,484,997 | ||||||
|
| |||||||
Utilities – 0.99% | ||||||||
Ameren Corp. | 287,083 | 20,199,160 | ||||||
American States Water Co. | 20,175 | 1,586,360 | ||||||
Artesian Resources Corp. - Class A | 279 | 10,125 | ||||||
Atlantic Power Corp.(1) | 4,183 | 8,366 | ||||||
Brookfield Infrastructure Corp. - Class A | 8,738 | 397,929 | ||||||
Cadiz, Inc.(1) | 6,101 | 61,986 | ||||||
California Water Service Group | 24,675 | 1,176,997 | ||||||
Chesapeake Utilities Corp. | 8,228 | 691,152 | ||||||
Clearway Energy, Inc. - Class A | 2,762 | 57,919 | ||||||
Clearway Energy, Inc. - Class C | 9,526 | 219,670 | ||||||
CMS Energy Corp. | 295,340 | 17,253,763 | ||||||
El Paso Electric Co. | 2,723 | 182,441 | ||||||
Genie Energy Ltd. - Class B | 6,990 | 51,446 | ||||||
Global Water Resources, Inc. | 6,921 | 72,947 | ||||||
MGE Energy, Inc. | 5,105 | 329,324 | ||||||
Middlesex Water Co. | 9,286 | 623,833 | ||||||
Northwest Natural Holding Co. | 1,750 | 97,632 | ||||||
NRG Energy, Inc. | 8,417 | 274,058 | ||||||
ONE Gas, Inc. | 3,066 | 236,235 | ||||||
Ormat Technologies, Inc. | 21,893 | 1,389,987 | ||||||
Otter Tail Corp. | 7,225 | 280,258 | ||||||
Pure Cycle Corp.(1) | 10,463 | 96,155 | ||||||
RGC Resources, Inc. | 1,933 | 46,721 | ||||||
SJW Group | 7,643 | 474,707 | ||||||
South Jersey Industries, Inc. | 29,832 | 745,502 | ||||||
Southwest Gas Holdings, Inc. | 2,416 | 166,825 | ||||||
Spark Energy, Inc. - Class A | 6,048 | 42,759 | ||||||
Sunnova Energy International, Inc.(1) | 2,223 | 37,947 | ||||||
TerraForm Power, Inc. - Class A | 4,453 | 82,113 | ||||||
York Water Co. | 7,142 | 342,530 | ||||||
|
| |||||||
Total Utilities |
| 47,236,847 | ||||||
|
| |||||||
Total Common Stocks (Cost: $3,877,316,648) |
| 4,702,520,198 | ||||||
|
| |||||||
SHORT-TERM INVESTMENTS – 2.18% | ||||||||
Money Market Funds – 2.01% | ||||||||
Goldman Sachs Financial Square Government Fund - Class I, 0.15%(2) | 96,213,135 | 96,213,135 | ||||||
|
| |||||||
Total Money Market Funds (Cost: $96,213,135) | 96,213,135 | |||||||
|
| |||||||
| Principal Amount | Value | |||||||
Time Deposits – 0.17% | ||||||||
BNP Paribas, Paris, 0.01% due 07/01/2020 | $ | 7,527,114 | 7,527,114 | |||||
National Australia Bank, London, 0.01% due 07/01/2020 | 188,364 | 188,364 | ||||||
Sumitomo, Tokyo, 0.01% due 07/01/2020 | 357,392 | 357,392 | ||||||
|
| |||||||
Total Time Deposits (Cost: $8,072,870) | 8,072,870 | |||||||
|
| |||||||
Total Short-Term Investments (Cost: $104,286,005) |
| 104,286,005 | ||||||
|
| |||||||
TOTAL INVESTMENTS IN SECURITIES – 100.26% | 4,806,806,203 | |||||||
|
| |||||||
LIABILITIES IN EXCESS OF OTHER ASSETS – (0.26)% | (12,659,106 | ) | ||||||
|
| |||||||
TOTAL NET ASSETS – 100.00% | $ | 4,794,147,097 | ||||||
|
| |||||||
Percentages are stated as a percent of net assets.
ADR American Depositary Receipt
CVR Contingent Value Right
REIT Real Estate Investment Trust
| (1) | Non-income producing security. |
| (2) | Represents annualized seven-day yield as of the close of the reporting period. |
| (3) | Security or includes securities categorized as Level 3 per the Trust’s fair value hierarchy. The value of these securities total $382, which represents 0.00% of total net assets. |
The accompanying notes are an integral part of this Schedule of Investments.
Bridge Builder Small/Mid Cap Value Fund
Schedule of Investments
June 30, 2020
| Shares | Value | |||||||
COMMON STOCKS – 97.97% | ||||||||
Communication Services – 1.67% | ||||||||
Activision Blizzard, Inc. | 67,026 | $ | 5,087,273 | |||||
Alaska Communications Systems Group, Inc. | 18,363 | 51,233 | ||||||
Altice USA, Inc. - Class A(1) | 283,777 | 6,396,334 | ||||||
AMC Entertainment Holdings, Inc. - Class A | 21,469 | 92,102 | ||||||
AMC Networks, Inc. - Class A(1) | 75,383 | 1,763,208 | ||||||
ATN International, Inc. | 4,294 | 260,088 | ||||||
Boston Omaha Corp. - Class A(1) | 4,129 | 66,064 | ||||||
Cars.com, Inc.(1) | 26,349 | 151,770 | ||||||
Central European Media Enterprises Ltd. - Class A(1) | 17,866 | 63,246 | ||||||
CenturyLink, Inc. | 36,479 | 365,884 | ||||||
Cincinnati Bell, Inc.(1) | 12,967 | 192,560 | ||||||
Cinemark Holdings, Inc. | 43,660 | 504,273 | ||||||
comScore, Inc.(1) | 24,386 | 75,597 | ||||||
Consolidated Communications Holdings, Inc.(1) | 25,655 | 173,684 | ||||||
Daily Journal Corp.(1) | 82 | 22,140 | ||||||
DHI Group, Inc.(1) | 18,710 | 39,291 | ||||||
Discovery, Inc. - Class A(1) | 5,145 | 108,559 | ||||||
Discovery, Inc. - Class C(1) | 10,942 | 210,743 | ||||||
DISH Network Corp. - Class A(1) | 8,193 | 282,740 | ||||||
Electronic Arts, Inc.(1) | 33,047 | 4,363,856 | ||||||
Emerald Holding, Inc. | 12,030 | 37,052 | ||||||
Entercom Communications Corp. - Class A | 48,804 | 67,349 | ||||||
Entravision Communications Corp. - Class A | 26,197 | 37,462 | ||||||
Eros International Plc(1) | 28,262 | 89,308 | ||||||
EW Scripps Co. - Class A | 23,133 | 202,414 | ||||||
Fluent, Inc.(1) | 18,400 | 32,752 | ||||||
Fox Corp. - Class A | 11,299 | 303,039 | ||||||
Fox Corp. - Class B | 5,357 | 143,782 | ||||||
Gaia, Inc. - Class A(1) | 4,295 | 35,992 | ||||||
Gannett Co., Inc. | 48,777 | 67,312 | ||||||
GCI Liberty, Inc. - Class A(1) | 3,293 | 234,198 | ||||||
Gogo, Inc.(1) | 2,448 | 7,736 | ||||||
Gray Television, Inc.(1) | 25,142 | 350,731 | ||||||
Hemisphere Media Group, Inc. - Class A(1) | 5,814 | 57,152 | ||||||
IDT Corp. - Class B(1) | 2,596 | 16,952 | ||||||
iHeartMedia, Inc. - Class A(1) | 11,599 | 96,852 | ||||||
IMAX Corp.(1) | 507,802 | 5,692,460 | ||||||
Interpublic Group of Companies, Inc. | 12,968 | 222,531 | ||||||
Iridium Communications, Inc.(1) | 16,920 | 430,445 | ||||||
John Wiley & Sons, Inc. - Class A | 1,436 | 56,004 | ||||||
Liberty Broadband Corp. - Class A(1) | 831 | 101,540 | ||||||
Liberty Broadband Corp. - Class C(1) | 3,494 | 433,116 | ||||||
Liberty Latin America Ltd. - Class A(1) | 18,098 | 175,913 | ||||||
Liberty Latin America Ltd. - Class C(1) | 45,778 | 432,144 | ||||||
Liberty Media Corp.-Liberty Braves - Class A(1) | 1,997 | 40,100 | ||||||
Liberty Media Corp.-Liberty Braves - Class C(1) | 6,123 | 120,868 | ||||||
Liberty Media Corp.-Liberty Formula One - Class A(1) | 786 | 22,935 | ||||||
Liberty Media Corp.-Liberty Formula One - Class C(1) | 192,702 | 6,110,580 | ||||||
Liberty Media Corp.-Liberty SiriusXM - Class A(1) | 2,456 | 84,781 | ||||||
Liberty Media Corp.-Liberty SiriusXM - Class C(1) | 5,116 | 176,246 | ||||||
Liberty TripAdvisor Holdings, Inc. - Class A(1) | 28,673 | 61,073 | ||||||
Lions Gate Entertainment Corp. - Class A(1) | 1,910 | 14,153 | ||||||
Lions Gate Entertainment Corp. - Class B(1) | 3,895 | 26,603 | ||||||
Live Nation Entertainment, Inc.(1) | 107,004 | 4,743,487 | ||||||
LiveXLive Media, Inc.(1) | 10,115 | 36,616 | ||||||
Loral Space & Communications, Inc. | 4,033 | 78,724 | ||||||
Madison Square Garden Co. - Class A(1) | 625 | 91,806 | ||||||
Madison Square Garden Entertainment Corp.(1) | 620 | 46,500 | ||||||
Marcus Corp. | 9,191 | 121,965 | ||||||
Meredith Corp. | 8,047 | 117,084 | ||||||
MSG Networks, Inc. - Class A(1) | 15,539 | 154,613 | ||||||
National CineMedia, Inc. | 26,395 | 78,393 | ||||||
New York Times Co. - Class A | 5,424 | 227,971 | ||||||
News Corp. - Class A | 12,924 | 153,279 | ||||||
News Corp. - Class B | 4,066 | 48,589 | ||||||
Nexstar Media Group, Inc. - Class A | 317,058 | 26,534,584 | ||||||
Omnicom Group, Inc. | 7,063 | 385,640 | ||||||
ORBCOMM, Inc.(1) | 25,789 | 99,288 | ||||||
Pinterest, Inc. - Class A(1) | 2,271 | 50,348 | ||||||
QuinStreet, Inc.(1) | 13,661 | 142,894 | ||||||
Saga Communications, Inc. - Class A | 1,696 | 43,418 | ||||||
Scholastic Corp. | 12,169 | 364,340 | ||||||
Sinclair Broadcast Group, Inc. - Class A | 21,597 | 398,681 | ||||||
Sirius XM Holdings, Inc. | 15,549 | 91,273 | ||||||
Spok Holdings, Inc. | 6,700 | 62,645 | ||||||
Take-Two Interactive Software, Inc.(1) | 282 | 39,359 | ||||||
TEGNA, Inc. | 304,234 | 3,389,167 | ||||||
Telephone & Data Systems, Inc. | 3,352 | 66,638 | ||||||
Tribune Publishing Co. | 6,756 | 67,492 | ||||||
TripAdvisor, Inc. | 3,326 | 63,227 | ||||||
TrueCar, Inc.(1) | 41,055 | 105,922 | ||||||
Twitter, Inc.(1) | 25,645 | 763,964 | ||||||
United States Cellular Corp.(1) | 480 | 14,818 | ||||||
ViacomCBS, Inc. - Class A | 331 | 8,474 | ||||||
ViacomCBS, Inc. - Class B | 226,804 | 5,289,069 | ||||||
Vonage Holdings Corp.(1) | 41,027 | 412,732 | ||||||
WideOpenWest, Inc.(1) | 11,097 | 58,481 | ||||||
Yelp, Inc. - Class A(1) | 171,649 | 3,970,241 | ||||||
Zillow Group, Inc. - Class A(1) | 1,721 | 98,923 | ||||||
Zillow Group, Inc. - Class C(1) | 4,006 | 230,786 | ||||||
Zynga, Inc. - Class A(1) | 5,266 | 50,238 | ||||||
|
| |||||||
Total Communication Services |
| 84,953,889 | ||||||
|
| |||||||
Consumer Discretionary – 10.69% | ||||||||
Aaron’s, Inc. | 163,910 | 7,441,514 | ||||||
Abercrombie & Fitch Co. - Class A | 25,803 | 274,544 | ||||||
Acushnet Holdings Corp. | 10,537 | 366,582 | ||||||
Adient Plc(1) | 35,191 | 577,836 | ||||||
Adtalem Global Education, Inc.(1) | 20,807 | 648,138 | ||||||
Advance Auto Parts, Inc. | 35,010 | 4,987,175 | ||||||
American Axle & Manufacturing Holdings, Inc.(1) | 184,030 | 1,398,628 | ||||||
American Eagle Outfitters, Inc. | 175,663 | 1,914,727 | ||||||
American Public Education, Inc.(1) | 5,825 | 172,420 | ||||||
America’s Car-Mart, Inc.(1) | 585 | 51,404 | ||||||
Aptiv Plc | 8,937 | 696,371 | ||||||
Aramark | 596,585 | 13,464,923 | ||||||
Asbury Automotive Group, Inc.(1) | 4,886 | 377,834 | ||||||
At Home Group, Inc.(1) | 19,564 | 126,970 | ||||||
AutoNation, Inc.(1) | 1,968 | 73,957 | ||||||
AutoZone, Inc.(1) | 12,834 | 14,478,292 | ||||||
BBX Capital Corp. - Class A | 24,802 | 62,997 | ||||||
Beazer Homes USA, Inc.(1) | 10,607 | 106,813 | ||||||
Bed Bath & Beyond, Inc. | 132,477 | 1,404,256 | ||||||
Best Buy Co., Inc. | 165,615 | 14,453,221 | ||||||
Big Lots, Inc. | 58,764 | 2,468,088 | ||||||
Biglari Holdings, Inc. - Class A(1) | 40 | 13,400 | ||||||
Biglari Holdings, Inc. - Class B(1) | 321 | 22,143 | ||||||
BJ’s Restaurants, Inc. | 7,865 | 164,693 | ||||||
Bloomin’ Brands, Inc. | 143,600 | 1,530,776 | ||||||
Bluegreen Vacations Corp. | 2,892 | 15,675 | ||||||
Boot Barn Holdings, Inc.(1) | 1,008 | 21,733 | ||||||
BorgWarner, Inc. | 455,190 | 16,068,207 | ||||||
Boyd Gaming Corp. | 32,916 | 687,944 | ||||||
Bright Horizons Family Solutions, Inc.(1) | 59,738 | 7,001,294 | ||||||
Brinker International, Inc. | 6,320 | 151,680 | ||||||
Brunswick Corp. | 322,027 | 20,612,948 | ||||||
Buckle, Inc. | 118,351 | 1,855,744 | ||||||
Burlington Stores, Inc.(1) | 230 | 45,294 | ||||||
Caesars Entertainment Corp.(1) | 18,985 | 230,288 | ||||||
Caleres, Inc. | 15,947 | 132,998 | ||||||
Callaway Golf Co. | 37,799 | 661,861 | ||||||
Capri Holdings Ltd.(1) | 4,718 | 73,742 | ||||||
CarMax, Inc.(1) | 5,015 | 449,093 | ||||||
Carnival Corp. | 15,670 | 257,301 | ||||||
Carriage Services, Inc. - Class A | 6,301 | 114,174 | ||||||
Carrols Restaurant Group, Inc.(1) | 14,342 | 69,415 | ||||||
Carter’s, Inc. | 141,703 | 11,435,432 | ||||||
Casper Sleep, Inc.(1) | 3,493 | 31,332 | ||||||
Cato Corp. - Class A | 9,028 | 73,849 | ||||||
Century Casinos, Inc.(1) | 10,815 | 44,882 | ||||||
Century Communities, Inc.(1) | 11,568 | 354,675 | ||||||
Cheesecake Factory, Inc. | 17,529 | 401,765 | ||||||
Chico’s FAS, Inc. | 56,054 | 77,355 | ||||||
Children’s Place, Inc. | 1,806 | 67,581 | ||||||
Choice Hotels International, Inc. | 1,164 | 91,840 | ||||||
Chuy’s Holdings, Inc.(1) | 6,349 | 94,473 | ||||||
Citi Trends, Inc. | 4,631 | 93,639 | ||||||
Clarus Corp. | 2,719 | 31,486 | ||||||
Collectors Universe, Inc. | 293 | 10,044 | ||||||
Columbia Sportswear Co. | 957 | 77,115 | ||||||
Conn’s, Inc.(1) | 7,635 | 77,037 | ||||||
Container Store Group, Inc.(1) | 8,198 | 26,562 | ||||||
Cooper Tire & Rubber Co. | 20,241 | 558,854 | ||||||
Cooper-Standard Holdings, Inc.(1) | 8,096 | 107,272 | ||||||
Core-Mark Holding Co., Inc. | 1,339 | 33,415 | ||||||
Cracker Barrel Old Country Store, Inc. | 5,618 | 623,092 | ||||||
Dana, Inc. | 591,516 | 7,210,580 | ||||||
Darden Restaurants, Inc. | 57,300 | 4,341,621 | ||||||
Dave & Buster’s Entertainment, Inc. | 11,822 | 157,587 | ||||||
Del Taco Restaurants, Inc.(1) | 11,181 | 66,303 | ||||||
Denny’s Corp.(1) | 7,431 | 75,053 | ||||||
Designer Brands, Inc. - Class A | 26,152 | 177,049 | ||||||
Dick’s Sporting Goods, Inc. | 113,258 | 4,673,025 | ||||||
Dillard’s, Inc. - Class A | 3,223 | 83,121 | ||||||
Dine Brands Global, Inc. | 31,082 | 1,308,552 | ||||||
Dollar General Corp. | 34,150 | 6,505,917 | ||||||
Dollar Tree, Inc.(1) | 48,842 | 4,526,677 | ||||||
DR Horton, Inc. | 11,027 | 611,447 | ||||||
Duluth Holdings, Inc. - Class B(1) | 5,209 | 38,390 | ||||||
Dunkin’ Brands Group, Inc. | 392 | 25,570 | ||||||
eBay, Inc. | 242,896 | 12,739,895 | ||||||
El Pollo Loco Holdings, Inc.(1) | 6,346 | 93,667 | ||||||
Eldorado Resorts, Inc.(1) | 1,835 | 73,510 | ||||||
Escalade, Inc. | 4,292 | 59,916 | ||||||
Ethan Allen Interiors, Inc. | 9,618 | 113,781 | ||||||
Everi Holdings, Inc.(1) | 20,993 | 108,324 | ||||||
Expedia Group, Inc. | 82,786 | 6,805,009 | ||||||
Express, Inc.(1) | 28,771 | 44,307 | ||||||
Extended Stay America, Inc. | 5,911 | 66,144 | ||||||
Fiesta Restaurant Group, Inc.(1) | 6,877 | 43,875 | ||||||
Foot Locker, Inc. | 301,925 | 8,804,133 | ||||||
Ford Motor Co. | 129,969 | 790,212 | ||||||
Fossil Group, Inc.(1) | 18,834 | 87,578 | ||||||
Franchise Group, Inc. | 6,577 | 143,905 | ||||||
Frontdoor, Inc.(1) | 2,386 | 105,771 | ||||||
Funko, Inc. - Class A(1) | 298,891 | 1,733,568 | ||||||
GameStop Corp. - Class A(1) | 23,687 | 102,802 | ||||||
GAN Ltd.(1) | 540 | 13,743 | ||||||
Gap, Inc. | 6,089 | 76,843 | ||||||
Garmin Ltd. | 4,994 | 486,915 | ||||||
Genesco, Inc.(1) | 5,974 | 129,397 | ||||||
Gentex Corp. | 247,409 | 6,375,730 | ||||||
Genuine Parts Co. | 4,690 | 407,842 | ||||||
G-III Apparel Group Ltd.(1) | 17,534 | 233,027 | ||||||
Golden Entertainment, Inc.(1) | 3,721 | 33,191 | ||||||
Goodyear Tire & Rubber Co. | 239,625 | 2,143,446 | ||||||
GoPro, Inc. - Class A(1) | 7,606 | 36,205 | ||||||
Graham Holdings Co. - Class B | 138 | 47,288 |
Grand Canyon Education, Inc.(1) | | 198,359 | | 17,957,440 | ||||
Green Brick Partners, Inc.(1) | 8,538 | 101,175 | ||||||
Group 1 Automotive, Inc. | 41,184 | 2,716,908 | ||||||
Groupon, Inc. - Class A(1) | 9,548 | 173,010 | ||||||
GrubHub, Inc.(1) | 2,769 | 194,661 | ||||||
Guess, Inc. | 17,908 | 173,170 | ||||||
H&R Block, Inc. | 1,960 | 27,989 | ||||||
Hamilton Beach Brands Holding Co. - Class A | 2,278 | 27,108 | ||||||
Hanesbrands, Inc. | 693,284 | 7,827,176 | ||||||
Harley-Davidson, Inc. | 405,125 | 9,629,821 | ||||||
Hasbro, Inc. | 4,238 | 317,638 | ||||||
Haverty Furniture Cos, Inc. | 7,033 | 112,528 | ||||||
Hibbett Sports, Inc.(1) | 6,787 | 142,120 | ||||||
Hilton Worldwide Holdings, Inc. | 9,101 | 668,468 | ||||||
Hooker Furniture Corp. | 4,417 | 85,911 | ||||||
Houghton Mifflin Harcourt Co.(1) | 47,759 | 86,444 | ||||||
Hudson Ltd. - Class A(1) | 15,890 | 77,384 | ||||||
Hyatt Hotels Corp. - Class A | 1,179 | 59,292 | ||||||
International Game Technology Plc | 389,536 | 3,466,870 | ||||||
Jack in the Box, Inc. | 8,069 | 597,832 | ||||||
Johnson Outdoors, Inc. - Class A | 1,049 | 95,480 | ||||||
K12, Inc.(1) | 15,944 | 434,315 | ||||||
KB Home | 30,201 | 926,567 | ||||||
Kohl’s Corp. | 85,664 | 1,779,241 | ||||||
Kontoor Brands, Inc. | 21,008 | 374,152 | ||||||
Kura Sushi USA, Inc. - Class A(1) | 1,230 | 17,564 | ||||||
L Brands, Inc. | 7,615 | 113,997 | ||||||
Lakeland Industries, Inc.(1) | 2,937 | 65,877 | ||||||
Lands’ End, Inc.(1) | 5,578 | 44,847 | ||||||
Las Vegas Sands Corp. | 130,529 | 5,944,291 | ||||||
Laureate Education, Inc. - Class A(1) | 795,634 | 7,928,493 | ||||||
La-Z-Boy, Inc. | 617,170 | 16,700,620 | ||||||
Lear Corp. | 81,656 | 8,902,137 | ||||||
Legacy Housing Corp.(1) | 2,176 | 30,943 | ||||||
Leggett & Platt, Inc. | 4,407 | 154,906 | ||||||
Lennar Corp. - Class A | 93,795 | 5,779,648 | ||||||
Lennar Corp. - Class B | 507 | 23,368 | ||||||
Lifetime Brands, Inc. | 4,500 | 30,240 | ||||||
Liquidity Services, Inc.(1) | 10,793 | 64,326 | ||||||
Lithia Motors, Inc. - Class A | 4,608 | 697,329 | ||||||
LKQ Corp.(1) | 409,274 | 10,722,979 | ||||||
Lumber Liquidators Holdings, Inc.(1) | 9,972 | 138,212 | ||||||
M/I Homes, Inc.(1) | 11,137 | 383,558 | ||||||
Macy’s, Inc. | 160,104 | 1,101,516 | ||||||
MarineMax, Inc.(1) | 8,565 | 191,770 | ||||||
Marriott International, Inc. - Class A | 62,848 | 5,387,959 | ||||||
Marriott Vacations Worldwide Corp. | 14,101 | 1,159,243 | ||||||
Mattel, Inc.(1) | 4,633 | 44,801 | ||||||
MDC Holdings, Inc. | 133,781 | 4,775,982 | ||||||
Meritage Homes Corp.(1) | 13,989 | 1,064,843 | ||||||
MGM Resorts International | 15,687 | 263,542 | ||||||
Modine Manufacturing Co.(1) | 20,401 | 112,614 | ||||||
Mohawk Industries, Inc.(1) | 100,092 | 10,185,362 | ||||||
Monarch Casino & Resort, Inc.(1) | 1,359 | 46,315 | ||||||
Monro, Inc. | 6,662 | 366,010 | ||||||
Motorcar Parts of America, Inc.(1) | 6,000 | 106,020 | ||||||
Movado Group, Inc. | 6,541 | 70,904 | ||||||
Nathan’s Famous, Inc. | 994 | 55,903 | ||||||
National Vision Holdings, Inc.(1) | 5,764 | 175,917 | ||||||
Nautilus, Inc.(1) | 12,866 | 119,268 | ||||||
Newell Brands, Inc. | 336,028 | 5,336,125 | ||||||
Noodles & Co. - Class A(1) | 6,127 | 37,068 | ||||||
Nordstrom, Inc. | 96,122 | 1,488,930 | ||||||
Norwegian Cruise Line Holdings Ltd.(1) | 8,529 | 140,131 | ||||||
NVR, Inc.(1) | 3,445 | 11,226,394 | ||||||
Office Depot, Inc. | 898,111 | 2,110,561 | ||||||
Ollie’s Bargain Outlet Holdings, Inc.(1) | 204 | 19,921 | ||||||
OneSpaWorld Holdings Ltd. | 17,391 | 82,955 |
Overstock.com, Inc.(1) | 2,878 | 81,822 | ||||||
Oxford Industries, Inc. | 178,049 | 7,835,937 | ||||||
Papa John’s International, Inc. | 1,778 | 141,191 | ||||||
Peloton Interactive, Inc. - Class A(1) | 2,466 | 142,461 | ||||||
Penn National Gaming, Inc.(1) | 26,662 | 814,257 | ||||||
Penske Automotive Group, Inc. | 44,168 | 1,709,743 | ||||||
Planet Fitness, Inc. - Class A(1) | 1,156 | 70,019 | ||||||
PlayAGS, Inc.(1) | 8,230 | 27,817 | ||||||
Polaris Industries, Inc. | 1,735 | 160,574 | ||||||
Pool Corp. | 12,905 | 3,508,482 | ||||||
PulteGroup, Inc. | 93,624 | 3,186,025 | ||||||
PVH Corp. | 126,678 | 6,086,878 | ||||||
Quotient Technology, Inc.(1) | 15,610 | 114,265 | ||||||
Qurate Retail, Inc.(1) | 12,696 | 120,612 | ||||||
Ralph Lauren Corp. - Class A | 1,594 | 115,597 | ||||||
RCI Hospitality Holdings, Inc. | 3,541 | 49,078 | ||||||
Red Robin Gourmet Burgers, Inc.(1) | 4,946 | 50,449 | ||||||
Red Rock Resorts, Inc. - Class A | 690,731 | 7,535,875 | ||||||
Regis Corp.(1) | 438,831 | 3,589,638 | ||||||
Rent-A-Center, Inc. | 2,374 | 66,045 | ||||||
Rocky Brands, Inc. | 2,872 | 59,048 | ||||||
Ross Stores, Inc. | 52,000 | 4,432,480 | ||||||
Royal Caribbean Cruises Ltd. | 30,990 | 1,558,797 | ||||||
Rubicon Project, Inc.(1) | 19,469 | 129,858 | ||||||
Sally Beauty Holdings, Inc.(1) | 45,414 | 569,037 | ||||||
Scientific Games Corp.(1) | 6,460 | 99,872 | ||||||
SeaWorld Entertainment, Inc.(1) | 11,104 | 164,450 | ||||||
Service Corp. International | 5,793 | 225,290 | ||||||
ServiceMaster Global Holdings, Inc.(1) | 506,762 | 18,086,336 | ||||||
Shoe Carnival, Inc. | 3,890 | 113,860 | ||||||
Signet Jewelers Ltd. | 22,085 | 226,813 | ||||||
Six Flags Entertainment Corp. | 224,217 | 4,307,209 | ||||||
Skechers U.S.A., Inc. - Class A(1) | 210,528 | 6,606,369 | ||||||
Sleep Number Corp.(1) | 76,372 | 3,180,130 | ||||||
Smith & Wesson Brands, Inc.(1) | 21,922 | 471,761 | ||||||
Sonic Automotive, Inc. - Class A | 9,866 | 314,824 | ||||||
Stamps.com, Inc.(1) | 18,934 | 3,477,986 | ||||||
Standard Motor Products, Inc. | 7,076 | 291,531 | ||||||
Steven Madden Ltd. | 19,149 | 472,789 | ||||||
Stitch Fix, Inc. - Class A(1) | 3,426 | 85,444 | ||||||
Stoneridge, Inc.(1) | 153,865 | 3,178,851 | ||||||
Sturm Ruger & Co., Inc. | 787 | 59,812 | ||||||
Superior Group of Cos, Inc. | 3,749 | 50,237 | ||||||
Tapestry, Inc. | 9,227 | 122,535 | ||||||
Target Hospitality Corp.(1) | 11,000 | 18,590 | ||||||
Taylor Morrison Home Corp. - Class A(1) | 45,434 | 876,422 | ||||||
Tempur Sealy International, Inc.(1) | 407 | 29,284 | ||||||
Tenneco, Inc. - Class A(1) | 67,880 | 513,173 | ||||||
The Michaels Companies, Inc.(1) | 31,721 | 224,267 | ||||||
Thor Industries, Inc. | 1,839 | 195,909 | ||||||
Tiffany & Co. | 4,038 | 492,394 | ||||||
Tilly’s, Inc. - Class A | 10,167 | 57,647 | ||||||
Toll Brothers, Inc. | 392,556 | 12,793,400 | ||||||
TRI Pointe Group, Inc.(1) | 51,425 | 755,433 | ||||||
Tupperware Brands Corp. | 21,052 | 99,997 | ||||||
Turtle Beach Corp.(1) | 5,328 | 78,428 | ||||||
Ulta Beauty, Inc.(1) | 126 | 25,631 | ||||||
Under Armour, Inc. - Class A(1) | 6,259 | 60,963 | ||||||
Under Armour, Inc. - Class C(1) | 6,303 | 55,719 | ||||||
Unifi, Inc.(1) | 5,438 | 70,041 | ||||||
Universal Electronics, Inc.(1) | 733 | 34,319 | ||||||
Urban Outfitters, Inc.(1) | 434,025 | 6,605,861 | ||||||
US Auto Parts Network, Inc.(1) | 927 | 8,028 | ||||||
Vail Resorts, Inc. | 54,447 | 9,917,521 | ||||||
Vera Bradley, Inc.(1) | 9,213 | 40,906 | ||||||
VF Corp. | 97,411 | 5,936,226 | ||||||
Vista Outdoor, Inc.(1) | 23,480 | 339,286 | ||||||
Visteon Corp.(1) | 63,364 | 4,340,434 |
Vivint Smart Home, Inc.(1) | 22,314 | 386,702 | ||||||
VOXX International Corp. - Class A(1) | 7,992 | 46,194 | ||||||
Wayfair, Inc. - Class A(1) | 193 | 38,139 | ||||||
Weyco Group, Inc. | 2,512 | 54,234 | ||||||
Whirlpool Corp. | 127,941 | 16,572,198 | ||||||
Williams-Sonoma, Inc. | 55,347 | 4,539,007 | ||||||
Winmark Corp. | 892 | 152,746 | ||||||
Wolverine World Wide, Inc. | 497,641 | 11,848,832 | ||||||
Workhorse Group, Inc.(1) | 25,455 | 442,662 | ||||||
WW International, Inc.(1) | 14,330 | 363,695 | ||||||
Wyndham Destinations, Inc. | 195,154 | 5,499,440 | ||||||
Wyndham Hotels & Resorts, Inc. | 277,215 | 11,814,903 | ||||||
Wynn Resorts Ltd. | 64,837 | 4,829,708 | ||||||
Yum China Holdings, Inc. | 11,183 | 537,567 | ||||||
Zumiez, Inc.(1) | 278,508 | 7,625,549 | ||||||
|
| |||||||
Total Consumer Discretionary |
| 545,219,337 | ||||||
|
| |||||||
Consumer Staples – 4.35% | ||||||||
Alico, Inc. | 1,973 | 61,479 | ||||||
Archer-Daniels-Midland Co. | 258,251 | 10,304,215 | ||||||
B&G Foods, Inc. | 3,088 | 75,285 | ||||||
BellRing Brands, Inc. - Class A(1) | 15,879 | 316,627 | ||||||
Beyond Meat Inc.(1) | 347 | 46,491 | ||||||
BJ’s Wholesale Club Holdings, Inc.(1) | 95,743 | 3,568,342 | ||||||
Bridgford Foods Corp.(1) | 418 | 6,922 | ||||||
Brown-Forman Corp. - Class A | 192 | 11,053 | ||||||
Brown-Forman Corp. - Class B | 925 | 58,886 | ||||||
Bunge Ltd. | 4,588 | 188,704 | ||||||
Cal-Maine Foods, Inc.(1) | 8,207 | 365,047 | ||||||
Campbell Soup Co. | 2,937 | 145,763 | ||||||
Casey’s General Stores, Inc. | 1,230 | 183,910 | ||||||
Central Garden & Pet Co. - Class A(1) | 2,854 | 102,716 | ||||||
Central Garden & Pet Co. - Class A(1) | 324,049 | 10,949,616 | ||||||
Clorox Co. | 1,224 | 268,509 | ||||||
Coca-Cola European Partners Plc | 143,340 | 5,412,518 | ||||||
Conagra Brands, Inc. | 219,854 | 7,732,265 | ||||||
Constellation Brands, Inc. - Class A | 105,460 | 18,450,227 | ||||||
Coty, Inc. - Class A | 9,589 | 42,863 | ||||||
Craft Brew Alliance, Inc.(1) | 4,576 | 70,425 | ||||||
Darling Ingredients, Inc.(1) | 64,553 | 1,589,295 | ||||||
Edgewell Personal Care Co.(1) | 21,830 | 680,223 | ||||||
Energizer Holdings, Inc. | 148,137 | 7,035,026 | ||||||
Farmer Brothers Co.(1) | 6,480 | 47,563 | ||||||
Flowers Foods, Inc. | 196,729 | 4,398,860 | ||||||
Fresh Del Monte Produce, Inc. | 12,528 | 308,439 | ||||||
Grocery Outlet Holding Corp.(1) | 1,083 | 44,186 | ||||||
Hain Celestial Group, Inc.(1) | 2,711 | 85,424 | ||||||
Herbalife Nutrition Ltd.(1) | 2,931 | 131,836 | ||||||
Hershey Co. | 1,120 | 145,174 | ||||||
HF Foods Group, Inc.(1) | 14,134 | 127,913 | ||||||
Hormel Foods Corp. | 9,307 | 449,249 | ||||||
Hostess Brands, Inc. - Class A(1) | 612,626 | 7,486,290 | ||||||
Ingles Markets, Inc. - Class A | 5,760 | 248,083 | ||||||
Ingredion, Inc. | 72,837 | 6,045,471 | ||||||
J&J Snack Foods Corp. | 4,456 | 566,491 | ||||||
Kellogg Co. | 5,530 | 365,312 | ||||||
Kroger Co. | 352,635 | 11,936,695 | ||||||
Lamb Weston Holdings, Inc. | 3,751 | 239,801 | ||||||
Lancaster Colony Corp. | 67,720 | 10,495,923 | ||||||
Landec Corp.(1) | 9,490 | 75,540 | ||||||
Limoneira Co. | 5,032 | 72,914 | ||||||
McCormick & Co., Inc. | 1,821 | 326,706 | ||||||
MGP Ingredients, Inc. | 1,234 | 45,294 | ||||||
Molson Coors Brewing Co. - Class B | 277,523 | 9,535,690 | ||||||
Natural Grocers by Vitamin Cottage, Inc. | 1,135 | 16,889 | ||||||
Nature’s Sunshine Products, Inc.(1) | 3,336 | 30,057 | ||||||
New Age Beverages Corp.(1) | 20,044 | 30,667 | ||||||
Nomad Foods Ltd.(1) | 763,357 | 16,374,008 | ||||||
Nu Skin Enterprises, Inc. - Class A | 1,708 | 65,297 | ||||||
Oil-Dri Corp. of America | 1,956 | 67,873 | ||||||
Performance Food Group Co.(1) | 595,067 | 17,340,252 | ||||||
Pilgrim’s Pride Corp.(1) | 133,713 | 2,258,413 | ||||||
Post Holdings, Inc.(1) | 206,792 | 18,119,115 | ||||||
PriceSmart, Inc. | 8,631 | 520,708 | ||||||
Primo Water Corp. | 62,713 | 862,304 | ||||||
Revlon, Inc. - Class A(1) | 2,608 | 25,819 | ||||||
Reynolds Consumer Products, Inc. | 1,171 | 40,681 | ||||||
Rite Aid Corp.(1) | 22,002 | 375,354 | ||||||
Sanderson Farms, Inc. | 49,284 | 5,711,523 | ||||||
Seaboard Corp. | 8 | 23,471 | ||||||
Seneca Foods Corp. - Class A(1) | 2,437 | 82,395 | ||||||
Simply Good Foods Co.(1) | 635,497 | 11,807,534 | ||||||
SpartanNash Co. | 14,331 | 304,534 | ||||||
Spectrum Brands Holdings, Inc. | 1,412 | 64,811 | ||||||
Sprouts Farmers Market, Inc.(1) | 632 | 16,173 | ||||||
The Andersons, Inc. | 12,424 | 170,954 | ||||||
The Chefs’ Warehouse, Inc.(1) | 10,644 | 144,546 | ||||||
The J.M. Smucker Co. | 59,251 | 6,269,348 | ||||||
Tootsie Roll Industries, Inc. | 1,008 | 34,544 | ||||||
TreeHouse Foods, Inc.(1) | 1,842 | 80,680 | ||||||
Tyson Foods, Inc. - Class A | 268,733 | 16,046,047 | ||||||
United Natural Foods, Inc.(1) | 49,832 | 907,441 | ||||||
Universal Corp. | 54,159 | 2,302,299 | ||||||
US Foods Holding Corp.(1) | 7,330 | 144,548 | ||||||
Vector Group Ltd. | 47,591 | 478,765 | ||||||
Village Super Market, Inc. - Class A | 3,461 | 95,939 | ||||||
WD-40 Co. | 314 | 62,266 | ||||||
Weis Markets, Inc. | 3,882 | 194,566 | ||||||
|
| |||||||
Total Consumer Staples |
| 221,915,082 | ||||||
|
| |||||||
Energy – 3.20% | ||||||||
Adams Resources & Energy, Inc. | 875 | 23,424 | ||||||
Antero Midstream Corp. | 9,551 | 48,710 | ||||||
Antero Resources Corp.(1) | 98,735 | 250,787 | ||||||
Apache Corp. | 12,586 | 169,911 | ||||||
Arch Resources, Inc. | 23,750 | 674,738 | ||||||
Archrock, Inc. | 53,423 | 346,715 | ||||||
Ardmore Shipping Corp. | 9,864 | 42,810 | ||||||
Aspen Aerogels, Inc.(1) | 7,297 | 48,014 | ||||||
Baker Hughes a GE Co. - Class A | 454,257 | 6,991,015 | ||||||
Berry Petroleum Corp. | 29,324 | 141,635 | ||||||
Bonanza Creek Energy, Inc.(1) | 7,303 | 108,230 | ||||||
Brigham Minerals, Inc. - Class A | 12,438 | 153,609 | ||||||
Bristow Group, Inc.(1) | 2,391 | 33,307 | ||||||
Cabot Oil & Gas Corp. | 13,064 | 224,440 | ||||||
Cactus, Inc. - Class A | 10,623 | 219,153 | ||||||
California Resources Corp.(1) | 21,689 | 26,461 | ||||||
Callon Petroleum Co.(1) | 1,096,845 | 1,261,372 | ||||||
ChampionX Corp.(1) | 914,215 | 8,922,738 | ||||||
Cimarex Energy Co. | 172,660 | 4,746,423 | ||||||
Clean Energy Fuels Corp.(1) | 50,361 | 111,801 | ||||||
CNX Resources Corp.(1) | 73,768 | 638,093 | ||||||
Comstock Resources, Inc.(1) | 7,307 | 32,005 | ||||||
Concho Resources, Inc. | 6,507 | 335,111 | ||||||
ConocoPhillips | 161,928 | 6,804,215 | ||||||
CONSOL Energy, Inc.(1) | 10,099 | 51,202 | ||||||
Contango Oil & Gas Co.(1) | 28,394 | 65,022 | ||||||
Continental Resources, Inc. | 2,501 | 43,843 | ||||||
CVR Energy, Inc. | 12,284 | 247,031 | ||||||
Delek US Holdings, Inc. | 109,084 | 1,899,152 | ||||||
Devon Energy Corp. | 12,741 | 144,483 | ||||||
DHT Holdings, Inc. | 44,277 | 227,141 | ||||||
Diamond S Shipping, Inc.(1) | 10,009 | 79,972 | ||||||
Diamondback Energy, Inc. | 5,250 | 219,555 | ||||||
DMC Global, Inc. | 3,059 | 84,428 | ||||||
Dorian LPG Ltd.(1) | 10,948 | 84,738 | ||||||
Dril-Quip, Inc.(1) | 14,029 | 417,924 | ||||||
Earthstone Energy, Inc. - Class A(1) | 10,289 | 29,221 | ||||||
Energy Fuels, Inc.(1) | 46,561 | 70,307 | ||||||
EQT Corp. | 8,501 | 101,162 | ||||||
Equitrans Midstream Corp. | 12,350 | 102,629 | ||||||
Evolution Petroleum Corp. | 12,314 | 34,479 | ||||||
Exterran Corp.(1) | 10,494 | 56,563 | ||||||
Falcon Minerals Corp. | 18,325 | 58,640 | ||||||
Frank’s International NV(1) | 1,711,222 | 3,816,025 | ||||||
Frontline Ltd./Bermuda | 46,874 | 327,181 | ||||||
Golar LNG Ltd.(1) | 36,620 | 265,129 | ||||||
Goodrich Petroleum Corp.(1) | 1,131 | 8,143 | ||||||
Green Plains, Inc.(1) | 13,558 | 138,495 | ||||||
Gulfport Energy Corp.(1) | 64,127 | 69,898 | ||||||
Halliburton Co. | 29,198 | 378,990 | ||||||
Helix Energy Solutions Group, Inc.(1) | 60,009 | 208,231 | ||||||
Helmerich & Payne, Inc. | 3,471 | 67,719 | ||||||
Hess Corp. | 9,158 | 474,476 | ||||||
HollyFrontier Corp. | 108,545 | 3,169,514 | ||||||
International Seaways, Inc. | 9,288 | 151,766 | ||||||
Kosmos Energy Ltd. | 164,146 | 272,482 | ||||||
Liberty Oilfield Services, Inc. - Class A | 27,806 | 152,377 | ||||||
Magnolia Oil & Gas Corp. - Class A(1) | 2,225,217 | 13,484,815 | ||||||
Marathon Oil Corp. | 26,308 | 161,005 | ||||||
Marathon Petroleum Corp. | 318,461 | 11,904,072 | ||||||
Matador Resources Co.(1) | 954,342 | 8,111,907 | ||||||
Matrix Service Co.(1) | 10,286 | 99,980 | ||||||
Montage Resources Corp.(1) | 7,758 | 30,644 | ||||||
Murphy Oil Corp. | 4,849 | 66,916 | ||||||
Nabors Industries Ltd. | 2,870 | 106,247 | ||||||
NACCO Industries, Inc. - Class A | 1,329 | 30,966 | ||||||
National Energy Services Reunited, Inc.(1) | 8,321 | 57,248 | ||||||
National Oilwell Varco, Inc. | 12,930 | 158,393 | ||||||
Newpark Resources, Inc.(1) | 37,231 | 83,025 | ||||||
NextDecade Corp.(1) | 7,837 | 16,928 | ||||||
NexTier Oilfield Solutions, Inc.(1) | 67,989 | 166,573 | ||||||
Noble Energy, Inc. | 1,081,963 | 9,694,388 | ||||||
Nordic American Tankers Ltd. | 55,057 | 223,531 | ||||||
Occidental Petroleum Corp. | 27,073 | 495,436 | ||||||
Oceaneering International, Inc.(1) | 40,763 | 260,476 | ||||||
Oil States International, Inc.(1) | 24,270 | 115,283 | ||||||
ONEOK, Inc. | 14,623 | 485,776 | ||||||
Overseas Shipholding Group, Inc. - Class A(1) | 22,289 | 41,458 | ||||||
Ovintiv, Inc. | 105,127 | 1,003,963 | ||||||
Par Pacific Holdings, Inc.(1) | 16,773 | 150,789 | ||||||
Parsley Energy, Inc. - Class A | 1,499,082 | 16,010,196 | ||||||
Patterson-UTI Energy, Inc. | 31,134 | 108,035 | ||||||
PBF Energy, Inc. - Class A | 39,297 | 402,401 | ||||||
PDC Energy, Inc.(1) | 40,072 | 498,496 | ||||||
Peabody Energy Corp. | 29,633 | 85,343 | ||||||
Penn Virginia Corp.(1) | 5,537 | 52,768 | ||||||
Pioneer Natural Resources Co. | 137,098 | 13,394,475 | ||||||
Plains GP Holdings LP - Class A(1) | 463,911 | 4,128,808 | ||||||
PrimeEnergy Resources Corp.(1) | 192 | 13,649 | ||||||
ProPetro Holding Corp.(1) | 33,895 | 174,220 | ||||||
Range Resources Corp. | 85,285 | 480,155 | ||||||
Renewable Energy Group, Inc.(1) | 15,204 | 376,755 | ||||||
REX American Resources Corp.(1) | 2,160 | 149,839 | ||||||
RPC, Inc.(1) | 26,250 | 80,850 | ||||||
Scorpio Tankers, Inc. | 20,200 | 258,762 | ||||||
SEACOR Holdings, Inc.(1) | 7,881 | 223,190 | ||||||
Select Energy Services, Inc. - Class A(1) | 23,781 | 116,527 | ||||||
SFL Corp. Ltd. | 37,148 | 345,105 | ||||||
SM Energy Co. | 47,388 | 177,705 | ||||||
Solaris Oilfield Infrastructure, Inc. - Class A | 12,802 | 94,991 | ||||||
Southwestern Energy Co.(1) | 216,234 | 553,559 | ||||||
Talos Energy, Inc.(1) | 4,251 | 39,109 | ||||||
Targa Resources Corp. | 7,678 | 154,097 | ||||||
Tellurian, Inc.(1) | 58,716 | 67,523 | ||||||
Tidewater, Inc.(1) | 16,158 | 90,323 |
Transocean Ltd.(1) | 237,024 | 433,754 | ||||||
Uranium Energy Corp.(1) | 42,777 | 37,545 | ||||||
US Silica Holdings, Inc. | 29,871 | 107,834 | ||||||
Valero Energy Corp. | 219,740 | 12,925,107 | ||||||
W&T Offshore, Inc.(1) | 36,883 | 84,093 | ||||||
Whiting Petroleum Corp.(1) | 36,292 | 41,010 | ||||||
Williams Cos, Inc. | 40,564 | 771,527 | ||||||
World Fuel Services Corp. | 90,278 | 2,325,561 | ||||||
WPX Energy, Inc.(1) | 2,467,681 | 15,743,805 | ||||||
|
| |||||||
Total Energy |
| 163,369,571 | ||||||
|
| |||||||
Financials – 19.90% | ||||||||
1st Constitution Bancorp | 3,471 | 43,040 | ||||||
1st Source Corp. | 6,855 | 243,901 | ||||||
ACNB Corp. | 3,369 | 88,200 | ||||||
Affiliated Managers Group, Inc. | 1,563 | 116,537 | ||||||
Aflac, Inc. | 165,052 | 5,946,824 | ||||||
AGNC Investment Corp. | 18,935 | 244,261 | ||||||
Alerus Financial Corp. | 6,375 | 125,970 | ||||||
Alleghany Corp. | 24,795 | 12,128,226 | ||||||
Allegiance Bancshares, Inc. | 7,108 | 180,472 | ||||||
Allstate Corp. | 260,005 | 25,217,885 | ||||||
Ally Financial, Inc. | 193,663 | 3,840,337 | ||||||
Amalgamated Bank - Class A | 6,398 | 80,871 | ||||||
A-Mark Precious Metals, Inc.(1) | 1,760 | 33,528 | ||||||
Ambac Financial Group, Inc.(1) | 18,435 | 263,989 | ||||||
Amerant Bancorp, Inc. - Class A(1) | 9,566 | 143,873 | ||||||
American Equity Investment Life Holding Co. | 35,960 | 888,572 | ||||||
American Financial Group, Inc. | 47,874 | 3,038,084 | ||||||
American International Group, Inc. | 501,344 | 15,631,906 | ||||||
American National Bankshares, Inc. | 4,703 | 117,763 | ||||||
American National Insurance Co. | 245 | 17,657 | ||||||
Ameriprise Financial, Inc. | 192,563 | 28,892,153 | ||||||
Ameris Bancorp | 25,778 | 608,103 | ||||||
AMERISAFE, Inc. | 7,431 | 454,480 | ||||||
Ames National Corp. | 3,921 | 77,401 | ||||||
Annaly Capital Management, Inc. | 335,863 | 2,203,261 | ||||||
Anworth Mortgage Asset Corp. | 46,092 | 78,356 | ||||||
AON Plc-CLASS A - Class A | 60,034 | 11,562,548 | ||||||
Apollo Commercial Real Estate Finance, Inc. | 62,251 | 610,682 | ||||||
Apollo Global Management, Inc. - Class A | 2,862 | 142,871 | ||||||
Arbor Realty Trust, Inc. | 41,675 | 385,077 | ||||||
Arch Capital Group Ltd.(1) | 13,103 | 375,401 | ||||||
Ares Commercial Real Estate Corp. | 12,190 | 111,173 | ||||||
Ares Management Corp. - Class A | 236,600 | 9,393,020 | ||||||
Argo Group International Holdings Ltd. | 13,460 | 468,812 | ||||||
Arlington Asset Investment Corp. - Class A | 16,853 | 50,053 | ||||||
ARMOUR Residential REIT, Inc. | 26,676 | 250,488 | ||||||
Arrow Financial Corp. | 5,703 | 169,550 | ||||||
Arthur J. Gallagher & Co. | 159,544 | 15,553,945 | ||||||
Artisan Partners Asset Management, Inc. - Class A | 13,169 | 427,992 | ||||||
Assetmark Financial Holdings, Inc.(1) | 4,034 | 110,088 | ||||||
Associated Banc-Corp. | 310,829 | 4,252,141 | ||||||
Associated Capital Group, Inc. - Class A | 626 | 22,968 | ||||||
Assurant, Inc. | 1,989 | 205,444 | ||||||
Assured Guaranty Ltd. | 121,693 | 2,970,526 | ||||||
Athene Holding Ltd. - Class A(1) | 377,895 | 11,786,545 | ||||||
Atlantic Capital Bancshares, Inc.(1) | 8,363 | 101,694 | ||||||
Atlantic Union Bankshares Corp. | 31,877 | 738,271 | ||||||
Auburn National Bancorporation, Inc. | 894 | 51,038 | ||||||
Axis Capital Holdings Ltd. | 92,019 | 3,732,291 | ||||||
Axos Financial, Inc.(1) | 20,646 | 455,864 | ||||||
B. Riley Financial, Inc. | 7,354 | 160,023 | ||||||
Banc of California, Inc. | 17,623 | 190,857 | ||||||
BancFirst Corp. | 7,720 | 313,200 | ||||||
Banco Latinoamericano de Comercio Exterior SA - Class E | 39,311 | 452,076 | ||||||
BancorpSouth Bank | 871,984 | 19,828,916 | ||||||
Bank First Corp. | 121 | 7,756 | ||||||
Bank of Commerce Holdings | 6,310 | 47,830 | ||||||
Bank of Hawaii Corp. | 123,156 | 7,563,010 | ||||||
Bank of Marin Bancorp | 5,809 | 193,614 | ||||||
Bank of NT Butterfield & Son Ltd. | 452,982 | 11,048,231 | ||||||
Bank of Princeton | 2,083 | 41,827 | ||||||
Bank OZK | 287,671 | 6,751,638 | ||||||
Bank7 Corp. | 890 | 9,661 | ||||||
BankFinancial Corp. | 5,796 | 48,686 | ||||||
BankUnited, Inc. | 288,391 | 5,839,918 | ||||||
Bankwell Financial Group, Inc. | 2,850 | 45,315 | ||||||
Banner Corp. | 9,876 | 375,288 | ||||||
Bar Harbor Bankshares | 6,025 | 134,900 | ||||||
Baycom Corp.(1) | 3,471 | 44,811 | ||||||
BCB Bancorp, Inc. | 5,513 | 51,161 | ||||||
Berkshire Hills Bancorp, Inc. | 18,053 | 198,944 | ||||||
BGC Partners, Inc. - Class A | 47,095 | 129,040 | ||||||
Blackstone Mortgage Trust, Inc. - Class A | 54,892 | 1,322,348 | ||||||
Blucora, Inc.(1) | 19,927 | 227,566 | ||||||
Bogota Financial Corp.(1) | 2,680 | 23,423 | ||||||
BOK Financial Corp. | 99,854 | 5,635,760 | ||||||
Boston Private Financial Holdings, Inc. | 33,990 | 233,851 | ||||||
Bridge Bancorp, Inc. | 7,093 | 162,004 | ||||||
Bridgewater Bancshares, Inc.(1) | 7,865 | 80,616 | ||||||
Brighthouse Financial, Inc.(1) | 156,107 | 4,342,897 | ||||||
Broadmark Realty Capital, Inc. | 51,753 | 490,101 | ||||||
Brookline Bancorp, Inc. | 665,292 | 6,706,143 | ||||||
Brown & Brown, Inc. | 7,440 | 303,254 | ||||||
Bryn Mawr Bank Corp. | 8,492 | 234,889 | ||||||
Business First Bancshares, Inc. | 5,685 | 87,265 | ||||||
Byline Bancorp, Inc. | 9,914 | 129,873 | ||||||
C&F Financial Corp. | 1,336 | 44,422 | ||||||
Cadence BanCorp - Class A | 47,087 | 417,191 | ||||||
California Bancorp, Inc.(1) | 2,691 | 40,096 | ||||||
Cambridge Bancorp | 1,954 | 115,755 | ||||||
Camden National Corp. | 6,398 | 220,987 | ||||||
Cannae Holdings, Inc.(1) | 33,850 | 1,391,235 | ||||||
Capital Bancorp, Inc.(1) | 2,921 | 31,255 | ||||||
Capital City Bank Group, Inc. | 6,186 | 129,597 | ||||||
Capitol Federal Financial, Inc. | 52,980 | 583,310 | ||||||
Capstar Financial Holdings, Inc. | 6,840 | 82,080 | ||||||
Capstead Mortgage Corp. | 36,705 | 201,510 | ||||||
Carlyle Group, Inc. | 3,505 | 97,789 | ||||||
Carter Bank & Trust | 9,164 | 73,953 | ||||||
Cathay General Bancorp | 469,414 | 12,345,588 | ||||||
CB Financial Services, Inc. | 1,860 | 40,585 | ||||||
CBOE Global Markets, Inc. | 2,856 | 266,408 | ||||||
CBTX, Inc. | 7,437 | 156,177 | ||||||
Central Pacific Financial Corp. | 7,312 | 117,211 | ||||||
Central Valley Community Bancorp | 4,680 | 72,025 | ||||||
Century Bancorp, Inc. - Class A | 931 | 72,357 | ||||||
Chemung Financial Corp. | 1,510 | 41,223 | ||||||
Cherry Hill Mortgage Investment Corp. | 5,547 | 50,034 | ||||||
Chimera Investment Corp. | 226,284 | 2,174,589 | ||||||
ChoiceOne Financial Services, Inc. | 2,542 | 75,142 | ||||||
Cincinnati Financial Corp. | 4,989 | 319,446 | ||||||
CIT Group, Inc. | 119,535 | 2,477,961 | ||||||
Citizens & Northern Corp. | 5,434 | 112,212 | ||||||
Citizens Financial Group, Inc. | 273,199 | 6,895,543 | ||||||
Citizens Holding Co. | 1,731 | 43,275 | ||||||
Citizens, Inc. - Class A(1) | 18,865 | 113,001 | ||||||
City Holding Co. | 6,147 | 400,600 | ||||||
Civista Bancshares, Inc. | 7,395 | 113,883 | ||||||
CNA Financial Corp. | 106,016 | 3,408,414 | ||||||
CNB Financial Corporation, Inc. | 6,214 | 111,417 | ||||||
CNO Financial Group, Inc. | 522,723 | 8,138,797 | ||||||
Coastal Financial Corp.(1) | 3,151 | 45,753 | ||||||
Codorus Valley Bancorp, Inc. | 3,991 | 55,196 | ||||||
Colony Bankcorp, Inc. | 3,037 | 35,745 | ||||||
Colony Credit Real Estate, Inc. | 32,834 | 230,495 |
Columbia Banking System, Inc. | 28,329 | 802,986 | ||||||
Columbia Financial, Inc.(1) | 13,849 | 193,263 | ||||||
Comerica, Inc. | 4,629 | 176,365 | ||||||
Commerce Bancshares, Inc. | 3,355 | 199,522 | ||||||
Community Bank System, Inc. | 19,945 | 1,137,264 | ||||||
Community Bankers Trust Corp. | 8,439 | 46,414 | ||||||
Community Financial Corp. | 2,122 | 51,777 | ||||||
Community Trust Bancorp, Inc. | 6,729 | 220,442 | ||||||
ConnectOne Bancorp, Inc. | 15,874 | 255,889 | ||||||
County Bancorp, Inc. | 1,778 | 37,214 | ||||||
Cowen, Inc. - Class A | 7,192 | 116,582 | ||||||
Crawford & Co. - Class A | 6,760 | 53,336 | ||||||
Credit Acceptance Corp.(1) | 314 | 131,569 | ||||||
CrossFirst Bankshares, Inc.(1) | 19,519 | 190,896 | ||||||
Cullen/Frost Bankers, Inc. | 133,798 | 9,996,049 | ||||||
Customers Bancorp, Inc.(1) | 10,730 | 128,975 | ||||||
CVB Financial Corp. | 946,907 | 17,745,037 | ||||||
Delmar Bancorp | 2,980 | 19,579 | ||||||
Diamond Hill Investment Group, Inc. | 1,249 | 141,974 | ||||||
Dime Community Bancshares, Inc. | 10,975 | 150,687 | ||||||
Discover Financial Services | 374,497 | 18,758,555 | ||||||
Donegal Group, Inc. - Class A | 4,096 | 58,245 | ||||||
Donnelley Financial Solutions, Inc.(1) | 11,972 | 100,565 | ||||||
Dynex Capital, Inc. | 8,265 | 118,189 | ||||||
E*TRADE Financial Corp. | 7,407 | 368,350 | ||||||
Eagle Bancorp Montana, Inc. | 2,741 | 47,639 | ||||||
Eagle Bancorp, Inc. | 9,020 | 295,405 | ||||||
East West Bancorp, Inc. | 196,164 | 7,108,983 | ||||||
Eaton Vance Corp. | 3,705 | 143,013 | ||||||
Element Fleet Management Corp. | 1,192,516 | 8,898,193 | ||||||
Ellington Financial, Inc. | 16,090 | 189,540 | ||||||
Ellington Residential Mortgage REIT | 3,435 | 35,380 | ||||||
Employers Holdings, Inc. | 8,701 | 262,335 | ||||||
Encore Capital Group, Inc.(1) | 245,084 | 8,376,971 | ||||||
Enova International, Inc.(1) | 12,109 | 180,061 | ||||||
Enstar Group Ltd.(1) | 25,164 | 3,844,304 | ||||||
Enterprise Bancorp, Inc. | 3,441 | 81,965 | ||||||
Enterprise Financial Services Corp. | 10,189 | 317,082 | ||||||
Equitable Holdings, Inc. | 13,569 | 261,746 | ||||||
Equity Bancshares, Inc. - Class A(1) | 5,670 | 98,885 | ||||||
Erie Indemnity Co. - Class A | 358 | 68,700 | ||||||
Esquire Financial Holdings, Inc.(1) | 1,770 | 29,913 | ||||||
ESSA Bancorp, Inc. | 3,628 | 50,502 | ||||||
Essent Group Ltd. | 340,819 | 12,361,505 | ||||||
Evans Bancorp, Inc. | 1,895 | 44,078 | ||||||
Evercore, Inc. - Class A | 1,312 | 77,303 | ||||||
Everest Re Group Ltd. | 83,013 | 17,117,281 | ||||||
EZCORP, Inc. - Class A(1) | 20,611 | 129,849 | ||||||
Farmers & Merchants Bancorp, Inc. | 3,900 | 82,836 | ||||||
Farmers National Banc Corp. | 11,786 | 139,782 | ||||||
FB Financial Corp. | 7,676 | 190,135 | ||||||
FBL Financial Group, Inc. - Class A | 4,236 | 152,030 | ||||||
Federal Agricultural Mortgage Corp. - Class C | 2,912 | 186,397 | ||||||
Federated Hermes, Inc. - Class B | 28,037 | 664,477 | ||||||
FedNat Holding Co. | 4,321 | 47,833 | ||||||
Ferroglobe Representation & Warranty Insurance Trust(1)(4) | 11,189 | — | ||||||
Fidelity D&D Bancorp, Inc. | 1,574 | 75,694 | ||||||
Fidelity National Financial, Inc. | 9,162 | 280,907 | ||||||
Fifth Third Bancorp | 1,090,435 | 21,023,587 | ||||||
Financial Institutions, Inc. | 7,095 | 132,038 | ||||||
First American Financial Corp. | 82,580 | 3,965,492 | ||||||
First Bancorp NC | 12,180 | 305,474 | ||||||
First BanCorp PR | 85,828 | 479,779 | ||||||
First Bancorp, Inc. | 4,106 | 89,100 | ||||||
First Bancshares, Inc. | 8,079 | 181,777 | ||||||
First Bank/Hamilton NJ | 5,547 | 36,166 | ||||||
First Busey Corp. | 20,515 | 382,605 | ||||||
First Business Financial Services, Inc. | 4,040 | 66,458 |
First Capital, Inc. | 1,257 | 87,324 | ||||||
First Choice Bancorp | 4,419 | 72,383 | ||||||
First Citizens BancShares, Inc. - Class A | 219 | 88,699 | ||||||
First Commonwealth Financial Corp. | 40,033 | 331,473 | ||||||
First Community Bankshares, Inc. | 7,235 | 162,426 | ||||||
First Community Corp/SC | 2,578 | 39,057 | ||||||
First Financial Bancorp | 38,939 | 540,863 | ||||||
First Financial Corp. | 5,834 | 214,925 | ||||||
First Foundation, Inc. | 12,884 | 210,525 | ||||||
First Guaranty Bancshares, Inc. | 1,454 | 17,782 | ||||||
First Hawaiian, Inc. | 476,913 | 8,221,980 | ||||||
First Horizon National Corp. | 10,289 | 102,478 | ||||||
First Internet Bancorp | 3,811 | 63,339 | ||||||
First Interstate BancSystem, Inc. - Class A | 17,531 | 542,760 | ||||||
First Merchants Corp. | 22,182 | 611,558 | ||||||
First Mid Bancshares, Inc. | 6,489 | 170,206 | ||||||
First Midwest Bancorp, Inc. | 45,568 | 608,333 | ||||||
First Northwest Bancorp | 3,187 | 39,583 | ||||||
First of Long Island Corp. | 9,505 | 155,312 | ||||||
First Republic Bank | 115,798 | 12,273,430 | ||||||
First Savings Financial Group, Inc. | 687 | 29,768 | ||||||
First United Corp. | 2,567 | 34,244 | ||||||
First Western Financial, Inc.(1) | 2,898 | 41,296 | ||||||
Flagstar Bancorp, Inc. | 14,461 | 425,587 | ||||||
Flushing Financial Corp. | 11,431 | 131,685 | ||||||
FNB Corp. | 10,758 | 80,685 | ||||||
FNCB Bancorp, Inc. | 6,952 | 39,974 | ||||||
Franklin Financial Network, Inc. | 5,036 | 129,677 | ||||||
Franklin Financial Services Corp. | 1,649 | 42,709 | ||||||
Franklin Resources, Inc. | 116,446 | 2,441,873 | ||||||
FS Bancorp, Inc. | 1,391 | 53,651 | ||||||
FS KKR Capital Corp. | 122,125 | 1,709,750 | ||||||
Fulton Financial Corp. | 65,739 | 692,232 | ||||||
FVCBankcorp, Inc.(1) | 4,255 | 45,784 | ||||||
GAIN Capital Holdings, Inc. | 7,792 | 46,908 | ||||||
GAMCO Investors, Inc. - Class A | 485 | 6,455 | ||||||
Genworth Financial, Inc. - Class A(1) | 201,812 | 466,186 | ||||||
German American Bancorp, Inc. | 9,308 | 289,479 | ||||||
Glacier Bancorp, Inc. | 564,598 | 19,924,663 | ||||||
Global Indemnity Ltd. | 2,832 | 67,798 | ||||||
Globe Life, Inc. | 97,026 | 7,202,240 | ||||||
Goosehead Insurance, Inc. - Class A(1) | 4,499 | 338,145 | ||||||
Granite Point Mortgage Trust, Inc. | 22,901 | 164,429 | ||||||
Great Ajax Corp. | 7,896 | 72,643 | ||||||
Great Southern Bancorp, Inc. | 4,690 | 189,288 | ||||||
Great Western Bancorp, Inc. | 18,608 | 256,046 | ||||||
Green Dot Corp. - Class A(1) | 18,090 | 887,857 | ||||||
Greene County Bancorp, Inc. | 1,083 | 24,151 | ||||||
Greenlight Capital Re Ltd. - Class A(1) | 11,363 | 74,087 | ||||||
Guaranty Bancshares, Inc. | 3,076 | 79,576 | ||||||
Hancock Whitney Corp. | 35,296 | 748,275 | ||||||
Hanmi Financial Corp. | 410,576 | 3,986,693 | ||||||
Hannon Armstrong Sustainable Infrastructure Capital, Inc. | 26,727 | 760,650 | ||||||
Hanover Insurance Group, Inc. | 48,345 | 4,898,799 | ||||||
HarborOne Bancorp, Inc.(1) | 21,274 | 181,680 | ||||||
Hartford Financial Services Group, Inc. | 305,805 | 11,788,783 | ||||||
Hawthorn Bancshares, Inc. | 2,310 | 45,484 | ||||||
HBT Financial, Inc. | 4,147 | 55,280 | ||||||
HCI Group, Inc. | 1,756 | 81,092 | ||||||
Heartland Financial USA, Inc. | 14,401 | 481,569 | ||||||
Heritage Commerce Corp. | 24,544 | 184,203 | ||||||
Heritage Financial Corp. | 13,700 | 274,000 | ||||||
Heritage Insurance Holdings, Inc. | 8,929 | 116,881 | ||||||
Hilltop Holdings, Inc. | 29,352 | 541,544 | ||||||
Hingham Institution for Savings | 533 | 89,427 | ||||||
Home Bancorp, Inc. | 3,601 | 96,327 | ||||||
Home Bancshares, Inc. | 62,226 | 957,036 | ||||||
HomeStreet, Inc. | 7,337 | 180,564 |
HomeTrust Bancshares, Inc. | 6,298 | 100,768 | ||||||
Hope Bancorp, Inc. | 35,604 | 328,269 | ||||||
Horace Mann Educators Corp. | 320,065 | 11,755,987 | ||||||
Horizon Bancorp | 18,754 | 200,480 | ||||||
Howard Bancorp, Inc.(1) | 4,646 | 49,341 | ||||||
Huntington Bancshares, Inc. | 1,966,757 | 17,769,649 | ||||||
IBERIABANK Corp. | 261,767 | 11,920,869 | ||||||
Independence Holding Co. | 2,026 | 61,975 | ||||||
Independent Bank Corp. | 315,597 | 21,173,403 | ||||||
Independent Bank Corp. MI | 9,256 | 137,452 | ||||||
Independent Bank Group, Inc. | 15,159 | 614,243 | ||||||
Interactive Brokers Group, Inc. - Class A | 2,400 | 100,248 | ||||||
International Bancshares Corp. | 21,856 | 699,829 | ||||||
INTL. FCStone, Inc.(1) | 6,143 | 337,865 | ||||||
Invesco Ltd. | 12,574 | 135,296 | ||||||
Invesco Mortgage Capital, Inc. | 553,407 | 2,069,742 | ||||||
Investar Holding Corp. | 4,870 | 70,615 | ||||||
Investors Bancorp, Inc. | 68,193 | 579,640 | ||||||
Investors Title Co. | 431 | 52,289 | ||||||
James River Group Holdings Ltd. | 1,554 | 69,930 | ||||||
Jefferies Financial Group, Inc. | 7,571 | 117,729 | ||||||
Kearny Financial Corp. | 23,925 | 195,706 | ||||||
Kemper Corp. | 2,059 | 149,319 | ||||||
KeyCorp | 1,429,397 | 17,410,055 | ||||||
KKR & Co., Inc. - Class Miscella | 17,748 | 548,058 | ||||||
KKR Real Estate Finance Trust, Inc. | 11,327 | 187,802 | ||||||
Ladder Capital Corp. - Class A | 41,223 | 333,906 | ||||||
Lakeland Bancorp, Inc. | 20,489 | 234,189 | ||||||
Lakeland Financial Corp. | 480,152 | 22,370,282 | ||||||
Landmark Bancorp, Inc./Manhattan KS | 1,732 | 42,798 | ||||||
Lazard Ltd. - Class A | 74,840 | 2,142,669 | ||||||
LCNB Corp. | 5,535 | 88,339 | ||||||
Legg Mason, Inc. | 3,372 | 167,757 | ||||||
LendingClub Corp.(1) | 26,815 | 122,008 | ||||||
LendingTree, Inc.(1) | 13 | 3,764 | ||||||
Level One Bancorp, Inc. | 1,906 | 31,906 | ||||||
Limestone Bancorp, Inc.(1) | 1,890 | 24,853 | ||||||
Lincoln National Corp. | 102,528 | 3,772,005 | ||||||
Live Oak Bancshares, Inc. | 10,928 | 158,565 | ||||||
Loews Corp. | 622,425 | 21,342,953 | ||||||
LPL Financial Holdings, Inc. | 2,407 | 188,709 | ||||||
Luther Burbank Corp. | 6,127 | 61,270 | ||||||
M&T Bank Corp. | 4,265 | 443,432 | ||||||
Macatawa Bank Corp. | 12,487 | 97,648 | ||||||
Mackinac Financial Corp. | 3,926 | 40,713 | ||||||
MainStreet Bancshares, Inc.(1) | 2,492 | 32,894 | ||||||
Markel Corp.(1) | 450 | 415,426 | ||||||
Marlin Business Services Corp. | 4,114 | 34,804 | ||||||
MBIA, Inc.(1) | 26,902 | 195,039 | ||||||
Mercantile Bank Corp. | 6,673 | 150,810 | ||||||
Merchants Bancorp | 3,271 | 60,481 | ||||||
Mercury General Corp. | 903 | 36,797 | ||||||
Meridian Bancorp, Inc. | 20,103 | 233,195 | ||||||
Meridian Corp.(1) | 1,418 | 22,475 | ||||||
Meta Financial Group, Inc. | 12,951 | 235,320 | ||||||
Metrocity Bankshares, Inc. | 7,808 | 111,889 | ||||||
Metropolitan Bank Holding Corp.(1) | 2,866 | 91,941 | ||||||
MFA Financial, Inc. | 183,451 | 456,793 | ||||||
MGIC Investment Corp. | 720,165 | 5,898,151 | ||||||
Mid Penn Bancorp, Inc. | 2,643 | 48,710 | ||||||
Middlefield Banc Corp. | 2,322 | 48,181 | ||||||
Midland States Bancorp, Inc. | 9,317 | 139,289 | ||||||
MidWestOne Financial Group, Inc. | 6,742 | 134,840 | ||||||
MMA Capital Holdings, Inc.(1) | 1,561 | 36,090 | ||||||
Morningstar, Inc. | 115 | 16,212 | ||||||
Mr Cooper Group, Inc.(1) | 390,355 | 4,856,016 | ||||||
MVB Financial Corp. | 3,898 | 51,843 | ||||||
Nasdaq, Inc. | 135,446 | 16,181,734 |
National Bank Holdings Corp. - Class A | 8,538 | 230,526 | ||||||
National Bankshares, Inc. | 2,530 | 72,358 | ||||||
National General Holdings Corp. | 122,633 | 2,650,099 | ||||||
National Western Life Group, Inc. - Class A | 999 | 202,987 | ||||||
Navient Corp. | 259,168 | 1,821,951 | ||||||
NBT Bancorp, Inc. | 16,574 | 509,816 | ||||||
Nelnet, Inc. - Class A | 6,941 | 331,363 | ||||||
New Residential Investment Corp. | 824,404 | 6,125,322 | ||||||
New York Community Bancorp, Inc. | 14,996 | 152,959 | ||||||
New York Mortgage Trust, Inc. | 430,623 | 1,123,926 | ||||||
NI Holdings, Inc.(1) | 3,235 | 47,781 | ||||||
Nicolet Bankshares, Inc.(1) | 3,687 | 202,048 | ||||||
NMI Holdings, Inc. - Class A(1) | 25,546 | 410,780 | ||||||
Northeast Bank | 1,941 | 34,065 | ||||||
Northern Trust Corp. | 6,406 | 508,252 | ||||||
Northfield Bancorp, Inc. | 17,055 | 196,474 | ||||||
Northrim BanCorp, Inc. | 2,944 | 74,012 | ||||||
Northwest Bancshares, Inc. | 47,230 | 482,927 | ||||||
Norwood Financial Corp. | 2,249 | 55,753 | ||||||
Oak Valley Bancorp | 2,625 | 33,285 | ||||||
OceanFirst Financial Corp. | 24,230 | 427,175 | ||||||
Oconee Federal Financial Corp. | 425 | 10,952 | ||||||
OFG Bancorp | 20,239 | 270,595 | ||||||
Ohio Valley Banc Corp. | 1,775 | 40,026 | ||||||
Old National Bancorp | 57,566 | 792,108 | ||||||
Old Republic International Corp. | 142,419 | 2,322,854 | ||||||
Old Second Bancorp, Inc. | 13,167 | 102,439 | ||||||
OneMain Holdings, Inc. - Class A | 2,172 | 53,301 | ||||||
OP Bancorp | 4,818 | 33,244 | ||||||
Oportun Financial Corp.(1) | 8,252 | 110,907 | ||||||
Oppenheimer Holdings, Inc. - Class A | 4,238 | 92,346 | ||||||
Orchid Island Capital, Inc. - Class A | 28,322 | 133,397 | ||||||
Origin Bancorp, Inc. | 9,584 | 210,848 | ||||||
Orrstown Financial Services, Inc. | 4,635 | 68,366 | ||||||
Pacific Premier Bancorp, Inc. | 34,489 | 747,722 | ||||||
PacWest Bancorp | 325,455 | 6,414,718 | ||||||
Park National Corp. | 5,971 | 420,239 | ||||||
Parke Bancorp, Inc. | 4,743 | 64,268 | ||||||
PCB Bancorp | 6,222 | 64,087 | ||||||
PCSB Financial Corp. | 4,882 | 61,904 | ||||||
PDL Community Bancorp(1) | 2,922 | 29,746 | ||||||
Peapack Gladstone Financial Corp. | 7,199 | 134,837 | ||||||
PennantPark Investment Corp. | 163,500 | 573,885 | ||||||
Penns Woods Bancorp, Inc. | 2,795 | 63,474 | ||||||
PennyMac Financial Services, Inc. | 15,350 | 641,476 | ||||||
PennyMac Mortgage Investment Trust | 38,721 | 678,779 | ||||||
Peoples Bancorp of North Carolina, Inc. | 1,943 | 34,333 | ||||||
Peoples Bancorp, Inc. | 7,962 | 169,431 | ||||||
Peoples Financial Services Corp. | 2,673 | 102,082 | ||||||
People’s United Financial, Inc. | 14,104 | 163,183 | ||||||
People’s Utah Bancorp | 6,798 | 152,751 | ||||||
Pinnacle Financial Partners, Inc. | 2,465 | 103,505 | ||||||
Pioneer Bancorp, Inc.(1) | 4,579 | 41,898 | ||||||
Piper Sandler Cos | 7,256 | 429,265 | ||||||
Plumas Bancorp | 1,884 | 41,674 | ||||||
Popular, Inc. | 43,394 | 1,612,955 | ||||||
PRA Group, Inc.(1) | 18,068 | 698,509 | ||||||
Preferred Bank Los Angeles | 5,639 | 241,631 | ||||||
Premier Financial Bancorp, Inc. | 5,386 | 69,049 | ||||||
Premier Financial Corp. | 15,447 | 272,948 | ||||||
Primerica, Inc. | 513 | 59,816 | ||||||
Principal Financial Group, Inc. | 81,860 | 3,400,464 | ||||||
ProAssurance Corp. | 21,127 | 305,708 | ||||||
Professional Holding Corp. - Class A(1) | 1,553 | 21,556 | ||||||
ProSight Global, Inc.(1) | 3,662 | 32,592 | ||||||
Prospect Capital Corp. | 295,600 | 1,510,516 | ||||||
Prosperity Bancshares, Inc. | 157,408 | 9,346,887 | ||||||
Protective Insurance Corp. - Class B | 3,527 | 53,152 |
Provident Bancorp, Inc. | 2,315 | 18,196 | ||||||
Provident Financial Holdings, Inc. | 2,612 | 35,027 | ||||||
Provident Financial Services, Inc. | 24,468 | 353,563 | ||||||
Prudential Bancorp, Inc. | 3,122 | 37,589 | ||||||
Prudential Financial, Inc. | 55,965 | 3,408,268 | ||||||
QCR Holdings, Inc. | 5,735 | 178,817 | ||||||
Radian Group, Inc. | 350,511 | 5,436,426 | ||||||
Raymond James Financial, Inc. | 250,690 | 17,254,993 | ||||||
RBB Bancorp | 6,808 | 92,929 | ||||||
Ready Capital Corp. | 14,496 | 125,970 | ||||||
Red River Bancshares, Inc. | 1,857 | 81,504 | ||||||
Redwood Trust, Inc. | 46,564 | 325,948 | ||||||
Regional Management Corp.(1) | 3,252 | 57,593 | ||||||
Regions Financial Corp. | 412,536 | 4,587,400 | ||||||
Reinsurance Group of America, Inc. - Class A | 299,870 | 23,521,803 | ||||||
Reliant Bancorp, Inc. | 5,819 | 94,792 | ||||||
RenaissanceRe Holdings Ltd. | 66,086 | 11,302,689 | ||||||
Renasant Corp. | 22,453 | 559,080 | ||||||
Republic Bancorp, Inc. - Class A | 3,913 | 127,994 | ||||||
Republic First Bancorp, Inc.(1) | 18,033 | 44,001 | ||||||
Richmond Mutual Bancorporation, Inc. | 4,608 | 51,794 | ||||||
Riverview Bancorp, Inc. | 10,955 | 61,896 | ||||||
RLI Corp. | 1,948 | 159,931 | ||||||
S&T Bancorp, Inc. | 15,383 | 360,731 | ||||||
Safeguard Scientifics, Inc. | 9,054 | 63,378 | ||||||
Safety Insurance Group, Inc. | 5,733 | 437,199 | ||||||
Salisbury Bancorp, Inc. | 993 | 40,703 | ||||||
Sandy Spring Bancorp, Inc. | 141,714 | 3,511,673 | ||||||
Santander Consumer USA Holdings, Inc. | 141,536 | 2,605,678 | ||||||
SB Financial Group, Inc. | 3,240 | 53,849 | ||||||
SB One Bancorp | 3,957 | 77,953 | ||||||
Sculptor Capital Management, Inc. - Class A | 7,542 | 97,518 | ||||||
Seacoast Banking Corp. of Florida(1) | 19,818 | 404,287 | ||||||
Security National Financial Corp. - Class A(1) | 3,093 | 20,862 | ||||||
SEI Investments Co. | 3,843 | 211,288 | ||||||
Select Bancorp, Inc.(1) | 6,303 | 51,306 | ||||||
Selective Insurance Group, Inc. | 360,466 | 19,010,977 | ||||||
ServisFirst Bancshares, Inc. | 5,493 | 196,430 | ||||||
Shore Bancshares, Inc. | 5,790 | 64,211 | ||||||
Sierra Bancorp | 6,405 | 120,926 | ||||||
Signature Bank | 98,414 | 10,522,425 | ||||||
Silvercrest Asset Management Group, Inc. - Class A | 1,933 | 24,568 | ||||||
Silvergate Capital Corp. - Class A(1) | 5,949 | 83,286 | ||||||
Simmons First National Corp. - Class A | 41,474 | 709,620 | ||||||
SLM Corp. | 1,174,417 | 8,256,152 | ||||||
SmartFinancial, Inc. | 5,237 | 84,735 | ||||||
South Plains Financial, Inc. | 4,225 | 60,164 | ||||||
South State Corp. | 231,510 | 11,033,767 | ||||||
Southern First Bancshares, Inc.(1) | 3,207 | 88,866 | ||||||
Southern Missouri Bancorp, Inc. | 3,006 | 73,046 | ||||||
Southern National Bancorp of Virginia, Inc. | 9,766 | 94,633 | ||||||
Southside Bancshares, Inc. | 12,221 | 338,766 | ||||||
Spirit of Texas Bancshares, Inc.(1) | 5,496 | 67,656 | ||||||
Standard AVB Financial Corp. | 1,762 | 40,878 | ||||||
Starwood Property Trust, Inc. | 9,136 | 136,675 | ||||||
State Auto Financial Corp. | 6,832 | 121,951 | ||||||
State Street Corp. | 194,494 | 12,360,094 | ||||||
Sterling Bancorp | 686,351 | 8,044,034 | ||||||
Sterling Bancorp, Inc. | 7,043 | 25,214 | ||||||
Stewart Information Services Corp. | 9,397 | 305,496 | ||||||
Stifel Financial Corp. | 26,971 | 1,279,235 | ||||||
Stock Yards Bancorp, Inc. | 7,392 | 297,158 | ||||||
Summit Financial Group, Inc. | 4,507 | 74,275 | ||||||
SVB Financial Group(1) | 36,962 | 7,966,420 | ||||||
SWK Holdings Corp.(1) | 1,171 | 14,029 | ||||||
Synchrony Financial | 254,353 | 5,636,462 | ||||||
Synovus Financial Corp. | 4,867 | 99,920 | ||||||
T Rowe Price Group, Inc. | 5,636 | 696,046 |
TCF Financial Corp. | 1,038,674 | 30,557,789 | ||||||
TD Ameritrade Holding Corp. | 213,610 | 7,771,132 | ||||||
Territorial Bancorp, Inc. | 2,880 | 68,515 | ||||||
Texas Capital Bancshares, Inc.(1) | 20,536 | 633,946 | ||||||
TFS Financial Corp. | 1,631 | 23,340 | ||||||
The Bancorp, Inc.(1) | 20,405 | 199,969 | ||||||
Third Point Reinsurance Ltd.(1) | 802,920 | 6,029,929 | ||||||
Timberland Bancorp, Inc. | 2,956 | 53,829 | ||||||
Tiptree, Inc. | 9,859 | 63,591 | ||||||
Tompkins Financial Corp. | 5,845 | 378,581 | ||||||
Towne Bank/Portsmouth VA | 27,657 | 521,058 | ||||||
TPG RE Finance Trust, Inc. | 23,540 | 202,444 | ||||||
Tradeweb Markets, Inc. - Class A | 410 | 23,837 | ||||||
Travelers Companies, Inc. | 42,871 | 4,889,438 | ||||||
TriCo Bancshares | 11,142 | 339,274 | ||||||
TriState Capital Holdings, Inc.(1) | 11,464 | 180,099 | ||||||
Triumph Bancorp, Inc.(1) | 8,376 | 203,286 | ||||||
Truist Financial Corp. | 360,981 | 13,554,837 | ||||||
TrustCo Bank Corp. NY | 39,586 | 250,579 | ||||||
Trustmark Corp. | 25,777 | 632,052 | ||||||
Two Harbors Investment Corp. | 858,744 | 4,328,070 | ||||||
UMB Financial Corp. | 211,564 | 10,906,124 | ||||||
Umpqua Holdings Corp. | 754,207 | 8,024,762 | ||||||
United Bankshares, Inc. | 50,073 | 1,385,019 | ||||||
United Community Banks, Inc. | 24,545 | 493,845 | ||||||
United Fire Group, Inc. | 8,869 | 245,760 | ||||||
United Insurance Holdings Corp. | 9,007 | 70,435 | ||||||
United Security Bancshares | 7,100 | 47,499 | ||||||
Unity Bancorp, Inc. | 2,894 | 41,384 | ||||||
Universal Insurance Holdings, Inc. | 98,265 | 1,744,204 | ||||||
Univest Financial Corp. | 12,075 | 194,891 | ||||||
Unum Group | 104,387 | 1,731,780 | ||||||
Valley National Bancorp | 161,352 | 1,261,773 | ||||||
Vericity, Inc. | 626 | 6,654 | ||||||
Veritex Holdings, Inc. | 18,713 | 331,220 | ||||||
Virtu Financial, Inc. - Class A | 227 | 5,357 | ||||||
Virtus Investment Partners, Inc. | 2,750 | 319,798 | ||||||
Voya Financial, Inc. | 74,399 | 3,470,713 | ||||||
Waddell & Reed Financial, Inc. - Class A | 26,834 | 416,195 | ||||||
Walker & Dunlop, Inc. | 10,496 | 533,302 | ||||||
Washington Federal, Inc. | 30,790 | 826,404 | ||||||
Washington Trust Bancorp, Inc. | 7,142 | 233,901 | ||||||
Waterstone Financial, Inc. | 9,512 | 141,063 | ||||||
Watford Holdings Ltd.(1) | 7,674 | 128,079 | ||||||
Webster Financial Corp. | 2,980 | 85,258 | ||||||
WesBanco, Inc. | 26,897 | 546,278 | ||||||
West Bancorporation, Inc. | 6,405 | 112,023 | ||||||
Westamerica Bancorporation | 8,742 | 501,966 | ||||||
Western Alliance Bancorp | 3,258 | 123,380 | ||||||
Western Asset Mortgage Capital Corp. | 22,440 | 61,486 | ||||||
Western New England Bancorp, Inc. | 9,114 | 52,770 | ||||||
Westwood Holdings Group, Inc. | 4,001 | 63,016 | ||||||
White Mountains Insurance Group Ltd. | 100 | 88,797 | ||||||
Willis Towers Watson Plc | 48,441 | 9,540,455 | ||||||
Wintrust Financial Corp. | 186,199 | 8,122,000 | ||||||
WisdomTree Investments, Inc. | 58,295 | 202,284 | ||||||
World Acceptance Corp.(1) | 2,085 | 136,609 | ||||||
WR Berkley Corp. | 4,636 | 265,596 | ||||||
WSFS Financial Corp. | 20,676 | 593,401 | ||||||
Zions Bancorp N.A. | 162,073 | 5,510,482 | ||||||
|
| |||||||
Total Financials |
| 1,015,089,432 | ||||||
|
| |||||||
Healthcare – 7.28% | ||||||||
Abeona Therapeutics, Inc.(1) | 16,327 | 47,593 | ||||||
Acadia Healthcare Co., Inc.(1) | 2,938 | 73,803 | ||||||
Acceleron Pharma, Inc.(1) | 92 | 8,765 | ||||||
AcelRx Pharmaceuticals, Inc.(1) | 23,036 | 27,874 | ||||||
ADMA Biologics, Inc.(1) | 2,070 | 6,065 | ||||||
Aduro Biotech, Inc.(1) | 4,952 | 11,439 | ||||||
Adverum Biotechnologies, Inc.(1) | 3,999 | 83,499 | ||||||
Aeglea BioTherapeutics, Inc.(1) | 2,726 | 25,215 | ||||||
Agilent Technologies, Inc. | 97,738 | 8,637,107 | ||||||
Agios Pharmaceuticals, Inc.(1) | 1,853 | 99,098 | ||||||
Akcea Therapeutics, Inc.(1) | 3,458 | 47,375 | ||||||
Albireo Pharma, Inc.(1) | 1,551 | 41,086 | ||||||
Alexion Pharmaceuticals, Inc.(1) | 101,103 | 11,347,801 | ||||||
Alkermes Plc(1) | 5,269 | 102,245 | ||||||
Allscripts Healthcare Solutions, Inc.(1) | 773,471 | 5,236,399 | ||||||
Alphatec Holdings, Inc.(1) | 2,437 | 11,454 | ||||||
AMAG Pharmaceuticals, Inc.(1) | 12,084 | 92,443 | ||||||
American Renal Associates Holdings, Inc.(1) | 2,876 | 18,752 | ||||||
AmerisourceBergen Corp. - Class A | 99,023 | 9,978,548 | ||||||
AMN Healthcare Services, Inc.(1) | 253,070 | 11,448,887 | ||||||
AnaptysBio, Inc.(1) | 8,764 | 195,788 | ||||||
AngioDynamics, Inc.(1) | 14,271 | 145,136 | ||||||
ANI Pharmaceuticals, Inc.(1) | 1,712 | 55,366 | ||||||
Anika Therapeutics, Inc.(1) | 5,730 | 216,193 | ||||||
Applied Genetic Technologies Corp./DE(1) | 9,549 | 52,901 | ||||||
Aptinyx, Inc.(1) | 9,676 | 40,349 | ||||||
Apyx Medical Corp.(1) | 11,553 | 64,119 | ||||||
Arena Pharmaceuticals, Inc.(1) | 20,752 | 1,306,338 | ||||||
Aspira Women’s Health, Inc.(1) | 1,460 | 5,606 | ||||||
Assembly Biosciences, Inc.(1) | 6,091 | 142,042 | ||||||
Atara Biotherapeutics, Inc.(1) | 5,928 | 86,371 | ||||||
Atreca, Inc. - Class A(1) | 580 | 12,342 | ||||||
Avanos Medical, Inc.(1) | 19,129 | 562,201 | ||||||
Avantor, Inc.(1) | 465,776 | 7,918,192 | ||||||
AVEO Pharmaceuticals, Inc.(1) | 1,808 | 9,311 | ||||||
Avid Bioservices, Inc.(1) | 3,108 | 20,404 | ||||||
Axcella Health, Inc.(1) | 1,249 | 6,907 | ||||||
Aytu BioScience, Inc.(1) | 8,435 | 11,978 | ||||||
BeyondSpring, Inc.(1) | 256 | 3,860 | ||||||
BioCryst Pharmaceuticals, Inc.(1) | 12,188 | 58,076 | ||||||
BioMarin Pharmaceutical, Inc.(1) | 561 | 69,194 | ||||||
Bio-Rad Laboratories, Inc. - Class A(1) | 708 | 319,655 | ||||||
Bio-Techne Corp. | 77 | 20,333 | ||||||
Bluebird Bio, Inc.(1) | 1,191 | 72,699 | ||||||
Boston Scientific Corp.(1) | 407,591 | 14,310,520 | ||||||
Brookdale Senior Living, Inc.(1) | 75,121 | 221,607 | ||||||
Bruker Corp. | 1,983 | 80,668 | ||||||
Cabaletta Bio, Inc.(1) | 4,931 | 54,931 | ||||||
Calyxt, Inc.(1) | 1,193 | 5,881 | ||||||
Cardinal Health, Inc. | 77,100 | 4,023,849 | ||||||
CASI Pharmaceuticals, Inc.(1) | 4,349 | 10,872 | ||||||
Cassava Sciences, Inc.(1) | 5,770 | 17,772 | ||||||
Catabasis Pharmaceuticals, Inc.(1) | 2,151 | 13,831 | ||||||
Catalent, Inc.(1) | 5,126 | 375,736 | ||||||
Catalyst Biosciences, Inc.(1) | 7,057 | 41,425 | ||||||
Cellular Biomedicine Group, Inc.(1) | 1,807 | 27,051 | ||||||
CEL-SCI Corp.(1) | 1,609 | 24,006 | ||||||
Centene Corp.(1) | 346,486 | 22,019,185 | ||||||
Change Healthcare, Inc.(1) | 479,940 | 5,375,328 | ||||||
Charles River Laboratories International, Inc.(1) | 187 | 32,603 | ||||||
Chimerix, Inc.(1) | 18,981 | 58,841 | ||||||
Cidara Therapeutics, Inc.(1) | 2,739 | 10,107 | ||||||
Community Health Systems, Inc.(1) | 33,199 | 99,929 | ||||||
Computer Programs & Systems, Inc. | 4,857 | 110,691 | ||||||
Concert Pharmaceuticals, Inc.(1) | 12,054 | 119,937 | ||||||
CorMedix, Inc.(1) | 1,295 | 8,158 | ||||||
Cortexyme, Inc.(1) | 369 | 17,085 | ||||||
Covetrus, Inc.(1) | 39,469 | 706,100 | ||||||
Cross Country Healthcare, Inc.(1) | 12,211 | 75,220 | ||||||
CryoLife, Inc.(1) | 2,279 | 43,688 | ||||||
Cyclerion Therapeutics, Inc.(1) | 8,810 | 52,067 | ||||||
Cymabay Therapeutics, Inc.(1) | 29,645 | 103,461 | ||||||
Cytokinetics, Inc.(1) | 2,558 | 60,292 | ||||||
DaVita, Inc.(1) | 67,312 | 5,327,072 |
Dentsply Sirona, Inc. | 7,304 | 321,814 | ||||||
Dyadic International, Inc.(1) | 1,455 | 12,600 | ||||||
Dynavax Technologies Corp. - Class A(1) | 5,537 | 49,113 | ||||||
Elanco Animal Health, Inc.(1) | 13,339 | 286,122 | ||||||
Enanta Pharmaceuticals, Inc.(1) | 7,003 | 351,621 | ||||||
Encompass Health Corp. | 1,808 | 111,969 | ||||||
Endo International Plc(1) | 50,168 | 172,076 | ||||||
Enochian Biosciences, Inc.(1) | 4,964 | 20,898 | ||||||
Envista Holdings Corp.(1) | 698,606 | 14,733,601 | ||||||
Enzo Biochem, Inc.(1) | 17,080 | 38,259 | ||||||
Epizyme, Inc.(1) | 13,409 | 215,349 | ||||||
Evofem Biosciences, Inc.(1) | 537 | 1,520 | ||||||
Evolent Health, Inc. - Class A(1) | 25,653 | 182,649 | ||||||
Evolus, Inc.(1) | 5,349 | 28,350 | ||||||
Exact Sciences Corp.(1) | 650 | 56,511 | ||||||
Exelixis, Inc.(1) | 6,463 | 153,432 | ||||||
Exicure, Inc.(1) | 3,103 | 7,571 | ||||||
FibroGen, Inc.(1) | 4,880 | 197,786 | ||||||
Five Prime Therapeutics, Inc.(1) | 10,879 | 66,362 | ||||||
Five Star Senior Living, Inc.(1) | 7,741 | 30,190 | ||||||
Fluidigm Corp.(1) | 25,024 | 100,346 | ||||||
FONAR Corp.(1) | 2,343 | 50,070 | ||||||
G1 Therapeutics, Inc.(1) | 7,580 | 183,891 | ||||||
Geron Corp.(1) | 76,562 | 166,905 | ||||||
Globus Medical, Inc. - Class A(1) | 2,473 | 117,987 | ||||||
GlycoMimetics, Inc.(1) | 13,718 | 51,580 | ||||||
Gossamer Bio, Inc.(1) | 11,890 | 154,570 | ||||||
Gritstone Oncology, Inc.(1) | 9,709 | 64,468 | ||||||
Haemonetics Corp.(1) | 114 | 10,210 | ||||||
Hanger, Inc.(1) | 13,123 | 217,317 | ||||||
Harvard Bioscience, Inc.(1) | 14,226 | 44,101 | ||||||
HCA Healthcare, Inc. | 120,478 | 11,693,595 | ||||||
HealthStream, Inc.(1) | 9,698 | 214,617 | ||||||
Henry Schein, Inc.(1) | 4,768 | 278,404 | ||||||
Heska Corp.(1) | 1,707 | 159,041 | ||||||
Hill-Rom Holdings, Inc. | 1,963 | 215,498 | ||||||
HMS Holdings Corp.(1) | 164,020 | 5,312,608 | ||||||
Hologic, Inc.(1) | 273,337 | 15,580,209 | ||||||
Hookipa Pharma, Inc.(1) | 257 | 2,986 | ||||||
Horizon Therapeutics Plc(1) | 465 | 25,845 | ||||||
Humana, Inc. | 35,654 | 13,824,838 | ||||||
iBio, Inc.(1) | 4,566 | 10,137 | ||||||
ICON Plc(1) | 54,278 | 9,143,672 | ||||||
ICU Medical, Inc.(1) | 70,463 | 12,987,036 | ||||||
Ideaya Biosciences, Inc.(1) | 3,989 | 56,684 | ||||||
Immunic, Inc.(1) | 680 | 8,242 | ||||||
ImmunoGen, Inc.(1) | 37,923 | 174,446 | ||||||
Innoviva, Inc.(1) | 116,200 | 1,624,476 | ||||||
Inogen, Inc.(1) | 2,617 | 92,956 | ||||||
Integer Holdings Corp.(1) | 208,146 | 15,205,065 | ||||||
Integra LifeSciences Holdings Corp.(1) | 2,404 | 112,964 | ||||||
Intra-Cellular Therapies, Inc.(1) | 13,787 | 353,912 | ||||||
IntriCon Corp.(1) | 3,320 | 44,886 | ||||||
Invacare Corp. | 12,992 | 82,759 | ||||||
Ionis Pharmaceuticals, Inc.(1) | 2,214 | 130,537 | ||||||
IQVIA Holdings, Inc.(1) | 181,410 | 25,738,451 | ||||||
IVERIC bio, Inc.(1) | 17,530 | 89,403 | ||||||
Jazz Pharmaceuticals Plc(1) | 129,404 | 14,278,437 | ||||||
Jounce Therapeutics, Inc.(1) | 7,111 | 49,066 | ||||||
KalVista Pharmaceuticals, Inc.(1) | 4,253 | 51,461 | ||||||
Keros Therapeutics, Inc.(1) | 176 | 6,602 | ||||||
Kezar Life Sciences, Inc.(1) | 10,354 | 53,634 | ||||||
Kindred Biosciences, Inc.(1) | 2,580 | 11,584 | ||||||
Kiniksa Pharmaceuticals Ltd. - Class A(1) | 613 | 15,619 | ||||||
Laboratory Corp. of America Holdings(1) | 103,573 | 17,204,511 | ||||||
Lannett Co., Inc.(1) | 69,768 | 506,516 | ||||||
LeMaitre Vascular, Inc. | 1,431 | 37,778 | ||||||
LivaNova Plc(1) | 5,794 | 278,865 |
MacroGenics, Inc.(1) | 12,513 | 349,363 | ||||||
Magellan Health, Inc.(1) | 5,079 | 370,665 | ||||||
Magenta Therapeutics, Inc.(1) | 1,191 | 8,944 | ||||||
Mallinckrodt Plc(1) | 168,148 | 450,637 | ||||||
Marker Therapeutics, Inc.(1) | 3,310 | 6,852 | ||||||
McKesson Corp. | 81,881 | 12,562,183 | ||||||
MEDNAX, Inc.(1) | 33,745 | 577,039 | ||||||
MEI Pharma, Inc.(1) | 6,543 | 27,023 | ||||||
MeiraGTx Holdings Plc(1) | 695 | 8,701 | ||||||
Menlo Therapeutics, Inc.(1) | 37,237 | 64,420 | ||||||
Meridian Bioscience, Inc.(1) | 2,074 | 48,303 | ||||||
Mettler-Toledo International, Inc.(1) | 47 | 37,861 | ||||||
Milestone Scientific, Inc.(1) | 2,805 | 5,470 | ||||||
Mirum Pharmaceuticals, Inc.(1) | 1,721 | 33,491 | ||||||
Misonix, Inc.(1) | 3,173 | 43,058 | ||||||
Molina Healthcare, Inc.(1) | 34,335 | 6,110,943 | ||||||
Momenta Pharmaceuticals, Inc.(1) | 3,112 | 103,536 | ||||||
Mylan NV(1) | 17,200 | 276,576 | ||||||
MyoKardia, Inc.(1) | 2,504 | 241,936 | ||||||
Myriad Genetics, Inc.(1) | 28,617 | 324,517 | ||||||
NanoString Technologies, Inc.(1) | 1,870 | 54,884 | ||||||
NantKwest, Inc.(1) | 1,642 | 20,164 | ||||||
Natera, Inc.(1) | 1,565 | 78,031 | ||||||
National HealthCare Corp. | 4,865 | 308,636 | ||||||
Natus Medical, Inc.(1) | 9,178 | 200,264 | ||||||
Nektar Therapeutics - Class A(1) | 5,773 | 133,703 | ||||||
NextCure, Inc.(1) | 220 | 4,717 | ||||||
NextGen Healthcare, Inc.(1) | 22,484 | 246,874 | ||||||
NGM Biopharmaceuticals, Inc.(1) | 708 | 13,976 | ||||||
Novavax, Inc.(1) | 16,985 | 1,415,700 | ||||||
Nymox Pharmaceutical Corp.(1) | 1,959 | 6,954 | ||||||
OPKO Health, Inc.(1) | 159,698 | 544,570 | ||||||
Option Care Health, Inc.(1) | 741 | 10,285 | ||||||
OraSure Technologies, Inc.(1) | 9,116 | 106,019 | ||||||
Orgenesis, Inc.(1) | 5,221 | 31,744 | ||||||
ORIC Pharmaceuticals, Inc.(1) | 220 | 7,421 | ||||||
Orthofix Medical, Inc.(1) | 7,516 | 240,512 | ||||||
Osmotica Pharmaceuticals Plc(1) | 1,486 | 10,001 | ||||||
Owens & Minor, Inc. | 25,015 | 190,614 | ||||||
Pacific Biosciences of California, Inc.(1) | 7,516 | 25,930 | ||||||
Passage Bio, Inc.(1) | 2,059 | 56,272 | ||||||
Patterson Cos, Inc. | 34,146 | 751,212 | ||||||
PDL BioPharma, Inc.(1) | 43,320 | 126,061 | ||||||
PerkinElmer, Inc. | 2,997 | 293,976 | ||||||
Perrigo Co. Plc | 4,560 | 252,031 | ||||||
Phibro Animal Health Corp. - Class A | 430 | 11,296 | ||||||
PPD, Inc.(1) | 172,825 | 4,631,710 | ||||||
PRA Health Sciences, Inc.(1) | 316 | 30,744 | ||||||
Precigen, Inc.(1) | 6,277 | 31,322 | ||||||
Precision BioSciences, Inc.(1) | 1,166 | 9,713 | ||||||
Premier, Inc. - Class A(1) | 252,769 | 8,664,921 | ||||||
Prestige Consumer Healthcare, Inc.(1) | 232,544 | 8,734,353 | ||||||
Principia Biopharma, Inc.(1) | 939 | 56,143 | ||||||
Prothena Corp. Plc(1) | 11,847 | 123,920 | ||||||
QIAGEN NV(1) | 7,502 | 321,161 | ||||||
Quest Diagnostics, Inc. | 4,463 | 508,603 | ||||||
Reata Pharmaceuticals, Inc. - Class A(1) | 83 | 12,950 | ||||||
Revance Therapeutics, Inc.(1) | 5,428 | 132,552 | ||||||
Rockwell Medical, Inc.(1) | 5,129 | 10,002 | ||||||
RTI Surgical Holdings, Inc.(1) | 22,550 | 71,709 | ||||||
Rubius Therapeutics, Inc.(1) | 11,732 | 70,157 | ||||||
Sage Therapeutics, Inc.(1) | 1,576 | 65,530 | ||||||
Savara, Inc.(1) | 18,647 | 46,431 | ||||||
SeaSpine Holdings Corp.(1) | 10,318 | 108,029 | ||||||
Selecta Biosciences, Inc.(1) | 13,560 | 38,510 | ||||||
Sientra, Inc.(1) | 4,179 | 16,173 | ||||||
Soleno Therapeutics, Inc.(1) | 3,719 | 8,256 | ||||||
Solid Biosciences, Inc.(1) | 10,100 | 29,593 |
Spectrum Pharmaceuticals, Inc.(1) | 45,344 | 153,263 | ||||||
Spero Therapeutics, Inc.(1) | 530 | 7,171 | ||||||
STERIS Plc | 2,659 | 407,997 | ||||||
Strongbridge Biopharma Plc(1) | 1,411 | 5,334 | ||||||
Supernus Pharmaceuticals, Inc.(1) | 15,246 | 362,092 | ||||||
Sutro Biopharma, Inc.(1) | 996 | 7,729 | ||||||
Syneos Health, Inc. - Class A(1) | 1,862 | 108,461 | ||||||
Tandem Diabetes Care, Inc.(1) | 214 | 21,169 | ||||||
TCR2 Therapeutics, Inc.(1) | 6,100 | 93,696 | ||||||
Teladoc Health, Inc.(1) | 237 | 45,229 | ||||||
Teleflex, Inc. | 576 | 209,652 | ||||||
Tenet Healthcare Corp.(1) | 37,650 | 681,841 | ||||||
TG Therapeutics, Inc.(1) | 5,391 | 105,017 | ||||||
The Cooper Companies, Inc. | 49,082 | 13,921,618 | ||||||
TherapeuticsMD, Inc.(1) | 13,730 | 17,163 | ||||||
Theravance Biopharma, Inc.(1) | 2,246 | 47,144 | ||||||
Tivity Health, Inc.(1) | 8,974 | 101,675 | ||||||
Triple-S Management Corp. - Class B(1) | 8,720 | 165,854 | ||||||
Turning Point Therapeutics, Inc.(1) | 641 | 41,402 | ||||||
United Therapeutics Corp.(1) | 23,952 | 2,898,192 | ||||||
Universal Health Services, Inc. - Class B | 123,438 | 11,466,156 | ||||||
UroGen Pharma Ltd.(1) | 2,991 | 78,125 | ||||||
Utah Medical Products, Inc. | 301 | 26,675 | ||||||
Vanda Pharmaceuticals, Inc.(1) | 21,645 | 247,619 | ||||||
Varex Imaging Corp.(1) | 15,045 | 227,932 | ||||||
Varian Medical Systems, Inc.(1) | 2,646 | 324,188 | ||||||
Vaxart, Inc.(1) | 2,530 | 22,391 | ||||||
VBI Vaccines, Inc.(1) | 13,670 | 42,377 | ||||||
Venus Concept, Inc.(1) | 3,048 | 10,638 | ||||||
Verastem, Inc.(1) | 41,750 | 71,810 | ||||||
Vericel Corp.(1) | 2,011 | 27,792 | ||||||
ViewRay, Inc.(1) | 27,722 | 62,097 | ||||||
Viking Therapeutics, Inc.(1) | 23,828 | 171,800 | ||||||
Waters Corp.(1) | 1,891 | 341,136 | ||||||
X4 Pharmaceuticals, Inc.(1) | 6,204 | 57,821 | ||||||
XBiotech, Inc.(1) | 5,432 | 74,473 | ||||||
Xencor, Inc.(1) | 1,135 | 36,763 | ||||||
Xeris Pharmaceuticals, Inc.(1) | 1,737 | 4,620 | ||||||
XOMA Corp.(1) | 387 | 7,647 | ||||||
Zentalis Pharmaceuticals, Inc.(1) | 261 | 12,533 | ||||||
Zimmer Biomet Holdings, Inc. | 102,157 | 12,193,460 | ||||||
ZIOPHARM Oncology, Inc.(1) | 27,852 | 91,355 | ||||||
|
| |||||||
Total Healthcare |
| 371,542,254 | ||||||
|
| |||||||
Industrials – 17.93% | ||||||||
AAR Corp. | 13,850 | 286,279 | ||||||
ABM Industries, Inc. | 292,017 | 10,600,217 | ||||||
Acacia Research Corp.(1) | 2,169 | 8,871 | ||||||
ACCO Brands Corp. | 36,718 | 260,698 | ||||||
Acuity Brands, Inc. | 19,305 | 1,848,261 | ||||||
ADT, Inc. | 3,747 | 29,901 | ||||||
Advanced Disposal Services, Inc.(1) | 1,938 | 58,469 | ||||||
AECOM(1) | 5,097 | 191,545 | ||||||
Aegion Corp. - Class A(1) | 11,770 | 186,790 | ||||||
AGCO Corp. | 193,040 | 10,705,998 | ||||||
Air Lease Corp. - Class A | 220,216 | 6,450,127 | ||||||
Alamo Group, Inc. | 721 | 74,003 | ||||||
Alaska Air Group, Inc. | 226,868 | 8,226,234 | ||||||
Albany International Corp. - Class A | 2,230 | 130,923 | ||||||
Allegiant Travel Co. - Class A | 4,696 | 512,850 | ||||||
Allegion Plc | 83,548 | 8,540,277 | ||||||
Allied Motion Technologies, Inc. | 229 | 8,084 | ||||||
Allison Transmission Holdings, Inc. | 110,917 | 4,079,527 | ||||||
Alta Equipment Group, Inc.(1) | 6,722 | 52,230 | ||||||
Altra Industrial Motion Corp. | 545,998 | 17,395,496 | ||||||
AMERCO | 298 | 90,053 | ||||||
American Airlines Group, Inc. | 128,561 | 1,680,292 | ||||||
American Superconductor Corp.(1) | 8,767 | 71,276 | ||||||
American Woodmark Corp.(1) | 6,916 | 523,195 | ||||||
AMETEK, Inc. | 380,889 | 34,040,050 | ||||||
AO Smith Corp. | 4,429 | 208,694 | ||||||
API Group Corp.(1)(2) | 56,338 | 684,507 | ||||||
Apogee Enterprises, Inc. | 9,469 | 218,166 | ||||||
Applied Industrial Technologies, Inc. | 9,600 | 598,944 | ||||||
ArcBest Corp. | 9,984 | 264,676 | ||||||
Arcosa, Inc. | 215,445 | 9,091,779 | ||||||
Argan, Inc. | 5,993 | 283,948 | ||||||
Armstrong World Industries, Inc. | 996 | 77,648 | ||||||
ASGN, Inc.(1) | 41,436 | 2,762,952 | ||||||
Astec Industries, Inc. | 9,120 | 422,347 | ||||||
Astronics Corp.(1) | 9,338 | 98,609 | ||||||
Atlas Air Worldwide Holdings, Inc.(1) | 71,524 | 3,077,678 | ||||||
AZZ, Inc. | 10,677 | 366,435 | ||||||
Barnes Group, Inc. | 19,197 | 759,433 | ||||||
Barrett Business Services, Inc. | 2,831 | 150,411 | ||||||
Beacon Roofing Supply, Inc.(1) | 22,118 | 583,252 | ||||||
BG Staffing, Inc. | 4,200 | 47,544 | ||||||
Bloom Energy Corp. - Class A(1) | 2,004 | 21,804 | ||||||
Blue Bird Corp.(1) | 3,839 | 57,547 | ||||||
BMC Stock Holdings, Inc.(1) | 598,808 | 15,054,033 | ||||||
Brady Corp. - Class A | 4,714 | 220,709 | ||||||
BrightView Holdings, Inc.(1) | 340,577 | 3,814,462 | ||||||
Brink’s Co. | 337,691 | 15,368,317 | ||||||
Builders FirstSource, Inc.(1) | 4,425 | 91,597 | ||||||
BWX Technologies, Inc. | 1,136 | 64,343 | ||||||
Caesarstone Ltd. | 8,784 | 104,090 | ||||||
CAI International, Inc.(1) | 5,019 | 83,617 | ||||||
Carlisle Companies, Inc. | 1,796 | 214,927 | ||||||
Carrier Global Corp. | 18,543 | 412,025 | ||||||
Casella Waste Systems, Inc. - Class A(1) | 332,548 | 17,332,402 | ||||||
CBIZ, Inc.(1) | 392,697 | 9,412,947 | ||||||
CECO Environmental Corp.(1) | 13,099 | 86,322 | ||||||
CH Robinson Worldwide, Inc. | 3,721 | 294,182 | ||||||
Chart Industries, Inc.(1) | 14,519 | 704,026 | ||||||
Cimpress Plc(1) | 4,797 | 366,203 | ||||||
Cintas Corp. | 335 | 89,231 | ||||||
CIRCOR International, Inc.(1) | 7,953 | 202,642 | ||||||
Clean Harbors, Inc.(1) | 1,721 | 103,226 | ||||||
Colfax Corp.(1) | 396,242 | 11,055,152 | ||||||
Columbus McKinnon Corp. | 9,468 | 316,705 | ||||||
Comfort Systems USA, Inc. | 10,402 | 423,881 | ||||||
CompX International, Inc. | 512 | 7,076 | ||||||
Concrete Pumping Holdings, Inc.(1) | 11,399 | 39,669 | ||||||
Construction Partners, Inc. - Class A(1) | 312,077 | 5,542,488 | ||||||
Copa Holdings SA - Class A | 1,057 | 53,442 | ||||||
CoreLogic, Inc. | 2,507 | 168,521 | ||||||
Cornerstone Building Brands, Inc.(1) | 10,126 | 61,364 | ||||||
Costamare, Inc. | 22,164 | 123,232 | ||||||
Covanta Holding Corp. | 29,646 | 284,305 | ||||||
Covenant Transportation Group, Inc. - Class A(1) | 5,368 | 77,460 | ||||||
CRA International, Inc. | 708 | 27,966 | ||||||
Crane Co. | 336,105 | 19,984,803 | ||||||
Cubic Corp. | 11,406 | 547,830 | ||||||
Cummins, Inc. | 121,464 | 21,044,853 | ||||||
Curtiss-Wright Corp. | 62,464 | 5,576,786 | ||||||
Delta Air Lines, Inc. | 21,254 | 596,175 | ||||||
Deluxe Corp. | 76,790 | 1,807,637 | ||||||
Donaldson Co., Inc. | 3,775 | 175,613 | ||||||
Douglas Dynamics, Inc. | 832 | 29,220 | ||||||
Dover Corp. | 169,193 | 16,337,276 | ||||||
Ducommun, Inc.(1) | 4,253 | 148,302 | ||||||
DXP Enterprises, Inc.(1) | 7,289 | 145,124 | ||||||
Dycom Industries, Inc.(1) | 3,435 | 140,457 | ||||||
Eagle Bulk Shipping, Inc.(1) | 19,150 | 41,939 | ||||||
Eastern Co. | 1,903 | 34,007 | ||||||
Eaton Corp. Plc | 155,452 | 13,598,941 | ||||||
Echo Global Logistics, Inc.(1) | 10,310 | 222,902 |
EMCOR Group, Inc. | 20,116 | 1,330,472 | ||||||
Encore Wire Corp. | 7,795 | 380,552 | ||||||
Enerpac Tool Group Corp. - Class A | 235,148 | 4,138,605 | ||||||
EnerSys | 71,323 | 4,591,775 | ||||||
Ennis, Inc. | 10,733 | 194,697 | ||||||
EnPro Industries, Inc. | 8,621 | 424,929 | ||||||
Equifax, Inc. | 1,040 | 178,755 | ||||||
ESCO Technologies, Inc. | 208,553 | 17,628,985 | ||||||
ExOne Co.(1) | 1,193 | 10,200 | ||||||
Expeditors International of Washington, Inc. | 65,880 | 5,009,515 | ||||||
Fastenal Co. | 3,605 | 154,438 | ||||||
Federal Signal Corp. | 1,757 | 52,236 | ||||||
Flowserve Corp. | 4,325 | 123,349 | ||||||
Fluor Corp. | 12,921 | 156,086 | ||||||
Fortive Corp. | 9,916 | 670,917 | ||||||
Fortune Brands Home & Security, Inc. | 4,589 | 293,375 | ||||||
Forward Air Corp. | 213,245 | 10,623,866 | ||||||
Foundation Building Materials, Inc.(1) | 6,766 | 105,617 | ||||||
Franklin Electric Co., Inc. | 1,358 | 71,322 | ||||||
FTI Consulting, Inc.(1) | 10,992 | 1,259,134 | ||||||
FuelCell Energy, Inc.(1) | 27,923 | 63,106 | ||||||
Gates Industrial Corp. Plc(1) | 1,625 | 16,705 | ||||||
GATX Corp. | 13,882 | 846,524 | ||||||
Genco Shipping & Trading Ltd. | 6,753 | 42,409 | ||||||
Gencor Industries, Inc.(1) | 2,487 | 31,436 | ||||||
Generac Holdings, Inc.(1) | 179 | 21,825 | ||||||
General Finance Corp.(1) | 3,608 | 24,210 | ||||||
Gibraltar Industries, Inc.(1) | 313,481 | 15,050,223 | ||||||
GMS, Inc.(1) | 218,237 | 5,366,448 | ||||||
Gorman-Rupp Co. | 5,842 | 181,569 | ||||||
GP Strategies Corp.(1) | 5,963 | 51,163 | ||||||
Graco, Inc. | 2,743 | 131,637 | ||||||
GrafTech International Ltd. | 2,433 | 19,415 | ||||||
Graham Corp. | 4,297 | 54,744 | ||||||
Granite Construction, Inc. | 17,161 | 328,462 | ||||||
Great Lakes Dredge & Dock Corp.(1) | 25,810 | 239,001 | ||||||
Greenbrier Cos, Inc. | 13,016 | 296,114 | ||||||
Griffon Corp. | 14,384 | 266,392 | ||||||
H&E Equipment Services, Inc. | 13,196 | 243,862 | ||||||
Harsco Corp.(1) | 31,783 | 429,388 | ||||||
Hawaiian Holdings, Inc. | 19,326 | 271,337 | ||||||
HD Supply Holdings, Inc.(1) | 572,250 | 19,828,462 | ||||||
Heartland Express, Inc. | 17,388 | 362,018 | ||||||
HEICO Corp. | 292 | 29,098 | ||||||
HEICO Corp. - Class A | 504 | 40,945 | ||||||
Heidrick & Struggles International, Inc. | 7,928 | 171,403 | ||||||
Helios Technologies, Inc. | 6,627 | 246,856 | ||||||
Herc Holdings, Inc.(1) | 9,512 | 292,304 | ||||||
Heritage-Crystal Clean, Inc.(1) | 5,966 | 104,166 | ||||||
Herman Miller, Inc. | 109,238 | 2,579,109 | ||||||
Hertz Global Holdings, Inc.(1) | 34,851 | 49,140 | ||||||
Hexcel Corp. | 125,634 | 5,681,169 | ||||||
Hillenbrand, Inc. | 30,245 | 818,732 | ||||||
HNI Corp. | 17,574 | 537,237 | ||||||
Howmet Aerospace, Inc. | 402,037 | 6,372,286 | ||||||
Hub Group, Inc. - Class A(1) | 108,445 | 5,190,178 | ||||||
Hubbell, Inc. - Class B | 127,551 | 15,989,793 | ||||||
Huntington Ingalls Industries, Inc. | 86,611 | 15,112,753 | ||||||
Hurco Cos, Inc. | 2,234 | 62,485 | ||||||
Huron Consulting Group, Inc.(1) | 8,251 | 365,107 | ||||||
Hyster-Yale Materials Handling, Inc. | 3,990 | 154,253 | ||||||
IAA, Inc.(1) | 3,407 | 131,408 | ||||||
ICF International, Inc. | 198,684 | 12,880,684 | ||||||
IDEX Corp. | 2,509 | 396,522 | ||||||
IES Holdings, Inc.(1) | 1,813 | 42,007 | ||||||
IHS Markit Ltd. | 6,023 | 454,737 | ||||||
Ingersoll Rand, Inc.(1) | 11,546 | 324,674 | ||||||
Insperity, Inc. | 7,354 | 476,024 |
Insteel Industries, Inc. | 7,208 | 137,457 | ||||||
Interface, Inc. - Class A | 18,969 | 154,408 | ||||||
ITT, Inc. | 217,556 | 12,779,239 | ||||||
Jacobs Engineering Group, Inc. | 4,180 | 354,464 | ||||||
JB Hunt Transport Services, Inc. | 2,043 | 245,855 | ||||||
JELD-WEN Holding, Inc.(1) | 27,652 | 445,474 | ||||||
JetBlue Airways Corp.(1) | 253,654 | 2,764,829 | ||||||
Johnson Controls International Plc | 24,825 | 847,526 | ||||||
Kaman Corp. | 10,306 | 428,730 | ||||||
Kansas City Southern | 101,768 | 15,192,945 | ||||||
KAR Auction Services, Inc. | 140,508 | 1,933,390 | ||||||
Kelly Services, Inc. - Class A | 14,229 | 225,032 | ||||||
Kennametal, Inc. | 290,626 | 8,343,872 | ||||||
Kimball International, Inc. - Class B | 15,221 | 175,955 | ||||||
Kirby Corp.(1) | 188,007 | 10,069,655 | ||||||
Knight-Swift Transportation Holdings, Inc. - Class A | 4,170 | 173,931 | ||||||
Knoll, Inc. | 501,536 | 6,113,724 | ||||||
Korn Ferry | 22,321 | 685,924 | ||||||
L3Harris Technologies, Inc. | 78,078 | 13,247,494 | ||||||
Landstar System, Inc. | 237 | 26,617 | ||||||
Lawson Products, Inc.(1) | 614 | 19,808 | ||||||
LB Foster Co. - Class A(1) | 4,275 | 54,592 | ||||||
Lennox International, Inc. | 1,151 | 268,171 | ||||||
Lincoln Electric Holdings, Inc. | 1,087 | 91,569 | ||||||
LSI Industries, Inc. | 9,977 | 64,551 | ||||||
Luxfer Holdings Plc | 10,575 | 149,636 | ||||||
Lydall, Inc.(1) | 6,737 | 91,354 | ||||||
Lyft, Inc. - Class A(1) | 7,939 | 262,066 | ||||||
Macquarie Infrastructure Corp. | 2,447 | 75,098 | ||||||
Manitowoc Co., Inc.(1) | 13,622 | 148,207 | ||||||
ManpowerGroup, Inc. | 115,275 | 7,925,156 | ||||||
Marten Transport Ltd. | 7,660 | 192,726 | ||||||
Masco Corp. | 183,110 | 9,193,953 | ||||||
MasTec, Inc.(1) | 162,564 | 7,294,247 | ||||||
Matson, Inc. | 17,237 | 501,597 | ||||||
Matthews International Corp. - Class A | 12,318 | 235,274 | ||||||
Maxar Technologies, Inc. | 24,316 | 436,715 | ||||||
Mayville Engineering Co., Inc.(1) | 2,694 | 21,283 | ||||||
McGrath RentCorp | 4,051 | 218,795 | ||||||
Mercury Systems, Inc.(1) | 337 | 26,508 | ||||||
Meritor, Inc.(1) | 6,087 | 120,523 | ||||||
Mesa Air Group, Inc.(1) | 11,784 | 40,537 | ||||||
Middleby Corp.(1) | 1,835 | 144,855 | ||||||
Miller Industries, Inc. | 4,057 | 120,777 | ||||||
Mistras Group, Inc.(1) | 7,037 | 27,796 | ||||||
Mobile Mini, Inc. | 13,531 | 399,164 | ||||||
Moog, Inc. - Class A | 63,411 | 3,359,515 | ||||||
MRC Global, Inc.(1) | 32,212 | 190,373 | ||||||
MSA Safety, Inc. | 942 | 107,802 | ||||||
MSC Industrial Direct Co., Inc. - Class A | 1,493 | 108,705 | ||||||
Mueller Industries, Inc. | 22,690 | 603,100 | ||||||
Mueller Water Products, Inc. - Class A | 60,172 | 567,422 | ||||||
MYR Group, Inc.(1) | 2,327 | 74,255 | ||||||
National Presto Industries, Inc. | 1,910 | 166,915 | ||||||
Navistar International Corp.(1) | 20,056 | 565,579 | ||||||
Nesco Holdings, Inc.(1) | 5,304 | 21,322 | ||||||
Nielsen Holdings Plc | 11,875 | 176,463 | ||||||
NL Industries, Inc. | 2,716 | 9,262 | ||||||
NN, Inc. | 17,327 | 82,130 | ||||||
Nordson Corp. | 350 | 66,398 | ||||||
Northwest Pipe Co.(1) | 3,530 | 88,497 | ||||||
NOW, Inc.(1) | 286,318 | 2,470,924 | ||||||
NV5 Global, Inc.(1) | 300 | 15,249 | ||||||
nVent Electric Plc | 907,416 | 16,995,902 | ||||||
Old Dominion Freight Line, Inc. | 455 | 77,163 | ||||||
Oshkosh Corp. | 393,928 | 28,213,123 | ||||||
Otis Worldwide Corp. | 303,804 | 17,274,295 | ||||||
Owens Corning | 338,143 | 18,854,854 |
PACCAR, Inc. | 98,644 | 7,383,503 | ||||||
PAE, Inc.(1) | 1,214,025 | 11,606,079 | ||||||
PAM Transportation Services, Inc.(1) | 580 | 17,835 | ||||||
Pangaea Logistics Solutions Ltd. | 4,391 | 11,021 | ||||||
Park Aerospace Corp. | 7,541 | 84,007 | ||||||
Parker-Hannifin Corp. | 116,605 | 21,370,198 | ||||||
Park-Ohio Holdings Corp. | 3,782 | 62,743 | ||||||
Parsons Corp.(1) | 2,549 | 92,376 | ||||||
Patrick Industries, Inc. | 524 | 32,095 | ||||||
Pentair Plc | 5,513 | 209,439 | ||||||
PGT Innovations, Inc.(1) | 14,183 | 222,389 | ||||||
PICO Holdings, Inc.(1) | 4,448 | 37,497 | ||||||
Pitney Bowes, Inc. | 159,986 | 415,964 | ||||||
Powell Industries, Inc. | 4,017 | 110,026 | ||||||
Preformed Line Products Co. | 1,221 | 61,062 | ||||||
Primoris Services Corp. | 8,495 | 150,871 | ||||||
Quad/Graphics, Inc. | 15,128 | 49,166 | ||||||
Quanex Building Products Corp. | 13,239 | 183,757 | ||||||
Quanta Services, Inc. | 320,314 | 12,565,918 | ||||||
Radiant Logistics, Inc.(1) | 15,622 | 61,394 | ||||||
Raven Industries, Inc. | 12,980 | 279,200 | ||||||
Regal Beloit Corp. | 158,497 | 13,839,958 | ||||||
Republic Services, Inc. - Class A | 7,012 | 575,335 | ||||||
Resideo Technologies, Inc.(1) | 50,012 | 586,141 | ||||||
Resources Connection, Inc. | 12,060 | 144,358 | ||||||
REV Group, Inc. | 10,887 | 66,411 | ||||||
Rexnord Corp. | 39,319 | 1,146,149 | ||||||
Robert Half International, Inc. | 146,536 | 7,741,497 | ||||||
Rockwell Automation, Inc. | 1,985 | 422,805 | ||||||
Rollins, Inc. | 617 | 26,155 | ||||||
Rush Enterprises, Inc. - Class A | 10,722 | 444,534 | ||||||
Rush Enterprises, Inc. - Class B | 2,110 | 75,243 | ||||||
Ryder System, Inc. | 1,744 | 65,417 | ||||||
Safe Bulkers, Inc.(1) | 18,803 | 22,940 | ||||||
Schneider National, Inc. - Class B | 483,476 | 11,927,353 | ||||||
Scorpio Bulkers, Inc. | 2,313 | 35,389 | ||||||
Sensata Technologies Holding Plc(1) | 278,261 | 10,359,657 | ||||||
SkyWest, Inc. | 20,001 | 652,433 | ||||||
Snap-on, Inc. | 1,797 | 248,902 | ||||||
Southwest Airlines Co. | 338,820 | 11,580,868 | ||||||
SP Plus Corp.(1) | 9,609 | 199,002 | ||||||
Spirit AeroSystems Holdings, Inc. - Class A | 159,517 | 3,818,837 | ||||||
Spirit Airlines, Inc.(1) | 34,914 | 621,469 | ||||||
SPX Corp.(1) | 4,377 | 180,114 | ||||||
SPX FLOW, Inc.(1) | 17,211 | 644,380 | ||||||
Standex International Corp. | 158,924 | 9,146,076 | ||||||
Stanley Black & Decker, Inc. | 5,143 | 716,831 | ||||||
Steelcase, Inc. - Class A | 214,324 | 2,584,747 | ||||||
Stericycle, Inc.(1) | 132,837 | 7,436,215 | ||||||
Sterling Construction Co., Inc.(1) | 9,575 | 100,250 | ||||||
Systemax, Inc. | 1,884 | 38,697 | ||||||
Team, Inc.(1) | 12,129 | 67,559 | ||||||
Teledyne Technologies, Inc.(1) | 1,209 | 375,939 | ||||||
Terex Corp. | 143,877 | 2,700,571 | ||||||
Textainer Group Holdings Ltd.(1) | 507,201 | 4,148,904 | ||||||
Textron, Inc. | 384,414 | 12,651,065 | ||||||
Thermon Group Holdings, Inc.(1) | 13,343 | 194,408 | ||||||
Timken Co. | 441,502 | 20,083,926 | ||||||
Titan Machinery, Inc.(1) | 8,261 | 89,714 | ||||||
Toro Co. | 350 | 23,219 | ||||||
Trane Technologies Plc | 73,089 | 6,503,459 | ||||||
TransDigm Group, Inc. | 1,354 | 598,536 | ||||||
TransUnion | 563 | 49,004 | ||||||
TriMas Corp.(1) | 328,066 | 7,857,181 | ||||||
Trinity Industries, Inc. | 140,031 | 2,981,260 | ||||||
Triton International Ltd. | 20,568 | 621,976 | ||||||
Triumph Group, Inc. | 11,037 | 99,443 | ||||||
TrueBlue, Inc.(1) | 14,486 | 221,201 |
Tutor Perini Corp.(1) | 16,216 | 197,511 | ||||||
UFP Industries, Inc. | 4,000 | 198,040 | ||||||
Ultralife Corp.(1) | 2,811 | 19,705 | ||||||
UniFirst Corp. | 5,676 | 1,015,720 | ||||||
United Continental Holdings, Inc.(1) | 108,475 | 3,754,320 | ||||||
United Rentals, Inc.(1) | 39,200 | 5,842,368 | ||||||
Univar, Inc.(1) | 628,537 | 10,597,134 | ||||||
Universal Logistics Holdings, Inc. | 1,704 | 29,616 | ||||||
US Ecology, Inc. | 420,291 | 14,239,459 | ||||||
US Xpress Enterprises, Inc. - Class A(1) | 9,139 | 54,834 | ||||||
Valmont Industries, Inc. | 699 | 79,420 | ||||||
Vectrus, Inc.(1) | 2,717 | 133,486 | ||||||
Veritiv Corp.(1) | 5,127 | 86,954 | ||||||
Viad Corp. | 8,711 | 165,683 | ||||||
Virgin Galactic Holdings, Inc.(1) | 276 | 4,510 | ||||||
VSE Corp. | 3,681 | 115,547 | ||||||
Wabash National Corp. | 89,820 | 953,888 | ||||||
Wabtec Corp. | 6,026 | 346,917 | ||||||
Watsco, Inc. | 1,087 | 193,160 | ||||||
Watts Water Technologies, Inc. - Class A | 6,206 | 502,686 | ||||||
Welbilt, Inc.(1) | 38,783 | 236,188 | ||||||
Werner Enterprises, Inc. | 2,845 | 123,843 | ||||||
WESCO International, Inc.(1) | 327,641 | 11,503,476 | ||||||
Willdan Group, Inc.(1) | 997 | 24,935 | ||||||
Willis Lease Finance Corp.(1) | 1,273 | 30,908 | ||||||
WillScot Corp. - Class A(1) | 1,347,517 | 16,560,984 | ||||||
Woodward, Inc. | 77,891 | 6,040,447 | ||||||
WW Grainger, Inc. | 394 | 123,779 | ||||||
XPO Logistics, Inc.(1) | 2,873 | 221,939 | ||||||
Xylem, Inc. | 5,954 | 386,772 | ||||||
|
| |||||||
Total Industrials |
| 914,595,816 | ||||||
|
| |||||||
Information Technology – 12.24% | ||||||||
2U, Inc.(1) | 1,377 | 52,271 | ||||||
3D Systems Corp.(1) | 46,782 | 327,006 | ||||||
8x8, Inc.(1) | 411,366 | 6,581,856 | ||||||
ACI Worldwide, Inc.(1) | 432,992 | 11,686,454 | ||||||
ADTRAN, Inc. | 18,827 | 205,779 | ||||||
Akamai Technologies, Inc.(1) | 939 | 100,558 | ||||||
Alliance Data Systems Corp. | 52,371 | 2,362,980 | ||||||
Alpha & Omega Semiconductor Ltd.(1) | 7,772 | 84,559 | ||||||
Ambarella, Inc.(1) | 9,255 | 423,879 | ||||||
Amdocs Ltd. | 157,807 | 9,607,290 | ||||||
Amkor Technology, Inc.(1) | 364,237 | 4,483,757 | ||||||
Amphenol Corp. - Class A | 3,910 | 374,617 | ||||||
Analog Devices, Inc. | 72,475 | 8,888,334 | ||||||
Applied Optoelectronics, Inc.(1) | 7,667 | 83,340 | ||||||
Arista Networks, Inc.(1) | 349 | 73,300 | ||||||
Arlo Technologies, Inc.(1) | 34,293 | 88,476 | ||||||
Arrow Electronics, Inc.(1) | 111,172 | 7,636,405 | ||||||
Aspen Technology, Inc.(1) | 154 | 15,956 | ||||||
Asure Software, Inc.(1) | 3,839 | 24,685 | ||||||
Avnet, Inc. | 102,329 | 2,853,444 | ||||||
Axcelis Technologies, Inc.(1) | 992 | 27,627 | ||||||
AXT, Inc.(1) | 14,980 | 71,305 | ||||||
Bel Fuse, Inc. - Class B | 3,815 | 40,935 | ||||||
Belden, Inc. | 17,931 | 583,654 | ||||||
Benchmark Electronics, Inc. | 14,888 | 321,581 | ||||||
Booz Allen Hamilton Holding Corp. - Class A | 85,800 | 6,674,382 | ||||||
Brooks Automation, Inc. | 505,228 | 22,351,287 | ||||||
CACI International, Inc. - Class A(1) | 109,740 | 23,800,411 | ||||||
CalAmp Corp.(1) | 4,970 | 39,810 | ||||||
Cardtronics Plc - Class A(1) | 3,834 | 91,939 | ||||||
CDK Global, Inc. | 3,526 | 146,047 | ||||||
CDW Corp. | 56,650 | 6,581,597 | ||||||
Cerence, Inc.(1) | 265,850 | 10,857,314 | ||||||
Ceridian HCM Holding, Inc.(1) | 1,049 | 83,154 | ||||||
Check Point Software Technologies Ltd.(1) | 160,209 | 17,211,253 | ||||||
Ciena Corp.(1) | 50,501 | 2,735,134 | ||||||
Cirrus Logic, Inc.(1) | 34,043 | 2,103,177 | ||||||
Citrix Systems, Inc. | 2,991 | 442,399 | ||||||
Cloudera, Inc.(1) | 42,269 | 537,662 | ||||||
Cognizant Technology Solutions Corp. - Class A | 124,027 | 7,047,214 | ||||||
Coherent, Inc.(1) | 142 | 18,599 | ||||||
Cohu, Inc. | 15,682 | 271,926 | ||||||
CommScope Holding Co., Inc.(1) | 6,050 | 50,397 | ||||||
Comtech Telecommunications Corp. | 9,534 | 161,029 | ||||||
Conduent, Inc.(1) | 70,481 | 168,450 | ||||||
Corning, Inc. | 186,178 | 4,822,010 | ||||||
Cree, Inc.(1) | 3,606 | 213,439 | ||||||
Crowdstrike Holdings, Inc. - Class A(1) | 1,053 | 105,605 | ||||||
CTS Corp. | 12,713 | 254,769 | ||||||
Daktronics, Inc. | 16,034 | 69,748 | ||||||
DASAN Zhone Solutions, Inc.(1) | 4,880 | 43,578 | ||||||
Diebold Nixdorf, Inc.(1) | 16,700 | 101,202 | ||||||
Digi International, Inc.(1) | 11,820 | 137,703 | ||||||
Digimarc Corp.(1) | 583 | 9,322 | ||||||
Diodes, Inc.(1) | 76,589 | 3,883,062 | ||||||
Dolby Laboratories, Inc. - Class A | 1,857 | 122,321 | ||||||
DSP Group, Inc.(1) | 48 | 762 | ||||||
DXC Technology Co. | 123,052 | 2,030,358 | ||||||
Eastman Kodak Co.(1) | 6,836 | 15,244 | ||||||
Ebix, Inc. | 5,354 | 119,715 | ||||||
EchoStar Corp. - Class A(1) | 1,610 | 45,016 | ||||||
eGain Corp.(1) | 4,825 | 53,606 | ||||||
Entegris, Inc. | 252,353 | 14,901,445 | ||||||
ePlus, Inc.(1) | 809 | 57,180 | ||||||
Euronet Worldwide, Inc.(1) | 1,672 | 160,211 | ||||||
EVERTEC, Inc. | 196,731 | 5,528,141 | ||||||
F5 Networks, Inc.(1) | 22,831 | 3,184,468 | ||||||
FARO Technologies, Inc.(1) | 434 | 23,262 | ||||||
Fidelity National Information Services, Inc. | 132,450 | 17,760,221 | ||||||
FireEye, Inc.(1) | 5,581 | 67,949 | ||||||
First Solar, Inc.(1) | 2,768 | 137,016 | ||||||
Fiserv, Inc.(1) | 178,275 | 17,403,206 | ||||||
Fitbit, Inc. - Class A(1) | 31,801 | 205,434 | ||||||
Flex Ltd.(1) | 480,978 | 4,930,025 | ||||||
FLIR Systems, Inc. | 4,348 | 176,398 | ||||||
Genpact Ltd. | 3,812 | 139,214 | ||||||
Global Payments, Inc. | 100,465 | 17,040,873 | ||||||
GSI Technology, Inc.(1) | 5,783 | 41,522 | ||||||
GTY Technology Holdings, Inc.(1) | 17,581 | 73,225 | ||||||
Guidewire Software, Inc.(1) | 2,237 | 247,971 | ||||||
Hackett Group, Inc. | 1,362 | 18,442 | ||||||
Harmonic, Inc.(1) | 38,264 | 181,754 | ||||||
Hewlett Packard Enterprise Co. | 475,745 | 4,628,999 | ||||||
HP, Inc. | 225,714 | 3,934,195 | ||||||
II-VI, Inc.(1) | 4,370 | 206,351 | ||||||
Immersion Corp.(1) | 1,476 | 9,195 | ||||||
Infinera Corp.(1) | 30,355 | 179,702 | ||||||
Information Services Group, Inc.(1) | 12,957 | 26,821 | ||||||
Insight Enterprises, Inc.(1) | 10,102 | 497,018 | ||||||
InterDigital, Inc. | 8,586 | 486,225 | ||||||
Intevac, Inc.(1) | 6,736 | 36,779 | ||||||
IPG Photonics Corp.(1) | 1,106 | 177,391 | ||||||
Jabil, Inc. | 125,874 | 4,038,038 | ||||||
Jack Henry & Associates, Inc. | 552 | 101,585 | ||||||
Juniper Networks, Inc. | 343,569 | 7,853,987 | ||||||
KBR, Inc. | 773,698 | 17,446,890 | ||||||
Keysight Technologies, Inc.(1) | 150,763 | 15,193,895 | ||||||
Kimball Electronics, Inc.(1) | 9,212 | 124,730 | ||||||
KLA-Tencor Corp. | 63,405 | 12,331,004 | ||||||
Knowles Corp.(1) | 35,771 | 545,865 | ||||||
KVH Industries, Inc.(1) | 5,519 | 49,285 | ||||||
Lam Research Corp. | 29,148 | 9,428,212 | ||||||
Leidos Holdings, Inc. | 114,893 | 10,762,027 | ||||||
Littelfuse, Inc. | 34,903 | 5,955,499 |
LiveRamp Holdings, Inc.(1) | 5,204 | 221,014 | ||||||
LogMeIn, Inc. | 1,483 | 125,714 | ||||||
Lumentum Holdings, Inc.(1) | 2,225 | 181,182 | ||||||
Manhattan Associates, Inc.(1) | 228 | 21,478 | ||||||
ManTech International Corp. - Class A | 6,211 | 425,391 | ||||||
Marvell Technology Group Ltd. | 21,983 | 770,724 | ||||||
Maxim Integrated Products, Inc. | 5,916 | 358,569 | ||||||
MAXIMUS, Inc. | 214,925 | 15,141,466 | ||||||
MaxLinear, Inc. - Class A(1) | 11,135 | 238,957 | ||||||
Methode Electronics, Inc. | 652,357 | 20,392,680 | ||||||
Microchip Technology, Inc. | 1,959 | 206,302 | ||||||
MicroStrategy, Inc. - Class A(1) | 1,091 | 129,054 | ||||||
MKS Instruments, Inc. | 453 | 51,298 | ||||||
MoneyGram International, Inc.(1) | 24,651 | 79,130 | ||||||
Motorola Solutions, Inc. | 5,092 | 713,542 | ||||||
MTS Systems Corp. | 7,726 | 135,900 | ||||||
National Instruments Corp. | 4,299 | 166,414 | ||||||
NCR Corp.(1) | 109,813 | 1,901,961 | ||||||
NeoPhotonics Corp.(1) | 5,807 | 51,566 | ||||||
NetApp, Inc. | 68,376 | 3,033,843 | ||||||
NETGEAR, Inc.(1) | 11,723 | 303,508 | ||||||
NetScout Systems, Inc.(1) | 28,247 | 721,993 | ||||||
nLight, Inc.(1) | 176,286 | 3,924,126 | ||||||
Nuance Communications, Inc.(1) | 9,377 | 237,285 | ||||||
NVE Corp. | 340 | 21,022 | ||||||
NXP Semiconductors NV | 156,208 | 17,813,960 | ||||||
ON Semiconductor Corp.(1) | 514,048 | 10,188,431 | ||||||
Onto Innovation, Inc.(1) | 14,357 | 488,712 | ||||||
Park City Group, Inc.(1) | 3,568 | 15,093 | ||||||
Paychex, Inc. | 2,243 | 169,907 | ||||||
PC Connection, Inc. | 4,149 | 192,348 | ||||||
PCTEL, Inc.(1) | 6,756 | 45,130 | ||||||
PDF Solutions, Inc.(1) | 775 | 15,159 | ||||||
Pegasystems, Inc. | 128 | 12,950 | ||||||
Perspecta, Inc. | 9,692 | 225,145 | ||||||
PFSweb, Inc.(1) | 1,466 | 9,793 | ||||||
Photronics, Inc.(1) | 18,912 | 210,491 | ||||||
Pixelworks, Inc.(1) | 2,021 | 6,528 | ||||||
Plantronics, Inc. | 9,666 | 141,897 | ||||||
Plexus Corp.(1) | 320,436 | 22,609,964 | ||||||
Powerfleet, Inc.(1) | 10,311 | 47,637 | ||||||
Pure Storage, Inc. - Class A(1) | 3,415 | 59,182 | ||||||
Qorvo, Inc.(1) | 136,037 | 15,036,170 | ||||||
Quantum Corp.(1) | 9,534 | 36,801 | ||||||
Rambus, Inc.(1) | 696,446 | 10,585,979 | ||||||
RealPage, Inc.(1) | 366 | 23,794 | ||||||
Ribbon Communications, Inc.(1) | 26,774 | 105,222 | ||||||
RingCentral, Inc. - Class A(1) | 17,160 | 4,890,772 | ||||||
Rogers Corp.(1) | 75,373 | 9,391,476 | ||||||
Rosetta Stone, Inc.(1) | 8,106 | 136,667 | ||||||
Sabre Corp. | 9,167 | 73,886 | ||||||
Sanmina Corp.(1) | 82,254 | 2,059,640 | ||||||
ScanSource, Inc.(1) | 9,867 | 237,696 | ||||||
Science Applications International Corp. | 119,447 | 9,278,643 | ||||||
SeaChange International, Inc.(1) | 8,987 | 13,570 | ||||||
Seagate Technology Plc | 101,600 | 4,918,456 | ||||||
SecureWorks Corp. - Class A(1) | 3,256 | 37,216 | ||||||
Semtech Corp.(1) | 184,459 | 9,632,449 | ||||||
ServiceSource International, Inc.(1) | 32,690 | 51,650 | ||||||
Skyworks Solutions, Inc. | 54,463 | 6,963,639 | ||||||
SMART Global Holdings, Inc.(1) | 237 | 6,442 | ||||||
SolarWinds Corp.(1) | 948,646 | 16,762,575 | ||||||
SS&C Technologies Holdings, Inc. | 5,918 | 334,249 | ||||||
StarTek, Inc.(1) | 6,203 | 31,511 | ||||||
SunPower Corp. - Class A(1) | 9,265 | 70,970 | ||||||
Super Micro Computer, Inc.(1) | 12,877 | 365,578 | ||||||
Sykes Enterprises, Inc.(1) | 14,705 | 406,740 | ||||||
Synaptics, Inc.(1) | 711 | 42,745 |
Synchronoss Technologies, Inc.(1) | 16,412 | 57,934 | ||||||
SYNNEX Corp. | 140,438 | 16,820,259 | ||||||
Synopsys, Inc.(1) | 358 | 69,810 | ||||||
TE Connectivity Ltd. | 181,505 | 14,801,733 | ||||||
Telenav, Inc.(1) | 7,594 | 41,691 | ||||||
Teradata Corp.(1) | 847 | 17,618 | ||||||
Trimble, Inc.(1) | 8,315 | 359,125 | ||||||
TTM Technologies, Inc.(1) | 215,631 | 2,557,384 | ||||||
Twilio, Inc. - Class A(1) | 719 | 157,763 | ||||||
Ubiquiti, Inc. | 53 | 9,252 | ||||||
Unisys Corp.(1) | 21,735 | 237,129 | ||||||
Veeco Instruments, Inc.(1) | 19,796 | 267,048 | ||||||
Verint Systems, Inc.(1) | 208,688 | 9,428,524 | ||||||
VeriSign, Inc.(1) | 1,390 | 287,494 | ||||||
Verra Mobility Corp. - Class A(1) | 742,849 | 7,636,488 | ||||||
ViaSat, Inc.(1) | 1,922 | 73,747 | ||||||
VirnetX Holding Corp. | 10,871 | 70,662 | ||||||
Vishay Intertechnology, Inc. | 152,289 | 2,325,453 | ||||||
Vishay Precision Group, Inc.(1) | 5,295 | 130,151 | ||||||
Western Digital Corp. | 311,395 | 13,748,089 | ||||||
Western Union Co. | 195,927 | 4,235,942 | ||||||
WEX, Inc.(1) | 1,318 | 217,483 | ||||||
WNS Holdings Ltd. - ADR(1) | 70,057 | 3,851,734 | ||||||
Xerox Corp. | 414,074 | 6,331,191 | ||||||
Xperi Holding Corp. | 38,931 | 574,622 | ||||||
Zebra Technologies Corp. - Class A(1) | 150 | 38,393 | ||||||
|
| |||||||
Total Information Technology |
| 624,340,040 | ||||||
|
| |||||||
Materials – 6.91% | ||||||||
Advanced Emissions Solutions, Inc. | 7,028 | 34,086 | ||||||
AdvanSix, Inc.(1) | 10,790 | 126,675 | ||||||
AgroFresh Solutions, Inc.(1) | 10,516 | 31,863 | ||||||
Albemarle Corp. | 3,519 | 271,702 | ||||||
Alcoa Corp.(1) | 75,468 | 848,260 | ||||||
Allegheny Technologies, Inc.(1) | 51,082 | 520,526 | ||||||
Amcor Plc | 45,419 | 463,728 | ||||||
American Vanguard Corp. | 8,800 | 121,088 | ||||||
Amyris, Inc.(1) | 24,597 | 105,029 | ||||||
AptarGroup, Inc. | 43,785 | 4,903,044 | ||||||
Arconic Corp.(1) | 75,063 | 1,045,628 | ||||||
Ardagh Group SA - Class A | 644 | 8,314 | ||||||
Ashland Global Holdings, Inc. | 144,860 | 10,009,826 | ||||||
Avery Dennison Corp. | 118,884 | 13,563,476 | ||||||
Axalta Coating Systems Ltd.(1) | 277,468 | 6,256,903 | ||||||
Balchem Corp. | 989 | 93,817 | ||||||
Ball Corp. | 680 | 47,253 | ||||||
Berry Global Group, Inc.(1) | 225,798 | 10,007,367 | ||||||
Boise Cascade Co. | 103,967 | 3,910,199 | ||||||
Cabot Corp. | 63,851 | 2,365,680 | ||||||
Caledonia Mining Corp. Plc | 2,617 | 45,326 | ||||||
Carpenter Technology Corp. | 19,262 | 467,681 | ||||||
Celanese Corp. - Class A | 59,231 | 5,114,005 | ||||||
Century Aluminum Co.(1) | 19,832 | 141,402 | ||||||
CF Industries Holdings, Inc. | 7,117 | 200,272 | ||||||
Chemours Co. | 125,643 | 1,928,620 | ||||||
Clearwater Paper Corp.(1) | 6,210 | 224,367 | ||||||
Cleveland-Cliffs, Inc. | 373,355 | 2,060,920 | ||||||
Coeur Mining, Inc.(1) | 96,577 | 490,611 | ||||||
Commercial Metals Co. | 47,959 | 978,364 | ||||||
Compass Minerals International, Inc. | 148,474 | 7,238,108 | ||||||
Constellium SE - Class A(1) | 2,161,825 | 16,602,816 | ||||||
Corteva, Inc. | 446,081 | 11,950,510 | ||||||
Crown Holdings, Inc.(1) | 279,647 | 18,213,409 | ||||||
Domtar Corp. | 66,271 | 1,398,981 | ||||||
DowDuPont, Inc. | 143,617 | 7,630,371 | ||||||
Eagle Materials, Inc. | 67,807 | 4,761,408 | ||||||
Eastman Chemical Co. | 74,422 | 5,182,748 | ||||||
Element Solutions, Inc.(1) | 1,018,296 | 11,048,512 | ||||||
Ferro Corp.(1) | 749,593 | 8,950,140 | ||||||
Ferroglobe Plc(1) | 749,901 | 371,876 | ||||||
FMC Corp. | 339,872 | 33,858,049 | ||||||
Freeport-McMoRan, Inc. | 48,316 | 559,016 | ||||||
FutureFuel Corp. | 9,683 | 115,712 | ||||||
GCP Applied Technologies, Inc.(1) | 4,008 | 74,469 | ||||||
Gold Resource Corp. | 23,801 | 97,822 | ||||||
Graphic Packaging Holding Co. | 1,319,794 | 18,463,918 | ||||||
Greif, Inc. - Class A | 114,113 | 3,926,628 | ||||||
Greif, Inc. - Class B | 2,250 | 94,118 | ||||||
Hawkins, Inc. | 1,742 | 74,174 | ||||||
Haynes International, Inc. | 4,710 | 110,026 | ||||||
HB Fuller Co. | 331,885 | 14,802,071 | ||||||
Hecla Mining Co. | 208,061 | 680,359 | ||||||
Huntsman Corp. | 214,886 | 3,861,501 | ||||||
Ingevity Corp.(1) | 117,904 | 6,198,213 | ||||||
Innospec, Inc. | 1,968 | 152,028 | ||||||
International Flavors & Fragrances, Inc. | 3,567 | 436,815 | ||||||
International Paper Co. | 92,723 | 3,264,777 | ||||||
Intrepid Potash, Inc.(1) | 42,403 | 41,979 | ||||||
Kaiser Aluminum Corp. | 90,997 | 6,699,199 | ||||||
Koppers Holdings, Inc.(1) | 3,326 | 62,662 | ||||||
Kraton Corp.(1) | 12,273 | 212,077 | ||||||
Kronos Worldwide, Inc. | 210,552 | 2,191,846 | ||||||
Livent Corp.(1) | 59,108 | 364,105 | ||||||
LyondellBasell Industries NV - Class A | 260,965 | 17,150,620 | ||||||
Martin Marietta Materials, Inc. | 2,071 | 427,806 | ||||||
Materion Corp. | 5,707 | 350,923 | ||||||
Minerals Technologies, Inc. | 13,566 | 636,652 | ||||||
Mosaic Co. | 528,139 | 6,607,019 | ||||||
Myers Industries, Inc. | 9,838 | 143,143 | ||||||
Neenah, Inc. | 6,792 | 335,932 | ||||||
NewMarket Corp. | 36 | 14,417 | ||||||
Novagold Resources, Inc.(1) | 5,824 | 53,464 | ||||||
Nucor Corp. | 10,052 | 416,253 | ||||||
Nutrien Ltd. | 52,206 | 1,675,813 | ||||||
O-I Glass, Inc. | 193,881 | 1,741,051 | ||||||
Olin Corp. | 4,749 | 54,566 | ||||||
Olympic Steel, Inc. | 3,568 | 41,924 | ||||||
Orion Engineered Carbons SA | 12,129 | 128,446 | ||||||
Packaging Corp. of America | 3,125 | 311,875 | ||||||
PH Glatfelter Co. | 525,297 | 8,431,017 | ||||||
PolyOne Corp. | 37,028 | 971,244 | ||||||
PPG Industries, Inc. | 59,924 | 6,355,539 | ||||||
PQ Group Holdings, Inc.(1) | 12,544 | 166,083 | ||||||
Ranpak Holdings Corp. - Class A(1) | 10,654 | 79,266 | ||||||
Rayonier Advanced Materials, Inc.(1) | 25,721 | 72,276 | ||||||
Reliance Steel & Aluminum Co. | 46,191 | 4,384,912 | ||||||
Royal Gold, Inc. | 618 | 76,830 | ||||||
RPM International, Inc. | 45,285 | 3,399,092 | ||||||
Ryerson Holding Corp.(1) | 6,549 | 36,871 | ||||||
Schnitzer Steel Industries, Inc. - Class A | 10,934 | 192,876 | ||||||
Schweitzer-Mauduit International, Inc. | 61,558 | 2,056,653 | ||||||
Scotts Miracle-Gro Co. | 85 | 11,430 | ||||||
Sealed Air Corp. | 116,890 | 3,839,837 | ||||||
Sensient Technologies Corp. | 10,247 | 534,484 | ||||||
Silgan Holdings, Inc. | 335,054 | 10,852,399 | ||||||
Sonoco Products Co. | 3,362 | 175,799 | ||||||
Steel Dynamics, Inc. | 378,358 | 9,871,360 | ||||||
Stepan Co. | 7,898 | 766,896 | ||||||
Summit Materials, Inc. - Class A(1) | 47,339 | 761,211 | ||||||
SunCoke Energy, Inc. | 32,529 | 96,286 | ||||||
TimkenSteel Corp.(1) | 17,783 | 69,176 | ||||||
Trecora Resources(1) | 9,303 | 58,330 | ||||||
Tredegar Corp. | 10,177 | 156,726 | ||||||
Trinseo SA | 50,421 | 1,117,329 | ||||||
Tronox Holdings Plc - Class A | 24,251 | 175,092 | ||||||
UFP Technologies, Inc.(1) | 2,381 | 104,907 | ||||||
United States Lime & Minerals, Inc. | 701 | 59,192 |
United States Steel Corp. | 88,598 | 639,678 | ||||||
US Concrete, Inc.(1) | 6,336 | 157,133 | ||||||
Valvoline, Inc. | 6,185 | 119,556 | ||||||
Verso Corp. - Class A | 14,400 | 172,224 | ||||||
Vulcan Materials Co. | 4,404 | 510,203 | ||||||
Warrior Met Coal, Inc. | 20,647 | 317,757 | ||||||
Westlake Chemical Corp. | 1,130 | 60,625 | ||||||
Westrock Co. | 77,955 | 2,203,008 | ||||||
Worthington Industries, Inc. | 15,119 | 563,939 | ||||||
WR Grace & Co. | 132,350 | 6,724,704 | ||||||
|
| |||||||
Total Materials |
| 352,508,319 | ||||||
|
| |||||||
Real Estate – 7.49% | ||||||||
Acadia Realty Trust | 34,723 | 450,705 | ||||||
Agree Realty Corp. | 21,047 | 1,382,998 | ||||||
Alexander & Baldwin, Inc. | 30,181 | 367,906 | ||||||
Alexander’s, Inc. | 50 | 12,045 | ||||||
Alexandria Real Estate Equities, Inc. | 4,175 | 677,394 | ||||||
Alpine Income Property Trust, Inc. | 2,696 | 43,837 | ||||||
Altisource Portfolio Solutions SA(1) | 1,897 | 27,962 | ||||||
American Assets Trust, Inc. | 20,388 | 567,602 | ||||||
American Campus Communities, Inc. | 156,026 | 5,454,669 | ||||||
American Finance Trust, Inc. | 45,287 | 359,352 | ||||||
American Homes 4 Rent - Class A | 319,912 | 8,605,633 | ||||||
American Realty Investors, Inc.(1) | 828 | 7,444 | ||||||
Americold Realty Trust | 6,010 | 218,163 | ||||||
Apartment Investment & Management Co. - Class A | 4,945 | 186,130 | ||||||
Apple Hospitality REIT, Inc. | 6,988 | 67,504 | ||||||
Armada Hoffler Properties, Inc. | 23,747 | 236,283 | ||||||
AvalonBay Communities, Inc. | 4,692 | 725,571 | ||||||
Bluerock Residential Growth REIT, Inc. - Class A | 6,025 | 48,682 | ||||||
Boston Properties, Inc. | 133,873 | 12,099,442 | ||||||
Brandywine Realty Trust | 313,506 | 3,414,080 | ||||||
Brixmor Property Group, Inc. | 697,366 | 8,940,232 | ||||||
Brookfield Property REIT, Inc. - Class A | 295 | 2,938 | ||||||
BRT Apartments Corp. | 5,206 | 56,329 | ||||||
Camden Property Trust | 3,147 | 287,069 | ||||||
CareTrust REIT, Inc. | 32,011 | 549,309 | ||||||
CatchMark Timber Trust, Inc. - Class A | 18,288 | 161,849 | ||||||
CBL & Associates Properties, Inc.(1) | 92,000 | 25,079 | ||||||
CBRE Group, Inc. - Class A(1) | 11,110 | 502,394 | ||||||
Chatham Lodging Trust | 124,851 | 764,088 | ||||||
City Office REIT, Inc. | 135,251 | 1,360,625 | ||||||
Clipper Realty, Inc. | 1,244 | 10,076 | ||||||
Colony Capital, Inc. | 198,427 | 476,225 | ||||||
Columbia Property Trust, Inc. | 46,996 | 617,527 | ||||||
CoreCivic, Inc. | 205,568 | 1,924,116 | ||||||
CorEnergy Infrastructure Trust, Inc. | 6,791 | 62,138 | ||||||
CorePoint Lodging, Inc. | 19,081 | 80,331 | ||||||
CoreSite Realty Corp. | 436 | 52,782 | ||||||
Corporate Office Properties Trust | 413,253 | 10,471,831 | ||||||
Cousins Properties, Inc. | 173,929 | 5,188,302 | ||||||
CTO Realty Growth, Inc. | 1,712 | 67,624 | ||||||
CubeSmart | 495,746 | 13,380,185 | ||||||
Cushman & Wakefield Plc(1) | 29,844 | 371,856 | ||||||
CyrusOne, Inc. | 234,583 | 17,065,913 | ||||||
DiamondRock Hospitality Co. | 469,144 | 2,594,366 | ||||||
Diversified Healthcare Trust | 356,081 | 1,575,658 | ||||||
Douglas Emmett, Inc. | 502,955 | 15,420,600 | ||||||
Duke Realty Corp. | 285,414 | 10,100,801 | ||||||
EastGroup Properties, Inc. | 71,012 | 8,422,733 | ||||||
Empire State Realty Trust, Inc. - Class A | 490,979 | 3,436,853 | ||||||
EPR Properties | 2,597 | 86,039 | ||||||
Equity Commonwealth | 3,895 | 125,419 | ||||||
Equity LifeStyle Properties, Inc. | 3,407 | 212,869 | ||||||
Equity Residential | 167,952 | 9,878,937 | ||||||
Essential Properties Realty Trust, Inc. | 36,886 | 547,388 | ||||||
Essex Property Trust, Inc. | 2,175 | 498,445 | ||||||
Extra Space Storage, Inc. | 1,241 | 114,631 | ||||||
Farmland Partners, Inc. | 9,365 | 64,150 | ||||||
Federal Realty Investment Trust | 2,509 | 213,792 | ||||||
First Industrial Realty Trust, Inc. | 4,188 | 160,987 | ||||||
Forestar Group, Inc.(1) | 6,375 | 96,135 | ||||||
Franklin Street Properties Corp. | 250,417 | 1,274,623 | ||||||
Front Yard Residential Corp. | 20,766 | 180,664 | ||||||
FRP Holdings, Inc.(1) | 2,486 | 100,882 | ||||||
Gaming & Leisure Properties, Inc. | 94,799 | 3,280,045 | ||||||
Getty Realty Corp. | 13,575 | 402,906 | ||||||
Gladstone Commercial Corp. | 10,626 | 199,237 | ||||||
Gladstone Land Corp. | 3,451 | 54,733 | ||||||
Global Medical REIT, Inc. | 15,578 | 176,499 | ||||||
Global Net Lease, Inc. | 146,263 | 2,446,980 | ||||||
Griffin Industrial Realty, Inc. | 309 | 16,739 | ||||||
Healthcare Realty Trust, Inc. | 53,595 | 1,569,798 | ||||||
Healthcare Trust of America, Inc. - Class A | 7,252 | 192,323 | ||||||
Healthpeak Properties, Inc. | 272,601 | 7,512,884 | ||||||
Hersha Hospitality Trust - Class A | 14,351 | 82,662 | ||||||
Highwoods Properties, Inc. | 3,434 | 128,191 | ||||||
Host Hotels & Resorts, Inc. | 251,113 | 2,709,509 | ||||||
Hudson Pacific Properties, Inc. | 5,009 | 126,026 | ||||||
Independence Realty Trust, Inc. | 38,209 | 439,021 | ||||||
Industrial Logistics Properties Trust | 618,943 | 12,719,279 | ||||||
Innovative Industrial Properties, Inc. - Class A | 3,930 | 345,919 | ||||||
Investors Real Estate Trust | 4,852 | 342,017 | ||||||
Invitation Homes, Inc. | 155,378 | 4,277,556 | ||||||
Iron Mountain, Inc. | 96,451 | 2,517,371 | ||||||
iStar, Inc. | 29,991 | 369,489 | ||||||
JBG SMITH Properties | 4,064 | 120,172 | ||||||
Jernigan Capital, Inc. | 9,040 | 123,667 | ||||||
Jones Lang LaSalle, Inc. | 31,221 | 3,230,125 | ||||||
Kennedy-Wilson Holdings, Inc. | 49,728 | 756,860 | ||||||
Kilroy Realty Corp. | 126,302 | 7,413,927 | ||||||
Kimco Realty Corp. | 13,771 | 176,820 | ||||||
Kite Realty Group Trust | 34,042 | 392,845 | ||||||
Lamar Advertising Co. - Class A | 113,883 | 7,602,829 | ||||||
Lexington Realty Trust | 979,127 | 10,329,790 | ||||||
Life Storage, Inc. | 85,568 | 8,124,682 | ||||||
LTC Properties, Inc. | 9,883 | 372,293 | ||||||
Macerich Co. | 57,622 | 516,869 | ||||||
Mack-Cali Realty Corp. | 36,672 | 560,715 | ||||||
Marcus & Millichap, Inc.(1) | 8,119 | 234,314 | ||||||
Maui Land & Pineapple Co., Inc.(1) | 1,050 | 11,655 | ||||||
Medical Properties Trust, Inc. | 17,360 | 326,368 | ||||||
Mid-America Apartment Communities, Inc. | 43,947 | 5,039,402 | ||||||
Monmouth Real Estate Investment Corp. | 4,131 | 59,858 | ||||||
National Health Investors, Inc. | 11,761 | 714,128 | ||||||
National Retail Properties, Inc. | 5,708 | 202,520 | ||||||
New Senior Investment Group, Inc. | 34,346 | 124,333 | ||||||
Newmark Group, Inc. - Class A | 59,461 | 288,980 | ||||||
NexPoint Residential Trust, Inc. | 7,297 | 257,949 | ||||||
Office Properties Income Trust | 423,442 | 10,996,789 | ||||||
Omega Healthcare Investors, Inc. | 167,400 | 4,976,802 | ||||||
One Liberty Properties, Inc. | 6,931 | 122,124 | ||||||
Outfront Media, Inc. | 357,927 | 5,071,826 | ||||||
Paramount Group, Inc. | 401,197 | 3,093,229 | ||||||
Park Hotels & Resorts, Inc. | 7,975 | 78,873 | ||||||
Pebblebrook Hotel Trust | 423,468 | 5,784,573 | ||||||
Physicians Realty Trust | 915,731 | 16,043,607 | ||||||
Piedmont Office Realty Trust, Inc. - Class A | 244,425 | 4,059,899 | ||||||
PotlatchDeltic Corp. | 26,297 | 1,000,075 | ||||||
Preferred Apartment Communities, Inc. - Class A | 19,676 | 149,538 | ||||||
QTS Realty Trust, Inc. - Class A | 334,765 | 21,455,089 | ||||||
Rafael Holdings, Inc. - Class B(1) | 3,535 | 50,798 | ||||||
Rayonier, Inc. | 4,549 | 112,770 | ||||||
Re/Max Holdings, Inc. - Class A | 7,340 | 230,696 | ||||||
Realogy Holdings Corp. | 46,484 | 344,446 | ||||||
Realty Income Corp. | 11,468 | 682,346 |
Regency Centers Corp. | 216,877 | 9,952,486 | ||||||
Retail Opportunity Investments Corp. | 46,781 | 530,029 | ||||||
Retail Properties of America, Inc. - Class A | 87,237 | 638,575 | ||||||
Retail Value, Inc. | 20,580 | 254,369 | ||||||
Rexford Industrial Realty, Inc. | 3,842 | 159,174 | ||||||
RLJ Lodging Trust | 66,424 | 627,043 | ||||||
RMR Group, Inc. - Class A | 988 | 29,116 | ||||||
RPT Realty | 34,069 | 237,120 | ||||||
Ryman Hospitality Properties, Inc. | 2,813 | 97,330 | ||||||
Sabra Health Care REIT, Inc. | 210,324 | 3,034,975 | ||||||
Safehold, Inc. | 2,972 | 170,860 | ||||||
Saul Centers, Inc. | 828 | 26,720 | ||||||
Seritage Growth Properties(1) | 13,631 | 155,393 | ||||||
Service Properties Trust | 138,363 | 980,994 | ||||||
Simon Property Group, Inc. | 2,159 | 147,632 | ||||||
SITE Centers Corp. | 313,069 | 2,535,859 | ||||||
SL Green Realty Corp. | 2,575 | 126,922 | ||||||
Spirit Realty Capital, Inc. | 80,362 | 2,801,419 | ||||||
St Joe Co.(1) | 6,090 | 118,268 | ||||||
STAG Industrial, Inc. | 301,796 | 8,848,659 | ||||||
STORE Capital Corp. | 126,491 | 3,011,751 | ||||||
Stratus Properties, Inc.(1) | 2,194 | 43,463 | ||||||
Summit Hotel Properties, Inc. | 209,378 | 1,241,612 | ||||||
Sun Communities, Inc. | 3,219 | 436,754 | ||||||
Sunstone Hotel Investors, Inc. | 87,409 | 712,383 | ||||||
Tanger Factory Outlet Centers, Inc. | 147,155 | 1,049,215 | ||||||
Taubman Centers, Inc. | 1,999 | 75,482 | ||||||
Tejon Ranch Co.(1) | 7,704 | 110,938 | ||||||
Terreno Realty Corp. | 15,141 | 797,022 | ||||||
The GEO Group, Inc. | 47,602 | 563,132 | ||||||
The Howard Hughes Corp.(1) | 1,297 | 67,379 | ||||||
Transcontinental Realty Investors, Inc.(1) | 548 | 16,451 | ||||||
UDR, Inc. | 9,775 | 365,390 | ||||||
UMH Properties, Inc. | 2,026 | 26,196 | ||||||
Uniti Group, Inc. | 179,700 | 1,680,195 | ||||||
Universal Health Realty Income Trust | 603 | 47,932 | ||||||
Urban Edge Properties | 544,677 | 6,465,316 | ||||||
Urstadt Biddle Properties, Inc. - Class A | 12,162 | 144,485 | ||||||
Ventas, Inc. | 12,444 | 455,699 | ||||||
VEREIT, Inc. | 646,794 | 4,158,885 | ||||||
VICI Properties, Inc. | 15,653 | 316,034 | ||||||
Vornado Realty Trust | 5,851 | 223,567 | ||||||
Washington Prime Group, Inc. | 278,400 | 234,079 | ||||||
Washington Real Estate Investment Trust | 32,940 | 731,268 | ||||||
Weingarten Realty Investors | 4,044 | 76,553 | ||||||
Welltower, Inc. | 205,495 | 10,634,366 | ||||||
Weyerhaeuser Co. | 24,908 | 559,434 | ||||||
Whitestone REIT - Class B | 17,062 | 124,041 | ||||||
WP Carey, Inc. | 5,702 | 385,740 | ||||||
Xenia Hotels & Resorts, Inc. | 215,790 | 2,013,321 | ||||||
|
| |||||||
Total Real Estate |
| 381,862,983 | ||||||
|
| |||||||
Utilities – 6.31% | ||||||||
AES Corp. | 22,053 | 319,548 | ||||||
ALLETE, Inc. | 21,114 | 1,153,036 | ||||||
Alliant Energy Corp. | 234,932 | 11,239,147 | ||||||
Ameren Corp. | 258,177 | 18,165,334 | ||||||
American Water Works Co., Inc. | 6,044 | 777,621 | ||||||
Artesian Resources Corp. - Class A | 2,697 | 97,874 | ||||||
Atlantic Power Corp.(1) | 27,743 | 55,486 | ||||||
Atlantica Yield Plc | 260,750 | 7,587,825 | ||||||
Atmos Energy Corp. | 4,039 | 402,204 | ||||||
Avangrid, Inc. | 1,881 | 78,964 | ||||||
Avista Corp. | 26,913 | 979,364 | ||||||
Black Hills Corp. | 194,632 | 11,027,849 | ||||||
Brookfield Infrastructure Corp. - Class A | 6,724 | 306,211 | ||||||
Cadiz, Inc.(1) | 2,953 | 30,002 | ||||||
California Water Service Group | 1,333 | 63,584 | ||||||
CenterPoint Energy, Inc. | 594,536 | 11,099,987 | ||||||
Chesapeake Utilities Corp. | 179 | 15,036 | ||||||
Clearway Energy, Inc. - Class A | 11,084 | 232,431 | ||||||
Clearway Energy, Inc. - Class C | 25,632 | 591,074 | ||||||
CMS Energy Corp. | 89,502 | 5,228,707 | ||||||
Consolidated Edison, Inc. | 11,171 | 803,530 | ||||||
Consolidated Water Co. Ltd. | 5,232 | 75,498 | ||||||
DTE Energy Co. | 105,273 | 11,316,847 | ||||||
Edison International | 234,854 | 12,754,921 | ||||||
El Paso Electric Co. | 14,204 | 951,668 | ||||||
Entergy Corp. | 153,656 | 14,414,469 | ||||||
Essential Utilities, Inc. | 7,457 | 314,984 | ||||||
Evergy, Inc. | 509,803 | 30,226,220 | ||||||
Eversource Energy | 79,541 | 6,623,379 | ||||||
Exelon Corp. | 131,200 | 4,761,248 | ||||||
FirstEnergy Corp. | 450,186 | 17,458,213 | ||||||
Hawaiian Electric Industries, Inc. | 3,567 | 128,626 | ||||||
IDACORP, Inc. | 1,683 | 147,044 | ||||||
MDU Resources Group, Inc. | 199,799 | 4,431,542 | ||||||
MGE Energy, Inc. | 135,123 | 8,716,785 | ||||||
National Fuel Gas Co. | 136,756 | 5,734,179 | ||||||
New Jersey Resources Corp. | 338,559 | 11,053,951 | ||||||
NiSource, Inc. | 12,769 | 290,367 | ||||||
Northwest Natural Holding Co. | 10,752 | 599,854 | ||||||
NorthWestern Corp. | 20,496 | 1,117,442 | ||||||
NRG Energy, Inc. | 116,410 | 3,790,310 | ||||||
OGE Energy Corp. | 6,663 | 202,289 | ||||||
ONE Gas, Inc. | 225,492 | 17,374,159 | ||||||
Otter Tail Corp. | 10,627 | 412,221 | ||||||
PG&E Corp.(1) | 17,673 | 156,759 | ||||||
Pinnacle West Capital Corp. | 3,749 | 274,764 | ||||||
PNM Resources, Inc. | 31,960 | 1,228,542 | ||||||
Portland General Electric Co. | 280,238 | 11,716,751 | ||||||
PPL Corp. | 303,895 | 7,852,647 | ||||||
Public Service Enterprise Group, Inc. | 201,848 | 9,922,848 | ||||||
RGC Resources, Inc. | 1,214 | 29,342 | ||||||
SJW Group | 4,841 | 300,675 | ||||||
South Jersey Industries, Inc. | 650,940 | 16,266,991 | ||||||
Southwest Gas Holdings, Inc. | 20,253 | 1,398,470 | ||||||
Spire, Inc. | 19,975 | 1,312,557 | ||||||
Sunnova Energy International, Inc.(1) | 11,464 | 195,690 | ||||||
TerraForm Power, Inc. - Class A | 32,254 | 594,764 | ||||||
UGI Corp. | 408,480 | 12,989,664 | ||||||
Unitil Corp. | 5,709 | 255,877 | ||||||
Vistra Energy Corp. | 1,722,059 | 32,064,739 | ||||||
WEC Energy Group, Inc. | 10,533 | 923,217 | ||||||
Xcel Energy, Inc. | 17,527 | 1,095,437 | ||||||
|
| |||||||
Total Utilities |
| 321,730,764 | ||||||
|
| |||||||
Total Common Stocks (Cost: $4,923,790,112) |
| 4,997,127,487 | ||||||
|
| |||||||
SHORT-TERM INVESTMENTS – 2.22% | ||||||||
Money Market Funds – 1.94% | ||||||||
Goldman Sachs Financial Square Government Fund - Class I, 0.15%(3) | 99,271,966 | 99,271,966 | ||||||
|
| |||||||
Total Money Market Funds (Cost: $99,271,966) | 99,271,966 | |||||||
|
| |||||||
| Principal Amount | Value | |||||||
Time Deposits – 0.28% | ||||||||
Banco Santander, Frankfurt, 0.01% due 07/01/2020 | $ | 5,666,959 | 5,666,959 | |||||
BBVA, Madrid, 0.01% due 07/01/2020 | 922,424 | 922,424 | ||||||
BNP Paribas, Paris, 0.01% due 07/01/2020 | 4,577,510 | 4,577,510 | ||||||
Brown Brothers Harriman, 0.01% due 07/01/2020 | 35 | 35 | ||||||
Brown Brothers Harriman, 0.02% due 07/02/2020 | CAD | 17 | 12 | |||||
China Construction Bank, New York, 0.01% due 07/01/2020 | $ | 157,799 | 157,799 | |||||
JP Morgan, New York, 0.01% due 07/01/2020 | 2,823,908 | 2,823,908 | ||||||
|
| |||||||
Total Time Deposits (Cost: $14,148,647) | 14,148,647 | |||||||
|
| |||||||
Total Short-Term Investments (Cost: $113,420,613) |
| 113,420,613 | ||||||
|
| |||||||
TOTAL INVESTMENTS IN SECURITIES – 100.19% | ||||||||
(Cost: $5,037,210,725) | 5,110,548,100 | |||||||
|
| |||||||
LIABILITIES IN EXCESS OF OTHER ASSETS – (0.19)% | (9,549,318 | ) | ||||||
|
| |||||||
TOTAL NET ASSETS – 100.00% | $ | 5,100,998,782 | ||||||
|
| |||||||
Percentages are stated as a percent of net assets.
Principal amounts are denominated in the currency in which the security was purchased.
ADR American Depositary Receipt
REIT Real Estate Investment Trust
CAD Canadian Dollar
| (1) | Non-income producing security. |
| (2) | Security was purchased exempt from registration in the U.S. pursuant to Rule 144(A) under the Securities Act of 1933. The value of the security totals $684,507, which represents 0.01% of total net assets. |
| (3) | Represents annualized seven-day yield as of the close of the reporting period. |
| (4) | Security or includes securities categorized as Level 3 per the Trust’s fair value hierarchy. The value of these securities total $0, which represents 0.00% of total net assets. |
The accompanying notes are an integral part of this Schedule of Investments.
Bridge Builder International Equity Fund
Schedule of Investments
June 30, 2020
| Shares | Value | |||||||
COMMON STOCKS – 95.92% | ||||||||
Argentina – 0.87% | ||||||||
MercadoLibre, Inc.(1) | 99,636 | $ | 98,218,180 | |||||
|
| |||||||
Total Argentina |
| 98,218,180 | ||||||
|
| |||||||
Australia – 2.12% | ||||||||
Afterpay Ltd.(1) | 9,339 | 403,330 | ||||||
AGL Energy Ltd. | 26,311 | 311,263 | ||||||
AMP Ltd.(1) | 133,809 | 173,139 | ||||||
Ampol Ltd. | 10,306 | 209,999 | ||||||
APA Group - Stapled Security | 52,310 | 404,478 | ||||||
Aristocrat Leisure Ltd. | 24,409 | 437,080 | ||||||
ASX Ltd. | 8,406 | 499,638 | ||||||
Aurizon Holdings Ltd. | 85,135 | 289,704 | ||||||
AusNet Services - Class Miscella | 71,038 | 82,075 | ||||||
Australia & New Zealand Banking Group Ltd. | 116,263 | 1,508,529 | ||||||
BHP Group Ltd. | 120,364 | 2,996,810 | ||||||
BHP Group Plc | 86,599 | 1,772,081 | ||||||
BlueScope Steel Ltd. | 19,806 | 163,159 | ||||||
Brambles Ltd. | 66,049 | 500,809 | ||||||
CIMIC Group Ltd. | 4,536 | 76,226 | ||||||
Coca-Cola Amatil Ltd. | 21,646 | 130,384 | ||||||
Cochlear Ltd. | 349,048 | 45,826,171 | ||||||
Coles Group Ltd. | 57,781 | 686,864 | ||||||
Commonwealth Bank of Australia | 72,330 | 3,493,130 | ||||||
Computershare Ltd. | 19,928 | 184,523 | ||||||
Crown Resorts Ltd. | 16,488 | 111,071 | ||||||
CSL Ltd. | 425,526 | 84,632,426 | ||||||
Dexus | 48,538 | 311,532 | ||||||
Evolution Mining Ltd. | 69,016 | 274,165 | ||||||
Fortescue Metals Group Ltd. | 69,728 | 677,873 | ||||||
Goodman Group | 71,677 | 739,580 | ||||||
GPT Group | 78,976 | 229,434 | ||||||
Insurance Australia Group Ltd. | 102,610 | 411,811 | ||||||
LendLease Group - Stapled Security | 29,659 | 256,350 | ||||||
Macquarie Group Ltd. | 13,862 | 1,150,437 | ||||||
Magellan Financial Group Ltd. | 5,310 | 216,837 | ||||||
Medibank Pvt Ltd. | 123,427 | 255,895 | ||||||
Mirvac Group | 161,298 | 243,657 | ||||||
National Australia Bank Ltd. | 129,986 | 1,647,230 | ||||||
Newcrest Mining Ltd. | 35,096 | 778,221 | ||||||
Northern Star Resources Ltd. | 31,765 | 299,576 | ||||||
Oil Search Ltd. | 78,461 | 173,882 | ||||||
Orica Ltd. | 16,820 | 194,517 | ||||||
Origin Energy Ltd. | 72,519 | 295,098 | ||||||
Qantas Airways Ltd. | 29,160 | 77,271 | ||||||
QBE Insurance Group Ltd. | 4,948,401 | 30,537,108 | ||||||
Ramsay Health Care Ltd. | 7,901 | 364,887 | ||||||
REA Group Ltd. | 2,418 | 182,205 | ||||||
Santos Ltd. | 74,373 | 276,413 | ||||||
Scentre Group | 215,709 | 327,477 | ||||||
Seek Ltd. | 1,875,766 | 28,697,109 | ||||||
Sonic Healthcare Ltd. | 19,983 | 421,977 | ||||||
South32 Ltd. | 201,749 | 285,621 | ||||||
Stockland | 97,445 | 225,956 | ||||||
Suncorp Group Ltd. | 51,920 | 333,633 | ||||||
Sydney Airport - Stapled Security | 46,151 | 182,139 | ||||||
Tabcorp Holdings Ltd. | 80,495 | 189,860 | ||||||
Telstra Corp. Ltd. | 171,399 | 372,044 | ||||||
TPG Corp. Ltd. | 15,038 | 92,362 | ||||||
Transurban Group - Stapled Security | 118,205 | 1,159,204 | ||||||
Treasury Wine Estates Ltd. | 2,546,799 | 18,530,184 | ||||||
Vicinity Centres | 159,169 | 159,536 | ||||||
Washington H Soul Pattinson & Co. Ltd. | 5,392 | 73,239 | ||||||
Wesfarmers Ltd. | 48,593 | 1,510,863 | ||||||
Westpac Banking Corp. | 147,057 | 1,843,122 | ||||||
WiseTech Global Ltd. | 6,677 | 90,326 | ||||||
Woodside Petroleum Ltd. | 38,799 | 586,356 | ||||||
Woolworths Group Ltd. | 54,783 | 1,412,129 | ||||||
|
| |||||||
Total Australia |
| 240,980,005 | ||||||
|
| |||||||
Austria – 0.01% | ||||||||
Andritz AG(1) | 3,341 | 121,816 | ||||||
Erste Group Bank AG(1) | 11,503 | 271,675 | ||||||
OMV AG(1) | 5,920 | 199,764 | ||||||
Raiffeisen Bank International AG(1) | 5,974 | 106,775 | ||||||
Verbund AG | 2,690 | 120,814 | ||||||
Voestalpine AG | 5,138 | 110,957 | ||||||
|
| |||||||
Total Austria |
| 931,801 | ||||||
|
| |||||||
Belgium – 0.12% | ||||||||
Ageas | 7,327 | 259,667 | ||||||
Anheuser-Busch InBev SA | 30,950 | 1,525,725 | ||||||
Colruyt SA | 2,185 | 120,086 | ||||||
Elia Group SA | 1,418 | 154,266 | ||||||
Galapagos NV(1) | 1,846 | 364,359 | ||||||
Groupe Bruxelles Lambert SA | 4,863 | 407,325 | ||||||
KBC Group NV | 154,256 | 8,862,201 | ||||||
Proximus | 5,745 | 117,066 | ||||||
Sofina SA | 707 | 186,686 | ||||||
Solvay SA | 3,016 | 241,961 | ||||||
Telenet Group Holding NV | 1,740 | 71,694 | ||||||
UCB SA | 5,430 | 630,132 | ||||||
Umicore SA | 8,729 | 412,045 | ||||||
|
| |||||||
Total Belgium |
| 13,353,213 | ||||||
|
| |||||||
Brazil – 0.29% | ||||||||
Raia Drogasil SA | 1,613,771 | 32,826,787 | ||||||
|
| |||||||
Total Brazil |
| 32,826,787 | ||||||
|
| |||||||
Canada – 3.86% | ||||||||
Canadian Pacific Railway Ltd. | 260,981 | 66,638,889 | ||||||
Fairfax Financial Holdings Ltd. | 51,145 | 15,801,228 | ||||||
Lululemon Athletica, Inc.(1) | 317,701 | 99,125,889 | ||||||
Shopify, Inc. - Class A(1) | 269,447 | 255,759,092 | ||||||
|
| |||||||
Total Canada |
| 437,325,098 | ||||||
|
| |||||||
Chile – 0.52% | ||||||||
Antofagasta Plc | 5,108,397 | 59,126,405 | ||||||
|
| |||||||
Total Chile |
| 59,126,405 | ||||||
|
| |||||||
China – 3.41% | ||||||||
Alibaba Group Holding Ltd. - ADR(1) | 377,300 | 81,383,610 | ||||||
Baidu, Inc. - ADR(1) | 175,160 | 20,999,932 | ||||||
BeiGene Ltd. - ADR(1) | 1,709 | 321,976 | ||||||
Lenovo Group Ltd. | 24,816,000 | 13,845,884 | ||||||
Meituan Dianping - Class B(1) | 1,846,900 | 41,271,523 | ||||||
Ping An Insurance Group Co. of China Ltd. - Class H | 2,829,500 | 28,207,262 | ||||||
Shanghai Fosun Pharmaceutical Group Co. Ltd. - Class H | 17,517,500 | 58,728,483 | ||||||
Tencent Holdings Ltd. | 1,127,956 | 72,277,066 | ||||||
Trip.com Group Ltd. - ADR(1) | 666,204 | 17,268,008 | ||||||
Tsingtao Brewery Co. Ltd. - Class H | 7,001,000 | 52,249,622 | ||||||
Yangzijiang Shipbuilding Holdings Ltd. | 113,800 | 76,609 | ||||||
|
| |||||||
Total China |
| 386,629,975 | ||||||
|
| |||||||
Denmark – 1.12% | ||||||||
Ambu - Class B | 6,811 | 215,311 | ||||||
AP Moller - Maersk - Class A | 146 | 159,645 | ||||||
AP Moller - Maersk - Class B | 31,342 | 36,733,058 | ||||||
Carlsberg - Class B | 4,634 | 614,506 | ||||||
CHR Hansen Holding | 4,608 | 475,294 | ||||||
Coloplast - Class B | 5,196 | 809,890 | ||||||
Danske Bank | 707,456 | 9,457,590 | ||||||
Demant(1) | 4,491 | 119,017 | ||||||
DSV Panalpina | 561,898 | 69,020,724 | ||||||
Genmab(1) | 2,829 | 953,919 | ||||||
GN Store Nord | 5,457 | 292,115 | ||||||
H Lundbeck | 2,828 | 106,854 | ||||||
Novo Nordisk - Class B | 76,916 | 5,010,903 | ||||||
Novozymes - Class B | 9,386 | 544,162 | ||||||
Orsted(2) | 8,042 | 928,058 | ||||||
Pandora | 4,466 | 243,908 | ||||||
Tryg | 4,769 | 138,560 | ||||||
Vestas Wind Systems | 8,646 | 885,375 | ||||||
|
| |||||||
Total Denmark |
| 126,708,889 | ||||||
|
| |||||||
Finland – 1.20% | ||||||||
Elisa OYJ | 6,107 | 371,621 | ||||||
Fortum OYJ | 19,344 | 369,047 | ||||||
Kone OYJ - Class B | 577,114 | 39,803,224 | ||||||
Metso OYJ | 4,024 | 132,243 | ||||||
Neste OYJ | 18,418 | 723,387 | ||||||
Nokia OYJ | 21,055,018 | 92,007,646 | ||||||
Nordea Bank Abp | 133,407 | 925,218 | ||||||
Orion OYJ - Class B | 4,826 | 234,034 | ||||||
Sampo OYJ - Class A | 19,395 | 668,542 | ||||||
Stora Enso OYJ - Class R | 23,922 | 286,331 | ||||||
UPM-Kymmene OYJ | 21,977 | 636,557 | ||||||
Wartsila OYJ Abp | 19,105 | 158,477 | ||||||
|
| |||||||
Total Finland |
| 136,316,327 | ||||||
|
| |||||||
France – 8.39% | ||||||||
Accor SA(1) | 7,975 | 217,651 | ||||||
Aeroports de Paris | 1,124 | 116,043 | ||||||
Air Liquide SA | 20,566 | 2,973,573 | ||||||
Airbus SE | 25,533 | 1,829,537 | ||||||
Alstom SA | 8,488 | 395,549 | ||||||
Amundi SA(2) | 287,159 | 22,574,554 | ||||||
Arkema SA | 2,813 | 270,397 | ||||||
Atos SE(1) | 3,865 | 331,359 | ||||||
AXA SA | 79,286 | 1,668,410 | ||||||
BioMerieux | 1,723 | 236,627 | ||||||
BNP Paribas SA | 45,777 | 1,828,975 | ||||||
Bollore SA | 39,067 | 123,271 | ||||||
Bouygues SA | 380,352 | 13,028,767 | ||||||
Bureau Veritas SA | 12,797 | 271,417 | ||||||
Capgemini SE | 6,624 | 764,420 | ||||||
Carrefour SA | 24,930 | 386,616 | ||||||
Casino Guichard Perrachon SA(1) | 1,920 | 71,133 | ||||||
Cie de Saint-Gobain | 2,613,666 | 94,303,609 | ||||||
Cie Generale des Etablissements Michelin SCA | 281,304 | 29,321,188 | ||||||
CNP Assurances | 6,542 | 75,877 | ||||||
Covivio | 1,971 | 142,964 | ||||||
Credit Agricole SA(1) | 47,511 | 451,150 | ||||||
Danone SA | 26,266 | 1,823,207 | ||||||
Dassault Aviation SA(1) | 115 | 105,512 | ||||||
Dassault Systemes | 5,631 | 977,502 | ||||||
Edenred | 10,357 | 454,239 | ||||||
Eiffage SA(1) | 3,430 | 314,417 | ||||||
Electricite de France SA | 25,109 | 233,440 | ||||||
Engie SA(1) | 75,206 | 932,700 | ||||||
EssilorLuxottica SA(1) | 105,273 | 13,539,001 | ||||||
EssilorLuxottica SA(1) | 172,788 | 22,351,550 | ||||||
Eurazeo SE(1) | 1,711 | 87,921 | ||||||
Faurecia SE(1) | 3,173 | 124,663 | ||||||
Gecina SA | 1,860 | 229,723 | ||||||
Getlink SE(1) | 18,735 | 270,922 | ||||||
Hermes International | 1,366 | 1,146,904 | ||||||
ICADE | 1,320 | 92,173 | ||||||
Iliad SA | 610 | 119,078 | ||||||
Ingenico Group SA | 2,673 | 429,483 | ||||||
Ipsen SA | 1,731 | 146,843 | ||||||
JCDecaux SA(1) | 3,769 | 70,406 | ||||||
Kering SA | 37,264 | 20,372,947 | ||||||
Klepierre SA | 7,744 | 154,793 | ||||||
La Francaise des Jeux SAEM(2) | 3,945 | 121,933 | ||||||
Legrand SA | 527,975 | 40,116,858 | ||||||
L’Oreal SA | 10,917 | 3,523,426 | ||||||
LVMH Moet Hennessy Louis Vuitton SE | 197,574 | 87,227,990 | ||||||
Natixis SA(1) | 36,791 | 97,038 | ||||||
Orange SA | 5,781,688 | 69,137,251 | ||||||
Orpea | 2,177 | 251,451 | ||||||
Pernod Ricard SA | 244,450 | 38,492,666 | ||||||
Peugeot SA | 24,641 | 404,091 | ||||||
Publicis Groupe SA | 497,930 | 16,175,269 | ||||||
Remy Cointreau SA | 147,286 | 20,093,637 | ||||||
Renault SA | 7,710 | 197,327 | ||||||
Rexel SA | 3,459,225 | 39,646,698 | ||||||
Safran SA(1) | 13,929 | 1,401,136 | ||||||
Sanofi SA | 2,031,812 | 207,213,718 | ||||||
Sartorius Stedim Biotech | 263,356 | 66,770,620 | ||||||
Schneider Electric SE | 130,676 | 14,535,973 | ||||||
SCOR SE(1) | 201,109 | 5,554,284 | ||||||
SEB SA | 887 | 147,135 | ||||||
Societe Generale SA | 33,373 | 557,986 | ||||||
Sodexo SA | 3,621 | 245,533 | ||||||
Suez SA | 13,964 | 164,127 | ||||||
Teleperformance(1) | 2,541 | 647,147 | ||||||
Thales SA | 4,387 | 355,064 | ||||||
TOTAL SA | 1,665,956 | 64,236,644 | ||||||
Ubisoft Entertainment SA(1) | 416,940 | 34,527,010 | ||||||
Unibail-Rodamco-Westfield | 5,698 | 321,178 | ||||||
Valeo SA | 9,283 | 244,843 | ||||||
Veolia Environnement SA | 22,190 | 501,076 | ||||||
Vinci SA | 21,131 | 1,959,336 | ||||||
Vivendi SA | 36,232 | 936,224 | ||||||
Wendel SA | 1,202 | 114,716 | ||||||
Worldline SA(1)(2) | 6,096 | 531,507 | ||||||
|
| |||||||
Total France |
| 951,811,403 | ||||||
|
| |||||||
Germany – 6.53% | ||||||||
Adidas AG(1) | 150,776 | 39,752,368 | ||||||
Allianz SE | 340,347 | 69,547,351 | ||||||
BASF SE | 544,454 | 30,581,622 | ||||||
Bayer AG | 880,012 | 65,229,625 | ||||||
Bayerische Motoren Werke AG | 13,633 | 870,340 | ||||||
Bechtle AG | 373,292 | 66,162,615 | ||||||
Beiersdorf AG | 4,289 | 487,721 | ||||||
Brenntag AG | 6,362 | 337,314 | ||||||
Carl Zeiss Meditec AG | 1,847 | 179,847 | ||||||
Commerzbank AG | 11,133,481 | 49,620,396 | ||||||
Continental AG(1) | 877,779 | 86,295,625 | ||||||
Covestro AG(2) | 852,149 | 32,456,874 | ||||||
Daimler AG - Class REGISTERED | 35,084 | 1,427,353 | ||||||
Delivery Hero SE(1)(2) | 5,489 | 564,090 | ||||||
Deutsche Bank AG(1) | 82,694 | 788,909 | ||||||
Deutsche Boerse AG | 8,259 | 1,494,687 | ||||||
Deutsche Lufthansa AG(1) | 10,585 | 106,194 | ||||||
Deutsche Post AG | 40,731 | 1,495,638 | ||||||
Deutsche Telekom AG | 1,399,314 | 23,479,427 | ||||||
Deutsche Wohnen SE | 14,483 | 650,803 | ||||||
E.ON SE | 5,525,268 | 62,367,449 | ||||||
Evonik Industries AG | 8,454 | 215,324 | ||||||
Fraport AG Frankfurt Airport Services Worldwide(1) | 1,671 | 73,198 | ||||||
Fresenius Medical Care AG & Co. KGaA | 861,023 | 74,073,704 | ||||||
Fresenius SE & Co. KGaA | 17,213 | 855,536 | ||||||
GEA Group AG | 6,282 | 199,380 | ||||||
Hannover Rueck SE | 2,483 | 429,122 | ||||||
HeidelbergCement AG | 6,127 | 327,989 | ||||||
Henkel AG & Co. KGaA | 4,279 | 357,983 | ||||||
HOCHTIEF AG | 1,076 | 95,742 | ||||||
Infineon Technologies AG | 54,088 | 1,267,400 | ||||||
KION Group AG(1) | 2,497 | 153,740 | ||||||
Knorr-Bremse AG(1) | 2,012 | 204,189 | ||||||
LANXESS AG(1) | 3,263 | 172,553 | ||||||
LEG Immobilien AG | 3,050 | 386,849 | ||||||
Merck KGaA | 5,609 | 653,156 | ||||||
METRO AG | 7,818 | 74,194 | ||||||
MTU Aero Engines AG | 2,186 | 380,584 | ||||||
Muenchener Rueckversicherungs-Gesellschaft AG in Muenchen | 5,942 | 1,547,267 | ||||||
Nemetschek SE | 350,778 | 24,102,757 | ||||||
Puma SE | 3,490 | 270,597 | ||||||
RWE AG | 24,047 | 841,815 | ||||||
SAP SE | 45,392 | 6,345,326 | ||||||
Scout24 AG(2) | 4,748 | 367,342 | ||||||
Siemens AG | 151,642 | 17,884,236 | ||||||
Siemens Healthineers AG(2) | 6,606 | 317,538 | ||||||
Symrise AG - Class A | 5,560 | 649,668 | ||||||
TeamViewer AG(1)(2) | 5,507 | 300,070 | ||||||
Telefonica Deutschland Holding AG | 46,944 | 138,447 | ||||||
ThyssenKrupp AG(1) | 18,573 | 132,505 | ||||||
Uniper SE | 8,201 | 264,639 | ||||||
United Internet AG - Class REG | 4,345 | 184,606 | ||||||
Volkswagen AG | 11,174 | 1,804,129 | ||||||
Vonovia SE | 20,837 | 1,273,621 | ||||||
Zalando SE(1)(2) | 990,121 | 70,239,725 | ||||||
|
| |||||||
Total Germany |
| 740,481,179 | ||||||
|
| |||||||
Hong Kong – 4.67% | ||||||||
AIA Group Ltd. | 10,913,284 | 102,122,202 | ||||||
ASM Pacific Technology Ltd. | 13,300 | 140,554 | ||||||
Bank of East Asia Ltd. | 53,600 | 122,867 | ||||||
BOC Hong Kong Holdings Ltd. | 152,500 | 488,289 | ||||||
Budweiser Brewing Co. APAC Ltd.(2) | 71,900 | 210,482 | ||||||
China Mobile Ltd. | 18,860,500 | 127,347,237 | ||||||
China Resources Power Holdings Co. Ltd. | 17,028,000 | 20,086,104 | ||||||
CK Asset Holdings Ltd. | 106,500 | 638,659 | ||||||
CK Hutchison Holdings Ltd. | 17,544,500 | 113,610,938 | ||||||
CK Infrastructure Holdings Ltd. | 29,000 | 149,909 | ||||||
CLP Holdings Ltd. | 67,500 | 662,934 | ||||||
Dairy Farm International Holdings Ltd. | 14,100 | 65,885 | ||||||
Galaxy Entertainment Group Ltd. | 1,195,000 | 8,197,401 | ||||||
Hang Lung Properties Ltd. | 79,000 | 187,805 | ||||||
Hang Seng Bank Ltd. | 31,500 | 530,532 | ||||||
Henderson Land Development Co. Ltd. | 60,758 | 231,713 | ||||||
HK Electric Investments & HK Electric Investments Ltd. | 117,500 | 122,046 | ||||||
HKT Trust & HKT Ltd. - Class Miscella | 152,000 | 223,055 | ||||||
Hong Kong & China Gas Co. Ltd. | 463,791 | 720,809 | ||||||
Hong Kong Exchanges & Clearing Ltd. | 52,099 | 2,218,987 | ||||||
Hongkong Land Holdings Ltd. | 50,300 | 209,224 | ||||||
Jardine Matheson Holdings Ltd. | 96,300 | 4,026,384 | ||||||
Jardine Strategic Holdings Ltd. | 994,000 | 21,441,670 | ||||||
Kerry Properties Ltd. | 23,500 | 61,044 | ||||||
Link Real Estate Investment Trust | 89,800 | 737,273 | ||||||
Melco Resorts & Entertainment Ltd. - ADR | 8,413 | 130,570 | ||||||
MTR Corp. Ltd. | 63,500 | 330,248 | ||||||
New World Development Co. Ltd. | 62,853 | 298,431 | ||||||
NWS Holdings Ltd. | 40,613 | 35,327 | ||||||
PCCW Ltd. | 164,000 | 93,769 | ||||||
Power Assets Holdings Ltd. | 57,000 | 311,452 | ||||||
Sino Land Co. Ltd. | 136,490 | 172,687 | ||||||
SJM Holdings Ltd. | 73,000 | 81,843 | ||||||
Sun Hung Kai Properties Ltd. | 53,500 | 683,475 | ||||||
Swire Pacific Ltd. - Class A | 4,729,000 | 25,133,575 | ||||||
Swire Properties Ltd. | 51,800 | 132,254 | ||||||
Techtronic Industries Co. Ltd. | 3,823,000 | 37,826,887 | ||||||
WH Group Ltd.(2) | 68,732,000 | 59,397,812 | ||||||
Wharf Real Estate Investment Co. Ltd. | 68,000 | 326,441 | ||||||
|
| |||||||
Total Hong Kong |
| 529,508,774 | ||||||
|
| |||||||
India – 1.43% | ||||||||
Asian Paints Ltd. | 1,942,494 | 43,417,123 | ||||||
HDFC Bank Ltd. - ADR | 875,017 | 39,778,273 | ||||||
Housing Development Finance Corp. Ltd. | 1,644,817 | 38,383,895 | ||||||
ICICI Lombard General Insurance Co. Ltd.(2) | 975,486 | 16,418,060 | ||||||
MakeMyTrip Ltd.(1) | 487,900 | 7,474,628 | ||||||
United Spirits Ltd.(1) | 2,077,412 | 16,260,808 | ||||||
|
| |||||||
Total India |
| 161,732,787 | ||||||
|
| |||||||
Ireland – 1.91% | ||||||||
Accenture Plc - Class A | 326,834 | 70,177,796 | ||||||
AerCap Holdings NV(1) | 5,046 | 155,417 | ||||||
CRH Plc | 32,333 | 1,112,911 | ||||||
DCC Plc | 4,052 | 338,114 | ||||||
Experian Plc | 2,021,660 | 70,957,948 | ||||||
Flutter Entertainment Plc | 3,101 | 406,538 | ||||||
Flutter Entertainment Plc | 3,401 | 449,015 | ||||||
ICON Plc(1) | 162,268 | 27,335,667 | ||||||
James Hardie Industries Plc | 19,535 | 376,412 | ||||||
Kerry Group Plc - Class A | 6,906 | 857,914 | ||||||
Kingspan Group Plc | 687,719 | 44,396,612 | ||||||
Smurfit Kappa Group Plc | 9,292 | 312,265 | ||||||
|
| |||||||
Total Ireland |
| 216,876,609 | ||||||
|
| |||||||
Isle of Man – 0.00%(3) | ||||||||
GVC Holdings Plc | 24,513 | 224,684 | ||||||
|
| |||||||
Total Isle of Man |
| 224,684 | ||||||
|
| |||||||
Israel – 0.03% | ||||||||
Azrieli Group Ltd. | 1,610 | 73,379 | ||||||
Bank Hapoalim BM | 47,993 | 286,910 | ||||||
Bank Leumi Le-Israel BM | 60,380 | 303,585 | ||||||
Check Point Software Technologies Ltd.(1) | 5,002 | 537,365 | ||||||
CyberArk Software Ltd.(1) | 1,739 | 172,631 | ||||||
Elbit Systems Ltd. | 1,178 | 161,884 | ||||||
ICL Group Ltd. | 31,328 | 93,317 | ||||||
Israel Discount Bank Ltd. - Class A | 52,528 | 160,210 | ||||||
Mizrahi Tefahot Bank Ltd. | 5,583 | 104,905 | ||||||
Nice Ltd.(1) | 2,659 | 501,227 | ||||||
Teva Pharmaceutical Industries Ltd. - ADR(1) | 44,653 | 550,571 | ||||||
Wix.com Ltd.(1) | 2,245 | 575,214 | ||||||
|
| |||||||
Total Israel |
| 3,521,198 | ||||||
|
| |||||||
Italy – 2.28% | ||||||||
Assicurazioni Generali SpA | 45,245 | 687,284 | ||||||
Atlantia SpA(1) | 20,401 | 329,993 | ||||||
Davide Campari-Milano SpA | 24,920 | 210,747 | ||||||
DiaSorin SpA | 1,030 | 197,807 | ||||||
Enel SpA | 11,537,068 | 99,777,719 | ||||||
ENI SpA | 11,307,017 | 108,389,239 | ||||||
Ferrari NV | 210,538 | 36,064,192 | ||||||
FinecoBank Banca Fineco SpA(1) | 26,113 | 353,415 | ||||||
Infrastrutture Wireless Italiane SpA(2) | 11,016 | 110,582 | ||||||
Intesa Sanpaolo SpA | 612,826 | 1,177,662 | ||||||
Leonardo SpA | 14,608 | 97,382 | ||||||
Mediobanca Banca di Credito Finanziario SpA | 26,483 | 191,242 | ||||||
Moncler SpA | 8,523 | 327,740 | ||||||
Nexi SpA(1)(2) | 15,902 | 275,749 | ||||||
Pirelli & C SpA(2) | 16,012 | 67,910 | ||||||
Poste Italiane SpA(2) | 20,768 | 181,414 | ||||||
Prysmian SpA | 9,687 | 224,722 | ||||||
Recordati SpA | 4,799 | 240,136 | ||||||
Snam SpA | 83,871 | 408,884 | ||||||
Telecom Italia SpA | 316,127 | 124,660 | ||||||
Telecom Italia SpA Savings Share | 237,549 | 92,454 | ||||||
Terna Rete Elettrica Nazionale SpA | 57,934 | 399,603 | ||||||
UniCredit SpA | 951,983 | 8,786,059 | ||||||
|
| |||||||
Total Italy |
| 258,716,595 | ||||||
|
| |||||||
Japan – 18.76% | ||||||||
ABC-Mart, Inc. | 1,300 | 76,262 | ||||||
Acom Co. Ltd. | 18,100 | 69,265 | ||||||
Advantest Corp. | 8,400 | 479,392 | ||||||
Aeon Co. Ltd. | 28,200 | 656,059 | ||||||
Aeon Mall Co. Ltd. | 4,500 | 59,799 | ||||||
AGC, Inc. | 8,000 | 229,356 | ||||||
Air Water, Inc. | 8,100 | 114,444 | ||||||
Aisin Seiki Co. Ltd. | 6,500 | 190,528 | ||||||
Ajinomoto Co., Inc. | 20,565 | 341,275 | ||||||
Alfresa Holdings Corp. | 8,300 | 173,979 | ||||||
Amada Co. Ltd. | 12,200 | 99,892 | ||||||
ANA Holdings, Inc. | 5,100 | 116,550 | ||||||
Aozora Bank Ltd. | 4,400 | 76,723 | ||||||
Asahi Group Holdings Ltd. | 15,900 | 558,444 | ||||||
Asahi Intecc Co. Ltd. | 8,100 | 231,177 | ||||||
Asahi Kasei Corp. | 51,700 | 423,205 | ||||||
Astellas Pharma, Inc. | 4,260,300 | 71,145,143 | ||||||
Bandai Namco Holdings, Inc. | 8,900 | 468,479 | ||||||
Bank of Kyoto Ltd. | 2,000 | 71,060 | ||||||
Benesse Holdings, Inc. | 2,800 | 75,095 | ||||||
Bridgestone Corp. | 22,000 | 710,060 | ||||||
Brother Industries Ltd. | 8,700 | 157,184 | ||||||
Calbee, Inc. | 4,000 | 110,559 | ||||||
Canon, Inc. | 41,200 | 821,859 | ||||||
Casio Computer Co. Ltd. | 8,800 | 153,521 | ||||||
Central Japan Railway Co. | 5,900 | 912,484 | ||||||
Chiba Bank Ltd. | 21,700 | 102,592 | ||||||
Chubu Electric Power Co., Inc. | 26,500 | 332,361 | ||||||
Chugai Pharmaceutical Co. Ltd. | 28,800 | 1,541,952 | ||||||
Chugoku Electric Power Co., Inc. | 11,100 | 147,986 | ||||||
Coca-Cola Bottlers Japan Holdings, Inc. | 5,000 | 90,683 | ||||||
Concordia Financial Group Ltd. | 46,900 | 150,786 | ||||||
Cosmos Pharmaceutical Corp. | 900 | 138,091 | ||||||
CyberAgent, Inc. | 4,600 | 226,107 | ||||||
Dai Nippon Printing Co. Ltd. | 9,800 | 225,306 | ||||||
Daicel Corp. | 11,000 | 85,254 | ||||||
Daifuku Co. Ltd. | 4,300 | 376,818 | ||||||
Dai-ichi Life Holdings, Inc. | 44,400 | 531,468 | ||||||
Daiichi Sankyo Co. Ltd. | 24,700 | 2,020,253 | ||||||
Daikin Industries Ltd. | 10,800 | 1,747,440 | ||||||
Daito Trust Construction Co. Ltd. | 2,700 | 248,836 | ||||||
Daiwa House Industry Co. Ltd. | 2,305,100 | 54,434,703 | ||||||
Daiwa House REIT Investment Corp. | 77 | 181,150 | ||||||
Daiwa Securities Group, Inc. | 58,700 | 246,593 | ||||||
Denso Corp. | 926,000 | 36,314,989 | ||||||
Dentsu Group, Inc. | 8,700 | 206,378 | ||||||
Disco Corp. | 1,200 | 292,666 | ||||||
East Japan Railway Co. | 724,500 | 50,204,420 | ||||||
Eisai Co. Ltd. | 11,000 | 873,938 | ||||||
Electric Power Development Co. Ltd. | 6,100 | 115,635 | ||||||
ENEOS Holdings, Inc. | 4,452,650 | 15,871,765 | ||||||
FamilyMart Co. Ltd. | 10,400 | 178,546 | ||||||
FANUC Corp. | 8,200 | 1,470,014 | ||||||
Fast Retailing Co. Ltd. | 2,500 | 1,436,930 | ||||||
Fuji Electric Co. Ltd. | 5,600 | 154,134 | ||||||
FUJIFILM Holdings Corp. | 1,635,300 | 69,993,640 | ||||||
Fujitsu Ltd. | 100,200 | 11,731,752 | ||||||
Fukuoka Financial Group, Inc. | 358,300 | 5,665,051 | ||||||
GLP J-Reit | 143 | 206,642 | ||||||
GMO Payment Gateway, Inc. | 1,700 | 177,809 | ||||||
Hakuhodo DY Holdings, Inc. | 9,800 | 116,962 | ||||||
Hamamatsu Photonics KK | 5,800 | 252,559 | ||||||
Hankyu Hanshin Holdings, Inc. | 9,410 | 317,853 | ||||||
Hikari Tsushin, Inc. | 900 | 205,783 | ||||||
Hino Motors Ltd. | 12,800 | 86,843 | ||||||
Hirose Electric Co. Ltd. | 1,415 | 155,379 | ||||||
Hisamitsu Pharmaceutical Co., Inc. | 2,200 | 118,923 | ||||||
Hitachi Construction Machinery Co. Ltd. | 4,100 | 113,894 | ||||||
Hitachi Ltd. | 40,900 | 1,300,000 | ||||||
Hitachi Metals Ltd. | 2,384,700 | 28,582,621 | ||||||
Honda Motor Co. Ltd. | 3,951,199 | 101,125,677 | ||||||
Hoshizaki Corp. | 2,300 | 197,135 | ||||||
Hoya Corp. | 16,400 | 1,570,448 | ||||||
Hulic Co. Ltd. | 13,900 | 131,230 | ||||||
Idemitsu Kosan Co. Ltd. | 7,565 | 161,453 | ||||||
Iida Group Holdings Co. Ltd. | 766,100 | 11,773,690 | ||||||
Inpex Corp. | 3,188,100 | 19,907,329 | ||||||
Isetan Mitsukoshi Holdings Ltd. | 14,900 | 85,750 | ||||||
Isuzu Motors Ltd. | 2,755,800 | 25,042,904 |
Ito En Ltd. | 2,200 | 124,187 | ||||||
ITOCHU Corp. | 56,800 | 1,229,028 | ||||||
Itochu Techno-Solutions Corp. | 4,000 | 150,427 | ||||||
Japan Airlines Co. Ltd. | 4,500 | 81,205 | ||||||
Japan Airport Terminal Co. Ltd. | 2,200 | 93,878 | ||||||
Japan Exchange Group, Inc. | 20,700 | 479,411 | ||||||
Japan Post Bank Co. Ltd. | 15,200 | 113,046 | ||||||
Japan Post Holdings Co. Ltd. | 64,900 | 463,170 | ||||||
Japan Post Insurance Co. Ltd. | 8,800 | 115,952 | ||||||
Japan Prime Realty Investment Corp. | 28 | 82,141 | ||||||
Japan Real Estate Investment Corp. | 53 | 272,002 | ||||||
Japan Retail Fund Investment Corp. | 116 | 145,090 | ||||||
Japan Tobacco, Inc. | 2,563,600 | 47,613,112 | ||||||
JFE Holdings, Inc. | 19,000 | 137,361 | ||||||
JGC Holdings Corp. | 9,800 | 103,340 | ||||||
JSR Corp. | 9,000 | 174,599 | ||||||
JTEKT Corp. | 8,400 | 65,589 | ||||||
Kajima Corp. | 18,000 | 215,223 | ||||||
Kakaku.com, Inc. | 1,102,000 | 28,072,614 | ||||||
Kamigumi Co. Ltd. | 4,000 | 78,666 | ||||||
Kansai Electric Power Co., Inc. | 29,000 | 281,010 | ||||||
Kansai Paint Co. Ltd. | 7,500 | 158,488 | ||||||
Kao Corp. | 381,700 | 30,290,879 | ||||||
Kawasaki Heavy Industries Ltd. | 4,975 | 71,857 | ||||||
KDDI Corp. | 67,100 | 2,002,072 | ||||||
Keihan Holdings Co. Ltd. | 4,400 | 196,501 | ||||||
Keikyu Corp. | 10,100 | 154,551 | ||||||
Keio Corp. | 4,300 | 246,090 | ||||||
Keisei Electric Railway Co. Ltd. | 5,900 | 184,908 | ||||||
Keyence Corp. | 232,208 | 97,309,443 | ||||||
Kikkoman Corp. | 6,200 | 299,445 | ||||||
Kintetsu Group Holdings Co. Ltd. | 7,600 | 341,008 | ||||||
Kirin Holdings Co. Ltd. | 35,800 | 754,655 | ||||||
Kobayashi Pharmaceutical Co. Ltd. | 2,200 | 193,434 | ||||||
Kobe Bussan Co. Ltd. | 2,800 | 159,000 | ||||||
Koito Manufacturing Co. Ltd. | 4,000 | 161,838 | ||||||
Komatsu Ltd. | 1,248,700 | 25,574,035 | ||||||
Konami Holdings Corp. | 4,300 | 143,486 | ||||||
Kose Corp. | 1,500 | 181,571 | ||||||
Kubota Corp. | 44,400 | 664,168 | ||||||
Kuraray Co. Ltd. | 14,400 | 150,692 | ||||||
Kurita Water Industries Ltd. | 4,400 | 122,400 | ||||||
Kyocera Corp. | 1,316,000 | 71,833,302 | ||||||
Kyowa Kirin Co. Ltd. | 11,100 | 292,204 | ||||||
Kyushu Electric Power Co., Inc. | 14,100 | 118,174 | ||||||
Kyushu Railway Co. | 5,800 | 150,706 | ||||||
Lasertec Corp. | 3,300 | 311,951 | ||||||
Lawson, Inc. | 2,300 | 115,691 | ||||||
LINE Corp.(1) | 2,500 | 125,823 | ||||||
Lion Corp. | 10,300 | 247,732 | ||||||
LIXIL Group Corp. | 10,300 | 144,656 | ||||||
M3, Inc. | 19,200 | 815,638 | ||||||
Makita Corp. | 9,400 | 341,826 | ||||||
Marubeni Corp. | 68,000 | 308,883 | ||||||
Marui Group Co. Ltd. | 7,800 | 141,097 | ||||||
Maruichi Steel Tube Ltd. | 2,000 | 49,851 | ||||||
Mazda Motor Corp. | 22,100 | 133,526 | ||||||
McDonald’s Holdings Co. Japan Ltd. | 3,050 | 164,845 | ||||||
Mebuki Financial Group, Inc. | 35,840 | 83,488 | ||||||
Medipal Holdings Corp. | 7,340 | 141,667 | ||||||
MEIJI Holdings Co. Ltd. | 5,100 | 405,838 | ||||||
Mercari, Inc.(1) | 3,900 | 121,100 | ||||||
Minebea Mitsumi, Inc. | 15,400 | 280,706 | ||||||
MISUMI Group, Inc. | 12,100 | 303,812 | ||||||
Mitsubishi Chemical Holdings Corp. | 52,750 | 307,620 | ||||||
Mitsubishi Corp. | 57,200 | 1,208,735 | ||||||
Mitsubishi Electric Corp. | 6,047,500 | 78,988,027 | ||||||
Mitsubishi Estate Co. Ltd. | 49,900 | 743,601 |
Mitsubishi Gas Chemical Co., Inc. | 7,200 | 109,508 | ||||||
Mitsubishi Heavy Industries Ltd. | 13,240 | 312,598 | ||||||
Mitsubishi Materials Corp. | 4,600 | 97,131 | ||||||
Mitsubishi Motors Corp. | 29,700 | 73,609 | ||||||
Mitsubishi UFJ Financial Group, Inc. | 498,000 | 1,959,891 | ||||||
Mitsubishi UFJ Lease & Finance Co. Ltd. | 18,300 | 87,325 | ||||||
Mitsui & Co. Ltd. | 807,400 | 11,962,940 | ||||||
Mitsui Chemicals, Inc. | 7,100 | 148,504 | ||||||
Mitsui Fudosan Co. Ltd. | 40,400 | 717,695 | ||||||
Miura Co. Ltd. | 4,000 | 166,681 | ||||||
Mizuho Financial Group, Inc. | 988,900 | 1,216,391 | ||||||
Monotaro Co. Ltd. | 5,100 | 204,910 | ||||||
MS&AD Insurance Group Holdings, Inc. | 1,661,440 | 45,753,909 | ||||||
Murata Manufacturing Co. Ltd. | 758,300 | 44,700,651 | ||||||
Nabtesco Corp. | 5,200 | 160,925 | ||||||
Nagoya Railroad Co. Ltd. | 8,500 | 239,576 | ||||||
NEC Corp. | 11,000 | 528,503 | ||||||
Nexon Co. Ltd. | 21,400 | 482,708 | ||||||
NGK Insulators Ltd. | 10,100 | 139,941 | ||||||
NGK Spark Plug Co. Ltd. | 6,900 | 99,173 | ||||||
NH Foods Ltd. | 3,400 | 136,818 | ||||||
Nidec Corp. | 589,000 | 39,680,217 | ||||||
Nihon M&A Center, Inc. | 6,300 | 286,511 | ||||||
Nikon Corp. | 13,300 | 111,698 | ||||||
Nintendo Co. Ltd. | 4,800 | 2,145,930 | ||||||
Nippon Building Fund, Inc. | 52 | 296,149 | ||||||
Nippon Express Co. Ltd. | 2,800 | 145,190 | ||||||
Nippon Paint Holdings Co. Ltd. | 6,100 | 444,915 | ||||||
Nippon Prologis Real Estate Investment Trust, Inc. | 89 | 270,438 | ||||||
Nippon Shinyaku Co. Ltd. | 1,900 | 155,083 | ||||||
Nippon Steel Corp. | 33,300 | 314,667 | ||||||
Nippon Telegraph & Telephone Corp. | 2,584,100 | 60,208,114 | ||||||
Nippon Yusen KK | 6,100 | 86,334 | ||||||
Nissan Chemical Corp. | 5,500 | 282,969 | ||||||
Nissan Motor Co. Ltd. | 95,600 | 354,528 | ||||||
Nisshin Seifun Group, Inc. | 8,500 | 126,919 | ||||||
Nissin Foods Holdings Co. Ltd. | 2,900 | 256,939 | ||||||
Nitori Holdings Co. Ltd. | 3,400 | 666,635 | ||||||
Nitto Denko Corp. | 6,500 | 368,486 | ||||||
Nomura Holdings, Inc. | 129,500 | 581,920 | ||||||
Nomura Real Estate Holdings, Inc. | 5,100 | 94,949 | ||||||
Nomura Real Estate Master Fund, Inc. | 177 | 211,992 | ||||||
Nomura Research Institute Ltd. | 14,114 | 385,492 | ||||||
NSK Ltd. | 15,900 | 118,656 | ||||||
NTT Data Corp. | 27,000 | 301,870 | ||||||
NTT DOCOMO, Inc. | 48,100 | 1,276,960 | ||||||
Obayashi Corp. | 26,400 | 248,199 | ||||||
Obic Co. Ltd. | 3,100 | 546,341 | ||||||
Odakyu Electric Railway Co. Ltd. | 12,400 | 304,516 | ||||||
Oji Holdings Corp. | 33,600 | 156,756 | ||||||
Olympus Corp. | 3,080,100 | 59,299,612 | ||||||
Omron Corp. | 7,900 | 529,128 | ||||||
Ono Pharmaceutical Co. Ltd. | 16,400 | 478,659 | ||||||
Oracle Corp. | 1,600 | 189,780 | ||||||
Oriental Land Co. Ltd. | 8,600 | 1,136,457 | ||||||
ORIX Corp. | 54,500 | 676,740 | ||||||
Orix JREIT, Inc. | 107 | 141,040 | ||||||
Osaka Gas Co. Ltd. | 15,400 | 304,411 | ||||||
Otsuka Corp. | 4,300 | 227,107 | ||||||
Otsuka Holdings Co. Ltd. | 16,130 | 702,977 | ||||||
Pan Pacific International Holdings Corp. | 17,500 | 385,292 | ||||||
Panasonic Corp. | 12,120,700 | 106,287,007 | ||||||
Park24 Co. Ltd. | 4,700 | 80,582 | ||||||
PeptiDream, Inc.(1) | 4,300 | 198,125 | ||||||
Persol Holdings Co. Ltd. | 7,200 | 99,265 | ||||||
Pigeon Corp. | 603,500 | 23,358,519 | ||||||
Pola Orbis Holdings, Inc. | 4,000 | 69,834 | ||||||
Rakuten, Inc. | 37,000 | 326,821 |
Recruit Holdings Co. Ltd. | 55,300 | 1,901,778 | ||||||
Renesas Electronics Corp.(1) | 32,200 | 165,521 | ||||||
Resona Holdings, Inc. | 2,430,900 | 8,318,281 | ||||||
Ricoh Co. Ltd. | 26,900 | 193,023 | ||||||
Rinnai Corp. | 1,500 | 125,615 | ||||||
Rohm Co. Ltd. | 427,500 | 28,425,072 | ||||||
Ryohin Keikaku Co. Ltd. | 9,000 | 128,012 | ||||||
Santen Pharmaceutical Co. Ltd. | 15,200 | 279,824 | ||||||
SBI Holdings, Inc. | 9,325 | 202,357 | ||||||
SCSK Corp. | 2,400 | 117,419 | ||||||
Secom Co. Ltd. | 8,800 | 772,136 | ||||||
Sega Sammy Holdings, Inc. | 7,100 | 85,109 | ||||||
Seibu Holdings, Inc. | 9,900 | 107,833 | ||||||
Seiko Epson Corp. | 11,500 | 131,740 | ||||||
Sekisui Chemical Co. Ltd. | 14,500 | 207,752 | ||||||
Sekisui House Ltd. | 25,600 | 488,759 | ||||||
Seven & i Holdings Co. Ltd. | 31,000 | 1,014,119 | ||||||
Seven Bank Ltd. | 26,100 | 71,536 | ||||||
SG Holdings Co. Ltd. | 7,300 | 238,226 | ||||||
Sharp Corp. | 8,605 | 92,285 | ||||||
Shimadzu Corp. | 9,300 | 248,284 | ||||||
Shimamura Co. Ltd. | 1,000 | 67,732 | ||||||
Shimano, Inc. | 208,500 | 40,092,212 | ||||||
Shimizu Corp. | 21,800 | 179,590 | ||||||
Shin-Etsu Chemical Co. Ltd. | 15,395 | 1,806,781 | ||||||
Shinsei Bank Ltd. | 6,900 | 83,457 | ||||||
Shionogi & Co. Ltd. | 11,700 | 733,981 | ||||||
Shiseido Co. Ltd. | 794,400 | 50,619,671 | ||||||
Shizuoka Bank Ltd. | 18,800 | 120,941 | ||||||
Showa Denko KK | 5,400 | 121,886 | ||||||
SMC Corp. | 106,100 | 54,527,023 | ||||||
Softbank Corp. | 78,800 | 1,004,403 | ||||||
SoftBank Group Corp. | 632,200 | 31,880,373 | ||||||
Sohgo Security Services Co. Ltd. | 3,300 | 154,088 | ||||||
Sompo Holdings, Inc. | 14,100 | 485,398 | ||||||
Sony Corp. | 1,711,800 | 118,165,862 | ||||||
Sony Financial Holdings, Inc. | 6,200 | 149,699 | ||||||
Square Enix Holdings Co. Ltd. | 4,200 | 212,789 | ||||||
Stanley Electric Co. Ltd. | 5,800 | 140,404 | ||||||
Subaru Corp. | 25,180 | 527,261 | ||||||
Sugi Holdings Co. Ltd. | 277,400 | 18,811,653 | ||||||
Sumco Corp. | 12,100 | 186,027 | ||||||
Sumitomo Chemical Co. Ltd. | 59,000 | 177,519 | ||||||
Sumitomo Corp. | 48,900 | 562,420 | ||||||
Sumitomo Dainippon Pharma Co. Ltd. | 7,900 | 109,475 | ||||||
Sumitomo Electric Industries Ltd. | 4,270,800 | 49,266,688 | ||||||
Sumitomo Heavy Industries Ltd. | 4,900 | 107,168 | ||||||
Sumitomo Metal Mining Co. Ltd. | 9,500 | 267,613 | ||||||
Sumitomo Mitsui Financial Group, Inc. | 2,327,300 | 65,680,601 | ||||||
Sumitomo Mitsui Trust Holdings, Inc. | 1,704,000 | 48,019,342 | ||||||
Sumitomo Realty & Development Co. Ltd. | 12,700 | 350,554 | ||||||
Sumitomo Rubber Industries Ltd. | 7,700 | 76,265 | ||||||
Sundrug Co. Ltd. | 3,300 | 109,216 | ||||||
Suntory Beverage & Food Ltd. | 6,310 | 246,205 | ||||||
Suzuken Co. Ltd. | 2,855 | 106,662 | ||||||
Suzuki Motor Corp. | 1,111,200 | 37,943,158 | ||||||
Sysmex Corp. | 615,500 | 47,246,819 | ||||||
T&D Holdings, Inc. | 688,700 | 5,915,388 | ||||||
Taiheiyo Cement Corp. | 4,900 | 113,847 | ||||||
Taisei Corp. | 7,800 | 284,280 | ||||||
Taisho Pharmaceutical Holdings Co. Ltd. | 1,360 | 83,459 | ||||||
Taiyo Nippon Sanso Corp. | 7,000 | 117,060 | ||||||
Takeda Pharmaceutical Co. Ltd. | 2,355,700 | 84,635,514 | ||||||
TDK Corp. | 5,300 | 527,623 | ||||||
Teijin Ltd. | 7,000 | 111,451 | ||||||
Terumo Corp. | 27,800 | 1,058,145 | ||||||
THK Co. Ltd. | 5,500 | 136,937 | ||||||
TIS, Inc. | 9,100 | 192,671 |
Tobu Railway Co. Ltd. | 8,330 | 275,218 | ||||||
Toho Co. Ltd. | 5,100 | 184,218 | ||||||
Toho Gas Co. Ltd. | 3,300 | 164,942 | ||||||
Tohoku Electric Power Co., Inc. | 16,600 | 157,693 | ||||||
Tokio Marine Holdings, Inc. | 1,532,200 | 67,069,035 | ||||||
Tokyo Century Corp. | 1,700 | 87,051 | ||||||
Tokyo Electric Power Co. Holdings, Inc.(1) | 57,400 | 176,573 | ||||||
Tokyo Electron Ltd. | 6,500 | 1,603,835 | ||||||
Tokyo Gas Co. Ltd. | 15,500 | 371,141 | ||||||
Tokyu Corp. | 22,000 | 309,724 | ||||||
Tokyu Fudosan Holdings Corp. | 25,800 | 121,376 | ||||||
Toppan Printing Co. Ltd. | 10,300 | 172,205 | ||||||
Toray Industries, Inc. | 56,900 | 268,570 | ||||||
Toshiba Corp. | 16,400 | 526,108 | ||||||
Tosoh Corp. | 11,500 | 157,974 | ||||||
TOTO Ltd. | 5,900 | 226,846 | ||||||
Toyo Suisan Kaisha Ltd. | 3,350 | 187,178 | ||||||
Toyoda Gosei Co. Ltd. | 2,900 | 60,591 | ||||||
Toyota Industries Corp. | 6,000 | 318,916 | ||||||
Toyota Motor Corp. | 86,694 | 5,451,673 | ||||||
Toyota Tsusho Corp. | 8,535 | 217,654 | ||||||
Trend Micro, Inc. | 5,200 | 290,599 | ||||||
Tsuruha Holdings, Inc. | 1,500 | 207,170 | ||||||
Unicharm Corp. | 17,400 | 713,618 | ||||||
United Urban Investment Corp. | 123 | 132,477 | ||||||
USS Co. Ltd. | 9,800 | 157,098 | ||||||
Welcia Holdings Co. Ltd. | 2,000 | 161,574 | ||||||
West Japan Railway Co. | 6,700 | 375,796 | ||||||
Yakult Honsha Co. Ltd. | 5,100 | 300,053 | ||||||
Yamada Denki Co. Ltd. | 31,640 | 156,947 | ||||||
Yamaha Corp. | 5,900 | 278,274 | ||||||
Yamaha Motor Co. Ltd. | 10,900 | 171,675 | ||||||
Yamato Holdings Co. Ltd. | 12,900 | 280,026 | ||||||
Yamazaki Baking Co. Ltd. | 4,800 | 82,451 | ||||||
Yaskawa Electric Corp. | 10,200 | 354,583 | ||||||
Yokogawa Electric Corp. | 10,100 | 158,254 | ||||||
Yokohama Rubber Co. Ltd. | 5,300 | 74,942 | ||||||
Z Holdings Corp. | 112,700 | 553,101 | ||||||
ZOZO, Inc. | 4,400 | 98,086 | ||||||
|
| |||||||
Total Japan |
| 2,128,530,339 | ||||||
|
| |||||||
Jordan – 0.00%(3) | ||||||||
Hikma Pharmaceuticals Plc | 5,883 | 161,436 | ||||||
|
| |||||||
Total Jordan |
| 161,436 | ||||||
|
| |||||||
Luxembourg – 0.04% | ||||||||
ArcelorMittal SA(1) | 360,371 | 3,817,002 | ||||||
Aroundtown SA | 50,416 | 288,975 | ||||||
Eurofins Scientific SE | 583 | 367,718 | ||||||
SES SA - Class A | 16,495 | 112,709 | ||||||
Tenaris SA | 17,897 | 116,306 | ||||||
|
| |||||||
Total Luxembourg |
| 4,702,710 | ||||||
|
| |||||||
Macau – 0.00%(3) | ||||||||
Sands China Ltd. | 100,000 | 393,924 | ||||||
Wynn Macau Ltd. | 69,200 | 120,023 | ||||||
|
| |||||||
Total Macau |
| 513,947 | ||||||
|
| |||||||
Mexico – 0.38% | ||||||||
Wal-Mart de Mexico SAB de CV | 17,987,222 | 43,018,451 | ||||||
|
| |||||||
Total Mexico |
| 43,018,451 | ||||||
|
| |||||||
Netherlands – 3.47% | ||||||||
ABN AMRO Bank NV(2) | 18,726 | 161,150 | ||||||
Adyen NV(1)(2) | 792 | 1,152,752 | ||||||
Aegon NV | 72,260 | 213,598 | ||||||
Akzo Nobel NV | 8,677 | 779,547 | ||||||
Altice Europe NV(1) | 28,587 | 110,561 | ||||||
ASML Holding NV | 211,464 | 77,356,321 | ||||||
ASML Holding NV - Class REG | 170,445 | 62,728,873 | ||||||
EXOR NV | 4,361 | 250,310 | ||||||
Heineken Holding NV | 5,119 | 418,975 | ||||||
Heineken NV | 11,153 | 1,028,244 | ||||||
ING Groep NV | 13,708,542 | 95,561,007 | ||||||
Just Eat Takeaway(1)(2) | 5,231 | 546,771 | ||||||
Koninklijke Ahold Delhaize NV | 45,122 | 1,229,758 | ||||||
Koninklijke DSM NV | 7,383 | 1,024,893 | ||||||
Koninklijke KPN NV | 4,654,819 | 12,381,430 | ||||||
Koninklijke Philips NV | 38,980 | 1,821,065 | ||||||
Koninklijke Vopak NV | 3,227 | 170,813 | ||||||
NN Group NV | 12,024 | 404,100 | ||||||
PostNL NV | 13,601,457 | 29,332,808 | ||||||
Prosus NV(1) | 309,623 | 28,868,485 | ||||||
QIAGEN NV - Aquis Listed(1) | 9,740 | 419,550 | ||||||
Randstad NV | 4,788 | 214,096 | ||||||
Royal Dutch Shell Plc - Class A | 168,172 | 2,692,646 | ||||||
Royal Dutch Shell Plc - Class A | 279,273 | 4,571,523 | ||||||
Royal Dutch Shell Plc - Class B | 4,584,428 | 69,501,270 | ||||||
Wolters Kluwer NV | 11,868 | 926,959 | ||||||
|
| |||||||
Total Netherlands |
| 393,867,505 | ||||||
|
| |||||||
New Zealand – 0.32% | ||||||||
a2 Milk Co. Ltd.(1) | 31,923 | 417,864 | ||||||
Auckland International Airport Ltd. | 48,694 | 207,084 | ||||||
Fisher & Paykel Healthcare Corp. Ltd. | 25,596 | 589,650 | ||||||
Mercury NZ Ltd. | 30,155 | 91,871 | ||||||
Meridian Energy Ltd. | 49,444 | 154,132 | ||||||
Ryman Healthcare Ltd. | 15,136 | 128,414 | ||||||
Spark New Zealand Ltd. | 81,327 | 240,619 | ||||||
Xero Ltd.(1) | 553,264 | 34,753,358 | ||||||
|
| |||||||
Total New Zealand |
| 36,582,992 | ||||||
|
| |||||||
Norway – 0.03% | ||||||||
DNB ASA | 39,042 | 521,113 | ||||||
Equinor ASA | 41,241 | 594,104 | ||||||
Gjensidige Forsikring ASA | 8,028 | 148,327 | ||||||
Mowi ASA | 19,168 | 365,374 | ||||||
Norsk Hydro ASA | 51,592 | 143,936 | ||||||
Orkla ASA | 34,046 | 298,910 | ||||||
Schibsted ASA - Class B | 4,503 | 106,363 | ||||||
Telenor ASA | 29,697 | 433,602 | ||||||
Yara International ASA | 7,229 | 252,020 | ||||||
|
| |||||||
Total Norway |
| 2,863,749 | ||||||
|
| |||||||
Peru – 0.44% | ||||||||
Credicorp Ltd. | 376,800 | 50,366,856 | ||||||
|
| |||||||
Total Peru |
| 50,366,856 | ||||||
|
| |||||||
Portugal – 0.32% | ||||||||
EDP - Energias de Portugal SA | 103,391 | 493,512 | ||||||
Galp Energia SGPS SA | 20,416 | 236,825 | ||||||
Jeronimo Martins SGPS SA(1) | 2,019,486 | 35,340,919 | ||||||
|
| |||||||
Total Portugal |
| 36,071,256 | ||||||
|
| |||||||
Russia – 0.00%(3) | ||||||||
Evraz Plc | 22,282 | 78,947 | ||||||
|
| |||||||
Total Russia |
| 78,947 | ||||||
|
| |||||||
Singapore – 2.06% | ||||||||
Ascendas Real Estate Investment Trust | 134,500 | 308,599 | ||||||
CapitaLand Commercial Trust | 104,651 | 128,078 | ||||||
CapitaLand Ltd.(1) | 110,900 | 234,292 | ||||||
CapitaLand Mall Trust | 107,300 | 152,251 | ||||||
City Developments Ltd. | 16,600 | 101,444 | ||||||
DBS Group Holdings Ltd. | 1,134,200 | 17,066,118 | ||||||
Genting Singapore Ltd. | 261,600 | 143,925 | ||||||
Jardine Cycle & Carriage Ltd. | 4,400 | 64,212 | ||||||
Keppel Corp. Ltd. | 60,500 | 260,569 | ||||||
Mapletree Commercial Trust | 83,100 | 116,274 | ||||||
Mapletree Logistics Trust | 122,100 | 171,417 | ||||||
Oversea-Chinese Banking Corp. Ltd. | 136,200 | 887,723 | ||||||
Singapore Airlines Ltd. | 52,300 | 141,169 | ||||||
Singapore Exchange Ltd. | 33,100 | 199,185 | ||||||
Singapore Technologies Engineering Ltd. | 65,300 | 155,855 | ||||||
Singapore Telecommunications Ltd. | 46,398,900 | 82,538,902 | ||||||
Suntec Real Estate Investment Trust | 84,700 | 86,525 | ||||||
United Overseas Bank Ltd. | 7,298,206 | 106,640,421 | ||||||
UOL Group Ltd. | 20,600 | 101,284 | ||||||
Venture Corp. Ltd. | 12,600 | 147,253 | ||||||
Wilmar International Ltd. | 7,998,700 | 23,658,319 | ||||||
|
| |||||||
Total Singapore |
| 233,303,815 | ||||||
|
| |||||||
South Africa – 0.47% | ||||||||
Naspers Ltd. - Class N | 290,502 | 53,388,569 | ||||||
|
| |||||||
Total South Africa |
| 53,388,569 | ||||||
|
| |||||||
South Korea – 2.11% | ||||||||
NAVER Corp. | 118,443 | 26,647,694 | ||||||
POSCO | 146,708 | 21,368,986 | ||||||
Samsung Electronics Co. Ltd. | 1,353,449 | 59,913,983 | ||||||
Samsung SDI Co. Ltd. | 405,864 | 124,097,637 | ||||||
Shinhan Financial Group Ltd. | 324,030 | 7,830,579 | ||||||
|
| |||||||
Total South Korea |
| 239,858,879 | ||||||
|
| |||||||
Spain – 1.77% | ||||||||
ACS Actividades de Construccion y Servicios SA | 10,439 | 268,271 | ||||||
Aena SA(2) | 2,779 | 371,668 | ||||||
Amadeus IT Group SA | 527,780 | 27,709,591 | ||||||
Banco Bilbao Vizcaya Argentaria SA | 274,554 | 945,280 | ||||||
Banco Santander SA | 21,291,673 | 52,089,262 | ||||||
Bankia SA | 7,552,230 | 8,074,285 | ||||||
Bankinter SA | 25,331 | 121,415 | ||||||
CaixaBank SA | 147,773 | 316,129 | ||||||
Cellnex Telecom SA(2) | 10,815 | 660,556 | ||||||
Enagas SA | 8,839 | 216,234 | ||||||
Endesa SA | 13,078 | 324,416 | ||||||
Ferrovial SA | 20,941 | 559,753 | ||||||
Grifols SA | 12,499 | 380,070 | ||||||
Iberdrola SA | 238,350 | 2,782,662 | ||||||
Industria de Diseno Textil SA | 1,562,645 | 41,462,382 | ||||||
Mapfre SA | 46,426 | 82,903 | ||||||
Naturgy Energy Group SA | 84,758 | 1,582,341 | ||||||
Red Electrica Corp. SA | 17,823 | 333,460 | ||||||
Repsol SA | 58,034 | 512,787 | ||||||
Siemens Gamesa Renewable Energy SA(1) | 10,690 | 190,335 | ||||||
Telefonica SA | 13,011,834 | 62,232,709 | ||||||
|
| |||||||
Total Spain |
| 201,216,509 | ||||||
|
| |||||||
Sweden – 3.10% | ||||||||
Alfa Laval AB | 12,912 | 284,841 | ||||||
Assa Abloy AB - Class B | 43,872 | 897,950 | ||||||
Atlas Copco AB - Class A | 2,397,257 | 102,088,259 | ||||||
Atlas Copco AB - Class B | 16,887 | 627,488 | ||||||
Boliden AB | 11,117 | 254,985 | ||||||
Electrolux AB | 10,352 | 174,171 | ||||||
Epiroc AB - Class A | 2,695,285 | 33,773,005 | ||||||
Epiroc AB - Class B | 16,060 | 197,235 | ||||||
EQT AB | 9,631 | 173,656 | ||||||
Essity AB - Class B | 26,524 | 859,945 | ||||||
Evolution Gaming Group AB(2) | 5,593 | 332,200 | ||||||
Hennes & Mauritz AB - Class B | 34,628 | 505,441 | ||||||
Hexagon AB - Class B | 12,234 | 718,449 | ||||||
Husqvarna AB - Class B | 15,690 | 129,129 | ||||||
ICA Gruppen AB | 4,534 | 215,522 | ||||||
Industrivarden AB - Class C | 6,082 | 138,633 | ||||||
Investment AB Latour - Class B | 6,795 | 123,372 | ||||||
Investor AB - Class B | 537,167 | 28,495,583 | ||||||
Kinnevik AB - Class B | 10,235 | 270,176 | ||||||
L E Lundbergforetagen AB - Class B | 3,365 | 153,389 | ||||||
Lundin Energy AB | 7,633 | 186,288 | ||||||
Nibe Industrier AB - Class B(1) | 1,901,424 | 42,173,250 | ||||||
Sandvik AB | 46,279 | 871,237 | ||||||
Securitas AB - Class B | 12,182 | 164,728 | ||||||
Skandinaviska Enskilda Banken AB - Class A | 67,014 | 581,718 | ||||||
Skanska AB - Class B | 14,894 | 304,065 | ||||||
SKF AB - Class B | 15,674 | 293,002 | ||||||
Spotify Technology SA(1) | 202,501 | 52,283,733 | ||||||
Svenska Cellulosa AB SCA - Class B(1) | 26,629 | 318,514 | ||||||
Svenska Handelsbanken AB - Class A | 64,062 | 608,289 | ||||||
Swedbank AB | 37,289 | 478,824 | ||||||
Swedish Match AB | 7,264 | 512,516 | ||||||
Tele2 AB - Class B | 21,247 | 282,837 | ||||||
Telefonaktiebolaget LM Ericsson - Class B | 1,357,103 | 12,579,743 | ||||||
Telia Co. AB | 18,410,600 | 68,877,753 | ||||||
Volvo AB - Class B | 65,187 | 1,025,711 | ||||||
|
| |||||||
Total Sweden |
| 351,955,637 | ||||||
|
| |||||||
Switzerland – 6.51% | ||||||||
ABB Ltd. | 3,566,407 | 80,896,583 | ||||||
Adecco Group AG | 1,131,892 | 53,352,405 | ||||||
Alcon, Inc.(1) | 925,714 | 53,190,812 | ||||||
Baloise Holding AG | 1,904 | 286,839 | ||||||
Banque Cantonale Vaudoise | 1,358 | 132,245 | ||||||
Barry Callebaut AG | 128 | 244,331 | ||||||
Chocoladefabriken Lindt & Spruengli AG | 46 | 379,930 | ||||||
Chocoladefabriken Lindt & Spruengli AG - REG | 4 | 345,027 | ||||||
Cie Financiere Richemont SA | 567,174 | 36,582,906 | ||||||
Clariant AG(1) | 7,652 | 150,598 | ||||||
Coca-Cola HBC AG | 8,326 | 208,426 | ||||||
Credit Suisse Group AG | 957,783 | 9,965,609 | ||||||
EMS-Chemie Holding AG | 371 | 288,231 | ||||||
Geberit AG | 1,610 | 807,795 | ||||||
Givaudan SA | 400 | 1,495,188 | ||||||
Glencore Plc(1) | 411,477 | 876,530 | ||||||
Julius Baer Group Ltd. | 9,943 | 417,582 | ||||||
Kuehne & Nagel International AG(1) | 2,165 | 360,621 | ||||||
LafargeHolcim Ltd.(1) | 21,557 | 949,716 | ||||||
Logitech International SA | 7,163 | 469,387 | ||||||
Lonza Group AG | 3,237 | 1,714,632 | ||||||
Nestle SA | 651,611 | 72,244,519 | ||||||
Novartis AG | 2,100,490 | 182,996,930 | ||||||
Partners Group Holding AG | 812 | 739,483 | ||||||
Roche Holding AG | 411,477 | 142,556,017 | ||||||
Schindler Holding AG | 826 | 195,821 | ||||||
Schindler Holding AG Participation Certificate | 1,808 | 427,879 | ||||||
SGS SA | 261 | 639,357 | ||||||
Sika AG | 249,618 | 48,119,477 | ||||||
Sonova Holding AG(1) | 2,461 | 492,631 | ||||||
STMicroelectronics NV | 27,525 | 750,285 | ||||||
Straumann Holding AG | 446 | 385,561 | ||||||
Swatch Group AG - BR | 1,172 | 235,234 | ||||||
Swatch Group AG - REG | 2,317 | 91,117 | ||||||
Swiss Life Holding AG | 1,291 | 480,276 | ||||||
Swiss Prime Site AG | 3,118 | 289,242 | ||||||
Swiss Re AG | 12,551 | 973,136 | ||||||
Swisscom AG | 1,056 | 553,768 | ||||||
Temenos AG | 2,912 | 452,594 | ||||||
u-blox Holding AG(1) | 4,017 | 275,519 | ||||||
UBS Group AG | 2,154,438 | 24,881,743 | ||||||
Vifor Pharma AG | 1,938 | 293,194 | ||||||
Zurich Insurance Group AG | 48,956 | 17,346,605 | ||||||
|
| |||||||
Total Switzerland |
| 738,535,781 | ||||||
|
| |||||||
Taiwan – 2.87% | ||||||||
Catcher Technology Co. Ltd. | 2,383,000 | 18,058,787 | ||||||
Hon Hai Precision Industry Co. Ltd. | 6,340,400 | 18,616,399 | ||||||
Taiwan Semiconductor Manufacturing Co. Ltd. | 7,472,860 | 79,806,560 | ||||||
Taiwan Semiconductor Manufacturing Co. Ltd. - ADR | 3,683,703 | 209,123,819 | ||||||
|
| |||||||
Total Taiwan |
| 325,605,565 | ||||||
|
| |||||||
Thailand – 0.10% | ||||||||
Thai Beverage PCL | 24,005,400 | 11,718,549 | ||||||
|
| |||||||
Total Thailand |
| 11,718,549 | ||||||
|
| |||||||
United Kingdom – 12.46% | ||||||||
3i Group Plc | 40,066 | 412,559 | ||||||
Admiral Group Plc | 7,647 | 216,861 | ||||||
Anglo American Plc | 50,574 | 1,165,893 | ||||||
Ashtead Group Plc | 19,516 | 658,334 | ||||||
ASOS Plc(1) | 414,853 | 17,632,257 | ||||||
Associated British Foods Plc | 14,669 | 346,837 | ||||||
AstraZeneca Plc | 982,097 | 102,211,143 | ||||||
Auto Trader Group Plc(2) | 6,723,910 | 43,777,733 | ||||||
AVEVA Group Plc | 2,965 | 150,335 | ||||||
Aviva Plc | 3,250,744 | 11,017,993 | ||||||
BAE Systems Plc | 132,008 | 789,337 | ||||||
Barclays Plc | 7,887,331 | 11,127,433 | ||||||
Barratt Developments Plc | 41,743 | 256,558 | ||||||
Berkeley Group Holdings Plc | 5,148 | 265,123 | ||||||
BP Plc | 29,628,305 | 113,507,313 | ||||||
British American Tobacco Plc | 94,083 | 3,608,348 | ||||||
British Land Co. Plc | 38,179 | 182,628 | ||||||
BT Group Plc - Class A | 362,880 | 513,203 | ||||||
Bunzl Plc | 13,868 | 371,983 | ||||||
Burberry Group Plc | 1,068,488 | 21,113,432 | ||||||
CNH Industrial NV | 43,281 | 304,075 | ||||||
Coca-Cola European Partners Plc | 8,451 | 319,110 | ||||||
Compass Group Plc | 77,103 | 1,060,818 | ||||||
Croda International Plc | 5,694 | 369,830 | ||||||
Diageo Plc | 101,586 | 3,376,450 | ||||||
Direct Line Insurance Group Plc | 54,508 | 182,768 | ||||||
Ferguson Plc | 9,281 | 758,875 | ||||||
Fiat Chrysler Automobiles NV | 45,180 | 457,136 | ||||||
GlaxoSmithKline Plc | 3,676,997 | 74,274,204 | ||||||
Halma Plc | 16,928 | 482,282 | ||||||
Hargreaves Lansdown Plc | 2,459,658 | 49,601,732 | ||||||
HomeServe Plc | 1,659,618 | 26,830,998 | ||||||
HSBC Holdings Plc | 4,804,356 | 22,328,672 | ||||||
Imperial Brands Plc | 38,969 | 741,839 | ||||||
Informa Plc | 61,850 | 357,601 | ||||||
InterContinental Hotels Group Plc | 7,653 | 337,843 | ||||||
Intertek Group Plc | 474,559 | 31,962,047 | ||||||
ITV Plc | 139,035 | 128,500 | ||||||
J Sainsbury Plc | 7,848,962 | 20,312,785 | ||||||
JD Sports Fashion Plc | 20,102 | 154,718 | ||||||
John Wood Group Plc | 12,274,596 | 29,431,825 | ||||||
Johnson Matthey Plc | 747,022 | 19,455,383 | ||||||
Jupiter Fund Management Plc | 2,617,803 | 8,300,584 | ||||||
Kingfisher Plc | 21,912,756 | 60,286,096 | ||||||
Land Securities Group Plc | 28,412 | 194,128 | ||||||
Legal & General Group Plc | 245,630 | 669,648 | ||||||
Lloyds Banking Group Plc | 151,173,003 | 58,316,546 | ||||||
London Stock Exchange Group Plc | 13,683 | 1,422,966 | ||||||
M&G Plc | 104,404 | 216,789 | ||||||
Melrose Industries Plc | 204,224 | 287,863 | ||||||
Mondi Plc | 19,993 | 373,969 | ||||||
National Grid Plc | 143,813 | 1,754,575 | ||||||
Next Plc | 5,474 | 331,423 | ||||||
Ocado Group Plc(1) | 19,088 | 479,688 | ||||||
Pearson Plc | 30,568 | 217,608 | ||||||
Persimmon Plc | 13,110 | 371,033 | ||||||
Prudential Plc | 106,635 | 1,606,783 | ||||||
Reckitt Benckiser Group Plc | 30,283 | 2,785,988 | ||||||
RELX Plc | 84,046 | 1,945,309 | ||||||
Rentokil Initial Plc | 78,732 | 497,836 | ||||||
Rightmove Plc | 7,310,175 | 49,413,416 | ||||||
Rio Tinto Ltd. | 15,989 | 1,094,824 | ||||||
Rio Tinto Plc | 46,038 | 2,590,860 | ||||||
Rolls-Royce Holdings Plc(1) | 83,749 | 295,685 | ||||||
Royal Bank of Scotland Group Plc | 8,937,917 | 13,418,005 | ||||||
RSA Insurance Group Plc | 41,288 | 209,100 | ||||||
Sage Group Plc | 48,436 | 402,064 | ||||||
Schroders Plc | 4,917 | 179,459 | ||||||
Segro Plc | 51,149 | 565,707 | ||||||
Severn Trent Plc | 9,798 | 299,856 | ||||||
Smith & Nephew Plc | 2,656,164 | 49,493,997 | ||||||
Smiths Group Plc | 16,203 | 283,259 | ||||||
Spirax-Sarco Engineering Plc | 3,265 | 401,954 | ||||||
SSE Plc | 4,851,823 | 82,156,496 |
St James’s Place Plc | 23,339 | 274,431 | ||||||
Standard Chartered Plc | 3,145,067 | 17,048,763 | ||||||
Standard Life Aberdeen Plc | 95,879 | 317,714 | ||||||
Taylor Wimpey Plc | 149,369 | 263,638 | ||||||
TechnipFMC Plc | 2,370,360 | 16,213,262 | ||||||
Tesco Plc | 72,413,070 | 203,673,635 | ||||||
Trainline Plc(1)(2) | 6,235,978 | 33,608,278 | ||||||
Travis Perkins Plc | 1,960,430 | 27,332,295 | ||||||
Unilever NV | 63,065 | 3,362,486 | ||||||
Unilever Plc | 50,795 | 2,739,936 | ||||||
United Utilities Group Plc | 28,077 | 315,494 | ||||||
Vodafone Group Plc | 67,143,248 | 106,741,670 | ||||||
Weir Group Plc | 846,036 | 11,117,982 | ||||||
Whitbread Plc | 8,237 | 226,621 | ||||||
Wm Morrison Supermarkets Plc | 96,642 | 227,663 | ||||||
WPP Plc | 4,636,952 | 36,151,146 | ||||||
|
| |||||||
Total United Kingdom |
| 1,413,033,322 | ||||||
|
| |||||||
United States – 1.95% | ||||||||
Mettler-Toledo International, Inc.(1) | 110,170 | 88,747,443 | ||||||
Mylan NV(1) | 1,146,770 | 18,440,062 | ||||||
ResMed, Inc. | 371,999 | 71,423,808 | ||||||
STERIS Plc | 274,121 | 42,061,126 | ||||||
|
| |||||||
Total United States |
| 220,672,439 | ||||||
|
| |||||||
Total Common Stocks (Cost: $10,308,011,888) |
| 10,881,337,162 | ||||||
|
| |||||||
PREFERRED STOCKS – 0.23% | ||||||||
Germany – 0.23% | ||||||||
Bayerische Motoren Werke AG | 2,262 | 109,881 | ||||||
Fuchs Petrolub SE | 2,928 | 117,687 | ||||||
Henkel AG & Co. KGaA | 7,336 | 684,403 | ||||||
Porsche Automobil Holding SE(1) | 6,306 | 365,236 | ||||||
Sartorius AG | 1,517 | 500,683 | ||||||
Volkswagen AG | 159,477 | 24,240,527 | ||||||
|
| |||||||
Total Germany |
| 26,018,417 | ||||||
|
| |||||||
Total Preferred Stocks (Cost: $24,463,518) |
| 26,018,417 | ||||||
|
| |||||||
RIGHTS – 0.02% | ||||||||
Spain – 0.02% | ||||||||
ACS Actividades de Construccion y Servicios SA, expires 07/10/2020(1) | 10,439 | 16,284 | ||||||
Repsol SA, expires 07/27/2020(1) | 58,034 | 28,252 | ||||||
Telefonica SA, expires 07/07/2020(1) | 13,011,834 | 2,559,751 | ||||||
|
| |||||||
Total Spain |
| 2,604,287 | ||||||
|
| |||||||
Total Rights (Cost: $2,875,850) |
| 2,604,287 | ||||||
|
| |||||||
SHORT-TERM INVESTMENTS – 3.45% | ||||||||
Money Market Funds – 3.26% | ||||||||
Goldman Sachs Financial Square Government Fund - Class I, 0.15%(4) | 370,088,795 | 370,088,795 | ||||||
|
| |||||||
Total Money Market Funds (Cost: $370,088,795) | 370,088,795 | |||||||
|
| |||||||
| Principal Amount | Value | |||||||
Time Deposits – 0.19% | ||||||||
ANZ, London, -0.10% due 07/01/2020 | AUD | 1,198,958 | 827,401 | |||||
BBVA, Madrid, 0.01% due 07/01/2020 | $ | 126,977 | 126,977 | |||||
BNP Paribas, Paris, -1.53% due 07/01/2020 | CHF | 133,407 | 140,806 | |||||
Brown Brothers Harriman, -0.30% due 07/01/2020 | NOK | 38,596 | 4,010 | |||||
Brown Brothers Harriman, -0.25% due 07/01/2020 | SEK | 38,027 | 4,081 | |||||
Brown Brothers Harriman, -0.16% due 07/01/2020 | DKK | 317,936 | 47,936 | |||||
Brown Brothers Harriman, -0.10% due 07/01/2020 | AUD | 10,731 | 7,405 | |||||
Brown Brothers Harriman, 0.00% due 07/01/2020 | NZD | 49,927 | 32,218 | |||||
Brown Brothers Harriman, 0.00% due 07/01/2020 | SGD | 55 | 39 | |||||
Brown Brothers Harriman, 0.01% due 07/01/2020 | GBP | 7,116 | 8,817 | |||||
Brown Brothers Harriman, 0.04% due 07/02/2020 | HKD | 2,098 | 271 | |||||
China Construction Bank, New York, 0.01% due 07/01/2020 | $ | 1,763,037 | 1,763,037 | |||||
Citibank, London, -0.68% due 07/01/2020 | EUR | 371,449 | 417,323 | |||||
Citibank, London, 0.01% due 07/01/2020 | GBP | 26,025 | 32,248 | |||||
HSBC, Hong Kong, 0.04% due 07/02/2020 | HKD | 1,790,408 | 231,005 | |||||
HSBC, Singapore, 0.00% due 07/01/2020 | SGD | 5,581,984 | 4,005,442 | |||||
JP Morgan, New York, 0.01% due 07/01/2020 | $ | 1,619,672 | 1,619,672 | |||||
National Australia Bank, London, 0.01% due 07/01/2020 | 3,737,128 | 3,737,128 | ||||||
Nordea Bank ABP, Oslo, -0.30% due 07/01/2020 | NOK | 254,969 | 26,490 | |||||
Skandinaviska Enskilda Banken AB, Stockholm, -0.25% due 07/01/2020 | SEK | 473,894 | 50,857 | |||||
Sumitomo, Tokyo, -0.25% due 07/01/2020 | JPY | 886,660,344 | 8,211,719 | |||||
|
| |||||||
Total Time Deposits (Cost: $21,294,882) | 21,294,882 | |||||||
|
| |||||||
Total Short-Term Investments (Cost: $391,383,677) |
| 391,383,677 | ||||||
|
| |||||||
TOTAL INVESTMENTS IN SECURITIES – 99.62% | 11,301,343,543 | |||||||
|
| |||||||
OTHER ASSETS IN EXCESS OF LIABILITIES – 0.38% | 43,161,119 | |||||||
|
| |||||||
TOTAL NET ASSETS – 100.00% | $ | 11,344,504,662 | ||||||
|
| |||||||
Percentages are stated as a percent of net assets.
Principal amounts are denominated in the currency in which the security was purchased.
ADR American Depositary Receipt
REIT Real Estate Investment Trust
AUD Australian Dollar
CHF Swiss Franc
DKK Danish Krone
EUR Euro
GBP British Pound
HKD Hong Kong Dollar
JPY Japanese Yen
NOK Norwegian Krone
NZD New Zealand Dollar
SEK Swedish Krona
SGD Singapore Dollar
| (1) | Non-income producing security. |
| (2) | Security was purchased exempt from registration in the U.S. pursuant to Rule 144(A) under the Securities Act of 1933. The value of these securities total $285,674,808, which represents 2.52% of total net assets. |
| (3) | Amount calculated is less than 0.005%. |
| (4) | Represents annualized seven-day yield as of the close of the reporting period. |
The accompanying notes are an integral part of this Schedule of Investments.
| COMMON STOCKS | Percentage of Net Assets | |||
Healthcare | 15.42 | % | ||
Consumer Discretionary | 14.21 | |||
Information Technology | 14.11 | |||
Industrials | 13.04 | |||
Financials | 11.95 | |||
Communication Services | 9.43 | |||
Consumer Staples | 7.62 | |||
Energy | 3.96 | |||
Materials | 2.84 | |||
Utilities | 2.49 | |||
Real Estate | 0.85 | |||
|
| |||
Total Common Stocks | 95.92 | |||
|
| |||
PREFERRED STOCKS | ||||
Consumer Discretionary | 0.22 | |||
Consumer Staples | 0.01 | |||
Healthcare | 0.00 | (1) | ||
Materials | 0.00 | (1) | ||
|
| |||
Total Preferred Stocks | 0.23 | |||
|
| |||
RIGHTS | ||||
Communication Services | 0.02 | |||
Energy | 0.00 | (1) | ||
Industrials | 0.00 | (1) | ||
|
| |||
Total Rights | 0.02 | |||
|
| |||
SHORT-TERM INVESTMENTS | 3.45 | |||
|
| |||
TOTAL INVESTMENTS | 99.62 | |||
OTHER ASSETS IN EXCESS OF LIABILITIES | 0.38 | |||
|
| |||
TOTAL NET ASSETS | 100.00 | % | ||
|
| |||
| (1) | Amount calculated is less than 0.005%. |
The accompanying notes are an integral part of this Schedule of Investments.
Report of Independent Registered Public Accounting Firm
To the Board of Trustees of Bridge Builder Trust and Shareholders of Bridge Builder Core Bond Fund, Bridge Builder Core Plus Bond Fund, Bridge Builder Municipal Bond Fund, Bridge Builder Large Cap Growth Fund, Bridge Builder Large Cap Value Fund, Bridge Builder Small/Mid Cap Growth Fund, Bridge Builder Small/Mid Cap Value Fund and Bridge Builder International Equity Fund
Opinions on the Financial Statements
We have audited the accompanying statements of assets and liabilities, including the summary schedules of investments, of Bridge Builder Core Bond Fund, Bridge Builder Core Plus Bond Fund, Bridge Builder Municipal Bond Fund, Bridge Builder Large Cap Growth Fund, Bridge Builder Large Cap Value Fund, Bridge Builder Small/Mid Cap Growth Fund, Bridge Builder Small/Mid Cap Value Fund and Bridge Builder International Equity Fund (eight of the funds constituting Bridge Builder Trust, hereafter collectively referred to as the “Funds”) as of June 30, 2020, the related statements of operations for the year ended June 30, 2020, the statements of changes in net assets for each of the two years in the period ended June 30, 2020, including the related notes, and the financial highlights for each of the periods indicated therein (included in Item 1 of this Form N-CSR) and the schedules of investments (included in Item 6 of this Form N-CSR) as of June 30, 2020 (collectively referred to as the “financial statements”). In our opinion, the financial statements present fairly, in all material respects, the financial position of each of the Funds as of June 30, 2020, the results of each of their operations for the year then ended, the changes in each of their net assets for each of the two years in the period ended June 30, 2020 and each of the financial highlights for each of the periods indicated therein, in conformity with accounting principles generally accepted in the United States of America.
Basis for Opinions
These financial statements are the responsibility of the Funds’ management. Our responsibility is to express an opinion on the Funds’ financial statements based on our audits. We are a public accounting firm registered with the Public Company Accounting Oversight Board (United States) (“PCAOB”) and are required to be independent with respect to the Funds in accordance with the U.S. federal securities laws and the applicable rules and regulations of the Securities and Exchange Commission and the PCAOB.
We conducted our audits of these financial statements in accordance with the standards of the PCAOB. Those standards require that we plan and perform the audit to obtain reasonable assurance about whether the financial statements are free of material misstatement, whether due to error or fraud.
Our audits included performing procedures to assess the risks of material misstatement of the financial statements, whether due to error or fraud, and performing procedures that respond to those risks. Such procedures included examining, on a test basis, evidence regarding the amounts and disclosures in the financial statements. Our audits also included evaluating the accounting principles used and significant estimates made by management, as well as evaluating the overall presentation of the financial statements. Our procedures included confirmation of securities owned as of June 30, 2020 by correspondence with the custodian, brokers and agent banks; when replies were not received from brokers and agent banks, we performed other auditing procedures. We believe that our audits provide a reasonable basis for our opinions.
/s/ PricewaterhouseCoopers LLP
Chicago, Illinois
August 26, 2020
We have served as the auditor of one or more investment companies in the Bridge Builder Trust since 2013.
ITEM 7. DISCLOSURE OF PROXY VOTING POLICIES AND PROCEDURES FOR CLOSED-END MANAGEMENT INVESTMENT COMPANIES.
Not applicable to open-end investment companies.
ITEM 8. PORTFOLIO MANAGERS OF CLOSED-END MANAGEMENT INVESTMENT COMPANIES.
Not applicable to open-end investment companies.
ITEM 9. PURCHASES OF EQUITY SECURITIES BY CLOSED-END MANAGEMENT INVESTMENT COMPANIES AND AFFILIATED PURCHASERS.
Not applicable to open-end investment companies.
ITEM 10. SUBMISSION OF MATTERS TO A VOTE OF SECURITY HOLDERS.
There have been no material changes to the procedures by which shareholders may recommend nominees to the registrant’s board of trustees.
ITEM 11. CONTROLS AND PROCEDURES.
| (a) | The Registrant’s Principal Executive Officer and Principal Financial Officer have reviewed the Registrant’s disclosure controls and procedures (as defined in Rule 30a-3(c) under the Investment Company Act of 1940 (the “Act”)) as of a date within 90 days of the filing of this report, as required by Rule 30a-3(b) under the Act and Rules 13a-15(b) or 15d-15(b) under the Securities Exchange Act of 1934. Based on their review, such officers have concluded that the disclosure controls and procedures are effective in ensuring that information required to be disclosed in this report is appropriately recorded, processed, summarized and reported and made known to them by others within the Registrant and by the Registrant’s service provider. |
| (b) | There were no changes in the Registrant’s internal control over financial reporting (as defined in Rule 30a-3(d) under the Act) that occurred during the period covered by this report that has materially affected, or is reasonably likely to materially affect, the Registrant’s internal control over financial reporting. |
ITEM 12. DISCLOSURE OF SECURITIES LENDING ACTIVITIES FOR CLOSED-END MANAGEMENT INVESTMENT COMPANIES.
Not applicable to open-end investment companies.
ITEM 13. EXHIBITS.
| (a) | (1) Any code of ethics or amendment thereto, that is the subject of the disclosure required by Item 2, to the extent that the registrant intends to satisfy Item 2 requirements through filing an exhibit. Not Applicable. |
(3) Any written solicitation to purchase securities under Rule 23c-1 under the Act sent or given during the period covered by the report by or on behalf of the registrant to 10 or more persons. Not applicable to open-end investment companies.
(4) Change in the registrant’s independent public accountant. There was no change in the registrant’s independent public accountant for the period covered by this report.
| (b) | Certifications pursuant to Section 906 of the Sarbanes-Oxley Act of 2002. Furnished herewith. |
SIGNATURES
Pursuant to the requirements of the Securities Exchange Act of 1934 and the Investment Company Act of 1940, the registrant has duly caused this report to be signed on its behalf by the undersigned, thereunto duly authorized.
| Bridge Builder Trust | ||
| By: | /s/ Julius A. Drelick III | |
| Julius A. Drelick III | ||
| Title: | Principal Executive Officer | |
| Date: | August 26, 2020 | |
Pursuant to the requirements of the Securities Exchange Act of 1934 and the Investment Company Act of 1940, this report has been signed below by the following persons on behalf of the registrant and in the capacities and on the dates indicated.
| By: | /s/ Julius A. Drelick III | |
| Julius A. Drelick III | ||
| Title: | Principal Executive Officer | |
| Date: | August 26, 2020 | |
| By: | /s/ Aaron Masek | |
| Aaron Masek | ||
| Title: | Principal Financial Officer | |
| Date: | August 26, 2020 | |