UNITED STATES
SECURITIES AND EXCHANGE COMMISSION
WASHINGTON, D.C. 20549
FORM N-CSR
CERTIFIED SHAREHOLDER REPORT OF REGISTERED
MANAGEMENT INVESTMENT COMPANIES
Investment Company Act File Number: 811-22811
Bridge Builder Trust
(Exact name of registrant as specified in charter)
Bridge Builder Trust
12555 Manchester Road
Des Peres, MO, 63131
(Address of principal executive offices)
Evan S. Posner, Secretary
Bridge Builder Trust
c/o 12555 Manchester Road
Des Peres, MO 63131
(Name and address of Agent for service)
Registrant’s telephone number, including area code: (314) 515-3289
Date of fiscal year end: June 30
Date of reporting period: June 30, 2023
Form N-CSR is to be used by management investment companies to file reports with the Commission not later than 10 days after the transmission to stockholders of any report that is required to be transmitted to stockholders under Rule 30e-1 under the Investment Company Act of 1940 (17 CFR 270.30e-1). The Commission may use the information provided on Form N-CSR in its regulatory, disclosure review, inspection, and policymaking roles.
A registrant is required to disclose the information specified by Form N-CSR, and the Commission will make this information public. A registrant is not required to respond to the collection of information contained in Form N-CSR unless the Form displays a currently valid Office of Management and Budget (“OMB”) control number. Please direct comments concerning the accuracy of the information collection burden estimate and any suggestions for reducing the burden to Secretary, Securities and Exchange Commission, 450 Fifth Street, NW, Washington, DC 20549-0609. The OMB has reviewed this collection of information under the clearance requirements of 44 U.S.C. § 3507.
ITEM 1. REPORT TO SHAREHOLDERS
The following is a copy of the Registrant’s annual report transmitted to shareholders pursuant to Rule 30e-1 under the Investment Company Act of 1940, as amended (the “1940 Act”)(17 CFR 270.30e-1).

Annual Report
June 30, 2023
Bridge Builder Core Bond Fund
Bridge Builder Core Plus Bond Fund
Bridge Builder Municipal Bond Fund
Bridge Builder Municipal High-Income Bond Fund
Bridge Builder Large Cap Growth Fund
Bridge Builder Large Cap Value Fund
Bridge Builder Tax Managed Large Cap Fund
Bridge Builder Small/Mid Cap Growth Fund
Bridge Builder Small/Mid Cap Value Fund
Bridge Builder Tax Managed Small/Mid Cap Fund
Bridge Builder International Equity Fund
Bridge Builder Tax Managed International Equity Fund
Table of Contents
| | |
| | | Annual Report • June 30, 2023 |
Bridge Builder Mutual Funds
Letter to Shareholders (Unaudited)
Dear Shareholder,
It is our pleasure to provide you with the Bridge Builder Mutual Funds (“Funds” or individually a “Fund”) annual report for the fiscal year ended June 30, 2023. In this report you will find fund performance information, a summary schedule of investments, financial statements and other important information about each of the Funds.
For details about individual fund performance and market commentary, please refer to the Management’s Discussion of Fund Performance section of this report for each Fund.
The Funds are available exclusively through Edward Jones Advisory Solutions®, an asset allocation program providing investment advisory services. Each Fund uses a multi-manager sub-advised structure, where several leading asset management firms are selected to invest a portion of a fund’s assets. Each manager within a Fund brings a unique perspective and investment approach. The Funds are managed according to the key tenets of our investment philosophy: diversification, high quality and a long-term approach.
All of the Funds’ sub-advisers are selected by Olive Street Investment Advisers, LLC (“Olive Street” or “Adviser”), an affiliate of Edward Jones, and approved by the Funds’ Board of Trustees. Olive Street strives to combine complementary investment styles, performance patterns and portfolio characteristics that have generally demonstrated a track record of success.
Since the inception of the Funds, they have provided investors in Edward Jones Advisory Solutions® with several important benefits. These benefits include: manager selection with oversight by Edward Jones’ Portfolio Solutions and Investment Management Research teams, access to certain institutional managers and investment strategies that are not available in the retail mutual fund marketplace, the ability to make changes among managers within the Funds in a potentially more tax- and cost-efficient manner, and lower overall Fund costs compared to Morningstar® category averages. As a result, your ownership of the Funds as part of the Edward Jones Advisory Solutions® has played an important role in the performance of your account.
Over the course of the past 12-months, there have been changes to the Funds’ lineup of sub-advisers and a new Fund was added to the Bridge Builder Trust. In April of 2023, Bridge Builder launched the Bridge Builder Municipal High-Income Bond Fund. Assets from the Bridge Builder Municipal Bond Fund were transitioned to the new Fund as was the T. Rowe Price Associates investment advisory mandate. Capital International, Inc. was also named as a sub-adviser to the new Fund.
For additional information about the Funds, visit www.bridgebuildermutualfunds.com.
We look forward to playing an important role in helping you pursue your financial goals.
Sincerely,
| | |
 |
|
John Tesoro Chairman, Bridge Builder Trust |
|
 |
|
Tom Kersting President, Olive Street Investment Advisers, LLC Principal, Edward Jones Investment and Protection Products |
| | |
| Annual Report • June 30, 2023 | | 1 |
Bridge Builder Core Bond Fund
Management’s Discussion of Fund Performance (Unaudited)
Investment Objective
The investment objective of the Bridge Builder Core Bond Fund (the “Fund”) is to provide total return (capital appreciation plus income).
Summary of the Investment Strategy
The Fund invests, under normal market conditions, at least 80% of its net assets (plus the amount of borrowings for investment purposes) in fixed income securities and other instruments, such as derivatives and certain investment companies, with economic characteristics similar to fixed income securities. The Fund’s assets are allocated across different fixed-income market sectors and maturities. Most of the Fund’s investments are fixed-income securities issued or guaranteed by the U.S. government or its agencies, corporate bonds, asset-backed securities, privately issued securities, floating rate securities and mortgage-related and mortgage-backed securities. The Fund may invest in securities issued by foreign entities, including emerging market securities. The Fund may buy or sell futures or swaps to gain or hedge exposure to risk factors or to alter the Fund’s investment characteristics. The Fund employs a multi-manager sub-advised structure.
Investment Commentary
The Fund returned -0.30% during the fiscal year ended June 30, 2023. The Fund outperformed its benchmark, the Bloomberg U.S. Aggregate Bond Index (the “Agg”), which returned -0.94% over the same period.
The U.S. Federal Reserve (the “Fed”) continued to have a dominant impact on fixed income markets during the second half of 2022. Its hawkish stance to address elevated inflation resulted in four rate hikes totaling 275 basis points (“bps”, 1bps equal 0.01%), pushing all major fixed income sectors into negative territory and deepening losses for the full calendar year: the Agg, an index measuring the investment grade, U.S. dollar-denominated, fixed-rate taxable bond market, posted a -13.01% return in 2022, the worst calendar year result in its history. The first half of 2023 brought renewed optimism as year-over-year inflation prints continued trending lower, providing market participants some relief and confidence in the Fed’s ability to orchestrate a “soft landing” despite one of the most aggressive tightening cycles ever undertaken. The Fed slowed the pace of rate hikes to 25bps in each of the first three meetings of 2023 and opted to pause altogether in June as they observed the economy’s digestion of materially higher interest rates. Despite a generally positive sentiment on the path of inflation, fixed income markets faced new challenges in the second quarter due to uncertainty around the looming U.S. debt ceiling; ultimately a deal was struck, and the debt ceiling extended to January of 2025.
Altogether, the 10-Year U.S. Treasury rate rose from 2.98% on June 30, 2022, to 3.81% on June 30, 2023. Meanwhile, corporate credit spreads narrowed over the period, particularly within U.S. high-yield, leading to gains for U.S. corporate bonds and other credit-sensitive areas of the market. Emerging markets debt similarly rallied, while the developed non-U.S. bond market closed the fiscal year with modest losses, driven in part by Bank of Japan’s policy action and resulting increase in Japanese yields. The U.S. dollar depreciated marginally relative to most other developed-markets currencies.
Against this backdrop, the Fund outperformed its benchmark by 0.64% over the fiscal year. The outperformance was primarily driven by an underweight to U.S. Treasuries and an overweight to and selection within the corporate bond sector, particularly within the industrials sub-sector. Duration and curve positioning within the securitized sector, specifically asset-backed and commercial mortgage-backed securities, were detractors from relative performance.
Investment Sub-advisers
| | | | | | |
Robert W. Baird & Co. Inc. utilizes a structured, risk-controlled philosophy with a disciplined duration neutral approach to invest its allocated portion of the Fund’s assets. | | J.P. Morgan Investment Management, Inc. incorporates a bottom-up, value-oriented approach in managing its allocated portion of the Fund’s assets. | | Loomis, Sayles & Company, L.P. employs an investment philosophy that focuses on research-driven, relative value investing on a risk-adjusted basis, seeking to add value primarily through security selection while continually managing risk in the portfolio. | | PGIM, Inc. uses a team approach to attempt to add value by tilting toward fixed-income sectors that it believes are attractive and by utilizing its extensive research capabilities to choose attractive fixed-income securities within sectors. |
| | |
| 2 | | Annual Report • June 30, 2023 |
Bridge Builder Core Bond Fund
Management’s Discussion of Fund Performance (Unaudited) (Continued)
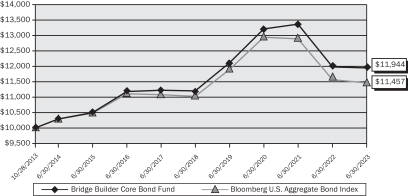
The following chart compares the value of a hypothetical $10,000 investment in the Bridge Builder Core Bond Fund from its inception (October 28, 2013) to June 30, 2023 as compared with the Bloomberg U.S. Aggregate Bond Index.
Growth of a Hypothetical $10,000 Investment as of June 30, 2023
vs.
Bloomberg U.S. Aggregate Bond Index
Average Annual Total Returns as of June 30, 2023
| | | | | | | | | | | | |
| | | 1 Year | | | 5 Years | | | Since Inception (10/28/2013) | |
Bridge Builder Core Bond Fund | | | -0.30 | % | | | 1.29 | % | | | 1.85 | % |
Bloomberg U.S. Aggregate Bond Index | | | -0.94 | % | | | 0.77 | % | | | 1.42 | % |
Performance data quoted represents past performance; past performance does not guarantee future results. The investment return and principal value of an investment will fluctuate so that an investor’s shares, when redeemed, may be worth more or less than their original cost. Current performance of the Fund may be lower or higher than the performance quoted. As of the latest prospectus, the gross and net expense ratios of the Fund were 0.34%(1) and 0.13%(2), respectively. Performance data current to the most recent month end may be obtained by calling 1.855.823.3611.
The performance table does not reflect the deduction of taxes that a shareholder may pay on Fund distributions or the redemption of Fund shares. Returns shown for the Fund include the reinvestment of all dividends, if any. Total return calculations reflect the effect of the Adviser’s fee waiver agreement for the Fund. If such fee waivers had not occurred, the quoted performance would be lower.
Portfolio Characteristics (3)
| | | | |
| Security Type Breakdown | | (% of Investments) | |
Mortgage-Backed Obligations | | | 35.9 | % |
Corporate Bonds | | | 28.8 | |
Government Related | | | 20.0 | |
Asset-Backed Obligations | | | 12.1 | |
Short-Term Investments | | | 3.2 | |
Preferred Stocks | | | 0.0 | * |
| | |
| Annual Report • June 30, 2023 | | 3 |
Bridge Builder Core Plus Bond Fund
Management’s Discussion of Fund Performance (Unaudited)
Investment Objective
The investment objective of the Bridge Builder Core Plus Bond Fund (the “Fund”) is to provide total return (capital appreciation plus income).
Summary of the Investment Strategy
The Fund invests, under normal market conditions, at least 80% of its net assets (plus the amount of borrowings for investment purposes) in fixed income securities of any maturity or duration and other instruments, such as derivatives, with economic characteristics similar to fixed income securities, and certain investment companies that seek to track the performance of fixed income securities. The Fund’s assets are allocated across different fixed-income market sectors and maturities. Most of the Fund’s investments are fixed-income securities issued or guaranteed by the U.S. government or its agencies, corporate bonds, asset-backed securities, privately issued securities, floating rate securities, and mortgage-related and mortgage-backed securities. The Fund may invest in high-yield securities deemed below investment grade, and securities issued by foreign entities, including emerging market securities. The Fund employs a multi-manager sub-advised structure.
Investment Commentary
The Fund returned 0.55% during the fiscal year ended June 30, 2023. The Fund modestly outperformed its benchmark, the Bloomberg U.S. Aggregate Bond Index, which returned -0.94% during the same period.
The Fed continued to have a dominant impact on fixed income markets during the second half of 2022. Its hawkish stance to address elevated inflation resulted in four rate hikes totaling 275bps pushing all major fixed income sectors into negative territory and deepening losses for the full calendar year: the Agg, an index measuring the investment grade, U.S. dollar-denominated, fixed-rate taxable bond market, posted a -13.01% return in 2022, the worst calendar year result in its history. The first half of 2023 brought renewed optimism as year-over-year inflation prints continued trending lower, providing market participants some relief and confidence in the Fed’s ability to orchestrate a “soft landing” despite one of the most aggressive tightening cycles ever undertaken. The Fed slowed the pace of rate hikes to 25bps in each of the first three meetings of 2023 and opted to pause altogether in June as they observed the economy’s digestion of materially higher interest rates. Despite a generally positive sentiment on the path of inflation, fixed income markets faced new challenges in the second quarter due to uncertainty around the looming U.S. debt ceiling; ultimately a deal was struck, and the debt ceiling extended to January of 2025.
Altogether, the 10-Year U.S. Treasury rate rose from 2.98% on June 30, 2022, to 3.81% on June 30, 2023. Meanwhile, corporate credit spreads narrowed over the period, particularly within U.S. high-yield, leading to gains for U.S. corporate bonds and other credit-sensitive areas of the market. Emerging markets debt similarly rallied, while the developed non-U.S. bond market closed the fiscal year with modest losses, driven in part by Bank of Japan’s policy action and resulting increase in Japanese yields. The U.S. dollar depreciated marginally relative to most other developed-markets currencies.
Against this backdrop, the Fund outperformed its benchmark by 1.49% over the fiscal year. The Fund’s overweight to and selection within corporate bonds, particularly the industrials sub-sector, was the largest contributor to relative results. The Fund’s lower duration compared to the benchmark also contributed to relative results as interest rates rose materially and more interest-rate-sensitive instruments sold off to a larger degree during the fiscal year.
| | |
| 4 | | Annual Report • June 30, 2023 |
Bridge Builder Core Plus Bond Fund
Management’s Discussion of Fund Performance (Unaudited) (Continued)
Investment Sub-advisers
| | | | | | |
| Pacific Investment Management Company LLC seeks to achieve the Fund’s investment objective by investing in a multi-sector portfolio of fixed-income instruments of varying maturities, which may be represented by derivatives such as forwards, futures contracts or swap agreements. | | BlackRock Investment Management, LLC will buy or sell securities whenever its portfolio management team sees an appropriate opportunity. Under normal circumstances, BlackRock invests primarily in fixed income securities and derivatives with similar economic characteristics. | | Loomis, Sayles & Company, L.P. generally seeks fixed-income securities of issuers whose credit profiles it believes are improving. Loomis Sayles relies primarily on issue selection as the key driver to investment performance. Loomis Sayles also analyzes different sectors of the economy and differences in the yields of various fixed-income securities in an effort to find securities that it believes may produce attractive returns in comparison to these securities’ risks. | | Metropolitan West Asset Management, LLC employs a value-oriented fixed-income management philosophy and an investment process predicated on a long-term economic outlook. |
| | |
| Annual Report • June 30, 2023 | | 5 |
Bridge Builder Core Plus Bond Fund
Management’s Discussion of Fund Performance (Unaudited) (Continued)
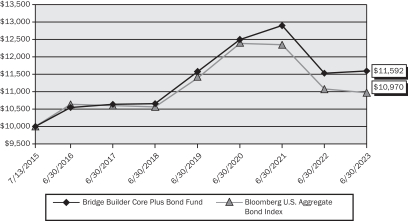
The following chart compares the value of a hypothetical $10,000 investment in the Bridge Builder Core Plus Bond Fund from its inception (July 13, 2015) to June 30, 2023 as compared with the Bloomberg U.S. Aggregate Bond Index.
Growth of a Hypothetical $10,000 Investment as of June 30, 2023
vs.
Bloomberg U.S. Aggregate Bond Index
Average Annual Total Returns as of June 30, 2023
| | | | | | | | | | | | |
| | | 1 Year | | | 5 Years | | | Since Inception (7/13/2015) | |
Bridge Builder Core Plus Bond Fund | | | 0.55 | % | | | 1.70 | % | | | 1.87 | % |
Bloomberg U.S. Aggregate Bond Index | | | -0.94 | % | | | 0.77 | % | | | 1.17 | % |
Performance data quoted represents past performance; past performance does not guarantee future results. The investment return and principal value of an investment will fluctuate so that an investor’s shares, when redeemed, may be worth more or less than their original cost. Current performance of the Fund may be lower or higher than the performance quoted. As of the latest prospectus, the gross and net expense ratios of the Fund were 0.41%(1) and 0.18%(2), respectively. Performance data current to the most recent month end may be obtained by calling 1.855.823.3611.
The performance table does not reflect the deduction of taxes that a shareholder may pay on Fund distributions or the redemption of Fund shares. Returns shown for the Fund include the reinvestment of all dividends, if any. Total return calculations reflect the effect of the Adviser’s fee waiver agreement for the Fund. If such fee waivers had not occurred, the quoted performance would be lower.
Portfolio Characteristics (3)
| | | | |
| Security Type Breakdown | | (% of Investments) | |
Mortgage-Backed Obligations | | | 32.5 | % |
Corporate Bonds | | | 25.1 | |
Government Related | | | 20.0 | |
Asset-Backed Obligations | | | 10.8 | |
Short-Term Investments | | | 10.0 | |
Bank Loans | | | 1.0 | |
Convertible Securities | | | 0.3 | |
Convertible Preferred Stocks | | | 0.2 | |
Common Stocks | | | 0.1 | |
Warrants | | | 0.0 | * |
Preferred Stocks | | | 0.0 | * |
Rights | | | — | ** |
| | |
| 6 | | Annual Report • June 30, 2023 |
Bridge Builder Municipal Bond Fund
Management’s Discussion of Fund Performance (Unaudited)
Investment Objective
The investment objective of the Bridge Builder Municipal Bond Fund (the “Fund”) is to provide current income exempt from federal tax, with a secondary goal of preservation of investment principal.
Summary of the Investment Strategy
The Fund invests, under normal market conditions, at least 80% of its net assets (plus the amount of borrowings for investment purposes) in municipal securities of any maturity or duration whose interest is exempt from federal income tax. These municipal securities include debt obligations issued by or on behalf of a state or local entity or other qualifying issuer that pay interest that is, in the opinion of bond counsel to the issuer, generally excludable from gross income for federal income tax purposes. Interest may be includable in taxable income for certain non-corporate taxpayers subject to the federal alternative minimum tax. The Fund employs a multi-manager sub-advised structure.
Investment Commentary
The Fund returned 3.03% during the fiscal year ended June 30, 2023. The Fund outperformed its benchmark, the Bloomberg Municipal 1-15 Year Index, which returned 2.78% during the same period.
The Fed continued to have a dominant impact on fixed income markets during the second half of 2022. Its hawkish stance to address elevated inflation resulted in four rate hikes totaling 275bps pushing all major fixed income sectors into negative territory and deepening losses for the full calendar year: the Agg, an index measuring the investment grade, U.S. dollar-denominated, fixed-rate taxable bond market, posted a -13.01% return in 2022, the worst calendar year result in its history. The first half of 2023 brought renewed optimism as year-over-year inflation prints continued trending lower, providing market participants some relief and confidence in the Fed’s ability to orchestrate a “soft landing” despite one of the most aggressive tightening cycles ever undertaken. The Fed slowed the pace of rate hikes to 25bps in each of the first three meetings of 2023 and opted to pause altogether in June as they observed the economy’s digestion of materially higher interest rates. Despite a generally positive sentiment on the path of inflation, fixed income markets faced new challenges in the second quarter due to uncertainty around the looming U.S. debt ceiling; ultimately a deal was struck, and the debt ceiling extended to January of 2025. Altogether, the 10-Year U.S. Treasury rate rose from 2.98% on June 30, 2022, to 3.81% on June 30, 2023.
Within the municipal bond market, the second half of 2022 saw municipal bond yields shift higher as a result of Fed policy action. This, combined with technical pressures of material outflows from the asset class overall, weighed on municipal bond returns. Conversely, during the first half of 2023 municipal bonds rebounded modestly, as investors reentered the space while new issuance was constrained, pushing yields, particularly on the long end of the curve, down to levels similar to the beginning of the fiscal year on June 30, 2022.
Against this backdrop, the Fund outperformed its benchmark by 0.25% for the fiscal year. The Fund’s outperformance was largely driven by its overall longer duration positioning relative to the benchmark.
Investment Sub-advisers
| | | | |
| FlAM LLC uses a municipal bond index as a guide in structuring and selecting its investments for its allocated portion of the Fund’s assets. FIAM considers a variety of factors when selecting investments, including the credit quality of issuers, security-specific features, current valuations relative to alternatives in the market, short-term trading opportunities resulting from market inefficiencies, and potential future valuations. | | MacKay Shields, LLC believes strong long-term performance can be achieved through an actively managed, research-driven, relative-value approach. Their investment strategy combines a top-down macro view with bottom-up credit research driven security selection. In doing so, the investment process seeks to identify mispricings and opportunities for total return with an emphasis and focus on risk management. | | BlackRock Investment Management, LLC takes a top-down, bottom-up approach with a flexible investment framework. Their security selection process is based on the relative value outlook and the quantitative assessment of the security and portfolio. BlackRock seeks total return derived primarily from coupon interest, and secondarily, capital appreciation. |
| | |
| Annual Report • June 30, 2023 | | 7 |
Bridge Builder Municipal Bond Fund
Management’s Discussion of Fund Performance (Unaudited) (Continued)
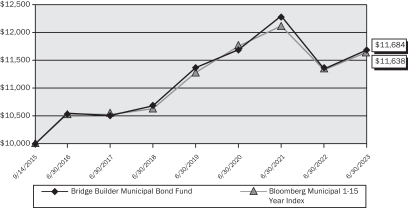
The following chart compares the value of a hypothetical $10,000 investment in the Bridge Builder Municipal Bond
Fund from its inception (September 14, 2015) to June 30, 2023 as compared with the Bloomberg Municipal 1-15 Year Index.
Growth of a Hypothetical $10,000 Investment as of June 30, 2023
vs.
Bloomberg Municipal 1-15 Year Index
Average Annual Total Returns as of June 30, 2023
| | | | | | | | | | | | |
| | | 1 Year | | | 5 Years | | | Since Inception (9/14/2015) | |
Bridge Builder Municipal Bond Fund | | | 3.03 | % | | | 1.81 | % | | | 2.02 | % |
Bloomberg Municipal 1-15 Year Index | | | 2.78 | % | | | 1.83 | % | | | 1.97 | % |
Performance data quoted represents past performance; past performance does not guarantee future results. The investment return and principal value of an investment will fluctuate so that an investor’s shares, when redeemed, may be worth more or less than their original cost. Current performance of the Fund may be lower or higher than the performance quoted. As of the latest prospectus, the gross and net expense ratios of the Fund were 0.38%(1) and 0.15%(2), respectively. Performance data current to the most recent month end may be obtained by calling 1.855.823.3611.
The performance table does not reflect the deduction of taxes that a shareholder may pay on Fund distributions or the redemption of Fund shares. Returns shown for the Fund include the reinvestment of all dividends, if any. Total return calculations reflect the effect of the Adviser’s fee waiver agreement for the Fund. If such fee waivers had not occurred, the quoted performance would be lower.
Portfolio Characteristics (3)
| | | | |
| Security Type Breakdown | | (% of Investments) | |
General Revenue | | | 26.1 | % |
General Obligation | | | 23.0 | |
Transportation | | | 15.5 | |
Utilities | | | 10.8 | |
Healthcare | | | 9.6 | |
Education | | | 7.4 | |
Housing | | | 5.3 | |
Short-Term Investments | | | 2.3 | |
| | | | |
| Breakdown by State | | (% of Long-Term Investments) | |
New York | | | 11.3 | % |
Texas | | | 10.1 | |
Illinois | | | 8.8 | |
California | | | 7.3 | |
Florida | | | 6.0 | |
New Jersey | | | 3.9 | |
Pennsylvania | | | 3.9 | |
Michigan | | | 3.5 | |
Georgia | | | 3.5 | |
Washington | | | 3.2 | |
Other | | | 38.5 | |
| | |
| 8 | | Annual Report • June 30, 2023 |
Bridge Builder Municipal High-Income Bond Fund
Management’s Discussion of Fund Performance (Unaudited)
Investment Objective
The investment objective of the Bridge Builder Municipal High-Income Bond Fund (the “Fund”) is to provide current income exempt from federal tax.
Summary of the Investment Strategy
The Fund invests, under normal market conditions, at least 80% of its net assets (plus the amount of borrowings for investment purposes) in municipal securities of any maturity or duration whose interest is exempt from federal income tax. These municipal securities include debt obligations issued by or on behalf of a state or local entity or other qualifying issuer that pay interest that is, in the opinion of bond counsel to the issuer, generally excludable from gross income for federal income tax purposes. Interest may be includable in taxable income for certain taxpayers subject to the federal alternative minimum tax. Additionally, the Fund invests at least 50% of its assets in municipal securities rated Baa1 or lower by Moody’s Investors Service, Inc., BBB+ or lower by Standard & Poor’s Corporation, or an equivalent rating by another nationally recognized securities rating organization, or in unrated securities that a sub-adviser of the Fund believes are of comparable quality. The Fund employs a multi-manager sub-advised structure.
Investment Commentary
The Fund returned 0.01% from its inception on April 13, 2023, through its fiscal period ended June 30, 2023. The Fund outperformed its benchmark, the Bloomberg Municipal 65% High-Grade/35% High-Yield Index, which returned -0.83% during the same period.
Investment Sub-advisers
| | |
| T. Rowe Price Associates Inc. uses an active investment management approach that emphasizes the value of in-depth fundamental credit research, diversification and risk management practices. By using fundamental research, T. Rowe Price seeks to add value through sector weights and issue selection over a full market cycle. | | Capital International, Inc. utilizing a system of multiple portfolio managers in managing its allocated portion of the Fund’s assets, seeks to invest in attractively priced securities that, in its opinion, represent good, long-term investment opportunities. |
| | |
| Annual Report • June 30, 2023 | | 9 |
Bridge Builder Municipal High-Income Bond Fund
Management’s Discussion of Fund Performance (Unaudited) (Continued)
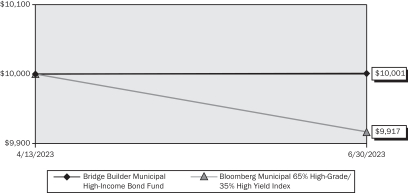
The following chart compares the value of a hypothetical $10,000 investment in the Bridge Builder Municipal High-Income Bond Fund from its inception (April 13, 2023) to June 30, 2023 as compared with the Bloomberg Municipal 65% High-Grade/35% High Yield Index.
Growth of a Hypothetical $10,000 Investment as of June 30, 2023
vs.
Bloomberg Municipal 65% High-Grade/35% High Yield Index
Average Annual Total Returns as of June 30, 2023
| | | | |
| | | Since Inception (4/13/2023) | |
Bridge Builder Municipal High-Income Bond Fund | | | 0.01 | % |
Bloomberg Municipal 65% High-Grade/35% High Yield Index | | | -0.83 | % |
Performance data quoted represents past performance; past performance does not guarantee future results. The investment return and principal value of an investment will fluctuate so that an investor’s shares, when redeemed, may be worth more or less than their original cost. Current performance of the Fund may be lower or higher than the performance quoted. As of the latest prospectus, the gross and net expense ratios of the Fund were 0.37%(1) and 0.16%(2), respectively. Performance data current to the most recent month end may be obtained by calling 1.855.823.3611.
The performance table does not reflect the deduction of taxes that a shareholder may pay on Fund distributions or the redemption of Fund shares. Returns shown for the Fund include the reinvestment of all dividends, if any. Total return calculations reflect the effect of the Adviser’s fee waiver agreement for the Fund. If such fee waivers had not occurred, the quoted performance would be lower.
Portfolio Characteristics (3)
| | | | |
| Security Type Breakdown | | (% of Investments) | |
General Revenue | | | 39.3 | % |
Healthcare | | | 17.2 | |
Transportation | | | 15.8 | |
Education | | | 7.9 | |
General Obligation | | | 7.4 | |
Housing | | | 6.1 | |
Utilities | | | 5.6 | |
Short-Term Investments | | | 0.7 | |
Common Stocks | | | 0.0 | * |
| | | | |
| Breakdown by State/Territory | | (% of Long-Term Investments) | |
Puerto Rico | | | 10.2 | % |
California | | | 9.4 | |
Illinois | | | 6.3 | |
Texas | | | 5.8 | |
New York | | | 5.4 | |
Pennsylvania | | | 4.9 | |
Ohio | | | 4.9 | |
Florida | | | 4.8 | |
New Jersey | | | 4.7 | |
Virginia | | | 4.4 | |
Other | | | 39.2 | |
| | |
| 10 | | Annual Report • June 30, 2023 |
Bridge Builder Large Cap Growth Fund
Management’s Discussion of Fund Performance (Unaudited)
Investment Objective
The investment objective of the Bridge Builder Large Cap Growth Fund (the “Fund”) is to provide capital appreciation.
Summary of the Investment Strategy
The Fund invests, under normal market conditions, at least 80% of its net assets (plus the amount of borrowings for investment purposes) in the securities of large capitalization companies and other instruments, such as certain investment companies that seek to track the performance of securities of large capitalization companies. Large capitalization companies are defined by the Fund as those companies whose market capitalizations at the time of purchase typically fall within the range of the Russell 1000® Index. The Fund follows an investing style that favors growth investments and employs a multi-manager sub-advised structure.
Investment Commentary
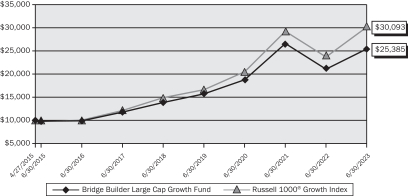
For the fiscal year ended June 30, 2023, the Fund returned 20.76%, underperforming its benchmark, the Russell 1000® Growth Index, which returned 27.11%.
For the year, large-capitalization growth stocks experienced two distinct halves of performance, where performance was negative for the first six months and lagged value stocks compared to a second half, where there was a strong reversal towards growth, returning 29% and outperforming value by nearly 24% during the period, versus 15% for the year. For the fiscal year, performance within large-capitalization growth stocks was largely driven by the technology sector, returning nearly 44% for the year and contributing roughly 17% of the benchmark’s 27.11% return. Given the technology sector’s weight in the benchmark and the magnitude of outperformance during the year, all other sectors lagged overall benchmark performance.
Compared to its benchmark, the Fund’s relative underperformance was driven predominantly by the underweight allocation to, and stock selection within, the technology sector. Overweight positioning and weak stock selection within health care and financials were also headwinds to performance. Stock selection within communication services was also another headwind to performance. Given the strong market performance over the trailing year, the Fund’s cash position also created a drag on relative performance versus the benchmark.
Two of the biggest headwinds for markets in 2022 – inflation and Federal Reserve policy – have started to turn favorably, while the economy has proved surprisingly resilient. Looking forward, we think inflation will continue to moderate, but growth is likely to downshift as the impact of the Fed’s rate hikes filters through the economy. While inflation remains high, progress has been made. As time passes, we think the impact of higher interest rates will be felt, and growth could weaken. However, the healthy starting point for the labor market should provide some cushion, and it is possible that just as consumption becomes less supportive, the slump in manufacturing and housing may start to reverse.
Investment Sub-advisers
| | | | | | |
| Lazard Asset Management LLC invests primarily in equity securities of U.S. companies that it believes have strong and/or improving financial productivity and are undervalued based on their earnings, cash flow or asset values. | | Sustainable Growth Advisers, LP seeks to identify large-capitalization companies that exhibit characteristics such as pricing power, repeat revenue streams and global reach that, in SGA’s judgement, have the potential for long-term earnings growth within the context of low business risk. | | Jennison Associates LLC invests in equity and equity-related companies that have strong capital appreciation potential. It follows a highly disciplined investment selection and management process of identifying companies that show superior absolute and relative earnings growth and are believed to be attractively valued. | | BlackRock Investment Management, LLC invests in equity securities with the objective of approximating as closely as practicable the capitalization weighted total rate of return of the segment of the United States market for publicly traded equity securities represented by the 1,000 largest capitalized companies. |
| | |
| Annual Report • June 30, 2023 | | 11 |
Bridge Builder Large Cap Growth Fund
Management’s Discussion of Fund Performance (Unaudited) (Continued)
The following chart compares the value of a hypothetical $10,000 investment in the Bridge Builder Large Cap Growth Fund from its inception (April 27, 2015) to June 30, 2023 as compared with the Russell 1000® Growth
Growth of a Hypothetical $10,000 Investment as of June 30, 2023
vs.
Russell 1000® Growth Index
Average Annual Total Returns as of June 30, 2023
| | | | | | | | | | | | |
| | | 1 Year | | | 5 Years | | | Since Inception (4/27/2015) | |
Bridge Builder Large Cap Growth Fund | | | 20.76 | % | | | 12.91 | % | | | 12.07 | % |
Russell 1000® Growth Index | | | 27.11 | % | | | 15.14 | % | | | 14.43 | % |
Performance data quoted represents past performance; past performance does not guarantee future results. The investment return and principal value of an investment will fluctuate so that an investor’s shares, when redeemed, may be worth more or less than their original cost. Current performance of the Fund may be lower or higher than the performance quoted. As of the latest prospectus, the gross and net expense ratios of the Fund were 0.46%(1) and 0.19%(2), respectively. Performance data current to the most recent month end may be obtained by calling 1.855.823.3611.
The performance table does not reflect the deduction of taxes that a shareholder may pay on Fund distributions or the redemption of Fund shares. Returns shown for the Fund include the reinvestment of all dividends, if any. Total return calculations reflect the effect of the Adviser’s fee waiver agreement for the Fund. If such fee waivers had not occurred, the quoted performance would be lower.
Portfolio Characteristics (3)
| | | | |
| Sector Breakdown | | (% of Investments) | |
Information Technology | | | 27.8 | % |
Financials | | | 16.0 | |
Healthcare | | | 15.4 | |
Consumer Discretionary | | | 15.0 | |
Communication Services | | | 8.1 | |
Consumer Staples | | | 4.6 | |
Industrials | | | 3.8 | |
Materials | | | 3.5 | |
Real Estate | | | 2.3 | |
Energy | | | 1.8 | |
Short-Term Investments | | | 1.7 | |
Utilities | | | 0.0 | * |
| | | | |
| Top Ten Equity Holdings | | (% of Net Assets) | |
Microsoft Corp. | | | 7.9 | % |
Amazon.com, Inc. | | | 5.6 | |
Visa, Inc. – Class A | | | 3.7 | |
Apple, Inc. | | | 3.1 | |
Alphabet, Inc. – Class A | | | 3.0 | |
NVIDIA Corp. | | | 2.7 | |
UnitedHealth Group, Inc. | | | 2.7 | |
Alphabet, Inc. – Class C | | | 2.0 | |
Thermo Fisher Scientific, Inc. | | | 1.9 | |
Salesforce, Inc. | | | 1.9 | |
| | |
| 12 | | Annual Report • June 30, 2023 |
Bridge Builder Large Cap Value Fund
Management’s Discussion of Fund Performance (Unaudited)
Investment Objective
The investment objective of the Bridge Builder Large Cap Value Fund (the “Fund”) is to provide capital appreciation.
Summary of the Investment Strategy
The Fund invests, under normal market conditions, at least 80% of its net assets (plus the amount of borrowings for investment purposes) in the securities of large capitalization companies and other instruments, such as certain investment companies, with economic characteristics that seek to track the performance of securities of large capitalization companies. Large capitalization companies are defined by the Fund as those companies whose market capitalizations at the time of purchase typically fall within the range of the Russell 1000® Index. The Fund follows an investing style that favors value investments and employs a multi-manager sub-advised structure.
Investment Commentary
For the fiscal year ended June 30, 2023, the Fund returned 13.52%, outperforming its benchmark, the Russell 1000® Value Index, which returned 11.54%.
For the fiscal year, within large-capitalization value stocks, six of the sectors led the broad market, while five lagged. Industrials, consumer discretionary, and energy were the top performing sectors, while utilities, real estate and health care were the three worst performers for the period. In addition, within the overall large-capitalization portion of the market, value stocks underperformed growth stocks for the one-year period.
Compared to its benchmark, the Fund’s relative outperformance was driven predominantly by the overweight allocation to, and stock selection within, the consumer discretionary sector. Stock selection within technology was an additional tailwind to performance. The Fund’s underweight position in energy and weak stock selection within consumer staples were the largest headwinds to relative performance for the year.
Two of the biggest headwinds for markets in 2022 – inflation and Federal Reserve policy – have started to turn favorably, while the economy has proved surprisingly resilient. Looking forward, we think inflation will continue to moderate, but growth is likely to downshift as the impact of the Fed’s rate hikes filters through the economy. While inflation remains high, progress has been made. As time passes, we think the impact of higher interest rates will be felt, and growth could weaken. However, the healthy starting point for the labor market should provide some cushion, and it is possible that just as consumption becomes less supportive, the slump in manufacturing and housing may start to reverse.
Investment Sub-advisers
| | | | | | |
| Artisan Partners Limited Partnership employs a fundamental investment process to construct a diversified portfolio of equity securities that are undervalued, in solid financial condition and have attractive business economics. | | Barrow, Hanley, Mewhinney & Strauss, LLC searches for companies that are temporarily undervalued for reasons Barrow Hanley can identify, understand, and believe will improve over time. In its valuation framework, Barrow Hanley strives to construct portfolios that trade at levels below the market across multiple metrics, such as the price-to-earnings and the price-to-book ratios, while simultaneously delivering an above-market dividend yield. | | Wellington Management Company, LLP uses substantial proprietary, fundamental research resources to identify companies with superior prospects for dividend growth and capital appreciation that sell at reasonable valuation levels. Wellington Management believes that above-average growth in dividends is an effective and often overlooked indicator of higher quality, shareholder-oriented companies that have the ability to produce consistent, above-average returns over the long-term. | | BlackRock Investment Management, LLC invests in equity securities with the objective of approximating as closely as practicable the capitalization weighted total rate of return of the segment of the United States market for publicly traded equity securities represented by the 1,000 largest capitalized companies. |
| | |
| Annual Report • June 30, 2023 | | 13 |
Bridge Builder Large Cap Value Fund
Management’s Discussion of Fund Performance (Unaudited) (Continued)
| | | | | | |
LSV Asset Management primarily invests in large and medium capitalization U.S. companies and uses a bottom-up investment style, seeking to identify companies that are trading at prices substantially below their intrinsic value. LSV follows an active investment strategy, focusing on using data and financial information and combining such information with the rigor of a quantitative model. | | T. Rowe Price Associates, Inc. active investment approach emphasizes the value of large-capitalization stocks that have a strong track record of paying dividends or that are believed to be undervalued. T. Rowe Price’s in-house research team seeks companies that appear to be undervalued by various measures and may be temporarily out of favor but have good prospects for capital appreciation and dividend growth. | | | | |
| | |
| 14 | | Annual Report • June 30, 2023 |
Bridge Builder Large Cap Value Fund
Management’s Discussion of Fund Performance (Unaudited) (Continued)
The following chart compares the value of a hypothetical $10,000 investment in the Bridge Builder Large Cap Value
Fund from its inception (April 27, 2015) to June 30, 2023 as compared with the Russell 1000® Value Index.
Growth of a Hypothetical $10,000 Investment as of June 30, 2023
vs.
Russell 1000® Value Index

Average Annual Total Returns as of June 30, 2023
| | | | | | | | | | | | |
| | | 1 Year | | | 5 Years | | | Since Inception (4/27/2015) | |
Bridge Builder Large Cap Value Fund | | | 13.52 | % | | | 10.43 | % | | | 9.60 | % |
Russell 1000® Value Index | | | 11.54 | % | | | 8.11 | % | | | 7.81 | % |
Performance data quoted represents past performance; past performance does not guarantee future results. The investment return and principal value of an investment will fluctuate so that an investor’s shares, when redeemed, may be worth more or less than their original cost. Current performance of the Fund may be lower or higher than the performance quoted. As of the latest prospectus, the gross and net expense ratios of the Fund were 0.46%(1) and 0.23%(2), respectively. Performance data current to the most recent month end may be obtained by calling 1.855.823.3611.
The performance table does not reflect the deduction of taxes that a shareholder may pay on Fund distributions or the redemption of Fund shares. Returns shown for the Fund include the reinvestment of all dividends, if any. Total return calculations reflect the effect of the Adviser’s fee waiver agreement for the Fund. If such fee waivers had not occurred, the quoted performance would be lower.
Portfolio Characteristics (3)
| | | | |
| Sector Breakdown | | (% of Investments) | |
Financials | | | 18.8 | % |
Industrials | | | 15.2 | |
Healthcare | | | 14.5 | |
Consumer Discretionary | | | 8.9 | |
Information Technology | | | 8.4 | |
Consumer Staples | | | 7.9 | |
Communication Services | | | 7.2 | |
Energy | | | 5.6 | |
Materials | | | 4.5 | |
Utilities | | | 3.3 | |
Short-Term Investments | | | 3.0 | |
Real Estate | | | 2.7 | |
| | | | |
| Top Ten Equity Holdings | | (% of Net Assets) | |
Medtronic Plc | | | 1.6 | % |
Merck & Co., Inc. | | | 1.5 | |
Philip Morris International, Inc. | | | 1.3 | |
Comcast Corp. – Class A | | | 1.3 | |
Alphabet, Inc. – Class C | | | 1.2 | |
Visa, Inc. – Class A | | | 1.2 | |
Meta Platforms, Inc. – Class A | | | 1.2 | |
Microsoft Corp. | | | 1.2 | |
UnitedHealth Group, Inc. | | | 1.2 | |
Chubb Ltd. | | | 1.1 | |
| | |
| Annual Report • June 30, 2023 | | 15 |
Bridge Builder Tax Managed Large Cap Fund
Management’s Discussion of Fund Performance (Unaudited)
Investment Objective
The investment objective of Bridge Builder Tax Managed Large Cap Fund (the “Fund”) is to seek to provide a tax-efficient investment return consisting of capital appreciation.
Summary of the Investment Strategy
The Fund invests, under normal market conditions, at least 80% of its net assets (plus the amount of borrowings for investment purposes) in the securities of large-capitalization companies and other instruments, such as certain investment companies, with economic characteristics that seek to track the performance of securities of large capitalization companies. Large capitalization companies are defined by the Fund as those companies whose market capitalizations at the time of purchase typically fall within the range of the Russell 1000® Index. The Fund implements the investment recommendations of the Fund’s sub-advisers through the use of Parametric Portfolio Associates LLC (“Parametric”) as overlay manager, as described in greater detail below. As overlay manager, Parametric has limited authority to vary from the model portfolios provided by the Fund’s sub-advisers, primarily for the purpose of efficient tax management of the Fund’s securities transactions. The Fund employs a multi-manager sub-advised structure.
Investment Commentary
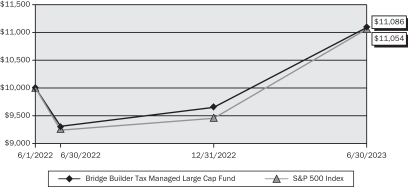
For the fiscal year ended June 30, 2023, the Fund returned 19.07%, underperforming its benchmark, the S&P 500 Index, which returned 19.59% for the period.
For the year, within large-capitalization stocks, approximately half of the benchmark’s performance came from the technology sector’s roughly 42% return, contributing nearly 10% of the benchmark’s 19.59% return. The technology sector’s significant outperformance and its 25% weight in the benchmark created a challenging market environment for other sectors to keep up with the performance of the benchmark overall. Only two other sectors, consumer discretionary and industrials, were able to outperform the broader market, while the other eight lagged. Utilities, real estate, and health care were the worst performing sectors for the year. In addition, within the overall large-capitalization portion of the market, value stocks underperformed growth stocks for the 1-year period.
Compared to its benchmark, the Fund’s relative underperformance was driven predominantly by weak stock selection within the financials and communication services sectors and an underweight to technology. Underperformance was partially offset by the Fund’s underweight to consumer staples and strong stock selection within industrials and health care.
Two of the biggest headwinds for markets in 2022 – inflation and Federal Reserve policy – have started to turn favorably, while the economy has proved surprisingly resilient. Looking forward, we think inflation will continue to moderate, but growth is likely to downshift as the impact of the Fed’s rate hikes filters through the economy. While inflation remains high, progress has been made. As time passes, we think the impact of higher interest rates will be felt, and growth could weaken. However, the healthy starting point for the labor market should provide some cushion, and it is possible that just as consumption becomes less supportive, the slump in manufacturing and housing may start to reverse.
| | |
| 16 | | Annual Report • June 30, 2023 |
Bridge Builder Tax Managed Large Cap Fund
Management’s Discussion of Fund Performance (Unaudited) (Continued)
Investment Sub-advisers
| | | | | | |
| T. Rowe Price Associates, Inc. seeks long-term capital appreciation and recommends primarily large capitalization companies with above-average rate of earnings and cash flow growth, as well as companies that T. Rowe Price believes have the ability to sustain earnings momentum even during times of slow economic growth. | | ClearBridge Investments, LLC seeks long-term appreciation of capital with individual company selection and management of cash reserves. ClearBridge typically recommends medium and large capitalization U.S. companies, but may also recommend small capitalization companies and foreign companies, selecting from among a strong core of growth and value stocks consisting primarily of blue-chip companies dominant in their industries. ClearBridge may also recommend companies with prospects for sustained earnings growth and/or a cyclical earnings record. | | Barrow, Hanley, Mewhinney & Strauss, LLC recommends companies that are temporarily undervalued for reasons Barrow Hanley can identify, understand, and believe will improve over time. In its valuation framework, Barrow Hanley strives to construct portfolios that trade at levels below the market across multiple metrics (e.g., price/earnings, price/book value) while simultaneously delivering an above-market dividend yield. | | Parametric Portfolio Associates LLC serves as the Fund’s overlay manager and also serves as the Fund’s direct indexing manager. As the Fund’s direct indexing manager, Parametric manages one or more allocated portions of the Fund pursuant to a strategy that is designed to provide similar exposure to the S&P 500 Growth Index and S&P 500 Value Index. As the Fund’s overlay manager, Parametric constructs a portfolio that represents the aggregation of the model portfolios of the Fund’s sub-advisers, including with respect to each direct indexing portion of the Fund, at weightings set by Olive Street Investment Advisers, LLC, the Fund’s investment adviser. In this role, Parametric manages the impact of taxes through active tax management strategies, including tax lot management, which impacts tax loss harvesting, capital gain deferral, and the minimization of wash sales. |
| | |
| Annual Report • June 30, 2023 | | 17 |
Bridge Builder Tax Managed Large Cap Fund
Management’s Discussion of Fund Performance (Unaudited) (Continued)
The following chart compares the value of a hypothetical $10,000 investment in the Bridge Builder Tax Managed Large Cap Fund from its inception (June 1, 2022) to June 30, 2023 as compared with the S&P 500 Index.
Growth of a Hypothetical $10,000 Investment as of June 30, 2023
vs.
S&P 500 Index
Average Annual Total Returns as of June 30, 2023
| | | | | | | | |
| Bridge Builder Tax Managed Large Cap Fund | | 1 Year | | | Since Inception (6/1/2022) | |
Return Before Taxes | | | 19.07 | % | | | 10.02 | % |
Return After Taxes on Distributions | | | 18.96 | % | | | 9.93 | % |
Return After Taxes on Distributions and Sale of Fund Shares | | | 11.32 | % | | | 7.61 | % |
S&P 500 Index | | | 19.59 | % | | | 9.73 | % |
Performance data quoted represents past performance; past performance does not guarantee future results. The investment return and principal value of an investment will fluctuate so that an investor’s shares, when redeemed, may be worth more or less than their original cost. Current performance of the Fund may be lower or higher than the performance quoted. As of the latest prospectus, the gross and net expense ratios of the Fund were 0.49%(1) and 0.34%(2), respectively. Performance data current to the most recent month end may be obtained by calling 1.855.823.3611.
The returns presented in this table reflect the return before taxes; the return after taxes on dividends and capital gain distributions; and the return after taxes on dividends, capital gain distributions, and gains (or losses) from the redemption of shares held for 1 year or since-inception periods, as applicable. After-tax returns reflect the highest federal income tax rates but exclude state and local taxes. The after-tax returns reflect the rates applicable to ordinary and qualified dividends and capital gains that were in effect for the period(s) presented in the table. During periods when the Fund incurs a loss, the post-liquidation after-tax return may exceed the Fund’s other returns because the loss generates a tax benefit that is factored into the result. An investor’s actual after-tax return will likely differ from those shown and depend on his or her tax situation. The Fund’s past returns (before and after taxes) do not necessarily indicate future performance. Returns shown for the Fund include the reinvestment of all dividends, if any. Total return calculations reflect the effect of the Adviser’s fee waiver agreement for the Fund. If such fee waivers had not occurred, the quoted performance would be lower.
Portfolio Characteristics (3)
| | | | |
| Sector Breakdown | | (% of Investments) | |
Information Technology | | | 24.8 | % |
Healthcare | | | 13.8 | |
Financials | | | 13.4 | |
Industrials | | | 10.1 | |
Consumer Discretionary | | | 9.5 | |
Communication Services | | | 8.8 | |
Materials | | | 4.9 | |
Energy | | | 4.4 | |
Consumer Staples | | | 4.0 | |
Short-Term Investments | | | 2.4 | |
Utilities | | | 2.1 | |
Real Estate | | | 1.8 | |
| | | | |
| Top Ten Equity Holdings | | (% of Net Assets) | |
Microsoft Corp. | | | 7.1 | % |
Apple, Inc. | | | 5.5 | |
Amazon.com, Inc. | | | 2.9 | |
UnitedHealth Group, Inc. | | | 2.4 | |
Alphabet, Inc. – Class A | | | 2.4 | |
NVIDIA Corp. | | | 2.2 | |
Berkshire Hathaway, Inc. – Class B | | | 1.9 | |
Visa, Inc. – Class A | | | 1.6 | |
Merck & Co., Inc. | | | 1.3 | |
Meta Platforms, Inc. – Class A | | | 1.3 | |
| | |
| 18 | | Annual Report • June 30, 2023 |
Bridge Builder Small/Mid Cap Growth Fund
Management’s Discussion of Fund Performance (Unaudited)
Investment Objective
The investment objective of the Bridge Builder Small/Mid Cap Growth Fund (the “Fund”) is to provide capital appreciation.
Summary of the Investment Strategy
The Fund invests, under normal market conditions, at least 80% of its net assets (plus the amount of borrowings for investment purposes) in the securities of small- and mid-capitalization companies and other instruments, such as certain investment companies, that seek to track the performance of small- and mid- capitalization companies. Small- and mid-capitalization companies are defined by the Fund as those companies whose market capitalizations at the time of purchase typically fall within the range of the Russell MidCap® Index and the Russell 2000® Index. The Fund follows an investing style that favors growth investments and employs a multi-manager sub-advised structure.
Investment Commentary
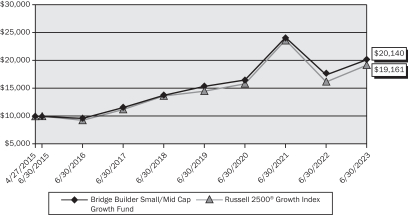
For the fiscal year ended June 30, 2023, the Fund returned 15.65%, while its benchmark, the Russell 2500® Growth Index, returned 18.58% for the period, which resulted in overall underperformance.
For the year, mid-capitalization stocks outperformed small-capitalization stocks. Within the investment universe, strongest performers included the information technology, industrials and consumer discretionary sectors. The utilities and real estate sectors were the weakest performers. Within both mid-capitalization and small-capitalization segments of the market, growth stocks outperformed value stocks.
Compared to its benchmark, the Fund’s relative underperformance was driven by weak stock selection within certain sectors. Stock selection within health care, financials, and consumer discretionary sectors detracted from performance. Cash exposure was also a headwind to the Fund’s performance over the year, which was offset by the overweight in information technology and underweights in materials, energy, utilities and real estate.
Two of the biggest headwinds for markets in 2022 – inflation and Federal Reserve policy – have started to turn favorably, while the economy has proved surprisingly resilient. Looking forward, we think inflation will continue to moderate, but growth is likely to downshift as the impact of the Fed’s rate hikes filters through the economy. While inflation remains high, progress has been made. As time passes, we think the impact of higher interest rates will be felt, and growth could weaken. However, the healthy starting point for the labor market should provide some cushion, and it is possible that just as consumption becomes less supportive, the slump in manufacturing and housing may start to reverse.
Investment Sub-advisers
| | | | | | |
| Eagle Asset Management, Inc. invests primarily in small-capitalization companies. The team generally focuses on investing in small-capitalization companies that demonstrate growth potential at a price that does not appear to reflect the company’s true underlying value. Eagle uses a three-pronged investment philosophy: quality, valuation and balance. | | Champlain Investment Partners, LLC seeks capital appreciation by investing mainly in equity securities of medium-sized companies that it believes have strong long-term fundamentals, superior capital appreciation potential and attractive valuations. Champlain expects to identify a diversified universe of medium-sized companies that trade at a discount to their estimated or intrinsic fair values. | | BlackRock Investment Management, LLC invests in equity securities with the objective of approximating as closely as practicable the capitalization-weighted total rate of return of the segments of the United States market for publicly traded equity securities represented by the Russell Midcap® Growth Index, which tracks the performance of mid-capitalization companies, and the Russell 2000® Growth Index, which tracks the performance of small-capitalization companies. | | Driehaus Capital Management LLC primarily invests in the equity securities of U.S. small capitalization and U.S. medium capitalization companies. Driehaus believes that fundamentally strong companies are more likely to generate superior earnings growth on a sustained basis and are more likely to experience positive earnings revisions. Investment decisions involve evaluating a company’s competitive position and industry dynamics, identifying potential growth catalysts and assessing the financial position of the company. |
| | |
| Annual Report • June 30, 2023 | | 19 |
Bridge Builder Small/Mid Cap Growth Fund
Management’s Discussion of Fund Performance (Unaudited) (Continued)
| | | | | | |
Victory Capital Management Inc. primarily invests in the equity securities of U.S. small capitalization companies. Victory Capital employs both fundamental analysis and quantitative screening in seeking to identify companies that it believes will produce sustainable earnings growth over a multi-year horizon. Valuation is an integral part of the growth investment process and purchase decisions are based on the team’s expectation of the potential reward relative to risk of each security. | | Stephens Investment Management Group, LLC employs a disciplined, bottom-up investment selection process that combines rigorous fundamental analysis with quantitative screening in an effort to identify companies that exhibit potential for superior earnings growth that is unrecognized by the markets. | | Artisan Partners Limited Partnership employs a fundamental investment process to construct a diversified portfolio of U.S. mid-capitalization growth companies. The team seeks to invest in companies that it believes possess franchise characteristics, are benefiting from an accelerating profit cycle and are trading at a discount to its estimate of private market value. | | |
| | |
| 20 | | Annual Report • June 30, 2023 |
Bridge Builder Small/Mid Cap Growth Fund
Management’s Discussion of Fund Performance (Unaudited) (Continued)
The following chart compares the value of a hypothetical $10,000 investment in the Bridge Builder Small/Mid Cap
Growth Fund from its inception (April 27, 2015) to June 30, 2023 as compared with the Russell 2500® Growth Index.
Growth of a Hypothetical $10,000 Investment as of June 30, 2023
vs.
Russell 2500® Growth Index
Average Annual Total Returns as of June 30, 2023
| | | | | | | | | | | | |
| | | 1 Year | | | 5 Years | | | Since Inception (4/27/2015) | |
Bridge Builder Small/Mid Cap Growth Fund | | | 15.65 | % | | | 7.93 | % | | | 8.94 | % |
Russell 2500® Growth Index | | | 18.58 | % | | | 7.00 | % | | | 8.28 | % |
Performance data quoted represents past performance; past performance does not guarantee future results. The investment return and principal value of an investment will fluctuate so that an investor’s shares, when redeemed, may be worth more or less than their original cost. Current performance of the Fund may be lower or higher than the performance quoted. As of the latest prospectus, the gross and net expense ratios of the Fund were 0.67%(1) and 0.38%(2), respectively. Performance data current to the most recent month end may be obtained by calling 1.855.823.3611.
The performance table does not reflect the deduction of taxes that a shareholder may pay on Fund distributions or the redemption of Fund shares. Returns shown for the Fund include the reinvestment of all dividends, if any. Total return calculations reflect the effect of the Adviser’s fee waiver agreement for the Fund. If such fee waivers had not occurred, the quoted performance would be lower.
Portfolio Characteristics (3)
| | | | |
| Sector Breakdown | | (% of Investments) | |
Information Technology | | | 25.2 | % |
Healthcare | | | 21.2 | |
Industrials | | | 19.4 | |
Consumer Discretionary | | | 10.1 | |
Financials | | | 8.9 | |
Consumer Staples | | | 4.8 | |
Short-Term Investments | | | 3.0 | |
Communication Services | | | 2.7 | |
Energy | | | 2.2 | |
Materials | | | 1.3 | |
Real Estate | | | 1.1 | |
Utilities | | | 0.1 | |
| | | | |
| Top Ten Equity Holdings | | (% of Net Assets) | |
Veeva Systems, Inc. – Class A | | | 1.7 | % |
Lattice Semiconductor Corp. | | | 1.3 | |
ON Semiconductor Corp. | | | 1.3 | |
Fortive Corp. | | | 1.2 | |
DexCom, Inc. | | | 1.2 | |
HubSpot, Inc. | | | 1.1 | |
West Pharmaceutical Services, Inc. | | | 1.0 | |
Zscaler, Inc. | | | 1.0 | |
Synopsys, Inc. | | | 0.9 | |
Tradeweb Markets, Inc. – Class A | | | 0.9 | |
| | |
| Annual Report • June 30, 2023 | | 21 |
Bridge Builder Small/Mid Cap Value Fund
Management’s Discussion of Fund Performance (Unaudited)
Investment Objective
The investment objective of the Bridge Builder Small/Mid Cap Value Fund (the “Fund”) is to provide capital appreciation.
Summary of the Investment Strategy
The Fund invests, under normal market conditions, at least 80% of its net assets (plus the amount of borrowings for investment purposes) in the securities of small- and mid-capitalization companies and other instruments, such as certain investment companies, that seek to track the performance of securities of small- and mid-capitalization companies. Small- and mid-capitalization companies are defined by the Fund as those companies whose market capitalizations at the time of purchase typically fall within the range of the Russell MidCap® Index and the Russell 2000® Index. The Fund follows an investing style that favors value investments and employs a multi-manager sub-advised structure.
Investment Commentary
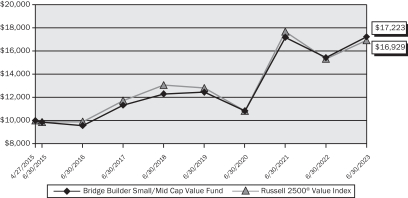
For the fiscal year ended June 30, 2023, the Fund returned 11.65%, outperforming its benchmark, the Russell 2500® Value Index, which returned 10.37% for the period.
For the year, mid-capitalization stocks outperformed small-capitalization stocks. Within the investment universe, strongest performers included the information technology, industrials and consumer discretionary sectors. The utilities, financials and real estate sectors were the weakest performers. Within both mid-capitalization and small-capitalization segments of the market, value stocks underperformed growth stocks.
Compared to its benchmark, the Fund’s relative outperformance was driven by the overweight to mid-cap stocks, favorable sector allocation, and strong stock selection within certain sectors. An underweight to real estate contributed to performance, which was partially offset by an overweight to utilities. Stock selection within the consumer discretionary, information technology and industrials sectors also contributed to performance. Given strong market returns, cash exposure was a headwind to the Fund’s performance over the year.
Two of the biggest headwinds for markets in 2022 – inflation and Federal Reserve policy – have started to turn favorably, while the economy has proved surprisingly resilient. Looking forward, we think inflation will continue to moderate, but growth is likely to downshift as the impact of the Fed’s rate hikes filters through the economy. While inflation remains high, progress has been made. As time passes, we think the impact of higher interest rates will be felt, and growth could weaken. However, the healthy starting point for the labor market should provide some cushion, and it is possible that just as consumption becomes less supportive, the slump in manufacturing and housing may start to reverse.
Investment Sub-advisers
| | | | | | |
| Vaughan Nelson Investment Management, LP uses a bottom- up value-oriented investment process. Vaughan Nelson seeks companies with the following characteristics: companies earning a positive return on capital with stable-to-improving returns, valued at a discount to their asset value and/or having an attractive and sustainable dividend level. | | Boston Partners Global Investors, Inc. primarily invests in medium-capitalization companies and uses bottom-up fundamental analysis to make investment decisions. Boston Partners’ strategy seeks to add value through bottom-up stock selection. The strategy is designed to identify companies with attractive valuation, sound business fundamentals and improving business momentum. | | Silvercrest Asset Management Group LLC primarily invests in small- capitalization companies that typically possess, in the opinion of the portfolio manager, one or more of the following attributes: business that results in relatively consistent longer-term earnings and cash flow growth, franchise/asset value that may make the company attractive to potential acquirers, cyclically depressed earnings and/or cash flow that has potential for improvement, or a catalyst that will promote recognition of the company’s undervalued status. | | BlackRock Investment Management, LLC invests in equity securities with the objective of approximating as closely as practicable the capitalization-weighted total rate of return of the segments of the United States market for publicly traded equity securities represented by the Russell Midcap® Value Index, which tracks the performance of mid-capitalization companies, and the Russell 2000® Value Index, which tracks the performance of small-capitalization companies. |
| | |
| 22 | | Annual Report • June 30, 2023 |
Bridge Builder Small/Mid Cap Value Fund
Management’s Discussion of Fund Performance (Unaudited) (Continued)
| | | | | | |
LSV Asset Management primarily invests in medium-capitalization companies. LSV uses a bottom-up investment style, seeking to identify companies that are trading at prices substantially below their intrinsic value. | | Diamond Hill Capital Management, Inc. typically invests in U.S. equity securities of small to medium market capitalization companies measured at the time of purchase. Diamond Hill’s objective is to seek long-term capital appreciation by investing in companies selling for less than Diamond Hill’s estimate of intrinsic value. | | MFS Investment Management primarily invests in securities of companies with small capitalizations. MFS focuses on investing in the stocks of companies that it believes are undervalued compared to their perceived worth (value companies). MFS uses an active bottom-up investment approach to buying and selling investments. Investments are selected primarily based on fundamental analysis of individual issuers. Quantitative screening tools that systematically evaluate issuers may also be considered. | | American Century Investment Management, Inc. looks for equity securities of smaller companies whose stock price may not reflect the company’s value. The portfolio managers attempt to purchase the stocks of these undervalued companies and hold each stock until the price has increased to, or is higher than, a level the portfolio managers believe more accurately reflects the value of the company. |
| | |
| Annual Report • June 30, 2023 | | 23 |
Bridge Builder Small/Mid Cap Value Fund
Management’s Discussion of Fund Performance (Unaudited) (Continued)
The following chart compares the value of a hypothetical $10,000 investment in the Bridge Builder Small/Mid Cap
Value Fund from its inception (April 27, 2015) to June 30, 2023 as compared with the Russell 2500® Value Index.
Growth of a Hypothetical $10,000 Investment as of June 30, 2023
vs.
Russell 2500® Value Index
Average Annual Total Returns as of June 30, 2023
| | | | | | | | | | | | |
| | | 1 Year | | | 5 Years | | | Since Inception (4/27/2015) | |
Bridge Builder Small/Mid Cap Value Fund | | | 11.65 | % | | | 6.97 | % | | | 6.88 | % |
Russell 2500® Value Index | | | 10.37 | % | | | 5.32 | % | | | 6.65 | % |
Performance data quoted represents past performance; past performance does not guarantee future results. The investment return and principal value of an investment will fluctuate so that an investor’s shares, when redeemed, may be worth more or less than their original cost. Current performance of the Fund may be lower or higher than the performance quoted. As of the latest prospectus, the gross and net expense ratios of the Fund were 0.67%(1) and 0.41%(2), respectively. Performance data current to the most recent month end may be obtained by calling 1.855.823.3611.
The performance table does not reflect the deduction of taxes that a shareholder may pay on Fund distributions or the redemption of Fund shares. Returns shown for the Fund include the reinvestment of all dividends, if any. Total return calculations reflect the effect of the Adviser’s fee waiver agreement for the Fund. If such fee waivers had not occurred, the quoted performance would be lower.
Portfolio Characteristics (3)
| | | | |
| Sector Breakdown | | (% of Investments) | |
Industrials | | | 20.8 | % |
Financials | | | 17.7 | |
Consumer Discretionary | | | 12.1 | |
Information Technology | | | 8.6 | |
Healthcare | | | 8.1 | |
Materials | | | 7.0 | |
Real Estate | | | 6.1 | |
Utilities | | | 5.4 | |
Energy | | | 5.2 | |
Consumer Staples | | | 4.1 | |
Short-Term Investments | | | 3.1 | |
Communication Services | | | 1.4 | |
Exchange Traded Funds | | | 0.4 | |
| | | | |
| Top Ten Equity Holdings | | (% of Net Assets) | |
AmerisourceBergen Corp. – Class A | | | 1.2 | % |
AutoZone, Inc. | | | 0.9 | |
AMETEK, Inc. | | | 0.8 | |
Parker-Hannifin Corp. | | | 0.8 | |
Republic Services, Inc. – Class A | | | 0.7 | |
Ameriprise Financial, Inc. | | | 0.7 | |
WESCO International, Inc. | | | 0.6 | |
Allstate Corp. | | | 0.6 | |
Arthur J. Gallagher & Co. | | | 0.6 | |
CACI International, Inc. – Class A | | | 0.6 | |
| | |
| 24 | | Annual Report • June 30, 2023 |
Bridge Builder Tax Managed Small/Mid Cap Fund
Management’s Discussion of Fund Performance (Unaudited)
Investment Objective
The investment objective of Bridge Builder Tax Managed Small/Mid Cap Fund (the “Fund”) is to seek to provide a tax-efficient investment return consisting of capital appreciation.
Summary of the Investment Strategy
The Fund invests, under normal market conditions, at least 80% of its net assets (plus the amount of borrowings for investment purposes) in the securities of small- and mid-capitalization companies and other instruments, such as certain investment companies, with economic characteristics that seek to track the performance of securities of small- and mid-capitalization companies. Small- and mid-capitalization companies are defined by the Fund as those companies whose market capitalizations at the time of purchase typically fall within the range of the Russell MidCap® Index and the Russell 2000® Index. The Fund implements the investment recommendations of the Fund’s sub-advisers through the use of Parametric Portfolio Associates LLC (“Parametric”) as overlay manager, as described in greater detail below. As overlay manager, Parametric has limited authority to vary from the model portfolios provided by the Fund’s sub-advisers, primarily for the purpose of efficient tax management of the Fund’s securities transactions. The Fund employs a multi-manager sub-advised structure.
Investment Commentary
For the fiscal year ended June 30, 2023, the Fund returned 16.46%, outperforming its benchmark, the Russell 2500® Index, which returned 13.58% for the period.
For the year, mid-capitalization stocks outperformed small-capitalization stocks. Within the investment universe, strongest performers included the industrials and technology sectors. The utilities, financials and real estate sectors were the weakest performers. Within both mid-capitalization and small-capitalization segments of the market, growth stocks outperformed value stocks.
Compared to its benchmark, the Fund’s relative outperformance benefited from its overweight to mid-capitalization stocks, favorable sector allocation, and strong stock selection within certain sectors. Relative performance was balanced across sectors as 8 of the 11 aided in outperformance for the year. The largest detractor for the year was driven by weak stock selection within consumer staples.
Two of the biggest headwinds for markets in 2022 – inflation and Federal Reserve policy – have started to turn favorably, while the economy has proved surprisingly resilient. Looking forward, we think inflation will continue to moderate, but growth is likely to downshift as the impact of the Fed’s rate hikes filters through the economy. While inflation remains high, progress has been made. As time passes, we think the impact of higher interest rates will be felt, and growth could weaken. However, the healthy starting point for the labor market should provide some cushion, and it is possible that just as consumption becomes less supportive, the slump in manufacturing and housing may start to reverse.
| | |
| Annual Report • June 30, 2023 | | 25 |
Bridge Builder Tax Managed Small/Mid Cap Fund
Management’s Discussion of Fund Performance (Unaudited) (Continued)
Investment Sub-advisers
| | | | | | |
| Goldman Sachs Asset Management, L.P. seeks long-term growth of capital and recommends primarily small- and medium-capitalization U.S. companies, and may also recommend foreign companies. Goldman Sachs utilizes a fundamental process to evaluate companies based on specific characteristics it believes indicate a high-quality business with sustainable growth. These specific characteristics include strong business franchises, favorable long-term prospects, and excellent management. Goldman Sachs also considers the valuation of a company in recommending its purchase or sale. | | J.P. Morgan Investment Management Inc. employs fundamental bottom-up investment process that combines research, valuation, and stock selection to identify companies that have a history of above-average growth or which it believes will achieve above-average growth in the future. J.P. Morgan expects to recommend the investment of equity securities of mid-capitalization companies and seeks growth companies with leading competitive positions that can achieve sustainable growth. | | Neuberger Berman Investment Advisers LLC seeks to recommend investments mainly in small- and medium-capitalization U.S. companies and may also recommend foreign companies. Neuberger Berman seeks to reduce risk by diversifying among companies and industries and may, at times, emphasize certain sectors that it believes will benefit from market or economic trends. Neuberger Berman focuses on companies that it believes to be high quality companies that have strong current market shares and balance sheets, and whose financial strength is largely based on existing business lines rather than on projected growth. Factors in identifying these companies may include: a history of above-average returns, an established market niche, circumstances that would make it difficult for new competitors to enter the market, the ability to finance their own growth, and/or a belief by Neuberger Berman that the company has sound future business prospects. | | AllianceBernstein L.P. recommends primarily small- and medium-capitalization U.S. companies that it believes are undervalued by using AllianceBernstein’s fundamental value approach. In making recommendations, AllianceBernstein uses its fundamental and quantitative research to identify companies whose long-term earnings power is not reflected in the current market price of their securities. |
| | | | | | |
| Allspring Global Investments, LLC recommends medium-capitalization companies and looks for undervalued companies that it believes have the potential for above average capital appreciation with below average risk. Allspring searches for companies with favorable reward-to-risk ratios and that possess, a long-term competitive advantage provided by a durable asset base, strong balance sheets, and sustainable cash flows. Typical recommendations by Allspring include stocks of companies that are generally out of favor in the marketplace or are undergoing reorganization or other corporate action that may create above-average price appreciation. | | Parametric Portfolio Associates LLC serves as the Fund’s overlay manager and also serves as the Fund’s direct indexing manager. As the Fund’s direct indexing manager, Parametric manages one or more allocated portions of the Fund pursuant to a strategy that is designed to provide similar exposure to the Russell Midcap® Growth Index, Russell Midcap® Value Index, Russell 2000® Growth Index and Russell 2000® Value Index. As the Fund’s overlay manager, Parametric constructs a portfolio that represents the aggregation of the model portfolios of the Fund’s sub-advisers, including with respect to each direct indexing portion of the Fund, at weightings set by Olive Street Investment Advisers, LLC, the Fund’s investment adviser. In this role, Parametric manages the impact of taxes through active tax management strategies, including tax lot management, which impacts tax loss harvesting, capital gain deferral, and the minimization of wash sales. | | | | |
| | |
| 26 | | Annual Report • June 30, 2023 |
Bridge Builder Tax Managed Small/Mid Cap Fund
Management’s Discussion of Fund Performance (Unaudited) (Continued)
The following chart compares the value of a hypothetical $10,000 investment in the Bridge Builder Tax Managed Small/Mid Cap Fund from its inception (June 1, 2022) to June 30, 2023 as compared with the Russell 2500® Index.
Growth of a Hypothetical $10,000 Investment as of June 30, 2023
vs.
Russell 2500® Index
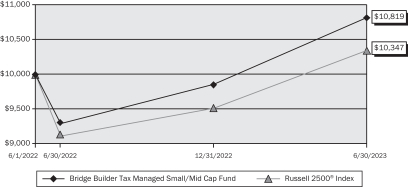
Average Annual Total Returns as of June 30, 2023
| | | | | | | | |
Bridge Builder Tax Managed Small/Mid Cap Fund | | 1 Year | | | Since Inception (6/1/2022) | |
Return Before Taxes | | | 16.46 | % | | | 7.56 | % |
Return After Taxes on Distributions | | | 16.37 | % | | | 7.49 | % |
Return After Taxes on Distributions and Sale of Fund Shares | | | 9.77 | % | | | 5.75 | % |
Russell 2500® Index | | | 13.58 | % | | | 3.21 | % |
Performance data quoted represents past performance; past performance does not guarantee future results. The investment return and principal value of an investment will fluctuate so that an investor’s shares, when redeemed, may be worth more or less than their original cost. Current performance of the Fund may be lower or higher than the performance quoted. As of the latest prospectus, the gross and net expense ratios of the Fund were 0.75%(1) and 0.54%(2), respectively. Performance data current to the most recent month end may be obtained by calling 1.855.823.3611.
The returns presented in this table reflect the return before taxes; the return after taxes on dividends and capital gain distributions; and the return after taxes on dividends, capital gain distributions, and gains (or losses) from the redemption of shares held for 1 year or since-inception periods, as applicable. After-tax returns reflect the highest federal income tax rates but exclude state and local taxes. The after-tax returns reflect the rates applicable to ordinary and qualified dividends and capital gains that were in effect for the period(s) presented in the table. During periods when the Fund incurs a loss, the post-liquidation after-tax return may exceed the Fund’s other returns because the loss generates a tax benefit that is factored into the result. An investor’s actual after-tax return will likely differ from those shown and depend on his or her tax situation. The Fund’s past returns (before and after taxes) do not necessarily indicate future performance. Returns shown for the Fund include the reinvestment of all dividends, if any. Total return calculations reflect the effect of the Adviser’s fee waiver agreement for the Fund. If such fee waivers had not occurred, the quoted performance would be lower.
Portfolio Characteristics (3)
| | | | |
| Sector Breakdown | | (% of Investments) | |
Industrials | | | 23.5 | % |
Information Technology | | | 15.6 | |
Financials | | | 13.1 | |
Healthcare | | | 12.7 | |
Consumer Discretionary | | | 11.8 | |
Energy | | | 4.5 | |
Materials | | | 4.2 | |
Real Estate | | | 4.0 | |
Consumer Staples | | | 3.4 | |
Short-Term Investments | | | 2.6 | |
Communication Services | | | 2.3 | |
Utilities | | | 2.3 | |
| | | | |
| Top Ten Equity Holdings | | (% of Net Assets) | |
Lattice Semiconductor Corp. | | | 1.1 | % |
MasTec, Inc. | | | 0.8 | |
Church & Dwight Co., Inc. | | | 0.8 | |
Toro Co. | | | 0.7 | |
Arch Capital Group Ltd. | | | 0.7 | |
Vulcan Materials Co. | | | 0.7 | |
Republic Services, Inc. – Class A | | | 0.7 | |
Nordson Corp. | | | 0.7 | |
AerCap Holdings NV | | | 0.6 | |
LKQ Corp. | | | 0.6 | |
| | |
| Annual Report • June 30, 2023 | | 27 |
Bridge Builder International Equity Fund
Management’s Discussion of Fund Performance (Unaudited)
Investment Objective
The investment objective of the Bridge Builder International Equity Fund (the “Fund”) is to provide capital appreciation.
Summary of the Investment Strategy
The Fund invests, under normal market conditions, at least 80% of its net assets (plus the amount of borrowings for investment purposes) in equity securities and other instruments, such as derivative instruments, with economic characteristics similar to equity securities, and certain investment companies that seek to track the performance of equity securities. The Fund primarily invests in non-U.S. dollar-denominated securities of large-capitalization companies that derive a majority of their revenues or profits from a country or countries other than the United States. The Fund employs a multi-manager sub-advised structure.
Investment Commentary
For the fiscal year ended June 30, 2023, the Fund returned 17.27%, underperforming its benchmark, the MSCI EAFE Index, which returned 18.77% for the period.
For the year, the U.S. dollar generally depreciated versus the currencies of other developed regions, contributing to the returns of international securities for U.S. investors. Emerging markets performance was weaker than developed markets. In developed markets, growth stocks outperformed value stocks, and large-capitalization stocks outperformed small-capitalization stocks. Real estate and communication services struggled over the year, while information technology, consumer discretionary, and industrials generated the strongest returns.
Compared to its benchmark, the Fund’s relative underperformance was driven by weak stock selection and exposure to emerging markets. Weak stock selection, particularly in consumer discretionary, information technology, and industrials detracted from relative returns. Sector allocation, such as the underweight to real estate and the overweight to consumer discretionary, contributed to returns, but were offset by the weak stock selection and the cash exposure.
Outside of the U.S., European economies continued to battle elevated inflation during the second quarter of 2023, as central banks in the euro area and U.K. raised interest rates to the highest levels in over 15 years. In our view, inflation trends in the European economies have lagged those in the U.S., particularly as energy and food prices remain elevated. As the Federal Reserve heads toward a potential pause in rates and European central banks continue to hike, we may see further cooling in the U.S. dollar, which could support European equities over time. In Japan, more government spending and regulatory reforms have also helped make Japan more competitive globally. While we may see some respite in the move higher in Japanese equities, we believe the trend over a longer term should continue to be more favorable for Japan. The Chinese government has vowed to support the economy following lackluster economic performance after reopening from lockdowns earlier this year, and the Chinese central bank cut its benchmark rate in June. In our view, stimulus measures should gradually lead to stabilization in the Chinese economy in the quarters ahead.
Investment Sub-advisers
| | | | |
| Baillie Gifford Overseas Limited primarily uses proprietary, fundamental research to identify companies for investment that can exhibit sustained, above-average growth with attractive financial characteristics and sustainable competitive advantages. When evaluating individual companies for investment, Baillie Gifford normally focuses on growth/quality, management, valuation and sell discipline. | | BlackRock Investment Management, LLC invests in international equity securities with the objective of approximating as closely as practicable the capitalization weighted total rates of return of the markets in certain countries for equity securities traded outside the United States, as represented by the MSCI EAFE Growth and MSCI EAFE Value Indices. | | Marathon Asset Management Limited invests primarily in equity securities of non-U.S. issuers in developed and emerging market countries. Marathon-London employs a bottom-up, fundamental investment philosophy focused on identifying attractive long-term investment opportunities that can arise as a result of certain “capital cycle” conditions which guides Marathon-London to invest in stocks in industries where consolidation has occurred and return on investment is expected to rise and/or where barriers to entry exist that may allow elevated return on investment to persist for longer than the market expects. Marathon-London’s portfolio is expected to have low turnover, to be well-diversified, and to have a bias towards the smaller-capitalization segments of the market. |
| | |
| 28 | | Annual Report • June 30, 2023 |
Bridge Builder International Equity Fund
Management’s Discussion of Fund Performance (Unaudited) (Continued)
| | | | |
| Pzena Investment Management, LLC focuses on deep value investing, seeking to identify international securities that are trading at prices substantially below their intrinsic value but have solid long term prospects. | | Mondrian Investment Partners Limited invests primarily in equity securities of non-U.S. large-capitalization issuers, including the securities of emerging market companies, that it believes are undervalued at the time of purchase based on fundamental value analysis employed by Mondrian. Portfolio construction is primarily driven by detailed bottom-up stock selection, based on rigorous dividend discount valuation analysis. | | WCM Investment Management LLC uses a bottom-up approach that seeks to identify companies with attractive fundamentals, such as long-term growth in revenue and earnings, and that show a high probability for superior future growth. WCM’s investment process focuses on seeking industry-leading companies that WCM believes possess growing competitive advantages; corporate cultures emphasizing strong, quality and experienced management; low or no debt; and attractive relative valuations. |
| | |
| Annual Report • June 30, 2023 | | 29 |
Bridge Builder International Equity Fund
Management’s Discussion of Fund Performance (Unaudited) (Continued)
The following chart compares the value of a hypothetical $10,000 investment in the Bridge Builder International
Fund from its inception (July 6, 2015) to June 30, 2023 as compared with the MSCI EAFE Index.
Growth of a Hypothetical $10,000 Investment as of June 30, 2023
vs.
MSCI EAFE Index
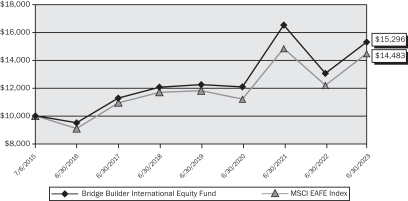
Average Annual Total Returns as of June 30, 2023
| | | | | | | | | | | | |
| | | 1 Year | | | 5 Years | | | Since Inception (7/6/2015) | |
Bridge Builder International Equity Fund | | | 17.27 | % | | | 4.89 | % | | | 5.47 | % |
MSCI EAFE Index | | | 18.77 | % | | | 4.39 | % | | | 4.75 | % |
Performance data quoted represents past performance; past performance does not guarantee future results. The investment return and principal value of an investment will fluctuate so that an investor’s shares, when redeemed, may be worth more or less than their original cost. Current performance of the Fund may be lower or higher than the performance quoted. As of the latest prospectus, the gross and net expense ratios of the Fund were 0.64%(1) and 0.37%(2), respectively. Performance data current to the most recent month end may be obtained by calling 1.855.823.3611.
The performance table does not reflect the deduction of taxes that a shareholder may pay on Fund distributions or the redemption of Fund shares. Returns shown for the Fund include the reinvestment of all dividends, if any. Total return calculations reflect the effect of the Adviser’s fee waiver agreement for the Fund. If such fee waivers had not occurred, the quoted performance would be lower.
Portfolio Characteristics (3)
| | | | |
| Sector Breakdown | | (% of Investments) | |
Industrials | | | 19.3 | % |
Financials | | | 17.0 | |
Consumer Discretionary | | | 14.4 | |
Healthcare | | | 13.6 | |
Information Technology | | | 9.2 | |
Consumer Staples | | | 9.1 | |
Materials | | | 4.9 | |
Communication Services | | | 4.1 | |
Energy | | | 3.7 | |
Utilities | | | 2.8 | |
Short-Term Investments | | | 1.6 | |
Real Estate | | | 0.3 | |
| | | | |
| Top Ten Equity Holdings | | (% of Net Assets) | |
Shell Plc | | | 1.4 | % |
Enel SpA | | | 1.3 | |
United Overseas Bank Ltd. | | | 1.3 | |
Novo Nordisk – Class B | | | 1.3 | |
Sanofi | | | 1.3 | |
Koninklijke Philips NV | | | 1.2 | |
BP Plc | | | 1.1 | |
Takeda Pharmaceutical Co. Ltd. | | | 1.0 | |
Tesco Plc | | | 1.0 | |
Sony Group Corp. | | | 1.0 | |
| | |
| 30 | | Annual Report • June 30, 2023 |
Bridge Builder International Equity Fund
Management’s Discussion of Fund Performance (Unaudited) (Continued)
| | | | |
| Country Breakdown | | (% of Long-Term Investments) | |
Japan | | | 19.7 | % |
United Kingdom | | | 18.0 | |
France | | | 9.0 | |
Netherlands | | | 6.4 | |
Germany | | | 6.0 | |
Switzerland | | | 5.6 | |
Italy | | | 3.8 | |
Sweden | | | 2.9 | |
Denmark | | | 2.9 | |
Hong Kong | | | 2.9 | |
Other | | | 22.8 | |
| | |
| Annual Report • June 30, 2023 | | 31 |
Bridge Builder Tax Managed International Equity Fund
Management’s Discussion of Fund Performance (Unaudited)
Investment Objective
The investment objective of the Bridge Builder Tax Managed International Equity Fund (the “Fund”) is to seek to provide a tax-efficient investment return consisting of capital appreciation.
Summary of the Investment Strategy
The Fund invests, under normal market conditions, at least 80% of its net assets (plus the amount of borrowings for investment purposes) in equity securities and other instruments, such as certain investment companies, with economic characteristics that seek to track the performance of equity securities. The Fund primarily invests in non-U.S. dollar denominated securities of large-capitalization companies that derive a majority of their revenues or profits from a country or countries other than the United States. The Fund implements the investment recommendations of the Fund’s sub-advisers through the use of Parametric Portfolio Associates LLC (“Parametric”) as overlay manager, as described in greater detail below. As overlay manager, Parametric has limited authority to vary from the model portfolios provided by the Fund’s sub-advisers, primarily for the purpose of efficient tax management of the Fund’s securities transactions. The Fund employs a multi-manager sub-advised structure.
Investment Commentary
For the fiscal year ended June 30, 2023, the Fund returned 19.47%, outperforming its benchmark, the MSCI EAFE Index, which returned 18.77% for the period.
For the year, the U.S. dollar generally depreciated versus the currencies of other developed regions, contributing to the returns of international securities for U.S. investors. Emerging markets performance was weaker than developed markets. In developed markets, growth stocks outperformed value stocks, and large-capitalization stocks outperformed small-capitalization stocks. Real estate and communication services struggled over the year, while information technology, consumer discretionary, and industrials performed the strongest.
Compared to its benchmark, the Fund’s relative outperformance was driven by sector allocation and strong stock selection. Strong stock selection in consumer staples, energy and financials offset weak stock selection in industrials, information technology, and consumer discretionary. The underweight to real estate and communication services and the overweight to information technology contributed to relative performance while the cash exposure was a headwind to the Fund’s performance over the year.
Outside of the U.S., European economies continued to battle elevated inflation during the second quarter of 2023, as central banks in the euro area and U.K. raised interest rates to the highest levels in over 15 years. In our view, inflation trends in the European economies have lagged those in the U.S., particularly as energy and food prices remain elevated. As the Federal Reserve heads toward a potential pause in rates and European central banks continue to hike, we may see further cooling in the U.S. dollar, which could support European equities over time. In Japan, more government spending and regulatory reforms have also helped make Japan more competitive globally. While we may see some respite in the move higher in Japanese equities, we believe the trend over a longer term should continue to be more favorable for Japan. The Chinese government has vowed to support the economy following lackluster economic performance after reopening from lockdowns earlier this year, and the Chinese central bank cut its benchmark rate in June. In our view, stimulus measures should gradually lead to stabilization in the Chinese economy in the quarters ahead.
| | |
| 32 | | Annual Report • June 30, 2023 |
Bridge Builder Tax Managed International Equity Fund
Management’s Discussion of Fund Performance (Unaudited) (Continued)
Investment Sub-advisers
| | | | | | |
| Pzena Investment Management, LLC focuses on deep value investing, seeking to identify international companies that are trading at prices substantially below their intrinsic value but have solid long-term prospects. Pzena may also recommend investments in emerging markets companies. Pzena performs fundamental research using a bottom-up security selection process. | | T. Rowe Price Associates, Inc. seeks long-term growth of capital through investments in non-U.S. companies. T. Rowe Price recommends investments in companies with a favorable combination of growth prospects and valuation. Several of the characteristics T. Rowe Price looks for include accelerating earnings and cash flow growth, reasonable valuation, and barriers to entry at industry and product level. | | Walter Scott & Partners Limited seeks a favorable real rate of return over the long term. Walter Scott seeks companies that perform relatively well and grow to a higher weight in the strategy based on fundamental company analysis and a bottom-up research process. Walter Scott recommends the purchase of these companies with no near-term expectation of recommending the sale of such companies. Walter Scott’s approach expects the strategy to realize low portfolio turnover. | | Parametric Portfolio Associates LLC serves as the Fund’s overlay manager and also serves as the Fund’s direct indexing manager. As the Fund’s direct indexing manager, Parametric manages one or more allocated portions of the Fund pursuant to a strategy that is designed to provide similar exposure to the MSCI EAFE Growth Index and the MSCI EAFE Value Index. As the Fund’s overlay manager, Parametric constructs a portfolio that represents the aggregation of the model portfolios of the Fund’s sub-advisers, including with respect to each direct indexing portion of the Fund, at weightings set by Olive Street Investment Advisers, LLC, the Fund’s investment adviser. In this role, Parametric manages the impact of taxes through active tax management strategies, including tax lot management, which impacts tax loss harvesting, capital gain deferral, and the minimization of wash sales. |
| | |
| Annual Report • June 30, 2023 | | 33 |
Bridge Builder Tax Managed International Equity Fund
Management’s Discussion of Fund Performance (Unaudited) (Continued)
The following chart compares the value of a hypothetical $10,000 investment in the Bridge Builder Tax Managed International Equity Fund from its inception (June 1, 2022) to June 30, 2023 as compared with the MSCI EAFE Index.
Growth of a Hypothetical $10,000 Investment as of June 30, 2023
vs.
MSCI EAFE Index
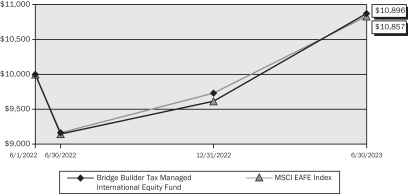
Average Annual Total Returns as of June 30, 2023
| | | | | | | | |
Bridge Builder Tax Managed International Equity Fund | | 1 Year | | | Since Inception (6/1/2022) | |
Return Before Taxes | | | 19.47 | % | | | 8.27 | % |
Return After Taxes on Distributions | | | 19.35 | % | | | 8.17 | % |
Return After Taxes on Distributions and Sale of Fund Shares | | | 11.56 | % | | | 6.28 | % |
MSCI EAFE Index | | | 18.77 | % | | | 7.92 | % |
Performance data quoted represents past performance; past performance does not guarantee future results. The investment return and principal value of an investment will fluctuate so that an investor’s shares, when redeemed, may be worth more or less than their original cost. Current performance of the Fund may be lower or higher than the performance quoted. As of the latest prospectus, the gross and net expense ratios of the Fund were 0.74%(1) and 0.55%(2), respectively. Performance data current to the most recent month end may be obtained by calling 1.855.823.3611.
The returns presented in this table reflect the return before taxes; the return after taxes on dividends and capital gain distributions; and the return after taxes on dividends, capital gain distributions, and gains (or losses) from the redemption of shares held for 1 year or since-inception periods, as applicable. After-tax returns reflect the highest federal income tax rates but exclude state and local taxes. The after-tax returns reflect the rates applicable to ordinary and qualified dividends and capital gains that were in effect for the period(s) presented in the table. During periods when the Fund incurs a loss, the post-liquidation after-tax return may exceed the Fund’s other returns because the loss generates a tax benefit that is factored into the result. An investor’s actual after-tax return will likely differ from those shown and depend on his or her tax situation. The Fund’s past returns (before and after taxes) do not necessarily indicate future performance. Returns shown for the Fund include the reinvestment of all dividends, if any. Total return calculations reflect the effect of the Adviser’s fee waiver agreement for the Fund. If such fee waivers had not occurred, the quoted performance would be lower.
Portfolio Characteristics (3)
| | | | |
| Sector Breakdown | | (% of Investments) | |
Industrials | | | 16.0 | % |
Financials | | | 15.9 | |
Healthcare | | | 15.6 | |
Consumer Discretionary | | | 13.8 | |
Information Technology | | | 11.5 | |
Consumer Staples | | | 8.9 | |
Materials | | | 7.5 | |
Short-Term Investments | | | 3.2 | |
Energy | | | 2.7 | |
Utilities | | | 2.1 | |
Communication Services | | | 2.1 | |
Real Estate | | | 0.7 | |
| | | | |
| Top Ten Equity Holdings | | (% of Net Assets) | |
Roche Holding AG | | | 1.8 | % |
Nestle SA | | | 1.7 | |
ASML Holding NV | | | 1.6 | |
Novo Nordisk – Class B | | | 1.6 | |
Sanofi | | | 1.3 | |
SAP SE | | | 1.2 | |
Novartis AG | | | 1.2 | |
LVMH Moet Hennessy Louis Vuitton SE | | | 1.2 | |
Compass Group Plc | | | 1.2 | |
L’Oreal SA | | | 1.1 | |
| | |
| 34 | | Annual Report • June 30, 2023 |
Bridge Builder Tax Managed International Equity Fund
Management’s Discussion of Fund Performance (Unaudited) (Continued)
| | | | |
| Country Breakdown | | (% of Long-Term Investments) | |
Japan | | | 20.0 | % |
France | | | 13.5 | |
United Kingdom | | | 11.8 | |
Germany | | | 9.7 | |
Switzerland | | | 9.1 | |
Netherlands | | | 5.9 | |
Denmark | | | 3.6 | |
Australia | | | 3.3 | |
Hong Kong | | | 3.2 | |
Canada | | | 3.1 | |
Other | | | 16.8 | |
| | |
| Annual Report • June 30, 2023 | | 35 |
Bridge Builder Mutual Funds
Management’s Discussion of Fund Performance (Unaudited)
Disclosures
| (1) | | The Gross Expense Ratio, per the Fund’s prospectus, includes all categories of expenses before any expense reductions or fee waivers. |
| (2) | | Olive Street has contractually agreed, until at least October 28, 2023 to waive its management fees to the extent management fees to be paid to the Adviser exceed the management fees the Fund is required to pay the Fund’s Sub-advisers. This contractual agreement may only be changed or eliminated with the approval of the Board of Trustees. Such waivers are not subject to recoupment by Olive Street. |
| (3) | | Fund holdings, sector and portfolio characteristics are subject to change at any time and are not recommendations to buy or sell any security. |
Mutual fund investing involves risk. The value of your investment in a Fund could go down as well as up. Investing in the bond market is subject to certain risks including market, credit, interest-rate and liquidity. Investments in asset-backed, mortgage-related and mortgage-backed securities may be more sensitive to changes in interest rates, prepayments and impairment of the value of the collateral underlying the security.
Investments in lower-rated and non-rated securities presents a greater risk of loss to principal and interest than higher-rated securities. The risks to the municipal bond market can include unusual volatility, liquidity issues, the inability of the issuer to repay the obligation and a tax risk to the investor if the municipal obligation fails to meet requirements. There is no guarantee that all of the municipal bond income will remain exempt from federal or state income taxes. Investments in municipal securities may be adversely affected by unfavorable legislative or political developments and economic developments that impact the financial condition of municipal issuers. Investments in large-cap companies may be unable to respond quickly to new competitive challenges, such as changes in technology. They may also not be able to attain the high growth rate of successful smaller companies. Investments in small-and mid-cap companies may involve additional risks such as limited liquidity and greater volatility than larger companies. Investments in non-U.S. dollar-denominated foreign securities (including emerging market securities) may be more sensitive to currency fluctuations, political and economic instability, differing government regulations and liquidity risk. Certain Funds are managed to seek to minimize tax consequences to shareholders, but there is no guarantee that such Funds will be able to operate without incurring taxable income and gains to shareholders. Multi-manager and multi-style management may lead to overlapping securities transactions and higher transaction expenses compared to single investment management styles. Outcomes depend on the skill of the sub-advisers and adviser and the allocation of assets amongst them.
You cannot invest directly in an index.
DEFINITIONS
Bloomberg U.S. Aggregate Bond Index measures the performance of the U.S. dollar-denominated investment grade, fixed-rate taxable bond market.
Bloomberg Municipal 1-15 Year Index (1-17) is a subset of the Bloomberg Municipal Bond Index covering only maturities between 1 and 17 years. The Bloomberg Municipal Bond Index is an unmanaged index composed of tax-exempt bonds with maturities greater than one year and a minimum credit rating of Baa.
Bloomberg Municipal 65% High-Grade/35% High Yield Index is an unmanaged index composed of investment and non-investment-grade bonds, with a 65% weighting in the U.S. Municipal Index and a 35% weighting to the Municipal High Yield Index.
Duration is a measure of the sensitivity of the price of a fixed-income security (or a portfolio of fixed-income securities) to changes in interest rates.
Free Cash Flow is a measure of financial performance calculated as operating cash flow minus capital expenditures. Free cash flow represents the cash that a company is able to generate after laying out the money required to maintain or expand its asset base. Free cash flow is important because it allows a company to pursue opportunities that enhance shareholder value. Without cash, it’s tough to develop new products, make acquisitions, pay dividends and reduce debt.
The Morgan Stanley Capital International (MSCI) Europe, Australasia, Far East (EAFE) Index is an unmanaged index of over 900 companies, and is a generally accepted benchmark for major overseas markets.
Price to Earnings Ratio is a valuation ratio of a company’s current share price compared to its per-share earnings. It is calculated by dividing the current closing price of the stock by the earnings per share of the last four quarters.
Price to Book Ratio is a ratio used to compare a stock’s market value to its book value. It is calculated by dividing the current closing price of the stock by the latest quarter’s book value per share.
The Russell 1000® Index consists of the largest 1,000 companies in a group of 3,000 U.S. companies in the Russell 3000® Index, as ranked by market capitalization.
The Russell 1000® Growth Index measures the performance of the large-cap growth segment of the U.S. equity universe. It includes those Russell 1000® companies with higher price-to-book ratios and higher forecasted growth values.
| | |
| 36 | | Annual Report • June 30, 2023 |
Bridge Builder Mutual Funds
Management’s Discussion of Fund Performance (Unaudited) (Continued)
The Russell 1000® Value Index measures the performance of the large-cap value segment of the U.S. equity universe. It includes those Russell 1000® companies with lower price-to-book ratios and lower expected growth values.
The Russell 2000® Index consists of the smallest 2,000 companies in a group of 3,000 U.S. companies in the Russell 3000® Index, as ranked by market capitalization.
The Russell 2000® Growth Index measures the performance of the small-cap growth segment of the U.S. equity universe. It includes those Russell 2000® companies with higher price-to-book ratios and higher forecasted growth values.
The Russell 2000® Value Index measures the performance of the small-cap value segment of the U.S. equity universe. It includes those Russell 2000® companies with lower price-to-book ratios and lower forecasted growth values.
The Russell 2500® Index measures the performance of the small-to mid-cap segment of the U.S. equity universe.
The Russell 2500® Growth Index measures the performance of the small-to mid-cap growth segment of the U.S. equity universe. It includes those Russell 2500® Index companies with higher price-to-book ratios and higher forecasted growth values.
The Russell 2500® Value Index measures the performance of the small-to mid-cap value segment of the U.S. equity universe. It includes those Russell 2500® Index companies with lower price-to-book and lower forecasted growth values.
The Russell 3000® Index measures the performance of the 3,000 largest publicly held companies incorporated in the U.S. based on market capitalization.
The Russell Midcap® Index measures the performance of the mid-cap segment of the U.S. equity universe.
The Russell Midcap® Growth Index measures the performance of the mid-cap growth segment of the U.S. equity universe. It includes those Russell 1000® companies with higher price-to-book ratios and higher forecasted growth values.
The Russell Midcap® Value Index measures the performance of the mid-cap value segment of the U.S. equity universe. It includes those Russell 1000® companies with lower price-to-book ratios and lower forecasted growth values.
The S&P 500® Index, an unmanaged index, consists of 500 stocks chosen for market size, liquidity, and industry group representation. It is a market-value weighted index (stock price times number of shares outstanding), with each stock’s weight in the Index proportionate to its market value.
The S&P 500® Growth Index, an unmanaged index, measures the performance of the large-capitalization growth segment of the U.S. equity market. It consists of those stocks in the S&P 500 Index exhibiting the strongest growth characteristics based on: (i) sales growth; (ii) the ratio of earnings change to price; and (iii) momentum.
The S&P 500® Value Index, an unmanaged index, measures the performance of the large-capitalization value segment of the U.S. equity market. It consists of those stocks in the S&P 500 Index exhibiting the strongest value characteristics based on the ratios of book value, earnings, and sales to price.
| | |
| Annual Report • June 30, 2023 | | 37 |
Bridge Builder Mutual Funds
Fund Expense Examples (Unaudited)
As a shareholder of the Funds, you incur two types of costs: (1) ongoing costs, including management fees and other Fund expenses; and (2) Edward Jones Advisory Solutions® program and administrative fees, which are charged outside of the Funds. This Example is intended to help you understand your ongoing costs (in dollars) of investing in the Funds and to compare these costs with the ongoing costs of investing in other mutual funds.
Actual Expenses
The Examples are based on $1,000 invested at the beginning of the period and held for the entire period from
January 1, 2023 (April 13, 2023 for Bridge Builder Municipal High-Income Bond Fund) to June 30, 2023.
The first line of the table below provides information about actual account values and actual expenses. You may use the information in this line, together with the amount you invested, to estimate the expenses you paid over the period. Simply divide your account value by $1,000 (for example, an $8,600 account value divided by $1,000 equals 8.6), then multiply the result by the number in the applicable line under the heading titled “Expenses paid during the period” to estimate the expenses you paid on your account during the period.
Hypothetical Example for Comparison Purposes
The second line of the table below provides information about hypothetical account values and hypothetical expenses based on the Funds’ actual expense ratio and an assumed rate of return of 5% per year before expenses, which is not the Funds’ actual return. The hypothetical account values and expenses may not be used to estimate the actual ending account balance or expenses you paid for the period. You may use this information to compare the ongoing costs of investing in the Funds with other funds. To do so, compare this 5% hypothetical example with the 5% hypothetical examples that appear in the shareholder reports of other funds.
Please note that the expenses shown in the table are meant to highlight your ongoing costs of owning shares of a Fund only and do not reflect annual Edward Jones Advisory Solutions® program and administrative fees. If fees of Edward Jones Advisory Solutions® had been included, your costs would have been higher. The second line of the table for each Fund is useful in comparing ongoing costs only and will not help you determine the relative total costs of owning different funds.
| | | | | | | | | | | | | | | | | | | | |
| | | | | | Beginning
account value | | | Ending
account value | | | Annualized
Expense Ratio | | | Expenses paid
during the period | |
Bridge Builder Core Bond Fund | | | | | | | | | | | | | | | | | | | | |
| | | Actual | * | | $ | 1,000.00 | | | $ | 1,026.50 | | | | 0.12 | % | | $ | 0.60 | |
| | | Hypothetical | * | | | 1,000.00 | | | | 1,024.20 | | | | | | | | 0.60 | |
Bridge Builder Core Plus Bond Fund | | | | | | | | | | | | | | | | | | | | |
| | | Actual | * | | | 1,000.00 | | | | 1,027.10 | | | | 0.17 | | | | 0.85 | |
| | | Hypothetical | * | | | 1,000.00 | | | | 1,023.95 | | | | | | | | 0.85 | |
Bridge Builder Municipal Bond Fund | | | | | | | | | | | | | | | | | | | | |
| | | Actual | * | | | 1,000.00 | | | | 1,026.10 | | | | 0.14 | | | | 0.70 | |
| | | Hypothetical | * | | | 1,000.00 | | | | 1,024.10 | | | | | | | | 0.70 | |
Bridge Builder Municipal High-Income Bond Fund | | | | | | | | | | | | | | | | | | | | |
| | | Actual | ** | | | 1,000.00 | | | | 1,000.10 | | | | 0.18 | | | | 0.37 | |
| | | Hypothetical | * | | | 1,000.00 | | | | 1,023.90 | | | | | | | | 0.90 | |
Bridge Builder Large Cap Growth Fund | | | | | | | | | | | | | | | | | | | | |
| | | Actual | * | | | 1,000.00 | | | | 1,201.90 | | | | 0.19 | | | | 1.04 | |
| | | Hypothetical | * | | | 1,000.00 | | | | 1,023.85 | | | | | | | | 0.95 | |
Bridge Builder Large Cap Value Fund | | | | | | | | | | | | | | | | | | | | |
| | | Actual | * | | | 1,000.00 | | | | 1,062.10 | | | | 0.23 | | | | 1.18 | |
| | | Hypothetical | * | | | 1,000.00 | | | | 1,023.65 | | | | | | | | 1.15 | |
Bridge Builder Tax Managed Large Cap Fund | | | | | | | | | | | | | | | | | | | | |
| | | Actual | * | | | 1,000.00 | | | | 1,148.60 | | | | 0.29 | | | | 1.54 | |
| | | Hypothetical | * | | | 1,000.00 | | | | 1,023.36 | | | | | | | | 1.45 | |
Bridge Builder Small/Mid Cap Growth Fund | | | | | | | | | | | | | | | | | | | | |
| | | Actual | * | | | 1,000.00 | | | | 1,139.60 | | | | 0.37 | | | | 1.96 | |
| | | Hypothetical | * | | | 1,000.00 | | | | 1,022.96 | | | | | | | | 1.86 | |
| | |
| 38 | | Annual Report • June 30, 2023 |
Bridge Builder Mutual Funds
Fund Expense Examples (Unaudited) (Continued)
| | | | | | | | | | | | | | | | | | | | |
| | | | | | Beginning
account value | | | Ending
account value | | | Annualized
Expense Ratio | | | Expenses paid
during the period | |
Bridge Builder Small/Mid Cap Value Fund | | | | | | | | | | | | | | | | | | | | |
| | | Actual | * | | $ | 1,000.00 | | | $ | 1,053.40 | | | | 0.40 | % | | $ | 2.04 | |
| | | Hypothetical | * | | | 1,000.00 | | | | 1,022.81 | | | | | | | | 2.01 | |
Bridge Builder Tax Managed Small/Mid Cap Fund | | | | | | | | | | | | | | | | | | | | |
| | | Actual | * | | | 1,000.00 | | | | 1,097.70 | | | | 0.50 | | | | 2.60 | |
| | | Hypothetical | * | | | 1,000.00 | | | | 1,022.32 | | | | | | | | 2.51 | |
Bridge Builder International Equity Fund | | | | | | | | | | | | | | | | | | | | |
| | | Actual | * | | | 1,000.00 | | | | 1,127.80 | | | | 0.36 | | | | 1.90 | |
| | | Hypothetical | * | | | 1,000.00 | | | | 1,023.01 | | | | | | | | 1.81 | |
Bridge Builder Tax Managed International Equity Fund | | | | | | | | | | | | | | | | | | | | |
| | | Actual | * | | | 1,000.00 | | | | 1,134.80 | | | | 0.45 | | | | 2.38 | |
| | | Hypothetical | * | | | 1,000.00 | | | | 1,022.56 | | | | | | | | 2.26 | |
| * | | Expenses are equal to the Funds’ annualized expense ratio, multiplied by the average account value over the period, multiplied by 181/365 (to reflect the six-month period). Expenses do not include Edward Jones Advisory Solutions® program and administrative fees, which are charged outside of the Funds. |
| ** | | Expenses are equal to the Funds’ annualized expense ratio, multiplied by the average account value over the period, multiplied by 75/365 (to reflect the actual period where expenses were accrued). Expenses do not include Edward Jones Advisory Solutions® program and administrative fees, which are charged outside of the Funds. Commencement of operations was April 13, 2023. |
| | |
| Annual Report • June 30, 2023 | | 39 |
Bridge Builder Core Bond Fund
Summary Schedule of Investments
June 30, 2023
(Amounts in thousands, except number of contracts)
| | | | | | | | |
| | | Principal
Amount
(000s) | | | Value
(000s) | |
BONDS & NOTES – 98.88% | | | | | | | | |
Asset-Backed Obligations – 12.33% | | | | | | | | |
Carlyle U.S. CLO 2021-11 Ltd., 6.35%, (3 Month LIBOR USD + 1.10%, 1.10% Floor), Jan. 2033,
Series 2021-11A, Class A (1)(2) | | $ | 30,000 | | | $ | 29,524 | |
Other Securities (1)(2)(3)(4)(5) | | | 2,100,815 | | | | 1,996,965 | |
| | | | | | | | |
Total Asset-Backed Obligations | | | | | | | 2,026,489 | |
| | | | | | | | |
Corporate Bonds – 29.45% | | | | | | | | |
| Basic Materials – 0.87% | | | | | | | | |
Various Securities (1)(6)(7) | | | 152,824 | | | | 142,262 | |
| | | | | | | | |
Total Basic Materials | | | | 142,262 | |
| | | | | |
| Communications – 2.43% | | | | | | | | |
T-Mobile USA, Inc., 3.88%, Apr. 2030 | | | 53,794 | | | | 49,558 | |
Other Securities (1) | | | 404,389 | | | | 350,012 | |
| | | | | | | | |
Total Communications | | | | 399,570 | |
| | | | | |
| Consumer, Cyclical – 1.43% | | | | | | | | |
Various Securities (1) | | | 257,871 | | | | 234,236 | |
| | | | | | | | |
Total Consumer, Cyclical | | | | 234,236 | |
| | | | | |
| Consumer, Non-cyclical – 3.74% | | | | | | | | |
Cigna Group, 4.38%, Oct. 2028 | | | 30,325 | | | | 29,324 | |
Other Securities (1) | | | 662,462 | | | | 585,134 | |
| | | | | | | | |
Total Consumer, Non-cyclical | | | | 614,458 | |
| | | | | |
| Energy – 3.11% | | | | | | | | |
Various Securities (1) | | | 549,806 | | | | 511,632 | |
| | | | | | | | |
Total Energy | | | | 511,632 | |
| | | | | |
| Financials – 11.33% | | | | | | | | |
Citigroup, Inc., 1.12%, (SOFR + 0.77%), Jan. 2027 (2) | | | 32,820 | | | | 29,258 | |
Bank of America Corp., 1.66%-7.75%, Aug. 2024-Jun. 2041 (2) | | | 199,972 | | | | 177,611 | |
Other Securities (1)(2)(5)(8) | | | 1,820,514 | | | | 1,656,869 | |
| | | | | | | | |
Total Financials | | | | 1,863,738 | |
| | | | | |
| Industrials – 1.65% | | | | | | | | |
Various Securities (1)(4) | | | 294,540 | | | | 270,422 | |
| | | | | | | | |
Total Industrials | | | | 270,422 | |
| | | | | |
| Technology – 1.40% | | | | | | | | |
Various Securities (1) | | | 262,067 | | | | 229,266 | |
| | | | | | | | |
Total Technology | | | | 229,266 | |
| | | | | |
| Utilities – 3.49% | | | | | | | | |
Various Securities (1)(4) | | | 631,591 | | | | 573,374 | |
| | | | | | | | |
Total Utilities | | | | 573,374 | |
| | | | | |
Total Corporate Bonds | | | | | | | 4,838,958 | |
| | | | | | | | |
Government Related – 20.44% | | | | | | | | |
| Other Government Related – 1.20% | | | | | | | | |
Various Securities (1) | | | 210,593 | | | | 196,734 | |
| | | | | | | | |
Total Other Government Related | | | | 196,734 | |
| | | | | |
| U.S. Treasury Obligations – 19.24% | | | | | | | | |
U.S. Treasury Note/Bond, 0.75%, Jan. 2028 | | | 73,860 | | | | 63,358 | |
U.S. Treasury Note/Bond, 1.13%, Oct. 2026 | | | 50,750 | | | | 45,635 | |
U.S. Treasury Note/Bond, 1.13%, Aug. 2028 | | | 88,275 | | | | 76,058 | |
The accompanying notes are an integral part of these financial statements.
| | |
| 40 | | Annual Report • June 30, 2023 |
Bridge Builder Core Bond Fund
Summary Schedule of Investments
June 30, 2023 (Continued)
(Amounts in thousands, except number of contracts)
| | | | | | | | |
| | | Principal
Amount
(000s) | | | Value
(000s) | |
| U.S. Treasury Obligations – 19.24% – (continued) | | | | | | | | |
U.S. Treasury Note/Bond, 1.25%, Mar. 2028 | | $ | 56,535 | | | $ | 49,481 | |
U.S. Treasury Note/Bond, 1.25%, Jun. 2028 | | | 90,462 | | | | 78,744 | |
U.S. Treasury Note/Bond, 1.38%, Nov. 2040 | | | 205,514 | | | | 137,501 | |
U.S. Treasury Note/Bond, 1.50%, Feb. 2025 | | | 92,025 | | | | 86,856 | |
U.S. Treasury Note/Bond, 1.88%, Feb. 2029 | | | 33,900 | | | | 30,146 | |
U.S. Treasury Note/Bond, 1.88%, Nov. 2051 | | | 44,455 | | | | 29,344 | |
U.S. Treasury Note/Bond, 2.25%, Nov. 2025 | | | 34,725 | | | | 32,807 | |
U.S. Treasury Note/Bond, 2.25%, May 2041 | | | 175,384 | | | | 135,072 | |
U.S. Treasury Note/Bond, 2.25%, Aug. 2046 | | | 39,102 | | | | 28,567 | |
U.S. Treasury Note/Bond, 2.38%, Mar. 2029 | | | 120,325 | | | | 109,853 | |
U.S. Treasury Note/Bond, 2.38%, Feb. 2042 | | | 99,404 | | | | 77,391 | |
U.S. Treasury Note/Bond, 2.38%, Nov. 2049 | | | 42,182 | | | | 31,496 | |
U.S. Treasury Note/Bond, 2.50%, Feb. 2045 | | | 147,275 | | | | 114,023 | |
U.S. Treasury Note/Bond, 2.75%, Jul. 2027 | | | 34,046 | | | | 32,098 | |
U.S. Treasury Note/Bond, 2.88%, Apr. 2029 | | | 42,000 | | | | 39,385 | |
U.S. Treasury Note/Bond, 2.88%, May 2032 | | | 78,770 | | | | 73,035 | |
U.S. Treasury Note/Bond, 2.88%, May 2043 | | | 107,560 | | | | 89,968 | |
U.S. Treasury Note/Bond, 2.88%, May 2052 | | | 64,456 | | | | 53,415 | |
U.S. Treasury Note/Bond, 3.00%, Aug. 2052 | | | 56,429 | | | | 47,978 | |
U.S. Treasury Note/Bond, 3.25%, Jun. 2029 | | | 40,000 | | | | 38,269 | |
U.S. Treasury Note/Bond, 3.38%, May 2033 | | | 43,407 | | | | 41,861 | |
U.S. Treasury Note/Bond, 3.50%, Feb. 2033 | | | 42,024 | | | | 40,934 | |
U.S. Treasury Note/Bond, 3.63%, Mar. 2028 | | | 53,811 | | | | 52,558 | |
U.S. Treasury Note/Bond, 3.63%, May 2028 | | | 41,095 | | | | 40,196 | |
U.S. Treasury Note/Bond, 3.63%, Feb. 2053 | | | 117,788 | | | | 113,040 | |
U.S. Treasury Note/Bond, 3.75%, May 2030 | | | 34,304 | | | | 33,827 | |
U.S. Treasury Note/Bond, 3.88%, Dec. 2029 | | | 133,230 | | | | 132,068 | |
U.S. Treasury Note/Bond, 4.25%, May 2025 | | | 47,721 | | | | 47,121 | |
U.S. Treasury Strip Coupon, 0.00%, Feb. 2032 | | | 46,250 | | | | 33,029 | |
U.S. Treasury Note/Bond, 0.25%-4.63%, May 2025-Nov. 2052 (9) | | | 1,235,841 | | | | 1,052,105 | |
Other Securities (10) | | | 140,441 | | | | 73,933 | |
| | | | | | | | |
Total U.S. Treasury Obligations | | | | 3,161,152 | |
| | | | | |
Total Government Related | | | | | | | 3,357,886 | |
| | | | | | | | |
Mortgage-Backed Obligations – 36.66% | | | | | | | | |
Fannie Mae, 2.00%, Jul. 2053 (11) | | | 38,930 | | | | 31,746 | |
Fannie Mae Pool, 2.00%, Oct. 2050 | | | 43,537 | | | | 35,849 | |
Fannie Mae Pool, 2.00%, Aug. 2051 | | | 47,620 | | | | 38,982 | |
Fannie Mae Pool, 2.00%, Oct. 2051 | | | 36,604 | | | | 29,993 | |
Fannie Mae Pool, 2.50%, Oct. 2050 (9) | | | 39,662 | | | | 33,844 | |
Fannie Mae Pool, 2.50%, Dec. 2051 | | | 47,281 | | | | 40,361 | |
Freddie Mac Pool, 2.50%, Jul. 2050 | | | 37,747 | | | | 32,145 | |
Freddie Mac Pool, 2.50%, Feb. 2051 | | | 37,314 | | | | 32,117 | |
Freddie Mac Pool, 2.50%, Nov. 2051 | | | 40,967 | | | | 35,077 | |
Freddie Mac Pool, 3.00%, Feb. 2052 | | | 41,633 | | | | 36,748 | |
Freddie Mac Pool, 3.50%, Apr. 2052 | | | 49,924 | | | | 45,696 | |
Freddie Mac Pool, 4.50%, Aug. 2052 | | | 62,227 | | | | 59,839 | |
Ginnie Mae, 2.00%, Jul. 2053 (11) | | | 48,315 | | | | 40,606 | |
Ginnie Mae II Pool, 2.50%, Aug. 2051 | | | 60,994 | | | | 52,889 | |
Fannie Mae Pool, 1.40%-8.50%, Jan. 2024-Mar. 2062 (2)(5) | | | 1,992,265 | | | | 1,779,308 | |
Freddie Mac Gold Pool, 2.00%-10.00%, Feb. 2024-Mar. 2048 | | | 202,778 | | | | 190,074 | |
Freddie Mac Pool, 1.50%-6.00%, Nov. 2028-Jul. 2053 | | | 598,758 | | | | 530,077 | |
Ginnie Mae, 2.50%-5.00%, Jul. 2042-Jul. 2053 (11) | | | 58,075 | | | | 54,692 | |
Ginnie Mae II Pool, 2.00%-8.50%, Mar. 2025-Jul. 2072 (2)(5)(9) | | | 787,029 | | | | 736,979 | |
The accompanying notes are an integral part of these financial statements.
| | |
| Annual Report • June 30, 2023 | | 41 |
Bridge Builder Core Bond Fund
Summary Schedule of Investments
June 30, 2023 (Continued)
(Amounts in thousands, except number of contracts)
| | | | | | | | |
| | | Principal
Amount
(000s) | | | Value
(000s) | |
Mortgage-Backed Obligations – 36.66% – (continued) | | | | | | | | |
Other Securities (1)(2)(3)(4)(5)(11)(12) | | $ | 2,966,709 | | | $ | 2,185,574 | |
| | | | | | | | |
Total Mortgage-Backed Obligations | | | | | | | 6,022,596 | |
| | | | | | | | |
Total Bonds & Notes
(Cost: $17,838,903) | | | | | | | 16,245,929 | |
| | | | | |
| | |
| | | Shares
(000s) | | | Value
(000s) | |
PREFERRED STOCKS – 0.01% | | | | | | | | |
| Financials – 0.01% | | | | | | | | |
State Street Corp., 5.35% | | | 95 | | | | 2,181 | |
| | | | | | | | |
Total Financials | | | | 2,181 | |
| | | | | |
Total Preferred Stocks
(Cost: $2,375) | | | | | | | 2,181 | |
| | | | | | | | |
SHORT-TERM INVESTMENTS – 3.28% | | | | | | | | |
| Money Market Funds – 3.26% | | | | | | | | |
Fidelity Institutional Money Market Government Fund – Class I, 5.03% (13) | | | 536,258 | | | | 536,258 | |
| | | | | | | | |
Total Money Market Funds | | | | | | | 536,258 | |
| | | | | | | | |
| | |
| | | Principal
Amount
(000s) | | | Value
(000s) | |
| Time Deposits – 0.02% | | | | | | | | |
Citibank, New York, 4.57% due 07/03/2023 | | $ | 3,082 | | | | 3,082 | |
Sumitomo Trust Bank, London, 4.57% due 07/03/2023 | | | 6 | | | | 6 | |
| | | | | | | | |
Total Time Deposits | | | | | | | 3,088 | |
| | | | | | | | |
Total Short-Term Investments
(Cost: $539,346) | | | | | | | 539,346 | |
| | | | | | | | |
TOTAL INVESTMENTS IN SECURITIES – 102.17%
(Cost: $18,380,624) | | | | | | | 16,787,456 | |
LIABILITIES IN EXCESS OF OTHER ASSETS – (2.17)% | | | | | | | (356,216 | ) |
| | | | | | | | |
TOTAL NET ASSETS – 100.00% | | | | | | $ | 16,431,240 | |
| | | | | | | | |
Percentages are stated as a percent of net assets.
| (1) | | Security or includes securities purchased exempt from registration in the U.S. pursuant to Rule 144(A) under the Securities Act of 1933. The value of these securities totals $3,355,878, which represents 20.42% of total net assets. |
| (2) | | Variable rate security or includes variable rate securities based on a reference index and spread. The rate reported is the rate in effect as of June 30, 2023. |
| (3) | | Includes securities that are categorized as Level 3 per the Trust’s fair value hierarchy. The value of these securities totals $30,876, which represents 0.19% of total net assets. |
| (4) | | Includes step-up bonds that pay an initial coupon rate for the first period and then a higher coupon rate for the following periods. The rate reported is the rate in effect as of June 30, 2023. |
| (5) | | Includes variable rate securities. The coupon is based on an underlying pool of assets. The rate reported is the rate in effect as of June 30, 2023. |
| (6) | | Includes securities in default as of June 30, 2023. The value of these securities totals $359, which represents 0.00% of total net assets. |
| (7) | | Includes securities that are non-income producing. |
The accompanying notes are an integral part of these financial statements.
| | |
| 42 | | Annual Report • June 30, 2023 |
Bridge Builder Core Bond Fund
Summary Schedule of Investments
June 30, 2023 (Continued)
(Amounts in thousands, except number of contracts)
| (8) | | Includes securities that are restricted at June 30, 2023. The value of these securities totals $5,961, which represents 0.04% of total net assets. |
| (9) | | Assigned as collateral or includes securities assigned as collateral for certain futures contracts. The value of these pledged issues totals $45,262, which represents 0.28% of total net assets. |
| (10) | | Includes inflation protected securities. The value of these securities totals $3,560, which represents 0.02% of total net assets. |
| (11) | | Delayed delivery purchase commitment security or includes delayed delivery purchase commitment securities. The value of these securities totals $252,162, which represents 1.53% of total net assets. |
| (12) | | Includes inverse floating rate securities whose interest rate moves in the opposite direction of reference interest rates. Reference interest rates are typically based on a negative multiplier or slope. |
| (13) | | Represents annualized seven-day yield as of the close of the reporting period. |
Open Futures Contracts
| | | | | | | | | | | | | | | | | | |
Number of Contracts
Purchased | | Reference Entity | | Expiration
Date | | | Notional
Amount | | | Value | | | Unrealized
Appreciation/
(Depreciation) | |
| 3,906 | | U.S. 5 Year Note Future | | | Sep. 2023 | | | $ | 425,981 | | | $ | 418,307 | | | $ | (7,674 | ) |
| 1,558 | | U.S. 10 Year Note Future | | | Sep. 2023 | | | | 177,680 | | | | 174,910 | | | | (2,770 | ) |
| 159 | | U.S. Ultra 10 Year Note Future | | | Sep. 2023 | | | | 19,033 | | | | 18,832 | | | | (201 | ) |
| 1,730 | | U.S. Ultra Bond Future | | | Sep. 2023 | | | | 234,242 | | | | 235,658 | | | | 1,416 | |
| | | | | | | | | | | | | | | | | | |
| | | | | | | | | | | | | | | | | (9,229 | ) |
| | | | | | | | | | | | | | | | | | |
| | | | | |
Number of Contracts
Sold | | Reference Entity | | Expiration
Date | | | Notional
Amount | | | Value | | | Unrealized
Appreciation/
(Depreciation) | |
| (391) | | U.S. 2 Year Note Future | | | Sep. 2023 | | | $ | (80,330 | ) | | $ | (79,507 | ) | | $ | 823 | |
| (381) | | U.S. Long Bond Future | | | Sep. 2023 | | | | (48,409 | ) | | | (48,351 | ) | | | 58 | |
| | | | | | | | | | | | | | | | | | |
| | | | | | | | | | | | | | | | | 881 | |
| | | | | | | | | | | | | | | | | | |
| | | | | | | | | | | | | | | | $ | (8,348 | ) |
| | | | | | | | | | | | | | | | | | |
The accompanying notes are an integral part of these financial statements.
| | |
| Annual Report • June 30, 2023 | | 43 |
Bridge Builder Core Plus Bond Fund
Summary Schedule of Investments
June 30, 2023
(Amounts in thousands, except number of contracts)
| | | | | | | | |
| | | Principal
Amount
(000s) | | | Value
(000s) | |
BONDS & NOTES – 96.67% | | | | | | | | |
Asset-Backed Obligations – 11.81% | | | | | | | | |
Various Securities *(1)(2)(3)(4)(5) | | $ | 3,911,665 | | | $ | 3,570,198 | |
| | | | | | | | |
Total Asset-Backed Obligations | | | | | | | 3,570,198 | |
| | | | | | | | |
Corporate Bonds – 27.33% | | | | | | | | |
| Basic Materials – 0.73% | | | | | | | | |
Various Securities *(2)(6) | | | 244,981 | | | | 220,446 | |
| | | | | | | | |
Total Basic Materials | | | | 220,446 | |
| | | | | |
| Communications – 2.82% | | | | | | | | |
Various Securities *(2)(7)(8)(9) | | | 1,033,458 | | | | 853,661 | |
| | | | | | | | |
Total Communications | | | | 853,661 | |
| | | | | |
| Consumer, Cyclical – 1.67% | | | | | | | | |
Various Securities *(2)(3)(4)(6)(7) | | | 592,967 | | | | 506,245 | |
| | | | | | | | |
Total Consumer, Cyclical | | | | 506,245 | |
| | | | | |
| Consumer, Non-cyclical – 3.35% | | | | | | | | |
Various Securities *(2)(6) | | | 1,129,100 | | | | 1,012,268 | |
| | | | | | | | |
Total Consumer, Non-cyclical | | | | 1,012,268 | |
| | | | | |
| Energy – 2.54% | | | | | | | | |
Various Securities *(2)(3)(6)(8)(9) | | | 871,295 | | | | 767,294 | |
| | | | | | | | |
Total Energy | | | | 767,294 | |
| | | | | |
| Financials – 11.46% | | | | | | | | |
Various Securities *(2)(3)(4)(6)(8)(9)(10) | | | 3,916,605 | | | | 3,461,577 | |
| | | | | | | | |
Total Financials | | | | 3,461,577 | |
| | | | | |
| Government – 0.00% (11) | | | | | | | | |
Various Securities * | | | 9,112,200 | | | | 1,283 | |
| | | | | | | | |
Total Government | | | | 1,283 | |
| | | | | |
| Industrials – 1.21% | | | | | | | | |
Various Securities *(2)(4)(6) | | | 401,511 | | | | 364,224 | |
| | | | | | | | |
Total Industrials | | | | 364,224 | |
| | | | | |
| Technology – 1.41% | | | | | | | | |
Various Securities *(2)(6) | | | 483,334 | | | | 424,731 | |
| | | | | | | | |
Total Technology | | | | 424,731 | |
| | | | | |
| Utilities – 2.14% | | | | | | | | |
Various Securities (2)(6) | | | 736,346 | | | | 648,269 | |
| | | | | | | | |
Total Utilities | | | | 648,269 | |
| | | | | |
Total Corporate Bonds | | | | | | | 8,259,998 | |
| | | | | | | | |
Convertible Securities – 0.29% | | | | | | | | |
| Communications – 0.09% | | | | | | | | |
Various Securities | | | 41,665 | | | | 26,626 | |
| | | | | | | | |
Total Communications | | | | 26,626 | |
| | | | | |
| Consumer, Cyclical – 0.03% | | | | | | | | |
Various Securities | | | 9,375 | | | | 9,981 | |
| | | | | | | | |
Total Consumer, Cyclical | | | | 9,981 | |
| | | | | |
| Consumer, Non-cyclical – 0.13% | | | | | | | | |
Various Securities | | | 40,975 | | | | 36,873 | |
| | | | | | | | |
Total Consumer, Non-cyclical | | | | 36,873 | |
| | | | | |
The accompanying notes are an integral part of these financial statements.
| | |
| 44 | | Annual Report • June 30, 2023 |
Bridge Builder Core Plus Bond Fund
Summary Schedule of Investments
June 30, 2023 (Continued)
(Amounts in thousands, except number of contracts)
| | | | | | | | |
| | | Principal
Amount
(000s) | | | Value
(000s) | |
| Utilities – 0.04% | | | | | | | | |
PPL Capital Funding, Inc., 2.88%, Mar. 2028 (2) | | $ | 13,700 | | | $ | 13,084 | |
| | | | | | | | |
Total Utilities | | | | 13,084 | |
| | | | | |
Total Convertible Securities | | | | | | | 86,564 | |
| | | | | | | | |
Government Related – 21.84% | | | | | | | | |
| Other Government Related – 1.36% | | | | | | | | |
Republic of South Africa Government Bond, 10.50%, Dec. 2026 | | ZAR | 1,574,700 | | | | 86,842 | |
Other Securities *(2)(3)(4)(5)(6)(8)(9) | | | 274,500,171 | | | | 324,902 | |
| | | | | | | | |
Total Other Government Related | | | | 411,744 | |
| | | | | |
| U.S. Treasury Obligations – 20.48% | | | | | | | | |
U.S. Treasury Inflation Indexed Bond, 0.13%, Jul. 2024 (12) | | $ | 246,515 | | | | 239,124 | |
U.S. Treasury Inflation Indexed Bond, 0.13%, Oct. 2024 (12) | | | 134,983 | | | | 130,196 | |
U.S. Treasury Inflation Indexed Bond, 0.38%, Jul. 2023 (12) | | | 82,607 | | | | 82,549 | |
U.S. Treasury Inflation Indexed Bond, 0.63%, Jul. 2032 (12) | | | 75,070 | | | | 73,797 | |
U.S. Treasury Inflation Indexed Bond, 0.63%, Jul. 2032 (12) | | | 82,067 | | | | 75,409 | |
U.S. Treasury Note/Bond, 0.38%, Apr. 2025 | | | 143,891 | | | | 132,391 | |
U.S. Treasury Note/Bond, 0.88%, Sep. 2026 | | | 83,692 | | | | 74,879 | |
U.S. Treasury Note/Bond, 1.25%, Mar. 2028 | | | 250,000 | | | | 218,809 | |
U.S. Treasury Note/Bond, 1.38%, Nov. 2031 | | | 308,700 | | | | 254,545 | |
U.S. Treasury Note/Bond, 1.88%, Feb. 2027 (13) | | | 153,529 | | | | 140,731 | |
U.S. Treasury Note/Bond, 1.88%, Feb. 2032 | | | 198,230 | | | | 169,796 | |
U.S. Treasury Note/Bond, 2.00%, Nov. 2041 | | | 701,007 | | | | 513,132 | |
U.S. Treasury Note/Bond, 2.25%, Aug. 2049 | | | 125,970 | | | | 91,520 | |
U.S. Treasury Note/Bond, 2.25%, Feb. 2052 | | | 118,625 | | | | 85,725 | |
U.S. Treasury Note/Bond, 3.25%, May 2042 | | | 159,565 | | | | 142,387 | |
U.S. Treasury Note/Bond, 3.38%, May 2033 | | | 121,245 | | | | 116,926 | |
U.S. Treasury Note/Bond, 3.50%, Feb. 2033 | | | 342,600 | | | | 333,714 | |
U.S. Treasury Note/Bond, 3.63%, May 2053 | | | 298,929 | | | | 287,299 | |
U.S. Treasury Note/Bond, 3.88%, Mar. 2025 | | | 77,767 | | | | 76,239 | |
U.S. Treasury Note/Bond, 3.88%, Dec. 2029 (13) | | | 816,675 | | | | 809,562 | |
U.S. Treasury Note/Bond, 3.88%, May 2043 | | | 215,600 | | | | 210,378 | |
U.S. Treasury Note/Bond, 4.00%, Jun. 2028 | | | 300,555 | | | | 298,911 | |
U.S. Treasury Note/Bond, 4.00%, Jun. 2028 | | | 73,150 | | | | 72,681 | |
U.S. Treasury Inflation Indexed Bond, 0.13%-2.13%, Jan. 2024-Feb. 2053 (12)(13) | | | 319,488 | | | | 300,561 | |
U.S. Treasury Note/Bond, 0.38%-4.63%, Feb. 2025-Feb. 2053 | | | 1,479,675 | | | | 1,259,227 | |
| | | | | | | | |
Total U.S. Treasury Obligations | | | | 6,190,488 | |
| | | | | |
Total Government Related | | | | | | | 6,602,232 | |
| | | | | | | | |
Mortgage-Backed Obligations – 35.40% | | | | | | | | |
Fannie Mae, 2.00%, Jul. 2053 (14) | | | 199,618 | | | | 162,774 | |
Fannie Mae, 2.00%, Aug. 2053 (14) | | | 184,400 | | | | 150,581 | |
Fannie Mae, 2.50%, Jul. 2053 (14) | | | 162,049 | | | | 137,400 | |
Fannie Mae, 3.00%, Jul. 2053 (14) | | | 170,203 | | | | 149,786 | |
Fannie Mae, 3.50%, Aug. 2053 (14) | | | 120,100 | | | | 109,549 | |
Fannie Mae, 4.00%, Jul. 2053 (14) | | | 222,645 | | | | 208,930 | |
Fannie Mae, 4.50%, Jul. 2053 (14) | | | 249,720 | | | | 240,083 | |
Fannie Mae, 4.50%, Aug. 2053 (14) | | | 114,600 | | | | 110,231 | |
Fannie Mae, 5.00%, Jul. 2053 (14) | | | 382,814 | | | | 375,099 | |
Fannie Mae, 5.50%, Jul. 2053 (14) | | | 482,369 | | | | 480,033 | |
Fannie Mae, 5.50%, Aug. 2053 (14) | | | 280,255 | | | | 278,855 | |
Fannie Mae Pool, 2.00%, Jan. 2052 | | | 120,193 | | | | 98,242 | |
Fannie Mae Pool, 2.50%, Feb. 2051 | | | 135,081 | | | | 115,050 | |
Fannie Mae Pool, 3.00%, Apr. 2052 | | | 82,667 | | | | 72,835 | |
Fannie Mae Pool, 4.50%, May 2053 | | | 90,129 | | | | 86,661 | |
Fannie Mae Pool, 5.50%, May 2053 | | | 76,141 | | | | 75,803 | |
Freddie Mac Pool, 2.50%, Jan. 2052 | | | 99,327 | | | | 84,769 | |
The accompanying notes are an integral part of these financial statements.
| | |
| Annual Report • June 30, 2023 | | 45 |
Bridge Builder Core Plus Bond Fund
Summary Schedule of Investments
June 30, 2023 (Continued)
(Amounts in thousands, except number of contracts)
| | | | | | | | |
| | | Principal
Amount
(000s) | | | Value
(000s) | |
Mortgage-Backed Obligations – 35.40% – (continued) | | | | | | | | |
Freddie Mac Pool, 3.00%, Jul. 2052 | | $ | 262,539 | | | $ | 231,139 | |
Freddie Mac Pool, 3.50%, Jul. 2052 | | | 158,755 | | | | 144,733 | |
Freddie Mac Pool, 5.50%, Jun. 2053 | | | 185,963 | | | | 185,088 | |
Ginnie Mae, 2.50%, Jul. 2053 (14) | | | 119,184 | | | | 103,196 | |
Ginnie Mae, 4.50%, Jul. 2053 (14) | | | 95,476 | | | | 92,149 | |
Towd Point Mortgage Funding, 5.84%, (Sterling Overnight Index Average + 1.35%), Jul. 2045 (2)(4) | | GBP | 58,472 | | | | 74,178 | |
Fannie Mae, 1.50%-6.50%, Jul. 2036-Aug. 2053 (14) | | $ | 228,971 | | | | 203,219 | |
Fannie Mae Pool, 1.50%-6.00%, Feb. 2030-Jun. 2053 | | | 2,017,144 | | | | 1,792,677 | |
Freddie Mac Pool, 1.50%-6.50%, Aug. 2026-Jul. 2053 | | | 1,313,359 | | | | 1,172,524 | |
Ginnie Mae, 2.00%-6.50%, Jul. 2038-Aug. 2053 (14) | | | 135,598 | | | | 125,215 | |
Ginnie Mae II Pool, 2.00%-5.50%, Feb. 2043-Dec. 2051 | | | 347,239 | | | | 314,028 | |
Other Securities *(2)(3)(4)(5)(6) | | | 3,944,925 | | | | 3,323,664 | |
| | | | | | | | |
Total Mortgage-Backed Obligations | | | | | | | 10,698,491 | |
| | | | | | | | |
Total Bonds & Notes
(Cost: $31,576,845) | | | | | | | 29,217,483 | |
| | | | | |
BANK LOANS – 1.10% | | | | | | | | |
Various Securities *(4)(7)(10) | | | 337,574 | | | | 332,358 | |
| | | | | | | | |
Total Bank Loans
(Cost: $329,436) | | | | | | | 332,358 | |
| | | | | |
| | |
| | | Shares
(000s) | | | Value
(000s) | |
COMMON STOCKS – 0.08% | | | | | | | | |
| Communications – 0.05% | | | | | | | | |
Various Securities (6)(7)(9) | | | 3,375 | | | | 15,343 | |
| | | | | |
Total Communications | | | | 15,343 | |
| | | | | |
| Consumer Discretionary – 0.03% | | | | | | | | |
Neiman Marcus Group, Inc. (6)(7)(9) | | | 62 | | | | 9,469 | |
| | | | | | | | |
Total Consumer Discretionary | | | | 9,469 | |
| | | | | |
| Financials – 0.00% (11) | | | | | | | | |
Various Securities (2)(7)(9) | | | 2 | | | | 37 | |
| | | | | | | | |
Total Financials | | | | 37 | |
| | | | | |
Total Common Stocks
(Cost: $53,207) | | | | | | | 24,849 | |
| | | | | |
CONVERTIBLE PREFERRED STOCKS – 0.17% | | | | | | | | |
| Financials – 0.17% | | | | | | | | |
Various Securities | | | 43 | | | | 50,746 | |
| | | | | | | | |
Total Financials | | | | 50,746 | |
| | | | | |
Total Convertible Preferred Stocks
(Cost: $62,493) | | | | | | | 50,746 | |
| | | | | |
PREFERRED STOCKS – 0.00% (11) | | | | | | | | |
| Financials – 0.00% (11) | | | | | | | | |
Cayenne Aviation Holdings LLC (2)(7)(9)(15) | | | 0 | | | | 7 | |
| | | | | | | | |
Total Financials | | | | 7 | |
| | | | | |
Total Preferred Stocks
(Cost: $61) | | | | | | | 7 | |
| | | | | |
The accompanying notes are an integral part of these financial statements.
| | |
| 46 | | Annual Report • June 30, 2023 |
Bridge Builder Core Plus Bond Fund
Summary Schedule of Investments
June 30, 2023 (Continued)
(Amounts in thousands, except number of contracts)
| | | | | | | | |
| | |
| | | Shares
(000s) | | | Value
(000s) | |
RIGHTS – 0.00% (11) | | | | | | | | |
| Communications – 0.00% (11) | | | | | | | | |
Various Securities (7)(9)(15) | | | 95 | | | $ | — | |
| | | | | | | | |
Total Communications | | | | — | |
| | | | | |
Total Rights
(Cost: $0) | | | | | | | — | |
| | | | | |
WARRANTS – 0.00% (11) | | | | | | | | |
| Communications – 0.00% (11) | | | | | | | | |
Various Securities (7)(9) | | | 14 | | | | 81 | |
| | | | | | | | |
Total Communications | | | | 81 | |
| | | | | |
Total Warrants
(Cost: $8,440) | | | | | | | 81 | |
| | | | | |
SHORT-TERM INVESTMENTS – 10.83% | | | | | | | | |
| Money Market Funds – 2.63% | | | | | | | | |
Fidelity Institutional Money Market Government Fund – Class I, 5.03% (16) | | | 794,788 | | | | 794,788 | |
| | | | | | | | |
Total Money Market Funds | | | | | | | 794,788 | |
| | | | | | | | |
| | |
| | | Principal
Amount
(000s) | | | Value
(000s) | |
| Government Related – 1.91% | | | | | | | | |
Federal Home Loan Bank Discount Notes, 0.00%-5.17%, Jul. 2023-Sep.2023 | | $ | 200,000 | | | | 198,541 | |
Japan Treasury Discount Bill, Jul. 2023-Sep. 2023 | | JPY | 51,992,000 | | | | 360,415 | |
Other Securities * | | | 4,426,252 | | | | 17,485 | |
| | | | | | | | |
Total Government Related | | | | | | | 576,441 | |
| | | | | | | | |
| Repurchase Agreements – 0.41% | | | | | | | | |
BNP Paribas SA, 5.16% dated 06/30/2023, due 07/03/2023, repurchase price $123,318
(collateralized by U.S. Treasury Inflation Indexed Bond, value $126,407, 0.13%, 07/15/2031) | | $ | 123,300 | | | | 123,300 | |
| | | | | | | | |
Total Repurchase Agreements | | | | | | | 123,300 | |
| | | | | | | | |
| U.S. Treasury Bills – 5.82% | | | | | | | | |
U.S. Treasury Bill, Jul. 2023-Dec. 2023 | | | 1,783,118 | | | | 1,762,092 | |
| | | | | | | | |
Total U.S. Treasury Bills | | | | | | | 1,762,092 | |
| | | | | | | | |
| Time Deposits – 0.06% | | | | | | | | |
ANZ, Hong Kong, 3.02% due 07/03/2023 | | AUD | 806 | | | | 537 | |
Brown Brothers Harriman, 2.47% due 07/03/2023 | | SEK | 7 | | | | 1 | |
Brown Brothers Harriman, 2.85% due 07/03/2023 | | NOK | 2,627 | | | | 245 | |
Brown Brothers Harriman, 4.15% due 07/03/2023 | | NZD | 91 | | | | 56 | |
Brown Brothers Harriman, 6.42% due 07/03/2023 | | ZAR | 4,301 | | | | 229 | |
Citibank, London, 2.62% due 07/03/2023 (15) | | EUR | 0 | | | | 0 | |
Citibank, New York, 4.57% due 07/03/2023 | | $ | 3,045 | | | | 3,045 | |
HSBC, Singapore, 3.05% due 07/03/2023 (15) | | SGD | 0 | | | | 0 | |
Royal Bank of Canada, Toronto, 3.79% due 07/04/2023 | | CAD | 1,384 | | | | 1,045 | |
Skandinaviska Enskilda Banken AB, Stockholm, 0.65% due 07/03/2023 | | CHF | 157 | | | | 176 | |
Skandinaviska Enskilda Banken AB, Stockholm, 2.62% due 07/03/2023 | | EUR | 3,223 | | | | 3,517 | |
Skandinaviska Enskilda Banken AB, Stockholm, 4.17% due 07/03/2023 | | GBP | 944 | | | | 1,199 | |
Sumitomo, Tokyo, -0.37% due 07/03/2023 | | JPY | 91,222 | | | | 632 | |
Sumitomo, Tokyo, 4.57% due 07/03/2023 | | $ | 1,684 | | | | 1,684 | |
Sumitomo Trust Bank, London, 4.57% due 07/03/2023 | | | 5,755 | | | | 5,755 | |
| | | | | | | | |
Total Time Deposits | | | | | | | 18,121 | |
| | | | | | | | |
The accompanying notes are an integral part of these financial statements.
| | |
| Annual Report • June 30, 2023 | | 47 |
Bridge Builder Core Plus Bond Fund
Summary Schedule of Investments
June 30, 2023 (Continued)
(Amounts in thousands, except number of contracts)
| | | | | | | | |
| | |
| | | Principal
Amount
(000s) | | | Value
(000s) | |
Total Short-Term Investments
(Cost: $3,289,417) | | | | | | $ | 3,274,742 | |
| | | | | |
TOTAL INVESTMENTS IN SECURITIES – 108.85%
(Cost: $35,319,899) | | | | | | | 32,900,266 | |
TBA SALE COMMITMENTS – (0.85)% | | | | | | | | |
| Mortgage-Backed Obligations – (0.85)% | | | | | | | | |
Fannie Mae, 2.50%-6.00%, Jul. 2038-Aug. 2053 (17) | | $ | (259,948 | ) | | | (244,815 | ) |
Ginnie Mae, 3.50%, Jul. 2042 (17) | | | (12,876 | ) | | | (11,884 | ) |
| | | | | | | | |
Total TBA Sale Commitments
(Proceeds Received: $(257,601)) | | | | | | | (256,699 | ) |
| | | | | | | | |
LIABILITIES IN EXCESS OF OTHER ASSETS – (8.00)% | | | | | | | (2,418,950 | ) |
| | | | | | | | |
TOTAL NET ASSETS – 100.00% | | | | | | $ | 30,224,617 | |
| | | | | | | | |
Percentages are stated as a percent of net assets.
Principal amounts are denominated in the currency in which the security was purchased.
| * | | Includes securities whose principal amounts are denominated in a currency other than the U.S. dollar. |
| (1) | | Adjustable rate security or includes adjustable rate securities. The rate reported is the rate in effect as of June 30, 2023. |
| (2) | | Security or includes securities purchased exempt from registration in the U.S. pursuant to Rule 144(A) under the Securities Act of 1933. The value of these securities totals $7,876,589, which represents 26.06% of total net assets. |
| (3) | | Includes step-up bonds that pay an initial coupon rate for the first period and then a higher coupon rate for the following periods. The rate reported is the rate in effect as of June 30, 2023. |
| (4) | | Variable rate security or includes variable rate securities based on a reference index and spread. The rate reported is the rate in effect as of June 30, 2023. |
| (5) | | Includes variable rate securities. The coupon is based on an underlying pool of assets. The rate reported is the rate in effect as of June 30, 2023. |
| (6) | | Restricted security or includes securities that are restricted at June 30, 2023. The value of these securities totals $48,939, which represents 0.16% of total net assets. |
| (7) | | Security or includes securities that are categorized as Level 3 per the Trust’s fair value hierarchy. The value of these securities totals $20,022, which represents 0.07% of total net assets. |
The accompanying notes are an integral part of these financial statements.
| | |
| 48 | | Annual Report • June 30, 2023 |
Bridge Builder Core Plus Bond Fund
Summary Schedule of Investments
June 30, 2023 (Continued)
(Amounts in thousands, except number of contracts)
| (8) | | Includes securities in default as of June 30, 2023. The value of these securities totals $3,155, which represents 0.01% of total net assets. |
| (9) | | Non-income producing security or includes securities that are non-income producing. |
| (10) | | Includes inverse floating rate securities whose interest rate moves in the opposite direction of reference interest rates. Reference interest rates are typically based on a negative multiplier or slope. |
| (11) | | Amount calculated is less than 0.005%. |
| (12) | | Inflation protected security or includes inflation protected securities. The value of these securities totals $901,636, which represents 2.98% of total net assets. |
| (13) | | Assigned as collateral for certain futures and swap contracts. The value of these pledged issues totals $142,152, which represents 0.47% of total net assets. |
| (14) | | Delayed delivery purchase commitment security or includes delayed delivery purchase commitment securities. The value of these securities totals $2,927,100, which represents 9.68% of total net assets. |
| (15) | | A zero balance may reflect actual amounts rounding to less than one thousand. |
| (16) | | Represents annualized seven-day yield as of the close of the reporting period. |
| (17) | | Delayed delivery sale commitment security or includes delayed delivery sales commitment securities. The value of these securities totals $(256,699), which represents (0.85)% of total net assets. |
Open Futures Contracts
| | | | | | | | | | | | | | | | | | |
Number of Contracts
Purchased | | Reference Entity | | Expiration
Date | | | Notional
Amount | | | Value | | | Unrealized
Appreciation/
(Depreciation) | |
| 49 | | 3 Month EURIBOR Future | | | Jun. 2024 | | | EUR | 11,859 | | | $ | 12,856 | | | $ | (85 | ) |
| 19 | | 3 Month SOFR Future | | | Mar. 2024 | | | $ | 4,520 | | | | 4,507 | | | | (13 | ) |
| 33 | | 3 Month SONIA Future | | | Jun. 2024 | | | GBP | 7,841 | | | | 9,838 | | | | (120 | ) |
| 275 | | Australian 10 Year Bond Future | | | Sep. 2023 | | | AUD | 32,115 | | | | 21,282 | | | | (112 | ) |
| 6 | | Canadian Bankers Acceptance Future | | | Sep. 2024 | | | CAD | 1,434 | | | | 1,077 | | | | (6 | ) |
| 13 | | Euro-Bobl Future | | | Sep. 2023 | | | EUR | 1,511 | | | | 1,641 | | | | (7 | ) |
| 11,950 | | U.S. 2 Year Note Future | | | Sep. 2023 | | | $ | 2,453,202 | | | | 2,429,956 | | | | (23,246 | ) |
| 11,787 | | U.S. 5 Year Note Future | | | Sep. 2023 | | | | 1,282,762 | | | | 1,262,314 | | | | (20,448 | ) |
| 6,931 | | U.S. 10 Year Note Future | | | Sep. 2023 | | | | 790,454 | | | | 778,113 | | | | (12,341 | ) |
| 5,079 | | U.S. Long Bond Future | | | Sep. 2023 | | | | 642,274 | | | | 644,557 | | | | 2,283 | |
| 10,010 | | U.S. Ultra 10 Year Note Future | | | Sep. 2023 | | | | 1,194,192 | | | | 1,185,559 | | | | (8,633 | ) |
| 1,399 | | U.S. Ultra Bond Future | | | Sep. 2023 | | | | 189,020 | | | | 190,570 | | | | 1,550 | |
| | | | | | | | | | | | | | | | | | |
| | | | | | | | | | | | | | | | | (61,178 | ) |
| | | | | | | | | | | | | | | | | | |
| | | | | |
Number of Contracts
Sold | | Reference Entity | | Expiration
Date | | | Notional
Amount | | | Value | | | Unrealized
Appreciation/
(Depreciation) | |
| (5) | | 3 Month SOFR Future | | | Dec. 2024 | | | $ | (1,207 | ) | | $ | (1,195 | ) | | $ | 12 | |
| (19) | | 3 Month SOFR Future | | | Dec. 2024 | | | | (4,582) | | | | (4,559 | ) | | | 23 | |
| (33) | | 3 Month SONIA Future | | | Jun. 2023 | | | GBP | (7,853 | ) | | | (9,934 | ) | | | 40 | |
| (346) | | Euro-Bund Future | | | Sep. 2023 | | | EUR | (46,717 | ) | | | (50,494 | ) | | | 483 | |
| (187) | | Japan 10 Year Bond Future | | | Sep. 2023 | | | JPY | (27,655,897 | ) | | | (192,514 | ) | | | (852 | ) |
| (1,057) | | U.S. 10 Year Note Future | | | Sep. 2023 | | | $ | (120,225 | ) | | | (118,665 | ) | | | 1,560 | |
| (1,556) | | U.S. Ultra 10 Year Note Future | | | Sep. 2023 | | | | (185,279) | | | | (184,289 | ) | | | 990 | |
| | | | | | | | | | | | | | | | | | |
| | | | | | | | | | | | | | | | | 2,256 | |
| | | | | | | | | | | | | | | | | | |
| | | | | | | | | | | | | | | | $ | (58,922) | |
| | | | | | | | | | | | | | | | | | |
The accompanying notes are an integral part of these financial statements.
| | |
| Annual Report • June 30, 2023 | | 49 |
Bridge Builder Core Plus Bond Fund
Summary Schedule of Investments
June 30, 2023 (Continued)
(Amounts in thousands, except number of contracts)
Over-the-Counter Forward Foreign Currency Exchange Contracts
| | | | | | | | | | | | | | | | | | |
| Currency Purchased | | | Currency Sold | | | Settlement
Date | | Counterparty | | Unrealized
Appreciation/
(Depreciation) | |
| AUD | | | 94,490 | | | USD | | | 61,428 | | | 07/05/23 | | Bank of America | | $ | 1,517 | |
| AUD | | | 29,598 | | | USD | | | 19,351 | | | 07/05/23 | | J.P. Morgan | | | 366 | |
| AUD | | | 104,776 | | | USD | | | 69,455 | | | 08/02/23 | | BNP Paribas | | | 404 | |
| BRL* | | | 6,558 | | | USD | | | 1,361 | | | 07/05/23 | | Barclays Bank | | | 8 | |
| BRL* | | | 2,155 | | | USD | | | 430 | | | 07/05/23 | | Goldman Sachs | | | 20 | |
| BRL* | | | 572,569 | | | USD | | | 111,714 | | | 08/02/23 | | J.P. Morgan | | | 7,222 | |
| CAD | | | 822 | | | USD | | | 621 | | | 09/20/23 | | BNP Paribas | | | 1 | |
| CLP* | | | 354,508 | | | USD | | | 440 | | | 07/18/23 | | Bank of America | | | 1 | |
| COP | | | 15,138,661 | | | USD | | | 3,615 | | | 07/05/23 | | Bank of America | | | 14 | |
| COP | | | 15,138,661 | | | USD | | | 3,612 | | | 07/05/23 | | J.P. Morgan | | | 17 | |
| CZK | | | 21,219 | | | USD | | | 960 | | | 07/18/23 | | Goldman Sachs | | | 13 | |
| EUR | | | 969 | | | USD | | | 1,052 | | | 07/05/23 | | Bank of America | | | 6 | |
| EUR | | | 410 | | | USD | | | 446 | | | 07/18/23 | | Bank of America | | | 1 | |
| GBP | | | 204,468 | | | USD | | | 258,475 | | | 07/05/23 | | J.P. Morgan | | | 1,199 | |
| GBP | | | 480 | | | USD | | | 605 | | | 07/18/23 | | Deutsche Bank | | | 5 | |
| HUF | | | 207,192 | | | USD | | | 600 | | | 07/18/23 | | J.P. Morgan | | | 5 | |
| IDR* | | | 64,380,916 | | | USD | | | 4,285 | | | 07/03/23 | | Morgan Stanley | | | 10 | |
| INR* | | | 37,177 | | | USD | | | 450 | | | 07/18/23 | | Citibank | | | 3 | |
| INR* | | | 677,405 | | | USD | | | 8,244 | | | 08/03/23 | | BNP Paribas | | | 1 | |
| INR* | | | 727,837 | | | USD | | | 8,858 | | | 08/03/23 | | Goldman Sachs | | | 1 | |
| INR* | | | 6,055 | | | USD | | | 73 | | | 09/20/23 | | J.P. Morgan (1) | | | 0 | |
| INR* | | | 5,100 | | | USD | | | 62 | | | 09/20/23 | | Morgan Stanley (1) | | | 0 | |
| JPY | | | 7,769,656 | | | USD | | | 53,984 | | | 08/02/23 | | BNP Paribas | | | 112 | |
| MXN | | | 17,387 | | | USD | | | 1,000 | | | 07/18/23 | | Goldman Sachs | | | 13 | |
| MXN | | | 955,361 | | | USD | | | 54,873 | | | 08/16/23 | | BNP Paribas | | | 469 | |
| MXN | | | 23,288 | | | USD | | | 1,281 | | | 08/31/23 | | J.P. Morgan | | | 64 | |
| PEN* | | | 16,696 | | | USD | | | 4,565 | | | 07/03/23 | | Deutsche Bank | | | 37 | |
| PEN* | | | 16,696 | | | USD | | | 4,597 | | | 07/03/23 | | Goldman Sachs | | | 5 | |
| PEN* | | | 16,696 | | | USD | | | 4,580 | | | 07/10/23 | | BNP Paribas | | | 20 | |
| PEN* | | | 32,302 | | | USD | | | 8,773 | | | 09/20/23 | | J.P. Morgan | | | 76 | |
| USD | | | 4,305 | | | IDR* | | | 64,380,916 | | | 07/03/23 | | Morgan Stanley | | | 11 | |
| USD | | | 54 | | | JPY | | | 7,452 | | | 07/05/23 | | Bank of America | | | 2 | |
| USD | | | 900 | | | BRL* | | | 4,296 | | | 07/05/23 | | Barclays Bank | | | 3 | |
| USD | | | 34 | | | JPY | | | 4,700 | | | 07/05/23 | | Deutsche Bank | | | 1 | |
| USD | | | 1,845 | | | AUD | | | 2,723 | | | 07/05/23 | | J.P. Morgan | | | 31 | |
| USD | | | 28,238 | | | JPY | | | 4,038,360 | | | 07/05/23 | | J.P. Morgan | | | 251 | |
| USD | | | 900 | | | TWD* | | | 27,437 | | | 07/13/23 | | Citibank | | | 19 | |
| USD | | | 300 | | | THB | | | 10,561 | | | 07/18/23 | | Bank of America | | | 2 | |
| USD | | | 450 | | | INR* | | | 36,938 | | | 07/18/23 | | Citibank (1) | | | 0 | |
| USD | | | 17,986 | | | JPY | | | 2,326,000 | | | 07/18/23 | | Deutsche Bank | | | 1,834 | |
| USD | | | 445 | | | GBP | | | 350 | | | 07/18/23 | | Goldman Sachs (1) | | | 0 | |
| USD | | | 740 | | | CLP* | | | 589,373 | | | 07/18/23 | | Morgan Stanley | | | 6 | |
| USD | | | 1,204 | | | KRW* | | | 1,573,869 | | | 07/31/23 | | Bank of America | | | 8 | |
| USD | | | 174 | | | KRW* | | | 227,434 | | | 07/31/23 | | BNP Paribas | | | 1 | |
| USD | | | 477 | | | KRW* | | | 623,479 | | | 07/31/23 | | Goldman Sachs | | | 3 | |
| USD | | | 244,424 | | | EUR | | | 222,763 | | | 08/02/23 | | BNP Paribas | | | 979 | |
| USD | | | 11,833 | | | KRW* | | | 15,512,377 | | | 08/03/23 | | BNP Paribas | | | 44 | |
| USD | | | 5,707 | | | KRW* | | | 7,505,307 | | | 08/03/23 | | Goldman Sachs | | | 3 | |
| USD | | | 386 | | | EUR | | | 349 | | | 08/08/23 | | Bank of America | | | 5 | |
| USD | | | 1,954 | | | ZAR | | | 36,206 | | | 08/08/23 | | Morgan Stanley | | | 37 | |
| USD | | | 16,175 | | | ZAR | | | 298,963 | | | 08/14/23 | | Deutsche Bank | | | 358 | |
| USD | | | 7,633 | | | ZAR | | | 141,652 | | | 08/14/23 | | Goldman Sachs | | | 138 | |
| USD | | | 11 | | | ZAR | | | 208 | | | 08/14/23 | | J.P. Morgan (1) | | | 0 | |
| USD | | | 35,434 | | | ZAR | | | 659,411 | | | 08/15/23 | | BNP Paribas | | | 550 | |
| USD | | | 2,417 | | | TWD* | | | 73,808 | | | 08/22/23 | | BNP Paribas | | | 46 | |
| USD | | | 6,553 | | | TWD* | | | 200,295 | | | 08/22/23 | | J.P. Morgan | | | 119 | |
The accompanying notes are an integral part of these financial statements.
| | |
| 50 | | Annual Report • June 30, 2023 |
Bridge Builder Core Plus Bond Fund
Summary Schedule of Investments
June 30, 2023 (Continued)
(Amounts in thousands, except number of contracts)
Over-the-Counter Forward Foreign Currency Exchange Contracts (Continued)
| | | | | | | | | | | | | | | | | | |
| Currency Purchased | | | Currency Sold | | | Settlement
Date | | Counterparty | | Unrealized
Appreciation/
(Depreciation) | |
| USD | | | 2,705 | | | TWD* | | | 82,040 | | | 08/22/23 | | Morgan Stanley | | $ | 69 | |
| USD | | | 68,544 | | | JPY | | | 9,451,068 | | | 08/28/23 | | Bank of America | | | 2,480 | |
| USD | | | 64,153 | | | JPY | | | 8,848,932 | | | 08/28/23 | | J.P. Morgan | | | 2,298 | |
| USD | | | 30,615 | | | JPY | | | 4,191,884 | | | 09/05/23 | | Bank of America | | | 1,277 | |
| USD | | | 111,245 | | | JPY | | | 15,274,000 | | | 09/11/23 | | Deutsche Bank | | | 4,244 | |
| USD | | | 1,006 | | | ZAR | | | 17,780 | | | 09/12/23 | | BNP Paribas | | | 68 | |
| USD | | | 44,493 | | | JPY | | | 6,180,000 | | | 09/19/23 | | Bank of America | | | 1,144 | |
| USD | | | 4,857 | | | TWD* | | | 147,458 | | | 09/20/23 | | Bank of America | | | 112 | |
| USD | | | 33,439 | | | TWD* | | | 1,017,671 | | | 09/20/23 | | Goldman Sachs | | | 687 | |
| USD | | | 1,956 | | | JPY | | | 272,727 | | | 09/20/23 | | J.P. Morgan | | | 42 | |
| USD | | | 3,423 | | | KRW* | | | 4,452,091 | | | 09/20/23 | | J.P. Morgan | | | 30 | |
| USD | | | 6,324 | | | KRW* | | | 8,213,295 | | | 09/20/23 | | Morgan Stanley | | | 64 | |
| USD | | | 166 | | | EUR | | | 151 | | | 09/20/23 | | UBS (1) | | | 0 | |
| USD | | | 182 | | | EUR | | | 166 | | | 09/22/23 | | Bank of America (1) | | | 0 | |
| USD | | | 90 | | | EUR | | | 82 | | | 09/22/23 | | Citibank (1) | | | 0 | |
| USD | | | 166 | | | EUR | | | 151 | | | 09/22/23 | | Deutsche Bank (1) | | | 0 | |
| USD | | | 40,581 | | | JPY | | | 5,722,000 | | | 09/25/23 | | Bank of America | | | 406 | |
| USD | | | 2,330 | | | IDR* | | | 34,893,198 | | | 09/26/23 | | Citibank | | | 13 | |
| USD | | | 1,828 | | | ZAR | | | 33,934 | | | 10/19/23 | | BNP Paribas | | | 45 | |
| USD | | | 5,193 | | | ZAR | | | 97,432 | | | 10/19/23 | | Goldman Sachs | | | 73 | |
| ZAR | | | 279 | | | USD | | | 15 | | | 08/15/23 | | BNP Paribas (1) | | | 0 | |
| | | | | | | | | | | | | | | | | | |
| | | | | | | | | | | | | | Total Unrealized Appreciation | | | 29,113 | |
| | | | | | | | | | | | | | | | | | |
| BRL* | | | 4,318 | | | USD | | | 900 | | | 08/02/23 | | Barclays Bank | | | (3 | ) |
| CLP* | | | 38,072,031 | | | USD | | | 48,189 | | | 07/14/23 | | BNP Paribas | | | (754 | ) |
| COP | | | 1,347,443 | | | USD | | | 312 | | | 12/20/23 | | Barclays Bank | | | (2 | ) |
| EUR | | | 224,236 | | | USD | | | 245,690 | | | 07/05/23 | | BNP Paribas | | | (1,004 | ) |
| EUR | | | 3,557 | | | USD | | | 3,884 | | | 07/05/23 | | J.P. Morgan | | | (3 | ) |
| EUR | | | 570 | | | USD | | | 623 | | | 07/18/23 | | J.P. Morgan | | | (1 | ) |
| GBP | | | 912 | | | USD | | | 1,161 | | | 07/05/23 | | Bank of America | | | (3 | ) |
| GBP | | | 3,044 | | | USD | | | 3,873 | | | 09/20/23 | | J.P. Morgan | | | (7 | ) |
| HUF | | | 153,097 | | | USD | | | 450 | | | 07/18/23 | | Goldman Sachs | | | (3 | ) |
| IDR* | | | 8,924,100 | | | USD | | | 600 | | | 07/18/23 | | Citibank | | | (7 | ) |
| IDR* | | | 50,871,938 | | | USD | | | 3,386 | | | 09/20/23 | | BNP Paribas | | | (8 | ) |
| IDR* | | | 74,077,223 | | | USD | | | 4,975 | | | 09/20/23 | | J.P. Morgan | | | (56 | ) |
| IDR* | | | 41,876,920 | | | USD | | | 2,804 | | | 09/20/23 | | Morgan Stanley | | | (23 | ) |
| IDR* | | | 1,147,768 | | | USD | | | 77 | | | 09/20/23 | | UBS | | | (1 | ) |
| IDR* | | | 157,688,663 | | | USD | | | 10,493 | | | 09/22/23 | | BNP Paribas | | | (23 | ) |
| IDR* | | | 102,161,783 | | | USD | | | 6,790 | | | 09/22/23 | | J.P. Morgan | | | (6 | ) |
| IDR* | | | 244,225,999 | | | USD | | | 16,314 | | | 09/26/23 | | Bank of America | | | (98 | ) |
| IDR* | | | 64,436,881 | | | USD | | | 4,305 | | | 09/26/23 | | Morgan Stanley | | | (27 | ) |
| INR* | | | 122,995 | | | USD | | | 1,498 | | | 08/03/23 | | BNP Paribas | | | (1 | ) |
| INR* | | | 506,229 | | | USD | | | 6,164 | | | 08/03/23 | | Goldman Sachs | | | (2 | ) |
| INR* | | | 865,052 | | | USD | | | 10,534 | | | 08/07/23 | | Goldman Sachs | | | (6 | ) |
| INR* | | | 841,896 | | | USD | | | 10,202 | | | 12/20/23 | | J.P. Morgan | | | (9 | ) |
| JPY | | | 11,870,639 | | | USD | | | 85,401 | | | 07/05/23 | | BNP Paribas | | | (3,136 | ) |
| JPY | | | 4,021,200 | | | USD | | | 28,238 | | | 08/02/23 | | J.P. Morgan | | | (241 | ) |
| KRW* | | | 11,337,694 | | | USD | | | 8,949 | | | 09/20/23 | | Bank of America | | | (308 | ) |
| KRW* | | | 44,734,823 | | | USD | | | 34,956 | | | 09/20/23 | | Morgan Stanley | | | (862 | ) |
| NOK | | | 337,964 | | | USD | | | 31,853 | | | 08/16/23 | | Goldman Sachs | | | (316 | ) |
| NOK | | | 124,621 | | | USD | | | 11,748 | | | 08/16/23 | | J.P. Morgan | | | (119 | ) |
| THB | | | 20,703 | | | USD | | | 600 | | | 07/18/23 | | Citibank | | | (15 | ) |
| TWD* | | | 13,806 | | | USD | | | 450 | | | 07/13/23 | | Barclays Bank | | | (7 | ) |
| USD | | | 4,597 | | | PEN* | | | 16,696 | | | 07/03/23 | | Deutsche Bank | | | (5 | ) |
| USD | | | 4,504 | | | PEN* | | | 16,696 | | | 07/03/23 | | Goldman Sachs | | | (98 | ) |
| USD | | | 3,612 | | | COP | | | 15,138,661 | | | 07/05/23 | | Bank of America | | | (17 | ) |
| USD | | | 470 | | | BRL* | | | 2,263 | | | 07/05/23 | | Barclays Bank | | | (3 | ) |
| USD | | | 69,400 | | | AUD | | | 104,776 | | | 07/05/23 | | BNP Paribas | | | (396 | ) |
| USD | | | 244,337 | | | EUR | | | 227,289 | | | 07/05/23 | | BNP Paribas | | | (3,681 | ) |
The accompanying notes are an integral part of these financial statements.
| | |
| Annual Report • June 30, 2023 | | 51 |
Bridge Builder Core Plus Bond Fund
Summary Schedule of Investments
June 30, 2023 (Continued)
(Amounts in thousands, except number of contracts)
Over-the-Counter Forward Foreign Currency Exchange Contracts (Continued)
| | | | | | | | | | | | | | | | | | | | | | |
| Currency Purchased | | | Currency Sold | | | Settlement
Date | | | Counterparty | | Unrealized
Appreciation/
(Depreciation) | |
| USD | | | 447 | | | | BRL* | | | | 2,155 | | | | 07/05/23 | | | Goldman Sachs | | $ | (3 | ) |
| USD | | | 3,256 | | | | COP | | | | 15,138,661 | | | | 07/05/23 | | | J.P. Morgan | | | (373 | ) |
| USD | | | 255,259 | | | | GBP | | | | 205,380 | | | | 07/05/23 | | | Morgan Stanley | | | (5,574 | ) |
| USD | | | 4,563 | | | | PEN* | | | | 16,696 | | | | 07/10/23 | | | Deutsche Bank | | | (38 | ) |
| USD | | | 300 | | | | HUF | | | | 102,942 | | | | 07/18/23 | | | Barclays Bank (1) | | | (0 | ) |
| USD | | | 603 | | | | GBP | | | | 480 | | | | 07/18/23 | | | Deutsche Bank | | | (6 | ) |
| USD | | | 1,070 | | | | EUR | | | | 990 | | | | 07/18/23 | | | J.P. Morgan | | | (11 | ) |
| USD | | | 744 | | | | EUR | | | | 690 | | | | 07/18/23 | | | UBS | | | (9 | ) |
| USD | | | 4,573 | | | | PEN* | | | | 16,696 | | | | 08/01/23 | | | BNP Paribas | | | (17 | ) |
| USD | | | 253,018 | | | | GBP | | | | 200,067 | | | | 08/02/23 | | | J.P. Morgan | | | (1,124 | ) |
| USD | | | 477 | | | | KRW* | | | | 629,492 | | | | 08/03/23 | | | BNP Paribas | | | (1 | ) |
| USD | | | 159 | | | | KRW* | | | | 209,741 | | | | 08/03/23 | | | Goldman Sachs (1) | | | (0 | ) |
| USD | | | 1,031 | | | | KRW* | | | | 1,360,095 | | | | 08/03/23 | | | J.P. Morgan | | | (3 | ) |
| USD | | | 11,974 | | | | KRW* | | | | 15,761,927 | | | | 08/07/23 | | | J.P. Morgan | | | (7 | ) |
| USD | | | 4,359 | | | | ZAR | | | | 84,485 | | | | 08/15/23 | | | Bank of America | | | (110 | ) |
| USD | | | 1,298 | | | | CAD | | | | 1,737 | | | | 08/16/23 | | | Bank of America | | | (13 | ) |
| USD | | | 2,133 | | | | CAD | | | | 2,852 | | | | 08/16/23 | | | J.P. Morgan | | | (21 | ) |
| USD | | | 53 | | | | ZAR | | | | 1,012 | | | | 08/18/23 | | | Deutsche Bank | | | (1 | ) |
| USD | | | 21,638 | | | | ZAR | | | | 419,821 | | | | 08/18/23 | | | Morgan Stanley | | | (565 | ) |
| USD | | | 6,183 | | | | MXN | | | | 113,139 | | | | 08/31/23 | | | Barclays Bank | | | (353 | ) |
| USD | | | 7,473 | | | | MXN | | | | 137,366 | | | | 08/31/23 | | | J.P. Morgan | | | (463 | ) |
| USD | | | 2,489 | | | | MXN | | | | 46,254 | | | | 08/31/23 | | | Morgan Stanley | | | (183 | ) |
| USD | | | 1,382 | | | | CZK | | | | 30,492 | | | | 09/06/23 | | | Barclays Bank | | | (14 | ) |
| USD | | | 352 | | | | EUR | | | | 322 | | | | 09/14/23 | | | Citibank | | | (1 | ) |
| USD | | | 1,220 | | | | CAD | | | | 1,618 | | | | 09/20/23 | | | BNP Paribas | | | (3 | ) |
| USD | | | 3,480 | | | | COP | | | | 15,138,661 | | | | 12/20/23 | | | Bank of America | | | (4 | ) |
| ZAR | | | 83,243 | | | | USD | | | | 4,552 | | | | 08/14/23 | | | Bank of America | | | (147 | ) |
| | | | | | | | | | | | | | | | | | | | | | |
| | | | | | | | | | | | | | | | | | Total Unrealized Depreciation | | | (20,295 | ) |
| | | | | | | | | | | | | | | | | | | | | | |
| | | | | | | | | | | | | | | | | | Net Unrealized Appreciation | | $ | 8,818 | |
| | | | | | | | | | | | | | | | | | | | | | |
| * | | Non-deliverable forward |
| (1) | | A zero balance may reflect actual amounts rounding to less than one thousand. |
The accompanying notes are an integral part of these financial statements.
| | |
| 52 | | Annual Report • June 30, 2023 |
Bridge Builder Core Plus Bond Fund
Summary Schedule of Investments
June 30, 2023 (Continued)
(Amounts in thousands, except number of contracts)
Centrally Cleared Credit Default Swaps – Buy Protection
| | | | | | | | | | | | | | | | | | | | | | | | | | |
| Reference Entity | | Fixed Annual
Rate Paid
by Fund | | Maturity
Date | | | Implied Credit
Spread at
June 30,
2023 | | | Notional
Amount | | | Upfront
Premium
Paid/
(Received) | | | Unrealized
Appreciation/
(Depreciation) | | | Value | |
iTraxx Europe Crossover
Series 39 Version 1 Index | | 5.00% | | | 6/20/2028 | | | | 4.00% | | | EUR | 2,744 | | | $ | (74 | ) | | $ | (49 | ) | | $ | (123 | ) |
| | | | | | | | | | | | | | | | | | | | | | | | | | |
| | | | | | | | | | | | | | | | $ | (74 | ) | | $ | (49 | ) | | $ | (123 | ) |
| | | | | | | | | | | | | | | | | | | | | | | | | | |
Centrally Cleared Credit Default Swaps – Sell Protection
| | | | | | | | | | | | | | | | | | | | | | | | | | |
| Reference Entity | | Fixed Annual
Rate Received
by Fund | | Maturity
Date | | | Implied Credit
Spread at
June 30,
2023 | | | Notional
Amount | | | Upfront
Premium
Paid/
(Received) | | | Unrealized
Appreciation/
(Depreciation) | | | Value | |
| AT&T, Inc. | | 1.00% | | | 12/20/2024 | | | | 0.62% | | | $ | 5,200 | | | $ | 8 | | | $ | 21 | | | $ | 29 | |
| AT&T, Inc. | | 1.00 | | | 6/20/2026 | | | | 0.74 | | | | 2,700 | | | | 325 | | | | (305 | ) | | | 20 | |
| AT&T, Inc. | | 1.00 | | | 6/20/2028 | | | | 0.96 | | | | 1,300 | | | | (7 | ) | | | 9 | | | | 2 | |
| Barclays Bank PLC (1) | | 1.00 | | | 12/20/2023 | | | | 0.84 | | | EUR | 6,200 | | | | 7 | | | | 0 | | | | 7 | |
| CDX.EM.30 | | 1.00 | | | 12/20/2023 | | | | 0.11 | | | $ | 6,120 | | | | (438 | ) | | | 466 | | | | 28 | |
| CDX.EM.31 | | 1.00 | | | 6/20/2024 | | | | 0.51 | | | | 7,482 | | | | (243 | ) | | | 280 | | | | 37 | |
| CDX.EM.32 | | 1.00 | | | 12/20/2024 | | | | 0.73 | | | | 11,050 | | | | (449 | ) | | | 495 | | | | 46 | |
| CDX.EM.34 | | 1.00 | | | 12/20/2025 | | | | 2.49 | | | | 2,852 | | | | (184 | ) | | | 90 | | | | (94 | ) |
| CDX.EM.36 | | 1.00 | | | 12/20/2026 | | | | 1.77 | | | | 26,864 | | | | (750 | ) | | | 118 | | | | (632 | ) |
| CDX.EM.38 | | 1.00 | | | 12/20/2027 | | | | 2.07 | | | | 3,800 | | | | (273 | ) | | | 117 | | | | (156 | ) |
| CDX.NA.HY.35 | | 5.00 | | | 12/20/2025 | | | | 2.98 | | | | 490 | | | | 39 | | | | (16 | ) | | | 23 | |
| CDX.NA.HY.39 | | 5.00 | | | 12/20/2027 | | | | 4.10 | | | | 20,654 | | | | (855 | ) | | | 1,558 | | | | 703 | |
| CDX.NA.HY.39 | | 5.00 | | | 6/20/2028 | | | | 2.13 | | | | 4,600 | | | | (324 | ) | | | 106 | | | | (218 | ) |
| CDX.NA.HY.40 | | 5.00 | | | 6/20/2028 | | | | 4.27 | | | | 44,613 | | | | 739 | | | | 608 | | | | 1,347 | |
| CDX.NA.HY.40 | | 5.00 | | | 6/20/2028 | | | | 4.27 | | | | 204,900 | | | | (288 | ) | | | 6,473 | | | | 6,185 | |
| Ford Motor Credit Co. LLC | | 5.00 | | | 6/20/2024 | | | | 1.03 | | | | 19,600 | | | | 535 | | | | 234 | | | | 769 | |
| Ford Motor Credit Co. LLC | | 5.00 | | | 12/20/2024 | | | | 1.24 | | | | 1,700 | | | | 63 | | | | 30 | | | | 93 | |
| Ford Motor Credit Co. LLC | | 5.00 | | | 6/20/2025 | | | | 1.34 | | | | 700 | | | | 27 | | | | 21 | | | | 48 | |
| Ford Motor Credit Co. LLC | | 5.00 | | | 12/20/2025 | | | | 1.58 | | | | 600 | | | | 23 | | | | 25 | | | | 48 | |
| Ford Motor Credit Co. LLC | | 5.00 | | | 6/20/2026 | | | | 1.73 | | | | 19,400 | | | | 1,229 | | | | 516 | | | | 1,745 | |
| General Electric Co. | | 1.00 | | | 12/20/2023 | | | | 0.28 | | | | 700 | | | | (6 | ) | | | 9 | | | | 3 | |
| Rolls-Royce PLC | | 1.00 | | | 6/20/2025 | | | | 1.27 | | | EUR | 14,300 | | | | (726 | ) | | | 651 | | | | (75 | ) |
| | | | | | | | | | | | | | | | | | | | | | | | | | |
| | | | | | | | | | | | | | | | $ | (1,548 | ) | | $ | 11,506 | | | $ | 9,958 | |
| | | | | | | | | | | | | | | | | | | | | | | | | | |
| (1) | A zero balance may reflect actual amounts rounding to less than one thousand. |
Over-the-Counter Credit Default Swaps – Buy Protection
| | | | | | | | | | | | | | | | | | | | | | | | | | | | |
| Counterparty | | Reference Entity | | Fixed Annual
Rate Paid
by Fund | | Payment
Frequency | | Maturity
Date | | | Implied Credit
Spread at
June 30,
2023 | | Notional
Amount | | | Upfront
Premium
Paid/
(Received) | | | Unrealized
Appreciation/
(Depreciation) | | | Value | |
| J.P. Morgan | | Abbott Laboratories | | 1.00% | | Quarterly | | | 6/20/2027 | | | 0.38% | | $ | 2,433 | | | $ | (59 | ) | | $ | 4 | | | $ | (55 | ) |
| Barclays Bank | | Brazilian Government International | | 1.00 | | Quarterly | | | 12/20/2024 | | | 0.40 | | | 974 | | | | 15 | | | | (23 | ) | | | (8 | ) |
| Barclays Bank | | Brazilian Government International | | 1.00 | | Quarterly | | | 12/20/2024 | | | 0.40 | | | 970 | | | | 15 | | | | (23 | ) | | | (8 | ) |
| Barclays Bank | | Brazilian Government International | | 1.00 | | Quarterly | | | 12/20/2024 | | | 0.40 | | | 976 | | | | 15 | | | | (23 | ) | | | (8 | ) |
| Barclays Bank | | Brazilian Government International | | 1.00 | | Quarterly | | | 12/20/2024 | | | 0.40 | | | 1,370 | | | | 21 | | | | (33 | ) | | | (12 | ) |
| Barclays Bank | | Brazilian Government International | | 1.00 | | Quarterly | | | 12/20/2024 | | | 0.40 | | | 975 | | | | 15 | | | | (24 | ) | | | (9 | ) |
The accompanying notes are an integral part of these financial statements.
| | |
| Annual Report • June 30, 2023 | | 53 |
Bridge Builder Core Plus Bond Fund
Summary Schedule of Investments
June 30, 2023 (Continued)
(Amounts in thousands, except number of contracts)
Over-the-Counter Credit Default Swaps – Buy Protection (Continued)
| | | | | | | | | | | | | | | | | | | | | | | | | | | | | | |
| Counterparty | | Reference Entity | | Fixed Annual
Rate Paid
by Fund | | Payment
Frequency | | Maturity
Date | | | Implied Credit
Spread at
June 30,
2023 | | | Notional
Amount | | | Upfront
Premium
Paid/
(Received) | | | Unrealized
Appreciation/
(Depreciation) | | | Value | |
| Barclays Bank | | Brazilian Government International | | 1.00 % | | Quarterly | | | 12/20/2024 | | | | 0.40 % | | | $ | 586 | | | $ | 9 | | | $ | (14 | ) | | $ | (5 | ) |
| Barclays Bank | | Brazilian Government International | | 1.00 | | Quarterly | | | 6/20/2028 | | | | 1.76 | | | | 2,517 | | | | 168 | | | | (86 | ) | | | 82 | |
| Barclays Bank | | Colombia Government International | | 1.00 | | Quarterly | | | 6/20/2028 | | | | 2.35 | | | | 2,280 | | | | 211 | | | | (81 | ) | | | 130 | |
| Morgan Stanley | | Colombia Government International | | 1.00 | | Quarterly | | | 6/20/2028 | | | | 2.35 | | | | 913 | | | | 53 | | | | (1 | ) | | | 52 | |
| Barclays Bank | | Mexico Government International | | 1.00 | | Quarterly | | | 6/20/2028 | | | | 1.03 | | | | 2,277 | | | | 40 | | | | (38 | ) | | | 2 | |
| | | | | | | | | | | | | | | | | | | | | | | | | | | | | | |
| | | | | | | | | | | | | | | | | | | | $ | 503 | | | | $(342 | ) | | $ | 161 | |
| | | | | | | | | | | | | | | | | | | | | | | | | | | | | | |
Over-the-Counter Credit Default Swaps – Sell Protection
| | | | | | | | | | | | | | | | | | | | | | | | | | | | |
| Counterparty | | Reference Entity | | Fixed Annual
Rate Received
by Fund | | Payment
Frequency | | Maturity
Date | | | Implied Credit
Spread at
June 30,
2023 | | Notional
Amount | | | Upfront
Premium
Paid/
(Received) | | | Unrealized
Appreciation/
(Depreciation) | | | Value | |
| Goldman Sachs | | Brazilian Government International | | 1.00% | | Quarterly | | | 12/20/2024 | | | 0.40% | | $ | 3,200 | | | $ | (15 | ) | | $ | 43 | | | $ | 28 | |
| BNP Paribas | | Colombia Government International | | 1.00 | | Quarterly | | | 12/20/2027 | | | 2.13 | | | 600 | | | | (54 | ) | | | 27 | | | | (27 | ) |
| Goldman Sachs | | Colombia Government International | | 1.00 | | Quarterly | | | 6/20/2027 | | | 1.87 | | | 1,900 | | | | (70 | ) | | | 12 | | | | (58 | ) |
| Goldman Sachs | | Colombia Government International | | 1.00 | | Quarterly | | | 12/20/2027 | | | 2.13 | | | 800 | | | | (71 | ) | | | 36 | | | | (35 | ) |
| J.P. Morgan | | Colombia Government International | | 1.00 | | Quarterly | | | 12/20/2026 | | | 1.67 | | | 1,400 | | | | (66 | ) | | | 37 | | | | (29 | ) |
| J.P. Morgan | | Colombia Government International | | 1.00 | | Quarterly | | | 6/20/2027 | | | 1.87 | | | 400 | | | | (15 | ) | | | 3 | | | | (12 | ) |
| Morgan Stanley | | Colombia Government International | | 1.00 | | Quarterly | | | 6/20/2027 | | | 1.87 | | | 900 | | | | (39 | ) | | | 11 | | | | (28 | ) |
| Morgan Stanley | | Colombia Government International | | 1.00 | | Quarterly | | | 12/20/2027 | | | 2.13 | | | 1,000 | | | | (89 | ) | | | 45 | | | | (44 | ) |
| Goldman Sachs | | Mexico Government International | | 1.00 | | Quarterly | | | 12/20/2023 | | | 0.13 | | | 8,500 | | | | (459 | ) | | | 497 | | | | 38 | |
| Goldman Sachs | | Mexico Government International (1) | | 1.00 | | Quarterly | | | 6/20/2028 | | | 1.03 | | | 200 | | | | (3 | ) | | | 3 | | | | 0 | |
| J.P. Morgan | | Mexico Government International (1) | | 1.00 | | Quarterly | | | 6/20/2024 | | | 0.19 | | | 100 | | | | 0 | | | | 0 | | | | 0 | |
| J.P. Morgan | | Mexico Government International | | 1.00 | | Quarterly | | | 6/20/2026 | | | 0.52 | | | 100 | | | | (1 | ) | | | 2 | | | | 1 | |
| Morgan Stanley | | Mexico Government International | | 1.00 | | Quarterly | | | 12/20/2024 | | | 0.28 | | | 300 | | | | (1 | ) | | | 4 | | | | 3 | |
| Morgan Stanley | | Mexico Government International | | 1.00 | | Quarterly | | | 12/20/2026 | | | 0.66 | | | 500 | | | | 168 | | | | (162 | ) | | | 6 | |
| Morgan Stanley | | Mexico Government International | | 1.00 | | Quarterly | | | 6/20/2027 | | | 0.77 | | | 400 | | | | (4 | ) | | | 7 | | | | 3 | |
| Morgan Stanley | | Mexico Government International | | 1.00 | | Quarterly | | | 6/20/2028 | | | 1.03 | | | 1,500 | | | | (34 | ) | | | 32 | | | | (2 | ) |
| Goldman Sachs | | Republic of South Africa | | 1.00 | | Quarterly | | | 6/20/2024 | | | 1.02 | | | 4,700 | | | | (42 | ) | | | 43 | | | | 1 | |
| Bank of America | | Turkey Government International | | 1.00 | | Quarterly | | | 12/20/2023 | | | 2.02 | | | 3,000 | | | | (55 | ) | | | 42 | | | | (13 | ) |
The accompanying notes are an integral part of these financial statements.
| | |
| 54 | | Annual Report • June 30, 2023 |
Bridge Builder Core Plus Bond Fund
Summary Schedule of Investments
June 30, 2023 (Continued)
(Amounts in thousands, except number of contracts)
Over-the-Counter Credit Default Swaps – Sell Protection (Continued)
| | | | | | | | | | | | | | | | | | | | | | | | | | | | | | |
| Counterparty | | Reference Entity | | Fixed Annual
Rate Received
by Fund | | Payment
Frequency | | Maturity
Date | | | Implied Credit
Spread at
June 30,
2023 | | | Notional
Amount | | | Upfront
Premium
Paid/
(Received) | | | Unrealized
Appreciation/
(Depreciation) | | | Value | |
| Bank of America | | Turkey Government International | | 1.00 % | | Quarterly | | | 6/20/2024 | | | | 3.12 % | | | $ | 400 | | | $ | (37 | ) | | $ | 29 | | | $ | (8 | ) |
| Bank of America | | Turkey Government International | | 1.00 | | Quarterly | | | 12/20/2024 | | | | 3.83 | | | | 1,300 | | | | (80 | ) | | | 29 | | | | (51 | ) |
| BNP Paribas | | Turkey Government International (1) | | 1.00 | | Quarterly | | | 12/20/2023 | | | | 2.02 | | | | 200 | | | | (14 | ) | | | 14 | | | | 0 | |
| BNP Paribas | | Turkey Government International | | 1.00 | | Quarterly | | | 12/20/2023 | | | | 2.02 | | | | 500 | | | | (40 | ) | | | 37 | | | | (3 | ) |
| BNP Paribas | | Turkey Government International | | 1.00 | | Quarterly | | | 6/20/2025 | | | | 4.17 | | | | 200 | | | | (34 | ) | | | 23 | | | | (11 | ) |
| Goldman Sachs | | Turkey Government International | | 1.00 | | Quarterly | | | 6/20/2024 | | | | 3.12 | | | | 1,200 | | | | (60 | ) | | | 36 | | | | (24 | ) |
| Goldman Sachs | | Turkey Government International | | 1.00 | | Quarterly | | | 12/20/2024 | | | | 3.83 | | | | 900 | | | | (96 | ) | | | 61 | | | | (35 | ) |
| J.P. Morgan | | Turkey Government International | | 1.00 | | Quarterly | | | 12/20/2023 | | | | 2.02 | | | | 200 | | | | (14 | ) | | | 13 | | | | (1 | ) |
| Morgan Stanley | | Turkey Government International | | 1.00 | | Quarterly | | | 12/20/2023 | | | | 2.02 | | | | 500 | | | | (39 | ) | | | 37 | | | | (2 | ) |
| Morgan Stanley | | Turkey Government International | | 1.00 | | Quarterly | | | 6/20/2024 | | | | 3.12 | | | | 400 | | | | (46 | ) | | | 38 | | | | (8 | ) |
| Morgan Stanley | | Turkey Government International | | 1.00 | | Quarterly | | | 12/20/2024 | | | | 3.83 | | | | 3,700 | | | | (284 | ) | | | 142 | | | | (142 | ) |
| Goldman Sachs | | CMBX NA Series 14 | | 3.00 | | Quarterly | | | 12/16/2072 | | | | 9.41 | | | | 645 | | | | (109 | ) | | | (78 | ) | | | (187 | ) |
| | | | | | | | | | | | | | | | | | | | | | | | | | | | | | |
| | | | | | | | | | | | | | | | | | | | $ | (1,703 | ) | | | $1,063 | | | $ | (640 | ) |
| | | | | | | | | | | | | | | | | | | | | | | | | | | | | | |
| (1) | A zero balance may reflect actual amounts rounding to less than one thousand. |
Centrally Cleared Interest Rate Swaps
| | | | | | | | | | | | | | | | | | | | | | | | | | | | | | |
Fixed Annual
Rate | | Floating Rate Index | | Floating Rate
Paid or
Received | | | Payment
Frequency | | | Maturity
Date | | | Notional
Amount | | | Upfront
Premium
Paid/
(Received) | | | Unrealized
Appreciation/
(Depreciation) | | | Value | |
| (0.45)% | | 6 Month EURIBOR | | | Received | | | | Semi-Annual | | | | 12/29/2023 | | | EUR | 2,800 | | | $ | — | | | $ | 74 | | | $ | 74 | |
| (0.43) | | 6 Month EURIBOR | | | Received | | | | Semi-Annual | | | | 6/28/2024 | | | | 2,700 | | | | — | | | | 128 | | | | 128 | |
| (0.40) | | 6 Month EURIBOR | | | Received | | | | Semi-Annual | | | | 12/30/2024 | | | | 1,200 | | | | — | | | | 86 | | | | 86 | |
| (0.36) | | 6 Month EURIBOR | | | Received | | | | Semi-Annual | | | | 6/30/2025 | | | | 2,300 | | | | — | | | | 202 | | | | 202 | |
| (0.33) | | 6 Month EURIBOR | | | Received | | | | Semi-Annual | | | | 12/30/2025 | | | | 1,400 | | | | — | | | | 149 | | | | 149 | |
| (0.29) | | 6 Month EURIBOR | | | Received | | | | Semi-Annual | | | | 6/30/2026 | | | | 700 | | | | — | | | | 84 | | | | 84 | |
| (0.15) | | 6 Month EURIBOR | | | Received | | | | Semi-Annual | | | | 3/18/2030 | | | | 16,100 | | | | 196 | | | | 3,364 | | | | 3,560 | |
| 0.00 | | SOFR | | | Paid | | | | Quarterly | | | | 9/12/2023 | | | $ | 3,200 | | | | — | | | | (45 | ) | | | (45 | ) |
| 0.00 | | 3 Month USD LIBOR | | | Received | | | | Quarterly | | | | 9/12/2023 | | | | 3,200 | | | | — | | | | 45 | | | | 45 | |
| 0.20 | | 1 Year JPY TONA (1) | | | Received | | | | Annual | | | | 2/3/2025 | | | JPY | 930,858 | | | | 0 | | | | (23 | ) | | | (23 | ) |
| 0.21 | | 1 Year JPY TONA (1) | | | Received | | | | Annual | | | | 2/3/2025 | | | | 930,858 | | | | 0 | | | | (23 | ) | | | (23 | ) |
| 0.50 | | 6 Month EURIBOR | | | Received | | | | Semi-Annual | | | | 6/17/2050 | | | EUR | 9,000 | | | | (259 | ) | | | 4,183 | | | | 3,924 | |
| 0.75 | | 3 Month USD LIBOR (1) | | | Paid | | | | Quarterly | | | | 9/16/2023 | | | $ | 108,850 | | | | 0 | | | | (1,359 | ) | | | (1,359 | ) |
| 0.75 | | SOFR | | | Paid | | | | Quarterly | | | | 6/16/2031 | | | | 108,850 | | | | (8,889 | ) | | | (13,396 | ) | | | (22,285 | ) |
| 0.83 | | 6 Month EURIBOR | | | Received | | | | Semi-Annual | | | | 12/9/2052 | | | EUR | 158,000 | | | | 946 | | | | 7,651 | | | | 8,597 | |
| 0.89 | | 1 Year JPY TONA (1) | | | Received | | | | Annual | | | | 2/15/2033 | | | JPY | 549,176 | | | | 0 | | | | (124 | ) | | | (124 | ) |
| 0.90 | | 1 Year JPY TONA (1) | | | Received | | | | Annual | | | | 2/15/2033 | | | | 549,176 | | | | 0 | | | | (129 | ) | | | (129 | ) |
| 0.90 | | 1 Year JPY TONA (1) | | | Received | | | | Annual | | | | 2/15/2033 | | | | 1,098,352 | | | | 0 | | | | (259 | ) | | | (259 | ) |
| 0.92 | | 1 Year JPY TONA (1) | | | Received | | | | Annual | | | | 2/15/2033 | | | | 1,590,716 | | | | 0 | | | | (394 | ) | | | (394 | ) |
| 1.25 | | 3 Month USD LIBOR (1) | | | Received | | | | Quarterly | | | | 9/16/2023 | | | $ | 48,900 | | | | 0 | | | | 548 | | | | 548 | |
The accompanying notes are an integral part of these financial statements.
| | |
| Annual Report • June 30, 2023 | | 55 |
Bridge Builder Core Plus Bond Fund
Summary Schedule of Investments
June 30, 2023 (Continued)
(Amounts in thousands, except number of contracts)
Centrally Cleared Interest Rate Swaps (Continued)
| | | | | | | | | | | | | | | | | | | | | | | | | | | | | | |
Fixed Annual
Rate | | Floating Rate Index | | Floating Rate
Paid or
Received | | | Payment
Frequency | | | Maturity
Date | | | Notional
Amount | | | Upfront
Premium
Paid/
(Received) | | | Unrealized
Appreciation/
(Depreciation) | | | Value | |
| 1.25 % | | SOFR | | | Paid | | | | Annual | | | | 6/15/2032 | | | $ | 26,170 | | | $ | (685 | ) | | $ | (3,989 | ) | | $ | (4,674 | ) |
| 1.25 | | SOFR | | | Received | | | | Quarterly | | | | 12/16/2050 | | | | 48,900 | | | | 4,987 | | | | 14,256 | | | | 19,243 | |
| 1.50 | | 3 Month USD LIBOR | | | Received | | | | Quarterly | | | | 9/17/2023 | | | | 81,200 | | | | 7 | | | | 842 | | | | 849 | |
| 1.50 | | SOFR | | | Received | | | | Quarterly | | | | 6/17/2050 | | | | 81,200 | | | | (15,116 | ) | | | 43,352 | | | | 28,236 | |
| 1.75 | | SOFR | | | Paid | | | | Annual | | | | 6/15/2029 | | | | 3,570 | | | | (350 | ) | | | (38 | ) | | | (388 | ) |
| 1.75 | | SOFR | | | Paid | | | | Annual | | | | 6/15/2032 | | | | 9,860 | | | | (395 | ) | | | (992 | ) | | | (1,387 | ) |
| 2.00 | | SOFR | | | Paid | | | | Annual | | | | 12/21/2029 | | | | 168,700 | | | | (14,118 | ) | | | (5,041 | ) | | | (19,159 | ) |
| 2.00 | | SOFR | | | Paid | | | | Annual | | | | 12/21/2032 | | | | 378,900 | | | | (43,294 | ) | | | (9,467 | ) | | | (52,761 | ) |
| 2.25 | | SOFR | | | Received | | | | Quarterly | | | | 3/12/2050 | | | | 3,200 | | | | (10 | ) | | | 719 | | | | 709 | |
| 2.44 | | 6 Month EURIBOR (1) | | | Paid | | | | Semi-Annual | | | | 7/14/2032 | | | EUR | 3,088 | | | | 0 | | | | (36 | ) | | | (36 | ) |
| 2.49 | | SOFR (1) | | | Received | | | | Annual | | | | 6/15/2053 | | | $ | 680 | | | | 0 | | | | (2 | ) | | | (2 | ) |
| 2.75 | | SOFR | | | Received | | | | Annual | | | | 6/21/2053 | | | | 91,000 | | | | 8,651 | | | | (1,077 | ) | | | 7,574 | |
| 3.00 | | 3 Month USD LIBOR | | | Paid | | | | Quarterly | | | | 9/19/2023 | | | | 6,100 | | | | 1 | | | | (42 | ) | | | (41 | ) |
| 3.00 | | 6 Month Australian Bank Bill | | | Paid | | | | Semi-Annual | | | | 3/21/2027 | | | AUD | 109,400 | | | | 418 | | | | (3,880 | ) | | | (3,462 | ) |
| 3.00 | | SOFR | | | Paid | | | | Quarterly | | | | 6/19/2029 | | | $ | 6,100 | | | | 484 | | | | (795 | ) | | | (311 | ) |
| 3.00 | | SOFR | | | Paid | | | | Annual | | | | 6/21/2033 | | | | 104,870 | | | | (1,898 | ) | | | (3,012 | ) | | | (4,910 | ) |
| 3.00 | | SOFR | | | Paid | | | | Annual | | | | 6/21/2033 | | | | 100 | | | | (2 | ) | | | (2 | ) | | | (4 | ) |
| 3.00 | | 6 Month EURIBOR | | | Received | | | | Semi-Annual | | | | 9/20/2033 | | | EUR | 36,800 | | | | (141 | ) | | | 118 | | | | (23 | ) |
| 3.00 | | SOFR | | | Received | | | | Annual | | | | 9/20/2053 | | | $ | 25,946 | | | | — | | | | 768 | | | | 768 | |
| 3.00 | | SOFR | | | Received | | | | Annual | | | | 9/20/2053 | | | | 26,103 | | | | — | | | | 773 | | | | 773 | |
| 3.19 | | KRW Certificate of Deposit Rate (1) | | | Paid | | | | Quarterly | | | | 9/20/2026 | | | KRW | 4,084,701 | | | | 0 | | | | (35 | ) | | | (35 | ) |
| 3.19 | | KRW Certificate of Deposit Rate (1) | | | Paid | | | | Quarterly | | | | 9/20/2026 | | | | 3,019,127 | | | | 0 | | | | (26 | ) | | | (26 | ) |
| 3.25 | | SOFR | | | Paid | | | | Annual | | | | 6/21/2028 | | | $ | 218,700 | | | | (3,385 | ) | | | (3,263 | ) | | | (6,648 | ) |
| 3.25 | | Sterling Overnight Index Average | | | Received | | | | Annual | | | | 9/20/2053 | | | GBP | 700 | | | | 23 | | | | 62 | | | | 85 | |
| 3.28 | | 3 Month Canadian Bank Bill | | | Paid | | | | Quarterly | | | | 4/25/2033 | | | CAD | 1,308 | | | | (4 | ) | | | (40 | ) | | | (44 | ) |
| 3.30 | | 3 Month Canadian Bank Bill (1) | | | Paid | | | | Quarterly | | | | 3/27/2033 | | | | 435 | | | | 0 | | | | (15 | ) | | | (15 | ) |
| 3.32 | | 3 Month Canadian Bank Bill | | | Received | | | | Quarterly | | | | 4/25/2053 | | | | 567 | | | | 3 | | | | 15 | | | | 18 | |
| 3.33 | | KRW Certificate of Deposit Rate (1) | | | Paid | | | | Quarterly | | | | 9/20/2026 | | | KRW | 1,636,900 | | | | 0 | | | | (9 | ) | | | (9 | ) |
| 3.35 | | 3 Month Canadian Bank Bill | | | Paid | | | | Quarterly | | | | 3/30/2033 | | | CAD | 442 | | | | (1 | ) | | | (13 | ) | | | (14 | ) |
| 3.36 | | Canadian Overnight Repo Rate Average(1) | | | Received | | | | Semi-Annual | | | | 6/22/2053 | | | | 4,267 | | | | 0 | | | | (103 | ) | | | (103 | ) |
The accompanying notes are an integral part of these financial statements.
| | |
| 56 | | Annual Report • June 30, 2023 |
Bridge Builder Core Plus Bond Fund
Summary Schedule of Investments
June 30, 2023 (Continued)
(Amounts in thousands, except number of contracts)
Centrally Cleared Interest Rate Swaps (Continued)
| | | | | | | | | | | | | | | | | | | | | | | | | | | | | | |
Fixed Annual
Rate | | Floating Rate Index | | Floating Rate
Paid or
Received | | | Payment
Frequency | | | Maturity
Date | | | Notional
Amount | | | Upfront
Premium
Paid/
(Received) | | | Unrealized
Appreciation/
(Depreciation) | | | Value | |
| 3.36 % | | 3 Month Canadian Bank Bill (1) | | | Paid | | | | Quarterly | | | | 5/12/2033 | | | CAD | 450 | | | $ | 0 | | | $ | (13 | ) | | $ | (13 | ) |
| 3.37 | | 3 Month Canadian Bank Bill (1) | | | Received | | | | Quarterly | | | | 3/27/2053 | | | | 188 | | | | 0 | | | | 5 | | | | 5 | |
| 3.38 | | 3 Month Canadian Bank Bill (1) | | | Received | | | | Quarterly | | | | 5/12/2053 | | | | 195 | | | | 0 | | | | 5 | | | | 5 | |
| 3.38 | | KRW Certificate of Deposit Rate (1) | | | Paid | | | | Quarterly | | | | 9/20/2026 | | | KRW | 1,637,145 | | | | 0 | | | | (7 | ) | | | (7 | ) |
| 3.38 | | KRW Certificate of Deposit Rate (1) | | | Paid | | | | Quarterly | | | | 9/20/2026 | | | | 1,637,145 | | | | 0 | | | | (7 | ) | | | (7 | ) |
| 3.40 | | 3 Month Canadian Bank Bill (1) | | | Received | | | | Quarterly | | | | 3/30/2053 | | | | CAD 192 | | | | 0 | | | | 4 | | | | 4 | |
| 3.40 | | Canadian Overnight Repo Rate Average | | | Received | | | | Semi-Annual | | | | 6/15/2053 | | | | 21,306 | | | | 1 | | | | (637 | ) | | | (636 | ) |
| 3.43 | | 3 Month Canadian Bank Bill | | | Paid | | | | Quarterly | | | | 5/15/2033 | | | | 1,349 | | | | (7 | ) | | | (25 | ) | | | (32 | ) |
| 3.44 | | 3 Month Canadian Bank Bill | | | Received | | | | Quarterly | | | | 5/15/2053 | | | | 585 | | | | 3 | | | | 6 | | | | 9 | |
| 3.44 | | 3 Month Canadian Bank Bill (1) | | | Paid | | | | Quarterly | | | | 5/9/2033 | | | | 443 | | | | 0 | | | | (10 | ) | | | (10 | ) |
| 3.48 | | 3 Month Canadian Bank Bill (1) | | | Received | | | | Quarterly | | | | 5/9/2053 | | | | 192 | | | | 0 | | | | 2 | | | | 2 | |
| 3.50 | | Sterling Overnight Index Average | | | Received | | | | Annual | | | | 9/20/2033 | | | GBP | 15,600 | | | | 129 | | | | 1,135 | | | | 1,264 | |
| 3.54 | | Canadian Overnight Repo Rate Average (1) | | | Paid | | | | Semi-Annual | | | | 6/22/2033 | | | CAD | 9,754 | | | | 0 | | | | 54 | | | | 54 | |
| 3.54 | | Canadian Overnight Repo Rate Average | | | Paid | | | | Semi-Annual | | | | 6/15/2033 | | | | 47,940 | | | | 1 | | | | 257 | | | | 258 | |
| 3.56 | | 3 Month Canadian Bank Bill (1) | | | Received | | | | Quarterly | | | | 6/1/2053 | | | | 208 | | | | 0 | | | | (1 | ) | | | (1 | ) |
| 3.58 | | 3 Month Canadian Bank Bill (1) | | | Received | | | | Quarterly | | | | 5/31/2053 | | | | 201 | | | | 0 | | | | (1 | ) | | | (1 | ) |
| 3.60 | | SOFR | | | Paid | | | | Annual | | | | 9/20/2025 | | | $ | 370,000 | | | | — | | | | (7,055 | ) | | | (7,055 | ) |
| 3.60 | | SOFR | | | Paid | | | | Annual | | | | 5/30/2025 | | | | 195,000 | | | | 1 | | | | (1,324 | ) | | | (1,323 | ) |
| 3.64 | | 3 Month Canadian Bank Bill (1) | | | Received | | | | Quarterly | | | | 6/29/2053 | | | CAD | 205 | | | | 0 | | | | (3 | ) | | | (3 | ) |
| 3.65 | | SOFR | | | Received | | | | Annual | | | | 5/30/2025 | | | $ | 195,000 | | | | 28 | | | | 1,303 | | | | 1,331 | |
| 3.66 | | 3 Month Canadian Bank Bill | | | Received | | | | Quarterly | | | | 5/30/2053 | | | CAD | 199 | | | | 1 | | | | (4 | ) | | | (3 | ) |
| 3.68 | | 3 Month Canadian Bank Bill (1) | | | Paid | | | | Quarterly | | | | 6/1/2033 | | | | 478 | | | | 0 | | | | (4 | ) | | | (4 | ) |
| 3.68 | | 3 Month Canadian Bank Bill (1) | | | Paid | | | | Quarterly | | | | 5/31/2033 | | | | 465 | | | | 0 | | | | (3 | ) | | | (3 | ) |
| 3.75 | | Sterling Overnight Index Average (1) | | | Received | | | | Annual | | | | 6/27/2053 | | | GBP | 6,403 | | | | 0 | | | | 126 | | | | 126 | |
| 3.77 | | 3 Month Canadian Bank Bill (1) | | | Received | | | | Quarterly | | | | 6/13/2053 | | | CAD | 37 | | | | 0 | | | | (1 | ) | | | (1 | ) |
| 3.77 | | 3 Month Canadian Bank Bill (1) | | | Paid | | | | Quarterly | | | | 5/30/2033 | | | | 459 | | | | 0 | | | | (1 | ) | | | (1 | ) |
| 3.85 | | 3 Month Canadian Bank Bill (1) | | | Paid | | | | Quarterly | | | | 6/29/2033 | | | | 472 | | | | 0 | | | | 2 | | | | 2 | |
| 3.92 | | 3 Month Canadian Bank Bill (1) | | | Paid | | | | Quarterly | | | | 6/13/2033 | | | | 86 | | | | 0 | | | | 1 | | | | 1 | |
The accompanying notes are an integral part of these financial statements.
| | |
| Annual Report • June 30, 2023 | | 57 |
Bridge Builder Core Plus Bond Fund
Summary Schedule of Investments
June 30, 2023 (Continued)
(Amounts in thousands, except number of contracts)
Centrally Cleared Interest Rate Swaps (Continued)
| | | | | | | | | | | | | | | | | | | | | | | | | | | | | | |
Fixed Annual
Rate | | Floating Rate Index | | Floating Rate
Paid or
Received | | | Payment
Frequency | | | Maturity
Date | | | Notional
Amount | | | Upfront
Premium
Paid/
(Received) | | | Unrealized
Appreciation/
(Depreciation) | | | Value | |
| 4.28 % | | Sterling Overnight Index Average | | | Paid | | | | Annual | | | | 6/27/2033 | | | GBP | 14,623 | | | $ | 1 | | | $ | (138 | ) | | $ | (137 | ) |
| 4.32 | | 6 Month CZK PRIBOR (1) | | | Paid | | | | Semi-Annual | | | | 9/20/2028 | | | CZK | 44,415 | | | | 0 | | | | 1 | | | | 1 | |
| 4.54 | | 6 Month CZK PRIBOR (1) | | | Paid | | | | Semi-Annual | | | | 9/20/2028 | | | | 37,841 | | | | 0 | | | | 18 | | | | 18 | |
| 4.62 | | 3 Month CZK PRIBOR (1) | | | Received | | | | Quarterly | | | | 6/19/2025 | | | | 190,403 | | | | 0 | | | | (3 | ) | | | (3 | ) |
| 5.16 | | Mexico Interbank TIIE 28 Day | | | Paid | | | | Lunar | | | | 6/6/2025 | | | MXN | 1,700 | | | | — | | | | (8 | ) | | | (8 | ) |
| 5.54 | | Mexico Interbank TIIE 28 Day (1) | | | Paid | | | | Lunar | | | | 5/4/2027 | | | | 3,400 | | | | 0 | | | | (20 | ) | | | (20 | ) |
| 5.64 | | Sterling Overnight Index Average | | | Paid | | | | Annual | | | | 6/24/2025 | | | GBP | 53,000 | | | | (13 | ) | | | (137 | ) | | | (150 | ) |
| 5.70 | | 6 Month PLN WIBOR (1) | | | Received | | | | Semi-Annual | | | | 9/20/2028 | | | PLN | 5,621 | | | | 0 | | | | (49 | ) | �� | | (49 | ) |
| 5.73 | | Sterling Overnight Index Average | | | Paid | | | | Annual | | | | 6/27/2025 | | | GBP | 26,000 | | | | (1 | ) | | | (44 | ) | | | (45 | ) |
| 7.15 | | Mexico Interbank TIIE 28 Day | | | Paid | | | | Lunar | | | | 6/11/2027 | | | MXN | 25,800 | | | | (12 | ) | | | (60 | ) | | | (72 | ) |
| 7.20 | | 3 Month ZAR SAJIBOR (1) | | | Paid | | | | Quarterly | | | | 3/20/2025 | | | ZAR | 79,003 | | | | 0 | | | | (45 | ) | | | (45 | ) |
| 7.36 | | Mexico Interbank TIIE 28 Day (1) | | | Received | | | | Lunar | | | | 8/21/2037 | | | MXN | 900 | | | | 3 | | | | 0 | | | | 3 | |
| 7.37 | | Mexico Interbank TIIE 28 Day | | | Paid | | | | Lunar | | | | 10/11/2027 | | | | 40,300 | | | | (1 | ) | | | (91 | ) | | | (92 | ) |
| 7.38 | | Mexico Interbank TIIE 28 Day (1) | | | Received | | | | Lunar | | | | 8/14/2037 | | | | 1,300 | | | | 4 | | | | 1 | | | | 5 | |
| 7.50 | | Mexico Interbank TIIE 28 Day | | | Received | | | | Lunar | | | | 1/14/2032 | | | | 5,900 | | | | 24 | | | | (11 | ) | | | 13 | |
| 7.50 | | Mexico Interbank TIIE 28 Day | | | Received | | | | Lunar | | | | 1/15/2032 | | | | 24,500 | | | | 89 | | | | (36 | ) | | | 53 | |
| 7.91 | | Mexico Interbank TIIE 28 Day | | | Received | | | | Lunar | | | | 12/30/2027 | | | | 800 | | | | — | | | | 1 | | | | 1 | |
| 7.98 | | Mexico Interbank TIIE 28 Day (1) | | | Received | | | | Lunar | | | | 12/10/2027 | | | | 3,300 | | | | 0 | | | | 3 | | | | 3 | |
| 7.99 | | Mexico Interbank TIIE 28 Day (1) | | | Received | | | | Lunar | | | | 12/21/2027 | | | | 100 | | | | — | | | | 0 | | | | 0 | |
| 8.01 | | Mexico Interbank TIIE 28 Day | | | Received | | | | Lunar | | | | 12/21/2027 | | | | 20,200 | | | | (6 | ) | | | 26 | | | | 20 | |
| 8.03 | | Mexico Interbank TIIE 28 Day (1) | | | Received | | | | Lunar | | | | 1/31/2028 | | | | 1,600 | | | | 0 | | | | 1 | | | | 1 | |
| 8.05 | | Mexico Interbank TIIE 28 Day | | | Received | | | | Lunar | | | | 1/31/2028 | | | | 2,400 | | | | — | | | | 2 | | | | 2 | |
| 8.35 | | Mexico Interbank TIIE 28 Day (1) | | | Paid | | | | Lunar | | | | 4/28/2028 | | | | 19,905 | | | | 0 | | | | (1 | ) | | | (1 | ) |
| 8.41 | | Mexico Interbank TIIE 28 Day | | | Received | | | | Lunar | | | | 3/31/2027 | | | | 14,300 | | | | — | | | | 5 | | | | 5 | |
| 8.42 | | Mexico Interbank TIIE 28 Day (1) | | | Paid | | | | Lunar | | | | 1/20/2028 | | | | 32,803 | | | | 0 | | | | (2 | ) | | | (2 | ) |
| 8.66 | | Mexico Interbank TIIE 28 Day | | | Received | | | | Lunar | | | | 4/4/2024 | | | | 49,700 | | | | — | | | | 55 | | | | 55 | |
| 8.68 | | Mexico Interbank TIIE 28 Day | | | Received | | | | Lunar | | | | 4/3/2024 | | | | 119,300 | | | | — | | | | 132 | | | | 132 | |
| 8.70 | | Mexico Interbank TIIE 28 Day | | | Received | | | | Lunar | | | | 3/31/2032 | | | | 14,300 | | | | — | | | | (31 | ) | | | (31 | ) |
| 8.73 | | Mexico Interbank TIIE 28 Day | | | Received | | | | Lunar | | | | 4/6/2027 | | | | 12,100 | | | | — | | | | (1 | ) | | | (1 | ) |
| 8.73 | | Mexico Interbank TIIE 28 Day | | | Received | | | | Lunar | | | | 3/30/2032 | | | | 6,000 | | | | — | | | | (13 | ) | | | (13 | ) |
| 8.75 | | Mexico Interbank TIIE 28 Day | | | Received | | | | Lunar | | | | 4/5/2024 | | | | 29,000 | | | | — | | | | 31 | | | | 31 | |
| 9.84 | | Mexico Interbank TIIE 28 Day (1) | | | Received | | | | Lunar | | | | 5/16/2025 | | | | 61,793 | | | | 0 | | | | 2 | | | | 2 | |
| | | | | | | | | | | | | | | | | | | | | | | | | | | | | | |
| | | | | | | | | | | | | | | | | | | | $ | (72,586 | ) | | $ | 23,182 | | | $ | (49,404 | ) |
| | | | | | | | | | | | | | | | | | | | | | | | | | | | | | |
Lunar – payment frequency equal periods of 28 days (a lunar month).
| (1) | A zero balance may reflect actual amounts rounding to less than one thousand. |
The accompanying notes are an integral part of these financial statements.
| | |
| 58 | | Annual Report • June 30, 2023 |
Bridge Builder Core Plus Bond Fund
Summary Schedule of Investments
June 30, 2023 (Continued)
(Amounts in thousands, except number of contracts)
Over-the-Counter Interest Rate Swaps
| | | | | | | | | | | | | | | | | | | | | | | | | | | | |
| Counterparty | | Fixed Annual
Rate | | Floating Rate
Index | | Floating Rate
Paid or
Received | | | Maturity
Date | | | Notional
Amount | | | Upfront
Premium
Paid/
(Received) | | | Unrealized
Appreciation/
(Depreciation) | | | Value | |
| Bank of America | | 11.38% | | Brazil Cetip DI
Interbank Deposit | | | Paid | | | | 1/2/2026 | | | BRL | 9,207 | | | $
| —
|
| | $ | 55 | | | $ | 55 | |
| Citibank | | 11.75 | | Brazil Cetip DI
Interbank Deposit | | | Paid | | | | 1/2/2026 | | | | 10,487 | | | | — | | | | 80 | | | | 80 | |
| Citibank | | 11.80 | | Brazil Cetip DI
Interbank Deposit | | | Paid | | | | 1/2/2026 | | | | 10,366 | | | | — | | | | 83 | | | | 83 | |
| Bank of America | | 11.87 | | Brazil Cetip DI
Interbank Deposit | | | Paid | | | | 1/2/2025 | | | | 16,259 | | | | — | | | | 45 | | | | 45 | |
| Bank of America | | 11.90 | | Colombia
Overnight
Interbank | | | Received | | | | 10/19/2024 | | | COP | 7,556,152 | | | | — | | | | (31 | ) | | | (31 | ) |
| Citibank | | 11.92 | | Brazil Cetip DI
Interbank Deposit | | | Paid | | | | 1/2/2026 | | | BRL | 15,279 | | | | — | | | | 131 | | | | 131 | |
| Citibank | | 12.37 | | Colombia
Overnight
Interbank | | | Received | | | | 4/18/2024 | | | COP | 14,570,937 | | | | — | | | | (22 | ) | | | (22 | ) |
| Bank of America | | 12.60 | | Brazil Cetip DI
Interbank Deposit | | | Paid | | | | 7/1/2024 | | | BRL | 13,937 | | | | — | | | | 18 | | | | 18 | |
| Goldman Sachs | | 12.97 | | Brazil Cetip DI
Interbank Deposit | | | Paid | | | | 7/1/2024 | | | | 4,956 | | | | — | | | | 11 | | | | 11 | |
| Citibank | | 12.97 | | Brazil Cetip DI
Interbank Deposit | | | Paid | | | | 7/1/2024 | | | | 8,195 | | | | — | | | | 17 | | | | 17 | |
| | | | | | | | | | | | | | | | | | | | | | | | | | | | |
| | | | | | | | | $ | — | | | $ | 387 | | | $ | 387 | |
| | | | | | | | | | | | | | | | | | | |
Centrally Cleared Inflation Linked Swaps
| | | | | | | | | | | | | | | | | | | | | | | | | | |
Fixed Annual
Rate | | Floating Rate Index | | Floating Rate
Paid or
Received | | | Maturity
Date | | | Notional
Amount | | | Upfront
Premium
Paid/
(Received) | | | Unrealized
Appreciation/
(Depreciation) | | | Value | |
| 2.43% | | 30-Year USD Inflation Linked | | | Received | | | | 6/30/2053 | | | $ | 6,185 | | | $ | 1 | | | $ | 47 | | | $ | 48 | |
| 2.45 | | 30-Year USD Inflation Linked (1) | | | Received | | | | 6/9/2053 | | | | 3,134 | | | | 0 | | | | 9 | | | | 9 | |
| 2.46 | | 30-Year USD Inflation Linked (1) | | | Received | | | | 6/9/2053 | | | | 3,134 | | | | 0 | | | | 2 | | | | 2 | |
| 2.53 | | 10-Year USD Inflation Linked (1) | | | Received | | | | 6/28/2033 | | | | 318 | | | | 0 | | | | 0 | | | | 0 | |
| 2.73 | | 30-Year EUR Inflation Linked (1) | | | Paid | | | | 6/15/2053 | | | EUR | 4,185 | | | | 0 | | | | 41 | | | | 41 | |
| 2.77 | | 30-Year EUR Inflation Linked (1) | | | Paid | | | | 6/15/2053 | | | | 2,249 | | | | 0 | | | | 53 | | | | 53 | |
| 2.77 | | 30-Year EUR Inflation Linked (1) | | | Paid | | | | 6/15/2053 | | | | 2,249 | | | | 0 | | | | 58 | | | | 58 | |
| 4.00 | | 10-Year GBP Inflation Linked | | | Paid | | | | 9/15/2031 | | | GBP | 7,300 | | | | (6 | ) | | | (1,373 | ) | | | (1,379 | ) |
| 4.06 | | 10-Year GBP Inflation Linked | | | Paid | | | | 9/15/2031 | | | | 6,800 | | | | 28 | | | | (1,265 | ) | | | (1,237 | ) |
| 4.07 | | 10-Year GBP Inflation Linked | | | Paid | | | | 9/15/2031 | | | | 13,100 | | | | (162 | ) | | | (2,202 | ) | | | (2,364 | ) |
| | | | | | | | | | | | | | | | | | | | | | | | | | |
| | | | | | | | | | | | | | | | $ | (139 | ) | | $ | (4,630 | ) | | $ | (4,769 | ) |
| | | | | | | | | | | | | | | | | | | | | | | | | | |
| (1) | A zero balance may reflect actual amounts rounding to less than one thousand. |
| | |
| EURIBOR | | Euro Interbank Offered Rate |
| |
| LIBOR | | London Interbank Offered Rate |
| |
| PRIBOR | | Prague Interbank Offered Rate |
| |
| SAJIBOR | | South African Johannesburg Interbank Offered Rate |
| | |
| SOFR | | Secured Overnight Financing Rate |
| |
| TIIE | | Interbank Equilibrium Interest Rate |
| |
| TONA | | Tokyo Overnight Average Rate |
| |
| WIBOR | | Warsaw Interbank Offered Rate |
The accompanying notes are an integral part of these financial statements.
| | |
| Annual Report • June 30, 2023 | | 59 |
Bridge Builder Municipal Bond Fund
Summary Schedule of Investments
June 30, 2023
(Amounts in thousands, except number of contracts)
| | | | | | | | |
| | | Principal
Amount
(000s) | | | Value
(000s) | |
MUNICIPAL BONDS – 96.90% | | | | | | | | |
| Education – 7.37% | | | | | | | | |
Connecticut State Health & Educational Facilities Authority, 1.10%, Jul. 2033 (1) | | $ | 22,000 | | | $ | 21,110 | |
New Jersey Economic Development Authority, 5.25%, Sep. 2026 (2) | | | 30,000 | | | | 31,703 | |
Tennessee State School Bond Authority, 5.00%, Nov. 2040 | | | 25,000 | | | | 26,052 | |
University of California, 5.00%, May 2039 | | | 20,000 | | | | 23,139 | |
Illinois Finance Authority, 4.00%-5.00%, Aug. 2025-Aug. 2049 (2)(3) | | | 27,480 | | | | 27,276 | |
Other Securities (1)(2) | | | 705,785 | | | | 733,697 | |
| | | | | | | | |
Total Education | | | | 862,977 | |
| | | | | |
| General Obligation – 22.78% | | | | | | | | |
City of New York NY, 5.25%, Sep. 2040 | | | 19,695 | | | | 22,462 | |
Commonwealth of Pennsylvania, 4.00%, Apr. 2033 | | | 20,000 | | | | 20,011 | |
Las Vegas Valley Water District, 5.00%, Jun. 2039 | | | 43,915 | | | | 47,440 | |
Northside Independent School District, 0.70%, Jun. 2050 (1) | | | 24,595 | | | | 23,225 | |
State of California, 5.00%, Oct. 2041 | | | 19,860 | | | | 22,199 | |
State of California, 5.00%, Sep. 2042 | | | 26,500 | | | | 29,994 | |
State of California, 5.00%, Oct. 2042 | | | 18,740 | | | | 20,404 | |
State of Illinois, 5.00%, Mar. 2035 | | | 26,675 | | | | 29,388 | |
State of Washington, 5.00%, Aug. 2039 | | | 28,350 | | | | 30,473 | |
City of New York NY, 3.00%-5.25%, Aug. 2025-Mar. 2050 | | | 92,490 | | | | 98,653 | |
Illinois Finance Authority, 3.00%-5.00%, Jul. 2028-Jul. 2035 (3) | | | 3,000 | | | | 2,785 | |
Michigan Finance Authority, 5.00%, Nov. 2025-Nov. 2027 (3) | | | 1,400 | | | | 1,490 | |
State of California, 4.00%-5.00%, Aug. 2023-Oct. 2039 | | | 137,750 | | | | 151,457 | |
State of Illinois, 4.00%-5.50%, Sep. 2023-May 2043 | | | 161,525 | | | | 171,693 | |
Other Securities (1)(2) | | | 1,917,224 | | | | 1,995,372 | |
| | | | | | | | |
Total General Obligation | | | | 2,667,046 | |
| | | | | |
| General Revenue – 25.93% | | | | | | | | |
Black Belt Energy Gas District, 4.00%, Oct. 2052 (1) | | | 20,065 | | | | 19,885 | |
Black Belt Energy Gas District, 4.36% (SIFMA Municipal Swap Index Yield + 0.35%), Oct. 2052 (4) | | | 24,660 | | | | 23,978 | |
California Infrastructure & Economic Development Bank, 3.65%, Jan. 2050 (2) | | | 54,350 | | | | 54,119 | |
Central Plains Energy Project, 4.00%, Dec. 2049 (1) | | | 32,905 | | | | 32,914 | |
Kentucky Public Energy Authority, 4.00%, Feb. 2050 (1) | | | 27,000 | | | | 26,694 | |
Louisiana Local Government Environmental Facilities & Community Development Auth, 5.00%, Aug. 2037 | | | 20,000 | | | | 20,740 | |
Main Street Natural Gas, Inc., 4.00%, Aug. 2049 (1) | | | 36,670 | | | | 36,776 | |
Main Street Natural Gas, Inc., 4.00%, May 2052 (1) | | | 23,800 | | | | 23,441 | |
Main Street Natural Gas, Inc., 5.00%, Sep. 2053 | | | 30,420 | | | | 31,938 | |
New Jersey Economic Development Authority, 5.00%, Mar. 2025 | | | 23,185 | | | | 23,761 | |
New York City Transitional Finance Authority Future Tax Secured Revenue, 4.00%, May 2038 | | | 26,755 | | | | 27,255 | |
New York City Transitional Finance Authority Future Tax Secured Revenue, 5.00%, Nov. 2040 | | | 19,305 | | | | 21,750 | |
New York State Dormitory Authority, 4.00%, Mar. 2042 | | | 20,445 | | | | 20,292 | |
Parish of St James LA, 4.40%, Nov. 2040 (1) | | | 30,000 | | | | 30,000 | |
Parish of St James LA, 4.41%, Nov. 2040 (1) | | | 61,725 | | | | 61,725 | |
Patriots Energy Group Financing Agency, 4.00%, Oct. 2048 (1) | | | 34,495 | | | | 34,500 | |
Port of Port Arthur Navigation District, 4.30%, Apr. 2040 (1) | | | 58,475 | | | | 58,475 | |
Puerto Rico Sales Tax Financing Corp. Sales Tax Revenue, 4.33%, Jul. 2040 | | | 28,882 | | | | 27,468 | |
Texas Municipal Gas Acquisition & Supply Corp. II, 4.35% (LIBOR + 0.69%), Sep. 2027 (4) | | | 31,555 | | | | 31,393 | |
Virginia College Building Authority, 5.00%, Feb. 2039 | | | 18,215 | | | | 20,472 | |
Black Belt Energy Gas District, 4.00%-5.50%, Jun. 2027-Dec. 2053 (1) | | | 72,805 | | | | 74,451 | |
Illinois Finance Authority, 5.00%, Mar. 2028 (3) | | | 15 | | | | 16 | |
Main Street Natural Gas, Inc., 4.00%-5.00%, May 2027-Jul. 2053 (1)(4) | | | 85,855 | | | | 86,482 | |
Michigan Finance Authority, 5.00%, Jun. 2027-Jun. 2049 (3) | | | 13,645 | | | | 14,470 | |
New Jersey Transportation Trust Fund Authority, 0.00%-5.50%, Dec. 2023-Jun. 2050 | | | 133,925 | | | | 137,093 | |
New York City Transitional Finance Authority Future Tax Secured Revenue, 3.00%-5.50%, Nov. 2023-Nov. 2045 (1) | | | 126,645 | | | | 133,706 | |
Other Securities (1)(2)(4) | | | 1,926,244 | | | | 1,961,853 | |
| | | | | | | | |
Total General Revenue | | | | 3,035,647 | |
| | | | | |
The accompanying notes are an integral part of these financial statements.
| | |
| 60 | | Annual Report • June 30, 2023 |
Bridge Builder Municipal Bond Fund
Summary Schedule of Investments
June 30, 2023 (Continued)
(Amounts in thousands, except number of contracts)
| | | | | | | | |
| | | Principal
Amount
(000s) | | | Value
(000s) | |
| Healthcare – 9.54% | | | | | | | | |
County of Utah UT, 5.00%, May 2045 | | $ | 27,500 | | | $ | 27,695 | |
Michigan Finance Authority, 4.00%, Dec. 2036 (3) | | | 28,845 | | | | 29,060 | |
Oregon State Facilities Authority, 5.00%, Jun. 2046 | | | 21,475 | | | | 21,840 | |
Illinois Finance Authority, 3.57%-5.25%, Nov. 2023-Aug. 2057 (1)(3) | | | 124,700 | | | | 128,842 | |
Michigan Finance Authority, 1.20%-5.00%, Dec. 2026-Nov. 2049 (3) | | | 61,445 | | | | 61,879 | |
Other Securities (1)(2)(4) | | | 830,215 | | | | 847,422 | |
| | | | | | | | |
Total Healthcare | | | | 1,116,738 | |
| | | | | |
| Housing – 5.30% | | | | | | | | |
New York City Housing Development Corp., 0.70%, Nov. 2060 (1) | | | 27,525 | | | | 25,632 | |
New York City Housing Development Corp., 0.90%, Nov. 2060 (1) | | | 24,505 | | | | 22,450 | |
Other Securities (1)(2)(4) | | | 586,612 | | | | 572,731 | |
| | | | | | | | |
Total Housing | | | | 620,813 | |
| | | | | |
| Transportation – 15.31% | | | | | | | | |
County of Miami-Dade FL Aviation Revenue, 5.00%, Oct. 2033 | | | 23,355 | | | | 23,567 | |
Illinois State Toll Highway Authority, 5.00%, Jan. 2038 | | | 33,715 | | | | 34,075 | |
New York Transportation Development Corp., 5.00%, Jul. 2046 | | | 41,870 | | | | 41,369 | |
State of Michigan Trunk Line Revenue, 4.00%, Nov. 2046 | | | 24,000 | | | | 23,503 | |
Michigan Finance Authority, 5.00%, Nov. 2024-Nov. 2025 (3) | | | 1,750 | | | | 1,813 | |
Other Securities (1)(4) | | | 1,591,605 | | | | 1,668,471 | |
| | | | | | | | |
Total Transportation | | | | 1,792,798 | |
| | | | | |
| Utilities – 10.67% | | | | | | | | |
City of Atlanta GA Water & Wastewater Revenue, 5.00%, Nov. 2040 | | | 24,425 | | | | 25,011 | |
City of San Antonio TX Electric & Gas Systems Revenue, 1.13%, Dec. 2045 (1) | | | 22,440 | | | | 19,827 | |
City of San Antonio TX Electric & Gas Systems Revenue, 5.00%, Feb. 2039 | | | 21,950 | | | | 22,251 | |
City of San Antonio TX Electric & Gas Systems Revenue, 5.25%, Feb. 2041 | | | 20,000 | | | | 22,832 | |
County of King WA Sewer Revenue, 5.00%, Jan. 2047 | | | 20,000 | | | | 20,204 | |
Development Authority of Monroe County, 3.96%, Nov. 2048 (1) | | | 38,000 | | | | 38,000 | |
Illinois Finance Authority, 5.25%, Jul. 2035 (3) | | | 20,085 | | | | 22,593 | |
Illinois Municipal Electric Agency, 4.00%, Feb. 2035 | | | 24,645 | | | | 24,745 | |
Illinois Finance Authority, 5.00%, Jan. 2029-Jul. 2035 (3) | | | 15,230 | | | | 16,775 | |
Michigan Finance Authority, 5.00%, Oct. 2024-Jul. 2035 (3) | | | 8,350 | | | | 8,697 | |
Other Securities (1)(2)(4) | | | 989,255 | | | | 1,027,770 | |
| | | | | | | | |
Total Utilities | | | | 1,248,705 | |
| | | | | |
Total Municipal Bonds
(Cost: $11,643,358) | | | | | | | 11,344,724 | |
| | | | | |
| | |
| | | Shares
(000s) | | | Value
(000s) | |
SHORT-TERM INVESTMENTS – 2.26% | | | | | | | | |
| Money Market Funds – 2.26% | | | | | | | | |
Fidelity Institutional Money Market Government Fund – Class I, 5.03% (5) | | | 264,215 | | | | 264,215 | |
| | | | | | | | |
Total Money Market Funds | | | | | | | 264,215 | |
| | | | | | | | |
The accompanying notes are an integral part of these financial statements.
| | |
| Annual Report • June 30, 2023 | | 61 |
Bridge Builder Municipal Bond Fund
Summary Schedule of Investments
June 30, 2023 (Continued)
(Amounts in thousands, except number of contracts)
| | | | | | | | |
| | | Principal
Amount
(000s) | | | Value
(000s) | |
| Time Deposits – 0.00% (6) | | | | | | | | |
Citibank, New York, 4.57% due 07/03/2023 | | $ | 427 | | | $ | 427 | |
| | | | | | | | |
Total Time Deposits | | | | | | | 427 | |
| | | | | | | | |
Total Short-Term Investments
(Cost: $264,642) | | | | | | | 264,642 | |
| | | | | | | | |
TOTAL INVESTMENTS IN SECURITIES – 99.16%
(Cost: $11,908,000) | | | | | | | 11,609,366 | |
OTHER ASSETS IN EXCESS OF LIABILITIES – 0.84% | | | | | | | 98,224 | |
| | | | | | | | |
TOTAL NET ASSETS – 100.00% | | | | | | $ | 11,707,590 | |
| | | | | | | | |
Percentages are stated as a percent of net assets.
| (1) | Adjustable rate security or includes adjustable rate securities. The rate reported is the rate in effect as of June 30, 2023. |
| (2) | Security or includes securities purchased exempt from registration in the U.S. pursuant to Rule 144(A) under the Securities Act of 1933. The value of these securities totals $270,481, which represents 2.31% of total net assets. |
| (3) | Issuer includes securities in multiple categories. The market value of the issuer as a whole is greater than 1% of the Fund’s total net assets. |
| (4) | Variable rate security or includes variable rate securities based on a reference index and spread. The rate reported is the rate in effect as of June 30, 2023. |
| (5) | Represents annualized seven-day yield as of the close of the reporting period. |
| (6) | Amount calculated is less than 0.005%. |
Open Futures Contracts
| | | | | | | | | | | | | | | | | | |
Number of Contracts
Sold | | Reference Entity | | Expiration
Date | | | Notional
Amount | | | Value | | | Unrealized
Appreciation/
(Depreciation) | |
| (200) | | U.S. 5 Year Note Future | | | Sep. 2023 | | | $ | (21,741 | ) | | $ | (21,419 | ) | | $ | 322 | |
| (700) | | U.S. 10 Year Note Future | | | Sep. 2023 | | | | (79,618 | ) | | | (78,586 | ) | | | 1,032 | |
| (900) | | U.S. Ultra 10 Year Note Future | | | Sep. 2023 | | | | (107,361 | ) | | | (106,594 | ) | | | 767 | |
| | | | | | | | | | | | | | | | | | |
| | | | | | | | | | | | | | | | $ | 2,121 | |
| | | | | | | | | | | | | | | | | | |
The accompanying notes are an integral part of these financial statements.
| | |
| 62 | | Annual Report • June 30, 2023 |
Bridge Builder Municipal Bond Fund
Summary Schedule of Investments
June 30, 2023 (Continued)
(Amounts in thousands, except number of contracts)
| | | | |
State/U.S. Territory | | Percentages of
Net Assets | |
Alabama | | | 2.59 | % |
Alaska | | | 0.16 | |
Arizona | | | 1.68 | |
Arkansas | | | 0.23 | |
California | | | 7.08 | |
Colorado | | | 2.04 | |
Connecticut | | | 2.55 | |
Delaware | | | 0.21 | |
District of Columbia | | | 1.55 | |
Florida | | | 5.81 | |
Georgia | | | 3.41 | |
Guam | | | 0.17 | |
Hawaii | | | 0.63 | |
Idaho | | | 0.16 | |
Illinois | | | 8.51 | |
Indiana | | | 1.50 | |
Iowa | | | 0.44 | |
Kansas | | | 0.22 | |
Kentucky | | | 1.45 | |
Louisiana | | | 2.01 | |
Maine | | | 0.08 | |
Maryland | | | 1.96 | |
Massachusetts | | | 1.78 | |
Michigan | | | 3.46 | |
Minnesota | | | 0.49 | |
Mississippi | | | 0.19 | |
Missouri | | | 0.95 | |
Montana | | | 0.10 | |
Nebraska | | | 0.48 | |
Nevada | | | 1.12 | |
New Hampshire | | | 0.35 | |
| | | | |
State/U.S. Territory (Continued) | | Percentages of
Net Assets | |
New Jersey | | | 3.78 | % |
New Mexico | | | 0.31 | |
New York | | | 10.96 | |
North Carolina | | | 0.78 | |
North Dakota | | | 0.13 | |
Ohio | | | 1.82 | |
Oklahoma | | | 0.37 | |
Oregon | | | 0.86 | |
Pennsylvania | | | 3.77 | |
Puerto Rico | | | 1.39 | |
Rhode Island | | | 0.40 | |
South Carolina | | | 0.85 | |
South Dakota | | | 0.12 | |
Tennessee | | | 1.02 | |
Texas | | | 9.77 | |
Utah | | | 0.60 | |
Vermont | | | 0.09 | |
Virgin Islands | | | 0.25 | |
Virginia | | | 1.45 | |
Washington | | | 3.08 | |
West Virginia | | | 0.16 | |
Wisconsin | | | 1.50 | |
Wyoming | | | 0.08 | |
| | | | |
Total Municipal Bonds | | | 96.90 | |
| | | | |
SHORT-TERM INVESTMENTS | | | 2.26 | |
| | | | |
TOTAL INVESTMENTS IN SECURITIES | | | 99.16 | |
OTHER ASSETS IN EXCESS OF LIABILITIES | | | 0.84 | |
| | | | |
TOTAL NET ASSETS | | | 100.00 | % |
| | | | |
The accompanying notes are an integral part of these financial statements.
| | |
| Annual Report • June 30, 2023 | | 63 |
Bridge Builder Municipal High-Income Bond Fund
Summary Schedule of Investments
June 30, 2023
(Amounts in thousands, except number of contracts)
| | | | | | | | |
| | | Principal
Amount
(000s) | | | Value
(000s) | |
MUNICIPAL BONDS – 98.14% | | | | | | | | |
| Education – 7.81% | | | | | | | | |
Clifton Higher Education Finance Corp., 6.13%, Aug. 2048 | | $ | 7,835 | | | $ | 7,889 | |
Private Colleges & Universities Authority, 4.00%, Sep. 2037 | | | 8,350 | | | | 8,707 | |
California Municipal Finance Authority, 5.00%-5.25%, Nov. 2046-Oct. 2057 (1)(2) | | | 5,135 | | | | 5,124 | |
California Statewide Communities Development Authority, 5.00%, Nov. 2032-Nov. 2041 (1)(2) | | | 2,010 | | | | 2,032 | |
Indiana Finance Authority, 5.50%, Jul. 2052 (2) | | | 4,145 | | | | 4,307 | |
New Jersey Economic Development Authority, 5.00%, Jun. 2024-Jun. 2054 (1)(2) | | | 5,250 | | | | 4,964 | |
Public Finance Authority, 4.00%-6.25%, Jun. 2029-Jan. 2056 (1)(2) | | | 14,065 | | | | 12,830 | |
Other Securities (1)(3)(4)(5) | | | 153,225 | | | | 141,259 | |
| | | | | | | | |
Total Education | | | | 187,112 | |
| | | | | |
| General Obligation – 7.32% | | | | | | | | |
Commonwealth of Puerto Rico, 5.38%, Jul. 2025 (2) | | | 15,968 | | | | 16,361 | |
Commonwealth of Puerto Rico, 5.75%, Jul. 2031 (2) | | | 7,451 | | | | 8,138 | |
State of Illinois, 5.00%, Nov. 2025 | | | 8,810 | | | | 9,097 | |
State of Illinois, 5.00%, Nov. 2028 | | | 8,485 | | | | 8,941 | |
Commonwealth of Puerto Rico, 0.00%-5.63%, Jul. 2023-Jul. 2046 (2)(3) | | | 41,556 | | | | 35,100 | |
State of Illinois, 4.00%-5.50%, Apr. 2024-May 2047 | | | 25,535 | | | | 26,308 | |
Other Securities (1) | | | 69,690 | | | | 71,433 | |
| | | | | | | | |
Total General Obligation | | | | 175,378 | |
| | | | | |
| General Revenue – 38.86% | | | | | | | | |
Allentown Neighborhood Improvement Zone Development Authority, 5.00%, May 2042 (1) | | | 7,130 | | | | 7,124 | |
Buckeye Tobacco Settlement Financing Authority, 5.00%, Jun. 2055 | | | 58,650 | | | | 54,927 | |
Gulf Coast Industrial Development Authority, 4.88%, May 2025 | | | 6,945 | | | | 6,926 | |
Louisiana Local Government Environmental Facilities & Community Development Auth, 3.50%, Nov. 2032 | | | 7,705 | | | | 7,420 | |
Mission Economic Development Corp., 4.63%, Oct. 2031 (1) | | | 7,895 | | | | 7,686 | |
New Jersey Economic Development Authority, 5.00%, Oct. 2047 (2) | | | 9,690 | | | | 9,693 | |
New Jersey Transportation Trust Fund Authority, 5.25%, Jun. 2043 (2) | | | 9,330 | | | | 9,822 | |
New York Liberty Development Corp., 5.38%, Nov. 2040 (1) | | | 7,910 | | | | 7,924 | |
New York Transportation Development Corp., 5.00%, Aug. 2031 (2) | | | 11,175 | | | | 11,186 | |
Ohio Air Quality Development Authority, 5.00%, Jul. 2049 (1) | | | 11,470 | | | | 10,535 | |
Pennsylvania Economic Development Financing Authority, 5.75%, Jun. 2048 (2) | | | 8,345 | | | | 9,168 | |
Puerto Rico Sales Tax Financing Corp. Sales Tax Revenue, 0.00%, Jul. 2046 | | | 47,136 | | | | 13,241 | |
Puerto Rico Sales Tax Financing Corp. Sales Tax Revenue, 4.33%, Jul. 2040 | | | 8,089 | | | | 7,693 | |
Puerto Rico Sales Tax Financing Corp. Sales Tax Revenue, 4.75%, Jul. 2053 | | | 10,715 | | | | 10,210 | |
Puerto Rico Sales Tax Financing Corp. Sales Tax Revenue, 4.78%, Jul. 2058 | | | 13,772 | | | | 13,052 | |
Puerto Rico Sales Tax Financing Corp. Sales Tax Revenue, 5.00%, Jul. 2058 | | | 16,430 | | | | 16,016 | |
State of Colorado, 6.00%, Dec. 2041 | | | 6,125 | | | | 7,297 | |
Tobacco Settlement Financing Corp., 5.00%, Jun. 2046 | | | 8,390 | | | | 8,422 | |
Tobacco Settlement Financing Corp., 5.00%, Jun. 2047 | | | 11,005 | | | | 10,290 | |
Tobacco Settlement Financing Corp., 5.25%, Jun. 2046 | | | 8,770 | | | | 9,103 | |
Tuscaloosa County Industrial Development Authority, 5.25%, May 2044 (1) | | | 9,160 | | | | 8,259 | |
Buckeye Tobacco Settlement Financing Authority, 4.00%, Jun. 2048 | | | 300 | | | | 278 | |
California Municipal Finance Authority, 4.00%, Jul. 2029-Sep. 2041 (2) | | | 650 | | | | 593 | |
California Statewide Communities Development Authority, 4.00%-5.00%, Sep. 2028-Sep. 2052 (2) | | | 13,165 | | | | 12,525 | |
Commonwealth of Puerto Rico, 0.00%, Nov. 2051 (2)(3) | | | 12,382 | | | | 6,284 | |
Indiana Finance Authority, 2.50%-7.00%, Dec. 2026-Jan. 2051 (2)(3) | | | 19,260 | | | | 18,962 | |
Maryland Economic Development Corp., 4.00%-5.75%, Sep. 2025-Jun. 2058 (2) | | | 7,940 | | | | 7,730 | |
Metropolitan Pier & Exposition Authority, 0.00%-5.50%, Dec. 2027-Jun. 2057 | | | 46,020 | | | | 37,664 | |
New Jersey Economic Development Authority, 4.00%-5.75%, Jan. 2024-Jan. 2052 (2) | | | 24,145 | | | | 24,285 | |
New Jersey Transportation Trust Fund Authority, 0.00%-5.50%, Dec. 2030-Jun. 2050 (2) | | | 21,450 | | | | 20,630 | |
New York Transportation Development Corp., 2.25%-5.38%, Aug. 2026-Oct. 2045 (2) | | | 16,315 | | | | 16,478 | |
Pennsylvania Economic Development Financing Authority, 3.25%-9.00%, Dec. 2034-Jun. 2061 (1)(2)(3)(5) | | | 17,265 | | | | 17,979 | |
Public Finance Authority, 4.00%-5.00%, Dec. 2025-Feb. 2062 (2)(5) | | | 14,935 | | | | 13,954 | |
Puerto Rico Sales Tax Financing Corp. Sales Tax Revenue, 0.00%-4.55%, Jul. 2027-Jul. 2053 | | | 26,711 | | | | 15,329 | |
Virginia Small Business Financing Authority, 5.00%, Jan. 2048 (1)(2)(3) | | | 500 | | | | 461 | |
Other Securities (1)(3)(4)(5)(6)(7) | | | 591,963 | | | | 492,526 | |
| | | | | | | | |
Total General Revenue | | | | 931,672 | |
| | | | | |
The accompanying notes are an integral part of these financial statements.
| | |
| 64 | | Annual Report • June 30, 2023 |
Bridge Builder Municipal High-Income Bond Fund
Summary Schedule of Investments
June 30, 2023 (Continued)
(Amounts in thousands, except number of contracts)
| | | | | | | | |
| | | Principal
Amount
(000s) | | | Value
(000s) | |
| Healthcare – 17.03% | | | | | | | | |
California Statewide Communities Development Authority, 5.25%, Dec. 2056 (1)(2) | | $ | 7,195 | | | $ | 6,953 | |
California Statewide Communities Development Authority, 5.50%, Dec. 2058 (1)(2) | | | 7,575 | | | | 7,516 | |
County of Cuyahoga OH, 5.50%, Feb. 2057 | | | 7,850 | | | | 7,947 | |
Regents of the University of California Medical Center Pooled Revenue, 5.00%, May 2047 | | | 10,825 | | | | 11,919 | |
California Municipal Finance Authority, 2.75%-5.25%, Nov. 2027-Nov. 2056 (2) | | | 5,660 | | | | 5,449 | |
California Statewide Communities Development Authority, 4.00%-5.50%, Dec. 2027-Dec. 2054 (1)(2) | | | 13,005 | | | | 12,915 | |
Indiana Finance Authority, 5.00%, Mar. 2036 (2) | | | 2,000 | | | | 2,046 | |
New Jersey Economic Development Authority, 0.00%, Jul. 2026 (2) | | | 170 | | | | 155 | |
North Carolina Medical Care Commission, 4.00%-6.25%, Oct. 2025-Sep. 2051 | | | 29,760 | | | | 27,188 | |
Pennsylvania Economic Development Financing Authority, 4.00%, Jul. 2033 (2) | | | 500 | | | | 476 | |
Public Finance Authority, 4.00%-5.25%, Sep. 2030-Jun. 2056 (1)(2) | | | 9,270 | | | | 7,393 | |
Virginia Small Business Financing Authority, 4.00%, Jan. 2045 (2) | | | 250 | | | | 223 | |
Other Securities (1)(3)(4)(6)(7) | | | 358,742 | | | | 318,078 | |
| | | | | | | | |
Total Healthcare | | | | 408,258 | |
| | | | | |
| Housing – 6.00% | | | | | | | | |
California Community Housing Agency, 4.00%, Feb. 2056 (1) | | | 10,435 | | | | 7,442 | |
Massachusetts Development Finance Agency, 5.00%, Oct. 2048 | | | 9,700 | | | | 9,220 | |
California Municipal Finance Authority, 4.00%-5.00%, May 2033-May 2052 (2) | | | 9,120 | | | | 9,200 | |
California Statewide Communities Development Authority, 5.00%, May 2040 (2) | | | 400 | | | | 407 | |
Indiana Finance Authority, 5.00%, Jun. 2053 (2) | | | 1,800 | | | | 1,817 | |
Maryland Economic Development Corp., 5.00%, Jul. 2027-Jul. 2036 (1)(2) | | | 1,710 | | | | 1,724 | |
New Jersey Economic Development Authority, 5.00%, Jan. 2030-Jan. 2048 (2) | | | 4,855 | | | | 4,473 | |
Public Finance Authority, 4.00%-9.00%, Jul. 2042-May 2071 (1)(2) | | | 13,245 | | | | 12,486 | |
Other Securities (1)(3) | | | 111,682 | | | | 97,096 | |
| | | | | | | | |
Total Housing | | | | 143,865 | |
| | | | | |
| Transportation – 15.64% | | | | | | | | |
California Municipal Finance Authority, 5.00%, Dec. 2043 (2) | | | 18,130 | | | | 18,416 | |
County of Miami-Dade FL Aviation Revenue, 5.00%, Oct. 2034 | | | 9,070 | | | | 9,133 | |
Foothill-Eastern Transportation Corridor Agency, 4.00%, Jan. 2046 | | | 8,300 | | | | 8,026 | |
Maryland Economic Development Corp., 5.25%, Jun. 2055 (2) | | | 18,375 | | | | 18,972 | |
Metropolitan Washington Airports Authority Aviation Revenue, 5.00%, Oct. 2043 | | | 8,000 | | | | 8,302 | |
Puerto Rico Highway & Transportation Authority, 0.00%, Jul. 2053 | | | 20,866 | | | | 12,728 | |
Puerto Rico Highway & Transportation Authority, 5.00%, Jul. 2062 | | | 7,125 | | | | 6,929 | |
Texas Private Activity Bond Surface Transportation Corp., 5.00%, Jun. 2058 | | | 9,765 | | | | 9,718 | |
Virginia Small Business Financing Authority, 4.00%, Jan. 2040 (2) | | | 8,715 | | | | 8,131 | |
Virginia Small Business Financing Authority, 4.00%, Jan. 2048 (2) | | | 9,475 | | | | 8,356 | |
Virginia Small Business Financing Authority, 5.00%, Dec. 2052 (2) | | | 10,465 | | | | 10,547 | |
Virginia Small Business Financing Authority, 5.00%, Dec. 2056 (2) | | | 8,315 | | | | 8,366 | |
California Municipal Finance Authority, 4.00%-5.00%, Dec. 2047-Jun. 2048 (2) | | | 1,950 | | | | 1,923 | |
Maryland Economic Development Corp., 5.00%, Jun. 2025-Jun. 2049 (2) | | | 6,465 | | | | 6,669 | |
New Jersey Transportation Trust Fund Authority, 0.00%, Dec. 2028-Dec. 2034 (2) | | | 2,200 | | | | 1,778 | |
New York Transportation Development Corp., 4.00%-5.00%, Dec. 2034-Jul. 2046 (2) | | | 7,460 | | | | 7,679 | |
Public Finance Authority, 4.00%-4.25%, Jul. 2041-Jul. 2054 (2) | | | 5,840 | | | | 4,243 | |
Virginia Small Business Financing Authority, 4.00%-5.00%, Jul. 2035-Dec. 2057 (2) | | | 22,655 | | | | 22,383 | |
Other Securities (4)(5) | | | 240,017 | | | | 202,757 | |
| | | | | | | | |
Total Transportation | | | | 375,056 | |
| | | | | |
| Utilities – 5.48% | | | | | | | | |
Puerto Rico Commonwealth Aqueduct & Sewer Authority, 4.00%, Jul. 2042 (1) | | | 13,160 | | | | 11,486 | |
Puerto Rico Commonwealth Aqueduct & Sewer Authority, 5.00%, Jul. 2030 (1) | | | 16,360 | | | | 16,815 | |
Puerto Rico Commonwealth Aqueduct & Sewer Authority, 5.00%, Jul. 2035 (1) | | | 9,315 | | | | 9,424 | |
Puerto Rico Commonwealth Aqueduct & Sewer Authority, 5.00%, Jul. 2037 (1) | | | 7,940 | | | | 7,976 | |
Puerto Rico Commonwealth Aqueduct & Sewer Authority, 5.00%, Jul. 2047 (1) | | | 7,660 | | | | 7,421 | |
New Jersey Economic Development Authority, 4.00%-5.00%, Aug. 2059 (2) | | | 1,490 | | | | 1,481 | |
Puerto Rico Commonwealth Aqueduct & Sewer Authority, 4.00%-6.13%, Jul. 2024-Jul. 2047 (1) | | | 14,020 | | | | 14,084 | |
The accompanying notes are an integral part of these financial statements.
| | |
| Annual Report • June 30, 2023 | | 65 |
Bridge Builder Municipal High-Income Bond Fund
Summary Schedule of Investments
June 30, 2023 (Continued)
(Amounts in thousands, except number of contracts)
| | | | | | | | |
| | | Principal
Amount
(000s) | | | Value
(000s) | |
| Utilities – 5.48% – (continued) | | | | | | | | |
Other Securities (1)(3)(6)(7) | | $ | 77,730 | | | $ | 62,793 | |
| | | | | | | | |
Total Utilities | | | | 131,480 | |
| | | | | |
Total Municipal Bonds
(Cost: $2,368,643) | | | | | | | 2,352,821 | |
| | | | | |
| | |
| | | Shares
(000s) | | | Value
(000s) | |
COMMON STOCKS – 0.00% (8) | | | | | | | | |
| Basic Materials – 0.00% (8) | | | | | | | | |
Ingevity Corp. (7)(9) | | | 0 | | | | 4 | |
| | | | | | | | |
Total Basic Materials | | | | | | | 4 | |
| | | | | | | | |
| Consumer, Cyclical – 0.00% (8) | | | | | | | | |
United Airlines Holdings, Inc. (7)(9) | | | 0 | | | | 1 | |
| | | | | | | | |
Total Consumer, Cyclical | | | | | | | 1 | |
| | | | | | | | |
| Industrials – 0.00% (8) | | | | | | | | |
Westrock Co. (9) | | | 0 | | | | 13 | |
| | | | | | | | |
Total Industrials | | | | | | | 13 | |
| | | | | | | | |
Total Common Stocks
(Cost: $19) | | | | | | | 18 | |
| | | | | |
SHORT-TERM INVESTMENTS – 0.73% | | | | | | | | |
| Money Market Funds – 0.72% | | | | | | | | |
Fidelity Institutional Money Market Government Fund – Class I, 5.03% (10) | | | 17,440 | | | | 17,440 | |
| | | | | | | | |
Total Money Market Funds | | | | | | | 17,440 | |
| | | | | | | | |
| | |
| | | Principal
Amount
(000s) | | | Value
(000s) | |
| Time Deposits – 0.01% | | | | | | | | |
JP Morgan, New York, 4.57% due 07/03/2023 | | $ | 168 | | | | 168 | |
| | | | | | | | |
Total Time Deposits | | | | | | | 168 | |
| | | | | | | | |
Total Short-Term Investments
(Cost: $17,608) | | | | | | | 17,608 | |
| | | | | | | | |
TOTAL INVESTMENTS IN SECURITIES – 98.87%
(Cost: $2,386,270) | | | | | | | 2,370,447 | |
OTHER ASSETS IN EXCESS OF LIABILITIES – 1.13% | | | | | | | 27,081 | |
| | | | | | | | |
TOTAL NET ASSETS – 100.00% | | | | | | $ | 2,397,528 | |
| | | | | | | | |
Percentages are stated as a percent of net assets.
| (1) | | Security or includes securities purchased exempt from registration in the U.S. pursuant to Rule 144(A) under the Securities Act of 1933. The value of these securities totals $419,426, which represents 17.49% of total net assets. |
| (2) | | Issuer includes securities in multiple categories. The market value of the issuer as a whole is greater than 1% of the Fund’s total net assets. |
| (3) | | Adjustable rate security or includes adjustable rate securities. The rate reported is the rate in effect as of June 30, 2023. |
| (4) | | Variable rate security or includes variable rate securities based on a reference index and spread. The rate reported is the rate in effect as of June 30, 2023. |
| (5) | | Includes securities restricted at June 30, 2023. The value of the restricted securities totals $9,568, which represents 0.40% of total net assets. |
The accompanying notes are an integral part of these financial statements.
| | |
| 66 | | Annual Report • June 30, 2023 |
Bridge Builder Municipal High-Income Bond Fund
Summary Schedule of Investments
June 30, 2023 (Continued)
(Amounts in thousands, except number of contracts)
| (6) | | Security in default or includes securities in default as of June 30, 2023. The value of these securities totals $19,546, which represents 0.82% of total net assets. |
| (7) | | Non-income producing security or includes securities that are non-income producing. |
| (8) | | Amount calculated is less than 0.005%. |
| (9) | | A zero balance may reflect actual amounts rounding to less than one thousand. |
| (10) | | Represents annualized seven-day yield as of the close of the reporting period. |
| | | | |
State/U.S. Territory | | Percentages of
Net Assets | |
Alabama | | | 1.97 | % |
Alaska | | | 0.12 | |
Arizona | | | 1.93 | |
Arkansas | | | 0.51 | |
California | | | 9.18 | |
Colorado | | | 3.98 | |
Connecticut | | | 0.81 | |
Delaware | | | 0.96 | |
District of Columbia | | | 1.21 | |
Florida | | | 4.75 | |
Georgia | | | 3.12 | |
Guam | | | 0.70 | |
Idaho | | | 0.28 | |
Illinois | | | 6.21 | |
Indiana | | | 1.36 | |
Iowa | | | 0.16 | |
Kansas | | | 0.32 | |
Kentucky | | | 1.21 | |
Louisiana | | | 1.09 | |
Maine | | | 0.05 | |
Maryland | | | 3.33 | |
Massachusetts | | | 0.76 | |
Michigan | | | 1.55 | |
Minnesota | | | 0.36 | |
Missouri | | | 1.22 | |
Montana | | | 0.08 | |
Nebraska | | | 0.37 | |
Nevada | | | 0.64 | |
New Hampshire | | | 0.52 | |
New Jersey | | | 4.65 | |
| | | | |
State/U.S. Territory (Continued) | | Percentages of
Net Assets | |
New Mexico | | | 0.10 | % |
New York | | | 5.26 | |
North Carolina | | | 1.97 | |
North Dakota | | | 0.00 | |
Ohio | | | 4.75 | |
Oklahoma | | | 0.57 | |
Oregon | | | 0.73 | |
Other Territory | | | 0.03 | |
Pennsylvania | | | 4.83 | |
Puerto Rico | | | 10.01 | |
Rhode Island | | | 0.04 | |
South Carolina | | | 1.08 | |
South Dakota | | | 0.19 | |
Tennessee | | | 1.02 | |
Texas | | | 5.65 | |
Utah | | | 0.81 | |
Vermont | | | 0.04 | |
Virgin Islands | | | 0.18 | |
Virginia | | | 4.35 | |
Washington | | | 0.57 | |
West Virginia | | | 0.32 | |
Wisconsin | | | 2.24 | |
| | | | |
Total Municipal Bonds | | | 98.14 | |
| | | | |
COMMON STOCKS | | | 0.00 | |
| | | | |
SHORT-TERM INVESTMENTS | | | 0.73 | |
| | | | |
TOTAL INVESTMENTS IN SECURITIES | | | 98.87 | |
OTHER ASSETS IN EXCESS OF LIABILITIES | | | 1.13 | |
| | | | |
TOTAL NET ASSETS | | | 100.00 | % |
| | | | |
The accompanying notes are an integral part of these financial statements.
| | |
| Annual Report • June 30, 2023 | | 67 |
Bridge Builder Large Cap Growth Fund
Summary Schedule of Investments
June 30, 2023
(Amounts in thousands, except number of contracts)
| | | | | | | | |
| | | Shares
(000s) | | | Value
(000s) | |
COMMON STOCKS – 97.98% | | | | | | | | |
| Communication Services – 8.12% | | | | | | | | |
Alphabet, Inc. – Class A (1) | | | 5,705 | | | $ | 682,934 | |
Alphabet, Inc. – Class C (1) | | | 3,687 | | | | 446,032 | |
Meta Platforms, Inc. – Class A (1) | | | 1,048 | | | | 300,633 | |
Netflix, Inc. (1) | | | 670 | | | | 295,224 | |
Other Securities (1) | | | 1,601 | | | | 132,220 | |
| | | | | | | | |
Total Communication Services | | | | 1,857,043 | |
| | | | | | | | |
| Consumer Discretionary – 14.77% | |
Amazon.com, Inc. (1) | | | 9,826 | | | | 1,280,895 | |
Home Depot, Inc. | | | 648 | | | | 201,349 | |
McDonald’s Corp. | | | 664 | | | | 198,157 | |
Starbucks Corp. | | | 2,540 | | | | 251,586 | |
Tesla, Inc. (1) | | | 1,205 | | | | 315,470 | |
Yum! Brands, Inc. | | | 1,998 | | | | 276,867 | |
Other Securities (1) | | | 4,824 | | | | 851,988 | |
| | | | | | | | |
Total Consumer Discretionary | | | | 3,376,312 | |
| | | | | | | | |
| Consumer Staples – 4.56% | |
Coca-Cola Co. | | | 2,740 | | | | 165,030 | |
Dollar General Corp. | | | 1,251 | | | | 212,361 | |
Procter & Gamble Co. | | | 1,131 | | | | 171,634 | |
Other Securities (1) | | | 3,543 | | | | 492,333 | |
| | | | | | | | |
Total Consumer Staples | | | | 1,041,358 | |
| | | | | | | | |
| Energy – 1.80% | |
Chevron Corp. | | | 1,136 | | | | 178,774 | |
ConocoPhillips | | | 1,623 | | | | 168,201 | |
Other Securities | | | 412 | | | | 65,636 | |
| | | | | | | | |
Total Energy | | | | 412,611 | |
| | | | | | | | |
| Financials – 16.03% | |
American Express Co. | | | 2,281 | | | | 397,435 | |
Aon Plc – Class A | | | 955 | | | | 329,510 | |
Bank of America Corp. | | | 7,377 | | | | 211,640 | |
FleetCor Technologies, Inc. (1) | | | 895 | | | | 224,757 | |
Goldman Sachs Group, Inc. | | | 515 | | | | 166,266 | |
Intercontinental Exchange, Inc. | | | 2,014 | | | | 227,689 | |
Marsh & McLennan Companies, Inc. | | | 916 | | | | 172,360 | |
Mastercard, Inc. – Class A | | | 387 | | | | 152,255 | |
MSCI, Inc. – Class A | | | 529 | | | | 248,294 | |
S&P Global, Inc. | | | 855 | | | | 342,590 | |
Visa, Inc. – Class A | | | 3,601 | | | | 855,100 | |
Other Securities (1)(2) | | | 5,289 | | | | 336,126 | |
| | | | | | | | |
Total Financials | | | | 3,664,022 | |
| | | | | | | | |
| Healthcare – 15.37% | |
Danaher Corp. | | | 1,798 | | | | 431,570 | |
Eli Lilly & Co. | | | 421 | | | | 197,529 | |
Intuitive Surgical, Inc. (1) | | | 790 | | | | 269,986 | |
IQVIA Holdings, Inc. (1) | | | 1,518 | | | | 341,142 | |
Johnson & Johnson | | | 1,873 | | | | 310,016 | |
Regeneron Pharmaceuticals, Inc. (1) | | | 269 | | | | 193,253 | |
Thermo Fisher Scientific, Inc. | | | 850 | | | | 443,586 | |
UnitedHealth Group, Inc. | | | 1,298 | | | | 623,809 | |
Other Securities (1) | | | 6,417 | | | | 702,332 | |
| | | | | | | | |
Total Healthcare | | | | 3,513,223 | |
| | | | | | | | |
| | | | | | | | |
| | | Shares
(000s) | | | Value
(000s) | |
| Industrials – 3.79% | |
Honeywell International, Inc. | | | 1,058 | | | $ | 219,454 | |
Other Securities (1) | | | 5,419 | | | | 647,749 | |
| | | | | | | | |
Total Industrials | | | | 867,203 | |
| | | | | | | | |
| Information Technology – 27.78% | |
Adobe, Inc. (1) | | | 805 | | | | 393,827 | |
Advanced Micro Devices, Inc. (1) | | | 1,333 | | | | 151,867 | |
Apple, Inc. | | | 3,659 | | | | 709,730 | |
Autodesk, Inc. (1) | | | 1,112 | | | | 227,546 | |
Intuit, Inc. | | | 567 | | | | 260,002 | |
Microsoft Corp. | | | 5,289 | | | | 1,801,225 | |
NVIDIA Corp. | | | 1,485 | | | | 628,385 | |
Salesforce, Inc. (1) | | | 2,097 | | | | 443,062 | |
ServiceNow, Inc. (1) | | | 452 | | | | 254,186 | |
Workday, Inc. – Class A (1) | | | 1,426 | | | | 322,057 | |
Other Securities (1) | | | 9,270 | | | | 1,156,404 | |
| | | | | | | | |
Total Information Technology | | | | 6,348,291 | |
| | | | | | | | |
| Materials – 3.46% | |
Ball Corp. | | | 3,230 | | | | 188,025 | |
Ecolab, Inc. | | | 1,577 | | | | 294,372 | |
Sherwin-Williams Co. | | | 858 | | | | 227,840 | |
Other Securities (1) | | | 521 | | | | 81,367 | |
| | | | | | | | |
Total Materials | | | | 791,604 | |
| | | | | | | | |
| Real Estate – 2.29% | |
Equinix, Inc. | | | 367 | | | | 287,571 | |
Prologis, Inc. | | | 1,391 | | | | 170,640 | |
Other Securities (1) | | | 374 | | | | 66,272 | |
| | | | | | | | |
Total Real Estate | | | | 524,483 | |
| | | | | | | | |
| Utilities – 0.01% | |
Various Securities | | | 57 | | | | 1,235 | |
| | | | | | | | |
Total Utilities | | | | 1,235 | |
| | | | | | | | |
Total Common Stocks
(Cost: $15,652,642) | | | | 22,397,385 | |
| | | | | | | | |
PREFERRED STOCKS – 0.17% | |
| Consumer Discretionary – 0.17% | |
Dr Ing hc F Porsche AG (2) | | | 316 | | | | 39,215 | |
| | | | | | | | |
Total Consumer Discretionary | | | | 39,215 | |
| | | | | | | | |
Total Preferred Stocks
(Cost: $30,605) | | | | 39,215 | |
| | | | | | | | |
SHORT-TERM INVESTMENTS – 1.74% | |
| Money Market Funds – 1.74% | |
Goldman Sachs Financial Square Government Fund – Class I, 5.02% (3) | | | 397,664 | | | | 397,664 | |
| | | | | | | | |
Total Money Market Funds | | | | 397,664 | |
| | | | | | | | |
The accompanying notes are an integral part of these financial statements.
| | |
| 68 | | Annual Report • June 30, 2023 |
Bridge Builder Large Cap Growth Fund
Summary Schedule of Investments
June 30, 2023 (Continued)
(Amounts in thousands, except number of contracts)
| | | | | | | | |
| | | Principal
Amount
(000s) | | | Value
(000s) | |
| Time Deposits – 0.00% (4) | |
Citibank, London, 2.62% due 07/03/2023 (5) | | EUR | 0 | | | $ | 0 | |
JP Morgan, New York, 4.57% due 07/03/2023 | | $ | 15 | | | | 15 | |
Sumitomo Trust Bank, London, 4.57% due 07/03/2023 | | | 533 | | | | 533 | |
| | | | | | | | |
Total Time Deposits | | | | 548 | |
| | | | | | | | |
Total Short-Term Investments
(Cost: $398,212) | | | | 398,212 | |
| | | | | | | | |
TOTAL INVESTMENTS IN SECURITIES – 99.89%
(Cost: $16,081,459) | | | | 22,834,812 | |
| OTHER ASSETS IN EXCESS OF LIABILITIES – 0.11% | | | | 25,307 | |
| | | | | | | | |
| TOTAL NET ASSETS – 100.00% | | | $ | 22,860,119 | |
| | | | | | | | |
Percentages are stated as a percent of net assets.
Principal amounts are denominated in the currency in which the security was purchased.
EUR Euro
| (1) | Non-income producing security or includes securities that are non-income producing. |
| (2) | Security or includes securities purchased exempt from registration in the U.S. pursuant to Rule 144(A) under the Securities Act of 1933. The value of these securities totals $93,430, which represents 0.41% of total net assets. |
| (3) | Represents annualized seven-day yield as of the close of the reporting period. |
| (4) | Amount calculated is less than 0.005%. |
| (5) | A zero balance may reflect actual amounts rounding to less than one thousand. |
Open Futures Contracts
| | | | | | | | | | | | | | | | | | |
Number of Contracts
Purchased | | Reference Entity | | Expiration
Date | | | Notional
Amount | | | Value | | | Unrealized
Appreciation/
(Depreciation) | |
| 11 | | NASDAQ 100 E-mini Future | | | Sep. 2023 | | | $ | 3,307 | | | $ | 3,374 | | | $ | 67 | |
| 7 | | S&P 500 E-mini Future | | | Sep. 2023 | | | | 1,536 | | | | 1,571 | | | | 35 | |
| | | | | | | | | | | | | | | | | | |
| | | | | | | | | | | | | | | | $ | 102 | |
| | | | | | | | | | | | | | | | | | |
The accompanying notes are an integral part of these financial statements.
| | |
| Annual Report • June 30, 2023 | | 69 |
Bridge Builder Large Cap Value Fund
Summary Schedule of Investments
June 30, 2023
(Amounts in thousands, except number of contracts)
| | | | | | | | |
| | | Shares
(000s) | | | Value
(000s) | |
COMMON STOCKS – 96.48% | |
| Communication Services – 7.21% | | | | | |
Alphabet, Inc. – Class C (1) | | | 1,756 | | | $ | 212,366 | |
Comcast Corp. – Class A | | | 5,317 | | | | 220,908 | |
Electronic Arts, Inc. | | | 1,034 | | | | 134,049 | |
Meta Platforms, Inc. – Class A (1) | | | 720 | | | | 206,580 | |
Other Securities (1)(2) | | | 13,048 | | | | 455,173 | |
| | | | | | | | |
Total Communication Services | | | | 1,229,076 | |
| | | | | |
| Consumer Discretionary – 8.62% | | | | | |
Compass Group Plc | | | 3,851 | | | | 107,837 | |
Las Vegas Sands Corp. (1) | | | 1,927 | | | | 111,769 | |
McDonald’s Corp. | | | 398 | | | | 118,731 | |
NIKE, Inc. – Class B | | | 1,016 | | | | 112,118 | |
TJX Companies, Inc. | | | 1,750 | | | | 148,356 | |
Other Securities (1) | | | 12,326 | | | | 870,636 | |
| | | | | | | | |
Total Consumer Discretionary | | | | 1,469,447 | |
| | | | | |
| Consumer Staples – 7.89% | | | | | |
Colgate-Palmolive Co. | | | 1,657 | | | | 127,636 | |
PepsiCo, Inc. | | | 595 | | | | 110,215 | |
Philip Morris International, Inc. | | | 2,306 | | | | 225,138 | |
Procter & Gamble Co. | | | 767 | | | | 116,354 | |
Other Securities (1) | | | 10,972 | | | | 766,516 | |
| | | | | | | | |
Total Consumer Staples | | | | 1,345,859 | |
| | | | | |
| Energy – 5.54% | | | | | |
EOG Resources, Inc. | | | 1,144 | | | | 130,954 | |
Exxon Mobil Corp. | | | 969 | | | | 103,873 | |
Hess Corp. | | | 795 | | | | 108,101 | |
Other Securities (1) | | | 11,147 | | | | 602,274 | |
| | | | | | | | |
Total Energy | | | | 945,202 | |
| | | | | |
| Financials – 18.71% | | | | | |
American Express Co. | | | 803 | | | | 139,916 | |
American International Group, Inc. | | | 2,425 | | | | 139,560 | |
Arch Capital Group Ltd. (1) | | | 1,606 | | | | 120,232 | |
Bank of America Corp. | | | 3,885 | | | | 111,462 | |
Berkshire Hathaway, Inc. – Class B (1) | | | 485 | | | | 165,262 | |
Chubb Ltd. | | | 962 | | | | 185,189 | |
Fiserv, Inc. (1) | | | 938 | | | | 118,369 | |
Marsh & McLennan Companies, Inc. | | | 599 | | | | 112,677 | |
Morgan Stanley | | | 1,388 | | | | 118,537 | |
PNC Financial Services Group, Inc. | | | 1,028 | | | | 129,512 | |
U.S. Bancorp | | | 5,049 | | | | 166,834 | |
Visa, Inc. – Class A | | | 882 | | | | 209,439 | |
Wells Fargo & Co. | | | 3,579 | | | | 152,770 | |
Other Securities (1) | | | 24,151 | | | | 1,322,140 | |
| | | | | | | | |
Total Financials | | | | 3,191,899 | |
| | | | | |
| Healthcare – 14.49% | | | | | |
Cigna Group | | | 441 | | | | 123,664 | |
Elevance Health, Inc. | | | 277 | | | | 122,850 | |
Johnson & Johnson | | | 1,047 | | | | 173,377 | |
Medtronic Plc | | | 3,009 | | | | 265,117 | |
Merck & Co., Inc. | | | 2,274 | | | | 262,385 | |
Stryker Corp. | | | 459 | | | | 140,177 | |
UnitedHealth Group, Inc. | | | 417 | | | | 200,276 | |
Other Securities (1) | | | 21,287 | | | | 1,182,837 | |
| | | | | | | | |
Total Healthcare | | | | 2,470,683 | |
| | | | | |
| | | | | | | | |
| | | Shares
(000s) | | | Value
(000s) | |
| Industrials – 15.18% | |
FedEx Corp. | | | 573 | | | $ | 141,979 | |
Honeywell International, Inc. | | | 612 | | | | 127,064 | |
Northrop Grumman Corp. | | | 357 | | | | 162,716 | |
Raytheon Technologies Corp. | | | 1,541 | | | | 150,993 | |
United Parcel Service, Inc. – Class B | | | 656 | | | | 117,516 | |
Vertiv Holdings Co. – Class A | | | 5,391 | | | | 133,527 | |
Other Securities (1) | | | 18,637 | | | | 1,754,864 | |
| | | | | | | | |
Total Industrials | | | | 2,588,659 | |
| | | | | |
| Information Technology – 8.43% | |
Accenture Plc – Class A | | | 384 | | | | 118,359 | |
Broadcom, Inc. | | | 141 | | | | 122,182 | |
Microsoft Corp. | | | 591 | | | | 201,325 | |
Oracle Corp. | | | 911 | | | | 108,492 | |
QUALCOMM, Inc. | | | 1,250 | | | | 148,807 | |
Samsung Electronics Co. Ltd. | | | 1,918 | | | | 105,622 | |
Texas Instruments, Inc. | | | 686 | | | | 123,512 | |
Other Securities (1) | | | 7,255 | | | | 508,898 | |
| | | | | | | | |
Total Information Technology | | | | 1,437,197 | |
| | | | | |
| Materials – 4.52% | |
Linde Plc | | | 309 | | | | 117,915 | |
Other Securities (1)(2) | | | 12,311 | | | | 653,277 | |
| | | | | | | | |
Total Materials | | | | 771,192 | |
| | | | | |
| Real Estate – 2.72% | |
Various Securities (1) | | | 10,442 | | | | 463,454 | |
| | | | | | | | |
Total Real Estate | | | | 463,454 | |
| | | | | |
| Utilities – 3.17% | |
Various Securities (1) | | | 9,947 | | | | 540,772 | |
| | | | | | | | |
Total Utilities | | | | 540,772 | |
| | | | | |
Total Common Stocks
(Cost: $12,013,646) | | | | 16,453,440 | |
| | | | | |
CONVERTIBLE PREFERRED STOCKS – 0.09% | |
| Utilities – 0.09% | |
Various Securities | | | 214 | | | | 14,742 | |
| | | | | | | | |
Total Utilities | | | | 14,742 | |
| | | | | |
Total Convertible Preferred Stocks
(Cost: $15,158) | | | | 14,742 | |
| | | | | |
PREFERRED STOCKS – 0.31% | | | | | | | | |
| Consumer Discretionary – 0.31% | |
Various Securities (3) | | | 405 | | | | 52,594 | |
| | | | | | | | |
Total Consumer Discretionary | | | | 52,594 | |
| | | | | |
Total Preferred Stocks
(Cost: $51,615) | | | | 52,594 | |
| | | | | |
SHORT-TERM INVESTMENTS – 3.02% | |
| Money Market Funds – 3.00% | |
Goldman Sachs Financial Square Government Fund – Class I, 5.02% (4) | | | 511,846 | | | | 511,846 | |
| | | | | | | | |
Total Money Market Funds | | | | 511,846 | |
| | | | | | | | |
The accompanying notes are an integral part of these financial statements.
| | |
| 70 | | Annual Report • June 30, 2023 |
Bridge Builder Large Cap Value Fund
Summary Schedule of Investments
June 30, 2023 (Continued)
(Amounts in thousands, except number of contracts)
| | | | | | | | |
| | | Principal
Amount
(000s) | | | Value
(000s) | |
| Time Deposits – 0.02% | |
Brown Brothers Harriman, 2.47% due 07/03/2023 (5) | | SEK | 0 | | | $ | 0 | |
Skandinaviska Enskilda Banken AB, Stockholm, 2.62% due 07/03/2023 | | EUR | 2,190 | | | | 2,390 | |
Skandinaviska Enskilda Banken AB, Stockholm, 4.17% due 07/03/2023 | | GBP | 2 | | | | 3 | |
Sumitomo, Tokyo, 4.57% due 07/03/2023 | | $ | 443 | | | | 443 | |
| | | | | | | | |
Total Time Deposits | | | | 2,836 | |
| | | | | | | | |
Total Short-Term Investments
(Cost: $514,682) | | | | 514,682 | |
| | | | | |
TOTAL INVESTMENTS IN SECURITIES – 99.90%
(Cost: $12,595,101) | | | | 17,035,458 | |
| OTHER ASSETS IN EXCESS OF LIABILITIES – 0.10% | | | | 17,292 | |
| | | | | | | | |
| TOTAL NET ASSETS – 100.00% | | | $ | 17,052,750 | |
| | | | | | | | |
Percentages are stated as a percent of net assets.
Principal amounts are denominated in the currency in which the security was purchased.
EUR Euro
GBP British Pound
SEK Swedish Krona
| (1) | Non-income producing security or includes securities that are non-income producing. |
| (2) | Includes securities that are categorized as Level 3 per the Trust’s fair value hierarchy. The value of these securities totals $7, which represents 0.00% of total net assets. |
| (3) | Includes securities purchased exempt from registration in the U.S. pursuant to Rule 144(A) under the Securities Act of 1933. The value of these securities totals $23,771, which represents 0.14% of total net assets. |
| (4) | Represents annualized seven-day yield as of the close of the reporting period. |
| (5) | A zero balance may reflect actual amounts rounding to less than one thousand. |
Open Futures Contracts
| | | | | | | | | | | | | | | | | | |
Number of Contracts
Purchased | | Reference Entity | | Expiration
Date | | | Notional
Amount | | | Value | | | Unrealized
Appreciation/
(Depreciation) | |
| 22 | | S&P 500 E-mini Future | | | Sep. 2023 | | | $ | 4,829 | | | $ | 4,937 | | | $ | 108 | |
| | | | | | | | | | | | | | | | | | |
| | | | | | | | | | | | | | | | $ | 108 | |
| | | | | | | | | | | | | | | | | | |
The accompanying notes are an integral part of these financial statements.
| | |
| Annual Report • June 30, 2023 | | 71 |
Bridge Builder Tax Managed Large Cap Fund
Summary Schedule of Investments
June 30, 2023
(Amounts in thousands, except number of contracts)
| | | | | | | | |
| | | Shares
(000s) | | | Value
(000s) | |
COMMON STOCKS – 97.78% | | | | | |
| Communication Services – 8.75% | | | | | |
Alphabet, Inc. – Class A (1) | | | 507 | | | $ | 60,648 | |
Alphabet, Inc. – Class C (1) | | | 244 | | | | 29,468 | |
Comcast Corp. – Class A | | | 495 | | | | 20,578 | |
Meta Platforms, Inc. – Class A (1) | | | 112 | | | | 32,127 | |
Netflix, Inc. (1) | | | 38 | | | | 16,696 | |
T-Mobile U.S., Inc. (1) | | | 140 | | | | 19,424 | |
Other Securities (1) | | | 621 | | | | 42,182 | |
| | | | | | | | |
Total Communication Services | | | | 221,123 | |
| | | | | |
| Consumer Discretionary – 9.53% | | | | | |
Amazon.com, Inc. (1) | | | 553 | | | | 72,028 | |
Home Depot, Inc. | | | 42 | | | | 12,954 | |
Las Vegas Sands Corp. (1) | | | 257 | | | | 14,903 | |
TJX Companies, Inc. | | | 228 | | | | 19,349 | |
Other Securities (1) | | | 1,783 | | | | 121,402 | |
| | | | | | | | |
Total Consumer Discretionary | | | | 240,636 | |
| | | | | |
| Consumer Staples – 4.02% | | | | | |
Procter & Gamble Co. | | | 96 | | | | 14,557 | |
Walmart, Inc. | | | 142 | | | | 22,265 | |
Other Securities (1) | | | 728 | | | | 64,819 | |
| | | | | | | | |
Total Consumer Staples | | | | 101,641 | |
| | | | | |
| Energy – 4.42% | | | | | |
Chevron Corp. | | | 107 | | | | 16,835 | |
Exxon Mobil Corp. | | | 158 | | | | 16,951 | |
Hess Corp. | | | 117 | | | | 15,845 | |
Pioneer Natural Resources Co. | | | 110 | | | | 22,809 | |
Other Securities | | | 1,035 | | | | 39,332 | |
| | | | | | | | |
Total Energy | | | | 111,772 | |
| | | | | |
| Financials – 13.44% | | | | | |
Berkshire Hathaway, Inc. – Class B (1) | | | 138 | | | | 46,959 | |
Fiserv, Inc. (1) | | | 166 | | | | 20,982 | |
JPMorgan Chase & Co. | | | 167 | | | | 24,225 | |
Mastercard, Inc. – Class A | | | 52 | | | | 20,466 | |
Travelers Companies, Inc. | | | 85 | | | | 14,807 | |
Visa, Inc. – Class A | | | 172 | | | | 40,930 | |
Other Securities (1) | | | 2,708 | | | | 171,055 | |
| | | | | | | | |
Total Financials | | | | 339,424 | |
| | | | | |
| Healthcare – 13.82% | | | | | |
Becton Dickinson & Co. | | | 71 | | | | 18,839 | |
Cigna Group | | | 60 | | | | 16,810 | |
Eli Lilly & Co. | | | 55 | | | | 25,763 | |
Humana, Inc. | | | 33 | | | | 14,610 | |
Intuitive Surgical, Inc. (1) | | | 46 | | | | 15,703 | |
Johnson & Johnson | | | 128 | | | | 21,220 | |
Merck & Co., Inc. | | | 295 | | | | 33,984 | |
Stryker Corp. | | | 80 | | | | 24,270 | |
Thermo Fisher Scientific, Inc. | | | 30 | | | | 15,881 | |
UnitedHealth Group, Inc. | | | 127 | | | | 61,249 | |
Other Securities (1) | | | 1,481 | | | | 100,707 | |
| | | | | | | | |
Total Healthcare | | | | 349,036 | |
| | | | | |
| | | | | | | | |
| | | Shares
(000s) | | | Value
(000s) | |
| Industrials – 10.08% | |
Automatic Data Processing, Inc. | | | 61 | | | $ | 13,418 | |
BWX Technologies, Inc. | | | 190 | | | | 13,600 | |
Honeywell International, Inc. | | | 88 | | | | 18,324 | |
Raytheon Technologies Corp. | | | 276 | | | | 27,012 | |
Vertiv Holdings Co. – Class A | | | 961 | | | | 23,796 | |
Waste Management, Inc. | | | 81 | | | | 13,992 | |
Other Securities (1) | | | 1,663 | | | | 144,474 | |
| | | | | | | | |
Total Industrials | | | | 254,616 | |
| | | | | |
| Information Technology – 24.85% | |
Adobe, Inc. (1) | | | 38 | | | | 18,778 | |
Apple, Inc. | | | 718 | | | | 139,233 | |
ASML Holding NV – Class REG | | | 32 | | | | 23,523 | |
Broadcom, Inc. | | | 23 | | | | 20,366 | |
Intuit, Inc. | | | 47 | | | | 21,734 | |
Microsoft Corp. | | | 525 | | | | 178,876 | |
NVIDIA Corp. | | | 130 | | | | 54,857 | |
Oracle Corp. | | | 241 | | | | 28,678 | |
Other Securities (1) | | | 1,205 | | | | 141,792 | |
| | | | | | | | |
Total Information Technology | | | | 627,837 | |
| | | | | |
| Materials – 4.93% | |
Air Products & Chemicals, Inc. | | | 82 | | | | 24,553 | |
Axalta Coating Systems Ltd. (1) | | | 393 | | | | 12,892 | |
CRH Plc – ADR | | | 230 | | | | 12,829 | |
Other Securities (1) | | | 1,269 | | | | 74,368 | |
| | | | | | | | |
Total Materials | | | | 124,642 | |
| | | | | |
| Real Estate – 1.85% | |
VICI Properties, Inc. – Class A | | | 481 | | | | 15,112 | |
Other Securities (1) | | | 503 | | | | 31,671 | |
| | | | | | | | |
Total Real Estate | | | | 46,783 | |
| | | | | |
| Utilities – 2.09% | |
Various Securities (1) | | | 980 | | | | 52,820 | |
| | | | | | | | |
Total Utilities | | | | 52,820 | |
| | | | | |
Total Common Stocks
(Cost: $2,105,484) | | | | 2,470,330 | |
| | | | | |
SHORT-TERM INVESTMENTS – 2.37% | |
| Money Market Funds – 2.37% | |
Goldman Sachs Financial Square Government Fund – Class I, 5.02% (2) | | | 59,767 | | | | 59,767 | |
| | | | | | | | |
Total Money Market Funds | | | | 59,767 | |
| | | | | | | | |
Total Short-Term Investments
(Cost: $59,767) | | | | 59,767 | |
| | | | | |
TOTAL INVESTMENTS IN SECURITIES – 100.15%
(Cost: $2,165,251) | | | | 2,530,097 | |
LIABILITIES IN EXCESS OF OTHER
ASSETS – (0.15)% | | | | (3,873 | ) |
| | | | | | | | |
| TOTAL NET ASSETS – 100.00% | | | $ | 2,526,224 | |
| | | | | | | | |
The accompanying notes are an integral part of these financial statements.
| | |
| 72 | | Annual Report • June 30, 2023 |
Bridge Builder Tax Managed Large Cap Fund
Summary Schedule of Investments
June 30, 2023 (Continued)
(Amounts in thousands, except number of contracts)
Percentages are stated as a percent of net assets.
ADR American Depositary Receipt
| (1) | Non-income producing security or includes securities that are non-income producing. |
| (2) | Represents annualized seven-day yield as of the close of the reporting period. |
The accompanying notes are an integral part of these financial statements.
| | |
| Annual Report • June 30, 2023 | | 73 |
Bridge Builder Small/Mid Cap Growth Fund
Summary Schedule of Investments
June 30, 2023
(Amounts in thousands, except number of contracts)
| | | | | | | | |
| | | Shares
(000s) | | | Value
(000s) | |
COMMON STOCKS – 97.14% | |
| Communication Services – 2.73% | |
Various Securities (1) | | | 3,254 | | | $ | 194,003 | |
| | | | | | | | |
Total Communication Services | | | | 194,003 | |
| | | | | |
| Consumer Discretionary – 10.14% | |
Chipotle Mexican Grill, Inc. – Class A (1) | | | 28 | | | | 59,294 | |
Deckers Outdoor Corp. (1) | | | 82 | | | | 43,004 | |
Five Below, Inc. (1) | | | 176 | | | | 34,588 | |
Other Securities (1) | | | 10,898 | | | | 584,889 | |
| | | | | | | | |
Total Consumer Discretionary | | | | 721,775 | |
| | | | | |
| Consumer Staples – 4.85% | |
Celsius Holdings, Inc. (1) | | | 292 | | | | 43,538 | |
Lamb Weston Holdings, Inc. | | | 323 | | | | 37,160 | |
Other Securities (1)(2) | | | 4,049 | | | | 264,169 | |
| | | | | | | | |
Total Consumer Staples | | | | 344,867 | |
| | | | | |
| Energy – 2.21% | |
Various Securities (1) | | | 7,265 | | | | 157,550 | |
| | | | | | | | |
Total Energy | | | | 157,550 | |
| | | | | |
| Financials – 8.86% | |
Arthur J. Gallagher & Co. | | | 191 | | | | 41,989 | |
Everest Re Group Ltd. | | | 143 | | | | 48,827 | |
Kinsale Capital Group, Inc. | | | 101 | | | | 37,817 | |
Ryan Specialty Holdings, Inc. – Class A (1) | | | 946 | | | | 42,453 | |
Toast, Inc. – Class A (1) | | | 1,645 | | | | 37,131 | |
Tradeweb Markets, Inc. – Class A | | | 961 | | | | 65,774 | |
Other Securities (1) | | | 7,727 | | | | 356,397 | |
| | | | | | | | |
Total Financials | | | | 630,388 | |
| | | | | |
| Healthcare – 21.28% | |
Agilent Technologies, Inc. | | | 301 | | | | 36,220 | |
Argenx SE – ADR (1) | | | 162 | | | | 63,271 | |
Cooper Companies, Inc. | | | 93 | | | | 35,634 | |
DexCom, Inc. (1) | | | 650 | | | | 83,532 | |
Edwards Lifesciences Corp. (1) | | | 388 | | | | 36,600 | |
Exact Sciences Corp. (1) | | | 498 | | | | 46,723 | |
Inspire Medical Systems, Inc. (1) | | | 133 | | | | 43,282 | |
Repligen Corp. (1) | | | 331 | | | | 46,842 | |
Shockwave Medical, Inc. (1) | | | 144 | | | | 41,023 | |
Veeva Systems, Inc. – Class A (1) | | | 599 | | | | 118,473 | |
West Pharmaceutical Services, Inc. | | | 189 | | | | 72,185 | |
Other Securities (1)(2)(3) | | | 17,536 | | | | 889,920 | |
| | | | | | | | |
Total Healthcare | | | | 1,513,705 | |
| | | | | |
| Industrials – 19.36% | |
AMETEK, Inc. | | | 348 | | | | 56,335 | |
Axon Enterprise, Inc. (1) | | | 226 | | | | 44,014 | |
Builders FirstSource, Inc. (1) | | | 273 | | | | 37,163 | |
Fortive Corp. | | | 1,122 | | | | 83,866 | |
Hubbell, Inc. – Class B | | | 117 | | | | 38,835 | |
Ingersoll Rand, Inc. | | | 763 | | | | 49,854 | |
Nordson Corp. | | | 139 | | | | 34,497 | |
Rockwell Automation, Inc. | | | 186 | | | | 61,242 | |
Saia, Inc. (1) | | | 120 | | | | 40,929 | |
| | | | | | | | |
| | | Shares
(000s) | | | Value
(000s) | |
Toro Co. | | | 364 | | | $ | 37,016 | |
Verisk Analytics, Inc. – Class A | | | 199 | | | | 44,997 | |
Other Securities (1) | | | 11,958 | | | | 849,133 | |
| | | | | | | | |
Total Industrials | | | | 1,377,881 | |
| | | | | |
| Information Technology – 25.19% | |
Arista Networks, Inc. (1) | | | 383 | | | | 61,994 | |
Atlassian Corp. – Class A (1) | | | 276 | | | | 46,373 | |
Axcelis Technologies, Inc. (1) | | | 209 | | | | 38,260 | |
HubSpot, Inc. (1) | | | 143 | | | | 76,280 | |
Lattice Semiconductor Corp. (1) | | | 962 | | | | 92,391 | |
MongoDB, Inc. – Class A (1) | | | 154 | | | | 63,132 | |
Monolithic Power Systems, Inc. | | | 91 | | | | 48,891 | |
Okta, Inc. – Class A (1) | | | 577 | | | | 40,042 | |
ON Semiconductor Corp. (1) | | | 972 | | | | 91,901 | |
Palo Alto Networks, Inc. (1) | | | 163 | | | | 41,669 | |
Pure Storage, Inc. – Class A (1) | | | 1,287 | | | | 47,376 | |
Super Micro Computer, Inc. (1) | | | 184 | | | | 45,795 | |
Synopsys, Inc. (1) | | | 152 | | | | 66,336 | |
Tyler Technologies, Inc. (1) | | | 106 | | | | 44,114 | |
Workday, Inc. – Class A (1) | | | 235 | | | | 53,084 | |
Zscaler, Inc. (1) | | | 463 | | | | 67,695 | |
Other Securities (1) | | | 12,310 | | | | 866,785 | |
| | | | | | | | |
Total Information Technology | | | | 1,792,118 | |
| | | | | |
| Materials – 1.34% | |
Various Securities (1) | | | 2,165 | | | | 95,696 | |
| | | | | | | | |
Total Materials | | | | 95,696 | |
| | | | | |
| Real Estate – 1.11% | |
CoStar Group, Inc. (1) | | | 404 | | | | 35,984 | |
Other Securities (1) | | | 1,214 | | | | 43,356 | |
| | | | | | | | |
Total Real Estate | | | | 79,340 | |
| | | | | |
| Utilities – 0.07% | |
Various Securities (1) | | | 156 | | | | 5,088 | |
| | | | | | | | |
Total Utilities | | | | 5,088 | |
| | | | | |
Total Common Stocks
(Cost: $5,488,790) | | | | 6,912,411 | |
| | | | | |
SHORT-TERM INVESTMENTS – 2.98% | |
| Money Market Funds – 2.94% | |
Goldman Sachs Financial Square Government Fund – Class I, 5.02% (4) | | | 209,776 | | | | 209,776 | |
| | | | | | | | |
Total Money Market Funds | | | | 209,776 | |
| | | | | | | | |
The accompanying notes are an integral part of these financial statements.
| | |
| 74 | | Annual Report • June 30, 2023 |
Bridge Builder Small/Mid Cap Growth Fund
Summary Schedule of Investments
June 30, 2023 (Continued)
(Amounts in thousands, except number of contracts)
| | | | | | | | |
| | | Principal
Amount
(000s) | | | Value
(000s) | |
| Time Deposits – 0.04% | |
ANZ, London, 4.57% due 07/03/2023 | | $ | 362 | | | $ | 362 | |
Citibank, New York, 4.57% due 07/03/2023 | | | 479 | | | | 479 | |
JP Morgan, New York, 4.57% due 07/03/2023 | | | 1,637 | | | | 1,637 | |
Sumitomo Trust Bank, London, 4.57% due 07/03/2023 | | | 80 | | | | 80 | |
| | | | | | | | |
Total Time Deposits | | | | 2,558 | |
| | | | | | | | |
Total Short-Term Investments
(Cost: $212,334) | | | | 212,334 | |
| | | | | |
TOTAL INVESTMENTS IN SECURITIES – 100.12%
(Cost: $5,701,124) | | | | 7,124,745 | |
| LIABILITIES IN EXCESS OF OTHER ASSETS – (0.12)% | | | | (8,399 | ) |
| | | | | | | | |
| TOTAL NET ASSETS – 100.00% | | | $ | 7,116,346 | |
| | | | | | | | |
Percentages are stated as a percent of net assets.
ADR American Depositary Receipt
| (1) | Non-income producing security or includes securities that are non-income producing. |
| (2) | Includes securities that are categorized as Level 3 per the Trust’s fair value hierarchy. The value of these securities totals $13, which represents 0.00% of total net assets. |
| (3) | Includes securities that are restricted at June 30, 2023. The value of these securities totals $0, which represents 0.00% of total net assets. |
| (4) | Represents annualized seven-day yield as of the close of the reporting period. |
Open Futures Contracts
| | | | | | | | | | | | | | | | | | |
Number of Contracts
Purchased | | Reference Entity | | Expiration
Date | | | Notional
Amount | | | Value | | | Unrealized
Appreciation/
(Depreciation) | |
| 13 | | E-mini Russell 2000 Future | | | Sep. 2023 | | | $ | 1,192 | | | $ | 1,236 | | | $ | 44 | |
| 4 | | S&P 500 E-mini Future | | | Sep. 2023 | | | | 878 | | | | 898 | | | | 20 | |
| 1 | | S&P MidCap 400 E-mini Future | | | Sep. 2023 | | | | 254 | | | | 265 | | | | 11 | |
| | | | | | | | | | | | | | | | | | |
| | | | | | | | | | | | | | | | $ | 75 | |
| | | | | | | | | | | | | | | | | | |
The accompanying notes are an integral part of these financial statements.
| | |
| Annual Report • June 30, 2023 | | 75 |
Bridge Builder Small/Mid Cap Value Fund
Summary Schedule of Investments
June 30, 2023
(Amounts in thousands, except number of contracts)
| | | | | | | | |
| | | Shares
(000s) | | | Value
(000s) | |
COMMON STOCKS – 96.92% | |
| Communication Services – 1.41% | | | | | |
Nexstar Media Group, Inc. – Class A | | | 137 | | | $ | 22,867 | |
Other Securities (1)(2) | | | 3,794 | | | | 72,587 | |
| | | | | | | | |
Total Communication Services | | | | 95,454 | |
| | | | | | | | |
| Consumer Discretionary – 12.12% | | | | | |
AutoZone, Inc. (1) | | | 23 | | | | 58,078 | |
NVR, Inc. (1) | | | 5 | | | | 33,201 | |
Red Rock Resorts, Inc. – Class A | | | 643 | | | | 30,088 | |
Other Securities (1) | | | 17,232 | | | | 699,665 | |
| | | | | | | | |
Total Consumer Discretionary | | | | 821,032 | |
| | | | | | | | |
| Consumer Staples – 4.09% | | | | | |
Church & Dwight Co., Inc. | | | 266 | | | | 26,646 | |
Lancaster Colony Corp. | | | 134 | | | | 27,036 | |
Performance Food Group Co. (1) | | | 482 | | | | 29,064 | |
Post Holdings, Inc. (1) | | | 252 | | | | 21,813 | |
Other Securities (1) | | | 4,652 | | | | 172,772 | |
| | | | | | | | |
Total Consumer Staples | | | | 277,331 | |
| | | | | | | | |
| Energy – 5.20% | | | | | |
Matador Resources Co. | | | 481 | | | | 25,182 | |
Other Securities (1) | | | 11,064 | | | | 326,750 | |
| | | | | | | | |
Total Energy | | | | 351,932 | |
| | | | | | | | |
| Financials – 17.76% | | | | | |
Allstate Corp. | | | 385 | | | | 41,989 | |
American International Group, Inc. | | | 484 | | | | 27,835 | |
Ameriprise Financial, Inc. | | | 133 | | | | 44,171 | |
Arthur J. Gallagher & Co. | | | 188 | | | | 41,258 | |
Discover Financial Services | | | 226 | | | | 26,419 | |
FactSet Research Systems, Inc. | | | 82 | | | | 32,681 | |
Hartford Financial Services Group, Inc. | | | 315 | | | | 22,710 | |
Nasdaq, Inc. | | | 607 | | | | 30,242 | |
Other Securities (1) | | | 32,111 | | | | 935,283 | |
| | | | | | | | |
Total Financials | | | | 1,202,588 | |
| | | | | | | | |
| Healthcare – 8.19% | | | | | |
AmerisourceBergen Corp. – Class A | | | 405 | | | | 77,955 | |
ICON Plc (1) | | | 128 | | | | 32,047 | |
IQVIA Holdings, Inc. (1) | | | 131 | | | | 29,430 | |
Other Securities (1)(2)(3) | | | 12,131 | | | | 415,225 | |
| | | | | | | | |
Total Healthcare | | | | 554,657 | |
| | | | | | | | |
| Industrials – 20.92% | | | | | |
Alaska Air Group, Inc. (1) | | | 425 | | | | 22,591 | |
Allegion Plc | | | 187 | | | | 22,450 | |
AMETEK, Inc. | | | 333 | | | | 53,924 | |
CACI International, Inc. – Class A (1) | | | 119 | | | | 40,495 | |
Dover Corp. | | | 166 | | | | 24,452 | |
Esab Corp. | | | 436 | | | | 29,019 | |
Howmet Aerospace, Inc. | | | 455 | | | | 22,575 | |
MAXIMUS, Inc. | | | 350 | | | | 29,543 | |
nVent Electric Plc | | | 602 | | | | 31,095 | |
Otis Worldwide Corp. | | | 356 | | | | 31,685 | |
Parker-Hannifin Corp. | | | 131 | | | | 51,015 | |
Regal Rexnord Corp. | | | 177 | | | | 27,183 | |
Republic Services, Inc. – Class A | | | 329 | | | | 50,327 | |
Textron, Inc. | | | 389 | | | | 26,330 | |
| | | | | | | | |
| | | Shares
(000s) | | | Value
(000s) | |
Timken Co. | | | 253 | | | $ | 23,160 | |
WESCO International, Inc. | | | 241 | | | | 43,205 | |
Other Securities (1) | | | 18,843 | | | | 887,028 | |
| | | | | | | | |
Total Industrials | | | | 1,416,077 | |
| | | | | | | | |
| Information Technology – 8.63% | | | | | |
Check Point Software Technologies Ltd. (1) | | | 228 | | | | 28,701 | |
Motorola Solutions, Inc. | | | 132 | | | | 38,857 | |
Tyler Technologies, Inc. (1) | | | 84 | | | | 34,927 | |
Other Securities (1) | | | 10,900 | | | | 482,183 | |
| | | | | | | | |
Total Information Technology | | | | 584,668 | |
| | | | | | | | |
| Materials – 7.00% | | | | | |
Avient Corp. | | | 572 | | | | 23,404 | |
Axalta Coating Systems Ltd. (1) | | | 855 | | | | 28,048 | |
Element Solutions, Inc. | | | 1,093 | | | | 20,990 | |
Vulcan Materials Co. | | | 113 | | | | 25,559 | |
Other Securities (1)(2) | | | 9,385 | | | | 376,085 | |
| | | | | | | | |
Total Materials | | | | 474,086 | |
| | | | | | | | |
| Real Estate – 6.18% | | | | | |
Various Securities (1) | | | 18,067 | | | | 418,598 | |
| | | | | | | | |
Total Real Estate | | | | 418,598 | |
| | | | | | | | |
| Utilities – 5.42% | | | | | |
Alliant Energy Corp. | | | 524 | | | | 27,523 | |
Ameren Corp. | | | 326 | | | | 26,612 | |
CenterPoint Energy, Inc. | | | 920 | | | | 26,827 | |
CMS Energy Corp. | | | 459 | | | | 26,937 | |
Evergy, Inc. | | | 457 | | | | 26,717 | |
Vistra Corp. | | | 1,253 | | | | 32,899 | |
WEC Energy Group, Inc. | | | 308 | | | | 27,196 | |
Other Securities (1) | | | 3,256 | | | | 172,644 | |
| | | | | | | | |
Total Utilities | | | | 367,355 | |
| | | | | | | | |
Total Common Stocks
(Cost: $5,141,057) | | | | 6,563,778 | |
| | | | | | | | |
| EXCHANGE TRADED FUNDS – 0.42% | |
iShares Russell Mid-Capital Value ETF | | | 260 | | | | 28,513 | |
| | | | | | | | |
Total Exchange Traded Funds
(Cost: $29,658) | | | | 28,513 | |
| | | | | | | | |
| SHORT-TERM INVESTMENTS – 3.16% | |
| Money Market Funds – 3.12% | |
Goldman Sachs Financial Square Government Fund – Class I, 5.02% (4) | | | 211,376 | | | | 211,376 | |
| | | | | | | | |
Total Money Market Funds | | | | 211,376 | |
| | | | | | | | |
The accompanying notes are an integral part of these financial statements.
| | |
| 76 | | Annual Report • June 30, 2023 |
Bridge Builder Small/Mid Cap Value Fund
Summary Schedule of Investments
June 30, 2023 (Continued)
(Amounts in thousands, except number of contracts)
| | | | | | | | |
| | |
| | | Principal
Amount
(000s) | | | Value
(000s) | |
| Time Deposits – 0.04% | | | | | | | | |
ANZ, London, 4.57% due 07/03/2023 | | $ | 845 | | | $ | 845 | |
Brown Brothers Harriman, 2.47% due 07/03/2023 (5) | | SEK | 0 | | | | 0 | |
JP Morgan, New York, 4.57% due 07/03/2023 | | $ | 1,717 | | | | 1,717 | |
Sumitomo, Tokyo, 4.57% due 07/03/2023 | | | 321 | | | | 321 | |
| | | | | | | | |
Total Time Deposits | | | | 2,883 | |
| | | | | | | | |
Total Short-Term Investments
(Cost: $214,259) | | | | 214,259 | |
| | | | | | | | |
TOTAL INVESTMENTS IN SECURITIES – 100.50%
(Cost: $5,384,974) | | | | 6,806,550 | |
| LIABILITIES IN EXCESS OF OTHER ASSETS –(0.50)% | | | | (34,061 | ) |
| | | | | | | | |
| TOTAL NET ASSETS – 100.00% | | | $ | 6,772,489 | |
| | | | | | | | |
Percentages are stated as a percent of net assets.
Principal amounts are denominated in the currency in which the security was purchased.
SEK Swedish Krona
| (1) | | Non-income producing security or includes securities that are non-income producing. |
| (2) | | Includes securities that are categorized as Level 3 per the Trust’s fair value hierarchy. The value of these securities totals $7, which represents 0.00% of total net assets. |
| (3) | | Includes securities that are restricted at June 30, 2023. The value of these securities totals $0, which represents 0.00% of total net assets. |
| (4) | | Represents annualized seven-day yield as of the close of the reporting period. |
| (5) | | A zero balance may reflect actual amounts rounding to less than one thousand. |
Open Futures Contracts
| | | | | | | | | | | | | | | | | | |
Number of Contracts
Purchased | | Reference Entity | | Expiration
Date | | | Notional
Amount | | | Value | | | Unrealized
Appreciation/
(Depreciation) | |
| 38 | | E-mini Russell 2000 Future | | | Sep. 2023 | | | $ | 3,528 | | | $ | 3,617 | | | $ | 89 | |
| 6 | | S&P 500 E-mini Future | | | Sep. 2023 | | | | 1,313 | | | | 1,347 | | | | 34 | |
| | | | | | | | | | | | | | | | | | |
| | | | | | | | | | | | | | | | $ | 123 | |
| | | | | | | | | | | | | | | | | | |
The accompanying notes are an integral part of these financial statements.
| | |
| Annual Report • June 30, 2023 | | 77 |
Bridge Builder Tax Managed Small/Mid Cap Fund
Summary Schedule of Investments
June 30, 2023
(Amounts in thousands, except number of contracts)
| | | | | | | | |
| | | Shares
(000s) | | | Value
(000s) | |
COMMON STOCKS – 97.02% | | | | | |
| Communication Services – 2.32% | | | | | |
Nexstar Media Group, Inc. – Class A | | | 20 | | | $ | 3,319 | |
Other Securities (1) | | | 504 | | | | 15,990 | |
| | | | | | | | |
Total Communication Services | | | | 19,309 | |
| | | | | |
| Consumer Discretionary – 11.80% | | | | | | | | |
Floor & Decor Holdings, Inc. – Class A (1) | | | 34 | | | | 3,513 | |
Fox Factory Holding Corp. (1) | | | 33 | | | | 3,578 | |
LKQ Corp. | | | 90 | | | | 5,257 | |
Pool Corp. | | | 12 | | | | 4,460 | |
Tractor Supply Co. | | | 20 | | | | 4,324 | |
Other Securities (1) | | | 1,411 | | | | 77,254 | |
| | | | | | | | |
Total Consumer Discretionary | | | | 98,386 | |
| | | | | |
| Consumer Staples – 3.40% | | | | | | | | |
Church & Dwight Co., Inc. | | | 64 | | | | 6,429 | |
Keurig Dr Pepper, Inc. | | | 111 | | | | 3,460 | |
Reynolds Consumer Products, Inc. | | | 133 | | | | 3,746 | |
Other Securities (1) | | | 424 | | | | 14,685 | |
| | | | | | | | |
Total Consumer Staples | | | | 28,320 | |
| | | | | |
| Energy – 4.50% | | | | | | | | |
Various Securities (1) | | | 1,197 | | | | 37,499 | |
| | | | | | | | |
Total Energy | | | | 37,499 | |
| | | | | |
| Financials – 13.08% | | | | | | | | |
Allstate Corp. | | | 31 | | | | 3,401 | |
Annaly Capital Management, Inc. | | | 167 | | | | 3,348 | |
Arch Capital Group Ltd. (1) | | | 75 | | | | 5,607 | |
Brown & Brown, Inc. | | | 59 | | | | 4,097 | |
Euronet Worldwide, Inc. (1) | | | 31 | | | | 3,605 | |
First Citizens BancShares, Inc. – Class A | | | 3 | | | | 3,254 | |
RLI Corp. | | | 24 | | | | 3,222 | |
Other Securities (1) | | | 2,411 | | | | 82,492 | |
| | | | | | | | |
Total Financials | | | | 109,026 | |
| | | | | |
| Healthcare – 12.60% | | | | | | | | |
Alcon, Inc. | | | 49 | | | | 4,045 | |
Bio-Techne Corp. | | | 60 | | | | 4,873 | |
Charles River Laboratories International, Inc. (1) | | | 19 | | | | 4,045 | |
ICON Plc (1) | | | 13 | | | | 3,159 | |
West Pharmaceutical Services, Inc. | | | 11 | | | | 4,212 | |
Other Securities (1)(2)(3) | | | 1,878 | | | | 84,708 | |
| | | | | | | | |
Total Healthcare | | | | 105,042 | |
| | | | | |
| Industrials – 23.36% | | | | | | | | |
AerCap Holdings NV (1) | | | 85 | | | | 5,415 | |
Carlisle Companies, Inc. | | | 17 | | | | 4,458 | |
Graco, Inc. | | | 43 | | | | 3,748 | |
Jacobs Solutions, Inc. | | | 40 | | | | 4,738 | |
Knight-Swift Transportation Holdings, Inc. – Class A | | | 63 | | | | 3,525 | |
Lincoln Electric Holdings, Inc. | | | 26 | | | | 5,232 | |
MasTec, Inc. (1) | | | 56 | | | | 6,643 | |
Nordson Corp. | | | 22 | | | | 5,442 | |
Quanta Services, Inc. | | | 21 | | | | 4,204 | |
RBC Bearings, Inc. (1) | | | 21 | | | | 4,629 | |
Republic Services, Inc. – Class A | | | 36 | | | | 5,472 | |
Tetra Tech, Inc. | | | 30 | | | | 4,929 | |
Timken Co. | | | 37 | | | | 3,347 | |
| | | | | | | | |
| | | Shares
(000s) | | | Value
(000s) | |
Toro Co. | | | 61 | | | $ | 6,215 | |
Valmont Industries, Inc. | | | 14 | | | | 4,138 | |
Vertiv Holdings Co. – Class A | | | 138 | | | | 3,423 | |
Watsco, Inc. | | | 11 | | | | 4,351 | |
Other Securities (1) | | | 2,082 | | | | 114,803 | |
| | | | | | | | |
Total Industrials | | | | 194,712 | |
| | | | | |
| Information Technology – 15.52% | | | | | | | | |
Amdocs Ltd. | | | 49 | | | | 4,839 | |
Entegris, Inc. | | | 36 | | | | 3,955 | |
Fair Isaac Corp. (1) | | | 6 | | | | 4,469 | |
Lattice Semiconductor Corp. (1) | | | 93 | | | | 8,962 | |
MKS Instruments, Inc. | | | 36 | | | | 3,906 | |
Synopsys, Inc. (1) | | | 10 | | | | 4,445 | |
Other Securities (1) | | | 1,661 | | | | 98,733 | |
| | | | | | | | |
Total Information Technology | | | | 129,309 | |
| | | | | |
| Materials – 4.22% | | | | | | | | |
Eagle Materials, Inc. | | | 20 | | | | 3,761 | |
Huntsman Corp. | | | 131 | | | | 3,534 | |
Vulcan Materials Co. | | | 25 | | | | 5,534 | |
Other Securities (1) | | | 448 | | | | 22,335 | |
| | | | | | | | |
Total Materials | | | | 35,164 | |
| | | | | |
| Real Estate – 3.93% | | | | | | | | |
CBRE Group, Inc. – Class A (1) | | | 52 | | | | 4,223 | |
Other Securities (1) | | | 1,064 | | | | 28,518 | |
| | | | | | | | |
Total Real Estate | | | | 32,741 | |
| | | | | |
| Utilities – 2.29% | | | | | | | | |
American Electric Power Co., Inc. | | | 40 | | | | 3,366 | |
FirstEnergy Corp. | | | 86 | | | | 3,334 | |
Other Securities (1) | | | 183 | | | | 12,402 | |
| | | | | | | | |
Total Utilities | | | | 19,102 | |
| | | | | |
Total Common Stocks
(Cost: $708,464) | | | | 808,610 | |
| | | | | |
SHORT-TERM INVESTMENTS – 2.61% | |
| Money Market Funds – 2.59% | |
Goldman Sachs Financial Square Government Fund – Class I, 5.02% (4) | | | 21,587 | | | | 21,587 | |
| | | | | | | | |
Total Money Market Funds | | | | 21,587 | |
| | | | | | | | |
| | |
| | | Principal
Amount
(000s) | | | Value
(000s) | |
| Time Deposits – 0.02% | | | | | | | | |
ANZ, London, 4.57% due 07/03/2023 | | $ | 156 | | | | 156 | |
| | | | | | | | |
Total Time Deposits | | | | 156 | |
| | | | | | | | |
Total Short-Term Investments
(Cost: $21,743) | | | | 21,743 | |
| | | | | |
TOTAL INVESTMENTS IN SECURITIES – 99.63%
(Cost: $730,207) | | | | 830,353 | |
| OTHER ASSETS IN EXCESS OF LIABILITIES –0.37% | | | | 3,078 | |
| | | | | | | | |
| TOTAL NET ASSETS – 100.00% | | | $ | 833,431 | |
| | | | | | | | |
The accompanying notes are an integral part of these financial statements.
| | |
| 78 | | Annual Report • June 30, 2023 |
Bridge Builder Tax Managed Small/Mid Cap Fund
Summary Schedule of Investments
June 30, 2023 (Continued)
(Amounts in thousands, except number of contracts)
Percentages are stated as a percent of net assets.
| (1) | Non-income producing security or includes securities that are non-income producing. |
| (2) | Includes securities that are categorized as Level 3 per the Trust’s fair value hierarchy. The value of these securities totals $0, which represents 0.00% of total net assets. |
| (3) | Includes securities that are restricted at June 30, 2023. The value of these securities totals $0, which represents 0.00% of total net assets. |
| (4) | Represents annualized seven-day yield as of the close of the reporting period. |
The accompanying notes are an integral part of these financial statements.
| | |
| Annual Report • June 30, 2023 | | 79 |
Bridge Builder International Equity Fund
Summary Schedule of Investments
June 30, 2023
(Amounts in thousands, except number of contracts)
| | | | | | | | |
| | | Shares
(000s) | | | Value
(000s) | |
COMMON STOCKS – 97.93% | |
| Communication Services – 4.14% | |
WPP Plc | | | 12,588 | | | $ | 131,948 | |
Other Securities (1)(2) | | | 168,695 | | | | 547,835 | |
| | | | | | | | |
Total Communication Services | | | | 679,783 | |
| | | | | | | | |
| Consumer Discretionary – 14.04% | | | | | | | | |
Cie Financiere Richemont SA | | | 777 | | | | 132,044 | |
Compass Group Plc | | | 3,264 | | | | 91,402 | |
Ferrari NV | | | 351 | | | | 114,869 | |
Honda Motor Co. Ltd. | | | 4,298 | | | | 130,209 | |
LVMH Moet Hennessy Louis Vuitton SE | | | 167 | | | | 157,526 | |
Sony Group Corp. | | | 1,821 | | | | 164,356 | |
Other Securities (1)(2) | | | 112,584 | | | | 1,513,255 | |
| | | | | | | | |
Total Consumer Discretionary | | | | 2,303,661 | |
| | | | | | | | |
| Consumer Staples – 9.08% | | | | | | | | |
Imperial Brands Plc | | | 5,904 | | | | 130,675 | |
Nestle SA | | | 706 | | | | 84,931 | |
Tesco Plc | | | 52,309 | | | | 165,012 | |
Other Securities (1)(2)(3)(4) | | | 211,478 | | | | 1,109,376 | |
| | | | | | | | |
Total Consumer Staples | | | | 1,489,994 | |
| | | | | | | | |
| Energy – 3.71% | | | | | | | | |
BP Plc | | | 31,697 | | | | 184,554 | |
Shell Plc | | | 7,753 | | | | 232,164 | |
Other Securities (2) | | | 16,054 | | | | 192,157 | |
| | | | | | | | |
Total Energy | | | | 608,875 | |
| | | | | | | | |
| Financials – 16.97% | | | | | | | | |
Adyen NV (1)(2) | | | 90 | | | | 155,055 | |
AIA Group Ltd. | | | 13,291 | | | | 134,990 | |
Allianz SE | | | 552 | | | | 128,516 | |
Aon Plc – Class A | | | 271 | | | | 93,656 | |
Banco Santander SA | | | 41,559 | | | | 153,856 | |
Lloyds Banking Group Plc | | | 267,899 | | | | 148,509 | |
Tokio Marine Holdings, Inc. | | | 3,884 | | | | 89,538 | |
United Overseas Bank Ltd. | | | 10,309 | | | | 213,928 | |
Other Securities (1)(2) | | | 178,009 | | | | 1,665,076 | |
| | | | | | | | |
Total Financials | | | | 2,783,124 | |
| | | | | | | | |
| Healthcare – 13.56% | | | | | | | | |
AstraZeneca Plc | | | 594 | | | | 85,084 | |
GSK Plc | | | 7,493 | | | | 132,788 | |
Koninklijke Philips NV | | | 9,362 | | | | 202,856 | |
Mettler-Toledo International, Inc. (2) | | | 84 | | | | 110,092 | |
Novartis AG | | | 1,484 | | | | 149,585 | |
Novo Nordisk – Class B | | | 1,315 | | | | 212,438 | |
Roche Holding AG | | | 417 | | | | 127,443 | |
Sanofi | | | 1,928 | | | | 207,528 | |
Takeda Pharmaceutical Co. Ltd. | | | 5,336 | | | | 167,672 | |
Other Securities (1)(2) | | | 18,249 | | | | 829,222 | |
| | | | | | | | |
Total Healthcare | | | | 2,224,708 | |
| | | | | | | | |
| Industrials – 19.23% | | | | | | | | |
Atlas Copco AB – Class A | | | 8,400 | | | | 121,270 | |
Bouygues SA | | | 4,053 | | | | 136,144 | |
Canadian Pacific Kansas City Ltd. | | | 1,762 | | | | 142,299 | |
Cie de Saint-Gobain | | | 1,652 | | | | 100,609 | |
CK Hutchison Holdings Ltd. | | | 19,535 | | | | 119,227 | |
| | | | | | | | |
| | | Shares
(000s) | | | Value
(000s) | |
DSV | | | 493 | | | $ | 103,598 | |
Experian Plc | | | 2,912 | | | | 111,771 | |
Hitachi Ltd. | | | 1,986 | | | | 123,495 | |
Mitsubishi Electric Corp. | | | 9,121 | | | | 128,941 | |
Schneider Electric SE | | | 640 | | | | 116,346 | |
Secom Co. Ltd. | | | 1,349 | | | | 91,312 | |
Toyota Industries Corp. | | | 1,995 | | | | 142,894 | |
Other Securities (1)(2) | | | 105,374 | | | | 1,716,356 | |
| | | | | | | | |
Total Industrials | | | | 3,154,262 | |
| | | | | | | | |
| Information Technology – 9.16% | | | | | | | | |
ASML Holding NV | | | 189 | | | | 136,943 | |
ASML Holding NV – Class REG | | | 101 | | | | 73,185 | |
FUJIFILM Holdings Corp. | | | 2,069 | | | | 123,272 | |
Keyence Corp. | | | 251 | | | | 119,104 | |
Taiwan Semiconductor Manufacturing Co. Ltd. | | | 3,160 | | | | 58,373 | |
Taiwan Semiconductor Manufacturing Co. Ltd. – ADR | | | 1,287 | | | | 129,850 | |
Other Securities (2) | | | 45,822 | | | | 862,363 | |
| | | | | | | | |
Total Information Technology | | | | 1,503,090 | |
| | | | | | | | |
| Materials – 4.93% | | | | | | | | |
Covestro AG (1)(2) | | | 1,728 | | | | 89,906 | |
Evonik Industries AG | | | 5,113 | | | | 97,433 | |
Other Securities (2)(3)(4) | | | 35,847 | | | | 620,710 | |
| | | | | | | | |
Total Materials | | | | | | | 808,049 | |
| | | | | | | | |
| Real Estate – 0.27% | | | | | | | | |
Various Securities (1)(2) | | | 5,063 | | | | 44,674 | |
| | | | | | | | |
Total Real Estate | | | | | | | 44,674 | |
| | | | | | | | |
| Utilities – 2.84% | | | | | | | | |
Enel SpA | | | 32,406 | | | | 218,496 | |
Snam SpA | | | 24,451 | | | | 127,787 | |
SSE Plc | | | 3,674 | | | | 86,149 | |
Other Securities (1)(2) | | | 2,856 | | | | 33,277 | |
| | | | | | | | |
Total Utilities | | | | | | | 465,709 | |
| | | | | | | | |
Total Common Stocks
(Cost: $14,443,231) | | | | 16,065,929 | |
| | | | | | | | |
PREFERRED STOCKS – 0.33% | | | | | | | | |
| Consumer Discretionary – 0.32% | | | | | | | | |
Various Securities (1)(2) | | | 397 | | | | 52,610 | |
| | | | | | | | |
Total Consumer Discretionary | | | | 52,610 | |
| | | | | | | | |
| Consumer Staples – 0.01% | | | | | | | | |
Various Securities | | | 16 | | | | 831 | |
| | | | | | | | |
Total Consumer Staples | | | | | | | 831 | |
| | | | | | | | |
| Healthcare – 0.00% (5) | | | | | | | | |
Sartorius AG | | | 1 | | | | 474 | |
| | | | | | | | |
Total Healthcare | | | | | | | 474 | |
| | | | | | | | |
Total Preferred Stocks
(Cost: $75,616) | | | | 53,915 | |
| | | | | | | | |
The accompanying notes are an integral part of these financial statements.
| | |
| 80 | | Annual Report • June 30, 2023 |
Bridge Builder International Equity Fund
Summary Schedule of Investments
June 30, 2023 (Continued)
(Amounts in thousands, except number of contracts)
| | | | | | | | |
| | | Shares
(000s) | | | Value
(000s) | |
SHORT-TERM INVESTMENTS – 1.56% | | | | | |
| Money Market Funds – 1.39% | | | | | | | | |
Goldman Sachs Financial Square Government Fund – Class I, 5.02% (6) | | | 227,347 | | | $ | 227,347 | |
| | | | | | | | |
Total Money Market Funds | | | | | | | 227,347 | |
| | | | | | | | |
| | |
| | | Principal
Amount
(000s) | | | Value
(000s) | |
| Time Deposits – 0.17% | | | | | | | | |
ANZ, Hong Kong, 3.02% due 07/03/2023 | | AUD | 149 | | | | 99 | |
Brown Brothers Harriman, 2.22% due 07/03/2023 | | DKK | 393 | | | | 58 | |
Brown Brothers Harriman, 2.47% due 07/03/2023 | | SEK | 635 | | | | 59 | |
Brown Brothers Harriman, 2.85% due 07/03/2023 | | NOK | 626 | | | | 58 | |
Brown Brothers Harriman, 4.15% due 07/03/2023 | | NZD | 190 | | | | 116 | |
Brown Brothers Harriman, 6.42% due 07/03/2023(7) | | ZAR | 2 | | | | 0 | |
Citibank, London, 2.62% due 07/03/2023 | | EUR | 1,189 | | | | 1,298 | |
HSBC, Hong Kong, 3.72% due 07/03/2023 | | HKD | 2,995 | | | | 382 | |
HSBC, Singapore, 3.05% due 07/03/2023 | | SGD | 74 | | | | 55 | |
JP Morgan, New York, 4.57% due 07/03/2023 | | $ | 971 | | | | 971 | |
Royal Bank of Canada, Toronto, 3.79% due 07/04/2023(7) | | CAD | 0 | | | | 0 | |
Skandinaviska Enskilda Banken AB, Stockholm, 0.65% due 07/03/2023 | | CHF | 24 | | | | 27 | |
Skandinaviska Enskilda Banken AB, Stockholm, 2.62% due 07/03/2023 | | EUR | 673 | | | | 735 | |
Skandinaviska Enskilda Banken AB, Stockholm, 4.17% due 07/03/2023 | | GBP | 1,325 | | | | 1,683 | |
Sumitomo Trust Bank, London, 4.57% due 07/03/2023 | | $ | 483 | | | | 483 | |
Sumitomo, Tokyo, -0.37% due 07/03/2023 | | | JPY 3,111,453 | | | | 21,563 | |
Sumitomo, Tokyo, 4.57% due 07/03/2023 | | $ | 447 | | | | 447 | |
| | | | | | | | |
Total Time Deposits | | | | | | | 28,034 | |
| | | | | | | | |
Total Short-Term Investments
(Cost: $255,381) | | | | 255,381 | |
| | | | | | | | |
TOTAL INVESTMENTS IN SECURITIES – 99.82%
(Cost: $14,774,228) | | | | 16,375,225 | |
| OTHER ASSETS IN EXCESS OF LIABILITIES – 0.18% | | | | 28,959 | |
| | | | | | | | |
| TOTAL NET ASSETS – 100.00% | | | $ | 16,404,184 | |
| | | | | | | | |
Percentages are stated as a percent of net assets.
Principal amounts are denominated in the currency in which the security was purchased.
ADR American Depositary Receipt
AUD Australian Dollar
CAD Canadian Dollar
CHF Swiss Franc
DKK Danish Krone
EUR Euro
GBP British Pound
HKD Hong Kong Dollar
JPY Japanese Yen
NOK Norwegian Krone
NZD New Zealand Dollar
SEK Swedish Krona
SGD Singapore Dollar
ZAR South African Rand
| (1) | Security or includes securities purchased exempt from registration in the U.S. pursuant to Rule 144(A) under the Securities Act of 1933. The value of these securities totals $674,184, which represents 4.11% of total net assets. |
| (2) | Non-income producing security or includes securities that are non-income producing. |
| (3) | Includes securities that are categorized as Level 3 per the Trust’s fair value hierarchy. The value of these securities totals $0, which represents 0.00% of total net assets. |
| (4) | Includes securities that are restricted at June 30, 2023. The value of these securities totals $0, which represents 0.00% of total net assets. |
| (5) | Amount calculated is less than 0.005%. |
| (6) | Represents annualized seven-day yield as of the close of the reporting period. |
| (7) | A zero balance may reflect actual amounts rounding to less than one thousand. |
The accompanying notes are an integral part of these financial statements.
| | |
| Annual Report • June 30, 2023 | | 81 |
Bridge Builder International Equity Fund
Summary Schedule of Investments
June 30, 2023 (Continued)
(Amounts in thousands, except number of contracts)
Open Futures Contracts
| | | | | | | | | | | | | | | | | | |
Number of Contracts
Purchased | | Reference Entity | | Expiration
Date | | | Notional
Amount | | | Value | | | Unrealized
Appreciation/
(Depreciation) | |
| 41 | | Euro Stoxx 50 Future | | | Sep. 2023 | | | EUR | 1,784 | | | $ | 1,981 | | | $ | 34 | |
| 14 | | FTSE 100 INDEX Future | | | Sep. 2023 | | | GBP | 1,063 | | | | 1,341 | | | | (9 | ) |
| 7 | | TOPIX INDEX Future | | | Sep. 2023 | | | JPY | 155,149 | | | | 1,110 | | | | 35 | |
| | | | | | | | | | | | | | | | | | |
| | | | | | | | | | | | | | | | $ | 60 | |
| | | | | | | | | | | | | | | | | | |
| | | | |
Country | | Percentages of
Net Assets | |
Australia | | | 2.03 | % |
Austria | | | 0.18 | |
Belgium | | | 0.30 | |
Bermuda | | | 0.40 | |
Brazil | | | 0.80 | |
Canada | | | 1.95 | |
China | | | 1.80 | |
Denmark | | | 2.86 | |
Finland | | | 0.60 | |
France | | | 8.82 | |
Germany | | | 5.91 | |
Hong Kong | | | 2.85 | |
Hungary | | | 0.04 | |
India | | | 1.51 | |
Indonesia | | | 0.04 | |
Ireland | | | 2.34 | |
Isle of Man | | | 0.03 | |
Israel | | | 0.03 | |
Italy | | | 3.76 | |
Japan | | | 19.38 | |
Luxembourg | | | 0.54 | |
Mexico | | | 0.24 | |
Netherlands | | | 6.25 | |
New Zealand | | | 0.32 | |
| | | | |
Country (Continued) | | Percentages of
Net Assets | |
Norway | | | 0.31 | % |
Portugal | | | 0.36 | |
Singapore | | | 1.83 | |
South Africa | | | 0.09 | |
South Korea | | | 0.37 | |
Spain | | | 1.70 | |
Sweden | | | 2.89 | |
Switzerland | | | 5.46 | |
Taiwan | | | 1.53 | |
Thailand | | | 0.02 | |
United Kingdom | | | 17.67 | |
United States | | | 2.68 | |
Uruguay | | | 0.37 | |
Other (individually each country is less than 0.005%) | | | 0.00 | |
| | | | |
Total Country | | | 98.26 | |
| | | | |
SHORT-TERM INVESTMENTS | | | 1.56 | |
| | | | |
TOTAL INVESTMENTS IN SECURITIES | | | 99.82 | |
OTHER ASSETS IN EXCESS OF LIABILITIES | | | 0.18 | |
| | | | |
TOTAL NET ASSETS | | | 100.00 | % |
| | | | |
The accompanying notes are an integral part of these financial statements.
| | |
| 82 | | Annual Report • June 30, 2023 |
Bridge Builder Tax Managed International Equity Fund
Summary Schedule of Investments
June 30, 2023
(Amounts in thousands, except number of contracts)
| | | | | | | | |
| | | Shares
(000s) | | | Value
(000s) | |
COMMON STOCKS – 96.07% | | | | | | | | |
| Communication Services – 2.04% | | | | | | | | |
Various Securities (1)(2) | | | 7,899 | | | $ | 23,209 | |
| | | | | | | | |
Total Communication Services | | | | 23,209 | |
| | | | | |
| Consumer Discretionary – 13.16% | | | | | | | | |
Accor SA | | | 206 | | | | 7,673 | |
Adidas AG | | | 39 | | | | 7,542 | |
Cie Generale des Etablissements
Michelin SCA | | | 282 | | | | 8,337 | |
Compass Group Plc | | | 479 | | | | 13,416 | |
Industria de Diseno Textil SA | | | 272 | | | | 10,555 | |
LVMH Moet Hennessy Louis Vuitton SE | | | 14 | | | | 13,550 | |
Other Securities (1)(2) | | | 5,497 | | | | 88,523 | |
| | | | | | | | |
Total Consumer Discretionary | | | | 149,596 | |
| | | | | |
| Consumer Staples – 8.84% | | | | | | | | |
Alimentation Couche-Tard, Inc. | | | 177 | | | | 9,067 | |
Diageo Plc | | | 254 | | | | 10,936 | |
J Sainsbury Plc | | | 2,348 | | | | 8,025 | |
L’Oreal SA | | | 28 | | | | 12,833 | |
Nestle SA | | | 163 | | | | 19,628 | |
Other Securities (2) | | | 5,232 | | | | 39,945 | |
| | | | | | | | |
Total Consumer Staples | | | | 100,434 | |
| | | | | |
| Energy – 2.73% | | | | | | | | |
Shell Plc | | | 330 | | | | 9,950 | |
Shell Plc – ADR | | | 38 | | | | 2,277 | |
TotalEnergies SE | | | 198 | | | | 11,346 | |
Other Securities (2) | | | 494 | | | | 7,408 | |
| | | | | | | | |
Total Energy | | | | 30,981 | |
| | | | | |
| Financials – 15.92% | | | | | | | | |
AIA Group Ltd. | | | 1,089 | | | | 11,063 | |
Amundi SA (1) | | | 139 | | | | 8,203 | |
HSBC Holdings Plc | | | 1,051 | | | | 8,321 | |
ING Groep NV | | | 841 | | | | 11,337 | |
Prudential Plc | | | 501 | | | | 7,081 | |
Other Securities (1)(2) | | | 16,913 | | | | 134,938 | |
| | | | | | | | |
Total Financials | | | | 180,943 | |
| | | | | |
| Healthcare – 15.60% | | | | | | | | |
CSL Ltd. | | | 45 | | | | 8,317 | |
Hoya Corp. | | | 69 | | | | 8,270 | |
Koninklijke Philips NV | | | 406 | | | | 8,804 | |
Novartis AG | | | 137 | | | | 13,801 | |
Novo Nordisk – Class B | | | 112 | | | | 18,043 | |
Roche Holding AG | | | 67 | | | | 20,408 | |
Sanofi | | | 136 | | | | 14,652 | |
Sysmex Corp. | | | 106 | | | | 7,268 | |
Other Securities (1)(2) | | | 1,577 | | | | 77,721 | |
| | | | | | | | |
Total Healthcare | | | | 177,284 | |
| | | | | |
| Industrials – 16.01% | | | | | | | | |
Canadian National Railway Co. | | | 68 | | | | 8,291 | |
Daikin Industries Ltd. | | | 52 | | | | 10,738 | |
Daimler Truck Holding AG | | | 259 | | | | 9,322 | |
Experian Plc | | | 201 | | | | 7,709 | |
FANUC Corp. | | | 201 | | | | 7,039 | |
Komatsu Ltd. | | | 317 | | | | 8,583 | |
| | | | | | | | |
| | | Shares
(000s) | | | Value
(000s) | |
Kone OYJ – Class B | | | 149 | | | $ | 7,778 | |
Randstad NV | | | 140 | | | | 7,402 | |
Rexel SA | | | 369 | | | | 9,132 | |
Siemens AG | | | 67 | | | | 11,241 | |
SMC Corp. | | | 16 | | | | 9,004 | |
Other Securities (1)(2) | | | 3,382 | | | | 85,720 | |
| | | | | | | | |
Total Industrials | | | | 181,959 | |
| | | | | |
| Information Technology – 11.46% | | | | | | | | |
ASML Holding NV | | | 25 | | | | 18,339 | |
Dassault Systemes SE | | | 166 | | | | 7,365 | |
Hon Hai Precision Industry Co. Ltd. | | | 2,053 | | | | 7,464 | |
Keyence Corp. | | | 23 | | | | 11,072 | |
Murata Manufacturing Co. Ltd. | | | 150 | | | | 8,594 | |
Samsung Electronics Co. Ltd. | | | 135 | | | | 7,416 | |
SAP SE | | | 103 | | | | 14,070 | |
Taiwan Semiconductor Manufacturing
Co. Ltd. | | | 372 | | | | 6,872 | |
Taiwan Semiconductor Manufacturing Co. Ltd. – ADR | | | 93 | | | | 9,428 | |
Other Securities (2) | | | 2,542 | | | | 39,551 | |
| | | | | | | | |
Total Information Technology | | | | 130,171 | |
| | | | | |
| Materials – 7.51% | | | | | | | | |
Air Liquide SA | | | 70 | | | | 12,558 | |
BASF SE | | | 159 | | | | 7,744 | |
Covestro AG (1)(2) | | | 245 | | | | 12,742 | |
Shin-Etsu Chemical Co. Ltd. | | | 288 | | | | 9,609 | |
Other Securities (2) | | | 2,934 | | | | 42,681 | |
| | | | | | | | |
Total Materials | | | | 85,334 | |
| | | | | |
| Real Estate – 0.68% | | | | | | | | |
Various Securities (1)(2) | | | 1,530 | | | | 7,783 | |
| | | | | | | | |
Total Real Estate | | | | 7,783 | |
| | | | | |
| Utilities – 2.12% | | | | | | | | |
Enel SpA | | | 1,183 | | | | 7,977 | |
Other Securities (1) | | | 1,680 | | | | 16,091 | |
| | | | | | | | |
Total Utilities | | | | 24,068 | |
| | | | | |
Total Common Stocks
(Cost: $948,231) | | | | 1,091,762 | |
| | | | | |
PREFERRED STOCKS – 0.67% | | | | | | | | |
| Consumer Discretionary – 0.66% | | | | | | | | |
Various Securities (1)(2) | | | 59 | | | | 7,535 | |
| | | | | | | | |
Total Consumer Discretionary | | | | 7,535 | |
| | | | | |
| Consumer Staples – 0.01% | | | | | | | | |
Henkel AG & Co. KGaA | | | 1 | | | | 63 | |
| | | | | | | | |
Total Consumer Staples | | | | 63 | |
| | | | | |
Total Preferred Stocks
(Cost: $7,520) | | | | 7,598 | |
| | | | | |
SHORT-TERM INVESTMENTS – 3.19% | |
| Money Market Funds – 2.97% | | | | | | | | |
Goldman Sachs Financial Square Government Fund – Class I, 5.02%(3) | | | 33,739 | | | | 33,739 | |
| | | | | | | | |
Total Money Market Funds | | | | 33,739 | |
| | | | | | | | |
The accompanying notes are an integral part of these financial statements.
| | |
| Annual Report • June 30, 2023 | | 83 |
Bridge Builder Tax Managed International Equity Fund
Summary Schedule of Investments
June 30, 2023 (Continued)
(Amounts in thousands, except number of contracts)
| | | | | | | | |
| | | Principal
Amount
(000s) | | | Value
(000s) | |
| Time Deposits – 0.22% | | | | | | | | |
ANZ, Hong Kong, 3.02% due 07/03/2023 | | AUD | 36 | | | $ | 24 | |
Brown Brothers Harriman, 2.22% due 07/03/2023(4) | | DKK | 0 | | | | 0 | |
Brown Brothers Harriman, 2.47% due 07/03/2023(4) | | SEK | 3 | | | | 0 | |
Brown Brothers Harriman, 2.85% due 07/03/2023 | | NOK | 3,252 | | | | 303 | |
Brown Brothers Harriman, 4.15% due 07/03/2023(4) | | NZD | 0 | | | | 0 | |
HSBC, Hong Kong, 3.72% due 07/03/2023 | | HKD | 691 | | | | 88 | |
HSBC, Singapore, 3.05% due 07/03/2023 | | SGD | 14 | | | | 11 | |
Royal Bank of Canada, Toronto, 3.79% due 07/04/2023 | | CAD | 110 | | | | 83 | |
Skandinaviska Enskilda Banken AB, Stockholm, 0.65% due 07/03/2023 | | CHF | 1 | | | | 1 | |
Skandinaviska Enskilda Banken AB, Stockholm, 2.62% due 07/03/2023 | | EUR | 344 | | | | 376 | |
Skandinaviska Enskilda Banken AB, Stockholm, 4.17% due 07/03/2023 | | GBP | 228 | | | | 289 | |
Sumitomo, Tokyo, -0.37% due 07/03/2023 | | JPY | 192,244 | | | | 1,333 | |
| | | | | | | | |
Total Time Deposits | | | | | | | 2,508 | |
| | | | | | | | |
Total Short-Term Investments
(Cost: $36,247) | | | | 36,247 | |
| | | | | |
TOTAL INVESTMENTS IN SECURITIES – 99.93%
(Cost: $991,998) | | | | 1,135,607 | |
| OTHER ASSETS IN EXCESS OF LIABILITIES – 0.07% | | | | 759 | |
| | | | | | | | |
| TOTAL NET ASSETS – 100.00% | | | $ | 1,136,366 | |
| | | | | | | | |
Percentages are stated as a percent of net assets.
Principal amounts are denominated in the currency in which the security was purchased.
ADR American Depositary Receipt
AUD Australian Dollar
CAD Canadian Dollar
CHF Swiss Franc
DKK Danish Krone
EUR Euro
GBP British Pound
HKD Hong Kong Dollar
JPY Japanese Yen
NOK Norwegian Krone
NZD New Zealand Dollar
SEK Swedish Krona
SGD Singapore Dollar
| (1) | Security or includes securities purchased exempt from registration in the U.S. pursuant to Rule 144(A) under the Securities Act of 1933. The value of these securities totals $30,896, which represents 2.72% of total net assets. |
| (2) | Non-income producing security or includes securities that are non-income producing. |
| (3) | Represents annualized seven-day yield as of the close of the reporting period. |
| (4) | A zero balance may reflect actual amounts rounding to less than one thousand. |
| | | | |
Country | | Percentages of
Net Assets | |
Australia | | | 3.16 | % |
Austria | | | 0.15 | |
Belgium | | | 0.16 | |
Brazil | | | 0.76 | |
Canada | | | 3.00 | |
Chile | | | 0.15 | |
China | | | 1.00 | |
Denmark | | | 3.44 | |
Finland | | | 1.70 | |
France | | | 13.08 | |
Germany | | | 9.39 | |
Hong Kong | | | 3.05 | |
Hungary | | | 0.09 | |
Ireland | | | 1.19 | |
Israel | | | 0.11 | |
Italy | | | 1.80 | |
Japan | | | 19.33 | |
Luxembourg | | | 0.48 | |
Netherlands | | | 5.73 | |
| | | | |
Country (Continued) | | Percentages of
Net Assets | |
New Zealand | | | 0.03 | % |
Norway | | | 0.82 | |
Portugal | | | 0.03 | |
Singapore | | | 0.84 | |
South Korea | | | 0.93 | |
Spain | | | 2.12 | |
Sweden | | | 1.26 | |
Switzerland | | | 8.83 | |
Taiwan | | | 2.12 | |
United Kingdom | | | 11.46 | |
United States | | | 0.53 | |
| | | | |
Total Country | | | 96.74 | |
| | | | |
SHORT-TERM INVESTMENTS | | | 3.19 | |
| | | | |
TOTAL INVESTMENTS IN SECURITIES | | | 99.93 | |
OTHER ASSETS IN EXCESS OF LIABILITIES | | | 0.07 | |
| | | | |
TOTAL NET ASSETS | | | 100.00 | % |
| | | | |
The accompanying notes are an integral part of these financial statements.
| | |
| 84 | | Annual Report • June 30, 2023 |
Bridge Builder Mutual Funds
Statements of Assets and Liabilities
June 30, 2023
(Amounts in thousands, except per share amounts)
| | | | | | | | | | | | | | | | |
| | | Bridge Builder
Core Bond Fund | | | Bridge Builder
Core Plus
Bond Fund | | | Bridge Builder
Municipal
Bond Fund | | | Bridge Builder
Municipal
High-Income
Bond Fund | |
Assets | | | | | | | | | | | | | | | | |
Investments, at value (1) | | $ | 16,787,456 | | | $ | 32,900,266 | | | $ | 11,609,366 | | | $ | 2,370,447 | |
Cash and cash equivalents | | | 17 | | | | 6,623 | | | | 12 | | | | 2 | |
Over-the-counter credit default swap contracts, at value | | | — | | | | 350 | | | | — | | | | — | |
Over-the-counter interest rate swap contracts, at value | | | — | | | | 440 | | | | — | | | | — | |
Receivable for investments sold | | | 183,999 | | | | 1,422,089 | | | | 579 | | | | 4,632 | |
Receivable for fund shares sold | | | 24,619 | | | | 54,051 | | | | 43,413 | | | | 8,417 | |
Unrealized appreciation on forward foreign currency exchange contracts | | | — | | | | 29,113 | | | | — | | | | — | |
Dividend and interest receivable | | | 101,760 | | | | 186,180 | | | | 130,436 | | | | 29,832 | |
Tax reclaim receivable | | | — | | | | 43 | | | | — | | | | — | |
Deposits at broker for futures contracts | | | — | | | | 26,233 | | | | — | | | | — | |
Variation margin on futures contracts | | | 6,158 | | | | 38,106 | | | | 4,174 | | | | 70 | |
Deposits at broker for centrally cleared swap contracts | | | — | | | | 55,618 | | | | — | | | | — | |
Variation margin on centrally cleared swap contracts | | | — | | | | 23,053 | | | | — | | | | — | |
Deposits at broker for TBA commitments | | | 1,889 | | | | 18,872 | | | | — | | | | — | |
Prepaid expenses and other assets | | | 98 | | | | 159 | | | | 98 | | | | 683 | |
Total Assets | | | 17,105,996 | | | | 34,761,196 | | | | 11,788,078 | | | | 2,414,083 | |
| | | | |
Liabilities | | | | | | | | | | | | | | | | |
TBA sale commitments, at value (2) | | | — | | | | 256,699 | | | | — | | | | — | |
Over-the-counter credit default swap contracts, at value | | | — | | | | 829 | | | | — | | | | — | |
Over-the-counter interest rate swap contracts, at value | | | — | | | | 53 | | | | — | | | | — | |
Due to broker for centrally cleared swap contracts | | | — | | | | 411 | | | | — | | | | — | |
Due to broker for forward foreign currency exchange contracts | | | — | | | | 21,042 | | | | — | | | | — | |
Due to broker for TBA commitments | | | — | | | | 790 | | | | — | | | | — | |
Payable for investments purchased | | | 661,167 | | | | 4,206,832 | | | | 69,692 | | | | 9,696 | |
Payable for fund shares redeemed | | | 10,960 | | | | 19,778 | | | | 9,077 | | | | 2,043 | |
Payable for swap contracts | | | — | | | | 573 | | | | — | | | | — | |
Interest payable | | | 26 | | | | 1,048 | | | | — | | | | — | |
Payable for foreign currency transactions | | | — | | | | 90 | | | | — | | | | — | |
Unrealized depreciation on forward foreign currency exchange contracts | | | — | | | | 20,295 | | | | — | | | | — | |
Unrealized depreciation on unfunded loan commitments | | | — | | | | 2 | | | | — | | | | — | |
Payable to Sub-advisers for Investment Advisory Fee | | | 1,404 | | | | 3,161 | | | | 1,093 | | | | 274 | |
Payable to Trustees | | | 8 | | | | 14 | | | | 5 | | | | 1 | |
Accrued expenses and other liabilities | | | 1,191 | | | | 4,962 | | | | 621 | | | | 4,541 | |
Total Liabilities | | | 674,756 | | | | 4,536,579 | | | | 80,488 | | | | 16,555 | |
Net Assets | | $ | 16,431,240 | | | $ | 30,224,617 | | | $ | 11,707,590 | | | $ | 2,397,528 | |
| | | | |
Net Assets Consist of | | | | | | | | | | | | | | | | |
Paid in capital ($0.00 par value common stock unlimited authorized shares) | | $ | 18,913,269 | | | $ | 35,335,684 | | | $ | 12,208,648 | | | $ | 2,413,375 | |
Total distributable earnings/(loss) | | | (2,482,029 | ) | | | (5,111,067 | ) | | | (501,058 | ) | | | (15,847 | ) |
Net Assets | | $ | 16,431,240 | | | $ | 30,224,617 | | | $ | 11,707,590 | | | $ | 2,397,528 | |
Net Assets | | $ | 16,431,240 | | | $ | 30,224,617 | | | $ | 11,707,590 | | | $ | 2,397,528 | |
Shares Outstanding | | | 1,847,932 | | | | 3,440,557 | | | | 1,194,640 | | | | 241,940 | |
Net Asset Value | | $ | 8.89 | | | $ | 8.78 | | | $ | 9.80 | | | $ | 9.91 | |
| | | | | | | | | | | | | | | | |
(1) Cost of investments | | | 18,380,624 | | | | 35,319,899 | | | | 11,908,000 | | | | 2,386,270 | |
(2) Proceeds from TBA sale commitments | | | — | | | | (257,601 | ) | | | — | | | | — | |
The accompanying notes are an integral part of these financial statements.
| | |
| Annual Report • June 30, 2023 | | 85 |
Bridge Builder Mutual Funds
Statements of Assets and Liabilities
June 30, 2023 (Continued)
(Amounts in thousands, except per share amounts)
| | | | | | | | | | | | | | | | |
| | | Bridge Builder
Large Cap
Growth Fund | | | Bridge Builder
Large Cap
Value Fund | | | Bridge Builder
Tax Managed
Large Cap Fund | | | Bridge Builder
Small/Mid Cap
Growth Fund | |
Assets | | | | | | | | | | | | | | | | |
Investments, at value (1) | | $ | 22,834,812 | | | $ | 17,035,458 | | | $ | 2,530,097 | | | $ | 7,124,745 | |
Cash and cash equivalents | | | 3 | | | | 18 | | | | 9 | | | | 11 | |
Receivable for foreign currency transactions | | | — | | | | 19 | | | | — | | | | — | |
Receivable for investments sold | | | 24,112 | | | | 27,839 | | | | — | | | | 9,115 | |
Receivable for fund shares sold | | | 33,157 | | | | 27,369 | | | | 9,690 | | | | 11,702 | |
Dividend and interest receivable | | | 8,582 | | | | 29,576 | | | | 2,241 | | | | 2,107 | |
Tax reclaim receivable | | | 642 | | | | 2,423 | | | | 40 | | | | 19 | |
Variation margin on futures contracts | | | 713 | | | | 317 | | | | — | | | | 172 | |
Prepaid expenses and other assets | | | 107 | | | | 142 | | | | 213 | | | | 35 | |
Total Assets | | | 22,902,128 | | | | 17,123,161 | | | | 2,542,290 | | | | 7,147,906 | |
| | | | |
Liabilities | | | | | | | | | | | | | | | | |
Payable for investments purchased | | | 13,823 | | | | 54,594 | | | | 12,546 | | | | 23,564 | |
Payable for fund shares redeemed | | | 24,228 | | | | 12,377 | | | | 2,738 | | | | 5,788 | |
Payable to Advisor | | | — | | | | — | | | | 48 | | | | — | |
Payable to Sub-advisers for Investment Advisory Fee | | | 3,165 | | | | 2,993 | | | | 468 | | | | 1,977 | |
Payable to Trustees | | | 12 | | | | 7 | | | | 1 | | | | 3 | |
Accrued expenses and other liabilities | | | 781 | | | | 440 | | | | 265 | | | | 228 | |
Total Liabilities | | | 42,009 | | | | 70,411 | | | | 16,066 | | | | 31,560 | |
Net Assets | | $ | 22,860,119 | | | $ | 17,052,750 | | | $ | 2,526,224 | | | $ | 7,116,346 | |
| | | | |
Net Assets Consist of | | | | | | | | | | | | | | | | |
Paid in capital ($0.00 par value common stock unlimited authorized shares) | | $ | 16,608,214 | | | $ | 12,300,237 | | | $ | 2,197,315 | | | $ | 6,470,837 | |
Total distributable earnings/(loss) | | | 6,251,905 | | | | 4,752,513 | | | | 328,909 | | | | 645,509 | |
Net Assets | | $ | 22,860,119 | | | $ | 17,052,750 | | | $ | 2,526,224 | | | $ | 7,116,346 | |
Net Assets | | $ | 22,860,119 | | | $ | 17,052,750 | | | $ | 2,526,224 | | | $ | 7,116,346 | |
Shares Outstanding | | | 1,112,706 | | | | 1,080,442 | | | | 228,526 | | | | 531,498 | |
Net Asset Value | | $ | 20.54 | | | $ | 15.78 | | | $ | 11.05 | | | $ | 13.39 | |
| | | | | | | | | | | | | | | | |
(1) Cost of investments | | | 16,081,459 | | | | 12,595,101 | | | | 2,165,251 | | | | 5,701,124 | |
The accompanying notes are an integral part of these financial statements.
| | |
| 86 | | Annual Report • June 30, 2023 |
Bridge Builder Mutual Funds
Statements of Assets and Liabilities
June 30, 2023 (Continued)
(Amounts in thousands, except per share amounts)
| | | | | | | | | | | | | | | | |
| | | Bridge Builder
Small/Mid Cap
Value Fund | | | Bridge Builder
Tax Managed
Small/Mid
Cap Fund | | | Bridge Builder
International
Equity Fund | | | Bridge Builder
Tax Managed
International
Equity Fund | |
Assets | | | | | | | | | | | | | | | | |
Investments, at value (1) | | $ | 6,806,550 | | | $ | 830,353 | | | $ | 16,375,225 | | | $ | 1,135,607 | |
Cash and cash equivalents | | | 13 | | | | 4 | | | | 235 | | | | 452 | |
Receivable for foreign currency transactions | | | — | | | | — | | | | 68 | | | | 15 | |
Receivable for investments sold | | | 8,948 | | | | — | | | | 6,753 | | | | — | |
Receivable for fund shares sold | | | 11,199 | | | | 3,443 | | | | 27,183 | | | | 5,377 | |
Dividend and interest receivable | | | 8,979 | | | | 854 | | | | 31,662 | | | | 1,702 | |
Tax reclaim receivable | | | 21 | | | | 2 | | | | 36,884 | | | | 1,293 | |
Variation margin on futures contracts | | | 356 | | | | — | | | | 307 | | | | — | |
Prepaid expenses and other assets | | | 49 | | | | 101 | | | | 42 | | | | 130 | |
Total Assets | | | 6,836,115 | | | | 834,757 | | | | 16,478,359 | | | | 1,144,576 | |
| | | | |
Liabilities | | | | | | | | | | | | | | | | |
Payable for investments purchased | | | 56,547 | | | | 156 | | | | 47,922 | | | | 6,645 | |
Payable for fund shares redeemed | | | 4,600 | | | | 745 | | | | 11,992 | | | | 1,017 | |
Foreign withholding tax payable | | | — | | | | — | | | | 7,625 | | | | — | |
Payable to Advisor | | | — | | | | 49 | | | | — | | | | 59 | |
Payable to Sub-advisers for Investment Advisory Fee | | | 2,048 | | | | 257 | | | | 4,360 | | | | 309 | |
Payable to Trustees | | | 3 | | | | 1 | | | | 10 | | | | 1 | |
Accrued expenses and other liabilities | | | 428 | | | | 118 | | | | 2,266 | | | | 179 | |
Total Liabilities | | | 63,626 | | | | 1,326 | | | | 74,175 | | | | 8,210 | |
Net Assets | | $ | 6,772,489 | | | $ | 833,431 | | | $ | 16,404,184 | | | $ | 1,136,366 | |
| | | | |
Net Assets Consist of | | | | | | | | | | | | | | | | |
Paid in capital ($0.00 par value common stock unlimited authorized shares) | | $ | 5,326,018 | | | $ | 766,718 | | | $ | 14,974,150 | | | $ | 990,457 | |
Total distributable earnings/(loss) | | | 1,446,471 | | | | 66,713 | | | | 1,430,034 | | | | 145,909 | |
Net Assets | | $ | 6,772,489 | | | $ | 833,431 | | | $ | 16,404,184 | | | $ | 1,136,366 | |
Net Assets | | $ | 6,772,489 | | | $ | 833,431 | | | $ | 16,404,184 | | | $ | 1,136,366 | |
Shares Outstanding | | | 519,776 | | | | 77,205 | | | | 1,356,688 | | | | 104,627 | |
Net Asset Value | | $ | 13.03 | | | $ | 10.80 | | | $ | 12.09 | | | $ | 10.86 | |
| | | | | | | | | | | | | | | | |
(1) Cost of investments | | | 5,384,974 | | | | 730,207 | | | | 14,774,228 | | | | 991,998 | |
The accompanying notes are an integral part of these financial statements.
| | |
| Annual Report • June 30, 2023 | | 87 |
Bridge Builder Mutual Funds
Statements of Operations
Year Ended June 30, 2023
(Amounts in thousands)
| | | | | | | | | | | | | | | | |
| | | Bridge Builder
Core Bond Fund | | | Bridge Builder
Core Plus
Bond Fund | | | Bridge Builder
Municipal
Bond Fund | | | Bridge Builder
Municipal
High-Income
Bond Fund** | |
Investment Income | | | | | | | | | | | | | | | | |
Dividend income | | $ | 19,016 | | | $ | 29,766 | | | $ | 12,237 | | | $ | 186 | |
Less: Foreign taxes withheld and issuance fees | | | — | | | | (79 | ) | | | — | | | | — | |
Interest | | | 555,891 | | | | 1,121,098 | | | | 330,188 | | | | 21,430 | |
Less: Foreign taxes withheld* | | | (9 | ) | | | (0 | ) | | | — | | | | — | |
Other Income* | | | 1 | | | | 259 | | | | 0 | | | | — | |
Total investment income | | | 574,899 | | | | 1,151,044 | | | | 342,425 | | | | 21,616 | |
Expenses | | | | | | | | | | | | | | | | |
Investment advisory fee | | | 52,203 | | | | 106,446 | | | | 42,022 | | | | 1,669 | |
Professional fees | | | 406 | | | | 722 | | | | 306 | | | | 70 | |
Administration fee | | | 10 | | | | 10 | | | | 10 | | | | 2 | |
Fund accounting fees | | | 1,096 | | | | 1,674 | | | | 929 | | | | 2 | |
Transfer agent fees and expenses | | | 33 | | | | 40 | | | | 34 | | | | 1 | |
Trustees fees and expenses | | | 262 | | | | 471 | | | | 191 | | | | 10 | |
Printing and mailing expense | | | 54 | | | | 218 | | | | 9 | | | | 3 | |
Custody fees | | | 386 | | | | 796 | | | | 153 | | | | 18 | |
Insurance expense | | | 93 | | | | 172 | | | | 67 | | | | 2 | |
Interest expense | | | — | | | | 4,811 | | | | — | | | | — | |
Registration fees | | | 334 | | | | 575 | | | | 576 | | | | 301 | |
Other expenses | | | 195 | | | | 379 | | | | 124 | | | | 40 | |
Total expenses before fee waivers | | | 55,072 | | | | 116,314 | | | | 44,421 | | | | 2,118 | |
Fee waivers and/or expense reimbursements by Adviser | | | (34,663 | ) | | | (67,264 | ) | | | (27,443 | ) | | | (1,045 | ) |
Net expenses | | | 20,409 | | | | 49,050 | | | | 16,978 | | | | 1,073 | |
Net Investment Income | | | 554,490 | | | | 1,101,994 | | | | 325,447 | | | | 20,543 | |
| | | | |
Realized Gain/(Loss) and Change in Unrealized Appreciation/(Depreciation) | | | | | | | | | | | | | | | | |
Net realized gain/(loss) on: | | | | | | | | | | | | | | | | |
Investments | | | (430,334 | ) | | | (1,220,356 | ) | | | (282,821 | ) | | | (85 | ) |
TBA sale commitments | | | 2,650 | | | | 14,089 | | | | — | | | | — | |
Forward foreign currency exchange contracts | | | — | | | | 37,719 | | | | — | | | | — | |
Foreign currency transactions | | | — | | | | 1,871 | | | | — | | | | — | |
Futures contracts | | | (56,960 | ) | | | (211,216 | ) | | | 15,656 | | | | (8 | ) |
Swap contracts | | | — | | | | (24,968 | ) | | | — | | | | — | |
Net realized gain/(loss) | | | (484,644 | ) | | | (1,402,861 | ) | | | (267,165 | ) | | | (93 | ) |
Net change in net unrealized appreciation/(depreciation) on: | | | | | | | | | | | | | | | | |
Investments | | | (146,959 | ) | | | 339,608 | | | | 345,608 | | | | (15,823 | ) |
TBA sale commitments | | | 49 | | | | 2,218 | | | | — | | | | — | |
Forward foreign currency exchange contracts | | | — | | | | (2,775 | ) | | | — | | | | — | |
Foreign currency transactions* | | | 0 | | | | 1,487 | | | | — | | | | — | |
Futures contracts | | | (3,203 | ) | | | (43,660 | ) | | | (1,860 | ) | | | — | |
Swap contracts | | | — | | | | 43,163 | | | | — | | | | — | |
Unfunded loan commitments | | | — | | | | 19 | | | | — | | | | — | |
Net change in unrealized appreciation/(depreciation) | | | (150,113 | ) | | | 340,060 | | | | 343,748 | | | | (15,823 | ) |
Net realized gain/(loss) and net change in unrealized appreciation/(depreciation) | | | (634,757 | ) | | | (1,062,801 | ) | | | 76,583 | | | | (15,916 | ) |
Net Increase/(Decrease) in Net Assets Resulting from Operations | | $ | (80,267 | ) | | $ | 39,193 | | | $ | 402,030 | | | $ | 4,627 | |
| * | A zero balance may reflect actual amounts rounding to less than one thousand. |
| ** | Fund inception date was April 13, 2023. |
The accompanying notes are an integral part of these financial statements.
| | |
| 88 | | Annual Report • June 30, 2023 |
Bridge Builder Mutual Funds
Statements of Operations
Year Ended June 30, 2023 (Continued)
(Amounts in thousands)
| | | | | | | | | | | | | | | | |
| | | Bridge Builder
Large Cap
Growth Fund | | | Bridge Builder
Large Cap
Value Fund | | | Bridge Builder
Tax Managed
Large Cap Fund | | | Bridge Builder
Small/Mid Cap
Growth Fund | |
Investment Income | | | | | | | | | | | | | | | | |
Dividend income | | $ | 201,017 | | | $ | 379,842 | | | $ | 25,541 | | | $ | 37,460 | |
Less: Foreign taxes withheld and issuance fees | | | (584 | ) | | | (3,650 | ) | | | (62 | ) | | | (89 | ) |
Interest | | | 130 | | | | 183 | | | | 88 | | | | 138 | |
Less: Foreign taxes withheld | | | — | | | | — | | | | — | | | | — | |
Other Income* | | | 1 | | | | 1 | | | | 0 | | | | 1 | |
Total investment income | | | 200,564 | | | | 376,376 | | | | 25,567 | | | | 37,510 | |
Expenses | | | | | | | | | | | | | | | | |
Investment advisory fee | | | 82,478 | | | | 72,211 | | | | 6,703 | | | | 38,431 | |
Professional fees | | | 391 | | | | 362 | | | | 74 | | | | 168 | |
Administration fee | | | 10 | | | | 11 | | | | 10 | | | | 10 | |
Fund accounting fees | | | 688 | | | | 613 | | | | 81 | | | | 248 | |
Recoupment expense | | | — | | | | — | | | | 48 | | | | — | |
Transfer agent fees and expenses | | | 38 | | | | 35 | | | | 32 | | | | 31 | |
Trustee fees and expenses | | | 322 | | | | 266 | | | | 33 | | | | 104 | |
Printing and mailing expense | | | 178 | | | | 139 | | | | 26 | | | | 43 | |
Custody fees | | | 202 | | | | 252 | | | | 30 | | | | 137 | |
Insurance expense | | | 103 | | | | 89 | | | | 9 | | | | 32 | |
Registration fees | | | 731 | | | | 364 | | | | 504 | | | | 409 | |
Other expenses | | | 193 | | | | 177 | | | | 107 | | | | 62 | |
Total expenses before fee waivers | | | 85,334 | | | | 74,519 | | | | 7,657 | | | | 39,675 | |
Fee waivers by Adviser | | | (49,578 | ) | | | (36,347 | ) | | | (3,094 | ) | | | (17,136 | ) |
Net expenses | | | 35,756 | | | | 38,172 | | | | 4,563 | | | | 22,539 | |
Net Investment Income | | | 164,808 | | | | 338,204 | | | | 21,004 | | | | 14,971 | |
| | | | |
Realized Gain/(Loss) and Change in Unrealized Appreciation/(Depreciation) | | | | | | | | | | | | | | | | |
Net realized gain/(loss) on: | | | | | | | | | | | | | | | | |
Investments | | | (410,384 | ) | | | 580,297 | | | | (50,688 | ) | | | (339,116 | ) |
Foreign currency transactions | | | 317 | | | | (118 | ) | | | — | | | | — | |
Futures contracts | | | 2,495 | | | | 260 | | | | — | | | | 181 | |
Net realized gain/(loss) | | | (407,572 | ) | | | 580,439 | | | | (50,688 | ) | | | (338,935 | ) |
Net change in net unrealized appreciation/(depreciation) on: | | | | | | | | | | | | | | | | |
Investments | | | 4,112,297 | | | | 1,212,562 | | | | 374,398 | | | | 1,238,201 | |
Foreign currency transactions | | | 9 | | | | 200 | | | | — | | | | — | |
Futures contracts | | | 348 | | | | 206 | | | | — | | | | 133 | |
Net change in unrealized appreciation/(depreciation) | | | 4,112,654 | | | | 1,212,968 | | | | 374,398 | | | | 1,238,334 | |
Net realized gain/(loss) and net change in unrealized appreciation/(depreciation) | | | 3,705,082 | | | | 1,793,407 | | | | 323,710 | | | | 899,399 | |
Net Increase/(Decrease) in Net Assets Resulting from Operations | | $ | 3,869,890 | | | $ | 2,131,611 | | | $ | 344,714 | | | $ | 914,370 | |
| * | A zero balance may reflect actual amounts rounding to less than one thousand. |
The accompanying notes are an integral part of these financial statements.
| | |
| Annual Report • June 30, 2023 | | 89 |
Bridge Builder Mutual Funds
Statements of Operations
Year Ended June 30, 2023 (Continued)
(Amounts in thousands)
| | | | | | | | | | | | | | | | |
| | | Bridge Builder
Small/Mid
Cap Value Fund | | | Bridge Builder
Tax Managed
Small/Mid Cap
Fund | | | Bridge Builder
International
Equity Fund | | | Bridge Builder
Tax Managed
International
Equity Fund | |
Investment Income | | | | | | | | | | | | | | | | |
Dividend income | | $ | 120,576 | | | $ | 7,728 | | | $ | 454,836 | | | $ | 26,744 | |
Less: Foreign taxes withheld and issuance fees | | | (235 | ) | | | (15 | ) | | | (39,198 | ) | | | (2,998 | ) |
Interest | | | 162 | | | | 58 | | | | 241 | | | | 67 | |
Less: Foreign taxes withheld | | | — | | | | — | | | | — | | | | — | |
Other Income* | | | 0 | | | | 0 | | | | 212 | | | | 5 | |
Total investment income | | | 120,503 | | | | 7,771 | | | | 416,091 | | | | 23,818 | |
Expenses | | | | | | | | | | | | | | | | |
Investment advisory fee | | | 39,766 | | | | 3,299 | | | | 88,981 | | | | 4,128 | |
Professional fees | | | 181 | | | | 56 | | | | 336 | | | | 63 | |
Administration fee | | | 10 | | | | 10 | | | | 10 | | | | 10 | |
Fund accounting fees | | | 261 | | | | 47 | | | | 662 | | | | 89 | |
Recoupment expense | | | — | | | | 49 | | | | — | | | | 59 | |
Transfer agent fees and expenses | | | 30 | | | | 31 | | | | 34 | | | | 31 | |
Trustee fees and expenses | | | 104 | | | | 13 | | | | 252 | | | | 17 | |
Printing and mailing expense | | | 11 | | | | 10 | | | | 154 | | | | 14 | |
Custody fees | | | 194 | | | | 28 | | | | 1,954 | | | | 210 | |
Insurance expense | | | 35 | | | | 3 | | | | 82 | | | | 4 | |
Registration fees | | | 288 | | | | 290 | | | | 347 | | | | 326 | |
Other expenses | | | 67 | | | | 93 | | | | 576 | | | | 100 | |
Total expenses before fee waivers | | | 40,947 | | | | 3,929 | | | | 93,388 | | | | 5,051 | |
Fee waivers by Adviser | | | (15,880 | ) | | | (1,255 | ) | | | (39,996 | ) | | | (1,804 | ) |
Net expenses | | | 25,067 | | | | 2,674 | | | | 53,392 | | | | 3,247 | |
Net Investment Income | | | 95,436 | | | | 5,097 | | | | 362,699 | | | | 20,571 | |
| | | | |
Realized Gain/(Loss) and Change in Unrealized Appreciation/(Depreciation) | | | | | | | | | | | | | | | | |
Net realized gain/(loss) on: | | | | | | | | | | | | | | | | |
Investments | | | 94,496 | | | | (36,783 | ) | | | (237,359 | ) | | | (12,838 | ) |
Foreign currency transactions | | | 1 | | | | — | | | | (2,821 | ) | | | (2,852 | ) |
Futures contracts | | | 112 | | | | — | | | | 842 | | | | — | |
Net realized gain/(loss) | | | 94,609 | | | | (36,783 | ) | | | (239,338 | ) | | | (15,690 | ) |
Net change in net unrealized appreciation/(depreciation) on: | | | | | | | | | | | | | | | | |
Investments | | | 527,067 | | | | 107,173 | | | | 2,329,826 | | | | 153,067 | |
Foreign currency transactions* | | | 0 | | | | — | | | | 2,447 | | | | 48 | |
Futures contracts | | | 245 | | | | — | | | | 122 | | | | — | |
Net change in unrealized appreciation/(depreciation) | | | 527,312 | | | | 107,173 | | | | 2,332,395 | | | | 153,115 | |
Net realized gain/(loss) and net change in unrealized appreciation/(depreciation) | | | 621,921 | | | | 70,390 | | | | 2,093,057 | | | | 137,425 | |
Net Increase/(Decrease) in Net Assets Resulting from Operations | | $ | 717,357 | | | $ | 75,487 | | | $ | 2,455,756 | | | $ | 157,996 | |
| * | A zero balance may reflect actual amounts rounding to less than one thousand. |
The accompanying notes are an integral part of these financial statements.
| | |
| 90 | | Annual Report • June 30, 2023 |
Bridge Builder Mutual Funds
Statements of Changes in Net Assets
(Amounts in thousands)
| | | | | | | | | | | | | | | | |
| | | Bridge Builder
Core Bond Fund | | | Bridge Builder Core
Plus Bond Fund | |
| | | Year Ended
June 30, 2023 | | | Year Ended
June 30, 2022 | | | Year Ended
June 30, 2023 | | | Year Ended
June 30, 2022 | |
Operations | | | | | | | | | | | | | | | | |
Net investment income | | $ | 554,490 | | | $ | 385,598 | | | $ | 1,101,994 | | | $ | 664,410 | |
Net realized gain/(loss) | | | (484,644 | ) | | | (284,886 | ) | | | (1,402,861 | ) | | | (849,510 | ) |
Net change in unrealized appreciation/(depreciation) | | | (150,113 | ) | | | (2,084,454 | ) | | | 340,060 | | | | (3,516,779 | ) |
Net increase/(decrease) in net assets resulting from operations | | | (80,267 | ) | | | (1,983,742 | ) | | | 39,193 | | | | (3,701,879 | ) |
Distributions to Shareholders | | | | | | | | | | | | | | | | |
From distributable earnings | | | (560,827 | ) | | | (441,022 | ) | | | (1,203,781 | ) | | | (814,204 | ) |
Total distributions | | | (560,827 | ) | | | (441,022 | ) | | | (1,203,781 | ) | | | (814,204 | ) |
Capital Transactions | | | | | | | | | | | | | | | | |
Proceeds from shares sold | | | 2,266,879 | | | | 3,161,843 | | | | 5,043,568 | | | | 5,882,428 | |
Reinvestment of dividends | | | 560,827 | | | | 441,022 | | | | 1,203,781 | | | | 814,204 | |
Cost of shares redeemed | | | (2,859,892 | ) | | | (1,964,432 | ) | | | (6,192,113 | ) | | | (3,536,432 | ) |
Net increase/(decrease) from capital transactions | | | (32,186 | ) | | | 1,638,433 | | | | 55,236 | | | | 3,160,200 | |
Net increase/(decrease) in net assets | | | (673,280 | ) | | | (786,331 | ) | | | (1,109,352 | ) | | | (1,355,883 | ) |
Net Assets | | | | | | | | | | | | | | | | |
Beginning of period | | | 17,104,520 | | | | 17,890,851 | | | | 31,333,969 | | | | 32,689,852 | |
End of period | | $ | 16,431,240 | | | $ | 17,104,520 | | | $ | 30,224,617 | | | $ | 31,333,969 | |
| | | | | | | | | | | | | | | | | |
| | | | |
| | | | | | | | | | | | | | | | |
Change in Shares Outstanding | | | | | | | | | | | | | | | | |
Shares outstanding, beginning of period | | | 1,853,648 | | | | 1,696,403 | | | | 3,442,151 | | | | 3,134,557 | |
Shares sold | | | 252,548 | | | | 311,473 | | | | 568,295 | | | | 585,917 | |
Shares issued to holders in reinvestments of dividends | | | 62,680 | | | | 43,810 | | | | 136,397 | | | | 81,629 | |
Shares redeemed | | | (320,944 | ) | | | (198,038 | ) | | | (706,286 | ) | | | (359,952 | ) |
Shares outstanding, end of period | | | 1,847,932 | | | | 1,853,648 | | | | 3,440,557 | | | | 3,442,151 | |
| | | | | | | | | | | | | | | | | |
The accompanying notes are an integral part of these financial statements.
| | |
| Annual Report • June 30, 2023 | | 91 |
Bridge Builder Mutual Funds
Statements of Changes in Net Assets (Continued)
(Amounts in thousands)
| | | | | | | | | | | | |
| | | Bridge Builder
Municipal Bond Fund | | | Bridge Builder
Municipal High-Income Bond Fund | |
| | | Year Ended
June 30, 2023 | | | Year Ended
June 30, 2022 | | | Period Ended
June 30, 2023* | |
Operations | | | | | | | | | | | | |
Net investment income | | $ | 325,447 | | | $ | 209,596 | | | $ | 20,543 | |
Net realized gain/(loss) | | | (267,165 | ) | | | (47,452 | ) | | | (93 | ) |
Net change in unrealized appreciation/(depreciation) | | | 343,748 | | | | (1,056,789 | ) | | | (15,823 | ) |
Net increase/(decrease) in net assets resulting from operations | | | 402,030 | | | | (894,645 | ) | | | 4,627 | |
Distributions to Shareholders | | | | | | | | | | | | |
From distributable earnings | | | (324,381 | ) | | | (209,403 | ) | | | (20,474 | ) |
Total distributions | | | (324,381 | ) | | | (209,403 | ) | | | (20,474 | ) |
Capital Transactions | | | | | | | | | | | | |
Proceeds from shares sold | | | 5,041,104 | | | | 3,708,759 | | | | 2,466,633 | |
Reinvestment of dividends | | | 324,381 | | | | 209,403 | | | | 20,474 | |
Cost of shares redeemed | | | (4,548,667 | ) | | | (1,889,846 | ) | | | (73,732 | ) |
Net increase/(decrease) from capital transactions | | | 816,818 | | | | 2,028,316 | | | | 2,413,375 | |
Net increase/(decrease) in net assets | | | 894,467 | | | | 924,268 | | | | 2,397,528 | |
Net Assets | | | | | | | | | | | | |
Beginning of period | | | 10,813,123 | | | | 9,888,855 | | | | — | |
End of period | | $ | 11,707,590 | | | $ | 10,813,123 | | | $ | 2,397,528 | |
| | | | | | | | | | | | | |
| | | |
| | | | | | | | | | | | |
Change in Shares Outstanding | | | | | | | | | | | | |
Shares outstanding, beginning of period | | | 1,106,061 | | | | 914,906 | | | | — | |
Shares sold | | | 519,606 | | | | 355,673 | | | | 247,312 | |
Shares issued to holders in reinvestments of dividends | | | 33,310 | | | | 20,166 | | | | 2,071 | |
Shares redeemed | | | (464,337 | ) | | | (184,684 | ) | | | (7,443 | ) |
Shares outstanding, end of period | | | 1,194,640 | | | | 1,106,061 | | | | 241,940 | |
| | | | | | | | | | | | | |
| * | Fund inception date was April 13, 2023. |
The accompanying notes are an integral part of these financial statements.
| | |
| 92 | | Annual Report • June 30, 2023 |
Bridge Builder Mutual Funds
Statements of Changes in Net Assets (Continued)
(Amounts in thousands)
| | | | | | | | | | | | | | | | |
| | | Bridge Builder
Large Cap Growth Fund | | | Bridge Builder
Large Cap Value Fund | |
| | | Year Ended
June 30, 2023 | | | Year Ended
June 30, 2022 | | | Year Ended
June 30, 2023 | | | Year Ended
June 30, 2022 | |
Operations | | | | | | | | | | | | | | | | |
Net investment income | | $ | 164,808 | | | $ | 105,943 | | | $ | 338,204 | | | $ | 320,965 | |
Net realized gain/(loss) | | | (407,572 | ) | | | 259,642 | | | | 580,439 | | | | 1,308,310 | |
Net change in unrealized appreciation/(depreciation) | | | 4,112,654 | | | | (4,272,356 | ) | | | 1,212,968 | | | | (2,617,637 | ) |
Net increase/(decrease) in net assets resulting from operations | | | 3,869,890 | | | | (3,906,771 | ) | | | 2,131,611 | | | | (988,362 | ) |
Distributions to Shareholders | | | | | | | | | | | | | | | | |
From distributable earnings | | | (130,160 | ) | | | (1,371,952 | ) | | | (1,341,399 | ) | | | (1,289,665 | ) |
Total distributions | | | (130,160 | ) | | | (1,371,952 | ) | | | (1,341,399 | ) | | | (1,289,665 | ) |
Capital Transactions | | | | | | | | | | | | | | | | |
Proceeds from shares sold | | | 5,917,474 | | | | 4,125,184 | | | | 2,468,061 | | | | 3,756,018 | |
Reinvestment of dividends | | | 130,160 | | | | 1,371,952 | | | | 1,341,399 | | | | 1,289,665 | |
Cost of shares redeemed | | | (2,308,196 | ) | | | (2,443,209 | ) | | | (4,580,179 | ) | | | (3,131,841 | ) |
Net increase/(decrease) from capital transactions | | | 3,739,438 | | | | 3,053,927 | | | | (770,719 | ) | | | 1,913,842 | |
Net increase/(decrease) in net assets | | | 7,479,168 | | | | (2,224,796 | ) | | | 19,493 | | | | (364,185 | ) |
Net Assets | | | | | | | | | | | | | | | | |
Beginning of period | | | 15,380,951 | | | | 17,605,747 | | | | 17,033,257 | | | | 17,397,442 | |
End of period | | $ | 22,860,119 | | | $ | 15,380,951 | | | $ | 17,052,750 | | | $ | 17,033,257 | |
| | | | | | | | | | | | | | | | | |
| | | | |
| | | | | | | | | | | | | | | | |
Change in Shares Outstanding | | | | | | | | | | | | | | | | |
Shares outstanding, beginning of period | | | 897,748 | | | | 754,992 | | | | 1,120,567 | | | | 1,009,277 | |
Shares sold | | | 332,845 | | | | 193,257 | | | | 160,837 | | | | 218,762 | |
Shares issued to holders in reinvestments of dividends | | | 7,666 | | | | 58,603 | | | | 89,529 | | | | 76,179 | |
Shares redeemed | | | (125,553 | ) | | | (109,104 | ) | | | (290,491 | ) | | | (183,651 | ) |
Shares outstanding, end of period | | | 1,112,706 | | | | 897,748 | | | | 1,080,442 | | | | 1,120,567 | |
| | | | | | | | | | | | | | | | | |
The accompanying notes are an integral part of these financial statements.
| | |
| Annual Report • June 30, 2023 | | 93 |
Bridge Builder Mutual Funds
Statements of Changes in Net Assets (Continued)
(Amounts in thousands)
| | | | | | | | | | | | | | | | |
| | | Bridge Builder
Tax Managed Large Cap Fund | | | Bridge Builder
Small/Mid Cap Growth Fund | |
| | | Year Ended
June 30, 2023 | | | Period Ended
June 30, 2022* | | | Year Ended
June 30, 2023 | | | Year Ended
June 30, 2022 | |
Operations | | | | | | | | | | | | | | | | |
Net investment income | | $ | 21,004 | | | $ | 114 | | | $ | 14,971 | | | $ | 6,987 | |
Net realized gain/(loss) | | | (50,688 | ) | | | 1 | | | | (338,935 | ) | | | 93,290 | |
Net change in unrealized appreciation/(depreciation) | | | 374,398 | | | | (9,552 | ) | | | 1,238,334 | | | | (1,997,955 | ) |
Net increase/(decrease) in net assets resulting from operations | | | 344,714 | | | | (9,437 | ) | | | 914,370 | | | | (1,897,678 | ) |
Distributions to Shareholders | | | | | | | | | | | | | | | | |
From distributable earnings | | | (6,368 | ) | | | — | | | | (10,849 | ) | | | (965,578 | ) |
Total distributions | | | (6,368 | ) | | | — | | | | (10,849 | ) | | | (965,578 | ) |
Capital Transactions | | | | | | | | | | | | | | | | |
Proceeds from shares sold | | | 2,254,109 | | | | 165,541 | | | | 1,562,429 | | | | 2,205,860 | |
Reinvestment of dividends | | | 6,368 | | | | — | | | | 10,849 | | | | 965,578 | |
Cost of shares redeemed | | | (224,465 | ) | | | (4,238 | ) | | | (692,290 | ) | | | (952,012 | ) |
Net increase/(decrease) from capital transactions | | | 2,036,012 | | | | 161,303 | | | | 880,988 | | | | 2,219,426 | |
Net increase/(decrease) in net assets | | | 2,374,358 | | | | 151,866 | | | | 1,784,509 | | | | (643,830 | ) |
Net Assets | | | | | | | | | | | | | | | | |
Beginning of period | | | 151,866 | | | | — | | | | 5,331,837 | | | | 5,975,667 | |
End of period | | $ | 2,526,224 | | | $ | 151,866 | | | $ | 7,116,346 | | | $ | 5,331,837 | |
| | | | | | | | | | | | | | | | | |
| | | | |
| | | | | | | | | | | | | | | | |
Change in Shares Outstanding | | | | | | | | | | | | | | | | |
Shares outstanding, beginning of period | | | 16,307 | | | | — | | | | 459,804 | | | | 314,116 | |
Shares sold | | | 234,031 | | | | 16,748 | | | | 126,877 | | | | 146,912 | |
Shares issued to holders in reinvestments of dividends | | | 663 | | | | — | | | | 932 | | | | 58,303 | |
Shares redeemed | | | (22,475 | ) | | | (441 | ) | | | (56,115 | ) | | | (59,527 | ) |
Shares outstanding, end of period | | | 228,526 | | | | 16,307 | | | | 531,498 | | | | 459,804 | |
| | | | | | | | | | | | | | | | | |
| * | Fund inception date was June 1, 2022. |
The accompanying notes are an integral part of these financial statements.
| | |
| 94 | | Annual Report • June 30, 2023 |
Bridge Builder Mutual Funds
Statements of Changes in Net Assets (Continued)
(Amounts in thousands)
| | | | | | | | | | | | | | | | |
| | | Bridge Builder
Small/Mid Cap Value Fund | | | Bridge Builder
Tax Managed Small/Mid Cap Fund | |
| | | Year Ended
June 30, 2023 | | | Year Ended
June 30, 2022 | | | Year Ended
June 30, 2023 | | | Period Ended
June 30, 2022* | |
Operations | | | | | | | | | | | | | | | | |
Net investment income | | $ | 95,436 | | | $ | 88,082 | | | $ | 5,097 | | | $ | 44 | |
Net realized gain/(loss) | | | 94,609 | | | | 550,118 | | | | (36,783 | ) | | | (28 | ) |
Net change in unrealized appreciation/(depreciation) | | | 527,312 | | | | (1,318,375 | ) | | | 107,173 | | | | (7,027 | ) |
Net increase/(decrease) in net assets resulting from operations | | | 717,357 | | | | (680,175 | ) | | | 75,487 | | | | (7,011 | ) |
Distributions to Shareholders | | | | | | | | | | | | | | | | |
From distributable earnings | | | (423,411 | ) | | | (737,343 | ) | | | (1,763 | ) | | | — | |
Total distributions | | | (423,411 | ) | | | (737,343 | ) | | | (1,763 | ) | | | — | |
Capital Transactions | | | | | | | | | | | | | | | | |
Proceeds from shares sold | | | 1,202,094 | | | | 1,706,279 | | | | 741,760 | | | | 100,053 | |
Reinvestment of dividends | | | 423,411 | | | | 737,343 | | | | 1,763 | | | | — | |
Cost of shares redeemed | | | (1,192,253 | ) | | | (1,989,101 | ) | | | (73,263 | ) | | | (3,595 | ) |
Net increase/(decrease) from capital transactions | | | 433,252 | | | | 454,521 | | | | 670,260 | | | | 96,458 | |
Net increase/(decrease) in net assets | | | 727,198 | | | | (962,997 | ) | | | 743,984 | | | | 89,447 | |
Net Assets | | | | | | | | | | | | | | | | |
Beginning of period | | | 6,045,291 | | | | 7,008,288 | | | | 89,447 | | | | — | |
End of period | | $ | 6,772,489 | | | $ | 6,045,291 | | | $ | 833,431 | | | $ | 89,447 | |
| | | | | | | | | | | | | | | | | |
| | | | |
| | | | | | | | | | | | | | | | |
Change in Shares Outstanding | | | | | | | | | | | | | | | | |
Shares outstanding, beginning of period | | | 481,427 | | | | 450,592 | | | | 9,633 | | | | — | |
Shares sold | | | 95,392 | | | | 116,301 | | | | 74,638 | | | | 10,015 | |
Shares issued to holders in reinvestments of dividends | | | 34,133 | | | | 50,657 | | | | 180 | | | | — | |
Shares redeemed | | | (91,176 | ) | | | (136,123 | ) | | | (7,246 | ) | | | (382 | ) |
Shares outstanding, end of period | | | 519,776 | | | | 481,427 | | | | 77,205 | | | | 9,633 | |
| | | | | | | | | | | | | | | | | |
| * | Fund inception date was June 1, 2022. |
The accompanying notes are an integral part of these financial statements.
| | |
| Annual Report • June 30, 2023 | | 95 |
Bridge Builder Mutual Funds
Statements of Changes in Net Assets (Continued)
(Amounts in thousands)
| | | | | | | | | | | | | | | | |
| | | Bridge Builder
International Equity Fund | | | Bridge Builder
Tax Managed International
Equity Fund | |
| | | Year Ended
June 30, 2023 | | | Year Ended
June 30, 2022 | | | Year Ended
June 30, 2023 | | | Period Ended
June 30, 2022* | |
Operations | | | | | | | | | | | | | | | | |
Net investment income | | $ | 362,699 | | | $ | 313,093 | | | $ | 20,571 | | | $ | 75 | |
Net realized gain/(loss) | | | (239,338 | ) | | | 263,546 | | | | (15,690 | ) | | | 245 | |
Net change in unrealized appreciation/(depreciation) | | | 2,332,395 | | | | (3,908,398 | ) | | | 153,115 | | | | (9,459 | ) |
Net increase/(decrease) in net assets resulting from operations | | | 2,455,756 | | | | (3,331,759 | ) | | | 157,996 | | | | (9,139 | ) |
Distributions to Shareholders | | | | | | | | | | | | | | | | |
From distributable earnings | | | (336,315 | ) | | | (1,359,777 | ) | | | (2,948 | ) | | | — | |
Total distributions | | | (336,315 | ) | | | (1,359,777 | ) | | | (2,948 | ) | | | — | |
Capital Transactions | | | | | | | | | | | | | | | | |
Proceeds from shares sold | | | 3,195,931 | | | | 4,808,044 | | | | 990,140 | | | | 126,483 | |
Reinvestment of dividends | | | 336,315 | | | | 1,359,777 | | | | 2,948 | | | | — | |
Cost of shares redeemed | | | (2,856,833 | ) | | | (3,080,388 | ) | | | (115,398 | ) | | | (13,716 | ) |
Net increase/(decrease) from capital transactions | | | 675,413 | | | | 3,087,433 | | | | 877,690 | | | | 112,767 | |
Net increase/(decrease) in net assets | | | 2,794,854 | | | | (1,604,103 | ) | | | 1,032,738 | | | | 103,628 | |
Net Assets | | | | | | | | | | | | | | | | |
Beginning of period | | | 13,609,330 | | | | 15,213,433 | | | | 103,628 | | | | — | |
End of period | | $ | 16,404,184 | | | $ | 13,609,330 | | | $ | 1,136,366 | | | $ | 103,628 | |
| | | | | | | | | | | | | | | | | |
| | | | |
| | | | | | | | | | | | | | | | |
Change in Shares Outstanding | | | | | | | | | | | | | | | | |
Shares outstanding, beginning of period | | | 1,289,825 | | | | 1,033,080 | | | | 11,357 | | | | — | |
Shares sold | | | 295,690 | | | | 380,233 | | | | 104,514 | | | | 12,840 | |
Shares issued to holders in reinvestments of dividends | | | 31,223 | | | | 100,819 | | | | 308 | | | | — | |
Shares redeemed | | | (260,050 | ) | | | (224,307 | ) | | | (11,552 | ) | | | (1,483 | ) |
Shares outstanding, end of period | | | 1,356,688 | | | | 1,289,825 | | | | 104,627 | | | | 11,357 | |
| | | | | | | | | | | | | | | | | |
| * | Fund inception date was June 1, 2022. |
The accompanying notes are an integral part of these financial statements.
| | |
| 96 | | Annual Report • June 30, 2023 |
[THIS PAGE INTENTIONALLY LEFT BLANK]
| | |
| Annual Report • June 30, 2023 | | 97 |
Bridge Builder Mutual Funds
Financial Highlights
| | | | | | | | | | | | | | | | | | | | | | | | | | | | |
| | | Per Share Operating Performance | |
| | | Change in Net Assets Resulting from
Operations | | | Less Distributions | |
| | | Net asset
value,
beginning of
period | | | Net
investment
income(2) | | | Net realized
and
unrealized
gain/(loss) | | | Net
increase/
(decrease)
in net asset
value from
operations | | | Distributions
from net
investment
income | | | Distributions
from net
realized
gains | | | Total
Distributions | |
Bridge Builder Core Bond Fund | | | | | | | | | | | | | | | | | | | | | | | | | | | | |
For the year ended June 30, 2023 | | $ | 9.23 | | | | 0.31 | | | | (0.34 | ) | | | (0.03 | ) | | | (0.31 | ) | | | — | | | | (0.31 | ) |
For the year ended June 30, 2022 | | $ | 10.55 | | | | 0.21 | | | | (1.28 | ) | | | (1.07 | ) | | | (0.23 | ) | | | (0.02 | ) | | | (0.25 | ) |
For the year ended June 30, 2021 | | $ | 10.91 | | | | 0.23 | | | | (0.10 | ) | | | 0.13 | | | | (0.26 | ) | | | (0.23 | ) | | | (0.49 | ) |
For the year ended June 30, 2020 | | $ | 10.34 | | | | 0.31 | | | | 0.61 | | | | 0.92 | | | | (0.32 | ) | | | (0.03 | ) | | | (0.35 | ) |
For the year ended June 30, 2019 | | $ | 9.87 | | | | 0.31 | | | | 0.48 | | | | 0.79 | | | | (0.32 | ) | | | — | | | | (0.32 | ) |
Bridge Builder Core Plus Bond Fund | | | | | | | | | | | | | | | | | | | | | | | | | | | | |
For the year ended June 30, 2023 | | $ | 9.10 | | | | 0.33 | | | | (0.28 | ) | | | 0.05 | | | | (0.37 | ) | | | — | | | | (0.37 | ) |
For the year ended June 30, 2022 | | $ | 10.43 | | | | 0.20 | | | | (1.28 | ) | | | (1.08 | ) | | | (0.22 | ) | | | (0.03 | ) | | | (0.25 | ) |
For the year ended June 30, 2021 | | $ | 10.56 | | | | 0.22 | | | | 0.12 | | | | 0.34 | | | | (0.25 | ) | | | (0.22 | ) | | | (0.47 | ) |
For the year ended June 30, 2020 | | $ | 10.27 | | | | 0.32 | | | | 0.47 | | | | 0.79 | | | | (0.36 | ) | | | (0.14 | ) | | | (0.50 | ) |
For the year ended June 30, 2019 | | $ | 9.81 | | | | 0.35 | | | | 0.48 | | | | 0.83 | | | | (0.37 | ) | | | — | | | | (0.37 | ) |
Bridge Builder Municipal Bond Fund | | | | | | | | | | | | | | | | | | | | | | | | | | | | |
For the year ended June 30, 2023 | | $ | 9.78 | | | | 0.27 | | | | 0.02 | | | | 0.29 | | | | (0.27 | ) | | | — | | | | (0.27 | ) |
For the year ended June 30, 2022 | | $ | 10.81 | | | | 0.20 | | | | (1.03 | ) | | | (0.83 | ) | | | (0.20 | ) | | | — | | | | (0.20 | ) |
For the year ended June 30, 2021 | | $ | 10.49 | | | | 0.22 | | | | 0.32 | | | | 0.54 | | | | (0.22 | ) | | | — | | | | (0.22 | ) |
For the year ended June 30, 2020 | | $ | 10.46 | | | | 0.26 | | | | 0.03 | | | | 0.29 | | | | (0.26 | ) | | | — | | | | (0.26 | ) |
For the year ended June 30, 2019 | | $ | 10.09 | | | | 0.27 | | | | 0.37 | | | | 0.64 | | | | (0.27 | ) | | | — | | | | (0.27 | ) |
Bridge Builder Municipal High-Income Bond Fund | | | | | | | | | | | | | | | | | | | | | |
For the period 4/13/23(6) - 6/30/23 | | $ | 10.00 | | | | 0.09 | | | | (0.09 | ) | | | — | | | | (0.09 | ) | | | — | | | | (0.09 | ) |
Bridge Builder Large Cap Growth Fund | | | | | | | | | | | | | | | | | | | | | | | | | | | | |
For the year ended June 30, 2023 | | $ | 17.13 | | | | 0.16 | | | | 3.37 | | | | 3.53 | | | | (0.12 | ) | | | — | | | | (0.12 | ) |
For the year ended June 30, 2022 | | $ | 23.32 | | | | 0.13 | | | | (4.51 | ) | | | (4.38 | ) | | | (0.12 | ) | | | (1.69 | ) | | | (1.81 | ) |
For the year ended June 30, 2021 | | $ | 17.11 | | | | 0.13 | | | | 6.83 | | | | 6.96 | | | | (0.11 | ) | | | (0.64 | ) | | | (0.75 | ) |
For the year ended June 30, 2020 | | $ | 14.64 | | | | 0.14 | | | | 2.65 | | | | 2.79 | | | | (0.14 | ) | | | (0.18 | ) | | | (0.32 | ) |
For the year ended June 30, 2019 | | $ | 13.53 | | | | 0.15 | | | | 1.60 | | | | 1.75 | | | | (0.14 | ) | | | (0.50 | ) | | | (0.64 | ) |
Bridge Builder Large Cap Value Fund | | | | | | | | | | | | | | | | | | | | | | | | | | | | |
For the year ended June 30, 2023 | | $ | 15.20 | | | | 0.32 | | | | 1.63 | | | | 1.95 | | | | (0.32 | ) | | | (1.05 | ) | | | (1.37 | ) |
For the year ended June 30, 2022 | | $ | 17.24 | | | | 0.30 | | | | (1.10 | ) | | | (0.80 | ) | | | (0.30 | ) | | | (0.94 | ) | | | (1.24 | ) |
For the year ended June 30, 2021 | | $ | 11.77 | | | | 0.26 | | | | 5.48 | | | | 5.74 | | | | (0.27 | ) | | | — | | | | (0.27 | ) |
For the year ended June 30, 2020 | | $ | 12.71 | | | | 0.24 | | | | (0.94 | ) | | | (0.70 | ) | | | (0.23 | ) | | | (0.01 | ) | | | (0.24 | ) |
For the year ended June 30, 2019 | | $ | 12.12 | | | | 0.24 | | | | 0.74 | | | | 0.98 | | | | (0.23 | ) | | | (0.16 | ) | | | (0.39 | ) |
Bridge Builder Tax Managed Large Cap Fund | | | | | | | | | | | | | | | | | | | | | | | | | |
For the year ended June 30, 2023 | | $ | 9.31 | | | | 0.14 | | | | 1.63 | | | | 1.77 | | | | (0.03 | ) | | | — | | | | (0.03 | ) |
For the period 6/01/22(6) - 6/30/22 | | $ | 10.00 | | | | 0.01 | | | | (0.70 | ) | | | (0.69 | ) | | | — | | | | — | | | | — | |
Bridge Builder Small/Mid Cap Growth Fund | | | | | | | | | | | | | | | | | | | | | |
For the year ended June 30, 2023 | | $ | 11.60 | | | | 0.03 | | | | 1.78 | | | | 1.81 | | | | (0.02 | ) | | | — | | | | (0.02 | ) |
For the year ended June 30, 2022 | | $ | 19.02 | | | | 0.02 | | | | (4.42 | ) | | | (4.40 | ) | | | (0.01 | ) | | | (3.01 | ) | | | (3.02 | ) |
For the year ended June 30, 2021 | | $ | 14.73 | | | | 0.02 | | | | 6.42 | | | | 6.44 | | | | (0.04 | ) | | | (2.11 | ) | | | (2.15 | ) |
For the year ended June 30, 2020 | | $ | 14.25 | | | | 0.05 | | | | 1.01 | | | | 1.06 | | | | (0.05 | ) | | | (0.53 | ) | | | (0.58 | ) |
For the year ended June 30, 2019 | | $ | 13.52 | | | | 0.05 | | | | 1.39 | | | | 1.44 | | | | (0.05 | ) | | | (0.66 | ) | | | (0.71 | ) |
Bridge Builder Small/Mid Cap Value Fund | | | | | | | | | | | | | | | | | | | | | | | | | | | | |
For the year ended June 30, 2023 | | $ | 12.56 | | | | 0.20 | | | | 1.21 | | | | 1.41 | | | | (0.15 | ) | | | (0.79 | ) | | | (0.94 | ) |
For the year ended June 30, 2022 | | $ | 15.55 | | | | 0.19 | | | | (1.57 | ) | | | (1.38 | ) | | | (0.16 | ) | | | (1.45 | ) | | | (1.61 | ) |
For the year ended June 30, 2021 | | $ | 9.92 | | | | 0.14 | | | | 5.64 | | | | 5.78 | | | | (0.15 | ) | | | — | | | | (0.15 | ) |
For the year ended June 30, 2020 | | $ | 11.55 | | | | 0.16 | | | | (1.63 | ) | | | (1.47 | ) | | | (0.16 | ) | | | — | | | | (0.16 | ) |
For the year ended June 30, 2019 | | $ | 11.97 | | | | 0.17 | | | | (0.10 | ) | | | 0.07 | | | | (0.14 | ) | | | (0.35 | ) | | | (0.49 | ) |
Bridge Builder Tax Managed Small/Mid Cap Fund | | | | | | | | | | | | | | | | | | | | | |
For the year ended June 30, 2023 | | $ | 9.29 | | | | 0.10 | | | | 1.44 | | | | 1.54 | | | | (0.03 | ) | | | — | | | | (0.03 | ) |
For the period 6/01/22(6) - 6/30/22 | | $ | 10.00 | | | | 0.01 | | | | (0.72 | ) | | | (0.71 | ) | | | — | | | | — | | | | — | |
Bridge Builder International Equity Fund | | | | | | | | | | | | | | | | | | | | | | | | | | | | |
For the year ended June 30, 2023 | | $ | 10.55 | | | | 0.27 | | | | 1.52 | | | | 1.79 | | | | (0.20 | ) | | | (0.05 | ) | | | (0.25 | ) |
For the year ended June 30, 2022 | | $ | 14.73 | | | | 0.29 | | | | (3.11 | ) | | | (2.82 | ) | | | (0.32 | ) | | | (1.04 | ) | | | (1.36 | ) |
For the year ended June 30, 2021 | | $ | 10.97 | | | | 0.29 | | | | 3.72 | | | | 4.01 | | | | (0.25 | ) | | | — | | | | (0.25 | ) |
For the year ended June 30, 2020 | | $ | 11.38 | | | | 0.23 | | | | (0.36 | ) | | | (0.13 | ) | | | (0.28 | ) | | | — | | | | (0.28 | ) |
For the year ended June 30, 2019 | | $ | 11.60 | | | | 0.28 | | | | (0.14 | ) | | | 0.14 | | | | (0.22 | ) | | | (0.14 | ) | | | (0.36 | ) |
Bridge Builder Tax Managed International Equity Fund | | | | | | | | | | | | | | | | | | | | | |
For the year ended June 30, 2023 | | $ | 9.12 | | | | 0.30 | | | | 1.47 | | | | 1.77 | | | | (0.03 | ) | | | — | | | | (0.03 | ) |
For the period 6/01/22(6) - 6/30/22 | | $ | 10.00 | | | | 0.01 | | | | (0.89 | ) | | | (0.88 | ) | | | — | | | | — | | | | — | |
| (1) | Annualized for periods less than one year. |
| (2) | Per share amounts based on average number of shares outstanding during the year/period. |
| (3) | Total return is calculated assuming an initial investment made at the net asset value at the beginning of the period, reinvestment of all dividends and distributions at net asset value during the period and redemption on the last day of the period and is not annualized. |
| (4) | Includes adjustments in accordance with accounting principles generally accepted in the United States of America and as such, the net asset value for financial reporting purposes and the returns based upon those net asset values may differ from the net asset value and returns for shareholder transactions. |
| (5) | Ratios do not include the impact of the expenses of the underlying funds in which the fund invests. |
| (7) | Since inception return. |
| (8) | Portfolio turnover rate does not include securities received as part of an in-kind capital contribution. |
The accompanying notes are an integral part of these financial statements.
| | |
| 98 | | Annual Report • June 30, 2023 |
| | | | | | | | | | | | | | | | | | | | | | | | | | |
| | | | Ratios/Supplemental Data | |
| | | | | | | | | |
Ratios to Average Net Assets of:(1) | | | | |
Net asset
value, end of
period | | | Total
return(3)(4) | | | Net assets,
end of period
(millions) | | | Expenses,
before
waivers(5) | | | Expenses, net of
waivers(5) | | | Net investment
income/
(loss) | | | Portfolio
turnover
rate | |
| | | | | | | | | | | | | | | | | | | | | | | | | | |
| $ | 8.89 | | | | (0.30 | )% | | $ | 16,431 | | | | 0.34 | % | | | 0.13 | % | | | 3.40 | % | | | 151 | % |
| $ | 9.23 | | | | (10.36 | )% | | $ | 17,105 | | | | 0.34 | % | | | 0.13 | % | | | 2.12 | % | | | 157 | % |
| $ | 10.55 | | | | 1.18 | % | | $ | 17,891 | | | | 0.34 | % | | | 0.13 | % | | | 2.19 | % | | | 153 | % |
| $ | 10.91 | | | | 9.01 | % | | $ | 14,140 | | | | 0.34 | % | | | 0.13 | % | | | 2.91 | % | | | 137 | % |
| $ | 10.34 | | | | 8.18 | % | | $ | 15,160 | | | | 0.34 | % | | | 0.14 | % | | | 3.15 | % | | | 153 | % |
| | | | | | | | | | | | | | | | | | | | | | | | | | |
| $ | 8.78 | | | | 0.55 | % | | $ | 30,225 | | | | 0.39 | % | | | 0.17 | % | | | 3.72 | % | | | 228 | % |
| $ | 9.10 | | | | (10.59 | )% | | $ | 31,334 | | | | 0.38 | % | | | 0.15 | % | | | 2.00 | % | | | 283 | % |
| $ | 10.43 | | | | 3.18 | % | | $ | 32,690 | | | | 0.38 | % | | | 0.15 | % | | | 2.06 | % | | | 281 | % |
| $ | 10.56 | | | | 7.94 | % | | $ | 19,434 | | | | 0.39 | % | | | 0.16 | % | | | 3.08 | % | | | 164 | % |
| $ | 10.27 | | | | 8.66 | % | | $ | 17,963 | | | | 0.47 | % | | | 0.24 | % | | | 3.50 | % | | | 242 | % |
| | | | | | | | | | | | | | | | | | | | | | | | | | |
| $ | 9.80 | | | | 3.03 | % | | $ | 11,708 | | | | 0.38 | % | | | 0.15 | % | | | 2.79 | % | | | 26 | % |
| $ | 9.78 | | | | (7.73 | )% | | $ | 10,813 | | | | 0.38 | % | | | 0.15 | % | | | 1.96 | % | | | 22 | % |
| $ | 10.81 | | | | 5.19 | % | | $ | 9,889 | | | | 0.38 | % | | | 0.16 | % | | | 2.03 | % | | | 18 | % |
| $ | 10.49 | | | | 2.80 | % | | $ | 6,520 | | | | 0.38 | % | | | 0.16 | % | | | 2.47 | % | | | 41 | % |
| $ | 10.46 | | | | 6.42 | % | | $ | 5,253 | | | | 0.39 | % | | | 0.17 | % | | | 2.64 | % | | | 42 | % |
| | | | | | | | | | | | | | | | | | | | | | | | | | |
| $ | 9.91 | | | | 0.01 | %(7) | | $ | 2,398 | | | | 0.41 | % | | | 0.18 | % | | | 4.48 | % | | | 6 | %(8) |
| | | | | | | | | | | | | | | | | | | | | | | | | | |
| $ | 20.54 | | | | 20.76 | % | | $ | 22,860 | | | | 0.46 | % | | | 0.19 | % | | | 0.88 | % | | | 21 | % |
| $ | 17.13 | | | | (20.83 | )% | | $ | 15,381 | | | | 0.46 | % | | | 0.19 | % | | | 0.60 | % | | | 23 | % |
| $ | 23.32 | | | | 41.44 | % | | $ | 17,606 | | | | 0.45 | % | | | 0.19 | % | | | 0.65 | % | | | 31 | % |
| $ | 17.11 | | | | 19.28 | % | | $ | 13,464 | | | | 0.46 | % | | | 0.22 | % | | | 0.90 | % | | | 42 | % |
| $ | 14.64 | | | | 13.76 | % | | $ | 6,998 | | | | 0.46 | % | | | 0.22 | % | | | 1.07 | % | | | 31 | % |
| | | | | | | | | | | | | | | | | | | | | | | | | | |
| $ | 15.78 | | | | 13.52 | % | | $ | 17,053 | | | | 0.45 | % | | | 0.23 | % | | | 2.06 | % | | | 21 | % |
| $ | 15.20 | | | | (5.27 | )% | | $ | 17,033 | | | | 0.46 | % | | | 0.23 | % | | | 1.76 | % | | | 24 | % |
| $ | 17.24 | | | | 49.10 | % | | $ | 17,397 | | | | 0.45 | % | | | 0.24 | % | | | 1.80 | % | | | 26 | % |
| $ | 11.77 | | | | (5.55 | )% | | $ | 12,499 | | | | 0.46 | % | | | 0.24 | % | | | 1.94 | % | | | 36 | %(8) |
| $ | 12.71 | | | | 8.46 | % | | $ | 8,731 | | | | 0.46 | % | | | 0.25 | % | | | 1.95 | % | | | 24 | % |
| | | | | | | | | | | | | | | | | | | | | | | | | | |
| $ | 11.05 | | | | 19.07 | % | | $ | 2,526 | | | | 0.50 | % | | | 0.30 | % | | | 1.38 | % | | | 19 | % |
| $ | 9.31 | | | | (6.90 | )%(7) | | $ | 152 | | | | 0.66 | % | | | 0.51 | % | | | 1.36 | % | | | 0 | % |
| | | | | | | | | | | | | | | | | | | | | | | | | | |
| $ | 13.39 | | | | 15.65 | % | | $ | 7,116 | | | | 0.66 | % | | | 0.38 | % | | | 0.25 | % | | | 63 | % |
| $ | 11.60 | | | | (27.88 | )% | | $ | 5,332 | | | | 0.67 | % | | | 0.38 | % | | | 0.12 | % | | | 84 | % |
| $ | 19.02 | | | | 46.08 | % | | $ | 5,976 | | | | 0.66 | % | | | 0.37 | % | | | 0.13 | % | | | 37 | % |
| $ | 14.73 | | | | 7.63 | % | | $ | 4,794 | | | | 0.66 | % | | | 0.38 | % | | | 0.34 | % | | | 65 | % |
| $ | 14.25 | | | | 11.66 | % | | $ | 4,024 | | | | 0.67 | % | | | 0.39 | % | | | 0.41 | % | | | 23 | % |
| | | | | | | | | | | | | | | | | | | | | | | | | | |
| $ | 13.03 | | | | 11.65 | % | | $ | 6,772 | | | | 0.66 | % | | | 0.40 | % | | | 1.54 | % | | | 41 | % |
| $ | 12.56 | | | | (10.21 | )% | | $ | 6,045 | | | | 0.66 | % | | | 0.40 | % | | | 1.26 | % | | | 33 | % |
| $ | 15.55 | | | | 58.63 | % | | $ | 7,008 | | | | 0.65 | % | | | 0.40 | % | | | 1.12 | % | | | 34 | % |
| $ | 9.92 | | | | (12.98 | )% | | $ | 5,101 | | | | 0.66 | % | | | 0.42 | % | | | 1.44 | % | | | 50 | % |
| $ | 11.55 | | | | 1.22 | % | | $ | 4,810 | | | | 0.67 | % | | | 0.43 | % | | | 1.47 | % | | | 38 | % |
| | | | | | | | | | | | | | | | | | | | | | | | | | |
| $ | 10.80 | | | | 16.46 | % | | $ | 833 | | | | 0.76 | % | | | 0.52 | % | | | 0.99 | % | | | 36 | % |
| $ | 9.29 | | | | (7.10 | )%(7) | | $ | 89 | | | | 1.13 | % | | | 0.73 | % | | | 0.84 | % | | | 0 | % |
| | | | | | | | | | | | | | | | | | | | | | | | | | |
| $ | 12.09 | | | | 17.27 | % | | $ | 16,404 | | | | 0.63 | % | | | 0.36 | % | | | 2.45 | % | | | 19 | % |
| $ | 10.55 | | | | (21.02 | )% | | $ | 13,609 | | | | 0.64 | % | | | 0.37 | % | | | 2.18 | % | | | 23 | % |
| $ | 14.73 | | | | 36.84 | % | | $ | 15,213 | | | | 0.63 | % | | | 0.32 | % | | | 2.21 | % | | | 52 | % |
| $ | 10.97 | | | | (1.40 | )% | | $ | 11,345 | | | | 0.63 | % | | | 0.33 | % | | | 2.10 | % | | | 36 | % |
| $ | 11.38 | | | | 1.57 | % | | $ | 10,645 | | | | 0.64 | % | | | 0.36 | % | | | 2.49 | % | | | 16 | % |
| | | | | | | | | | | | | | | | | | | | | | | | | | |
| $ | 10.86 | | | | 19.47 | % | | $ | 1,136 | | | | 0.73 | % | | | 0.47 | % | | | 2.99 | % | | | 12 | % |
| $ | 9.12 | | | | (8.80 | )%(7) | | $ | 104 | | | | 1.20 | % | | | 0.67 | % | | | 1.10 | % | | | 0 | % |
The accompanying notes are an integral part of these financial statements.
| | |
| Annual Report • June 30, 2023 | | 99 |
Bridge Builder Mutual Funds
Notes to Financial Statements
1. ORGANIZATION
The Bridge Builder Trust (the “Trust”) is a Delaware statutory trust organized under the laws of the State of Delaware on December 19, 2012, and is registered with the Securities and Exchange Commission (the “SEC”) as an open-end management investment company under the Investment Company Act of 1940, as amended (the “1940 Act”). As of June 30, 2023, the Trust consisted of fifteen series, of which twelve are active series, identified below and presented in this report (each a “Fund,” and collectively, the “Funds”). The Bridge Builder Municipal High-Income Bond Fund was launched on April 13, 2023. The three remaining series are inactive and currently not available for purchase.
Olive Street Investment Advisers, LLC (the “Adviser”) acts as investment adviser to the Funds.
| | |
| Fund | | Investment Objective |
Bridge Builder Core Bond Fund
(“Core Bond Fund”) | | To provide total return (capital appreciation plus income) |
Bridge Builder Core Plus Bond Fund
(“Core Plus Bond Fund”) | | To provide total return (capital appreciation plus income) |
Bridge Builder Municipal Bond Fund
(“Municipal Bond Fund”) | | To provide current income exempt from federal tax, with a secondary goal of preservation of investment principal |
Bridge Builder Municipal High-Income Bond Fund
(“Municipal High-Income Bond Fund”) | | To provide current income exempt from federal tax. |
Bridge Builder Large Cap Growth Fund
(“Large Cap Growth Fund”) | | To provide capital appreciation |
Bridge Builder Large Cap Value Fund
(“Large Cap Value Fund”) | | To provide capital appreciation |
Bridge Builder Tax Managed Large Cap Fund
(“Tax Managed Large Cap Fund”) | | To seek to provide a tax-efficient investment return consisting of capital appreciation |
Bridge Builder Small/Mid Cap Growth Fund
(“Small/Mid Cap Growth Fund”) | | To provide capital appreciation |
Bridge Builder Small/Mid Cap Value Fund
(“Small/Mid Cap Value Fund”) | | To provide capital appreciation |
Bridge Builder Tax Managed Small/Mid Cap Fund
(“Tax Managed Small/Mid Cap Fund”) | | To seek to provide a tax-efficient investment return consisting of capital appreciation |
Bridge Builder International Equity Fund
(“International Equity Fund”) | | To provide capital appreciation |
| Bridge Builder Tax Managed International Equity Fund (“Tax Managed International Equity Fund”) | | To seek to provide a tax-efficient investment return consisting of capital appreciation |
The Funds are diversified and each currently offers a single class of shares. The Funds are available for investment exclusively through Edward Jones Advisory Solutions® and to current and former Trustees of the Trust.
2. SIGNIFICANT ACCOUNTING POLICIES
The following is a summary of significant accounting policies consistently followed by the Trust in the preparation of its financial statements. These policies are in conformity with generally accepted accounting principles (“GAAP”) in the United States of America.
The Funds are investment companies and, accordingly, follow the investment company accounting and reporting guidance of the Financial Accounting Standards Board (“FASB”) Accounting Standards Codification Topic 946 – Investment Companies, which is part of GAAP.
a) Use of Estimates – The presentation of financial statements in conformity with GAAP requires management to make estimates and assumptions that affect the reported amounts of assets and liabilities at the date of the financial statements and the reported amounts of revenues and expenses during the reporting period. Actual results could differ from those estimates and assumptions.
b) Investment Valuation – All securities and other investments are recorded at their estimated fair value, as described in Note 4.
| | |
| 100 | | Annual Report • June 30, 2023 |
Bridge Builder Mutual Funds
Notes to Financial Statements (Continued)
c) Federal Income Taxes – Each Fund is treated as a separate taxable entity for federal income tax purposes. The Funds intend to comply with the requirements of Subchapter M of the Internal Revenue Code of 1986, as amended (the “Internal Revenue Code”), applicable to regulated investment companies and to distribute substantially all of their net investment income and capital gains to shareholders. Funds may utilize earnings and profits distributed to shareholders on the redemption of shares as part of the dividends paid deduction. As a result, no provision for federal income tax is recorded in the financial statements.
The Adviser has reviewed the Funds’ tax positions for all open tax years (the prior three years of tax filings or since inception, if shorter, are considered open for examination) and has concluded that there is no tax liability/benefit resulting from uncertain income tax positions taken or expected to be taken in future tax returns. The Funds are also not aware of any tax position for which it is reasonably possible that the total amounts of unrecognized tax expense will significantly change in the next twelve months.
As of June 30, 2023, the Funds had no tax examinations or audits in progress.
d) Distributions to Shareholders – Distributions to shareholders are recorded on the ex-dividend date. Distributions of net investment income for the Core Bond, Core Plus Bond, Municipal Bond and Municipal High-Income Bond Funds are generally declared daily and paid monthly. The Large Cap Value Fund will generally declare and pay distributions of net investment income quarterly. The Large Cap Growth, Tax Managed Large Cap, Small/Mid Cap Growth, Small/Mid Cap Value, Tax Managed Small/Mid Cap, International Equity and Tax Managed International Equity Funds will generally declare and pay distributions of net investment income annually, as necessary. Realized capital gains, if any, are distributed by each Fund at least annually, as necessary. The amount and timing of distributions are determined in accordance with federal income tax regulations, which may differ from GAAP. To the extent these “book/tax” differences are permanent in nature, these amounts are reclassified within the capital accounts in the financial statements to reflect their tax character.
e) Indemnifications – In the normal course of business, the Trust may enter into contracts with service providers that contain general indemnification clauses. The Trust’s maximum exposure under these arrangements is unknown, as this would involve future claims against the Trust that have not yet occurred.
f) Investment Transactions, Income and Expense Allocation – Investment transactions are recorded on trade date. Securities gains and losses, net of foreign taxes withheld, if any, are calculated on the basis of identified cost. Dividend income (expense), net of foreign taxes withheld, if any, is recognized on ex-dividend date except in the case of foreign securities, in which case dividends are recorded as soon as the information becomes available, which may be after the published ex-dividend date. Non-cash dividend income received in the form of securities in-lieu of cash are recorded at the fair value of the securities received. Issuance fees, if any, are custodial fees on American Depositary Receipts (“ADRs”) charged by ADR agents on ADR dividends and are recorded when paid. Interest income is recognized on an accrual basis, while discounts and premiums on securities purchased are accreted or amortized, respectively, using the constant yield method over the life of the security. Expenses common to multiple Funds are allocated among the respective Funds based upon their relative net asset values or other reasonable allocation methods.
g) Foreign Currency Translation and Transactions – The books and records of the Funds are maintained in U.S. dollars. The Funds’ assets and liabilities in foreign currencies are translated into U.S. dollars at the prevailing exchange rate on the valuation date. Transactions denominated in foreign currencies are translated into U.S. dollars at the prevailing exchange rate on the date of the transaction. The Funds’ income earned and expense incurred in foreign denominated currencies are translated into U.S. dollars at the prevailing exchange rate on the date of such activity.
The Funds do not isolate that portion of the results of operations arising from changes in the foreign exchange rates on investments and derivatives from the fluctuations that result from changes in the market prices of investments
| | |
| Annual Report • June 30, 2023 | | 101 |
Bridge Builder Mutual Funds
Notes to Financial Statements (Continued)
and derivatives held or sold during the period. Accordingly, such foreign currency gains/(losses) are included in the reported net realized gains/(losses) on investments in securities and derivatives and net change in unrealized appreciation/(depreciation) on investment securities and derivatives on the Statements of Operations.
h) Regulatory Updates – In December 2020, the SEC adopted a rule addressing fair valuation of fund investments. New Rule 2a-5 under the 1940 Act sets forth requirements for good faith determinations of fair value, including related oversight and reporting obligations. Pursuant to the new rule, the Trust’s Board of Trustees (the “Board”) has designated the Adviser as the Funds’ valuation designee to make all fair value determinations with respect to the Funds’ portfolio investments, subject to the Board’s oversight.
The new rule also defines “readily available market quotations” for purposes of determining whether the fund should value a security at its market value (as opposed to fair value) under the 1940 Act, and the SEC noted that this definition would apply in all contexts under the 1940 Act. The effective date for the rule was March 8, 2021. The compliance date for both the new rule and the associated new recordkeeping requirements was September 8, 2022. The rule has been implemented and there were no material impacts to the financial statements.
On October 28, 2020, the SEC adopted new regulations governing the use of derivatives by registered investment companies. New Rule 18f-4 under the 1940 Act imposes new limits on the amount of derivatives a fund can enter into, replaced the asset segregation framework previously used by funds to comply with Section 18 of the 1940 Act, and requires funds whose use of derivatives is more than a limited specified exposure amount to establish and maintain a comprehensive derivatives risk management program and for boards of such funds to appoint a derivatives risk manager. The effective date for the rule was February 19, 2021. The compliance date for the new rule was August 19, 2022. The rule has been implemented and there were no material impacts to the financial statements.
In November 2022, the SEC adopted amendments to the requirements for annual and semi-annual shareholder reports provided by mutual funds and exchange-traded funds (ETFs) to highlight key information for investors. The amendments also require that funds tag their reports to shareholders using the Inline eXtensible Business Reporting Language (“Inline XBRL”) structured data language to provide machine-readable data that retail investors and other market participants may use to more efficiently access and evaluate investments. The SEC also adopted amendments to the advertising rules for registered investment companies and business development companies to promote more transparent and balanced statements about investment costs. The effective date for the amendments was January 24, 2023. The SEC adopted an eighteen-month transition period beginning from the effective date for the new shareholder report amendments. At this time, management is evaluating the implications of these changes on the financial statements.
3. SECURITIES AND OTHER INVESTMENTS
a) Delayed Delivery Securities – In the case of delayed delivery mortgage purchase commitments, the unit price and the estimated principal amount are established when the Fund enters into a contract, with the actual principal amount being within a specified range of the estimate. Forward commitments may be considered securities in themselves, and involve a risk of loss if the value of the security to be purchased declines prior to the settlement date. This risk is in addition to the risk of decline in the value of the Fund’s other assets. Where such purchases are made through dealers, the Fund relies on the dealer to consummate the sale. The dealer’s failure to do so may result in a loss to the Fund of an advantageous yield or price. Although the Fund will generally enter into forward commitments with the intention of acquiring securities for its portfolio, the Fund may dispose of a commitment prior to settlement if it deems it appropriate to do so.
A Fund may enter into delayed delivery sale commitments to hedge its portfolio positions or to sell securities it owns under delayed delivery arrangements. Proceeds of the sale commitments are not received until the contractual
| | |
| 102 | | Annual Report • June 30, 2023 |
Bridge Builder Mutual Funds
Notes to Financial Statements (Continued)
settlement date. Unsettled sale commitments are valued at current market value of the underlying securities. If the sale commitment is closed through the acquisition of an offsetting purchase commitment, the Fund realizes a gain or (loss) on the commitment without regard to any unrealized appreciation/(depreciation) on the underlying security. If the Fund delivers securities under the commitment, the Fund realizes a gain or (loss) from the sale of the securities based upon the unit price established at the date the commitment was entered into.
Rule 18f-4 under the 1940 Act permits a Fund to enter into when-issued or forward-settling securities and nonstandard settlement cycle securities notwithstanding the limitation on the issuance of senior securities in Section 18 of the 1940 Act, provided that the Fund intends to physically settle the transaction and the transaction will settle within 35 days of its trade date (the “Delayed-Settlement Securities Provision”). If a when-issued, forward- settling or non-standard settlement cycle security does not satisfy the Delayed-Settlement Securities Provision, then it is treated as a derivatives transaction under Rule 18f-4. The requirements of Rule 18f-4 may limit a Fund’s ability to engage in derivatives transactions as part of its investment strategies. These requirements may also increase the cost of a Fund’s investments and cost of doing business, which could adversely affect the value of the Fund’s investments and/or the performance of the Fund. The rule also may not be effective to limit a Fund’s risk of loss.
b) Derivatives – Certain Funds invest in derivatives as permitted by their investment strategies and policies. Derivatives are financial instruments whose value is based on the value of another underlying asset, interest rate, index or financial instrument. Derivatives may be riskier than other types of investments because derivatives may be more sensitive to changes in economic or market conditions than other types of investments and could result in losses that significantly exceed a Fund’s original investment. Derivatives are subject to the risk that changes in the value of a derivative may not correlate with the underlying asset, rate, or index. The use of derivatives may not be successful, resulting in losses to a Fund, and the cost of such strategies may reduce a Fund’s returns. Certain derivatives also expose a Fund to the risk that a counterparty will not fulfill its obligations under the derivatives contract. Certain of a Fund’s transactions in derivatives could also affect the amount, timing, and character of distributions to shareholders, which may result in a Fund realizing more short-term capital gain and ordinary income subject to tax at ordinary income tax rates than it would if it did not engage in such transactions, which may adversely affect a Fund’s after-tax returns. Investing in derivatives may result in a form of leverage, which may cause a Fund to be more volatile than if the Fund had not been leveraged because leverage tends to exaggerate the effect of any increase or decrease in the value of the Fund’s portfolio securities. Regulation relating to a Fund’s use of derivatives and related instruments, including Rule 18f-4 under the 1940 Act, could potentially limit or impact the Fund’s ability to invest in derivatives, limit the Fund’s ability to employ certain strategies that use derivatives and/or adversely affect the value of derivatives and the Fund’s performance.
Futures Contracts – Certain Funds may enter into futures contracts, which are agreements between two parties to buy or sell a specified underlying instrument for a fixed price on a specified future date. The Funds buy and sell futures contracts to gain or hedge exposure to certain risk factors. Upon entering into a futures contract, the Funds are required to deposit with the broker cash or securities, which are referred to as initial margin. Securities deposited as initial margin are designated on the Summary Schedule of Investments, and cash deposited is recorded as Deposits at broker for futures contracts on the Statements of Assets and Liabilities.
Exchange traded futures are marked to market daily based on the price movement of the contract. This change in value creates either a payable or receivable for the Fund as either more or less margin is required by the clearing agent. This change in value, known as variation margin, is moved daily between the Fund and its counterparty.
A change in the market value of an open futures contract is recorded as unrealized appreciation/(depreciation) until the contract is closed. When a contract is closed, the Fund will record a realized gain or (loss) equal to the difference between the proceeds of the closing transaction and the Fund’s basis in the contract. Futures contracts outstanding at period end, if any, are listed within each Fund’s Summary Schedule of Investments. During the period, all Funds, except the Tax Managed Large Cap, Tax Managed Small/Mid Cap and the Tax Managed International Equity Funds, participated in futures contracts transactions.
| | |
| Annual Report • June 30, 2023 | | 103 |
Bridge Builder Mutual Funds
Notes to Financial Statements (Continued)
Forward Foreign Currency Exchange Contracts – Core Plus Bond Fund and International Equity Fund may invest in forward foreign currency exchange contracts, which are agreements between two parties to buy and sell currencies at a set price on a future date. These contracts are used to protect against a decline in value relative to the U.S. dollar of the currencies in which portfolio securities are denominated or quoted (or an increase in the value of a currency in which securities that a Fund intends to buy are denominated, when a Fund holds cash reserves and short-term investments), or for other investment purposes. The market value of the contract will fluctuate with changes in currency exchange rates. The contract is marked to market daily and the change in market value is recorded as unrealized appreciation/ (depreciation). When the contract is closed in its foreign currency, the Funds record a realized gain or (loss) equal to the difference between the value of the contract at the time it was opened and the value at the time it was closed. Non-deliverable forward foreign currency exchange contracts are settled with the counterparty in U.S. dollars without the delivery of foreign currency. The Funds could be exposed to risk if the value of the currency changes unfavorably, if the counterparties to the contracts are unable to meet the terms of their contracts or if the Funds are unable to enter into a closing position. Forward foreign currency exchange contracts outstanding at period end, if any, are listed within each Fund’s Summary Schedule of Investments. During the period, the Core Plus Bond Fund participated in transactions of forward foreign currency exchange contracts.
Repurchase Agreements – In a repurchase agreement, a Fund buys a security from another party (the counterparty), usually a financial institution, with the agreement that it be sold back in the future. Repurchase agreements subject a Fund to counterparty risk, meaning that the Fund could lose money if the other party fails to perform under the terms of the agreement. A Fund mitigates this risk by ensuring that the Fund’s repurchase agreements are collateralized by cash and/or U.S. government securities. All collateral is held by a Fund’s custodian (or, with multiparty agreements, the agent’s bank) and is monitored daily to ensure that its market value is at least equal to the repurchase price under the agreement. In the event of a default by the counterparty, realization of the collateral proceeds could be delayed or limited and the value of the collateral may decline. Investments in repurchase agreements are also based on a review of the credit quality of the repurchase agreement counterparty. Certain Funds may enter into repurchase agreements in which eligible securities are transferred into joint trading accounts maintained by the custodian or sub-custodian under a Master Repurchase Agreement for investment companies and other clients advised by the Sub-adviser (as defined below) and its affiliates. A Fund may participate with the other investment companies and clients in its share of the securities transferred under such repurchase agreements and in its share of proceeds from any repurchase or other disposition of such securities. Repurchase agreements are subject to master netting agreements, which are agreements between a Fund and its counterparties that provide for the net settlement of all transactions and collateral with the Fund through a single payment, in the event of default or termination. Repurchase agreement amounts, if any, presented on the Summary Schedule of Investments are gross settlement amounts.
Swap Contracts – Certain Funds may invest in swap contracts. Swap contracts are bilaterally negotiated agreements between a Fund and a counterparty to exchange or swap investment cash flows, assets, or market-linked returns at specified, future intervals. Swap contracts may be privately negotiated in the over-the-counter market (“OTC Swaps”) or may be cleared through a third-party, known as a central counterparty or derivatives clearing organization (“Centrally Cleared Swaps”).
A Fund may enter into credit default, interest rate and/or total return swap contracts to manage the Fund’s exposure to credit, interest rate and equity risk. Securities or cash may be used as collateral or margin in accordance with the terms of the swap contract in order to provide assets in the event of a default or bankruptcy.
Centrally Cleared Swaps are marked to market daily and the change, if any, is recorded as variation margin on centrally cleared swap contracts on the Statements of Assets and Liabilities. OTC Swaps are marked to market daily and the change, if any, is included in the over-the-counter swap contracts, at value line item on the Statements of Assets and Liabilities. Both OTC and Centrally Cleared Swaps show this component as change in unrealized appreciation/(depreciation) on the Statements of Operations. Swap variation margin is accounted for as unrealized appreciation/(depreciation) until the contract is closed, at which time the gains or (losses) are realized. Upfront
| | |
| 104 | | Annual Report • June 30, 2023 |
Bridge Builder Mutual Funds
Notes to Financial Statements (Continued)
premiums received/(paid) represent cash payments made upon the opening of the swap contract to compensate for differences between the stated terms of the contract and the current market value contract. These upfront payments are recorded as assets/(liabilities) and are included within the market value of the swap contract. Upon liquidation or termination of the swap contract, these payments are recorded as realized gain/(loss) on the Statements of Operations. Net periodic payments received/(paid) by the Fund are also included in the realized gain/ (loss) on swap contracts on the Statements of Operations. Swap contracts outstanding, including their respective notional amounts at period end, if any, are listed within each Fund’s Summary Schedule of Investments.
Interest Rate Swaps – Core Bond Fund and Core Plus Bond Fund may enter into interest rate swap contracts to manage fund exposure to interest rates or to either preserve or generate a return on a particular investment or portion of its portfolio. These are agreements between counterparties to exchange periodic payments based on interest rates or on an inflation index. One cash flow stream will typically be a floating rate payment based upon a specified interest rate while the other is typically a fixed interest rate. During the period, the Core Plus Bond Fund entered into interest rate swap contracts.
Credit Default Swap Contracts – Core Plus Bond Fund may enter into credit default swap contracts to provide a measure of protection against risk of loss following a default, or other credit event in respect of issuers within an underlying index or a single issuer, or to gain credit exposure to an underlying index or issuer. In a credit default swap contract, the protection buyer typically makes an upfront payment and a periodic stream of payments to the protection seller, in exchange for the right to receive a contingent payment upon the occurrence of a credit event on the reference obligation or other equally ranked obligations of the reference entity. As a seller of protection on a credit default swap contract, the Fund will generally receive from the protection buyer a fixed rate of income throughout the term of the swap provided there is no credit event. Credit events are contract specific but may include bankruptcy, failure to pay, restructuring and obligation acceleration. Upon the occurrence of a credit event, the difference between the par value and market value of the reference obligation, net of any proportional amount of the upfront payment, is recorded as a realized gain or (loss).
Implied credit spreads are used to determine the value of credit default swap contracts and reflect the cost of buying/selling protection, which may include upfront payments made to enter into the contract. Therefore, higher spreads indicate a greater likelihood that a seller will be obligated to perform (i.e. make payment) under the swap contract. Implied credit spreads for credit default swaps on credit indexes are linked to the weighted average spread across the underlying reference obligations included in a particular index.
Risks of loss may exceed amounts recognized on the Summary Schedule of Investments. A Fund’s maximum risk of loss from counterparty risk, either as the protection seller or as the protection buyer, is the fair value of the contract. This risk may be mitigated by having a master netting arrangement between the specific Fund and the counterparty. Where a Fund is a seller of protection, the maximum potential amount of future payments the Fund may be required to make is equal to the notional amount of the relevant credit default contract. The Fund’s risk of loss associated with these instruments may exceed their value, as recorded in the Summary Schedule of Investments. During the period, the Core Plus Bond Fund entered into credit default swap contracts.
Total Return Swap Contracts – Core Plus Bond Fund may enter into total return swaps to obtain exposure to the underlying referenced instruments, obtain leverage or attain the returns from ownership without actually owning the underlying position. Total return swaps are two-party contracts that generally obligate one party to pay the positive return and the other party to pay the negative return on a specified reference security, security index or index component during the period of the swap. Total return swap contracts are marked to market daily and the change, if any, is recorded as net change in unrealized appreciation/(depreciation) on swap contracts in the Statements of Operations. Total return swaps normally do not involve the delivery of securities or other underlying assets. If the counterparty to a total return swap contract defaults, a Fund’s risk of loss consists of the net amount of payments the Fund is contractually entitled to receive, if any. The use of long total return swap contracts subject the Funds to risk of loss in excess of the amounts shown on the Statements of Assets and Liabilities. The use of short total
| | |
| Annual Report • June 30, 2023 | | 105 |
Bridge Builder Mutual Funds
Notes to Financial Statements (Continued)
return swaps subject the Funds to unlimited loss. Periodic payments received (paid) by the Funds are recorded as net realized gain/(loss) on swap contracts in the Statements of Operations. Total return swap contracts outstanding at period end, if any, are listed after each Fund’s Summary Schedule of Investments.
c) Loan Participation, Assignments and Unfunded Commitments – Certain Funds may enter into loan participations and assignments. When one of the Funds purchases a loan participation, the Fund typically enters into a contractual relationship with the lender or a third party selling such participations (“Selling Participant”), but not the borrower. In this case, the Fund assumes the credit risk of the borrower and the Selling Participant and any other persons inter-positioned between the Fund and the borrower (“Intermediate Participants”). In contrast, when one of the Funds purchases an assignment, the contractual relationship is with the borrower and the credit risk assumed by the Fund is only with the borrower. Although certain loan participations or assignments are secured by collateral, the Fund could experience delays or limitations in realizing such collateral or have its interest subordinated to other indebtedness of the obligor.
The Funds may also enter into unfunded loan commitments, which are contractual obligations for future funding. These unfunded commitments represent a future obligation in full, even though a percentage of the loan may not be utilized by the borrower. These types of investments may include standby financing commitments, such as revolving credit facilities, which obligate the Funds to supply additional cash to the borrower on demand. The value of the unfunded portion of the investment is determined using pro-rata allocation, based on its par value relative to the par value of the entire investment. The unfunded loan commitments are marked daily and any unrealized appreciation/ (depreciation) from unfunded commitments is reported in the Statements of Assets and Liabilities as well as the Statements of Operations.
When investing in loan participations, a Fund has the right to receive payments of principal, interest and any fees to which it is entitled only from the lender selling the loan participation and only upon receipt of payments by the lender from the borrower. The Fund may receive a commitment fee based on the undrawn portion of the underlying line of credit portion of the loan. In certain circumstances, the Fund may receive a penalty fee upon the prepayment of a loan by a borrower. Fees earned or paid are recorded as a component of interest income or interest expense, respectively, on the Statements of Operations. In addition, loan participations and assignments are vulnerable to market conditions such that economic conditions or other events may reduce the demand for loan participations and assignments, and certain loan participations and assignments which were liquid, when purchased, may become illiquid. The following table summarizes Core Plus Bond Fund’s unfunded loan positions as of June 30, 2023.
| | | | | | | | | | | | | | |
Fund | | Borrower | | Unfunded Bank Loan
Commitment
(000s) | | | Value of
Underlying Bank
Loan Commitment
(000s) | | | Unrealized
Appreciation/
(Depreciation)
(000s) | |
Core Plus Bond Fund | | Athena Health Group, Inc. | | $ | 321 | | | $ | 319 | | | $ | (2 | ) |
d) Restricted Securities – The Funds may own investment securities that are unregistered or have other legal or contractual limitations, and thus are restricted as to resale. These securities are valued after giving due consideration to pertinent factors, including recent private sales, market conditions and the issuer’s financial performance. Where future disposition of these securities requires registration under the Securities Act of 1933, a Fund may have the right to include these securities in such registration, generally without cost to the Fund. A Fund generally has no right to require registration of the unregistered securities it holds. The Funds held the following restricted securities at June 30, 2023.
Core Bond Fund
| | | | | | | | | | | | | | | | |
Issuer Description | | Acquisition Date | | | Acquisition Cost
(000s) | | | Market Value at
June 30, 2023
(000s) | | | % of Net Assets at
June 30, 2023 | |
Deutsche Bank AG | | | 11/17/2020 | | | $ | 6,700 | | | $ | 5,961 | | | | 0.04 | % |
| | | | | | | | | | | | | | | | |
| | | | | | $ | 6,700 | | | $ | 5,961 | | | | 0.04 | % |
| | | | | | | | | | | | | | | | |
| | |
| 106 | | Annual Report • June 30, 2023 |
Bridge Builder Mutual Funds
Notes to Financial Statements (Continued)
Core Plus Bond Fund
| | | | | | | | | | | | | | | | |
Issuer Description | | Acquisition Date | | | Acquisition Cost
(000s) | | | Market Value at
June 30, 2023
(000s) | | | % of Net Assets at
June 30, 2023 | |
Atento Luxco 1 SA | | | 10/27/2022 | | | $ | 44 | | | $ | 17 | | | | 0.00 | %* |
Bahrain Government International Bond | | | 6/23/2023 | | | | 183 | | | | 182 | | | | 0.00 | * |
Benin Government International Bond | | | 6/20/2023 | | | | 160 | | | | 159 | | | | 0.00 | * |
Cold Storage Trust 2020-ICE5 | | | 10/22/2020 | | | | 3,534 | | | | 3,465 | | | | 0.01 | |
Comision Federal de Electricidad | | | 10/3/2022 | | | | 370 | | | | 371 | | | | 0.00 | * |
Czech Republic Government Bond | | | 3/15/2023 | | | | 231 | | | | 238 | | | | 0.00 | * |
Deutsche Bank AG | | | 6/21/2021 - 1/11/2023 | | | | 4,147 | | | | 3,400 | | | | 0.01 | |
Dominican Republic International Bond | | | 6/20/2023 - 6/22/2023 | | | | 341 | | | | 339 | | | | 0.00 | * |
Egypt Government International Bond | | | 11/16/2022 - 6/19/2023 | | | | 616 | | | | 424 | | | | 0.00 | * |
Empresa Nacional del Petroleo | | | 9/14/2022 | | | | 346 | | | | 354 | | | | 0.00 | * |
Ghana Government International Bond | | | 2/4/2022 | | | | 276 | | | | 99 | | | | 0.00 | * |
Gruma SAB de CV | | | 10/3/2022 | | | | 253 | | | | 253 | | | | 0.00 | * |
Grupo Bimbo SAB de CV | | | 11/2/2022 | | | | 215 | | | | 215 | | | | 0.00 | * |
Intelsat S.A. | | | 6/19/2017 - 2/24/2022 | | | | 24,897 | | | | 9,501 | | | | 0.03 | |
Ivory Coast Government International Bond | | | 6/14/2023 - 6/19/2023 | | | | 202 | | | | 203 | | | | 0.00 | * |
Jordan Government International Bond | | | 6/19/2023 | | | | 184 | | | | 183 | | | | 0.00 | * |
Leviathan Bond Ltd. | | | 6/27/2023 | | | | 31 | | | | 31 | | | | 0.00 | * |
MAF Global Securities Ltd. | | | 6/23/2023 | | | | 195 | | | | 194 | | | | 0.00 | * |
Metalsa Sapi de CV | | | 11/2/2021 - 11/9/2021 | | | | 288 | | | | 224 | | | | 0.00 | * |
Mexico City Airport Trust | | | 9/14/2022 | | | | 349 | | | | 360 | | | | 0.00 | * |
Morgan Stanley | | | 2/11/2020 | | | | 12,558 | | | | 9,212 | | | | 0.03 | |
Neiman Marcus Group, Inc. | | | 9/25/2020 | | | | 2,007 | | | | 9,469 | | | | 0.03 | |
Nemak SAB de CV | | | 11/2/2021 - 11/3/2021 | | | | 376 | | | | 193 | | | | 0.00 | * |
Nigeria Government International Bond | | | 6/14/2023 - 6/19/2023 | | | | 529 | | | | 526 | | | | 0.01 | |
OCP S.A. | | | 9/23/2022 | | | | 252 | | | | 251 | | | | 0.00 | * |
Oleoducto Central S.A. | | | 7/13/2022 - 7/18/2022 | | | | 479 | | | | 299 | | | | 0.00 | * |
Oman Government International Bond | | | 6/14/2023 | | | | 187 | | | | 186 | | | | 0.00 | * |
Oracle Corp. | | | 6/17/2021 - 10/5/2021 | | | | 9,013 | | | | 5,977 | | | | 0.02 | |
Paraguay Government International Bond | | | 6/14/2023 | | | | 171 | | | | 171 | | | | 0.00 | * |
Promigas SA ESP | | | 11/4/2021 | | | | 379 | | | | 321 | | | | 0.00 | * |
Puma International Financing S.A. | | | 4/25/2022 | | | | 318 | | | | 257 | | | | 0.00 | * |
Romanian Government International Bond | | | 6/14/2023 | | | | 181 | | | | 183 | | | | 0.00 | * |
Saudi Government International Bond | | | 11/16/2022 - 6/14/2023 | | | | 1,034 | | | | 599 | | | | 0.01 | |
Senegal Government International Bond | | | 6/19/2023 | | | | 93 | | | | 94 | | | | 0.00 | * |
Ukraine Government International Bond | | | 5/23/2023 - 6/28/2023 | | | | 778 | | | | 834 | | | | 0.01 | |
YPF S.A. | | | 12/8/2022 - 1/19/2023 | | | | 144 | | | | 155 | | | | 0.00 | * |
| | | | | | | | | | | | | | | | |
| | | | | | $ | 65,361 | | | $ | 48,939 | | | | 0.16 | % |
| | | | | | | | | | | | | | | | |
Municipal High-Income Bond Fund
| | | | | | | | | | | | | | | | |
Issuer Description | | Acquisition Date | | | Acquisition Cost
(000s) | | | Market Value at
June 30, 2023
(000s) | | | % of Net Assets at
June 30, 2023 | |
Central Falls Detention Facility Corp. | | | 04/21/2023 | | | $ | 154 | | | $ | 154 | | | | 0.01 | % |
Connector 2000 Association, Inc. | | | 04/14/2023 | | | | 546 | | | | 544 | | | | 0.02 | |
County of Anne Arundel MD | | | 04/21/2023 | | | | 590 | | | | 590 | | | | 0.03 | |
Mashantucket Western Pequot Tribe | | | 04/21/2023 | | | | 442 | | | | 442 | | | | 0.02 | |
Pennsylvania Economic Development Financing Authority | | | 04/21/2023 | | | | 597 | | | | 597 | | | | 0.02 | |
Public Finance Authority | | | 04/14/2023 | | | | 6,841 | | | | 6,863 | | | | 0.29 | |
Tolomato Community Development District | | | 04/21/2023 | | | | 41 | | | | 41 | | | | 0.00 | * |
Town of Shoals IN | | | 04/21/2023 | | | | 338 | | | | 337 | | | | 0.01 | |
| | | | | | | | | | | | | | | | |
| | | | | | $ | 9,549 | | | $ | 9,568 | | | | 0.40 | % |
| | | | | | | | | | | | | | | | |
| | |
| Annual Report • June 30, 2023 | | 107 |
Bridge Builder Mutual Funds
Notes to Financial Statements (Continued)
Small/Mid Cap Growth Fund
| | | | | | | | | | | | | | | | |
Issuer Description | | Acquisition Date | | | Acquisition Cost
(000s) | | | Market Value at
June 30, 2023
(000s) | | | % of Net Assets at
June 30, 2023 | |
OmniAb, Inc. - Class CR3** | | | 8/10/2015 - 8/22/2022 | | | $ | — | | | $ | — | | | | 0.00 | %* |
OmniAb, Inc. - Class CR4** | | | 8/10/2015 - 8/22/2022 | | | | — | | | | — | | | | 0.00 | * |
| | | | | | | | | | | | | | | | |
| | | | | | $ | — | | | $ | — | | | | 0.00 | %* |
| | | | | | | | | | | | | | | | |
Small/Mid Cap Value Fund
| | | | | | | | | | | | | | | | |
Issuer Description | | Acquisition Date | | | Acquisition Cost
(000s) | | | Market Value at
June 30, 2023
(000s) | | | % of Net Assets at
June 30, 2023 | |
OmniAb, Inc. - Class CR3** | | | 6/25/2021 - 9/7/2022 | | | $ | — | | | $ | — | | | | 0.00 | %* |
OmniAb, Inc. - Class CR4** | | | 6/25/2021 - 9/7/2022 | | | | — | | | | — | | | | 0.00 | * |
| | | | | | | | | | | | | | | | |
| | | | | | $ | — | | | $ | — | | | | 0.00 | %* |
| | | | | | | | | | | | | | | | |
Tax Managed Small/Mid Cap Fund
| | | | | | | | | | | | | | | | |
Issuer Description | | Acquisition Date | | | Acquisition Cost
(000s) | | | Market Value at
June 30, 2023
(000s) | | | % of Net Assets at
June 30, 2023 | |
OmniAb, Inc. - Class CR3** | | | 8/25/2022 | | | $ | — | | | $ | — | | | | 0.00 | %* |
OmniAb, Inc. - Class CR4** | | | 8/25/2022 | | | | — | | | | — | | | | 0.00 | * |
| | | | | | | | | | | | | | | | |
| | | | | | $ | — | | | $ | — | | | | 0.00 | %* |
| | | | | | | | | | | | | | | | |
International Equity Fund
| | | | | | | | | | | | | | | | |
Issuer Description | | Acquisition Date | | | Acquisition Cost
(000s) | | | Market Value at
June 30, 2023
(000s) | | | % of Net Assets at
June 30, 2023 | |
Severstal PAO** | | | 7/15/2021 - 11/29/2021 | | | $ | 3,360 | | | $ | — | | | | 0.00 | %* |
X5 Retail Group NV** | | | 7/15/2021 - 1/27/2022 | | | | 2,010 | | | | — | | | | 0.00 | * |
| | | | | | | | | | | | | | | | |
| | | | | | $ | 5,370 | | | $ | — | | | | 0.00 | %* |
| | | | | | | | | | | | | | | | |
| * | Amount less than 0.005%. |
| ** | A zero balance may reflect actual amounts rounding to less than one thousand. |
e) Defaulted Securities – Certain Funds may hold defaulted securities or other securities which were placed in non-accrual status as the collection of a portion or all of the interest has been deemed to be uncollectible. Debt obligations may be placed on non-accrual status and the related interest income, amortization or accretion may be reduced or stopped entirely. Additionally, current income accruals and interest receivables may be written off when the collection of the interest income has become doubtful. A debt obligation is removed from non-accrual status when the issuer resumes interest payments or when collectability of interest is probable.
f) Sale-buyback and Buy-saleback Transactions – A sale-buyback financing transaction consists of a sale of a security by a Fund to a counterparty, with a simultaneous agreement to repurchase the same or substantially the same security at an agreed-upon price and date.
During the year ended June 30, 2023, the Core Plus Bond Fund participated in sale-buyback transactions which were as follows:
| | | | | | | | | | | | | | | | |
Fund | | Outstanding
Sale-Buyback Transactions
(000s) | | | Average Amount
Borrowed
(000s) | | | Incurred Interest
Expense
(000s) | | | % of Weighted Average
Interest Rate | |
Core Plus Bond Fund | | $ | — | | | $ | 123,116 | | | $ | 4,811 | | | | 3.68 | % |
A buy-saleback lending transaction consists of a purchase of a security by a Fund from a counterparty, with a simultaneous agreement to sell the same or substantially the same security at an agreed-upon price and date. The
| | |
| 108 | | Annual Report • June 30, 2023 |
Bridge Builder Mutual Funds
Notes to Financial Statements (Continued)
party who sold the security is not entitled to receive principal and interest payments, if any, made on the security during the term of the agreement.
During the year ended June 30, 2023, the Core Plus Bond Fund did not participate in buy-saleback transactions.
Sale-buyback and buy-saleback transactions are governed by Master Securities Forward Transaction Agreements (“Master Forward Agreements”), which are agreements between the Fund and select counterparties. The Master Forward Agreements maintain provisions for, among other things, transaction initiation and confirmation, payment and transfer, events of default, termination and maintenance of collateral. The market value of any pending sale-buyback and buy-saleback transactions as of period end is disclosed in each Fund’s Summary Schedule of Investments.
4. INVESTMENT VALUATION AND FAIR VALUE MEASUREMENTS
a) Investment Valuation Policies – The Net Asset Value (“NAV”) of the Funds’ shares are generally valued as of the close of the regular trading on the New York Stock Exchange (“NYSE”), normally 4:00 p.m. Eastern time, on each day the NYSE is open. The NAV per share of each Fund is computed by dividing the total net assets of the Fund by the total number of shares outstanding. In calculating NAV, each Fund generally values its investment portfolio at market price. If market quotations are not readily available or they are unreliable, securities are valued at fair value. The Board has ultimate responsibility for determining the fair value of investments. Pursuant to Rule 2a-5 under the 1940 Act, the Board has designated the Adviser as the valuation designee of the Funds. The Adviser performs the fair value determination relating to the Funds’ investments that do not have readily available market quotations, or that have market quotations that are unreliable, subject to Board oversight and certain reporting and other requirements. The Adviser monitors the continual appropriateness of valuation methods applied and determines if adjustments should be made in light of market factor changes and events affecting issuers. The Adviser performs a series of activities to provide reasonable assurance of the appropriateness of the prices utilized including but not limited to: periodic vendor due diligence meetings and reviewing the results of back testing on a monthly basis. The Adviser provides the Board with reporting on the results of the back testing as well as positions which were fair valued during the period.
The Adviser has established a Valuation Committee with members from relevant departments within the Adviser to assist the Adviser in carrying out its responsibilities under Rule 2a-5 and in accordance with the Adviser’s valuation policy and procedures. The function of the Valuation Committee is to assess and manage any material risks associated with the determination of the fair value of the Funds’ investments, review the appropriateness and accuracy of fair value methodologies and monitor for circumstances that may necessitate the use of fair value pricing or a change in fair value methodologies, and to determine fair value for the Funds’ investments.
Additionally, the Adviser has adopted, and the Board has approved, valuation policies and procedures that allow for the use of fair value pricing in appropriate circumstances. For example, such circumstances may arise when trading in a security has been halted or suspended, when a security has been delisted from a national exchange, when a security has not been traded for an extended period of time, or when a significant event with respect to a security occurs after the close of the market or exchange on which the security principally trades and before the time a Fund calculates its own share price. If a readily-available market quotation for a security is unavailable or unreliable, the Adviser may utilize evaluated prices provided by independent pricing services or brokers to assist in its determination of fair value, and may rely on its Valuation Committee to determine fair value in accordance with its valuation policies and procedures adopted by the Adviser. In such circumstances where fair value pricing is necessary, securities are valued in accordance with the Adviser’s valuation policies and procedures and implemented through the Adviser’s Valuation Committee described above. In establishing a fair value for an investment, the Adviser will use valuation methodologies established by the Adviser and may consider inputs and methodologies provided by, among others, third-party independent pricing services and/or independent broker dealers.
| | |
| Annual Report • June 30, 2023 | | 109 |
Bridge Builder Mutual Funds
Notes to Financial Statements (Continued)
Thinly traded securities and certain foreign securities may be impacted more by the use of fair valuations than other securities. In using fair value pricing, the Adviser attempts to establish the price that it might reasonably have expected to receive upon a sale of the security at 4:00 p.m. Eastern time. Valuing securities at fair value involves greater reliance on judgment than valuation of securities based on readily available market quotations.
When using fair value to price securities, the Adviser may value those securities higher or lower than a fund using market quotations or fair value to price the same securities. Further, there can be no assurance that the Fund could obtain the fair value assigned to a security if it were to sell the security at approximately the same time at which the Fund determines its net asset value.
b) Fair Value Hierarchy – The Adviser has performed an analysis of all existing investments to determine the significance and character of all inputs to their fair value determination. Various inputs are used in determining the value of each Fund’s investments. These inputs are summarized in the following three broad categories:
| | • | | Level 1 – Inputs using unadjusted quoted prices in active markets or exchanges for identical assets and liabilities. |
| | • | | Level 2 – Inputs other than quoted prices included within Level 1 that are observable for the asset or liability. Other significant observable market inputs include, but are not limited to, quoted prices for similar instruments in active markets, quoted adjusted prices in active markets, quoted prices for identical or similar instruments in markets that are not active, and model-derived valuations in which the majority of significant inputs and significant value drivers are observable in active markets. |
| | • | | Level 3 – Significant unobservable inputs (including the Adviser’s own assumptions). |
c) Valuation Techniques – Fixed-income securities, including corporate, convertible and municipal bonds and notes, U.S. government agencies, U.S. Treasury obligations, sovereign issues, bank loans, convertible preferred securities and non-U.S. bonds (other than short-term securities) are valued using that day’s evaluated price provided by an independent pricing service. Independent pricing services typically use information provided by market makers or estimates of market values obtained from yields and other relevant data relating to investments or securities with similar characteristics. The independent pricing service’s internal models use inputs that are observable such as, among other things, issuer details, interest rates, yield curves, prepayment speeds, trade information, market color, credit risks/spreads, default rates and quoted prices for similar assets and the securities’ terms and conditions. Securities that use similar valuation techniques and inputs as described above are generally categorized as Level 2 of the fair value hierarchy.
Mortgage- and asset-backed securities are usually issued as separate tranches, or classes, of securities within each package of underlying securities. These securities are also normally valued by independent pricing service providers that use broker-dealer quotations or valuation estimates from their internal pricing models. The pricing models for these securities usually consider tranche level attributes, estimated cash flows and market-based yield spreads for each tranche and current market data and packaged collateral performance, as available. Mortgage- and asset-backed securities that use such valuation techniques and inputs are typically categorized as Level 2.
Short-term securities without a vendor price and with 60 days or less remaining to maturity when acquired by a Fund are generally valued on an amortized cost basis, which approximates fair value. These securities are typically categorized as Level 2 in the fair value hierarchy.
Equity securities traded on a national securities exchange are valued at the last reported sale price at the close of regular trading on each day the exchange is open for trading. Securities listed on the NASDAQ National Market System for which market quotations are readily available are valued using the NASDAQ Official Closing Price. These valuations are typically categorized as Level 1 in the fair value hierarchy. Securities and financial instruments for which prices are not available from an independent pricing service may be valued using market quotations obtained from one or more dealers that make markets in the respective securities in accordance with procedures adopted by the Board and are classified as Level 2 or Level 3 depending on the observability of inputs.
| | |
| 110 | | Annual Report • June 30, 2023 |
Bridge Builder Mutual Funds
Notes to Financial Statements (Continued)
Foreign securities, currencies and other assets denominated in currencies other than U.S. dollars are translated to U.S. dollars using exchange rates obtained from independent pricing services. All assets denominated in foreign currencies are converted to U.S. dollars using the applicable currency exchange rates as of the close of the NYSE, generally 4:00 p.m. Eastern time.
Valuation adjustments may be applied to certain common and preferred stocks that are solely traded on a foreign exchange to account for the market movement between the close of the foreign market and the close of the NYSE. These securities are generally valued using independent pricing service providers that consider the correlation of the trading patterns of the foreign securities to the intraday trading in the U.S. markets for investments. Securities using these valuation adjustments are categorized as Level 2 of the fair value hierarchy.
Open-ended mutual funds (including money market funds) are valued at the end of the day’s net asset value and are categorized as Level 1 of the fair value hierarchy.
Exchange traded financial derivative instruments, such as futures contracts or options contracts that are traded on a national securities or commodities exchange, are valued at the last reported sales or settlement price. To the extent these securities are actively traded and valuation adjustments are not applied, they are categorized as Level 1 of the fair value hierarchy. If there was no sale activity, the financial derivative is valued at the mean between the bid and ask price on the relevant exchange closest to the close of the NYSE, or at the bid, if no ask is available and are categorized as Level 2 of the fair value hierarchy.
OTC derivatives, including forward foreign currency exchange contracts and swap contracts, are valued by the Funds on a daily basis using observable inputs, such as quotations provided by an independent pricing service, the counterparty, dealers or brokers, whenever available and considered reliable. These securities are typically categorized as Level 2 of the fair value hierarchy.
The U.S. dollar value of forward foreign currency exchange contracts is determined using current forward currency exchange rates supplied by an independent pricing service.
Centrally cleared credit default and interest rate swap contracts are valued daily based on quotations as provided by an independent pricing service. The independent pricing services aggregate valuation information from various market participants to create a single reference value for each credit default swap contract and interest rate swap contract. These securities are typically categorized as Level 2 of the fair value hierarchy.
The Adviser, on behalf of the Funds, values the repurchase agreements the Funds have entered into based on the respective contract amounts, which approximate fair value. As such, repurchase agreements are carried at the amount of cash paid plus accrued interest receivable (or interest payable in periods of increased demand for collateral). These securities are typically categorized as Level 2 of the fair value hierarchy.
| | |
| Annual Report • June 30, 2023 | | 111 |
Bridge Builder Mutual Funds
Notes to Financial Statements (Continued)
Quantitative Information
The following tables represent each Fund’s valuation inputs as presented in the Summary Schedule of Investments as of June 30, 2023.
Core Bond Fund
| | | | | | | | | | | | | | | | |
| | | Level 1
(000s) | | | Level 2
(000s) | | | Level 3
(000s) | | | Total
(000s) | |
Assets | | | | | | | | | | | | | | | | |
Asset-Backed Obligations | | $ | — | | | $ | 2,005,446 | | | $ | 21,043 | | | $ | 2,026,489 | |
Corporate Bonds | | | | | | | | | | | | | | | | |
Basic Materials | | | — | | | | 142,262 | | | | — | | | | 142,262 | |
Communications | | | — | | | | 399,570 | | | | — | | | | 399,570 | |
Consumer, Cyclical | | | — | | | | 234,236 | | | | — | | | | 234,236 | |
Consumer, Non-cyclical | | | — | | | | 614,458 | | | | — | | | | 614,458 | |
Energy | | | — | | | | 511,632 | | | | — | | | | 511,632 | |
Financials | | | — | | | | 1,863,738 | | | | — | | | | 1,863,738 | |
Industrials | | | — | | | | 270,422 | | | | — | | | | 270,422 | |
Technology | | | — | | | | 229,266 | | | | — | | | | 229,266 | |
Utilities | | | — | | | | 573,374 | | | | — | | | | 573,374 | |
Government Related | | | | | | | | | | | | | | | | |
Other Government Related | | | — | | | | 196,734 | | | | — | | | | 196,734 | |
U.S. Treasury Obligations | | | — | | | | 3,161,152 | | | | — | | | | 3,161,152 | |
Mortgage-Backed Obligations | | | — | | | | 6,012,763 | | | | 9,833 | | | | 6,022,596 | |
Preferred Stocks | | | | | | | | | | | | | | | | |
Financials | | | 2,181 | | | | — | | | | — | | | | 2,181 | |
Short-Term Investments | | | | | | | | | | | | | | | | |
Money Market Funds | | | 536,258 | | | | — | | | | — | | | | 536,258 | |
Time Deposits | | | — | | | | 3,088 | | | | — | | | | 3,088 | |
Futures Contracts (1) | | | 2,297 | | | | — | | | | — | | | | 2,297 | |
Total Assets | | $ | 540,736 | | | $ | 16,218,141 | | | $ | 30,876 | | | $ | 16,789,753 | |
Liabilities | | | | | | | | | | | | | | | | |
Futures Contracts (1) | | $ | (10,645 | ) | | $ | — | | | $ | — | | | $ | (10,645 | ) |
Total Liabilities | | $ | (10,645 | ) | | $ | — | | | $ | — | | | $ | (10,645 | ) |
| | |
| 112 | | Annual Report • June 30, 2023 |
Bridge Builder Mutual Funds
Notes to Financial Statements (Continued)
Core Plus Bond Fund
| | | | | | | | | | | | | | | | |
| | | Level 1
(000s) | | | Level 2
(000s) | | | Level 3
(000s) | | | Total
(000s) | |
Assets | | | | | | | | | | | | | | | | |
Asset-Backed Obligations | | $ | — | | | $ | 3,570,198 | | | $ | — | | | $ | 3,570,198 | |
Corporate Bonds | | | | | | | | | | | | | | | | |
Basic Materials | | | — | | | | 220,446 | | | | — | | | | 220,446 | |
Communications | | | — | | | | 853,661 | | | | — | (2) | | | 853,661 | |
Consumer, Cyclical | | | — | | | | 506,245 | | | | — | (2) | | | 506,245 | |
Consumer, Non-cyclical | | | — | | | | 1,012,268 | | | | — | | | | 1,012,268 | |
Energy | | | — | | | | 767,294 | | | | — | | | | 767,294 | |
Financials | | | — | | | | 3,461,577 | | | | — | | | | 3,461,577 | |
Government | | | — | | | | 1,283 | | | | — | | | | 1,283 | |
Industrials | | | — | | | | 364,224 | | | | — | | | | 364,224 | |
Technology | | | — | | | | 424,731 | | | | — | | | | 424,731 | |
Utilities | | | — | | | | 648,269 | | | | — | | | | 648,269 | |
Convertible Securities | | | | | | | | | | | | | | | | |
Communications | | | — | | | | 26,626 | | | | — | | | | 26,626 | |
Consumer, Cyclical | | | — | | | | 9,981 | | | | — | | | | 9,981 | |
Consumer, Non-cyclical | | | — | | | | 36,873 | | | | — | | | | 36,873 | |
Utilities | | | — | | | | 13,084 | | | | — | | | | 13,084 | |
Government Related | | | | | | | | | | | | | | | | |
Other Government Related | | | — | | | | 411,744 | | | | — | | | | 411,744 | |
U.S. Treasury Obligations | | | — | | | | 6,190,488 | | | | — | | | | 6,190,488 | |
Mortgage-Backed Obligations | | | — | | | | 10,698,491 | | | | — | | | | 10,698,491 | |
Bank Loans | | | — | | | | 323,090 | | | | 9,268 | | | | 332,358 | |
Common Stocks | | | | | | | | | | | | | | | | |
Communications | | | 4,645 | | | | 9,501 | | | | 1,197 | | | | 15,343 | |
Consumer Discretionary | | | — | | | | — | | | | 9,469 | | | | 9,469 | |
Financials | | | 37 | | | | — | | | | — | | | | 37 | |
Convertible Preferred Stocks | | | | | | | | | | | | | | | | |
Financials | | | 50,746 | | | | — | | | | — | | | | 50,746 | |
Preferred Stocks | | | | | | | | | | | | | | | | |
Financials | | | — | | | | — | | | | 7 | | | | 7 | |
Rights | | | | | | | | | | | | | | | | |
Communications | | | — | | | | — | | | | — | (2) | | | — | |
Warrants | | | | | | | | | | | | | | | | |
Communications | | | — | | | | — | | | | 81 | | | | 81 | |
Short-Term Investments | | | | | | | | | | | | | | | | |
Money Market Funds | | | 794,788 | | | | — | | | | — | | | | 794,788 | |
Government Related | | | — | | | | 576,441 | | | | — | | | | 576,441 | |
Repurchase Agreements | | | — | | | | 123,300 | | | | — | | | | 123,300 | |
U.S. Treasury Bills | | | — | | | | 1,762,092 | | | | — | | | | 1,762,092 | |
Time Deposits | | | — | | | | 18,121 | | | | — | | | | 18,121 | |
Futures Contracts (1) | | | 6,941 | | | | — | | | | — | | | | 6,941 | |
Forward Foreign Currency Exchange Contracts (1) | | | — | | | | 29,113 | | | | — | | | | 29,113 | |
Swap Contracts (1) | | | — | | | | 91,188 | | | | — | | | | 91,188 | |
Total Assets | | $ | 857,157 | | | $ | 32,150,329 | | | $ | 20,022 | | | $ | 33,027,508 | |
Liabilities | | | | | | | | | | | | | | | | |
TBA Sale Commitments | | $ | — | | | $ | (256,699 | ) | | $ | — | | | $ | (256,699 | ) |
Futures Contracts (1) | | | (65,863 | ) | | | — | | | | — | | | | (65,863 | ) |
Forward Foreign Currency Exchange Contracts (1) | | | — | | | | (20,295 | ) | | | — | | | | (20,295 | ) |
Swap Contracts (1) | | | — | | | | (135,618 | ) | | | — | | | | (135,618 | ) |
Total Liabilities | | $ | (65,863 | ) | | $ | (412,612 | ) | | $ | — | | | $ | (478,475 | ) |
| | |
| Annual Report • June 30, 2023 | | 113 |
Bridge Builder Mutual Funds
Notes to Financial Statements (Continued)
Municipal Bond Fund
| | | | | | | | | | | | | | | | |
| | | Level 1
(000s) | | | Level 2
(000s) | | | Level 3
(000s) | | | Total
(000s) | |
Assets | | | | | | | | | | | | | | | | |
Municipal Bonds | | | | | | | | | | | | | | | | |
Education | | $ | — | | | $ | 862,977 | | | $ | — | | | $ | 862,977 | |
General Obligation | | | — | | | | 2,667,046 | | | | — | | | | 2,667,046 | |
General Revenue | | | — | | | | 3,035,647 | | | | — | | | | 3,035,647 | |
Healthcare | | | — | | | | 1,116,738 | | | | — | | | | 1,116,738 | |
Housing | | | — | | | | 620,813 | | | | — | | | | 620,813 | |
Transportation | | | — | | | | 1,792,798 | | | | — | | | | 1,792,798 | |
Utilities | | | — | | | | 1,248,705 | | | | — | | | | 1,248,705 | |
Short-Term Investments | | | | | | | | | | | | | | | | |
Money Market Funds | | | 264,215 | | | | — | | | | — | | | | 264,215 | |
Time Deposits | | | — | | | | 427 | | | | — | | | | 427 | |
Futures Contracts (1) | | | 2,121 | | | | — | | | | — | | | | 2,121 | |
Total Assets | | $ | 266,336 | | | $ | 11,345,151 | | | $ | — | | | $ | 11,611,487 | |
Municipal High-Income Bond Fund
| | | | | | | | | | | | | | | | |
| | | Level 1
(000s) | | | Level 2
(000s) | | | Level 3
(000s) | | | Total
(000s) | |
Assets | | | | | | | | | | | | | | | | |
Municipal Bonds | | | | | | | | | | | | | | | | |
Education | | $ | — | | | $ | 187,112 | | | $ | — | | | $ | 187,112 | |
General Obligation | | | — | | | | 175,378 | | | | — | | | | 175,378 | |
General Revenue | | | — | | | | 931,672 | | | | — | | | | 931,672 | |
Healthcare | | | — | | | | 408,258 | | | | — | | | | 408,258 | |
Housing | | | — | | | | 143,865 | | | | — | | | | 143,865 | |
Transportation | | | — | | | | 375,056 | | | | — | | | | 375,056 | |
Utilities | | | — | | | | 131,480 | | | | — | | | | 131,480 | |
Common Stocks | | | | | | | | | | | | | | | | |
Basic Materials | | | 4 | | | | — | | | | — | | | | 4 | |
Consumer, Cyclical | | | 1 | | | | — | | | | — | | | | 1 | |
Industrials | | | 13 | | | | — | | | | — | | | | 13 | |
Short-Term Investments | | | | | | | | | | | | | | | | |
Money Market Funds | | | 17,440 | | | | — | | | | — | | | | 17,440 | |
Time Deposits | | | — | | | | 168 | | | | — | | | | 168 | |
Total Assets | | $ | 17,458 | | | $ | 2,352,989 | | | $ | — | | | $ | 2,370,447 | |
| | |
| 114 | | Annual Report • June 30, 2023 |
Bridge Builder Mutual Funds
Notes to Financial Statements (Continued)
Large Cap Growth Fund
| | | | | | | | | | | | | | | | |
| | | Level 1
(000s) | | | Level 2
(000s) | | | Level 3
(000s) | | | Total
(000s) | |
Assets | | | | | | | | | | | | | | | | |
Common Stocks | | | | | | | | | | | | | | | | |
Communication Services | | $ | 1,857,043 | | | $ | — | | | $ | — | | | $ | 1,857,043 | |
Consumer Discretionary | | | 3,253,832 | | | | 122,480 | | | | — | | | | 3,376,312 | |
Consumer Staples | | | 971,939 | | | | 69,419 | | | | — | | | | 1,041,358 | |
Energy | | | 412,611 | | | | — | | | | — | | | | 412,611 | |
Financials | | | 3,609,807 | | | | 54,215 | | | | — | | | | 3,664,022 | |
Healthcare | | | 3,513,223 | | | | — | | | | — | | | | 3,513,223 | |
Industrials | | | 867,203 | | | | — | | | | — | | | | 867,203 | |
Information Technology | | | 6,348,291 | | | | — | | | | — | | | | 6,348,291 | |
Materials | | | 791,604 | | | | — | | | | — | | | | 791,604 | |
Real Estate | | | 524,483 | | | | — | | | | — | | | | 524,483 | |
Utilities | | | 1,235 | | | | — | | | | — | | | | 1,235 | |
Preferred Stocks | | | | | | | | | | | | | | | | |
Consumer Discretionary | | | — | | | | 39,215 | | | | — | | | | 39,215 | |
Short-Term Investments | | | | | | | | | | | | | | | | |
Money Market Funds | | | 397,664 | | | | — | | | | — | | | | 397,664 | |
Time Deposits | | | — | | | | 548 | | | | — | | | | 548 | |
Futures Contracts (1) | | | 102 | | | | — | | | | — | | | | 102 | |
Total Assets | | $ | 22,549,037 | | | $ | 285,877 | | | $ | — | | | $ | 22,834,914 | |
Large Cap Value Fund
| | | | | | | | | | | | | | | | |
| | | Level 1
(000s) | | | Level 2
(000s) | | | Level 3
(000s) | | | Total
(000s) | |
Assets | | | | | | | | | | | | | | | | |
Common Stocks | | | | | | | | | | | | | | | | |
Communication Services | | $ | 1,229,076 | | | $ | — | | | $ | — | (2) | | $ | 1,229,076 | |
Consumer Discretionary | | | 1,361,610 | | | | 107,837 | | | | — | | | | 1,469,447 | |
Consumer Staples | | | 1,255,950 | | | | 89,909 | | | | — | | | | 1,345,859 | |
Energy | | | 881,210 | | | | 63,992 | | | | — | | | | 945,202 | |
Financials | | | 3,191,899 | | | | — | | | | — | | | | 3,191,899 | |
Healthcare | | | 2,386,967 | | | | 83,716 | | | | — | | | | 2,470,683 | |
Industrials | | | 2,358,578 | | | | 230,081 | | | | — | | | | 2,588,659 | |
Information Technology | | | 1,331,575 | | | | 105,622 | | | | — | | | | 1,437,197 | |
Materials | | | 771,185 | | | | — | | | | 7 | | | | 771,192 | |
Real Estate | | | 463,454 | | | | — | | | | — | | | | 463,454 | |
Utilities | | | 540,772 | | | | — | | | | — | | | | 540,772 | |
Convertible Preferred Stocks | | | | | | | | | | | | | | | | |
Utilities | | | 14,742 | | | | — | | | | — | | | | 14,742 | |
Preferred Stocks | | | | | | | | | | | | | | | | |
Consumer Discretionary | | | — | | | | 52,594 | | | | — | | | | 52,594 | |
Short-Term Investments | | | | | | | | | | | | | | | | |
Money Market Funds | | | 511,846 | | | | — | | | | — | | | | 511,846 | |
Time Deposits | | | — | | | | 2,836 | | | | — | | | | 2,836 | |
Futures Contracts (1) | | | 108 | | | | — | | | | — | | | | 108 | |
Total Assets | | $ | 16,298,972 | | | $ | 736,587 | | | $ | 7 | | | $ | 17,035,566 | |
| | |
| Annual Report • June 30, 2023 | | 115 |
Bridge Builder Mutual Funds
Notes to Financial Statements (Continued)
Tax Managed Large Cap Fund
| | | | | | | | | | | | | | | | |
| | | Level 1
(000s) | | | Level 2
(000s) | | | Level 3
(000s) | | | Total
(000s) | |
Assets | | | | | | | | | | | | | | | | |
Common Stocks | | | | | | | | | | | | | | | | |
Communication Services | | $ | 221,123 | | | $ | — | | | $ | — | | | $ | 221,123 | |
Consumer Discretionary | | | 240,636 | | | | — | | | | — | | | | 240,636 | |
Consumer Staples | | | 101,641 | | | | — | | | | — | | | | 101,641 | |
Energy | | | 111,772 | | | | — | | | | — | | | | 111,772 | |
Financials | | | 339,424 | | | | — | | | | — | | | | 339,424 | |
Healthcare | | | 349,036 | | | | — | | | | — | | | | 349,036 | |
Industrials | | | 254,616 | | | | — | | | | — | | | | 254,616 | |
Information Technology | | | 627,837 | | | | — | | | | — | | | | 627,837 | |
Materials | | | 124,642 | | | | — | | | | — | | | | 124,642 | |
Real Estate | | | 46,783 | | | | — | | | | — | | | | 46,783 | |
Utilities | | | 52,820 | | | | — | | | | — | | | | 52,820 | |
Short-Term Investments | | | | | | | | | | | | | | | | |
Money Market Funds | | | 59,767 | | | | — | | | | — | | | | 59,767 | |
Total Assets | | $ | 2,530,097 | | | $ | — | | | $ | — | | | $ | 2,530,097 | |
| | | | |
| Small/Mid Cap Growth Fund | | | | | | | | | | | | | | | | |
| | | Level 1
(000s) | | | Level 2
(000s) | | | Level 3
(000s) | | | Total
(000s) | |
Assets | | | | | | | | | | | | | | | | |
Common Stocks | | | | | | | | | | | | | | | | |
Communication Services | | $ | 194,003 | | | $ | — | | | $ | — | | | $ | 194,003 | |
Consumer Discretionary | | | 721,775 | | | | — | | | | — | | | | 721,775 | |
Consumer Staples | | | 344,867 | | | | — | | | | — | (2) | | | 344,867 | |
Energy | | | 157,550 | | | | — | | | | — | | | | 157,550 | |
Financials | | | 630,388 | | | | — | | | | — | | | | 630,388 | |
Healthcare | | | 1,513,692 | | | | — | | | | 13 | (2) | | | 1,513,705 | |
Industrials | | | 1,377,881 | | | | — | | | | — | | | | 1,377,881 | |
Information Technology | | | 1,792,118 | | | | — | | | | — | | | | 1,792,118 | |
Materials | | | 95,696 | | | | — | | | | — | | | | 95,696 | |
Real Estate | | | 79,340 | | | | — | | | | — | | | | 79,340 | |
Utilities | | | 5,088 | | | | — | | | | — | | | | 5,088 | |
Short-Term Investments | | | | | | | | | | | | | | | | |
Money Market Funds | | | 209,776 | | | | — | | | | — | | | | 209,776 | |
Time Deposits | | | — | | | | 2,558 | | | | — | | | | 2,558 | |
Futures Contracts (1) | | | 75 | | | | — | | | | — | | | | 75 | |
Total Assets | | $ | 7,122,249 | | | $ | 2,558 | | | $ | 13 | | | $ | 7,124,820 | |
| | |
| 116 | | Annual Report • June 30, 2023 |
Bridge Builder Mutual Funds
Notes to Financial Statements (Continued)
Small/Mid Cap Value Fund
| | | | | | | | | | | | | | | | |
| | | Level 1
(000s) | | | Level 2
(000s) | | | Level 3
(000s) | | | Total
(000s) | |
Assets | | | | | | | | | | | | | | | | |
Common Stocks | | | | | | | | | | | | | | | | |
Communication Services | | $ | 95,454 | | | $ | — | | | $ | — | (2) | | $ | 95,454 | |
Consumer Discretionary | | | 821,032 | | | | — | | | | — | | | | 821,032 | |
Consumer Staples | | | 277,331 | | | | — | | | | — | | | | 277,331 | |
Energy | | | 351,932 | | | | — | | | | — | | | | 351,932 | |
Financials | | | 1,202,588 | | | | — | | | | — | | | | 1,202,588 | |
Healthcare | | | 554,654 | | | | — | | | | 3 | (2) | | | 554,657 | |
Industrials | | | 1,414,417 | | | | 1,660 | | | | — | | | | 1,416,077 | |
Information Technology | | | 584,668 | | | | — | | | | — | | | | 584,668 | |
Materials | | | 474,082 | | | | — | | | | 4 | | | | 474,086 | |
Real Estate | | | 418,598 | | | | — | | | | — | | | | 418,598 | |
Utilities | | | 367,355 | | | | — | | | | — | | | | 367,355 | |
Exchange Traded Funds | | | 28,513 | | | | — | | | | — | | | | 28,513 | |
Short-Term Investments | | | | | | | | | | | | | | | | |
Money Market Funds | | | 211,376 | | | | — | | | | — | | | | 211,376 | |
Time Deposits | | | — | | | | 2,883 | | | | — | | | | 2,883 | |
Futures Contracts (1) | | | 123 | | | | — | | | | — | | | | 123 | |
Total Assets | | $ | 6,802,123 | | | $ | 4,543 | | | $ | 7 | | | $ | 6,806,673 | |
Tax Managed Small/Mid Cap Fund
| | | | | | | | | | | | | | | | |
| | | Level 1
(000s) | | | Level 2
(000s) | | | Level 3
(000s) | | | Total
(000s) | |
Assets | | | | | | | | | | | | | | | | |
Common Stocks | | | | | | | | | | | | | | | | |
Communication Services | | $ | 19,309 | | | $ | — | | | $ | — | | | $ | 19,309 | |
Consumer Discretionary | | | 98,386 | | | | — | | | | — | | | | 98,386 | |
Consumer Staples | | | 28,320 | | | | — | | | | — | | | | 28,320 | |
Energy | | | 37,499 | | | | — | | | | — | | | | 37,499 | |
Financials | | | 109,026 | | | | — | | | | — | | | | 109,026 | |
Healthcare | | | 105,042 | | | | — | | | | — | (2) | | | 105,042 | |
Industrials | | | 194,712 | | | | — | | | | — | | | | 194,712 | |
Information Technology | | | 129,309 | | | | — | | | | — | | | | 129,309 | |
Materials | | | 35,164 | | | | — | | | | — | | | | 35,164 | |
Real Estate | | | 32,741 | | | | — | | | | — | | | | 32,741 | |
Utilities | | | 19,102 | | | | — | | | | — | | | | 19,102 | |
Short-Term Investments | | | | | | | | | | | | | | | | |
Money Market Funds | | | 21,587 | | | | — | | | | — | | | | 21,587 | |
Time Deposits | | | — | | | | 156 | | | | — | | | | 156 | |
Total Assets | | $ | 830,197 | | | $ | 156 | | | $ | — | | | $ | 830,353 | |
| | |
| Annual Report • June 30, 2023 | | 117 |
Bridge Builder Mutual Funds
Notes to Financial Statements (Continued)
International Equity Fund
| | | | | | | | | | | | | | | | |
| | | Level 1
(000s) | | | Level 2
(000s) | | | Level 3
(000s) | | | Total
(000s) | |
Assets | | | | | | | | | | | | | | | | |
Common Stocks | | | | | | | | | | | | | | | | |
Communication Services | | $ | 43,333 | | | $ | 636,450 | | | $ | — | | | $ | 679,783 | |
Consumer Discretionary | | | 210,665 | | | | 2,092,996 | | | | — | | | | 2,303,661 | |
Consumer Staples | | | 155,171 | | | | 1,334,823 | | | | — | (2) | | | 1,489,994 | |
Energy | | | — | | | | 608,875 | | | | — | | | | 608,875 | |
Financials | | | 249,087 | | | | 2,534,037 | | | | — | | | | 2,783,124 | |
Healthcare | | | 296,199 | | | | 1,928,509 | | | | — | | | | 2,224,708 | |
Industrials | | | 259,348 | | | | 2,894,914 | | | | — | | | | 3,154,262 | |
Information Technology | | | 445,948 | | | | 1,057,142 | | | | — | | | | 1,503,090 | |
Materials | | | 59,145 | | | | 748,904 | | | | — | (2) | | | 808,049 | |
Real Estate | | | — | | | | 44,674 | | | | — | | | | 44,674 | |
Utilities | | | — | | | | 465,709 | | | | — | | | | 465,709 | |
Preferred Stocks | | | | | | | | | | | | | | | | |
Consumer Discretionary | | | — | | | | 52,610 | | | | — | | | | 52,610 | |
Consumer Staples | | | — | | | | 831 | | | | — | | | | 831 | |
Healthcare | | | — | | | | 474 | | | | — | | | | 474 | |
Short-Term Investments | | | | | | | | | | | | | | | | |
Money Market Funds | | | 227,347 | | | | — | | | | — | | | | 227,347 | |
Time Deposits | | | — | | | | 28,034 | | | | — | | | | 28,034 | |
Futures Contracts (1) | | | 69 | | | | — | | | | — | | | | 69 | |
Total Assets | | $ | 1,946,312 | | | $ | 14,428,982 | | | $ | — | | | $ | 16,375,294 | |
Liabilities | | | | | | | | | | | | | | | | |
Futures Contracts (1) | | $ | (9 | ) | | $ | — | | | $ | — | | | $ | (9 | ) |
Total Liabilities | | $ | (9 | ) | | $ | — | | | $ | — | | | $ | (9 | ) |
Tax Managed International Equity Fund
| | | | | | | | | | | | | | | | |
| | | Level 1
(000s) | | | Level 2
(000s) | | | Level 3
(000s) | | | Total
(000s) | |
Assets | | | | | | | | | | | | | | | | |
Common Stocks | | | | | | | | | | | | | | | | |
Communication Services | | $ | 1,143 | | | $ | 22,066 | | | $ | — | | | $ | 23,209 | |
Consumer Discretionary | | | 9,248 | | | | 140,348 | | | | — | | | | 149,596 | |
Consumer Staples | | | 16,596 | | | | 83,838 | | | | — | | | | 100,434 | |
Energy | | | 3,537 | | | | 27,444 | | | | — | | | | 30,981 | |
Financials | | | 14,142 | | | | 166,801 | | | | — | | | | 180,943 | |
Healthcare | | | 6,346 | | | | 170,938 | | | | — | | | | 177,284 | |
Industrials | | | 9,378 | | | | 172,581 | | | | — | | | | 181,959 | |
Information Technology | | | 18,386 | | | | 111,785 | | | | — | | | | 130,171 | |
Materials | | | 597 | | | | 84,737 | | | | — | | | | 85,334 | |
Real Estate | | | — | | | | 7,783 | | | | — | | | | 7,783 | |
Utilities | | | — | | | | 24,068 | | | | — | | | | 24,068 | |
Preferred Stocks | | | | | | | | | | | | | | | | |
Consumer Discretionary | | | — | | | | 7,535 | | | | — | | | | 7,535 | |
Consumer Staples | | | — | | | | 63 | | | | — | | | | 63 | |
Short-Term Investments | | | | | | | | | | | | | | | | |
Money Market Funds | | | 33,739 | | | | — | | | | — | | | | 33,739 | |
Time Deposits | | | — | | | | 2,508 | | | | — | | | | 2,508 | |
Total Assets | | $ | 113,112 | | | $ | 1,022,495 | | | $ | — | | | $ | 1,135,607 | |
| (1) | Derivative instruments, including futures, total return swap contracts and forward foreign currency exchange contracts are reported at the cumulative unrealized appreciation/(depreciation) of the instrument within the Funds’ Summary Schedule of Investments. Credit default swaps, interest rate swaps and inflation linked swaps are reported at market value. Only current day’s variation margin is reported within the Statements of Assets and Liabilities for exchange-traded and centrally cleared derivatives. |
| (2) | Includes a security valued less than one thousand |
| | |
| 118 | | Annual Report • June 30, 2023 |
Bridge Builder Mutual Funds
Notes to Financial Statements (Continued)
The Core Bond, Core Plus Bond, Large Cap Value, Small/Mid Cap Growth, Small/Mid Cap Value, Tax Managed Small/Mid Cap and International Equity Funds all held Level 3 securities at the end of the period. In the aggregate, securities classified as Level 3 in the Core Bond, Core Plus Bond, Large Cap Value, Small/Mid Cap Growth, Small/Mid Cap Value, Tax Managed Small/Mid Cap and International Equity Funds have been deemed immaterial with respect to each Fund.
The realized and unrealized gains/(losses) from Level 3 transactions are included with the net realized gain/(loss) on investments and net change in unrealized appreciation/(depreciation) on investments on the Statements of Operations, respectively.
5. DERIVATIVE INSTRUMENTS
Certain Funds use derivative instruments as part of their investment strategy to achieve their stated investment objective. The Funds’ derivative contracts held at period end are not accounted for as hedging instruments under GAAP. For financial reporting purposes, the Funds do not offset derivative assets and derivative liabilities across derivative types that are subject to master netting arrangements in the Statements of Assets and Liabilities. There were no financial instruments subject to a netting agreement for which the Funds are not currently netting.
The following table lists the fair value of derivative instruments held by the Funds, by primary underlying risk and contract type, as included in the Statements of Assets and Liabilities at period end.
| | | | | | | | | | | | | | | | | | | | | | | | |
| | | Assets | | | Liabilities | |
| | | Unrealized
Appreciation on
Futures Contracts*
(000s) | | | Swaps at
Value*
(000s) | | | Unrealized
Appreciation on
Forward Foreign
Currency
Exchange
Contracts
(000s) | | | Unrealized
Depreciation on
Futures Contracts*
(000s) | | | Swaps at
Value*
(000s) | | | Unrealized
Depreciation
on Forward
Foreign
Currency
Exchange
Contracts
(000s) | |
Interest Rate Risk: | | | | | | | | | | | | | | | | | | | | | | | | |
Core Bond Fund | | $ | 2,297 | | | $ | — | | | $ | — | | | $ | (10,645 | ) | | $ | — | | | $ | — | |
Core Plus Bond Fund | | | 6,941 | | | | 79,709 | | | | — | | | | (65,863 | ) | | | (133,495 | ) | | | — | |
Municipal Bond Fund | | | 2,121 | | | | — | | | | — | | | | — | | | | — | | | | — | |
Equity Risk: | | | | | | | | | | | | | | | | | | | | | | | | |
Large Cap Growth Fund | | | 102 | | | | — | | | | — | | | | — | | | | — | | | | — | |
Large Cap Value Fund | | | 108 | | | | — | | | | — | | | | — | | | | — | | | | — | |
Small/Mid Cap Growth Fund | | | 75 | | | | — | | | | — | | | | — | | | | — | | | | — | |
Small/Mid Cap Value Fund | | | 123 | | | | — | | | | — | | | | — | | | | — | | | | — | |
International Equity Fund | | | 69 | | | | — | | | | — | | | | (9 | ) | | | — | | | | — | |
Foreign Exchange Risk: | | | | | | | | | | | | | | | | | | | | | | | | |
Core Plus Bond Fund | | | — | | | | — | | | | 29,113 | | | | — | | | | — | | | | (20,295 | ) |
Credit Risk: | | | | | | | | | | | | | | | | | | | | | | | | |
Core Plus Bond Fund | | | — | | | | 11,479 | | | | — | | | | — | | | | (2,123 | ) | | | — | |
| * | May include cumulative unrealized appreciation/(deprecation) as reported on the Summary Schedule of Investments. Only current day’s variation margin is reported on the Statements of Assets and Liabilities for exchange traded derivatives and centrally-cleared derivatives. |
| | |
| Annual Report • June 30, 2023 | | 119 |
Bridge Builder Mutual Funds
Notes to Financial Statements (Continued)
The following table lists the effect of derivative instruments held by the Funds, by primary underlying risk and contract type, on the Statements of Operations for the year ended June 30, 2023.
| | | | | | | | | | | | | | | | | | | | | | | | |
| | | Realized Gain/(Loss) on Derivatives
recognized as a result of Operations | | | Net Change in Unrealized
Appreciation/(Depreciation) on
Derivatives recognized as a result of
Operations | |
| | | Futures Contracts
(000s) | | | Forward Foreign
Currency Exchange
Contracts
(000s) | | | Swaps
(000s) | | | Futures Contracts
(000s) | | | Forward Foreign
Currency Exchange
Contracts
(000s) | | | Swaps
(000s) | |
Interest Rate Risk: | | | | | | | | | | | | | | | | | | | | | | | | |
Core Bond Fund | | $ | (56,960 | ) | | $ | — | | | $ | — | | | $ | (3,203 | ) | | $ | — | | | $ | — | |
Core Plus Bond Fund | | | (211,216 | ) | | | — | | | | (20,202 | ) | | | (43,660 | ) | | | — | | | | (2,815 | ) |
Municipal Bond Fund | | | 15,656 | | | | — | | | | — | | | | (1,860 | ) | | | — | | | | — | |
Municipal High-Income Bond Fund | | | (8 | ) | | | — | | | | — | | | | — | | | | — | | | | — | |
Equity Risk: | | | | | | | | | | | | | | | | | | | | | | | | |
Large Cap Growth Fund | | | 2,495 | | | | — | | | | — | | | | 348 | | | | — | | | | — | |
Large Cap Value Fund | | | 260 | | | | — | | | | — | | | | 206 | | | | — | | | | — | |
Small/Mid Cap Growth Fund | | | 181 | | | | — | | | | — | | | | 133 | | | | — | | | | — | |
Small/Mid Cap Value Fund | | | 112 | | | | — | | | | — | | | | 245 | | | | — | | | | — | |
International Equity Fund | | | 842 | | | | — | | | | — | | | | 122 | | | | — | | | | — | |
Foreign Exchange Risk: | | | | | | | | | | | | | | | | | | | | | | | | |
Core Plus Bond Fund | | | — | | | | 37,719 | | | | — | | | | — | | | | (2,775 | ) | | | — | |
Credit Risk: | | | | | | | | | | | | | | | | | | | | | | | | |
Core Plus Bond Fund | | | — | | | | — | | | | (4,766 | ) | | | — | | | | — | | | | 45,978 | |
The following tables present the Funds’ gross OTC derivative assets and liabilities by counterparty and contract type, net of amounts available for offset under a master netting agreement and the related collateral received or pledged by the Funds as of June 30, 2023:
| | | | | | | | | | | | | | | | | | | | | | | | | | |
| Core Plus Bond Fund | | | | | | | | | | | | | | | | |
| | | | | Gross Amounts of
Recognized Assets
Presented in the
Statements of
Assets & Liabilities
(000s) | | | | | | | | | Gross Amounts
not offset in the
Statements of
Assets & Liabilities
(000s) | | | | |
| Counterparty | | Investment
Type | | Gross Amounts
Available for Offset
(000s) | | | Net
Amounts
(000s) | | | Financial
Instruments | | | Collateral
Received | | | Net
Amount
(000s) | |
Bank of America | | Interest
Rate
Swap
Contracts | | $ | 118 | | | $ | (31 | ) | | $ | 87 | | | $ | — | | | $ | — | | | $ | 87 | |
Bank of America | | Forward
Foreign
Currency
Exchange
Contracts | | | 6,975 | | | | (700 | ) | | | 6,275 | | | | — | | | | (6,275 | ) | | | — | |
Barclays Bank | | Credit
Default
Swap
Contracts | | | 214 | | | | (50 | ) | | | 164 | | | | — | | | | — | | | | 164 | |
Barclays Bank | | Forward
Foreign
Currency
Exchange
Contracts | | | 11 | | | | (11 | ) | | | — | | | | — | | | | — | | | | — | |
| | |
| 120 | | Annual Report • June 30, 2023 |
Bridge Builder Mutual Funds
Notes to Financial Statements (Continued)
| | | | | | | | | | | | | | | | | | | | | | | | | | | | |
| Core Plus Bond Fund | | | | | | | | | | | | | | | | |
| | | | | | Gross Amounts of
Recognized Assets
Presented in the
Statements of
Assets & Liabilities
(000s) | | | | | | | | | Gross Amounts
not offset in the
Statements of
Assets & Liabilities
(000s) | | | | |
| Counterparty | | Investment
Type | | | Gross Amounts
Available for Offset
(000s) | | | Net
Amounts
(000s) | | | Financial
Instruments | | | Collateral
Received | | | Net
Amount
(000s) | |
BNP Paribas | |
| Forward
Foreign
Currency
Exchange
Contracts |
| | $ | 2,740 | | | $ | (2,740 | ) | | $ | — | | | $ | — | | | $ | — | | | $ | — | |
Citibank | |
| Interest
Rate
Swap
Contracts |
| | | 311 | | | | (22 | ) | | | 289 | | | | — | | | | — | | | | 289 | |
Citibank | |
| Forward
Foreign
Currency
Exchange
Contracts |
| | | 35 | | | | (23 | ) | | | 12 | | | | — | | | | — | | | | 12 | |
Deutsche Bank | |
| Forward
Foreign
Currency
Exchange
Contracts |
| | | 6,479 | | | | (50 | ) | | | 6,429 | | | | — | | | | (6,429 | ) | | | — | |
Goldman Sachs | |
| Credit
Default
Swap
Contracts |
| | | 67 | | | | (67 | ) | | | — | | | | — | | | | — | | | | — | |
Goldman Sachs | |
| Interest
Rate
Swap
Contracts |
| | | 11 | | | | — | | | | 11 | | | | — | | | | — | | | | 11 | |
Goldman Sachs | |
| Forward
Foreign
Currency
Exchange
Contracts |
| | | 956 | | | | (428 | ) | | | 528 | | | | — | | | | — | | | | 528 | |
J.P. Morgan | |
| Credit
Default
Swap
Contracts |
| | | 1 | | | | (1 | ) | | | — | | | | — | | | | — | | | | — | |
J.P. Morgan | |
| Forward
Foreign
Currency
Exchange
Contracts |
| | | 11,720 | | | | (2,444 | ) | | | 9,276 | | | | — | | | | (8,082 | ) | | | 1,194 | |
Morgan Stanley | |
| Credit
Default
Swap
Contracts |
| | | 64 | | | | (64 | ) | | | — | | | | — | | | | — | | | | — | |
Morgan Stanley | |
| Forward
Foreign
Currency
Exchange
Contracts |
| | | 197 | | | | (197 | ) | | | — | | | | — | | | | | | | | — | |
Total Financial Instruments Subject to a Master Netting Arrangement or Similar Arrangement | | | | | | | 29,899 | | | | (6,828 | ) | | | 23,071 | | | | — | | | | (20,786 | ) | | | 2,285 | |
| | |
| Annual Report • June 30, 2023 | | 121 |
Bridge Builder Mutual Funds
Notes to Financial Statements (Continued)
| | | | | | | | | | | | | | | | | | | | | | | | | | |
| | | | | Gross Amounts of
Recognized Liabilities
Presented in the
Statements of
Assets & Liabilities
(000s) | | | | | | | | | Gross Amounts
not offset in the
Statements of
Assets & Liabilities
(000s) | | | | |
| Counterparty | | Investment
Type | | Gross Amounts
Available for Offset
(000s) | | | Net
Amounts
(000s) | | | Financial
Instruments | | | Collateral
Pledged | | | Net
Amount
(000s) | |
Bank of America | | Credit
Default
Swap
Contracts | | $ | 72 | | | $ | — | | | $ | 72 | | | $ | — | | | $ | — | | | $ | 72 | |
Bank of America | | Interest
Rate
Swap
Contracts | | | 31 | | | | (31 | ) | | | — | | | | — | | | | — | | | | — | |
Bank of America | | Forward
Foreign
Currency
Exchange
Contracts | | | 700 | | | | (700 | ) | | | — | | | | — | | | | — | | | | — | |
Barclays Bank | | Credit
Default
Swap
Contracts | | | 50 | | | | (50 | ) | | | — | | | | — | | | | — | | | | — | |
Barclays Bank | | Forward
Foreign
Currency
Exchange
Contracts | | | 382 | | | | (11 | ) | | | 371 | | | | — | | | | — | | | | 371 | |
BNP Paribas | | Credit
Default
Swap
Contracts | | | 41 | | | | — | | | | 41 | | | | — | | | | — | | | | 41 | |
BNP Paribas | | Forward
Foreign
Currency
Exchange
Contracts | | | 9,024 | | | | (2,740 | ) | | | 6,284 | | | | — | | | | — | | | | 6,284 | |
Citibank | | Interest
Rate
Swap
Contracts | | | 22 | | | | (22 | ) | | | — | | | | — | | | | — | | | | — | |
Citibank | | Forward
Foreign
Currency
Exchange
Contracts | | | 23 | | | | (23 | ) | | | — | | | | — | | | | — | | | | — | |
Deutsche Bank | | Forward
Foreign
Currency
Exchange
Contracts | | | 50 | | | | (50 | ) | | | — | | | | — | | | | — | | | | — | |
Goldman Sachs | | Credit
Default
Swap
Contracts | | | 339 | | | | (67 | ) | | | 272 | | | | — | | | | — | | | | 272 | |
Goldman Sachs | | Forward
Foreign
Currency
Exchange
Contracts | | | 428 | | | | (428 | ) | | | — | | | | — | | | | — | | | | — | |
| | |
| 122 | | Annual Report • June 30, 2023 |
Bridge Builder Mutual Funds
Notes to Financial Statements (Continued)
| | | | | | | | | | | | | | | | | | | | | | | | | | | | |
| | | | | | Gross Amounts of
Recognized Liabilities
Presented in the
Statements of
Assets & Liabilities
(000s) | | | | | | | | | Gross Amounts
not offset in the
Statements of
Assets & Liabilities
(000s) | | | | |
| Counterparty | | Investment
Type | | | Gross Amounts
Available for Offset
(000s) | | | Net
Amounts
(000s) | | | Financial
Instruments | | | Collateral
Pledged | | | Net
Amount
(000s) | |
J.P. Morgan | |
| Credit
Default
Swap
Contracts |
| | $ | 97 | | | $ | (1 | ) | | $ | 96 | | | $ | — | | | $ | — | | | $ | 96 | |
J.P. Morgan | |
| Forward
Foreign
Currency
Exchange
Contracts |
| | | 2,444 | | | | (2,444 | ) | | | — | | | | — | | | | — | | | | — | |
Morgan Stanley | |
| Credit
Default
Swap
Contracts |
| | | 226 | | | | (64 | ) | | | 162 | | | | — | | | | — | | | | 162 | |
Morgan Stanley | |
| Forward
Foreign
Currency
Exchange
Contracts |
| | | 7,234 | | | | (197 | ) | | | 7,037 | | | | — | | | | — | | | | 7,037 | |
UBS | |
| Forward
Foreign
Currency
Exchange
Contracts |
| | | 10 | | | | — | | | | 10 | | | | — | | | | — | | | | 10 | |
Total Financial Instruments Subject to a Master Netting Arrangement or Similar Arrangement | | | | | | | 21,173 | | | | (6,828 | ) | | | 14,345 | | | | — | | | | — | | | | 14,345 | |
The Funds’ average monthly notional amount of derivatives during the year ended June 30, 2023 were as follows:
| | | | | | | | | | | | | | | | | | | | | | | | | | | | | | | | | | | | |
| | | Core Bond
Fund
(000s) | | | Core Plus
Bond Fund*
(000s) | | | Municipal
Bond Fund
(000s) | | | Municipal
High-Income
Bond Fund**
(000s) | | | Large Cap
Growth Fund
(000s) | | | Large Cap
Value Fund
(000s) | | | Small/Mid
Cap Growth
Fund
(000s) | | | Small/Mid
Cap Value
Fund
(000s) | | | International
Equity Fund*
(000s) | |
Futures Contracts | | | | | | | | | | | | | | | | | | | | | | | | | | | | | | | | | | | | |
Average Notional Balance – Long | | $ | 899,887 | | | $ | 5,092,612 | | | $ | — | | | $ | 558 | | | $ | 9,410 | | | $ | 4,770 | | | $ | 2,979 | | | $ | 3,558 | | | $ | 5,398 | |
Average Notional Balance – Short | | | (92,851 | ) | | | (655,314 | ) | | | (284,986 | ) | | | — | | | | — | | | | — | | | | — | | | | — | | | | — | |
Forward Foreign Currency Exchange Contracts | | | | | | | | | | | | | | | | | | | | | | | | | | | | | | | | | | | | |
Average Amounts – Purchased | | | — | | | | 1,690,791 | | | | — | | | | — | | | | — | | | | — | | | | — | | | | — | | | | — | |
Average Amounts – Sold | | | — | | | | (1,060,984 | ) | | | — | | | | — | | | | — | | | | — | | | | — | | | | — | | | | — | |
Credit Default Swaps | | | | | | | | | | | | | | | | | | | | | | | | | | | | | | | | | | | | |
Average Amounts – Buy Protection | | | — | | | | 53,455 | | | | — | | | | — | | | | — | | | | — | | | | — | | | | — | | | | — | |
Average Amounts – Sell Protection | | | — | | | | (591,663 | ) | | | — | | | | — | | | | — | | | | — | | | | — | | | | — | | | | — | |
Interest Rate Swaps | | | | | | | | | | | | | | | | | | | | | | | | | | | | | | | | | | | | |
Average Amounts – Pays Fixed Rate | | | — | | | | 781,715 | | | | — | | | | — | | | | — | | | | — | | | | — | | | | — | | | | — | |
Average Amounts – Receives Fixed Rate | | | — | | | | (1,766,552 | ) | | | — | | | | — | | | | — | | | | — | | | | — | | | | — | | | | — | |
| | |
| Annual Report • June 30, 2023 | | 123 |
Bridge Builder Mutual Funds
Notes to Financial Statements (Continued)
| | | | | | | | | | | | | | | | | | | | | | | | | | | | | | | | | | | | |
| | | Core Bond
Fund
(000s) | | | Core Plus
Bond
Fund*
(000s) | | | Municipal
Bond
Fund
(000s) | | | Municipal
High-Income
Bond Fund**
(000s) | | | Large Cap
Growth Fund
(000s) | | | Large Cap
Value Fund
(000s) | | | Small/Mid
Cap Growth
Fund
(000s) | | | Small/Mid
Cap Value
Fund
(000s) | | | International
Equity Fund*
(000s) | |
Total Return Swaps | | | | | | | | | | | | | | | | | | | | | | | | | | | | | | | | | | | | |
Average Amounts – Long | | $ | — | | | $ | 6,528 | | | $ | — | | | $ | — | | | $ | — | | | $ | — | | | $ | — | | | $ | — | | | $ | — | |
Average Amounts – Short | | | — | | | | (15,873 | ) | | | — | | | | — | | | | — | | | | — | | | | — | | | | — | | | | — | |
Inflation Linked Swaps | | | | | | | | | | | | | | | | | | | | | | | | | | | | | | | | | | | | |
Average Amounts – Receives Floating Rate | | | — | | | | 33,906 | | | | — | | | | — | | | | — | | | | — | | | | — | | | | — | | | | — | |
Average Amounts – Pays Floating Rate | | | — | | | | (1,664 | ) | | | — | | | | — | | | | — | | | | — | | | | — | | | | — | | | | — | |
| * | Notional amounts shown have been converted to USD. |
| ** | Fund inception date was April 13, 2023. |
6. FEES AND OTHER TRANSACTIONS WITH AFFILIATES
The Adviser acts as investment adviser to the Funds pursuant to an investment advisory agreement (the “Advisory Agreement”) with the Trust. The Adviser is a wholly owned subsidiary of The Jones Financial Companies, L.L.L.P. Under the Advisory Agreement, the Adviser furnishes, at its own expense, all services, facilities and personnel necessary in connection with managing the Funds’ investments.
The Adviser provides the Trust with such investment research, advice and investment supervision as the Trust may from time to time consider necessary for the proper management of the investments of the Funds and furnishes continuously an investment program for the Funds. In fulfilling this obligation, the Adviser, among other things, recommends the hiring and termination, and monitors the ongoing performance, of the investment advisers (the “Sub-advisers”) and allocates Fund assets among the Sub-advisers.
In consideration of the services provided by the Adviser pursuant to the Advisory Agreement, the Funds pay the Adviser an investment advisory fee at an annual rate based on a percentage of each Fund’s average daily net assets. For its advisory services, the investment advisory fee shall be accrued daily by the Fund and paid to the Adviser on the first business day of the succeeding month. In an effort to pass along lower fund expenses to shareholders, the Adviser does not retain any portion of the advisory fees. The Adviser has contractually agreed to waive its advisory fees for each Fund to the extent advisory fees to be paid to the Adviser exceed the aggregate advisory fees the Fund is required to pay its Sub-advisers. The annual advisory fee and amounts of advisory fees waived by the Adviser during the period ended June 30, 2023 are noted in the table below:
| | | | | | | | |
Fund | | Annual
Management Fee | | | Management Fees
Waived by Adviser
(000s) | |
Core Bond Fund | | | 0.32 | % | | $ | 34,663 | |
Core Plus Bond Fund | | | 0.36 | | | | 67,264 | |
Municipal Bond Fund | | | 0.36 | | | | 27,443 | |
Municipal High-Income Bond Fund | | | 0.36 | | | | 1,045 | |
Large Cap Growth Fund | | | 0.44 | | | | 49,578 | |
Large Cap Value Fund | | | 0.44 | | | | 36,347 | |
Tax Managed Large Cap Fund | | | 0.44 | | | | 3,094 | |
Small/Mid Cap Growth Fund | | | 0.64 | | | | 17,136 | |
Small/Mid Cap Value Fund | | | 0.64 | | | | 15,880 | |
Tax Managed Small/Mid Cap Fund | | | 0.64 | | | | 1,255 | |
International Equity Fund | | | 0.60 | | | | 39,996 | |
Tax Managed International Equity Fund | | | 0.60 | | | | 1,804 | |
None of the advisory fees waived by the Adviser pursuant to the agreement described above are subject to recoupment by the Adviser.
| | |
| 124 | | Annual Report • June 30, 2023 |
Bridge Builder Mutual Funds
Notes to Financial Statements (Continued)
The Adviser has selected and the Board has approved the following Sub-advisers to sub-advise discrete portions of each of the Fund’s assets:
| | |
| Fund | | Sub-advisers |
| Core Bond Fund | | Robert W. Baird & Co., Inc. J.P. Morgan Investment Management, Inc. Loomis, Sayles & Company, L.P. PGIM, Inc. |
| Core Plus Bond Fund | | Pacific Investment Management Company LLC Loomis, Sayles & Company, L.P. Metropolitan West Asset Management, LLC * BlackRock Investment Management, LLC |
| Municipal Bond Fund | | FIAM, LLC BlackRock Investment Management, LLC MacKay Shields LLC |
| Municipal High-Income Bond Fund | | Capital International, Inc. T. Rowe Price Associates, Inc. |
| Large Cap Growth Fund | | Lazard Asset Management LLC Sustainable Growth Advisers, LP Jennison Associates LLC BlackRock Investment Management, LLC |
| Large Cap Value Fund | | Barrow, Hanley, Mewhinney & Strauss, LLC Wellington Management Company LLP Artisan Partners Limited Partnership BlackRock Investment Management, LLC T. Rowe Price Associates, Inc. LSV Asset Management |
| Tax Managed Large Cap Fund | | Barrow, Hanley, Mewhinney & Strauss, LLC ClearBridge Investments, LLC Parametric Portfolio Associates, LLC T. Rowe Price Associates, Inc. |
| Small/Mid Cap Growth Fund | | Champlain Investment Partners, LLC Eagle Asset Management, Inc. Stephens Investment Management Group, LLC BlackRock Investment Management, LLC Artisan Partners Limited Partnership Driehaus Capital Management LLC Victory Capital Management Inc. |
| Small/Mid Cap Value Fund | | Boston Partners Global Investors, Inc. Vaughan Nelson Investment Management, L.P. Silvercrest Asset Management Group LLC BlackRock Investment Management, LLC LSV Asset Management MFS Investment Management Diamond Hill Capital Management, Inc. American Century Investment Management, Inc. |
| Tax Managed Small/Mid Cap Fund | | AllianceBernstein L.P. Goldman Sachs Asset Management L.P. J.P. Morgan Investment Management, Inc. Neuberger Berman Investment Advisers, LLC Parametric Portfolio Associates, LLC Allspring Global Investments, LLC |
| International Equity Fund | | Baillie Gifford Overseas Limited Mondrian Investment Partners Limited WCM Investment Management, LLC BlackRock Investment Management, LLC Pzena Investment Management, LLC Marathon Asset Management Limited |
| Tax Managed International Equity Fund | | Parametric Portfolio Associates, LLC Pzena Investment Management, LLC T. Rowe Price Associates, Inc. Walter Scott & Partners Limited |
| * | Blackrock has entered into a sub-sub-advisory agreement with each of Blackrock International Limited (“BIL”), a U.K.-based affiliate of Blackrock, and Blackrock (Singapore) Limited (“BRS”), a Singapore-based affiliate of Blackrock, to facilitate the provision of advice and trading out of non-U.S. jurisdictions. BIL and BRS, each registered as an investment adviser with the SEC, organized in 1995 and 2000, respectively. |
| | |
| Annual Report • June 30, 2023 | | 125 |
Bridge Builder Mutual Funds
Notes to Financial Statements (Continued)
Subject to the supervision of the Adviser, the Sub-advisers provide the Funds, among other services, a continuous investment program and determine from time to time which securities or other investments shall be purchased, sold or exchanged for the Funds, including providing or obtaining such services as may be necessary in managing, acquiring or disposing of securities, cash or other investments. For their services as Sub-advisers to the Funds, each Sub-adviser is entitled to receive fees directly from each Fund it serves, except that any fees payable to BIL or BRS for their services as sub-sub-advisers to the Core Plus Bond Fund would be paid by BlackRock (and not the Adviser or the Core Plus Bond Fund).
Pursuant to an operating expense limitation agreement between the Adviser and the Funds, effective until October 28, 2023 (the “Expense Limitation Agreement”), the Adviser has contractually agreed to waive its fees and/or reimburse Fund expenses (excluding acquired fund fees and expenses, portfolio transaction expenses, interest expense in connection with investment activities, taxes and non-routine expenses) to limit total annual fund operating expenses after fee waivers and/or expense reimbursements to each of the amounts listed below (each an “Expense Cap”).
| | |
| Fund | | Expense Cap |
| Core Bond Fund | | 0.48% |
| Core Plus Bond Fund | | 0.42 |
| Municipal Bond Fund | | 0.48 |
| Municipal High-Income Bond Fund | | 0.48 |
| Large Cap Growth Fund | | 0.51 |
| Large Cap Value Fund | | 0.51 |
| Tax Managed Large Cap Fund | | 0.51 |
| Small/Mid Cap Growth Fund | | 0.73 |
| Small/Mid Cap Value Fund | | 0.73 |
| Tax Managed Small/Mid Cap Fund | | 0.73 |
| International Equity Fund | | 0.67 |
| Tax Managed International Equity Fund | | 0.67 |
Any fee reductions or expense payments made by the Adviser pursuant to the Expense Limitation Agreement are subject to reimbursement by a Fund, if requested by the Adviser in the thirty-six (36) month period following such fee waiver and/or expense payment, if the aggregate amount actually paid by the Fund toward its aggregate operating expenses, as accrued each month (taking into account the reimbursement) does not exceed the applicable Expense Cap accrued for such month (a) at the time of the fee waiver and/or expense payment and (b) at the time of the reimbursement.
For the year ended June 30, 2023, the Adviser recouped $47,785, $48,812 and $59,497 from the Tax Managed Large Cap, Tax Managed Small/Mid Cap and Tax Managed International Equity Funds, respectively. There are no amounts available for potential future recoupment by the Adviser as of June 30, 2023.
Administrator – Brown Brothers Harriman & Co. (“BBH”) acts as Administrator to the Trust pursuant to an Administrative Agency Agreement. As Administrator, BBH provides certain services to the Trust, including, among other responsibilities, administrative, tax, legal, accounting services, portfolio compliance monitoring, and financial reporting for the maintenance and operations of the Funds. In addition, BBH makes available the personnel and facilities to provide such services. In its capacity as Administrator, BBH does not have any responsibility or authority for the portfolio management of the Funds, the determination of investment policy, or for any matter pertaining to the distribution of Fund shares. Pursuant to the Administrative Agency Agreement, the Trust has agreed to pay such compensation as is mutually agreed upon from time to time and such out-of-pocket expenses as incurred by BBH in the performance of its duties. The amounts paid directly to the Administrator by the Funds for administrative services are included in the Administration fee in the Statements of Operations.
| | |
| 126 | | Annual Report • June 30, 2023 |
Bridge Builder Mutual Funds
Notes to Financial Statements (Continued)
Custodian – BBH also acts as Custodian to the Trust. In this capacity, BBH holds all cash and, directly or through a book entry system or an agent, securities of each Fund, delivers and receives payment for securities sold by such Fund, collects income from investments of each Fund and performs other duties as set forth in the Custodian Agreement between the Trust, on behalf of the Funds, and BBH. Custodian fees are paid monthly and based on assets held in custody, investment purchases and sales activity and account maintenance fees, plus reimbursement for certain out-of-pocket expenses. The amounts paid directly to the Custodian by the Funds for custody services are included in Custody fees in the Statements of Operations.
Trustees – Trustee fees and expenses displayed in the Statements of Operations include amounts accrued by the Funds to pay remuneration to each Trustee who is not an “interested person” as defined by the 1940 Act (an “Independent Trustee”) of the Trust or a non-Edward Jones interested trustee. The Trustees who are affiliated with the Adviser or its parent company, are not compensated by the Trust.
Affiliated Transactions – The Funds may participate in purchase and sale transactions with other Funds or accounts that have a common investment adviser or Sub-adviser, commonly referred to as “cross trades.” These cross trades are executed in accordance with procedures adopted by the Trust’s Board and comply with Rule 17a-7 of the 1940 Act, which require, among other things, that such cross trades be effected at the independent current market price of the security.
During the year ended June 30, 2023, the aggregate value of purchases and sales of cross trades with other Funds or accounts were as follows:
| | | | | | | | | | | | |
| | | Purchases
(000s) | | | Sales
(000s) | | | Realized
Gain/(Loss)
(000s) | |
Core Plus Bond Fund | | $ | 741 | | | $ | — | | | $ | — | |
Large Cap Growth Fund | | | 231,027 | | | | 153,251 | | | | 4,240 | |
Large Cap Value Fund | | | 95,899 | | | | 108,870 | | | | 19,756 | |
Small/Mid Cap Growth Fund | | | 74,323 | | | | 72,968 | | | | (4,637 | ) |
Small/Mid Cap Value Fund | | | 68,442 | | | | 86,583 | | | | 5,849 | |
International Equity Fund | | | 62,892 | | | | 61,276 | | | | (5,795 | ) |
7. INTERFUND LENDING AGREEMENT
On June 1, 2016, the Funds received exemptive relief from the SEC to enter into a master interfund lending agreement with each other that permits each Fund to lend money directly to and borrow money directly from other Funds for temporary purposes. Each Fund may lend, in the aggregate, up to 15% of its current net assets at the time of the loan but no more than 5% of its lending Fund’s net assets may be loaned to a single fund. A loan under the agreement will not exceed duration of seven days and interest is charged on borrowings at a rate determined based on current short-term market interest rates and short-term lending rates available to the Funds. As of June 30, 2023, the Funds have yet to lend under this agreement.
| | |
| Annual Report • June 30, 2023 | | 127 |
Bridge Builder Mutual Funds
Notes to Financial Statements (Continued)
8. INVESTMENT TRANSACTIONS
For the year or period ended June 30, 2023, purchases and sales of investment securities, other than short-term investments, were as follows:
| | | | | | | | | | | | | | | | | | | | | | | | |
| | | Core Bond Fund
(000s) | | | Core Plus
Bond Fund
(000s) | | | Municipal
Bond Fund
(000s) | | | Municipal High-
Income Bond
Fund*
(000s) | | | Large Cap
Growth Fund
(000s) | | | Large Cap
Value Fund
(000s) | |
Purchases: | | | | | | | | | | | | | | | | | | | | | | | | |
U.S. Government | | $ | 19,282,598 | | | $ | 58,341,575 | | | $ | — | | | $ | 237 | | | $ | — | | | $ | — | |
Other | | | 5,140,248 | | | | 8,185,690 | | | | 5,665,127 | | | | 344,866 | | | | 7,571,987 | | | | 3,305,314 | |
Sales: | | | | | | | | | | | | | | | | | | | | | | | | |
U.S. Government | | | 19,297,514 | | | | 57,161,266 | | | | 8 | | | | 3 | | | | — | | | | — | |
Other | | | 5,152,151 | | | | 9,852,802 | | | | 2,931,405 | | | | 125,618 | | | | 3,790,469 | | | | 5,242,829 | |
| | | | | | |
| | | Tax
Managed Large
Cap Fund
(000s) | | | Small/Mid Cap
Growth Fund
(000s) | | | Small/Mid Cap
Value Fund
(000s) | | | Tax Managed
Small/Mid Cap
Fund
(000s) | | | International
Equity Fund
(000s) | | | Tax Managed
International
Equity Fund
(000s) | |
Purchases: | | | | | | | | | | | | | | | | | | | | | | | | |
U.S. Government | | $ | — | | | $ | — | | | $ | — | | | $ | — | | | $ | — | | | $ | — | |
Other | | | 2,287,088 | | | | 4,577,909 | | | | 2,576,650 | | | | 831,088 | | | | 3,471,748 | | | | 938,360 | |
Sales: | | | | | | | | | | | | | | | | | | | | | | | | |
U.S. Government | | | — | | | | — | | | | — | | | | — | | | | — | | | | — | |
Other | | | 282,346 | | | | 3,697,078 | | | | 2,457,824 | | | | 177,329 | | | | 2,768,297 | | | | 78,289 | |
| * | Fund inception date was April 13, 2023. |
9. CAPITAL TRANSACTIONS
(Amounts in thousands)
During the year ended June 30, 2023, the Municipal Bond Fund redeemed 191,378 shares via a redemption-in-kind with total proceeds in the amount of $1,900,387. The net realized loss of $128,986 was not realized for federal tax purposes.
The redemption-in-kind proceeds from the Municipal Bond Fund were contributed in-kind on April 14, 2023 to the Municipal High-Income Bond Fund through a transfer of investment securities and cash in the amount of $1,900,387. On April 21, 2023, the Municipal High-Income Bond Fund received a second contribution-in-kind of investment securities and cash in the amount of $293,184.
10. FEDERAL INCOME TAX INFORMATION
GAAP requires that certain components of net assets be reclassified between financial and tax reporting. Temporary differences do not require reclassification. Temporary differences and permanent reclassifications have no effect on net assets. For the fiscal year or period ended June 30, 2023, the Funds made permanent book-to-tax reclassifications primarily related to the treatment of foreign currency, passive foreign investment company sales adjustments, paydowns, utilization of earnings and profits distributed to shareholders on redemption of shares, differences between book and tax accretion methods, and redemptions-in-kind to fund shareholders.
| | |
| 128 | | Annual Report • June 30, 2023 |
Bridge Builder Mutual Funds
Notes to Financial Statements (Continued)
For the fiscal year or period ended June 30, 2023, the Funds made the following reclassifications between total distributable earnings and paid-in capital:
| | | | | | | | |
| | | Total Distributable
Earnings/(Loss)
(000s) | | | Paid-in Capital
(000s) | |
Core Bond Fund* | | $ | 0 | | | $ | 0 | |
Core Plus Bond Fund | | | (26 | ) | | | 26 | |
Municipal Bond Fund | | | 132,004 | | | | (132,004 | ) |
Municipal High-Income Bond Fund | | | — | | | | — | |
Large Cap Growth Fund | | | 163 | | | | (163 | ) |
Large Cap Value Fund | | | (21,472 | ) | | | 21,472 | |
Tax Managed Large Cap Fund | | | — | | | | — | |
Small/Mid Cap Growth Fund | | | (41 | ) | | | 41 | |
Small/Mid Cap Value Fund* | | | 0 | | | | 0 | |
Tax Managed Small/Mid Cap Fund | | | — | | | | — | |
International Equity Fund | | | (2,000 | ) | | | 2,000 | |
Tax Managed International Equity Fund* | | | 0 | | | | 0 | |
| * | A zero balance may reflect actual amounts rounding to less than one thousand. |
At June 30, 2023, gross unrealized appreciation and (depreciation) of investments and derivative contracts based on cost for federal income tax purposes were as follows:
| | | | | | | | | | | | | | | | | | | | | | | | |
| | | Core Bond
Fund
(000s) | | | Core Plus
Bond Fund
(000s) | | | Municipal
Bond Fund
(000s) | | | Municipal
High-Income
Bond Fund
(000s) | | | Large Cap
Growth Fund
(000s) | | | Large Cap Value
Fund (000s) | |
Tax Cost of Portfolio | | $ | 18,439,363 | | | $ | 35,315,608 | | | $ | 11,914,567 | | | $ | 2,386,833 | | | $ | 16,277,769 | | | $ | 12,792,608 | |
| | | | | | | | | | | | | | | | | | | | | | | | |
Gross Unrealized App | | $ | 32,579 | | | $ | 356,910 | | | $ | 91,237 | | | $ | 14,469 | | | $ | 7,042,067 | | | $ | 4,894,870 | |
Gross Unrealized Dep | | | (1,692,834 | ) | | | (2,866,786 | ) | | | (394,317 | ) | | | (30,855 | ) | | | (484,922 | ) | | | (651,912 | ) |
| | | | | | | | | | | | | | | | | | | | | | | | |
Net Unrealized App/(Dep) | | $ | (1,660,255 | ) | | $ | (2,509,876 | ) | | $ | (303,080 | ) | | $ | (16,386 | ) | | $ | 6,557,145 | | | $ | 4,242,958 | |
| | | | | | | | | | | | | | | | | | | | | | | | |
| | | | | | |
| | | Tax
Managed Large
Cap Fund
(000s) | | | Small/Mid Cap
Growth Fund
(000s) | | | Small/Mid
Cap Value
Fund
(000s) | | | Tax Managed
Small/
Mid Cap
Fund
(000s) | | | International
Equity Fund
(000s) | | | Tax Managed
International
Equity Fund
(000s) | |
Tax Cost of Portfolio | | $ | 2,165,251 | | | $ | 5,832,555 | | | $ | 5,495,108 | | | $ | 730,204 | | | $ | 15,050,319 | | | $ | 995,697 | |
| | | | | | | | | | | | | | | | | | | | | | | | |
Gross Unrealized App | | $ | 402,934 | | | $ | 1,675,554 | | | $ | 1,711,419 | | | $ | 117,435 | | | $ | 3,294,749 | | | $ | 168,324 | |
Gross Unrealized Dep | | | (38,088 | ) | | | (383,289 | ) | | | (399,854 | ) | | | (17,286 | ) | | | (1,969,783 | ) | | | (28,414 | ) |
| | | | | | | | | | | | | | | | | | | | | | | | |
Net Unrealized App/(Dep) | | $ | 364,846 | | | $ | 1,292,265 | | | $ | 1,311,565 | | | $ | 100,149 | | | $ | 1,324,966 | | | $ | 139,910 | |
| | | | | | | | | | | | | | | | | | | | | | | | |
The differences between book basis and tax basis appreciation/(depreciation) on investments is primarily attributable to wash sale loss deferrals, and differences in the tax treatment of mark to market on passive foreign investment companies, mark to market on derivatives, non-REIT return of capital, outstanding partnership basis, the amortization of premiums and defaulted bond accrual.
| | |
| Annual Report • June 30, 2023 | | 129 |
Bridge Builder Mutual Funds
Notes to Financial Statements (Continued)
As of June 30, 2023, the components of distributable earnings/(losses) on a tax basis were as follows:
| | | | | | | | | | | | | | | | | | | | | | | | |
| | | Core Bond
Fund
(000s) | | | Core Plus
Bond Fund
(000s) | | | Municipal
Bond Fund
(000s) | | | Municipal
High-Income
BondFund
(000s) | | | Large Cap
Growth Fund
(000s) | | | Large Cap
Value Fund
(000s) | |
Accumulated Capital and Losses (1) | | $ | (824,507 | ) | | $ | (2,630,587 | ) | | $ | (203,349 | ) | | $ | (94 | ) | | $ | (397,588 | ) | | $ | — | |
Other (2)(3) | | | (196 | ) | | | (2,269 | ) | | | (15 | ) | | | — | | | | (2 | ) | | | (1 | ) |
Undistributed Ordinary Income | | | 2,785 | | | | 30,774 | | | | — | | | | — | | | | 92,350 | | | | — | |
Undistributed Tax Exempt Income | | | — | | | | — | | | | 5,386 | | | | 666 | | | | — | | | | — | |
Undistributed Long Term Capital Gain | | | — | | | | — | | | | — | | | | — | | | | — | | | | 509,540 | |
Unrealized Appreciation/(Depreciation) | | | (1,660,111 | ) | | | (2,508,985 | ) | | | (303,080 | ) | | | (16,419 | ) | | | 6,557,145 | | | | 4,242,974 | |
| | | | | | | | | | | | | | | | | | | | | | | | |
Total Distributable Earnings/(Loss) | | $ | (2,482,029 | ) | | $ | (5,111,067 | ) | | $ | (501,058 | ) | | $ | (15,847 | ) | | $ | 6,251,905 | | | $ | 4,752,513 | |
| | | | | | | | | | | | | | | | | | | | | | | | |
| | | | | | |
| | | Tax Managed
Large
Cap Fund
(000s) | | | Small/Mid
Cap
Growth Fund
(000s) | | | Small/Mid
Cap
Value Fund
(000s) | | | Tax Managed
Small/
Mid Cap
Fund
(000s) | | | International
Equity Fund
(000s) | | | Tax Managed
International
Equity Fund
(000s) | |
Accumulated Capital and Losses (1) | | $ | (50,688 | ) | | $ | (654,796 | ) | | $ | — | | | $ | (36,810 | ) | | $ | (191,586 | ) | | $ | (12,201 | ) |
Other (2)(3) | | | — | | | | — | | | | — | | | | — | | | | (10 | ) | | | — | |
Undistributed Ordinary Income | | | 14,751 | | | | 8,040 | | | | 45,763 | | | | 3,374 | | | | 309,730 | | | | 18,153 | |
Undistributed Tax Exempt Income | | | — | | | | — | | | | — | | | | — | | | | — | | | | — | |
Undistributed Long Term Capital Gain | | | — | | | | — | | | | 89,143 | | | | — | | | | — | | | | — | |
Unrealized Appreciation/(Depreciation) | | | 364,846 | | | | 1,292,265 | | | | 1,311,565 | | | | 100,149 | | | | 1,311,900 | | | | 139,957 | |
| | | | | | | | | | | | | | | | | | | | | | | | |
Total Distributable Earnings/(Loss) | | $ | 328,909 | | | $ | 645,509 | | | $ | 1,446,471 | | | $ | 66,713 | | | $ | 1,430,034 | | | $ | 145,909 | |
| | | | | | | | | | | | | | | | | | | | | | | | |
| (1) | | Includes capital loss carryforwards. |
| (2) | | Includes straddle loss deferrals. |
| (3) | | A zero balance may reflect actual amounts rounding to less than one thousand. |
At June 30, 2023, the Funds had the following capital loss carryforwards. The capital loss carryforwards do not have an expiration date and will retain their character as either short-term or long-term capital losses. The ability to utilize capital loss carryforwards in the future may be limited under the Internal Revenue Code and related regulations based on the results of future transactions.
| | | | | | | | | | | | | | | | | | | | | | | | |
| | | Core Bond Fund
(000s) | | | Core Plus
Bond Fund
(000s) | | | Municipal
Bond Fund
(000s) | | | Municipal High-Income
Bond Fund
(000s) | | | Large Cap
Growth Fund
(000s) | | | Large Cap
Value Fund
(000s) | |
Short-Term | | $ | 414,822 | | | $ | 1,378,590 | | | $ | 77,760 | | | $ | 90 | | | $ | 348,406 | | | $ | — | |
Long-Term | | | 409,685 | | | | 1,251,997 | | | | 125,589 | | | | 4 | | | | 49,182 | | | | — | |
| | | | | | | | | | | | | | | | | | | | | | | | |
| | $ | 824,507 | | | $ | 2,630,587 | | | $ | 203,349 | | | $ | 94 | | | $ | 397,588 | | | $ | — | |
| | | | | | | | | | | | | | | | | | | | | | | | |
| | | | | | |
| | | Tax Managed Large
Cap Fund
(000s) | | | Small/Mid Cap
Growth Fund
(000s) | | | Small/Mid Cap
Value Fund
(000s) | | | Tax Managed
Small/Mid Cap Fund
(000s) | | | International
Equity Fund
(000s) | | | Tax Managed
International
Equity Fund
(000s) | |
Short-Term | | | $ 50,396 | | | $ | 654,796 | | | $ | — | | | $ | 36,810 | | | $ | 36,421 | | | $ | 12,201 | |
Long-Term | | | 292 | | | | — | | | | — | | | | — | | | | 155,165 | | | | — | |
| | | | | | | | | | | | | | | | | | | | | | | | |
| | | $ 50,688 | | | $ | 654,796 | | | $ | — | | | $ | 36,810 | | | $ | 191,586 | | | $ | 12,201 | |
| | | | | | | | | | | | | | | | | | | | | | | | |
The tax character of distributions paid by the Funds during the fiscal periods ended June 30, 2023 and June 30, 2022 were as follows:
| | | | | | | | | | | | | | | | | | | | | | | | | | | | |
| | | Core Bond Fund
(000s) | | | Core Plus
Bond Fund
(000s) | | | Municipal
Bond Fund
(000s) | | | Municipal
High-Income
Bond Fund
(000s) | |
| | | 2023 | | | 2022 | | | 2023 | | | 2022 | | | 2023 | | | 2022 | | | 2023 | |
Distributions paid from: | | | | | | | | | | | | | | | | | | | | | | | | | | | | |
Ordinary Income(1) | | $ | 560,827 | | | $ | 414,458 | | | $ | 1,203,781 | | | $ | 736,321 | | | $ | 14,934 | | | $ | 1,722 | | | $ | 995 | |
Tax Exempt Income | | | — | | | | — | | | | — | | | | — | | | | 309,447 | | | | 207,681 | | | | 19,479 | |
Long-term Capital Gains | | | — | | | | 26,564 | | | | — | | | | 77,883 | | | | — | | | | — | | | | — | |
Return of Capital | | | — | | | | — | | | | — | | | | — | | | | — | | | | — | | | | — | |
| | | | | | | | | | | | | | | | | | | | | | | | | | | | |
Total Distributions Paid | | $ | 560,827 | | | $ | 441,022 | | | $ | 1,203,781 | | | $ | 814,204 | | | $ | 324,381 | | | $ | 209,403 | | | $ | 20,474 | |
| | | | | | | | | | | | | | | | | | | | | | | | | | | | |
| | |
| 130 | | Annual Report • June 30, 2023 |
Bridge Builder Mutual Funds
Notes to Financial Statements (Continued)
| | | | | | | | | | | | | | | | | | | | | | | | | | | | | | | | | | | | | | | | |
| | | Large Cap
Growth Fund
(000s) | | Large Cap
Value Fund
(000s) | | Tax Managed
Large Cap Fund
(000s) | | Small/Mid Cap
Growth Fund
(000s) |
| | | 2023 | | 2022 | | 2023 | | 2022 | | 2023 | | 2022 | | 2023 | | 2022 |
Distributions paid from: | | | | | | | | | | | | | | | | | | | | | | | | | | | | | | | | | | | | | | | | |
Ordinary Income(1) | | | $ | 130,160 | | | | $ | 709,609 | | | | $ | 404,103 | | | | $ | 593,022 | | | | $ | 6,368 | | | | $ | — | | | | $ | 10,849 | | | | $ | 253,410 | |
Tax Exempt Income | | | | — | | | | | — | | | | | — | | | | | — | | | | | — | | | | | — | | | | | — | | | | | — | |
Long-term Capital Gains | | | | — | | | | | 662,343 | | | | | 937,296 | | | | | 696,643 | | | | | — | | | | | — | | | | | — | | | | | 712,168 | |
Return of Capital | | | | — | | | | | — | | | | | — | | | | | — | | | | | — | | | | | — | | | | | — | | | | | — | |
| | | | | | | | | | | | | | | | | | | | | | | | | | | | | | | | | | | | | | | | |
Total Distributions Paid | | | $ | 130,160 | | | | $ | 1,371,952 | | | | $ | 1,341,399 | | | | $ | 1,289,665 | | | | $ | 6,368 | | | | $ | — | | | | $ | 10,849 | | | | $ | 965,578 | |
| | | | | | | | | | | | | | | | | | | | | | | | | | | | | | | | | | | | | | | | |
| | | | |
| | | Small/Mid Cap
Value Fund
(000s) | | Tax Managed
Small/Mid
Cap Fund
(000s) | | International
Equity Fund
(000s) | | Tax Managed
International
Equity Fund
(000s) |
| | | 2023 | | 2022 | | 2023 | | 2022 | | 2023 | | 2022 | | 2023 | | 2022 |
Distributions paid from: | | | | | | | | | | | | | | | | | | | | | | | | | | | | | | | | | | | | | | | | |
Ordinary Income(1) | | | $ | 70,751 | | | | $ | 327,837 | | | | $ | 1,763 | | | | $ | — | | | | $ | 269,812 | | | | $ | 676,301 | | | | $ | 2,948 | | | | $ | — | |
Tax Exempt Income | | | | — | | | | | — | | | | | — | | | | | — | | | | | — | | | | | — | | | | | — | | | | | — | |
Long-term Capital Gains | | | | 352,660 | | | | | 409,506 | | | | | — | | | | | — | | | | | 66,503 | | | | | 683,476 | | | | | — | | | | | — | |
Return of Capital | | | | — | | | | | — | | | | | — | | | | | — | | | | | — | | | | | — | | | | | — | | | | | — | |
| | | | | | | | | | | | | | | | | | | | | | | | | | | | | | | | | | | | | | | | |
Total Distributions Paid | | | $ | 423,411 | | | | $ | 737,343 | | | | $ | 1,763 | | | | $ | — | | | | $ | 336,315 | | | | $ | 1,359,777 | | | | $ | 2,948 | | | | $ | — | |
| | | | | | | | | | | | | | | | | | | | | | | | | | | | | | | | | | | | | | | | |
| (1) | Ordinary Income includes net short-term capital gains, if any. |
11. RISKS
Investing in the Funds may involve certain risks including, but not limited to, those described below. Please refer to the Funds’ prospectuses and statements of additional information for more information on risks associated with investing in the Funds.
a) Interest Rate Risk – Certain Funds invest in fixed-income securities that change in value based on changes in interest rates. If rates increase, the value of these investments generally declines. Alternatively, if rates fall, the value of these investments generally increases. A low interest rate environment may present greater interest rate risk, because there may be a greater likelihood of rates increasing and rates may increase more rapidly. A rise in interest rates may, in turn, increase volatility and reduce liquidity in the fixed-income markets and result in a decline in the value of the fixed-income investments held by the Funds. The value of a fixed-income security with greater duration will be more sensitive to changes in interest rates than a similar security with shorter duration. Duration is a measure of the sensitivity of the price of a fixed-income security (or a portfolio of fixed-income securities) to changes in interest rates. The prices of fixed-income securities with shorter duration generally will be less affected by changes in interest rates than the prices of fixed-income securities with greater duration. For example, a five-year duration means the fixed-income security is expected to decrease in value by 5% if interest rates rise 1% and increase in value by 5% if interest rates fall 1%, holding other factors constant. Usually, the changes in the value of fixed-income securities will not affect cash income generated, but may affect the value of an investment in the Fund. Floating rate instruments also react to interest rate changes in a similar manner although generally to a lesser degree (depending, however, on the characteristics of the reset terms, including the benchmark rate chosen, frequency of reset and reset caps or floors, among other things). Zero coupon bonds have longer durations than coupon-bearing bonds with comparable maturities and generally experience greater volatility in response to changing interest rates. In certain interest rate environments, such as when real interest rates are rising faster than nominal interest rates, inflation-indexed bonds may experience greater losses than other fixed-income securities with similar durations. Interest rate changes can be sudden and unpredictable, and a wide variety of factors can cause interest rates to rise or fall. Changing interest rates may have unpredictable effects on markets, may result in heightened market volatility and may detract from performance to the extent the Funds are exposed to such interest rates and/or volatility.
b) Liquidity Risk – Low trading volume, a lack of a market maker, or contractual or legal restrictions may limit or prevent a Fund from selling securities or closing derivative positions at desirable times or prices. During times of significant market or economic turmoil, usually liquid markets for certain of a Fund’s investments may experience
| | |
| Annual Report • June 30, 2023 | | 131 |
Bridge Builder Mutual Funds
Notes to Financial Statements (Continued)
extreme reductions in buy-side demand, which may result in values of a Fund’s portfolio securities declining significantly over short or extended periods of time. These reductions in value may occur regardless of whether there has been a change in interest rates or a change in the credit rating of the issuer of the security. Under certain adverse market or economic conditions, Fund investments previously determined to be liquid may be deemed to be illiquid, and, because of regulatory limitations on investments in illiquid securities, a Fund may not be able to make or gain the desired level of exposure to certain investments that it otherwise would.
c) Redemption Risk – A Fund may experience losses when selling securities to meet redemption requests. This risk is greater for larger redemption requests or redemption requests during adverse market conditions. Because the Funds currently are available only to participants in a single asset allocation program, a reduction in the allocation of program assets to the Funds could result in one or more large redemption requests. Moreover, as a result of the requirement that a Fund satisfy redemption requests even during times of significant market or economic turmoil, a Fund may be forced to sell portfolio securities during periods of reduced liquidity when prices are rapidly declining. This may require a Fund to realize investment losses at times that a Sub-adviser believes that it would have been advisable to hold a particular investment until a more orderly sale could occur or the market recovers.
d) Credit Risk – There is a risk that issuers and counterparties will not make payments on securities, repurchase agreements or other investments held by a Fund. Such defaults could result in losses to a Fund. In addition, the credit quality of securities held by a Fund may be lowered if an issuer’s financial condition changes. Lower credit quality may lead to greater volatility in the price of a security and in shares of a Fund. Lower credit quality also may affect liquidity and make it difficult for the Fund to sell the security.
A Fund may invest in securities that are rated in the lowest investment grade category. Such securities may exhibit speculative characteristics similar to high yield securities, and issuers of such securities may be more vulnerable to changes in economic conditions than issuers of higher grade securities.
e) Counterparty Risk – When a Fund enters into an investment contract, such as a derivative or a repurchase agreement, the Fund is exposed to the risk that the other party will not fulfill its contractual obligations. For example, in a repurchase agreement, there exists the risk that a Fund buys a security from a seller (counterparty) that agrees to repurchase the security at an agreed upon price and time, but the counterparty later fails to repurchase the security.
f) Market Risk – Various market risks can affect the price or liquidity of an issuer’s securities in which a Fund may invest. Returns from the securities in which a Fund invests may underperform returns from the various general securities markets or different asset classes. Different types of securities tend to go through cycles of outperformance and underperformance in comparison to the general securities markets. Adverse events occurring with respect to an issuer’s performance or financial position can depress the value of the issuer’s securities. The liquidity in a market for a particular security will affect its value and may be affected by factors relating to the issuer, as well as the depth of the market for that security. Declines in dealer market-making capacity as a result of structural or regulatory changes could decrease liquidity and/or increase volatility in the fixed-income markets. As a result, a Fund’s value may fluctuate and/or a Fund may experience increased redemptions from shareholders, which may impact the Fund’s liquidity or force the Fund to sell securities into a declining or illiquid market. The interconnection of international markets means that events in one country or region may affect the markets in other countries and regions, increasing the likelihood that regulatory events, inflation, interest rates, government defaults, government shutdowns, wars, regional conflicts, social unrest, natural disasters, acts of terrorism, infectious illness or other public health issues and recessions could affect the securities market. Other market risks that can affect value include a market’s current attitudes about types of securities, market reactions to political or economic events, including litigation, and tax and regulatory effects (including lack of adequate regulations for a market or particular type of instrument).
As it pertains to infectious illness, the coronavirus (COVID-19) pandemic and the ongoing responses of the U.S. government and various state, local and foreign governments have adversely affected global business activities and
| | |
| 132 | | Annual Report • June 30, 2023 |
Bridge Builder Mutual Funds
Notes to Financial Statements (Continued)
have resulted in significant uncertainty in the global economy and volatility in financial markets. Although vaccines for COVID-19 have become more widely available, the duration of the COVID-19 outbreak and its variants and its full impacts are unknown, resulting in a high degree of uncertainty for potentially extended periods of time, especially in certain sectors in which a Fund may make investments. The impact of these events and other epidemics or pandemics in the future could adversely affect a Fund’s performance.
As it pertains to wars and regional conflicts, Russia’s large-scale invasion of Ukraine on February 24, 2022 and the resulting responses by the United States and other countries could increase volatility and uncertainty in the financial markets and adversely affect regional and global economies. The United States and other countries have imposed broad-ranging economic sanctions on Russia, certain Russian individuals, banking entities and corporations, and Belarus as a response to Russia’s invasion of Ukraine and may impose sanctions on other countries that provide military or economic support to Russia. The extent and duration of Russia’s military actions or future escalation of such hostilities, and the extent and impact of the resulting sanctions (including any retaliatory actions or countermeasures that may be taken by those subject to sanctions, including cyber-attacks) are impossible to predict, but could result in significant market disruptions, including in certain industries or sectors, such as the oil and natural gas markets, and may negatively affect global supply chains, inflation and global growth. These and any related events could have a significant impact on a Fund’s performance and the value of the Fund’s investments, even if the Fund does not have direct exposure to Russian issuers or issuers in other countries affected by the invasion.
g) Equity Risk – Since certain Funds purchase equity securities, those Funds are subject to equity risk. This is the risk that stock prices will fall over short or extended periods of time. Although the stock market has historically outperformed other asset classes over the long term, the stock market tends to move in cycles. Individual stock prices may fluctuate drastically from day-to-day and may underperform other asset classes over an extended period of time. Individual companies may report poor results or be negatively affected by industry and/or economic trends and developments. The prices of securities issued by such companies may suffer a decline in response. These price movements may result from factors affecting individual companies, industries or the securities market as a whole.
h) Multi-Manager and Multi-Style Management Risk – Fund performance is dependent upon the success of the Adviser and the Sub-advisers in implementing a Fund’s investment strategies in pursuit of its objective. To a significant extent, a Fund’s performance will depend on the success of the Adviser’s methodology in allocating the Fund’s assets to Sub-advisers and its selection and oversight of the Sub-advisers and on a Sub-adviser’s skill in executing the relevant strategy and selecting investments for the Fund. There can be no assurance that the Adviser or Sub-advisers will be successful in this regard. In addition, because portions of each Fund’s assets are managed by different Sub-advisers using different styles/strategies, a Fund could experience overlapping security transactions. Certain Sub-advisers may be purchasing securities at the same time that other Sub-advisers may be selling those same securities, which may lead to higher transaction expenses compared to a fund using a single investment management style. The Adviser’s and the Sub-advisers’ judgments about the attractiveness, value and potential appreciation of a particular asset class or individual security in which a Fund invests may prove to be incorrect, and there is no guarantee that the Adviser’s or a Sub-adviser’s judgment will produce the desired results. In addition, a Fund may allocate its assets so as to under- or over-emphasize certain strategies or investments under market conditions that are not optimal, in which case a Fund’s value may be adversely affected.
i) Foreign Securities Risk – The securities of foreign issuers, including ADRs and GDRs and including securities of issuers in emerging market countries, may be less liquid and more volatile than securities of comparable U.S. issuers. The costs associated with securities transactions are often higher in foreign countries than the United States. Additionally, investments in securities of foreign issuers, even those publicly traded in the United States, may involve risks which are in addition to those inherent in domestic investments. Foreign companies may not be subject to the same regulatory requirements of U.S. companies, and as a consequence, there may be less publicly available information about such companies. Also, foreign companies may not be subject to uniform accounting, and financial reporting standards and requirements comparable to those applicable to U.S. companies. Foreign governments and foreign economies, particularly in emerging markets, may be less stable than the U.S. Government and the U.S. economy.
| | |
| Annual Report • June 30, 2023 | | 133 |
Bridge Builder Mutual Funds
Notes to Financial Statements (Continued)
j) Currency Risk – While the Funds’ net assets are valued in U.S. dollars, the securities of foreign companies are frequently denominated in foreign currencies. Thus, a change in the value of a foreign currency against the U.S. dollar will result in a corresponding change in value of securities denominated in that currency. Some of the factors that may impair the investments denominated in a foreign currency are: (1) it may be expensive to convert foreign currencies into U.S. dollars and vice versa; (2) complex political and economic factors may significantly affect the values of various currencies, including U.S. dollars, and their exchange rates; (3) government intervention may increase risks involved in purchasing or selling foreign currency options, forward foreign currency exchange contracts and futures contracts, since exchange rates may not be free to fluctuate in response to other market forces; (4) there may be no systematic reporting of last sale information for foreign currencies or regulatory requirement that quotations available through dealers or other market sources be firm or revised on a timely basis; (5) available quotation information is generally representative of very large round-lot transactions in the inter-bank market and thus may not reflect exchange rates for smaller odd-lot transactions (less than $1 million) where rates may be less favorable; and (6) the inter-bank market in foreign currencies is a global, around-the-clock market. To the extent that a market is closed while the markets for the underlying currencies remain open, certain markets may not always reflect significant price and rate movements.
k) Geographic Focus Risk – To the extent that a significant portion of a Fund’s portfolio is invested in the securities of companies in a particular country or region, a Fund may be more susceptible to economic, political, regulatory or other events or conditions affecting issuers within that country or region. As a result, a Fund may be subject to greater price volatility and risk of loss than a fund holding more geographically diverse investments.
l) High Yield Securities Risk – High yield, or “junk”, securities involve greater risks of default or downgrade and are more volatile than investment grade securities. Junk bonds involve greater risk of price declines than investment grade securities due to actual or perceived changes in the issuer’s credit worthiness.
m) Cybersecurity Risk – The Funds and their service providers may be susceptible to operational, information, security and related risks. While the Funds’ service providers have established business continuity plans in the event of such cyber incidents, there are inherent limitations in such plans and systems. Additionally, the Funds cannot control the cybersecurity plans and systems put in place by their service providers or any other third parties whose operations may affect the Funds or their shareholders.
n) LIBOR Replacement Risk – The London Inter-Bank Offered Rate (“LIBOR”) is intended to represent the rate at which contributing banks may obtain short-term borrowings from each other in the London interbank market. The publication of LIBOR on a representative basis ceased for the one-week and two-month U.S. dollar LIBOR settings immediately after December 31, 2021 and ceased for the remaining U.S. dollar LIBOR settings immediately after June 30, 2023. The U.S. Federal Reserve, based on the recommendations of the New York Federal Reserve’s Alternative Reference Rate Committee (comprised of major derivative market participants and their regulators), has begun publishing a Secured Overnight Financing Rate (“SOFR”), which is intended to replace U.S. dollar LIBOR. Alternative reference rates for other currencies have also been announced or have already begun publication. Markets are slowly developing in response to these new rates.
Neither the effect of the LIBOR transition process nor its ultimate success can yet be known. Not all existing LIBOR-based instruments may have alternative rate-setting provisions and there remains uncertainty regarding the willingness and ability of issuers to add alternative rate-setting provisions in certain existing instruments. Global regulators have advised market participants to cease entering into new contracts using LIBOR as a reference rate, and it is possible that investments in LIBOR-based instruments could invite regulatory scrutiny. In addition, a liquid market for newly-issued instruments that use a reference rate other than LIBOR still may be developing. Accordingly, it is difficult to predict the full impact of the transition away from LIBOR on the Funds until new reference rates and fallbacks for both legacy and new products, instruments and contracts are commercially accepted.
o) Taxation Risk – Certain Funds are managed to seek to minimize tax consequences to shareholders, but there is no guarantee that such Funds will be able to operate without incurring taxable income and gains to shareholders.
| | |
| 134 | | Annual Report • June 30, 2023 |
Bridge Builder Mutual Funds
Notes to Financial Statements (Continued)
Such Funds will engage in tax management techniques such as tax loss harvesting, whereby securities are sold in order to generate capital losses to offset current and future capital gains. However, there are certain risks inherent with tax loss harvesting, including the possibility that such activity does not improve the Fund’s after-tax returns. During certain market conditions, such as lower volatility periods and periods of strong economic growth, a Fund’s ability to generate capital losses to offset capital gains may be limited, which would limit the Fund’s ability to implement its tax loss harvesting strategy. In addition, because loss harvesting continuously decreases the cost-basis of a Fund’s portfolio, there is a risk that opportunities to realize losses may decrease over time.
Tax loss harvesting may also increase a Fund’s portfolio turnover rates. In addition, the “wash sales” rule will limit a Fund’s ability to currently recognize a loss from the tax loss harvesting strategy when selling and purchasing substantially identical assets within a 61-day window (i.e., a period beginning 30 days before the date of such purchase or the sale and ending 30 days after such date). In such a case, the basis of the newly purchased securities will be adjusted to reflect the disallowed loss.
12. RECENT ACCOUNTING PRONOUNCEMENTS
In March 2020, FASB issued Accounting Standards Update (“ASU”) 2020-04, Reference Rate Reform (“Topic 848”): Facilitation of the Effects of Reference Rate Reform on Financial Reporting. The main objective of the new guidance is to provide relief to companies that will be impacted by the expected change in benchmark interest rates at the end of 2021, when participating banks will no longer be required to submit LIBOR quotes by the UK Financial Conduct Authority (FCA). In 2021, the UK Financial Conduct Authority (FCA) delayed the intended cessation date of certain tenors of USD LIBOR to June 30, 2023.
The new guidance allows companies to, provided the only change to existing contracts are a change to an approved benchmark interest rate, account for modifications as a continuance of the existing contract without additional analysis. In addition, derivative contracts that qualified for hedge accounting prior to modification, will be allowed to continue to receive such treatment, even if critical terms change due to a change in the benchmark interest rate. To ensure the relief in Topic 848 covers the period of time during which a significant number of modifications may take place, the amendments in the proposed ASU have deferred the sunset date of Topic 848 from December 31, 2022, to December 31, 2024, after which entities would no longer be permitted to apply the relief in Topic 848. At this time, management has determined there has been no impact of the ASU’s adoption to the Funds’ financial statements and various filings.
| | |
| Annual Report • June 30, 2023 | | 135 |
Bridge Builder Mutual Funds
Report of Independent Registered Public Accounting Firm
To the Board of Trustees of Bridge Builder Trust and Shareholders of Bridge Builder Core Bond Fund, Bridge Builder Core Plus Bond Fund, Bridge Builder Municipal Bond Fund, Bridge Builder Municipal High-Income Bond Fund, Bridge Builder Large Cap Growth Fund, Bridge Builder Large Cap Value Fund, Bridge Builder Tax Managed Large Cap Fund, Bridge Builder Small/Mid Cap Growth Fund, Bridge Builder Small/Mid Cap Value Fund, Bridge Builder Tax Managed Small/Mid Cap Fund, Bridge Builder International Equity Fund, and Bridge Builder Tax Managed International Equity Fund
Opinions on the Financial Statements
We have audited the accompanying statements of assets and liabilities, including the summary schedules of investments, of each of the funds listed in the table below (twelve of the funds constituting Bridge Builder Trust, hereafter collectively referred to as the “Funds”) as of June 30, 2023, the related statements of operations and of changes in net assets for each of the periods indicated in the table below, including the related notes, and the financial highlights for each of the periods indicated therein (collectively referred to as the “financial statements”). In our opinion, the financial statements present fairly, in all material respects, the financial position of each of the Funds as of June 30, 2023, the results of each of their operations and the changes in each of their net assets for the periods indicated in the table below, and each of the financial highlights for each of the periods indicated therein, in conformity with accounting principles generally accepted in the United States of America.
Bridge Builder Core Bond Fund (1)
Bridge Builder Core Plus Bond Fund (1)
Bridge Builder Municipal Bond Fund (1)
Bridge Builder Large Cap Growth Fund (1)
Bridge Builder Large Cap Value Fund (1)
Bridge Builder Tax Managed Large Cap Fund (2)
Bridge Builder Small/Mid Cap Growth Fund (1)
Bridge Builder Small/Mid Cap Value Fund (1)
Bridge Builder Tax Managed Small/Mid Cap Fund (2)
Bridge Builder International Equity Fund (1)
Bridge Builder Tax Managed International Equity Fund (2)
Bridge Builder Municipal High-Income Bond Fund (3)
(1) Statement of operations for the year ended June 30, 2023 and statements of changes in net assets for the years ended June 30, 2023 and 2022
(2) Statement of operations for the year ended June 30, 2023 and statements of changes in net assets for the year ended June 30, 2023 and the period June 1, 2022 (inception date) through June 30, 2022
(3) Statement of operations and statement of changes in net assets for the period April 13, 2023 (inception date) through June 30, 2023
Basis for Opinions
These financial statements are the responsibility of the Funds’ management. Our responsibility is to express an opinion on the Funds’ financial statements based on our audits. We are a public accounting firm registered with the Public Company Accounting Oversight Board (United States) (PCAOB) and are required to be independent with respect to the Funds in accordance with the U.S. federal securities laws and the applicable rules and regulations of the Securities and Exchange Commission and the PCAOB.
We conducted our audits of these financial statements in accordance with the standards of the PCAOB. Those standards require that we plan and perform the audit to obtain reasonable assurance about whether the financial statements are free of material misstatement, whether due to error or fraud.
| | |
| 136 | | Annual Report • June 30, 2023 |
Bridge Builder Mutual Funds
Report of Independent Registered Public Accounting Firm (Continued)
Our audits included performing procedures to assess the risks of material misstatement of the financial statements, whether due to error or fraud, and performing procedures that respond to those risks. Such procedures included examining, on a test basis, evidence regarding the amounts and disclosures in the financial statements. Our audits also included evaluating the accounting principles used and significant estimates made by management, as well as evaluating the overall presentation of the financial statements. Our procedures included confirmation of securities owned as of June 30, 2023 by correspondence with the custodian, brokers and agent banks; when replies were not received from brokers, we performed other auditing procedures. We believe that our audits provide a reasonable basis for our opinions.
/s/PricewaterhouseCoopers LLP
Chicago, Illinois
August 25, 2023
We have served as the auditor of one or more investment companies in the Bridge Builder Trust since 2013.
| | |
| Annual Report • June 30, 2023 | | 137 |
Bridge Builder Mutual Funds
Trustees and Officers (Unaudited)
Independent Trustees of the Trust (1)
| | | | | | | | | | |
| Name and Year of Birth | | Position with the Trust | | Term of Office and Length of Time Served | | Principal Occupation During Past Five Years | | Number of Portfolios in Fund Complex (4) Overseen by Trustees | | Other Directorships Held During Past Five
Years |
Jean E. Carter (Born: 1957) | | Trustee | | Indefinite Term; Since Inception | | Retired; Director of Investment Management Group for Russell Investment Group (1982-2005). | | 16 | | Trustee, Brandes U.S. registered mutual funds (2008-2020). |
Craig A. Griffith (Born: 1958) | | Trustee | | Indefinite Term; Since April 2022 | | Retired; Partner at Sidley Austin LLP (1998-2019). | | 16 | | None. |
Timothy J. Jacoby (Born: 1952) | | Trustee | | Indefinite Term; Since April 2022 | | Retired; Partner at Deloitte & Touche LLP (2000-2014). | | 16 | | Audit Committee Chair, Perth Mint Physical Gold ETF (AAAU) (2018-2020); Independent Trustee, Exchange Traded Concepts Trust (20 funds) (2014-present); Exchange Listed Funds Trust (19 funds) (2014-present). |
Michelle M. Keeley (Born: 1964) | | Trustee | | Indefinite Term; Since August 2015 | | Retired; Executive Vice President, Ameriprise Financial Services, Inc. (2002-2010). | | 16 | | Independent Director, American Equity Life Holding Company (2020-2022); Independent Director, Federal Home Loan Bank of Des Moines (2015-2021). |
| | |
| 138 | | Annual Report • June 30, 2023 |
Bridge Builder Mutual Funds
Trustees and Officers (Unaudited) (Continued)
Independent Trustees of the Trust (1)
| | | | | | | | | | |
| Name and Year of Birth | | Position with the Trust | | Term of Office and Length of Time Served | | Principal Occupation During Past Five Years | | Number of Portfolios in Fund Complex (4) Overseen by Trustees | | Other Directorships Held During Past Five
Years |
Heidi Stam (Born: 1956) | | Trustee | | Indefinite Term; Since April 2022 | | Retired; Managing Director and General Counsel, Vanguard (2005-2016). | | 16 | | Trustee, CBRE Global Real Estate Income Fund (2021-present); Vice Chair, Investor Advisory Committee, U.S. Securities and Exchange Commission (2020-2021); Committee Member, Investor Advisory Committee, U.S. Securities and Exchange Commission (2017-2021); Council Member, National Adjudicatory Council, FINRA (2017-2021). |
David D. Sylvester (Born: 1950) | | Trustee | | Indefinite Term; Since April 2022 | | Retired; Portfolio Manager at Wells, Fargo & Co. (1979-2015). | | 16 | | Trustee, Minnehaha Academy (2017-2022). |
John M. Tesoro (Born: 1952) | | Chairman (since April 2022) and Trustee | | Indefinite Term; Since Inception | | Retired; Partner, KPMG LLP (2002-2012). | | 16 | | Independent Trustee, BBH Trust (8 funds) (2014-present); Director, Teton Advisors, Inc., registered investment adviser (2013-2021). |
| | |
| Annual Report • June 30, 2023 | | 139 |
Bridge Builder Mutual Funds
Trustees and Officers (Unaudited) (Continued)
Non-Edward Jones Interested Trustee of the Trust (2)
| | | | | | | | | | |
| Name and Year of Birth | | Position with the Trust | | Term of Office and Length of Time Served | | Principal Occupation During Past Five Years | | Number of Portfolios in Fund Complex (4) Overseen by Trustees | | Other Directorships Held During Past Five
Years |
Maureen Leary-Jago (Born: 1957) | | Trustee | | Indefinite Term; Since April 2022 | | Retired; Senior Global Advisor at MFS (2004-2016). | | 16 | | None. |
Interested Trustees of the Trust (3)
| | | | | | | | | | |
Name and Year of Birth | | Position with the Trust | | Term of Office and Length of Time Served | | Principal Occupation During Past Five Years | | Number of Portfolios in Fund Complex(4) Overseen by Trustees | | Other Directorships Held During Past Five
Years |
Lena Haas (Born: 1975) | | Trustee | | Indefinite Term; Since April 2022 | | Principal, Wealth Management Advice and Solutions, Edward Jones, and General Partner, The Jones Financial Companies, LLLP (January 2022- present); Principal, Products (March 2020-December 2021) and Principal, Banking and Trust Services (November 2017-March 2020) at Edward Jones; Senior Vice President, Head of Investing Product Management and Retirement, E*TRADE Financial and President of E*TRADE Capital Management (2011-2017). | | 16 | | Director, Craft Alliance Center of Art and Design. |
Merry L. Mosbacher (Born: 1958) | | Trustee | | Indefinite Term; Since January 2020 | | Subordinated Limited Partner, The Jones Financial Companies, LLLP (since 2020); Principal, Edward Jones, and General Partner, The Jones Financial Companies, LLLP (1986-2019); Associate, Edward Jones (1982-1985). | | 16 | | None. |
| | |
| 140 | | Annual Report • June 30, 2023 |
Bridge Builder Mutual Funds
Trustees and Officers (Unaudited) (Continued)
Officers of the Trust
| | | | | | | | | | |
Name and Year of Birth | | Position with the Trust | | Term of Office and Length of Time Served | | Principal Occupation During Past Five Years | | Number of Portfolios in Fund Complex (4) Overseen by Trustees | | Other Directorships Held During Past Five
Years |
Colleen R. Dean (Born: 1980) | | President | | Indefinite Term; Since June 2022 | | Director of Proprietary Funds Strategy and Management at Edward Jones (since 2022); Senior Vice President, PIMCO, and Assistant Treasurer or Deputy Treasurer for various PIMCO-sponsored mutual funds (2013-2022); Vice President, Cohen & Steers Capital Management (2006-2013). | | N/A | | N/A |
Aaron J. Masek (Born: 1974) | | Treasurer | | Indefinite Term; Since July, 2016 | | Director, Finance, Edward Jones (since 2015); Vice President and Treasurer, AQR Funds (2010-2015). | | N/A | | N/A |
Alan J. Herzog (Born: 1973) | | Chief Compliance Officer, Vice President and Anti-Money Laundering Officer | | Indefinite Term; Since March 2022 | | Principal, Compliance, Edward Jones, and General Partner, The Jones Financial Companies, L.L.L.P. (since 2013); Chief Compliance Officer, Anti-Money Laundering Officer and Vice President of the Trust (2015-2019). | | N/A | | N/A |
Evan S. Posner (Born: 1979) | | Secretary | | Indefinite Term; Since July 2021 | | Associate General Counsel at Edward Jones (since 2018); Assistant Secretary of the Trust (2019-2021); Vice President, Counsel at Voya Investment Management (2012-2018). | | N/A | | N/A |
| | |
| Annual Report • June 30, 2023 | | 141 |
Bridge Builder Mutual Funds
Trustees and Officers (Unaudited) (Continued)
| | | | | | | | | | |
Name and Year of Birth | | Position with the Trust | | Term of Office and Length of Time Served | | Principal Occupation During Past Five
Years | | Number of Portfolios in Fund Complex (4) Overseen by Trustees | | Other Directorships Held During Past Five
Years |
Gregory M. Rees (Born: 1987) | | Assistant Secretary | | Indefinite Term; Since December 2022 | | Associate General Counsel at Edward Jones (since 2021); Assistant Vice President at State Street Bank & Trust Company (2019-2021); Fund Administration Legal Contractor for State Street Bank & Trust Company (2017-2019). | | N/A | | N/A |
| (1) | The Trustees of the Trust who are not “interested persons” of the Trust as defined under the 1940 Act (“Independent Trustees”). |
| (2) | Ms. Leary-Jago is treated as an “interested person” of the Trust as defined by the 1940 Act by virtue of the fact that she has an immediate family member who is considered an affiliated person of an existing investment sub-adviser to one of the portfolios of the Trust. However, Ms. Leary-Jago is not an affiliated person of Edward D. Jones & Co., L.P. or any of its affiliates and, therefore, serves as an independent trustee of the Edward Jones Money Market Fund, which is advised by the Adviser. |
| (3) | Ms. Haas and Ms. Mosbacher are “interested persons” of the Trust as defined by the 1940 Act by virtue of the fact that they are affiliated persons of the Adviser’s parent company, The Jones Financial Companies, L.L.L.P. |
| (4) | The “Fund Complex” is comprised of each Fund offered by the Trust, three of which are not included in this Annual Report, and the Edward Jones Money Market Fund. Each Trustee also serves as a Trustee of the Edward Jones Money Market Fund. |
The business address of the Trustees and Officers is the address of the Trust: 12555 Manchester Road, St. Louis, MO 63131.
Each Fund’s Statement of Additional Information includes additional information about the Trustees and is available upon request, without charge, by calling 1-855-823-3611.
| | |
| 142 | | Annual Report • June 30, 2023 |
Bridge Builder Mutual Funds
Board Considerations of the Investment Advisory Agreement and Investment Sub-advisory Agreements for the Traditional Funds (Unaudited)
Pursuant to Section 15 of the Investment Company Act of 1940 (the “1940 Act”), the Board of Trustees (the “Board” or the “Trustees”) of the Bridge Builder Trust (the “Trust”), including a majority of the Trustees who are not parties to the agreements or “interested persons” of any party, as defined in the 1940 Act (the “Independent Trustees”), must determine annually whether to approve the continuation of the Trust’s investment advisory and sub-advisory agreements.
At an in-person meeting held on May 17-18, 2023 (the “May Renewal Meeting”), the Trustees, including the Independent Trustees, considered and approved the continuance of an investment advisory agreement (the “Advisory Agreement”) with Olive Street Investment Advisers, LLC (“Olive Street” or the “Adviser”) for the Bridge Builder Core Bond Fund (the “Core Bond Fund”), the Bridge Builder Core Plus Bond Fund (the “Core Plus Bond Fund”), the Bridge Builder Municipal Bond Fund (the “Municipal Bond Fund”), the Bridge Builder Large Cap Growth Fund (the “Large Cap Growth Fund”), the Bridge Builder Large Cap Value Fund (the “Large Cap Value Fund”), the Bridge Builder Small/Mid Cap Growth Fund (the “Small/Mid Cap Growth Fund”), the Bridge Builder Small/Mid Cap Value Fund (the “Small/Mid Cap Value Fund”), and the Bridge Builder International Equity Fund (the “International Equity Fund”) (collectively, the “Funds” or the “Traditional Funds”). The Trustees, including the Independent Trustees, also considered and approved the continuance of an investment sub-advisory agreement or investment sub-sub-advisory agreement, as applicable (each, a “Sub-advisory Agreement” and collectively, the “Sub-advisory Agreements”), with each of the following Fund subadvisers or sub-subadvisers whose Sub-advisory Agreements were subject to renewal at the May Renewal Meeting (listed next to the Fund(s) for which it serves as subadviser or sub-subadviser) (each, a “Subadviser” and collectively, the “Subadvisers”):
| | |
| Bridge Builder Fund | | Sub-Advisers and Sub-Sub-Advisers |
| Core Bond Fund | | Robert W. Baird & Co. Inc. (“Baird”) J.P. Morgan Investment Management Inc. (“J.P. Morgan”) Loomis, Sayles & Company, L.P. (“Loomis”) PGIM, Inc. (“PGIM”) |
| Core Plus Bond Fund | | Pacific Investment Management Company LLC (“PIMCO”) Loomis Metropolitan West Asset Management, LLC (“MetWest”) BlackRock Investment Management, LLC* (“BIM”) BlackRock International Limited (UK) (Sub-sub-adviser)* BlackRock (Singapore) Limited (Sub-sub-adviser)* |
| Municipal Bond Fund | | FIAM LLC (“FIAM”) MacKay Shields LLC (“MacKay Shields”) BIM |
| Large Cap Growth Fund | | Lazard Asset Management LLC (“Lazard”) Sustainable Growth Advisers, LP (“SGA”) Jennison Associates LLC (“Jennison”) BIM |
| Large Cap Value Fund | | Artisan Partners Limited Partnership (“Artisan Partners”) Barrow, Hanley, Mewhinney & Strauss, LLC (“Barrow Hanley”) Wellington Management Company, LLP (“Wellington”) BIM T. Rowe Price Associates, Inc. (“T. Rowe Price”) LSV Asset Management (“LSV”) |
| Small/Mid Cap Growth Fund | | Eagle Asset Management, Inc. (“Eagle”) Champlain Investment Partners, LLC (“Champlain”) Artisan Partners BIM Stephens Investment Management Group, LLC (“Stephens”) Driehaus Capital Management LLC (“Driehaus”) Victory Capital Management, Inc. (“Victory”) |
| Small/Mid Cap Value Fund | | Vaughan Nelson Investment Management, LP (“Vaughan Nelson”) Boston Partners Global Investors, Inc. (“Boston Partners”) Silvercrest Asset Management Group LLC (“Silvercrest”) BIM LSV Diamond Hill Capital Management, Inc. (“Diamond Hill”) Massachusetts Financial Services Company (d/b/a MFS Investment Management) (“MFS”) American Century Investment Management, Inc. (“American Century”) |
| | |
| Annual Report • June 30, 2023 | | 143 |
Bridge Builder Mutual Funds
Board Considerations of the Investment Advisory Agreement and Investment Sub-advisory Agreements for the Traditional Funds (Unaudited) (Continued)
| | |
| Bridge Builder Fund | | Sub-Advisers and Sub-Sub-Advisers |
| International Equity Fund | | Baillie Gifford Overseas Limited (“Baillie Gifford”) BIM Pzena Investment Management, LLC (“Pzena”) Mondrian Investment Partners Limited (“Mondrian”) WCM Investment Management (“WCM”) Marathon Asset Management Limited (“Marathon”) |
| * | BlackRock International Limited (UK) (“BIL”) and BlackRock (Singapore) Limited (“BSL”) each serve as investment sub-sub-advisers of the Core Plus Bond Fund pursuant to Investment Sub-sub-advisory Agreements between BlackRock Investment Management LLC (“BIM” and, together with BIL and BSL, “BlackRock”) and BIL and BSL, respectively. |
In connection with the annual contract review process and in advance of the May Renewal Meeting, the Adviser and the Subadvisers provided information to the Board in response to requests for information by the Independent Trustees to facilitate the Board’s evaluation of the Advisory Agreement and Sub-advisory Agreements (collectively, the “Agreements”). The information furnished by the Adviser and the Subadvisers included materials describing, among other matters: (i) the nature, extent, and quality of the services provided by the Adviser and the Subadvisers; (ii) each Fund’s historical investment performance and the historical investment performance of each Subadviser; (iii) the Adviser’s and the Subadvisers’ business, operations and personnel, including portfolio managers; (iv) the investment practices and techniques used by the Adviser and the Subadvisers in managing the Funds; (v) the management fees payable by the Funds to the Adviser and the Funds’ overall fees and operating expenses, including in comparison to those of a category and a peer group of mutual funds; (vi) the sub-advisory fees payable to each Subadviser; (vii) the Adviser’s and the Subadvisers’ compliance policies and procedures; (viii) the Adviser’s and the Subadvisers’ financial condition; and (ix) other “fall-out” benefits the Adviser and/or its affiliates and the Subadvisers may receive based on their relationships with the Funds. At a meeting held on May 3, 2023 and at the May Renewal Meeting (collectively, the “May Meetings”), representatives of the Adviser made presentations and responded to questions regarding services, fees, and other aspects of the Agreements.
In addition to the May Meetings, the Board met periodically over the course of the year since the most recent annual renewal of the Agreements. At these meetings, representatives of the Adviser and the Subadvisers furnished reports and other information to the Board, and engaged in discussions with the Board, regarding, among other things, the performance of the Funds, the services provided to the Funds by the Adviser and the Subadvisers, and compliance, risk and operational matters related to the Trust, the Funds, the Adviser, and the Subadvisers. In addition, the Board received information between regularly scheduled meetings on particular matters as the need arose.
Throughout the evaluation process, including at the May Meetings, the Trustees received advice from Fund counsel, and the Independent Trustees received separate advice from their independent legal counsel, including detailed memoranda from independent legal counsel regarding the legal standards applicable to the consideration of the approval of advisory and sub-advisory agreements. In connection with their deliberations, the Independent Trustees met separately with their independent legal counsel on May 1, 2023 and in executive session on several occasions, outside the presence of the interested Trustees, Trust officers, and representatives of the Adviser and the Subadvisers, to discuss the Agreements and other materials presented.
In considering and approving the Agreements, the Trustees considered information that they deemed relevant, including, but not limited to, the information discussed in further detail below. The Board’s decision to approve the continuation of the Agreements was based on a comprehensive consideration of all information provided to the Board throughout the year and specifically in connection with the May Meetings, as well as the knowledge gained over time through previous interactions with the Adviser and the Subadvisers. The Board did not identify any particular information or consideration that was all-important or controlling, and each individual Trustee may have attributed different weights to various factors and information.
1. The Nature, Extent and Quality of the Services Provided by the Adviser and the Subadvisers. The Trustees considered the nature, extent and quality of the services provided to the Funds by the Adviser and each Subadviser,
| | |
| 144 | | Annual Report • June 30, 2023 |
Bridge Builder Mutual Funds
Board Considerations of the Investment Advisory Agreement and Investment Sub-advisory Agreements for the Traditional Funds (Unaudited) (Continued)
including their respective responsibilities for management of the Funds. In this regard, the Board considered the Adviser’s oversight role and responsibilities with regard to the Subadvisers, and the Subadvisers’ roles in the day-to-day management of each Fund’s portfolio. The Board evaluated information about the nature and extent of responsibilities retained and risks assumed by the Adviser that were not delegated to or assumed by the Subadvisers, including the Adviser’s assumption of business, entrepreneurial, overall managerial and other risks by sponsoring and advising the Funds. The Board also evaluated the Adviser’s ongoing oversight of the Subadvisers, which includes continuous analysis of, and regular discussions with each Subadviser about, the investment strategies, performance and trading operations of the portion of a Fund’s assets managed by a particular Subadviser, and periodic on-site or virtual and other meetings with the Subadvisers. The Board further considered the Adviser’s provision of advisory services in connection with designing the Funds, selecting, monitoring, and terminating Subadvisers, and making asset allocation adjustments among the Subadvisers, as well as the impact of the Adviser’s services on each Fund’s investment performance. The Board also took into account the Adviser’s oversight of the Funds’ operations and the Funds’ other service providers.
The Board considered the Adviser’s and each Subadviser’s operations, including personnel and other resources devoted to supporting such operations. The Board noted key personnel additions to and departures from the Adviser and certain Subadvisers, as well as their succession planning practices to ensure continuity of services provided to the Funds. The Board considered the Adviser’s and each Subadviser’s ability to attract and retain qualified personnel to service the Funds and the experience and skills of management and investment personnel of the Adviser and the Subadvisers. With respect to the Subadvisers, the Board considered each Subadviser’s investment philosophy and process, investment research capabilities and resources, trade execution capabilities, experience and reputation. The Board also noted the compliance programs and compliance experience of the Adviser and the Subadvisers. The Board considered the Adviser’s day-to-day oversight of the Fund’s compliance with applicable laws and regulations, noting that regulatory and other developments had over time led to an increase in the scope of the Adviser’s oversight responsibilities in this regard. In addition, the Board considered the administrative and other services that are provided to the Funds by the Adviser, including analytical and other tools the Adviser employs to help manage the Funds’ risks.
Based on these considerations, the Board concluded, within the context of its full deliberations, that the Adviser and the Subadvisers are capable of continuing to provide services of the nature, extent and quality contemplated by the terms of the Agreements.
2. Fees and Other Expenses. The Board received and reviewed reports prepared by Broadridge Financial Solutions (“Broadridge”), an independent provider of mutual fund industry data, comparing each Fund’s management fees and gross and net expense ratios (net of fee and expense waivers and reimbursements) to those paid by an independently-selected category and peer group of mutual funds. The Board noted that each of the Funds’ gross and net expense ratios were below their respective peer group medians. The Board also noted that, except for the Core Plus Bond Fund, each Fund’s management fee was equal to or below its respective peer group median. The Board noted that the management fee before waivers for the Core Plus Bond Fund was higher than the peer group median, but the Fund’s net management fee was lower than its peer group median. The Board received a description of the methodology used by Broadridge to select the mutual funds in each Fund’s peer group. While the Board recognized that comparisons between a Fund and its peer group may be imprecise, the comparative, independently-selected information provided by Broadridge assisted the Board in evaluating the reasonableness of the Funds’ management fees and total expenses.
The Board observed that, except for the Municipal Bond Fund, the Adviser advised that it has no other clients with investments strategies similar to those of the Funds for purposes of comparison. With respect to the Municipal Bond Fund, the Board observed that the Fund’s contractual management fee is identical to that of a comparable mutual fund that was recently launched by the Adviser, the Bridge Builder Municipal High-Income Bond Fund. The
| | |
| Annual Report • June 30, 2023 | | 145 |
Bridge Builder Mutual Funds
Board Considerations of the Investment Advisory Agreement and Investment Sub-advisory Agreements for the Traditional Funds (Unaudited) (Continued)
Board reviewed the information provided by certain of the Subadvisers regarding fees that they charged to other clients with investment strategies similar to those of the portion of the Fund’s assets allocated to the particular Subadviser, including institutional separate account clients, if any. To the extent provided, the Board reviewed information about structural, operational and other differences, including the amount of assets being managed and the range of services provided, between such other clients and the portion of the Fund’s assets managed by the particular Subadviser.
The Board noted that the Adviser has contractually agreed to waive its management fees to the extent fees payable to the Adviser exceed the aggregate sub-advisory fees paid to a Subadviser. The Board noted that the Adviser may terminate this waiver arrangement without Board approval effective upon the end of the then current one-year period, by providing the Board written notice of such termination by April 15. The Board further noted that the Adviser has irrevocably agreed not to exercise its right to terminate the waiver arrangement upon the end of the current one-year period, resulting in the arrangement continuing until at least October 28, 2024.
Based on these considerations, the Board concluded, within the context of its full deliberations, that the advisory and sub-advisory fees payable under the Agreements are reasonable in light of the nature, extent and quality of the services rendered by the Adviser and the Subadvisers.
3. The Funds’ Investment Performance Record. The Board reviewed the investment performance of each Fund over different time periods and evaluated the Adviser’s analysis of the Fund’s performance for these time periods. The Board considered the investment performance of each Fund on an absolute basis and in comparison to appropriate benchmarks and each Fund’s respective Morningstar category and peer group as independently selected by Broadridge. For purposes of the Fund-by-Fund discussion below, each performance time period for the performance of the Funds and Subadvisers is the applicable period ended December 31, 2022, and the performance of each Fund and its Subadvisers relative to the “benchmark index” refers to the Fund’s benchmark index as identified by Broadridge.
The Board reviewed the performance of the Core Bond Fund. The Board observed that the Core Bond Fund outperformed its peer group median and benchmark index for the one-, three- and five-year periods. The Board also reviewed the investment performance of each Subadviser of the Core Bond Fund. In so doing, the Board observed that: (i) J.P. Morgan outperformed the benchmark index for the one-, three- and five-year periods; and (ii) Loomis, PGIM and Baird each outperformed the benchmark index for the three- and five-year periods and underperformed the benchmark index for the one-year period.
The Board reviewed the performance of the Core Plus Bond Fund. The Board observed that the Core Plus Bond Fund outperformed its peer group median and benchmark index for the one-, three- and five-year periods. The Board also reviewed the investment performance of each Subadviser of the Core Plus Bond Fund. In doing so, the Board observed that: (i) Loomis and PIMCO each outperformed the benchmark index for the one-, three- and five-year periods; (ii) MetWest outperformed the benchmark index for the three- and five-year periods and underperformed the benchmark index over the one-year period; and (iii) BlackRock underperformed the benchmark index for the one-year period, and BlackRock’s performance information for the three- and five-year periods was unavailable as BlackRock began managing its sleeve of the Fund in October 2021.
The Board reviewed the performance of the Municipal Bond Fund. The Board observed that the Municipal Bond Fund outperformed its peer group median for the three- and five-year periods and was equal to the performance of its peer group median for the one-year period. The Board further observed that the Municipal Bond Fund underperformed the benchmark index for the one-, three- and five-year periods. In reviewing the investment performance of each Subadviser of the Municipal Bond Fund, the Board observed that: (i) BIM underperformed the benchmark index for the one-year and three-year periods, and BIM’s performance information for the five-year period was unavailable as BIM had begun managing its sleeve of the Fund in September 2018; (ii) FIAM underperformed
| | |
| 146 | | Annual Report • June 30, 2023 |
Bridge Builder Mutual Funds
Board Considerations of the Investment Advisory Agreement and Investment Sub-advisory Agreements for the Traditional Funds (Unaudited) (Continued)
the benchmark index for the one- and three-year periods and was equal to the performance of its benchmark index for the five-year period; and (iii) MacKay Shields underperformed the benchmark index for the one-year period, and MacKay Shields’ performance information for the three- and five-year periods was unavailable as MacKay Shields began managing its sleeve of the Fund in January 2021. The Board noted that while performance information had been presented for T. Rowe Price’s sleeve of the Municipal Bond Fund, T. Rowe Price had been terminated as a subadviser of the Fund, effective April 18, 2023.
The Board reviewed the investment performance of the Large Cap Growth Fund. The Board observed that the Fund outperformed its peer group median for the one-, three- and five-year periods. The Board noted that the Large Cap Growth Fund outperformed the benchmark index for the one-year period and underperformed the benchmark index for the three- and five-year periods. In reviewing the investment performance of each Subadviser of the Large Cap Growth Fund, the Board noted that: (i) Jennison underperformed the benchmark index for the one, three- and five-year periods; (ii) SGA outperformed the benchmark index for the one-year period and underperformed the benchmark index for the three- and five-year periods; (iii) BIM performed within 3 basis points of the benchmark index for the one-, three- and five-year periods; and (iv) Lazard outperformed the benchmark index for the one- and three-year periods and underperformed the benchmark index for the five-year period.
The Board considered the performance of the Large Cap Value Fund. The Board noted that the Large Cap Value Fund outperformed its peer group median and its benchmark index for the one-, three- and five-year periods. In reviewing the investment performance of each Subadviser of the Large Cap Value Fund, the Board noted that: (i) Wellington and Barrow Hanley each outperformed the benchmark index for the one-, three- and five-year periods; (ii) Artisan Partners outperformed the benchmark index for the three- and five-year periods and underperformed the benchmark index for the one-year period; (iii) BIM underperformed the benchmark index for the one-, three- and five-year periods, but was within 10 basis points of the benchmark index for each of these periods; and (iv) LSV and T. Rowe Price each outperformed the benchmark index for the one-year period, and neither Subadviser’s performance information for the three- and five-year periods was available as each Subadviser began managing its sleeve of the Fund in May 2020.
The Board reviewed the investment performance of the Small/Mid Cap Growth Fund. The Board observed that the Fund outperformed its peer group median for the three-year period, underperformed its peer group median for the one-year period and was equal to the performance of its peer group median for the five-year period. The Board noted that the Small/Mid Cap Growth Fund outperformed its benchmark index for the three- and five-year periods and underperformed its benchmark index for the one-year period. In reviewing the investment performance of each Subadviser of the Small/Mid Cap Growth Fund, the Board observed that: (i) Eagle outperformed the benchmark index for the one-, three- and five-year periods; (ii) Stephens and Champlain each outperformed the benchmark index for the three- and five-year periods and underperformed the benchmark index for the one-year period; (iii) one BIM sleeve of the Fund underperformed the benchmark index for the one-, three- and five-year periods, while the other BIM sleeve of the Fund outperformed the benchmark index for the three- and five-year periods and underperformed the benchmark index in for the one-year period; (iv) Artisan, Victory and Driehaus each underperformed the benchmark for the one-year period, and the performance information for each of Artisan, Victory and Driehaus for the three- and five-year periods was unavailable as each Subadviser has not been managing its respective sleeve of the Fund for an entire three-year period.
The Board reviewed the performance of the Small/Mid Cap Value Fund. The Board observed that the Fund outperformed its peer group median and its benchmark index for the one-, three- and five-year periods. In reviewing the investment performance of each Subadviser of the Small/Mid Cap Value Fund, the Board noted that: (i) Boston Partners and Vaughan Nelson each outperformed the benchmark index for the one-, three- and five-year periods; (ii) Silvercrest and LSV outperformed the benchmark index for the one- and three-year periods and underperformed the benchmark index for the five-year period; (iii) one BIM sleeve of the Fund underperformed the benchmark index for the one-, three- and five-year periods, while the other BIM sleeve of the Fund outperformed the benchmark index
| | |
| Annual Report • June 30, 2023 | | 147 |
Bridge Builder Mutual Funds
Board Considerations of the Investment Advisory Agreement and Investment Sub-advisory Agreements for the Traditional Funds (Unaudited) (Continued)
for the one-, three- and five-year periods; (iv) MFS outperformed the benchmark index for the one- and three-year periods and MFS’s performance information for the five-year period was unavailable as MFS began managing its sleeve of the Fund in January 2019; (v) Diamond Hill outperformed the benchmark index for the one-year period but underperformed the benchmark index for the three-year period, and Diamond Hill’s performance information for the five-year period was unavailable as Diamond Hill began managing its sleeve of the Fund in January 2019; and (vi) American Century underperformed the benchmark index for the one-year period and American Century’s performance information for the three- and five-year periods was unavailable as American Century began managing its sleeve of the Fund in June 2021.
The Board considered the performance of the International Equity Fund. The Board observed that the International Equity Fund underperformed its peer group median and benchmark index for the one-year period, underperformed its peer group median and outperformed its benchmark index for the three-year period, and outperformed its peer group median and its benchmark index for the five-year period. In reviewing the performance of each Subadviser of the International Equity Fund, the Board noted that: (i) Pzena outperformed the benchmark index for the one-, three- and five-year periods; (ii) WCM underperformed the benchmark index for the one-year period and outperformed the benchmark index for the three- and five-year periods; (iii) Mondrian outperformed the benchmark index for the one-year period and underperformed the benchmark for the three- and five-year periods; (iv) Baillie Gifford underperformed the benchmark index for the one-, three- and five-year periods; (v) one BIM sleeve of the Fund underperformed the benchmark index for the one- and three-year periods and outperformed the benchmark index for the five-year period, while the other BIM sleeve of the Fund outperformed the benchmark index for the one-year period and underperformed the benchmark index for the three- and five-year periods; and (vi) Marathon outperformed the benchmark index for the one-year period and Marathon’s performance information for the three- and five-year periods was unavailable as Marathon began managing its sleeve of the Fund in June 2021.
Taking into account the performance information above and other performance information deemed relevant by the Board, including steps that the Adviser and Subadvisers had taken, or had agreed to take, to address underperformance, the Board concluded that the investment performance generated by each Subadviser was generally satisfactory, or that any steps taken, or agreed to be taken, by the Adviser and Subadvisers to address any performance issues were satisfactory.
4. Profitability and Economies of Scale. The Board considered that the Adviser has contractually agreed to waive its management fees to the extent management fees to be paid to the Adviser exceed the sub-advisory fees to be paid to a Subadviser for management of its allocated portion of a Fund or Funds. Therefore, the Board considered that the Adviser does not profit or receive any differential compensation from allocating assets in any particular manner among the Subadvisers. In addition, the Board did not consider the profitability of the Subadvisers to be a material factor with respect to the Board’s consideration of the Sub-advisory Agreements, given that the Subadvisers are not affiliated with the Adviser and, therefore, the sub-advisory fees are the result of an arms’ length negotiation. Further, the Board was satisfied that the Adviser employed a rigorous sub-advisory fee negotiation process. The Board also considered information about the extent to which economies of scale may be realized as the Funds’ assets grow and whether the Funds’ fee structure is designed to share economies of scale with shareholders as the Funds’ assets grow. In this regard, the Board noted that most of the Subadvisers have agreed to contractual breakpoints in their sub-advisory fee schedules, which accrue to the benefit of Fund shareholders in light of the Adviser’s contractual management fee waiver.
5. Indirect Benefits. The Board considered other benefits to the Adviser and its affiliates and the Subadvisers from their relationships with the Funds. The Board noted that Fund shares are available exclusively to investors participating in Edward Jones Advisory Solutions®, an investment advisory program (asset-based fee program) sponsored by Edward D. Jones & Co., L.P. (“Edward Jones”), an affiliate of the Adviser, as well as current and former Trustees. Accordingly, the Board received and considered information about asset-based fee rates charged
| | |
| 148 | | Annual Report • June 30, 2023 |
Bridge Builder Mutual Funds
Board Considerations of the Investment Advisory Agreement and Investment Sub-advisory Agreements for the Traditional Funds (Unaudited) (Continued)
by Edward Jones to participants in Edward Jones Advisory Solutions® in connection with their investments in the Funds as an indirect or “fall-out” benefit. In addition, the Board considered that the Adviser, Edward Jones and each Subadviser may derive a benefit to their reputations and standing in the investment community from their relationship with the Funds. The Board also noted that certain Subadvisers use soft dollars generated from executing Fund portfolio trades to purchase research, which could be viewed as a fall-out benefit to such Subadvisers to the extent they use the research generated from such trading activities across their client base.
Conclusion. Based on the Board’s deliberations and its evaluation of the information described above and other information it believed relevant, the Board, including all of the Independent Trustees, unanimously approved the continuation of the Agreements for an additional year.
| | |
| Annual Report • June 30, 2023 | | 149 |
Bridge Builder Mutual Funds
Board Considerations of the Investment Advisory Agreement and Investment Sub-advisory Agreements for Tax Managed Funds (Unaudited)
Pursuant to Section 15 of the Investment Company Act of 1940 (the “1940 Act”), the Board of Trustees (the “Board” or the “Trustees”) of the Bridge Builder Trust (the “Trust”), including a majority of the Trustees who are not parties to the agreements or “interested persons” of any party, as defined in the 1940 Act (the “Independent Trustees”), must determine annually whether to approve the continuation of the Trust’s investment advisory and sub-advisory agreements.
At a meeting held on May 17-18, 2023 (the “May Renewal Meeting”), the Trustees, including the Independent Trustees, considered and approved the continuance of an investment advisory agreement (the “Advisory Agreement”) with Olive Street Investment Advisers, LLC (“Olive Street” or the “Adviser”) for the Bridge Builder Tax Managed Large Cap Fund, the Bridge Builder Tax Managed Small/Mid Cap Fund and the Bridge Builder Tax Managed International Equity Fund (collectively, the “Funds”). The Trustees, including the Independent Trustees, also considered and approved the continuance of an investment sub-advisory agreement (each, a “Sub-advisory Agreement” and collectively, the “Sub-advisory Agreements”) with each of the following Fund sub-advisers whose Sub-advisory Agreements were subject to renewal at the May Renewal Meeting (listed next to the Fund(s) for which it serves as subadviser) (each, a “Sub-adviser” and collectively, the “Sub-advisers”):
| | |
| Bridge Builder Fund | | Sub-Advisers |
| Bridge Builder Tax Managed Large Cap Fund | | Parametric Portfolio Associates LLC Barrow, Hanley, Mewhinney & Strauss, LLC ClearBridge Investments, LLC T. Rowe Price Associates, Inc. |
| Bridge Builder Tax Managed Small/Mid Cap Fund | | Parametric Portfolio Associates LLC AllianceBernstein L.P. Goldman Sachs Asset Management, L.P. J.P. Morgan Investment Management Inc. Neuberger Berman Investment Advisers LLC Allspring Global Investments, LLC |
| Bridge Builder Tax Managed International Equity Fund | | Parametric Portfolio Associates LLC Pzena Investment Management, LLC T. Rowe Price Associates, Inc. Walter Scott & Partners Limited |
Parametric Portfolio Associates LLC (“Parametric”) serves as the tax overlay manager and as the direct indexing manager for each Fund. Each Subadviser other than Parametric is referred to herein as a “Model Provider.”
In connection with the annual contract review process and in advance of the May Renewal Meeting, the Adviser and the Subadvisers provided information to the Board in response to requests for information by the Independent Trustees to facilitate the Board’s evaluation of the Advisory Agreement and Sub-advisory Agreements (collectively, the “Agreements”). The information furnished by the Adviser and the Subadvisers included materials describing, among other matters: (i) the nature, extent, and quality of the services provided by the Adviser and the Subadvisers; (ii) each Fund’s historical investment performance and the historical investment performance of each Subadviser; (iii) the Adviser’s and the Subadvisers’ business, operations and personnel, including portfolio managers; (iv) the investment practices and techniques used by the Adviser and the Subadvisers in managing the Funds; (v) the management fees payable by the Funds to the Adviser and the Funds’ overall fees and operating expenses, including in comparison to those of a category and a peer group of mutual funds; (vi) the sub-advisory fees payable to each Subadviser; (vii) the Adviser’s and the Subadvisers’ compliance policies and procedures; (viii) the Adviser’s and the Subadvisers’ financial condition; and (ix) other “fall-out” benefits the Adviser and/or its affiliates and the Subadvisers may receive based on their relationships with the Funds. At a meeting held on May 3, 2023 and at the May Renewal Meeting (collectively, the “May Meetings”), representatives of the Adviser made presentations and responded to questions regarding services, fees, and other aspects of the Agreements.
In addition to the May Meetings, the Board met periodically over the course of the year since the most recent approval of the Agreements. At these meetings, representatives of the Adviser and the Subadvisers furnished
| | |
| 150 | | Annual Report • June 30, 2023 |
Bridge Builder Mutual Funds
Board Considerations of the Investment Advisory Agreement and Investment Sub-advisory Agreements for Tax Managed Funds (Unaudited) (Continued)
reports and other information to the Board, and engaged in discussions with the Board, regarding, among other things, the performance of the Funds, the services provided to the Funds by the Adviser and the Sub-advisers, and compliance, risk and operational matters related to the Trust, the Funds, the Adviser, and the Sub-advisers. In addition, the Board received information between regularly scheduled meetings on particular matters as the need arose.
Throughout the evaluation process, including at the May Meetings, the Trustees received advice from Fund counsel, and the Independent Trustees received separate advice from their independent legal counsel, including detailed memoranda from independent legal counsel regarding the legal standards applicable to the consideration of the approval of advisory and sub-advisory agreements. In connection with their deliberations, the Independent Trustees met separately with their independent legal counsel on May 1, 2023 and in executive session on several occasions, outside the presence of the interested Trustees, Trust officers, and representatives of the Adviser and the Sub-advisers, to discuss the Agreements and other materials presented.
In considering and approving the Agreements, the Trustees considered information that they deemed relevant, including, but not limited to, the information discussed in further detail below. The Board’s decision to approve the continuation of the Agreements was based on a comprehensive consideration of all information provided to the Board throughout the year and specifically in connection with the May Meetings, as well as the knowledge gained over time through previous interactions with the Adviser and the Subadvisers. The Board did not identify any particular information or consideration that was all-important or controlling, and each individual Trustee may have attributed different weights to various factors and information.
1. The Nature, Extent and Quality of the Services Provided by the Adviser and the Subadvisers. The Trustees considered the nature, extent and quality of the services provided to the Funds by the Adviser and each Subadviser, including their respective responsibilities for management of the Funds. In this regard, the Board considered the terms of the Advisory Agreement and Sub-advisory Agreements and the range of services provided by the Adviser, Parametric and the Model Providers, including the Adviser’s oversight role and responsibilities with regard to the Subadvisers, and the Subadvisers’ roles in the day-to-day management of each Fund’s portfolio. The Board evaluated information about the nature and extent of responsibilities retained and risks assumed by the Adviser that were not delegated to or assumed by the Subadvisers, including the Adviser’s assumption of business, entrepreneurial, overall managerial and other risks by sponsoring and advising the Funds. The Board also evaluated the Adviser’s ongoing oversight of the Subadvisers, which includes continuous analysis of, and regular discussions with each Subadviser about, the Subadviser’s investment results and the performance of the Subadviser’s obligations under its Sub-advisory Agreement, and periodic on-site or virtual and other meetings with the Subadvisers. The Board further considered the Adviser’s provision of advisory services in connection with designing the Funds, selecting, monitoring, and terminating Subadvisers, and making asset allocation adjustments among each Model Provider and Parametric in its capacity as direct indexing manager, as well as the impact of the Adviser’s services on each Fund’s investment performance. The Board also took into account the Adviser’s oversight of the Funds’ operations and the Funds’ other service providers and other services provided to the Funds by the Adviser, such as monitoring Parametric’s process for selecting broker-dealers to execute portfolio transactions and other trading operations.
The Board considered the Adviser’s and each Sub-adviser’s operations, including personnel and other resources devoted to supporting such operations. The Board noted key personnel additions to and departures from the Adviser and certain Sub-advisers, as well as their succession planning practices to ensure continuity of services provided to the Funds. The Board considered the Adviser’s and each Sub-adviser’s ability to attract and retain qualified personnel to service the Funds and the experience and skills of management and investment personnel of the Adviser and the Sub-advisers. The Board also noted the compliance programs and compliance experience of the Adviser and the Sub-advisers. The Board considered the Adviser’s day-to-day oversight of the Fund’s compliance with applicable laws and regulations, noting that regulatory and other developments had over time led to an
| | |
| Annual Report • June 30, 2023 | | 151 |
Bridge Builder Mutual Funds
Board Considerations of the Investment Advisory Agreement and Investment Sub-advisory Agreements for Tax Managed Funds (Unaudited) (Continued)
increase in the scope of the Adviser’s oversight responsibilities in this regard. In addition, the Board considered the administrative and other services that are provided to the Funds by the Adviser, including analytical and other tools the Adviser employs to help manage the Funds’ risks.
With respect to the Model Providers, the Board considered that the services provided by each Model Provider include providing a model portfolio to Parametric that represents the Model Provider’s recommendation as to the securities to be purchased, sold, or retained by a Fund and monitoring and updating such model portfolio on an on-going basis. The Board considered the investment research capabilities and investment philosophy and processes used by the Model Provider in constructing, maintaining and updating their model portfolios.
With respect to Parametric, the Board considered Parametric’s role as tax overlay manager with respect to each Fund’s portfolio. The Board considered that, in this capacity, Parametric is responsible for constructing a portfolio that represents the aggregation of the model portfolios of the Subadvisers, including with respect to the direct indexing portion of a Fund, and implementing the investment recommendations of the Subadvisers for the Fund’s portfolio based on the aggregated model portfolio. The Board considered Parametric’s limited authority to vary from the model portfolios of the Subadvisers, primarily for the purpose of efficient tax management of a Fund’s securities transactions. The Board considered Parametric’s experience with respect to portfolio implementation and the practices, techniques and systems and tools used by Parametric in delivering these services. The Board also considered Parametric’s role as direct indexing manager for each Fund, pursuant to which Parametric manages an allocated portion of the Fund in a manner designed to provide exposure to a designated index.
The Board considered the special attributes of the Fund’s centralized portfolio management structure that uses Parametric as a tax overlay manager and the benefits that are expected to be realized from such a structure. The Board also considered the resources committed by the Adviser and its affiliates to support the on-going operations of the Funds’ portfolio management structure, including the model portfolio delivery process.
Based on the above factors, as well as those discussed below, the Board concluded, within the context of its full deliberations, that the Adviser and the Subadvisers are capable of continuing to provide services of the nature, extent and quality contemplated by the terms of the Agreements.
2. Fees and Other Expenses. The Board received and reviewed reports prepared by Broadridge Financial Solutions (“Broadridge”), an independent provider of mutual fund industry data, comparing each Fund’s management fees and gross and net expense ratios (net of fee and expense waivers and reimbursements) to those paid by an independently-selected category and peer group of mutual funds. The Board noted that each of the Funds’ gross and net expense ratios were below their respective peer group medians. The Board also noted that each Fund’s management fee was below its respective peer group median. The Board received a description of the methodology used by Broadridge to select the mutual funds in each Fund’s peer group. While the Board recognized that comparisons between a Fund and its peer group may be imprecise, the comparative, independently-selected information provided by Broadridge assisted the Board in evaluating the reasonableness of the Funds’ management fees and total expenses.
The Board observed that the Adviser advised that it has no other clients with investments strategies similar to those of the Funds for purposes of comparison. The Board also reviewed comparative fee information provided by the Subadvisers, including information (i) from each Model Provider regarding the fees charged to other accounts and funds, if any, managed by the Model Provider that have investment objectives and investment strategies similar those that the Model Provider utilizes for a portion of a Fund and (ii) from Parametric regarding fees charged to other accounts and funds, for which Parametric serves as direct indexing manager and tax overlay manager. The Board reviewed information about structural, operational and other differences, including the amount of assets being managed and the range of services provided, between such other accounts and funds managed by each Subadviser and the portion of each Fund’s assets managed by the Subadviser.
| | |
| 152 | | Annual Report • June 30, 2023 |
Bridge Builder Mutual Funds
Board Considerations of the Investment Advisory Agreement and Investment Sub-advisory Agreements for Tax Managed Funds (Unaudited) (Continued)
The Board noted that the Adviser has contractually agreed to waive its management fees to the extent fees payable to the Adviser exceed the aggregate sub-advisory fees paid to a Subadviser. The Board noted that the Adviser may terminate this waiver arrangement without Board approval effective upon the end of the then current one-year period, by providing the Board written notice of such termination by April 15. The Board further noted that the Adviser has irrevocably agreed not to exercise its right to terminate the waiver arrangement upon the end of the current one-year period, resulting in the arrangement continuing until at least October 28, 2024.
Based on the above factors, as well as those discussed below, within the context of its full deliberations, that the advisory and sub-advisory fees payable under the Agreements are reasonable in light of the nature, extent and quality of the services rendered by the Adviser and the Subadvisers.
3. The Funds’ Investment Performance Record. The Board observed that performance information for the one-, three- and five-year periods ending December 31, 2022 was unavailable because the Funds launched on June 1, 2022. The Board received and considered information about the performance of the Fund and the Subadvisers since the Funds’ inception and noted the Adviser’s view that the limited track records of the Funds were not sufficient to draw meaningful conclusions surrounding the performance of the Funds. The Board further noted the Adviser’s representations that the performance of each of the Funds and each of the Fund’s Subadvisers since the Funds’ inception has been in line with the Adviser’s expectations, including the performance of Parametric in providing tax overlay services to the Funds. The Board also noted the Adviser’s commitment to continue to report to the Board the performance of the Funds and the Subadvisers on a quarterly basis throughout the upcoming year to facilitate the Board’s ongoing review of the Funds’ investment performance.
Taking into account the performance information above and other performance information deemed relevant by the Board, the Board concluded that the investment performance generated by each Subadviser was generally satisfactory.
4. Profitability and Economies of Scale. The Board considered that the Adviser has contractually agreed to waive its management fees to the extent management fees to be paid to the Adviser exceed the aggregate sub-advisory fees to be paid to the Subadvisers. Therefore, the Board considered that the Adviser does not profit from providing advisory services to the Funds or receive any differential compensation from allocating assets in any particular manner among each Model Provider and Parametric in its capacity as direct indexing manager. In addition, the Board did not consider the profitability of the Subadvisers to be a material factor in their determination, given that the Subadvisers are not affiliated with the Adviser and, therefore, the sub-advisory fees are the result of an arms’ length negotiation. Further, the Board was satisfied that the Adviser employed a rigorous sub-advisory fee negotiation process. The Board also considered information about the extent to which economies of scale may be realized as the Funds’ assets grow and whether the Funds’ fee structure is designed to share economies of scale with shareholders as the Funds’ assets grow. In this regard, the Board noted that most of the Subadvisers have agreed to contractual breakpoints in their sub-advisory fee schedules, which accrue to the benefit of Fund shareholders in light of the Adviser’s contractual management fee waiver.
5. Indirect Benefits. The Board considered other benefits to the Adviser and its affiliates and the Subadvisers from their relationships with the Funds. The Board noted that Fund shares are available exclusively to investors participating in Edward Jones Advisory Solutions®, an investment advisory program (asset-based fee program) sponsored by Edward D. Jones & Co., L.P. (“Edward Jones”), an affiliate of the Adviser, as well as current and former Trustees. Accordingly, the Board received and considered information about asset-based fee rates charged by Edward Jones to participants in Edward Jones Advisory Solutions® in connection with their investments in the Funds as an indirect or “fall-out” benefit. In addition, the Board considered that the Adviser, Edward Jones and each Subadviser may derive a benefit to their reputations and standing in the investment community from their relationship with the Funds.
| | |
| Annual Report • June 30, 2023 | | 153 |
Bridge Builder Mutual Funds
Board Considerations of the Investment Advisory Agreement and Investment Sub-advisory Agreements for Tax Managed Funds (Unaudited) (Continued)
Conclusion. Based on the Board’s deliberations and its evaluation of the information described above and other information it believed relevant, the Board, including all of the Independent Trustees, unanimously approved the continuation of the Agreements for an additional year.
| | |
| 154 | | Annual Report • June 30, 2023 |
Bridge Builder Mutual Funds
Board Considerations of Investment Advisory Agreement and Investment Sub-advisory Agreements for Bridge Builder Municipal High-Income Bond Fund (Unaudited)
Pursuant to Section 15 of the Investment Company of 1940 (the “1940 Act”), the Board of Trustees (each member, a “Trustee” and, collectively, the “Board”) of the Bridge Builder Trust (the “Trust”), including a majority of the Trustees who are not parties to the Agreements (as defined below) or “interested persons” of any party, as defined in the 1940 Act (the “Independent Trustees”), must determine whether to initially approve and, after an initial two year term, to approve annually the continuance of the Agreements.
At its meetings held on November 11, 2022 (the “November Meeting”) and December 1-2, 2022 (the “December Meeting”), the Board considered the approval of: (i) an amendment to the investment advisory agreement (the “Advisory Agreement”) between the Trust and Olive Street Investment Advisors, LLC (the “Adviser”) for the purpose of adding the Bridge Builder Municipal High-Income Bond Fund (the “New Fund”), a new series of the Trust; (ii) an amendment to the existing sub-advisory agreement (the “T. Rowe Price Sub-Advisory Agreement”) among the Adviser, the Trust and T. Rowe Price Associates, Inc. (“T. Rowe Price”) for the purpose of adding the New Fund to the schedule to the T. Rowe Price Sub-Advisory Agreement; and (iii) a new sub-advisory agreement (together with the T. Rowe Price Sub-Advisory Agreement, the “Sub-Advisory Agreements” and collectively with the Advisory Agreement and the T. Rowe Price Sub-Advisory Agreement, the “Agreements”) among the Adviser, the Trust and Capital International, Inc. (“Capital International,” and together with T. Rowe Price, the “Subadvisers”), on behalf of the New Fund. At the December Meeting, the Board, including the Independent Trustees, unanimously voted to approve each Agreement for an initial two-year term.
In advance of the November Meeting, the Adviser and the Subadvisers provided information to the Board in response to requests for information by independent legal counsel on behalf of the Independent Trustees to facilitate the Board’s evaluation of the Agreements. The information furnished by the Adviser and the Subadvisers included materials describing, among other matters: (i) the nature, extent and quality of the services proposed to be provided by the Adviser and the Subadvisers; (ii) the Adviser’s and the Subadvisers’ personnel, including portfolio managers; (iii) the Adviser’s and the Subadvisers’ operations and financial health; (iv) each Subadviser’s investment philosophy and investment process; (v) the advisory fees proposed to be payable to the Adviser by the New Fund, and the New Fund’s anticipated overall fees and operating expenses, in each case compared with those of a category and a peer group of mutual funds; (vi) the sub-advisory fees proposed to be payable to each Subadviser by the Adviser; (vii) the Adviser’s and the Subadvisers’ compliance policies and procedures; (viii) the Adviser’s and its affiliates’ experience in selecting and monitoring third-party investment managers; (ix) the investment performance of accounts managed by each Subadviser with investment strategies similar to the portion of the New Fund proposed to be managed by such Subadviser (each, a “sleeve”); and (x) other “fall-out” benefits the Adviser and/or its affiliates and the Subadvisers may receive based on their relationships with the New Fund.
At the November Meeting, representatives of the Adviser and the Subadvisers made presentations, provided materials and responded to questions regarding services, fees and other aspects of the Agreements. The Board also discussed these presentations and materials at the December Meeting. Throughout the evaluation process, the Board received advice from Fund counsel, and the Independent Trustees received separate advice from their independent legal counsel, including advice regarding the legal standards applicable to the consideration of the approval of the proposed advisory and sub-advisory arrangements. The Independent Trustees met separately in executive session with their independent legal counsel on several occasions to discuss the materials presented and other matters deemed relevant to their consideration of the Agreements.
In considering and approving the Agreements, the Board considered information and factors that they deemed relevant, including but not limited to, the information and factors discussed in further detail below. The Board’s determination to approve the Agreements was based on a comprehensive consideration of all information provided to the Board. The Board considered not only the specific information presented to the Board in connection with its consideration of the Agreements, but also the Board’s experience through past interactions with the Adviser and T. Rowe Price in connection with the Board’s oversight of existing series of the Trust. The Board did not identify any particular information or consideration that was all-important or controlling, and each individual Trustee may have attributed different weights to various factors and information.
| | |
| Annual Report • June 30, 2023 | | 155 |
Bridge Builder Mutual Funds
Board Considerations of Investment Advisory Agreement and Investment Sub-advisory Agreements for Bridge Builder Municipal High-Income Bond Fund (Unaudited) (Continued)
1. The Nature, Extent and Quality of the Services Proposed to be Provided by the Adviser and the Subadvisers. The Board considered the nature, extent and quality of the services proposed to be provided to the New Fund by the Adviser and each Subadviser, including their respective responsibilities for management of the New Fund. The Board reviewed the advisory services to be provided by the Adviser, including designing the New Fund and identifying, analyzing and recommending the engagement of the Subadvisers. The Board reviewed the resources of the Adviser and the Subadvisers, and the terms of the Agreements, including the Adviser’s obligation to supervise and monitor the performance of the Subadvisers and to determine the weighting of New Fund assets allocated to each Subadviser. In this regard, the Board considered that the Adviser’s on-going oversight and due diligence of the Subadvisers would include continuous analysis of, and regular discussions with each Subadviser about, the Subadviser’s investment results and the performance of the Subadviser’s obligations under its Sub-Advisory Agreement, and periodic on-site or virtual and other meetings with the Subadvisers. The Board also considered other services proposed to be provided to the New Fund by the Adviser, such as supervising and coordinating with the New Fund’s other service providers, monitoring adherence to investment guidelines and restrictions, monitoring compliance with various New Fund policies and procedures and with applicable securities laws and regulations, valuing portfolio investments for which market quotations are not readily available, managing the New Fund’s derivatives risks and monitoring liquidity, and monitoring the Subadvisers’ approaches to risk management. The Board also considered the Adviser’s assumption of business, entrepreneurial and other risks by sponsoring and managing the New Fund.
The Board also reviewed the portfolio management services and investment process proposed to be provided to each sleeve of the New Fund by its respective Subadviser, including how the Subadviser’s investment philosophy and process complement those of the other Subadviser. The Board also reviewed the background and experience of each Subadviser’s portfolio management personnel that will have a role in the day-to-day management of a sleeve of the New Fund. The Board considered each Subadviser’s ability to attract and retain qualified investment professionals, and the experience and skills of management and investment personnel of each Subadviser. The Board also considered other services to be provided to each sleeve of the New Fund by its respective Subadviser under the Adviser’s supervision, such as monitoring adherence to the New Fund’s investment restrictions, monitoring compliance with various New Fund policies and procedures and with applicable securities laws and regulations, monitoring valuation and liquidity, and selecting broker-dealers to execute portfolio transactions. The Board considered the report of the chief compliance officer of the Trust regarding the due diligence review of each Subadviser’s compliance program and other operational matters, and the chief compliance officer’s view that each Subadviser’s compliance program is reasonably designed and effectively implemented to prevent violations of the federal securities laws with respect to its services to be provided to the sleeve of the New Fund and that each Subadviser has adopted procedures reasonably necessary to prevent access persons from violating the Subadviser’s code of ethics.
Based on these considerations, the Board concluded, within the context of its full deliberations, that the Adviser and Subadvisers are capable of providing services of the nature, extent and quality contemplated by the terms of the Agreements.
2. Fees and Other Expenses. The Board reviewed a report on the advisory fees proposed to be payable by the New Fund to the Adviser, as well as the sub-advisory fees proposed to be payable by the Adviser to each Subadviser. The Board also reviewed reports prepared by Broadridge Financial Solutions, an independent provider of mutual fund industry data, comparing the New Fund’s proposed advisory fees and anticipated gross and net total expense ratios to those paid by an independently-selected category and peer group of mutual funds. The Board noted that the New Funds’ anticipated gross and net total expense ratios were below their respective category and peer group medians. The Board also noted that the New Fund’s proposed advisory fee was below its category and peer group medians.
The Board also reviewed comparative fee information provided by the Subadvisers, including information from each Subadviser regarding the fees charged to other accounts and funds, if any, managed by the Subadviser that have
| | |
| 156 | | Annual Report • June 30, 2023 |
Bridge Builder Mutual Funds
Board Considerations of Investment Advisory Agreement and Investment Sub-advisory Agreements for Bridge Builder Municipal High-Income Bond Fund (Unaudited) (Continued)
investment objectives and investment strategies similar those that the Subadviser proposes to utilize for its sleeve of the New Fund. The Board reviewed information about any structural, operational and other differences, including the amount of assets being managed and the range of services provided, between such other accounts and funds managed by each Subadviser and the sleeve of the New Fund’s assets anticipated to be managed by each Subadviser.
The Board considered that the Adviser would contractually agree to waive its advisory fees to the extent advisory fees to be paid to the Adviser exceed the aggregate sub-advisory fees to be paid to the Subadvisers. The Board noted that the Adviser would not have the unilateral ability to terminate this waiver arrangement until October 28, 2024 at the earliest.
Based on these considerations, the Board concluded, within the context of its full deliberations, that the proposed advisory and sub-advisory fees payable under the Agreements are reasonable in light of the nature, extent and quality of the services expected to be rendered by the Adviser and the Subadvisers.
3. Investment Performance. Because the New Fund had not commenced operations, the New Fund did not yet have investment performance records. However, the Board received and considered information about the investment performance of the Subadvisers, including, for purposes of considering the investment skill and experience of the Subadvisers, composite or other performance data showing the Subadvisers’ capabilities in managing other accounts and funds with investment strategies similar to the sleeve of the New Fund proposed to be managed by the respective Subadviser. In this regard, the Board considered the performance of T. Rowe Price in managing a sleeve of the Bridge Builder Municipal Bond Fund, an existing series of the Trust, noting that T. Rowe Price’s proposed investment strategy for managing its sleeve of the New Fund would be substantially similar to its investment strategy currently utilized for managing its sleeve of the Bridge Builder Municipal Bond Fund. The Board also considered the Adviser’s work in developing a framework in which to evaluate and monitor the performance of the Subadvisers with respect to their management of the New Fund’s portfolio.
Based on these considerations, the Board concluded that it was satisfied that the Adviser and the Subadvisers have the capability of providing satisfactory investment performance for the New Fund.
4. Profitability and Economies of Scale. The Board considered that, because the Adviser would contractually agree to waive its advisory fees to the extent advisory fees to be paid to the Adviser exceed the aggregate sub-advisory fees to be paid to the Subadvisers, the Adviser would not profit from providing advisory services to the New Fund. In addition, the Board did not consider profitability of the Subadvisers to be a material factor in its determination, given that the Subadvisers are not affiliated with the Adviser and, therefore, the sub-advisory fees are the result of arm’s length negotiations. Further, the Board was satisfied that the Adviser employed a rigorous sub-advisory fee negotiation process. The Board also considered whether the New Fund’s fee structure is designed to share economies of scale with shareholders as the New Fund’s assets grow. In this regard, the Board noted that each Subadviser has agreed to contractual breakpoints in their fee schedules, which would accrue to the benefit of New Fund shareholders in light of the Adviser’s contractual fee waiver.
5. Indirect Benefits. The Board noted that New Fund shares would be available exclusively to investors participating in Edward Jones Advisory Solutions®, an investment advisory program (asset-based fee program) sponsored by Edward D. Jones & Co., L.P. (“Edward Jones”), an affiliate of the Adviser, as well as current and former Trustees. Accordingly, the Board received and considered information about asset-based fees that Edward Jones would expect to receive from participants in Edward Jones Advisory Solutions® in connection with their investments in the New Fund as an indirect or “fall-out” benefit. In addition, the Board considered that the Adviser, Edward Jones and each Subadviser may derive a benefit to their reputations and standing in the investment community from their relationships with the New Fund.
| | |
| Annual Report • June 30, 2023 | | 157 |
Bridge Builder Mutual Funds
Board Considerations of Investment Advisory Agreement and Investment Sub-advisory Agreements for Bridge Builder Municipal High-Income Bond Fund (Unaudited) (Continued)
Based on the Board’s deliberations and its evaluation of the information described above and other factors and information it believed relevant, the Board, including all of the Independent Trustees, unanimously voted to approve each Agreement for an initial two-year term.
| | |
| 158 | | Annual Report • June 30, 2023 |
Bridge Builder Mutual Funds
Liquidity Risk Management Program (Unaudited)
As required by Rule 22e-4 (the “Liquidity Rule”) under the Investment Company Act of 1940, as amended, each series of Bridge Builder Trust (each a “Fund,” collectively, the “Funds”) has adopted and implemented a written liquidity risk management program (“LRMP”) including policies and procedures reasonably designed to assess and manage the risk that a Fund may not be able to meet shareholder redemption requests without significantly diluting the interest of shareholders remaining in the Fund.
The Bridge Builder Trust Board of Trustees (the “Board”) designated the Funds’ Investment Adviser, Olive Street Investment Advisers, LLC (the “Adviser”), as the LRMP Administrator (the “Administrator”) for the Funds. The Administrator established a committee made up of representatives from relevant departments within the Adviser and its affiliates (the “Liquidity Committee”) to assist in the implementation and day-to-day administration of the LRMP, and to carry out its liquidity risk management responsibilities.
During the period December 1, 2021 through November 30, 2022 (the “Period”), as required by the LRMP, each Fund classified each of its investments into one of four liquidity categories based on the number of days reasonably needed to sell and convert a reasonably anticipated sized trade of each investment into cash without significantly impacting the price of the investment. The Administrator relied on a third-party data provider to facilitate the classification of each Fund’s investments based on criteria in each Fund’s LRMP. During the Period, the Funds primarily held assets that are classified as highly liquid investments and thus were not required to establish highly liquid investment minimums. During the Period, no Fund held more than 15% of its net assets in illiquid investments that are assets.
During the Period, the Liquidity Committee met monthly or more frequently, as necessary or appropriate in response to relevant market, trading or investment-specific considerations, to, among other things, review and determine liquidity classifications for portfolio investments and monitor the Funds’ liquidity risk. The Liquidity Committee also evaluated the potential influence of market volatility associated with rising interest rates, inflation, and global geopolitical events on the Funds’ liquidity classifications, their status as primarily highly liquid funds and each Fund’s ongoing ability to meet shareholder redemption requests without significant dilution of the Fund’s remaining investors.
As required by the LRMP, the Administrator assessed, managed and reviewed each Fund’s liquidity risk (the “Review”) for the Period. As part of this Review, the Administrator considered each Fund’s investment strategy; the liquidity of its investments; long-term cash flow projections during both normal and reasonably foreseeable stressed conditions; and its holdings of cash and cash equivalents, borrowing arrangements and other funding sources, as set forth in more detail below.
A. A Fund’s investment strategy and liquidity of portfolio investments during both normal and reasonably foreseeable stressed conditions: The Liquidity Committee reviewed whether each Fund’s strategy is appropriate for an open-end fund structure. During the Period, none of the Funds changed their strategy, allowed concentrated investments, or relied extensively upon borrowing or derivatives.
B. Short-term and long-term cash flow projections during both normal and reasonably foreseeable stressed conditions: The Liquidity Committee reviewed historical shareholder activity. The Liquidity Committee also considered each Fund’s shareholder ownership, and the degree of confidence associated with a Fund’s short-term and long-term cash flow projections.
Further, the Liquidity Committee considered that each Fund may, under highly unusual circumstances, pay all or part of redemption proceeds in securities with a market value equal to the redemption price (redemption in kind) in order to protect the Fund’s remaining shareholders.
C. Holdings of cash and cash equivalents, as well as borrowing arrangements: The Liquidity Committee considered the average and lowest daily cash holdings of each Fund measured against the highest net redemptions during the Period. The Committee also considered other types of borrowing available to the Funds, such as the ability to use interfund lending, as applicable.
| | |
| Annual Report • June 30, 2023 | | 159 |
Bridge Builder Mutual Funds
Liquidity Risk Management Program (Unaudited) (Continued)
The Administrator reflected the results of its Review in a written report to the Board, which addressed the operation, adequacy and effectiveness of the implementation of the LRMP and described any material changes made to the
LRMP (the “Report”). At its meeting on May 8, 2023, the Board received the Report covering the Period. The Report concluded that each Fund’s LRMP is operating as intended and is effective in implementing the requirements of the Liquidity Rule. The Report further concluded that, during the Period, the Funds remained primarily highly liquid and each Fund did not encounter significant challenges meeting shareholder redemption requests without diluting the interests of its remaining shareholders.
There can be no assurance that the LRMP will achieve its objectives in the future. Please refer to the prospectus for more information regarding a Fund’s exposure to liquidity risk and other principal risks to which an investment in the Fund may be subject.
| | |
| 160 | | Annual Report • June 30, 2023 |
Bridge Builder Mutual Funds
General Information (Unaudited)
Proxy Voting Procedures and Proxy Voting Record
A description of the policies and procedures that the Funds use to determine how to vote proxies relating to portfolio securities is available, free of charge, by calling 1-855-823-3611. This information is also available through the Securities and Exchange Commission’s website at http://www.sec.gov. Information regarding how the Trust voted proxies relating to portfolio securities during the 12-month period ending June 30 is available without charge, upon request, by calling 1-855-823-3611. This information is also available through the Securities and Exchange Commission’s website at http://www.sec.gov.
Form N-PORT Disclosure
The Trust files its complete schedule of portfolio holdings with the Securities and Exchange Commission for the first and third quarters of each fiscal year as an exhibit to its reports on Form N-PORT. The Trust’s Form N-PORT filings are available on the Securities and Exchange Commission’s website at http://www.sec.gov. Information regarding the Trust’s Form N-PORT filings is also available, without charge, by calling, 1-855-823-3611.
Household Delivery of Shareholder Documents
To reduce expenses the Funds may mail only one copy of the prospectus, Statement of Additional Information and each annual and semiannual report to those addresses shared by two or more accounts. If you wish to receive individual copies of these documents, please call the Trust at 1-855-823-3611. You will begin receiving individual copies thirty days after your request is received.
Schedule of Investments
Each Fund’s complete schedule of investments in securities of unaffiliated issuers is available without charge, upon request, by calling 1-855-823-3611, and on the Securities and Exchange Commission website at http://www.sec.gov as a part of Form N-CSR.
Tax Notice
The following table lists the percentages of dividend income distributed by the Funds for the period ended June 30, 2023, that were designated as qualified dividend income under the Jobs and Growth Tax Relief Reconciliation Act of 2003 and qualify for the corporate dividends received deduction, respectively.
| | | | | | | | |
| | | % of Dividend Income Distributed | |
| Fund | | Qualified Dividend Income | | | Corporate Dividends Received Deduction | |
| Core Bond Fund | | | — | % | | | — | % |
| Core Plus Bond Fund | | | — | | | | — | |
| Municipal Bond Fund | | | — | | | | — | |
| Municipal High-Income Bond Fund | | | — | | | | — | |
| Large Cap Growth Fund | | | 70.06 | | | | 70.50 | |
| Large Cap Value Fund | | | 83.72 | | | | 72.52 | |
| Tax Managed Large Cap Fund | | | 98.20 | | | | 98.20 | |
| Small/Mid Cap Growth Fund | | | 67.95 | | | | 67.89 | |
| Small/Mid Cap Value Fund | | | 95.09 | | | | 100.00 | |
| Tax Managed Small/Mid Cap Fund | | | 97.47 | | | | 97.47 | |
| International Equity Fund | | | 88.47 | | | | 3.27 | |
| Tax Managed International Equity Fund | | | 91.19 | | | | 0.21 | |
The following table lists the percentages of ordinary income distributions paid by the Funds, for the period ended June 30, 2023, that were designated as short-term capital gain distributions under Internal Revenue Code Section 871(k)(2)(A) and qualify as interest related dividends under Internal Revenue Code Section 871(k)(1)(A), respectively.
| | |
| Annual Report • June 30, 2023 | | 161 |
Bridge Builder Mutual Funds
General Information (Unaudited) (Continued)
| | | | |
| | | % of Ordinary Income Distribution | |
| Fund | | Short Term Capital Gain Distribution | |
| Core Bond Fund | | | — | % |
| Core Plus Bond Fund | | | — | |
| Municipal Bond Fund | | | — | |
| Municipal High-Income Bond Fund | | | — | |
| Large Cap Growth Fund | | | — | |
| Large Cap Value Fund | | | 16.34 | |
| Tax Managed Large Cap Fund | | | — | |
| Small/Mid Cap Growth Fund | | | — | |
| Small/Mid Cap Value Fund | | | — | |
| Tax Managed Small/Mid Cap Fund | | | — | |
| International Equity Fund | | | — | |
| Tax Managed International Equity Fund | | | — | |
For the Fiscal Year Ended June 30, 2023, the International Equity Fund earned foreign source income of $447,395,951 which amounts to $0.33 per share, and paid foreign taxes of $39,109,588 which amounts to $0.03 per share, which it intends to pass through to its shareholders pursuant to Section 853 of the Internal Revenue Code.
For the Fiscal Year Ended June 30, 2023, the Tax Managed International Equity Fund earned foreign source income of $25,845,253 which amounts to $0.25 per share, and paid foreign taxes of $2,985,518 which amounts to $0.03
per share, which it intends to pass through to its shareholders pursuant to Section 853 of the Internal Revenue Code.
As of June 30, 2023, the following Funds are designating amounts as long-term capital gain distributions under
Section 852(b)(3) as follows:
| | | | |
| Fund | | Long-Term Capital Gain Distributions (000) | |
| Core Bond Fund | | $ | — | |
| Core Plus Bond Fund | | | — | |
| Municipal Bond Fund | | | — | |
| Municipal High-Income Bond Fund | | | — | |
| Large Cap Growth Fund | | | — | |
| Large Cap Value Fund* | | | 958,768 | |
| Tax Managed Large Cap Fund | | | — | |
| Small/Mid Cap Growth Fund | | | — | |
| Small/Mid Cap Value Fund | | | 352,660 | |
| Tax Managed Small/Mid Cap Fund | | | — | |
| International Equity Fund | | | 66,503 | |
| Tax Managed International Equity Fund | | | — | |
| * | $21,472 from the utilization of earnings and profits distributed to shareholders on redemption of shares is included in this amount. |
| | |
| 162 | | Annual Report • June 30, 2023 |
Bridge Builder Mutual Funds
Privacy Notice (Unaudited)
June 2023
| | | | |
FACTS | | What Does the Bridge Builder Trust (“Bridge Builder”) Do with Your Personal Information? |
Why? | | Financial companies choose how they share your personal information. Federal law gives consumers the right to limit some but not all sharing. Federal law also requires us to tell you how we collect, share and protect your personal information. Please read this notice carefully to understand what we do. |
What? | | The types of personal information we collect and share depend on the product or service you have with us. This information can include: |
| | | * Social Security number | | * Investment experience |
| | | * Account balances | | * Income and risk tolerance |
| | | * Transaction history | | * Assets and account transactions |
| | |
| | | When you are no longer our customer, we continue to share your information as described in this notice. |
How? | | All financial companies need to share customers’ personal information to run their everyday business. In the section below, we list the reasons financial companies can share their customers’ personal information; the reasons Bridge Builder chooses to share; and whether you can limit this sharing. |
| | | | |
| | | |
| REASONS WE CAN SHARE YOUR PERSONAL INFORMATION | | DOES BRIDGE
BUILDER SHARE? | | CAN YOU LIMIT THIS
SHARING? |
| For our everyday business purposes – such as to process your transactions, maintain your account(s), respond to court orders and legal investigations, or report to credit bureaus | | Yes | | No |
| For our marketing purposes – to offer our products and services to you | | No | | We don’t share |
| For joint marketing with other financial companies | | No | | We don’t share |
For our affiliates’ everyday business purposes – information about your transactions and
experiences | | Yes | | No |
| For our affiliates’ everyday business purposes – information about your creditworthiness | | No | | We don’t share |
| For nonaffiliates to market to you | | No | | We don’t share |
| | |
WHO WE ARE | | |
| | |
Who is providing this notice? | | Bridge Builder Trust |
| | |
WHAT WE DO | | |
How does Bridge Builder protect my personal information? | | To protect your personal information from unauthorized access and use, we use security measures that comply with federal law. These measures include computer safeguards and secured files and buildings. |
How does Bridge Builder collect my personal information? | | We collect your personal information, for example, when you deposit money with us, if you ever were to give us your contact information, open an account with us, provide us account information or make a wire transfer. We also collect your personal information from others, such as credit bureaus, affiliates or other companies. |
Why can’t I limit all sharing? | | Federal law gives you the right to limit only: * Sharing for affiliates’ everyday business purposes – information about your creditworthiness * Affiliates from using your information to market to you * Sharing for nonaffiliates to market to you State laws and individual companies may give you additional rights to limit sharing. See the Other Important Information section for your rights under state law. |
| | |
DEFINITIONS | | |
Affiliates | | Companies related by common ownership or control. They can be financial and nonfinancial companies. * Olive Street Investment Advisers, LLC (“Olive Street”), our investment adviser, may be deemed to be affiliated with us. Olive Street is a wholly owned subsidiary of The Jones Financial Companies, L.L.L.P. (“JFC”), and is affiliated with other subsidiaries of JFC, including Edward D. Jones & Co., L.P. and Edward Jones Trust Company. |
Nonaffiliates | | Companies not related by common ownership or control. They can be financial and nonfinancial companies. * Bridge Builder does not share with non-affiliates so they can market to you. |
Joint Marketing | | A formal agreement between nonaffiliated financial companies that together market financial products or services to you. Bridge Builder does not currently engage in joint marketing efforts. |
| | |
OTHER IMPORTANT INFORMATION |
| California residents | | We will not share information we collect about you with companies outside of Bridge Builder, unless permitted by law. We also limit sharing among Bridge Builder and our affiliate companies to the extent required by California law. |
Nevada
residents | | We are providing this notice to you pursuant to state law. Nevada law requires us to disclose that you may request to be placed on our internal “Do Not Call” list at any time by calling 800-441-2357, and that you may obtain further information by contacting the Nevada Attorney General, 555 E. Washington Ave., Suite 3900, Las Vegas, NV 89101; phone 702-486-3132; email BCPINFO@ag.state.nv.us. |
|
| |
| Questions? Call 855-823-3611 or go to www.bridgebuildermutualfunds.com |
| | |
| Annual Report • June 30, 2023 | | 163 |
Investment Adviser
Olive Street Investment Advisers, LLC
12555 Manchester Road
St. Louis, MO 63131
Administrator & Fund Accountant
Brown Brothers Harriman & Co.
50 Post Office Square
Boston, MA 02110
Transfer Agent
ALPS Fund Services, Inc.
1290 Broadway, Suite 1100
Denver, CO 80203
Distributor
ALPS Distributors, Inc.
1290 Broadway, Suite 1100
Denver, CO 80203
Custodian
Brown Brothers Harriman & Co.
140 Broadway
New York, NY 10005
Legal Counsel
Morgan Lewis & Bockius, LLP
1701 Market Street
Philadelphia, PA 19103
Independent Registered Public Accounting Firm
PricewaterhouseCoopers LLP
One North Wacker Drive
Chicago, IL 60606

Bridge Builder Mutual Funds
Bridge Builder mutual funds, available exclusively through Edward Jones Advisory Solutions®, provide investors diversified expertise from leading asset management firms. The management of Bridge Builder mutual funds is rooted in our investment philosophy of diversification, a long-term approach and high quality.
Visit www.bridgebuildermutualfunds.com for more information.
Enroll in e-delivery
Add convenience and organization to your financial life by signing up for e-delivery. Visit www.edwardjones.com/edelivery to learn more and enroll.
This report is authorized for distribution to prospective investors only when preceded or accompanied by the Funds’ prospectus. Investors should carefully consider the investment objectives, risks and charges and expenses of the Funds prior to investing. The prospectus contains this and other important information and should be read carefully before investing.
DES-8308-A
ITEM 2. CODE OF ETHICS.
The registrant has adopted a code of ethics that applies to the registrant’s principal executive officer and principal financial officer. The registrant has not made any amendments to its code of ethics during the period covered by this report. The registrant has not granted any waivers from any provisions of the code of ethics during the period covered by this report.
Incorporated by reference to the Registrant’s Form N-CSR filed December 16, 2015.
ITEM 3. AUDIT COMMITTEE FINANCIAL EXPERT.
The registrant’s board of trustees has determined that Timothy Jacoby is the “audit committee financial experts” and is considered to be “independent” as each term is defined in Item 3 of Form N-CSR.
ITEM 4. PRINCIPAL ACCOUNTANT FEES AND SERVICES.
The registrant has engaged its principal accountant to perform audit services, audit-related services, and tax services during the past two fiscal years. “Audit fees” refer to performing an audit of the registrant’s annual financial statements or services that are normally provided by the accountant in connection with statutory and regulatory filings or engagements for those fiscal years. “Audit-related fees” refer to the assurance and related services by the principal accountant that are reasonably related to the performance of the audit. “Tax fees” refer to professional services rendered by the principal accountant for tax compliance, tax advice, and tax planning. The following table details the aggregate fees billed or expected to be billed for the last two fiscal years for audit fees, audit-related fees, tax fees and other fees by the principal accountant.
| | | | | | | | |
| | | FYE 06/30/2023 | | | FYE 06/30/2022 | |
Audit Fees | | $ | 931,260 | | | $ | 776,950 | |
Audit-Related Fees | | $ | 0 | | | $ | 0 | |
Tax Fees | | $ | 111,831 | | | $ | 90,229 | |
All Other Fees | | $ | 0 | | | $ | 0 | |
The audit committee has adopted pre-approval policies and procedures that require the audit committee to pre-approve all audit and non-audit services of the registrant, including services provided to any entity affiliated with the registrant.
The percentage of services described in each of paragraphs (b) through (d) of this Item that were approved by the audit committee pursuant to paragraph (c)(7)(i)(C) of Rule 2-01 of Regulation S-X were as follows:
| | | | | | | | |
| | | FYE 6/30/2023 | | | FYE 6/30/2022 | |
Audit-Related Fees | | | 0 | % | | | 0 | % |
Tax Fees | | | 0 | % | | | 0 | % |
All Other Fees | | | 0 | % | | | 0 | % |
All of the principal accountant’s hours spent on auditing the registrant’s financial statements were attributed to work performed by full-time permanent employees of the principal accountant. The following table indicates the non-audit fees billed or expected to be billed by the registrant’s accountant for services to the registrant and to the registrant’s investment adviser (and any entity controlling, controlled by, or under common control with the investment adviser) for the last two years.
| | | | | | | | |
Non-Audit Related Fees | | FYE 06/30/2023 | | | FYE 06/30/2022 | |
Registrant | | $ | 111,831 | | | $ | 90,229 | |
Registrant’s Investment Adviser | | $ | 0 | | | $ | 0 | |
The registrant’s Audit Committee has considered that the provision of non-audit services that were rendered to the registrant’s adviser (not including any sub-adviser whose role is primarily portfolio management and is subcontracted with or overseen by another investment adviser), and any entity controlling, controlled by, or under common control with the investment adviser that provides ongoing services to the registrant that were not pre-approved pursuant to paragraph (c)(7)(ii) of Rule 2-01 of Regulation S-X is compatible with maintaining the principal accountant’s independence.
| | | | |
| | | Fiscal Year Ended 2023 | |
Non-Audit Related Fees | | $ | 1,465,900 | |
Tax Fees | | $ | 636,229 | |
All Other Fees | | $ | 246,000 | |
ITEM 5. AUDIT COMMITTEE OF LISTED REGISTRANTS.
Not applicable to registrants who are not listed issuers (as defined in Rule 10A-3 under the Securities Exchange Act of 1934).
ITEM 6. INVESTMENTS.
Bridge Builder Core Bond Fund
Schedule of Investments
June 30, 2023
(Amounts in thousands, except number of contracts)
| | | | | | | | |
| | | Principal
Amount
(000s) | | | Value
(000s) | |
BONDS & NOTES – 98.88% | | | | | | | | |
Asset-Backed Obligations – 12.33% | | | | | | | | |
510 Asset Backed 2021-NPL1 Trust | | | | | | | | |
2.24%, 06/25/2061, Series 2021-NPL1, Class A1(1)(2) | | $ | 1,167 | | | $ | 1,072 | |
510 Asset Backed 2021-NPL2 Trust | | | | | | | | |
2.12%, 06/25/2061, Series 2021-NPL2, Class A1(1)(2) | | | 4,440 | | | | 4,017 | |
Academic Loan Funding Trust 2013-1 | | | | | | | | |
5.95% (1 Month LIBOR USD + 0.80%), 12/26/2044, Series 2013-1A, Class A(1)(3) | | | 454 | | | | 436 | |
ACC Trust 2022-1 | | | | | | | | |
2.55%, 02/20/2025, Series 2022-1, Class B(1) | | | 5,000 | | | | 4,906 | |
Accelerated 2021-1H LLC | | | | | | | | |
1.90%, 10/20/2040, Series 2021-1H, Class B(1) | | | 2,340 | | | | 2,098 | |
Allegro CLO VII Ltd. | | | | | | | | |
6.36% (3 Month LIBOR USD + 1.10%, 1.10% Floor), 06/13/2031, Series 2018-1A, Class A(1)(3) | | | 12,000 | | | | 11,838 | |
Ally Auto Receivables Trust 2019-4 | | | | | | | | |
1.92%, 01/15/2025, Series 2019-4, Class A4 | | | 951 | | | | 950 | |
American Credit Acceptance Receivables Trust 2020-4 | | | | | | | | |
1.31%, 12/14/2026, Series 2020-4, Class C(1) | | | 1,059 | | | | 1,046 | |
American Credit Acceptance Receivables Trust 2022-3 | | | | | | | | |
4.12%, 02/13/2026, Series 2022-3, Class A(1) | | | 800 | | | | 798 | |
American Express Credit Account Master Trust 2023-1 | | | | | | | | |
4.87%, 05/15/2028, Series 2023-1, Class A | | | 3,852 | | | | 3,829 | |
American Express Credit Account Master Trust 2023-2 | | | | | | | | |
4.80%, 05/15/2030, Series 2023-2, Class A | | | 1,137 | | | | 1,126 | |
American Homes 4 Rent 2014-SFR2 Trust | | | | | | | | |
3.79%, 10/17/2036, Series 2014-SFR2, Class A(1) | | | 3,495 | | | | 3,391 | |
4.29%, 10/17/2036, Series 2014-SFR2, Class B(1) | | | 300 | | | | 292 | |
6.23%, 10/17/2036, Series 2014-SFR2, Class E(1) | | | 1,000 | | | | 987 | |
American Homes 4 Rent 2014-SFR3 Trust | | | | | | | | |
4.60%, 12/17/2036, Series 2014-SFR3, Class C(1) | | | 600 | | | | 584 | |
6.42%, 12/17/2036, Series 2014-SFR3, Class E(1) | | | 1,000 | | | | 988 | |
American Homes 4 Rent 2015-SFR1 Trust | | | | | | | | |
3.47%, 04/17/2052, Series 2015-SFR1, Class A(1) | | | 1,902 | | | | 1,819 | |
5.64%, 04/17/2052, Series 2015-SFR1, Class E(1) | | | 3,900 | | | | 3,813 | |
American Homes 4 Rent 2015-SFR2 Trust | | | | | | | | |
3.73%, 10/17/2052, Series 2015-SFR2, Class A(1) | | | 1,666 | | | | 1,595 | |
AmeriCredit Automobile Receivables Trust 2019-1 | | | | | | | | |
3.36%, 02/18/2025, Series 2019-1, Class C | | | 86 | | | | 86 | |
AmeriCredit Automobile Receivables Trust 2020-2 | | | | | | | | |
0.97%, 02/18/2026, Series 2020-2, Class B | | | 753 | | | | 747 | |
AmeriCredit Automobile Receivables Trust 2021-1 | | | | | | | | |
0.37%, 08/18/2025, Series 2021-1, Class A3 | | | 1,433 | | | | 1,420 | |
AmeriCredit Automobile Receivables Trust 2021-2 | | | | | | | | |
1.01%, 01/19/2027, Series 2021-2, Class C | | | 4,600 | | | | 4,203 | |
AmeriCredit Automobile Receivables Trust 2021-3 | | | | | | | | |
0.76%, 08/18/2026, Series 2021-3, Class A3 | | | 2,823 | | | | 2,728 | |
1.41%, 08/18/2027, Series 2021-3, Class C | | | 5,100 | | | | 4,605 | |
AmeriCredit Automobile Receivables Trust 2023-1 | | | | | | | | |
5.80%, 12/18/2028, Series 2023-1, Class C | | | 6,800 | | | | 6,735 | |
Amortizing Residential Collateral Trust 2002-BC5 | | | | | | | | |
6.19% (1 Month LIBOR USD + 1.04%, 1.04% Floor), 07/25/2032, Series 2002-BC5, Class M1(3) | | | 327 | | | | 325 | |
AMSR 2019-SFR1 Trust | | | | | | | | |
3.02%, 01/19/2039, Series 2019-SFR1, Class B(1) | | | 2,471 | | | | 2,230 | |
AMSR 2020-SFR3 Trust | | | | | | | | |
2.56%, 09/17/2037, Series 2020-SFR3, Class E1(1) | | | 7,734 | | | | 6,995 | |
AMSR 2020-SFR4 Trust | | | | | | | | |
1.36%, 11/17/2037, Series 2020-SFR4, Class A(1) | | | 4,300 | | | | 3,882 | |
1.86%, 11/17/2037, Series 2020-SFR4, Class C(1) | | | 9,000 | | | | 8,092 | |
AMSR 2021-SFR1 Trust | | | | | | | | |
2.90%, 06/17/2038, Series 2021-SFR1, Class E2(1)(4) | | | 3,950 | | | | 3,228 | |
AMSR 2022-SFR3 Trust | | | | | | | | |
4.00%, 10/17/2039, Series 2022-SFR3, Class E1(1) | | | 10,000 | | | | 8,738 | |
Anchorage Capital CLO 2013-1 Ltd. | | | | | | | | |
6.49% (3 Month LIBOR USD + 1.25%), 10/13/2030, Series 2013-1A, Class A1R(1)(3) | | | 2,424 | | | | 2,403 | |
Anchorage Capital CLO 26 Ltd. | | | | | | | | |
7.32% (3 Month Term SOFR + 2.20%, 2.20% Floor), 07/19/2034, Series 2023-26A, Class A1(1)(3) | | | 20,750 | | | | 20,762 | |
Anchorage Capital CLO 8 Ltd. | | | | | | | | |
6.49% (3 Month LIBOR USD + 1.20%, 1.20% Floor), 10/27/2034, Series 2016-8A, Class AR2A(1)(3) | | | 15,500 | | | | 15,134 | |
Apres Static CLO Ltd. | | | | | | | | |
6.33% (3 Month LIBOR USD + 1.07%), 10/15/2028, Series 2019-1A, Class A1R(1)(3) | | | 1,030 | | | | 1,024 | |
Asset Backed Securities Corp. Home Equity Loan Trust Series 2003-HE6 | | | | | | | | |
5.83% (1 Month LIBOR USD + 0.68%, 0.68% Floor), 11/25/2033, Series 2003-HE6, Class A2(3) | | | 1,255 | | | | 1,237 | |
Atlas Senior Loan Fund III Ltd. | | | | | | | | |
6.16% (3 Month LIBOR USD + 0.83%), 11/17/2027, Series 2013-1A, Class AR(1)(3) | | | 976 | | | | 972 | |
Avis Budget Rental Car Funding AESOP LLC | | | | | | | | |
1.38%, 08/20/2027, Series 2021-1A, Class A(1) | | | 12,900 | | | | 11,331 | |
| | | | | | | | |
1.66%, 02/20/2028, Series 2021-2A, Class A(1) | | | 14,400 | | | | 12,454 | |
2.33%, 08/20/2026, Series 2020-1A, Class A(1) | | | 6,100 | | | | 5,672 | |
2.36%, 03/20/2026, Series 2019-3A, Class A(1) | | | 12,000 | | | | 11,330 | |
3.83%, 08/21/2028, Series 2022-1A, Class A(1) | | | 17,300 | | | | 16,042 | |
4.00%, 03/20/2025, Series 2018-2A, Class A(1) | | | 5,800 | | | | 5,745 | |
5.20%, 10/20/2027, Series 2023-2A, Class A(1) | | | 4,500 | | | | 4,399 | |
BA Credit Card Trust | | | | | | | | |
0.34%, 05/15/2026, Series 2020-A1, Class A1 | | | 3,665 | | | | 3,580 | |
4.79%, 05/15/2028, Series 2023-A1, Class A1 | | | 4,609 | | | | 4,576 | |
Balboa Bay Loan Funding 2020-1 Ltd. | | | | | | | | |
6.37% (3 Month LIBOR USD + 1.12%, 1.12% Floor), 01/20/2032, Series 2020-1A, Class AR(1)(3) | | | 16,750 | | | | 16,513 | |
Barings CLO Ltd. 2023-I | | | | | | | | |
6.35% (3 Month LIBOR USD + 1.10%, 1.10% Floor), 01/20/2034, Series LP-2A, Class A(1)(3) | | | 22,150 | | | | 21,858 | |
Battalion CLO X Ltd. | | | | | | | | |
6.44% (3 Month LIBOR USD + 1.17%, 1.17% Floor), 01/25/2035, Series 2016-10A, Class A1R2(1)(3) | | | 2,000 | | | | 1,956 | |
Bayview Financial Mortgage Pass-Through Trust 2007-B | | | | | | | | |
7.33%, 08/28/2047, Series 2007-B, Class 1A2(2) | | | 100 | | | | 83 | |
Bear Stearns Asset Backed Securities Trust 2003-2 | | | | | | | | |
6.65% (1 Month LIBOR USD + 1.50%, 1.50% Floor, 11.00% Cap), 03/25/2043, Series 2003-2, Class A3(3) | | | 1,573 | | | | 1,531 | |
BMW Vehicle Owner Trust 2020-A | | | | | | | | |
0.62%, 04/26/2027, Series 2020-A, Class A4 | | | 3,009 | | | | 2,922 | |
BOF VII AL Funding Trust I | | | | | | | | |
6.29%, 07/26/2032, Series 2023-CAR3, Class A2(1) | | | 10,900 | | | | 10,870 | |
6.63%, 07/26/2032, Series 2023-CAR3, Class B(1) | | | 4,000 | | | | 3,989 | |
Business Jet Securities 2020-1 LLC | | | | | | | | |
2.98%, 11/15/2035, Series 2020-1A, Class A(1) | | | 2,684 | | | | 2,536 | |
Business Jet Securities 2021-1 LLC | | | | | | | | |
2.16%, 04/15/2036, Series 2021-1A, Class A(1) | | | 3,017 | | | | 2,767 | |
BXG Receivables Note Trust 2022-A | | | | | | | | |
5.35%, 09/28/2037, Series 2022-A, Class C(1) | | | 8,695 | | | | 8,148 | |
Capital One Multi-Asset Execution Trust | | | | | | | | |
1.39%, 07/15/2030, Series 2021-A2, Class A2 | | | 4,701 | | | | 3,946 | |
4.42%, 05/15/2028, Series 2023-A1, Class A | | | 10,233 | | | | 10,056 | |
Capital One Prime Auto Receivables Trust 2021-1 | | | | | | | | |
0.77%, 09/15/2026, Series 2021-1, Class A3 | | | 1,585 | | | | 1,514 | |
Carlyle U.S. CLO 2021-11 Ltd. | | | | | | | | |
6.35% (3 Month LIBOR USD + 1.10%, 1.10% Floor), 01/25/2033, Series 2021-11A, Class A(1)(3) | | | 30,000 | | | | 29,524 | |
CarMax Auto Owner Trust 2020-3 | | | | | | | | |
0.77%, 03/16/2026, Series 2020-3, Class A4 | | | 2,901 | | | | 2,796 | |
Carmax Auto Owner Trust 2021-1 | | | | | | | | |
0.34%, 12/15/2025, Series 2021-1, Class A3 | | | 1,878 | | | | 1,823 | |
0.53%, 10/15/2026, Series 2021-1, Class A4 | | | 4,057 | | | | 3,763 | |
CarMax Auto Owner Trust 2021-2 | | | | | | | | |
1.34%, 02/16/2027, Series 2021-2, Class C | | | 4,180 | | | | 3,822 | |
CarMax Auto Owner Trust 2021-3 | | | | | | | | |
0.55%, 06/15/2026, Series 2021-3, Class A3 | | | 4,619 | | | | 4,427 | |
1.25%, 05/17/2027, Series 2021-3, Class C | | | 3,350 | | | | 3,012 | |
CarMax Auto Owner Trust 2021-4 | | | | | | | | |
0.56%, 09/15/2026, Series 2021-4, Class A3 | | | 4,296 | | | | 4,094 | |
1.38%, 07/15/2027, Series 2021-4, Class C | | | 2,850 | | | | 2,552 | |
CarMax Auto Owner Trust 2022-1 | | | | | | | | |
1.47%, 12/15/2026, Series 2022-1, Class A3 | | | 6,679 | | | | 6,395 | |
2.20%, 11/15/2027, Series 2022-1, Class C | | | 4,200 | | | | 3,838 | |
2.47%, 07/17/2028, Series 2022-1, Class D | | | 2,000 | | | | 1,806 | |
CarMax Auto Owner Trust 2023-1 | | | | | | | | |
4.75%, 10/15/2027, Series 2023-1, Class A3 | | | 4,464 | | | | 4,401 | |
CarNow Auto Receivables Trust 2021-2 | | | | | | | | |
1.30%, 01/15/2026, Series 2021-2A, Class B(1) | | | 886 | | | | 878 | |
Carvana Auto Receivables Trust 2019-3 | | | | | | | | |
3.04%, 04/15/2025, Series 2019-3A, Class D(1) | | | 3,607 | | | | 3,587 | |
Carvana Auto Receivables Trust 2021-N2 | | | | | | | | |
0.75%, 03/10/2028, Series 2021-N2, Class B | | | 788 | | | | 723 | |
Carvana Auto Receivables Trust 2021-P3 | | | | | | | | |
1.03%, 06/10/2027, Series 2021-P3, Class A4 | | | 2,994 | | | | 2,651 | |
Carvana Auto Receivables Trust 2023-N1 | | | | | | | | |
5.92%, 07/10/2029, Series 2023-N1, Class C(1) | | | 6,625 | | | | 6,483 | |
6.36%, 04/12/2027, Series 2023-N1, Class A(1) | | | 4,316 | | | | 4,302 | |
CFIN 2022-RTL1 Issuer LLC | | | | | | | | |
3.25%, 02/16/2026, Series 2022-RTL1, Class AA(1) | | | 11,000 | | | | 10,258 | |
Chase Funding Trust Series 2003-4 | | | | | | | | |
4.86%, 05/25/2033, Series 2003-4, Class 1A5(2) | | | 70 | | | | 66 | |
Chase Funding Trust Series 2003-6 | | | | | | | | |
4.83%, 11/25/2034, Series 2003-6, Class 1A5(2) | | | 82 | | | | 79 | |
4.83%, 11/25/2034, Series 2003-6, Class 1A7(2) | | | 139 | | | | 133 | |
CIFC Funding 2018-II Ltd. | | | | | | | | |
6.29% (3 Month LIBOR USD + 1.04%), 04/20/2031, Series 2018-2A, Class A1(1)(3) | | | 11,800 | | | | 11,674 | |
CIFC Funding 2021-V Ltd. | | | | | | | | |
6.40% (3 Month LIBOR USD + 1.14%, 1.40% Floor), 07/15/2034, Series 2021-5A, Class A(1)(3) | | | 10,000 | | | | 9,834 | |
CIG Auto Receivables Trust 2020-1 | | | | | | | | |
2.35%, 01/12/2026, Series 2020-1A, Class D(1) | | | 4,867 | | | | 4,830 | |
Citizens Auto Receivables Trust 2023-1 | | | | | | | | |
5.78%, 10/15/2030, Series 2023-1, Class A4(1) | | | 5,372 | | | | 5,349 | |
5.84%, 01/18/2028, Series 2023-1, Class A3(1) | | | 11,475 | | | | 11,443 | |
| | | | | | | | |
Commonbond Student Loan Trust 2017-B-GS | | | | | | | | |
2.68%, 09/25/2042, Series 2017-BGS, Class A1(1) | | | 2,281 | | | | 2,063 | |
Commonbond Student Loan Trust 2018-A-GS | | | | | | | | |
3.21%, 02/25/2044, Series 2018-AGS, Class A1(1) | | | 1,819 | | | | 1,671 | |
Commonbond Student Loan Trust 2018-C-GS | | | | | | | | |
3.87%, 02/25/2046, Series 2018-CGS, Class A1(1) | | | 489 | | | | 460 | |
Consumer Receivables Asset Investment Trust 2021-1 | | | | | | | | |
8.74% (3 Month Term SOFR + 3.75%, 3.00% Floor), 12/15/2024, Series 2021-1, Class A1X(1)(3) | | | 1,858 | | | | 1,863 | |
Continental Finance Credit Card ABS Master Trust | | | | | | | | |
2.24%, 12/15/2028, Series 2020-1A, Class A(1) | | | 4,000 | | | | 3,831 | |
6.19%, 10/15/2030, Series 2022-A, Class A(1) | | | 10,045 | | | | 9,639 | |
COOF Securitization Trust 2014-1 Ltd. | | | | | | | | |
2.90%, 06/25/2040, Series 2014-1, Class A(1)(4) | | | 311 | | | | 23 | |
Corevest American Finance 2019-1 Trust | | | | | | | | |
3.88%, 03/15/2052, Series 2019-1, Class B(1) | | | 4,860 | | | | 4,778 | |
Corevest American Finance 2019-3 Trust | | | | | | | | |
2.71%, 10/15/2052, Series 2019-3, Class A(1) | | | 3,006 | | | | 2,833 | |
3.16%, 10/15/2052, Series 2019-3, Class B(1) | | | 2,250 | | | | 1,916 | |
3.27%, 10/15/2052, Series 2019-3, Class C(1) | | | 5,862 | | | | 4,914 | |
Corevest American Finance 2020-3 Trust | | | | | | | | |
2.20%, 08/15/2053, Series 2020-3, Class B(1) | | | 6,314 | | | | 4,970 | |
Countrywide Asset-Backed Certificates | | | | | | | | |
5.12%, 02/25/2035, Series 2004-S1, Class A3(2) | | | 6 | | | | 6 | |
CPS Auto Receivables Trust 2022-C | | | | | | | | |
4.18%, 04/15/2030, Series 2022-C, Class A(1) | | | 2,879 | | | | 2,857 | |
5.28%, 04/15/2030, Series 2022-C, Class C(1) | | | 6,000 | | | | 5,874 | |
Credit Acceptance Auto Loan Trust 2020-2 | | | | | | | | |
2.73%, 11/15/2029, Series 2020-2A, Class C(1) | | | 3,500 | | | | 3,453 | |
Credit Acceptance Auto Loan Trust 2021-4 | | | | | | | | |
1.26%, 10/15/2030, Series 2021-4, Class A(1) | | | 2,488 | | | | 2,379 | |
Credit Acceptance Auto Loan Trust 2022-3 | | | | | | | | |
8.45%, 02/15/2033, Series 2022-3A, Class C(1) | | | 9,500 | | | | 9,765 | |
Credit Acceptance Auto Loan Trust 2023-1 | | | | | | | | |
6.48%, 03/15/2033, Series 2023-1A, Class A(1) | | | 907 | | | | 906 | |
Credit Acceptance Auto Loan Trust 2023-2 | | | | | | | | |
5.92%, 05/16/2033, Series 2023-2A, Class A(1) | | | 17,288 | | | | 17,054 | |
Crossroads Asset Trust 2021-A | | | | | | | | |
2.52%, 01/20/2026, Series 2021-A, Class D(1) | | | 1,500 | | | | 1,434 | |
CWABS Asset-Backed Certificates Trust 2005-10 | | | | | | | | |
4.10%, 02/25/2036, Series 2005-10, Class AF6(4) | | | 4 | | | | 4 | |
CWABS Asset-Backed Certificates Trust 2005-17 | | | | | | | | |
5.56%, 05/25/2036, Series 2005-17, Class 1AF5(4) | | | 6 | | | | 6 | |
CWABS Asset-Backed Certificates Trust 2006-10 | | | | | | | | |
5.97%, 09/25/2046, Series 2006-10, Class 1AF3(4) | | | 7 | | | | 7 | |
CWABS, Inc. Asset-Backed Certificates Series 2004-1 | | | | | | | | |
5.71% (1 Month LIBOR USD + 0.56%, 0.56% Floor), 04/25/2034, Series 2004-1, Class 3A(3) | | | 1 | | | | 1 | |
5.90% (1 Month LIBOR USD + 0.75%, 0.75% Floor), 03/25/2034, Series 2004-1, Class M1(3) | | | 6 | | | | 5 | |
5.98% (1 Month LIBOR USD + 0.83%, 0.83% Floor), 03/25/2034, Series 2004-1, Class M2(3) | | | 5 | | | | 5 | |
CWABS, Inc. Asset-Backed Certificates Trust 2004-6 | | | | | | | | |
5.93% (1 Month LIBOR USD + 0.78%, 0.78% Floor), 11/25/2034, Series 2004-6, Class 2A5(3) | | | 307 | | | | 291 | |
6.05% (1 Month LIBOR USD + 0.90%, 0.90% Floor), 10/25/2034, Series 2004-6, Class M1(3) | | | 7 | | | | 7 | |
DataBank Issuer | | | | | | | | |
2.06%, 02/27/2051, Series 2021-1A, Class A2(1) | | | 6,150 | | | | 5,389 | |
Delta Air Lines 2015-1 Class AA Pass-Through Trust | | | | | | | | |
3.63%, 07/30/2027 | | | 875 | | | | 797 | |
Diamond Resorts Owner Trust 2019-1 | | | | | | | | |
3.53%, 02/20/2032, Series 2019-1A, Class B(1) | | | 1,514 | | | | 1,437 | |
Discover Card Execution Note Trust | | | | | | | | |
1.03%, 09/15/2028, Series 2021-A2, Class A2 | | | 4,668 | | | | 4,107 | |
4.93%, 06/15/2028, Series 2023-A2, Class A | | | 11,947 | | | | 11,894 | |
Diversified Abs Phase VI LLC | | | | | | | | |
7.50%, 11/28/2039, Series VI, Class A | | | 6,976 | | | | 6,795 | |
Drive Auto Receivables Trust 2020-2 | | | | | | | | |
2.28%, 08/17/2026, Series 2020-2, Class C | | | 84 | | | | 84 | |
Drive Auto Receivables Trust 2021-1 | | | | | | | | |
1.02%, 06/15/2027, Series 2021-1, Class C | | | 1,611 | | | | 1,589 | |
Drive Auto Receivables Trust 2021-2 | | | | | | | | |
0.58%, 12/15/2025, Series 2021-2, Class B | | | 592 | | | | 591 | |
DT Auto Owner Trust 2021-2 | | | | | | | | |
1.10%, 02/16/2027, Series 2021-2A, Class C(1) | | | 1,835 | | | | 1,775 | |
DT Auto Owner Trust 2021-4 | | | | | | | | |
0.56%, 09/15/2025, Series 2021-4A, Class A(1) | | | 715 | | | | 711 | |
1.02%, 05/15/2026, Series 2021-4A, Class B(1) | | | 4,753 | | | | 4,630 | |
DT Auto Owner Trust 2023-1 | | | | | | | | |
5.19%, 10/16/2028, Series 2023-1A, Class B(1) | | | 2,241 | | | | 2,200 | |
DT Auto Owner Trust 2023-2 | | | | | | | | |
5.79%, 02/15/2029, Series 2023-2A, Class C(1) | | | 8,785 | | | | 8,662 | |
Elmwood CLO II Ltd. | | | | | | | | |
6.40% (3 Month LIBOR USD + 1.15%, 1.15% Floor), 04/20/2034, Series 2019-2A, Class AR(1)(3) | | | 20,000 | | | | 19,672 | |
Enterprise Fleet Financing 2023-2 LLC | | | | | | | | |
5.56%, 04/22/2030, Series 2023-2, Class A2(1) | | | 11,000 | | | | 10,939 | |
Exeter Automobile Receivables Trust 2021-4 | | | | | | | | |
1.05%, 05/15/2026, Series 2021-4A, Class B | | | 2,799 | | | | 2,766 | |
| | | | | | | | |
Exeter Automobile Receivables Trust 2022-2 | | | | | | | | |
4.56%, 07/17/2028, Series 2022-2A, Class D | | | 11,635 | | | | 11,075 | |
Exeter Automobile Receivables Trust 2022-4 | | | | | | | | |
5.98%, 12/15/2028, Series 2022-4A, Class D | | | 6,264 | | | | 6,145 | |
Exeter Automobile Receivables Trust 2023-3 | | | | | | | | |
6.21%, 06/15/2028, Series 2023-3A, Class C | | | 5,400 | | | | 5,382 | |
FirstKey Homes 2020-SFR2 Trust | | | | | | | | |
1.27%, 10/19/2037, Series 2020-SFR2, Class A(1) | | | 19,284 | | | | 17,312 | |
2.67%, 10/19/2037, Series 2020-SFR2, Class E(1) | | | 7,948 | | | | 7,198 | |
FirstKey Homes 2021-SFR1 Trust | | | | | | | | |
1.54%, 08/17/2038, Series 2021-SFR1, Class A(1) | | | 12,383 | | | | 10,837 | |
2.19%, 08/17/2038, Series 2021-SFR1, Class D(1) | | | 7,500 | | | | 6,440 | |
FirstKey Homes 2022-SFR1 Trust | | | | | | | | |
4.15%, 05/17/2039, Series 2022-SFR1, Class A(1) | | | 10,789 | | | | 10,164 | |
5.20%, 05/17/2039, Series 2022-SFR1, Class D(1) | | | 4,935 | | | | 4,610 | |
Flagship Credit Auto Trust 2019-4 | | | | | | | | |
3.12%, 01/15/2026, Series 2019-4, Class D(1) | | | 9,275 | | | | 8,983 | |
Flagship Credit Auto Trust 2021-2 | | | | | | | | |
0.37%, 12/15/2026, Series 2021-2, Class A(1) | | | 749 | | | | 742 | |
Flagship Credit Auto Trust 2022-2 | | | | | | | | |
5.80%, 04/17/2028, Series 2022-2, Class D(1) | | | 4,000 | | | | 3,851 | |
Flagship Credit Auto Trust 2022-3 | | | | | | | | |
6.00%, 07/17/2028, Series 2022-3, Class D(1) | | | 4,043 | | | | 3,949 | |
Flagship Credit Auto Trust 2023-1 | | | | | | | | |
5.38%, 12/15/2026, Series 2023-1, Class A2(1) | | | 4,640 | | | | 4,617 | |
FMC GMSR Issuer Trust | | | | | | | | |
3.62%, 07/25/2026, Series 2021-GT1, Class A(1)(4) | | | 10,900 | | | | 8,856 | |
3.65%, 02/25/2024, Series 2021-SAT1, Class A(1)(4) | | | 16,715 | | | | 15,846 | |
3.85%, 10/25/2026, Series 2021-GT2, Class A(1)(4) | | | 8,250 | | | | 6,726 | |
4.45%, 01/25/2026, Series 2020-GT1, Class A(1)(4) | | | 9,700 | | | | 8,319 | |
6.19%, 04/25/2027, Series 2022-GT1, Class A(1) | | | 8,210 | | | | 7,572 | |
Ford Credit Auto Owner Trust 2018-REV1 | | | | | | | | |
3.19%, 07/15/2031, Series 2018-1, Class A(1) | | | 20,424 | | | | 19,625 | |
Ford Credit Auto Owner Trust 2020-A | | | | | | | | |
1.04%, 08/15/2024, Series 2020-A, Class A3 | | | 82 | | | | 81 | |
1.35%, 07/15/2025, Series 2020-A, Class A4 | | | 2,163 | | | | 2,129 | |
Ford Credit Auto Owner Trust 2020-B | | | | | | | | |
0.79%, 11/15/2025, Series 2020-B, Class A4 | | | 3,711 | | | | 3,623 | |
Ford Credit Auto Owner Trust 2020-C | | | | | | | | |
0.51%, 08/15/2026, Series 2020-C, Class A4 | | | 5,576 | | | | 5,227 | |
Ford Credit Auto Owner Trust 2020-REV1 | | | | | | | | |
2.04%, 08/15/2031, Series 2020-1, Class A(1) | | | 12,300 | | | | 11,576 | |
Ford Credit Auto Owner Trust 2020-REV2 | | | | | | | | |
1.06%, 04/15/2033, Series 2020-2, Class A(1) | | | 3,800 | | | | 3,431 | |
Ford Credit Auto Owner Trust 2021-REV1 | | | | | | | | |
1.61%, 10/17/2033, Series 2021-1, Class B(1) | | | 2,320 | | | | 2,063 | |
Ford Credit Auto Owner Trust 2021-REV2 | | | | | | | | |
1.53%, 05/15/2034, Series 2021-2, Class A(1) | | | 5,255 | | | | 4,628 | |
1.91%, 05/15/2034, Series 2021-2, Class B(1) | | | 2,150 | | | | 1,896 | |
Ford Credit Auto Owner Trust 2022-A | | | | | | | | |
1.29%, 06/15/2026, Series 2022-A, Class A3 | | | 3,920 | | | | 3,765 | |
Ford Credit Auto Owner Trust 2022-B | | | | | | | | |
3.74%, 09/15/2026, Series 2022-B, Class A3 | | | 4,754 | | | | 4,645 | |
Ford Credit Auto Owner Trust 2023-A | | | | | | | | |
4.65%, 02/15/2028, Series 2023-A, Class A3 | | | 2,094 | | | | 2,067 | |
Ford Credit Auto Owner Trust 2023-B | | | | | | | | |
5.23%, 05/15/2028, Series 2023-B, Class A3 | | | 3,958 | | | | 3,951 | |
Ford Credit Auto Owner Trust 2023-REV1 | | | | | | | | |
4.85%, 08/15/2035, Series 2023-1, Class A(1) | | | 25,573 | | | | 25,023 | |
Ford Credit Floorplan Master Owner Trust A | | | | | | | | |
1.06%, 09/15/2027, Series 2020-2, Class A | | | 14,747 | | | | 13,379 | |
4.92%, 05/15/2028, Series 2023-1, Class A1(1) | | | 22,976 | | | | 22,720 | |
Foundation Finance Trust 2019-1 | | | | | | | | |
3.86%, 11/15/2034, Series 2019-1A, Class A(1) | | | 501 | | | | 492 | |
Foursight Capital Automobile Receivables Trust 2021-1 | | | | | | | | |
1.32%, 03/15/2027, Series 2021-1, Class D(1) | | | 900 | | | | 850 | |
Foursight Capital Automobile Receivables Trust 2021-2 | | | | | | | | |
1.92%, 09/15/2027, Series 2021-2, Class D(1) | | | 850 | | | | 784 | |
FREED ABS Trust 2022-3FP | | | | | | | | |
5.79%, 08/20/2029, Series 2022-3FP, Class B(1) | | | 2,303 | | | | 2,289 | |
GE Capital Mortgage Services, Inc. 1999-HE1 Trust | | | | | | | | |
6.71%, 04/25/2029, Series 1999-HE1, Class M(4) | | | 8 | | | | 7 | |
GLS Auto Receivables Issuer Trust 2021-1 | | | | | | | | |
1.68%, 01/15/2027, Series 2021-1A, Class D(1) | | | 1,200 | | | | 1,131 | |
GLS Auto Receivables Issuer Trust 2021-2 | | | | | | | | |
0.77%, 09/15/2025, Series 2021-2A, Class B(1) | | | 370 | | | | 369 | |
1.42%, 04/15/2027, Series 2021-2A, Class D(1) | | | 2,250 | | | | 2,087 | |
GLS Auto Receivables Issuer Trust 2021-4 | | | | | | | | |
1.53%, 04/15/2026, Series 2021-4A, Class B(1) | | | 5,850 | | | | 5,696 | |
GM Financial Automobile Leasing Trust 2023-2 | | | | | | | | |
5.09%, 05/20/2027, Series 2023-2, Class A4 | | | 3,304 | | | | 3,267 | |
5.44%, 10/20/2025, Series 2023-2, Class A2A | | | 1,749 | | | | 1,742 | |
GM Financial Consumer Automobile Receivables Trust 2020-2 | | | | | | | | |
| | | | | | | | |
1.49%, 12/16/2024, Series 2020-2, Class A3 | | | 272 | | | | 271 | |
GM Financial Consumer Automobile Receivables Trust 2020-3 | | | | | | | | |
0.45%, 04/16/2025, Series 2020-3, Class A3 | | | 894 | | | | 880 | |
GM Financial Consumer Automobile Receivables Trust 2020-4 | | | | | | | | |
0.50%, 02/17/2026, Series 2020-4, Class A4 | | | 5,097 | | | | 4,824 | |
GM Financial Consumer Automobile Receivables Trust 2021-1 | | | | | | | | |
0.54%, 05/17/2027, Series 2021-1, Class A4 | | | 4,174 | | | | 3,899 | |
GM Financial Consumer Automobile Receivables Trust 2023-1 | | | | | | | | |
5.19%, 03/16/2026, Series 2023-1, Class A2A | | | 4,533 | | | | 4,516 | |
GM Financial Revolving Receivables Trust 2021-1 | | | | | | | | |
1.17%, 06/12/2034, Series 2021-1, Class A(1) | | | 2,882 | | | | 2,518 | |
1.49%, 06/12/2034, Series 2021-1, Class B(1) | | | 500 | | | | 433 | |
GMF Floorplan Owner Revolving Trust | | | | | | | | |
0.68%, 08/15/2025, Series 2020-1, Class A(1) | | | 4,031 | | | | 4,008 | |
Gold Key Resorts 2014-A LLC | | | | | | | | |
3.22%, 03/17/2031, Series 2014-A, Class A(1) | | | 15 | | | | 14 | |
Golden Credit Card Trust | | | | | | | | |
4.31%, 09/15/2027, Series 2022-4A, Class A(1) | | | 10,250 | | | | 10,014 | |
Goodgreen 2017-1 Trust | | | | | | | | |
3.74%, 10/15/2052, Series 2017-1A, Class A(1) | | | 688 | | | | 605 | |
Goodgreen 2017-2 Trust | | | | | | | | |
3.26%, 10/15/2053, Series 2017-2A, Class A(1) | | | 1,926 | | | | 1,692 | |
Goodgreen 2017-R1 Trust | | | | | | | | |
5.00%, 10/20/2051, Series 2017-R1(1)(5) | | | 1,777 | | | | 1,475 | |
Goodgreen 2019-2 | | | | | | | | |
2.76%, 04/15/2055, Series 2019-2A, Class A(1) | | | 2,920 | | | | 2,417 | |
Goodgreen 2023-1 | | | | | | | | |
5.90%, 01/17/2061, Series 2023-1A, Class A(1)(5) | | | 7,184 | | | | 7,024 | |
Greenwood Park CLO Ltd. | | | | | | | | |
6.27% (3 Month LIBOR USD + 1.01%), 04/15/2031, Series 2018-1A, Class A2(1)(3) | | | 23,000 | | | | 22,745 | |
Harley-Davidson Motorcycle Trust 2021-A | | | | | | | | |
0.37%, 04/15/2026, Series 2021-A, Class A3 | | | 3,433 | | | | 3,351 | |
0.53%, 09/15/2028, Series 2021-A, Class A4 | | | 4,288 | | | | 4,016 | |
HERO Funding 2017-3 | | | | | | | | |
3.95%, 09/20/2048, Series 2017-3A, Class A2(1) | | | 1,311 | | | | 1,148 | |
HERO Funding Trust 2016-2 | | | | | | | | |
3.75%, 09/20/2041, Series 2016-2A, Class A(1) | | | 718 | | | | 643 | |
HERO Funding Trust 2016-3 | | | | | | | | |
3.08%, 09/20/2042, Series 2016-3A, Class A1(1) | | | 297 | | | | 259 | |
HERO Funding Trust 2016-4A | | | | | | | | |
3.57%, 09/20/2047, Series 2016-4A, Class A1(1) | | | 976 | | | | 863 | |
HERO Funding Trust 2017-1A | | | | | | | | |
4.46%, 09/20/2047, Series 2017-1A, Class A2(1) | | | 1,837 | | | | 1,654 | |
HERO Funding Trust 2017-2 | | | | | | | | |
3.28%, 09/20/2048, Series 2017-2A, Class A1(1) | | | 1,634 | | | | 1,405 | |
Hertz Vehicle Financing III LLC | | | | | | | | |
5.49%, 06/25/2027, Series 2023-1A, Class A(1) | | | 12,400 | | | | 12,228 | |
Hertz Vehicle Financing III LP | | | | | | | | |
1.68%, 12/27/2027, Series 2021-2A, Class A(1) | | | 7,200 | | | | 6,274 | |
Hertz Vehicle Financing LLC | | | | | | | | |
1.21%, 12/26/2025, Series 2021-1A, Class A(1) | | | 8,200 | | | | 7,682 | |
2.33%, 06/26/2028, Series 2022-2A, Class A(1) | | | 18,900 | | | | 16,602 | |
Hilton Grand Vacations Trust 2017-A | | | | | | | | |
2.66%, 12/26/2028, Series 2017-AA, Class A(1) | | | 271 | | | | 268 | |
Hilton Grand Vacations Trust 2022-1D | | | | | | | | |
4.10%, 06/20/2034, Series 2022-1D, Class B(1) | | | 2,772 | | | | 2,604 | |
HIN Timeshare Trust 2020-A | | | | | | | | |
2.23%, 10/09/2039, Series 2020-A, Class B(1) | | | 1,606 | | | | 1,460 | |
Home Partners of America 2021-2 Trust | | | | | | | | |
1.90%, 12/17/2026, Series 2021-2, Class A(1) | | | 7,010 | | | | 6,114 | |
2.95%, 12/17/2026, Series 2021-2, Class E2(1) | | | 6,269 | | | | 5,402 | |
Home Partners of America 2021-3 Trust | | | | | | | | |
2.20%, 01/17/2041, Series 2021-3, Class A(1) | | | 3,773 | | | | 3,198 | |
3.20%, 01/17/2041, Series 2021-3, Class E1(1) | | | 5,315 | | | | 4,459 | |
Honda Auto Receivables 2021-4 Owner Trust | | | | | | | | |
0.88%, 01/21/2026, Series 2021-4, Class A3 | | | 4,355 | | | | 4,180 | |
Hyundai Auto Lease Securitization Trust 2022-C | | | | | | | | |
4.38%, 10/15/2025, Series 2022-C, Class A3(1) | | | 4,446 | | | | 4,380 | |
Hyundai Auto Lease Securitization Trust 2023-B | | | | | | | | |
5.15%, 06/15/2026, Series 2023-B, Class A3(1) | | | 4,810 | | | | 4,775 | |
5.17%, 04/15/2027, Series 2023-B, Class A4(1) | | | 2,099 | | | | 2,070 | |
5.47%, 09/15/2025, Series 2023-B, Class A2A(1) | | | 1,813 | | | | 1,804 | |
Hyundai Auto Receivables Trust 2020-A | | | | | | | | |
1.41%, 11/15/2024, Series 2020-A, Class A3 | | | 567 | | | | 563 | |
1.72%, 06/15/2026, Series 2020-A, Class A4 | | | 3,308 | | | | 3,233 | |
Hyundai Auto Receivables Trust 2021-B | | | | | | | | |
0.38%, 01/15/2026, Series 2021-B, Class A3 | | | 4,648 | | | | 4,497 | |
Hyundai Auto Receivables Trust 2022-A | | | | | | | | |
2.22%, 10/15/2026, Series 2022-A, Class A3 | | | 1,642 | | | | 1,576 | |
Jonah 2022-1 A2 | | | | | | | | |
7.80%, 11/10/2037, Series 2022-1, Class A2(1) | | | 6,943 | | | | 6,729 | |
Jonah Energy Abs I LLC | | | | | | | | |
7.20%, 12/10/2037, Series 2022-1, Class A1(1) | | | 5,593 | | | | 5,481 | |
| | | | | | | | |
KGS-Alpha SBA COOF Trust | | | | | | | | |
0.50%, 05/25/2039, Series 2012-6, Class A(1)(4) | | | 905 | | | | 11 | |
KGS-Alpha SBA COOF Trust 2012-2 | | | | | | | | |
0.82%, 08/25/2038, Series 2012-2, Class A(1)(4) | | | 967 | | | | 18 | |
KGS-Alpha SBA COOF Trust 2014-2 | | | | | | | | |
2.89%, 04/25/2040, Series 2014-2, Class A(1)(4) | | | 289 | | | | 19 | |
KKR CLO 11 Ltd. | | | | | | | | |
6.44% (3 Month LIBOR USD + 1.18%, 1.44% Floor), 01/15/2031, Series 11, Class AR(1)(3) | | | 8,222 | | | | 8,138 | |
KKR CLO 32 Ltd. | | | | | | | | |
6.58% (3 Month LIBOR USD + 1.32%, 1.32% Floor), 01/15/2032, Series 32A, Class A1(1)(3) | | | 26,000 | | | | 25,751 | |
Laurel Road Prime Student Loan Trust 2017-C | | | | | | | | |
2.81%, 11/25/2042, Series 2017-C, Class A2B(1) | | | 196 | | | | 193 | |
Laurel Road Prime Student Loan Trust 2018-B | | | | | | | | |
3.54%, 05/26/2043, Series 2018-B, Class A2FX(1) | | | 464 | | | | 456 | |
LendingPoint 2020-REV1 Asset Securitization Trust | | | | | | | | |
2.73%, 10/15/2028, Series 2020-REV1, Class A(1) | | | 1,624 | | | | 1,616 | |
4.49%, 10/15/2028, Series 2020-REV1, Class B(1) | | | 8,407 | | | | 8,277 | |
Long Beach Mortgage Loan Trust 2004-1 | | | | | | | | |
5.90% (1 Month LIBOR USD + 0.75%, 0.75% Floor), 02/25/2034, Series 2004-1, Class M1(3) | | | 68 | | | | 65 | |
Long Beach Mortgage Loan Trust 2004-3 | | | | | | | | |
6.01% (1 Month LIBOR USD + 0.86%, 0.86% Floor), 07/25/2034, Series 2004-3, Class M1(3) | | | 26 | | | | 25 | |
LP LMS 2021-1 | | | | | | | | |
3.23%, 10/15/2028, Series 2021-1(1) | | | 482 | | | | 481 | |
LP LMS 2021-2 Asset Securitization Trust | | | | | | | | |
1.75%, 01/15/2029, Series 2021-2A, Class A(1) | | | 2,111 | | | | 2,064 | |
Madison Park Funding LIX Ltd. | | | | | | | | |
6.40% (3 Month LIBOR USD + 1.14%, 1.14% Floor), 01/18/2034, Series 2021-59A, Class A(1)(3) | | | 20,000 | | | | 19,711 | |
Mariner Finance Issuance Trust 2019-A | | | | | | | | |
2.96%, 07/20/2032, Series 2019-AA, Class A(1) | | | 986 | | | | 979 | |
3.51%, 07/20/2032, Series 2019-AA, Class B(1) | | | 5,235 | | | | 5,119 | |
Mariner Finance Issuance Trust 2021-A | | | | | | | | |
2.33%, 03/20/2036, Series 2021-AA, Class B(1) | | | 5,700 | | | | 4,856 | |
MidOcean Credit CLO III | | | | | | | | |
6.38% (3 Month LIBOR USD + 1.12%, 1.12% Floor), 04/21/2031, Series 2014-3A, Class A1R(1)(3) | | | 15,218 | | | | 15,054 | |
MidOcean Credit CLO IX | | | | | | | | |
6.40% (3 Month LIBOR USD + 1.15%, 1.15% Floor), 07/20/2031, Series 2018-9A, Class A1(1)(3) | | | 4,000 | | | | 3,934 | |
Mid-State Capital Corp. 2006-1 Trust | | | | | | | | |
6.08%, 10/15/2040, Series 2006-1, Class M1(1) | | | 380 | | | | 367 | |
MMAF Equipment Finance LLC 2019-B | | | | | | | | |
2.29%, 11/12/2041, Series 2019-B, Class A5(1) | | | 7,200 | | | | 6,627 | |
Mountain View CLO IX Ltd. | | | | | | | | |
6.38% (3 Month LIBOR USD + 1.12%), 07/15/2031, Series 2015-9A, Class A1R(1)(3) | | | 20,000 | | | | 19,785 | |
Navient Private Education Refi Loan Trust 2018-A | | | | | | | | |
3.19%, 02/18/2042, Series 2018-A, Class A2(1) | | | 203 | | | | 203 | |
Navient Private Education Refi Loan Trust 2018-C | | | | | | | | |
3.52%, 06/16/2042, Series 2018-CA, Class A2(1) | | | 525 | | | | 515 | |
Navient Private Education Refi Loan Trust 2019-C | | | | | | | | |
3.13%, 02/15/2068, Series 2019-CA, Class A2(1) | | | 2,246 | | | | 2,123 | |
Navient Private Education Refi Loan Trust 2020-B | | | | | | | | |
2.12%, 01/15/2069, Series 2020-BA, Class A2(1) | | | 2,611 | | | | 2,366 | |
Navient Private Education Refi Loan Trust 2021-G | | | | | | | | |
1.58%, 04/15/2070, Series 2021-GA, Class A(1) | | | 8,852 | | | | 7,598 | |
Nelnet Student Loan Trust 2021-D | | | | | | | | |
1.63%, 04/20/2062, Series 2021-DA, Class AFX(1) | | | 8,504 | | | | 7,624 | |
New Century Home Equity Loan Trust Series 2003-5 | | | | | | | | |
4.80%, 11/25/2033, Series 2003-5, Class AI6(2) | | | 88 | | | | 82 | |
New Residential Mortgage Loan Trust 2018-1 | | | | | | | | |
4.00%, 12/25/2057, Series 2018-1A, Class A1A(1)(4) | | | 1,321 | | | | 1,239 | |
New Residential Mortgage Loan Trust 2022-SFR2 | | | | | | | | |
4.00%, 09/04/2039, Series 2022-SFR2, Class D(1) | | | 5,000 | | | | 4,443 | |
Nissan Auto Lease Trust 2023-A | | | | | | | | |
4.91%, 01/15/2026, Series 2023-A, Class A3 | | | 7,933 | | | | 7,848 | |
Nissan Auto Lease Trust 2023-B | | | | | | | | |
5.61%, 11/15/2027, Series 2023-B, Class A4 | | | 2,808 | | | | 2,811 | |
5.69%, 07/15/2026, Series 2023-B, Class A3 | | | 3,572 | | | | 3,577 | |
5.74%, 08/15/2025, Series 2023-B, Class A2A | | | 2,216 | | | | 2,213 | |
Nissan Auto Receivables 2020-A Owner Trust | | | | | | | | |
1.38%, 12/16/2024, Series 2020-A, Class A3 | | | 545 | | | | 541 | |
Nissan Auto Receivables 2021-A Owner Trust | | | | | | | | |
0.33%, 10/15/2025, Series 2021-A, Class A3 | | | 7,367 | | | | 7,150 | |
Nissan Auto Receivables 2023-A Owner Trust | | | | | | | | |
4.91%, 11/15/2027, Series 2023-A, Class A3 | | | 2,418 | | | | 2,397 | |
NRZ Excess Spread-Collateralized Notes | | | | | | | | |
3.10%, 07/25/2026, Series 2021-FHT1, Class A(1) | | | 10,718 | | | | 9,541 | |
3.23%, 05/25/2026, Series 2021-FNT2, Class A(1) | | | 5,477 | | | | 4,931 | |
3.47%, 11/25/2026, Series 2021-GNT1, Class A(1) | | | 9,638 | | | | 8,672 | |
NRZ Excess Spread-Collateralized Notes Series 2020-PLS1 | | | | | | | | |
3.84%, 12/25/2025, Series 2020-PLS1, Class A(1) | | | 4,176 | | | | 3,877 | |
OCP CLO 2015-9 Ltd. | | | | | | | | |
6.24% (3 Month Term SOFR + 1.25%, 1.25% Floor), 01/15/2033, Series 2015-9A, Class A1R2(1)(3) | | | 15,000 | | | | 14,801 | |
Octane Receivables Trust 2021-1 | | | | | | | | |
1.53%, 04/20/2027, Series 2021-1A, Class B(1) | | | 700 | | | | 649 | |
Octane Receivables Trust 2023-1 | | | | | | | | |
| | | | | | | | |
5.96%, 07/20/2029, Series 2023-1A, Class B(1) | | | 4,100 | | | | 4,050 | |
OL SP 2018-B LLC | | | | | | | | |
4.16%, 02/09/2030, Series 2018, Class A | | | 682 | | | | 664 | |
4.61%, 02/09/2030, Series 2018, Class B | | | 148 | | | | 144 | |
OneMain Direct Auto Receivables Trust 2019-1 | | | | | | | | |
3.63%, 09/14/2027, Series 2019-1A, Class A(1) | | | 14,600 | | | | 14,051 | |
OneMain Direct Auto Receivables Trust 2021-1 | | | | | | | | |
1.26%, 07/14/2028, Series 2021-1A, Class B(1) | | | 10,300 | | | | 9,316 | |
OneMain Direct Auto Receivables Trust 2023-1 | | | | | | | | |
5.41%, 11/14/2029, Series 2023-1A, Class A(1) | | | 12,500 | | | | 12,281 | |
7.07%, 02/14/2033, Series 2023-1A, Class D(1) | | | 6,480 | | | | 6,477 | |
OneMain Financial Issuance Trust 2020-2 | | | | | | | | |
1.75%, 09/14/2035, Series 2020-2A, Class A(1) | | | 9,400 | | | | 8,387 | |
OneMain Financial Issuance Trust 2020-A | | | | | | | | |
3.84%, 05/14/2032, Series 2020-1A, Class A(1) | | | 561 | | | | 559 | |
OneMain Financial Issuance Trust 2021-1 | | | | | | | | |
5.83% (30-day Average SOFR + 0.76%), 06/16/2036, Series 2021-1A, Class A2(1)(3) | | | 10,342 | | | | 10,071 | |
OneMain Financial Issuance Trust 2022-2 | | | | | | | | |
4.89%, 10/14/2034, Series 2022-2A, Class A(1) | | | 8,510 | | | | 8,320 | |
Oportun Funding XIV LLC | | | | | | | | |
1.76%, 03/08/2028, Series 2021-A, Class B(1) | | | 4,586 | | | | 4,354 | |
Oportun Issuance Trust 2021-B | | | | | | | | |
1.47%, 05/08/2031, Series 2021-B, Class A(1) | | | 5,610 | | | | 5,083 | |
Oportun Issuance Trust 2022-2 | | | | | | | | |
5.94%, 10/09/2029, Series 2022-2, Class A(1) | | | 3,393 | | | | 3,379 | |
7.40%, 10/09/2029, Series 2022-2, Class B(1) | | | 8,500 | | | | 8,376 | |
Oportun Issuance Trust 2022-3 | | | | | | | | |
5.05%, 06/09/2031, Series 2022-A, Class A(1) | | | 10,500 | | | | 10,172 | |
Option One Mortgage Loan Trust 2004-3 | | | | | | | | |
6.05% (1 Month LIBOR USD + 0.90%, 0.90% Floor), 11/25/2034, Series 2004-3, Class A4(3) | | | 1,692 | | | | 1,586 | |
OZLM Funding IV Ltd. | | | | | | | | |
6.52% (3 Month LIBOR USD + 1.25%), 10/22/2030, Series 2013-4A, Class A1R(1)(3) | | | 8,073 | | | | 8,021 | |
OZLM XXII Ltd. | | | | | | | | |
6.33% (3 Month LIBOR USD + 1.07%), 01/17/2031, Series 2018-22A, Class A1(1)(3) | | | 6,671 | | | | 6,586 | |
P4 SFR 2019-STL | | | | | | | | |
7.25%, 10/11/2026, Series 2019, Class A | | | 5,700 | | | | 5,401 | |
Pagaya AI Debt Selection Trust 2021-1 | | | | | | | | |
1.18%, 11/15/2027, Series 2021-1, Class A(1) | | | 498 | | | | 497 | |
Palmer Square CLO 2014-1 Ltd. | | | | | | | | |
6.39% (3 Month LIBOR USD + 1.13%, 1.13% Floor), 01/17/2031, Series 2014-1A, Class A1R2(1)(3) | | | 3,586 | | | | 3,559 | |
Palmer Square CLO 2018-2 Ltd. | | | | | | | | |
6.36% (3 Month LIBOR USD + 1.10%), 07/16/2031, Series 2018-2A, Class A1A(1)(3) | | | 20,000 | | | | 19,814 | |
Park Avenue Institutional Advisers CLO Ltd. 2018-1 | | | | | | | | |
6.25% (3 Month LIBOR USD + 1.00%, 1.00% Floor), 10/20/2031, Series 2018-1A, Class A1AR(1)(3) | | | 21,500 | | | | 21,273 | |
Pennsylvania Higher Education Assistance Agency | | | | | | | | |
5.67% (1 Month LIBOR USD + 0.53%, 0.53% Floor), 05/25/2070, Series 2021-1A, Class A(1)(3) | | | 6,521 | | | | 6,311 | |
PFS Financing Corp. | | | | | | | | |
5.80%, 03/15/2028, Series 2023-A, Class A(1) | | | 12,575 | | | | 12,579 | |
PNMAC GMSR ISSUER TRUST 2022-GT1 | | | | | | | | |
9.32% (30-day Average SOFR + 4.25%), 05/25/2027, Series 2022-GT1, Class A(1)(3) | | | 9,425 | | | | 9,414 | |
PRET 2021-RN4 LLC | | | | | | | | |
2.49%, 10/25/2051, Series 2021-RN4, Class A1(1)(4) | | | 14,559 | | | | 13,178 | |
Pretium Mortgage Credit Partners I 2021-NPL1 LLC | | | | | | | | |
2.24%, 09/27/2060, Series 2021-NPL1, Class A1(1)(2) | | | 6,548 | | | | 6,160 | |
Progress Residential 2020-SFR3 Trust | | | | | | | | |
2.30%, 10/17/2027, Series 2020-SFR3, Class E(1) | | | 6,000 | | | | 5,384 | |
Progress Residential 2021-SFR1 | | | | | | | | |
1.56%, 04/17/2038, Series 2021-SFR1, Class C(1) | | | 3,500 | | | | 3,067 | |
Progress Residential 2021-SFR2 Trust | | | | | | | | |
2.55%, 04/19/2038, Series 2021-SFR2, Class E1(1) | | | 5,000 | | | | 4,377 | |
Progress Residential 2021-SFR3 | | | | | | | | |
2.54%, 05/17/2026, Series 2021-SFR3, Class E1(1) | | | 6,250 | | | | 5,417 | |
Progress Residential 2021-SFR9 Trust | | | | | | | | |
2.81%, 11/17/2040, Series 2021-SFR9, Class E1(1) | | | 5,400 | | | | 4,405 | |
Progress Residential 2022-SFR1 Trust | | | | | | | | |
3.93%, 02/17/2041, Series 2022-SFR1, Class E1(1) | | | 11,100 | | | | 9,461 | |
Progress Residential 2022-SFR2 Trust | | | | | | | | |
3.95%, 04/17/2027, Series 2022-SFR2, Class D(1) | | | 3,000 | | | | 2,715 | |
Progress Residential 2022-SFR3 Trust | | | | | | | | |
5.20%, 04/17/2039, Series 2022-SFR3, Class E1(1) | | | 9,025 | | | | 8,244 | |
Regional Management Issuance Trust 2020-1 | | | | | | | | |
3.23%, 10/15/2030, Series 2020-1, Class B(1) | | | 2,590 | | | | 2,379 | |
Regional Management Issuance Trust 2021-1 | | | | | | | | |
1.68%, 03/17/2031, Series 2021-1, Class A(1) | | | 3,183 | | | | 2,944 | |
Renaissance Home Equity Loan Trust | | | | | | | | |
5.61%, 04/25/2037, Series 2007-1, Class AF3(2) | | | 299 | | | | 83 | |
Renew 2017-1 | | | | | | | | |
3.67%, 09/20/2052, Series 2017-1A, Class A(1) | | | 881 | | | | 764 | |
Rockford Tower CLO 2020-1 Ltd. | | | | | | | | |
6.53% (3 Month LIBOR USD + 1.28%), 01/20/2032, Series 2020-1A, Class A(1)(3) | | | 12,000 | | | | 11,902 | |
Santander Consumer Auto Receivables Trust 2021-A | | | | | | | | |
0.33%, 10/15/2025, Series 2021-AA, Class A3(1) | | | 1,455 | | | | 1,440 | |
0.48%, 06/15/2026, Series 2021-AA, Class A4(1) | | | 3,258 | | | | 3,117 | |
| | | | | | | | |
Santander Drive Auto Receivables Trust 2020-4 | | | | | | | | |
1.01%, 01/15/2026, Series 2020-4, Class C | | | 979 | | | | 975 | |
Santander Drive Auto Receivables Trust 2021-2 | | | | | | | | |
0.90%, 06/15/2026, Series 2021-2, Class C | | | 1,033 | | | | 1,019 | |
1.35%, 07/15/2027, Series 2021-2, Class D | | | 9,300 | | | | 8,789 | |
Santander Drive Auto Receivables Trust 2021-3 | | | | | | | | |
0.95%, 09/15/2027, Series 2021-3, Class C | | | 8,015 | | | | 7,850 | |
Santander Drive Auto Receivables Trust 2021-4 | | | | | | | | |
1.26%, 02/16/2027, Series 2021-4, Class C | | | 10,600 | | | | 10,189 | |
Santander Drive Auto Receivables Trust 2022-1 | | | | | | | | |
2.56%, 04/17/2028, Series 2022-1, Class C | | | 6,590 | | | | 6,294 | |
Santander Drive Auto Receivables Trust 2022-4 | | | | | | | | |
4.05%, 07/15/2025, Series 2022-4, Class A2 | | | 422 | | | | 422 | |
4.14%, 02/16/2027, Series 2022-4, Class A3 | | | 13,225 | | | | 13,041 | |
Santander Drive Auto Receivables Trust 2022-5 | | | | | | | | |
4.74%, 10/16/2028, Series 2022-5, Class C | | | 939 | | | | 909 | |
Santander Drive Auto Receivables Trust 2022-6 | | | | | | | | |
4.49%, 11/16/2026, Series 2022-6, Class A3 | | | 2,176 | | | | 2,149 | |
4.96%, 11/15/2028, Series 2022-6, Class C | | | 6,097 | | | | 5,925 | |
Santander Drive Auto Receivables Trust 2023-1 | | | | | | | | |
4.88%, 04/15/2027, Series 2023-1, Class A3 | | | 4,801 | | | | 4,737 | |
5.09%, 05/15/2030, Series 2023-1, Class C | | | 2,300 | | | | 2,240 | |
Santander Drive Auto Receivables Trust 2023-2 | | | | | | | | |
5.21%, 07/15/2027, Series 2023-2, Class A3 | | | 2,471 | | | | 2,445 | |
SART 2017-1 | | | | | | | | |
4.75%, 07/15/2024, Series 2017-1, Class A | | | 933 | | | | 914 | |
SART 2018-1 | | | | | | | | |
4.76%, 06/15/2025, Series 2018-1 | | | 1,331 | | | | 1,318 | |
SCF Equipment Leasing 2021-1 LLC | | | | | | | | |
1.93%, 09/20/2030, Series 2021-1A, Class D(1) | | | 3,600 | | | | 3,185 | |
Securitized Asset Backed Receivables LLC Trust 2006-CB1 | | | | | | | | |
2.86%, 01/25/2036, Series 2006-CB1, Class AF2(2) | | | 43 | | | | 34 | |
SFS Auto Receivables Securitization Trust 2023-1 | | | | | | | | |
5.71%, 01/22/2030, Series 2023-1A, Class B(1) | | | 1,200 | | | | 1,195 | |
5.97%, 02/20/2031, Series 2023-1A, Class C(1) | | | 1,550 | | | | 1,544 | |
Sierra Timeshare 2019-3 Receivables Funding LLC | | | | | | | | |
2.75%, 08/20/2036, Series 2019-3A, Class B(1) | | | 895 | | | | 839 | |
Sierra Timeshare 2020-2 Receivables Funding LLC | | | | | | | | |
1.33%, 07/20/2037, Series 2020-2A, Class A(1) | | | 949 | | | | 879 | |
Sierra Timeshare 2021-1 Receivables Funding LLC | | | | | | | | |
1.34%, 11/20/2037, Series 2021-1A, Class B(1) | | | 2,375 | | | | 2,186 | |
Sixth Street CLO XVI Ltd. | | | | | | | | |
6.57% (3 Month LIBOR USD + 1.32%, 1.32% Floor), 10/20/2032, Series 2020-16A, Class A1A(1)(3) | | | 20,000 | | | | 19,845 | |
SoFi Professional Loan Program 2017-F LLC | | | | | | | | |
2.84%, 01/25/2041, Series 2017-F, Class A2FX(1) | | | 2,876 | | | | 2,757 | |
SoFi Professional Loan Program 2018-B Trust | | | | | | | | |
3.34%, 08/25/2047, Series 2018-B, Class A2FX(1) | | | 1,219 | | | | 1,177 | |
SoFi Professional Loan Program 2019-C LLC | | | | | | | | |
2.37%, 11/16/2048, Series 2019-C, Class A2FX(1) | | | 3,464 | | | | 3,188 | |
SoFi Professional Loan Program 2020-ATrust | | | | | | | | |
2.54%, 05/15/2046, Series 2020-A, Class A2FX(1) | | | 4,677 | | | | 4,304 | |
Sound Point CLO II Ltd. | | | | | | | | |
6.34% (3 Month LIBOR USD + 1.07%, 1.07% Floor), 01/26/2031, Series 2013-1A, Class A1R(1)(3) | | | 9,000 | | | | 8,900 | |
SOUND POINT CLO XXII Ltd. | | | | | | | | |
6.33% (3 Month LIBOR USD + 1.08%, 1.08% Floor), 01/20/2032, Series 2019-1A, Class AR(1)(3) | | | 2,500 | | | | 2,471 | |
Structured Asset Securities Corp. Mortgage Pass-Through Certificates Series 2004-6XS | | | | | | | | |
6.03%, 03/25/2034, Series 2004-6XS, Class A5A(2) | | | 8 | | | | 8 | |
6.05%, 03/25/2034, Series 2004-6XS, Class A5B(2) | | | 6 | | | | 6 | |
Structured Asset Securities Corp. Pass-Through Certificates Series 2002-AL1 | | | | | | | | |
3.45%, 02/25/2032, Series 2002-AL1, Class A2 | | | 3 | | | | 3 | |
3.45%, 02/25/2032, Series 2002-AL1, Class A3 | | | 19 | | | | 10 | |
Synchrony Card Funding LLC | | | | | | | | |
3.37%, 04/15/2028, Series 2022-A1, Class A | | | 10,650 | | | | 10,269 | |
Texas Natural Gas Securitization Finance Corp. | | | | | | | | |
5.10%, 04/01/2035 | | | 11,516 | | | | 11,558 | |
5.17%, 04/01/2041 | | | 10,028 | | | | 10,320 | |
Towd Point HE Trust 2023-1 | | | | | | | | |
6.88%, 02/25/2063, Series 2023-1, Class A1A(1) | | | 1,445 | | | | 1,437 | |
Towd Point Mortgage Trust 2020-MH1 | | | | | | | | |
2.25%, 02/25/2060, Series 2020-MH1, Class A1(1)(4) | | | 3,487 | | | | 3,240 | |
Toyota Auto Loan Extended Note Trust 2020-1 | | | | | | | | |
1.35%, 05/25/2033, Series 2020-1A, Class A(1) | | | 7,685 | | | | 7,095 | |
Toyota Auto Receivables 2020-A Owner Trust | | | | | | | | |
1.68%, 05/15/2025, Series 2020-A, Class A4 | | | 1,054 | | | | 1,041 | |
Toyota Auto Receivables 2020-B Owner Trust | | | | | | | | |
1.36%, 08/15/2024, Series 2020-B, Class A3 | | | 238 | | | | 237 | |
1.66%, 09/15/2025, Series 2020-B, Class A4 | | | 3,189 | | | | 3,123 | |
Toyota Auto Receivables 2020-D Owner Trust | | | | | | | | |
0.47%, 01/15/2026, Series 2020-D, Class A4 | | | 4,856 | | | | 4,649 | |
Toyota Auto Receivables 2021-B Owner Trust | | | | | | | | |
0.53%, 10/15/2026, Series 2021-B, Class A4 | | | 1,886 | | | | 1,743 | |
Toyota Auto Receivables 2021-D Owner Trust | | | | | | | | |
1.02%, 03/15/2027, Series 2021-D, Class A4 | | | 854 | | | | 776 | |
| | | | | | | | |
Toyota Auto Receivables 2023-B Owner Trust | | | | | | | | |
4.71%, 02/15/2028, Series 2023-B, Class A3 | | | 4,282 | | | | 4,236 | |
Toyota Lease Owner Trust 2023-A | | | | | | | | |
5.30%, 08/20/2025, Series 2023-A, Class A2(1) | | | 1,290 | | | | 1,284 | |
United Auto Credit Securitization Trust | | | | | | | | |
1.14%, 06/10/2026, Series 2021-1, Class D(1) | | | 627 | | | | 620 | |
Upstart Pass-Through Trust Series 2021-ST9 | | | | | | | | |
1.70%, 11/20/2029, Series 2021-ST9, Class A(1) | | | 1,810 | | | | 1,724 | |
VCAT 2021-NPL1 LLC | | | | | | | | |
2.29%, 12/26/2050, Series 2021-NPL1, Class A1(1)(2) | | | 1,116 | | | | 1,069 | |
VCAT 2021-NPL5 LLC | | | | | | | | |
1.87%, 08/25/2051, Series 2021-NPL5, Class A1(1)(2) | | | 5,492 | | | | 4,973 | |
VCAT 2021-NPL6 LLC | | | | | | | | |
1.92%, 09/25/2051, Series 2021-NPL6, Class A1(1)(2) | | | 2,132 | | | | 1,932 | |
Venture 32 CLO Ltd. | | | | | | | | |
6.36% (3 Month LIBOR USD + 1.10%, 1.10% Floor), 07/18/2031, Series 2018-32A, Class A1(1)(3) | | | 8,000 | | | | 7,869 | |
Venture 43 CLO Ltd. | | | | | | | | |
6.50% (3 Month LIBOR USD + 1.24%, 1.24% Floor), 04/15/2034, Series 2021-43A, Class A1(1)(3) | | | 3,000 | | | | 2,917 | |
Vericrest Opportunity Loan Transferee | | | | | | | | |
1.87%, 08/25/2051, Series 2021-NP11, Class A1(1)(2) | | | 5,304 | | | | 4,806 | |
Verizon Master Trust | | | | | | | | |
0.50%, 05/20/2027, Series 2021-1, Class A | | | 7,883 | | | | 7,525 | |
1.04%, 01/20/2027, Series 2022-1, Class A | | | 11,241 | | | | 11,215 | |
3.67%, 01/22/2029, Series 2022-6, Class A | | | 6,485 | | | | 6,274 | |
3.72%, 07/20/2027, Series 2022-5, Class A1A | | | 7,022 | | | | 6,936 | |
4.49%, 01/22/2029, Series 2023-1, Class A | | | 8,973 | | | | 8,813 | |
Veros Auto Receivables Trust 2021-1 | | | | | | | | |
0.92%, 10/15/2026, Series 2021-1, Class A(1) | | | 322 | | | | 320 | |
VM Debt | | | | | | | | |
7.46%, 07/18/2027, Series 2019-1(1)(5) | | | 14,998 | | | | 12,544 | |
Volkswagen Auto Lease Trust 2022-A | | | | | | | | |
3.44%, 07/21/2025, Series 2022-A, Class A3 | | | 4,541 | | | | 4,448 | |
3.65%, 01/20/2027, Series 2022-A, Class A4 | | | 5,487 | | | | 5,338 | |
Volkswagen Auto Loan Enhanced Trust 2020-1 | | | | | | | | |
0.98%, 11/20/2024, Series 2020-1, Class A3 | | | 518 | | | | 515 | |
Volkswagen Auto Loan Enhanced Trust 2023-1 | | | | | | | | |
5.01%, 01/22/2030, Series 2023-1, Class A4 | | | 1,748 | | | | 1,742 | |
5.02%, 06/20/2028, Series 2023-1, Class A3 | | | 1,753 | | | | 1,747 | |
VOLT CV LLC | | | | | | | | |
2.49%, 11/27/2051, Series 2021-CF2, Class A1(1)(2) | | | 7,893 | | | | 7,003 | |
VOLT XCII LLC | | | | | | | | |
1.89%, 02/27/2051, Series 2021-NPL1, Class A1(1)(2) | | | 5,629 | | | | 5,083 | |
VOLT XCIII LLC | | | | | | | | |
1.89%, 02/27/2051, Series 2021-NPL2, Class A1(1)(2) | | | 11,022 | | | | 9,964 | |
VOLT XCIV LLC | | | | | | | | |
2.24%, 02/27/2051, Series 2021-NPL3, Class A1(1)(2) | | | 10,659 | | | | 9,794 | |
VOLT XCIX LLC | | | | | | | | |
2.12%, 04/25/2051, Series 2021-NPL8, Class A1(1)(2) | | | 3,904 | | | | 3,541 | |
VOLT XCVI LLC | | | | | | | | |
2.12%, 03/27/2051, Series 2021-NPL5, Class A1(1)(2) | | | 9,678 | | | | 9,059 | |
VOLT XCVII LLC | | | | | | | | |
2.24%, 04/25/2051, Series 2021-NPL6, Class A1(1)(2) | | | 9,912 | | | | 9,028 | |
Voya CLO 2015-1 Ltd. | | | | | | | | |
6.16% (3 Month LIBOR USD + 0.90%, 0.90% Floor), 01/18/2029, Series 2015-1A, Class A1R(1)(3) | | | 2,879 | | | | 2,861 | |
Voya CLO 2019-3 Ltd. | | | | | | | | |
6.34% (3 Month LIBOR USD + 1.08%, 1.08% Floor), 10/17/2032, Series 2019-3A, Class AR(1)(3) | | | 20,000 | | | | 19,738 | |
VSE 2018-A Voi Mortgage LLC | | | | | | | | |
3.56%, 02/20/2036, Series 2018-A, Class A(1) | | | 620 | | | | 598 | |
Westgate Resorts 2020-1 LLC | | | | | | | | |
3.96%, 03/20/2034, Series 2020-1A, Class B(1) | | | 1,462 | | | | 1,430 | |
Westlake Automobile Receivables Trust 2020-3 | | | | | | | | |
1.65%, 02/17/2026, Series 2020-3A, Class D(1) | | | 1,875 | | | | 1,801 | |
Westlake Automobile Receivables Trust 2022-2 | | | | | | | | |
3.36%, 08/15/2025, Series 2022-2A, Class A2A(1) | | | 3,598 | | | | 3,567 | |
5.48%, 09/15/2027, Series 2022-2A, Class D(1) | | | 3,500 | | | | 3,401 | |
Westlake Automobile Receivables Trust 2023-1 | | | | | | | | |
5.21%, 01/18/2028, Series 2023-1A, Class A3(1) | | | 4,523 | | | | 4,474 | |
5.41%, 01/18/2028, Series 2023-1A, Class B(1) | | | 841 | | | | 831 | |
6.79%, 11/15/2028, Series 2023-1A, Class D(1) | | | 3,345 | | | | 3,337 | |
Westlake Automobile Receivables Trust 2023-2 | | | | | | | | |
7.01%, 11/15/2028, Series 2023-2A, Class D(1) | | | 7,312 | | | | 7,304 | |
Wheels Fleet Lease Funding 1 LLC | | | | | | | | |
5.80%, 04/18/2038, Series 2023-1A, Class A(1) | | | 14,500 | | | | 14,400 | |
World Financial Network Credit Card Master Trust | | | | | | | | |
5.02%, 03/15/2030, Series 2023-A, Class A | | | 5,852 | | | | 5,783 | |
World Omni Auto Receivables Trust 2019-C | | | | | | | | |
1.96%, 12/16/2024, Series 2019-C, Class A3 | | | 88 | | | | 88 | |
World Omni Auto Receivables Trust 2020-C | | | | | | | | |
0.48%, 11/17/2025, Series 2020-C, Class A3 | | | 845 | | | | 826 | |
0.61%, 10/15/2026, Series 2020-C, Class A4 | | | 3,043 | | | | 2,865 | |
World Omni Auto Receivables Trust 2023-A | | | | | | | | |
4.83%, 05/15/2028, Series 2023-A, Class A3 | | | 7,292 | | | | 7,209 | |
World Omni Auto Receivables Trust 2023-B | | | | | | | | |
| | | | | | | | |
4.66%, 05/15/2028, Series 2023-B, Class A3 | | | 2,201 | | | | 2,170 | |
World Omni Automobile Lease Securitization Trust 2023-A | | | | | | | | |
5.04%, 07/17/2028, Series 2023-A, Class A4 | | | 1,470 | | | | 1,457 | |
5.07%, 09/15/2026, Series 2023-A, Class A3 | | | 2,436 | | | | 2,417 | |
World Omni Select Auto Trust 2021-A | | | | | | | | |
1.09%, 11/15/2027, Series 2021-A, Class C | | | 2,350 | | | | 2,129 | |
Zais CLO 7 Ltd. | | | | | | | | |
6.55% (3 Month LIBOR USD + 1.29%), 04/15/2030, Series 2017-2A, Class A(1)(3) | | | 3,802 | | | | 3,775 | |
| | | | | | | | |
Total Asset-Backed Obligations (Cost: $2,124,511) | | | | | | | 2,026,489 | |
| | | | | | | | |
Corporate Bonds – 29.45% | | | | | | | | |
Basic Materials – 0.87% | | | | | | | | |
Albemarle Corp. | | | | | | | | |
5.45%, 12/01/2044 | | | 600 | | | | 564 | |
Anglo American Capital Plc | | | | | | | | |
2.88%, 03/17/2031(1) | | | 8,022 | | | | 6,623 | |
3.63%, 09/11/2024(1) | | | 630 | | | | 612 | |
4.75%, 04/10/2027(1) | | | 5,500 | | | | 5,315 | |
5.63%, 04/01/2030(1) | | | 4,300 | | | | 4,280 | |
ArcelorMittal SA | | | | | | | | |
6.75%, 03/01/2041 | | | 3,462 | | | | 3,523 | |
Barrick Gold Corp. | | | | | | | | |
6.45%, 10/15/2035 | | | 203 | | | | 216 | |
Barrick North America Finance LLC | | | | | | | | |
5.75%, 05/01/2043 | | | 4,480 | | | | 4,602 | |
BHP Billiton Finance USA Ltd. | | | | | | | | |
4.88%, 02/27/2026 | | | 11,809 | | | | 11,748 | |
Celulosa Arauco y Constitucion SA | | | | | | | | |
4.50%, 08/01/2024 | | | 779 | | | | 766 | |
CF Industries, Inc. | | | | | | | | |
4.95%, 06/01/2043 | | | 1,800 | | | | 1,558 | |
5.38%, 03/15/2044 | | | 2,040 | | | | 1,858 | |
Dow Chemical Co. | | | | | | | | |
4.55%, 11/30/2025 | | | 437 | | | | 426 | |
DuPont de Nemours, Inc. | | | | | | | | |
5.32%, 11/15/2038 | | | 5,665 | | | | 5,613 | |
5.42%, 11/15/2048 | | | 1,200 | | | | 1,183 | |
EIDP, Inc. | | | | | | | | |
4.50%, 05/15/2026 | | | 2,961 | | | | 2,907 | |
FMC Corp. | | | | | | | | |
6.38%, 05/18/2053 | | | 2,502 | | | | 2,539 | |
Freeport Indonesia PT | | | | | | | | |
4.76%, 04/14/2027(1) | | | 660 | | | | 637 | |
5.32%, 04/14/2032(1) | | | 2,965 | | | | 2,796 | |
6.20%, 04/14/2052(1) | | | 814 | | | | 734 | |
Glencore Funding LLC | | | | | | | | |
2.50%, 09/01/2030(1) | | | 5,040 | | | | 4,127 | |
2.63%, 09/23/2031(1) | | | 4,000 | | | | 3,220 | |
3.88%, 10/27/2027(1) | | | 875 | | | | 817 | |
3.88%, 04/27/2051(1) | | | 1,000 | | | | 742 | |
4.00%, 03/27/2027(1) | | | 6,300 | | | | 6,005 | |
4.63%, 04/29/2024(1) | | | 500 | | | | 494 | |
5.40%, 05/08/2028(1) | | | 2,849 | | | | 2,821 | |
5.70%, 05/08/2033(1) | | | 1,700 | | | | 1,687 | |
Indonesia Asahan Aluminium PT / Mineral Industri Indonesia Persero PT | | | | | | | | |
4.75%, 05/15/2025(1) | | | 5,657 | | | | 5,507 | |
International Flavors & Fragrances, Inc. | | | | | | | | |
1.83%, 10/15/2027(1) | | | 2,105 | | | | 1,775 | |
2.30%, 11/01/2030(1) | | | 878 | | | | 696 | |
3.27%, 11/15/2040(1) | | | 1,205 | | | | 843 | |
LYB International Finance BV | | | | | | | | |
4.88%, 03/15/2044 | | | 300 | | | | 264 | |
5.25%, 07/15/2043 | | | 610 | | | | 556 | |
LYB International Finance III LLC | | | | | | | | |
1.25%, 10/01/2025 | | | 692 | | | | 626 | |
4.20%, 10/15/2049 | | | 7,837 | | | | 5,996 | |
LyondellBasell Industries NV | | | | | | | | |
5.75%, 04/15/2024 | | | 1,453 | | | | 1,450 | |
Mosaic Co. | | | | | | | | |
5.63%, 11/15/2043 | | | 2,055 | | | | 1,933 | |
Nucor Corp. | | | | | | | | |
2.98%, 12/15/2055 | | | 800 | | | | 512 | |
Nutrien Ltd. | | | | | | | | |
4.13%, 03/15/2035 | | | 1,960 | | | | 1,720 | |
4.20%, 04/01/2029 | | | 420 | | | | 397 | |
5.25%, 01/15/2045 | | | 1,444 | | | | 1,336 | |
Reliance Steel & Aluminum Co. | | | | | | | | |
2.15%, 08/15/2030 | | | 3,100 | | | | 2,526 | |
Rio Tinto Alcan, Inc. | | | | | | | | |
5.75%, 06/01/2035 | | | 54 | | | | 55 | |
Samarco Mineracao SA | | | | | | | | |
5.75%, 10/24/2023(1)(6)(7) | | | 537 | | | | 359 | |
Sasol Financing USA LLC | | | | | | | | |
| | | | | | | | |
5.88%, 03/27/2024 | | | 3,249 | | | | 3,206 | |
6.50%, 09/27/2028 | | | 1,555 | | | | 1,388 | |
Solvay Finance America LLC | | | | | | | | |
4.45%, 12/03/2025(1) | | | 11,810 | | | | 11,329 | |
Steel Dynamics, Inc. | | | | | | | | |
1.65%, 10/15/2027 | | | 1,637 | | | | 1,391 | |
Union Carbide Corp. | | | | | | | | |
7.75%, 10/01/2096 | | | 681 | | | | 803 | |
Vale Overseas Ltd. | | | | | | | | |
3.75%, 07/08/2030 | | | 2,255 | | | | 1,985 | |
6.13%, 06/12/2033 | | | 7,269 | | | | 7,282 | |
6.88%, 11/21/2036 | | | 5,167 | | | | 5,403 | |
6.88%, 11/10/2039 | | | 2,107 | | | | 2,205 | |
8.25%, 01/17/2034 | | | 984 | | | | 1,145 | |
Westlake Corp. | | | | | | | | |
3.38%, 08/15/2061 | | | 1,910 | | | | 1,161 | |
| | | | | | | | |
Total Basic Materials | | | | 142,262 | |
| | | | | | | | |
Communications – 2.43% | | | | | | | | |
Amazon.com, Inc. | | | | | | | | |
3.88%, 08/22/2037 | | | 1,700 | | | | 1,552 | |
3.95%, 04/13/2052 | | | 4,000 | | | | 3,486 | |
America Movil SAB de CV | | | | | | | | |
4.38%, 04/22/2049 | | | 1,214 | | | | 1,053 | |
AT&T, Inc. | | | | | | | | |
1.65%, 02/01/2028 | | | 525 | | | | 451 | |
2.25%, 02/01/2032 | | | 3,510 | | | | 2,788 | |
2.55%, 12/01/2033 | | | 14,473 | | | | 11,368 | |
3.50%, 06/01/2041 | | | 1,353 | | | | 1,039 | |
3.50%, 09/15/2053 | | | 17,629 | | | | 12,480 | |
3.55%, 09/15/2055 | | | 10,545 | | | | 7,382 | |
3.65%, 06/01/2051 | | | 1,565 | | | | 1,149 | |
3.65%, 09/15/2059 | | | 1,685 | | | | 1,173 | |
3.80%, 12/01/2057 | | | 987 | | | | 715 | |
4.50%, 05/15/2035 | | | 7,570 | | | | 6,959 | |
4.65%, 06/01/2044 | | | 2,145 | | | | 1,869 | |
5.40%, 02/15/2034 | | | 14,050 | | | | 14,074 | |
6.00%, 08/15/2040 | | | 2,275 | | | | 2,342 | |
Bell Telephone Co. of Canada or Bell Canada | | | | | | | | |
5.10%, 05/11/2033 | | | 5,098 | | | | 5,035 | |
British Telecommunications Plc | | | | | | | | |
9.63%, 12/15/2030 | | | 5,000 | | | | 6,152 | |
Charter Communications Operating LLC | | | | | | | | |
2.30%, 02/01/2032 | | | 4,000 | | | | 3,028 | |
3.50%, 06/01/2041 | | | 13,115 | | | | 8,871 | |
3.50%, 03/01/2042 | | | 8,745 | | | | 5,850 | |
3.70%, 04/01/2051 | | | 2,580 | | | | 1,630 | |
3.90%, 06/01/2052 | | | 2,310 | | | | 1,512 | |
4.80%, 03/01/2050 | | | 4,051 | | | | 3,056 | |
4.91%, 07/23/2025 | | | 10,000 | | | | 9,806 | |
5.05%, 03/30/2029 | | | 3,791 | | | | 3,615 | |
5.38%, 04/01/2038 | | | 835 | | | | 711 | |
5.38%, 05/01/2047 | | | 4,610 | | | | 3,810 | |
5.75%, 04/01/2048 | | | 1,603 | | | | 1,372 | |
6.38%, 10/23/2035 | | | 5,867 | | | | 5,718 | |
6.48%, 10/23/2045 | | | 1,275 | | | | 1,199 | |
6.83%, 10/23/2055 | | | 690 | | | | 650 | |
Comcast Corp. | | | | | | | | |
2.89%, 11/01/2051 | | | 5,748 | | | | 3,854 | |
2.94%, 11/01/2056 | | | 845 | | | | 550 | |
2.99%, 11/01/2063 | | | 2,980 | | | | 1,888 | |
3.25%, 11/01/2039 | | | 3,295 | | | | 2,614 | |
3.75%, 04/01/2040 | | | 2,195 | | | | 1,849 | |
3.90%, 03/01/2038 | | | 455 | | | | 395 | |
3.97%, 11/01/2047 | | | 154 | | | | 128 | |
4.00%, 11/01/2049 | | | 638 | | | | 527 | |
4.05%, 11/01/2052 | | | 156 | | | | 130 | |
4.20%, 08/15/2034 | | | 555 | | | | 517 | |
4.25%, 01/15/2033 | | | 3,107 | | | | 2,952 | |
5.35%, 05/15/2053 | | | 14,121 | | | | 14,337 | |
Corning, Inc. | | | | | | | | |
3.90%, 11/15/2049 | | | 960 | | | | 718 | |
Cox Communications, Inc. | | | | | | | | |
2.60%, 06/15/2031(1) | | | 15,920 | | | | 12,995 | |
2.95%, 10/01/2050(1) | | | 1,275 | | | | 801 | |
3.35%, 09/15/2026(1) | | | 369 | | | | 345 | |
3.50%, 08/15/2027(1) | | | 8,245 | | | | 7,667 | |
3.60%, 06/15/2051(1) | | | 1,250 | | | | 875 | |
3.85%, 02/01/2025(1) | | | 1,250 | | | | 1,209 | |
4.80%, 02/01/2035(1) | | | 6,000 | | | | 5,403 | |
Crown Castle Towers LLC | | | | | | | | |
3.66%, 05/15/2025(1) | | | 955 | | | | 910 | |
Deutsche Telekom International Finance BV | | | | | | | | |
4.88%, 03/06/2042(1) | | | 240 | | | | 221 | |
| | | | | | | | |
8.75%, 06/15/2030 | | | 49 | | | | 59 | |
Discovery Communications LLC | | | | | | | | |
3.63%, 05/15/2030 | | | 2,500 | | | | 2,193 | |
5.20%, 09/20/2047 | | | 1,375 | | | | 1,125 | |
eBay, Inc. | | | | | | | | |
2.60%, 05/10/2031 | | | 8,000 | | | | 6,670 | |
Grupo Televisa SAB | | | | | | | | |
6.13%, 01/31/2046 | | | 382 | | | | 378 | |
Level 3 Financing, Inc. | | | | | | | | |
3.40%, 03/01/2027(1) | | | 3,500 | | | | 2,970 | |
Meta Platforms, Inc. | | | | | | | | |
5.60%, 05/15/2053 | | | 4,700 | | | | 4,827 | |
NBCUniversal Media LLC | | | | | | | | |
4.45%, 01/15/2043 | | | 10 | | | | 9 | |
NBN Co. Ltd. | | | | | | | | |
2.63%, 05/05/2031(1) | | | 15,025 | | | | 12,603 | |
Paramount Global | | | | | | | | |
2.90%, 01/15/2027 | | | 1,000 | | | | 901 | |
3.70%, 06/01/2028 | | | 870 | | | | 774 | |
4.90%, 08/15/2044 | | | 315 | | | | 231 | |
Rogers Communications, Inc. | | | | | | | | |
3.80%, 03/15/2032(1) | | | 4,650 | | | | 4,065 | |
4.55%, 03/15/2052(1) | | | 1,995 | | | | 1,604 | |
Sprint Capital Corp. | | | | | | | | |
6.88%, 11/15/2028 | | | 7,612 | | | | 8,069 | |
Sprint LLC | | | | | | | | |
7.63%, 03/01/2026 | | | 918 | | | | 954 | |
TCI Communications, Inc. | | | | | | | | |
7.13%, 02/15/2028 | | | 138 | | | | 150 | |
Telecom Italia Capital SA | | | | | | | | |
7.20%, 07/18/2036 | | | 1,644 | | | | 1,413 | |
Telefonica Emisiones SA | | | | | | | | |
4.10%, 03/08/2027 | | | 4,775 | | | | 4,581 | |
4.67%, 03/06/2038 | | | 1,175 | | | | 995 | |
4.90%, 03/06/2048 | | | 4,575 | | | | 3,818 | |
Time Warner Cable Enterprises LLC | | | | | | | | |
8.38%, 07/15/2033 | | | 529 | | | | 581 | |
Time Warner Cable LLC | | | | | | | | |
5.50%, 09/01/2041 | | | 6,815 | | | | 5,670 | |
5.88%, 11/15/2040 | | | 1,275 | | | | 1,125 | |
6.55%, 05/01/2037 | | | 375 | | | | 360 | |
6.75%, 06/15/2039 | | | 539 | | | | 518 | |
7.30%, 07/01/2038 | | | 1,418 | | | | 1,445 | |
T-Mobile USA, Inc. | | | | | | | | |
3.00%, 02/15/2041 | | | 2,300 | | | | 1,682 | |
3.60%, 11/15/2060 | | | 3,920 | | | | 2,751 | |
3.88%, 04/15/2030 | | | 53,794 | | | | 49,558 | |
5.05%, 07/15/2033 | | | 3,360 | | | | 3,299 | |
5.65%, 01/15/2053 | | | 1,000 | | | | 1,015 | |
5.75%, 01/15/2054 | | | 1,406 | | | | 1,452 | |
Verizon Communications, Inc. | | | | | | | | |
1.68%, 10/30/2030 | | | 765 | | | | 604 | |
2.10%, 03/22/2028 | | | 2,390 | | | | 2,100 | |
2.36%, 03/15/2032 | | | 1,056 | | | | 849 | |
2.55%, 03/21/2031 | | | 20,643 | | | | 17,236 | |
2.65%, 11/20/2040 | | | 2,329 | | | | 1,620 | |
3.15%, 03/22/2030 | | | 5,000 | | | | 4,443 | |
3.40%, 03/22/2041 | | | 1,500 | | | | 1,158 | |
3.70%, 03/22/2061 | | | 3,000 | | | | 2,182 | |
4.02%, 12/03/2029 | | | 712 | | | | 667 | |
4.27%, 01/15/2036 | | | 2,311 | | | | 2,084 | |
4.33%, 09/21/2028 | | | 9,408 | | | | 9,069 | |
4.40%, 11/01/2034 | | | 2,500 | | | | 2,307 | |
4.81%, 03/15/2039 | | | 7,941 | | | | 7,430 | |
5.05%, 05/09/2033 | | | 21,645 | | | | 21,403 | |
Vodafone Group Plc | | | | | | | | |
5.63%, 02/10/2053 | | | 475 | | | | 466 | |
6.15%, 02/27/2037 | | | 4,600 | | | | 4,815 | |
Walt Disney Co. | | | | | | | | |
6.20%, 12/15/2034 | | | 150 | | | | 165 | |
7.63%, 11/30/2028 | | | 310 | | | | 347 | |
| | | | | | | | |
Total Communications | | | | 399,570 | |
| | | | | | | | |
Consumer, Cyclical – 1.43% | | | | | | | | |
7-Eleven, Inc. | | | | | | | | |
0.95%, 02/10/2026(1) | | | 3,971 | | | | 3,547 | |
1.80%, 02/10/2031(1) | | | 1,270 | | | | 1,004 | |
2.50%, 02/10/2041(1) | | | 1,298 | | | | 868 | |
Air Canada 2013-1 Class A Pass-Through Trust | | | | | | | | |
4.13%, 05/15/2025(1) | | | 1,243 | | | | 1,162 | |
Air Canada 2015-1 Class A Pass-Through Trust | | | | | | | | |
3.60%, 03/15/2027(1) | | | 582 | | | | 540 | |
Air Canada 2015-2 Class AA Pass-Through Trust | | | | | | | | |
3.75%, 12/15/2027(1) | | | 944 | | | | 859 | |
| | | | | | | | |
Air Canada 2017-1 Class A Pass-Through Trust | | | | | | | | |
3.55%, 01/15/2030(1) | | | 2,273 | | | | 1,943 | |
Air Canada 2017-1 Class AA Pass-Through Trust | | | | | | | | |
3.30%, 01/15/2030(1) | | | 4,399 | | | | 3,892 | |
Alimentation Couche-Tard, Inc. | | | | | | | | |
3.44%, 05/13/2041(1) | | | 2,460 | | | | 1,773 | |
3.63%, 05/13/2051(1) | | | 3,500 | | | | 2,398 | |
3.80%, 01/25/2050(1) | | | 2,100 | | | | 1,523 | |
American Airlines 2014-1 Class A Pass-Through Trust | | | | | | | | |
3.70%, 10/01/2026 | | | 276 | | | | 248 | |
American Airlines 2015-1 Class A Pass-Through Trust | | | | | | | | |
3.38%, 05/01/2027 | | | 2,543 | | | | 2,279 | |
American Airlines 2015-2 Class AA Pass-Through Trust | | | | | | | | |
3.60%, 09/22/2027 | | | 475 | | | | 441 | |
American Airlines 2016-2 Class A Pass-Through Trust | | | | | | | | |
3.65%, 06/15/2028 | | | 836 | | | | 718 | |
American Airlines 2016-2 Class AA Pass-Through Trust | | | | | | | | |
3.20%, 06/15/2028 | | | 1,059 | | | | 949 | |
American Airlines 2016-3 Class AA Pass-Through Trust | | | | | | | | |
3.00%, 10/15/2028 | | | 1,049 | | | | 929 | |
AutoZone, Inc. | | | | | | | | |
1.65%, 01/15/2031 | | | 1,540 | | | | 1,202 | |
British Airways 2018-1 Class A Pass-Through Trust | | | | | | | | |
4.13%, 09/20/2031(1) | | | 1,862 | | | | 1,652 | |
British Airways 2018-1 Class AA Pass-Through Trust | | | | | | | | |
3.80%, 09/20/2031(1) | | | 876 | | | | 797 | |
British Airways 2019-1 Class AA Pass-Through Trust | | | | | | | | |
3.30%, 12/15/2032(1) | | | 1,352 | | | | 1,172 | |
CK Hutchison International 21 Ltd. | | | | | | | | |
3.13%, 04/15/2041(1) | | | 1,915 | | | | 1,492 | |
Continental Airlines 2012-2 Class A Pass-Through Trust | | | | | | | | |
4.00%, 10/29/2024 | | | 3,503 | | | �� | 3,391 | |
Delta Air Lines 2015-1 Class B Pass-Through Trust | | | | | | | | |
4.25%, 07/30/2023 | | | 1,410 | | | | 1,406 | |
Dollar Tree, Inc. | | | | | | | | |
2.65%, 12/01/2031 | | | 3,488 | | | | 2,853 | |
Ford Motor Co. | | | | | | | | |
5.29%, 12/08/2046 | | | 280 | | | | 231 | |
General Motors Co. | | | | | | | | |
5.00%, 04/01/2035 | | | 4,591 | | | | 4,161 | |
5.20%, 04/01/2045 | | | 2,750 | | | | 2,346 | |
6.13%, 10/01/2025 | | | 14,000 | | | | 14,097 | |
6.25%, 10/02/2043 | | | 3,100 | | | | 3,031 | |
6.60%, 04/01/2036 | | | 685 | | | | 703 | |
General Motors Financial Co., Inc. | | | | | | | | |
1.20%, 10/15/2024 | | | 1,910 | | | | 1,797 | |
1.25%, 01/08/2026 | | | 4,283 | | | | 3,821 | |
2.35%, 01/08/2031 | | | 1,707 | | | | 1,337 | |
2.70%, 06/10/2031 | | | 3,430 | | | | 2,736 | |
3.80%, 04/07/2025 | | | 1,785 | | | | 1,721 | |
3.95%, 04/13/2024 | | | 5,535 | | | | 5,448 | |
4.30%, 07/13/2025 | | | 1,765 | | | | 1,712 | |
5.80%, 06/23/2028 | | | 5,807 | | | | 5,785 | |
6.40%, 01/09/2033 | | | 4,344 | | | | 4,415 | |
Harley-Davidson Financial Services, Inc. | | | | | | | | |
6.50%, 03/10/2028(1) | | | 4,387 | | | | 4,388 | |
Home Depot, Inc. | | | | | | | | |
4.40%, 03/15/2045 | | | 268 | | | | 244 | |
4.95%, 09/15/2052 | | | 2,189 | | | | 2,174 | |
Hyatt Hotels Corp. | | | | | | | | |
5.75%, 01/30/2027 | | | 2,370 | | | | 2,364 | |
Hyundai Capital America | | | | | | | | |
1.30%, 01/08/2026(1) | | | 1,005 | | | | 899 | |
1.50%, 06/15/2026(1) | | | 2,215 | | | | 1,962 | |
1.80%, 10/15/2025(1) | | | 1,190 | | | | 1,086 | |
1.80%, 01/10/2028(1) | | | 2,170 | | | | 1,829 | |
2.38%, 10/15/2027(1) | | | 1,200 | | | | 1,050 | |
3.00%, 02/10/2027(1) | | | 675 | | | | 615 | |
3.40%, 06/20/2024(1) | | | 1,500 | | | | 1,462 | |
5.68%, 06/26/2028(1) | | | 14,839 | | | | 14,721 | |
JetBlue 2020-1 Class B Pass-Through Trust | | | | | | | | |
7.75%, 11/15/2028 | | | 1,390 | | | | 1,393 | |
Kia Corp. | | | | | | | | |
1.75%, 10/16/2026(1) | | | 1,620 | | | | 1,433 | |
Lear Corp. | | | | | | | | |
2.60%, 01/15/2032 | | | 1,225 | | | | 952 | |
Lowe’s Companies, Inc. | | | | | | | | |
1.70%, 10/15/2030 | | | 2,300 | | | | 1,843 | |
2.63%, 04/01/2031 | | | 2,845 | | | | 2,402 | |
5.85%, 04/01/2063 | | | 4,154 | | | | 4,141 | |
Marriott International, Inc. | | | | | | | | |
4.90%, 04/15/2029 | | | 1,750 | | | | 1,703 | |
McDonald’s Corp. | | | | | | | | |
| | | | | | | | |
4.45%, 03/01/2047 | | | 360 | | | | 324 | |
4.70%, 12/09/2035 | | | 216 | | | | 210 | |
6.30%, 10/15/2037 | | | 394 | | | | 433 | |
MDC Holdings, Inc. | | | | | | | | |
2.50%, 01/15/2031 | | | 1,595 | | | | 1,253 | |
Nissan Motor Acceptance Co. LLC | | | | | | | | |
1.85%, 09/16/2026(1) | | | 10,723 | | | | 9,097 | |
2.00%, 03/09/2026(1) | | | 5,686 | | | | 4,975 | |
2.75%, 03/09/2028(1) | | | 1,801 | | | | 1,480 | |
O’Reilly Automotive, Inc. | | | | | | | | |
3.60%, 09/01/2027 | | | 802 | | | | 759 | |
4.70%, 06/15/2032 | | | 3,150 | | | | 3,034 | |
Spirit Airlines Pass-Through Trust 2017-1AA | | | | | | | | |
3.38%, 02/15/2030 | | | 711 | | | | 625 | |
Stellantis Finance U.S., Inc. | | | | | | | | |
2.69%, 09/15/2031(1) | | | 2,008 | | | | 1,605 | |
Toll Brothers Finance Corp. | | | | | | | | |
4.35%, 02/15/2028 | | | 17,435 | | | | 16,373 | |
United Airlines 2012-1 Class A Pass-Through Trust | | | | | | | | |
4.15%, 04/11/2024 | | | 838 | | | | 823 | |
United Airlines 2013-1 Class A Pass-Through Trust | | | | | | | | |
4.30%, 08/15/2025 | | | 2,576 | | | | 2,478 | |
United Airlines 2014-1 Class A Pass-Through Trust | | | | | | | | |
4.00%, 04/11/2026 | | | 631 | | | | 593 | |
United Airlines 2016-1 Class A Pass-Through Trust | | | | | | | | |
3.45%, 07/07/2028 | | | 1,260 | | | | 1,088 | |
United Airlines 2016-1 Class AA Pass-Through Trust | | | | | | | | |
3.10%, 07/07/2028 | | | 5,671 | | | | 5,125 | |
United Airlines 2016-1 Class B Pass-Through Trust | | | | | | | | |
3.65%, 01/07/2026 | | | 1,425 | | | | 1,312 | |
United Airlines 2016-2 Class A Pass-Through Trust | | | | | | | | |
3.10%, 10/07/2028 | | | 2,128 | | | | 1,801 | |
United Airlines 2016-2 Class AA Pass-Through Trust | | | | | | | | |
2.88%, 10/07/2028 | | | 1,277 | | | | 1,124 | |
United Airlines 2016-2 Class B Pass-Through Trust | | | | | | | | |
3.65%, 10/07/2025 | | | 1,693 | | | | 1,569 | |
United Airlines 2018-1 Class A Pass-Through Trust | | | | | | | | |
3.70%, 03/01/2030 | | | 3,031 | | | | 2,624 | |
United Airlines 2018-1 Class AA Pass-Through Trust | | | | | | | | |
3.50%, 03/01/2030 | | | 3,901 | | | | 3,516 | |
United Airlines 2018-1 Class B Pass-Through Trust | | | | | | | | |
4.60%, 03/01/2026 | | | 929 | | | | 871 | |
United Airlines 2019-1 Class A Pass-Through Trust | | | | | | | | |
4.55%, 08/25/2031 | | | 1,727 | | | | 1,537 | |
United Airlines 2019-1 Class AA Pass-Through Trust | | | | | | | | |
4.15%, 08/25/2031 | | | 1,976 | | | | 1,810 | |
United Airlines 2019-2 Class AA Pass-Through Trust | | | | | | | | |
2.70%, 05/01/2032 | | | 2,495 | | | | 2,089 | |
Volkswagen Group of America Finance LLC | | | | | | | | |
1.63%, 11/24/2027(1) | | | 897 | | | | 767 | |
4.35%, 06/08/2027(1) | | | 12,500 | | | | 12,034 | |
Warnermedia Holdings, Inc. | | | | | | | | |
4.05%, 03/15/2029 | | | 1,650 | | | | 1,508 | |
5.05%, 03/15/2042 | | | 8,041 | | | | 6,777 | |
5.14%, 03/15/2052 | | | 6,856 | | | | 5,582 | |
| | | | | | | | |
Total Consumer, Cyclical | | | | 234,236 | |
| | | | | | | | |
Consumer, Non-cyclical – 3.74% | | | | | | | | |
AbbVie, Inc. | | | | | | | | |
2.60%, 11/21/2024 | | | 5,387 | | | | 5,169 | |
3.60%, 05/14/2025 | | | 12,060 | | | | 11,658 | |
3.80%, 03/15/2025 | | | 3,000 | | | | 2,917 | |
4.05%, 11/21/2039 | | | 8,792 | | | | 7,655 | |
4.25%, 11/21/2049 | | | 10,406 | | | | 8,982 | |
4.40%, 11/06/2042 | | | 1,700 | | | | 1,522 | |
4.45%, 05/14/2046 | | | 425 | | | | 374 | |
4.55%, 03/15/2035 | | | 6,025 | | | | 5,737 | |
4.70%, 05/14/2045 | | | 4,415 | | | | 4,034 | |
Aetna, Inc. | | | | | | | | |
4.50%, 05/15/2042 | | | 4,205 | | | | 3,608 | |
4.75%, 03/15/2044 | | | 1,800 | | | | 1,595 | |
6.75%, 12/15/2037 | | | 341 | | | | 376 | |
Ahold Finance USA LLC | | | | | | | | |
6.88%, 05/01/2029 | | | 3,280 | | | | 3,496 | |
AHS Hospital Corp. | | | | | | | | |
2.78%, 07/01/2051 | | | 2,730 | | | | 1,793 | |
Altria Group, Inc. | | | | | | | | |
2.45%, 02/04/2032 | | | 3,845 | | | | 2,999 | |
3.40%, 02/04/2041 | | | 8,495 | | | | 5,929 | |
Amgen, Inc. | | | | | | | | |
1.65%, 08/15/2028 | | | 1,155 | | | | 988 | |
2.80%, 08/15/2041 | | | 15,620 | | | | 11,036 | |
3.00%, 01/15/2052 | | | 2,500 | | | | 1,667 | |
3.15%, 02/21/2040 | | | 2,000 | | | | 1,529 | |
| | | | | | | | |
5.25%, 03/02/2030 | | | 467 | | | | 468 | |
5.25%, 03/02/2033 | | | 3,420 | | | | 3,424 | |
5.60%, 03/02/2043 | | | 2,000 | | | | 2,006 | |
5.65%, 03/02/2053 | | | 4,870 | | | | 4,932 | |
5.75%, 03/02/2063 | | | 1,485 | | | | 1,506 | |
Anheuser-Busch InBev Finance, Inc. | | | | | | | | |
4.63%, 02/01/2044 | | | 455 | | | | 417 | |
Anheuser-Busch InBev Worldwide, Inc. | | | | | | | | |
4.38%, 04/15/2038 | | | 2,240 | | | | 2,074 | |
4.44%, 10/06/2048 | | | 590 | | | | 531 | |
4.60%, 04/15/2048 | | | 3,913 | | | | 3,632 | |
4.70%, 02/01/2036 | | | 7,057 | | | | 6,864 | |
4.90%, 02/01/2046 | | | 6,000 | | | | 5,735 | |
4.95%, 01/15/2042 | | | 2,735 | | | | 2,669 | |
5.45%, 01/23/2039 | | | 7,035 | | | | 7,279 | |
Ascension Health | | | | | | | | |
2.53%, 11/15/2029 | | | 1,740 | | | | 1,496 | |
3.11%, 11/15/2039 | | | 2,670 | | | | 2,088 | |
AstraZeneca Plc | | | | | | | | |
4.00%, 09/18/2042 | | | 540 | | | | 481 | |
6.45%, 09/15/2037 | | | 500 | | | | 573 | |
Baptist Healthcare System Obligated Group | | | | | | | | |
3.54%, 08/15/2050 | | | 2,280 | | | | 1,687 | |
BAT Capital Corp. | | | | | | | | |
2.26%, 03/25/2028 | | | 2,000 | | | | 1,714 | |
2.73%, 03/25/2031 | | | 6,820 | | | | 5,432 | |
3.56%, 08/15/2027 | | | 3,615 | | | | 3,324 | |
3.73%, 09/25/2040 | | | 1,240 | | | | 882 | |
4.39%, 08/15/2037 | | | 3,610 | | | | 2,888 | |
4.54%, 08/15/2047 | | | 3,153 | | | | 2,320 | |
BAT International Finance Plc | | | | | | | | |
1.67%, 03/25/2026 | | | 1,390 | | | | 1,250 | |
Baxalta, Inc. | | | | | | | | |
5.25%, 06/23/2045 | | | 50 | | | | 49 | |
Becton Dickinson & Co. | | | | | | | | |
3.73%, 12/15/2024 | | | 515 | | | | 500 | |
Bimbo Bakeries USA, Inc. | | | | | | | | |
4.00%, 05/17/2051(1) | | | 3,755 | | | | 3,014 | |
Bon Secours Mercy Health, Inc. | | | | | | | | |
3.21%, 06/01/2050 | | | 1,730 | | | | 1,206 | |
Boston Scientific Corp. | | | | | | | | |
4.55%, 03/01/2039 | | | 356 | | | | 331 | |
6.50%, 11/15/2035 | | | 845 | | | | 942 | |
Bristol-Myers Squibb Co. | | | | | | | | |
4.13%, 06/15/2039 | | | 1,512 | | | | 1,379 | |
4.35%, 11/15/2047 | | | 7,950 | | | | 7,188 | |
4.55%, 02/20/2048 | | | 1,374 | | | | 1,281 | |
4.63%, 05/15/2044 | | | 2,640 | | | | 2,496 | |
Bunge Ltd. Finance Corp. | | | | | | | | |
2.75%, 05/14/2031 | | | 3,900 | | | | 3,274 | |
Campbell Soup Co. | | | | | | | | |
2.38%, 04/24/2030 | | | 895 | | | | 754 | |
3.13%, 04/24/2050 | | | 494 | | | | 339 | |
Centene Corp. | | | | | | | | |
2.45%, 07/15/2028 | | | 6,512 | | | | 5,566 | |
Children’s Health System of Texas | | | | | | | | |
2.51%, 08/15/2050 | | | 2,270 | | | | 1,406 | |
Children’s Hospital | | | | | | | | |
2.93%, 07/15/2050 | | | 1,340 | | | | 871 | |
Children’s Hospital Corp. | | | | | | | | |
2.59%, 02/01/2050 | | | 1,290 | | | | 827 | |
Cigna Group | | | | | | | | |
3.25%, 04/15/2025 | | | 970 | | | | 929 | |
4.38%, 10/15/2028 | | | 30,325 | | | | 29,324 | |
4.80%, 07/15/2046 | | | 218 | | | | 200 | |
Coca-Cola Femsa SAB de CV | | | | | | | | |
1.85%, 09/01/2032 | | | 1,500 | | | | 1,174 | |
2.75%, 01/22/2030 | | | 619 | | | | 544 | |
CommonSpirit Health | | | | | | | | |
1.55%, 10/01/2025 | | | 1,290 | | | | 1,173 | |
2.78%, 10/01/2030 | | | 5,925 | | | | 4,981 | |
3.91%, 10/01/2050 | | | 1,265 | | | | 977 | |
Conagra Brands, Inc. | | | | | | | | |
1.38%, 11/01/2027 | | | 1,755 | | | | 1,486 | |
7.00%, 10/01/2028 | | | 3,250 | | | | 3,467 | |
Constellation Brands, Inc. | | | | | | | | |
2.25%, 08/01/2031 | | | 1,970 | | | | 1,610 | |
2.88%, 05/01/2030 | | | 3,620 | | | | 3,140 | |
4.50%, 05/09/2047 | | | 180 | | | | 156 | |
4.65%, 11/15/2028 | | | 4,780 | | | | 4,687 | |
4.75%, 05/09/2032 | | | 400 | | | | 388 | |
Cottage Health Obligated Group | | | | | | | | |
3.30%, 11/01/2049 | | | 1,530 | | | | 1,132 | |
| | | | | | | | |
CVS Health Corp. | | | | | | | | |
2.70%, 08/21/2040 | | | 2,500 | | | | 1,745 | |
4.30%, 03/25/2028 | | | 783 | | | | 755 | |
4.78%, 03/25/2038 | | | 6,550 | | | | 6,045 | |
4.88%, 07/20/2035 | | | 2,515 | | | | 2,390 | |
5.00%, 01/30/2029 | | | 7,990 | | | | 7,913 | |
5.05%, 03/25/2048 | | | 5,000 | | | | 4,609 | |
5.25%, 01/30/2031 | | | 3,467 | | | | 3,456 | |
5.25%, 02/21/2033 | | | 3,100 | | | | 3,088 | |
5.88%, 06/01/2053 | | | 5,890 | | | | 6,040 | |
CVS Pass-Through Trust | | | | | | | | |
5.77%, 01/10/2033(1) | | | 625 | | | | 601 | |
5.93%, 01/10/2034(1) | | | 477 | | | | 452 | |
7.51%, 01/10/2032(1) | | | 684 | | | | 714 | |
CVS Pass-Through Trust Series 2009 | | | | | | | | |
8.35%, 07/10/2031(1) | | | 689 | | | | 742 | |
CVS Pass-Through Trust Series 2013 | | | | | | | | |
4.70%, 01/10/2036(1) | | | 762 | | | | 703 | |
DENTSPLY SIRONA, Inc. | | | | | | | | |
3.25%, 06/01/2030 | | | 3,000 | | | | 2,596 | |
DH Europe Finance II Sarl | | | | | | | | |
3.25%, 11/15/2039 | | | 431 | | | | 350 | |
Element Fleet Management Corp. | | | | | | | | |
1.60%, 04/06/2024(1) | | | 1,405 | | | | 1,355 | |
3.85%, 06/15/2025(1) | | | 3,000 | | | | 2,837 | |
6.27%, 06/26/2026(1) | | | 7,530 | | | | 7,504 | |
Elevance Health, Inc. | | | | | | | | |
3.60%, 03/15/2051 | | | 4,420 | | | | 3,380 | |
4.10%, 03/01/2028 | | | 920 | | | | 883 | |
4.38%, 12/01/2047 | | | 4,500 | | | | 3,922 | |
4.63%, 05/15/2042 | | | 400 | | | | 359 | |
4.65%, 01/15/2043 | | | 391 | | | | 357 | |
4.65%, 08/15/2044 | | | 395 | | | | 355 | |
5.10%, 01/15/2044 | | | 1,690 | | | | 1,602 | |
ERAC USA Finance LLC | | | | | | | | |
4.50%, 02/15/2045(1) | | | 300 | | | | 261 | |
4.60%, 05/01/2028(1) | | | 6,090 | | | | 5,914 | |
5.40%, 05/01/2053(1) | | | 3,614 | | | | 3,608 | |
5.63%, 03/15/2042(1) | | | 357 | | | | 357 | |
Experian Finance Plc | | | | | | | | |
2.75%, 03/08/2030(1) | | | 9,240 | | | | 7,881 | |
Ford Foundation | | | | | | | | |
2.82%, 06/01/2070 | | | 2,735 | | | | 1,691 | |
Fresenius Medical Care U.S. Finance III, Inc. | | | | | | | | |
3.00%, 12/01/2031(1) | | | 8,000 | | | | 6,211 | |
General Mills, Inc. | | | | | | | | |
3.00%, 02/01/2051 | | | 3,007 | | | | 2,124 | |
Gilead Sciences, Inc. | | | | | | | | |
1.65%, 10/01/2030 | | | 1,700 | | | | 1,387 | |
2.60%, 10/01/2040 | | | 1,855 | | | | 1,343 | |
4.60%, 09/01/2035 | | | 4,225 | | | | 4,068 | |
Global Payments, Inc. | | | | | | | | |
3.20%, 08/15/2029 | | | 4,843 | | | | 4,209 | |
5.30%, 08/15/2029 | | | 964 | | | | 939 | |
Grupo Bimbo SAB de CV | | | | | | | | |
4.70%, 11/10/2047(1) | | | 4,500 | | | | 4,054 | |
Hackensack Meridian Health, Inc. | | | | | | | | |
2.68%, 09/01/2041 | | | 3,780 | | | | 2,693 | |
2.88%, 09/01/2050 | | | 2,000 | | | | 1,342 | |
Haleon U.S. Capital LLC | | | | | | | | |
3.38%, 03/24/2029 | | | 2,865 | | | | 2,603 | |
Hartford HealthCare Corp. | | | | | | | | |
3.45%, 07/01/2054 | | | 3,370 | | | | 2,365 | |
HCA, Inc. | | | | | | | | |
3.50%, 07/15/2051 | | | 116 | | | | 80 | |
3.63%, 03/15/2032(1) | | | 3,500 | | | | 3,038 | |
4.50%, 02/15/2027 | | | 7,000 | | | | 6,753 | |
5.13%, 06/15/2039 | | | 1,715 | | | | 1,591 | |
5.25%, 06/15/2026 | | | 4,200 | | | | 4,154 | |
5.50%, 06/15/2047 | | | 1,955 | | | | 1,841 | |
5.88%, 02/01/2029 | | | 4,000 | | | | 4,026 | |
JBS USA LUX SA | | | | | | | | |
3.00%, 05/15/2032(1) | | | 7,450 | | | | 5,718 | |
5.75%, 04/01/2033(1) | | | 7,500 | | | | 7,050 | |
Johnson & Johnson | | | | | | | | |
4.38%, 12/05/2033 | | | 1,070 | | | | 1,080 | |
Kellogg Co. | | | | | | | | |
5.25%, 03/01/2033 | | | 2,385 | | | | 2,395 | |
Keurig Dr Pepper, Inc. | | | | | | | | |
4.42%, 12/15/2046 | | | 3,850 | | | | 3,306 | |
Kimberly-Clark de Mexico SAB de CV | | | | | | | | |
2.43%, 07/01/2031(1) | | | 7,500 | | | | 6,363 | |
Kraft Heinz Foods Co. | | | | | | | | |
| | | | | | | | |
3.00%, 06/01/2026 | | | 3,353 | | | | 3,164 | |
4.38%, 06/01/2046 | | | 9,813 | | | | 8,340 | |
4.63%, 10/01/2039 | | | 2,357 | | | | 2,130 | |
Kroger Co. | | | | | | | | |
4.45%, 02/01/2047 | | | 1,600 | | | | 1,389 | |
5.40%, 07/15/2040 | | | 95 | | | | 91 | |
Laboratory Corp. of America Holdings | | | | | | | | |
2.95%, 12/01/2029 | | | 2,190 | | | | 1,919 | |
Mars, Inc. | | | | | | | | |
4.75%, 04/20/2033(1) | | | 9,419 | | | | 9,336 | |
Massachusetts Institute of Technology | | | | | | | | |
3.89%, 07/01/2116 | | | 2,906 | | | | 2,235 | |
4.68%, 07/01/2114 | | | 1,645 | | | | 1,534 | |
Medtronic Global Holdings SCA | | | | | | | | |
4.50%, 03/30/2033 | | | 8,093 | | | | 7,932 | |
Memorial Health Services | | | | | | | | |
3.45%, 11/01/2049 | | | 3,040 | | | | 2,230 | |
Merck & Co., Inc. | | | | | | | | |
2.75%, 12/10/2051 | | | 1,415 | | | | 976 | |
5.00%, 05/17/2053 | | | 1,335 | | | | 1,352 | |
5.15%, 05/17/2063 | | | 1,040 | | | | 1,062 | |
Molson Coors Beverage Co. | | | | | | | | |
4.20%, 07/15/2046 | | | 1,511 | | | | 1,251 | |
Mount Sinai Hospitals Group, Inc. | | | | | | | | |
3.98%, 07/01/2048 | | | 999 | | | | 796 | |
MultiCare Health System | | | | | | | | |
2.80%, 08/15/2050 | | | 3,003 | | | | 1,823 | |
Mylan, Inc. | | | | | | | | |
4.55%, 04/15/2028 | | | 700 | | | | 659 | |
5.20%, 04/15/2048 | | | 7,550 | | | | 5,882 | |
5.40%, 11/29/2043 | | | 3,770 | | | | 3,149 | |
MyMichigan Health | | | | | | | | |
3.41%, 06/01/2050 | | | 3,480 | | | | 2,487 | |
Nationwide Children’s Hospital, Inc. | | | | | | | | |
4.56%, 11/01/2052 | | | 646 | | | | 597 | |
NYU Langone Hospitals | | | | | | | | |
3.38%, 07/01/2055 | | | 1,270 | | | | 906 | |
Orlando Health Obligated Group | | | | | | | | |
4.09%, 10/01/2048 | | | 2,605 | | | | 2,140 | |
Pepperdine University | | | | | | | | |
3.30%, 12/01/2059 | | | 1,440 | | | | 1,014 | |
Pfizer Investment Enterprises Pte Ltd. | | | | | | | | |
4.45%, 05/19/2028 | | | 17,563 | | | | 17,264 | |
5.11%, 05/19/2043 | | | 2,027 | | | | 2,032 | |
5.30%, 05/19/2053 | | | 9,477 | | | | 9,853 | |
Philip Morris International, Inc. | | | | | | | | |
4.88%, 02/15/2028 | | | 7,757 | | | | 7,638 | |
Piedmont Healthcare, Inc. | | | | | | | | |
2.86%, 01/01/2052 | | | 2,195 | | | | 1,415 | |
President & Fellows of Harvard College | | | | | | | | |
2.52%, 10/15/2050 | | | 3,480 | | | | 2,327 | |
3.30%, 07/15/2056 | | | 4,420 | | | | 3,377 | |
Providence St Joseph Health Obligated Group | | | | | | | | |
2.75%, 10/01/2026 | | | 1,200 | | | | 1,096 | |
Quanta Services, Inc. | | | | | | | | |
2.35%, 01/15/2032 | | | 2,965 | | | | 2,333 | |
Quest Diagnostics, Inc. | | | | | | | | |
3.45%, 06/01/2026 | | | 223 | | | | 212 | |
3.50%, 03/30/2025 | | | 4,820 | | | | 4,647 | |
Regeneron Pharmaceuticals, Inc. | | | | | | | | |
1.75%, 09/15/2030 | | | 2,800 | | | | 2,232 | |
RELX Capital, Inc. | | | | | | | | |
4.75%, 05/20/2032 | | | 2,745 | | | | 2,693 | |
Revvity, Inc. | | | | | | | | |
3.63%, 03/15/2051 | | | 3,400 | | | | 2,473 | |
Reynolds American, Inc. | | | | | | | | |
4.45%, 06/12/2025 | | | 5,000 | | | | 4,859 | |
5.70%, 08/15/2035 | | | 2,487 | | | | 2,337 | |
Royalty Pharma Plc | | | | | | | | |
1.20%, 09/02/2025 | | | 874 | | | | 788 | |
2.15%, 09/02/2031 | | | 1,291 | | | | 1,012 | |
S&P Global, Inc. | | | | | | | | |
2.90%, 03/01/2032 | | | 2,118 | | | | 1,836 | |
Sysco Corp. | | | | | | | | |
5.95%, 04/01/2030 | | | 5,000 | | | | 5,234 | |
6.60%, 04/01/2050 | | | 1,000 | | | | 1,140 | |
Takeda Pharmaceutical Co. Ltd. | | | | | | | | |
3.03%, 07/09/2040 | | | 3,675 | | | | 2,782 | |
3.18%, 07/09/2050 | | | 1,920 | | | | 1,352 | |
Texas Health Resources | | | | | | | | |
2.33%, 11/15/2050 | | | 970 | | | | 568 | |
4.33%, 11/15/2055 | | | 1,000 | | | | 877 | |
Triton Container International Ltd. | | | | | | | | |
| | | | | | | | |
1.15%, 06/07/2024(1) | | | 2,755 | | | | 2,613 | |
UnitedHealth Group, Inc. | | | | | | | | |
3.25%, 05/15/2051 | | | 1,395 | | | | 1,041 | |
3.50%, 08/15/2039 | | | 1,675 | | | | 1,405 | |
4.63%, 07/15/2035 | | | 427 | | | | 417 | |
4.75%, 05/15/2052 | | | 1,620 | | | | 1,537 | |
5.05%, 04/15/2053 | | | 15,900 | | | | 15,804 | |
5.88%, 02/15/2053 | | | 1,495 | | | | 1,661 | |
University of Chicago | | | | | | | | |
2.76%, 04/01/2045 | | | 1,575 | | | | 1,177 | |
University of Miami | | | | | | | | |
4.06%, 04/01/2052 | | | 1,280 | | | | 1,087 | |
University of Southern California | | | | | | | | |
3.23%, 10/01/2120 | | | 1,370 | | | | 848 | |
Utah Acquisition Sub, Inc. | | | | | | | | |
3.95%, 06/15/2026 | | | 532 | | | | 505 | |
5.25%, 06/15/2046 | | | 275 | | | | 217 | |
Verisk Analytics, Inc. | | | | | | | | |
4.00%, 06/15/2025 | | | 7,000 | | | | 6,793 | |
5.75%, 04/01/2033 | | | 2,280 | | | | 2,387 | |
Viatris, Inc. | | | | | | | | |
2.30%, 06/22/2027 | | | 3,525 | | | | 3,080 | |
3.85%, 06/22/2040 | | | 4,820 | | | | 3,331 | |
4.00%, 06/22/2050 | | | 4,000 | | | | 2,645 | |
Viterra Finance BV | | | | | | | | |
3.20%, 04/21/2031(1) | | | 10,250 | | | | 8,584 | |
5.25%, 04/21/2032(1) | | | 5,295 | | | | 5,082 | |
Yale-New Haven Health Services Corp. | | | | | | | | |
2.50%, 07/01/2050 | | | 1,530 | | | | 926 | |
Zoetis, Inc. | | | | | | | | |
2.00%, 05/15/2030 | | | 1,590 | | | | 1,327 | |
3.90%, 08/20/2028 | | | 4,685 | | | | 4,495 | |
| | | | | | | | |
Total Consumer, Non-cyclical | | | | 614,458 | |
| | | | | | | | |
Energy – 3.11% | | | | | | | | |
Abu Dhabi Crude Oil Pipeline LLC | | | | | | | | |
4.60%, 11/02/2047(1) | | | 3,131 | | | | 2,905 | |
Aker BP ASA | | | | | | | | |
2.00%, 07/15/2026(1) | | | 1,517 | | | | 1,362 | |
3.10%, 07/15/2031(1) | | | 2,730 | | | | 2,259 | |
5.60%, 06/13/2028(1) | | | 3,380 | | | | 3,355 | |
6.00%, 06/13/2033(1) | | | 3,000 | | | | 3,001 | |
Apache Corp. | | | | | | | | |
5.10%, 09/01/2040 | | | 4,727 | | | | 3,841 | |
Boardwalk Pipelines LP | | | | | | | | |
3.40%, 02/15/2031 | | | 1,145 | | | | 984 | |
3.60%, 09/01/2032 | | | 5,000 | | | | 4,245 | |
5.95%, 06/01/2026 | | | 3,000 | | | | 3,023 | |
BP Capital Markets America, Inc. | | | | | | | | |
2.94%, 06/04/2051 | | | 3,935 | | | | 2,685 | |
4.89%, 09/11/2033 | | | 9,574 | | | | 9,475 | |
Buckeye Partners LP | | | | | | | | |
5.60%, 10/15/2044 | | | 2,000 | | | | 1,440 | |
5.85%, 11/15/2043 | | | 591 | | | | 437 | |
Canadian Natural Resources Ltd. | | | | | | | | |
6.25%, 03/15/2038 | | | 5,000 | | | | 5,090 | |
6.50%, 02/15/2037 | | | 118 | | | | 120 | |
Cenovus Energy, Inc. | | | | | | | | |
5.25%, 06/15/2037 | | | 5,270 | | | | 4,851 | |
5.40%, 06/15/2047 | | | 5,827 | | | | 5,275 | |
6.80%, 09/15/2037 | | | 2,100 | | | | 2,183 | |
Cheniere Corpus Christi Holdings LLC | | | | | | | | |
5.88%, 03/31/2025 | | | 5,900 | | | | 5,872 | |
Cheniere Energy Partners LP | | | | | | | | |
5.95%, 06/30/2033(1) | | | 3,000 | | | | 3,009 | |
Columbia Pipeline Group, Inc. | | | | | | | | |
5.80%, 06/01/2045 | | | 2,700 | | | | 2,663 | |
ConocoPhillips Co. | | | | | | | | |
5.30%, 05/15/2053 | | | 6,775 | | | | 6,891 | |
Continental Resources, Inc. | | | | | | | | |
2.27%, 11/15/2026(1) | | | 3,235 | | | | 2,880 | |
Coterra Energy, Inc. | | | | | | | | |
3.90%, 05/15/2027 | | | 3,045 | | | | 2,870 | |
DCP Midstream Operating LP | | | | | | | | |
5.13%, 05/15/2029 | | | 6,025 | | | | 5,894 | |
5.38%, 07/15/2025 | | | 5,260 | | | | 5,207 | |
5.63%, 07/15/2027 | | | 9,639 | | | | 9,624 | |
Diamondback Energy, Inc. | | | | | | | | |
3.25%, 12/01/2026 | | | 9,210 | | | | 8,653 | |
Eastern Gas Transmission & Storage, Inc. | | | | | | | | |
4.60%, 12/15/2044 | | | 1,300 | | | | 1,094 | |
Ecopetrol SA | | | | | | | | |
4.13%, 01/16/2025 | | | 383 | | | | 368 | |
5.38%, 06/26/2026 | | | 537 | | | | 514 | |
| | | | | | | | |
8.63%, 01/19/2029 | | | 9,727 | | | | 9,749 | |
8.88%, 01/13/2033 | | | 998 | | | | 988 | |
EIG Pearl Holdings Sarl | | | | | | | | |
3.55%, 08/31/2036(1) | | | 5,996 | | | | 5,104 | |
Enbridge Energy Partners LP | | | | | | | | |
7.38%, 10/15/2045 | | | 2,600 | | | | 2,993 | |
7.50%, 04/15/2038 | | | 4,949 | | | | 5,552 | |
Enbridge, Inc. | | | | | | | | |
4.25%, 12/01/2026 | | | 3,124 | | | | 3,013 | |
5.70%, 03/08/2033 | | | 9,888 | | | | 10,024 | |
Energy Transfer LP | | | | | | | | |
4.00%, 10/01/2027 | | | 5,036 | | | | 4,716 | |
4.40%, 03/15/2027 | | | 900 | | | | 861 | |
4.75%, 01/15/2026 | | | 1,822 | | | | 1,781 | |
4.95%, 05/15/2028 | | | 1,615 | | | | 1,563 | |
4.95%, 01/15/2043 | | | 1,482 | | | | 1,229 | |
5.00%, 05/15/2050 | | | 8,380 | | | | 7,077 | |
5.25%, 04/15/2029 | | | 5,631 | | | | 5,497 | |
5.30%, 04/01/2044 | | | 200 | | | | 173 | |
5.40%, 10/01/2047 | | | 1,500 | | | | 1,322 | |
5.50%, 06/01/2027 | | | 277 | | | | 275 | |
6.05%, 06/01/2041 | | | 2,000 | | | | 1,920 | |
6.13%, 12/15/2045 | | | 810 | | | | 770 | |
6.25%, 04/15/2049 | | | 3,505 | | | | 3,423 | |
6.50%, 02/01/2042 | | | 3,000 | | | | 3,038 | |
6.63%, 10/15/2036 | | | 2,000 | | | | 2,046 | |
ENI SpA | | | | | | | | |
4.25%, 05/09/2029(1) | | | 2,825 | | | | 2,666 | |
5.70%, 10/01/2040(1) | | | 557 | | | | 507 | |
ENI USA, Inc. | | | | | | | | |
7.30%, 11/15/2027 | | | 400 | | | | 428 | |
Enterprise Products Operating LLC | | | | | | | | |
4.85%, 08/15/2042 | | | 4,000 | | | | 3,667 | |
4.95%, 10/15/2054 | | | 177 | | | | 161 | |
5.75%, 03/01/2035 | | | 1,075 | | | | 1,067 | |
5.95%, 02/01/2041 | | | 201 | | | | 209 | |
EQM Midstream Partners LP | | | | | | | | |
4.00%, 08/01/2024 | | | 749 | | | | 733 | |
EQT Corp. | | | | | | | | |
3.90%, 10/01/2027 | | | 805 | | | | 744 | |
Exxon Mobil Corp. | | | | | | | | |
3.00%, 08/16/2039 | | | 3,535 | | | | 2,803 | |
3.10%, 08/16/2049 | | | 2,040 | | | | 1,492 | |
Flex Intermediate Holdco LLC | | | | | | | | |
3.36%, 06/30/2031(1) | | | 3,360 | | | | 2,671 | |
4.32%, 12/30/2039(1) | | | 1,365 | | | | 986 | |
Galaxy Pipeline Assets Bidco Ltd. | | | | | | | | |
2.94%, 09/30/2040(1) | | | 2,327 | | | | 1,865 | |
Gray Oak Pipeline LLC | | | | | | | | |
2.00%, 09/15/2023(1) | | | 1,220 | | | | 1,210 | |
2.60%, 10/15/2025(1) | | | 5,580 | | | | 5,123 | |
Greensaif Pipelines Bidco Sarl | | | | | | | | |
6.13%, 02/23/2038(1) | | | 1,665 | | | | 1,701 | |
6.51%, 02/23/2042(1) | | | 2,235 | | | | 2,323 | |
Halliburton Co. | | | | | | | | |
4.75%, 08/01/2043 | | | 565 | | | | 495 | |
4.85%, 11/15/2035 | | | 200 | | | | 188 | |
7.60%, 08/15/2096(1) | | | 258 | | | | 270 | |
HF Sinclair Corp. | | | | | | | | |
2.63%, 10/01/2023 | | | 250 | | | | 248 | |
5.88%, 04/01/2026 | | | 4,573 | | | | 4,593 | |
Kinder Morgan Energy Partners LP | | | | | | | | |
4.30%, 05/01/2024 | | | 3,700 | | | | 3,650 | |
6.95%, 01/15/2038 | | | 8,490 | | | | 9,117 | |
7.30%, 08/15/2033 | | | 1,650 | | | | 1,797 | |
7.50%, 11/15/2040 | | | 483 | | | | 536 | |
Kinder Morgan, Inc. | | | | | | | | |
5.05%, 02/15/2046 | | | 600 | | | | 513 | |
7.80%, 08/01/2031 | | | 4,600 | | | | 5,173 | |
Magellan Midstream Partners LP | | | | | | | | |
3.20%, 03/15/2025 | | | 386 | | | | 367 | |
4.20%, 03/15/2045 | | | 5,725 | | | | 4,176 | |
Marathon Petroleum Corp. | | | | | | | | |
4.50%, 04/01/2048 | | | 3,000 | | | | 2,365 | |
4.70%, 05/01/2025 | | | 1,352 | | | | 1,326 | |
5.13%, 12/15/2026 | | | 10,583 | | | | 10,479 | |
MPLX LP | | | | | | | | |
2.65%, 08/15/2030 | | | 7,390 | | | | 6,183 | |
4.50%, 04/15/2038 | | | 6,723 | | | | 5,787 | |
4.88%, 06/01/2025 | | | 3,000 | | | | 2,944 | |
5.20%, 03/01/2047 | | | 695 | | | | 610 | |
5.20%, 12/01/2047 | | | 560 | | | | 490 | |
5.50%, 02/15/2049 | | | 950 | | | | 861 | |
| | | | | | | | |
NGPL PipeCo LLC | | | | | | | | |
3.25%, 07/15/2031(1) | | | 2,055 | | | | 1,692 | |
Occidental Petroleum Corp. | | | | | | | | |
6.20%, 03/15/2040 | | | 2,572 | | | | 2,535 | |
8.50%, 07/15/2027 | | | 8,213 | | | | 8,872 | |
ONEOK Partners LP | | | | | | | | |
6.20%, 09/15/2043 | | | 2,500 | | | | 2,416 | |
6.65%, 10/01/2036 | | | 1,050 | | | | 1,078 | |
ONEOK, Inc. | | | | | | | | |
2.75%, 09/01/2024 | | | 6,954 | | | | 6,720 | |
3.10%, 03/15/2030 | | | 13,970 | | | | 11,998 | |
4.50%, 03/15/2050 | | | 915 | | | | 699 | |
4.95%, 07/13/2047 | | | 1,850 | | | | 1,524 | |
Ovintiv, Inc. | | | | | | | | |
5.65%, 05/15/2028 | | | 3,505 | | | | 3,435 | |
7.10%, 07/15/2053 | | | 1,392 | | | | 1,433 | |
Petroleos Mexicanos | | | | | | | | |
6.35%, 02/12/2048 | | | 1,928 | | | | 1,166 | |
6.49%, 01/23/2027 | | | 1,185 | | | | 1,053 | |
6.50%, 03/13/2027 | | | 1,090 | | | | 970 | |
6.50%, 01/23/2029 | | | 970 | | | | 804 | |
6.75%, 09/21/2047 | | | 3,790 | | | | 2,380 | |
6.88%, 08/04/2026 | | | 2,390 | | | | 2,232 | |
Phillips 66 | | | | | | | | |
4.88%, 11/15/2044 | | | 70 | | | | 64 | |
5.88%, 05/01/2042 | | | 3,000 | | | | 3,111 | |
Phillips 66 Co. | | | | | | | | |
3.15%, 12/15/2029 | | | 19,655 | | | | 17,150 | |
3.55%, 10/01/2026 | | | 190 | | | | 178 | |
3.61%, 02/15/2025 | | | 560 | | | | 540 | |
4.90%, 10/01/2046 | | | 1,012 | | | | 894 | |
4.95%, 12/01/2027 | | | 3,483 | | | | 3,452 | |
Pioneer Natural Resources Co. | | | | | | | | |
1.90%, 08/15/2030 | | | 10,650 | | | | 8,631 | |
5.10%, 03/29/2026 | | | 2,810 | | | | 2,793 | |
Plains All American Pipeline LP | | | | | | | | |
3.55%, 12/15/2029 | | | 2,800 | | | | 2,467 | |
4.50%, 12/15/2026 | | | 3,255 | | | | 3,152 | |
4.70%, 06/15/2044 | | | 5,724 | | | | 4,465 | |
5.15%, 06/01/2042 | | | 1,594 | | | | 1,322 | |
QatarEnergy | | | | | | | | |
1.38%, 09/12/2026(1) | | | 1,534 | | | | 1,379 | |
2.25%, 07/12/2031(1) | | | 3,240 | | | | 2,716 | |
Reliance Industries Ltd. | | | | | | | | |
2.88%, 01/12/2032(1) | | | 3,000 | | | | 2,501 | |
Sabal Trail Transmission LLC | | | | | | | | |
4.68%, 05/01/2038(1) | | | 10,000 | | | | 9,143 | |
Sabine Pass Liquefaction LLC | | | | | | | | |
4.50%, 05/15/2030 | | | 3,320 | | | | 3,156 | |
5.00%, 03/15/2027 | | | 1,700 | | | | 1,673 | |
5.63%, 03/01/2025 | | | 505 | | | | 503 | |
5.75%, 05/15/2024 | | | 10,193 | | | | 10,175 | |
5.88%, 06/30/2026 | | | 6,680 | | | | 6,735 | |
Saudi Arabian Oil Co. | | | | | | | | |
3.50%, 04/16/2029(1) | | | 6,290 | | | | 5,788 | |
Schlumberger Holdings Corp. | | | | | | | | |
3.90%, 05/17/2028(1) | | | 1,066 | | | | 1,004 | |
Shell International Finance BV | | | | | | | | |
2.75%, 04/06/2030 | | | 3,300 | | | | 2,947 | |
Southern Natural Gas Co. LLC | | | | | | | | |
4.80%, 03/15/2047(1) | | | 428 | | | | 361 | |
8.00%, 03/01/2032 | | | 446 | | | | 512 | |
Spectra Energy Partners LP | | | | | | | | |
4.50%, 03/15/2045 | | | 3,225 | | | | 2,657 | |
Suncor Energy, Inc. | | | | | | | | |
5.95%, 12/01/2034 | | | 1,048 | | | | 1,050 | |
6.80%, 05/15/2038 | | | 423 | | | | 449 | |
7.88%, 06/15/2026 | | | 543 | | | | 572 | |
Targa Resources Corp. | | | | | | | | |
4.20%, 02/01/2033 | | | 1,060 | | | | 938 | |
5.20%, 07/01/2027 | | | 4,000 | | | | 3,927 | |
TC PipeLines LP | | | | | | | | |
3.90%, 05/25/2027 | | | 5,000 | | | | 4,760 | |
4.38%, 03/13/2025 | | | 8,465 | | | | 8,221 | |
Texas Eastern Transmission LP | | | | | | | | |
3.50%, 01/15/2028(1) | | | 450 | | | | 416 | |
TotalEnergies Capital International SA | | | | | | | | |
2.99%, 06/29/2041 | | | 4,000 | | | | 3,045 | |
3.13%, 05/29/2050 | | | 2,465 | | | | 1,790 | |
3.46%, 07/12/2049 | | | 1,905 | | | | 1,477 | |
TransCanada PipeLines Ltd. | | | | | | | | |
4.75%, 05/15/2038 | | | 1,000 | | | | 893 | |
6.20%, 10/15/2037 | | | 573 | | | | 593 | |
| | | | | | | | |
Valero Energy Corp. | | | | | | | | |
2.15%, 09/15/2027 | | | 1,143 | | | | 1,012 | |
4.35%, 06/01/2028 | | | 3,416 | | | | 3,265 | |
6.63%, 06/15/2037 | | | 5,000 | | | | 5,365 | |
7.50%, 04/15/2032 | | | 175 | | | | 197 | |
Var Energi ASA | | | | | | | | |
5.00%, 05/18/2027(1) | | | 11,460 | | | | 10,873 | |
8.00%, 11/15/2032(1) | | | 4,000 | | | | 4,232 | |
Western Midstream Operating LP | | | | | | | | |
5.45%, 04/01/2044 | | | 2,606 | | | | 2,201 | |
5.50%, 02/01/2050 | | | 1,750 | | | | 1,433 | |
6.15%, 04/01/2033 | | | 2,000 | | | | 2,016 | |
Williams Companies, Inc. | | | | | | | | |
2.60%, 03/15/2031 | | | 2,530 | | | | 2,097 | |
3.75%, 06/15/2027 | | | 3,814 | | | | 3,599 | |
4.85%, 03/01/2048 | | | 3,000 | | | | 2,595 | |
4.90%, 01/15/2045 | | | 2,355 | | | | 2,055 | |
5.10%, 09/15/2045 | | | 4,510 | | | | 4,056 | |
5.40%, 03/02/2026 | | | 1,830 | | | | 1,825 | |
5.40%, 03/04/2044 | | | 2,750 | | | | 2,533 | |
5.75%, 06/24/2044 | | | 2,500 | | | | 2,436 | |
6.30%, 04/15/2040 | | | 333 | | | | 350 | |
Woodside Finance Ltd. | | | | | | | | |
3.65%, 03/05/2025(1) | | | 3,300 | | | | 3,177 | |
| | | | | | | | |
Total Energy | | | | 511,632 | |
| | | | | | | | |
Financials – 11.33% | | | | | | | | |
ABN AMRO Bank NV | | | | | | | | |
1.54% (1 Year CMT Index + 0.80%), 06/16/2027(1)(3) | | | 5,000 | | | | 4,375 | |
2.47% (1 Year CMT Index + 1.10%), 12/13/2029(1)(3) | | | 1,300 | | | | 1,088 | |
3.32% (5 Year CMT Index + 1.90%), 03/13/2037(1)(3) | | | 2,500 | | | | 1,899 | |
4.75%, 07/28/2025(1) | | | 5,000 | | | | 4,822 | |
AerCap Ireland Capital DAC | | | | | | | | |
1.65%, 10/29/2024 | | | 330 | | | | 310 | |
1.75%, 01/30/2026 | | | 1,140 | | | | 1,023 | |
2.45%, 10/29/2026 | | | 1,045 | | | | 933 | |
2.88%, 08/14/2024 | | | 1,060 | | | | 1,019 | |
3.00%, 10/29/2028 | | | 1,290 | | | | 1,115 | |
3.30%, 01/30/2032 | | | 1,225 | | | | 1,002 | |
4.45%, 10/01/2025 | | | 3,500 | | | | 3,367 | |
4.50%, 09/15/2023 | | | 930 | | | | 927 | |
6.50%, 07/15/2025 | | | 1,848 | | | | 1,857 | |
AIA Group Ltd. | | | | | | | | |
3.20%, 03/11/2025(1) | | | 5,545 | | | | 5,332 | |
3.20%, 09/16/2040(1) | | | 915 | | | | 702 | |
3.60%, 04/09/2029(1) | | | 795 | | | | 736 | |
3.90%, 04/06/2028(1) | | | 1,000 | | | | 956 | |
AIB Group Plc | | | | | | | | |
4.26% (3 Month LIBOR USD + 1.87%), 04/10/2025(1)(3) | | | 1,265 | | | | 1,236 | |
AIG SunAmerica Global Financing X | | | | | | | | |
6.90%, 03/15/2032(1) | | | 955 | | | | 1,021 | |
Air Lease Corp. | | | | | | | | |
1.88%, 08/15/2026 | | | 3,070 | | | | 2,726 | |
2.88%, 01/15/2026 | | | 1,300 | | | | 1,203 | |
3.25%, 03/01/2025 | | | 710 | | | | 676 | |
3.25%, 10/01/2029 | | | 3,950 | | | | 3,417 | |
3.38%, 07/01/2025 | | | 1,835 | | | | 1,739 | |
3.88%, 07/03/2023 | | | 2,500 | | | | 2,500 | |
Alexandria Real Estate Equities, Inc. | | | | | | | | |
1.88%, 02/01/2033 | | | 1,190 | | | | 870 | |
2.00%, 05/18/2032 | | | 2,180 | | | | 1,646 | |
3.80%, 04/15/2026 | | | 338 | | | | 323 | |
4.00%, 02/01/2050 | | | 1,451 | | | | 1,082 | |
5.15%, 04/15/2053 | | | 6,745 | | | | 6,045 | |
American Express Co. | | | | | | | | |
3.55% (5 Year CMT Index + 2.85%), 09/15/2171(3) | | | 3,475 | | | | 2,884 | |
American International Group, Inc. | | | | | | | | |
2.50%, 06/30/2025 | | | 5,429 | | | | 5,113 | |
American Tower Corp. | | | | | | | | |
1.50%, 01/31/2028 | | | 2,660 | | | | 2,232 | |
1.88%, 10/15/2030 | | | 2,485 | | | | 1,961 | |
2.10%, 06/15/2030 | | | 1,300 | | | | 1,050 | |
2.95%, 01/15/2051 | | | 875 | | | | 552 | |
3.10%, 06/15/2050 | | | 1,340 | | | | 874 | |
3.38%, 10/15/2026 | | | 506 | | | | 472 | |
3.70%, 10/15/2049 | | | 2,065 | | | | 1,480 | |
Ameriprise Financial, Inc. | | | | | | | | |
5.15%, 05/15/2033 | | | 5,719 | | | | 5,678 | |
AmFam Holdings, Inc. | | | | | | | | |
2.81%, 03/11/2031(1) | | | 5,000 | | | | 3,733 | |
ANZ New Zealand Int’l Ltd. | | | | | | | | |
3.45%, 01/21/2028(1) | | | 500 | | | | 462 | |
Aon Corp. / Aon Global Holdings Plc | | | | | | | | |
3.90%, 02/28/2052 | | | 4,250 | | | | 3,335 | |
| | | | | | | | |
Arthur J Gallagher & Co. | | | | | | | | |
3.50%, 05/20/2051 | | | 3,000 | | | | 2,146 | |
Athene Global Funding | | | | | | | | |
2.50%, 01/14/2025(1) | | | 629 | | | | 588 | |
2.67%, 06/07/2031(1) | | | 3,828 | | | | 2,971 | |
2.95%, 11/12/2026(1) | | | 8,845 | | | | 7,839 | |
Australia & New Zealand Banking Group Ltd. | | | | | | | | |
2.57% (5 Year CMT Index + 1.70%), 11/25/2035(1)(3) | | | 4,590 | | | | 3,487 | |
4.40%, 05/19/2026(1) | | | 1,816 | | | | 1,724 | |
4.50%, 03/19/2024(1) | | | 5,485 | | | | 5,416 | |
Aviation Capital Group LLC | | | | | | | | |
5.50%, 12/15/2024(1) | | | 1,745 | | | | 1,708 | |
Avolon Holdings Funding Ltd. | | | | | | | | |
2.13%, 02/21/2026(1) | | | 1,430 | | | | 1,271 | |
2.53%, 11/18/2027(1) | | | 15,330 | | | | 12,925 | |
2.88%, 02/15/2025(1) | | | 3,704 | | | | 3,445 | |
3.95%, 07/01/2024(1) | | | 2,835 | | | | 2,750 | |
4.25%, 04/15/2026(1) | | | 1,710 | | | | 1,593 | |
4.38%, 05/01/2026(1) | | | 790 | | | | 738 | |
5.13%, 10/01/2023(1) | | | 3,000 | | | | 2,988 | |
5.25%, 05/15/2024(1) | | | 2,790 | | | | 2,741 | |
5.50%, 01/15/2026(1) | | | 4,364 | | | | 4,228 | |
Banco Nacional de Panama | | | | | | | | |
2.50%, 08/11/2030(1) | | | 2,750 | | | | 2,158 | |
Banco Santander SA | | | | | | | | |
1.72% (1 Year CMT Index + 0.90%), 09/14/2027(3) | | | 3,000 | | | | 2,605 | |
1.85%, 03/25/2026 | | | 3,400 | | | | 3,042 | |
2.75%, 05/28/2025 | | | 4,800 | | | | 4,506 | |
3.23% (1 Year CMT Index + 1.60%), 11/22/2032(3) | | | 2,000 | | | | 1,584 | |
5.15%, 08/18/2025 | | | 600 | | | | 589 | |
5.18%, 11/19/2025 | | | 1,500 | | | | 1,457 | |
Bank of America Corp. | | | | | | | | |
1.66% (SOFR + 0.91%), 03/11/2027(3) | | | 950 | | | | 855 | |
1.73% (SOFR + 0.96%), 07/22/2027(3) | | | 7,170 | | | | 6,401 | |
1.90% (SOFR + 1.53%), 07/23/2031(3) | | | 1,285 | | | | 1,023 | |
2.09% (SOFR + 1.06%), 06/14/2029(3) | | | 15,630 | | | | 13,335 | |
2.30% (SOFR + 1.22%), 07/21/2032(3) | | | 32,201 | | | | 25,754 | |
2.46% (3 Month Term SOFR + 1.13%), 10/22/2025(3) | | | 2,000 | | | | 1,910 | |
2.55% (SOFR + 1.05%), 02/04/2028(3) | | | 3,075 | | | | 2,775 | |
2.57% (SOFR + 1.21%), 10/20/2032(3) | | | 4,515 | | | | 3,677 | |
2.59% (SOFR + 2.15%), 04/29/2031(3) | | | 11,813 | | | | 9,917 | |
2.68% (SOFR + 1.93%), 06/19/2041(3) | | | 7,418 | | | | 5,209 | |
2.69% (SOFR + 1.32%), 04/22/2032(3) | | | 17,025 | | | | 14,109 | |
2.88% (3 Month Term SOFR + 1.45%), 10/22/2030(3) | | | 5,130 | | | | 4,417 | |
2.97% (SOFR + 1.33%), 02/04/2033(3) | | | 4,550 | | | | 3,793 | |
3.09% (3 Month Term SOFR + 1.35%), 10/01/2025(3) | | | 5,000 | | | | 4,809 | |
3.37% (3 Month Term SOFR + 1.07%), 01/23/2026(3) | | | 1,500 | | | | 1,437 | |
3.59% (3 Month Term SOFR + 1.63%), 07/21/2028(3) | | | 7,800 | | | | 7,251 | |
3.71% (3 Month Term SOFR + 1.77%), 04/24/2028(3) | | | 4,500 | | | | 4,218 | |
3.82% (3 Month Term SOFR + 1.84%), 01/20/2028(3) | | | 10,000 | | | | 9,455 | |
3.95%, 04/21/2025 | | | 3,850 | | | | 3,728 | |
3.97% (3 Month Term SOFR + 1.47%), 02/07/2030(3) | | | 2,820 | | | | 2,611 | |
4.00%, 01/22/2025 | | | 3,860 | | | | 3,754 | |
4.20%, 08/26/2024 | | | 4,140 | | | | 4,062 | |
4.27% (3 Month Term SOFR + 1.57%), 07/23/2029(3) | | | 1,500 | | | | 1,423 | |
4.38% (SOFR + 1.58%), 04/27/2028(3) | | | 4,000 | | | | 3,840 | |
4.45%, 03/03/2026 | | | 7,140 | | | | 6,940 | |
5.08% (SOFR + 1.29%), 01/20/2027(3) | | | 3,080 | | | | 3,033 | |
5.20% (SOFR + 1.63%), 04/25/2029(3) | | | 14,423 | | | | 14,265 | |
5.29% (SOFR + 1.91%), 04/25/2034(3) | | | 10,460 | | | | 10,363 | |
6.20% (SOFR + 1.99%), 11/10/2028(3) | | | 3,000 | | | | 3,084 | |
7.75%, 05/14/2038 | | | 137 | | | | 163 | |
Bank of Ireland Group Plc | | | | | | | | |
2.03% (1 Year CMT Index + 1.10%), 09/30/2027(1)(3) | | | 6,132 | | | | 5,300 | |
6.25% (1 Year CMT Index + 2.65%), 09/16/2026(1)(3) | | | 3,159 | | | | 3,134 | |
Bank of Montreal | | | | | | | | |
3.80% (5 Year Swap Rate USD + 1.43%), 12/15/2032(3) | | | 7,167 | | | | 6,318 | |
Bank of New York Mellon Corp. | | | | | | | | |
3.00%, 02/24/2025 | | | 5,360 | | | | 5,150 | |
4.95% (SOFR + 1.03%), 04/26/2027(3) | | | 4,368 | | | | 4,314 | |
Bank of Nova Scotia | | | | | | | | |
4.85%, 02/01/2030 | | | 3,702 | | | | 3,571 | |
5.45%, 06/12/2025 | | | 7,783 | | | | 7,743 | |
Banque Federative du Credit Mutuel SA | | | | | | | | |
1.60%, 10/04/2026(1) | | | 3,100 | | | | 2,735 | |
4.94%, 01/26/2026(1) | | | 1,940 | | | | 1,903 | |
Barclays Plc | | | | | | | | |
1.01% (1 Year CMT Index + 0.80%), 12/10/2024(3) | | | 3,434 | | | | 3,348 | |
2.89% (1 Year CMT Index + 1.30%), 11/24/2032(3) | | | 1,572 | | | | 1,237 | |
3.65%, 03/16/2025 | | | 1,500 | | | | 1,438 | |
3.93% (3 Month LIBOR USD + 1.61%), 05/07/2025(3) | | | 7,000 | | | | 6,841 | |
4.97% (3 Month LIBOR USD + 1.90%), 05/16/2029(3) | | | 2,450 | | | | 2,315 | |
5.50% (1 Year CMT Index + 2.65%), 08/09/2028(3) | | | 2,360 | | | | 2,301 | |
| | | | | | | | |
6.22% (SOFR + 2.98%), 05/09/2034(3) | | | 6,871 | | | | 6,844 | |
Berkshire Hathaway Finance Corp. | | | | | | | | |
3.85%, 03/15/2052 | | | 2,265 | | | | 1,872 | |
4.30%, 05/15/2043 | | | 322 | | | | 294 | |
4.40%, 05/15/2042 | | | 1,524 | | | | 1,451 | |
Blackstone Holdings Finance Co. LLC | | | | | | | | |
4.45%, 07/15/2045(1) | | | 170 | | | | 135 | |
Blackstone Secured Lending Fund | | | | | | | | |
3.65%, 07/14/2023 | | | 2,110 | | | | 2,108 | |
BNP Paribas SA | | | | | | | | |
1.32% (SOFR + 1.00%), 01/13/2027(1)(3) | | | 8,178 | | | | 7,252 | |
1.68% (SOFR + 0.91%), 06/30/2027(1)(3) | | | 2,660 | | | | 2,345 | |
1.90% (SOFR + 1.61%), 09/30/2028(1)(3) | | | 6,280 | | | | 5,349 | |
2.16% (SOFR + 1.22%), 09/15/2029(1)(3) | | | 4,000 | | | | 3,331 | |
2.22% (SOFR + 2.07%), 06/09/2026(1)(3) | | | 1,557 | | | | 1,440 | |
2.59% (5 Year CMT Index + 2.05%), 08/12/2035(1)(3) | | | 2,000 | | | | 1,533 | |
2.82% (3 Month LIBOR USD + 1.11%), 11/19/2025(1)(3) | | | 4,000 | | | | 3,814 | |
2.87% (SOFR + 1.39%), 04/19/2032(1)(3) | | | 3,560 | | | | 2,916 | |
3.38%, 01/09/2025(1) | | | 7,335 | | | | 7,045 | |
4.71% (3 Month LIBOR USD + 2.24%), 01/10/2025(1)(3) | | | 1,600 | | | | 1,586 | |
5.34% (1 Year CMT Index + 1.50%), 06/12/2029(1)(3) | | | 16,679 | | | | 16,449 | |
BOC Aviation USA Corp. | | | | | | | | |
1.63%, 04/29/2024(1) | | | 2,170 | | | | 2,094 | |
Boston Properties LP | | | | | | | | |
6.50%, 01/15/2034 | | | 3,013 | | | | 3,032 | |
BPCE SA | | | | | | | | |
1.00%, 01/20/2026(1) | | | 3,225 | | | | 2,870 | |
1.65% (SOFR + 1.52%), 10/06/2026(1)(3) | | | 1,566 | | | | 1,404 | |
2.28% (SOFR + 1.31%), 01/20/2032(1)(3) | | | 10,100 | | | | 7,798 | |
3.12% (SOFR + 1.73%), 10/19/2032(1)(3) | | | 7,900 | | | | 6,097 | |
3.25%, 01/11/2028(1) | | | 7,815 | | | | 7,084 | |
4.50%, 03/15/2025(1) | | | 2,000 | | | | 1,919 | |
4.63%, 07/11/2024(1) | | | 1,300 | | | | 1,270 | |
5.15%, 07/21/2024(1) | | | 2,800 | | | | 2,749 | |
5.70%, 10/22/2023(1) | | | 3,645 | | | | 3,629 | |
5.75% (SOFR + 2.87%), 07/19/2033(1)(3) | | | 1,200 | | | | 1,172 | |
5.98% (SOFR + 2.10%), 01/18/2027(1)(3) | | | 4,300 | | | | 4,259 | |
Brixmor Operating Partnership LP | | | | | | | | |
2.25%, 04/01/2028 | | | 1,930 | | | | 1,621 | |
2.50%, 08/16/2031 | | | 1,080 | | | | 838 | |
3.85%, 02/01/2025 | | | 1,100 | | | | 1,052 | |
4.05%, 07/01/2030 | | | 2,286 | | | | 2,061 | |
Brookfield Finance, Inc. | | | | | | | | |
3.90%, 01/25/2028 | | | 770 | | | | 713 | |
4.70%, 09/20/2047 | | | 158 | | | | 132 | |
4.85%, 03/29/2029 | | | 875 | | | | 839 | |
Brown & Brown, Inc. | | | | | | | | |
2.38%, 03/15/2031 | | | 4,150 | | | | 3,345 | |
4.20%, 03/17/2032 | | | 6,000 | | | | 5,388 | |
Capital One Financial Corp. | | | | | | | | |
1.88% (SOFR + 0.86%), 11/02/2027(3) | | | 361 | | | | 309 | |
2.62% (SOFR + 1.27%), 11/02/2032(3) | | | 2,495 | | | | 1,922 | |
4.20%, 10/29/2025 | | | 400 | | | | 382 | |
4.99% (SOFR + 2.16%), 07/24/2026(3) | | | 600 | | | | 582 | |
6.31% (SOFR + 2.64%), 06/08/2029(3) | | | 16,810 | | | | 16,697 | |
Cboe Global Markets, Inc. | | | | | | | | |
1.63%, 12/15/2030 | | | 10,880 | | | | 8,546 | |
CBRE Services, Inc. | | | | | | | | |
5.95%, 08/15/2034 | | | 4,795 | | | | 4,735 | |
Charles Schwab Corp. | | | | | | | | |
1.65%, 03/11/2031 | | | 11,130 | | | | 8,474 | |
Citigroup, Inc. | | | | | | | | |
1.12% (SOFR + 0.77%), 01/28/2027(3) | | | 32,820 | | | | 29,258 | |
2.52% (SOFR + 1.18%), 11/03/2032(3) | | | 1,140 | | | | 919 | |
2.56% (SOFR + 1.17%), 05/01/2032(3) | | | 19,270 | | | | 15,734 | |
3.06% (SOFR + 1.35%), 01/25/2033(3) | | | 6,852 | | | | 5,721 | |
3.20%, 10/21/2026 | | | 905 | | | | 847 | |
3.52% (3 Month Term SOFR + 1.41%), 10/27/2028(3) | | | 3,846 | | | | 3,572 | |
3.67% (3 Month Term SOFR + 1.65%), 07/24/2028(3) | | | 7,895 | | | | 7,381 | |
3.70%, 01/12/2026 | | | 9,150 | | | | 8,778 | |
3.79% (SOFR + 1.94%), 03/17/2033(3) | | | 1,000 | | | | 884 | |
3.89% (3 Month Term SOFR + 1.82%), 01/10/2028(3) | | | 12,600 | | | | 11,940 | |
3.98% (3 Month Term SOFR + 1.60%), 03/20/2030(3) | | | 3,490 | | | | 3,227 | |
4.08% (3 Month Term SOFR + 1.45%), 04/23/2029(3) | | | 1,111 | | | | 1,046 | |
4.30%, 11/20/2026 | | | 1,570 | | | | 1,503 | |
4.40%, 06/10/2025 | | | 12,181 | | | | 11,832 | |
4.45%, 09/29/2027 | | | 8,213 | | | | 7,842 | |
6.17% (SOFR + 2.66%), 05/25/2034(3) | | | 6,610 | | | | 6,668 | |
6.63%, 01/15/2028 | | | 387 | | | | 409 | |
Citizens Financial Group, Inc. | | | | | | | | |
3.25%, 04/30/2030 | | | 5,000 | | | | 4,086 | |
CNA Financial Corp. | | | | | | | | |
3.45%, 08/15/2027 | | | 820 | | | | 760 | |
| | | | | | | | |
5.50%, 06/15/2033 | | | 8,225 | | | | 8,021 | |
Commonwealth Bank of Australia | | | | | | | | |
3.31%, 03/11/2041(1) | | | 1,255 | | | | 875 | |
3.74%, 09/12/2039(1) | | | 5,000 | | | | 3,757 | |
Cooperatieve Rabobank UA | | | | | | | | |
4.38%, 08/04/2025 | | | 570 | | | | 550 | |
5.56% (1 Year CMT Index + 1.40%), 02/28/2029(1)(3) | | | 6,316 | | | | 6,232 | |
Corebridge Financial, Inc. | | | | | | | | |
3.65%, 04/05/2027 | | | 2,055 | | | | 1,918 | |
3.85%, 04/05/2029 | | | 1,455 | | | | 1,309 | |
Corporate Office Properties LP | | | | | | | | |
2.00%, 01/15/2029 | | | 860 | | | | 655 | |
2.90%, 12/01/2033 | | | 5,350 | | | | 3,702 | |
Credit Agricole SA | | | | | | | | |
1.25% (SOFR + 0.89%), 01/26/2027(1)(3) | | | 10,596 | | | | 9,385 | |
1.91% (SOFR + 1.68%), 06/16/2026(1)(3) | | | 6,715 | | | | 6,181 | |
2.81%, 01/11/2041(1) | | | 1,485 | | | | 979 | |
4.00% (5 Year Swap Rate USD + 1.64%), 01/10/2033(1)(3) | | | 5,000 | | | | 4,451 | |
4.38%, 03/17/2025(1) | | | 305 | | | | 294 | |
Credit Suisse AG | | | | | | | | |
1.25%, 08/07/2026 | | | 1,858 | | | | 1,600 | |
3.70%, 02/21/2025 | | | 3,340 | | | | 3,192 | |
7.50%, 02/15/2028 | | | 315 | | | | 335 | |
7.95%, 01/09/2025 | | | 4,166 | | | | 4,250 | |
Credit Suisse Group AG | | | | | | | | |
0.52%, 08/09/2023 | | | 2,500 | | | | 2,480 | |
4.75%, 08/09/2024 | | | 6,895 | | | | 6,739 | |
Crown Castle, Inc. | | | | | | | | |
4.00%, 03/01/2027 | | | 261 | | | | 248 | |
5.10%, 05/01/2033 | | | 3,500 | | | | 3,439 | |
CubeSmart LP | | | | | | | | |
2.25%, 12/15/2028 | | | 7,275 | | | | 6,130 | |
Danske Bank | | | | | | | | |
1.62% (1 Year CMT Index + 1.35%), 09/11/2026(1)(3) | | | 2,000 | | | | 1,794 | |
6.47% (1 Year CMT Index + 2.10%), 01/09/2026(1)(3) | | | 1,575 | | | | 1,571 | |
Deutsche Bank AG | | | | | | | | |
2.13% (SOFR + 1.87%), 11/24/2026(3)(14) | | | 6,700 | | | | 5,961 | |
2.22% (SOFR + 2.16%), 09/18/2024(3) | | | 2,835 | | | | 2,799 | |
2.55% (SOFR + 1.32%), 01/07/2028(3) | | | 3,350 | | | | 2,905 | |
3.70%, 05/30/2024 | | | 850 | | | | 825 | |
3.70%, 05/30/2024 | | | 2,063 | | | | 2,007 | |
3.74% (SOFR + 2.26%), 01/07/2033(3) | | | 5,000 | | | | 3,667 | |
6.72% (SOFR + 3.18%), 01/18/2029(3) | | | 875 | | | | 876 | |
Dexia Credit Local SA | | | | | | | | |
3.25%, 09/26/2023(1) | | | 500 | | | | 498 | |
Digital Realty Trust LP | | | | | | | | |
5.55%, 01/15/2028 | | | 3,000 | | | | 2,956 | |
Discover Bank | | | | | | | | |
3.45%, 07/27/2026 | | | 2,800 | | | | 2,577 | |
4.20%, 08/08/2023 | | | 6,305 | | | | 6,293 | |
4.65%, 09/13/2028 | | | 4,000 | | | | 3,713 | |
Discover Financial Services | | | | | | | | |
3.75%, 03/04/2025 | | | 2,920 | | | | 2,780 | |
4.10%, 02/09/2027 | | | 3,471 | | | | 3,220 | |
DNB Bank ASA | | | | | | | | |
1.13% (1 Year CMT Index + 0.85%), 09/16/2026(1)(3) | | | 4,000 | | | | 3,572 | |
1.61% (1 Year CMT Index + 0.68%), 03/30/2028(1)(3) | | | 3,435 | | | | 2,963 | |
Equinix, Inc. | | | | | | | | |
2.00%, 05/15/2028 | | | 4,467 | | | | 3,803 | |
2.90%, 11/18/2026 | | | 2,580 | | | | 2,366 | |
Essex Portfolio LP | | | | | | | | |
1.65%, 01/15/2031 | | | 910 | | | | 690 | |
2.65%, 03/15/2032 | | | 1,740 | | | | 1,399 | |
Extra Space Storage LP | | | | | | | | |
5.70%, 04/01/2028 | | | 7,954 | | | | 7,946 | |
F&G Global Funding | | | | | | | | |
1.75%, 06/30/2026(1) | | | 1,905 | | | | 1,686 | |
Fairfax Financial Holdings Ltd. | | | | | | | | |
5.63%, 08/16/2032 | | | 9,000 | | | | 8,694 | |
Federation des Caisses Desjardins du Quebec | | | | | | | | |
2.05%, 02/10/2025(1) | | | 5,000 | | | | 4,692 | |
5.70%, 03/14/2028(1) | | | 2,800 | | | | 2,797 | |
FMR LLC | | | | | | | | |
4.95%, 02/01/2033(1) | | | 250 | | | | 237 | |
6.45%, 11/15/2039(1) | | | 258 | | | | 270 | |
GAIF Bond Issuer Pty Ltd. | | | | | | | | |
3.40%, 09/30/2026(1) | | | 1,000 | | | | 925 | |
Globe Life, Inc. | | | | | | | | |
4.55%, 09/15/2028 | | | 3,000 | | | | 2,901 | |
Goldman Sachs Capital I | | | | | | | | |
6.35%, 02/15/2034 | | | 127 | | | | 127 | |
Goldman Sachs Group, Inc. | | | | | | | | |
1.43% (SOFR + 0.80%), 03/09/2027(3) | | | 5,125 | | | | 4,579 | |
| | | | | | | | |
1.54% (SOFR + 0.82%), 09/10/2027(3) | | | 6,340 | | | | 5,572 | |
1.95% (SOFR + 0.91%), 10/21/2027(3) | | | 2,541 | | | | 2,260 | |
1.99% (SOFR + 1.09%), 01/27/2032(3) | | | 7,395 | | | | 5,822 | |
2.38% (SOFR + 1.25%), 07/21/2032(3) | | | 3,165 | | | | 2,535 | |
2.62% (SOFR + 1.28%), 04/22/2032(3) | | | 9,805 | | | | 8,041 | |
2.64% (SOFR + 1.11%), 02/24/2028(3) | | | 8,243 | | | | 7,479 | |
3.27% (3 Month Term SOFR + 1.46%), 09/29/2025(3) | | | 5,590 | | | | 5,401 | |
3.50%, 01/23/2025 | | | 5,795 | | | | 5,591 | |
3.62% (SOFR + 1.85%), 03/15/2028(3) | | | 14,810 | | | | 13,896 | |
3.69% (3 Month Term SOFR + 1.77%), 06/05/2028(3) | | | 9,911 | | | | 9,312 | |
3.75%, 02/25/2026 | | | 9,005 | | | | 8,643 | |
4.22% (3 Month Term SOFR + 1.56%), 05/01/2029(3) | | | 5,000 | | | | 4,722 | |
4.41% (3 Month Term SOFR + 1.69%), 04/23/2039(3) | | | 2,075 | | | | 1,811 | |
5.15%, 05/22/2045 | | | 4,000 | | | | 3,735 | |
6.75%, 10/01/2037 | | | 2,170 | | | | 2,334 | |
Goodman U.S. Finance Four LLC | | | | | | | | |
4.50%, 10/15/2037(1) | | | 200 | | | | 167 | |
Goodman U.S. Finance Three LLC | | | | | | | | |
3.70%, 03/15/2028(1) | | | 862 | | | | 781 | |
Great-West Lifeco Finance 2018 LP | | | | | | | | |
4.58%, 05/17/2048(1) | | | 650 | | | | 553 | |
GTP Acquisition Partners I LLC | | | | | | | | |
3.48%, 06/16/2025(1) | | | 1,824 | | | | 1,742 | |
Guardian Life Insurance Co. of America | | | | | | | | |
4.85%, 01/24/2077(1) | | | 5,610 | | | | 4,667 | |
Hanover Insurance Group, Inc. | | | | | | | | |
2.50%, 09/01/2030 | | | 5,610 | | | | 4,410 | |
Hartford Financial Services Group, Inc. | | | | | | | | |
3.60%, 08/19/2049 | | | 1,000 | | | | 755 | |
4.30%, 04/15/2043 | | | 1,080 | | | | 880 | |
Healthcare Realty Holdings LP | | | | | | | | |
2.00%, 03/15/2031 | | | 1,380 | | | | 1,059 | |
Healthpeak OP LLC | | | | | | | | |
3.40%, 02/01/2025 | | | 41 | | | | 39 | |
3.50%, 07/15/2029 | | | 1,742 | | | | 1,562 | |
High Street Funding Trust II | | | | | | | | |
4.68%, 02/15/2048(1) | | | 5,250 | | | | 4,393 | |
HSBC Holdings Plc | | | | | | | | |
1.59% (SOFR + 1.29%), 05/24/2027(3) | | | 4,240 | | | | 3,742 | |
2.01% (SOFR + 1.73%), 09/22/2028(3) | | | 3,585 | | | | 3,072 | |
2.21% (SOFR + 1.29%), 08/17/2029(3) | | | 2,075 | | | | 1,736 | |
2.36% (SOFR + 1.95%), 08/18/2031(3) | | | 2,580 | | | | 2,059 | |
2.87% (SOFR + 1.41%), 11/22/2032(3) | | | 2,095 | | | | 1,689 | |
3.97% (3 Month Term SOFR + 1.87%), 05/22/2030(3) | | | 1,000 | | | | 898 | |
4.04% (3 Month Term SOFR + 1.81%), 03/13/2028(3) | | | 3,161 | | | | 2,960 | |
4.29% (3 Month Term SOFR + 1.61%), 09/12/2026(3) | | | 8,009 | | | | 7,702 | |
6.10%, 01/14/2042 | | | 1,060 | | | | 1,122 | |
7.39% (SOFR + 3.35%), 11/03/2028(3) | | | 3,360 | | | | 3,546 | |
8.11% (SOFR + 4.25%), 11/03/2033(3) | | | 3,208 | | | | 3,561 | |
ING Groep NV | | | | | | | | |
1.73% (SOFR + 1.01%), 04/01/2027(3) | | | 705 | | | | 628 | |
Intesa Sanpaolo SpA | | | | | | | | |
4.00%, 09/23/2029(1) | | | 10,590 | | | | 9,198 | |
Invesco Finance Plc | | | | | | | | |
3.75%, 01/15/2026 | | | 4,000 | | | | 3,854 | |
Jefferies Financial Group, Inc. | | | | | | | | |
6.25%, 01/15/2036 | | | 155 | | | | 158 | |
6.45%, 06/08/2027 | | | 428 | | | | 442 | |
JP Morgan Chase & Co. | | | | | | | | |
1.04% (3 Month Term SOFR + 0.70%), 02/04/2027(3) | | | 1,950 | | | | 1,737 | |
1.47% (SOFR + 0.77%), 09/22/2027(3) | | | 15,960 | | | | 14,090 | |
1.56% (SOFR + 0.61%), 12/10/2025(3) | | | 9,475 | | | | 8,871 | |
1.58% (SOFR + 0.89%), 04/22/2027(3) | | | 5,000 | | | | 4,491 | |
2.58% (3 Month Term SOFR + 1.25%), 04/22/2032(3) | | | 6,390 | | | | 5,308 | |
2.95% (SOFR + 1.17%), 02/24/2028(3) | | | 2,600 | | | | 2,387 | |
3.13%, 01/23/2025 | | | 4,000 | | | | 3,869 | |
3.96% (3 Month Term SOFR + 1.64%), 11/15/2048(3) | | | 5,770 | | | | 4,744 | |
4.00% (3 Month Term SOFR + 2.75%), 10/01/2171(3) | | | 4,275 | | | | 3,905 | |
4.01% (3 Month Term SOFR + 1.38%), 04/23/2029(3) | | | 2,320 | | | | 2,184 | |
4.26% (3 Month Term SOFR + 1.84%), 02/22/2048(3) | | | 5,140 | | | | 4,435 | |
4.32% (SOFR + 1.56%), 04/26/2028(3) | | | 1,995 | | | | 1,926 | |
4.45% (3 Month Term SOFR + 1.59%), 12/05/2029(3) | | | 9,660 | | | | 9,257 | |
4.60% (3 Month Term SOFR + 3.13%), 08/01/2171(3) | | | 1,985 | | | | 1,851 | |
5.00% (3 Month Term SOFR + 3.38%), 02/01/2172(3) | | | 5,010 | | | | 4,894 | |
5.35% (SOFR + 1.85%), 06/01/2034(3) | | | 3,293 | | | | 3,319 | |
KeyCorp | | | | | | | | |
4.79% (SOFR + 2.06%), 06/01/2033(3) | | | 590 | | | | 495 | |
LeasePlan Corp. NV | | | | | | | | |
2.88%, 10/24/2024(1) | | | 5,500 | | | | 5,240 | |
Liberty Mutual Group, Inc. | | | | | | | | |
3.95%, 10/15/2050(1) | | | 6,769 | | | | 4,950 | |
4.57%, 02/01/2029(1) | | | 2,301 | | | | 2,170 | |
5.50%, 06/15/2052(1) | | | 5,750 | | | | 5,415 | |
| | | | | | | | |
Liberty Mutual Insurance Co. | | | | | | | | |
7.70%, 10/15/2097(1) | | | 100 | | | | 112 | |
8.50%, 05/15/2025(1) | | | 700 | | | | 715 | |
Life Storage LP | | | | | | | | |
2.20%, 10/15/2030 | | | 2,630 | | | | 2,104 | |
2.40%, 10/15/2031 | | | 1,310 | | | | 1,038 | |
4.00%, 06/15/2029 | | | 1,831 | | | | 1,660 | |
Lincoln National Corp. | | | | | | | | |
7.00%, 06/15/2040 | | | 1,715 | | | | 1,793 | |
Lloyds Banking Group Plc | | | | | | | | |
1.63% (1 Year CMT Index + 0.85%), 05/11/2027(3) | | | 2,280 | | | | 2,017 | |
3.51% (1 Year CMT Index + 1.60%), 03/18/2026(3) | | | 1,075 | | | | 1,023 | |
3.57% (3 Month LIBOR USD + 1.21%), 11/07/2028(3) | | | 1,000 | | | | 906 | |
3.75%, 01/11/2027 | | | 2,000 | | | | 1,873 | |
4.38%, 03/22/2028 | | | 949 | | | | 900 | |
4.50%, 11/04/2024 | | | 2,010 | | | | 1,951 | |
4.58%, 12/10/2025 | | | 550 | | | | 527 | |
LSEGA Financing Plc | | | | | | | | |
2.00%, 04/06/2028(1) | | | 4,565 | | | | 3,913 | |
M&T Bank Corp. | | | | | | | | |
4.00%, 07/15/2024 | | | 4,350 | | | | 4,237 | |
Macquarie Bank Ltd. | | | | | | | | |
3.05% (5 Year CMT Index + 1.70%), 03/03/2036(1)(3) | | | 2,090 | | | | 1,586 | |
Macquarie Group Ltd. | | | | | | | | |
2.87% (SOFR + 1.53%), 01/14/2033(1)(3) | | | 4,000 | | | | 3,195 | |
5.03% (3 Month LIBOR USD + 1.75%), 01/15/2030(1)(3) | | | 4,445 | | | | 4,350 | |
6.21%, 11/22/2024(1) | | | 3,339 | | | | 3,335 | |
Markel Group, Inc. | | | | | | | | |
4.15%, 09/17/2050 | | | 655 | | | | 511 | |
Massachusetts Mutual Life Insurance Co. | | | | | | | | |
3.73%, 10/15/2070(1) | | | 2,690 | | | | 1,829 | |
4.90%, 04/01/2077(1) | | | 5,000 | | | | 4,254 | |
7.63%, 11/15/2023(1) | | | 300 | | | | 301 | |
MassMutual Global Funding II | | | | | | | | |
5.05%, 06/14/2028(1) | | | 12,919 | | | | 12,815 | |
MBIA Insurance Corp. | | | | | | | | |
16.52% (3 Month LIBOR USD + 11.26%), 01/15/2033(1)(3) | | | 86 | | | | 3 | |
MetLife, Inc. | | | | | | | | |
4.88%, 11/13/2043 | | | 3,000 | | | | 2,758 | |
Metropolitan Life Global Funding I | | | | | | | | |
3.00%, 09/19/2027(1) | | | 1,180 | | | | 1,086 | |
5.15%, 03/28/2033(1) | | | 6,518 | | | | 6,446 | |
Mid-America Apartments LP | | | | | | | | |
1.70%, 02/15/2031 | | | 1,330 | | | | 1,050 | |
4.00%, 11/15/2025 | | | 1,500 | | | | 1,451 | |
Mitsubishi HC Capital, Inc. | | | | | | | | |
3.96%, 09/19/2023(1) | | | 2,730 | | | | 2,716 | |
Mitsubishi UFJ Financial Group, Inc. | | | | | | | | |
1.54% (1 Year CMT Index + 0.75%), 07/20/2027(3) | | | 2,780 | | | | 2,454 | |
2.05%, 07/17/2030 | | | 2,940 | | | | 2,384 | |
2.19%, 02/25/2025 | | | 5,000 | | | | 4,712 | |
3.75%, 07/18/2039 | | | 1,615 | | | | 1,369 | |
5.24% (1 Year CMT Index + 1.70%), 04/19/2029(3) | | | 10,115 | | | | 9,951 | |
5.44% (1 Year CMT Index + 1.63%), 02/22/2034(3) | | | 1,930 | | | | 1,923 | |
5.54% (1 Year CMT Index + 1.50%), 04/17/2026(3) | | | 7,930 | | | | 7,881 | |
Mizuho Financial Group, Inc. | | | | | | | | |
1.23% (1 Year CMT Index + 0.67%), 05/22/2027(3) | | | 2,378 | | | | 2,089 | |
2.17% (1 Year CMT Index + 0.87%), 05/22/2032(3) | | | 8,000 | | | | 6,239 | |
2.23% (3 Month Term SOFR + 1.09%), 05/25/2026(3) | | | 1,740 | | | | 1,613 | |
2.26% (1 Year CMT Index + 0.90%), 07/09/2032(3) | | | 1,000 | | | | 779 | |
2.87% (SOFR + 1.57%), 09/13/2030(3) | | | 1,620 | | | | 1,371 | |
5.75% (1 Year CMT Index + 1.90%), 07/06/2034(3) | | | 4,842 | | | | 4,856 | |
5.78% (1 Year CMT Index + 1.65%), 07/06/2029(3) | | | 6,247 | | | | 6,262 | |
Morgan Stanley | | | | | | | | |
1.79% (SOFR + 1.03%), 02/13/2032(3) | | | 2,440 | | | | 1,893 | |
1.93% (SOFR + 1.02%), 04/28/2032(3) | | | 13,945 | | | | 10,886 | |
2.24% (SOFR + 1.18%), 07/21/2032(3) | | | 3,555 | | | | 2,825 | |
2.48% (SOFR + 1.00%), 01/21/2028(3) | | | 526 | | | | 475 | |
2.72% (SOFR + 1.15%), 07/22/2025(3) | | | 873 | | | | 842 | |
3.22% (SOFR + 1.49%), 04/22/2042(3) | | | 5,000 | | | | 3,791 | |
3.59%, 07/22/2028(4) | | | 5,882 | | | | 5,427 | |
3.63%, 01/20/2027 | | | 8,854 | | | | 8,407 | |
3.77% (3 Month Term SOFR + 1.40%), 01/24/2029(3) | | | 4,371 | | | | 4,081 | |
3.88%, 01/27/2026 | | | 1,725 | | | | 1,665 | |
3.95%, 04/23/2027 | | | 14,190 | | | | 13,436 | |
4.35%, 09/08/2026 | | | 930 | | | | 898 | |
4.43% (3 Month Term SOFR + 1.89%), 01/23/2030(3) | | | 2,304 | | | | 2,192 | |
5.00%, 11/24/2025 | | | 3,000 | | | | 2,949 | |
5.12% (SOFR + 1.73%), 02/01/2029(3) | | | 15,574 | | | | 15,360 | |
5.16% (SOFR + 1.59%), 04/20/2029(3) | | | 4,465 | | | | 4,410 | |
5.25% (SOFR + 1.87%), 04/21/2034(3) | | | 6,291 | | | | 6,212 | |
6.30% (SOFR + 2.24%), 10/18/2028(3) | | | 5,350 | | | | 5,497 | |
MUFG Bank Ltd. | | | | | | | | |
| | | | | | | | |
3.75%, 03/10/2024(1) | | | 3,215 | | | | 3,169 | |
Nasdaq, Inc. | | | | | | | | |
5.55%, 02/15/2034 | | | 1,120 | | | | 1,124 | |
National Australia Bank Ltd. | | | | | | | | |
2.33%, 08/21/2030(1) | | | 7,300 | | | | 5,689 | |
3.35% (5 Year CMT Index + 1.70%), 01/12/2037(1)(3) | | | 2,600 | | | | 2,047 | |
3.93% (5 Year CMT Index + 1.88%), 08/02/2034(1)(3) | | | 2,330 | | | | 2,003 | |
Nationwide Building Society | | | | | | | | |
1.50%, 10/13/2026(1) | | | 2,800 | | | | 2,433 | |
4.00%, 09/14/2026(1) | | | 9,650 | | | | 8,861 | |
Nationwide Mutual Insurance Co. | | | | | | | | |
9.38%, 08/15/2039(1) | | | 7,150 | | | | 9,206 | |
NatWest Group Plc | | | | | | | | |
1.64% (1 Year CMT Index + 0.90%), 06/14/2027(3) | | | 8,225 | | | | 7,238 | |
3.75% (5 Year CMT Index + 2.10%), 11/01/2029(3) | | | 1,833 | | | | 1,721 | |
4.45% (3 Month LIBOR USD + 1.87%), 05/08/2030(3) | | | 985 | | | | 905 | |
4.80%, 04/05/2026 | | | 3,017 | | | | 2,928 | |
4.89% (3 Month LIBOR USD + 1.75%), 05/18/2029(3) | | | 6,005 | | | | 5,712 | |
5.08% (3 Month LIBOR USD + 1.91%), 01/27/2030(3) | | | 7,000 | | | | 6,677 | |
5.85% (1 Year CMT Index + 1.35%), 03/02/2027(3) | | | 12,048 | | | | 11,916 | |
6.02% (1 Year CMT Index + 2.10%), 03/02/2034(3) | | | 2,010 | | | | 2,021 | |
7.47% (1 Year CMT Index + 2.85%), 11/10/2026(3) | | | 2,165 | | | | 2,214 | |
NatWest Markets Plc | | | | | | | | |
1.60%, 09/29/2026(1) | | | 2,390 | | | | 2,095 | |
New York Life Insurance Co. | | | | | | | | |
4.45%, 05/15/2069(1) | | | 4,225 | | | | 3,520 | |
NNN REIT, Inc. | | | | | | | | |
3.50%, 10/15/2027 | | | 400 | | | | 367 | |
3.60%, 12/15/2026 | | | 700 | | | | 651 | |
3.90%, 06/15/2024 | | | 1,310 | | | | 1,282 | |
Nomura Holdings, Inc. | | | | | | | | |
1.65%, 07/14/2026 | | | 5,000 | | | | 4,398 | |
1.85%, 07/16/2025 | | | 5,000 | | | | 4,573 | |
2.61%, 07/14/2031 | | | 2,025 | | | | 1,607 | |
2.65%, 01/16/2025 | | | 2,597 | | | | 2,459 | |
2.68%, 07/16/2030 | | | 1,550 | | | | 1,268 | |
2.71%, 01/22/2029 | | | 11,000 | | | | 9,271 | |
Nordea Bank Abp | | | | | | | | |
5.38%, 09/22/2027(1) | | | 2,035 | | | | 2,009 | |
Northern Trust Corp. | | | | | | | | |
3.38% (3 Month LIBOR USD + 1.13%), 05/08/2032(3) | | | 411 | | | | 365 | |
Northwestern Mutual Global Funding | | | | | | | | |
1.70%, 06/01/2028(1) | | | 1,995 | | | | 1,703 | |
4.35%, 09/15/2027(1) | | | 845 | | | | 824 | |
4.90%, 06/12/2028(1) | | | 2,856 | | | | 2,833 | |
Ontario Teachers’ Cadillac Fairview Properties Trust | | | | | | | | |
3.88%, 03/20/2027(1) | | | 1,044 | | | | 963 | |
Pacific Life Insurance Co. | | | | | | | | |
4.30% (3 Month LIBOR USD + 2.80%), 10/24/2067(1)(3) | | | 743 | | | | 565 | |
Park Aerospace Holdings Ltd. | | | | | | | | |
5.50%, 02/15/2024(1) | | | 275 | | | | 272 | |
Physicians Realty LP | | | | | | | | |
2.63%, 11/01/2031 | | | 1,360 | | | | 1,058 | |
PNC Bank N.A. | | | | | | | | |
3.88%, 04/10/2025 | | | 7,840 | | | | 7,484 | |
4.20%, 11/01/2025 | | | 322 | | | | 306 | |
PNC Financial Services Group, Inc. | | | | | | | | |
4.76% (SOFR + 1.09%), 01/26/2027(3) | | | 5,776 | | | | 5,645 | |
5.07% (SOFR + 1.93%), 01/24/2034(3) | | | 3,433 | | | | 3,292 | |
5.58% (SOFR + 1.84%), 06/12/2029(3) | | | 18,729 | | | | 18,641 | |
5.67% (SOFR + 1.09%), 10/28/2025(3) | | | 595 | | | | 590 | |
Principal Life Global Funding II | | | | | | | | |
3.00%, 04/18/2026(1) | | | 2,000 | | | | 1,853 | |
Private Export Funding Corp. | | | | | | | | |
3.25%, 06/15/2025 | | | 1,280 | | | | 1,233 | |
3.55%, 01/15/2024 | | | 2,489 | | | | 2,463 | |
Prologis LP | | | | | | | | |
1.25%, 10/15/2030 | | | 10,115 | | | | 7,810 | |
2.25%, 04/15/2030 | | | 305 | | | | 259 | |
2.88%, 11/15/2029 | | | 800 | | | | 700 | |
4.88%, 06/15/2028 | | | 7,342 | | | | 7,275 | |
5.25%, 06/15/2053 | | | 2,896 | | | | 2,846 | |
Protective Life Corp. | | | | | | | | |
4.30%, 09/30/2028(1) | | | 4,500 | | | | 4,179 | |
Prudential Financial, Inc. | | | | | | | | |
3.91%, 12/07/2047 | | | 1,231 | | | | 982 | |
6.63%, 06/21/2040 | | | 5,995 | | | | 6,518 | |
Prudential Insurance Co. of America | | | | | | | | |
8.30%, 07/01/2025(1) | | | 1,691 | | | | 1,752 | |
Public Storage | | | | | | | | |
1.95%, 11/09/2028 | | | 1,668 | | | | 1,430 | |
2.25%, 11/09/2031 | | | 1,401 | | | | 1,144 | |
Realty Income Corp. | | | | | | | | |
| | | | | | | | |
1.80%, 03/15/2033 | | | 1,320 | | | | 961 | |
4.60%, 02/06/2024 | | | 7,100 | | | | 7,038 | |
Regency Centers LP | | | | | | | | |
2.95%, 09/15/2029 | | | 2,200 | | | | 1,886 | |
Sabra Health Care LP | | | | | | | | |
3.20%, 12/01/2031 | | | 2,195 | | | | 1,637 | |
Safehold GL Holdings LLC | | | | | | | | |
2.80%, 06/15/2031 | | | 7,000 | | | | 5,429 | |
2.85%, 01/15/2032 | | | 4,308 | | | | 3,302 | |
Sammons Financial Group, Inc. | | | | | | | | |
3.35%, 04/16/2031(1) | | | 7,000 | | | | 5,438 | |
4.75%, 04/08/2032(1) | | | 5,000 | | | | 4,180 | |
Santander UK Group Holdings Plc | | | | | | | | |
1.67% (SOFR + 0.99%), 06/14/2027(3) | | | 2,290 | | | | 1,973 | |
6.53% (SOFR + 2.60%), 01/10/2029(3) | | | 9,500 | | | | 9,565 | |
6.83% (SOFR + 2.75%), 11/21/2026(3) | | | 3,588 | | | | 3,596 | |
Santander UK Plc | | | | | | | | |
5.00%, 11/07/2023(1) | | | 4,150 | | | | 4,122 | |
Scentre Group Trust 1 / Scentre Group Trust 2 | | | | | | | | |
3.50%, 02/12/2025(1) | | | 1,390 | | | | 1,333 | |
Scentre Group Trust 2 | | | | | | | | |
4.75% (5 Year CMT Index + 4.38%), 09/24/2080(1)(3) | | | 1,865 | | | | 1,670 | |
SITE Centers Corp. | | | | | | | | |
4.70%, 06/01/2027 | | | 368 | | | | 337 | |
Societe Generale SA | | | | | | | | |
1.49% (1 Year CMT Index + 1.10%), 12/14/2026(1)(3) | | | 19,302 | | | | 16,985 | |
1.79% (1 Year CMT Index + 1.00%), 06/09/2027(1)(3) | | | 5,930 | | | | 5,184 | |
2.80% (1 Year CMT Index + 1.30%), 01/19/2028(1)(3) | | | 1,020 | | | | 903 | |
2.89% (1 Year CMT Index + 1.30%), 06/09/2032(1)(3) | | | 8,975 | | | | 7,032 | |
3.00%, 01/22/2030(1) | | | 562 | | | | 471 | |
3.63%, 03/01/2041(1) | | | 6,000 | | | | 3,892 | |
4.03% (1 Year CMT Index + 1.90%), 01/21/2043(1)(3) | | | 2,851 | | | | 1,902 | |
4.25%, 04/14/2025(1) | | | 2,880 | | | | 2,746 | |
5.00%, 01/17/2024(1) | | | 860 | | | | 850 | |
6.22% (1 Year CMT Index + 3.20%), 06/15/2033(1)(3) | | | 4,500 | | | | 4,189 | |
6.45% (1 Year CMT Index + 2.55%), 01/10/2029(1)(3) | | | 3,550 | | | | 3,555 | |
6.45% (1 Year CMT Index + 2.30%), 01/12/2027(1)(3) | | | 4,935 | | | | 4,923 | |
6.69% (1 Year CMT Index + 2.95%), 01/10/2034(1)(3) | | | 2,398 | | | | 2,441 | |
Standard Chartered Plc | | | | | | | | |
1.46% (1 Year CMT Index + 1.00%), 01/14/2027(1)(3) | | | 10,474 | | | | 9,277 | |
1.82% (1 Year CMT Index + 0.95%), 11/23/2025(1)(3) | | | 4,741 | | | | 4,433 | |
2.61% (1 Year CMT Index + 1.18%), 01/12/2028(1)(3) | | | 5,000 | | | | 4,427 | |
2.82% (3 Month LIBOR USD + 1.21%), 01/30/2026(1)(3) | | | 1,360 | | | | 1,282 | |
4.87% (5 Year 1100 Run ICE Swap Rate USD + 1.97%), 03/15/2033(1)(3) | | | 800 | | | | 724 | |
6.19% (1 Year CMT Index + 1.85%), 07/06/2027(1)(3) | | | 1,985 | | | | 1,986 | |
6.30% (1 Year CMT Index + 2.58%), 07/06/2034(1)(3) | | | 2,000 | | | | 2,001 | |
State Bank of India | | | | | | | | |
4.38%, 01/24/2024(1) | | | 6,475 | | | | 6,415 | |
State Street Corp. | | | | | | | | |
2.20%, 03/03/2031 | | | 2,110 | | | | 1,714 | |
Sumitomo Life Insurance Co. | | | | | | | | |
4.00% (3 Month LIBOR USD + 2.99%), 09/14/2077(1)(3) | | | 1,000 | | | | 922 | |
Sumitomo Mitsui Financial Group, Inc. | | | | | | | | |
2.13%, 07/08/2030 | | | 2,650 | | | | 2,156 | |
2.63%, 07/14/2026 | | | 644 | | | | 592 | |
3.04%, 07/16/2029 | | | 5,005 | | | | 4,372 | |
5.52%, 01/13/2028 | | | 2,790 | | | | 2,801 | |
5.71%, 01/13/2030 | | | 2,790 | | | | 2,823 | |
Sumitomo Mitsui Trust Bank Ltd. | | | | | | | | |
1.55%, 03/25/2026(1) | | | 3,871 | | | | 3,478 | |
Svenska Handelsbanken AB | | | | | | | | |
5.50%, 06/15/2028(1) | | | 9,406 | | | | 9,217 | |
Swedbank AB | | | | | | | | |
5.34%, 09/20/2027(1) | | | 5,125 | | | | 5,051 | |
5.47%, 06/15/2026(1) | | | 10,242 | | | | 10,152 | |
Synchrony Financial | | | | | | | | |
3.95%, 12/01/2027 | | | 1,500 | | | | 1,307 | |
4.50%, 07/23/2025 | | | 4,000 | | | | 3,771 | |
Teachers Insurance & Annuity Association of America | | | | | | | | |
4.27%, 05/15/2047(1) | | | 3,360 | | | | 2,778 | |
4.90%, 09/15/2044(1) | | | 200 | | | | 181 | |
6.85%, 12/16/2039(1) | | | 218 | | | | 240 | |
Toronto-Dominion Bank | | | | | | | | |
4.46%, 06/08/2032 | | | 5,000 | | | | 4,745 | |
5.16%, 01/10/2028 | | | 6,065 | | | | 6,025 | |
Travelers Companies, Inc. | | | | | | | | |
5.45%, 05/25/2053 | | | 1,700 | | | | 1,779 | |
Trinity Acquisition Plc | | | | | | | | |
4.40%, 03/15/2026 | | | 2,300 | | | | 2,216 | |
6.13%, 08/15/2043 | | | 5,000 | | | | 4,741 | |
Truist Financial Corp. | | | | | | | | |
4.80% (5 Year CMT Index + 3.00%), 12/31/2099(3) | | | 3,460 | | | | 2,950 | |
5.12% (SOFR + 1.85%), 01/26/2034(3) | | | 1,770 | | | | 1,677 | |
| | | | | | | | |
5.87% (SOFR + 2.36%), 06/08/2034(3) | | | 1,470 | | | | 1,471 | |
6.05% (SOFR + 2.05%), 06/08/2027(3) | | | 1,935 | | | | 1,936 | |
Trustage Financial Group, Inc. | | | | | | | | |
4.63%, 04/15/2032(1) | | | 5,000 | | | | 4,333 | |
U.S. Bancorp | | | | | | | | |
4.65% (SOFR + 1.23%), 02/01/2029(3) | | | 3,783 | | | | 3,614 | |
UBS Group AG | | | | | | | | |
1.36% (1 Year CMT Index + 1.08%), 01/30/2027(1)(3) | | | 4,700 | | | | 4,118 | |
2.10% (1 Year CMT Index + 1.00%), 02/11/2032(1)(3) | | | 3,610 | | | | 2,734 | |
2.19% (SOFR + 2.04%), 06/05/2026(1)(3) | | | 1,020 | | | | 935 | |
2.59% (SOFR + 1.56%), 09/11/2025(1)(3) | | | 2,637 | | | | 2,514 | |
2.75% (1 Year CMT Index + 1.10%), 02/11/2033(1)(3) | | | 1,450 | | | | 1,129 | |
3.09% (SOFR + 1.73%), 05/14/2032(1)(3) | | | 2,915 | | | | 2,358 | |
3.75%, 03/26/2025 | | | 2,600 | | | | 2,488 | |
3.87% (3 Month LIBOR USD + 1.41%), 01/12/2029(1)(3) | | | 4,375 | | | | 3,955 | |
4.25%, 03/23/2028(1) | | | 3,000 | | | | 2,784 | |
4.28%, 01/09/2028(1) | | | 3,973 | | | | 3,672 | |
4.49% (1 Year CMT Index + 1.55%), 05/12/2026(1)(3) | | | 1,770 | | | | 1,711 | |
4.49% (1 Year CMT Index + 1.60%), 08/05/2025(1)(3) | | | 4,000 | | | | 3,909 | |
4.55%, 04/17/2026 | | | 1,500 | | | | 1,442 | |
5.71% (1 Year CMT Index + 1.55%), 01/12/2027(1)(3) | | | 5,000 | | | | 4,950 | |
6.54% (SOFR + 3.92%), 08/12/2033(1)(3) | | | 4,000 | | | | 4,098 | |
6.67% (SOFR + 1.58%), 05/12/2026(1)(3) | | | 5,330 | | | | 5,356 | |
UDR, Inc. | | | | | | | | |
1.90%, 03/15/2033 | | | 2,025 | | | | 1,481 | |
2.10%, 08/01/2032 | | | 1,430 | | | | 1,086 | |
2.95%, 09/01/2026 | | | 276 | | | | 252 | |
3.00%, 08/15/2031 | | | 415 | | | | 351 | |
3.20%, 01/15/2030 | | | 1,565 | | | | 1,382 | |
UniCredit SpA | | | | | | | | |
1.98% (1 Year CMT Index + 1.20%), 06/03/2027(1)(3) | | | 1,135 | | | | 1,000 | |
2.57% (1 Year CMT Index + 2.30%), 09/22/2026(1)(3) | | | 2,330 | | | | 2,103 | |
5.86% (5 Year 1100 Run ICE Swap Rate USD + 3.70%), 06/19/2032(1)(3) | | | 1,400 | | | | 1,272 | |
7.30% (5 Year 1100 Run ICE Swap Rate USD + 4.91%), 04/02/2034(1)(3) | | | 715 | | | | 674 | |
Ventas Realty LP | | | | | | | | |
3.25%, 10/15/2026 | | | 323 | | | | 296 | |
3.50%, 02/01/2025 | | | 251 | | | | 240 | |
3.75%, 05/01/2024 | | | 382 | | | | 375 | |
3.85%, 04/01/2027 | | | 677 | | | | 634 | |
4.13%, 01/15/2026 | | | 126 | | | | 121 | |
Wells Fargo & Co. | | | | | | | | |
2.16% (3 Month Term SOFR + 1.01%), 02/11/2026(3) | | | 10,183 | | | | 9,589 | |
2.39% (SOFR + 2.10%), 06/02/2028(3) | | | 2,875 | | | | 2,562 | |
2.57% (3 Month Term SOFR + 1.26%), 02/11/2031(3) | | | 12,110 | | | | 10,253 | |
3.00%, 04/22/2026 | | | 2,125 | | | | 1,998 | |
4.10%, 06/03/2026 | | | 3,580 | | | | 3,435 | |
4.30%, 07/22/2027 | | | 729 | | | | 699 | |
4.40%, 06/14/2046 | | | 626 | | | | 508 | |
4.61% (SOFR + 2.13%), 04/25/2053(3) | | | 3,301 | | | | 2,895 | |
4.65%, 11/04/2044 | | | 675 | | | | 573 | |
4.90%, 11/17/2045 | | | 1,571 | | | | 1,383 | |
5.38%, 11/02/2043 | | | 317 | | | | 298 | |
5.39% (SOFR + 2.02%), 04/24/2034(3) | | | 4,173 | | | | 4,146 | |
Welltower OP LLC | | | | | | | | |
3.10%, 01/15/2030 | | | 1,085 | | | | 940 | |
6.50%, 03/15/2041 | | | 700 | | | | 721 | |
Westpac Banking Corp. | | | | | | | | |
3.13%, 11/18/2041 | | | 2,377 | | | | 1,611 | |
Weyerhaeuser Co. | | | | | | | | |
7.38%, 03/15/2032 | | | 142 | | | | 158 | |
Willis North America, Inc. | | | | | | | | |
5.05%, 09/15/2048 | | | 7,500 | | | | 6,444 | |
WP Carey, Inc. | | | | | | | | |
2.40%, 02/01/2031 | | | 1,800 | | | | 1,447 | |
2.45%, 02/01/2032 | | | 1,360 | | | | 1,064 | |
4.25%, 10/01/2026 | | | 3,404 | | | | 3,268 | |
WR Berkley Corp. | | | | | | | | |
4.75%, 08/01/2044 | | | 3,445 | | | | 3,015 | |
XL Group Ltd. | | | | | | | | |
5.25%, 12/15/2043 | | | 2,700 | | | | 2,658 | |
| | | | | | | | |
Total Financials | | | | 1,863,738 | |
| | | | | | | | |
Industrials – 1.65% | | | | | | | | |
Airbus SE | | | | | | | | |
3.15%, 04/10/2027(1) | | | 736 | | | | 689 | |
3.95%, 04/10/2047(1) | | | 150 | | | | 127 | |
Allegion U.S. Holding Co., Inc. | | | | | | | | |
3.20%, 10/01/2024 | | | 2,000 | | | | 1,920 | |
Amphenol Corp. | | | | | | | | |
3.20%, 04/01/2024 | | | 8,135 | | | | 7,977 | |
Arrow Electronics, Inc. | | | | | | | | |
3.25%, 09/08/2024 | | | 219 | | | | 211 | |
3.88%, 01/12/2028 | | | 221 | | | | 204 | |
BAE Systems Plc | | | | | | | | |
| | | | | | | | |
1.90%, 02/15/2031(1) | | | 6,886 | | | | 5,529 | |
3.00%, 09/15/2050(1) | | | 754 | | | | 517 | |
5.80%, 10/11/2041(1) | | | 400 | | | | 410 | |
Berry Global, Inc. | | | | | | | | |
1.57%, 01/15/2026 | | | 17,410 | | | | 15,699 | |
Boeing Co. | | | | | | | | |
2.20%, 02/04/2026 | | | 19,535 | | | | 17,930 | |
2.75%, 02/01/2026 | | | 1,415 | | | | 1,318 | |
3.10%, 05/01/2026 | | | 1,529 | | | | 1,436 | |
3.25%, 03/01/2028 | | | 2,061 | | | | 1,875 | |
3.30%, 03/01/2035 | | | 1,410 | | | | 1,092 | |
3.63%, 02/01/2031 | | | 4,745 | | | | 4,274 | |
3.95%, 08/01/2059 | | | 4,825 | | | | 3,563 | |
4.88%, 05/01/2025 | | | 1,165 | | | | 1,148 | |
5.04%, 05/01/2027 | | | 1,185 | | | | 1,171 | |
5.15%, 05/01/2030 | | | 4,225 | | | | 4,184 | |
5.71%, 05/01/2040 | | | 1,555 | | | | 1,551 | |
5.81%, 05/01/2050 | | | 10,245 | | | | 10,208 | |
Burlington Northern Santa Fe LLC | | | | | | | | |
3.05%, 02/15/2051 | | | 4,625 | | | | 3,276 | |
3.30%, 09/15/2051 | | | 530 | | | | 396 | |
3.55%, 02/15/2050 | | | 517 | | | | 410 | |
4.38%, 09/01/2042 | | | 462 | | | | 418 | |
4.45%, 01/15/2053 | | | 1,800 | | | | 1,647 | |
5.15%, 09/01/2043 | | | 389 | | | | 385 | |
5.20%, 04/15/2054 | | | 9,818 | | | | 10,013 | |
5.40%, 06/01/2041 | | | 542 | | | | 553 | |
5.75%, 05/01/2040 | | | 373 | | | | 394 | |
6.15%, 05/01/2037 | | | 320 | | | | 353 | |
7.29%, 06/01/2036 | | | 134 | | | | 157 | |
Cellnex Finance Co. SA | | | | | | | | |
3.88%, 07/07/2041(1) | | | 3,000 | | | | 2,198 | |
CH Robinson Worldwide, Inc. | | | | | | | | |
4.20%, 04/15/2028 | | | 6,000 | | | | 5,746 | |
CRH America Finance, Inc. | | | | | | | | |
3.40%, 05/09/2027(1) | | | 200 | | | | 187 | |
CRH America, Inc. | | | | | | | | |
3.88%, 05/18/2025(1) | | | 354 | | | | 341 | |
5.13%, 05/18/2045(1) | | | 230 | | | | 207 | |
CSX Corp. | | | | | | | | |
3.35%, 09/15/2049 | | | 305 | | | | 225 | |
4.10%, 03/15/2044 | | | 175 | | | | 150 | |
4.65%, 03/01/2068 | | | 2,000 | | | | 1,790 | |
4.75%, 11/15/2048 | | | 1,280 | | | | 1,184 | |
5.50%, 04/15/2041 | | | 402 | | | | 407 | |
Eaton Corp. | | | | | | | | |
4.15%, 03/15/2033 | | | 143 | | | | 136 | |
5.80%, 03/15/2037 | | | 500 | | | | 507 | |
Embraer Netherlands Finance BV | | | | | | | | |
5.05%, 06/15/2025 | | | 2,202 | | | | 2,169 | |
Embraer Overseas Ltd. | | | | | | | | |
5.70%, 09/16/2023(1) | | | 4,000 | | | | 3,988 | |
FedEx Corp. | | | | | | | | |
4.95%, 10/17/2048 | | | 3,000 | | | | 2,754 | |
Flex Ltd. | | | | | | | | |
3.75%, 02/01/2026 | | | 14,000 | | | | 13,305 | |
Graphic Packaging International LLC | | | | | | | | |
0.82%, 04/15/2024(1) | | | 6,170 | | | | 5,920 | |
1.51%, 04/15/2026(1) | | | 11,485 | | | | 10,234 | |
JB Hunt Transport Services, Inc. | | | | | | | | |
3.85%, 03/15/2024 | | | 650 | | | | 638 | |
Johnson Controls International Plc | | | | | | | | |
4.95%, 07/02/2064(2) | | | 928 | | | | 824 | |
Keysight Technologies, Inc. | | | | | | | | |
4.60%, 04/06/2027 | | | 13,000 | | | | 12,792 | |
L3Harris Technologies, Inc. | | | | | | | | |
3.83%, 04/27/2025 | | | 820 | | | | 794 | |
4.85%, 04/27/2035 | | | 1,000 | | | | 960 | |
Lennox International, Inc. | | | | | | | | |
1.70%, 08/01/2027 | | | 2,000 | | | | 1,738 | |
Lockheed Martin Corp. | | | | | | | | |
4.75%, 02/15/2034 | | | 6,773 | | | | 6,757 | |
Martin Marietta Materials, Inc. | | | | | | | | |
3.45%, 06/01/2027 | | | 811 | | | | 763 | |
3.50%, 12/15/2027 | | | 6,165 | | | | 5,746 | |
4.25%, 07/02/2024 | | | 1,705 | | | | 1,684 | |
6.25%, 05/01/2037 | | | 107 | | | | 106 | |
Masco Corp. | | | | | | | | |
2.00%, 10/01/2030 | | | 760 | | | | 600 | |
6.50%, 08/15/2032 | | | 1,240 | | | | 1,278 | |
Mexico City Airport Trust | | | | | | | | |
3.88%, 04/30/2028(1) | | | 3,645 | | | | 3,438 | |
4.25%, 10/31/2026(1) | | | 1,245 | | | | 1,199 | |
| | | | | | | | |
5.50%, 07/31/2047(1) | | | 3,902 | | | | 3,411 | |
Norfolk Southern Corp. | | | | | | | | |
3.95%, 10/01/2042 | | | 332 | | | | 272 | |
4.05%, 08/15/2052 | | | 1,100 | | | | 905 | |
4.80%, 08/15/2043 | | | 1,273 | | | | 1,114 | |
5.59%, 05/17/2025 | | | 6 | | | | 6 | |
7.80%, 05/15/2027 | | | 1,705 | | | | 1,867 | |
Northrop Grumman Corp. | | | | | | | | |
3.85%, 04/15/2045 | | | 195 | | | | 159 | |
nVent Finance Sarl | | | | | | | | |
4.55%, 04/15/2028 | | | 3,625 | | | | 3,391 | |
Otis Worldwide Corp. | | | | | | | | |
2.57%, 02/15/2030 | | | 3,430 | | | | 2,957 | |
Parker-Hannifin Corp. | | | | | | | | |
4.45%, 11/21/2044 | | | 333 | | | | 298 | |
Penske Truck Leasing Co. LP | | | | | | | | |
1.20%, 11/15/2025(1) | | | 7,300 | | | | 6,493 | |
3.95%, 03/10/2025(1) | | | 7,000 | | | | 6,728 | |
Penske Truck Leasing Co. LP / PTL Finance Corp. | | | | | | | | |
6.20%, 06/15/2030(1) | | | 2,925 | | | | 2,940 | |
Precision Castparts Corp. | | | | | | | | |
4.20%, 06/15/2035 | | | 75 | | | | 69 | |
4.38%, 06/15/2045 | | | 415 | | | | 370 | |
Raytheon Technologies Corp. | | | | | | | | |
2.82%, 09/01/2051 | | | 2,550 | | | | 1,713 | |
3.75%, 11/01/2046 | | | 1,130 | | | | 910 | |
4.15%, 05/15/2045 | | | 1,683 | | | | 1,431 | |
4.35%, 04/15/2047 | | | 970 | | | | 860 | |
4.50%, 06/01/2042 | | | 1,823 | | | | 1,678 | |
5.15%, 02/27/2033 | | | 2,076 | | | | 2,104 | |
Siemens Financieringsmaatschappij NV | | | | | | | | |
2.35%, 10/15/2026(1) | | | 700 | | | | 644 | |
4.40%, 05/27/2045(1) | | | 513 | | | | 474 | |
SMBC Aviation Capital Finance DAC | | | | | | | | |
1.90%, 10/15/2026(1) | | | 1,400 | | | | 1,223 | |
Teledyne Technologies, Inc. | | | | | | | | |
2.75%, 04/01/2031 | | | 12,950 | | | | 10,814 | |
Textron, Inc. | | | | | | | | |
3.65%, 03/15/2027 | | | 4,975 | | | | 4,660 | |
Timken Co. | | | | | | | | |
3.88%, 09/01/2024 | | | 1,000 | | | | 974 | |
TTX Co. | | | | | | | | |
3.60%, 01/15/2025(1) | | | 2,000 | | | | 1,936 | |
Union Pacific Corp. | | | | | | | | |
4.10%, 09/15/2067 | | | 200 | | | | 165 | |
Vontier Corp. | | | | | | | | |
2.40%, 04/01/2028 | | | 8,000 | | | | 6,662 | |
Vulcan Materials Co. | | | | | | | | |
4.70%, 03/01/2048 | | | 2,054 | | | | 1,831 | |
Westinghouse Air Brake Technologies Corp. | | | | | | | | |
3.45%, 11/15/2026 | | | 5,000 | | | | 4,675 | |
4.38%, 08/15/2023 | | | 322 | | | | 321 | |
WestRock MWV LLC | | | | | | | | |
8.20%, 01/15/2030 | | | 537 | | | | 616 | |
WRKCo, Inc. | | | | | | | | |
3.75%, 03/15/2025 | | | 1,300 | | | | 1,251 | |
Xylem, Inc. | | | | | | | | |
1.95%, 01/30/2028 | | | 2,170 | | | | 1,903 | |
2.25%, 01/30/2031 | | | 960 | | | | 797 | |
| | | | | | | | |
Total Industrials | | | | 270,422 | |
| | | | | | | | |
Technology – 1.40% | | | | | | | | |
Activision Blizzard, Inc. | | | | | | | | |
1.35%, 09/15/2030 | | | 1,423 | | | | 1,138 | |
Analog Devices, Inc. | | | | | | | | |
2.95%, 10/01/2051 | | | 2,122 | | | | 1,499 | |
Apple, Inc. | | | | | | | | |
4.85%, 05/10/2053 | | | 7,500 | | | | 7,686 | |
Broadcom, Inc. | | | | | | | | |
2.45%, 02/15/2031(1) | | | 4,393 | | | | 3,573 | |
3.14%, 11/15/2035(1) | | | 20,453 | | | | 15,688 | |
3.19%, 11/15/2036(1) | | | 17,915 | | | | 13,539 | |
4.75%, 04/15/2029 | | | 6,850 | | | | 6,627 | |
CDW LLC / CDW Finance Corp. | | | | | | | | |
2.67%, 12/01/2026 | | | 14,070 | | | | 12,633 | |
CGI, Inc. | | | | | | | | |
1.45%, 09/14/2026 | | | 2,182 | | | | 1,927 | |
2.30%, 09/14/2031 | | | 3,919 | | | | 3,065 | |
Dell International LLC / EMC Corp. | | | | | | | | |
3.38%, 12/15/2041(1) | | | 2,208 | | | | 1,557 | |
5.25%, 02/01/2028 | | | 5,305 | | | | 5,294 | |
5.30%, 10/01/2029 | | | 1,100 | | | | 1,092 | |
6.02%, 06/15/2026 | | | 7,055 | | | | 7,171 | |
Fiserv, Inc. | | | | | | | | |
| | | | | | | | |
3.20%, 07/01/2026 | | | 890 | | | | 835 | |
3.85%, 06/01/2025 | | | 5,000 | | | | 4,830 | |
4.40%, 07/01/2049 | | | 2,850 | | | | 2,408 | |
Genpact Luxembourg Sarl | | | | | | | | |
3.38%, 12/01/2024 | | | 7,000 | | | | 6,747 | |
Intel Corp. | | | | | | | | |
5.63%, 02/10/2043 | | | 2,925 | | | | 2,970 | |
5.70%, 02/10/2053 | | | 3,230 | | | | 3,286 | |
5.90%, 02/10/2063 | | | 966 | | | | 998 | |
KLA Corp. | | | | | | | | |
3.30%, 03/01/2050 | | | 1,800 | | | | 1,350 | |
Leidos, Inc. | | | | | | | | |
2.30%, 02/15/2031 | | | 1,075 | | | | 847 | |
3.63%, 05/15/2025 | | | 3,500 | | | | 3,357 | |
5.75%, 03/15/2033 | | | 1,000 | | | | 993 | |
Microchip Technology, Inc. | | | | | | | | |
0.97%, 02/15/2024 | | | 22,950 | | | | 22,235 | |
0.98%, 09/01/2024 | | | 620 | | | | 586 | |
2.67%, 09/01/2023 | | | 5,353 | | | | 5,331 | |
Microsoft Corp. | | | | | | | | |
2.53%, 06/01/2050 | | | 9,330 | | | | 6,454 | |
NXP BV / NXP Funding LLC / NXP USA, Inc. | | | | | | | | |
2.50%, 05/11/2031 | | | 3,495 | | | | 2,848 | |
2.65%, 02/15/2032 | | | 4,875 | | | | 3,946 | |
2.70%, 05/01/2025 | | | 2,110 | | | | 2,000 | |
3.25%, 05/11/2041 | | | 3,600 | | | | 2,620 | |
3.25%, 11/30/2051 | | | 1,505 | | | | 1,003 | |
4.30%, 06/18/2029 | | | 7,077 | | | | 6,670 | |
Oracle Corp. | | | | | | | | |
3.25%, 11/15/2027 | | | 1,744 | | | | 1,618 | |
3.60%, 04/01/2040 | | | 6,210 | | | | 4,804 | |
3.60%, 04/01/2050 | | | 5,792 | | | | 4,139 | |
3.80%, 11/15/2037 | | | 600 | | | | 491 | |
3.85%, 07/15/2036 | | | 1,065 | | | | 889 | |
3.90%, 05/15/2035 | | | 936 | | | | 808 | |
4.30%, 07/08/2034 | | | 8,062 | | | | 7,322 | |
4.38%, 05/15/2055 | | | 400 | | | | 320 | |
4.90%, 02/06/2033 | | | 2,930 | | | | 2,844 | |
5.55%, 02/06/2053 | | | 4,080 | | | | 3,951 | |
QUALCOMM, Inc. | | | | | | | | |
4.50%, 05/20/2052 | | | 1,615 | | | | 1,469 | |
Roper Technologies, Inc. | | | | | | | | |
1.40%, 09/15/2027 | | | 3,050 | | | | 2,629 | |
2.00%, 06/30/2030 | | | 1,150 | | | | 940 | |
ServiceNow, Inc. | | | | | | | | |
1.40%, 09/01/2030 | | | 6,530 | | | | 5,170 | |
SK Hynix, Inc. | | | | | | | | |
1.50%, 01/19/2026(1) | | | 2,000 | | | | 1,772 | |
Texas Instruments, Inc. | | | | | | | | |
5.05%, 05/18/2063 | | | 2,516 | | | | 2,521 | |
TSMC Arizona Corp. | | | | | | | | |
3.13%, 10/25/2041 | | | 4,500 | | | | 3,594 | |
TSMC Global Ltd. | | | | | | | | |
4.63%, 07/22/2032(1) | | | 1,610 | | | | 1,598 | |
VMware, Inc. | | | | | | | | |
1.40%, 08/15/2026 | | | 8,282 | | | | 7,313 | |
1.80%, 08/15/2028 | | | 1,928 | | | | 1,616 | |
4.65%, 05/15/2027 | | | 1,370 | | | | 1,331 | |
Workday, Inc. | | | | | | | | |
3.50%, 04/01/2027 | | | 3,141 | | | | 2,977 | |
3.80%, 04/01/2032 | | | 2,910 | | | | 2,620 | |
Xilinx, Inc. | | | | | | | | |
2.38%, 06/01/2030 | | | 2,000 | | | | 1,727 | |
| | | | | | | | |
Total Technology | | | | 229,266 | |
| | | | | | | | |
Utilities – 3.49% | | | | | | | | |
Abu Dhabi National Energy Co. PJSC | | | | | | | | |
2.00%, 04/29/2028(1) | | | 2,015 | | | | 1,790 | |
AEP Texas, Inc. | | | | | | | | |
3.80%, 10/01/2047 | | | 3,715 | | | | 2,807 | |
AEP Transmission Co. LLC | | | | | | | | |
3.15%, 09/15/2049 | | | 580 | | | | 413 | |
3.75%, 12/01/2047 | | | 2,600 | | | | 2,074 | |
4.00%, 12/01/2046 | | | 2,020 | | | | 1,693 | |
4.25%, 09/15/2048 | | | 4,790 | | | | 4,116 | |
Alabama Power Co. | | | | | | | | |
2.80%, 04/01/2025 | | | 2,025 | | | | 1,941 | |
3.75%, 03/01/2045 | | | 182 | | | | 143 | |
4.10%, 01/15/2042 | | | 233 | | | | 194 | |
4.15%, 08/15/2044 | | | 205 | | | | 171 | |
6.13%, 05/15/2038 | | | 219 | | | | 235 | |
Alexander Funding Trust | | | | | | | | |
1.84%, 11/15/2023(1) | | | 2,000 | | | | 1,956 | |
Alfa Desarrollo SpA | | | | | | | | |
| | | | | | | | |
4.55%, 09/27/2051(1) | | | 2,463 | | | | 1,807 | |
Ameren Corp. | | | | | | | | |
2.50%, 09/15/2024 | | | 2,153 | | | | 2,063 | |
American Electric Power Co., Inc. | | | | | | | | |
0.75%, 11/01/2023 | | | 3,032 | | | | 2,981 | |
5.70%, 08/15/2025 | | | 6,918 | | | | 6,871 | |
American Water Capital Corp. | | | | | | | | |
3.45%, 06/01/2029 | | | 590 | | | | 548 | |
4.00%, 12/01/2046 | | | 2,350 | | | | 1,896 | |
6.59%, 10/15/2037 | | | 386 | | | | 435 | |
APA Infrastructure Ltd. | | | | | | | | |
4.20%, 03/23/2025(1) | | | 2,100 | | | | 2,036 | |
4.25%, 07/15/2027(1) | | | 1,098 | | | | 1,046 | |
Arizona Public Service Co. | | | | | | | | |
3.35%, 06/15/2024 | | | 676 | | | | 659 | |
3.75%, 05/15/2046 | | | 2,290 | | | | 1,693 | |
5.05%, 09/01/2041 | | | 349 | | | | 318 | |
Atmos Energy Corp. | | | | | | | | |
4.13%, 10/15/2044 | | | 1,860 | | | | 1,565 | |
4.15%, 01/15/2043 | | | 830 | | | | 716 | |
Ausgrid Finance Pty Ltd. | | | | | | | | |
4.35%, 08/01/2028(1) | | | 10,275 | | | | 9,703 | |
Avangrid, Inc. | | | | | | | | |
3.15%, 12/01/2024 | | | 610 | | | | 585 | |
Baltimore Gas & Electric Co. | | | | | | | | |
2.90%, 06/15/2050 | | | 950 | | | | 633 | |
3.20%, 09/15/2049 | | | 1,105 | | | | 800 | |
3.50%, 08/15/2046 | | | 375 | | | | 283 | |
Berkshire Hathaway Energy Co. | | | | | | | | |
2.85%, 05/15/2051 | | | 7,650 | | | | 4,945 | |
6.13%, 04/01/2036 | | | 366 | | | | 382 | |
Boston Gas Co. | | | | | | | | |
4.49%, 02/15/2042(1) | | | 253 | | | | 211 | |
Brooklyn Union Gas Co. | | | | | | | | |
3.87%, 03/04/2029(1) | | | 1,125 | | | | 1,022 | |
4.27%, 03/15/2048(1) | | | 1,100 | | | | 841 | |
4.50%, 03/10/2046(1) | | | 2,000 | | | | 1,565 | |
CenterPoint Energy Houston Electric LLC | | | | | | | | |
3.95%, 03/01/2048 | | | 151 | | | | 125 | |
CenterPoint Energy Resources Corp. | | | | | | | | |
5.25%, 03/01/2028 | | | 6,869 | | | | 6,866 | |
Cleveland Electric Illuminating Co. | | | | | | | | |
3.50%, 04/01/2028(1) | | | 1,333 | | | | 1,221 | |
CMS Energy Corp. | | | | | | | | |
2.95%, 02/15/2027 | | | 348 | | | | 320 | |
3.00%, 05/15/2026 | | | 110 | | | | 103 | |
3.45%, 08/15/2027 | | | 350 | | | | 327 | |
Comision Federal de Electricidad | | | | | | | | |
4.69%, 05/15/2029(1) | | | 3,900 | | | | 3,502 | |
4.88%, 01/15/2024(1) | | | 322 | | | | 319 | |
Commonwealth Edison Co. | | | | | | | | |
3.65%, 06/15/2046 | | | 364 | | | | 285 | |
3.75%, 08/15/2047 | | | 1,000 | | | | 791 | |
4.00%, 03/01/2048 | | | 4,615 | | | | 3,856 | |
Consolidated Edison Co. of New York, Inc. | | | | | | | | |
3.85%, 06/15/2046 | | | 2,940 | | | | 2,275 | |
3.88%, 06/15/2047 | | | 1,800 | | | | 1,411 | |
4.13%, 05/15/2049 | | | 4,293 | | | | 3,518 | |
4.30%, 12/01/2056 | | | 3,050 | | | | 2,475 | |
4.50%, 05/15/2058 | | | 538 | | | | 449 | |
5.70%, 06/15/2040 | | | 318 | | | | 319 | |
Consolidated Edison, Inc. | | | | | | | | |
0.65%, 12/01/2023 | | | 7,561 | | | | 7,408 | |
Constellation Energy Generation LLC | | | | | | | | |
5.75%, 10/01/2041 | | | 3,192 | | | | 3,118 | |
5.80%, 03/01/2033 | | | 2,817 | | | | 2,884 | |
6.25%, 10/01/2039 | | | 300 | | | | 311 | |
Consumers Energy Co. | | | | | | | | |
3.25%, 08/15/2046 | | | 190 | | | | 140 | |
4.35%, 08/31/2064 | | | 191 | | | | 155 | |
Delmarva Power & Light Co. | | | | | | | | |
4.00%, 06/01/2042 | | | 170 | | | | 136 | |
Dominion Energy, Inc. | | | | | | | | |
2.85%, 08/15/2026 | | | 304 | | | | 281 | |
3.90%, 10/01/2025 | | | 3,558 | | | | 3,427 | |
4.90%, 08/01/2041 | | | 212 | | | | 190 | |
5.25%, 08/01/2033 | | | 1,161 | | | | 1,142 | |
7.00%, 06/15/2038 | | | 124 | | | | 136 | |
DTE Energy Co. | | | | | | | | |
2.53%, 10/01/2024(2) | | | 3,878 | | | | 3,713 | |
4.22%, 11/01/2024(2) | | | 12,313 | | | | 12,037 | |
Duke Energy Carolinas LLC | | | | | | | | |
4.25%, 12/15/2041 | | | 141 | | | | 122 | |
| | | | | | | | |
4.95%, 01/15/2033 | | | 7,935 | | | | 7,876 | |
6.00%, 12/01/2028 | | | 235 | | | | 246 | |
Duke Energy Corp. | | | | | | | | |
2.65%, 09/01/2026 | | | 9,417 | | | | 8,703 | |
3.75%, 09/01/2046 | | | 13,800 | | | | 10,439 | |
3.95%, 08/15/2047 | | | 1,740 | | | | 1,351 | |
Duke Energy Florida LLC | | | | | | | | |
4.20%, 07/15/2048 | | | 3,636 | | | | 3,097 | |
Duke Energy Indiana LLC | | | | | | | | |
3.75%, 05/15/2046 | | | 600 | | | | 465 | |
Duke Energy Ohio, Inc. | | | | | | | | |
5.25%, 04/01/2033 | | | 2,515 | | | | 2,533 | |
Duke Energy Progress LLC | | | | | | | | |
2.90%, 08/15/2051 | | | 1,645 | | | | 1,098 | |
3.70%, 10/15/2046 | | | 506 | | | | 393 | |
4.10%, 05/15/2042 | | | 217 | | | | 183 | |
4.10%, 03/15/2043 | | | 181 | | | | 152 | |
4.15%, 12/01/2044 | | | 129 | | | | 107 | |
4.20%, 08/15/2045 | | | 325 | | | | 271 | |
4.38%, 03/30/2044 | | | 132 | | | | 114 | |
Duquesne Light Holdings, Inc. | | | | | | | | |
2.53%, 10/01/2030(1) | | | 2,500 | | | | 1,998 | |
3.62%, 08/01/2027(1) | | | 6,675 | | | | 5,991 | |
Edison International | | | | | | | | |
3.55%, 11/15/2024 | | | 3,606 | | | | 3,485 | |
5.75%, 06/15/2027 | | | 2,170 | | | | 2,170 | |
6.95%, 11/15/2029 | | | 8,820 | | | | 9,278 | |
Electricite de France SA | | | | | | | | |
4.75%, 10/13/2035(1) | | | 5,000 | | | | 4,400 | |
6.90%, 05/23/2053(1) | | | 1,474 | | | | 1,527 | |
Emera U.S. Finance LP | | | | | | | | |
3.55%, 06/15/2026 | | | 1,260 | | | | 1,191 | |
4.75%, 06/15/2046 | | | 900 | | | | 730 | |
Enel Finance America LLC | | | | | | | | |
7.10%, 10/14/2027(1) | | | 8,531 | | | | 8,964 | |
Enel Finance International NV | | | | | | | | |
1.88%, 07/12/2028(1) | | | 2,050 | | | | 1,719 | |
2.65%, 09/10/2024(1) | | | 1,440 | | | | 1,386 | |
3.50%, 04/06/2028(1) | | | 4,065 | | | | 3,719 | |
4.75%, 05/25/2047(1) | | | 7,050 | | | | 5,997 | |
6.00%, 10/07/2039(1) | | | 307 | | | | 302 | |
6.80%, 10/14/2025(1) | | | 5,402 | | | | 5,503 | |
6.80%, 09/15/2037(1) | | | 2,425 | | | | 2,552 | |
7.75%, 10/14/2052(1) | | | 1,054 | | | | 1,235 | |
Engie Energia Chile SA | | | | | | | | |
3.40%, 01/28/2030(1) | | | 1,600 | | | | 1,333 | |
Entergy Arkansas LLC | | | | | | | | |
2.65%, 06/15/2051 | | | 960 | | | | 597 | |
Entergy Corp. | | | | | | | | |
2.95%, 09/01/2026 | | | 310 | | | | 286 | |
Entergy Louisiana LLC | | | | | | | | |
2.40%, 10/01/2026 | | | 650 | | | | 595 | |
2.90%, 03/15/2051 | | | 1,570 | | | | 1,035 | |
3.05%, 06/01/2031 | | | 440 | | | | 381 | |
3.12%, 09/01/2027 | | | 370 | | | | 341 | |
4.00%, 03/15/2033 | | | 2,610 | | | | 2,369 | |
Entergy Texas, Inc. | | | | | | | | |
4.50%, 03/30/2039 | | | 11,000 | | | | 9,883 | |
Evergy Kansas Central, Inc. | | | | | | | | |
4.13%, 03/01/2042 | | | 4,175 | | | | 3,514 | |
Evergy Metro, Inc. | | | | | | | | |
4.20%, 03/15/2048 | | | 500 | | | | 411 | |
5.30%, 10/01/2041 | | | 1,032 | | | | 1,003 | |
Evergy, Inc. | | | | | | | | |
2.90%, 09/15/2029 | | | 2,190 | | | | 1,911 | |
Eversource Energy | | | | | | | | |
2.90%, 03/01/2027 | | | 1,978 | | | | 1,822 | |
4.75%, 05/15/2026 | | | 3,264 | | | | 3,199 | |
5.45%, 03/01/2028 | | | 10,116 | | | | 10,184 | |
Exelon Corp. | | | | | | | | |
4.95%, 06/15/2035 | | | 1,500 | | | | 1,437 | |
5.30%, 03/15/2033 | | | 6,311 | | | | 6,291 | |
Fells Point Funding Trust | | | | | | | | |
3.05%, 01/31/2027(1) | | | 9,320 | | | | 8,568 | |
FirstEnergy Corp. | | | | | | | | |
3.40%, 03/01/2050 | | | 2,376 | | | | 1,637 | |
FirstEnergy Transmission LLC | | | | | | | | |
2.87%, 09/15/2028(1) | | | 1,567 | | | | 1,379 | |
4.35%, 01/15/2025(1) | | | 15,221 | | | | 14,842 | |
4.55%, 04/01/2049(1) | | | 2,143 | | | | 1,788 | |
5.45%, 07/15/2044(1) | | | 5,027 | | | | 4,648 | |
Florida Power & Light Co. | | | | | | | | |
5.40%, 09/01/2035 | | | 700 | | | | 701 | |
| | | | | | | | |
Fortis, Inc. | | | | | | | | |
3.06%, 10/04/2026 | | | 2,291 | | | | 2,111 | |
Georgia Power Co. | | | | | | | | |
4.95%, 05/17/2033 | | | 4,019 | | | | 3,967 | |
Indiana Michigan Power Co. | | | | | | | | |
3.25%, 05/01/2051 | | | 1,570 | | | | 1,093 | |
Israel Electric Corp. Ltd. | | | | | | | | |
3.75%, 02/22/2032(1) | | | 3,154 | | | | 2,690 | |
5.00%, 11/12/2024(1) | | | 1,884 | | | | 1,863 | |
ITC Holdings Corp. | | | | | | | | |
2.95%, 05/14/2030(1) | | | 890 | | | | 765 | |
Jersey Central Power & Light Co. | | | | | | | | |
4.30%, 01/15/2026(1) | | | 740 | | | | 716 | |
6.15%, 06/01/2037 | | | 400 | | | | 414 | |
KeySpan Gas East Corp. | | | | | | | | |
2.74%, 08/15/2026(1) | | | 538 | | | | 489 | |
Massachusetts Electric Co. | | | | | | | | |
4.00%, 08/15/2046(1) | | | 624 | | | | 472 | |
Metropolitan Edison Co. | | | | | | | | |
5.20%, 04/01/2028(1) | | | 11,180 | | | | 11,066 | |
Mid-Atlantic Interstate Transmission LLC | | | | | | | | |
4.10%, 05/15/2028(1) | | | 9,900 | | | | 9,359 | |
Monongahela Power Co. | | | | | | | | |
5.40%, 12/15/2043(1) | | | 1,650 | | | | 1,600 | |
National Rural Utilities Cooperative Finance Corp. | | | | | | | | |
8.00%, 03/01/2032 | | | 791 | | | | 926 | |
Nevada Power Co. | | | | | | | | |
5.38%, 09/15/2040 | | | 261 | | | | 249 | |
5.45%, 05/15/2041 | | | 386 | | | | 371 | |
New England Power Co. | | | | | | | | |
3.80%, 12/05/2047(1) | | | 5,108 | | | | 4,007 | |
New York State Electric & Gas Corp. | | | | | | | | |
3.25%, 12/01/2026(1) | | | 804 | | | | 749 | |
NextEra Energy Capital Holdings, Inc. | | | | | | | | |
4.26%, 09/01/2024 | | | 19,287 | | | | 18,968 | |
4.45%, 06/20/2025 | | | 5,994 | | | | 5,880 | |
6.05%, 03/01/2025 | | | 2,590 | | | | 2,600 | |
Niagara Mohawk Power Corp. | | | | | | | | |
1.96%, 06/27/2030(1) | | | 2,150 | | | | 1,718 | |
3.51%, 10/01/2024(1) | | | 258 | | | | 248 | |
NiSource, Inc. | | | | | | | | |
1.70%, 02/15/2031 | | | 1,640 | | | | 1,282 | |
2.95%, 09/01/2029 | | | 1,520 | | | | 1,331 | |
5.25%, 03/30/2028 | | | 4,300 | | | | 4,297 | |
5.40%, 06/30/2033 | | | 2,010 | | | | 2,011 | |
5.80%, 02/01/2042 | | | 774 | | | | 747 | |
Northern States Power Co. | | | | | | | | |
3.60%, 09/15/2047 | | | 2,395 | | | | 1,883 | |
4.13%, 05/15/2044 | | | 1,480 | | | | 1,257 | |
NRG Energy, Inc. | | | | | | | | |
2.00%, 12/02/2025(1) | | | 2,685 | | | | 2,409 | |
2.45%, 12/02/2027(1) | | | 6,215 | | | | 5,237 | |
4.45%, 06/15/2029(1) | | | 1,155 | | | | 1,021 | |
Ohio Power Co. | | | | | | | | |
2.90%, 10/01/2051 | | | 1,390 | | | | 923 | |
4.15%, 04/01/2048 | | | 1,190 | | | | 973 | |
Oncor Electric Delivery Co. LLC | | | | | | | | |
3.10%, 09/15/2049 | | | 1,895 | | | | 1,338 | |
5.75%, 03/15/2029 | | | 124 | | | | 129 | |
Pacific Gas & Electric Co. | | | | | | | | |
1.70%, 11/15/2023 | | | 1,880 | | | | 1,848 | |
2.95%, 03/01/2026 | | | 990 | | | | 907 | |
3.25%, 02/16/2024 | | | 15,020 | | | | 14,742 | |
3.45%, 07/01/2025 | | | 1,570 | | | | 1,482 | |
3.75%, 02/15/2024 | | | 3,148 | | | | 3,096 | |
3.75%, 08/15/2042 | | | 376 | | | | 260 | |
3.85%, 11/15/2023 | | | 9,208 | | | | 9,127 | |
3.95%, 12/01/2047 | | | 779 | | | | 531 | |
4.00%, 12/01/2046 | | | 2,289 | | | | 1,534 | |
4.25%, 08/01/2023 | | | 2,482 | | | | 2,479 | |
4.30%, 03/15/2045 | | | 638 | | | | 455 | |
4.45%, 04/15/2042 | | | 1,905 | | | | 1,438 | |
4.50%, 07/01/2040 | | | 5,755 | | | | 4,474 | |
4.60%, 06/15/2043 | | | 2,024 | | | | 1,530 | |
4.95%, 07/01/2050 | | | 4,255 | | | | 3,342 | |
6.10%, 01/15/2029 | | | 975 | | | | 959 | |
6.40%, 06/15/2033 | | | 3,090 | | | | 3,073 | |
PacifiCorp | | | | | | | | |
5.50%, 05/15/2054 | | | 166 | | | | 156 | |
PECO Energy Co. | | | | | | | | |
2.80%, 06/15/2050 | | | 860 | | | | 567 | |
2.85%, 09/15/2051 | | | 1,445 | | | | 952 | |
3.70%, 09/15/2047 | | | 2,120 | | | | 1,674 | |
| | | | | | | | |
3.90%, 03/01/2048 | | | 5,235 | | | | 4,301 | |
4.15%, 10/01/2044 | | | 353 | | | | 298 | |
Pennsylvania Electric Co. | | | | | | | | |
3.25%, 03/15/2028(1) | | | 2,386 | | | | 2,162 | |
Pepco Holdings LLC | | | | | | | | |
7.45%, 08/15/2032 | | | 222 | | | | 242 | |
PG&E Wildfire Recovery Funding LLC | | | | | | | | |
4.26%, 06/01/2036 | | | 1,735 | | | | 1,650 | |
5.10%, 06/01/2052 | | | 2,420 | | | | 2,448 | |
5.21%, 12/01/2047 | | | 1,285 | | | | 1,282 | |
Potomac Electric Power Co. | | | | | | | | |
6.50%, 11/15/2037 | | | 136 | | | | 152 | |
PPL Electric Utilities Corp. | | | | | | | | |
3.00%, 10/01/2049 | | | 2,105 | | | | 1,489 | |
4.13%, 06/15/2044 | | | 208 | | | | 177 | |
Public Service Co. of Colorado | | | | | | | | |
3.55%, 06/15/2046 | | | 353 | | | | 252 | |
4.10%, 06/15/2048 | | | 2,515 | | | | 2,066 | |
Public Service Co. of Oklahoma | | | | | | | | |
6.63%, 11/15/2037 | | | 649 | | | | 691 | |
Public Service Electric & Gas Co. | | | | | | | | |
3.60%, 12/01/2047 | | | 1,605 | | | | 1,260 | |
4.65%, 03/15/2033 | | | 7,255 | | | | 7,118 | |
5.38%, 11/01/2039 | | | 117 | | | | 114 | |
Public Service Enterprise Group, Inc. | | | | | | | | |
1.60%, 08/15/2030 | | | 8,395 | | | | 6,576 | |
Puget Energy, Inc. | | | | | | | | |
2.38%, 06/15/2028 | | | 4,023 | | | | 3,470 | |
3.65%, 05/15/2025 | | | 1,200 | | | | 1,147 | |
San Diego Gas & Electric Co. | | | | | | | | |
2.95%, 08/15/2051 | | | 2,230 | | | | 1,509 | |
3.75%, 06/01/2047 | | | 4,417 | | | | 3,442 | |
3.95%, 11/15/2041 | | | 310 | | | | 245 | |
5.35%, 05/15/2040 | | | 3,430 | | | | 3,336 | |
SCE Recovery Funding LLC | | | | | | | | |
4.70%, 06/15/2040 | | | 2,395 | | | | 2,330 | |
Sempra Energy | | | | | | | | |
6.00%, 10/15/2039 | | | 752 | | | | 769 | |
Sigeco Securitization I LLC | | | | | | | | |
5.03%, 11/15/2036 | | | 2,617 | | | | 2,613 | |
Southern California Edison Co. | | | | | | | | |
2.95%, 02/01/2051 | | | 6,220 | | | | 4,073 | |
3.65%, 03/01/2028 | | | 1,200 | | | | 1,119 | |
3.90%, 12/01/2041 | | | 392 | | | | 306 | |
4.05%, 03/15/2042 | | | 800 | | | | 647 | |
4.13%, 03/01/2048 | | | 1,880 | | | | 1,525 | |
4.90%, 06/01/2026 | | | 5,813 | | | | 5,730 | |
5.45%, 06/01/2052 | | | 1,815 | | | | 1,763 | |
5.88%, 12/01/2053 | | | 2,647 | | | | 2,700 | |
6.05%, 03/15/2039 | | | 253 | | | | 263 | |
Southern California Gas Co. | | | | | | | | |
2.55%, 02/01/2030 | | | 2,621 | | | | 2,253 | |
Southern Co. | | | | | | | | |
4.48%, 08/01/2024(2) | | | 9,015 | | | | 8,850 | |
5.11%, 08/01/2027 | | | 2,466 | | | | 2,443 | |
Southern Co. Gas Capital Corp. | | | | | | | | |
3.25%, 06/15/2026 | | | 225 | | | | 212 | |
3.95%, 10/01/2046 | | | 282 | | | | 218 | |
4.40%, 06/01/2043 | | | 160 | | | | 132 | |
5.88%, 03/15/2041 | | | 1,210 | | | | 1,218 | |
Southern Power Co. | | | | | | | | |
5.15%, 09/15/2041 | | | 746 | | | | 697 | |
Southwest Gas Corp. | | | | | | | | |
3.80%, 09/29/2046 | | | 508 | | | | 368 | |
Southwestern Public Service Co. | | | | | | | | |
4.50%, 08/15/2041 | | | 350 | | | | 305 | |
Toledo Edison Co. | | | | | | | | |
2.65%, 05/01/2028(1) | | | 1,208 | | | | 1,067 | |
6.15%, 05/15/2037 | | | 680 | | | | 708 | |
Union Electric Co. | | | | | | | | |
3.65%, 04/15/2045 | | | 1,370 | | | | 1,060 | |
3.90%, 04/01/2052 | | | 3,065 | | | | 2,500 | |
Virginia Electric & Power Co. | | | | | | | | |
3.50%, 03/15/2027 | | | 1,732 | | | | 1,639 | |
3.80%, 04/01/2028 | | | 2,675 | | | | 2,534 | |
4.45%, 02/15/2044 | | | 126 | | | | 108 | |
4.65%, 08/15/2043 | | | 1,765 | | | | 1,565 | |
5.45%, 04/01/2053 | | | 5,460 | | | | 5,462 | |
Vistra Operations Co. LLC | | | | | | | | |
3.55%, 07/15/2024(1) | | | 8,460 | | | | 8,171 | |
WEC Energy Group, Inc. | | | | | | | | |
3.55%, 06/15/2025 | | | 204 | | | | 196 | |
Xcel Energy, Inc. | | | | | | | | |
| | | | | | | | |
3.35%, 12/01/2026 | | | 5,105 | | | | 4,789 | |
| | | | | | | | |
Total Utilities | | | | 573,374 | |
| | | | | | | | |
Total Corporate Bonds (Cost: $5,362,045) | | | | | | | 4,838,958 | |
| | | | | | | | |
Government Related – 20.44% | | | | | | | | |
Other Government Related – 1.20% | | | | | | | | |
Alabama Economic Settlement Authority | | | | | | | | |
4.26%, 09/15/2032 | | | 610 | | | | 581 | |
American Municipal Power, Inc. | | | | | | | | |
7.50%, 02/15/2050 | | | 1,350 | | | | 1,678 | |
Atlanta Independent School System | | | | | | | | |
5.56%, 03/01/2026 | | | 535 | | | | 539 | |
Bank Gospodarstwa Krajowego | | | | | | | | |
5.38%, 05/22/2033(1) | | | 4,915 | | | | 4,886 | |
Bay Area Toll Authority | | | | | | | | |
6.26%, 04/01/2049 | | | 1,650 | | | | 1,954 | |
Bermuda Government International Bond | | | | | | | | |
2.38%, 08/20/2030(1) | | | 1,765 | | | | 1,471 | |
California Municipal Finance Authority | | | | | | | | |
3.28%, 02/01/2046 | | | 4,000 | | | | 2,813 | |
California Qualified School Bond Joint Powers Authority | | | | | | | | |
7.16%, 03/01/2027 | | | 535 | | | | 558 | |
Chile Government International Bond | | | | | | | | |
2.55%, 01/27/2032 | | | 1,398 | | | | 1,194 | |
City of Houston TX Combined Utility System Revenue | | | | | | | | |
3.83%, 05/15/2028 | | | 1,850 | | | | 1,800 | |
City of Los Angeles Department of Airports | | | | | | | | |
6.58%, 05/15/2039 | | | 1,515 | | | | 1,678 | |
Clark County School District | | | | | | | | |
5.51%, 06/15/2024 | | | 865 | | | | 863 | |
Curators of the University of Missouri | | | | | | | | |
5.96%, 11/01/2039 | | | 3,310 | | | | 3,581 | |
District of Columbia Water & Sewer Authority | | | | | | | | |
4.81%, 10/01/2114 | | | 875 | | | | 812 | |
Eaton Community City School District | | | | | | | | |
5.39%, 08/25/2027 | | | 275 | | | | 275 | |
Export-Import Bank of India | | | | | | | | |
3.88%, 02/01/2028(1) | | | 3,480 | | | | 3,262 | |
Fannie Mae | | | | | | | | |
0.00%, 03/17/2031 | | | 2,250 | | | | 1,615 | |
0.88%, 08/05/2030 | | | 555 | | | | 446 | |
1.63%, 01/07/2025 | | | 6,247 | | | | 5,923 | |
2.63%, 09/06/2024 | | | 5,221 | | | | 5,066 | |
6.63%, 11/15/2030 | | | 2,550 | | | | 2,959 | |
7.13%, 01/15/2030 | | | 1,500 | | | | 1,762 | |
Federal Home Loan Banks | | | | | | | | |
4.00%, 10/24/2029 | | | 2,000 | | | | 1,961 | |
Federal Home Loan Mortgage Corp. | | | | | | | | |
6.25%, 07/15/2032 | | | 3,749 | | | | 4,355 | |
Finnvera OYJ | | | | | | | | |
2.38%, 06/04/2025(1) | | | 600 | | | | 569 | |
Idaho Energy Resources Authority | | | | | | | | |
2.86%, 09/01/2046 | | | 3,175 | | | | 2,308 | |
Israel Government AID Bond | | | | | | | | |
0.00%, 09/15/2023 | | | 1,837 | | | | 1,817 | |
0.00%, 11/01/2024 | | | 1,000 | | | | 929 | |
5.50%, 09/18/2033 | | | 619 | | | | 680 | |
Japan Finance Organization for Municipalities | | | | | | | | |
1.75%, 09/05/2024(1) | | | 200 | | | | 191 | |
2.13%, 10/25/2023(1) | | | 3,400 | | | | 3,363 | |
Korea National Oil Corp. | | | | | | | | |
4.75%, 04/03/2026(1) | | | 1,570 | | | | 1,539 | |
4.88%, 04/03/2028(1) | | | 1,760 | | | | 1,743 | |
Los Angeles Department of Water & Power | | | | | | | | |
6.60%, 07/01/2050 | | | 2,400 | | | | 2,970 | |
Mexico Government International Bond | | | | | | | | |
2.66%, 05/24/2031 | | | 2,579 | | | | 2,144 | |
3.50%, 02/12/2034 | | | 3,202 | | | | 2,682 | |
3.75%, 01/11/2028 | | | 3,517 | | | | 3,344 | |
3.77%, 05/24/2061 | | | 1,753 | | | | 1,190 | |
4.35%, 01/15/2047 | | | 42 | | | | 34 | |
4.40%, 02/12/2052 | | | 1,340 | | | | 1,055 | |
4.60%, 01/23/2046 | | | 1,494 | | | | 1,239 | |
4.60%, 02/10/2048 | | | 1,482 | | | | 1,215 | |
4.75%, 03/08/2044 | | | 450 | | | | 384 | |
5.75%, 10/12/2110 | | | 588 | | | | 524 | |
6.34%, 05/04/2053 | | | 2,123 | | | | 2,163 | |
New Hampshire Housing Finance Authority | | | | | | | | |
3.75%, 07/01/2034 | | | 5 | | | | 5 | |
New Jersey Transportation Trust Fund Authority | | | | | | | | |
5.75%, 12/15/2028 | | | 6,790 | | | | 6,853 | |
New Jersey Turnpike Authority | | | | | | | | |
7.10%, 01/01/2041 | | | 5,870 | | | | 7,150 | |
| | | | | | | | |
New York State Dormitory Authority | | | | | | | | |
2.20%, 03/15/2034 | | | 4,165 | | | | 3,274 | |
5.60%, 03/15/2040 | | | 260 | | | | 276 | |
New York State Urban Development Corp. | | | | | | | | |
5.84%, 03/15/2040 | | | 2,000 | | | | 2,127 | |
North Carolina Housing Finance Agency | | | | | | | | |
3.00%, 01/01/2033 | | | 65 | | | | 65 | |
Ohio State University | | | | | | | | |
4.05%, 12/01/2056 | | | 406 | | | | 340 | |
4.80%, 06/01/2111 | | | 1,102 | | | | 1,012 | |
Panama Government International Bond | | | | | | | | |
4.50%, 04/16/2050 | | | 1,610 | | | | 1,245 | |
4.50%, 01/19/2063 | | | 8,120 | | | | 5,927 | |
Peruvian Government International Bond | | | | | | | | |
2.78%, 01/23/2031 | | | 2,220 | | | | 1,898 | |
3.00%, 01/15/2034 | | | 1,569 | | | | 1,302 | |
5.63%, 11/18/2050 | | | 190 | | | | 196 | |
Port Authority of New York & New Jersey | | | | | | | | |
4.46%, 10/01/2062 | | | 2,065 | | | | 1,886 | |
5.65%, 11/01/2040 | | | 435 | | | | 467 | |
5.65%, 11/01/2040 | | | 1,260 | | | | 1,353 | |
Province of Manitoba Canada | | | | | | | | |
2.13%, 06/22/2026 | | | 400 | | | | 371 | |
Regents of the University of California Medical Center Pooled Revenue | | | | | | | | |
3.71%, 05/15/2120 | | | 3,270 | | | | 2,187 | |
Resolution Funding Corp. Principal Strip | | | | | | | | |
0.00%, 04/15/2030 | | | 929 | | | | 689 | |
Romanian Government International Bond | | | | | | | | |
6.00%, 05/25/2034(1) | | | 6,002 | | | | 5,943 | |
Saudi Government International Bond | | | | | | | | |
2.25%, 02/02/2033(1) | | | 1,533 | | | | 1,234 | |
3.45%, 02/02/2061(1) | | | 1,185 | | | | 832 | |
5.00%, 01/18/2053(1) | | | 948 | | | | 877 | |
St Johns County Industrial Development Authority | | | | | | | | |
2.54%, 10/01/2030 | | | 10,000 | | | | 8,195 | |
State of California | | | | | | | | |
7.30%, 10/01/2039 | | | 3,335 | | | | 4,027 | |
7.50%, 04/01/2034 | | | 5,540 | | | | 6,746 | |
State of Illinois | | | | | | | | |
5.10%, 06/01/2033 | | | 13,030 | | | | 12,804 | |
Tennessee Valley Authority | | | | | | | | |
0.75%, 05/15/2025 | | | 5,562 | | | | 5,132 | |
1.50%, 09/15/2031 | | | 1,230 | | | | 994 | |
2.88%, 02/01/2027 | | | 805 | | | | 757 | |
4.25%, 09/15/2065 | | | 1,720 | | | | 1,542 | |
4.63%, 09/15/2060 | | | 1,308 | | | | 1,266 | |
5.50%, 06/15/2038 | | | 57 | | | | 62 | |
5.88%, 04/01/2036 | | | 2,967 | | | | 3,367 | |
7.13%, 05/01/2030 | | | 1,615 | | | | 1,881 | |
Tennessee Valley Authority Generic Strip | | | | | | | | |
0.00%, 07/15/2028 | | | 2,000 | | | | 1,600 | |
0.00%, 03/15/2032 | | | 1,514 | | | | 1,015 | |
Tennessee Valley Authority Principal Strip | | | | | | | | |
0.00%, 11/01/2025 | | | 1,847 | | | | 1,651 | |
0.00%, 06/15/2035 | | | 258 | | | | 150 | |
Texas Private Activity Bond Surface Transportation Corp. | | | | | | | | |
3.92%, 12/31/2049 | | | 1,810 | | | | 1,466 | |
Three Rivers Local School District | | | | | | | | |
5.21%, 09/15/2027 | | | 285 | | | | 285 | |
University of Michigan | | | | | | | | |
4.45%, 04/01/2122 | | | 7,800 | | | | 6,760 | |
University of Pittsburgh-of the Commonwealth System of Higher Education | | | | | | | | |
3.56%, 09/15/2119 | | | 2,045 | | | | 1,401 | |
University of Virginia | | | | | | | | |
2.58%, 11/01/2051 | | | 3,150 | | | | 2,094 | |
4.18%, 09/01/2117 | | | 1,540 | | | | 1,251 | |
West Contra Costa Unified School District | | | | | | | | |
6.25%, 08/01/2030 | | | 215 | | | | 234 | |
Westlake City School District | | | | | | | | |
5.23%, 12/01/2026 | | | 430 | | | | 430 | |
| | | | | | | | |
Total Other Government Related | | | | 196,734 | |
| | | | | | | | |
U.S. Treasury Obligations – 19.24% | | | | | | | | |
U.S. Treasury Inflation Indexed Bonds | | | | | | | | |
1.75%, 01/15/2028(8) | | | 869 | | | | 859 | |
2.50%, 01/15/2029(8) | | | 584 | | | | 601 | |
3.63%, 04/15/2028(8) | | | 1,956 | | | | 2,100 | |
U.S. Treasury Note/Bond | | | | | | | | |
0.25%, 05/31/2025 | | | 5,775 | | | | 5,285 | |
0.50%, 02/28/2026 | | | 28,285 | | | | 25,408 | |
0.63%, 08/15/2030 | | | 2,700 | | | | 2,151 | |
0.75%, 03/31/2026(9) | | | 3,470 | | | | 3,136 | |
0.75%, 04/30/2026 | | | 1,030 | | | | 927 | |
0.75%, 01/31/2028 | | | 73,860 | | | | 63,358 | |
| | | | | | | | |
0.88%, 09/30/2026 | | | 1,365 | | | | 1,221 | |
0.88%, 11/15/2030 | | | 20,235 | | | | 16,375 | |
1.00%, 07/31/2028 | | | 32,000 | | | | 27,445 | |
1.13%, 10/31/2026 | | | 50,750 | | | | 45,635 | |
1.13%, 08/31/2028 | | | 88,275 | | | | 76,058 | |
1.13%, 05/15/2040 | | | 1,975 | | | | 1,280 | |
1.13%, 08/15/2040 | | | 9,056 | | | | 5,823 | |
1.25%, 03/31/2028 | | | 56,535 | | | | 49,481 | |
1.25%, 06/30/2028 | | | 90,462 | | | | 78,744 | |
1.25%, 08/15/2031 | | | 22,265 | | | | 18,271 | |
1.25%, 05/15/2050 | | | 46,509 | | | | 26,152 | |
1.38%, 11/15/2031 | | | 8,874 | | | | 7,317 | |
1.38%, 11/15/2040 | | | 205,514 | | | | 137,501 | |
1.38%, 08/15/2050 | | | 48,240 | | | | 28,030 | |
1.50%, 02/15/2025 | | | 92,025 | | | | 86,856 | |
1.50%, 01/31/2027 | | | 822 | | | | 745 | |
1.50%, 02/15/2030 | | | 1,855 | | | | 1,589 | |
1.63%, 05/15/2031 | | | 4,225 | | | | 3,590 | |
1.63%, 11/15/2050 | | | 38,952 | | | | 24,190 | |
1.75%, 12/31/2026 | | | 115 | | | | 105 | |
1.75%, 01/31/2029 | | | 8,475 | | | | 7,492 | |
1.75%, 08/15/2041 | | | 17,437 | | | | 12,250 | |
1.88%, 02/28/2029 | | | 33,900 | | | | 30,146 | |
1.88%, 02/15/2032 | | | 32,500 | | | | 27,838 | |
1.88%, 02/15/2041 | | | 37,782 | | | | 27,438 | |
1.88%, 02/15/2051 | | | 36,494 | | | | 24,165 | |
1.88%, 11/15/2051 | | | 44,455 | | | | 29,344 | |
2.00%, 08/15/2025 | | | 150 | | | | 142 | |
2.00%, 11/15/2026 | | | 14,125 | | | | 13,065 | |
2.00%, 11/15/2041 | | | 27,138 | | | | 19,865 | |
2.00%, 02/15/2050 | | | 29,756 | | | | 20,398 | |
2.00%, 08/15/2051 | | | 25,211 | | | | 17,186 | |
2.25%, 11/15/2025 | | | 34,725 | | | | 32,807 | |
2.25%, 02/15/2027 | | | 1,530 | | | | 1,423 | |
2.25%, 05/15/2041 | | | 175,384 | | | | 135,072 | |
2.25%, 08/15/2046 | | | 39,102 | | | | 28,567 | |
2.25%, 08/15/2049 | | | 12,480 | | | | 9,067 | |
2.25%, 02/15/2052 | | | 30,950 | | | | 22,366 | |
2.38%, 03/31/2029 | | | 120,325 | | | | 109,853 | |
2.38%, 02/15/2042 | | | 99,404 | | | | 77,391 | |
2.38%, 11/15/2049 | | | 42,182 | | | | 31,496 | |
2.38%, 05/15/2051 | | | 18,851 | | | | 14,015 | |
2.50%, 02/28/2026 | | | 1,285 | | | | 1,218 | |
2.50%, 03/31/2027 | | | 8,062 | | | | 7,555 | |
2.50%, 02/15/2045 | | | 147,275 | | | | 114,023 | |
2.50%, 05/15/2046 | | | 2 | | | | 2 | |
2.63%, 05/31/2027 | | | 23,000 | | | | 21,611 | |
2.75%, 04/30/2027 | | | 9,343 | | | | 8,826 | |
2.75%, 07/31/2027 | | | 34,046 | | | | 32,098 | |
2.75%, 05/31/2029 | | | 380 | | | | 354 | |
2.75%, 08/15/2042 | | | 19,600 | | | | 16,150 | |
2.75%, 11/15/2042 | | | 13,300 | | | | 10,940 | |
2.88%, 06/15/2025 | | | 250 | | | | 240 | |
2.88%, 04/30/2029 | | | 42,000 | | | | 39,385 | |
2.88%, 05/15/2032 | | | 78,770 | | | | 73,035 | |
2.88%, 05/15/2043 | | | 107,560 | | | | 89,968 | |
2.88%, 08/15/2045 | | | 8,405 | | | | 6,936 | |
2.88%, 05/15/2049 | | | 7,305 | | | | 6,038 | |
2.88%, 05/15/2052 | | | 64,456 | | | | 53,415 | |
3.00%, 11/15/2044 | | | 1,585 | | | | 1,341 | |
3.00%, 02/15/2047 | | | 780 | | | | 657 | |
3.00%, 02/15/2048 | | | 870 | | | | 734 | |
3.00%, 08/15/2052 | | | 56,429 | | | | 47,978 | |
3.13%, 08/15/2025 | | | 21,175 | | | | 20,451 | |
3.13%, 08/31/2027 | | | 21,865 | | | | 20,911 | |
3.13%, 08/31/2029 | | | 21,580 | | | | 20,497 | |
3.13%, 02/15/2043 | | | 18,100 | | | | 15,784 | |
3.13%, 05/15/2048 | | | 24,938 | | | | 21,512 | |
3.25%, 06/30/2027 | | | 12,172 | | | | 11,706 | |
3.25%, 06/30/2029 | | | 40,000 | | | | 38,269 | |
3.25%, 05/15/2042 | | | 19,933 | | | | 17,787 | |
3.38%, 05/15/2033 | | | 43,407 | | | | 41,861 | |
3.38%, 08/15/2042 | | | 17,622 | | | | 15,995 | |
3.50%, 01/31/2028 | | | 26,308 | | | | 25,547 | |
3.50%, 04/30/2028 | | | 12,217 | | | | 11,871 | |
3.50%, 02/15/2033 | | | 42,024 | | | | 40,934 | |
3.50%, 02/15/2039 | | | 22,157 | | | | 21,226 | |
3.63%, 03/31/2028 | | | 53,811 | | | | 52,558 | |
3.63%, 05/31/2028 | | | 41,095 | | | | 40,196 | |
3.63%, 03/31/2030 | | | 7,400 | | | | 7,239 | |
3.63%, 08/15/2043 | | | 16,350 | | | | 15,347 | |
3.63%, 02/15/2044 | | | 10,150 | | | | 9,509 | |
3.63%, 02/15/2053 | | | 117,788 | | | | 113,040 | |
| | | | | | | | |
3.75%, 05/31/2030 | | | 34,304 | | | | 33,827 | |
3.75%, 11/15/2043 | | | 10,943 | | | | 10,458 | |
3.88%, 11/30/2027 | | | 18,733 | | | | 18,467 | |
3.88%, 12/31/2027 | | | 19,416 | | | | 19,144 | |
3.88%, 12/31/2029 | | | 133,230 | | | | 132,068 | |
3.88%, 08/15/2040 | | | 25,825 | | | | 25,624 | |
3.88%, 02/15/2043 | | | 22,284 | | | | 21,727 | |
3.88%, 05/15/2043 | | | 28,742 | | | | 28,046 | |
4.00%, 02/15/2026 | | | 23,175 | | | | 22,819 | |
4.00%, 02/29/2028 | | | 19,331 | | | | 19,188 | |
4.00%, 06/30/2028 | | | 16,681 | | | | 16,590 | |
4.00%, 11/15/2042 | | | 24,483 | | | | 24,326 | |
4.00%, 11/15/2052 | | | 15,962 | | | | 16,396 | |
4.13%, 06/15/2026 | | | 18,366 | | | | 18,181 | |
4.13%, 09/30/2027 | | | 10,566 | | | | 10,507 | |
4.13%, 10/31/2027 | | | 13,431 | | | | 13,361 | |
4.25%, 05/31/2025 | | | 47,721 | | | | 47,121 | |
4.25%, 05/15/2039 | | | 9,000 | | | | 9,410 | |
4.38%, 11/15/2039 | | | 25,454 | | | | 26,949 | |
4.38%, 05/15/2041 | | | 1,500 | | | | 1,579 | |
4.50%, 05/15/2038 | | | 5,903 | | | | 6,356 | |
4.63%, 06/30/2025 | | | 9,285 | | | | 9,243 | |
U.S. Treasury Strip Coupon | | | | | | | | |
0.00%, 02/15/2025 | | | 799 | | | | 738 | |
0.00%, 08/15/2027 | | | 4,314 | | | | 3,625 | |
0.00%, 11/15/2027 | | | 4,607 | | | | 3,838 | |
0.00%, 02/15/2031 | | | 12,590 | | | | 9,332 | |
0.00%, 02/15/2032 | | | 46,250 | | | | 33,029 | |
0.00%, 11/15/2034 | | | 2,487 | | | | 1,588 | |
0.00%, 02/15/2035 | | | 1,824 | | | | 1,153 | |
0.00%, 05/15/2035 | | | 1,920 | | | | 1,200 | |
0.00%, 08/15/2035 | | | 175 | | | | 108 | |
0.00%, 05/15/2036 | | | 121 | | | | 73 | |
0.00%, 05/15/2039 | | | 255 | | | | 134 | |
0.00%, 02/15/2041 | | | 50,000 | | | | 24,122 | |
0.00%, 08/15/2041 | | | 1,425 | | | | 671 | |
0.00%, 05/15/2043 | | | 36,515 | | | | 15,922 | |
0.00%, 02/15/2046 | | | 20,000 | | | | 7,869 | |
| | | | | | | | |
Total U.S. Treasury Obligations | | | | 3,161,152 | |
| | | | | | | | |
Total Government Related (Cost: $3,800,674) | | | | | | | 3,357,886 | |
| | | | | | | | |
Mortgage-Backed Obligations – 36.66% | | | | | | | | |
20 Times Square Trust 2018-20TS | | | | | | | | |
3.20%, 05/15/2035, Series 2018-20TS, Class D(1)(4) | | | 5,204 | | | | 4,098 | |
ACRE Commercial Mortgage 2021-FL4 Ltd. | | | | | | | | |
6.31% (1 Month Term SOFR + 1.21%, 1.10% Floor), 12/18/2037, Series 2021-FL4, Class AS(1)(3) | | | 3,990 | | | | 3,888 | |
Ajax Mortgage Loan Trust 2021-B | | | | | | | | |
2.24%, 06/25/2066, Series 2021-B, Class A(1)(2) | | | 5,772 | | | | 5,419 | |
Alternative Loan Trust 2003-22CB | | | | | | | | |
6.00%, 12/25/2033, Series 2003-22CB, Class 3A1 | | | 1,116 | | | | 1,071 | |
Alternative Loan Trust 2004-2CB | | | | | | | | |
5.75%, 03/25/2034, Series 2004-2CB, Class 1A9 | | | 260 | | | | 257 | |
Alternative Loan Trust 2005-1CB | | | | | | | | |
1.95% (1 Month LIBOR USD + 7.10%, 7.10% Cap), 03/25/2035, Series 2005-1CB, Class 1A6(3)(10) | | | 79 | | | | 5 | |
Alternative Loan Trust 2005-20CB | | | | | | | | |
0.00% (1 Month LIBOR USD + 4.75%, 4.75% Cap), 07/25/2035, Series 2005-20CB, Class 3A8(3)(10) | | | 296 | | | | 10 | |
Alternative Loan Trust 2005-22T1 | | | | | | | | |
0.00% (1 Month LIBOR USD + 5.07%, 5.07% Cap), 06/25/2035, Series 2005-22T1, Class A2(3)(10) | | | 418 | | | | 26 | |
Alternative Loan Trust 2005-28CB | | | | | | | | |
5.50%, 08/25/2035, Series 2005-28CB, Class 1A4 | | | 116 | | | | 99 | |
6.00%, 08/25/2035, Series 2005-28CB, Class 3A5 | | | 5 | | | | 2 | |
Alternative Loan Trust 2005-37T1 | | | | | | | | |
0.00% (1 Month LIBOR USD + 5.05%, 5.05% Cap), 09/25/2035, Series 2005-37T1, Class A2(3)(10) | | | 1,363 | | | | 65 | |
Alternative Loan Trust 2005-54CB | | | | | | | | |
0.00% (1 Month LIBOR USD + 4.85%, 4.85% Cap), 11/25/2035, Series 2005-54CB, Class 1A2(3)(10) | | | 375 | | | | 13 | |
5.50%, 11/25/2035, Series 2005-54CB, Class 1A7 | | | 1 | | | | 1 | |
5.50%, 11/25/2035, Series 2005-54CB, Class 1A11 | | | 95 | | | | 74 | |
Alternative Loan Trust 2005-64CB | | | | | | | | |
5.50%, 12/25/2035, Series 2005-64CB, Class 1A9 | | | 45 | | | | 40 | |
Alternative Loan Trust 2006-28CB | | | | | | | | |
6.00%, 10/25/2036, Series 2006-28CB, Class A17 | | | 49 | | | | 26 | |
Alternative Loan Trust 2006-43CB | | | | | | | | |
6.00%, 07/25/2034, Series 2006-43CB, Class 2A1 | | | 1 | | | | 1 | |
American General Mortgage Loan Trust 2006-1 | | | | | | | | |
5.75%, 12/25/2035, Series 2006-1, Class A5(1)(4)(11) | | | 0 | | | | 0 | |
Anchor Mortgage Trust 2021-RTL1 | | | | | | | | |
2.60%, 10/25/2026, Series 2021-1, Class A1(1) | | | 4,839 | | | | 4,737 | |
Arbor Multifamily Mortgage Securities Trust 2022-MF4 | | | | | | | | |
3.40%, 02/15/2055, Series 2022-MF4, Class A5(1)(4) | | | 17,500 | | | | 15,170 | |
ASG Resecuritization Trust 2011-1 | | | | | | | | |
6.00%, 09/28/2036, Series 2011-1, Class 2A35(1)(4) | | | 27 | | | | 9 | |
Assurant Commercial Mortgage Trust 2016-1 | | | | | | | | |
3.17%, 05/15/2049, Series 2016-1A, Class AS(1) | | | 6,931 | | | | 6,629 | |
| | | | | | | | |
BAMLL Commercial Mortgage Securities Trust 2014-520M | | | | | | | | |
4.35%, 08/15/2046, Series 2014-520M, Class C(1)(4) | | | 1,200 | | | | 813 | |
Banc of America Alternative Loan Trust 2004-6 | | | | | | | | |
0.00%, 07/25/2049, Series 2004-6, Class 15PO(11) | | | 1 | | | | 0 | |
Banc of America Alternative Loan Trust 2005-11 | | | | | | | | |
5.50%, 12/25/2035, Series 2005-11, Class 1CB4 | | | 5 | | | | 4 | |
Banc of America Alternative Loan Trust 2006-5 | | | | | | | | |
6.00%, 06/25/2046, Series 2006-5, Class CB7 | | | 18 | | | | 16 | |
Banc of America Funding 2004-1 Trust | | | | | | | | |
0.00%, 03/25/2034, Series 2004-1, Class PO | | | 12 | | | | 8 | |
Banc of America Funding 2004-2 Trust | | | | | | | | |
5.75%, 09/20/2034, Series 2004-2, Class 1CB1 | | | 552 | | | | 542 | |
Banc of America Funding 2005-6 Trust | | | | | | | | |
5.50%, 10/25/2035, Series 2005-6, Class 2A7 | | | 17 | | | | 14 | |
Banc of America Funding 2005-7 Trust | | | | | | | | |
0.00%, 11/25/2035, Series 2005-7, Class 30PO | | | 9 | | | | 9 | |
Banc of America Funding 2005-8 Trust | | | | | | | | |
0.00%, 01/25/2036, Series 2005-8, Class 30PO | | | 3 | | | | 2 | |
Banc of America Funding 2006-1 Trust | | | | | | | | |
0.00%, 01/25/2036, Series 2006-1, Class XPO | | | 3 | | | | 2 | |
Banc of America Mortgage 2003-C Trust | | | | | | | | |
4.75%, 04/25/2033, Series 2003-C, Class 3A1(4) | | | 2 | | | | 2 | |
BANK 2017-BNK4 | | | | | | | | |
3.63%, 05/15/2050, Series 2017-BNK4, Class A4 | | | 6,790 | | | | 6,228 | |
BANK 2017-BNK8 | | | | | | | | |
3.49%, 11/15/2050, Series 2017-BNK8, Class A4 | | | 12,745 | | | | 11,531 | |
BANK 2017-BNK9 | | | | | | | | |
3.54%, 11/15/2054, Series 2017-BNK9, Class A4 | | | 6,100 | | | | 5,595 | |
BANK 2018-BNK10 | | | | | | | | |
3.69%, 02/15/2061, Series 2018-BN10, Class A5 | | | 4,000 | | | | 3,689 | |
BANK 2019-BNK21 | | | | | | | | |
2.85%, 10/17/2052, Series 2019-BN21, Class A5 | | | 13,192 | | | | 11,253 | |
BANK 2019-BNK23 | | | | | | | | |
2.92%, 12/15/2052, Series 2019-BN23, Class A3 | | | 8,058 | | | | 6,968 | |
BANK 2020-BNK29 | | | | | | | | |
2.00%, 11/15/2053, Series 2020-BN29, Class A4 | | | 11,175 | | | | 8,637 | |
BANK 2021-BNK37 | | | | | | | | |
2.37%, 11/15/2064, Series 2021-BN37, Class A4 | | | 22,400 | | | | 18,081 | |
BANK5 2023-5YR2 | | | | | | | | |
6.66%, 06/15/2028 | | | 20,000 | | | | 20,618 | |
BBCMS Mortgage Trust 2018-C2 | | | | | | | | |
4.05%, 12/15/2051, Series 2018-C2, Class A4 | | | 20,000 | | | | 18,671 | |
4.31%, 12/15/2051, Series 2018-C2, Class A5 | | | 5,475 | | | | 5,151 | |
BBCMS Mortgage Trust 2021-C12 | | | | | | | | |
2.42%, 11/15/2054, Series 2021-C12, Class A4 | | | 25,600 | | | | 20,929 | |
BBCMS Mortgage Trust 2022-C15 | | | | | | | | |
3.68%, 04/15/2055, Series 2022-C15, Class ASB(4) | | | 8,700 | | | | 8,003 | |
BBCMS Mortgage Trust 2022-C16 | | | | | | | | |
4.60%, 06/15/2055, Series 2022-C16, Class A5(4) | | | 8,750 | | | | 8,301 | |
BBCMS Mortgage Trust 2023-C20 | | | | | | | | |
5.58%, 07/15/2056, Series 2023-C20, Class A5(4) | | | 1,393 | | | | 1,433 | |
BB-UBS Trust 2012-SHOW | | | | | | | | |
3.43%, 11/05/2036, Series 2012-SHOW, Class A(1) | | | 4,602 | | | | 4,303 | |
Bear Stearns ARM Trust 2003-2 | | | | | | | | |
4.46%, 01/25/2033, Series 2003-2, Class A5(1)(4) | | | 49 | | | | 48 | |
Bear Stearns ARM Trust 2003-7 | | | | | | | | |
4.66%, 10/25/2033, Series 2003-7, Class 3A(4) | | | 2 | | | | 2 | |
Bear Stearns ARM Trust 2004-2 | | | | | | | | |
3.86%, 05/25/2034, Series 2004-2, Class 14A(4) | | | 21 | | | | 20 | |
Bear Stearns ARM Trust 2006-1 | | | | | | | | |
6.80% (1 Year CMT Index + 2.25%, 2.25% Floor, 9.90% Cap), 02/25/2036, Series 2006-1, Class A1(3) | | | 53 | | | | 51 | |
Bear Stearns Asset Backed Securities I Trust 2004-AC2 | | | | | | | | |
5.00%, 05/25/2034, Series 2004-AC2, Class 2A | | | 13 | | | | 11 | |
Bear Stearns Commercial Mortgage Securities Trust 2007-TOP26 | | | | | | | | |
1.17%, 01/12/2045, Series 2007-T26, Class X1(1)(4)(11) | | �� | 52 | | | | 0 | |
Bellemeade RE 2021-3 Ltd. | | | | | | | | |
6.07% (30-day Average SOFR + 1.00%, 1.00% Floor), 09/25/2031, Series 2021-3A, Class M1A(1)(3) | | | 3,992 | | | | 3,966 | |
6.07% (30-day Average SOFR + 1.00%, 1.00% Floor), 09/25/2031, Series 2021-3A, Class A2(1)(3) | | | 8,400 | | | | 8,211 | |
Benchmark 2018-B3 Mortgage Trust | | | | | | | | |
3.76%, 04/10/2051, Series 2018-B3, Class A4 | | | 17,400 | | | | 15,922 | |
Benchmark 2018-B6 Mortgage Trust | | | | | | | | |
4.26%, 10/10/2051, Series 2018-B6, Class A4 | | | 8,862 | | | | 8,171 | |
Benchmark 2019-B15 Mortgage Trust | | | | | | | | |
2.67%, 12/15/2072, Series 2019-B15, Class A4 | | | 30,000 | | | | 24,953 | |
Benchmark 2020-B19 Mortgage Trust | | | | | | | | |
1.55%, 09/15/2053, Series 2020-B19, Class A4 | | | 21,500 | | | | 17,044 | |
1.85%, 09/15/2053, Series 2020-B19, Class A5 | | | 5,098 | | | | 3,946 | |
Benchmark 2020-B21 Mortgage Trust | | | | | | | | |
1.98%, 12/17/2053, Series 2020-B21, Class A5 | | | 3,252 | | | | 2,561 | |
Benchmark 2021-B24 Mortgage Trust | | | | | | | | |
2.01%, 03/15/2054, Series 2021-B24, Class A3 | | | 10,000 | | | | 8,410 | |
2.26%, 03/15/2054, Series 2021-B24, Class A4 | | | 20,000 | | | | 15,944 | |
Benchmark 2021-B27 Mortgage Trust | | | | | | | | |
| | | | | | | | |
2.10%, 07/15/2054, Series 2021-B27, Class A4 | | | 22,500 | | | | 17,645 | |
2.39%, 07/15/2054, Series 2021-B27, Class A5 | | | 1,984 | | | | 1,551 | |
Benchmark 2022-B32 Mortgage Trust | | | | | | | | |
3.04%, 01/15/2055, Series 2022-B32, Class A3 | | | 23,000 | | | | 19,779 | |
Benchmark 2023-V2 Mortgage Trust | | | | | | | | |
5.81%, 05/15/2055, Series 2023-V2, Class A3(4) | | | 2,329 | | | | 2,338 | |
Cascade Funding Mortgage Trust 2021-FRR1 | | | | | | | | |
2.09%, 02/28/2025, Series 2021-FRR1, Class BK45(1)(4) | | | 4,450 | | | | 3,952 | |
CD 2006-CD3 Mortgage Trust | | | | | | | | |
0.18%, 10/15/2048, Series 2006-CD3, Class XS(1)(4) | | | 82 | | | | 1 | |
CD 2019-CD8 Mortgage Trust | | | | | | | | |
2.66%, 08/15/2057, Series 2019-CD8, Class A3 | | | 20,000 | | | | 16,863 | |
CFCRE Commercial Mortgage Trust 2017-C8 | | | | | | | | |
3.30%, 06/15/2050, Series 2017-C8, Class A3 | | | 20,214 | | | | 18,627 | |
Chase Home Lending Mortgage Trust 2023-RPL1 | | | | | | | | |
3.50%, 06/25/2062, Series 2023-RPL1, Class A1(1)(4) | | | 7,009 | | | | 6,254 | |
Chase Mortgage Finance Trust Series 2006-A1 | | | | | | | | |
4.37%, 09/25/2036, Series 2006-A1, Class 2A3(4) | | | 62 | | | | 54 | |
Chase Mortgage Finance Trust Series 2007-A1 | | | | | | | | |
4.48%, 02/25/2037, Series 2007-A1, Class 1A3(4) | | | 12 | | | | 12 | |
4.74%, 02/25/2037, Series 2007-A1, Class 9A1(4) | | | 13 | | | | 13 | |
5.14%, 02/25/2037, Series 2007-A1, Class 7A1(4) | | | 3 | | | | 3 | |
5.16%, 02/25/2037, Series 2007-A1, Class 2A1(4) | | | 24 | | | | 22 | |
Chase Mortgage Finance Trust Series 2007-A2 | | | | | | | | |
4.14%, 06/25/2035, Series 2007-A2, Class 2A1(4) | | | 18 | | | | 17 | |
5.15%, 06/25/2035, Series 2007-A2, Class 1A1(4) | | | 6 | | | | 6 | |
CHL Mortgage Pass-Through Trust 2002-18 | | | | | | | | |
0.00%, 11/25/2032, Series 2002-18, Class PO | | | 4 | | | | 3 | |
CHL Mortgage Pass-Through Trust 2004-3 | | | | | | | | |
5.50%, 04/25/2034, Series 2004-3, Class A26 | | | 13 | | | | 12 | |
5.75%, 04/25/2034, Series 2004-3, Class A4 | | | 9 | | | | 8 | |
CHL Mortgage Pass-Through Trust 2004-5 | | | | | | | | |
5.50%, 06/25/2034, Series 2004-5, Class 1A4 | | | 56 | | | | 55 | |
CHL Mortgage Pass-Through Trust 2004-7 | | | | | | | | |
4.60%, 06/25/2034, Series 2004-7, Class 2A1(4) | | | 4 | | | | 3 | |
CHL Mortgage Pass-Through Trust 2004-8 | | | | | | | | |
4.50%, 06/25/2049, Series 2004-8, Class 2A1 | | | 1 | | | | 1 | |
CHL Mortgage Pass-Through Trust 2004-HYB1 | | | | | | | | |
4.50%, 05/20/2034, Series 2004-HYB1, Class 2A(4) | | | 7 | | | | 6 | |
CHL Mortgage Pass-Through Trust 2004-HYB3 | | | | | | | | |
3.83%, 06/20/2034, Series 2004-HYB3, Class 2A(4) | | | 27 | | | | 25 | |
CHL Mortgage Pass-Through Trust 2004-HYB6 | | | | | | | | |
4.03%, 11/20/2034, Series 2004-HYB6, Class A3(4) | | | 22 | | | | 20 | |
CHL Mortgage Pass-Through Trust 2005-14 | | | | | | | | |
5.50%, 07/25/2035, Series 2005-14, Class A2 | | | 10 | | | | 5 | |
CHL Mortgage Pass-Through Trust 2005-16 | | | | | | | | |
5.50%, 09/25/2035, Series 2005-16, Class A23 | | | 5 | | | | 3 | |
CHL Mortgage Pass-Through Trust 2005-22 | | | | | | | | |
3.50%, 11/25/2035, Series 2005-22, Class 2A1(4) | | | 89 | | | | 71 | |
CIM Trust 2023-R2 | | | | | | | | |
5.50%, 08/25/2064, Series 2023-R2, Class A1(1)(4) | | | 10,728 | | | | 10,576 | |
Citicorp Mortgage Securities Trust Series 2006-4 | | | | | | | | |
6.00%, 08/25/2036, Series 2006-4, Class 1A2 | | | 20 | | | | 17 | |
Citigroup Commercial Mortgage Trust 2014-GC21 | | | | | | | | |
3.58%, 05/10/2047, Series 2014-GC21, Class A4 | | | 2,091 | | | | 2,060 | |
Citigroup Commercial Mortgage Trust 2014-GC23 | | | | | | | | |
3.36%, 07/10/2047, Series 2014-GC23, Class A3 | | | 6,719 | | | | 6,561 | |
Citigroup Commercial Mortgage Trust 2015-GC29 | | | | | | | | |
2.94%, 04/10/2048, Series 2015-GC29, Class A3 | | | 9,387 | | | | 8,881 | |
Citigroup Commercial Mortgage Trust 2015-GC33 | | | | | | | | |
3.78%, 09/10/2058, Series 2015-GC33, Class A4 | | | 717 | | | | 676 | |
Citigroup Commercial Mortgage Trust 2016-C1 | | | | | | | | |
2.94%, 05/10/2049, Series 2016-C1, Class A3 | | | 10,100 | | | | 9,356 | |
Citigroup Commercial Mortgage Trust 2016-C3 | | | | | | | | |
3.15%, 11/15/2049, Series 2016-C3, Class A4 | | | 2,764 | | | | 2,531 | |
Citigroup Commercial Mortgage Trust 2016-GC37 | | | | | | | | |
3.05%, 04/10/2049, Series 2016-GC37, Class A3 | | | 7,531 | | | | 6,995 | |
Citigroup Commercial Mortgage Trust 2016-P6 | | | | | | | | |
3.72%, 12/10/2049, Series 2016-P6, Class A5(4) | | | 2,783 | | | | 2,588 | |
Citigroup Commercial Mortgage Trust 2017-P7 | | | | | | | | |
3.44%, 04/14/2050, Series 2017-P7, Class A3 | | | 14,523 | | | | 13,364 | |
Citigroup Commercial Mortgage Trust 2017-P8 | | | | | | | | |
3.20%, 09/15/2050, Series 2017-P8, Class A3 | | | 21,000 | | | | 19,105 | |
Citigroup Commercial Mortgage Trust 2018-B2 | | | | | | | | |
3.74%, 03/10/2051, Series 2018-B2, Class A3 | | | 22,000 | | | | 20,169 | |
4.01%, 03/10/2051, Series 2018-B2, Class A4 | | | 1,020 | | | | 943 | |
Citigroup Commercial Mortgage Trust 2019-C7 | | | | | | | | |
2.86%, 12/15/2072, Series 2019-C7, Class A3 | | | 2,550 | | | | 2,180 | |
Citigroup Commercial Mortgage Trust 2020-GC46 | | | | | | | | |
2.72%, 02/15/2053, Series 2020-GC46, Class A5 | | | 13,520 | | | | 11,372 | |
Citigroup Global Markets Mortgage Securities VII, Inc. | | | | | | | | |
0.00%, 06/25/2033, Series 2003-UP2, Class PO1(11) | | | 0 | | | | 0 | |
4.24%, 09/25/2033, Series 2003-HYB1, Class A(4) | | | 14 | | | | 14 | |
| | | | | | | | |
Citigroup Mortgage Loan Trust 2009-10 | | | | | | | | |
4.15%, 09/25/2033, Series 2009-10, Class 1A1(1)(4) | | | 49 | | | | 48 | |
Citigroup Mortgage Loan Trust 2015-A | | | | | | | | |
4.50%, 06/25/2058, Series 2015-A, Class B2(1)(4) | | | 209 | | | | 196 | |
Citigroup Mortgage Loan Trust, Inc. | | | | | | | | |
0.00%, 09/25/2033, Series 2003-1, Class PO3 | | | 1 | | | | 1 | |
0.00%, 10/25/2033, Series 2003-1, Class PO2(11) | | | 0 | | | | 0 | |
3.15%, 02/25/2035, Series 2005-1, Class 2A1A(4) | | | 17 | | | | 14 | |
4.33%, 08/25/2035, Series 2005-5, Class 1A2(4) | | | 43 | | | | 36 | |
5.25%, 10/25/2033, Series 2003-1, Class 2A5 | | | 6 | | | | 5 | |
5.50%, 05/25/2035, Series 2005-2, Class 2A11 | | | 49 | | | | 47 | |
5.50%, 11/25/2035, Series 2005-9, Class 2A2 | | | 1 | | | | 1 | |
5.91%, 08/25/2034, Series 2004-UST1, Class A6(4) | | | 5 | | | | 5 | |
6.00%, 11/25/2035, Series 2005-9, Class 22A2 | | | 836 | | | | 809 | |
7.00%, 09/25/2033, Series 2003-UP3, Class A3 | | | 2 | | | | 2 | |
COMM 2013-300P Mortgage Trust | | | | | | | | |
4.35%, 08/10/2030, Series 2013-300P, Class A1(1) | | | 516 | | | | 471 | |
COMM 2013-CCRE11 Mortgage Trust | | | | | | | | |
4.26%, 08/10/2050, Series 2013-CR11, Class A4 | | | 717 | | | | 716 | |
COMM 2014-CCRE19 Mortgage Trust | | | | | | | | |
3.80%, 08/10/2047, Series 2014-CR19, Class A5 | | | 17,769 | | | | 17,271 | |
COMM 2014-CCRE20 Mortgage Trust | | | | | | | | |
3.33%, 11/10/2047, Series 2014-CR20, Class A3 | | | 9,799 | | | | 9,454 | |
COMM 2015-CCRE24 Mortgage Trust | | | | | | | | |
3.43%, 08/10/2048, Series 2015-CR24, Class A4 | | | 4,624 | | | | 4,395 | |
3.70%, 08/10/2048, Series 2015-CR24, Class A5 | | | 771 | | | | 731 | |
COMM 2015-CCRE25 Mortgage Trust | | | | | | | | |
3.51%, 08/10/2048, Series 2015-CR25, Class A3 | | | 8,655 | | | | 8,219 | |
3.76%, 08/10/2048, Series 2015-CR25, Class A4 | | | 2,437 | | | | 2,313 | |
COMM 2015-LC23 Mortgage Trust | | | | | | | | |
3.77%, 10/10/2048, Series 2015-LC23, Class A4 | | | 4,039 | | | | 3,823 | |
COMM 2018-HOME Mortgage Trust | | | | | | | | |
3.94%, 04/10/2033, Series 2018-HOME, Class A(1)(4) | | | 10,975 | | | | 9,850 | |
COMM 2020-CBM Mortgage Trust | | | | | | | | |
3.40%, 02/10/2037, Series 2020-CBM, Class C(1) | | | 6,090 | | | | 5,579 | |
Connecticut Avenue Securities Trust 2021-R03 | | | | | | | | |
5.92% (30-day Average SOFR + 0.85%), 12/25/2041, Series 2021-R03, Class 1M1(1)(3) | | | 5,111 | | | | 5,069 | |
Connecticut Avenue Securities Trust 2022-R01 | | | | | | | | |
6.97% (30-day Average SOFR + 1.90%), 12/25/2041, Series 2022-R01, Class 1M2(1)(3) | | | 7,380 | | | | 7,191 | |
Connecticut Avenue Securities Trust 2023-R05 | | | | | | | | |
6.97% (30-day Average SOFR + 1.90%, 1.90% Floor), 06/25/2043, Series 2023-R05, Class 1M1(1)(3) | | | 6,580 | | | | 6,586 | |
Credit Suisse Commercial Mortgage Trust Series 2007-C2 | | | | | | | | |
0.05%, 01/15/2049, Series 2007-C2, Class AX(1)(4)(11) | | | 1,794 | | | | 0 | |
Credit Suisse First Boston Mortgage Securities Corp. | | | | | | | | |
0.00%, 10/25/2033, Series 2003-23, Class 1P | | | 23 | | | | 16 | |
4.73%, 06/25/2033, Series 2003-AR15, Class 3A1(4) | | | 6 | | | | 5 | |
5.25%, 09/25/2033, Series 2003-21, Class 1A4 | | | 23 | | | | 22 | |
6.66%, 02/25/2033, Series 2003-1, Class DB1(4) | | | 45 | | | | 44 | |
CSAIL 2015-C4 Commercial Mortgage Trust | | | | | | | | |
3.54%, 11/15/2048, Series 2015-C4, Class A3 | | | 7,447 | | | | 7,136 | |
CSAIL 2016-C7 Commercial Mortgage Trust | | | | | | | | |
3.50%, 11/15/2049, Series 2016-C7, Class A5 | | | 1,882 | | | | 1,734 | |
CSAIL 2017-C8 Commercial Mortgage Trust | | | | | | | | |
3.13%, 06/15/2050, Series 2017-C8, Class A3 | | | 14,798 | | | | 13,227 | |
CSAIL 2019-C16 Commercial Mortgage Trust | | | | | | | | |
3.33%, 06/15/2052, Series 2019-C16, Class A3 | | | 1,299 | | | | 1,144 | |
CSAIL 2021-C20 Commercial Mortgage Trust | | | | | | | | |
2.49%, 03/15/2054, Series 2021-C20, Class A2 | | | 21,115 | | | | 17,448 | |
CSFB Mortgage-Backed Pass-Through Certificates Series 2003-27 | | | | | | | | |
5.25%, 11/25/2033, Series 2003-27, Class 5A4 | | | 1 | | | | 1 | |
CSFB Mortgage-Backed Pass-Through Certificates Series 2004-4 | | | | | | | | |
5.50%, 09/25/2034, Series 2004-4, Class 2A4 | | | 18 | | | | 17 | |
CSFB Mortgage-Backed Pass-Through Certificates Series 2004-8 | | | | | | | | |
5.50%, 12/25/2034, Series 2004-8, Class 1A4 | | | 55 | | | | 54 | |
CSFB Mortgage-Backed Pass-Through Certificates Series 2005-10 | | | | | | | | |
0.00%, 11/25/2035, Series 2005-10, Class AP | | | 5 | | | | 3 | |
CSFB Mortgage-Backed Pass-Through Certificates Series 2005-9 | | | | | | | | |
0.00%, 10/25/2035, Series 2005-9, Class AP | | | 4 | | | | 3 | |
5.50%, 10/25/2035, Series 2005-9, Class DX | | | 97 | | | | 10 | |
CSMC 2014-USA OA LLC | | | | | | | | |
4.37%, 09/15/2037, Series 2014-USA, Class D(1) | | | 3,000 | | | | 2,168 | |
CSMC 2018-RPL9 Trust | | | | | | | | |
3.85%, 09/25/2057, Series 2018-RPL9, Class A(1)(4) | | | 3,787 | | | | 3,535 | |
CSMC 2020-RPL3 Trust | | | | | | | | |
2.69%, 03/25/2060, Series 2020-RPL3, Class A1(1)(4) | | | 2,137 | | | | 2,072 | |
CSMC 2020-RPL6 Trust | | | | | | | | |
2.69%, 03/25/2059, Series 2020-RPL6, Class A1(1)(4) | | | 3,510 | | | | 3,395 | |
CSMC 2022-RPL4 Trust | | | | | | | | |
3.90%, 04/25/2062, Series 2022-RPL4, Class A1(1)(4) | | | 4,059 | | | | 3,711 | |
CSMCM 2018-RPL4 Trust | | | | | | | | |
0.00%, 05/25/2058, Series 2018-RPL4(1)(4) | | | 2,457 | | | | 2,163 | |
CSMCM 2018-RPL9 Trust | | | | | | | | |
4.35%, 09/25/2057, Series 2018-RPL9, Class CERT(1)(4) | | | 1,864 | | | | 1,503 | |
| | | | | | | | |
DBJPM 16-C1 Mortgage Trust | | | | | | | | |
3.02%, 05/10/2049, Series 2016-C1, Class A3A | | | 13,217 | | | | 12,208 | |
DBJPM 2016-C3 Mortgage Trust | | | | | | | | |
2.89%, 08/10/2049, Series 2016-C3, Class A5 | | | 3,064 | | | | 2,787 | |
DBJPM 20-C9 Mortgage Trust | | | | | | | | |
1.64%, 08/15/2053, Series 2020-C9, Class A4 | | | 20,600 | | | | 16,464 | |
Eagle RE 2018-1 Ltd. | | | | | | | | |
6.85% (1 Month LIBOR USD + 1.70%, 1.70% Floor), 11/25/2028, Series 2018-1, Class M1(1)(3) | | | 1,514 | | | | 1,516 | |
Eagle RE 2019-1 Ltd. | | | | | | | | |
6.95% (1 Month LIBOR USD + 1.80%), 04/25/2029, Series 2019-1, Class M1B(1)(3) | | | 866 | | | | 865 | |
Eagle RE 2021-2 Ltd. | | | | | | | | |
6.62% (30-day Average SOFR + 1.55%, 1.55% Floor), 04/25/2034, Series 2021-2, Class M1A(1)(3) | | | 11,643 | | | | 11,645 | |
EDP Finance BV | | | | | | | | |
3.63%, 07/15/2024(1) | | | 700 | | | | 682 | |
Fannie Mae | | | | | | | | |
2.00%, 07/01/2038(12) | | | 5,840 | | | | 5,175 | |
2.00%, 07/01/2053(12) | | | 38,930 | | | | 31,746 | |
2.50%, 07/01/2053(12) | | | 27,930 | | | | 23,682 | |
3.00%, 07/01/2038(12) | | | 3,475 | | | | 3,242 | |
3.00%, 07/01/2053(12) | | | 10,935 | | | | 9,623 | |
3.50%, 07/01/2053(12) | | | 25,860 | | | | 23,564 | |
4.00%, 07/01/2036(12) | | | 2,625 | | | | 2,534 | |
4.00%, 07/01/2053(12) | | | 6,615 | | | | 6,208 | |
4.50%, 07/01/2053(12) | | | 11,755 | | | | 11,301 | |
5.00%, 07/01/2038(12) | | | 3,045 | | | | 3,025 | |
5.00%, 07/01/2053(12) | | | 14,685 | | | | 14,389 | |
5.50%, 07/01/2053(12) | | | 10,770 | | | | 10,718 | |
6.00%, 07/01/2053(12) | | | 11,555 | | | | 11,657 | |
Fannie Mae Grantor Trust 1999-T2 | | | | | | | | |
7.50%, 01/19/2039, Series 1999-T2, Class A1(4) | | | 33 | | | | 33 | |
Fannie Mae Grantor Trust 2001-T3 | | | | | | | | |
7.50%, 11/25/2040, Series 2001-T3, Class A1 | | | 59 | | | | 59 | |
Fannie Mae Grantor Trust 2002-T16 | | | | | | | | |
7.00%, 07/25/2042, Series 2002-T16, Class A2 | | | 73 | | | | 76 | |
Fannie Mae Grantor Trust 2004-T1 | | | | | | | | |
6.50%, 01/25/2044, Series 2004-T1, Class 1A2 | | | 12 | | | | 12 | |
Fannie Mae Grantor Trust 2004-T2 | | | | | | | | |
4.06%, 07/25/2043, Series 2004-T2, Class 2A(4) | | | 49 | | | | 48 | |
7.50%, 11/25/2043, Series 2004-T2, Class 1A4 | | | 106 | | | | 109 | |
Fannie Mae Grantor Trust 2004-T3 | | | | | | | | |
6.50%, 02/25/2044, Series 2004-T3, Class 1A2 | | | 188 | | | | 190 | |
7.00%, 02/25/2044, Series 2004-T3, Class 1A3 | | | 77 | | | | 79 | |
9.39%, 01/25/2044, Series 2004-T3, Class PT1(4) | | | 14 | | | | 15 | |
Fannie Mae Grantor Trust 2017-T1 | | | | | | | | |
2.90%, 06/25/2027, Series 2017-T1, Class A | | | 6,501 | | | | 6,016 | |
Fannie Mae Interest Strip | | | | | | | | |
0.00%, 09/25/2024, Series 300, Class 1 | | | 2 | | | | 2 | |
0.00%, 01/25/2033, Series 329, Class 1 | | | 4 | | | | 3 | |
5.00%, 12/25/2033, Series 345, Class 6(4) | | | 5 | | | | 1 | |
5.50%, 05/25/2036, Series 365, Class 8 | | | 20 | | | | 4 | |
5.50%, 08/25/2036, Series 374, Class 5 | | | 14 | | | | 2 | |
5.50%, 04/25/2037, Series 393, Class 6 | | | 5 | | | | 1 | |
5.65% (1 Month LIBOR USD + 0.50%, 0.50% Floor, 6.50% Cap), 08/25/2042, Series 412, Class F2(3) | | | 243 | | | | 243 | |
5.70% (1 Month LIBOR USD + 0.55%, 0.55% Floor, 6.50% Cap), 08/25/2042, Series 411, Class F1(3) | | | 788 | | | | 767 | |
6.00%, 01/25/2038, Series 383, Class 33 | | | 13 | | | | 3 | |
9.00%, 03/25/2024, Series 265, Class 2(11) | | | 0 | | | | 0 | |
Fannie Mae Pool | | | | | | | | |
1.40%, 11/01/2032 | | | 8,500 | | | | 6,442 | |
1.50%, 01/01/2031 | | | 10,000 | | | | 8,001 | |
1.50%, 02/01/2036 | | | 11,101 | | | | 9,578 | |
1.50%, 03/01/2041 | | | 1,115 | | | | 907 | |
1.50%, 02/01/2042 | | | 1,397 | | | | 1,131 | |
1.50%, 10/01/2050 | | | 1,933 | | | | 1,497 | |
1.50%, 11/01/2050 | | | 11,559 | | | | 8,940 | |
1.50%, 12/01/2050 | | | 21,254 | | | | 16,439 | |
1.50%, 01/01/2051 | | | 1,527 | | | | 1,179 | |
1.50%, 02/01/2051 | | | 18,771 | | | | 14,549 | |
1.50%, 07/01/2051 | | | 6,845 | | | | 5,294 | |
1.50%, 11/01/2051 | | | 7,233 | | | | 5,601 | |
1.56%, 01/01/2031 | | | 2,275 | | | | 1,829 | |
1.75%, 03/01/2032(4) | | | 14,992 | | | | 12,091 | |
1.80%, 10/01/2033 | | | 7,500 | | | | 5,928 | |
2.00%, 08/01/2031 | | | 1,121 | | | | 1,016 | |
2.00%, 09/01/2035 | | | 471 | | | | 420 | |
2.00%, 05/01/2036 | | | 7,222 | | | | 6,403 | |
2.00%, 05/01/2036 | | | 7,565 | | | | 6,707 | |
2.00%, 06/01/2036 | | | 8,266 | | | | 7,371 | |
2.00%, 12/01/2036 | | | 23,936 | | | | 21,219 | |
2.00%, 02/01/2037 | | | 11,575 | | | | 10,263 | |
2.00%, 03/01/2037 | | | 3,012 | | | | 2,673 | |
2.00%, 06/01/2040 | | | 2,715 | | | | 2,334 | |
2.00%, 07/01/2040 | | | 2,576 | | | | 2,217 | |
2.00%, 09/01/2040 | | | 1,466 | | | | 1,261 | |
| | | | | | | | |
2.00%, 02/01/2041 | | | 7,144 | | | | 6,100 | |
2.00%, 05/01/2041 | | | 23,036 | | | | 19,609 | |
2.00%, 06/01/2041 | | | 7,273 | | | | 6,196 | |
2.00%, 10/01/2041 | | | 977 | | | | 831 | |
2.00%, 04/01/2042 | | | 5,841 | | | | 4,959 | |
2.00%, 09/01/2050 | | | 21,164 | | | | 17,411 | |
2.00%, 10/01/2050 | | | 1,529 | | | | 1,260 | |
2.00%, 10/01/2050 | | | 42,008 | | | | 34,589 | |
2.00%, 11/01/2050 | | | 1,460 | | | | 1,208 | |
2.00%, 11/01/2050 | | | 14,161 | | | | 11,647 | |
2.00%, 12/01/2050 | | | 9,679 | | | | 7,960 | |
2.00%, 01/01/2051 | | | 3,587 | | | | 2,949 | |
2.00%, 01/01/2051 | | | 18,126 | | | | 14,906 | |
2.00%, 03/01/2051 | | | 4,520 | | | | 3,703 | |
2.00%, 03/01/2051 | | | 21,476 | | | | 17,597 | |
2.00%, 05/01/2051 | | | 8,418 | | | | 6,893 | |
2.00%, 07/01/2051 | | | 2,881 | | | | 2,362 | |
2.00%, 08/01/2051 | | | 2,124 | | | | 1,740 | |
2.00%, 08/01/2051 | | | 3,605 | | | | 2,947 | |
2.00%, 08/01/2051 | | | 11,725 | | | | 9,632 | |
2.00%, 08/01/2051 | | | 30,166 | | | | 24,663 | |
2.00%, 10/01/2051 | | | 164 | | | | 134 | |
2.00%, 10/01/2051 | | | 268 | | | | 219 | |
2.00%, 10/01/2051 | | | 9,808 | | | | 8,112 | |
2.00%, 10/01/2051 | | | 12,095 | | | | 9,876 | |
2.00%, 10/01/2051 | | | 14,269 | | | | 11,652 | |
2.00%, 12/01/2051 | | | 11,885 | | | | 9,761 | |
2.00%, 12/01/2051 | | | 13,159 | | | | 10,843 | |
2.00%, 01/01/2052 | | | 13,268 | | | | 10,837 | |
2.00%, 02/01/2052 | | | 1,646 | | | | 1,344 | |
2.00%, 02/01/2052 | | | 5,595 | | | | 4,570 | |
2.00%, 02/01/2052 | | | 8,689 | | | | 7,090 | |
2.00%, 02/01/2052 | | | 9,940 | | | | 8,203 | |
2.00%, 03/01/2052 | | | 19,108 | | | | 15,608 | |
2.00%, 04/01/2052 | | | 1,431 | | | | 1,169 | |
2.08%, 10/01/2033 | | | 9,759 | | | | 7,991 | |
2.16%, 01/01/2034 | | | 6,070 | | | | 4,857 | |
2.22%, 02/01/2032 | | | 5,100 | | | | 4,231 | |
2.50%, 04/01/2030 | | | 814 | | | | 756 | |
2.50%, 05/01/2030 | | | 1,016 | | | | 944 | |
2.50%, 11/01/2031 | | | 1,440 | | | | 1,334 | |
2.50%, 07/01/2032 | | | 3,012 | | | | 2,783 | |
2.50%, 08/01/2032 | | | 3,227 | | | | 2,982 | |
2.50%, 09/01/2032 | | | 3,151 | | | | 2,912 | |
2.50%, 12/01/2034 | | | 7,447 | | | | 6,835 | |
2.50%, 07/01/2035 | | | 11,721 | | | | 10,833 | |
2.50%, 08/01/2035 | | | 1,988 | | | | 1,814 | |
2.50%, 08/01/2035 | | | 3,736 | | | | 3,410 | |
2.50%, 09/01/2035 | | | 5,121 | | | | 4,675 | |
2.50%, 10/01/2035 | | | 138 | | | | 126 | |
2.50%, 01/01/2036 | | | 13,012 | | | | 11,895 | |
2.50%, 07/01/2036 | | | 4,865 | | | | 4,465 | |
2.50%, 12/01/2036 | | | 1,234 | | | | 1,114 | |
2.50%, 04/01/2042 | | | 8,873 | | | | 7,705 | |
2.50%, 05/01/2042 | | | 3,605 | | | | 3,131 | |
2.50%, 01/01/2043 | | | 1,231 | | | | 1,063 | |
2.50%, 02/01/2043 | | | 558 | | | | 481 | |
2.50%, 10/01/2043 | | | 1,127 | | | | 973 | |
2.50%, 05/01/2046 | | | 490 | | | | 422 | |
2.50%, 07/01/2046 | | | 1,244 | | | | 1,070 | |
2.50%, 08/01/2046 | | | 465 | | | | 400 | |
2.50%, 10/01/2046 | | | 372 | | | | 320 | |
2.50%, 03/01/2050 | | | 658 | | | | 562 | |
2.50%, 05/01/2050 | | | 9,179 | | | | 7,790 | |
2.50%, 05/01/2050 | | | 9,885 | | | | 8,468 | |
2.50%, 06/01/2050 | | | 966 | | | | 824 | |
2.50%, 06/01/2050 | | | 1,669 | | | | 1,420 | |
2.50%, 06/01/2050 | | | 2,137 | | | | 1,824 | |
2.50%, 06/01/2050 | | | 4,537 | | | | 3,863 | |
2.50%, 06/01/2050 | | | 14,083 | | | | 12,056 | |
2.50%, 07/01/2050 | | | 2,271 | | | | 1,941 | |
2.50%, 07/01/2050 | | | 5,336 | | | | 4,553 | |
2.50%, 07/01/2050 | | | 11,815 | | | | 10,154 | |
2.50%, 08/01/2050 | | | 2,661 | | | | 2,273 | |
2.50%, 08/01/2050 | | | 17,788 | | | | 15,178 | |
2.50%, 09/01/2050 | | | 2,922 | | | | 2,519 | |
2.50%, 09/01/2050 | | | 6,845 | | | | 5,671 | |
2.50%, 09/01/2050 | | | 8,069 | | | | 6,865 | |
2.50%, 10/01/2050(9) | | | 39,662 | | | | 33,844 | |
2.50%, 12/01/2050 | | | 11,166 | | | | 9,532 | |
2.50%, 01/01/2051 | | | 1,316 | | | | 1,123 | |
2.50%, 02/01/2051 | | | 1,360 | | | | 1,171 | |
2.50%, 02/01/2051 | | | 3,944 | | | | 3,372 | |
| | | | | | | | |
2.50%, 02/01/2051 | | | 4,596 | | | | 3,920 | |
2.50%, 03/01/2051 | | | 2,552 | | | | 2,177 | |
2.50%, 04/01/2051 | | | 3,017 | | | | 2,573 | |
2.50%, 04/01/2051 | | | 24,719 | | | | 21,069 | |
2.50%, 05/01/2051 | | | 3,012 | | | | 2,567 | |
2.50%, 05/01/2051 | | | 6,417 | | | | 5,578 | |
2.50%, 05/01/2051 | | | 10,396 | | | | 8,854 | |
2.50%, 06/01/2051 | | | 808 | | | | 688 | |
2.50%, 07/01/2051 | | | 2,333 | | | | 1,985 | |
2.50%, 08/01/2051 | | | 1,049 | | | | 899 | |
2.50%, 08/01/2051 | | | 3,250 | | | | 2,762 | |
2.50%, 08/01/2051 | | | 9,941 | | | | 8,502 | |
2.50%, 09/01/2051 | | | 788 | | | | 682 | |
2.50%, 09/01/2051 | | | 867 | | | | 710 | |
2.50%, 09/01/2051 | | | 7,413 | | | | 6,304 | |
2.50%, 09/01/2051 | | | 12,317 | | | | 10,521 | |
2.50%, 10/01/2051 | | | 56 | | | | 47 | |
2.50%, 10/01/2051 | | | 1,019 | | | | 865 | |
2.50%, 10/01/2051 | | | 2,657 | | | | 2,255 | |
2.50%, 10/01/2051 | | | 11,394 | | | | 9,675 | |
2.50%, 11/01/2051 | | | 1,360 | | | | 1,161 | |
2.50%, 11/01/2051 | | | 10,341 | | | | 8,878 | |
2.50%, 11/01/2051 | | | 16,720 | | | | 14,250 | |
2.50%, 12/01/2051 | | | 1,329 | | | | 1,136 | |
2.50%, 12/01/2051 | | | 6,885 | | | | 5,870 | |
2.50%, 12/01/2051 | | | 12,563 | | | | 10,786 | |
2.50%, 12/01/2051 | | | 13,183 | | | | 11,257 | |
2.50%, 12/01/2051 | | | 13,321 | | | | 11,312 | |
2.50%, 01/01/2052 | | | 4,219 | | | | 3,578 | |
2.50%, 01/01/2052 | | | 10,369 | | | | 8,822 | |
2.50%, 01/01/2052 | | | 12,834 | | | | 10,899 | |
2.50%, 02/01/2052 | | | 65 | | | | 55 | |
2.50%, 02/01/2052 | | | 19,299 | | | | 16,389 | |
2.50%, 03/01/2052 | | | 69 | | | | 59 | |
2.50%, 03/01/2052 | | | 26,461 | | | | 22,449 | |
2.50%, 04/01/2052 | | | 53 | | | | 45 | |
2.50%, 05/01/2052 | | | 33,341 | | | | 28,500 | |
2.50%, 11/01/2052 | | | 1,754 | | | | 1,487 | |
2.50%, 03/01/2053 | | | 1,787 | | | | 1,519 | |
2.50%, 07/01/2053 | | | 59 | | | | 50 | |
2.50%, 07/01/2061 | | | 10,581 | | | | 8,681 | |
2.50%, 09/01/2061 | | | 6,278 | | | | 5,151 | |
2.50%, 03/01/2062 | | | 9,526 | | | | 7,797 | |
2.52%, 11/01/2029 | | | 14,074 | | | | 12,494 | |
2.58%, 09/01/2028 | | | 3,717 | | | | 3,388 | |
2.59%, 09/01/2028 | | | 7,458 | | | | 6,800 | |
2.62%, 10/01/2028 | | | 8,761 | | | | 7,973 | |
2.67%, 12/01/2035 | | | 15,510 | | | | 12,546 | |
2.68%, 05/01/2025 | | | 1,691 | | | | 1,610 | |
2.81%, 04/01/2025 | | | 2,900 | | | | 2,769 | |
2.81%, 05/01/2027 | | | 1,806 | | | | 1,688 | |
2.83%, 05/01/2027 | | | 7,845 | | | | 7,313 | |
2.90%, 10/01/2029 | | | 3,235 | | | | 2,954 | |
3.00%, 06/01/2027 | | | 1,932 | | | | 1,811 | |
3.00%, 08/01/2028 | | | 386 | | | | 369 | |
3.00%, 09/01/2028 | | | 704 | | | | 672 | |
3.00%, 12/01/2028 | | | 226 | | | | 215 | |
3.00%, 05/01/2030 | | | 624 | | | | 594 | |
3.00%, 08/01/2034 | | | 1,135 | | | | 1,063 | |
3.00%, 10/01/2034 | | | 2,148 | | | | 2,011 | |
3.00%, 10/01/2035 | | | 349 | | | | 326 | |
3.00%, 04/01/2036 | | | 528 | | | | 489 | |
3.00%, 08/01/2036 | | | 508 | | | | 470 | |
3.00%, 03/01/2037 | | | 4,113 | | | | 3,849 | |
3.00%, 05/01/2038 | | | 7,000 | | | | 6,477 | |
3.00%, 05/01/2042 | | | 196 | | | | 176 | |
3.00%, 10/01/2042 | | | 1,777 | | | | 1,604 | |
3.00%, 11/01/2042 | | | 1,216 | | | | 1,097 | |
3.00%, 12/01/2042 | | | 48 | | | | 43 | |
3.00%, 12/01/2042 | | | 395 | | | | 356 | |
3.00%, 12/01/2042 | | | 630 | | | | 570 | |
3.00%, 01/01/2043 | | | 404 | | | | 365 | |
3.00%, 01/01/2043 | | | 636 | | | | 574 | |
3.00%, 01/01/2043 | | | 709 | | | | 642 | |
3.00%, 01/01/2043 | | | 719 | | | | 649 | |
3.00%, 02/01/2043 | | | 368 | | | | 333 | |
3.00%, 04/01/2043 | | | 488 | | | | 440 | |
3.00%, 04/01/2043 | | | 616 | | | | 556 | |
3.00%, 04/01/2043 | | | 1,158 | | | | 1,045 | |
3.00%, 05/01/2043 | | | 18 | | | | 16 | |
3.00%, 05/01/2043 | | | 120 | | | | 108 | |
3.00%, 05/01/2043 | | | 756 | | | | 682 | |
3.00%, 05/01/2043 | | | 3,997 | | | | 3,608 | |
| | | | | | | | |
3.00%, 06/01/2043 | | | 30 | | | | 27 | |
3.00%, 06/01/2043 | | | 227 | | | | 205 | |
3.00%, 06/01/2043 | | | 244 | | | | 220 | |
3.00%, 06/01/2043 | | | 1,390 | | | | 1,255 | |
3.00%, 06/01/2043 | | | 2,306 | | | | 2,082 | |
3.00%, 07/01/2043 | | | 31 | | | | 28 | |
3.00%, 07/01/2043 | | | 67 | | | | 60 | |
3.00%, 07/01/2043 | | | 226 | | | | 204 | |
3.00%, 07/01/2043 | | | 778 | | | | 703 | |
3.00%, 07/01/2043 | | | 3,521 | | | | 3,178 | |
3.00%, 08/01/2043 | | | 810 | | | | 731 | |
3.00%, 08/01/2043 | | | 2,248 | | | | 2,029 | |
3.00%, 10/01/2043 | | | 49 | | | | 45 | |
3.00%, 10/01/2043 | | | 6,519 | | | | 5,890 | |
3.00%, 02/01/2044 | | | 2,838 | | | | 2,562 | |
3.00%, 03/01/2044 | | | 319 | | | | 288 | |
3.00%, 04/01/2045 | | | 3,573 | | | | 3,225 | |
3.00%, 05/01/2046 | | | 2,768 | | | | 2,482 | |
3.00%, 09/01/2046 | | | 424 | | | | 380 | |
3.00%, 11/01/2046 | | | 940 | | | | 841 | |
3.00%, 11/01/2046 | | | 2,936 | | | | 2,651 | |
3.00%, 11/01/2046 | | | 3,305 | | | | 2,968 | |
3.00%, 01/01/2047 | | | 1,976 | | | | 1,770 | |
3.00%, 02/01/2047 | | | 439 | | | | 396 | |
3.00%, 03/01/2047 | | | 340 | | | | 305 | |
3.00%, 12/01/2047 | | | 905 | | | | 810 | |
3.00%, 07/01/2049 | | | 801 | | | | 714 | |
3.00%, 07/01/2049 | | | 2,176 | | | | 1,939 | |
3.00%, 08/01/2049 | | | 11,835 | | | | 10,568 | |
3.00%, 11/01/2049 | | | 622 | | | | 552 | |
3.00%, 11/01/2049 | | | 5,181 | | | | 4,603 | |
3.00%, 12/01/2049 | | | 212 | | | | 189 | |
3.00%, 12/01/2049 | | | 715 | | | | 637 | |
3.00%, 12/01/2049 | | | 3,671 | | | | 3,260 | |
3.00%, 02/01/2050 | | | 4,268 | | | | 3,790 | |
3.00%, 02/01/2050 | | | 5,513 | | | | 4,885 | |
3.00%, 03/01/2050 | | | 1,299 | | | | 1,151 | |
3.00%, 03/01/2050 | | | 2,230 | | | | 1,981 | |
3.00%, 05/01/2050 | | | 366 | | | | 327 | |
3.00%, 05/01/2050 | | | 1,655 | | | | 1,474 | |
3.00%, 06/01/2050 | | | 566 | | | | 501 | |
3.00%, 06/01/2050 | | | 2,073 | | | | 1,838 | |
3.00%, 07/01/2050 | | | 869 | | | | 775 | |
3.00%, 08/01/2050 | | | 2,192 | | | | 1,943 | |
3.00%, 08/01/2050 | | | 4,670 | | | | 4,139 | |
3.00%, 09/01/2050 | | | 1,853 | | | | 1,653 | |
3.00%, 09/01/2050 | | | 5,212 | | | | 4,616 | |
3.00%, 11/01/2050 | | | 383 | | | | 342 | |
3.00%, 02/01/2051 | | | 1,417 | | | | 1,264 | |
3.00%, 02/01/2051 | | | 4,520 | | | | 3,990 | |
3.00%, 04/01/2051 | | | 6,046 | | | | 5,342 | |
3.00%, 05/01/2051 | | | 3,794 | | | | 3,343 | |
3.00%, 06/01/2051 | | | 3,561 | | | | 3,139 | |
3.00%, 07/01/2051 | | | 1,310 | | | | 1,160 | |
3.00%, 07/01/2051 | | | 6,593 | | | | 5,825 | |
3.00%, 10/01/2051 | | | 2,152 | | | | 1,897 | |
3.00%, 12/01/2051 | | | 20,380 | | | | 18,088 | |
3.00%, 01/01/2052 | | | 9,455 | | | | 8,334 | |
3.00%, 02/01/2052 | | | 4,917 | | | | 4,336 | |
3.00%, 02/01/2052 | | | 10,026 | | | | 8,904 | |
3.00%, 03/01/2052 | | | 7,129 | | | | 6,326 | |
3.00%, 03/01/2052 | | | 11,545 | | | | 10,209 | |
3.00%, 04/01/2052 | | | 9,021 | | | | 8,021 | |
3.00%, 07/01/2060 | | | 8,153 | | | | 6,955 | |
3.00%, 12/01/2061 | | | 10,832 | | | | 9,385 | |
3.02%, 07/01/2029 | | | 8,085 | | | | 7,457 | |
3.07%, 02/01/2025 | | | 4,995 | | | | 4,805 | |
3.08%, 12/01/2024 | | | 1,727 | | | | 1,665 | |
3.08%, 01/01/2028 | | | 8,000 | | | | 7,469 | |
3.09%, 09/01/2029 | | | 7,484 | | | | 6,863 | |
3.10%, 01/01/2028 | | | 6,471 | | | | 6,054 | |
3.12%, 11/01/2026 | | | 901 | | | | 853 | |
3.12%, 06/01/2035 | | | 3,400 | | | | 3,004 | |
3.13%, 03/01/2027 | | | 6,581 | | | | 6,201 | |
3.14%, 12/01/2026 | | | 1,661 | | | | 1,574 | |
3.19%, 01/01/2033 | | | 3,625 | | | | 3,381 | |
3.19%, 03/01/2036 | | | 2,168 | | | | 1,997 | |
3.22%, 09/01/2032 | | | 6,000 | | | | 5,322 | |
3.25%, 09/01/2026 | | | 1,370 | | | | 1,305 | |
3.25%, 02/01/2027 | | | 5,275 | | | | 5,000 | |
3.34%, 02/01/2027 | | | 1,500 | | | | 1,423 | |
3.44% (1 Year LIBOR USD + 1.19%, 1.19% Floor, 10.99% Cap), 11/01/2037(3) | | | 33 | | | | 32 | |
3.45%, 04/01/2035 | | | 1,714 | | | | 1,581 | |
| | | | | | | | |
3.46% (6 Month LIBOR USD + 1.20%, 1.20% Floor, 10.20% Cap), 08/01/2034(3) | | | 12 | | | | 12 | |
3.50%, 12/01/2029 | | | 1,020 | | | | 974 | |
3.50%, 05/01/2030 | | | 210 | | | | 200 | |
3.50%, 12/01/2030 | | | 652 | | | | 625 | |
3.50%, 07/01/2032 | | | 49 | | | | 47 | |
3.50%, 11/01/2032 | | | 364 | | | | 349 | |
3.50%, 12/01/2032 | | | 156 | | | | 149 | |
3.50%, 02/01/2033 | | | 179 | | | | 171 | |
3.50%, 02/01/2033 | | | 217 | | | | 207 | |
3.50%, 03/01/2033 | | | 1,190 | | | | 1,139 | |
3.50%, 04/01/2033 | | | 791 | | | | 758 | |
3.50%, 06/01/2033 | | | 89 | | | | 85 | |
3.50%, 10/01/2033 | | | 3,982 | | | | 3,769 | |
3.50%, 06/01/2040 | | | 770 | | | | 716 | |
3.50%, 12/01/2040 | | | 36 | | | | 33 | |
3.50%, 02/01/2041 | | | 3,144 | | | | 2,944 | |
3.50%, 06/01/2041 | | | 6,008 | | | | 5,619 | |
3.50%, 11/01/2041 | | | 135 | | | | 126 | |
3.50%, 12/01/2041 | | | 104 | | | | 97 | |
3.50%, 12/01/2041 | | | 175 | | | | 164 | |
3.50%, 12/01/2041 | | | 223 | | | | 209 | |
3.50%, 02/01/2042 | | | 119 | | | | 111 | |
3.50%, 02/01/2042 | | | 154 | | | | 144 | |
3.50%, 04/01/2042 | | | 93 | | | | 87 | |
3.50%, 05/01/2042 | | | 2,441 | | | | 2,281 | |
3.50%, 05/01/2042 | | | 2,553 | | | | 2,391 | |
3.50%, 06/01/2042 | | | 620 | | | | 581 | |
3.50%, 07/01/2042 | | | 511 | | | | 479 | |
3.50%, 07/01/2042 | | | 1,608 | | | | 1,505 | |
3.50%, 07/01/2042 | | | 8,654 | | | | 8,102 | |
3.50%, 08/01/2042 | | | 319 | | | | 299 | |
3.50%, 09/01/2042 | | | 250 | | | | 234 | |
3.50%, 09/01/2042 | | | 283 | | | | 264 | |
3.50%, 09/01/2042 | | | 326 | | | | 303 | |
3.50%, 09/01/2042 | | | 1,987 | | | | 1,861 | |
3.50%, 10/01/2042 | | | 127 | | | | 119 | |
3.50%, 10/01/2042 | | | 160 | | | | 149 | |
3.50%, 10/01/2042 | | | 273 | | | | 255 | |
3.50%, 10/01/2042 | | | 464 | | | | 432 | |
3.50%, 11/01/2042 | | | 1,208 | | | | 1,130 | |
3.50%, 11/01/2042 | | | 3,026 | | | | 2,831 | |
3.50%, 01/01/2043 | | | 293 | | | | 272 | |
3.50%, 01/01/2043 | | | 366 | | | | 342 | |
3.50%, 02/01/2043 | | | 19 | | | | 18 | |
3.50%, 02/01/2043 | | | 31 | | | | 29 | |
3.50%, 03/01/2043 | | | 224 | | | | 208 | |
3.50%, 03/01/2043 | | | 655 | | | | 613 | |
3.50%, 03/01/2043 | | | 1,491 | | | | 1,388 | |
3.50%, 04/01/2043 | | | 737 | | | | 688 | |
3.50%, 04/01/2043 | | | 1,718 | | | | 1,605 | |
3.50%, 05/01/2043 | | | 27 | | | | 25 | |
3.50%, 05/01/2043 | | | 195 | | | | 181 | |
3.50%, 05/01/2043 | | | 691 | | | | 643 | |
3.50%, 05/01/2043 | | | 747 | | | | 695 | |
3.50%, 07/01/2043 | | | 4,081 | | | | 3,808 | |
3.50%, 08/01/2043 | | | 738 | | | | 686 | |
3.50%, 06/01/2044 | | | 2,609 | | | | 2,427 | |
3.50%, 04/01/2045 | | | 4,750 | | | | 4,422 | |
3.50%, 06/01/2045 | | | 659 | | | | 613 | |
3.50%, 06/01/2045 | | | 2,991 | | | | 2,782 | |
3.50%, 11/01/2045 | | | 1,238 | | | | 1,151 | |
3.50%, 12/01/2045 | | | 208 | | | | 194 | |
3.50%, 01/01/2046 | | | 3,530 | | | | 3,315 | |
3.50%, 02/01/2046 | | | 1,063 | | | | 989 | |
3.50%, 04/01/2046 | | | 529 | | | | 493 | |
3.50%, 08/01/2046 | | | 1,800 | | | | 1,674 | |
3.50%, 09/01/2046 | | | 1,651 | | | | 1,538 | |
3.50%, 11/01/2046 | | | 4,754 | | | | 4,422 | |
3.50%, 12/01/2046 | | | 1,546 | | | | 1,430 | |
3.50%, 12/01/2046 | | | 3,485 | | | | 3,262 | |
3.50%, 02/01/2047 | | | 2,739 | | | | 2,552 | |
3.50%, 06/01/2047 | | | 262 | | | | 243 | |
3.50%, 11/01/2047 | | | 2,550 | | | | 2,353 | |
3.50%, 12/01/2047 | | | 1,790 | | | | 1,652 | |
3.50%, 01/01/2048 | | | 1,821 | | | | 1,684 | |
3.50%, 04/01/2048 | | | 11,056 | | | | 10,204 | |
3.50%, 08/01/2048 | | | 6,094 | | | | 5,624 | |
3.50%, 10/01/2048 | | | 2,308 | | | | 2,130 | |
3.50%, 03/01/2050 | | | 8,736 | | | | 8,060 | |
3.50%, 02/01/2052 | | | 9,370 | | | | 8,580 | |
3.50%, 03/01/2052 | | | 1,436 | | | | 1,319 | |
3.50%, 06/01/2052 | | | 7,631 | | | | 6,958 | |
3.50%, 03/01/2060 | | | 6,509 | | | | 5,932 | |
| | | | | | | | |
3.50%, 03/01/2062 | | | 9,556 | | | | 8,650 | |
3.53%, 04/01/2033 | | | 12,230 | | | | 11,293 | |
3.54%, 06/01/2032 | | | 15,495 | | | | 14,373 | |
3.54%, 11/01/2032 | | | 10,031 | | | | 9,290 | |
3.55%, 02/01/2030 | | | 1,500 | | | | 1,416 | |
3.57%, 06/01/2028 | | | 8,361 | | | | 7,985 | |
3.61%, 04/01/2028 | | | 2,817 | | | | 2,696 | |
3.64%, 01/01/2025 | | | 505 | | | | 491 | |
3.66%, 03/01/2027 | | | 2,201 | | | | 2,108 | |
3.70% (1 Year LIBOR USD + 1.45%, 1.45% Floor, 9.98% Cap), 10/01/2034(3) | | | 4 | | | | 4 | |
3.73% (1 Year LIBOR USD + 1.48%, 1.48% Floor, 10.30% Cap), 11/01/2033(3) | | | 23 | | | | 22 | |
3.74% (6 Month LIBOR USD + 1.41%, 1.41% Floor, 9.28% Cap), 09/01/2033(3) | | | 21 | | | | 21 | |
3.77%, 12/01/2025 | | | 1,661 | | | | 1,608 | |
3.80%, 09/01/2032 | | | 9,609 | | | | 9,092 | |
3.81%, 12/01/2028 | | | 7,000 | | | | 6,738 | |
3.82% (1 Year LIBOR USD + 1.57%, 1.57% Floor, 11.07% Cap), 09/01/2036(3) | | | 12 | | | | 12 | |
3.85% (ECOFC + 1.25%, 1.89% Floor, 12.64% Cap), 09/01/2027(3) | | | 1 | | | | 1 | |
3.86% (1 Year LIBOR USD + 1.61%, 1.61% Floor, 9.95% Cap), 08/01/2034(3) | | | 6 | | | | 6 | |
3.89% (1 Year LIBOR USD + 1.64%, 1.64% Floor, 10.10% Cap), 09/01/2035(3) | | | 8 | | | | 8 | |
3.90%, 02/01/2033 | | | 12,350 | | | | 11,775 | |
3.90% (1 Year LIBOR USD + 1.65%, 1.65% Floor, 10.98% Cap), 09/01/2034(3) | | | 1 | | | | 1 | |
3.91% (1 Year LIBOR USD + 1.53%, 1.53% Floor, 10.11% Cap), 01/01/2035(3) | | | 4 | | | | 4 | |
3.93% (1 Year LIBOR USD + 1.61%, 1.61% Floor, 9.19% Cap), 01/01/2034(3) | | | 2 | | | | 2 | |
3.98% (1 Year LIBOR USD + 1.73%, 1.73% Floor, 9.98% Cap), 11/01/2034(3) | | | 3 | | | | 3 | |
3.98% (1 Year LIBOR USD + 1.73%, 1.73% Floor, 11.22% Cap), 09/01/2036(3) | | | 18 | | | | 18 | |
4.00%, 06/01/2033 | | | 321 | | | | 312 | |
4.00%, 12/01/2033 | | | 25 | | | | 24 | |
4.00%, 05/01/2037 | | | 3,408 | | | | 3,284 | |
4.00%, 10/01/2037 | | | 683 | | | | 658 | |
4.00%, 11/01/2037 | | | 21,114 | | | | 20,379 | |
4.00%, 07/01/2040 | | | 1,843 | | | | 1,772 | |
4.00%, 08/01/2040 | | | 57 | | | | 55 | |
4.00%, 09/01/2040 | | | 458 | | | | 440 | |
4.00%, 12/01/2040 | | | 92 | | | | 89 | |
4.00%, 12/01/2040 | | | 393 | | | | 378 | |
4.00%, 01/01/2041 | | | 83 | | | | 80 | |
4.00%, 01/01/2041 | | | 194 | | | | 187 | |
4.00%, 01/01/2041 | | | 358 | | | | 344 | |
4.00%, 01/01/2041 | | | 411 | | | | 396 | |
4.00%, 01/01/2041 | | | 483 | | | | 464 | |
4.00%, 01/01/2041 | | | 644 | | | | 619 | |
4.00%, 01/01/2041 | | | 665 | | | | 639 | |
4.00%, 02/01/2041 | | | 21 | | | | 20 | |
4.00%, 02/01/2041 | | | 752 | | | | 723 | |
4.00%, 03/01/2041 | | | 2,837 | | | | 2,727 | |
4.00%, 09/01/2041 | | | 79 | | | | 76 | |
4.00%, 10/01/2041 | | | 352 | | | | 338 | |
4.00%, 10/01/2041 | | | 463 | | | | 445 | |
4.00%, 12/01/2041 | | | 581 | | | | 558 | |
4.00%, 12/01/2041 | | | 711 | | | | 683 | |
4.00%, 01/01/2042 | | | 1,032 | | | | 993 | |
4.00%, 03/01/2042 | | | 25 | | | | 23 | |
4.00%, 07/01/2042 | | | 156 | | | | 150 | |
4.00%, 07/01/2042 | | | 201 | | | | 192 | |
4.00%, 07/01/2042 | | | 205 | | | | 196 | |
4.00%, 07/01/2042 | | | 222 | | | | 213 | |
4.00%, 08/01/2042 | | | 2,171 | | | | 2,088 | |
4.00%, 12/01/2042 | | | 165 | | | | 159 | |
4.00%, 04/01/2043 | | | 3,465 | | | | 3,358 | |
4.00%, 07/01/2043 | | | 387 | | | | 371 | |
4.00%, 11/01/2043 | | | 1,028 | | | | 988 | |
4.00%, 12/01/2043 | | | 48 | | | | 46 | |
4.00%, 12/01/2043 | | | 676 | | | | 648 | |
4.00%, 07/01/2044 | | | 898 | | | | 860 | |
4.00%, 09/01/2044 | | | 366 | | | | 351 | |
4.00%, 12/01/2044 | | | 10,216 | | | | 9,816 | |
4.00%, 01/01/2045 | | | 2,630 | | | | 2,515 | |
4.00%, 07/01/2045 | | | 2,602 | | | | 2,488 | |
4.00%, 10/01/2045 | | | 272 | | | | 260 | |
4.00%, 12/01/2045 | | | 386 | | | | 369 | |
4.00%, 12/01/2045 | | | 1,431 | | | | 1,367 | |
4.00%, 01/01/2046 | | | 903 | | | | 863 | |
4.00%, 08/01/2046 | | | 1,321 | | | | 1,260 | |
4.00%, 03/01/2047 | | | 2,694 | | | | 2,574 | |
4.00%, 03/01/2047 | | | 2,723 | | | | 2,584 | |
4.00%, 06/01/2047 | | | 1,425 | | | | 1,358 | |
4.00%, 08/01/2047 | | | 2,792 | | | | 2,668 | |
4.00%, 11/01/2047 | | | 2,380 | | | | 2,274 | |
4.00%, 11/01/2047 | | | 8,111 | | | | 7,743 | |
4.00%, 01/01/2048 | | | 2,545 | | | | 2,412 | |
4.00%, 01/01/2048 | | | 4,433 | | | | 4,231 | |
4.00%, 03/01/2048 | | | 856 | | | | 816 | |
4.00%, 03/01/2048 | | | 5,457 | | | | 5,214 | |
| | | | | | | | |
4.00%, 06/01/2048 | | | 5,369 | | | | 5,116 | |
4.00%, 09/01/2048 | | | 310 | | | | 296 | |
4.00%, 10/01/2048 | | | 243 | | | | 232 | |
4.00%, 03/01/2049 | | | 3,272 | | | | 3,119 | |
4.00%, 05/01/2049 | | | 9,415 | | | | 9,011 | |
4.00%, 07/01/2049 | | | 442 | | | | 418 | |
4.00%, 07/01/2049 | | | 1,850 | | | | 1,771 | |
4.00%, 10/01/2049 | | | 2,522 | | | | 2,426 | |
4.00%, 01/01/2050 | | | 3,496 | | | | 3,334 | |
4.00%, 05/01/2050 | | | 2,615 | | | | 2,481 | |
4.00%, 07/01/2050 | | | 2,321 | | | | 2,203 | |
4.00%, 04/01/2052 | | | 5,690 | | | | 5,343 | |
4.00%, 05/01/2052 | | | 9,534 | | | | 8,989 | |
4.00%, 06/01/2052 | | | 13,895 | | | | 13,044 | |
4.00%, 07/01/2052 | | | 494 | | | | 464 | |
4.00%, 09/01/2052 | | | 19,452 | | | | 18,257 | |
4.00% (1 Year LIBOR USD + 1.51%, 1.51% Floor, 9.70% Cap), 03/01/2035(3) | | | 12 | | | | 12 | |
4.01% (1 Year LIBOR USD + 1.76%, 1.76% Floor, 11.26% Cap), 09/01/2037(3) | | | 3 | | | | 3 | |
4.02% (1 Year LIBOR USD + 1.77%, 1.77% Floor, 11.22% Cap), 07/01/2036(3) | | | 13 | | | | 13 | |
4.02% (1 Year LIBOR USD + 1.77%, 1.77% Floor, 10.84% Cap), 08/01/2036(3) | | | 35 | | | | 35 | |
4.03% (1 Year CMT Index + 2.01%, 2.01% Floor, 10.78% Cap), 11/01/2037(3) | | | 19 | | | | 20 | |
4.03% (1 Year LIBOR USD + 1.72%, 1.72% Floor, 10.63% Cap), 01/01/2037(3) | | | 9 | | | | 8 | |
4.04% (1 Year LIBOR USD + 1.78%, 1.78% Floor, 10.37% Cap), 07/01/2037(3) | | | 16 | | | | 16 | |
4.05% (1 Year LIBOR USD + 1.80%, 1.80% Floor, 10.83% Cap), 12/01/2036(3) | | | 29 | | | | 28 | |
4.06% (1 Year LIBOR USD + 1.81%, 1.81% Floor, 9.16% Cap), 09/01/2033(3) | | | 5 | | | | 5 | |
4.07% (1 Year LIBOR USD + 1.82%, 1.82% Floor, 11.20% Cap), 09/01/2036(3) | | | 12 | | | | 12 | |
4.09% (1 Year LIBOR USD + 1.84%, 1.84% Floor, 11.00% Cap), 06/01/2036(3) | | | 28 | | | | 28 | |
4.10% (6 Month LIBOR USD + 1.60%, 1.60% Floor, 10.35% Cap), 09/01/2036(3) | | | 19 | | | | 19 | |
4.12% (1 Year CMT Index + 2.00%, 2.00% Floor, 9.02% Cap), 11/01/2034(3) | | | 3 | | | | 3 | |
4.13% (1 Year LIBOR USD + 1.88%, 1.88% Floor, 11.50% Cap), 08/01/2036(3) | | | 11 | | | | 10 | |
4.16% (1 Year LIBOR USD + 1.91%, 1.91% Floor, 12.16% Cap), 09/01/2037(3) | | | 4 | | | | 4 | |
4.17% (1 Year CMT Index + 2.05%, 2.05% Floor, 9.42% Cap), 07/01/2034(3)(11) | | | 0 | | | | 0 | |
4.18% (1 Year LIBOR USD + 1.93%, 1.93% Floor, 11.27% Cap), 10/01/2036(3) | | | 14 | | | | 13 | |
4.18%, 11/01/2030 | | | 3,511 | | | | 3,368 | |
4.19%, 04/01/2033 | | | 1,565 | | | | 1,528 | |
4.19%, 04/01/2033 | | | 8,000 | | | | 7,814 | |
4.20% (1 Year LIBOR USD + 1.95%, 1.95% Floor, 12.32% Cap), 11/01/2036(3)(11) | | | 0 | | | | 0 | |
4.24% (1 Year LIBOR USD + 1.61%, 1.61% Floor, 10.92% Cap), 04/01/2037(3) | | | 9 | | | | 9 | |
4.25% (1 Year LIBOR USD + 1.80%, 1.80% Floor, 11.34% Cap), 07/01/2037(3) | | | 23 | | | | 23 | |
4.26% (6 Month LIBOR USD + 2.03%, 2.03% Floor, 11.29% Cap), 02/01/2037(3) | | | 13 | | | | 13 | |
4.27% (ECOFC + 1.25%, 3.76% Floor, 13.36% Cap), 03/01/2029(3) | | | 1 | | | | 1 | |
4.29% (1 Year LIBOR USD + 1.79%, 1.79% Floor, 10.28% Cap), 01/01/2038(3) | | | 11 | | | | 11 | |
4.32% (1 Year CMT Index + 2.25%, 2.25% Floor, 10.51% Cap), 12/01/2037(3) | | | 38 | | | | 38 | |
4.32%, 03/01/2030 | | | 12,400 | | | | 12,189 | |
4.32%, 06/01/2033 | | | 4,991 | | | | 4,925 | |
4.33% (1 Year LIBOR USD + 2.08%, 2.08% Floor, 10.76% Cap), 10/01/2036(3) | | | 18 | | | | 17 | |
4.33% (1 Year LIBOR USD + 2.08%, 2.08% Floor, 10.83% Cap), 10/01/2036(3) | | | 40 | | | | 40 | |
4.35% (1 Year CMT Index + 2.32%, 2.32% Floor, 11.08% Cap), 09/01/2037(3) | | | 8 | | | | 8 | |
4.37%, 03/01/2033 | | | 3,190 | | | | 3,153 | |
4.48% (1 Year CMT Index + 2.38%, 2.38% Floor, 10.20% Cap), 10/01/2034(3) | | | 18 | | | | 18 | |
4.50%, 08/01/2029 | | | 51 | | | | 50 | |
4.50%, 09/01/2029 | | | 57 | | | | 56 | |
4.50%, 01/01/2030 | | | 98 | | | | 96 | |
4.50%, 10/01/2033 | | | 1,757 | | | | 1,731 | |
4.50%, 11/01/2033 | | | 5 | | | | 5 | |
4.50%, 09/01/2034 | | | 9 | | | | 9 | |
4.50%, 04/01/2039 | | | 2,877 | | | | 2,880 | |
4.50%, 11/01/2039 | | | 8 | | | | 8 | |
4.50%, 08/01/2040 | | | 1,257 | | | | 1,242 | |
4.50%, 08/01/2040 | | | 1,271 | | | | 1,255 | |
4.50%, 12/01/2040 | | | 578 | | | | 570 | |
4.50%, 12/01/2040 | | | 1,914 | | | | 1,890 | |
4.50%, 03/01/2041 | | | 482 | | | | 476 | |
4.50%, 04/01/2041 | | | 267 | | | | 264 | |
4.50%, 05/01/2041 | | | 497 | | | | 491 | |
4.50%, 05/01/2041 | | | 3,063 | | | | 3,025 | |
4.50%, 07/01/2041 | | | 115 | | | | 114 | |
4.50%, 08/01/2041 | | | 935 | | | | 923 | |
4.50%, 01/01/2042 | | | 995 | | | | 982 | |
4.50%, 11/01/2042 | | | 2,618 | | | | 2,586 | |
4.50%, 02/01/2046 | | | 3,146 | | | | 3,107 | |
4.50%, 08/01/2047 | | | 322 | | | | 316 | |
4.50%, 05/01/2048 | | | 576 | | | | 562 | |
4.50%, 07/01/2049 | | | 3,176 | | | | 3,110 | |
4.50%, 03/01/2050 | | | 9,004 | | | | 8,816 | |
4.50%, 09/01/2050 | | | 1,851 | | | | 1,789 | |
4.50%, 02/01/2051 | | | 997 | | | | 960 | |
4.50%, 10/01/2052 | | | 8,831 | | | | 8,527 | |
4.51%, 12/01/2026(4) | | | 579 | | | | 574 | |
4.51% (1 Year CMT Index + 2.13%, 2.13% Floor, 12.31% Cap), 07/01/2035(3) | | | 1 | | | | 1 | |
4.54% (1 Year CMT Index + 2.22%, 2.22% Floor, 9.73% Cap), 01/01/2036(3) | | | 10 | | | | 10 | |
4.57% (1 Year LIBOR USD + 1.60%, 1.60% Floor, 9.29% Cap), 08/01/2033(3) | | | 12 | | | | 12 | |
4.58% (1 Year CMT Index + 2.47%, 2.47% Floor, 10.39% Cap), 10/01/2035(3) | | | 28 | | | | 28 | |
| | | | | | | | |
4.59%, 04/01/2033 | | | 12,165 | | | | 12,272 | |
4.62% (1 Year LIBOR USD + 2.37%, 2.37% Floor, 11.22% Cap), 08/01/2037(3) | | | 32 | | | | 32 | |
4.65% (1 Year CMT Index + 2.12%, 2.12% Floor, 10.31% Cap), 08/01/2036(3) | | | 5 | | | | 5 | |
4.77%, 08/01/2026 | | | 572 | | | | 569 | |
4.92% (1 Year CMT Index + 2.25%, 2.25% Floor, 9.73% Cap), 04/01/2035(3) | | | 14 | | | | 14 | |
4.97%, 12/01/2030 | | | 8,242 | | | | 8,398 | |
4.98%, 11/01/2032 | | | 7,522 | | | | 7,750 | |
5.00% (1 Year LIBOR USD + 1.86%, 1.86% Floor, 10.32% Cap), 06/01/2036(3) | | | 8 | | | | 8 | |
5.00% (6 Month LIBOR USD + 2.50%, 2.50% Floor, 11.21% Cap), 03/01/2036(3) | | | 94 | | | | 96 | |
5.00%, 08/01/2024 | | | 1 | | | | 1 | |
5.00%, 05/01/2028 | | | 6 | | | | 6 | |
5.00%, 04/01/2031 | | | 26 | | | | 26 | |
5.00%, 12/01/2032(11) | | | 0 | | | | 0 | |
5.00%, 06/01/2033 | | | 5 | | | | 5 | |
5.00%, 07/01/2033 | | | 7 | | | | 7 | |
5.00%, 07/01/2033 | | | 7 | | | | 7 | |
5.00%, 11/01/2033 | | | 2 | | | | 2 | |
5.00%, 11/01/2033 | | | 18 | | | | 18 | |
5.00%, 11/01/2033 | | | 1,340 | | | | 1,349 | |
5.00%, 04/01/2034 | | | 42 | | | | 42 | |
5.00%, 05/01/2034 | | | 17 | | | | 17 | |
5.00%, 12/01/2034 | | | 12 | | | | 12 | |
5.00%, 01/01/2035 | | | 7 | | | | 7 | |
5.00%, 02/01/2035 | | | 241 | | | | 242 | |
5.00%, 02/01/2035 | | | 1,143 | | | | 1,151 | |
5.00%, 06/01/2035 | | | 209 | | | | 211 | |
5.00%, 07/01/2035 | | | 6 | | | | 6 | |
5.00%, 07/01/2035 | | | 1,008 | | | | 1,009 | |
5.00%, 07/01/2035 | | | 1,162 | | | | 1,170 | |
5.00%, 09/01/2035 | | | 26 | | | | 26 | |
5.00%, 10/01/2035 | | | 101 | | | | 102 | |
5.00%, 11/01/2035 | | | 234 | | | | 235 | |
5.00%, 01/01/2036 | | | 19 | | | | 19 | |
5.00%, 02/01/2036 | | | 15 | | | | 15 | |
5.00%, 07/01/2037 | | | 299 | | | | 302 | |
5.00%, 01/01/2039 | | | 922 | | | | 924 | |
5.00%, 09/01/2039 | | | 50 | | | | 50 | |
5.00%, 04/01/2040 | | | 112 | | | | 112 | |
5.00%, 08/01/2040 | | | 100 | | | | 101 | |
5.00%, 05/01/2041 | | | 51 | | | | 51 | |
5.00%, 05/01/2042 | | | 819 | | | | 825 | |
5.00%, 09/01/2043 | | | 385 | | | | 387 | |
5.00%, 01/01/2048 | | | 424 | | | | 422 | |
5.00%, 05/01/2048 | | | 1,033 | | | | 1,029 | |
5.00%, 01/01/2049 | | | 3,604 | | | | 3,591 | |
5.00%, 06/01/2052 | | | 8,092 | | | | 7,938 | |
5.00%, 07/01/2052 | | | 488 | | | | 478 | |
5.00%, 07/01/2052 | | | 4,466 | | | | 4,405 | |
5.00%, 08/01/2052 | | | 3,342 | | | | 3,283 | |
5.00%, 08/01/2052 | | | 9,950 | | | | 9,760 | |
5.00%, 08/01/2052 | | | 10,837 | | | | 10,626 | |
5.00%, 10/01/2052 | | | 13,732 | | | | 13,461 | |
5.00%, 02/01/2053 | | | 7,516 | | | | 7,370 | |
5.00%, 03/01/2053 | | | 15,135 | | | | 14,839 | |
5.00%, 06/01/2053 | | | 15,800 | | | | 15,484 | |
5.00%, 07/01/2053 | | | 1,404 | | | | 1,376 | |
5.00%, 03/01/2062 | | | 5,061 | | | | 5,051 | |
5.04% (1 Year LIBOR USD + 1.29%, 1.29% Floor, 9.96% Cap), 05/01/2035(3) | | | 5 | | | | 4 | |
5.10% (1 Year LIBOR USD + 1.73%, 1.73% Floor, 11.26% Cap), 05/01/2036(3) | | | 2 | | | | 2 | |
5.14% (1 Year LIBOR USD + 1.60%, 1.60% Floor, 10.84% Cap), 05/01/2035(3) | | | 4 | | | | 3 | |
5.25% (6 Month LIBOR USD + 2.50%, 2.50% Floor, 10.63% Cap), 02/01/2036(3) | | | 4 | | | | 4 | |
5.42% (1 Year CMT Index + 2.30%, 2.30% Floor, 9.17% Cap), 06/01/2034(3) | | | 18 | | | | 18 | |
5.50%, 07/01/2025 | | | 1 | | | | 1 | |
5.50%, 11/01/2032 | | | 29 | | | | 30 | |
5.50%, 02/01/2033 | | | 1 | | | | 1 | |
5.50%, 03/01/2033 | | | 32 | | | | 33 | |
5.50%, 04/01/2033 | | | 23 | | | | 23 | |
5.50%, 07/01/2033 | | | 4 | | | | 4 | |
5.50%, 09/01/2033 | | | 86 | | | | 88 | |
5.50%, 11/01/2033 | | | 2 | | | | 2 | |
5.50%, 12/01/2033 | | | 39 | | | | 40 | |
5.50%, 01/01/2034 | | | 5 | | | | 5 | |
5.50%, 03/01/2034 | | | 4 | | | | 4 | |
5.50%, 09/01/2034 | | | 8 | | | | 8 | |
5.50%, 10/01/2034 | | | 11 | | | | 11 | |
5.50%, 02/01/2035 | | | 26 | | | | 26 | |
5.50%, 12/01/2035 | | | 9 | | | | 9 | |
5.50%, 04/01/2036 | | | 28 | | | | 29 | |
5.50%, 05/01/2036 | | | 24 | | | | 24 | |
5.50%, 05/01/2036 | | | 38 | | | | 39 | |
5.50%, 11/01/2036 | | | 9 | | | | 9 | |
5.50%, 03/01/2037 | | | 187 | | | | 192 | |
5.50%, 04/01/2037 | | | 62 | | | | 63 | |
| | | | | | | | |
5.50%, 05/01/2037 | | | 62 | | | | 64 | |
5.50%, 01/01/2038 | | | 46 | | | | 47 | |
5.50%, 05/01/2038 | | | 10 | | | | 10 | |
5.50%, 06/01/2038 | | | 1 | | | | 1 | |
5.50%, 06/01/2038 | | | 52 | | | | 53 | |
5.50%, 06/01/2038 | | | 395 | | | | 404 | |
5.50%, 09/01/2038 | | | 337 | | | | 346 | |
5.50%, 06/01/2039 | | | 14 | | | | 14 | |
5.50%, 09/01/2039 | | | 19 | | | | 19 | |
5.50%, 12/01/2039 | | | 27 | | | | 27 | |
5.50%, 01/01/2040 | | | 225 | | | | 230 | |
5.50%, 11/01/2052 | | | 7,352 | | | | 7,326 | |
5.50%, 02/01/2053 | | | 7,472 | | | | 7,455 | |
5.50%, 03/01/2053 | | | 8,770 | | | | 8,751 | |
5.55% (6 Month LIBOR USD + 1.28%, 1.28% Floor, 12.23% Cap), 07/01/2037(3) | | | 23 | | | | 23 | |
5.67% (6 Month LIBOR USD + 1.17%, 1.17% Floor, 12.80% Cap), 09/01/2036(3) | | | 36 | | | | 37 | |
5.67% (1 Month LIBOR USD + 0.48%, 0.48% Floor, 98.56% Cap), 09/01/2024(3) | | | 3,212 | | | | 3,184 | |
5.69% (6 Month LIBOR USD + 1.52%, 1.52% Floor, 12.84% Cap), 02/01/2037(3) | | | 22 | | | | 22 | |
5.71% (12 Month U.S. Treasury Average + 1.91%, 1.91% Floor, 8.50% Cap), 01/01/2036(3) | | | 34 | | | | 34 | |
5.71% (6 Month LIBOR USD + 1.47%, 1.47% Floor, 12.63% Cap), 01/01/2037(3) | | | 19 | | | | 19 | |
5.79% (6 Month LIBOR USD + 1.55%, 1.55% Floor, 10.94% Cap), 02/01/2035(3) | | | 2 | | | | 2 | |
6.00%, 01/01/2024(11) | | | 0 | | | | 0 | |
6.00%, 01/01/2024 | | | 1 | | | | 1 | |
6.00%, 07/01/2024(11) | | | 0 | | | | 0 | |
6.00%, 07/01/2026 | | | 7 | | | | 7 | |
6.00%, 07/01/2027 | | | 11 | | | | 11 | |
6.00%, 11/01/2027 | | | 6 | | | | 6 | |
6.00%, 12/01/2027 | | | 17 | | | | 17 | |
6.00%, 01/01/2028 | | | 29 | | | | 30 | |
6.00%, 10/01/2028 | | | 20 | | | | 20 | |
6.00%, 12/01/2028 | | | 1 | | | | 1 | |
6.00%, 01/01/2029 | | | 1 | | | | 1 | |
6.00%, 09/01/2029 | | | 13 | | | | 14 | |
6.00%, 12/01/2032 | | | 8 | | | | 8 | |
6.00%, 12/01/2032 | | | 63 | | | | 64 | |
6.00%, 03/01/2033(11) | | | 0 | | | | 0 | |
6.00%, 03/01/2033 | | | 1 | | | | 1 | |
6.00%, 03/01/2033 | | | 1 | | | | 1 | |
6.00%, 03/01/2033 | | | 2 | | | | 2 | |
6.00%, 03/01/2033 | | | 3 | | | | 3 | |
6.00%, 05/01/2033 | | | 9 | | | | 10 | |
6.00%, 08/01/2033 | | | 2 | | | | 2 | |
6.00%, 09/01/2033 | | | 6 | | | | 6 | |
6.00%, 09/01/2033 | | | 9 | | | | 9 | |
6.00%, 11/01/2034 | | | 2 | | | | 2 | |
6.00%, 04/01/2035 | | | 41 | | | | 42 | |
6.00%, 02/01/2036 | | | 1 | | | | 1 | |
6.00%, 09/01/2036 | | | 137 | | | | 142 | |
6.00%, 11/01/2036 | | | 17 | | | | 17 | |
6.00%, 03/01/2037 | | | 23 | | | | 23 | |
6.00%, 09/01/2037 | | | 36 | | | | 37 | |
6.00%, 04/01/2038 | | | 9 | | | | 9 | |
6.00%, 05/01/2038 | | | 97 | | | | 100 | |
6.00%, 11/01/2038 | | | 36 | | | | 38 | |
6.00%, 12/01/2039 | | | 508 | | | | 527 | |
6.00%, 10/01/2040 | | | 651 | | | | 675 | |
6.00%, 07/01/2041 | | | 1,721 | | | | 1,787 | |
6.00%, 11/01/2048 | | | 24 | | | | 24 | |
6.12% (6 Month LIBOR USD + 1.52%, 1.52% Floor, 10.87% Cap), 01/01/2035(3) | | | 57 | | | | 58 | |
6.50%, 02/01/2024(11) | | | 0 | | | | 0 | |
6.50%, 07/01/2024(11) | | | 0 | | | | 0 | |
6.50%, 04/01/2025(11) | | | 0 | | | | 0 | |
6.50%, 08/01/2026 | | | 12 | | | | 12 | |
6.50%, 03/01/2029 | | | 5 | | | | 5 | |
6.50%, 11/01/2029 | | | 151 | | | | 154 | |
6.50%, 08/01/2031 | | | 7 | | | | 7 | |
6.50%, 02/01/2032 | | | 26 | | | | 26 | |
6.50%, 01/01/2036 | | | 102 | | | | 105 | |
6.50%, 04/01/2036 | | | 1 | | | | 1 | |
6.50%, 07/01/2036 | | | 3 | | | | 3 | |
6.50%, 08/01/2036 | | | 71 | | | | 72 | |
6.50%, 10/01/2036 | | | 15 | | | | 16 | |
6.50%, 01/01/2037 | | | 31 | | | | 31 | |
6.50%, 08/01/2037 | | | 12 | | | | 13 | |
6.50%, 08/01/2037 | | | 20 | | | | 21 | |
6.50%, 10/01/2037 | | | 29 | | | | 30 | |
6.50%, 10/01/2038 | | | 34 | | | | 36 | |
6.50%, 10/01/2038 | | | 132 | | | | 137 | |
7.00%, 01/01/2024(11) | | | 0 | | | | 0 | |
7.00%, 09/01/2027(11) | | | 0 | | | | 0 | |
7.00%, 01/01/2029(11) | | | 0 | | | | 0 | |
7.00%, 02/01/2033 | | | 1 | | | | 1 | |
7.00%, 06/01/2033 | | | 34 | | | | 35 | |
| | | | | | | | |
7.00%, 02/01/2036 | | | 7 | | | | 7 | |
7.00%, 03/01/2036 | | | 1 | | | | 1 | |
7.00%, 03/01/2037 | | | 3 | | | | 3 | |
7.00%, 04/01/2037 | | | 3 | | | | 3 | |
7.00%, 09/01/2037 | | | 22 | | | | 22 | |
7.00%, 09/01/2038 | | | 35 | | | | 37 | |
7.00%, 10/01/2038 | | | 38 | | | | 40 | |
7.00%, 11/01/2038 | | | 26 | | | | 27 | |
7.00%, 12/01/2038 | | | 88 | | | | 94 | |
7.00%, 01/01/2039 | | | 122 | | | | 129 | |
7.50%, 10/01/2024(11) | | | 0 | | | | 0 | |
7.50%, 01/01/2035 | | | 14 | | | | 14 | |
7.50%, 03/01/2035 | | | 14 | | | | 15 | |
7.50%, 05/01/2037 | | | 10 | | | | 10 | |
7.50%, 10/01/2037 | | | 67 | | | | 70 | |
7.50%, 11/01/2037 | | | 20 | | | | 21 | |
7.50%, 11/01/2038 | | | 17 | | | | 17 | |
7.50%, 04/01/2039 | | | 81 | | | | 85 | |
8.00%, 05/01/2024(11) | | | 0 | | | | 0 | |
8.00%, 03/01/2027 | | | 3 | | | | 3 | |
8.00%, 06/01/2027 | | | 2 | | | | 3 | |
8.00%, 06/01/2028(11) | | | 0 | | | | 0 | |
8.00%, 09/01/2028 | | | 1 | | | | 1 | |
8.00%, 11/01/2028 | | | 7 | | | | 7 | |
8.00%, 11/01/2037 | | | 8 | | | | 9 | |
8.00%, 01/01/2038 | | | 1 | | | | 1 | |
8.50%, 07/01/2024(11) | | | 0 | | | | 0 | |
8.50%, 05/01/2025(11) | | | 0 | | | | 0 | |
Fannie Mae REMIC Trust 2003-W1 | | | | | | | | |
4.81%, 12/25/2042, Series 2003-W1, Class 1A1(4) | | | 61 | | | | 58 | |
5.22%, 12/25/2042, Series 2003-W1, Class 2A(4) | | | 17 | | | | 16 | |
Fannie Mae REMIC Trust 2003-W4 | | | | | | | | |
5.19%, 10/25/2042, Series 2003-W4, Class 2A(4) | | | 8 | | | | 8 | |
Fannie Mae REMIC Trust 2004-W10 | | | | | | | | |
5.75%, 08/25/2034, Series 2004-W10, Class A6 | | | 231 | | | | 229 | |
Fannie Mae REMIC Trust 2004-W11 | | | | | | | | |
6.00%, 05/25/2044, Series 2004-W11, Class 1A1 | | | 48 | | | | 48 | |
Fannie Mae REMIC Trust 2005-W1 | | | | | | | | |
6.50%, 10/25/2044, Series 2005-W1, Class 1A2 | | | 86 | | | | 88 | |
Fannie Mae REMIC Trust 2006-W3 | | | | | | | | |
6.00%, 09/25/2046, Series 2006-W3, Class 2A | | | 53 | | | | 52 | |
Fannie Mae REMIC Trust 2007-W1 | | | | | | | | |
6.30%, 08/25/2047, Series 2007-W10, Class 2A(4) | | | 6 | | | | 6 | |
Fannie Mae REMIC Trust 2007-W3 | | | | | | | | |
6.75%, 04/25/2037, Series 2007-W3, Class 1A3 | | | 13 | | | | 13 | |
Fannie Mae REMIC Trust 2007-W5 | | | | | | | | |
0.00%, 06/25/2037, Series 2007-W5, Class PO | | | 11 | | | | 9 | |
Fannie Mae REMIC Trust 2007-W7 | | | | | | | | |
8.35% (1 Month LIBOR USD + 39.18%, 39.18% Cap), 07/25/2037, Series 2007-W7, Class 1A4(3)(10) | | | 8 | | | | 9 | |
Fannie Mae REMIC Trust 2009-W1 | | | | | | | | |
6.00%, 12/25/2049, Series 2009-W1, Class A | | | 192 | | | | 192 | |
Fannie Mae REMICS | | | | | | | | |
0.00%, 09/25/2023, Series 1993-205, Class H(11) | | | 0 | | | | 0 | |
0.00%, 01/25/2032, Series 2001-81, Class LO | | | 1 | | | | 1 | |
0.00%, 04/25/2032, Series 2002-21, Class LO | | | 1 | | | | 1 | |
0.00%, 12/25/2032, Series 2004-59, Class BG | | | 5 | | | | 4 | |
0.00%, 05/25/2033, Series 2003-35, Class EA | | | 3 | | | | 2 | |
0.00%, 08/25/2033, Series 2003-132, Class OA | | | 1 | | | | 1 | |
0.00%, 12/25/2033, Series 2006-44, Class P | | | 42 | | | | 35 | |
0.00%, 03/25/2034, Series 2004-46, Class EP | | | 24 | | | | 23 | |
0.00% (1 Month LIBOR USD + 25.50%, 25.50% Cap), 06/25/2035, Series 2005-59, Class SU(3)(10) | | | 14 | | | | 12 | |
0.00%, 09/25/2035, Series 2005-90, Class PO | | | 2 | | | | 2 | |
0.00%, 10/25/2035, Series 2010-39, Class OT | | | 10 | | | | 8 | |
0.00%, 03/25/2036, Series 2006-16, Class OA | | | 7 | | | | 6 | |
0.00%, 03/25/2036, Series 2006-8, Class WQ | | | 88 | | | | 70 | |
0.00%, 04/25/2036, Series 2006-23, Class KO | | | 8 | | | | 7 | |
0.00%, 04/25/2036, Series 2006-27, Class OH | | | 15 | | | | 13 | |
0.00%, 04/25/2036, Series 2006-22, Class AO | | | 27 | | | | 23 | |
0.00%, 06/25/2036, Series 2006-43, Class PO | | | 7 | | | | 6 | |
0.00%, 06/25/2036, Series 2006-44, Class GO | | | 15 | | | | 13 | |
0.00%, 06/25/2036, Series 2006-43, Class DO | | | 23 | | | | 19 | |
0.00%, 06/25/2036, Series 2006-50, Class JO | | | 54 | | | | 45 | |
0.00%, 06/25/2036, Series 2006-50, Class PS | | | 65 | | | | 56 | |
0.00%, 07/25/2036, Series 2006-58, Class AP | | | 5 | | | | 4 | |
0.00%, 07/25/2036, Series 2006-58, Class PO | | | 9 | | | | 8 | |
0.00%, 07/25/2036, Series 2006-65, Class QO | | | 17 | | | | 15 | |
0.00%, 08/25/2036, Series 2006-72, Class TO | | | 5 | | | | 4 | |
0.00%, 08/25/2036, Series 2006-79, Class DO | | | 13 | | | | 11 | |
0.00%, 08/25/2036, Series 2006-79, Class OP | | | 18 | | | | 15 | |
0.00%, 08/25/2036, Series 2006-72, Class GO | | | 30 | | | | 26 | |
0.00%, 09/25/2036, Series 2008-42, Class AO | | | 7 | | | | 6 | |
0.00%, 09/25/2036, Series 2006-90, Class AO | | | 12 | | | | 10 | |
0.00%, 09/25/2036, Series 2006-86, Class OB | | | 17 | | | | 13 | |
| | | | | | | | |
0.00%, 11/25/2036, Series 2006-109, Class PO | | | 5 | | | | 4 | |
0.00%, 11/25/2036, Series 2006-111, Class EO | | | 14 | | | | 12 | |
0.00%, 11/25/2036, Series 2006-110, Class PO | | | 25 | | | | 21 | |
0.00%, 12/25/2036, Series 2006-119, Class PO | | | 8 | | | | 7 | |
0.00%, 12/25/2036, Series 2006-115, Class OK | | | 14 | | | | 12 | |
0.00%, 01/25/2037, Series 2006-128, Class PO | | | 15 | | | | 12 | |
0.00%, 01/25/2037, Series 2009-70, Class CO | | | 43 | | | | 36 | |
0.00%, 03/25/2037, Series 2007-14, Class OP | | | 12 | | | | 10 | |
0.00%, 04/25/2037, Series 2007-28, Class EO | | | 39 | | | | 32 | |
0.00%, 05/25/2037, Series 2007-42, Class AO | | | 2 | | | | 2 | |
0.00%, 07/25/2037, Series 2007-67, Class PO | | | 29 | | | | 24 | |
0.00%, 10/25/2037, Series 2009-86, Class OT | | | 256 | | | | 208 | |
0.00%, 01/25/2038, Series 2007-116, Class HI(4) | | | 144 | | | | 5 | |
0.00%, 05/25/2038, Series 2008-44, Class PO | | | 1 | | | | 1 | |
0.00%, 01/25/2040, Series 2009-113, Class AO | | | 22 | | | | 18 | |
0.00%, 06/25/2040, Series 2010-63, Class AP | | | 35 | | | | 29 | |
0.00% (1 Month LIBOR USD + 4.44%, 4.44% Cap), 11/25/2040, Series 2010-125, Class SA(3)(10) | | | 166 | | | | 4 | |
0.00%, 04/25/2041, Series 2011-30, Class LS(4) | | | 230 | | | | 12 | |
0.00%, 09/25/2043, Series 2013-92, Class PO | | | 520 | | | | 390 | |
0.00%, 10/25/2043, Series 2013-101, Class DO | | | 425 | | | | 312 | |
0.00%, 12/25/2043, Series 2013-128, Class PO | | | 916 | | | | 699 | |
0.00%, 06/25/2038, Series 2008-46, Class HI(4) | | | 25 | | | | 1 | |
0.50% (1 Month LIBOR USD + 17.67%, 17.67% Cap), 04/25/2040, Series 2010-35, Class SJ(3)(10) | | | 60 | | | | 56 | |
0.57% (1 Month LIBOR USD + 7.47%, 7.47% Cap), 08/25/2033, Series 2003-71, Class DS(3)(10) | | | 50 | | | | 44 | |
0.63% (1 Month LIBOR USD + 5.78%, 5.78% Cap), 06/25/2037, Series 2007-92, Class YS(3)(10) | | | 17 | | | | 1 | |
0.70% (1 Month LIBOR USD + 5.85%, 5.85% Cap), 09/25/2038, Series 2008-81, Class SB(3)(10) | | | 74 | | | | 4 | |
0.70% (1 Month LIBOR USD + 5.85%, 5.85% Cap), 09/25/2038, Series 2008-80, Class SA(3)(10) | | | 74 | | | | 5 | |
0.75% (1 Month LIBOR USD + 5.90%, 5.90% Cap), 10/25/2039, Series 2009-84, Class WS(3)(10) | | | 22 | | | | 1 | |
0.76% (1 Month LIBOR USD + 5.91%, 5.91% Cap), 02/25/2038, Series 2008-1, Class BI(3)(10) | | | 78 | | | | 5 | |
0.82% (1 Month LIBOR USD + 13.75%, 13.75% Cap), 07/25/2033, Series 2003-64, Class SX(3)(10) | | | 10 | | | | 9 | |
0.85% (1 Month LIBOR USD + 6.00%, 6.00% Cap), 02/25/2038, Series 2008-4, Class SD(3)(10) | | | 210 | | | | 14 | |
0.88% (30-day Average SOFR + 5.95%, 5.95% Cap), 08/25/2052, Series 2022-51, Class PS(3)(10) | | | 10,817 | | | | 621 | |
0.90% (1 Month LIBOR USD + 10.17%, 10.17% Cap), 08/25/2033, Series 2003-74, Class SH(3)(10) | | | 7 | | | | 6 | |
0.90% (1 Month LIBOR USD + 6.05%, 6.05% Cap), 04/25/2050, Series 2020-24, Class SP(3)(10) | | | 4,550 | | | | 505 | |
0.93% (1 Month LIBOR USD + 6.08%, 6.08% Cap), 03/25/2037, Series 2007-22, Class SC(3)(10)(11) | | | 2 | | | | 0 | |
0.95% (1 Month LIBOR USD + 6.10%, 6.10% Cap), 04/25/2037, Series 2007-35, Class SI(3)(10) | | | 33 | | | | 1 | |
0.95% (1 Month LIBOR USD + 6.10%, 6.10% Cap), 06/25/2037, Series 2007-54, Class WI(3)(10) | | | 20 | | | | 1 | |
0.95% (1 Month LIBOR USD + 6.10%, 6.10% Cap), 06/25/2037, Series 2007-53, Class SH(3)(10) | | | 72 | | | | 4 | |
0.95% (1 Month LIBOR USD + 6.10%, 6.10% Cap), 11/25/2049, Series 2010-103, Class SB(3)(10) | | | 44 | | | | 3 | |
1.03% (1 Month LIBOR USD + 6.18%, 6.18% Cap), 12/25/2039, Series 2009-99, Class SC(3)(10) | | | 28 | | | | 2 | |
1.05% (1 Month LIBOR USD + 6.20%, 6.20% Cap), 03/25/2038, Series 2008-16, Class IS(3)(10) | | | 27 | | | | 2 | |
1.08% (1 Month LIBOR USD + 6.23%, 6.23% Cap), 03/25/2038, Series 2008-10, Class XI(3)(10) | | | 29 | | | | 2 | |
1.10% (1 Month LIBOR USD + 6.25%, 6.25% Cap), 01/25/2040, Series 2009-112, Class ST(3)(10) | | | 63 | | | | 5 | |
1.21% (1 Month LIBOR USD + 6.36%, 6.36% Cap), 12/25/2037, Series 2007-108, Class SA(3)(10)(11) | | | 3 | | | | 0 | |
1.25% (1 Month LIBOR USD + 6.40%, 6.40% Cap), 07/25/2037, Series 2007-72, Class EK(3)(10) | | | 186 | | | | 16 | |
1.25% (1 Month LIBOR USD + 6.40%, 6.40% Cap), 12/25/2037, Series 2007-109, Class AI(3)(10) | | | 92 | | | | 5 | |
1.25% (1 Month LIBOR USD + 6.40%, 6.40% Cap), 05/25/2040, Series 2010-42, Class S(3)(10) | | | 29 | | | | 2 | |
1.27% (1 Month LIBOR USD + 6.42%, 6.42% Cap), 04/25/2040, Series 2010-35, Class SB(3)(10) | | | 41 | | | | 3 | |
1.29% (1 Month LIBOR USD + 6.44%, 6.44% Cap), 03/25/2037, Series 2007-14, Class ES(3)(10) | | | 104 | | | | 8 | |
1.30% (1 Month LIBOR USD + 6.45%, 6.45% Cap), 10/25/2037, Series 2007-100, Class SM(3)(10) | | | 68 | | | | 6 | |
1.30% (1 Month LIBOR USD + 6.45%, 6.45% Cap), 12/25/2037, Series 2007-112, Class SA(3)(10) | | | 103 | | | | 10 | |
1.31% (1 Month LIBOR USD + 6.46%, 6.46% Cap), 10/25/2037, Series 2007-91, Class ES(3)(10) | | | 106 | | | | 8 | |
1.35% (1 Month LIBOR USD + 6.50%, 6.50% Cap), 08/25/2036, Series 2007-7, Class SG(3)(10) | | | 93 | | | | 11 | |
1.37% (1 Month LIBOR USD + 6.52%, 6.52% Cap), 07/25/2036, Series 2006-58, Class IG(3)(10) | | | 16 | | | | 1 | |
1.38% (1 Month LIBOR USD + 6.53%, 6.53% Cap), 01/25/2041, Series 2010-147, Class SA(3)(10) | | | 324 | | | | 36 | |
1.39% (1 Month LIBOR USD + 6.54%, 6.54% Cap), 09/25/2037, Series 2007-88, Class VI(3)(10) | | | 98 | | | | 9 | |
1.40% (1 Month LIBOR USD + 6.55%, 6.55% Cap), 02/25/2039, Series 2009-6, Class GS(3)(10) | | | 51 | | | | 4 | |
1.43% (1 Month LIBOR USD + 6.58%, 6.58% Cap), 06/25/2036, Series 2006-53, Class US(3)(10) | | | 61 | | | | 5 | |
1.47% (1 Month LIBOR USD + 6.62%, 6.62% Cap), 07/25/2037, Series 2007-65, Class KI(3)(10) | | | 65 | | | | 6 | |
1.50% (1 Month LIBOR USD + 6.65%, 6.65% Cap), 12/25/2036, Series 2006-117, Class GS(3)(10) | | | 61 | | | | 3 | |
1.50% (1 Month LIBOR USD + 6.65%, 6.65% Cap), 03/25/2039, Series 2009-17, Class QS(3)(10) | | | 15 | | | | 1 | |
1.55% (1 Month LIBOR USD + 6.70%, 6.70% Cap), 03/25/2036, Series 2006-8, Class WN(3)(10) | | | 322 | | | | 28 | |
1.56% (1 Month LIBOR USD + 6.71%, 6.71% Cap), 07/25/2035, Series 2005-56, Class S(3)(10) | | | 28 | | | | 2 | |
1.60% (1 Month LIBOR USD + 8.10%, 1.60% Cap), 03/25/2032, Series 2002-13, Class SJ(3)(10)(11) | | | 17 | | | | 0 | |
1.70% (1 Month LIBOR USD + 6.85%, 6.85% Cap), 04/25/2038, Series 2008-32, Class SA(3)(10) | | | 14 | | | | 1 | |
1.75% (1 Month LIBOR USD + 6.90%, 6.90% Cap), 04/25/2038, Series 2008-27, Class SN(3)(10) | | | 33 | | | | 3 | |
1.84% (1 Month LIBOR USD + 6.99%, 6.99% Cap), 03/25/2038, Series 2008-20, Class SA(3)(10) | | | 37 | | | | 3 | |
1.84%, 03/25/2027, Series 1997-20, Class IB(4)(11) | | | 0 | | | | 0 | |
1.84%, 03/25/2027, Series 1997-20, Class IO(4)(11) | | | 0 | | | | 0 | |
2.00% (1 Month LIBOR USD + 7.15%, 7.15% Cap), 07/25/2037, Series 2007-60, Class AX(3)(10) | | | 296 | | | | 33 | |
2.00%, 12/25/2043, Series 2020-35, Class MA | | | 1,729 | | | | 1,556 | |
2.00%, 06/25/2046, Series 2020-51, Class BA | | | 4,195 | | | | 3,608 | |
2.05% (1 Month LIBOR USD + 7.20%, 7.20% Cap), 07/25/2038, Series 2008-53, Class CI(3)(10) | | | 20 | | | | 2 | |
2.34% (1 Month LIBOR USD + 16.50%, 16.50% Cap), 05/25/2034, Series 2004-46, Class SK(3)(10) | | | 4 | | | | 4 | |
2.36% (1 Month LIBOR USD + 12.66%, 12.66% Cap), 03/25/2040, Series 2010-49, Class SC(3)(10) | | | 94 | | | | 90 | |
2.45% (1 Month LIBOR USD + 7.60%, 7.60% Cap), 07/25/2028, Series 2008-55, Class S(3)(10) | | | 71 | | | | 3 | |
2.45% (1 Month LIBOR USD + 7.60%, 7.60% Cap), 11/25/2033, Series 2003-116, Class SB(3)(10) | | | 47 | | | | 3 | |
2.50%, 12/25/2042, Series 2012-134, Class ZC | | | 6,862 | | | | 5,236 | |
2.69% (1 Year LIBOR USD + 14.86%, 14.86% Cap), 09/25/2023, Series 1993-165, Class SD(3)(10)(11) | | | 0 | | | | 0 | |
2.70% (1 Month LIBOR USD + 18.15%, 18.15% Cap), 08/25/2033, Series 2005-56, Class TP(3)(10) | | | 6 | | | | 5 | |
3.00%, 12/25/2028, Series 2013-118, Class YL | | | 1,238 | | | | 1,146 | |
3.00%, 10/25/2033, Series 2013-100, Class WB | | | 740 | | | | 691 | |
3.00%, 02/25/2043, Series 2013-81, Class TA | | | 401 | | | | 381 | |
| | | | | | | | |
3.00%, 01/25/2046, Series 2016-38, Class NA | | | 1,037 | | | | 944 | |
3.00%, 02/25/2047, Series 2017-51, Class CP | | | 1,064 | | | | 957 | |
3.00%, 06/25/2048, Series 2018-45, Class TM | | | 8,935 | | | | 7,990 | |
3.27% (1 Month LIBOR USD + 16.15%, 16.15% Cap), 09/25/2037, Series 2007-85, Class SL(3)(10) | | | 5 | | | | 5 | |
3.40% (1 Month LIBOR USD + 24.00%, 24.00% Cap), 05/25/2034, Series 2004-46, Class QB(3)(10) | | | 9 | | | | 9 | |
3.50%, 04/25/2031, Series 2011-31, Class DB | | | 347 | | | | 331 | |
3.50%, 09/25/2033, Series 2013-90, Class DL | | | 1,500 | | | | 1,410 | |
3.50%, 03/25/2042, Series 2013-136, Class QB | | | 578 | | | | 531 | |
3.50%, 02/25/2043, Series 2013-4, Class AJ | | | 146 | | | | 136 | |
3.50%, 11/25/2057, Series 2019-7, Class CA | | | 3,193 | | | | 2,981 | |
3.60% (1 Month LIBOR USD + 24.20%, 24.20% Cap), 09/25/2035, Series 2005-75, Class SV(3)(10) | | | 3 | | | | 3 | |
3.62% (1 Month LIBOR USD + 16.50%, 16.50% Cap), 07/25/2037, Series 2007-62, Class SE(3)(10) | | | 13 | | | | 13 | |
3.70% (1 Month LIBOR USD + 14.00%, 14.00% Cap), 03/25/2038, Series 2008-18, Class SP(3)(10) | | | 14 | | | | 12 | |
3.79% (1 Month LIBOR USD + 11.52%, 11.52% Cap), 01/25/2034, Series 2003-130, Class SX(3)(10) | | | 1 | | | | 1 | |
3.82% (1 Month LIBOR USD + 16.70%, 16.70% Cap), 08/25/2035, Series 2005-73, Class PS(3)(10) | | | 14 | | | | 14 | |
3.92% (1 Month LIBOR USD + 12.50%, 12.50% Cap), 09/25/2033, Series 2003-91, Class SD(3)(10) | | | 7 | | | | 7 | |
3.94% (1 Month LIBOR USD + 14.24%, 14.24% Cap), 07/25/2034, Series 2004-51, Class SY(3)(10) | | | 7 | | | | 6 | |
3.95% (1 Month LIBOR USD + 9.10%, 9.10% Cap), 07/25/2030, Series 2000-20, Class SA(3)(10)(11) | | | 2 | | | | 0 | |
4.00% (1 Month LIBOR USD + 16.88%, 16.88% Cap), 08/25/2035, Series 2005-72, Class SB(3)(10) | | | 10 | | | | 10 | |
4.00% (1 Month LIBOR USD + 16.88%, 16.88% Cap), 10/25/2035, Series 2005-90, Class ES(3)(10) | | | 14 | | | | 14 | |
4.00%, 04/25/2033, Series 2003-22, Class UD | | | 96 | | | | 91 | |
4.00%, 05/25/2033, Series 2003-42, Class GB | | | 7 | | | | 7 | |
4.00%, 04/25/2041, Series 2014-21, Class KW | | | 1,285 | | | | 1,237 | |
4.12% (1 Month LIBOR USD + 17.00%, 17.00% Cap), 05/25/2035, Series 2005-42, Class PS(3)(10) | | | 2 | | | | 2 | |
4.50% (1 Month LIBOR USD + 17.38%, 17.38% Cap), 07/25/2035, Series 2005-66, Class SG(3)(10) | | | 14 | | | | 15 | |
4.50%, 10/25/2036, Series 2009-19, Class PW | | | 79 | | | | 76 | |
4.50%, 02/25/2039, Series 2009-4, Class BD | | | 1 | | | | 1 | |
4.50%, 04/25/2042, Series 2014-11, Class VB | | | 1,500 | | | | 1,456 | |
4.54% (1 Month LIBOR USD + 0.25%, 0.25% Floor), 06/27/2036, Series 2007-101, Class A2(3) | | | 195 | | | | 193 | |
4.68% (1 Year LIBOR USD + 29.75%, 29.75% Cap), 10/25/2023, Series 1993-179, Class SB(3)(10)(11) | | | 0 | | | | 0 | |
4.83%, 12/25/2039, Series 2009-103, Class MB(4) | | | 66 | | | | 67 | |
5.00%, 11/25/2024, Series 2004-81, Class JG | | | 12 | | | | 12 | |
5.00%, 03/25/2029, Series 2009-11, Class NB | | | 30 | | | | 29 | |
5.00%, 11/25/2032, Series 2002-71, Class AP | | | 4 | | | | 4 | |
5.00%, 03/25/2033, Series 2003-14, Class TI(11) | | | 6 | | | | 0 | |
5.00%, 03/25/2037, Series 2009-63, Class P | | | 2 | | | | 2 | |
5.00%, 07/25/2038, Series 2008-56, Class AC | | | 17 | | | | 16 | |
5.00%, 07/25/2038, Series 2008-60, Class JC | | | 23 | | | | 22 | |
5.00%, 07/25/2039, Series 2009-52, Class PI | | | 37 | | | | 6 | |
5.00%, 08/25/2039, Series 2009-59, Class HB | | | 146 | | | | 144 | |
5.00%, 09/25/2039, Series 2009-65, Class MT | | | 33 | | | | 33 | |
5.00%, 06/25/2040, Series 2010-64, Class DM | | | 196 | | | | 194 | |
5.00%, 09/25/2040, Series 2010-102, Class PN | | | 133 | | | | 132 | |
5.04% (1 Month LIBOR USD + 14.48%, 14.48% Cap), 12/25/2032, Series 2002-77, Class S(3)(10) | | | 4 | | | | 4 | |
5.13% (1 Month LIBOR USD + 24.02%, 24.02% Cap), 08/25/2037, Series 2007-79, Class SB(3)(10) | | | 25 | | | | 26 | |
5.20% (1 Month LIBOR USD + 0.06%, 0.06% Floor), 12/25/2036, Series 2006-118, Class A1(3) | | | 26 | | | | 26 | |
5.21% (1 Month LIBOR USD + 15.50%, 15.50% Cap), 11/25/2031, Series 2004-74, Class SW(3)(10) | | | 7 | | | | 8 | |
5.25% (1 Month LIBOR USD + 20.70%, 20.70% Cap), 04/25/2038, Series 2008-28, Class QS(3)(10) | | | 14 | | | | 14 | |
5.32% (1 Month LIBOR USD + 24.20%, 24.20% Cap), 06/25/2036, Series 2006-46, Class SW(3)(10) | | | 2 | | | | 3 | |
5.36% (1 Month LIBOR USD + 19.53%, 19.53% Cap), 04/25/2034, Series 2004-25, Class SA(3)(10) | | | 17 | | | | 17 | |
5.36% (1 Month LIBOR USD + 19.53%, 19.53% Cap), 05/25/2034, Series 2004-36, Class SA(3)(10) | | | 42 | | | | 44 | |
5.40% (1 Month LIBOR USD + 0.25%, 0.25% Floor, 7.00% Cap), 04/25/2036, Series 2006-23, Class FK(3) | | | 50 | | | | 49 | |
5.40% (1 Month LIBOR USD + 0.25%, 0.25% Floor, 6.50% Cap), 02/25/2037, Series 2007-10, Class FD(3) | | | 26 | | | | 26 | |
5.44% (1 Month LIBOR USD + 0.29%, 0.29% Floor, 7.50% Cap), 07/25/2036, Series 2006-56, Class FC(3) | | | 137 | | | | 136 | |
5.45% (1 Month LIBOR USD + 0.30%, 0.30% Floor, 6.75% Cap), 05/25/2037, Series 2007-43, Class FL(3) | | | 21 | | | | 20 | |
5.47% (1 Month LIBOR USD + 17.47%, 17.47% Cap), 12/25/2031, Series 2001-72, Class SX(3)(10) | | | 1 | | | | 1 | |
5.50% (1 Month LIBOR USD + 22.67%, 22.67% Cap), 04/25/2037, Series 2007-29, Class SG(3)(10) | | | 20 | | | | 22 | |
5.50%, 07/25/2024, Series 2004-53, Class NC(11) | | | 0 | | | | 0 | |
5.50%, 08/25/2024, Series 2004-65, Class EY | | | 5 | | | | 5 | |
5.50%, 08/25/2025, Series 2005-67, Class EY | | | 21 | | | | 20 | |
5.50%, 01/25/2026, Series 2005-121, Class DX | | | 9 | | | | 8 | |
5.50%, 04/18/2029, Series 1999-18, Class Z | | | 2 | | | | 2 | |
5.50%, 12/25/2032, Series 2002-78, Class Z | | | 54 | | | | 53 | |
5.50%, 08/25/2033, Series 2003-72, Class IE | | | 98 | | | | 14 | |
5.50%, 08/25/2033, Series 2003-73, Class HC | | | 43 | | | | 43 | |
5.50%, 10/25/2033, Series 2003-105, Class AZ | | | 339 | | | | 340 | |
5.50%, 04/25/2034, Series 2004-17, Class H | | | 106 | | | | 107 | |
5.50%, 07/25/2034, Series 2004-50, Class VZ | | | 182 | | | | 182 | |
5.50%, 08/25/2035, Series 2005-68, Class PG | | | 39 | | | | 39 | |
5.50%, 08/25/2035, Series 2005-73, Class ZB | | | 336 | | | | 335 | |
5.50%, 12/25/2035, Series 2006-46, Class UC | | | 6 | | | | 6 | |
5.50%, 12/25/2035, Series 2005-110, Class GL | | | 226 | | | | 228 | |
5.50%, 01/25/2036, Series 2006-39, Class WC | | | 2 | | | | 2 | |
5.50%, 03/25/2036, Series 2006-16, Class HZ | | | 19 | | | | 19 | |
5.50%, 03/25/2036, Series 2006-12, Class BZ | | | 92 | | | | 91 | |
5.50%, 03/25/2036, Series 2006-8, Class JZ | | | 113 | | | | 113 | |
5.50%, 01/25/2037, Series 2006-128, Class BP | | | 5 | | | | 5 | |
5.50%, 07/25/2037, Series 2007-70, Class Z | | | 66 | | | | 66 | |
5.50%, 08/25/2037, Series 2007-76, Class AZ | | | 18 | | | | 18 | |
5.50%, 07/25/2038, Series 2011-47, Class ZA | | | 80 | | | | 81 | |
5.50%, 10/25/2039, Series 2009-86, Class IP | | | 88 | | | | 16 | |
5.50%, 06/25/2040, Series 2010-58, Class MB | | | 378 | | | | 375 | |
5.50%, 07/25/2040, Series 2010-71, Class HJ | | | 131 | | | | 133 | |
| | | | | | | | |
5.50%, 10/25/2040, Series 2010-111, Class AM | | | 408 | | | | 418 | |
5.50% (1 Month LIBOR USD + 0.35%, 0.35% Floor, 6.75% Cap), 04/25/2035, Series 2005-25, Class PF(3) | | | 48 | | | | 48 | |
5.50% (1 Month LIBOR USD + 0.35%, 0.35% Floor, 7.50% Cap), 08/25/2036, Series 2006-79, Class DF(3) | | | 53 | | | | 52 | |
5.50%, 07/25/2051, Series 2011-58, Class WA(4) | | | 19 | | | | 19 | |
5.52% (1 Month LIBOR USD + 0.37%, 0.37% Floor, 7.50% Cap), 07/25/2037, Series 2007-64, Class FB(3) | | | 31 | | | | 31 | |
5.52% (1 Month LIBOR USD + 0.06%, 0.06% Floor), 12/25/2036, Series 2006-118, Class A2(3) | | | 121 | | | | 118 | |
5.55% (1 Month LIBOR USD + 0.40%, 0.40% Floor, 7.50% Cap), 03/25/2034, Series 2004-28, Class PF(3) | | | 22 | | | | 22 | |
5.55% (1 Month LIBOR USD + 0.40%, 0.40% Floor, 7.50% Cap), 05/25/2034, Series 2004-36, Class FA(3) | | | 98 | | | | 98 | |
5.55% (1 Month LIBOR USD + 0.40%, 0.40% Floor, 7.00% Cap), 06/25/2036, Series 2006-46, Class FW(3) | | | 16 | | | | 15 | |
5.55% (1 Month LIBOR USD + 0.40%, 0.40% Floor, 7.00% Cap), 06/25/2037, Series 2007-54, Class FA(3) | | | 99 | | | | 97 | |
5.60% (1 Month LIBOR USD + 26.20%, 26.20% Cap), 10/25/2036, Series 2006-95, Class SG(3)(10) | | | 10 | | | | 11 | |
5.60% (1 Month LIBOR USD + 0.45%, 6.50% Cap), 06/25/2037, Series 2007-98, Class FB(3) | | | 12 | | | | 12 | |
5.60% (1 Month LIBOR USD + 0.45%, 0.45% Floor, 6.50% Cap), 09/25/2042, Series 2012-99, Class FA(3) | | | 145 | | | | 141 | |
5.61% (1 Month LIBOR USD + 0.46%, 0.46% Floor, 7.00% Cap), 07/25/2036, Series 2006-58, Class FL(3) | | | 15 | | | | 14 | |
5.63% (1 Year LIBOR USD + 31.01%, 31.01% Cap), 12/25/2023, Series 1993-247, Class SA(3)(10)(11) | | | 0 | | | | 0 | |
5.65% (1 Month LIBOR USD + 0.50%, 0.50% Floor, 7.00% Cap), 03/25/2037, Series 2007-77, Class FG(3) | | | 29 | | | | 29 | |
5.65% (1 Month LIBOR USD + 0.50%, 0.50% Floor, 7.00% Cap), 07/25/2037, Series 2007-97, Class FC(3) | | | 17 | | | | 17 | |
5.65% (1 Month LIBOR USD + 0.50%, 0.50% Floor, 6.50% Cap), 07/25/2041, Series 2011-149, Class EF(3) | | | 17 | | | | 16 | |
5.65% (1 Month LIBOR USD + 0.50%, 0.50% Floor, 6.50% Cap), 11/25/2041, Series 2011-149, Class MF(3) | | | 70 | | | | 70 | |
5.65% (1 Month LIBOR USD + 0.50%, 0.50% Floor, 6.50% Cap), 09/25/2042, Series 2012-101, Class FC(3) | | | 66 | | | | 64 | |
5.65% (1 Month LIBOR USD + 0.50%, 0.50% Floor, 6.50% Cap), 09/25/2042, Series 2012-97, Class FB(3) | | | 476 | | | | 464 | |
5.65% (1 Month LIBOR USD + 0.50%, 0.50% Floor, 6.50% Cap), 10/25/2042, Series 2012-108, Class F(3) | | | 184 | | | | 179 | |
5.68% (1 Month LIBOR USD + 24.57%, 24.57% Cap), 11/25/2035, Series 2005-106, Class US(3)(10) | | | 61 | | | | 62 | |
5.68% (1 Month LIBOR USD + 24.57%, 24.57% Cap), 03/25/2036, Series 2006-11, Class PS(3)(10) | | | 9 | | | | 10 | |
5.70% (1 Month LIBOR USD + 0.55%, 0.55% Floor, 6.50% Cap), 08/25/2041, Series 2011-75, Class FA(3) | | | 41 | | | | 41 | |
5.75%, 06/25/2033, Series 2003-47, Class PE | | | 31 | | | | 31 | |
5.75%, 07/25/2035, Series 2005-66, Class ZH | | | 940 | | | | 933 | |
5.75%, 10/25/2035, Series 2005-84, Class XM | | | 29 | | | | 29 | |
5.75% (1 Month LIBOR USD + 0.60%, 0.60% Floor, 9.00% Cap), 12/25/2023, Series 1993-230, Class FA(3)(11) | | | 0 | | | | 0 | |
5.75% (1 Month LIBOR USD + 0.60%, 0.60% Floor, 7.00% Cap), 04/25/2040, Series 2010-40, Class FJ(3) | | | 13 | | | | 13 | |
5.75% (1 Month LIBOR USD + 0.60%, 0.60% Floor, 7.00% Cap), 05/25/2040, Series 2010-43, Class FD(3) | | | 28 | | | | 28 | |
5.86% (1 Month LIBOR USD + 20.02%, 20.02% Cap), 05/25/2035, Series 2005-74, Class CS(3)(10) | | | 21 | | | | 21 | |
5.86%, 02/25/2051, Series 2011-2, Class WA(4) | | | 37 | | | | 37 | |
5.87% (1 Month LIBOR USD + 24.75%, 24.75% Cap), 05/25/2035, Series 2005-74, Class CP(3)(10) | | | 5 | | | | 5 | |
5.90% (1 Month LIBOR USD + 16.20%, 16.20% Cap), 01/25/2034, Series 2003-131, Class SK(3)(10)(11) | | | 0 | | | | 0 | |
5.90% (1 Month LIBOR USD + 0.75%, 0.75% Floor, 8.00% Cap), 01/25/2034, Series 2004-87, Class F(3) | | | 56 | | | | 57 | |
5.90% (1 Month LIBOR USD + 0.75%, 6.50% Cap), 03/25/2037, Series 2007-16, Class FC(3) | | | 18 | | | | 17 | |
5.95% (1 Month LIBOR USD + 0.80%, 0.80% Floor, 8.00% Cap), 11/25/2032, Series 2004-61, Class FH(3) | | | 123 | | | | 124 | |
5.96% (1 Month LIBOR USD + 26.56%, 26.56% Cap), 12/25/2036, Series 2006-115, Class ES(3)(10) | | | 2 | | | | 2 | |
5.97% (1 Month LIBOR USD + 20.13%, 20.13% Cap), 05/25/2035, Series 2005-74, Class SK(3)(10) | | | 14 | | | | 14 | |
6.00%, 07/25/2023, Series 1993-136, Class ZB(4)(11) | | | 0 | | | | 0 | |
6.00%, 07/18/2028, Series 1998-36, Class ZB | | | 2 | | | | 2 | |
6.00%, 12/25/2028, Series 1998-66, Class C(11) | | | 0 | | | | 0 | |
6.00%, 07/25/2031, Series 2001-33, Class ID | | | 13 | | | | 2 | |
6.00%, 11/25/2031, Series 2001-60, Class PX | | | 22 | | | | 23 | |
6.00%, 04/25/2032, Series 2002-15, Class ZA | | | 59 | | | | 58 | |
6.00%, 11/25/2032, Series 2011-39, Class ZA | | | 169 | | | | 171 | |
6.00%, 05/25/2033, Series 2003-39, Class IO(4) | | | 4 | | | | 1 | |
6.00%, 05/25/2033, Series 2003-34, Class AX | | | 15 | | | | 15 | |
6.00%, 05/25/2033, Series 2003-34, Class GE | | | 43 | | | | 44 | |
6.00%, 05/25/2033, Series 2003-34, Class ED | | | 66 | | | | 67 | |
6.00%, 12/25/2035, Series 2005-109, Class PC | | | 4 | | | | 4 | |
6.00%, 07/25/2036, Series 2006-71, Class ZL | | | 185 | | | | 187 | |
6.00%, 03/25/2037, Series 2007-18, Class MZ | | | 128 | | | | 127 | |
6.00%, 05/25/2037, Series 2007-42, Class B | | | 56 | | | | 57 | |
6.00%, 08/25/2037, Series 2007-78, Class CB | | | 8 | | | | 8 | |
6.00%, 08/25/2037, Series 2007-76, Class ZG | | | 18 | | | | 18 | |
6.00%, 08/25/2037, Series 2007-78, Class PE | | | 19 | | | | 19 | |
6.00%, 08/25/2037, Series 2007-81, Class GE | | | 27 | | | | 28 | |
6.00%, 08/25/2039, Series 2009-60, Class HT | | | 175 | | | | 181 | |
6.03%, 09/25/2039, Series 2009-69, Class WA(4) | | | 54 | | | | 54 | |
6.05%, 10/25/2037, Series 2007-106, Class A7(4) | | | 21 | | | | 21 | |
6.05% (1 Month LIBOR USD + 0.90%, 0.90% Floor, 6.75% Cap), 03/25/2038, Series 2008-18, Class FA(3) | | | 19 | | | | 19 | |
6.15% (1 Month LIBOR USD + 1.00%, 1.00% Floor, 9.50% Cap), 12/25/2023, Series 1993-247, Class FE(3)(11) | | | 0 | | | | 0 | |
6.15%, 03/25/2040, Series 2010-16, Class WB(4) | | | 107 | | | | 108 | |
6.23%, 02/25/2040, Series 2010-1, Class WA(4) | | | 25 | | | | 25 | |
6.30%, 12/25/2039, Series 2009-99, Class WA(4) | | | 145 | | | | 147 | |
6.35%, 04/25/2029, Series 1999-17, Class C | | | 2 | | | | 2 | |
6.44%, 03/25/2040, Series 2010-16, Class WA(4) | | | 99 | | | | 100 | |
6.47% (1 Month LIBOR USD + 24.50%, 24.50% Cap), 12/25/2023, Series 2002-1, Class UD(3)(10)(11) | | | 0 | | | | 0 | |
6.47% (1 Month LIBOR USD + 24.50%, 24.50% Cap), 09/25/2031, Series 2001-60, Class QS(3)(10) | | | 10 | | | | 10 | |
6.50%, 09/25/2023, Series 1993-178, Class PK(11) | | | 0 | | | | 0 | |
6.50%, 10/25/2023, Series 1993-189, Class PL(11) | | | 0 | | | | 0 | |
6.50%, 10/25/2023, Series 1993-183, Class KA | | | 1 | | | | 1 | |
6.50%, 11/25/2023, Series 1995-19, Class Z(11) | | | 0 | | | | 0 | |
6.50%, 12/25/2023, Series 1993-225, Class UB(11) | | | 0 | | | | 0 | |
6.50%, 03/25/2024, Series 1994-37, Class L(11) | | | 0 | | | | 0 | |
6.50%, 03/25/2024, Series 1994-40, Class Z | | | 4 | | | | 4 | |
6.50%, 04/25/2027, Series 1997-32, Class PG | | | 4 | | | | 4 | |
6.50%, 07/18/2027, Series 1997-42, Class ZC(11) | | | 0 | | | | 0 | |
6.50%, 09/25/2031, Series 2001-49, Class Z | | | 4 | | | | 4 | |
6.50%, 10/25/2031, Series 2001-52, Class KB | | | 3 | | | | 3 | |
6.50%, 04/25/2032, Series 2002-21, Class PE | | | 10 | | | | 10 | |
| | | | | | | | |
6.50%, 05/25/2032, Series 2002-28, Class PK | | | 20 | | | | 21 | |
6.50%, 06/25/2032, Series 2002-37, Class Z | | | 9 | | | | 10 | |
6.50%, 07/25/2032, Series 2006-130, Class GI | | | 34 | | | | 3 | |
6.50%, 08/25/2032, Series 2002-48, Class GH | | | 26 | | | | 26 | |
6.50%, 02/25/2033, Series 2003-9, Class NZ | | | 9 | | | | 10 | |
6.50%, 05/25/2033, Series 2003-33, Class IA | | | 37 | | | | 7 | |
6.50%, 07/25/2036, Series 2006-63, Class ZH | | | 96 | | | | 100 | |
6.50%, 07/25/2036, Series 2011-19, Class ZY | | | 127 | | | | 132 | |
6.50%, 08/25/2036, Series 2006-78, Class BZ | | | 10 | | | | 10 | |
6.50%, 08/25/2036, Series 2006-77, Class PC | | | 41 | | | | 41 | |
6.50%, 09/25/2036, Series 2006-85, Class MZ | | | 4 | | | | 4 | |
6.50%, 06/25/2037, Series 2007-92, Class YA | | | 10 | | | | 11 | |
6.50%, 12/25/2037, Series 2007-112, Class MJ | | | 73 | | | | 75 | |
6.50%, 06/25/2042, Series 2002-90, Class A1 | | | 35 | | | | 35 | |
6.88%, 08/25/2023, Series 2002-83, Class CS(11) | | | 0 | | | | 0 | |
6.97% (1 Month LIBOR USD + 30.15%, 30.15% Cap), 05/25/2036, Series 2006-33, Class LS(3)(10) | | | 9 | | | | 10 | |
6.99% (10 Year CMT Index + 10.75%, 10.00% Cap), 08/25/2023, Series 1996-14, Class SE(3)(10)(11) | | | 0 | | | | 0 | |
7.00%, 07/25/2023, Series 2002-1, Class G(11) | | | 0 | | | | 0 | |
7.00%, 07/25/2023, Series 1993-99, Class Z(11) | | | 0 | | | | 0 | |
7.00%, 08/25/2023, Series 1993-141, Class Z(11) | | | 0 | | | | 0 | |
7.00%, 04/25/2024, Series 1994-63, Class PK | | | 3 | | | | 3 | |
7.00%, 04/25/2024, Series 1994-62, Class PK | | | 7 | | | | 7 | |
7.00%, 11/25/2026, Series 1996-48, Class Z | | | 3 | | | | 3 | |
7.00%, 12/18/2027, Series 1997-81, Class PI(11) | | | 2 | | | | 0 | |
7.00%, 03/25/2031, Series 2001-7, Class PF | | | 2 | | | | 2 | |
7.00%, 07/25/2031, Series 2001-30, Class PM | | | 7 | | | | 7 | |
7.00%, 08/25/2031, Series 2001-36, Class DE | | | 13 | | | | 14 | |
7.00%, 09/25/2031, Series 2001-44, Class PU | | | 2 | | | | 3 | |
7.00%, 09/25/2031, Series 2001-44, Class PD | | | 3 | | | | 3 | |
7.00%, 09/25/2031, Series 2001-44, Class MY | | | 17 | | | | 18 | |
7.00%, 11/25/2031, Series 2001-61, Class Z | | | 26 | | | | 26 | |
7.00%, 05/25/2033, Series 2007-97, Class KI | | | 69 | | | | 6 | |
7.00%, 07/25/2039, Series 2009-47, Class MT | | | 1 | | | | 1 | |
7.00%, 11/25/2041, Series 2011-118, Class LB | | | 396 | | | | 417 | |
7.00%, 11/25/2041, Series 2011-118, Class NT | | | 417 | | | | 434 | |
7.00%, 11/25/2041, Series 2011-118, Class MT | | | 484 | | | | 507 | |
7.22% (1 Year LIBOR USD + 12.95%, 4.00% Floor, 12.95% Cap), 12/25/2023, Series 1993-247, Class SU(3)(10)(11) | | | 0 | | | | 0 | |
7.50% (1 Month LIBOR USD + 33.25%, 33.25% Cap), 10/25/2026, Series 2006-94, Class GK(3)(10) | | | 4 | | | | 4 | |
7.50% (1 Month LIBOR USD + 22.95%, 22.95% Cap), 10/25/2031, Series 2003-52, Class SX(3)(10) | | | 5 | | | | 6 | |
7.50%, 04/18/2027, Series 1997-27, Class J | | | 1 | | | | 2 | |
7.50%, 04/20/2027, Series 1997-29, Class J | | | 2 | | | | 2 | |
7.50%, 05/20/2027, Series 1997-39, Class PD | | | 7 | | | | 7 | |
7.50%, 12/18/2029, Series 1999-62, Class PB | | | 3 | | | | 3 | |
7.50%, 02/25/2030, Series 2000-2, Class ZE | | | 14 | | | | 14 | |
8.10% (1 Month LIBOR USD + 39.00%, 39.00% Cap), 02/25/2037, Series 2007-1, Class SD(3)(10) | | | 8 | | | | 13 | |
8.20% (1 Month LIBOR USD + 28.80%, 28.80% Cap), 07/25/2036, Series 2006-60, Class AK(3)(10) | | | 9 | | | | 9 | |
8.45% (1 Month LIBOR USD + 25.19%, 25.19% Cap), 02/25/2032, Series 2002-1, Class SA(3)(10) | | | 2 | | | | 2 | |
8.50%, 01/25/2025, Series 1995-2, Class Z(11) | | | 0 | | | | 0 | |
8.50%, 01/25/2031, Series 2000-52, Class IO(11) | | | 1 | | | | 0 | |
8.50% (1 Month LIBOR USD + 51.00%, 8.50% Cap), 11/25/2032, Series 2004-61, Class SK(3)(10) | | | 8 | | | | 8 | |
8.80%, 01/25/2025, Series G95-1, Class C(11) | | | 0 | | | | 0 | |
8.96% (1 Month LIBOR USD + 23.38%, 23.38% Cap), 10/25/2023, Series 1999-52, Class NS(3)(10)(11) | | | 0 | | | | 0 | |
9.00% (1 Month LIBOR USD + 39.90%, 39.90% Cap), 07/25/2036, Series 2006-62, Class PS(3)(10) | | | 6 | | | | 8 | |
10.00% (1 Month LIBOR USD + 54.00%, 10.00% Cap), 03/25/2032, Series 2002-13, Class ST(3)(10)(11) | | | 0 | | | | 0 | |
10.50% (1 Year LIBOR USD + 63.39%, 10.50% Cap), 10/25/2023, Series 1993-179, Class SC(3)(10)(11) | | | 0 | | | | 0 | |
12.50% (1 Month LIBOR USD + 77.31%, 12.50% Cap), 09/25/2023, Series 1993-165, Class SK(3)(10)(11) | | | 0 | | | | 0 | |
Fannie Mae Trust 2003-W2 | | | | | | | | |
5.90%, 07/25/2042, Series 2003-W2, Class 2A9 | | | 34 | | | | 33 | |
6.50%, 07/25/2042, Series 2003-W2, Class 1A1 | | | 57 | | | | 57 | |
Fannie Mae Trust 2003-W6 | | | | | | | | |
5.20%, 09/25/2042, Series 2003-W6, Class 2A4 | | | 195 | | | | 190 | |
6.50%, 09/25/2042, Series 2003-W6, Class 3A | | | 69 | | | | 69 | |
Fannie Mae Trust 2003-W8 | | | | | | | | |
5.55% (1 Month LIBOR USD + 0.40%, 0.40% Floor, 8.00% Cap), 05/25/2042, Series 2003-W8, Class 3F1(3) | | | 17 | | | | 17 | |
7.00%, 10/25/2042, Series 2003-W8, Class 2A | | | 75 | | | | 76 | |
Fannie Mae Trust 2004-W1 | | | | | | | | |
7.00%, 12/25/2033, Series 2004-W1, Class 2A2 | | | 125 | | | | 130 | |
Fannie Mae Trust 2004-W15 | | | | | | | | |
5.40% (1 Month LIBOR USD + 0.25%, 0.25% Floor), 08/25/2044, Series 2004-W15, Class 2AF(3) | | | 61 | | | | 60 | |
Fannie Mae Trust 2004-W2 | | | | | | | | |
7.00%, 02/25/2044, Series 2004-W2, Class 2A2 | | | 21 | | | | 21 | |
Fannie Mae Trust 2004-W8 | | | | | | | | |
7.50%, 06/25/2044, Series 2004-W8, Class 3A | | | 19 | | | | 19 | |
Fannie Mae Trust 2005-W3 | | | | | | | | |
5.37% (1 Month LIBOR USD + 0.22%, 0.22% Floor, 9.50% Cap), 03/25/2045, Series 2005-W3, Class 2AF(3) | | | 509 | | | | 504 | |
Fannie Mae Trust 2005-W4 | | | | | | | | |
6.00%, 08/25/2045, Series 2005-W4, Class 1A1 | | | 27 | | | | 27 | |
Fannie Mae Trust 2006-W2 | | | | | | | | |
3.44%, 11/25/2045, Series 2006-W2, Class 2A(4) | | | 69 | | | | 68 | |
5.37% (1 Month LIBOR USD + 0.22%, 0.22% Floor, 9.50% Cap), 02/25/2046, Series 2006-W2, Class 1AF1(3) | | | 230 | | | | 226 | |
Fannie Mae Whole Loan | | | | | | | | |
5.41% (1 Month LIBOR USD + 0.26%, 0.26% Floor, 9.50% Cap), 11/25/2046, Series 2007-W1, Class 1AF1(3) | | | 521 | | | | 516 | |
Fannie Mae-Aces | | | | | | | | |
| | | | | | | | |
0.75%, 09/25/2028, Series 2020-M39, Class 1A1 | | | 10,108 | | | | 9,499 | |
1.00%, 11/25/2033, Series 2021-M3, Class 1A1 | | | 2,275 | | | | 2,133 | |
1.20%, 10/25/2030, Series 2020-M50, Class A2 | | | 1,052 | | | | 928 | |
1.59%, 11/25/2028, Series 2020-M38, Class 2A1 | | | 1,828 | | | | 1,601 | |
1.76%, 11/25/2031, Series 2022-M3, Class A2(4) | | | 13,600 | | | | 10,989 | |
1.93%, 10/25/2030, Series 2020-M50, Class X1(4) | | | 14,784 | | | | 943 | |
2.05%, 11/25/2033, Series 2021-M3, Class X1(4) | | | 27,438 | | | | 2,380 | |
2.06%, 07/25/2030, Series 2020-M39, Class X1(4) | | | 101,636 | | | | 7,983 | |
2.10%, 11/25/2028, Series 2020-M38, Class X2(4) | | | 11,458 | | | | 765 | |
2.53%, 09/25/2024, Series 2015-M1, Class A2 | | | 921 | | | | 887 | |
2.55%, 12/25/2026, Series 2017-M3, Class A2(4) | | | 1,130 | | | | 1,050 | |
2.59%, 12/25/2024, Series 2015-M7, Class A2 | | | 1,038 | | | | 995 | |
2.64%, 12/25/2026, Series 2017-M4, Class A2(4) | | | 6,566 | | | | 6,111 | |
2.90%, 01/25/2025, Series 2015-M8, Class A2(4) | | | 1,698 | | | | 1,627 | |
2.96%, 02/25/2027, Series 2017-M7, Class A2(4) | | | 2,998 | | | | 2,825 | |
2.98%, 08/25/2029, Series 2017-M11, Class A2 | | | 2,196 | | | | 2,015 | |
3.02%, 08/25/2024, Series 2014-M13, Class A2(4) | | | 600 | | | | 582 | |
3.06%, 05/25/2027, Series 2017-M8, Class A2(4) | | | 4,264 | | | | 4,006 | |
3.09%, 04/25/2027, Series 2015-M10, Class A2(4) | | | 4,414 | | | | 4,169 | |
3.16%, 06/25/2027, Series 2017-M12, Class A2(4) | | | 3,629 | | | | 3,424 | |
3.17%, 03/25/2028, Series 2018-M4, Class A2(4) | | | 2,974 | | | | 2,795 | |
3.17%, 02/25/2030, Series 2018-M3, Class A2(4) | | | 2,441 | | | | 2,242 | |
3.17%, 04/25/2029, Series 2017-M5, Class A2(4) | | | 3,208 | | | | 2,984 | |
3.41%, 06/25/2028, Series 2018-M8, Class A2(4) | | | 4,682 | | | | 4,424 | |
3.47%, 07/25/2028, Series 2018-M10, Class A2(4) | | | 6,977 | | | | 6,604 | |
3.47%, 07/25/2028, Series 2018-M10, Class A1(4) | | | 394 | | | | 390 | |
3.50%, 01/25/2024, Series 2014-M3, Class A2(4) | | | 1,494 | | | | 1,474 | |
3.51%, 12/25/2023, Series 2014-M2, Class A2(4) | | | 679 | | | | 672 | |
3.67%, 09/25/2028, Series 2019-M1, Class A2(4) | | | 6,437 | | | | 6,136 | |
3.76%, 08/25/2030, Series 2018-M12, Class A2(4) | | | 5,611 | | | | 5,289 | |
FHLMC-Ginnie Mae | | | | | | | | |
6.25%, 11/25/2023, Series 24, Class ZE(11) | | | 0 | | | | 0 | |
7.50%, 04/25/2024, Series 29, Class L | | | 1 | | | | 1 | |
First Horizon Alternative Mortgage Securities Trust 2005-FA8 | | | | | | | | |
5.50%, 11/25/2035, Series 2005-FA8, Class 1A19 | | | 52 | | | | 27 | |
First Horizon Alternative Mortgage Securities Trust 2006-FA6 | | | | | | | | |
5.75%, 11/25/2024, Series 2006-FA6, Class 3A1(11) | | | 1 | | | | 0 | |
First Horizon Alternative Mortgage Securities Trust 2007-FA4 | | | | | | | | |
0.50% (1 Month LIBOR USD + 5.65%, 5.65% Cap), 08/25/2037, Series 2007-FA4, Class 1A2(3)(10) | | | 537 | | | | 44 | |
Freddie Mac Gold Pool | | | | | | | | |
2.00%, 01/01/2032 | | | 2,306 | | | | 2,092 | |
2.50%, 06/01/2028 | | | 277 | | | | 262 | |
2.50%, 03/01/2030 | | | 517 | | | | 481 | |
2.50%, 07/01/2030 | | | 1,350 | | | | 1,257 | |
2.50%, 07/01/2031 | | | 1,232 | | | | 1,143 | |
2.50%, 08/01/2031 | | | 675 | | | | 626 | |
2.50%, 11/01/2046 | | | 1,240 | | | | 1,068 | |
3.00%, 07/01/2028 | | | 457 | | | | 437 | |
3.00%, 08/01/2028 | | | 273 | | | | 261 | |
3.00%, 09/01/2028 | | | 1,023 | | | | 976 | |
3.00%, 10/01/2028 | | | 406 | | | | 388 | |
3.00%, 05/01/2029 | | | 398 | | | | 380 | |
3.00%, 09/01/2031 | | | 454 | | | | 426 | |
3.00%, 02/01/2032 | | | 2,548 | | | | 2,401 | |
3.00%, 07/01/2035 | | | 3,308 | | | | 3,086 | |
3.00%, 09/01/2036 | | | 1,304 | | | | 1,207 | |
3.00%, 08/01/2042 | | | 673 | | | | 608 | |
3.00%, 10/01/2042 | | | 1,801 | | | | 1,628 | |
3.00%, 11/01/2042 | | | 3,135 | | | | 2,834 | |
3.00%, 02/01/2043 | | | 156 | | | | 141 | |
3.00%, 03/01/2043 | | | 1,073 | | | | 970 | |
3.00%, 03/01/2043 | | | 2,146 | | | | 1,939 | |
3.00%, 04/01/2043 | | | 39 | | | | 36 | |
3.00%, 04/01/2043 | | | 6,235 | | | | 5,635 | |
3.00%, 06/01/2043 | | | 18 | | | | 17 | |
3.00%, 07/01/2043 | | | 12 | | | | 11 | |
3.00%, 07/01/2043 | | | 128 | | | | 116 | |
3.00%, 08/01/2043 | | | 252 | | | | 228 | |
3.00%, 08/01/2043 | | | 2,841 | | | | 2,567 | |
3.00%, 05/01/2045 | | | 440 | | | | 398 | |
3.00%, 05/01/2045 | | | 1,315 | | | | 1,188 | |
3.00%, 06/01/2045 | | | 263 | | | | 238 | |
3.00%, 10/01/2045 | | | 2,007 | | | | 1,814 | |
3.00%, 10/01/2046 | | | 3,389 | | | | 3,037 | |
3.00%, 10/01/2046 | | | 10,150 | | | | 9,145 | |
3.00%, 01/01/2047 | | | 824 | | | | 738 | |
3.00%, 02/01/2047 | | | 4,617 | | | | 4,135 | |
3.00%, 03/01/2047 | | | 592 | | | | 530 | |
3.00%, 05/01/2047 | | | 7,222 | | | | 6,477 | |
3.50%, 01/01/2032 | | | 200 | | | | 193 | |
3.50%, 03/01/2032 | | | 78 | | | | 75 | |
3.50%, 02/01/2033 | | | 104 | | | | 100 | |
3.50%, 05/01/2033 | | | 81 | | | | 78 | |
| | | | | | | | |
3.50%, 05/01/2033 | | | 332 | | | | 317 | |
3.50%, 01/01/2034 | | | 2,853 | | | | 2,742 | |
3.50%, 04/01/2037 | | | 3,281 | | | | 3,108 | |
3.50%, 11/01/2037 | | | 893 | | | | 846 | |
3.50%, 05/01/2042 | | | 336 | | | | 315 | |
3.50%, 06/01/2042 | | | 146 | | | | 137 | |
3.50%, 06/01/2042 | | | 995 | | | | 926 | |
3.50%, 08/01/2042 | | | 220 | | | | 206 | |
3.50%, 09/01/2042 | | | 1,432 | | | | 1,342 | |
3.50%, 09/01/2042 | | | 1,970 | | | | 1,846 | |
3.50%, 10/01/2042 | | | 1,000 | | | | 937 | |
3.50%, 10/01/2042 | | | 5,154 | | | | 4,831 | |
3.50%, 11/01/2042 | | | 77 | | | | 71 | |
3.50%, 11/01/2042 | | | 440 | | | | 412 | |
3.50%, 11/01/2042 | | | 1,212 | | | | 1,136 | |
3.50%, 12/01/2042 | | | 1,227 | | | | 1,150 | |
3.50%, 01/01/2043 | | | 3,108 | | | | 2,907 | |
3.50%, 03/01/2043 | | | 270 | | | | 253 | |
3.50%, 05/01/2043 | | | 102 | | | | 95 | |
3.50%, 06/01/2043 | | | 305 | | | | 284 | |
3.50%, 06/01/2043 | | | 603 | | | | 564 | |
3.50%, 07/01/2043 | | | 209 | | | | 196 | |
3.50%, 10/01/2043 | | | 89 | | | | 83 | |
3.50%, 05/01/2044 | | | 7,250 | | | | 6,783 | |
3.50%, 01/01/2045 | | | 5,955 | | | | 5,580 | |
3.50%, 06/01/2045 | | | 516 | | | | 481 | |
3.50%, 12/01/2045 | | | 1,442 | | | | 1,342 | |
3.50%, 01/01/2046 | | | 3,427 | | | | 3,191 | |
3.50%, 05/01/2046 | | | 909 | | | | 846 | |
3.50%, 07/01/2046 | | | 1,516 | | | | 1,407 | |
3.50%, 08/01/2046 | | | 3,243 | | | | 3,019 | |
3.50%, 12/01/2046 | | | 3,006 | | | | 2,791 | |
3.50%, 01/01/2047 | | | 1,134 | | | | 1,053 | |
3.50%, 07/01/2047 | | | 16,662 | | | | 15,450 | |
3.50%, 10/01/2047 | | | 2,681 | | | | 2,482 | |
3.50%, 03/01/2048 | | | 2,015 | | | | 1,862 | |
4.00%, 09/01/2040 | | | 234 | | | | 225 | |
4.00%, 11/01/2040 | | | 14 | | | | 13 | |
4.00%, 11/01/2040 | | | 622 | | | | 598 | |
4.00%, 12/01/2040 | | | 173 | | | | 166 | |
4.00%, 12/01/2040 | | | 365 | | | | 351 | |
4.00%, 12/01/2040 | | | 404 | | | | 386 | |
4.00%, 12/01/2040 | | | 447 | | | | 430 | |
4.00%, 12/01/2040 | | | 488 | | | | 470 | |
4.00%, 01/01/2041 | | | 393 | | | | 376 | |
4.00%, 10/01/2041 | | | 1,618 | | | | 1,557 | |
4.00%, 11/01/2041 | | | 5 | | | | 5 | |
4.00%, 01/01/2042 | | | 61 | | | | 59 | |
4.00%, 05/01/2042 | | | 6 | | | | 6 | |
4.00%, 06/01/2042 | | | 760 | | | | 729 | |
4.00%, 10/01/2042 | | | 39 | | | | 36 | |
4.00%, 01/01/2043 | | | 105 | | | | 101 | |
4.00%, 09/01/2043 | | | 2,724 | | | | 2,622 | |
4.00%, 11/01/2043 | | | 29 | | | | 27 | |
4.00%, 11/01/2043 | | | 53 | | | | 50 | |
4.00%, 12/01/2043 | | | 81 | | | | 78 | |
4.00%, 12/01/2043 | | | 157 | | | | 151 | |
4.00%, 12/01/2043 | | | 499 | | | | 480 | |
4.00%, 01/01/2044 | | | 65 | | | | 63 | |
4.00%, 01/01/2044 | | | 164 | | | | 158 | |
4.00%, 03/01/2044 | | | 851 | | | | 817 | |
4.00%, 10/01/2044 | | | 2,663 | | | | 2,553 | |
4.00%, 01/01/2045 | | | 133 | | | | 127 | |
4.00%, 10/01/2045 | | | 173 | | | | 166 | |
4.00%, 10/01/2045 | | | 2,457 | | | | 2,337 | |
4.00%, 11/01/2045 | | | 3,639 | | | | 3,483 | |
4.00%, 01/01/2046 | | | 1,760 | | | | 1,685 | |
4.00%, 05/01/2046 | | | 89 | | | | 85 | |
4.00%, 06/01/2046 | | | 3,749 | | | | 3,587 | |
4.00%, 08/01/2046 | | | 911 | | | | 870 | |
4.00%, 01/01/2047 | | | 5,544 | | | | 5,302 | |
4.00%, 06/01/2047 | | | 1,329 | | | | 1,268 | |
4.50%, 11/01/2035 | | | 5 | | | | 4 | |
4.50%, 07/01/2039 | | | 68 | | | | 68 | |
4.50%, 10/01/2039 | | | 569 | | | | 562 | |
4.50%, 11/01/2039 | | | 641 | | | | 634 | |
4.50%, 11/01/2039 | | | 911 | | | | 901 | |
4.50%, 05/01/2040 | | | 330 | | | | 327 | |
4.50%, 08/01/2040 | | | 131 | | | | 129 | |
4.50%, 09/01/2040 | | | 109 | | | | 108 | |
4.50%, 09/01/2040 | | | 420 | | | | 416 | |
4.50%, 03/01/2041 | | | 86 | | | | 85 | |
4.50%, 05/01/2041 | | | 744 | | | | 736 | |
| | | | | | | | |
4.50%, 08/01/2041 | | | 208 | | | | 206 | |
4.50%, 12/01/2043 | | | 2,568 | | | | 2,539 | |
4.50%, 03/01/2044 | | | 195 | | | | 192 | |
4.50%, 05/01/2044 | | | 274 | | | | 269 | |
4.50%, 07/01/2044 | | | 22 | | | | 21 | |
4.50%, 07/01/2044 | | | 105 | | | | 103 | |
4.50%, 09/01/2044 | | | 656 | | | | 645 | |
4.50%, 09/01/2046 | | | 1,187 | | | | 1,166 | |
4.50%, 10/01/2046 | | | 938 | | | | 922 | |
4.50%, 11/01/2046 | | | 4,865 | | | | 4,810 | |
4.50%, 07/01/2047 | | | 464 | | | | 456 | |
4.50%, 07/01/2047 | | | 476 | | | | 470 | |
4.50%, 11/01/2047 | | | 328 | | | | 323 | |
5.00%, 01/01/2034 | | | 11 | | | | 11 | |
5.00%, 06/01/2034 | | | 31 | | | | 30 | |
5.00%, 09/01/2034 | | | 44 | | | | 44 | |
5.00%, 03/01/2035 | | | 11 | | | | 11 | |
5.00%, 08/01/2035 | | | 462 | | | | 466 | |
5.00%, 03/01/2036 | | | 1,083 | | | | 1,092 | |
5.00%, 07/01/2036 | | | 1 | | | | 1 | |
5.00%, 11/01/2036 | | | 29 | | | | 30 | |
5.00%, 03/01/2037 | | | 67 | | | | 67 | |
5.00%, 06/01/2037 | | | 80 | | | | 81 | |
5.00%, 08/01/2037 | | | 80 | | | | 81 | |
5.00%, 02/01/2038 | | | 104 | | | | 105 | |
5.00%, 03/01/2038 | | | 27 | | | | 27 | |
5.00%, 03/01/2038 | | | 97 | | | | 98 | |
5.00%, 03/01/2038 | | | 118 | | | | 119 | |
5.00%, 03/01/2038 | | | 124 | | | | 125 | |
5.00%, 04/01/2038 | | | 63 | | | | 63 | |
5.00%, 09/01/2038 | | | 13 | | | | 14 | |
5.00%, 09/01/2038 | | | 77 | | | | 78 | |
5.00%, 11/01/2038 | | | 1 | | | | 1 | |
5.00%, 11/01/2038 | | | 27 | | | | 27 | |
5.00%, 12/01/2038(11) | | | 0 | | | | 0 | |
5.00%, 12/01/2038 | | | 91 | | | | 92 | |
5.00%, 02/01/2039 | | | 185 | | | | 186 | |
5.00%, 05/01/2039 | | | 4 | | | | 4 | |
5.00%, 10/01/2039 | | | 210 | | | | 211 | |
5.00%, 01/01/2040 | | | 50 | | | | 50 | |
5.00%, 03/01/2040 | | | 90 | | | | 90 | |
5.00%, 03/01/2040 | | | 819 | | | | 826 | |
5.00%, 08/01/2040 | | | 127 | | | | 128 | |
5.00%, 04/01/2041 | | | 443 | | | | 446 | |
5.00%, 06/01/2041 | | | 193 | | | | 195 | |
5.00%, 12/01/2047 | | | 1,366 | | | | 1,349 | |
5.00%, 02/01/2048 | | | 613 | | | | 612 | |
5.50%, 02/01/2024(11) | | | 0 | | | | 0 | |
5.50%, 01/01/2033 | | | 16 | | | | 16 | |
5.50%, 10/01/2033 | | | 18 | | | | 18 | |
5.50%, 07/01/2035 | | | 40 | | | | 41 | |
5.50%, 01/01/2036 | | | 8 | | | | 8 | |
5.50%, 12/01/2036 | | | 16 | | | | 17 | |
5.50%, 05/01/2038 | | | 23 | | | | 24 | |
5.50%, 08/01/2038 | | | 31 | | | | 32 | |
5.50%, 01/01/2039 | | | 1,227 | | | | 1,257 | |
5.50%, 03/01/2040 | | | 11 | | | | 12 | |
5.50%, 05/01/2040 | | | 806 | | | | 827 | |
5.50%, 08/01/2040 | | | 322 | | | | 331 | |
6.00%, 10/01/2029 | | | 4 | | | | 4 | |
6.00%, 12/01/2033 | | | 9 | | | | 9 | |
6.00%, 01/01/2034 | | | 14 | | | | 14 | |
6.00%, 11/01/2036 | | | 5 | | | | 5 | |
6.00%, 12/01/2036 | | | 3 | | | | 3 | |
6.00%, 12/01/2036 | | | 8 | | | | 8 | |
6.50%, 01/01/2028 | | | 10 | | | | 10 | |
6.50%, 06/01/2029 | | | 5 | | | | 5 | |
6.50%, 08/01/2029 | | | 49 | | | | 50 | |
6.50%, 11/01/2034 | | | 3 | | | | 3 | |
6.50%, 01/01/2035 | | | 42 | | | | 43 | |
6.50%, 12/01/2035 | | | 10 | | | | 10 | |
6.50%, 12/01/2035 | | | 29 | | | | 30 | |
6.50%, 11/01/2036 | | | 9 | | | | 9 | |
6.50%, 11/01/2036 | | | 84 | | | | 86 | |
6.50%, 11/01/2036 | | | 85 | | | | 87 | |
6.50%, 12/01/2036 | | | 59 | | | | 61 | |
6.50%, 12/01/2036 | | | 118 | | | | 122 | |
6.50%, 01/01/2037 | | | 3 | | | | 3 | |
6.50%, 01/01/2037 | | | 5 | | | | 5 | |
6.50%, 02/01/2037 | | | 7 | | | | 7 | |
6.50%, 06/01/2037 | | | 4 | | | | 4 | |
6.50%, 11/01/2037 | | | 22 | | | | 22 | |
6.50%, 03/01/2038 | | | 27 | | | | 28 | |
| | | | | | | | |
7.00%, 04/01/2026(11) | | | 0 | | | | 0 | |
7.00%, 12/01/2028 | | | 10 | | | | 10 | |
7.00%, 07/01/2029 | | | 1 | | | | 1 | |
7.00%, 01/01/2031 | | | 14 | | | | 15 | |
7.00%, 07/01/2032 | | | 2 | | | | 2 | |
7.00%, 08/01/2032 | | | 3 | | | | 3 | |
7.00%, 02/01/2037 | | | 4 | | | | 4 | |
7.50%, 08/01/2025(11) | | | 0 | | | | 0 | |
7.50%, 01/01/2032 | | | 32 | | | | 32 | |
7.50%, 12/01/2036 | | | 98 | | | | 100 | |
7.50%, 01/01/2038 | | | 14 | | | | 14 | |
7.50%, 01/01/2038 | | | 37 | | | | 38 | |
7.50%, 09/01/2038 | | | 15 | | | | 15 | |
8.00%, 08/01/2024(11) | | | 0 | | | | 0 | |
8.00%, 11/01/2024(11) | | | 0 | | | | 0 | |
8.50%, 07/01/2028 | | | 1 | | | | 1 | |
10.00%, 10/01/2030 | | | 1 | | | | 1 | |
Freddie Mac Multifamily Structured Pass-Through Certificates | | | | | | | | |
0.81%, 12/25/2030, Series K124, Class X1(4) | | | 40,560 | | | | 1,718 | |
1.31%, 10/25/2030, Series K120, Class XAM(4) | | | 31,375 | | | | 2,236 | |
1.48%, 03/25/2026, Series K055, Class X1(4) | | | 25,481 | | | | 799 | |
1.48%, 01/25/2030, Series K106, Class X1(4) | | | 134,276 | | | | 9,456 | |
1.64%, 01/25/2030, Series K107, Class A2 | | | 1,890 | | | | 1,582 | |
1.68%, 05/25/2030, Series K111, Class X1(4) | | | 28,031 | | | | 2,356 | |
1.89%, 01/25/2032, Series K138, Class AM | | | 4,300 | | | | 3,473 | |
2.13%, 11/25/2031, Series K136, Class A2 | | | 14,260 | | | | 11,914 | |
2.40%, 03/25/2032, Series K142, Class A2 | | | 13,700 | | | | 11,661 | |
2.81%, 09/25/2024, Series KJ14, Class A2 | | | 2,788 | | | | 2,714 | |
2.92%, 06/25/2032, Series K146, Class A2 | | | 9,700 | | | | 8,582 | |
3.08%, 01/25/2031, Series K152, Class A2 | | | 4,126 | | | | 3,752 | |
3.12%, 06/25/2027, Series K066, Class A2 | | | 4,263 | | | | 4,019 | |
3.19%, 09/25/2027, Series K069, Class A2(4) | | | 11,650 | | | | 10,988 | |
3.19%, 07/25/2027, Series K067, Class A2 | | | 9,215 | | | | 8,699 | |
3.24%, 04/25/2027, Series K065, Class A2 | | | 7,030 | | | | 6,678 | |
3.24%, 08/25/2027, Series K068, Class A2 | | | 13,296 | | | | 12,570 | |
3.30%, 11/25/2027, Series K070, Class A2(4) | | | 4,589 | | | | 4,344 | |
3.33%, 05/25/2027, Series K065, Class AM | | | 1,779 | | | | 1,686 | |
3.34%, 04/25/2028, Series W5FX, Class AFX(4) | | | 3,315 | | | | 3,076 | |
3.51%, 03/25/2029, Series K091, Class A2 | | | 2,527 | | | | 2,395 | |
3.71%, 09/25/2032, Series K-150, Class A2(4) | | | 11,105 | | | | 10,457 | |
3.80%, 10/25/2032, Series K-151, Class A2(4) | | | 12,850 | | | | 12,185 | |
3.82%, 12/25/2032, Series K-153, Class A2(4) | | | 10,300 | | | | 9,775 | |
3.85%, 06/25/2028, Series K078, Class A2 | | | 7,875 | | | | 7,628 | |
3.90%, 10/25/2033, Series K158, Class A3(4) | | | 6,500 | | | | 6,144 | |
Freddie Mac Non Gold Pool | | | | | | | | |
3.83% (1 Year LIBOR USD + 1.58%, 1.58% Floor, 11.73% Cap), 12/01/2036(3) | | | 46 | | | | 45 | |
3.85% (1 Year LIBOR USD + 1.60%, 1.60% Floor, 11.32% Cap), 10/01/2036(3) | | | 12 | | | | 11 | |
3.88% (1 Year CMT Index + 2.13%, 2.13% Floor, 12.13% Cap), 07/01/2026(3) | | | 2 | | | | 2 | |
3.89% (1 Year LIBOR USD + 1.64%, 1.64% Floor, 11.05% Cap), 11/01/2036(3) | | | 23 | | | | 23 | |
3.92% (1 Year LIBOR USD + 1.67%, 1.67% Floor, 11.29% Cap), 08/01/2035(3) | | | 5 | | | | 5 | |
3.92% (1 Year LIBOR USD + 1.67%, 1.67% Floor, 11.97% Cap), 12/01/2036(3) | | | 96 | | | | 97 | |
3.94% (1 Year LIBOR USD + 1.69%, 1.69% Floor, 11.32% Cap), 12/01/2036(3) | | | 4 | | | | 4 | |
3.97% (1 Year LIBOR USD + 1.67%, 1.67% Floor, 11.05% Cap), 11/01/2036(3) | | | 11 | | | | 10 | |
3.99% (1 Year LIBOR USD + 1.74%, 1.75% Floor, 11.49% Cap), 11/01/2036(3) | | | 17 | | | | 17 | |
4.00% (1 Year LIBOR USD + 1.75%, 1.75% Floor, 11.75% Cap), 11/01/2037(3) | | | 5 | | | | 4 | |
4.02% (1 Year LIBOR USD + 1.77%, 1.77% Floor, 11.29% Cap), 09/01/2036(3) | | | 15 | | | | 15 | |
4.02% (1 Year LIBOR USD + 1.67%, 1.67% Floor, 10.09% Cap), 02/01/2036(3) | | | 6 | | | | 6 | |
4.07% (1 Year CMT Index + 2.25%, 2.25% Floor, 10.86% Cap), 07/01/2036(3) | | | 9 | | | | 9 | |
4.07% (1 Year LIBOR USD + 1.70%, 1.70% Floor, 11.06% Cap), 02/01/2037(3) | | | 8 | | | | 8 | |
4.12% (1 Year LIBOR USD + 1.87%, 1.87% Floor, 11.99% Cap), 07/01/2037(3) | | | 2 | | | | 2 | |
4.16% (1 Year LIBOR USD + 1.78%, 1.78% Floor, 10.73% Cap), 01/01/2037(3) | | | 17 | | | | 17 | |
4.19% (1 Year LIBOR USD + 1.95%, 1.95% Floor, 11.15% Cap), 12/01/2036(3) | | | 33 | | | | 32 | |
4.31% (1 Year CMT Index + 2.11%, 2.11% Floor, 12.37% Cap), 01/01/2027(3) | | | 1 | | | | 1 | |
4.31% (1 Year CMT Index + 2.25%, 2.25% Floor, 11.40% Cap), 11/01/2036(3) | | | 35 | | | | 36 | |
4.33% (1 Year LIBOR USD + 1.90%, 1.90% Floor, 11.34% Cap), 02/01/2037(3) | | | 14 | | | | 14 | |
4.34% (1 Year CMT Index + 2.24%, 2.24% Floor, 9.66% Cap), 11/01/2036(3) | | | 14 | | | | 14 | |
4.36% (1 Year CMT Index + 2.23%, 2.23% Floor, 9.36% Cap), 12/01/2033(3) | | | 11 | | | | 11 | |
4.36% (1 Year CMT Index + 2.25%, 2.25% Floor, 10.08% Cap), 02/01/2036(3) | | | 20 | | | | 20 | |
4.38% (1 Year CMT Index + 2.25%, 2.25% Floor, 9.88% Cap), 01/01/2035(3) | | | 17 | | | | 16 | |
4.38% (1 Year CMT Index + 2.25%, 2.25% Floor, 10.06% Cap), 01/01/2035(3) | | | 53 | | | | 53 | |
4.38% (1 Year LIBOR USD + 1.88%, 1.88% Floor, 11.17% Cap), 09/01/2036(3) | | | 51 | | | | 51 | |
4.38% (1 Year LIBOR USD + 2.13%, 2.13% Floor, 10.93% Cap), 12/01/2036(3) | | | 1 | | | | 1 | |
4.40% (1 Year LIBOR USD + 1.84%, 1.84% Floor, 9.14% Cap), 07/01/2040(3) | | | 14 | | | | 14 | |
4.42% (1 Year CMT Index + 2.25%, 2.25% Floor, 10.33% Cap), 07/01/2036(3) | | | 17 | | | | 17 | |
4.45% (1 Year LIBOR USD + 2.20%, 2.20% Floor, 10.78% Cap), 10/01/2036(3) | | | 20 | | | | 20 | |
4.47% (1 Year CMT Index + 2.37%, 2.37% Floor, 10.10% Cap), 09/01/2032(3) | | | 2 | | | | 2 | |
4.48% (1 Year CMT Index + 2.36%, 2.36% Floor, 10.88% Cap), 10/01/2036(3) | | | 12 | | | | 11 | |
4.49% (1 Year CMT Index + 2.25%, 2.25% Floor, 11.68% Cap), 04/01/2030(3)(11) | | | 0 | | | | 0 | |
4.54% (1 Year LIBOR USD + 2.04%, 2.04% Floor, 10.84% Cap), 03/01/2036(3) | | | 32 | | | | 31 | |
4.56% (1 Year LIBOR USD + 2.04%, 2.04% Floor, 10.96% Cap), 05/01/2037(3) | | | 26 | | | | 26 | |
4.63% (1 Year LIBOR USD + 2.03%, 2.03% Floor, 11.07% Cap), 04/01/2038(3) | | | 18 | | | | 18 | |
4.66% (1 Year CMT Index + 2.37%, 2.37% Floor, 10.60% Cap), 09/01/2034(3) | | | 44 | | | | 44 | |
4.67% (1 Year LIBOR USD + 1.98%, 1.98% Floor, 10.62% Cap), 04/01/2037(3) | | | 24 | | | | 23 | |
| | | | | | | | |
4.73% (1 Year CMT Index + 2.25%, 2.25% Floor, 10.36% Cap), 05/01/2033(3) | | | 44 | | | | 43 | |
4.76% (1 Year LIBOR USD + 2.42%, 2.43% Floor, 12.06% Cap), 03/01/2037(3) | | | 3 | | | | 3 | |
4.81% (1 Year LIBOR USD + 1.75%, 1.75% Floor, 9.13% Cap), 04/01/2034(3) | | | 6 | | | | 6 | |
4.91% (6 Month LIBOR USD + 2.12%, 2.12% Floor, 11.05% Cap), 05/01/2037(3) | | | 2 | | | | 2 | |
4.97% (1 Year LIBOR USD + 1.86%, 1.86% Floor, 10.88% Cap), 05/01/2038(3) | | | 4 | | | | 4 | |
5.23% (1 Year LIBOR USD + 1.99%, 1.99% Floor, 10.89% Cap), 06/01/2036(3) | | | 51 | | | | 50 | |
5.25% (1 Year CMT Index + 2.25%, 2.25% Floor, 10.58% Cap), 05/01/2036(3) | | | 10 | | | | 10 | |
5.26% (1 Year CMT Index + 2.25%, 2.25% Floor, 10.66% Cap), 05/01/2036(3) | | | 34 | | | | 34 | |
5.28% (1 Year LIBOR USD + 2.47%, 2.47% Floor, 11.60% Cap), 03/01/2036(3) | | | 8 | | | | 8 | |
5.29% (1 Year LIBOR USD + 1.95%, 1.95% Floor, 11.00% Cap), 06/01/2036(3) | | | 59 | | | | 59 | |
5.52% (1 Year LIBOR USD + 2.33%, 2.33% Floor, 10.91% Cap), 05/01/2036(3) | | | 5 | | | | 5 | |
5.56% (1 Year LIBOR USD + 2.18%, 2.18% Floor, 11.04% Cap), 05/01/2037(3) | | | 26 | | | | 25 | |
6.00% (6 Month LIBOR USD + 1.62%, 1.62% Floor, 12.25% Cap), 08/01/2036(3) | | | 18 | | | | 18 | |
6.02% (6 Month LIBOR USD + 2.14%, 2.14% Floor, 12.14% Cap), 12/01/2035(3) | | | 8 | | | | 8 | |
6.02% (6 Month LIBOR USD + 1.79%, 1.79% Floor, 12.87% Cap), 08/01/2036(3) | | | 17 | | | | 17 | |
6.05% (6 Month LIBOR USD + 1.79%, 1.79% Floor, 12.50% Cap), 07/01/2036(3) | | | 21 | | | | 21 | |
6.14% (6 Month LIBOR USD + 1.70%, 1.70% Floor, 12.39% Cap), 10/01/2036(3) | | | 23 | | | | 23 | |
6.26% (6 Month LIBOR USD + 1.84%, 1.84% Floor, 12.19% Cap), 03/01/2037(3) | | | 31 | | | | 31 | |
6.31% (6 Month LIBOR USD + 2.11%, 2.11% Floor, 12.44% Cap), 02/01/2037(3) | | | 24 | | | | 25 | |
6.31% (6 Month LIBOR USD + 1.76%, 1.76% Floor, 12.99% Cap), 10/01/2036(3) | | | 51 | | | | 51 | |
6.42% (6 Month LIBOR USD + 1.67%, 1.67% Floor, 10.42% Cap), 01/01/2037(3) | | | 5 | | | | 5 | |
6.57% (6 Month LIBOR USD + 1.86%, 1.86% Floor, 12.35% Cap), 10/01/2036(3) | | | 19 | | | | 19 | |
6.59% (6 Month LIBOR USD + 1.56%, 1.56% Floor, 11.81% Cap), 05/01/2037(3) | | | 38 | | | | 38 | |
6.69% (6 Month LIBOR USD + 2.01%, 2.01% Floor, 12.43% Cap), 05/01/2037(3) | | | 6 | | | | 6 | |
7.00% (6 Month LIBOR USD + 2.01%, 2.01% Floor, 12.23% Cap), 05/01/2037(3) | | | 25 | | | | 25 | |
Freddie Mac Pool | | | | | | | | |
1.50%, 12/01/2040 | | | 11,839 | | | | 9,645 | |
1.50%, 11/01/2050 | | | 7,556 | | | | 5,844 | |
1.80%, 11/01/2028 | | | 14,000 | | | | 12,052 | |
2.00%, 08/01/2035 | | | 5,143 | | | | 4,575 | |
2.00%, 06/01/2036 | | | 2,058 | | | | 1,825 | |
2.00%, 06/01/2040 | | | 1,430 | | | | 1,231 | |
2.00%, 12/01/2041 | | | 9,547 | | | | 8,045 | |
2.00%, 12/01/2041 | | | 17,794 | | | | 15,118 | |
2.00%, 03/01/2042 | | | 12,153 | | | | 10,322 | |
2.00%, 09/01/2050 | | | 3,776 | | | | 3,106 | |
2.00%, 09/01/2050 | | | 5,404 | | | | 4,445 | |
2.00%, 11/01/2050 | | | 1,693 | | | | 1,392 | |
2.00%, 12/01/2050 | | | 1,564 | | | | 1,286 | |
2.00%, 03/01/2051 | | | 5,293 | | | | 4,336 | |
2.00%, 05/01/2051 | | | 917 | | | | 752 | |
2.00%, 05/01/2051 | | | 8,224 | | | | 6,796 | |
2.00%, 05/01/2051 | | | 11,048 | | | | 9,050 | |
2.00%, 08/01/2051 | | | 5,118 | | | | 4,182 | |
2.00%, 08/01/2051 | | | 14,680 | | | | 12,002 | |
2.00%, 09/01/2051 | | | 8,928 | | | | 7,338 | |
2.00%, 11/01/2051 | | | 374 | | | | 306 | |
2.00%, 11/01/2051 | | | 431 | | | | 352 | |
2.00%, 11/01/2051 | | | 11,903 | | | | 9,712 | |
2.00%, 12/01/2051 | | | 3,460 | | | | 2,828 | |
2.00%, 12/01/2051 | | | 4,836 | | | | 3,964 | |
2.00%, 02/01/2052 | | | 7,084 | | | | 5,560 | |
2.00%, 02/01/2052 | | | 17,518 | | | | 14,361 | |
2.50%, 07/01/2035 | | | 386 | | | | 352 | |
2.50%, 12/01/2035 | | | 1,001 | | | | 915 | |
2.50%, 02/01/2042 | | | 10,465 | | | | 9,112 | |
2.50%, 04/01/2042 | | | 8,354 | | | | 7,255 | |
2.50%, 07/01/2050 | | | 1,435 | | | | 1,189 | |
2.50%, 07/01/2050 | | | 14,303 | | | | 12,216 | |
2.50%, 07/01/2050 | | | 22,009 | | | | 18,740 | |
2.50%, 09/01/2050 | | | 861 | | | | 735 | |
2.50%, 10/01/2050 | | | 6,724 | | | | 5,738 | |
2.50%, 11/01/2050 | | | 2,096 | | | | 1,788 | |
2.50%, 02/01/2051 | | | 12,206 | | | | 10,470 | |
2.50%, 02/01/2051 | | | 12,509 | | | | 10,757 | |
2.50%, 02/01/2051 | | | 12,599 | | | | 10,890 | |
2.50%, 03/01/2051 | | | 634 | | | | 545 | |
2.50%, 04/01/2051 | | | 23,832 | | | | 20,319 | |
2.50%, 05/01/2051 | | | 6,706 | | | | 5,703 | |
2.50%, 05/01/2051 | | | 8,714 | | | | 7,421 | |
2.50%, 06/01/2051 | | | 1,355 | | | | 1,153 | |
2.50%, 08/01/2051 | | | 6,806 | | | | 5,805 | |
2.50%, 09/01/2051 | | | 9,638 | | | | 8,199 | |
2.50%, 10/01/2051 | | | 2,418 | | | | 2,056 | |
2.50%, 11/01/2051 | | | 10,788 | | | | 9,262 | |
2.50%, 11/01/2051 | | | 12,948 | | | | 11,101 | |
2.50%, 11/01/2051 | | | 17,231 | | | | 14,714 | |
2.50%, 02/01/2052 | | | 3,429 | | | | 2,928 | |
2.50%, 02/01/2052 | | | 4,988 | | | | 4,236 | |
2.50%, 02/01/2052 | | | 7,028 | | | | 5,992 | |
2.50%, 03/01/2052 | | | 51 | | | | 44 | |
2.50%, 03/01/2052 | | | 73 | | | | 62 | |
2.50%, 03/01/2052 | | | 73 | | | | 62 | |
| | | | | | | | |
2.50%, 04/01/2052 | | | 5,722 | | | | 4,904 | |
2.50%, 06/01/2052 | | | 895 | | | | 760 | |
2.50%, 07/01/2053 | | | 64 | | | | 55 | |
3.00%, 01/01/2046 | | | 7,693 | | | | 6,890 | |
3.00%, 08/01/2048 | | | 2,282 | | | | 2,039 | |
3.00%, 02/01/2049 | | | 9,812 | | | | 8,833 | |
3.00%, 10/01/2049 | | | 1,308 | | | | 1,161 | |
3.00%, 11/01/2049 | | | 1,028 | | | | 913 | |
3.00%, 12/01/2049 | | | 464 | | | | 413 | |
3.00%, 01/01/2050 | | | 1,453 | | | | 1,294 | |
3.00%, 01/01/2050 | | | 1,459 | | | | 1,296 | |
3.00%, 01/01/2050 | | | 2,022 | | | | 1,797 | |
3.00%, 02/01/2050 | | | 7,272 | | | | 6,479 | |
3.00%, 02/01/2050 | | | 10,285 | | | | 9,131 | |
3.00%, 04/01/2050 | | | 847 | | | | 755 | |
3.00%, 06/01/2050 | | | 610 | | | | 540 | |
3.00%, 06/01/2050 | | | 7,623 | | | | 6,799 | |
3.00%, 07/01/2050 | | | 4,773 | | | | 4,253 | |
3.00%, 09/01/2050 | | | 49 | | | | 43 | |
3.00%, 09/01/2050 | | | 1,089 | | | | 974 | |
3.00%, 03/01/2051 | | | 1,945 | | | | 1,725 | |
3.00%, 04/01/2051 | | | 12,367 | | | | 10,941 | |
3.00%, 06/01/2051 | | | 2,867 | | | | 2,526 | |
3.00%, 01/01/2052 | | | 8,639 | | | | 7,633 | |
3.00%, 02/01/2052 | | | 978 | | | | 868 | |
3.00%, 02/01/2052 | | | 7,532 | | | | 6,639 | |
3.00%, 02/01/2052 | | | 10,280 | | | | 9,108 | |
3.00%, 02/01/2052 | | | 22,843 | | | | 20,133 | |
3.00%, 04/01/2052 | | | 11,041 | | | | 9,723 | |
3.50%, 08/01/2035 | | | 3,691 | | | | 3,530 | |
3.50%, 02/01/2042 | | | 823 | | | | 770 | |
3.50%, 08/01/2044 | | | 2,053 | | | | 1,912 | |
3.50%, 10/01/2047 | | | 185 | | | | 171 | |
3.50%, 03/01/2048 | | | 3,855 | | | | 3,558 | |
3.50%, 10/01/2049 | | | 1,140 | | | | 1,053 | |
3.50%, 01/01/2051 | | | 11,330 | | | | 10,453 | |
3.50%, 04/01/2052 | | | 18,572 | | | | 16,927 | |
3.50%, 04/01/2052 | | | 31,352 | | | | 28,769 | |
3.50%, 09/01/2052 | | | 265 | | | | 241 | |
3.70%, 06/01/2034 | | | 11,150 | | | | 10,408 | |
3.75%, 08/01/2032 | | | 15,000 | | | | 14,080 | |
4.00%, 04/01/2038 | | | 1,950 | | | | 1,882 | |
4.00%, 06/01/2038 | | | 883 | | | | 852 | |
4.00%, 02/01/2046 | | | 3,955 | | | | 3,803 | |
4.00%, 01/01/2049 | | | 2,911 | | | | 2,776 | |
4.00%, 07/01/2049 | | | 9,433 | | | | 9,020 | |
4.00%, 05/01/2050 | | | 386 | | | | 369 | |
4.00%, 02/01/2051 | | | 3,698 | | | | 3,493 | |
4.00%, 06/01/2052 | | | 13,176 | | | | 12,372 | |
4.00%, 08/01/2052 | | | 17,482 | | | | 16,414 | |
4.00%, 10/01/2052 | | | 12,503 | | | | 11,743 | |
4.50%, 06/01/2048 | | | 2,814 | | | | 2,760 | |
4.50%, 12/01/2048 | | | 3,234 | | | | 3,161 | |
4.50%, 09/01/2050 | | | 4,786 | | | | 4,673 | |
4.50%, 05/01/2052 | | | 933 | | | | 897 | |
4.50%, 07/01/2052 | | | 1,495 | | | | 1,438 | |
4.50%, 08/01/2052 | | | 62,227 | | | | 59,839 | |
4.50%, 09/01/2052 | | | 5,350 | | | | 5,144 | |
4.50%, 10/01/2052 | | | 9,745 | | | | 9,370 | |
4.50%, 11/01/2052 | | | 8,081 | | | | 7,770 | |
5.00%, 07/01/2052 | | | 5,820 | | | | 5,708 | |
5.00%, 10/01/2052 | | | 3,593 | | | | 3,524 | |
5.00%, 07/01/2053 | | | 2,595 | | | | 2,543 | |
5.50%, 11/01/2052 | | | 11,365 | | | | 11,322 | |
5.50%, 06/01/2053 | | | 7,567 | | | | 7,534 | |
6.00%, 12/01/2052 | | | 4,724 | | | | 4,766 | |
6.00%, 06/01/2053 | | | 7,775 | | | | 7,845 | |
Freddie Mac Reference REMIC | | | | | | | | |
6.00%, 04/15/2036, Series R006, Class ZA | | | 136 | | | | 141 | |
6.00%, 05/15/2036, Series R007, Class ZA | | | 183 | | | | 188 | |
Freddie Mac REMICS | | | | | | | | |
0.00%, 02/15/2024, Series 1865, Class D(11) | | | 0 | | | | 0 | |
0.00%, 05/15/2024, Series 2306, Class K(11) | | | 0 | | | | 0 | |
0.00%, 09/15/2032, Series 3393, Class JO | | | 480 | | | | 411 | |
0.00%, 12/15/2032, Series 2835, Class QO | | | 9 | | | | 7 | |
0.00%, 07/15/2034, Series 3611, Class PO | | | 50 | | | | 42 | |
0.00%, 02/15/2035, Series 2990, Class GO | | | 16 | | | | 13 | |
0.00%, 04/15/2035, Series 3077, Class TO | | | 9 | | | | 9 | |
0.00%, 08/15/2035, Series 3014, Class OD | | | 4 | | | | 3 | |
0.00%, 09/15/2035, Series 3029, Class SO | | | 12 | | | | 11 | |
0.00%, 02/15/2036, Series 3117, Class OG | | | 8 | | | | 7 | |
0.00%, 02/15/2036, Series 3117, Class OK | | | 11 | | | | 9 | |
0.00%, 02/15/2036, Series 3117, Class EO | | | 13 | | | | 11 | |
| | | | | | | | |
0.00%, 02/15/2036, Series 3117, Class AO | | | 25 | | | | 23 | |
0.00%, 03/15/2036, Series 3134, Class PO | | | 3 | | | | 3 | |
0.00%, 03/15/2036, Series 3122, Class OP | | | 14 | | | | 13 | |
0.00%, 03/15/2036, Series 3122, Class OH | | | 16 | | | | 13 | |
0.00%, 04/15/2036, Series 3138, Class PO | | | 17 | | | | 14 | |
0.00%, 04/15/2036, Series 3607, Class AO | | | 30 | | | | 25 | |
0.00%, 04/15/2036, Series 3147, Class PO | | | 30 | | | | 26 | |
0.00%, 04/15/2036, Series 3607, Class BO | | | 56 | | | | 47 | |
0.00%, 05/15/2036, Series 3233, Class OP | | | 4 | | | | 3 | |
0.00%, 05/15/2036, Series 3149, Class SO | | | 9 | | | | 7 | |
0.00%, 05/15/2036, Series 3151, Class PO | | | 19 | | | | 16 | |
0.00%, 05/15/2036, Series 3153, Class EO | | | 24 | | | | 20 | |
0.00%, 06/15/2036, Series 3171, Class MO | | | 35 | | | | 31 | |
0.00%, 07/15/2036, Series 3179, Class OA | | | 11 | | | | 9 | |
0.00%, 08/15/2036, Series 3200, Class PO | | | 18 | | | | 15 | |
0.00%, 09/15/2036, Series 3218, Class AO | | | 8 | | | | 6 | |
0.00%, 09/15/2036, Series 3213, Class OA | | | 9 | | | | 8 | |
0.00%, 10/15/2036, Series 3225, Class EO | | | 19 | | | | 16 | |
0.00%, 12/15/2036, Series 3256, Class PO | | | 11 | | | | 9 | |
0.00%, 01/15/2037, Series 3261, Class OA | | | 11 | | | | 9 | |
0.00%, 02/15/2037, Series 3274, Class JO | | | 3 | | | | 3 | |
0.00%, 02/15/2037, Series 3510, Class OD | | | 27 | | | | 23 | |
0.00%, 03/15/2037, Series 3286, Class PO | | | 1 | | | | 1 | |
0.00%, 04/15/2037, Series 3373, Class TO | | | 11 | | | | 9 | |
0.00%, 05/15/2037, Series 3318, Class AO(11) | | | 1 | | | | 0 | |
0.00%, 05/15/2037, Series 3316, Class PO | | | 20 | | | | 16 | |
0.00%, 05/15/2037, Series 3607, Class PO | | | 113 | | | | 91 | |
0.00%, 06/15/2037, Series 3326, Class JO | | | 2 | | | | 1 | |
0.00%, 06/15/2037, Series 3331, Class PO | | | 10 | | | | 9 | |
0.00%, 07/15/2037, Series 3607, Class OP | | | 164 | | | | 133 | |
0.00%, 09/15/2037, Series 3365, Class PO | | | 16 | | | | 13 | |
0.00%, 10/15/2039, Series 3607, Class TO | | | 53 | | | | 43 | |
0.00%, 01/15/2040, Series 3802, Class LS(4) | | | 271 | | | | 11 | |
0.00%, 01/15/2040, Series 3621, Class BO | | | 47 | | | | 39 | |
0.00%, 10/15/2049, Series 3582, Class PO | | | 210 | | | | 181 | |
0.00% (30-day Average SOFR + 3.55%, 3.55% Cap), 10/25/2050, Series 5021, Class SB(3)(10) | | | 14,202 | | | | 422 | |
0.00% (30-day Average SOFR + 3.50%, 3.50% Cap), 05/25/2052, Series 5222, Class SA(3)(10) | | | 2,102 | | | | 31 | |
0.19% (1 Month LIBOR USD + 17.50%, 17.50% Cap), 02/15/2040, Series 3632, Class BS(3)(10) | | | 142 | | | | 133 | |
0.66% (1 Month LIBOR USD + 5.85%, 5.85% Cap), 08/15/2038, Series 3481, Class SJ(3)(10) | | | 97 | | | | 7 | |
0.81% (1 Month LIBOR USD + 6.00%, 6.00% Cap), 01/15/2038, Series 3404, Class SC(3)(10) | | | 148 | | | | 9 | |
0.81% (1 Month LIBOR USD + 6.00%, 6.00% Cap), 02/15/2039, Series 3511, Class SA(3)(10) | | | 41 | | | | 2 | |
0.81% (1 Month LIBOR USD + 6.00%, 6.00% Cap), 10/15/2040, Series 3740, Class SB(3)(10) | | | 116 | | | | 6 | |
0.81% (1 Month LIBOR USD + 6.00%, 6.00% Cap), 10/15/2040, Series 3740, Class SC(3)(10) | | | 106 | | | | 9 | |
0.91% (1 Month LIBOR USD + 6.10%, 6.10% Cap), 05/15/2039, Series 3531, Class SM(3)(10)(11) | | | 7 | | | | 0 | |
0.95% (1 Month LIBOR USD + 6.14%, 6.14% Cap), 01/15/2037, Series 3260, Class CS(3)(10) | | | 17 | | | | 1 | |
1.01% (1 Month LIBOR USD + 6.20%, 6.20% Cap), 06/15/2038, Series 3455, Class SE(3)(10) | | | 66 | | | | 7 | |
1.06% (1 Month LIBOR USD + 6.25%, 6.25% Cap), 12/15/2039, Series 3608, Class SC(3)(10) | | | 36 | | | | 2 | |
1.11% (1 Month LIBOR USD + 6.30%, 6.30% Cap), 05/15/2039, Series 3531, Class SA(3)(10) | | | 56 | | | | 1 | |
1.23% (1 Month LIBOR USD + 6.42%, 6.42% Cap), 11/15/2037, Series 3387, Class SA(3)(10) | | | 129 | | | | 9 | |
1.26% (1 Month LIBOR USD + 6.45%, 6.45% Cap), 03/15/2037, Series 3290, Class SB(3)(10) | | | 34 | | | | 2 | |
1.26% (1 Month LIBOR USD + 6.45%, 6.45% Cap), 11/15/2037, Series 3383, Class SA(3)(10) | | | 76 | | | | 7 | |
1.41% (1 Month LIBOR USD + 6.60%, 6.60% Cap), 07/15/2037, Series 3344, Class SL(3)(10) | | | 18 | | | | 2 | |
1.46% (1 Month LIBOR USD + 6.65%, 6.65% Cap), 08/15/2036, Series 3202, Class HI(3)(10) | | | 241 | | | | 19 | |
1.51% (1 Month LIBOR USD + 6.70%, 6.70% Cap), 10/15/2036, Series 3232, Class ST(3)(10) | | | 29 | | | | 2 | |
1.61% (1 Month LIBOR USD + 6.80%, 6.80% Cap), 04/15/2038, Series 3424, Class PI(3)(10) | | | 78 | | | | 7 | |
1.91% (1 Month LIBOR USD + 7.10%, 7.10% Cap), 07/15/2036, Series 3194, Class SA(3)(10) | | | 5 | | | | 1 | |
2.00%, 12/25/2051, Series 5190, Class EC | | | 8,277 | | | | 7,098 | |
2.00%, 02/25/2052, Series 5197, Class EA | | | 8,311 | | | | 7,101 | |
2.69% (1 Month LIBOR USD + 20.00%, 20.00% Cap), 11/15/2035, Series 3064, Class SG(3)(10) | | | 15 | | | | 16 | |
2.74% (10 Year CMT Index + -0.85%, 10.00% Cap), 03/15/2024, Series 1709, Class FA(3)(11) | | | 0 | | | | 0 | |
2.76% (1 Month LIBOR USD + 7.95%, 7.95% Cap), 03/15/2032, Series 2444, Class ES(3)(10) | | | 12 | | | | 1 | |
2.81% (1 Month LIBOR USD + 8.00%, 8.00% Cap), 02/15/2032, Series 2475, Class S(3)(10) | | | 30 | | | | 3 | |
2.81% (1 Month LIBOR USD + 8.00%, 8.00% Cap), 03/15/2032, Series 2450, Class SW(3)(10) | | | 8 | | | | 1 | |
2.90% (1 Month LIBOR USD + 13.29%, 13.29% Cap), 07/15/2033, Series 2692, Class SC(3)(10) | | | 13 | | | | 12 | |
2.96% (10 Year CMT Index + -0.70%, 10.00% Cap), 07/15/2023, Series 1541, Class O(3)(11) | | | 0 | | | | 0 | |
3.00%, 08/15/2033, Series 4238, Class WY | | | 248 | | | | 231 | |
3.00%, 06/15/2043, Series 4217, Class KY | | | 206 | | | | 179 | |
3.00%, 12/15/2047, Series 4740, Class P | | | 1,051 | | | | 939 | |
3.00%, 10/25/2050, Series 5019, Class IP | | | 2,031 | | | | 305 | |
3.34% (1 Month LIBOR USD + 8.01%, 8.01% Cap), 10/15/2033, Series 2733, Class SB(3)(10) | | | 241 | | | | 224 | |
3.41% (1 Month LIBOR USD + 8.60%, 3.00% Floor, 8.60% Cap), 07/15/2023, Series 2638, Class DS(3)(10)(11) | | | 0 | | | | 0 | |
3.46% (1 Month LIBOR USD + 8.65%, 8.65% Cap), 02/15/2032, Series 2410, Class QX(3)(10)(11) | | | 6 | | | | 0 | |
3.50%, 01/15/2026, Series 3793, Class AB | | | 298 | | | | 290 | |
3.50%, 01/15/2042, Series 3989, Class JW | | | 1,323 | | | | 1,222 | |
3.50%, 09/25/2044, Series 5230, Class DM | | | 15,948 | | | | 15,058 | |
3.50%, 02/15/2047, Series 4661, Class KZ | | | 12,421 | | | | 11,219 | |
3.50%, 08/15/2047, Series 4710, Class KZ | | | 16,425 | | | | 14,840 | |
3.50%, 11/15/2047, Series 4739, Class Z | | | 1,903 | | | | 1,745 | |
3.50%, 12/15/2047, Series 4746, Class ZN | | | 5,902 | | | | 5,414 | |
3.50%, 01/25/2051, Series 5228, Class BH | | | 6,077 | | | | 5,728 | |
3.50%, 10/15/2053, Series 4821, Class MA | | | 2,153 | | | | 2,053 | |
3.63% (1 Month LIBOR USD + 17.03%, 17.03% Cap), 06/15/2035, Series 2990, Class WP(3)(10)(11) | | | 0 | | | | 0 | |
3.70%, 02/15/2039, Series 3546, Class A(4) | | | 31 | | | | 31 | |
| | | | | | | | |
3.89% (1 Month LIBOR USD + 16.88%, 16.88% Cap), 08/15/2025, Series 3022, Class SX(3)(10) | | | 1 | | | | 1 | |
4.00%, 12/15/2024, Series 3614, Class QB | | | 19 | | | | 18 | |
4.00%, 11/15/2041, Series 3957, Class B | | | 136 | | | | 130 | |
4.00%, 12/15/2041, Series 3966, Class NA | | | 125 | | | | 120 | |
4.00%, 11/25/2051, Series 5249, Class AB | | | 8,380 | | | | 7,955 | |
4.16% (1 Month LIBOR USD + 0.40%, 0.40% Floor), 07/15/2037, Series 4048, Class FJ(3) | | | 262 | | | | 255 | |
4.21% (1 Month LIBOR USD + 6.80%, 4.00% Floor, 6.80% Cap), 07/15/2033, Series 2642, Class SL(3)(10)(11) | | | 0 | | | | 0 | |
4.47% (1 Month LIBOR USD + 17.45%, 17.45% Cap), 02/15/2038, Series 3422, Class SE(3)(10) | | | 6 | | | | 6 | |
4.50%, 06/15/2025, Series 3684, Class CY | | | 66 | | | | 65 | |
4.50%, 12/15/2039, Series 3610, Class CA | | | 1,397 | | | | 1,349 | |
4.50%, 05/15/2041, Series 3852, Class CE | | | 374 | | | | 365 | |
4.50%, 09/15/2043, Series 4247, Class AY | | | 1,000 | | | | 969 | |
5.00%, 11/15/2023, Series 2709, Class PG | | | 5 | | | | 5 | |
5.00%, 12/15/2023, Series 2720, Class PC(11) | | | 0 | | | | 0 | |
5.00%, 12/15/2024, Series 2903, Class Z | | | 3 | | | | 3 | |
5.00%, 04/15/2030, Series 3654, Class DC | | | 480 | | | | 475 | |
5.00%, 07/15/2033, Series 2653, Class PZ | | | 163 | | | | 160 | |
5.00%, 01/15/2034, Series 3920, Class LP | | | 117 | | | | 116 | |
5.00%, 12/15/2040, Series 3770, Class ZB | | | 642 | | | | 644 | |
5.00%, 05/15/2041, Series 3860, Class PZ | | | 1,268 | | | | 1,254 | |
5.07% (1 Month LIBOR USD + 16.50%, 16.50% Cap), 11/15/2033, Series 2780, Class SY(3)(10) | | | 5 | | | | 5 | |
5.18% (1 Month LIBOR USD + 28.03%, 28.03% Cap), 10/15/2025, Series 3051, Class DP(3)(10) | | | 3 | | | | 3 | |
5.24% (1 Month LIBOR USD + 14.76%, 14.76% Cap), 09/15/2033, Series 2671, Class S(3)(10) | | | 9 | | | | 10 | |
5.26% (1 Month LIBOR USD + 33.83%, 33.83% Cap), 04/15/2025, Series 2967, Class S(3)(10) | | | 1 | | | | 1 | |
5.31% (1 Month LIBOR USD + 28.16%, 28.16% Cap), 02/15/2035, Series 2929, Class MS(3)(10) | | | 20 | | | | 18 | |
5.33% (1 Month LIBOR USD + 14.85%, 14.85% Cap), 06/15/2033, Series 2631, Class SA(3)(10) | | | 32 | | | | 33 | |
5.38% (1 Month LIBOR USD + 19.66%, 19.66% Cap), 06/15/2036, Series 3523, Class SD(3)(10) | | | 12 | | | | 11 | |
5.49% (1 Month LIBOR USD + 0.30%, 0.30% Floor, 6.50% Cap), 06/15/2035, Series 2988, Class AF(3) | | | 41 | | | | 40 | |
5.50%, 11/15/2023, Series 2710, Class HB(11) | | | 0 | | | | 0 | |
5.50%, 02/15/2034, Series 2744, Class PE(11) | | | 0 | | | | 0 | |
5.50%, 08/15/2036, Series 3645, Class KZ | | | 26 | | | | 26 | |
5.50%, 08/15/2036, Series 3200, Class AY | | | 73 | | | | 74 | |
5.50%, 03/15/2038, Series 3423, Class PB | | | 196 | | | | 199 | |
5.50%, 05/15/2038, Series 3453, Class B | | | 9 | | | | 9 | |
5.50%, 01/15/2039, Series 3501, Class CB | | | 83 | | | | 84 | |
5.50% (1 Month LIBOR USD + 27.21%, 5.50% Cap), 05/15/2041, Series 3852, Class QN(3)(10) | | | 80 | | | | 77 | |
5.50% (1 Month LIBOR USD + 27.50%, 5.50% Cap), 05/15/2041, Series 3852, Class TP(3)(10) | | | 201 | | | | 203 | |
5.52% (1 Month LIBOR USD + 24.57%, 24.57% Cap), 01/15/2036, Series 3102, Class HS(3)(10) | | | 3 | | | | 3 | |
5.59% (1 Month LIBOR USD + 0.40%, 0.40% Floor, 6.50% Cap), 05/15/2035, Series 2981, Class FA(3) | | | 26 | | | | 25 | |
5.59% (1 Month LIBOR USD + 0.40%, 0.40% Floor, 7.00% Cap), 10/15/2041, Series 4048, Class FB(3) | | | 203 | | | | 201 | |
5.59% (1 Month LIBOR USD + 0.40%, 0.40% Floor, 7.00% Cap), 09/15/2042, Series 4106, Class DF(3) | | | 270 | | | | 264 | |
5.63% (1 Month LIBOR USD + 0.44%, 0.44% Floor, 6.50% Cap), 02/15/2037, Series 3275, Class FL(3) | | | 15 | | | | 15 | |
5.64% (1 Month LIBOR USD + 0.45%, 0.45% Floor, 7.00% Cap), 08/15/2042, Series 4091, Class TF(3) | | | 906 | | | | 887 | |
5.65%, 10/15/2038, Series 3895, Class WA(4) | | | 34 | | | | 34 | |
5.69% (1 Month LIBOR USD + 0.50%, 0.50% Floor, 7.00% Cap), 03/15/2042, Series 4012, Class FN(3) | | | 372 | | | | 365 | |
5.69% (1 Month LIBOR USD + 0.50%, 0.50% Floor, 6.50% Cap), 07/15/2042, Series 4077, Class FB(3) | | | 155 | | | | 151 | |
5.71% (1 Month LIBOR USD + 16.10%, 16.10% Cap), 02/15/2032, Series 2412, Class SP(3)(10) | | | 14 | | | | 15 | |
5.74% (1 Month LIBOR USD + 0.55%, 0.55% Floor, 6.50% Cap), 12/15/2040, Series 3996, Class XF(3) | | | 221 | | | | 220 | |
5.74% (1 Month LIBOR USD + 0.55%, 0.55% Floor, 6.50% Cap), 03/15/2041, Series 4013, Class QF(3) | | | 205 | | | | 204 | |
5.79% (1 Month LIBOR USD + 0.60%, 0.60% Floor, 9.00% Cap), 03/15/2024, Series 1699, Class FC(3)(11) | | | 0 | | | | 0 | |
5.79% (1 Month LIBOR USD + 0.60%, 0.60% Floor, 8.50% Cap), 01/15/2029, Series 2388, Class FB(3) | | | 5 | | | | 5 | |
5.79% (1 Month LIBOR USD + 0.60%, 0.60% Floor, 9.50% Cap), 12/15/2033, Series 2722, Class PF(3) | | | 81 | | | | 81 | |
5.79% (1 Month LIBOR USD + 0.60%, 0.60% Floor, 7.00% Cap), 09/15/2037, Series 3371, Class FA(3) | | | 8 | | | | 8 | |
5.87% (1 Month LIBOR USD + 22.75%, 22.75% Cap), 10/15/2023, Series 1602, Class SA(3)(10)(11) | | | 0 | | | | 0 | |
5.87% (1 Month LIBOR USD + 0.68%, 0.68% Floor, 7.00% Cap), 11/15/2037, Series 3386, Class KF(3) | | | 276 | | | | 275 | |
5.89% (1 Month LIBOR USD + 0.70%, 0.70% Floor, 9.00% Cap), 02/15/2027, Series 1935, Class FL(3)(11) | | | 0 | | | | 0 | |
5.94% (1 Month LIBOR USD + 0.75%, 0.75% Floor, 8.50% Cap), 12/15/2032, Series 2571, Class FY(3) | | | 19 | | | | 20 | |
5.99% (1 Month LIBOR USD + 0.80%, 0.80% Floor, 7.50% Cap), 08/15/2035, Series 3085, Class WF(3) | | | 23 | | | | 24 | |
6.00% (1 Month LIBOR USD + 19.50%, 19.50% Cap), 02/15/2032, Series 2410, Class QS(3)(10) | | | 16 | | | | 17 | |
6.00%, 11/15/2023, Series 1642, Class PJ(11) | | | 0 | | | | 0 | |
6.00%, 06/15/2024, Series 1737, Class L | | | 1 | | | | 1 | |
6.00%, 05/15/2027, Series 1981, Class Z | | | 4 | | | | 4 | |
6.00%, 07/15/2028, Series 2070, Class C | | | 4 | | | | 4 | |
6.00%, 09/15/2028, Series 2086, Class GB | | | 1 | | | | 1 | |
6.00%, 11/15/2028, Series 2095, Class PE | | | 9 | | | | 9 | |
6.00%, 12/15/2028, Series 2106, Class ZD | | | 21 | | | | 21 | |
6.00%, 01/15/2029, Series 2110, Class PG | | | 26 | | | | 26 | |
6.00%, 02/15/2029, Series 2125, Class JZ | | | 6 | | | | 6 | |
6.00%, 09/15/2032, Series 2500, Class MC | | | 21 | | | | 21 | |
6.00%, 12/15/2032, Series 2544, Class HC | | | 15 | | | | 15 | |
6.00%, 12/15/2032, Series 2543, Class YX | | | 39 | | | | 40 | |
6.00%, 01/15/2033, Series 2552, Class ME | | | 25 | | | | 25 | |
6.00%, 02/15/2033, Series 2567, Class QD | | | 22 | | | | 22 | |
6.00%, 02/15/2033, Series 2575, Class ME | | | 97 | | | | 99 | |
6.00%, 03/15/2033, Series 2596, Class QG | | | 15 | | | | 15 | |
6.00%, 05/15/2034, Series 2802, Class OH | | | 34 | | | | 34 | |
6.00%, 04/15/2035, Series 2968, Class EH | | | 508 | | | | 509 | |
6.00%, 01/15/2036, Series 3101, Class UZ | | | 56 | | | | 58 | |
6.00%, 03/15/2036, Series 3122, Class ZB | | | 3 | | | | 3 | |
6.00%, 04/15/2036, Series 3219, Class DI | | | 29 | | | | 5 | |
6.00%, 04/15/2036, Series 3137, Class XP | | | 41 | | | | 43 | |
6.00%, 04/15/2036, Series 3819, Class ZQ | | | 295 | | | | 302 | |
6.00%, 06/15/2036, Series 3164, Class MG | | | 7 | | | | 8 | |
| | | | | | | | |
6.00%, 02/15/2037, Series 3274, Class B | | | 23 | | | | 23 | |
6.00%, 04/15/2037, Series 3302, Class UT | | | 28 | | | | 29 | |
6.00%, 05/15/2037, Series 3315, Class HZ | | | 21 | | | | 21 | |
6.00%, 06/15/2038, Series 3461, Class LZ | | | 7 | | | | 8 | |
6.00%, 06/15/2038, Series 3461, Class Z | | | 169 | | | | 170 | |
6.09% (1 Month LIBOR USD + 0.90%, 0.90% Floor, 9.00% Cap), 02/15/2032, Series 2418, Class FO(3) | | | 16 | | | | 16 | |
6.14% (1 Month LIBOR USD + 18.60%, 18.60% Cap), 12/15/2032, Series 2571, Class SY(3)(10) | | | 11 | | | | 11 | |
6.25%, 10/15/2023, Series 1591, Class PV(11) | | | 0 | | | | 0 | |
6.25%, 08/15/2028, Series 2075, Class PM | | | 13 | | | | 13 | |
6.25%, 02/15/2029, Series 2126, Class CB | | | 24 | | | | 24 | |
6.38%, 02/15/2032, Series 2410, Class OE | | | 3 | | | | 3 | |
6.39% (1 Month LIBOR USD + 1.20%, 1.20% Floor, 7.00% Cap), 07/15/2039, Series 3549, Class FA(3) | | | 6 | | | | 6 | |
6.50%, 09/15/2023, Series 1608, Class L | | | 1 | | | | 1 | |
6.50%, 12/15/2023, Series 1983, Class Z(11) | | | 0 | | | | 0 | |
6.50%, 12/15/2023, Series 2283, Class K(11) | | | 0 | | | | 0 | |
6.50%, 03/15/2026, Series 1829, Class ZB(11) | | | 0 | | | | 0 | |
6.50%, 07/15/2026, Series 1863, Class Z | | | 1 | | | | 1 | |
6.50%, 01/15/2027, Series 1927, Class ZA | | | 2 | | | | 2 | |
6.50%, 12/15/2027, Series 2019, Class Z | | | 3 | | | | 3 | |
6.50%, 06/15/2028, Series 2063, Class PG | | | 5 | | | | 5 | |
6.50%, 08/15/2028, Series 2075, Class PH | | | 12 | | | | 12 | |
6.50%, 05/15/2031, Series 2313, Class LA | | | 2 | | | | 2 | |
6.50%, 08/15/2031, Series 2351, Class PZ | | | 6 | | | | 6 | |
6.50%, 08/15/2031, Series 2345, Class NE | | | 6 | | | | 7 | |
6.50%, 08/15/2031, Series 2344, Class ZJ | | | 9 | | | | 9 | |
6.50%, 08/15/2031, Series 2344, Class ZD | | | 71 | | | | 72 | |
6.50%, 10/15/2031, Series 2367, Class ME | | | 8 | | | | 8 | |
6.50%, 01/15/2032, Series 2399, Class OH | | | 9 | | | | 9 | |
6.50%, 01/15/2032, Series 2399, Class TH | | | 10 | | | | 10 | |
6.50%, 02/15/2032, Series 2410, Class NG | | | 12 | | | | 12 | |
6.50%, 02/15/2032, Series 2420, Class XK | | | 15 | | | | 16 | |
6.50%, 03/15/2032, Series 2430, Class WF | | | 18 | | | | 18 | |
6.50%, 03/15/2032, Series 2423, Class TB | | | 20 | | | | 20 | |
6.50%, 04/15/2032, Series 2441, Class GF | | | 5 | | | | 5 | |
6.50%, 04/15/2032, Series 2435, Class CJ | | | 27 | | | | 27 | |
6.50%, 04/15/2032, Series 2434, Class ZA | | | 31 | | | | 32 | |
6.50%, 05/15/2032, Series 2455, Class GK | | | 14 | | | | 14 | |
6.50%, 06/15/2032, Series 2466, Class DH | | | 6 | | | | 6 | |
6.50%, 06/15/2032, Series 2458, Class ZM | | | 11 | | | | 11 | |
6.50%, 06/15/2032, Series 2466, Class PH | | | 17 | | | | 17 | |
6.50%, 07/15/2032, Series 2474, Class NR | | | 17 | | | | 17 | |
6.50%, 07/15/2032, Series 2484, Class LZ | | | 20 | | | | 21 | |
6.50%, 03/15/2033, Series 2586, Class WI | | | 9 | | | | 1 | |
6.50%, 07/15/2036, Series 3195, Class PD | | | 28 | | | | 28 | |
6.50%, 07/15/2036, Series 3181, Class AZ | | | 33 | | | | 34 | |
6.62% (1 Month LIBOR USD + 70.64%, 9.00% Cap), 03/15/2037, Series 3443, Class SY(3)(10) | | | 10 | | | | 10 | |
7.00%, 09/15/2023, Series 1573, Class PZ(11) | | | 0 | | | | 0 | |
7.00%, 01/15/2024, Series 1658, Class GZ(11) | | | 0 | | | | 0 | |
7.00%, 02/15/2024, Series 1671, Class L(11) | | | 0 | | | | 0 | |
7.00%, 03/15/2024, Series 1695, Class EB(11) | | | 0 | | | | 0 | |
7.00%, 03/15/2024, Series 1706, Class K | | | 1 | | | | 1 | |
7.00%, 03/15/2028, Series 2038, Class PN(11) | | | 3 | | | | 0 | |
7.00%, 06/15/2028, Series 2064, Class TE | | | 1 | | | | 1 | |
7.00%, 10/15/2028, Series 2089, Class PJ(11) | | | 5 | | | | 0 | |
7.00%, 04/15/2029, Series 2141, Class IO(11) | | | 0 | | | | 0 | |
7.00%, 06/15/2029, Series 2169, Class TB | | | 23 | | | | 24 | |
7.00%, 07/15/2029, Series 2172, Class QC | | | 13 | | | | 14 | |
7.00%, 08/15/2029, Series 2176, Class OJ | | | 7 | | | | 7 | |
7.00%, 01/15/2030, Series 2208, Class PG | | | 12 | | | | 13 | |
7.00%, 10/15/2030, Series 2259, Class ZM | | | 10 | | | | 10 | |
7.00%, 03/15/2031, Series 2296, Class PD | | | 7 | | | | 7 | |
7.00%, 06/15/2031, Series 2325, Class PM | | | 4 | | | | 4 | |
7.00%, 07/15/2031, Series 2332, Class ZH | | | 12 | | | | 12 | |
7.00%, 03/15/2032, Series 2423, Class MC | | | 11 | | | | 11 | |
7.00%, 03/15/2032, Series 2423, Class MT | | | 13 | | | | 14 | |
7.00%, 04/15/2032, Series 2436, Class MC | | | 6 | | | | 6 | |
7.00%, 04/15/2032, Series 2434, Class TC | | | 24 | | | | 25 | |
7.00%, 05/15/2032, Series 2450, Class GZ | | | 14 | | | | 15 | |
7.00%, 12/15/2036, Series 3704, Class CT | | | 576 | | | | 606 | |
7.01% (10 Year CMT Index + 10.60%, 10.00% Cap), 05/15/2024, Series 2306, Class SE(3)(10)(11) | | | 1 | | | | 0 | |
7.25%, 07/15/2027, Series 1970, Class PG(11) | | | 0 | | | | 0 | |
7.25%, 09/15/2030, Series 2256, Class MC | | | 7 | | | | 7 | |
7.25%, 12/15/2030, Series 2271, Class PC | | | 10 | | | | 10 | |
7.41% (1 Month LIBOR USD + 2.22%, 8.32% Cap), 07/15/2034, Series 3305, Class MG(3) | | | 20 | | | | 20 | |
7.50%, 04/15/2024, Series 1720, Class PL(11) | | | 0 | | | | 0 | |
7.50%, 08/15/2024, Series 1745, Class D | | | 1 | | | | 1 | |
7.50%, 09/15/2026, Series 1890, Class H | | | 1 | | | | 1 | |
7.50%, 01/15/2027, Series 1963, Class Z | | | 2 | | | | 2 | |
7.50%, 01/15/2027, Series 1927, Class PH | | | 5 | | | | 6 | |
7.50%, 09/15/2027, Series 1987, Class PE | | | 2 | | | | 2 | |
7.50%, 03/15/2028, Series 2040, Class PE | | | 9 | | | | 9 | |
7.50%, 05/15/2028, Series 2054, Class PV | | | 4 | | | | 4 | |
7.50%, 06/15/2029, Series 2163, Class PC(11) | | | 2 | | | | 0 | |
| | | | | | | | |
7.50%, 11/15/2029, Series 2196, Class TL(11) | | | 0 | | | | 0 | |
7.50%, 05/15/2030, Series 2234, Class PZ | | | 4 | | | | 4 | |
7.50%, 08/15/2030, Series 2247, Class Z | | | 4 | | | | 4 | |
7.50%, 10/15/2030, Series 2262, Class Z | | | 1 | | | | 1 | |
7.50%, 11/15/2036, Series 3704, Class DT | | | 249 | | | | 264 | |
7.50%, 12/15/2036, Series 3704, Class ET | | | 201 | | | | 214 | |
7.54%, 11/15/2046, Series 3688, Class GT(4) | | | 285 | | | | 302 | |
7.55% (1 Month LIBOR USD + 10.13%, 19.24% Cap), 02/15/2024, Series 1686, Class SH(3)(10)(11) | | | 0 | | | | 0 | |
8.00%, 09/15/2026, Series 1899, Class ZE | | | 2 | | | | 2 | |
8.00%, 11/15/2029, Series 2201, Class C | | | 4 | | | | 4 | |
8.00%, 01/15/2030, Series 2209, Class TC | | | 3 | | | | 4 | |
8.00%, 01/15/2030, Series 2210, Class Z | | | 14 | | | | 14 | |
8.00%, 03/15/2030, Series 2224, Class CB | | | 3 | | | | 3 | |
8.00%, 04/15/2030, Series 2230, Class Z | | | 4 | | | | 5 | |
8.14% (1 Month LIBOR USD + 30.55%, 30.55% Cap), 03/15/2029, Series 2132, Class SB(3)(10) | | | 1 | | | | 1 | |
8.50%, 06/15/2031, Series 2359, Class ZB | | | 11 | | | | 12 | |
10.00% (11th District Cost of Funds Index + 44.15%, 10.00% Cap), 02/15/2024, Series 1671, Class QC(3)(10)(11) | | | 0 | | | | 0 | |
12.10% (1 Month LIBOR USD + 34.50%, 34.50% Cap), 09/15/2023, Series 2571, Class SK(3)(10)(11) | | | 0 | | | | 0 | |
17.37% (ECOFIN + 27.47%, 27.47% Cap), 07/15/2023, Series 1541, Class M(3)(10)(11) | | | 0 | | | | 0 | |
19.88% (ECOFIN + 31.43%, 31.43% Cap), 03/15/2024, Series 2033, Class SN(3)(10)(11) | | | 0 | | | | 0 | |
Freddie Mac STACR REMIC Trust 2021-DNA3 | | | | | | | | |
7.17% (30-day Average SOFR + 2.10%), 10/25/2033, Series 2021-DNA3, Class M2(1)(3) | | | 10,610 | | | | 10,407 | |
Freddie Mac STACR REMIC Trust 2021-DNA5 | | | | | | | | |
6.72% (30-day Average SOFR + 1.65%), 01/25/2034, Series 2021-DNA5, Class M2(1)(3) | | | 860 | | | | 859 | |
Freddie Mac STACR REMIC Trust 2021-DNA7 | | | | | | | | |
5.92% (30-day Average SOFR + 0.85%), 11/25/2041, Series 2021-DNA7, Class M1(1)(3) | | | 319 | | | | 315 | |
Freddie Mac STACR REMIC Trust 2021-HQA3 | | | | | | | | |
5.92% (30-day Average SOFR + 0.85%), 09/25/2041, Series 2021-HQA3, Class M1(1)(3) | | | 21,832 | | | | 21,178 | |
Freddie Mac STACR REMIC Trust 2022-DNA1 | | | | | | | | |
6.07% (30-day Average SOFR + 1.00%), 01/25/2042, Series 2022-DNA1, Class M1A(1)(3) | | | 6,094 | | | | 5,988 | |
Freddie Mac STACR REMIC Trust 2022-DNA2 | | | | | | | | |
6.37% (30-day Average SOFR + 1.30%), 02/25/2042, Series 2022-DNA2, Class M1A(1)(3) | | | 4,013 | | | | 3,990 | |
Freddie Mac STACR REMIC Trust 2022-DNA6 | | | | | | | | |
7.22% (30-day Average SOFR + 2.15%), 09/25/2042, Series 2022-DNA6, Class M1A(1)(3) | | | 2,144 | | | | 2,157 | |
Freddie Mac STACR REMIC Trust 2022-DNA7 | | | | | | | | |
7.57% (30-day Average SOFR + 2.50%), 03/25/2052, Series 2022-DNA7, Class M1A(1)(3) | | | 6,151 | | | | 6,203 | |
Freddie Mac Strips | | | | | | | | |
0.00%, 04/01/2028, Series 197, Class PO | | | 19 | | | | 17 | |
0.00%, 09/15/2043, Series 310, Class PO | | | 382 | | | | 286 | |
2.51% (1 Month LIBOR USD + 7.70%, 7.70% Cap), 08/15/2036, Series 239, Class S30(3)(10) | | | 161 | | | | 20 | |
3.00%, 08/15/2042, Series 267, Class 30 | | | 563 | | | | 509 | |
3.00%, 01/15/2043, Series 299, Class 300 | | | 121 | | | | 110 | |
3.50%, 07/15/2042, Series 262, Class 35 | | | 2,150 | | | | 2,008 | |
5.00%, 09/15/2035, Series 233, Class 12 | | | 46 | | | | 7 | |
5.00%, 09/15/2035, Series 233, Class 11 | | | 53 | | | | 10 | |
5.00%, 09/15/2035, Series 233, Class 13 | | | 86 | | | | 15 | |
5.69% (1 Month LIBOR USD + 0.50%, 0.50% Floor, 6.50% Cap), 08/15/2042, Series 270, Class F1(3) | | | 427 | | | | 415 | |
5.74% (1 Month LIBOR USD + 0.55%, 0.55% Floor, 6.50% Cap), 07/15/2042, Series 264, Class F1(3) | | | 726 | | | | 708 | |
5.74% (1 Month LIBOR USD + 0.55%, 0.55% Floor, 6.50% Cap), 08/15/2042, Series 272, Class F2(3) | | | 381 | | | | 371 | |
Freddie Mac Structured Pass-Through Certificates | | | | | | | | |
0.00%, 07/25/2043, Series T-57, Class 1AP | | | 13 | | | | 10 | |
0.00%, 09/25/2043, Series T-58, Class APO | | | 14 | | | | 11 | |
0.00%, 10/25/2043, Series T-59, Class 1AP | | | 16 | | | | 9 | |
2.02%, 10/25/2037, Series T-76, Class 2A(4) | | | 619 | | | | 581 | |
4.32%, 07/25/2032, Series T-41, Class 3A(4) | | | 37 | | | | 35 | |
4.39%, 07/25/2033, Series T-48, Class 1A(4) | | | 109 | | | | 103 | |
5.18% (12 Month U.S. Treasury Average + 1.20%, 1.20% Floor), 10/25/2044, Series T-62, Class 1A1(3) | | | 237 | | | | 218 | |
5.23%, 05/25/2043, Series T-56, Class A5 | | | 372 | | | | 358 | |
6.50%, 02/25/2043, Series T-54, Class 2A | | | 174 | | | | 182 | |
7.00%, 02/25/2043, Series T-54, Class 3A | | | 56 | | | | 59 | |
7.00%, 10/25/2043, Series T-59, Class 1A2 | | | 188 | | | | 190 | |
7.50%, 02/25/2042, Series T-42, Class A5 | | | 149 | | | | 150 | |
7.50%, 08/25/2042, Series T-51, Class 2A(4) | | | 30 | | | | 31 | |
7.50%, 07/25/2043, Series T-57, Class 1A3 | | | 35 | | | | 37 | |
7.50%, 09/25/2043, Series T-58, Class 4A | | | 195 | | | | 198 | |
FREMF 2013-K35 Mortgage Trust | | | | | | | | |
4.19%, 12/25/2046, Series 2013-K35, Class C(1)(4) | | | 2,951 | | | | 2,935 | |
FREMF 2014-K40 Mortgage Trust | | | | | | | | |
4.20%, 11/25/2047, Series 2014-K40, Class C(1)(4) | | | 2,273 | | | | 2,195 | |
FREMF 2014-K41 Mortgage Trust | | | | | | | | |
3.96%, 11/25/2047, Series 2014-K41, Class C(1)(4) | | | 6,000 | | | | 5,770 | |
FREMF 2015-K44 Mortgage Trust | | | | | | | | |
3.85%, 01/25/2048, Series 2015-K44, Class B(1)(4) | | | 3,510 | | | | 3,368 | |
FREMF 2015-K45 Mortgage Trust | | | | | | | | |
3.73%, 04/25/2048, Series 2015-K45, Class B(1)(4) | | | 2,135 | | | | 2,044 | |
FREMF 2015-K49 Mortgage Trust | | | | | | | | |
3.85%, 10/25/2048, Series 2015-K49, Class C(1)(4) | | | 4,000 | | | | 3,790 | |
FREMF 2015-K51 Mortgage Trust | | | | | | | | |
4.09%, 10/25/2048, Series 2015-K51, Class C(1)(4) | | | 1,500 | | | | 1,423 | |
FREMF 2016-K52 Mortgage Trust | | | | | | | | |
4.07%, 01/25/2049, Series 2016-K52, Class B(1)(4) | | | 4,750 | | | | 4,511 | |
FREMF 2016-K59 Mortgage Trust | | | | | | | | |
3.70%, 11/25/2049, Series 2016-K59, Class B(1)(4) | | | 2,450 | | | | 2,281 | |
| | | | | | | | |
FREMF 2017-KGS1 Mortgage Trust | | | | | | | | |
7.69% (1 Month LIBOR USD + 2.50%, 2.50% Floor), 10/25/2027, Series 2017-KGL1, Class BFL(1)(3) | | | 4,424 | | | | 4,172 | |
FREMF 2019-K92 Mortgage Trust | | | | | | | | |
4.34%, 05/25/2052, Series 2019-K92, Class B(1)(4) | | | 6,595 | | | | 6,104 | |
Ginnie Mae | | | | | | | | |
0.00%, 06/16/2033, Series 2003-52, Class AP | | | 18 | | | | 17 | |
0.00%, 06/20/2034, Series 2004-46, Class PO | | | 30 | | | | 27 | |
0.00%, 08/20/2035, Series 2010-14, Class CO | | | 69 | | | | 59 | |
0.00%, 10/20/2035, Series 2005-82, Class PO | | | 17 | | | | 14 | |
0.00%, 11/20/2035, Series 2010-14, Class BO | | | 24 | | | | 19 | |
0.00%, 03/20/2036, Series 2006-16, Class OP | | | 20 | | | | 17 | |
0.00%, 05/20/2036, Series 2006-22, Class AO | | | 29 | | | | 26 | |
0.00%, 07/20/2036, Series 2006-34, Class PO | | | 4 | | | | 3 | |
0.00%, 03/20/2037, Series 2007-57, Class PO | | | 22 | | | | 21 | |
0.00%, 04/16/2037, Series 2007-17, Class JO | | | 40 | | | | 33 | |
0.00%, 05/20/2037, Series 2007-28, Class BO | | | 6 | | | | 5 | |
0.00%, 06/16/2037, Series 2007-36, Class HO | | | 10 | | | | 10 | |
0.00%, 06/16/2037, Series 2007-35, Class PO | | | 102 | | | | 87 | |
0.00%, 11/16/2037, Series 2009-79, Class OK | | | 108 | | | | 91 | |
0.00%, 01/20/2038, Series 2008-1, Class PO | | | 4 | | | | 3 | |
0.00%, 12/20/2040, Series 2010-157, Class OP | | | 217 | | | | 180 | |
0.00% (1 Month LIBOR USD + 3.36%, 0.02% Cap), 01/20/2050, Series 2021-165, Class ST(3)(10) | | | 2,682 | | | | 1 | |
0.00% (30-day Average SOFR + 3.50%, 3.50% Cap), 03/20/2052, Series 2022-46, Class S(3)(10) | | | 4,505 | | | | 64 | |
0.00% (30-day Average SOFR + 3.50%, 3.50% Cap), 03/20/2052, Series 2022-51, Class SC(3)(10) | | | 21,126 | | | | 277 | |
0.00% (30-day Average SOFR + 3.85%, 3.85% Cap), 04/20/2052, Series 2022-68, Class SP(3)(10) | | | 5,567 | | | | 87 | |
0.00% (30-day Average SOFR + 3.85%, 3.85% Cap), 04/20/2052, Series 2022-66, Class SB(3)(10) | | | 7,098 | | | | 120 | |
0.00% (30-day Average SOFR + 3.75%, 3.75% Cap), 04/20/2052, Series 2022-78, Class SB(3)(10) | | | 12,279 | | | | 189 | |
0.00% (30-day Average SOFR + 3.60%, 3.60% Cap), 04/20/2052, Series 2022-78, Class MS(3)(10) | | | 18,519 | | | | 246 | |
0.00% (30-day Average SOFR + 3.65%, 3.65% Cap), 05/20/2052, Series 2022-93, Class GS(3)(10) | | | 4,212 | | | | 50 | |
0.00% (30-day Average SOFR + 3.95%, 3.95% Cap), 07/20/2052, Series 2022-133, Class SA(3)(10) | | | 9,208 | | | | 162 | |
0.00% (30-day Average SOFR + 3.76%, 3.76% Cap), 07/20/2052, Series 2022-126, Class CS(3)(10) | | | 25,156 | | | | 382 | |
0.00% (30-day Average SOFR + 3.60%, 3.60% Cap), 08/20/2052, Series 2022-148, Class DS(3)(10) | | | 9,328 | | | | 147 | |
0.55% (1 Month LIBOR USD + 5.70%, 5.70% Cap), 12/20/2038, Series 2008-93, Class AS(3)(10) | | | 104 | | | | 4 | |
0.75% (1 Month LIBOR USD + 5.90%, 5.90% Cap), 09/20/2038, Series 2008-76, Class US(3)(10) | | | 92 | | | | 2 | |
0.80% (1 Month LIBOR USD + 5.95%, 5.95% Cap), 02/20/2039, Series 2009-10, Class SA(3)(10) | | | 73 | | | | 3 | |
0.80% (1 Month LIBOR USD + 5.95%, 5.95% Cap), 06/20/2039, Series 2009-43, Class SA(3)(10) | | | 71 | | | | 2 | |
0.84% (1 Month LIBOR USD + 6.00%, 6.00% Cap), 11/20/2037, Series 2007-73, Class MI(3)(10) | | | 69 | | | | 1 | |
0.85%, 05/20/2067, Series 2017-H11, Class LI(4) | | | 8,078 | | | | 672 | |
0.85% (1 Month LIBOR USD + 6.00%, 6.00% Cap), 02/20/2038, Series 2009-106, Class ST(3)(10) | | | 559 | | | | 20 | |
0.85% (1 Month LIBOR USD + 6.00%, 6.00% Cap), 08/20/2038, Series 2008-71, Class SC(3)(10)(11) | | | 26 | | | | 0 | |
0.85% (1 Month LIBOR USD + 6.00%, 6.00% Cap), 12/20/2038, Series 2008-96, Class SL(3)(10) | | | 57 | | | | 1 | |
0.89% (1 Month LIBOR USD + 6.04%, 6.04% Cap), 02/20/2039, Series 2009-6, Class SH(3)(10)(11) | | | 44 | | | | 0 | |
0.93% (1 Month LIBOR USD + 6.09%, 6.09% Cap), 09/20/2039, Series 2009-81, Class SB(3)(10) | | | 191 | | | | 11 | |
0.93% (1 Month LIBOR USD + 6.08%, 6.08% Cap), 11/20/2034, Series 2004-96, Class SC(3)(10)(11) | | | 107 | | | | 0 | |
0.93% (1 Month LIBOR USD + 6.08%, 6.08% Cap), 06/20/2039, Series 2009-42, Class SC(3)(10) | | | 97 | | | | 5 | |
0.94% (1 Month LIBOR USD + 6.10%, 6.10% Cap), 02/16/2039, Series 2009-6, Class SA(3)(10)(11) | | | 36 | | | | 0 | |
0.94% (1 Month LIBOR USD + 6.10%, 6.10% Cap), 07/16/2039, Series 2009-64, Class SN(3)(10) | | | 91 | | | | 4 | |
0.95% (1 Month LIBOR USD + 6.10%, 6.10% Cap), 10/20/2034, Series 2004-90, Class SI(3)(10) | | | 178 | | | | 7 | |
0.99% (1 Month LIBOR USD + 6.15%, 6.15% Cap), 02/16/2039, Series 2009-11, Class SC(3)(10) | | | 52 | | | | 1 | |
1.00% (1 Month LIBOR USD + 6.15%, 6.15% Cap), 07/20/2038, Series 2008-60, Class CS(3)(10) | | | 76 | | | | 1 | |
1.04% (1 Month LIBOR USD + 6.20%, 6.20% Cap), 03/20/2037, Series 2007-9, Class CI(3)(10) | | | 76 | | | | 3 | |
1.05% (1 Month LIBOR USD + 6.20%, 6.20% Cap), 04/20/2037, Series 2007-19, Class SD(3)(10) | | | 38 | | | | 1 | |
1.05% (1 Month LIBOR USD + 6.20%, 6.20% Cap), 05/20/2037, Series 2007-27, Class SD(3)(10) | | | 76 | | | | 2 | |
1.05% (1 Month LIBOR USD + 6.20%, 6.20% Cap), 05/20/2037, Series 2007-26, Class SC(3)(10) | | | 68 | | | | 2 | |
1.05% (1 Month LIBOR USD + 6.20%, 6.20% Cap), 06/20/2038, Series 2008-55, Class SA(3)(10) | | | 22 | | | | 1 | |
1.05% (1 Month LIBOR USD + 6.20%, 6.20% Cap), 09/20/2038, Series 2008-81, Class S(3)(10) | | | 193 | | | | 3 | |
1.09% (1 Month LIBOR USD + 6.25%, 6.25% Cap), 08/16/2039, Series 2009-72, Class SM(3)(10) | | | 109 | | | | 6 | |
1.09% (1 Month LIBOR USD + 6.25%, 6.25% Cap), 06/20/2037, Series 2007-36, Class SJ(3)(10) | | | 55 | | | | 1 | |
1.12% (1 Month LIBOR USD + 6.27%, 6.27% Cap), 04/20/2039, Series 2009-22, Class SA(3)(10) | | | 118 | | | | 5 | |
1.14% (1 Month LIBOR USD + 6.30%, 6.30% Cap), 09/20/2035, Series 2005-68, Class KI(3)(10) | | | 239 | | | | 17 | |
1.14% (1 Month LIBOR USD + 6.30%, 6.30% Cap), 03/20/2039, Series 2009-31, Class TS(3)(10)(11) | | | 43 | | | | 0 | |
1.15% (1 Month LIBOR USD + 6.30%, 6.30% Cap), 04/20/2038, Series 2008-36, Class SH(3)(10)(11) | | | 89 | | | | 0 | |
1.24% (1 Month LIBOR USD + 6.40%, 6.40% Cap), 05/16/2038, Series 2008-40, Class SA(3)(10) | | | 294 | | | | 15 | |
1.24% (1 Month LIBOR USD + 6.40%, 6.40% Cap), 11/16/2039, Series 2009-106, Class AS(3)(10) | | | 159 | | | | 11 | |
1.31% (1 Month LIBOR USD + 6.47%, 6.47% Cap), 06/16/2037, Series 2007-36, Class SE(3)(10) | | | 45 | | | | 1 | |
1.35% (1 Month LIBOR USD + 6.51%, 6.51% Cap), 11/20/2037, Series 2007-67, Class SI(3)(10) | | | 74 | | | | 2 | |
1.35% (1 Month LIBOR USD + 6.50%, 6.50% Cap), 06/20/2036, Series 2006-38, Class SW(3)(10)(11) | | | 0 | | | | 0 | |
1.35% (1 Month LIBOR USD + 6.50%, 6.50% Cap), 11/20/2037, Series 2007-76, Class SB(3)(10) | | | 134 | | | | 2 | |
1.38% (1 Month LIBOR USD + 6.54%, 6.54% Cap), 11/16/2037, Series 2007-74, Class SL(3)(10) | | | 75 | | | | 2 | |
1.39% (1 Month LIBOR USD + 6.55%, 6.55% Cap), 11/16/2033, Series 2003-97, Class SA(3)(10) | | | 28 | | | | 1 | |
1.39% (1 Month LIBOR USD + 6.55%, 6.55% Cap), 12/16/2033, Series 2003-112, Class SA(3)(10) | | | 35 | | | | 1 | |
1.39% (1 Month LIBOR USD + 6.55%, 6.55% Cap), 09/16/2034, Series 2004-73, Class JL(3)(10) | | | 126 | | | | 9 | |
1.39% (1 Month LIBOR USD + 6.55%, 6.55% Cap), 09/20/2037, Series 2007-53, Class ES(3)(10) | | | 61 | | | | 2 | |
1.39% (1 Month LIBOR USD + 6.55%, 6.55% Cap), 11/20/2037, Series 2007-72, Class US(3)(10) | | | 61 | | | | 1 | |
1.39% (1 Month LIBOR USD + 6.55%, 6.55% Cap), 12/20/2037, Series 2007-79, Class SY(3)(10) | | | 90 | | | | 2 | |
1.44% (1 Month LIBOR USD + 6.60%, 6.60% Cap), 05/20/2041, Series 2011-75, Class SM(3)(10) | | | 140 | | | | 7 | |
1.48% (1 Month LIBOR USD + 6.64%, 6.64% Cap), 07/20/2037, Series 2007-45, Class QA(3)(10) | | | 87 | | | | 4 | |
1.53% (1 Month LIBOR USD + 6.68%, 6.68% Cap), 07/20/2037, Series 2007-40, Class SN(3)(10) | | | 83 | | | | 2 | |
1.54% (1 Month LIBOR USD + 6.70%, 6.70% Cap), 10/20/2036, Series 2006-59, Class SD(3)(10) | | | 38 | | | | 2 | |
1.60% (1 Month LIBOR USD + 6.75%, 6.75% Cap), 01/20/2035, Series 2005-3, Class SK(3)(10) | | | 117 | | | | 7 | |
1.60% (1 Month LIBOR USD + 6.75%, 6.75% Cap), 07/20/2037, Series 2007-40, Class SD(3)(10) | | | 60 | | | | 3 | |
1.64% (1 Month LIBOR USD + 6.80%, 6.80% Cap), 06/20/2035, Series 2008-79, Class CS(3)(10) | | | 59 | | | | 54 | |
1.64% (1 Month LIBOR USD + 6.80%, 6.80% Cap), 11/20/2036, Series 2006-65, Class SA(3)(10) | | | 64 | | | | 1 | |
| | | | | | | | |
1.65%, 01/20/2063, Series 2013-H01, Class FA | | | 1 | | | | 1 | |
1.65%, 02/20/2063, Series 2013-H04, Class BA | | | 7 | | | | 7 | |
1.65%, 04/20/2063, Series 2013-H09, Class HA | | | 8 | | | | 7 | |
1.65% (1 Month LIBOR USD + 6.81%, 6.81% Cap), 04/16/2037, Series 2007-17, Class JI(3)(10) | | | 103 | | | | 8 | |
2.00%, 07/01/2053(12) | | | 48,315 | | | | 40,606 | |
2.15% (1 Month LIBOR USD + 7.30%, 7.30% Cap), 12/20/2038, Series 2008-95, Class DS(3)(10) | | | 167 | | | | 5 | |
2.19%, 06/20/2067, Series 2017-H14, Class XI(4) | | | 7,678 | | | | 288 | |
2.45% (1 Month LIBOR USD + 7.60%, 7.60% Cap), 09/20/2038, Series 2009-25, Class SE(3)(10) | | | 40 | | | | 2 | |
2.50%, 07/01/2053(12) | | | 6,630 | | | | 5,741 | |
2.54% (1 Month LIBOR USD + 7.70%, 7.70% Cap), 04/16/2038, Series 2008-33, Class XS(3)(10) | | | 38 | | | | 2 | |
2.54% (1 Month LIBOR USD + 7.70%, 7.70% Cap), 02/20/2033, Series 2003-12, Class SP(3)(10)(11) | | | 10 | | | | 0 | |
3.00%, 12/20/2041, Series 2011-157, Class UY | | | 1,000 | | | | 872 | |
3.00%, 07/15/2042(12) | | | 8,790 | | | | 7,854 | |
3.00%, 10/20/2045, Series 2015-144, Class HP | | | 628 | | | | 562 | |
3.00%, 02/20/2047, Series 2018-7, Class GA | | | 771 | | | | 717 | |
3.00%, 09/20/2047, Series 2017-139, Class BA | | | 811 | | | | 729 | |
3.09% (1 Month LIBOR USD + 8.25%, 8.25% Cap), 08/16/2031, Series 2001-35, Class SA(3)(10)(11) | | | 7 | | | | 0 | |
3.11% (1 Month LIBOR USD + 13.40%, 13.40% Cap), 10/20/2037, Series 2008-7, Class SP(3)(10) | | | 10 | | | | 9 | |
3.20% (1 Month LIBOR USD + 22.73%, 22.73% Cap), 08/20/2035, Series 2005-65, Class SA(3)(10) | | | 3 | | | | 3 | |
3.50%, 07/01/2042(12) | | | 3,285 | | | | 3,032 | |
3.50%, 07/20/2046, Series 2018-160, Class PA | | | 854 | | | | 815 | |
3.50%, 09/20/2046, Series 2018-34, Class DL | | | 1,266 | | | | 1,210 | |
3.50%, 06/20/2048, Series 2018-78, Class NZ | | | 23,419 | | | | 20,965 | |
3.64% (1 Month LIBOR USD + 20.83%, 20.83% Cap), 08/16/2035, Series 2005-66, Class SP(3)(10) | | | 7 | | | | 7 | |
3.71%, 01/20/2042, Series 2012-141, Class WC(4) | | | 150 | | | | 142 | |
3.94% (1 Month LIBOR USD + 0.55%, 0.55% Floor), 10/20/2061, Series 2012-H26, Class JA(3) | | | 2 | | | | 2 | |
3.95% (1 Month LIBOR USD + 0.55%, 0.55% Floor), 04/20/2062, Series 2013-H07, Class MA(3) | | | 1 | | | | 1 | |
4.00%, 07/01/2053(12) | | | 6,515 | | | | 6,165 | |
4.00% (1 Month LIBOR USD + 16.43%, 16.43% Cap), 06/17/2035, Series 2005-68, Class DP(3)(10) | | | 32 | | | | 32 | |
4.02%, 09/16/2042, Series 2012-141, Class WB(4) | | | 100 | | | | 95 | |
4.14% (1 Month LIBOR USD + 29.46%, 29.46% Cap), 09/20/2034, Series 2004-71, Class SB(3)(10) | | | 13 | | | | 13 | |
4.44%, 04/20/2043, Series 2013-91, Class WA(4) | | | 136 | | | | 129 | |
4.50%, 07/01/2053(12) | | | 22,010 | | | | 21,243 | |
4.51% (1 Month LIBOR USD + 19.95%, 19.95% Cap), 11/20/2037, Series 2008-7, Class SK(3)(10) | | | 7 | | | | 7 | |
4.52%, 11/16/2041, Series 2012-141, Class WA(4) | | | 178 | | | | 172 | |
4.56%, 10/20/2041, Series 2014-188, Class W(4) | | | 261 | | | | 253 | |
4.60% (1 Month LIBOR USD + 0.60%, 0.60% Floor, 4.60% Cap), 10/20/2062, Series 2012-H24, Class FE(3) | | | 5 | | | | 5 | |
4.65% (1 Month LIBOR USD + 1.28%, 1.28% Floor), 02/20/2071, Series 2021-H03, Class LF(3) | | | 12,292 | | | | 12,346 | |
4.69%, 09/20/2041, Series 2013-26, Class AK(4) | | | 149 | | | | 146 | |
4.69%, 10/20/2042, Series 2014-41, Class W(4) | | | 529 | | | | 513 | |
4.69% (1 Month LIBOR USD + 0.50%, 0.50% Floor), 01/20/2063, Series 2013-H01, Class TA(3) | | | 4 | | | | 3 | |
4.74% (1 Month LIBOR USD + 20.21%, 20.21% Cap), 09/20/2037, Series 2007-53, Class SW(3)(10) | | | 14 | | | | 14 | |
4.77%, 03/20/2048, Series 2020-30, Class PT(4) | | | 6,372 | | | | 6,249 | |
4.87% (1 Month LIBOR USD + 0.70%, 0.70% Floor), 05/20/2061, Series 2012-H21, Class CF(3) | | | 8 | | | | 8 | |
4.87% (1 Month LIBOR USD + 0.65%, 0.65% Floor), 05/20/2061, Series 2012-H21, Class DF(3) | | | 8 | | | | 8 | |
4.88% (1 Month LIBOR USD + 0.55%, 0.55% Floor), 07/20/2062, Series 2012-H26, Class MA(3) | | | 4 | | | | 4 | |
4.89%, 11/20/2042, Series 2013-54, Class WA(4) | | | 101 | | | | 99 | |
4.97% (1 Month LIBOR USD + 0.58%, 0.58% Floor), 09/20/2062, Series 2012-H28, Class FA(3) | | | 5 | | | | 5 | |
5.00%, 07/01/2053(12) | | | 10,845 | | | | 10,657 | |
5.08% (1 Month LIBOR USD + 0.30%, 0.30% Floor), 11/20/2062, Series 2013-H02, Class HF(3)(11) | | | 0 | | | | 0 | |
5.10%, 06/20/2040, Series 2013-75, Class WA(4) | | | 79 | | | | 79 | |
5.14%, 07/20/2060, Series 2010-H17, Class XQ(4) | | | 2 | | | | 1 | |
5.33% (1 Month LIBOR USD + 0.47%, 11.00% Cap), 02/20/2065, Series 2015-H07, Class ES(3) | | | 752 | | | | 746 | |
5.34%, 01/20/2039, Series 2014-6, Class W(4) | | | 320 | | | | 319 | |
5.37% (1 Month LIBOR USD + 16.72%, 16.72% Cap), 05/18/2034, Series 2005-7, Class JM(3)(10)(11) | | | 1 | | | | 0 | |
5.39% (1 Month LIBOR USD + 0.30%, 0.30% Floor, 5.59% Cap), 08/20/2060, Series 2013-H03, Class FA(3)(11) | | | 0 | | | | 0 | |
5.41% (1 Month LIBOR USD + 0.32%, 0.32% Floor, 10.50% Cap), 01/20/2063, Series 2013-H01, Class JA(3) | | | 202 | | | | 199 | |
5.43% (1 Month LIBOR USD + 0.34%, 0.34% Floor, 11.00% Cap), 12/20/2062, Series 2012-H31, Class FD(3) | | | 994 | | | | 986 | |
5.46% (1 Month LIBOR USD + 0.30%, 0.30% Floor, 6.50% Cap), 05/16/2037, Series 2007-25, Class FN(3) | | | 32 | | | | 32 | |
5.47% (1 Month LIBOR USD + 24.38%, 24.38% Cap), 10/16/2034, Series 2004-89, Class LS(3)(10) | | | 11 | | | | 11 | |
5.48% (1 Month LIBOR USD + 19.66%, 19.66% Cap), 04/16/2034, Series 2004-28, Class S(3)(10) | | | 17 | | | | 18 | |
5.50%, 01/16/2033, Series 2011-43, Class ZQ | | | 167 | | | | 166 | |
5.50%, 04/20/2033, Series 2003-25, Class PZ | | | 92 | | | | 92 | |
5.50%, 03/16/2034, Series 2004-17, Class MZ | | | 1,384 | | | | 1,375 | |
5.50%, 07/20/2035, Series 2005-56, Class IC | | | 12 | | | | 2 | |
5.50%, 09/20/2035, Series 2005-72, Class AZ | | | 59 | | | | 59 | |
5.50%, 02/20/2038, Series 2008-17, Class IO(11) | | | 13 | | | | 0 | |
5.50%, 05/20/2039, Series 2009-33, Class CI | | | 16 | | | | 2 | |
5.50%, 09/20/2039, Series 2009-75, Class MN | | | 311 | | | | 312 | |
5.50%, 10/20/2039, Series 2009-87, Class BE | | | 380 | | | | 381 | |
5.50% (1 Month LIBOR USD + 0.45%, 0.45% Floor, 5.50% Cap), 03/20/2060, Series 2012-H24, Class FA(3) | | | 18 | | | | 17 | |
5.50% (1 Month LIBOR USD + 0.45%, 0.45% Floor, 5.50% Cap), 05/20/2062, Series 2012-H15, Class FA(3)(11) | | | 0 | | | | 0 | |
5.50% (1 Month LIBOR USD + 0.41%, 0.41% Floor, 11.00% Cap), 03/20/2063, Series 2013-H07, Class HA(3) | | | 273 | | | | 271 | |
5.51% (1 Month LIBOR USD + 0.42%, 0.42% Floor, 10.50% Cap), 02/20/2063, Series 2013-H04, Class SA(3) | | | 135 | | | | 134 | |
5.52% (1 Month LIBOR USD + 0.43%, 0.43% Floor, 5.59% Cap), 04/20/2060, Series 2012-H24, Class FG(3) | | | 9 | | | | 9 | |
5.53% (1 Month LIBOR USD + 0.44%, 0.44% Floor, 11.00% Cap), 07/20/2065, Series 2015-H16, Class FL(3) | | | 2,151 | | | | 2,134 | |
5.54% (1 Month LIBOR USD + 0.45%, 0.45% Floor, 11.00% Cap), 06/20/2065, Series 2015-H18, Class FA(3) | | | 592 | | | | 588 | |
5.54% (1 Month LIBOR USD + 0.45%, 0.45% Floor, 11.00% Cap), 08/20/2067, Series 2017-H19, Class FA(3) | | | 645 | | | | 641 | |
5.55%, 01/20/2038, Series 2015-137, Class WA(4) | | | 322 | | | | 327 | |
5.56% (1 Month LIBOR USD + 0.47%, 0.47% Floor), 08/20/2061, Series 2011-H19, Class FA(3) | | | 158 | | | | 157 | |
5.56% (1 Month LIBOR USD + 0.47%, 0.47% Floor, 10.50% Cap), 03/20/2063, Series 2013-H07, Class GA(3) | | | 71 | | | | 70 | |
5.56% (1 Month LIBOR USD + 0.47%, 0.47% Floor, 11.00% Cap), 06/20/2063, Series 2013-H14, Class FD(3) | | | 581 | | | | 578 | |
5.56% (1 Month LIBOR USD + 0.47%, 0.47% Floor, 11.00% Cap), 07/20/2064, Series 2014-H14, Class GF(3) | | | 955 | | | | 950 | |
| | | | | | | | |
5.56% (1 Month LIBOR USD + 0.47%, 0.47% Floor, 11.00% Cap), 09/20/2064, Series 2014-H19, Class FE(3) | | | 2,071 | | | | 2,055 | |
5.56% (1 Month LIBOR USD + 0.47%, 0.47% Floor, 11.00% Cap), 08/20/2065, Series 2015-H20, Class FA(3) | | | 356 | | | | 353 | |
5.56%, 10/20/2036, Series 2006-57, Class PZ | | | 71 | | | | 70 | |
5.57% (1 Month LIBOR USD + 0.48%, 0.48% Floor, 11.00% Cap), 02/20/2065, Series 2015-H05, Class FC(3) | | | 2,381 | | | | 2,355 | |
5.57% (1 Month LIBOR USD + 0.48%, 0.48% Floor, 11.00% Cap), 03/20/2065, Series 2015-H08, Class FC(3) | | | 4,474 | | | | 4,445 | |
5.57% (1 Month LIBOR USD + 0.48%, 11.00% Cap), 04/20/2065, Series 2015-H10, Class FC(3) | | | 3,435 | | | | 3,409 | |
5.58%, 08/20/2038, Series 2012-59, Class WA(4) | | | 113 | | | | 113 | |
5.59% (1 Month LIBOR USD + 0.50%, 0.50% Floor, 10.66% Cap), 03/20/2061, Series 2011-H11, Class FA(3) | | | 763 | | | | 759 | |
5.59% (1 Month LIBOR USD + 0.50%, 0.50% Floor, 11.00% Cap), 06/20/2064, Series 2014-H11, Class VA(3) | | | 1,367 | | | | 1,356 | |
5.59% (1 Month LIBOR USD + 0.50%, 0.50% Floor, 11.00% Cap), 07/20/2064, Series 2014-H15, Class FA(3) | | | 1,137 | | | | 1,128 | |
5.59% (1 Month LIBOR USD + 0.50%, 0.50% Floor, 11.00% Cap), 07/20/2064, Series 2014-H17, Class FC(3) | | | 1,309 | | | | 1,294 | |
5.59% (1 Month LIBOR USD + 0.50%, 0.50% Floor, 11.00% Cap), 12/20/2064, Series 2015-H03, Class FA(3) | | | 927 | | | | 923 | |
5.59% (1 Month LIBOR USD + 0.50%, 0.50% Floor, 11.00% Cap), 06/20/2067, Series 2017-H14, Class FV(3) | | | 3,502 | | | | 3,475 | |
5.59%, 07/20/2040, Series 2011-137, Class WA(4) | | | 109 | | | | 112 | |
5.61% (1 Month LIBOR USD + 0.52%, 0.52% Floor, 11.50% Cap), 10/20/2062, Series 2012-H29, Class FA(3) | | | 483 | | | | 480 | |
5.65% (1 Month LIBOR USD + 0.56%, 0.56% Floor, 11.00% Cap), 03/20/2067, Series 2017-H09, Class DF(3) | | | 3,063 | | | | 3,041 | |
5.68%, 08/20/2034, Series 2010-103, Class WA(4) | | | 34 | | | | 34 | |
5.69% (1 Month LIBOR USD + 0.60%, 0.60% Floor, 11.00% Cap), 04/20/2064, Series 2014-H09, Class TA(3) | | | 1,026 | | | | 1,023 | |
5.69% (1 Month LIBOR USD + 0.60%, 0.60% Floor), 04/20/2064, Series 2014-H10, Class TA(3) | | | 2,024 | | | | 2,010 | |
5.69% (1 Month LIBOR USD + 0.60%, 0.60% Floor, 11.00% Cap), 05/20/2064, Series 2014-H07, Class FA(3) | | | 3,407 | | | | 3,387 | |
5.69% (1 Month LIBOR USD + 0.60%, 0.60% Floor, 7.00% Cap), 10/20/2064, Series 2014-H20, Class LF(3) | | | 1,061 | | | | 1,050 | |
5.74% (1 Month LIBOR USD + 0.65%, 0.65% Floor, 11.00% Cap), 01/20/2064, Series 2014-H01, Class FD(3) | | | 824 | | | | 821 | |
5.74% (1 Month LIBOR USD + 0.65%, 0.65% Floor, 11.00% Cap), 02/20/2064, Series 2014-H04, Class FB(3) | | | 1,986 | | | | 1,981 | |
5.74% (1 Month LIBOR USD + 0.65%, 0.65% Floor, 11.00% Cap), 03/20/2064, Series 2014-H06, Class HB(3) | | | 851 | | | | 848 | |
5.75%, 07/20/2038, Series 2008-69, Class QD | | | 26 | | | | 25 | |
5.78% (1 Month LIBOR USD + 0.69%, 0.69% Floor, 11.00% Cap), 02/20/2064, Series 2014-H05, Class FA(3) | | | 1,926 | | | | 1,919 | |
5.79% (1 Month LIBOR USD + 0.70%, 0.70% Floor, 11.00% Cap), 04/20/2062, Series 2012-H08, Class FS(3) | | | 502 | | | | 500 | |
5.82%, 10/20/2033, Series 2010-41, Class WA(4) | | | 63 | | | | 63 | |
5.87%, 02/20/2037, Series 2011-22, Class WA(4) | | | 24 | | | | 25 | |
5.88%, 12/20/2038, Series 2011-163, Class WA(4) | | | 262 | | | | 266 | |
5.91%, 04/20/2037, Series 2010-129, Class AW(4) | | | 42 | | | | 43 | |
5.97% (1 Month LIBOR USD + 0.82%, 0.82% Floor, 7.00% Cap), 07/20/2038, Series 2008-58, Class FA(3) | | | 168 | | | | 169 | |
6.00%, 02/20/2029, Series 1999-4, Class ZB | | | 31 | | | | 31 | |
6.00%, 09/16/2033, Series 2003-75, Class ZX | | | 53 | | | | 53 | |
6.00%, 06/20/2034, Series 2004-49, Class Z | | | 123 | | | | 124 | |
6.00%, 12/20/2035, Series 2005-91, Class PI | | | 25 | | | | 3 | |
6.00%, 06/20/2038, Series 2008-50, Class KB | | | 46 | | | | 47 | |
6.00%, 05/20/2039, Series 2009-33, Class TI | | | 21 | | | | 3 | |
6.12%, 11/20/2038, Series 2011-97, Class WA(4) | | | 63 | | | | 64 | |
6.50%, 07/20/2032, Series 2002-52, Class GH | | | 33 | | | | 33 | |
6.50%, 01/20/2033, Series 2003-58, Class BE | | | 43 | | | | 43 | |
6.50%, 05/20/2033, Series 2003-46, Class MG | | | 34 | | | | 34 | |
6.50%, 07/20/2036, Series 2006-33, Class Z | | | 127 | | | | 129 | |
6.50%, 08/20/2036, Series 2006-38, Class ZK | | | 161 | | | | 160 | |
6.50%, 03/20/2039, Series 2009-14, Class KI | | | 25 | | | | 3 | |
6.50%, 03/20/2039, Series 2009-14, Class NI | | | 56 | | | | 6 | |
7.00% (1 Month LIBOR USD + 44.50%, 7.00% Cap), 09/20/2034, Series 2004-71, Class ST(3)(10) | | | 13 | | | | 13 | |
7.00%, 08/16/2039, Series 2009-104, Class AB | | | 16 | | | | 16 | |
7.00%, 10/16/2040, Series 2010-130, Class CP | | | 198 | | | | 207 | |
Ginnie Mae I Pool | | | | | | | | |
3.00%, 05/15/2043 | | | 244 | | | | 222 | |
3.00%, 07/15/2045 | | | 582 | | | | 524 | |
3.50%, 01/15/2042 | | | 1,903 | | | | 1,795 | |
3.50%, 03/15/2043 | | | 751 | | | | 708 | |
3.50%, 04/15/2043 | | | 1,617 | | | | 1,526 | |
3.50%, 06/15/2043 | | | 707 | | | | 666 | |
3.50%, 07/15/2043 | | | 319 | | | | 301 | |
4.00%, 06/15/2039 | | | 175 | | | | 168 | |
4.00%, 10/15/2040 | | | 95 | | | | 93 | |
4.50%, 04/15/2040 | | | 683 | | | | 675 | |
5.50%, 04/15/2033 | | | 157 | | | | 160 | |
5.50%, 06/15/2033 | | | 1 | | | | 1 | |
5.50%, 12/15/2033 | | | 6 | | | | 6 | |
5.50%, 07/15/2034 | | | 2 | | | | 2 | |
5.50%, 09/15/2034 | | | 2 | | | | 2 | |
6.00%, 11/15/2028 | | | 1 | | | | 1 | |
6.50%, 01/15/2024(11) | | | 0 | | | | 0 | |
6.50%, 03/15/2028 | | | 3 | | | | 3 | |
6.50%, 09/15/2028 | | | 7 | | | | 7 | |
6.50%, 10/15/2028(11) | | | 0 | | | | 0 | |
6.50%, 01/15/2032 | | | 28 | | | | 29 | |
6.50%, 07/15/2032 | | | 2 | | | | 2 | |
6.50%, 02/15/2033 | | | 6 | | | | 6 | |
6.50%, 04/15/2033 | | | 5 | | | | 5 | |
6.50%, 12/15/2035 | | | 29 | | | | 29 | |
7.00%, 11/15/2023(11) | | | 0 | | | | 0 | |
7.00%, 09/15/2031 | | | 32 | | | | 33 | |
7.00%, 02/15/2033 | | | 4 | | | | 4 | |
7.00%, 06/15/2033 | | | 10 | | | | 11 | |
7.00%, 06/15/2035 | | | 72 | | | | 75 | |
7.00%, 04/15/2037 | | | 9 | | | | 9 | |
7.50%, 11/15/2026(11) | | | 0 | | | | 0 | |
7.50%, 07/15/2027 | | | 1 | | | | 1 | |
| | | | | | | | |
7.50%, 09/15/2028 | | | 1 | | | | 1 | |
7.50%, 10/15/2037 | | | 14 | | | | 15 | |
8.00%, 08/15/2028(11) | | | 0 | | | | 0 | |
Ginnie Mae II Pool | | | | | | | | |
2.00%, 03/20/2051 | | | 4,490 | | | | 3,788 | |
2.00%, 07/20/2051 | | | 2,627 | | | | 2,215 | |
2.00%, 10/20/2051 | | | 2,535 | | | | 2,134 | |
2.00%, 12/20/2051 | | | 482 | | | | 405 | |
2.50%, 12/20/2046 | | | 997 | | | | 875 | |
2.50%, 09/20/2050 | | | 56 | | | | 49 | |
2.50%, 09/20/2050 | | | 3,129 | | | | 2,699 | |
2.50%, 09/20/2050 | | | 4,961 | | | | 4,344 | |
2.50%, 10/20/2050 | | | 256 | | | | 223 | |
2.50%, 11/20/2050 | | | 194 | | | | 169 | |
2.50%, 12/20/2050 | | | 3,880 | | | | 3,376 | |
2.50%, 02/20/2051 | | | 13,908 | | | | 12,099 | |
2.50%, 03/20/2051 | | | 13,194 | | | | 11,247 | |
2.50%, 03/20/2051 | | | 16,005 | | | | 13,913 | |
2.50%, 05/20/2051 | | | 9,827 | | | | 8,538 | |
2.50%, 06/20/2051 | | | 14,257 | | | | 12,299 | |
2.50%, 08/20/2051 | | | 60,994 | | | | 52,889 | |
2.50%, 09/20/2051 | | | 14,411 | | | | 12,491 | |
2.50%, 10/20/2051 | | | 7,663 | | | | 6,640 | |
2.50%, 11/20/2051 | | | 12,882 | | | | 11,154 | |
2.50%, 12/20/2051 | | | 32,894 | | | | 28,494 | |
2.50%, 01/20/2052 | | | 19,557 | | | | 16,940 | |
2.50%, 03/20/2052 | | | 12,994 | | | | 11,252 | |
2.50%, 05/20/2052 | | | 66 | | | | 57 | |
2.50%, 02/20/2053 | | | 3,403 | | | | 2,952 | |
2.93%, 10/20/2070(4) | | | 6,530 | | | | 5,681 | |
3.00%, 06/20/2042 | | | 136 | | | | 124 | |
3.00%, 08/20/2042 | | | 1,775 | | | | 1,620 | |
3.00%, 11/20/2042 | | | 1,003 | | | | 916 | |
3.00%, 12/20/2042 | | | 511 | | | | 467 | |
3.00%, 01/20/2043 | | | 508 | | | | 464 | |
3.00%, 04/20/2043 | | | 1,251 | | | | 1,144 | |
3.00%, 09/20/2043 | | | 388 | | | | 355 | |
3.00%, 10/20/2043 | | | 61 | | | | 56 | |
3.00%, 01/20/2044 | | | 346 | | | | 317 | |
3.00%, 07/20/2044 | | | 132 | | | | 121 | |
3.00%, 12/20/2044 | | | 211 | | | | 193 | |
3.00%, 04/20/2045 | | | 1,898 | | | | 1,730 | |
3.00%, 05/20/2045 | | | 337 | | | | 308 | |
3.00%, 07/20/2045 | | | 809 | | | | 740 | |
3.00%, 10/20/2045 | | | 921 | | | | 841 | |
3.00%, 11/20/2045 | | | 223 | | | | 203 | |
3.00%, 02/20/2046 | | | 321 | | | | 293 | |
3.00%, 04/20/2046 | | | 1,909 | | | | 1,737 | |
3.00%, 05/20/2046 | | | 82 | | | | 75 | |
3.00%, 07/20/2046 | | | 1,573 | | | | 1,432 | |
3.00%, 08/20/2046 | | | 11,795 | | | | 10,715 | |
3.00%, 09/20/2046 | | | 542 | | | | 493 | |
3.00%, 01/20/2047 | | | 1,275 | | | | 1,156 | |
3.00%, 02/20/2047 | | | 1,894 | | | | 1,718 | |
3.00%, 03/20/2047 | | | 203 | | | | 184 | |
3.00%, 10/20/2047 | | | 10,180 | | | | 9,215 | |
3.00%, 04/20/2049 | | | 494 | | | | 447 | |
3.00%, 07/20/2049 | | | 1,547 | | | | 1,396 | |
3.00%, 10/20/2049 | | | 5,131 | | | | 4,629 | |
3.00%, 12/20/2049(9) | | | 6,656 | | | | 5,991 | |
3.00%, 01/20/2050 | | | 6,860 | | | | 6,189 | |
3.00%, 02/20/2050 | | | 117 | | | | 105 | |
3.00%, 09/20/2050 | | | 341 | | | | 307 | |
3.00%, 09/20/2050 | | | 2,469 | | | | 2,213 | |
3.00%, 09/20/2050 | | | 6,999 | | | | 6,522 | |
3.00%, 05/20/2051 | | | 4,972 | | | | 4,466 | |
3.00%, 07/20/2051 | | | 28,884 | | | | 25,926 | |
3.00%, 08/20/2051 | | | 21,167 | | | | 18,985 | |
3.00%, 09/20/2051 | | | 2,933 | | | | 2,631 | |
3.00%, 10/20/2051 | | | 4,075 | | | | 3,654 | |
3.00%, 11/20/2051 | | | 454 | | | | 407 | |
3.00%, 12/20/2051 | | | 2,128 | | | | 1,906 | |
3.00%, 12/20/2051 | | | 5,207 | | | | 4,778 | |
3.02%, 12/20/2070(4) | | | 3,343 | | | | 2,899 | |
3.04%, 06/20/2070(4) | | | 4,338 | | | | 3,784 | |
3.08%, 09/20/2070(4) | | | 4,033 | | | | 3,523 | |
3.09%, 12/20/2071(4) | | | 9,547 | | | | 8,241 | |
3.47%, 04/20/2072(4) | | | 3,229 | | | | 2,832 | |
3.50%, 10/20/2042 | | | 1,956 | | | | 1,841 | |
3.50%, 11/20/2042 | | | 678 | | | | 639 | |
3.50%, 05/20/2043 | | | 470 | | | | 444 | |
3.50%, 03/20/2045 | | | 479 | | | | 449 | |
3.50%, 04/20/2045 | | | 3,650 | | | | 3,426 | |
| | | | | | | | |
3.50%, 10/20/2045 | | | 3,089 | | | | 2,893 | |
3.50%, 01/20/2046 | | | 1,861 | | | | 1,746 | |
3.50%, 02/20/2046 | | | 5,521 | | | | 5,172 | |
3.50%, 03/20/2046 | | | 1,490 | | | | 1,395 | |
3.50%, 04/20/2046 | | | 11,721 | | | | 10,978 | |
3.50%, 05/20/2046 | | | 3,741 | | | | 3,507 | |
3.50%, 06/20/2046 | | | 1,708 | | | | 1,590 | |
3.50%, 07/20/2046(9) | | | 3,338 | | | | 3,126 | |
3.50%, 08/20/2046 | | | 497 | | | | 466 | |
3.50%, 09/20/2046 | | | 388 | | | | 363 | |
3.50%, 11/20/2046 | | | 593 | | | | 557 | |
3.50%, 12/20/2046 | | | 2,666 | | | | 2,497 | |
3.50%, 01/20/2047 | | | 17 | | | | 16 | |
3.50%, 02/20/2047 | | | 2,664 | | | | 2,495 | |
3.50%, 03/20/2047 | | | 115 | | | | 108 | |
3.50%, 04/20/2047 | | | 273 | | | | 256 | |
3.50%, 05/20/2047 | | | 2,749 | | | | 2,583 | |
3.50%, 07/20/2047 | | | 2,231 | | | | 2,089 | |
3.50%, 08/20/2047 | | | 243 | | | | 227 | |
3.50%, 11/20/2047 | | | 4,805 | | | | 4,495 | |
3.50%, 12/20/2047 | | | 797 | | | | 747 | |
3.50%, 02/20/2048 | | | 9,610 | | | | 8,990 | |
3.50%, 04/20/2048 | | | 2,765 | | | | 2,583 | |
3.50%, 06/20/2049 | | | 777 | | | | 724 | |
3.50%, 11/20/2049 | | | 2,899 | | | | 2,707 | |
3.50%, 08/20/2050 | | | 6,982 | | | | 6,445 | |
3.50%, 01/20/2051 | | | 8,352 | | | | 7,543 | |
3.50%, 06/20/2051 | | | 1,762 | | | | 1,638 | |
3.50%, 02/20/2052 | | | 2,018 | | | | 1,875 | |
3.50%, 02/20/2052 | | | 3,384 | | | | 3,145 | |
3.50%, 02/20/2052 | | | 5,062 | | | | 4,618 | |
4.00%, 10/20/2040 | | | 813 | | | | 789 | |
4.00%, 06/20/2042 | | | 1,143 | | | | 1,110 | |
4.00%, 10/20/2042 | | | 2,584 | | | | 2,509 | |
4.00%, 12/20/2042 | | | 1,324 | | | | 1,285 | |
4.00%, 02/20/2043 | | | 562 | | | | 546 | |
4.00%, 10/20/2043 | | | 1,487 | | | | 1,441 | |
4.00%, 11/20/2044 | | | 829 | | | | 801 | |
4.00%, 12/20/2044 | | | 612 | | | | 592 | |
4.00%, 03/20/2045 | | | 166 | | | | 161 | |
4.00%, 05/20/2045 | | | 1,961 | | | | 1,890 | |
4.00%, 07/20/2045 | | | 470 | | | | 452 | |
4.00%, 08/20/2045 | | | 4,496 | | | | 4,330 | |
4.00%, 11/20/2045 | | | 1,412 | | | | 1,361 | |
4.00%, 01/20/2046 | | | 332 | | | | 319 | |
4.00%, 03/20/2046 | | | 360 | | | | 346 | |
4.00%, 04/20/2046 | | | 936 | | | | 901 | |
4.00%, 05/20/2046 | | | 1,585 | | | | 1,525 | |
4.00%, 06/20/2046 | | | 749 | | | | 722 | |
4.00%, 11/20/2046 | | | 663 | | | | 637 | |
4.00%, 02/20/2047 | | | 977 | | | | 937 | |
4.00%, 03/20/2047 | | | 1,961 | | | | 1,883 | |
4.00%, 05/20/2047 | | | 155 | | | | 147 | |
4.00%, 05/20/2047 | | | 164 | | | | 157 | |
4.00%, 06/20/2047 | | | 1,302 | | | | 1,249 | |
4.00%, 07/20/2047 | | | 2,766 | | | | 2,655 | |
4.00%, 09/20/2047 | | | 896 | | | | 862 | |
4.00%, 12/20/2047 | | | 1,289 | | | | 1,237 | |
4.00%, 01/20/2048 | | | 726 | | | | 697 | |
4.00%, 06/20/2048 | | | 2,138 | | | | 2,042 | |
4.00%, 01/20/2050 | | | 2,546 | | | | 2,432 | |
4.00%, 12/20/2051 | | | 4,252 | | | | 3,963 | |
4.00%, 12/20/2051 | | | 11,175 | | | | 10,407 | |
4.00%, 08/20/2052 | | | 25,093 | | | | 23,742 | |
4.25%, 12/20/2047 | | | 1,062 | | | | 1,018 | |
4.50%, 06/20/2040 | | | 282 | | | | 279 | |
4.50%, 01/20/2041 | | | 252 | | | | 251 | |
4.50%, 03/20/2041 | | | 223 | | | | 221 | |
4.50%, 05/20/2041 | | | 110 | | | | 109 | |
4.50%, 06/20/2041 | | | 791 | | | | 785 | |
4.50%, 09/20/2041 | | | 269 | | | | 267 | |
4.50%, 09/20/2043 | | | 604 | | | | 598 | |
4.50%, 10/20/2043 | | | 1,153 | | | | 1,143 | |
4.50%, 12/20/2043 | | | 634 | | | | 629 | |
4.50%, 10/20/2045 | | | 6,786 | | | | 6,726 | |
4.50%, 01/20/2046 | | | 950 | | | | 942 | |
4.50%, 07/20/2046 | | | 429 | | | | 426 | |
4.50%, 09/20/2046 | | | 851 | | | | 827 | |
4.50%, 11/20/2046 | | | 1,295 | | | | 1,282 | |
4.50%, 03/20/2047 | | | 228 | | | | 224 | |
4.50%, 07/20/2047 | | | 2,160 | | | | 2,120 | |
4.50%, 08/20/2047 | | | 563 | | | | 552 | |
4.50%, 09/20/2047 | | | 2,923 | | | | 2,871 | |
| | | | | | | | |
4.50%, 01/20/2048 | | | 417 | | | | 408 | |
4.50%, 02/20/2048 | | | 1,874 | | | | 1,836 | |
4.50%, 03/20/2048 | | | 208 | | | | 204 | |
4.50%, 04/20/2048 | | | 173 | | | | 169 | |
4.50%, 04/20/2048 | | | 1,180 | | | | 1,148 | |
4.50%, 04/20/2048 | | | 1,197 | | | | 1,159 | |
4.50%, 04/20/2048 | | | 1,424 | | | | 1,384 | |
4.50%, 05/20/2048 | | | 706 | | | | 682 | |
4.50%, 05/20/2048 | | | 1,983 | | | | 1,909 | |
4.50%, 05/20/2048 | | | 2,595 | | | | 2,521 | |
4.50%, 09/20/2048 | | | 423 | | | | 413 | |
4.50%, 11/20/2049 | | | 5,258 | | | | 5,076 | |
4.50%, 07/20/2052 | | | 5,046 | | | | 4,873 | |
5.00%, 10/20/2037 | | | 156 | | | | 159 | |
5.00%, 07/20/2040 | | | 74 | | | | 75 | |
5.00%, 06/20/2044 | | | 329 | | | | 334 | |
5.00%, 07/20/2044 | | | 285 | | | | 289 | |
5.00%, 08/20/2045 | | | 346 | | | | 349 | |
5.00%, 09/20/2046 | | | 824 | | | | 837 | |
5.00%, 10/20/2047 | | | 110 | | | | 110 | |
5.00%, 11/20/2047 | | | 569 | | | | 568 | |
5.00%, 06/20/2048 | | | 820 | | | | 821 | |
5.00%, 07/20/2048 | | | 229 | | | | 231 | |
5.00%, 07/20/2048 | | | 1,415 | | | | 1,401 | |
5.00%, 02/20/2049 | | | 2,816 | | | | 2,798 | |
5.00%, 07/20/2049 | | | 277 | | | | 282 | |
5.00%, 08/20/2049 | | | 5,347 | | | | 5,400 | |
5.00%, 09/20/2049 | | | 3,271 | | | | 3,237 | |
5.00%, 05/20/2052 | | | 3,565 | | | | 3,472 | |
5.50%, 09/20/2039 | | | 52 | | | | 53 | |
5.93% (1 Year CMT Index + 1.47%, 1.47% Floor, 6.59% Cap), 11/20/2071(3) | | | 3,565 | | | | 3,627 | |
6.00%, 03/20/2028 | | | 2 | | | | 2 | |
6.00%, 11/20/2033 | | | 2 | | | | 2 | |
6.00%, 09/20/2038 | | | 190 | | | | 199 | |
6.00%, 11/20/2038 | | | 1 | | | | 1 | |
6.00%, 08/20/2039 | | | 89 | | | | 93 | |
6.00%, 01/20/2053 | | | 3,103 | | | | 3,125 | |
6.04% (1 Year CMT Index + 1.57%, 1.57% Floor, 6.71% Cap), 11/20/2071(3) | | | 4,478 | | | | 4,579 | |
6.12% (1 Year CMT Index + 1.63%, 1.64% Floor, 6.76% Cap), 11/20/2071(3) | | | 4,011 | | | | 4,114 | |
6.12% (1 Year CMT Index + 1.64%, 1.64% Floor, 8.69% Cap), 05/20/2072(3) | | | 9,936 | | | | 10,230 | |
6.15% (1 Year CMT Index + 1.67%, 1.67% Floor, 8.25% Cap), 04/20/2072(3) | | | 13,469 | | | | 13,882 | |
6.18% (1 Year CMT Index + 1.70%, 1.70% Floor, 8.40% Cap), 04/20/2072(3) | | | 10,028 | | | | 10,348 | |
6.18% (1 Year CMT Index + 1.71%, 1.71% Floor, 7.86% Cap), 03/20/2072(3) | | | 10,536 | | | | 10,877 | |
6.19% (1 Year CMT Index + 1.74%, 1.74% Floor, 6.84% Cap), 10/20/2071(3) | | | 10,750 | | | | 11,082 | |
6.19% (1 Year CMT Index + 1.77%, 1.77% Floor, 6.85% Cap), 08/20/2071(3) | | | 9,750 | | | | 10,063 | |
6.21% (1 Year CMT Index + 1.75%, 1.75% Floor, 6.92% Cap), 11/20/2071(3) | | | 11,470 | | | | 11,844 | |
6.21% (1 Year CMT Index + 1.75%, 1.75% Floor, 6.86% Cap), 10/20/2071(3) | | | 10,874 | | | | 11,213 | |
6.22% (1 Year CMT Index + 1.76%, 1.76% Floor, 6.90% Cap), 11/20/2071(3) | | | 10,921 | | | | 11,279 | |
6.23% (1 Year CMT Index + 1.74%, 1.73% Floor, 8.37% Cap), 04/20/2072(3) | | | 9,708 | | | | 10,022 | |
6.24% (1 Year CMT Index + 1.78%, 1.78% Floor, 7.00% Cap), 12/20/2071(3) | | | 10,216 | | | | 10,566 | |
6.24% (1 Year CMT Index + 1.79%, 1.79% Floor, 6.86% Cap), 09/20/2071(3) | | | 10,075 | | | | 10,412 | |
6.27% (1 Year CMT Index + 1.78%, 1.78% Floor, 8.41% Cap), 04/20/2072(3) | | | 3,467 | | | | 3,590 | |
6.29% (1 Year CMT Index + 1.84%, 1.84% Floor, 6.91% Cap), 08/20/2071(3) | | | 10,076 | | | | 10,433 | |
6.30% (1 Year CMT Index + 1.83%, 1.83% Floor, 9.68% Cap), 07/20/2072(3) | | | 10,305 | | | | 10,739 | |
6.45% (1 Year CMT Index + 1.95%, 1.95% Floor, 8.14% Cap), 03/20/2072(3) | | | 9,753 | | | | 10,167 | |
6.50%, 07/20/2029 | | | 29 | | | | 30 | |
7.00%, 08/20/2038 | | | 7 | | | | 7 | |
7.50%, 02/20/2028(11) | | | 0 | | | | 0 | |
7.50%, 09/20/2028 | | | 1 | | | | 1 | |
8.00%, 12/20/2025(11) | | | 0 | | | | 0 | |
8.00%, 06/20/2026(11) | | | 0 | | | | 0 | |
8.00%, 08/20/2026(11) | | | 0 | | | | 0 | |
8.00%, 09/20/2026(11) | | | 0 | | | | 0 | |
8.00%, 11/20/2026(11) | | | 0 | | | | 0 | |
8.00%, 10/20/2027 | | | 1 | | | | 1 | |
8.00%, 11/20/2027 | | | 1 | | | | 1 | |
8.00%, 12/20/2027(11) | | | 0 | | | | 0 | |
8.00%, 09/20/2028(11) | | | 0 | | | | 0 | |
8.50%, 03/20/2025(11) | | | 0 | | | | 0 | |
8.50%, 04/20/2025(11) | | | 0 | | | | 0 | |
8.50%, 05/20/2025(11) | | | 0 | | | | 0 | |
GMACM Mortgage Loan Trust 2005-AR3 | | | | | | | | |
3.87%, 06/19/2035, Series 2005-AR3, Class 3A4(4) | | | 27 | | | | 25 | |
GS Mortgage Securities Corp. Trust 2021-RENT | | | | | | | | |
5.86% (1 Month LIBOR USD + 0.70%, 0.70% Floor), 11/21/2035, Series 2021-RENT, Class A(1)(3) | | | 5,072 | | | | 4,821 | |
GS Mortgage Securities Trust | | | | | | | | |
4.26%, 07/10/2051, Series 2018-GS10, Class A3(4) | | | 28,521 | | | | 27,478 | |
GS Mortgage Securities Trust 2013-GC16 | | | | | | | | |
1.16%, 11/10/2046, Series 2013-GC16, Class XA(4) | | | 8,063 | | | | 3 | |
GS Mortgage Securities Trust 2014-GC18 | | | | | | | | |
4.07%, 01/10/2047, Series 2014-GC18, Class A4 | | | 8,419 | | | | 8,301 | |
GS Mortgage Securities Trust 2014-GC26 | | | | | | | | |
3.36%, 11/10/2047, Series 2014-GC26, Class A4 | | | 4,612 | | | | 4,445 | |
| | | | | | | | |
GS Mortgage Securities Trust 2015-GC28 | | | | | | | | |
3.14%, 02/10/2048, Series 2015-GC28, Class A4 | | | 8,289 | | | | 8,022 | |
GS Mortgage Securities Trust 2016-GS4 | | | | | | | | |
3.18%, 11/10/2049, Series 2016-GS4, Class A3 | | | 11,387 | | | | 10,517 | |
3.44%, 11/10/2049, Series 2016-GS4, Class A4(4) | | | 1,317 | | | | 1,215 | |
GSMPS Mortgage Loan Trust 2004-4 | | | | | | | | |
5.55% (1 Month LIBOR USD + 0.40%, 0.40% Floor), 06/25/2034, Series 2004-4, Class 1AF(1)(3) | | | 35 | | | | 30 | |
GSMPS Mortgage Loan Trust 2005-RP2 | | | | | | | | |
5.50% (1 Month LIBOR USD + 0.35%, 0.35% Floor), 03/25/2035, Series 2005-RP2, Class 1AF(1)(3) | | | 59 | | | | 51 | |
GSMPS Mortgage Loan Trust 2005-RP3 | | | | | | | | |
0.00%, 09/25/2035, Series 2005-RP3, Class 1AS(1)(4) | | | 301 | | | | 3 | |
5.50% (1 Month LIBOR USD + 0.35%, 0.35% Floor, 9.50% Cap), 09/25/2035, Series 2005-RP3, Class 1AF(1)(3) | | | 408 | | | | 343 | |
GSR Mortgage Loan Trust 2003-3F | | | | | | | | |
5.75%, 04/25/2033, Series 2003-3F, Class 4A3 | | | 5 | | | | 5 | |
GSR Mortgage Loan Trust 2004-13F | | | | | | | | |
6.00%, 11/25/2034, Series 2004-13F, Class 3A3 | | | 11 | | | | 10 | |
GSR Mortgage Loan Trust 2004-6F | | | | | | | | |
5.50%, 05/25/2034, Series 2004-6F, Class 2A4 | | | 26 | | | | 25 | |
6.50%, 05/25/2034, Series 2004-6F, Class 3A4 | | | 21 | | | | 22 | |
GSR Mortgage Loan Trust 2005-5F | | | | | | | | |
5.50% (1 Month LIBOR USD + 0.50%, 0.50% Floor, 5.50% Cap), 06/25/2035, Series 2005-5F, Class 8A3(3) | | | 10 | | | | 9 | |
GSR Mortgage Loan Trust 2005-7F | | | | | | | | |
6.00%, 09/25/2035, Series 2005-7F, Class 3A9 | | | 45 | | | | 43 | |
GSR Mortgage Loan Trust 2005-AR6 | | | | | | | | |
4.02%, 09/25/2035, Series 2005-AR6, Class 3A1(4) | | | 3 | | | | 3 | |
GSR Mortgage Loan Trust 2006-1F | | | | | | | | |
5.50%, 02/25/2036, Series 2006-1F, Class 1A3 | | | 13 | | | | 21 | |
6.00%, 02/25/2036, Series 2006-1F, Class 2A4 | | | 175 | | | | 89 | |
Home RE 2019-1 Ltd. | | | | | | | | |
6.80% (1 Month LIBOR USD + 1.65%), 05/25/2029, Series 2019-1, Class M1(1)(3) | | | 513 | | | | 513 | |
Home RE 2022-1 Ltd. | | | | | | | | |
7.92% (30-day Average SOFR + 2.85%), 10/25/2034, Series 2022-1, Class M1A(1)(3) | | | 8,800 | | | | 8,851 | |
HPA 2022-SFR1 | | | | | | | | |
3.95%, 04/15/2026(4)(5) | | | 9,833 | | | | 9,833 | |
Impac CMB Trust Series 2004-4 | | | | | | | | |
5.33%, 09/25/2034, Series 2004-4, Class 2A2(2) | | | 5 | | | | 5 | |
Impac CMB Trust Series 2004-7 | | | | | | | | |
5.89% (1 Month LIBOR USD + 0.74%, 11.25% Cap), 11/25/2034, Series 2004-7, Class 1A1(3) | | | 245 | | | | 239 | |
Impac CMB Trust Series 2005-4 | | | | | | | | |
5.75% (1 Month LIBOR USD + 0.30%, 0.30% Floor, 10.25% Cap), 05/25/2035, Series 2005-4, Class 2A1(3) | | | 70 | | | | 62 | |
Impac Secured Assets CMN Owner Trust | | | | | | | | |
5.50%, 08/25/2033, Series 2003-2, Class A1 | | | 36 | | | | 30 | |
Impac Secured Assets Trust 2006-1 | | | | | | | | |
5.85% (1 Month LIBOR USD + 0.70%, 0.70% Floor, 11.50% Cap), 05/25/2036, Series 2006-1, Class 2A1(3) | | | 52 | | | | 44 | |
Independence Plaza Trust 2018-INDP | | | | | | | | |
3.76%, 07/10/2035, Series 2018-INDP, Class A(1) | | | 5,445 | | | | 5,083 | |
JP Morgan Alternative Loan Trust | | | | | | | | |
4.11%, 03/25/2036, Series 2006-A1, Class 2A1(4) | | | 16 | | | | 12 | |
JP Morgan Chase Commercial Mortgage Securities Trust 2005-CIBC11 | | | | | | | | |
0.22%, 08/12/2037, Series 2005-CB11, Class X1(1)(4)(11) | | | 751 | | | | 0 | |
JP Morgan Chase Commercial Mortgage Securities Trust 2006-CIBC15 | | | | | | | | |
0.77%, 06/12/2043, Series 2006-CB15, Class X1(4)(11) | | | 128 | | | | 0 | |
JP Morgan Chase Commercial Mortgage Securities Trust 2007-LDP12 | | | | | | | | |
0.00%, 02/15/2051, Series 2007-LD12, Class X(4)(11) | | | 730 | | | | 0 | |
JP Morgan Chase Commercial Mortgage Securities Trust 2019-BKWD | | | | | | | | |
6.44% (1 Month LIBOR USD + 1.25%, 1.00% Floor), 09/15/2029, Series 2019-BKWD, Class A(1)(3) | | | 7,918 | | | | 7,335 | |
JP Morgan Mortgage Trust 2004-A3 | | | | | | | | |
5.63%, 07/25/2034, Series 2004-A3, Class 4A1(4) | | | 1 | | | | 1 | |
JP Morgan Mortgage Trust 2004-A4 | | | | | | | | |
5.15%, 09/25/2034, Series 2004-A4, Class 1A1(4) | | | 8 | | | | 7 | |
JP Morgan Mortgage Trust 2004-S1 | | | | | | | | |
5.00%, 09/25/2034, Series 2004-S1, Class 1A7 | | | 2 | | | | 2 | |
JP Morgan Mortgage Trust 2005-A1 | | | | | | | | |
4.16%, 02/25/2035, Series 2005-A1, Class 3A4(4) | | | 30 | | | | 29 | |
JP Morgan Mortgage Trust 2005-A4 | | | | | | | | |
4.68%, 07/25/2035, Series 2005-A4, Class 1A1(4) | | | 7 | | | | 7 | |
JP Morgan Mortgage Trust 2006-A2 | | | | | | | | |
4.19%, 11/25/2033, Series 2006-A2, Class 5A3(4) | | | 66 | | | | 63 | |
5.05%, 08/25/2034, Series 2006-A2, Class 4A1(4) | | | 191 | | | | 191 | |
JP Morgan Mortgage Trust 2006-A3 | | | | | | | | |
4.02%, 08/25/2034, Series 2006-A3, Class 6A1(4) | | | 20 | | | | 20 | |
JP Morgan Mortgage Trust 2006-A7 | | | | | | | | |
3.88%, 01/25/2037, Series 2006-A7, Class 2A2(4) | | | 25 | | | | 20 | |
3.88%, 01/25/2037, Series 2006-A7, Class 2A4R(4) | | | 44 | | | | 35 | |
JP Morgan Mortgage Trust 2007-A1 | | | | | | | | |
4.05%, 07/25/2035, Series 2007-A1, Class 5A1(4) | | | 19 | | | | 19 | |
4.05%, 07/25/2035, Series 2007-A1, Class 5A2(4) | | | 295 | | | | 288 | |
JP Morgan Mortgage Trust 2007-A2 | | | | | | | | |
4.20%, 04/25/2037, Series 2007-A2, Class 2A3(4) | | | 93 | | | | 68 | |
JPMBB Commercial Mortgage Securities Trust 2013-C17 | | | | | | | | |
3.93%, 01/15/2047, Series 2013-C17, Class A3 | | | 632 | | | | 629 | |
JPMBB Commercial Mortgage Securities Trust 2014-C25 | | | | | | | | |
3.41%, 11/15/2047, Series 2014-C25, Class A4A1 | | | 6,260 | | | | 6,020 | |
| | | | | | | | |
JPMCC Commercial Mortgage Securities Trust 2017-JP5 | | | | | | | | |
3.46%, 03/15/2050, Series 2017-JP5, Class A4 | | | 6,324 | | | | 5,991 | |
JPMCC Commercial Mortgage Securities Trust 2017-JP7 | | | | | | | | |
3.19%, 09/15/2050, Series 2017-JP7, Class A4 | | | 20,000 | | | | 17,964 | |
Ladder Capital Commercial Mortgage 2013-GCP Mortgage Trust | | | | | | | | |
3.99%, 02/15/2036, Series 2013-GCP, Class A2(1) | | | 1,027 | | | | 905 | |
LCCM 2017-LC26 | | | | | | | | |
3.29%, 07/12/2050, Series 2017-LC26, Class A3(1) | | | 15,067 | | | | 13,782 | |
Legacy Mortgage Asset Trust 2019-PR1 | | | | | | | | |
6.86%, 09/25/2059, Series 2019-PR1, Class A1(1)(2) | | | 9,752 | | | | 9,600 | |
Legacy Mortgage Asset Trust 2020-GS1 | | | | | | | | |
5.88%, 10/25/2059, Series 2020-GS1, Class A1(1)(2) | | | 3,744 | | | | 3,676 | |
Legacy Mortgage Asset Trust 2021-GS1 | | | | | | | | |
1.89%, 10/25/2066, Series 2021-GS1, Class A1(1)(2) | | | 4,930 | | | | 4,596 | |
Legacy Mortgage Asset Trust 2021-GS2 | | | | | | | | |
1.75%, 04/25/2061, Series 2021-GS2, Class A1(1)(2) | | | 4,916 | | | | 4,547 | |
Legacy Mortgage Asset Trust 2021-GS4 | | | | | | | | |
1.65%, 11/25/2060, Series 2021-GS4, Class A1(1)(2) | | | 2,152 | | | | 1,954 | |
Lehman Mortgage Trust 2006-2 | | | | | | | | |
5.89%, 04/25/2036, Series 2006-2, Class 1A1(4) | | | 40 | | | | 26 | |
Lehman Mortgage Trust 2007-6 | | | | | | | | |
6.00%, 07/25/2037, Series 2007-6, Class 1A8 | | | 10 | | | | 8 | |
Lehman Mortgage Trust 2008-2 | | | | | | | | |
6.00%, 03/25/2038, Series 2008-2, Class 1A6 | | | 222 | | | | 78 | |
LHOME Mortgage Trust 2021-RTL1 | | | | | | | | |
2.09%, 02/25/2026, Series 2021-RTL1, Class A1(1)(4) | | | 2,582 | | | | 2,545 | |
Linden Park Apartments | | | | | | | | |
4.09%, 07/01/2033 | | | 11,800 | | | | 11,651 | |
MASTR Adjustable Rate Mortgages Trust 2004-13 | | | | | | | | |
4.58%, 04/21/2034, Series 2004-13, Class 2A1(4) | | | 49 | | | | 47 | |
MASTR Adjustable Rate Mortgages Trust 2004-15 | | | | | | | | |
4.44%, 12/25/2034, Series 2004-15, Class 3A1(4) | | | 7 | | | | 7 | |
MASTR Adjustable Rate Mortgages Trust 2004-3 | | | | | | | | |
3.46%, 04/25/2034, Series 2004-3, Class 4A2(4) | | | 18 | | | | 16 | |
MASTR Alternative Loan Trust 2003-9 | | | | | | | | |
6.00%, 12/25/2033, Series 2003-9, Class 2A1 | | | 21 | | | | 21 | |
6.00%, 01/25/2034, Series 2003-9, Class 8A1 | | | 11 | | | | 11 | |
MASTR Alternative Loan Trust 2004-3 | | | | | | | | |
6.00%, 04/25/2034, Series 2004-3, Class 3A1 | | | 116 | | | | 114 | |
6.25%, 04/25/2034, Series 2004-3, Class 2A1 | | | 18 | | | | 17 | |
MASTR Alternative Loan Trust 2004-6 | | | | | | | | |
0.00%, 07/25/2034, Series 2004-6, Class 30PO | | | 14 | | | | 10 | |
6.00%, 07/25/2034, Series 2004-6, Class 7A1 | | | 10 | | | | 10 | |
MASTR Alternative Loan Trust 2004-7 | | | | | | | | |
0.00%, 08/25/2034, Series 2004-7, Class 30PO | | | 10 | | | | 8 | |
MASTR Alternative Loan Trust 2005-6 | | | | | | | | |
5.50%, 12/25/2035, Series 2005-6, Class 3A1 | | | 8 | | | | 6 | |
MASTR Asset Securitization Trust 2003-12 | | | | | | | | |
0.00%, 12/25/2033, Series 2003-12, Class 30PO | | | 1 | | | | 1 | |
5.00%, 12/25/2033, Series 2003-12, Class 6A1 | | | 8 | | | | 7 | |
MASTR Asset Securitization Trust 2004-1 | | | | | | | | |
0.00%, 02/25/2034, Series 2004-1, Class 30PO | | | 1 | | | | 1 | |
MASTR Asset Securitization Trust 2004-4 | | | | | | | | |
5.25%, 12/26/2033, Series 2004-4, Class 1A6 | | | 19 | | | | 18 | |
MASTR Reperforming Loan Trust 2005-2 | | | | | | | | |
5.50% (1 Month LIBOR USD + 0.35%, 0.35% Floor, 9.50% Cap), 05/25/2035, Series 2005-2, Class 1A1F(1)(3) | | | 624 | | | | 329 | |
MASTR Reperforming Loan Trust 2006-2 | | | | | | | | |
4.06%, 05/25/2036, Series 2006-2, Class 1A1(1)(4) | | | 66 | | | | 51 | |
MASTR Resecuritization Trust 2005-PO | | | | | | | | |
0.00%, 05/28/2035, Series 2005-PO, Class 3PO(1) | | | 9 | | | | 7 | |
Merrill Lynch Mortgage Backed Securities Trust Series 2007-3 | | | | | | | | |
5.87%, 06/25/2037, Series 2007-3, Class 1A3(4) | | | 4 | | | | 4 | |
Merrill Lynch Mortgage Investors Trust Series 2003-A5 | | | | | | | | |
4.37%, 08/25/2033, Series 2003-A5, Class 2A6(4) | | | 12 | | | | 11 | |
Merrill Lynch Mortgage Investors Trust Series MLCC 2003-E | | | | | | | | |
5.77% (1 Month LIBOR USD + 0.62%, 0.62% Floor, 11.75% Cap), 10/25/2028, Series 2003-E, Class A1(3) | | | 26 | | | | 24 | |
Merrill Lynch Mortgage Investors Trust Series MLCC 2003-F | | | | | | | | |
5.79% (1 Month LIBOR USD + 0.64%, 0.64% Floor, 11.75% Cap), 10/25/2028, Series 2003-F, Class A1(3) | | | 23 | | | | 22 | |
Merrill Lynch Mortgage Investors Trust Series MLCC 2004-1 | | | | | | | | |
4.01%, 12/25/2034, Series 2004-1, Class 2A1(4) | | | 31 | | | | 29 | |
Merrill Lynch Mortgage Investors Trust Series MLCC 2004-A | | | | | | | | |
5.61% (1 Month LIBOR USD + 0.46%, 0.46% Floor, 11.75% Cap), 04/25/2029, Series 2004-A, Class A1(3) | | | 10 | | | | 9 | |
Merrill Lynch Mortgage Investors Trust Series MLCC 2004-C | | | | | | | | |
6.28% (6 Month LIBOR USD + 0.60%, 0.60% Floor, 11.75% Cap), 07/25/2029, Series 2004-C, Class A2(3) | | | 19 | | | | 18 | |
Merrill Lynch Mortgage Investors Trust Series MLMI 2004-A4 | | | | | | | | |
4.18%, 08/25/2034, Series 2004-A4, Class A2(4) | | | 31 | | | | 29 | |
Merrill Lynch Mortgage Investors Trust Series MLMI 2005-A2 | | | | | | | | |
4.16%, 02/25/2035, Series 2005-A2, Class A1(4) | | | 53 | | | | 50 | |
MFA 2021-RPL1 Trust | | | | | | | | |
1.13%, 07/25/2060, Series 2021-RPL1, Class A1(1)(4) | | | 9,166 | | | | 8,040 | |
MHC Commercial Mortgage Trust 2021-MHC | | | | | | | | |
6.61% (1 Month Term SOFR + 1.47%, 1.35% Floor), 04/15/2038, Series 2021-MHC, Class C(1)(3) | | | 11,300 | | | | 11,017 | |
Mill City Mortgage Loan Trust 2021-NMR1 | | | | | | | | |
| | | | | | | | |
1.13%, 11/25/2060, Series 2021-NMR1, Class A1(1)(4) | | | 1,703 | | | | 1,569 | |
Mill City Securities 2021-RS1 Ltd. | | | | | | | | |
2.91%, 04/28/2066, Series 2021-RS1, Class A1(1)(4) | | | 7,623 | | | | 6,751 | |
Morgan Stanley Bank of America Merrill Lynch Trust 2015-C20 | | | | | | | | |
3.25%, 02/15/2048, Series 2015-C20, Class A4 | | | 3,652 | | | | 3,474 | |
Morgan Stanley Bank of America Merrill Lynch Trust 2015-C23 | | | | | | | | |
3.45%, 07/15/2050, Series 2015-C23, Class A3 | | | 17,305 | | | | 16,444 | |
Morgan Stanley Bank of America Merrill Lynch Trust 2015-C24 | | | | | | | | |
3.48%, 05/15/2048, Series 2015-C24, Class A3 | | | 4,106 | | | | 3,897 | |
3.73%, 05/15/2048, Series 2015-C24, Class A4 | | | 6,507 | | | | 6,176 | |
Morgan Stanley Bank of America Merrill Lynch Trust 2016-C30 | | | | | | | | |
2.86%, 09/15/2049, Series 2016-C30, Class A5 | | | 7,086 | | | | 6,419 | |
Morgan Stanley Bank of America Merrill Lynch Trust 2016-C32 | | | | | | | | |
3.72%, 12/15/2049, Series 2016-C32, Class A4 | | | 8,436 | | | | 7,881 | |
Morgan Stanley Capital I Trust 2015-UBS8 | | | | | | | | |
3.81%, 12/15/2048, Series 2015-UBS8, Class A4 | | | 6,675 | | | | 6,267 | |
Morgan Stanley Capital I Trust 2016-UB11 | | | | | | | | |
2.53%, 08/15/2049, Series 2016-UB11, Class A3 | | | 19,530 | | | | 17,680 | |
Morgan Stanley Mortgage Loan Trust 2004-3 | | | | | | | | |
5.65%, 04/25/2034, Series 2004-3, Class 4A(4) | | | 79 | | | | 76 | |
MRCD 2019-MARK Mortgage Trust | | | | | | | | |
2.72%, 12/15/2036, Series 2019-PARK, Class D(1) | | | 6,108 | | | | 5,374 | |
2.72%, 12/15/2036, Series 2019-PARK, Class A(1) | | | 9,990 | | | | 9,143 | |
MRFC Mortgage Pass-Through Trust Series 1999-TBC2 | | | | | | | | |
5.67% (1 Month LIBOR USD + 0.48%, 0.24% Floor, 10.00% Cap), 06/15/2030, Series 2000-TBC2, Class A1(3) | | | 60 | | | | 58 | |
MRFC Mortgage Pass-Through Trust Series 2000-TBC3 | | | | | | | | |
5.63% (1 Month LIBOR USD + 0.44%, 0.22% Floor, 10.00% Cap), 12/15/2030, Series 2000-TBC3, Class A1(3) | | | 15 | | | | 14 | |
NACC Reperforming Loan REMIC Trust 2004-R2 | | | | | | | | |
6.50%, 10/25/2034, Series 2004-R2, Class A1(1)(4) | | | 31 | | | | 27 | |
New Residential Mortgage Loan Trust 2017-2 | | | | | | | | |
4.00%, 03/25/2057, Series 2017-2A, Class A3(1)(4) | | | 1,378 | | | | 1,283 | |
New Residential Mortgage Loan Trust 2017-3 | | | | | | | | |
4.00%, 04/25/2057, Series 2017-3A, Class A1(1)(4) | | | 2,308 | | | | 2,170 | |
New Residential Mortgage Loan Trust 2017-4 | | | | | | | | |
4.00%, 05/25/2057, Series 2017-4A, Class A1(1)(4) | | | 1,343 | | | | 1,228 | |
Nomura Asset Acceptance Corp. Alternative Loan Trust Series 2003-A1 | | | | | | | | |
5.50%, 05/25/2033, Series 2003-A1, Class A1 | | | 2 | | | | 2 | |
6.00%, 05/25/2033, Series 2003-A1, Class A2 | | | 6 | | | | 6 | |
7.00%, 04/25/2033, Series 2003-A1, Class A5 | | | 8 | | | | 8 | |
Oaktown Re II Ltd. | | | | | | | | |
6.70% (1 Month LIBOR USD + 1.55%), 07/25/2028, Series 2018-1A, Class M1(1)(3) | | | 233 | | | | 233 | |
Oaktown Re VII Ltd. | | | | | | | | |
6.67% (30-day Average SOFR + 1.60%, 1.60% Floor), 04/25/2034, Series 2021-2, Class M1A(1)(3) | | | 14,728 | | | | 14,678 | |
OBX 2022-NQM2 Trust | | | | | | | | |
2.95%, 01/25/2062, Series 2022-NQM2, Class A1(1)(4) | | | 8,196 | | | | 7,276 | |
OBX 2022-NQM5 Trust | | | | | | | | |
4.31%, 05/25/2062, Series 2022-NQM5, Class A1(1)(2) | | | 9,455 | | | | 8,962 | |
PMT Credit Risk Transfer Trust 2021-1R | | | | | | | | |
8.08% (1 Month LIBOR USD + 2.90%, 2.90% Floor), 02/27/2024, Series 2021-1R, Class A(1)(3) | | | 9,339 | | | | 9,121 | |
PMT Credit Risk Transfer Trust 2023-1R | | | | | | | | |
9.47% (30-day Average SOFR + 4.40%), 03/27/2025, Series 2023-1R, Class A(1)(3) | | | 9,124 | | | | 9,130 | |
Prime Mortgage Trust 2004-CL1 | | | | | | | | |
6.00%, 02/25/2034, Series 2004-CL1, Class 1A1 | | | 24 | | | | 23 | |
PRPM 2021-1 LLC | | | | | | | | |
2.12%, 01/25/2026, Series 2021-1, Class A1(1)(4) | | | 5,953 | | | | 5,547 | |
PRPM 2021-10 LLC | | | | | | | | |
2.49%, 10/25/2026, Series 2021-10, Class A1(1)(2) | | | 1,866 | | | | 1,738 | |
PRPM 2021-2 LLC | | | | | | | | |
2.12%, 03/25/2026, Series 2021-2, Class A1(1)(4) | | | 5,569 | | | | 5,253 | |
PRPM 2021-3 LLC | | | | | | | | |
1.87%, 04/25/2026, Series 2021-3, Class A1(1)(2) | | | 1,623 | | | | 1,513 | |
PRPM 2021-5 LLC | | | | | | | | |
1.79%, 06/25/2026, Series 2021-5, Class A1(1)(2) | | | 2,320 | | | | 2,105 | |
PRPM 2021-9 LLC | | | | | | | | |
2.36%, 10/25/2026, Series 2021-9, Class A1(1)(2) | | | 1,523 | | | | 1,415 | |
PRPM 2021-RPL1 LLC | | | | | | | | |
1.32%, 07/25/2051, Series 2021-RPL1, Class A1(1)(2) | | | 2,929 | | | | 2,547 | |
RALI Series 2002-QS16 Trust | | | | | | | | |
5.85% (1 Month LIBOR USD + 16.62%, 16.62% Cap), 10/25/2049, Series 2002-QS16, Class A3(3)(10)(11) | | | 0 | | | | 0 | |
RALI Series 2003-QS9 Trust | | | | | | | | |
2.40% (1 Month LIBOR USD + 7.55%, 7.55% Cap), 05/25/2049, Series 2003-QS9, Class A3(3)(10)(11) | | | 1 | | | | 0 | |
RALI Series 2005-QA6 Trust | | | | | | | | |
5.68%, 05/25/2035, Series 2005-QA6, Class A32(4) | | | 74 | | | | 44 | |
RALI Series 2007-QS1 Trust | | | | | | | | |
6.00%, 01/25/2037, Series 2007-QS1, Class 1A1 | | | 8 | | | | 6 | |
RBS Commercial Funding, Inc. 2013-SMV Trust | | | | | | | | |
3.26%, 03/11/2031, Series 2013-SMV, Class A(1) | | | 512 | | | | 475 | |
RCO VI Mortgage LLC 2022-1 | | | | | | | | |
3.00%, 01/25/2027, Series 2022-1, Class A1(1)(2) | | | 6,612 | | | | 6,210 | |
Reperforming Loan REMIC Trust 2005-R1 | | | | | | | | |
0.00%, 03/25/2035, Series 2005-R1, Class 2APO(1) | | | 4 | | | | 2 | |
Residential Asset Securitization Trust 2004-A7 | | | | | | | | |
5.50%, 10/25/2034, Series 2004-A7, Class A6 | | | 1,220 | | | | 1,169 | |
| | | | | | | | |
Seasoned Credit Risk Transfer Trust 2017-4 | | | | | | | | |
3.50%, 06/25/2057, Series 2017-4, Class MT | | | 2,433 | | | | 2,178 | |
Seasoned Credit Risk Transfer Trust Series 2018-1 | | | | | | | | |
3.50%, 05/25/2057, Series 2018-1, Class M60C | | | 9,652 | | | | 8,997 | |
Seasoned Credit Risk Transfer Trust Series 2018-2 | | | | | | | | |
3.50%, 11/25/2057, Series 2018-2, Class MT | | | 5,681 | | | | 5,061 | |
Seasoned Credit Risk Transfer Trust Series 2018-4 | | | | | | | | |
3.50%, 03/25/2058, Series 2018-4, Class MZ | | | 9,417 | | | | 7,420 | |
Seasoned Credit Risk Transfer Trust Series 2019-1 | | | | | | | | |
3.50%, 07/25/2058, Series 2019-1, Class MT | | | 6,585 | | | | 5,862 | |
Seasoned Credit Risk Transfer Trust Series 2019-3 | | | | | | | | |
3.50%, 10/25/2058, Series 2019-3, Class MB | | | 3,880 | �� | | | 3,229 | |
Seasoned Credit Risk Transfer Trust Series 2019-4 | | | | | | | | |
4.00%, 02/25/2059, Series 2019-4, Class M55D | | | 4,382 | | | | 4,110 | |
Seasoned Credit Risk Transfer Trust Series 2020-1 | | | | | | | | |
3.00%, 08/25/2059, Series 2020-1, Class M55G | | | 5,369 | | | | 4,853 | |
Seasoned Credit Risk Transfer Trust Series 2020-3 | | | | | | | | |
2.00%, 05/25/2060, Series 2020-3, Class MT | | | 4,904 | | | | 4,005 | |
3.00%, 05/25/2060, Series 2020-3, Class M5TW | | | 5,748 | | | | 5,083 | |
Seasoned Credit Risk Transfer Trust Series 2022-1 | | | | | | | | |
3.25%, 11/25/2061, Series 2022-1, Class MTU | | | 8,957 | | | | 7,805 | |
Sequoia Mortgage Trust 2004-10 | | | | | | | | |
5.47% (1 Month LIBOR USD + 0.62%, 0.62% Floor, 11.50% Cap), 11/20/2034, Series 2004-10, Class A1A(3) | | | 18 | | | | 17 | |
Sequoia Mortgage Trust 2004-11 | | | | | | | | |
5.76% (1 Month LIBOR USD + 0.60%, 0.60% Floor, 11.50% Cap), 12/20/2034, Series 2004-11, Class A1(3) | | | 46 | | | | 42 | |
Sequoia Mortgage Trust 2004-12 | | | | | | | | |
5.99% (6 Month LIBOR USD + 0.32%, 0.32% Floor, 11.50% Cap), 01/20/2035, Series 2004-12, Class A3(3) | | | 50 | | | | 46 | |
Sequoia Mortgage Trust 2004-8 | | | | | | | | |
5.86% (1 Month LIBOR USD + 0.70%, 0.70% Floor, 11.50% Cap), 09/20/2034, Series 2004-8, Class A1(3) | | | 373 | | | | 328 | |
5.92% (6 Month LIBOR USD + 0.74%, 0.74% Floor, 11.50% Cap), 09/20/2034, Series 2004-8, Class A2(3) | | | 58 | | | | 53 | |
Series RR 2014-1 Trust | | | | | | | | |
0.00%, 05/25/2047, Series 2014-1, Class A(1) | | | 1,603 | | | | 1,496 | |
SLG Office Trust 2021-OVA | | | | | | | | |
2.59%, 07/15/2041, Series 2021-OVA, Class A(1) | | | 9,955 | | | | 7,978 | |
Starwood Mortgage Residential Trust 2022-1 | | | | | | | | |
2.45%, 12/25/2066, Series 2022-1, Class A1(1)(4) | | | 14,901 | | | | 12,532 | |
Structured Asset Mortgage Investments II Trust 2004-AR5 | | | | | | | | |
5.81% (1 Month LIBOR USD + 0.66%, 0.66% Floor, 11.00% Cap), 10/19/2034, Series 2004-AR5, Class 1A1(3) | | | 47 | | | | 44 | |
Structured Asset Mortgage Investments II Trust 2005-AR5 | | | | | | | | |
5.65% (1 Month LIBOR USD + 0.50%, 0.50% Floor, 11.00% Cap), 07/19/2035, Series 2005-AR5, Class A3(3) | | | 204 | | | | 185 | |
Structured Asset Mortgage Investments Trust 2003-CL1 | | | | | | | | |
5.55% (1 Month LIBOR USD + 0.40%, 0.40% Floor, 8.00% Cap), 07/25/2032, Series 2003-CL1, Class 1F1(3) | | | 76 | | | | 74 | |
Structured Asset Securities Corp. | | | | | | | | |
4.93%, 02/25/2034, Series 2004-4XS, Class 1A5(2) | | | 104 | | | | 97 | |
5.50% (1 Month LIBOR USD + 0.35%, 0.35% Floor), 06/25/2035, Series 2005-RF3, Class 1A(1)(3) | | | 43 | | | | 39 | |
Structured Asset Securities Corp. Mortgage Pass-Through Certificates Series 2003-34A | | | | | | | | |
4.83%, 11/25/2033, Series 2003-34A, Class 3A3(4) | | | 8 | | | | 7 | |
Structured Asset Securities Corp. Mortgage Pass-Through Certificates Series 2003-37A | | | | | | | | |
4.40%, 12/25/2033, Series 2003-37A, Class 8A2(4) | | | 670 | | | | 644 | |
4.59%, 12/25/2033, Series 2003-37A, Class 2A(4) | | | 67 | | | | 63 | |
Thornburg Mortgage Securities Trust 2003-4 | | | | | | | | |
5.79% (1 Month LIBOR USD + 0.64%, 0.64% Floor, 11.50% Cap), 09/25/2043, Series 2003-4, Class A1(3) | | | 230 | | | | 216 | |
Thornburg Mortgage Securities Trust 2003-5 | | | | | | | | |
3.63%, 10/25/2043, Series 2003-5, Class 3A(4) | | | 992 | | | | 951 | |
Thornburg Mortgage Securities Trust 2004-4 | | | | | | | | |
3.75%, 12/25/2044, Series 2004-4, Class 3A(4) | | | 113 | | | | 105 | |
Thornburg Mortgage Securities Trust 2005-1 | | | | | | | | |
3.84%, 04/25/2045, Series 2005-1, Class A3(4) | | | 276 | | | | 261 | |
Towd Point Mortgage Trust 2017-2 | | | | | | | | |
2.75%, 04/25/2057, Series 2017-2, Class A1(1)(4) | | | 358 | | | | 354 | |
Towd Point Mortgage Trust 2017-6 | | | | | | | | |
2.75%, 10/25/2057, Series 2017-6, Class A1(1)(4) | | | 2,182 | | | | 2,062 | |
Towd Point Mortgage Trust 2018-1 | | | | | | | | |
3.00%, 01/25/2058, Series 2018-1, Class A1(1)(4) | | | 1,868 | | | | 1,788 | |
Towd Point Mortgage Trust 2019-1 | | | | | | | | |
3.75%, 03/25/2058, Series 2019-1, Class A1(1)(4) | | | 3,590 | | | | 3,359 | |
Towd Point Mortgage Trust 2019-HY3 | | | | | | | | |
6.15% (1 Month LIBOR USD + 1.00%, 1.00% Floor), 10/25/2059, Series 2019-HY3, Class A1A(1)(3) | | | 814 | | | | 805 | |
Towd Point Mortgage Trust 2020-2 | | | | | | | | |
1.64%, 04/25/2060, Series 2020-2, Class A1A(1)(4) | | | 18,981 | | | | 16,395 | |
Towd Point Mortgage Trust 2020-4 | | | | | | | | |
1.75%, 10/25/2060, Series 2020-4, Class A1(1) | | | 2,352 | | | | 2,044 | |
Towd Point Mortgage Trust 2021-R1 | | | | | | | | |
2.92%, 11/30/2060, Series 2021-R1, Class A1(1)(4) | | | 13,633 | | | | 11,138 | |
Towd Point Mortgage Trust 2021-SJ1 | | | | | | | | |
2.25%, 07/25/2068, Series 2021-SJ1, Class A1(1)(4) | | | 7,773 | | | | 7,189 | |
Towd Point Mortgage Trust 2021-SJ2 | | | | | | | | |
2.25%, 12/25/2061, Series 2021-SJ2, Class A1A(1)(4) | | | 11,290 | | | | 10,259 | |
Towd Point Mortgage Trust 2022-2 | | | | | | | | |
3.75%, 07/01/2062, Series 2022-2, Class A1(1)(4) | | | 16,408 | | | | 15,021 | |
Towd Point Mortgage Trust 2022-3 | | | | | | | | |
3.75%, 08/01/2062, Series 2022-3, Class A1(1)(4) | | | 16,029 | | | | 14,590 | |
Towd Point Mortgage Trust 2023-1 | | | | | | | | |
| | | | | | | | |
3.75%, 01/25/2063, Series 2023-1, Class A1(1) | | | 8,015 | | | | 7,310 | |
UBS Commercial Mortgage Trust 2017-C5 | | | | | | | | |
3.21%, 11/15/2050, Series 2017-C5, Class A4 | | | 21,500 | | | | 19,665 | |
UBS Commercial Mortgage Trust 2018-C9 | | | | | | | | |
3.85%, 03/15/2051, Series 2018-C9, Class A3 | | | 9,355 | | | | 8,590 | |
UBS-BAMLL Trust 2012-WRM | | | | | | | | |
3.66%, 06/10/2030, Series 2012-WRM, Class A(1) | | | 57 | | | | 53 | |
UBS-Barclays Commercial Mortgage Trust 2012-C2 | | | | | | | | |
0.66%, 05/10/2063, Series 2012-C2, Class XA(1)(4)(11) | | | 765 | | | | 0 | |
Vendee Mortgage Trust 1994-1 | | | | | | | | |
4.71%, 02/15/2024, Series 1994-1, Class 1(4) | | | 2 | | | | 2 | |
6.50%, 02/15/2024, Series 1994-1, Class 2ZB | | | 12 | | | | 12 | |
Vendee Mortgage Trust 1996-1 | | | | | | | | |
6.75%, 02/15/2026, Series 1996-1, Class 1Z | | | 28 | | | | 28 | |
Vendee Mortgage Trust 1996-2 | | | | | | | | |
6.75%, 06/15/2026, Series 1996-2, Class 1Z | | | 12 | | | | 12 | |
Vendee Mortgage Trust 1997-1 | | | | | | | | |
7.50%, 02/15/2027, Series 1997-1, Class 2Z | | | 40 | | | | 41 | |
Vendee Mortgage Trust 1998-1 | | | | | | | | |
7.00%, 03/15/2028, Series 1998-1, Class 2E | | | 32 | | | | 32 | |
VM Master Issuer LLC | | | | | | | | |
5.16%, 05/24/2025, Series 2022-1, Class A1(1)(4) | | | 10,800 | | | | 10,058 | |
Wachovia Bank Commercial Mortgage Trust Series 2006-C24 | | | | | | | | |
0.00%, 03/15/2045, Series 2006-C24, Class XC(1)(4)(11) | | | 285 | | | | 0 | |
WaMu Mortgage Pass-Through Certificates Series 2003-AR11 Trust | | | | | | | | |
4.22%, 10/25/2033, Series 2003-AR11, Class A6(4) | | | 89 | | | | 83 | |
WaMu Mortgage Pass-Through Certificates Series 2003-AR7 Trust | | | | | | | | |
3.95%, 08/25/2033, Series 2003-AR7, Class A7(4) | | | 31 | | | | 29 | |
WaMu Mortgage Pass-Through Certificates Series 2003-AR9 Trust | | | | | | | | |
4.15%, 09/25/2033, Series 2003-AR9, Class 1A6(4) | | | 161 | | | | 149 | |
4.16%, 09/25/2033, Series 2003-AR9, Class 2A(4) | | | 16 | | | | 14 | |
WaMu Mortgage Pass-Through Certificates Series 2003-S1 Trust | | | | | | | | |
5.50%, 04/25/2033, Series 2003-S1, Class A5 | | | 35 | | | | 34 | |
WaMu Mortgage Pass-Through Certificates Series 2003-S4 | | | | | | | | |
3.30% (1 Month LIBOR USD + 17.46%, 17.46% Cap), 06/25/2033, Series 2003-S4, Class 2A10(3)(10) | | | 9 | | | | 8 | |
WaMu Mortgage Pass-Through Certificates Series 2003-S9 Trust | | | | | | | | |
0.00%, 10/25/2033, Series 2003-S9, Class P | | | 1 | | | | 1 | |
5.25%, 10/25/2033, Series 2003-S9, Class A8 | | | 109 | | | | 103 | |
WaMu Mortgage Pass-Through Certificates Series 2004-AR14 Trust | | | | | | | | |
4.20%, 01/25/2035, Series 2004-AR14, Class A1(4) | | | 948 | | | | 864 | |
WaMu Mortgage Pass-Through Certificates Series 2004-AR3 Trust | | | | | | | | |
4.52%, 06/25/2034, Series 2004-AR3, Class A2(4) | | | 46 | | | | 42 | |
4.52%, 06/25/2034, Series 2004-AR3, Class A1(4) | | | 816 | | | | 743 | |
WaMu Mortgage Pass-Through Certificates Series 2004-CB2 Trust | | | | | | | | |
6.00%, 08/25/2034, Series 2004-CB2, Class 3A | | | 296 | | | | 290 | |
WaMu Mortgage Pass-Through Certificates Series 2004-CB3 Trust | | | | | | | | |
6.50%, 10/25/2034, Series 2004-CB3, Class 2A | | | 862 | | | | 848 | |
WaMu Mortgage Pass-Through Certificates Series 2004-RS2 | | | | | | | | |
5.00%, 11/25/2033, Series 2004-RS2, Class A4 | | | 18 | | | | 16 | |
WaMu Mortgage Pass-Through Certificates Series 2004-S2 Trust | | | | | | | | |
5.50%, 06/25/2034, Series 2004-S2, Class 2A4 | | | 78 | | | | 75 | |
WaMu Mortgage Pass-Through Certificates Series 2004-S3 Trust | | | | | | | | |
5.00%, 07/25/2034, Series 2004-S3, Class 1A5 | | | 6 | | | | 6 | |
WaMu Mortgage Pass-Through Certificates Series 2006-AR10 Trust | | | | | | | | |
3.63%, 09/25/2036, Series 2006-AR10, Class 2P(4) | | | 4 | | | | 3 | |
WaMu Mortgage Pass-Through Certificates Series 2006-AR8 Trust | | | | | | | | |
3.69%, 08/25/2046, Series 2006-AR8, Class 1A2(4) | | | 29 | | | | 26 | |
Washington Mutual Mortgage Pass-Through Certificates WMALT Series 2005-1 Trust | | | | | | | | |
0.00%, 03/25/2035, Series 2005-1, Class CP | | | 4 | | | | 3 | |
5.50%, 03/25/2035, Series 2005-1, Class 1A1 | | | 42 | | | | 38 | |
Washington Mutual Mortgage Pass-Through Certificates WMALT Series 2005-2 Trust | | | | | | | | |
0.00% (1 Month LIBOR USD + 5.00%, 5.00% Cap), 04/25/2035, Series 2005-2, Class 2A3(3)(10) | | | 70 | | | | 2 | |
0.00% (1 Month LIBOR USD + 5.05%, 5.05% Cap), 04/25/2035, Series 2005-2, Class 1A4(3)(10) | | | 336 | | | | 10 | |
Washington Mutual Mortgage Pass-Through Certificates WMALT Series 2005-4 Trust | | | | | | | | |
5.50%, 06/25/2035, Series 2005-4, Class CX | | | 117 | | | | 18 | |
5.50%, 06/25/2035, Series 2005-4, Class CB7 | | | 117 | | | | 103 | |
Washington Mutual Mortgage Pass-Through Certificates WMALT Series 2005-6 Trust | | | | | | | | |
5.50%, 08/25/2035, Series 2005-6, Class 2A4 | | | 18 | | | | 15 | |
Washington Mutual Mortgage Pass-Through Certificates WMALT Series 2006-1 Trust | | | | | | | | |
5.75%, 02/25/2036, Series 2006-1, Class 3A2 | | | 9 | | | | 8 | |
Washington Mutual MSC Mortgage Pass-Through Certificates Series 2003-MS7 Trust | | | | | | | | |
0.00%, 03/25/2033, Series 2003-MS7, Class P(11) | | | 0 | | | | 0 | |
Wells Fargo Alternative Loan 2003-1 Trust | | | | | | | | |
0.00%, 09/25/2033, Series 2003-1, Class APO | | | 1 | | | | 1 | |
Wells Fargo Alternative Loan 2007-PA3 Trust | | | | | | | | |
5.75%, 07/25/2037, Series 2007-PA3, Class 1A2 | | | 11 | | | | 10 | |
Wells Fargo Commercial Mortgage Trust 2015-C26 | | | | | | | | |
2.99%, 02/15/2048, Series 2015-C26, Class ASB | | | 2,840 | | | | 2,766 | |
Wells Fargo Commercial Mortgage Trust 2015-C29 | | | | | | | | |
3.37%, 06/15/2048, Series 2015-C29, Class A3 | | | 6,649 | | | | 6,328 | |
Wells Fargo Commercial Mortgage Trust 2015-C30 | | | | | | | | |
3.66%, 09/15/2058, Series 2015-C30, Class A4 | | | 729 | | | | 691 | |
Wells Fargo Commercial Mortgage Trust 2015-C31 | | | | | | | | |
| | | | | | | | |
3.70%, 11/15/2048, Series 2015-C31, Class A4 | | | 3,280 | | | | 3,098 | |
Wells Fargo Commercial Mortgage Trust 2015-NXS2 | | | | | | | | |
3.50%, 07/15/2058, Series 2015-NXS2, Class A4 | | | 15,000 | | | | 14,259 | |
Wells Fargo Commercial Mortgage Trust 2015-P2 | | | | | | | | |
3.81%, 12/15/2048, Series 2015-P2, Class A4 | | | 7,273 | | | | 6,875 | |
Wells Fargo Commercial Mortgage Trust 2016-C34 | | | | | | | | |
3.10%, 06/15/2049, Series 2016-C34, Class A4 | | | 3,698 | | | | 3,395 | |
Wells Fargo Commercial Mortgage Trust 2016-NXS6 | | | | | | | | |
2.64%, 11/15/2049, Series 2016-NXS6, Class A3 | | | 20,000 | | | | 18,422 | |
Wells Fargo Commercial Mortgage Trust 2017-C38 | | | | | | | | |
3.19%, 07/15/2050, Series 2017-C38, Class A4 | | | 12,977 | | | | 11,846 | |
Wells Fargo Commercial Mortgage Trust 2017-RC1 | | | | | | | | |
3.63%, 01/15/2060, Series 2017-RC1, Class A4 | | | 10,000 | | | | 9,269 | |
Wells Fargo Commercial Mortgage Trust 2018-C47 | | | | | | | | |
4.44%, 09/15/2061, Series 2018-C47, Class A4 | | | 8,850 | | | | 8,377 | |
Wells Fargo Commercial Mortgage Trust 2020-C57 | | | | | | | | |
1.86%, 08/15/2053, Series 2020-C57, Class A3 | | | 19,500 | | | | 15,588 | |
Wells Fargo Commercial Mortgage Trust 2020-C58 | | | | | | | | |
1.81%, 07/15/2053, Series 2020-C58, Class A3 | | | 23,000 | | | | 18,444 | |
Wells Fargo Commercial Mortgage Trust 2021-SAVE | | | | | | | | |
6.34% (1 Month LIBOR USD + 1.15%, 1.15% Floor), 02/15/2040, Series 2021-SAVE, Class A(1)(3) | | | 4,981 | | | | 4,683 | |
Wells Fargo Commercial Mortgage Trust 2022-C62 | | | | | | | | |
4.00%, 04/15/2055, Series 2022-C62, Class A4(4) | | | 3,819 | | | | 3,435 | |
Wells Fargo Mortgage Backed Securities 2007-7 Trust | | | | | | | | |
6.00%, 06/25/2037, Series 2007-7, Class A7 | | | 6 | | | | 5 | |
WFRBS Commercial Mortgage Trust 2013-C11 | | | | | | | | |
4.20%, 03/15/2045, Series 2013-C11, Class D(1)(4) | | | 300 | | | | 209 | |
WFRBS Commercial Mortgage Trust 2014-C21 | | | | | | | | |
3.68%, 08/15/2047, Series 2014-C21, Class A5 | | | 7,000 | | | | 6,774 | |
WFRBS Commercial Mortgage Trust 2014-C25 | | | | | | | | |
3.63%, 11/15/2047, Series 2014-C25, Class A5 | | | 3,846 | | | | 3,685 | |
WFRBS Commercial Mortgage Trust 2014-LC14 | | | | | | | | |
3.77%, 03/15/2047, Series 2014-LC14, Class A4 | | | 6,452 | | | | 6,399 | |
| | | | | | | | |
Total Mortgage-Backed Obligations (Cost: $6,551,673) | | | | | | | 6,022,596 | |
| | | | | | | | |
Total Bonds & Notes (Cost: $17,838,903) | | | | | | | 16,245,929 | |
| | | | | | | | |
| | |
| | | Shares
(000s) | | | Value
(000s) | |
| | | | | | | |
PREFERRED STOCKS – 0.01% | | | | |
Financials – 0.01% | | | | |
State Street Corp., 5.35% | | | 95 | | | | 2,181 | |
| | | | | | | | |
Total Financials | | | | 2,181 | |
| | | | | | | | |
Total Preferred Stocks (Cost: $2,375) | | | | 2,181 | |
| | | | | | | | |
SHORT-TERM INVESTMENTS – 3.28% | | | | | | | | |
Money Market Funds – 3.26% | | | | | | | | |
Fidelity Institutional Money Market Government Fund - Class I, 5.03%(13) | | | 536,258 | | | | 536,258 | |
| | | | | | | | |
Total Money Market Funds (Cost: $536,258) | | | | | | | 536,258 | |
| | | | | | | | |
| | | Principal
Amount
(000s) | | | Value
(000s) | |
| | | | | | | |
Time Deposits – 0.02% | | | | | | | | |
Citibank, New York, 4.57% due 07/03/2023 | | $ | 3,082 | | | | 3,082 | |
Sumitomo Trust Bank, London, 4.57% due 07/03/2023 | | | 6 | | | | 6 | |
| | | | | | | | |
Total Time Deposits (Cost: $3,088) | | | | | | | 3,088 | |
| | | | | | | | |
Total Short-Term Investments (Cost: $539,346) | | | | 539,346 | |
| | | | | | | | |
TOTAL INVESTMENTS IN SECURITIES – 102.17%
(Cost: $18,380,624) | | | | | | | 16,787,456 | |
| | | | | | | | |
LIABILITIES IN EXCESS OF OTHER ASSETS – (2.17)% | | | | | | | (356,216 | ) |
| | | | | | | | |
TOTAL NET ASSETS – 100.00% | | | | | | $ | 16,431,240 | |
| | | | | | | | |
Percentages are stated as a percent of net assets.
REIT Real Estate Investment Trust
| (1) | Security was purchased exempt from registration in the U.S. pursuant to Rule 144(A) under the Securities Act of 1933. The value of these securities totals $3,355,878, which represents 20.42% of total net assets. |
| (2) | Step-up bond that pays an initial coupon rate for the first period and then a higher coupon rate for the following periods. The rate reported is the rate in effect as of June 30, 2023. |
| (3) | Variable rate security based on a reference index and spread. The rate reported is the rate in effect as of June 30, 2023. |
| (4) | Variable rate security. The coupon is based on an underlying pool of assets. The rate reported is the rate in effect as of June 30, 2023. |
| (5) | Security that is categorized as Level 3 per the Trust’s fair value hierarchy. The value of these securities totals $30,876, which represents 0.19% of total net assets. |
| (6) | Security in default as of June 30, 2023. The value of these securities totals $359, which represents 0.00% of total net assets. |
| (7) | Non-income producing security. |
| (8) | Inflation protected security. The value of these securities totals $3,560, which represents 0.02% of total net assets. |
| (9) | Assigned as collateral for certain futures contracts. The value of these pledged issues totals $45,262, which represents 0.28% of total net assets. |
| (10) | Inverse floating rate security whose interest rate moves in the opposite direction of reference interest rates. Reference interest rates are typically based on a negative multiplier or slope. |
| (11) | A zero balance may reflect actual amounts rounding to less than one thousand. |
| (12) | Delayed delivery purchase commitment security. The value of these securities totals $252,162, which represents 1.53% of total net assets. |
| (13) | Represents annualized seven-day yield as of the close of the reporting period. |
| (14) | Security that is restricted at June 30, 2023. The value of these securities totals $5,961, which represents 0.04% of total net assets. |
The accompanying notes are an integral part of this Schedule of Investments.
Open Futures Contracts
| | | | | | | | | | | | | | | | | | |
Number of Contracts
Purchased | | Reference Entity | | Expiration
Date | | | Notional
Amount | | | Value | | | Unrealized
Appreciation/
(Depreciation) | |
| 3,906 | | U.S. 5 Year Note Future | | | Sep. 2023 | | | $ | 425,981 | | | $ | 418,307 | | | $ | (7,674 | ) |
| 1,558 | | U.S. 10 Year Note Future | | | Sep. 2023 | | | | 177,680 | | | | 174,910 | | | | (2,770 | ) |
| 159 | | U.S. Ultra 10 Year Note Future | | | Sep. 2023 | | | | 19,033 | | | | 18,832 | | | | (201 | ) |
| 1,730 | | U.S. Ultra Bond Future | | | Sep. 2023 | | | | 234,242 | | | | 235,658 | | | | 1,416 | |
| | | | | | | | | | | | | | | | | | |
| | | | | | | | | | | | | | | | | (9,229 | ) |
| | | | | | | | | | | | | | | | | | |
| | | | | |
Number of Contracts
Sold | | Reference Entity | | Expiration
Date | | | Notional
Amount | | | Value | | | Unrealized
Appreciation/
(Depreciation) | |
| (391) | | U.S. 2 Year Note Future | | | Sep. 2023 | | | $ | (80,330 | ) | | $ | (79,507 | ) | | $ | 823 | |
| (381) | | U.S. Long Bond Future | | | Sep. 2023 | | | | (48,409 | ) | | | (48,351 | ) | | | 58 | |
| | | | | | | | | | | | | | | | | | |
| | | | | | | | | | | | | | | | | 881 | |
| | | | | | | | | | | | | | | | | | |
| | | | | | | | | | | | | | | | $ | (8,348 | ) |
| | | | | | | | | | | | | | | | | | |
Bridge Builder Core Plus Bond Fund
Schedule of Investments
June 30, 2023
(Amounts in thousands, except number of contracts)
| | | | | | | | |
| | | Principal
Amount
(000s) | | | Value
(000s) | |
| | | | | | | |
BONDS & NOTES – 96.67% | | | | |
Asset-Backed Obligations – 11.81% | | | | |
522 Funding CLO 2018-3A Ltd. | | | | | | | | |
6.29% (3 Month LIBOR USD + 1.04%, 1.04% Floor), 10/20/2031, Series 2018-3A, Class AR(1)(2) | | $ | 2,870 | | | $ | 2,829 | |
522 Funding CLO 2019-5 Ltd. | | | | | | | | |
6.32% (3 Month Term SOFR + 1.33%, 1.33% Floor), 04/15/2035, Series 2019-5A, Class AR(1)(2) | | | 4,710 | | | | 4,607 | |
Aaset 2021-2 Trust | | | | | | | | |
2.80%, 01/15/2047, Series 2021-2A, Class A(1) | | | 7,242 | | | | 6,145 | |
AASET 2022-1 LLC | | | | | | | | |
6.00%, 05/16/2047, Series 2022-1A, Class A(1) | | | 1,869 | | | | 1,802 | |
ABFC 2005-WMC1 Trust | | | | | | | | |
5.89% (1 Month LIBOR USD + 0.74%, 0.74% Floor), 06/25/2035, Series 2005-WMC1, Class M3(2) | | | 4,010 | | | | 3,845 | |
ABFC 2007-NC1 Trust | | | | | | | | |
5.45% (1 Month LIBOR USD + 0.30%, 0.30% Floor), 05/25/2037, Series 2007-NC1, Class A2(1)(2) | | | 8,463 | | | | 7,780 | |
Accredited Mortgage Loan Trust 2006-2 | | | | | | | | |
5.41% (1 Month LIBOR USD + 0.26%, 0.26% Floor), 09/25/2036, Series 2006-2, Class A4(2) | | | 149 | | | | 146 | |
ACE Securities Corp. Home Equity Loan Trust Series 2004-HE3 | | | | | | | | |
6.08% (1 Month LIBOR USD + 0.93%, 0.93% Floor), 11/25/2034, Series 2004-HE3, Class M1(2) | | | 3,760 | | | | 3,611 | |
ACE Securities Corp. Home Equity Loan Trust Series 2005-HE3 | | | | | | | | |
5.86% (1 Month LIBOR USD + 0.71%, 0.71% Floor), 05/25/2035, Series 2005-HE3, Class M3(2) | | | 2,505 | | | | 2,439 | |
ACREC 2023-FL2 LLC | | | | | | | | |
7.32% (1 Month Term SOFR + 2.23%, 2.23% Floor), 02/19/2038, Series 2023-FL2, Class A(1)(2) | | | 1,740 | | | | 1,727 | |
ACRES Commercial Realty 2021-FL2 Ltd. | | | | | | | | |
6.56% (1 Month Term SOFR + 1.51%, 1.51% Floor), 01/15/2037, Series 2021-FL2, Class A(1)(2) | | | 5,330 | | | | 5,229 | |
Adams Outdoor Advertising LP | | | | | | | | |
5.65%, 11/15/2048, Series 2018-1, Class B(1) | | | 1,475 | | | | 1,381 | |
Aegis Asset Backed Securities Corp. Mortgage Pass-Through Certificates Series 2003-2 | | | | | | | | |
6.28% (1 Month LIBOR USD + 1.13%, 1.13% Floor), 11/25/2033, Series 2003-2, Class M1(2) | | | 598 | | | | 555 | |
Affirm Asset Securitization Trust 2021-B | | | | | | | | |
1.40%, 08/17/2026, Series 2021-B, Class C(1) | | | 835 | | | | 782 | |
AGL Core CLO 15 Ltd. | | | | | | | | |
6.40% (3 Month LIBOR USD + 1.15%, 1.15% Floor), 01/20/2035, Series 2021-15A, Class A1(1)(2) | | | 3,850 | | | | 3,769 | |
AIG CLO 2019-2 Ltd. | | | | | | | | |
6.86% (3 Month LIBOR USD + 1.60%, 1.60% Floor), 10/25/2033, Series 2019-2A, Class BR(1)(2) | | | 4,500 | | | | 4,415 | |
AIG CLO 2021-2 LLC | | | | | | | | |
6.42% (3 Month LIBOR USD + 1.17%, 1.17% Floor), 07/20/2034, Series 2021-2A, Class A(1)(2) | | | 2,670 | | | | 2,616 | |
Aimco CLO 12 Ltd. | | | | | | | | |
6.16% (3 Month Term SOFR + 1.17%, 1.17% Floor), 01/17/2032, Series 2020-12A, Class AR(1)(2) | | | 2,189 | | | | 2,164 | |
Aligned Data Centers Issuer LLC | | | | | | | | |
1.94%, 08/15/2046, Series 2021-1A, Class A2(1) | | | 17,968 | | | | 15,711 | |
Allegro CLO IX Ltd. | | | | | | | | |
6.43% (3 Month LIBOR USD + 1.17%, 1.17% Floor), 10/16/2031, Series 2018-3A, Class A(1)(2) | | | 11,400 | | | | 11,284 | |
American Credit Acceptance Receivables Trust 2019-3 | | | | | | | | |
2.89%, 09/12/2025, Series 2019-3, Class D(1) | | | 316 | | | | 316 | |
American Credit Acceptance Receivables Trust 2020-3 | | | | | | | | |
2.40%, 06/15/2026, Series 2020-3, Class D(1) | | | 105 | | | | 103 | |
American Credit Acceptance Receivables Trust 2020-4 | | | | | | | | |
1.77%, 12/14/2026, Series 2020-4, Class D(1) | | | 2,785 | | | | 2,694 | |
American Credit Acceptance Receivables Trust 2021-4 | | | | | | | | |
1.82%, 02/14/2028, Series 2021-4, Class D(1) | | | 3,655 | | | | 3,567 | |
American Credit Acceptance Receivables Trust 2022-1 | | | | | | | | |
2.46%, 03/13/2028, Series 2022-1, Class D(1) | | | 3,475 | | | | 3,254 | |
American Credit Acceptance Receivables Trust 2022-4 | | | | | | | | |
7.86%, 02/15/2029, Series 2022-4, Class C(1) | | | 1,650 | | | | 1,678 | |
American Credit Acceptance Receivables Trust 2023-2 | | | | | | | | |
5.96%, 08/13/2029, Series 2023-2, Class C(1) | | | 9,950 | | | | 9,829 | |
American Homes 4 Rent 2014-SFR2 Trust | | | | | | | | |
6.23%, 10/17/2036, Series 2014-SFR2, Class E(1) | | | 515 | | | | 508 | |
American Homes 4 Rent 2015-SFR1 Trust | | | | | | | | |
5.64%, 04/17/2052, Series 2015-SFR1, Class E(1) | | | 6,400 | | | | 6,257 | |
5.89%, 04/17/2052, Series 2015-SFR1, Class F(1) | | | 2,378 | | | | 2,319 | |
AmeriCredit Automobile Receivables Trust 2019-3 | | | | | | | | |
2.58%, 09/18/2025, Series 2019-3, Class D | | | 1,330 | | | | 1,296 | |
AmeriCredit Automobile Receivables Trust 2020-1 | | | | | | | | |
1.80%, 12/18/2025, Series 2020-1, Class D | | | 3,030 | | | | 2,900 | |
AmeriCredit Automobile Receivables Trust 2020-2 | | | | | | | | |
2.13%, 03/18/2026, Series 2020-2, Class D | | | 5,720 | | | | 5,417 | |
AmeriCredit Automobile Receivables Trust 2020-3 | | | | | | | | |
1.49%, 09/18/2026, Series 2020-3, Class D | | | 7,135 | | | | 6,600 | |
AmeriCredit Automobile Receivables Trust 2021-1 | | | | | | | | |
0.89%, 10/19/2026, Series 2021-1, Class C | | | 4,735 | | | | 4,396 | |
1.21%, 12/18/2026, Series 2021-1, Class D | | | 5,425 | | | | 4,949 | |
AMSR 2022-SFR3 Trust | | | | | | | | |
4.00%, 10/17/2039, Series 2022-SFR3, Class B(1) | | | 20,305 | | | | 18,643 | |
Anchorage Capital CLO 15 Ltd. | | | | | | | | |
6.45% (3 Month LIBOR USD + 1.20%, 1.20% Floor), 07/20/2034, Series 2020-15A, Class AR(1)(2) | | | 250 | | | | 244 | |
Anchorage Capital CLO 16 Ltd. | | | | | | | | |
6.47% (3 Month LIBOR USD + 1.20%, 1.20% Floor), 01/19/2035, Series 2020-16A, Class A1R(1)(2) | | | 2,870 | | | | 2,787 | |
Anchorage Capital CLO 3-R Ltd. | | | | | | | | |
6.32% (3 Month LIBOR USD + 1.05%), 01/28/2031, Series 2014-3RA, Class A(1)(2) | | | 473 | | | | 467 | |
Apidos CLO XX | | | | | | | | |
| | | | | | | | |
6.36% (3 Month LIBOR USD + 1.10%), 07/16/2031, Series 2015-20A, Class A1RA(1)(2) | | | 4,190 | | | | 4,152 | |
Apidos CLO XXIII | | | | | | | | |
6.48% (3 Month LIBOR USD + 1.22%, 1.22% Floor), 04/15/2033, Series 2015-23A, Class AR(1)(2) | | | 5,000 | | | | 4,937 | |
Apidos CLO XXIV | | | | | | | | |
6.20% (3 Month LIBOR USD + 0.95%, 0.95% Floor), 10/20/2030, Series 2016-24A, Class A1AL(1)(2) | | | 1,700 | | | | 1,680 | |
Applebee’s Funding LLC / IHOP Funding LLC | | | | | | | | |
7.82%, 03/05/2053, Series 2023-1A, Class A2(1) | | | 10,610 | | | | 10,439 | |
Apres Static CLO Ltd. | | | | | | | | |
7.66% (3 Month LIBOR USD + 2.40%), 10/15/2028, Series 2019-1A, Class BR(1)(2) | | | 10,045 | | | | 10,008 | |
Aqua Finance Trust 2021-A | | | | | | | | |
2.40%, 07/17/2046, Series 2021-A, Class B(1) | | | 1,550 | | | | 1,264 | |
Arbor Realty Commercial Real Estate Notes 2021-FL3 Ltd. | | | | | | | | |
7.74% (1 Month LIBOR USD + 2.55%, 2.66% Floor), 08/15/2034, Series 2021-FL3, Class E(1)(2) | | | 6,250 | | | | 5,731 | |
Arbor Realty Commercial Real Estate Notes 2021-FL4 Ltd. | | | | | | | | |
6.54% (1 Month LIBOR USD + 1.35%, 1.46% Floor), 11/15/2036, Series 2021-FL4, Class A(1)(2) | | | 11,190 | | | | 10,971 | |
Arbor Realty Commercial Real Estate Notes 2022-FL1 Ltd. | | | | | | | | |
6.52% (30-day Average SOFR + 1.45%, 1.45% Floor), 01/15/2037, Series 2022-FL1, Class A(1)(2) | | | 10,000 | | | | 9,819 | |
Arbor Realty Commercial Real Estate Notes 2022-FL2 Ltd. | | | | | | | | |
7.00% (1 Month Term SOFR + 1.85%, 1.85% Floor), 05/15/2037, Series 2022-FL2, Class A(1)(2) | | | 2,733 | | | | 2,667 | |
Ares European CLO | | | | | | | | |
4.32% (3 Month EURIBOR + 0.66%, 0.66% Floor), 10/15/2030, Series 7A, Class A1RR(1)(2) | | EUR | 26,332 | | | | 28,155 | |
Ares LIX CLO Ltd. | | | | | | | | |
6.29% (3 Month LIBOR USD + 1.03%, 1.03% Floor), 04/25/2034, Series 2021-59A, Class A(1)(2) | | $ | 6,590 | | | | 6,442 | |
6.66% (3 Month LIBOR USD + 1.40%, 1.40% Floor), 04/25/2034, Series 2021-59A, Class B1(1)(2) | | | 4,500 | | | | 4,347 | |
Ares LXII CLO Ltd. | | | | | | | | |
6.91% (3 Month LIBOR USD + 1.65%, 1.65% Floor), 01/25/2034, Series 2021-62A, Class B(1)(2) | | | 8,350 | | | | 8,075 | |
Asset Backed Securities Corp. Home Equity Loan Trust Series OOMC 2006-HE3 | | | | | | | | |
2.97% (1 Month LIBOR USD + 0.45%, 0.45% Floor), 03/25/2036, Series 2006-HE3, Class M1(2) | | | 12,279 | | | | 10,097 | |
Aurium CLO III DAC | | | | | | | | |
4.33% (3 Month EURIBOR + 0.67%, 0.67% Floor), 04/16/2030, Series 3A, Class AR(1)(2) | | EUR | 892 | | | | 954 | |
Avis Budget Rental Car Funding AESOP LLC | | | | | | | | |
2.02%, 02/20/2027, Series 2020-2A, Class A(1) | | $ | 9,740 | | | | 8,823 | |
2.35%, 02/20/2028, Series 2021-2A, Class C(1) | | | 3,030 | | | | 2,586 | |
2.36%, 03/20/2026, Series 2019-3A, Class A(1) | | | 12,120 | | | | 11,444 | |
4.08%, 02/20/2028, Series 2021-2A, Class D(1) | | | 7,500 | | | | 6,292 | |
6.03%, 10/20/2027, Series 2023-2A, Class B(1) | | | 850 | | | | 836 | |
7.24%, 06/20/2029, Series 2023-4A, Class C(1) | | | 5,640 | | | | 5,539 | |
Bain Capital Credit CLO 2018-2 | | | | | | | | |
6.35% (3 Month LIBOR USD + 1.08%), 07/19/2031, Series 2018-2A, Class A1(1)(2) | | | 250 | | | | 248 | |
Bain Capital Credit CLO 2020-4 Ltd. | | | | | | | | |
6.66% (3 Month LIBOR USD + 1.41%, 1.41% Floor), 10/20/2033, Series 2020-4A, Class A1(1)(2) | | | 250 | | | | 247 | |
Bain Capital Credit CLO 2021-4 Ltd. | | | | | | | | |
6.42% (3 Month LIBOR USD + 1.17%, 1.17% Floor), 10/20/2034, Series 2021-4A, Class A1(1)(2) | | | 2,840 | | | | 2,773 | |
6.90% (3 Month LIBOR USD + 1.65%, 1.65% Floor), 10/20/2034, Series 2021-4A, Class B(1)(2) | | | 4,075 | | | | 3,946 | |
Bain Capital Euro CLO 2018-2 DAC | | | | | | | | |
3.94% (3 Month EURIBOR + 0.74%, 0.74% Floor), 01/20/2032, Series 2018-2A, Class AR(1)(2) | | EUR | 24,755 | | | | 26,239 | |
Ballyrock CLO 15 Ltd. | | | | | | | | |
6.32% (3 Month LIBOR USD + 1.06%, 1.06% Floor), 04/15/2034, Series 2021-1A, Class A1(1)(2) | | $ | 10,050 | | | | 9,827 | |
Barings CLO Ltd. 2018-III | | | | | | | | |
6.20% (3 Month LIBOR USD + 0.95%), 07/20/2029, Series 2018-3A, Class A1(1)(2) | | | 356 | | | | 353 | |
BCMSC Trust 1999-B | | | | | | | | |
6.61%, 12/15/2029, Series 1999-B, Class A1B(3) | | | 3,594 | | | | 404 | |
BDS 2021-FL10 Ltd. | | | | | | | | |
6.51% (1 Month LIBOR USD + 1.35%, 1.46% Floor), 12/16/2036, Series 2021-FL10, Class A(1)(2) | | | 15,910 | | | | 15,597 | |
BDS 2021-FL7 Ltd. | | | | | | | | |
6.23% (1 Month LIBOR USD + 1.07%, 1.07% Floor), 06/16/2036, Series 2021-FL7, Class A(1)(2) | | | 10,000 | | | | 9,740 | |
BDS 2022-FL11 LLC | | | | | | | | |
6.88% (1 Month Term SOFR + 1.80%, 1.80% Floor), 03/19/2039, Series 2022-FL11, Class ATS(1)(2) | | | 2,871 | | | | 2,833 | |
Bear Stearns Asset Backed Securities I Trust 2005-AQ1 | | | | | | | | |
6.28% (1 Month LIBOR USD + 1.13%, 1.13% Floor), 03/25/2035, Series 2005-AQ1, Class M3(2) | | | 239 | | | | 236 | |
Bear Stearns Asset Backed Securities I Trust 2005-EC1 | | | | | | | | |
4.72% (1 Month LIBOR USD + 0.78%), 11/25/2035, Series 2005-EC1, Class M3(2) | | | 7,092 | | | | 7,036 | |
Bear Stearns Asset Backed Securities I Trust 2005-HE1 | | | | | | | | |
5.16% (1 Month LIBOR USD + 2.33%, 2.33% Floor), 01/25/2035, Series 2005-HE1, Class M5(2) | | | 1,292 | | | | 1,198 | |
Bear Stearns Asset Backed Securities I Trust 2007-HE2 | | | | | | | | |
5.31% (1 Month LIBOR USD + 0.16%, 0.16% Floor), 02/25/2037, Series 2007-HE2, Class 2A3(2) | | | 1,956 | | | | 1,932 | |
Benefit Street Partners CLO IV Ltd. | | | | | | | | |
6.80% (3 Month LIBOR USD + 1.55%, 1.55% Floor), 01/20/2032, Series 2014-IVA, Class A2AR(1)(2) | | | 9,595 | | | | 9,381 | |
Benefit Street Partners CLO X Ltd. | | | | | | | | |
6.46% (3 Month LIBOR USD + 1.21%, 1.21% Floor), 04/20/2034, Series 2016-10A, Class A1RR(1)(2) | | | 12,795 | | | | 12,575 | |
Benefit Street Partners CLO XX Ltd. | | | | | | | | |
6.43% (3 Month LIBOR USD + 1.17%, 1.17% Floor), 07/15/2034, Series 2020-20A, Class AR(1)(2) | | | 6,155 | | | | 6,048 | |
BHG Securitization Trust 2022-A | | | | | | | | |
2.70%, 02/20/2035, Series 2022-A, Class B(1) | | | 12,175 | | | | 10,877 | |
BHG Securitization Trust 2022-C | | | | | | | | |
5.93%, 10/17/2035, Series 2022-C, Class B(1) | | | 551 | | | | 537 | |
Birch Grove CLO 2 Ltd. | | | | | | | | |
6.53% (3 Month LIBOR USD + 1.26%, 1.26% Floor), 10/19/2034, Series 2021-2A, Class A1(1)(2) | | | 4,000 | | | | 3,903 | |
Blackbird Capital Aircraft Lease Securitization Ltd. 2016-1 | | | | | | | | |
4.21%, 12/16/2041, Series 2016-1A, Class A(1)(4) | | | 941 | | | | 866 | |
BPCRE 2022-FL2 Ltd. | | | | | | | | |
7.49% (1 Month Term SOFR + 2.40%, 2.40% Floor), 01/16/2037, Series 2022-FL2, Class A(1)(2) | | | 1,493 | | | | 1,485 | |
BRE Grand Islander Timeshare Issuer 2019-A LLC | | | | | | | | |
3.28%, 09/26/2033, Series 2019-A, Class A(1) | | | 1,114 | | | | 1,047 | |
BSPRT 2021-FL7 Issuer Ltd. | | | | | | | | |
6.51% (1 Month LIBOR USD + 1.32%, 1.32% Floor), 12/15/2038, Series 2021-FL7, Class A(1)(2) | | | 9,900 | | | | 9,684 | |
Business Jet Securities 2021-1 LLC | | | | | | | | |
2.16%, 04/15/2036, Series 2021-1A, Class A(1) | | | 2,015 | | | | 1,848 | |
Carlyle Global Market Strategies CLO 2013-4 Ltd. | | | | | | | | |
| | | | | | | | |
6.26% (3 Month LIBOR USD + 1.00%, 1.00% Floor), 01/15/2031, Series 2013-4A, Class A1RR(1)(2) | | | 1,071 | | | | 1,061 | |
Carlyle Global Market Strategies CLO 2014-1 Ltd. | | | | | | | | |
6.23% (3 Month LIBOR USD + 0.97%, 0.97% Floor), 04/17/2031, Series 2014-1A, Class A1R2(1)(2) | | | 997 | | | | 988 | |
Carlyle Global Market Strategies CLO 2014-2R Ltd. | | | | | | | | |
6.37% (3 Month LIBOR USD + 1.05%), 05/15/2031, Series 2014-2RA, Class A1(1)(2) | | | 1,168 | | | | 1,155 | |
Carlyle Global Market Strategies CLO 2014-3-R Ltd. | | | | | | | | |
6.34% (3 Month LIBOR USD + 1.05%), 07/27/2031, Series 2014-3RA, Class A1A(1)(2) | | | 2,321 | | | | 2,293 | |
Carlyle Global Market Strategies CLO 2014-5 Ltd. | | | | | | | | |
6.40% (3 Month LIBOR USD + 1.14%, 1.14% Floor), 07/15/2031, Series 2014-5A, Class A1RR(1)(2) | | | 9,518 | | | | 9,426 | |
Carlyle U.S. CLO 2017-4 Ltd. | | | | | | | | |
6.44% (3 Month LIBOR USD + 1.18%, 1.18% Floor), 01/15/2030, Series 2017-4A, Class A1(1)(2) | | | 12,853 | | | | 12,760 | |
Carlyle U.S. CLO 2019-1 Ltd. | | | | | | | | |
6.33% (3 Month LIBOR USD + 1.08%, 1.08% Floor), 04/20/2031, Series 2019-1A, Class A1AR(1)(2) | | | 3,980 | | | | 3,928 | |
Carlyle U.S. CLO 2021-1 Ltd. | | | | | | | | |
6.40% (3 Month LIBOR USD + 1.14%, 1.14% Floor), 04/15/2034, Series 2021-1A, Class A1(1)(2) | | | 1,750 | | | | 1,720 | |
CarMax Auto Owner Trust 2019-3 | | | | | | | | |
2.85%, 01/15/2026, Series 2019-3, Class D | | | 1,120 | | | | 1,111 | |
CarMax Auto Owner Trust 2020-1 | | | | | | | | |
2.64%, 07/15/2026, Series 2020-1, Class D | | | 2,622 | | | | 2,555 | |
CarMax Auto Owner Trust 2020-3 | | | | | | | | |
2.53%, 01/15/2027, Series 2020-3, Class D | | | 1,510 | | | | 1,450 | |
CarMax Auto Owner Trust 2020-4 | | | | | | | | |
1.75%, 04/15/2027, Series 2020-4, Class D | | | 1,875 | | | | 1,745 | |
CarMax Auto Owner Trust 2021-1 | | | | | | | | |
1.28%, 07/15/2027, Series 2021-1, Class D | | | 825 | | | | 754 | |
CarMax Auto Owner Trust 2021-3 | | | | | | | | |
1.50%, 01/18/2028, Series 2021-3, Class D | | | 2,010 | | | | 1,789 | |
CarMax Auto Owner Trust 2022-1 | | | | | | | | |
2.47%, 07/17/2028, Series 2022-1, Class D | | | 1,235 | | | | 1,115 | |
CarMax Auto Owner Trust 2023-2 | | | | | | | | |
6.55%, 10/15/2029, Series 2023-2, Class D | | | 1,155 | | | | 1,140 | |
Carvana Auto Receivables Trust 2021-N3 | | | | | | | | |
1.02%, 06/12/2028, Series 2021-N3, Class C | | | 1,816 | | | | 1,715 | |
Carvana Auto Receivables Trust 2021-N4 | | | | | | | | |
1.72%, 09/11/2028, Series 2021-N4, Class C | | | 1,610 | | | | 1,545 | |
2.30%, 09/11/2028, Series 2021-N4, Class D | | | 5,760 | | | | 5,413 | |
Carvana Auto Receivables Trust 2021-P3 | | | | | | | | |
1.93%, 10/12/2027, Series 2021-P3, Class C | | | 4,125 | | | | 3,523 | |
Carvana Auto Receivables Trust 2021-P4 | | | | | | | | |
2.33%, 02/10/2028, Series 2021-P4, Class C | | | 2,720 | | | | 2,309 | |
Carvana Auto Receivables Trust 2023-N1 | | | | | | | | |
6.69%, 07/10/2029, Series N1, Class D(1) | | | 1,140 | | | | 1,119 | |
Castlelake Aircraft Securitization Trust 2018-1 | | | | | �� | | | |
4.13%, 06/15/2043, Series 2018-1, Class A(1) | | | 2,123 | | | | 1,915 | |
CBAM 2019-9 Ltd. | | | | | | | | |
6.54% (3 Month LIBOR USD + 1.28%, 1.28% Floor), 02/12/2030, Series 2019-9A, Class A(1)(2) | | | 10,788 | | | | 10,698 | |
Cedar Funding IX CLO Ltd. | | | | | | | | |
6.23% (3 Month LIBOR USD + 0.98%, 0.98% Floor), 04/20/2031, Series 2018-9A, Class A1(1)(2) | | | 8,110 | | | | 8,032 | |
Cedar Funding X CLO Ltd. | | | | | | | | |
6.85% (3 Month LIBOR USD + 1.60%, 1.60% Floor), 10/20/2032, Series 2019-10A, Class BR(1)(2) | | | 5,430 | | | | 5,308 | |
Centex Home Equity Loan Trust 2005-B | | | | | | | | |
5.80% (1 Month LIBOR USD + 0.65%, 0.65% Floor), 03/25/2035, Series 2005-B, Class M2(2) | | | 2,260 | | | | 2,229 | |
Centex Home Equity Loan Trust 2005-D | | | | | | | | |
6.11% (1 Month LIBOR USD + 0.96%, 0.96% Floor), 10/25/2035, Series 2005-D, Class M5(2) | | | 2,131 | | | | 2,084 | |
Centex Home Equity Loan Trust 2006-A | | | | | | | | |
5.65% (1 Month LIBOR USD + 0.50%, 0.50% Floor), 06/25/2036, Series 2006-A, Class M3(2) | | | 9,500 | | | | 8,382 | |
CHEC Loan Trust 2004-2 | | | | | | | | |
6.11% (1 Month LIBOR USD + 0.96%, 0.96% Floor), 06/25/2034, Series 2004-2, Class M1(2) | | | 1,095 | | | | 1,065 | |
Chesapeake Funding II LLC | | | | | | | | |
6.69%, 05/15/2035, Series 2023-1A, Class D(1) | | | 665 | | | | 656 | |
CIFC Funding 2015-IV Ltd. | | | | | | | | |
6.32% (3 Month LIBOR USD + 1.07%, 1.07% Floor), 04/20/2034, Series 2015-4A, Class A1A2(1)(2) | | | 19,600 | | | | 19,202 | |
6.70% (3 Month LIBOR USD + 1.45%, 1.45% Floor), 04/20/2034, Series 2015-4A, Class A2R2(1)(2) | | | 2,145 | | | | 2,096 | |
CIFC Funding 2017-III Ltd. | | | | | | | | |
6.47% (3 Month LIBOR USD + 1.22%), 07/20/2030, Series 2017-3A, Class A1(1)(2) | | | 464 | | | | 461 | |
CIFC Funding 2018-I Ltd. | | | | | | | | |
6.26% (3 Month LIBOR USD + 1.00%), 04/18/2031, Series 2018-1A, Class A(1)(2) | | | 3,400 | | | | 3,371 | |
CIFC Funding 2019-V Ltd. | | | | | | | | |
6.40% (3 Month LIBOR USD + 1.14%, 1.14% Floor), 01/15/2035, Series 2019-5A, Class A1R1(1)(2) | | | 3,350 | | | | 3,283 | |
CIFC Funding 2021-VII Ltd. | | | | | | | | |
6.40% (3 Month LIBOR USD + 1.13%, 1.13% Floor), 01/23/2035, Series 2021-7A, Class A1(1)(2) | | | 11,700 | | | | 11,468 | |
CIM TRUST 2023-NR2 | | | | | | | | |
6.00%, 06/25/2062, Series 2023-NR2, Class A1(1)(4) | | | 18,103 | | | | 18,646 | |
CIT Mortgage Loan Trust 2007-1 | | | | | | | | |
6.65% (1 Month LIBOR USD + 1.50%, 1.50% Floor), 10/25/2037, Series 2007-1, Class 1M1(1)(2) | | | 2,000 | | | | 1,942 | |
Citigroup Mortgage Loan Trust, Inc. | | | | | | | | |
5.78% (1 Month LIBOR USD + 0.63%, 0.63% Floor), 02/25/2035, Series 2005-OPT1, Class M1(2) | | | 1,734 | | | | 1,575 | |
6.05% (1 Month LIBOR USD + 0.90%, 0.90% Floor), 09/25/2035, Series 2005-HE3, Class M4(2) | | | 7,900 | | | | 7,274 | |
6.05% (1 Month LIBOR USD + 0.90%, 0.90% Floor), 10/25/2035, Series 2005-HE4, Class M4(2) | | | 14,327 | | | | 11,171 | |
CLI Funding VIII LLC | | | | | | | | |
6.31%, 06/18/2048, Series 2023-1A, Class A(1) | | | 13,396 | | | | 13,352 | |
College Ave Student Loans 2021-A LLC | | | | | | | | |
2.92%, 07/25/2051, Series 2021-A, Class C(1) | | | 401 | | | | 357 | |
College Avenue Student Loans 2018-A LLC | | | | | | | | |
4.13%, 12/26/2047, Series 2018-A, Class A2(1) | | | 1,511 | | | | 1,418 | |
6.35% (1 Month LIBOR USD + 1.20%), 12/26/2047, Series 2018-A, Class A1(1)(2) | | | 1,108 | | | | 1,091 | |
College Avenue Student Loans LLC | | | | | | | | |
6.80% (1 Month LIBOR USD + 1.65%, 1.65% Floor), 11/26/2046, Series 2017-A, Class A1(1)(2) | | | 1,977 | | | | 1,974 | |
Commonbond Student Loan Trust 2020-1 | | | | | | | | |
| | | | | | | | |
1.69%, 10/25/2051, Series 2020-1, Class A(1) | | | 1,483 | | | | 1,309 | |
Commonwealth of Puerto Rico | | | | | | | | |
0.00%, 11/01/2043(5) | | | 1,531 | | | | 771 | |
Concord Music Royalties LLC | | | | | | | | |
6.50%, 01/20/2073, Series 2022-1A, Class A2(1) | | | 1,884 | | | | 1,855 | |
Conseco Finance Securitizations Corp. | | | | | | | | |
7.97%, 05/01/2032, Series 2000-4, Class A5 | | | 734 | | | | 139 | |
8.06%, 09/01/2029, Series 2000-1, Class A5(3) | | | 13,024 | | | | 2,656 | |
8.31%, 05/01/2032, Series 2000-4, Class A6(3) | | | 8,505 | | | | 1,681 | |
Conseco Financial Corp. | | | | | | | | |
7.70%, 05/15/2027(3) | | | 2,403 | | | | 2,237 | |
CoreVest American Finance 2018-2 Trust | | | | | | | | |
4.03%, 11/15/2052, Series 2018-2, Class A(1) | | | 4,339 | | | | 4,320 | |
CoreVest American Finance 2019-3 Trust | | | | | | | | |
2.71%, 10/15/2052, Series 2019-3, Class A(1) | | | 1,485 | | | | 1,400 | |
3.16%, 10/15/2052, Series 2019-3, Class B(1) | | | 1,470 | | | | 1,252 | |
CoreVest American Finance 2021-1 Trust | | | | | | | | |
2.80%, 04/15/2053, Series 2021-1, Class C(1) | | | 1,525 | | | | 1,245 | |
CoreVest American Finance 2021-2 Trust | | | | | | | | |
2.48%, 07/15/2054, Series 2021-2, Class C(1) | | | 3,100 | | | | 2,435 | |
CoreVest American Finance 2021-3 Trust | | | | | | | | |
3.47%, 10/15/2054, Series 2021-3, Class D(1) | | | 1,630 | | | | 1,319 | |
Countrywide Asset-Backed Certificates | | | | | | | | |
5.65% (1 Month LIBOR USD + 0.50%, 0.50% Floor), 01/25/2046, Series 2006-8, Class 2A4(2) | | | 18,740 | | | | 17,414 | |
Credit Acceptance Auto Loan Trust 2020-2 | | | | | | | | |
2.73%, 11/15/2029, Series 2020-2A, Class C(1) | | | 1,935 | | | | 1,909 | |
Credit Acceptance Auto Loan Trust 2021-3 | | | | | | | | |
1.63%, 09/16/2030, Series 2021-3A, Class C(1) | | | 2,360 | | | | 2,177 | |
Credit Acceptance Auto Loan Trust 2021-4 | | | | | | | | |
1.94%, 02/18/2031, Series 2021-4, Class C(1) | | | 5,235 | | | | 4,751 | |
Credit Acceptance Auto Loan Trust 2023-1 | | | | | | | | |
7.71%, 07/15/2033, Series 2023-1A, Class C(1) | | | 2,135 | | | | 2,144 | |
Credit Acceptance Auto Loan Trust 2023-2 | | | | | | | | |
7.15%, 09/15/2033, Series 2023-2A, Class C(1) | | | 3,525 | | | | 3,477 | |
Credit-Based Asset Servicing & Securitization LLC | | | | | | | | |
5.45% (1 Month LIBOR USD + 0.30%, 0.30% Floor), 10/25/2036, Series 2006-CB8, Class A2C(2) | | | 10,432 | | | | 8,577 | |
5.93% (1 Month LIBOR USD + 0.78%, 0.78% Floor), 07/25/2033, Series 2004-CB2, Class M1(2) | | | 3,339 | | | | 3,186 | |
Crown City CLO III | | | | | | | | |
6.42% (3 Month LIBOR USD + 1.17%, 1.17% Floor), 07/20/2034, Series 2021-1A, Class A1A(1)(2) | | | 250 | | | | 243 | |
CVS Pass-Through Trust | | | | | | | | |
6.94%, 01/10/2030 | | | 744 | | | | 758 | |
CWABS Asset-Backed Certificates Trust 2004-13 | | | | | | | | |
6.58% (1 Month LIBOR USD + 1.43%, 1.43% Floor), 06/25/2035, Series 2004-14, Class M4(2) | | | 4,034 | | | | 3,949 | |
CWABS Asset-Backed Certificates Trust 2005-9 | | | | | | | | |
6.13% (1 Month LIBOR USD + 0.98%, 0.98% Floor), 01/25/2036, Series 2005-9, Class M2(2) | | | 4,212 | | | | 4,067 | |
CWABS Asset-Backed Certificates Trust 2005-AB4 | | | | | | | | |
5.63% (1 Month LIBOR USD + 0.48%, 0.48% Floor), 03/25/2036, Series 2005-AB4, Class 1A(2) | | | 1,726 | | | | 1,520 | |
CWABS Asset-Backed Certificates Trust 2006-2 | | | | | | | | |
5.38% (1 Month LIBOR USD + 0.23%, 0.23% Floor), 04/25/2047, Series 2006-20, Class 2A4(2) | | | 20,739 | | | | 18,772 | |
5.78% (1 Month LIBOR USD + 0.63%, 0.63% Floor), 06/25/2036, Series 2006-2, Class M2(2) | | | 24,500 | | | | 22,910 | |
CWABS Asset-Backed Certificates Trust 2006-22 | | | | | | | | |
5.37% (1 Month LIBOR USD + 0.22%, 0.22% Floor), 05/25/2047, Series 2006-22, Class 2A4(2) | | | 6,867 | | | | 6,413 | |
CWABS Asset-Backed Certificates Trust 2006-BC1 | | | | | | | | |
5.74% (1 Month LIBOR USD + 0.59%, 0.59% Floor), 04/25/2036, Series 2006-BC1, Class M3(2) | | | 1,000 | | | | 894 | |
CWABS Asset-Backed Certificates Trust 2007-10 | | | | | | | | |
5.33% (1 Month LIBOR USD + 0.18%, 0.18% Floor), 06/25/2047, Series 2007-10, Class 1A1(2) | | | 23,877 | | | | 22,187 | |
CWABS Asset-Backed Certificates Trust 2007-2 | | | | | | | | |
5.37% (1 Month LIBOR USD + 0.22%, 0.22% Floor), 08/25/2037, Series 2007-2, Class 2A4(2) | | | 25,730 | | | | 22,219 | |
CWABS Asset-Backed Certificates Trust 2007-8 | | | | | | | | |
5.40% (1 Month LIBOR USD + 0.25%, 0.25% Floor), 02/25/2036, Series 2007-9, Class 2A4(2) | | | 1,324 | | | | 1,233 | |
CWABS Asset-Backed Certificates Trust 2007-BC2 | | | | | | | | |
5.44% (1 Month LIBOR USD + 0.29%, 0.29% Floor), 06/25/2037, Series 2007-BC2, Class 2A4(2) | | | 5,599 | | | | 5,366 | |
CWABS Revolving Home Equity Loan Trust Series 2004-T | | | | | | | | |
5.43% (1 Month LIBOR USD + 0.24%, 0.24% Floor, 16.00% Cap), 02/15/2030, Series 2004-T, Class 2A(2) | | | 2,651 | | | | 2,598 | |
CWABS, Inc. Asset-backed Certificates Series 2007-12 | | | | | | | | |
5.89% (1 Month LIBOR USD + 0.74%, 0.74% Floor), 08/25/2047, Series 2007-12, Class 1A1(2) | | | 3,048 | | | | 2,886 | |
CWHEQ Revolving Home Equity Loan Resuritization Trust Series 2006-RES | | | | | | | | |
5.38% (1 Month LIBOR USD + 0.19%, 0.19% Floor, 16.00% Cap), 05/15/2035, Series 2006-RES, Class 5B1B(1)(2) | | | 163 | | | | 162 | |
CWHEQ Revolving Home Equity Loan Trust Series 2006-I | | | | | | | | |
5.33% (1 Month LIBOR USD + 0.14%, 0.14% Floor), 01/15/2037, Series 2006-I, Class 1A(2) | | | 96 | | | | 87 | |
DB Master Finance LLC | | | | | | | | |
4.03%, 11/20/2047, Series 2017-1A, Class A2II(1) | | | 2,081 | | | | 1,902 | |
4.35%, 05/20/2049, Series 2019-1A, Class A23(1) | | | 1,781 | | | | 1,625 | |
Dell Equipment Finance Trust 2020-2 | | | | | | | | |
1.37%, 01/22/2024, Series 2020-2, Class C(1) | | | 4,755 | | | | 4,742 | |
1.92%, 03/23/2026, Series 2020-2, Class D(1) | | | 500 | | | | 499 | |
Dewolf Park CLO Ltd. | | | | | | | | |
6.71% (3 Month LIBOR USD + 1.45%, 1.35% Floor), 10/15/2030, Series 2017-1A, Class BR(1)(2) | | | 12,235 | | | | 11,949 | |
Diameter Capital CLO 1 Ltd. | | | | | | | | |
6.50% (3 Month LIBOR USD + 1.24%, 1.50% Floor), 07/15/2036, Series 2021-1A, Class A1A(1)(2) | | | 4,390 | | | | 4,261 | |
Diameter Capital CLO 3 Ltd. | | | | | | | | |
6.38% (3 Month Term SOFR + 1.39%, 1.39% Floor), 04/15/2037, Series 2022-3A, Class A1A(1)(2) | | | 4,770 | | | | 4,676 | |
Domino’s Pizza Master Issuer LLC | | | | | | | | |
2.66%, 04/25/2051, Series 2021-1A, Class A2I(1) | | | 11,393 | | | | 9,658 | |
3.67%, 10/25/2049, Series 2019-1A, Class A2(1) | | | 6,282 | | | | 5,489 | |
4.33%, 07/25/2048, Series 2018-1A, Class A2II(1) | | | 2,378 | | | | 2,221 | |
Drive Auto Receivables Trust 2021-1 | | | | | | | | |
1.45%, 01/16/2029, Series 2021-1, Class D | | | 6,530 | | | | 6,142 | |
Dryden 30 Senior Loan Fund | | | | | | | | |
| | | | | | | | |
6.14% (3 Month LIBOR USD + 0.82%), 11/15/2028, Series 2013-30A, Class AR(1)(2) | | | 852 | | | | 844 | |
Dryden 36 Senior Loan Fund | | | | | | | | |
6.27% (3 Month Term SOFR + 1.28%, 1.02% Floor), 04/15/2029, Series 2014-36A, Class AR3(1)(2) | | | 8,207 | | | | 8,153 | |
Dryden 64 CLO Ltd. | | | | | | | | |
6.23% (3 Month LIBOR USD + 0.97%), 04/18/2031, Series 2018-64A, Class A(1)(2) | | | 5,900 | | | | 5,833 | |
Dryden 83 CLO Ltd. | | | | | | | | |
6.48% (3 Month LIBOR USD + 1.22%, 1.22% Floor), 01/18/2032, Series 2020-83A, Class A(1)(2) | | | 1,250 | | | | 1,236 | |
Dryden 86 CLO Ltd. | | | | | | | | |
6.36% (3 Month LIBOR USD + 1.10%, 1.10% Floor), 07/17/2034, Series 2020-86A, Class A1R(1)(2) | | | 8,050 | | | | 7,907 | |
Dryden XXVI Senior Loan Fund | | | | | | | | |
6.16% (3 Month LIBOR USD + 0.90%), 04/15/2029, Series 2013-26A, Class AR(1)(2) | | | 3,771 | | | | 3,739 | |
DT Auto Owner Trust 2019-3 | | | | | | | | |
2.96%, 04/15/2025, Series 2019-3A, Class D(1) | | | 661 | | | | 656 | |
DT Auto Owner Trust 2020-3 | | | | | | | | |
1.47%, 06/15/2026, Series 2020-3A, Class C(1) | | | 2,641 | | | | 2,583 | |
DT Auto Owner Trust 2021-1 | | | | | | | | |
1.16%, 11/16/2026, Series 2021-1A, Class D(1) | | | 2,650 | | | | 2,452 | |
DT Auto Owner Trust 2021-2 | | | | | | | | |
1.50%, 02/16/2027, Series 2021-2A, Class D(1) | | | 2,250 | | | | 2,095 | |
DT Auto Owner Trust 2022-1 | | | | | | | | |
3.40%, 12/15/2027, Series 2022-1A, Class D(1) | | | 11,305 | | | | 10,559 | |
DT Auto Owner Trust 2023-2 | | | | | | | | |
6.62%, 02/15/2029, Series 2023-2A, Class D(1) | | | 8,095 | | | | 8,017 | |
Eaton Vance CLO 2014-1R Ltd. | | | | | | | | |
6.75% (3 Month LIBOR USD + 1.49%), 07/15/2030, Series 2014-1RA, Class A2(1)(2) | | | 1,000 | | | | 986 | |
Eaton Vance CLO 2019-1 Ltd. | | | | | | | | |
6.36% (3 Month LIBOR USD + 1.10%, 1.10% Floor), 04/15/2031, Series 2019-1A, Class AR(1)(2) | | | 23,000 | | | | 22,635 | |
ECAF I Ltd. | | | | | | | | |
3.47%, 06/15/2040, Series 2015-1A, Class A1(1) | | | 227 | | | | 132 | |
ECMC Group Student Loan Trust | | | | | | | | |
6.15% (1 Month LIBOR USD + 1.00%), 07/25/2069, Series 2019-1A, Class A1B(1)(2) | | | 736 | | | | 721 | |
ECMC Group Student Loan Trust 2017-2 | | | | | | | | |
6.20% (1 Month LIBOR USD + 1.05%), 05/25/2067, Series 2017-2A, Class A(1)(2) | | | 6,574 | | | | 6,377 | |
EDvestinU Private Education Loan Issue No 4 LLC | | | | | | | | |
5.25%, 11/25/2040, Series 2022-A, Class A(1) | | | 1,056 | | | | 1,017 | |
Elara HGV Timeshare Issuer 2021-A LLC | | | | | | | | |
2.09%, 08/27/2035, Series 2021-A, Class C(1) | | | 419 | | | | 366 | |
ELFI Graduate Loan Program 2019-A LLC | | | | | | | | |
2.54%, 03/25/2044, Series 2019-A, Class A(1) | | | 1,476 | | | | 1,334 | |
ELFI Graduate Loan Program 2021-A LLC | | | | | | | | |
2.09%, 12/26/2046, Series 2021-A, Class B(1)(3) | | | 471 | | | | 393 | |
Ellington Loan Acquisition Trust 2007-1 | | | | | | | | |
6.25% (1 Month LIBOR USD + 1.10%, 1.10% Floor), 05/25/2037, Series 2007-1, Class A1(1)(2) | | | 619 | | | | 590 | |
Elmwood CLO 15 Ltd. | | | | | | | | |
6.41% (3 Month Term SOFR + 1.34%, 1.34% Floor), 04/22/2035, Series 2022-2A, Class A1(1)(2) | | | 11,210 | | | | 10,997 | |
Elmwood CLO I Ltd. | | | | | | | | |
6.70% (3 Month LIBOR USD + 1.45%, 1.45% Floor), 10/20/2033, Series 2019-1A, Class AR(1)(2) | | | 2,000 | | | | 1,988 | |
Exeter Automobile Receivables Trust 2020-2 | | | | | | | | |
4.73%, 04/15/2026, Series 2020-2A, Class D(1) | | | 2,859 | | | | 2,840 | |
Exeter Automobile Receivables Trust 2020-3 | | | | | | | | |
1.73%, 07/15/2026, Series 2020-3A, Class D | | | 1,175 | | | | 1,149 | |
Exeter Automobile Receivables Trust 2021-2 | | | | | | | | |
1.08%, 11/16/2026, Series 2021-1A, Class D | | | 2,515 | | | | 2,391 | |
Exeter Automobile Receivables Trust 2022-2 | | | | | | | | |
4.56%, 07/17/2028, Series 2022-2A, Class D | | | 2,920 | | | | 2,779 | |
Exeter Automobile Receivables Trust 2022-6 | | | | | | | | |
6.32%, 05/15/2028, Series 2022-6A, Class C | | | 2,180 | | | | 2,179 | |
Exeter Automobile Receivables Trust 2023-1 | | | | | | | | |
6.69%, 06/15/2029, Series 2023-1A, Class D | | | 1,960 | | | | 1,952 | |
Exeter Automobile Receivables Trust 2023-2 | | | | | | | | |
5.61%, 09/15/2027, Series 2023-2A, Class B | | | 22,400 | | | | 22,149 | |
6.32%, 08/15/2029, Series 2023-2A, Class D | | | 4,420 | | | | 4,340 | |
Exeter Automobile Receivables Trust 2023-3 | | | | | | | | |
6.68%, 04/16/2029, Series 2023-3A, Class D | | | 2,230 | | | | 2,220 | |
FHF Trust 2021-1 | | | | | | | | |
2.29%, 03/15/2027, Series 2021-1A, Class B(1) | | | 4,000 | | | | 3,736 | |
FHF Trust 2022-1 | | | | | | | | |
4.43%, 01/18/2028, Series 2022-1A, Class A(1) | | | 4,675 | | | | 4,560 | |
Fieldstone Mortgage Investment Trust Series 2006-3 | | | | | | | | |
5.42% (1 Month LIBOR USD + 0.28%, 0.28% Floor, 12.25% Cap), 11/25/2036, Series 2006-3, Class 1A(2) | | | 3,533 | | | | 3,122 | |
First Franklin Mortgage Loan Trust 2002-FF4 | | | | | | | | |
6.30% (1 Month LIBOR USD + 1.13%, 1.13% Floor), 02/25/2033, Series 2002-FF4, Class 1A2(2) | | | 3,335 | | | | 3,148 | |
First Franklin Mortgage Loan Trust 2003-FFH2 | | | | | | | | |
6.82% (1 Month LIBOR USD + 1.65%, 1.65% Floor), 02/25/2034, Series 2003-FFH2, Class M1A(2) | | | 3,861 | | | | 3,823 | |
First Franklin Mortgage Loan Trust 2004-FF7 | | | | | | | | |
7.33% (1 Month LIBOR USD + 2.18%, 2.18% Floor), 09/25/2034, Series 2004-FF7, Class M5(2) | | | 854 | | | | 878 | |
First Franklin Mortgage Loan Trust 2006-FF11 | | | | | | | | |
5.51% (1 Month LIBOR USD + 0.36%, 0.36% Floor), 08/25/2036, Series 2006-FF11, Class 1A2(2) | | | 26,104 | | | | 24,859 | |
First Franklin Mortgage Loan Trust 2006-FF16 | | | | | | | | |
5.57% (1 Month LIBOR USD + 0.42%, 0.42% Floor), 12/25/2036, Series 2006-FF16, Class 2A4(2) | | | 5,264 | | | | 2,207 | |
First Franklin Mortgage Loan Trust 2006-FF17 | | | | | | | | |
5.30% (1 Month LIBOR USD + 0.15%, 0.15% Floor), 12/25/2036, Series 2006-FF17, Class A5(2) | | | 2,879 | | | | 2,604 | |
First Franklin Mortgage Loan Trust 2006-FF2 | | | | | | | | |
5.75% (1 Month LIBOR USD + 0.60%, 0.60% Floor), 02/25/2036, Series 2006-FF2, Class A5(2) | | | 9,421 | | | | 8,460 | |
First Franklin Mortgage Loan Trust Series 2005-FF12 | | | | | | | | |
5.86% (1 Month LIBOR USD + 0.71%, 0.71% Floor), 11/25/2036, Series 2005-FF12, Class M2(2) | | | 1,704 | | | | 1,619 | |
First Investors Auto Owner Trust 2022-1 | | | | | | | | |
3.79%, 06/15/2028, Series 2022-1A, Class D(1) | | | 2,875 | | | | 2,653 | |
FirstKey Homes 2020-SFR1 Trust | | | | | | | | |
| | | | | | | | |
2.24%, 08/17/2037, Series 2020-SFR1, Class D(1) | | | 1,590 | | | | 1,442 | |
2.79%, 08/17/2037, Series 2020-SFR1, Class E(1) | | | 805 | | | | 736 | |
FirstKey Homes 2021-SFR1 Trust | | | | | | | | |
2.39%, 08/17/2038, Series 2021-SFR1, Class E1(1) | | | 4,795 | | | | 4,096 | |
FirstKey Homes 2021-SFR2 Trust | | | | | | | | |
2.26%, 09/17/2038, Series 2021-SFR2, Class E1(1) | | | 3,380 | | | | 2,895 | |
2.36%, 09/17/2038, Series 2021-SFR2, Class E2(1) | | | 2,000 | | | | 1,708 | |
FirstKey Homes 2022-SFR2 Trust | | | | | | | | |
4.50%, 07/17/2039, Series 2022-SFR2, Class D(1) | | | 10,352 | | | | 9,444 | |
Flagship Credit Auto Trust 2018-2 | | | | | | | | |
4.23%, 09/16/2024, Series 2018-2, Class D(1) | | | 336 | | | | 335 | |
Flagship Credit Auto Trust 2019-3 | | | | | | | | |
2.86%, 12/15/2025, Series 2019-3, Class D(1) | | | 2,235 | | | | 2,184 | |
Flagship Credit Auto Trust 2020-4 | | | | | | | | |
2.18%, 02/16/2027, Series 2020-4, Class D(1) | | | 8,135 | | | | 7,541 | |
Flagship Credit Auto Trust 2021-1 | | | | | | | | |
1.27%, 03/15/2027, Series 2021-1, Class D(1) | | | 1,480 | | | | 1,346 | |
Flagship Credit Auto Trust 2021-2 | | | | | | | | |
1.59%, 06/15/2027, Series 2021-2, Class D(1) | | | 3,085 | | | | 2,763 | |
Flagship Credit Auto Trust 2022-2 | | | | | | | | |
4.76%, 05/17/2027, Series 2022-2, Class B(1) | | | 5,200 | | | | 5,080 | |
Flagship Credit Auto Trust 2023-2 | | | | | | | | |
6.62%, 05/15/2029, Series 2023-2, Class D(1) | | | 8,385 | | | | 8,240 | |
Flatiron CLO 19 Ltd. | | | | | | | | |
6.40% (3 Month LIBOR USD + 1.08%, 1.08% Floor), 11/16/2034, Series 2019-1A, Class AR(1)(2) | | | 500 | | | | 492 | |
Ford Auto Securitization Trust | | | | | | | | |
2.47%, 02/15/2025, Series 2019-BA, Class A3(1) | | CAD | 1,705 | | | | 1,276 | |
2.76%, 04/15/2028, Series 2020-AA, Class C(1) | | | 290 | | | | 207 | |
Ford Credit Auto Owner Trust 2020-B | | | | | | | | |
0.56%, 10/15/2024, Series 2020-B, Class A3 | | $ | 470 | | | | 469 | |
Ford Credit Auto Owner Trust 2020-C | | | | | | | | |
0.41%, 07/15/2025, Series 2020-C, Class A3 | | | 3,941 | | | | 3,854 | |
Ford Credit Auto Owner Trust 2021-A | | | | | | | | |
0.30%, 08/15/2025, Series 2021-A, Class A3 | | | 8,387 | | | | 8,178 | |
Ford Credit Floorplan Master Owner Trust A | | | | | | | | |
1.32%, 09/15/2027, Series 2020-2, Class B | | | 4,235 | | | | 3,828 | |
Foursight Capital Automobile Receivables Trust 2021-1 | | | | | | | | |
1.32%, 03/15/2027, Series 2021-1, Class D(1) | | | 4,890 | | | | 4,616 | |
Foursight Capital Automobile Receivables Trust 2021-2 | | | | | | | | |
1.92%, 09/15/2027, Series 2021-2, Class D(1) | | | 3,280 | | | | 3,024 | |
FREED ABS Trust 2021-2 | | | | | | | | |
1.94%, 06/19/2028, Series 2021-2, Class C(1) | | | 579 | | | | 570 | |
FREED ABS Trust 2021-3FP | | | | | | | | |
2.37%, 11/20/2028, Series 2021-3FP, Class D(1) | | | 3,655 | | | | 3,395 | |
FREED ABS Trust 2022-1FP | | | | | | | | |
3.35%, 03/19/2029, Series 2022-1FP, Class D(1) | | | 3,290 | | | | 2,964 | |
Fremont Home Loan Trust 2003-1 | | | | | | | | |
6.43% (1 Month LIBOR USD + 1.28%, 1.28% Floor), 02/25/2033, Series 2003-1, Class M1(2) | | | 1,610 | | | | 1,617 | |
Fremont Home Loan Trust 2004-4 | | | | | | | | |
5.95% (1 Month LIBOR USD + 0.80%, 0.80% Floor), 03/25/2035, Series 2004-4, Class M1(2) | | | 20,295 | | | | 18,723 | |
Fremont Home Loan Trust 2004-C | | | | | | | | |
6.13% (1 Month LIBOR USD + 0.98%, 0.98% Floor), 08/25/2034, Series 2004-C, Class M1(2) | | | 6,886 | | | | 6,367 | |
Fremont Home Loan Trust 2005-1 | | | | | | | | |
6.31% (1 Month LIBOR USD + 1.16%, 1.16% Floor), 06/25/2035, Series 2005-1, Class M6(2) | | | 3,072 | | | | 2,384 | |
Fremont Home Loan Trust 2005-2 | | | | | | | | |
5.90% (1 Month LIBOR USD + 0.75%, 0.75% Floor), 06/25/2035, Series 2005-2, Class M3(2) | | | 1,675 | | | | 1,624 | |
Fremont Home Loan Trust 2005-C | | | | | | | | |
5.93% (1 Month LIBOR USD + 0.78%, 0.78% Floor), 07/25/2035, Series 2005-C, Class M3(2) | | | 10,200 | | | | 9,547 | |
6.08% (1 Month LIBOR USD + 0.93%, 0.93% Floor), 07/25/2035, Series 2005-C, Class M4(2) | | | 6,749 | | | | 5,157 | |
Fremont Home Loan Trust 2005-E | | | | | | | | |
5.81% (1 Month LIBOR USD + 0.66%, 0.66% Floor), 01/25/2036, Series 2005-E, Class 2A4(2) | | | 8,509 | | | | 7,861 | |
FS Rialto 2022-Fl4 Issuer LLC | | | | | | | | |
6.97% (30-day Average SOFR + 1.90%, 1.90% Floor), 01/19/2039, Series 2022-FL4, Class A(1)(2) | | | 4,908 | | | | 4,830 | |
FS Rialto 2022-FL6 Issuer LLC | | | | | | | | |
7.66% (1 Month Term SOFR + 2.58%, 2.58% Floor), 08/17/2037, Series 2022-FL6, Class A(1)(2) | | | 3,607 | | | | 3,599 | |
FS Rialto 2022-FL7 Issuer LLC | | | | | | | | |
7.99% (1 Month Term SOFR + 2.90%, 2.90% Floor), 10/19/2039, Series 2022-FL7, Class A(1)(2) | | | 1,583 | | | | 1,584 | |
Galaxy XXII CLO Ltd. | | | | | | | | |
6.46% (3 Month LIBOR USD + 1.20%, 1.20% Floor), 04/16/2034, Series 2016-22A, Class ARR(1)(2) | | | 6,490 | | | | 6,360 | |
Gallatin CLO IX 2018-1 Ltd. | | | | | | | | |
6.31% (3 Month LIBOR USD + 1.05%, 1.05% Floor), 01/21/2028, Series 2018-1A, Class A(1)(2) | | | 3,107 | | | | 3,094 | |
Gallatin CLO VIII 2017-1 Ltd. | | | | | | | | |
6.35% (3 Month LIBOR USD + 1.09%, 1.09% Floor), 07/15/2031, Series 2017-1A, Class A1R(1)(2) | | | 34,600 | | | | 34,037 | |
Generate CLO 5 Ltd. | | | | | | | | |
6.45% (3 Month LIBOR USD + 1.18%), 10/22/2031, Series 5A, Class A(1)(2) | | | 500 | | | | 495 | |
Generate CLO 6 Ltd. | | | | | | | | |
6.47% (3 Month LIBOR USD + 1.20%, 1.20% Floor), 01/22/2035, Series 6A, Class A1R(1)(2) | | | 750 | | | | 734 | |
Generate CLO 7 Ltd. | | | | | | | | |
6.64% (3 Month LIBOR USD + 1.37%, 1.37% Floor), 01/22/2033, Series 7A, Class A1(1)(2) | | | 1,400 | | | | 1,380 | |
GITSIT Mortgage Loan Trust 2023-NPL1 | | | | | | | | |
8.35%, 05/25/2053, Series 2023-NPL1, Class A1(1)(3) | | | 10,474 | | | | 10,433 | |
GLS Auto Receivables Issuer Trust 2021-2 | | | | | | | | |
1.42%, 04/15/2027, Series 2021-2A, Class D(1) | | | 5,235 | | | | 4,856 | |
GLS Auto Receivables Issuer Trust 2023-2 | | | | | | | | |
6.31%, 03/15/2029, Series 2023-2A, Class D(1) | | | 3,335 | | | | 3,273 | |
GM Financial Automobile Leasing Trust 2021-1 | | | | | | | | |
1.01%, 07/21/2025, Series 2021-1, Class D | | | 3,055 | | | | 3,046 | |
GM Financial Consumer Automobile Receivables Trust 2021-1 | | | | | | | | |
0.35%, 10/16/2025, Series 2021-1, Class A3 | | | 2,822 | | | | 2,752 | |
| | | | | | | | |
GM Financial Consumer Automobile Receivables Trust 2021-2 | | | | | | | | |
0.51%, 04/16/2026, Series 2021-2, Class A3 | | | 10,662 | | | | 10,304 | |
GMF Floorplan Owner Revolving Trust | | | | | | | | |
1.31%, 10/15/2025, Series 2020-2, Class C(1) | | | 3,040 | | | | 2,993 | |
1.48%, 08/15/2025, Series 2020-1, Class C(1) | | | 735 | | | | 731 | |
3.30%, 04/15/2026, Series 2019-2, Class C(1) | | | 6,875 | | | | 6,682 | |
Goldentree Loan Management U.S. CLO 10 Ltd. | | | | | | | | |
6.35% (3 Month LIBOR USD + 1.10%, 1.10% Floor), 07/20/2034, Series 2021-10A, Class A(1)(2) | | | 1,000 | | | | 977 | |
Goldentree Loan Management U.S. CLO 8 Ltd. | | | | | | | | |
6.40% (3 Month LIBOR USD + 1.15%, 1.15% Floor), 10/20/2034, Series 2020-8A, Class AR(1)(2) | | | 4,735 | | | | 4,652 | |
GoldenTree Loan Opportunities IX Ltd. | | | | | | | | |
6.41% (3 Month LIBOR USD + 1.11%, 1.11% Floor), 10/29/2029, Series 2014-9A, Class AR2(1)(2) | | | 7,048 | | | | 7,015 | |
Goldman Home Improvement Trust 2022-GRN2 Issuer Trust | | | | | | | | |
6.80%, 10/25/2052, Series 2022-GRN2, Class A(1) | | | 1,149 | | | | 1,133 | |
Golub Capital Partners CLO 41B-R Ltd. | | | | | | | | |
6.57% (3 Month LIBOR USD + 1.32%, 1.32% Floor), 01/20/2034, Series 2019-41A, Class AR(1)(2) | | | 2,945 | | | | 2,875 | |
Golub Capital Partners CLO 51M Ltd. | | | | | | | | |
6.88% (3 Month LIBOR USD + 1.55%, 1.55% Floor), 05/05/2034, Series 2021-51A, Class A(1)(2) | | | 25,300 | | | | 24,758 | |
Golub Capital Partners CLO 55B Ltd. | | | | | | | | |
6.45% (3 Month LIBOR USD + 1.20%, 1.20% Floor), 07/20/2034, Series 2021-55A, Class A(1)(2) | | | 3,990 | | | | 3,924 | |
GoodLeap Sustainable Home Solutions Trust 2022-3 | | | | | | | | |
4.95%, 07/20/2049, Series 2022-3CS, Class A(1) | | | 1,730 | | | | 1,586 | |
GoodLeap Sustainable Home Solutions Trust 2023-1 | | | | | | | | |
5.52%, 02/22/2055, Series 2023-1GS, Class A(1) | | | 1,456 | | | | 1,385 | |
Gracie Point International Funding 2022-2 | | | | | | | | |
7.79% (30-day Average SOFR + 2.75%), 07/01/2024, Series 2022-2A, Class A(1)(2) | | | 3,156 | | | | 3,158 | |
8.42% (30-day Average SOFR + 3.35%), 07/01/2024, Series 2022-2A, Class B(1)(2) | | | 1,257 | | | | 1,258 | |
Greystone Commercial Real Estate Notes 2019-FL2 Ltd. | | | | | | | | |
6.37% (1 Month LIBOR USD + 1.18%, 1.18% Floor), 09/15/2037, Series 2019-FL2, Class A(1)(2) | | | 856 | | | | 841 | |
Greystone CRE Notes 2021-FL3 Ltd. | | | | | | | | |
6.28% (1 Month Term SOFR + 1.13%, 1.02% Floor), 07/15/2039, Series 2021-FL3, Class A(1)(2) | | | 548 | | | | 535 | |
Greywolf CLO VII Ltd. | | | | | | | | |
6.49% (3 Month Term SOFR + 1.44%, 1.44% Floor), 10/20/2031, Series 2018-2A, Class A1(1)(2) | | | 500 | | | | 495 | |
GSAMP Trust 2005-AHL | | | | | | | | |
6.13% (1 Month LIBOR USD + 0.98%, 0.98% Floor), 04/25/2035, Series 2005-AHL, Class M2(2) | | | 3,606 | | | | 3,268 | |
GSAMP Trust 2007-FM2 | | | | | | | | |
5.21% (1 Month LIBOR USD + 0.06%, 0.06% Floor), 01/25/2037, Series 2007-FM2, Class A2A(2) | | | 1,529 | | | | 883 | |
Gulf Stream Meridian 1 Ltd. | | | | | | | | |
6.63% (3 Month LIBOR USD + 1.37%, 1.37% Floor), 04/15/2033, Series 2020-IA, Class A1(1)(2) | | | 2,000 | | | | 1,969 | |
Gulf Stream Meridian 3 Ltd. | | | | | | | | |
6.58% (3 Month LIBOR USD + 1.32%, 1.32% Floor), 04/15/2034, Series 2021-IIIA, Class A1(1)(2) | | | 3,200 | | | | 3,166 | |
Gulf Stream Meridian 4 Ltd. | | | | | | | | |
6.46% (3 Month LIBOR USD + 1.20%, 1.20% Floor), 07/15/2034, Series 2021-4A, Class A1(1)(2) | | | 1,250 | | | | 1,229 | |
Gulf Stream Meridian 7 Ltd. | | | | | | | | |
6.35% (3 Month Term SOFR + 1.36%, 1.36% Floor), 07/15/2035, Series 2022-7A, Class A1(1)(2) | | | 18,270 | | | | 17,852 | |
HalseyPoint CLO 3 Ltd. | | | | | | | | |
6.75% (3 Month LIBOR USD + 1.45%, 1.45% Floor), 11/30/2032, Series 2020-3A, Class A1A(1)(2) | | | 1,050 | | | | 1,038 | |
Hardee’s Funding LLC | | | | | | | | |
2.87%, 06/20/2051, Series 2021-1A, Class A2(1) | | | 4,694 | | | | 3,740 | |
4.96%, 06/20/2048, Series 2018-1A, Class A2II(1) | | | 7,158 | | | | 6,671 | |
Harley Marine Financing LLC | | | | | | | | |
6.68%, 05/15/2043, Series 2018-1A, Class A2(1)(4) | | | 674 | | | | 665 | |
Harvest CLO XXI DAC | | | | | | | | |
1.04%, 07/15/2031, Series 21A, Class A2R(1) | | EUR | 4,100 | | | | 4,067 | |
4.42% (3 Month EURIBOR + 0.76%, 0.76% Floor), 07/15/2031, Series 21A, Class A1R(1)(2) | | | 34,400 | | | | 36,438 | |
Harvest SBA Loan Trust 2018-1 | | | | | | | | |
7.39% (1 Month LIBOR USD + 2.25%), 08/25/2044, Series 2018-1, Class A(1)(2) | | $ | 1,952 | | | | 1,906 | |
Hertz Vehicle Financing III LLC | | | | | | | | |
4.85%, 06/25/2026, Series 2022-1A, Class D(1) | | | 11,604 | | | | 10,726 | |
6.31%, 03/25/2025, Series 2022-3A, Class D(1) | | | 8,879 | | | | 8,725 | |
Hertz Vehicle Financing LLC | | | | | | | | |
6.56%, 09/25/2026, Series 2022-4A, Class D(1) | | | 6,660 | | | | 6,299 | |
Hilton Grand Vacations Trust 2017-A | | | | | | | | |
2.66%, 12/26/2028, Series 2017-AA, Class A(1) | | | 40 | | | | 39 | |
2.96%, 12/26/2028, Series 2017-AA, Class B(1) | | | 18 | | | | 18 | |
HIN Timeshare Trust 2020-A | | | | | | | | |
3.42%, 10/09/2039, Series 2020-A, Class C(1) | | | 130 | | | | 119 | |
Hipgnosis Music Assets 2022-1 LP | | | | | | | | |
5.00%, 05/16/2062, Series 2022-1, Class A(1) | | | 2,434 | | | | 2,265 | |
Home Partners of America 2019-1 Trust | | | | | | | | |
3.41%, 09/17/2039, Series 2019-1, Class D(1) | | | 1,133 | | | | 996 | |
Home Partners of America 2019-2 Trust | | | | | | | | |
3.12%, 10/19/2039, Series 2019-2, Class D(1) | | | 1,190 | | | | 1,025 | |
Home Partners of America 2021-1 Trust | | | | | | | | |
2.58%, 09/17/2041, Series 2021-1, Class E(1) | | | 765 | | | | 624 | |
Home Partners of America 2021-2 Trust | | | | | | | | |
2.95%, 12/17/2026, Series 2021-2, Class E2(1) | | | 4,243 | | | | 3,657 | |
Home Partners of America 2021-3 Trust | | | | | | | | |
2.20%, 01/17/2041, Series 2021-3, Class A(1) | | | 15,274 | | | | 12,945 | |
Honda Auto Receivables 2020-1 Owner Trust | | | | | | | | |
1.61%, 04/22/2024, Series 2020-1, Class A3 | | | 98 | | | | 98 | |
Honda Auto Receivables 2020-3 Owner Trust | | | | | | | | |
0.37%, 10/18/2024, Series 2020-3, Class A3 | | | 1,731 | | | | 1,707 | |
Honda Auto Receivables 2021-1 Owner Trust | | | | | | | | |
0.27%, 04/21/2025, Series 2021-1, Class A3 | | | 4,191 | | | | 4,092 | |
Horizon Aircraft Finance I Ltd. | | | | | | | | |
4.46%, 12/15/2038, Series 2018-1, Class A(1) | | | 2,334 | | | | 2,013 | |
Horizon Aircraft Finance II Ltd. | | | | | | | | |
3.72%, 07/15/2039, Series 2019-1, Class A(1) | | | 1,085 | | | | 927 | |
| | | | | | | | |
Horizon Aircraft Finance III Ltd. | | | | | | | | |
3.43%, 11/15/2039, Series 2019-2, Class A(1) | | | 5,433 | | | | 4,292 | |
HPEFS Equipment Trust | | | | | | | | |
2.40%, 11/20/2029, Series 2022-1A, Class D(1) | | | 3,390 | | | | 3,153 | |
HPEFS Equipment Trust 2021-1 | | | | | | | | |
1.03%, 03/20/2031, Series 2021-1A, Class D(1) | | | 1,775 | | | | 1,713 | |
Huntington CDO Ltd. | | | | | | | | |
5.03% (3 Month LIBOR USD + 0.50%), 11/05/2040, Series 2005-1A, Class A2(1)(2) | | | 6,895 | | | | 6,670 | |
IXIS Real Estate Capital Trust 2005-HE2 | | | | | | | | |
6.13% (1 Month LIBOR USD + 0.98%, 0.98% Floor), 09/25/2035, Series 2005-HE2, Class M5(2) | | | 3,711 | | | | 3,677 | |
JMP Credit Advisors CLO IV Ltd. | | | | | | | | |
6.53% (3 Month Term SOFR + 1.54%, 1.28% Floor), 07/17/2029, Series 2017-1A, Class AR(1)(2) | | | 1,369 | | | | 1,366 | |
JP Morgan Mortgage Acquisition Corp. 2005-FRE1 | | | | | | | | |
2.81% (1 Month LIBOR USD + 0.65%, 0.65% Floor), 10/25/2035, Series 2005-FRE1, Class M2(2) | | | 7,044 | | | | 6,033 | |
JP Morgan Mortgage Acquisition Corp. 2006-FRE2 | | | | | | | | |
5.69% (1 Month LIBOR USD + 0.54%, 0.54% Floor), 02/25/2036, Series 2006-FRE2, Class M2(2) | | | 8,467 | | | | 7,273 | |
JP Morgan Mortgage Acquisition Corp. 2006-WMC1 | | | | | | | | |
5.69% (1 Month LIBOR USD + 0.54%, 0.54% Floor), 03/25/2036, Series 2006-WMC1, Class A5(2) | | | 5,722 | | | | 5,281 | |
JP Morgan Mortgage Acquisition Trust 2006-CW1 | | | | | | | | |
5.59% (1 Month LIBOR USD + 0.44%, 0.44% Floor), 05/25/2036, Series 2006-CW1, Class M2(2) | | | 11,322 | | | | 9,786 | |
JP Morgan Mortgage Acquisition Trust 2006-WMC4 | | | | | | | | |
5.27% (1 Month LIBOR USD + 0.12%, 0.12% Floor), 12/25/2036, Series 2006-WMC4, Class A3(2) | | | 18,998 | | | | 9,856 | |
5.30% (1 Month LIBOR USD + 0.15%, 0.15% Floor), 12/25/2036, Series 2006-WMC4, Class A4(2) | | | 17,303 | | | | 8,999 | |
JP Morgan Mortgage Acquisition Trust 2007-CH3 | | | | | | | | |
5.41% (1 Month LIBOR USD + 0.26%, 0.26% Floor), 03/25/2037, Series 2007-CH3, Class A5(2) | | | 11,604 | | | | 11,231 | |
JP Morgan Mortgage Acquisition Trust 2007-CH5 | | | | | | | | |
5.42% (1 Month LIBOR USD + 0.27%, 0.27% Floor), 06/25/2037, Series 2007-CH5, Class M1(2) | | | 6,439 | | | | 6,016 | |
Kestrel Aircraft Funding Ltd. | | | | | | | | |
4.25%, 12/15/2038, Series 2018-1A, Class A(1) | | | 2,759 | | | | 2,367 | |
KKR CLO 11 Ltd. | | | | | | | | |
6.44% (3 Month LIBOR USD + 1.18%, 1.44% Floor), 01/15/2031, Series 11, Class AR(1)(2) | | | 8,608 | | | | 8,521 | |
KKR CLO 29 Ltd. | | | | | | | | |
6.76% (3 Month LIBOR USD + 1.50%, 1.50% Floor), 01/15/2032, Series 29A, Class B(1)(2) | | | 8,540 | | | | 8,302 | |
KREF 2022-FL3 Ltd. | | | | | | | | |
6.53% (1 Month Term SOFR + 1.45%, 1.45% Floor), 02/17/2039, Series 2022-FL3, Class A(1)(2) | | | 10,000 | | | | 9,766 | |
Laurel Road Prime Student Loan Trust 2020-A | | | | | | | | |
1.40%, 11/25/2050, Series 2020-A, Class A2FX(1) | | | 3,967 | | | | 3,544 | |
LCM XVII LP | | | | | | | | |
6.39% (3 Month LIBOR USD + 1.13%, 1.13% Floor), 10/15/2031, Series 17A, Class A1AR(1)(2) | | | 1,500 | | | | 1,486 | |
Lehman XS Trust 2007-6 | | | | | | | | |
5.57% (1 Month LIBOR USD + 0.42%, 0.42% Floor), 05/25/2037, Series 2007-6, Class 2A1(2) | | | 6,703 | | | | 5,561 | |
Lendmark Funding Trust 2022-1 | | | | | | | | |
5.12%, 07/20/2032, Series 2022-1A, Class A(1) | | | 2,819 | | | | 2,739 | |
LoanCore 2022-CRE7 Issuer Ltd. | | | | | | | | |
6.62% (30-day Average SOFR + 1.55%, 1.55% Floor), 01/17/2037, Series 2022-CRE7, Class A(1)(2) | | | 10,854 | | | | 10,639 | |
Long Beach Mortgage Loan Trust 2004-6 | | | | | | | | |
6.35% (1 Month LIBOR USD + 1.20%, 1.20% Floor), 11/25/2034, Series 2004-6, Class M1(2) | | | 17,175 | | | | 15,272 | |
Long Beach Mortgage Loan Trust 2005-2 | | | | | | | | |
6.28% (1 Month LIBOR USD + 1.13%, 1.13% Floor), 04/25/2035, Series 2005-2, Class M6(2) | | | 12,500 | | | | 11,676 | |
Long Beach Mortgage Loan Trust 2005-WL2 | | | | | | | | |
5.93% (1 Month LIBOR USD + 0.78%, 0.78% Floor), 08/25/2035, Series 2005-WL2, Class M3(2) | | | 8,536 | | | | 8,251 | |
Long Beach Mortgage Loan Trust 2005-WL3 | | | | | | | | |
5.86% (1 Month LIBOR USD + 0.71%, 0.71% Floor), 11/25/2035, Series 2005-WL3, Class M2(2) | | | 10,014 | | | | 9,145 | |
Long Beach Mortgage Loan Trust 2006-WL1 | | | | | | | | |
5.78% (1 Month LIBOR USD + 0.63%, 0.63% Floor), 01/25/2046, Series 2006-WL1, Class M1(2) | | | 13,653 | | | | 12,593 | |
Louisiana Local Government Environmental Facilities & Community Development Auth | | | | | | | | |
4.15%, 02/01/2033, Series ELL, Class A2 | | | 2,190 | | | | 2,115 | |
Madison Park Funding XLVII Ltd. | | | | | | | | |
7.12% (3 Month LIBOR USD + 1.85%, 1.85% Floor), 01/19/2034, Series 2020-47A, Class B(1)(2) | | | 500 | | | | 492 | |
Madison Park Funding XLVIII Ltd. | | | | | | | | |
6.72% (3 Month LIBOR USD + 1.45%, 1.45% Floor), 04/19/2033, Series 2021-48A, Class B(1)(2) | | | 2,750 | | | | 2,689 | |
Madison Park Funding XVIII Ltd. | | | | | | | | |
6.20% (3 Month LIBOR USD + 0.94%, 0.94% Floor), 10/21/2030, Series 2015-18A, Class ARR(1)(2) | | | 5,140 | | | | 5,088 | |
Madison Park Funding XXV Ltd. | | | | | | | | |
6.91% (3 Month LIBOR USD + 1.65%, 1.65% Floor), 04/25/2029, Series 2017-25A, Class A2R(1)(2) | | | 8,235 | | | | 8,097 | |
Madison Park Funding XXVI Ltd. | | | | | | | | |
6.50% (3 Month LIBOR USD + 1.20%), 07/29/2030, Series 2017-26A, Class AR(1)(2) | | | 2,904 | | | | 2,884 | |
Madison Park Funding XXXIII Ltd. | | | | | | | | |
6.28% (3 Month Term SOFR + 1.29%, 1.29% Floor), 10/15/2032, Series 2019-33A, Class AR(1)(2) | | | 14,360 | | | | 14,179 | |
Madison Park Funding XXXIV Ltd. | | | | | | | | |
6.38% (3 Month LIBOR USD + 1.12%, 1.12% Floor), 04/25/2032, Series 2019-34A, Class AR(1)(2) | | | 250 | | | | 247 | |
Madison Park Funding XXXIX Ltd. | | | | | | | | |
6.92% (3 Month LIBOR USD + 1.65%, 1.65% Floor), 10/22/2034, Series 2021-39A, Class B(1)(2) | | | 25,900 | | | | 25,397 | |
Madison Park Funding XXXV Ltd. | | | | | | | | |
6.24% (3 Month LIBOR USD + 0.99%, 0.99% Floor), 04/20/2032, Series 2019-35A, Class A1R(1)(2) | | | 2,500 | | | | 2,469 | |
Madison Park Funding XXXVII Ltd. | | | | | | | | |
6.33% (3 Month LIBOR USD + 1.07%, 1.07% Floor), 07/15/2033, Series 2019-37A, Class AR(1)(2) | | | 3,845 | | | | 3,789 | |
Magnetite VII Ltd. | | | | | | | | |
6.06% (3 Month LIBOR USD + 0.80%), 01/15/2028, Series 2012-7A, Class A1R2(1)(2) | | | 8,170 | | | | 8,113 | |
Magnetite VIII Ltd. | | | | | | | | |
6.24% (3 Month LIBOR USD + 0.98%, 0.98% Floor), 04/15/2031, Series 2014-8A, Class AR2(1)(2) | | | 1,080 | | | | 1,072 | |
Magnetite XXV Ltd. | | | | | | | | |
6.46% (3 Month LIBOR USD + 1.20%, 1.20% Floor), 01/25/2032, Series 2020-25A, Class A(1)(2) | | | 18,000 | | | | 17,850 | |
MAPS 2018-1 Ltd. | | | | | | | | |
4.21%, 05/15/2043, Series 2018-1A, Class A(1) | | | 3,992 | | | | 3,562 | |
MAPS 2019-1 Ltd. | | | | | | | | |
4.46%, 03/15/2044, Series 2019-1A, Class A(1) | | | 889 | | | | 795 | |
MAPS 2021-1 Trust | | | | | | | | |
2.52%, 06/15/2046, Series 2021-1A, Class A(1) | | | 14,496 | | | | 12,499 | |
| | | | | | | | |
Marble Point CLO X Ltd. | | | | | | | | |
6.30% (3 Month LIBOR USD + 1.04%, 1.04% Floor), 10/15/2030, Series 2017-1A, Class AR(1)(2) | | | 682 | | | | 674 | |
Mariner Finance Issuance Trust 2019-A | | | | | | | | |
3.51%, 07/20/2032, Series 2019-AA, Class B(1) | | | 535 | | | | 523 | |
Mariner Finance Issuance Trust 2022-A | | | | | | | | |
6.45%, 10/20/2037, Series 2022-AA, Class A(1) | | | 2,778 | | | | 2,772 | |
Marlette Funding Trust 2021-2 | | | | | | | | |
1.50%, 09/15/2031, Series 2021-2A, Class C(1) | | | 1,120 | | | | 1,055 | |
Marlette Funding Trust 2021-3 | | | | | | | | |
1.81%, 12/15/2031, Series 2021-3A, Class C(1) | | | 2,145 | | | | 1,952 | |
Marlette Funding Trust 2023-2 | | | | | | | | |
6.54%, 06/15/2033, Series 2023-2A, Class B(1) | | | 3,730 | | | | 3,706 | |
MASTR Asset Backed Securities Trust 2004-WMC1 | | | | | | | | |
5.93% (1 Month LIBOR USD + 0.78%, 0.78% Floor), 02/25/2034, Series 2004-WMC1, Class M1(2) | | | 892 | | | | 890 | |
MASTR Specialized Loan Trust | | | | | | | | |
5.67% (1 Month LIBOR USD + 0.52%, 0.52% Floor), 02/25/2036, Series 2006-2, Class A(1)(2) | | | 403 | | | | 383 | |
Mercury Financial Credit Card Master Trust | | | | | | | | |
8.04%, 09/20/2027, Series 2023-1A, Class A(1) | | | 12,045 | | | | 12,030 | |
Merlin Aviation Holdings DAC | | | | | | | | |
4.50%, 12/15/2032, Series 2016-1, Class A(1)(4) | | | 843 | | | | 745 | |
Merrill Lynch First Franklin Mortgage Loan Trust Series 2007-2 | | | | | | | | |
5.63% (1 Month LIBOR USD + 0.48%, 0.48% Floor), 05/25/2037, Series 2007-2, Class A2C(2) | | | 2,122 | | | | 1,584 | |
Merrill Lynch First Franklin Mortgage Loan Trust Series 2007-5 | | | | | | | | |
6.15% (1 Month LIBOR USD + 1.00%, 1.00% Floor), 10/25/2037, Series 2007-5, Class 2A2(2) | | | 14,011 | | | | 11,513 | |
Merrill Lynch Mortgage Investors Trust Series 2006-OPT1 | | | | | | | | |
5.44% (1 Month LIBOR USD + 0.29%, 0.29% Floor), 08/25/2037, Series 2006-OPT1, Class A1(2) | | | 11,306 | | | | 10,141 | |
Merrill Lynch Mortgage Investors Trust Series 2006-RM2 | | | | | | | | |
5.35% (1 Month LIBOR USD + 0.20%, 0.20% Floor), 05/25/2037, Series 2006-RM2, Class A2B(2) | | | 12,019 | | | | 1,370 | |
5.48% (1 Month LIBOR USD + 0.33%, 0.33% Floor), 05/25/2037, Series 2006-RM2, Class A2C(2) | | | 28,810 | | | | 3,331 | |
Merrill Lynch Mortgage Investors Trust Series 2006-RM3 | | | | | | | | |
5.45% (1 Month LIBOR USD + 0.30%, 0.30% Floor), 06/25/2037, Series 2006-RM3, Class A2C(2) | | | 43,949 | | | | 9,310 | |
METAL 2017-1 LLC | | | | | | | | |
4.58%, 10/15/2042, Series 2017-1, Class A(1) | | | 2,932 | | | | 1,756 | |
MF1 2020-FL4 Ltd. | | | | | | | | |
6.96% (1 Month Term SOFR + 1.81%, 1.70% Floor), 11/15/2035, Series 2020-FL4, Class A(1)(2) | | | 15,332 | | | | 15,283 | |
MF1 2021-FL6 Ltd. | | | | | | | | |
6.32% (1 Month Term SOFR + 1.21%, 1.10% Floor), 07/16/2036, Series 2021-FL6, Class A(1)(2) | | | 16,219 | | | | 15,911 | |
MF1 2021-FL7 Ltd. | | | | | | | | |
6.24% (1 Month LIBOR USD + 1.08%, 1.08% Floor), 10/16/2036, Series 2021-FL7, Class A(1)(2) | | | 24,302 | | | | 23,713 | |
MF1 2022-FL10 LLC | | | | | | | | |
7.71% (1 Month Term SOFR + 2.64%, 2.64% Floor), 09/17/2037, Series 2022-FL10, Class A(1)(2) | | | 793 | | | | 795 | |
MF1 2022-FL8 Ltd. | | | | | | | | |
6.42% (30-day Average SOFR + 1.35%, 1.35% Floor), 02/19/2037, Series 2022-FL8, Class A(1)(2) | | | 6,050 | | | | 5,899 | |
MF1 2022-FL9 LLC | | | | | | | | |
7.23% (1 Month Term SOFR + 2.15%, 2.15% Floor), 06/19/2037, Series 2022-FL9, Class A(1)(2) | | | 1,546 | | | | 1,541 | |
Midocean Credit CLO VIII | | | | | | | | |
6.43% (3 Month LIBOR USD + 1.05%, 1.05% Floor), 02/20/2031, Series 2018-8A, Class A1R(1)(2) | | | 27,194 | | | | 26,851 | |
Mission Lane Credit Card Master Trust | | | | | | | | |
7.23%, 07/17/2028, Series 2023-A, Class A(1) | | | 2,920 | | | | 2,891 | |
Morgan Stanley ABS Capital I, Inc. Trust 2004-HE8 | | | | | | | | |
6.11% (1 Month LIBOR USD + 0.96%, 0.96% Floor), 09/25/2034, Series 2004-HE8, Class M1(2) | | | 1,232 | | | | 1,190 | |
Morgan Stanley ABS Capital I, Inc. Trust 2005-WMC2 | | | | | | | | |
6.08% (1 Month LIBOR USD + 0.93%, 0.93% Floor), 02/25/2035, Series 2005-WMC2, Class M4(2) | | | 1,569 | | | | 1,388 | |
Morgan Stanley ABS Capital I, Inc. Trust 2006-HE8 | | | | | | | | |
5.28% (1 Month LIBOR USD + 0.13%, 0.13% Floor), 10/25/2036, Series 2006-HE8, Class A1(2) | | | 452 | | | | 397 | |
Morgan Stanley Capital I, Inc. Trust 2006-HE1 | | | | | | | | |
5.73% (1 Month LIBOR USD + 0.58%, 0.58% Floor), 01/25/2036, Series 2006-HE1, Class A4(2) | | | 5,159 | | | | 4,916 | |
Morgan Stanley Mortgage Loan Trust 2006-15XS | | | | | | | | |
6.70%, 11/25/2036, Series 2006-15XS, Class A4A(4) | | | 12,446 | | | | 2,829 | |
Morgan Stanley Mortgage Loan Trust 2007-8XS | | | | | | | | |
5.68% (1 Month LIBOR USD + 0.53%, 0.53% Floor, 6.25% Cap), 04/25/2037, Series 2007-8XS, Class A5(2) | | | 19,313 | | | | 6,959 | |
5.69% (1 Month LIBOR USD + 0.54%, 0.54% Floor, 6.26% Cap), 04/25/2037, Series 2007-8XS, Class A9(2) | | | 1,865 | | | | 672 | |
Mosaic Solar Loan Trust 2022-3 | | | | | | | | |
6.10%, 06/20/2053, Series 2022-3A, Class A(1) | | | 481 | | | | 480 | |
Mosaic Solar Loan Trust 2023-1 | | | | | | | | |
5.32%, 06/20/2053, Series 2023-1A, Class A(1) | | | 1,671 | | | | 1,608 | |
Mountain View CLO 2017-1 LLC | | | | | | | | |
6.35% (3 Month LIBOR USD + 1.09%, 1.09% Floor), 10/16/2029, Series 2017-1A, Class AR(1)(2) | | | 9,398 | | | | 9,313 | |
Mountain View CLO IX Ltd. | | | | | | | | |
6.38% (3 Month LIBOR USD + 1.12%), 07/15/2031, Series 2015-9A, Class A1R(1)(2) | | | 1,400 | | | | 1,385 | |
MVW 2020-1 LLC | | | | | | | | |
4.21%, 10/20/2037, Series 2020-1A, Class C(1) | | | 228 | | | | 214 | |
MVW 2021-1W LLC | | | | | | | | |
1.94%, 01/22/2041, Series 2021-1WA, Class C(1) | | | 501 | | | | 449 | |
MVW 2021-2 LLC | | | | | | | | |
2.23%, 05/20/2039, Series 2021-2A, Class C(1) | | | 8,668 | | | | 7,653 | |
MVW Owner Trust 2017-1 | | | | | | | | |
2.75%, 12/20/2034, Series 2017-1A, Class B(1) | | | 25 | | | | 25 | |
MVW Owner Trust 2019-1 | | | | | | | | |
3.33%, 11/20/2036, Series 2019-1A, Class C(1) | | | 144 | | | | 135 | |
Nassau 2017-I Ltd. | | | | | | | | |
6.41% (3 Month LIBOR USD + 1.15%), 10/15/2029, Series 2017-IA, Class A1AS(1)(2) | | | 6,243 | | | | 6,212 | |
National Collegiate Student Loan Trust 2005-3 | | | | | | | | |
5.40% (1 Month LIBOR USD + 0.29%), 10/25/2033, Series 2005-3W, Class A51(1)(2) | | | 2,819 | | | | 2,738 | |
Navient Private Education Loan Trust 2014-A | | | | | | | | |
6.79% (1 Month LIBOR USD + 1.60%), 10/15/2031, Series 2014-AA, Class A3(1)(2) | | | 790 | | | | 789 | |
Navient Private Education Loan Trust 2015-A | | | | | | | | |
6.89% (1 Month LIBOR USD + 1.70%), 11/15/2030, Series 2015-AA, Class A3(1)(2) | | | 850 | | | | 852 | |
Navient Private Education Loan Trust 2015-B | | | | | | | | |
| | | | | | | | |
6.64% (1 Month LIBOR USD + 1.45%), 07/16/2040, Series 2015-BA, Class A3(1)(2) | | | 9,079 | | | | 9,059 | |
Navient Private Education Loan Trust 2017-A | | | | | | | | |
2.88%, 12/16/2058, Series 2017-A, Class A2A(1) | | | 53 | | | | 52 | |
3.91%, 12/16/2058, Series 2017-A, Class B(1) | | | 440 | | | | 414 | |
Navient Private Education Loan Trust 2018-B | | | | | | | | |
3.61%, 12/15/2059, Series 2018-BA, Class A2A(1) | | | 989 | | | | 953 | |
Navient Private Education Refi Loan Trust 2018-A | | | | | | | | |
3.19%, 02/18/2042, Series 2018-A, Class A2(1) | | | 58 | | | | 57 | |
Navient Private Education Refi Loan Trust 2018-C | | | | | | | | |
3.52%, 06/16/2042, Series 2018-CA, Class A2(1) | | | 120 | | | | 117 | |
Navient Private Education Refi Loan Trust 2018-D | | | | | | | | |
4.00%, 12/15/2059, Series 2018-DA, Class A2A(1) | | | 881 | | | | 840 | |
Navient Private Education Refi Loan Trust 2019-C | | | | | | | | |
3.13%, 02/15/2068, Series 2019-CA, Class A2(1) | | | 589 | | | | 556 | |
Navient Private Education Refi Loan Trust 2019-F | | | | | | | | |
2.60%, 08/15/2068, Series 2019-FA, Class A2(1) | | | 2,603 | | | | 2,387 | |
Navient Private Education Refi Loan Trust 2019-G | | | | | | | | |
2.40%, 10/15/2068, Series 2019-GA, Class A(1) | | | 2,712 | | | | 2,496 | |
Navient Private Education Refi Loan Trust 2020-B | | | | | | | | |
2.12%, 01/15/2069, Series 2020-BA, Class A2(1) | | | 2,724 | | | | 2,469 | |
Navient Private Education Refi Loan Trust 2020-C | | | | | | | | |
2.15%, 11/15/2068, Series 2020-CA, Class A2A(1) | | | 3,700 | | | | 3,370 | |
2.83%, 11/15/2068, Series 2020-CA, Class B(1) | | | 4,665 | | | | 3,800 | |
Navient Private Education Refi Loan Trust 2020-D | | | | | | | | |
1.69%, 05/15/2069, Series 2020-DA, Class A(1) | | | 4,740 | | | | 4,255 | |
Navient Private Education Refi Loan Trust 2020-G | | | | | | | | |
1.17%, 09/16/2069, Series 2020-GA, Class A(1) | | | 3,185 | | | | 2,818 | |
Navient Private Education Refi Loan Trust 2020-H | | | | | | | | |
1.31%, 01/15/2069, Series 2020-HA, Class A(1) | | | 2,129 | | | | 1,923 | |
1.33%, 04/15/2069, Series 2020-IA, Class A1A(1) | | | 7,174 | | | | 6,297 | |
6.19% (1 Month LIBOR USD + 1.00%, 1.00% Floor), 04/15/2069, Series 2020-IA, Class A1B(1)(2) | | | 12,368 | | | | 12,165 | |
Navient Private Education Refi Loan Trust 2021-A | | | | | | | | |
0.84%, 05/15/2069, Series 2021-A, Class A(1) | | | 2,731 | | | | 2,369 | |
2.24%, 05/15/2069, Series 2021-A, Class B(1) | | | 360 | | | | 260 | |
Navient Private Education Refi Loan Trust 2021-E | | | | | | | | |
2.03%, 12/16/2069, Series 2021-EA, Class B(1) | | | 1,680 | | | | 1,120 | |
Navient Private Education Refi Loan Trust 2021-F | | | | | | | | |
2.12%, 02/18/2070, Series 2021-FA, Class B(1) | | | 3,810 | | | | 2,445 | |
Navient Student Loan Trust 2014-3 | | | | | | | | |
5.77% (1 Month LIBOR USD + 0.62%), 03/25/2083, Series 2014-3, Class A(2) | | | 196 | | | | 189 | |
Navient Student Loan Trust 2016-2 | | | | | | | | |
6.65% (1 Month LIBOR USD + 1.50%), 06/25/2065, Series 2016-2A, Class A3(1)(2) | | | 5,117 | | | | 5,120 | |
Navient Student Loan Trust 2018-2 | | | | | | | | |
5.90% (1 Month LIBOR USD + 0.75%), 03/25/2067, Series 2018-2A, Class A3(1)(2) | | | 13,430 | | | | 13,112 | |
Navient Student Loan Trust 2019-B | | | | | | | | |
3.39%, 12/15/2059, Series 2019-BA, Class A2A(1) | | | 422 | | | | 398 | |
Navigator Aircraft ABS Ltd. | | | | | | | | |
2.77%, 11/15/2046, Series 2021-1, Class A(1)(4) | | | 12,899 | | | | 11,202 | |
Nelnet Student Loan Trust 2006-1 | | | | | | | | |
5.84% (3 Month LIBOR USD + 0.45%), 08/23/2036, Series 2006-1, Class A6(1)(2) | | | 17,708 | | | | 17,220 | |
Nelnet Student Loan Trust 2014-2 | | | | | | | | |
6.00% (1 Month LIBOR USD + 0.85%), 07/27/2037, Series 2014-2A, Class A3(1)(2) | | | 4,250 | | | | 4,192 | |
Nelnet Student Loan Trust 2021-B | | | | | | | | |
1.42%, 04/20/2062, Series 2021-BA, Class AFX(1) | | | 6,478 | | | | 5,756 | |
Neuberger Berman CLO XIV Ltd. | | | | | | | | |
6.30% (3 Month LIBOR USD + 1.03%, 1.03% Floor), 01/28/2030, Series 2013-14A, Class AR2(1)(2) | | | 2,214 | | | | 2,196 | |
Neuberger Berman CLO XVI-S Ltd. | | | | | | | | |
6.30% (3 Month LIBOR USD + 1.04%, 1.04% Floor), 04/15/2034, Series 2017-16SA, Class AR(1)(2) | | | 18,770 | | | | 18,409 | |
Neuberger Berman Loan Advisers CLO 32 Ltd. | | | | | | | | |
6.26% (3 Month LIBOR USD + 0.99%, 0.99% Floor), 01/20/2032, Series 2019-32A, Class AR(1)(2) | | | 15,740 | | | | 15,521 | |
Neuberger Berman Loan Advisers CLO 42 Ltd. | | | | | | | | |
6.36% (3 Month LIBOR USD + 1.10%, 1.10% Floor), 07/16/2035, Series 2021-42A, Class A(1)(2) | | | 550 | | | | 540 | |
Neuberger Berman Loan Advisers CLO 43 Ltd. | | | | | | | | |
6.39% (3 Month LIBOR USD + 1.13%, 1.13% Floor), 07/17/2035, Series 2021-43A, Class A(1)(2) | | | 29,715 | | | | 29,247 | |
Neuberger Berman Loan Advisers CLO 45 Ltd. | | | | | | | | |
6.38% (3 Month LIBOR USD + 1.13%, 1.13% Floor), 10/14/2035, Series 2021-45A, Class A(1)(2) | | | 3,240 | | | | 3,181 | |
New Century Home Equity Loan Trust 2005-1 | | | | | | | | |
5.83% (1 Month LIBOR USD + 0.68%, 0.68% Floor, 12.50% Cap), 03/25/2035, Series 2005-1, Class M1(2) | | | 2,849 | | | | 2,806 | |
New Century Home Equity Loan Trust Series 2005-D | | | | | | | | |
5.86% (1 Month LIBOR USD + 0.71%, 0.71% Floor), 02/25/2036, Series 2005-D, Class M2(2) | | | 10,390 | | | | 8,616 | |
Nissan Auto Receivables 2020-A Owner Trust | | | | | | | | |
1.38%, 12/16/2024, Series 2020-A, Class A3 | | | 1,065 | | | | 1,057 | |
Nissan Auto Receivables 2020-B Owner Trust | | | | | | | | |
0.55%, 07/15/2024, Series 2020-B, Class A3 | | | 35 | | | | 35 | |
Nomura Home Equity Loan, Inc. Home Equity Loan Trust Series 2006-HE1 | | | | | | | | |
5.77% (1 Month LIBOR USD + 0.62%, 0.62% Floor), 02/25/2036, Series 2006-HE1, Class M1(2) | | | 75 | | | | 75 | |
OCP CLO 2014-5 Ltd. | | | | | | | | |
6.35% (3 Month LIBOR USD + 1.08%, 1.08% Floor), 04/26/2031, Series 2014-5A, Class A1R(1)(2) | | | 1,250 | | | | 1,237 | |
OCP CLO 2014-7 Ltd. | | | | | | | | |
6.37% (3 Month LIBOR USD + 1.12%), 07/20/2029, Series 2014-7A, Class A1RR(1)(2) | | | 12,662 | | | | 12,562 | |
OCP CLO 2020-19 Ltd. | | | | | | | | |
6.40% (3 Month LIBOR USD + 1.15%, 1.15% Floor), 10/20/2034, Series 2020-19A, Class AR(1)(2) | | | 12,450 | | | | 12,178 | |
Octagon Investment Partners 29 Ltd. | | | | | | | | |
6.45% (3 Month LIBOR USD + 1.18%), 01/24/2033, Series 2016-1A, Class AR(1)(2) | | | 7,880 | | | | 7,766 | |
Octagon Investment Partners 43 Ltd. | | | | | | | | |
6.91% (3 Month LIBOR USD + 1.65%, 1.65% Floor), 10/25/2032, Series 2019-1A, Class A2(1)(2) | | | 1,250 | | | | 1,236 | |
Octagon Investment Partners XV Ltd. | | | | | | | | |
6.24% (3 Month LIBOR USD + 0.97%, 0.97% Floor), 07/19/2030, Series 2013-1A, Class A1RR(1)(2) | | | 8,426 | | | | 8,352 | |
Octagon Investment Partners XVI Ltd. | | | | | | | | |
| | | | | | | | |
6.28% (3 Month LIBOR USD + 1.02%, 1.02% Floor), 07/17/2030, Series 2013-1A, Class A1R(1)(2) | | | 1,000 | | | | 989 | |
Octagon Investment Partners XVII Ltd. | | | | | | | | |
6.66% (3 Month LIBOR USD + 1.40%), 01/25/2031, Series 2013-1A, Class BR2(1)(2) | | | 2,500 | | | | 2,416 | |
OHA Credit Funding 3 Ltd. | | | | | | | | |
6.39% (3 Month LIBOR USD + 1.14%, 1.14% Floor), 07/02/2035, Series 2019-3A, Class AR(1)(2) | | | 8,770 | | | | 8,619 | |
OHA Credit Funding 4 Ltd. | | | | | | | | |
6.42% (3 Month LIBOR USD + 1.15%, 1.15% Floor), 10/22/2036, Series 2019-4A, Class AR(1)(2) | | | 750 | | | | 735 | |
OHA Credit Funding 6 Ltd. | | | | | | | | |
6.39% (3 Month LIBOR USD + 1.14%, 1.14% Floor), 07/20/2034, Series 2020-6A, Class AR(1)(2) | | | 6,730 | | | | 6,619 | |
OHA Credit Funding 7 Ltd. | | | | | | | | |
6.33% (3 Month Term SOFR + 1.30%, 1.30% Floor), 02/24/2037, Series 2020-7A, Class AR(1)(2) | | | 330 | | | | 324 | |
OHA Credit Partners XIII Ltd. | | | | | | | | |
6.96% (3 Month LIBOR USD + 1.70%, 1.70% Floor), 10/25/2034, Series 2016-13A, Class BR(1)(2) | | | 250 | | | | 245 | |
OHA Credit Partners XV Ltd. | | | | | | | | |
6.62% (3 Month LIBOR USD + 1.37%), 01/20/2030, Series 2017-15A, Class B(1)(2) | | | 15,180 | | | | 14,925 | |
OHA Credit Partners XVI | | | | | | | | |
6.41% (3 Month LIBOR USD + 1.15%, 1.15% Floor), 10/18/2034, Series 2021-16A, Class A(1)(2) | | | 6,680 | | | | 6,555 | |
OneMain Direct Auto Receivables Trust 2023-1 | | | | | | | | |
7.07%, 02/14/2033, Series 2023-1A, Class D(1) | | | 1,145 | | | | 1,145 | |
OneMain Financial Issuance Trust 2018-2 | | | | | | | | |
3.57%, 03/14/2033, Series 2018-2A, Class A(1) | | | 1,779 | | | | 1,752 | |
4.04%, 03/14/2033, Series 2018-2A, Class C(1) | | | 1,015 | | | | 968 | |
OneMain Financial Issuance Trust 2019-2 | | | | | | | | |
3.14%, 10/14/2036, Series 2019-2A, Class A(1) | | | 356 | | | | 322 | |
OneMain Financial Issuance Trust 2020-2 | | | | | | | | |
1.75%, 09/14/2035, Series 2020-2A, Class A(1) | | | 3,465 | | | | 3,092 | |
OneMain Financial Issuance Trust 2020-A | | | | | | | | |
4.83%, 05/14/2032, Series 2020-1A, Class B(1) | | | 2,425 | | | | 2,410 | |
OneMain Financial Issuance Trust 2021-1 | | | | | | | | |
2.47%, 06/16/2036, Series 2021-1A, Class D(1) | | | 3,300 | | | | 2,619 | |
5.83% (30-day Average SOFR + 0.76%), 06/16/2036, Series 2021-1A, Class A2(1)(2) | | | 244 | | | | 238 | |
OneMain Financial Issuance Trust 2022-2 | | | | | | | | |
4.89%, 10/14/2034, Series 2022-2A, Class A(1) | | | 33,800 | | | | 33,045 | |
OneMain Financial Issuance Trust 2022-3 | | | | | | | | |
5.94%, 05/15/2034, Series 2022-3A, Class A(1) | | | 5,301 | | | | 5,274 | |
OneMain Financial Issuance Trust 2022-S1 | | | | | | | | |
5.20%, 05/14/2035, Series 2022-S1, Class D(1) | | | 8,785 | | | | 8,016 | |
Option One Mortgage Loan Trust 2004-2 | | | | | | | | |
5.95% (1 Month LIBOR USD + 0.80%, 0.80% Floor), 05/25/2034, Series 2004-2, Class M1(2) | | | 4,810 | | | | 4,609 | |
Option One Mortgage Loan Trust 2005-2 | | | | | | | | |
5.81% (1 Month LIBOR USD + 0.66%, 0.66% Floor), 05/25/2035, Series 2005-2, Class M1(2) | | | 27 | | | | 27 | |
Option One Mortgage Loan Trust 2006-1 | | | | | | | | |
5.75% (1 Month LIBOR USD + 0.60%, 0.60% Floor), 01/25/2036, Series 2006-1, Class 2A4(2) | | | 5,534 | | | | 5,381 | |
Option One Mortgage Loan Trust 2006-3 | | | | | | | | |
5.29% (1 Month LIBOR USD + 0.14%, 0.14% Floor), 02/25/2037, Series 2006-3, Class 1A1(2) | | | 15,469 | | | | 10,054 | |
Option One Mortgage Loan Trust 2007-4 | | | | | | | | |
5.33% (1 Month LIBOR USD + 0.18%, 0.18% Floor), 04/25/2037, Series 2007-4, Class 2A2(2) | | | 14,208 | | | | 7,907 | |
OZLM VI Ltd. | | | | | | | | |
6.34% (3 Month LIBOR USD + 1.08%), 04/17/2031, Series 2014-6A, Class A1S(1)(2) | | | 15,517 | | | | 15,295 | |
OZLM VII Ltd. | | | | | | | | |
6.27% (3 Month LIBOR USD + 1.01%, 1.01% Floor), 07/17/2029, Series 2014-7RA, Class A1R(1)(2) | | | 3,611 | | | | 3,585 | |
OZLM VIII Ltd. | | | | | | | | |
6.24% (3 Month LIBOR USD + 0.98%, 0.98% Floor), 10/17/2029, Series 2014-8A, Class A1R3(1)(2) | | | 27,122 | | | | 26,895 | |
6.91% (3 Month LIBOR USD + 1.65%, 1.65% Floor), 10/17/2029, Series 2014-8A, Class A2R3(1)(2) | | | 2,955 | | | | 2,916 | |
Pagaya AI Debt Selection Trust 2021-5 | | | | | | | | |
1.53%, 08/15/2029, Series 2021-5, Class A(1) | | | 11,183 | | | | 10,975 | |
Palmer Square CLO 2013-2 Ltd. | | | | | | | | |
6.76% (3 Month LIBOR USD + 1.50%, 1.76% Floor), 10/17/2031, Series 2013-2A, Class A2R3(1)(2) | | | 250 | | | | 246 | |
Palmer Square CLO 2020-3 Ltd. | | | | | | | | |
6.40% (3 Month LIBOR USD + 1.08%, 1.08% Floor), 11/15/2031, Series 2020-3A, Class A1AR(1)(2) | | | 26,020 | | | | 25,729 | |
Palmer Square CLO 2021-2 Ltd. | | | | | | | | |
6.41% (3 Month LIBOR USD + 1.15%, 1.41% Floor), 07/15/2034, Series 2021-2A, Class A(1)(2) | | | 9,020 | | | | 8,832 | |
Palmer Square CLO 2021-4 Ltd. | | | | | | | | |
6.43% (3 Month LIBOR USD + 1.17%, 1.43% Floor), 10/15/2034, Series 2021-4A, Class A(1)(2) | | | 22,275 | | | | 21,852 | |
Palmer Square Loan Funding 2020-1 Ltd. | | | | | | | | |
7.28% (3 Month LIBOR USD + 1.90%, 1.90% Floor), 02/20/2028, Series 2020-1A, Class B(1)(2) | | | 4,590 | | | | 4,547 | |
Palmer Square Loan Funding 2021-2 Ltd. | | | | | | | | |
6.63% (3 Month LIBOR USD + 1.25%, 1.25% Floor), 05/20/2029, Series 2021-2A, Class A2(1)(2) | | | 11,775 | | | | 11,612 | |
Palmer Square Loan Funding 2021-3 Ltd. | | | | | | | | |
6.05% (3 Month LIBOR USD + 0.80%, 0.80% Floor), 07/20/2029, Series 2021-3A, Class A1(1)(2) | | | 3,304 | | | | 3,261 | |
6.65% (3 Month LIBOR USD + 1.40%, 1.40% Floor), 07/20/2029, Series 2021-3A, Class A2(1)(2) | | | 4,000 | | | | 3,937 | |
Palmer Square Loan Funding 2021-4 Ltd. | | | | | | | | |
6.66% (3 Month LIBOR USD + 1.40%, 1.66% Floor), 10/15/2029, Series 2021-4A, Class A2(1)(2) | | | 2,000 | | | | 1,951 | |
Park Place Securities, Inc. Asset-Backed Pass-Through Certificates Series 2005-WHQ4 | | | | | | | | |
5.93% (1 Month LIBOR USD + 0.78%, 0.78% Floor), 09/25/2035, Series 2005-WHQ4, Class M3(2) | | | 8,000 | | | | 6,681 | |
Planet Fitness Master Issuer LLC | | | | | | | | |
3.25%, 12/05/2051, Series 2022-1A, Class A2I(1) | | | 12,793 | | | | 11,369 | |
3.86%, 12/05/2049, Series 2019-1A, Class A2(1) | | | 1,423 | | | | 1,206 | |
4.67%, 09/05/2048, Series 2018-1A, Class A2II(1) | | | 4,201 | | | | 4,007 | |
Post CLO 2023-1 Ltd. | | | | | | | | |
6.83% (3 Month Term SOFR + 1.95%, 1.95% Floor), 04/20/2036, Series 2023-1A, Class A(1)(2) | | | 14,310 | | | | 14,295 | |
Prestige Auto Receivables Trust 2020-1 | | | | | | | | |
3.67%, 02/15/2028, Series 2020-1A, Class E(1) | | | 3,270 | | | | 3,169 | |
Prestige Auto Receivables Trust 2023-1 | | | | | | | | |
6.33%, 04/16/2029, Series 2023-1A, Class D(1) | | | 4,170 | | | | 4,102 | |
PRET 2021-NPL5 LLC | | | | | | | | |
2.49%, 10/25/2051, Series 2021-NPL5, Class A1(1)(4) | | | 22,488 | | | | 20,923 | |
PRET 2021-RN3 LLC | | | | | | | | |
1.84%, 09/25/2051, Series 2021-RN3, Class A1(1)(4) | | | 30,124 | | | | 27,348 | |
| | | | | | | | |
PRET 2022-RN1 LLC | | | | | | | | |
3.72%, 07/25/2051, Series 2022-RN1, Class A1(1)(4) | | | 21,004 | | | | 19,634 | |
PRET 2022-RN2 LLC | | | | | | | | |
5.00%, 06/25/2052, Series 2022-RN2, Class A1(1)(4) | | | 28,081 | | | | 26,127 | |
Progress Residential 2019-SFR4 Trust | | | | | | | | |
3.14%, 10/17/2036, Series 2019-SFR4, Class D(1) | | | 1,915 | | | | 1,821 | |
Progress Residential 2020-SFR3 Trust | | | | | | | | |
1.50%, 10/17/2027, Series 2020-SFR3, Class B(1) | | | 345 | | | | 311 | |
1.90%, 10/17/2027, Series 2020-SFR3, Class D(1) | | | 1,390 | | | | 1,247 | |
2.30%, 10/17/2027, Series 2020-SFR3, Class E(1) | | | 545 | | | | 489 | |
2.80%, 10/17/2027, Series 2020-SFR3, Class F(1) | | | 10,915 | | | | 9,790 | |
Progress Residential 2021-SFR11 Trust | | | | | | | | |
2.28%, 01/17/2039, Series 2021-SFR11, Class A(1) | | | 11,973 | | | | 10,094 | |
Progress Residential 2021-SFR2 Trust | | | | | | | | |
2.55%, 04/19/2038, Series 2021-SFR2, Class E1(1) | | | 4,365 | | | | 3,821 | |
Progress Residential 2021-SFR3 | | | | | | | | |
2.54%, 05/17/2026, Series 2021-SFR3, Class E1(1) | | | 1,815 | | | | 1,573 | |
2.69%, 05/17/2026, Series 2021-SFR3, Class E2(1) | | | 1,510 | | | | 1,315 | |
Progress Residential 2021-SFR4 | | | | | | | | |
2.41%, 05/17/2038, Series 2021-SFR4, Class E1(1) | | | 955 | | | | 825 | |
2.56%, 05/17/2038, Series 2021-SFR4, Class E2(1) | | | 640 | | | | 552 | |
Progress Residential 2021-SFR5 Trust | | | | | | | | |
2.21%, 07/17/2038, Series 2021-SFR5, Class E1(1) | | | 2,185 | | | | 1,865 | |
2.36%, 07/17/2038, Series 2021-SFR5, Class E2(1) | | | 545 | | | | 464 | |
Progress Residential 2021-SFR7 Trust | | | | | | | | |
2.59%, 08/17/2040, Series 2021-SFR7, Class E1(1) | | | 3,970 | | | | 3,182 | |
2.64%, 08/17/2040, Series 2021-SFR7, Class E2(1) | | | 1,035 | | | | 820 | |
Progress Residential 2021-SFR9 Trust | | | | | | | | |
2.81%, 11/17/2040, Series 2021-SFR9, Class E1(1) | | | 1,130 | | | | 922 | |
3.01%, 11/17/2040, Series 2021-SFR9, Class E2(1) | | | 615 | | | | 501 | |
Progress Residential 2023-SFR1 Trust | | | | | | | | |
4.65%, 03/17/2040, Series 2023-SFR1, Class C(1) | | | 950 | | | | 883 | |
4.65%, 03/17/2040, Series 2023-SFR1, Class D(1) | | | 1,455 | | | | 1,330 | |
Progress Residential Trust | | | | | | | | |
2.43%, 07/17/2038, Series 2021-SFR6, Class E1(1) | | | 2,730 | | | | 2,353 | |
2.53%, 07/17/2038, Series 2021-SFR6, Class E2(1) | | | 1,375 | | | | 1,180 | |
RAAC Series 2006-RP4 Trust | | | | | | | | |
5.70% (1 Month LIBOR USD + 0.55%, 0.55% Floor, 14.00% Cap), 01/25/2046, Series 2006-RP4, Class M1(1)(2) | | | 8,101 | | | | 7,978 | |
Rad CLO 15 Ltd. | | | | | | | | |
6.34% (3 Month LIBOR USD + 1.09%, 1.09% Floor), 01/20/2034, Series 2021-15A, Class A(1)(2) | | | 5,310 | | | | 5,227 | |
Rad CLO 5 Ltd. | | | | | | | | |
6.39% (3 Month LIBOR USD + 1.12%, 1.12% Floor), 07/24/2032, Series 2019-5A, Class AR(1)(2) | | | 700 | | | | 690 | |
RAMP Series 2005-RS5 Trust | | | | | | | | |
6.17% (1 Month LIBOR USD + 0.68%, 0.68% Floor, 14.00% Cap), 05/25/2035, Series 2005-RS5, Class M5(2) | | | 420 | | | | 413 | |
RAMP Series 2006-RZ5 Trust | | | | | | | | |
5.51% (1 Month LIBOR USD + 0.36%, 0.36% Floor, 14.00% Cap), 08/25/2046, Series 2006-RZ5, Class M1(2) | | | 12,303 | | | | 10,856 | |
RASC Series 2005-KS10 Trust | | | | | | | | |
5.81% (1 Month LIBOR USD + 0.66%, 0.66% Floor, 14.00% Cap), 11/25/2035, Series 2005-KS10, Class M2(2) | | | 918 | | | | 911 | |
RASC Series 2006-EMX6 Trust | | | | | | | | |
5.69% (1 Month LIBOR USD + 0.27%, 0.27% Floor, 14.00% Cap), 07/25/2036, Series 2006-EMX6, Class A4(2) | | | 208 | | | | 178 | |
RASC Series 2007-KS3 Trust | | | | | | | | |
5.49% (1 Month LIBOR USD + 0.34%, 0.34% Floor, 14.00% Cap), 04/25/2037, Series 2007-KS3, Class AI4(2) | | | 24,395 | | | | 22,561 | |
Regional Management Issuance Trust 2021-1 | | | | | | | | |
1.68%, 03/17/2031, Series 2021-1, Class A(1) | | | 1,170 | | | | 1,082 | |
Regional Management Issuance Trust 2021-2 | | | | | | | | |
1.90%, 08/15/2033, Series 2021-2, Class A(1) | | | 356 | | | | 302 | |
Regional Management Issuance Trust 2022-1 | | | | | | | | |
3.07%, 03/15/2032, Series 2022-1, Class A(1) | | | 2,672 | | | | 2,476 | |
Republic Finance Issuance Trust 2021-A | | | | | | | | |
3.53%, 12/22/2031, Series 2021-A, Class C(1) | | | 795 | | | | 677 | |
Rockford Tower CLO 2017-3 Ltd. | | | | | | | | |
6.44% (3 Month LIBOR USD + 1.19%), 10/20/2030, Series 2017-3A, Class A(1)(2) | | | 6,772 | | | | 6,712 | |
Rockford Tower CLO 2019-2 Ltd. | | | | | | | | |
6.48% (3 Month LIBOR USD + 1.10%, 1.10% Floor), 08/20/2032, Series 2019-2A, Class AR(1)(2) | | | 13,850 | | | | 13,604 | |
Rockford Tower CLO 2021-1 Ltd. | | | | | | | | |
6.42% (3 Month LIBOR USD + 1.17%, 1.17% Floor), 07/20/2034, Series 2021-1A, Class A1(1)(2) | | | 25,790 | | | | 25,247 | |
RR 3 Ltd. | | | | | | | | |
6.35% (3 Month LIBOR USD + 1.09%, 1.09% Floor), 01/15/2030, Series 2018-3A, Class A1R2(1)(2) | | | 2,792 | | | | 2,769 | |
Santander Drive Auto Receivables Trust 2019-3 | | | | | | | | |
2.68%, 10/15/2025, Series 2019-3, Class D | | | 322 | | | | 321 | |
Santander Drive Auto Receivables Trust 2020-1 | | | | | | | | |
4.11%, 12/15/2025, Series 2020-1, Class C | | | 254 | | | | 253 | |
5.35%, 03/15/2028, Series 2020-1, Class D | | | 7,195 | | | | 7,148 | |
Santander Drive Auto Receivables Trust 2020-4 | | | | | | | | |
1.48%, 01/15/2027, Series 2020-4, Class D | | | 595 | | | | 575 | |
Santander Drive Auto Receivables Trust 2021-3 | | | | | | | | |
1.33%, 09/15/2027, Series 2021-3, Class D | | | 9,445 | | | | 8,818 | |
Santander Drive Auto Receivables Trust 2021-4 | | | | | | | | |
1.67%, 10/15/2027, Series 2021-4, Class D | | | 6,305 | | | | 5,819 | |
Santander Drive Auto Receivables Trust 2023-2 | | | | | | | | |
5.24%, 05/15/2028, Series 2023-2, Class B | | | 22,400 | | | | 22,075 | |
Santander Retail Auto Lease Trust 2021-A | | | | | | | | |
1.38%, 03/22/2027, Series 2021-A, Class D(1) | | | 8,685 | | | | 8,279 | |
Saxon Asset Securities Trust 2006-1 | | | | | | | | |
5.62% (1 Month LIBOR USD + 0.47%, 0.47% Floor, 12.25% Cap), 03/25/2036, Series 2006-1, Class M1(2) | | | 953 | | | | 905 | |
Saxon Asset Securities Trust 2007-2 | | | | | | | | |
5.35% (1 Month LIBOR USD + 0.20%, 0.20% Floor), 05/25/2047, Series 2007-2, Class A1(2) | | | 17,080 | | | | 14,712 | |
Saxon Asset Securities Trust 2007-3 | | | | | | | | |
5.46% (1 Month LIBOR USD + 0.31%, 0.31% Floor), 09/25/2037, Series 2007-3, Class 1A(2) | | | 13,839 | | | | 13,003 | |
| | | | | | | | |
SCF Equipment Leasing 2021-1 LLC | | | | | | | | |
1.93%, 09/20/2030, Series 2021-1A, Class D(1) | | | 340 | | | | 301 | |
SCF Equipment Leasing 2022-1 LLC | | | | | | | | |
3.79%, 11/20/2031, Series 2022-1A, Class D(1) | | | 2,740 | | | | 2,424 | |
SCF Equipment Leasing 2022-2 LLC | | | | | | | | |
6.50%, 08/20/2032, Series 2022-2A, Class C(1) | | | 3,145 | | | | 3,076 | |
Sculptor CLO XXVIII Ltd. | | | | | | | | |
7.05% (3 Month LIBOR USD + 1.80%, 1.80% Floor), 01/20/2035, Series 28A, Class B1(1)(2) | | | 3,700 | | | | 3,627 | |
Securitized Asset Backed Receivables LLC Trust 2004-OP1 | | | | | | | | |
5.92% (1 Month LIBOR USD + 0.77%, 0.77% Floor), 02/25/2034, Series 2004-OP1, Class M1(2) | | | 6,927 | | | | 6,881 | |
Securitized Asset Backed Receivables LLC Trust 2005-HE1 | | | | | | | | |
5.80% (1 Month LIBOR USD + 0.65%, 0.65% Floor), 10/25/2035, Series 2005-HE1, Class M1(2) | | | 2,627 | | | | 2,162 | |
Securitized Asset Backed Receivables LLC Trust 2006-CB5 | | | | | | | | |
5.43% (1 Month LIBOR USD + 0.28%, 0.28% Floor), 06/25/2036, Series 2006-CB5, Class A3(2) | | | 3,976 | | | | 2,488 | |
ServiceMaster Funding LLC | | | | | | | | |
2.84%, 01/30/2051, Series 2020-1, Class A2I(1) | | | 617 | | | | 511 | |
Sesac Finance LLC | | | | | | | | |
5.50%, 07/25/2052, Series 2022-1, Class A2(1) | | | 872 | | | | 819 | |
SFS Auto Receivables Securitization Trust 2023-1 | | | | | | | | |
5.97%, 02/20/2031, Series 2023-1A, Class C(1) | | | 1,965 | | | | 1,957 | |
Shackleton 2019-XIV CLO Ltd. | | | | | | | | |
7.05% (3 Month LIBOR USD + 1.80%, 1.80% Floor), 07/20/2034, Series 2019-14A, Class BR(1)(2) | | | 3,430 | | | | 3,341 | |
Shenton Aircraft Investment I Ltd. | | | | | | | | |
4.75%, 10/15/2042, Series 2015-1A, Class A(1) | | | 1,409 | | | | 1,184 | |
Sierra Timeshare 2019-1 Receivables Funding LLC | | | | | | | | |
3.20%, 01/20/2036, Series 2019-1A, Class A(1) | | | 427 | | | | 409 | |
Sierra Timeshare 2019-2 Receivables Funding LLC | | | | | | | | |
3.12%, 05/20/2036, Series 2019-2A, Class C(1) | | | 822 | | | | 789 | |
Sierra Timeshare 2019-3 Receivables Funding LLC | | | | | | | | |
3.00%, 08/20/2036, Series 2019-3A, Class C(1) | | | 535 | | | | 499 | |
Sierra Timeshare 2021-1 Receivables Funding LLC | | | | | | | | |
1.34%, 11/20/2037, Series 2021-1A, Class B(1) | | | 1,582 | | | | 1,457 | |
1.79%, 11/20/2037, Series 2021-1A, Class C(1) | | | 439 | | | | 402 | |
Sierra Timeshare 2023-1 Receivables Funding LLC | | | | | | | | |
7.00%, 01/20/2040, Series 2023-1A, Class C(1) | | | 1,235 | | | | 1,220 | |
Sixth Street CLO XVI Ltd. | | | | | | | | |
6.57% (3 Month LIBOR USD + 1.32%, 1.32% Floor), 10/20/2032, Series 2020-16A, Class A1A(1)(2) | | | 6,370 | | | | 6,321 | |
Slam 2021-1 Ltd. | | | | | | | | |
2.43%, 06/15/2046, Series 2021-1A, Class A(1) | | | 8,689 | | | | 7,452 | |
SLM Private Credit Student Loan Trust 2003-B | | | | | | | | |
0.00%, 03/15/2033, Series 2003-B, Class A3(3) | | | 1,254 | | | | 1,230 | |
SLM Private Credit Student Loan Trust 2005-B | | | | | | | | |
5.88% (3 Month LIBOR USD + 0.33%), 06/15/2039, Series 2005-B, Class A4(2) | | | 4,310 | | | | 4,139 | |
SLM Student Loan Trust 2003-7 | | | | | | | | |
6.75% (3 Month LIBOR USD + 1.20%, 1.20% Floor), 12/15/2033, Series 2003-7A, Class A5A(1)(2) | | | 5,605 | | | | 5,494 | |
SLM Student Loan Trust 2005-4 | | | | | | | | |
5.43% (3 Month LIBOR USD + 0.17%), 07/25/2040, Series 2005-4, Class A4(2) | | | 10,149 | | | | 9,741 | |
SLM Student Loan Trust 2006-10 | | | | | | | | |
5.48% (3 Month LIBOR USD + 0.22%), 03/25/2044, Series 2006-10, Class B(2) | | | 1,285 | | | | 1,194 | |
SLM Student Loan Trust 2007-7 | | | | | | | | |
5.59% (3 Month LIBOR USD + 0.33%), 01/18/2024, Series 2007-7, Class A4(2) | | | 1,525 | | | | 1,477 | |
SLM Student Loan Trust 2008-5 | | | | | | | | |
6.96% (3 Month LIBOR USD + 1.70%, 1.70% Floor), 07/25/2023, Series 2008-5, Class A4(2) | | | 2,289 | | | | 2,286 | |
7.11% (3 Month LIBOR USD + 1.85%, 1.85% Floor), 07/25/2073, Series 2008-5, Class B(2) | | | 7,350 | | | | 7,153 | |
SLM Student Loan Trust 2008-6 | | | | | | | | |
6.36% (3 Month LIBOR USD + 1.10%), 07/25/2023, Series 2008-6, Class A4(2) | | | 8,312 | | | | 8,113 | |
SLM Student Loan Trust 2008-7 | | | | | | | | |
6.16% (3 Month LIBOR USD + 0.90%), 07/25/2023, Series 2008-7, Class A4(2) | | | 6,451 | | | | 6,326 | |
SLM Student Loan Trust 2012-1 | | | | | | | | |
6.10% (1 Month LIBOR USD + 0.95%, 0.95% Floor), 09/25/2028, Series 2012-1, Class A3(2) | | | 8,507 | | | | 8,156 | |
SLM Student Loan Trust 2012-2 | | | | | | | | |
5.85% (1 Month LIBOR USD + 0.70%), 01/25/2029, Series 2012-2, Class A(2) | | | 9,999 | | | | 9,575 | |
SLM Student Loan Trust 2012-7 | | | | | | | | |
5.80% (1 Month LIBOR USD + 0.65%, 0.65% Floor), 05/26/2026, Series 2012-7, Class A3(2) | | | 3,381 | | | | 3,222 | |
6.95% (1 Month LIBOR USD + 1.80%, 1.80% Floor), 09/25/2043, Series 2012-7, Class B(2) | | | 2,220 | | | | 2,038 | |
SLM Student Loan Trust 2014-1 | | | | | | | | |
5.75% (1 Month LIBOR USD + 0.60%), 02/26/2029, Series 2014-1, Class A3(2) | | | 1,959 | | | | 1,878 | |
SMB Private Education Loan Trust 2015-B | | | | | | | | |
6.94% (1 Month LIBOR USD + 1.75%), 05/17/2032, Series 2015-B, Class A3(1)(2) | | | 191 | | | | 192 | |
SMB Private Education Loan Trust 2015-C | | | | | | | | |
3.50%, 09/15/2043, Series 2015-C, Class B(1) | | | 1,295 | | | | 1,233 | |
SMB Private Education Loan Trust 2016-A | | | | | | | | |
2.70%, 05/15/2031, Series 2016-A, Class A2A(1) | | | 68 | | | | 66 | |
SMB Private Education Loan Trust 2016-B | | | | | | | | |
2.43%, 02/17/2032, Series 2016-B, Class A2A(1) | | | 1,211 | | | | 1,164 | |
SMB Private Education Loan Trust 2016-C | | | | | | | | |
2.34%, 09/15/2034, Series 2016-C, Class A2A(1) | | | 131 | | | | 126 | |
SMB Private Education Loan Trust 2017-A | | | | | | | | |
2.88%, 09/15/2034, Series 2017-A, Class A2A(1) | | | 447 | | | | 428 | |
SMB Private Education Loan Trust 2017-B | | | | | | | | |
2.82%, 10/15/2035, Series 2017-B, Class A2A(1) | | | 1,056 | | | | 1,005 | |
SMB Private Education Loan Trust 2018-A | | | | | | | | |
3.50%, 02/15/2036, Series 2018-A, Class A2A(1) | | | 5,672 | | | | 5,419 | |
SMB Private Education Loan Trust 2018-B | | | | | | | | |
3.60%, 01/15/2037, Series 2018-B, Class A2A(1) | | | 2,422 | | | | 2,308 | |
4.00%, 07/15/2042, Series 2018-B, Class B(1) | | | 285 | | | | 254 | |
SMB Private Education Loan Trust 2018-C | | | | | | | | |
3.63%, 11/15/2035, Series 2018-C, Class A2A(1) | | | 5,921 | | | | 5,637 | |
4.00%, 11/17/2042, Series 2018-C, Class B(1) | | | 770 | | | | 692 | |
| | | | | | | | |
SMB Private Education Loan Trust 2019-A | | | | | | | | |
3.44%, 07/15/2036, Series 2019-A, Class A2A(1) | | | 4,029 | | | | 3,831 | |
SMB Private Education Loan Trust 2019-B | | | | | | | | |
2.84%, 06/15/2037, Series 2019-B, Class A2A(1) | | | 3,902 | | | | 3,632 | |
SMB Private Education Loan Trust 2020-A | | | | | | | | |
2.23%, 09/15/2037, Series 2020-A, Class A2A(1) | | | 7,537 | | | | 6,908 | |
SMB Private Education Loan Trust 2020-PTB | | | | | | | | |
1.60%, 09/15/2054, Series 2020-PTB, Class A2A(1) | | | 4,750 | | | | 4,210 | |
SMB Private Education Loan Trust 2021-A | | | | | | | | |
1.07%, 01/15/2053, Series 2021-A, Class APT1(1) | | | 6,857 | | | | 5,873 | |
SMB Private Education Loan Trust 2022-B | | | | | | | | |
3.94%, 02/16/2055, Series 2022-B, Class A1A(1) | | | 30,555 | | | | 28,716 | |
6.52% (30-day Average SOFR + 1.45%), 02/16/2055, Series 2022-B, Class A1B(1)(2) | | | 27,556 | | | | 27,291 | |
SoFi Consumer Loan Program 2021-1 Trust | | | | | | | | |
2.04%, 09/25/2030, Series 2021-1, Class D(1) | | | 925 | | | | 849 | |
SoFi Professional Loan Program 2017-A LLC | | | | | | | | |
4.43%, 03/26/2040, Series 2017-A, Class C(1)(3) | | | 1,030 | | | | 945 | |
SoFi Professional Loan Program 2017-D LLC | | | | | | | | |
2.65%, 09/25/2040, Series 2017-D, Class A2FX(1) | | | 667 | | | | 635 | |
SoFi Professional Loan Program 2017-E LLC | | | | | | | | |
4.16%, 11/26/2040, Series 2017-E, Class C(1) | | | 695 | | | | 617 | |
SoFi Professional Loan Program 2017-F LLC | | | | | | | | |
3.62%, 01/25/2041, Series 2017-F, Class BFX(1) | | | 1,405 | | | | 1,248 | |
SoFi Professional Loan Program 2018-C Trust | | | | | | | | |
4.13%, 01/25/2048, Series 2018-C, Class BFX(1) | | | 1,875 | | | | 1,691 | |
Sound Point CLO XIV Ltd. | | | | | | | | |
6.26% (3 Month LIBOR USD + 0.99%, 0.99% Floor), 01/23/2029, Series 2016-3A, Class AR2(1)(2) | | | 375 | | | | 374 | |
Sound Point CLO XV Ltd. | | | | | | | | |
6.17% (3 Month LIBOR USD + 0.90%, 0.90% Floor), 01/23/2029, Series 2017-1A, Class ARR(1)(2) | | | 1,229 | | | | 1,219 | |
Sound Point CLO XX Ltd. | | | | | | | | |
6.37% (3 Month LIBOR USD + 1.10%), 07/26/2031, Series 2018-2A, Class A(1)(2) | | | 530 | | | | 522 | |
Soundview Home Loan Trust 2006-OPT5 | | | | | | | | |
5.63% (1 Month LIBOR USD + 0.48%, 0.48% Floor), 07/25/2036, Series 2006-OPT5, Class 2A4(2) | | | 21,571 | | | | 18,304 | |
Southwick Park CLO LLC | | | | | | | | |
6.31% (3 Month LIBOR USD + 1.06%, 1.06% Floor), 07/20/2032, Series 2019-4A, Class A1R(1)(2) | | | 11,400 | | | | 11,236 | |
Specialty Underwriting & Residential Finance Trust Series 2006-BC2 | | | | | | | | |
3.70%, 02/25/2037, Series 2006-BC2, Class A2C(4) | | | 10,586 | | | | 4,049 | |
Specialty Underwriting & Residential Finance Trust Series 2006-BC5 | | | | | | | | |
5.43% (1 Month LIBOR USD + 0.28%, 0.28% Floor), 11/25/2037, Series 2006-BC5, Class A1(2) | | | 10,348 | | | | 8,144 | |
Stack Infrastructure Issuer LLC Series 2019-1 | | | | | | | | |
4.54%, 02/25/2044, Series 2019-1A, Class A2(1) | | | 5,229 | | | | 5,148 | |
Stratus CLO 2021-3 Ltd. | | | | | | | | |
6.20% (3 Month LIBOR USD + 0.95%, 0.95% Floor), 12/29/2029, Series 2021-3A, Class A(1)(2) | | | 25,607 | | | | 25,359 | |
Structured Adjustable Rate Mortgage Loan Trust | | | | | | | | |
4.29%, 02/25/2035, Series 2005-1, Class 1A1(3) | | | 3,356 | | | | 3,153 | |
Structured Asset Investment Loan Trust 2004-8 | | | | | | | | |
6.05% (1 Month LIBOR USD + 0.90%, 0.90% Floor), 09/25/2034, Series 2004-8, Class M1(2) | | | 598 | | | | 588 | |
Structured Asset Investment Loan Trust 2004-9 | | | | | | | | |
6.25% (1 Month LIBOR USD + 1.10%, 1.10% Floor), 10/25/2034, Series 2004-9, Class M2(2) | | | 2,781 | | | | 2,747 | |
Structured Asset Investment Loan Trust 2005-HE2 | | | | | | | | |
5.90% (1 Month LIBOR USD + 0.75%, 0.75% Floor), 07/25/2035, Series 2005-HE2, Class M2(2) | | | 4,975 | | | | 4,753 | |
Structured Asset Mortgage Investments II Trust 2007-AR3 | | | | | | | | |
5.34% (1 Month LIBOR USD + 0.19%, 0.19% Floor, 10.50% Cap), 09/25/2047, Series 2007-AR3, Class 2A1(2) | | | 11,107 | | | | 9,966 | |
Structured Asset Securities Corp. Mortgage Loan Trust 2007-WF2 | | | | | | | | |
6.15% (1 Month LIBOR USD + 1.00%, 1.00% Floor), 08/25/2037, Series 2007-WF2, Class A1(2) | | | 144 | | | | 142 | |
STWD 2019-FL1 Ltd. | | | | | | | | |
6.30% (1 Month Term SOFR + 1.19%, 1.08% Floor), 07/15/2038, Series 2019-FL1, Class A(1)(2) | | | 14,147 | | | | 14,005 | |
Sunnova Helios XI Issuer LLC | | | | | | | | |
5.60%, 05/20/2050, Series 2023-A, Class B(1) | | | 6,497 | | | | 6,077 | |
Symphony CLO XVII Ltd. | | | | | | | | |
6.14% (3 Month LIBOR USD + 0.88%), 04/15/2028, Series 2016-17A, Class AR(1)(2) | | | 994 | | | | 989 | |
Symphony CLO XX Ltd. | | | | | | | | |
6.91% (3 Month LIBOR USD + 1.65%, 1.65% Floor), 01/16/2032, Series 2018-20A, Class BR(1)(2) | | | 11,220 | | | | 10,956 | |
Symphony CLO XXIII Ltd. | | | | | | | | |
6.28% (3 Month LIBOR USD + 1.02%, 1.02% Floor), 01/15/2034, Series 2020-23A, Class AR(1)(2) | | | 14,200 | | | | 14,046 | |
Symphony CLO XXIV Ltd. | | | | | | | | |
6.47% (3 Month LIBOR USD + 1.20%, 1.20% Floor), 01/23/2032, Series 2020-24A, Class A(1)(2) | | | 650 | | | | 640 | |
Symphony CLO XXVI Ltd. | | | | | | | | |
6.33% (3 Month LIBOR USD + 1.08%, 1.08% Floor), 04/20/2033, Series 2021-26A, Class AR(1)(2) | | | 4,650 | | | | 4,572 | |
Taco Bell Funding LLC | | | | | | | | |
2.29%, 08/25/2051, Series 2021-1A, Class A2II(1) | | | 9,013 | | | | 7,399 | |
TCW CLO 2019-1 AMR Ltd. | | | | | | | | |
7.07% (3 Month LIBOR USD + 1.75%, 1.75% Floor), 08/16/2034, Series 2019-1A, Class BR(1)(2) | | | 3,365 | | | | 3,233 | |
TCW CLO 2020-1 Ltd. | | | | | | | | |
6.41% (3 Month LIBOR USD + 1.16%, 1.16% Floor), 04/20/2034, Series 2020-1A, Class A1RR(1)(2) | | | 8,600 | | | | 8,398 | |
TCW CLO 2022-1 Ltd. | | | | | | | | |
6.41% (3 Month Term SOFR + 1.34%, 1.34% Floor), 04/22/2033, Series 2022-1A, Class A1(1)(2) | | | 9,080 | | | | 8,917 | |
Theorem Funding Trust 2022-1 | | | | | | | | |
1.85%, 02/15/2028, Series 2022-1A, Class A(1) | | | 1,487 | | | | 1,464 | |
Theorem Funding Trust 2023-1 | | | | | | | | |
7.58%, 04/15/2029, Series 2023-1A, Class A(1) | | | 11,585 | | | | 11,600 | |
THL Credit Wind River 2019-3 CLO Ltd. | | | | | | | | |
6.91% (3 Month LIBOR USD + 1.65%, 1.65% Floor), 04/15/2031, Series 2019-3A, Class BR(1)(2) | | | 7,550 | | | | 7,267 | |
TIAA CLO I Ltd. | | | | | | | | |
6.45% (3 Month LIBOR USD + 1.20%), 07/20/2031, Series 2016-1A, Class AR(1)(2) | | | 18,750 | | | | 18,516 | |
TICP CLO X Ltd. | | | | | | | | |
6.72% (3 Month LIBOR USD + 1.47%, 1.47% Floor), 04/20/2031, Series 2018-10A, Class B(1)(2) | | | 4,080 | | | | 3,984 | |
Towd Point Mortgage Trust 2019-MH1 | | | | | | | | |
3.00%, 11/25/2058, Series 2019-MH1, Class A1(1)(3) | | | 74 | | | | 73 | |
| | | | | | | | |
Toyota Auto Receivables 2020-C Owner Trust | | | | | | | | |
0.44%, 10/15/2024, Series 2020-C, Class A3 | | | 1,094 | | | | 1,087 | |
Tricon American Homes 2019-SFR1 Trust | | | | | | | | |
3.20%, 03/17/2038, Series 2019-SFR1, Class D(1) | | | 1,270 | | | | 1,169 | |
Tricon American Homes 2020-SFR1 | | | | | | | | |
2.05%, 07/17/2038, Series 2020-SFR1, Class B(1) | | | 1,180 | | | | 1,054 | |
2.55%, 07/17/2038, Series 2020-SFR1, Class D(1) | | | 1,220 | | | | 1,086 | |
Tricon American Homes 2020-SFR2 Trust | | | | | | | | |
2.73%, 11/17/2039, Series 2020-SFR2, Class E1(1) | | | 1,855 | | | | 1,572 | |
Tricon Residential 2021-SFR1 Trust | | | | | | | | |
2.79%, 07/17/2038, Series 2021-SFR1, Class E1(1) | | | 1,760 | | | | 1,549 | |
2.89%, 07/17/2038, Series 2021-SFR1, Class E2(1) | | | 4,695 | | | | 4,123 | |
Trimaran Cavu 2019-1 Ltd. | | | | | | | | |
7.15% (3 Month LIBOR USD + 1.90%, 1.90% Floor), 07/20/2032, Series 2019-1A, Class A2(1)(2) | | | 1,820 | | | | 1,801 | |
Trimaran Cavu 2021-2 Ltd. | | | | | | | | |
7.01% (3 Month LIBOR USD + 1.75%, 1.75% Floor), 10/25/2034, Series 2021-2A, Class B1(1)(2) | | | 2,500 | | | | 2,429 | |
Upstart Securitization Trust 2021-5 | | | | | | | | |
1.31%, 11/20/2031, Series 2021-5, Class A(1) | | | 1,469 | | | | 1,436 | |
Upstart Securitization Trust 2022-1 | | | | | | | | |
3.12%, 03/20/2032, Series 2022-1, Class A(1) | | | 7,951 | | | | 7,783 | |
Upstart Securitization Trust 2022-3 | | | | | | | | |
5.50%, 06/20/2032, Series 2022-3, Class A(1) | | | 7,657 | | | | 7,498 | |
Upstart Structured Pass-Through Trust Series 2022-2A | | | | | | | | |
4.25%, 06/17/2030, Series 2022-2A, Class A(1) | | | 3,003 | | | | 2,871 | |
VCAT 2021-NPL1 LLC | | | | | | | | |
2.29%, 12/26/2050, Series 2021-NPL1, Class A1(1)(4) | | | 1,175 | | | | 1,126 | |
VCAT 2021-NPL5 LLC | | | | | | | | |
1.87%, 08/25/2051, Series 2021-NPL5, Class A1(1)(4) | | | 7,208 | | | | 6,528 | |
VCAT 2021-NPL6 LLC | | | | | | | | |
1.92%, 09/25/2051, Series 2021-NPL6, Class A1(1)(4) | | | 9,028 | | | | 8,180 | |
Venture XIV CLO Ltd. | | | | | | | | |
6.49% (3 Month LIBOR USD + 1.03%, 1.03% Floor), 08/28/2029, Series 2013-14A, Class ARR(1)(2) | | | 33,579 | | | | 33,376 | |
Venture XXIX CLO Ltd. | | | | | | | | |
6.31% (3 Month LIBOR USD + 0.99%, 0.99% Floor), 09/07/2030, Series 2017-29A, Class AR(1)(2) | | | 1,995 | | | | 1,969 | |
Venture Xxv CLO Ltd. | | | | | | | | |
6.27% (3 Month LIBOR USD + 1.02%, 1.02% Floor), 04/20/2029, Series 2016-25A, Class ARR(1)(2) | | | 10,914 | | | | 10,859 | |
VOLT XCII LLC | | | | | | | | |
1.89%, 02/27/2051, Series 2021-NPL1, Class A1(1)(4) | | | 1,442 | | | | 1,302 | |
VOLT XCIII LLC | | | | | | | | |
1.89%, 02/27/2051, Series 2021-NPL2, Class A1(1)(4) | | | 3,852 | | | | 3,482 | |
VOLT XCIV LLC | | | | | | | | |
2.24%, 02/27/2051, Series 2021-NPL3, Class A1(1)(4) | | | 6,155 | | | | 5,656 | |
VOLT XCIX LLC | | | | | | | | |
2.12%, 04/25/2051, Series 2021-NPL8, Class A1(1)(4) | | | 12,220 | | | | 11,085 | |
VOLT XCVI LLC | | | | | | | | |
2.12%, 03/27/2051, Series 2021-NPL5, Class A1(1)(4) | | | 2,669 | | | | 2,499 | |
VOLT XCVII LLC | | | | | | | | |
2.24%, 04/25/2051, Series 2021-NPL6, Class A1(1)(4) | | | 11,217 | | | | 10,216 | |
Voya CLO 2013-2 Ltd. | | | | | | | | |
6.30% (3 Month Term SOFR + 1.23%, 0.97% Floor), 04/25/2031, Series 2013-2A, Class A1R(1)(2) | | | 2,000 | | | | 1,975 | |
Voya CLO 2020-1 Ltd. | | | | | | | | |
6.96% (3 Month LIBOR USD + 1.70%, 1.70% Floor), 07/16/2034, Series 2020-1A, Class BR(1)(2) | | | 9,000 | | | | 8,826 | |
WaMu Mortgage Pass-Through Certificates Series 2007-HY1 Trust | | | | | | | | |
3.77%, 02/25/2037, Series 2007-HY1, Class 4A1(3) | | | 5,957 | | | | 5,317 | |
Washington Mutual Mortgage Pass-Through Certificates WMALT Series 2007-OA3 Trust | | | | | | | | |
5.23% (12 Month U.S. Treasury Average + 1.25%, 1.25% Floor), 04/25/2047, Series 2007-OA3, Class 5A(2) | | | 300 | | | | 252 | |
WAVE 2017-1 Trust | | | | | | | | |
3.84%, 11/15/2042, Series 2017-1A, Class A(1) | | | 4,002 | | | | 3,182 | |
Wellfleet CLO 2017-2A Ltd. | | | | | | | | |
6.31% (3 Month LIBOR USD + 1.06%), 10/20/2029, Series 2017-2A, Class A1R(1)(2) | | | 3,905 | | | | 3,877 | |
Wellfleet CLO 2017-3 Ltd. | | | | | | | | |
6.41% (3 Month LIBOR USD + 1.15%, 1.15% Floor), 01/17/2031, Series 2017-3A, Class A1(1)(2) | | | 6,181 | | | | 6,099 | |
Wellfleet CLO 2021-3 Ltd. | | | | | | | | |
7.06% (3 Month LIBOR USD + 1.80%, 1.80% Floor), 01/15/2035, Series 2021-3A, Class B(1)(2) | | | 6,165 | | | | 5,955 | |
Wellfleet CLO X Ltd. | | | | | | | | |
6.42% (3 Month LIBOR USD + 1.17%), 07/20/2032, Series 2019-XA, Class A1R(1)(2) | | | 8,700 | | | | 8,528 | |
Wells Fargo Home Equity Asset-Backed Securities 2004-2 Trust | | | | | | | | |
6.05% (1 Month LIBOR USD + 0.90%, 0.90% Floor), 10/25/2034, Series 2004-2, Class M1(2) | | | 1,267 | | | | 1,252 | |
Wendy’s Funding LLC | | | | | | | | |
2.37%, 06/15/2051, Series 2021-1A, Class A2I(1) | | | 5,205 | | | | 4,304 | |
Westlake Automobile Receivables Trust 2020-3 | | | | | | | | |
1.24%, 11/17/2025, Series 2020-3A, Class C(1) | | | 669 | | | | 661 | |
Westlake Automobile Receivables Trust 2021-2 | | | | | | | | |
1.23%, 12/15/2026, Series 2021-2A, Class D(1) | | | 5,075 | | | | 4,702 | |
Westlake Automobile Receivables Trust 2021-3 | | | | | | | | |
2.12%, 01/15/2027, Series 2021-3A, Class D(1) | | | 9,200 | | | | 8,501 | |
Westlake Automobile Receivables Trust 2023-1 | | | | | | | | |
6.79%, 11/15/2028, Series 2023-1A, Class D(1) | | | 2,480 | | | | 2,474 | |
Westlake Automobile Receivables Trust 2023-2 | | | | | | | | |
7.01%, 11/15/2028, Series 2023-2A, Class D(1) | | | 5,285 | | | | 5,279 | |
Willis Engine Structured Trust VI | | | | | | | | |
3.10%, 05/15/2046, Series 2021-A, Class A(1) | | | 2,299 | | | | 1,825 | |
World Omni Auto Receivables Trust 2020-A | | | | | | | | |
1.64%, 08/17/2026, Series 2020-A, Class C | | | 3,190 | | | | 3,091 | |
| | | | | | | | |
Total Asset-Backed Obligations (Cost: $3,764,833) | | | | | | | 3,570,198 | |
| | | | | | | | |
Corporate Bonds – 27.33% | | | | |
Basic Materials – 0.73% | | | | |
Alcoa Nederland Holding BV | | | | | | | | |
| | | | | | | | |
4.13%, 03/31/2029(1) | | | 2,945 | | | | 2,632 | |
5.50%, 12/15/2027(1) | | | 2,745 | | | | 2,655 | |
6.13%, 05/15/2028(1) | | | 4,000 | | | | 3,978 | |
Anglo American Capital Plc | | | | | | | | |
2.25%, 03/17/2028(1) | | | 641 | | | | 551 | |
2.63%, 09/10/2030(1) | | | 40,530 | | | | 33,433 | |
2.88%, 03/17/2031(1) | | | 2,675 | | | | 2,209 | |
4.00%, 09/11/2027(1) | | | 1,620 | | | | 1,523 | |
4.50%, 03/15/2028(1) | | | 22,397 | | | | 21,345 | |
4.75%, 04/10/2027(1) | | | 712 | | | | 688 | |
5.50%, 05/02/2033(1) | | | 5,036 | | | | 4,920 | |
5.63%, 04/01/2030(1) | | | 2,297 | | | | 2,286 | |
ArcelorMittal SA | | | | | | | | |
6.75%, 03/01/2041 | | | 12,270 | | | | 12,487 | |
6.80%, 11/29/2032 | | | 7,845 | | | | 8,054 | |
Braskem Netherlands Finance BV | | | | | | | | |
4.50%, 01/31/2030(1) | | | 5,210 | | | | 4,476 | |
5.88%, 01/31/2050(1) | | | 4,160 | | | | 3,362 | |
Celanese US Holdings LLC | | | | | | | | |
6.33%, 07/15/2029 | | | 2,310 | | | | 2,294 | |
6.38%, 07/15/2032 | | | 1,700 | | | | 1,715 | |
CF Industries, Inc. | | | | | | | | |
4.50%, 12/01/2026(1) | | | 5,145 | | | | 4,962 | |
CSN Resources SA | | | | | | | | |
5.88%, 04/08/2032(1) | | | 511 | | | | 412 | |
Eastman Chemical Co. | | | | | | | | |
5.75%, 03/08/2033 | | | 597 | | | | 596 | |
First Quantum Minerals Ltd. | | | | | | | | |
6.88%, 03/01/2026(1) | | | 2,855 | | | | 2,810 | |
6.88%, 10/15/2027(1) | | | 7,600 | | | | 7,414 | |
7.50%, 04/01/2025(1) | | | 1,185 | | | | 1,184 | |
FMC Corp. | | | | | | | | |
3.45%, 10/01/2029 | | | 1,850 | | | | 1,618 | |
FMG Resources August 2006 Pty Ltd. | | | | | | | | |
4.38%, 04/01/2031(1) | | | 6,670 | | | | 5,695 | |
Freeport Indonesia PT | | | | | | | | |
4.76%, 04/14/2027 | | | 200 | | | | 193 | |
Freeport-McMoRan, Inc. | | | | | | | | |
4.25%, 03/01/2030 | | | 6,345 | | | | 5,847 | |
4.63%, 08/01/2030 | | | 2,455 | | | | 2,313 | |
Glencore Funding LLC | | | | | | | | |
2.63%, 09/23/2031(1) | | | 4,910 | | | | 3,953 | |
2.85%, 04/27/2031(1) | | | 10,245 | | | | 8,457 | |
3.88%, 10/27/2027(1) | | | 11,555 | | | | 10,785 | |
4.88%, 03/12/2029(1) | | | 8,160 | | | | 7,856 | |
5.70%, 05/08/2033(1) | | | 8,734 | | | | 8,666 | |
Indonesia Asahan Aluminium PT / Mineral Industri Indonesia Persero PT | | | | | | | | |
5.45%, 05/15/2030(1) | | | 1,400 | | | | 1,356 | |
International Flavors & Fragrances, Inc. | | | | | | | | |
2.30%, 11/01/2030(1) | | | 14,875 | | | | 11,787 | |
5.00%, 09/26/2048 | | | 11,420 | | | | 9,666 | |
Newmont Corp. | | | | | | | | |
2.25%, 10/01/2030 | | | 1,785 | | | | 1,462 | |
2.80%, 10/01/2029 | | | 669 | | | | 575 | |
OCP SA | | | | | | | | |
4.50%, 10/22/2025(18) | | | 259 | | | | 251 | |
Orbia Advance Corp. SAB de CV | | | | | | | | |
2.88%, 05/11/2031(1) | | | 3,025 | | | | 2,401 | |
Sasol Financing USA LLC | | | | | | | | |
5.88%, 03/27/2024 | | | 1,123 | | | | 1,108 | |
8.75%, 05/03/2029(1) | | | 200 | | | | 195 | |
Suzano Austria GmbH | | | | | | | | |
3.75%, 01/15/2031 | | | 6,505 | | | | 5,552 | |
5.00%, 01/15/2030 | | | 200 | | | | 189 | |
Syngenta Finance NV | | | | | | | | |
4.89%, 04/24/2025(1) | | | 550 | | | | 538 | |
Valvoline, Inc. | | | | | | | | |
3.63%, 06/15/2031(1) | | | 1,036 | | | | 842 | |
Vedanta Resources Finance II Plc | | | | | | | | |
8.95%, 03/11/2025(1) | | | 509 | | | | 384 | |
Volcan Compania Minera SAA | | | | | | | | |
4.38%, 02/11/2026(1) | | | 1,290 | | | | 959 | |
Westlake Corp. | | | | | | | | |
1.63%, 07/17/2029 | | EUR | 2,025 | | | | 1,812 | |
| | | | | | | | |
Total Basic Materials | | | | 220,446 | |
| | | | | | | | |
Communications – 2.82% | | | | |
Altice Financing SA | | | | | | | | |
5.75%, 08/15/2029(1) | | $ | 7,503 | | | | 5,812 | |
AT&T, Inc. | | | | | | | | |
2.25%, 02/01/2032 | | | 2,559 | | | | 2,033 | |
2.55%, 12/01/2033 | | | 3,587 | | | | 2,818 | |
2.75%, 06/01/2031 | | | 3,935 | | | | 3,320 | |
3.10%, 02/01/2043 | | | 1,464 | | | | 1,051 | |
3.50%, 09/15/2053 | | | 3,020 | | | | 2,138 | |
3.55%, 09/15/2055 | | | 8,440 | | | | 5,909 | |
3.65%, 06/01/2051 | | | 1,210 | | | | 888 | |
3.65%, 09/15/2059 | | | 6,334 | | | | 4,410 | |
3.80%, 12/01/2057 | | | 4,910 | | | | 3,555 | |
4.30%, 02/15/2030 | | | 3,251 | | | | 3,086 | |
| | | | | | | | |
4.35%, 03/01/2029 | | | 2,424 | | | | 2,329 | |
4.50%, 05/15/2035 | | | 4,084 | | | | 3,754 | |
4.50%, 03/09/2048 | | | 6,420 | | | | 5,430 | |
4.90%, 08/15/2037 | | | 2,132 | | | | 2,001 | |
5.40%, 02/15/2034 | | | 9,087 | | | | 9,103 | |
Axtel SAB de CV | | | | | | | | |
6.38%, 11/14/2024(1) | | | 425 | | | | 432 | |
C&W Senior Financing DAC | | | | | | | | |
6.88%, 09/15/2027(1) | | | 600 | | | | 524 | |
Cable One, Inc. | | | | | | | | |
4.00%, 11/15/2030(1) | | | 3,478 | | | | 2,717 | |
CCO Holdings LLC / CCO Holdings Capital Corp. | | | | | | | | |
4.25%, 01/15/2034(1) | | | 2,285 | | | | 1,727 | |
Charter Communications Operating LLC | | | | | | | | |
2.25%, 01/15/2029 | | | 1,626 | | | | 1,354 | |
2.30%, 02/01/2032 | | | 20,750 | | | | 15,708 | |
2.80%, 04/01/2031 | | | 32,784 | | | | 26,380 | |
3.70%, 04/01/2051 | | | 13,744 | | | | 8,685 | |
3.75%, 02/15/2028 | | | 6,703 | | | | 6,145 | |
3.85%, 04/01/2061 | | | 4,609 | | | | 2,788 | |
3.90%, 06/01/2052 | | | 2,625 | | | | 1,718 | |
3.95%, 06/30/2062 | | | 30,133 | | | | 18,539 | |
4.20%, 03/15/2028 | | | 3,376 | | | | 3,165 | |
4.40%, 04/01/2033 | | | 4,100 | | | | 3,599 | |
4.80%, 03/01/2050 | | | 16,239 | | | | 12,252 | |
5.25%, 04/01/2053 | | | 4,269 | | | | 3,448 | |
5.38%, 04/01/2038 | | | 980 | | | | 835 | |
5.38%, 05/01/2047 | | | 15,069 | | | | 12,455 | |
5.75%, 04/01/2048 | | | 5,030 | | | | 4,305 | |
6.48%, 10/23/2045 | | | 343 | | | | 322 | |
6.83%, 10/23/2055 | | | 1,022 | | | | 963 | |
Comcast Corp. | | | | | | | | |
2.65%, 02/01/2030 | | | 4,520 | | | | 3,954 | |
2.89%, 11/01/2051 | | | 1,211 | | | | 812 | |
2.94%, 11/01/2056 | | | 1,921 | | | | 1,251 | |
3.25%, 11/01/2039 | | | 1,028 | | | | 815 | |
4.00%, 03/01/2048 | | | 905 | | | | 754 | |
CommScope Technologies LLC | | | | | | | | |
5.00%, 03/15/2027(1) | | | 1,985 | | | | 1,382 | |
CommScope, Inc. | | | | | | | | |
4.75%, 09/01/2029(1) | | | 9,905 | | | | 7,809 | |
6.00%, 03/01/2026(1) | | | 2,205 | | | | 2,055 | |
7.13%, 07/01/2028(1) | | | 3,625 | | | | 2,574 | |
Cox Communications, Inc. | | | | | | | | |
3.15%, 08/15/2024(1) | | | 1,043 | | | | 1,008 | |
Crown Castle Towers LLC | | | | | | | | |
3.66%, 05/15/2025(1) | | | 1,300 | | | | 1,238 | |
CSC Holdings LLC | | | | | | | | |
3.38%, 02/15/2031(1) | | | 8,660 | | | | 5,862 | |
4.13%, 12/01/2030(1) | | | 2,415 | | | | 1,689 | |
4.50%, 11/15/2031(1) | | | 6,505 | | | | 4,535 | |
4.63%, 12/01/2030(1) | | | 26,645 | | | | 11,855 | |
5.00%, 11/15/2031(1) | | | 1,145 | | | | 533 | |
5.38%, 02/01/2028(1) | | | 530 | | | | 426 | |
5.50%, 04/15/2027(1) | | | 2,300 | | | | 1,914 | |
5.75%, 01/15/2030(1) | | | 6,059 | | | | 2,861 | |
6.50%, 02/01/2029(1) | | | 10,866 | | | | 8,780 | |
7.50%, 04/01/2028(1) | | | 1,000 | | | | 570 | |
Diamond Sports Group LLC / Diamond Sports Finance Co. | | | | | | | | |
5.38%, 08/15/2026(1)(6)(7) | | | 12,101 | | | | 408 | |
Digicel Group Holdings Ltd. | | | | | | | | |
8.00%, 04/01/2025(1) | | | 384 | | | | 165 | |
Digicel International Finance Ltd./Digicel international Holdings Ltd. | | | | | | | | |
8.00%, 12/31/2026(1) | | | 73 | | | | 12 | |
8.75%, 05/25/2024(1) | | | 188 | | | | 172 | |
DISH DBS Corp. | | | | | | | | |
5.13%, 06/01/2029 | | | 2,380 | | | | 1,105 | |
5.25%, 12/01/2026(1) | | | 11,995 | | | | 9,622 | |
5.75%, 12/01/2028(1) | | | 16,035 | | | | 11,927 | |
Expedia Group, Inc. | | | | | | | | |
2.95%, 03/15/2031 | | | 30,140 | | | | 25,398 | |
3.25%, 02/15/2030 | | | 12,682 | | | | 11,038 | |
FactSet Research Systems, Inc. | | | | | | | | |
3.45%, 03/01/2032 | | | 4,194 | | | | 3,568 | |
Frontier Communications Holdings LLC | | | | | | | | |
5.00%, 05/01/2028(1) | | | 2,250 | | | | 1,941 | |
8.63%, 03/15/2031(1) | | | 7,138 | | | | 6,908 | |
8.75%, 05/15/2030(1) | | | 1,000 | | | | 977 | |
iHeartCommunications, Inc. | | | | | | | | |
4.75%, 01/15/2028(1) | | | 4,120 | | | | 3,106 | |
5.25%, 08/15/2027(1) | | | 3,710 | | | | 2,837 | |
Intelsat Jackson Holdings SA | | | | | | | | |
5.50%, 08/01/2023(8)(9) | | | 12,702 | | | | — | |
6.50%, 03/15/2030(1) | | | 30,220 | | | | 27,511 | |
9.75%, 07/15/2025(1)(8)(9) | | | 15,687 | | | | — | |
Juniper Networks, Inc. | | | | | | | | |
2.00%, 12/10/2030 | | | 864 | | | | 670 | |
Kenbourne Invest SA | | | | | | | | |
6.88%, 11/26/2024(1) | | | 300 | | | | 261 | |
| | | | | | | | |
Level 3 Financing, Inc. | | | | | | | | |
4.63%, 09/15/2027(1) | | | 510 | | | | 355 | |
Liquid Telecommunications Financing Plc | | | | | | | | |
5.50%, 09/04/2026(1) | | | 355 | | | | 198 | |
Meta Platforms Inc | | | | | | | | |
4.45%, 08/15/2052 | | | 4,844 | | | | 4,212 | |
Meta Platforms, Inc. | | | | | | | | |
4.95%, 05/15/2033 | | | 29,985 | | | | 29,962 | |
5.60%, 05/15/2053 | | | 15,794 | | | | 16,221 | |
5.75%, 05/15/2063 | | | 5,276 | | | | 5,460 | |
Motorola Solutions, Inc. | | | | | | | | |
2.30%, 11/15/2030 | | | 7,753 | | | | 6,263 | |
2.75%, 05/24/2031 | | | 8,098 | | | | 6,634 | |
5.50%, 09/01/2044 | | | 2,299 | | | | 2,182 | |
5.60%, 06/01/2032 | | | 3,469 | | | | 3,437 | |
NBN Co. Ltd. | | | | | | | | |
2.63%, 05/05/2031(1) | | | 475 | | | | 398 | |
Netflix, Inc. | | | | | | | | |
3.63%, 06/15/2025(1) | | | 3,500 | | | | 3,372 | |
3.63%, 06/15/2030 | | EUR | 2,000 | | | | 2,074 | |
3.88%, 11/15/2029 | | | 2,502 | | | | 2,657 | |
4.63%, 05/15/2029 | | | 2,300 | | | | 2,537 | |
4.88%, 06/15/2030(1) | | $ | 27,736 | | | | 27,295 | |
5.38%, 11/15/2029(1) | | | 1,415 | | | | 1,420 | |
5.88%, 11/15/2028 | | | 10,972 | | | | 11,332 | |
6.38%, 05/15/2029 | | | 12,834 | | | | 13,578 | |
Nokia OYJ | | | | | | | | |
4.38%, 06/12/2027 | | | 2,895 | | | | 2,727 | |
Northwest Fiber LLC / Northwest Fiber Finance Sub, Inc. | | | | | | | | |
4.75%, 04/30/2027(1) | | | 909 | | | | 803 | |
NTT Finance Corp. | | | | | | | | |
1.59%, 04/03/2028(1) | | | 777 | | | | 666 | |
Prosus NV | | | | | | | | |
1.99%, 07/13/2033 | | EUR | 4,100 | | | | 3,057 | |
SES GLOBAL Americas Holdings, Inc. | | | | | | | | |
5.30%, 03/25/2044(1) | | $ | 10,000 | | | | 7,434 | |
Sirius XM Radio, Inc. | | | | | | | | |
4.00%, 07/15/2028(1) | | | 674 | | | | 586 | |
5.00%, 08/01/2027(1) | | | 1,385 | | | | 1,285 | |
5.50%, 07/01/2029(1) | | | 115 | | | | 104 | |
Sprint Capital Corp. | | | | | | | | |
6.88%, 11/15/2028 | | | 1,262 | | | | 1,338 | |
8.75%, 03/15/2032 | | | 24,955 | | | | 30,161 | |
Sprint LLC | | | | | | | | |
7.13%, 06/15/2024 | | | 23,080 | | | | 23,286 | |
7.63%, 02/15/2025 | | | 9,898 | | | | 10,110 | |
7.63%, 03/01/2026 | | | 137 | | | | 142 | |
7.88%, 09/15/2023 | | | 30,621 | | | | 30,695 | |
Sprint Spectrum Co. LLC / Sprint Spectrum Co. II LLC / Sprint Spectrum Co. III LLC | | | | | | | | |
4.74%, 03/20/2025(1) | | | 4,274 | | | | 4,219 | |
5.15%, 03/20/2028(1) | | | 26,278 | | | | 26,001 | |
Tencent Holdings Ltd. | | | | | | | | |
3.84%, 04/22/2051(1) | | | 8,495 | | | | 6,239 | |
Time Warner Cable LLC | | | | | | | | |
4.50%, 09/15/2042 | | | 13,975 | | | | 10,453 | |
5.50%, 09/01/2041 | �� | | 11,204 | | | | 9,321 | |
5.88%, 11/15/2040 | | | 6,520 | | | | 5,752 | |
T-Mobile USA, Inc. | | | | | | | | |
2.25%, 02/15/2026 | | | 14,809 | | | | 13,607 | |
2.40%, 03/15/2029 | | | 1,515 | | | | 1,302 | |
2.55%, 02/15/2031 | | | 15,389 | | | | 12,791 | |
2.70%, 03/15/2032 | | | 2,720 | | | | 2,247 | |
3.38%, 04/15/2029 | | | 10,920 | | | | 9,861 | |
3.50%, 04/15/2031 | | | 15,220 | | | | 13,430 | |
3.88%, 04/15/2030 | | | 56,741 | | | | 52,274 | |
4.50%, 04/15/2050 | | | 2,613 | | | | 2,242 | |
4.80%, 07/15/2028 | | | 18,000 | | | | 17,628 | |
Uber Technologies, Inc. | | | | | | | | |
4.50%, 08/15/2029(1) | | | 6,200 | | | | 5,706 | |
6.25%, 01/15/2028(1) | | | 7,305 | | | | 7,269 | |
7.50%, 09/15/2027(1) | | | 1,395 | | | | 1,427 | |
Verizon Communications, Inc. | | | | | | | | |
1.75%, 01/20/2031 | | | 8,558 | | | | 6,752 | |
2.36%, 03/15/2032 | | | 8,497 | | | | 6,834 | |
2.65%, 11/20/2040 | | | 2,211 | | | | 1,538 | |
2.99%, 10/30/2056 | | | 1,701 | | | | 1,080 | |
3.00%, 11/20/2060 | | | 1,080 | | | | 675 | |
4.40%, 11/01/2034 | | | 6,780 | | | | 6,258 | |
4.50%, 08/10/2033 | | | 2,517 | | | | 2,375 | |
5.05%, 05/09/2033 | | | 2,330 | | | | 2,304 | |
5.85%, 09/15/2035 | | | 974 | | | | 1,005 | |
7.75%, 12/01/2030 | | | 508 | | | | 590 | |
Vodafone Group Plc | | | | | | | | |
4.25%, 09/17/2050 | | | 1,955 | | | | 1,570 | |
4.88%, 06/19/2049 | | | 6,963 | | | | 6,167 | |
VZ Secured Financing BV | | | | | | | | |
5.00%, 01/15/2032(1) | | | 3,500 | | | | 2,819 | |
Zayo Group Holdings, Inc. | | | | | | | | |
4.00%, 03/01/2027(1) | | | 1,000 | | | | 706 | |
| | | | | | | | |
Ziggo BV | | | | | | | | |
4.88%, 01/15/2030(1) | | | 3,900 | | | | 3,237 | |
| | | | | | | | |
Total Communications | | | | 853,661 | |
| | | | | | | | |
Consumer, Cyclical – 1.67% | | | | | | | | |
7-Eleven, Inc. | | | | | | | | |
0.80%, 02/10/2024(1) | | | 10,725 | | | | 10,395 | |
ABRA Global Finance | | | | | | | | |
11.50%, 03/02/2028(1)(10) | | | 397 | | | | 323 | |
Air Canada 2015-2 Class B Pass-Through Trust | | | | | | | | |
5.00%, 12/15/2023(1) | | | 851 | | | | 846 | |
Air Canada 2017-1 Class B Pass-Through Trust | | | | | | | | |
3.70%, 01/15/2026(1) | | | 8,275 | | | | 7,680 | |
Alaska Airlines 2020-1 Class A Pass-Through Trust | | | | | | | | |
4.80%, 08/15/2027(1) | | | 1,242 | | | | 1,193 | |
Alimentation Couche-Tard, Inc. | | | | | | | | |
3.80%, 01/25/2050(1) | | | 4,513 | | | | 3,272 | |
American Airlines 2015-1 Class A Pass-Through Trust | | | | | | | | |
3.38%, 05/01/2027 | | | 540 | | | | 484 | |
American Airlines 2015-2 Class B Pass-Through Trust | | | | | | | | |
4.40%, 09/22/2023 | | | 6,175 | | | | 6,130 | |
American Airlines 2016-1 Class B Pass-Through Trust | | | | | | | | |
5.25%, 01/15/2024 | | | 294 | | | | 290 | |
American Airlines 2016-2 Class B Pass-Through Trust | | | | | | | | |
4.38%, 06/15/2024(1) | | | 2,017 | | | | 1,949 | |
American Airlines 2016-3 Class B Pass-Through Trust | | | | | | | | |
3.75%, 10/15/2025 | | | 1,822 | | | | 1,664 | |
American Airlines 2017-2 Class A Pass-Through Trust | | | | | | | | |
3.60%, 10/15/2029 | | | 171 | | | | 144 | |
American Airlines 2017-2 Class B Pass-Through Trust | | | | | | | | |
3.70%, 10/15/2025 | | | 932 | | | | 876 | |
American Airlines 2019-1 Class B Pass-Through Trust | | | | | | | | |
3.85%, 02/15/2028 | | | 8,332 | | | | 7,088 | |
American Airlines 2021-1 Class A Pass-Through Trust | | | | | | | | |
2.88%, 07/11/2034 | | | 12,846 | | | | 10,727 | |
AutoNation, Inc. | | | | | | | | |
4.75%, 06/01/2030 | | | 1,030 | | | | 963 | |
AutoZone, Inc. | | | | | | | | |
4.00%, 04/15/2030 | | | 8,465 | | | | 7,860 | |
Avianca Midco 2 Plc | | | | | | | | |
9.00%, 12/01/2028(1) | | | 138 | | | | 116 | |
British Airways 2018-1 Class AA Pass-Through Trust | | | | | | | | |
3.80%, 09/20/2031(1) | | | 1,633 | | | | 1,486 | |
British Airways 2019-1 Class A Pass-Through Trust | | | | | | | | |
3.35%, 06/15/2029(1) | | | 2,213 | | | | 1,932 | |
British Airways 2019-1 Class AA Pass-Through Trust | | | | | | | | |
3.30%, 12/15/2032(1) | | | 346 | | | | 300 | |
British Airways 2020-1 Class A Pass-Through Trust | | | | | | | | |
4.25%, 11/15/2032(1) | | | 311 | | | | 284 | |
Carnival Corp. | | | | | | | | |
4.00%, 08/01/2028(1) | | | 1,285 | | | | 1,139 | |
9.88%, 08/01/2027(1) | | | 5,400 | | | | 5,625 | |
Carvana Co. | | | | | | | | |
4.88%, 09/01/2029(1) | | | 5,701 | | | | 3,233 | |
5.50%, 04/15/2027(1) | | | 890 | | | | 596 | |
10.25%, 05/01/2030(1) | | | 23,700 | | | | 18,669 | |
Dillard’s, Inc. | | | | | | | | |
7.00%, 12/01/2028 | | | 380 | | | | 380 | |
7.75%, 07/15/2026 | | | 135 | | | | 137 | |
7.75%, 05/15/2027 | | | 85 | | | | 87 | |
Dollar General Corp. | | | | | | | | |
3.50%, 04/03/2030 | | | 3,125 | | | | 2,802 | |
Ferguson Finance Plc | | | | | | | | |
3.25%, 06/02/2030(1) | | | 1,720 | | | | 1,493 | |
Fertitta Entertainment LLC / Fertitta Entertainment Finance Co., Inc. | | | | | | | | |
6.75%, 01/15/2030(1) | | | 2,228 | | | | 1,896 | |
FirstCash, Inc. | | | | | | | | |
5.63%, 01/01/2030(1) | | | 5,000 | | | | 4,519 | |
General Motors Co. | | | | | | | | |
5.20%, 04/01/2045 | | | 18,095 | | | | 15,435 | |
6.25%, 10/02/2043 | | | 65 | | | | 64 | |
General Motors Financial Co., Inc. | | | | | | | | |
3.10%, 01/12/2032 | | | 2,030 | | | | 1,642 | |
4.00%, 10/06/2026 | | | 537 | | | | 509 | |
4.30%, 07/13/2025 | | | 182 | | | | 177 | |
4.35%, 04/09/2025 | | | 1,518 | | | | 1,478 | |
5.65%, 01/17/2029 | | | 613 | | | | 603 | |
5.80%, 06/23/2028 | | | 3,130 | | | | 3,118 | |
5.85%, 04/06/2030 | | | 1,770 | | | | 1,755 | |
6.00%, 01/09/2028 | | | 14,095 | | | | 14,208 | |
6.40%, 01/09/2033 | | | 4,470 | | | | 4,543 | |
GENM Capital Labuan Ltd. | | | | | | | | |
3.88%, 04/19/2031(1) | | | 10,990 | | | | 8,887 | |
Greene King Finance Plc | | | | | | | | |
4.06%, 03/15/2035 | | GBP | 3,047 | | | | 3,157 | |
5.11%, 03/15/2034 | | | 400 | | | | 445 | |
Grupo Posadas SAB de CV | | | | | | | | |
5.00%, 12/30/2027(4) | | $ | 266 | | | | 227 | |
Hyundai Capital America | | | | | | | | |
1.80%, 10/15/2025(1) | | | 5,395 | | | | 4,921 | |
| | | | | | | | |
2.10%, 09/15/2028(1) | | | 6,385 | | | | 5,352 | |
Intelsat Jackson Holdings SA | | | | | | | | |
8.50%, 10/15/2024(1)(8)(9) | | | 18,280 | | | | — | |
JetBlue 2019-1 Class AA Pass-Through Trust | | | | | | | | |
2.75%, 05/15/2032 | | | 589 | | | | 501 | |
JetBlue 2020-1 Class A Pass-Through Trust | | | | | | | | |
4.00%, 11/15/2032 | | | 2,927 | | | | 2,666 | |
Lithia Motors, Inc. | | | | | | | | |
3.88%, 06/01/2029(1) | | | 5,095 | | | | 4,427 | |
Lowe’s Companies, Inc. | | | | | | | | |
2.80%, 09/15/2041 | | | 2,756 | | | | 1,949 | |
4.50%, 04/15/2030 | | | 4,481 | | | | 4,356 | |
Marriott International, Inc. | | | | | | | | |
2.75%, 10/15/2033 | | | 1,322 | | | | 1,051 | |
2.85%, 04/15/2031 | | | 2,750 | | | | 2,312 | |
3.75%, 10/01/2025 | | | 297 | | | | 285 | |
4.63%, 06/15/2030 | | | 940 | | | | 900 | |
Marriott Ownership Resorts, Inc. | | | | | | | | |
4.50%, 06/15/2029(1) | | | 745 | | | | 643 | |
MDC Holdings, Inc. | | | | | | | | |
3.97%, 08/06/2061 | | | 7,835 | | | | 4,675 | |
6.00%, 01/15/2043 | | | 7,970 | | | | 7,188 | |
Mercedes-Benz Finance North America LLC | | | | | | | | |
2.45%, 03/02/2031(1) | | | 1,015 | | | | 863 | |
Metalsa Sapi de CV | | | | | | | | |
3.75%, 05/04/2031(18) | | | 284 | | | | 224 | |
Michaels Companies, Inc. | | | | | | | | |
7.88%, 05/01/2029(1) | | | 11,145 | | | | 7,509 | |
Mileage Plus Holdings LLC / Mileage Plus Intellectual Property Assets Ltd. | | | | | | | | |
6.50%, 06/20/2027(1) | | | 7,232 | | | | 7,250 | |
Mitchells & Butlers Finance Plc | | | | | | | | |
6.00% (3 Month LIBOR USD + 0.45%), 12/15/2030(2) | | | 6,253 | | | | 5,695 | |
6.01%, 12/15/2028 | | GBP | 265 | | | | 301 | |
NCL Corp. Ltd. | | | | | | | | |
5.88%, 03/15/2026(1) | | $ | 1,420 | | | | 1,329 | |
5.88%, 02/15/2027(1) | | | 7,150 | | | | 6,960 | |
Nemak SAB de CV | | | | | | | | |
3.63%, 06/28/2031(18) | | | 247 | | | | 193 | |
Nissan Motor Acceptance Co. LLC | | | | | | | | |
1.85%, 09/16/2026(1) | | | 45,200 | | | | 38,346 | |
2.00%, 03/09/2026(1) | | | 14,300 | | | | 12,513 | |
2.45%, 09/15/2028(1) | | | 4,800 | | | | 3,833 | |
2.75%, 03/09/2028(1) | | | 14,600 | | | | 11,999 | |
Nissan Motor Co. Ltd. | | | | | | | | |
3.52%, 09/17/2025(1) | | | 1,400 | | | | 1,302 | |
4.35%, 09/17/2027(1) | | | 10,500 | | | | 9,550 | |
4.81%, 09/17/2030(1) | | | 57,500 | | | | 50,436 | |
Royal Caribbean Cruises Ltd. | | | | | | | | |
5.50%, 04/01/2028(1) | | | 2,075 | | | | 1,935 | |
Sands China Ltd. | | | | | | | | |
4.30%, 01/08/2026 | | | 900 | | | | 846 | |
5.63%, 08/08/2025 | | | 6,939 | | | | 6,770 | |
5.90%, 08/08/2028 | | | 1,200 | | | | 1,144 | |
Tapestry, Inc. | | | | | | | | |
3.05%, 03/15/2032 | | | 3,325 | | | | 2,655 | |
Tractor Supply Co. | | | | | | | | |
5.25%, 05/15/2033 | | | 600 | | | | 595 | |
Travel + Leisure Co. | | | | | | | | |
4.50%, 12/01/2029(1) | | | 755 | | | | 642 | |
6.00%, 04/01/2027 | | | 5,015 | | | | 4,868 | |
U.S. Airways 2011-1 Class A Pass-Through Trust | | | | | | | | |
7.13%, 10/22/2023 | | | 900 | | | | 897 | |
U.S. Airways 2013-1 Class A Pass-Through Trust | | | | | | | | |
3.95%, 11/15/2025 | | | 931 | | | | 868 | |
United Airlines 2018-1 Class A Pass-Through Trust | | | | | | | | |
3.70%, 03/01/2030 | | | 502 | | | | 434 | |
United Airlines 2018-1 Class B Pass-Through Trust | | | | | | | | |
4.60%, 03/01/2026 | | | 3,984 | | | | 3,737 | |
United Airlines 2019-1 Class AA Pass-Through Trust | | | | | | | | |
4.15%, 08/25/2031 | | | 525 | | | | 481 | |
United Airlines 2019-2 Class A Pass-Through Trust | | | | | | | | |
2.90%, 05/01/2028 | | | 1,276 | | | | 1,107 | |
United Airlines 2019-2 Class AA Pass-Through Trust | | | | | | | | |
2.70%, 05/01/2032 | | | 799 | | | | 669 | |
United Airlines 2020-1 Class A Pass-Through Trust | | | | | | | | |
5.88%, 10/15/2027 | | | 16,242 | | | | 16,103 | |
United Airlines 2023-1 Class A Pass-Through Trust | | | | | | | | |
5.80%, 01/15/2036 | | | 27,995 | | | | 28,446 | |
Warnermedia Holdings, Inc. | | | | | | | | |
3.76%, 03/15/2027 | | | 12,015 | | | | 11,207 | |
4.05%, 03/15/2029 | | | 4,505 | | | | 4,118 | |
4.28%, 03/15/2032 | | | 12,075 | | | | 10,709 | |
5.05%, 03/15/2042 | | | 21,535 | | | | 18,151 | |
5.14%, 03/15/2052 | | | 32,921 | | | | 26,806 | |
Yum! Brands, Inc. | | | | | | | | |
4.75%, 01/15/2030(1) | | | 750 | | | | 702 | |
| | | | | | | | |
Total Consumer, Cyclical | | | | | | | 506,245 | |
| | | | | | | | |
Consumer, Non-cyclical – 3.35% | | | | | | | | |
AbbVie, Inc. | | | | | | | | |
| | | | | | | | |
4.45%, 05/14/2046 | | | 1,625 | | | | 1,431 | |
4.50%, 05/14/2035 | | | 3,710 | | | | 3,525 | |
4.55%, 03/15/2035 | | | 4,015 | | | | 3,823 | |
Adtalem Global Education Inc | | | | | | | | |
5.50%, 03/01/2028(1) | | | 1,000 | | | | 908 | |
Aetna, Inc. | | | | | | | | |
3.50%, 11/15/2024 | | | 3,370 | | | | 3,265 | |
4.75%, 03/15/2044 | | | 966 | | | | 856 | |
Alcon Finance Corp. | | | | | | | | |
5.38%, 12/06/2032(1) | | | 5,350 | | | | 5,421 | |
Altria Group, Inc. | | | | | | | | |
3.40%, 02/04/2041 | | | 2,320 | | | | 1,619 | |
4.25%, 08/09/2042 | | | 1,701 | | | | 1,327 | |
5.80%, 02/14/2039 | | | 1,523 | | | | 1,491 | |
Amgen, Inc. | | | | | | | | |
4.05%, 08/18/2029 | | | 5,832 | | | | 5,530 | |
4.40%, 02/22/2062 | | | 6,807 | | | | 5,587 | |
5.25%, 03/02/2030 | | | 8,485 | | | | 8,502 | |
5.25%, 03/02/2033 | | | 4,530 | | | | 4,536 | |
5.60%, 03/02/2043 | | | 8,530 | | | | 8,556 | |
5.65%, 03/02/2053 | | | 12,940 | | | | 13,104 | |
5.75%, 03/02/2063 | | | 2,681 | | | | 2,720 | |
Ashtead Capital, Inc. | | | | | | | | |
5.50%, 08/11/2032(1) | | | 2,475 | | | | 2,393 | |
5.55%, 05/30/2033(1) | | | 3,820 | | | | 3,724 | |
Astrazeneca Finance LLC | | | | | | | | |
4.88%, 03/03/2028 | | | 12,130 | | | | 12,123 | |
Atento Luxco 1 SA | | | | | | | | |
8.00%, 02/10/2026(18) | | | 110 | | | | 17 | |
8.00%, 02/10/2026(1) | | | 444 | | | | 71 | |
Bacardi Ltd. | | | | | | | | |
4.45%, 05/15/2025(1) | | | 13,085 | | | | 12,734 | |
4.70%, 05/15/2028(1) | | | 232 | | | | 224 | |
Bacardi Ltd. / Bacardi-Martini BV | | | | | | | | |
5.40%, 06/15/2033(1) | | | 13,960 | | | | 13,837 | |
Baptist Healthcare System Obligated Group | | | | | | | | |
3.54%, 08/15/2050 | | | 8,700 | | | | 6,439 | |
BAT Capital Corp. | | | | | | | | |
2.73%, 03/25/2031 | | | 29,370 | | | | 23,392 | |
3.56%, 08/15/2027 | | | 6,250 | | | | 5,747 | |
3.98%, 09/25/2050 | | | 4,103 | | | | 2,765 | |
4.39%, 08/15/2037 | | | 1,020 | | | | 816 | |
4.54%, 08/15/2047 | | | 10,555 | | | | 7,767 | |
4.76%, 09/06/2049 | | | 7,037 | | | | 5,312 | |
5.65%, 03/16/2052 | | | 8,040 | | | | 6,985 | |
Bausch Health Companies, Inc. | | | | | | | | |
4.88%, 06/01/2028(1) | | | 3,165 | | | | 1,884 | |
Bayer U.S. Finance II LLC | | | | | | | | |
2.85%, 04/15/2025(1) | | | 8,635 | | | | 8,141 | |
3.38%, 07/15/2024(1) | | | 5,915 | | | | 5,779 | |
4.25%, 12/15/2025(1) | | | 5,060 | | | | 4,882 | |
4.38%, 12/15/2028(1) | | | 4,685 | | | | 4,444 | |
4.40%, 07/15/2044(1) | | | 6,355 | | | | 5,064 | |
4.88%, 06/25/2048(1) | | | 11,025 | | | | 9,915 | |
Bayer U.S. Finance LLC | | | | | | | | |
3.38%, 10/08/2024(1) | | | 5,000 | | | | 4,841 | |
Becton Dickinson & Co. | | | | | | | | |
3.36%, 06/06/2024 | | | 864 | | | | 845 | |
Catalent Pharma Solutions, Inc. | | | | | | | | |
3.13%, 02/15/2029(1) | | | 950 | | | | 772 | |
3.50%, 04/01/2030(1) | | | 4,000 | | | | 3,240 | |
Centene Corp. | | | | | | | | |
2.45%, 07/15/2028 | | | 9,492 | | | | 8,113 | |
2.50%, 03/01/2031 | | | 14,567 | | | | 11,617 | |
2.63%, 08/01/2031 | | | 5,600 | | | | 4,463 | |
3.00%, 10/15/2030 | | | 18,676 | | | | 15,563 | |
3.38%, 02/15/2030 | | | 2,527 | | | | 2,172 | |
4.25%, 12/15/2027 | | | 14,078 | | | | 13,162 | |
4.63%, 12/15/2029 | | | 315 | | | | 290 | |
CHS/Community Health Systems, Inc. | | | | | | | | |
4.75%, 02/15/2031(1) | | | 3,200 | | | | 2,419 | |
5.63%, 03/15/2027(1) | | | 16,800 | | | | 14,805 | |
8.00%, 03/15/2026(1) | | | 4,312 | | | | 4,200 | |
Cigna Group | | | | | | | | |
3.40%, 03/01/2027 | | | 6,858 | | | | 6,460 | |
4.38%, 10/15/2028 | | | 7,670 | | | | 7,417 | |
CommonSpirit Health | | | | | | | | |
1.55%, 10/01/2025 | | | 3,450 | | | | 3,137 | |
2.78%, 10/01/2030 | | | 7,175 | | | | 6,032 | |
CoStar Group, Inc. | | | | | | | | |
2.80%, 07/15/2030(1) | | | 11,000 | | | | 9,073 | |
CVS Health Corp. | | | | | | | | |
1.88%, 02/28/2031 | | | 1,464 | | | | 1,163 | |
3.25%, 08/15/2029 | | | 6,270 | | | | 5,631 | |
5.00%, 01/30/2029 | | | 981 | | | | 972 | |
5.05%, 03/25/2048 | | | 30,725 | | | | 28,320 | |
5.13%, 07/20/2045 | | | 2,250 | | | | 2,082 | |
5.25%, 01/30/2031 | | | 2,475 | | | | 2,467 | |
CVS Pass-Through Trust | | | | | | | | |
| | | | | | | | |
5.77%, 01/10/2033(1) | | | 53 | | | | 51 | |
5.77%, 01/10/2033 | | | 1,948 | | | | 1,875 | |
6.04%, 12/10/2028 | | | 921 | | | | 913 | |
CVS Pass-Through Trust Series 2013 | | | | | | | | |
4.70%, 01/10/2036(1) | | | 4,052 | | | | 3,740 | |
CVS Pass-Through Trust Series 2014 | | | | | | | | |
4.16%, 08/11/2036(1) | | | 9,006 | | | | 7,770 | |
Element Fleet Management Corp. | | | | | | | | |
1.60%, 04/06/2024(1) | | | 2,195 | | | | 2,117 | |
Elevance Health, Inc. | | | | | | | | |
3.60%, 03/15/2051 | | | 960 | | | | 734 | |
3.65%, 12/01/2027 | | | 2,580 | | | | 2,436 | |
4.55%, 05/15/2052 | | | 2,306 | | | | 2,060 | |
Embecta Corp. | | | | | | | | |
5.00%, 02/15/2030(1) | | | 2,488 | | | | 2,066 | |
ERAC USA Finance LLC | | | | | | | | |
3.80%, 11/01/2025(1) | | | 4,605 | | | | 4,404 | |
4.90%, 05/01/2033(1) | | | 11,015 | | | | 10,763 | |
Ford Foundation | | | | | | | | |
2.82%, 06/01/2070 | | | 880 | | | | 544 | |
Fresenius Medical Care U.S. Finance III, Inc. | | | | | | | | |
1.88%, 12/01/2026(1) | | | 9,545 | | | | 8,233 | |
Frigorifico Concepcion SA | | | | | | | | |
7.70%, 07/21/2028(1) | | | 282 | | | | 220 | |
Gartner, Inc. | | | | | | | | |
3.63%, 06/15/2029(1) | | | 970 | | | | 854 | |
Gilead Sciences, Inc. | | | | | | | | |
2.60%, 10/01/2040 | | | 3,404 | | | | 2,465 | |
4.15%, 03/01/2047 | | | 967 | | | | 839 | |
4.80%, 04/01/2044 | | | 4,250 | | | | 4,057 | |
Global Payments, Inc. | | | | | | | | |
1.20%, 03/01/2026 | | | 1,644 | | | | 1,461 | |
2.15%, 01/15/2027 | | | 1,022 | | | | 908 | |
2.90%, 05/15/2030 | | | 7,262 | | | | 6,155 | |
2.90%, 11/15/2031 | | | 7,080 | | | | 5,760 | |
3.20%, 08/15/2029 | | | 7,222 | | | | 6,277 | |
4.45%, 06/01/2028 | | | 2,920 | | | | 2,740 | |
4.80%, 04/01/2026 | | | 1,172 | | | | 1,144 | |
4.95%, 08/15/2027 | | | 3,759 | | | | 3,663 | |
5.30%, 08/15/2029 | | | 5,989 | | | | 5,835 | |
5.40%, 08/15/2032 | | | 12,685 | | | | 12,361 | |
5.95%, 08/15/2052 | | | 6,053 | | | | 5,792 | |
Grifols Escrow Issuer SA | | | | | | | | |
4.75%, 10/15/2028(1) | | | 5,459 | | | | 4,738 | |
Gruma SAB de CV | | | | | | | | |
4.88%, 12/01/2024(18) | | | 256 | | | | 253 | |
Grupo Bimbo SAB de CV | | | | | | | | |
3.88%, 06/27/2024(18) | | | 219 | | | | 215 | |
HCA, Inc. | | | | | | | | |
3.38%, 03/15/2029(1) | | | 9,345 | | | | 8,309 | |
3.50%, 09/01/2030 | | | 13,119 | | | | 11,499 | |
3.50%, 07/15/2051 | | | 1,680 | | | | 1,162 | |
3.63%, 03/15/2032(1) | | | 5,600 | | | | 4,861 | |
4.13%, 06/15/2029 | | | 31,082 | | | | 28,762 | |
4.63%, 03/15/2052(1) | | | 5,570 | | | | 4,577 | |
5.25%, 04/15/2025 | | | 1,814 | | | | 1,791 | |
5.25%, 06/15/2026 | | | 8 | | | | 8 | |
5.25%, 06/15/2049 | | | 6,070 | | | | 5,477 | |
5.38%, 02/01/2025 | | | 2,587 | | | | 2,564 | |
5.38%, 09/01/2026 | | | 7,650 | | | | 7,590 | |
5.50%, 06/01/2033 | | | 24,530 | | | | 24,487 | |
5.50%, 06/15/2047 | | | 12,742 | | | | 12,002 | |
5.88%, 02/15/2026 | | | 4,128 | | | | 4,131 | |
5.88%, 02/01/2029 | | | 6,798 | | | | 6,842 | |
7.50%, 11/06/2033 | | | 435 | | | | 475 | |
7.58%, 09/15/2025 | | | 1,322 | | | | 1,366 | |
7.69%, 06/15/2025 | | | 1,654 | | | | 1,699 | |
Humana, Inc. | | | | | | | | |
3.70%, 03/23/2029 | | | 11,540 | | | | 10,569 | |
3.85%, 10/01/2024 | | | 4,014 | | | | 3,920 | |
4.88%, 04/01/2030 | | | 5,815 | | | | 5,697 | |
Illumina, Inc. | | | | | | | | |
2.55%, 03/23/2031 | | | 11,640 | | | | 9,597 | |
Imperial Brands Finance Plc | | | | | | | | |
3.13%, 07/26/2024(1) | | | 10,790 | | | | 10,425 | |
3.50%, 07/26/2026(1) | | | 8,675 | | | | 8,079 | |
4.25%, 07/21/2025(1) | | | 4,170 | | | | 3,999 | |
6.13%, 07/27/2027(1) | | | 18,800 | | | | 18,832 | |
Integris Baptist Medical Center, Inc. | | | | | | | | |
3.88%, 08/15/2050 | | | 7,000 | | | | 5,278 | |
IQVIA, Inc. | | | | | | | | |
5.70%, 05/15/2028(1) | | | 16,850 | | | | 16,681 | |
JBS USA LUX SA | | | | | | | | |
3.00%, 02/02/2029(1) | | | 5,290 | | | | 4,486 | |
3.75%, 12/01/2031(1) | | | 7,152 | | | | 5,865 | |
4.38%, 02/02/2052(1) | | | 2,090 | | | | 1,466 | |
5.50%, 01/15/2030(1) | | | 5,130 | | | | 4,921 | |
5.75%, 04/01/2033(1) | | | 7,770 | | | | 7,303 | |
6.50%, 12/01/2052(1) | | | 7,760 | | | | 7,354 | |
| | | | | | | | |
JDE Peet’s NV | | | | | | | | |
2.25%, 09/24/2031(1) | | | 4,500 | | | | 3,485 | |
Kevlar SpA | | | | | | | | |
6.50%, 09/01/2029(1) | | | 7,500 | | | | 6,394 | |
Market Bidco Finco Plc | | | | | | | | |
4.75%, 11/04/2027 | | EUR | 16,000 | | | | 13,969 | |
Mass General Brigham, Inc. | | | | | | | | |
3.34%, 07/01/2060 | | $ | 3,500 | | | | 2,448 | |
Massachusetts Institute of Technology | | | | | | | | |
4.68%, 07/01/2114 | | | 45 | | | | 42 | |
5.60%, 07/01/2111 | | | 72 | | | | 81 | |
ModivCare Escrow Issuer, Inc. | | | | | | | | |
5.00%, 10/01/2029(1) | | | 5,046 | | | | 3,734 | |
ModivCare, Inc. | | | | | | | | |
5.88%, 11/15/2025(1) | | | 2,835 | | | | 2,626 | |
Molina Healthcare, Inc. | | | | | | | | |
3.88%, 11/15/2030(1) | | | 4,206 | | | | 3,614 | |
4.38%, 06/15/2028(1) | | | 10,418 | | | | 9,604 | |
Moody’s Corp. | | | | | | | | |
2.55%, 08/18/2060 | | | 1,104 | | | | 608 | |
3.10%, 11/29/2061 | | | 1,491 | | | | 978 | |
4.25%, 02/01/2029 | | | 878 | | | | 845 | |
4.88%, 12/17/2048 | | | 1,679 | | | | 1,573 | |
Natura Cosmeticos SA | | | | | | | | |
4.13%, 05/03/2028(1) | | | 5,270 | | | | 4,559 | |
New York & Presbyterian Hospital | | | | | | | | |
3.56%, 08/01/2036 | | | 2,630 | | | | 2,199 | |
Option Care Health, Inc. | | | | | | | | |
4.38%, 10/31/2029(1) | | | 5,500 | | | | 4,841 | |
Pfizer Investment Enterprises Pte Ltd. | | | | | | | | |
4.75%, 05/19/2033 | | | 12,660 | | | | 12,612 | |
5.30%, 05/19/2053 | | | 1,840 | | | | 1,913 | |
5.34%, 05/19/2063 | | | 9,582 | | | | 9,696 | |
Philip Morris International, Inc. | | | | | | | | |
5.13%, 11/17/2027 | | | 3,261 | | | | 3,271 | |
Pilgrim’s Pride Corp. | | | | | | | | |
3.50%, 03/01/2032 | | | 18,075 | | | | 14,290 | |
4.25%, 04/15/2031 | | | 2,650 | | | | 2,273 | |
5.88%, 09/30/2027(1) | | | 3,772 | | | | 3,727 | |
6.25%, 07/01/2033 | | | 8,865 | | | | 8,587 | |
Pomona College | | | | | | | | |
2.89%, 01/01/2051 | | | 3,570 | | | | 2,509 | |
Prestige Brands, Inc. | | | | | | | | |
3.75%, 04/01/2031(1) | | | 3,352 | | | | 2,775 | |
Providence St Joseph Health Obligated Group | | | | | | | | |
5.40%, 10/01/2033 | | | 13,835 | | | | 13,654 | |
Revvity, Inc. | | | | | | | | |
2.25%, 09/15/2031 | | | 2,250 | | | | 1,805 | |
2.55%, 03/15/2031 | | | 11,115 | | | | 9,160 | |
Reynolds American, Inc. | | | | | | | | |
5.70%, 08/15/2035 | | | 6,650 | | | | 6,250 | |
5.85%, 08/15/2045 | | | 13,100 | | | | 11,650 | |
Rockefeller Foundation | | | | | | | | |
2.49%, 10/01/2050 | | | 3,400 | | | | 2,209 | |
S&P Global, Inc. | | | | | | | | |
1.25%, 08/15/2030 | | | 2,597 | | | | 2,045 | |
4.25%, 05/01/2029 | | | 2,585 | | | | 2,512 | |
Simmons Foods, Inc./Simmons Prepared Foods, Inc./Simmons Pet Food, Inc./Simmons Feed | | | | | | | | |
4.63%, 03/01/2029(1) | | | 4,526 | | | | 3,626 | |
Smithfield Foods, Inc. | | | | | | | | |
2.63%, 09/13/2031(1) | | | 10,000 | | | | 7,390 | |
3.00%, 10/15/2030(1) | | | 925 | | | | 725 | |
4.25%, 02/01/2027(1) | | | 1,290 | | | | 1,189 | |
Spectrum Brands, Inc. | | | | | | | | |
5.50%, 07/15/2030(1) | | | 1,617 | | | | 1,476 | |
Sutter Health | | | | | | | | |
3.16%, 08/15/2040 | | | 4,700 | | | | 3,548 | |
3.36%, 08/15/2050 | | | 11,400 | | | | 8,182 | |
Teva Pharmaceutical Finance Netherlands III BV | | | | | | | | |
3.15%, 10/01/2026 | | | 7,935 | | | | 7,110 | |
4.10%, 10/01/2046 | | | 11,660 | | | | 7,664 | |
4.75%, 05/09/2027 | | | 6,755 | | | | 6,249 | |
5.13%, 05/09/2029 | | | 4,885 | | | | 4,431 | |
7.88%, 09/15/2029 | | | 4,405 | | | | 4,539 | |
8.13%, 09/15/2031 | | | 3,170 | | | | 3,322 | |
Thermo Fisher Scientific, Inc. | | | | | | | | |
2.00%, 10/15/2031 | | | 740 | | | | 604 | |
4.95%, 11/21/2032 | | | 895 | | | | 911 | |
Triton Water Holdings, Inc. | | | | | | | | |
6.25%, 04/01/2029(1) | | | 6,045 | | | | 5,188 | |
U.S. Renal Care, Inc. | | | | | | | | |
10.63%, 07/15/2027(1) | | | 558 | | | | 140 | |
UnitedHealth Group, Inc. | | | | | | | | |
3.75%, 10/15/2047 | | | 1,480 | | | | 1,218 | |
3.88%, 12/15/2028 | | | 1,070 | | | | 1,025 | |
4.25%, 04/15/2047 | | | 1,517 | | | | 1,337 | |
4.38%, 03/15/2042 | | | 665 | | | | 602 | |
4.75%, 05/15/2052 | | | 3,922 | | | | 3,721 | |
4.95%, 05/15/2062 | | | 1,293 | | | | 1,243 | |
| | | | | | | | |
6.05%, 02/15/2063 | | | 1,195 | | | | 1,351 | |
Universal Health Services Inc | | | | | | | | |
1.65%, 09/01/2026 | | | 8,275 | | | | 7,234 | |
Upbound Group, Inc. | | | | | | | | |
6.38%, 02/15/2029(1) | | | 1,250 | | | | 1,109 | |
Verisk Analytics, Inc. | | | | | | | | |
4.13%, 03/15/2029 | | | 3,835 | | | | 3,661 | |
5.75%, 04/01/2033 | | | 7,965 | | | | 8,339 | |
WASH Multifamily Acquisition, Inc. | | | | | | | | |
5.75%, 04/15/2026(1) | | | 1,250 | | | | 1,167 | |
| | | | | | | | |
Total Consumer, Non-cyclical | | | | 1,012,268 | |
| | | | | | | | |
Energy – 2.54% | | | | | | | | |
Aker BP ASA | | | | | | | | |
3.10%, 07/15/2031(1) | | | 5,635 | | | | 4,663 | |
3.75%, 01/15/2030(1) | | | 15,485 | | | | 13,763 | |
4.00%, 01/15/2031(1) | | | 14,110 | | | | 12,548 | |
Archrock Partners LP / Archrock Partners Finance Corp. | | | | | | | | |
6.25%, 04/01/2028(1) | | | 1,000 | | | | 939 | |
BP Capital Markets America, Inc. | | | | | | | | |
4.81%, 02/13/2033 | | | 7,772 | | | | 7,659 | |
Cameron LNG LLC | | | | | | | | |
3.30%, 01/15/2035(1) | | | 6,655 | | | | 5,548 | |
3.40%, 01/15/2038(1) | | | 2,968 | | | | 2,468 | |
Canadian Natural Resources Ltd. | | | | | | | | |
6.25%, 03/15/2038 | | | 1,345 | | | | 1,369 | |
Cenovus Energy, Inc. | | | | | | | | |
6.75%, 11/15/2039 | | | 3,823 | | | | 4,008 | |
6.80%, 09/15/2037 | | | 1,309 | | | | 1,361 | |
Cheniere Corpus Christi Holdings LLC | | | | | | | | |
3.70%, 11/15/2029 | | | 6,889 | | | | 6,237 | |
5.13%, 06/30/2027 | | | 11,411 | | | | 11,218 | |
5.88%, 03/31/2025 | | | 8,820 | | | | 8,778 | |
Cheniere Energy Partners LP | | | | | | | | |
3.25%, 01/31/2032 | | | 14,513 | | | | 11,939 | |
4.00%, 03/01/2031 | | | 28,079 | | | | 24,722 | |
4.50%, 10/01/2029 | | | 14,861 | | | | 13,639 | |
5.95%, 06/30/2033(1) | | | 9,156 | | | | 9,183 | |
Continental Resources, Inc. | | | | | | | | |
2.88%, 04/01/2032(1) | | | 25,449 | | �� | | 19,553 | |
5.75%, 01/15/2031(1) | | | 37,211 | | | | 35,374 | |
Continuum Energy Levanter Pte Ltd. | | | | | | | | |
4.50%, 02/09/2027(1) | | | 264 | | | | 246 | |
DCP Midstream Operating LP | | | | | | | | |
3.25%, 02/15/2032 | | | 15,045 | | | | 12,734 | |
5.13%, 05/15/2029 | | | 3,380 | | | | 3,306 | |
Devon Energy Corp. | | | | | | | | |
4.50%, 01/15/2030 | | | 2,784 | | | | 2,621 | |
5.25%, 10/15/2027 | | | 792 | | | | 780 | |
8.25%, 08/01/2023 | | | 588 | | | | 588 | |
Diamondback Energy, Inc. | | | | | | | | |
3.13%, 03/24/2031 | | | 8,960 | | | | 7,675 | |
3.25%, 12/01/2026 | | | 13,155 | | | | 12,360 | |
3.50%, 12/01/2029 | | | 18,560 | | | | 16,706 | |
Ecopetrol SA | | | | | | | | |
5.88%, 09/18/2023 | | | 147 | | | | 147 | |
6.88%, 04/29/2030 | | | 923 | | | | 842 | |
8.63%, 01/19/2029 | | | 1,166 | | | | 1,169 | |
8.88%, 01/13/2033 | | | 1,549 | | | | 1,534 | |
EIG Pearl Holdings Sarl | | | | | | | | |
4.39%, 11/30/2046(1) | | | 1,119 | | | | 876 | |
Empresa Nacional del Petroleo | | | | | | | | |
3.75%, 08/05/2026(18) | | | 374 | | | | 354 | |
Enbridge, Inc. | | | | | | | | |
2.50%, 08/01/2033 | | | 761 | | | | 594 | |
5.70%, 03/08/2033 | | | 24,043 | | | | 24,372 | |
Energean Israel Finance Ltd. | | | | | | | | |
5.38%, 03/30/2028(1) | | | 4,950 | | | | 4,467 | |
5.88%, 03/30/2031(1) | | | 6,495 | | | | 5,675 | |
8.50%, 09/30/2033(1) | | | 108 | | | | 108 | |
Energy Transfer LP | | | | | | | | |
2.90%, 05/15/2025 | | | 2,346 | | | | 2,223 | |
3.90%, 05/15/2024 | | | 1,106 | | | | 1,087 | |
4.00%, 10/01/2027 | | | 5,865 | | | | 5,492 | |
4.40%, 03/15/2027 | | | 1,105 | | | | 1,057 | |
4.50%, 04/15/2024 | | | 2,483 | | | | 2,454 | |
4.75%, 01/15/2026 | | | 4,720 | | | | 4,614 | |
4.95%, 06/15/2028 | | | 2,049 | | | | 1,987 | |
5.00%, 05/15/2050 | | | 14,689 | | | | 12,406 | |
5.15%, 02/01/2043 | | | 1,738 | | | | 1,477 | |
5.15%, 03/15/2045 | | | 2,700 | | | | 2,328 | |
5.25%, 04/15/2029 | | | 728 | | | | 711 | |
5.30%, 04/01/2044 | | | 806 | | | | 698 | |
5.30%, 04/15/2047 | | | 2,739 | | | | 2,382 | |
5.35%, 05/15/2045 | | | 3,759 | | | | 3,285 | |
5.40%, 10/01/2047 | | | 24,296 | | | | 21,413 | |
5.50%, 06/01/2027 | | | 1,013 | | | | 1,008 | |
5.75%, 02/15/2033 | | | 8,258 | | | | 8,312 | |
6.00%, 06/15/2048 | | | 2,857 | | | | 2,709 | |
6.13%, 12/15/2045 | | | 800 | | | | 760 | |
| | | | | | | | |
6.25%, 04/15/2049 | | | 4,076 | | | | 3,981 | |
ENI SpA | | | | | | | | |
4.75%, 09/12/2028(1) | | | 4,075 | | | | 3,978 | |
EnLink Midstream LLC | | | | | | | | |
6.50%, 09/01/2030(1) | | | 4,475 | | | | 4,470 | |
Enterprise Products Operating LLC | | | | | | | | |
3.30%, 02/15/2053 | | | 1,234 | | | | 881 | |
3.70%, 01/31/2051 | | | 1,429 | | | | 1,093 | |
5.10%, 02/15/2045 | | | 1,429 | | | | 1,364 | |
EQT Corp. | | | | | | | | |
3.13%, 05/15/2026(1) | | | 4,583 | | | | 4,214 | |
3.63%, 05/15/2031(1) | | | 10,071 | | | | 8,662 | |
3.90%, 10/01/2027 | | | 18,223 | | | | 16,848 | |
5.00%, 01/15/2029 | | | 8,555 | | | | 8,054 | |
5.70%, 04/01/2028 | | | 3,666 | | | | 3,618 | |
7.00%, 02/01/2030 | | | 8,104 | | | | 8,485 | |
Galaxy Pipeline Assets Bidco Ltd. | | | | | | | | |
2.16%, 03/31/2034(1) | | | 1,873 | | | | 1,590 | |
Gazprom PJSC Via Gaz Capital SA | | | | | | | | |
4.95%, 03/23/2027 | | | 20,900 | | | | 15,675 | |
Gazprom PJSC via Gaz Finance Plc | | | | | | | | |
2.95%, 04/15/2025 | | EUR | 15,000 | | | | 12,276 | |
2.95%, 01/27/2029(1) | | $ | 28,600 | | | | 18,590 | |
3.00%, 06/29/2027 | | | 10,000 | | | | 6,900 | |
Gray Oak Pipeline LLC | | | | | | | | |
2.00%, 09/15/2023(1) | | | 504 | | | | 500 | |
2.60%, 10/15/2025(1) | | | 532 | | | | 488 | |
3.45%, 10/15/2027(1) | | | 983 | | | | 878 | |
Hess Corp. | | | | | | | | |
5.60%, 02/15/2041 | | | 5,327 | | | | 5,097 | |
KazMunayGas National Co. JSC | | | | | | | | |
3.50%, 04/14/2033 | | | 351 | | | | 271 | |
5.38%, 04/24/2030 | | | 2,346 | | | | 2,176 | |
Kinder Morgan Energy Partners LP | | | | | | | | |
4.70%, 11/01/2042 | | | 2,609 | | | | 2,168 | |
5.00%, 03/01/2043 | | | 1,186 | | | | 1,020 | |
5.50%, 03/01/2044 | | | 2,520 | | | | 2,297 | |
Leviathan Bond Ltd. | | | | | | | | |
6.13%, 06/30/2025(1) | | | 5,495 | | | | 5,353 | |
6.75%, 06/30/2030(1)(18) | | | 33 | | | | 31 | |
MC Brazil Downstream Trading Sarl | | | | | | | | |
7.25%, 06/30/2031(1) | | | 320 | | | | 216 | |
NGPL PipeCo LLC | | | | | | | | |
3.25%, 07/15/2031(1) | | | 7,256 | | | | 5,976 | |
4.88%, 08/15/2027(1) | | | 7,307 | | | | 6,924 | |
Northwest Pipeline LLC | | | | | | | | |
4.00%, 04/01/2027 | | | 5,289 | | | | 5,026 | |
Occidental Petroleum Corp. | | | | | | | | |
6.45%, 09/15/2036 | | | 1,149 | | | | 1,179 | |
7.88%, 09/15/2031 | | | 1,470 | | | | 1,639 | |
8.50%, 07/15/2027 | | | 1,705 | | | | 1,842 | |
8.88%, 07/15/2030 | | | 2,618 | | | | 3,009 | |
Oleoducto Central SA | | | | | | | | |
4.00%, 07/14/2027(18) | | | 341 | | | | 299 | |
Ovintiv, Inc. | | | | | | | | |
6.50%, 08/15/2034 | | | 11,993 | | | | 12,019 | |
7.38%, 11/01/2031 | | | 1,182 | | | | 1,268 | |
Pertamina Persero PT | | | | | | | | |
3.10%, 08/27/2030(1) | | | 4,663 | | | | 4,041 | |
Petrobras Global Finance BV | | | | | | | | |
6.25%, 12/14/2026 | | GBP | 1,100 | | | | 1,318 | |
Petroleos de Venezuela SA | | | | | | | | |
5.38%, 04/12/2027(6)(7) | | $ | 2,052 | | | | 62 | |
5.50%, 04/12/2037(6)(7) | | | 2,500 | | | | 88 | |
6.00%, 05/16/2024(6)(7) | | | 2,312 | | | | 81 | |
6.00%, 11/15/2026(6)(7) | | | 4,600 | | | | 143 | |
9.00%, 11/17/2023(6)(7) | | | 200 | | | | 7 | |
9.75%, 05/17/2035(6)(7) | | | 830 | | | | 29 | |
Petroleos Mexicanos | | | | | | | | |
4.88%, 01/18/2024 | | | 374 | | | | 368 | |
5.50%, 06/27/2044 | | | 203 | | | | 117 | |
5.95%, 01/28/2031 | | | 2,268 | | | | 1,657 | |
6.35%, 02/12/2048 | | | 480 | | | | 290 | |
6.63%, 06/15/2035 | | | 1,733 | | | | 1,208 | |
6.70%, 02/16/2032 | | | 30,644 | | | | 23,299 | |
6.75%, 09/21/2047 | | | 12,346 | | | | 7,752 | |
6.88%, 08/04/2026 | | | 1,957 | | | | 1,828 | |
6.95%, 01/28/2060 | | | 3,895 | | | | 2,429 | |
7.69%, 01/23/2050 | | | 1,470 | | | | 996 | |
8.75%, 06/02/2029 | | | 710 | | | | 643 | |
Plains All American Pipeline LP | | | | | | | | |
3.55%, 12/15/2029 | | | 800 | | | | 705 | |
Plains All American Pipeline LP / PAA Finance Corp. | | | | | | | | |
3.80%, 09/15/2030 | | | 4,120 | | | | 3,656 | |
4.30%, 01/31/2043 | | | 1,335 | | | | 998 | |
Puma International Financing SA | | | | | | | | |
5.00%, 01/24/2026(18) | | | 286 | | | | 257 | |
5.13%, 10/06/2024(1) | | | 531 | | | | 522 | |
QatarEnergy | | | | | | | | |
| | | | | | | | |
2.25%, 07/12/2031 | | | 2,900 | | | | 2,431 | |
QazaqGaz NC JSC | | | | | | | | |
4.38%, 09/26/2027 | | | 600 | | | | 558 | |
Reliance Industries Ltd. | | | | | | | | |
4.13%, 01/28/2025 | | | 250 | | | | 244 | |
Rio Oil Finance Trust Series 2014-1 | | | | | | | | |
9.25%, 07/06/2024 | | | 93 | | | | 93 | |
Rio Oil Finance Trust Series 2014-3 | | | | | | | | |
9.75%, 01/06/2027 | | | 146 | | | | 150 | |
Rio Oil Finance Trust Series 2018-1 | | | | | | | | |
8.20%, 04/06/2028(1) | | | 403 | | | | 405 | |
Rockies Express Pipeline LLC | | | | | | | | |
4.95%, 07/15/2029(1) | | | 5,700 | | | | 5,216 | |
6.88%, 04/15/2040(1) | | | 3,535 | | | | 3,190 | |
Sabine Pass Liquefaction LLC | | | | | | | | |
4.50%, 05/15/2030 | | | 7,173 | | | | 6,818 | |
5.00%, 03/15/2027 | | | 1,558 | | | | 1,534 | |
5.63%, 03/01/2025 | | | 15,406 | | | | 15,345 | |
5.88%, 06/30/2026 | | | 12,561 | | | | 12,664 | |
5.90%, 09/15/2037(1) | | | 1,016 | | | | 1,031 | |
Southern Gas Corridor CJSC | | | | | | | | |
6.88%, 03/24/2026 | | | 1,584 | | | | 1,608 | |
Southern Natural Gas Co. LLC | | | | | | | | |
4.80%, 03/15/2047(1) | | | 1,000 | | | | 843 | |
Southwestern Energy Co. | | | | | | | | |
4.75%, 02/01/2032 | | | 1,850 | | | | 1,630 | |
Suncor Energy, Inc. | | | | | | | | |
6.50%, 06/15/2038 | | | 708 | | | | 735 | |
Targa Resources Corp. | | | | | | | | |
5.20%, 07/01/2027 | | | 775 | | | | 761 | |
6.13%, 03/15/2033 | | | 7,190 | | | | 7,347 | |
6.50%, 02/15/2053 | | | 953 | | | | 973 | |
Targa Resources Partners LP / Targa Resources Partners Finance Corp. | | | | | | | | |
4.00%, 01/15/2032 | | | 2,449 | | | | 2,117 | |
4.88%, 02/01/2031 | | | 9,273 | | | | 8,570 | |
5.00%, 01/15/2028 | | | 5,457 | | | | 5,208 | |
5.50%, 03/01/2030 | | | 2,828 | | | | 2,722 | |
6.88%, 01/15/2029 | | | 488 | | | | 498 | |
TC PipeLines LP | | | | | | | | |
4.38%, 03/13/2025 | | | 3,330 | | | | 3,234 | |
Texas Eastern Transmission LP | | | | | | | | |
3.50%, 01/15/2028(1) | | | 4,374 | | | | 4,045 | |
TMS Issuer Sarl | | | | | | | | |
5.78%, 08/23/2032 | | | 3,500 | | | | 3,588 | |
Topaz Solar Farms LLC | | | | | | | | |
4.88%, 09/30/2039(1) | | | 411 | | | | 376 | |
5.75%, 09/30/2039(1) | | | 3,185 | | | | 3,123 | |
Transcontinental Gas Pipe Line Co. LLC | | | | | | | | |
3.25%, 05/15/2030 | | | 544 | | | | 483 | |
4.00%, 03/15/2028 | | | 3,145 | | | | 2,960 | |
4.60%, 03/15/2048 | | | 3,113 | | | | 2,646 | |
7.85%, 02/01/2026 | | | 3,334 | | | | 3,491 | |
TransMontaigne Partners LP / TLP Finance Corp. | | | | | | | | |
6.13%, 02/15/2026 | | | 5,540 | | | | 4,790 | |
Transocean Poseidon Ltd. | | | | | | | | |
6.88%, 02/01/2027(1) | | | 3,071 | | | | 3,029 | |
Var Energi ASA | | | | | | | | |
8.00%, 11/15/2032(1) | | | 11,505 | | | | 12,172 | |
Variable Energi ASA | | | | | | | | |
7.50%, 01/15/2028(1) | | | 5,135 | | | | 5,277 | |
Venture Global Calcasieu Pass LLC | | | | | | | | |
3.88%, 08/15/2029(1) | | | 3,000 | | | | 2,621 | |
3.88%, 11/01/2033(1) | | | 7,265 | | | | 5,949 | |
4.13%, 08/15/2031(1) | | | 3,297 | | | | 2,835 | |
6.25%, 01/15/2030(1) | | | 4,920 | | | | 4,880 | |
Viper Energy Partners LP | | | | | | | | |
5.38%, 11/01/2027(1) | | | 1,550 | | | | 1,488 | |
Western Midstream Operating LP | | | | | | | | |
4.30%, 02/01/2030 | | | 1,775 | | | | 1,594 | |
5.30%, 03/01/2048 | | | 5,089 | | | | 4,248 | |
5.45%, 04/01/2044 | | | 1,256 | | | | 1,061 | |
5.50%, 08/15/2048 | | | 940 | | | | 786 | |
5.50%, 02/01/2050 | | | 2,350 | | | | 1,925 | |
6.15%, 04/01/2033 | | | 1,320 | | | | 1,330 | |
Williams Companies, Inc. | | | | | | | | |
2.60%, 03/15/2031 | | | 4,619 | | | | 3,828 | |
3.50%, 10/15/2051 | | | 1,016 | | | | 701 | |
5.75%, 06/24/2044 | | | 514 | | | | 501 | |
YPF SA | | | | | | | | |
7.00%, 09/30/2033(4)(18) | | | 208 | | | | 155 | |
7.00%, 12/15/2047(1) | | | 164 | | | | 112 | |
| | | | | | | | |
Total Energy | | | | 767,294 | |
| | | | | | | | |
Financials – 11.46% | | | | | | | | |
AerCap Ireland Capital DAC | | | | | | | | |
3.00%, 10/29/2028 | | | 43,843 | | | | 37,909 | |
3.30%, 01/30/2032 | | | 11,692 | | | | 9,565 | |
3.50%, 01/15/2025 | | | 958 | | | | 917 | |
3.65%, 07/21/2027 | | | 200 | | | | 183 | |
3.88%, 01/23/2028 | | | 10,445 | | | | 9,603 | |
| | | | | | | | |
5.75%, 06/06/2028 | | | 971 | | | | 963 | |
6.50%, 07/15/2025 | | | 250 | | | | 251 | |
Air Lease Corp. | | | | | | | | |
3.00%, 02/01/2030 | | | 4,635 | | | | 3,876 | |
3.13%, 12/01/2030 | | | 6,675 | | | | 5,560 | |
3.25%, 10/01/2029 | | | 1,245 | | | | 1,077 | |
3.38%, 07/01/2025 | | | 5,355 | | | | 5,075 | |
3.88%, 07/03/2023 | | | 4,000 | | | | 4,000 | |
4.63%, 10/01/2028 | | | 30 | | | | 28 | |
5.85%, 12/15/2027 | | | 9,015 | | | | 9,003 | |
Aircastle Ltd. | | | | | | | | |
4.13%, 05/01/2024 | | | 5,440 | | | | 5,293 | |
Alexandria Real Estate Equities, Inc. | | | | | | | | |
3.95%, 01/15/2027 | | | 253 | | | | 240 | |
3.95%, 01/15/2028 | | | 364 | | | | 339 | |
4.70%, 07/01/2030 | | | 42 | | | | 40 | |
Alliant Holdings Intermediate LLC / Alliant Holdings Co.-Issuer | | | | | | | | |
6.75%, 10/15/2027(1) | | | 1,000 | | | | 940 | |
Ally Financial, Inc. | | | | | | | | |
2.20%, 11/02/2028 | | | 4,235 | | | | 3,380 | |
4.63%, 03/30/2025 | | | 11,750 | | | | 11,311 | |
5.75%, 11/20/2025 | | | 3,260 | | | | 3,140 | |
8.00%, 11/01/2031 | | | 8,450 | | | | 8,772 | |
American Assets Trust LP | | | | | | | | |
3.38%, 02/01/2031 | | | 10,870 | | | | 8,494 | |
American Express Co. | | | | | | | | |
2.55%, 03/04/2027 | | | 10,180 | | | | 9,268 | |
American Homes 4 Rent LP | | | | | | | | |
2.38%, 07/15/2031 | | | 1,690 | | | | 1,342 | |
3.38%, 07/15/2051 | | | 3,567 | | | | 2,331 | |
3.63%, 04/15/2032 | | | 5,685 | | | | 4,913 | |
4.30%, 04/15/2052 | | | 1,578 | | | | 1,229 | |
American Tower Corp. | | | | | | | | |
1.88%, 10/15/2030 | | | 3,573 | | | | 2,819 | |
2.10%, 06/15/2030 | | | 15,907 | | | | 12,845 | |
2.30%, 09/15/2031 | | | 18,676 | | | | 14,857 | |
2.70%, 04/15/2031 | | | 14,389 | | | | 11,932 | |
3.80%, 08/15/2029 | | | 3,240 | | | | 2,956 | |
3.95%, 03/15/2029 | | | 4,407 | | | | 4,061 | |
5.50%, 03/15/2028 | | | 8,760 | | | | 8,699 | |
5.55%, 07/15/2033 | | | 7,474 | | | | 7,525 | |
5.65%, 03/15/2033 | | | 10,453 | | | | 10,600 | |
AmFam Holdings, Inc. | | | | | | | | |
2.81%, 03/11/2031(1) | | | 5,500 | | | | 4,107 | |
Antares Holdings LP | | | | | | | | |
2.75%, 01/15/2027(1) | | | 8,970 | | | | 7,370 | |
3.75%, 07/15/2027(1) | | | 20,265 | | | | 16,954 | |
Aon Corp. | | | | | | | | |
2.80%, 05/15/2030 | | | 6,979 | | | | 6,040 | |
4.50%, 12/15/2028 | | | 602 | | | | 579 | |
Aon Corp. / Aon Global Holdings Plc | | | | | | | | |
2.05%, 08/23/2031 | | | 1,542 | | | | 1,230 | |
2.60%, 12/02/2031 | | | 10,260 | | | | 8,449 | |
3.90%, 02/28/2052 | | | 1,262 | | | | 990 | |
5.35%, 02/28/2033 | | | 6,436 | | | | 6,483 | |
Ares Capital Corp. | | | | | | | | |
2.88%, 06/15/2028 | | | 8,315 | | | | 6,876 | |
3.20%, 11/15/2031 | | | 18,865 | | | | 14,461 | |
Arthur J Gallagher & Co. | | | | | | | | |
3.05%, 03/09/2052 | | | 1,995 | | | | 1,271 | |
5.75%, 03/02/2053 | | | 735 | | | | 739 | |
ASG Finance Designated Activity Co. | | | | | | | | |
7.88%, 12/03/2024(1) | | | 493 | | | | 477 | |
Athene Global Funding | | | | | | | | |
1.61%, 06/29/2026(1) | | | 9,100 | | | | 7,783 | |
1.72%, 01/07/2025(1) | | | 27,575 | | | | 25,518 | |
1.99%, 08/19/2028(1) | | | 12,230 | | | | 9,814 | |
2.55%, 11/19/2030(1) | | | 3,300 | | | | 2,555 | |
2.72%, 01/07/2029(1) | | | 3,800 | | | | 3,095 | |
3.21%, 03/08/2027(1) | | | 5,070 | | | | 4,536 | |
5.79% (SOFR + 0.70%), 05/24/2024(1)(2) | | | 10,525 | | | | 10,424 | |
Athene Holding Ltd. | | | | | | | | |
3.50%, 01/15/2031 | | | 1,835 | | | | 1,516 | |
4.13%, 01/12/2028 | | | 11,630 | | | | 10,608 | |
Aviation Capital Group LLC | | | | | | | | |
1.95%, 01/30/2026(1) | | | 5,720 | | | | 5,095 | |
4.88%, 10/01/2025(1) | | | 2,789 | | | | 2,661 | |
5.50%, 12/15/2024(1) | | | 3,900 | | | | 3,817 | |
6.25%, 04/15/2028(1) | | | 3,810 | | | | 3,801 | |
6.38%, 07/15/2030(1) | | | 10,175 | | | | 10,090 | |
Avolon Holdings Funding Ltd. | | | | | | | | |
2.53%, 11/18/2027(1) | | | 35,158 | | | | 29,642 | |
2.75%, 02/21/2028(1) | | | 6,105 | | | | 5,143 | |
2.88%, 02/15/2025(1) | | | 3,919 | | | | 3,645 | |
3.25%, 02/15/2027(1) | | | 1,791 | | | | 1,596 | |
3.95%, 07/01/2024(1) | | | 1,634 | | | | 1,585 | |
4.25%, 04/15/2026(1) | | | 515 | | | | 480 | |
4.38%, 05/01/2026(1) | | | 886 | | | | 828 | |
5.50%, 01/15/2026(1) | | | 1,069 | | | | 1,036 | |
| | | | | | | | |
Banco Mercantil del Norte SA | | | | | | | | |
5.88% (5 Year CMT Index + 4.64%), 01/24/2172(1)(2) | | | 500 | | | | 426 | |
Banco Santander Mexico SA Institucion de Banca Multiple Grupo Financiero Santand | | | | | | | | |
5.38%, 04/17/2025(1) | | | 5,395 | | | | 5,337 | |
Banco Santander SA | | | | | | | | |
0.70% (1 Year CMT Index + 0.45%), 06/30/2024(2) | | | 19,200 | | | | 19,094 | |
1.72% (1 Year CMT Index + 0.90%), 09/14/2027(2) | | | 1,800 | | | | 1,563 | |
2.75%, 12/03/2030 | | | 3,200 | | | | 2,508 | |
3.49%, 05/28/2030 | | | 800 | | | | 697 | |
5.18%, 11/19/2025 | | | 2,400 | | | | 2,331 | |
Bank of America Corp. | | | | | | | | |
1.66% (SOFR + 0.91%), 03/11/2027(2) | | | 40,757 | | | | 36,676 | |
1.73% (SOFR + 0.96%), 07/22/2027(2) | | | 40,854 | | | | 36,473 | |
1.90% (SOFR + 1.53%), 07/23/2031(2) | | | 3,918 | | | | 3,120 | |
1.92% (SOFR + 1.37%), 10/24/2031(2) | | | 8,009 | | | | 6,340 | |
2.09% (SOFR + 1.06%), 06/14/2029(2) | | | 19,260 | | | | 16,432 | |
2.30% (SOFR + 1.22%), 07/21/2032(2) | | | 8,323 | | | | 6,656 | |
2.48% (5 Year CMT Index + 1.20%), 09/21/2036(2) | | | 11,315 | | | | 8,656 | |
2.50% (3 Month Term SOFR + 1.25%), 02/13/2031(2) | | | 8,466 | | | | 7,088 | |
2.57% (SOFR + 1.21%), 10/20/2032(2) | | | 8,673 | | | | 7,064 | |
2.59% (SOFR + 2.15%), 04/29/2031(2) | | | 25,162 | | | | 21,124 | |
2.65% (SOFR + 1.22%), 03/11/2032(2) | | | 7,385 | | | | 6,117 | |
2.69% (SOFR + 1.32%), 04/22/2032(2) | | | 10,720 | | | | 8,884 | |
2.88% (3 Month Term SOFR + 1.45%), 10/22/2030(2) | | | 295 | | | | 254 | |
2.97% (SOFR + 1.33%), 02/04/2033(2) | | | 13,306 | | | | 11,092 | |
3.19% (3 Month Term SOFR + 1.44%), 07/23/2030(2) | | | 596 | | | | 525 | |
3.42% (3 Month Term SOFR + 1.30%), 12/20/2028(2) | | | 4,766 | | | | 4,371 | |
3.71% (3 Month Term SOFR + 1.77%), 04/24/2028(2) | | | 33 | | | | 31 | |
3.97% (3 Month Term SOFR + 1.33%), 03/05/2029(2) | | | 5,036 | | | | 4,715 | |
4.18%, 11/25/2027 | | | 16,659 | | | | 15,826 | |
4.25%, 10/22/2026 | | | 13,040 | | | | 12,586 | |
4.27% (3 Month Term SOFR + 1.57%), 07/23/2029(2) | | | 5,139 | | | | 4,876 | |
4.45%, 03/03/2026 | | | 855 | | | | 831 | |
4.57% (SOFR + 1.83%), 04/27/2033(2) | | | 16,024 | | | | 15,066 | |
5.20% (SOFR + 1.63%), 04/25/2029(2) | | | 13,970 | | | | 13,817 | |
5.29% (SOFR + 1.91%), 04/25/2034(2) | | | 3,320 | | | | 3,289 | |
Barclays Plc | | | | | | | | |
2.28% (1 Year CMT Index + 1.05%), 11/24/2027(2) | | | 25,615 | | | | 22,533 | |
2.85% (SOFR + 2.71%), 05/07/2026(2) | | | 1,840 | | | | 1,723 | |
3.56% (5 Year CMT Index + 2.90%), 09/23/2035(2) | | | 45,920 | | | | 36,337 | |
3.93% (3 Month LIBOR USD + 1.61%), 05/07/2025(2) | | | 5,648 | | | | 5,520 | |
4.38%, 01/12/2026 | | | 2,670 | | | | 2,565 | |
4.38% (5 Year CMT Index + 3.41%), 12/15/2171(2) | | | 10,985 | | | | 7,463 | |
4.97% (3 Month LIBOR USD + 1.90%), 05/16/2029(2) | | | 3,700 | | | | 3,497 | |
5.09% (3 Month LIBOR USD + 3.05%), 06/20/2030(2) | | | 1,570 | | | | 1,428 | |
6.22% (SOFR + 2.98%), 05/09/2034(2) | | | 12,439 | | | | 12,390 | |
7.44% (1 Year CMT Index + 3.50%), 11/02/2033(2) | | | 4,467 | | | | 4,833 | |
Barings BDC, Inc. | | | | | | | | |
3.30%, 11/23/2026 | | | 8,585 | | | | 7,479 | |
BBVA Bancomer SA | | | | | | | | |
1.88%, 09/18/2025(1) | | | 6,755 | | | | 6,215 | |
Blackstone Secured Lending Fund | | | | | | | | |
2.13%, 02/15/2027 | | | 21,770 | | | | 18,381 | |
BNP Paribas SA | | | | | | | | |
1.32% (SOFR + 1.00%), 01/13/2027(1)(2) | | | 6,822 | | | | 6,050 | |
1.68% (SOFR + 0.91%), 06/30/2027(1)(2) | | | 17,105 | | | | 15,077 | |
2.16% (SOFR + 1.22%), 09/15/2029(1)(2) | | | 1,585 | | | | 1,320 | |
2.59% (SOFR + 1.23%), 01/20/2028(1)(2) | | | 15,155 | | | | 13,544 | |
Brixmor Operating Partnership LP | | | | | | | | |
2.25%, 04/01/2028 | | | 925 | | | | 777 | |
3.85%, 02/01/2025 | | | 1,035 | | | | 990 | |
3.90%, 03/15/2027 | | | 2,430 | | | | 2,234 | |
4.05%, 07/01/2030 | | | 2,337 | | | | 2,106 | |
4.13%, 06/15/2026 | | | 1,967 | | | | 1,837 | |
4.13%, 05/15/2029 | | | 4,342 | | | | 3,873 | |
Brookfield Finance I UK Plc / Brookfield Finance, Inc. | | | | | | | | |
2.34%, 01/30/2032 | | | 14,500 | | | | 11,290 | |
CaixaBank SA | | | | | | | | |
6.21% (SOFR + 2.70%), 01/18/2029(1)(2) | | | 4,300 | | | | 4,289 | |
Capital One Financial Corp. | | | | | | | | |
3.27% (SOFR + 1.79%), 03/01/2030(2) | | | 14,270 | | | | 12,116 | |
5.82% (SOFR + 2.60%), 02/01/2034(2) | | | 4,298 | | | | 4,101 | |
6.38% (SOFR + 2.86%), 06/08/2034(2) | | | 2,090 | | | | 2,075 | |
Charles Schwab Corp. | | | | | | | | |
4.00% (5 Year CMT Index + 3.17%), 06/01/2171(2) | | | 10,400 | | | | 8,453 | |
4.00% (10 Year CMT Index + 3.08%), 03/01/2172(2) | | | 5,700 | | | | 4,160 | |
CIFI Holdings Group Co. Ltd. | | | | | | | | |
4.45%, 08/17/2026 | | | 300 | | | | 33 | |
6.00%, 07/16/2025 | | | 1,755 | | | | 190 | |
6.45%, 11/07/2024 | | | 660 | | | | 73 | |
Citigroup, Inc. | | | | | | | | |
0.98% (SOFR + 0.67%), 05/01/2025(2) | | | 800 | | | | 766 | |
1.46% (SOFR + 0.77%), 06/09/2027(2) | | | 19,055 | | | | 16,922 | |
2.52% (SOFR + 1.18%), 11/03/2032(2) | | | 8,130 | | | | 6,550 | |
2.56% (SOFR + 1.17%), 05/01/2032(2) | | | 14,459 | | | | 11,806 | |
2.57% (SOFR + 2.11%), 06/03/2031(2) | | | 6,732 | | | | 5,617 | |
2.98% (SOFR + 1.42%), 11/05/2030(2) | | | 2,380 | | | | 2,062 | |
3.06% (SOFR + 1.35%), 01/25/2033(2) | | | 18,848 | | | | 15,736 | |
3.07% (SOFR + 1.28%), 02/24/2028(2) | | | 2,490 | | | | 2,291 | |
| | | | | | | | |
3.11% (SOFR + 2.84%), 04/08/2026(2) | | | 1,756 | | | | 1,676 | |
4.08% (3 Month Term SOFR + 1.45%), 04/23/2029(2) | | | 1,315 | | | | 1,238 | |
4.13%, 07/25/2028 | | | 1,675 | | | | 1,579 | |
4.41% (SOFR + 3.91%), 03/31/2031(2) | | | 25,365 | | | | 23,850 | |
CNO Financial Group, Inc. | | | | | | | | |
5.25%, 05/30/2025 | | | 580 | | | | 570 | |
5.25%, 05/30/2029 | | | 3,840 | | | | 3,633 | |
Corporate Office Properties LP | | | | | | | | |
2.75%, 04/15/2031 | | | 1,555 | | | | 1,182 | |
Country Garden Holdings Co. Ltd. | | | | | | | | |
2.70%, 07/12/2026 | | | 500 | | | | 149 | |
3.30%, 01/12/2031 | | | 4,895 | | | | 1,319 | |
3.88%, 10/22/2030 | | | 300 | | | | 84 | |
Credit Agricole SA | | | | | | | | |
4.00% (5 Year Swap Rate USD + 1.64%), 01/10/2033(1)(2) | | | 21,168 | | | | 18,845 | |
4.38%, 03/17/2025(1) | | | 1,717 | | | | 1,654 | |
Credit Suisse AG | | | | | | | | |
0.50%, 02/02/2024 | | | 902 | | | | 868 | |
3.70%, 02/21/2025 | | | 17,634 | | | | 16,851 | |
5.00%, 07/09/2027 | | | 3,593 | | | | 3,469 | |
7.50%, 02/15/2028 | | | 51,881 | | | | 55,108 | |
7.95%, 01/09/2025 | | | 3,288 | | | | 3,355 | |
Credit Suisse Group AG | | | | | | | | |
3.63%, 09/09/2024 | | | 5,216 | | | | 5,023 | |
4.75%, 08/09/2024 | | | 858 | | | | 839 | |
6.50%, 08/08/2023(1) | | | 1,400 | | | | 1,390 | |
Credit Suisse USA, Inc. | | | | | | | | |
7.13%, 07/15/2032 | | | 1,331 | | | | 1,474 | |
Crown Castle, Inc. | | | | | | | | |
2.10%, 04/01/2031 | | | 9,453 | | | | 7,561 | |
2.25%, 01/15/2031 | | | 3,949 | | | | 3,219 | |
2.50%, 07/15/2031 | | | 3,665 | | | | 3,011 | |
3.10%, 11/15/2029 | | | 2,341 | | | | 2,038 | |
3.25%, 01/15/2051 | | | 1,090 | | | | 743 | |
3.30%, 07/01/2030 | | | 8,362 | | | | 7,386 | |
4.30%, 02/15/2029 | | | 14,556 | | | | 13,686 | |
5.10%, 05/01/2033 | | | 18,136 | | | | 17,822 | |
CTP NV | | | | | | | | |
1.25%, 06/21/2029 | | EUR | 300 | | | | 236 | |
Danske Bank | | | | | | | | |
3.24% (3 Month LIBOR USD + 1.59%), 12/20/2025(1)(2) | | $ | 4,479 | | | | 4,252 | |
5.38%, 01/12/2024(1) | | | 7,143 | | | | 7,101 | |
Deutsche Bank AG | | | | | | | | |
0.96%, 11/08/2023 | | | 20,885 | | | | 20,465 | |
1.75% (3 Month EURIBOR + 2.05%), 11/19/2030(2)(11) | | EUR | 800 | | | | 689 | |
2.13% (SOFR + 1.87%), 11/24/2026(2)(18) | | $ | 900 | | | | 801 | |
2.22% (SOFR + 2.16%), 09/18/2024(2) | | | 4,895 | | | | 4,833 | |
2.31% (SOFR + 1.22%), 11/16/2027(2) | | | 1,206 | | | | 1,036 | |
3.04% (SOFR + 1.72%), 05/28/2032(2)(18) | | | 3,300 | | | | 2,599 | |
3.55% (SOFR + 3.04%), 09/18/2031(2) | | | 16,820 | | | | 13,969 | |
3.73% (SOFR + 2.76%), 01/14/2032(2) | | | 5,330 | | | | 4,031 | |
3.96% (SOFR + 2.58%), 11/26/2025(2) | | | 6,012 | | | | 5,732 | |
5.37%, 09/09/2027 | | | 4,852 | | | | 4,771 | |
6.72% (SOFR + 3.18%), 01/18/2029(2) | | | 3,850 | | | | 3,855 | |
Discover Bank | | | | | | | | |
2.45%, 09/12/2024 | | | 1,310 | | | | 1,241 | |
2.70%, 02/06/2030 | | | 949 | | | | 766 | |
4.65%, 09/13/2028 | | | 891 | | | | 827 | |
Discover Financial Services | | | | | | | | |
3.95%, 11/06/2024 | | | 6,058 | | | | 5,838 | |
4.10%, 02/09/2027 | | | 6,102 | | | | 5,661 | |
DNB Bank ASA | | | | | | | | |
1.61% (1 Year CMT Index + 0.68%), 03/30/2028(1)(2) | | | 15,397 | | | | 13,283 | |
EPR Properties | | | | | | | | |
4.75%, 12/15/2026 | | | 140 | | | | 127 | |
4.95%, 04/15/2028 | | | 414 | | | | 370 | |
Equinix, Inc. | | | | | | | | |
2.15%, 07/15/2030 | | | 24,207 | | | | 19,563 | |
3.20%, 11/18/2029 | | | 11,179 | | | | 9,814 | |
Equitable Financial Life Global Funding | | | | | | | | |
1.70%, 11/12/2026(1) | | | 1,055 | | | | 920 | |
1.80%, 03/08/2028(1) | | | 7,665 | | | | 6,464 | |
Essential Properties LP | | | | | | | | |
2.95%, 07/15/2031 | | | 2,800 | | | | 2,098 | |
Extra Space Storage LP | | | | | | | | |
2.35%, 03/15/2032 | | | 2,585 | | | | 2,020 | |
2.55%, 06/01/2031 | | | 3,085 | | | | 2,495 | |
3.90%, 04/01/2029 | | | 4,655 | | | | 4,240 | |
5.50%, 07/01/2030 | | | 1,280 | | | | 1,269 | |
Farmers Exchange Capital II | | | | | | | | |
6.15% (3 Month LIBOR USD + 3.74%), 11/01/2053(1)(2) | | | 3,860 | | | | 3,749 | |
Farmers Exchange Capital III | | | | | | | | |
5.45% (3 Month LIBOR USD + 3.45%), 10/15/2054(1)(2) | | | 8,000 | | | | 7,034 | |
Farmers Insurance Exchange | | | | | | | | |
4.75% (3 Month LIBOR USD + 3.23%), 11/01/2057(1)(2) | | | 3,000 | | | | 2,351 | |
8.63%, 05/01/2024(1) | | | 4,480 | | | | 4,511 | |
Fidelity & Guaranty Life Holdings, Inc. | | | | | | | | |
5.50%, 05/01/2025(1) | | | 2,360 | | | | 2,295 | |
Fidelity National Financial, Inc. | | | | | | | | |
| | | | | | | | |
2.45%, 03/15/2031 | | | 6,840 | | | | 5,358 | |
3.40%, 06/15/2030 | | | 5,874 | | | | 5,129 | |
4.50%, 08/15/2028 | | | 15,455 | | | | 14,685 | |
Fifth Third Bancorp | | | | | | | | |
2.55%, 05/05/2027 | | | 1,020 | | | | 901 | |
First American Financial Corp. | | | | | | | | |
2.40%, 08/15/2031 | | | 6,800 | | | | 5,171 | |
FS KKR Capital Corp. | | | | | | | | |
3.13%, 10/12/2028 | | | 2,340 | | | | 1,905 | |
Gaci First Investment Co. | | | | | | | | |
4.75%, 02/14/2030 | | | 510 | | | | 500 | |
5.00%, 10/13/2027 | | | 587 | | | | 584 | |
5.25%, 10/13/2032 | | | 540 | | | | 549 | |
GGAM Finance Ltd. | | | | | | | | |
8.00%, 06/15/2028(1) | | | 4,697 | | | | 4,699 | |
Global Atlantic Finance Co. | | | | | | | | |
4.40%, 10/15/2029(1) | | | 2,987 | | | | 2,519 | |
Global Bank Corp. | | | | | | | | |
5.25% (3 Month LIBOR USD + 3.30%), 04/16/2029(2) | | | 200 | | | | 182 | |
GLP Capital LP / GLP Financing II, Inc. | | | | | | | | |
3.25%, 01/15/2032 | | | 10,298 | | | | 8,315 | |
4.00%, 01/15/2030 | | | 10,945 | | | | 9,486 | |
4.00%, 01/15/2031 | | | 1,050 | | | | 908 | |
5.25%, 06/01/2025 | | | 239 | | | | 234 | |
5.30%, 01/15/2029 | | | 6,339 | | | | 6,036 | |
5.38%, 04/15/2026 | | | 4,965 | | | | 4,860 | |
5.75%, 06/01/2028 | | | 15,441 | | | | 15,107 | |
Goldman Sachs Group, Inc. | | | | | | | | |
0.66% (SOFR + 0.51%), 09/10/2024(2) | | | 6,303 | | | | 6,232 | |
1.22%, 12/06/2023 | | | 20,000 | | | | 19,615 | |
1.43% (SOFR + 0.80%), 03/09/2027(2) | | | 35,615 | | | | 31,822 | |
1.54% (SOFR + 0.82%), 09/10/2027(2) | | | 13,410 | | | | 11,786 | |
1.95% (SOFR + 0.91%), 10/21/2027(2) | | | 20,405 | | | | 18,151 | |
1.99% (SOFR + 1.09%), 01/27/2032(2) | | | 4,050 | | | | 3,188 | |
2.38% (SOFR + 1.25%), 07/21/2032(2) | | | 20,118 | | | | 16,114 | |
2.62% (SOFR + 1.28%), 04/22/2032(2) | | | 3,899 | | | | 3,198 | |
2.65% (SOFR + 1.26%), 10/21/2032(2) | | | 11,963 | | | | 9,751 | |
3.27% (3 Month Term SOFR + 1.46%), 09/29/2025(2) | | | 6,686 | | | | 6,460 | |
3.50%, 04/01/2025 | | | 4,424 | | | | 4,250 | |
4.48% (SOFR + 1.73%), 08/23/2028(2) | | | 6,325 | | | | 6,115 | |
Guardian Life Global Funding | | | | | | | | |
1.63%, 09/16/2028(1) | | | 5,000 | | | | 4,193 | |
Hartford Financial Services Group, Inc. | | | | | | | | |
5.95%, 10/15/2036 | | | 739 | | | | 757 | |
Healthcare Realty Holdings LP | | | | | | | | |
2.00%, 03/15/2031 | | | 7,380 | | | | 5,666 | |
2.05%, 03/15/2031 | | | 1,183 | | | | 887 | |
2.40%, 03/15/2030 | | | 2,955 | | | | 2,339 | |
3.10%, 02/15/2030 | | | 4,831 | | | | 4,138 | |
3.50%, 08/01/2026 | | | 2,000 | | | | 1,840 | |
3.63%, 01/15/2028 | | | 1,092 | | | | 966 | |
Healthpeak OP LLC | | | | | | | | |
2.88%, 01/15/2031 | | | 1,980 | | | | 1,672 | |
3.40%, 02/01/2025 | | | 160 | | | | 154 | |
3.50%, 07/15/2029 | | | 231 | | | | 207 | |
Highwoods Realty LP | | | | | | | | |
4.13%, 03/15/2028 | | | 358 | | | | 313 | |
HSBC Holdings Plc | | | | | | | | |
1.59% (SOFR + 1.29%), 05/24/2027(2) | | | 10,490 | | | | 9,258 | |
1.65% (SOFR + 1.54%), 04/18/2026(2) | | | 2,982 | | | | 2,747 | |
2.01% (SOFR + 1.73%), 09/22/2028(2) | | | 26,400 | | | | 22,622 | |
2.10% (SOFR + 1.93%), 06/04/2026(2) | | | 5,008 | | | | 4,634 | |
2.21% (SOFR + 1.29%), 08/17/2029(2) | | | 17,585 | | | | 14,711 | |
2.36% (SOFR + 1.95%), 08/18/2031(2) | | | 2,300 | | | | 1,836 | |
2.80% (SOFR + 1.19%), 05/24/2032(2) | | | 11,365 | | | | 9,192 | |
2.85% (SOFR + 2.39%), 06/04/2031(2) | | | 34,320 | | | | 28,470 | |
2.87% (SOFR + 1.41%), 11/22/2032(2) | | | 40,000 | | | | 32,251 | |
3.97% (3 Month Term SOFR + 1.87%), 05/22/2030(2) | | | 13,200 | | | | 11,853 | |
4.58% (3 Month Term SOFR + 1.80%), 06/19/2029(2) | | | 3,200 | | | | 3,011 | |
4.76% (SOFR + 2.11%), 06/09/2028(2) | | | 2,075 | | | | 1,994 | |
6.16% (SOFR + 1.97%), 03/09/2029(2) | | | 12,000 | | | | 12,102 | |
6.33% (SOFR + 2.65%), 03/09/2044(2) | | | 4,320 | | | | 4,478 | |
Hudson Pacific Properties LP | | | | | | | | |
3.25%, 01/15/2030 | | | 1,942 | | | | 1,229 | |
3.95%, 11/01/2027 | | | 12,527 | | | | 9,111 | |
4.65%, 04/01/2029 | | | 905 | | | | 639 | |
5.95%, 02/15/2028 | | | 1,600 | | | | 1,272 | |
Icahn Enterprises LP / Icahn Enterprises Finance Corp. | | | | | | | | |
4.38%, 02/01/2029 | | | 1,265 | | | | 994 | |
5.25%, 05/15/2027 | | | 3,058 | | | | 2,637 | |
6.25%, 05/15/2026 | | | 3,000 | | | | 2,730 | |
6.38%, 12/15/2025 | | | 1,058 | | | | 984 | |
Intercontinental Exchange, Inc. | | | | | | | | |
1.85%, 09/15/2032 | | | 21,260 | | | | 16,388 | |
2.10%, 06/15/2030 | | | 3,955 | | | | 3,310 | |
Intesa Sanpaolo SpA | | | | | | | | |
6.63%, 06/20/2033(1) | | | 6,140 | | | | 6,117 | |
Invitation Homes Operating Partnership LP | | | | | | | | |
2.00%, 08/15/2031 | | | 9,736 | | | | 7,459 | |
| | | | | | | | |
2.30%, 11/15/2028 | | | 1,475 | | | | 1,254 | |
Jane Street Group / JSG Finance, Inc. | | | | | | | | |
4.50%, 11/15/2029(1) | | | 3,000 | | | | 2,581 | |
Jefferies Financial Group, Inc. | | | | | | | | |
4.85%, 01/15/2027 | | | 1,500 | | | | 1,469 | |
6.25%, 01/15/2036 | | | 1,430 | | | | 1,458 | |
6.45%, 06/08/2027 | | | 3,660 | | | | 3,779 | |
6.50%, 01/20/2043 | | | 1,125 | | | | 1,126 | |
JP Morgan Chase & Co. | | | | | | | | |
0.97% (3 Month Term SOFR + 0.58%), 06/23/2025(2) | | | 35,140 | | | | 33,355 | |
1.04% (3 Month Term SOFR + 0.70%), 02/04/2027(2) | | | 3,799 | | | | 3,383 | |
1.47% (SOFR + 0.77%), 09/22/2027(2) | | | 8,340 | | | | 7,363 | |
1.58% (SOFR + 0.89%), 04/22/2027(2) | | | 23,223 | | | | 20,859 | |
1.76% (3 Month Term SOFR + 1.11%), 11/19/2031(2) | | | 2,252 | | | | 1,782 | |
1.95% (SOFR + 1.07%), 02/04/2032(2) | | | 5,064 | | | | 4,035 | |
2.07% (SOFR + 1.02%), 06/01/2029(2) | | | 1,210 | | | | 1,038 | |
2.18% (SOFR + 1.89%), 06/01/2028(2) | | | 2,402 | | | | 2,135 | |
2.52% (SOFR + 2.04%), 04/22/2031(2) | | | 10,031 | | | | 8,485 | |
2.55% (SOFR + 1.18%), 11/08/2032(2) | | | 8,369 | | | | 6,857 | |
2.58% (3 Month Term SOFR + 1.25%), 04/22/2032(2) | | | 6,326 | | | | 5,254 | |
2.74% (3 Month Term SOFR + 1.51%), 10/15/2030(2) | | | 6,869 | | | | 5,917 | |
2.95% (SOFR + 1.17%), 02/24/2028(2) | | | 8,895 | | | | 8,167 | |
2.96% (3 Month Term SOFR + 2.52%), 05/13/2031(2) | | | 4,470 | | | | 3,833 | |
2.96% (SOFR + 1.26%), 01/25/2033(2) | | | 19,902 | | | | 16,766 | |
4.01% (3 Month Term SOFR + 1.38%), 04/23/2029(2) | | | 2,740 | | | | 2,580 | |
4.49% (3 Month Term SOFR + 3.79%), 03/24/2031(2) | | | 13,825 | | | | 13,290 | |
JPMorgan Chase & Co. | | | | | | | | |
0.82% (3 Month Term SOFR + 0.54%), 06/01/2025(2) | | | 5,635 | | | | 5,357 | |
4.57% (SOFR + 1.75%), 06/14/2030(2) | | | 2,957 | | | | 2,841 | |
Kilroy Realty LP | | | | | | | | |
2.65%, 11/15/2033 | | | 120 | | | | 81 | |
Kimco Realty OP LLC | | | | | | | | |
3.25%, 08/15/2026 | | | 1,665 | | | | 1,540 | |
Life Storage LP | | | | | | | | |
2.20%, 10/15/2030 | | | 4,425 | | | | 3,540 | |
2.40%, 10/15/2031 | | | 8,544 | | | | 6,769 | |
3.88%, 12/15/2027 | | | 2,475 | | | | 2,297 | |
Lloyds Banking Group Plc | | | | | | | | |
1.63% (1 Year CMT Index + 0.85%), 05/11/2027(2) | | | 14,105 | | | | 12,476 | |
3.57% (3 Month LIBOR USD + 1.21%), 11/07/2028(2) | | | 420 | | | | 380 | |
3.87% (1 Year CMT Index + 3.50%), 07/09/2025(2) | | | 1,675 | | | | 1,631 | |
4.45%, 05/08/2025 | | | 3,665 | | | | 3,551 | |
4.98% (1 Year CMT Index + 2.30%), 08/11/2033(2) | | | 12,190 | | | | 11,403 | |
Logan Group Co. Ltd. | | | | | | | | |
4.25%, 07/12/2025 | | | 2,205 | | | | 209 | |
4.85%, 12/14/2026 | | | 2,995 | | | | 283 | |
LSEGA Financing Plc | | | | | | | | |
2.00%, 04/06/2028(1) | | | 6,811 | | | | 5,838 | |
LXP Industrial Trust | | | | | | | | |
2.38%, 10/01/2031 | | | 2,050 | | | | 1,560 | |
Macquarie Group Ltd. | | | | | | | | |
1.34% (SOFR + 1.07%), 01/12/2027(1)(2) | | | 10,480 | | | | 9,328 | |
2.87% (SOFR + 1.53%), 01/14/2033(1)(2) | | | 14,785 | | | | 11,808 | |
4.44% (SOFR + 2.41%), 06/21/2033(1)(2) | | | 6,445 | | | | 5,747 | |
MAF Global Securities Ltd. | | | | | | | | |
6.38% (5 Year CMT Index + 3.54%), 09/20/2171(2)(18) | | | 200 | | | | 194 | |
Marsh & McLennan Companies, Inc. | | | | | | | | |
2.25%, 11/15/2030 | | | 697 | | | | 579 | |
5.45%, 03/15/2053 | | | 1,547 | | | | 1,574 | |
5.75%, 11/01/2032 | | | 2,000 | | | | 2,102 | |
Metropolitan Life Global Funding I | | | | | | | | |
5.15%, 03/28/2033(1) | | | 5,610 | | | | 5,548 | |
Morgan Stanley | | | | | | | | |
0.00%, 04/02/2032(4)(18) | | | 14,800 | | | | 9,212 | |
1.16% (SOFR + 0.56%), 10/21/2025(2) | | | 29,255 | | | | 27,342 | |
1.51% (SOFR + 0.86%), 07/20/2027(2) | | | 3,292 | | | | 2,917 | |
1.59% (SOFR + 0.88%), 05/04/2027(2) | | | 12,593 | | | | 11,273 | |
1.79% (SOFR + 1.03%), 02/13/2032(2) | | | 11,113 | | | | 8,620 | |
1.93% (SOFR + 1.02%), 04/28/2032(2) | | | 5,519 | | | | 4,308 | |
2.24% (SOFR + 1.18%), 07/21/2032(2) | | | 29,672 | | | | 23,583 | |
2.48% (SOFR + 1.00%), 01/21/2028(2) | | | 22,470 | | | | 20,278 | |
2.48% (SOFR + 1.36%), 09/16/2036(2) | | | 6,600 | | | | 5,008 | |
2.51% (SOFR + 1.20%), 10/20/2032(2) | | | 3,577 | | | | 2,889 | |
2.70% (SOFR + 1.14%), 01/22/2031(2) | | | 11,308 | | | | 9,617 | |
2.72% (SOFR + 1.15%), 07/22/2025(2) | | | 2,177 | | | | 2,099 | |
2.94% (SOFR + 1.29%), 01/21/2033(2) | | | 8,924 | | | | 7,418 | |
3.22% (SOFR + 1.49%), 04/22/2042(2) | | | 751 | | | | 569 | |
3.95%, 04/23/2027 | | | 6,690 | | | | 6,334 | |
4.43% (3 Month Term SOFR + 1.89%), 01/23/2030(2) | | | 1,771 | | | | 1,685 | |
4.89% (SOFR + 2.08%), 07/20/2033(2) | | | 738 | | | | 710 | |
5.16% (SOFR + 1.59%), 04/20/2029(2) | | | 30,101 | | | | 29,733 | |
5.25% (SOFR + 1.87%), 04/21/2034(2) | | | 23,136 | | | | 22,846 | |
5.95% (5 Year CMT Index + 2.43%), 01/19/2038(2) | | | 2,945 | | | | 2,907 | |
6.34% (SOFR + 2.56%), 10/18/2033(2) | | | 7,049 | | | | 7,499 | |
Morgan Stanley Bank N.A. | | | | | | | | |
4.75%, 04/21/2026 | | | 5,520 | | | | 5,439 | |
Nasdaq, Inc. | | | | | | | | |
5.55%, 02/15/2034 | | | 4,773 | | | | 4,792 | |
6.10%, 06/28/2063 | | | 1,595 | | | | 1,631 | |
| | | | | | | | |
National General Holdings Corp. | | | | | | | | |
6.75%, 05/15/2024(1) | | | 12,910 | | | | 12,826 | |
Nationwide Building Society | | | | | | | | |
0.55%, 01/22/2024(1) | | | 16,400 | | | | 15,916 | |
3.96% (3 Month LIBOR USD + 1.86%), 07/18/2030(1)(2) | | | 5,650 | | | | 5,013 | |
4.30% (3 Month LIBOR USD + 1.45%), 03/08/2029(1)(2) | | | 8,600 | | | | 7,967 | |
4.36% (3 Month LIBOR USD + 1.39%), 08/01/2024(1)(2) | | | 4,000 | | | | 3,992 | |
Nationwide Mutual Insurance Co. | | | | | | | | |
7.84% (3 Month LIBOR USD + 2.29%), 12/15/2024(1)(2) | | | 6,180 | | | | 6,174 | |
Natwest Group Plc | | | | | | | | |
4.27% (3 Month LIBOR USD + 1.76%), 03/22/2025(2) | | | 26,116 | | | | 25,653 | |
NatWest Group Plc | | | | | | | | |
1.64% (1 Year CMT Index + 0.90%), 06/14/2027(2) | | | 12,170 | | | | 10,710 | |
4.45% (3 Month LIBOR USD + 1.87%), 05/08/2030(2) | | | 4,390 | | | | 4,035 | |
4.89% (3 Month LIBOR USD + 1.75%), 05/18/2029(2) | | | 2,900 | | | | 2,759 | |
5.08% (3 Month LIBOR USD + 1.91%), 01/27/2030(2) | | | 6,600 | | | | 6,295 | |
5.52% (1 Year CMT Index + 2.27%), 09/30/2028(2) | | | 5,115 | | | | 5,014 | |
New York Life Global Funding | | | | | | | | |
2.35%, 07/14/2026(1) | | | 1,000 | | | | 919 | |
New York Life Insurance Co. | | | | | | | | |
3.75%, 05/15/2050(1) | | | 2,736 | | | | 2,090 | |
NNN REIT, Inc. | | | | | | | | |
3.00%, 04/15/2052 | | | 687 | | | | 418 | |
3.10%, 04/15/2050 | | | 1,139 | | | | 703 | |
4.80%, 10/15/2048 | | | 1,354 | | | | 1,114 | |
Nomura Holdings, Inc. | | | | | | | | |
2.17%, 07/14/2028 | | | 19,200 | | | | 16,198 | |
Northwestern Mutual Life Insurance Co. | | | | | | | | |
3.45%, 03/30/2051(1) | | | 2,420 | | | | 1,727 | |
Oaktree Specialty Lending Corp. | | | | | | | | |
2.70%, 01/15/2027 | | | 5,520 | | | | 4,762 | |
Old Republic International Corp. | | | | | | | | |
3.88%, 08/26/2026 | | | 5,155 | | | | 4,850 | |
Owl Rock Capital Corp. | | | | | | | | |
2.63%, 01/15/2027 | | | 7,570 | | | | 6,426 | |
2.88%, 06/11/2028 | | | 20,400 | | | | 16,622 | |
Owl Rock Technology Finance Corp. | | | | | | | | |
2.50%, 01/15/2027 | | | 10,635 | | | | 8,803 | |
Park Aerospace Holdings Ltd. | | | | | | | | |
5.50%, 02/15/2024(1) | | | 1,247 | | | | 1,233 | |
Physicians Realty LP | | | | | | | | |
2.63%, 11/01/2031 | | | 5,885 | | | | 4,578 | |
PNC Financial Services Group, Inc. | | | | | | | | |
5.07% (SOFR + 1.93%), 01/24/2034(2) | | | 10,718 | | | | 10,278 | |
5.58% (SOFR + 1.84%), 06/12/2029(2) | | | 4,520 | | | | 4,499 | |
6.04% (SOFR + 2.14%), 10/28/2033(2) | | | 8,655 | | | | 8,857 | |
Prologis LP | | | | | | | | |
1.25%, 10/15/2030 | | | 670 | | | | 517 | |
5.13%, 01/15/2034 | | | 4,108 | | | | 4,079 | |
Realty Income Corp. | | | | | | | | |
2.20%, 06/15/2028 | | | 1,212 | | | | 1,049 | |
3.25%, 01/15/2031 | | | 809 | | | | 707 | |
3.40%, 01/15/2028 | | | 3,938 | | | | 3,631 | |
3.95%, 08/15/2027 | | | 4,030 | | | | 3,827 | |
Regency Centers LP | | | | | | | | |
3.70%, 06/15/2030 | | | 1,359 | | | | 1,214 | |
4.13%, 03/15/2028 | | | 970 | | | | 906 | |
Retail Opportunity Investments Partnership LP | | | | | | | | |
4.00%, 12/15/2024 | | | 895 | | | | 857 | |
Rocket Mortgage LLC / Rocket Mortgage Co.-Issuer, Inc. | | | | | | | | |
2.88%, 10/15/2026(1) | | | 8,290 | | | | 7,337 | |
3.63%, 03/01/2029 | | | 4,385 | | | | 3,685 | |
3.88%, 03/01/2031(1) | | | 29,710 | | | | 24,091 | |
4.00%, 10/15/2033(1) | | | 29,285 | | | | 22,908 | |
Sabra Health Care LP | | | | | | | | |
3.20%, 12/01/2031 | | | 2,700 | | | | 2,014 | |
Santander Holdings USA, Inc. | | | | | | | | |
3.24%, 10/05/2026 | | | 6,255 | | | | 5,632 | |
3.50%, 06/07/2024 | | | 50 | | | | 49 | |
Santander UK Group Holdings Plc | | | | | | | | |
1.09% (SOFR + 0.79%), 03/15/2025(2) | | | 25,339 | | | | 24,276 | |
1.53% (1 Year CMT Index + 1.25%), 08/21/2026(2) | | | 6,242 | | | | 5,558 | |
1.67% (SOFR + 0.99%), 06/14/2027(2) | | | 11,405 | | | | 9,826 | |
2.47% (SOFR + 1.22%), 01/11/2028(2) | | | 800 | | | | 698 | |
2.90% (SOFR + 1.48%), 03/15/2032(2) | | | 24,900 | | | | 20,136 | |
3.82% (3 Month LIBOR USD + 1.40%), 11/03/2028(2) | | | 4,990 | | | | 4,491 | |
4.80% (3 Month LIBOR USD + 1.57%), 11/15/2024(2) | | | 14,535 | | | | 14,424 | |
6.53% (SOFR + 2.60%), 01/10/2029(2) | | | 13,600 | | | | 13,693 | |
Sberbank of Russia Via SB Capital SA | | | | | | | | |
5.13%, 10/29/2049 | | | 1,300 | | | | 65 | |
Shimao Group Holdings Ltd. | | | | | | | | |
3.45%, 01/11/2031 | | | 5,645 | | | | 425 | |
4.60%, 07/13/2030 | | | 400 | | | | 30 | |
4.75%, 07/03/2023(6)(7) | | | 4,359 | | | | 330 | |
5.20%, 01/16/2027 | | | 4,595 | | | | 348 | |
5.60%, 07/15/2026(6)(7) | | | 3,025 | | | | 229 | |
6.13%, 02/21/2024 | | | 1,275 | | | | 93 | |
Simon Property Group LP | | | | | | | | |
2.65%, 07/15/2030 | | | 3,540 | | | | 3,007 | |
| | | | | | | | |
Sino-Ocean Land Treasure IV Ltd. | | | | | | | | |
4.75%, 08/05/2029 | | | 1,725 | | | | 343 | |
4.75%, 01/14/2030 | | | 3,305 | | | | 659 | |
SiriusPoint Ltd. | | | | | | | | |
4.60%, 11/01/2026(1) | | | 2,520 | | | | 2,093 | |
SITE Centers Corp. | | | | | | | | |
3.63%, 02/01/2025 | | | 1,914 | | | | 1,801 | |
4.25%, 02/01/2026 | | | 2,500 | | | | 2,342 | |
4.70%, 06/01/2027 | | | 8,000 | | | | 7,316 | |
Societe Generale SA | | | | | | | | |
2.89% (1 Year CMT Index + 1.30%), 06/09/2032(1)(2) | | | 10,400 | | | | 8,148 | |
3.65% (5 Year CMT Index + 3.00%), 07/08/2035(1)(2) | | | 7,705 | | | | 6,181 | |
4.25%, 04/14/2025(1) | | | 2,340 | | | | 2,231 | |
4.75%, 11/24/2025(1) | | | 9,285 | | | | 8,844 | |
6.69% (1 Year CMT Index + 2.95%), 01/10/2034(1)(2) | | | 19,000 | | | | 19,343 | |
Standard Chartered Plc | | | | | | | | |
2.68% (1 Year CMT Index + 1.20%), 06/29/2032(1)(2) | | | 52,100 | | | | 40,742 | |
2.82% (3 Month LIBOR USD + 1.21%), 01/30/2026(1)(2) | | | 3,241 | | | | 3,056 | |
3.27% (5 Year CMT Index + 2.30%), 02/18/2036(1)(2) | | | 41,220 | | | | 32,437 | |
4.64% (1 Year CMT Index + 3.85%), 04/01/2031(1)(2) | | | 22,853 | | | | 21,078 | |
Stewart Information Services Corp. | | | | | | | | |
3.60%, 11/15/2031 | | | 14,990 | | | | 11,509 | |
Stichting AK Rabobank Certificaten | | | | | | | | |
6.50%, 03/29/2170(4) | | EUR | 3,876 | | | | 3,923 | |
Sumitomo Mitsui Financial Group, Inc. | | | | | | | | |
5.46%, 01/13/2026 | | $ | 13,915 | | | | 13,869 | |
Sunac China Holdings Ltd. | | | | | | | | |
7.00%, 07/09/2025 | | | 700 | | | | 102 | |
Synchrony Bank | | | | | | | | |
5.63%, 08/23/2027 | | | 6,350 | | | | 5,958 | |
Synchrony Financial | | | | | | | | |
4.25%, 08/15/2024 | | | 5,145 | | | | 4,960 | |
4.38%, 03/19/2024 | | | 9,540 | | | | 9,354 | |
Teachers Insurance & Annuity Association of America | | | | | | | | |
3.30%, 05/15/2050(1) | | | 3,665 | | | | 2,535 | |
4.27%, 05/15/2047(1) | | | 515 | | | | 426 | |
4.38% (3 Month LIBOR USD + 2.66%), 09/15/2054(1)(2) | | | 7,500 | | | | 7,239 | |
4.90%, 09/15/2044(1) | | | 1,505 | | | | 1,363 | |
Times China Holdings Ltd. | | | | | | | | |
5.75%, 01/14/2027 | | | 5,214 | | | | 346 | |
6.20%, 03/22/2026 | | | 1,950 | | | | 129 | |
6.75%, 07/08/2025 | | | 1,715 | | | | 113 | |
U.S. Bancorp | | | | | | | | |
4.84% (SOFR + 1.60%), 02/01/2034(2) | | | 17,236 | | | | 16,099 | |
5.84% (SOFR + 2.26%), 06/12/2034(2) | | | 5,230 | | | | 5,268 | |
5.85% (SOFR + 2.09%), 10/21/2033(2) | | | 8,795 | | | | 8,807 | |
UBS Group AG | | | | | | | | |
1.31% (SOFR + 0.98%), 02/02/2027(1)(2) | | | 24,465 | | | | 21,374 | |
1.49% (1 Year CMT Index + 0.85%), 08/10/2027(1)(2) | | | 2,725 | | | | 2,340 | |
2.13% (UK Government Bonds 1 Year Note Generic Bid Yield + 1.55%), 11/15/2029(2) | | GBP | 600 | | | | 594 | |
2.19% (SOFR + 2.04%), 06/05/2026(1)(2) | | $ | 2,785 | | | | 2,554 | |
2.59% (SOFR + 1.56%), 09/11/2025(1)(2) | | | 6,725 | | | | 6,410 | |
2.88% (1 Year Swap Rate EUR + 1.95%), 04/02/2032(2) | | EUR | 200 | | | | 190 | |
3.09% (SOFR + 1.73%), 05/14/2032(1)(2) | | $ | 35,005 | | | | 28,316 | |
3.75%, 03/26/2025 | | | 6,396 | | | | 6,120 | |
3.87% (3 Month LIBOR USD + 1.41%), 01/12/2029(1)(2) | | | 3,445 | | | | 3,114 | |
4.19% (SOFR + 3.73%), 04/01/2031(1)(2) | | | 10,164 | | | | 9,047 | |
4.28%, 01/09/2028(1) | | | 5,202 | | | | 4,808 | |
4.55%, 04/17/2026 | | | 4,129 | | | | 3,969 | |
5.96% (1 Year CMT Index + 2.20%), 01/12/2034(1)(2) | | | 13,100 | | | | 13,031 | |
6.37% (SOFR + 3.34%), 07/15/2026(1)(2) | | | 21,340 | | | | 21,205 | |
6.44% (SOFR + 3.70%), 08/11/2028(1)(2) | | | 14,337 | | | | 14,390 | |
6.54% (SOFR + 3.92%), 08/12/2033(1)(2) | | | 63,498 | | | | 65,047 | |
7.75% (CMS 1 Year Rate EUR + 4.95%), 03/01/2029(2) | | EUR | 1,800 | | | | 2,174 | |
9.02% (SOFR + 5.02%), 11/15/2033(1)(2) | | $ | 32,831 | | | | 39,352 | |
UniCredit SpA | | | | | | | | |
1.98% (1 Year CMT Index + 1.20%), 06/03/2027(1)(2) | | | 6,036 | | | | 5,316 | |
2.57% (1 Year CMT Index + 2.30%), 09/22/2026(1)(2) | | | 2,600 | | | | 2,347 | |
5.46% (5 Year CMT Index + 4.75%), 06/30/2035(1)(2) | | | 1,930 | | | | 1,638 | |
7.83%, 12/04/2023(1) | | | 13,400 | | | | 13,445 | |
Unique Pub Finance Co. Plc | | | | | | | | |
7.40%, 03/28/2024 | | GBP | 843 | | | | 1,065 | |
Uniti Group LP / Uniti Group Finance, Inc. / CSL Capital LLC | | | | | | | | |
10.50%, 02/15/2028(1) | | $ | 1,671 | | | | 1,658 | |
VICI Properties LP | | | | | | | | |
4.95%, 02/15/2030 | | | 3,301 | | | | 3,097 | |
5.13%, 05/15/2032 | | | 8,032 | | | | 7,515 | |
5.63%, 05/15/2052 | | | 6,534 | | | | 5,820 | |
VICI Properties LP / VICI Note Co., Inc. | | | | | | | | |
3.75%, 02/15/2027(1) | | | 7,421 | | | | 6,808 | |
3.88%, 02/15/2029(1) | | | 13,390 | | | | 11,751 | |
4.13%, 08/15/2030(1) | | | 5,921 | | | | 5,213 | |
4.25%, 12/01/2026(1) | | | 15,582 | | | | 14,577 | |
4.50%, 09/01/2026(1) | | | 11,600 | | | | 10,959 | |
4.50%, 01/15/2028(1) | | | 2,144 | | | | 1,970 | |
4.63%, 06/15/2025(1) | | | 8,280 | | | | 8,001 | |
4.63%, 12/01/2029(1) | | | 9,069 | | | | 8,233 | |
5.63%, 05/01/2024(1) | | | 6,145 | | | | 6,107 | |
5.75%, 02/01/2027(1) | | | 6,509 | | | | 6,370 | |
| | | | | | | | |
Voyager Aviation Holdings LLC | | | | | | | | |
8.50%, 05/09/2026(1) | | | 67 | | | | 52 | |
Wells Fargo & Co. | | | | | | | | |
2.16% (3 Month Term SOFR + 1.01%), 02/11/2026(2) | | | 8,250 | | | | 7,769 | |
2.39% (SOFR + 2.10%), 06/02/2028(2) | | | 10,769 | | | | 9,597 | |
2.57% (3 Month Term SOFR + 1.26%), 02/11/2031(2) | | | 4,803 | | | | 4,067 | |
2.88% (3 Month Term SOFR + 1.43%), 10/30/2030(2) | | | 17,525 | | | | 15,136 | |
3.20% (3 Month Term SOFR + 1.43%), 06/17/2027(2) | | | 5,739 | | | | 5,390 | |
3.35% (SOFR + 1.50%), 03/02/2033(2) | | | 37,537 | | | | 32,126 | |
3.53% (SOFR + 1.51%), 03/24/2028(2) | | | 21,860 | | | | 20,403 | |
3.58% (3 Month Term SOFR + 1.57%), 05/22/2028(2) | | | 4,315 | | | | 4,019 | |
4.30%, 07/22/2027 | | | 1,344 | | | | 1,289 | |
4.90% (SOFR + 2.10%), 07/25/2033(2) | | | 8,770 | | | | 8,412 | |
5.01% (3 Month Term SOFR + 4.50%), 04/04/2051(2) | | | 3,925 | | | | 3,656 | |
5.39% (SOFR + 2.02%), 04/24/2034(2) | | | 7,756 | | | | 7,706 | |
Welltower OP LLC | | | | | | | | |
4.00%, 06/01/2025 | | | 4,690 | | | | 4,531 | |
4.50%, 01/15/2024 | | | 650 | | | | 643 | |
Weyerhaeuser Co. | | | | | | | | |
4.00%, 04/15/2030 | | | 9,630 | | | | 8,856 | |
Willis North America, Inc. | | | | | | | | |
5.35%, 05/15/2033 | | | 11,665 | | | | 11,374 | |
WP Carey, Inc. | | | | | | | | |
2.40%, 02/01/2031 | | | 2,789 | | | | 2,242 | |
| | | | | | | | |
Total Financials | | | | 3,461,577 | |
| | | | | | | | |
Government – 0.00%(12) | | | | | | | | |
Asian Development Bank | | | | | | | | |
4.70%, 03/12/2024 | | MXN | 12,200 | | | | 673 | |
International Finance Corp. | | | | | | | | |
8.00%, 10/09/2023 | | IDR | 9,100,000 | | | | 610 | |
| | | | | | | | |
Total Government | | | | 1,283 | |
| | | | | | | | |
Industrials – 1.21% | | | | | | | | |
Amcor Finance USA, Inc. | | | | | | | | |
3.63%, 04/28/2026 | | $ | 12,260 | | | | 11,590 | |
Ardagh Packaging Finance Plc / Ardagh Holdings USA, Inc. | | | | | | | | |
5.25%, 08/15/2027(1) | | | 1,320 | | | | 1,118 | |
5.25%, 08/15/2027(1) | | | 5,681 | | | | 4,812 | |
Arrow Electronics, Inc. | | | | | | | | |
6.13%, 03/01/2026 | | | 9,930 | | | | 9,906 | |
Artera Services LLC | | | | | | | | |
9.03%, 12/04/2025(1) | | | 6,400 | | | | 5,600 | |
Avnet, Inc. | | | | | | | | |
5.50%, 06/01/2032 | | | 5,440 | | | | 5,165 | |
BAE Systems Plc | | | | | | | | |
3.40%, 04/15/2030(1) | | | 16,944 | | | | 15,322 | |
Berry Global, Inc. | | | | | | | | |
1.57%, 01/15/2026 | | | 1,353 | | | | 1,220 | |
1.65%, 01/15/2027 | | | 2,340 | | | | 2,018 | |
4.88%, 07/15/2026(1) | | | 18,610 | | | | 17,890 | |
Boeing Co. | | | | | | | | |
1.43%, 02/04/2024 | | | 16,015 | | | | 15,590 | |
2.95%, 02/01/2030 | | | 2,790 | | | | 2,425 | |
3.83%, 03/01/2059 | | | 840 | | | | 600 | |
3.95%, 08/01/2059 | | | 963 | | | | 711 | |
4.88%, 05/01/2025 | | | 3,005 | | | | 2,962 | |
5.15%, 05/01/2030 | | | 1,535 | | | | 1,520 | |
5.71%, 05/01/2040 | | | 5,651 | | | | 5,637 | |
5.81%, 05/01/2050 | | | 3,700 | | | | 3,686 | |
5.93%, 05/01/2060 | | | 8,003 | | | | 7,926 | |
Burlington Northern Santa Fe LLC | | | | | | | | |
2.88%, 06/15/2052 | | | 1,959 | | | | 1,339 | |
3.05%, 02/15/2051 | | | 1,732 | | | | 1,227 | |
4.05%, 06/15/2048 | | | 1,359 | | | | 1,164 | |
4.13%, 06/15/2047 | | | 638 | | | | 551 | |
5.05%, 03/01/2041 | | | 1,184 | | | | 1,166 | |
Cemex SAB de CV | | | | | | | | |
3.88%, 07/11/2031(1) | | | 24,365 | | | | 20,514 | |
5.13% (5 Year CMT Index + 4.53%), 09/08/2171(1)(2) | | | 5,670 | | | | 5,046 | |
5.20%, 09/17/2030(1) | | | 8,900 | | | | 8,328 | |
5.45%, 11/19/2029(1) | | | 3,460 | | | | 3,336 | |
CSX Corp. | | | | | | | | |
3.35%, 09/15/2049 | | | 1,944 | | | | 1,434 | |
4.50%, 03/15/2049 | | | 902 | | | | 806 | |
4.75%, 11/15/2048 | | | 1,336 | | | | 1,236 | |
Embraer Netherlands Finance BV | | | | | | | | |
5.05%, 06/15/2025 | | | 1,630 | | | | 1,606 | |
Flex Ltd. | | | | | | | | |
6.00%, 01/15/2028 | | | 4,845 | | | | 4,920 | |
GATX Corp. | | | | | | | | |
5.45%, 09/15/2033 | | | 14,990 | | | | 14,749 | |
Huntington Ingalls Industries, Inc. | | | | | | | | |
2.04%, 08/16/2028 | | | 2,516 | | | | 2,113 | |
3.48%, 12/01/2027 | | | 4,418 | | | | 4,049 | |
4.20%, 05/01/2030 | | | 4,419 | | | | 4,094 | |
IHS Holding Ltd. | | | | | | | | |
5.63%, 11/29/2026 | | | 200 | | | | 174 | |
Jabil, Inc. | | | | | | | | |
1.70%, 04/15/2026 | | | 4,870 | | | | 4,357 | |
3.00%, 01/15/2031 | | | 2,470 | | | | 2,099 | |
| | | | | | | | |
Keysight Technologies, Inc. | | | | | | | | |
3.00%, 10/30/2029 | | | 5,800 | | | | 5,080 | |
L3Harris Technologies, Inc. | | | | | | | | |
1.80%, 01/15/2031 | | | 4,956 | | | | 3,922 | |
3.85%, 12/15/2026 | | | 811 | | | | 773 | |
Lockheed Martin Corp. | | | | | | | | |
1.85%, 06/15/2030 | | | 2,412 | | | | 2,007 | |
3.60%, 03/01/2035 | | | 4,285 | | | | 3,830 | |
Mexico City Airport Trust | | | | | | | | |
4.25%, 10/31/2026(18) | | | 374 | | | | 360 | |
Norfolk Southern Corp. | | | | | | | | |
2.90%, 08/25/2051 | | | 799 | | | | 529 | |
3.05%, 05/15/2050 | | | 2,298 | | | | 1,589 | |
3.16%, 05/15/2055 | | | 792 | | | | 541 | |
3.40%, 11/01/2049 | | | 815 | | | | 600 | |
4.05%, 08/15/2052 | | | 2,331 | | | | 1,918 | |
4.55%, 06/01/2053 | | | 1,125 | | | | 1,016 | |
Northrop Grumman Corp. | | | | | | | | |
3.85%, 04/15/2045 | | | 1,857 | | | | 1,513 | |
4.03%, 10/15/2047 | | | 1,906 | | | | 1,637 | |
4.70%, 03/15/2033 | | | 2,054 | | | | 2,016 | |
4.95%, 03/15/2053 | | | 9,102 | | | | 8,867 | |
5.25%, 05/01/2050 | | | 3,459 | | | | 3,515 | |
OT Merger Corp. | | | | | | | | |
7.88%, 10/15/2029(1) | | | 4,250 | | | | 2,656 | |
Owens Corning | | | | | | | | |
3.88%, 06/01/2030 | | | 612 | | | | 559 | |
Penske Truck Leasing Co. LP / PTL Finance Corp. | | | | | | | | |
4.20%, 04/01/2027(1) | | | 1,635 | | | | 1,530 | |
5.70%, 02/01/2028(1) | | | 1,825 | | | | 1,801 | |
5.88%, 11/15/2027(1) | | | 3,273 | | | | 3,245 | |
Raytheon Technologies Corp. | | | | | | | | |
2.25%, 07/01/2030 | | | 2,106 | | | | 1,776 | |
2.82%, 09/01/2051 | | | 5,524 | | | | 3,710 | |
3.03%, 03/15/2052 | | | 5,174 | | | | 3,637 | |
3.13%, 07/01/2050 | | | 2,460 | | | | 1,781 | |
3.75%, 11/01/2046 | | | 3,132 | | | | 2,524 | |
4.05%, 05/04/2047 | | | 129 | | | | 110 | |
4.13%, 11/16/2028 | | | 10,208 | | | | 9,832 | |
5.38%, 02/27/2053 | | | 1,606 | | | | 1,668 | |
6.70%, 08/01/2028 | | | 1,393 | | | | 1,495 | |
Republic Services, Inc. | | | | | | | | |
5.00%, 04/01/2034 | | | 1,357 | | | | 1,354 | |
Rolls-Royce Plc | | | | | | | | |
5.75%, 10/15/2027 | | GBP | 1,525 | | | | 1,794 | |
Ryder System, Inc. | | | | | | | | |
5.25%, 06/01/2028 | | $ | 3,125 | | | | 3,086 | |
5.65%, 03/01/2028 | | | 3,864 | | | | 3,866 | |
Sensata Technologies, Inc. | | | | | | | | |
3.75%, 02/15/2031(1) | | | 910 | | | | 778 | |
Siemens Financieringsmaatschappij NV | | | | | | | | |
2.15%, 03/11/2031(1) | | | 689 | | | | 575 | |
SMBC Aviation Capital Finance DAC | | | | | | | | |
5.45%, 05/03/2028(1) | | | 9,005 | | | | 8,883 | |
TD SYNNEX Corp. | | | | | | | | |
1.75%, 08/09/2026 | | | 10,725 | | | | 9,348 | |
Textron, Inc. | | | | | | | | |
2.45%, 03/15/2031 | | | 2,171 | | | | 1,790 | |
3.00%, 06/01/2030 | | | 23,695 | | | | 20,655 | |
3.38%, 03/01/2028 | | | 3,699 | | | | 3,372 | |
3.90%, 09/17/2029 | | | 1,871 | | | | 1,715 | |
TransDigm, Inc. | | | | | | | | |
6.75%, 08/15/2028(1) | | | 3,793 | | | | 3,807 | |
Transnet SOC Ltd. | | | | | | | | |
8.25%, 02/06/2028(1) | | | 765 | | | | 743 | |
Trimble, Inc. | | | | | | | | |
6.10%, 03/15/2033 | | | 13,375 | | | | 13,552 | |
Union Pacific Corp. | | | | | | | | |
2.97%, 09/16/2062 | | | 4,190 | | | | 2,728 | |
3.84%, 03/20/2060 | | | 1,861 | | | | 1,480 | |
3.85%, 02/14/2072 | | | 1,667 | | | | 1,281 | |
Waste Management, Inc. | | | | | | | | |
2.95%, 06/01/2041 | | | 1,074 | | | | 796 | |
Waste Pro USA, Inc. | | | | | | | | |
5.50%, 02/15/2026(1) | | | 4,920 | | | | 4,561 | |
WRKCo, Inc. | | | | | | | | |
3.75%, 03/15/2025 | | | 815 | | | | 784 | |
4.00%, 03/15/2028 | | | 1,325 | | | | 1,233 | |
| | | | | | | | |
Total Industrials | | | | 364,224 | |
| | | | | | | | |
Technology – 1.41% | | | | | | | | |
Amdocs Ltd. | | | | | | | | |
2.54%, 06/15/2030 | | | 9,503 | | | | 7,935 | |
Apple, Inc. | | | | | | | | |
3.85%, 05/04/2043 | | | 1,250 | | | | 1,115 | |
Broadcom, Inc. | | | | | | | | |
2.45%, 02/15/2031(1) | | | 17,505 | | | | 14,237 | |
2.60%, 02/15/2033(1) | | | 4,450 | | | | 3,478 | |
3.14%, 11/15/2035(1) | | | 6,380 | | | | 4,894 | |
3.42%, 04/15/2033(1) | | | 7,160 | | | | 5,988 | |
| | | | | | | | |
3.47%, 04/15/2034(1) | | | 19,707 | | | | 16,166 | |
4.15%, 11/15/2030 | | | 8,850 | | | | 8,142 | |
CDW LLC / CDW Finance Corp. | | | | | | | | |
2.67%, 12/01/2026 | | | 3,325 | | | | 2,985 | |
3.25%, 02/15/2029 | | | 4,035 | | | | 3,457 | |
3.28%, 12/01/2028 | | | 6,400 | | | | 5,552 | |
3.57%, 12/01/2031 | | | 44,205 | | | | 37,300 | |
4.25%, 04/01/2028 | | | 1,910 | | | | 1,752 | |
CGI, Inc. | | | | | | | | |
2.30%, 09/14/2031 | | | 14,300 | | | | 11,184 | |
Dell International LLC / EMC Corp. | | | | | | | | |
4.90%, 10/01/2026 | | | 5,448 | | | | 5,409 | |
Entegris Escrow Corp. | | | | | | | | |
4.75%, 04/15/2029(1) | | | 19,155 | | | | 17,782 | |
Exela Intermediate LLC / Exela Finance, Inc. | | | | | | | | |
11.50%, 07/15/2026(1) | | | 218 | | | | 20 | |
Fiserv, Inc. | | | | | | | | |
5.60%, 03/02/2033 | | | 12,420 | | | | 12,641 | |
Hewlett Packard Enterprise Co. | | | | | | | | |
5.25%, 07/01/2028 | | | 5,048 | | | | 4,999 | |
Intel Corp. | | | | | | | | |
3.05%, 08/12/2051 | | | 891 | | | | 597 | |
3.20%, 08/12/2061 | | | 1,574 | | | | 1,022 | |
4.88%, 02/10/2028 | | | 68 | | | | 68 | |
5.70%, 02/10/2053 | | | 1,350 | | | | 1,373 | |
KLA Corp. | | | | | | | | |
3.30%, 03/01/2050 | | | 1,518 | | | | 1,138 | |
5.00%, 03/15/2049 | | | 1,456 | | | | 1,413 | |
5.25%, 07/15/2062 | | | 683 | | | | 691 | |
Leidos, Inc. | | | | | | | | |
5.75%, 03/15/2033 | | | 11,560 | | | | 11,484 | |
Marvell Technology, Inc. | | | | | | | | |
2.45%, 04/15/2028 | | | 5,625 | | | | 4,911 | |
2.95%, 04/15/2031 | | | 4,805 | | | | 4,028 | |
Micron Technology, Inc. | | | | | | | | |
4.19%, 02/15/2027 | | | 5,359 | | | | 5,134 | |
4.66%, 02/15/2030 | | | 15,005 | | | | 14,149 | |
5.33%, 02/06/2029 | | | 6,490 | | | | 6,390 | |
5.88%, 02/09/2033 | | | 10,870 | | | | 10,816 | |
5.88%, 09/15/2033 | | | 33,485 | | | | 33,181 | |
6.75%, 11/01/2029 | | | 3,435 | | | | 3,571 | |
MSCI, Inc. | | | | | | | | |
3.25%, 08/15/2033(1) | | | 2,591 | | | | 2,087 | |
3.63%, 11/01/2031(1) | | | 855 | | | | 730 | |
4.00%, 11/15/2029(1) | | | 2,750 | | | | 2,489 | |
NCR Corp. | | | | | | | | |
5.13%, 04/15/2029(1) | | | 3,000 | | | | 2,656 | |
5.25%, 10/01/2030(1) | | | 3,500 | | | | 3,043 | |
NXP BV | | | | | | | | |
5.35%, 03/01/2026 | | | 2,223 | | | | 2,208 | |
NXP BV / NXP USA, Inc. | | | | | | | | |
2.70%, 05/01/2025 | | | 169 | | | | 160 | |
3.15%, 05/01/2027 | | | 5,302 | | | | 4,868 | |
3.40%, 05/01/2030 | | | 2,076 | | | | 1,837 | |
4.30%, 06/18/2029 | | | 5,057 | | | | 4,766 | |
4.40%, 06/01/2027 | | | 1,715 | | | | 1,658 | |
Open Text Corp. | | | | | | | | |
6.90%, 12/01/2027(1) | | | 6,455 | | | | 6,571 | |
Oracle Corp. | | | | | | | | |
2.80%, 04/01/2027 | | | 2,410 | | | | 2,215 | |
3.60%, 04/01/2040 | | | 13,491 | | | | 10,437 | |
3.60%, 04/01/2050 | | | 17,540 | | | | 12,533 | |
3.80%, 11/15/2037 | | | 937 | | | | 766 | |
3.85%, 07/15/2036 | | | 6,000 | | | | 5,008 | |
3.85%, 04/01/2060 | | | 5,972 | | | | 4,209 | |
3.95%, 03/25/2051 | | | 12,429 | | | | 9,398 | |
4.00%, 07/15/2046 | | | 8,933 | | | | 6,866 | |
4.00%, 11/15/2047 | | | 4,860 | | | | 3,742 | |
4.10%, 03/25/2061(18) | | | 8,100 | | | | 5,977 | |
4.13%, 05/15/2045 | | | 8,420 | | | | 6,598 | |
4.50%, 07/08/2044 | | | 6,113 | | | | 5,109 | |
6.15%, 11/09/2029 | | | 8,005 | | | | 8,338 | |
6.25%, 11/09/2032 | | | 2,500 | | | | 2,654 | |
6.50%, 04/15/2038 | | | 6,215 | | | | 6,617 | |
6.90%, 11/09/2052 | | | 4,295 | | | | 4,821 | |
QUALCOMM, Inc. | | | | | | | | |
4.50%, 05/20/2052 | | | 2,270 | | | | 2,065 | |
Seagate HDD Cayman | | | | | | | | |
4.09%, 06/01/2029 | | | 365 | | | | 321 | |
9.63%, 12/01/2032(1) | | | 746 | | | | 823 | |
SK Hynix, Inc. | | | | | | | | |
6.38%, 01/17/2028(1) | | | 2,810 | | | | 2,822 | |
Skyworks Solutions, Inc. | | | | | | | | |
1.80%, 06/01/2026 | | | 1,340 | | | | 1,197 | |
Take-Two Interactive Software, Inc. | | | | | | | | |
4.00%, 04/14/2032 | | | 1,448 | | | | 1,326 | |
TSMC Global Ltd. | | | | | | | | |
1.00%, 09/28/2027(1) | | | 661 | | | | 560 | |
VMware, Inc. | | | | | | | | |
| | | | | | | | |
1.80%, 08/15/2028 | | | 704 | | | | 590 | |
2.20%, 08/15/2031 | | | 12,754 | | | | 10,022 | |
Western Digital Corp. | | | | | | | | |
2.85%, 02/01/2029 | | | 4,080 | | | | 3,260 | |
4.75%, 02/15/2026 | | | 8,800 | | | | 8,382 | |
| | | | | | | | |
Total Technology | | | | | | | 424,731 | |
| | | | | | | | |
Utilities – 2.14% | | | | | | | | |
AEP Texas, Inc. | | | | | | | | |
2.10%, 07/01/2030 | | | 671 | | | | 548 | |
3.45%, 01/15/2050 | | | 2,254 | | | | 1,617 | |
3.80%, 10/01/2047 | | | 869 | | | | 657 | |
3.95%, 06/01/2028 | | | 2,112 | | | | 1,982 | |
5.25%, 05/15/2052 | | | 2,202 | | | | 2,077 | |
5.40%, 06/01/2033 | | | 4,233 | | | | 4,211 | |
AEP Transmission Co. LLC | | | | | | | | |
2.75%, 08/15/2051 | | | 1,644 | | | | 1,060 | |
3.15%, 09/15/2049 | | | 1,098 | | | | 781 | |
3.65%, 04/01/2050 | | | 897 | | | | 697 | |
3.80%, 06/15/2049 | | | 1,494 | | | | 1,193 | |
4.50%, 06/15/2052 | | | 3,654 | | | | 3,268 | |
AES Corp. | | | | | | | | |
2.45%, 01/15/2031 | | | 4,485 | | | | 3,625 | |
3.95%, 07/15/2030(1) | | | 2,040 | | | | 1,829 | |
Alabama Power Co. | | | | | | | | |
3.13%, 07/15/2051 | | | 1,108 | | | | 766 | |
3.45%, 10/01/2049 | | | 856 | | | | 626 | |
3.75%, 03/01/2045 | | | 1,569 | | | | 1,233 | |
4.30%, 01/02/2046 | | | 895 | | | | 752 | |
4.30%, 07/15/2048 | | | 800 | | | | 681 | |
Alliant Energy Finance LLC | | | | | | | | |
1.40%, 03/15/2026(1) | | | 925 | | | | 818 | |
Ameren Illinois Co. | | | | | | | | |
3.25%, 03/15/2050 | | | 720 | | | | 526 | |
5.90%, 12/01/2052 | | | 692 | | | | 754 | |
American Electric Power Co., Inc. | | | | | | | | |
5.95%, 11/01/2032 | | | 1,350 | | | | 1,408 | |
American Transmission Systems, Inc. | | | | | | | | |
2.65%, 01/15/2032(1) | | | 10,922 | | | | 9,032 | |
American Water Capital Corp. | | | | | | | | |
4.15%, 06/01/2049 | | | 1,425 | | | | 1,193 | |
Arizona Public Service Co. | | | | | | | | |
3.35%, 05/15/2050 | | | 3,522 | | | | 2,429 | |
5.55%, 08/01/2033 | | | 7,110 | | | | 7,115 | |
Atmos Energy Corp. | | | | | | | | |
5.75%, 10/15/2052 | | | 536 | | | | 567 | |
Baltimore Gas & Electric Co. | | | | | | | | |
2.90%, 06/15/2050 | | | 1,333 | | | | 889 | |
3.20%, 09/15/2049 | | | 864 | | | | 626 | |
3.75%, 08/15/2047 | | | 1,765 | | | | 1,378 | |
4.55%, 06/01/2052 | | | 1,960 | | | | 1,743 | |
5.40%, 06/01/2053 | | | 8,750 | | | | 8,889 | |
Black Hills Corp. | | | | | | | | |
4.35%, 05/01/2033 | | | 6,250 | | | | 5,567 | |
CenterPoint Energy Houston Electric LLC | | | | | | | | |
3.35%, 04/01/2051 | | | 1,097 | | | | 818 | |
3.60%, 03/01/2052 | | | 1,205 | | | | 935 | |
4.95%, 04/01/2033 | | | 4,338 | | | | 4,330 | |
CenterPoint Energy Resources Corp. | | | | | | | | |
5.25%, 03/01/2028 | | | 2,206 | | | | 2,205 | |
Cleco Power LLC | | | | | | | | |
6.00%, 12/01/2040 | | | 1,000 | | | | 966 | |
Comision Federal de Electricidad | | | | | | | | |
4.88%, 01/15/2024(18) | | | 374 | | | | 371 | |
Commonwealth Edison Co. | | | | | | | | |
3.13%, 03/15/2051 | | | 2,610 | | | | 1,829 | |
3.20%, 11/15/2049 | | | 861 | | | | 616 | |
3.85%, 03/15/2052 | | | 805 | | | | 643 | |
4.35%, 11/15/2045 | | | 822 | | | | 716 | |
Connecticut Light & Power Co. | | | | | | | | |
4.90%, 07/01/2033 | | | 2,606 | | | | 2,592 | |
Consolidated Edison Co. of New York, Inc. | | | | | | | | |
3.20%, 12/01/2051 | | | 1,051 | | | | 728 | |
3.85%, 06/15/2046 | | | 773 | | | | 598 | |
4.63%, 12/01/2054 | | | 1,424 | | | | 1,222 | |
6.15%, 11/15/2052 | | | 681 | | | | 749 | |
Consumers Energy Co. | | | | | | | | |
2.65%, 08/15/2052 | | | 950 | | | | 609 | |
3.10%, 08/15/2050 | | | 744 | | | | 526 | |
3.75%, 02/15/2050 | | | 1,633 | | | | 1,300 | |
4.20%, 09/01/2052 | | | 4,282 | | | | 3,664 | |
DTE Electric Co. | | | | | | | | |
3.25%, 04/01/2051 | | | 1,541 | | | | 1,115 | |
3.75%, 08/15/2047 | | | 1,237 | | | | 972 | |
3.95%, 03/01/2049 | | | 1,703 | | | | 1,399 | |
4.05%, 05/15/2048 | | | 558 | | | | 463 | |
5.40%, 04/01/2053 | | | 1,460 | | | | 1,507 | |
Duke Energy Carolinas LLC | | | | | | | | |
2.45%, 02/01/2030 | | | 530 | | | | 456 | |
2.55%, 04/15/2031 | | | 3,610 | | | | 3,063 | |
| | | | | | | | |
2.85%, 03/15/2032 | | | 1,652 | | | | 1,404 | |
3.45%, 04/15/2051 | | | 3,353 | | | | 2,450 | |
3.70%, 12/01/2047 | | | 2,500 | | | | 1,959 | |
3.88%, 03/15/2046 | | | 4,803 | | | | 3,825 | |
3.95%, 03/15/2048 | | | 1,542 | | | | 1,256 | |
4.25%, 12/15/2041 | | | 1,650 | | | | 1,428 | |
5.35%, 01/15/2053 | | | 1,482 | | | | 1,501 | |
5.40%, 01/15/2054 | | | 735 | | | | 749 | |
Duke Energy Corp. | | | | | | | | |
4.30%, 03/15/2028 | | | 623 | | | | 598 | |
Duke Energy Florida LLC | | | | | | | | |
1.75%, 06/15/2030 | | | 3,663 | | | | 2,980 | |
3.00%, 12/15/2051 | | | 865 | | | | 593 | |
3.80%, 07/15/2028 | | | 1,822 | | | | 1,734 | |
5.95%, 11/15/2052 | | | 4,775 | | | | 5,201 | |
Duke Energy Ohio, Inc. | | | | | | | | |
4.30%, 02/01/2049 | | | 715 | | | | 598 | |
Duke Energy Progress LLC | | | | | | | | |
2.50%, 08/15/2050 | | | 1,900 | | | | 1,179 | |
3.45%, 03/15/2029 | | | 2,533 | | | | 2,322 | |
3.60%, 09/15/2047 | | | 1,135 | | | | 869 | |
4.00%, 04/01/2052 | | | 1,539 | | | | 1,246 | |
4.10%, 03/15/2043 | | | 900 | | | | 755 | |
4.20%, 08/15/2045 | | | 1,000 | | | | 832 | |
5.35%, 03/15/2053 | | | 977 | | | | 983 | |
Edison International | | | | | | | | |
5.25%, 11/15/2028 | | | 5,576 | | | | 5,426 | |
6.95%, 11/15/2029 | | | 4,336 | | | | 4,561 | |
Empresas Publicas de Medellin ESP | | | | | | | | |
4.38%, 02/15/2031 | | | 1,400 | | | | 1,048 | |
Enel Finance International NV | | | | | | | | |
1.88%, 07/12/2028(1) | | | 519 | | | | 435 | |
2.25%, 07/12/2031(1) | | | 496 | | | | 389 | |
3.50%, 04/06/2028(1) | | | 1,505 | | | | 1,377 | |
Entergy Arkansas LLC | | | | | | | | |
3.35%, 06/15/2052 | | | 847 | | | | 605 | |
Entergy Louisiana LLC | | | | | | | | |
4.20%, 09/01/2048 | | | 2,366 | | | | 1,979 | |
4.20%, 04/01/2050 | | | 893 | | | | 747 | |
Entergy Mississippi LLC | | | | | | | | |
2.85%, 06/01/2028 | | | 1,098 | | | | 984 | |
Evergy Kansas Central, Inc. | | | | | | | | |
5.70%, 03/15/2053 | | | 1,445 | | | | 1,488 | |
Evergy Metro, Inc. | | | | | | | | |
4.95%, 04/15/2033 | | | 10,000 | | | | 9,837 | |
Eversource Energy | | | | | | | | |
4.60%, 07/01/2027 | | | 9,315 | | | | 9,082 | |
5.45%, 03/01/2028 | | | 5,101 | | | | 5,135 | |
Exelon Corp. | | | | | | | | |
5.10%, 06/15/2045 | | | 1,414 | | | | 1,310 | |
5.60%, 03/15/2053 | | | 2,311 | | | | 2,328 | |
FirstEnergy Corp. | | | | | | | | |
3.40%, 03/01/2050 | | | 2,515 | | | | 1,733 | |
FirstEnergy Transmission LLC | | | | | | | | |
2.87%, 09/15/2028(1) | | | 16,876 | | | | 14,851 | |
4.35%, 01/15/2025(1) | | | 2,000 | | | | 1,950 | |
4.55%, 04/01/2049(1) | | | 3,972 | | | | 3,314 | |
Florida Power & Light Co. | | | | | | | | |
3.15%, 10/01/2049 | | | 1,466 | | | | 1,069 | |
3.99%, 03/01/2049 | | | 4,715 | | | | 3,974 | |
IPALCO Enterprises, Inc. | | | | | | | | |
4.25%, 05/01/2030 | | | 1,245 | | | | 1,126 | |
ITC Holdings Corp. | | | | | | | | |
3.25%, 06/30/2026 | | | 2,000 | | | | 1,890 | |
Jersey Central Power & Light Co. | | | | | | | | |
2.75%, 03/01/2032(1) | | | 2,000 | | | | 1,650 | |
4.30%, 01/15/2026(1) | | | 2,000 | | | | 1,934 | |
4.70%, 04/01/2024(1) | | | 150 | | | | 148 | |
KeySpan Gas East Corp. | | | | | | | | |
2.74%, 08/15/2026(1) | | | 4,500 | | | | 4,086 | |
5.99%, 03/06/2033(1) | | | 12,840 | | | | 12,940 | |
Metropolitan Edison Co. | | | | | | | | |
4.00%, 04/15/2025(1) | | | 4,000 | | | | 3,830 | |
4.30%, 01/15/2029(1) | | | 5,000 | | | | 4,727 | |
MidAmerican Energy Co. | | | | | | | | |
2.70%, 08/01/2052 | | | 2,250 | | | | 1,422 | |
3.15%, 04/15/2050 | | | 1,661 | | | | 1,162 | |
3.65%, 08/01/2048 | | | 681 | | | | 524 | |
Mong Duong Finance Holdings BV | | | | | | | | |
5.13%, 05/07/2029 | | | 300 | | | | 263 | |
NextEra Energy Capital Holdings, Inc. | | | | | | | | |
2.25%, 06/01/2030 | | | 4,105 | | | | 3,414 | |
NiSource, Inc. | | | | | | | | |
3.49%, 05/15/2027 | | | 640 | | | | 602 | |
5.25%, 03/30/2028 | | | 2,930 | | | | 2,928 | |
5.40%, 06/30/2033 | | | 1,360 | | | | 1,361 | |
Northern States Power Co. | | | | | | | | |
2.60%, 06/01/2051 | | | 1,764 | | | | 1,131 | |
3.20%, 04/01/2052 | | | 3,638 | | | | 2,605 | |
| | | | | | | | |
3.60%, 09/15/2047 | | | 1,800 | | | | 1,415 | |
4.00%, 08/15/2045 | | | 1,000 | | | | 813 | |
NPC Ukrenergo | | | | | | | | |
6.88%, 11/09/2028 | | | 400 | | | | 84 | |
NRG Energy, Inc. | | | | | | | | |
2.45%, 12/02/2027(1) | | | 1,834 | | | | 1,546 | |
4.45%, 06/15/2029(1) | | | 5,885 | | | | 5,201 | |
Ohio Power Co. | | | | | | | | |
2.60%, 04/01/2030 | | | 1,872 | | | | 1,599 | |
2.90%, 10/01/2051 | | | 3,153 | | | | 2,093 | |
5.00%, 06/01/2033 | | | 4,462 | | | | 4,377 | |
6.60%, 02/15/2033 | | | 760 | | | | 821 | |
Oncor Electric Delivery Co. LLC | | | | | | | | |
3.10%, 09/15/2049 | | | 2,631 | | | | 1,858 | |
4.55%, 09/15/2032 | | | 263 | | | | 255 | |
4.95%, 09/15/2052(1) | | | 8,535 | | | | 8,231 | |
Pacific Gas & Electric Co. | | | | | | | | |
2.10%, 08/01/2027 | | | 19,308 | | | | 16,493 | |
2.50%, 02/01/2031 | | | 15,565 | | | | 12,186 | |
2.95%, 03/01/2026 | | | 4,765 | | | | 4,365 | |
3.00%, 06/15/2028 | | | 13,949 | | | | 12,023 | |
3.15%, 01/01/2026 | | | 6,569 | | | | 6,095 | |
3.25%, 06/01/2031 | | | 11,300 | | | | 9,189 | |
3.30%, 03/15/2027 | | | 2,052 | | | | 1,862 | |
3.30%, 12/01/2027 | | | 3,700 | | | | 3,244 | |
3.40%, 08/15/2024 | | | 2,476 | | | | 2,396 | |
3.45%, 07/01/2025 | | | 7,760 | | | | 7,326 | |
3.50%, 06/15/2025 | | | 10,754 | | | | 10,180 | |
3.50%, 08/01/2050 | | | 1,670 | | | | 1,062 | |
3.75%, 02/15/2024 | | | 2,914 | | | | 2,866 | |
3.75%, 07/01/2028 | | | 18,444 | | | | 16,525 | |
3.75%, 08/15/2042 | | | 1,883 | | | | 1,301 | |
3.85%, 11/15/2023 | | | 1,259 | | | | 1,248 | |
4.00%, 12/01/2046 | | | 13,182 | | | | 8,835 | |
4.20%, 03/01/2029 | | | 4,334 | | | | 3,892 | |
4.25%, 08/01/2023 | | | 20,431 | | | | 20,411 | |
4.25%, 03/15/2046 | | | 409 | | | | 290 | |
4.30%, 03/15/2045 | | | 10,332 | | | | 7,372 | |
4.40%, 03/01/2032 | | | 11,850 | | | | 10,262 | |
4.45%, 04/15/2042 | | | 7,667 | | | | 5,788 | |
4.50%, 12/15/2041 | | | 3,353 | | | | 2,464 | |
4.55%, 07/01/2030 | | | 40,108 | | | | 36,300 | |
4.60%, 06/15/2043 | | | 1,248 | | | | 944 | |
4.65%, 08/01/2028 | | | 100 | | | | 92 | |
4.75%, 02/15/2044 | | | 6,611 | | | | 5,130 | |
4.95%, 07/01/2050 | | | 7,965 | | | | 6,255 | |
5.25%, 03/01/2052 | | | 5,800 | | | | 4,710 | |
5.45%, 06/15/2027 | | | 3,084 | | | | 2,999 | |
5.90%, 06/15/2032 | | | 7,090 | | | | 6,823 | |
6.70%, 04/01/2053 | | | 520 | | | | 511 | |
PECO Energy Co. | | | | | | | | |
2.85%, 09/15/2051 | | | 2,757 | | | | 1,816 | |
3.00%, 09/15/2049 | | | 822 | | | | 571 | |
4.60%, 05/15/2052 | | | 704 | | | | 644 | |
Pennsylvania Electric Co. | | | | | | | | |
5.15%, 03/30/2026(1) | | | 820 | | | | 808 | |
PG&E Wildfire Recovery Funding LLC | | | | | | | | |
4.26%, 06/01/2036 | | | 3,170 | | | | 3,016 | |
4.38%, 06/01/2039 | | | 3,510 | | | | 3,239 | |
4.45%, 12/01/2047 | | | 18,300 | | | | 16,667 | |
4.67%, 12/01/2051 | | | 2,100 | | | | 1,967 | |
Piedmont Natural Gas Co., Inc. | | | | | | | | |
2.50%, 03/15/2031 | | | 12,028 | | | | 9,820 | |
3.50%, 06/01/2029 | | | 1,252 | | | | 1,134 | |
4.10%, 09/18/2034 | | | 40 | | | | 35 | |
5.05%, 05/15/2052 | | | 4,100 | | | | 3,689 | |
Promigas SA ESP | | | | | | | | |
3.75%, 10/16/2029(1) | | | 305 | | | | 259 | |
3.75%, 10/16/2029(18) | | | 378 | | | | 321 | |
Public Service Co. of Colorado | | | | | | | | |
5.25%, 04/01/2053 | | | 8,000 | | | | 7,683 | |
Public Service Co. of New Hampshire | | | | | | | | |
5.15%, 01/15/2053 | | | 2,211 | | | | 2,216 | |
Public Service Co. of New Mexico | | | | | | | | |
3.85%, 08/01/2025 | | | 7,000 | | | | 6,697 | |
Public Service Electric & Gas Co. | | | | | | | | |
2.05%, 08/01/2050 | | | 2,065 | | | | 1,215 | |
2.45%, 01/15/2030 | | | 2,722 | | | | 2,346 | |
3.15%, 01/01/2050 | | | 1,066 | | | | 775 | |
3.60%, 12/01/2047 | | | 1,035 | | | | 813 | |
4.90%, 12/15/2032 | | | 1,462 | | | | 1,460 | |
San Diego Gas & Electric Co. | | | | | | | | |
3.32%, 04/15/2050 | | | 1,686 | | | | 1,206 | |
5.35%, 04/01/2053 | | | 1,566 | | | | 1,553 | |
Southern California Edison Co. | | | | | | | | |
2.25%, 06/01/2030 | | | 5,237 | | | | 4,377 | |
2.85%, 08/01/2029 | | | 905 | | | | 791 | |
4.20%, 03/01/2029 | | | 1,310 | | | | 1,245 | |
5.95%, 11/01/2032 | | | 6,329 | | | | 6,625 | |
| | | | | | | | |
Southern Co. Gas Capital Corp. | | | | | | | | |
4.40%, 05/30/2047 | | | 1,915 | | | | 1,590 | |
5.88%, 03/15/2041 | | | 7,873 | | | | 7,926 | |
Southwestern Electric Power Co. | | | | | | | | |
4.10%, 09/15/2028 | | | 10,000 | | | | 9,479 | |
5.30%, 04/01/2033 | | | 6,727 | | | | 6,640 | |
Southwestern Public Service Co. | | | | | | | | |
3.15%, 05/01/2050 | | | 3,333 | | | | 2,320 | |
3.70%, 08/15/2047 | | | 749 | | | | 574 | |
3.75%, 06/15/2049 | | | 565 | | | | 433 | |
4.40%, 11/15/2048 | | | 1,254 | | | | 1,070 | |
Spire, Inc. | | | | | | | | |
3.54%, 02/27/2024 | | | 5,000 | | | | 4,910 | |
Tucson Electric Power Co. | | | | | | | | |
3.05%, 03/15/2025 | | | 3,000 | | | | 2,870 | |
Union Electric Co. | | | | | | | | |
5.45%, 03/15/2053 | | | 1,068 | | | | 1,088 | |
Vistra Operations Co. LLC | | | | | | | | |
3.70%, 01/30/2027(1) | | | 6,435 | | | | 5,893 | |
| | | | | | | | |
Total Utilities | | | | 648,269 | |
| | | | | | | | |
Total Corporate Bonds (Cost: $9,120,786) | | | | | | | 8,259,998 | |
| | | | | | | | |
Convertible Securities – 0.29% | | | | | | | | |
Communications – 0.09% | | | | | | | | |
DISH Network Corp. | | | | | | | | |
0.00%, 12/15/2025 | | | 2,700 | | | | 1,428 | |
2.38%, 03/15/2024 | | | 7,520 | | | | 6,665 | |
3.38%, 08/15/2026 | | | 25,080 | | | | 12,728 | |
Uber Technologies, Inc. | | | | | | | | |
0.00%, 12/15/2025 | | | 6,365 | | | | 5,805 | |
| | | | | | | | |
Total Communications | | | | 26,626 | |
| | | | | | | | |
Consumer, Cyclical – 0.03% | | | | | | | | |
Peloton Interactive, Inc. | | | | | | | | |
0.00%, 02/15/2026 | | | 1,975 | | | | 1,496 | |
Southwest Airlines Co. | | | | | | | | |
1.25%, 05/01/2025 | | | 7,400 | | | | 8,485 | |
| | | | | | | | |
Total Consumer, Cyclical | | | | 9,981 | |
| | | | | | | | |
Consumer, Non-cyclical – 0.13% | | | | | | | | |
BioMarin Pharmaceutical, Inc. | | | | | | | | |
0.60%, 08/01/2024 | | | 10,090 | | | | 9,911 | |
1.25%, 05/15/2027 | | | 8,650 | | | | 8,696 | |
Livongo Health, Inc. | | | | | | | | |
0.88%, 06/01/2025 | | | 5,435 | | | | 4,911 | |
Teladoc Health, Inc. | | | | | | | | |
1.25%, 06/01/2027 | | | 16,800 | | | | 13,355 | |
| | | | | | | | |
Total Consumer, Non-cyclical | | | | 36,873 | |
| | | | | | | | |
Utilities – 0.04% | | | | | | | | |
PPL Capital Funding, Inc. | | | | | | | | |
2.88%, 03/15/2028(1) | | | 13,700 | | | | 13,084 | |
| | | | | | | | |
Total Utilities | | | | 13,084 | |
| | | | | | | | |
Total Convertible Securities (Cost: $106,939) | | | | | | | 86,564 | |
| | | | | | | | |
Government Related – 21.84% | | | | | | | | |
Other Government Related – 1.36% | | | | | | | | |
Africa Finance Corp. | | | | | | | | |
3.88%, 04/13/2024(1) | | | 1,085 | | | | 1,059 | |
American Municipal Power, Inc. | | | | | | | | |
8.08%, 02/15/2050 | | | 1,070 | | | | 1,447 | |
Angolan Government International Bond | | | | | | | | |
8.75%, 04/14/2032(1) | | | 365 | | | | 307 | |
Argentina Treasury Bond BONCER | | | | | | | | |
1.45%, 08/13/2023 | | ARS | 357,452 | | | | 6,643 | |
Argentine Bonos del Tesoro | | | | | | | | |
15.50%, 10/17/2026 | | | 110,804 | | | | 104 | |
Argentine Republic Government International Bond | | | | | | | | |
0.50%, 07/09/2030(4) | | $ | 25,484 | | | | 8,462 | |
1.00%, 07/09/2029 | | | 1,109 | | | | 359 | |
1.50%, 07/09/2035(4) | | | 4,447 | | | | 1,326 | |
1.50%, 07/09/2046(4) | | | 115 | | | | 34 | |
3.50%, 07/09/2041(4) | | | 12,427 | | | | 3,982 | |
3.88%, 01/09/2038(4) | | | 261 | | | | 92 | |
Bahrain Government International Bond | | | | | | | | |
7.50%, 09/20/2047(18) | | | 200 | | | | 182 | |
Bank Gospodarstwa Krajowego | | | | | | | | |
5.38%, 05/22/2033(1) | | | 649 | | | | 645 | |
Bay Area Toll Authority | | | | | | | | |
7.04%, 04/01/2050 | | | 2,790 | | | | 3,581 | |
Benin Government International Bond | | | | | | | | |
4.88%, 01/19/2032(18) | | EUR | 100 | | | | 82 | |
6.88%, 01/19/2052(18) | | | 100 | | | | 77 | |
Brazilian Government International Bond | | | | | | | | |
3.88%, 06/12/2030 | | $ | 4,400 | | | | 3,896 | |
6.00%, 10/20/2033 | | | 600 | | | | 593 | |
California State University | | | | | | | | |
2.37%, 11/01/2035 | | | 5,080 | | | | 3,903 | |
Chile Government International Bond | | | | | | | | |
2.55%, 01/27/2032 | | | 3,355 | | | | 2,864 | |
2.55%, 07/27/2033 | | | 1,500 | | | | 1,225 | |
4.34%, 03/07/2042 | | | 200 | | | | 177 | |
| | | | | | | | |
City of New York NY | | | | | | | | |
2.05%, 03/01/2032 | | | 2,480 | | | | 1,984 | |
3.55%, 12/01/2028 | | | 3,645 | | | | 3,420 | |
City of San Antonio TX Electric & Gas Systems Revenue | | | | | | | | |
5.81%, 02/01/2041 | | | 1,315 | | | | 1,433 | |
City of San Francisco CA Public Utilities Commission Water Revenue | | | | | | | | |
2.19%, 11/01/2032 | | | 1,610 | | | | 1,306 | |
2.83%, 11/01/2041 | | | 4,645 | | | | 3,633 | |
Ciudad Autonoma de Buenos Aires | | | | | | | | |
95.32% (Argentina Deposit Rates Badlar Private Banks ARS 30 to 35 Days + 3.25%), 03/29/2024(2) | | ARS | 314,346 | | | | 1,237 | |
95.64% (Argentina Deposit Rates Badlar Private Banks ARS 30 to 35 Days + 3.75%), 02/22/2028(2) | | | 401,380 | | | | 1,698 | |
Colombia Government International Bond | | | | | | | | |
3.00%, 01/30/2030 | | $ | 1,000 | | | | 777 | |
3.13%, 04/15/2031 | | | 388 | | | | 292 | |
4.13%, 05/15/2051 | | | 345 | | | | 206 | |
4.50%, 03/15/2029 | | | 834 | | | | 730 | |
8.00%, 04/20/2033 | | | 475 | | | | 482 | |
Colombian TES | | | | | | | | |
5.75%, 11/03/2027 | | COP | 4,631,000 | | | | 955 | |
7.25%, 10/18/2034 | | | 2,725,000 | | | | 527 | |
7.50%, 08/26/2026 | | | 7,676,000 | | | | 1,727 | |
County of Miami-Dade FL Aviation Revenue | | | | | | | | |
2.61%, 10/01/2032 | | $ | 900 | | | | 743 | |
2.71%, 10/01/2033 | | | 1,290 | | | | 1,055 | |
Czech Republic Government Bond | | | | | | | | |
0.95%, 05/15/2030(18) | | CZK | 6,510 | | | | 238 | |
4.20%, 12/04/2036 | | | 6,220 | | | | 279 | |
5.00%, 09/30/2030 | | | 18,740 | | | | 889 | |
Dominican Republic International Bond | | | | | | | | |
4.50%, 01/30/2030(1) | | $ | 3,982 | | | | 3,485 | |
4.88%, 09/23/2032(1) | | | 157 | | | | 133 | |
4.88%, 09/23/2032 | | | 1,800 | | | | 1,530 | |
5.30%, 01/21/2041(18) | | | 150 | | | | 117 | |
5.95%, 01/25/2027(18) | | | 103 | | | | 101 | |
6.88%, 01/29/2026(18) | | | 120 | | | | 121 | |
Egypt Government International Bond | | | | | | | | |
7.50%, 02/16/2061(18) | | | 501 | | | | 250 | |
7.63%, 05/29/2032(18) | | | 300 | | | | 174 | |
Finance Department Government of Sharjah | | | | | | | | |
6.50%, 11/23/2032(1) | | | 621 | | | | 639 | |
Gabon Government International Bond | | | | | | | | |
7.00%, 11/24/2031 | | | 247 | | | | 196 | |
Ghana Government International Bond | | | | | | | | |
7.63%, 05/16/2029(18) | | | 232 | | | | 99 | |
Golden State Tobacco Securitization Corp. | | | | | | | | |
2.25%, 06/01/2029 | | | 1,300 | | | | 1,108 | |
3.00%, 06/01/2046 | | | 475 | | | | 437 | |
3.49%, 06/01/2036 | | | 1,600 | | | | 1,305 | |
3.85%, 06/01/2050 | | | 2,530 | | | | 2,292 | |
4.21%, 06/01/2050 | | | 7,900 | | | | 5,903 | |
Guatemala Government Bond | | | | | | | | |
3.70%, 10/07/2033 | | | 2,000 | | | | 1,610 | |
4.65%, 10/07/2041(1) | | | 203 | | | | 162 | |
5.25%, 08/10/2029(1) | | | 31 | | | | 29 | |
5.25%, 08/10/2029 | | | 1,300 | | | | 1,235 | |
6.60%, 06/13/2036(1) | | | 221 | | | | 222 | |
Hungary Government International Bond | | | | | | | | |
2.13%, 09/22/2031(1) | | | 3,700 | | | | 2,855 | |
5.25%, 06/16/2029 | | | 1,000 | | | | 971 | |
5.38%, 03/25/2024 | | | 70 | | | | 70 | |
5.50%, 06/16/2034 | | | 313 | | | | 303 | |
Indonesia Government International Bond | | | | | | | | |
2.85%, 02/14/2030 | | | 1,783 | | | | 1,582 | |
3.05%, 03/12/2051 | | | 4,490 | | | | 3,280 | |
4.10%, 04/24/2028 | | | 200 | | | | 193 | |
Indonesia Treasury Bond | | | | | | | | |
6.38%, 08/15/2028 | | IDR | 231,987,000 | | | | 15,771 | |
7.50%, 05/15/2038 | | | 11,601,000 | | | | 839 | |
8.25%, 05/15/2029 | | | 6,883,000 | | | | 506 | |
9.00%, 03/15/2029 | | | 4,494,000 | | | | 342 | |
Israel Government International Bond | | | | | | | | |
4.50%, 04/03/2120 | | $ | 1,400 | | | | 1,126 | |
Ivory Coast Government International Bond | | | | | | | | |
4.88%, 01/30/2032(18) | | EUR | 100 | | | | 85 | |
5.88%, 10/17/2031(18) | | | 130 | | | | 118 | |
Jordan Government International Bond | | | | | | | | |
5.85%, 07/07/2030(18) | | $ | 200 | | | | 183 | |
Los Angeles Community College District | | | | | | | | |
6.60%, 08/01/2042 | | | 955 | | | | 1,156 | |
Los Angeles Unified School District | | | | | | | | |
5.75%, 07/01/2034 | | | 170 | | | | 180 | |
6.76%, 07/01/2034 | | | 2,990 | | | | 3,382 | |
Massachusetts School Building Authority | | | | | | | | |
2.50%, 02/15/2037 | | | 4,495 | | | | 3,396 | |
Metropolitan Transportation Authority | | | | | | | | |
5.18%, 11/15/2049 | | | 2,065 | | | | 1,881 | |
5.87%, 11/15/2039 | | | 300 | | | | 297 | |
6.67%, 11/15/2039 | | | 140 | | | | 149 | |
6.81%, 11/15/2040 | | | 310 | | | | 335 | |
| | | | | | | | |
Mexican Bonos | | | | | | | | |
7.50%, 06/03/2027 | | MXN | 25,800 | | | | 1,433 | |
8.50%, 05/31/2029 | | | 102,510 | | | | 5,929 | |
8.50%, 11/18/2038 | | | 38,241 | | | | 2,176 | |
Mexico Cetes | | | | | | | | |
0.00%, 11/28/2024 | | | 925,000 | | | | 4,679 | |
0.00%, 01/23/2025 | | | 316,479 | | | | 1,579 | |
Mexico Government International Bond | | | | | | | | |
2.66%, 05/24/2031 | | $ | 15,288 | | | | 12,709 | |
3.50%, 02/12/2034 | | | 773 | | | | 647 | |
4.50%, 01/31/2050 | | | 7,786 | | | | 6,340 | |
4.75%, 04/27/2032 | | | 2,000 | | | | 1,905 | |
6.34%, 05/04/2053 | | | 339 | | | | 345 | |
MFB Magyar Fejlesztesi Bank Zrt | | | | | | | | |
6.50%, 06/29/2028 | | | 275 | | | | 272 | |
Morocco Government International Bond | | | | | | | | |
6.50%, 09/08/2033 | | | 200 | | | | 206 | |
6.50%, 09/08/2033(1) | | | 667 | | | | 685 | |
Municipal Electric Authority of Georgia | | | | | | | | |
6.64%, 04/01/2057 | | | 971 | | | | 1,108 | |
New Jersey Turnpike Authority | | | | | | | | |
1.86%, 01/01/2031 | | | 2,370 | | | | 1,937 | |
7.41%, 01/01/2040 | | | 941 | | | | 1,179 | |
New York City Municipal Water Finance Authority | | | | | | | | |
5.88%, 06/15/2044 | | | 1,200 | | | | 1,347 | |
6.01%, 06/15/2042 | | | 255 | | | | 291 | |
New York City Transitional Finance Authority Future Tax Secured Revenue | | | | | | | | |
2.40%, 11/01/2032 | | | 2,580 | | | | 2,096 | |
2.69%, 05/01/2033 | | | 1,275 | | | | 1,054 | |
2.80%, 02/01/2026 | | | 1,850 | | | | 1,746 | |
3.95%, 08/01/2032 | | | 1,900 | | | | 1,765 | |
5.27%, 05/01/2027 | | | 5,820 | | | | 5,851 | |
5.51%, 08/01/2037 | | | 670 | | | | 697 | |
New York State Dormitory Authority | | | | | | | | |
5.29%, 03/15/2033 | | | 830 | | | | 852 | |
Nigeria Government International Bond | | | | | | | | |
7.63%, 11/28/2047(18) | | | 200 | | | | 142 | |
7.88%, 02/16/2032(18) | | | 231 | | | | 193 | |
9.25%, 01/21/2049(18) | | | 231 | | | | 191 | |
Oman Government International Bond | | | | | | | | |
5.63%, 01/17/2028 | | | 3,300 | | | | 3,262 | |
6.50%, 03/08/2047(18) | | | 200 | | | | 186 | |
Panama Government International Bond | | | | | | | | |
2.25%, 09/29/2032 | | | 3,170 | | | | 2,419 | |
3.16%, 01/23/2030 | | | 1,954 | | | | 1,709 | |
3.88%, 03/17/2028 | | | 2,308 | | | | 2,185 | |
4.50%, 04/01/2056 | | | 5,792 | | | | 4,340 | |
6.40%, 02/14/2035 | | | 724 | | | | 754 | |
6.85%, 03/28/2054 | | | 240 | | | | 250 | |
Paraguay Government International Bond | | | | | | | | |
4.95%, 04/28/2031 | | | 1,200 | | | | 1,151 | |
5.40%, 03/30/2050(18) | | | 200 | | | | 171 | |
Peru Government Bond | | | | | | | | |
5.94%, 02/12/2029 | | PEN | 9,770 | | | | 2,639 | |
6.15%, 08/12/2032 | | | 5,276 | | | | 1,388 | |
6.95%, 08/12/2031 | | | 5,192 | | | | 1,450 | |
Perusahaan Penerbit SBSN Indonesia III | | | | | | | | |
2.80%, 06/23/2030(1) | | $ | 1,700 | | | | 1,499 | |
Peruvian Government International Bond | | | | | | | | |
1.86%, 12/01/2032 | | | 1,946 | | | | 1,498 | |
2.78%, 01/23/2031 | | | 4,470 | | | | 3,821 | |
2.84%, 06/20/2030 | | | 1,370 | | | | 1,199 | |
3.55%, 03/10/2051 | | | 2,819 | | | | 2,107 | |
4.13%, 08/25/2027 | | | 1,766 | | | | 1,716 | |
5.94%, 02/12/2029 | | PEN | 5,487 | | | | 1,482 | |
5.94%, 02/12/2029(1) | | | 11,100 | | | | 2,998 | |
6.15%, 08/12/2032(1) | | | 1,752 | | | | 462 | |
6.90%, 08/12/2037(1) | | | 340 | | | | 92 | |
6.95%, 08/12/2031 | | | 593 | | | | 166 | |
6.95%, 08/12/2031(1) | | | 4,375 | | | | 1,222 | |
Philippine Government International Bond | | | | | | | | |
3.00%, 02/01/2028 | | $ | 3,452 | | | | 3,210 | |
3.20%, 07/06/2046 | | | 4,745 | | | | 3,489 | |
Port Authority of New York & New Jersey | | | | | | | | |
4.93%, 10/01/2051 | | | 825 | | | | 825 | |
4.96%, 08/01/2046 | | | 1,010 | | | | 988 | |
5.65%, 11/01/2040 | | | 825 | | | | 886 | |
Provincia de Buenos Aires | | | | | | | | |
88.73% (Argentina Deposit Rates Badlar Private Banks ARS 30 to 35 Days + 3.75%), 04/12/2025(1)(2) | | ARS | 1,038,361 | | | | 4,530 | |
Puerto Rico Electric Power Authority | | | | | | | | |
6.05%, 07/01/2032(6)(7) | | $ | 100 | | | | 38 | |
Regents of the University of California Medical Center Pooled Revenue | | | | | | | | |
3.26%, 05/15/2060 | | | 11,150 | | | | 7,827 | |
Republic of Poland Government International Bond | | | | | | | | |
4.25%, 02/14/2043 | | EUR | 39 | | | | 42 | |
4.88%, 10/04/2033 | | $ | 2,380 | | | | 2,335 | |
5.50%, 04/04/2053 | | | 44 | | | | 44 | |
5.75%, 11/16/2032 | | | 517 | | | | 542 | |
Republic of South Africa Government Bond | | | | | | | | |
| | | | | | | | |
8.00%, 01/31/2030 | | ZAR | 39,108 | | | | 1,834 | |
8.88%, 02/28/2035 | | | 312,655 | | | | 13,589 | |
10.50%, 12/21/2026 | | | 1,574,700 | | | | 86,842 | |
Republic of South Africa Government International Bond | | | | | | | | |
4.85%, 09/30/2029 | | $ | 1,158 | | | | 1,017 | |
5.00%, 10/12/2046 | | | 208 | | | | 138 | |
5.88%, 04/20/2032 | | | 1,740 | | | | 1,539 | |
Romanian Government International Bond | | | | | | | | |
2.12%, 07/16/2031(18) | | EUR | 78 | | | | 64 | |
2.13%, 03/07/2028 | | | 397 | | | | 375 | |
2.50%, 02/08/2030(18) | | | 66 | | | | 59 | |
2.88%, 03/11/2029(18) | | | 63 | | | | 60 | |
3.00%, 02/14/2031 | | $ | 3,400 | | | | 2,814 | |
5.25%, 11/25/2027(1) | | | 60 | | | | 58 | |
Russian Federal Bond—OFZ | | | | | | | | |
6.10%, 07/18/2035 | | RUB | 111,613 | | | | 418 | |
Russian Foreign Bond—Eurobond | | | | | | | | |
4.25%, 06/23/2027 | | $ | 1,000 | | | | 440 | |
5.10%, 03/28/2035 | | | 200 | | | | 80 | |
5.25%, 06/23/2047(1) | | | 200 | | | | 76 | |
5.25%, 06/23/2047 | | | 4,000 | | | | 1,520 | |
5.63%, 04/04/2042 | | | 1,200 | | | | 774 | |
5.88%, 09/16/2043 | | | 2,600 | | | | 1,651 | |
Saudi Government International Bond | | | | | | | | |
2.25%, 02/02/2033(18) | | | 212 | | | | 171 | |
3.25%, 10/22/2030 | | | 990 | | | | 897 | |
3.45%, 02/02/2061(18) | | | 610 | | | | 428 | |
Senegal Government International Bond | | | | | | | | |
4.75%, 03/13/2028(18) | | EUR | 100 | | | | 94 | |
State of California | | | | | | | | |
4.60%, 04/01/2038 | | $ | 1,395 | | | | 1,337 | |
7.55%, 04/01/2039 | | | 2,705 | | | | 3,408 | |
State of Illinois | | | | | | | | |
5.10%, 06/01/2033 | | | 5,305 | | | | 5,213 | |
6.73%, 04/01/2035 | | | 65 | | | | 68 | |
7.35%, 07/01/2035 | | | 51 | | | | 55 | |
State of Israel | | | | | | | | |
3.80%, 05/13/2060 | | | 16,900 | | | | 12,806 | |
State of Texas | | | | | | | | |
5.52%, 04/01/2039 | | | 3,155 | | | | 3,381 | |
Turkey Government International Bond | | | | | | | | |
4.25%, 03/13/2025 | | | 400 | | | | 373 | |
5.75%, 05/11/2047 | | | 2,800 | | | | 1,907 | |
6.13%, 10/24/2028 | | | 2,700 | | | | 2,407 | |
7.63%, 04/26/2029 | | | 8,600 | | | | 8,108 | |
Turkiye Ihracat Kredi Bankasi AS | | | | | | | | |
8.25%, 01/24/2024(1) | | | 1,000 | | | | 997 | |
Ukraine Government International Bond | | | | | | | | |
4.38%, 01/27/2032(18) | | EUR | 413 | | | | 96 | |
7.25%, 03/15/2035(18) | | $ | 375 | | | | 86 | |
7.38%, 09/25/2034(18) | | | 1,137 | | | | 260 | |
7.75%, 09/01/2028(18) | | | 138 | | | | 33 | |
7.75%, 09/01/2029(18) | | | 628 | | | | 149 | |
7.75%, 08/01/2041(3)(18) | | | 538 | | | | 210 | |
University of California | | | | | | | | |
4.86%, 05/15/2112 | | | 1,543 | | | | 1,371 | |
Uruguay Government International Bond | | | | | | | | |
4.38%, 10/27/2027 | | | 1,783 | | | | 1,769 | |
5.10%, 06/18/2050 | | | 1,868 | | | | 1,858 | |
5.75%, 10/28/2034 | | | 91 | | | | 99 | |
Venezuela Government International Bond | | | | | | | | |
6.00%, 12/09/2049(6)(7) | | | 30 | | | | 2 | |
7.00%, 03/31/2038(6)(7) | | | 187 | | | | 15 | |
7.65%, 04/21/2025(6)(7) | | | 534 | | | | 44 | |
7.75%, 10/13/2099(6)(7) | | | 100 | | | | 5 | |
8.25%, 10/13/2024(6)(7) | | | 7,294 | | | | 620 | |
9.00%, 05/07/2049(6)(7) | | | 110 | | | | 9 | |
9.00%, 05/07/2049(6)(7) | | | 7,405 | | | | 629 | |
9.25%, 09/15/2027(6)(7) | | | 1,049 | | | | 89 | |
9.25%, 05/07/2028(6)(7) | | | 420 | | | | 36 | |
11.75%, 10/21/2026(6)(7) | | | 120 | | | | 11 | |
11.95%, 08/05/2031(6)(7) | | | 3,200 | | | | 280 | |
| | | | | | | | |
Total Other Government Related | | | | 411,744 | |
| | | | | | | | |
U.S. Treasury Obligations – 20.48% | | | | | | | | |
U.S. Treasury Inflation Indexed Bond | | | | | | | | |
0.13%, 07/15/2024(13) | | | 246,515 | | | | 239,124 | |
0.13%, 10/15/2024(13) | | | 134,983 | | | | 130,196 | |
0.13%, 04/15/2025(13) | | | 20,230 | | | | 19,244 | |
0.13%, 07/15/2030(13) | | | 11,501 | | | | 10,311 | |
0.13%, 01/15/2031(13) | | | 1,865 | | | | 1,657 | |
0.13%, 07/15/2031(13) | | | 2,490 | | | | 2,208 | |
0.25%, 01/15/2025(13) | | | 57,348 | | | | 54,974 | |
0.25%, 07/15/2029(13)(14) | | | 42,608 | | | | 38,899 | |
0.25%, 02/15/2050(13) | | | 4,035 | | | | 2,819 | |
0.38%, 07/15/2023(13) | | | 82,607 | | | | 82,549 | |
0.50%, 04/15/2024(13) | | | 29,469 | | | | 28,756 | |
0.63%, 01/15/2024(13) | | | 75,070 | | | | 73,797 | |
0.63%, 07/15/2032(13) | | | 82,067 | | | | 75,409 | |
0.63%, 02/15/2043(13) | | | 396 | | | | 324 | |
| | | | | | | | |
0.75%, 02/15/2042(13) | | | 671 | | | | 570 | |
0.75%, 02/15/2045(13) | | | 4,509 | | | | 3,723 | |
0.88%, 02/15/2047(13) | | | 4,524 | | | | 3,792 | |
1.00%, 02/15/2046(13) | | | 2,561 | | | | 2,219 | |
1.00%, 02/15/2048(13) | | | 4,060 | | | | 3,489 | |
1.00%, 02/15/2049(13) | | | 6,763 | | | | 5,810 | |
1.13%, 01/15/2033(13) | | | 66,436 | | | | 63,636 | |
1.25%, 04/15/2028(13) | | | 57,995 | | | | 56,110 | |
1.38%, 02/15/2044(13) | | | 651 | | | | 613 | |
1.50%, 02/15/2053(13) | | | 679 | | | | 660 | |
2.13%, 02/15/2040(13) | | | 281 | | | | 301 | |
2.13%, 02/15/2041(13) | | | 416 | | | | 446 | |
U.S. Treasury Note/Bond | | | | | | | | |
0.38%, 04/30/2025 | | | 143,891 | | | | 132,391 | |
0.38%, 09/30/2027 | | | 12,333 | | | | 10,497 | |
0.50%, 04/30/2027 | | | 42,629 | | | | 36,947 | |
0.50%, 05/31/2027 | | | 42,629 | | | | 36,856 | |
0.50%, 08/31/2027 | | | 33,720 | | | | 28,928 | |
0.88%, 09/30/2026 | | | 83,692 | | | | 74,879 | |
1.13%, 02/29/2028 | | | 76,082 | | | | 66,304 | |
1.13%, 05/15/2040 | | | 22,663 | | | | 14,691 | |
1.13%, 08/15/2040 | | | 22,663 | | | | 14,572 | |
1.25%, 03/31/2028 | | | 250,000 | | | | 218,809 | |
1.25%, 08/15/2031 | | | 62,353 | | | | 51,168 | |
1.38%, 11/15/2031 | | | 308,700 | | | | 254,545 | |
1.38%, 11/15/2040 | | | 22,663 | | | | 15,163 | |
1.38%, 08/15/2050 | | | 55,516 | | | | 32,258 | |
1.50%, 02/15/2025 | | | 21,900 | | | | 20,670 | |
1.50%, 02/15/2030 | | | 13,021 | | | | 11,152 | |
1.63%, 05/15/2031 | | | 37,687 | | | | 32,026 | |
1.63%, 11/15/2050 | | | 12,333 | | | | 7,659 | |
1.75%, 08/15/2041 | | | 22,663 | | | | 15,922 | |
1.88%, 02/28/2027(14) | | | 153,529 | | | | 140,731 | |
1.88%, 02/15/2032 | | | 198,230 | | | | 169,796 | |
1.88%, 02/15/2051 | | | 38,400 | | | | 25,427 | |
2.00%, 11/15/2041 | | | 701,007 | | | | 513,132 | |
2.00%, 08/15/2051 | | | 31,605 | | | | 21,544 | |
2.25%, 08/15/2049 | | | 125,970 | | | | 91,520 | |
2.25%, 02/15/2052 | | | 118,625 | | | | 85,725 | |
2.38%, 02/15/2042 | | | 46,425 | | | | 36,144 | |
2.38%, 05/15/2051 | | | 35,300 | | | | 26,244 | |
2.50%, 02/15/2045 | | | 49,400 | | | | 38,246 | |
2.63%, 04/15/2025 | | | 24,854 | | | | 23,841 | |
2.75%, 05/15/2025 | | | 20,400 | | | | 19,595 | |
2.75%, 08/15/2032 | | | 45,265 | | | | 41,497 | |
2.75%, 11/15/2047 | | | 31,855 | | | | 25,622 | |
2.88%, 06/15/2025 | | | 21,900 | | | | 21,066 | |
2.88%, 05/15/2032 | | | 11,426 | | | | 10,594 | |
2.88%, 05/15/2049 | | | 11,130 | | | | 9,199 | |
3.00%, 05/15/2045 | | | 30,000 | | | | 25,337 | |
3.00%, 05/15/2047 | | | 12,732 | | | | 10,721 | |
3.00%, 02/15/2048 | | | 47,405 | | | | 39,970 | |
3.00%, 08/15/2048 | | | 10,405 | | | | 8,778 | |
3.00%, 02/15/2049 | | | 76,710 | | | | 64,871 | |
3.00%, 08/15/2052 | | | 42,646 | | | | 36,259 | |
3.13%, 08/15/2044 | | | 12,429 | | | | 10,756 | |
3.13%, 05/15/2048 | | | 12,780 | | | | 11,024 | |
3.25%, 05/15/2042 | | | 159,565 | | | | 142,387 | |
3.38%, 05/15/2033 | | | 121,245 | | | | 116,926 | |
3.38%, 08/15/2042 | | | 60,530 | | | | 54,943 | |
3.38%, 11/15/2048 | | | 44,977 | | | | 40,646 | |
3.50%, 02/15/2033 | | | 342,600 | | | | 333,714 | |
3.63%, 05/31/2028 | | | 13,260 | | | | 12,970 | |
3.63%, 02/15/2053 | | | 8,682 | | | | 8,332 | |
3.63%, 05/15/2053 | | | 298,929 | | | | 287,299 | |
3.75%, 05/31/2030 | | | 21,900 | | | | 21,595 | |
3.88%, 03/31/2025 | | | 77,767 | | | | 76,239 | |
3.88%, 11/30/2027 | | | 21,935 | | | | 21,624 | |
3.88%, 09/30/2029 | | | 30,177 | | | | 29,880 | |
3.88%, 12/31/2029(14) | | | 816,675 | | | | 809,562 | |
3.88%, 02/15/2043 | | | 18,891 | | | | 18,419 | |
3.88%, 05/15/2043 | | | 215,600 | | | | 210,378 | |
4.00%, 06/30/2028 | | | 300,555 | | | | 298,911 | |
4.00%, 10/31/2029 | | | 45,265 | | | | 45,146 | |
4.00%, 11/15/2042 | | | 73,150 | | | | 72,681 | |
4.00%, 11/15/2052 | | | 55,050 | | | | 56,547 | |
4.25%, 05/31/2025 | | | 4,846 | | | | 4,785 | |
4.38%, 05/15/2040 | | | 12,427 | | | | 13,130 | |
4.50%, 08/15/2039 | | | 24,858 | | | | 26,721 | |
4.63%, 06/30/2025 | | | 2,955 | | | | 2,941 | |
| | | | | | | | |
Total U.S. Treasury Obligations | | | | | | | 6,190,488 | |
| | | | | | | | |
Total Government Related (Cost: $7,223,850) | | | | | | | 6,602,232 | |
| | | | | | | | |
Mortgage-Backed Obligations – 35.40% | | | | | | | | |
1211 Avenue of the Americas Trust 2015-1211 | | | | | | | | |
3.90%, 08/10/2035, Series 2015-1211, Class A1A2(1) | | | 4,300 | | | | 4,002 | |
4.23%, 08/10/2035, Series 2015-1211, Class B(1)(3) | | | 4,700 | | | | 4,267 | |
4.28%, 08/10/2035, Series 2015-1211, Class C(1)(3) | | | 6,290 | | | | 5,634 | |
280 Park Avenue 2017-280P Mortgage Trust | | | | | | | | |
| | | | | | | | |
6.06% (1 Month LIBOR USD + 0.88%, 0.88% Floor), 09/15/2034, Series 2017-280P, Class A(1)(2) | | | 1,316 | | | | 1,276 | |
Ajax Mortgage Loan Trust 2019-F | | | | | | | | |
2.86%, 07/25/2059, Series 2019-F, Class A1(1)(4) | | | 11,362 | | | | 10,607 | |
Ajax Mortgage Loan Trust 2021-F | | | | | | | | |
1.88%, 06/25/2061, Series 2021-F, Class A(1)(4) | | | 943 | | | | 846 | |
Alen 2021-ACEN Mortgage Trust | | | | | | | | |
6.34% (1 Month LIBOR USD + 1.15%, 1.15% Floor), 04/15/2034, Series 2021-ACEN, Class A(1)(2) | | | 11,160 | | | | 9,816 | |
Alternative Loan Trust 2003-22CB | | | | | | | | |
5.75%, 12/25/2033, Series 2003-22CB, Class 1A1 | | | 328 | | | | 321 | |
6.00%, 12/25/2033, Series 2003-22CB, Class 3A1 | | | 101 | | | | 97 | |
Alternative Loan Trust 2004-16CB | | | | | | | | |
5.50%, 07/25/2034, Series 2004-16CB, Class 1A1 | | | 164 | | | | 157 | |
5.50%, 08/25/2034, Series 2004-16CB, Class 3A1 | | | 164 | | | | 158 | |
Alternative Loan Trust 2005-56 | | | | | | | | |
6.61% (1 Month LIBOR USD + 1.46%, 1.46% Floor), 11/25/2035, Series 2005-56, Class 1A1(2) | | | 3,183 | | | | 2,909 | |
Alternative Loan Trust 2005-74T1 | | | | | | | | |
6.00%, 01/25/2036, Series 2005-74T1, Class A1 | | | 8,399 | | | | 5,288 | |
Alternative Loan Trust 2006-HY12 | | | | | | | | |
3.95%, 08/25/2036, Series 2006-HY12, Class A5(3) | | | 133 | | | | 124 | |
Alternative Loan Trust 2006-OA17 | | | | | | | | |
5.35% (1 Month LIBOR USD + 0.20%, 0.20% Floor), 12/20/2046, Series 2006-OA17, Class 1A1A(2) | | | 10,092 | | | | 8,407 | |
Alternative Loan Trust 2006-OA22 | | | | | | | | |
5.57% (1 Month LIBOR USD + 0.42%, 0.42% Floor), 02/25/2047, Series 2006-OA22, Class A2(2) | | | 8,543 | | | | 7,396 | |
Alternative Loan Trust 2006-OA3 | | | | | | | | |
5.55% (1 Month LIBOR USD + 0.40%, 0.40% Floor), 05/25/2036, Series 2006-OA3, Class 1A1(2) | | | 4,041 | | | | 3,456 | |
Alternative Loan Trust 2006-OA7 | | | | | | | | |
4.92% (12 Month U.S. Treasury Average + 0.94%, 0.94% Floor), 06/25/2046, Series 2006-OA7, Class 2A1(2) | | | 8,097 | | | | 6,490 | |
Alternative Loan Trust 2006-OC5 | | | | | | | | |
5.67% (1 Month LIBOR USD + 0.52%, 0.52% Floor), 06/25/2046, Series 2006-OC5, Class 2A3(2) | | | 6,137 | | | | 5,125 | |
Alternative Loan Trust 2007-5CB | | | | | | | | |
6.00%, 04/25/2037, Series 2007-5CB, Class 1A4 | | | 12,623 | | | | 7,266 | |
Alternative Loan Trust 2007-HY7C | | | | | | | | |
5.43% (1 Month LIBOR USD + 0.28%, 0.28% Floor), 08/25/2037, Series 2007-HY7C, Class A1(2) | | | 1,746 | | | | 1,520 | |
Alternative Loan Trust 2007-OA2 | | | | | | | | |
4.82% (12 Month U.S. Treasury Average + 0.84%, 0.84% Floor), 03/25/2047, Series 2007-OA2, Class 1A1(2) | | | 15,683 | | | | 13,199 | |
5.41% (1 Month LIBOR USD + 0.26%, 0.26% Floor), 03/25/2047, Series 2007-OA2, Class 2A1(2) | | | 9,306 | | | | 7,186 | |
Alternative Loan Trust 2007-OA4 | | | | | | | | |
5.49% (1 Month LIBOR USD + 0.34%, 0.34% Floor), 05/25/2047, Series 2007-OA4, Class A1(2) | | | 1,210 | | | | 1,036 | |
American Home Mortgage Investment Trust 2007-1 | | | | | | | | |
5.34% (1 Month LIBOR USD + 0.19%, 0.19% Floor), 05/25/2047, Series 2007-1, Class GA1C(2) | | | 771 | | | | 420 | |
Angel Oak Mortgage Trust 2020-5 | | | | | | | | |
2.04%, 05/25/2065, Series 2020-5, Class A3(1)(3) | | | 538 | | | | 493 | |
2.97%, 05/25/2065, Series 2020-5, Class M1(1)(3) | | | 2,480 | | | | 2,096 | |
Angel Oak Mortgage Trust 2021-1 | | | | | | | | |
1.22%, 01/25/2066, Series 2021-1, Class A3(1)(3) | | | 2,683 | | | | 2,176 | |
Angel Oak Mortgage Trust 2021-3 | | | | | | | | |
1.31%, 05/25/2066, Series 2021-3, Class A2(1)(3) | | | 2,944 | | | | 2,393 | |
Angel Oak Mortgage Trust 2021-7 | | | | | | | | |
1.98%, 10/25/2066, Series 2021-7, Class A1(1)(3) | | | 6,582 | | | | 5,412 | |
Angel Oak Mortgage Trust 2022-2 | | | | | | | | |
3.35%, 01/25/2067, Series 2022-2, Class A1(1)(3) | | | 35,819 | | | | 32,139 | |
Angel Oak Mortgage Trust I LLC 2019-2 | | | | | | | | |
4.07%, 03/25/2049, Series 2019-2, Class M1(1)(3) | | | 2,595 | | | | 2,531 | |
Arbor Multifamily Mortgage Securities Trust 2021-MF3 | | | | | | | | |
2.57%, 10/15/2054, Series 2021-MF3, Class A5(1) | | | 525 | | | | 430 | |
Arbor Multifamily Mortgage Securities Trust 2022-MF4 | | | | | | | | |
2.92%, 02/15/2055, Series 2022-MF4, Class A3(1) | | | 6,700 | | | | 5,950 | |
AREIT 2022-CRE6 Trust | | | | | | | | |
6.32% (30-day Average SOFR + 1.25%, 1.25% Floor), 01/20/2037, Series 2022-CRE6, Class A(1)(2) | | | 9,014 | | | | 8,799 | |
Ashford Hospitality Trust 2018-ASHF | | | | | | | | |
7.42% (1 Month LIBOR USD + 2.23%, 2.23% Floor), 04/15/2035, Series 2018-ASHF, Class D(1)(2) | | | 266 | | | | 255 | |
Ashford Hospitality Trust 2018-KEYS | | | | | | | | |
6.77% (1 Month LIBOR USD + 1.45%, 1.45% Floor), 06/15/2035, Series 2018-KEYS, Class B(1)(2) | | | 3,000 | | | | 2,906 | |
Austin Fairmont Hotel Trust 2019-FAIR | | | | | | | | |
6.44% (1 Month LIBOR USD + 1.25%, 1.25% Floor), 09/15/2032, Series 2019-FAIR, Class B(1)(2) | | | 2,155 | | | | 2,133 | |
6.64% (1 Month LIBOR USD + 1.45%, 1.45% Floor), 09/15/2032, Series 2019-FAIR, Class C(1)(2) | | | 5,500 | | | | 5,430 | |
6.99% (1 Month LIBOR USD + 1.80%, 1.80% Floor), 09/15/2032, Series 2019-FAIR, Class D(1)(2) | | | 10,145 | | | | 9,991 | |
Aventura Mall Trust | | | | | | | | |
4.25%, 07/05/2040, Series 2018-AVM, Class A(1)(3) | | | 5,325 | | | | 4,808 | |
BAMLL Commercial Mortgage Securities Trust 2018-DSNY | | | | | | | | |
6.54% (1 Month LIBOR USD + 1.35%, 1.35% Floor), 09/15/2034, Series 2018-DSNY, Class C(1)(2) | | | 1,800 | | | | 1,779 | |
6.89% (1 Month LIBOR USD + 1.70%, 1.70% Floor), 09/15/2034, Series 2018-DSNY, Class D(1)(2) | | | 134 | | | | 132 | |
BAMLL Commercial Mortgage Securities Trust 2018-PARK | | | | | | | | |
4.23%, 08/10/2038, Series 2018-PARK, Class A(1)(3) | | | 6,110 | | | | 5,353 | |
BAMLL Commercial Mortgage Securities Trust 2019-RLJ | | | | | | | | |
6.25% (1 Month LIBOR USD + 1.05%, 1.05% Floor), 04/15/2036, Series 2019-RLJ, Class A(1)(2) | | | 1,350 | | | | 1,335 | |
BAMLL Re-REMIC Trust 2016-RRLD11 | | | | | | | | |
6.01%, 06/17/2050, Series 2016-LD11, Class AJB(1)(3) | | | 100 | | | | 21 | |
Banc of America Commercial Mortgage Trust 2015-UBS7 | | | | | | | | |
4.48%, 09/15/2048, Series 2015-UBS7, Class B(3) | | | 167 | | | | 149 | |
Banc of America Funding 2015-R7 Trust | | | | | | | | |
3.09% (12 Month U.S. Treasury Average + 0.92%), 09/26/2046, Series 2015-R7, Class 1A1(1)(2) | | | 147 | | | | 145 | |
Banc of America Funding 2015-R9 Trust | | | | | | | | |
5.36% (1 Month LIBOR USD + 0.21%, 0.21% Floor), 02/26/2037, Series 2015-R9, Class 2A1(1)(2) | | | 2,978 | | | | 2,921 | |
BANK 2021-BNK35 | | | | | | | | |
2.46%, 06/15/2064, Series 2021-BN35, Class AS | | | 6,770 | | | | 5,229 | |
Barclays Mortgage Loan Trust 2022-NQM1 | | | | | | | | |
4.55%, 07/25/2052, Series 2022-NQM1, Class A1(1)(4) | | | 2,021 | | | | 1,932 | |
Barclays Mortgage Trust 2021-NPL1 | | | | | | | | |
| | | | | | | | |
2.00%, 11/25/2051, Series 2021-NPL1, Class A(1)(4) | | | 1,674 | | | | 1,492 | |
Barclays Mortgage Trust 2022-RPL1 | | | | | | | | |
4.25%, 02/25/2028, Series 2022-RPL1, Class A(1)(4) | | | 5,898 | | | | 5,676 | |
Bayview MSR Opportunity Master Fund Trust 2021-INV4 | | | | | | | | |
2.50%, 10/25/2051, Series 2021-4, Class A20(1)(3) | | | 5,161 | | | | 3,988 | |
BBCCRE Trust 2015-GTP | | | | | | | | |
4.70%, 08/10/2033, Series 2015-GTP, Class C(1)(3) | | | 2,715 | | | | 2,265 | |
BBSG 2016-MRP Mortgage Trust | | | | | | | | |
3.28%, 06/05/2036, Series 2016-MRP, Class A(1) | | | 2,045 | | | | 1,641 | |
BB-UBS Trust | | | | | | | | |
2.89%, 06/05/2030, Series 2012-TFT, Class A(1) | | | 980 | | | | 913 | |
BCAP LLC 2014-RR2 | | | | | | | | |
2.30% (1 Month LIBOR USD + 0.24%, 0.24% Floor), 10/26/2036, Series 2014-RR2, Class 6A8(1)(2) | | | 9,194 | | | | 8,749 | |
BDS 2022-FL12 LLC | | | | | | | | |
7.23% (1 Month Term SOFR + 2.14%, 2.14% Floor), 08/19/2038, Series 2022-FL12, Class A(1)(2) | | | 1,030 | | | | 1,025 | |
Bear Stearns ALT-A Trust 2005-1 | | | | | | | | |
6.28% (1 Month LIBOR USD + 1.13%, 1.13% Floor, 11.50% Cap), 01/25/2035, Series 2005-1, Class M2(2) | | | 6,178 | | | | 5,681 | |
Bear Stearns ARM Trust 2003-3 | | | | | | | | |
4.71%, 05/25/2033, Series 2003-3, Class 3A1(3) | | | 345 | | | | 323 | |
Bear Stearns Commercial Mortgage Securities Trust 2006-TOP24 | | | | | | | | |
5.66%, 10/12/2041, Series 2006-T24, Class B(1)(3) | | | 410 | | | | 383 | |
Bear Stearns Mortgage Funding Trust 2007-AR4 | | | | | | | | |
5.36% (1 Month LIBOR USD + 0.21%, 0.21% Floor, 10.50% Cap), 06/25/2037, Series 2007-AR4, Class 2A1(2) | | | 8,486 | | | | 7,834 | |
Beast Mortgage Trust | | | | | | | | |
6.01% (1 Month Term SOFR + 0.86%, 0.75% Floor), 04/15/2036, Series 2021-SSCP, Class A(1)(2) | | | 524 | | | | 504 | |
Benchmark 2018-B1 Mortgage Trust | | | | | | | | |
3.88%, 01/15/2051, Series 2018-B1, Class AM(3) | | | 2,050 | | | | 1,810 | |
Benchmark 2021-B29 Mortgage Trust | | | | | | | | |
2.39%, 09/15/2054, Series 2021-B29, Class A5 | | | 381 | | | | 306 | |
BFLD 2019-DPLO | | | | | | | | |
6.80% (1 Month Term SOFR + 1.65%, 1.54% Floor), 10/15/2034, Series 2019-DPLO, Class C(1)(2) | | | 4,650 | | | | 4,574 | |
BFLD Trust 2020-EYP | | | | | | | | |
7.29% (1 Month LIBOR USD + 2.10%, 2.10% Floor), 10/15/2035, Series 2020-EYP, Class C(1)(2) | | | 5,140 | | | | 2,776 | |
BFLD Trust 2020-OBRK | | | | | | | | |
7.31% (1 Month Term SOFR + 2.16%, 2.05% Floor), 11/15/2028, Series 2020-OBRK, Class A(1)(2) | | | 13,350 | | | | 13,278 | |
BINOM Securitization Trust 2022-RPL1 | | | | | | | | |
3.00%, 02/25/2061, Series 2022-RPL1, Class M1(1)(3) | | | 8,591 | | | | 6,294 | |
BLP Commercial Mortgage Trust 2023-IND | | | | | | | | |
6.84% (1 Month Term SOFR + 1.69%, 1.69% Floor), 03/15/2040, Series 2023-IND, Class A(1)(2) | | | 1,152 | | | | 1,135 | |
BMO 2023-C5 Mortgage Trust | | | | | | | | |
0.73%, 06/15/2056, Series 2023-C5, Class XA(3) | | | 5,716 | | | | 302 | |
BOCA Commercial Mortgage Trust 2022-BOCA | | | | | | | | |
6.92% (1 Month Term SOFR + 1.77%, 1.77% Floor), 05/15/2039, Series 2022-BOCA, Class A(1)(2) | | | 824 | | | | 818 | |
BPR Trust 2021-NRD | | | | | | | | |
7.23% (1 Month Term SOFR + 2.12%, 2.12% Floor), 12/15/2038, Series 2021-NRD, Class B(1)(2) | | | 2,830 | | | | 2,632 | |
7.53% (1 Month Term SOFR + 2.42%, 2.42% Floor), 12/15/2038, Series 2021-NRD, Class C(1)(2) | | | 2,880 | | | | 2,667 | |
8.83% (1 Month Term SOFR + 3.72%, 3.72% Floor), 12/15/2038, Series 2021-NRD, Class D(1)(2) | | | 1,770 | | | | 1,629 | |
BPR Trust 2022-OANA | | | | | | | | |
7.04% (1 Month Term SOFR + 1.90%, 1.90% Floor), 04/15/2037, Series 2022-OANA, Class A(1)(2) | | | 25,012 | | | | 24,262 | |
BPR Trust 2022-STAR | | | | | | | | |
8.38% (1 Month Term SOFR + 3.23%, 3.23% Floor), 08/15/2024, Series 2022-STAR, Class A(1)(2) | | | 8,395 | | | | 8,321 | |
Braemar Hotels & Resorts Trust 2018-Prime | | | | | | | | |
6.37% (1 Month LIBOR USD + 1.05%, 1.05% Floor), 06/15/2035, Series 2018-PRME, Class B(1)(2) | | | 3,000 | | | | 2,957 | |
Brass NO 8 Plc | | | | | | | | |
6.02% (3 Month LIBOR USD + 0.70%), 11/16/2066, Series 8A, Class A1(1)(2) | | | 138 | | | | 138 | |
BRAVO Residential Funding Trust 2022-NQM3 | | | | | | | | |
3.63%, 09/25/2061, Series 2022-NQM1, Class A1(1)(3) | | | 3,849 | | | | 3,560 | |
BX Commercial Mortgage Trust 2019-XL | | | | | | | | |
6.18% (1 Month Term SOFR + 1.03%, 0.92% Floor), 10/15/2036, Series 2019-XL, Class A(1)(2) | | | 15,813 | | | | 15,715 | |
BX Commercial Mortgage Trust 2020-VIV3 | | | | | | | | |
3.66%, 03/09/2044, Series 2020-VIV3, Class B(1)(3) | | | 69 | | | | 58 | |
BX Commercial Mortgage Trust 2020-VIV4 | | | | | | | | |
2.84%, 03/09/2044, Series 2020-VIV4, Class A(1) | | | 180 | | | | 148 | |
BX Commercial Mortgage Trust 2020-VIVA | | | | | | | | |
3.67%, 03/11/2044, Series 2020-VIVA, Class D(1)(3) | | | 6,370 | | | | 5,074 | |
BX Commercial Mortgage Trust 2020-VKNG | | | | | | | | |
6.19% (1 Month Term SOFR + 1.04%, 0.93% Floor), 10/15/2037, Series 2020-VKNG, Class A(1)(2) | | | 113 | | | | 112 | |
BX Commercial Mortgage Trust 2021-CIP | | | | | | | | |
6.11% (1 Month LIBOR USD + 0.92%, 0.92% Floor), 12/15/2038, Series 2021-CIP, Class A(1)(2) | | | 185 | | | | 180 | |
BX Commercial Mortgage Trust 2022-AHP | | | | | | | | |
6.99% (1 Month Term SOFR + 1.84%, 1.84% Floor), 01/17/2039, Series 2022-AHP, Class B(1)(2) | | | 6,753 | | | | 6,604 | |
BX Commercial Mortgage Trust 2022-CSMO | | | | | | | | |
7.26% (1 Month Term SOFR + 2.11%, 2.12% Floor), 06/15/2027, Series 2022-CSMO, Class A(1)(2) | | | 20,460 | | | | 20,422 | |
8.29% (1 Month Term SOFR + 3.14%, 3.14% Floor), 06/15/2027, Series 2022-CSMO, Class B(1)(2) | | | 12,065 | | | | 12,004 | |
BX Trust 2018-GW | | | | | | | | |
6.24% (1 Month LIBOR USD + 1.05%, 0.80% Floor), 05/15/2035, Series 2018-GW, Class A(1)(2) | | | 2,485 | | | | 2,455 | |
BX Trust 2019-OC11 | | | | | | | | |
3.20%, 12/09/2041, Series 2019-OC11, Class A(1) | | | 7,400 | | | | 6,324 | |
BX Trust 2021-ARIA | | | | | | | | |
6.09% (1 Month LIBOR USD + 0.90%, 0.90% Floor), 10/15/2036, Series 2021-ARIA, Class A(1)(2) | | | 368 | | | | 357 | |
BX Trust 2021-LBA | | | | | | | | |
6.06% (1 Month Term SOFR + 0.91%, 0.80% Floor), 02/15/2036, Series 2021-LBA, Class AV(1)(2) | | | 381 | | | | 369 | |
6.06% (1 Month Term SOFR + 0.91%, 0.80% Floor), 02/15/2036, Series 2021-LBA, Class AJV(1)(2) | | | 1,885 | | | | 1,827 | |
BX Trust 2021-RISE | | | | | | | | |
6.94% (1 Month LIBOR USD + 1.75%, 1.75% Floor), 11/15/2036, Series 2021-RISE, Class D(1)(2) | | | 13,757 | | | | 13,239 | |
BX Trust 2021-SDMF | | | | | | | | |
5.78% (1 Month LIBOR USD + 0.59%, 0.59% Floor), 09/15/2034, Series 2021-SDMF, Class A(1)(2) | | | 288 | | | | 278 | |
BX Trust 2022-GPA | | | | | | | | |
7.31% (1 Month Term SOFR + 2.17%, 2.17% Floor), 10/15/2039, Series 2022-GPA, Class A(1)(2) | | | 6,760 | | | | 6,749 | |
| | | | | | | | |
BX Trust 2022-LBA6 | | | | | | | | |
6.15% (1 Month Term SOFR + 1.00%, 1.00% Floor), 01/15/2039, Series 2022-LBA6, Class A(1)(2) | | | 712 | | | | 695 | |
BX Trust 2022-VAMF | | | | | | | | |
6.00% (1 Month Term SOFR + 0.85%, 0.85% Floor), 01/15/2039, Series 2022-VAMF, Class A(1)(2) | | | 519 | | | | 504 | |
BX Trust 2023-DELC | | | | | | | | |
7.69% (1 Month Term SOFR + 2.69%, 2.69% Floor), 05/15/2038, Series 2023-DELC, Class A(1)(2) | | | 2,680 | | | | 2,673 | |
BXP Trust 2017-GM | | | | | | | | |
3.38%, 06/13/2039, Series 2017-GM, Class A(1) | | | 3,800 | | | | 3,404 | |
CAFL 2021-RTL1 Issuer LLC | | | | | | | | |
2.24%, 03/28/2029, Series 2021-RTL1, Class A1(1)(4) | | | 12,585 | | | | 11,474 | |
Capitalsource Real Estate Loan Trust | | | | | | | | |
5.86% (3 Month LIBOR USD + 0.65%), 01/20/2037, Series 2006-1A, Class C(1)(2) | | | 1,904 | | | | 1,750 | |
5.96% (3 Month LIBOR USD + 0.75%), 01/20/2037, Series 2006-1A, Class D(1)(2) | | | 1,200 | | | | 996 | |
6.06% (3 Month LIBOR USD + 0.85%), 01/20/2037, Series 2006-1A, Class E(1)(2) | | | 700 | | | | 568 | |
Cassia 2022-1 SRL | | | | | | | | |
5.88% (3 Month EURIBOR + 2.50%, 2.50% Floor), 05/22/2034, Series 2022-1A, Class A(1)(2) | | EUR | 2,488 | | | | 2,579 | |
Century Plaza Towers 2019-CPT | | | | | | | | |
2.87%, 11/13/2039, Series 2019-CPT, Class A(1) | | $ | 3,205 | | | | 2,577 | |
Chase Home Lending Mortgage Trust 2023-RPL1 | | | | | | | | |
3.50%, 06/25/2062, Series 2023-RPL1, Class A1(1)(3) | | | 13,332 | | | | 11,897 | |
CHL Mortgage Pass-Through Trust Resecuritization 2008-3R | | | | | | | | |
6.00%, 08/25/2037, Series 2008-3R, Class 1A1(1) | | | 4,401 | | | | 2,286 | |
CHNGE Mortgage Trust 2022-4 | | | | | | | | |
6.00%, 10/25/2057, Series 2022-4, Class A1(1)(4) | | | 273 | | | | 266 | |
CIM Trust 2019-R3 | | | | | | | | |
2.63%, 06/25/2058, Series 2019-R3, Class A(1)(3) | | | 10,705 | | | | 9,691 | |
CIM Trust 2019-R4 | | | | | | | | |
3.00%, 10/25/2059, Series 2019-R4, Class A1(1)(3) | | | 13,184 | | | | 11,892 | |
CIM Trust 2020-R1 | | | | | | | | |
2.85%, 10/27/2059, Series 2020-R1, Class A1(1)(3) | | | 18,866 | | | | 15,515 | |
CIM Trust 2020-R6 | | | | | | | | |
2.25%, 12/25/2060, Series 2020-R6, Class A1A(1)(3) | | | 10,869 | | | | 9,020 | |
CIM Trust 2020-R7 | | | | | | | | |
2.25%, 12/27/2061, Series 2020-R7, Class A1A(1)(3) | | | 17,261 | | | | 14,968 | |
CIM Trust 2021-INV1 | | | | | | | | |
2.50%, 07/01/2051, Series 2021-INV1, Class A8(1)(3) | | | 4,385 | | | | 3,742 | |
CIM Trust 2021-NR2 | | | | | | | | |
2.57%, 07/25/2059, Series 2021-NR2, Class A1(1)(4) | | | 5,216 | | | | 4,972 | |
CIM Trust 2021-NR3 | | | | | | | | |
2.57%, 06/25/2057, Series 2021-NR3, Class A1(1)(4) | | | 8,915 | | | | 8,503 | |
CIM Trust 2021-R1 | | | | | | | | |
2.40%, 08/25/2056, Series 2021-R1, Class A2(1)(3) | | | 17,711 | | | | 15,250 | |
CIM Trust 2021-R2 | | | | | | | | |
2.50%, 01/25/2057, Series 2021-R2, Class A2(1)(3) | | | 7,868 | | | | 6,849 | |
CIM Trust 2021-R3 | | | | | | | | |
1.95%, 06/25/2057, Series 2021-R3, Class A1A(1)(3) | | | 26,568 | | | | 23,187 | |
CIM Trust 2021-R4 | | | | | | | | |
2.00%, 05/01/2061, Series 2021-R4, Class A1A(1)(3) | | | 27,690 | | | | 23,167 | |
CIM Trust 2021-R5 | | | | | | | | |
2.00%, 08/25/2061, Series 2021-R5, Class A1A(1)(3) | | | 22,648 | | | | 17,519 | |
CIM Trust 2022-I1 | | | | | | | | |
4.35%, 02/25/2067, Series 2022-I1, Class A1(1)(3) | | | 21,130 | | | | 19,908 | |
CIM TRUST 2022-R2 | | | | | | | | |
3.75%, 12/25/2061, Series 2022-R2, Class A1(1)(3) | | | 32,843 | | | | 30,089 | |
CIM TRUST 2022-R3 | | | | | | | | |
4.50%, 03/25/2062, Series 2022-R3, Class A1(1)(3) | | | 42,949 | | | | 40,802 | |
CIM Trust 2023-R1 | | | | | | | | |
5.40%, 04/25/2062, Series 2023-R1, Class A1A(1)(3) | | | 41,104 | | | | 36,874 | |
CIM Trust 2023-R3 | | | | | | | | |
4.50%, 01/25/2063, Series 2023-R3, Class A1A(1)(3) | | | 34,229 | | | | 30,704 | |
Citigroup Commercial Mortgage Trust 2013-375P | | | | | | | | |
3.63%, 05/10/2035, Series 2013-375P, Class C(1)(3) | | | 9,030 | | | | 7,904 | |
Citigroup Commercial Mortgage Trust 2017-P7 | | | | | | | | |
3.92%, 04/14/2050, Series 2017-P7, Class AS | | | 1,418 | | | | 1,252 | |
Citigroup Mortgage Loan Trust 2019-RP1 | | | | | | | | |
3.50%, 01/25/2066, Series 2019-RP1, Class A1(1)(3) | | | 1,390 | | | | 1,305 | |
Citigroup Mortgage Loan Trust, Inc. | | | | | | | | |
2.50%, 08/25/2050, Series 2020-EXP2, Class A4(1)(3) | | | 1,123 | | | | 913 | |
Cold Storage Trust 2020-ICE5 | | | | | | | | |
6.09% (1 Month LIBOR USD + 0.90%, 0.90% Floor), 11/15/2037, Series 2020-ICE5, Class A(1)(2) | | | 1,141 | | | | 1,122 | |
6.84% (1 Month LIBOR USD + 1.65%, 1.65% Floor), 11/15/2037, Series 2020-ICE5, Class C(1)(2)(18) | | | 3,534 | | | | 3,465 | |
COLT 2020-3 Mortgage Loan Trust | | | | | | | | |
1.51%, 04/27/2065, Series 2020-3, Class A1(1)(3) | | | 401 | | | | 371 | |
COLT 2021-5 Mortgage Loan Trust | | | | | | | | |
1.73%, 11/26/2066, Series 2021-5, Class A1(1)(3) | | | 16,591 | | | | 13,731 | |
COLT 2021-6 Mortgage Loan Trust | | | | | | | | |
1.91%, 12/25/2066, Series 2021-6, Class A1(1)(3) | | | 16,199 | | | | 13,634 | |
COLT 2021-RPL1 Trust | | | | | | | | |
1.67%, 09/25/2061, Series 2021-RPL1, Class A1(1)(3) | | | 19,317 | | | | 16,631 | |
COLT 2022-4 Mortgage Loan Trust | | | | | | | | |
4.30%, 03/25/2067, Series 2022-4, Class A1(1)(3) | | | 24,633 | | | | 23,382 | |
COLT 2022-5 Mortgage Loan Trust | | | | | | | | |
4.55%, 04/25/2067, Series 2022-5, Class A1(1)(3) | | | 30,858 | | | | 29,639 | |
COLT 2022-6 Mortgage Loan Trust | | | | | | | | |
4.65%, 06/27/2067, Series 2022-6, Class A1(1)(4) | | | 7,200 | | | | 6,891 | |
COMM 2012-CCRE3 Mortgage Trust | | | | | | | | |
3.42%, 10/15/2045, Series 2012-CR3, Class AM(1) | | | 2,317 | | | | 2,102 | |
Comm 2013-CCRE13 Mortgage Trust | | | | | | | | |
5.03%, 11/10/2046, Series 2013-CR13, Class C(3) | | | 7,470 | | | | 6,741 | |
| | | | | | | | |
COMM 2015-CCRE24 Mortgage Trust | | | | | | | | |
3.70%, 08/10/2048, Series 2015-CR24, Class A5 | | | 1,990 | | | | 1,887 | |
COMM 2015-DC1 Mortgage Trust | | | | | | | | |
3.72%, 02/10/2048, Series 2015-DC1, Class AM | | | 2,495 | | | | 2,304 | |
COMM 2015-LC19 Mortgage Trust | | | | | | | | |
3.83%, 02/10/2048, Series 2015-LC19, Class B(3) | | | 169 | | | | 152 | |
COMM 2016-787S Mortgage Trust | | | | | | | | |
3.55%, 02/10/2036, Series 2016-787S, Class A(1) | | | 2,000 | | | | 1,815 | |
3.96%, 02/10/2036, Series 2016-787S, Class C(1)(3) | | | 1,000 | | | | 854 | |
3.96%, 02/10/2036, Series 2016-787S, Class B(1)(3) | | | 1,700 | | | | 1,488 | |
COMM 2017-COR2 Mortgage Trust | | | | | | | | |
3.51%, 09/10/2050, Series 2017-COR2, Class A3 | | | 3,110 | | | | 2,828 | |
COMM 2017-PANW Mortgage Trust | | | | | | | | |
3.53%, 10/10/2029, Series 2017-PANW, Class B(1)(3) | | | 1,285 | | | | 1,191 | |
COMM 2020-CBM Mortgage Trust | | | | | | | | |
3.40%, 02/10/2037, Series 2020-CBM, Class C(1) | | | 5,150 | | | | 4,718 | |
Commercial Mortgage Pass-Through Certificates | | | | | | | | |
3.40%, 10/05/2030, Series 2012-LTRT, Class A2(1) | | | 668 | | | | 553 | |
Connecticut Avenue Securities Trust 2022-R06 | | | | | | | | |
7.82% (30-day Average SOFR + 2.75%), 05/25/2042, Series 2022-R06, Class 1M1(1)(2) | | | 2,825 | | | | 2,880 | |
Connecticut Avenue Securities Trust 2023-R02 | | | | | | | | |
7.37% (30-day Average SOFR + 2.30%), 01/25/2043, Series 2023-R02, Class 1M1(1)(2) | | | 6,803 | | | | 6,828 | |
Credit Suisse Mortgage Capital Certificates | | | | | | | | |
2.44%, 02/25/2061, Series 2021-RPL9, Class A1(1)(3) | | | 14,526 | | | | 13,395 | |
Credit Suisse Mortgage Capital Certificates 2019-ICE4 | | | | | | | | |
6.17% (1 Month LIBOR USD + 0.98%, 0.98% Floor), 05/15/2036, Series 2019-ICE4, Class A(1)(2) | | | 9,952 | | | | 9,903 | |
CRSNT Trust 2021-MOON | | | | | | | | |
6.40% (1 Month LIBOR USD + 1.20%, 1.20% Floor), 04/15/2036, Series 2021-MOON, Class B(1)(2) | | | 20,000 | | | | 18,243 | |
6.75% (1 Month LIBOR USD + 1.55%, 1.55% Floor), 04/15/2036, Series 2021-MOON, Class C(1)(2) | | | 12,000 | | | | 10,795 | |
CSAIL 2019-C17 Commercial Mortgage Trust | | | | | | | | |
2.76%, 09/15/2052, Series 2019-C17, Class A4 | | | 6,050 | | | | 5,101 | |
3.28%, 09/15/2052, Series 2019-C17, Class AS | | | 2,625 | | | | 2,199 | |
CSFB Mortgage-Backed Pass-Through Certificates Series 2003-27 | | | | | | | | |
5.75%, 11/25/2033, Series 2003-27, Class 4A4 | | | 62 | | | | 60 | |
CSMC 2014-USA OA LLC | | | | | | | | |
4.18%, 09/15/2037, Series 2014-USA, Class B(1) | | | 5,255 | | | | 4,232 | |
4.34%, 09/15/2037, Series 2014-USA, Class C(1) | | | 400 | | | | 307 | |
4.37%, 09/15/2037, Series 2014-USA, Class D(1) | | | 6,175 | | | | 4,463 | |
CSMC 2019-RP10 Trust | | | | | | | | |
3.04%, 12/26/2059, Series 2019-RP10, Class A1(1)(3) | | | 26,517 | | | | 26,404 | |
CSMC 2020-NET | | | | | | | | |
2.26%, 08/15/2037, Series 2020-NET, Class A(1) | | | 2,736 | | | | 2,448 | |
3.53%, 08/15/2037, Series 2020-NET, Class C(1) | �� | | 4,405 | | | | 3,862 | |
CSMC 2020-RPL3 Trust | | | | | | | | |
2.69%, 03/25/2060, Series 2020-RPL3, Class A1(1)(3) | | | 7,593 | | | | 7,362 | |
CSMC 2020-RPL5 Trust | | | | | | | | |
3.02%, 08/25/2060, Series 2020-RPL5, Class A1(1)(3) | | | 2,285 | | | | 2,222 | |
CSMC 2021-ADV | | | | | | | | |
7.49% (1 Month LIBOR USD + 2.30%, 2.30% Floor), 07/15/2038, Series 2021-ADV, Class C(1)(2) | | | 3,400 | | | | 2,871 | |
CSMC 2021-BHAR | | | | | | | | |
6.34% (1 Month LIBOR USD + 1.15%, 1.15% Floor), 11/15/2038, Series 2021-BHAR, Class A(1)(2) | | | 896 | | | | 877 | |
6.69% (1 Month LIBOR USD + 1.50%, 1.50% Floor), 11/15/2038, Series 2021-BHAR, Class B(1)(2) | | | 380 | | | | 370 | |
7.19% (1 Month LIBOR USD + 2.00%, 2.00% Floor), 11/15/2038, Series 2021-BHAR, Class C(1)(2) | | | 625 | | | | 609 | |
CSMC 2021-NQM8 | | | | | | | | |
1.84%, 10/25/2066, Series 2021-NQM8, Class A1(1)(3) | | | 12,195 | | | | 10,013 | |
CSMC 2021-RPL11 Trust | | | | | | | | |
3.78%, 10/25/2061, Series 2021-RP11, Class PT(1)(3) | | | 26,677 | | | | 18,807 | |
CSMC 2021-RPL3 Trust | | | | | | | | |
3.75%, 01/25/2060, Series 2021-RPL3, Class M2(1) | | | 995 | | | | 749 | |
CSMC 2021-RPL6 Trust | | | | | | | | |
2.75%, 10/25/2060, Series 2021-RPL6, Class M1(1) | | | 8,505 | | | | 6,319 | |
CSMC 2022-ATH3 | | | | | | | | |
4.99%, 08/25/2067, Series 2022-ATH3, Class A1(1)(3) | | | 10,566 | | | | 10,231 | |
CSMC 2022-NQM1 | | | | | | | | |
2.27%, 11/25/2066, Series 2022-NQM1, Class A1(1)(3) | | | 15,220 | | | | 12,877 | |
CSMC 2022-NWPT | | | | | | | | |
8.29% (1 Month Term SOFR + 3.14%, 3.14% Floor), 09/09/2024, Series 2022-NWPT, Class A(1)(2) | | | 1,867 | | | | 1,865 | |
CSMC 2022-RPL1 Trust | | | | | | | | |
4.51%, 04/25/2061, Series 2022-RPL1, Class PT(1)(3) | | | 29,110 | | | | 24,613 | |
CSMC 2022-RPL3 Trust | | | | | | | | |
3.71%, 03/25/2061, Series 2022-RPL3, Class A1(1)(3) | | | 37,214 | | | | 35,701 | |
CSMC Mortgage-Backed Trust Series 2006-4 | | | | | | | | |
6.00%, 05/25/2036, Series 2006-4, Class 1A3 | | | 108 | | | | 63 | |
CSMC Trust 2013-5R | | | | | | | | |
5.46% (1 Month LIBOR USD + 0.25%, 0.25% Floor), 02/27/2036, Series 2013-5R, Class 1A6(1)(2) | | | 82 | | | | 82 | |
CSMCM 2021-RPL11 Trust | | | | | | | | |
3.78%, 10/27/2061, Series 2021-RP11, Class CERT(1) | | | 1,137 | | | | 849 | |
CSMCM 2022-RPL1 Trust | | | | | | | | |
4.23%, 04/25/2061, Series 2022-RPL1, Class CERT(1) | | | 1,235 | | | | 1,044 | |
DBCG 2017-BBG Mortgage Trust | | | | | | | | |
5.89% (1 Month LIBOR USD + 0.70%), 06/15/2034, Series 2017-BBG, Class A(1)(2) | | | 2,645 | | | | 2,611 | |
DBGS 2018-5BP Mortgage Trust | | | | | | | | |
6.74% (1 Month LIBOR USD + 1.50%, 1.35% Floor), 06/15/2033, Series 2018-5BP, Class D(1)(2) | | | 5,171 | | | | 4,458 | |
DBUBS 2017-BRBK Mortgage Trust | | | | | | | | |
3.65%, 10/10/2034, Series 2017-BRBK, Class D(1)(3) | | | 2,540 | | | | 2,013 | |
DC Office Trust 2019-MTC | | | | | | | | |
2.97%, 09/15/2045, Series 2019-MTC, Class A(1) | | | 12,545 | | | | 9,895 | |
Deephaven Residential Mortgage Trust 2021-2 | | | | | | | | |
1.21%, 04/25/2066, Series 2021-2, Class A2(1)(3) | | | 1,933 | | | | 1,626 | |
| | | | | | | | |
Deephaven Residential Mortgage Trust 2022-2 | | | | | | | | |
4.30%, 03/25/2067, Series 2022-2, Class A1(1)(3) | | | 9,712 | | | | 8,993 | |
Deutsche Alternative-A Securities, Inc. Mortgage Loan Trust Series 2005-2 | | | | | | | | |
5.55% (1 Month LIBOR USD + 0.40%, 0.40% Floor), 04/25/2035, Series 2005-2, Class 1A1(2) | | | 2,654 | | | | 2,322 | |
Eleven Madison Trust 2015-11MD Mortgage Trust | | | | | | | | |
3.67%, 09/10/2035, Series 2015-11MD, Class A(1)(3) | | | 870 | | | | 774 | |
Ellington Financial Mortgage Trust 2019-2 | | | | | | | | |
2.74%, 11/25/2059, Series 2019-2, Class A1(1)(3) | | | 1,195 | | | | 1,100 | |
3.05%, 11/25/2059, Series 2019-2, Class A3(1)(3) | | | 733 | | | | 668 | |
Ellington Financial Mortgage Trust 2020-2 | | | | | | | | |
1.18%, 10/25/2065, Series 2020-2, Class A1(1)(3) | | | 2,627 | | | | 2,337 | |
Ellington Financial Mortgage Trust 2021-2 | | | | | | | | |
1.09%, 06/25/2066, Series 2021-2, Class A2(1)(3) | | | 4,093 | | | | 3,229 | |
Ellington Financial Mortgage Trust 2021-3 | | | | | | | | |
1.24%, 09/25/2066, Series 2021-3, Class A1(1)(3) | | | 4,331 | | | | 3,333 | |
Ellington Financial Mortgage Trust 2022-1 | | | | | | | | |
2.21%, 01/25/2067, Series 2022-1, Class A1(1)(3) | | | 14,812 | | | | 12,310 | |
Ellington Financial Mortgage Trust 2022-4 | | | | | | | | |
5.90%, 09/25/2067, Series 2022-4, Class A1(1)(4) | | | 73,610 | | | | 72,613 | |
Eurosail-UK 2007-5np Plc | | | | | | | | |
5.76% (Sterling Overnight Index Average + 0.89%), 09/13/2045, Series 2007-5X, Class A1A(2) | | GBP | 6,708 | | | | 7,820 | |
Eurosail-UK 2007-6nc Plc | | | | | | | | |
5.69% (Sterling Overnight Index Average + 0.82%), 09/13/2045, Series 2007-6NCX, Class A3A(2) | | | 144 | | | | 181 | |
Extended Stay America Trust 2021-ESH | | | | | | | | |
6.27% (1 Month LIBOR USD + 1.08%, 1.08% Floor), 07/15/2038, Series 2021-ESH, Class A(1)(2) | | $ | 73,957 | | | | 72,495 | |
6.57% (1 Month LIBOR USD + 1.38%, 1.38% Floor), 07/15/2038, Series 2021-ESH, Class B(1)(2) | | | 6,799 | | | | 6,633 | |
8.89% (1 Month LIBOR USD + 3.70%, 3.70% Floor), 07/15/2038, Series 2021-ESH, Class F(1)(2) | | | 164 | | | | 156 | |
Fannie Mae | | | | | | | | |
1.50%, 07/01/2038(15) | | | 2,628 | | | | 2,267 | |
1.50%, 07/01/2053(15) | | | 1,064 | | | | 822 | |
2.00%, 07/01/2038(15) | | | 24,778 | | | | 21,956 | |
2.00%, 07/01/2053(15) | | | 199,618 | | | | 162,774 | |
2.00%, 08/01/2053(15) | | | 184,400 | | | | 150,581 | |
2.50%, 07/01/2038(15) | | | 10,966 | | | | 9,983 | |
2.50%, 07/01/2053(15) | | | 162,049 | | | | 137,400 | |
2.50%, 08/01/2053(15) | | | 78,250 | | | | 66,445 | |
3.00%, 07/01/2053(15) | | | 170,203 | | | | 149,786 | |
3.00%, 08/01/2053(15) | | | 49,075 | | | | 43,249 | |
3.50%, 07/01/2053(15) | | | 31,521 | | | | 28,722 | |
3.50%, 08/01/2053(15) | | | 120,100 | | | | 109,549 | |
4.00%, 07/01/2036(15) | | | 3,009 | | | | 2,905 | |
4.00%, 07/01/2053(15) | | | 222,645 | | | | 208,930 | |
4.00%, 08/01/2053(15) | | | 15,141 | | | | 14,220 | |
4.50%, 07/01/2038(15) | | | 2,947 | | | | 2,889 | |
4.50%, 07/01/2053(15) | | | 249,720 | | | | 240,083 | |
4.50%, 08/01/2053(15) | | | 114,600 | | | | 110,231 | |
5.00%, 07/01/2053(15) | | | 382,814 | | | | 375,099 | |
5.50%, 07/01/2053(15) | | | 482,369 | | | | 480,033 | |
5.50%, 08/01/2053(15) | | | 280,255 | | | | 278,855 | |
6.00%, 07/01/2053(15) | | | 2,642 | | | | 2,665 | |
6.50%, 07/01/2053(15) | | | 6,550 | | | | 6,688 | |
6.50%, 08/01/2053(15) | | | 400 | | | | 408 | |
Fannie Mae Interest Strip | | | | | | | | |
3.00%, 03/25/2050, Series 428, Class C16 | | | 4,588 | | | | 717 | |
3.50%, 08/25/2049, Series 427, Class C85 | | | 1,420 | | | | 248 | |
Fannie Mae Pool | | | | | | | | |
1.50%, 12/01/2035 | | | 477 | | | | 411 | |
1.50%, 03/01/2036 | | | 723 | | | | 629 | |
1.50%, 05/01/2036 | | | 1,141 | | | | 993 | |
1.50%, 06/01/2036 | | | 4,095 | | | | 3,556 | |
1.50%, 12/01/2036 | | | 2,737 | | | | 2,374 | |
1.50%, 02/01/2037 | | | 1,200 | | | | 1,044 | |
1.50%, 11/01/2041 | | | 37,402 | | | | 30,295 | |
1.50%, 12/01/2041 | | | 19,215 | | | | 15,564 | |
1.50%, 10/01/2050 | | | 4,833 | | | | 3,743 | |
1.50%, 11/01/2050 | | | 4,196 | | | | 3,245 | |
1.50%, 03/01/2051 | | | 5,618 | | | | 4,345 | |
2.00%, 06/01/2035 | | | 539 | | | | 480 | |
2.00%, 06/01/2035 | | | 1,132 | | | | 1,010 | |
2.00%, 09/01/2035 | | | 536 | | | | 478 | |
2.00%, 02/01/2036 | | | 882 | | | | 787 | |
2.00%, 03/01/2036 | | | 937 | | | | 831 | |
2.00%, 04/01/2036 | | | 1,337 | | | | 1,192 | |
2.00%, 05/01/2036 | | | 893 | | | | 793 | |
2.00%, 07/01/2036 | | | 1,465 | | | | 1,307 | |
2.00%, 11/01/2036 | | | 661 | | | | 586 | |
2.00%, 01/01/2037 | | | 650 | | | | 577 | |
2.00%, 02/01/2037 | | | 279 | | | | 247 | |
2.00%, 02/01/2037 | | | 640 | | | | 568 | |
2.00%, 02/01/2037 | | | 1,431 | | | | 1,268 | |
2.00%, 03/01/2037 | | | 755 | | | | 670 | |
2.00%, 03/01/2037 | | | 3,471 | | | | 3,078 | |
2.00%, 03/01/2037 | | | 3,565 | | | | 3,162 | |
2.00%, 04/01/2037 | | | 1,988 | | | | 1,763 | |
2.00%, 10/01/2040 | | | 6,937 | | | | 5,916 | |
2.00%, 11/01/2040 | | | 18,062 | | | | 15,347 | |
2.00%, 05/01/2041 | | | 6,293 | | | | 5,357 | |
2.00%, 06/01/2041 | | | 24,971 | | | | 21,272 | |
2.00%, 12/01/2041 | | | 2,947 | | | | 2,493 | |
| | | | | | | | |
2.00%, 02/01/2042 | | | 1,266 | | | | 1,070 | |
2.00%, 02/01/2042 | | | 1,403 | | | | 1,192 | |
2.00%, 03/01/2042 | | | 13,386 | | | | 11,329 | |
2.00%, 04/01/2042 | | | 2,096 | | | | 1,780 | |
2.00%, 09/01/2050 | | | 2,405 | | | | 1,979 | |
2.00%, 10/01/2050 | | | 4,326 | | | | 3,561 | |
2.00%, 12/01/2050 | | | 1,043 | | | | 862 | |
2.00%, 12/01/2050 | | | 3,259 | | | | 2,685 | |
2.00%, 01/01/2051 | | | 26,912 | | | | 22,131 | |
2.00%, 02/01/2051 | | | 3,602 | | | | 2,958 | |
2.00%, 03/01/2051 | | | 1,191 | | | | 984 | |
2.00%, 03/01/2051 | | | 2,121 | | | | 1,747 | |
2.00%, 04/01/2051 | | | 742 | | | | 613 | |
2.00%, 04/01/2051 | | | 1,284 | | | | 1,063 | |
2.00%, 04/01/2051 | | | 2,076 | | | | 1,710 | |
2.00%, 04/01/2051 | | | 2,417 | | | | 1,997 | |
2.00%, 05/01/2051 | | | 59,233 | | | | 48,502 | |
2.00%, 08/01/2051 | | | 6,781 | | | | 5,572 | |
2.00%, 08/01/2051 | | | 8,824 | | | | 7,209 | |
2.00%, 08/01/2051 | | | 10,254 | | | | 8,377 | |
2.00%, 09/01/2051 | | | 15,541 | | | | 12,726 | |
2.00%, 10/01/2051 | | | 42,911 | | | | 35,039 | |
2.00%, 11/01/2051 | | | 1,257 | | | | 1,037 | |
2.00%, 11/01/2051 | | | 1,604 | | | | 1,323 | |
2.00%, 11/01/2051 | | | 2,915 | | | | 2,402 | |
2.00%, 11/01/2051 | | | 4,299 | | | | 3,515 | |
2.00%, 11/01/2051 | | | 4,891 | | | | 4,026 | |
2.00%, 11/01/2051 | | | 5,534 | | | | 4,522 | |
2.00%, 11/01/2051 | | | 24,013 | | | | 19,615 | |
2.00%, 12/01/2051 | | | 735 | | | | 615 | |
2.00%, 12/01/2051 | | | 1,166 | | | | 952 | |
2.00%, 12/01/2051 | | | 1,670 | | | | 1,374 | |
2.00%, 12/01/2051 | | | 2,529 | | | | 2,081 | |
2.00%, 12/01/2051 | | | 3,779 | | | | 3,102 | |
2.00%, 12/01/2051 | | | 3,820 | | | | 3,133 | |
2.00%, 12/01/2051 | | | 33,544 | | | | 27,401 | |
2.00%, 01/01/2052 | | | 937 | | | | 767 | |
2.00%, 01/01/2052 | | | 2,668 | | | | 2,197 | |
2.00%, 01/01/2052 | | | 2,977 | | | | 2,450 | |
2.00%, 01/01/2052 | | | 3,454 | | | | 2,846 | |
2.00%, 01/01/2052 | | | 4,594 | | | | 3,804 | |
2.00%, 01/01/2052 | | | 105,563 | | | | 86,178 | |
2.00%, 02/01/2052 | | | 1,742 | | | | 1,435 | |
2.00%, 02/01/2052 | | | 2,101 | | | | 1,729 | |
2.00%, 02/01/2052 | | | 4,035 | | | | 3,321 | |
2.00%, 02/01/2052 | | | 5,917 | | | | 4,830 | |
2.00%, 02/01/2052 | | | 8,972 | | | | 7,369 | |
2.00%, 02/01/2052 | | | 17,040 | | | | 14,005 | |
2.00%, 03/01/2052 | | | 2,245 | | | | 1,846 | |
2.00%, 03/01/2052 | | | 3,202 | | | | 2,632 | |
2.00%, 03/01/2052 | | | 5,851 | | | | 4,801 | |
2.00%, 04/01/2052 | | | 61,267 | | | | 49,997 | |
2.46%, 04/01/2040 | | | 8,775 | | | | 6,321 | |
2.50%, 11/01/2031 | | | 825 | | | | 763 | |
2.50%, 01/01/2032 | | | 692 | | | | 643 | |
2.50%, 02/01/2035 | | | 1,914 | | | | 1,773 | |
2.50%, 03/01/2036 | | | 4,223 | | | | 3,876 | |
2.50%, 07/01/2050 | | | 3,153 | | | | 2,725 | |
2.50%, 07/01/2050 | | | 4,891 | | | | 4,203 | |
2.50%, 07/01/2050 | | | 4,972 | | | | 4,273 | |
2.50%, 07/01/2050 | | | 4,997 | | | | 4,295 | |
2.50%, 08/01/2050 | | | 1,607 | | | | 1,381 | |
2.50%, 08/01/2050 | | | 5,145 | | | | 4,422 | |
2.50%, 08/01/2050 | | | 6,287 | | | | 5,403 | |
2.50%, 10/01/2050 | | | 1 | | | | 1 | |
2.50%, 11/01/2050 | | | 1,117 | | | | 966 | |
2.50%, 11/01/2050 | | | 3,635 | | | | 3,142 | |
2.50%, 01/01/2051 | | | 890 | | | | 765 | |
2.50%, 02/01/2051 | | | 4,478 | | | | 3,816 | |
2.50%, 02/01/2051 | | | 21,015 | | | | 17,904 | |
2.50%, 02/01/2051 | | | 29,151 | | | | 24,845 | |
2.50%, 02/01/2051 | | | 80,437 | | | | 68,485 | |
2.50%, 03/01/2051 | | | 15 | | | | 13 | |
2.50%, 03/01/2051 | | | 38 | | | | 33 | |
2.50%, 09/01/2051 | | | 13,550 | | | | 11,590 | |
2.50%, 11/01/2051 | | | 2,331 | | | | 2,004 | |
2.50%, 11/01/2051 | | | 15,972 | | | | 13,619 | |
2.50%, 12/01/2051 | | | 1 | | | | 1 | |
2.50%, 12/01/2051 | | | 47,973 | | | | 40,742 | |
2.50%, 01/01/2052 | | | 2,588 | | | | 2,241 | |
2.50%, 01/01/2052 | | | 4,215 | | | | 3,592 | |
2.50%, 01/01/2052 | | | 4,340 | | | | 3,709 | |
2.50%, 01/01/2052 | | | 4,542 | | | | 3,912 | |
2.50%, 01/01/2052 | | | 5,480 | | | | 4,697 | |
2.50%, 01/01/2052 | | | 5,506 | | | | 4,731 | |
2.50%, 01/01/2052 | | | 6,208 | | | | 5,336 | |
2.50%, 01/01/2052 | | | 6,812 | | | | 5,825 | |
2.50%, 01/01/2052 | | | 8,299 | | | | 7,098 | |
2.50%, 01/01/2052 | | | 10,207 | | | | 8,749 | |
| | | | | | | | |
2.50%, 02/01/2052 | | | 950 | | | | 821 | |
2.50%, 02/01/2052 | | | 1,375 | | | | 1,184 | |
2.50%, 02/01/2052 | | | 4,902 | | | | 4,202 | |
2.50%, 02/01/2052 | | | 5,796 | | | | 4,965 | |
2.50%, 02/01/2052 | | | 48,383 | | | | 41,087 | |
2.50%, 04/01/2052 | | | 20,790 | | | | 17,664 | |
3.00%, 02/01/2030 | | | 2,417 | | | | 2,331 | |
3.00%, 03/01/2030 | | | 2,741 | | | | 2,640 | |
3.00%, 09/01/2030 | | | 928 | | | | 884 | |
3.00%, 04/01/2031 | | | 4,245 | | | | 4,007 | |
3.00%, 06/01/2032 | | | 497 | | | | 468 | |
3.00%, 09/01/2032 | | | 998 | | | | 939 | |
3.00%, 10/01/2032 | | | 3,688 | | | | 3,471 | |
3.00%, 12/01/2032 | | | 1,059 | | | | 996 | |
3.00%, 12/01/2032 | | | 2,265 | | | | 2,132 | |
3.00%, 10/01/2033 | | | 942 | | | | 881 | |
3.00%, 11/01/2033 | | | 2,985 | | | | 2,815 | |
3.00%, 02/01/2034 | | | 1,644 | | | | 1,548 | |
3.00%, 12/01/2034 | | | 2,485 | | | | 2,327 | |
3.00%, 01/01/2035 | | | 919 | | | | 860 | |
3.00%, 01/01/2035 | | | 1,694 | | | | 1,586 | |
3.00%, 02/01/2035 | | | 1,473 | | | | 1,379 | |
3.00%, 02/01/2035 | | | 2,342 | | | | 2,204 | |
3.00%, 11/01/2035 | | | 3,671 | | | | 3,460 | |
3.00%, 11/01/2036 | | | 733 | | | | 678 | |
3.00%, 11/01/2036 | | | 985 | | | | 911 | |
3.00%, 12/01/2036 | | | 979 | | | | 904 | |
3.00%, 03/01/2038 | | | 776 | | | | 714 | |
3.00%, 01/01/2043 | | | 1,186 | | | | 1,071 | |
3.00%, 02/01/2043 | | | 1,809 | | | | 1,633 | |
3.00%, 04/01/2043 | | | 1,336 | | | | 1,206 | |
3.00%, 06/01/2043 | | | 1,450 | | | | 1,309 | |
3.00%, 08/01/2043 | | | 4,204 | | | | 3,795 | |
3.00%, 09/01/2043 | | | 692 | | | | 625 | |
3.00%, 07/01/2045 | | | 2,768 | | | | 2,499 | |
3.00%, 05/01/2046 | | | 3,339 | | | | 2,995 | |
3.00%, 07/01/2046 | | | 802 | | | | 718 | |
3.00%, 09/01/2046 | | | 2,680 | | | | 2,419 | |
3.00%, 10/01/2046 | | | 952 | | | | 852 | |
3.00%, 11/01/2046 | | | 204 | | | | 183 | |
3.00%, 11/01/2046 | | | 734 | | | | 657 | |
3.00%, 11/01/2046 | | | 943 | | | | 844 | |
3.00%, 11/01/2046 | | | 968 | | | | 866 | |
3.00%, 11/01/2046 | | | 1,020 | | | | 913 | |
3.00%, 11/01/2046 | | | 2,290 | | | | 2,050 | |
3.00%, 01/01/2047 | | | 1,015 | | | | 908 | |
3.00%, 01/01/2047 | | | 7,259 | | | | 6,503 | |
3.00%, 04/01/2047 | | | 940 | | | | 841 | |
3.00%, 04/01/2047 | | | 1,193 | | | | 1,064 | |
3.00%, 06/01/2047 | | | 1,319 | | | | 1,181 | |
3.00%, 08/01/2047 | | | 5,974 | | | | 5,349 | |
3.00%, 11/01/2047 | | | 2,373 | | | | 2,123 | |
3.00%, 04/01/2048 | | | 10,699 | | | | 9,659 | |
3.00%, 09/01/2048 | | | 789 | | | | 707 | |
3.00%, 02/01/2049 | | | 1,115 | | | | 998 | |
3.00%, 08/01/2049 | | | 1,048 | | | | 939 | |
3.00%, 08/01/2049 | | | 21,840 | | | | 19,374 | |
3.00%, 09/01/2049 | | | 14,525 | | | | 12,971 | |
3.00%, 09/01/2049 | | | 18,064 | | | | 16,114 | |
3.00%, 10/01/2049 | | | 29,556 | | | | 26,336 | |
3.00%, 11/01/2049 | | | 21,361 | | | | 19,055 | |
3.00%, 03/01/2050 | | | 1,106 | | | | 981 | |
3.00%, 03/01/2050 | | | 7,317 | | | | 6,498 | |
3.00%, 07/01/2050 | | | 1,975 | | | | 1,752 | |
3.00%, 07/01/2050 | | | 24,488 | | | | 21,818 | |
3.00%, 08/01/2050 | | | 1,020 | | | | 902 | |
3.00%, 08/01/2050 | | | 1,883 | | | | 1,667 | |
3.00%, 10/01/2050 | | | 3,438 | | | | 3,047 | |
3.00%, 04/01/2051 | | | 8,856 | | | | 7,901 | |
3.00%, 03/01/2052 | | | 134 | | | | 118 | |
3.00%, 03/01/2052 | | | 267 | | | | 235 | |
3.00%, 03/01/2052 | | | 959 | | | | 844 | |
3.00%, 03/01/2052 | | | 43,110 | | | | 37,953 | |
3.00%, 04/01/2052 | | | 33 | | | | 29 | |
3.00%, 04/01/2052 | | | 264 | | | | 232 | |
3.00%, 04/01/2052 | | | 354 | | | | 312 | |
3.00%, 04/01/2052 | | | 525 | | | | 463 | |
3.00%, 04/01/2052 | | | 2,079 | | | | 1,831 | |
3.00%, 04/01/2052 | | | 2,318 | | | | 2,043 | |
3.00%, 04/01/2052 | | | 7,112 | | | | 6,264 | |
3.00%, 04/01/2052 | | | 69,982 | | | | 61,661 | |
3.00%, 05/01/2052 | | | 392 | | | | 345 | |
3.00%, 05/01/2052 | | | 952 | | | | 838 | |
3.00%, 05/01/2052 | | | 964 | | | | 849 | |
3.00%, 05/01/2052 | | | 978 | | | | 862 | |
3.00%, 05/01/2052 | | | 1,190 | | | | 1,048 | |
3.00%, 05/01/2052 | | | 10,518 | | | | 9,260 | |
3.00%, 06/01/2052 | | | 48 | | | | 43 | |
3.00%, 06/01/2052 | | | 365 | | | | 321 | |
| | | | | | | | |
3.00%, 06/01/2052 | | | 472 | | | | 416 | |
3.00%, 06/01/2052 | | | 484 | | | | 426 | |
3.00%, 06/01/2052 | | | 628 | | | | 553 | |
3.00%, 06/01/2052 | | | 682 | | | | 600 | |
3.00%, 06/01/2052 | | | 968 | | | | 852 | |
3.00%, 06/01/2052 | | | 1,074 | | | | 946 | |
3.00%, 06/01/2052 | | | 2,127 | | | | 1,874 | |
3.00%, 06/01/2052 | | | 4,576 | | | | 4,030 | |
3.00%, 06/01/2052 | | | 65,723 | | | | 57,879 | |
3.00%, 07/01/2052 | | | 1,086 | | | | 956 | |
3.00%, 07/01/2052 | | | 2,074 | | | | 1,826 | |
3.00%, 07/01/2052 | | | 2,105 | | | | 1,854 | |
3.00%, 07/01/2052 | | | 44,621 | | | | 39,296 | |
3.00%, 08/01/2052 | | | 15,846 | | | | 13,951 | |
3.50%, 11/01/2032 | | | 619 | | | | 593 | |
3.50%, 09/01/2033 | | | 2,442 | | | | 2,339 | |
3.50%, 12/01/2033 | | | 2,104 | | | | 2,012 | |
3.50%, 07/01/2034 | | | 1,965 | | | | 1,882 | |
3.50%, 01/01/2038 | | | 1,902 | | | | 1,800 | |
3.50%, 09/01/2042 | | | 68 | | | | 64 | |
3.50%, 12/01/2042 | | | 471 | | | | 437 | |
3.50%, 12/01/2042 | | | 715 | | | | 664 | |
3.50%, 06/01/2043 | | | 666 | | | | 623 | |
3.50%, 06/01/2043 | | | 904 | | | | 841 | |
3.50%, 08/01/2043 | | | 46 | | | | 43 | |
3.50%, 01/01/2044 | | | 2,169 | | | | 2,016 | |
3.50%, 04/01/2045 | | | 9 | | | | 8 | |
3.50%, 06/01/2045 | | | 730 | | | | 679 | |
3.50%, 06/01/2045 | | | 874 | | | | 813 | |
3.50%, 07/01/2045 | | | 980 | | | | 912 | |
3.50%, 09/01/2045 | | | 1,558 | | | | 1,458 | |
3.50%, 11/01/2045 | | | 1,884 | | | | 1,752 | |
3.50%, 02/01/2046 | | | 3,666 | | | | 3,410 | |
3.50%, 06/01/2046 | | | 1,168 | | | | 1,087 | |
3.50%, 06/01/2046 | | | 1,437 | | | | 1,336 | |
3.50%, 06/01/2046 | | | 1,572 | | | | 1,463 | |
3.50%, 09/01/2046 | | | 1,652 | | | | 1,536 | |
3.50%, 12/01/2046 | | | 608 | | | | 563 | |
3.50%, 01/01/2047 | | | 1,959 | | | | 1,817 | |
3.50%, 01/01/2047 | | | 6,189 | | | | 5,733 | |
3.50%, 02/01/2047 | | | 397 | | | | 367 | |
3.50%, 07/01/2047 | | | 2,663 | | | | 2,463 | |
3.50%, 08/01/2047 | | | 5,756 | | | | 5,353 | |
3.50%, 11/01/2047 | | | 2,766 | | | | 2,553 | |
3.50%, 12/01/2047 | | | 1,190 | | | | 1,098 | |
3.50%, 12/01/2047 | | | 1,513 | | | | 1,398 | |
3.50%, 12/01/2047 | | | 1,734 | | | | 1,600 | |
3.50%, 12/01/2047 | | | 1,824 | | | | 1,687 | |
3.50%, 01/01/2048 | | | 1,744 | | | | 1,612 | |
3.50%, 01/01/2048 | | | 3,471 | | | | 3,203 | |
3.50%, 01/01/2048 | | | 4,511 | | | | 4,171 | |
3.50%, 02/01/2048 | | | 710 | | | | 661 | |
3.50%, 02/01/2048 | | | 4,458 | | | | 4,115 | |
3.50%, 12/01/2048 | | | 9,480 | | | | 8,755 | |
3.50%, 06/01/2049 | | | 5,159 | | | | 4,775 | |
3.50%, 09/01/2049 | | | 2,095 | | | | 1,933 | |
3.50%, 07/01/2050 | | | 4,194 | | | | 3,874 | |
3.50%, 01/01/2051 | | | 12,485 | | | | 11,513 | |
3.50%, 07/01/2051 | | | 2,897 | | | | 2,650 | |
3.50%, 04/01/2052 | | | 3,891 | | | | 3,550 | |
3.50%, 04/01/2052 | | | 4,899 | | | | 4,468 | |
3.50%, 04/01/2052 | | | 6,787 | | | | 6,187 | |
3.50%, 05/01/2052 | | | 1,742 | | | | 1,587 | |
3.50%, 05/01/2052 | | | 4,039 | | | | 3,682 | |
3.50%, 05/01/2052 | | | 4,860 | | | | 4,431 | |
3.50%, 05/01/2052 | | | 6,611 | | | | 6,031 | |
3.50%, 05/01/2052 | | | 13,296 | | | | 12,135 | |
3.50%, 06/01/2052 | | | 49 | | | | 44 | |
3.50%, 06/01/2052 | | | 207 | | | | 189 | |
3.50%, 06/01/2052 | | | 3,882 | | | | 3,540 | |
3.50%, 07/01/2052 | | | 127 | | | | 116 | |
3.50%, 07/01/2052 | | | 365 | | | | 333 | |
3.50%, 07/01/2052 | | | 511 | | | | 466 | |
3.50%, 07/01/2052 | | | 2,935 | | | | 2,677 | |
3.50%, 07/01/2052 | | | 3,228 | | | | 2,943 | |
3.50%, 07/01/2052 | | | 35,210 | | | | 32,101 | |
3.50%, 08/01/2052 | | | 24 | | | | 22 | |
3.50%, 08/01/2052 | | | 494 | | | | 450 | |
3.50%, 08/01/2052 | | | 494 | | | | 450 | |
3.50%, 08/01/2052 | | | 941 | | | | 858 | |
3.50%, 08/01/2052 | | | 6,885 | | | | 6,276 | |
3.50%, 09/01/2052 | | | 121 | | | | 110 | |
3.50%, 10/01/2052 | | | 163 | | | | 149 | |
3.50%, 10/01/2052 | | | 4,756 | | | | 4,335 | |
3.50%, 11/01/2052 | | | 487 | | | | 444 | |
3.50%, 11/01/2052 | | | 496 | | | | 452 | |
3.50%, 12/01/2052 | | | 2,739 | | | | 2,497 | |
3.50%, 12/01/2052 | | | 4,066 | | | | 3,706 | |
4.00%, 02/01/2039 | | | 82 | | | | 79 | |
| | | | | | | | |
4.00%, 11/01/2040 | | | 1,010 | | | | 961 | |
4.00%, 01/01/2042 | | | 1,153 | | | | 1,109 | |
4.00%, 03/01/2042 | | | 1,326 | | | | 1,275 | |
4.00%, 06/01/2042 | | | 4,687 | | | | 4,460 | |
4.00%, 08/01/2042 | | | 990 | | | | 950 | |
4.00%, 02/01/2043 | | | 148 | | | | 140 | |
4.00%, 12/01/2043 | | | 1,043 | | | | 1,001 | |
4.00%, 06/01/2045 | | | 2,114 | | | | 1,992 | |
4.00%, 10/01/2045 | | | 963 | | | | 911 | |
4.00%, 12/01/2045 | | | 1,680 | | | | 1,603 | |
4.00%, 03/01/2046 | | | 4,835 | | | | 4,625 | |
4.00%, 09/01/2046 | | | 483 | | | | 458 | |
4.00%, 12/01/2046 | | | 1,882 | | | | 1,795 | |
4.00%, 02/01/2047 | | | 911 | | | | 870 | |
4.00%, 02/01/2047 | | | 1,439 | | | | 1,375 | |
4.00%, 03/01/2047 | | | 603 | | | | 569 | |
4.00%, 04/01/2047 | | | 153 | | | | 146 | |
4.00%, 04/01/2047 | | | 616 | | | | 587 | |
4.00%, 05/01/2047 | | | 15 | | | | 14 | |
4.00%, 05/01/2047 | | | 676 | | | | 645 | |
4.00%, 06/01/2047 | | | 648 | | | | 618 | |
4.00%, 07/01/2047 | | | 597 | | | | 569 | |
4.00%, 08/01/2047 | | | 13 | | | | 12 | |
4.00%, 08/01/2047 | | | 691 | | | | 659 | |
4.00%, 08/01/2047 | | | 971 | | | | 928 | |
4.00%, 08/01/2047 | | | 5,602 | | | | 5,341 | |
4.00%, 09/01/2047 | | | 107 | | | | 102 | |
4.00%, 10/01/2047 | | | 3,054 | | | | 2,912 | |
4.00%, 01/01/2048 | | | 41 | | | | 39 | |
4.00%, 03/01/2048 | | | 115 | | | | 109 | |
4.00%, 04/01/2048 | | | 59 | | | | 56 | |
4.00%, 04/01/2048 | | | 191 | | | | 182 | |
4.00%, 05/01/2048 | | | 219 | | | | 208 | |
4.00%, 06/01/2048 | | | 3,416 | | | | 3,257 | |
4.00%, 07/01/2048 | | | 149 | | | | 142 | |
4.00%, 07/01/2048 | | | 158 | | | | 151 | |
4.00%, 07/01/2048 | | | 2,619 | | | | 2,493 | |
4.00%, 08/01/2048 | | | 9 | | | | 9 | |
4.00%, 08/01/2048 | | | 44 | | | | 42 | |
4.00%, 08/01/2048 | | | 171 | | | | 163 | |
4.00%, 09/01/2048 | | | 16 | | | | 15 | |
4.00%, 09/01/2048 | | | 68 | | | | 65 | |
4.00%, 09/01/2048 | | | 101 | | | | 96 | |
4.00%, 09/01/2048 | | | 1,109 | | | | 1,056 | |
4.00%, 09/01/2048 | | | 10,024 | | | | 9,613 | |
4.00%, 10/01/2048 | | | 464 | | | | 442 | |
4.00%, 11/01/2048 | | | 24 | | | | 22 | |
4.00%, 11/01/2048 | | | 188 | | | | 179 | |
4.00%, 12/01/2048 | | | 66 | | | | 63 | |
4.00%, 12/01/2048 | | | 143 | | | | 136 | |
4.00%, 12/01/2048 | | | 563 | | | | 537 | |
4.00%, 01/01/2049 | | | 2,898 | | | | 2,785 | |
4.00%, 02/01/2049 | | | 2,415 | | | | 2,315 | |
4.00%, 03/01/2049 | | | 324 | | | | 309 | |
4.00%, 03/01/2049 | | | 10,168 | | | | 9,672 | |
4.00%, 06/01/2049 | | | 14,550 | | | | 13,854 | |
4.00%, 08/01/2049 | | | 85 | | | | 81 | |
4.00%, 09/01/2049 | | | 4,155 | | | | 3,949 | |
4.00%, 10/01/2049 | | | 79 | | | | 75 | |
4.00%, 11/01/2049 | | | 335 | | | | 319 | |
4.00%, 11/01/2049 | | | 630 | | | | 598 | |
4.00%, 12/01/2049 | | | 344 | | | | 328 | |
4.00%, 12/01/2049 | | | 537 | | | | 512 | |
4.00%, 02/01/2050 | | | 4,151 | | | | 3,971 | |
4.00%, 03/01/2050 | | | 1,884 | | | | 1,786 | |
4.00%, 03/01/2050 | | | 4,577 | | | | 4,352 | |
4.00%, 04/01/2050 | | | 118 | | | | 113 | |
4.00%, 04/01/2050 | | | 769 | | | | 731 | |
4.00%, 05/01/2050 | | | 624 | | | | 592 | |
4.00%, 05/01/2050 | | | 1,733 | | | | 1,649 | |
4.00%, 06/01/2050 | | | 2,454 | | | | 2,327 | |
4.00%, 08/01/2050 | | | 760 | | | | 721 | |
4.00%, 08/01/2050 | | | 59,260 | | | | 56,222 | |
4.00%, 11/01/2050 | | | 54 | | | | 52 | |
4.00%, 11/01/2050 | | | 179 | | | | 170 | |
4.00%, 01/01/2051 | | | 217 | | | | 205 | |
4.00%, 01/01/2051 | | | 8,861 | | | | 8,434 | |
4.00%, 03/01/2051 | | | 1,138 | | | | 1,083 | |
4.00%, 03/01/2051 | | | 10,055 | | | | 9,557 | |
4.00%, 05/01/2051 | | | 22,960 | | | | 21,832 | |
4.00%, 10/01/2051 | | | 23,316 | | | | 22,130 | |
4.00%, 05/01/2052 | | | 3,760 | | | | 3,531 | |
4.00%, 04/01/2053 | | | 11,908 | | | | 11,176 | |
4.00%, 05/01/2053 | | | 10,999 | | | | 10,323 | |
4.00%, 06/01/2053 | | | 10,999 | | | | 10,323 | |
4.50%, 11/01/2035 | | | 128 | | | | 126 | |
4.50%, 11/01/2040 | | | 899 | | | | 888 | |
4.50%, 05/01/2041 | | | 1,394 | | | | 1,373 | |
4.50%, 05/01/2041 | | | 2,326 | | | | 2,292 | |
| | | | | | | | |
4.50%, 06/01/2045 | | | 148 | | | | 145 | |
4.50%, 02/01/2046 | | | 801 | | | | 786 | |
4.50%, 03/01/2046 | | | 681 | | | | 668 | |
4.50%, 09/01/2046 | | | 1,116 | | | | 1,095 | |
4.50%, 02/01/2047 | | | 3,273 | | | | 3,233 | |
4.50%, 05/01/2047 | | | 1,889 | | | | 1,865 | |
4.50%, 11/01/2047 | | | 1,274 | | | | 1,250 | |
4.50%, 04/01/2048 | | | 667 | | | | 652 | |
4.50%, 05/01/2048 | | | 1,861 | | | | 1,819 | |
4.50%, 05/01/2048 | | | 4,461 | | | | 4,363 | |
4.50%, 08/01/2048 | | | 393 | | | | 384 | |
4.50%, 08/01/2048 | | | 3,101 | | | | 3,024 | |
4.50%, 09/01/2048 | | | 1,009 | | | | 986 | |
4.50%, 11/01/2048 | | | 536 | | | | 523 | |
4.50%, 12/01/2048 | | | 1,291 | | | | 1,264 | |
4.50%, 05/01/2049 | | | 2,109 | | | | 2,060 | |
4.50%, 09/01/2049 | | | 4,717 | | | | 4,617 | |
4.50%, 01/01/2050 | | | 2,692 | | | | 2,606 | |
4.50%, 07/01/2052 | | | 768 | | | | 738 | |
4.50%, 05/01/2053 | | | 90,129 | | | | 86,661 | |
5.00%, 11/01/2044 | | | 1,381 | | | | 1,391 | |
5.00%, 12/01/2052 | | | 775 | | | | 760 | |
5.00%, 01/01/2053 | | | 991 | | | | 971 | |
5.00%, 01/01/2053 | | | 5,821 | | | | 5,705 | |
5.00%, 04/01/2053 | | | 6,506 | | | | 6,401 | |
5.50%, 05/01/2034 | | | 758 | | | | 776 | |
5.50%, 12/01/2039 | | | 133 | | | | 136 | |
5.50%, 03/01/2040 | | | 833 | | | | 853 | |
5.50%, 06/01/2041 | | | 121 | | | | 124 | |
5.50%, 02/01/2042 | | | 501 | | | | 512 | |
5.50%, 10/01/2043 | | | 245 | | | | 250 | |
5.50%, 05/01/2044 | | | 3,091 | | | | 3,166 | |
5.50%, 12/01/2052 | | | 389 | | | | 388 | |
5.50%, 12/01/2052 | | | 681 | | | | 677 | |
5.50%, 01/01/2053 | | | 180 | | | | 179 | |
5.50%, 01/01/2053 | | | 519 | | | | 517 | |
5.50%, 01/01/2053 | | | 1,515 | | | | 1,512 | |
5.50%, 01/01/2053 | | | 1,953 | | | | 1,947 | |
5.50%, 02/01/2053 | | | 1,157 | | | | 1,151 | |
5.50%, 02/01/2053 | | | 2,446 | | | | 2,434 | |
5.50%, 02/01/2053 | | | 3,313 | | | | 3,303 | |
5.50%, 02/01/2053 | | | 10,985 | | | | 10,933 | |
5.50%, 03/01/2053 | | | 422 | | | | 420 | |
5.50%, 03/01/2053 | | | 1,865 | | | | 1,856 | |
5.50%, 03/01/2053 | | | 3,056 | | | | 3,041 | |
5.50%, 04/01/2053 | | | 1,040 | | | | 1,036 | |
5.50%, 05/01/2053 | | | 1,016 | | | | 1,013 | |
5.50%, 05/01/2053 | | | 1,035 | | | | 1,031 | |
5.50%, 05/01/2053 | | | 3,931 | | | | 3,919 | |
5.50%, 05/01/2053 | | | 3,996 | | | | 3,979 | |
5.50%, 05/01/2053 | | | 4,918 | | | | 4,904 | |
5.50%, 05/01/2053 | | | 61,245 | | | | 60,957 | |
5.50%, 06/01/2053 | | | 3,518 | | | | 3,508 | |
5.50%, 06/01/2053 | | | 67,468 | | | | 67,151 | |
6.00%, 07/01/2041 | | | 2,821 | | | | 2,930 | |
6.00%, 11/01/2052 | | | 638 | | | | 646 | |
6.00%, 12/01/2052 | | | 31,824 | | | | 32,141 | |
6.00%, 01/01/2053 | | | 991 | | | | 1,014 | |
6.00%, 01/01/2053 | | | 3,890 | | | | 3,927 | |
6.00%, 04/01/2053 | | | 2,253 | | | | 2,278 | |
6.00%, 05/01/2053 | | | 585 | | | | 592 | |
6.00%, 05/01/2053 | | | 592 | | | | 606 | |
6.00%, 05/01/2053 | | | 1,208 | | | | 1,222 | |
6.00%, 05/01/2053 | | | 3,746 | | | | 3,787 | |
Fannie Mae REMICS | | | | | | | | |
3.00%, 09/25/2049, Series 2019-52, Class PA | | | 354 | | | | 311 | |
3.50%, 03/25/2042, Series 2012-20, Class ZT | | | 2,159 | | | | 1,980 | |
3.50%, 01/25/2047, Series 2018-55, Class PA | | | 2,250 | | | | 2,141 | |
3.50%, 06/25/2047, Series 2018-38, Class PA | | | 2,896 | | | | 2,725 | |
3.50%, 02/25/2051, Series 2021-3, Class MI | | | 1,373 | | | | 241 | |
4.00%, 05/25/2047, Series 2018-86, Class JA | | | 928 | | | | 887 | |
4.00%, 06/25/2051, Series 2021-31, Class IB | | | 1,400 | | | | 273 | |
5.65% (1 Month LIBOR USD + 0.50%, 0.50% Floor, 6.50% Cap), 01/25/2050, Series 2019-79, Class FA(2) | | | 1,932 | | | | 1,874 | |
Flagstar Mortgage Trust 2017-2 | | | | | | | | |
4.01%, 10/25/2047, Series 2017-2, Class B1(1)(3) | | | 1,183 | | | | 1,057 | |
Flagstar Mortgage Trust 2020-1NV | | | | | | | | |
5.99% (1 Month LIBOR USD + 0.85%, 6.00% Cap), 03/25/2050, Series 2020-1INV, Class A11(1)(2) | | | 735 | | | | 681 | |
Flagstar Mortgage Trust 2021-5INV | | | | | | | | |
2.50%, 07/25/2051, Series 2021-5INV, Class A16(1)(3) | | | 3,746 | | | | 2,918 | |
2.50%, 07/25/2051, Series 2021-5INV, Class A2(1)(3) | | | 5,418 | | | | 4,349 | |
Fontainebleau Miami Beach Trust 2019-FBLU | | | | | | | | |
3.75%, 12/10/2036, Series 2019-FBLU, Class C(1) | | | 7,500 | | | | 7,085 | |
Formentera Issuer Plc | | | | | | | | |
5.36% (Sterling Overnight Index Average + 0.80%), 07/28/2047, Series 2022-1, Class A(2) | | GBP | 22,359 | | | | 28,160 | |
Freddie Mac Gold Pool | | | | | | | | |
2.50%, 02/01/2032 | | $ | 3,769 | | | | 3,495 | |
3.00%, 03/01/2031 | | | 246 | | | | 232 | |
3.00%, 12/01/2032 | | | 840 | | | | 792 | |
3.00%, 06/01/2033 | | | 337 | | | | 316 | |
| | | | | | | | |
3.00%, 02/01/2038 | | | 1,153 | | | | 1,063 | |
3.00%, 04/01/2046 | | | 58 | | | | 52 | |
3.00%, 06/01/2046 | | | 2,122 | | | | 1,905 | |
3.00%, 08/01/2046 | | | 2,627 | | | | 2,355 | |
3.00%, 09/01/2046 | | | 7,971 | | | | 7,143 | |
3.00%, 10/01/2046 | | | 2,564 | | | | 2,304 | |
3.00%, 11/01/2046 | | | 2,853 | | | | 2,550 | |
3.00%, 12/01/2046 | | | 1,963 | | | | 1,761 | |
3.00%, 01/01/2047 | | | 3,566 | | | | 3,194 | |
3.00%, 02/01/2047 | | | 3,546 | | | | 3,176 | |
3.00%, 03/01/2047 | | | 2,097 | | | | 1,878 | |
3.00%, 04/01/2047 | | | 1,289 | | | | 1,154 | |
3.50%, 05/01/2033 | | | 171 | | | | 164 | |
3.50%, 08/01/2033 | | | 1,394 | | | | 1,338 | |
3.50%, 08/01/2033 | | | 4,075 | | | | 3,909 | |
3.50%, 11/01/2033 | | | 2,626 | | | | 2,518 | |
3.50%, 07/01/2043 | | | 159 | | | | 148 | |
3.50%, 10/01/2045 | | | 4,794 | | | | 4,466 | |
3.50%, 06/01/2046 | | | 1,861 | | | | 1,731 | |
3.50%, 08/01/2046 | | | 2,898 | | | | 2,714 | |
3.50%, 08/01/2046 | | | 8,660 | | | | 8,063 | |
3.50%, 11/01/2046 | | | 698 | | | | 648 | |
3.50%, 02/01/2047 | | | 347 | | | | 321 | |
3.50%, 04/01/2047 | | | 1,351 | | | | 1,250 | |
3.50%, 09/01/2047 | | | 4,653 | | | | 4,265 | |
3.50%, 10/01/2047 | | | 1,017 | | | | 940 | |
3.50%, 11/01/2047 | | | 690 | | | | 637 | |
3.50%, 11/01/2047 | | | 1,131 | | | | 1,045 | |
3.50%, 12/01/2047 | | | 15,596 | | | | 14,448 | |
3.50%, 01/01/2048 | | | 822 | | | | 760 | |
3.50%, 01/01/2048 | | | 10,852 | | | | 10,124 | |
3.50%, 02/01/2048 | | | 730 | | | | 675 | |
3.50%, 03/01/2048 | | | 16,377 | | | | 15,172 | |
4.00%, 01/01/2045 | | | 807 | | | | 775 | |
4.00%, 12/01/2045 | | | 1,645 | | | | 1,575 | |
4.00%, 03/01/2048 | | | 3,826 | | | | 3,659 | |
4.00%, 07/01/2048 | | | 4,145 | | | | 3,965 | |
4.00%, 11/01/2048 | | | 16,298 | | | | 15,592 | |
4.50%, 05/01/2044 | | | 146 | | | | 144 | |
4.50%, 06/01/2045 | | | 361 | | | | 357 | |
4.50%, 02/01/2046 | | | 383 | | | | 379 | |
4.50%, 05/01/2046 | | | 406 | | | | 402 | |
4.50%, 06/01/2046 | | | 408 | | | | 401 | |
4.50%, 02/01/2047 | | | 327 | | | | 324 | |
4.50%, 12/01/2047 | | | 1,050 | | | | 1,031 | |
4.50%, 10/01/2048 | | | 2,433 | | | | 2,385 | |
5.00%, 07/01/2048 | | | 508 | | | | 507 | |
5.00%, 08/01/2048 | | | 236 | | | | 235 | |
5.00%, 09/01/2048 | | | 155 | | | | 154 | |
5.00%, 10/01/2048 | | | 654 | | | | 651 | |
5.00%, 11/01/2048 | | | 1,032 | | | | 1,028 | |
5.50%, 08/01/2041 | | | 2,940 | | | | 3,012 | |
8.00%, 04/01/2032 | | | 102 | | | | 106 | |
Freddie Mac Multifamily Structured Pass-Through Certificates | | | | | | | | |
0.91%, 01/25/2031, Series KLU1, Class X1(3) | | | 246,212 | | | | 4,611 | |
1.05%, 04/25/2034, Series K-1512, Class X1(3) | | | 18,848 | | | | 1,202 | |
3.10%, 10/25/2046, Series Q010, Class APT3(3) | | | 198 | | | | 188 | |
3.75%, 04/25/2033, Series K155, Class A3 | | | 5,505 | | | | 5,108 | |
4.42%, 12/25/2047, Series Q010, Class APT2(3) | | | 106 | | | | 106 | |
Freddie Mac Pool | | | | | | | | |
1.50%, 04/01/2036 | | | 915 | | | | 797 | |
1.50%, 04/01/2036 | | | 5,566 | | | | 4,857 | |
1.50%, 05/01/2036 | | | 1,213 | | | | 1,053 | |
1.50%, 08/01/2050 | | | 1,842 | | | | 1,428 | |
1.50%, 10/01/2050 | | | 4,628 | | | | 3,585 | |
2.00%, 09/01/2035 | | | 1,573 | | | | 1,404 | |
2.00%, 01/01/2036 | | | 3,410 | | | | 3,043 | |
2.00%, 02/01/2036 | | | 1,823 | | | | 1,625 | |
2.00%, 02/01/2036 | | | 3,474 | | | | 3,098 | |
2.00%, 03/01/2036 | | | 616 | | | | 547 | |
2.00%, 05/01/2036 | | | 3,779 | | | | 3,354 | |
2.00%, 04/01/2037 | | | 1,246 | | | | 1,105 | |
2.00%, 09/01/2040 | | | 9,488 | | | | 8,135 | |
2.00%, 10/01/2040 | | | 7,466 | | | | 6,368 | |
2.00%, 05/01/2041 | | | 1,670 | | | | 1,426 | |
2.00%, 02/01/2042 | | | 859 | | | | 730 | |
2.00%, 03/01/2042 | | | 3,162 | | | | 2,686 | |
2.00%, 04/01/2042 | | | 898 | | | | 760 | |
2.00%, 04/01/2042 | | | 5,165 | | | | 4,366 | |
2.00%, 08/01/2050 | | | 648 | | | | 534 | |
2.00%, 11/01/2050 | | | 1,185 | | | | 979 | |
2.00%, 02/01/2051 | | | 37,543 | | | | 30,794 | |
2.00%, 03/01/2051 | | | 7,549 | | | | 6,185 | |
2.00%, 04/01/2051 | | | 3,920 | | | | 3,244 | |
2.00%, 04/01/2051 | | | 78,472 | | | | 64,257 | |
2.00%, 05/01/2051 | | | 2,129 | | | | 1,759 | |
2.00%, 07/01/2051 | | | 8,471 | | | | 7,022 | |
2.00%, 09/01/2051 | | | 487 | | | | 401 | |
2.00%, 09/01/2051 | | | 2,469 | | | | 2,027 | |
| | | | | | | | |
2.00%, 10/01/2051 | | | 650 | | | | 531 | |
2.00%, 10/01/2051 | | | 8,002 | | | | 6,538 | |
2.00%, 12/01/2051 | | | 396 | | | | 327 | |
2.00%, 12/01/2051 | | | 979 | | | | 806 | |
2.00%, 12/01/2051 | | | 2,061 | | | | 1,696 | |
2.00%, 12/01/2051 | | | 2,615 | | | | 2,155 | |
2.00%, 12/01/2051 | | | 4,778 | | | | 3,902 | |
2.00%, 01/01/2052 | | | 4,566 | | | | 3,775 | |
2.00%, 01/01/2052 | | | 6,189 | | | | 5,101 | |
2.00%, 01/01/2052 | | | 19,745 | | | | 16,291 | |
2.00%, 02/01/2052 | | | 256 | | | | 210 | |
2.00%, 02/01/2052 | | | 853 | | | | 697 | |
2.00%, 02/01/2052 | | | 2,324 | | | | 1,912 | |
2.50%, 01/01/2035 | | | 13,454 | | | | 12,348 | |
2.50%, 01/01/2036 | | | 1,075 | | | | 984 | |
2.50%, 01/01/2036 | | | 1,955 | | | | 1,790 | |
2.50%, 07/01/2050 | | | 874 | | | | 750 | |
2.50%, 02/01/2051 | | | 7,436 | | | | 6,427 | |
2.50%, 03/01/2051 | | | 29 | | | | 24 | |
2.50%, 05/01/2051 | | | 4,336 | | | | 3,766 | |
2.50%, 05/01/2051 | | | 19,731 | | | | 16,926 | |
2.50%, 08/01/2051 | | | 9,589 | | | | 8,155 | |
2.50%, 11/01/2051 | | | 4,258 | | | | 3,665 | |
2.50%, 11/01/2051 | | | 19,054 | | | | 16,336 | |
2.50%, 12/01/2051 | | | 10,724 | | | | 9,188 | |
2.50%, 01/01/2052 | | | 12,996 | | | | 11,117 | |
2.50%, 01/01/2052 | | | 37,054 | | | | 31,465 | |
2.50%, 01/01/2052 | | | 49,277 | | | | 42,187 | |
2.50%, 02/01/2052 | | | 77,818 | | | | 66,083 | |
2.50%, 04/01/2052 | | | 20,473 | | | | 17,368 | |
2.50%, 04/01/2052 | | | 20,972 | | | | 17,975 | |
2.50%, 05/01/2052 | | | 47,835 | | | | 40,581 | |
3.00%, 05/01/2031 | | | 3,288 | | | | 3,140 | |
3.00%, 11/01/2034 | | | 867 | | | | 812 | |
3.00%, 09/01/2046 | | | 6,816 | | | | 6,124 | |
3.00%, 05/01/2047 | | | 2,764 | | | | 2,487 | |
3.00%, 09/01/2049 | | | 1,217 | | | | 1,091 | |
3.00%, 11/01/2049 | | | 8,442 | | | | 7,539 | |
3.00%, 01/01/2050 | | | 6,745 | | | | 6,010 | |
3.00%, 01/01/2050 | | | 25,750 | | | | 22,969 | |
3.00%, 02/01/2050 | | | 3,230 | | | | 2,785 | |
3.00%, 02/01/2050 | | | 7,225 | | | | 6,451 | |
3.00%, 04/01/2050 | | | 5,014 | | | | 4,467 | |
3.00%, 07/01/2050 | | | 21,957 | | | | 19,563 | |
3.00%, 08/01/2050 | | | 4,486 | | | | 3,997 | |
3.00%, 12/01/2050 | | | 7,656 | | | | 6,829 | |
3.00%, 01/01/2052 | | | 44 | | | | 39 | |
3.00%, 02/01/2052 | | | 75 | | | | 66 | |
3.00%, 03/01/2052 | | | 921 | | | | 811 | |
3.00%, 03/01/2052 | | | 66,866 | | | | 58,867 | |
3.00%, 04/01/2052 | | | 49 | | | | 43 | |
3.00%, 04/01/2052 | | | 457 | | | | 403 | |
3.00%, 04/01/2052 | | | 866 | | | | 763 | |
3.00%, 04/01/2052 | | | 960 | | | | 846 | |
3.00%, 04/01/2052 | | | 979 | | | | 862 | |
3.00%, 04/01/2052 | | | 29,979 | | | | 26,407 | |
3.00%, 05/01/2052 | | | 33 | | | | 29 | |
3.00%, 05/01/2052 | | | 953 | | | | 839 | |
3.00%, 05/01/2052 | | | 1,418 | | | | 1,249 | |
3.00%, 05/01/2052 | | | 5,268 | | | | 4,638 | |
3.00%, 06/01/2052 | | | 40 | | | | 36 | |
3.00%, 06/01/2052 | | | 288 | | | | 254 | |
3.00%, 06/01/2052 | | | 1,015 | | | | 894 | |
3.00%, 06/01/2052 | | | 1,178 | | | | 1,037 | |
3.00%, 06/01/2052 | | | 1,446 | | | | 1,274 | |
3.00%, 06/01/2052 | | | 13,389 | | | | 11,787 | |
3.00%, 06/01/2052 | | | 55,313 | | | | 48,696 | |
3.00%, 07/01/2052 | | | 43 | | | | 38 | |
3.00%, 07/01/2052 | | | 974 | | | | 858 | |
3.00%, 07/01/2052 | | | 2,237 | | | | 1,972 | |
3.00%, 07/01/2052 | | | 3,245 | | | | 2,858 | |
3.00%, 07/01/2052 | | | 256,039 | | | | 225,413 | |
3.00%, 08/01/2052 | | | 6,444 | | | | 5,673 | |
3.50%, 06/01/2033 | | | 3,206 | | | | 3,072 | |
3.50%, 06/01/2042 | | | 28 | | | | 26 | |
3.50%, 06/01/2046 | | | 292 | | | | 271 | |
3.50%, 11/01/2047 | | | 12,479 | | | | 11,536 | |
3.50%, 12/01/2047 | | | 148 | | | | 137 | |
3.50%, 03/01/2048 | | | 3,429 | | | | 3,165 | |
3.50%, 08/01/2049 | | | 2,189 | | | | 2,019 | |
3.50%, 01/01/2050 | | | 416 | | | | 384 | |
3.50%, 11/01/2050 | | | 2,042 | | | | 1,882 | |
3.50%, 02/01/2052 | | | 23 | | | | 21 | |
3.50%, 04/01/2052 | | | 5,837 | | | | 5,322 | |
3.50%, 05/01/2052 | | | 249 | | | | 227 | |
3.50%, 05/01/2052 | | | 984 | | | | 897 | |
3.50%, 05/01/2052 | | | 20,917 | | | | 19,067 | |
3.50%, 05/01/2052 | | | 33,728 | | | | 30,754 | |
3.50%, 06/01/2052 | | | 933 | | | | 851 | |
| | | | | | | | |
3.50%, 06/01/2052 | | | 989 | | | | 902 | |
3.50%, 06/01/2052 | | | 2,922 | | | | 2,665 | |
3.50%, 06/01/2052 | | | 4,826 | | | | 4,401 | |
3.50%, 06/01/2052 | | | 35,224 | | | | 32,123 | |
3.50%, 07/01/2052 | | | 980 | | | | 893 | |
3.50%, 07/01/2052 | | | 2,849 | | | | 2,598 | |
3.50%, 07/01/2052 | | | 38,742 | | | | 35,346 | |
3.50%, 07/01/2052 | | | 116,184 | | | | 105,896 | |
3.50%, 08/01/2052 | | | 152 | | | | 138 | |
3.50%, 08/01/2052 | | | 30,408 | | | | 27,731 | |
3.50%, 08/01/2052 | | | 40,248 | | | | 36,699 | |
3.50%, 09/01/2052 | | | 7,443 | | | | 6,784 | |
3.50%, 10/01/2052 | | | 695 | | | | 634 | |
3.50%, 11/01/2052 | | | 16,700 | | | | 15,221 | |
3.50%, 01/01/2053 | | | 8,071 | | | | 7,356 | |
4.00%, 08/01/2038 | | | 319 | | | | 301 | |
4.00%, 11/01/2042 | | | 329 | | | | 313 | |
4.00%, 05/01/2047 | | | 175 | | | | 167 | |
4.00%, 04/01/2048 | | | 188 | | | | 180 | |
4.00%, 07/01/2048 | | | 10 | | | | 9 | |
4.00%, 07/01/2048 | | | 215 | | | | 205 | |
4.00%, 07/01/2048 | | | 565 | | | | 539 | |
4.00%, 11/01/2048 | | | 289 | | | | 276 | |
4.00%, 12/01/2048 | | | 256 | | | | 244 | |
4.00%, 12/01/2049 | | | 1,607 | | | | 1,529 | |
4.00%, 01/01/2050 | | | 1,944 | | | | 1,845 | |
4.00%, 02/01/2050 | | | 1,336 | | | | 1,276 | |
4.00%, 03/01/2050 | | | 60 | | | | 57 | |
4.00%, 03/01/2050 | | | 166 | | | | 158 | |
4.00%, 03/01/2050 | | | 4,735 | | | | 4,515 | |
4.00%, 05/01/2050 | | | 31 | | | | 29 | |
4.00%, 05/01/2050 | | | 66 | | | | 63 | |
4.00%, 06/01/2050 | | | 88 | | | | 83 | |
4.00%, 06/01/2050 | | | 562 | | | | 532 | |
4.00%, 05/01/2051 | | | 217 | | | | 204 | |
4.00%, 09/01/2051 | | | 56 | | | | 53 | |
4.00%, 07/01/2052 | | | 8,262 | | | | 7,758 | |
4.00%, 04/01/2053 | | | 10,999 | | | | 10,323 | |
4.00%, 05/01/2053 | | | 10,999 | | | | 10,323 | |
4.00%, 06/01/2053 | | | 10,999 | | | | 10,323 | |
4.00%, 07/01/2053 | | | 10,999 | | | | 10,323 | |
4.50%, 03/01/2050 | | | 1,484 | | | | 1,452 | |
4.50%, 07/01/2052 | | | 723 | | | | 695 | |
4.50%, 07/01/2052 | | | 4,540 | | | | 4,365 | |
4.50%, 08/01/2052 | | | 1,415 | | | | 1,360 | |
4.50%, 08/01/2052 | | | 24,107 | | | | 23,182 | |
4.50%, 11/01/2052 | | | 2,107 | | | | 2,025 | |
5.00%, 12/01/2041 | | | 573 | | | | 573 | |
5.00%, 03/01/2042 | | | 157 | | | | 161 | |
5.00%, 10/01/2052 | | | 54,115 | | | | 53,033 | |
5.00%, 11/01/2052 | | | 1,673 | | | | 1,639 | |
5.00%, 12/01/2052 | | | 1,868 | | | | 1,833 | |
5.00%, 12/01/2052 | | | 2,111 | | | | 2,071 | |
5.00%, 12/01/2052 | | | 3,462 | | | | 3,396 | |
5.00%, 01/01/2053 | | | 2,162 | | | | 2,121 | |
5.00%, 02/01/2053 | | | 697 | | | | 683 | |
5.50%, 08/01/2026(9) | | | 0 | | | | 0 | |
5.50%, 09/01/2052 | | | 606 | | | | 603 | |
5.50%, 01/01/2053 | | | 517 | | | | 514 | |
5.50%, 01/01/2053 | | | 557 | | | | 556 | |
5.50%, 01/01/2053 | | | 2,327 | | | | 2,317 | |
5.50%, 01/01/2053 | | | 18,456 | | | | 18,370 | |
5.50%, 02/01/2053 | | | 654 | | | | 651 | |
5.50%, 02/01/2053 | | | 1,437 | | | | 1,430 | |
5.50%, 03/01/2053 | | | 44 | | | | 43 | |
5.50%, 03/01/2053 | | | 4,541 | | | | 4,527 | |
5.50%, 03/01/2053 | | | 5,405 | | | | 5,380 | |
5.50%, 04/01/2053 | | | 15,656 | | | | 15,583 | |
5.50%, 05/01/2053 | | | 999 | | | | 994 | |
5.50%, 05/01/2053 | | | 4,288 | | | | 4,274 | |
5.50%, 05/01/2053 | | | 4,823 | | | | 4,809 | |
5.50%, 06/01/2053 | | | 185,963 | | | | 185,088 | |
6.00%, 11/01/2052 | | | 604 | | | | 611 | |
6.00%, 01/01/2053 | | | 2,849 | | | | 2,877 | |
6.00%, 01/01/2053 | | | 3,152 | | | | 3,225 | |
6.00%, 01/01/2053 | | | 10,140 | | | | 10,229 | |
6.00%, 02/01/2053 | | | 134 | | | | 138 | |
6.00%, 02/01/2053 | | | 237 | | | | 245 | |
6.00%, 02/01/2053 | | | 1,576 | | | | 1,591 | |
6.00%, 02/01/2053 | | | 2,076 | | | | 2,124 | |
6.00%, 02/01/2053 | | | 5,124 | | | | 5,235 | |
6.00%, 03/01/2053 | | | 986 | | | | 996 | |
6.00%, 03/01/2053 | | | 1,460 | | | | 1,501 | |
6.00%, 03/01/2053 | | | 2,804 | | | | 2,869 | |
6.00%, 04/01/2053 | | | 1,925 | | | | 1,943 | |
6.00%, 05/01/2053 | | | 1,472 | | | | 1,488 | |
6.00%, 05/01/2053 | | | 4,074 | | | | 4,111 | |
6.00%, 06/01/2053 | | | 3,351 | | | | 3,388 | |
6.50%, 01/01/2053 | | | 627 | | | | 640 | |
| | | | | | | | |
6.50%, 02/01/2053 | | | 140 | | | | 144 | |
6.50%, 03/01/2053 | | | 943 | | | | 963 | |
Freddie Mac REMICS | | | | | | | | |
3.00%, 01/15/2049, Series 4896, Class DA | | | 764 | | | | 681 | |
3.00%, 04/15/2049, Series 4879, Class BC | | | 2,088 | | | | 1,852 | |
3.00%, 11/25/2051, Series 5161, Class LI | | | 2,604 | | | | 338 | |
3.00%, 02/25/2052, Series 5196, Class DI | | | 1,313 | | | | 202 | |
3.50%, 03/25/2051, Series 5081, Class AI | | | 774 | | | | 135 | |
4.00%, 12/25/2050, Series 5052, Class KI | | | 544 | | | | 104 | |
Freddie Mac STACR REMIC Trust 2021-DNA3 | | | | | | | | |
7.17% (30-day Average SOFR + 2.10%), 10/25/2033, Series 2021-DNA3, Class M2(1)(2) | | | 7,025 | | | | 6,891 | |
Freddie Mac STACR REMIC Trust 2021-DNA5 | | | | | | | | |
6.72% (30-day Average SOFR + 1.65%), 01/25/2034, Series 2021-DNA5, Class M2(1)(2) | | | 2,709 | | | | 2,704 | |
Freddie Mac STACR REMIC Trust 2021-DNA6 | | | | | | | | |
6.57% (30-day Average SOFR + 1.50%), 10/25/2041, Series 2021-DNA6, Class M2(1)(2) | | | 18,350 | | | | 17,891 | |
Freddie Mac STACR REMIC Trust 2021-HQA3 | | | | | | | | |
5.92% (30-day Average SOFR + 0.85%), 09/25/2041, Series 2021-HQA3, Class M1(1)(2) | | | 7,295 | | | | 7,076 | |
Freddie Mac STACR REMIC Trust 2022-DNA7 | | | | | | | | |
10.07% (30-day Average SOFR + 5.00%), 03/25/2052, Series 2022-DNA7, Class M1B(1)(2) | | | 9,000 | | | | 9,663 | |
Freddie Mac STACR Trust 2018-DNA2 | | | | | | | | |
6.10% (1 Month LIBOR USD + 0.95%), 12/25/2030, Series 2018-DNA2, Class M2AS(1)(2) | | | 3,121 | | | | 3,110 | |
Freddie Mac Strips | | | | | | | | |
3.00%, 09/15/2044, Series 337, Class 300 | | | 37,111 | | | | 33,571 | |
3.00%, 10/15/2052, Series 389, Class C45 | | | 10,865 | | | | 1,772 | |
Freddie Mac Structured Agency Credit Risk Debt Notes | | | | | | | | |
7.17% (30-day Average SOFR + 2.10%), 04/25/2043, Series 2023-DNA2, Class M1A(1)(2) | | | 3,990 | | | | 4,001 | |
Freddie Mac Whole Loan Securities Trust | | | | | | | | |
3.65%, 12/25/2046, Series 2017-SC01, Class M1(1)(3) | | | 929 | | | | 887 | |
FREMF 2019-K736 Mortgage Trust | | | | | | | | |
3.89%, 07/25/2026, Series 2019-K736, Class B(1)(3) | | | 5,440 | | | | 5,105 | |
FREMF 2019-K94 Mortgage Trust | | | | | | | | |
4.10%, 07/25/2052, Series 2019-K94, Class B(1)(3) | | | 2,800 | | | | 2,557 | |
FREMF 2019-K98 Mortgage Trust | | | | | | | | |
3.86%, 10/25/2052, Series 2019-K98, Class B(1)(3) | | | 2,895 | | | | 2,606 | |
Galton Funding Mortgage Trust 2018-2 | | | | | | | | |
4.00%, 10/25/2058, Series 2018-2, Class A22(1)(3) | | | 329 | | | | 304 | |
Galton Funding Mortgage Trust 2019-1 | | | | | | | | |
4.00%, 02/25/2059, Series 2019-1, Class A22(1)(3) | | | 357 | | | | 336 | |
Galton Funding Mortgage Trust 2019-H1 | | | | | | | | |
2.96%, 10/25/2059, Series 2019-H1, Class A3(1)(3) | | | 1,835 | | | | 1,778 | |
GCAT 2019-RPL1 Trust | | | | | | | | |
2.65%, 10/25/2068, Series 2019-RPL1, Class A1(1)(3) | | | 1,748 | | | | 1,631 | |
GCAT 2022-NQM4 Trust | | | | | | | | |
5.27%, 08/25/2067, Series 2022-NQM4, Class A1(1)(4) | | | 2,056 | | | | 2,006 | |
GCT Commercial Mortgage Trust 2021-GCT | | | | | | | | |
6.89% (1 Month LIBOR USD + 1.70%, 1.70% Floor), 02/15/2038, Series 2021-GCT, Class C(1)(2) | | | 3,000 | | | | 2,088 | |
Ginnie Mae | | | | | | | | |
2.00%, 07/01/2053(15) | | | 48,240 | | | | 40,542 | |
2.50%, 07/01/2053(15) | | | 119,184 | | | | 103,196 | |
3.00%, 07/15/2042(15) | | | 7,726 | | | | 6,903 | |
3.00%, 07/20/2049, Series 2019-90, Class HE | | | 165 | | | | 146 | |
3.00%, 09/20/2049, Series 2019-119, Class JE | | | 1,286 | | | | 1,141 | |
3.50%, 07/01/2042(15) | | | 344 | | | | 317 | |
3.50%, 08/20/2048, Series 2018-115, Class DE | | | 2,319 | | | | 2,156 | |
3.50%, 09/20/2048, Series 2018-124, Class NW | | | 1,744 | | | | 1,634 | |
3.50%, 12/20/2048, Series 2019-44, Class CA | | | 19 | | | | 18 | |
3.50%, 08/01/2053(15) | | | 600 | | | | 554 | |
4.00%, 07/01/2053(15) | | | 16,769 | | | | 15,867 | |
4.00%, 08/01/2053(15) | | | 5,400 | | | | 5,113 | |
4.50%, 07/01/2053(15) | | | 95,476 | | | | 92,149 | |
5.00%, 07/01/2053(15) | | | 37,559 | | | | 36,908 | |
5.50%, 07/01/2038(15) | | | 9,517 | | | | 9,472 | |
6.00%, 07/01/2053(15) | | | 6,352 | | | | 6,394 | |
6.50%, 07/01/2053(15) | | | 3,091 | | | | 3,145 | |
Ginnie Mae I Pool | | | | | | | | |
4.50%, 05/15/2041 | | | 244 | | | | 236 | |
5.00%, 09/15/2041 | | | 102 | | | | 103 | |
5.00%, 07/15/2044 | | | 70 | | | | 70 | |
7.50%, 08/15/2033 | | | 74 | | | | 76 | |
Ginnie Mae II Pool | | | | | | | | |
2.00%, 08/20/2050 | | | 13,663 | | | | 11,542 | |
2.00%, 11/20/2050 | | | 1,828 | | | | 1,543 | |
2.00%, 01/20/2051 | | | 21,962 | | | | 18,511 | |
2.00%, 02/20/2051 | | | 1,630 | | | | 1,374 | |
2.50%, 04/20/2051 | | | 3,274 | | | | 2,845 | |
2.50%, 10/20/2051 | | | 52,784 | | | | 45,739 | |
2.50%, 12/20/2051 | | | 34,365 | | | | 29,767 | |
3.00%, 02/20/2043 | | | 1,145 | | | | 1,028 | |
3.00%, 06/20/2045 | | | 12,338 | | | | 11,248 | |
3.00%, 10/20/2045 | | | 2,444 | | | | 2,234 | |
3.00%, 05/20/2046 | | | 3,880 | | | | 3,528 | |
3.00%, 07/20/2046 | | | 4,733 | | | | 4,308 | |
3.00%, 10/20/2046 | | | 738 | | | | 670 | |
3.00%, 12/20/2046 | | | 1,813 | | | | 1,646 | |
3.00%, 03/20/2047 | | | 486 | | | | 441 | |
3.00%, 09/20/2047 | | | 4,828 | | | | 4,369 | |
3.00%, 11/20/2047 | | | 1,682 | | | | 1,523 | |
3.00%, 01/20/2048 | | | 2,132 | | | | 1,931 | |
3.00%, 10/20/2049 | | | 4,521 | | | | 3,954 | |
| | | | | | | | |
3.00%, 03/20/2050 | | | 2,210 | | | | 1,947 | |
3.00%, 04/20/2050 | | | 119 | | | | 105 | |
3.00%, 04/20/2051 | | | 11,297 | | | | 10,153 | |
3.00%, 07/20/2051 | | | 22,027 | | | | 19,771 | |
3.50%, 06/20/2043 | | | 769 | | | | 725 | |
3.50%, 07/20/2043 | | | 778 | | | | 733 | |
3.50%, 01/20/2045 | | | 990 | | | | 928 | |
3.50%, 12/20/2045 | | | 900 | | | | 840 | |
3.50%, 01/20/2046 | | | 622 | | | | 584 | |
3.50%, 03/20/2046 | | | 6,785 | | | | 6,355 | |
3.50%, 04/20/2046 | | | 2,253 | | | | 2,110 | |
3.50%, 05/20/2046 | | | 1,037 | | | | 972 | |
3.50%, 06/20/2046 | | | 1,459 | | | | 1,369 | |
3.50%, 12/20/2046 | | | 1,549 | | | | 1,451 | |
3.50%, 01/20/2047 | | | 1,874 | | | | 1,757 | |
3.50%, 04/20/2047 | | | 2,496 | | | | 2,338 | |
3.50%, 05/20/2047 | | | 110 | | | | 103 | |
3.50%, 06/20/2047 | | | 6,571 | | | | 6,152 | |
3.50%, 07/20/2047 | | | 1,904 | | | | 1,784 | |
3.50%, 08/20/2047 | | | 1,694 | | | | 1,583 | |
3.50%, 09/20/2047 | | | 4,290 | | | | 4,007 | |
3.50%, 10/20/2047 | | | 341 | | | | 319 | |
3.50%, 11/20/2047 | | | 5,886 | | | | 5,506 | |
3.50%, 12/20/2047 | | | 3,893 | | | | 3,646 | |
3.50%, 01/20/2048 | | | 2,679 | | | | 2,511 | |
3.50%, 02/20/2048 | | | 1,339 | | | | 1,252 | |
3.50%, 02/20/2048 | | | 3,902 | | | | 3,650 | |
3.50%, 02/20/2048 | | | 6,160 | | | | 5,744 | |
3.50%, 04/20/2048 | | | 10,929 | | | | 10,196 | |
3.50%, 05/20/2048 | | | 3,047 | | | | 2,840 | |
3.50%, 06/20/2049 | | | 200 | | | | 184 | |
3.50%, 07/20/2049 | | | 1,297 | | | | 1,185 | |
3.50%, 03/20/2050 | | | 495 | | | | 460 | |
3.50%, 02/20/2051 | | | 9,495 | | | | 8,881 | |
3.50%, 08/20/2051 | | | 9,147 | | | | 8,498 | |
4.00%, 09/20/2045 | | | 669 | | | | 645 | |
4.00%, 03/20/2047 | | | 488 | | | | 468 | |
4.00%, 04/20/2047 | | | 1,015 | | | | 974 | |
4.00%, 05/20/2047 | | | 803 | | | | 771 | |
4.00%, 06/20/2047 | | | 909 | | | | 873 | |
4.00%, 09/20/2047 | | | 1,271 | | | | 1,223 | |
4.00%, 11/20/2047 | | | 903 | | | | 867 | |
4.00%, 12/20/2047 | | | 863 | | | | 828 | |
4.00%, 01/20/2048 | | | 1,177 | | | | 1,130 | |
4.00%, 06/20/2048 | | | 4,561 | | | | 4,355 | |
4.00%, 08/20/2048 | | | 1,693 | | | | 1,622 | |
4.00%, 09/20/2048 | | | 977 | | | | 932 | |
4.00%, 10/20/2048 | | | 380 | | | | 364 | |
4.00%, 10/20/2050 | | | 8,133 | | | | 7,766 | |
4.50%, 07/20/2045 | | | 1,443 | | | | 1,431 | |
4.50%, 09/20/2046 | | | 1,795 | | | | 1,744 | |
4.50%, 01/20/2047 | | | 1,157 | | | | 1,146 | |
4.50%, 05/20/2047 | | | 1,936 | | | | 1,903 | |
4.50%, 06/20/2047 | | | 2,669 | | | | 2,624 | |
4.50%, 08/20/2047 | | | 773 | | | | 759 | |
4.50%, 09/20/2047 | | | 760 | | | | 746 | |
4.50%, 08/20/2048 | | | 3,177 | | | | 3,105 | |
4.50%, 09/20/2048 | | | 346 | | | | 338 | |
5.00%, 12/20/2044 | | | 138 | | | | 139 | |
5.00%, 06/20/2047 | | | 1,395 | | | | 1,393 | |
5.00%, 09/20/2047 | | | 784 | | | | 783 | |
5.00%, 12/20/2047 | | | 556 | | | | 555 | |
5.00%, 01/20/2048 | | | 673 | | | | 672 | |
5.00%, 02/20/2048 | | | 530 | | | | 534 | |
5.00%, 08/20/2048 | | | 1,148 | | | | 1,143 | |
5.00%, 10/20/2048 | | | 1,016 | | | | 1,013 | |
5.50%, 05/20/2048 | | | 956 | | | | 971 | |
5.50%, 11/20/2048 | | | 597 | | | | 604 | |
5.50%, 03/20/2049 | | | 758 | | | | 767 | |
Government National Mortgage Association | | | | | | | | |
1.25%, 01/16/2061, Series 2021-31, Class B | | | 9,748 | | | | 7,340 | |
1.25%, 09/16/2062, Series 2020-193, Class AC | | | 4,665 | | | | 3,520 | |
1.34%, 06/16/2063, Series 2021-14, Class AB | | | 5,587 | | | | 4,263 | |
1.40%, 06/16/2063, Series 2021-21, Class AH | | | 8,972 | | | | 6,899 | |
1.50%, 06/16/2063, Series 2021-2, Class AH | | | 13,122 | | | | 10,065 | |
3.00%, 05/20/2051, Series 2021-83, Class PI | | | 5,458 | | | | 790 | |
3.00%, 08/20/2051, Series 2022-78, Class IO | | | 2,915 | | | | 414 | |
Great Wolf Trust 2019-WOLF | | | | | | | | |
6.30% (1 Month Term SOFR + 1.15%, 1.03% Floor), 12/15/2036, Series 2019-WOLF, Class A(1)(2) | | | 13,655 | | | | 13,491 | |
Grifonas Finance No 1 Plc | | | | | | | | |
3.51% (6 Month EURIBOR + 0.28%), 08/28/2039, Series 1, Class A(2) | | EUR | 2,867 | | | | 2,987 | |
GS Mortgage Securities Corp. Trust 2012-BWTR | | | | | | | | |
2.95%, 11/05/2034, Series 2012-BWTR, Class A(1) | | $ | 4,135 | | | | 2,958 | |
GS Mortgage Securities Corp. Trust 2012-TMSQ | | | | | | | | |
3.84%, 04/10/2031, Series 2013-G1, Class B(1)(3) | | | 1,998 | | | | 1,849 | |
GS Mortgage Securities Corp. Trust 2013-PEMB | | | | | | | | |
3.67%, 03/05/2033, Series 2013-PEMB, Class A(1)(3) | | | 4,610 | | | | 4,043 | |
3.67%, 03/05/2033, Series 2013-PEMB, Class D(1)(3) | | | 5,150 | | | | 4,178 | |
GS Mortgage Securities Corp. Trust 2017-SLP | | | | | | | | |
| | | | | | | | |
3.92%, 10/10/2032, Series 2017-SLP, Class C(1) | | | 8,029 | | | | 7,696 | |
GS Mortgage Securities Corp. Trust 2021-DM | | | | | | | | |
6.08% (1 Month LIBOR USD + 0.89%, 0.89% Floor), 11/15/2036, Series 2021-DM, Class A(1)(2) | | | 11,038 | | | | 10,771 | |
GS Mortgage Securities Corp. Trust 2021-STAR | | | | | | | | |
6.14% (1 Month LIBOR USD + 0.95%, 0.95% Floor), 12/15/2036, Series 2021-STAR, Class A(1)(2) | | | 5,100 | | | | 4,950 | |
GS Mortgage Securities Corp. Trust 2022-AGSS | | | | | | | | |
7.34% (1 Month Term SOFR + 2.19%, 2.20% Floor), 08/15/2039, Series 2022-ECI, Class A(1)(2) | | | 1,740 | | | | 1,741 | |
7.84% (1 Month Term SOFR + 2.69%, 2.79% Floor), 11/15/2027, Series 2022-AGSS, Class A(1)(2) | | | 2,930 | | | | 2,917 | |
GS Mortgage Securities Corp. Trust 2022-SHIP | | | | | | | | |
5.88% (1 Month Term SOFR + 0.73%, 0.73% Floor), 08/15/2036, Series 2022-SHIP, Class A(1)(2) | | | 2,110 | | | | 2,096 | |
GS Mortgage Securities Trust 2011-GC5 | | | | | | | | |
5.30%, 08/10/2044, Series 2011-GC5, Class D(1)(3) | | | 266 | | | | 83 | |
GS Mortgage Securities Trust 2013-GC16 | | | | | | | | |
5.16%, 11/10/2046, Series 2013-GC16, Class B(3) | | | 7,561 | | | | 7,375 | |
GS Mortgage Securities Trust 2014-GC18 | | | | | | | | |
3.80%, 01/10/2047, Series 2014-GC18, Class A3 | | | 11,511 | | | | 11,432 | |
4.38%, 01/10/2047, Series 2014-GC18, Class AS | | | 2,355 | | | | 2,191 | |
4.89%, 01/10/2047, Series 2014-GC18, Class B(3) | | | 9,523 | | | | 7,824 | |
GS Mortgage-Backed Securities Corp. Trust 2021-NQM1 | | | | | | | | |
1.02%, 07/25/2061, Series 2021-NQM1, Class A1(1)(3) | | | 14,677 | | | | 12,465 | |
GS Mortgage-Backed Securities Trust 2020-INV1 | | | | | | | | |
2.93%, 10/25/2050, Series 2020-INV1, Class A14(1)(3) | | | 3,713 | | | | 3,118 | |
GS Mortgage-Backed Securities Trust 2021-GR1 | | | | | | | | |
2.50%, 11/25/2051, Series 2021-GR1, Class A4(1)(3) | | | 5,606 | | | | 4,332 | |
GS Mortgage-Backed Securities Trust 2021-GR2 | | | | | | | | |
2.50%, 02/25/2052, Series 2021-GR2, Class A4(1)(3) | | | 3,492 | | | | 2,698 | |
2.50%, 02/25/2052, Series 2021-GR2, Class A6(1)(3) | | | 10,248 | | | | 8,751 | |
GS Mortgage-Backed Securities Trust 2021-PJ6 | | | | | | | | |
2.50%, 11/25/2051, Series 2021-PJ6, Class A2(1)(3) | | | 10,457 | | | | 8,420 | |
HarborView Mortgage Loan Trust 2005-9 | | | | | | | | |
6.06% (1 Month LIBOR USD + 0.90%, 0.90% Floor, 11.00% Cap), 06/20/2035, Series 2005-9, Class 2A1C(2) | | | 4,647 | | | | 4,210 | |
HarborView Mortgage Loan Trust 2006-10 | | | | | | | | |
5.36% (1 Month LIBOR USD + 0.20%, 0.20% Floor), 11/19/2036, Series 2006-10, Class 1A1A(2) | | | 7,082 | | | | 5,604 | |
HarborView Mortgage Loan Trust 2006-12 | | | | | | | | |
5.57% (1 Month LIBOR USD + 0.41%, 0.41% Floor), 12/19/2036, Series 2006-12, Class 1A1A(2) | | | 24,622 | | | | 20,454 | |
HarborView Mortgage Loan Trust 2006-7 | | | | | | | | |
5.55% (1 Month LIBOR USD + 0.40%, 0.40% Floor), 09/19/2046, Series 2006-7, Class 2A1A(2) | | | 2,202 | | | | 2,022 | |
HarborView Mortgage Loan Trust 2007-6 | | | | | | | | |
5.36% (1 Month LIBOR USD + 0.20%, 10.50% Cap), 08/19/2037, Series 2007-6, Class 1A1A(2) | | | 5,824 | | | | 4,908 | |
Harbour | | | | | | | | |
5.36% (Sterling Overnight Index Average + 0.80%), 01/28/2054, Series 1, Class A1(2) | | GBP | 698 | | | | 879 | |
Harvest Commercial Capital Loan Trust 2019-1 | | | | | | | | |
3.29%, 09/25/2046, Series 2019-1, Class A(1)(3) | | $ | 1,820 | | | | 1,765 | |
Hawaii Hotel Trust 2019-MAUI | | | | | | | | |
6.64% (1 Month LIBOR USD + 1.45%, 1.45% Floor), 05/15/2038, Series 2019-MAUI, Class B(1)(2) | | | 1,155 | | | | 1,136 | |
Hilton Orlando Trust 2018-ORL | | | | | | | | |
6.74% (1 Month LIBOR USD + 1.55%, 1.30% Floor), 12/15/2034, Series 2018-ORL, Class C(1)(2) | | | 14,000 | | | | 13,753 | |
HIT Trust 2022-HI32 | | | | | | | | |
7.54% (1 Month Term SOFR + 2.39%, 2.39% Floor), 07/15/2024, Series 2022-HI32, Class A(1)(2) | | | 384 | | | | 383 | |
Homeward Opportunities Fund Trust 2022-1 | | | | | | | | |
5.08%, 07/25/2067, Series 2022-1, Class A1(1)(4) | | | 2,030 | | | | 1,956 | |
HPLY Trust 2019-HIT | | | | | | | | |
6.79% (1 Month LIBOR USD + 1.60%, 1.60% Floor), 11/15/2036, Series 2019-HIT, Class C(1)(2) | | | 7,603 | | | | 7,431 | |
HSI Asset Securitization Corp. Trust 2005-NC1 | | | | | | | | |
6.11% (1 Month LIBOR USD + 0.96%, 0.96% Floor), 07/25/2035, Series 2005-NC1, Class M3(2) | | | 6,336 | | | | 5,987 | |
Hudsons Bay Simon JV Trust 2015-HBS | | | | | | | | |
3.91%, 08/05/2034, Series 2015-HB7, Class A7(1) | | | 1,140 | | | | 986 | |
4.15%, 08/05/2034, Series 2015-HB10, Class A10(1) | | | 3,540 | | | | 3,036 | |
ILPT Commercial Mortgage Trust 2022-LPF2 | | | | | | | | |
7.39% (1 Month Term SOFR + 2.25%, 2.25% Floor), 10/15/2039, Series 2022-LPF2, Class A(1)(2) | | | 3,330 | | | | 3,320 | |
ILPT Trust 2019-SURF | | | | | | | | |
4.15%, 02/11/2041, Series 2019-SURF, Class A(1) | | | 7,575 | | | | 6,871 | |
Impac CMB Trust Series 2004-7 | | | | | | | | |
5.79% (1 Month LIBOR USD + 0.64%, 11.25% Cap), 11/25/2034, Series 2004-7, Class 2A(2) | | | 1,707 | | | | 1,645 | |
Imperial Fund Mortgage Trust 2021-NQM2 | | | | | | | | |
1.07%, 09/25/2056, Series 2021-NQM2, Class A1(1)(3) | | | 2,826 | | | | 2,231 | |
Independence Plaza Trust 2018-INDP | | | | | | | | |
3.76%, 07/10/2035, Series 2018-INDP, Class A(1) | | | 3,265 | | | | 3,048 | |
IndyMac INDX Mortgage Loan Trust 2006-AR19 | | | | | | | | |
3.47%, 08/25/2036, Series 2006-AR19, Class 5A2(3) | | | 13,939 | | | | 10,678 | |
IndyMac INDX Mortgage Loan Trust 2007-AR15 | | | | | | | | |
3.60%, 08/25/2037, Series 2007-AR15, Class 1A1(3) | | | 3,110 | | | | 2,355 | |
INTOWN 2022-STAY Mortgage Trust | | | | | | | | |
7.64% (1 Month Term SOFR + 2.49%, 2.49% Floor), 08/15/2039, Series 2022-STAY, Class A(1)(2) | | | 1,920 | | | | 1,920 | |
JP Morgan Chase Commercial Mortgage Securities Trust 2012-LC9 | | | | | | | | |
3.91%, 12/15/2047, Series 2012-LC9, Class D(1)(3) | | | 215 | | | | 191 | |
3.91%, 12/15/2047, Series 2012-LC9, Class C(1)(3) | | | 6,115 | | | | 5,717 | |
JP Morgan Chase Commercial Mortgage Securities Trust 2016-JP2 | | | | | | | | |
3.06%, 08/15/2049, Series 2016-JP2, Class AS | | | 1,993 | | | | 1,771 | |
JP Morgan Chase Commercial Mortgage Securities Trust 2018-ASH8 | | | | | | | | |
6.24% (1 Month LIBOR USD + 1.05%, 0.84% Floor), 02/15/2035, Series 2018-ASH8, Class A(1)(2) | | | 6,551 | | | | 6,452 | |
JP Morgan Chase Commercial Mortgage Securities Trust 2018-WPT | | | | | | | | |
4.25%, 07/05/2033, Series 2018-WPT, Class AFX(1) | | | 965 | | | | 866 | |
5.35%, 07/05/2033, Series 2018-WPT, Class DFX(1) | | | 10,060 | | | | 8,420 | |
JP Morgan Chase Commercial Mortgage Securities Trust 2019-OSB | | | | | | | | |
3.40%, 06/05/2039, Series 2019-OSB, Class A(1) | | | 8,013 | | | | 6,915 | |
JP Morgan Chase Commercial Mortgage Securities Trust 2021-1440 | | | | | | | | |
6.49% (1 Month LIBOR USD + 1.30%, 1.30% Floor), 03/15/2036, Series 2021-1440, Class A(1)(2) | | | 5,000 | | | | 4,554 | |
JP Morgan Chase Commercial Mortgage Securities Trust 2021-HTL5 | | | | | | | | |
| | | | | | | | |
7.16% (1 Month LIBOR USD + 1.97%, 1.97% Floor), 11/15/2038, Series 2021-HTL5, Class C(1)(2) | | | 8,700 | | | | 8,450 | |
JP Morgan Chase Commercial Mortgage Securities Trust 2021-MHC | | | | | | | | |
6.06% (1 Month Term SOFR + 0.91%, 0.80% Floor), 04/15/2038, Series 2021-MHC, Class A(1)(2) | | | 142 | | | | 139 | |
6.56% (1 Month Term SOFR + 1.41%, 1.30% Floor), 04/15/2038, Series 2021-MHC, Class C(1)(2) | | | 1,000 | | | | 973 | |
6.96% (1 Month Term SOFR + 1.81%, 1.70% Floor), 04/15/2038, Series 2021-MHC, Class D(1)(2) | | | 4,263 | | | | 4,117 | |
JP Morgan Chase Commercial Mortgage Securities Trust 2022-CGSS | | | | | | | | |
7.62% (1 Month Term SOFR + 2.47%, 2.97% Floor), 12/15/2036, Series 2022-CGSS, Class A(1)(2) | | | 1,922 | | | | 1,920 | |
JP Morgan Chase Commercial Mortgage Securities Trust 2022-NXSS | | | | | | | | |
7.33% (1 Month Term SOFR + 2.18%, 2.18% Floor), 09/15/2039, Series 2022-NXSS, Class A(1)(2) | | | 2,895 | | | | 2,896 | |
JP Morgan Mortgage Trust 2019-7 | | | | | | | | |
2.99%, 02/25/2050, Series 2019-7, Class B2A(1)(3) | | | 5,014 | | | | 4,027 | |
JP Morgan Mortgage Trust 2019-INV1 | | | | | | | | |
4.95%, 10/25/2049, Series 2019-INV1, Class B3(1)(3) | | | 1,474 | | | | 1,322 | |
JP Morgan Mortgage Trust 2019-INV3 | | | | | | | | |
3.50%, 05/25/2050, Series 2019-INV3, Class A15(1)(3) | | | 826 | | | | 724 | |
3.50%, 05/25/2050, Series 2019-INV3, Class A3(1)(3) | | | 967 | | | | 853 | |
JP Morgan Mortgage Trust 2020-7 | | | | | | | | |
3.00%, 01/25/2051, Series 2020-7, Class A15(1)(3) | | | 2,943 | | | | 2,490 | |
JP Morgan Mortgage Trust 2020-INV1 | | | | | | | | |
3.50%, 08/25/2050, Series 2020-INV1, Class A3(1)(3) | | | 824 | | | | 724 | |
JP Morgan Mortgage Trust 2020-INV2 | | | | | | | | |
3.00%, 10/25/2050, Series 2020-INV2, Class A15(1)(3) | | | 1,224 | | | | 1,040 | |
JP Morgan Mortgage Trust 2020-LTV1 | | | | | | | | |
3.29%, 06/25/2050, Series 2020-LTV1, Class B1A(1)(3) | | | 4,645 | | | | 3,870 | |
JP Morgan Mortgage Trust 2021-13 | | | | | | | | |
2.50%, 04/25/2052, Series 2021-13, Class A3(1)(3) | | | 37,218 | | | | 29,967 | |
JP Morgan Mortgage Trust 2021-14 | | | | | | | | |
2.50%, 05/25/2052, Series 2021-14, Class A3(1)(3) | | | 17,409 | | | | 14,018 | |
JP Morgan Mortgage Trust 2022-1 | | | | | | | | |
3.00%, 07/25/2052, Series 2022-1, Class A2(1)(3) | | | 7,283 | | | | 6,115 | |
JP Morgan Seasoned Mortgage Trust 2010-1 | | | | | | | | |
0.00%, 03/25/2050, Series 2010-1, Class B(1)(3) | | | 4,882 | | | | 3,966 | |
JP Morgan Trust 2015-1 | | | | | | | | |
6.19%, 12/25/2044, Series 2015-1, Class B4(1)(3) | | | 861 | | | | 822 | |
JPMBB Commercial Mortgage Securities Trust 2015-C30 | | | | | | | | |
3.82%, 07/15/2048, Series 2015-C30, Class A5 | | | 1,841 | | | | 1,736 | |
JPMCC Commercial Mortgage Securities Trust 2017-JP5 | | | | | | | | |
3.88%, 03/15/2050, Series 2017-JP5, Class AS(3) | | | 4,990 | | | | 4,561 | |
JPMDB Commercial Mortgage Securities Trust 2016-C4 | | | | | | | | |
3.38%, 12/15/2049, Series 2016-C4, Class AS | | | 4,040 | | | | 3,526 | |
Kinbane 2022-RPL 1 DAC | | | | | | | | |
4.26% (1 Month EURIBOR + 0.85%), 09/25/2062, Series 2022-RPL1A, Class A(1)(2) | | EUR | 15,433 | | | | 16,542 | |
Legacy Mortgage Asset Trust 2019-GS7 | | | | | | | | |
6.25%, 11/25/2059, Series 2019-GS7, Class A1(1)(4) | | $ | 3,939 | | | | 3,906 | |
Legacy Mortgage Asset Trust 2020-GS1 | | | | | | | | |
5.88%, 10/25/2059, Series 2020-GS1, Class A1(1)(4) | | | 2,799 | | | | 2,748 | |
Legacy Mortgage Asset Trust 2020-GS5 | | | | | | | | |
3.25%, 06/25/2060, Series 2020-GS5, Class A1(1)(4) | | | 743 | | | | 729 | |
Legacy Mortgage Asset Trust 2020-SL1 | | | | | | | | |
2.73%, 01/25/2060, Series 2020-SL1, Class A(1)(4) | | | 923 | | | | 914 | |
Legacy Mortgage Asset Trust 2021-GS2 | | | | | | | | |
1.75%, 04/25/2061, Series 2021-GS2, Class A1(1)(4) | | | 4,250 | | | | 3,930 | |
Legacy Mortgage Asset Trust 2021-GS3 | | | | | | | | |
1.75%, 07/25/2061, Series 2021-GS3, Class A1(1)(4) | | | 8,788 | | | | 8,221 | |
Legacy Mortgage Asset Trust 2021-GS4 | | | | | | | | |
1.65%, 11/25/2060, Series 2021-GS4, Class A1(1)(4) | | | 7,720 | | | | 7,010 | |
Legacy Mortgage Asset Trust 2021-GS5 | | | | | | | | |
2.25%, 07/25/2067, Series 2021-GS5, Class A1(1)(4) | | | 7,108 | | | | 6,570 | |
Lehman XS Trust Series 2005-5N | | | | | | | | |
5.51% (1 Month LIBOR USD + 0.36%, 0.36% Floor), 11/25/2035, Series 2005-5N, Class 3A2(2) | | | 9,084 | | | | 8,079 | |
Life 2021-BMR Mortgage Trust | | | | | | | | |
7.61% (1 Month Term SOFR + 2.46%, 2.35% Floor), 03/15/2038, Series 2021-BMR, Class F(1)(2) | | | 9,830 | | | | 9,305 | |
8.21% (1 Month Term SOFR + 3.06%, 2.95% Floor), 03/15/2038, Series 2021-BMR, Class G(1)(2) | | | 9,214 | | | | 8,724 | |
Ludgate Funding Plc | | | | | | | | |
5.03% (3 Month LIBOR GBP + 0.60%), 01/01/2061, Series 2008-W1X, Class A1(2) | | GBP | 430 | | | | 519 | |
Mansard Mortgages 2007-1 Plc | | | | | | | | |
4.77% (Sterling Overnight Index Average + 0.30%), 04/15/2047, Series 2007-1X, Class A2(2) | | | 4,093 | | | | 4,990 | |
4.89% (Sterling Overnight Index Average + 0.42%), 04/15/2049, Series 2007-1X, Class M1(2) | | | 3,958 | | | | 4,677 | |
Med Trust 2021-MDLN | | | | | | | | |
6.64% (1 Month LIBOR USD + 1.45%, 1.45% Floor), 11/15/2038, Series 2021-MDLN, Class B(1)(2) | | $ | 6,384 | | | | 6,160 | |
6.99% (1 Month LIBOR USD + 1.80%, 1.80% Floor), 11/15/2038, Series 2021-MDLN, Class C(1)(2) | | | 6,195 | | | | 5,970 | |
7.19% (1 Month LIBOR USD + 2.00%, 2.00% Floor), 11/15/2038, Series 2021-MDLN, Class D(1)(2) | | | 2,831 | | | | 2,698 | |
Mello Mortgage Capital Acceptance 2021-INV4 | | | | | | | | |
2.50%, 12/25/2051, Series 2021-INV4, Class A3(1)(3) | | | 9,298 | | | | 7,463 | |
Merrill Lynch Alternative Note Asset Trust Series 2007-A3 | | | | | | | | |
5.57% (1 Month LIBOR USD + 0.42%, 0.42% Floor), 04/25/2037, Series 2007-A3, Class A1(2) | | | 27,961 | | | | 5,559 | |
Merrill Lynch Mortgage Investors Trust Series MLCC 2004-HB1 | | | | | | | | |
5.03%, 04/25/2029, Series 2004-HB1, Class A3(3) | | | 252 | | | | 226 | |
Metlife Securitization Trust 2018-1 | | | | | | | | |
3.75%, 03/25/2057, Series 2018-1A, Class A(1)(3) | | | 6,667 | | | | 6,216 | |
MF1 2021-W10X | | | | | | | | |
6.22% (1 Month Term SOFR + 1.07%, 1.07% Floor), 12/15/2034, Series 2021-W10, Class A(1)(2) | | | 5,140 | | | | 4,963 | |
MF1 Multifamily Housing Mortgage Loan Trust | | | | | | | | |
6.46% (1 Month Term SOFR + 1.31%, 1.31% Floor), 07/15/2036, Series 2021-FL5, Class AS(1)(2) | | | 15,000 | | | | 14,556 | |
MFA 2021-NQM2 Trust | | | | | | | | |
1.03%, 11/25/2064, Series 2021-NQM2, Class A1(1)(3) | | | 2,540 | | | | 2,100 | |
MFA 2022-NQM3 Trust | | | | | | | | |
5.57%, 09/25/2067, Series 2022-NQM3, Class A1(1)(4) | | | 18,207 | | | | 17,762 | |
MFA 2022-RPL1 Trust | | | | | | | | |
| | | | | | | | |
3.30%, 08/25/2061, Series 2022-RPL1, Class A1(1)(3) | | | 29,161 | | | | 26,368 | |
MHC Commercial Mortgage Trust 2021-MHC | | | | | | | | |
6.06% (1 Month Term SOFR + 0.92%, 0.80% Floor), 04/15/2038, Series 2021-MHC, Class A(1)(2) | | | 186 | | | | 183 | |
6.61% (1 Month Term SOFR + 1.47%, 1.35% Floor), 04/15/2038, Series 2021-MHC, Class C(1)(2) | | | 3,500 | | | | 3,412 | |
MHC Trust 2021-MHC2 | | | | | | | | |
7.21% (1 Month Term SOFR + 2.06%, 1.95% Floor), 05/15/2038, Series 2021-MHC2, Class E(1)(2) | | | 2,050 | | | | 1,978 | |
7.66% (1 Month Term SOFR + 2.51%, 2.40% Floor), 05/15/2038, Series 2021-MHC2, Class F(1)(2) | | | 3,000 | | | | 2,849 | |
Mill City Mortgage Loan Trust 2017-2 | | | | | | | | |
2.75%, 07/25/2059, Series 2017-2, Class A1(1)(3) | | | 25 | | | | 24 | |
Mill City Mortgage Loan Trust 2018-1 | | | | | | | | |
3.25%, 05/25/2062, Series 2018-1, Class A1(1)(3) | | | 1,148 | | | | 1,103 | |
Mill City Mortgage Loan Trust 2018-2 | | | | | | | | |
3.75%, 05/25/2058, Series 2018-2, Class M1(1)(3) | | | 494 | | | | 463 | |
Mill City Mortgage Loan Trust 2018-3 | | | | | | | | |
3.50%, 08/25/2058, Series 2018-3, Class A1(1)(3) | | | 878 | | | | 837 | |
Mill City Mortgage Loan Trust 2019-1 | | | | | | | | |
3.50%, 10/25/2069, Series 2019-1, Class M1(1)(3) | | | 1,188 | | | | 1,063 | |
Mill City Mortgage Loan Trust 2019-GS1 | | | | | | | | |
2.75%, 07/25/2059, Series 2019-GS1, Class A1(1)(3) | | | 2,288 | | | | 2,140 | |
3.25%, 07/25/2059, Series 2019-GS1, Class M2(1)(3) | | | 1,115 | | | | 913 | |
Mill City Mortgage Loan Trust 2019-GS2 | | | | | | | | |
2.75%, 08/25/2059, Series 2019-GS2, Class A1(1)(3) | | | 6,252 | | | | 5,800 | |
Mill City Mortgage Loan Trust 2021-NMR1 | | | | | | | | |
2.50%, 11/25/2060, Series 2021-NMR1, Class M2(1)(3) | | | 1,000 | | | | 830 | |
Morgan Stanley Bank of America Merrill Lynch Trust 2013-C11 | | | | | | | | |
4.48%, 08/15/2046, Series 2013-C11, Class B(3) | | | 1,563 | | | | 1,260 | |
Morgan Stanley Bank of America Merrill Lynch Trust 2013-C12 | | | | | | | | |
5.10%, 10/15/2046, Series 2013-C12, Class C(3) | | | 900 | | | | 854 | |
Morgan Stanley Bank of America Merrill Lynch Trust 2014-C15 | | | | | | | | |
4.26%, 04/15/2047, Series 2014-C15, Class AS | | | 1,940 | | | | 1,895 | |
Morgan Stanley Bank of America Merrill Lynch Trust 2014-C17 | | | | | | | | |
3.74%, 08/15/2047, Series 2014-C17, Class A5 | | | 974 | | | | 944 | |
4.46%, 08/15/2047, Series 2014-C17, Class B(3) | | | 122 | | | | 116 | |
Morgan Stanley Bank of America Merrill Lynch Trust 2015-C24 | | | | | | | | |
3.73%, 05/15/2048, Series 2015-C24, Class A4 | | | 6,000 | | | | 5,695 | |
Morgan Stanley Bank of America Merrill Lynch Trust 2016-C30 | | | | | | | | |
2.86%, 09/15/2049, Series 2016-C30, Class A5 | | | 3,220 | | | | 2,917 | |
Morgan Stanley Capital I Trust 2011-C2 | | | | | | | | |
5.39%, 06/15/2044, Series 2011-C2, Class E(1)(3) | | | 1,415 | | | | 1,014 | |
Morgan Stanley Capital I Trust 2018-H4 | | | | | | | | |
4.31%, 12/15/2051, Series 2018-H4, Class A4 | | | 1,361 | | | | 1,267 | |
Morgan Stanley Capital I Trust 2018-SUN | | | | | | | | |
6.59% (1 Month LIBOR USD + 1.40%, 1.40% Floor), 07/15/2035, Series 2018-SUN, Class C(1)(2) | | | 16,000 | | | | 15,688 | |
Morgan Stanley Capital I Trust 2021-230P | | | | | | | | |
6.99% (1 Month Term SOFR + 1.91%, 1.80% Floor), 12/15/2038, Series 2021-230P, Class C(1)(2) | | | 9,974 | | | | 9,260 | |
MRCD 2019-MARK Mortgage Trust | | | | | | | | |
2.72%, 12/15/2036, Series 2019-PARK, Class D(1) | | | 3,000 | | | | 2,639 | |
MSBAM Commercial Mortgage Securities Trust 2012-CKSV | | | | | | | | |
3.28%, 10/15/2030, Series 2012-CKSV, Class A2(1) | | | 737 | | | | 575 | |
MSCG Trust 2018-SELF | | | | | | | | |
6.09% (1 Month LIBOR USD + 0.90%, 0.90% Floor), 10/15/2037, Series 2018-SELF, Class A(1)(2) | | | 3,756 | | | | 3,712 | |
MTN Commercial Mortgage Trust 2022-LPFL | | | | | | | | |
6.54% (1 Month Term SOFR + 1.40%, 1.40% Floor), 03/15/2039, Series 2022-LPFL, Class A(1)(2) | | | 14,320 | | | | 14,051 | |
New Orleans Hotel Trust 2019-HNLA | | | | | | | | |
6.18% (1 Month LIBOR USD + 0.99%, 0.99% Floor), 04/15/2032, Series 2019-HNLA, Class A(1)(2) | | | 5,000 | | | | 4,802 | |
6.48% (1 Month LIBOR USD + 1.29%, 1.29% Floor), 04/15/2032, Series 2019-HNLA, Class B(1)(2) | | | 6,425 | | | | 6,181 | |
New Residential Mortgage Loan Trust 2019-NQM5 | | | | | | | | |
2.71%, 11/25/2059, Series 2019-NQM5, Class A1(1)(3) | | | 912 | | | | 805 | |
New Residential Mortgage Loan Trust 2019-RPL3 | | | | | | | | |
2.75%, 07/25/2059, Series 2019-RPL3, Class A1(1)(3) | | | 17,925 | | | | 16,522 | |
New Residential Mortgage Loan Trust 2020-NQM | | | | | | | | |
3.89%, 05/24/2060, Series 2020-NQM2, Class M1(1)(3) | | | 8,812 | | | | 7,159 | |
New Residential Mortgage Loan Trust 2020-NQM1 | | | | | | | | |
2.46%, 01/26/2060, Series 2020-NQM1, Class A1(1)(3) | | | 1,009 | | | | 908 | |
New Residential Mortgage Loan Trust 2021-INV1 | | | | | | | | |
2.50%, 06/25/2051, Series 2021-INV1, Class A6(1)(3) | | | 5,778 | | | | 4,974 | |
New Residential Mortgage Loan Trust 2021-NQM1R | | | | | | | | |
1.10%, 07/25/2055, Series 2021-NQ1R, Class A2(1)(3) | | | 1,015 | | | | 853 | |
1.20%, 07/25/2055, Series 2021-NQ1R, Class A3(1)(3) | | | 1,247 | | | | 1,046 | |
Newgate Funding Plc | | | | | | | | |
4.60% (3 Month LIBOR GBP + 0.17%), 12/01/2050, Series 2006-2, Class A3A(2) | | GBP | 6,483 | | | | 7,867 | |
NLT 2021-INV3 Trust | | | | | | | | |
0.00%, 11/25/2056, Series 2021-INV3, Class PT(1)(3) | | $ | 19,999 | | | | 18,092 | |
NYO Commercial Mortgage Trust 2021-1290 | | | | | | | | |
6.36% (1 Month Term SOFR + 1.21%, 1.10% Floor), 11/15/2038, Series 2021-1290, Class A(1)(2) | | | 10,900 | | | | 9,890 | |
OBX 2018-EXP1 Trust | | | | | | | | |
4.00%, 04/25/2048, Series 2018-EXP1, Class 1A3(1)(3) | | | 237 | | | | 218 | |
6.00% (1 Month LIBOR USD + 0.85%, 0.85% Floor), 04/25/2048, Series 2018-EXP1, Class 2A1(1)(2) | | | 108 | | | | 107 | |
OBX 2019-EXP2 Trust | | | | | | | | |
4.00%, 06/25/2059, Series 2019-EXP2, Class 1A3(1)(3) | | | 743 | | | | 674 | |
OBX 2019-EXP3 Trust | | | | | | | | |
3.50%, 10/25/2059, Series 2019-EXP3, Class 1A8(1)(3) | | | 487 | | | | 435 | |
OBX 2020-EXP1 Trust | | | | | | | | |
3.50%, 02/25/2060, Series 2020-EXP1, Class 1A8(1)(3) | | | 1,054 | | | | 924 | |
5.90% (1 Month LIBOR USD + 0.75%), 02/25/2060, Series 2020-EXP1, Class 2A1(1)(2) | | | 215 | | | | 198 | |
OBX 2020-EXP2 Trust | | | | | | | | |
3.00%, 05/25/2060, Series 2020-EXP2, Class A8(1)(3) | | | 2,552 | | | | 2,170 | |
OBX 2020-EXP3 Trust | | | | | | | | |
3.00%, 01/25/2060, Series 2020-EXP3, Class 1A9(1)(3) | | | 1,965 | | | | 1,674 | |
| | | | | | | | |
OBX 2020-INV1 Trust | | | | | | | | |
3.50%, 12/25/2049, Series 2020-INV1, Class A5(1)(3) | | | 1,134 | | | | 1,003 | |
OBX 2021-NQM3 Trust | | | | | | | | |
1.05%, 07/25/2061, Series 2021-NQM3, Class A1(1)(3) | | | 8,232 | | | | 6,187 | |
1.26%, 07/25/2061, Series 2021-NQM3, Class A2(1)(3) | | | 2,331 | | | | 1,739 | |
OBX 2023-NQM3 Trust | | | | | | | | |
5.95%, 02/25/2063, Series 2023-NQM3, Class A1(1)(4) | | | 25,991 | | | | 25,749 | |
OBX 2023-NQM4 Trust | | | | | | | | |
6.11%, 03/25/2063, Series 2023-NQM4, Class A1(1)(4) | | | 14,469 | | | | 14,365 | |
OBX 2023-NQM5 Trust | | | | | | | | |
6.57%, 06/25/2063, Series 2023-NQM5, Class A1A(1)(4) | | | 11,800 | | | | 11,768 | |
ONE 2021-PARK Mortgage Trust | | | | | | | | |
6.36% (1 Month Term SOFR + 1.21%, 1.10% Floor), 03/15/2036, Series 2021-PARK, Class C(1)(2) | | | 2,175 | | | | 1,985 | |
One Bryant Park Trust 2019-OBP | | | | | | | | |
2.52%, 09/15/2054, Series 2019-OBP, Class A(1) | | | 7,724 | | | | 6,271 | |
One Market Plaza Trust 2017-1MKT | | | | | | | | |
3.61%, 02/10/2032, Series 2017-1MKT, Class A(1) | | | 9,606 | | | | 8,879 | |
PFP 2022-9 Ltd. | | | | | | | | |
7.38% (1 Month Term SOFR + 2.27%, 2.27% Floor), 08/19/2035, Series 2022-9, Class A(1)(2) | | | 1,770 | | | | 1,766 | |
Precise Mortgage Funding 2018-2B Plc | | | | | | | | |
6.00% (Sterling Overnight Index Average + 1.14%), 03/12/2055, Series 2018-2B, Class A(2) | | GBP | 826 | | | | 1,049 | |
Pretium Mortgage Credit Partners LLC | | | | | | | | |
5.00%, 08/25/2052, Series 2022-RN3, Class A1(1)(3) | | $ | 32,456 | | | | 32,041 | |
PRKCM 2021-AFC2 Trust | | | | | | | | |
2.07%, 11/25/2056, Series 2021-AFC2, Class A1(1)(3) | | | 510 | | | | 417 | |
PRKCM 2022-AFC1 Trust | | | | | | | | |
4.10%, 04/25/2057, Series 2022-AFC1, Class A1A(1)(3) | | | 283 | | | | 263 | |
PRKCM 2022-AFC2 Trust | | | | | | | | |
5.34%, 08/25/2057, Series 2022-AFC2, Class A1(1)(3) | | | 2,111 | | | | 2,054 | |
PRPM 2020-4 LLC | | | | | | | | |
2.95%, 10/25/2025, Series 2020-4, Class A1(1)(4) | | | 2,180 | | | | 2,149 | |
PRPM 2021-1 LLC | | | | | | | | |
2.12%, 01/25/2026, Series 2021-1, Class A1(1)(3) | | | 4,938 | | | | 4,602 | |
PRPM 2021-10 LLC | | | | | | | | |
2.49%, 10/25/2026, Series 2021-10, Class A1(1)(4) | | | 5,614 | | | | 5,228 | |
PRPM 2021-2 LLC | | | | | | | | |
2.12%, 03/25/2026, Series 2021-2, Class A1(1)(3) | | | 2,089 | | | | 1,970 | |
PRPM 2021-6 LLC | | | | | | | | |
1.79%, 07/25/2026, Series 2021-6, Class A1(1)(4) | | | 19,635 | | | | 17,804 | |
PRPM 2021-8 LLC | | | | | | | | |
1.74%, 09/25/2026, Series 2021-8, Class A1(1)(3) | | | 4,365 | | | | 4,012 | |
PRPM 2022-1 LLC | | | | | | | | |
3.72%, 02/25/2027, Series 2022-1, Class A1(1)(4) | | | 34,547 | | | | 32,726 | |
PRPM 2022-4 LLC | | | | | | | | |
5.00%, 08/25/2027, Series 2022-4, Class A1(1)(4) | | | 10,520 | | | | 10,182 | |
PRPM 2022-5 LLC | | | | | | | | |
6.90%, 09/27/2027, Series 2022-5, Class A1(1)(4) | | | 14,337 | | | | 14,105 | |
PRPM 2023-RCF1 LLC | | | | | | | | |
4.00%, 06/25/2053, Series 2023-RCF1, Class A1(1)(4) | | | 7,700 | | | | 7,182 | |
PRPM LLC | | | | | | | | |
5.50%, 08/25/2067, Series 2022-NQM1, Class A1(1)(4) | | | 18,527 | | | | 18,092 | |
RALI Series 2006-QS9 Trust | | | | | | | | |
6.00%, 07/25/2036, Series 2006-QS9, Class 1A3 | | | 2,493 | | | | 1,899 | |
RALI Series 2007-QH8 Trust | | | | | | | | |
4.65%, 10/25/2037, Series 2007-QH8, Class A(3) | | | 758 | | | | 669 | |
RALI Series 2007-QS2 Trust | | | | | | | | |
6.25%, 01/25/2037, Series 2007-QS2, Class A4 | | | 13,364 | | | | 10,786 | |
RATE Mortgage Trust 2021-HB1 | | | | | | | | |
2.50%, 12/25/2051, Series 2021-HB1, Class A1(1)(3) | | | 15,826 | | | | 12,605 | |
RBS Commercial Funding, Inc. 2013-GSP Trust | | | | | | | | |
3.96%, 01/15/2032, Series 2013-GSP, Class A(1)(3) | | | 6,870 | | | | 6,633 | |
RCKT Mortgage Trust 2021-6 | | | | | | | | |
2.50%, 12/25/2051, Series 2021-6, Class A1(1)(3) | | | 15,207 | | | | 12,206 | |
RCKT Mortgage Trust 2022-1 | | | | | | | | |
2.50%, 01/25/2052, Series 2022-1, Class A1(1)(3) | | | 9,353 | | | | 7,508 | |
Ready Capital Mortgage Financing 2022-FL10 LLC | | | | | | | | |
7.64% (1 Month Term SOFR + 2.55%, 2.55% Floor), 10/25/2039, Series 2022-FL10, Class A(1)(2) | | | 3,190 | | | | 3,187 | |
Ready Capital Mortgage Financing 2022-FL9 LLC | | | | | | | | |
7.56% (1 Month Term SOFR + 2.47%, 2.47% Floor), 06/25/2037, Series 2022-FL9, Class A(1)(2) | | | 692 | | | | 690 | |
Ready Capital Mortgage Financing 2023-FL11 LLC | | | | | | | | |
7.46% (1 Month Term SOFR + 2.37%, 2.37% Floor), 10/25/2039, Series 2023-FL11, Class A(1)(2) | | | 1,760 | | | | 1,753 | |
Real Estate Asset Liquidity Trust | | | | | | | | |
2.42%, 06/12/2054, Series 2019-1A, Class A1(1)(3) | | CAD | 5,304 | | | | 3,939 | |
Residential Mortgage Securities 32 Plc | | | | | | | | |
6.16% (Sterling Overnight Index Average + 1.25%), 06/20/2070, Series 32A, Class A(1)(2) | | GBP | 1,128 | | | | 1,434 | |
6.81% (Sterling Overnight Index Average + 1.90%), 06/20/2070, Series 32X, Class B(2) | | | 5,000 | | | | 6,294 | |
RIAL 2022-FL8 Issuer Ltd. | | | | | | | | |
7.34% (1 Month Term SOFR + 2.25%, 2.25% Floor), 01/19/2037, Series 2022-FL8, Class A(1)(2) | | $ | 3,298 | | | | 3,239 | |
Ripon Mortgages Plc | | | | | | | | |
5.49% (Sterling Overnight Index Average + 0.70%), 08/28/2056, Series 1RA, Class A(1)(2) | | GBP | 38,247 | | | | 48,296 | |
SCOTT Trust 2023-SFS | | | | | | | | |
5.91%, 03/15/2040, Series 2023-SFS, Class A(1) | | $ | 5,330 | | | | 5,291 | |
Seasoned Loans Structured Transaction Trust Series 2020-3 | | | | | | | | |
4.75%, 04/26/2060, Series 2020-3, Class M1(1)(3) | | | 332 | | | | 317 | |
Sequoia Mortgage Trust 2003-2 | | | | | | | | |
5.82% (1 Month LIBOR USD + 0.66%, 0.66% Floor, 11.50% Cap), 06/20/2033, Series 2003-2, Class A1(2) | | | 185 | | | | 178 | |
Sequoia Mortgage Trust 2004-9 | | | | | | | | |
5.65% (6 Month LIBOR USD + 0.72%, 0.72% Floor, 11.50% Cap), 10/20/2034, Series 2004-9, Class A2(2) | | | 715 | | | | 625 | |
Sequoia Mortgage Trust 2013-4 | | | | | | | | |
| | | | | | | | |
3.44%, 04/25/2043, Series 2013-4, Class B1(3) | | | 429 | | | | 394 | |
Sequoia Mortgage Trust 2017-CH1 | | | | | | | | |
4.00%, 08/25/2047, Series 2017-CH1, Class A1(1)(3) | | | 434 | | | | 405 | |
Sequoia Mortgage Trust 2017-CH2 | | | | | | | | |
4.00%, 12/25/2047, Series 2017-CH2, Class A1(1)(3) | | | 192 | | | | 177 | |
4.00%, 12/25/2047, Series 2017-CH2, Class A19(1)(3) | | | 199 | | | | 182 | |
Sequoia Mortgage Trust 2018-CH1 | | | | | | | | |
3.50%, 03/25/2048, Series 2018-CH1, Class A2(1)(3) | | | 47 | | | | 42 | |
Sequoia Mortgage Trust 2018-CH2 | | | | | | | | |
4.00%, 06/25/2048, Series 2018-CH2, Class A21(1)(3) | | | 148 | | | | 135 | |
Sequoia Mortgage Trust 2018-CH3 | | | | | | | | |
4.00%, 08/25/2048, Series 2018-CH3, Class A2(1)(3) | | | 139 | | | | 133 | |
4.50%, 08/25/2048, Series 2018-CH3, Class A19(1)(3) | | | 58 | | | | 56 | |
4.50%, 08/25/2048, Series 2018-CH3, Class A13(1)(3) | | | 344 | | | | 333 | |
Sequoia Mortgage Trust 2018-CH4 | | | | | | | | |
4.00%, 10/25/2048, Series 2018-CH4, Class A2(1)(3) | | | 10 | | | | 10 | |
SFO Commercial Mortgage Trust 2021-555 | | | | | | | | |
6.34% (1 Month Term SOFR + 1.26%, 1.15% Floor), 05/15/2038, Series 2021-555, Class A(1)(2) | | | 4,900 | | | | 4,280 | |
6.99% (1 Month Term SOFR + 1.91%, 1.80% Floor), 05/15/2038, Series 2021-555, Class C(1)(2) | | | 6,550 | | | | 5,153 | |
SG Residential Mortgage Trust 2022-2 | | | | | | | | |
5.35%, 08/25/2062, Series 2022-2, Class A1(1)(4) | | | 428 | | | | 416 | |
SMRT 2022-MINI | | | | | | | | |
6.15% (1 Month Term SOFR + 1.00%, 1.00% Floor), 01/15/2039, Series 2022-MINI, Class A(1)(2) | | | 5,351 | | | | 5,183 | |
7.10% (1 Month Term SOFR + 1.95%, 1.95% Floor), 01/15/2039, Series 2022-MINI, Class D(1)(2) | | | 1,120 | | | | 1,057 | |
SREIT Trust 2021-MFP2 | | | | | | | | |
6.01% (1 Month LIBOR USD + 0.82%, 0.82% Floor), 11/15/2036, Series 2021-MFP2, Class A(1)(2) | | | 5,370 | | | | 5,232 | |
STACR Trust 2018-DNA3 | | | | | | | | |
6.05% (1 Month LIBOR USD + 0.90%), 09/25/2048, Series 2018-DNA3, Class M2AS(1)(2) | | | 1,752 | | | | 1,747 | |
Starwood Mortgage Residential Trust 2020-INV | | | | | | | | |
2.50%, 11/25/2055, Series 2020-INV1, Class M1(1) | | | 1,545 | | | | 1,264 | |
Stratton Mortgage Funding | | | | | | | | |
5.86% (Sterling Overnight Index Average + 0.90%), 07/20/2060, Series 2021-2A, Class A(1)(2) | | GBP | 12,854 | | | | 16,312 | |
STWD 2021-LIH Mortgage Trust | | | | | | | | |
7.15% (1 Month LIBOR USD + 1.96%, 1.96% Floor), 11/15/2036, Series 2021-LIH, Class C(1)(2) | | $ | 16,200 | | | | 15,680 | |
8.10% (1 Month LIBOR USD + 2.90%, 2.90% Floor), 11/15/2036, Series 2021-LIH, Class E(1)(2) | | | 6,877 | | | | 6,480 | |
STWD Trust 2021-FLWR | | | | | | | | |
7.12% (1 Month LIBOR USD + 1.92%, 1.92% Floor), 07/15/2036, Series 2021-FLWR, Class E(1)(2) | | | 9,325 | | | | 8,810 | |
Taubman Centers Commercial Mortgage Trust 2022-DPM | | | | | | | | |
7.33% (1 Month Term SOFR + 2.19%, 2.19% Floor), 05/15/2037, Series 2022-DPM, Class A(1)(2) | | | 2,380 | | | | 2,312 | |
Toorak Mortgage Corp. 2021-1 Ltd. | | | | | | | | |
2.24%, 06/25/2024, Series 2021-1, Class A1(1)(4) | | | 7,160 | | | | 6,960 | |
Towd Point Mortgage Funding | | | | | | | | |
5.84% (Sterling Overnight Index Average + 1.35%), 07/20/2045, Series 2019-A13A, Class A1(1)(2) | | GBP | 58,472 | | | | 74,178 | |
Towd Point Mortgage Funding 2018—Auburn 12 Plc | | | | | | | | |
6.22% (Sterling Overnight Index Average + 1.47%, 1.35% Floor), 02/20/2045, Series 2018-A12X, Class A(2) | | | 1,281 | | | | 1,629 | |
Towd Point Mortgage Funding 2019—Granite4 Plc | | | | | | | | |
6.10% (Sterling Overnight Index Average + 1.14%), 10/20/2051, Series 2019-GR4A, Class A1(1)(2) | | | 12,468 | | | | 15,838 | |
Towd Point Mortgage Trust 2015-4 | | | | | | | | |
3.75%, 04/25/2055, Series 2015-4, Class M2(1)(3) | | $ | 85 | | | | 82 | |
Towd Point Mortgage Trust 2017-1 | | | | | | | | |
2.75%, 10/25/2056, Series 2017-1, Class A1(1)(3) | | | 29 | | | | 29 | |
3.75%, 10/25/2056, Series 2017-1, Class M1(1)(3) | | | 6,315 | | | | 5,906 | |
Towd Point Mortgage Trust 2017-2 | | | | | | | | |
2.75%, 04/25/2057, Series 2017-2, Class A1(1)(3) | | | 12 | | | | 12 | |
Towd Point Mortgage Trust 2017-3 | | | | | | | | |
3.00%, 07/25/2057, Series 2017-3, Class A2(1)(3) | | | 320 | | | | 299 | |
Towd Point Mortgage Trust 2017-4 | | | | | | | | |
3.25%, 06/25/2057, Series 2017-4, Class M2(1)(3) | | | 3,873 | | | | 3,201 | |
Towd Point Mortgage Trust 2017-5 | | | | | | | | |
4.60% (1 Month LIBOR USD + 0.60%), 02/25/2057, Series 2017-5, Class A1(1)(2) | | | 102 | | | | 102 | |
Towd Point Mortgage Trust 2018-3 | | | | | | | | |
3.75%, 05/25/2058, Series 2018-3, Class A1(1)(3) | | | 2,825 | | | | 2,662 | |
Towd Point Mortgage Trust 2018-4 | | | | | | | | |
3.00%, 06/25/2058, Series 2018-4, Class A2(1)(3) | | | 1,015 | | | | 823 | |
Towd Point Mortgage Trust 2018-5 | | | | | | | | |
3.25%, 07/25/2058, Series 2018-5, Class M1(1)(3) | | | 2,250 | | | | 1,789 | |
3.25%, 07/25/2058, Series 2018-5, Class A1(1)(3) | | | 8,744 | | | | 8,070 | |
Towd Point Mortgage Trust 2019-1 | | | | | | | | |
3.75%, 03/25/2058, Series 2019-1, Class A1(1)(3) | | | 5,169 | | | | 4,837 | |
Towd Point Mortgage Trust 2019-2 | | | | | | | | |
3.75%, 12/25/2058, Series 2019-2, Class M1(1)(3) | | | 9,810 | | | | 8,098 | |
Towd Point Mortgage Trust 2019-4 | | | | | | | | |
2.90%, 10/25/2059, Series 2019-4, Class A1(1)(3) | | | 52,720 | | | | 48,429 | |
3.50%, 10/25/2059, Series 2019-4, Class M1(1)(3) | | | 1,155 | | | | 970 | |
Towd Point Mortgage Trust 2020-1 | | | | | | | | |
3.25%, 01/25/2060, Series 2020-1, Class A2B(1)(3) | | | 575 | | | | 477 | |
Towd Point Mortgage Trust 2020-2 | | | | | | | | |
3.00%, 04/25/2060, Series 2020-2, Class A2B(1)(3) | | | 310 | | | | 246 | |
Towd Point Mortgage Trust 2021-SJ2 | | | | | | | | |
2.25%, 12/25/2061, Series 2021-SJ2, Class A1A(1)(3) | | | 31,665 | | | | 28,775 | |
Trinity Square 2021-1 Plc | | | | | | | | |
6.36% (Sterling Overnight Index Average + 1.40%), 07/15/2059, Series 2021-1A, Class B(1)(2) | | GBP | 11,459 | | | | 14,448 | |
6.66% (Sterling Overnight Index Average + 1.70%), 07/15/2059, Series 2021-1A, Class C(1)(2) | | | 3,286 | | | | 4,116 | |
6.96% (Sterling Overnight Index Average + 2.00%), 07/15/2059, Series 2021-1A, Class D(1)(2) | | | 2,364 | | | | 2,941 | |
7.71% (Sterling Overnight Index Average + 2.75%), 07/15/2059, Series 2021-1A, Class E(1)(2) | | | 1,143 | | | | 1,423 | |
TRK 2021-INV1 Trust | | | | | | | | |
1.15%, 07/25/2056, Series 2021-INV1, Class A1(1)(3) | | $ | 3,610 | | | | 3,005 | |
TRK 2022-INV1 Trust | | | | | | | | |
2.58%, 02/25/2057, Series 2022-INV1, Class A1(1)(3) | | | 10,254 | | | | 8,916 | |
| | | | | | | | |
UBS-Barclays Commercial Mortgage Trust 2012-C2 | | | | | | | | |
4.84%, 05/10/2063, Series 2012-C2, Class E(1)(3) | | | 3,235 | | | | 32 | |
4.84%, 05/10/2063, Series 2012-C2, Class D(1)(3) | | | 1,135 | | | | 34 | |
Uropa Securities Plc | | | | | | | | |
3.26% (3 Month EURIBOR + 0.20%), 10/10/2040, Series 2007-1, Class A3B(2) | | EUR | 1,577 | | | | 1,636 | |
UWM Mortgage Trust 2021-INV2 | | | | | | | | |
2.50%, 09/25/2051, Series 2021-INV2, Class A15(1)(3) | | $ | 5,924 | | | | 4,578 | |
VASA Trust 2021-VASA | | | | | | | | |
6.44% (1 Month LIBOR USD + 1.25%, 1.25% Floor), 07/15/2039, Series 2021-VASA, Class B(1)(2) | | | 14,000 | | | | 11,649 | |
6.94% (1 Month LIBOR USD + 1.75%, 1.75% Floor), 07/15/2039, Series 2021-VASA, Class C(1)(2) | | | 12,000 | | | | 9,543 | |
Verus Securitization Trust 2019-4 | | | | | | | | |
2.64%, 11/25/2059, Series 2019-4, Class A1(1)(4) | | | 640 | | | | 612 | |
2.85%, 11/25/2059, Series 2019-4, Class A2(1)(4) | | | 751 | | | | 718 | |
3.00%, 11/25/2059, Series 2019-4, Class A3(1)(4) | | | 1,304 | | | | 1,244 | |
Verus Securitization Trust 2019-INV2 | | | | | | | | |
3.12%, 07/25/2059, Series 2019-INV2, Class A2(1)(3) | | | 1,492 | | | | 1,437 | |
Verus Securitization Trust 2019-INV3 | | | | | | | | |
2.69%, 11/25/2059, Series 2019-INV3, Class A1(1)(3) | | | 1,471 | | | | 1,404 | |
Verus Securitization Trust 2020-1 | | | | | | | | |
2.72%, 01/25/2060, Series 2020-1, Class A3(1)(4) | | | 2,426 | | | | 2,258 | |
Verus Securitization Trust 2021-1 | | | | | | | | |
1.16%, 01/25/2066, Series 2021-1, Class A3(1)(3) | | | 2,279 | | | | 1,909 | |
Verus Securitization Trust 2021-5 | | | | | | | | |
1.01%, 09/25/2066, Series 2021-5, Class A1(1)(3) | | | 20,386 | | | | 16,069 | |
Verus Securitization Trust 2021-7 | | | | | | | | |
1.83%, 10/25/2066, Series 2021-7, Class A1(1)(3) | | | 9,895 | | | | 8,380 | |
Verus Securitization Trust 2021-8 | | | | | | | | |
1.82%, 11/25/2066, Series 2021-8, Class A1(1)(3) | | | 13,286 | | | | 11,102 | |
Verus Securitization Trust 2021-R1 | | | | | | | | |
1.26%, 10/25/2063, Series 2021-R1, Class A3(1)(3) | | | 1,371 | | | | 1,223 | |
Verus Securitization Trust 2021-R2 | | | | | | | | |
1.23%, 02/25/2064, Series 2021-R2, Class A3(1)(3) | | | 2,215 | | | | 1,900 | |
Verus Securitization Trust 2022-3 | | | | | | | | |
4.13%, 02/25/2067, Series 2022-3, Class A1(1)(4) | | | 21,806 | | | | 19,914 | |
Verus Securitization Trust 2022-4 | | | | | | | | |
4.47%, 04/25/2067, Series 2022-4, Class A1(1)(4) | | | 12,598 | | | | 12,028 | |
Verus Securitization Trust 2022-7 | | | | | | | | |
5.15%, 07/25/2067, Series 2022-7, Class A1(1)(4) | | | 15,196 | | | | 14,619 | |
Verus Securitization Trust 2023-4 | | | | | | | | |
5.81%, 05/25/2068, Series 2023-4, Class A1(1)(4) | | | 8,418 | | | | 8,343 | |
Verus Securitization Trust 2023-5 | | | | | | | | |
6.48%, 06/25/2068, Series 2023-5, Class A1(1)(4) | | | 6,400 | | | | 6,381 | |
Vista Point Securitization Trust 2020-1 | | | | | | | | |
3.20%, 03/25/2065, Series 2020-1, Class A3(1)(3) | | | 3,765 | | | | 3,498 | |
Vista Point Securitization Trust 2020-2 | | | | | | | | |
1.48%, 04/25/2065, Series 2020-2, Class A1(1)(3) | | | 937 | | | | 830 | |
WaMu Mortgage Pass-Through Certificates Series 2005-AR11 Trust | | | | | | | | |
5.79% (1 Month LIBOR USD + 0.64%, 0.64% Floor, 10.50% Cap), 08/25/2045, Series 2005-AR11, Class A1A(2) | | | 1,264 | | | | 1,190 | |
WaMu Mortgage Pass-Through Certificates Series 2005-AR13 Trust | | | | | | | | |
5.73% (1 Month LIBOR USD + 0.58%, 0.58% Floor, 10.50% Cap), 10/25/2045, Series 2005-AR13, Class A1A1(2) | | | 1,831 | | | | 1,721 | |
WaMu Mortgage Pass-Through Certificates Series 2005-AR15 Trust | | | | | | | | |
5.67% (1 Month LIBOR USD + 0.52%, 0.52% Floor, 10.50% Cap), 11/25/2045, Series 2005-AR15, Class A1A1(2) | | | 3,111 | | | | 2,869 | |
WaMu Mortgage Pass-Through Certificates Series 2005-AR2 Trust | | | | | | | | |
5.81% (1 Month LIBOR USD + 0.66%, 0.66% Floor, 10.50% Cap), 01/25/2045, Series 2005-AR2, Class 1A1A(2) | | | 3,157 | | | | 2,930 | |
WaMu Mortgage Pass-Through Certificates Series 2006-AR1 Trust | | | | | | | | |
5.05% (12 Month U.S. Treasury Average + 1.07%, 1.07% Floor), 01/25/2046, Series 2006-AR1, Class 2A1A(2) | | | 6,212 | | | | 5,716 | |
WaMu Mortgage Pass-Through Certificates Series 2007-OA5 Trust | | | | | | | | |
4.73% (12 Month U.S. Treasury Average + 0.75%, 0.75% Floor), 06/25/2047, Series 2007-OA5, Class 1A(2) | | | 8,366 | | | | 6,791 | |
Washington Mutual Mortgage Pass-Through Certificates WMALT Series 2007-2 Trust | | | | | | | | |
5.50%, 04/25/2037, Series 2007-2, Class 2A1 | | | 4,552 | | | | 4,228 | |
Wells Fargo Commercial Mortgage Trust 2013-LC12 | | | | | | | | |
4.44%, 07/15/2046, Series 2013-LC12, Class B(3) | | | 1,940 | | | | 1,455 | |
Wells Fargo Commercial Mortgage Trust 2014-LC16 | | | | | | | | |
4.02%, 08/15/2050, Series 2014-LC16, Class AS | | | 3,015 | | | | 2,902 | |
Wells Fargo Commercial Mortgage Trust 2016-C33 | | | | | | | | |
3.16%, 03/15/2059, Series 2016-C33, Class A3 | | | 840 | | | | 783 | |
4.51%, 03/15/2059, Series 2016-C33, Class B(3) | | | 4,317 | | | | 3,957 | |
Wells Fargo Commercial Mortgage Trust 2016-C35 | | | | | | | | |
3.18%, 07/15/2048, Series 2016-C35, Class AS | | | 3,155 | | | | 2,829 | |
Wells Fargo Commercial Mortgage Trust 2016-C36 | | | | | | | | |
3.42%, 11/15/2059, Series 2016-C36, Class AS | | | 4,341 | | | | 3,901 | |
Wells Fargo Commercial Mortgage Trust 2016-LC24 | | | | | | | | |
3.37%, 10/15/2049, Series 2016-LC24, Class AS | | | 6,000 | | | | 5,396 | |
Wells Fargo Commercial Mortgage Trust 2019-JWDR | | | | | | | | |
2.58%, 09/15/2031, Series 2019-JWDR, Class A(1)(3) | | | 6,560 | | | | 5,826 | |
3.14%, 09/15/2031, Series 2019-JWDR, Class C(1)(3) | | | 290 | | | | 256 | |
3.44%, 09/15/2031, Series 2019-JWDR, Class D(1)(3) | | | 10,000 | | | | 8,857 | |
3.99%, 09/15/2031, Series 2019-JWDR, Class E(1)(3) | | | 6,766 | | | | 6,008 | |
Wells Fargo Commercial Mortgage Trust 2020-C55 | | | | | | | | |
2.73%, 02/15/2053, Series 2020-C55, Class A5 | | | 5,200 | | | | 4,374 | |
Wells Fargo Mortgage Backed Securities 2021-RR1 Trust | | | | | | | | |
2.50%, 12/25/2050, Series 2021-RR1, Class A1(1)(3) | | | 5,284 | | | | 4,242 | |
WFRBS Commercial Mortgage Trust 2013-C15 | | | | | | | | |
4.58%, 08/15/2046, Series 2013-C15, Class B(3) | | | 1,525 | | | | 1,267 | |
WFRBS Commercial Mortgage Trust 2014-C20 | | | | | | | | |
4.38%, 05/15/2047, Series 2014-C20, Class B | | | 2,365 | | | | 1,732 | |
WFRBS Commercial Mortgage Trust 2014-C22 | | | | | | | | |
4.07%, 09/15/2057, Series 2014-C22, Class AS(3) | | | 4,250 | | | | 3,914 | |
WFRBS Commercial Mortgage Trust 2014-C24 | | | | | | | | |
| | | | | | | | |
4.20%, 11/15/2047, Series 2014-C24, Class B(3) | | | 825 | | | | 739 | |
WMRK Commercial Mortgage Trust 2022-WMRK | | | | | | | | |
7.94% (1 Month Term SOFR + 2.79%, 2.79% Floor), 11/15/2027, Series 2022-WMRK, Class A(1)(2) | | | 2,158 | | | | 2,155 | |
Worldwide Plaza Trust 2017-WWP | | | | | | | | |
3.53%, 11/10/2036, Series 2017-WWP, Class A(1) | | | 1,740 | | | | 1,464 | |
3.72%, 11/10/2036, Series 2017-WWP, Class C(1)(3) | | | 320 | | | | 232 | |
| | | | | | | | |
Total Mortgage-Backed Obligations (Cost: $11,360,437) | | | | | | | 10,698,491 | |
| | | | | | | | |
Total Bonds & Notes (Cost: $31,576,845) | | | | 29,217,483 | |
| | | | | | | | |
BANK LOANS – 1.10% | | | | | | | | |
1011778 BC ULC | | | | | | | | |
6.94% (LIBOR + 1.75%), 11/19/2026(2) | | | 1,536 | | | | 1,523 | |
8th Avenue Food & Provisions, Inc. | | | | | | | | |
0.00%, 10/01/2025 | | | 198 | | | | 182 | |
AAdvantage Loyality IP Ltd. | | | | | | | | |
10.00% (LIBOR + 4.75%), 04/20/2028(2) | | | 2,848 | | | | 2,905 | |
Acrisure LLC | | | | | | | | |
8.69% (LIBOR + 3.50%), 02/15/2027(2) | | | 2,954 | | | | 2,862 | |
Acuity Specialty Products, Inc. | | | | | | | | |
9.24% (LIBOR + 4.00%), 08/12/2024(2) | | | 2,369 | | | | 2,004 | |
AEA International Holdings SARL | | | | | | | | |
9.25% (CME Term SOFR + 3.75%), 09/07/2028(2) | | | 1,336 | | | | 1,331 | |
Allied Universal Holdco LLC | | | | | | | | |
8.95% (CME Term SOFR + 3.75%), 05/12/2028(2) | | | 1,118 | | | | 1,085 | |
Amentum Government Services Holdings LLC | | | | | | | | |
9.22% (CME Term SOFR + 4.00%), 01/29/2027(2) | | | 403 | | | | 396 | |
AmSurg LLC | | | | | | | | |
0.00%, 04/29/2027 | | | 7,463 | | | | 8,806 | |
16.70% (CME Term SOFR + 11.65%), 04/28/2028(2) | | | 3,284 | | | | 1,749 | |
AmWINS Group, Inc. | | | | | | | | |
7.44% (LIBOR + 2.25%), 02/19/2028(2) | | | 5,067 | | | | 5,015 | |
AppLovin Corp. | | | | | | | | |
0.00%, 08/15/2025 | | | 1,116 | | | | 1,115 | |
Arches Buyer, Inc. | | | | | | | | |
8.45% (CME Term SOFR + 3.25%), 12/06/2027(2) | | | 730 | | | | 703 | |
ASP Blade Holdings, Inc. | | | | | | | | |
9.19% (LIBOR + 4.00%), 10/13/2028(2) | | | 250 | | | | 217 | |
Asurion LLC | | | | | | | | |
0.00%, 11/03/2024 | | | 1,783 | | | | 1,780 | |
8.79% (LIBOR + 3.25%), 12/23/2026(2) | | | 612 | | | | 588 | |
Athena Health Group, Inc. | | | | | | | | |
8.59% (CME Term SOFR + 3.50%), 02/15/2029(2) | | | 2,693 | | | | 2,589 | |
Avantor Funding, Inc. | | | | | | | | |
7.45% (CME Term SOFR + 2.25%), 11/08/2027(2) | | | 1,266 | | | | 1,265 | |
Avolon TLB Borrower 1 (US) LLC | | | | | | | | |
7.58% (CME Term SOFR + 2.50%), 06/22/2028(2) | | | 281 | | | | 281 | |
AZZ, Inc. | | | | | | | | |
9.45% (CME Term SOFR + 4.25%), 05/13/2029(2) | | | 278 | | | | 278 | |
Bakelite U.S. Holdco, Inc. | | | | | | | | |
9.39% (CME Term SOFR + 4.00%), 05/29/2029(2) | | | 2,281 | | | | 2,237 | |
Bally’s Corp. | | | | | | | | |
8.40% (LIBOR + 3.25%), 10/02/2028(2) | | | 2,965 | | | | 2,894 | |
Bausch + Lomb Corp. | | | | | | | | |
8.59% (CME Term SOFR + 3.25%), 05/10/2027(2) | | | 1,280 | | | | 1,240 | |
BCPE North Star U.S. Holdco 2, Inc. | | | | | | | | |
9.54% (CME Term SOFR + 4.00%), 06/09/2028(2) | | | 1,513 | | | | 1,384 | |
Berry Global, Inc. | | | | | | | | |
6.97% (LIBOR + 1.75%), 07/01/2026(2) | | | 1,312 | | | | 1,310 | |
Carnival Corp. | | | | | | | | |
7.17% (EURIBOR + 3.75%), 06/30/2025(2) | | EUR | 4,850 | | | | 5,260 | |
8.22% (CME Term SOFR + 3.00%), 06/30/2025(2) | | $ | 10,476 | | | | 10,453 | |
8.47% (CME Term SOFR + 3.25%), 10/18/2028(2) | | | 1,327 | | | | 1,314 | |
Central Parent, Inc. | | | | | | | | |
9.49% (CME Term SOFR + 4.25%), 07/06/2029(2) | | | 2,139 | | | | 2,132 | |
Charter Communications Operating LLC | | | | | | | | |
6.80% (CME Term SOFR + 1.75%), 02/01/2027(2) | | | 482 | | | | 479 | |
Chemours Co. | | | | | | | | |
6.95% (CME Term SOFR + 1.75%), 04/03/2025(2) | | | 147 | | | | 145 | |
City Brewing Co., LLC | | | | | | | | |
0.00%, 04/05/2028 | | | 722 | | | | 466 | |
Coherent Corp. | | | | | | | | |
7.97% (CME Term SOFR + 2.75%), 07/02/2029(2) | | | 1,234 | | | | 1,229 | |
Commscope, Inc. | | | | | | | | |
8.47% (CME Term SOFR + 3.25%), 04/06/2026(2) | | | 4,375 | | | | 4,183 | |
ConnectWise LLC | | | | | | | | |
8.69% (LIBOR + 3.50%), 09/29/2028(2) | | | 1,398 | | | | 1,358 | |
Corporation Service Co. | | | | | | | | |
8.45% (CME Term SOFR + 3.25%), 11/02/2029(2) | | | 430 | | | | 430 | |
Creative Artists Agency LLC | | | | | | | | |
8.60% (CME Term SOFR + 3.50%), 11/27/2028(2) | | | 1 | | | | 1 | |
Crown Finance U.S., Inc. | | | | | | | | |
15.19% (CME Term SOFR + 10.00%), 09/07/2023(2) | | | 2,841 | | | | 2,866 | |
CSC Holdings LLC | | | | | | | | |
0.00%, 04/15/2027 | | | 1,306 | | | | 1,138 | |
Dave & Buster’s, Inc. | | | | | | | | |
0.00%, 06/29/2029 | | | 452 | | | | 450 | |
Deerfield Dakota Holding LLC | | | | | | | | |
8.99% (CME Term SOFR + 3.75%), 04/09/2027(2) | | | 1,753 | | | | 1,698 | |
Delos Finance Sarl | | | | | | | | |
| | | | | | | | |
0.00%, 10/06/2023 | | | 468 | | | | 467 | |
DIRECTV Financing LLC | | | | | | | | |
10.22% (CME Term SOFR + 5.00%), 08/02/2027(2) | | | 9,099 | | | | 8,885 | |
DTI Holdco, Inc. | | | | | | | | |
9.80% (CME Term SOFR + 4.75%), 04/26/2029(2) | | | 286 | | | | 265 | |
Elanco Animal Health, Inc. | | | | | | | | |
7.01% (CME Term SOFR + 1.75%), 08/01/2027(2) | | | 5,906 | | | | 5,793 | |
Element Materials Technology Group U.S. Holdings, Inc. | | | | | | | | |
9.59% (CME Term SOFR + 4.25%), 06/22/2029(2) | | | 282 | | | | 276 | |
9.59% (CME Term SOFR + 4.25%), 06/22/2029(2) | | | 612 | | | | 598 | |
Entegris, Inc. | | | | | | | | |
7.95% (CME Term SOFR + 2.75%), 07/06/2029(2) | | | 598 | | | | 598 | |
Envalior Finance GmbH | | | | | | | | |
8.92% (EURIBOR + 5.50%), 03/29/2030(2) | | EUR | 4,100 | | | | 4,257 | |
10.60% (CME Term SOFR + 5.50%), 03/29/2030(2) | | $ | 8,180 | | | | 7,699 | |
Envision Healthcare Corp. | | | | | | | | |
0.00%, 07/10/2026 | | | 2,346 | | | | 2,205 | |
Fanatics Commerce Intermediate Holdco LLC | | | | | | | | |
8.61% (CME Term SOFR + 3.25%), 11/24/2028(2) | | | 477 | | | | 475 | |
Fertitta Entertainment LLC | | | | | | | | |
9.10% (CME Term SOFR + 4.00%), 01/27/2029(2) | | | 5,593 | | | | 5,512 | |
Filtration Group Corp. | | | | | | | | |
9.45% (CME Term SOFR + 4.25%), 10/21/2028(2) | | | 418 | | | | 418 | |
Formula One Management Ltd. | | | | | | | | |
8.10% (CME Term SOFR + 3.00%), 01/15/2030(2) | | | 168 | | | | 168 | |
Frontier Communications Holdings LLC | | | | | | | | |
9.00% (LIBOR + 3.75%), 05/01/2028(2) | | | 1,644 | | | | 1,589 | |
Gainwell Acquisition Corp. | | | | | | | | |
9.34% (CME Term SOFR + 4.00%), 10/01/2027(2) | | | 2,462 | | | | 2,422 | |
Gen Digital, Inc. | | | | | | | | |
6.95% (CME Term SOFR + 1.75%), 09/10/2027(2) | | | 2,880 | | | | 2,813 | |
7.20% (CME Term SOFR + 2.00%), 09/12/2029(2) | | | 3 | | | | 3 | |
Genesee & Wyoming, Inc. | | | | | | | | |
7.34% (CME Term SOFR + 2.00%), 12/30/2026(2) | | | 1,214 | | | | 1,213 | |
Gray Television, Inc. | | | | | | | | |
8.27% (CME Term SOFR + 3.00%), 12/01/2028(2) | | | 2,137 | | | | 2,084 | |
Grifols Worldwide Operations Ltd. | | | | | | | | |
7.36% (CME Term SOFR + 2.00%), 11/15/2027(2) | | | 4,514 | | | | 4,437 | |
H-Food Holdings LLC | | | | | | | | |
9.27% (LIBOR + 3.69%), 05/23/2025(2) | | | 350 | | | | 307 | |
Hilton Worldwide Finance LLC | | | | | | | | |
6.94% (CME Term SOFR + 1.75%), 06/22/2026(2) | | | 361 | | | | 361 | |
Horizon Therapeutics USA, Inc. | | | | | | | | |
0.00%, 05/22/2026 | | | 985 | | | | 983 | |
6.95% (CME Term SOFR + 1.75%), 03/15/2028(2) | | | 2,997 | | | | 2,987 | |
Hostess Brands LLC | | | | | | | | |
5.10% (CME Term SOFR + 2.50%), 07/31/2023 | | | 2,182 | | | | 2,175 | |
ICON Plc | | | | | | | | |
7.75% (CME Term SOFR + 2.25%), 07/03/2028(2) | | | 147 | | | | 147 | |
7.75% (CME Term SOFR + 2.25%), 07/03/2028(2) | | | 591 | | | | 591 | |
Ingenico Group | | | | | | | | |
8.85% (EURIBOR + 5.25%), 07/25/2028(2) | | EUR | 36,800 | | | | 39,151 | |
Intelsat Jackson Holdings SA | | | | | | | | |
9.44% (CME Term SOFR + 4.25%), 02/01/2029(2) | | $ | 2,859 | | | | 2,845 | |
IQVIA, Inc. | | | | | | | | |
7.29% (LIBOR + 1.75%), 06/11/2025(2) | | | 1,402 | | | | 1,401 | |
Jazz Pharmaceuticals Plc | | | | | | | | |
8.86% (CME Term SOFR + 3.50%), 05/05/2028(2) | | | 4,622 | | | | 4,615 | |
KFC Holding Co. | | | | | | | | |
6.90% (LIBOR + 1.75%), 03/15/2028(2) | | | 1,143 | | | | 1,132 | |
Lealand Finance Co. BV | | | | | | | | |
0.00%, 06/30/2025 | | | 642 | | | | 360 | |
8.22% (CME Term SOFR + 3.00%), 06/28/2024(2) | | | 149 | | | | 112 | |
Light and Wonder International, Inc. | | | | | | | | |
8.25% (CME Term SOFR + 3.00%), 04/14/2029(2) | | | 895 | | | | 893 | |
Market Bidco Ltd. | | | | | | | | |
8.07% (EURIBOR + 4.75%), 11/04/2027(2) | | EUR | 21,570 | | | | 20,144 | |
Medline Borrower LP | | | | | | | | |
8.35% (CME Term SOFR + 3.25%), 10/23/2028(2) | | $ | 2,716 | | | | 2,683 | |
MH Sub I LLC | | | | | | | | |
9.35% (CME Term SOFR + 4.25%), 05/03/2028(2) | | | 883 | | | | 846 | |
Naked Juice LLC | | | | | | | | |
8.59% (CME Term SOFR + 3.25%), 01/24/2029(2) | | | 2,795 | | | | 2,595 | |
11.34% (CME Term SOFR + 6.00%), 01/24/2030(2) | | | 778 | | | | 613 | |
Open Text Corp. | | | | | | | | |
0.00%, 05/30/2025 | | | 723 | | | | 722 | |
8.70% (CME Term SOFR + 3.50%), 01/31/2030(2) | | | 1,116 | | | | 1,121 | |
Oracle Corp. | | | | | | | | |
6.78% (CME Term SOFR + 1.60%), 08/16/2027(2) | | | 5,585 | | | | 5,529 | |
Organon & Co. | | | | | | | | |
8.25% (LIBOR + 3.00%), 06/02/2028(2) | | | 4,459 | | | | 4,452 | |
Osmosis Buyer Ltd. | | | | | | | | |
8.90% (CME Term SOFR + 3.75%), 07/31/2028(2) | | | 1,223 | | | | 1,199 | |
Patriot Container Corp. | | | | | | | | |
0.00%, 03/20/2025 | | | 198 | | | | 182 | |
Penn Entertainment, Inc. | | | | | | | | |
7.95% (CME Term SOFR + 2.75%), 05/03/2029(2) | | | 669 | | | | 666 | |
Peraton Corp. | | | | | | | | |
8.95% (CME Term SOFR + 3.75%), 02/01/2028(2) | | | 1,295 | | | | 1,270 | |
| | | | | | | | |
Pre-Paid Legal Services, Inc. | | | | | | | | |
8.94% (LIBOR + 3.75%), 12/15/2028(2) | | | 1,059 | | | | 1,043 | |
Prime Security Services Borrower LLC | | | | | | | | |
7.94% (LIBOR + 2.75%), 09/23/2026(2) | | | 961 | | | | 960 | |
Proofpoint, Inc. | | | | | | | | |
8.47% (CME Term SOFR + 3.25%), 08/31/2028(2) | | | 188 | | | | 184 | |
RealPage, Inc. | | | | | | | | |
8.22% (CME Term SOFR + 3.00%), 04/24/2028(2) | | | 445 | | | | 435 | |
Renaissance Holding Corp. | | | | | | | | |
9.99% (CME Term SOFR + 4.75%), 04/05/2030(2) | | | 871 | | | | 859 | |
Safe Fleet Holdings LLC | | | | | | | | |
8.93% (CME Term SOFR + 3.75%), 02/23/2029(2) | | | 390 | | | | 389 | |
SBA Senior Finance II LLC | | | | | | | | |
6.95% (LIBOR + 1.75%), 04/11/2025(2) | | | 2,613 | | | | 2,612 | |
Setanta Aircraft Leasing DAC | | | | | | | | |
7.54% (LIBOR + 2.00%), 11/05/2028(2) | | | 1,500 | | | | 1,498 | |
Sigma Holdco BV | | | | | | | | |
6.24% (EURIBOR + 3.50%), 07/02/2025(2) | | EUR | 7,690 | | | | 8,190 | |
Sophia LP | | | | | | | | |
9.04% (LIBOR + 3.50%), 10/07/2027(2) | | $ | 407 | | | | 403 | |
Sotera Health Holdings LLC | | | | | | | | |
8.02% (LIBOR + 2.75%), 12/11/2026(2) | | | 12,000 | | | | 11,798 | |
Spin Holdco, Inc. | | | | | | | | |
9.23% (LIBOR + 4.00%), 03/04/2028(2) | | | 3,016 | | | | 2,574 | |
SS&C Technologies Holdings, Inc. | | | | | | | | |
6.97% (CME Term SOFR + 1.75%), 04/16/2025(2) | | | 222 | | | | 221 | |
6.97% (CME Term SOFR + 1.75%), 04/16/2025(2) | | | 243 | | | | 243 | |
Sunshine Luxembourg VII Sarl | | | | | | | | |
9.09% (CME Term SOFR + 3.75%), 10/01/2026(2) | | | 3,243 | | | | 3,222 | |
SVF II Finco LP | | | | | | | | |
5.00% (FIXED + 5.00%), 12/22/2023(8) | | | 9,268 | | | | 9,268 | |
Syniverse Holdings LLC | | | | | | | | |
12.24% (CME Term SOFR + 7.00%), 05/13/2027(2) | | | 289 | | | | 263 | |
Trans Union LLC | | | | | | | | |
7.47% (CME Term SOFR + 2.25%), 12/01/2028(2) | | | 2,641 | | | | 2,633 | |
TransDigm, Inc. | | | | | | | | |
8.49% (CME Term SOFR + 3.25%), 02/22/2027(2) | | | 2,724 | | | | 2,724 | |
8.49% (CME Term SOFR + 3.25%), 08/24/2028(2) | | | 39,985 | | | | 39,946 | |
TruGreen LP | | | | | | | | |
9.20% (CME Term SOFR + 4.00%), 11/02/2027(2) | | | 441 | | | | 405 | |
U.S. Renal Care, Inc. | | | | | | | | |
10.19% (LIBOR + 5.00%), 06/26/2026(2) | | | 1,127 | | | | 506 | |
United AirLines, Inc. | | | | | | | | |
9.29% (LIBOR + 3.75%), 04/21/2028(2) | | | 525 | | | | 524 | |
William Morris Endeavor Entertainment LLC | | | | | | | | |
7.95% (LIBOR + 2.75%), 05/18/2025(2) | | | 842 | | | | 839 | |
Windstream Services LLC | | | | | | | | |
9.20% (CME Term SOFR + 4.00%), 02/23/2027(2) | | | 4,210 | | | | 4,084 | |
11.45% (CME Term SOFR + 6.25%), 09/21/2027(2) | | | 72 | | | | 67 | |
Zayo Group Holdings, Inc. | | | | | | | | |
8.22% (CME Term SOFR + 3.00%), 03/09/2027(2) | | | 5,111 | | | | 4,000 | |
9.35% (CME Term SOFR + 4.25%), 03/09/2027(2) | | | 1,100 | | | | 868 | |
| | | | | | | | |
Total Bank Loans (Cost: $329,436) | | | | 332,358 | |
| | | | | | | | |
| | |
| | | Shares
(000s) | | | Value
(000s) | |
COMMON STOCKS – 0.08% | | | | | | | | |
Communications – 0.05% | | | | | | | | |
Clear Channel Outdoor Holdings, Inc.– Class A(7) | | | 2,065 | | | | 2,829 | |
iHeartMedia, Inc.– Class A(7) | | | 499 | | | | 1,816 | |
iHeartMedia, Inc.– Class B(7)(8) | | | 365 | | | | 1,197 | |
Intelsat SA(7)(18) | | | 446 | | | | 9,501 | |
| | | | | | | | |
Total Communications | | | | 15,343 | |
| | | | | | | | |
Consumer Discretionary – 0.03% | | | | | | | | |
Neiman Marcus Group, Inc.(7)(8)(18) | | | 62 | | | | 9,469 | |
| | | | | | | | |
Total Consumer Discretionary | | | | 9,469 | |
| | | | | | | | |
Financials – 0.00%(12) | | | | | | | | |
CBL & Associates Properties, Inc. | | | 2 | | | | 37 | |
Voyager Aviation Holdings LLC(1)(7)(8)(9) | | | 0 | | | | — | |
Total Financials | | | | 37 | |
Total Common Stocks (Cost: $53,207) | | | | 24,849 | |
| | | | | | | | |
CONVERTIBLE PREFERRED STOCKS – 0.17% | | | | | | | | |
Financials – 0.17% | | | | | | | | |
Bank of America Corp., 7.25% | | | 23 | | | | 27,392 | |
Wells Fargo & Co., 7.50% | | | 20 | | | | 23,354 | |
| | | | | | | | |
Total Financials | | | | 50,746 | |
| | | | | | | | |
Total Convertible Preferred Stocks (Cost: $62,493) | | | | 50,746 | |
| | | | | | | | |
PREFERRED STOCKS – 0.00%(12) | | | | | | | | |
Financials – 0.00%(12) | | | | | | | | |
Cayenne Aviation Holdings LLC(1)(7)(8)(9) | | | 0 | | | | 7 | |
| | | | | | | | |
Total Financials | | | | 7 | |
| | | | | | | | |
Total Preferred Stocks (Cost: $61) | | | | 7 | |
| | | | | | | | |
RIGHTS – 0.00%(12) | | | | | | | | |
Communications – 0.00%(12) | | | | | | | | |
Intelsat Jackson Holdings SA, expires 12/31/2049(7)(8)(9) | | | 47 | | | | — | |
Intelsat Jackson Holdings SA, expires 12/31/2049(7)(8)(9) | | | 48 | | | | — | |
| | | | | | | | |
Total Communications | | | | — | |
| | | | | | | | |
Total Rights (Cost: $0) | | | | — | |
| | | | | | | | |
| | | | | | | | |
WARRANTS – 0.00%(12) | | | | | | | | |
Communications – 0.00%(12) | | | | | | | | |
Intelsat SA, expires 02/17/2027(7)(8)(9) | | | 1 | | | | — | |
Intelsat SA, expires 02/17/2027(7)(8)(9) | | | 4 | | | | — | |
Windstream Holdings II LLC, expires 09/21/2055(7)(8) | | | 9 | | | | 81 | |
| | | | | | | | |
Total Communications | | | | 81 | |
| | | | | | | | |
Total Warrants (Cost: $8,440) | | | | 81 | |
| | | | | | | | |
SHORT-TERM INVESTMENTS – 10.83% | | | | | | | | |
Money Market Funds – 2.63% | | | | | | | | |
Fidelity Institutional Money Market Government Fund—Class I, 5.03%(16) | | | 794,788 | | | | 794,788 | |
| | | | | | | | |
Total Money Market Funds (Cost: $794,788) | | | | | | | 794,788 | |
| | | | | | | | |
| | |
| | | Principal
Amount
(000s) | | | Value
(000s) | |
Government Related – 1.91% | | | | | | | | |
Federal Home Loan Bank Discount Notes, 0.00%, 07/24/2023 | | $ | 50,000 | | | | 49,859 | |
Federal Home Loan Bank Discount Notes, 0.00%, 08/09/2023 | | | 50,000 | | | | 49,750 | |
Federal Home Loan Bank Discount Notes, 5.08%, 08/25/2023 | | | 25,000 | | | | 24,821 | |
Federal Home Loan Bank Discount Notes, 5.17%, 09/28/2023 | | | 75,000 | | | | 74,111 | |
Japan Treasury Discount Bill, -0.20%, 07/18/2023 | | JPY | 2,326,000 | | | | 16,121 | |
Japan Treasury Discount Bill, -0.20%, 08/28/2023 | | | 18,300,000 | | | | 126,853 | |
Japan Treasury Discount Bill, -0.20%, 09/11/2023 | | | 15,274,000 | | | | 105,884 | |
Japan Treasury Discount Bill, -0.18%, 09/04/2023 | | | 4,190,000 | | | | 29,045 | |
Japan Treasury Discount Bill, -0.17%, 09/19/2023 | | | 6,180,000 | | | | 42,843 | |
Japan Treasury Discount Bill, -0.15%, 09/25/2023 | | | 5,722,000 | | | | 39,669 | |
Republic of Argentina, -32.42%, 10/18/2023 | | ARS | 461,390 | | | | 1,968 | |
Republic of Argentina, -12.08%, 11/23/2023 | | | 2,553,390 | | | | 10,786 | |
Republic of Argentina, 0.00%, 09/18/2023 | | | 1,211,472 | | | | 4,731 | |
| | | | | | | | |
Total Government Related (Cost: $590,840) | | | | | | | 576,441 | |
| | | | | | | | |
Repurchase Agreements – 0.41% | | | | | | | | |
BNP Paribas SA, 5.16% dated 06/30/2023, due 07/03/2023, repurchase price $123,318 (collateralized by U.S. Treasury Inflation Indexed Bond, value $126,407, 0.13%, 07/15/2031) | | $ | 123,300 | | | | 123,300 | |
| | | | | | | | |
Total Repurchase Agreements (Cost: $123,300) | | | | | | | 123,300 | |
| | | | | | | | |
U.S. Treasury Bills – 5.82% | | | | | | | | |
U.S. Treasury Bill, 0.00%, 07/20/2023 | | | 221,290 | | | | 220,767 | |
U.S. Treasury Bill, 0.00%, 07/25/2023 | | | 200,000 | | | | 199,389 | |
U.S. Treasury Bill, 0.00%, 08/01/2023 | | | 50,000 | | | | 49,796 | |
U.S. Treasury Bill, 0.00%, 08/03/2023 | | | 16,206 | | | | 16,135 | |
U.S. Treasury Bill, 0.00%, 08/10/2023 | | | 73,640 | | | | 73,241 | |
U.S. Treasury Bill, 0.00%, 09/07/2023 | | | 50,000 | | | | 49,529 | |
U.S. Treasury Bill, 0.00%, 10/03/2023 | | | 69,930 | | | | 69,007 | |
U.S. Treasury Bill, 0.00%, 10/05/2023 | | | 60,080 | | | | 59,268 | |
U.S. Treasury Bill, 0.00%, 10/12/2023 | | | 210,710 | | | | 207,644 | |
U.S. Treasury Bill, 0.00%, 10/19/2023 | | | 630,272 | | | | 620,437 | |
U.S. Treasury Bill, 0.00%, 10/24/2023 | | | 46,610 | | | | 45,848 | |
U.S. Treasury Bill, 0.00%, 11/16/2023 | | | 30,910 | | | | 30,305 | |
U.S. Treasury Bill, 0.00%, 11/24/2023 | | | 30,670 | | | | 30,034 | |
U.S. Treasury Bill, 0.00%, 12/07/2023 | | | 92,800 | | | | 90,692 | |
| | | | | | | | |
Total U.S. Treasury Bills (Cost: $1,762,368) | | | | | | | 1,762,092 | |
| | | | | | | | |
| | | | | | | | |
Time Deposits – 0.06% | | | | | | | | |
ANZ, Hong Kong, 3.02% due 07/03/2023 | | AUD | 806 | | | | 537 | |
Brown Brothers Harriman, 2.47% due 07/03/2023 | | SEK | 7 | | | | 1 | |
Brown Brothers Harriman, 2.85% due 07/03/2023 | | NOK | 2,627 | | | | 245 | |
Brown Brothers Harriman, 4.15% due 07/03/2023 | | NZD | 91 | | | | 56 | |
Brown Brothers Harriman, 6.42% due 07/03/2023 | | ZAR | 4,301 | | | | 229 | |
Citibank, London, 2.62% due 07/03/2023(9) | | EUR | 0 | | | | 0 | |
Citibank, New York, 4.57% due 07/03/2023 | | $ | 3,045 | | | | 3,045 | |
HSBC, Singapore, 3.05% due 07/03/2023(9) | | SGD | 0 | | | | 0 | |
Royal Bank of Canada, Toronto, 3.79% due 07/04/2023 | | CAD | 1,384 | | | | 1,045 | |
Skandinaviska Enskilda Banken AB, Stockholm, 0.65% due 07/03/2023 | | CHF | 157 | | | | 176 | |
Skandinaviska Enskilda Banken AB, Stockholm, 2.62% due 07/03/2023 | | EUR | 3,223 | | | | 3,517 | |
Skandinaviska Enskilda Banken AB, Stockholm, 4.17% due 07/03/2023 | | GBP | 944 | | | | 1,199 | |
Sumitomo, Tokyo, -0.37% due 07/03/2023 | | JPY | 91,222 | | | | 632 | |
Sumitomo, Tokyo, 4.57% due 07/03/2023 | | $ | 1,684 | | | | 1,684 | |
Sumitomo Trust Bank, London, 4.57% due 07/03/2023 | | $ | 5,755 | | | | 5,755 | |
| | | | | | | | |
Total Time Deposits (Cost: $18,121) | | | | | | | 18,121 | |
| | | | | | | | |
Total Short-Term Investments (Cost: $3,289,417) | | | | 3,274,742 | |
| | | | | | | | |
TOTAL INVESTMENTS IN SECURITIES – 108.85% | | | | | | | | |
(Cost: $35,319,899) | | | | | | | 32,900,266 | |
| | | | | | | | |
TBA SALE COMMITMENTS – (0.85)% | | | | | | | | |
Mortgage-Backed Obligations – (0.85)% | | | | | | | | |
Fannie Mae | | | | | | | | |
2.50%, 07/01/2053(17) | | | (3,827 | ) | | | (3,245 | ) |
2.50%, 08/01/2053(17) | | | (22,913 | ) | | | (19,456 | ) |
3.00%, 07/01/2038(17) | | | (9,736 | ) | | | (9,082 | ) |
3.50%, 07/01/2038(17) | | | (1,419 | ) | | | (1,349 | ) |
3.50%, 07/01/2053(17) | | | (2,800 | ) | | | (2,551 | ) |
4.00%, 07/01/2053(17) | | | (42,800 | ) | | | (40,163 | ) |
4.00%, 08/01/2053(17) | | | (69,425 | ) | | | (65,203 | ) |
4.50%, 07/01/2053(17) | | | (69,728 | ) | | | (67,036 | ) |
4.50%, 08/01/2053(17) | | | (19,100 | ) | | | (18,372 | ) |
5.00%, 08/01/2053(17) | | | (100 | ) | | | (98 | ) |
6.00%, 07/01/2053(17) | | | (18,100 | ) | | | (18,260 | ) |
Ginnie Mae | | | | | | | | |
3.50%, 07/01/2042(17) | | | (12,876 | ) | | | (11,884 | ) |
| | | | | | | | |
Total Mortgage-Backed Obligations (Proceeds Received: $(257,601)) | | | | (256,699 | ) |
| | | | | | | | |
Total TBA Sale Commitments (Proceeds Received: $(257,601)) | | | | (256,699 | ) |
| | | | | | | | |
LIABILITIES IN EXCESS OF OTHER ASSETS – (8.00)% | | | | | | | (2,418,950 | ) |
| | | | | | | | |
TOTAL NET ASSETS – 100.00% | | | | | | $ | 30,224,617 | |
| | | | | | | | |
Percentages are stated as a percent of net assets.
Principal amounts are denominated in the currency in which the security was purchased.
REIT Real Estate Investment Trust
ARS Argentine Peso
AUD Australian Dollar
CAD Canadian Dollar
CHF Swiss Franc
COP Colombian Peso
CZK Czech Koruna
EUR Euro
GBP British Pound
IDR Indonesian Rupiah
JPY Japanese Yen
MXN Mexican Peso
NOK Norwegian Krone
NZD New Zealand Dollar
PEN Peruvian Sol
RUB Russian Ruble
SEK Swedish Krona
SGD Singapore Dollar
ZAR South African Rand
| (1) | Security was purchased exempt from registration in the U.S. pursuant to Rule 144(A) under the Securities Act of 1933. The value of these securities totals $7,876,589, which represents 26.06% of total net assets. |
| (2) | Variable rate security based on a reference index and spread. The rate reported is the rate in effect as of June 30, 2023. |
| (3) | Variable rate security. The coupon is based on an underlying pool of assets. The rate reported is the rate in effect as of June 30, 2023. |
| (4) | Step-up bond that pays an initial coupon rate for the first period and then a higher coupon rate for the following periods. The rate reported is the rate in effect as of June 30, 2023. |
| (5) | Adjustable rate security. The rate reported is the rate in effect as of June 30, 2023. |
| (6) | Security in default as of June 30, 2023. The value of these securities totals $3,155, which represents 0.01% of total net assets. |
| (7) | Non-income producing security. |
| (8) | Security that is categorized as Level 3 per the Trust’s fair value hierarchy. The value of these securities totals $20,022, which represents 0.07% of total net assets. |
| (9) | A zero balance may reflect actual amounts rounding to less than one thousand. |
| (10) | Payment in-kind security for which part of the income earned may be paid as additional principal. |
| (11) | Inverse floating rate security whose interest rate moves in the opposite direction of reference interest rates. Reference interest rates are typically based on a negative multiplier or slope. |
| (12) | Amount calculated is less than 0.005%. |
| (13) | Inflation protected security. The value of these securities totals $901,636, which represents 2.98% of total net assets. |
| (14) | Assigned as collateral for certain futures and swap contracts and delayed delivery securities. The value of these pledged issues totals $142,152, which represents 0.47% of total net assets. |
| (15) | Delayed delivery purchase commitment security. The value of these securities totals $2,927,100, which represents 9.68% of total net assets. |
| (16) | Represents annualized seven-day yield as of the close of the reporting period. |
| (17) | Delayed delivery sale commitment security. The value of these securities totals $(256,699), which represents (0.85)% of total net assets. |
| (18) | Security that is restricted at June 30, 2023. The value of the restricted security totals $48,939, which represents 0.16% of total net assets. |
The accompanying notes are an integral part of this Schedule of Investments.
Open Futures Contracts
| | | | | | | | | | | | | | | | | | |
Number of Contracts
Purchased | | Reference Entity | | Expiration Date | | | Notional
Amount | | | Value | | | Unrealized
Appreciation/
(Depreciation) | |
| 49 | | 3 Month EURIBOR Future | | | Jun. 2024 | | | EUR | 11,859 | | | $ | 12,856 | | | $ | (85) | |
| 19 | | 3 Month SOFR Future | | | Mar. 2024 | | | $ | 4,520 | | | | 4,507 | | | | (13) | |
| 33 | | 3 Month SONIA Future | | | Jun. 2024 | | | GBP | 7,841 | | | | 9,838 | | | | (120) | |
| 275 | | Australian 10 Year Bond Future | | | Sep. 2023 | | | AUD | 32,115 | | | | 21,282 | | | | (112) | |
| 6 | | Canadian Bankers Acceptance Future | | | Sep. 2024 | | | CAD | 1,434 | | | | 1,077 | | | | (6) | |
| 13 | | Euro-Bobl Future | | | Sep. 2023 | | | EUR | 1,511 | | | | 1,641 | | | | (7) | |
| 11,950 | | U.S. 2 Year Note Future | | | Sep. 2023 | | | $ | 2,453,202 | | | | 2,429,956 | | | | (23,246 | ) |
| 11,787 | | U.S. 5 Year Note Future | | | Sep. 2023 | | | | 1,282,762 | | | | 1,262,314 | | | | (20,448 | ) |
| 6,931 | | U.S. 10 Year Note Future | | | Sep. 2023 | | | | 790,454 | | | | 778,113 | | | | (12,341 | ) |
| 5,079 | | U.S. Long Bond Future | | | Sep. 2023 | | | | 642,274 | | | | 644,557 | | | | 2,283 | |
| 10,010 | | U.S. Ultra 10 Year Note Future | | | Sep. 2023 | | | | 1,194,192 | | | | 1,185,559 | | | | (8,633 | ) |
| 1,399 | | U.S. Ultra Bond Future | | | Sep. 2023 | | | | 189,020 | | | | 190,570 | | | | 1,550 | |
| | | | | | | | | | | | | | | | | | |
| | | | | | | | | | | | | | | | | (61,178 | ) |
| | | | | | | | | | | | | | | | | | |
| | | | | | | | | | | | | | | | | | |
| | | | | |
Number of Contracts
Sold | | Reference Entity | | Expiration Date | | | Notional
Amount | | | Value | | | Unrealized
Appreciation/
(Depreciation) | |
| (5) | | 3 Month SOFR Future | | | Dec. 2024 | | | $ | (1,207) | | | $ | (1,195 | ) | | $ | 12 | |
| (19) | | 3 Month SOFR Future | | | Dec. 2024 | | | | (4,582) | | | | (4,559 | ) | | | 23 | |
| (33) | | 3 Month SONIA Future | | | Jun. 2023 | | | GBP | (7,853) | | | | (9,934 | ) | | | 40 | |
| (346) | | Euro-Bund Future | | | Sep. 2023 | | | EUR | (46,717) | | | | (50,494 | ) | | | 483 | |
| (187) | | Japan 10 Year Bond Future | | | Sep. 2023 | | | JPY | (27,655,897) | | | | (192,514 | ) | | | (852 | ) |
| (1,057) | | U.S. 10 Year Note Future | | | Sep. 2023 | | | $ | (120,225) | | | | (118,665 | ) | | | 1,560 | |
| (1,556) | | U.S. Ultra 10 Year Note Future | | | Sep. 2023 | | | | (185,279) | | | | (184,289 | ) | | | 990 | |
| | | | | | | | | | | | | | | | | | |
| | | | | | | | | | | | | | | | | 2,256 | |
| | | | | | | | | | | | | | | | | | |
| | | | | | | | | | | | | | | | $ | (58,922 | ) |
| | | | | | | | | | | | | | | | | | |
Over-the-Counter Forward Foreign Currency Exchange Contracts
| | | | | | | | | | | | | | | | | | |
Currency Purchased | | | Currency Sold | | | Settlement
Date | | Counterparty | | Unrealized
Appreciation/
(Depreciation) | |
AUD | | | 94,490 | | | USD | | | 61,428 | | | 07/05/23 | | Bank of America | | $ | 1,517 | |
AUD | | | 29,598 | | | USD | | | 19,351 | | | 07/05/23 | | J.P. Morgan | | | 366 | |
AUD | | | 104,776 | | | USD | | | 69,455 | | | 08/02/23 | | BNP Paribas | | | 404 | |
BRL* | | | 6,558 | | | USD | | | 1,361 | | | 07/05/23 | | Barclays Bank | | | 8 | |
BRL* | | | 2,155 | | | USD | | | 430 | | | 07/05/23 | | Goldman Sachs | | | 20 | |
BRL* | | | 572,569 | | | USD | | | 111,714 | | | 08/02/23 | | J.P. Morgan | | | 7,222 | |
CAD | | | 822 | | | USD | | | 621 | | | 09/20/23 | | BNP Paribas | | | 1 | |
CLP* | | | 354,508 | | | USD | | | 440 | | | 07/18/23 | | Bank of America | | | 1 | |
COP | | | 15,138,661 | | | USD | | | 3,615 | | | 07/05/23 | | Bank of America | | | 14 | |
COP | | | 15,138,661 | | | USD | | | 3,612 | | | 07/05/23 | | J.P. Morgan | | | 17 | |
CZK | | | 21,219 | | | USD | | | 960 | | | 07/18/23 | | Goldman Sachs | | | 13 | |
EUR | | | 969 | | | USD | | | 1,052 | | | 07/05/23 | | Bank of America | | | 6 | |
EUR | | | 410 | | | USD | | | 446 | | | 07/18/23 | | Bank of America | | | 1 | |
GBP | | | 204,468 | | | USD | | | 258,475 | | | 07/05/23 | | J.P. Morgan | | | 1,199 | |
GBP | | | 480 | | | USD | | | 605 | | | 07/18/23 | | Deutsche Bank | | | 5 | |
HUF | | | 207,192 | | | USD | | | 600 | | | 07/18/23 | | J.P. Morgan | | | 5 | |
IDR* | | | 64,380,916 | | | USD | | | 4,285 | | | 07/03/23 | | Morgan Stanley | | | 10 | |
INR* | | | 37,177 | | | USD | | | 450 | | | 07/18/23 | | Citibank | | | 3 | |
INR* | | | 677,405 | | | USD | | | 8,244 | | | 08/03/23 | | BNP Paribas | | | 1 | |
INR* | | | 727,837 | | | USD | | | 8,858 | | | 08/03/23 | | Goldman Sachs | | | 1 | |
INR* | | | 6,055 | | | USD | | | 73 | | | 09/20/23 | | J.P. Morgan(1) | | | 0 | |
INR* | | | 5,100 | | | USD | | | 62 | | | 09/20/23 | | Morgan Stanley(1) | | | 0 | |
JPY | | | 7,769,656 | | | USD | | | 53,984 | | | 08/02/23 | | BNP Paribas | | | 112 | |
MXN | | | 17,387 | | | USD | | | 1,000 | | | 07/18/23 | | Goldman Sachs | | | 13 | |
MXN | | | 955,361 | | | USD | | | 54,873 | | | 08/16/23 | | BNP Paribas | | | 469 | |
MXN | | | 23,288 | | | USD | | | 1,281 | | | 08/31/23 | | J.P. Morgan | | | 64 | |
PEN* | | | 16,696 | | | USD | | | 4,565 | | | 07/03/23 | | Deutsche Bank | | | 37 | |
PEN* | | | 16,696 | | | USD | | | 4,597 | | | 07/03/23 | | Goldman Sachs | | | 5 | |
PEN* | | | 16,696 | | | USD | | | 4,580 | | | 07/10/23 | | BNP Paribas | | | 20 | |
PEN* | | | 32,302 | | | USD | | | 8,773 | | | 09/20/23 | | J.P. Morgan | | | 76 | |
USD | | | 4,305 | | | IDR* | | | 64,380,916 | | | 07/03/23 | | Morgan Stanley | | | 11 | |
USD | | | 54 | | | JPY | | | 7,452 | | | 07/05/23 | | Bank of America | | | 2 | |
USD | | | 900 | | | BRL* | | | 4,296 | | | 07/05/23 | | Barclays Bank | | | 3 | |
USD | | | 34 | | | JPY | | | 4,700 | | | 07/05/23 | | Deutsche Bank | | | 1 | |
USD | | | 1,845 | | | AUD | | | 2,723 | | | 07/05/23 | | J.P. Morgan | | | 31 | |
USD | | | 28,238 | | | JPY | | | 4,038,360 | | | 07/05/23 | | J.P. Morgan | | | 251 | |
USD | | | 900 | | | TWD* | | | 27,437 | | | 07/13/23 | | Citibank | | | 19 | |
USD | | | 300 | | | THB | | | 10,561 | | | 07/18/23 | | Bank of America | | | 2 | |
USD | | | 450 | | | INR* | | | 36,938 | | | 07/18/23 | | Citibank(1) | | | 0 | |
USD | | | 17,986 | | | JPY | | | 2,326,000 | | | 07/18/23 | | Deutsche Bank | | | 1,834 | |
USD | | | 445 | | | GBP | | | 350 | | | 07/18/23 | | Goldman Sachs(1) | | | 0 | |
| | | | | | | | | | | | | | | | | | |
USD | | | 740 | | | CLP* | | | 589,373 | | | 07/18/23 | | Morgan Stanley | | | 6 | |
USD | | | 1,204 | | | KRW* | | | 1,573,869 | | | 07/31/23 | | Bank of America | | | 8 | |
USD | | | 174 | | | KRW* | | | 227,434 | | | 07/31/23 | | BNP Paribas | | | 1 | |
USD | | | 477 | | | KRW* | | | 623,479 | | | 07/31/23 | | Goldman Sachs | | | 3 | |
USD | | | 244,424 | | | EUR | | | 222,763 | | | 08/02/23 | | BNP Paribas | | | 979 | |
USD | | | 11,833 | | | KRW* | | | 15,512,377 | | | 08/03/23 | | BNP Paribas | | | 44 | |
USD | | | 5,707 | | | KRW* | | | 7,505,307 | | | 08/03/23 | | Goldman Sachs | | | 3 | |
USD | | | 386 | | | EUR | | | 349 | | | 08/08/23 | | Bank of America | | | 5 | |
USD | | | 1,954 | | | ZAR | | | 36,206 | | | 08/08/23 | | Morgan Stanley | | | 37 | |
USD | | | 16,175 | | | ZAR | | | 298,963 | | | 08/14/23 | | Deutsche Bank | | | 358 | |
USD | | | 7,633 | | | ZAR | | | 141,652 | | | 08/14/23 | | Goldman Sachs | | | 138 | |
USD | | | 11 | | | ZAR | | | 208 | | | 08/14/23 | | J.P. Morgan(1) | | | 0 | |
USD | | | 35,434 | | | ZAR | | | 659,411 | | | 08/15/23 | | BNP Paribas | | | 550 | |
USD | | | 2,417 | | | TWD* | | | 73,808 | | | 08/22/23 | | BNP Paribas | | | 46 | |
USD | | | 6,553 | | | TWD* | | | 200,295 | | | 08/22/23 | | J.P. Morgan | | | 119 | |
USD | | | 2,705 | | | TWD* | | | 82,040 | | | 08/22/23 | | Morgan Stanley | | | 69 | |
USD | | | 68,544 | | | JPY | | | 9,451,068 | | | 08/28/23 | | Bank of America | | | 2,480 | |
USD | | | 64,153 | | | JPY | | | 8,848,932 | | | 08/28/23 | | J.P. Morgan | | | 2,298 | |
USD | | | 30,615 | | | JPY | | | 4,191,884 | | | 09/05/23 | | Bank of America | | | 1,277 | |
USD | | | 111,245 | | | JPY | | | 15,274,000 | | | 09/11/23 | | Deutsche Bank | | | 4,244 | |
USD | | | 1,006 | | | ZAR | | | 17,780 | | | 09/12/23 | | BNP Paribas | | | 68 | |
USD | | | 44,493 | | | JPY | | | 6,180,000 | | | 09/19/23 | | Bank of America | | | 1,144 | |
USD | | | 4,857 | | | TWD* | | | 147,458 | | | 09/20/23 | | Bank of America | | | 112 | |
USD | | | 33,439 | | | TWD* | | | 1,017,671 | | | 09/20/23 | | Goldman Sachs | | | 687 | |
USD | | | 1,956 | | | JPY | | | 272,727 | | | 09/20/23 | | J.P. Morgan | | | 42 | |
USD | | | 3,423 | | | KRW* | | | 4,452,091 | | | 09/20/23 | | J.P. Morgan | | | 30 | |
USD | | | 6,324 | | | KRW* | | | 8,213,295 | | | 09/20/23 | | Morgan Stanley | | | 64 | |
USD | | | 166 | | | EUR | | | 151 | | | 09/20/23 | | UBS(1) | | | 0 | |
USD | | | 182 | | | EUR | | | 166 | | | 09/22/23 | | Bank of America(1) | | | 0 | |
USD | | | 90 | | | EUR | | | 82 | | | 09/22/23 | | Citibank(1) | | | 0 | |
USD | | | 166 | | | EUR | | | 151 | | | 09/22/23 | | Deutsche Bank(1) | | | 0 | |
USD | | | 40,581 | | | JPY | | | 5,722,000 | | | 09/25/23 | | Bank of America | | | 406 | |
USD | | | 2,330 | | | IDR* | | | 34,893,198 | | | 09/26/23 | | Citibank | | | 13 | |
USD | | | 1,828 | | | ZAR | | | 33,934 | | | 10/19/23 | | BNP Paribas | | | 45 | |
USD | | | 5,193 | | | ZAR | | | 97,432 | | | 10/19/23 | | Goldman Sachs | | | 73 | |
ZAR | | | 279 | | | USD | | | 15 | | | 08/15/23 | | BNP Paribas(1) | | | 0 | |
| | | | | | | | | | | | | | | | | | |
| | | | | | | | Total Unrealized Appreciation | | | 29,113 | |
| | | | | | | | | | | | | | | | | | |
BRL* | | | 4,318 | | | USD | | | 900 | | | 08/02/23 | | Barclays Bank | | | (3 | ) |
CLP* | | | 38,072,031 | | | USD | | | 48,189 | | | 07/14/23 | | BNP Paribas | | | (754 | ) |
COP | | | 1,347,443 | | | USD | | | 312 | | | 12/20/23 | | Barclays Bank | | | (2 | ) |
EUR | | | 224,236 | | | USD | | | 245,690 | | | 07/05/23 | | BNP Paribas | | | (1,004 | ) |
EUR | | | 3,557 | | | USD | | | 3,884 | | | 07/05/23 | | J.P. Morgan | | | (3 | ) |
EUR | | | 570 | | | USD | | | 623 | | | 07/18/23 | | J.P. Morgan | | | (1 | ) |
GBP | | | 912 | | | USD | | | 1,161 | | | 07/05/23 | | Bank of America | | | (3 | ) |
GBP | | | 3,044 | | | USD | | | 3,873 | | | 09/20/23 | | J.P. Morgan | | | (7 | ) |
HUF | | | 153,097 | | | USD | | | 450 | | | 07/18/23 | | Goldman Sachs | | | (3 | ) |
IDR* | | | 8,924,100 | | | USD | | | 600 | | | 07/18/23 | | Citibank | | | (7 | ) |
| | | | | | | | | | | | | | |
IDR* | | 50,871,938 | | USD | | 3,386 | | 09/20/23 | | BNP Paribas | | | (8 | ) |
IDR* | | 74,077,223 | | USD | | 4,975 | | 09/20/23 | | J.P. Morgan | | | (56 | ) |
IDR* | | 41,876,920 | | USD | | 2,804 | | 09/20/23 | | Morgan Stanley | | | (23 | ) |
IDR* | | 1,147,768 | | USD | | 77 | | 09/20/23 | | UBS | | | (1 | ) |
IDR* | | 157,688,663 | | USD | | 10,493 | | 09/22/23 | | BNP Paribas | | | (23 | ) |
IDR* | | 102,161,783 | | USD | | 6,790 | | 09/22/23 | | J.P. Morgan | | | (6 | ) |
IDR* | | 244,225,999 | | USD | | 16,314 | | 09/26/23 | | Bank of America | | | (98 | ) |
IDR* | | 64,436,881 | | USD | | 4,305 | | 09/26/23 | | Morgan Stanley | | | (27 | ) |
INR* | | 122,995 | | USD | | 1,498 | | 08/03/23 | | BNP Paribas | | | (1 | ) |
INR* | | 506,229 | | USD | | 6,164 | | 08/03/23 | | Goldman Sachs | | | (2 | ) |
INR* | | 865,052 | | USD | | 10,534 | | 08/07/23 | | Goldman Sachs | | | (6 | ) |
INR* | | 841,896 | | USD | | 10,202 | | 12/20/23 | | J.P. Morgan | | | (9 | ) |
JPY | | 11,870,639 | | USD | | 85,401 | | 07/05/23 | | BNP Paribas | | | (3,136 | ) |
JPY | | 4,021,200 | | USD | | 28,238 | | 08/02/23 | | J.P. Morgan | | | (241 | ) |
KRW* | | 11,337,694 | | USD | | 8,949 | | 09/20/23 | | Bank of America | | | (308 | ) |
KRW* | | 44,734,823 | | USD | | 34,956 | | 09/20/23 | | Morgan Stanley | | | (862 | ) |
NOK | | 337,964 | | USD | | 31,853 | | 08/16/23 | | Goldman Sachs | | | (316 | ) |
NOK | | 124,621 | | USD | | 11,748 | | 08/16/23 | | J.P. Morgan | | | (119 | ) |
THB | | 20,703 | | USD | | 600 | | 07/18/23 | | Citibank | | | (15 | ) |
TWD* | | 13,806 | | USD | | 450 | | 07/13/23 | | Barclays Bank | | | (7 | ) |
USD | | 4,597 | | PEN* | | 16,696 | | 07/03/23 | | Deutsche Bank | | | (5 | ) |
USD | | 4,504 | | PEN* | | 16,696 | | 07/03/23 | | Goldman Sachs | | | (98 | ) |
USD | | 3,612 | | COP | | 15,138,661 | | 07/05/23 | | Bank of America | | | (17 | ) |
USD | | 470 | | BRL* | | 2,263 | | 07/05/23 | | Barclays Bank | | | (3 | ) |
USD | | 69,400 | | AUD | | 104,776 | | 07/05/23 | | BNP Paribas | | | (396 | ) |
USD | | 244,337 | | EUR | | 227,289 | | 07/05/23 | | BNP Paribas | | | (3,681 | ) |
USD | | 447 | | BRL* | | 2,155 | | 07/05/23 | | Goldman Sachs | | | (3 | ) |
USD | | 3,256 | | COP | | 15,138,661 | | 07/05/23 | | J.P. Morgan | | | (373 | ) |
USD | | 255,259 | | GBP | | 205,380 | | 07/05/23 | | Morgan Stanley | | | (5,574 | ) |
USD | | 4,563 | | PEN* | | 16,696 | | 07/10/23 | | Deutsche Bank | | | (38 | ) |
USD | | 300 | | HUF | | 102,942 | | 07/18/23 | | Barclays Bank(1) | | | (0 | ) |
USD | | 603 | | GBP | | 480 | | 07/18/23 | | Deutsche Bank | | | (6 | ) |
USD | | 1,070 | | EUR | | 990 | | 07/18/23 | | J.P. Morgan | | | (11 | ) |
USD | | 744 | | EUR | | 690 | | 07/18/23 | | UBS | | | (9 | ) |
USD | | 4,573 | | PEN* | | 16,696 | | 08/01/23 | | BNP Paribas | | | (17 | ) |
USD | | 253,018 | | GBP | | 200,067 | | 08/02/23 | | J.P. Morgan | | | (1,124 | ) |
USD | | 477 | | KRW* | | 629,492 | | 08/03/23 | | BNP Paribas | | | (1 | ) |
USD | | 159 | | KRW* | | 209,741 | | 08/03/23 | | Goldman Sachs(1) | | | (0 | ) |
USD | | 1,031 | | KRW* | | 1,360,095 | | 08/03/23 | | J.P. Morgan | | | (3 | ) |
USD | | 11,974 | | KRW* | | 15,761,927 | | 08/07/23 | | J.P. Morgan | | | (7 | ) |
USD | | 4,359 | | ZAR | | 84,485 | | 08/15/23 | | Bank of America | | | (110 | ) |
USD | | 1,298 | | CAD | | 1,737 | | 08/16/23 | | Bank of America | | | (13 | ) |
USD | | 2,133 | | CAD | | 2,852 | | 08/16/23 | | J.P. Morgan | | | (21 | ) |
USD | | 53 | | ZAR | | 1,012 | | 08/18/23 | | Deutsche Bank | | | (1 | ) |
USD | | 21,638 | | ZAR | | 419,821 | | 08/18/23 | | Morgan Stanley | | | (565 | ) |
USD | | 6,183 | | MXN | | 113,139 | | 08/31/23 | | Barclays Bank | | | (353 | ) |
USD | | 7,473 | | MXN | | 137,366 | | 08/31/23 | | J.P. Morgan | | | (463 | ) |
| | | | | | | | | | | | | | |
USD | | 2,489 | | MXN | | 46,254 | | 08/31/23 | | Morgan Stanley | | | (183 | ) |
USD | | 1,382 | | CZK | | 30,492 | | 09/06/23 | | Barclays Bank | | | (14 | ) |
USD | | 352 | | EUR | | 322 | | 09/14/23 | | Citibank | | | (1 | ) |
USD | | 1,220 | | CAD | | 1,618 | | 09/20/23 | | BNP Paribas | | | (3 | ) |
USD | | 3,480 | | COP | | 15,138,661 | | 12/20/23 | | Bank of America | | | (4 | ) |
ZAR | | 83,243 | | USD | | 4,552 | | 08/14/23 | | Bank of America | | | (147 | ) |
| | | | | | | | | | | | | | |
| | | | | | Total Unrealized Depreciation | | | (20,295 | ) |
| | | | | | | | | | | | | | |
| | | | | | Net Unrealized Appreciation | | $ | 8,818 | |
| | | | | | | | | | | | | | |
| (1) | A zero balance may reflect actual amounts rounding to less than one thousand. |
| | |
| AUD | | Australian Dollar |
| BRL | | Brazilian Real |
| CAD | | Canadian Dollar |
| CLP | | Chilean Peso |
| COP | | Colombian Peso |
| CZK | | Czech Koruna |
| EUR | | Euro |
| GBP | | British Pound |
| HUF | | Hungarian Forint |
| IDR | | Indonesian Rupiah |
| INR | | Indian Rupee |
| JPY | | Japanese Yen |
| KRW | | Korean Won |
| MXN | | Mexican Peso |
| NOK | | Norwegian Krone |
| PEN | | Peruvian Sol |
| THB | | Thai Baht |
| TWD | | Taiwan New Dollar |
| USD | | United States Dollar |
| ZAR | | South African Rand |
Centrally Cleared Credit Default Swaps – Buy Protection
| | | | | | | | | | | | | | | | | | | | | | | | | | | | |
Reference Entity | | Fixed Annual
Rate Paid
by Fund | | | Maturity
Date | | | Implied Credit
Spread
at June 30, 2023 | | | Notional
Amount | | | Upfront
Premium
Paid/
(Received) | | | Unrealized
Appreciation/
(Depreciation) | | | Value | |
iTraxx Europe Crossover Series 39 Version 1 Index | | | 5.00 | % | | | 6/20/2028 | | | | 4.00 | % | | EUR | 2,744 | | | $ | (74 | ) | | $ | (49 | ) | | $ | (123 | ) |
| | | | | | | | | | | | | | | | | | | | | | | | | | | | |
| | | | | | | | | | | | | | | | | | $ | (74 | ) | | $ | (49 | ) | | $ | (123 | ) |
| | | | | | | | | | | | | | | | | | | | | | | | | | | | |
Centrally Cleared Credit Default Swaps – Sell Protection
| | | | | | | | | | | | | | | | | | | | | | | | | | | | |
Reference Entity | | Fixed Annual
Rate Received
by Fund | | | Maturity
Date | | | Implied Credit
Spread
at June 30, 2023 | | | Notional
Amount | | | Upfront
Premium
Paid/
(Received) | | | Unrealized
Appreciation/
(Depreciation) | | | Value | |
AT&T, Inc. | | | 1.00 | % | | | 12/20/2024 | | | | 0.62 | % | | $ | 5,200 | | | $ | 8 | | | $ | 21 | | | $ | 29 | |
AT&T, Inc. | | | 1.00 | | | | 6/20/2026 | | | | 0.74 | | | | 2,700 | | | | 325 | | | | (305 | ) | | | 20 | |
AT&T, Inc. | | | 1.00 | | | | 6/20/2028 | | | | 0.96 | | | | 1,300 | | | | (7 | ) | | | 9 | | | | 2 | |
Barclays Bank PLC(1) | | | 1.00 | | | | 12/20/2023 | | | | 0.84 | | | EUR | 6,200 | | | | 7 | | | | 0 | | | | 7 | |
CDX.EM.30 | | | 1.00 | | | | 12/20/2023 | | | | 0.11 | | | $ | 6,120 | | | | (438 | ) | | | 466 | | | | 28 | |
CDX.EM.31 | | | 1.00 | | | | 6/20/2024 | | | | 0.51 | | | | 7,482 | | | | (243 | ) | | | 280 | | | | 37 | |
CDX.EM.32 | | | 1.00 | | | | 12/20/2024 | | | | 0.73 | | | | 11,050 | | | | (449 | ) | | | 495 | | | | 46 | |
CDX.EM.34 | | | 1.00 | | | | 12/20/2025 | | | | 2.49 | | | | 2,852 | | | | (184 | ) | | | 90 | | | | (94 | ) |
CDX.EM.36 | | | 1.00 | | | | 12/20/2026 | | | | 1.77 | | | | 26,864 | | | | (750 | ) | | | 118 | | | | (632 | ) |
CDX.EM.38 | | | 1.00 | | | | 12/20/2027 | | | | 2.07 | | | | 3,800 | | | | (273 | ) | | | 117 | | | | (156 | ) |
CDX.NA.HY.35 | | | 5.00 | | | | 12/20/2025 | | | | 2.98 | | | | 490 | | | | 39 | | | | (16 | ) | | | 23 | |
CDX.NA.HY.39 | | | 5.00 | | | | 12/20/2027 | | | | 4.10 | | | | 20,654 | | | | (855 | ) | | | 1,558 | | | | 703 | |
CDX.NA.HY.39 | | | 5.00 | | | | 6/20/2028 | | | | 2.13 | | | | 4,600 | | | | (324 | ) | | | 106 | | | | (218 | ) |
CDX.NA.HY.40 | | | 5.00 | | | | 6/20/2028 | | | | 4.27 | | | | 44,613 | | | | 739 | | | | 608 | | | | 1,347 | |
CDX.NA.HY.40 | | | 5.00 | | | | 6/20/2028 | | | | 4.27 | | | | 204,900 | | | | (288 | ) | | | 6,473 | | | | 6,185 | |
Ford Motor Credit Co. LLC | | | 5.00 | | | | 6/20/2024 | | | | 1.03 | | | | 19,600 | | | | 535 | | | | 234 | | | | 769 | |
Ford Motor Credit Co. LLC | | | 5.00 | | | | 12/20/2024 | | | | 1.24 | | | | 1,700 | | | | 63 | | | | 30 | | | | 93 | |
Ford Motor Credit Co. LLC | | | 5.00 | | | | 6/20/2025 | | | | 1.34 | | | | 700 | | | | 27 | | | | 21 | | | | 48 | |
Ford Motor Credit Co. LLC | | | 5.00 | | | | 12/20/2025 | | | | 1.58 | | | | 600 | | | | 23 | | | | 25 | | | | 48 | |
Ford Motor Credit Co. LLC | | | 5.00 | | | | 6/20/2026 | | | | 1.73 | | | | 19,400 | | | | 1,229 | | | | 516 | | | | 1,745 | |
General Electric Co. | | | 1.00 | | | | 12/20/2023 | | | | 0.28 | | | | 700 | | | | (6 | ) | | | 9 | | | | 3 | |
Rolls-Royce PLC | | | 1.00 | | | | 6/20/2025 | | | | 1.27 | | | EUR | 14,300 | | | | (726 | ) | | | 651 | | | | (75 | ) |
| | | | | | | | | | | | | | | | | | | | | | | | | | | | |
| | | | | | | | | | | | | | | | | | $ | (1,548 | ) | | $ | 11,506 | | | $ | 9,958 | |
| | | | | | | | | | | | | | | | | | | | | | | | | | | | |
| (1) | A zero balance may reflect actual amounts rounding to less than one thousand. |
Over-the-Counter Credit Default Swaps – Buy Protection
| | | | | | | | | | | | | | | | | | | | | | | | | | | | | | | | | | |
Counterparty | | Reference Entity | | Fixed Annual
Rate Paid by
Fund | | | Payment
Frequency | | | Maturity
Date | | | Implied
Credit
Spread at
June 30, 2023 | | | Notional
Amount | | | Upfront
Premium
Paid/
(Received) | | | Unrealized
Appreciation/
(Depreciation) | | | Value | |
J.P. Morgan | | Abbott Laboratories | | | 1.00 | % | | | Quarterly | | | | 6/20/2027 | | | | 0.38 | % | | $ | 2,433 | | | $ | (59 | ) | | $ | 4 | | | $ | (55 | ) |
Barclays Bank | | Brazilian Government International | | | 1.00 | | | | Quarterly | | | | 12/20/2024 | | | | 0.40 | | | | 974 | | | | 15 | | | | (23 | ) | | | (8 | ) |
Barclays Bank | | Brazilian Government International | | | 1.00 | | | | Quarterly | | | | 12/20/2024 | | | | 0.40 | | | | 970 | | | | 15 | | | �� | (23 | ) | | | (8 | ) |
Barclays Bank | | Brazilian Government International | | | 1.00 | | | | Quarterly | | | | 12/20/2024 | | | | 0.40 | | | | 976 | | | | 15 | | | | (23 | ) | | | (8 | ) |
Barclays Bank | | Brazilian Government International | | | 1.00 | | | | Quarterly | | | | 12/20/2024 | | | | 0.40 | | | | 1,370 | | | | 21 | | | | (33 | ) | | | (12 | ) |
Barclays Bank | | Brazilian Government International | | | 1.00 | | | | Quarterly | | | | 12/20/2024 | | | | 0.40 | | | | 975 | | | | 15 | | | | (24 | ) | | | (9 | ) |
Barclays Bank | | Brazilian Government International | | | 1.00 | | | | Quarterly | | | | 12/20/2024 | | | | 0.40 | | | | 586 | | | | 9 | | | | (14 | ) | | | (5 | ) |
Barclays Bank | | Brazilian Government International | | | 1.00 | | | | Quarterly | | | | 6/20/2028 | | | | 1.76 | | | | 2,517 | | | | 168 | | | | (86 | ) | | | 82 | |
Barclays Bank | | Colombia Government International | | | 1.00 | | | | Quarterly | | | | 6/20/2028 | | | | 2.35 | | | | 2,280 | | | | 211 | | | | (81 | ) | | | 130 | |
Morgan Stanley | | Colombia Government International | | | 1.00 | | | | Quarterly | | | | 6/20/2028 | | | | 2.35 | | | | 913 | | | | 53 | | | | (1 | ) | | | 52 | |
Barclays Bank | | Mexico Government International | | | 1.00 | | | | Quarterly | | | | 6/20/2028 | | | | 1.03 | | | | 2,277 | | | | 40 | | | | (38 | ) | | | 2 | |
| | | | | | | | | | | | | | | | | | | | | | | | | | | | | | | | | | |
| | | | | | | | | | | | | | | | | | | | | | | | $ | 503 | | | $ | (342 | ) | | $ | 161 | |
| | | | | | | | | | | | | | | | | | | | | | | | | | | | | | | | | | |
Over-the-Counter Credit Default Swaps – Sell Protection
| | | | | | | | | | | | | | | | | | | | | | | | | | | | | | | | | | |
Counterparty | | Reference Entity | | Fixed Annual Rate
Received by Fund | | | Payment
Frequency | | | Maturity
Date | | | Implied
Credit
Spread at
June 30, 2023 | | | Notional
Amount | | | Upfront
Premium
Paid/
(Received) | | | Unrealized
Appreciation/
(Depreciation) | | | Value | |
Goldman Sachs | | Brazilian Government International | | | 1.00 | % | | | Quarterly | | | | 12/20/2024 | | | | 0.40 | % | | $ | 3,200 | | | $ | (15 | ) | | $ | 43 | | | $ | 28 | |
BNP Paribas | | Colombia Government International | | | 1.00 | | | | Quarterly | | | | 12/20/2027 | | | | 2.13 | | | | 600 | | | | (54 | ) | | | 27 | | | | (27 | ) |
Goldman Sachs | | Colombia Government International | | | 1.00 | | | | Quarterly | | | | 6/20/2027 | | | | 1.87 | | | | 1,900 | | | | (70 | ) | | | 12 | | | | (58 | ) |
Goldman Sachs | | Colombia Government International | | | 1.00 | | | | Quarterly | | | | 12/20/2027 | | | | 2.13 | | | | 800 | | | | (71 | ) | | | 36 | | | | (35 | ) |
J.P. Morgan | | Colombia Government International | | | 1.00 | | | | Quarterly | | | | 12/20/2026 | | | | 1.67 | | | | 1,400 | | | | (66 | ) | | | 37 | | | | (29 | ) |
J.P. Morgan | | Colombia Government International | | | 1.00 | | | | Quarterly | | | | 6/20/2027 | | | | 1.87 | | | | 400 | | | | (15 | ) | | | 3 | | | | (12 | ) |
Morgan Stanley | | Colombia Government International | | | 1.00 | | | | Quarterly | | | | 6/20/2027 | | | | 1.87 | | | | 900 | | | | (39 | ) | | | 11 | | | | (28 | ) |
Morgan Stanley | | Colombia Government International | | | 1.00 | | | | Quarterly | | | | 12/20/2027 | | | | 2.13 | | | | 1,000 | | | | (89 | ) | | | 45 | | | | (44 | ) |
Goldman Sachs | | Mexico Government International | | | 1.00 | | | | Quarterly | | | | 12/20/2023 | | | | 0.13 | | | | 8,500 | | | | (459 | ) | | | 497 | | | | 38 | |
Goldman Sachs | | Mexico Government International(1) | | | 1.00 | | | | Quarterly | | | | 6/20/2028 | | | | 1.03 | | | | 200 | | | | (3 | ) | | | 3 | | | | 0 | |
J.P. Morgan | | Mexico Government International(1) | | | 1.00 | | | | Quarterly | | | | 6/20/2024 | | | | 0.19 | | | | 100 | | | | 0 | | | | 0 | | | | 0 | |
J.P. Morgan | | Mexico Government International | | | 1.00 | | | | Quarterly | | | | 6/20/2026 | | | | 0.52 | | | | 100 | | | | (1 | ) | | | 2 | | | | 1 | |
Morgan Stanley | | Mexico Government International | | | 1.00 | | | | Quarterly | | | | 12/20/2024 | | | | 0.28 | | | | 300 | | | | (1 | ) | | | 4 | | | | 3 | |
Morgan Stanley | | Mexico Government International | | | 1.00 | | | | Quarterly | | | | 12/20/2026 | | | | 0.66 | | | | 500 | | | | 168 | | | | (162 | ) | | | 6 | |
Morgan Stanley | | Mexico Government International | | | 1.00 | | | | Quarterly | | | | 6/20/2027 | | | | 0.77 | | | | 400 | | | | (4 | ) | | | 7 | | | | 3 | |
Morgan Stanley | | Mexico Government International | | | 1.00 | | | | Quarterly | | | | 6/20/2028 | | | | 1.03 | | | | 1,500 | | | | (34 | ) | | | 32 | | | | (2 | ) |
Goldman Sachs | | Republic of South Africa | | | 1.00 | | | | Quarterly | | | | 6/20/2024 | | | | 1.02 | | | | 4,700 | | | | (42 | ) | | | 43 | | | | 1 | |
Bank of America | | Turkey Government International | | | 1.00 | | | | Quarterly | | | | 12/20/2023 | | | | 2.02 | | | | 3,000 | | | | (55 | ) | | | 42 | | | | (13 | ) |
Bank of America | | Turkey Government International | | | 1.00 | | | | Quarterly | | | | 6/20/2024 | | | | 3.12 | | | | 400 | | | | (37 | ) | | | 29 | | | | (8 | ) |
Bank of America | | Turkey Government International | | | 1.00 | | | | Quarterly | | | | 12/20/2024 | | | | 3.83 | | | | 1,300 | | | | (80 | ) | | | 29 | | | | (51 | ) |
BNP Paribas | | Turkey Government International(1) | | | 1.00 | | | | Quarterly | | | | 12/20/2023 | | | | 2.02 | | | | 200 | | | | (14 | ) | | | 14 | | | | 0 | |
BNP Paribas | | Turkey Government International | | | 1.00 | | | | Quarterly | | | | 12/20/2023 | | | | 2.02 | | | | 500 | | | | (40 | ) | | | 37 | | | | (3 | ) |
BNP Paribas | | Turkey Government International | | | 1.00 | | | | Quarterly | | | | 6/20/2025 | | | | 4.17 | | | | 200 | | | | (34 | ) | | | 23 | | | | (11 | ) |
Goldman Sachs | | Turkey Government International | | | 1.00 | | | | Quarterly | | | | 6/20/2024 | | | | 3.12 | | | | 1,200 | | | | (60 | ) | | | 36 | | | | (24 | ) |
Goldman Sachs | | Turkey Government International | | | 1.00 | | | | Quarterly | | | | 12/20/2024 | | | | 3.83 | | | | 900 | | | | (96 | ) | | | 61 | | | | (35 | ) |
J.P. Morgan | | Turkey Government International | | | 1.00 | | | | Quarterly | | | | 12/20/2023 | | | | 2.02 | | | | 200 | | | | (14 | ) | | | 13 | | | | (1 | ) |
Morgan Stanley | | Turkey Government International | | | 1.00 | | | | Quarterly | | | | 12/20/2023 | | | | 2.02 | | | | 500 | | | | (39 | ) | | | 37 | | | | (2 | ) |
Morgan Stanley | | Turkey Government International | | | 1.00 | | | | Quarterly | | | | 6/20/2024 | | | | 3.12 | | | | 400 | | | | (46 | ) | | | 38 | | | | (8 | ) |
Morgan Stanley | | Turkey Government International | | | 1.00 | | | | Quarterly | | | | 12/20/2024 | | | | 3.83 | | | | 3,700 | | | | (284 | ) | | | 142 | | | | (142 | ) |
Goldman Sachs | | CMBX NA Series 14 | | | 3.00 | | | | Quarterly | | | | 12/16/2072 | | | | 9.41 | | | | 645 | | | | (109 | ) | | | (78 | ) | | | (187 | ) |
| | | | | | | | | | | | | | | | | | | | | | | | | | | | | | | | | | |
| | | | | | | | | | | | | | | | | | | | | | | | $ | (1,703 | ) | | $ | 1,063 | | | $ | (640 | ) |
| | | | | | | | | | | | | | | | | | | | | | | | | | | | | | | | | | |
| (1) | A zero balance may reflect actual amounts rounding to less than one thousand. |
Centrally Cleared Interest Rate Swaps
| | | | | | | | | | | | | | | | | | | | | | | | | | | | |
Fixed Annual Rate | | Floating Rate Index | | Floating Rate
Paid or Received | | Payment
Frequency | | | Maturity
Date | | | Notional
Amount | | | Upfront
Premium
Paid/
(Received) | | | Unrealized
Appreciation/
(Depreciation) | | | Value | |
(0.45)% | | 6 Month EURIBOR | | Received | | | Semi-Annual | | | | 12/29/2023 | | | EUR | 2,800 | | | $ | – | | | $ | 74 | | | $ | 74 | |
(0.43) | | 6 Month EURIBOR | | Received | | | Semi-Annual | | | | 6/28/2024 | | | | 2,700 | | | | – | | | | 128 | | | | 128 | |
(0.40) | | 6 Month EURIBOR | | Received | | | Semi-Annual | | | | 12/30/2024 | | | | 1,200 | | | | – | | | | 86 | | | | 86 | |
(0.36) | | 6 Month EURIBOR | | Received | | | Semi-Annual | | | | 6/30/2025 | | | | 2,300 | | | | – | | | | 202 | | | | 202 | |
(0.33) | | 6 Month EURIBOR | | Received | | | Semi-Annual | | | | 12/30/2025 | | | | 1,400 | | | | – | | | | 149 | | | | 149 | |
(0.29) | | 6 Month EURIBOR | | Received | | | Semi-Annual | | | | 6/30/2026 | | | | 700 | | | | – | | | | 84 | | | | 84 | |
(0.15) | | 6 Month EURIBOR | | Received | | | Semi-Annual | | | | 3/18/2030 | | | | 16,100 | | | | 196 | | | | 3,364 | | | | 3,560 | |
0.00 | | SOFR | | Paid | | | Quarterly | | | | 9/12/2023 | | | $ | 3,200 | | | | – | | | | (45 | ) | | | (45 | ) |
0.00 | | 3 Month USD LIBOR | | Received | | | Quarterly | | | | 9/12/2023 | | | | 3,200 | | | | – | | | | 45 | | | | 45 | |
0.20 | | 1 Year JPY TONA(1) | | Received | | | Annual | | | | 2/3/2025 | | | JPY | 930,858 | | | | 0 | | | | (23 | ) | | | (23 | ) |
0.21 | | 1 Year JPY TONA(1) | | Received | | | Annual | | | | 2/3/2025 | | | | 930,858 | | | | 0 | | | | (23 | ) | | | (23 | ) |
0.50 | | 6 Month EURIBOR | | Received | | | Semi-Annual | | | | 6/17/2050 | | | EUR | 9,000 | | | | (259 | ) | | | 4,183 | | | | 3,924 | |
0.75 | | 3 Month USD LIBOR(1) | | Paid | | | Quarterly | | | | 9/16/2023 | | | $ | 108,850 | | | | 0 | | | | (1,359 | ) | | | (1,359 | ) |
0.75 | | SOFR | | Paid | | | Quarterly | | | | 6/16/2031 | | | | 108,850 | | | | (8,889 | ) | | | (13,396 | ) | | | (22,285 | ) |
0.83 | | 6 Month EURIBOR | | Received | | | Semi-Annual | | | | 12/9/2052 | | | EUR | 158,000 | | | | 946 | | | | 7,651 | | | | 8,597 | |
0.89 | | 1 Year JPY TONA(1) | | Received | | | Annual | | | | 2/15/2033 | | | JPY | 549,176 | | | | 0 | | | | (124 | ) | | | (124 | ) |
0.90 | | 1 Year JPY TONA(1) | | Received | | | Annual | | | | 2/15/2033 | | | | 549,176 | | | | 0 | | | | (129 | ) | | | (129 | ) |
0.90 | | 1 Year JPY TONA(1) | | Received | | | Annual | | | | 2/15/2033 | | | | 1,098,352 | | | | 0 | | | | (259 | ) | | | (259 | ) |
0.92 | | 1 Year JPY TONA(1) | | Received | | | Annual | | | | 2/15/2033 | | | | 1,590,716 | | | | 0 | | | | (394 | ) | | | (394 | ) |
1.25 | | 3 Month USD LIBOR(1) | | Received | | | Quarterly | | | | 9/16/2023 | | | $ | 48,900 | | | | 0 | | | | 548 | | | | 548 | |
1.25 | | SOFR | | Paid | | | Annual | | | | 6/15/2032 | | | | 26,170 | | | | (685 | ) | | | (3,989 | ) | | | (4,674 | ) |
1.25 | | SOFR | | Received | | | Quarterly | | | | 12/16/2050 | | | | 48,900 | | | | 4,987 | | | | 14,256 | | | | 19,243 | |
1.50 | | 3 Month USD LIBOR | | Received | | | Quarterly | | | | 9/17/2023 | | | | 81,200 | | | | 7 | | | | 842 | | | | 849 | |
1.50 | | SOFR | | Received | | | Quarterly | | | | 6/17/2050 | | | | 81,200 | | | | (15,116 | ) | | | 43,352 | | | | 28,236 | |
1.75 | | SOFR | | Paid | | | Annual | | | | 6/15/2029 | | | | 3,570 | | | | (350 | ) | | | (38 | ) | | | (388 | ) |
1.75 | | SOFR | | Paid | | | Annual | | | | 6/15/2032 | | | | 9,860 | | | | (395 | ) | | | (992 | ) | | | (1,387 | ) |
2.00 | | SOFR | | Paid | | | Annual | | | | 12/21/2029 | | | | 168,700 | | | | (14,118 | ) | | | (5,041 | ) | | | (19,159 | ) |
2.00 | | SOFR | | Paid | | | Annual | | | | 12/21/2032 | | | | 378,900 | | | | (43,294 | ) | | | (9,467 | ) | | | (52,761 | ) |
2.25 | | SOFR | | Received | | | Quarterly | | | | 3/12/2050 | | | | 3,200 | | | | (10 | ) | | | 719 | | | | 709 | |
2.44 | | 6 Month EURIBOR(1) | | Paid | | | Semi-Annual | | | | 7/14/2032 | | | EUR | 3,088 | | | | 0 | | | | (36 | ) | | | (36 | ) |
2.49 | | SOFR(1) | | Received | | | Annual | | | | 6/15/2053 | | | $ | 680 | | | | 0 | | | | (2 | ) | | | (2 | ) |
2.75 | | SOFR | | Received | | | Annual | | | | 6/21/2053 | | | | 91,000 | | | | 8,651 | | | | (1,077 | ) | | | 7,574 | |
3.00 | | 3 Month USD LIBOR | | Paid | | | Quarterly | | | | 9/19/2023 | | | | 6,100 | | | | 1 | | | | (42 | ) | | | (41 | ) |
3.00 | | 6 Month Australian Bank Bill | | Paid | | | Semi-Annual | | | | 3/21/2027 | | | AUD | 109,400 | | | | 418 | | | | (3,880 | ) | | | (3,462 | ) |
3.00 | | SOFR | | Paid | | | Quarterly | | | | 6/19/2029 | | | $ | 6,100 | | | | 484 | | | | (795 | ) | | | (311 | ) |
3.00 | | SOFR | | Paid | | | Annual | | | | 6/21/2033 | | | | 104,870 | | | | (1,898 | ) | | | (3,012 | ) | | | (4,910 | ) |
3.00 | | SOFR | | Paid | | | Annual | | | | 6/21/2033 | | | | 100 | | | | (2 | ) | | | (2 | ) | | | (4 | ) |
3.00 | | 6 Month EURIBOR | | Received | | | Semi-Annual | | | | 9/20/2033 | | | EUR | 36,800 | | | | (141 | ) | | | 118 | | | | (23 | ) |
3.00 | | SOFR | | Received | | | Annual | | | | 9/20/2053 | | | $ | 25,946 | | | | – | | | | 768 | | | | 768 | |
3.00 | | SOFR | | Received | | | Annual | | | | 9/20/2053 | | | | 26,103 | | | | – | | | | 773 | | | | 773 | |
3.19 | | KRW Certificate of Deposit Rate(1) | | Paid | | | Quarterly | | | | 9/20/2026 | | | KRW | 4,084,701 | | | | 0 | | | | (35 | ) | | | (35 | ) |
3.19 | | KRW Certificate of Deposit Rate(1) | | Paid | | | Quarterly | | | | 9/20/2026 | | | | 3,019,127 | | | | 0 | | | | (26 | ) | | | (26 | ) |
3.25 | | SOFR | | Paid | | | Annual | | | | 6/21/2028 | | | $ | 218,700 | | | | (3,385 | ) | | | (3,263 | ) | | | (6,648 | ) |
3.25 | | Sterling Overnight Index Average | | Received | | | Annual | | | | 9/20/2053 | | | GBP | 700 | | | | 23 | | | | 62 | | | | 85 | |
3.28 | | 3 Month Canadian Bank Bill | | Paid | | | Quarterly | | | | 4/25/2033 | | | CAD | 1,308 | | | | (4 | ) | | | (40 | ) | | | (44 | ) |
3.30 | | 3 Month Canadian Bank Bill(1) | | Paid | | | Quarterly | | | | 3/27/2033 | | | | 435 | | | | 0 | | | | (15 | ) | | | (15 | ) |
3.32 | | 3 Month Canadian Bank Bill | | Received | | | Quarterly | | | | 4/25/2053 | | | | 567 | | | | 3 | | | | 15 | | | | 18 | |
3.33 | | KRW Certificate of Deposit Rate(1) | | Paid | | | Quarterly | | | | 9/20/2026 | | | KRW | 1,636,900 | | | | 0 | | | | (9 | ) | | | (9 | ) |
3.35 | | 3 Month Canadian Bank Bill | | Paid | | | Quarterly | | | | 3/30/2033 | | | CAD | 442 | | | | (1 | ) | | | (13 | ) | | | (14 | ) |
3.36 | | Canadian Overnight Repo Rate
Average(1) | | Received | | | Semi-Annual | | | | 6/22/2053 | | | | 4,267 | | | | 0 | | | | (103 | ) | | | (103 | ) |
3.36 | | 3 Month Canadian Bank Bill(1) | | Paid | | | Quarterly | | | | 5/12/2033 | | | | 450 | | | | 0 | | | | (13 | ) | | | (13 | ) |
3.37 | | 3 Month Canadian Bank Bill(1) | | Received | | | Quarterly | | | | 3/27/2053 | | | | 188 | | | | 0 | | | | 5 | | | | 5 | |
3.38 | | 3 Month Canadian Bank Bill(1) | | Received | | | Quarterly | | | | 5/12/2053 | | | | 195 | | | | 0 | | | | 5 | | | | 5 | |
3.38 | | KRW Certificate of Deposit Rate(1) | | Paid | | | Quarterly | | | | 9/20/2026 | | | KRW | 1,637,145 | | | | 0 | | | | (7 | ) | | | (7 | ) |
3.38 | | KRW Certificate of Deposit Rate(1) | | Paid | | | Quarterly | | | | 9/20/2026 | | | | 1,637,145 | | | | 0 | | | | (7 | ) | | | (7 | ) |
3.40 | | 3 Month Canadian Bank Bill(1) | | Received | | | Quarterly | | | | 3/30/2053 | | | CAD | 192 | | | | 0 | | | | 4 | | | | 4 | |
3.40 | | Canadian Overnight Repo Rate Average | | Received | | | Semi-Annual | | | | 6/15/2053 | | | | 21,306 | | | | 1 | | | | (637 | ) | | | (636 | ) |
3.43 | | 3 Month Canadian Bank Bill | | Paid | | | Quarterly | | | | 5/15/2033 | | | | 1,349 | | | | (7 | ) | | | (25 | ) | | | (32 | ) |
3.44 | | 3 Month Canadian Bank Bill | | Received | | | Quarterly | | | | 5/15/2053 | | | | 585 | | | | 3 | | | | 6 | | | | 9 | |
3.44 | | 3 Month Canadian Bank Bill(1) | | Paid | | | Quarterly | | | | 5/9/2033 | | | | 443 | | | | 0 | | | | (10 | ) | | | (10 | ) |
3.48 | | 3 Month Canadian Bank Bill(1) | | Received | | | Quarterly | | | | 5/9/2053 | | | | 192 | | | | 0 | | | | 2 | | | | 2 | |
3.50 | | Sterling Overnight Index Average | | Received | | | Annual | | | | 9/20/2033 | | | GBP | 15,600 | | | | 129 | | | | 1,135 | | | | 1,264 | |
3.54 | | Canadian Overnight Repo Rate Average(1) | | Paid | | | Semi-Annual | | | | 6/22/2033 | | | CAD | 9,754 | | | | 0 | | | | 54 | | | | 54 | |
3.54 | | Canadian Overnight Repo Rate Average | | Paid | | | Semi-Annual | | | | 6/15/2033 | | | | 47,940 | | | | 1 | | | | 257 | | | | 258 | |
3.56 | | 3 Month Canadian Bank Bill(1) | | Received | | | Quarterly | | | | 6/1/2053 | | | | 208 | | | | 0 | | | | (1 | ) | | | (1 | ) |
3.58 | | 3 Month Canadian Bank Bill(1) | | Received | | | Quarterly | | | | 5/31/2053 | | | | 201 | | | | 0 | | | | (1 | ) | | | (1 | ) |
3.60 | | SOFR | | Paid | | | Annual | | | | 9/20/2025 | | | $ | 370,000 | | | | – | | | | (7,055 | ) | | | (7,055 | ) |
3.60 | | SOFR | | Paid | | | Annual | | | | 5/30/2025 | | | | 195,000 | | | | 1 | | | | (1,324 | ) | | | (1,323 | ) |
3.64 | | 3 Month Canadian Bank B ill(1) | | Received | | | Quarterly | | | | 6/29/2053 | | | CAD | 205 | | | | 0 | | | | (3 | ) | | | (3 | ) |
3.65 | | SOFR | | Received | | | Annual | | | | 5/30/2025 | | | $ | 195,000 | | | | 28 | | | | 1,303 | | | | 1,331 | |
3.66 | | 3 Month Canadian Bank Bill | | Received | | | Quarterly | | | | 5/30/2053 | | | CAD | 199 | | | | 1 | | | | (4 | ) | | | (3 | ) |
3.68 | | 3 Month Canadian Bank Bill(1) | | Paid | | | Quarterly | | | | 6/1/2033 | | | | 478 | | | | 0 | | | | (4 | ) | | | (4 | ) |
3.68 | | 3 Month Canadian Bank Bill(1) | | Paid | | | Quarterly | | | | 5/31/2033 | | | | 465 | | | | 0 | | | | (3 | ) | | | (3 | ) |
3.75 | | Sterling Overnight Index Average(1) | | Received | | | Annual | | | | 6/27/2053 | | | GBP | 6,403 | | | | 0 | | | | 126 | | | | 126 | |
3.77 | | 3 Month Canadian Bank Bill(1) | | Received | | | Quarterly | | | | 6/13/2053 | | | CAD | 37 | | | | 0 | | | | (1 | ) | | | (1 | ) |
3.77 | | 3 Month Canadian Bank Bill(1) | | Paid | | | Quarterly | | | | 5/30/2033 | | | | 459 | | | | 0 | | | | (1 | ) | | | (1 | ) |
| | | | | | | | | | | | | | | | | | | | | | | | | | | | | | |
3.85 | | 3 Month Canadian Bank Bill(1) | | | Paid | | | | Quarterly | | | | 6/29/2033 | | | | 472 | | | | 0 | | | | 2 | | | | 2 | |
3.92 | | 3 Month Canadian Bank Bill(1) | | | Paid | | | | Quarterly | | | | 6/13/2033 | | | | 86 | | | | 0 | | | | 1 | | | | 1 | |
4.28 | | Sterling Overnight Index Average | | | Paid | | | | Annual | | | | 6/27/2033 | | | GBP | 14,623 | | | | 1 | | | | (138 | ) | | | (137 | ) |
4.32 | | 6 Month CZK PRIBOR(1) | | | Paid | | | | Semi-Annual | | | | 9/20/2028 | | | CZK | 44,415 | | | | 0 | | | | 1 | | | | 1 | |
4.54 | | 6 Month CZK PRIBOR(1) | | | Paid | | | | Semi-Annual | | | | 9/20/2028 | | | | 37,841 | | | | 0 | | | | 18 | | | | 18 | |
4.62 | | 3 Month CZK PRIBOR(1) | | | Received | | | | Quarterly | | | | 6/19/2025 | | | | 190,403 | | | | 0 | | | | (3 | ) | | | (3 | ) |
5.16 | | Mexico Interbank TIIE 28 Day | | | Paid | | | | Lunar | | | | 6/6/2025 | | | MXN | 1,700 | | | | – | | | | (8 | ) | | | (8 | ) |
5.54 | | Mexico Interbank TIIE 28 Day(1) | | | Paid | | | | Lunar | | | | 5/4/2027 | | | | 3,400 | | | | 0 | | | | (20 | ) | | | (20 | ) |
5.64 | | Sterling Overnight Index Average | | | Paid | | | | Annual | | | | 6/24/2025 | | | GBP | 53,000 | | | | (13 | ) | | | (137 | ) | | | (150 | ) |
5.70 | | 6 Month PLN WIBOR(1) | | | Received | | | | Semi-Annual | | | | 9/20/2028 | | | PLN | 5,621 | | | | 0 | | | | (49 | ) | | | (49 | ) |
5.73 | | Sterling Overnight Index Average | | | Paid | | | | Annual | | | | 6/27/2025 | | | GBP | 26,000 | | | | (1 | ) | | | (44 | ) | | | (45 | ) |
7.15 | | Mexico Interbank TIIE 28 Day | | | Paid | | | | Lunar | | | | 6/11/2027 | | | MXN | 25,800 | | | | (12 | ) | | | (60 | ) | | | (72 | ) |
7.20 | | 3 Month ZAR SAJIBOR(1) | | | Paid | | | | Quarterly | | | | 3/20/2025 | | | ZAR | 79,003 | | | | 0 | | | | (45 | ) | | | (45 | ) |
7.36 | | Mexico Interbank TIIE 28 Day(1) | | | Received | | | | Lunar | | | | 8/21/2037 | | | MXN | 900 | | | | 3 | | | | 0 | | | | 3 | |
7.37 | | Mexico Interbank TIIE 28 Day | | | Paid | | | | Lunar | | | | 10/11/2027 | | | | 40,300 | | | | (1 | ) | | | (91 | ) | | | (92 | ) |
7.38 | | Mexico Interbank TIIE 28 Day(1) | | | Received | | | | Lunar | | | | 8/14/2037 | | | | 1,300 | | | | 4 | | | | 1 | | | | 5 | |
7.50 | | Mexico Interbank TIIE 28 Day | | | Received | | | | Lunar | | | | 1/14/2032 | | | | 5,900 | | | | 24 | | | | (11 | ) | | | 13 | |
7.50 | | Mexico Interbank TIIE 28 Day | | | Received | | | | Lunar | | | | 1/15/2032 | | | | 24,500 | | | | 89 | | | | (36 | ) | | | 53 | |
7.91 | | Mexico Interbank TIIE 28 Day | | | Received | | | | Lunar | | | | 12/30/2027 | | | | 800 | | | | – | | | | 1 | | | | 1 | |
7.98 | | Mexico Interbank TIIE 28 Day(1) | | | Received | | | | Lunar | | | | 12/10/2027 | | | | 3,300 | | | | 0 | | | | 3 | | | | 3 | |
7.99 | | Mexico Interbank TIIE 28 Day(1) | | | Received | | | | Lunar | | | | 12/21/2027 | | | | 100 | | | | – | | | | 0 | | | | 0 | |
8.01 | | Mexico Interbank TIIE 28 Day | | | Received | | | | Lunar | | | | 12/21/2027 | | | | 20,200 | | | | (6 | ) | | | 26 | | | | 20 | |
8.03 | | Mexico Interbank TIIE 28 Day(1) | | | Received | | | | Lunar | | | | 1/31/2028 | | | | 1,600 | | | | 0 | | | | 1 | | | | 1 | |
8.05 | | Mexico Interbank TIIE 28 Day | | | Received | | | | Lunar | | | | 1/31/2028 | | | | 2,400 | | | | – | | | | 2 | | | | 2 | |
8.35 | | Mexico Interbank TIIE 28 Day(1) | | | Paid | | | | Lunar | | | | 4/28/2028 | | | | 19,905 | | | | 0 | | | | (1 | ) | | | (1 | ) |
8.41 | | Mexico Interbank TIIE 28 Day | | | Received | | | | Lunar | | | | 3/31/2027 | | | | 14,300 | | | | – | | | | 5 | | | | 5 | |
8.42 | | Mexico Interbank TIIE 28 Day(1) | | | Paid | | | | Lunar | | | | 1/20/2028 | | | | 32,803 | | | | 0 | | | | (2 | ) | | | (2 | ) |
8.66 | | Mexico Interbank TIIE 28 Day | | | Received | | | | Lunar | | | | 4/4/2024 | | | | 49,700 | | | | – | | | | 55 | | | | 55 | |
8.68 | | Mexico Interbank TIIE 28 Day | | | Received | | | | Lunar | | | | 4/3/2024 | | | | 119,300 | | | | – | | | | 132 | | | | 132 | |
8.70 | | Mexico Interbank TIIE 28 Day | | | Received | | | | Lunar | | | | 3/31/2032 | | | | 14,300 | | | | – | | | | (31 | ) | | | (31 | ) |
8.73 | | Mexico Interbank TIIE 28 Day | | | Received | | | | Lunar | | | | 4/6/2027 | | | | 12,100 | | | | – | | | | (1 | ) | | | (1 | ) |
8.73 | | Mexico Interbank TIIE 28 Day | | | Received | | | | Lunar | | | | 3/30/2032 | | | | 6,000 | | | | – | | | | (13 | ) | | | (13 | ) |
8.75 | | Mexico Interbank TIIE 28 Day | | | Received | | | | Lunar | | | | 4/5/2024 | | | | 29,000 | | | | – | | | | 31 | | | | 31 | |
9.84 | | Mexico Interbank TIIE 28 Day(1) | | | Received | | | | Lunar | | | | 5/16/2025 | | | | 61,793 | | | | 0 | | | | 2 | | | | 2 | |
| | | | | | | | | | | | | | | | | | | | | | | | | | | | | | |
| | | | | | | | | | | | | | | | | | | | $ | (72,586 | ) | | $ | 23,182 | | | $ | (49,404 | ) |
| | | | | | | | | | | | | | | | | | | | | | | | | | | | | | |
Lunar - payment frequency equal periods of 28 days (a lunar month).
| (1) | A zero balance may reflect actual amounts rounding to less than one thousand. |
Over-the-Counter Interest Rate Swaps
| | | | | | | | | | | | | | | | | | | | | | | | | | |
Counterparty | | Fixed Annual
Rate | | Floating Rate Index | | Floating Rate
Paid or Received | | Maturity
Date | | | Notional
Amount | | | Upfront
Premium
Paid/
(Received) | | | Unrealized
Appreciation/
(Depreciation) | | | Value | |
Bank of America | | 11.38% | | Brazil Cetip DI Interbank Deposit | | Paid | | | 1/2/2026 | | | BRL | 9,207 | | | $ | – | | | $ | 55 | | | $ | 55 | |
Citibank | | 11.75 | | Brazil Cetip DI Interbank Deposit | | Paid | | | 1/2/2026 | | | | 10,487 | | | | – | | | | 80 | | | | 80 | |
Citibank | | 11.80 | | Brazil Cetip DI Interbank Deposit | | Paid | | | 1/2/2026 | | | | 10,366 | | | | – | | | | 83 | | | | 83 | |
Bank of America | | 11.87 | | Brazil Cetip DI Interbank Deposit | | Paid | | | 1/2/2025 | | | | 16,259 | | | | – | | | | 45 | | | | 45 | |
Bank of America | | 11.90 | | Colombia Overnight Interbank | | Received | | | 10/19/2024 | | | COP | 7,556,152 | | | | – | | | | (31 | ) | | | (31 | ) |
Citibank | | 11.92 | | Brazil Cetip DI Interbank Deposit | | Paid | | | 1/2/2026 | | | BRL | 15,279 | | | | – | | | | 131 | | | | 131 | |
Citibank | | 12.37 | | Colombia Overnight Interbank | | Received | | | 4/18/2024 | | | COP | 14,570,937 | | | | – | | | | (22 | ) | | | (22 | ) |
Bank of America | | 12.60 | | Brazil Cetip DI Interbank Deposit | | Paid | | | 7/1/2024 | | | BRL | 13,937 | | | | – | | | | 18 | | | | 18 | |
Goldman Sachs | | 12.97 | | Brazil Cetip DI Interbank Deposit | | Paid | | | 7/1/2024 | | | | 4,956 | | | | – | | | | 11 | | | | 11 | |
Citibank | | 12.97 | | Brazil Cetip DI Interbank Deposit | | Paid | | | 7/1/2024 | | | | 8,195 | | | | – | | | | 17 | | | | 17 | |
| | | | | | | | | | | | | | | | | | | | | | | | | | |
| | | | | | | | | $ | – | | | $ | 387 | | | $ | 387 | |
| | | | | | | | | | | | | | | | | | | |
Centrally Cleared Inflation Linked Swaps
| | | | | | | | | | | | | | | | | | | | | | | | | | |
Fixed Annual Rate | | Floating Rate Index | | Floating Rate
Paid or Received | | | Maturity
Date | | | Notional
Amount | | | Upfront
Premium
Paid/
(Received) | | | Unrealized
Appreciation/
(Depreciation) | | | Value | |
| 2.43% | | 30-Year USD Inflation Linked | | | Received | | | | 6/30/2053 | | | $ | 6,185 | | | $ | 1 | | | $ | 47 | | | $ | 48 | |
| 2.45 | | 30-Year USD Inflation Linked(1) | | | Received | | | | 6/9/2053 | | | | 3,134 | | | | 0 | | | | 9 | | | | 9 | |
| 2.46 | | 30-Year USD Inflation Linked(1) | | | Received | | | | 6/9/2053 | | | | 3,134 | | | | 0 | | | | 2 | | | | 2 | |
| 2.53 | | 10-Year USD Inflation Linked(1) | | | Received | | | | 6/28/2033 | | | | 318 | | | | 0 | | | | 0 | | | | 0 | |
| 2.73 | | 30-Year EUR Inflation Linked(1) | | | Paid | | | | 6/15/2053 | | | EUR | 4,185 | | | | 0 | | | | 41 | | | | 41 | |
| 2.77 | | 30-Year EUR Inflation Linked(1) | | | Paid | | | | 6/15/2053 | | | | 2,249 | | | | 0 | | | | 53 | | | | 53 | |
| 2.77 | | 30-Year EUR Inflation Linked(1) | | | Paid | | | | 6/15/2053 | | | | 2,249 | | | | 0 | | | | 58 | | | | 58 | |
| 4.00 | | 10-Year GBP Inflation Linked | | | Paid | | | | 9/15/2031 | | | GBP | 7,300 | | | | (6 | ) | | | (1,373 | ) | | | (1,379 | ) |
| 4.06 | | 10-Year GBP Inflation Linked | | | Paid | | | | 9/15/2031 | | | | 6,800 | | | | 28 | | | | (1,265 | ) | | | (1,237 | ) |
| 4.07 | | 10-Year GBP Inflation Linked | | | Paid | | | | 9/15/2031 | | | | 13,100 | | | | (162 | ) | | | (2,202 | ) | | | (2,364 | ) |
| | | | | | | | | | | | | | | | | | | | | | | | | | |
| | | | | | | | | | | | | | | | $ | (139 | ) | | $ | (4,630 | ) | | $ | (4,769 | ) |
| | | | | | | | | | | | | | | | | | | | | | | | | | |
| (1) | A zero balance may reflect actual amounts rounding to less than one thousand. |
| | | | | | |
| EURIBOR | | Euro Interbank Offered Rate | | SOFR | | Secured Overnight Financing Rate |
| LIBOR | | London Interbank Offered Rate | | TIIE | | Interbank Equilibrium Interest Rate |
| PRIBOR | | Prague Interbank Offered Rate | | TONA | | Tokyo Overnight Average Rate |
| SAJIBOR | | South African Johannesburg Interbank Offered Rate | | WIBOR | | Warsaw Interbank Offered Rate |
Bridge Builder Municipal Bond Fund
Schedule of Investments
June 30, 2023
(Amounts in thousands, except number of contracts)
| | | | | | | | |
| | | Principal
Amount
(000s) | | | Value
(000s) | |
MUNICIPAL BONDS – 96.90% | | | | | | | | |
Alabama – 2.59% | | | | | | | | |
Alabama Community College System ACCS Enhancements Fee Revenue | | | | | | | | |
4.00%, 09/01/2035 | | $ | 430 | | | $ | 441 | |
4.00%, 09/01/2037 | | | 750 | | | | 758 | |
Alabama Federal Aid Highway Finance Authority | | | | | | | | |
5.00%, 09/01/2031 | | | 4,845 | | | | 4,937 | |
5.00%, 09/01/2036 | | | 10,000 | | | | 10,647 | |
Alabama Housing Finance Authority | | | | | | | | |
3.88%, 12/01/2023 | | | 2,500 | | | | 2,498 | |
5.00%, 06/01/2026(1) | | | 3,430 | | | | 3,487 | |
Alabama Public School & College Authority | | | | | | | | |
5.00%, 11/01/2025 | | | 5,000 | | | | 5,228 | |
5.00%, 06/01/2035 | | | 4,000 | | | | 4,104 | |
5.00%, 11/01/2035 | | | 6,400 | | | | 7,253 | |
Birmingham Airport Authority | | | | | | | | |
5.00%, 07/01/2028 | | | 700 | | | | 768 | |
5.00%, 07/01/2030 | | | 1,000 | | | | 1,129 | |
5.00%, 07/01/2031 | | | 350 | | | | 394 | |
5.00%, 07/01/2032 | | | 300 | | | | 338 | |
5.00%, 07/01/2034 | | | 800 | | | | 896 | |
Black Belt Energy Gas District | | | | | | | | |
4.00%, 12/01/2049(1) | | | 12,530 | | | | 12,457 | |
4.00%, 07/01/2052(1) | | | 6,805 | | | | 6,784 | |
4.00%, 10/01/2052(1) | | | 20,065 | | | | 19,885 | |
4.00%, 12/01/2052(1) | | | 5,550 | | | | 5,392 | |
4.00%, 04/01/2053(1) | | | 10,210 | | | | 10,092 | |
4.36% (SIFMA Municipal Swap Index Yield + 0.35%), 10/01/2052(2) | | | 24,660 | | | | 23,978 | |
5.00%, 06/01/2027 | | | 1,585 | | | | 1,651 | |
5.00%, 06/01/2028 | | | 2,270 | | | | 2,386 | |
5.25%, 06/01/2027 | | | 1,300 | | | | 1,361 | |
5.25%, 12/01/2027 | | | 1,170 | | | | 1,230 | |
5.25%, 06/01/2028 | | | 1,540 | | | | 1,623 | |
5.25%, 12/01/2028 | | | 1,275 | | | | 1,346 | |
5.25%, 02/01/2053(1) | | | 7,500 | | | | 7,851 | |
5.25%, 12/01/2053 | | | 2,880 | | | | 3,076 | |
5.50%, 11/01/2053(1) | | | 18,190 | | | | 19,202 | |
City of Hoover AL | | | | | | | | |
5.00%, 03/01/2041 | | | 8,210 | | | | 9,215 | |
City of Montgomery AL | | | | | | | | |
4.00%, 12/01/2036 | | | 400 | | | | 412 | |
4.00%, 12/01/2037 | | | 500 | | | | 512 | |
Cooper Green Mercy Health Services Authority | | | | | | | | |
5.00%, 09/01/2024 | | | 440 | | | | 449 | |
5.00%, 09/01/2025 | | | 475 | | | | 489 | |
5.00%, 09/01/2026 | | | 500 | | | | 524 | |
5.00%, 09/01/2028 | | | 550 | | | | 595 | |
County of Jefferson AL Sewer Revenue | | | | | | | | |
6.00%, 10/01/2042 | | | 9,350 | | | | 9,848 | |
Health Care Authority of the City of Huntsville | | | | | | | | |
5.00%, 06/01/2036 | | | 2,600 | | | | 2,769 | |
5.00%, 06/01/2037 | | | 3,300 | | | | 3,482 | |
Homewood Educational Building Authority | | | | | | | | |
4.00%, 12/01/2038 | | | 1,385 | | | | 1,338 | |
Industrial Development Board of the City of Mobile Alabama | | | | | | | | |
1.00%, 06/01/2034(1) | | | 3,870 | | | | 3,669 | |
2.90%, 07/15/2034(1) | | | 200 | | | | 199 | |
3.80%, 06/01/2034(1) | | | 12,750 | | | | 12,750 | |
Lower Alabama Gas District | | | | | | | | |
4.00%, 12/01/2050(1) | | | 12,610 | | | | 12,537 | |
Mobile County Board of School Commissioners | | | | | | | | |
4.00%, 03/01/2034 | | | 1,315 | | | | 1,356 | |
4.00%, 03/01/2035 | | | 1,360 | | | | 1,389 | |
4.00%, 03/01/2036 | | | 1,500 | | | | 1,517 | |
4.00%, 03/01/2038 | | | 1,750 | | | | 1,745 | |
4.00%, 03/01/2039 | | | 1,700 | | | | 1,683 | |
4.00%, 03/01/2040 | | | 1,580 | | | | 1,563 | |
4.00%, 03/01/2041 | | | 2,765 | | | | 2,732 | |
5.00%, 03/01/2028 | | | 1,030 | | | | 1,072 | |
5.00%, 03/01/2038 | | | 1,400 | | | | 1,534 | |
5.00%, 03/01/2039 | | | 1,720 | | | | 1,877 | |
Montgomery County Public Facilities Authority | | | | | | | | |
4.00%, 03/01/2038 | | | 685 | | | | 689 | |
4.00%, 03/01/2039 | | | 415 | | | | 414 | |
4.00%, 03/01/2041 | | | 400 | | | | 392 | |
Montgomery Medical Clinic Board | | | | | | | | |
| | | | | | | | |
5.00%, 03/01/2029 | | | 1,000 | | | | 994 | |
Prichard Water Works & Sewer Board | | | | | | | | |
2.25%, 11/01/2027 | | | 210 | | | | 123 | |
2.38%, 11/01/2028 | | | 550 | | | | 310 | |
Southeast Alabama Gas Supply District | | | | | | | | |
4.00%, 06/01/2049(1) | | | 11,010 | | | | 10,989 | |
4.31% (1 Month LIBOR USD + 0.85%), 06/01/2049(2) | | | 5,365 | | | | 5,365 | |
Southeast Energy Authority A Cooperative District | | | | | | | | |
5.00%, 05/01/2053(1) | | | 12,765 | | | | 13,197 | |
5.50%, 01/01/2053(1) | | | 12,400 | | | | 13,186 | |
State of Alabama | | | | | | | | |
3.00%, 08/01/2026 | | | 5,000 | | | | 4,968 | |
Sumter County Industrial Development Authority | | | | | | | | |
6.00%, 07/15/2052(1) | | | 5,000 | | | | 3,381 | |
Town of Pike Road AL | | | | | | | | |
5.00%, 03/01/2041 | | | 1,795 | | | | 2,007 | |
5.00%, 03/01/2042 | | | 1,560 | | | | 1,737 | |
5.00%, 03/01/2048 | | | 7,415 | | | | 8,117 | |
University of Alabama | | | | | | | | |
4.00%, 06/01/2033 | | | 1,070 | | | | 1,122 | |
| | | | | | | | |
Total Alabama | | | | 303,439 | |
| | | | | | | | |
Alaska – 0.16% | | | | | | | | |
Alaska Housing Finance Corp. | | | | | | | | |
3.00%, 06/01/2051 | | | 1,180 | | | | 1,131 | |
Alaska Industrial Development & Export Authority | | | | | | | | |
5.00%, 10/01/2030 | | | 1,385 | | | | 1,494 | |
Alaska Municipal Bond Bank Authority | | | | | | | | |
5.00%, 12/01/2037 | | | 1,500 | | | | 1,588 | |
5.00%, 12/01/2040 | | | 2,500 | | | | 2,726 | |
5.00%, 12/01/2042 | | | 1,500 | | | | 1,561 | |
5.25%, 12/01/2047 | | | 1,620 | | | | 1,705 | |
Municipality of Anchorage AK | | | | | | | | |
4.00%, 09/01/2040 | | | 1,500 | | | | 1,500 | |
Northern Tobacco Securitization Corp. | | | | | | | | |
4.00%, 06/01/2034 | | | 1,000 | | | | 1,010 | |
4.00%, 06/01/2050 | | | 1,670 | | | | 1,660 | |
4.00%, 06/01/2050 | | | 3,145 | | | | 2,780 | |
5.00%, 06/01/2032 | | | 875 | | | | 962 | |
5.00%, 06/01/2033 | | | 750 | | | | 820 | |
| | | | | | | | |
Total Alaska | | | | 18,937 | |
| | | | | | | | |
Arizona – 1.68% | | | | | | | | |
Arizona Health Facilities Authority | | | | | | | | |
4.26% (SIFMA Municipal Swap Index Yield + 0.25%), 01/01/2046(2) | | | 3,750 | | | | 3,676 | |
5.00%, 12/01/2039 | | | 1,150 | | | | 1,157 | |
Arizona Industrial Development Authority | | | | | | | | |
2.65%, 07/01/2026 | | | 330 | | | | 314 | |
3.00%, 12/15/2031(3) | | | 400 | | | | 344 | |
4.00%, 07/01/2031 | | | 275 | | | | 275 | |
4.00%, 07/01/2031 | | | 310 | | | | 303 | |
4.00%, 11/01/2039 | | | 1,140 | | | | 1,078 | |
5.00%, 02/01/2034 | | | 2,585 | | | | 2,968 | |
Arizona State University | | | | | | | | |
5.00%, 07/01/2042 | | | 500 | | | | 515 | |
Chandler Industrial Development Authority | | | | | | | | |
5.00%, 06/01/2049(1) | | | 18,960 | | | | 19,105 | |
5.00%, 09/01/2052(1) | | | 8,350 | | | | 8,545 | |
City of Glendale AZ Excise Tax Revenue | | | | | | | | |
5.00%, 07/01/2030 | | | 1,780 | | | | 1,922 | |
City of Mesa AZ | | | | | | | | |
4.00%, 07/01/2028 | | | 1,265 | | | | 1,319 | |
City of Mesa AZ Utility System Revenue | | | | | | | | |
5.00%, 07/01/2043 | | | 2,500 | | | | 2,691 | |
City of Phoenix Civic Improvement Corp. | | | | | | | | |
5.00%, 07/01/2025 | | | 1,295 | | | | 1,344 | |
5.00%, 07/01/2026 | | | 1,675 | | | | 1,741 | |
5.00%, 07/01/2027 | | | 4,600 | | | | 4,853 | |
5.00%, 07/01/2028 | | | 1,070 | | | | 1,160 | |
5.00%, 07/01/2028 | | | 4,440 | | | | 4,753 | |
5.00%, 07/01/2029 | | | 725 | | | | 785 | |
5.00%, 07/01/2029 | | | 12,865 | | | | 12,865 | |
5.00%, 07/01/2030 | | | 1,000 | | | | 1,098 | |
5.00%, 07/01/2030 | | | 1,500 | | | | 1,500 | |
5.00%, 07/01/2031 | | | 725 | | | | 795 | |
5.00%, 07/01/2032 | | | 120 | | | | 131 | |
5.00%, 07/01/2032 | | | 800 | | | | 844 | |
5.00%, 07/01/2036 | | | 3,000 | | | | 3,187 | |
5.00%, 07/01/2036 | | | 4,210 | | | | 4,331 | |
5.00%, 07/01/2037 | | | 1,765 | | | | 1,812 | |
5.00%, 07/01/2039 | | | 4,700 | | | | 4,890 | |
5.00%, 07/01/2042 | | | 540 | | | | 556 | |
5.00%, 07/01/2045 | | | 635 | | | | 665 | |
Gilbert Water Resource Municipal Property Corp. | | | | | | | | |
5.00%, 07/15/2032 | | | 1,370 | | | | 1,626 | |
| | | | | | | | |
5.00%, 07/15/2033 | | | 1,920 | | | | 2,275 | |
5.00%, 07/15/2034 | | | 1,785 | | | | 2,104 | |
Glendale Industrial Development Authority | | | | | | | | |
5.00%, 05/15/2056 | | | 1,375 | | | | 1,173 | |
Industrial Development Authority of the City of Phoenix Arizona | | | | | | | | |
5.00%, 07/01/2033 | | | 415 | | | | 432 | |
5.00%, 07/01/2034 | | | 765 | | | | 792 | |
5.00%, 07/01/2038 | | | 1,295 | | | | 1,314 | |
Industrial Development Authority of the County of Pima | | | | | | | | |
4.00%, 04/01/2035 | | | 415 | | | | 414 | |
4.00%, 04/01/2036 | | | 420 | | | | 412 | |
4.00%, 04/01/2040 | | | 675 | | | | 639 | |
5.00%, 04/01/2033 | | | 575 | | | | 629 | |
5.00%, 04/01/2034 | | | 795 | | | | 869 | |
Industrial Development Authority of the County of Yavapai | | | | | | | | |
2.20%, 03/01/2028(1) | | | 2,100 | | | | 2,066 | |
3.80%, 04/01/2029(1) | | | 3,000 | | | | 3,000 | |
Maricopa County Industrial Development Authority | | | | | | | | |
5.00%, 01/01/2046(1) | | | 3,210 | | | | 3,352 | |
5.00%, 07/01/2047 | | | 1,000 | | | | 1,051 | |
5.75%, 01/01/2036(3) | | | 1,500 | | | | 1,208 | |
6.00%, 01/01/2048(3) | | | 1,155 | | | | 834 | |
Maricopa County School District No 83-Cartwright Elementary | | | | | | | | |
4.00%, 07/01/2036 | | | 1,315 | | | | 1,355 | |
4.00%, 07/01/2037 | | | 860 | | | | 879 | |
4.00%, 07/01/2038 | | | 500 | | | | 508 | |
4.00%, 07/01/2039 | | | 1,035 | | | | 1,045 | |
4.00%, 07/01/2040 | | | 1,090 | | | | 1,095 | |
Maricopa County Special Health Care District | | | | | | | | |
4.00%, 07/01/2035 | | | 805 | | | | 835 | |
4.00%, 07/01/2038 | | | 19,340 | | | | 19,367 | |
5.00%, 07/01/2025 | | | 5,000 | | | | 5,175 | |
5.00%, 07/01/2026 | | | 7,000 | | | | 7,391 | |
5.00%, 07/01/2033 | | | 6,555 | | | | 7,482 | |
Mizuho Floater/Residual Trust | | | | | | | | |
4.21%, 03/01/2026(3) | | | 3,820 | | | | 3,820 | |
Salt River Project Agricultural Improvement & Power District | | | | | | | | |
4.00%, 01/01/2041 | | | 4,680 | | | | 4,708 | |
5.00%, 01/01/2024 | | | 1,600 | | | | 1,615 | |
5.00%, 01/01/2033 | | | 1,000 | | | | 1,096 | |
5.00%, 12/01/2036 | | | 6,670 | | | | 6,853 | |
5.00%, 01/01/2038 | | | 3,985 | | | | 4,184 | |
Salt Verde Financial Corp. | | | | | | | | |
5.00%, 12/01/2032 | | | 5,020 | | | | 5,327 | |
State of Arizona | | | | | | | | |
5.00%, 10/01/2024 | | | 1,075 | | | | 1,099 | |
University of Arizona | | | | | | | | |
5.00%, 06/01/2038 | | | 1,955 | | | | 2,131 | |
5.00%, 06/01/2046 | | | 2,000 | | | | 2,054 | |
Western Maricopa Education Center District No 402 | | | | | | | | |
5.00%, 07/01/2024 | | | 320 | | | | 326 | |
5.00%, 07/01/2025 | | | 1,410 | | | | 1,461 | |
Yuma & La Paz Counties Community College District | | | | | | | | |
4.00%, 07/01/2033 | | | 370 | | | | 390 | |
4.00%, 07/01/2034 | | | 375 | | | | 391 | |
4.00%, 07/01/2035 | | | 350 | | | | 360 | |
| | | | | | | | |
Total Arizona | | | | 196,659 | |
| | | | | | | | |
Arkansas – 0.23% | | | | | | | | |
Arkansas Development Finance Authority | | | | | | | | |
3.13%, 07/01/2036 | | | 180 | | | | 142 | |
4.00%, 07/01/2027 | | | 220 | | | | 217 | |
4.50%, 09/01/2049(3) | | | 4,150 | | | | 3,748 | |
5.70%, 05/01/2053 | | | 3,175 | | | | 3,219 | |
County of Pulaski AR | | | | | | | | |
5.00%, 03/01/2036 | | | 1,000 | | | | 1,115 | |
5.00%, 03/01/2040 | | | 500 | | | | 542 | |
5.00%, 03/01/2042 | | | 1,225 | | | | 1,317 | |
Tender Option Bond Trust Receipts/Certificates | | | | | | | | |
0.00%, 09/01/2044(3) | | | 10,000 | | | | 10,000 | |
University of Arkansas | | | | | | | | |
5.00%, 03/01/2033 | | | 5,845 | | | | 5,976 | |
5.00%, 11/01/2047 | | | 1,000 | | | | 1,046 | |
| | | | | | | | |
Total Arkansas | | | | 27,322 | |
| | | | | | | | |
California – 7.08% | | | | | | | | |
Alameda Corridor Transportation Authority | | | | | | | | |
5.00%, 10/01/2036 | | | 1,710 | | | | 1,782 | |
Alisal Union School District | | | | | | | | |
5.25%, 08/01/2042 | | | 740 | | | | 793 | |
Anaheim Public Financing Authority | | | | | | | | |
5.00%, 09/01/2029 | | | 1,860 | | | | 2,065 | |
Apple Valley Public Financing Authority | | | | | | | | |
4.00%, 06/01/2036 | | | 1,350 | | | | 1,379 | |
Bay Area Toll Authority | | | | | | | | |
| | | | | | | | |
2.85%, 04/01/2047(1) | | | 965 | | | | 953 | |
2.95%, 04/01/2047(1) | | | 1,130 | | | | 1,107 | |
4.42% (SIFMA Municipal Swap Index Yield + 0.41%), 04/01/2056(2) | | | 15,000 | | | | 14,587 | |
4.46% (SIFMA Municipal Swap Index Yield + 0.45%), 04/01/2056(2) | | | 10,000 | | | | 9,889 | |
5.26% (SIFMA Municipal Swap Index Yield + 1.25%), 04/01/2036(2) | | | 1,000 | | | | 1,006 | |
Calexico Unified School District | | | | | | | | |
4.00%, 08/01/2042 | | | 680 | | | | 683 | |
California Community Choice Financing Authority | | | | | | | | |
5.00%, 07/01/2053 | | | 3,910 | | | | 4,108 | |
5.25%, 01/01/2054 | | | 12,325 | | | | 12,893 | |
California Community Housing Agency | | | | | | | | |
3.00%, 08/01/2056(3) | | | 570 | | | | 378 | |
4.00%, 08/01/2051(3) | | | 925 | | | | 668 | |
California County Tobacco Securitization Agency | | | | | | | | |
4.00%, 06/01/2034 | | | 400 | | | | 410 | |
4.00%, 06/01/2036 | | | 275 | | | | 278 | |
4.00%, 06/01/2037 | | | 275 | | | | 275 | |
4.00%, 06/01/2038 | | | 275 | | | | 273 | |
5.00%, 06/01/2026 | | | 215 | | | | 225 | |
California Health Facilities Financing Authority | | | | | | | | |
4.00%, 03/01/2033 | | | 11,945 | | | | 11,784 | |
4.00%, 04/01/2035 | | | 1,930 | | | | 1,943 | |
4.00%, 04/01/2045 | | | 2,000 | | | | 1,888 | |
5.00%, 08/15/2034 | | | 125 | | | | 133 | |
California Housing Finance | | | | | | | | |
3.50%, 11/20/2035 | | | 7,850 | | | | 7,344 | |
4.00%, 03/20/2033 | | | 472 | | | | 463 | |
California Housing Finance Agency | | | | | | | | |
4.38%, 09/20/2036 | | | 2,873 | | | | 2,868 | |
California Infrastructure & Economic Development Bank | | | | | | | | |
3.65%, 01/01/2050(3) | | | 54,350 | | | | 54,119 | |
5.00%, 11/01/2044 | | | 555 | | | | 571 | |
California Municipal Finance Authority | | | | | | | | |
0.70%, 12/01/2044(1) | | | 3,550 | | | | 3,488 | |
4.00%, 05/15/2032 | | | 750 | | | | 772 | |
4.00%, 05/15/2036 | | | 2,750 | | | | 2,763 | |
4.13%, 10/01/2041(1) | | | 6,000 | | | | 6,035 | |
5.00%, 08/15/2029 | | | 1,000 | | | | 1,088 | |
5.00%, 11/01/2033 | | | 765 | | | | 845 | |
5.00%, 08/15/2034 | | | 1,065 | | | | 1,155 | |
5.25%, 11/01/2034 | | | 1,000 | | | | 1,124 | |
California Public Finance Authority | | | | | | | | |
2.13%, 11/15/2027(3) | | | 875 | | | | 843 | |
4.00%, 07/15/2041 | | | 2,800 | | | | 2,812 | |
California School Finance Authority | | | | | | | | |
2.00%, 10/01/2024(3) | | | 285 | | | | 276 | |
3.00%, 10/01/2031(3) | | | 215 | | | | 198 | |
4.00%, 11/01/2031(3) | | | 500 | | | | 470 | |
4.00%, 11/01/2041(3) | | | 980 | | | | 812 | |
California State Public Works Board | | | | | | | | |
4.00%, 11/01/2038 | | | 4,000 | | | | 4,082 | |
5.00%, 03/01/2024 | | | 2,500 | | | | 2,533 | |
5.00%, 03/01/2025 | | | 3,340 | | | | 3,446 | |
5.00%, 08/01/2030 | | | 970 | | | | 1,124 | |
5.00%, 08/01/2033 | | | 1,800 | | | | 2,116 | |
5.00%, 09/01/2039 | | | 10,705 | | | | 10,869 | |
California Statewide Communities Development Authority | | | | | | | | |
4.00%, 09/02/2025 | | | 375 | | | | 371 | |
4.00%, 09/02/2029 | | | 300 | | | | 293 | |
4.00%, 09/02/2031 | | | 300 | | | | 289 | |
4.00%, 04/01/2036 | | | 675 | | | | 679 | |
4.00%, 05/15/2036 | | | 1,540 | | | | 1,563 | |
4.00%, 04/01/2037 | | | 700 | | | | 698 | |
4.00%, 05/15/2037 | | | 3,595 | | | | 3,617 | |
4.00%, 05/15/2038 | | | 2,795 | | | | 2,796 | |
4.00%, 05/15/2039 | | | 2,030 | | | | 2,017 | |
5.00%, 04/01/2035 | | | 1,300 | | | | 1,411 | |
5.00%, 02/01/2045 | | | 1,175 | | | | 705 | |
5.00%, 04/01/2046(1) | | | 4,300 | | | | 4,829 | |
City of Los Angeles Department of Airports | | | | | | | | |
4.00%, 05/15/2035 | | | 685 | | | | 696 | |
4.00%, 05/15/2036 | | | 800 | | | | 808 | |
4.00%, 05/15/2037 | | | 850 | | | | 851 | |
4.00%, 05/15/2038 | | | 460 | | | | 485 | |
4.00%, 05/15/2038 | | | 750 | | | | 744 | |
4.00%, 05/15/2038 | | | 8,235 | | | | 8,165 | |
4.00%, 05/15/2039 | | | 775 | | | | 767 | |
4.00%, 05/15/2039 | | | 11,305 | | | | 11,192 | |
4.00%, 05/15/2040 | | | 750 | | | | 741 | |
4.00%, 05/15/2041 | | | 800 | | | | 788 | |
4.75%, 05/15/2035 | | | 8,340 | | | | 8,483 | |
5.00%, 05/15/2025 | | | 240 | | | | 247 | |
5.00%, 05/15/2025 | | | 1,760 | | | | 1,804 | |
| | | | | | | | |
5.00%, 05/15/2026 | | | 520 | | | | 541 | |
5.00%, 05/15/2026 | | | 1,455 | | | | 1,515 | |
5.00%, 05/15/2027 | | | 1,325 | | | | 1,400 | |
5.00%, 05/15/2028 | | | 1,150 | | | | 1,232 | |
5.00%, 05/15/2031 | | | 2,325 | | | | 2,486 | |
5.00%, 05/15/2033 | | | 1,325 | | | | 1,415 | |
5.00%, 05/15/2033 | | | 1,600 | | | | 1,790 | |
5.00%, 05/15/2034 | | | 130 | | | | 147 | |
5.00%, 05/15/2034 | | | 1,860 | | | | 2,033 | |
5.00%, 05/15/2034 | | | 2,295 | | | | 2,545 | |
5.00%, 05/15/2035 | | | 1,510 | | | | 1,618 | |
5.00%, 05/15/2036 | | | 145 | | | | 163 | |
5.00%, 05/15/2036 | | | 2,515 | | | | 2,652 | |
5.00%, 05/15/2036 | | | 2,585 | | | | 2,815 | |
5.00%, 05/15/2037 | | | 2,000 | | | | 2,153 | |
5.00%, 05/15/2038 | | | 3,705 | | | | 3,956 | |
5.00%, 05/15/2040 | | | 1,095 | | | | 1,112 | |
5.00%, 05/15/2040 | | | 10,000 | | | | 10,578 | |
5.00%, 05/15/2041 | | | 2,255 | | | | 2,391 | |
5.25%, 05/15/2031 | | | 4,805 | | | | 5,202 | |
5.25%, 05/15/2032 | | | 1,000 | | | | 1,082 | |
5.50%, 05/15/2036 | | | 3,500 | | | | 3,987 | |
City of Rancho Cordova CA | | | | | | | | |
5.00%, 09/01/2035 | | | 1,155 | | | | 1,301 | |
5.00%, 09/01/2036 | | | 1,255 | | | | 1,401 | |
5.00%, 09/01/2037 | | | 2,705 | | | | 2,994 | |
City of Rocklin CA | | | | | | | | |
4.00%, 09/01/2043 | | | 1,500 | | | | 1,507 | |
City of San Mateo CA | | | | | | | | |
5.25%, 09/01/2035 | | | 2,930 | | | | 3,287 | |
City of Vernon CA Electric System Revenue | | | | | | | | |
5.00%, 10/01/2027 | | | 475 | | | | 495 | |
CMFA Special Finance Agency VII | | | | | | | | |
3.00%, 08/01/2056(3) | | | 2,000 | | | | 1,320 | |
CMFA Special Finance Agency VIII | | | | | | | | |
3.00%, 08/01/2056(3) | | | 3,000 | | | | 1,970 | |
Compton Community College District | | | | | | | | |
0.00%, 08/01/2038 | | | 3,000 | | | | 1,095 | |
Corona Community Facilities District | | | | | | | | |
5.00%, 09/01/2027 | | | 100 | | | | 105 | |
5.25%, 09/01/2034 | | | 185 | | | | 201 | |
County of Los Angeles CA Community Facilities District No 2021-01 | | | | | | | | |
5.00%, 09/01/2029 | | | 150 | | | | 162 | |
5.00%, 09/01/2031 | | | 225 | | | | 241 | |
5.00%, 09/01/2034 | | | 335 | | | | 359 | |
5.00%, 09/01/2036 | | | 560 | | | | 587 | |
County of Sacramento CA Airport System Revenue | | | | | | | | |
5.00%, 07/01/2041 | | | 1,000 | | | | 1,035 | |
CSCDA Community Improvement Authority | | | | | | | | |
3.00%, 09/01/2056(3) | | | 6,565 | | | | 4,332 | |
3.13%, 08/01/2056(3) | | | 1,550 | | | | 1,059 | |
3.13%, 06/01/2057(3) | | | 4,540 | | | | 2,962 | |
3.25%, 04/01/2057(3) | | | 2,880 | | | | 2,005 | |
4.00%, 10/01/2056(3) | | | 250 | | | | 205 | |
4.00%, 12/01/2056(3) | | | 1,280 | | | | 907 | |
4.00%, 06/01/2058(3) | | | 1,575 | | | | 1,232 | |
4.00%, 12/01/2058(3) | | | 3,360 | | | | 2,552 | |
4.00%, 12/01/2059(3) | | | 255 | | | | 165 | |
East Bay Municipal Utility District Water System Revenue | | | | | | | | |
5.00%, 06/01/2038 | | | 2,500 | | | | 2,860 | |
Fontana Unified School District | | | | | | | | |
2.38%, 08/01/2044 | | | 1,500 | | | | 1,073 | |
Foothill-de Anza Community College District | | | | | | | | |
5.00%, 04/01/2035 | | | 250 | | | | 256 | |
5.00%, 04/01/2036 | | | 200 | | | | 205 | |
Golden State Tobacco Securitization Corp. | | | | | | | | |
0.00%, 06/01/2024 | | | 1,000 | | | | 973 | |
5.00%, 06/01/2024 | | | 255 | | | | 260 | |
Hercules Redevelopment Agency Successor Agency | | | | | | | | |
5.00%, 08/01/2037 | | | 2,050 | | | | 2,285 | |
5.00%, 08/01/2042 | | | 630 | | | | 688 | |
Indian Wells Redevelopment Agency Successor Agency | | | | | | | | |
5.00%, 09/01/2033 | | | 2,400 | | | | 2,550 | |
Kern Community College District | | | | | | | | |
5.25%, 08/01/2036 | | | 1,150 | | | | 1,366 | |
Los Angeles Community College District | | | | | | | | |
4.00%, 08/01/2036 | | | 10,020 | | | | 10,236 | |
Los Angeles County Metropolitan Transportation Authority Sales Tax Revenue | | | | | | | | |
4.00%, 06/01/2035 | | | 2,500 | | | | 2,647 | |
Los Angeles County Public Works Financing Authority | | | | | | | | |
5.00%, 12/01/2029 | | | 1,200 | | | | 1,265 | |
5.00%, 12/01/2030 | | | 2,520 | | | | 2,654 | |
5.00%, 12/01/2032 | | | 3,250 | | | | 3,853 | |
| | | | | | | | |
5.00%, 12/01/2034 | |
| 5,375
|
| | | 6,341 | |
Los Angeles Department of Water & Power | | | | | | | | |
5.00%, 07/01/2039 | | | 2,500 | | | | 2,829 | |
5.00%, 07/01/2039 | | | 12,645 | | | | 14,047 | |
5.00%, 07/01/2040 | | | 9,185 | | | | 10,148 | |
5.00%, 07/01/2042 | | | 4,495 | | | | 4,670 | |
5.00%, 07/01/2046 | | | 3,880 | | | | 4,269 | |
Los Angeles Unified School District | | | | | | | | |
4.00%, 07/01/2036 | | | 6,190 | | | | 6,432 | |
4.00%, 07/01/2037 | | | 3,000 | | | | 3,090 | |
5.00%, 07/01/2027 | | | 2,385 | | | | 2,601 | |
Madera Unified School District | | | | | | | | |
4.00%, 08/01/2044 | | | 1,250 | | | | 1,251 | |
Mendocino-Lake Community College District | | | | | | | | |
5.00%, 08/01/2027 | | | 1,700 | | | | 1,777 | |
5.00%, 08/01/2028 | | | 1,000 | | | | 1,042 | |
5.00%, 08/01/2029 | | | 775 | | | | 808 | |
5.00%, 08/01/2030 | | | 2,530 | | | | 2,637 | |
Metropolitan Water District of Southern California | | | | | | | | |
4.15% (SIFMA Municipal Swap Index Yield + 0.14%), 07/01/2037(2) | | | 2,530 | | | | 2,528 | |
4.15% (SIFMA Municipal Swap Index Yield + 0.14%), 07/01/2037(2) | | | 6,650 | | | | 6,653 | |
Mount Diablo Unified School District | | | | | | | | |
4.00%, 08/01/2026 | | | 1,225 | | | | 1,266 | |
4.00%, 08/01/2029 | | | 1,000 | | | | 1,073 | |
4.00%, 08/01/2030 | | | 1,445 | | | | 1,563 | |
4.00%, 08/01/2032 | | | 2,030 | | | | 2,206 | |
Napa Valley Community College District | | | | | | | | |
4.00%, 08/01/2033 | | | 2,500 | | | | 2,563 | |
Norman Y Mineta San Jose International Airport SJC | | | | | | | | |
4.00%, 03/01/2034 | | | 4,000 | | | | 4,045 | |
5.00%, 03/01/2028 | | | 1,340 | | | | 1,401 | |
5.00%, 03/01/2030 | | | 1,700 | | | | 1,784 | |
5.00%, 03/01/2042 | | | 1,390 | | | | 1,449 | |
North Coast County Water District | | | | | | | | |
4.00%, 10/01/2033 | | | 250 | | | | 267 | |
Oakland Unified School District/Alameda County | | | | | | | | |
4.00%, 08/01/2046 | | | 2,815 | | | | 2,813 | |
Ontario International Airport Authority | | | | | | | | |
4.00%, 05/15/2039 | | | 850 | | | | 841 | |
4.00%, 05/15/2040 | | | 635 | | | | 626 | |
4.00%, 05/15/2041 | | | 400 | | | | 393 | |
Orange County Sanitation District | | | | | | | | |
5.00%, 02/01/2036 | | | 5,000 | | | | 5,095 | |
Orange County Transportation Authority | | | | | | | | |
5.00%, 10/15/2024 | | | 6,385 | | | | 6,548 | |
Pittsburg Unified School District | | | | | | | | |
4.00%, 08/01/2035 | | | 280 | | | | 290 | |
4.00%, 08/01/2039 | | | 400 | | | | 402 | |
Port of Los Angeles | | | | | | | | |
5.00%, 08/01/2027 | | | 1,810 | | | | 1,836 | |
Port of Oakland | | | | | | | | |
5.00%, 05/01/2024 | | | 150 | | | | 152 | |
5.00%, 05/01/2025 | | | 4,800 | | | | 4,921 | |
5.00%, 05/01/2026 | | | 1,170 | | | | 1,209 | |
5.00%, 05/01/2027 | | | 3,970 | | | | 4,162 | |
5.00%, 05/01/2028 | | | 1,875 | | | | 1,993 | |
5.00%, 05/01/2029 | | | 1,875 | | | | 2,021 | |
5.00%, 11/01/2029 | | | 1,875 | | | | 2,034 | |
Regents of the University of California Medical Center Pooled Revenue | | | | | | | | |
5.00%, 05/15/2039 | | | 15,000 | | | | 17,048 | |
Sacramento City Financing Authority | | | | | | | | |
5.00%, 12/01/2033 | | | 875 | | | | 916 | |
Sacramento City Unified School District | | | | | | | | |
5.00%, 07/01/2031 | | | 1,740 | | | | 2,052 | |
San Diego County Regional Airport Authority | | | | | | | | |
4.00%, 07/01/2035 | | | 4,815 | | | | 4,881 | |
5.00%, 07/01/2030 | | | 205 | | | | 223 | |
5.00%, 07/01/2037 | | | 6,000 | | | | 6,426 | |
5.00%, 07/01/2038 | | | 6,100 | | | | 6,502 | |
San Diego Unified School District | | | | | | | | |
5.00%, 07/01/2047 | | | 3,090 | | | | 3,261 | |
San Francisco Bay Area Rapid Transit District | | | | | | | | |
3.00%, 08/01/2050 | | | 4,195 | | | | 3,249 | |
5.00%, 08/01/2032 | | | 5,000 | | | | 5,201 | |
5.00%, 08/01/2039 | | | 2,650 | | | | 3,010 | |
San Francisco City & County Airport Comm-San Francisco International Airport | | | | | | | | |
5.00%, 05/01/2037 | | | 945 | | | | 999 | |
5.00%, 05/01/2044 | | | 1,500 | | | | 1,514 | |
San Francisco City & County Public Utilities Commission Wastewater Revenue | | | | | | | | |
5.00%, 10/01/2043 | | | 1,970 | | | | 2,111 | |
San Joaquin Hills Transportation Corridor Agency | | | | | | | | |
5.25%, 01/15/2044 | | | 2,000 | | | | 2,039 | |
5.25%, 01/15/2049 | | | 4,260 | | | | 4,337 | |
| | | | | | | | |
Southern California Public Power Authority | | | | | | | | |
5.00%, 07/01/2040 | | | 2,230 | | | | 2,551 | |
State of California | | | | | | | | |
4.00%, 10/01/2024 | | | 4,475 | | | | 4,535 | |
4.00%, 03/01/2025 | | | 3,500 | | | | 3,564 | |
4.00%, 10/01/2025 | | | 2,240 | | | | 2,287 | |
4.00%, 03/01/2026 | | | 375 | | | | 384 | |
4.00%, 10/01/2026 | | | 2,740 | | | | 2,831 | |
4.00%, 10/01/2033 | | | 2,900 | | | | 3,119 | |
4.00%, 11/01/2035 | | | 1,750 | | | | 1,852 | |
4.00%, 03/01/2036 | | | 2,385 | | | | 2,492 | |
4.00%, 10/01/2036 | | | 6,300 | | | | 6,534 | |
4.00%, 11/01/2036 | | | 2,735 | | | | 2,854 | |
5.00%, 08/01/2023 | | | 3,000 | | | | 3,004 | |
5.00%, 12/01/2023 | | | 2,980 | | | | 3,004 | |
5.00%, 05/01/2024 | | | 1,945 | | | | 1,978 | |
5.00%, 10/01/2024 | | | 1,790 | | | | 1,836 | |
5.00%, 12/01/2024 | | | 1,255 | | | | 1,292 | |
5.00%, 10/01/2025 | | | 1,280 | | | | 1,338 | |
5.00%, 09/01/2026 | | | 2,000 | | | | 2,131 | |
5.00%, 08/01/2027 | | | 620 | | | | 647 | |
5.00%, 11/01/2028 | | | 8,000 | | | | 8,952 | |
5.00%, 08/01/2029 | | | 935 | | | | 993 | |
5.00%, 09/01/2029 | | | 370 | | | | 394 | |
5.00%, 11/01/2029 | | | 3,170 | | | | 3,456 | |
5.00%, 04/01/2030 | | | 5,130 | | | | 5,897 | |
5.00%, 08/01/2030 | | | 3,500 | | | | 3,720 | |
5.00%, 08/01/2030 | | | 3,910 | | | | 4,249 | |
5.00%, 11/01/2032 | | | 11,555 | | | | 13,406 | |
5.00%, 03/01/2033 | | | 7,765 | | | | 8,912 | |
5.00%, 09/01/2034 | | | 1,430 | | | | 1,698 | |
5.00%, 10/01/2034 | | | 1,440 | | | | 1,719 | |
5.00%, 04/01/2035 | | | 2,585 | | | | 3,041 | |
5.00%, 04/01/2035 | | | 4,980 | | | | 5,516 | |
5.00%, 09/01/2035 | | | 1,365 | | | | 1,610 | |
5.00%, 09/01/2035 | | | 2,320 | | | | 2,736 | |
5.00%, 09/01/2035 | | | 9,000 | | | | 9,535 | |
5.00%, 10/01/2036 | | | 4,410 | | | | 5,187 | |
5.00%, 10/01/2037 | | | 15,000 | | | | 17,124 | |
5.00%, 10/01/2039 | | | 6,615 | | | | 7,630 | |
5.00%, 10/01/2041 | | | 19,860 | | | | 22,199 | |
5.00%, 09/01/2042 | | | 26,500 | | | | 29,994 | |
5.00%, 10/01/2042 | | | 18,740 | | | | 20,404 | |
State of California Department of Water Resources | | | | | | | | |
5.00%, 12/01/2025 | | | 1,500 | | | | 1,574 | |
5.00%, 12/01/2033 | | | 8,530 | | | | 9,960 | |
University of California | | | | | | | | |
5.00%, 05/15/2034 | | | 1,500 | | | | 1,825 | |
5.00%, 05/15/2036 | | | 1,135 | | | | 1,354 | |
5.00%, 05/15/2039 | | | 20,000 | | | | 23,139 | |
5.50%, 05/15/2040 | | | 14,250 | | | | 16,940 | |
West Contra Costa Healthcare District | | | | | | | | |
4.00%, 07/01/2034 | | | 1,125 | | | | 1,168 | |
4.00%, 07/01/2036 | | | 1,220 | | | | 1,247 | |
4.00%, 07/01/2038 | | | 1,320 | | | | 1,331 | |
| | | | | | | | |
Total California | | | | 829,206 | |
| | | | | | | | |
Colorado – 2.04% | | | | | | | | |
Adams 12 Five Star Schools | | | | | | | | |
5.00%, 12/15/2028 | | | 2,050 | | | | 2,180 | |
5.00%, 12/15/2030 | | | 3,500 | | | | 3,712 | |
Adams County School District No 1 | | | | | | | | |
5.00%, 12/01/2033 | | | 1,000 | | | | 1,060 | |
Arapahoe County School District No 5 Cherry Creek | | | | | | | | |
2.00%, 12/15/2026 | | | 1,500 | | | | 1,414 | |
2.30%, 12/15/2028 | | | 2,500 | | | | 2,318 | |
Arapahoe County School District No 6 Littleton | | | | | | | | |
5.50%, 12/01/2033 | | | 1,150 | | | | 1,305 | |
5.50%, 12/01/2043 | | | 1,750 | | | | 1,928 | |
Arkansas River Power Authority | | | | | | | | |
5.00%, 10/01/2031 | | | 750 | | | | 777 | |
5.00%, 10/01/2038 | | | 4,665 | | | | 4,719 | |
5.00%, 10/01/2043 | | | 5,000 | | | | 4,993 | |
Boulder Larimer & Weld Counties St Vrain Valley School District Re1J | | | | | | | | |
5.00%, 12/15/2035 | | | 2,195 | | | | 2,314 | |
5.00%, 12/15/2036 | | | 1,500 | | | | 1,575 | |
City & County of Denver CO Airport System Revenue | | | | | | | | |
4.00%, 11/15/2023 | | | 4,465 | | | | 4,470 | |
5.00%, 11/15/2025 | | | 4,390 | | | | 4,520 | |
5.00%, 11/15/2027 | | | 8,200 | | | | 8,699 | |
5.00%, 11/15/2029 | | | 3,105 | | | | 3,292 | |
5.00%, 12/01/2029 | | | 1,130 | | | | 1,213 | |
5.00%, 12/01/2031 | | | 7,045 | | | | 7,543 | |
5.00%, 11/15/2032 | | | 2,175 | | | | 2,490 | |
| | | | | | | | |
5.00%, 12/01/2032 | | | 385 | | | | 412 | |
5.00%, 12/01/2035 | | | 5,520 | | | | 5,840 | |
5.00%, 12/01/2043 | | | 5,350 | | | | 5,523 | |
5.50%, 11/15/2031 | | | 6,030 | | | | 6,960 | |
5.50%, 11/15/2032 | | | 1,660 | | | | 1,935 | |
5.50%, 11/15/2033 | | | 1,865 | | | | 2,170 | |
5.50%, 11/15/2042 | | | 2,760 | | | | 3,061 | |
5.75%, 11/15/2034 | | | 960 | | | | 1,144 | |
5.75%, 11/15/2035 | | | 890 | | | | 1,050 | |
5.75%, 11/15/2040 | | | 6,500 | | | | 7,415 | |
5.75%, 11/15/2041 | | | 1,300 | | | | 1,478 | |
City & County of Denver CO Pledged Excise Tax Revenue | | | | | | | | |
5.00%, 08/01/2042 | | | 3,095 | | | | 3,209 | |
City of Colorado Springs CO Utilities System Revenue | | | | | | | | |
5.00%, 11/15/2035 | | | 1,500 | | | | 1,702 | |
5.00%, 11/15/2042 | | | 1,550 | | | | 1,632 | |
Colorado Educational & Cultural Facilities Authority | | | | | | | | |
4.00%, 05/01/2026 | | | 80 | | | | 79 | |
4.00%, 06/01/2026 | | | 535 | | | | 538 | |
4.00%, 06/01/2028 | | | 580 | | | | 588 | |
4.00%, 05/01/2029 | | | 70 | | | | 69 | |
4.00%, 05/01/2030 | | | 65 | | | | 63 | |
4.00%, 06/01/2030 | | | 325 | | | | 331 | |
4.00%, 06/01/2032 | | | 340 | | | | 346 | |
4.00%, 05/01/2036 | | | 75 | | | | 70 | |
4.00%, 07/01/2036 | | | 1,295 | | | | 1,290 | |
4.00%, 12/15/2036 | | | 750 | | | | 740 | |
Colorado Health Facilities Authority | | | | | | | | |
2.13%, 05/15/2028 | | | 750 | | | | 680 | |
4.00%, 01/01/2035 | | | 2,495 | | | | 2,566 | |
4.00%, 08/01/2044 | | | 1,520 | | | | 1,420 | |
5.00%, 11/01/2023 | | | 1,350 | | | | 1,357 | |
5.00%, 11/01/2024 | | | 1,125 | | | | 1,146 | |
5.00%, 11/01/2025 | | | 1,715 | | | | 1,776 | |
5.00%, 11/01/2026 | | | 1,330 | | | | 1,401 | |
5.00%, 08/01/2027 | | | 1,000 | | | | 1,054 | |
5.00%, 08/01/2028 | | | 1,000 | | | | 1,069 | |
5.00%, 05/15/2031 | | | 1,000 | | | | 1,154 | |
5.00%, 05/15/2032 | | | 1,000 | | | | 1,168 | |
5.00%, 11/15/2036(1) | | | 1,790 | | | | 1,801 | |
5.00%, 11/15/2036(1) | | | 4,980 | | | | 5,012 | |
5.00%, 08/01/2044 | | | 6,110 | | | | 6,308 | |
5.00%, 09/01/2046 | | | 1,000 | | | | 1,012 | |
5.00%, 08/01/2049(1) | | | 1,330 | | | | 1,371 | |
5.00%, 11/15/2049(1) | | | 235 | | | | 251 | |
5.00%, 11/15/2049(1) | | | 2,350 | | | | 2,467 | |
5.00%, 05/15/2062(1) | | | 3,295 | | | | 3,461 | |
5.00%, 05/15/2062(1) | | | 4,415 | | | | 4,827 | |
5.25%, 11/01/2038 | | | 1,100 | | | | 1,197 | |
5.25%, 11/01/2039 | | | 1,000 | | | | 1,081 | |
Colorado Housing & Finance Authority | | | | | | | | |
4.25%, 11/01/2049 | | | 360 | | | | 359 | |
4.25%, 11/01/2049 | | | 675 | | | | 674 | |
County of El Paso CO | | | | | | | | |
4.00%, 12/01/2033 | | | 800 | | | | 840 | |
4.00%, 12/01/2035 | | | 910 | | | | 946 | |
5.00%, 12/01/2031 | | | 600 | | | | 680 | |
Denver City & County School District No 1 | | | | | | | | |
5.00%, 12/01/2039 | | | 10,000 | | | | 11,313 | |
Denver Convention Center Hotel Authority | | | | | | | | |
5.00%, 12/01/2030 | | | 1,000 | | | | 1,030 | |
E-470 Public Highway Authority | | | | | | | | |
3.74% (SOFR + 0.35%), 09/01/2039(2) | | | 2,195 | | | | 2,186 | |
Eagle County Airport Terminal Corp. | | | | | | | | |
5.00%, 05/01/2033 | | | 2,000 | | | | 2,058 | |
Eagle County School District No Re50J | | | | | | | | |
4.00%, 12/01/2036 | | | 980 | | | | 1,005 | |
Fiddlers Business Improvement District | | | | | | | | |
5.00%, 12/01/2032(3) | | | 1,190 | | | | 1,205 | |
Ground Water Management Subdistrict of Central Colorado Water Conservancy Distributors | | | | | | | | |
4.00%, 12/01/2040 | | | 2,735 | | | | 2,707 | |
Mesa County Valley School District No 51 Grand Junction CO | | | | | | | | |
5.25%, 12/01/2033 | | | 2,000 | | | | 2,180 | |
Morgan Hill Metropolitan District No 3 | | | | | | | | |
3.00%, 12/01/2031 | | | 490 | | | | 400 | |
Regional Transportation District | | | | | | | | |
4.00%, 01/15/2033 | | | 850 | | | | 876 | |
4.00%, 07/15/2033 | | | 270 | | | | 280 | |
4.00%, 07/15/2034 | | | 750 | | | | 771 | |
5.00%, 06/01/2031 | | | 1,315 | | | | 1,461 | |
5.00%, 07/15/2032 | | | 600 | | | | 662 | |
Reunion Metropolitan District | | | | | | | | |
3.63%, 12/01/2044 | | | 1,673 | | | | 1,233 | |
| | | | | | | | |
Sierra Ridge Metropolitan District No 2 | | | | | | | | |
4.00%, 12/01/2042 | | | 1,035 | | | | 1,028 | |
Southlands Metropolitan District No 1 | | | | | | | | |
3.50%, 12/01/2027 | | | 500 | | | | 469 | |
State of Colorado | | | | | | | | |
4.00%, 12/15/2035 | | | 7,400 | | | | 7,693 | |
4.00%, 12/15/2037 | | | 1,800 | | | | 1,828 | |
6.00%, 12/15/2038 | | | 7,700 | | | | 9,294 | |
6.00%, 12/15/2040 | | | 7,000 | | | | 8,367 | |
STC Metropolitan District No 2 | | | | | | | | |
3.00%, 12/01/2025 | | | 555 | | | | 529 | |
University of Colorado | | | | | | | | |
2.00%, 06/01/2051(1) | | | 1,310 | | | | 1,242 | |
2.00%, 06/01/2051(1) | | | 1,545 | | | | 1,485 | |
2.00%, 06/01/2054(1) | | | 5,955 | | | | 5,808 | |
5.00%, 06/01/2047 | | | 500 | | | | 529 | |
University of Colorado Hospital Authority | | | | | | | | |
5.00%, 11/15/2047(1) | | | 9,530 | | | | 9,641 | |
Vauxmont Metropolitan District | | | | | | | | |
5.00%, 12/01/2024 | | | 200 | | | | 204 | |
5.00%, 12/15/2024 | | | 135 | | | | 138 | |
5.00%, 12/01/2025 | | | 180 | | | | 187 | |
5.00%, 12/15/2025 | | | 85 | | | | 89 | |
5.00%, 12/01/2026 | | | 195 | | | | 206 | |
5.00%, 12/01/2027 | | | 205 | | | | 220 | |
5.00%, 12/01/2028 | | | 210 | | | | 229 | |
5.00%, 12/15/2028 | | | 130 | | | | 137 | |
5.00%, 12/01/2029 | | | 210 | | | | 232 | |
5.00%, 12/15/2029 | | | 5 | | | | 5 | |
5.00%, 12/15/2030 | | | 125 | | | | 132 | |
5.00%, 12/01/2031 | | | 230 | | | | 254 | |
5.00%, 12/01/2032 | | | 250 | | | | 276 | |
5.00%, 12/01/2035 | | | 100 | | | | 109 | |
VDW Metropolitan District No 2 | | | | | | | | |
4.00%, 12/01/2045 | | | 885 | | | | 854 | |
Weld County School District No RE-2 Eaton | | | | | | | | |
5.00%, 12/01/2037 | | | 2,280 | | | | 2,497 | |
Weld County School District No RE-4 | | | | | | | | |
5.00%, 12/01/2042 | | | 1,000 | | | | 1,115 | |
| | | | | | | | |
Total Colorado | | | | 239,409 | |
| | | | | | | | |
Connecticut – 2.55% | | | | | | | | |
City of Bridgeport CT | | | | | | | | |
4.00%, 08/01/2036 | | | 225 | | | | 229 | |
4.00%, 06/01/2037 | | | 2,460 | | | | 2,473 | |
4.00%, 09/01/2042 | | | 995 | | | | 958 | |
5.00%, 09/15/2029 | | | 2,600 | | | | 2,901 | |
5.00%, 09/15/2030 | | | 2,250 | | | | 2,513 | |
5.00%, 06/01/2033 | | | 1,985 | | | | 2,217 | |
5.00%, 08/01/2034 | | | 250 | | | | 282 | |
5.00%, 09/01/2040 | | | 1,380 | | | | 1,492 | |
City of Hartford CT | | | | | | | | |
5.00%, 07/15/2023 | | | 2,000 | | | | 2,001 | |
5.00%, 07/15/2026 | | | 2,430 | | | | 2,523 | |
City of New Britain CT | | | | | | | | |
5.00%, 03/01/2027 | | | 1,260 | | | | 1,338 | |
5.00%, 03/01/2028 | | | 1,490 | | | | 1,587 | |
5.00%, 03/01/2033 | | | 1,900 | | | | 2,021 | |
City of New Haven CT | | | | | | | | |
4.00%, 08/01/2037 | | | 1,000 | | | | 982 | |
5.00%, 08/15/2029 | | | 2,000 | | | | 2,111 | |
5.00%, 08/15/2031 | | | 1,000 | | | | 1,056 | |
5.25%, 08/01/2023 | | | 1,115 | | | | 1,116 | |
City of West Haven CT | | | | | | | | |
4.00%, 09/15/2030 | | | 300 | | | | 315 | |
4.00%, 09/15/2031 | | | 325 | | | | 340 | |
Connecticut Housing Finance Authority | | | | | | | | |
2.25%, 11/15/2023 | | | 1,250 | | | | 1,243 | |
3.00%, 11/15/2050 | | | 5,355 | | | | 5,167 | |
3.00%, 05/15/2051 | | | 7,925 | | | | 7,613 | |
5.00%, 05/15/2025 | | | 1,995 | | | | 2,049 | |
5.00%, 11/15/2025 | | | 1,270 | | | | 1,314 | |
5.00%, 05/15/2026 | | | 1,290 | | | | 1,346 | |
5.00%, 11/15/2026 | | | 600 | | | | 632 | |
5.00%, 05/15/2027 | | | 675 | | | | 717 | |
5.00%, 11/15/2027 | | | 550 | | | | 589 | |
5.00%, 05/15/2028 | | | 700 | | | | 755 | |
5.00%, 11/15/2028 | | | 750 | | | | 816 | |
5.00%, 05/15/2029 | | | 720 | | | | 788 | |
5.00%, 11/15/2029 | | | 1,000 | | | | 1,102 | |
Connecticut State Health & Educational Facilities Authority | | | | | | | | |
0.38%, 07/01/2035(1) | | | 5,885 | | | | 5,688 | |
0.55%, 07/01/2037(1) | | | 4,500 | | | | 4,500 | |
1.10%, 07/01/2033(1) | | | 22,000 | | | | 21,110 | |
| | | | | | | | |
1.80%, 07/01/2049(1) | | | 2,005 | | | | 1,967 | |
2.00%, 07/01/2042(1) | | | 6,470 | | | | 6,128 | |
3.20%, 07/01/2037 | | | 5,365 | | | | 5,369 | |
4.00%, 07/01/2032 | | | 250 | | | | 265 | |
4.00%, 07/01/2033 | | | 265 | | | | 279 | |
4.00%, 07/01/2034 | | | 275 | | | | 287 | |
4.00%, 07/01/2035 | | | 250 | | | | 258 | |
4.00%, 07/01/2036 | | | 200 | | | | 203 | |
4.00%, 07/01/2046 | | | 880 | | | | 784 | |
5.00%, 11/01/2023 | | | 695 | | | | 699 | |
5.00%, 11/01/2024 | | | 475 | | | | 486 | |
5.00%, 07/01/2025(3) | | | 435 | | | | 428 | |
5.00%, 06/01/2027 | | | 200 | | | | 213 | |
5.00%, 06/01/2028 | | | 400 | | | | 433 | |
5.00%, 11/01/2028 | | | 1,245 | | | | 1,377 | |
5.00%, 07/01/2029 | | | 150 | | | | 166 | |
5.00%, 07/01/2029(3) | | | 440 | | | | 429 | |
5.00%, 07/01/2029 | | | 1,000 | | | | 1,084 | |
5.00%, 07/01/2030 | | | 175 | | | | 196 | |
5.00%, 06/01/2031 | | | 600 | | | | 671 | |
5.00%, 07/01/2031 | | | 250 | | | | 284 | |
5.00%, 07/01/2031 | | | 2,500 | | | | 2,536 | |
5.00%, 07/01/2032 | | | 700 | | | | 776 | |
5.00%, 07/01/2032 | | | 2,000 | | | | 2,178 | |
5.00%, 07/01/2033 | | | 235 | | | | 267 | |
5.00%, 07/01/2033 | | | 600 | | | | 664 | |
5.00%, 07/01/2033 | | | 2,730 | | | | 3,000 | |
5.00%, 07/01/2034 | | | 320 | | | | 362 | |
5.00%, 07/01/2034 | | | 700 | | | | 773 | |
5.00%, 07/01/2035 | | | 350 | | | | 393 | |
5.00%, 07/01/2035 | | | 525 | | | | 576 | |
5.00%, 07/01/2036 | | | 360 | | | | 400 | |
5.00%, 07/01/2036 | | | 1,000 | | | | 1,088 | |
5.00%, 07/01/2037 | | | 390 | | | | 430 | |
5.00%, 07/01/2039(3) | | | 1,500 | | | | 1,456 | |
5.00%, 07/01/2039 | | | 3,275 | | | | 3,562 | |
5.00%, 07/01/2049(3) | | | 1,550 | | | | 1,324 | |
5.00%, 07/01/2053(1) | | | 2,625 | | | | 2,749 | |
5.00%, 07/01/2053(1) | | | 3,445 | | | | 3,504 | |
Metropolitan District | | | | | | | | |
4.00%, 09/01/2037 | | | 3,980 | | | | 4,079 | |
4.00%, 09/01/2038 | | | 3,000 | | | | 3,048 | |
State of Connecticut | | | | | | | | |
3.00%, 01/15/2024 | | | 450 | | | | 450 | |
3.00%, 01/15/2032 | | | 3,030 | | | | 2,939 | |
3.00%, 01/15/2039 | | | 1,475 | | | | 1,269 | |
4.00%, 01/15/2024 | | | 290 | | | | 291 | |
4.00%, 01/15/2036 | | | 2,605 | | | | 2,720 | |
4.00%, 04/15/2037 | | | 3,075 | | | | 3,122 | |
4.00%, 01/15/2039 | | | 5,000 | | | | 5,095 | |
4.00%, 01/15/2039 | | | 8,835 | | | | 8,945 | |
5.00%, 07/15/2023 | | | 1,160 | | | | 1,161 | |
5.00%, 01/15/2026 | | | 850 | | | | 891 | |
5.00%, 04/15/2026 | | | 1,500 | | | | 1,580 | |
5.00%, 08/01/2026 | | | 2,800 | | | | 2,967 | |
5.00%, 06/15/2027 | | | 1,680 | | | | 1,740 | |
5.00%, 08/01/2027 | | | 2,315 | | | | 2,503 | |
5.00%, 09/15/2027 | | | 1,000 | | | | 1,084 | |
5.00%, 03/01/2029 | | | 1,500 | | | | 1,517 | |
5.00%, 04/15/2030 | | | 565 | | | | 631 | |
5.00%, 06/15/2032 | | | 500 | | | | 588 | |
5.00%, 06/15/2032 | | | 710 | | | | 734 | |
5.00%, 09/15/2032 | | | 325 | | | | 384 | |
5.00%, 11/15/2032 | | | 200 | | | | 208 | |
5.00%, 09/15/2033 | | | 4,500 | | | | 4,972 | |
5.00%, 04/15/2034 | | | 645 | | | | 713 | |
5.00%, 04/15/2035 | | | 225 | | | | 248 | |
5.00%, 06/15/2035 | | | 300 | | | | 347 | |
5.00%, 11/15/2035 | | | 1,500 | | | | 1,740 | |
5.00%, 11/15/2035 | | | 1,500 | | | | 1,740 | |
5.00%, 04/15/2036 | | | 2,300 | | | | 2,518 | |
5.00%, 11/15/2036 | | | 1,000 | | | | 1,149 | |
5.00%, 06/15/2038 | | | 700 | | | | 787 | |
5.00%, 01/15/2040 | | | 8,325 | | | | 8,988 | |
5.00%, 01/15/2042 | | | 8,780 | | | | 9,622 | |
State of Connecticut Special Tax Revenue | | | | | | | | |
4.00%, 05/01/2036 | | | 1,220 | | | | 1,268 | |
4.00%, 05/01/2038 | | | 830 | | | | 848 | |
4.00%, 05/01/2038 | | | 1,025 | | | | 1,055 | |
4.00%, 05/01/2039 | | | 3,680 | | | | 3,735 | |
4.00%, 05/01/2040 | | | 7,545 | | | | 7,623 | |
4.00%, 11/01/2040 | | | 4,240 | | | | 4,286 | |
5.00%, 09/01/2023 | | | 900 | | | | 902 | |
| | | | | | | | |
5.00%, 05/01/2030 | | | 2,000 | | | | 2,280 | |
5.00%, 05/01/2033 | | | 3,000 | | | | 3,409 | |
5.00%, 05/01/2034 | | | 3,400 | | | | 3,849 | |
5.00%, 05/01/2034 | | | 8,900 | | | | 10,228 | |
5.00%, 05/01/2035 | | | 2,800 | | | | 3,190 | |
5.00%, 01/01/2036 | | | 1,500 | | | | 1,611 | |
5.00%, 05/01/2037 | | | 5,000 | | | | 5,530 | |
5.00%, 07/01/2038 | | | 6,500 | | | | 7,362 | |
5.00%, 07/01/2039 | | | 6,000 | | | | 6,765 | |
5.25%, 07/01/2040 | | | 3,500 | | | | 4,007 | |
5.25%, 07/01/2042 | | | 2,500 | | | | 2,847 | |
Town of Hamden CT | | | | | | | | |
5.00%, 08/15/2026 | | | 500 | | | | 509 | |
5.00%, 08/15/2026 | | | 1,335 | | | | 1,398 | |
5.00%, 08/01/2030 | | | 500 | | | | 552 | |
Town of Stratford CT | | | | | | | | |
4.00%, 01/01/2038 | | | 1,920 | | | | 1,922 | |
University of Connecticut | | | | | | | | |
5.00%, 11/01/2028 | | | 1,290 | | | | 1,427 | |
5.00%, 05/01/2042 | | | 5,000 | | | | 5,530 | |
5.25%, 11/15/2034 | | | 3,705 | | | | 4,111 | |
| | | | | | | | |
Total Connecticut | | | | 298,942 | |
| | | | | | | | |
Delaware – 0.21% | | | | | | | | |
Delaware Municipal Electric Corp. | | | | | | | | |
4.00%, 07/01/2036 | | | 365 | | | | 374 | |
Delaware River & Bay Authority | | | | | | | | |
4.00%, 01/01/2042 | | | 185 | | | | 184 | |
4.00%, 01/01/2046 | | | 1,100 | | | | 1,082 | |
5.00%, 01/01/2029 | | | 350 | | | | 391 | |
5.00%, 01/01/2032 | | | 500 | | | | 586 | |
5.00%, 01/01/2035 | | | 350 | | | | 406 | |
Delaware State Economic Development Authority | | | | | | | | |
1.05%, 01/01/2031(1) | | | 4,630 | | | | 4,383 | |
Delaware Transportation Authority | | | | | | | | |
5.00%, 07/01/2032 | | | 3,210 | | | | 3,684 | |
5.00%, 09/01/2034 | | | 6,750 | | | | 7,653 | |
5.00%, 09/01/2035 | | | 1,000 | | | | 1,126 | |
State of Delaware | | | | | | | | |
5.00%, 05/01/2025 | | | 5,045 | | | | 5,223 | |
| | | | | | | | |
Total Delaware | | | | 25,092 | |
| | | | | | | | |
District of Columbia – 1.55% | | | | | | | | |
District of Columbia | | | | | | | | |
4.00%, 02/01/2037 | | | 2,860 | | | | 2,933 | |
5.00%, 03/01/2024 | | | 455 | | | | 461 | |
5.00%, 10/01/2029 | | | 5,000 | | | | 5,663 | |
5.00%, 06/01/2030 | | | 1,085 | | | | 1,104 | |
5.00%, 12/01/2033 | | | 5,000 | | | | 5,617 | |
5.00%, 06/01/2034 | | | 1,000 | | | | 1,036 | |
5.00%, 06/01/2034 | | | 2,100 | | | | 2,262 | |
5.00%, 03/01/2035 | | | 3,770 | | | | 4,230 | |
5.00%, 06/01/2035 | | | 3,000 | | | | 3,042 | |
5.00%, 06/01/2037 | | | 3,095 | | | | 3,183 | |
5.00%, 06/01/2038 | | | 3,000 | | | | 3,082 | |
5.00%, 06/01/2038 | | | 4,635 | | | | 4,684 | |
5.00%, 01/01/2040 | | | 2,050 | | | | 2,322 | |
5.00%, 07/01/2040 | | | 1,445 | | | | 1,627 | |
5.00%, 06/01/2042 | | | 2,000 | | | | 2,100 | |
District of Columbia Housing Finance Agency | | | | | | | | |
5.00%, 12/01/2026(1) | | | 3,725 | | | | 3,816 | |
5.00%, 12/01/2026 | | | 5,500 | | | | 5,636 | |
District of Columbia Water & Sewer Authority | | | | | | | | |
1.75%, 10/01/2054(1) | | | 9,340 | | | | 9,076 | |
3.00%, 10/01/2057(1) | | | 8,715 | | | | 8,538 | |
Metropolitan Washington Airports Authority Aviation Revenue | | | | | | | | |
4.00%, 10/01/2037 | | | 570 | | | | 567 | |
4.00%, 10/01/2038 | | | 635 | | | | 630 | |
5.00%, 10/01/2023 | | | 850 | | | | 852 | |
5.00%, 10/01/2024 | | | 1,325 | | | | 1,345 | |
5.00%, 10/01/2024 | | | 1,500 | | | | 1,531 | |
5.00%, 10/01/2025 | | | 1,185 | | | | 1,234 | |
5.00%, 10/01/2026 | | | 13,500 | | | | 14,086 | |
5.00%, 10/01/2027 | | | 500 | | | | 529 | |
5.00%, 10/01/2028 | | | 4,150 | | | | 4,459 | |
5.00%, 10/01/2029 | | | 4,155 | | | | 4,451 | |
5.00%, 10/01/2030 | | | 2,530 | | | | 2,773 | |
5.00%, 10/01/2030 | | | 5,280 | | | | 5,592 | |
5.00%, 10/01/2030 | | | 7,500 | | | | 8,219 | |
5.00%, 10/01/2031 | | | 4,305 | | | | 4,774 | |
5.00%, 10/01/2031 | | | 5,335 | | | | 5,718 | |
5.00%, 10/01/2032 | | | 5,000 | | | | 5,210 | |
5.00%, 10/01/2032 | | | 11,490 | | | | 12,728 | |
5.00%, 10/01/2033 | | | 6,230 | | | | 6,890 | |
5.00%, 10/01/2034 | | | 1,520 | | | | 1,673 | |
| | | | | | | | |
5.00%, 10/01/2035 | | | 1,350 | | | | 1,473 | |
5.00%, 10/01/2036 | | | 1,075 | | | | 1,167 | |
5.00%, 10/01/2037 | | | 1,000 | | | | 1,040 | |
5.00%, 10/01/2038 | | | 1,855 | | | | 2,008 | |
Metropolitan Washington Airports Authority Dulles Toll Road Revenue | | | | | | | | |
0.00%, 10/01/2032 | | | 3,145 | | | | 2,263 | |
4.00%, 10/01/2038 | | | 415 | | | | 414 | |
5.00%, 10/01/2034 | | | 1,500 | | | | 1,624 | |
Washington Convention & Sports Authority | | | | | | | | |
5.00%, 10/01/2023 | | | 1,330 | | | | 1,334 | |
5.00%, 10/01/2024 | | | 1,030 | | | | 1,051 | |
Washington Metropolitan Area Transit Authority | | | | | | | | |
5.00%, 07/01/2024 | | | 2,115 | | | | 2,153 | |
5.00%, 07/01/2032 | | | 1,255 | | | | 1,344 | |
Washington Metropolitan Area Transit Authority Dedicated Revenue | | | | | | | | |
4.00%, 07/15/2035 | | | 2,190 | | | | 2,299 | |
5.00%, 07/15/2023 | | | 1,665 | | | | 1,666 | |
5.00%, 07/15/2024 | | | 1,100 | | | | 1,120 | |
5.00%, 07/15/2036 | | | 2,550 | | | | 2,964 | |
5.00%, 07/15/2037 | | | 2,300 | | | | 2,590 | |
5.00%, 07/15/2039 | | | 1,445 | | | | 1,641 | |
| | | | | | | | |
Total District of Columbia | | | | 181,824 | |
| | | | | | | | |
Florida – 5.81% | | | | | | | | |
Alachua County School Board | | | | | | | | |
5.00%, 07/01/2027 | | | 1,155 | | | | 1,234 | |
5.00%, 07/01/2030 | | | 2,140 | | | | 2,432 | |
Artisan Lakes East Community Development District | | | | | | | | |
2.75%, 05/01/2031 | | | 250 | | | | 216 | |
2.75%, 05/01/2031(3) | | | 270 | | | | 233 | |
Astonia Community Development District | | | | | | | | |
2.50%, 05/01/2026(3) | | | 190 | | | | 181 | |
3.00%, 05/01/2031(3) | | | 205 | | | | 183 | |
Ave Maria Stewardship Community District | | | | | | | | |
2.88%, 05/01/2027 | | | 1,020 | | | | 976 | |
Babcock Ranch Community Independent Special District | | | | | | | | |
2.38%, 05/01/2026 | | | 95 | | | | 90 | |
2.88%, 05/01/2031 | | | 250 | | | | 218 | |
5.00%, 05/01/2042 | | | 1,920 | | | | 1,892 | |
5.00%, 05/01/2053 | | | 1,440 | | | | 1,343 | |
Berry Bay Community Development District | | | | | | | | |
2.63%, 05/01/2026 | | | 150 | | | | 143 | |
Brevard County Health Facilities Authority | | | | | | | | |
5.00%, 04/01/2037 | | | 2,285 | | | | 2,483 | |
5.00%, 04/01/2040 | | | 5,000 | | | | 5,321 | |
Capital Projects Finance Authority | | | | | | | | |
5.00%, 10/01/2024 | | | 550 | | | | 554 | |
5.00%, 10/01/2025 | | | 2,630 | | | | 2,669 | |
5.00%, 10/01/2026 | | | 1,275 | | | | 1,307 | |
5.00%, 10/01/2027 | | | 1,750 | | | | 1,808 | |
Capital Trust Agency, Inc. | | | | | | | | |
5.00%, 12/15/2039 | | | 1,270 | | | | 1,265 | |
5.35%, 07/01/2029 | | | 245 | | | | 245 | |
Celebration Community Development District | | | | | | | | |
2.25%, 05/01/2026 | | | 105 | | | | 99 | |
2.75%, 05/01/2031 | | | 120 | | | | 103 | |
Central Florida Expressway Authority | | | | | | | | |
4.00%, 07/01/2039 | | | 1,525 | | | | 1,547 | |
5.00%, 07/01/2026 | | | 1,375 | | | | 1,455 | |
5.00%, 07/01/2035 | | | 5,000 | | | | 5,496 | |
CFM Community Development District | | | | | | | | |
2.88%, 05/01/2031 | | | 420 | | | | 365 | |
Charles Cove Community Development District | | | | | | | | |
3.00%, 05/01/2031 | | | 280 | | | | 246 | |
City of Fort Lauderdale FL Water & Sewer Revenue | | | | | | | | |
4.00%, 03/01/2038 | | | 2,400 | | | | 2,433 | |
City of Gainesville FL Utilities System Revenue | | | | | | | | |
5.00%, 10/01/2047 | | | 330 | | | | 349 | |
City of Jacksonville FL | | | | | | | | |
5.00%, 10/01/2026 | | | 475 | | | | 505 | |
5.00%, 10/01/2027 | | | 380 | | | | 412 | |
5.00%, 08/15/2028 | | | 3,045 | | | | 3,340 | |
5.00%, 10/01/2028 | | | 755 | | | | 836 | |
5.00%, 08/15/2029 | | | 2,500 | | | | 2,793 | |
5.00%, 10/01/2029 | | | 655 | | | | 735 | |
5.00%, 08/15/2030 | | | 1,700 | | | | 1,884 | |
5.00%, 10/01/2030 | | | 615 | | | | 702 | |
5.00%, 08/15/2031 | | | 2,250 | | | | 2,494 | |
5.00%, 08/15/2032 | | | 1,200 | | | | 1,329 | |
5.00%, 10/01/2032 | | | 565 | | | | 663 | |
5.00%, 08/15/2033 | | | 1,200 | | | | 1,326 | |
City of Miami Gardens FL | | | | | | | | |
5.00%, 07/01/2034 | | | 1,725 | | | | 1,756 | |
City of Orlando FL | | | | | | | | |
| | | | | | | | |
5.00%, 10/01/2031 | | | 1,120 | | | | 1,248 | |
5.00%, 10/01/2032 | | | 1,300 | | | | 1,366 | |
5.00%, 10/01/2032 | | | 1,680 | | | | 1,871 | |
5.00%, 10/01/2035 | | | 1,200 | | | | 1,326 | |
5.00%, 10/01/2036 | | | 1,000 | | | | 1,098 | |
City of Orlando FL Tourist Development Tax Revenue | | | | | | | | |
5.00%, 11/01/2029 | | | 2,000 | | | | 2,157 | |
City of Palmetto FL | | | | | | | | |
4.25%, 06/01/2027 | | | 205 | | | | 204 | |
5.00%, 06/01/2032 | | | 400 | | | | 414 | |
City of Pompano Beach FL | | | | | | | | |
1.45%, 01/01/2027 | | | 600 | | | | 532 | |
City Of South Miami Health Facilities Authority, Inc. | | | | | | | | |
5.00%, 08/15/2023 | | | 250 | | | | 250 | |
5.00%, 08/15/2024 | | | 400 | | | | 407 | |
5.00%, 08/15/2025 | | | 700 | | | | 722 | |
City of Tallahassee FL | | | | | | | | |
5.00%, 12/01/2026 | | | 1,380 | | | | 1,419 | |
City of Tampa FL | | | | | | | | |
5.00%, 07/01/2037 | | | 1,785 | | | | 1,826 | |
Cobblestone Community Development District | | | | | | | | |
3.40%, 05/01/2027 | | | 120 | | | | 116 | |
Collier County Educational Facilities Authority | | | | | | | | |
5.50%, 06/01/2032 | | | 2,490 | | | | 2,713 | |
Cordova Palms Community Development District | | | | | | | | |
2.40%, 05/01/2026(3) | | | 105 | | | | 99 | |
2.80%, 05/01/2031(3) | | | 245 | | | | 212 | |
4.50%, 05/01/2027 | | | 115 | | | | 115 | |
5.10%, 05/01/2032 | | | 170 | | | | 172 | |
5.30%, 05/01/2032 | | | 105 | | | | 106 | |
County of Broward FL Airport System Revenue | | | | | | | | |
5.00%, 10/01/2025 | | | 2,125 | | | | 2,182 | |
5.00%, 10/01/2026 | | | 1,000 | | | | 1,042 | |
5.00%, 10/01/2026 | | | 3,665 | | | | 3,820 | |
5.00%, 10/01/2027 | | | 1,650 | | | | 1,743 | |
5.00%, 10/01/2027 | | | 3,500 | | | | 3,698 | |
5.00%, 10/01/2028 | | | 1,500 | | | | 1,603 | |
5.00%, 10/01/2029 | | | 500 | | | | 514 | |
5.00%, 10/01/2029 | | | 1,150 | | | | 1,246 | |
5.00%, 10/01/2030 | | | 405 | | | | 429 | |
5.00%, 10/01/2031 | | | 1,525 | | | | 1,653 | |
5.00%, 10/01/2036 | | | 1,350 | | | | 1,435 | |
5.00%, 10/01/2036 | | | 1,500 | | | | 1,563 | |
5.00%, 10/01/2038 | | | 1,420 | | | | 1,496 | |
5.00%, 10/01/2040 | | | 10,000 | | | | 10,116 | |
County of Broward FL Port Facilities Revenue | | | | | | | | |
4.00%, 09/01/2036 | | | 1,000 | | | | 1,003 | |
5.00%, 09/01/2030 | | | 310 | | | | 348 | |
5.00%, 09/01/2030 | | | 1,780 | | | | 1,928 | |
5.00%, 09/01/2032 | | | 265 | | | | 293 | |
5.00%, 09/01/2034 | | | 1,925 | | | | 2,072 | |
5.00%, 09/01/2035 | | | 2,000 | | | | 2,141 | |
County of Broward FL Tourist Development Tax Revenue | | | | | | | | |
4.00%, 09/01/2039 | | | 4,500 | | | | 4,492 | |
County of Clay FL Sales Surtax Revenue | | | | | | | | |
5.00%, 10/01/2026 | | | 1,170 | | | | 1,241 | |
5.00%, 10/01/2030 | | | 1,680 | | | | 1,887 | |
5.00%, 10/01/2031 | | | 1,375 | | | | 1,544 | |
5.00%, 10/01/2035 | | | 1,805 | | | | 2,001 | |
County of Hillsborough FL Community Investment Tax Revenue | | | | | | | | |
5.00%, 11/01/2025 | | | 1,800 | | | | 1,876 | |
County of Lee FL Airport Revenue | | | | | | | | |
5.00%, 10/01/2039 | | | 7,240 | | | | 7,698 | |
County of Lee FL Solid Waste System Revenue | | | | | | | | |
5.00%, 10/01/2025 | | | 3,045 | | | | 3,094 | |
County of Miami-Dade FL | | | | | | | | |
5.00%, 07/01/2023 | | | 1,000 | | | | 1,000 | |
5.00%, 07/01/2023 | | | 7,135 | | | | 7,135 | |
5.00%, 10/01/2024 | | | 1,785 | | | | 1,823 | |
5.00%, 07/01/2037 | | | 1,500 | | | | 1,560 | |
5.00%, 07/01/2038 | | | 1,060 | | | | 1,100 | |
County of Miami-Dade FL Aviation Revenue | | | | | | | | |
4.00%, 10/01/2034 | | | 1,600 | | | | 1,664 | |
4.00%, 10/01/2038 | | | 1,900 | | | | 1,911 | |
4.00%, 10/01/2040 | | | 1,450 | | | | 1,427 | |
5.00%, 10/01/2024 | | | 2,510 | | | | 2,556 | |
5.00%, 10/01/2029 | | | 625 | | | | 631 | |
5.00%, 10/01/2030 | | | 250 | | | | 283 | |
5.00%, 10/01/2031 | | | 7,500 | | | | 7,567 | |
5.00%, 10/01/2033 | | | 23,355 | | | | 23,567 | |
5.00%, 10/01/2034 | | | 5,520 | | | | 5,559 | |
5.00%, 10/01/2035 | | | 1,000 | | | | 1,006 | |
5.00%, 10/01/2037 | | | 2,990 | | | | 3,019 | |
| | | | | | | | |
5.00%, 10/01/2038 | | | 490 | | | | 494 | |
5.00%, 10/01/2040 | | | 2,380 | | | | 2,441 | |
County of Miami-Dade FL Transit System | | | | | | | | |
4.00%, 07/01/2036 | | | 1,755 | | | | 1,784 | |
5.00%, 07/01/2043 | | | 2,535 | | | | 2,779 | |
5.00%, 07/01/2044 | | | 12,040 | | | | 13,164 | |
County of Miami-Dade FL Water & Sewer System Revenue | | | | | | | | |
3.00%, 10/01/2036 | | | 1,600 | | | | 1,471 | |
4.00%, 10/01/2035 | | | 1,540 | | | | 1,588 | |
4.00%, 10/01/2038 | | | 1,250 | | | | 1,263 | |
4.00%, 10/01/2040 | | | 8,880 | | | | 8,578 | |
5.00%, 10/01/2031 | | | 4,000 | | | | 4,126 | |
5.00%, 10/01/2032 | | | 1,275 | | | | 1,315 | |
County of Miami-Dade Seaport Department | | | | | | | | |
4.00%, 10/01/2038 | | | 1,000 | | | | 1,008 | |
4.00%, 10/01/2039 | | | 7,000 | | | | 7,028 | |
4.00%, 10/01/2040 | | | 6,000 | | | | 5,956 | |
4.00%, 10/01/2041 | | | 10,000 | | | | 9,975 | |
6.00%, 10/01/2038 | | | 7,000 | | | | 7,046 | |
6.25%, 10/01/2038 | | | 2,000 | | | | 2,013 | |
County of Palm Beach FL | | | | | | | | |
5.00%, 05/01/2029 | | | 1,915 | | | | 2,011 | |
County of Pasco FL | | | | | | | | |
5.00%, 10/01/2050 | | | 4,785 | | | | 5,103 | |
5.25%, 09/01/2032 | | | 550 | | | | 639 | |
5.25%, 09/01/2033 | | | 750 | | | | 876 | |
5.25%, 09/01/2034 | | | 675 | | | | 785 | |
5.25%, 09/01/2035 | | | 585 | | | | 673 | |
5.50%, 09/01/2037 | | | 1,550 | | | | 1,782 | |
5.50%, 09/01/2038 | | | 2,820 | | | | 3,227 | |
5.50%, 09/01/2039 | | | 500 | | | | 570 | |
5.50%, 09/01/2040 | | | 1,250 | | | | 1,417 | |
Duval County Public Schools | | | | | | | | |
5.00%, 07/01/2031 | | | 8,280 | | | | 9,322 | |
5.00%, 07/01/2032 | | | 5,500 | | | | 6,185 | |
5.00%, 07/01/2033 | | | 5,860 | | | | 6,576 | |
5.00%, 07/01/2034 | | | 8,350 | | | | 9,344 | |
5.00%, 07/01/2035 | | | 11,000 | | | | 12,217 | |
East Nassau Stewardship District | | | | | | | | |
2.40%, 05/01/2026 | | | 110 | | | | 104 | |
3.00%, 05/01/2031 | | | 245 | | | | 215 | |
Elevation Pointe Community Development District | | | | | | | | |
3.90%, 05/01/2027 | | | 130 | | | | 127 | |
4.13%, 05/01/2032 | | | 250 | | | | 239 | |
4.40%, 05/01/2032 | | | 1,100 | | | | 1,062 | |
Entrada Community Development District | | | | | | | | |
2.13%, 05/01/2026(3) | | | 270 | | | | 253 | |
Epperson North Community Development District | | | | | | | | |
2.45%, 11/01/2026 | | | 125 | | | | 117 | |
2.50%, 05/01/2026 | | | 65 | | | | 62 | |
3.00%, 05/01/2031 | | | 165 | | | | 145 | |
3.10%, 11/01/2031 | | | 185 | | | | 163 | |
Escambia County Health Facilities Authority | | | | | | | | |
4.00%, 08/15/2045 | | | 1,305 | | | | 1,167 | |
Esplanade Lake Club Community Development District | | | | | | | | |
3.25%, 11/01/2025 | | | 40 | | | | 39 | |
3.25%, 11/01/2025 | | | 155 | | | | 151 | |
Florida Department of Management Services | | | | | | | | |
3.00%, 11/01/2035 | | | 1,810 | | | | 1,700 | |
Florida Development Finance Corp. | | | | | | | | |
1.75%, 06/01/2026(3) | | | 310 | | | | 300 | |
3.00%, 07/01/2031(3) | | | 375 | | | | 338 | |
3.00%, 06/01/2032 | | | 795 | | | | 631 | |
4.00%, 06/01/2024(3) | | | 105 | | | | 104 | |
4.00%, 06/01/2026(3) | | | 110 | | | | 106 | |
4.00%, 07/01/2031 | | | 170 | | | | 165 | |
4.00%, 11/15/2034 | | | 3,300 | | | | 3,332 | |
4.00%, 11/15/2035 | | | 2,850 | | | | 2,856 | |
5.00%, 04/01/2028 | | | 315 | | | | 336 | |
5.00%, 04/01/2029 | | | 250 | | | | 269 | |
5.00%, 05/01/2029(3) | | | 2,915 | | | | 2,777 | |
5.00%, 06/01/2031(3) | | | 140 | | | | 134 | |
5.00%, 06/15/2032 | | | 545 | | | | 558 | |
5.00%, 06/01/2035(3) | | | 125 | | | | 116 | |
5.00%, 02/01/2036 | | | 1,905 | | | | 1,916 | |
5.00%, 06/15/2038 | | | 860 | | | | 863 | |
5.00%, 06/15/2056 | | | 2,570 | | | | 2,443 | |
Florida Higher Educational Facilities Financial Authority | | | | | | | | |
5.00%, 10/01/2029 | | | 1,000 | | | | 1,051 | |
5.00%, 10/01/2033 | | | 1,000 | | | | 1,042 | |
Florida Housing Finance Corp. | | | | | | | | |
3.50%, 07/01/2051 | | | 2,290 | | | | 2,243 | |
4.50%, 05/01/2026(1) | | | 9,742 | | | | 9,823 | |
| | | | | | | | |
Florida Municipal Power Agency | | | | | | | | |
3.00%, 10/01/2032 | | | 1,400 | | | | 1,330 | |
5.00%, 10/01/2025 | | | 3,475 | | | | 3,612 | |
Fort Pierce Utilities Authority | | | | | | | | |
5.00%, 10/01/2031 | | | 200 | | | | 229 | |
5.00%, 10/01/2032 | | | 150 | | | | 173 | |
5.00%, 10/01/2033 | | | 200 | | | | 230 | |
5.00%, 10/01/2035 | | | 250 | | | | 284 | |
Greater Orlando Aviation Authority | | | | | | | | |
5.00%, 10/01/2031 | | | 2,000 | | | | 2,058 | |
5.00%, 10/01/2033 | | | 2,020 | | | | 2,074 | |
5.00%, 10/01/2034 | | | 11,000 | | | | 11,856 | |
Harbor Bay Community Development District | | | | | | | | |
3.10%, 05/01/2024 | | | 100 | | | | 99 | |
3.10%, 05/01/2024 | | | 100 | | | | 99 | |
Hillsborough County Aviation Authority | | | | | | | | |
4.00%, 10/01/2038 | | | 1,000 | | | | 1,012 | |
4.00%, 10/01/2040 | | | 1,610 | | | | 1,617 | |
4.00%, 10/01/2041 | | | 1,100 | | | | 1,097 | |
5.00%, 10/01/2025 | | | 2,300 | | | | 2,364 | |
5.00%, 10/01/2031 | | | 4,400 | | | | 4,458 | |
5.00%, 10/01/2032 | | | 375 | | | | 414 | |
5.00%, 10/01/2032 | | | 2,500 | | | | 2,532 | |
5.00%, 10/01/2033 | | | 465 | | | | 512 | |
5.00%, 10/01/2034 | | | 2,150 | | | | 2,363 | |
5.00%, 10/01/2035 | | | 2,275 | | | | 2,487 | |
5.00%, 10/01/2036 | | | 2,650 | | | | 2,881 | |
5.00%, 10/01/2037 | | | 700 | | | | 734 | |
5.00%, 10/01/2040 | | | 12,500 | | | | 12,787 | |
5.00%, 10/01/2047 | | | 8,000 | | | | 8,647 | |
Hillsborough County Port District | | | | | | | | |
5.00%, 06/01/2038 | | | 900 | | | | 932 | |
Hillsborough County School Board | | | | | | | | |
5.00%, 07/01/2029 | | | 1,795 | | | | 1,974 | |
Hilltop Point Community Development District | | | | | | | | |
5.00%, 05/01/2033 | | | 200 | | | | 198 | |
Hyde Park Community Development District No 1 | | | | | | | | |
3.25%, 05/01/2027 | | | 345 | | | | 330 | |
3.60%, 05/01/2032 | | | 505 | | | | 457 | |
JEA Electric System Revenue | | | | | | | | |
4.00%, 10/01/2038 | | | 10,830 | | | | 10,767 | |
4.00%, 10/01/2039 | | | 10,550 | | | | 10,453 | |
5.00%, 10/01/2026 | | | 1,120 | | | | 1,187 | |
5.00%, 10/01/2031 | | | 1,360 | | | | 1,531 | |
5.00%, 10/01/2033 | | | 2,130 | | | | 2,393 | |
5.00%, 10/01/2034 | | | 1,215 | | | | 1,359 | |
JEA Water & Sewer System Revenue | | | | | | | | |
4.00%, 10/01/2038 | | | 4,390 | | | | 4,425 | |
Lakes of Sarasota Community Development District | | | | | | | | |
3.63%, 05/01/2031 | | | 130 | | | | 122 | |
3.88%, 05/01/2031 | | | 625 | | | | 598 | |
4.13%, 05/01/2031 | | | 1,000 | | | | 966 | |
Lakewood Ranch Stewardship District | | | | | | | | |
2.30%, 05/01/2026 | | | 140 | | | | 132 | |
2.50%, 05/01/2025(3) | | | 285 | | | | 275 | |
2.63%, 05/01/2031 | | | 300 | | | | 256 | |
3.13%, 05/01/2030(3) | | | 310 | | | | 280 | |
4.35%, 05/01/2024 | | | 285 | | | | 285 | |
4.55%, 05/01/2024(3) | | | 160 | | | | 160 | |
Laurel Road Community Development District | | | | | | | | |
3.00%, 05/01/2031 | | | 350 | | | | 307 | |
3.13%, 05/01/2031 | | | 950 | | | | 840 | |
Lee County Industrial Development Authority | | | | | | | | |
5.00%, 11/15/2039 | | | 1,850 | | | | 1,836 | |
Lee County School Board | | | | | | | | |
5.00%, 08/01/2028 | | | 3,275 | | | | 3,599 | |
Lee Memorial Health System | | | | | | | | |
5.00%, 04/01/2033(1) | | | 2,850 | | | | 2,935 | |
5.00%, 04/01/2035 | | | 6,575 | | | | 7,084 | |
5.00%, 04/01/2037 | | | 2,060 | | | | 2,183 | |
Live Oak Lake Community Development District | | | | | | | | |
3.80%, 05/01/2030 | | | 1,745 | | | | 1,639 | |
LT Ranch Community Development District | | | | | | | | |
3.00%, 05/01/2025 | | | 300 | | | | 293 | |
Manatee County School District | | | | | | | | |
5.00%, 10/01/2025 | | | 520 | | | | 541 | |
5.00%, 10/01/2029 | | | 1,250 | | | | 1,346 | |
5.00%, 10/01/2030 | | | 1,250 | | | | 1,345 | |
Marion County School Board | | | | | | | | |
5.00%, 06/01/2026 | | | 1,455 | | | | 1,499 | |
Martin County Health Facilities Authority | | | | | | | | |
5.00%, 11/15/2023 | | | 800 | | | | 804 | |
Meadow View at Twin Creeks Community Development District | | | | | | | | |
| | | | | | | | |
2.40%, 05/01/2026 | | | 100 | | | | 94 | |
3.00%, 05/01/2031 | | | 310 | | | | 272 | |
Miami Beach Health Facilities Authority | | | | | | | | |
4.00%, 11/15/2041 | | | 500 | | | | 467 | |
Miami-Dade County Expressway Authority | | | | | | | | |
5.00%, 07/01/2030 | | | 1,225 | | | | 1,273 | |
5.00%, 07/01/2044 | | | 10,190 | | | | 10,222 | |
Miami-Dade County Health Facilities Authority | | | | | | | | |
5.00%, 08/01/2025 | | | 110 | | | | 113 | |
5.00%, 08/01/2026 | | | 155 | | | | 162 | |
5.00%, 08/01/2027 | | | 345 | | | | 365 | |
5.00%, 08/01/2028 | | | 400 | | | | 423 | |
5.00%, 08/01/2028 | | | 460 | | | | 493 | |
5.00%, 08/01/2029 | | | 480 | | | | 507 | |
5.00%, 08/01/2030 | | | 680 | | | | 716 | |
5.00%, 08/01/2030 | | | 1,050 | | | | 1,143 | |
5.00%, 08/01/2032 | | | 750 | | | | 789 | |
Mid-Bay Bridge Authority | | | | | | | | |
5.00%, 10/01/2040 | | | 1,375 | | | | 1,381 | |
Midtown Miami Community Development District | | | | | | | | |
5.00%, 05/01/2037 | | | 965 | | | | 948 | |
Mirada II Community Development District | | | | | | | | |
2.50%, 05/01/2026 | | | 305 | | | | 289 | |
Monroe County School District | | | | | | | | |
5.00%, 06/01/2033 | | | 540 | | | | 588 | |
5.00%, 06/01/2035 | | | 500 | | | | 542 | |
North AR-1 Pasco Community Development District | | | | | | | | |
2.63%, 05/01/2026 | | | 150 | | | | 143 | |
North Springs Improvement District | | | | | | | | |
4.00%, 05/01/2041 | | | 2,000 | | | | 2,006 | |
Orange County Convention Center | | | | | | | | |
5.00%, 10/01/2023 | | | 1,510 | | | | 1,515 | |
Orange County Health Facilities Authority | | | | | | | | |
5.00%, 10/01/2039 | | | 1,125 | | | | 1,167 | |
Orange County School Board | | | | | | | | |
5.00%, 08/01/2029 | | | 1,000 | | | | 1,040 | |
5.00%, 08/01/2033 | | | 1,740 | | | | 1,850 | |
Orlando Utilities Commission | | | | | | | | |
1.25%, 10/01/2046(1) | | | 1,190 | | | | 1,021 | |
Palm Beach County Health Facilities Authority | | | | | | | | |
4.00%, 06/01/2026 | | | 150 | | | | 146 | |
4.00%, 06/01/2031 | | | 625 | | | | 576 | |
5.00%, 12/01/2023 | | | 105 | | | | 106 | |
5.00%, 05/15/2024 | | | 615 | | | | 607 | |
5.00%, 12/01/2024 | | | 105 | | | | 108 | |
5.00%, 05/15/2028 | | | 1,920 | | | | 1,791 | |
Palm Beach County School District | | | | | | | | |
5.00%, 08/01/2023 | | | 500 | | | | 501 | |
5.00%, 08/01/2024 | | | 220 | | | | 224 | |
5.00%, 08/01/2026 | | | 1,065 | | | | 1,125 | |
5.00%, 08/01/2026 | | | 3,750 | | | | 3,963 | |
5.00%, 08/01/2030 | | | 4,520 | | | | 4,663 | |
5.00%, 08/01/2032 | | | 3,000 | | | | 3,090 | |
5.00%, 08/01/2038 | | | 1,280 | | | | 1,420 | |
5.00%, 08/01/2039 | | | 2,560 | | | | 2,829 | |
5.25%, 08/01/2038 | | | 6,500 | | | | 7,412 | |
Palm Coast Park Community Development District | | | | | | | | |
2.40%, 05/01/2026 | | | 115 | | | | 109 | |
4.63%, 05/01/2032 | | | 500 | | | | 497 | |
Pasco County School Board | | | | | | | | |
5.00%, 08/01/2030 | | | 450 | | | | 516 | |
5.00%, 08/01/2033 | | | 1,000 | | | | 1,131 | |
Pine Isle Community Development District | | | | | | | | |
3.00%, 12/15/2031(3) | | | 100 | | | | 91 | |
Pinellas County Housing Finance Authority | | | | | | | | |
0.65%, 01/01/2025(1) | | | 2,210 | | | | 2,125 | |
Poitras East Community Development District | | | | | | | | |
4.00%, 05/01/2028 | | | 1,000 | | | | 991 | |
Portico Community Development District | | | | | | | | |
2.80%, 05/01/2025 | | | 415 | | | | 401 | |
Preston Cove Community Development District | | | | | | | | |
3.25%, 05/01/2027 | | | 200 | | | | 191 | |
3.60%, 05/01/2032 | | | 340 | | | | 308 | |
Reunion East Community Development District | | | | | | | | |
2.40%, 05/01/2026 | | | 110 | | | | 104 | |
2.85%, 05/01/2031 | | | 200 | | | | 176 | |
Reunion West Community Development District | | | | | | | | |
3.00%, 05/01/2036 | | | 450 | | | | 376 | |
Ridge at Apopka Community Development District | | | | | | | | |
4.75%, 05/01/2027 | | | 205 | | | | 205 | |
River Hall Community Development District | | | | | | | | |
3.00%, 05/01/2031 | | | 250 | | | | 221 | |
Rivers Edge II Community Development District | | | | | | | | |
| | | | | | | | |
2.40%, 05/01/2026 | | | 345 | | | | 326 | |
3.00%, 05/01/2031 | | | 300 | | | | 263 | |
Rolling Hills Community Development District | | | | | | | | |
3.13%, 05/01/2027 | | | 305 | | | | 290 | |
3.65%, 05/01/2032 | | | 400 | | | | 363 | |
3.75%, 05/01/2042 | | | 485 | | | | 387 | |
Sawyers Landing Community Development District | | | | | | | | |
3.25%, 05/01/2026 | | | 300 | | | | 284 | |
School Board of Miami-Dade County | | | | | | | | |
5.00%, 05/01/2025 | | | 3,000 | | | | 3,089 | |
5.00%, 05/01/2026 | | | 1,000 | | | | 1,023 | |
5.00%, 05/01/2028 | | | 2,785 | | | | 2,856 | |
5.00%, 11/01/2029 | | | 1,180 | | | | 1,202 | |
5.00%, 02/01/2030 | | | 500 | | | | 519 | |
5.00%, 05/01/2031 | | | 5,000 | | | | 5,143 | |
5.00%, 05/01/2031(1) | | | 6,410 | | | | 6,490 | |
School District of Broward County | | | | | | | | |
5.00%, 07/01/2028 | | | 1,500 | | | | 1,612 | |
5.00%, 07/01/2029 | | | 2,545 | | | | 2,734 | |
5.00%, 07/01/2030 | | | 3,955 | | | | 4,457 | |
5.00%, 07/01/2030 | | | 5,500 | | | | 5,659 | |
5.00%, 07/01/2031 | | | 1,000 | | | | 1,120 | |
5.00%, 07/01/2033 | | | 5,000 | | | | 5,648 | |
5.00%, 07/01/2038 | | | 6,410 | | | | 7,133 | |
5.00%, 07/01/2045 | | | 12,400 | | | | 13,553 | |
Seminole Improvement District | | | | | | | | |
4.40%, 10/01/2027 | | | 250 | | | | 248 | |
5.00%, 10/01/2032 | | | 250 | | | | 250 | |
5.30%, 10/01/2037 | | | 500 | | | | 503 | |
Somerset Community Development District | | | | | | | | |
4.00%, 05/01/2024 | | | 200 | | | | 199 | |
4.00%, 05/01/2025 | | | 210 | | | | 208 | |
4.00%, 05/01/2032 | | | 255 | | | | 241 | |
Southern Groves Community Development District No 5 | | | | | | | | |
2.80%, 05/01/2031 | | | 200 | | | | 173 | |
Southshore Bay Community Development District | | | | | | | | |
3.00%, 05/01/2033(3) | | | 300 | | | | 254 | |
St Johns County Industrial Development Authority | | | | | | | | |
4.00%, 12/15/2025 | | | 170 | | | | 165 | |
4.00%, 12/15/2026 | | | 185 | | | | 178 | |
4.00%, 12/15/2027 | | | 215 | | | | 204 | |
St Johns County School Board | | | | | | | | |
5.00%, 07/01/2029 | | | 1,250 | | | | 1,402 | |
5.00%, 07/01/2030 | | | 1,500 | | | | 1,684 | |
5.00%, 07/01/2031 | | | 1,000 | | | | 1,123 | |
State of Florida | | | | | | | | |
5.00%, 06/01/2024 | | | 2,415 | | | | 2,457 | |
5.00%, 07/01/2024 | | | 2,460 | | | | 2,506 | |
State of Florida Department of Transportation Turnpike System Revenue | | | | | | | | |
3.00%, 07/01/2035 | | | 1,530 | | | | 1,432 | |
4.00%, 07/01/2039 | | | 3,625 | | | | 3,680 | |
State of Florida Lottery Revenue | | | | | | | | |
5.00%, 07/01/2024 | | | 1,400 | | | | 1,426 | |
5.00%, 07/01/2024 | | | 4,000 | | | | 4,074 | |
Stillwater Community Development District | | | | | | | | |
2.38%, 06/15/2026(3) | | | 185 | | | | 174 | |
Sunbridge Stewardship District | | | | | | | | |
5.20%, 05/01/2042 | | | 500 | | | | 488 | |
Sunshine Skyway Bridge | | | | | | | | |
4.00%, 07/01/2037 | | | 2,355 | | | | 2,390 | |
Tampa Bay Water | | | | | | | | |
5.00%, 10/01/2042 | | | 1,875 | | | | 2,085 | |
5.00%, 10/01/2043 | | | 2,000 | | | | 2,220 | |
5.00%, 10/01/2044 | | | 3,345 | | | | 3,703 | |
Tolomato Community Development District | | | | | | | | |
2.00%, 05/01/2024 | | | 1,295 | | | | 1,270 | |
2.10%, 05/01/2025 | | | 1,345 | | | | 1,291 | |
2.80%, 05/01/2027 | | | 1,635 | | | | 1,553 | |
2.88%, 05/01/2027 | | | 140 | | | | 133 | |
3.00%, 05/01/2032 | | | 1,500 | | | | 1,317 | |
3.50%, 05/01/2024 | | | 100 | | | | 99 | |
Tradition Community Development District No 9 | | | | | | | | |
2.30%, 05/01/2026 | | | 195 | | | | 184 | |
2.70%, 05/01/2031 | | | 270 | | | | 232 | |
Two Rivers North Community Development District | | | | | | | | |
4.63%, 05/01/2027 | | | 105 | | | | 104 | |
4.88%, 05/01/2032 | | | 250 | | | | 248 | |
V-Dana Community Development District | | | | | | | | |
2.60%, 05/01/2026 | | | 95 | | | | 90 | |
3.13%, 05/01/2031 | | | 125 | | | | 112 | |
Verano No 3 Community Development District | | | | | | | | |
2.38%, 05/01/2026 | | | 60 | | | | 57 | |
3.00%, 05/01/2031 | | | 120 | | | | 107 | |
| | | | | | | | |
Viera Stewardship District | | | | | | | | |
2.30%, 05/01/2026 | | | 255 | | | | 240 | |
2.80%, 05/01/2031 | | | 465 | | | | 403 | |
4.60%, 05/01/2033 | | | 1,770 | | | | 1,763 | |
Village Community Development District No 15 | | | | | | | | |
4.38%, 05/01/2033(3) | | | 485 | | | | 487 | |
Volusia County Educational Facility Authority | | | | | | | | |
4.00%, 10/15/2037 | | | 740 | | | | 733 | |
5.00%, 10/15/2044 | | | 390 | | | | 408 | |
5.00%, 10/15/2049 | | | 730 | | | | 759 | |
Volusia County School Board | | | | | | | | |
5.00%, 08/01/2024 | | | 2,100 | | | | 2,139 | |
Watergrass Community Development District II | | | | | | | | |
2.00%, 05/01/2026 | | | 285 | | | | 266 | |
2.50%, 05/01/2031 | | | 310 | | | | 262 | |
West Villages Improvement District | | | | | | | | |
4.00%, 05/01/2024 | | | 105 | | | | 105 | |
Westside Community Development District | | | | | | | | |
3.50%, 05/01/2024(3) | | | 155 | | | | 154 | |
Westside Haines City Community Development District | | | | | | | | |
2.50%, 05/01/2026 | | | 95 | | | | 90 | |
3.00%, 05/01/2031 | | | 215 | | | | 190 | |
Windward at Lakewood Ranch Community Development District | | | | | | | | |
3.25%, 05/01/2027 | | | 350 | | | | 335 | |
3.63%, 05/01/2032 | | | 345 | | | | 313 | |
Wiregrass II Community Development District | | | | | | | | |
4.50%, 05/01/2027 | | | 100 | | | | 99 | |
4.80%, 05/01/2032 | | | 240 | | | | 238 | |
| | | | | | | | |
Total Florida | | | | 679,914 | |
| | | | | | | | |
Georgia – 3.41% | | | | | | | | |
Atlanta Urban Redevelopment Agency | | | | | | | | |
2.38%, 07/01/2026(3) | | | 1,350 | | | | 1,297 | |
2.88%, 07/01/2031(3) | | | 1,680 | | | | 1,554 | |
Bartow County Development Authority | | | | | | | | |
3.95%, 12/01/2032 | | | 8,030 | | | | 8,011 | |
Brookhaven Development Authority | | | | | | | | |
5.00%, 07/01/2025 | | | 1,400 | | | | 1,450 | |
5.00%, 07/01/2031 | | | 650 | | | | 727 | |
5.00%, 07/01/2037 | | | 1,800 | | | | 1,950 | |
City of Atlanta GA Department of Aviation | | | | | | | | |
4.00%, 07/01/2038 | | | 255 | | | | 253 | |
5.00%, 07/01/2026 | | | 580 | | | | 603 | |
5.00%, 07/01/2026 | | | 1,210 | | | | 1,279 | |
5.00%, 07/01/2027 | | | 2,635 | | | | 2,838 | |
5.00%, 01/01/2029 | | | 875 | | | | 879 | |
5.00%, 07/01/2032 | | | 250 | | | | 276 | |
5.00%, 07/01/2033 | | | 350 | | | | 386 | |
5.00%, 07/01/2033 | | | 2,000 | | | | 2,230 | |
5.00%, 07/01/2034 | | | 250 | | | | 275 | |
5.00%, 07/01/2034 | | | 1,300 | | | | 1,445 | |
5.00%, 07/01/2035 | | | 350 | | | | 382 | |
5.00%, 07/01/2036 | | | 350 | | | | 380 | |
5.00%, 07/01/2037 | | | 385 | | | | 415 | |
City of Atlanta GA Water & Wastewater Revenue | | | | | | | | |
5.00%, 11/01/2038 | | | 1,590 | | | | 1,694 | |
5.00%, 11/01/2040 | | | 24,425 | | | | 25,011 | |
Cobb County Kennestone Hospital Authority | | | | | | | | |
4.00%, 04/01/2033 | | | 500 | | | | 512 | |
Columbus Medical Center Hospital Authority | | | | | | | | |
5.00%, 07/01/2054(1) | | | 2,700 | | | | 2,923 | |
5.00%, 07/01/2054(1) | | | 3,330 | | | | 3,439 | |
DeKalb Private Hospital Authority | | | | | | | | |
5.00%, 07/01/2027 | | | 1,235 | | | | 1,332 | |
Development Authority for Fulton County | | | | | | | | |
5.00%, 06/15/2044 | | | 580 | | | | 625 | |
Development Authority of Burke County | | | | | | | | |
1.50%, 01/01/2040(1) | | | 4,000 | | | | 3,779 | |
1.70%, 12/01/2049(1) | | | 2,400 | | | | 2,323 | |
2.88%, 12/01/2049(1) | | | 5,640 | | | | 5,475 | |
2.93%, 11/01/2053(1) | | | 2,940 | | | | 2,907 | |
3.25%, 11/01/2045(1) | | | 3,000 | | | | 2,956 | |
3.80%, 10/01/2032 | | | 5,555 | | | | 5,549 | |
3.95%, 11/01/2052(1) | | | 12,175 | | | | 12,175 | |
4.00%, 07/01/2049(1) | | | 12,000 | | | | 12,000 | |
Development Authority of Monroe County | | | | | | | | |
3.88%, 10/01/2048 | | | 4,815 | | | | 4,816 | |
3.96%, 11/01/2048(1) | | | 38,000 | | | | 38,000 | |
Fayette County Hospital Authority | | | | | | | | |
5.00%, 07/01/2054(1) | | | 1,300 | | | | 1,308 | |
Fulton County Residential Care Facilities for the Elderly Authority | | | | | | | | |
3.00%, 04/01/2024(3) | | | 150 | | | | 147 | |
George L Smith II Congress Center Authority | | | | | | | | |
2.38%, 01/01/2031 | | | 1,250 | | | | 1,086 | |
| | | | | | | | |
4.00%, 01/01/2036 | | | 2,000 | | | | 1,906 | |
Glynn-Brunswick Memorial Hospital Authority | | | | | | | | |
4.00%, 08/01/2036 | | | 2,000 | | | | 1,906 | |
4.00%, 08/01/2037 | | | 750 | | | | 701 | |
Griffin-Spalding County Hospital Authority | | | | | | | | |
3.00%, 04/01/2027 | | | 635 | | | | 626 | |
LaGrange-Troup County Hospital Authority | | | | | | | | |
5.00%, 04/01/2024 | | | 500 | | | | 505 | |
Main Street Natural Gas, Inc. | | | | | | | | |
4.00%, 12/01/2029 | | | 1,370 | | | | 1,351 | |
4.00%, 04/01/2048(1) | | | 7,520 | | | | 7,527 | |
4.00%, 08/01/2048(1) | | | 13,275 | | | | 13,279 | |
4.00%, 08/01/2049(1) | | | 36,670 | | | | 36,776 | |
4.00%, 03/01/2050(1) | | | 10,000 | | | | 9,940 | |
4.00%, 05/01/2052(1) | | | 23,800 | | | | 23,441 | |
4.00%, 07/01/2052(1) | | | 12,855 | | | | 12,813 | |
4.00%, 09/01/2052(1) | | | 11,210 | | | | 11,001 | |
4.29% (1 Month LIBOR USD + 0.83%), 08/01/2048(2) | | | 1,700 | | | | 1,699 | |
5.00%, 05/15/2027 | | | 5,500 | | | | 5,620 | |
5.00%, 12/01/2052(1) | | | 5,490 | | | | 5,663 | |
5.00%, 06/01/2053 | | | 11,180 | | | | 11,576 | |
5.00%, 07/01/2053 | | | 5,755 | | | | 6,013 | |
5.00%, 09/01/2053 | | | 30,420 | | | | 31,938 | |
Metropolitan Atlanta Rapid Transit Authority | | | | | | | | |
5.00%, 07/01/2033 | | | 1,250 | | | | 1,498 | |
5.00%, 07/01/2034 | | | 1,000 | | | | 1,195 | |
5.00%, 07/01/2035 | | | 525 | | | | 623 | |
5.00%, 07/01/2039 | | | 900 | | | | 1,026 | |
Municipal Electric Authority of Georgia | | | | | | | | |
4.00%, 11/01/2023 | | | 805 | | | | 806 | |
4.00%, 01/01/2034 | | | 1,800 | | | | 1,816 | |
4.00%, 01/01/2035 | | | 435 | | | | 433 | |
4.00%, 01/01/2035 | | | 1,500 | | | | 1,510 | |
4.00%, 01/01/2036 | | | 435 | | | | 427 | |
4.00%, 01/01/2037 | | | 860 | | | | 839 | |
4.00%, 01/01/2038 | | | 850 | | | | 803 | |
4.00%, 01/01/2039 | | | 850 | | | | 795 | |
4.00%, 01/01/2046 | | | 400 | | | | 387 | |
4.00%, 01/01/2046 | | | 590 | | | | 567 | |
4.00%, 01/01/2051 | | | 220 | | | | 189 | |
4.00%, 01/01/2051 | | | 1,100 | | | | 1,002 | |
5.00%, 01/01/2024 | | | 830 | | | | 835 | |
5.00%, 01/01/2025 | | | 350 | | | | 357 | |
5.00%, 01/01/2025 | | | 900 | | | | 918 | |
5.00%, 01/01/2025 | | | 950 | | | | 969 | |
5.00%, 01/01/2026 | | | 300 | | | | 311 | |
5.00%, 01/01/2026 | | | 320 | | | | 331 | |
5.00%, 01/01/2026 | | | 1,000 | | | | 1,035 | |
5.00%, 01/01/2027 | | | 300 | | | | 315 | |
5.00%, 01/01/2027 | | | 1,500 | | | | 1,575 | |
5.00%, 11/01/2027 | | | 200 | | | | 213 | |
5.00%, 01/01/2028 | | | 25 | | | | 27 | |
5.00%, 01/01/2028 | | | 750 | | | | 801 | |
5.00%, 11/01/2028 | | | 275 | | | | 298 | |
5.00%, 11/01/2029 | | | 300 | | | | 329 | |
5.00%, 01/01/2030 | | | 1,000 | | | | 1,070 | |
5.00%, 01/01/2031 | | | 685 | | | | 740 | |
5.00%, 01/01/2033 | | | 1,200 | | | | 1,291 | |
5.00%, 01/01/2034 | | | 1,080 | | | | 1,198 | |
5.00%, 01/01/2035 | | | 465 | | | | 497 | |
5.00%, 01/01/2039 | | | 605 | | | | 629 | |
5.00%, 01/01/2056 | | | 190 | | | | 189 | |
5.00%, 01/01/2056 | | | 280 | | | | 286 | |
5.00%, 01/01/2056 | | | 1,930 | | | | 1,957 | |
5.00%, 01/01/2062 | | | 700 | | | | 725 | |
5.00%, 01/01/2062 | | | 1,155 | | | | 1,197 | |
5.00%, 01/01/2063 | | | 515 | | | | 513 | |
Paulding County Hospital Authority | | | | | | | | |
4.00%, 04/01/2041 | | | 3,225 | | | | 3,127 | |
5.00%, 04/01/2033 | | | 250 | | | | 276 | |
5.00%, 04/01/2034 | | | 350 | | | | 385 | |
5.00%, 04/01/2035 | | | 200 | | | | 218 | |
5.00%, 04/01/2036 | | | 330 | | | | 357 | |
5.00%, 04/01/2037 | | | 300 | | | | 322 | |
5.00%, 04/01/2038 | | | 450 | | | | 479 | |
5.00%, 04/01/2039 | | | 725 | | | | 768 | |
5.00%, 04/01/2042 | | | 1,875 | | | | 1,970 | |
5.00%, 04/01/2043 | | | 2,250 | | | | 2,360 | |
Private Colleges & Universities Authority | | | | | | | | |
4.00%, 04/01/2037 | | | 1,000 | | | | 1,025 | |
5.00%, 10/01/2023 | | | 300 | | | | 301 | |
5.00%, 04/01/2027 | | | 1,900 | | | | 1,926 | |
5.00%, 04/01/2028 | | | 400 | | | | 432 | |
| | | | | | | | |
5.00%, 04/01/2034 | | | 780 | | | | 882 | |
5.00%, 04/01/2044 | | | 1,000 | | | | 1,014 | |
State of Georgia | | | | | | | | |
4.00%, 08/01/2034 | | | 6,455 | | | | 6,913 | |
4.00%, 02/01/2036 | | | 5,000 | | | | 5,104 | |
| | | | | | | | |
Total Georgia | | | | 399,349 | |
| | | | | | | | |
Guam – 0.17% | | | | | | | | |
Guam Department of Education | | | | | | | | |
3.63%, 02/01/2025 | | | 570 | | | | 554 | |
Territory of Guam | | | | | | | | |
4.00%, 01/01/2036 | | | 6,405 | | | | 6,112 | |
4.00%, 01/01/2042 | | | 500 | | | | 442 | |
5.00%, 11/01/2027 | | | 430 | | | | 447 | |
5.00%, 01/01/2028 | | | 375 | | | | 388 | |
5.00%, 11/01/2028 | | | 485 | | | | 509 | |
5.00%, 12/01/2028 | | | 2,500 | | | | 2,573 | |
5.00%, 01/01/2029 | | | 850 | | | | 885 | |
5.00%, 11/01/2029 | | | 485 | | | | 512 | |
5.00%, 01/01/2030 | | | 750 | | | | 783 | |
5.00%, 12/01/2030 | | | 1,750 | | | | 1,800 | |
5.00%, 01/01/2031 | | | 625 | | | | 656 | |
5.00%, 11/15/2031 | | | 1,450 | | | | 1,496 | |
5.00%, 12/01/2034 | | | 2,500 | | | | 2,560 | |
5.00%, 11/15/2039 | | | 500 | | | | 497 | |
| | | | | | | | |
Total Guam | | | | 20,214 | |
| | | | | | | | |
Hawaii – 0.63% | | | | | | | | |
City & County of Honolulu HI | | | | | | | | |
5.00%, 09/01/2024 | | | 1,275 | | | | 1,303 | |
5.00%, 11/01/2024 | | | 1,895 | | | | 1,942 | |
5.00%, 06/01/2027 | | | 3,075 | | | | 3,191 | |
5.00%, 11/01/2028 | | | 540 | | | | 601 | |
5.00%, 10/01/2029 | | | 2,000 | | | | 2,084 | |
5.00%, 11/01/2029 | | | 1,800 | | | | 2,038 | |
5.00%, 07/01/2034 | | | 810 | | | | 921 | |
5.00%, 07/01/2035 | | | 1,345 | | | | 1,518 | |
Kauai County Community Facilities District | | | | | | | | |
4.00%, 05/15/2028 | | | 485 | | | | 475 | |
State of Hawaii | | | | | | | | |
5.00%, 08/01/2023 | | | 1,925 | | | | 1,927 | |
5.00%, 01/01/2030 | | | 2,330 | | | | 2,601 | |
5.00%, 01/01/2032 | | | 12,800 | | | | 14,258 | |
5.00%, 01/01/2033 | | | 9,500 | | | | 10,573 | |
State of Hawaii Airports System Revenue | | | | | | | | |
5.00%, 07/01/2031 | | | 1,275 | | | | 1,363 | |
5.00%, 07/01/2032 | | | 1,500 | | | | 1,602 | |
5.00%, 07/01/2033 | | | 1,425 | | | | 1,521 | |
5.00%, 07/01/2041 | | | 3,000 | | | | 3,029 | |
State of Hawaii Harbor System Revenue | | | | | | | | |
4.00%, 07/01/2034 | | | 2,000 | | | | 2,025 | |
4.00%, 07/01/2035 | | | 2,320 | | | | 2,337 | |
4.00%, 07/01/2036 | | | 545 | | | | 558 | |
4.00%, 07/01/2039 | | | 1,000 | | | | 1,005 | |
University of Hawaii | | | | | | | | |
5.00%, 10/01/2028 | | | 4,015 | | | | 4,441 | |
5.00%, 10/01/2028 | | | 4,445 | | | | 4,917 | |
5.00%, 10/01/2029 | | | 1,225 | | | | 1,381 | |
5.00%, 10/01/2030 | | | 5,350 | | | | 6,137 | |
| | | | | | | | |
Total Hawaii | | | | 73,748 | |
| | | | | | | | |
Idaho – 0.16% | | | | | | | | |
Idaho Health Facilities Authority | | | | | | | | |
4.00%, 03/01/2034 | | | 400 | | | | 406 | |
4.00%, 03/01/2035 | | | 250 | | | | 251 | |
4.00%, 03/01/2039 | | | 700 | | | | 674 | |
4.00%, 03/01/2040 | | | 835 | | | | 800 | |
4.00%, 03/01/2041 | | | 850 | | | | 807 | |
4.00%, 03/01/2046 | | | 2,900 | | | | 2,623 | |
Idaho Housing & Finance Association | | | | | | | | |
3.00%, 05/01/2032 | | | 480 | | | | 442 | |
3.00%, 05/01/2032 | | | 630 | | | | 581 | |
4.00%, 07/15/2036 | | | 500 | | | | 506 | |
4.00%, 07/15/2037 | | | 645 | | | | 646 | |
4.00%, 07/15/2038 | | | 1,250 | | | | 1,244 | |
4.00%, 07/15/2039 | | | 6,500 | | | | 6,429 | |
4.00%, 01/01/2050 | | | 175 | | | | 174 | |
5.00%, 07/15/2035 | | | 875 | | | | 989 | |
5.00%, 08/15/2040 | | | 2,380 | | | | 2,682 | |
| | | | | | | | |
Total Idaho | | | | 19,254 | |
| | | | | | | | |
Illinois – 8.51% | | | | | | | | |
Champaign County Community Unit School District No 4 Champaign | | | | | | | | |
0.00%, 01/01/2025 | | | 485 | | | | 458 | |
Chicago Board of Education | | | | | | | | |
5.00%, 12/01/2023 | | | 2,000 | | | | 2,007 | |
5.00%, 12/01/2024 | | | 130 | | | | 131 | |
| | | | | | | | |
5.00%, 12/01/2024 | | | 2,175 | | | | 2,199 | |
5.00%, 12/01/2025 | | | 2,500 | | | | 2,559 | |
5.00%, 12/01/2026 | | | 145 | | | | 150 | |
5.00%, 12/01/2026 | | | 3,660 | | | | 3,784 | |
5.00%, 12/01/2028 | | | 1,270 | | | | 1,331 | |
5.00%, 12/01/2029 | | | 540 | | | | 569 | |
5.00%, 12/01/2030 | | | 2,000 | | | | 2,100 | |
5.00%, 12/01/2030 | | | 2,430 | | | | 2,551 | |
5.00%, 12/01/2031 | | | 2,185 | | | | 2,288 | |
5.00%, 12/01/2033 | | | 300 | | | | 311 | |
5.00%, 12/01/2033 | | | 2,310 | | | | 2,310 | |
5.00%, 12/01/2033 | | | 5,845 | | | | 6,146 | |
5.00%, 12/01/2037 | | | 7,950 | | | | 8,131 | |
5.00%, 12/01/2038 | | | 1,250 | | | | 1,273 | |
5.00%, 12/01/2039 | | | 5,000 | | | | 5,074 | |
5.00%, 12/01/2041 | | | 550 | | | | 554 | |
5.00%, 12/01/2042 | | | 200 | | | | 197 | |
5.00%, 12/01/2042 | | | 925 | | | | 925 | |
5.00%, 12/01/2046 | | | 1,200 | | | | 1,177 | |
5.00%, 12/01/2046 | | | 3,555 | | | | 3,488 | |
5.00%, 12/01/2047 | | | 5,295 | | | | 5,280 | |
5.25%, 12/01/2039 | | | 2,000 | | | | 2,004 | |
6.50%, 12/01/2046 | | | 100 | | | | 105 | |
6.75%, 12/01/2030(3) | | | 1,500 | | | | 1,667 | |
7.00%, 12/01/2046(3) | | | 400 | | | | 432 | |
Chicago Midway International Airport | | | | | | | | |
4.00%, 01/01/2033 | | | 1,915 | | | | 1,921 | |
5.00%, 01/01/2027 | | | 1,000 | | | | 1,003 | |
5.00%, 01/01/2027 | | | 1,800 | | | | 1,846 | |
5.00%, 01/01/2030 | | | 865 | | | | 868 | |
5.00%, 01/01/2034 | | | 1,000 | | | | 1,003 | |
5.00%, 01/01/2041 | | | 835 | | | | 852 | |
5.50%, 01/01/2028 | | | 5,000 | | | | 5,004 | |
Chicago O’Hare International Airport | | | | | | | | |
4.00%, 01/01/2035 | | | 6,450 | | | | 6,671 | |
4.00%, 01/01/2036 | | | 2,500 | | | | 2,563 | |
4.00%, 01/01/2036 | | | 3,285 | | | | 3,364 | |
4.00%, 01/01/2037 | | | 2,500 | | | | 2,544 | |
4.00%, 01/01/2038 | | | 1,500 | | | | 1,509 | |
5.00%, 01/01/2025 | | | 415 | | | | 422 | |
5.00%, 01/01/2027 | | | 520 | | | | 542 | |
5.00%, 01/01/2028 | | | 1,000 | | | | 1,043 | |
5.00%, 01/01/2030 | | | 520 | | | | 559 | |
5.00%, 01/01/2030 | | | 2,000 | | | | 2,047 | |
5.00%, 01/01/2030 | | | 3,105 | | | | 3,154 | |
5.00%, 01/01/2031 | | | 660 | | | | 691 | |
5.00%, 01/01/2031 | | | 700 | | | | 711 | |
5.00%, 01/01/2031 | | | 835 | | | | 897 | |
5.00%, 01/01/2032 | | | 600 | | | | 666 | |
5.00%, 01/01/2032 | | | 1,140 | | | | 1,225 | |
5.00%, 01/01/2032 | | | 1,300 | | | | 1,320 | |
5.00%, 01/01/2032 | | | 11,555 | | | | 11,826 | |
5.00%, 01/01/2033 | | | 345 | | | | 359 | |
5.00%, 01/01/2033 | | | 400 | | | | 443 | |
5.00%, 01/01/2033 | | | 1,200 | | | | 1,288 | |
5.00%, 01/01/2033 | | | 2,520 | | | | 2,579 | |
5.00%, 07/01/2033 | | | 550 | | | | 572 | |
5.00%, 01/01/2034 | | | 325 | | | | 359 | |
5.00%, 01/01/2034 | | | 400 | | | | 416 | |
5.00%, 01/01/2035 | | | 715 | | | | 786 | |
5.00%, 01/01/2035 | | | 1,285 | | | | 1,371 | |
5.00%, 01/01/2036 | | | 430 | | | | 445 | |
5.00%, 01/01/2036 | | | 750 | | | | 817 | |
5.00%, 01/01/2037 | | | 2,000 | | | | 2,065 | |
5.00%, 01/01/2042 | | | 500 | | | | 509 | |
5.00%, 01/01/2048 | | | 880 | | | | 922 | |
5.00%, 01/01/2048 | | | 1,025 | | | | 1,054 | |
5.00%, 01/01/2053 | | | 615 | | | | 641 | |
Chicago Park District | | | | | | | | |
5.00%, 01/01/2029 | | | 3,000 | | | | 3,022 | |
5.00%, 01/01/2044 | | | 5,700 | | | | 5,987 | |
Chicago Transit Authority Capital Grant Receipts Revenue | | | | | | | | |
5.00%, 06/01/2024 | | | 200 | | | | 202 | |
5.00%, 06/01/2025 | | | 200 | | | | 205 | |
5.00%, 06/01/2026 | | | 160 | | | | 167 | |
5.00%, 06/01/2026 | | | 8,275 | | | | 8,621 | |
5.00%, 06/01/2029 | | | 1,500 | | | | 1,634 | |
City of Calumet City IL | | | | | | | | |
4.50%, 03/01/2043 | | | 1,945 | | | | 1,912 | |
5.50%, 03/01/2030 | | | 755 | | | | 846 | |
5.50%, 03/01/2034 | | | 700 | | | | 780 | |
5.50%, 03/01/2036 | | | 400 | | | | 440 | |
5.50%, 03/01/2038 | | | 555 | | | | 601 | |
| | | | | | | | |
City of Chicago IL | | | | | | | | |
4.00%, 01/01/2035 | | | 1,300 | | | | 1,283 | |
4.00%, 01/01/2036 | | | 4,000 | | | | 3,892 | |
5.00%, 01/01/2027 | | | 500 | | | | 513 | |
5.00%, 01/01/2027 | | | 2,000 | | | | 2,093 | |
5.00%, 01/01/2030 | | | 2,000 | | | | 2,154 | |
5.00%, 01/01/2030 | | | 2,380 | | | | 2,564 | |
5.00%, 01/01/2031 | | | 2,400 | | | | 2,570 | |
5.00%, 01/01/2031 | | | 2,915 | | | | 3,167 | |
5.00%, 01/01/2032 | | | 13,095 | | | | 14,190 | |
5.00%, 01/01/2033 | | | 2,000 | | | | 2,165 | |
5.00%, 01/01/2034 | | | 1,445 | | | | 1,562 | |
5.00%, 01/01/2035 | | | 2,650 | | | | 2,673 | |
5.00%, 01/01/2035 | | | 7,540 | | | | 8,180 | |
5.25%, 01/01/2027 | | | 2,435 | | | | 2,620 | |
5.50%, 01/01/2039 | | | 4,400 | | | | 4,831 | |
5.50%, 01/01/2041 | | | 4,000 | | | | 4,291 | |
5.63%, 01/01/2031 | | | 1,500 | | | | 1,593 | |
5.75%, 01/01/2034 | | | 2,000 | | | | 2,133 | |
6.00%, 01/01/2038 | | | 1,910 | | | | 2,032 | |
City of Chicago IL Motor Fuel Tax Revenue | | | | | | | | |
5.00%, 01/01/2025 | | | 2,000 | | | | 2,017 | |
City of Chicago IL Wastewater Transmission Revenue | | | | | | | | |
5.00%, 01/01/2024 | | | 500 | | | | 503 | |
5.00%, 01/01/2028 | | | 2,900 | | | | 2,919 | |
5.00%, 01/01/2029 | | | 1,300 | | | | 1,308 | |
5.00%, 01/01/2030 | | | 1,000 | | | | 1,052 | |
5.00%, 01/01/2030 | | | 1,310 | | | | 1,346 | |
5.00%, 01/01/2038 | | | 1,775 | | | | 1,958 | |
5.00%, 01/01/2039 | | | 2,500 | | | | 2,743 | |
5.00%, 01/01/2044 | | | 10,000 | | | | 9,991 | |
City of Chicago IL Waterworks Revenue | | | | | | | | |
4.00%, 11/01/2023 | | | 1,025 | | | | 1,025 | |
5.00%, 11/01/2023 | | | 650 | | | | 653 | |
5.00%, 11/01/2024 | | | 250 | | | | 255 | |
5.00%, 11/01/2024 | | | 1,000 | | | | 1,019 | |
5.00%, 11/01/2024 | | | 1,150 | | | | 1,172 | |
5.00%, 11/01/2025 | | | 1,000 | | | | 1,015 | |
5.00%, 11/01/2038 | | | 1,250 | | | | 1,374 | |
5.00%, 11/01/2039 | | | 2,000 | | | | 2,192 | |
City of Galesburg IL | | | | | | | | |
4.00%, 10/01/2036 | | | 565 | | | | 535 | |
5.00%, 10/01/2029 | | | 230 | | | | 243 | |
5.00%, 10/01/2031 | | | 325 | | | | 347 | |
City of Joliet IL | | | | | | | | |
5.00%, 12/15/2037 | | | 1,000 | | | | 1,107 | |
5.00%, 12/15/2038 | | | 1,090 | | | | 1,198 | |
5.25%, 12/15/2039 | | | 730 | | | | 814 | |
5.50%, 12/15/2042 | | | 1,305 | | | | 1,466 | |
5.50%, 12/15/2044 | | | 3,075 | | | | 3,472 | |
City of Springfield IL | | | | | | | | |
5.00%, 12/01/2025 | | | 395 | | | | 410 | |
5.00%, 12/01/2026 | | | 160 | | | | 164 | |
City of Sterling IL | | | | | | | | |
4.00%, 11/01/2031 | | | 500 | | | | 531 | |
4.00%, 11/01/2032 | | | 500 | | | | 527 | |
City of Waukegan IL Water & Sewer System Revenue | | | | | | | | |
4.00%, 12/30/2036 | | | 500 | | | | 506 | |
5.00%, 12/30/2031 | | | 635 | | | | 725 | |
Community Unit School District Number 427 DeKalb & Kane Counties Illinois | | | | | | | | |
4.00%, 02/01/2032 | | | 700 | | | | 738 | |
4.00%, 02/01/2035 | | | 350 | | | | 361 | |
4.00%, 02/01/2037 | | | 535 | | | | 538 | |
4.00%, 02/01/2039 | | | 415 | | | | 413 | |
4.00%, 02/01/2041 | | | 475 | | | | 472 | |
Cook County Community College District No 508 | | | | | | | | |
5.25%, 12/01/2028 | | | 1,150 | | | | 1,153 | |
Cook County School District No 87 Berkeley | | | | | | | | |
3.00%, 12/01/2034 | | | 1,000 | | | | 928 | |
3.00%, 12/01/2037 | | | 1,000 | | | | 865 | |
3.00%, 12/01/2038 | | | 1,000 | | | | 857 | |
Cook Kane Lake & McHenry Counties Community College District No 512 | | | | | | | | |
5.00%, 12/01/2024 | | | 850 | | | | 868 | |
County of Cook IL | | | | | | | | |
4.00%, 11/15/2026 | | | 555 | | | | 570 | |
4.00%, 11/15/2027 | | | 560 | | | | 581 | |
4.00%, 11/15/2028 | | | 280 | | | | 293 | |
5.00%, 11/15/2023 | | | 350 | | | | 352 | |
5.00%, 11/15/2023 | | | 3,090 | | | | 3,109 | |
5.00%, 11/15/2024 | | | 375 | | | | 383 | |
5.00%, 11/15/2025 | | | 375 | | | | 389 | |
5.00%, 11/15/2026 | | | 750 | | | | 791 | |
5.00%, 11/15/2026 | | | 1,450 | | | | 1,530 | |
| | | | | | | | |
5.00%, 11/15/2029 | | | 1,000 | | | | 1,052 | |
5.00%, 11/15/2029 | | | 1,630 | | | | 1,807 | |
5.00%, 11/15/2030 | | | 500 | | | | 526 | |
5.00%, 11/15/2031 | | | 1,750 | | | | 1,965 | |
5.00%, 11/15/2032 | | | 2,800 | | | | 3,137 | |
5.00%, 11/15/2034 | | | 1,200 | | | | 1,231 | |
County of Cook IL Sales Tax Revenue | | | | | | | | |
5.00%, 11/15/2032 | | | 175 | | | | 201 | |
5.00%, 11/15/2033 | | | 150 | | | | 170 | |
5.00%, 11/15/2033 | | | 2,795 | | | | 2,987 | |
5.00%, 11/15/2035 | | | 315 | | | | 351 | |
5.00%, 11/15/2036 | | | 645 | | | | 711 | |
5.25%, 11/15/2035 | | | 3,000 | | | | 3,211 | |
County of Kendall IL | | | | | | | | |
5.00%, 12/15/2024 | | | 2,190 | | | | 2,242 | |
County of Sangamon IL | | | | | | | | |
3.00%, 12/15/2032 | | | 500 | | | | 484 | |
4.00%, 12/15/2036 | | | 500 | | | | 506 | |
Crawford Hospital District | | | | | | | | |
4.00%, 01/01/2041 | | | 580 | | | | 545 | |
Illinois Development Finance Authority | | | | | | | | |
0.00%, 07/15/2025 | | | 4,500 | | | | 4,194 | |
Illinois Finance Authority | | | | | | | | |
3.00%, 07/01/2035 | | | 2,250 | | | | 1,983 | |
3.57%, 08/15/2057 | | | 1,100 | | | | 1,100 | |
3.63%, 02/15/2032 | | | 355 | | | | 357 | |
3.75%, 02/15/2034 | | | 200 | | | | 202 | |
4.00%, 10/01/2028(3) | | | 280 | | | | 264 | |
4.00%, 10/15/2028 | | | 670 | | | | 628 | |
4.00%, 11/01/2028 | | | 235 | | | | 233 | |
4.00%, 10/01/2029(3) | | | 405 | | | | 378 | |
4.00%, 10/15/2029 | | | 1,045 | | | | 965 | |
4.00%, 10/01/2030(3) | | | 630 | | | | 582 | |
4.00%, 10/15/2030 | | | 730 | | | | 664 | |
4.00%, 11/01/2030 | | | 250 | | | | 247 | |
4.00%, 11/01/2030 | | | 2,500 | | | | 2,523 | |
4.00%, 10/01/2031(3) | | | 620 | | | | 566 | |
4.00%, 10/15/2031 | | | 1,135 | | | | 1,018 | |
4.00%, 10/01/2032(3) | | | 340 | | | | 307 | |
4.00%, 10/01/2033(3) | | | 375 | | | | 334 | |
4.00%, 08/01/2034 | | | 2,050 | | | | 1,961 | |
4.00%, 08/01/2035 | | | 1,625 | | | | 1,534 | |
4.00%, 02/15/2036 | | | 800 | | | | 806 | |
4.00%, 07/15/2037 | | | 3,090 | | | | 3,124 | |
4.00%, 08/01/2037 | | | 1,160 | | | | 1,059 | |
4.00%, 07/15/2038 | | | 5,750 | | | | 5,775 | |
4.00%, 08/01/2038 | | | 1,165 | | | | 1,051 | |
4.00%, 10/01/2038 | | | 7,090 | | | | 6,958 | |
4.00%, 07/15/2039 | | | 6,280 | | | | 6,290 | |
4.00%, 08/15/2039 | | | 9,280 | | | | 8,952 | |
4.00%, 02/15/2041 | | | 5 | | | | 5 | |
4.00%, 02/15/2041 | | | 130 | | | | 134 | |
4.13%, 08/15/2037 | | | 1,090 | | | | 1,034 | |
5.00%, 11/15/2023 | | | 1,680 | | | | 1,689 | |
5.00%, 12/01/2023 | | | 1,880 | | | | 1,889 | |
5.00%, 01/01/2024 | | | 250 | | | | 252 | |
5.00%, 02/15/2024 | | | 215 | | | | 217 | |
5.00%, 05/15/2024 | | | 350 | | | | 355 | |
5.00%, 02/15/2025 | | | 695 | | | | 712 | |
5.00%, 07/15/2025 | | | 230 | | | | 238 | |
5.00%, 08/01/2025 | | | 1,605 | | | | 1,622 | |
5.00%, 02/15/2026 | | | 360 | | | | 376 | |
5.00%, 02/15/2026 | | | 1,345 | | | | 1,400 | |
5.00%, 08/15/2026 | | | 1,500 | | | | 1,586 | |
5.00%, 03/01/2028 | | | 15 | | | | 16 | |
5.00%, 05/15/2028 | | | 12,620 | | | | 13,482 | |
5.00%, 07/01/2028 | | | 750 | | | | 802 | |
5.00%, 09/01/2028 | | | 500 | | | | 499 | |
5.00%, 01/01/2029 | | | 1,650 | | | | 1,775 | |
5.00%, 02/15/2029 | | | 1,445 | | | | 1,535 | |
5.00%, 10/01/2029 | | | 505 | | | | 555 | |
5.00%, 12/01/2029 | | | 340 | | | | 354 | |
5.00%, 02/15/2030 | | | 1,240 | | | | 1,317 | |
5.00%, 05/15/2030 | | | 1,180 | | | | 1,077 | |
5.00%, 07/01/2030 | | | 275 | | | | 291 | |
5.00%, 07/15/2030 | | | 710 | | | | 772 | |
5.00%, 09/01/2030 | | | 430 | | | | 428 | |
5.00%, 10/01/2030 | | | 565 | | | | 619 | |
5.00%, 11/01/2030 | | | 1,455 | | | | 1,524 | |
5.00%, 11/15/2030 | | | 2,000 | | | | 2,061 | |
5.00%, 01/01/2031 | | | 3,545 | | | | 3,785 | |
5.00%, 02/15/2031 | | | 300 | | | | 318 | |
5.00%, 05/15/2031 | | | 5,000 | | | | 5,273 | |
| | | | | | | | |
5.00%, 07/01/2031 | | | 1,420 | | | | 1,530 | |
5.00%, 08/15/2031 | | | 1,525 | | | | 1,731 | |
5.00%, 05/15/2032 | | | 3,745 | | | | 3,943 | |
5.00%, 08/15/2032 | | | 730 | | | | 825 | |
5.00%, 07/01/2033 | | | 10,000 | | | | 11,167 | |
5.00%, 08/15/2033 | | | 250 | | | | 264 | |
5.00%, 08/15/2033 | | | 1,695 | | | | 1,911 | |
5.00%, 10/01/2033 | | | 500 | | | | 535 | |
5.00%, 10/01/2033 | | | 700 | | | | 757 | |
5.00%, 12/01/2033 | | | 700 | | | | 724 | |
5.00%, 01/01/2034 | | | 605 | | | | 646 | |
5.00%, 02/15/2034 | | | 1,770 | | | | 1,868 | |
5.00%, 07/01/2034 | | | 300 | | | | 317 | |
5.00%, 08/15/2034 | | | 2,500 | | | | 2,645 | |
5.00%, 10/01/2034 | | | 430 | | | | 459 | |
5.00%, 11/15/2034 | | | 300 | | | | 306 | |
5.00%, 11/15/2034 | | | 3,000 | | | | 3,062 | |
5.00%, 07/01/2035 | | | 2,160 | | | | 2,303 | |
5.00%, 08/15/2035 | | | 100 | | | | 102 | |
5.00%, 08/15/2035 | | | 600 | | | | 634 | |
5.00%, 10/01/2035 | | | 400 | | | | 423 | |
5.00%, 10/01/2035 | | | 4,470 | | | | 4,615 | |
5.00%, 02/15/2036 | | | 735 | | | | 771 | |
5.00%, 07/01/2036 | | | 830 | | | | 878 | |
5.00%, 08/15/2036 | | | 1,000 | | | | 1,056 | |
5.00%, 10/01/2036 | | | 620 | | | | 657 | |
5.00%, 01/01/2037 | | | 2,785 | | | | 3,018 | |
5.00%, 05/15/2037 | | | 500 | | | | 566 | |
5.00%, 08/15/2037 | | | 1,000 | | | | 1,056 | |
5.00%, 08/15/2038 | | | 1,000 | | | | 1,093 | |
5.00%, 11/15/2038 | | | 3,795 | | | | 3,840 | |
5.00%, 05/15/2039 | | | 1,100 | | | | 1,227 | |
5.00%, 08/15/2039 | | | 1,200 | | | | 1,302 | |
5.00%, 08/15/2040 | | | 5,000 | | | | 5,391 | |
5.00%, 02/15/2041 | | | 840 | | | | 868 | |
5.00%, 08/01/2042 | | | 120 | | | | 120 | |
5.00%, 01/01/2044 | | | 4,145 | | | | 4,492 | |
5.00%, 08/15/2044 | | | 200 | | | | 200 | |
5.00%, 12/01/2046 | | | 5,950 | | | | 5,980 | |
5.00%, 08/01/2049 | | | 140 | | | | 137 | |
5.00%, 05/15/2050(1) | | | 1,625 | | | | 1,641 | |
5.00%, 05/15/2050(1) | | | 2,170 | | | | 2,249 | |
5.25%, 08/15/2031 | | | 500 | | | | 532 | |
5.25%, 07/01/2035 | | | 20,085 | | | | 22,593 | |
Illinois Housing Development Authority | | | | | | | | |
0.80%, 07/01/2026 | | | 1,000 | | | | 916 | |
3.50%, 04/01/2052 | | | 5,300 | | | | 5,173 | |
3.75%, 04/01/2050 | | | 545 | | | | 537 | |
4.50%, 10/01/2048 | | | 3,525 | | | | 3,535 | |
6.25%, 10/01/2052 | | | 5,825 | | | | 6,320 | |
Illinois Municipal Electric Agency | | | | | | | | |
4.00%, 02/01/2034 | | | 4,500 | | | | 4,522 | |
4.00%, 02/01/2035 | | | 24,645 | | | | 24,745 | |
5.00%, 02/01/2031 | | | 470 | | | | 482 | |
5.00%, 02/01/2032 | | | 5,000 | | | | 5,121 | |
Illinois Sports Facilities Authority | | | | | | | | |
5.00%, 06/15/2030 | | | 700 | | | | 716 | |
5.00%, 06/15/2030 | | | 750 | | | | 765 | |
5.00%, 06/15/2031 | | | 575 | | | | 585 | |
5.25%, 06/15/2032 | | | 1,735 | | | | 1,757 | |
Illinois State Toll Highway Authority | | | | | | | | |
5.00%, 01/01/2024 | | | 935 | | | | 943 | |
5.00%, 01/01/2025 | | | 1,250 | | | | 1,283 | |
5.00%, 01/01/2026 | | | 1,550 | | | | 1,620 | |
5.00%, 01/01/2028 | | | 3,000 | | | | 3,262 | |
5.00%, 12/01/2031 | | | 235 | | | | 244 | |
5.00%, 12/01/2032 | | | 425 | | | | 442 | |
5.00%, 01/01/2034 | | | 1,300 | | | | 1,416 | |
5.00%, 01/01/2036 | | | 1,000 | | | | 1,115 | |
5.00%, 01/01/2037 | | | 1,260 | | | | 1,295 | |
5.00%, 01/01/2037 | | | 4,425 | | | | 4,449 | |
5.00%, 01/01/2038 | | | 13,715 | | | | 13,982 | |
5.00%, 01/01/2038 | | | 20,000 | | | | 20,093 | |
5.00%, 01/01/2039 | | | 2,000 | | | | 2,009 | |
5.00%, 01/01/2040 | | | 1,150 | | | | 1,173 | |
5.00%, 01/01/2040 | | | 5,000 | | | | 5,149 | |
5.00%, 01/01/2041 | | | 2,190 | | | | 2,401 | |
5.00%, 01/01/2041 | | | 6,665 | | | | 6,896 | |
5.00%, 01/01/2042 | | | 6,840 | | | | 7,177 | |
5.00%, 01/01/2044 | | | 2,270 | | | | 2,398 | |
5.00%, 01/01/2046 | | | 1,140 | | | | 1,227 | |
Illinois State University | | | | | | | | |
5.00%, 04/01/2032 | | | 1,745 | | | | 1,890 | |
| | | | | | | | |
Jersey & Greene County Community Unit School District No 100 Jerseyville | | | | | | | | |
5.00%, 12/01/2027 | | | 1,105 | | | | 1,151 | |
Kane & DeKalb Counties Community Unit School District No 302 Kaneland | | | | | | | | |
5.00%, 02/01/2025 | | | 4,125 | | | | 4,232 | |
5.00%, 02/01/2026 | | | 1,930 | | | | 2,018 | |
La Salle County Community Unit School District No 2 Serena | | | | | | | | |
5.25%, 12/01/2036 | | | 1,440 | | | | 1,624 | |
5.50%, 12/01/2040 | | | 2,145 | | | | 2,401 | |
Lake County Community Unit School District No 60 Waukegan | | | | | | | | |
5.00%, 01/01/2026 | | | 1,000 | | | | 1,026 | |
5.00%, 01/01/2027 | | | 100 | | | | 103 | |
5.00%, 01/01/2027 | | | 2,100 | | | | 2,157 | |
Lake County Consolidated High School District No 120 Mundelein | | | | | | | | |
5.50%, 12/01/2039 | | | 1,000 | | | | 1,126 | |
Lake County School District No 112 North Shore | | | | | | | | |
4.00%, 12/01/2037 | | | 1,695 | | | | 1,716 | |
Macon & de Witt Counties Community Unit School District No 2 Maroa-Forsyth | | | | | | | | |
4.00%, 12/01/2034 | | | 820 | | | | 856 | |
4.00%, 12/01/2035 | | | 870 | | | | 895 | |
4.00%, 12/01/2036 | | | 500 | | | | 507 | |
4.00%, 12/01/2037 | | | 400 | | | | 401 | |
Macon County School District No 61 Decatur | | | | | | | | |
4.00%, 01/01/2029 | | | 1,240 | | | | 1,280 | |
4.00%, 01/01/2033 | | | 1,950 | | | | 2,005 | |
4.00%, 01/01/2034 | | | 1,750 | | | | 1,793 | |
Madison County Community Unit School District No 8 Bethalto | | | | | | | | |
4.00%, 12/01/2034 | | | 775 | | | | 797 | |
4.00%, 12/01/2040 | | | 1,965 | | | | 1,933 | |
McHenry County Community Unit School District No 200 Woodstock | | | | | | | | |
0.00%, 01/15/2024 | | | 460 | | | | 452 | |
0.00%, 01/15/2024 | | | 540 | | | | 529 | |
0.00%, 01/15/2025 | | | 1,000 | | | | 943 | |
0.00%, 01/15/2026 | | | 1,000 | | | | 909 | |
Metropolitan Pier & Exposition Authority | | | | | | | | |
0.00%, 12/15/2023 | | | 165 | | | | 162 | |
0.00%, 06/15/2028 | | | 15,615 | | | | 12,948 | |
0.00%, 06/15/2029 | | | 2,540 | | | | 2,029 | |
0.00%, 12/15/2030 | | | 11,000 | | | | 8,255 | |
5.00%, 12/15/2028 | | | 1,000 | | | | 1,047 | |
5.00%, 12/15/2032 | | | 550 | | | | 576 | |
5.00%, 06/15/2050 | | | 11,060 | | | | 11,244 | |
Metropolitan Water Reclamation District of Greater Chicago | | | | | | | | |
5.25%, 12/01/2032 | | | 1,800 | | | | 2,165 | |
Northern Illinois University | | | | | | | | |
4.00%, 10/01/2032 | | | 515 | | | | 521 | |
4.00%, 10/01/2034 | | | 1,000 | | | | 1,008 | |
Peoria Metropolitan Airport Authority | | | | | | | | |
5.00%, 12/01/2026 | | | 1,375 | | | | 1,469 | |
Peoria Public Building Commission | | | | | | | | |
5.00%, 12/01/2023 | | | 2,375 | | | | 2,391 | |
Railsplitter Tobacco Settlement Authority | | | | | | | | |
5.00%, 06/01/2024 | | | 2,275 | | | | 2,306 | |
Regional Transportation Authority | | | | | | | | |
5.75%, 06/01/2034 | | | 3,400 | | | | 4,113 | |
Sales Tax Securitization Corp. | | | | | | | | |
5.00%, 01/01/2025 | | | 1,000 | | | | 1,024 | |
5.00%, 01/01/2025 | | | 4,000 | | | | 4,095 | |
5.00%, 01/01/2026 | | | 2,000 | | | | 2,076 | |
5.00%, 01/01/2029 | | | 1,000 | | | | 1,090 | |
5.00%, 01/01/2037 | | | 1,140 | | | | 1,232 | |
5.25%, 01/01/2043 | | | 1,100 | | | | 1,155 | |
Sangamon & Christian Counties Community Unit School District No 3A Rochester | | | | | | | | |
5.50%, 02/01/2040 | | | 805 | | | | 891 | |
5.50%, 02/01/2043 | | | 530 | | | | 584 | |
5.50%, 02/01/2047 | | | 530 | | | | 579 | |
Sangamon & Morgan Counties Community Unit School District No 16 New Berlin | | | | | | | | |
5.00%, 12/01/2040 | | | 1,625 | | | | 1,740 | |
Sangamon Logan & Menard Counties Community Unit School Distributors No 15 Williamsville | | | | | | | | |
5.00%, 12/01/2027 | | | 325 | | | | 347 | |
5.00%, 12/01/2029 | | | 710 | | | | 783 | |
5.00%, 12/01/2031 | | | 600 | | | | 657 | |
5.00%, 12/01/2033 | | | 375 | | | | 408 | |
Southern Illinois University | | | | | | | | |
4.00%, 04/01/2029 | | | 200 | | | | 205 | |
4.00%, 04/01/2035 | | | 300 | | | | 295 | |
4.00%, 04/01/2039 | | | 500 | | | | 473 | |
5.00%, 04/01/2032 | | | 240 | | | | 260 | |
5.00%, 04/01/2033 | | | 300 | | | | 323 | |
Southwestern Illinois Development Authority | | | | | | | | |
4.00%, 04/15/2031 | | | 1,000 | | | | 1,059 | |
5.50%, 12/01/2035 | | | 750 | | | | 870 | |
5.50%, 12/01/2037 | | | 2,850 | | | | 3,248 | |
5.50%, 12/01/2038 | | | 6,250 | | | | 7,077 | |
| | | | | | | | |
5.50%, 12/01/2039 | | | 6,350 | | | | 7,151 | |
State of Illinois | | | | | | | | |
4.00%, 03/01/2024 | | | 4,000 | | | | 4,008 | |
4.00%, 02/01/2030 | | | 4,725 | | | | 4,826 | |
4.00%, 03/01/2031 | | | 1,500 | | | | 1,553 | |
4.00%, 10/01/2032 | | | 1,390 | | | | 1,429 | |
4.00%, 03/01/2038 | | | 1,125 | | | | 1,103 | |
5.00%, 09/01/2023 | | | 1,365 | | | | 1,368 | |
5.00%, 09/01/2024 | | | 1,365 | | | | 1,386 | |
5.00%, 11/01/2024 | | | 750 | | | | 763 | |
5.00%, 02/01/2025 | | | 455 | | | | 458 | |
5.00%, 05/01/2025 | | | 3,050 | | | | 3,079 | |
5.00%, 06/01/2025 | | | 880 | | | | 903 | |
5.00%, 10/01/2025 | | | 10,000 | | | | 10,311 | |
5.00%, 11/01/2025 | | | 2,040 | | | | 2,106 | |
5.00%, 11/01/2025 | | | 8,965 | | | | 9,256 | |
5.00%, 02/01/2026 | | | 705 | | | | 731 | |
5.00%, 06/01/2026 | | | 125 | | | | 130 | |
5.00%, 10/01/2026 | | | 2,270 | | | | 2,378 | |
5.00%, 11/01/2026 | | | 2,120 | | | | 2,224 | |
5.00%, 12/01/2026 | | | 1,380 | | | | 1,450 | |
5.00%, 02/01/2027 | | | 635 | | | | 669 | |
5.00%, 03/01/2027 | | | 250 | | | | 264 | |
5.00%, 02/01/2028 | | | 1,000 | | | | 1,052 | |
5.00%, 05/01/2028 | | | 265 | | | | 268 | |
5.00%, 07/01/2028 | | | 8,465 | | | | 9,127 | |
5.00%, 11/01/2028 | | | 12,940 | | | | 13,774 | |
5.00%, 02/01/2029 | | | 1,000 | | | | 1,054 | |
5.00%, 03/01/2029 | | | 2,620 | | | | 2,852 | |
5.00%, 04/01/2029 | | | 605 | | | | 612 | |
5.00%, 05/01/2029 | | | 2,820 | | | | 3,080 | |
5.00%, 03/01/2030 | | | 1,875 | | | | 2,069 | |
5.00%, 03/01/2030 | | | 11,310 | | | | 12,480 | |
5.00%, 10/01/2030 | | | 3,575 | | | | 3,977 | |
5.00%, 03/01/2031 | | | 11,350 | | | | 12,669 | |
5.00%, 10/01/2031 | | | 1,750 | | | | 1,950 | |
5.00%, 10/01/2031 | | | 6,500 | | | | 7,011 | |
5.00%, 05/01/2032 | | | 800 | | | | 808 | |
5.00%, 01/01/2033 | | | 415 | | | | 427 | |
5.00%, 03/01/2033 | | | 1,000 | | | | 1,109 | |
5.00%, 03/01/2034 | | | 1,000 | | | | 1,112 | |
5.00%, 01/01/2035 | | | 1,400 | | | | 1,432 | |
5.00%, 03/01/2035 | | | 3,670 | | | | 4,043 | |
5.00%, 03/01/2035 | | | 23,005 | | | | 25,345 | |
5.00%, 07/01/2035 | | | 2,340 | | | | 2,578 | |
5.00%, 03/01/2036 | | | 1,000 | | | | 1,091 | |
5.00%, 07/01/2036 | | | 11,055 | | | | 12,053 | |
5.00%, 05/01/2038 | | | 1,200 | | | | 1,248 | |
5.00%, 02/01/2039 | | | 1,500 | | | | 1,505 | |
5.00%, 01/01/2041 | | | 800 | | | | 807 | |
5.00%, 11/01/2041 | | | 1,500 | | | | 1,517 | |
5.25%, 02/01/2029 | | | 3,720 | | | | 3,757 | |
5.25%, 02/01/2030 | | | 100 | | | | 101 | |
5.25%, 12/01/2030 | | | 11,685 | | | | 12,594 | |
5.25%, 02/01/2031 | | | 760 | | | | 767 | |
5.25%, 05/01/2043 | | | 4,680 | | | | 5,017 | |
5.50%, 07/01/2024 | | | 1,000 | | | | 1,000 | |
5.50%, 07/01/2025 | | | 400 | | | | 400 | |
State of Illinois Sales Tax Revenue | | | | | | | | |
4.00%, 06/15/2027 | | | 1,000 | | | | 1,008 | |
5.00%, 06/15/2024 | | | 590 | | | | 596 | |
5.00%, 06/15/2024 | | | 4,905 | | | | 4,909 | |
5.00%, 06/15/2025 | | | 340 | | | | 349 | |
5.00%, 06/15/2025 | | | 4,190 | | | | 4,194 | |
5.00%, 06/15/2026 | | | 500 | | | | 520 | |
5.00%, 06/15/2027 | | | 1,000 | | | | 1,056 | |
University of Illinois | | | | | | | | |
3.00%, 04/01/2034 | | | 3,400 | | | | 3,130 | |
4.00%, 04/01/2036 | | | 1,500 | | | | 1,491 | |
Village of Bolingbrook IL | | | | | | | | |
4.00%, 03/01/2025 | | | 500 | | | | 505 | |
4.00%, 03/01/2027 | | | 1,000 | | | | 1,028 | |
Village of Bourbonnais IL | | | | | | | | |
5.25%, 12/01/2042 | | | 2,840 | | | | 3,115 | |
Will County Community Unit School District No 365 Valley View | | | | | | | | |
0.00%, 11/01/2025 | | | 1,520 | | | | 1,381 | |
0.00%, 11/01/2026 | | | 905 | | | | 802 | |
5.00%, 11/01/2023 | | | 420 | | | | 422 | |
5.00%, 11/01/2024 | | | 2,390 | | | | 2,446 | |
5.00%, 11/01/2026 | | | 1,800 | | | | 1,918 | |
Will County School District No 114 Manhattan | | | | | | | | |
5.00%, 01/01/2037 | | | 370 | | | | 410 | |
5.00%, 01/01/2038 | | | 355 | | | | 389 | |
| | | | | | | | |
5.25%, 01/01/2039 | | | 280 | | | | 312 | |
5.25%, 01/01/2041 | | | 1,160 | | | | 1,282 | |
5.50%, 01/01/2047 | | | 4,880 | | | | 5,439 | |
Woodford Lasalle Livingston Etc Counties Community Unit Distributors No 6 Fieldcrest | | | | | | | | |
4.00%, 12/01/2034 | | | 1,000 | | | | 1,038 | |
4.00%, 12/01/2036 | | | 1,095 | | | | 1,109 | |
| | | | | | | | |
Total Illinois | | | | 994,664 | |
| | | | | | | | |
Indiana – 1.50% | | | | | | | | |
Ball State University | | | | | | | | |
5.00%, 07/01/2033 | | | 955 | | | | 1,029 | |
Center Grove Community School Corp. | | | | | | | | |
5.00%, 01/01/2024 | | | 1,435 | | | | 1,442 | |
City of Indianapolis Department of Public Utilities Water System Revenue | | | | | | | | |
5.00%, 10/01/2037 | | | 10,000 | | | | 10,322 | |
City of Whiting IN | | | | | | | | |
5.00%, 12/01/2044(1) | | | 18,900 | | | | 19,451 | |
County of St Joseph IN | | | | | | | | |
5.00%, 04/01/2033 | | | 1,245 | | | | 1,349 | |
Elkhart County Building Corp. | | | | | | | | |
4.00%, 12/01/2032 | | | 1,265 | | | | 1,326 | |
Evansville Waterworks District | | | | | | | | |
5.00%, 01/01/2037 | | | 500 | | | | 560 | |
Indiana Finance Authority | | | | | | | | |
0.65%, 08/01/2025 | | | 2,250 | | | | 2,059 | |
0.70%, 12/01/2046(1) | | | 8,525 | | | | 7,776 | |
0.75%, 12/01/2038(1) | | | 500 | | | | 445 | |
0.95%, 12/01/2038(1) | | | 900 | | | | 808 | |
1.40%, 08/01/2029 | | | 2,500 | | | | 2,178 | |
2.25%, 12/01/2058(1) | | | 1,285 | | | | 1,248 | |
3.75%, 03/01/2031(1) | | | 1,450 | | | | 1,453 | |
3.80%, 05/01/2028(1) | | | 8,000 | | | | 8,001 | |
4.00%, 02/01/2036 | | | 15,000 | | | | 15,557 | |
4.00%, 10/01/2036 | | | 1,100 | | | | 1,123 | |
4.00%, 02/01/2037 | | | 12,395 | | | | 12,692 | |
4.05%, 05/01/2034(1) | | | 2,500 | | | | 2,500 | |
4.05%, 12/01/2037(1) | | | 6,000 | | | | 6,000 | |
4.13%, 12/01/2026 | | | 2,815 | | | | 2,784 | |
4.50%, 05/01/2035(1) | | | 1,200 | | | | 1,204 | |
4.50%, 12/15/2046(1) | | | 10,000 | | | | 9,980 | |
5.00%, 12/01/2024 | | | 3,000 | | | | 3,080 | |
5.00%, 05/01/2026 | | | 1,100 | | | | 1,154 | |
5.00%, 11/01/2026 | | | 1,200 | | | | 1,271 | |
5.00%, 05/01/2027 | | | 700 | | | | 749 | |
5.00%, 05/01/2029 | | | 685 | | | | 760 | |
5.00%, 11/01/2029 | | | 2,350 | | | | 2,550 | |
5.00%, 09/01/2031 | | | 440 | | | | 463 | |
5.00%, 03/01/2036 | | | 2,000 | | | | 2,046 | |
5.00%, 09/01/2036 | | | 1,000 | | | | 1,040 | |
5.25%, 02/01/2033 | | | 2,500 | | | | 2,592 | |
Indiana Housing & Community Development Authority | | | | | | | | |
3.00%, 07/01/2050 | | | 845 | | | | 815 | |
3.00%, 07/01/2051 | | | 905 | | | | 874 | |
3.50%, 01/01/2049 | | | 835 | | | | 819 | |
5.00%, 01/01/2024 | | | 285 | | | | 287 | |
5.00%, 01/01/2024 | | | 500 | | | | 504 | |
5.00%, 07/01/2024 | | | 295 | | | | 300 | |
5.00%, 07/01/2024 | | | 500 | | | | 508 | |
5.00%, 01/01/2025 | | | 300 | | | | 308 | |
5.00%, 01/01/2025 | | | 1,245 | | | | 1,274 | |
5.00%, 01/01/2026 | | | 300 | | | | 314 | |
5.00%, 01/01/2026 | | | 600 | | | | 623 | |
5.00%, 07/01/2026 | | | 320 | | | | 338 | |
5.00%, 07/01/2026 | | | 400 | | | | 419 | |
5.00%, 10/01/2026 | | | 3,445 | | | | 3,505 | |
5.00%, 01/01/2027 | | | 300 | | | | 320 | |
5.00%, 01/01/2027 | | | 575 | | | | 609 | |
5.00%, 07/01/2027 | | | 300 | | | | 323 | |
5.00%, 07/01/2027 | | | 400 | | | | 428 | |
5.00%, 01/01/2028 | | | 600 | | | | 646 | |
5.00%, 07/01/2028 | | | 500 | | | | 542 | |
Indianapolis Local Public Improvement Bond Bank | | | | | | | | |
4.00%, 01/01/2035 | | | 1,725 | | | | 1,726 | |
5.00%, 07/15/2023 | | | 300 | | | | 300 | |
5.00%, 07/15/2024 | | | 1,000 | | | | 1,019 | |
5.00%, 01/01/2025 | | | 1,195 | | | | 1,214 | |
5.00%, 07/15/2025 | | | 750 | | | | 778 | |
5.00%, 01/15/2027 | | | 700 | | | | 749 | |
5.00%, 01/01/2028 | | | 455 | | | | 457 | |
5.00%, 01/15/2028 | | | 500 | | | | 547 | |
5.00%, 01/01/2029 | | | 1,000 | | | | 1,035 | |
5.00%, 01/01/2030 | | | 3,530 | | | | 3,544 | |
5.00%, 01/01/2031 | | | 1,000 | | | | 1,037 | |
5.00%, 01/01/2032 | | | 5,000 | | | | 5,090 | |
| | | | | | | | |
5.00%, 01/01/2036 | | | 615 | | | | 694 | |
5.00%, 01/01/2037 | | | 900 | | | | 1,005 | |
5.00%, 01/01/2038 | | | 1,125 | | | | 1,244 | |
5.00%, 01/01/2039 | | | 1,250 | | | | 1,374 | |
5.00%, 02/01/2054 | | | 2,020 | | | | 2,112 | |
5.25%, 01/01/2039 | | | 2,000 | | | | 2,175 | |
Lebanon Middle School Building Corp. | | | | | | | | |
5.00%, 07/10/2023 | | | 1,740 | | | | 1,740 | |
Mount Vernon of Hancock County Multi-School Building Corp. | | | | | | | | |
5.50%, 07/15/2035 | | | 500 | | | | 581 | |
5.50%, 07/15/2036 | | | 1,000 | | | | 1,152 | |
5.50%, 07/15/2038 | | | 1,000 | | | | 1,135 | |
Northwestern School Building Corp. | | | | | | | | |
6.00%, 07/15/2039 | | | 900 | | | | 1,044 | |
Tippecanoe County School Building Corp. | | | | | | | | |
6.00%, 01/15/2043 | | | 825 | | | | 987 | |
Westfield-Washington Multi-School Building Corp. | | | | | | | | |
5.00%, 01/15/2028 | | | 390 | | | | 404 | |
5.00%, 01/15/2029 | | | 540 | | | | 560 | |
5.00%, 01/15/2030 | | | 700 | | | | 726 | |
| | | | | | | | |
Total Indiana | | | | 175,177 | |
| | | | | | | | |
Iowa – 0.44% | | | | | | | | |
City of Coralville IA | | | | | | | | |
4.00%, 06/01/2026 | | | 415 | | | | 403 | |
4.00%, 06/01/2028 | | | 300 | | | | 288 | |
4.00%, 05/01/2030 | | | 700 | | | | 700 | |
4.00%, 06/01/2034 | | | 890 | | | | 822 | |
5.00%, 05/01/2036 | | | 735 | | | | 771 | |
5.00%, 05/01/2038 | | | 1,400 | | | | 1,449 | |
5.00%, 05/01/2040 | | | 2,260 | | | | 2,321 | |
5.00%, 05/01/2041 | | | 1,650 | | | | 1,690 | |
City of Des Moines IA | | | | | | | | |
1.88%, 06/01/2040 | | | 1,500 | | | | 1,026 | |
College Community School District Infrastructure Sales Services & Use Tax | | | | | | | | |
4.13%, 06/01/2042 | | | 3,170 | | | | 3,168 | |
Dubuque Community School District Infrastructure Sales Services & Use Tax | | | | | | | | |
3.00%, 07/01/2036 | | | 600 | | | | 545 | |
3.00%, 07/01/2037 | | | 675 | | | | 598 | |
Iowa City Community School District | | | | | | | | |
2.50%, 06/01/2038 | | | 2,000 | | | | 1,576 | |
Iowa Finance Authority | | | | | | | | |
1.50%, 01/01/2042(1) | | | 1,370 | | | | 1,336 | |
5.00%, 08/01/2036 | | | 4,545 | | | | 5,323 | |
5.00%, 08/01/2037 | | | 2,040 | | | | 2,363 | |
5.00%, 05/15/2043 | | | 270 | | | | 207 | |
5.00%, 05/15/2048 | | | 825 | | | | 602 | |
Iowa Higher Education Loan Authority | | | | | | | | |
4.00%, 10/01/2030 | | | 380 | | | | 382 | |
4.00%, 10/01/2031 | | | 395 | | | | 395 | |
4.00%, 10/01/2032 | | | 140 | | | | 139 | |
4.00%, 10/01/2033 | | | 275 | | | | 272 | |
4.00%, 10/01/2036 | | | 325 | | | �� | 309 | |
Iowa Student Loan Liquidity Corp. | | | | | | | | |
5.00%, 12/01/2025 | | | 1,000 | | | | 1,027 | |
5.00%, 12/01/2025 | | | 1,775 | | | | 1,819 | |
5.00%, 12/01/2028 | | | 1,640 | | | | 1,760 | |
5.00%, 12/01/2029 | | | 1,275 | | | | 1,380 | |
5.00%, 12/01/2030 | | | 1,000 | | | | 1,095 | |
PEFA, Inc. | | | | | | | | |
5.00%, 09/01/2049(1) | | | 17,160 | | | | 17,498 | |
| | | | | | | | |
Total Iowa | | | | 51,264 | |
| | | | | | | | |
Kansas – 0.22% | | | | | | | | |
City of Manhattan KS | | | | | | | | |
4.00%, 06/01/2028 | | | 300 | | | | 282 | |
4.00%, 06/01/2036 | | | 500 | | | | 417 | |
City of Prairie Village KS | | | | | | | | |
2.88%, 04/01/2030 | | | 315 | | | | 281 | |
3.13%, 04/01/2036 | | | 500 | | | | 405 | |
Kansas Development Finance Authority | | | | | | | | |
5.00%, 11/15/2054(1) | | | 4,710 | | | | 5,299 | |
5.00%, 11/15/2054 | | | 12,320 | | | | 13,366 | |
Wyandotte County Unified School District No 500 Kansas City | | | | | | | | |
4.13%, 09/01/2037 | | | 750 | | | | 777 | |
Wyandotte County-Kansas City Unified Government Utility System Revenue | | | | | | | | |
5.00%, 09/01/2035 | | | 4,315 | | | | 4,433 | |
| | | | | | | | |
Total Kansas | | | | 25,260 | |
| | | | | | | | |
Kentucky – 1.45% | | | | | | | | |
City of Ashland KY | | | | | | | | |
5.00%, 02/01/2028 | | | 255 | | | | 269 | |
5.00%, 02/01/2032 | | | 395 | | | | 417 | |
City of Berea KY | | | | | | | | |
3.82%, 06/01/2032(1) | | | 500 | | | | 500 | |
City of Henderson KY | | | | | | | | |
| | | | | | | | |
3.70%, 01/01/2032(3) | | | 5,000 | | | | 4,854 | |
4.45%, 01/01/2042(3) | | | 6,920 | | | | 6,650 | |
County of Carroll KY | | | | | | | | |
1.55%, 09/01/2042(1) | | | 10,750 | | | | 9,757 | |
1.75%, 10/01/2034(1) | | | 1,045 | | | | 955 | |
County of Trimble KY | | | | | | | | |
1.30%, 09/01/2044(1) | | | 3,000 | | | | 2,527 | |
Kentucky Asset Liability Commission | | | | | | | | |
5.00%, 09/01/2024 | | | 1,000 | | | | 1,019 | |
5.00%, 09/01/2025 | | | 1,250 | | | | 1,298 | |
Kentucky Bond Development Corp. | | | | | | | | |
5.00%, 09/01/2038 | | | 1,000 | | | | 1,085 | |
Kentucky Economic Development Finance Authority | | | | | | | | |
3.80%, 04/01/2031(1) | | | 10,000 | | | | 10,001 | |
4.15%, 05/01/2034(1) | | | 19,000 | | | | 19,000 | |
5.00%, 08/01/2030 | | | 2,160 | | | | 2,328 | |
Kentucky Public Energy Authority | | | | | | | | |
4.00%, 04/01/2048(1) | | | 8,000 | | | | 7,993 | |
4.00%, 01/01/2049(1) | | | 12,500 | | | | 12,499 | |
4.00%, 12/01/2049(1) | | | 10,000 | | | | 9,953 | |
4.00%, 02/01/2050(1) | | | 27,000 | | | | 26,694 | |
4.00%, 12/01/2050(1) | | | 17,720 | | | | 17,683 | |
Kentucky State Property & Building Commission | | | | | | | | |
5.00%, 11/01/2026 | | | 1,495 | | | | 1,581 | |
5.00%, 04/01/2027 | | | 1,000 | | | | 1,066 | |
5.00%, 11/01/2027 | | | 2,435 | | | | 2,584 | |
5.00%, 05/01/2029 | | | 1,000 | | | | 1,071 | |
5.00%, 05/01/2029 | | | 1,025 | | | | 1,115 | |
5.00%, 11/01/2031 | | | 1,685 | | | | 1,844 | |
5.00%, 05/01/2032 | | | 270 | | | | 294 | |
Kentucky State University | | | | | | | | |
3.00%, 11/01/2032 | | | 160 | | | | 155 | |
4.00%, 11/01/2038 | | | 500 | | | | 500 | |
5.00%, 11/01/2031 | | | 180 | | | | 208 | |
Kentucky Turnpike Authority | | | | | | | | |
5.00%, 07/01/2033 | | | 340 | | | | 392 | |
5.00%, 07/01/2035 | | | 500 | | | | 568 | |
Louisville & Jefferson County Metropolitan Government | | | | | | | | |
4.00%, 04/01/2036 | | | 12,510 | | | | 12,943 | |
5.00%, 10/01/2023 | | | 1,565 | | | | 1,570 | |
5.00%, 10/01/2030 | | | 2,500 | | | | 2,602 | |
5.00%, 10/01/2032 | | | 430 | | | | 447 | |
5.00%, 10/01/2037 | | | 1,200 | | | | 1,257 | |
5.00%, 10/01/2047(1) | | | 740 | | | | 767 | |
5.00%, 10/01/2047(1) | | | 1,100 | | | | 1,178 | |
5.00%, 10/01/2047(1) | | | 2,165 | | | | 2,171 | |
| | | | | | | | |
Total Kentucky | | | | 169,795 | |
| | | | | | | | |
Louisiana – 2.01% | | | | | | | | |
City of Youngsville LA Sales Tax Revenue | | | | | | | | |
4.00%, 05/01/2036 | | | 250 | | | | 259 | |
Greater New Orleans Expressway Commission | | | | | | | | |
5.00%, 11/01/2034 | | | 1,000 | | | | 1,036 | |
Greater Ouachita Water Co. | | | | | | | | |
5.00%, 09/01/2027 | | | 1,000 | | | | 1,080 | |
5.00%, 09/01/2028 | | | 960 | | | | 1,058 | |
5.00%, 09/01/2029 | | | 365 | | | | 410 | |
Jefferson Parish Consolidated Sewerage District No 1 | | | | | | | | |
4.00%, 02/01/2035 | | | 1,330 | | | | 1,392 | |
4.00%, 02/01/2036 | | | 750 | | | | 777 | |
4.00%, 02/01/2038 | | | 1,055 | | | | 1,057 | |
4.00%, 02/01/2039 | | | 2,740 | | | | 2,737 | |
4.00%, 02/01/2042 | | | 370 | | | | 370 | |
Jefferson Parish Consolidated Waterworks District No 2 | | | | | | | | |
4.00%, 02/01/2037 | | | 5,000 | | | | 5,093 | |
Louisiana Local Government Environmental Facilities & Community Development Auth | | | | | | | | |
0.88%, 02/01/2046(1) | | | 7,420 | | | | 7,058 | |
5.00%, 10/01/2028 | | | 1,045 | | | | 1,139 | |
5.00%, 08/15/2037 | | | 20,000 | | | | 20,740 | |
Louisiana Offshore Terminal Authority | | | | | | | | |
1.65%, 09/01/2027(1) | | | 2,500 | | | | 2,475 | |
1.65%, 09/01/2034(1) | | | 4,500 | | | | 4,456 | |
Louisiana Public Facilities Authority | | | | | | | | |
0.00%, 10/01/2027 | | | 2,000 | | | | 2,032 | |
4.00%, 10/01/2036 | | | 765 | | | | 743 | |
4.00%, 10/01/2037 | | | 1,005 | | | | 963 | |
5.00%, 12/15/2023 | | | 335 | | | | 337 | |
5.00%, 12/15/2024 | | | 330 | | | | 338 | |
5.00%, 12/15/2025 | | | 275 | | | | 287 | |
5.00%, 12/15/2026 | | | 300 | | | | 320 | |
5.00%, 12/15/2028 | | | 250 | | | | 271 | |
5.00%, 12/15/2029 | | | 200 | | | | 217 | |
5.00%, 12/15/2030 | | | 150 | | | | 162 | |
5.00%, 05/15/2031 | | | 1,250 | | | | 1,315 | |
| | | | | | | | |
5.00%, 12/15/2031 | | | 390 | | | | 422 | |
5.00%, 05/15/2032 | | | 1,000 | | | | 1,050 | |
5.00%, 05/15/2050(1) | | | 7,500 | | | | 7,656 | |
New Orleans Aviation Board | | | | | | | | |
5.00%, 01/01/2024 | | | 55 | | | | 55 | |
5.00%, 01/01/2024 | | | 1,525 | | | | 1,532 | |
5.00%, 01/01/2027 | | | 850 | | | | 861 | |
5.00%, 01/01/2028 | | | 155 | | | | 162 | |
5.00%, 01/01/2028 | | | 1,250 | | | | 1,270 | |
5.00%, 01/01/2029 | | | 810 | | | | 822 | |
5.00%, 01/01/2030 | | | 275 | | | | 287 | |
5.00%, 01/01/2033 | | | 740 | | | | 772 | |
5.00%, 01/01/2033 | | | 2,600 | | | | 2,787 | |
5.00%, 01/01/2034 | | | 170 | | | | 177 | |
5.00%, 01/01/2034 | | | 750 | | | | 781 | |
5.00%, 01/01/2034 | | | 2,750 | | | | 2,938 | |
5.00%, 01/01/2040 | | | 9,890 | | | | 9,928 | |
Parish of St James LA | | | | | | | | |
4.40%, 11/01/2040(1) | | | 30,000 | | | | 30,000 | |
4.41%, 11/01/2040(1) | | | 61,725 | | | | 61,725 | |
Parish of St John the Baptist LA | | | | | | | | |
2.10%, 06/01/2037(1) | | | 5,995 | | | | 5,879 | |
2.13%, 06/01/2037(1) | | | 7,600 | | | | 7,455 | |
2.20%, 06/01/2037(1) | | | 2,475 | | | | 2,337 | |
4.05%, 06/01/2037(1) | | | 5,090 | | | | 5,067 | |
Port New Orleans Board of Commissioners | | | | | | | | |
5.00%, 04/01/2034 | | | 750 | | | | 789 | |
5.00%, 04/01/2035 | | | 420 | | | | 438 | |
5.00%, 04/01/2035 | | | 1,000 | | | | 1,038 | |
5.00%, 04/01/2037 | | | 500 | | | | 518 | |
Regional Transit Authority Sales Tax Revenue | | | | | | | | |
5.00%, 01/01/2035 | | | 6,080 | | | | 6,844 | |
State of Louisiana | | | | | | | | |
4.00%, 05/01/2032 | | | 5,000 | | | | 5,063 | |
4.00%, 05/01/2034 | | | 10,685 | | | | 10,818 | |
5.00%, 03/01/2038 | | | 5,000 | | | | 5,447 | |
State of Louisiana Gasoline & Fuels Tax Revenue | | | | | | | | |
3.60%, 05/01/2043 | | | 2,700 | | | | 2,700 | |
| | | | | | | | |
Total Louisiana | | | | 235,740 | |
| | | | | | | | |
Maine – 0.08% | | | | | | | | |
Maine Health & Higher Educational Facilities Authority | | | | | | | | |
4.00%, 07/01/2035 | | | 250 | | | | 254 | |
4.00%, 07/01/2041 | | | 1,480 | | | | 1,311 | |
4.00%, 07/01/2046 | | | 330 | | | | 278 | |
5.00%, 07/01/2032 | | | 550 | | | | 615 | |
5.00%, 07/01/2034 | | | 600 | | | | 669 | |
5.00%, 07/01/2034 | | | 1,000 | | | | 1,096 | |
5.00%, 07/01/2041 | | | 1,235 | | | | 1,210 | |
5.00%, 07/01/2043 | | | 610 | | | | 610 | |
5.00%, 07/01/2046 | | | 590 | | | | 541 | |
Maine Municipal Bond Bank | | | | | | | | |
5.00%, 11/01/2033 | | | 650 | | | | 709 | |
Maine Turnpike Authority | | | | | | | | |
5.00%, 07/01/2032 | | | 885 | | | | 1,006 | |
5.00%, 07/01/2034 | | | 900 | | | | 1,019 | |
| | | | | | | | |
Total Maine | | | | 9,318 | |
| | | | | �� | | | |
Maryland – 1.96% | | | | | | | | |
City of Baltimore MD | | | | | | | | |
4.00%, 07/01/2036 | | | 1,460 | | | | 1,505 | |
4.00%, 07/01/2037 | | | 790 | | | | 809 | |
4.00%, 07/01/2037 | | | 1,235 | | | | 1,264 | |
4.00%, 07/01/2039 | | | 605 | | | | 609 | |
4.50%, 06/01/2033 | | | 150 | | | | 147 | |
5.00%, 09/01/2023 | | | 1,000 | | | | 999 | |
5.00%, 07/01/2026 | | | 720 | | | | 759 | |
5.00%, 07/01/2029 | | | 4,770 | | | | 5,118 | |
5.00%, 09/01/2030 | | | 3,000 | | | | 3,011 | |
5.00%, 09/01/2032 | | | 1,000 | | | | 1,003 | |
5.00%, 10/15/2037 | | | 890 | | | | 1,018 | |
County of Baltimore MD | | | | | | | | |
4.00%, 03/01/2036 | | | 5,075 | | | | 5,274 | |
5.00%, 10/01/2023 | | | 2,495 | | | | 2,506 | |
5.00%, 03/01/2024 | | | 1,100 | | | | 1,114 | |
5.00%, 03/01/2040 | | | 4,610 | | | | 5,271 | |
County of Montgomery MD | | | | | | | | |
5.00%, 10/01/2024 | | | 1,210 | | | | 1,239 | |
County of Prince George’s MD | | | | | | | | |
4.00%, 08/01/2029 | | | 4,035 | | | | 4,037 | |
5.00%, 07/01/2034 | | | 2,000 | | | | 2,371 | |
5.00%, 07/15/2035 | | | 6,480 | | | | 7,124 | |
Maryland Community Development Administration | | | | | | | | |
2.75%, 09/01/2023 | | | 125 | | | | 125 | |
2.85%, 03/01/2024 | | | 325 | | | | 324 | |
| | | | | | | | |
2.95%, 03/01/2025 | | | 385 | | | | 382 | |
3.00%, 09/01/2051 | | | 19,975 | | | | 19,183 | |
3.10%, 03/01/2026 | | | 180 | | | | 178 | |
3.25%, 03/01/2027 | | | 595 | | | | 590 | |
3.50%, 03/01/2050 | | | 860 | | | | 843 | |
4.00%, 09/01/2049 | | | 730 | | | | 724 | |
5.00%, 09/01/2042 | | | 2,000 | | | | 2,060 | |
6.00%, 03/01/2053 | | | 5,000 | | | | 5,400 | |
Maryland Economic Development Corp. | | | | | | | | |
3.25%, 09/01/2030 | | | 1,225 | | | | 1,146 | |
4.00%, 09/01/2040 | | | 410 | | | | 370 | |
4.00%, 09/01/2050 | | | 1,295 | | | | 1,100 | |
5.00%, 06/01/2028 | | | 2,000 | | | | 2,098 | |
5.00%, 11/12/2028 | | | 7,185 | | | | 7,421 | |
5.00%, 06/30/2038 | | | 2,800 | | | | 2,943 | |
5.00%, 12/31/2039 | | | 2,350 | | | | 2,458 | |
5.00%, 12/31/2040 | | | 3,575 | | | | 3,723 | |
5.00%, 06/30/2041 | | | 4,860 | | | | 5,040 | |
5.00%, 12/31/2041 | | | 5,950 | | | | 6,170 | |
5.00%, 06/30/2042 | | | 5,000 | | | | 5,165 | |
5.38%, 07/01/2038 | | | 1,215 | | | | 1,327 | |
Maryland Health & Higher Educational Facilities Authority | | | | | | | | |
4.00%, 07/01/2042 | | | 120 | | | | 111 | |
5.00%, 07/01/2024 | | | 535 | | | | 543 | |
5.00%, 07/01/2032 | | | 750 | | | | 774 | |
5.00%, 07/01/2035 | | | 75 | | | | 77 | |
5.00%, 07/01/2045(1) | | | 2,075 | | | | 2,177 | |
5.50%, 01/01/2029 | | | 1,500 | | | | 1,601 | |
5.50%, 01/01/2030 | | | 1,750 | | | | 1,867 | |
Maryland Stadium Authority | | | | | | | | |
5.00%, 05/01/2032 | | | 765 | | | | 805 | |
5.00%, 05/01/2036 | | | 2,500 | | | | 2,609 | |
5.00%, 05/01/2041 | | | 5,000 | | | | 5,285 | |
5.00%, 05/01/2047 | | | 6,725 | | | | 7,028 | |
Maryland State Transportation Authority | | | | | | | | |
5.00%, 07/01/2023 | | | 500 | | | | 500 | |
5.00%, 07/01/2024 | | | 1,000 | | | | 1,018 | |
5.00%, 07/01/2030 | | | 4,655 | | | | 5,040 | |
5.00%, 07/01/2034 | | | 1,550 | | | | 1,768 | |
Montgomery County Housing Opportunities Commission | | | | | | | | |
0.80%, 07/01/2025 | | | 700 | | | | 659 | |
Prince George’s County Revenue Authority | | | | | | | | |
5.00%, 05/01/2030 | | | 1,085 | | | | 1,192 | |
State of Maryland | | | | | | | | |
3.00%, 08/01/2027 | | | 6,490 | | | | 6,496 | |
4.00%, 08/01/2035 | | | 1,000 | | | | 1,067 | |
5.00%, 08/01/2024 | | | 1,450 | | | | 1,479 | |
5.00%, 06/01/2034 | | | 2,115 | | | | 2,502 | |
5.00%, 06/01/2035 | | | 3,700 | | | | 4,338 | |
5.00%, 03/15/2036 | | | 6,535 | | | | 7,687 | |
5.00%, 06/01/2036 | | | 10,250 | | | | 11,905 | |
5.00%, 06/01/2037 | | | 5,500 | | | | 6,329 | |
State of Maryland Department of Transportation | | | | | | | | |
3.00%, 10/01/2031 | | | 6,000 | | | | 5,928 | |
3.00%, 10/01/2033 | | | 2,500 | | | | 2,438 | |
4.00%, 10/01/2032 | | | 1,400 | | | | 1,455 | |
5.00%, 12/01/2023 | | | 815 | | | | 821 | |
5.00%, 10/01/2024 | | | 5,000 | | | | 5,115 | |
5.00%, 10/01/2026 | | | 11,570 | | | | 12,315 | |
5.00%, 12/01/2027 | | | 1,205 | | | | 1,316 | |
5.00%, 12/01/2028 | | | 1,335 | | | | 1,485 | |
Washington Suburban Sanitary Commission | | | | | | | | |
3.00%, 06/01/2026 | | | 5,000 | | | | 4,990 | |
5.00%, 06/01/2040 | | | 2,800 | | | | 3,210 | |
5.00%, 06/01/2041 | | | 1,670 | | | | 1,906 | |
| | | | | | | | |
Total Maryland | | | | 229,784 | |
| | | | | | | | |
Massachusetts – 1.78% | | | | | | | | |
City of Waltham MA | | | | | | | | |
2.13%, 10/15/2039 | | | 2,340 | | | | 1,730 | |
Commonwealth of Massachusetts | | | | | | | | |
2.00%, 03/01/2037 | | | 5,500 | | | | 4,231 | |
4.00%, 11/01/2037 | | | 2,500 | | | | 2,567 | |
4.00%, 11/01/2040 | | | 1,075 | | | | 1,082 | |
4.00%, 02/01/2042 | | | 6,000 | | | | 5,979 | |
5.00%, 09/01/2023 | | | 2,500 | | | | 2,507 | |
5.00%, 09/01/2025 | | | 6,400 | | | | 6,672 | |
5.00%, 07/01/2028 | | | 350 | | | | 371 | |
5.00%, 12/01/2030 | | | 1,500 | | | | 1,602 | |
5.00%, 01/01/2032 | | | 1,890 | | | | 2,068 | |
5.00%, 10/01/2033 | | | 4,075 | | | | 4,812 | |
5.00%, 07/01/2035 | | | 1,500 | | | | 1,654 | |
5.00%, 01/01/2036 | | | 1,000 | | | | 1,099 | |
5.00%, 04/01/2036 | | | 1,520 | | | | 1,621 | |
| | | | | | | | |
5.00%, 07/01/2036 | | | 1,000 | | | | 1,096 | |
5.00%, 07/01/2036 | | | 12,630 | | | | 13,012 | |
5.00%, 04/01/2037 | | | 3,850 | | | | 4,089 | |
5.00%, 09/01/2038 | | | 2,620 | | | | 2,826 | |
5.00%, 11/01/2038 | | | 10,000 | | | | 10,647 | |
5.00%, 05/01/2039 | | | 925 | | | | 1,049 | |
5.00%, 05/01/2040 | | | 1,250 | | | | 1,410 | |
5.00%, 07/01/2040 | | | 5,000 | | | | 5,120 | |
5.00%, 05/01/2049 | | | 2,665 | | | | 2,830 | |
5.50%, 08/01/2030 | | | 1,140 | | | | 1,328 | |
Commonwealth of Massachusetts Transportation Fund Revenue | | | | | | | | |
5.00%, 06/01/2040 | | | 7,435 | | | | 7,969 | |
Massachusetts Bay Transportation Authority Sales Tax Revenue | | | | | | | | |
5.00%, 07/01/2040 | | | 5,000 | | | | 5,119 | |
5.00%, 07/01/2041 | | | 4,000 | | | | 4,562 | |
Massachusetts Clean Water Trust | | | | | | | | |
5.00%, 08/01/2031 | | | 1,790 | | | | 1,976 | |
Massachusetts Development Finance Agency | | | | | | | | |
4.00%, 07/15/2036 | | | 16,860 | | | | 17,183 | |
4.00%, 07/01/2045 | | | 1,325 | | | | 1,270 | |
5.00%, 07/01/2023 | | | 900 | | | | 900 | |
5.00%, 10/01/2024 | | | 2,020 | | | | 2,063 | |
5.00%, 07/01/2025 | | | 1,090 | | | | 1,113 | |
5.00%, 10/01/2025 | | | 905 | | | | 916 | |
5.00%, 07/01/2026 | | | 1,140 | | | | 1,178 | |
5.00%, 10/01/2026 | | | 955 | | | | 974 | |
5.00%, 10/01/2028 | | | 475 | | | | 513 | |
5.00%, 07/01/2030 | | | 590 | | | | 642 | |
5.00%, 01/01/2031 | | | 475 | | | | 491 | |
5.00%, 10/01/2031 | | | 355 | | | | 389 | |
5.00%, 01/01/2032 | | | 635 | | | | 655 | |
5.00%, 07/01/2032 | | | 500 | | | | 528 | |
5.00%, 10/01/2032 | | | 1,000 | | | | 1,184 | |
5.00%, 01/01/2033 | | | 540 | | | | 556 | |
5.00%, 07/15/2033(3) | | | 315 | | | | 306 | |
5.00%, 10/01/2033 | | | 750 | | | | 762 | |
5.00%, 10/01/2033 | | | 1,000 | | | | 1,179 | |
5.00%, 01/01/2034 | | | 710 | | | | 730 | |
5.00%, 07/01/2034 | | | 500 | | | | 526 | |
5.00%, 07/15/2034(3) | | | 270 | | | | 259 | |
5.00%, 10/01/2034 | | | 835 | | | | 846 | |
5.00%, 01/01/2035 | | | 745 | | | | 765 | |
5.00%, 07/15/2035(3) | | | 275 | | | | 260 | |
5.00%, 01/01/2036 | | | 1,100 | | | | 1,125 | |
5.00%, 07/15/2036(3) | | | 230 | | | | 213 | |
5.00%, 07/01/2037 | | | 2,235 | | | | 2,283 | |
5.00%, 07/15/2037(3) | | | 245 | | | | 225 | |
5.00%, 07/01/2038(1) | | | 8,525 | | | | 8,595 | |
5.00%, 10/01/2039 | | | 2,250 | | | | 2,555 | |
5.00%, 01/01/2040 | | | 755 | | | | 765 | |
5.00%, 10/01/2041 | | | 1,450 | | | | 1,429 | |
5.00%, 03/01/2044 | | | 1,000 | | | | 1,006 | |
5.00%, 10/01/2048 | | | 1,750 | | | | 1,753 | |
Massachusetts Educational Financing Authority | | | | | | | | |
2.00%, 07/01/2037 | | | 2,700 | | | | 2,277 | |
5.00%, 07/01/2024 | | | 2,190 | | | | 2,212 | |
5.00%, 07/01/2026 | | | 5,000 | | | | 5,168 | |
5.00%, 07/01/2027 | | | 1,500 | | | | 1,568 | |
5.00%, 07/01/2028 | | | 1,250 | | | | 1,319 | |
5.00%, 07/01/2029 | | | 1,600 | | | | 1,705 | |
5.00%, 07/01/2030 | | | 1,425 | | | | 1,534 | |
Massachusetts Housing Finance Agency | | | | | | | | |
0.80%, 12/01/2025 | | | 1,820 | | | | 1,666 | |
1.85%, 12/01/2050 | | | 5,250 | | | | 5,031 | |
4.56% (SIFMA Municipal Swap Index Yield + 0.55%), 11/01/2048(2) | | | 9,220 | | | | 9,220 | |
Massachusetts School Building Authority | | | | | | | | |
5.00%, 01/15/2028 | | | 1,500 | | | | 1,542 | |
5.00%, 11/15/2034 | | | 10,000 | | | | 10,657 | |
5.00%, 08/15/2037 | | | 4,500 | | | | 4,630 | |
Massachusetts Water Resources Authority | | | | | | | | |
5.25%, 08/01/2033 | | | 2,065 | | | | 2,527 | |
| | | | | | | | |
Total Massachusetts | | | | 208,221 | |
| | | | | | | | |
Michigan – 3.46% | | | | | | | | |
Avondale School District | | | | | | | | |
5.00%, 11/01/2023 | | | 680 | | | | 684 | |
5.00%, 11/01/2024 | | | 800 | | | | 819 | |
5.00%, 11/01/2025 | | | 785 | | | | 820 | |
5.00%, 11/01/2026 | | | 765 | | | | 816 | |
Calhoun County Hospital Finance Authority | | | | | | | | |
5.00%, 02/15/2028 | | | 750 | | | | 770 | |
Center Line Public Schools | | | | | | | | |
5.25%, 05/01/2048 | | | 3,000 | | | | 3,272 | |
City of Detroit MI | | | | | | | | |
| | | | | | | | |
5.00%, 04/01/2024 | | | 900 | | | | 905 | |
5.00%, 04/01/2025 | | | 900 | | | | 907 | |
5.00%, 04/01/2034 | | | 750 | | | | 777 | |
5.00%, 04/01/2035 | | | 1,700 | | | | 1,756 | |
5.00%, 04/01/2036 | | | 300 | | | | 307 | |
City of Greenville MI | | | | | | | | |
4.00%, 06/01/2029 | | | 285 | | | | 301 | |
4.00%, 06/01/2035 | | | 715 | | | | 746 | |
City of Lansing MI | | | | | | | | |
5.00%, 06/01/2037 | | | 1,000 | | | | 1,134 | |
City of Royal Oak MI | | | | | | | | |
5.00%, 04/01/2029 | | | 500 | | | | 553 | |
5.00%, 04/01/2031 | | | 1,045 | | | | 1,157 | |
City of Saginaw MI Water Supply System Revenue | | | | | | | | |
4.00%, 07/01/2034 | | | 355 | | | | 376 | |
4.00%, 07/01/2035 | | | 185 | | | | 195 | |
4.00%, 07/01/2036 | | | 195 | | | | 204 | |
City of Wyandotte MI Electric System Revenue | | | | | | | | |
5.00%, 10/01/2023 | | | 500 | | | | 502 | |
5.00%, 10/01/2024 | | | 765 | | | | 781 | |
County of Jackson MI | | | | | | | | |
4.00%, 05/01/2034 | | | 610 | | | | 640 | |
County of Kent MI | | | | | | | | |
5.00%, 06/01/2028 | | | 700 | | | | 738 | |
Dearborn School District | | | | | | | | |
5.00%, 05/01/2035 | | | 1,080 | | | | 1,214 | |
Detroit City School District | | | | | | | | |
5.25%, 05/01/2030 | | | 3,345 | | | | 3,851 | |
Detroit Downtown Development Authority | | | | | | | | |
5.00%, 07/01/2037 | | | 540 | | | | 543 | |
DeWitt Public Schools | | | | | | | | |
5.00%, 05/01/2036 | | | 1,000 | | | | 1,138 | |
Ferndale Public Schools | | | | | | | | |
5.00%, 05/01/2043 | | | 650 | | | | 703 | |
5.00%, 05/01/2049 | | | 2,795 | | | | 2,995 | |
Grand Rapids Public Schools | | | | | | | | |
5.00%, 05/01/2025 | | | 1,075 | | | | 1,105 | |
5.00%, 11/01/2037 | | | 1,750 | | | | 1,885 | |
5.00%, 11/01/2038 | | | 1,000 | | | | 1,074 | |
Great Lakes Water Authority Sewage Disposal System Revenue | | | | | | | | |
5.00%, 07/01/2030 | | | 3,000 | | | | 3,150 | |
5.00%, 07/01/2032 | | | 290 | | | | 341 | |
5.00%, 07/01/2034 | | | 355 | | | | 410 | |
Great Lakes Water Authority Water Supply System Revenue | | | | | | | | |
5.00%, 07/01/2032 | | | 215 | | | | 253 | |
5.00%, 07/01/2034 | | | 395 | | | | 456 | |
5.00%, 07/01/2046 | | | 2,625 | | | | 2,737 | |
5.00%, 07/01/2046 | | | 3,120 | | | | 3,189 | |
Karegnondi Water Authority | | | | | | | | |
5.00%, 11/01/2041 | | | 2,225 | | | | 2,299 | |
Lake Orion Community School District | | | | | | | | |
5.00%, 05/01/2025 | | | 3,275 | | | | 3,387 | |
Lansing Board of Water & Light | | | | | | | | |
2.00%, 07/01/2051(1) | | | 8,585 | | | | 8,071 | |
5.00%, 07/01/2037 | | | 4,875 | | | | 5,313 | |
5.00%, 07/01/2038 | | | 2,620 | | | | 2,837 | |
Lapeer Community Schools | | | | | | | | |
5.00%, 05/01/2039 | | | 2,730 | | | | 2,988 | |
Michigan Finance Authority | | | | | | | | |
1.20%, 10/15/2030(1) | | | 1,900 | | | | 1,660 | |
1.20%, 10/15/2038(1) | | | 18,900 | | | | 16,511 | |
3.75%, 11/15/2049(1) | | | 3,600 | | | | 3,620 | |
4.00%, 12/01/2035 | | | 1,500 | | | | 1,521 | |
4.00%, 12/01/2036 | | | 6,610 | | | | 6,673 | |
4.00%, 12/01/2036 | | | 22,235 | | | | 22,387 | |
4.00%, 12/01/2040 | | | 1,485 | | | | 1,476 | |
5.00%, 10/01/2023 | | | 420 | | | | 420 | |
5.00%, 10/01/2024 | | | 3,000 | | | | 3,069 | |
5.00%, 11/01/2024 | | | 750 | | | | 768 | |
5.00%, 11/01/2025 | | | 400 | | | | 418 | |
5.00%, 11/01/2025 | | | 1,000 | | | | 1,045 | |
5.00%, 11/01/2026 | | | 500 | | | | 532 | |
5.00%, 12/01/2026 | | | 1,190 | | | | 1,260 | |
5.00%, 06/01/2027 | | | 3,190 | | | | 3,349 | |
5.00%, 11/01/2027 | | | 500 | | | | 540 | |
5.00%, 04/15/2029 | | | 4,000 | | | | 4,416 | |
5.00%, 06/01/2029 | | | 1,500 | | | | 1,611 | |
5.00%, 12/01/2029 | | | 500 | | | | 541 | |
5.00%, 04/15/2030 | | | 4,155 | | | | 4,650 | |
5.00%, 06/01/2030 | | | 1,725 | | | | 1,872 | |
5.00%, 07/01/2030 | | | 600 | | | | 616 | |
5.00%, 10/01/2030 | | | 800 | | | | 811 | |
5.00%, 06/01/2031 | | | 2,895 | | | | 3,157 | |
| | | | | | | | |
5.00%, 04/15/2032 | | | 3,165 | | | | 3,636 | |
5.00%, 06/01/2032 | | | 280 | | | | 304 | |
5.00%, 08/01/2032 | | | 850 | | | | 867 | |
5.00%, 10/01/2032 | | | 1,150 | | | | 1,329 | |
5.00%, 11/15/2032 | | | 1,445 | | | | 1,510 | |
5.00%, 04/15/2033 | | | 1,935 | | | | 2,220 | |
5.00%, 06/01/2033 | | | 510 | | | | 553 | |
5.00%, 04/15/2034 | | | 970 | | | | 1,110 | |
5.00%, 07/01/2034 | | | 1,600 | | | | 1,639 | |
5.00%, 04/15/2035 | | | 555 | | | | 630 | |
5.00%, 07/01/2035 | | | 2,000 | | | | 2,044 | |
5.00%, 04/15/2036 | | | 5,000 | | | | 5,606 | |
5.00%, 12/01/2039 | | | 3,000 | | | | 3,165 | |
5.00%, 06/01/2040 | | | 900 | | | | 937 | |
5.00%, 11/01/2044 | | | 2,710 | | | | 2,752 | |
5.00%, 11/15/2044(1) | | | 2,035 | | | | 2,114 | |
5.00%, 12/01/2044(1) | | | 2,550 | | | | 2,614 | |
5.00%, 06/01/2049 | | | 1,425 | | | | 1,456 | |
Michigan Mathematics & Science Initiative | | | | | | | | |
4.00%, 01/01/2031 | | | 390 | | | | 365 | |
Michigan State Building Authority | | | | | | | | |
5.00%, 04/15/2034 | | | 13,375 | | | | 13,878 | |
5.00%, 04/15/2035 | | | 1,250 | | | | 1,387 | |
5.00%, 04/15/2038 | | | 10,000 | | | | 10,320 | |
Michigan State Hospital Finance Authority | | | | | | | | |
4.00%, 11/15/2047(1) | | | 4,505 | | | | 4,521 | |
5.00%, 12/01/2023 | | | 1,150 | | | | 1,158 | |
5.00%, 12/01/2024 | | | 275 | | | | 282 | |
5.00%, 12/01/2025 | | | 700 | | | | 728 | |
5.00%, 12/01/2027 | | | 415 | | | | 448 | |
Michigan State Housing Development Authority | | | | | | | | |
3.00%, 06/01/2052 | | | 2,000 | | | | 1,921 | |
3.50%, 12/01/2050 | | | 805 | | | | 788 | |
5.00%, 12/01/2025 | | | 3,710 | | | | 3,752 | |
5.00%, 12/01/2025(1) | | | 4,593 | | | | 4,651 | |
5.00%, 02/01/2026 | | | 8,581 | | | | 8,705 | |
5.00%, 06/01/2053 | | | 3,785 | | | | 3,911 | |
5.50%, 06/01/2053 | | | 17,170 | | | | 18,107 | |
Michigan Strategic Fund | | | | | | | | |
1.80%, 10/01/2049(1) | | | 2,075 | | | | 2,016 | |
5.00%, 06/30/2025 | | | 2,000 | | | | 2,017 | |
5.00%, 12/31/2025 | | | 2,595 | | | | 2,637 | |
5.00%, 06/30/2026 | | | 2,800 | | | | 2,858 | |
5.00%, 12/31/2026 | | | 355 | | | | 364 | |
5.00%, 06/30/2030 | | | 1,080 | | | | 1,131 | |
5.00%, 06/30/2032 | | | 150 | | | | 157 | |
Michigan Technological University | | | | | | | | |
4.00%, 10/01/2051 | | | 1,255 | | | | 1,196 | |
5.00%, 10/01/2025 | | | 400 | | | | 414 | |
5.00%, 10/01/2026 | | | 270 | | | | 285 | |
5.00%, 10/01/2027 | | | 595 | | | | 640 | |
5.00%, 10/01/2028 | | | 890 | | | | 973 | |
5.00%, 10/01/2029 | | | 2,000 | | | | 2,225 | |
5.00%, 10/01/2030 | | | 355 | | | | 401 | |
Oakland University | | | | | | | | |
5.00%, 03/01/2041 | | | 2,190 | | | | 2,228 | |
Portage Public Schools | | | | | | | | |
5.00%, 11/01/2028 | | | 1,000 | | | | 1,051 | |
Rib Floater Trust Various States | | | | | | | | |
3.82%, 06/01/2044(3) | | | 5,495 | | | | 5,495 | |
Richfield Public School Academy | | | | | | | | |
2.50%, 09/01/2025 | | | 180 | | | | 169 | |
Romeo Community School District | | | | | | | | |
4.00%, 05/01/2027 | | | 325 | | | | 337 | |
4.00%, 05/01/2033 | | | 525 | | | | 564 | |
4.00%, 05/01/2034 | | | 540 | | | | 575 | |
4.00%, 05/01/2035 | | | 755 | | | | 801 | |
4.00%, 05/01/2036 | | | 780 | | | | 818 | |
4.00%, 05/01/2037 | | | 815 | | | | 844 | |
4.00%, 05/01/2038 | | | 1,255 | | | | 1,286 | |
Royal Oak Hospital Finance Authority | | | | | | | | |
5.00%, 09/01/2039 | | | 10,320 | | | | 10,443 | |
Royal Oak School District | | | | | | | | |
5.00%, 05/01/2024 | | | 600 | | | | 609 | |
Saginaw City School District | | | | | | | | |
4.00%, 05/01/2031 | | | 1,290 | | | | 1,387 | |
4.00%, 05/01/2034 | | | 1,035 | | | | 1,083 | |
Saginaw Hospital Finance Authority | | | | | | | | |
5.00%, 07/01/2027 | | | 825 | | | | 866 | |
5.00%, 07/01/2028 | | | 435 | | | | 463 | |
South Lyon Community Schools | | | | | | | | |
5.00%, 05/01/2037 | | | 755 | | | | 852 | |
5.00%, 05/01/2040 | | | 1,585 | | | | 1,733 | |
| | | | | | | | |
5.00%, 05/01/2042 | | | 1,620 | | | | 1,762 | |
5.00%, 05/01/2043 | | | 845 | | | | 917 | |
State of Michigan | | | | | | | | |
5.00%, 03/15/2025 | | | 1,145 | | | | 1,178 | |
State of Michigan Trunk Line Revenue | | | | | | | | |
4.00%, 11/15/2044 | | | 6,000 | | | | 5,926 | |
4.00%, 11/15/2046 | | | 24,000 | | | | 23,503 | |
5.00%, 11/15/2036 | | | 7,550 | | | | 8,501 | |
5.00%, 11/15/2045 | | | 1,250 | | | | 1,354 | |
Summit Academy North | | | | | | | | |
2.25%, 11/01/2026 | | | 440 | | | | 403 | |
4.00%, 11/01/2031 | | | 785 | | | | 722 | |
University of Michigan | | | | | | | | |
4.00%, 04/01/2049(1) | | | 9,650 | | | | 9,666 | |
5.00%, 04/01/2024 | | | 1,670 | | | | 1,693 | |
5.00%, 04/01/2033 | | | 560 | | | | 659 | |
Van Buren Public Schools | | | | | | | | |
4.00%, 11/01/2037 | | | 1,925 | | | | 1,940 | |
4.00%, 11/01/2038 | | | 2,005 | | | | 2,012 | |
Wayne County Airport Authority | | | | | | | | |
5.00%, 12/01/2023 | | | 250 | | | | 252 | |
5.00%, 12/01/2023 | | | 400 | | | | 403 | |
5.00%, 12/01/2023 | | | 550 | | | | 552 | |
5.00%, 12/01/2024 | | | 375 | | | | 384 | |
5.00%, 12/01/2024 | | | 500 | | | | 508 | |
5.00%, 12/01/2025 | | | 600 | | | | 617 | |
5.00%, 12/01/2025 | | | 1,000 | | | | 1,029 | |
5.00%, 12/01/2027 | | | 4,055 | | | | 4,159 | |
5.00%, 12/01/2031 | | | 350 | | | | 375 | |
5.00%, 12/01/2032 | | | 1,400 | | | | 1,416 | |
5.00%, 12/01/2033 | | | 325 | | | | 350 | |
5.00%, 12/01/2040 | | | 1,000 | | | | 1,024 | |
5.00%, 12/01/2040 | | | 2,000 | | | | 2,187 | |
5.00%, 12/01/2041 | | | 1,000 | | | | 1,090 | |
5.00%, 12/01/2046 | | | 4,250 | | | | 4,582 | |
Wayne State University | | | | | | | | |
5.00%, 11/15/2036 | | | 3,090 | | | | 3,344 | |
Wayne-Westland Community Schools | | | | | | | | |
4.00%, 11/01/2034 | | | 3,705 | | | | 3,912 | |
4.00%, 11/01/2036 | | | 4,305 | | | | 4,422 | |
5.00%, 11/01/2023 | | | 80 | | | | 80 | |
5.00%, 11/01/2024 | | | 185 | | | | 189 | |
5.00%, 11/01/2025 | | | 95 | | | | 99 | |
5.00%, 11/01/2026 | | | 1,000 | | | | 1,067 | |
5.00%, 11/01/2027 | | | 600 | | | | 652 | |
5.00%, 11/01/2029 | | | 585 | | | | 650 | |
Wyoming Public Schools | | | | | | | | |
4.00%, 05/01/2041 | | | 685 | | | | 685 | |
| | | | | | | | |
Total Michigan | | | | 404,612 | |
| | | | | | | | |
Minnesota – 0.49% | | | | | | | | |
City of Independence MN | | | | | | | | |
4.00%, 07/01/2041 | | | 1,500 | | | | 1,210 | |
City of Minneapolis MN | | | | | | | | |
4.00%, 11/15/2037 | | | 1,625 | | | | 1,607 | |
City of Moorhead MN | | | | | | | | |
5.00%, 12/01/2025 | | | 595 | | | | 602 | |
City of Shakopee MN Senior Housing Revenue | | | | | | | | |
5.85%, 11/01/2058(1)(3) | | | 2,280 | | | | 2,244 | |
County of Hennepin MN | | | | | | | | |
5.00%, 12/15/2037 | | | 2,500 | | | | 2,776 | |
County of Washington MN | | | | | | | | |
2.40%, 02/01/2029 | | | 2,255 | | | | 2,113 | |
2.50%, 02/01/2030 | | | 2,320 | | | | 2,172 | |
Duluth Economic Development Authority | | | | | | | | |
5.00%, 02/15/2033 | | | 500 | | | | 528 | |
5.00%, 02/15/2034 | | | 750 | | | | 791 | |
5.00%, 02/15/2037 | | | 1,250 | | | | 1,300 | |
Elk River Independent School District No 728 | | | | | | | | |
2.25%, 02/01/2037 | | | 6,555 | | | | 5,168 | |
Minneapolis Special School District No 1 | | | | | | | | |
4.00%, 02/01/2037 | | | 800 | | | | 824 | |
Minneapolis-St Paul Metropolitan Airports Commission | | | | | | | | |
5.00%, 01/01/2032 | | | 295 | | | | 327 | |
5.00%, 01/01/2036 | | | 1,335 | | | | 1,454 | |
5.00%, 01/01/2037 | | | 1,750 | | | | 1,853 | |
Minnesota Housing Finance Agency | | | | | | | | |
3.00%, 07/01/2051 | | | 650 | | | | 626 | |
3.00%, 01/01/2052 | | | 2,645 | | | | 2,545 | |
5.00%, 08/01/2032 | | | 1,400 | | | | 1,626 | |
5.00%, 08/01/2033 | | | 770 | | | | 892 | |
5.00%, 08/01/2035 | | | 920 | | | | 1,049 | |
5.00%, 08/01/2036 | | | 2,965 | | | | 3,345 | |
Roseville Independent School District No 623 | | | | | | | | |
| | | | | | | | |
5.00%, 02/01/2025 | | | 3,895 | | | | 4,008 | |
5.00%, 02/01/2026 | | | 2,315 | | | | 2,424 | |
Shakopee Independent School District No 720 | | | | | | | | |
5.00%, 02/01/2024 | | | 3,185 | | | | 3,216 | |
State of Minnesota | | | | | | | | |
5.00%, 08/01/2023 | | | 1,465 | | | | 1,467 | |
5.00%, 08/01/2032 | | | 2,925 | | | | 3,481 | |
White Bear Lake Independent School District No 624 | | | | | | | | |
2.50%, 02/01/2039 | | | 5,000 | | | | 3,918 | |
2.50%, 02/01/2040 | | | 4,500 | | | | 3,466 | |
| | | | | | | | |
Total Minnesota | | | | 57,032 | |
| | | | | | | | |
Mississippi – 0.19% | | | | | | | | |
Mississippi Business Finance Corp. | | | | | | | | |
7.75%, 07/15/2047(1) | | | 8,435 | | | | 6,315 | |
Mississippi Development Bank | | | | | | | | |
4.00%, 10/01/2034(3) | | | 1,825 | | | | 1,687 | |
4.00%, 10/01/2041(3) | | | 1,640 | | | | 1,373 | |
5.00%, 03/01/2035 | | | 1,250 | | | | 1,342 | |
5.00%, 04/01/2035 | | | 1,210 | | | | 1,373 | |
Mississippi Hospital Equipment & Facilities Authority | | | | | | | | |
5.00%, 01/01/2029 | | | 910 | | | | 974 | |
5.00%, 01/01/2033 | | | 1,750 | | | | 1,884 | |
5.00%, 10/01/2035 | | | 700 | | | | 747 | |
5.00%, 10/01/2036 | | | 2,000 | | | | 2,115 | |
5.00%, 10/01/2040(1) | | | 1,215 | | | | 1,269 | |
5.00%, 09/01/2044(1) | | | 2,000 | | | | 2,065 | |
State of Mississippi | | | | | | | | |
5.00%, 10/01/2030 | | | 1,000 | | | | 1,083 | |
| | | | | | | | |
Total Mississippi | | | | 22,227 | |
| | | | | | | | |
Missouri – 0.95% | | | | | | | | |
Belton School District No 124 | | | | | | | | |
5.00%, 03/01/2028 | | | 250 | | | | 273 | |
5.50%, 03/01/2033 | | | 500 | | | | 551 | |
5.50%, 03/01/2036 | | | 500 | | | | 547 | |
Cape Girardeau County Industrial Development Authority | | | | | | | | |
5.00%, 03/01/2032 | | | 1,000 | | | | 1,023 | |
City of Kansas City MO Sanitary Sewer System Revenue | | | | | | | | |
5.00%, 01/01/2026 | | | 285 | | | | 299 | |
5.00%, 01/01/2031 | | | 135 | | | | 148 | |
City of St Louis MO Airport Revenue | | | | | | | | |
5.00%, 07/01/2025 | | | 400 | | | | 409 | |
Hannibal Industrial Development Authority | | | | | | | | |
5.00%, 10/01/2047 | | | 1,580 | | | | 1,604 | |
Health & Educational Facilities Authority of the State of Missouri | | | | | | | | |
4.00%, 08/01/2031 | | | 310 | | | | 280 | |
4.00%, 02/15/2034 | | | 500 | | | | 497 | |
4.00%, 07/01/2035 | | | 1,500 | | | | 1,524 | |
4.00%, 02/15/2039 | | | 990 | | | | 904 | |
4.00%, 02/01/2040 | | | 100 | | | | 97 | |
5.00%, 06/01/2025 | | | 7,000 | | | | 7,200 | |
5.00%, 04/01/2027 | | | 1,705 | | | | 1,714 | |
5.00%, 02/01/2029 | | | 1,000 | | | | 1,028 | |
5.00%, 06/01/2033 | | | 1,550 | | | | 1,741 | |
5.00%, 02/01/2036 | | | 200 | | | | 205 | |
5.00%, 10/01/2042 | | | 6,370 | | | | 6,684 | |
5.00%, 10/01/2046 | | | 6,000 | | | | 6,400 | |
Jefferson City School District | | | | | | | | |
5.50%, 03/01/2043 | | | 9,450 | | | | 10,685 | |
Jefferson County School District No R-1 Northwest | | | | | | | | |
5.25%, 03/01/2040 | | | 2,945 | | | | 3,255 | |
5.25%, 03/01/2041 | | | 1,505 | | | | 1,656 | |
Kansas City Industrial Development Authority | | | | | | | | |
5.00%, 03/01/2025 | | | 1,250 | | | | 1,284 | |
5.00%, 03/01/2025 | | | 2,000 | | | | 2,035 | |
5.00%, 03/01/2026 | | | 4,395 | | | | 4,530 | |
5.00%, 03/01/2027 | | | 2,955 | | | | 3,148 | |
5.00%, 03/01/2028 | | | 3,350 | | | | 3,542 | |
5.00%, 03/01/2033 | | | 1,000 | | | | 1,071 | |
Liberty Public School District No 53 | | | | | | | | |
5.00%, 03/01/2039 | | | 1,375 | | | | 1,524 | |
5.00%, 03/01/2040 | | | 2,290 | | | | 2,520 | |
Missouri Housing Development Commission | | | | | | | | |
3.25%, 05/01/2051 | | | 2,915 | | | | 2,828 | |
4.00%, 05/01/2050 | | | 215 | | | | 213 | |
North Kansas City School District No 74 | | | | | | | | |
5.25%, 03/01/2039 | | | 8,000 | | | | 9,149 | |
5.25%, 03/01/2040 | | | 7,450 | | | | 8,471 | |
Springfield School District No R-12 | | | | | | | | |
5.00%, 03/01/2040 | | | 8,635 | | | | 9,549 | |
St Charles County School District No R-IV Wentzville | | | | | | | | |
1.88%, 03/01/2039 | | | 12,110 | | | | 8,563 | |
St Louis County Industrial Development Authority | | | | | | | | |
5.13%, 09/01/2048 | | | 590 | | | | 504 | |
| | | | | | | | |
5.50%, 09/01/2033 | | | 1,000 | | | | 1,000 | |
Washington Industrial Development Authority | | | | | | | | |
2.50%, 11/01/2029 | | | 145 | | | | 133 | |
Wright City R-II School District | | | | | | | | |
6.00%, 03/01/2037 | | | 575 | | | | 697 | |
6.00%, 03/01/2040 | | | 1,100 | | | | 1,311 | |
| | | | | | | | |
Total Missouri | | | | 110,796 | |
| | | | | | | | |
Montana – 0.10% | | | | | | | | |
City of Forsyth MT | | | | | | | | |
3.88%, 07/01/2028 | | | 4,500 | | | | 4,515 | |
County of Gallatin MT | | | | | | | | |
4.00%, 10/15/2032(3) | | | 1,770 | | | | 1,627 | |
4.00%, 10/15/2036(3) | | | 2,965 | | | | 2,579 | |
4.00%, 10/15/2041(3) | | | 1,800 | | | | 1,456 | |
4.00%, 10/15/2046(3) | | | 1,160 | | | | 896 | |
4.00%, 10/15/2051(3) | | | 950 | | | | 703 | |
Montana Board of Housing | | | | | | | | |
4.00%, 12/01/2047 | | | 100 | | | | 99 | |
4.00%, 06/01/2050 | | | 120 | | | | 119 | |
| | | | | | | | |
Total Montana | | | | 11,994 | |
| | | | | | | | |
Nebraska – 0.48% | | | | | | | | |
Ashland-Greenwood Public Schools | | | | | | | | |
4.00%, 12/15/2037 | | | 1,340 | | | | 1,358 | |
4.00%, 12/15/2039 | | | 1,000 | | | | 999 | |
Central Plains Energy Project | | | | | | | | |
4.00%, 12/01/2049(1) | | | 32,905 | | | | 32,914 | |
City of Lincoln NE Electric System Revenue | | | | | | | | |
5.00%, 09/01/2027 | | | 1,710 | | | | 1,838 | |
Douglas County Hospital Authority No 2 | | | | | | | | |
4.00%, 11/15/2036 | | | 425 | | | | 429 | |
Hershey Public Schools | | | | | | | | |
4.00%, 12/15/2026 | | | 400 | | | | 413 | |
4.00%, 12/15/2028 | | | 640 | | | | 660 | |
Nebraska Investment Finance Authority | | | | | | | | |
3.00%, 09/01/2045 | | | 1,770 | | | | 1,703 | |
3.50%, 09/01/2050 | | | 720 | | | | 705 | |
3.75%, 09/01/2049 | | | 660 | | | | 649 | |
4.00%, 09/01/2049 | | | 570 | | | | 561 | |
Nebraska Public Power District | | | | | | | | |
5.00%, 01/01/2024 | | | 2,455 | | | | 2,476 | |
Omaha Airport Authority | | | | | | | | |
5.00%, 12/15/2031 | | | 230 | | | | 244 | |
5.00%, 12/15/2031 | | | 285 | | | | 297 | |
Omaha Public Power District | | | | | | | | |
5.00%, 02/01/2033 | | | 1,075 | | | | 1,257 | |
5.00%, 02/01/2042 | | | 5,400 | | | | 5,716 | |
Omaha Public Power District Nebraska City Station Unit 2 | | | | | | | | |
5.25%, 02/01/2042 | | | 4,250 | | | | 4,320 | |
| | | | | | | | |
Total Nebraska | | | | 56,539 | |
| | | | | | | | |
Nevada – 1.12% | | | | | | | | |
Carson City NV | | | | | | | | |
5.00%, 09/01/2026 | | | 550 | | | | 570 | |
City of Henderson NV | | | | | | | | |
4.00%, 06/01/2035 | | | 900 | | | | 942 | |
4.00%, 06/01/2036 | | | 925 | | | | 958 | |
5.00%, 06/01/2037 | | | 3,230 | | | | 3,593 | |
City of Las Vegas NV Special Improvement District No 816 | | | | | | | | |
2.75%, 06/01/2036 | | | 420 | | | | 322 | |
City of North Las Vegas NV | | | | | | | | |
4.00%, 06/01/2036 | | | 1,240 | | | | 1,260 | |
6.00%, 06/01/2052(3) | | | 1,300 | | | | 1,308 | |
Clark County School District | | | | | | | | |
4.00%, 06/15/2034 | | | 5,000 | | | | 5,097 | |
5.00%, 06/15/2024 | | | 4,500 | | | | 4,573 | |
5.00%, 06/15/2025 | | | 25 | | | | 26 | |
5.00%, 06/15/2025 | | | 3,780 | | | | 3,909 | |
5.00%, 06/15/2025 | | | 6,060 | | | | 6,265 | |
5.00%, 06/15/2029 | | | 4,080 | | | | 4,459 | |
5.00%, 06/15/2033 | | | 410 | | | | 464 | |
5.00%, 06/15/2034 | | | 1,555 | | | | 1,701 | |
5.00%, 06/15/2034 | | | 2,350 | | | | 2,568 | |
5.00%, 06/15/2037 | | | 1,000 | | | | 1,114 | |
County of Clark Department of Aviation | | | | | | | | |
5.00%, 07/01/2024 | | | 3,320 | | | | 3,364 | |
5.00%, 07/01/2028 | | | 630 | | | | 640 | |
5.00%, 07/01/2030 | | | 730 | | | | 742 | |
5.00%, 07/01/2035 | | | 7,000 | | | | 7,971 | |
5.00%, 07/01/2036 | | | 2,250 | | | | 2,544 | |
County of Clark NV | | | | | | | | |
4.00%, 07/01/2039 | | | 4,500 | | | | 4,505 | |
5.00%, 11/01/2028 | | | 3,000 | | | | 3,187 | |
5.00%, 06/01/2032 | | | 3,000 | | | | 3,278 | |
5.00%, 12/01/2032 | | | 5,385 | | | | 5,928 | |
| | | | | | | | |
5.00%, 06/01/2035 | | | 2,070 | | | | 2,244 | |
County of Clark NV Passenger Facility Charge Revenue | | | | | | | | |
5.00%, 07/01/2025 | | | 2,220 | | | | 2,274 | |
Henderson Local Improvement Districts | | | | | | | | |
2.00%, 09/01/2024 | | | 120 | | | | 116 | |
3.00%, 09/01/2036 | | | 175 | | | | 135 | |
Las Vegas Valley Water District | | | | | | | | |
4.00%, 06/01/2028 | | | 1,000 | | | | 1,018 | |
5.00%, 06/01/2039 | | | 2,815 | | | | 2,865 | |
5.00%, 06/01/2039 | | | 41,100 | | | | 44,575 | |
5.00%, 06/01/2046 | | | 1,500 | | | | 1,546 | |
Nevada Housing Division | | | | | | | | |
4.00%, 10/01/2049 | | | 350 | | | | 347 | |
5.00%, 12/01/2025(1) | | | 2,775 | | | | 2,812 | |
Tahoe-Douglas Visitors Authority | | | | | | | | |
4.00%, 07/01/2025 | | | 500 | | | | 495 | |
4.00%, 07/01/2026 | | | 1,540 | | | | 1,520 | |
| | | | | | | | |
Total Nevada | | | | 131,235 | |
| | | | | | | | |
New Hampshire – 0.35% | | | | | | | | |
New Hampshire Business Finance Authority | | | | | | | | |
4.00%, 10/20/2036 | | | 3,993 | | | | 3,782 | |
4.00%, 08/15/2039 | | | 1,100 | | | | 1,045 | |
4.13%, 01/20/2034 | | | 2,559 | | | | 2,496 | |
4.38%, 09/20/2036 | | | 2,716 | | | | 2,660 | |
4.39% (SIFMA Municipal Swap Index Yield + 0.38%), 10/01/2033(2) | | | 7,520 | | | | 7,370 | |
5.00%, 01/01/2024 | | | 720 | | | | 724 | |
5.00%, 08/15/2029 | | | 750 | | | | 814 | |
New Hampshire Health & Education Facilities Authority Act | | | | | | | | |
4.00%, 10/01/2038 | | | 115 | | | | 103 | |
5.00%, 07/01/2023 | | | 500 | | | | 500 | |
5.00%, 08/01/2027 | | | 1,575 | | | | 1,662 | |
5.00%, 10/01/2028 | | | 1,580 | | | | 1,637 | |
5.00%, 07/01/2030 | | | 390 | | | | 424 | |
5.00%, 07/01/2030 | | | 5,325 | | | | 5,986 | |
5.00%, 08/01/2030 | | | 305 | | | | 325 | |
5.00%, 10/01/2032 | | | 2,825 | | | | 2,896 | |
5.00%, 07/01/2035 | | | 5,000 | | | | 5,129 | |
5.00%, 10/01/2038 | | | 425 | | | | 426 | |
5.00%, 07/01/2044 | | | 3,040 | | | | 2,912 | |
| | | | | | | | |
Total New Hampshire | | | | 40,891 | |
| | | | | | | | |
New Jersey – 3.78% | | | | | | | | |
Atlantic County Improvement Authority | | | | | | | | |
4.00%, 07/01/2037 | | | 460 | | | | 455 | |
Camden County Improvement Authority | | | | | | | | |
5.00%, 01/15/2028 | | | 500 | | | | 536 | |
5.00%, 01/15/2029 | | | 1,000 | | | | 1,072 | |
5.00%, 01/15/2033 | | | 500 | | | | 536 | |
6.00%, 06/15/2042 | | | 265 | | | | 284 | |
Cherry Hill Township School District | | | | | | | | |
4.00%, 08/01/2038 | | | 11,000 | | | | 11,224 | |
Clearview Regional High School District | | | | | | | | |
4.00%, 08/01/2040 | | | 3,640 | | | | 3,662 | |
County of Essex NJ | | | | | | | | |
2.00%, 08/15/2031 | | | 3,265 | | | | 2,901 | |
County of Hudson NJ | | | | | | | | |
3.00%, 11/15/2025 | | | 4,000 | | | | 3,974 | |
County of Mercer NJ | | | | | | | | |
2.00%, 02/15/2032 | | | 1,180 | | | | 1,041 | |
2.38%, 02/15/2030 | | | 2,020 | | | | 1,898 | |
County of Union NJ | | | | | | | | |
3.00%, 03/01/2026 | | | 3,000 | | | | 3,001 | |
Garden State Preservation Trust | | | | | | | | |
5.75%, 11/01/2028 | | | 2,000 | | | | 2,172 | |
Gloucester County Improvement Authority | | | | | | | | |
4.00%, 07/01/2039 | | | 750 | | | | 743 | |
5.00%, 07/01/2037 | | | 1,130 | | | | 1,235 | |
Hudson County Improvement Authority | | | | | | | | |
4.00%, 01/01/2036 | | | 1,125 | | | | 1,151 | |
4.00%, 01/01/2037 | | | 855 | | | | 869 | |
5.00%, 10/01/2026 | | | 1,500 | | | | 1,598 | |
5.00%, 10/01/2027 | | | 1,000 | | | | 1,089 | |
New Jersey Economic Development Authority | | | | | | | | |
2.20%, 10/01/2039(1) | | | 1,400 | | | | 1,217 | |
3.13%, 07/01/2029 | | | 445 | | | | 425 | |
3.75%, 11/01/2034 | | | 2,480 | | | | 2,466 | |
4.00%, 06/15/2035 | | | 500 | | | | 511 | |
4.00%, 06/15/2037 | | | 600 | | | | 602 | |
4.00%, 06/15/2038 | | | 600 | | | | 596 | |
4.00%, 11/01/2039 | | | 1,000 | | | | 985 | |
4.00%, 06/15/2040 | | | 1,000 | | | | 979 | |
5.00%, 03/01/2025 | | | 23,185 | | | | 23,761 | |
5.00%, 06/15/2025 | | | 5,190 | | | | 5,343 | |
5.00%, 03/01/2026 | | | 10,150 | | | | 10,557 | |
| | | | | | | | |
5.00%, 06/01/2026 | | | 900 | | | | 940 | |
5.00%, 06/15/2026 | | | 470 | | | | 488 | |
5.00%, 06/15/2027 | | | 1,675 | | | | 1,729 | |
5.00%, 06/15/2029 | | | 1,000 | | | | 1,100 | |
5.00%, 06/15/2030 | | | 455 | | | | 462 | |
5.00%, 06/15/2030 | | | 4,000 | | | | 4,341 | |
5.00%, 11/01/2030 | | | 1,315 | | | | 1,451 | |
5.00%, 11/01/2031 | | | 2,200 | | | | 2,415 | |
5.00%, 06/15/2032 | | | 370 | | | | 376 | |
5.00%, 06/15/2033 | | | 1,300 | | | | 1,412 | |
5.00%, 06/15/2033 | | | 5,000 | | | | 5,473 | |
5.00%, 07/01/2033 | | | 2,000 | | | | 2,107 | |
5.00%, 11/01/2033 | | | 1,500 | | | | 1,703 | |
5.00%, 06/15/2034 | | | 1,000 | | | | 1,094 | |
5.00%, 06/15/2035 | | | 1,595 | | | | 1,705 | |
5.00%, 11/01/2035 | | | 1,415 | | | | 1,576 | |
5.00%, 10/01/2039(3) | | | 355 | | | | 257 | |
5.00%, 01/01/2040(3) | | | 540 | | | | 388 | |
5.00%, 06/15/2040 | | | 1,910 | | | | 1,938 | |
5.25%, 09/01/2025(3) | | | 1,605 | | | | 1,664 | |
5.25%, 09/01/2026(3) | | | 30,000 | | | | 31,703 | |
5.25%, 06/15/2036 | | | 1,945 | | | | 2,117 | |
5.50%, 06/15/2030 | | | 2,000 | | | | 2,176 | |
5.63%, 11/15/2030 | | | 750 | | | | 762 | |
New Jersey Educational Facilities Authority | | | | | | | | |
4.00%, 07/01/2034 | | | 3,375 | | | | 3,430 | |
5.00%, 07/01/2023 | | | 3,390 | | | | 3,390 | |
5.00%, 07/01/2032 | | | 4,920 | | | | 5,076 | |
New Jersey Health Care Facilities Financing Authority | | | | | | | | |
4.00%, 07/01/2038 | | | 1,640 | | | | 1,488 | |
4.00%, 07/01/2038 | | | 2,850 | | | | 2,868 | |
4.00%, 07/01/2039 | | | 1,705 | | | | 1,533 | |
5.00%, 07/01/2023 | | | 140 | | | | 140 | |
5.00%, 07/01/2025 | | | 120 | | | | 124 | |
5.00%, 07/01/2026 | | | 40 | | | | 42 | |
5.00%, 07/01/2028 | | | 155 | | | | 164 | |
5.00%, 07/01/2035 | | | 1,415 | | | | 1,506 | |
5.00%, 07/01/2036 | | | 1,490 | | | | 1,570 | |
5.00%, 07/01/2037 | | | 1,565 | | | | 1,631 | |
5.00%, 07/01/2041 | | | 815 | | | | 815 | |
5.00%, 07/01/2042(1) | | | 2,755 | | | | 2,837 | |
5.00%, 07/01/2043(1) | | | 2,250 | | | | 2,285 | |
5.00%, 07/01/2045(1) | | | 3,705 | | | | 3,858 | |
New Jersey Higher Education Student Assistance Authority | | | | | | | | |
5.00%, 12/01/2023 | | | 300 | | | | 301 | |
5.00%, 12/01/2023 | | | 460 | | | | 463 | |
5.00%, 12/01/2024 | | | 745 | | | | 761 | |
5.00%, 12/01/2024 | | | 1,000 | | | | 1,015 | |
5.00%, 12/01/2025 | | | 490 | | | | 508 | |
5.00%, 12/01/2025 | | | 535 | | | | 549 | |
5.00%, 12/01/2025 | | | 1,000 | | | | 1,027 | |
5.00%, 12/01/2025 | | | 2,600 | | | | 2,670 | |
5.00%, 12/01/2026 | | | 1,330 | | | | 1,377 | |
5.00%, 12/01/2026 | | | 1,550 | | | | 1,605 | |
5.00%, 12/01/2027 | | | 1,455 | | | | 1,524 | |
5.00%, 12/01/2027 | | | 1,470 | | | | 1,540 | |
5.00%, 12/01/2027 | | | 2,965 | | | | 3,106 | |
5.00%, 12/01/2030 | | | 4,805 | | | | 5,176 | |
New Jersey Housing & Mortgage Finance Agency | | | | | | | | |
3.50%, 07/01/2025(1) | | | 5,000 | | | | 4,970 | |
3.55%, 04/01/2027 | | | 1,690 | | | | 1,643 | |
3.65%, 04/01/2028 | | | 1,215 | | | | 1,174 | |
New Jersey Infrastructure Bank | | | | | | | | |
5.00%, 09/01/2025 | | | 1,665 | | | | 1,737 | |
New Jersey Transportation Trust Fund Authority | | | | | | | | |
0.00%, 12/15/2026 | | | 2,600 | | | | 2,300 | |
0.00%, 12/15/2026 | | | 3,000 | | | | 2,656 | |
0.00%, 12/15/2027 | | | 3,260 | | | | 2,790 | |
0.00%, 12/15/2028 | | | 1,020 | | | | 840 | |
0.00%, 12/15/2030 | | | 1,000 | | | | 762 | |
0.00%, 12/15/2030 | | | 2,000 | | | | 1,517 | |
0.00%, 12/15/2031 | | | 1,985 | | | | 1,452 | |
0.00%, 12/15/2031 | | | 4,275 | | | | 3,111 | |
4.00%, 06/15/2034 | | | 1,920 | | | | 1,983 | |
4.00%, 06/15/2037 | | | 2,000 | | | | 2,005 | |
4.00%, 06/15/2039 | | | 2,250 | | | | 2,217 | |
4.00%, 06/15/2039 | | | 2,800 | | | | 2,759 | |
4.00%, 06/15/2040 | | | 1,820 | | | | 1,781 | |
4.00%, 06/15/2040 | | | 4,250 | | | | 4,159 | |
4.00%, 06/15/2040 | | | 6,550 | | | | 6,410 | |
4.00%, 06/15/2050 | | | 4,030 | | | | 3,799 | |
5.00%, 12/15/2023 | | | 2,720 | | | | 2,738 | |
5.00%, 06/15/2024 | | | 2,500 | | | | 2,500 | |
| | | | | | | | |
5.00%, 12/15/2024 | | | 1,335 | | | | 1,364 | |
5.00%, 06/15/2025 | | | 450 | | | | 450 | |
5.00%, 12/15/2025 | | | 1,255 | | | | 1,301 | |
5.00%, 12/15/2026 | | | 2,000 | | | | 2,110 | |
5.00%, 06/15/2027 | | | 505 | | | | 528 | |
5.00%, 12/15/2028 | | | 5,510 | | | | 6,018 | |
5.00%, 06/15/2029 | | | 1,200 | | | | 1,256 | |
5.00%, 12/15/2029 | | | 820 | | | | 909 | |
5.00%, 06/15/2030 | | | 4,850 | | | | 5,072 | |
5.00%, 06/15/2031 | | | 2,420 | | | | 2,527 | |
5.00%, 06/15/2032 | | | 235 | | | | 241 | |
5.00%, 06/15/2032 | | | 1,910 | | | | 2,171 | |
5.00%, 06/15/2032 | | | 2,725 | | | | 2,956 | |
5.00%, 06/15/2032 | | | 7,440 | | | | 8,357 | |
5.00%, 12/15/2032 | | | 1,940 | | | | 2,103 | |
5.00%, 06/15/2033 | | | 6,385 | | | | 7,228 | |
5.00%, 12/15/2033 | | | 595 | | | | 650 | |
5.00%, 12/15/2033 | | | 2,200 | | | | 2,376 | |
5.00%, 06/15/2034 | | | 1,500 | | | | 1,696 | |
5.00%, 06/15/2034 | | | 4,040 | | | | 4,544 | |
5.00%, 12/15/2034 | | | 1,130 | | | | 1,217 | |
5.00%, 06/15/2035 | | | 1,280 | | | | 1,426 | |
5.00%, 12/15/2036 | | | 1,915 | | | | 2,028 | |
5.00%, 06/15/2037 | | | 1,470 | | | | 1,609 | |
5.00%, 06/15/2037 | | | 1,780 | | | | 1,917 | |
5.00%, 06/15/2037 | | | 2,980 | | | | 3,249 | |
5.00%, 06/15/2038 | | | 5,000 | | | | 5,447 | |
5.00%, 06/15/2040 | | | 2,040 | | | | 2,173 | |
5.00%, 06/15/2050 | | | 905 | | | | 954 | |
5.25%, 12/15/2023 | | | 3,940 | | | | 3,970 | |
5.25%, 06/15/2036 | | | 2,000 | | | | 2,255 | |
5.25%, 06/15/2039 | | | 5,000 | | | | 5,518 | |
5.25%, 06/15/2041 | | | 5,000 | | | | 5,502 | |
5.50%, 12/15/2023 | | | 190 | | | | 192 | |
New Jersey Turnpike Authority | | | | | | | | |
5.00%, 01/01/2028 | | | 1,540 | | | | 1,624 | |
5.00%, 01/01/2033 | | | 5,000 | | | | 5,129 | |
5.00%, 01/01/2034 | | | 1,000 | | | | 1,015 | |
5.00%, 01/01/2034 | | | 1,175 | | | | 1,204 | |
5.00%, 01/01/2042 | | | 10,950 | | | | 12,148 | |
Newark Board of Education | | | | | | | | |
4.00%, 07/15/2037 | | | 2,075 | | | | 2,053 | |
5.00%, 07/15/2031 | | | 1,300 | | | | 1,466 | |
5.00%, 07/15/2033 | | | 1,600 | | | | 1,799 | |
Salem County Improvement Authority | | | | | | | | |
4.00%, 08/15/2042 | | | 400 | | | | 391 | |
Sayreville School District | | | | | | | | |
4.00%, 01/15/2036 | | | 5,530 | | | | 5,736 | |
4.00%, 01/15/2038 | | | 3,700 | | | | 3,760 | |
State of New Jersey | | | | | | | | |
2.00%, 06/01/2036 | | | 1,770 | | | | 1,371 | |
4.00%, 06/01/2030 | | | 4,560 | | | | 4,842 | |
4.00%, 06/01/2031 | | | 3,845 | | | | 4,108 | |
4.00%, 06/01/2032 | | | 470 | | | | 504 | |
5.00%, 06/01/2025 | | | 2,635 | | | | 2,728 | |
5.00%, 06/01/2026 | | | 3,420 | | | | 3,606 | |
5.00%, 06/01/2027 | | | 7,000 | | | | 7,527 | |
5.00%, 06/01/2029 | | | 13,235 | | | | 14,781 | |
5.00%, 06/01/2039 | | | 3,902 | | | | 4,257 | |
5.00%, 06/01/2040 | | | 2,220 | | | | 2,407 | |
Tender Option Bond Trust Receipts/Certificates | | | | | | | | |
4.31%, 12/15/2028(1)(3) | | | 1,035 | | | | 1,035 | |
Tobacco Settlement Financing Corp. | | | | | | | | |
5.00%, 06/01/2046 | | | 1,590 | | | | 1,596 | |
| | | | | | | | |
Total New Jersey | | | | 442,343 | |
| | | | | | | | |
New Mexico – 0.31% | | | | | | | | |
Albuquerque Bernalillo County Water Utility Authority | | | | | | | | |
5.00%, 07/01/2027 | | | 2,400 | | | | 2,541 | |
5.00%, 07/01/2028 | | | 1,700 | | | | 1,799 | |
Albuquerque Municipal School District No 12 | | | | | | | | |
5.00%, 08/01/2025 | | | 800 | | | | 829 | |
Farmington Municipal School District No 5 | | | | | | | | |
5.00%, 09/01/2024 | | | 490 | | | | 500 | |
New Mexico Educational Assistance Foundation | | | | | | | | |
5.00%, 09/01/2024 | | | 4,750 | | | | 4,816 | |
5.00%, 09/01/2026 | | | 1,530 | | | | 1,588 | |
5.00%, 09/01/2027 | | | 2,130 | | | | 2,241 | |
5.00%, 09/01/2029 | | | 1,000 | | | | 1,076 | |
New Mexico Hospital Equipment Loan Council | | | | | | | | |
5.00%, 08/01/2049(1) | | | 2,360 | | | | 2,430 | |
New Mexico Mortgage Finance Authority | | | | | | | | |
3.75%, 01/01/2050 | | | 480 | | | | 473 | |
New Mexico Municipal Energy Acquisition Authority | | | | | | | | |
| | | | | | | | |
5.00%, 11/01/2039(1) | | | 17,250 | | | | 17,618 | |
| | | | | | | | |
Total New Mexico | | | | 35,911 | |
| | | | | | | | |
New York – 10.96% | | | | | | | | |
Broome County Local Development Corp. | | | | | | | | |
4.00%, 04/01/2034 | | | 1,000 | | | | 1,022 | |
Buffalo Sewer Authority | | | | | | | | |
4.00%, 06/15/2036 | | | 265 | | | | 270 | |
Build NYC Resource Corp. | | | | | | | | |
5.00%, 08/01/2023 | | | 515 | | | | 516 | |
City of Long Beach NY | | | | | | | | |
5.00%, 09/01/2028 | | | 2,000 | | | | 2,118 | |
5.00%, 09/01/2029 | | | 2,800 | | | | 3,013 | |
City of New York NY | | | | | | | | |
3.00%, 08/01/2036 | | | 2,500 | | | | 2,327 | |
4.00%, 10/01/2035 | | | 905 | | | | 939 | |
4.00%, 08/01/2037 | | | 2,500 | | | | 2,555 | |
4.00%, 08/01/2038 | | | 3,500 | | | | 3,552 | |
4.00%, 03/01/2040 | | | 5,870 | | | | 5,889 | |
4.00%, 08/01/2040 | | | 3,305 | | | | 3,317 | |
4.00%, 03/01/2042 | | | 530 | | | | 528 | |
5.00%, 08/01/2025 | | | 1,600 | | | | 1,661 | |
5.00%, 08/01/2026 | | | 2,575 | | | | 2,733 | |
5.00%, 08/01/2027 | | | 400 | | | | 411 | |
5.00%, 08/01/2027 | | | 2,975 | | | | 3,086 | |
5.00%, 08/01/2027 | | | 5,510 | | | | 5,961 | |
5.00%, 08/01/2028 | | | 400 | | | | 419 | |
5.00%, 08/01/2028 | | | 700 | | | | 740 | |
5.00%, 08/01/2028 | | | 3,975 | | | | 4,122 | |
5.00%, 08/01/2029 | | | 1,305 | | | | 1,424 | |
5.00%, 08/01/2031 | | | 1,000 | | | | 1,089 | |
5.00%, 08/01/2032 | | | 1,745 | | | | 1,884 | |
5.00%, 11/01/2032 | | | 2,200 | | | | 2,514 | |
5.00%, 08/01/2033 | | | 1,000 | | | | 1,171 | |
5.00%, 01/01/2034 | | | 1,575 | | | | 1,739 | |
5.00%, 06/01/2034 | | | 2,685 | | | | 2,768 | |
5.00%, 08/01/2034 | | | 1,690 | | | | 1,914 | |
5.00%, 05/01/2035 | | | 585 | | | | 675 | |
5.00%, 06/01/2035 | | | 13,455 | | | | 13,839 | |
5.00%, 08/01/2037 | | | 1,500 | | | | 1,718 | |
5.00%, 03/01/2038 | | | 2,250 | | | | 2,469 | |
5.00%, 09/01/2038 | | | 2,200 | | | | 2,479 | |
5.00%, 08/01/2047 | | | 6,100 | | | | 6,652 | |
5.00%, 03/01/2050 | | | 575 | | | | 621 | |
5.25%, 09/01/2040 | | | 19,695 | | | | 22,462 | |
5.25%, 10/01/2040 | | | 2,275 | | | | 2,597 | |
5.25%, 09/01/2041 | | | 10,355 | | | | 11,769 | |
5.25%, 10/01/2047 | | | 2,750 | | | | 3,091 | |
City of Yonkers NY | | | | | | | | |
5.00%, 09/01/2025 | | | 1,015 | | | | 1,054 | |
County of Erie NY | | | | | | | | |
5.00%, 06/01/2025 | | | 1,000 | | | | 1,037 | |
County of Nassau NY | | | | | | | | |
5.00%, 10/01/2024 | | | 3,000 | | | | 3,071 | |
County of Suffolk NY | | | | | | | | |
4.00%, 02/01/2028 | | | 1,865 | | | | 1,965 | |
5.00%, 06/15/2024 | | | 665 | | | | 676 | |
5.00%, 06/15/2025 | | | 710 | | | | 736 | |
5.00%, 10/01/2025 | | | 810 | | | | 844 | |
5.00%, 10/01/2026 | | | 415 | | | | 442 | |
5.00%, 10/01/2028 | | | 680 | | | | 756 | |
5.00%, 06/15/2029 | | | 985 | | | | 1,110 | |
Erie County Fiscal Stability Authority | | | | | | | | |
5.00%, 09/01/2033 | | | 525 | | | | 568 | |
Genesee County Funding Corp. | | | | | | | | |
5.00%, 12/01/2031 | | | 375 | | | | 400 | |
5.00%, 12/01/2032 | | | 460 | | | | 487 | |
5.00%, 12/01/2033 | | | 750 | | | | 792 | |
5.00%, 12/01/2034 | | | 700 | | | | 736 | |
5.00%, 12/01/2035 | | | 540 | | | | 563 | |
Hempstead Town Local Development Corp. | | | | | | | | |
4.00%, 07/01/2039 | | | 575 | | | | 565 | |
5.53%, 02/01/2040 | | | 3,500 | | | | 3,371 | |
5.89%, 02/01/2032 | | | 1,250 | | | | 1,266 | |
6.24%, 02/01/2047 | | | 1,000 | | | | 1,019 | |
6.47%, 02/01/2033 | | | 1,000 | | | | 1,040 | |
Hudson Yards Infrastructure Corp. | | | | | | | | |
4.00%, 02/15/2038 | | | 8,720 | | | | 8,836 | |
4.00%, 02/15/2039 | | | 1,450 | | | | 1,461 | |
4.00%, 02/15/2044 | | | 18,870 | | | | 18,617 | |
4.00%, 02/15/2047 | | | 2,230 | | | | 2,179 | |
5.00%, 02/15/2032 | | | 2,325 | | | | 2,490 | |
5.00%, 02/15/2035 | | | 1,700 | | | | 1,812 | |
5.00%, 02/15/2037 | | | 1,335 | | | | 1,413 | |
| | | | | | | | |
Long Island Power Authority | | | | | | | | |
0.00%, 12/01/2029 | | | 14,875 | | | | 14,766 | |
0.85%, 09/01/2050(1) | | | 16,125 | | | | 15,109 | |
1.00%, 09/01/2025 | | | 9,250 | | | | 8,608 | |
1.50%, 09/01/2051(1) | | | 4,310 | | | | 3,992 | |
1.65%, 09/01/2049(1) | | | 4,395 | | | | 4,288 | |
5.00%, 09/01/2023 | | | 550 | | | | 551 | |
5.00%, 09/01/2024 | | | 565 | | | | 578 | |
5.00%, 09/01/2025 | | | 1,000 | | | | 1,043 | |
5.00%, 09/01/2026 | | | 2,000 | | | | 2,132 | |
5.00%, 09/01/2027 | | | 6,500 | | | | 7,079 | |
5.00%, 09/01/2033 | | | 600 | | | | 711 | |
5.00%, 09/01/2034 | | | 650 | | | | 767 | |
5.00%, 09/01/2037 | | | 1,000 | | | | 1,070 | |
5.00%, 09/01/2039 | | | 1,000 | | | | 1,016 | |
5.00%, 09/01/2052(1) | | | 6,450 | | | | 6,835 | |
Metropolitan Transportation Authority | | | | | | | | |
0.00%, 11/15/2033 | | | 1,600 | | | | 1,053 | |
4.00%, 11/15/2039 | | | 540 | | | | 542 | |
4.00%, 11/15/2045 | | | 5,560 | | | | 5,248 | |
4.00%, 11/15/2046 | | | 2,545 | | | | 2,393 | |
5.00%, 11/15/2024 | | | 1,500 | | | | 1,538 | |
5.00%, 11/15/2024 | | | 1,885 | | | | 1,896 | |
5.00%, 11/15/2025 | | | 1,155 | | | | 1,190 | |
5.00%, 11/15/2026 | | | 1,600 | | | | 1,669 | |
5.00%, 11/15/2026 | | | 2,350 | | | | 2,451 | |
5.00%, 11/15/2028 | | | 2,970 | | | | 3,173 | |
5.00%, 11/15/2028 | | | 4,000 | | | | 4,280 | |
5.00%, 11/15/2029 | | | 745 | | | | 761 | |
5.00%, 11/15/2029 | | | 2,220 | | | | 2,285 | |
5.00%, 11/15/2030 | | | 730 | | | | 775 | |
5.00%, 11/15/2031 | | | 1,055 | | | | 1,093 | |
5.00%, 11/15/2033 | | | 1,025 | | | | 1,050 | |
5.00%, 11/15/2033 | | | 1,715 | | | | 1,821 | |
5.00%, 11/15/2033 | | | 3,645 | | | | 3,870 | |
5.00%, 11/15/2034 | | | 275 | | | | 320 | |
5.00%, 11/15/2034 | | | 7,500 | | | | 7,941 | |
5.00%, 11/15/2035 | | | 1,750 | | | | 1,787 | |
5.00%, 11/15/2036 | | | 820 | | | | 865 | |
5.00%, 11/15/2037 | | | 1,500 | | | | 1,546 | |
5.00%, 11/15/2039 | | | 2,000 | | | | 2,010 | |
5.00%, 11/15/2048(1) | | | 1,410 | | | | 1,425 | |
5.25%, 11/15/2036 | | | 5,000 | | | | 5,315 | |
Monroe County Industrial Development Corp. | | | | | | | | |
5.00%, 07/01/2025 | | | 885 | | | | 919 | |
5.00%, 12/01/2032 | | | 1,000 | | | | 1,050 | |
5.00%, 12/01/2033 | | | 1,000 | | | | 1,048 | |
5.00%, 12/01/2034 | | | 1,100 | | | | 1,149 | |
5.00%, 01/01/2050 | | | 490 | | | | 390 | |
MTA Hudson Rail Yards Trust Obligations | | | | | | | | |
5.00%, 11/15/2051 | | | 1,500 | | | | 1,500 | |
5.00%, 11/15/2056 | | | 4,380 | | | | 4,383 | |
New York City Educational Construction Fund | | | | | | | | |
5.00%, 04/01/2052 | | | 3,070 | | | | 3,269 | |
New York City Health & Hospitals Corp. | | | | | | | | |
4.00%, 02/15/2025 | | | 1,060 | | | | 1,075 | |
New York City Housing Development Corp. | | | | | | | | |
0.60%, 05/01/2061(1) | | | 2,775 | | | | 2,568 | |
0.70%, 11/01/2060(1) | | | 7,205 | | | | 6,726 | |
0.70%, 11/01/2060(1) | | | 20,320 | | | | 18,906 | |
0.90%, 11/01/2060(1) | | | 24,505 | | | | 22,450 | |
1.13%, 05/01/2060(1) | | | 7,500 | | | | 7,210 | |
3.40%, 11/01/2062(1) | | | 7,060 | | | | 6,956 | |
5.00%, 05/01/2026 | | | 110 | | | | 115 | |
5.00%, 05/01/2027 | | | 600 | | | | 638 | |
5.00%, 11/01/2027 | | | 855 | | | | 918 | |
5.00%, 05/01/2028 | | | 875 | | | | 947 | |
5.00%, 11/01/2028 | | | 600 | | | | 654 | |
5.00%, 05/01/2029 | | | 300 | | | | 329 | |
5.00%, 11/01/2029 | | | 875 | | | | 964 | |
5.00%, 11/01/2030 | | | 500 | | | | 557 | |
New York City Industrial Development Agency | | | | | | | | |
5.00%, 01/01/2024 | | | 2,250 | | | | 2,268 | |
5.00%, 01/01/2031 | | | 1,250 | | | | 1,405 | |
New York City Municipal Water Finance Authority | | | | | | | | |
3.65%, 06/15/2048(1) | | | 2,850 | | | | 2,850 | |
3.65%, 06/15/2049 | | | 2,800 | | | | 2,800 | |
4.00%, 06/15/2039 | | | 1,500 | | | | 1,515 | |
4.00%, 06/15/2039 | | | 9,020 | | | | 9,117 | |
4.00%, 06/15/2040 | | | 5,200 | | | | 5,218 | |
5.00%, 06/15/2029 | | | 1,100 | | | | 1,198 | |
5.00%, 06/15/2031 | | | 6,075 | | | | 6,279 | |
5.00%, 06/15/2032 | | | 1,000 | | | | 1,159 | |
| | | | | | | | |
5.00%, 06/15/2034 | | | 6,000 | | | | 7,089 | |
5.00%, 06/15/2035 | | | 9,025 | | | | 9,385 | |
5.00%, 06/15/2036 | | | 5,000 | | | | 5,194 | |
5.00%, 06/15/2037 | | | 6,000 | | | | 6,173 | |
5.00%, 06/15/2038 | | | 2,375 | | | | 2,593 | |
5.00%, 06/15/2039 | | | 2,000 | | | | 2,056 | |
5.00%, 06/15/2039 | | | 8,320 | | | | 8,555 | |
5.00%, 06/15/2040 | | | 1,130 | | | | 1,232 | |
5.00%, 06/15/2040 | | | 2,115 | | | | 2,292 | |
5.00%, 06/15/2040 | | | 5,000 | | | | 5,326 | |
5.00%, 06/15/2049 | | | 3,375 | | | | 3,577 | |
New York City Transitional Finance Authority Building Aid Revenue | | | | | | | | |
4.00%, 07/15/2040 | | | 1,060 | | | | 1,062 | |
5.00%, 07/15/2025 | | | 1,695 | | | | 1,759 | |
5.00%, 07/15/2026 | | | 1,995 | | | | 2,115 | |
5.00%, 07/15/2027 | | | 1,940 | | | | 2,104 | |
5.00%, 07/15/2032 | | | 2,000 | | | | 2,163 | |
5.00%, 07/15/2035 | | | 10,000 | | | | 10,410 | |
5.00%, 07/15/2037 | | | 1,905 | | | | 2,050 | |
5.00%, 07/15/2043 | | | 3,240 | | | | 3,333 | |
New York City Transitional Finance Authority Future Tax Secured Revenue | | | | | | | | |
3.00%, 11/01/2037 | | | 9,000 | | | | 8,046 | |
3.00%, 11/01/2039 | | | 1,975 | | | | 1,709 | |
3.60%, 08/01/2039(1) | | | 1,800 | | | | 1,800 | |
3.75%, 11/01/2044(1) | | | 2,000 | | | | 2,000 | |
4.00%, 05/01/2036 | | | 2,000 | | | | 2,076 | |
4.00%, 02/01/2038 | | | 9,675 | | | | 9,882 | |
4.00%, 05/01/2038 | | | 26,755 | | | | 27,255 | |
4.00%, 08/01/2038 | | | 500 | | | | 507 | |
4.00%, 05/01/2039 | | | 5,000 | | | | 5,045 | |
4.00%, 02/01/2043 | | | 1,600 | | | | 1,583 | |
4.00%, 05/01/2043 | | | 785 | | | | 776 | |
5.00%, 11/01/2023 | | | 2,165 | | | | 2,178 | |
5.00%, 11/01/2024 | | | 4,215 | | | | 4,323 | |
5.00%, 11/01/2025 | | | 5,355 | | | | 5,595 | |
5.00%, 11/01/2028 | | | 1,500 | | | | 1,567 | |
5.00%, 11/01/2029 | | | 2,000 | | | | 2,067 | |
5.00%, 11/01/2029 | | | 7,000 | | | | 7,098 | |
5.00%, 02/01/2030 | | | 4,480 | | | | 4,682 | |
5.00%, 11/01/2030 | | | 8,000 | | | | 8,112 | |
5.00%, 05/01/2033 | | | 2,535 | | | | 2,773 | |
5.00%, 08/01/2034 | | | 700 | | | | 766 | |
5.00%, 11/01/2034 | | | 2,300 | | | | 2,678 | |
5.00%, 08/01/2035 | | | 1,600 | | | | 1,742 | |
5.00%, 11/01/2036 | | | 350 | | | | 402 | |
5.00%, 11/01/2037 | | | 4,165 | | | | 4,767 | |
5.00%, 08/01/2038 | | | 1,975 | | | | 2,123 | |
5.00%, 02/01/2039 | | | 10,000 | | | | 11,176 | |
5.00%, 02/01/2040 | | | 2,870 | | | | 3,010 | |
5.00%, 11/01/2040 | | | 19,305 | | | | 21,750 | |
5.00%, 02/01/2041 | | | 200 | | | | 204 | |
5.00%, 02/01/2041 | | | 5,000 | | | | 5,542 | |
5.00%, 05/01/2042 | | | 4,250 | | | | 4,464 | |
5.25%, 11/01/2037 | | | 3,750 | | | | 4,369 | |
5.25%, 11/01/2037 | | | 7,000 | | | | 8,156 | |
5.50%, 11/01/2045 | | | 10,900 | | | | 12,488 | |
New York Convention Center Development Corp. | | | | | | | | |
5.00%, 11/15/2033 | | | 3,000 | | | | 3,100 | |
5.00%, 11/15/2040 | | | 1,085 | | | | 1,111 | |
New York Liberty Development Corp. | | | | | | | | |
2.75%, 11/15/2041 | | | 14,370 | | | | 11,328 | |
4.00%, 02/15/2043 | | | 3,550 | | | | 3,488 | |
4.00%, 02/15/2043 | | | 4,250 | | | | 4,173 | |
5.00%, 11/15/2044(3) | | | 3,720 | | | | 3,657 | |
New York Power Authority | | | | | | | | |
4.00%, 11/15/2038 | | | 3,500 | | | | 3,581 | |
New York State Bridge Authority | | | | | | | | |
5.00%, 01/01/2035 | | | 565 | | | | 640 | |
5.00%, 01/01/2036 | | | 475 | | | | 533 | |
5.00%, 01/01/2037 | | | 535 | | | | 592 | |
New York State Dormitory Authority | | | | | | | | |
3.00%, 03/15/2041 | | | 3,860 | | | | 3,265 | |
4.00%, 03/15/2037 | | | 3,030 | | | | 3,097 | |
4.00%, 03/15/2038 | | | 7,685 | | | | 7,783 | |
4.00%, 03/15/2039 | | | 1,200 | | | | 1,208 | |
4.00%, 03/15/2042 | | | 20,445 | | | | 20,292 | |
4.00%, 03/15/2043 | | | 4,000 | | | | 3,962 | |
4.00%, 03/15/2045 | | | 1,150 | | | | 1,130 | |
5.00%, 07/01/2023 | | | 5 | | | | 5 | |
5.00%, 07/01/2023 | | | 5 | | | | 5 | |
5.00%, 07/01/2023 | | | 240 | | | | 240 | |
5.00%, 07/01/2023 | | | 1,000 | | | | 1,000 | |
5.00%, 03/15/2024 | | | 3,700 | | | | 3,750 | |
| | | | | | | | |
5.00%, 05/01/2024 | | | 4,870 | | | | 4,932 | |
5.00%, 07/01/2024 | | | 5 | | | | 5 | |
5.00%, 07/01/2024 | | | 10 | | | | 10 | |
5.00%, 07/01/2024 | | | 335 | | | | 341 | |
5.00%, 03/15/2025 | | | 500 | | | | 517 | |
5.00%, 07/01/2025 | | | 5 | | | | 5 | |
5.00%, 07/01/2025 | | | 5 | | | | 5 | |
5.00%, 07/01/2025 | | | 250 | | | | 259 | |
5.00%, 03/15/2027 | | | 2,500 | | | | 2,585 | |
5.00%, 07/01/2027 | | | 200 | | | | 207 | |
5.00%, 07/01/2028 | | | 110 | | | | 115 | |
5.00%, 10/01/2029 | | | 1,430 | | | | 1,550 | |
5.00%, 07/01/2030 | | | 150 | | | | 159 | |
5.00%, 10/01/2030 | | | 1,910 | | | | 2,068 | |
5.00%, 03/15/2032 | | | 3,000 | | | | 3,344 | |
5.00%, 03/15/2033 | | | 2,335 | | | | 2,731 | |
5.00%, 07/01/2034 | | | 410 | | | | 437 | |
5.00%, 10/01/2034 | | | 3,745 | | | | 4,082 | |
5.00%, 03/15/2035 | | | 1,500 | | | | 1,537 | |
5.00%, 03/15/2036 | | | 3,500 | | | | 4,015 | |
5.00%, 03/15/2036 | | | 5,000 | | | | 5,660 | |
5.00%, 07/01/2036 | | | 735 | | | | 770 | |
5.00%, 07/15/2037 | | | 700 | | | | 724 | |
5.00%, 02/15/2039 | | | 2,995 | | | | 3,171 | |
5.00%, 10/01/2040 | | | 1,000 | | | | 1,100 | |
5.00%, 03/15/2041 | | | 1,065 | | | | 1,180 | |
5.00%, 03/15/2041 | | | 1,335 | | | | 1,431 | |
5.00%, 10/01/2041 | | | 1,950 | | | | 2,135 | |
5.00%, 05/01/2048(1) | | | 1,040 | | | | 1,071 | |
5.00%, 05/01/2048(1) | | | 5,695 | | | | 5,719 | |
5.25%, 03/15/2033 | | | 6,000 | | | | 6,250 | |
5.25%, 03/15/2038 | | | 1,930 | | | | 2,109 | |
New York State Housing Finance Agency | | | | | | | | |
0.55%, 11/01/2024 | | | 4,015 | | | | 3,850 | |
0.65%, 11/01/2056(1) | | | 7,645 | | | | 7,031 | |
0.75%, 05/01/2025 | | | 10,450 | | | | 9,751 | |
0.75%, 11/01/2025 | | | 960 | | | | 878 | |
0.75%, 11/01/2025 | | | 2,785 | | | | 2,570 | |
0.75%, 11/01/2025 | | | 4,545 | | | | 4,180 | |
1.00%, 11/01/2061(1) | | | 1,815 | | | | 1,650 | |
1.10%, 11/01/2061(1) | | | 13,130 | | | | 11,632 | |
2.50%, 11/01/2060(1) | | | 9,700 | | | | 9,247 | |
3.80%, 11/01/2062 | | | 7,355 | | | | 7,363 | |
New York State Thruway Authority | | | | | | | | |
4.00%, 01/01/2039 | | | 4,470 | | | | 4,501 | |
4.00%, 01/01/2040 | | | 5,000 | | | | 5,005 | |
4.00%, 03/15/2043 | | | 9,000 | | | | 8,890 | |
5.00%, 01/01/2032 | | | 775 | | | | 794 | |
5.00%, 01/01/2033 | | | 6,000 | | | | 6,046 | |
5.00%, 03/15/2034 | | | 2,750 | | | | 3,228 | |
5.00%, 03/15/2038 | | | 10,260 | | | | 11,619 | |
New York State Urban Development Corp. | | | | | | | | |
3.00%, 03/15/2048 | | | 1,000 | | | | 778 | |
4.00%, 03/15/2038 | | | 800 | | | | 810 | |
4.00%, 03/15/2038 | | | 8,675 | | | | 8,823 | |
4.00%, 03/15/2039 | | | 9,995 | | | | 10,088 | |
4.00%, 03/15/2042 | | | 1,500 | | | | 1,491 | |
4.00%, 03/15/2045 | | | 790 | | | | 778 | |
5.00%, 03/15/2024 | | | 400 | | | | 405 | |
5.00%, 03/15/2035 | | | 2,800 | | | | 2,829 | |
5.00%, 03/15/2035 | | | 3,000 | | | | 3,404 | |
5.00%, 03/15/2036 | | | 2,090 | | | | 2,354 | |
5.00%, 03/15/2037 | | | 8,135 | | | | 8,939 | |
5.00%, 03/15/2038 | | | 1,275 | | | | 1,373 | |
New York Transportation Development Corp. | | | | | | | | |
4.00%, 10/01/2030 | | | 3,860 | | | | 3,848 | |
4.00%, 12/01/2039 | | | 450 | | | | 438 | |
4.00%, 12/01/2040 | | | 500 | | | | 484 | |
4.00%, 12/01/2041 | | | 450 | | | | 433 | |
4.00%, 12/01/2042 | | | 500 | | | | 477 | |
5.00%, 12/01/2028 | | | 400 | | | | 423 | |
5.00%, 12/01/2028 | | | 1,300 | | | | 1,404 | |
5.00%, 12/01/2029 | | | 300 | | | | 328 | |
5.00%, 12/01/2030 | | | 250 | | | | 276 | |
5.00%, 01/01/2031 | | | 1,015 | | | | 1,054 | |
5.00%, 12/01/2031 | | | 300 | | | | 331 | |
5.00%, 12/01/2032 | | | 1,775 | | | | 1,953 | |
5.00%, 12/01/2032 | | | 2,355 | | | | 2,566 | |
5.00%, 01/01/2033 | | | 5,500 | | | | 5,706 | |
5.00%, 12/01/2033 | | | 700 | | | | 748 | |
5.00%, 12/01/2033 | | | 985 | | | | 1,082 | |
5.00%, 12/01/2033 | | | 3,650 | | | | 3,956 | |
5.00%, 12/01/2034 | | | 500 | | | | 546 | |
| | | | | | | | |
5.00%, 12/01/2034 | | | 3,990 | | | | 4,298 | |
5.00%, 12/01/2035 | | | 500 | | | | 542 | |
5.00%, 12/01/2035 | | | 800 | | | | 846 | |
5.00%, 12/01/2035 | | | 2,335 | | | | 2,499 | |
5.00%, 12/01/2036 | | | 550 | | | | 591 | |
5.00%, 12/01/2036 | | | 1,360 | | | | 1,442 | |
5.00%, 12/01/2037 | | | 600 | | | | 641 | |
5.00%, 12/01/2037 | | | 3,625 | | | | 3,812 | |
5.00%, 12/01/2038 | | | 500 | | | | 533 | |
5.00%, 12/01/2038 | | | 2,420 | | | | 2,537 | |
5.00%, 07/01/2041 | | | 2,300 | | | | 2,299 | |
5.00%, 07/01/2046 | | | 41,870 | | | | 41,369 | |
Niagara Area Development Corp. | | | | | | | | |
5.00%, 07/01/2052 | | | 1,000 | | | | 756 | |
Oneida County Local Development Corp. | | | | | | | | |
5.00%, 12/01/2025 | | | 320 | | | | 323 | |
5.00%, 12/01/2027 | | | 1,425 | | | | 1,436 | |
5.00%, 12/01/2028 | | | 1,000 | | | | 1,008 | |
5.00%, 12/01/2035 | | | 1,160 | | | | 1,282 | |
Onondaga Civic Development Corp. | | | | | | | | |
5.00%, 12/01/2033 | | | 1,000 | | | | 1,143 | |
Port Authority of New York & New Jersey | | | | | | | | |
3.00%, 12/01/2032 | | | 5,000 | | | | 4,995 | |
4.00%, 11/01/2037 | | | 2,000 | | | | 2,016 | |
5.00%, 09/15/2024 | | | 5,115 | | | | 5,196 | |
5.00%, 09/15/2026 | | | 1,000 | | | | 1,042 | |
5.00%, 10/15/2028 | | | 4,000 | | | | 4,100 | |
5.00%, 09/15/2029 | | | 1,500 | | | | 1,593 | |
5.00%, 10/15/2029 | | | 1,000 | | | | 1,049 | |
5.00%, 07/15/2031 | | | 4,000 | | | | 4,391 | |
5.00%, 12/01/2031 | | | 5,000 | | | | 5,022 | |
5.00%, 09/15/2032 | | | 1,500 | | | | 1,589 | |
5.00%, 10/15/2033 | | | 1,200 | | | | 1,214 | |
5.00%, 10/15/2033 | | | 6,000 | | | | 6,285 | |
5.00%, 11/15/2033 | | | 5,660 | | | | 5,866 | |
5.00%, 12/01/2033 | | | 5,070 | | | | 5,092 | |
5.00%, 08/01/2034 | | | 7,415 | | | | 8,228 | |
5.00%, 10/15/2034 | | | 980 | | | | 992 | |
5.00%, 01/15/2035 | | | 150 | | | | 177 | |
5.00%, 01/15/2036 | | | 200 | | | | 233 | |
5.00%, 10/15/2036 | | | 2,300 | | | | 2,321 | |
5.00%, 01/15/2037 | | | 225 | | | | 258 | |
5.00%, 10/15/2037 | | | 4,665 | | | | 4,702 | |
5.00%, 01/15/2039 | | | 360 | | | | 389 | |
5.00%, 01/15/2039 | | | 450 | | | | 507 | |
5.00%, 01/15/2040 | | | 500 | | | | 560 | |
5.00%, 01/15/2041 | | | 475 | | | | 530 | |
5.00%, 10/15/2041 | | | 3,240 | | | | 3,337 | |
5.00%, 11/15/2041 | | | 1,550 | | | | 1,589 | |
5.00%, 01/15/2042 | | | 975 | | | | 1,082 | |
5.25%, 08/01/2040 | | | 2,000 | | | | 2,189 | |
5.50%, 08/01/2041 | | | 11,255 | | | | 12,543 | |
St Lawrence County Industrial Development Agency | | | | | | | | |
5.00%, 07/01/2032 | | | 350 | | | | 402 | |
5.00%, 07/01/2033 | | | 400 | | | | 457 | |
5.00%, 07/01/2034 | | | 350 | | | | 398 | |
5.00%, 07/01/2035 | | | 400 | | | | 451 | |
5.00%, 07/01/2036 | | | 840 | | | | 938 | |
5.00%, 07/01/2037 | | | 880 | | | | 972 | |
State of New York Mortgage Agency | | | | | | | | |
2.20%, 10/01/2029 | | | 1,000 | | | | 897 | |
3.25%, 10/01/2051 | | | 9,000 | | | | 8,689 | |
5.00%, 10/01/2023 | | | 920 | | | | 922 | |
Suffolk County Economic Development Corp. | | | | | | | | |
5.38%, 11/01/2054(3) | | | 1,210 | | | | 916 | |
Tender Option Bond Trust Receipts/Certificates | | | | | | | | |
4.31%, 05/01/2030(1)(3) | | | 3,600 | | | | 3,600 | |
Town of Hempstead NY | | | | | | | | |
4.00%, 06/15/2028 | | | 3,665 | | | | 3,804 | |
Town of Oyster Bay NY | | | | | | | | |
2.00%, 03/01/2033 | | | 1,415 | | | | 1,231 | |
Triborough Bridge & Tunnel Authority | | | | | | | | |
2.00%, 05/15/2045(1) | | | 2,425 | | | | 2,215 | |
2.00%, 05/15/2045(1) | | | 6,375 | | | | 5,848 | |
4.00%, 11/15/2033 | | | 570 | | | | 624 | |
4.00%, 11/15/2034 | | | 115 | | | | 124 | |
4.00%, 05/15/2040 | | | 1,250 | | | | 1,247 | |
4.00%, 05/15/2042 | | | 2,840 | | | | 2,811 | |
5.00%, 11/15/2030 | | | 4,000 | | | | 4,641 | |
5.00%, 11/15/2030 | | | 14,000 | | | | 15,939 | |
5.00%, 11/15/2032 | | | 8,095 | | | | 9,634 | |
5.00%, 11/15/2033 | | | 6,000 | | | | 6,875 | |
5.00%, 11/15/2034 | | | 430 | | | | 514 | |
| | | | | | | | |
5.00%, 11/15/2034 | | | 4,165 | | | | 4,598 | |
5.00%, 11/15/2035 | | | 3,835 | | | | 4,103 | |
5.00%, 11/15/2038 | | | 1,000 | | | | 1,033 | |
5.00%, 05/15/2039 | | | 11,650 | | | | 13,018 | |
5.00%, 11/15/2039 | | | 3,000 | | | | 3,388 | |
5.00%, 05/15/2041 | | | 5,075 | | | | 5,613 | |
5.00%, 11/15/2042 | | | 1,910 | | | | 2,040 | |
5.00%, 11/15/2042 | | | 2,900 | | | | 3,196 | |
5.00%, 05/15/2051(1) | | | 1,900 | | | | 1,981 | |
5.00%, 05/15/2051 | | | 3,100 | | | | 3,337 | |
5.25%, 05/15/2041 | | | 1,895 | | | | 2,150 | |
Triborough Bridge & Tunnel Authority Sales Tax Revenue | | | | | | | | |
5.00%, 05/15/2040 | | | 340 | | | | 383 | |
5.00%, 05/15/2041 | | | 720 | | | | 807 | |
Utility Debt Securitization Authority | | | | | | | | |
5.00%, 12/15/2041 | | | 5,000 | | | | 5,382 | |
Westchester County Local Development Corp. | | | | | | | | |
2.88%, 07/01/2026(3) | | | 1,500 | | | | 1,430 | |
| | | | | | | | |
Total New York | | | | 1,281,487 | |
| | | | | | | | |
North Carolina – 0.78% | | | | | | | | |
Charlotte-Mecklenburg Hospital Authority | | | | | | | | |
3.60%, 01/15/2044 | | | 1,775 | | | | 1,775 | |
3.75%, 01/15/2037(1) | | | 8,000 | | | | 8,000 | |
5.00%, 01/15/2050(1) | | | 1,500 | | | | 1,642 | |
City of Charlotte NC | | | | | | | | |
4.00%, 06/01/2038 | | | 2,450 | | | | 2,498 | |
County of New Hanover NC | | | | | | | | |
5.00%, 10/01/2027 | | | 100 | | | | 109 | |
5.00%, 10/01/2034 | | | 1,000 | | | | 1,089 | |
5.00%, 10/01/2047 | | | 840 | | | | 915 | |
Greater Asheville Regional Airport Authority | | | | | | | | |
5.00%, 07/01/2032 | | | 1,000 | | | | 1,111 | |
5.00%, 07/01/2035 | | | 1,750 | | | | 1,917 | |
5.00%, 07/01/2036 | | | 1,505 | | | | 1,633 | |
5.00%, 07/01/2037 | | | 1,520 | | | | 1,645 | |
5.00%, 07/01/2037 | | | 1,780 | | | | 1,914 | |
5.25%, 07/01/2038 | | | 1,200 | | | | 1,315 | |
5.25%, 07/01/2040 | | | 500 | | | | 547 | |
5.25%, 07/01/2041 | | | 1,210 | | | | 1,319 | |
5.25%, 07/01/2042 | | | 1,000 | | | | 1,085 | |
5.25%, 07/01/2042 | | | 1,100 | | | | 1,186 | |
5.25%, 07/01/2043 | | | 700 | | | | 758 | |
5.25%, 07/01/2048 | | | 2,565 | | | | 2,747 | |
North Carolina Capital Facilities Finance Agency | | | | | | | | |
3.80%, 07/01/2034(1) | | | 5,000 | | | | 5,000 | |
4.00%, 05/01/2024 | | | 190 | | | | 191 | |
5.00%, 05/01/2031 | | | 1,000 | | | | 1,110 | |
North Carolina Housing Finance Agency | | | | | | | | |
3.75%, 07/01/2052 | | | 3,600 | | | | 3,547 | |
6.00%, 07/01/2053 | | | 4,645 | | | | 5,006 | |
North Carolina Medical Care Commission | | | | | | | | |
2.55%, 06/01/2048(1) | | | 3,955 | | | | 3,853 | |
4.00%, 03/01/2029 | | | 140 | | | | 131 | |
4.00%, 03/01/2030 | | | 145 | | | | 134 | |
4.00%, 03/01/2031 | | | 145 | | | | 133 | |
4.00%, 09/01/2033 | | | 180 | | | | 172 | |
5.00%, 10/01/2024 | | | 300 | | | | 310 | |
5.00%, 03/01/2027 | | | 150 | | | | 149 | |
5.00%, 03/01/2028 | | | 155 | | | | 153 | |
5.00%, 02/01/2051(1) | | | 1,000 | | | | 1,045 | |
North Carolina Turnpike Authority | | | | | | | | |
5.00%, 02/01/2024 | | | 15,390 | | | | 15,542 | |
5.00%, 01/01/2049 | | | 3,325 | | | | 3,435 | |
Raleigh Durham Airport Authority | | | | | | | | |
5.00%, 05/01/2025 | | | 3,000 | | | | 3,074 | |
State of North Carolina | | | | | | | | |
2.00%, 03/01/2036 | | | 2,230 | | | | 1,781 | |
5.00%, 05/01/2026 | | | 4,750 | | | | 5,023 | |
5.00%, 05/01/2027 | | | 7,500 | | | | 8,110 | |
| | | | | | | | |
Total North Carolina | | | | 91,104 | |
| | | | | | | | |
North Dakota – 0.13% | | | | | | | | |
City of Grand Forks ND | | | | | | | | |
4.00%, 12/01/2037 | | | 675 | | | | 602 | |
4.00%, 12/01/2041 | | | 1,830 | | | | 1,569 | |
4.00%, 12/01/2046 | | | 1,425 | | | | 1,185 | |
5.00%, 12/01/2027 | | | 1,110 | | | | 1,141 | |
5.00%, 12/01/2028 | | | 1,500 | | | | 1,556 | |
5.00%, 12/01/2031 | | | 2,650 | | | | 2,785 | |
North Dakota Housing Finance Agency | | | | | | | | |
3.00%, 07/01/2051 | | | 5,740 | | | | 5,544 | |
3.00%, 01/01/2052 | | | 1,410 | | | | 1,358 | |
| | | | | | | | |
Total North Dakota | | | | 15,740 | |
| | | | | | | | |
Ohio – 1.82% | | | | | | | | |
| | | | | | | | |
Akron Bath Copley Joint Township Hospital District | | | | | | | | |
4.00%, 11/15/2037 | | | 700 | | | | 642 | |
4.00%, 11/15/2038 | | | 450 | | | | 407 | |
5.25%, 11/15/2031 | | | 530 | | | | 555 | |
5.25%, 11/15/2032 | | | 645 | | | | 675 | |
5.25%, 11/15/2033 | | | 1,770 | | | | 1,845 | |
5.25%, 11/15/2046 | | | 1,255 | | | | 1,271 | |
American Municipal Power, Inc. | | | | | | | | |
1.00%, 02/15/2048(1) | | | 2,015 | | | | 1,950 | |
4.00%, 02/15/2036 | | | 1,975 | | | | 1,993 | |
4.00%, 02/15/2038 | | | 2,860 | | | | 2,817 | |
5.00%, 02/15/2035 | | | 3,285 | | | | 3,686 | |
Buckeye Tobacco Settlement Financing Authority | | | | | | | | |
3.00%, 06/01/2048 | | | 3,100 | | | | 2,388 | |
4.00%, 06/01/2038 | | | 1,000 | | | | 990 | |
5.00%, 06/01/2027 | | | 1,365 | | | | 1,432 | |
5.00%, 06/01/2055 | | | 17,515 | | | | 16,402 | |
City of Cleveland OH Airport System Revenue | | | | | | | | |
5.00%, 01/01/2024 | | | 2,450 | | | | 2,469 | |
City of Columbus OH | | | | | | | | |
5.00%, 04/01/2033 | | | 1,345 | | | | 1,511 | |
City of Hamilton OH Electric System Revenue | | | | | | | | |
4.00%, 10/01/2037 | | | 1,000 | | | | 1,015 | |
City of Upper Arlington OH | | | | | | | | |
5.75%, 12/01/2042 | | | 500 | | | | 524 | |
Clermont County Port Authority | | | | | | | | |
5.00%, 12/01/2029 | | | 750 | | | | 781 | |
5.00%, 12/01/2030 | | | 850 | | | | 883 | |
County of Allen OH Hospital Facilities Revenue | | | | | | | | |
5.00%, 12/01/2029 | | | 585 | | | | 654 | |
5.00%, 12/01/2030 | | | 585 | | | | 661 | |
County of Cuyahoga OH | | | | | | | | |
5.00%, 12/01/2026 | | | 2,500 | | | | 2,530 | |
County of Fairfield OH | | | | | | | | |
4.25%, 06/15/2024 | | | 1,470 | | | | 1,460 | |
County of Franklin OH | | | | | | | | |
3.55%, 11/01/2042 | | | 16,000 | | | | 16,000 | |
County of Hamilton OH | | | | | | | | |
5.00%, 09/15/2034 | | | 1,050 | | | | 1,074 | |
County of Montgomery OH | | | | | | | | |
4.00%, 08/01/2038 | | | 2,055 | | | | 2,033 | |
4.00%, 08/01/2039 | | | 2,220 | | | | 2,180 | |
5.00%, 08/01/2025 | | | 515 | | | | 531 | |
County of Scioto OH | | | | | | | | |
5.00%, 02/15/2029 | | | 1,200 | | | | 1,251 | |
Crestview Local School District/Columbiana County | | | | | | | | |
4.00%, 12/01/2043 | | | 385 | | | | 382 | |
Euclid City School District | | | | | | | | |
5.25%, 01/15/2044 | | | 3,925 | | | | 4,045 | |
Forest Hills Local School District | | | | | | | | |
5.00%, 12/01/2044 | | | 4,725 | | | | 4,786 | |
Miami University/Oxford OH | | | | | | | | |
4.00%, 09/01/2036 | | | 1,000 | | | | 1,022 | |
5.00%, 09/01/2030 | | | 475 | | | | 543 | |
5.00%, 09/01/2032 | | | 1,000 | | | | 1,141 | |
5.00%, 09/01/2034 | | | 700 | | | | 735 | |
North Olmsted City School District | | | | | | | | |
5.00%, 10/15/2048 | | | 1,450 | | | | 1,539 | |
Ohio Air Quality Development Authority | | | | | | | | |
2.10%, 12/01/2027(1) | | | 5,000 | | | | 4,836 | |
2.10%, 07/01/2028(1) | | | 15,500 | | | | 14,990 | |
2.10%, 10/01/2028(1) | | | 12,000 | | | | 11,605 | |
2.88%, 02/01/2026 | | | 5,400 | | | | 5,100 | |
3.25%, 09/01/2029 | | | 1,000 | | | | 932 | |
4.00%, 09/01/2030(1) | | | 1,500 | | | | 1,487 | |
4.25%, 11/01/2039(1) | | | 7,575 | | | | 7,515 | |
4.50%, 01/15/2048(3) | | | 1,230 | | | | 1,165 | |
Ohio Higher Educational Facility Commission | | | | | | | | |
3.70%, 01/01/2043(1) | | | 1,500 | | | | 1,500 | |
4.00%, 07/01/2031 | | | 865 | | | | 865 | |
4.00%, 07/01/2032 | | | 900 | | | | 898 | |
4.00%, 07/01/2035 | | | 505 | | | | 496 | |
5.00%, 05/01/2028 | | | 1,535 | | | | 1,656 | |
5.00%, 01/01/2032 | | | 235 | | | | 254 | |
5.00%, 10/01/2032 | | | 1,000 | | | | 1,089 | |
5.00%, 01/01/2033 | | | 285 | | | | 307 | |
5.00%, 05/01/2033 | | | 995 | | | | 1,097 | |
5.00%, 01/01/2034 | | | 360 | | | | 389 | |
5.00%, 01/15/2034 | | | 600 | | | | 612 | |
5.25%, 01/01/2035 | | | 375 | | | | 410 | |
5.25%, 01/01/2036 | | | 500 | | | | 542 | |
5.25%, 01/01/2037 | | | 420 | | | | 451 | |
Ohio Housing Finance Agency | | | | | | | | |
| | | | | | | | |
4.50%, 03/01/2050 | | | 160 | | | | 160 | |
Ohio State University | | | | | | | | |
4.00%, 12/01/2039 | | | 7,350 | | | | 7,394 | |
Ohio Turnpike & Infrastructure Commission | | | | | | | | |
5.00%, 02/15/2039 | | | 1,100 | | | | 1,240 | |
5.00%, 02/15/2051 | | | 795 | | | | 859 | |
Ohio Water Development Authority | | | | | | | | |
5.00%, 06/01/2031 | | | 450 | | | | 525 | |
5.00%, 12/01/2031 | | | 600 | | | | 705 | |
5.00%, 06/01/2032 | | | 350 | | | | 414 | |
5.00%, 12/01/2032 | | | 400 | | | | 476 | |
5.00%, 06/01/2033 | | | 350 | | | | 417 | |
5.00%, 12/01/2033 | | | 400 | | | | 475 | |
5.00%, 06/01/2034 | | | 300 | | | | 356 | |
5.00%, 12/01/2034 | | | 425 | | | | 502 | |
5.00%, 06/01/2035 | | | 500 | | | | 588 | |
5.00%, 12/01/2035 | | | 600 | | | | 702 | |
5.00%, 12/01/2035 | | | 1,000 | | | | 1,146 | |
5.00%, 12/01/2040 | | | 435 | | | | 493 | |
Port of Greater Cincinnati Development Authority | | | | | | | | |
3.75%, 12/01/2031(3) | | | 485 | | | | 420 | |
State of Ohio | | | | | | | | |
2.75%, 01/01/2052 | | | 2,215 | | | | 2,164 | |
4.00%, 01/15/2037 | | | 1,700 | | | | 1,664 | |
4.00%, 01/15/2038 | | | 800 | | | | 778 | |
4.00%, 01/15/2041 | | | 655 | | | | 628 | |
4.00%, 01/15/2050 | | | 450 | | | | 415 | |
5.00%, 08/01/2024 | | | 2,500 | | | | 2,552 | |
5.00%, 02/01/2028 | | | 1,295 | | | | 1,422 | |
5.00%, 03/01/2028 | | | 690 | | | | 759 | |
5.00%, 03/01/2028 | | | 860 | | | | 946 | |
5.00%, 03/15/2028 | | | 1,725 | | | | 1,899 | |
5.00%, 01/01/2030 | | | 1,170 | | | | 1,275 | |
5.00%, 12/15/2030 | | | 1,500 | | | | 1,732 | |
5.00%, 12/15/2031 | | | 1,000 | | | | 1,151 | |
5.00%, 12/15/2032 | | | 1,000 | | | | 1,151 | |
5.00%, 12/15/2033 | | | 1,000 | | | | 1,149 | |
5.00%, 12/15/2034 | | | 1,000 | | | | 1,137 | |
5.00%, 01/15/2035 | | | 1,645 | | | | 1,758 | |
5.00%, 10/01/2035 | | | 1,410 | | | | 1,508 | |
5.00%, 12/31/2035 | | | 1,010 | | | | 1,020 | |
5.00%, 03/01/2037 | | | 1,365 | | | | 1,539 | |
5.00%, 03/01/2040 | | | 3,200 | | | | 3,582 | |
Tender Option Bond Trust Receipts/Certificates | | | | | | | | |
0.00%, 09/01/2048(3) | | | 10,000 | | | | 10,000 | |
United Local School District | | | | | | | | |
4.00%, 12/01/2032 | | | 320 | | | | 332 | |
University of Akron | | | | | | | | |
4.00%, 01/01/2027 | | | 2,780 | | | | 2,838 | |
5.00%, 01/01/2037 | | | 6,675 | | | | 6,788 | |
University of Cincinnati | | | | | | | | |
5.00%, 06/01/2028 | | | 250 | | | | 270 | |
5.00%, 06/01/2029 | | | 400 | | | | 433 | |
| | | | | | | | |
Total Ohio | | | | 212,761 | |
| | | | | | | | |
Oklahoma – 0.37% | | | | | | | | |
Canadian County Educational Facilities Authority | | | | | | | | |
4.00%, 09/01/2025 | | | 1,500 | | | | 1,516 | |
5.00%, 09/01/2026 | | | 1,725 | | | | 1,820 | |
5.00%, 09/01/2028 | | | 1,120 | | | | 1,176 | |
Cleveland County Educational Facilities Authority | | | | | | | | |
5.00%, 09/01/2025 | | | 300 | | | | 311 | |
5.00%, 09/01/2026 | | | 375 | | | | 395 | |
Dewey County Educational Facilities Authority | | | | | | | | |
5.00%, 09/01/2030 | | | 2,470 | | | | 2,597 | |
Garvin County Educational Facilities Authority | | | | | | | | |
5.00%, 12/01/2024 | | | 515 | | | | 525 | |
5.00%, 12/01/2025 | | | 545 | | | | 564 | |
5.00%, 12/01/2026 | | | 820 | | | | 863 | |
Grady County School Finance Authority | | | | | | | | |
5.00%, 09/01/2028 | | | 375 | | | | 404 | |
5.00%, 09/01/2030 | | | 1,235 | | | | 1,324 | |
Muskogee Industrial Trust | | | | | | | | |
4.00%, 09/01/2030 | | | 2,000 | | | | 2,002 | |
Oklahoma City Airport Trust | | | | | | | | |
5.00%, 07/01/2025 | | | 2,040 | | | | 2,088 | |
5.00%, 07/01/2026 | | | 2,195 | | | | 2,279 | |
5.00%, 07/01/2030 | | | 1,350 | | | | 1,443 | |
5.00%, 07/01/2032 | | | 2,960 | | | | 3,153 | |
5.00%, 07/01/2035 | | | 3,240 | | | | 3,422 | |
5.00%, 07/01/2043 | | | 1,065 | | | | 1,097 | |
Oklahoma Department of Transportation | | | | | | | | |
5.00%, 09/01/2030 | | | 1,015 | | | | 1,121 | |
Oklahoma Development Finance Authority | | | | | | | | |
| | | | | | | | |
5.00%, 08/01/2023 | | | 515 | | | | 515 | |
5.00%, 08/01/2026 | | | 75 | | | | 76 | |
5.00%, 08/01/2030 | | | 1,010 | | | | 1,047 | |
Oklahoma State University | | | | | | | | |
5.00%, 09/01/2031 | | | 1,500 | | | | 1,714 | |
Oklahoma Turnpike Authority | | | | | | | | |
5.00%, 01/01/2025 | | | 700 | | | | 719 | |
5.00%, 01/01/2026 | | | 2,500 | | | | 2,620 | |
5.00%, 01/01/2027 | | | 3,000 | | | | 3,210 | |
5.00%, 01/01/2028 | | | 2,905 | | | | 3,173 | |
Tulsa Airports Improvement Trust | | | | | | | | |
5.00%, 06/01/2031 | | | 1,120 | | | | 1,195 | |
5.00%, 06/01/2033 | | | 1,240 | | | | 1,322 | |
| | | | | | | | |
Total Oklahoma | | | | 43,691 | |
| | | | | | | | |
Oregon – 0.86% | | | | | | | | |
City of Eugene OR Electric Utility System Revenue | | | | | | | | |
4.00%, 08/01/2036 | | | 300 | | | | 314 | |
County of Yamhill OR | | | | | | | | |
4.00%, 12/01/2030 | | | 950 | | | | 984 | |
Hillsboro School District No 1J | | | | | | | | |
4.00%, 06/15/2035 | | | 750 | | | | 778 | |
4.00%, 06/15/2037 | | | 2,250 | | | | 2,291 | |
5.00%, 06/15/2028 | | | 1,525 | | | | 1,644 | |
Medford Hospital Facilities Authority | | | | | | | | |
5.00%, 08/15/2036 | | | 1,145 | | | | 1,235 | |
Oregon State Business Development Commission | | | | | | | | |
2.40%, 12/01/2040 | | | 2,500 | | | | 2,495 | |
Oregon State Facilities Authority | | | | | | | | |
5.00%, 06/01/2030 | | | 5,000 | | | | 5,496 | |
5.00%, 06/01/2046 | | | 21,475 | | | | 21,840 | |
Oregon State Lottery | | | | | | | | |
5.00%, 04/01/2036 | | | 2,500 | | | | 2,657 | |
Port of Portland OR Airport Revenue | | | | | | | | |
5.00%, 07/01/2027 | | | 1,000 | | | | 1,050 | |
5.00%, 07/01/2027 | | | 2,000 | | | | 2,099 | |
5.00%, 07/01/2028 | | | 2,000 | | | | 2,130 | |
5.00%, 07/01/2028 | | | 2,190 | | | | 2,332 | |
5.00%, 07/01/2029 | | | 750 | | | | 821 | |
5.00%, 07/01/2031 | | | 1,000 | | | | 1,047 | |
5.00%, 07/01/2032 | | | 1,000 | | | | 1,010 | |
5.00%, 07/01/2032 | | | 12,930 | | | | 14,405 | |
5.00%, 07/01/2033 | | | 3,485 | | | | 3,521 | |
5.00%, 07/01/2036 | | | 2,200 | | | | 2,413 | |
5.00%, 07/01/2038 | | | 1,370 | | | | 1,479 | |
5.00%, 07/01/2045 | | | 2,420 | | | | 2,515 | |
5.25%, 07/01/2039 | | | 7,000 | | | | 7,723 | |
Salem Hospital Facility Authority | | | | | | | | |
4.00%, 05/15/2041 | | | 1,500 | | | | 1,456 | |
State of Oregon | | | | | | | | |
5.00%, 05/01/2035 | | | 2,120 | | | | 2,175 | |
5.00%, 05/01/2043 | | | 3,300 | | | | 3,717 | |
5.00%, 08/01/2043 | | | 1,060 | | | | 1,194 | |
State of Oregon Department of Transportation | | | | | | | | |
5.25%, 11/15/2047 | | | 2,705 | | | | 3,058 | |
State of Oregon Housing & Community Services Department | | | | | | | | |
3.50%, 01/01/2051 | | | 1,095 | | | | 1,072 | |
4.00%, 07/01/2051 | | | 2,725 | | | | 2,709 | |
Yamhill County Hospital Authority | | | | | | | | |
1.75%, 11/15/2026 | | | 1,355 | | | | 1,270 | |
2.13%, 11/15/2027 | | | 1,000 | | | | 904 | |
2.50%, 11/15/2028 | | | 1,000 | | | | 856 | |
| | | | | | | | |
Total Oregon | | | | 100,690 | |
| | | | | | | | |
Pennsylvania – 3.77% | | | | | | | | |
Allegheny County Airport Authority | | | | | | | | |
4.00%, 01/01/2046 | | | 1,000 | | | | 941 | |
5.00%, 01/01/2033 | | | 1,365 | | | | 1,493 | |
5.00%, 01/01/2056 | | | 13,570 | | | | 14,395 | |
Allegheny County Higher Education Building Authority | | | | | | | | |
4.00%, 03/01/2032 | | | 300 | | | | 311 | |
4.00%, 03/01/2033 | | | 300 | | | | 309 | |
4.00%, 03/01/2035 | | | 345 | | | | 353 | |
4.00%, 03/01/2041 | | | 2,615 | | | | 2,520 | |
Allegheny County Hospital Development Authority | | | | | | | | |
5.00%, 07/15/2025 | | | 2,370 | | | | 2,442 | |
5.00%, 07/15/2034 | | | 5,100 | | | | 5,580 | |
Allegheny County Industrial Development Authority | | | | | | | | |
3.50%, 12/01/2031 | | | 915 | | | | 758 | |
4.00%, 12/01/2041 | | | 1,720 | | | | 1,264 | |
4.25%, 12/01/2050 | | | 1,915 | | | | 1,328 | |
Allentown City School District | | | | | | | | |
5.00%, 02/01/2031 | | | 500 | | | | 551 | |
5.00%, 02/01/2033 | | | 470 | | | | 517 | |
Allentown Neighborhood Improvement Zone Development Authority | | | | | | | | |
| | | | | | | | |
5.00%, 05/01/2027(3) | | | 1,000 | | | | 1,020 | |
6.00%, 05/01/2042(3) | | | 450 | | | | 462 | |
Bucks County Industrial Development Authority | | | | | | | | |
5.00%, 07/01/2026 | | | 475 | | | | 467 | |
5.00%, 07/01/2027 | | | 475 | | | | 467 | |
5.00%, 07/01/2028 | | | 425 | | | | 417 | |
5.00%, 07/01/2033 | | | 640 | | | | 616 | |
5.00%, 07/01/2034 | | | 1,580 | | | | 1,519 | |
5.00%, 07/01/2035 | | | 435 | | | | 416 | |
5.00%, 07/01/2036 | | | 665 | | | | 633 | |
5.00%, 07/01/2037 | | | 1,410 | | | | 1,332 | |
5.00%, 07/01/2038 | | | 1,460 | | | | 1,370 | |
5.00%, 07/01/2039 | | | 1,510 | | | | 1,408 | |
Capital Region Water Revenue | | | | | | | | |
5.00%, 07/15/2023 | | | 1,750 | | | | 1,751 | |
5.00%, 07/15/2025 | | | 1,000 | | | | 1,035 | |
Capital Region Water Sewer Revenue | | | | | | | | |
5.00%, 07/15/2024 | | | 430 | | | | 437 | |
5.00%, 07/15/2028 | | | 350 | | | | 377 | |
5.00%, 07/15/2042 | | | 1,250 | | | | 1,297 | |
Chester County Industrial Development Authority | | | | | | | | |
5.00%, 10/15/2032(3) | | | 1,415 | | | | 1,400 | |
Chichester School District | | | | | | | | |
4.00%, 09/15/2028 | | | 750 | | | | 786 | |
4.00%, 09/15/2029 | | | 900 | | | | 948 | |
City of Oil City PA | | | | | | | | |
4.00%, 12/01/2032 | | | 185 | | | | 194 | |
City of Philadelphia PA | | | | | | | | |
5.00%, 08/01/2023 | | | 4,000 | | | | 4,004 | |
5.00%, 07/15/2026 | | | 2,475 | | | | 2,499 | |
5.00%, 08/01/2027 | | | 1,500 | | | | 1,618 | |
5.00%, 08/01/2028 | | | 6,000 | | | | 6,208 | |
5.00%, 02/01/2029 | | | 3,175 | | | | 3,511 | |
5.00%, 08/01/2031 | | | 500 | | | | 576 | |
5.00%, 08/01/2031 | | | 8,000 | | | | 8,582 | |
5.00%, 08/01/2033 | | | 2,000 | | | | 2,156 | |
City of Philadelphia PA Airport Revenue | | | | | | | | |
4.00%, 07/01/2037 | | | 2,085 | | | | 2,062 | |
5.00%, 07/01/2026 | | | 1,155 | | | | 1,217 | |
5.00%, 07/01/2027 | | | 1,520 | | | | 1,633 | |
5.00%, 07/01/2029 | | | 230 | | | | 248 | |
5.00%, 07/01/2030 | | | 1,000 | | | | 1,054 | |
5.00%, 07/01/2031 | | | 2,000 | | | | 2,108 | |
5.00%, 07/01/2032 | | | 1,745 | | | | 1,838 | |
5.00%, 07/01/2033 | | | 1,000 | | | | 1,053 | |
5.00%, 07/01/2047 | | | 1,060 | | | | 1,081 | |
City of Philadelphia PA Water & Wastewater Revenue | | | | | | | | |
5.00%, 11/01/2026 | | | 1,165 | | | | 1,237 | |
5.00%, 11/01/2027 | | | 1,540 | | | | 1,667 | |
5.00%, 11/01/2032 | | | 1,000 | | | | 1,080 | |
City of Reading PA | | | | | | | | |
5.00%, 11/01/2027 | | | 2,330 | | | | 2,505 | |
Coatesville School District | | | | | | | | |
5.00%, 08/01/2025 | | | 875 | | | | 908 | |
Commonwealth Financing Authority | | | | | | | | |
4.00%, 06/01/2039 | | | 20,000 | | | | 19,660 | |
5.00%, 06/01/2027 | | | 750 | | | | 803 | |
5.00%, 06/01/2027 | | | 1,500 | | | | 1,589 | |
5.00%, 06/01/2027 | | | 2,165 | | | | 2,314 | |
5.00%, 06/01/2028 | | | 2,555 | | | | 2,749 | |
5.00%, 06/01/2030 | | | 1,750 | | | | 1,967 | |
Commonwealth of Pennsylvania | | | | | | | | |
4.00%, 02/01/2032 | | | 2,380 | | | | 2,435 | |
4.00%, 04/01/2033 | | | 20,000 | | | | 20,011 | |
5.00%, 01/01/2024 | | | 5,800 | | | | 5,852 | |
5.00%, 01/01/2025 | | | 9,000 | | | | 9,253 | |
5.00%, 01/01/2027 | | | 2,095 | | | | 2,240 | |
5.00%, 10/01/2036 | | | 3,215 | | | | 3,703 | |
County of Lancaster PA | | | | | | | | |
4.00%, 11/01/2030 | | | 560 | | | | 588 | |
County of Lehigh PA | | | | | | | | |
4.00%, 07/01/2039 | | | 1,955 | | | | 1,913 | |
Cumberland County Municipal Authority | | | | | | | | |
4.00%, 01/01/2033 | | | 210 | | | | 212 | |
4.00%, 01/01/2033 | | | 545 | | | | 514 | |
4.00%, 01/01/2033 | | | 745 | | | | 754 | |
Dauphin County General Authority | | | | | | | | |
5.00%, 10/15/2030(3) | | | 2,000 | | | | 1,944 | |
5.00%, 06/01/2035 | | | 1,000 | | | | 1,035 | |
Deer Creek Drainage Basin Authority | | | | | | | | |
4.00%, 12/01/2033 | | | 575 | | | | 604 | |
4.00%, 12/01/2035 | | | 375 | | | | 389 | |
5.00%, 12/01/2028 | | | 275 | | | | 305 | |
| | | | | | | | |
Delaware County Authority | | | | | | | | |
5.00%, 08/01/2030 | | | 1,150 | | | | 1,195 | |
Delaware River Port Authority | | | | | | | | |
5.00%, 01/01/2037 | | | 5,300 | | | | 5,335 | |
Doylestown Hospital Authority | | | | | | | | |
5.00%, 07/01/2046 | | | 3,700 | | | | 3,092 | |
5.00%, 07/01/2049 | | | 1,310 | | | | 1,065 | |
Easton Area School District | | | | | | | | |
5.00%, 04/01/2029 | | | 1,000 | | | | 1,049 | |
5.00%, 04/01/2030 | | | 2,805 | | | | 2,939 | |
Geisinger Authority | | | | | | | | |
5.00%, 04/01/2035 | | | 3,000 | | | | 3,209 | |
5.00%, 02/15/2039 | | | 1,500 | | | | 1,549 | |
General Authority of Southcentral Pennsylvania | | | | | | | | |
5.00%, 06/01/2038 | | | 1,970 | | | | 2,088 | |
5.00%, 06/01/2044 | | | 1,085 | | | | 1,134 | |
Indiana County Industrial Development Authority | | | | | | | | |
5.00%, 05/01/2029 | | | 740 | | | | 796 | |
Lancaster City Parking Authority | | | | | | | | |
4.00%, 09/01/2035 | | | 1,100 | | | | 1,129 | |
Lancaster County Hospital Authority | | | | | | | | |
5.00%, 11/01/2051 | | | 2,600 | | | | 2,669 | |
Lancaster Industrial Development Authority | | | | | | | | |
4.00%, 07/01/2031 | | | 165 | | | | 150 | |
4.00%, 07/01/2037 | | | 130 | | | | 110 | |
Manheim Central School District | | | | | | | | |
4.00%, 05/01/2038 | | | 850 | | | | 861 | |
Monroeville Finance Authority | | | | | | | | |
5.00%, 05/15/2034 | | | 640 | | | | 725 | |
Montgomery County Higher Education & Health Authority | | | | | | | | |
5.00%, 09/01/2023 | | | 460 | | | | 461 | |
5.00%, 10/01/2023 | | | 50 | | | | 50 | |
5.00%, 09/01/2024 | | | 410 | | | | 416 | |
5.00%, 10/01/2028 | | | 1,000 | | | | 1,009 | |
5.00%, 09/01/2032 | | | 1,000 | | | | 1,078 | |
5.00%, 09/01/2033 | | | 305 | | | | 328 | |
5.00%, 10/01/2036 | | | 1,320 | | | | 1,311 | |
5.00%, 10/01/2040 | | | 1,595 | | | | 1,497 | |
North Allegheny School District | | | | | | | | |
4.00%, 05/01/2035 | | | 1,000 | | | | 1,041 | |
4.00%, 05/01/2036 | | | 705 | | | | 728 | |
Northampton County General Purpose Authority | | | | | | | | |
4.66% (1 Month LIBOR USD + 1.04%), 08/15/2048(2) | | | 1,625 | | | | 1,626 | |
5.00%, 08/15/2036 | | | 455 | | | | 470 | |
Pennsylvania Economic Development Financing Authority | | | | | | | | |
0.40%, 10/01/2023 | | | 7,500 | | | | 7,419 | |
1.75%, 08/01/2038(1) | | | 10,000 | | | | 9,762 | |
4.00%, 04/15/2037 | | | 1,000 | | | | 998 | |
4.00%, 11/15/2042 | | | 7,500 | | | | 7,256 | |
4.41% (SIFMA Municipal Swap Index Yield + 0.40%), 06/01/2041(2) | | | 3,085 | | | | 3,031 | |
5.00%, 04/15/2026 | | | 2,500 | | | | 2,610 | |
5.00%, 04/15/2031 | | | 2,095 | | | | 2,328 | |
5.00%, 05/15/2031 | | | 7,175 | | | | 8,060 | |
5.00%, 05/15/2032 | | | 700 | | | | 794 | |
5.00%, 05/15/2032 | | | 850 | | | | 965 | |
5.00%, 05/15/2033 | | | 525 | | | | 602 | |
5.00%, 05/15/2033 | | | 550 | | | | 630 | |
5.00%, 05/15/2034 | | | 700 | | | | 800 | |
5.00%, 05/15/2034 | | | 750 | | | | 857 | |
5.25%, 06/30/2035 | | | 2,700 | | | | 2,989 | |
5.50%, 06/30/2037 | | | 5,450 | | | | 6,054 | |
5.50%, 06/30/2038 | | | 5,450 | | | | 6,022 | |
Pennsylvania Higher Educational Facilities Authority | | | | | | | | |
5.00%, 06/15/2024 | | | 3,005 | | | | 3,054 | |
5.00%, 06/15/2025 | | | 1,855 | | | | 1,917 | |
5.00%, 08/15/2029 | | | 1,600 | | | | 1,725 | |
Pennsylvania Housing Finance Agency | | | | | | | | |
3.00%, 10/01/2051 | | | 14,390 | | | | 13,687 | |
3.00%, 10/01/2052 | | | 8,445 | | | | 8,026 | |
3.50%, 04/01/2051 | | | 550 | | | | 542 | |
5.75%, 10/01/2053 | | | 7,115 | | | | 7,582 | |
Pennsylvania State University | | | | | | | | |
5.00%, 09/01/2041 | | | 1,080 | | | | 1,122 | |
Pennsylvania Turnpike Commission | | | | | | | | |
4.00%, 12/01/2036 | | | 905 | | | | 914 | |
4.00%, 12/01/2037 | | | 1,000 | | | | 1,002 | |
4.00%, 12/01/2038 | | | 360 | | | | 367 | |
4.00%, 12/01/2039 | | | 4,000 | | | | 4,044 | |
4.00%, 12/01/2042 | | | 625 | | | | 616 | |
5.00%, 06/01/2028 | | | 2,085 | | | | 2,188 | |
5.00%, 12/01/2031 | | | 350 | | | | 406 | |
5.00%, 06/01/2032 | | | 2,000 | | | | 2,142 | |
5.00%, 12/01/2032 | | | 350 | | | | 410 | |
| | | | | | | | |
5.00%, 12/01/2032 | | | 1,295 | | | | 1,496 | |
5.00%, 06/01/2033 | | | 3,155 | | | | 3,373 | |
5.00%, 12/01/2033 | | | 375 | | | | 433 | |
5.00%, 12/01/2033 | | | 5,250 | | | | 6,083 | |
5.00%, 12/01/2034 | | | 300 | | | | 344 | |
5.00%, 12/01/2034 | | | 1,240 | | | | 1,332 | |
5.00%, 12/01/2034 | | | 2,155 | | | | 2,440 | |
5.00%, 12/01/2035 | | | 500 | | | | 563 | |
5.00%, 12/01/2035 | | | 575 | | | | 649 | |
5.00%, 12/01/2036 | | | 500 | | | | 562 | |
5.00%, 12/01/2037 | | | 450 | | | | 496 | |
5.00%, 12/01/2037 | | | 550 | | | | 614 | |
5.00%, 12/01/2039 | | | 1,000 | | | | 1,108 | |
5.00%, 12/01/2039 | | | 2,155 | | | | 2,198 | |
5.00%, 12/01/2041 | | | 2,560 | | | | 2,647 | |
5.00%, 12/01/2044 | | | 10,000 | | | | 10,169 | |
Pennsylvania Turnpike Commission Oil Franchise Tax Revenue | | | | | | | | |
5.00%, 12/01/2038 | | | 1,035 | | | | 1,099 | |
5.25%, 12/01/2044 | | | 3,180 | | | | 3,402 | |
Philadelphia Gas Works Co. | | | | | | | | |
4.00%, 08/01/2036 | | | 1,000 | | | | 1,019 | |
5.00%, 08/01/2024 | | | 425 | | | | 432 | |
5.00%, 08/01/2024 | | | 500 | | | | 509 | |
5.00%, 08/01/2025 | | | 450 | | | | 466 | |
5.00%, 08/01/2027 | | | 750 | | | | 806 | |
5.00%, 08/01/2028 | | | 625 | | | | 683 | |
5.00%, 08/01/2029 | | | 1,000 | | | | 1,111 | |
5.00%, 08/01/2031 | | | 1,760 | | | | 1,981 | |
5.00%, 08/01/2032 | | | 1,000 | | | | 1,122 | |
5.00%, 08/01/2033 | | | 1,250 | | | | 1,401 | |
5.00%, 08/01/2034 | | | 1,410 | | | | 1,577 | |
5.00%, 08/01/2035 | | | 1,000 | | | | 1,111 | |
5.00%, 08/01/2036 | | | 1,690 | | | | 1,858 | |
Pittsburgh School District | | | | | | | | |
3.00%, 09/01/2039 | | | 3,290 | | | | 2,796 | |
Pittsburgh Water & Sewer Authority | | | | | | | | |
4.66% (SIFMA Municipal Swap Index Yield + 0.65%), 09/01/2040(2) | | | 15,000 | | | | 15,000 | |
5.00%, 09/01/2038 | | | 1,000 | | | | 1,090 | |
Reading School District | | | | | | | | |
5.00%, 03/01/2035 | | | 1,100 | | | | 1,172 | |
5.00%, 03/01/2036 | | | 1,250 | | | | 1,325 | |
School District of Philadelphia | | | | | | | | |
5.00%, 09/01/2026 | | | 1,625 | | | | 1,703 | |
5.00%, 09/01/2029 | | | 1,500 | | | | 1,647 | |
5.00%, 09/01/2030 | | | 15 | | | | 16 | |
5.00%, 09/01/2030 | | | 3,985 | | | | 4,161 | |
5.00%, 09/01/2031 | | | 1,000 | | | | 1,042 | |
5.00%, 09/01/2031 | | | 1,200 | | | | 1,307 | |
5.00%, 09/01/2032 | | | 1,200 | | | | 1,306 | |
5.00%, 09/01/2032 | | | 2,200 | | | | 2,406 | |
5.00%, 09/01/2033 | | | 960 | | | | 1,061 | |
5.00%, 09/01/2033 | | | 1,500 | | | | 1,654 | |
5.00%, 09/01/2043 | | | 1,690 | | | | 1,777 | |
Scranton School District | | | | | | | | |
5.00%, 06/01/2033 | | | 530 | | | | 585 | |
5.00%, 06/01/2035 | | | 515 | | | | 566 | |
South Wayne County Water & Sewer Authority | | | | | | | | |
4.00%, 02/15/2036 | | | 600 | | | | 618 | |
State Public School Building Authority | | | | | | | | |
4.00%, 06/15/2033 | | | 685 | | | | 717 | |
4.00%, 06/15/2034 | | | 700 | | | | 734 | |
5.00%, 06/15/2025 | | | 3,000 | | | | 3,074 | |
5.00%, 06/01/2026 | | | 180 | | | | 185 | |
5.00%, 06/01/2029 | | | 665 | | | | 738 | |
5.00%, 12/01/2032 | | | 725 | | | | 774 | |
5.00%, 12/01/2032 | | | 2,335 | | | | 2,447 | |
5.25%, 09/15/2030 | | | 990 | | | | 1,072 | |
Susquehanna Area Regional Airport Authority | | | | | | | | |
5.00%, 01/01/2038 | | | 1,000 | | | | 1,007 | |
Trinity Area School District | | | | | | | | |
4.00%, 11/01/2043 | | | 2,250 | | | | 2,264 | |
Upper Merion Area School District | | | | | | | | |
5.00%, 01/15/2030 | | | 600 | | | | 630 | |
Waverly Township Municipal Authority | | | | | | | | |
4.00%, 02/15/2029 | | | 1,030 | | | | 1,082 | |
West Shore School District | | | | | | | | |
5.00%, 11/15/2043 | | | 1,000 | | | | 1,042 | |
York County School of Technology Authority | | | | | | | | |
5.00%, 02/15/2028 | | | 400 | | | | 407 | |
| | | | | | | | |
Total Pennsylvania | | | | | | | 441,313 | |
| | | | | | | | |
Puerto Rico – 1.39% | | | | | | | | |
Commonwealth of Puerto Rico | | | | | | | | |
0.00%, 07/01/2024 | | | 1,751 | | | | 1,678 | |
| | | | | | | | |
4.00%, 07/01/2033 | | | 13,090 | | | | 12,437 | |
4.00%, 07/01/2035 | | | 4,835 | | | | 4,494 | |
5.25%, 07/01/2023 | | | 4,615 | | | | 4,615 | |
5.38%, 07/01/2025 | | | 1,800 | | | | 1,844 | |
5.63%, 07/01/2027 | | | 17,133 | | | | 18,040 | |
5.63%, 07/01/2029 | | | 6,158 | | | | 6,594 | |
5.75%, 07/01/2031 | | | 7,165 | | | | 7,826 | |
Puerto Rico Commonwealth Aqueduct & Sewer Authority | | | | | | | | |
5.00%, 07/01/2028(3) | | | 2,075 | | | | 2,127 | |
5.00%, 07/01/2033(3) | | | 4,540 | | | | 4,663 | |
5.00%, 07/01/2035(3) | | | 5,555 | | | | 5,620 | |
5.00%, 07/01/2037(3) | | | 920 | | | | 924 | |
5.00%, 07/01/2037(3) | | | 2,430 | | | | 2,442 | |
5.00%, 07/01/2047(3) | | | 9,025 | | | | 8,743 | |
Puerto Rico Housing Finance Authority | | | | | | | | |
5.00%, 12/01/2023 | | | 4,300 | | | | 4,326 | |
5.00%, 12/01/2024 | | | 9,270 | | | | 9,464 | |
Puerto Rico Industrial Tourist Educational Medical & Envirml Ctl Facs Fing Auth | | | | | | | | |
4.00%, 07/01/2037 | | | 240 | | | | 220 | |
5.00%, 07/01/2030 | | | 285 | | | | 311 | |
Puerto Rico Sales Tax Financing Corp. Sales Tax Revenue | | | | | | | | |
0.00%, 07/01/2024 | | | 1,659 | | | | 1,593 | |
0.00%, 07/01/2024 | | | 4,596 | | | | 4,414 | |
0.00%, 07/01/2027 | | | 2,061 | | | | 1,750 | |
0.00%, 07/01/2033 | | | 8,101 | | | | 5,266 | |
4.33%, 07/01/2040 | | | 5,787 | | | | 5,504 | |
4.33%, 07/01/2040 | | | 23,095 | | | | 21,964 | |
4.55%, 07/01/2040 | | | 5,850 | | | | 5,715 | |
4.75%, 07/01/2053 | | | 3,974 | | | | 3,787 | |
5.00%, 07/01/2058 | | | 17,365 | | | | 16,929 | |
| | | | | | | | |
Total Puerto Rico | | | | 163,290 | |
| | | | | | | | |
Rhode Island – 0.40% | | | | | | | | |
Providence Public Building Authority | | | | | | | | |
5.00%, 09/15/2038 | | | 2,570 | | | | 2,728 | |
Providence Redevelopment Agency | | | | | | | | |
5.00%, 04/01/2028 | | | 1,200 | | | | 1,220 | |
Rhode Island Health & Educational Building Corp. | | | | | | | | |
4.00%, 05/15/2034 | | | 1,750 | | | | 1,843 | |
4.00%, 09/15/2042 | | | 5,000 | | | | 4,792 | |
5.00%, 09/01/2031 | | | 2,215 | | | | 2,188 | |
5.00%, 09/01/2036 | | | 100 | | | | 94 | |
5.00%, 05/15/2039 | | | 700 | | | | 702 | |
5.50%, 05/15/2040 | | | 1,205 | | | | 1,356 | |
5.50%, 05/15/2041 | | | 1,570 | | | | 1,759 | |
5.50%, 05/15/2047 | | | 4,130 | | | | 4,580 | |
Rhode Island Housing & Mortgage Finance Corp. | | | | | | | | |
3.00%, 10/01/2051 | | | 3,505 | | | | 3,361 | |
3.50%, 10/01/2050 | | | 925 | | | | 906 | |
4.00%, 10/01/2049 | | | 385 | | | | 382 | |
5.00%, 10/01/2026 | | | 395 | | | | 416 | |
5.00%, 04/01/2027 | | | 215 | | | | 229 | |
5.00%, 10/01/2027 | | | 250 | | | | 268 | |
5.00%, 10/01/2027 | | | 520 | | | | 555 | |
5.00%, 04/01/2028 | | | 480 | | | | 515 | |
5.00%, 10/01/2028 | | | 275 | | | | 300 | |
5.00%, 10/01/2029 | | | 285 | | | | 315 | |
Rhode Island Infrastructure Bank | | | | | | | | |
4.00%, 10/01/2034 | | | 2,000 | | | | 2,116 | |
Rhode Island Student Loan Authority | | | | | | | | |
3.50%, 12/01/2034 | | | 245 | | | | 237 | |
5.00%, 12/01/2024 | | | 600 | | | | 610 | |
5.00%, 12/01/2025 | | | 500 | | | | 514 | |
5.00%, 12/01/2025 | | | 1,000 | | | | 1,027 | |
5.00%, 12/01/2026 | | | 750 | | | | 781 | |
5.00%, 12/01/2026 | | | 1,000 | | | | 1,042 | |
5.00%, 12/01/2027 | | | 800 | | | | 846 | |
5.00%, 12/01/2027 | | | 1,000 | | | | 1,058 | |
5.00%, 12/01/2028 | | | 1,150 | | | | 1,223 | |
5.00%, 12/01/2029 | | | 675 | | | | 732 | |
5.00%, 12/01/2030 | | | 1,645 | | | | 1,800 | |
State of Rhode Island | | | | | | | | |
4.13%, 08/01/2042 | | | 5,350 | | | | 5,411 | |
Tobacco Settlement Financing Corp. | | | | | | | | |
5.00%, 06/01/2024 | | | 1,455 | | | | 1,468 | |
| | | | | | | | |
Total Rhode Island | | | | 47,374 | |
| | | | | | | | |
South Carolina – 0.85% | | | | | | | | |
Aiken County Consolidated School District | | | | | | | | |
4.00%, 04/01/2034 | | | 2,415 | | | | 2,537 | |
County of Richland SC | | | | | | | | |
5.00%, 03/01/2025 | | | 2,900 | | | | 2,993 | |
Greenville Housing Authority | | | | | | | | |
5.00%, 10/01/2026 | | | 3,710 | | | | 3,790 | |
Lexington County Health Services District, Inc. | | | | | | | | |
| | | | | | | | |
5.00%, 11/01/2023 | | | 300 | | | | 301 | |
5.00%, 11/01/2024 | | | 780 | | | | 796 | |
Patriots Energy Group Financing Agency | | | | | | | | |
4.00%, 10/01/2048(1) | | | 34,495 | | | | 34,500 | |
Piedmont Municipal Power Agency | | | | | | | | |
4.00%, 01/01/2034 | | | 4,000 | | | | 4,047 | |
Scago Educational Facilities Corp. for Union School District | | | | | | | | |
5.00%, 12/01/2023 | | | 1,060 | | | | 1,067 | |
South Carolina Jobs-Economic Development Authority | | | | | | | | |
5.00%, 04/01/2031 | | | 510 | | | | 552 | |
South Carolina Ports Authority | | | | | | | | |
5.00%, 07/01/2026 | | | 1,940 | | | | 2,012 | |
5.00%, 07/01/2027 | | | 3,120 | | | | 3,281 | |
5.00%, 07/01/2028 | | | 1,100 | | | | 1,174 | |
South Carolina Public Service Authority | | | | | | | | |
4.00%, 12/01/2036 | | | 3,500 | | | | 3,505 | |
5.00%, 12/01/2031 | | | 2,860 | | | | 3,124 | |
5.00%, 12/01/2032 | | | 1,500 | | | | 1,550 | |
5.00%, 12/01/2032 | | | 3,670 | | | | 3,997 | |
5.00%, 12/01/2035 | | | 1,500 | | | | 1,548 | |
5.00%, 12/01/2041 | | | 3,000 | | | | 3,048 | |
5.25%, 12/01/2038 | | | 10,000 | | | | 11,090 | |
South Carolina State Housing Finance & Development Authority | | | | | | | | |
4.00%, 01/01/2050 | | | 605 | | | | 600 | |
4.00%, 07/01/2050 | | | 600 | | | | 595 | |
South Carolina Transportation Infrastructure Bank | | | | | | | | |
5.00%, 10/01/2025 | | | 305 | | | | 318 | |
5.00%, 10/01/2035 | | | 5,325 | | | | 5,706 | |
Tender Option Bond Trust Receipts/Certificates | | | | | | | | |
0.00%, 08/01/2042(3) | | | 7,500 | | | | 7,500 | |
| | | | | | | | |
Total South Carolina | | | | 99,631 | |
| | | | | | | | |
South Dakota – 0.12% | | | | | | | | |
County of Lawrence SD | | | | | | | | |
4.00%, 12/01/2036 | | | 730 | | | | 760 | |
4.00%, 12/01/2038 | | | 810 | | | | 819 | |
South Dakota Health & Educational Facilities Authority | | | | | | | | |
5.00%, 09/01/2024 | | | 355 | | | | 360 | |
5.00%, 09/01/2025 | | | 880 | | | | 904 | |
5.00%, 09/01/2026 | | | 2,000 | | | | 2,083 | |
5.00%, 11/01/2029 | | | 800 | | | | 835 | |
5.00%, 11/01/2030 | | | 1,000 | | | | 1,043 | |
5.00%, 07/01/2033(1) | | | 2,630 | | | | 2,653 | |
South Dakota Housing Development Authority | | | | | | | | |
3.00%, 11/01/2051 | | | 1,080 | | | | 1,041 | |
4.00%, 11/01/2047 | | | 3,285 | | | | 3,262 | |
| | | | | | | | |
Total South Dakota | | | | 13,760 | |
| | | | | | | | |
Tennessee – 1.02% | | | | | | | | |
Greeneville Health & Educational Facilities Board | | | | | | | | |
5.00%, 07/01/2025 | | | 1,850 | | | | 1,850 | |
Health Educational & Housing Facility Board of the City of Memphis | | | | | | | | |
5.00%, 07/01/2027(1) | | | 4,220 | | | | 4,339 | |
5.00%, 07/01/2027(1) | | | 7,157 | | | | 7,357 | |
Johnson City Health & Educational Facilities Board | | | | | | | | |
5.00%, 07/01/2025 | | | 1,425 | | | | 1,463 | |
Knox County Health Educational & Housing Facility Board | | | | | | | | |
5.00%, 04/01/2024 | | | 1,000 | | | | 1,009 | |
5.00%, 04/01/2027 | | | 1,740 | | | | 1,811 | |
Metropolitan Government Nashville & Davidson County Health & Educational Facs Bd | | | | | | | | |
4.00%, 04/01/2026(1) | | | 4,580 | | | | 4,583 | |
5.00%, 06/01/2044(1) | | | 10,000 | | | | 10,180 | |
Metropolitan Government of Nashville & Davidson County TN | | | | | | | | |
1.75%, 01/01/2036 | | | 6,820 | | | | 5,152 | |
5.00%, 07/01/2031 | | | 1,100 | | | | 1,142 | |
Metropolitan Government of Nashville & Davidson County TN Electric Revenue | | | | | | | | |
5.00%, 05/15/2042 | | | 2,000 | | | | 2,093 | |
Metropolitan Nashville Airport Authority | | | | | | | | |
5.00%, 07/01/2030 | | | 1,950 | | | | 2,132 | |
5.00%, 07/01/2031 | | | 1,920 | | | | 2,122 | |
5.00%, 07/01/2036 | | | 2,050 | | | | 2,190 | |
5.25%, 07/01/2032 | | | 1,150 | | | | 1,303 | |
5.25%, 07/01/2033 | | | 1,000 | | | | 1,137 | |
5.25%, 07/01/2034 | | | 1,250 | | | | 1,416 | |
5.25%, 07/01/2035 | | | 1,375 | | | | 1,543 | |
5.50%, 07/01/2036 | | | 1,125 | | | | 1,275 | |
5.50%, 07/01/2037 | | | 2,400 | | | | 2,696 | |
5.50%, 07/01/2038 | | | 3,225 | | | | 3,606 | |
5.50%, 07/01/2039 | | | 2,300 | | | | 2,559 | |
5.50%, 07/01/2040 | | | 2,000 | | | | 2,216 | |
Nashville Metropolitan Development & Housing Agency | | | | | | | | |
4.50%, 06/01/2028(3) | | | 485 | | | | 488 | |
New Memphis Arena Public Building Authority | | | | | | | | |
0.00%, 04/01/2029 | | | 625 | | | | 560 | |
0.00%, 04/01/2030 | | | 750 | | | | 669 | |
| | | | | | | | |
0.00%, 04/01/2031 | | | 650 | | | | 579 | |
Tennergy Corp. | | | | | | | | |
5.00%, 02/01/2050(1) | | | 9,320 | | | | 9,432 | |
Tennessee Energy Acquisition Corp. | | | | | | | | |
4.00%, 11/01/2049(1) | | | 8,955 | | | | 8,906 | |
Tennessee Housing Development Agency | | | | | | | | |
3.00%, 01/01/2052 | | | 1,560 | | | | 1,497 | |
3.75%, 07/01/2052 | | | 2,315 | | | | 2,281 | |
5.00%, 01/01/2053 | | | 3,215 | | | | 3,313 | |
Tennessee State School Bond Authority | | | | | | | | |
5.00%, 11/01/2040 | | | 25,000 | | | | 26,052 | |
| | | | | | | | |
Total Tennessee | | | | 118,951 | |
| | | | | | | | |
Texas – 9.77% | | | | | | | | |
Alamito Public Facility Corp. | | | | | | | | |
3.50%, 09/01/2025(1) | | | 1,990 | | | | 1,985 | |
3.50%, 09/01/2025(1) | | | 4,315 | | | | 4,287 | |
Arlington Higher Education Finance Corp. | | | | | | | | |
4.00%, 08/15/2031 | | | 435 | | | | 454 | |
4.00%, 08/15/2038 | | | 4,410 | | | | 4,406 | |
4.00%, 08/15/2039 | | | 4,925 | | | | 4,883 | |
4.00%, 08/15/2040 | | | 5,130 | | | | 5,047 | |
4.00%, 08/15/2041 | | | 5,400 | | | | 5,274 | |
4.00%, 08/15/2042 | | | 3,000 | | | | 2,907 | |
Arlington Independent School District | | | | | | | | |
4.00%, 02/15/2039 | | | 1,500 | | | | 1,524 | |
Austin Community College District Public Facility Corp. | | | | | | | | |
5.00%, 08/01/2024 | | | 430 | | | | 438 | |
5.00%, 08/01/2028 | | | 310 | | | | 335 | |
5.00%, 08/01/2031 | | | 300 | | | | 325 | |
5.00%, 08/01/2031 | | | 580 | | | | 628 | |
Austin Independent School District | | | | | | | | |
4.00%, 08/01/2032 | | | 2,835 | | | | 3,022 | |
4.00%, 08/01/2033 | | | 3,160 | | | | 3,355 | |
4.00%, 08/01/2034 | | | 3,620 | | | | 3,831 | |
4.00%, 08/01/2035 | | | 2,465 | | | | 2,583 | |
Austin-Bergstrom Landhost Enterprises, Inc. | | | | | | | | |
5.00%, 10/01/2023 | | | 1,425 | | | | 1,427 | |
5.00%, 10/01/2025 | | | 1,780 | | | | 1,811 | |
5.00%, 10/01/2026 | | | 1,400 | | | | 1,439 | |
5.00%, 10/01/2028 | | | 1,925 | | | | 2,006 | |
5.00%, 10/01/2030 | | | 2,175 | | | | 2,268 | |
5.00%, 10/01/2033 | | | 2,000 | | | | 2,077 | |
5.00%, 10/01/2034 | | | 2,000 | | | | 2,072 | |
5.00%, 10/01/2036 | | | 1,000 | | | | 1,026 | |
Barbers Hill Independent School District | | | | | | | | |
4.00%, 02/15/2041 | | | 1,625 | | | | 1,634 | |
Baytown Area Water Authority | | | | | | | | |
5.00%, 05/01/2024 | | | 1,000 | | | | 1,013 | |
5.00%, 05/01/2025 | | | 1,000 | | | | 1,029 | |
Birdville Independent School District | | | | | | | | |
5.00%, 02/15/2026 | | | 725 | | | | 762 | |
Boerne Independent School District | | | | | | | | |
3.13%, 02/01/2053 | | | 2,270 | | | | 2,247 | |
Brazosport Independent School District | | | | | | | | |
2.13%, 02/15/2033 | | | 1,310 | | | | 1,123 | |
Capital Area Housing Finance Corp. | | | | | | | | |
0.29%, 08/01/2039(1) | | | 2,015 | | | | 1,927 | |
Central Texas Regional Mobility Authority | | | | | | | | |
4.00%, 01/01/2033 | | | 965 | | | | 1,003 | |
4.00%, 01/01/2033 | | | 1,000 | | | | 1,032 | |
4.00%, 01/01/2036 | | | 500 | | | | 510 | |
4.00%, 01/01/2037 | | | 620 | | | | 627 | |
5.00%, 01/01/2024 | | | 175 | | | | 176 | |
5.00%, 01/01/2025 | | | 225 | | | | 230 | |
5.00%, 01/01/2025 | | | 3,795 | | | | 3,846 | |
5.00%, 01/01/2028 | | | 300 | | | | 309 | |
5.00%, 01/01/2029 | | | 750 | | | | 809 | |
5.00%, 01/01/2031 | | | 500 | | | | 551 | |
5.00%, 01/01/2031 | | | 600 | | | | 662 | |
5.00%, 01/01/2032 | | | 500 | | | | 551 | |
5.00%, 01/01/2034 | | | 1,475 | | | | 1,529 | |
Central Texas Turnpike System | | | | | | | | |
5.00%, 08/15/2039 | | | 1,560 | | | | 1,673 | |
City of Amarillo TX Waterworks & Sewer System Revenue | | | | | | | | |
4.00%, 04/01/2039 | | | 1,310 | | | | 1,311 | |
4.00%, 04/01/2040 | | | 1,450 | | | | 1,436 | |
City of Arlington TX | | | | | | | | |
5.00%, 08/15/2031 | | | 265 | | | | 282 | |
5.00%, 08/15/2033 | | | 290 | | | | 307 | |
5.00%, 08/15/2035 | | | 320 | | | | 336 | |
City of Arlington TX Special Tax Revenue | | | | | | | | |
4.00%, 02/15/2044 | | | 1,000 | | | | 974 | |
City of Austin TX | | | | | | | | |
| | | | | | | | |
5.00%, 09/01/2023 | | | 2,160 | | | | 2,166 | |
5.00%, 09/01/2037 | | | 2,900 | | | | 3,307 | |
City of Austin TX Airport System Revenue | | | | | | | | |
5.00%, 11/15/2026 | | | 1,140 | | | | 1,191 | |
5.00%, 11/15/2028 | | | 1,000 | | | | 1,012 | |
City of Austin TX Electric Utility Revenue | | | | | | | | |
5.00%, 11/15/2040 | | | 15,550 | | | | 17,494 | |
City of Austin TX Water & Wastewater System Revenue | | | | | | | | |
5.00%, 11/15/2032 | | | 750 | | | | 889 | |
5.00%, 11/15/2034 | | | 500 | | | | 588 | |
5.00%, 11/15/2039 | | | 1,575 | | | | 1,772 | |
5.00%, 11/15/2040 | | | 2,820 | | | | 3,146 | |
5.00%, 11/15/2041 | | | 2,500 | | | | 2,773 | |
City of Bryan TX | | | | | | | | |
2.25%, 08/15/2035 | | | 2,465 | | | | 2,052 | |
City of College Station TX | | | | | | | | |
2.13%, 02/15/2040 | | | 2,000 | | | | 1,436 | |
2.25%, 02/15/2041 | | | 1,000 | | | | 720 | |
City of Crandall TX | | | | | | | | |
3.38%, 09/15/2026(3) | | | 50 | | | | 46 | |
4.00%, 09/15/2031(3) | | | 100 | | | | 92 | |
City of Dallas TX | | | | | | | | |
5.00%, 02/15/2024 | | | 1,055 | | | | 1,067 | |
5.00%, 02/15/2027 | | | 8,125 | | | | 8,697 | |
City of Dallas TX Hotel Occupancy Tax Revenue | | | | | | | | |
4.00%, 08/15/2029 | | | 1,110 | | | | 1,127 | |
4.00%, 08/15/2030 | | | 1,040 | | | | 1,055 | |
4.00%, 08/15/2032 | | | 1,000 | | | | 1,011 | |
City of Dallas TX Waterworks & Sewer System Revenue | | | | | | | | |
4.00%, 10/01/2032 | | | 3,210 | | | | 3,377 | |
5.00%, 10/01/2031 | | | 800 | | | | 844 | |
City of El Paso TX | | | | | | | | |
5.00%, 08/15/2025 | | | 2,245 | | | | 2,329 | |
City of El Paso TX Water & Sewer Revenue | | | | | | | | |
5.00%, 03/01/2034 | | | 1,725 | | | | 1,965 | |
5.00%, 03/01/2035 | | | 1,035 | | | | 1,171 | |
5.00%, 03/01/2036 | | | 2,355 | | | | 2,643 | |
5.00%, 03/01/2040 | | | 1,700 | | | | 1,905 | |
5.25%, 03/01/2049 | | | 7,500 | | | | 8,297 | |
City of Elgin TX | | | | | | | | |
4.00%, 07/15/2029 | | | 350 | | | | 364 | |
4.00%, 07/15/2034 | | | 175 | | | | 181 | |
City of Fort Worth TX | | | | | | | | |
2.00%, 03/01/2040 | | | 3,000 | | | | 2,103 | |
City of Fort Worth TX Water & Sewer System Revenue | | | | | | | | |
5.00%, 02/15/2040 | | | 5,950 | | | | 6,619 | |
City of Garland TX Water & Sewer System Revenue | | | | | | | | |
5.00%, 03/01/2028 | | | 700 | | | | 748 | |
City of Georgetown TX Utility System Revenue | | | | | | | | |
5.00%, 08/15/2029 | | | 750 | | | | 831 | |
5.00%, 08/15/2032 | | | 1,250 | | | | 1,424 | |
5.00%, 08/15/2034 | | | 1,300 | | | | 1,473 | |
City of Grand Prairie TX | | | | | | | | |
4.00%, 02/15/2039 | | | 1,300 | | | | 1,309 | |
City of Houston TX | | | | | | | | |
5.00%, 03/01/2025 | | | 750 | | | | 771 | |
5.00%, 03/01/2028 | | | 1,000 | | | | 1,075 | |
5.00%, 03/01/2031 | | | 2,880 | | | | 3,202 | |
City of Houston TX Airport System Revenue | | | | | | | | |
5.00%, 07/01/2027 | | | 3,000 | | | | 3,230 | |
5.00%, 07/01/2029 | | | 1,000 | | | | 1,068 | |
5.00%, 07/01/2031 | | | 1,750 | | | | 1,866 | |
5.00%, 07/01/2032 | | | 1,750 | | | | 1,864 | |
5.00%, 07/01/2033 | | | 1,770 | | | | 1,952 | |
5.00%, 07/01/2034 | | | 2,815 | | | | 3,094 | |
City of Houston TX Combined Utility System Revenue | | | | | | | | |
4.00%, 11/15/2035 | | | 300 | | | | 313 | |
4.00%, 11/15/2036 | | | 300 | | | | 309 | |
5.00%, 11/15/2023 | | | 225 | | | | 226 | |
5.00%, 05/15/2028 | | | 410 | | | | 416 | |
5.00%, 11/15/2033 | | | 400 | | | | 423 | |
5.00%, 11/15/2035 | | | 2,650 | | | | 2,886 | |
5.00%, 11/15/2036 | | | 1,000 | | | | 1,050 | |
City of Houston TX Hotel Occupancy Tax & Special Revenue | | | | | | | | |
5.00%, 09/01/2036 | | | 2,100 | | | | 2,252 | |
City of Lubbock TX Electric Light & Power System Revenue | | | | | | | | |
4.00%, 04/15/2038 | | | 3,000 | | | | 3,035 | |
4.00%, 04/15/2039 | | | 2,500 | | | | 2,511 | |
City of Midland TX | | | | | | | | |
4.00%, 03/01/2044 | | | 1,250 | | | | 1,228 | |
City of Pearland TX | | | | | | | | |
5.00%, 03/01/2024 | | | 650 | | | | 658 | |
City of Plano TX | | | | | | | | |
| | | | | | | | |
5.00%, 09/01/2024 | | | 1,075 | | | | 1,098 | |
5.00%, 09/01/2024 | | | 8,780 | | | | 8,965 | |
City of San Antonio TX | | | | | | | | |
4.00%, 08/01/2033 | | | 1,185 | | | | 1,278 | |
City of San Antonio TX Airport System | | | | | | | | |
5.00%, 07/01/2027 | | | 2,000 | | | | 2,105 | |
5.00%, 07/01/2028 | | | 1,750 | | | | 1,861 | |
5.00%, 07/01/2030 | | | 1,000 | | | | 1,078 | |
City of San Antonio TX Electric & Gas Systems Revenue | | | | | | | | |
1.13%, 12/01/2045(1) | | | 22,440 | | | | 19,827 | |
1.75%, 02/01/2049(1) | | | 4,000 | | | | 3,777 | |
2.00%, 02/01/2049(1) | | | 15,940 | | | | 14,586 | |
5.00%, 02/01/2030 | | | 1,000 | | | | 1,076 | |
5.00%, 02/01/2039 | | | 1,700 | | | | 1,865 | |
5.00%, 02/01/2039 | | | 20,250 | | | | 20,386 | |
5.00%, 02/01/2040 | | | 1,465 | | | | 1,601 | |
5.00%, 02/01/2041 | | | 570 | | | | 620 | |
5.25%, 02/01/2041 | | | 20,000 | | | | 22,832 | |
City of Temple TX | | | | | | | | |
4.00%, 08/01/2031 | | | 225 | | | | 238 | |
4.00%, 08/01/2033 | | | 200 | | | | 209 | |
4.00%, 08/01/2034 | | | 240 | | | | 250 | |
4.00%, 08/01/2035 | | | 215 | | | | 222 | |
4.00%, 08/01/2039 | | | 220 | | | | 220 | |
4.00%, 08/01/2041 | | | 170 | | | | 167 | |
City of Waco TX | | | | | | | | |
4.00%, 02/01/2039 | | | 1,605 | | | | 1,611 | |
5.00%, 02/01/2025 | | | 1,710 | | | | 1,728 | |
Clifton Higher Education Finance Corp. | | | | | | | | |
3.00%, 08/15/2032 | | | 370 | | | | 363 | |
3.00%, 08/15/2033 | | | 260 | | | | 250 | |
3.00%, 08/15/2034 | | | 490 | | | | 466 | |
3.00%, 08/15/2035 | | | 680 | | | | 637 | |
3.00%, 08/15/2036 | | | 330 | | | | 303 | |
3.00%, 08/15/2037 | | | 730 | | | | 652 | |
3.00%, 08/15/2038 | | | 380 | | | | 332 | |
3.00%, 08/15/2039 | | | 780 | | | | 668 | |
3.00%, 08/15/2040 | | | 935 | | | | 783 | |
3.00%, 08/15/2041 | | | 965 | | | | 795 | |
4.00%, 08/15/2036 | | | 350 | | | | 357 | |
4.00%, 08/15/2037 | | | 500 | | | | 506 | |
5.00%, 08/15/2030 | | | 170 | | | | 189 | |
Collin County Community College District | | | | | | | | |
4.00%, 08/15/2038 | | | 3,300 | | | | 3,351 | |
Comal Independent School District | | | | | | | | |
3.00%, 02/01/2040 | | | 7,150 | | | | 6,246 | |
Conroe Local Government Corp. | | | | | | | | |
5.00%, 10/01/2033 | | | 200 | | | | 225 | |
5.00%, 10/01/2034 | | | 200 | | | | 226 | |
5.00%, 10/01/2035 | | | 135 | | | | 151 | |
Coppell Independent School District | | | | | | | | |
4.00%, 08/15/2034 | | | 2,310 | | | | 2,391 | |
4.00%, 08/15/2036 | | | 2,580 | | | | 2,641 | |
County of Collin TX | | | | | | | | |
4.00%, 02/15/2037 | | | 1,105 | | | | 1,134 | |
County of Denton TX | | | | | | | | |
3.00%, 07/15/2033 | | | 5,215 | | | | 5,114 | |
County of El Paso TX | | | | | | | | |
5.00%, 02/15/2029 | | | 1,500 | | | | 1,617 | |
5.00%, 02/15/2031 | | | 1,280 | | | | 1,340 | |
County of Harris TX | | | | | | | | |
5.00%, 10/01/2027 | | | 5,000 | | | | 5,434 | |
5.00%, 08/15/2031 | | | 1,760 | | | | 2,041 | |
5.00%, 08/15/2032 | | | 1,000 | | | | 1,176 | |
County of Lubbock TX | | | | | | | | |
4.00%, 02/15/2040 | | | 3,385 | | | | 3,358 | |
5.00%, 02/15/2035 | | | 765 | | | | 876 | |
County of Tarrant TX | | | | | | | | |
5.00%, 07/15/2037 | | | 945 | | | | 1,059 | |
5.00%, 07/15/2038 | | | 2,500 | | | | 2,789 | |
Cypress-Fairbanks Independent School District | | | | | | | | |
3.00%, 02/15/2034 | | | 2,420 | | | | 2,369 | |
4.00%, 02/15/2033 | | | 575 | | | | 607 | |
5.00%, 02/15/2025 | | | 1,000 | | | | 1,012 | |
5.00%, 02/15/2025 | | | 1,205 | | | | 1,242 | |
5.00%, 02/15/2027 | | | 470 | | | | 494 | |
5.00%, 02/15/2038 | | | 3,470 | | | | 3,947 | |
5.00%, 02/15/2039 | | | 11,225 | | | | 12,680 | |
5.00%, 02/15/2040 | | | 13,055 | | | | 14,644 | |
Dallas Area Rapid Transit | | | | | | | | |
5.00%, 12/01/2024 | | | 550 | | | | 563 | |
Dallas College | | | | | | | | |
5.00%, 02/15/2035 | | | 3,250 | | | | 3,361 | |
| | | | | | | | |
5.00%, 02/15/2036 | | | 2,250 | | | | 2,321 | |
5.00%, 02/15/2037 | | | 2,250 | | | | 2,315 | |
Dallas County Utility & Reclamation District | | | | | | | | |
5.00%, 02/15/2024 | | | 1,125 | | | | 1,136 | |
Dallas Fort Worth International Airport | | | | | | | | |
4.00%, 11/01/2034 | | | 1,930 | | | | 2,014 | |
4.00%, 11/01/2035 | | | 3,870 | | | | 3,991 | |
4.00%, 11/01/2045 | | | 4,215 | | | | 4,086 | |
4.00%, 11/01/2046 | | | 3,950 | | | | 3,811 | |
5.00%, 11/01/2031 | | | 2,310 | | | | 2,643 | |
5.00%, 11/01/2032 | | | 1,500 | | | | 1,763 | |
5.25%, 11/01/2027 | | | 1,145 | | | | 1,149 | |
Dallas Independent School District | | | | | | | | |
4.00%, 02/15/2025 | | | 1,655 | | | | 1,681 | |
4.00%, 02/15/2026 | | | 1,000 | | | | 1,024 | |
Decatur Hospital Authority | | | | | | | | |
5.00%, 09/01/2030 | | | 555 | | | | 544 | |
5.00%, 09/01/2032 | | | 1,110 | | | | 1,080 | |
Deer Park Independent School District | | | | | | | | |
5.00%, 08/15/2047 | | | 2,750 | | | | 3,026 | |
Denton Independent School District | | | | | | | | |
0.00%, 08/15/2025 | | | 500 | | | | 467 | |
2.00%, 08/01/2044(1) | | | 175 | | | | 173 | |
2.00%, 08/01/2044 | | | 845 | | | | 834 | |
2.00%, 08/01/2044 | | | 4,315 | | | | 4,228 | |
Eagle Mountain & Saginaw Independent School District | | | | | | | | |
5.00%, 08/15/2032 | | | 800 | | | | 939 | |
5.00%, 08/15/2034 | | | 1,225 | | | | 1,424 | |
Edinburg Consolidated Independent School District | | | | | | | | |
5.00%, 02/15/2035 | | | 1,235 | | | | 1,280 | |
El Paso County Hospital District | | | | | | | | |
5.00%, 08/15/2027 | | | 1,260 | | | | 1,262 | |
5.00%, 08/15/2029 | | | 50 | | | | 50 | |
Forney Independent School District | | | | | | | | |
5.00%, 08/15/2034 | | | 2,540 | | | | 2,931 | |
Fort Bend Independent School District | | | | | | | | |
0.72%, 08/01/2051(1) | | | 8,890 | | | | 7,885 | |
0.88%, 08/01/2050(1) | | | 2,775 | | | | 2,606 | |
Fort Worth Independent School District | | | | | | | | |
5.00%, 02/15/2035 | | | 1,125 | | | | 1,322 | |
5.00%, 02/15/2036 | | | 560 | | | | 652 | |
5.00%, 02/15/2047 | | | 2,500 | | | | 2,635 | |
Frisco Independent School District | | | | | | | | |
5.00%, 02/15/2038 | | | 1,000 | | | | 1,127 | |
5.00%, 02/15/2039 | | | 5,465 | | | | 6,131 | |
5.00%, 02/15/2040 | | | 2,870 | | | | 3,204 | |
Galveston Independent School District | | | | | | | | |
5.00%, 02/01/2034 | | | 500 | | | | 564 | |
Georgetown Independent School District | | | | | | | | |
2.50%, 08/15/2035 | | | 3,000 | | | | 2,603 | |
Grand Parkway Transportation Corp. | | | | | | | | |
5.00%, 10/01/2031 | | | 2,630 | | | | 2,889 | |
5.00%, 10/01/2033 | | | 1,205 | | | | 1,318 | |
5.00%, 10/01/2034 | | | 1,500 | | | | 1,634 | |
5.00%, 10/01/2038 | | | 2,000 | | | | 2,137 | |
5.00%, 10/01/2052(1) | | | 9,910 | | | | 9,934 | |
Greater Texoma Utility Authority | | | | | | | | |
5.00%, 10/01/2037 | | | 1,305 | | | | 1,437 | |
Harlandale Independent School District | | | | | | | | |
5.00%, 08/01/2030 | | | 1,305 | | | | 1,412 | |
Harris County Cultural Education Facilities Finance Corp. | | | | | | | | |
0.90%, 05/15/2050(1) | | | 1,630 | | | | 1,533 | |
3.65%, 12/01/2059 | | | 9,000 | | | | 9,000 | |
5.00%, 07/01/2049(1) | | | 1,480 | | | | 1,508 | |
5.00%, 10/01/2051(1) | | | 14,500 | | | | 16,561 | |
Harris County Flood Control District | | | | | | | | |
4.00%, 10/01/2036 | | | 480 | | | | 497 | |
4.00%, 10/01/2037 | | | 4,400 | | | | 4,516 | |
5.00%, 10/01/2031 | | | 3,145 | | | | 3,614 | |
Houston Higher Education Finance Corp. | | | | | | | | |
3.38%, 10/01/2037 | | | 1,000 | | | | 853 | |
Irving Hospital Authority | | | | | | | | |
5.00%, 10/15/2035 | | | 625 | | | | 642 | |
Keller Independent School District | | | | | | | | |
4.00%, 08/15/2038 | | | 10,000 | | | | 10,035 | |
Lake Houston Redevelopment Authority | | | | | | | | |
3.00%, 09/01/2039 | | | 350 | | | | 270 | |
4.00%, 09/01/2035 | | | 250 | | | | 237 | |
5.00%, 09/01/2030 | | | 250 | | | | 258 | |
Lamar Consolidated Independent School District | | | | | | | | |
5.00%, 02/15/2040 | | | 4,675 | | | | 5,200 | |
Leander Independent School District | | | | | | | | |
5.00%, 08/15/2038 | | | 9,955 | | | | 10,237 | |
| | | | | | | | |
Lewisville Independent School District | | | | | | | | |
5.00%, 08/15/2024 | | | 8,500 | | | | 8,672 | |
Love Field Airport Modernization Corp. | | | | | | | | |
4.00%, 11/01/2038 | | | 1,000 | | | | 980 | |
5.00%, 11/01/2030 | | | 1,080 | | | | 1,110 | |
5.00%, 11/01/2035 | | | 1,000 | | | | 1,033 | |
Lower Colorado River Authority | | | | | | | | |
5.00%, 05/15/2025 | | | 1,190 | | | | 1,228 | |
5.00%, 05/15/2026 | | | 1,000 | | | | 1,050 | |
5.00%, 05/15/2030 | | | 1,635 | | | | 1,844 | |
5.00%, 05/15/2032 | | | 705 | | | | 817 | |
5.00%, 05/15/2036 | | | 1,425 | | | | 1,550 | |
5.00%, 05/15/2038 | | | 3,480 | | | | 3,772 | |
5.00%, 05/15/2039 | | | 3,250 | | | | 3,649 | |
5.00%, 05/15/2040 | | | 3,275 | | | | 3,608 | |
5.00%, 05/15/2040 | | | 5,250 | | | | 5,641 | |
5.00%, 05/15/2051 | | | 5,000 | | | | 5,296 | |
Magnolia Independent School District | | | | | | | | |
5.00%, 08/15/2037 | | | 1,450 | | | | 1,639 | |
5.00%, 08/15/2038 | | | 515 | | | | 578 | |
Midlothian Independent School District | | | | | | | | |
2.00%, 08/01/2051(1) | | | 1,065 | | | | 1,044 | |
Mission Economic Development Corp. | | | | | | | | |
4.63%, 10/01/2031(3) | | | 955 | | | | 930 | |
Needville Independent School District | | | | | | | | |
5.00%, 08/15/2025 | | | 1,175 | | | | 1,220 | |
New Hope Cultural Education Facilities Finance Corp. | | | | | | | | |
4.00%, 08/15/2023(3) | | | 700 | | | | 699 | |
4.00%, 08/15/2026(3) | | | 665 | | | | 644 | |
4.00%, 08/15/2028(3) | | | 1,075 | | | | 1,027 | |
4.00%, 08/15/2029(3) | | | 1,000 | | | | 949 | |
4.00%, 08/15/2031(3) | | | 1,210 | | | | 1,128 | |
4.00%, 08/15/2036(3) | | | 1,545 | | | | 1,340 | |
4.25%, 10/01/2026 | | | 2,000 | | | | 1,966 | |
5.00%, 08/15/2024 | | | 730 | | | | 744 | |
5.00%, 08/15/2026 | | | 200 | | | | 211 | |
5.00%, 08/15/2027 | | | 375 | | | | 402 | |
5.00%, 08/15/2030 | | | 3,500 | | | | 3,769 | |
Newark Higher Education Finance Corp. | | | | | | | | |
5.00%, 04/01/2029 | | | 505 | | | | 527 | |
North East Independent School District | | | | | | | | |
2.00%, 08/01/2052(1) | | | 9,700 | | | | 9,691 | |
North Texas Municipal Water District Upper East Fork Wastewater Interceptor System | | | | | | | | |
5.00%, 06/01/2028 | | | 1,050 | | | | 1,138 | |
5.00%, 06/01/2029 | | | 600 | | | | 651 | |
North Texas Tollway Authority | | | | | | | | |
4.00%, 01/01/2033 | | | 1,000 | | | | 1,044 | |
4.00%, 01/01/2034 | | | 1,000 | | | | 1,040 | |
4.00%, 01/01/2035 | | | 1,000 | | | | 1,032 | |
4.00%, 01/01/2036 | | | 1,600 | | | | 1,635 | |
4.00%, 01/01/2037 | | | 1,650 | | | | 1,669 | |
4.00%, 01/01/2038 | | | 1,250 | | | | 1,251 | |
4.00%, 01/01/2040 | | | 1,250 | | | | 1,225 | |
5.00%, 01/01/2025 | | | 860 | | | | 882 | |
5.00%, 01/01/2030 | | | 75 | | | | 79 | |
5.00%, 01/01/2030 | | | 6,250 | | | | 6,294 | |
5.00%, 01/01/2031 | | | 105 | | | | 110 | |
5.00%, 01/01/2031 | | | 500 | | | | 523 | |
5.00%, 01/01/2031 | | | 1,100 | | | | 1,190 | |
5.00%, 01/01/2031 | | | 1,900 | | | | 1,916 | |
5.00%, 01/01/2032 | | | 1,100 | | | | 1,187 | |
5.00%, 01/01/2033 | | | 500 | | | | 530 | |
5.00%, 01/01/2033 | | | 1,250 | | | | 1,345 | |
5.00%, 01/01/2034 | | | 1,400 | | | | 1,503 | |
5.00%, 01/01/2035 | | | 1,500 | | | | 1,603 | |
5.00%, 01/01/2036 | | | 550 | | | | 570 | |
5.00%, 01/01/2045 | | | 10,005 | | | | 10,160 | |
5.25%, 01/01/2038 | | | 5,400 | | | | 5,982 | |
Northside Independent School District | | | | | | | | |
0.70%, 06/01/2050(1) | | | 24,595 | | | | 23,225 | |
1.60%, 08/01/2049(1) | | | 14,805 | | | | 14,407 | |
3.00%, 08/01/2053 | | | 18,120 | | | | 17,816 | |
Old Spanish Trail-Alemda Corridors Redevelopment Authority | | | | | | | | |
4.00%, 09/01/2033 | | | 1,360 | | | | 1,423 | |
Pasadena Independent School District | | | | | | | | |
1.50%, 02/15/2044(1) | | | 4,295 | | | | 4,183 | |
Permanent University Fund—Texas A&M University System | | | | | | | | |
5.00%, 07/01/2037 | | | 6,585 | | | | 7,541 | |
Permanent University Fund—University of Texas System | | | | | | | | |
5.00%, 07/01/2029 | | | 235 | | | | 247 | |
5.00%, 07/01/2032 | | | 5,315 | | | | 6,295 | |
5.00%, 07/01/2033 | | | 3,795 | | | | 4,549 | |
Pflugerville Independent School District | | | | | | | | |
| | | | | | | | |
2.50%, 02/15/2039(1) | | | 1,340 | | | | 1,338 | |
Plano Independent School District | | | | | | | | |
5.00%, 02/15/2033 | | | 2,600 | | | | 3,060 | |
5.00%, 02/15/2034 | | | 2,175 | | | | 2,553 | |
Port Arthur Independent School District | | | | | | | | |
4.00%, 02/15/2034 | | | 550 | | | | 582 | |
Port Beaumont Navigation District | | | | | | | | |
1.88%, 01/01/2026(3) | | | 850 | | | | 774 | |
2.00%, 01/01/2027(3) | | | 550 | | | | 484 | |
2.13%, 01/01/2028(3) | | | 575 | | | | 490 | |
2.25%, 01/01/2029(3) | | | 820 | | | | 679 | |
2.50%, 01/01/2030(3) | | | 1,000 | | | | 810 | |
2.63%, 01/01/2031(3) | | | 800 | | | | 636 | |
Port of Port Arthur Navigation District | | | | | | | | |
4.30%, 04/01/2040(1) | | | 17,485 | | | | 17,485 | |
4.30%, 04/01/2040(1) | | | 40,990 | | | | 40,990 | |
4.31%, 04/01/2040(1) | | | 13,865 | | | | 13,865 | |
Rockwall Independent School District | | | | | | | | |
0.00%, 02/15/2024 | | | 1,005 | | | | 984 | |
Sabine-Neches Navigation District | | | | | | | | |
5.25%, 02/15/2036 | | | 500 | | | | 568 | |
5.25%, 02/15/2038 | | | 650 | | | | 726 | |
5.25%, 02/15/2040 | | | 1,890 | | | | 2,092 | |
5.25%, 02/15/2042 | | | 1,500 | | | | 1,650 | |
San Antonio Independent School District | | | | | | | | |
5.00%, 08/15/2039 | | | 3,500 | | | | 3,925 | |
5.00%, 08/15/2040 | | | 4,330 | | | | 4,834 | |
San Antonio Public Facilities Corp. | | | | | | | | |
5.00%, 09/15/2025 | | | 1,000 | | | | 1,037 | |
5.00%, 09/15/2026 | | | 1,000 | | | | 1,056 | |
San Antonio Water System | | | | | | | | |
4.00%, 05/15/2039 | | | 4,500 | | | | 4,518 | |
5.00%, 05/15/2032 | | | 270 | | | | 315 | |
5.00%, 05/15/2033 | | | 1,500 | | | | 1,570 | |
5.00%, 05/15/2035 | | | 540 | | | | 621 | |
5.00%, 05/15/2036 | | | 590 | | | | 673 | |
Southwest Houston Redevelopment Authority | | | | | | | | |
4.00%, 09/01/2031 | | | 400 | | | | 423 | |
4.00%, 09/01/2033 | | | 425 | | | | 441 | |
4.00%, 09/01/2034 | | | 355 | | | | 367 | |
4.00%, 09/01/2035 | | | 225 | | | | 230 | |
4.00%, 09/01/2036 | | | 700 | | | | 712 | |
Spring Branch Independent School District | | | | | | | | |
3.00%, 02/01/2032 | | | 1,985 | | | | 1,967 | |
State of Texas | | | | | | | | |
5.00%, 08/01/2025 | | | 2,035 | | | | 2,038 | |
5.00%, 08/01/2026 | | | 1,000 | | | | 1,021 | |
5.00%, 04/01/2027 | | | 5,000 | | | | 5,267 | |
5.00%, 10/01/2032 | | | 3,710 | | | | 3,849 | |
5.00%, 04/01/2033 | | | 3,900 | | | | 4,100 | |
5.00%, 04/01/2035 | | | 9,000 | | | | 9,437 | |
5.00%, 04/01/2039 | | | 10,000 | | | | 10,134 | |
5.50%, 08/01/2032 | | | 1,000 | | | | 1,065 | |
Tarrant County College District | | | | | | | | |
5.00%, 08/15/2038 | | | 5,000 | | | | 5,661 | |
5.00%, 08/15/2039 | | | 7,000 | | | | 7,891 | |
Tarrant County Cultural Education Facilities Finance Corp. | | | | | | | | |
4.00%, 10/01/2041 | | | 1,950 | | | | 1,924 | |
4.00%, 10/01/2042 | | | 1,285 | | | | 1,253 | |
5.00%, 07/01/2026 | | | 1,775 | | | | 1,860 | |
5.00%, 11/15/2037 | | | 4,400 | | | | 4,555 | |
5.00%, 10/01/2038 | | | 1,775 | | | | 1,928 | |
5.00%, 10/01/2039 | | | 1,650 | | | | 1,785 | |
5.00%, 11/15/2040 | | | 1,650 | | | | 1,645 | |
5.00%, 11/15/2052(1) | | | 3,100 | | | | 3,428 | |
Tarrant County Hospital District | | | | | | | | |
5.25%, 08/15/2034 | | | 3,200 | | | | 3,779 | |
Texas A&M University | | | | | | | | |
3.00%, 05/15/2028 | | | 2,300 | | | | 2,297 | |
5.00%, 05/15/2035 | | | 1,500 | | | | 1,736 | |
Texas Department of Housing & Community Affairs | | | | | | | | |
2.95%, 07/01/2036 | | | 1,587 | | | | 1,419 | |
3.50%, 03/01/2051 | | | 5,690 | | | | 5,557 | |
3.50%, 07/01/2052 | | | 7,570 | | | | 7,386 | |
4.00%, 03/01/2050 | | | 1,280 | | | | 1,271 | |
6.00%, 03/01/2053 | | | 5,990 | | | | 6,538 | |
Texas Municipal Gas Acquisition & Supply Corp. I | | | | | | | | |
5.25%, 12/15/2025 | | | 3,000 | | | | 3,078 | |
6.25%, 12/15/2026 | | | 2,580 | | | | 2,688 | |
Texas Municipal Gas Acquisition & Supply Corp. II | | | | | | | | |
4.35% (3 Month LIBOR USD + 0.69%), 09/15/2027(2) | | | 31,555 | | | | 31,393 | |
Texas Municipal Gas Acquisition & Supply Corp. III | | | | | | | | |
5.00%, 12/15/2028 | | | 15,315 | | | | 15,730 | |
| | | | | | | | |
5.00%, 12/15/2030 | | | 7,480 | | | | 7,765 | |
Texas Municipal Power Agency | | | | | | | | |
3.00%, 09/01/2034 | | | 785 | | | | 730 | |
3.00%, 09/01/2038 | | | 2,900 | | | | 2,503 | |
3.00%, 09/01/2040 | | | 1,800 | | | | 1,520 | |
Texas Private Activity Bond Surface Transportation Corp. | | | | | | | | |
4.00%, 12/31/2032 | | | 2,500 | | | | 2,495 | |
4.00%, 12/31/2033 | | | 2,040 | | | | 2,026 | |
4.00%, 06/30/2036 | | | 1,175 | | | | 1,137 | |
5.00%, 12/31/2045 | | | 1,020 | | | | 1,022 | |
Texas Public Finance Authority | | | | | | | | |
5.00%, 02/01/2028 | | | 2,300 | | | | 2,507 | |
Texas State Technical College | | | | | | | | |
5.25%, 08/01/2035 | | | 2,750 | | | | 3,181 | |
5.25%, 08/01/2036 | | | 2,675 | | | | 3,066 | |
Texas State University System | | | | | | | | |
5.00%, 03/15/2029 | | | 610 | | | | 654 | |
5.00%, 03/15/2032 | | | 1,325 | | | | 1,415 | |
Texas Transportation Commission | | | | | | | | |
0.65%, 10/01/2041(1) | | | 15,145 | | | | 13,729 | |
Texas Transportation Commission State Highway 249 System | | | | | | | | |
0.00%, 08/01/2034 | | | 1,060 | | | | 669 | |
0.00%, 08/01/2037 | | | 725 | | | | 383 | |
0.00%, 08/01/2038 | | | 800 | | | | 397 | |
0.00%, 08/01/2039 | | | 710 | | | | 333 | |
0.00%, 08/01/2040 | | | 1,500 | | | | 663 | |
Texas Transportation Commission State Highway Fund | | | | | | | | |
5.00%, 10/01/2023 | | | 5,020 | | | | 5,042 | |
Texas Water Development Board | | | | | | | | |
4.00%, 08/01/2035 | | | 2,640 | | | | 2,765 | |
4.00%, 10/15/2036 | | | 8,740 | | | | 8,923 | |
4.00%, 10/15/2044 | | | 5,000 | | | | 5,003 | |
5.00%, 04/15/2028 | | | 1,500 | | | | 1,647 | |
5.00%, 10/15/2028 | | | 2,370 | | | | 2,630 | |
5.00%, 04/15/2029 | | | 2,000 | | | | 2,242 | |
5.00%, 10/15/2029 | | | 4,100 | | | | 4,639 | |
5.00%, 04/15/2030 | | | 2,000 | | | | 2,283 | |
5.00%, 10/15/2030 | | | 3,060 | | | | 3,523 | |
5.00%, 04/15/2032 | | | 1,420 | | | | 1,603 | |
5.00%, 04/15/2033 | | | 1,000 | | | | 1,186 | |
5.00%, 10/15/2033 | | | 3,420 | | | | 4,049 | |
5.00%, 10/15/2034 | | | 1,900 | | | | 2,238 | |
5.00%, 08/01/2037 | | | 285 | | | | 329 | |
5.00%, 08/01/2038 | | | 340 | | | | 390 | |
5.00%, 08/01/2039 | | | 1,190 | | | | 1,358 | |
5.00%, 08/01/2040 | | | 950 | | | | 1,079 | |
5.00%, 08/01/2041 | | | 6,000 | | | | 6,717 | |
5.00%, 10/15/2043 | | | 1,040 | | | | 1,102 | |
Tomball Independent School District | | | | | | | | |
5.00%, 02/15/2041 | | | 4,000 | | | | 4,235 | |
University of Houston | | | | | | | | |
5.00%, 02/15/2030 | | | 860 | | | | 900 | |
University of North Texas System | | | | | | | | |
5.00%, 04/15/2032 | | | 210 | | | | 244 | |
5.00%, 04/15/2033 | | | 205 | | | | 236 | |
5.00%, 04/15/2034 | | | 280 | | | | 323 | |
5.00%, 04/15/2035 | | | 295 | | | | 339 | |
5.00%, 04/15/2036 | | | 280 | | | | 318 | |
5.00%, 04/15/2037 | | | 370 | | | | 415 | |
5.00%, 04/15/2038 | | | 425 | | | | 472 | |
5.00%, 04/15/2039 | | | 465 | | | | 514 | |
Uptown Development Authority | | | | | | | | |
4.00%, 09/01/2032 | | | 425 | | | | 416 | |
5.00%, 09/01/2033 | | | 715 | | | | 735 | |
Viridian Municipal Management District | | | | | | | | |
4.00%, 12/01/2029 | | | 520 | | | | 523 | |
4.00%, 12/01/2031 | | | 560 | | | | 563 | |
4.00%, 12/01/2032 | | | 580 | | | | 583 | |
4.00%, 12/01/2033 | | | 605 | | | | 607 | |
Weatherford Independent School District | | | | | | | | |
5.00%, 02/15/2040 | | | 2,550 | | | | 2,608 | |
Wylie Independent School District | | | | | | | | |
0.00%, 08/15/2037 | | | 600 | | | | 340 | |
| | | | | | | | |
Total Texas | | | | 1,143,049 | |
| | | | | | | | |
Utah – 0.60% | | | | | | | | |
Canyons School District | | | | | | | | |
2.50%, 06/15/2030 | | | 1,965 | | | | 1,848 | |
Central Utah Water Conservancy District | | | | | | | | |
4.00%, 10/01/2039 | | | 1,460 | | | | 1,466 | |
County of Utah UT | | | | | | | | |
5.00%, 05/15/2041 | | | 6,820 | | | | 7,013 | |
5.00%, 05/15/2045 | | | 27,500 | | | | 27,695 | |
Intermountain Power Agency | | | | | | | | |
| | | | | | | | |
4.00%, 07/01/2036 | | | 1,860 | | | | 1,925 | |
5.00%, 07/01/2029 | | | 1,125 | | | | 1,266 | |
5.00%, 07/01/2030 | | | 1,250 | | | | 1,432 | |
5.00%, 07/01/2037 | | | 5,175 | | | | 5,787 | |
5.00%, 07/01/2041 | | | 1,000 | | | | 1,101 | |
5.00%, 07/01/2042 | | | 640 | | | | 702 | |
Salt Lake City Corp. Airport Revenue | | | | | | | | |
5.00%, 07/01/2025 | | | 1,000 | | | | 1,024 | |
5.00%, 07/01/2026 | | | 1,700 | | | | 1,762 | |
5.00%, 07/01/2026 | | | 3,000 | | | | 3,110 | |
5.00%, 07/01/2030 | | | 1,000 | | | | 1,068 | |
State of Utah | | | | | | | | |
5.00%, 07/01/2023 | | | 1,760 | | | | 1,760 | |
Utah Charter School Finance Authority | | | | | | | | |
4.00%, 04/15/2040 | | | 2,440 | | | | 2,287 | |
4.00%, 10/15/2040 | | | 2,130 | | | | 1,979 | |
Utah Infrastructure Agency | | | | | | | | |
4.00%, 10/15/2029 | | | 610 | | | | 597 | |
4.00%, 10/15/2031 | | | 250 | | | | 243 | |
4.00%, 10/15/2033 | | | 600 | | | | 574 | |
4.00%, 10/15/2034 | | | 1,410 | | | | 1,333 | |
4.00%, 10/15/2036 | | | 500 | | | | 455 | |
4.00%, 10/15/2041 | | | 800 | | | | 789 | |
4.00%, 10/15/2041 | | | 1,550 | | | | 1,312 | |
4.00%, 10/15/2044 | | | 960 | | | | 935 | |
5.00%, 10/15/2027 | | | 550 | | | | 562 | |
5.25%, 10/15/2039 | | | 400 | | | | 441 | |
| | | | | | | | |
Total Utah | | | | 70,466 | |
| | | | | | | | |
Vermont – 0.09% | | | | | | | | |
University of Vermont & State Agricultural College | | | | | | | | |
5.00%, 10/01/2040 | | | 3,710 | | | | 3,770 | |
Vermont Educational & Health Buildings Financing Agency | | | | | | | | |
5.00%, 10/15/2027 | | | 1,000 | | | | 1,005 | |
5.00%, 10/15/2029 | | | 890 | | | | 898 | |
Vermont Housing Finance Agency | | | | | | | | |
3.00%, 11/01/2051 | | | 1,872 | | | | 1,781 | |
Vermont Student Assistance Corp. | | | | | | | | |
5.00%, 06/15/2025 | | | 800 | | | | 817 | |
5.00%, 06/15/2026 | | | 100 | | | | 103 | |
5.00%, 06/15/2026 | | | 500 | | | | 517 | |
5.00%, 06/15/2027 | | | 700 | | | | 722 | |
5.00%, 06/15/2030 | | | 450 | | | | 480 | |
5.00%, 06/15/2031 | | | 500 | | | | 536 | |
| | | | | | | | |
Total Vermont | | | | 10,629 | |
| | | | | | | | |
Virgin Islands – 0.25% | | | | | | | | |
Matching Fund Special Purpose Securitization Corp. | | | | | | | | |
5.00%, 10/01/2026 | | | 5,995 | | | | 6,043 | |
5.00%, 10/01/2027 | | | 14,870 | | | | 14,949 | |
5.00%, 10/01/2028 | | | 4,145 | | | | 4,145 | |
5.00%, 10/01/2030 | | | 4,035 | | | | 4,030 | |
| | | | | | | | |
Total Virgin Islands | | | | 29,167 | |
| | | | | | | | |
Virginia – 1.45% | | | | | | | | |
Arlington County Industrial Development Authority | | | | | | | | |
5.00%, 01/01/2026 | | | 3,710 | | | | 3,827 | |
5.00%, 07/01/2027 | | | 905 | | | | 961 | |
Chesapeake Bay Bridge & Tunnel District | | | | | | | | |
5.00%, 07/01/2041 | | | 4,835 | | | | 4,972 | |
Chesapeake Economic Development Authority | | | | | | | | |
3.65%, 02/01/2032 | | | 1,000 | | | | 996 | |
Chesapeake Redevelopment & Housing Authority | | | | | | | | |
5.00%, 06/01/2026 | | | 5,260 | | | | 5,364 | |
City of Harrisonburg VA | | | | | | | | |
1.75%, 07/15/2035 | | | 595 | | | | 463 | |
1.75%, 07/15/2036 | | | 4,000 | | | | 3,016 | |
County of Fairfax VA | | | | | | | | |
4.00%, 10/01/2038 | | | 2,660 | | | | 2,742 | |
County of Loudoun VA | | | | | | | | |
5.00%, 12/01/2023 | | | 825 | | | | 831 | |
Fairfax County Industrial Development Authority | | | | | | | | |
4.00%, 05/15/2042 | | | 4,740 | | | | 4,710 | |
Farmville Industrial Development Authority | | | | | | | | |
5.00%, 01/01/2032 | | | 1,255 | | | | 1,293 | |
5.00%, 01/01/2033 | | | 1,320 | | | | 1,356 | |
Hampton Roads Transportation Accountability Commission | | | | | | | | |
5.00%, 07/01/2026 | | | 9,300 | | | | 9,839 | |
5.00%, 07/01/2027 | | | 835 | | | | 905 | |
5.00%, 07/01/2045 | | | 3,435 | | | | 3,732 | |
5.50%, 07/01/2057 | | | 1,275 | | | | 1,425 | |
James City County Economic Development Authority | | | | | | | | |
4.00%, 12/01/2027 | | | 445 | | | | 434 | |
4.00%, 12/01/2029 | | | 235 | | | | 225 | |
4.00%, 12/01/2035 | | | 515 | | | | 467 | |
5.00%, 02/01/2026(1) | | | 4,267 | | | | 4,326 | |
| | | | | | | | |
Louisa Industrial Development Authority | | | | | | | | |
3.65%, 11/01/2035 | | | 1,100 | | | | 1,096 | |
Norfolk Redevelopment & Housing Authority | | | | | | | | |
4.00%, 01/01/2025 | | | 3,070 | | | | 2,993 | |
Salem Economic Development Authority | | | | | | | | |
5.00%, 04/01/2030 | | | 710 | | | | 755 | |
5.00%, 04/01/2031 | | | 400 | | | | 425 | |
5.00%, 04/01/2032 | | | 700 | | | | 741 | |
5.00%, 04/01/2033 | | | 350 | | | | 370 | |
5.00%, 04/01/2034 | | | 925 | | | | 976 | |
Stafford County Economic Development Authority | | | | | | | | |
4.00%, 06/15/2037 | | | 50 | | | | 49 | |
5.00%, 06/15/2030 | | | 150 | | | | 156 | |
5.00%, 06/15/2033 | | | 150 | | | | 156 | |
5.00%, 06/15/2034 | | | 500 | | | | 519 | |
Virginia College Building Authority | | | | | | | | |
3.00%, 02/01/2036 | | | 1,320 | | | | 1,229 | |
3.00%, 02/01/2039 | | | 1,080 | | | | 939 | |
4.00%, 02/01/2034 | | | 2,610 | | | | 2,683 | |
4.00%, 09/01/2036 | | | 6,500 | | | | 6,652 | |
4.00%, 09/01/2041 | | | 1,690 | | | | 1,685 | |
5.00%, 09/01/2023 | | | 1,000 | | | | 1,003 | |
5.00%, 02/01/2026 | | | 1,000 | | | | 1,050 | |
5.00%, 02/01/2030 | | | 1,500 | | | | 1,636 | |
5.00%, 02/01/2034 | | | 1,000 | | | | 1,128 | |
5.00%, 02/01/2039 | | | 18,215 | | | | 20,472 | |
5.00%, 02/01/2040 | | | 5,750 | | | | 6,513 | |
5.25%, 02/01/2041 | | | 6,400 | | | | 7,256 | |
Virginia Commonwealth Transportation Board | | | | | | | | |
4.00%, 05/15/2031 | | | 1,250 | | | | 1,276 | |
5.00%, 09/15/2023 | | | 2,500 | | | | 2,509 | |
Virginia Port Authority | | | | | | | | |
5.00%, 07/01/2041 | | | 2,460 | | | | 2,496 | |
Virginia Public Building Authority | | | | | | | | |
5.00%, 08/01/2023 | | | 1,425 | | | | 1,427 | |
5.00%, 08/01/2024 | | | 2,245 | | | | 2,291 | |
Virginia Public School Authority | | | | | | | | |
5.00%, 08/01/2036 | | | 4,220 | | | | 4,978 | |
Virginia Small Business Financing Authority | | | | | | | | |
4.00%, 01/01/2033 | | | 3,250 | | | | 3,258 | |
4.00%, 07/01/2033 | | | 1,160 | | | | 1,162 | |
4.00%, 01/01/2034 | | | 2,500 | | | | 2,505 | |
4.00%, 07/01/2034 | | | 1,785 | | | | 1,786 | |
4.00%, 01/01/2048 | | | 2,955 | | | | 2,606 | |
5.00%, 01/01/2026 | | | 750 | | | | 768 | |
5.00%, 01/01/2027 | | | 1,000 | | | | 1,036 | |
5.00%, 01/01/2033 | | | 4,000 | | | | 4,325 | |
5.00%, 07/01/2033 | | | 2,325 | | | | 2,509 | |
5.00%, 01/01/2036 | | | 2,500 | | | | 2,646 | |
5.00%, 01/01/2038 | | | 2,000 | | | | 2,078 | |
5.00%, 07/01/2038 | | | 6,250 | | | | 6,488 | |
5.00%, 12/31/2038 | | | 830 | | | | 878 | |
Williamsburg Economic Development Authority | | | | | | | | |
4.00%, 07/01/2043 | | | 4,000 | | | | 3,956 | |
Wise County Industrial Development Authority | | | | | | | | |
1.20%, 11/01/2040(1) | | | 3,355 | | | | 3,255 | |
York County Economic Development Authority | | | | | | | | |
3.65%, 05/01/2033 | | | 3,650 | | | | 3,635 | |
| | | | | | | | |
Total Virginia | | | | 170,234 | |
| | | | | | | | |
Washington – 3.08% | | | | | | | | |
Auburn School District No 408 of King & Pierce Counties | | | | | | | | |
5.00%, 12/01/2033 | | | 2,000 | | | | 2,160 | |
Central Puget Sound Regional Transit Authority | | | | | | | | |
4.00%, 11/01/2040 | | | 7,500 | | | | 7,527 | |
5.00%, 11/01/2035 | | | 960 | | | | 1,004 | |
City of Seattle WA Municipal Light & Power Revenue | | | | | | | | |
4.00%, 01/01/2032 | | | 3,385 | | | | 3,512 | |
4.00%, 07/01/2035 | | | 3,430 | | | | 3,620 | |
4.00%, 07/01/2041 | | | 2,360 | | | | 2,382 | |
4.50% (SIFMA Municipal Swap Index Yield + 0.49%), 11/01/2046(2) | | | 5,000 | | | | 5,001 | |
City of Tacoma WA Electric System Revenue | | | | | | | | |
5.00%, 01/01/2039 | | | 675 | | | | 708 | |
City of Tacoma WA Solid Waste Utility Revenue | | | | | | | | |
5.00%, 12/01/2031 | | | 460 | | | | 482 | |
Clark County Public Utility District No 1 Water Revenue | | | | | | | | |
5.00%, 01/01/2024 | | | 395 | | | | 398 | |
County of King WA Sewer Revenue | | | | | | | | |
4.24% (SIFMA Municipal Swap Index Yield + 0.23%), 01/01/2040(2) | | | 13,060 | | | | 12,735 | |
5.00%, 01/01/2047 | | | 20,000 | | | | 20,204 | |
County of Pierce WA | | | | | | | | |
2.60%, 07/01/2036 | | | 2,040 | | | | 1,729 | |
East Pierce Fire & Rescue | | | | | | | | |
5.00%, 12/01/2029 | | | 635 | | | | 703 | |
| | | | | | | | |
5.00%, 12/01/2031 | | | 925 | | | | 1,024 | |
Energy Northwest | | | | | | | | |
5.00%, 07/01/2028 | | | 15,000 | | | | 16,584 | |
5.00%, 07/01/2034 | | | 6,890 | | �� | | 7,859 | |
5.00%, 07/01/2038 | | | 1,000 | | | | 1,027 | |
Franklin County School District No 1 Pasco | | | | | | | | |
5.50%, 12/01/2040 | | | 8,125 | | | | 9,425 | |
King County Housing Authority | | | | | | | | |
3.00%, 06/01/2024 | | | 785 | | | | 782 | |
3.00%, 12/01/2024 | | | 800 | | | | 794 | |
4.00%, 12/01/2026 | | | 430 | | | | 436 | |
4.00%, 06/01/2027 | | | 585 | | | | 595 | |
4.00%, 12/01/2027 | | | 400 | | | | 409 | |
4.00%, 06/01/2028 | | | 1,115 | | | | 1,139 | |
4.00%, 06/01/2029 | | | 840 | | | | 864 | |
4.00%, 06/01/2030 | | | 400 | | | | 412 | |
4.00%, 06/01/2031 | | | 650 | | | | 662 | |
4.00%, 11/01/2031 | | | 1,640 | | | | 1,677 | |
4.00%, 06/01/2032 | | | 625 | | | | 634 | |
4.00%, 11/01/2032 | | | 1,705 | | | | 1,732 | |
4.00%, 06/01/2033 | | | 500 | | | | 507 | |
4.00%, 06/01/2034 | | | 525 | | | | 530 | |
4.00%, 06/01/2035 | | | 735 | | | | 738 | |
5.00%, 11/01/2027 | | | 1,000 | | | | 1,073 | |
5.00%, 11/01/2028 | | | 1,430 | | | | 1,562 | |
5.00%, 11/01/2029 | | | 750 | | | | 833 | |
King County Public Hospital District No 1 | | | | | | | | |
5.00%, 12/01/2032 | | | 4,500 | | | | 4,693 | |
King County School District No 403 Renton | | | | | | | | |
5.00%, 12/01/2038 | | | 2,410 | | | | 2,692 | |
King County School District No 414 Lake Washington | | | | | | | | |
5.00%, 12/01/2035 | | | 1,600 | | | | 1,749 | |
5.00%, 12/01/2036 | | | 3,205 | | | | 3,483 | |
5.00%, 12/01/2037 | | | 1,425 | | | | 1,542 | |
5.00%, 12/01/2038 | | | 865 | | | | 934 | |
Pierce County School District No 10 Tacoma | | | | | | | | |
5.00%, 12/01/2034 | | | 2,800 | | | | 2,871 | |
Port of Seattle WA | | | | | | | | |
5.00%, 07/01/2024 | | | 595 | | | | 595 | |
5.00%, 03/01/2025 | | | 440 | | | | 448 | |
5.00%, 04/01/2029 | | | 5,050 | | | | 5,420 | |
5.00%, 04/01/2030 | | | 2,000 | | | | 2,024 | |
5.00%, 08/01/2031 | | | 12,510 | | | | 13,752 | |
5.00%, 04/01/2033 | | | 3,205 | | | | 3,432 | |
5.00%, 04/01/2034 | | | 1,000 | | | | 1,011 | |
5.00%, 04/01/2036 | | | 3,940 | | | | 4,172 | |
5.00%, 01/01/2037 | | | 3,500 | | | | 3,701 | |
5.00%, 05/01/2037 | | | 3,000 | | | | 3,093 | |
5.00%, 08/01/2038 | | | 12,000 | | | | 12,798 | |
5.00%, 08/01/2039 | | | 1,380 | | | | 1,466 | |
5.00%, 08/01/2041 | | | 2,930 | | | | 3,118 | |
Port of Tacoma WA | | | | | | | | |
5.00%, 12/01/2043 | | | 8,000 | | | | 8,166 | |
Seattle Housing Authority | | | | | | | | |
1.00%, 06/01/2026 | | | 2,365 | | | | 2,163 | |
Snohomish County Housing Authority | | | | | | | | |
5.00%, 04/01/2031 | | | 1,135 | | | | 1,236 | |
Snohomish County Public Utility District No 1 Electric System Revenue | | | | | | | | |
5.00%, 12/01/2037 | | | 5,530 | | | | 5,721 | |
5.00%, 12/01/2040 | | | 3,500 | | | | 3,612 | |
State of Washington | | | | | | | | |
4.00%, 07/01/2035 | | | 1,600 | | | | 1,693 | |
4.00%, 07/01/2035 | | | 3,700 | | | | 3,915 | |
5.00%, 08/01/2027 | | | 235 | | | | 248 | |
5.00%, 08/01/2027 | | | 550 | | | | 571 | |
5.00%, 08/01/2028 | | | 235 | | | | 249 | |
5.00%, 08/01/2030 | | | 235 | | | | 249 | |
5.00%, 08/01/2030 | | | 1,830 | | | | 1,978 | |
5.00%, 06/01/2034 | | | 660 | | | | 725 | |
5.00%, 02/01/2035 | | | 8,800 | | | | 8,882 | |
5.00%, 08/01/2035 | | | 1,855 | | | | 1,988 | |
5.00%, 07/01/2036 | | | 1,505 | | | | 1,641 | |
5.00%, 08/01/2036 | | | 2,750 | | | | 3,163 | |
5.00%, 02/01/2039 | | | 2,135 | | | | 2,284 | |
5.00%, 06/01/2039 | | | 2,000 | | | | 2,149 | |
5.00%, 08/01/2039 | | | 13,350 | | | | 13,535 | |
5.00%, 08/01/2039 | | | 15,000 | | | | 16,938 | |
5.00%, 06/01/2042 | | | 1,000 | | | | 1,103 | |
5.00%, 07/01/2042 | | | 6,750 | | | | 7,599 | |
5.00%, 08/01/2042 | | | 1,810 | | | | 1,900 | |
5.00%, 02/01/2047 | | | 2,650 | | | | 2,902 | |
5.00%, 08/01/2047 | | | 1,500 | | | | 1,650 | |
Thurston & Pierce Counties Community Schools | | | | | | | | |
| | | | | | | | |
5.00%, 12/01/2031 | | | 1,100 | | | | 1,229 | |
Tobacco Settlement Authority | | | | | | | | |
5.00%, 06/01/2024 | | | 1,000 | | | | 1,001 | |
University of Washington | | | | | | | | |
4.00%, 12/01/2028 | | | 2,260 | | | | 2,297 | |
4.00%, 05/01/2048(1) | | | 10,000 | | | | 10,273 | |
Washington Health Care Facilities Authority | | | | | | | | |
5.00%, 08/15/2023 | | | 650 | | | | 651 | |
5.00%, 10/01/2024 | | | 465 | | | | 465 | |
5.00%, 07/01/2025 | | | 360 | | | | 364 | |
5.00%, 08/01/2028 | | | 1,005 | | | | 1,074 | |
5.00%, 07/01/2029 | | | 115 | | | | 116 | |
5.00%, 07/01/2030 | | | 410 | | | | 413 | |
5.00%, 08/01/2030 | | | 3,500 | | | | 3,772 | |
5.00%, 08/15/2030 | | | 1,000 | | | | 1,048 | |
5.00%, 08/15/2031 | | | 845 | | | | 882 | |
5.00%, 09/01/2031 | | | 185 | | | | 203 | |
5.00%, 08/15/2032 | | | 480 | | | | 499 | |
5.00%, 09/01/2032 | | | 180 | | | | 197 | |
5.00%, 09/01/2033 | | | 225 | | | | 246 | |
5.00%, 07/01/2034 | | | 105 | | | | 105 | |
5.00%, 09/01/2034 | | | 450 | | | | 491 | |
5.00%, 09/01/2035 | | | 365 | | | | 396 | |
5.00%, 07/01/2042 | | | 2,415 | | | | 2,384 | |
5.00%, 08/01/2049(1) | | | 10,000 | | | | 10,203 | |
5.00%, 09/01/2050 | | | 500 | | | | 522 | |
Washington Higher Education Facilities Authority | | | | | | | | |
4.00%, 10/01/2035 | | | 380 | | | | 366 | |
5.00%, 05/01/2028 | | | 420 | | | | 451 | |
5.00%, 05/01/2029 | | | 180 | | | | 196 | |
5.00%, 10/01/2029 | | | 565 | | | | 598 | |
5.00%, 10/01/2029 | | | 1,855 | | | | 1,923 | |
5.00%, 10/01/2033 | | | 690 | | | | 732 | |
5.00%, 10/01/2033 | | | 735 | | | | 758 | |
Washington State Convention Center Public Facilities District | | | | | | | | |
4.00%, 07/01/2031 | | | 13,860 | | | | 13,263 | |
Washington State Housing Finance Commission | | | | | | | | |
2.13%, 07/01/2027(3) | | | 1,625 | | | | 1,464 | |
3.70%, 07/01/2030 | | | 5,000 | | | | 5,034 | |
4.56% (SIFMA Municipal Swap Index Yield + 0.55%), 12/01/2048(2) | | | 10,000 | | | | 9,997 | |
5.00%, 01/01/2024(3) | | | 180 | | | | 179 | |
5.00%, 01/01/2025(3) | | | 375 | | | | 367 | |
5.00%, 01/01/2026(3) | | | 300 | | | | 290 | |
5.00%, 12/01/2026 | | | 350 | | | | 370 | |
5.00%, 06/01/2028 | | | 500 | | | | 541 | |
5.00%, 06/01/2029 | | | 500 | | | | 548 | |
5.00%, 06/01/2030 | | | 500 | | | | 555 | |
5.00%, 12/01/2030 | | | 500 | | | | 558 | |
Washington State University | | | | | | | | |
5.00%, 04/01/2029 | | | 425 | | | | 430 | |
5.00%, 04/01/2029 | | | 860 | | | | 871 | |
| | | | | | | | |
Total Washington | | | | 361,039 | |
| | | | | | | | |
West Virginia – 0.16% | | | | | | | | |
Ohio County Board of Education | | | | | | | | |
3.00%, 06/01/2030 | | | 2,275 | | | | 2,275 | |
State of West Virginia | | | | | | | | |
5.00%, 12/01/2036 | | | 2,910 | | | | 3,142 | |
5.00%, 06/01/2041 | | | 1,330 | | | | 1,434 | |
West Virginia Hospital Finance Authority | | | | | | | | |
4.46%, 06/01/2033(1) | | | 4,550 | | | | 4,550 | |
5.00%, 01/01/2031 | | | 620 | | | | 642 | |
5.00%, 09/01/2039 | | | 2,625 | | | | 2,647 | |
West Virginia Lottery Excess Lottery Revenue | | | | | | | | |
5.00%, 07/01/2032 | | | 940 | | | | 985 | |
West Virginia Parkways Authority | | | | | | | | |
5.00%, 06/01/2047 | | | 3,280 | | | | 3,555 | |
| | | | | | | | |
Total West Virginia | | | | 19,230 | |
| | | | | | | | |
Wisconsin – 1.50% | | | | | | | | |
City of Madison WI | | | | | | | | |
2.00%, 10/01/2025 | | | 7,690 | | | | 7,389 | |
City of Milwaukee WI | | | | | | | | |
5.00%, 04/01/2027 | | | 3,255 | | | | 3,446 | |
5.00%, 04/01/2030 | | | 3,000 | | | | 3,336 | |
County of Waushara WI | | | | | | | | |
4.75%, 12/01/2023 | | | 2,500 | | | | 2,503 | |
Hudson School District | | | | | | | | |
2.25%, 03/01/2027 | | | 1,185 | | | | 1,113 | |
Milwaukee Redevelopment Authority | | | | | | | | |
5.00%, 11/15/2031 | | | 570 | | | | 602 | |
5.00%, 11/15/2032 | | | 500 | | | | 528 | |
Monroe School District/WI | | | | | | | | |
4.00%, 03/01/2041 | | | 1,485 | | | | 1,467 | |
5.00%, 03/01/2037 | | | 775 | | | | 849 | |
| | | | | | | | |
5.00%, 03/01/2038 | | | 700 | | | | 761 | |
Norwalk-Ontario-Wilton School District | | | | | | | | |
4.50%, 12/07/2023(3) | | | 10,600 | | | | 10,621 | |
PMA Levy & Aid Anticipation Notes Program | | | | | | | | |
4.00%, 09/27/2023 | | | 2,750 | | | | 2,751 | |
Public Finance Authority | | | | | | | | |
3.00%, 04/01/2025(3) | | | 5 | | | | 5 | |
3.00%, 04/01/2025(3) | | | 215 | | | | 208 | |
3.00%, 12/01/2026 | | | 500 | | | | 475 | |
4.00%, 03/01/2024(3) | | | 1,015 | | | | 1,005 | |
4.00%, 03/01/2025(3) | | | 535 | | | | 520 | |
4.00%, 06/15/2031(3) | | | 450 | | | | 410 | |
4.00%, 12/01/2031 | | | 450 | | | | 431 | |
4.00%, 04/01/2032(3) | | | 850 | | | | 811 | |
4.00%, 12/01/2041 | | | 2,000 | | | | 1,789 | |
4.00%, 06/15/2042(3) | | | 750 | | | | 604 | |
4.13%, 05/01/2026(3) | | | 395 | | | | 382 | |
5.00%, 12/01/2027 | | | 7,815 | | | | 7,942 | |
5.00%, 05/15/2028(3) | | | 200 | | | | 196 | |
5.00%, 07/01/2035 | | | 5,000 | | | | 5,369 | |
5.00%, 07/01/2036 | | | 305 | | | | 322 | |
5.00%, 01/01/2037 | | | 500 | | | | 523 | |
5.00%, 01/01/2038 | | | 350 | | | | 363 | |
5.00%, 07/01/2038 | | | 375 | | | | 389 | |
5.00%, 03/01/2041 | | | 5,640 | | | | 5,751 | |
5.00%, 10/01/2043(3) | | | 170 | | | | 150 | |
5.00%, 10/01/2044 | | | 1,300 | | | | 1,342 | |
5.00%, 03/01/2046 | | | 6,900 | | | | 7,001 | |
5.00%, 10/01/2048(3) | | | 265 | | | | 226 | |
5.00%, 10/01/2053(3) | | | 780 | | | | 649 | |
5.25%, 07/01/2028 | | | 4,000 | | | | 4,002 | |
5.25%, 05/15/2037(3) | | | 50 | | | | 47 | |
5.25%, 03/01/2042 | | | 1,605 | | | | 1,623 | |
5.25%, 05/15/2042(3) | | | 60 | | | | 55 | |
5.25%, 10/01/2043 | | | 2,105 | | | | 2,079 | |
5.25%, 05/15/2047(3) | | | 60 | | | | 53 | |
5.25%, 10/01/2048 | | | 2,105 | | | | 2,034 | |
5.25%, 05/15/2052(3) | | | 115 | | | | 100 | |
State of Wisconsin | | | | | | | | |
5.00%, 05/01/2024 | | | 7,470 | | | | 7,582 | |
5.00%, 05/01/2025 | | | 520 | | | | 533 | |
5.00%, 05/01/2025 | | | 1,730 | | | | 1,790 | |
5.00%, 05/01/2025 | | | 5,335 | | | | 5,517 | |
5.00%, 05/01/2030 | | | 1,000 | | | | 1,055 | |
5.00%, 05/01/2032 | | | 450 | | | | 497 | |
5.00%, 05/01/2033 | | | 9,790 | | | | 10,799 | |
5.00%, 05/01/2034 | | | 2,400 | | | | 2,530 | |
5.00%, 05/01/2034 | | | 5,000 | | | | 5,156 | |
University of Wisconsin Hospitals & Clinics | | | | | | | | |
3.60%, 04/01/2048(1) | | | 6,900 | | | | 6,900 | |
4.00%, 04/01/2037 | | | 1,375 | | | | 1,375 | |
4.00%, 04/01/2038 | | | 2,110 | | | | 2,074 | |
Village of Mount Pleasant WI | | | | | | | | |
3.00%, 03/01/2027 | | | 1,875 | | | | 1,840 | |
Wisconsin Center District | | | | | | | | |
0.00%, 12/15/2028 | | | 1,025 | | | | 844 | |
0.00%, 12/15/2030 | | | 550 | | | | 417 | |
0.00%, 12/15/2030 | | | 1,045 | | | | 793 | |
0.00%, 12/15/2032 | | | 1,400 | | | | 971 | |
0.00%, 12/15/2033 | | | 1,500 | | | | 992 | |
Wisconsin Health & Educational Facilities Authority | | | | | | | | |
2.55%, 11/01/2027 | | | 135 | | | | 127 | |
2.83%, 11/01/2028 | | | 605 | | | | 536 | |
4.00%, 02/15/2025 | | | 270 | | | | 273 | |
4.00%, 02/15/2026 | | | 510 | | | | 518 | |
4.00%, 02/15/2031 | | | 460 | | | | 468 | |
4.00%, 02/15/2033 | | | 550 | | | | 559 | |
4.00%, 11/15/2039 | | | 2,280 | | | | 2,265 | |
4.66% (SIFMA Municipal Swap Index Yield + 0.65%), 08/15/2054(2) | | | 4,000 | | | | 4,001 | |
5.00%, 11/01/2024 | | | 155 | | | | 153 | |
5.00%, 04/01/2025 | | | 2,000 | | | | 2,056 | |
5.00%, 04/01/2026 | | | 1,000 | | | | 1,046 | |
5.00%, 02/15/2027 | | | 300 | | | | 311 | |
5.00%, 04/01/2027 | | | 1,700 | | | | 1,812 | |
5.00%, 10/01/2027 | | | 580 | | | | 625 | |
5.00%, 04/01/2028 | | | 900 | | | | 976 | |
5.00%, 10/01/2028 | | | 700 | | | | 768 | |
5.00%, 11/01/2029 | | | 760 | | | | 718 | |
5.00%, 04/01/2030 | | | 1,670 | | | | 1,828 | |
5.00%, 12/15/2033 | | | 1,450 | | | | 1,562 | |
5.00%, 09/01/2036 | | | 400 | | | | 432 | |
5.00%, 08/15/2039 | | | 5,395 | | | | 5,645 | |
5.00%, 08/15/2054(1) | | | 830 | | | | 869 | |
| | | | | | | | |
Wisconsin Housing & Economic Development Authority Home Ownership Revenue | | | | | | | | |
3.00%, 03/01/2052 | | | 1,340 | | | | 1,288 | |
3.00%, 09/01/2052 | | | 2,195 | | | | 2,107 | |
3.50%, 09/01/2050 | | | 1,760 | | | | 1,721 | |
Wisconsin Housing & Economic Development Authority Housing Revenue | | | | | | | | |
0.40%, 05/01/2045(1) | | | 4,760 | | | | 4,694 | |
0.50%, 11/01/2050(1) | | | 3,100 | | | | 2,931 | |
0.61%, 11/01/2042(1) | | | 405 | | | | 391 | |
0.81%, 11/01/2052(1) | | | 1,350 | | | | 1,280 | |
| | | | | | | | |
Total Wisconsin | | | | 175,847 | |
| | | | | | | | |
Wyoming – 0.08% | | | | | | | | |
County of Laramie WY | | | | | | | | |
4.00%, 05/01/2026 | | | 200 | | | | 204 | |
4.00%, 05/01/2031 | | | 500 | | | | 520 | |
4.00%, 05/01/2033 | | | 500 | | | | 511 | |
4.00%, 05/01/2035 | | | 500 | | | | 509 | |
4.00%, 05/01/2038 | | | 1,365 | | | | 1,342 | |
Wyoming Community Development Authority | | | | | | | | |
3.00%, 06/01/2049 | | | 6,300 | | | | 6,073 | |
| | | | | | | | |
Total Wyoming | | | | 9,159 | |
| | | | | | | | |
Total Municipal Bonds (Cost: $11,643,358) | | | | 11,344,724 | |
| | | | | | | | |
| | | | | | | | |
| | | Shares
(000s) | | | Value
(000s) | |
SHORT-TERM INVESTMENTS – 2.26% | | | | | | | | |
Money Market Funds – 2.26% | | | | | | | | |
Fidelity Institutional Money Market Government Fund—Class I, 5.03%(4) | | | 264,215 | | | | 264,215 | |
| | | | | | | | |
Total Money Market Funds (Cost: $264,215) | | | | | | | 264,215 | |
| | | | | | | | |
| | | | | | | | |
| | |
| | | Principal
Amount
(000s) | | | Value
(000s) | |
Time Deposits – 0.00%(5) | | | | | | | | |
Citibank, New York, 4.57% due 07/03/2023 | | $ | 427 | | | | 427 | |
| | | | | | | | |
Total Time Deposits (Cost: $427) | | | | | | | 427 | |
| | | | | | | | |
Total Short-Term Investments (Cost: $264,642) | | | | 264,642 | |
| | | | | | | | |
TOTAL INVESTMENTS IN SECURITIES – 99.16% | | | | | | | | |
(Cost: $11,908,000) | | | | | | | 11,609,366 | |
| | | | | | | | |
OTHER ASSETS IN EXCESS OF LIABILITIES – 0.84% | | | | | | | 98,224 | |
| | | | | | | | |
TOTAL NET ASSETS – 100.00% | | | | | | $ | 11,707,590 | |
| | | | | | | | |
Percentages are stated as a percent of net assets.
| (1) | Adjustable rate security. The rate reported is the rate in effect as of June 30, 2023. |
| (2) | Variable rate security based on a reference index and spread. The rate reported is the rate in effect as of June 30, 2023. |
| (3) | Security was purchased exempt from registration in the U.S. pursuant to Rule 144(A) under the Securities Act of 1933. The value of these securities totals $270,481, which represents 2.31% of total net assets. |
| (4) | Represents annualized seven-day yield as of the close of the reporting period. |
| (5) | Amount calculated is less than 0.005%. |
The accompanying notes are an integral part of this Schedule of Investments.
Open Futures Contracts
| | | | | | | | | | | | | | | | |
Number of Contracts
Sold | | Reference Entity | | Expiration Date | | Notional
Amount | | | Value | | | Unrealized
Appreciation/
(Depreciation) | |
| (200) | | U.S. 5 Year Note Future | | Sep. 2023 | | $ | (21,741 | ) | | $ | (21,419 | ) | | $ | 322 | |
| (700) | | U.S. 10 Year Note Future | | Sep. 2023 | | | (79,618 | ) | | | (78,586 | ) | | | 1,032 | |
| (900) | | U.S. Ultra 10 Year Note Future | | Sep. 2023 | | | (107,361 | ) | | | (106,594 | ) | | | 767 | |
| | | | | | | | | | | | | | | | |
| | | | | | | | | | | | | | $ | 2,121 | |
| | | | | | | | | | | | | | | | |
| | | | |
| MUNICIPAL BONDS | | % of Net Assets | |
Education | | | 7.37 | % |
General Obligation | | | 22.78 | % |
General Revenue | | | 25.93 | % |
Healthcare | | | 9.54 | % |
Housing | | | 5.30 | % |
Transportation | | | 15.31 | % |
Utilities | | | 10.67 | % |
| | | | |
Total Municipal Bonds | | | 96.90 | % |
| | | | |
SHORT-TERM INVESTMENTS | | | 2.26 | % |
| | | | |
TOTAL INVESTMENTS | | | 99.16 | % |
OTHER ASSETS IN EXCESS OF LIABILITIES | | | 0.84 | % |
| | | | |
TOTAL NET ASSETS | | | 100.00 | % |
| | | | |
The accompanying notes are an integral part of this Schedule of Investments.
Bridge Builder Municipal High-Income Bond Fund
Schedule of Investments
June 30, 2023
(Amounts in thousands, except number of contracts)
| | | | | | | | |
| | | Principal
Amount
(000s) | | | Value
(000s) | |
| | | | | | | |
MUNICIPAL BONDS – 98.14% | | | | |
Alabama – 1.97% | | | | | | | | |
Black Belt Energy Gas District | | | | | | | | |
4.00%, 06/01/2051(1) | | $ | 1,500 | | | $ | 1,482 | |
4.00%, 10/01/2052(1) | | | 1,075 | | | | 1,065 | |
4.00%, 10/01/2052(1) | | | 3,380 | | | | 3,350 | |
5.25%, 02/01/2053(1) | | | 6,265 | | | | 6,558 | |
5.25%, 12/01/2053(1) | | | 190 | | | | 203 | |
County of Jefferson AL Sewer Revenue | | | | | | | | |
0.00%, 10/01/2034 | | | 225 | | | | 100 | |
5.00%, 10/01/2044 | | | 1,500 | | | | 1,527 | |
5.25%, 10/01/2048 | | | 1,650 | | | | 1,684 | |
5.50%, 10/01/2053 | | | 2,275 | | | | 2,326 | |
Health Care Authority of the City of Huntsville | | | | | | | | |
4.00%, 06/01/2045 | | | 2,500 | | | | 2,334 | |
Huntsville-Redstone Village Special Care Facilities Financing Authority | | | | | | | | |
5.50%, 01/01/2028(2)(3) | | | 250 | | | | 150 | |
5.50%, 01/01/2043(2)(3) | | | 195 | | | | 117 | |
6.88%, 01/01/2043(2)(3) | | | 135 | | | | 81 | |
7.50%, 01/01/2047(2)(3) | | | 245 | | | | 147 | |
Southeast Alabama Gas Supply District | | | | | | | | |
4.00%, 06/01/2049(1) | | | 6,000 | | | | 5,988 | |
Southeast Energy Authority A Cooperative District | | | | | | | | |
4.00%, 11/01/2051(1) | | | 325 | | | | 321 | |
4.00%, 12/01/2051(1) | | | 5,815 | | | | 5,652 | |
5.50%, 01/01/2053(1) | | | 2,000 | | | | 2,127 | |
Tuscaloosa County Industrial Development Authority | | | | | | | | |
4.50%, 05/01/2032(4) | | | 4,071 | | | | 3,800 | |
5.25%, 05/01/2044(4) | | | 9,160 | | | | 8,259 | |
| | | | | | | | |
Total Alabama | | | | 47,271 | |
| | | | | | | | |
Alaska – 0.12% | | | | | | | | |
Alaska Industrial Development & Export Authority | | | | | | | | |
5.00%, 01/01/2030 | | | 1,415 | | | | 1,440 | |
City of Valdez AK | | | | | | | | |
3.65%, 12/01/2029(1) | | | 400 | | | | 400 | |
Northern Tobacco Securitization Corp. | | | | | | | | |
4.00%, 06/01/2050 | | | 1,080 | | | | 1,073 | |
| | | | | | | | |
Total Alaska | | | | 2,913 | |
| | | | | | | | |
Arizona – 1.93% | | | | | | | | |
Arizona Health Facilities Authority | | | | | | | | |
4.28% (3 Month LIBOR USD + 0.81%), 01/01/2037(5) | | | 185 | | | | 173 | |
Arizona Industrial Development Authority | | | | | | | | |
3.63%, 05/20/2033 | | | 935 | | | | 870 | |
4.00%, 07/15/2040(4) | | | 65 | | | | 54 | |
4.00%, 07/15/2041(4) | | | 265 | | | | 217 | |
4.00%, 12/15/2041(4) | | | 600 | | | | 483 | |
4.00%, 07/15/2050(4) | | | 1,610 | | | | 1,208 | |
4.00%, 07/01/2051 | | | 1,825 | | | | 1,501 | |
4.00%, 07/15/2051(4) | | | 500 | | | | 373 | |
4.00%, 12/15/2051(4) | | | 1,025 | | | | 749 | |
4.00%, 07/15/2056(4) | | | 475 | | | | 344 | |
4.50%, 07/15/2029(4) | | | 2,500 | | | | 2,424 | |
5.00%, 07/01/2032 | | | 325 | | | | 345 | |
5.00%, 07/15/2039 | | | 90 | | | | 88 | |
5.00%, 07/15/2040(4) | | | 250 | | | | 237 | |
5.00%, 07/15/2040(4) | | | 1,250 | | | | 1,213 | |
5.00%, 07/01/2049(4) | | | 945 | | | | 838 | |
5.00%, 07/15/2049 | | | 580 | | | | 536 | |
5.00%, 07/15/2050(4) | | | 2,365 | | | | 2,177 | |
5.25%, 07/01/2037(4) | | | 205 | | | | 203 | |
5.50%, 07/01/2052(4) | | | 885 | | | | 836 | |
Chandler Industrial Development Authority | | | | | | | | |
5.00%, 09/01/2052(1) | | | 1,900 | | | | 1,944 | |
City of Phoenix Civic Improvement Corp. | | | | | | | | |
4.00%, 07/01/2045 | | | 2,000 | | | | 1,905 | |
County of Pima AZ Sewer System Revenue | | | | | | | | |
5.00%, 07/01/2023 | | | 1,660 | | | | 1,660 | |
Florence Town, Inc. Industrial Development Authority | | | | | | | | |
5.75%, 07/01/2033(4) | | | 1,000 | | | | 1,000 | |
Glendale Industrial Development Authority | | | | | | | | |
4.00%, 07/01/2028 | | | 300 | | | | 276 | |
5.00%, 07/01/2033 | | | 435 | | | | 398 | |
5.00%, 07/01/2038 | | | 450 | | | | 390 | |
5.00%, 07/01/2048 | | | 915 | | | | 728 | |
Industrial Development Authority of the City of Phoenix Arizona | | | | | | | | |
5.00%, 07/01/2030 | | | 700 | | | | 729 | |
| | | | | | | | |
5.00%, 07/01/2035(4) | | | 250 | | | | 250 | |
5.00%, 07/01/2037 | | | 4,750 | | | | 4,821 | |
5.00%, 07/01/2044 | | | 70 | | | | 70 | |
5.00%, 07/01/2049 | | | 565 | | | | 560 | |
5.00%, 07/01/2059 | | | 145 | | | | 141 | |
Industrial Development Authority of the County of Pima | | | | | | | | |
4.00%, 06/15/2041(4) | | | 1,880 | | | | 1,538 | |
4.00%, 06/15/2051(4) | | | 1,215 | | | | 896 | |
4.00%, 06/15/2057(4) | | | 1,245 | | | | 886 | |
Maricopa County Industrial Development Authority | | | | | | | | |
4.00%, 07/01/2029(4) | | | 295 | | | | 283 | |
4.00%, 10/15/2047(4) | | | 2,730 | | | | 2,338 | |
4.00%, 07/01/2056(4) | | | 1,350 | | | | 990 | |
Maricopa County Pollution Control Corp. | | | | | | | | |
4.50%, 08/01/2042 | | | 220 | | | | 212 | |
Peoria Industrial Development Authority | | | | | | | | |
5.50%, 11/15/2034(2)(3) | | | 250 | | | | 193 | |
5.75%, 11/15/2040(2)(3) | | | 405 | | | | 298 | |
Salt Verde Financial Corp. | | | | | | | | |
5.00%, 12/01/2032 | | | 240 | | | | 255 | |
5.00%, 12/01/2037 | | | 5,545 | | | | 5,798 | |
State of Arizona Distribution Revenue | | | | | | | | |
5.50%, 07/01/2030 | | | 580 | | | | 685 | |
5.50%, 07/01/2033 | | | 85 | | | | 105 | |
Tempe Industrial Development Authority | | | | | | | | |
4.00%, 12/01/2038 | | | 1,190 | | | | 959 | |
4.00%, 12/01/2046 | | | 170 | | | | 122 | |
5.00%, 12/01/2050 | | | 500 | | | | 415 | |
5.00%, 12/01/2054 | | | 750 | | | | 610 | |
| | | | | | | | |
Total Arizona | | | | 46,324 | |
| | | | | | | | |
Arkansas – 0.51%
| | | | | | | | |
Arkansas Development Finance Authority | | | | | | | | |
4.50%, 09/01/2049(4) | | | 5,390 | | | | 4,867 | |
4.75%, 09/01/2049(4) | | | 2,840 | | | | 2,666 | |
5.45%, 09/01/2052 | | | 4,265 | | | | 4,265 | |
5.70%, 05/01/2053 | | | 500 | | | | 507 | |
| | | | | | | | |
Total Arkansas | | | | 12,305 | |
| | | | | | | | |
California – 9.18% | | | | | | | | |
Abag Finance Authority for Nonprofit Corps | | | | | | | | |
5.00%, 08/01/2033 | | | 1,300 | | | | 1,301 | |
Alameda Corridor Transportation Authority | | | | | | | | |
5.00%, 10/01/2036 | | | 2,500 | | | | 2,562 | |
5.00%, 10/01/2037 | | | 2,000 | | | | 2,041 | |
California Community Choice Financing Authority | | | | | | | | |
4.00%, 02/01/2052(1) | | | 250 | | | | 248 | |
5.00%, 07/01/2053(1) | | | 3,030 | | | | 3,184 | |
5.00%, 12/01/2053(1) | | | 5,995 | | | | 6,255 | |
California Community Housing Agency | | | | | | | | |
3.00%, 08/01/2056(4) | | | 200 | | | | 133 | |
4.00%, 08/01/2047(4) | | | 1,600 | | | | 1,230 | |
4.00%, 08/01/2050(4) | | | 3,350 | | | | 2,451 | |
4.00%, 02/01/2056(4) | | | 3,085 | | | | 2,331 | |
4.00%, 02/01/2056(4) | | | 7,350 | | | | 5,111 | |
5.00%, 08/01/2049(4) | | | 7,040 | | | | 6,641 | |
California Educational Facilities Authority | | | | | | | | |
5.00%, 05/01/2045 | | | 1,000 | | | | 1,183 | |
California Health Facilities Financing Authority | | | | | | | | |
5.00%, 07/01/2037 | | | 2,000 | | | | 2,000 | |
California Housing Finance | | | | | | | | |
3.50%, 11/20/2035 | | | 290 | | | | 271 | |
4.00%, 03/20/2033 | | | 2,831 | | | | 2,780 | |
4.25%, 01/15/2035 | | | 965 | | | | 966 | |
4.38%, 09/20/2036 | | | 999 | | | | 997 | |
California Infrastructure & Economic Development Bank | | | | | | | | |
4.00%, 10/01/2041 | | | 2,235 | | | | 2,283 | |
5.00%, 11/01/2047 | | | 155 | | | | 161 | |
5.00%, 11/01/2057 | | | 1,380 | | | | 1,416 | |
California Municipal Finance Authority | | | | | | | | |
2.75%, 11/15/2027 | | | 125 | | | | 118 | |
3.00%, 10/01/2049 | | | 100 | | | | 70 | |
4.00%, 07/15/2029 | | | 100 | | | | 99 | |
4.00%, 08/15/2037 | | | 1,560 | | | | 1,505 | |
4.00%, 09/01/2041 | | | 550 | | | | 494 | |
4.00%, 08/15/2042 | | | 1,635 | | | | 1,508 | |
4.00%, 12/31/2047 | | | 395 | | | | 355 | |
4.00%, 03/01/2050 | | | 250 | | | | 187 | |
4.00%, 02/01/2051 | | | 1,215 | | | | 1,116 | |
4.00%, 11/15/2056 | | | 750 | | | | 541 | |
5.00%, 07/01/2032 | | | 1,055 | | | | 1,105 | |
5.00%, 05/15/2033 | | | 1,870 | | | | 1,998 | |
5.00%, 05/15/2036 | | | 2,680 | | | | 2,792 | |
5.00%, 12/31/2043 | | | 18,130 | | | | 18,416 | |
5.00%, 11/01/2046(4) | | | 965 | | | | 935 | |
| | | | | | | | |
5.00%, 12/31/2047 | | | 555 | | | | 561 | |
5.00%, 06/01/2048 | | | 1,000 | | | | 1,007 | |
5.00%, 05/15/2049 | | | 1,205 | | | | 1,225 | |
5.00%, 10/01/2049(4) | | | 515 | | | | 466 | |
5.00%, 05/15/2052 | | | 170 | | | | 172 | |
5.00%, 10/01/2057(4) | | | 1,000 | | | | 883 | |
5.25%, 11/01/2052 | | | 2,165 | | | | 2,312 | |
5.25%, 06/01/2053 | | | 2,655 | | | | 2,840 | |
California Pollution Control Financing Authority | | | | | | | | |
4.25%, 07/01/2043(1)(4) | | | 700 | | | | 700 | |
5.00%, 07/01/2037(4) | | | 5,000 | | | | 5,004 | |
California Public Finance Authority | | | | | | | | |
2.13%, 11/15/2027(4) | | | 1,180 | | | | 1,137 | |
2.38%, 11/15/2028(4) | | | 600 | | | | 575 | |
3.13%, 05/15/2029(4) | | | 110 | | | | 103 | |
5.00%, 11/15/2036(4) | | | 250 | | | | 243 | |
5.00%, 11/15/2046(4) | | | 50 | | | | 45 | �� |
5.00%, 10/15/2047 | | | 3,075 | | | | 3,077 | |
California School Finance Authority | | | | | | | | |
4.00%, 06/01/2061(4) | | | 1,000 | | | | 663 | |
5.00%, 07/01/2037(4) | | | 215 | | | | 221 | |
5.00%, 07/01/2047(4) | | | 500 | | | | 452 | |
5.00%, 07/01/2052(4) | | | 1,340 | | | | 1,184 | |
California Statewide Communities Development Authority | | | | | | | | |
4.00%, 09/02/2028 | | | 20 | | | | 20 | |
4.00%, 09/02/2029 | | | 20 | | | | 20 | |
4.00%, 09/02/2029 | | | 335 | | | | 336 | |
4.00%, 09/02/2030 | | | 20 | | | | 19 | |
4.00%, 09/02/2031 | | | 15 | | | | 14 | |
4.00%, 09/02/2031 | | | 75 | | | | 74 | |
4.00%, 04/01/2038 | | | 2,400 | | | | 2,313 | |
4.00%, 09/02/2041 | | | 110 | | | | 95 | |
4.00%, 09/02/2041 | | | 110 | | | | 99 | |
4.00%, 09/02/2041 | | | 135 | | | | 121 | |
4.00%, 09/02/2051 | | | 1,070 | | | | 852 | |
4.00%, 09/02/2051 | | | 1,315 | | | | 1,103 | |
4.00%, 09/02/2051 | | | 1,340 | | | | 1,122 | |
5.00%, 12/01/2027(4) | | | 205 | | | | 209 | |
5.00%, 11/01/2032(4) | | | 1,135 | | | | 1,163 | |
5.00%, 09/02/2034 | | | 75 | | | | 79 | |
5.00%, 01/01/2038 | | | 750 | | | | 773 | |
5.00%, 09/02/2039 | | | 70 | | | | 71 | |
5.00%, 09/02/2039 | | | 745 | | | | 768 | |
5.00%, 05/15/2040 | | | 400 | | | | 407 | |
5.00%, 11/01/2041(4) | | | 875 | | | | 869 | |
5.00%, 09/02/2042 | | | 1,600 | | | | 1,608 | |
5.00%, 01/01/2043 | | | 1,000 | | | | 1,022 | |
5.00%, 09/02/2044 | | | 700 | | | | 713 | |
5.00%, 09/02/2044 | | | 1,000 | | | | 1,011 | |
5.00%, 09/02/2044 | | | 1,350 | | | | 1,386 | |
5.00%, 12/01/2046(4) | | | 270 | | | | 262 | |
5.00%, 01/01/2048 | | | 2,840 | | | | 2,887 | |
5.00%, 09/02/2049 | | | 35 | | | | 35 | |
5.00%, 09/02/2049 | | | 700 | | | | 709 | |
5.00%, 09/02/2052 | | | 2,325 | | | | 2,270 | |
5.25%, 12/01/2048(4) | | | 800 | | | | 784 | |
5.25%, 12/01/2056(4) | | | 7,195 | | | | 6,953 | |
5.38%, 11/01/2049(4) | | | 340 | | | | 272 | |
5.50%, 12/01/2054 | | | 4,400 | | | | 4,393 | |
5.50%, 12/01/2058(4) | | | 7,575 | | | | 7,516 | |
California Statewide Financing Authority | | | | | | | | |
6.00%, 05/01/2043 | | | 100 | | | | 102 | |
City & County of San Francisco CA Special Tax District No 2020-1 | | | | | | | | |
4.00%, 09/01/2041(4) | | | 1,500 | | | | 1,312 | |
City of Irvine CA | | | | | | | | |
4.00%, 09/02/2027 | | | 20 | | | | 20 | |
4.00%, 09/02/2028 | | | 30 | | | | 30 | |
City of Los Angeles Department of Airports | | | | | | | | |
4.00%, 05/15/2044 | | | 3,000 | | | | 2,926 | |
5.50%, 05/15/2047 | | | 2,725 | | | | 2,984 | |
City of Vernon CA Electric System Revenue | | | | | | | | |
5.00%, 08/01/2023 | | | 580 | | | | 580 | |
5.00%, 10/01/2025 | | | 500 | | | | 509 | |
CMFA Special Finance Agency | | | | | | | | |
4.00%, 08/01/2045(4) | | | 1,215 | | | | 991 | |
CMFA Special Finance Agency VII | | | | | | | | |
4.00%, 08/01/2047(4) | | | 2,900 | | | | 2,429 | |
CMFA Special Finance Agency XII | | | | | | | | |
4.38%, 08/01/2049(4) | | | 1,015 | | | | 786 | |
CSCDA Community Improvement Authority | | | | | | | | |
3.00%, 07/01/2045(4) | | | 1,500 | | | | 1,088 | |
3.00%, 06/01/2048(4) | | | 100 | | | | 68 | |
3.10%, 07/01/2045(4) | | | 100 | | | | 75 | |
| | | | | | | | |
3.38%, 07/01/2043(4) | | | 500 | | | | 401 | |
4.00%, 07/01/2056(4) | | | 5,637 | | | | 3,968 | |
4.00%, 08/01/2056(4) | | | 1,485 | | | | 1,136 | |
4.00%, 09/01/2056(4) | | | 1,015 | | | | 760 | |
4.00%, 10/01/2056(4) | | | 500 | | | | 411 | |
4.00%, 10/01/2056(4) | | | 6,210 | | | | 4,578 | |
4.00%, 12/01/2056(4) | | | 4,000 | | | | 2,834 | |
4.00%, 04/01/2057(4) | | | 100 | | | | 69 | |
5.00%, 07/01/2051(4) | | | 165 | | | | 153 | |
5.00%, 01/01/2054(4) | | | 250 | | | | 214 | |
Foothill-Eastern Transportation Corridor Agency | | | | | | | | |
4.00%, 01/15/2046 | | | 8,300 | | | | 8,026 | |
Freddie Mac Multifamily ML Certificates | | | | | | | | |
0.00%, 06/25/2035(1)(4) | | | 5,057 | | | | 309 | |
2.75%, 11/25/2035(4) | | | 250 | | | | 214 | |
Golden State Tobacco Securitization Corp. | | | | | | | | |
0.00%, 06/01/2066 | | | 34,335 | | | | 3,732 | |
5.00%, 06/01/2051 | | | 290 | | | | 302 | |
Hayward Unified School District | | | | | | | | |
4.00%, 08/01/2050 | | | 250 | | | | 243 | |
Irvine Unified School District | | | | | | | | |
5.00%, 03/01/2057 | | | 795 | | | | 800 | |
Lodi Unified School District | | | | | | | | |
3.00%, 08/01/2046 | | | 500 | | | | 395 | |
Northern California Gas Authority No 1 | | | | | | | | |
4.19% (3 Month LIBOR USD + 0.72%), 07/01/2027(5) | | | 390 | | | | 388 | |
Orange County Community Facilities District | | | | | | | | |
5.25%, 08/15/2045 | | | 975 | | | | 989 | |
Regents of the University of California Medical Center Pooled Revenue | | | | | | | | |
5.00%, 05/15/2047 | | | 10,825 | | | | 11,919 | |
River Islands Public Financing Authority | | | | | | | | |
4.00%, 09/01/2041 | | | 485 | | | | 419 | |
Riverside County Redevelopment Successor Agency | | | | | | | | |
0.00%, 10/01/2039 | | | 1,000 | | | | 488 | |
Riverside County Transportation Commission | | | | | | | | |
3.00%, 06/01/2049 | | | 250 | | | | 189 | |
4.00%, 06/01/2046 | | | 5,250 | | | | 4,971 | |
San Diego County Regional Airport Authority | | | | | | | | |
4.00%, 07/01/2056 | | | 250 | | | | 235 | |
Santa Margarita Water District | | | | | | | | |
5.63%, 09/01/2043 | | | 165 | | | | 166 | |
State of California | | | | | | | | |
3.00%, 11/01/2040 | | | 500 | | | | 434 | |
4.00%, 11/01/2037 | | | 1,625 | | | | 1,682 | |
4.00%, 03/01/2040 | | | 2,500 | | | | 2,548 | |
5.00%, 04/01/2042 | | | 1,700 | | | | 1,817 | |
5.00%, 04/01/2042 | | | 1,750 | | | | 1,972 | |
5.00%, 09/01/2052 | | | 1,000 | | | | 1,107 | |
5.25%, 10/01/2050 | | | 2,650 | | | | 3,034 | |
5.50%, 12/01/2052 | | | 1,545 | | | | 1,732 | |
Transbay Joint Powers Authority | | | | | | | | |
5.00%, 10/01/2033 | | | 250 | | | | 265 | |
5.00%, 10/01/2034 | | | 250 | | | | 264 | |
5.00%, 10/01/2035 | | | 240 | | | | 251 | |
5.00%, 10/01/2038 | | | 600 | | | | 617 | |
West Sacramento Financing Authority | | | | | | | | |
5.00%, 09/01/2034 | | | 135 | | | | 154 | |
| | | | | | | | |
Total California | | | | 220,088 | |
| | | | | | | | |
Colorado – 3.98% | | | | | | | | |
Aerotropolis Regional Transportation Authority | | | | | | | | |
4.38%, 12/01/2052 | | | 2,715 | | | | 2,127 | |
Amber Creek Metropolitan District | | | | | | | | |
5.00%, 12/01/2037 | | | 731 | | | | 697 | |
5.13%, 12/01/2047 | | | 1,050 | | | | 948 | |
Arista Metropolitan District | | | | | | | | |
5.00%, 12/01/2038 | | | 500 | | | | 484 | |
5.13%, 12/01/2048 | | | 1,000 | | | | 926 | |
Arkansas River Power Authority | | | | | | | | |
5.00%, 10/01/2043 | | | 225 | | | | 225 | |
Aurora Crossroads Metropolitan District No 2 | | | | | | | | |
5.00%, 12/01/2040 | | | 500 | | | | 468 | |
5.00%, 12/01/2050 | | | 1,000 | | | | 882 | |
Baseline Metropolitan District No 1 | | | | | | | | |
5.00%, 12/01/2051 | | | 500 | | | | 444 | |
Berthoud-Heritage Metropolitan District No 1 | | | | | | | | |
5.63%, 12/01/2048 | | | 1,990 | | | | 1,915 | |
Brighton Crossing Metropolitan District No 4 | | | | | | | | |
5.00%, 12/01/2037 | | | 525 | | | | 516 | |
Brighton Crossing Metropolitan District No | | | | | | | | |
6 5.00%, 12/01/2040 | | | 515 | | | | 465 | |
5.00%, 12/01/2050 | | | 1,340 | | | | 1,154 | |
Canyons Metropolitan District No 5 | | | | | | | | |
6.00%, 12/01/2037 | | | 600 | | | | 588 | |
| | | | | | | | |
City & County of Denver CO | | | | | | | | |
5.00%, 10/01/2032 | | | 3,525 | | | | 3,528 | |
City & County of Denver CO Airport System Revenue | | | | | | | | |
5.00%, 12/01/2048 | | | 340 | | | | 350 | |
City & County of Denver CO Pledged Excise Tax Revenue | | | | | | | | |
0.00%, 08/01/2034 | | | 500 | | | | 320 | |
Colorado Crossing Metropolitan District No 2 | | | | | | | | |
5.00%, 12/01/2050 | | | 500 | | | | 376 | |
Colorado Health Facilities Authority | | | | | | | | |
4.00%, 05/15/2031 | | | 40 | | | | 38 | |
4.00%, 05/15/2032 | | | 50 | | | | 47 | |
4.00%, 05/15/2033 | | | 55 | | | | 51 | |
4.00%, 05/15/2034 | | | 55 | | | | 51 | |
4.00%, 05/15/2035 | | | 55 | | | | 50 | |
4.00%, 05/15/2036 | | | 60 | | | | 53 | |
4.00%, 11/01/2039 | | | 3,775 | | | | 3,615 | |
4.00%, 05/15/2041 | | | 100 | | | | 82 | |
4.00%, 05/15/2048 | | | 150 | | | | 115 | |
4.00%, 08/01/2049 | | | 250 | | | | 229 | |
4.00%, 09/01/2050 | | | 375 | | | | 330 | |
5.75%, 12/01/2035(4) | | | 100 | | | | 74 | |
6.13%, 12/01/2045(4) | | | 875 | | | | 597 | |
6.25%, 12/01/2050(4) | | | 485 | | | | 326 | |
Colorado High Performance Transportation Enterprise | | | | | | | | |
5.00%, 12/31/2047 | | | 3,330 | | | | 3,332 | |
5.00%, 12/31/2051 | | | 5,000 | | | | 5,000 | |
5.00%, 12/31/2056 | | | 5,760 | | | | 5,714 | |
Colorado International Center Metropolitan District No 14 | | | | | | | | |
5.88%, 12/01/2046 | | | 1,090 | | | | 1,067 | |
Copperleaf Metropolitan District No 4 | | | | | | | | |
5.00%, 12/01/2039 | | | 775 | | | | 740 | |
5.00%, 12/01/2049 | | | 1,500 | | | | 1,346 | |
Cornerstar Metropolitan District | | | | | | | | |
5.13%, 12/01/2037 | | | 500 | | | | 492 | |
Cottonwood Highlands Metropolitan District No 1 | | | | | | | | |
5.00%, 12/01/2049 | | | 900 | | | | 816 | |
Denver Convention Center Hotel Authority | | | | | | | | |
5.00%, 12/01/2030 | | | 2,000 | | | | 2,060 | |
Denver Gateway Center Metropolitan District | | | | | | | | |
5.50%, 12/01/2038 | | | 1,357 | | | | 1,305 | |
5.63%, 12/01/2048 | | | 2,130 | | | | 1,979 | |
Denver Health & Hospital Authority | | | | | | | | |
5.00%, 12/01/2048 | | | 1,800 | | | | 1,770 | |
Denver International Business Center Metropolitan District No 1 | | | | | | | | |
6.00%, 12/01/2048 | | | 600 | | | | 598 | |
Denver Urban Renewal Authority | | | | | | | | |
5.25%, 12/01/2039(4) | | | 1,000 | | | | 1,010 | |
E-470 Public Highway Authority | | | | | | | | |
5.00%, 09/01/2040 | | | 4,975 | | | | 5,027 | |
Fitzsimons Village Metropolitan District No 1 | | | | | | | | |
5.00%, 12/01/2049 | | | 500 | | | | 439 | |
Great Western Metropolitan District | | | | | | | | |
4.75%, 12/01/2050 | | | 625 | | | | 541 | |
Highlands Metropolitan District No 1 | | | | | | | | |
4.00%, 12/01/2031 | | | 500 | | | | 426 | |
5.00%, 12/01/2041 | | | 550 | | | | 478 | |
Hogback Metropolitan District | | | | | | | | |
5.00%, 12/01/2041 | | | 725 | | | | 664 | |
5.00%, 12/01/2051 | | | 1,050 | | | | 910 | |
Mirabelle Metropolitan District No 2 | | | | | | | | |
5.00%, 12/01/2039 | | | 700 | | | | 665 | |
5.00%, 12/01/2049 | | | 1,000 | | | | 891 | |
Painted Prairie Metropolitan District No 2 | | | | | | | | |
5.25%, 12/01/2048 | | | 1,350 | | | | 1,235 | |
Park Creek Metropolitan District | | | | | | | | |
5.00%, 12/01/2027 | | | 50 | | | | 52 | |
5.00%, 12/01/2045 | | | 3,100 | | | | 3,116 | |
Peak Metropolitan District No 1 | | | | | | | | |
5.00%, 12/01/2041(4) | | | 1,000 | | | | 920 | |
Pronghorn Valley Metropolitan District | | | | | | | | |
3.75%, 12/01/2041 | | | 515 | | | | 401 | |
4.00%, 12/01/2051 | | | 650 | | | | 486 | |
Public Authority for Colorado Energy | | | | | | | | |
6.25%, 11/15/2028 | | | 410 | | | | 440 | |
6.50%, 11/15/2038 | | | 790 | | | | 953 | |
Pueblo Urban Renewal Authority | | | | | | | | |
0.00%, 12/01/2025(4) | | | 250 | | | | 202 | |
4.75%, 12/01/2045(4) | | | 2,390 | | | | 1,625 | |
Rampart Range Metropolitan District No 1 | | | | | | | | |
5.00%, 12/01/2047 | | | 650 | | | | 665 | |
Rampart Range Metropolitan District No 5 | | | | | | | | |
4.00%, 12/01/2036 | | | 750 | | | | 630 | |
4.00%, 12/01/2051 | | | 2,725 | | | | 1,948 | |
| | | | | | | | |
Riverwalk Metropolitan District No 2 | | | | | | | | |
5.00%, 12/01/2052 | | | 1,865 | | | | 1,609 | |
Serenity Ridge Metropolitan District No 2 | | | | | | | | |
5.13%, 12/01/2037 | | | 1,290 | | | | 1,337 | |
Southglenn Metropolitan District | | | | | | | | |
5.00%, 12/01/2046 | | | 625 | | | | 579 | |
State of Colorado | | | | | | | | |
6.00%, 12/15/2039 | | | 1,200 | | | | 1,441 | |
6.00%, 12/15/2040 | | | 5,165 | | | | 6,174 | |
6.00%, 12/15/2041 | | | 6,125 | | | | 7,297 | |
STC Metropolitan District No 2 | | | | | | | | |
4.00%, 12/01/2029 | | | 750 | | | | 698 | |
5.00%, 12/01/2038 | | | 565 | | | | 527 | |
5.00%, 12/01/2049 | | | 500 | | | | 450 | |
Thompson Crossing Metropolitan District No 4 | | | | | | | | |
5.00%, 12/01/2049 | | | 500 | | | | 440 | |
Vauxmont Metropolitan District | | | | | | | | |
5.00%, 12/15/2030 | | | 375 | | | | 395 | |
5.00%, 12/01/2032 | | | 50 | | | | 55 | |
5.00%, 12/01/2035 | | | 20 | | | | 22 | |
Weld County School District No 6 Greeley | | | | | | | | |
4.00%, 12/01/2045 | | | 1,000 | | | | 1,000 | |
Willow Bend Metropolitan District | | | | | | | | |
5.00%, 12/01/2039 | | | 600 | | | | 573 | |
5.00%, 12/01/2049 | | | 1,000 | | | | 899 | |
| | | | | | | | |
Total Colorado | | | | 95,510 | |
| | | | | | | | |
Connecticut – 0.81% | | | | | | | | |
Connecticut State Health & Educational Facilities Authority | | | | | | | | |
4.00%, 07/01/2044 | | | 1,110 | | | | 884 | |
4.00%, 07/01/2049 | | | 3,730 | | | | 2,834 | |
5.00%, 07/01/2031 | | | 270 | | | | 268 | |
5.00%, 07/01/2032 | | | 280 | | | | 276 | |
5.00%, 07/01/2033 | | | 175 | | | | 171 | |
5.00%, 07/01/2034 | | | 125 | | | | 121 | |
5.00%, 07/01/2043 | | | 2,445 | | | | 2,256 | |
5.00%, 09/01/2053(4) | | | 110 | | | | 87 | |
Mashantucket Western Pequot Tribe | | | | | | | | |
6.05%, 07/01/2031(9) | | | 1,985 | | | | 442 | |
Mohegan Tribe of Indians of Connecticut | | | | | | | | |
5.75%, 02/01/2024(4) | | | 500 | | | | 500 | |
6.75%, 02/01/2045(4) | | | 438 | | | | 438 | |
State of Connecticut Special Tax Revenue | | | | | | | | |
4.00%, 05/01/2036 | | | 3,260 | | | | 3,387 | |
5.00%, 01/01/2038 | | | 4,400 | | | | 4,677 | |
Steel Point Infrastructure Improvement District | | | | | | | | |
4.00%, 04/01/2051(4) | | | 485 | | | | 363 | |
Town of Hamden CT | | | | | | | | |
5.00%, 01/01/2040 | | | 2,485 | | | | 2,210 | |
5.00%, 01/01/2050 | | | 570 | | | | 470 | |
| | | | | | | | |
Total Connecticut | | | | 19,384 | |
| | | | | | | | |
Delaware – 0.96% | | | | | | | | |
County of Kent DE | | | | | | | | |
5.00%, 07/01/2032 | | | 20 | | | | 20 | |
5.00%, 07/01/2040 | | | 2,195 | | | | 2,124 | |
5.00%, 07/01/2048 | | | 2,505 | | | | 2,320 | |
5.00%, 07/01/2053 | | | 295 | | | | 269 | |
5.00%, 07/01/2058 | | | 250 | | | | 225 | |
County of Sussex DE | | | | | | | | |
5.00%, 01/01/2036 | | | 2,790 | | | | 2,675 | |
Delaware State Economic Development Authority | | | | | | | | |
4.00%, 09/01/2030 | | | 195 | | | | 195 | |
4.00%, 09/01/2041 | | | 550 | | | | 499 | |
4.00%, 06/01/2042 | | | 1,000 | | | | 805 | |
4.00%, 06/01/2052 | | | 110 | | | | 81 | |
4.00%, 06/01/2057 | | | 105 | | | | 75 | |
5.00%, 09/01/2036 | | | 1,225 | | | | 1,257 | |
5.00%, 08/01/2039 | | | 715 | | | | 702 | |
5.00%, 09/01/2040 | | | 340 | | | | 350 | |
5.00%, 09/01/2046 | | | 700 | | | | 705 | |
5.00%, 11/15/2048 | | | 2,000 | | | | 1,890 | |
5.00%, 08/01/2049 | | | 900 | | | | 849 | |
5.00%, 09/01/2050 | | | 370 | | | | 374 | |
5.00%, 08/01/2054 | | | 835 | | | | 775 | |
Delaware State Health Facilities Authority | | | | | | | | |
5.00%, 06/01/2037 | | | 1,455 | | | | 1,514 | |
5.00%, 06/01/2043 | | | 1,420 | | | | 1,454 | |
5.00%, 06/01/2048 | | | 675 | | | | 686 | |
5.00%, 06/01/2050 | | | 3,165 | | | | 3,204 | |
| | | | | | | | |
Total Delaware | | | | 23,048 | |
| | | | | | | | |
District of Columbia – 1.21% | | | | | | | | |
District of Columbia | | | | | | | | |
0.00%, 06/01/2046(4) | | | 1,440 | | | | 926 | |
5.00%, 06/01/2036 | | | 205 | | | | 208 | |
| | | | | | | | |
5.00%, 07/01/2037 | | | 195 | | | | 181 | |
5.00%, 06/01/2041 | | | 380 | | | | 381 | |
5.00%, 07/01/2042 | | | 2,200 | | | | 1,948 | |
5.00%, 06/01/2046 | | | 3,565 | | | | 3,567 | |
5.00%, 07/01/2052 | | | 2,065 | | | | 1,719 | |
5.13%, 01/01/2035 | | | 105 | | | | 93 | |
5.25%, 01/01/2039 | | | 70 | | | | 60 | |
District of Columbia Tobacco Settlement Financing Corp. | | | | | | | | |
0.00%, 06/15/2046 | | | 3,560 | | | | 692 | |
0.00%, 06/15/2046 | | | 16,530 | | | | 3,835 | |
Metropolitan Washington Airports Authority Aviation Revenue | | | | | | | | |
5.00%, 10/01/2043 | | | 8,000 | | | | 8,302 | |
Metropolitan Washington Airports Authority Dulles Toll Road Revenue | | | | | | | | |
0.00%, 10/01/2035 | | | 6,025 | | | | 3,805 | |
0.00%, 10/01/2037 | | | 1,870 | | | | 1,059 | |
0.00%, 10/01/2038 | | | 680 | | | | 357 | |
0.00%, 10/01/2039 | | | 135 | | | | 67 | |
0.00%, 10/01/2040 | | | 340 | | | | 159 | |
4.00%, 10/01/2053 | | | 500 | | | | 475 | |
6.50%, 10/01/2044 | | | 950 | | | | 1,070 | |
| | | | | | | | |
Total District of Columbia | | | | 28,904 | |
| | | | | | | | |
Florida – 4.75% | | | | | | | | |
Alachua County Health Facilities Authority | | | | | | | | |
4.00%, 12/01/2049 | | | 5,000 | | | | 4,626 | |
5.00%, 12/01/2036 | | | 1,000 | | | | 1,008 | |
5.00%, 12/01/2044 | | | 3,350 | | | | 3,351 | |
6.00%, 11/15/2034 | | | 50 | | | | 39 | |
6.25%, 11/15/2044 | | | 400 | | | | 285 | |
6.38%, 11/15/2049 | | | 940 | | | | 657 | |
Avenir Community Development District | | | | | | | | |
5.38%, 05/01/2043 | | | 200 | | | | 197 | |
5.63%, 05/01/2054 | | | 2,095 | | | | 2,061 | |
Boggy Creek Improvement District | | | | | | | | |
5.13%, 05/01/2043 | | | 605 | | | | 605 | |
Brevard County Health Facilities Authority | | | | | | | | |
5.00%, 04/01/2039 | | | 1,335 | | | | 1,346 | |
Capital Projects Finance Authority | | | | | | | | |
5.00%, 10/01/2034 | | | 585 | | | | 602 | |
5.00%, 10/01/2035 | | | 500 | | | | 511 | |
Capital Trust Agency, Inc. | | | | | | | | |
4.00%, 06/15/2025(4) | | | 250 | | | | 245 | |
4.00%, 06/15/2031(4) | | | 700 | | | | 639 | |
4.00%, 06/15/2041(4) | | | 155 | | | | 125 | |
4.00%, 06/15/2051(4) | | | 235 | | | | 173 | |
5.00%, 07/01/2049(4) | | | 265 | | | | 236 | |
5.25%, 12/01/2058(4) | | | 3,270 | | | | 2,970 | |
Celebration Pointe Community Development District No 1 | | | | | | | | |
3.00%, 05/01/2031 | | | 50 | | | | 44 | |
3.38%, 05/01/2041 | | | 90 | | | | 71 | |
4.00%, 05/01/2053 | | | 115 | | | | 92 | |
4.75%, 05/01/2024 | | | 15 | | | | 15 | |
5.00%, 05/01/2032 | | | 70 | | | | 71 | |
5.13%, 05/01/2045 | | | 65 | | | | 64 | |
City of Atlantic Beach FL | | | | | | | | |
5.00%, 11/15/2043 | | | 250 | | | | 221 | |
5.00%, 11/15/2048 | | | 500 | | | | 425 | |
City of Gainesville FL Utilities System Revenue | | | | | | | | |
3.72%, 10/01/2047(1) | | | 1,360 | | | | 1,360 | |
City of Jacksonville FL | | | | | | | | |
5.00%, 06/01/2053(4) | | | 2,265 | | | | 2,000 | |
City of Tampa FL | | | | | | | | |
0.00%, 09/01/2036 | | | 800 | | | | 447 | |
0.00%, 09/01/2037 | | | 800 | | | | 420 | |
5.00%, 04/01/2040 | | | 1,115 | | | | 1,131 | |
County of Miami-Dade FL Aviation Revenue | | | | | | | | |
4.00%, 10/01/2041 | | | 1,500 | | | | 1,467 | |
5.00%, 10/01/2034 | | | 3,000 | | | | 3,021 | |
5.00%, 10/01/2034 | | | 6,070 | | | | 6,112 | |
County of Miami-Dade FL Water & Sewer System Revenue | | | | | | | | |
4.00%, 10/01/2048 | | | 2,085 | | | | 2,032 | |
Crossings At Fleming Island Community Development District | | | | | | | | |
4.50%, 05/01/2030 | | | 3,310 | | | | 3,277 | |
Double Branch Community Development District | | | | | | | | |
4.00%, 05/01/2025 | | | 15 | | | | 15 | |
Everest GMR Community Development District | | | | | | | | |
6.20%, 05/01/2054 | | | 3,515 | | | | 3,520 | |
Florida Development Finance Corp. | | | | | | | | |
3.00%, 06/01/2032 | | | 3,580 | | | | 2,843 | |
4.00%, 07/01/2051(4) | | | 1,000 | | | | 818 | |
4.00%, 02/01/2052 | | | 255 | | | | 192 | |
5.00%, 06/15/2028 | | | 310 | | | | 318 | |
5.00%, 02/15/2031 | | | 595 | | | | 607 | |
5.00%, 06/15/2035 | | | 145 | | | | 147 | |
| | | | | | | | |
5.00%, 02/15/2038 | | | 600 | | | | 603 | |
5.00%, 09/15/2040(4) | | | 500 | | | | 444 | |
5.00%, 02/15/2048 | | | 1,600 | | | | 1,604 | |
5.00%, 06/15/2050 | | | 100 | | | | 97 | |
5.00%, 02/01/2052 | | | 2,955 | | | | 2,713 | |
6.13%, 07/01/2032(1)(4) | | | 5,000 | | | | 5,031 | |
Florida Higher Educational Facilities Financial Authority | | | | | | | | |
4.50%, 06/01/2033(4) | | | 2,000 | | | | 1,939 | |
4.75%, 06/01/2038(4) | | | 215 | | | | 201 | |
5.00%, 06/01/2048(4) | | | 3,155 | | | | 2,844 | |
Halifax Hospital Medical Center | | | | | | | | |
5.00%, 06/01/2036 | | | 3,000 | | | | 3,097 | |
JEA Electric System Revenue | | | | | | | | |
4.00%, 10/01/2036 | | | 250 | | | | 252 | |
Lakes of Sarasota Community Development District | | | | | | | | |
3.88%, 05/01/2031 | | | 430 | | | | 411 | |
3.90%, 05/01/2041 | | | 285 | | | | 243 | |
4.10%, 05/01/2051 | | | 265 | | | | 216 | |
4.13%, 05/01/2031 | | | 1,000 | | | | 966 | |
4.13%, 05/01/2041 | | | 200 | | | | 176 | |
4.30%, 05/01/2051 | | | 325 | | | | 274 | |
Lakewood Ranch Stewardship District | | | | | | | | |
3.13%, 05/01/2025 | | | 130 | | | | 127 | |
3.40%, 05/01/2030 | | | 370 | | | | 342 | |
4.00%, 05/01/2040 | | | 600 | | | | 521 | |
4.00%, 05/01/2050 | | | 1,000 | | | | 791 | |
5.00%, 05/01/2036 | | | 100 | | | | 101 | |
5.13%, 05/01/2046 | | | 200 | | | | 195 | |
5.25%, 05/01/2037 | | | 245 | | | | 248 | |
5.30%, 05/01/2039 | | | 70 | | | | 71 | |
5.38%, 05/01/2047 | | | 310 | | | | 314 | |
5.45%, 05/01/2048 | | | 115 | | | | 115 | |
5.50%, 05/01/2039(4) | | | 65 | | | | 66 | |
5.65%, 05/01/2048(4) | | | 80 | | | | 81 | |
Laurel Road Community Development District | | | | | | | | |
3.00%, 05/01/2031 | | | 200 | | | | 175 | |
3.13%, 05/01/2031 | | | 1,455 | | | | 1,287 | |
4.00%, 05/01/2052 | | | 1,450 | | | | 1,129 | |
Lee County Industrial Development Authority | | | | | | | | |
5.63%, 12/01/2037(4) | | | 350 | | | | 270 | |
5.75%, 12/01/2052(4) | | | 1,310 | | | | 899 | |
Miami-Dade County Educational Facilities Authority | | | | | | | | |
5.00%, 04/01/2040 | | | 2,855 | | | | 2,906 | |
5.00%, 04/01/2045 | | | 1,010 | | | | 1,025 | |
Miami-Dade County Industrial Development Authority | | | | | | | | |
6.25%, 01/01/2059(4) | | | 500 | | | | 493 | |
Orange County Health Facilities Authority | | | | | | | | |
4.00%, 10/01/2052 | | | 395 | | | | 361 | |
5.00%, 08/01/2035 | | | 1,500 | | | | 1,505 | |
5.00%, 10/01/2053 | | | 2,300 | | | | 2,412 | |
Palm Beach County Health Facilities Authority | | | | | | | | |
4.00%, 06/01/2041 | | | 175 | | | | 137 | |
4.25%, 06/01/2056 | | | 2,100 | | | | 1,512 | |
5.00%, 06/01/2055 | | | 2,500 | | | | 2,112 | |
Pinellas County Industrial Development Authority | | | | | | | | |
5.00%, 07/01/2039 | | | 100 | | | | 101 | |
Sarasota County Health Facilities Authority | | | | | | | | |
5.00%, 01/01/2037 | | | 95 | | | | 87 | |
5.00%, 01/01/2042 | | | 840 | | | | 741 | |
5.00%, 01/01/2047 | | | 1,095 | | | | 932 | |
5.00%, 01/01/2052 | | | 460 | | | | 383 | |
Sawyers Landing Community Development District | | | | | | | | |
3.75%, 05/01/2031 | | | 500 | | | | 454 | |
4.13%, 05/01/2041 | | | 205 | | | | 175 | |
4.25%, 05/01/2053 | | | 2,720 | | | | 2,157 | |
Seminole County Industrial Development Authority | | | | | | | | |
4.00%, 06/15/2041(4) | | | 425 | | | | 349 | |
4.00%, 06/15/2051(4) | | | 830 | | | | 617 | |
4.00%, 06/15/2056(4) | | | 705 | | | | 505 | |
Southeast Overtown Park West Community Redevelopment Agency | | | | | | | | |
5.00%, 03/01/2030(4) | | | 1,550 | | | | 1,561 | |
St Johns County Industrial Development Authority | | | | | | | | |
4.00%, 12/15/2050 | | | 500 | | | | 361 | |
Tolomato Community Development District | | | | | | | | |
0.00%, 05/01/2040(9) | | | 45 | | | | 41 | |
Town of Davie FL | | | | | | | | |
5.00%, 04/01/2048 | | | 1,440 | | | | 1,480 | |
Viera Stewardship District | | | | | | | | |
3.13%, 05/01/2041 | | | 820 | | | | 613 | |
4.00%, 05/01/2053 | | | 110 | | | | 86 | |
5.30%, 05/01/2043 | | | 2,000 | | | | 1,985 | |
5.50%, 05/01/2054 | | | 1,505 | | | | 1,487 | |
Village Community Development District No 13 | | | | | | | | |
| | | | | | | | |
Village Community Development District No | | | | | | | | |
13 3.00%, 05/01/2029 | | | 955 | | | | 894 | |
3.38%, 05/01/2034 | | | 965 | | | | 881 | |
Village Community Development District No | | | | | | | | |
14 5.38%, 05/01/2042 | | | 4,095 | | | | 4,223 | |
Village Community Development District No | | | | | | | | |
15 5.25%, 05/01/2054(4) | | | 3,000 | | | | 3,042 | |
| | | | | | | | |
Total Florida | | | | | | | 113,867 | |
| | | | | | | | |
Georgia – 3.12% | | | | | | | | |
Atlanta Development Authority | | | | | | | | |
5.25%, 07/01/2044 | | | 5,500 | | | | 5,604 | |
6.50%, 01/01/2029(2)(3) | | | 665 | | | | 299 | |
6.75%, 01/01/2035(2)(3) | | | 3,570 | | | | 1,607 | |
7.00%, 01/01/2040(2)(3) | | | 3,315 | | | | 1,492 | |
Atlanta Urban Redevelopment Agency | | | | | | | | |
2.38%, 07/01/2026(4) | | | 100 | | | | 95 | |
2.88%, 07/01/2031(4) | | | 140 | | | | 129 | |
3.63%, 07/01/2042(4) | | | 290 | | | | 256 | |
3.88%, 07/01/2051(4) | | | 365 | | | | 316 | |
Augusta GA Airport Revenue | | | | | | | | |
5.00%, 01/01/2027 | | | 370 | | | | 375 | |
Cobb County Kennestone Hospital Authority | | | | | | | | |
5.00%, 04/01/2047 | | | 1,150 | | | | 1,175 | |
Coweta County Residential Care Facilities for the Elderly Authority | | | | | | | | |
4.00%, 03/01/2031 | | | 1,260 | | | | 1,159 | |
4.00%, 03/01/2041 | | | 935 | | | | 745 | |
Development Authority for Fulton County | | | | | | | | |
5.00%, 04/01/2047 | | | 1,500 | | | | 1,533 | |
Development Authority of Burke County | | | | | | | | |
1.50%, 01/01/2040(1) | | | 345 | | | | 326 | |
Development Authority Of The City Of Marietta | | | | | | | | |
5.00%, 11/01/2027(4) | | | 235 | | | | 236 | |
5.00%, 11/01/2037(4) | | | 3,815 | | | | 3,701 | |
5.00%, 11/01/2047(4) | | | 1,245 | | | | 1,129 | |
Fulton County Residential Care Facilities for the Elderly Authority | | | | | | | | |
4.00%, 04/01/2041(4) | | | 205 | | | | 154 | |
4.00%, 04/01/2051(4) | | | 2,075 | | | | 1,394 | |
5.00%, 04/01/2047(4) | | | 935 | | | | 779 | |
5.00%, 04/01/2054(4) | | | 735 | | | | 591 | |
Gainesville & Hall County Hospital Authority | | | | | | | | |
5.00%, 02/15/2045 | | | 220 | | | | 225 | |
5.50%, 02/15/2042 | | | 1,330 | | | | 1,409 | |
George L Smith II Congress Center Authority | | | | | | | | |
2.38%, 01/01/2031 | | | 190 | | | | 165 | |
3.63%, 01/01/2031(4) | | | 105 | | | | 94 | |
4.00%, 01/01/2036 | | | 100 | | | | 95 | |
4.00%, 01/01/2054 | | | 7,480 | | | | 6,337 | |
5.00%, 01/01/2036(4) | | | 225 | | | | 214 | |
5.00%, 01/01/2054(4) | | | 6,620 | | | | 5,562 | |
Macon-Bibb County Urban Development Authority | | | | | | | | |
5.00%, 06/15/2027(4) | | | 15 | | | | 15 | |
5.75%, 06/15/2037(4) | | | 1,105 | | | | 1,118 | |
5.88%, 06/15/2047(4) | | | 240 | | | | 240 | |
6.00%, 06/15/2052(4) | | | 105 | | | | 105 | |
Main Street Natural Gas, Inc. | | | | | | | | |
4.00%, 08/01/2049(1) | | | 1,000 | | | | 1,003 | |
5.00%, 05/15/2043 | | | 4,520 | | | | 4,529 | |
5.00%, 12/01/2052(1) | | | 6,490 | | | | 6,695 | |
5.00%, 07/01/2053(1) | | | 250 | | | | 261 | |
5.00%, 09/01/2053(1) | | | 2,100 | | | | 2,205 | |
Municipal Electric Authority of Georgia | | | | | | | | |
5.00%, 01/01/2034 | | | 500 | | | | 535 | |
5.00%, 01/01/2049 | | | 4,455 | | | | 4,516 | |
5.25%, 07/01/2064 | | | 2,000 | | | | 2,091 | |
Private Colleges & Universities Authority | | | | | | | | |
4.00%, 09/01/2037 | | | 8,350 | | | | 8,707 | |
4.00%, 09/01/2038 | | | 4,665 | | | | 4,791 | |
Savannah Economic Development Authority | | | | | | | | |
7.25%, 01/01/2044 | | | 650 | | | | 662 | |
7.25%, 01/01/2049 | | | 120 | | | | 122 | |
| | | | | | | | |
Total Georgia | | | | | | | 74,791 | |
| | | | | | | | |
Guam – 0.70% | | | | | | | | |
Antonio B Won Pat International Airport Authority | | | | | | | | |
5.13%, 10/01/2034 | | | 780 | | | | 787 | |
5.25%, 10/01/2029 | | | 1,145 | | | | 1,177 | |
5.38%, 10/01/2033 | | | 1,050 | | | | 1,081 | |
5.38%, 10/01/2043 | | | 1,250 | | | | 1,232 | |
Guam Government Waterworks Authority | | | | | | | | |
5.00%, 07/01/2035 | | | 1,550 | | | | 1,562 | |
Guam Power Authority | | | | | | | | |
5.00%, 10/01/2042 | | | 350 | | | | 361 | |
5.00%, 10/01/2043 | | | 1,965 | | | | 2,023 | |
5.00%, 10/01/2044 | | | 1,145 | | | | 1,175 | |
Territory of Guam | | | | | | | | |
| | | | | | | | |
4.00%, 01/01/2036 | | | 305 | | | | 291 | |
4.00%, 01/01/2042 | | | 2,115 | | | | 1,869 | |
5.00%, 01/01/2030 | | | 70 | | | | 73 | |
5.00%, 11/01/2030 | | | 250 | | | | 265 | |
5.00%, 01/01/2031 | | | 70 | | | | 73 | |
5.00%, 11/15/2031 | | | 1,935 | | | | 1,996 | |
5.00%, 11/01/2035 | | | 875 | | | | 912 | |
5.00%, 11/01/2040 | | | 2,000 | | | | 2,017 | |
| | | | | | | | |
Total Guam | | | | 16,894 | |
| | | | | | | | |
Idaho – 0.28% | | | | | | | | |
Idaho Health Facilities Authority | | | | | | | | |
5.00%, 03/01/2034 | | | 3,155 | | | | 3,177 | |
Power County Industrial Development Corp. | | | | | | | | |
6.45%, 08/01/2032 | | | 310 | | | | 311 | |
Spring Valley Community Infrastructure District No | | | | | | | | |
1 3.75%, 09/01/2051(4) | | | 4,387 | | | | 3,324 | |
| | | | | | | | |
Total Idaho | | | | 6,812 | |
| | | | | | | | |
Illinois – 6.21% | | | | | | | | |
Chicago Board of Education | | | | | | | | |
0.00%, 12/01/2024 | | | 165 | | | | 156 | |
0.00%, 12/01/2025 | | | 575 | | | | 521 | |
0.00%, 12/01/2027 | | | 1,055 | | | | 883 | |
0.00%, 12/01/2028 | | | 25 | | | | 20 | |
0.00%, 12/01/2029 | | | 100 | | | | 77 | |
0.00%, 12/01/2029 | | | 965 | | | | 755 | |
0.00%, 12/01/2030 | | | 1,765 | | | | 1,289 | |
4.00%, 12/01/2041 | | | 1,000 | | | | 907 | |
4.00%, 12/01/2047 | | | 500 | | | | 437 | |
5.00%, 12/01/2033 | | | 1,750 | | | | 1,827 | |
5.00%, 12/01/2034 | | | 320 | | | | 338 | |
5.00%, 12/01/2034 | | | 555 | | | | 555 | |
5.00%, 12/01/2035 | | | 1,050 | | | | 1,091 | |
5.00%, 12/01/2036 | | | 335 | | | | 339 | |
5.00%, 12/01/2041 | | | 100 | | | | 101 | |
5.00%, 12/01/2042 | | | 555 | | | | 548 | |
7.00%, 12/01/2042(4) | | | 100 | | | | 108 | |
7.00%, 12/01/2044 | | | 115 | | | | 121 | |
Chicago Midway International Airport | | | | | | | | |
5.00%, 01/01/2027 | | | 6,750 | | | | 6,773 | |
5.00%, 01/01/2032 | | | 2,000 | | | | 2,007 | |
5.00%, 01/01/2046 | | | 300 | | | | 305 | |
Chicago Transit Authority Sales Tax Receipts Fund | | | | | | | | |
4.00%, 12/01/2049 | | | 2,000 | | | | 1,892 | |
City of Chicago IL | | | | | | | | |
0.00%, 01/01/2027 | | | 680 | | | | 608 | |
4.00%, 01/01/2036 | | | 250 | | | | 243 | |
5.00%, 01/01/2024 | | | 1,000 | | | | 1,006 | |
5.00%, 01/01/2028 | | | 1,290 | | | | 1,364 | |
5.00%, 01/01/2034 | | | 200 | | | | 218 | |
5.00%, 01/01/2035 | | | 750 | | | | 764 | |
5.00%, 01/01/2038 | | | 2,500 | | | | 2,526 | |
5.00%, 01/01/2039 | | | 1,290 | | | | 1,332 | |
5.00%, 01/01/2040 | | | 205 | | | | 211 | |
5.50%, 01/01/2035 | | | 270 | | | | 291 | |
5.50%, 01/01/2035 | | | 1,100 | | | | 1,120 | |
5.50%, 01/01/2039 | | | 215 | | | | 236 | |
5.50%, 01/01/2040 | | | 815 | | | | 828 | |
5.50%, 01/01/2040 | | | 3,465 | | | | 3,789 | |
5.50%, 01/01/2041 | | | 180 | | | | 193 | |
5.50%, 01/01/2043 | | | 1,830 | | | | 1,955 | |
5.63%, 01/01/2031 | | | 500 | | | | 531 | |
City of Chicago IL Wastewater Transmission Revenue | | | | | | | | |
5.00%, 01/01/2033 | | | 2,000 | | | | 2,038 | |
5.00%, 01/01/2039 | | | 1,000 | | | | 1,009 | |
5.25%, 01/01/2053 | | | 940 | | | | 1,024 | |
City of Chicago IL Waterworks Revenue | | | | | | | | |
5.00%, 11/01/2033 | | | 500 | | | | 509 | |
5.00%, 11/01/2038 | | | 525 | | | | 577 | |
Illinois Development Finance Authority | | | | | | | | |
8.00%, 06/01/2032 | | | 1,050 | | | | 1,051 | |
Illinois Finance Authority | | | | | | | | |
2.45%, 10/01/2039(1) | | | 250 | | | | 225 | |
5.00%, 02/15/2032 | | | 80 | | | | 79 | |
5.00%, 05/15/2033 | | | 1,720 | | | | 1,580 | |
5.00%, 02/15/2034 | | | 120 | | | | 127 | |
5.00%, 08/15/2035 | | | 180 | | | | 184 | |
5.00%, 02/15/2036 | | | 170 | | | | 178 | |
5.00%, 05/15/2036 | | | 95 | | | | 80 | |
5.00%, 05/15/2037 | | | 655 | | | | 649 | |
5.00%, 05/15/2037 | | | 1,050 | | | | 1,086 | |
5.00%, 05/15/2040 | | | 85 | | | | 67 | |
5.00%, 02/15/2041 | | | 235 | | | | 243 | |
5.00%, 05/15/2041 | | | 400 | | | | 343 | |
| | | | | | | | |
5.00%, 08/15/2044 | | | 340 | | | | 340 | |
5.00%, 05/15/2047 | | | 205 | | | | 187 | |
5.00%, 05/15/2051 | | | 1,000 | | | | 795 | |
5.00%, 05/15/2056 | | | 1,630 | | | | 1,264 | |
5.13%, 05/15/2038 | | | 1,745 | | | | 1,489 | |
5.25%, 02/15/2037 | | | 435 | | | | 431 | |
5.25%, 05/15/2042 | | | 135 | | | | 110 | |
5.25%, 05/15/2045 | | | 80 | | | | 83 | |
5.25%, 05/15/2050 | | | 220 | | | | 228 | |
5.25%, 05/15/2054 | | | 1,575 | | | | 1,169 | |
5.63%, 08/01/2053(4) | | | 1,705 | | | | 1,708 | |
6.13%, 11/15/2035 | | | 210 | | | | 212 | |
6.38%, 11/15/2043 | | | 270 | | | | 272 | |
Illinois Housing Development Authority | | | | | | | | |
5.00%, 10/01/2046 | | | 120 | | | | 123 | |
6.25%, 10/01/2052 | | | 115 | | | | 125 | |
Illinois State Toll Highway Authority | | | | | | | | |
4.00%, 01/01/2046 | | | 2,000 | | | | 1,920 | |
5.00%, 01/01/2042 | | | 250 | | | | 262 | |
Metropolitan Pier & Exposition Authority | | | | | | | | |
0.00%, 12/15/2029 | | | 1,000 | | | | 786 | |
0.00%, 12/15/2030 | | | 260 | | | | 195 | |
0.00%, 12/15/2032 | | | 1,000 | | | | 691 | |
0.00%, 12/15/2033 | | | 3,955 | | | | 2,619 | |
0.00%, 12/15/2034 | | | 550 | | | | 347 | |
0.00%, 12/15/2035 | | | 75 | | | | 44 | |
0.00%, 12/15/2035 | | | 10,000 | | | | 5,964 | |
0.00%, 06/15/2036 | | | 65 | | | | 37 | |
0.00%, 06/15/2036 | | | 1,000 | | | | 579 | |
0.00%, 06/15/2037 | | | 1,585 | | | | 848 | |
0.00%, 12/15/2038 | | | 205 | | | | 101 | |
0.00%, 06/15/2039 | | | 220 | | | | 105 | |
0.00%, 06/15/2041 | | | 1,535 | | | | 657 | |
4.00%, 06/15/2050 | | | 1,000 | | | | 905 | |
4.00%, 06/15/2052 | | | 2,030 | | | | 1,822 | |
5.00%, 12/15/2027 | | | 2,500 | | | | 2,564 | |
5.00%, 06/15/2042 | | | 4,600 | | | | 4,749 | |
5.00%, 12/15/2045 | | | 50 | | | | 51 | |
5.00%, 06/15/2050 | | | 6,115 | | | | 6,218 | |
5.00%, 06/15/2057 | | | 3,275 | | | | 3,303 | |
5.50%, 06/15/2053 | | | 5,000 | | | | 5,079 | |
Northern Illinois University | | | | | | | | |
4.00%, 10/01/2039 | | | 875 | | | | 828 | |
4.00%, 10/01/2040 | | | 800 | | | | 749 | |
4.00%, 10/01/2041 | | | 800 | | | | 742 | |
4.00%, 10/01/2043 | | | 975 | | | | 895 | |
Regional Transportation Authority | | | | | | | | |
6.00%, 07/01/2033 | | | 510 | | | | 624 | |
State of Illinois | | | | | | | | |
4.00%, 03/01/2039 | | | 2,055 | | | | 1,986 | |
4.00%, 11/01/2039 | | | 2,000 | | | | 1,928 | |
5.00%, 04/01/2024 | | | 110 | | | | 111 | |
5.00%, 10/01/2025 | | | 355 | | | | 366 | |
5.00%, 11/01/2025 | | | 8,810 | | | | 9,097 | |
5.00%, 02/01/2026 | | | 95 | | | | 98 | |
5.00%, 11/01/2026 | | | 3,000 | | | | 3,147 | |
5.00%, 02/01/2027 | | | 1,000 | | | | 1,053 | |
5.00%, 11/01/2027 | | | 100 | | | | 105 | |
5.00%, 02/01/2028 | | | 290 | | | | 305 | |
5.00%, 11/01/2028 | | | 3,485 | | | | 3,710 | |
5.00%, 11/01/2028 | | | 5,000 | | | | 5,231 | |
5.00%, 11/01/2029 | | | 725 | | | | 773 | |
5.00%, 10/01/2031 | | | 170 | | | | 183 | |
5.00%, 10/01/2031 | | | 955 | | | | 1,030 | |
5.00%, 05/01/2032 | | | 5,250 | | | | 5,305 | |
5.00%, 10/01/2032 | | | 215 | | | | 231 | |
5.00%, 12/01/2033 | | | 235 | | | | 261 | |
5.00%, 05/01/2034 | | | 2,635 | | | | 2,659 | |
5.50%, 05/01/2025 | | | 840 | | | | 868 | |
5.50%, 07/01/2038 | | | 1,500 | | | | 1,500 | |
5.50%, 03/01/2042 | | | 3,410 | | | | 3,753 | |
5.50%, 03/01/2047 | | | 435 | | | | 472 | |
5.50%, 05/01/2047 | | | 160 | | | | 174 | |
State of Illinois Sales Tax Revenue | | | | | | | | |
5.00%, 06/15/2027 | | | 175 | | | | 185 | |
Upper Illinois River Valley Development Authority | | | | | | | | |
5.00%, 12/01/2032(4) | | | 285 | | | | 269 | |
5.25%, 12/01/2037(4) | | | 2,005 | | | | 1,878 | |
5.25%, 12/01/2047(4) | | | 550 | | | | 483 | |
Village of Hillside IL | | | | | | | | |
5.00%, 01/01/2024 | | | 220 | | | | 221 | |
| | | | | | | | |
| Total Illinois | | | | 148,916 | |
| | | | | | | | |
| | | | | | | | |
Indiana – 1.36% | | | | | | | | |
City of East Chicago IN | | | | | | | | |
5.50%, 09/01/2028 | | | 120 | | | �� | 113 | |
City of Valparaiso IN | | | | | | | | |
6.75%, 01/01/2034 | | | 500 | | | | 507 | |
7.00%, 01/01/2044 | | | 680 | | | | 690 | |
City of Whiting IN | | | | | | | | |
4.40%, 11/01/2045(1) | | | 440 | | | | 449 | |
5.00%, 12/01/2044(1) | | | 2,725 | | | | 2,805 | |
Indiana Finance Authority | | | | | | | | |
2.50%, 11/01/2030 | | | 1,000 | | | | 874 | |
3.00%, 11/01/2030 | | | 1,000 | | | | 905 | |
4.05%, 05/01/2034(1) | | | 1,470 | | | | 1,470 | |
4.13%, 12/01/2026 | | | 5,180 | | | | 5,123 | |
4.25%, 11/01/2030 | | | 4,615 | | | | 4,590 | |
5.00%, 03/01/2036 | | | 2,000 | | | | 2,046 | |
5.00%, 06/01/2053 | | | 1,800 | | | | 1,817 | |
5.25%, 01/01/2051 | | | 5,450 | | | | 5,450 | |
5.50%, 07/01/2052 | | | 4,145 | | | | 4,307 | |
7.00%, 11/15/2043 | | | 545 | | | | 550 | |
Indiana Housing & Community Development Authority | | | | | | | | |
3.00%, 01/01/2052 | | | 520 | | | | 498 | |
Town of Shoals IN | | | | | | | | |
7.25%, 11/01/2043(9) | | | 335 | | | | 337 | |
| | | | | | | | |
Total Indiana | | | | 32,531 | |
| | | | | |
Iowa – 0.16% | | | | | | | | |
Iowa Finance Authority | | | | | | | | |
4.75%, 08/01/2042 | | | 1,180 | | | | 1,151 | |
5.00%, 12/01/2050 | | | 1,000 | | | | 1,013 | |
Iowa Tobacco Settlement Authority | | | | | | | | |
0.00%, 06/01/2065 | | | 7,000 | | | | 804 | |
4.00%, 06/01/2036 | | | 775 | | | | 775 | |
| | | | | | | | |
Total Iowa | | | | 3,743 | |
| | | | | |
Kansas – 0.32% | | | | | | | | |
City of Lenexa KS | | | | | | | | |
5.00%, 05/15/2030 | | | 85 | | | | 85 | |
5.00%, 05/15/2032 | | | 80 | | | | 80 | |
5.00%, 05/15/2039 | | | 405 | | | | 382 | |
City of Manhattan KS | | | | | | | | |
4.00%, 06/01/2027 | | | 2,885 | | | | 2,877 | |
4.00%, 06/01/2046 | | | 250 | | | | 181 | |
City of Overland Park KS Sales Tax Revenue | | | | | | | | |
6.50%, 11/15/2042(4) | | | 4,025 | | | | 4,120 | |
| | | | | | | | |
Total Kansas | | | | 7,725 | |
| | | | | |
Kentucky – 1.21% | | | | | | | | |
City of Ashland KY | | | | | | | | |
4.00%, 02/01/2034 | | | 500 | | | | 496 | |
4.00%, 02/01/2038 | | | 620 | | | | 573 | |
City of Henderson KY | | | | | | | | |
4.45%, 01/01/2042(4) | | | 1,165 | | | | 1,120 | |
4.70%, 01/01/2052(4) | | | 1,000 | | | | 952 | |
4.70%, 01/01/2052(4) | | | 2,495 | | | | 2,375 | |
County of Boyle KY | | | | | | | | |
5.25%, 06/01/2049 | | | 1,900 | | | | 2,023 | |
Kentucky Economic Development Finance Authority | | | | | | | | |
5.00%, 05/15/2031 | | | 350 | | | | 321 | |
5.00%, 06/01/2037 | | | 785 | | | | 792 | |
5.00%, 06/01/2041 | | | 570 | | | | 566 | |
5.00%, 06/01/2045 | | | 1,550 | | | | 1,523 | |
5.00%, 12/01/2045 | | | 300 | | | | 307 | |
5.00%, 05/15/2046 | | | 980 | | | | 739 | |
5.00%, 12/01/2047 | | | 180 | | | | 180 | |
5.00%, 05/15/2051 | | | 575 | | | | 418 | |
5.25%, 06/01/2041 | | | 1,240 | | | | 1,269 | |
5.25%, 06/01/2050 | | | 955 | | | | 961 | |
5.38%, 11/15/2042 | | | 305 | | | | 252 | |
5.50%, 11/15/2045 | | | 160 | | | | 131 | |
6.00%, 11/15/2036 | | | 275 | | | | 231 | |
6.25%, 11/15/2046 | | | 2,565 | | | | 1,987 | |
6.38%, 11/15/2051 | | | 645 | | | | 494 | |
Kentucky Higher Education Student Loan Corp. | | | | | | | | |
4.00%, 06/01/2037 | | | 500 | | | | 482 | |
Kentucky Public Energy Authority | | | | | | | | |
4.00%, 04/01/2048(1) | | | 4,000 | | | | 3,996 | |
4.00%, 02/01/2050(1) | | | 4,805 | | | | 4,751 | |
Kentucky Public Transportation Infrastructure Authority | | | | | | | | |
5.75%, 07/01/2049 | | | 1,060 | | | | 1,060 | |
6.00%, 07/01/2053 | | | 970 | | | | 970 | |
| | | | | | | | |
Total Kentucky | | | | 28,969 | |
| | | | | |
Louisiana – 1.09% | | | | | | | | |
City of New Orleans LA Sewerage Service Revenue | | | | | | | | |
5.00%, 06/01/2033 | | | 100 | | | | 104 | |
5.00%, 06/01/2040 | | | 185 | | | | 192 | |
5.00%, 06/01/2045 | | | 120 | | | | 124 | |
| | | | | | | | |
City of New Orleans LA Water System Revenue | | | | | | | | |
5.00%, 12/01/2045 | | | 375 | | | | 391 | |
Jefferson Parish Economic Development & Port District | | | | | | | | |
5.50%, 06/15/2038(4) | | | 765 | | | | 760 | |
5.63%, 06/15/2048(4) | | | 1,750 | | | | 1,681 | |
Juban Crossing Economic Development District | | | | | | | | |
7.00%, 09/15/2044(4) | | | 1,000 | | | | 1,003 | |
Louisiana Housing Corp. | | | | | | | | |
5.75%, 06/01/2054 | | | 650 | | | | 703 | |
Louisiana Local Government Environmental Facilities & Community Development Auth | | | | | | | | |
3.50%, 11/01/2032 | | | 7,705 | | | | 7,420 | |
Louisiana Public Facilities Authority | | | | | | | | |
5.00%, 07/01/2051 | | | 500 | | | | 505 | |
New Orleans Aviation Board | | | | | | | | |
5.00%, 01/01/2031 | | | 45 | | | | 47 | |
5.00%, 01/01/2034 | | | 55 | | | | 57 | |
5.00%, 01/01/2035 | | | 45 | | | | 47 | |
5.00%, 01/01/2036 | | | 500 | | | | 517 | |
5.00%, 01/01/2037 | | | 500 | | | | 515 | |
5.00%, 01/01/2040 | | | 1,540 | | | | 1,561 | |
5.00%, 01/01/2043 | | | 135 | | | | 137 | |
5.00%, 01/01/2048 | | | 525 | | | | 532 | |
Parish of St James LA | | | | | | | | |
5.85%, 08/01/2041(1)(4) | | | 110 | | | | 113 | |
6.10%, 06/01/2038(1)(4) | | | 1,360 | | | | 1,466 | |
6.10%, 12/01/2040(1)(4) | | | 2,400 | | | | 2,587 | |
6.35%, 07/01/2040(4) | | | 3,380 | | | | 3,653 | |
6.35%, 10/01/2040(4) | | | 440 | | | | 475 | |
Parish of St John the Baptist LA | | | | | | | | |
2.13%, 06/01/2037(1) | | | 575 | | | | 564 | |
2.38%, 06/01/2037(1) | | | 1,000 | | | | 949 | |
| | | | | | | | |
Total Louisiana | | | | 26,103 | |
| | | | | |
Maine – 0.05% | | | | | | | | |
Maine Health & Higher Educational Facilities Authority | | | | | | | | |
5.00%, 07/01/2046 | | | 1,250 | | | | 1,146 | |
| | | | | | | | |
Total Maine | | | | 1,146 | |
| | | | | |
Maryland – 3.33% | | | | | | | | |
City of Baltimore MD | | | | | | | | |
5.00%, 09/01/2031 | | | 1,000 | | | | 1,004 | |
5.00%, 09/01/2036 | | | 2,790 | | | | 2,740 | |
5.00%, 09/01/2042 | | | 195 | | | | 182 | |
5.00%, 09/01/2046 | | | 4,010 | | | | 3,647 | |
City of Gaithersburg MD | | | | | | | | |
5.00%, 01/01/2027 | | | 1,435 | | | | 1,442 | |
5.00%, 01/01/2028 | | | 135 | | | | 136 | |
5.00%, 01/01/2033 | | | 635 | | | | 631 | |
City of Rockville MD | | | | | | | | |
4.25%, 11/01/2037 | | | 25 | | | | 20 | |
4.50%, 11/01/2043 | | | 135 | | | | 108 | |
5.00%, 11/01/2029 | | | 35 | | | | 34 | |
5.00%, 11/01/2031 | | | 100 | | | | 95 | |
5.00%, 11/01/2032 | | | 35 | | | | 33 | |
5.00%, 11/01/2035 | | | 70 | | | | 64 | |
5.00%, 11/01/2037 | | | 135 | | | | 122 | |
5.00%, 11/01/2042 | | | 2,480 | | | | 2,150 | |
5.00%, 11/01/2047 | | | 2,335 | | | | 1,962 | |
City of Westminster MD | | | | | | | | |
5.00%, 07/01/2024 | | | 60 | | | | 60 | |
5.13%, 07/01/2034 | | | 305 | | | | 310 | |
5.50%, 07/01/2044 | | | 305 | | | | 311 | |
6.25%, 07/01/2044 | | | 2,275 | | | | 2,289 | |
County of Anne Arundel MD | | | | | | | | |
6.50%, 07/01/2033(9) | | | 200 | | | | 200 | |
6.75%, 07/01/2043(9) | | | 390 | | | | 390 | |
County of Montgomery MD | | | | | | | | |
5.38%, 07/01/2048 | | | 1,065 | | | | 894 | |
County of Prince George’s MD | | | | | | | | |
5.13%, 07/01/2039(4) | | | 1,500 | | | | 1,483 | |
County of Washington MD | | | | | | | | |
4.00%, 05/01/2026 | | | 120 | | | | 116 | |
4.00%, 05/01/2027 | | | 120 | | | | 114 | |
4.00%, 05/01/2030 | | | 140 | | | | 126 | |
4.00%, 05/01/2031 | | | 75 | | | | 66 | |
4.00%, 05/01/2036 | | | 1,690 | | | | 1,383 | |
4.00%, 05/01/2042 | | | 3,770 | | | | 2,835 | |
Maryland Community Development Administration | | | | | | | | |
6.00%, 03/01/2053 | | | 3,000 | | | | 3,240 | |
Maryland Economic Development Corp. | | | | | | | | |
4.00%, 06/01/2038 | | | 350 | | | | 295 | |
4.00%, 09/01/2040 | | | 150 | | | | 135 | |
4.00%, 09/01/2050 | | | 950 | | | | 807 | |
4.38%, 07/01/2036 | | | 150 | | | | 143 | |
4.50%, 07/01/2044 | | | 500 | | | | 465 | |
| | | | | | | | |
5.00%, 06/01/2025 | | | 70 | | | | 71 | |
5.00%, 06/01/2027 | | | 70 | | | | 73 | |
5.00%, 07/01/2027 | | | 1,100 | | | | 1,101 | |
5.00%, 06/01/2028 | | | 100 | | | | 105 | |
5.00%, 07/01/2028 | | | 100 | | | | 102 | |
5.00%, 11/12/2028 | | | 3,145 | | | | 3,248 | |
5.00%, 06/01/2029(4) | | | 165 | | | | 170 | |
5.00%, 07/01/2029 | | | 75 | | | | 76 | |
5.00%, 06/01/2030 | | | 70 | | | | 74 | |
5.00%, 06/01/2032 | | | 70 | | | | 74 | |
5.00%, 06/01/2033(4) | | | 170 | | | | 175 | |
5.00%, 06/01/2035 | | | 1,590 | | | | 1,659 | |
5.00%, 07/01/2036 | | | 100 | | | | 100 | |
5.00%, 06/01/2049 | | | 1,350 | | | | 1,365 | |
5.00%, 06/01/2058 | | | 945 | | | | 880 | |
5.25%, 06/30/2053 | | | 2,395 | | | | 2,484 | |
5.25%, 06/30/2055 | | | 18,375 | | | | 18,972 | |
5.75%, 09/01/2025 | | | 2,500 | | | | 2,521 | |
Maryland Health & Higher Educational Facilities Authority | | | | | | | | |
4.00%, 06/01/2046 | | | 1,080 | | | | 962 | |
4.00%, 06/01/2051 | | | 1,805 | | | | 1,559 | |
4.00%, 06/01/2055 | | | 1,125 | | | | 953 | |
5.00%, 07/01/2030 | | | 600 | | | | 620 | |
5.00%, 07/01/2032 | | | 40 | | | | 41 | |
5.00%, 07/01/2033 | | | 105 | | | | 108 | |
5.00%, 07/01/2034 | | | 120 | | | | 124 | |
5.00%, 07/01/2035 | | | 110 | | | | 113 | |
5.00%, 07/01/2036 | | | 100 | | | | 103 | |
5.00%, 08/15/2038 | | | 1,945 | | | | 1,979 | |
5.00%, 07/01/2043 | | | 500 | | | | 502 | |
5.00%, 01/01/2045 | | | 70 | | | | 71 | |
5.00%, 07/01/2045 | | | 2,000 | | | | 2,023 | |
5.50%, 01/01/2036 | | | 465 | | | | 483 | |
5.50%, 01/01/2046 | | | 3,410 | | | | 3,472 | |
6.75%, 07/01/2044 | | | 185 | | | | 185 | |
Maryland Stadium Authority Built to Learn Revenue | | | | | | | | |
4.00%, 06/01/2046 | | | 3,000 | | | | 2,887 | |
Prince George’s County Revenue Authority | | | | | | | | |
4.75%, 07/01/2036(4) | | | 120 | | | | 120 | |
5.00%, 07/01/2046(4) | | | 170 | | | | 170 | |
Washington Suburban Sanitary Commission | | | | | | | | |
4.00%, 06/01/2038 | | | 100 | | | | 102 | |
| | | | | | | | |
| Total Maryland | | | | 79,859 | |
| | | | | |
Massachusetts – 0.76% | | | | | | | | |
Massachusetts Development Finance Agency | | | | | | | | |
5.00%, 07/15/2036(4) | | | 235 | | | | 217 | |
5.00%, 07/15/2037(4) | | | 245 | | | | 225 | |
5.00%, 10/01/2037(4) | | | 645 | | | | 623 | |
5.00%, 11/15/2038(4) | | | 180 | | | | 183 | |
5.00%, 10/01/2041 | | | 825 | | | | 813 | |
5.00%, 07/15/2046(4) | | | 1,000 | | | | 865 | |
5.00%, 10/01/2047(4) | | | 1,825 | | | | 1,651 | |
5.00%, 10/01/2048 | | | 9,700 | | | | 9,220 | |
5.00%, 10/01/2057(4) | | | 1,880 | | | | 1,650 | |
5.13%, 01/01/2040 | | | 1,020 | | | | 933 | |
5.13%, 11/15/2046(4) | | | 1,050 | | | | 1,061 | |
5.25%, 01/01/2050 | | | 180 | | | | 156 | |
5.45%, 05/15/2059 | | | 170 | | | | 192 | |
5.63%, 07/15/2036 | | | 40 | | | | 39 | |
5.75%, 07/15/2043 | | | 225 | | | | 220 | |
Massachusetts Educational Financing Authority | | | | | | | | |
4.25%, 07/01/2044 | | | 100 | | | | 99 | |
| | | | | | | | |
| Total Massachusetts | | | | 18,147 | |
| | | | | |
Michigan – 1.55% | | | | | | | | |
Calhoun County Hospital Finance Authority | | | | | | | | |
5.00%, 02/15/2037 | | | 1,765 | | | | 1,771 | |
5.00%, 02/15/2041 | | | 385 | | | | 377 | |
5.00%, 02/15/2047 | | | 1,080 | | | | 1,026 | |
City of Detroit MI | | | | | | | | |
5.00%, 04/01/2029 | | | 50 | | | | 51 | |
5.00%, 04/01/2030 | | | 50 | | | | 51 | |
5.00%, 04/01/2031 | | | 50 | | | | 51 | |
5.00%, 04/01/2032 | | | 60 | | | | 62 | |
5.00%, 04/01/2033 | | | 80 | | | | 82 | |
5.00%, 04/01/2034 | | | 1,000 | | | | 1,024 | |
5.00%, 04/01/2037 | | | 145 | | | | 146 | |
5.00%, 04/01/2038 | | | 95 | | | | 95 | |
5.00%, 04/01/2050 | | | 155 | | | | 148 | |
5.50%, 04/01/2031 | | | 560 | | | | 598 | |
5.50%, 04/01/2033 | | | 470 | | | | 501 | |
5.50%, 04/01/2035 | | | 350 | | | | 371 | |
5.50%, 04/01/2037 | | | 465 | | | | 486 | |
5.50%, 04/01/2039 | | | 645 | | | | 668 | |
| | | | | | | | |
5.50%, 04/01/2045 | | | 750 | | | | 766 | |
5.50%, 04/01/2050 | | | 605 | | | | 614 | |
Detroit Downtown Development Authority | | | | | | | | |
5.00%, 07/01/2038 | | | 1,000 | | | | 1,006 | |
Flint Hospital Building Authority | | | | | | | | |
5.00%, 07/01/2023 | | | 190 | | | | 190 | |
Gerald R Ford International Airport Authority | | | | | | | | |
5.00%, 01/01/2046 | | | 1,500 | | | | 1,583 | |
5.00%, 01/01/2051 | | | 1,345 | | | | 1,412 | |
Grand Rapids Economic Development Corp. | | | | | | | | |
5.00%, 11/01/2032 | | | 145 | | | | 134 | |
5.00%, 11/01/2037 | | | 80 | | | | 69 | |
5.00%, 11/01/2047 | | | 190 | | | | 149 | |
5.00%, 11/01/2052 | | | 80 | | | | 61 | |
Great Lakes Water Authority Sewage Disposal System Revenue | | | | | | | | |
5.00%, 07/01/2036 | | | 1,000 | | | | 1,044 | |
5.25%, 07/01/2047 | | | 4,330 | | | | 4,721 | |
Karegnondi Water Authority | | | | | | | | |
5.00%, 11/01/2036 | | | 1,300 | | | | 1,376 | |
5.25%, 11/01/2040 | | | 130 | | | | 130 | |
Kentwood Economic Development Corp. | | | | | | | | |
4.00%, 11/15/2043 | | | 1,000 | | | | 770 | |
4.00%, 11/15/2045 | | | 750 | | | | 564 | |
Michigan Finance Authority | | | | | | | | |
4.00%, 11/15/2050 | | | 160 | | | | 147 | |
5.00%, 07/01/2033 | | | 350 | | | | 359 | |
5.00%, 07/01/2034 | | | 280 | | | | 287 | |
5.00%, 07/01/2035 | | | 420 | | | | 429 | |
Michigan State Building Authority | | | | | | | | |
4.00%, 10/15/2041 | | | 1,400 | | | | 1,398 | |
Michigan State Housing Development Authority | | | | | | | | |
5.00%, 06/01/2053 | | | 1,000 | | | | 1,033 | |
Michigan Strategic Fund | | | | | | | | |
4.00%, 10/01/2061(1) | | | 2,000 | | | | 1,989 | |
Michigan Tobacco Settlement Finance Authority | | | | | | | | |
0.00%, 06/01/2052 | | | 4,030 | | | | 471 | |
State of Michigan Trunk Line Revenue | | | | | | | | |
4.00%, 11/15/2046 | | | 250 | | | | 245 | |
University of Michigan | | | | | | | | |
3.60%, 04/01/2038(1) | | | 1,300 | | | | 1,300 | |
Wayne County Airport Authority | | | | | | | | |
5.00%, 12/01/2037 | | | 250 | | | | 265 | |
5.00%, 12/01/2040 | | | 3,000 | | | | 3,073 | |
5.00%, 12/01/2042 | | | 900 | | | | 923 | |
5.00%, 12/01/2042 | | | 1,000 | | | | 1,000 | |
5.00%, 12/01/2047 | | | 2,000 | | | | 2,046 | |
| | | | | | | | |
Total Michigan | | | | 37,062 | |
| | | | | |
Minnesota – 0.36% | | | | | | | | |
City of Deephaven MN | | | | | | | | |
5.00%, 10/01/2037 | | | 1,285 | | | | 1,163 | |
5.00%, 10/01/2049 | | | 2,270 | | | | 1,911 | |
City of Rochester MN | | | | | | | | |
5.00%, 12/01/2025 | | | 700 | | | | 684 | |
5.00%, 11/15/2057 | | | 3,120 | | | | 3,361 | |
5.25%, 12/01/2038 | | | 1,000 | | | | 873 | |
City of Woodbury MN | | | | | | | | |
4.00%, 07/01/2041 | | | 60 | | | | 48 | |
4.00%, 07/01/2051 | | | 45 | | | | 33 | |
4.00%, 07/01/2056 | | | 40 | | | | 28 | |
Housing & Redevelopment Authority of The City of St Paul Minnesota | | | | | | | | |
4.00%, 11/01/2042 | | | 675 | | | | 528 | |
| | | | | | | | |
Total Minnesota | | | | 8,629 | |
| | | | | |
Missouri – 1.22% | | | | | | | | |
Cape Girardeau County Industrial Development Authority | | | | | | | | |
3.00%, 03/01/2046 | | | 100 | | | | 69 | |
Health & Educational Facilities Authority of the State of Missouri | | | | | | | | |
3.60%, 10/01/2035(1) | | | 1,000 | | | | 1,000 | |
4.00%, 08/01/2031 | | | 310 | | | | 280 | |
4.00%, 08/01/2041 | | | 410 | | | | 324 | |
5.00%, 02/01/2035 | | | 1,945 | | | | 1,897 | |
5.00%, 08/01/2040 | | | 1,145 | | | | 1,092 | |
5.00%, 02/01/2046 | | | 440 | | | | 404 | |
Industrial Development Authority of the City of St Louis Missouri | | | | | | | | |
3.88%, 11/15/2029 | | | 150 | | | | 130 | |
4.38%, 11/15/2035 | | | 415 | | | | 331 | |
4.75%, 11/15/2047 | | | 1,450 | | | | 1,066 | |
Kansas City Industrial Development Authority | | | | | | | | |
4.00%, 03/01/2050 | | | 170 | | | | 159 | |
4.00%, 03/01/2050 | | | 4,515 | | | | 4,163 | |
4.00%, 03/01/2057 | | | 7,525 | | | | 6,923 | |
5.00%, 03/01/2054 | | | 340 | | | | 347 | |
Kirkwood Industrial Development Authority | | | | | | | | |
5.25%, 05/15/2037 | | | 135 | | | | 115 | |
| | | | | | | | |
5.25%, 05/15/2042 | | | 115 | | | | 93 | |
5.25%, 05/15/2050 | | | 270 | | | | 204 | |
St Louis County Industrial Development Authority | | | | | | | | |
5.00%, 12/01/2025 | | | 465 | | | | 465 | |
5.00%, 08/15/2030 | | | 70 | | | | 67 | |
5.00%, 08/15/2035 | | | 50 | | | | 46 | |
5.00%, 12/01/2035 | | | 135 | | | | 128 | |
5.00%, 09/01/2038 | | | 820 | | | | 750 | |
5.00%, 09/01/2048 | | | 1,845 | | | | 1,548 | |
5.13%, 08/15/2045 | | | 315 | | | | 267 | |
5.13%, 12/01/2045 | | | 145 | | | | 131 | |
5.13%, 09/01/2048 | | | 3,050 | | | | 2,607 | |
St Louis Land Clearance for Redevelopment Authority | | | | | | | | |
5.00%, 06/01/2029 | | | 1,000 | | | | 1,031 | |
5.13%, 06/01/2046 | | | 350 | | | | 353 | |
5.38%, 06/01/2043 | | | 2,995 | | | | 3,056 | |
Taney County Industrial Development Authority | | | | | | | | |
6.00%, 10/01/2049(4) | | | 300 | | | | 296 | |
| | | | | | | | |
Total Missouri | | | | 29,342 | |
| | | | | |
Montana – 0.08% | | | | | | | | |
City of Kalispell MT | | | | | | | | |
5.25%, 05/15/2037 | | | 810 | | | | 722 | |
5.25%, 05/15/2047 | | | 990 | | | | 803 | |
5.25%, 05/15/2052 | | | 560 | | | | 442 | |
| | | | | | | | |
Total Montana | | | | 1,967 | |
| | | | | |
Nebraska – 0.37% | | | | | | | | |
Central Plains Energy Project | | | | | | | | |
5.00%, 09/01/2030 | | | 240 | | | | 254 | |
5.00%, 09/01/2033 | | | 1,500 | | | | 1,616 | |
5.00%, 09/01/2035 | | | 1,025 | | | | 1,095 | |
5.00%, 03/01/2050(1) | | | 5,670 | | | | 5,694 | |
5.00%, 05/01/2053(1) | | | 100 | | | | 104 | |
| | | | | | | | |
Total Nebraska | | | | 8,763 | |
| | | | | |
Nevada – 0.64% | | | | | | | | |
City of Las Vegas NV Special Improvement District No 814 | | | | | | | | |
4.00%, 06/01/2039 | | | 440 | | | | 396 | |
4.00%, 06/01/2049 | | | 1,050 | | | | 863 | |
City of Las Vegas NV Special Improvement District No 815 | | | | | | | | |
4.75%, 12/01/2040 | | | 895 | | | | 861 | |
City of Las Vegas NV Special Improvement District No 816 | | | | | | | | |
3.00%, 06/01/2041 | | | 630 | | | | 458 | |
3.13%, 06/01/2046 | | | 1,300 | | | | 888 | |
City of North Las Vegas NV | | | | | | | | |
4.63%, 06/01/2043 | | | 115 | | | | 108 | |
City of Reno NV | | | | | | | | |
0.00%, 07/01/2058(4) | | | 12,500 | | | | 1,616 | |
5.00%, 06/01/2033 | | | 15 | | | | 16 | |
5.00%, 06/01/2036 | | | 15 | | | | 16 | |
5.00%, 06/01/2037 | | | 35 | | | | 37 | |
5.00%, 06/01/2038 | | | 155 | | | | 164 | |
5.00%, 06/01/2048 | | | 35 | | | | 36 | |
Clark County School District | | | | | | | | |
4.00%, 06/15/2038 | | | 775 | | | | 781 | |
5.00%, 06/15/2035 | | | 500 | | | | 561 | |
Henderson Public Improvement Trust | | | | | | | | |
5.50%, 01/01/2034 | | | 120 | | | | 123 | |
5.50%, 01/01/2039 | | | 175 | | | | 179 | |
5.50%, 01/01/2044 | | | 255 | | | | 261 | |
Las Vegas Convention & Visitors Authority | | | | | | | | |
5.00%, 07/01/2031 | | | 600 | | | | 639 | |
5.00%, 07/01/2043 | | | 2,500 | | | | 2,606 | |
Las Vegas Redevelopment Agency | | | | | | | | |
5.00%, 06/15/2030 | | | 1,030 | | | | 1,066 | |
5.00%, 06/15/2040 | | | 990 | | | | 1,008 | |
5.00%, 06/15/2045 | | | 540 | | | | 547 | |
Las Vegas Valley Water District | | | | | | | | |
4.00%, 06/01/2051 | | | 500 | | | | 488 | |
State of Nevada Department of Business & Industry | | | | | | | | |
4.13%, 12/01/2026(1)(4) | | | 1,650 | | | | 1,651 | |
| | | | | | | | |
Total Nevada | | | | 15,369 | |
| | | | | |
New Hampshire – 0.52% | | | | | | | | |
New Hampshire Business Finance Authority | | | | | | | | |
3.63%, 07/01/2043(1)(4) | | | 250 | | | | 191 | |
3.75%, 07/01/2045(1)(4) | | | 1,280 | | | | 994 | |
4.00%, 10/20/2036 | | | 4,632 | | | | 4,388 | |
4.00%, 01/01/2041 | | | 2,000 | | | | 1,660 | |
4.00%, 01/01/2051 | | | 3,000 | | | | 2,279 | |
4.13%, 01/20/2034 | | | 878 | | | | 857 | |
4.63%, 11/01/2042(4) | | | 500 | | | | 430 | |
5.25%, 07/01/2039(4) | | | 345 | | | | 312 | |
5.63%, 07/01/2046(4) | | | 185 | | | | 167 | |
5.75%, 07/01/2054(4) | | | 465 | | | | 418 | |
New Hampshire Health & Education Facilities Authority Act | | | | | | | | |
| | | | | | | | |
5.00%, 10/01/2036 | | | 55 | | | | 55 | |
5.00%, 10/01/2040 | | | 50 | | | | 49 | |
5.00%, 10/01/2046 | | | 415 | | | | 398 | |
5.25%, 07/01/2027(2)(3)(4) | | | 459 | | | | 101 | |
6.13%, 07/01/2037(2)(3)(4) | | | 96 | | | | 21 | |
6.13%, 07/01/2052(2)(3)(4) | | | 442 | | | | 97 | |
6.25%, 07/01/2042(2)(3)(4) | | | 730 | | | | 161 | |
| | | | | | | | |
Total New Hampshire | | | | 12,578 | |
| | | | | |
New Jersey – 4.65% | | | | | | | | |
Essex County Improvement Authority | | | | | | | | |
4.00%, 06/15/2046 | | | 135 | | | | 117 | |
4.00%, 06/15/2056 | | | 150 | | | | 123 | |
Industrial Pollution Control Financing Authority of Gloucester County | | | | | | | | |
5.00%, 12/01/2024 | | | 110 | | | | 111 | |
New Brunswick Parking Authority | | | | | | | | |
5.00%, 09/01/2039 | | | 2,000 | | | | 2,077 | |
New Jersey Economic Development Authority | | | | | | | | |
0.00%, 07/01/2026 | | | 170 | | | | 155 | |
4.00%, 11/01/2038 | | | 825 | | | | 820 | |
4.00%, 11/01/2044 | | | 1,555 | | | | 1,497 | |
4.00%, 08/01/2059 | | | 355 | | | | 316 | |
4.38%, 01/01/2024 | | | 20 | | | | 20 | |
4.88%, 01/01/2029 | | | 70 | | | | 69 | |
5.00%, 06/15/2024 | | | 2,000 | | | | 2,030 | |
5.00%, 03/01/2028 | | | 485 | | | | 521 | |
5.00%, 01/01/2030 | | | 635 | | | | 630 | |
5.00%, 01/01/2031 | | | 500 | | | | 503 | |
5.00%, 01/01/2034 | | | 135 | | | | 133 | |
5.00%, 06/15/2037 | | | 85 | | | | 85 | |
5.00%, 10/01/2037 | | | 6,080 | | | | 6,179 | |
5.00%, 10/01/2047 | | | 9,690 | | | | 9,693 | |
5.00%, 01/01/2048 | | | 4,220 | | | | 3,843 | |
5.00%, 06/15/2054(4) | | | 3,250 | | | | 2,934 | |
5.00%, 08/01/2059 | | | 1,135 | | | | 1,165 | |
5.13%, 01/01/2034 | | | 705 | | | | 709 | |
5.13%, 06/15/2043 | | | 2,570 | | | | 2,570 | |
5.25%, 09/15/2029 | | | 1,000 | | | | 1,003 | |
5.25%, 01/01/2044 | | | 525 | | | | 491 | |
5.50%, 01/01/2027 | | | 500 | | | | 504 | |
5.63%, 11/15/2030 | | | 2,095 | | | | 2,128 | |
5.63%, 11/15/2030 | | | 2,840 | | | | 2,885 | |
5.63%, 01/01/2052 | | | 3,155 | | | | 3,166 | |
5.75%, 09/15/2027 | | | 1,000 | | | | 1,002 | |
New Jersey Educational Facilities Authority | | | | | | | | |
5.00%, 07/01/2040 | | | 270 | | | | 279 | |
New Jersey Health Care Facilities Financing Authority | | | | | | | | |
5.00%, 07/01/2027 | | | 1,000 | | | | 1,056 | |
5.00%, 07/01/2033 | | | 500 | | | | 521 | |
5.00%, 07/01/2046 | | | 2,375 | | | | 2,396 | |
New Jersey Higher Education Student Assistance Authority | | | | | | | | |
4.00%, 12/01/2044 | | | 600 | | | | 583 | |
5.00%, 12/01/2044 | | | 1,000 | | | | 973 | |
New Jersey Transportation Trust Fund Authority | | | | | | | | |
0.00%, 12/15/2028 | | | 2,000 | | | | 1,650 | |
0.00%, 12/15/2030 | | | 2,305 | | | | 1,756 | |
0.00%, 12/15/2031 | | | 2,075 | | | | 1,518 | |
0.00%, 12/15/2034 | | | 200 | | | | 128 | |
4.00%, 06/15/2039 | | | 1,050 | | | | 1,035 | |
4.00%, 06/15/2040 | | | 1,750 | | | | 1,713 | |
4.00%, 06/15/2042 | | | 1,210 | | | | 1,168 | |
4.00%, 06/15/2045 | | | 1,975 | | | | 1,888 | |
4.00%, 06/15/2046 | | | 1,790 | | | | 1,705 | |
4.00%, 06/15/2050 | | | 1,565 | | | | 1,475 | |
5.00%, 12/15/2030 | | | 2,250 | | | | 2,442 | |
5.00%, 06/15/2031 | | | 1,125 | | | | 1,175 | |
5.00%, 06/15/2036 | | | 70 | | | | 77 | |
5.00%, 06/15/2038 | | | 1,675 | | | | 1,813 | |
5.25%, 06/15/2043 | | | 9,330 | | | | 9,822 | |
5.25%, 06/15/2046 | | | 1,425 | | | | 1,556 | |
5.50%, 06/15/2050 | | | 1,185 | | | | 1,309 | |
New Jersey Turnpike Authority | | | | | | | | |
4.00%, 01/01/2051 | | | 725 | | | | 714 | |
5.25%, 01/01/2052 | | | 5,000 | | | | 5,604 | |
State of New Jersey | | | | | | | | |
4.00%, 06/01/2032 | | | 1,900 | | | | 2,038 | |
Tobacco Settlement Financing Corp. | | | | | | | | |
5.00%, 06/01/2046 | | | 8,390 | | | | 8,422 | |
5.25%, 06/01/2046 | | | 8,770 | | | | 9,103 | |
| | | | | | | | |
Total New Jersey | | | | 111,398 | |
| | | | | |
New Mexico – 0.10% | | | | | | | | |
City of Farmington NM | | | | | | | | |
2.15%, 04/01/2033 | | | 550 | | | | 439 | |
3.90%, 06/01/2040(1) | | | 500 | | | | 502 | |
| | | | | | | | |
New Mexico Mortgage Finance Authority | | | | | | | | |
3.00%, 07/01/2052 | | | 1,000 | | | | 958 | |
3.00%, 03/01/2053 | | | 510 | | | | 489 | |
| | | | | | | | |
Total New Mexico | | | | 2,388 | |
| | | | | |
New York – 5.26% | | | | | | | | |
Brooklyn Arena Local Development Corp. | | | | | | | | |
5.00%, 07/15/2042 | | | 2,025 | | | | 2,027 | |
Build NYC Resource Corp. | | | | | | | | |
4.00%, 06/15/2031(4) | | | 300 | | | | 280 | |
4.88%, 05/01/2031(4) | | | 740 | | | | 731 | |
5.00%, 01/01/2035(4) | | | 4,750 | | | | 4,813 | |
5.00%, 12/01/2041(4) | | | 2,550 | | | | 2,263 | |
5.00%, 06/01/2051(4) | | | 170 | | | | 153 | |
5.00%, 06/15/2051(4) | | | 6,125 | | | | 5,248 | |
5.00%, 12/01/2051(4) | | | 1,760 | | | | 1,471 | |
5.00%, 12/01/2055(4) | | | 1,500 | | | | 1,227 | |
5.50%, 05/01/2048(4) | | | 1,390 | | | | 1,370 | |
City of New York NY | | | | | | | | |
4.00%, 08/01/2050 | | | 350 | | | | 340 | |
5.00%, 08/01/2030 | | | 1,360 | | | | 1,555 | |
5.25%, 10/01/2047 | | | 3,180 | | | | 3,575 | |
5.50%, 05/01/2044 | | | 900 | | | | 1,033 | |
Glen Cove Local Economic Assistance Corp. | | | | | | | | |
0.00%, 01/01/2045 | | | 5,450 | | | | 1,411 | |
0.00%, 01/01/2055 | | | 1,365 | | | | 1,200 | |
5.00%, 01/01/2056 | | | 1,925 | | | | 1,676 | |
Long Island Power Authority | | | | | | | | |
5.00%, 09/01/2039 | | | 1,725 | | | | 1,862 | |
Metropolitan Transportation Authority | | | | | | | | |
4.00%, 11/15/2042 | | | 1,230 | | | | 1,180 | |
5.00%, 11/15/2050 | | | 225 | | | | 233 | |
5.00%, 11/15/2052 | | | 1,000 | | | | 1,028 | |
Monroe County Industrial Development Corp. | | | | | | | | |
5.00%, 12/01/2023 | | | 500 | | | | 502 | |
Nassau County Industrial Development Agency | | | | | | | | |
5.00%, 01/01/2058(1) | | | 2,484 | | | | 1,118 | |
9.00%, 01/01/2041(4) | | | 1,085 | | | | 901 | |
New York City Industrial Development Agency | | | | | | | | |
3.00%, 01/01/2034 | | | 1,000 | | | | 926 | |
3.00%, 01/01/2037 | | | 1,205 | | | | 1,042 | |
4.00%, 03/01/2045 | | | 3,500 | | | | 3,360 | |
New York City Municipal Water Finance Authority | | | | | | | | |
3.75%, 06/15/2053(1) | | | 300 | | | | 300 | |
4.13%, 06/15/2047 | | | 605 | | | | 603 | |
New York City Transitional Finance Authority Future Tax Secured Revenue | | | | | | | | |
3.75%, 11/01/2042(1) | | | 2,200 | | | | 2,200 | |
4.00%, 05/01/2044 | | | 315 | | | | 311 | |
4.00%, 02/01/2051 | | | 1,000 | | | | 975 | |
5.00%, 02/01/2047 | | | 3,375 | | | | 3,681 | |
New York Liberty Development Corp. | | | | | | | | |
2.63%, 09/15/2069 | | | 400 | | | | 365 | |
2.80%, 09/15/2069 | | | 1,025 | | | | 934 | |
3.00%, 11/15/2051 | | | 500 | | | | 361 | |
5.00%, 11/15/2044(4) | | | 2,800 | | | | 2,753 | |
5.15%, 11/15/2034(4) | | | 2,920 | | | | 2,926 | |
5.25%, 10/01/2035 | | | 4,405 | | | | 5,029 | |
5.38%, 11/15/2040(4) | | | 7,910 | | | | 7,924 | |
New York State Dormitory Authority | | | | | | | | |
5.00%, 12/01/2026(4) | | | 300 | | | | 301 | |
5.00%, 12/01/2026(4) | | | 1,500 | | | | 1,506 | |
5.00%, 12/01/2027(4) | | | 500 | | | | 502 | |
5.00%, 12/01/2028(4) | | | 600 | | | | 602 | |
5.00%, 12/01/2028(4) | | | 3,300 | | | | 3,324 | |
5.00%, 12/01/2029(4) | | | 450 | | | | 452 | |
5.00%, 12/01/2030(4) | | | 1,000 | | | | 1,004 | |
5.00%, 12/01/2031(4) | | | 1,200 | | | | 1,209 | |
5.00%, 12/01/2033(4) | | | 700 | | | | 704 | |
5.00%, 12/01/2036(4) | | | 100 | | | | 100 | |
5.00%, 03/15/2046 | | | 2,220 | | | | 2,421 | |
New York State Thruway Authority | | | | | | | | |
4.00%, 01/01/2047 | | | 2,500 | | | | 2,443 | |
New York Transportation Development Corp. | | | | | | | | |
2.25%, 08/01/2026 | | | 2,030 | | | | 1,954 | |
3.00%, 08/01/2031 | | | 205 | | | | 182 | |
4.00%, 10/01/2030 | | | 750 | | | | 748 | |
4.00%, 12/01/2039 | | | 100 | | | | 97 | |
4.00%, 12/01/2042 | | | 500 | | | | 467 | |
4.38%, 10/01/2045 | | | 1,425 | | | | 1,388 | |
5.00%, 08/01/2026 | | | 1,320 | | | | 1,322 | |
5.00%, 01/01/2027 | | | 3,500 | | | | 3,608 | |
5.00%, 08/01/2031 | | | 11,175 | | | | 11,186 | |
5.00%, 01/01/2034 | | | 500 | | | | 518 | |
5.00%, 12/01/2034 | | | 400 | | | | 425 | |
| | | | | | | | |
5.00%, 12/01/2034 | | | 1,395 | | | | 1,524 | |
5.00%, 10/01/2035 | | | 425 | | | | 445 | |
5.00%, 01/01/2036 | | | 1,830 | | | | 1,887 | |
5.00%, 12/01/2037 | | | 500 | | | | 521 | |
5.00%, 12/01/2039 | | | 885 | | | | 924 | |
5.00%, 10/01/2040 | | | 2,460 | | | | 2,513 | |
5.00%, 12/01/2040 | | | 560 | | | | 582 | |
5.00%, 07/01/2041 | | | 500 | | | | 500 | |
5.00%, 12/01/2041 | | | 560 | | | | 580 | |
5.00%, 12/01/2042 | | | 560 | | | | 577 | |
5.00%, 07/01/2046 | | | 1,500 | | | | 1,482 | |
5.25%, 08/01/2031 | | | 605 | | | | 629 | |
5.38%, 08/01/2036 | | | 1,265 | | | | 1,284 | |
Niagara Area Development Corp. | | | | | | | | |
4.75%, 11/01/2042(4) | | | 1,000 | | | | 875 | |
Port Authority of New York & New Jersey | | | | | | | | |
5.50%, 08/01/2052 | | | 1,000 | | | | 1,094 | |
Suffolk County Economic Development Corp. | | | | | | | | |
5.38%, 11/01/2054(4) | | | 1,115 | | | | 844 | |
Tompkins County Development Corp. | | | | | | | | |
5.00%, 07/01/2029 | | | 60 | | | | 60 | |
5.00%, 07/01/2034 | | | 160 | | | | 160 | |
Westchester County Local Development Corp. | | | | | | | | |
5.00%, 01/01/2037 | | | 525 | | | | 526 | |
5.00%, 01/01/2041 | | | 500 | | | | 491 | |
5.00%, 11/01/2046 | | | 100 | | | | 97 | |
5.50%, 05/01/2042 | | | 1,065 | | | | 1,067 | |
| | | | | | | | |
Total New York | | | | 126,012 | |
| | | | | |
North Carolina – 1.97% | | | | | | | | |
City of Charlotte NC Airport Special Facilities Revenue | | | | | | | | |
4.00%, 07/01/2038 | | | 1,525 | | | | 1,512 | |
4.00%, 07/01/2039 | | | 1,670 | | | | 1,644 | |
4.00%, 07/01/2040 | | | 2,030 | | | | 1,989 | |
4.00%, 07/01/2041 | | | 1,500 | | | | 1,463 | |
Greater Asheville Regional Airport Authority | | | | | | | | |
5.50%, 07/01/2047 | | | 3,950 | | | | 4,317 | |
North Carolina Housing Finance Agency | | | | | | | | |
3.00%, 07/01/2051 | | | 1,000 | | | | 963 | |
5.00%, 07/01/2047 | | | 135 | | | | 137 | |
North Carolina Medical Care Commission | | | | | | | | |
4.00%, 03/01/2036 | | | 160 | | | | 136 | |
4.00%, 03/01/2041 | | | 2,225 | | | | 1,730 | |
4.00%, 09/01/2041 | | | 75 | | | | 63 | |
4.00%, 03/01/2042 | | | 1,830 | | | | 1,402 | |
4.00%, 09/01/2047 | | | 1,065 | | | | 837 | |
4.00%, 03/01/2051 | | | 170 | | | | 118 | |
4.00%, 09/01/2051 | | | 65 | | | | 50 | |
4.70%, 07/01/2037 | | | 185 | | | | 154 | |
4.88%, 07/01/2040 | | | 915 | | | | 746 | |
5.00%, 10/01/2025 | | | 1,000 | | | | 1,000 | |
5.00%, 10/01/2025 | | | 1,120 | | | | 1,121 | |
5.00%, 10/01/2030 | | | 550 | | | | 547 | |
5.00%, 10/01/2030 | | | 2,100 | | | | 2,049 | |
5.00%, 01/01/2031 | | | 625 | | | | 616 | |
5.00%, 10/01/2031 | | | 3,070 | | | | 3,007 | |
5.00%, 09/01/2037 | | | 3,145 | | | | 3,212 | |
5.00%, 10/01/2037 | | | 355 | | | | 331 | |
5.00%, 01/01/2039 | | | 1,225 | | | | 1,135 | |
5.00%, 07/01/2039 | | | 1,110 | | | | 1,019 | |
5.00%, 09/01/2041 | | | 555 | | | | 573 | |
5.00%, 10/01/2043 | | | 2,000 | | | | 1,675 | |
5.00%, 07/01/2045 | | | 300 | | | | 235 | |
5.00%, 10/01/2045 | | | 1,270 | | | | 1,246 | |
5.00%, 07/01/2047 | | | 80 | | | | 61 | |
5.00%, 07/01/2049 | | | 900 | | | | 767 | |
5.00%, 10/01/2050 | | | 500 | | | | 429 | |
5.25%, 10/01/2037 | | | 60 | | | | 55 | |
5.38%, 10/01/2045 | | | 1,800 | | | | 1,569 | |
6.25%, 07/01/2035 | | | 1,305 | | | | 1,305 | |
North Carolina Turnpike Authority | | | | | | | | |
4.00%, 01/01/2055 | | | 3,730 | | | | 3,394 | |
5.00%, 01/01/2027 | | | 530 | | | | 562 | |
5.00%, 01/01/2032 | | | 1,000 | | | | 1,053 | |
5.00%, 07/01/2047 | | | 385 | | | | 391 | |
5.00%, 07/01/2051 | | | 2,055 | | | | 2,083 | |
5.00%, 07/01/2054 | | | 585 | | | | 592 | |
| | | | | | | | |
Total North Carolina | | | | 47,288 | |
| | | | | |
North Dakota – 0.00%(6) | | | | | | | | |
County of Ward ND 5.00%, 06/01/2043 | | | 50 | | | | 42 | |
| | | | | | | | |
Total North Dakota | | | | 42 | |
| | | | | |
| | | | | | | | |
Ohio – 4.75% | | | | | | | | |
Akron Bath Copley Joint Township Hospital District | | | | | | | | |
4.00%, 11/15/2033 | | | 425 | | | | 417 | |
4.00%, 11/15/2034 | | | 500 | | | | 488 | |
4.00%, 11/15/2036 | | | 2,000 | | | | 1,859 | |
4.00%, 11/15/2037 | | | 1,600 | | | | 1,468 | |
Buckeye Tobacco Settlement Financing Authority | | | | | | | | |
4.00%, 06/01/2048 | | | 300 | | | | 278 | |
5.00%, 06/01/2055 | | | 58,650 | | | | 54,927 | |
Cleveland-Cuyahoga County Port Authority | | | | | | | | |
5.50%, 12/01/2043 | | | 240 | | | | 243 | |
5.50%, 12/01/2053 | | | 2,260 | | | | 2,264 | |
Columbus-Franklin County Finance Authority | | | | | | | | |
5.00%, 12/01/2051 | | | 500 | | | | 484 | |
County of Cuyahoga OH | | | | | | | | |
5.00%, 02/15/2042 | | | 5,355 | | | | 5,367 | |
5.00%, 02/15/2057 | | | 205 | | | | 201 | |
5.50%, 02/15/2052 | | | 3,145 | | | | 3,192 | |
5.50%, 02/15/2057 | | | 7,850 | | | | 7,947 | |
County of Lucas OH | | | | | | | | |
5.25%, 11/15/2048 | | | 2,090 | | | | 1,824 | |
County of Marion OH | | | | | | | | |
5.00%, 12/01/2039 | | | 110 | | | | 91 | |
5.13%, 12/01/2049 | | | 700 | | | | 544 | |
County of Muskingum OH | | | | | | | | |
5.00%, 02/15/2033 | | | 1,000 | | | | 996 | |
5.00%, 02/15/2044 | | | 340 | | | | 318 | |
5.00%, 02/15/2048 | | | 2,080 | | | | 1,923 | |
County of Warren OH | | | | | | | | |
5.00%, 07/01/2039 | | | 800 | | | | 803 | |
County of Washington OH | | | | | | | | |
6.75%, 12/01/2052 | | | 1,000 | | | | 1,016 | |
Franklin County Convention Facilities Authority | | | | | | | | |
5.00%, 12/01/2044 | | | 3,165 | | | | 3,018 | |
5.00%, 12/01/2051 | | | 2,645 | | | | 2,484 | |
Ohio Air Quality Development Authority | | | | | | | | |
2.88%, 02/01/2026 | | | 1,000 | | | | 944 | |
3.25%, 09/01/2029 | | | 2,585 | | | | 2,410 | |
4.00%, 09/01/2030(1) | | | 10 | | | | 10 | |
4.50%, 01/15/2048(4) | | | 2,135 | | | | 2,023 | |
5.00%, 07/01/2049(4) | | | 11,470 | | | | 10,535 | |
Ohio Higher Educational Facility Commission | | | | | | | | |
5.25%, 01/01/2047 | | | 500 | | | | 517 | |
5.25%, 01/01/2052 | | | 250 | | | | 256 | |
Ohio Water Development Authority Water Pollution Control Loan Fund | | | | | | | | |
5.00%, 12/01/2043 | | | 2,500 | | | | 2,818 | |
Southeastern Ohio Port Authority | | | | | | | | |
5.50%, 12/01/2043 | | | 1,000 | | | | 909 | |
State of Ohio 4.00%, 01/15/2038 | | | 70 | | | | 68 | |
4.00%, 01/15/2039 | | | 135 | | | | 131 | |
5.00%, 01/15/2050 | | | 1,170 | | | | 1,205 | |
| | | | | | | | |
Total Ohio | | | | 113,978 | |
| | | | | |
Oklahoma – 0.57% | | | | | | | | |
Norman Regional Hospital Authority | | | | | | | | |
4.00%, 09/01/2045 | | | 2,315 | | | | 1,935 | |
Oklahoma County Finance Authority | | | | | | | | |
5.00%, 04/01/2033(2)(3) | | | 70 | | | | 35 | |
5.13%, 04/01/2042(2)(3) | | | 2,105 | | | | 1,053 | |
5.70%, 04/01/2025(2)(3) | | | 335 | | | | 168 | |
5.75%, 04/01/2027(2)(3) | | | 45 | | | | 23 | |
5.88%, 04/01/2030(2)(3) | | | 230 | | | | 115 | |
6.00%, 04/01/2030(2)(3) | | | 55 | | | | 28 | |
Oklahoma Development Finance Authority | | | | | | | | |
5.25%, 08/15/2048 | | | 3,710 | | | | 3,437 | |
5.50%, 08/15/2052 | | | 250 | | | | 238 | |
5.50%, 08/15/2057 | | | 2,555 | | | | 2,416 | |
Tulsa Airports Improvement Trust | | | | | | | | |
5.50%, 12/01/2035 | | | 745 | | | | 746 | |
Tulsa County Industrial Authority | | | | | | | | |
5.00%, 11/15/2023 | | | 230 | | | | 231 | |
5.00%, 11/15/2029 | | | 400 | | | | 412 | |
5.00%, 11/15/2031 | | | 125 | | | | 128 | |
5.25%, 11/15/2037 | | | 1,085 | | | | 1,104 | |
5.25%, 11/15/2045 | | | 1,595 | | | | 1,596 | |
| | | | | | | | |
Total Oklahoma | | | | 13,665 | |
| | | | | |
Oregon – 0.73% | | | | | | | | |
Clackamas County Hospital Facility Authority | | | | | | | | |
5.00%, 11/15/2032 | | | 35 | | | | 34 | |
5.00%, 11/15/2037 | | | 35 | | | | 33 | |
5.00%, 11/15/2047 | | | 95 | | | | 85 | |
5.00%, 11/15/2052 | | | 100 | | | | 88 | |
Hospital Facilities Authority of Multnomah County Oregon | | | | | | | | |
4.00%, 12/01/2051 | | | 125 | | | | 84 | |
Klamath Falls Intercommunity Hospital Authority | | | | | | | | |
| | | | | | | | |
5.00%, 09/01/2031 | | | 200 | | | | 208 | |
5.00%, 09/01/2032 | | | 270 | | | | 280 | |
5.00%, 09/01/2046 | | | 1,000 | | | | 1,015 | |
Oregon State Facilities Authority | | | | | | | | |
5.00%, 06/01/2030 | | | 2,775 | | | | 3,050 | |
5.00%, 06/01/2052 | | | 325 | | | | 336 | |
Port of Portland OR Airport Revenue | | | | | | | | |
4.00%, 07/01/2040 | | | 5,800 | | | | 5,698 | |
Salem Hospital Facility Authority | | | | | | | | |
4.00%, 05/15/2040 | | | 1,000 | | | | 811 | |
4.00%, 05/15/2047 | | | 475 | | | | 352 | |
4.00%, 05/15/2057 | | | 1,500 | | | | 1,041 | |
Yamhill County Hospital Authority | | | | | | | | |
4.00%, 11/15/2026 | | | 20 | | | | 19 | |
5.00%, 11/15/2031 | | | 25 | | | | 24 | |
5.00%, 11/15/2036 | | | 30 | | | | 27 | |
5.00%, 11/15/2046 | | | 85 | | | | 68 | |
5.00%, 11/15/2046 | | | 1,540 | | | | 1,225 | |
5.00%, 11/15/2051 | | | 1,005 | | | | 774 | |
5.00%, 11/15/2051 | | | 1,100 | | | | 847 | |
5.00%, 11/15/2056 | | | 1,940 | | | | 1,439 | |
| | | | | | | | |
Total Oregon | | | | 17,538 | |
| | | | | |
Other Territory – 0.03% | | | | | | | | |
Freddie Mac Multifamily ML Certificates | | | | | | | | |
0.00%, 01/25/2040(1) | | | 750 | | | | 697 | |
| | | | | | | | |
Total Other Territory | | | | 697 | |
| | | | | |
Pennsylvania – 4.83% | | | | | | | | |
Allegheny County Industrial Development Authority | | | | | | | | |
4.88%, 11/01/2024 | | | 85 | | | | 86 | |
Allentown Neighborhood Improvement Zone Development Authority | | | | | | | | |
5.00%, 05/01/2027(4) | | | 1,050 | | | | 1,071 | |
5.00%, 05/01/2028 | | | 20 | | | | 21 | |
5.00%, 05/01/2030 | | | 25 | | | | 26 | |
5.00%, 05/01/2031 | | | 45 | | | | 48 | |
5.00%, 05/01/2032 | | | 75 | | | | 80 | |
5.00%, 05/01/2032(4) | | | 2,260 | | | | 2,301 | |
5.00%, 05/01/2033 | | | 55 | | | | 59 | |
5.00%, 05/01/2033(4) | | | 240 | | | | 245 | |
5.00%, 05/01/2034 | | | 50 | | | | 53 | |
5.00%, 05/01/2035 | | | 60 | | | | 63 | |
5.00%, 05/01/2036 | | | 850 | | | | 886 | |
5.00%, 05/01/2042(4) | | | 2,175 | | | | 2,168 | |
5.00%, 05/01/2042 | | | 3,875 | | | | 3,911 | |
5.00%, 05/01/2042(4) | | | 4,955 | | | | 4,956 | |
5.25%, 05/01/2042(4) | | | 535 | | | | 535 | |
5.38%, 05/01/2042(4) | | | 645 | | | | 649 | |
Berks County Industrial Development Authority | | | | | | | | |
4.00%, 11/01/2047 | | | 340 | | | | 202 | |
5.00%, 05/15/2032 | | | 150 | | | | 151 | |
Berks County Municipal Authority | | | | | | | | |
5.00%, 02/01/2040(1) | | | 500 | | | | 340 | |
Bucks County Industrial Development Authority | | | | | | | | |
4.00%, 07/01/2046 | | | 1,000 | | | | 737 | |
4.00%, 08/15/2050 | | | 250 | | | | 224 | |
4.00%, 07/01/2051 | | | 250 | | | | 176 | |
5.00%, 07/01/2028 | | | 500 | | | | 491 | |
5.00%, 07/01/2029 | | | 500 | | | | 491 | |
5.00%, 07/01/2030 | | | 675 | | | | 662 | |
5.00%, 07/01/2054 | | | 250 | | | | 213 | |
Butler County Hospital Authority | | | | | | | | |
5.00%, 07/01/2035 | | | 570 | | | | 561 | |
5.00%, 07/01/2039 | | | 320 | | | | 302 | |
Chester County Industrial Development Authority | | | | | | | | |
4.38%, 03/01/2028(4) | | | 96 | | | | 95 | |
5.00%, 03/01/2038(4) | | | 325 | | | | 317 | |
5.13%, 03/01/2048(4) | | | 848 | | | | 792 | |
5.88%, 10/15/2047(4) | | | 3,385 | | | | 3,365 | |
County of Luzerne PA | | | | | | | | |
5.00%, 12/15/2029 | | | 750 | | | | 807 | |
Cumberland County Municipal Authority | | | | | | | | |
3.00%, 01/01/2024 | | | 500 | | | | 494 | |
4.50%, 01/01/2036(4) | | | 270 | | | | 231 | |
4.50%, 01/01/2040(4) | | | 3,825 | | | | 3,149 | |
4.50%, 01/01/2041(4) | | | 285 | | | | 232 | |
Delaware River Joint Toll Bridge Commission | | | | | | | | |
5.00%, 07/01/2042 | | | 1,100 | | | | 1,149 | |
Doylestown Hospital Authority | | | | | | | | |
4.00%, 07/01/2045 | | | 750 | | | | 545 | |
5.00%, 07/01/2049 | | | 2,410 | | | | 1,959 | |
East Hempfield Township Industrial Development Authority | | | | | | | | |
5.00%, 07/01/2030 | | | 55 | | | | 57 | |
5.00%, 07/01/2034 | | | 70 | | | | 71 | |
5.00%, 07/01/2035 | | | 70 | | | | 72 | |
| | | | | | | | |
5.00%, 07/01/2039 | | | 70 | | | | 71 | |
5.00%, 07/01/2046 | | | 105 | | | | 107 | |
5.00%, 07/01/2047 | | | 510 | | | | 528 | |
Franklin County Industrial Development Authority | | | | | | | | |
5.00%, 12/01/2043 | | | 80 | | | | 66 | |
5.00%, 12/01/2048 | | | 90 | | | | 71 | |
5.00%, 12/01/2053 | | | 595 | | | | 457 | |
Hospitals & Higher Education Facilities Authority of Philadelphia | | | | | | | | |
5.00%, 07/01/2028 | | | 340 | | | | 352 | |
5.00%, 07/01/2030 | | | 850 | | | | 879 | |
5.00%, 07/01/2034 | | | 2,000 | | | | 2,056 | |
Lancaster County Hospital Authority | | | | | | | | |
5.00%, 07/01/2023 | | | 775 | | | | 775 | |
5.00%, 07/01/2031 | | | 560 | | | | 533 | |
5.00%, 07/01/2032 | | | 560 | | | | 528 | |
5.00%, 12/01/2032 | | | 250 | | | | 228 | |
5.00%, 12/01/2037 | | | 820 | | | | 710 | |
5.00%, 07/01/2045 | | | 1,970 | | | | 1,787 | |
5.00%, 12/01/2047 | | | 2,010 | | | | 1,590 | |
5.25%, 07/01/2035 | | | 15 | | | | 14 | |
5.50%, 07/01/2045 | | | 70 | | | | 65 | |
Latrobe Industrial Development Authority | | | | | | | | |
4.00%, 03/01/2037 | | | 450 | | | | 402 | |
4.00%, 03/01/2039 | | | 320 | | | | 277 | |
4.00%, 03/01/2040 | | | 500 | | | | 428 | |
4.00%, 03/01/2046 | | | 750 | | | | 602 | |
4.00%, 03/01/2051 | | | 800 | | | | 617 | |
Luzerne County Industrial Development Authority | | | | | | | | |
5.00%, 12/15/2027 | | | 1,000 | | | | 1,041 | |
Montgomery County Higher Education & Health Authority | | | | | | | | |
5.00%, 12/01/2037 | | | 160 | | | | 155 | |
5.00%, 09/01/2043 | | | 345 | | | | 356 | |
Montgomery County Industrial Development Authority | | | | | | | | |
4.10%, 04/01/2053(1) | | | 1,000 | | | | 1,019 | |
5.25%, 01/15/2036 | | | 2,500 | | | | 2,575 | |
5.25%, 01/01/2040 | | | 1,750 | | | | 1,588 | |
5.38%, 01/01/2050 | | | 960 | | | | 828 | |
Pennsylvania Economic Development Financing Authority | | | | | | | | |
3.25%, 08/01/2039(4) | | | 905 | | | | 663 | |
3.88%, 08/01/2045(1) | | | 1,600 | | | | 1,600 | |
4.00%, 07/01/2033 | | | 500 | | | | 476 | |
5.00%, 12/31/2034 | | | 1,000 | | | | 1,022 | |
5.00%, 12/31/2038 | | | 4,750 | | | | 4,804 | |
5.25%, 06/30/2053 | | | 1,000 | | | | 1,038 | |
5.50%, 06/30/2040 | | | 270 | | | | 295 | |
5.50%, 06/30/2041 | | | 160 | | | | 174 | |
5.50%, 06/30/2043 | | | 160 | | | | 173 | |
5.50%, 11/01/2044(9) | | | 595 | | | | 597 | |
5.75%, 06/30/2048 | | | 8,345 | | | | 9,168 | |
6.00%, 06/30/2061 | | | 3,015 | | | | 3,359 | |
9.00%, 04/01/2051(1)(4) | | | 3,810 | | | | 4,254 | |
Pennsylvania Higher Education Assistance Agency | | | | | | | | |
4.00%, 06/01/2044 | | | 150 | | | | 147 | |
Pennsylvania Higher Educational Facilities Authority | | | | | | | | |
4.12% (3 Month LIBOR USD + 0.65%), 07/01/2039(5) | | | 570 | | | | 511 | |
5.00%, 07/15/2038 | | | 165 | | | | 166 | |
Pennsylvania Housing Finance Agency | | | | | | | | |
5.75%, 10/01/2053 | | | 3,625 | | | | 3,863 | |
Pennsylvania Turnpike Commission | | | | | | | | |
4.00%, 12/01/2045 | | | 2,000 | | | | 1,962 | |
4.00%, 12/01/2046 | | | 2,000 | | | | 1,953 | |
4.00%, 12/01/2050 | | | 250 | | | | 241 | |
5.25%, 12/01/2052 | | | 1,585 | | | | 1,732 | |
Pennsylvania Turnpike Commission Oil Franchise Tax Revenue | | | | | | | | |
4.00%, 12/01/2051 | | | 3,995 | | | | 3,919 | |
Philadelphia Authority for Industrial Development | | | | | | | | |
4.00%, 06/01/2031 | | | 665 | | | | 632 | |
4.00%, 06/01/2041 | | | 750 | | | | 621 | |
4.00%, 06/01/2051 | | | 800 | | | | 607 | |
4.00%, 06/01/2056 | | | 850 | | | | 623 | |
5.00%, 07/01/2031 | | | 205 | | | | 190 | |
5.00%, 07/01/2032 | | | 600 | | | | 550 | |
5.00%, 07/01/2037 | | | 365 | | | | 318 | |
5.00%, 06/15/2039 | | | 500 | | | | 481 | |
5.00%, 06/15/2040(4) | | | 900 | | | | 901 | |
5.00%, 08/01/2040 | | | 620 | | | | 620 | |
5.00%, 07/01/2042 | | | 145 | | | | 121 | |
5.00%, 07/01/2049 | | | 245 | | | | 196 | |
5.00%, 06/15/2050 | | | 1,375 | | | | 1,235 | |
5.00%, 06/15/2050(4) | | | 1,700 | | | | 1,620 | |
5.00%, 08/01/2050 | | | 1,050 | | | | 1,013 | |
5.25%, 11/01/2052 | | | 3,030 | | | | 3,219 | |
School District of Philadelphia | | | | | | | | |
| | | | | | | | |
4.00%, 09/01/2036 | | | 910 | | | | 917 | |
Susquehanna Area Regional Airport Authority | | | | | | | | |
5.00%, 01/01/2035 | | | 1,000 | | | | 1,022 | |
5.00%, 01/01/2038 | | | 3,125 | | | | 3,145 | |
| | | | | | | | |
| Total Pennsylvania | | | | 115,896 | |
| | | | | |
Puerto Rico – 10.01% | | | | | | | | |
Commonwealth of Puerto Rico | | | | | | | | |
0.00%, 07/01/2024 | | | 937 | | | | 898 | |
0.00%, 07/01/2033 | | | 3,596 | | | | 2,198 | |
0.00%, 11/01/2043(1) | | | 7,127 | | | | 3,590 | |
0.00%, 11/01/2051(1) | | | 12,382 | | | | 6,284 | |
4.00%, 07/01/2033 | | | 5,888 | | | | 5,594 | |
4.00%, 07/01/2035 | | | 3,881 | | | | 3,607 | |
4.00%, 07/01/2037 | | | 6,234 | | | | 5,594 | |
4.00%, 07/01/2041 | | | 3,932 | | | | 3,414 | |
4.00%, 07/01/2046 | | | 1,000 | | | | 845 | |
5.25%, 07/01/2023 | | | 2,246 | | | | 2,246 | |
5.38%, 07/01/2025 | | | 15,968 | | | | 16,361 | |
5.63%, 07/01/2027 | | | 4,280 | | | | 4,507 | |
5.63%, 07/01/2029 | | | 2,435 | | | | 2,607 | |
5.75%, 07/01/2031 | | | 7,451 | | | | 8,138 | |
Puerto Rico Commonwealth Aqueduct & Sewer Authority | | | | | | | | |
4.00%, 07/01/2042(4) | | | 2,320 | | | | 2,025 | |
4.00%, 07/01/2042(4) | | | 4,960 | | | | 4,329 | |
4.00%, 07/01/2042(4) | | | 5,880 | | | | 5,132 | |
4.00%, 07/01/2047(4) | | | 395 | | | | 331 | |
4.00%, 07/01/2047(4) | | | 1,200 | | | | 1,007 | |
5.00%, 07/01/2027(4) | | | 1,070 | | | | 1,096 | |
5.00%, 07/01/2029(4) | | | 1,660 | | | | 1,705 | |
5.00%, 07/01/2029(4) | | | 3,395 | | | | 3,487 | |
5.00%, 07/01/2030(4) | | | 16,360 | | | | 16,815 | |
5.00%, 07/01/2033(4) | | | 475 | | | | 488 | |
5.00%, 07/01/2033(4) | | | 5,620 | | | | 5,763 | |
5.00%, 07/01/2035(4) | | | 9,315 | | | | 9,424 | |
5.00%, 07/01/2037(4) | | | 580 | | | | 583 | |
5.00%, 07/01/2037(4) | | | 1,145 | | | | 1,150 | |
5.00%, 07/01/2037(4) | | | 6,215 | | | | 6,243 | |
5.00%, 07/01/2047(4) | | | 7,660 | | | | 7,421 | |
6.13%, 07/01/2024 | | | 205 | | | | 207 | |
Puerto Rico Electric Power Authority | | | | | | | | |
3.70%, 07/01/2050(2)(3) | | | 30 | | | | 11 | |
4.75%, 07/01/2033 | | | 165 | | | | 161 | |
5.00%, 07/01/2050(2)(3) | | | 15 | | | | 6 | |
5.00%, 07/01/2050(2)(3) | | | 250 | | | | 94 | |
5.00%, 07/01/2050(2)(3) | | | 40 | | | | 15 | |
5.00%, 07/01/2050(2)(3) | | | 140 | | | | 53 | |
5.00%, 07/01/2024(2)(3) | | | 570 | | | | 214 | |
5.00%, 07/01/2025(2)(3) | | | 75 | | | | 28 | |
5.00%, 07/01/2026(2)(3) | | | 125 | | | | 47 | |
5.00%, 07/01/2027(2)(3) | | | 25 | | | | 9 | |
5.00%, 07/01/2027(2)(3) | | | 35 | | | | 13 | |
5.00%, 07/01/2028(2)(3) | | | 45 | | | | 17 | |
5.00%, 07/01/2028(2)(3) | | | 170 | | | | 64 | |
5.00%, 07/01/2029(2)(3) | | | 755 | | | | 283 | |
5.00%, 07/01/2032(2)(3) | | | 815 | | | | 306 | |
5.00%, 07/01/2037(2)(3) | | | 3,515 | | | | 1,318 | |
5.00%, 07/01/2042(2)(3) | | | 110 | | | | 41 | |
5.05%, 07/01/2042(2)(3) | | | 130 | | | | 49 | |
5.25%, 07/01/2050(2)(3) | | | 395 | | | | 148 | |
5.25%, 07/01/2023(2)(3) | | | 3,530 | | | | 1,324 | |
5.25%, 07/01/2024(2)(3) | | | 125 | | | | 47 | |
5.25%, 07/01/2026(2)(3) | | | 105 | | | | 39 | |
5.25%, 07/01/2026(2)(3) | | | 135 | | | | 51 | |
5.25%, 07/01/2026(2)(3) | | | 965 | | | | 362 | |
5.25%, 07/01/2027(2)(3) | | | 215 | | | | 81 | |
5.25%, 07/01/2027(2)(3) | | | 410 | | | | 154 | |
5.25%, 07/01/2027(2)(3) | | | 415 | | | | 156 | |
5.25%, 07/01/2028(2)(3) | | | 295 | | | | 111 | |
5.25%, 07/01/2029(2)(3) | | | 340 | | | | 128 | |
5.25%, 07/01/2033(2)(3) | | | 135 | | | | 51 | |
5.25%, 07/01/2035(2)(3) | | | 300 | | | | 113 | |
5.25%, 07/01/2040(2)(3) | | | 4,145 | | | | 1,554 | |
5.50%, 07/01/2051(2)(3) | | | 40 | | | | 15 | |
5.50%, 07/01/2038(2)(3) | | | 4,340 | | | | 1,628 | |
5.75%, 07/01/2036(2)(3) | | | 1,400 | | | | 525 | |
6.75%, 07/01/2036(2)(3) | | | 2,265 | | | | 849 | |
7.25%, 07/01/2030(2)(3) | | | 265 | | | | 99 | |
Puerto Rico Highway & Transportation Authority | | | | | | | | |
0.00%, 07/01/2053 | | | 20,866 | | | | 12,728 | |
5.00%, 07/01/2062 | | | 7,125 | | | | 6,929 | |
Puerto Rico Industrial Tourist Educational Medical & Envirml Ctl Facs Fing Auth | | | | | | | | |
5.00%, 07/01/2030 | | | 500 | | | | 545 | |
Puerto Rico Sales Tax Financing Corp. Sales Tax Revenue | | | | | | | | |
| | | | | | | | |
0.00%, 07/01/2027 | | | 912 | | | | 774 | |
0.00%, 07/01/2029 | | | 3,394 | | | | 2,637 | |
0.00%, 07/01/2031 | | | 7,092 | | | | 5,059 | |
0.00%, 07/01/2033 | | | 5,431 | | | | 3,530 | |
0.00%, 07/01/2046 | | | 47,136 | | | | 13,241 | |
0.00%, 07/01/2051 | | | 8,235 | | | | 1,731 | |
4.33%, 07/01/2040 | | | 1,232 | | | | 1,172 | |
4.33%, 07/01/2040 | | | 6,857 | | | | 6,521 | |
4.54%, 07/01/2053 | | | 205 | | | | 189 | |
4.55%, 07/01/2040 | | | 1,442 | | | | 1,409 | |
4.75%, 07/01/2053 | | | 10,715 | | | | 10,210 | |
4.78%, 07/01/2058 | | | 13,772 | | | | 13,052 | |
5.00%, 07/01/2058 | | | 16,430 | | | | 16,016 | |
University of Puerto Rico | | | | | | | | |
5.00%, 06/01/2024 | | | 355 | | | | 353 | |
5.00%, 06/01/2025 | | | 150 | | | | 148 | |
5.00%, 06/01/2026 | | | 100 | | | | 98 | |
5.00%, 06/01/2030 | | | 35 | | | | 34 | |
5.00%, 06/01/2036 | | | 20 | | | | 19 | |
| | | | | | | | |
Total Puerto Rico | | | | 239,648 | |
| | | | | |
Rhode Island – 0.04% | | | | | | | | |
Central Falls Detention Facility Corp. | | | | | | | | |
7.25%, 07/15/2035(2)(3)(9) | | | 855 | | | | 154 | |
Rhode Island Health & Educational Building Corp. | | | | | | | | |
5.00%, 09/01/2036 | | | 340 | | | | 320 | |
5.50%, 09/01/2028 | | | 205 | | | | 206 | |
6.00%, 09/01/2033 | | | 270 | | | | 271 | |
| | | | | | | | |
Total Rhode Island | | | | 951 | |
| | | | | |
South Carolina – 1.08% | | | | | | | | |
Connector 2000 Association, Inc. | | | | | | | | |
0.00%, 01/01/2032(9) | | | 1,164 | | | | 434 | |
0.00%, 01/01/2032 | | | 4,844 | | | | 2,651 | |
0.00%, 01/01/2042 | | | 8,410 | | | | 2,103 | |
0.00%, 07/22/2051(9) | | | 180 | | | | 5 | |
0.00%, 07/22/2051(9) | | | 1,510 | | | | 105 | |
0.00%, 07/22/2051 | | | 28,969 | | | | 3,518 | |
South Carolina Jobs-Economic Development Authority | | | | | | | | |
4.00%, 04/01/2033(1) | | | 1,730 | | | | 1,733 | |
5.00%, 05/01/2037 | | | 500 | | | | 436 | |
5.00%, 05/01/2042 | | | 500 | | | | 410 | |
5.00%, 11/15/2042 | | | 585 | | | | 530 | |
5.00%, 05/01/2043 | | | 4,675 | | | | 4,758 | |
5.00%, 04/01/2047 | | | 2,000 | | | | 1,686 | |
5.00%, 04/01/2052 | | | 1,750 | | | | 1,436 | |
5.00%, 11/15/2054 | | | 1,000 | | | | 849 | |
6.00%, 02/01/2035(2)(3)(4) | | | 955 | | | | 382 | |
6.25%, 02/01/2045(2)(3)(4) | | | 1,860 | | | | 744 | |
8.00%, 12/06/2029(2)(3) | | | 135 | | | | 111 | |
South Carolina Public Service Authority | | | | | | | | |
5.00%, 12/01/2037 | | | 400 | | | | 408 | |
5.25%, 12/01/2055 | | | 910 | | | | 918 | |
5.50%, 12/01/2054 | | | 555 | | | | 559 | |
5.75%, 12/01/2043 | | | 2,000 | | | | 2,020 | |
| | | | | | | | |
Total South Carolina | | | | 25,796 | |
| | | | | |
South Dakota – 0.19% | | | | | | | | |
City of Sioux Falls SD | | | | | | | | |
5.00%, 11/01/2028 | | | 100 | | | | 99 | |
5.00%, 11/01/2030 | | | 105 | | | | 103 | |
5.00%, 11/01/2032 | | | 95 | | | | 92 | |
5.00%, 11/01/2042 | | | 885 | | | | 780 | |
County of Lincoln SD | | | | | | | | |
4.00%, 08/01/2051 | | | 2,060 | | | | 1,660 | |
South Dakota Health & Educational Facilities Authority | | | | | | | | |
5.00%, 11/01/2045 | | | 1,500 | | | | 1,515 | |
South Dakota Housing Development Authority | | | | | | | | |
4.00%, 11/01/2047 | | | 390 | | | | 387 | |
| | | | | | | | |
Total South Dakota | | | | 4,636 | |
| | | | | |
Tennessee – 1.02% | | | | | | | | |
Blount County Health & Educational Facilities Board | | | | | | | | |
5.00%, 01/01/2037(2)(3) | | | 1,240 | | | | 744 | |
Chattanooga Health Educational & Housing Facility Board | | | | | | | | |
5.00%, 10/01/2030 | | | 500 | | | | 511 | |
5.00%, 10/01/2032 | | | 1,215 | | | | 1,239 | |
5.00%, 10/01/2035 | | | 2,445 | | | | 2,486 | |
Greeneville Health & Educational Facilities Board | | | | | | | | |
5.00%, 07/01/2035 | | | 1,275 | | | | 1,342 | |
Memphis-Shelby County Industrial Development Board | | | | | | | | |
4.75%, 07/01/2027 | | | 540 | | | | 465 | |
5.50%, 07/01/2037 | | | 1,600 | | | | 1,164 | |
Metropolitan Government Nashville & Davidson County Industrial Development Board | | | | | | | | |
0.00%, 06/01/2043(4) | | | 250 | | | | 87 | |
Metropolitan Nashville Airport Authority | | | | | | | | |
5.50%, 07/01/2052 | | | 2,050 | | | | 2,229 | |
| | | | | | | | |
Nashville Metropolitan Development & Housing Agency | | | | | | | | |
4.50%, 06/01/2028(4) | | | 360 | | | | 362 | |
5.13%, 06/01/2036(4) | | | 3,290 | | | | 3,338 | |
Shelby County Health Educational & Housing Facilities Board | | | | | | | | |
5.00%, 12/01/2034 | | | 35 | | | | 33 | |
5.00%, 09/01/2037(4) | | | 1,590 | | | | 1,353 | |
5.25%, 12/01/2044 | | | 80 | | | | 73 | |
5.25%, 12/01/2049 | | | 230 | | | | 205 | |
Tennessee Energy Acquisition Corp. | | | | | | | | |
5.00%, 02/01/2027 | | | 2,725 | | | | 2,747 | |
5.00%, 05/01/2052(1) | | | 5,160 | | | | 5,353 | |
5.25%, 09/01/2026 | | | 810 | | | | 827 | |
| | | | | | | | |
Total Tennessee | | | | 24,558 | |
| | | | | |
Texas – 5.65% | | | | | | | | |
Arlington Higher Education Finance Corp. | | | | | | | | |
4.00%, 08/15/2041 | | | 610 | | | | 488 | |
5.00%, 12/01/2036 | | | 1,405 | | | | 1,420 | |
Austin Convention Enterprises, Inc. | | | | | | | | |
5.00%, 01/01/2025 | | | 150 | | | | 149 | |
5.00%, 01/01/2027 | | | 400 | | | | 398 | |
5.00%, 01/01/2028 | | | 575 | | | | 573 | |
5.00%, 01/01/2028 | | | 1,630 | | | | 1,662 | |
5.00%, 01/01/2029 | | | 555 | | | | 554 | |
5.00%, 01/01/2029 | | | 1,045 | | | | 1,067 | |
5.00%, 01/01/2030 | | | 140 | | | | 143 | |
5.00%, 01/01/2030 | | | 720 | | | | 720 | |
5.00%, 01/01/2031 | | | 200 | | | | 204 | |
5.00%, 01/01/2032 | | | 155 | | | | 155 | |
5.00%, 01/01/2032 | | | 1,925 | | | | 1,967 | |
5.00%, 01/01/2033 | | | 210 | | | | 214 | |
5.00%, 01/01/2034 | | | 240 | | | | 245 | |
5.00%, 01/01/2034 | | | 1,215 | | | | 1,214 | |
Board of Managers Joint Guadalupe County-City of Seguin Hospital | | | | | | | | |
5.00%, 12/01/2028 | | | 95 | | | | 95 | |
5.00%, 12/01/2030 | | | 115 | | | | 115 | |
5.00%, 12/01/2040 | | | 200 | | | | 189 | |
5.00%, 12/01/2045 | | | 740 | | | | 678 | |
5.25%, 12/01/2035 | | | 665 | | | | 666 | |
Brazoria County Industrial Development Corp. | | | | | | | | |
10.00%, 06/01/2042(1)(4) | | | 250 | | | | 239 | |
12.00%, 06/01/2043(4) | | | 500 | | | | 500 | |
Brazos Higher Education Authority, Inc. | | | | | | | | |
3.00%, 04/01/2040 | | | 500 | | | | 378 | |
Central Texas Regional Mobility Authority | | | | | | | | |
5.00%, 01/01/2034 | | | 35 | | | | 39 | |
5.00%, 01/01/2035 | | | 600 | | | | 661 | |
5.00%, 01/01/2036 | | | 600 | | | | 656 | |
5.00%, 01/01/2037 | | | 605 | | | | 655 | |
5.00%, 01/01/2039 | | | 10 | | | | 11 | |
5.00%, 01/01/2046 | | | 270 | | | | 285 | |
Central Texas Turnpike System | | | | | | | | |
5.00%, 08/15/2037 | | | 2,500 | | | | 2,523 | |
5.00%, 08/15/2042 | | | 1,400 | | | | 1,409 | |
City of Austin TX Airport System Revenue | | | | | | | | |
5.00%, 11/15/2041 | | | 35 | | | | 36 | |
5.00%, 11/15/2043 | | | 80 | | | | 85 | |
5.25%, 11/15/2047 | | | 2,160 | | | | 2,311 | |
City of Houston TX Airport System Revenue | | | | | | | | |
4.00%, 07/01/2041 | | | 3,590 | | | | 3,255 | |
4.00%, 07/15/2041 | | | 6,340 | | | | 5,747 | |
4.75%, 07/01/2024 | | | 1,490 | | | | 1,491 | |
5.00%, 07/01/2027 | | | 1,625 | | | | 1,645 | |
5.00%, 07/15/2027 | | | 2,325 | | | | 2,353 | |
5.00%, 07/15/2030 | | | 480 | | | | 483 | |
5.00%, 07/15/2035 | | | 1,450 | | | | 1,454 | |
City of San Antonio TX Electric & Gas Systems Revenue | | | | | | | | |
5.00%, 02/01/2048 | | | 195 | | | | 207 | |
Clifton Higher Education Finance Corp. | | | | | | | | |
6.13%, 08/15/2048 | | | 7,835 | | | | 7,889 | |
6.25%, 06/15/2053(4) | | | 350 | | | | 345 | |
Conroe Local Government Corp. | | | | | | | | |
3.50%, 10/01/2031(4) | | | 20 | | | | 17 | |
4.00%, 10/01/2050 | | | 110 | | | | 88 | |
5.00%, 10/01/2050(4) | | | 370 | | | | 304 | |
County of Harris TX | | | | | | | | |
4.24% (3 Month LIBOR USD + 0.67%), 08/15/2035(5) | | | 500 | | | | 500 | |
Cypress-Fairbanks Independent School District | | | | | | | | |
4.00%, 02/15/2048 | | | 250 | | | | 245 | |
Dallas Fort Worth International Airport | | | | | | | | |
5.00%, 11/01/2032 | | | 1,600 | | | | 1,604 | |
Fort Bend County Industrial Development Corp. | | | | | | | | |
4.75%, 11/01/2042 | | | 340 | | | | 327 | |
Gulf Coast Industrial Development Authority | | | | | | | | |
| | | | | | | | |
4.88%, 05/01/2025 | | | 6,945 | | | | 6,926 | |
Harris County Cultural Education Facilities Finance Corp. | | | | | | | | |
5.00%, 01/01/2038 | | | 35 | | | | 31 | |
5.00%, 01/01/2043 | | | 215 | | | | 181 | |
Hidalgo County Regional Mobility Authority | | | | | | | | |
4.00%, 12/01/2038 | | | 115 | | | | 108 | |
4.00%, 12/01/2039 | | | 70 | | | | 65 | |
4.00%, 12/01/2040 | | | 70 | | | | 64 | |
4.00%, 12/01/2041 | | | 70 | | | | 64 | |
Love Field Airport Modernization Corp. | | | | | | | | |
5.00%, 11/01/2028 | | | 1,250 | | | | 1,250 | |
Lower Colorado River Authority | | | | | | | | |
6.00%, 05/15/2052 | | | 1,825 | | | | 2,098 | |
Mission Economic Development Corp. | | | | | | | | |
4.63%, 10/01/2031(4) | | | 7,895 | | | | 7,686 | |
Montgomery County Toll Road Authority | | | | | | | | |
5.00%, 09/15/2032 | | | 85 | | | | 86 | |
5.00%, 09/15/2033 | | | 310 | | | | 315 | |
5.00%, 09/15/2034 | | | 95 | | | | 96 | |
5.00%, 09/15/2035 | | | 1,185 | | | | 1,199 | |
5.00%, 09/15/2036 | | | 170 | | | | 172 | |
5.00%, 09/15/2037 | | | 1,245 | | | | 1,253 | |
5.00%, 09/15/2038 | | | 215 | | | | 216 | |
5.00%, 09/15/2043 | | | 645 | | | | 645 | |
5.00%, 09/15/2048 | | | 1,335 | | | | 1,313 | |
New Hope Cultural Education Facilities Finance Corp. | | | | | | | | |
2.00%, 11/15/2061(1) | | | 475 | | | | 189 | |
5.00%, 04/01/2029 | | | 1,395 | | | | 1,389 | |
5.00%, 04/01/2030 | | | 35 | | | | 36 | |
5.00%, 04/01/2031 | | | 335 | | | | 351 | |
5.00%, 10/01/2031 | | | 230 | | | | 218 | |
5.00%, 11/01/2031 | | | 1,750 | | | | 1,768 | |
5.00%, 10/01/2032 | | | 30 | | | | 28 | |
5.00%, 10/01/2033 | | | 70 | | | | 65 | |
5.00%, 04/01/2034 | | | 475 | | | | 481 | |
5.00%, 10/01/2034 | | | 255 | | | | 236 | |
5.00%, 04/01/2035 | | | 105 | | | | 108 | |
5.00%, 07/01/2035 | | | 2,100 | | | | 1,901 | |
5.00%, 04/01/2036 | | | 820 | | | | 860 | |
5.00%, 11/15/2036 | | | 35 | | | | 36 | |
5.00%, 04/01/2037 | | | 1,425 | | | | 1,525 | |
5.00%, 10/01/2039 | | | 350 | | | | 298 | |
5.00%, 07/01/2040 | | | 4,000 | | | | 3,574 | |
5.00%, 11/01/2040 | | | 1,100 | | | | 1,062 | |
5.00%, 04/01/2042 | | | 135 | | | | 144 | |
5.00%, 04/01/2046 | | | 210 | | | | 210 | |
5.00%, 04/01/2046 | | | 1,060 | | | | 967 | |
5.00%, 11/15/2046 | | | 105 | | | | 109 | |
5.00%, 04/01/2047 | | | 410 | | | | 423 | |
5.00%, 07/01/2047 | | | 1,075 | | | | 973 | |
5.00%, 04/01/2048 | | | 1,250 | | | | 1,311 | |
5.00%, 07/01/2057 | | | 680 | | | | 557 | |
5.00%, 07/01/2058 | | | 475 | | | | 478 | |
5.25%, 10/01/2049 | | | 1,020 | | | | 819 | |
5.38%, 11/15/2036 | | | 35 | | | | 31 | |
5.50%, 11/15/2046 | | | 70 | | | | 58 | |
5.50%, 11/15/2052 | | | 320 | | | | 256 | |
5.50%, 07/01/2054 | | | 305 | | | | 237 | |
North Texas Tollway Authority | | | | | | | | |
4.25%, 01/01/2049 | | | 500 | | | | 495 | |
5.00%, 01/01/2033 | | | 3,150 | | | | 3,220 | |
5.00%, 01/01/2039 | | | 170 | | | | 175 | |
Port Beaumont Navigation District | | | | | | | | |
2.88%, 01/01/2041(4) | | | 1,000 | | | | 651 | |
3.00%, 01/01/2050(4) | | | 170 | | | | 99 | |
3.63%, 01/01/2035(4) | | | 140 | | | | 112 | |
4.00%, 01/01/2050(4) | | | 1,295 | | | | 924 | |
San Antonio Water System | | | | | | | | |
5.00%, 05/15/2050 | | | 250 | | | | 268 | |
Tarrant County Cultural Education Facilities Finance Corp. | | | | | | | | |
5.00%, 11/15/2035(2)(3) | | | 1,015 | | | | 183 | |
5.00%, 11/15/2035 | | | 1,750 | | | | 1,684 | |
5.00%, 11/15/2037 | | | 170 | | | | 171 | |
5.00%, 11/15/2040 | | | 265 | | | | 264 | |
5.00%, 11/15/2040 | | | 1,800 | | | | 1,666 | |
5.00%, 11/15/2045(2)(3) | | | 1,885 | | | | 339 | |
5.00%, 11/15/2046 | | | 1,900 | | | | 1,837 | |
5.25%, 11/15/2047(2)(3) | | | 135 | | | | 27 | |
5.75%, 12/01/2054(2)(3) | | | 1,036 | | | | 673 | |
Texas City Independent School District | | | | | | | | |
4.00%, 08/15/2053 | | | 255 | | | | 245 | |
Texas Municipal Gas Acquisition & Supply Corp. | | | | | | | | |
I 6.25%, 12/15/2026 | | | 2,210 | | | | 2,303 | |
| | | | | | | | |
Texas Private Activity Bond Surface Transportation Corp. | | | | | | | | |
5.00%, 12/31/2034 | | | 3,000 | | | | 3,167 | |
5.00%, 12/31/2050 | | | 5,410 | | | | 5,414 | |
5.00%, 12/31/2055 | | | 3,030 | | | | 3,025 | |
5.00%, 06/30/2058 | | | 9,765 | | | | 9,718 | |
Texas Transportation Commission State Highway 249 System | | | | | | | | |
5.00%, 08/01/2057 | | | 3,680 | | | | 3,694 | |
| | | | | | | | |
Total Texas | | | | 135,478 | |
| | | | | |
Utah – 0.81% | | | | | | | | |
Mida Mountain Village Public Infrastructure District | | | | | | | | |
4.00%, 08/01/2027(4) | | | 885 | | | | 854 | |
4.00%, 08/01/2031(4) | | | 1,000 | | | | 925 | |
4.00%, 08/01/2050(4) | | | 750 | | | | 565 | |
Military Installation Development Authority | | | | | | | | |
4.00%, 06/01/2041 | | | 200 | | | | 162 | |
4.00%, 06/01/2041 | | | 1,415 | | | | 1,134 | |
4.00%, 06/01/2052 | | | 4,145 | | | | 3,068 | |
Salt Lake City Corp. Airport Revenue | | | | | | | | |
5.00%, 07/01/2043 | | | 235 | | | | 242 | |
5.00%, 07/01/2046 | | | 395 | | | | 412 | |
5.00%, 07/01/2047 | | | 5,000 | | | | 5,101 | |
5.25%, 07/01/2048 | | | 3,000 | | | | 3,111 | |
UIPA Crossroads Public Infrastructure District | | | | | | | | |
4.38%, 06/01/2052(4) | | | 4,365 | | | | 3,754 | |
| | | | | | | | |
Total Utah | | | | 19,328 | |
| | | | | |
Vermont – 0.04% | | | | | | | | |
Vermont Economic Development Authority | | | | | | | | |
4.00%, 05/01/2045 | | | 1,000 | | | | 765 | |
Vermont Student Assistance Corp. | | | | | | | | |
4.00%, 06/15/2041 | | | 230 | | | | 220 | |
| | | | | | | | |
Total Vermont | | | | 985 | |
| | | | | |
Virgin Islands – 0.18% | | | | | | | | |
Matching Fund Special Purpose Securitization Corp. | | | | | | | | |
5.00%, 10/01/2028 | | | 535 | | | | 535 | |
5.00%, 10/01/2030 | | | 125 | | | | 125 | |
5.00%, 10/01/2039 | | | 750 | | | | 740 | |
Virgin Islands Public Finance Authority | | | | | | | | |
5.00%, 10/01/2032 | | | 3,000 | | | | 3,001 | |
| | | | | | | | |
Total Virgin Islands | | | | 4,401 | |
| | | | | |
Virginia – 4.35% | | | | | | | | |
Chesapeake Bay Bridge & Tunnel District | | | | | | | | |
5.00%, 11/01/2023 | | | 1,700 | | | | 1,706 | |
5.00%, 07/01/2046 | | | 5,610 | | | | 5,686 | |
5.00%, 07/01/2051 | | | 1,670 | | | | 1,688 | |
City of Chesapeake VA Chesapeake Expressway Toll Road Revenue | | | | | | | | |
0.00%, 07/15/2040 | | | 510 | | | | 521 | |
County of Botetourt VA | | | | | | | | |
4.75%, 07/01/2023 | | | 25 | | | | 25 | |
6.00%, 07/01/2034 | | | 1,995 | | | | 2,008 | |
Fairfax County Economic Development Authority | | | | | | | | |
5.00%, 12/01/2032 | | | 110 | | | | 111 | |
5.00%, 12/01/2042 | | | 1,480 | | | | 1,490 | |
5.00%, 12/01/2047 | | | 135 | | | | 136 | |
Fairfax County Industrial Development Authority | | | | | | | | |
5.00%, 05/15/2044 | | | 975 | | | | 981 | |
Farmville Industrial Development Authority | | | | | | | | |
5.00%, 01/01/2050 | | | 1,000 | | | | 941 | |
Fredericksburg Economic Development Authority | | | | | | | | |
5.00%, 06/15/2031 | | | 500 | | | | 505 | |
Hanover County Economic Development Authority | | | | | | | | |
4.00%, 07/01/2040(4) | | | 2,000 | | | | 1,530 | |
4.00%, 07/01/2047(4) | | | 2,000 | | | | 1,404 | |
Henrico County Economic Development Authority | | | | | | | | |
5.00%, 10/01/2047 | | | 1,185 | | | | 1,207 | |
James City County Economic Development Authority | | | | | | | | |
4.00%, 12/01/2050 | | | 1,000 | | | | 768 | |
Lynchburg Economic Development Authority | | | | | | | | |
3.00%, 01/01/2051 | | | 250 | | | | 176 | |
4.00%, 01/01/2055 | | | 345 | | | | 310 | |
Norfolk Redevelopment & Housing Authority | | | | | | | | |
4.00%, 01/01/2025 | | | 800 | | | | 780 | |
5.00%, 01/01/2035 | | | 275 | | | | 254 | |
5.00%, 01/01/2046 | | | 590 | | | | 481 | |
5.00%, 01/01/2049 | | | 720 | | | | 574 | |
5.38%, 01/01/2035 | | | 425 | | | | 408 | |
5.38%, 01/01/2046 | | | 290 | | | | 250 | |
Stafford County Economic Development Authority | | | | | | | | |
5.00%, 06/15/2033 | | | 70 | | | | 73 | |
5.00%, 06/15/2035 | | | 90 | | | | 93 | |
Tobacco Settlement Financing Corp. | | | | | | | | |
0.00%, 06/01/2047 | | | 4,835 | | | | 1,267 | |
5.00%, 06/01/2047 | | | 11,005 | | | | 10,290 | |
Virginia College Building Authority | | | | | | | | |
| | | | | | | | |
4.00%, 11/01/2036(1) | | | 2,000 | | | | 2,000 | |
5.00%, 07/01/2023(4) | | | 100 | | | | 100 | |
5.00%, 07/01/2024(4) | | | 100 | | | | 100 | |
5.00%, 07/01/2025(4) | | | 100 | | | | 100 | |
5.00%, 07/01/2030(4) | | | 820 | | | | 823 | |
5.00%, 07/01/2045(4) | | | 710 | | | | 668 | |
5.00%, 07/01/2045(4) | | | 3,905 | | | | 3,672 | |
5.25%, 07/01/2030(4) | | | 100 | | | | 101 | |
5.25%, 07/01/2035(4) | | | 1,120 | | | | 1,125 | |
Virginia Housing Development Authority | | | | | | | | |
5.25%, 11/01/2057 | | | 1,350 | | | | 1,405 | |
Virginia Small Business Financing Authority | | | | | | | | |
4.00%, 01/01/2036 | | | 2,000 | | | | 1,967 | |
4.00%, 01/01/2037 | | | 1,515 | | | | 1,470 | |
4.00%, 01/01/2038 | | | 330 | | | | 314 | |
4.00%, 01/01/2039 | | | 6,770 | | | | 6,384 | |
4.00%, 01/01/2040 | | | 2,750 | | | | 2,562 | |
4.00%, 01/01/2040 | | | 5,965 | | | | 5,569 | |
4.00%, 01/01/2041 | | | 185 | | | | 171 | |
4.00%, 01/01/2042 | | | 90 | | | | 83 | |
4.00%, 01/01/2045 | | | 250 | | | | 223 | |
4.00%, 01/01/2048 | | | 9,475 | | | | 8,356 | |
5.00%, 07/01/2035 | | | 305 | | | | 325 | |
5.00%, 01/01/2036 | | | 70 | | | | 74 | |
5.00%, 07/01/2037 | | | 160 | | | | 167 | |
5.00%, 12/31/2047 | | | 100 | | | | 101 | |
5.00%, 12/31/2047 | | | 5,025 | | | | 5,153 | |
5.00%, 01/01/2048(1)(4) | | | 500 | | | | 461 | |
5.00%, 12/31/2049 | | | 3,850 | | | | 3,885 | |
5.00%, 12/31/2052 | | | 10,465 | | | | 10,547 | |
5.00%, 12/31/2056 | | | 8,315 | | | | 8,366 | |
5.00%, 12/31/2057 | | | 2,255 | | | | 2,289 | |
| | | | | | | | |
Total Virginia | | | | 104,224 | |
| | | | | |
Washington – 0.57% | | | | | | | | |
Adams County Public Hospital District No | | | | | | | | |
2 5.13%, 12/01/2044 | | | 1,180 | | | | 1,182 | |
Port of Seattle WA | | | | | | | | |
5.00%, 08/01/2042 | | | 150 | | | | 159 | |
Washington Health Care Facilities Authority | | | | | | | | |
5.00%, 12/01/2036 | | | 125 | | | | 133 | |
Washington Higher Education Facilities Authority | | | | | | | | |
4.00%, 05/01/2045 | | | 1,000 | | | | 922 | |
4.00%, 05/01/2050 | | | 950 | | | | 863 | |
Washington State Convention Center Public Facilities District | | | | | | | | |
3.00%, 07/01/2048 | | | 115 | | | | 83 | |
4.00%, 07/01/2031 | | | 2,510 | | | | 2,402 | |
4.00%, 07/01/2058 | | | 100 | | | | 84 | |
Washington State Housing Finance Commission | | | | | | | | |
3.50%, 12/20/2035 | | | 3,098 | | | | 2,861 | |
4.00%, 07/01/2026(4) | | | 720 | | | | 686 | |
5.00%, 07/01/2031(4) | | | 1,000 | | | | 941 | |
5.00%, 01/01/2046(4) | | | 220 | | | | 166 | |
5.00%, 07/01/2048(4) | | | 145 | | | | 117 | |
5.00%, 07/01/2048(4) | | | 195 | | | | 142 | |
5.00%, 01/01/2051(4) | | | 455 | | | | 332 | |
5.00%, 07/01/2053(4) | | | 480 | | | | 341 | |
5.00%, 01/01/2055(4) | | | 3,200 | | | | 2,288 | |
| | | | | | | | |
Total Washington | | | | 13,702 | |
| | | | | |
West Virginia – 0.32% | | | | | | | | |
Monongalia County Commission Excise Tax District | | | | | | | | |
4.13%, 06/01/2043(4) | | | 860 | | | | 762 | |
4.88%, 06/01/2043(4) | | | 350 | | | | 326 | |
5.50%, 06/01/2037(4) | | | 365 | | | | 373 | |
5.75%, 06/01/2043(4) | | | 365 | | | | 373 | |
West Virginia Economic Development Authority | | | | | | | | |
4.70%, 04/01/2036(1) | | | 2,150 | | | | 2,154 | |
5.00%, 07/01/2045(1) | | | 3,635 | | | | 3,641 | |
| | | | | | | | |
Total West Virginia | | | | 7,629 | |
| | | | | |
Wisconsin – 2.24% | | | | | | | | |
Public Finance Authority | | | | | | | | |
4.00%, 06/15/2029(4) | | | 55 | | | | 51 | |
4.00%, 07/01/2030(4) | | | 25 | | | | 23 | |
4.00%, 04/01/2032(4) | | | 110 | | | | 105 | |
4.00%, 08/01/2035(9) | | | 7,810 | | | | 6,863 | |
4.00%, 07/01/2041 | | | 1,315 | | | | 1,018 | |
4.00%, 04/01/2042(4) | | | 850 | | | | 713 | |
4.00%, 07/01/2046 | | | 1,000 | | | | 822 | |
4.00%, 07/01/2051(4) | | | 190 | | | | 146 | |
4.00%, 07/01/2051 | | | 250 | | | | 198 | |
4.00%, 04/01/2052(4) | | | 1,350 | | | | 1,040 | |
4.00%, 06/01/2056(4) | | | 2,650 | | | | 1,763 | |
4.00%, 07/01/2061(4) | | | 1,280 | | | | 937 | |
4.05%, 11/01/2030 | | | 170 | | | | 165 | |
| | | | | | | | |
4.25%, 07/01/2054 | | | 4,525 | | | | 3,225 | |
4.30%, 11/01/2030 | | | 3,105 | | | | 3,070 | |
5.00%, 12/01/2025 | | | 1,405 | | | | 1,429 | |
5.00%, 09/01/2030(4) | | | 55 | | | | 52 | |
5.00%, 06/15/2034 | | | 500 | | | | 518 | |
5.00%, 06/01/2037(4) | | | 435 | | | | 404 | |
5.00%, 06/15/2037(4) | | | 1,130 | | | | 1,043 | |
5.00%, 07/01/2037 | | | 880 | | | | 882 | |
5.00%, 09/01/2038(4) | | | 115 | | | | 101 | |
5.00%, 06/15/2039(4) | | | 70 | | | | 63 | |
5.00%, 06/15/2039(4) | | | 410 | | | | 384 | |
5.00%, 06/15/2039 | | | 500 | | | | 504 | |
5.00%, 04/01/2040(4) | | | 400 | | | | 392 | |
5.00%, 07/01/2040(4) | | | 650 | | | | 591 | |
5.00%, 10/01/2043(4) | | | 155 | | | | 137 | |
5.00%, 07/01/2047 | | | 135 | | | | 132 | |
5.00%, 10/01/2048(4) | | | 1,735 | | | | 1,479 | |
5.00%, 06/15/2049(4) | | | 420 | | | | 372 | |
5.00%, 06/15/2049(4) | | | 870 | | | | 724 | |
5.00%, 06/15/2049 | | | 1,100 | | | | 1,071 | |
5.00%, 04/01/2050(4) | | | 100 | | | | 113 | |
5.00%, 04/01/2050(4) | | | 450 | | | | 419 | |
5.00%, 02/01/2052 | | | 2,155 | | | | 2,143 | |
5.00%, 06/01/2052(4) | | | 1,235 | | | | 1,006 | |
5.00%, 07/01/2052 | | | 290 | | | | 279 | |
5.00%, 10/01/2053(4) | | | 915 | | | | 761 | |
5.00%, 06/15/2054(4) | | | 455 | | | | 396 | |
5.00%, 07/01/2055(4) | | | 650 | | | | 549 | |
5.00%, 01/01/2056(4) | | | 555 | | | | 414 | |
5.00%, 05/01/2060(4) | | | 5,245 | | | | 4,596 | |
5.00%, 02/01/2062 | | | 290 | | | | 284 | |
5.13%, 06/15/2047(4) | | | 180 | | | | 155 | |
5.25%, 05/15/2037(4) | | | 485 | | | | 461 | |
5.25%, 07/01/2042 | | | 1,405 | | | | 1,548 | |
5.25%, 05/15/2047(4) | | | 85 | | | | 75 | |
5.25%, 05/15/2052(4) | | | 155 | | | | 134 | |
5.25%, 07/01/2061(4) | | | 565 | | | | 450 | |
5.38%, 07/01/2047 | | | 2,135 | | | | 2,347 | |
6.25%, 06/15/2053(4) | | | 1,930 | | | | 1,897 | |
9.00%, 05/01/2071(4) | | | 2,425 | | | | 2,462 | |
Wisconsin Health & Educational Facilities Authority | | | | | | | | |
3.00%, 12/01/2031 | | | 60 | | | | 51 | |
4.00%, 09/15/2036 | | | 55 | | | | 48 | |
4.00%, 09/15/2041 | | | 50 | | | | 41 | |
4.00%, 09/15/2041 | | | 1,010 | | | | 825 | |
4.00%, 09/15/2045 | | | 45 | | | | 35 | |
4.00%, 09/15/2045 | | | 950 | | | | 741 | |
5.00%, 06/01/2037 | | | 75 | | | | 68 | |
5.00%, 09/15/2040 | | | 70 | | | | 70 | |
5.00%, 06/01/2041 | | | 115 | | | | 101 | |
5.00%, 09/15/2045 | | | 90 | | | | 90 | |
5.00%, 09/15/2050 | | | 645 | | | | 647 | |
| | | | | | | | |
Total Wisconsin | | | | 53,623 | |
| | | | | |
Total Municipal Bonds (Cost: $2,368,643) | | | | 2,352,821 | |
| | | | | |
| | |
| | | Shares
(000s) | | | Value
(000s) | |
COMMON STOCKS – 0.00%(6) | | | | | | | | |
Basic Materials – 0.00%(6) | | | | | | | | |
Ingevity Corp.(3)(7) | | | 0 | | | | 4 | |
| | | | | | | | |
Total Basic Materials | | | | 4 | |
| | | | | |
Consumer, Cyclical – 0.00%(6) | | | | | | | | |
United Airlines Holdings, Inc.(3)(7) | | | 0 | | | | 1 | |
| | | | | | | | |
Total Consumer, Cyclical | | | | 1 | |
| | | | | |
Industrials – 0.00%(6) | | | | | | | | |
Westrock Co.(7) | | | 0 | | | | 13 | |
| | | | | | | | |
Total Industrials | | | | 13 | |
| | | | | |
Total Common Stocks (Cost: $19) | | | | 18 | |
| | | | | |
SHORT-TERM INVESTMENTS – 0.73% | | | | | | | | |
Money Market Funds – 0.72% | | | | | | | | |
Fidelity Institutional Money Market Government Fund-Class I, 5.03%(8) | | | 17,440 | | | | 17,440 | |
| | | | | | | | |
Total Money Market Funds (Cost: $17,440) | | | | | | | 17,440 | |
| | | | | | | | |
| | |
| | | Principal
Amount
(000s) | | | Value
(000s) | |
Time Deposits – 0.01% | | | | | | | | |
JP Morgan, New York, 4.57% due 07/03/2023 | | $ | 168 | | | | 168 | |
| | | | | | | | |
Total Time Deposits (Cost: $168) | | | | | | | 168 | |
| | | | | | | | |
Total Short-Term Investments (Cost: $17,608) | | | | 17,608 | |
| | | | | |
TOTAL INVESTMENTS IN SECURITIES – 98.87% | | | | | | | | |
(Cost: $2,386,270) | | | | | | | 2,370,447 | |
| | | | | | | | |
OTHER ASSETS IN EXCESS OF LIABILITIES – 1.13% | | | | | | | 27,081 | |
| | | | | | | | |
TOTAL NET ASSETS – 100.00% | | | | | | $ | 2,397,528 | |
| | | | | | | | |
Percentages are stated as a percent of net assets.
| (1) | Adjustable rate security. The rate reported is the rate in effect as of June 30, 2023. |
| (2) | Security in default as of June 30, 2023. The value of these securities totals $19,546, which represents 0.82% of total net assets. |
| (3) | Non-income producing security. |
| (4) | Security was purchased exempt from registration in the U.S. pursuant to Rule 144(A) under the Securities Act of 1933. The value of these securities totals $419,426, which represents 17.49% of total net assets. |
| (5) | Variable rate security based on a reference index and spread. The rate reported is the rate in effect as of June 30, 2023. |
| (6) | Amount calculated is less than 0.005%. |
| (7) | A zero balance may reflect actual amounts rounding to less than one thousand. |
| (8) | Represents annualized seven-day yield as of the close of the reporting period. |
| (9) | Security that is restricted at June 30, 2023. The value of the restricted securities totals $9,568, which represents 0.40% of total net assets. |
The accompanying notes are an integral part of this Schedule of Investments.
| | | | |
| COMMON STOCKS | | % of Net Assets | |
Basic Materials | | | 0.00 | %(1) |
Consumer, Cyclical | | | 0.00 | %(1) |
Industrials | | | 0.00 | %(1) |
| | | | |
Total Common Stocks | | | 0.00 | %(1) |
| | | | |
| MUNICIPAL BONDS | | | |
Education | | | 7.81 | % |
General Obligation | | | 7.32 | % |
General Revenue | | | 38.86 | % |
Healthcare | | | 17.03 | % |
Housing | | | 6.00 | % |
Transportation | | | 15.64 | % |
Utilities | | | 5.48 | % |
| | | | |
Total Municipal Bonds | | | 98.14 | % |
| | | | |
SHORT-TERM INVESTMENTS | | | 0.73 | % |
| | | | |
TOTAL INVESTMENTS | | | 98.87 | % |
OTHER ASSETS IN EXCESS OF LIABILITIES | | | 1.13 | % |
| | | | |
TOTAL NET ASSETS | | | 100.00 | % |
| | | | |
| (1) | Amount calculated is less than 0.005%. |
The accompanying notes are an integral part of this Schedule of Investments.
Bridge Builder Large Cap Growth Fund
Schedule of Investments
June 30, 2023
(Amounts in thousands, except number of contracts)
| | | | | | | | |
| | | Shares
(000s) | | | Value
(000s) | |
COMMON STOCKS – 97.98% | | | | | | | | |
Communication Services – 8.12% | | | | | | | | |
Alphabet, Inc. - Class A(1) | | | 5,705 | | | $ | 682,934 | |
Alphabet, Inc. - Class C(1) | | | 3,687 | | | | 446,032 | |
Cable One, Inc.(2) | | | 0 | | | | 29 | |
Charter Communications, Inc. - Class A(1) | | | 11 | | | | 4,105 | |
Iridium Communications, Inc. | | | 13 | | | | 791 | |
Liberty Broadband Corp. - Class A(1) | | | 1 | | | | 65 | |
Liberty Broadband Corp. - Class C(1) | | | 3 | | | | 211 | |
Live Nation Entertainment, Inc.(1) | | | 4 | | | | 351 | |
Match Group, Inc.(1) | | | 28 | | | | 1,168 | |
Meta Platforms, Inc. - Class A(1) | | | 1,048 | | | | 300,633 | |
Netflix, Inc.(1) | | | 670 | | | | 295,224 | |
Nexstar Media Group, Inc. - Class A | | | 1 | | | | 213 | |
Pinterest, Inc. - Class A(1) | | | 65 | | | | 1,769 | |
Playtika Holding Corp.(1) | | | 10 | | | | 121 | |
ROBLOX Corp. - Class A(1) | | | 49 | | | | 1,956 | |
Roku, Inc. - Class A(1) | | | 2 | | | | 107 | |
Spotify Technology SA(1) | | | 15 | | | | 2,411 | |
Trade Desk, Inc. - Class A(1) | | | 401 | | | | 30,965 | |
Walt Disney Co.(1) | | | 975 | | | | 87,004 | |
World Wrestling Entertainment, Inc. - Class A | | | 5 | | | | 507 | |
ZoomInfo Technologies, Inc. - Class A(1) | | | 18 | | | | 447 | |
| | | | | | | | |
Total Communication Services | | | | | | | 1,857,043 | |
| | | | | | | | |
Consumer Discretionary – 14.77% | | | | | | | | |
Airbnb, Inc. - Class A(1) | | | 492 | | | | 63,104 | |
Amazon.com, Inc.(1) | | | 9,826 | | | | 1,280,895 | |
Aptiv Plc(1) | | | 546 | | | | 55,741 | |
AutoZone, Inc.(1) | | | 2 | | | | 4,171 | |
Best Buy Co., Inc. | | | 3 | | | | 239 | |
Booking Holdings, Inc.(1) | | | 4 | | | | 10,923 | |
Bright Horizons Family Solutions, Inc.(1) | | | 1 | | | | 72 | |
Brunswick Corp. | | | 1 | | | | 54 | |
Burlington Stores, Inc.(1) | | | 7 | | | | 1,112 | |
Caesars Entertainment, Inc.(1) | | | 9 | | | | 468 | |
CarMax, Inc.(1) | | | 1 | | | | 81 | |
Chipotle Mexican Grill, Inc. - Class A(1) | | | 18 | | | | 37,749 | |
Choice Hotels International, Inc. | | | 4 | | | | 421 | |
Churchill Downs, Inc. | | | 8 | | | | 1,083 | |
Coupang, Inc. - Class A(1) | | | 120 | | | | 2,080 | |
Crocs, Inc.(1) | | | 7 | | | | 746 | |
Darden Restaurants, Inc. | | | 6 | | | | 1,027 | |
Deckers Outdoor Corp.(1) | | | 3 | | | | 1,508 | |
Domino’s Pizza, Inc. | | | 4 | | | | 1,301 | |
DoorDash, Inc. - Class A(1) | | | 26 | | | | 1,969 | |
DraftKings, Inc. - Class A(1) | | | 46 | | | | 1,212 | |
eBay, Inc. | | | 4 | | | | 162 | |
Etsy, Inc.(1) | | | 8 | | | | 635 | |
Expedia Group, Inc.(1) | | | 11 | | | | 1,254 | |
Five Below, Inc.(1) | | | 6 | | | | 1,152 | |
Floor & Decor Holdings, Inc. - Class A(1) | | | 11 | | | | 1,159 | |
Grand Canyon Education, Inc.(1) | | | 1 | | | | 95 | |
H&R Block, Inc. | | | 11 | | | | 342 | |
Hilton Worldwide Holdings, Inc. | | | 13 | | | | 1,870 | |
Home Depot, Inc. | | | 648 | | | | 201,349 | |
Las Vegas Sands Corp.(1) | | | 34 | | | | 1,951 | |
Lowe’s Companies, Inc. | | | 48 | | | | 10,765 | |
Lululemon Athletica, Inc.(1) | | | 227 | | | | 85,911 | |
LVMH Moet Hennessy Louis Vuitton SE | | | 130 | | | | 122,480 | |
Marriott International, Inc. - Class A | | | 352 | | | | 64,701 | |
McDonald’s Corp. | | | 664 | | | | 198,157 | |
MercadoLibre, Inc.(1) | | | 122 | | | | 144,160 | |
Mobileye Global, Inc. - Class A(1) | | | 1,068 | | | | 41,033 | |
Murphy U.S.A, Inc. | | | 2 | | | | 635 | |
NIKE, Inc. - Class B | | | 1,068 | | | | 117,826 | |
Norwegian Cruise Line Holdings Ltd.(1) | | | 11 | | | | 242 | |
NVR, Inc.(1)(2) | | | 0 | | | | 184 | |
Ollie’s Bargain Outlet Holdings, Inc.(1) | | | 2 | | | | 125 | |
O’Reilly Automotive, Inc.(1) | | | 6 | | | | 5,396 | |
Peloton Interactive, Inc. - Class A(1) | | | 34 | | | | 258 | |
Planet Fitness, Inc. - Class A(1) | | | 4 | | | | 299 | |
Polaris, Inc. | | | 1 | | | | 63 | |
Pool Corp. | | | 4 | | | | 1,533 | |
RH(1)(2) | | | 0 | | | | 96 | |
| | | | | | | | |
Ross Stores, Inc. | | | 34 | | | | 3,834 | |
Royal Caribbean Cruises Ltd.(1) | | | 8 | | | | 797 | |
Service Corp. International | | | 6 | | | | 381 | |
Skechers U.S.A, Inc. - Class A(1) | | | 2 | | | | 115 | |
Starbucks Corp. | | | 2,540 | | | | 251,586 | |
Tapestry, Inc. | | | 2 | | | | 70 | |
Tempur Sealy International, Inc. | | | 4 | | | | 148 | |
Tesla, Inc.(1) | | | 1,205 | | | | 315,470 | |
Texas Roadhouse, Inc. - Class A | | | 7 | | | | 819 | |
TJX Companies, Inc. | | | 126 | | | | 10,648 | |
TopBuild Corp.(1)(2) | | | 0 | | | | 60 | |
Tractor Supply Co. | | | 12 | | | | 2,631 | |
Travel + Leisure Co. | | | 4 | | | | 148 | |
Ulta Beauty, Inc.(1) | | | 86 | | | | 40,690 | |
Vail Resorts, Inc.(2) | | | 0 | | | | 109 | |
Valvoline, Inc. | | | 5 | | | | 184 | |
Victoria’s Secret & Co.(1) | | | 6 | | | | 109 | |
Wayfair, Inc. - Class A(1) | | | 3 | | | | 204 | |
Wendy’s Co. | | | 18 | | | | 398 | |
Williams-Sonoma, Inc. | | | 1 | | | | 115 | |
Wingstop, Inc. | | | 3 | | | | 654 | |
Wyndham Hotels & Resorts, Inc. | | | 1 | | | | 45 | |
Wynn Resorts Ltd. | | | 1 | | | | 73 | |
YETI Holdings, Inc.(1) | | | 9 | | | | 368 | |
Yum! Brands, Inc. | | | 1,998 | | | | 276,867 | |
| | | | | | | | |
Total Consumer Discretionary | | | | | | | 3,376,312 | |
| | | | | | | | |
Consumer Staples – 4.56% | | | | | | | | |
Albertsons Companies, Inc. - Class A | | | 4 | | | | 85 | |
BJ’s Wholesale Club Holdings, Inc.(1) | | | 5 | | | | 316 | |
Boston Beer Co., Inc. - Class A(1) | | | 1 | | | | 303 | |
Brown-Forman Corp. - Class A | | | 4 | | | | 289 | |
Brown-Forman Corp. - Class B | | | 16 | | | | 1,063 | |
Casey’s General Stores, Inc. | | | 1 | | | | 143 | |
Celsius Holdings, Inc.(1) | | | 6 | | | | 885 | |
Church & Dwight Co., Inc. | | | 24 | | | | 2,393 | |
Clorox Co. | | | 13 | | | | 2,146 | |
Coca-Cola Co. | | | 2,740 | | | | 165,030 | |
Constellation Brands, Inc. - Class A | | | 2 | | | | 411 | |
Costco Wholesale Corp. | | | 226 | | | | 121,716 | |
Dollar General Corp. | | | 1,251 | | | | 212,361 | |
Estee Lauder Companies, Inc. - Class A | | | 387 | | | | 76,061 | |
Freshpet, Inc.(1) | | | 1 | | | | 90 | |
Hershey Co. | | | 12 | | | | 2,978 | |
Kimberly-Clark Corp. | | | 35 | | | | 4,776 | |
Lamb Weston Holdings, Inc. | | | 15 | | | | 1,778 | |
L’Oreal SA | | | 149 | | | | 69,419 | |
Mondelez International, Inc. - Class A | | | 1,206 | | | | 87,956 | |
Monster Beverage Corp.(1) | | | 81 | | | | 4,664 | |
PepsiCo, Inc. | | | 104 | | | | 19,225 | |
Performance Food Group Co.(1) | | | 8 | | | | 473 | |
Procter & Gamble Co. | | | 1,131 | | | | 171,634 | |
Sysco Corp. | | | 1,193 | | | | 88,541 | |
Target Corp. | | | 50 | | | | 6,622 | |
| | | | | | | | |
Total Consumer Staples | | | | | | | 1,041,358 | |
| | | | | | | | |
Energy – 1.80% | | | | | | | | |
Antero Midstream Corp. | | | 12 | | | | 143 | |
APA Corp. | | | 30 | | | | 1,024 | |
Cheniere Energy, Inc. | | | 26 | | | | 4,031 | |
Chevron Corp. | | | 1,136 | | | | 178,774 | |
ConocoPhillips | | | 1,623 | | | | 168,201 | |
Halliburton Co. | | | 20 | | | | 650 | |
Hess Corp. | | | 17 | | | | 2,300 | |
New Fortress Energy, Inc. - Class A | | | 6 | | | | 156 | |
ONEOK, Inc. | | | 3 | | | | 166 | |
Ovintiv, Inc. | | | 12 | | | | 446 | |
Pioneer Natural Resources Co. | | | 261 | | | | 54,061 | |
Targa Resources Corp. | | | 24 | | | | 1,844 | |
Texas Pacific Land Corp. | | | 1 | | | | 815 | |
| | | | | | | | |
Total Energy | | | | | | | 412,611 | |
| | | | | | | | |
Financials – 16.03% | | | | | | | | |
Adyen NV(1)(3) | | | 31 | | | | 54,215 | |
American Express Co. | | | 2,281 | | | | 397,435 | |
Ameriprise Financial, Inc. | | | 11 | | | | 3,810 | |
Aon Plc - Class A | | | 955 | | | | 329,510 | |
Apollo Global Management, Inc. | | | 57 | | | | 4,372 | |
Arch Capital Group Ltd.(1) | | | 6 | | | | 412 | |
Ares Management Corp. - Class A | | | 17 | | | | 1,684 | |
Arthur J. Gallagher & Co. | | | 1 | | | | 284 | |
Bank of America Corp. | | | 7,377 | | | | 211,640 | |
Blackstone, Inc. - Class A | | | 77 | | | | 7,150 | |
Block, Inc. - Class A(1) | | | 22 | | | | 1,465 | |
| | | | | | | | |
Blue Owl Capital, Inc. - Class A | | | 7 | | | | 85 | |
Brown & Brown, Inc. | | | 10 | | | | 694 | |
Charles Schwab Corp. | | | 704 | | | | 39,918 | |
Commerce Bancshares, Inc. | | | 919 | | | | 44,766 | |
Equitable Holdings, Inc. | | | 39 | | | | 1,059 | |
Euronet Worldwide, Inc.(1) | | | 3 | | | | 302 | |
Everest Re Group Ltd. | | | 1 | | | | 213 | |
FactSet Research Systems, Inc. | | | 4 | | | | 1,655 | |
First Citizens BancShares, Inc. - Class A(2) | | | 0 | | | | 166 | |
Fiserv, Inc.(1) | | | 18 | | | | 2,320 | |
FleetCor Technologies, Inc.(1) | | | 895 | | | | 224,757 | |
Goldman Sachs Group, Inc. | | | 515 | | | | 166,266 | |
Intercontinental Exchange, Inc. | | | 2,014 | | | | 227,689 | |
Jack Henry & Associates, Inc. | | | 3 | | | | 421 | |
Kinsale Capital Group, Inc. | | | 2 | | | | 891 | |
KKR & Co., Inc. - Class Miscella | | | 17 | | | | 971 | |
Lincoln National Corp. | | | 4 | | | | 102 | |
LPL Financial Holdings, Inc. | | | 9 | | | | 1,881 | |
MarketAxess Holdings, Inc. | | | 4 | | | | 1,044 | |
Marsh & McLennan Companies, Inc. | | | 916 | | | | 172,360 | |
Mastercard, Inc. - Class A | | | 387 | | | | 152,255 | |
Moody’s Corp. | | | 77 | | | | 26,658 | |
Morningstar, Inc. | | | 3 | | | | 549 | |
MSCI, Inc. - Class A | | | 529 | | | | 248,294 | |
NU Holdings Ltd. - Class A(1) | | | 172 | | | | 1,360 | |
PayPal Holdings, Inc.(1) | | | 111 | | | | 7,409 | |
Primerica, Inc. | | | 3 | | | | 508 | |
Progressive Corp. | | | 48 | | | | 6,325 | |
RenaissanceRe Holdings Ltd. | | | 1 | | | | 265 | |
RLI Corp. | | | 1 | | | | 132 | |
Rocket Companies, Inc. - Class A(1) | | | 8 | | | | 71 | |
Ryan Specialty Holdings, Inc. - Class A(1) | | | 10 | | | | 442 | |
S&P Global, Inc. | | | 855 | | | | 342,590 | |
Shift4 Payments, Inc. - Class A(1) | | | 6 | | | | 375 | |
SLM Corp. | | | 10 | | | | 169 | |
Toast, Inc. - Class A(1) | | | 39 | | | | 872 | |
Tradeweb Markets, Inc. - Class A | | | 4 | | | | 297 | |
UWM Holdings Corp. | | | 10 | | | | 55 | |
Visa, Inc. - Class A | | | 3,601 | | | | 855,100 | |
Wells Fargo & Co. | | | 2,811 | | | | 119,958 | |
Western Union Co. | | | 6 | | | | 70 | |
WEX, Inc.(1) | | | 2 | | | | 389 | |
Willis Towers Watson Plc | | | 1 | | | | 342 | |
| | | | | | | | |
Total Financials | | | | | | | 3,664,022 | |
| | | | | | | | |
Healthcare – 15.37% | | | | | | | | |
10X Genomics, Inc. - Class A(1) | | | 9 | | | | 494 | |
Abbott Laboratories | | | 12 | | | | 1,298 | |
AbbVie, Inc. | | | 192 | | | | 25,924 | |
Agilent Technologies, Inc. | | | 26 | | | | 3,150 | |
agilon health, Inc.(1) | | | 26 | | | | 455 | |
Align Technology, Inc.(1) | | | 8 | | | | 2,945 | |
Alnylam Pharmaceuticals, Inc.(1) | | | 11 | | | | 2,060 | |
AmerisourceBergen Corp. - Class A | | | 18 | | | | 3,390 | |
Amgen, Inc. | | | 40 | | | | 8,780 | |
Apellis Pharmaceuticals, Inc.(1) | | | 11 | | | | 991 | |
AstraZeneca Plc - ADR | | | 943 | | | | 67,501 | |
BioMarin Pharmaceutical, Inc.(1) | | | 2 | | | | 209 | |
Bio-Techne Corp. | | | 16 | | | | 1,305 | |
Boston Scientific Corp.(1) | | | 2,104 | | | | 113,794 | |
Bruker Corp. | | | 11 | | | | 846 | |
Cardinal Health, Inc. | | | 14 | | | | 1,363 | |
Certara, Inc.(1) | | | 8 | | | | 144 | |
Chemed Corp. | | | 1 | | | | 620 | |
Cigna Group | | | 2 | | | | 662 | |
Danaher Corp. | | | 1,798 | | | | 431,570 | |
DaVita, Inc.(1) | | | 6 | | | | 601 | |
DexCom, Inc.(1) | | | 42 | | | | 5,423 | |
Doximity, Inc. - Class A(1) | | | 6 | | | | 189 | |
Edwards Lifesciences Corp.(1) | | | 66 | | | | 6,191 | |
Elevance Health, Inc. | | | 3 | | | | 1,529 | |
Eli Lilly & Co. | | | 421 | | | | 197,529 | |
Exact Sciences Corp.(1) | | | 7 | | | | 634 | |
Exelixis, Inc.(1) | | | 26 | | | | 493 | |
GE HealthCare Technologies, Inc. | | | 3 | | | | 263 | |
HCA Healthcare, Inc. | | | 5 | | | | 1,402 | |
Horizon Therapeutics Plc(1) | | | 22 | | | | 2,295 | |
Humana, Inc. | | | 124 | | | | 55,307 | |
ICON Plc(1) | | | 1 | | | | 332 | |
IDEXX Laboratories, Inc.(1) | | | 9 | | | | 4,513 | |
Illumina, Inc.(1) | | | 5 | | | | 964 | |
Incyte Corp.(1) | | | 15 | | | | 924 | |
| | | | | | | | |
Inspire Medical Systems, Inc.(1) | | | 3 | | | | 1,018 | |
Insulet Corp.(1) | | | 7 | | | | 2,153 | |
Intuitive Surgical, Inc.(1) | | | 790 | | | | 269,986 | |
Ionis Pharmaceuticals, Inc.(1) | | | 14 | | | | 587 | |
IQVIA Holdings, Inc.(1) | | | 1,518 | | | | 341,142 | |
Jazz Pharmaceuticals Plc(1) | | | 3 | | | | 427 | |
Johnson & Johnson | | | 1,873 | | | | 310,016 | |
Karuna Therapeutics, Inc.(1) | | | 3 | | | | 752 | |
Maravai LifeSciences Holdings, Inc. - Class A(1) | | | 12 | | | | 146 | |
Masimo Corp.(1) | | | 5 | | | | 853 | |
McKesson Corp. | | | 6 | | | | 2,434 | |
Medpace Holdings, Inc.(1) | | | 3 | | | | 610 | |
Medtronic Plc | | | 1,074 | | | | 94,583 | |
Merck & Co., Inc. | | | 51 | | | | 5,887 | |
Mettler-Toledo International, Inc.(1) | | | 2 | | | | 3,109 | |
Molina Healthcare, Inc.(1) | | | 3 | | | | 1,033 | |
Natera, Inc.(1) | | | 11 | | | | 551 | |
Neurocrine Biosciences, Inc.(1) | | | 10 | | | | 971 | |
Novo Nordisk A/S - ADR | | | 549 | | | | 88,925 | |
Novocure Ltd.(1) | | | 11 | | | | 465 | |
Penumbra, Inc.(1) | | | 4 | | | | 1,334 | |
Regeneron Pharmaceuticals, Inc.(1) | | | 269 | | | | 193,253 | |
Repligen Corp.(1) | | | 3 | | | | 379 | |
ResMed, Inc. | | | 16 | | | | 3,446 | |
Roivant Sciences Ltd.(1) | | | 25 | | | | 254 | |
Sarepta Therapeutics, Inc.(1) | | | 10 | | | | 1,120 | |
Seagen, Inc.(1) | | | 15 | | | | 2,943 | |
Shockwave Medical, Inc.(1) | | | 4 | | | | 1,129 | |
Sotera Health Co.(1) | | | 8 | | | | 142 | |
Stryker Corp. | | | 10 | | | | 3,005 | |
Tandem Diabetes Care, Inc.(1) | | | 1 | | | | 23 | |
Thermo Fisher Scientific, Inc. | | | 850 | | | | 443,586 | |
Ultragenyx Pharmaceutical, Inc.(1) | | | 7 | | | | 341 | |
UnitedHealth Group, Inc. | | | 1,298 | | | | 623,809 | |
Veeva Systems, Inc. - Class A(1) | | | 16 | | | | 3,124 | |
Vertex Pharmaceuticals, Inc.(1) | | | 191 | | | | 67,205 | |
Waters Corp.(1) | | | 6 | | | | 1,712 | |
West Pharmaceutical Services, Inc. | | | 8 | | | | 3,071 | |
Zoetis, Inc. - Class A | | | 532 | | | | 91,609 | |
| | | | | | | | |
Total Healthcare | | | | | | | 3,513,223 | |
| | | | | | | | |
Industrials – 3.79% | | | | | | | | |
Advanced Drainage Systems, Inc. | | | 7 | | | | 767 | |
Allegion Plc | | | 9 | | | | 1,062 | |
Allison Transmission Holdings, Inc. | | | 1 | | | | 54 | |
American Airlines Group, Inc.(1) | | | 26 | | | | 471 | |
AO Smith Corp. | | | 1 | | | | 104 | |
Armstrong World Industries, Inc. | | | 1 | | | | 105 | |
Automatic Data Processing, Inc. | | | 39 | | | | 8,514 | |
Avis Budget Group, Inc.(1) | | | 1 | | | | 175 | |
Axon Enterprise, Inc.(1) | | | 8 | | | | 1,480 | |
Boeing Co.(1) | | | 8 | | | | 1,748 | |
Booz Allen Hamilton Holding Corp. - Class A | | | 14 | | | | 1,579 | |
Broadridge Financial Solutions, Inc. | | | 11 | | | | 1,770 | |
BWX Technologies, Inc. | | | 2 | | | | 122 | |
Caterpillar, Inc. | | | 314 | | | | 77,268 | |
Ceridian HCM Holding, Inc.(1) | | | 1 | | | | 93 | |
CH Robinson Worldwide, Inc. | | | 10 | | | | 922 | |
ChargePoint Holdings, Inc.(1) | | | 28 | | | | 248 | |
Cintas Corp. | | | 8 | | | | 4,182 | |
Copart, Inc.(1) | | | 47 | | | | 4,269 | |
CSX Corp. | | | 25 | | | | 839 | |
Deere & Co. | | | 28 | | | | 11,278 | |
Delta Air Lines, Inc.(1) | | | 4 | | | | 170 | |
Donaldson Co., Inc. | | | 5 | | | | 342 | |
EMCOR Group, Inc. | | | 2 | | | | 327 | |
Equifax, Inc. | | | 9 | | | | 2,165 | |
Expeditors International of Washington, Inc. | | | 2 | | | | 274 | |
Fastenal Co. | | | 47 | | | | 2,753 | |
Ferguson Plc | | | 1 | | | | 191 | |
FTI Consulting, Inc.(1) | | | 1 | | | | 128 | |
Genpact Ltd. | | | 5 | | | | 183 | |
Graco, Inc. | | | 7 | | | | 644 | |
HEICO Corp. | | | 451 | | | | 79,839 | |
HEICO Corp. - Class A | | | 8 | | | | 1,115 | |
Honeywell International, Inc. | | | 1,058 | | | | 219,454 | |
Hubbell, Inc. - Class B | | | 3 | | | | 883 | |
IDEX Corp. | | | 1 | | | | 144 | |
Illinois Tool Works, Inc. | | | 27 | | | | 6,749 | |
JB Hunt Transport Services, Inc. | | | 2 | | | | 320 | |
KBR, Inc. | | | 5 | | | | 349 | |
Landstar System, Inc. | | | 3 | | | | 659 | |
| | | | | | | | |
Lincoln Electric Holdings, Inc. | | | 6 | | | | 1,129 | |
Lockheed Martin Corp. | | | 25 | | | | 11,351 | |
Lyft, Inc. - Class A(1) | | | 28 | | | | 271 | |
MSA Safety, Inc. | | | 1 | | | | 118 | |
Nordson Corp. | | | 101 | | | | 25,135 | |
Norfolk Southern Corp. | | | 521 | | | | 118,065 | |
Northrop Grumman Corp. | | | 1 | | | | 406 | |
Old Dominion Freight Line, Inc. | | | 10 | | | | 3,705 | |
Otis Worldwide Corp. | | | 3 | | | | 237 | |
Paychex, Inc. | | | 35 | | | | 3,943 | |
Paycom Software, Inc. | | | 6 | | | | 1,788 | |
Paylocity Holding Corp.(1) | | | 4 | | | | 792 | |
Quanta Services, Inc. | | | 4 | | | | 810 | |
RB Global, Inc. | | | 15 | | | | 909 | |
Rockwell Automation, Inc. | | | 13 | | | | 4,130 | |
Rollins, Inc. | | | 23 | | | | 987 | |
Saia, Inc.(1)(2) | | | 0 | | | | 109 | |
SiteOne Landscape Supply, Inc.(1) | | | 2 | | | | 261 | |
Spirit AeroSystems Holdings, Inc. - Class A | | | 1 | | | | 34 | |
Tetra Tech, Inc. | | | 1 | | | | 171 | |
Toro Co. | | | 11 | | | | 1,146 | |
Trane Technologies Plc | | | 7 | | | | 1,402 | |
TransDigm Group, Inc. | | | 1 | | | | 865 | |
Trex Co., Inc.(1) | | | 12 | | | | 773 | |
Uber Technologies, Inc.(1) | | | 2,618 | | | | 113,022 | |
U-Haul Holding Co. - Class B | | | 3 | | | | 171 | |
Union Pacific Corp. | | | 28 | | | | 5,827 | |
United Parcel Service, Inc. - Class B | | | 22 | | | | 3,925 | |
United Rentals, Inc. | | | 2 | | | | 683 | |
Valmont Industries, Inc.(2) | | | 0 | | | | 86 | |
Verisk Analytics, Inc. - Class A | | | 16 | | | | 3,519 | |
Vertiv Holdings Co. - Class A | | | 5 | | | | 126 | |
Waste Management, Inc. | | | 708 | | | | 122,784 | |
Watsco, Inc. | | | 1 | | | | 344 | |
WillScot Mobile Mini Holdings Corp. - Class A(1) | | | 5 | | | | 258 | |
WW Grainger, Inc. | | | 5 | | | | 3,835 | |
Xylem, Inc. | | | 3 | | | | 347 | |
| | | | | | | | |
Total Industrials | | | | | | | 867,203 | |
| | | | | | | | |
Information Technology – 27.78% | | | | | | | | |
Accenture Plc - Class A | | | 364 | | | | 112,256 | |
Adobe, Inc.(1) | | | 805 | | | | 393,827 | |
Advanced Micro Devices, Inc.(1) | | | 1,333 | | | | 151,867 | |
Allegro MicroSystems, Inc.(1) | | | 7 | | | | 313 | |
Alteryx, Inc. - Class A(1) | | | 6 | | | | 287 | |
Amphenol Corp. - Class A | | | 1,582 | | | | 134,430 | |
Analog Devices, Inc. | | | 779 | | | | 151,696 | |
ANSYS, Inc.(1) | | | 8 | | | | 2,580 | |
Apple, Inc. | | | 3,659 | | | | 709,730 | |
Applied Materials, Inc. | | | 793 | | | | 114,598 | |
AppLovin Corp. - Class A(1) | | | 6 | | | | 164 | |
Arista Networks, Inc.(1) | | | 27 | | | | 4,435 | |
Atlassian Corp. - Class A(1) | | | 16 | | | | 2,640 | |
Autodesk, Inc.(1) | | | 1,112 | | | | 227,546 | |
Bentley Systems, Inc. - Class B | | | 19 | | | | 1,056 | |
Broadcom, Inc. | | | 116 | | | | 100,701 | |
Cadence Design Systems, Inc.(1) | | | 346 | | | | 81,110 | |
CDW Corp. | | | 14 | | | | 2,549 | |
Cisco Systems, Inc. | | | 2,096 | | | | 108,471 | |
Cloudflare, Inc. - Class A(1) | | | 31 | | | | 1,997 | |
Cognex Corp. | | | 661 | | | | 37,040 | |
Confluent, Inc. - Class A(1) | | | 20 | | | | 713 | |
Crowdstrike Holdings, Inc. - Class A(1) | | | 241 | | | | 35,351 | |
Datadog, Inc. - Class A(1) | | | 30 | | | | 2,931 | |
DocuSign, Inc. - Class A(1) | | | 21 | | | | 1,091 | |
DoubleVerify Holdings, Inc. - Class Rights(1) | | | 12 | | | | 477 | |
Dropbox, Inc. - Class A(1) | | | 27 | | | | 721 | |
Dynatrace, Inc.(1) | | | 23 | | | | 1,192 | |
Elastic NV(1) | | | 8 | | | | 542 | |
Enphase Energy, Inc.(1) | | | 14 | | | | 2,369 | |
Entegris, Inc. | | | 1 | | | | 94 | |
EPAM Systems, Inc.(1) | | | 6 | | | | 1,323 | |
Fair Isaac Corp.(1) | | | 3 | | | | 2,131 | |
Five9, Inc.(1) | | | 8 | | | | 635 | |
Fortinet, Inc.(1) | | | 72 | | | | 5,417 | |
Gartner, Inc.(1) | | | 8 | | | | 2,941 | |
Gen Digital, Inc. | | | 9 | | | | 175 | |
Gitlab, Inc. - Class A(1) | | | 5 | | | | 272 | |
Globant SA(1) | | | 4 | | | | 800 | |
GoDaddy, Inc. - Class A(1) | | | 10 | | | | 766 | |
HashiCorp, Inc. - Class A(1) | | | 7 | | | | 181 | |
HP, Inc. | | | 19 | | | | 591 | |
| | | | | | | | |
HubSpot, Inc.(1) | | | 5 | | | | 2,655 | |
Informatica, Inc. - Class A(1) | | | 1 | | | | 10 | |
International Business Machines Corp. | | | 242 | | | | 32,449 | |
Intuit, Inc. | | | 567 | | | | 260,002 | |
Jabil, Inc. | | | 9 | | | | 956 | |
Keysight Technologies, Inc.(1) | | | 5 | | | | 830 | |
KLA Corp. | | | 15 | | | | 7,267 | |
Lam Research Corp. | | | 14 | | | | 8,904 | |
Lattice Semiconductor Corp.(1) | | | 15 | | | | 1,398 | |
Manhattan Associates, Inc.(1) | | | 7 | | | | 1,343 | |
Microchip Technology, Inc. | | | 42 | | | | 3,749 | |
Micron Technology, Inc. | | | 329 | | | | 20,788 | |
Microsoft Corp. | | | 5,289 | | | | 1,801,225 | |
MongoDB, Inc. - Class A(1) | | | 41 | | | | 16,900 | |
Monolithic Power Systems, Inc. | | | 5 | | | | 2,680 | |
Motorola Solutions, Inc. | | | 17 | | | | 4,865 | |
National Instruments Corp. | | | 11 | | | | 641 | |
nCino, Inc.(1) | | | 1 | | | | 36 | |
NetApp, Inc. | | | 9 | | | | 709 | |
New Relic, Inc.(1) | | | 6 | | | | 368 | |
Nutanix, Inc. - Class A(1) | | | 6 | | | | 171 | |
NVIDIA Corp. | | | 1,485 | | | | 628,385 | |
Okta, Inc. - Class A(1) | | | 1 | | | | 73 | |
Oracle Corp. | | | 68 | | | | 8,115 | |
Palantir Technologies, Inc. - Class A(1) | | | 204 | | | | 3,133 | |
Palo Alto Networks, Inc.(1) | | | 33 | | | | 8,307 | |
Pegasystems, Inc. | | | 5 | | | | 222 | |
Procore Technologies, Inc.(1) | | | 9 | | | | 557 | |
PTC, Inc.(1) | | | 6 | | | | 883 | |
Pure Storage, Inc. - Class A(1) | | | 24 | | | | 883 | |
QUALCOMM, Inc. | | | 106 | | | | 12,627 | |
RingCentral, Inc. - Class A(1) | | | 9 | | | | 293 | |
Salesforce, Inc.(1) | | | 2,097 | | | | 443,062 | |
SentinelOne, Inc. - Class A(1) | | | 3 | | | | 42 | |
ServiceNow, Inc.(1) | | | 452 | | | | 254,186 | |
Smartsheet, Inc. - Class A(1) | | | 14 | | | | 532 | |
Snowflake, Inc. - Class A(1) | | | 398 | | | | 70,098 | |
Splunk, Inc.(1) | | | 18 | | | | 1,875 | |
Synopsys, Inc.(1) | | | 17 | | | | 7,211 | |
Teradata Corp.(1) | | | 11 | | | | 592 | |
Teradyne, Inc. | | | 14 | | | | 1,577 | |
Texas Instruments, Inc. | | | 40 | | | | 7,278 | |
Twilio, Inc. - Class A(1) | | | 3 | | | | 194 | |
Tyler Technologies, Inc.(1) | | | 3 | | | | 1,429 | |
Ubiquiti, Inc.(2) | | | 0 | | | | 37 | |
UiPath, Inc. - Class A(1) | | | 31 | | | | 521 | |
Unity Software, Inc.(1) | | | 12 | | | | 536 | |
Universal Display Corp. | | | 2 | | | | 332 | |
VeriSign, Inc.(1) | | | 1 | | | | 118 | |
VMware, Inc. - Class A(1) | | | 23 | | | | 3,373 | |
Vontier Corp. | | | 6 | | | | 185 | |
Workday, Inc. - Class A(1) | | | 1,426 | | | | 322,057 | |
Zebra Technologies Corp. - Class A(1) | | | 1 | | | | 297 | |
Zscaler, Inc.(1) | | | 9 | | | | 1,329 | |
| | | | | | | | |
Total Information Technology | | | | | | | 6,348,291 | |
| | | | | | | | |
Materials – 3.46% | | | | | | | | |
Ardagh Metal Packaging SA | | | 4 | | | | 16 | |
Avery Dennison Corp. | | | 437 | | | | 75,002 | |
Axalta Coating Systems Ltd.(1) | | | 3 | | | | 85 | |
Ball Corp. | | | 3,230 | | | | 188,025 | |
Eagle Materials, Inc. | | | 3 | | | | 477 | |
Ecolab, Inc. | | | 1,577 | | | | 294,372 | |
FMC Corp. | | | 2 | | | | 212 | |
Ginkgo Bioworks Holdings, Inc.(1) | | | 14 | | | | 26 | |
Graphic Packaging Holding Co. | | | 18 | | | | 427 | |
Linde Plc | | | 5 | | | | 1,918 | |
PPG Industries, Inc. | | | 6 | | | | 953 | |
RPM International, Inc. | | | 3 | | | | 238 | |
Scotts Miracle-Gro Co. | | | 5 | | | | 282 | |
Sealed Air Corp. | | | 9 | | | | 347 | |
Sherwin-Williams Co. | | | 858 | | | | 227,840 | |
Southern Copper Corp. | | | 9 | | | | 667 | |
Vulcan Materials Co. | | | 3 | | | | 717 | |
| | | | | | | | |
Total Materials | | | | | | | 791,604 | |
| | | | | | | | |
Real Estate – 2.29% | | | | | | | | |
American Tower Corp. | | | 296 | | | | 57,321 | |
CoStar Group, Inc.(1) | | | 19 | | | | 1,688 | |
Crown Castle, Inc. | | | 5 | | | | 570 | |
Equinix, Inc. | | | 367 | | | | 287,571 | |
Equity LifeStyle Properties, Inc. | | | 6 | | | | 424 | |
Extra Space Storage, Inc. | | | 1 | | | | 125 | |
| | | | | | | | |
Iron Mountain, Inc. | | | 16 | | | | 888 | |
Lamar Advertising Co. - Class A | | | 7 | | | | 724 | |
Prologis, Inc. | | | 1,391 | | | | 170,640 | |
Public Storage | | | 10 | | | | 2,900 | |
SBA Communications Corp. - Class A | | | 1 | | | | 274 | |
Simon Property Group, Inc. | | | 8 | | | | 891 | |
Sun Communities, Inc. | | | 3 | | | | 381 | |
UDR, Inc. | | | 2 | | | | 86 | |
| | | | | | | | |
Total Real Estate | | | | | | | 524,483 | |
| | | | | | | | |
Utilities – 0.01% | | | | | | | | |
AES Corp. | | | 45 | | | | 922 | |
Vistra Corp. | | | 12 | | | | 313 | |
| | | | | | | | |
Total Utilities | | | | | | | 1,235 | |
| | | | | | | | |
Total Common Stocks (Cost: $15,652,642) | | | | | | | 22,397,385 | |
| | | | | | | | |
PREFERRED STOCKS – 0.17% | | | | | | | | |
Consumer Discretionary – 0.17% | | | | | | | | |
Dr Ing hc F Porsche AG(3) | | | 316 | | | | 39,215 | |
| | | | | | | | |
Total Consumer Discretionary | | | | 39,215 | |
| | | | | | | | |
Total Preferred Stocks (Cost: $30,605) | | | | 39,215 | |
| | | | | | | | |
SHORT-TERM INVESTMENTS – 1.74% | | | | | | | | |
Money Market Funds – 1.74% | | | | | | | | |
Goldman Sachs Financial Square Government Fund - Class I, 5.02%(4) | | | 397,664 | | | | 397,664 | |
| | | | | | | | |
Total Money Market Funds (Cost: $397,664) | | | | | | | 397,664 | |
| | | | | | | | |
| | |
| | | Principal
Amount
(000s) | | | Value
(000s) | |
Time Deposits – 0.00%(5) | | | | | | | | |
Citibank, London, 2.62% due 07/03/2023(2) | | EUR | 0 | | | | 0 | |
JP Morgan, New York, 4.57% due 07/03/2023 | | $ | 15 | | | | 15 | |
Sumitomo Trust Bank, London, 4.57% due 07/03/2023 | | | 533 | | | | 533 | |
| | | | | | | | |
Total Time Deposits (Cost: $548) | | | | | | | 548 | |
| | | | | | | | |
Total Short-Term Investments (Cost: $398,212) | | | | 398,212 | |
| | | | | | | | |
TOTAL INVESTMENTS IN SECURITIES – 99.89%
(Cost: $16,081,459) | | | | | | | 22,834,812 | |
| | | | | | | | |
OTHER ASSETS IN EXCESS OF LIABILITIES – 0.11% | | | | | | | 25,307 | |
| | | | | | | | |
TOTAL NET ASSETS – 100.00% | | | | | | $ | 22,860,119 | |
| | | | | | | | |
Percentages are stated as a percent of net assets.
Principal amounts are denominated in the currency in which the security was purchased.
ADR American Depositary Receipt
EUR Euro
| (1) | Non-income producing security. |
| (2) | A zero balance may reflect actual amounts rounding to less than one thousand. |
| (3) | Security was purchased exempt from registration in the U.S. pursuant to Rule 144(A) under the Securities Act of 1933. The value of these securities totals $93,430, which represents 0.41% of total net assets. |
| (4) | Represents annualized seven-day yield as of the close of the reporting period. |
| (5) | Amount calculated is less than 0.005%. |
The accompanying notes are an integral part of this Schedule of Investments.
Open Futures Contracts
| | | | | | | | | | | | | | | | |
Number of Contracts
Purchased | | Reference Entity | | Expiration Date | | Notional
Amount | | | Value | | | Unrealized
Appreciation/
(Depreciation) | |
| 11 | | NASDAQ 100 E-mini Future | | Sep. 2023 | | $ | 3,307 | | | $ | 3,374 | | | $ | 67 | |
| 7 | | S&P 500 E-mini Future | | Sep. 2023 | | | 1,536 | | | | 1,571 | | | | 35 | |
| | | | | | | | | | | | | | | | |
| | | | | | | | | | | | | | $ | 102 | |
| | | | | | | | | | | | | | | | |
Bridge Builder Large Cap Value Fund
Schedule of Investments
June 30, 2023
(Amounts in thousands, except number of contracts)
| | | | | | | | |
| | | Shares
(000s) | | | Value
(000s) | |
COMMON STOCKS – 96.48% | | | | | | | | |
Communication Services – 7.21% | | | | | | | | |
Activision Blizzard, Inc.(1) | | | 33 | | | $ | 2,821 | |
Alphabet, Inc. - Class C(1) | | | 1,756 | | | | 212,366 | |
AMC Entertainment Holdings, Inc. - Class A(1) | | | 22 | | | | 98 | |
AT&T, Inc. | | | 1,801 | | | | 28,723 | |
Cable One, Inc.(2) | | | 0 | | | | 147 | |
Comcast Corp. - Class A | | | 5,317 | | | | 220,908 | |
DISH Network Corp. - Class A(1) | | | 11 | | | | 70 | |
Electronic Arts, Inc. | | | 1,034 | | | | 134,049 | |
ESC GCI Liberty, Inc.(1)(2)(5) | | | 4 | | | | — | |
Fox Corp. - Class A | | | 203 | | | | 6,902 | |
Fox Corp. - Class B | | | 6 | | | | 199 | |
Frontier Communications Parent, Inc.(1) | | | 11 | | | | 205 | |
IAC, Inc.(1) | | | 3 | | | | 212 | |
Interpublic Group of Companies, Inc. | | | 16 | | | | 634 | |
Iridium Communications, Inc.(2) | | | 0 | | | | 21 | |
Liberty Broadband Corp. - Class A(1)(2) | | | 0 | | | | 28 | |
Liberty Broadband Corp. - Class C(1) | | | 4 | | | | 316 | |
Liberty Media Corp.-Liberty Formula One - Class A(1) | | | 1 | | | | 60 | |
Liberty Media Corp.-Liberty Formula One - Class C(1) | | | 8 | | | | 623 | |
Liberty Media Corp.-Liberty SiriusXM - Class A(1) | | | 3 | | | | 104 | |
Liberty Media Corp.-Liberty SiriusXM - Class C(1) | | | 7 | | | | 214 | |
Live Nation Entertainment, Inc.(1) | | | 5 | | | | 471 | |
Lumen Technologies, Inc. | | | 327 | | | | 738 | |
Madison Square Garden Sports Corp. - Class A | | | 1 | | | | 149 | |
Match Group, Inc.(1) | | | 1 | | | | 36 | |
Meta Platforms, Inc. - Class A(1) | | | 720 | | | | 206,580 | |
Netflix, Inc.(1) | | | 220 | | | | 97,087 | |
New York Times Co. - Class A | | | 7 | | | | 282 | |
News Corp. - Class A | | | 2,474 | | | | 48,248 | �� |
News Corp. - Class B | | | 252 | | | | 4,960 | |
Nexstar Media Group, Inc. - Class A | | | 48 | | | | 8,071 | |
Omnicom Group, Inc. | | | 8 | | | | 801 | |
Paramount Global - Class B | | | 359 | | | | 5,704 | |
Playtika Holding Corp.(1) | | | 2 | | | | 17 | |
Roku, Inc. - Class A(1) | | | 5 | | | | 294 | |
Sirius XM Holdings, Inc. | | | 29 | | | | 130 | |
Take-Two Interactive Software, Inc.(1) | | | 7 | | | | 1,035 | |
TEGNA, Inc. | | | 273 | | | | 4,430 | |
T-Mobile U.S., Inc.(1) | | | 295 | | | | 40,910 | |
TripAdvisor, Inc.(1) | | | 5 | | | | 78 | |
Verizon Communications, Inc. | | | 1,274 | | | | 47,387 | |
Walt Disney Co.(1) | | | 1,122 | | | | 100,195 | |
Warner Bros Discovery, Inc.(1) | | | 4,195 | | | | 52,610 | |
ZoomInfo Technologies, Inc. - Class A(1) | | | 6 | | | | 163 | |
| | | | | | | | |
Total Communication Services | | | | 1,229,076 | |
| | | | | | | | |
Consumer Discretionary – 8.62% | | | | | | | | |
Academy Sports & Outdoors, Inc. | | | 104 | | | | 5,637 | |
ADT, Inc. | | | 8 | | | | 49 | |
Advance Auto Parts, Inc. | | | 2 | | | | 171 | |
Aptiv Plc(1) | | | 599 | | | | 61,102 | |
Aramark | | | 1,762 | | | | 75,841 | |
AutoNation, Inc.(1) | | | 358 | | | | 58,901 | |
AutoZone, Inc.(1)(2) | | | 0 | | | | 322 | |
Bath & Body Works, Inc. | | | 10 | | | | 371 | |
Best Buy Co., Inc. | | | 277 | | | | 22,699 | |
Bloomin’ Brands, Inc. | | | 260 | | | | 6,983 | |
Booking Holdings, Inc.(1) | | | 29 | | | | 77,905 | |
BorgWarner, Inc. | | | 160 | | | | 7,820 | |
Boyd Gaming Corp. | | | 3 | | | | 225 | |
Bright Horizons Family Solutions, Inc.(1) | | | 2 | | | | 199 | |
Brunswick Corp. | | | 3 | | | | 229 | |
Caesars Entertainment, Inc.(1) | | | 5 | | | | 264 | |
Capri Holdings Ltd.(1) | | | 99 | | | | 3,560 | |
CarMax, Inc.(1) | | | 6 | | | | 535 | |
Carnival Corp.(1) | | | 42 | | | | 795 | |
Carter’s, Inc. | | | 74 | | | | 5,388 | |
Columbia Sportswear Co. | | | 1 | | | | 115 | |
Compass Group Plc | | | 3,851 | | | | 107,837 | |
Darden Restaurants, Inc. | | | 3 | | | | 459 | |
Dick’s Sporting Goods, Inc. | | | 70 | | | | 9,268 | |
DoorDash, Inc. - Class A(1) | | | 3 | | | | 213 | |
DR Horton, Inc. | | | 13 | | | | 1,616 | |
| | | | | | | | |
eBay, Inc. | | | 269 | | | | 12,030 | |
Etsy, Inc.(1) | | | 2 | | | | 194 | |
Expedia Group, Inc.(1) | | | 2 | | | | 180 | |
Foot Locker, Inc. | | | 126 | | | | 3,405 | |
Ford Motor Co. | | | 1,039 | | | | 15,727 | |
GameStop Corp. - Class A(1) | | | 12 | | | | 283 | |
Gap, Inc. | | | 9 | | | | 78 | |
Garmin Ltd. | | | 7 | | | | 696 | |
General Motors Co. | | | 428 | | | | 16,522 | |
Gentex Corp. | | | 10 | | | | 305 | |
Genuine Parts Co. | | | 6 | | | | 1,013 | |
Grand Canyon Education, Inc.(1) | | | 1 | | | | 96 | |
H&R Block, Inc. | | | 2 | | | | 73 | |
Harley-Davidson, Inc. | | | 180 | | | | 6,331 | |
Hasbro, Inc. | | | 6 | | | | 371 | |
Hilton Worldwide Holdings, Inc. | | | 6 | | | | 865 | |
Home Depot, Inc. | | | 213 | | | | 66,170 | |
Hyatt Hotels Corp. - Class A | | | 2 | | | | 245 | |
Kohl’s Corp. | | | 686 | | | | 15,805 | |
Las Vegas Sands Corp.(1) | | | 1,927 | | | | 111,769 | |
La-Z-Boy, Inc. | | | 211 | | | | 6,034 | |
Lear Corp. | | | 3 | | | | 368 | |
Leggett & Platt, Inc. | | | 6 | | | | 171 | |
Lennar Corp. - Class A | | | 85 | | | | 10,603 | |
Lennar Corp. - Class B | | | 1 | | | | 85 | |
Lithia Motors, Inc. - Class A | | | 158 | | | | 48,112 | |
LKQ Corp. | | | 11 | | | | 665 | |
Lowe’s Companies, Inc. | | | 7 | | | | 1,535 | |
Lucid Group, Inc.(1) | | | 32 | | | | 219 | |
Macy’s, Inc. | | | 195 | | | | 3,128 | |
Marriott International, Inc. - Class A | | | 494 | | | | 90,762 | |
Marriott Vacations Worldwide Corp. | | | 341 | | | | 41,795 | |
Mattel, Inc.(1) | | | 1,092 | | | | 21,338 | |
McDonald’s Corp. | | | 398 | | | | 118,731 | |
MGM Resorts International | | | 1,082 | | | | 47,505 | |
Mister Car Wash, Inc.(1) | | | 3 | | | | 31 | |
Mohawk Industries, Inc.(1) | | | 2 | | | | 237 | |
Newell Brands, Inc. | | | 16 | | | | 139 | |
NIKE, Inc. - Class B | | | 1,016 | | | | 112,118 | |
Nordstrom, Inc. | | | 94 | | | | 1,930 | |
Norwegian Cruise Line Holdings Ltd.(1) | | | 14 | | | | 298 | |
NVR, Inc.(1)(2) | | | 0 | | | | 730 | |
Ollie’s Bargain Outlet Holdings, Inc.(1) | | | 2 | | | | 103 | |
O’Reilly Automotive, Inc.(1)(2) | | | 0 | | | | 378 | |
Penn Entertainment, Inc.(1) | | | 7 | | | | 168 | |
Penske Automotive Group, Inc. | | | 92 | | | | 15,318 | |
Petco Health & Wellness Co., Inc. - Class A(1) | | | 4 | | | | 34 | |
Planet Fitness, Inc. - Class A(1) | | | 2 | | | | 128 | |
Polaris, Inc. | | | 2 | | | | 253 | |
PulteGroup, Inc. | | | 167 | | | | 13,007 | |
PVH Corp. | | | 83 | | | | 7,034 | |
QuantumScape Corp. - Class A(1) | | | 12 | | | | 92 | |
Ralph Lauren Corp. - Class A | | | 2 | | | | 223 | |
RH(1) | | | 1 | | | | 175 | |
Rivian Automotive, Inc. - Class A(1) | | | 23 | | | | 376 | |
Ross Stores, Inc. | | | 1 | | | | 108 | |
Royal Caribbean Cruises Ltd.(1) | | | 7 | | | | 724 | |
SeaWorld Entertainment, Inc.(1) | | | 940 | | | | 52,672 | |
Service Corp. International | | | 4 | | | | 261 | |
Skechers USA, Inc. - Class A(1) | | | 5 | | | | 288 | |
Tapestry, Inc. | | | 9 | | | | 405 | |
Tempur Sealy International, Inc. | | | 6 | | | | 227 | |
Thor Industries, Inc. | | | 81 | | | | 8,407 | |
TJX Companies, Inc. | | | 1,750 | | | | 148,356 | |
Toll Brothers, Inc. | | | 5 | | | | 372 | |
TopBuild Corp.(1) | | | 1 | | | | 336 | |
Travel + Leisure Co. | | | 2 | | | | 70 | |
Under Armour, Inc. - Class A(1) | | | 8 | | | | 60 | |
Under Armour, Inc. - Class C(1) | | | 9 | | | | 57 | |
Vail Resorts, Inc. | | | 2 | | | | 387 | |
Valvoline, Inc. | | | 5 | | | | 203 | |
VF Corp. | | | 15 | | | | 289 | |
Victoria’s Secret & Co.(1) | | | 1 | | | | 16 | |
Wayfair, Inc. - Class A(1) | | | 2 | | | | 148 | |
Whirlpool Corp. | | | 70 | | | | 10,402 | |
Williams-Sonoma, Inc. | | | 2 | | | | 303 | |
Wyndham Hotels & Resorts, Inc. | | | 3 | | | | 228 | |
Wynn Resorts Ltd. | | | 4 | | | | 441 | |
Yum! Brands, Inc. | | | 1 | | | | 202 | |
| | | | | | | | |
Total Consumer Discretionary | | | | 1,469,447 | |
| | | | | | | | |
| | | | | | | | |
Consumer Staples – 7.89% | | | | | | | | |
Albertsons Companies, Inc. - Class A | | | 388 | | | | 8,456 | |
Altria Group, Inc. | | | 1,966 | | | | 89,040 | |
Archer-Daniels-Midland Co. | | | 127 | | | | 9,584 | |
BJ’s Wholesale Club Holdings, Inc.(1) | | | 4 | | | | 234 | |
Brown-Forman Corp. - Class A | | | 1 | | | | 48 | |
Brown-Forman Corp. - Class B | | | 2 | | | | 108 | |
Bunge Ltd. | | | 65 | | | | 6,104 | |
Campbell Soup Co. | | | 8 | | | | 388 | |
Casey’s General Stores, Inc. | | | 1 | | | | 331 | |
Church & Dwight Co., Inc. | | | 1 | | | | 109 | |
Coca-Cola Co. | | | 1,479 | | | | 89,068 | |
Colgate-Palmolive Co. | | | 1,657 | | | | 127,636 | |
Conagra Brands, Inc. | | | 1,459 | | | | 49,206 | |
Constellation Brands, Inc. - Class A | | | 78 | | | | 19,122 | |
Costco Wholesale Corp. | | | 148 | | | | 79,691 | |
Coty, Inc. - Class A(1) | | | 16 | | | | 195 | |
Darling Ingredients, Inc.(1) | | | 7 | | | | 421 | |
Diageo Plc - ADR | | | 367 | | | | 63,696 | |
Dollar General Corp. | | | 261 | | | | 44,228 | |
Dollar Tree, Inc.(1) | | | 9 | | | | 1,277 | |
Edgewell Personal Care Co. | | | 115 | | | | 4,764 | |
Estee Lauder Companies, Inc. - Class A | | | 7 | | | | 1,320 | |
Flowers Foods, Inc. | | | 8 | | | | 211 | |
Freshpet, Inc.(1) | | | 1 | | | | 93 | |
General Mills, Inc. | | | 25 | | | | 1,923 | |
Grocery Outlet Holding Corp.(1) | | | 4 | | | | 116 | |
Heineken Holding NV | | | 1,033 | | | | 89,909 | |
Herbalife Ltd.(1) | | | 208 | | | | 2,750 | |
Hershey Co. | | | 2 | | | | 405 | |
Hormel Foods Corp. | | | 12 | | | | 499 | |
Ingredion, Inc. | | | 91 | | | | 9,666 | |
J.M. Smucker Co. | | | 4 | | | | 649 | |
Kellogg Co. | | | 11 | | | | 747 | |
Kenvue, Inc.(1) | | | 226 | | | | 5,971 | |
Keurig Dr Pepper, Inc. | | | 41 | | | | 1,272 | |
Kimberly-Clark Corp. | | | 255 | | | | 35,253 | |
Kraft Heinz Co. | | | 324 | | | | 11,494 | |
Kroger Co. | | | 410 | | | | 19,258 | |
Lamb Weston Holdings, Inc.(2) | | | 0 | | | | 40 | |
McCormick & Co., Inc. | | | 11 | | | | 935 | |
Molson Coors Beverage Co. - Class B | | | 277 | | | | 18,268 | |
Mondelez International, Inc. - Class A | | | 122 | | | | 8,924 | |
Olaplex Holdings, Inc.(1) | | | 6 | | | | 21 | |
PepsiCo, Inc. | | | 595 | | | | 110,215 | |
Performance Food Group Co.(1) | | | 3 | | | | 209 | |
Philip Morris International, Inc. | | | 2,306 | | | | 225,138 | |
Pilgrim’s Pride Corp.(1) | | | 2 | | | | 38 | |
Post Holdings, Inc.(1) | | | 2 | | | | 206 | |
Procter & Gamble Co. | | | 767 | | | | 116,354 | |
Reynolds Consumer Products, Inc. | | | 2 | | | | 66 | |
Seaboard Corp.(2) | | | 0 | | | | 32 | |
Spectrum Brands Holdings, Inc. | | | 2 | | | | 143 | |
Sprouts Farmers Market, Inc.(1) | | | 290 | | | | 10,655 | |
Target Corp. | | | 30 | | | | 3,891 | |
Tyson Foods, Inc. - Class A | | | 562 | | | | 28,676 | |
U.S. Foods Holding Corp.(1) | | | 9 | | | | 415 | |
Walgreens Boots Alliance, Inc. | | | 238 | | | | 6,777 | |
Walmart, Inc. | | | 252 | | | | 39,614 | |
| | | | | | | | |
Total Consumer Staples | | | | 1,345,859 | |
| | | | | | | | |
Energy – 5.54% | | | | | | | | |
Antero Midstream Corp. | | | 10 | | | | 112 | |
Antero Resources Corp.(1) | | | 12 | | | | 278 | |
APA Corp. | | | 208 | | | | 7,101 | |
Baker Hughes Co. - Class A | | | 43 | | | | 1,366 | |
California Resources Corp. | | | 1 | | | | 50 | |
Chesapeake Energy Corp. | | | 76 | | | | 6,368 | |
Chevron Corp. | | | 136 | | | | 21,432 | |
Civitas Resources, Inc. | | | 86 | | | | 5,934 | |
ConocoPhillips | | | 134 | | | | 13,853 | |
Coterra Energy, Inc. | | | 32 | | | | 817 | |
Devon Energy Corp. | | | 27 | | | | 1,322 | |
Diamondback Energy, Inc. | | | 8 | | | | 1,015 | |
DT Midstream, Inc. | | | 4 | | | | 212 | |
Enbridge, Inc. | | | 1,843 | | | | 68,472 | |
EOG Resources, Inc. | | | 1,144 | | | | 130,954 | |
EQT Corp. | | | 171 | | | | 7,020 | |
Exxon Mobil Corp. | | | 969 | | | | 103,873 | |
Halliburton Co. | | | 1,773 | | | | 58,491 | |
Hess Corp. | | | 795 | | | | 108,101 | |
HF Sinclair Corp. | | | 190 | | | | 8,461 | |
Kinder Morgan, Inc. | | | 84 | | | | 1,441 | |
| | | | | | | | |
Marathon Oil Corp. | | | 286 | | | | 6,584 | |
Marathon Petroleum Corp. | | | 117 | | | | 13,594 | |
NOV, Inc. | | | 17 | | | | 272 | |
Occidental Petroleum Corp. | | | 30 | | | | 1,767 | |
ONEOK, Inc. | | | 18 | | | | 1,112 | |
Ovintiv, Inc. | | | 6 | | | | 219 | |
PDC Energy, Inc. | | | 4 | | | | 263 | |
Phillips 66 | | | 683 | | | | 65,108 | |
Pioneer Natural Resources Co. | | | 350 | | | | 72,546 | |
Range Resources Corp. | | | 10 | | | | 293 | |
Schlumberger NV | | | 2,107 | | | | 103,510 | |
Southwestern Energy Co.(1) | | | 45 | | | | 272 | |
Suncor Energy, Inc. | | | 129 | | | | 3,768 | |
TC Energy Corp. | | | 649 | | | | 26,212 | |
TechnipFMC Plc(1) | | | 19 | | | | 311 | |
TotalEnergies SE - ADR | | | 294 | | | | 16,971 | |
TotalEnergies SE | | | 1,115 | | | | 63,992 | |
Valero Energy Corp. | | | 94 | | | | 11,012 | |
Vitesse Energy, Inc. | | | 22 | | | | 486 | |
Williams Companies, Inc. | | | 314 | | | | 10,237 | |
| | | | | | | | |
Total Energy | | | | 945,202 | |
| | | | | | | | |
Financials – 18.71% | | | | | | | | |
Affiliated Managers Group, Inc. | | | 32 | | | | 4,807 | |
Affirm Holdings, Inc. - Class A(1) | | | 11 | | | | 162 | |
Aflac, Inc. | | | 234 | | | | 16,353 | |
AGNC Investment Corp. | | | 25 | | | | 256 | |
Allstate Corp. | | | 522 | | | | 56,894 | |
Ally Financial, Inc. | | | 12 | | | | 312 | |
American Express Co. | | | 803 | | | | 139,916 | |
American Financial Group, Inc. | | | 51 | | | | 6,106 | |
American International Group, Inc. | | | 2,425 | | | | 139,560 | |
Ameriprise Financial, Inc. | | | 57 | | | | 18,903 | |
Annaly Capital Management, Inc. | | | 149 | | | | 2,974 | |
Aon Plc - Class A | | | 9 | | | | 2,979 | |
Apollo Global Management, Inc. | | | 109 | | | | 8,360 | |
Arch Capital Group Ltd.(1) | | | 1,606 | | | | 120,232 | |
Ares Capital Corp. | | | 394 | | | | 7,401 | |
Arthur J. Gallagher & Co. | | | 9 | | | | 1,873 | |
Assurant, Inc. | | | 2 | | | | 259 | |
Assured Guaranty Ltd. | | | 2 | | | | 136 | |
Axis Capital Holdings Ltd. | | | 776 | | | | 41,795 | |
Bank of America Corp. | | | 3,885 | | | | 111,462 | |
Bank of New York Mellon Corp. | | | 331 | | | | 14,750 | |
Bank OZK | | | 5 | | | | 202 | |
BankUnited, Inc. | | | 162 | | | | 3,480 | |
Berkshire Hathaway, Inc. - Class B(1) | | | 485 | | | | 165,262 | |
BlackRock, Inc. - Class A | | | 6 | | | | 4,404 | |
Block, Inc. - Class A(1) | | | 15 | | | | 967 | |
Blue Owl Capital, Inc. - Class A | | | 16 | | | | 189 | |
BOK Financial Corp. | | | 1 | | | | 96 | |
Brighthouse Financial, Inc.(1) | | | 3 | | | | 138 | |
Brown & Brown, Inc. | | | 6 | | | | 425 | |
Capital One Financial Corp. | | | 134 | | | | 14,708 | |
Carlyle Group, Inc. | | | 321 | | | | 10,245 | |
CBOE Global Markets, Inc. | | | 5 | | | | 632 | |
Charles Schwab Corp. | | | 311 | | | | 17,654 | |
Chubb Ltd. | | | 962 | | | | 185,189 | |
Cincinnati Financial Corp. | | | 7 | | | | 637 | |
Citigroup, Inc. | | | 750 | | | | 34,513 | |
Citizens Financial Group, Inc. | | | 395 | | | | 10,298 | |
CME Group, Inc. - Class A | | | 456 | | | | 84,507 | |
CNA Financial Corp. | | | 140 | | | | 5,397 | |
Coinbase Global, Inc. - Class A(1) | | | 7 | | | | 496 | |
Columbia Banking System, Inc. | | | 9 | | | | 190 | |
Comerica, Inc. | | | 6 | | | | 243 | |
Commerce Bancshares, Inc. | | | 5 | | | | 240 | |
Credit Acceptance Corp.(1)(2) | | | 0 | | | | 132 | |
Cullen/Frost Bankers, Inc. | | | 3 | | | | 275 | |
Discover Financial Services | | | 69 | | | | 8,053 | |
East West Bancorp, Inc. | | | 6 | | | | 323 | |
Equitable Holdings, Inc. | | | 1,711 | | | | 46,466 | |
Essent Group Ltd. | | | 99 | | | | 4,647 | |
Euronet Worldwide, Inc.(1) | | | 1 | | | | 119 | |
Evercore, Inc. - Class A | | | 2 | | | | 203 | |
Everest Re Group Ltd. | | | 20 | | | | 6,824 | |
Fidelity National Financial, Inc. | | | 11 | | | | 407 | |
Fidelity National Information Services, Inc. | | | 1,152 | | | | 63,005 | |
Fifth Third Bancorp | | | 1,348 | | | | 35,319 | |
First American Financial Corp. | | | 4 | | | | 236 | |
First Citizens BancShares, Inc. - Class A(2) | | | 0 | | | | 529 | |
First Hawaiian, Inc. | | | 6 | | | | 106 | |
| | | | | | | | |
First Horizon Corp. | | | 99 | | | | 1,120 | |
Fiserv, Inc.(1) | | | 938 | | | | 118,369 | |
FleetCor Technologies, Inc.(1)(2) | | | 0 | | | | 54 | |
FNB Corp. | | | 431 | | | | 4,932 | |
Franklin Resources, Inc. | | | 132 | | | | 3,515 | |
Global Payments, Inc. | | | 58 | | | | 5,691 | |
Globe Life, Inc. | | | 4 | | | | 424 | |
Goldman Sachs Group, Inc. | | | 287 | | | | 92,475 | |
Hanover Insurance Group, Inc. | | | 2 | | | | 184 | |
Hartford Financial Services Group, Inc. | | | 611 | | | | 44,031 | |
Houlihan Lokey, Inc. - Class A | | | 2 | | | | 193 | |
Huntington Bancshares, Inc. | | | 2,535 | | | | 27,328 | |
Interactive Brokers Group, Inc. - Class A | | | 4 | | | | 355 | |
Intercontinental Exchange, Inc. | | | 24 | | | | 2,691 | |
Invesco Ltd. | | | 16 | | | | 266 | |
Jack Henry & Associates, Inc. | | | 2 | | | | 354 | |
Janus Henderson Group Plc | | | 6 | | | | 158 | |
Jefferies Financial Group, Inc. | | | 2,083 | | | | 69,085 | |
JPMorgan Chase & Co. | | | 437 | | | | 63,522 | |
Kemper Corp. | | | 3 | | | | 134 | |
KeyCorp | | | 365 | | | | 3,372 | |
KKR & Co., Inc. - Class Miscella | | | 21 | | | | 1,164 | |
Lazard Ltd. - Class A | | | 4 | | | | 124 | |
Lincoln National Corp. | | | 132 | | | | 3,399 | |
Loews Corp. | | | 490 | | | | 29,108 | |
M&T Bank Corp. | | | 412 | | | | 50,965 | |
Markel Group, Inc.(1) | | | 1 | | | | 775 | |
Marsh & McLennan Companies, Inc. | | | 599 | | | | 112,677 | |
Mastercard, Inc. - Class A | | | 252 | | | | 99,154 | |
MetLife, Inc. | | | 983 | | | | 55,559 | |
MGIC Investment Corp. | | | 411 | | | | 6,485 | |
Moody’s Corp. | | | 1 | | | | 207 | |
Morgan Stanley | | | 1,388 | | | | 118,537 | |
MSCI, Inc. - Class A | | | 2 | | | | 778 | |
Nasdaq, Inc. | | | 15 | | | | 726 | |
Navient Corp. | | | 415 | | | | 7,711 | |
New York Community Bancorp, Inc. | | | 31 | | | | 349 | |
Northern Trust Corp. | | | 395 | | | | 29,313 | |
NU Holdings Ltd. - Class A(1) | | | 31 | | | | 245 | |
Old Republic International Corp. | | | 12 | | | | 304 | |
OneMain Holdings, Inc. - Class A | | | 5 | | | | 225 | |
PayPal Holdings, Inc.(1) | | | 19 | | | | 1,288 | |
Pinnacle Financial Partners, Inc. | | | 3 | | | | 187 | |
PNC Financial Services Group, Inc. | | | 1,028 | | | | 129,512 | |
Popular, Inc. | | | 3 | | | | 190 | |
Primerica, Inc. | | | 1 | | | | 107 | |
Principal Financial Group, Inc. | | | 10 | | | | 782 | |
Progressive Corp. | | | 6 | | | | 829 | |
Prosperity Bancshares, Inc. | | | 4 | | | | 214 | |
Prudential Financial, Inc. | | | 16 | | | | 1,406 | |
Radian Group, Inc. | | | 253 | | | | 6,398 | |
Raymond James Financial, Inc. | | | 92 | | | | 9,501 | |
Regions Financial Corp. | | | 676 | | | | 12,049 | |
Reinsurance Group of America, Inc. - Class A | | | 15 | | | | 2,060 | |
RenaissanceRe Holdings Ltd. | | | 2 | | | | 287 | |
Rithm Capital Corp. | | | 555 | | | | 5,186 | |
RLI Corp. | | | 1 | | | | 182 | |
Robinhood Markets, Inc. - Class A(1) | | | 28 | | | | 284 | |
Rocket Companies, Inc. - Class A(1) | | | 2 | | | | 22 | |
S&P Global, Inc. | | | 13 | | | | 5,056 | |
SEI Investments Co. | | | 5 | | | | 272 | |
SLM Corp. | | | 6 | | | | 102 | |
SoFi Technologies, Inc.(1) | | | 39 | | | | 328 | |
Starwood Property Trust, Inc. | | | 13 | | | | 248 | |
State Street Corp. | | | 293 | | | | 21,407 | |
Stifel Financial Corp. | | | 89 | | | | 5,283 | |
Synchrony Financial | | | 207 | | | | 7,028 | |
Synovus Financial Corp. | | | 6 | | | | 183 | |
T Rowe Price Group, Inc. | | | 9 | | | | 1,054 | |
TFS Financial Corp. | | | 2 | | | | 26 | |
TPG, Inc. - Class A | | | 2 | | | | 57 | |
Tradeweb Markets, Inc. - Class A | | | 3 | | | | 219 | |
Travelers Companies, Inc. | | | 10 | | | | 1,708 | |
Truist Financial Corp. | | | 195 | | | | 5,924 | |
U.S. Bancorp | | | 5,049 | | | | 166,834 | |
Unum Group | | | 9 | | | | 409 | |
Virtu Financial, Inc. - Class A | | | 4 | | | | 69 | |
Visa, Inc. - Class A | | | 882 | | | | 209,439 | |
Voya Financial, Inc. | | | 91 | | | | 6,493 | |
Webster Financial Corp. | | | 8 | | | | 291 | |
Wells Fargo & Co. | | | 3,579 | | | | 152,770 | |
| | | | | | | | |
Western Alliance Bancorp | | | 5 | | | | 168 | |
Western Union Co. | | | 319 | | | | 3,740 | |
WEX, Inc.(1) | | | 1 | | | | 180 | |
White Mountains Insurance Group Ltd.(2) | | | 0 | | | | 171 | |
Willis Towers Watson Plc | | | 286 | | | | 67,395 | |
Wintrust Financial Corp. | | | 3 | | | | 196 | |
WR Berkley Corp. | | | 9 | | | | 547 | |
XP, Inc. - Class A(1) | | | 13 | | | | 305 | |
Zions Bancorp N.A. | | | 194 | | | | 5,209 | |
| | | | | | | | |
Total Financials | | | | 3,191,899 | |
| | | | | | | | |
Healthcare – 14.49% | | | | | | | | |
Abbott Laboratories | | | 714 | | | | 77,849 | |
AbbVie, Inc. | | | 238 | | | | 32,050 | |
Acadia Healthcare Co., Inc.(1) | | | 4 | | | | 310 | |
Agilent Technologies, Inc. | | | 2 | | | | 283 | |
agilon health, Inc.(1) | | | 1 | | | | 16 | |
Alnylam Pharmaceuticals, Inc.(1) | | | 1 | | | | 198 | |
Amedisys, Inc.(1) | | | 1 | | | | 122 | |
Amgen, Inc. | | | 78 | | | | 17,428 | |
AstraZeneca Plc - ADR | | | 255 | | | | 18,222 | |
Avantor, Inc.(1) | | | 2,704 | | | | 55,536 | |
Azenta, Inc.(1) | | | 3 | | | | 146 | |
Baxter International, Inc. | | | 2,024 | | | | 92,213 | |
Becton Dickinson & Co. | | | 251 | | | | 66,287 | |
Biogen, Inc.(1) | | | 57 | | | | 16,284 | |
BioMarin Pharmaceutical, Inc.(1) | | | 7 | | | | 610 | |
Bio-Rad Laboratories, Inc. - Class A(1) | | | 1 | | | | 351 | |
Bio-Techne Corp.(2) | | | 0 | | | | 31 | |
Boston Scientific Corp.(1) | | | 62 | | | | 3,331 | |
Bristol Myers Squibb Co. | | | 504 | | | | 32,226 | |
Cardinal Health, Inc. | | | 222 | | | | 20,988 | |
Catalent, Inc.(1) | | | 8 | | | | 333 | |
Centene Corp.(1) | | | 269 | | | | 18,118 | |
Certara, Inc.(1) | | | 3 | | | | 59 | |
Charles River Laboratories International, Inc.(1) | | | 2 | | | | 455 | |
Chemed Corp.(2) | | | 0 | | | | 96 | |
Cigna Group | | | 441 | | | | 123,664 | |
Cooper Companies, Inc. | | | 2 | | | | 806 | |
CVS Health Corp. | | | 1,309 | | | | 90,500 | |
Danaher Corp. | | | 406 | | | | 97,356 | |
DaVita, Inc.(1) | | | 71 | | | | 7,123 | |
Dentsply Sirona, Inc. | | | 9 | | | | 379 | |
Doximity, Inc. - Class A(1) | | | 2 | | | | 83 | |
Elanco Animal Health, Inc.(1) | | | 21 | | | | 211 | |
Elevance Health, Inc. | | | 277 | | | | 122,850 | |
Encompass Health Corp. | | | 4 | | | | 296 | |
Enovis Corp.(1) | | | 2 | | | | 135 | |
Envista Holdings Corp.(1) | | | 7 | | | | 241 | |
Exact Sciences Corp.(1) | | | 5 | | | | 467 | |
Exelixis, Inc.(1) | | | 4 | | | | 69 | |
GE HealthCare Technologies, Inc. | | | 256 | | | | 20,812 | |
Gilead Sciences, Inc. | | | 332 | | | | 25,609 | |
Globus Medical, Inc. - Class A(1) | | | 3 | | | | 193 | |
HCA Healthcare, Inc. | | | 62 | | | | 18,944 | |
Henry Schein, Inc.(1) | | | 102 | | | | 8,293 | |
Hologic, Inc.(1) | | | 11 | | | | 852 | |
Horizon Therapeutics Plc(1) | | | 1 | | | | 114 | |
Humana, Inc. | | | 105 | | | | 46,805 | |
ICON Plc(1) | | | 3 | | | | 740 | |
ICU Medical, Inc.(1) | | | 1 | | | | 154 | |
Illumina, Inc.(1) | | | 5 | | | | 888 | |
Incyte Corp.(1) | | | 2 | | | | 128 | |
Inmode Ltd.(1) | | | 2 | | | | 86 | |
Integra LifeSciences Holdings Corp.(1) | | | 3 | | | | 130 | |
Ionis Pharmaceuticals, Inc.(1)(2) | | | 0 | | | | 18 | |
IQVIA Holdings, Inc.(1) | | | 1 | | | | 129 | |
Jazz Pharmaceuticals Plc(1) | | | 91 | | | | 11,278 | |
Johnson & Johnson | | | 1,047 | | | | 173,377 | |
Karuna Therapeutics, Inc.(1)(2) | | | 0 | | | | 35 | |
Koninklijke Philips NV | | | 2,929 | | | | 63,466 | |
Laboratory Corp. of America Holdings | | | 4 | | | | 925 | |
Lantheus Holdings, Inc.(1) | | | 53 | | | | 4,439 | |
LivaNova Plc(1) | | | 634 | | | | 32,591 | |
Maravai LifeSciences Holdings, Inc. - Class A(1) | | | 2 | | | | 25 | |
McKesson Corp. | | | 44 | | | | 18,998 | |
Medtronic Plc | | | 3,009 | | | | 265,117 | |
Merck & Co., Inc. | | | 2,274 | | | | 262,385 | |
Mirati Therapeutics, Inc.(1) | | | 2 | | | | 66 | |
Moderna, Inc.(1) | | | 14 | | | | 1,744 | |
Molina Healthcare, Inc.(1) | | | 1 | | | | 339 | |
Organon & Co. | | | 105 | | | | 2,180 | |
| | | | | | | | |
Perrigo Co. Plc | | | 1,678 | | | | 56,971 | |
Pfizer, Inc. | | | 2,498 | | | | 91,619 | |
Premier, Inc. - Class A | | | 5 | | | | 146 | |
QIAGEN NV(1) | | | 10 | | | | 446 | |
Quest Diagnostics, Inc. | | | 45 | | | | 6,300 | |
QuidelOrtho Corp.(1) | | | 4 | | | | 291 | |
R1 RCM, Inc.(1) | | | 7 | | | | 120 | |
Regeneron Pharmaceuticals, Inc.(1) | | | 4 | | | | 2,977 | |
Repligen Corp.(1) | | | 1 | | | | 187 | |
Revvity, Inc. | | | 6 | | | | 663 | |
Royalty Pharma Plc - Class A | | | 16 | | | | 495 | |
Sanofi - ADR | | | 78 | | | | 4,208 | |
Sanofi | | | 188 | | | | 20,250 | |
Select Medical Holdings Corp. | | | 169 | | | | 5,398 | |
Sotera Health Co.(1) | | | 1 | | | | 24 | |
STERIS Plc | | | 4 | | | | 952 | |
Stryker Corp. | | | 459 | | | | 140,177 | |
Syneos Health, Inc. - Class A(1) | | | 4 | | | | 186 | |
Tandem Diabetes Care, Inc.(1) | | | 2 | | | | 58 | |
Teladoc Health, Inc.(1) | | | 6 | | | | 162 | |
Teleflex, Inc. | | | 2 | | | | 497 | |
Tenet Healthcare Corp.(1) | | | 5 | | | | 374 | |
Thermo Fisher Scientific, Inc. | | | 6 | | | | 3,300 | |
United Therapeutics Corp.(1) | | | 24 | | | | 5,286 | |
UnitedHealth Group, Inc. | | | 417 | | | | 200,276 | |
Universal Health Services, Inc. - Class B | | | 55 | | | | 8,670 | |
Vertex Pharmaceuticals, Inc.(1) | | | 1 | | | | 329 | |
Viatris, Inc. | | | 2,172 | | | | 21,673 | |
Zimmer Biomet Holdings, Inc. | | | 275 | | | | 40,066 | |
| | | | | | | | |
Total Healthcare | | | | 2,470,683 | |
| | | | | | | | |
Industrials – 15.18% | | | | | | | | |
3M Co. | | | 81 | | | | 8,069 | |
Acuity Brands, Inc. | | | 47 | | | | 7,707 | |
AECOM | | | 747 | | | | 63,263 | |
AerCap Holdings NV(1) | | | 929 | | | | 58,993 | |
AGCO Corp. | | | 121 | | | | 15,923 | |
Air Lease Corp. - Class A | | | 1,432 | | | | 59,928 | |
Airbus SE | | | 709 | | | | 102,490 | |
Alaska Air Group, Inc.(1) | | | 159 | | | | 8,442 | |
Allegion Plc(2) | | | 0 | | | | 34 | |
Allison Transmission Holdings, Inc. | | | 133 | | | | 7,503 | |
American Airlines Group, Inc.(1) | | | 17 | | | | 313 | |
AMETEK, Inc. | | | 10 | | | | 1,589 | |
AO Smith Corp. | | | 5 | | | | 340 | |
Armstrong World Industries, Inc. | | | 1 | | | | 99 | |
Atkore, Inc.(1) | | | 91 | | | | 14,159 | |
Automatic Data Processing, Inc. | | | 282 | | | | 62,068 | |
Avis Budget Group, Inc.(1) | | | 1 | | | | 131 | |
AZEK Co., Inc. - Class A(1) | | | 6 | | | | 174 | |
Boeing Co.(1) | | | 191 | | | | 40,389 | |
Broadridge Financial Solutions, Inc. | | | 1 | | | | 136 | |
Builders FirstSource, Inc.(1) | | | 5 | | | | 739 | |
BWX Technologies, Inc. | | | 1,103 | | | | 78,974 | |
CACI International, Inc. - Class A(1) | | | 199 | | | | 67,791 | |
Canadian National Railway Co. | | | 614 | | | | 74,290 | |
Carlisle Companies, Inc. | | | 2 | | | | 554 | |
Carrier Global Corp. | | | 36 | | | | 1,767 | |
Caterpillar, Inc. | | | 41 | | | | 10,115 | |
Ceridian HCM Holding, Inc.(1) | | | 6 | | | | 385 | |
CH Robinson Worldwide, Inc. | | | 1 | | | | 102 | |
Cintas Corp.(2) | | | 0 | | | | 202 | |
Clarivate Plc(1) | | | 20 | | | | 188 | |
Clean Harbors, Inc.(1) | | | 2 | | | | 363 | |
CNH Industrial NV | | | 71 | | | | 1,019 | |
Concentrix Corp. | | | 2 | | | | 154 | |
Core & Main, Inc. - Class A(1) | | | 4 | | | | 114 | |
Crane Co. | | | 47 | | | | 4,168 | |
Crane NXT Co. | | | 47 | | | | 2,640 | |
CSX Corp. | | | 78 | | | | 2,644 | |
Cummins, Inc. | | | 68 | | | | 16,751 | |
Curtiss-Wright Corp. | | | 2 | | | | 304 | |
Deere & Co. | | | 136 | | | | 55,092 | |
Delta Air Lines, Inc.(1) | | | 188 | | | | 8,922 | |
Donaldson Co., Inc. | | | 3 | | | | 189 | |
Dover Corp. | | | 6 | | | | 879 | |
Driven Brands Holdings, Inc.(1) | | | 3 | | | | 72 | |
Dun & Bradstreet Holdings, Inc. | | | 11 | | | | 124 | |
Eaton Corp. Plc | | | 17 | | | | 3,435 | |
EMCOR Group, Inc. | | | 1 | | | | 242 | |
Emerson Electric Co. | | | 24 | | | | 2,202 | |
Equifax, Inc. | | | 2 | | | | 377 | |
| | | | | | | | |
Esab Corp. | | | 2 | | | | 158 | |
Expeditors International of Washington, Inc. | | | 6 | | | | 687 | |
Fastenal Co. | | | 6 | | | | 361 | |
FedEx Corp. | | | 573 | | | | 141,979 | |
Ferguson Plc | | | 8 | | | | 1,310 | |
Flowserve Corp. | | | 81 | | | | 3,008 | |
Fortive Corp. | | | 15 | | | | 1,128 | |
Fortune Brands Innovations, Inc. | | | 5 | | | | 388 | |
FTI Consulting, Inc.(1) | | | 1 | | | | 220 | |
Gates Industrial Corp. Plc(1) | | | 5 | | | | 73 | |
Generac Holdings, Inc.(1) | | | 3 | | | | 387 | |
General Dynamics Corp. | | | 387 | | | | 83,221 | |
General Electric Co. | | | 695 | | | | 76,320 | |
Genpact Ltd. | | | 6 | | | | 216 | |
Graco, Inc. | | | 4 | | | | 364 | |
GXO Logistics, Inc.(1) | | | 5 | | | | 313 | |
Hayward Holdings, Inc.(1) | | | 4 | | | | 45 | |
HEICO Corp.(2) | | | 0 | | | | 24 | |
HEICO Corp. - Class A(2) | | | 0 | | | | 33 | |
Hertz Global Holdings, Inc.(1) | | | 6 | | | | 105 | |
Hexcel Corp. | | | 4 | | | | 283 | |
Hillenbrand, Inc. | | | 158 | | | | 8,112 | |
Honeywell International, Inc. | | | 612 | | | | 127,064 | |
Howmet Aerospace, Inc. | | | 16 | | | | 802 | |
Hub Group, Inc. - Class A(1) | | | 1 | | | | 44 | |
Hubbell, Inc. - Class B | | | 1 | | | | 412 | |
Huntington Ingalls Industries, Inc. | | | 26 | | | | 5,911 | |
IDEX Corp. | | | 3 | | | | 638 | |
Illinois Tool Works, Inc. | | | 2 | | | | 599 | |
Ingersoll Rand, Inc. | | | 17 | | | | 1,129 | |
ITT, Inc. | | | 4 | | | | 343 | |
Jacobs Solutions, Inc. | | | 5 | | | | 638 | |
JB Hunt Transport Services, Inc. | | | 382 | | | | 69,129 | |
Johnson Controls International Plc | | | 29 | | | | 1,998 | |
KBR, Inc. | | | 4 | | | | 239 | |
Kirby Corp.(1) | | | 3 | | | | 207 | |
Knight-Swift Transportation Holdings, Inc. - Class A | | | 7 | | | | 382 | |
L3Harris Technologies, Inc. | | | 260 | | | | 50,847 | |
Landstar System, Inc.(2) | | | 0 | | | | 60 | |
Leidos Holdings, Inc. | | | 6 | | | | 522 | |
Lennox International, Inc. | | | 1 | | | | 451 | |
Lincoln Electric Holdings, Inc.(2) | | | 0 | | | | 31 | |
Lockheed Martin Corp. | | | 143 | | | | 65,967 | |
ManpowerGroup, Inc. | | | 2 | | | | 171 | |
Masco Corp. | | | 10 | | | | 553 | |
MasTec, Inc.(1) | | | 3 | | | | 321 | |
MDU Resources Group, Inc. | | | 1,937 | | | | 40,556 | |
Mercury Systems, Inc.(1) | | | 2 | | | | 77 | |
Middleby Corp.(1) | | | 2 | | | | 320 | |
Moog, Inc. - Class A | | | 65 | | | | 7,025 | |
MSA Safety, Inc. | | | 1 | | | | 227 | |
MSC Industrial Direct Co., Inc. - Class A | | | 2 | | | | 189 | |
Nordson Corp. | | | 2 | | | | 605 | |
Norfolk Southern Corp. | | | 45 | | | | 10,135 | |
Northrop Grumman Corp. | | | 357 | | | | 162,716 | |
nVent Electric Plc | | | 7 | | | | 373 | |
Old Dominion Freight Line, Inc.(2) | | | 0 | | | | 107 | |
Oshkosh Corp. | | | 3 | | | | 252 | |
Otis Worldwide Corp. | | | 17 | | | | 1,477 | |
Owens Corning | | | 96 | | | | 12,480 | |
PACCAR, Inc. | | | 22 | | | | 1,830 | |
Parker-Hannifin Corp. | | | 5 | | | | 2,127 | |
Paycor HCM, Inc.(1) | | | 1 | | | | 30 | |
Pentair Plc | | | 7 | | | | 460 | |
Plug Power, Inc.(1) | | | 22 | | | | 230 | |
Quanta Services, Inc. | | | 5 | | | | 888 | |
Raytheon Technologies Corp. | | | 1,541 | | | | 150,993 | |
RB Global, Inc. | | | 2 | | | | 109 | |
RBC Bearings, Inc.(1) | | | 1 | | | | 262 | |
Regal Rexnord Corp. | | | 3 | | | | 447 | |
Republic Services, Inc. - Class A | | | 9 | | | | 1,350 | |
Robert Half International, Inc. | | | 4 | | | | 337 | |
Ryder System, Inc. | | | 102 | | | | 8,615 | |
Safran SA | | | 603 | | | | 94,522 | |
Saia, Inc.(1) | | | 1 | | | | 345 | |
Schneider National, Inc. - Class B | | | 3 | | | | 76 | |
Science Applications International Corp. | | | 42 | | | | 4,689 | |
Sensata Technologies Holding Plc | | | 7 | | | | 298 | |
Siemens AG | | | 198 | | | | 33,069 | |
SiteOne Landscape Supply, Inc.(1) | | | 1 | | | | 215 | |
Snap-on, Inc. | | | 41 | | | | 11,693 | |
| | | | | | | | |
Southwest Airlines Co. | | | 2,799 | | | | 101,353 | |
Spirit AeroSystems Holdings, Inc. - Class A | | | 4 | | | | 117 | |
SS&C Technologies Holdings, Inc. | | | 9 | | | | 562 | |
Stanley Black & Decker, Inc. | | | 1,017 | | | | 95,287 | |
Stericycle, Inc.(1) | | | 336 | | | | 15,626 | |
Sunrun, Inc.(1) | | | 9 | | | | 164 | |
Tetra Tech, Inc. | | | 2 | | | | 303 | |
Textron, Inc. | | | 137 | | | | 9,285 | |
Timken Co. | | | 3 | | | | 243 | |
Trane Technologies Plc | | | 7 | | | | 1,310 | |
TransDigm Group, Inc. | | | 2 | | | | 1,662 | |
TransUnion | | | 8 | | | | 645 | |
U-Haul Holding Co.(2) | | | 0 | | | | 22 | |
U-Haul Holding Co. - Class B | | | 2 | | | | 107 | |
Union Pacific Corp. | | | 467 | | | | 95,613 | |
United Airlines Holdings, Inc.(1) | | | 145 | | | | 7,964 | |
United Parcel Service, Inc. - Class B | | | 656 | | | | 117,516 | |
United Rentals, Inc. | | | 15 | | | | 6,737 | |
Univar Solutions, Inc.(1) | | | 217 | | | | 7,761 | |
Valmont Industries, Inc. | | | 1 | | | | 235 | |
Vertiv Holdings Co. - Class A | | | 5,391 | | | | 133,527 | |
Waste Management, Inc. | | | 2 | | | | 304 | |
Watsco, Inc. | | | 1 | | | | 406 | |
Werner Enterprises, Inc. | | | 135 | | | | 5,955 | |
WESCO International, Inc. | | | 2 | | | | 338 | |
Westinghouse Air Brake Technologies Corp. | | | 8 | | | | 859 | |
WillScot Mobile Mini Holdings Corp. - Class A(1) | | | 6 | | | | 300 | |
Woodward, Inc. | | | 3 | | | | 302 | |
XPO, Inc.(1) | | | 5 | | | | 287 | |
Xylem, Inc. | | | 9 | | | | 1,004 | |
| | | | | | | | |
Total Industrials | | | | 2,588,659 | |
| | | | | | | | |
Information Technology – 8.43% | | | | | | | | |
Accenture Plc - Class A | | | 384 | | | | 118,359 | |
Advanced Micro Devices, Inc.(1) | | | 30 | | | | 3,376 | |
Akamai Technologies, Inc.(1) | | | 7 | | | | 590 | |
Amdocs Ltd. | | | 74 | | | | 7,314 | |
Amkor Technology, Inc. | | | 293 | | | | 8,708 | |
Amphenol Corp. - Class A | | | 12 | | | | 1,050 | |
Analog Devices, Inc. | | | 22 | | | | 4,222 | |
ANSYS, Inc.(1) | | | 1 | | | | 214 | |
Applied Materials, Inc. | | | 225 | | | | 32,535 | |
AppLovin Corp. - Class A(1) | | | 7 | | | | 186 | |
Arrow Electronics, Inc.(1) | | | 93 | | | | 13,306 | |
Aspen Technology, Inc.(1) | | | 1 | | | | 199 | |
Avnet, Inc. | | | 110 | | | | 5,547 | |
Bentley Systems, Inc. - Class B | | | 1 | | | | 33 | |
BILL Holdings, Inc.(1) | | | 4 | | | | 513 | |
Black Knight, Inc.(1) | | | 7 | | | | 397 | |
Broadcom, Inc. | | | 141 | | | | 122,182 | |
CCC Intelligent Solutions Holdings, Inc.(1) | | | 9 | | | | 97 | |
CDW Corp.(2) | | | 0 | | | | 61 | |
Ciena Corp.(1) | | | 6 | | | | 272 | |
Cirrus Logic, Inc.(1) | | | 2 | | | | 192 | |
Cisco Systems, Inc. | | | 751 | | | | 38,880 | |
Cognex Corp. | | | 7 | | | | 413 | |
Cognizant Technology Solutions Corp. - Class A | | | 513 | | | | 33,481 | |
Coherent Corp.(1) | | | 5 | | | | 260 | |
Consensus Cloud Solutions, Inc.(1) | | | 19 | | | | 590 | |
Corning, Inc. | | | 32 | | | | 1,137 | |
Dell Technologies, Inc. - Class C | | | 206 | | | | 11,130 | |
Diodes, Inc.(1) | | | 77 | | | | 7,159 | |
Dolby Laboratories, Inc. - Class A | | | 3 | �� | | | 213 | |
Dropbox, Inc. - Class A(1) | | | 1 | | | | 24 | |
DXC Technology Co.(1) | | | 177 | | | | 4,718 | |
Entegris, Inc. | | | 6 | | | | 669 | |
F5, Inc.(1) | | | 3 | | | | 377 | |
First Solar, Inc.(1) | | | 5 | | | | 888 | |
Flex Ltd.(1) | | | 337 | | | | 9,326 | |
Gen Digital, Inc. | | | 20 | | | | 370 | |
GLOBALFOUNDRIES, Inc.(1) | | | 3 | | | | 216 | |
GoDaddy, Inc. - Class A(1) | | | 3 | | | | 195 | |
Guidewire Software, Inc.(1) | | | 4 | | | | 272 | |
HashiCorp, Inc. - Class A(1) | | | 1 | | | | 33 | |
Hewlett Packard Enterprise Co. | | | 527 | | | | 8,857 | |
HP, Inc. | | | 605 | | | | 18,590 | |
Informatica, Inc. - Class A(1) | | | 2 | | | | 31 | |
Intel Corp. | | | 578 | | | | 19,328 | |
International Business Machines Corp. | | | 93 | | | | 12,452 | |
IPG Photonics Corp.(1) | | | 1 | | | | 199 | |
Jabil, Inc. | | | 107 | | | | 11,565 | |
Juniper Networks, Inc. | | | 14 | | | | 433 | |
| | | | | | | | |
Keysight Technologies, Inc.(1) | | | 6 | | | | 943 | |
Kyndryl Holdings, Inc.(1) | | | 9 | | | | 125 | |
Lam Research Corp.(2) | | | 0 | | | | 195 | |
Littelfuse, Inc. | | | 1 | | | | 310 | |
Lumentum Holdings, Inc.(1) | | | 3 | | | | 175 | |
Marvell Technology, Inc. | | | 36 | | | | 2,180 | |
Microchip Technology, Inc. | | | 720 | | | | 64,469 | |
Micron Technology, Inc. | | | 47 | | | | 2,960 | |
Microsoft Corp. | | | 591 | | | | 201,325 | |
MKS Instruments, Inc. | | | 3 | | | | 307 | |
Motorola Solutions, Inc. | | | 1 | | | | 165 | |
National Instruments Corp. | | | 1 | | | | 70 | |
nCino, Inc.(1) | | | 3 | | | | 82 | |
NCR Corp.(1) | | | 5 | | | | 126 | |
NetApp, Inc. | | | 5 | | | | 420 | |
Nutanix, Inc. - Class A(1) | | | 7 | | | | 208 | |
NXP Semiconductors NV | | | 263 | | | | 53,848 | |
Okta, Inc. - Class A(1) | | | 6 | | | | 418 | |
ON Semiconductor Corp.(1) | | | 18 | | | | 1,740 | |
Oracle Corp. | | | 911 | | | | 108,492 | |
PTC, Inc.(1) | | | 2 | | | | 315 | |
Pure Storage, Inc. - Class A(1) | | | 3 | | | | 96 | |
Qorvo, Inc.(1) | | | 55 | | | | 5,635 | |
QUALCOMM, Inc. | | | 1,250 | | | | 148,807 | |
Roper Technologies, Inc. | | | 5 | | | | 2,169 | |
Salesforce, Inc.(1) | | | 10 | | | | 2,100 | |
Samsung Electronics Co. Ltd. | | | 1,918 | | | | 105,622 | |
Seagate Technology Holdings Plc | | | 106 | | | | 6,546 | |
SentinelOne, Inc. - Class A(1) | | | 7 | | | | 105 | |
Skyworks Solutions, Inc. | | | 649 | | | | 71,821 | |
TD SYNNEX Corp. | | | 88 | | | | 8,316 | |
TE Connectivity Ltd. | | | 84 | | | | 11,840 | |
Teledyne Technologies, Inc.(1) | | | 2 | | | | 824 | |
Teradyne, Inc. | | | 1 | | | | 124 | |
Texas Instruments, Inc. | | | 686 | | | | 123,512 | |
Trimble, Inc.(1) | | | 11 | | | | 564 | |
Twilio, Inc. - Class A(1) | | | 6 | | | | 384 | |
Tyler Technologies, Inc.(1)(2) | | | 0 | | | | 180 | |
Ubiquiti, Inc.(2) | | | 0 | | | | 5 | |
UiPath, Inc. - Class A(1) | | | 4 | | | | 62 | |
Unity Software, Inc.(1) | | | 7 | | | | 323 | |
Universal Display Corp. | | | 1 | | | | 157 | |
VeriSign, Inc.(1) | | | 4 | | | | 830 | |
Viasat, Inc.(1) | | | 3 | | | | 132 | |
VMware, Inc. - Class A(1) | | | 33 | | | | 4,804 | |
Vontier Corp. | | | 4 | | | | 141 | |
Western Digital Corp.(1) | | | 14 | | | | 522 | |
Wolfspeed, Inc.(1) | | | 5 | | | | 298 | |
Zebra Technologies Corp. - Class A(1) | | | 2 | | | | 530 | |
Zoom Video Communications, Inc. - Class A(1) | | | 11 | | | | 716 | |
| | | | | | | | |
Total Information Technology | | | | 1,437,197 | |
| | | | | | | | |
Materials – 4.52% | | | | | | | | |
Air Products & Chemicals, Inc. | | | 268 | | | | 80,203 | |
Albemarle Corp. | | | 5 | | | | 1,114 | |
Alcoa Corp. | | | 8 | | | | 264 | |
Amcor Plc | | | 64 | | | | 641 | |
AptarGroup, Inc. | | | 3 | | | | 337 | |
Ardagh Group SA - Class A(1)(5) | | | 1 | | | | 7 | |
Ardagh Metal Packaging SA | | | 4 | | | | 16 | |
Ashland, Inc. | | | 2 | | | | 186 | |
Avery Dennison Corp. | | | 2 | | | | 397 | |
Axalta Coating Systems Ltd.(1) | | | 2,310 | | | | 75,801 | |
Ball Corp. | | | 13 | | | | 765 | |
Berry Global Group, Inc. | | | 147 | | | | 9,469 | |
Celanese Corp. - Class A | | | 4 | | | | 488 | |
CF Industries Holdings, Inc. | | | 696 | | | | 48,295 | |
Chemours Co. | | | 6 | | | | 234 | |
Cleveland-Cliffs, Inc.(1) | | | 22 | | | | 371 | |
Corteva, Inc. | | | 30 | | | | 1,744 | |
CRH Plc - ADR | | | 1,344 | | | | 74,912 | |
Crown Holdings, Inc. | | | 5 | | | | 393 | |
Dow, Inc. | | | 30 | | | | 1,608 | |
DuPont de Nemours, Inc. | | | 667 | | | | 47,674 | |
Eagle Materials, Inc. | | | 1 | | | | 97 | |
Eastman Chemical Co. | | | 102 | | | | 8,574 | |
Ecolab, Inc. | | | 536 | | | | 100,122 | |
Element Solutions, Inc. | | | 2,830 | | | | 54,342 | |
FMC Corp. | | | 5 | | | | 473 | |
Freeport-McMoRan, Inc. | | | 61 | | | | 2,456 | |
Ginkgo Bioworks Holdings, Inc.(1) | | | 60 | | | | 111 | |
Graphic Packaging Holding Co. | | | 256 | | | | 6,155 | |
| | | | | | | | |
Huntsman Corp. | | | 301 | | | | 8,144 | |
Ingevity Corp.(1) | | | 87 | | | | 5,060 | |
International Flavors & Fragrances, Inc. | | | 156 | | | | 12,405 | |
International Paper Co. | | | 1,202 | | | | 38,222 | |
Knife River Corp.(1) | | | 482 | | | | 20,967 | |
Linde Plc | | | 309 | | | | 117,915 | |
Louisiana-Pacific Corp. | | | 3 | | | | 211 | |
LyondellBasell Industries NV - Class A | | | 84 | | | | 7,680 | |
Martin Marietta Materials, Inc. | | | 3 | | | | 1,216 | |
Mosaic Co. | | | 14 | | | | 494 | |
MP Materials Corp.(1) | | | 4 | | | | 101 | |
NewMarket Corp. | | | 10 | | | | 4,170 | |
Newmont Corp. | | | 34 | | | | 1,448 | |
Nucor Corp. | | | 11 | | | | 1,761 | |
Olin Corp. | | | 5 | | | | 281 | |
Packaging Corp. of America | | | 4 | | | | 499 | |
PPG Industries, Inc. | | | 8 | | | | 1,112 | |
Reliance Steel & Aluminum Co. | | | 48 | | | | 12,975 | |
Royal Gold, Inc. | | | 3 | | | | 310 | |
RPM International, Inc. | | | 102 | | | | 9,191 | |
Sealed Air Corp. | | | 3 | | | | 110 | |
Sherwin-Williams Co. | | | 2 | | | | 450 | |
Silgan Holdings, Inc. | | | 4 | | | | 171 | |
Sonoco Products Co. | | | 4 | | | | 255 | |
SSR Mining, Inc. | | | 9 | | | | 127 | |
Steel Dynamics, Inc. | | | 7 | | | | 746 | |
United States Steel Corp. | | | 10 | | | | 242 | |
Vulcan Materials Co. | | | 4 | | | | 994 | |
Westlake Corp. | | | 1 | | | | 168 | |
Westrock Co. | | | 224 | | | | 6,518 | |
| | | | | | | | |
Total Materials | | | | 771,192 | |
| | | | | | | | |
Real Estate – 2.72% | | | | | | | | |
Agree Realty Corp. | | | 4 | | | | 248 | |
Alexandria Real Estate Equities, Inc. | | | 7 | | | | 830 | |
American Assets Trust, Inc. | | | 152 | | | | 2,926 | |
American Homes 4 Rent - Class A | | | 14 | | | | 506 | |
American Tower Corp. | | | 263 | | | | 50,976 | |
Americold Realty Trust, Inc. | | | 12 | | | | 381 | |
Apartment Income REIT Corp. | | | 6 | | | | 230 | |
AvalonBay Communities, Inc. | | | 6 | | | | 1,128 | |
Boston Properties, Inc. | | | 7 | | | | 391 | |
Brandywine Realty Trust | | | 330 | | | | 1,536 | |
Brixmor Property Group, Inc. | | | 13 | | | | 296 | |
Camden Property Trust | | | 4 | | | | 484 | |
CBRE Group, Inc. - Class A(1) | | | 13 | | | | 1,067 | |
Corporate Office Properties Trust | | | 1,278 | | | | 30,344 | |
CoStar Group, Inc.(1) | | | 10 | | | | 875 | |
Cousins Properties, Inc. | | | 91 | | | | 2,072 | |
Crown Castle, Inc. | | | 17 | | | | 1,881 | |
CubeSmart | | | 10 | | | | 436 | |
Digital Realty Trust, Inc. | | | 13 | | | | 1,434 | |
EastGroup Properties, Inc. | | | 2 | | | | 320 | |
EPR Properties | | | 3 | | | | 142 | |
Equinix, Inc. | | | 2 | | | | 1,555 | |
Equity LifeStyle Properties, Inc. | | | 5 | | | | 341 | |
Equity Residential | | | 674 | | | | 44,454 | |
Essex Property Trust, Inc. | | | 3 | | | | 638 | |
Extra Space Storage, Inc. | | | 5 | | | | 800 | |
Federal Realty Investment Trust | | | 3 | | | | 336 | |
First Industrial Realty Trust, Inc. | | | 6 | | | | 310 | |
Gaming & Leisure Properties, Inc. | | | 11 | | | | 512 | |
Healthcare Realty Trust, Inc. - Class A | | | 16 | | | | 310 | |
Healthpeak Properties, Inc. | | | 24 | | | | 476 | |
Highwoods Properties, Inc. | | | 4 | | | | 107 | |
Host Hotels & Resorts, Inc. | | | 444 | | | | 7,478 | |
Howard Hughes Corp.(1) | | | 738 | | | | 58,265 | |
Invitation Homes, Inc. | | | 27 | | | | 925 | |
Iron Mountain, Inc. | | | 6 | | | | 354 | |
Jones Lang LaSalle, Inc.(1) | | | 2 | | | | 322 | |
Kilroy Realty Corp. | | | 5 | | | | 156 | |
Kimco Realty Corp. | | | 26 | | | | 515 | |
Lamar Advertising Co. - Class A | | | 1 | | | | 85 | |
Life Storage, Inc. | | | 4 | | | | 487 | |
Medical Properties Trust, Inc. | | | 232 | | | | 2,150 | |
Mid-America Apartment Communities, Inc. | | | 5 | | | | 771 | |
National Storage Affiliates Trust | | | 4 | | | | 126 | |
NNN REIT, Inc. | | | 8 | | | | 340 | |
Office Properties Income Trust | | | 132 | | | | 1,014 | |
Omega Healthcare Investors, Inc. | | | 186 | | | | 5,712 | |
Park Hotels & Resorts, Inc. | | | 9 | | | | 121 | |
Prologis, Inc. | | | 40 | | | | 4,850 | |
| | | | | | | | |
Public Storage | | | 176 | | | | 51,496 | |
Rayonier, Inc. | | | 727 | | | | 22,830 | |
Realty Income Corp. | | | 28 | | | | 1,686 | |
Regency Centers Corp. | | | 7 | | | | 458 | |
Rexford Industrial Realty, Inc. | | | 8 | | | | 442 | |
SBA Communications Corp. - Class A | | | 4 | | | | 955 | |
Simon Property Group, Inc. | | | 11 | | | | 1,250 | |
Spirit Realty Capital, Inc. | | | 6 | | | | 237 | |
STAG Industrial, Inc. | | | 8 | | | | 275 | |
Sun Communities, Inc. | | | 4 | | | | 535 | |
UDR, Inc. | | | 13 | | | | 568 | |
Ventas, Inc. | | | 17 | | | | 817 | |
VICI Properties, Inc. - Class A | | | 2,868 | | | | 90,151 | |
Vornado Realty Trust | | | 74 | | | | 1,338 | |
Welltower, Inc. | | | 82 | | | | 6,619 | |
Weyerhaeuser Co. | | | 1,513 | | | | 50,701 | |
WP Carey, Inc. | | | 9 | | | | 625 | |
Zillow Group, Inc. - Class A(1) | | | 3 | | | | 123 | |
Zillow Group, Inc. - Class C(1) | | | 7 | | | | 335 | |
| | | | | | | | |
Total Real Estate | | | | 463,454 | |
| | | | | | | | |
Utilities – 3.17% | | | | | | | | |
AES Corp. | | | 11 | | | | 230 | |
Alliant Energy Corp. | | | 11 | | | | 569 | |
Ameren Corp. | | | 218 | | | | 17,802 | |
American Electric Power Co., Inc. | | | 22 | | | | 1,851 | |
American Water Works Co., Inc. | | | 8 | | | | 1,208 | |
Atmos Energy Corp. | | | 6 | | | | 732 | |
Avangrid, Inc. | | | 3 | | | | 112 | |
Brookfield Renewable Corp. - Class A | | | 6 | | | | 175 | |
CenterPoint Energy, Inc. | | | 1,990 | | | | 58,020 | |
Clearway Energy, Inc. - Class A | | | 1 | | | | 40 | |
Clearway Energy, Inc. - Class C | | | 3 | | | | 100 | |
CMS Energy Corp. | | | 13 | | | | 736 | |
Consolidated Edison, Inc. | | | 15 | | | | 1,338 | |
Constellation Energy Corp. | | | 14 | | | | 1,280 | |
Dominion Energy, Inc. | | | 831 | | | | 43,061 | |
DTE Energy Co. | | | 9 | | | | 971 | |
Duke Energy Corp. | | | 33 | | | | 2,969 | |
Edison International | | | 16 | | | | 1,120 | |
Entergy Corp. | | | 604 | | | | 58,859 | |
Essential Utilities, Inc. | | | 10 | | | | 400 | |
Evergy, Inc. | | | 10 | | | | 562 | |
Eversource Energy | | | 15 | | | | 1,072 | |
Exelon Corp. | | | 1,310 | | | | 53,372 | |
FirstEnergy Corp. | | | 23 | | | | 903 | |
Hawaiian Electric Industries, Inc. | | | 5 | | | | 168 | |
IDACORP, Inc. | | | 2 | | | | 218 | |
National Fuel Gas Co. | | | 96 | | | | 4,920 | |
NextEra Energy, Inc. | | | 728 | | | | 54,048 | |
NiSource, Inc. | | | 277 | | | | 7,577 | |
NRG Energy, Inc. | | | 311 | | | | 11,628 | |
OGE Energy Corp. | | | 9 | | | | 310 | |
PG&E Corp.(1) | | | 367 | | | | 6,338 | |
Pinnacle West Capital Corp. | | | 764 | | | | 62,246 | |
PPL Corp. | | | 31 | | | | 833 | |
Public Service Enterprise Group, Inc. | | | 21 | | | | 1,328 | |
Sempra Energy | | | 224 | | | | 32,578 | |
Southern Co. | | | 1,332 | | | | 93,572 | |
UGI Corp. | | | 175 | | | | 4,714 | |
Vistra Corp. | | | 386 | | | | 10,142 | |
WEC Energy Group, Inc. | | | 13 | | | | 1,188 | |
Xcel Energy, Inc. | | | 24 | | | | 1,482 | |
| | | | | | | | |
Total Utilities | | | | 540,772 | |
| | | | | | | | |
Total Common Stocks (Cost: $12,013,646) | | | | 16,453,440 | |
| | | | | | | | |
CONVERTIBLE PREFERRED STOCKS – 0.09% | | | | | | | | |
Utilities – 0.09% | | | | | | | | |
NextEra Energy, Inc., 6.93% | | | 125 | | | | 5,672 | |
NiSource, Inc., 7.75% | | | 89 | | | | 9,070 | |
| | | | | | | | |
Total Utilities | | | | 14,742 | |
| | | | | | | | |
Total Convertible Preferred Stocks (Cost: $15,158) | | | | 14,742 | |
| | | | | | | | |
PREFERRED STOCKS – 0.31% | | | | | | | | |
Consumer Discretionary – 0.31% | | | | | | | | |
Dr Ing hc F Porsche AG(3) | | | 191 | | | | 23,771 | |
Volkswagen AG | | | 214 | | | | 28,823 | |
| | | | | | | | |
Total Consumer Discretionary | | | | 52,594 | |
| | | | | | | | |
Total Preferred Stocks (Cost: $51,615) | | | | 52,594 | |
| | | | | | | | |
| | | | | | | | |
SHORT-TERM INVESTMENTS – 3.02% | | | | | | | | |
Money Market Funds – 3.00% | | | | | | | | |
Goldman Sachs Financial Square Government Fund - Class I, 5.02%(4) | | | 511,846 | | | | 511,846 | |
| | | | | | | | |
Total Money Market Funds (Cost: $511,846) | | | | | | | 511,846 | |
| | | | | | | | |
| | |
| | | Principal
Amount
(000s) | | | Value
(000s) | |
Time Deposits – 0.02% | | | | | | | | |
Brown Brothers Harriman, 2.47% due 07/03/2023(2) | | SEK | 0 | | | | 0 | |
Skandinaviska Enskilda Banken AB, Stockholm, 2.62% due 07/03/2023 | | EUR | 2,190 | | | | 2,390 | |
Skandinaviska Enskilda Banken AB, Stockholm, 4.17% due 07/03/2023 | | GBP | 2 | | | | 3 | |
Sumitomo, Tokyo, 4.57% due 07/03/2023 | | $ | 443 | | | | 443 | |
| | | | | | | | |
Total Time Deposits (Cost: $2,836) | | | | | | | 2,836 | |
| | | | | | | | |
Total Short-Term Investments (Cost: $514,682) | | | | 514,682 | |
| | | | | | | | |
TOTAL INVESTMENTS IN SECURITIES – 99.90%
(Cost: $12,595,101) | | | | | | | 17,035,458 | |
| | | | | | | | |
OTHER ASSETS IN EXCESS OF LIABILITIES – 0.10% | | | | | | | 17,292 | |
| | | | | | | | |
TOTAL NET ASSETS – 100.00% | | | | | | $ | 17,052,750 | |
| | | | | | | | |
Percentages are stated as a percent of net assets.
Principal amounts are denominated in the currency in which the security was purchased.
ADR American Depositary Receipt
REIT Real Estate Investment Trust
EUR Euro
GBP British Pound
SEK Swedish Krona
| (1) | Non-income producing security. |
| (2) | A zero balance may reflect actual amounts rounding to less than one thousand. |
| (3) | Security was purchased exempt from registration in the U.S. pursuant to Rule 144(A) under the Securities Act of 1933. The value of these securities totals $23,771, which represents 0.14% of total net assets. |
| (4) | Represents annualized seven-day yield as of the close of the reporting period. |
| (5) | Security that is categorized as Level 3 per the Trust’s fair value hierarchy. The value of these securities totals $7, which represents 0.00% of total net assets. |
The accompanying notes are an integral part of this Schedule of Investments.
Open Futures Contracts
| | | | | | | | | | | | | | | | |
Number of Contracts
Purchased | | Reference Entity | | Expiration Date | | Notional
Amount | | | Value | | | Unrealized
Appreciation/
(Depreciation) | |
| 22 | | S&P 500 E-mini Future | | Sep. 2023 | | $ | 4,829 | | | $ | 4,937 | | | $ | 108 | |
| | | | | | | | | | | | | | | | |
| | | | | | | | | | | | | | $ | 108 | |
| | | | | | | | | | | | | | | | |
Bridge Builder Tax Managed Large Cap Fund
Schedule of Investments
June 30, 2023
(Amounts in thousands, except number of contracts)
| | | | | | | | |
| | | Shares
(000s) | | | Value
(000s) | |
COMMON STOCKS – 97.78% | | | | | | | | |
Communication Services – 8.75% | | | | | | | | |
Activision Blizzard, Inc.(1) | | | 77 | | | $ | 6,521 | |
Alphabet, Inc. - Class A(1) | | | 507 | | | | 60,648 | |
Alphabet, Inc. - Class C(1) | | | 244 | | | | 29,468 | |
AT&T, Inc. | | | 64 | | | | 1,027 | |
Comcast Corp. - Class A | | | 495 | | | | 20,578 | |
Electronic Arts, Inc. | | | 89 | | | | 11,491 | |
IAC, Inc.(1) | | | 30 | | | | 1,853 | |
Live Nation Entertainment, Inc.(1) | | | 13 | | | | 1,173 | |
Meta Platforms, Inc. - Class A(1) | | | 112 | | | | 32,127 | |
Netflix, Inc.(1) | | | 38 | | | | 16,696 | |
Omnicom Group, Inc. | | | 8 | | | | 795 | |
Spotify Technology SA(1) | | | 31 | | | | 4,907 | |
T-Mobile U.S., Inc.(1) | | | 140 | | | | 19,424 | |
Trade Desk, Inc. - Class A(1) | | | 29 | | | | 2,251 | |
Verizon Communications, Inc. | | | 186 | | | | 6,908 | |
Walt Disney Co.(1) | | | 53 | | | | 4,741 | |
Warner Bros Discovery, Inc.(1) | | | 41 | | | | 515 | |
| | | | | | | | |
Total Communication Services | | | | 221,123 | |
| | | | | |
Consumer Discretionary – 9.53% | | | | | | | | |
Advance Auto Parts, Inc. | | | 6 | | | | 429 | |
Amazon.com, Inc.(1) | | | 553 | | | | 72,028 | |
Aptiv Plc(1) | | | 92 | | | | 9,353 | |
Aramark | | | 292 | | | | 12,569 | |
AutoZone, Inc.(1)(2) | | | 0 | | | | 476 | |
Bath & Body Works, Inc. | | | 28 | | | | 1,043 | |
Best Buy Co., Inc. | | | 1 | | | | 102 | |
Booking Holdings, Inc.(1) | | | 3 | | | | 9,060 | |
BorgWarner, Inc. | | | 2 | | | | 78 | |
Caesars Entertainment, Inc.(1) | | | 8 | | | | 430 | |
Carnival Corp.(1) | | | 207 | | | | 3,900 | |
Chipotle Mexican Grill, Inc. - Class A(1) | | | 3 | | | | 6,404 | |
Coupang, Inc. - Class A(1) | | | 124 | | | | 2,163 | |
Darden Restaurants, Inc.(2) | | | 0 | | | | 1 | |
Domino’s Pizza, Inc. | | | 2 | | | | 626 | |
DR Horton, Inc. | | | 8 | | | | 932 | |
eBay, Inc. | | | 15 | | | | 655 | |
Ford Motor Co. | | | 77 | | | | 1,163 | |
General Motors Co. | | | 65 | | | | 2,510 | |
Hilton Worldwide Holdings, Inc. | | | 3 | | | | 506 | |
Home Depot, Inc. | | | 42 | | | | 12,954 | |
Las Vegas Sands Corp.(1) | | | 257 | | | | 14,903 | |
Lithia Motors, Inc. - Class A | | | 24 | | | | 7,260 | |
LKQ Corp. | | | 10 | | | | 592 | |
Lowe’s Companies, Inc. | | | 6 | | | | 1,386 | |
| | | | | | | | |
Lululemon Athletica, Inc.(1) | | | 6 | | | | 2,432 | |
Marriott International, Inc. - Class A | | | 15 | | | | 2,789 | |
Marriott Vacations Worldwide Corp. | | | 41 | | | | 5,080 | |
McDonald’s Corp. | | | 7 | | | | 2,006 | |
MGM Resorts International | | | 164 | | | | 7,195 | |
NIKE, Inc. - Class B | | | 34 | | | | 3,746 | |
Norwegian Cruise Line Holdings Ltd.(1) | | | 30 | | | | 653 | |
O’Reilly Automotive, Inc.(1) | | | 1 | | | | 992 | |
Peloton Interactive, Inc. - Class A(1) | | | 64 | | | | 489 | |
Pool Corp. | | | 1 | | | | 467 | |
PulteGroup, Inc. | | | 3 | | | | 225 | |
Ralph Lauren Corp. - Class A | | | 1 | | | | 140 | |
Rivian Automotive, Inc. - Class A(1) | | | 124 | | | | 2,063 | |
Ross Stores, Inc. | | | 99 | | | | 11,093 | |
SeaWorld Entertainment, Inc.(1) | | | 162 | | | | 9,072 | |
Starbucks Corp. | | | 8 | | | | 806 | |
Tapestry, Inc. | | | 9 | | | | 382 | |
Tesla, Inc.(1) | | | 38 | | | | 10,021 | |
TJX Companies, Inc. | | | 228 | | | | 19,349 | |
Ulta Beauty, Inc.(1)(2) | | | 0 | | | | 113 | |
| | | | | | | | |
Total Consumer Discretionary | | | | 240,636 | |
| | | | | |
Consumer Staples – 4.02% | | | | | | | | |
Altria Group, Inc. | | | 18 | | | | 825 | |
Campbell Soup Co. | | | 10 | | | | 435 | |
Coca-Cola Co. | | | 161 | | | | 9,723 | |
Colgate-Palmolive Co. | | | 5 | | | | 369 | |
Conagra Brands, Inc. | | | 1 | | | | 23 | |
Costco Wholesale Corp. | | | 4 | | | | 2,143 | |
Dollar General Corp. | | | 42 | | | | 7,208 | |
Dollar Tree, Inc.(1) | | | 2 | | | | 248 | |
General Mills, Inc. | | | 14 | | | | 1,036 | |
Hershey Co. | | | 1 | | | | 128 | |
J.M. Smucker Co.(2) | | | 0 | | | | 36 | |
Kellogg Co. | | | 6 | | | | 414 | |
Kimberly-Clark Corp. | | | 4 | | | | 521 | |
Kraft Heinz Co. | | | 8 | | | | 297 | |
Kroger Co. | | | 4 | | | | 165 | |
Mondelez International, Inc. - Class A | | | 122 | | | | 8,926 | |
Monster Beverage Corp.(1) | | | 138 | | | | 7,921 | |
PepsiCo, Inc. | | | 67 | | | | 12,424 | |
Philip Morris International, Inc. | | | 118 | | | | 11,527 | |
Procter & Gamble Co. | | | 96 | | | | 14,557 | |
Target Corp. | | | 3 | | | | 450 | |
Walmart, Inc. | | | 142 | | | | 22,265 | |
| | | | | | | | |
Total Consumer Staples | | | | 101,641 | |
| | | | | |
Energy – 4.42% | | | | | | | | |
Baker Hughes Co. - Class A | | | 31 | | | | 979 | |
Chevron Corp. | | | 107 | | | | 16,835 | |
Coterra Energy, Inc. | | | 28 | | | | 718 | |
Diamondback Energy, Inc. | | | 3 | | | | 432 | |
Enbridge, Inc. | | | 170 | | | | 6,321 | |
EOG Resources, Inc. | | | 4 | | | | 462 | |
| | | | | | | | |
EQT Corp. | | | 119 | | | | 4,886 | |
Exxon Mobil Corp. | | | 158 | | | | 16,951 | |
Halliburton Co. | | | 273 | | | | 8,994 | |
Hess Corp. | | | 117 | | | | 15,845 | |
Kinder Morgan, Inc. | | | 253 | | | | 4,362 | |
Marathon Petroleum Corp. | | | 4 | | | | 509 | |
Occidental Petroleum Corp. | | | 4 | | | | 226 | |
ONEOK, Inc. | | | 1 | | | | 73 | |
Phillips 66 | | | 96 | | | | 9,193 | |
Pioneer Natural Resources Co. | | | 110 | | | | 22,809 | |
Schlumberger NV | | | 5 | | | | 270 | |
Targa Resources Corp. | | | 5 | | | | 364 | |
Valero Energy Corp. | | | 6 | | | | 710 | |
Vitesse Energy, Inc. | | | 23 | | | | 516 | |
Williams Companies, Inc. | | | 10 | | | | 317 | |
| | | | | | | | |
Total Energy | | | | 111,772 | |
| | | | | |
Financials – 13.44% | | | | | | | | |
Affirm Holdings, Inc. - Class A(1) | | | 123 | | | | 1,890 | |
Allstate Corp. | | | 72 | | | | 7,894 | |
American Express Co. | | | 40 | | | | 7,011 | |
American International Group, Inc. | | | 159 | | | | 9,130 | |
Ameriprise Financial, Inc.(2) | | | 0 | | | | 33 | |
Aon Plc - Class A | | | 4 | | | | 1,248 | |
Arthur J. Gallagher & Co.(2) | | | 0 | | | | 61 | |
Axis Capital Holdings Ltd. | | | 131 | | | | 7,071 | |
Bank of America Corp. | | | 303 | | | | 8,702 | |
Berkshire Hathaway, Inc. - Class B(1) | | | 138 | | | | 46,959 | |
BlackRock, Inc. - Class A | | | 1 | | | | 793 | |
Brown & Brown, Inc. | | | 10 | | | | 694 | |
Capital One Financial Corp. | | | 26 | | | | 2,868 | |
Charles Schwab Corp. | | | 14 | | | | 766 | |
Chubb Ltd. | | | 50 | | | | 9,637 | |
Citigroup, Inc. | | | 22 | | | | 1,018 | |
CME Group, Inc. - Class A | | | 36 | | | | 6,704 | |
Discover Financial Services | | | 3 | | | | 399 | |
FactSet Research Systems, Inc.(2) | | | 0 | | | | 74 | |
Fidelity National Information Services, Inc. | | | 183 | | | | 10,008 | |
Fifth Third Bancorp | | | 50 | | | | 1,320 | |
Fiserv, Inc.(1) | | | 166 | | | | 20,982 | |
Global Payments, Inc. | | | 58 | | | | 5,707 | |
Globe Life, Inc.(2) | | | 0 | | | | 1 | |
Goldman Sachs Group, Inc. | | | 1 | | | | 291 | |
Hartford Financial Services Group, Inc. | | | 54 | | | | 3,914 | |
Intercontinental Exchange, Inc. | | | 52 | | | | 5,895 | |
Invesco Ltd. | | | 26 | | | | 442 | |
Jefferies Financial Group, Inc. | | | 294 | | | | 9,755 | |
JPMorgan Chase & Co. | | | 167 | | | | 24,225 | |
Lincoln National Corp. | | | 39 | | | | 1,011 | |
M&T Bank Corp. | | | 53 | | | | 6,518 | |
Marsh & McLennan Companies, Inc. | | | 3 | | | | 645 | |
Mastercard, Inc. - Class A | | | 52 | | | | 20,466 | |
Moody’s Corp. | | | 2 | | | | 727 | |
| | | | | | | | |
MSCI, Inc. - Class A | | | 1 | | | | 583 | |
Nasdaq, Inc. | | | 8 | | | | 383 | |
Northern Trust Corp. | | | 53 | | | | 3,962 | |
PayPal Holdings, Inc.(1) | | | 20 | | | | 1,348 | |
PNC Financial Services Group, Inc. | | | 6 | | | | 725 | |
Progressive Corp. | | | 72 | | | | 9,500 | |
Prudential Financial, Inc. | | | 21 | | | | 1,829 | |
Raymond James Financial, Inc.(2) | | | 0 | | | | 1 | |
S&P Global, Inc. | | | 3 | | | | 1,058 | |
State Street Corp. | | | 2 | | | | 119 | |
T Rowe Price Group, Inc. | | | 12 | | | | 1,375 | |
Tradeweb Markets, Inc. - Class A | | | 80 | | | | 5,478 | |
Travelers Companies, Inc. | | | 85 | | | | 14,807 | |
U.S. Bancorp | | | 386 | | | | 12,763 | |
Visa, Inc. - Class A | | | 172 | | | | 40,930 | |
Wells Fargo & Co. | | | 185 | | | | 7,902 | |
Willis Towers Watson Plc | | | 50 | | | | 11,775 | |
WR Berkley Corp.(2) | | | 0 | | | | 27 | |
| | | | | | | | |
Total Financials | | | | 339,424 | |
| | | | | |
Healthcare – 13.82% | | | | | | | | |
Abbott Laboratories | | | 9 | | | | 991 | |
AbbVie, Inc. | | | 42 | | | | 5,635 | |
Align Technology, Inc.(1) | | | 3 | | | | 1,138 | |
AmerisourceBergen Corp. - Class A(2) | | | 0 | | | | 73 | |
Amgen, Inc. | | | 5 | | | | 1,077 | |
Avantor, Inc.(1) | | | 384 | | | | 7,884 | |
Baxter International, Inc. | | | 19 | | | | 859 | |
Becton Dickinson & Co. | | | 71 | | | | 18,839 | |
Bio-Rad Laboratories, Inc. - Class A(1) | | | 1 | | | | 278 | |
Bio-Techne Corp. | | | 3 | | | | 265 | |
Boston Scientific Corp.(1) | | | 11 | | | | 594 | |
Bristol Myers Squibb Co. | | | 19 | | | | 1,183 | |
Catalent, Inc.(1) | | | 14 | | | | 604 | |
Charles River Laboratories International, Inc.(1) | | | 5 | | | | 985 | |
Cigna Group | | | 60 | | | | 16,810 | |
CVS Health Corp. | | | 98 | | | | 6,754 | |
Danaher Corp. | | | 2 | | | | 474 | |
DaVita, Inc.(1) | | | 9 | | | | 919 | |
DexCom, Inc.(1) | | | 3 | | | | 406 | |
Edwards Lifesciences Corp.(1) | | | 12 | | | | 1,164 | |
Elevance Health, Inc. | | | 22 | | | | 9,929 | |
Eli Lilly & Co. | | | 55 | | | | 25,763 | |
GE HealthCare Technologies, Inc. | | | 2 | | | | 148 | |
Gilead Sciences, Inc. | | | 9 | | | | 678 | |
HCA Healthcare, Inc. | | | 13 | | | | 4,030 | |
Hologic, Inc.(1) | | | 27 | | | | 2,221 | |
Humana, Inc. | | | 33 | | | | 14,610 | |
IDEXX Laboratories, Inc.(1) | | | 2 | | | | 852 | |
Illumina, Inc.(1) | | | 2 | | | | 388 | |
Incyte Corp.(1) | | | 1 | | | | 49 | |
Insulet Corp.(1) | | | 10 | | | | 2,956 | |
Intuitive Surgical, Inc.(1) | | | 46 | | | | 15,703 | |
| | | | | | | | |
IQVIA Holdings, Inc.(1) | | | 4 | | | | 1,002 | |
Johnson & Johnson | | | 128 | | | | 21,220 | |
Laboratory Corp. of America Holdings | | | 2 | | | | 562 | |
Legend Biotech Corp. - ADR(1) | | | 38 | | | | 2,643 | |
LivaNova Plc(1) | | | 85 | | | | 4,358 | |
McKesson Corp. | | | 3 | | | | 1,268 | |
Medtronic Plc | | | 118 | | | | 10,421 | |
Merck & Co., Inc. | | | 295 | | | | 33,984 | |
Moderna, Inc.(1) | | | 4 | | | | 431 | |
Penumbra, Inc.(1) | | | 8 | | | | 2,687 | |
Perrigo Co. Plc | | | 236 | | | | 7,995 | |
Pfizer, Inc. | | | 217 | | | | 7,978 | |
Regeneron Pharmaceuticals, Inc.(1) | | | 1 | | | | 682 | |
ResMed, Inc. | | | 4 | | | | 785 | |
Stryker Corp. | | | 80 | | | | 24,270 | |
Teleflex, Inc.(2) | | | 0 | | | | 115 | |
Thermo Fisher Scientific, Inc. | | | 30 | | | | 15,881 | |
UnitedHealth Group, Inc. | | | 127 | | | | 61,249 | |
Vertex Pharmaceuticals, Inc.(1) | | | 18 | | | | 6,252 | |
Viatris, Inc. | | | 11 | | | | 114 | |
Zoetis, Inc. - Class A | | | 5 | | | | 880 | |
| | | | | | | | |
Total Healthcare | | | | 349,036 | |
| | | | | |
Industrials – 10.08% | | | | | | | | |
AECOM | | | 132 | | | | 11,207 | |
AerCap Holdings NV(1) | | | 155 | | | | 9,869 | |
AMETEK, Inc. | | | 3 | | | | 532 | |
Automatic Data Processing, Inc. | | | 61 | | | | 13,418 | |
Boeing Co.(1) | | | 6 | | | | 1,332 | |
BWX Technologies, Inc. | | | 190 | | | | 13,600 | |
CACI International, Inc. - Class A(1) | | | 31 | | | | 10,605 | |
Canadian Pacific Kansas City Ltd. | | | 72 | | | | 5,800 | |
Caterpillar, Inc. | | | 2 | | | | 556 | |
Ceridian HCM Holding, Inc.(1) | | | 2 | | | | 112 | |
CH Robinson Worldwide, Inc. | | | 11 | | | | 1,069 | |
Copart, Inc.(1) | | | 16 | | | | 1,473 | |
CSX Corp. | | | 41 | | | | 1,396 | |
Cummins, Inc.(2) | | | 0 | | | | 50 | |
Deere & Co. | | | 16 | | | | 6,511 | |
Delta Air Lines, Inc.(1) | | | 14 | | | | 666 | |
Dover Corp. | | | 3 | | | | 468 | |
Eaton Corp. Plc | | | 48 | | | | 9,627 | |
Emerson Electric Co. | | | 53 | | | | 4,746 | |
Fastenal Co. | | | 2 | | | | 94 | |
FedEx Corp. | | | 1 | | | | 260 | |
Generac Holdings, Inc.(1) | | | 5 | | | | 732 | |
General Dynamics Corp.(2) | | | 0 | | | | 60 | |
General Electric Co. | | | 10 | | | | 1,080 | |
Honeywell International, Inc. | | | 88 | | | | 18,324 | |
Illinois Tool Works, Inc. | | | 5 | | | | 1,178 | |
Ingersoll Rand, Inc. | | | 133 | | | | 8,673 | |
Jacobs Solutions, Inc. | | | 12 | | | | 1,419 | |
JB Hunt Transport Services, Inc. | | | 62 | | | | 11,257 | |
| | | | | | | | |
Lockheed Martin Corp. | | | 3 | | | | 1,398 | |
MDU Resources Group, Inc. | | | 306 | | | | 6,402 | |
Norfolk Southern Corp. | | | 3 | | | | 678 | |
Northrop Grumman Corp. | | | 4 | | | | 1,613 | |
Old Dominion Freight Line, Inc. | | | 7 | | | | 2,685 | |
Otis Worldwide Corp. | | | 1 | | | | 77 | |
PACCAR, Inc. | | | 7 | | | | 600 | |
Parker-Hannifin Corp.(2) | | | 0 | | | | 190 | |
Paychex, Inc. | | | 6 | | | | 699 | |
Paylocity Holding Corp.(1) | | | 11 | | | | 1,983 | |
Pentair Plc | | | 21 | | | | 1,362 | |
Quanta Services, Inc.(2) | | | 0 | | | | 68 | |
Raytheon Technologies Corp. | | | 276 | | | | 27,012 | |
Republic Services, Inc. - Class A | | | 4 | | | | 574 | |
Rockwell Automation, Inc. | | | 1 | | | | 459 | |
Southwest Airlines Co. | | | 271 | | | | 9,818 | |
Stanley Black & Decker, Inc. | | | 96 | | | | 9,007 | |
Textron, Inc.(2) | | | 0 | | | | 0 | |
Trane Technologies Plc(2) | | | 0 | | | | 34 | |
Union Pacific Corp. | | | 18 | | | | 3,626 | |
United Parcel Service, Inc. - Class B | | | 69 | | | | 12,313 | |
Vertiv Holdings Co. - Class A | | | 961 | | | | 23,796 | |
Waste Management, Inc. | | | 81 | | | | 13,992 | |
Westinghouse Air Brake Technologies Corp.(2) | | | 0 | | | | 1 | |
WW Grainger, Inc.(2) | | | 0 | | | | 115 | |
| | | | | | | | |
Total Industrials | | | | 254,616 | |
| | | | | |
Information Technology – 24.85% | | | | | | | | |
Accenture Plc - Class A | | | 19 | | | | 5,780 | |
Adobe, Inc.(1) | | | 38 | | | | 18,778 | |
Advanced Micro Devices, Inc.(1) | | | 52 | | | | 5,911 | |
Akamai Technologies, Inc.(1) | | | 14 | | | | 1,299 | |
Amphenol Corp. - Class A | | | 116 | | | | 9,817 | |
Analog Devices, Inc. | | | 8 | | | | 1,496 | |
ANSYS, Inc.(1) | | | 3 | | | | 865 | |
Apple, Inc. | | | 718 | | | | 139,233 | |
Applied Materials, Inc. | | | 7 | | | | 1,001 | |
Arista Networks, Inc.(1) | | | 66 | | | | 10,720 | |
ASML Holding NV - Class REG | | | 32 | | | | 23,523 | |
Atlassian Corp. - Class A(1) | | | 24 | | | | 3,950 | |
Autodesk, Inc.(1) | | | 4 | | | | 807 | |
Broadcom, Inc. | | | 23 | | | | 20,366 | |
Cadence Design Systems, Inc.(1) | | | 37 | | | | 8,613 | |
CDW Corp. | | | 1 | | | | 117 | |
Cisco Systems, Inc. | | | 23 | | | | 1,209 | |
Cognizant Technology Solutions Corp. - Class A | | | 101 | | | | 6,581 | |
DXC Technology Co.(1) | | | 17 | | | | 462 | |
Dynatrace, Inc.(1) | | | 76 | | | | 3,900 | |
First Solar, Inc.(1) | | | 3 | | | | 489 | |
Fortinet, Inc.(1) | | | 24 | | | | 1,807 | |
Hewlett Packard Enterprise Co. | | | 8 | | | | 128 | |
Intel Corp. | | | 30 | | | | 990 | |
Intuit, Inc. | | | 47 | | | | 21,734 | |
| | | | | | | | |
Lam Research Corp. | | | 2 | | | | 1,076 | |
Marvell Technology, Inc. | | | 116 | | | | 6,925 | |
Microchip Technology, Inc. | | | 114 | | | | 10,212 | |
Micron Technology, Inc. | | | 11 | | | | 715 | |
Microsoft Corp. | | | 525 | | | | 178,876 | |
MongoDB, Inc. - Class A(1) | | | 11 | | | | 4,617 | |
Motorola Solutions, Inc. | | | 4 | | | | 1,215 | |
NVIDIA Corp. | | | 130 | | | | 54,857 | |
NXP Semiconductors NV | | | 2 | | | | 453 | |
ON Semiconductor Corp.(1) | | | 5 | | | | 451 | |
Oracle Corp. | | | 241 | | | | 28,678 | |
QUALCOMM, Inc. | | | 98 | | | | 11,697 | |
Roper Technologies, Inc.(2) | | | 0 | | | | 123 | |
Salesforce, Inc.(1) | | | 44 | | | | 9,217 | |
ServiceNow, Inc.(1) | | | 19 | | | | 10,448 | |
Skyworks Solutions, Inc. | | | 99 | | | | 10,988 | |
Synopsys, Inc.(1) | | | 2 | | | | 854 | |
TE Connectivity Ltd. | | | 7 | | | | 1,023 | |
Teledyne Technologies, Inc.(1) | | | 8 | | | | 3,256 | |
Teradyne, Inc. | | | 1 | | | | 103 | |
Texas Instruments, Inc. | | | 7 | | | | 1,314 | |
Trimble, Inc.(1) | | | 22 | | | | 1,163 | |
| | | | | | | | |
Total Information Technology | | | | 627,837 | |
| | | | | |
Materials – 4.93% | | | | | | | | |
Air Products & Chemicals, Inc. | | | 82 | | | | 24,553 | |
Albemarle Corp. | | | 2 | | | | 482 | |
Amcor Plc | | | 23 | | | | 231 | |
ArcelorMittal SA | | | 222 | | | | 6,068 | |
Axalta Coating Systems Ltd.(1) | | | 393 | | | | 12,892 | |
Ball Corp. | | | 89 | | | | 5,171 | |
Corteva, Inc. | | | 5 | | | | 284 | |
CRH Plc - ADR | | | 230 | | | | 12,829 | |
Dow, Inc. | | | 9 | | | | 500 | |
DuPont de Nemours, Inc. | | | 110 | | | | 7,851 | |
Ecolab, Inc. | | | 34 | | | | 6,301 | |
Element Solutions, Inc. | | | 478 | | | | 9,177 | |
Freeport-McMoRan, Inc. | | | 10 | | | | 407 | |
International Flavors & Fragrances, Inc. | | | 15 | | | | 1,232 | |
Knife River Corp.(1) | | | 76 | | | | 3,325 | |
Linde Plc | | | 8 | | | | 3,049 | |
LyondellBasell Industries NV - Class A | | | 11 | | | | 1,010 | |
Martin Marietta Materials, Inc.(2) | | | 0 | | | | 48 | |
Newmont Corp. | | | 8 | | | | 343 | |
Nucor Corp. | | | 5 | | | | 849 | |
PPG Industries, Inc. | | | 83 | | | | 12,274 | |
Sherwin-Williams Co. | | | 26 | | | | 6,784 | |
Vulcan Materials Co. | | | 38 | | | | 8,493 | |
Westrock Co. | | | 17 | | | | 489 | |
| | | | | | | | |
Total Materials | | | | 124,642 | |
| | | | | |
Real Estate – 1.85% | | | | | | | | |
American Tower Corp. | | | 51 | | | | 9,807 | |
AvalonBay Communities, Inc. | | | 5 | | | | 916 | |
| | | | | | | | |
Boston Properties, Inc. | | | 22 | | | | 1,265 | |
Camden Property Trust | | | 4 | | | | 421 | |
CBRE Group, Inc. - Class A(1) | | | 1 | | | | 84 | |
Corporate Office Properties Trust | | | 215 | | | | 5,097 | |
CoStar Group, Inc.(1) | | | 10 | | | | 883 | |
Equinix, Inc. | | | 1 | | | | 649 | |
Equity Residential | | | 18 | | | | 1,165 | |
Healthpeak Properties, Inc. | | | 48 | | | | 956 | |
Howard Hughes Corp.(1) | | | 109 | | | | 8,586 | |
Prologis, Inc. | | | 8 | | | | 942 | |
Realty Income Corp. | | | 8 | | | | 503 | |
Simon Property Group, Inc. | | | 3 | | | | 397 | |
UDR, Inc.(2) | | | 0 | | | | 0 | |
VICI Properties, Inc. - Class A | | | 481 | | | | 15,112 | |
| | | | | | | | |
Total Real Estate | | | | 46,783 | |
| | | | | |
Utilities – 2.09% | | | | | | | | |
Ameren Corp. | | | 9 | | | | 701 | |
American Water Works Co., Inc. | | | 3 | | | | 412 | |
CenterPoint Energy, Inc. | | | 326 | | | | 9,508 | |
CMS Energy Corp.(2) | | | 0 | | | | 0 | |
Consolidated Edison, Inc. | | | 8 | | | | 760 | |
Dominion Energy, Inc. | | | 23 | | | | 1,195 | |
DTE Energy Co. | | | 2 | | | | 239 | |
Duke Energy Corp. | | | 10 | | | | 897 | |
Entergy Corp. | | | 83 | | | | 8,075 | |
Eversource Energy | | | 15 | | | | 1,066 | |
Exelon Corp. | | | 212 | | | | 8,627 | |
NextEra Energy, Inc. | | | 46 | | | | 3,392 | |
NiSource, Inc. | | | 6 | | | | 167 | |
PG&E Corp.(1) | | | 24 | | | | 412 | |
Pinnacle West Capital Corp. | | | 134 | | | | 10,911 | |
PPL Corp. | | | 13 | | | | 348 | |
Sempra Energy | | | 19 | | | | 2,757 | |
Southern Co. | | | 19 | | | | 1,362 | |
WEC Energy Group, Inc. | | | 10 | | | | 883 | |
Xcel Energy, Inc. | | | 18 | | | | 1,108 | |
| | | | | | | | |
Total Utilities | | | | 52,820 | |
| | | | | |
Total Common Stocks (Cost: $2,105,484) | | | | 2,470,330 | |
| | | | | | | | |
SHORT-TERM INVESTMENTS – 2.37% | | | | | | | | |
Money Market Funds – 2.37% | | | | | | | | |
Goldman Sachs Financial Square Government Fund - Class I, 5.02%(3) | | | 59,767 | | | | 59,767 | |
| | | | | | | | |
Total Money Market Funds (Cost: $59,767) | | | | | | | 59,767 | |
| | | | | | | | |
Total Short-Term Investments (Cost: $59,767) | | | | | | | 59,767 | |
| | | | | |
TOTAL INVESTMENTS IN SECURITIES – 100.15%
(Cost: $2,165,251) | | | | | | | 2,530,097 | |
| | | | | | | | |
LIABILITIES IN EXCESS OF OTHER ASSETS – (0.15)% | | | | | | | (3,873 | ) |
| | | | | | | | |
TOTAL NET ASSETS – 100.00% | | | | | | $ | 2,526,224 | |
| | | | | | | | |
Percentages are stated as a percent of net assets.
ADR American Depositary Receipt
| (1) | Non-income producing security. |
| (2) | A zero balance may reflect actual amounts rounding to less than one thousand. |
| (3) | Represents annualized seven-day yield as of the close of the reporting period. |
The accompanying notes are an integral part of this Schedule of Investments.
Bridge Builder Small/Mid Cap Growth Fund
Schedule of Investments
June 30, 2023
(Amounts in thousands, except number of contracts)
| | | | | | | | |
| | | Shares
(000s) | | | Value
(000s) | |
COMMON STOCKS – 97.14% | | | | | | | | |
Communication Services – 2.73% | | | | | | | | |
Anterix, Inc.(1) | | | 3 | | | $ | 100 | |
AST SpaceMobile, Inc. - Class A(1) | | | 11 | | | | 50 | |
Bandwidth, Inc. - Class A(1) | | | 1 | | | | 13 | |
Boston Omaha Corp. - Class A(1)(2) | | | 0 | | | | 4 | |
Cable One, Inc. | | | 14 | | | | 9,062 | |
Cargurus, Inc. - Class A(1) | | | 17 | | | | 396 | |
Cars.com, Inc.(1) | | | 12 | | | | 238 | |
Charge Enterprises, Inc.(1) | | | 24 | | | | 23 | |
Cinemark Holdings, Inc.(1) | | | 17 | | | | 272 | |
Cogent Communications Holdings, Inc. | | | 5 | | | | 330 | |
Consolidated Communications Holdings, Inc.(1) | | | 1 | | | | 4 | |
Daily Journal Corp.(1)(2) | | | 0 | | | | 11 | |
Electronic Arts, Inc. | | | 63 | | | | 8,214 | |
Endeavor Group Holdings, Inc. - Class A(1) | | | 310 | | | | 7,423 | |
Entravision Communications Corp. - Class A | | | 10 | | | | 46 | |
Eventbrite, Inc. - Class A(1) | | | 12 | | | | 118 | |
EverQuote, Inc. - Class A(1) | | | 4 | | | | 24 | |
EW Scripps Co. - Class A(1) | | | 5 | | | | 45 | |
Gambling.com Group Ltd.(1) | | | 2 | | | | 18 | |
Globalstar, Inc.(1) | | | 106 | | | | 115 | |
Gogo, Inc.(1) | | | 1 | | | | 19 | |
Gray Television, Inc. | | | 1 | | | | 9 | |
Grindr, Inc.(1) | | | 7 | | | | 40 | |
IDT Corp. - Class B(1) | | | 2 | | | | 53 | |
IMAX Corp.(1) | | | 8 | | | | 141 | |
Integral Ad Science Holding Corp.(1) | | | 7 | | | | 120 | |
Iridium Communications, Inc. | | | 328 | | | | 20,397 | |
John Wiley & Sons, Inc. - Class A | | | 106 | | | | 3,591 | |
Liberty Broadband Corp. - Class A(1) | | | 1 | | | | 46 | |
Liberty Broadband Corp. - Class C(1) | | | 3 | | | | 274 | |
Liberty Media Corp.-Liberty Braves - Class A(1) | | | 2 | | | | 76 | |
Liberty Media Corp.-Liberty Braves - Class C(1) | | | 7 | | | | 262 | |
Liberty Media Corp.-Liberty Formula One - Class C(1) | | | 237 | | | | 17,811 | |
Lions Gate Entertainment Corp. - Class A(1) | | | 8 | | | | 67 | |
Lions Gate Entertainment Corp. - Class B(1) | | | 13 | | | | 110 | |
Live Nation Entertainment, Inc.(1) | | | 357 | | | | 32,532 | |
Loop Media, Inc.(1) | | | 6 | | | | 15 | |
Madison Square Garden Entertainment Corp. - Class A(1) | | | 7 | | | | 226 | |
Magnite, Inc.(1) | | | 10 | | | | 136 | |
Match Group, Inc.(1) | | | 37 | | | | 1,531 | |
MediaAlpha, Inc. - Class A(1) | | | 4 | | | | 40 | |
Nexstar Media Group, Inc. - Class A | | | 2 | | | | 294 | |
Nextdoor Holdings, Inc.(1) | | | 16 | | | | 51 | |
Ooma, Inc.(1) | | | 4 | | | | 62 | |
Pinterest, Inc. - Class A(1) | | | 365 | | | | 9,971 | |
Playtika Holding Corp.(1) | | | 3 | | | | 34 | |
PubMatic, Inc. - Class A(1) | | | 1 | | | | 27 | |
QuinStreet, Inc.(1) | | | 9 | | | | 80 | |
ROBLOX Corp. - Class A(1) | | | 252 | | | | 10,159 | |
Roku, Inc. - Class A(1) | | | 2 | | | | 142 | |
Shutterstock, Inc. | | | 53 | | | | 2,578 | |
Sinclair, Inc. | | | 1 | | | | 14 | |
Spotify Technology SA(1) | | | 90 | | | | 14,480 | |
Take-Two Interactive Software, Inc.(1) | | | 180 | | | | 26,533 | |
| | | | | | | | |
TechTarget, Inc.(1) | | | 5 | | | | 144 | |
Townsquare Media, Inc. - Class A | | | 2 | | | | 24 | |
Trade Desk, Inc. - Class A(1) | | | 64 | | | | 4,946 | |
Vimeo, Inc.(1) | | | 6 | | | | 24 | |
Vivid Seats, Inc. - Class A(1) | | | 2 | | | | 12 | |
Warner Music Group Corp. - Class A | | | 268 | | | | 7,003 | |
World Wrestling Entertainment, Inc. - Class A | | | 111 | | | | 12,039 | |
Yelp, Inc. - Class A(1) | | | 12 | | | | 438 | |
Ziff Davis, Inc.(1) | | | 2 | | | | 133 | |
ZipRecruiter, Inc. - Class A(1) | | | 12 | | | | 221 | |
ZoomInfo Technologies, Inc. - Class A(1) | | | 23 | | | | 592 | |
| | | | | | | | |
Total Communication Services | | | | 194,003 | |
| | | | | |
Consumer Discretionary – 10.14% | | | | | | | | |
2U, Inc.(1) | | | 1 | | | | 5 | |
Abercrombie & Fitch Co. - Class A(1) | | | 4 | | | | 167 | |
Academy Sports & Outdoors, Inc. | | | 13 | | | | 716 | |
Accel Entertainment, Inc. - Class A(1) | | | 9 | | | | 99 | |
Acushnet Holdings Corp. | | | 96 | | | | 5,224 | |
Advance Auto Parts, Inc. | | | 218 | | | | 15,325 | |
American Eagle Outfitters, Inc. | | | 7 | | | | 85 | |
Arko Corp. | | | 14 | | | | 113 | |
Bally’s Corp.(1) | | | 3 | | | | 45 | |
Bath & Body Works, Inc. | | | 500 | | | | 18,750 | |
Best Buy Co., Inc. | | | 4 | | | | 316 | |
BJ’s Restaurants, Inc.(1) | | | 3 | | | | 80 | |
Bloomin’ Brands, Inc. | | | 16 | | | | 423 | |
Bluegreen Vacations Holding Corp. - Class A | | | 2 | | | | 54 | |
Boot Barn Holdings, Inc.(1) | | | 5 | | | | 451 | |
Bowlero Corp.(1) | | | 4 | | | | 51 | |
Bright Horizons Family Solutions, Inc.(1) | | | 115 | | | | 10,663 | |
Brinker International, Inc.(1) | | | 7 | | | | 267 | |
Brunswick Corp. | | | 1 | | | | 71 | |
Buckle, Inc. | | | 6 | | | | 194 | |
Build-A-Bear Workshop, Inc. | | | 2 | | | | 41 | |
Burlington Stores, Inc.(1) | | | 63 | | | | 9,846 | |
Caesars Entertainment, Inc.(1) | | | 12 | | | | 620 | |
Camping World Holdings, Inc. - Class A | | | 8 | | | | 229 | |
CarMax, Inc.(1) | | | 1 | | | | 107 | |
CarParts.com, Inc.(1) | | | 9 | | | | 38 | |
Carriage Services, Inc. - Class A | | | 2 | | | | 78 | |
Carvana Co. - Class A(1) | | | 1 | | | | 28 | |
Cava Group, Inc.(1)(2) | | | 0 | | | | 13 | |
Cavco Industries, Inc.(1) | | | 2 | | | | 457 | |
Century Casinos, Inc.(1) | | | 4 | | | | 29 | |
Cheesecake Factory, Inc. | | | 9 | | | | 304 | |
Chegg, Inc.(1) | | | 18 | | | | 159 | |
Chipotle Mexican Grill, Inc. - Class A(1) | | | 28 | | | | 59,294 | |
Choice Hotels International, Inc. | | | 4 | | | | 514 | |
Churchill Downs, Inc. | | | 98 | | | | 13,692 | |
Chuy’s Holdings, Inc.(1) | | | 3 | | | | 112 | |
Clarus Corp.(2) | | | 0 | | | | 4 | |
Columbia Sportswear Co. | | | 48 | | | | 3,734 | |
Cooper-Standard Holdings, Inc.(1)(2) | | | 0 | | | | 2 | |
Coupang, Inc. - Class A(1) | | | 159 | | | | 2,771 | |
Coursera, Inc.(1) | | | 24 | | | | 307 | |
Cracker Barrel Old Country Store, Inc. | | | 4 | | | | 360 | |
Cricut, Inc. - Class A | | | 8 | | | | 103 | |
Crocs, Inc.(1) | | | 89 | | | | 10,037 | |
Darden Restaurants, Inc. | | | 8 | | | | 1,364 | |
Dave & Buster’s Entertainment, Inc.(1) | | | 8 | | | | 346 | |
Deckers Outdoor Corp.(1) | | | 82 | | | | 43,004 | |
Denny’s Corp.(1) | | | 7 | | | | 91 | |
Dick’s Sporting Goods, Inc. | | | 1 | | | | 85 | |
| | | | | | | | |
Dillard’s, Inc. - Class A | | | 1 | | | | 208 | |
Dine Brands Global, Inc. | | | 3 | | | | 153 | |
Domino’s Pizza, Inc. | | | 33 | | | | 11,149 | |
DoorDash, Inc. - Class A(1) | | | 34 | | | | 2,626 | |
Dorman Products, Inc.(1) | | | 5 | | | | 371 | |
DR Horton, Inc. | | | 136 | | | | 16,493 | |
DraftKings, Inc. - Class A(1) | | | 590 | | | | 15,666 | |
Dream Finders Homes, Inc. - Class A(1) | | | 2 | | | | 43 | |
Duluth Holdings, Inc. - Class B(1)(2) | | | 0 | | | | 0 | |
Duolingo, Inc. - Class A(1) | | | 5 | | | | 730 | |
eBay, Inc. | | | 5 | | | | 215 | |
Envela Corp.(1) | | | 1 | | | | 9 | |
Etsy, Inc.(1) | | | 155 | | | | 13,144 | |
European Wax Center, Inc. - Class A(1) | | | 6 | | | | 104 | |
Everi Holdings, Inc.(1) | | | 10 | | | | 142 | |
EVgo, Inc. - Class A(1) | | | 2 | | | | 7 | |
Expedia Group, Inc.(1) | | | 15 | | | | 1,675 | |
Farfetch Ltd. - Class A(1) | | | 695 | | | | 4,199 | |
First Watch Restaurant Group, Inc.(1) | | | 1 | | | | 18 | |
Fisker, Inc.(1) | | | 36 | | | | 201 | |
Five Below, Inc.(1) | | | 176 | | | | 34,588 | |
Floor & Decor Holdings, Inc. - Class A(1) | | | 43 | | | | 4,484 | |
Fox Factory Holding Corp.(1) | | | 162 | | | | 17,555 | |
Franchise Group, Inc. | | | 4 | | | | 115 | |
Frontdoor, Inc.(1) | | | 15 | | | | 467 | |
Full House Resorts, Inc.(1) | | | 5 | | | | 33 | |
Funko, Inc. - Class A(1) | | | 4 | | | | 45 | |
Gentherm, Inc.(1) | | | 187 | | | | 10,592 | |
Global Business Travel Group I(1) | | | 6 | | | | 41 | |
Global-e Online Ltd.(1) | | | 336 | | | | 13,766 | |
Golden Entertainment, Inc.(1) | | | 4 | | | | 148 | |
Grand Canyon Education, Inc.(1) | | | 1 | | | | 125 | |
Green Brick Partners, Inc.(1) | | | 2 | | | | 86 | |
Guess?, Inc. | | | 1 | | | | 14 | |
H&R Block, Inc. | | | 14 | | | | 452 | |
Hanesbrands, Inc. | | | 42 | | | | 189 | |
Hibbett, Inc. | | | 2 | | | | 66 | |
Hilton Grand Vacations, Inc.(1) | | | 15 | | | | 661 | |
Hilton Worldwide Holdings, Inc. | | | 17 | | | | 2,495 | |
Hyatt Hotels Corp. - Class A | | | 97 | | | | 11,068 | |
Inspired Entertainment, Inc.(1) | | | 4 | | | | 57 | |
Installed Building Products, Inc. | | | 33 | | | | 4,693 | |
International Game Technology Plc | | | 19 | | | | 621 | |
iRobot Corp.(1) | | | 4 | | | | 197 | |
Jack in the Box, Inc. | | | 4 | | | | 363 | |
Kontoor Brands, Inc. | | | 10 | | | | 419 | |
Krispy Kreme, Inc. | | | 5 | | | | 71 | |
Kura Sushi USA, Inc. - Class A(1) | | | 1 | | | | 96 | |
Laureate Education, Inc. - Class A | | | 20 | | | | 239 | |
LCI Industries | | | 2 | | | | 217 | |
Leslie’s, Inc.(1) | | | 1,997 | | | | 18,754 | |
LGI Homes, Inc.(1)(2) | | | 0 | | | | 33 | |
Life Time Group Holdings, Inc.(1) | | | 2 | | | | 48 | |
Light & Wonder, Inc.(1) | | | 8 | | | | 525 | |
Lindblad Expeditions Holdings, Inc.(1)(2) | | | 0 | | | | 5 | |
Livewire Group, Inc.(1) | | | 2 | | | | 23 | |
Lovesac Co.(1) | | | 3 | | | | 68 | |
Lululemon Athletica, Inc.(1) | | | 57 | | | | 21,746 | |
Luminar Technologies, Inc. - Class A(1) | | | 49 | | | | 336 | |
Malibu Boats, Inc. - Class A(1) | | | 2 | | | | 128 | |
Marine Products Corp. | | | 1 | | | | 24 | |
MasterCraft Boat Holdings, Inc.(1) | | | 3 | | | | 94 | |
Mobileye Global, Inc. - Class A(1) | | | 252 | | | | 9,692 | |
| | | | | | | | |
Modine Manufacturing Co.(1) | | | 6 | | | | 192 | |
Monarch Casino & Resort, Inc. | | | 2 | | | | 165 | |
Mondee Holdings, Inc. - Class A(1) | | | 7 | | | | 60 | |
Murphy USA, Inc. | | | 3 | | | | 840 | |
Nathan’s Famous, Inc.(2) | | | 0 | | | | 33 | |
National Vision Holdings, Inc.(1) | | | 142 | | | | 3,450 | |
Nerdy, Inc.(1) | | | 10 | | | | 42 | |
Noodles & Co. - Class A(1) | | | 7 | | | | 23 | |
Norwegian Cruise Line Holdings Ltd.(1) | | | 353 | | | | 7,675 | |
NVR, Inc.(1)(2) | | | 0 | | | | 241 | |
Ollie’s Bargain Outlet Holdings, Inc.(1) | | | 129 | | | | 7,456 | |
ONE Group Hospitality, Inc.(1) | | | 4 | | | | 27 | |
OneSpaWorld Holdings Ltd.(1) | | | 13 | | | | 154 | |
Oxford Industries, Inc. | | | 2 | | | | 194 | |
Papa John’s International, Inc. | | | 107 | | | | 7,892 | |
Patrick Industries, Inc.(2) | | | 0 | | | | 38 | |
Peloton Interactive, Inc. - Class A(1) | | | 44 | | | | 342 | |
Planet Fitness, Inc. - Class A(1) | | | 306 | | | | 20,628 | |
PlayAGS, Inc.(1) | | | 6 | | | | 36 | |
Polaris, Inc. | | | 1 | | | | 84 | |
Pool Corp. | | | 58 | | | | 21,635 | |
Portillo’s, Inc. - Class A(1) | | | 7 | | | | 168 | |
Potbelly Corp.(1) | | | 5 | | | | 40 | |
Qurate Retail, Inc. - Class B(1) | | | 1 | | | | 6 | |
Ralph Lauren Corp. - Class A | | | 77 | | | | 9,525 | |
RCI Hospitality Holdings, Inc. | | | 1 | | | | 114 | |
Red Robin Gourmet Burgers, Inc.(1) | | | 3 | | | | 39 | |
Red Rock Resorts, Inc. - Class A | | | 5 | | | | 212 | |
Rent the Runway, Inc. - Class A(1) | | | 1 | | | | 2 | |
Revolve Group, Inc. - Class A(1) | | | 179 | | | | 2,934 | |
RH(1)(2) | | | 0 | | | | 128 | |
Rocky Brands, Inc.(2) | | | 0 | | | | 1 | |
Ross Stores, Inc. | | | 46 | | | | 5,108 | |
Rover Group, Inc. - Class A(1) | | | 16 | | | | 80 | |
Royal Caribbean Cruises Ltd.(1) | | | 10 | | | | 1,069 | |
Rush Street Interactive, Inc.(1) | | | 12 | | | | 36 | |
Sabre Corp.(1) | | | 15 | | | | 47 | |
Sally Beauty Holdings, Inc.(1) | | | 18 | | | | 224 | |
SeaWorld Entertainment, Inc.(1) | | | 7 | | | | 373 | |
Service Corp. International | | | 8 | | | | 505 | |
Shake Shack, Inc. - Class A(1) | | | 45 | | | | 3,479 | |
Six Flags Entertainment Corp.(1) | | | 10 | | | | 269 | |
Skechers USA, Inc. - Class A(1) | | | 136 | | | | 7,176 | |
Skyline Champion Corp.(1) | | | 120 | | | | 7,857 | |
Sleep Number Corp.(1) | | | 2 | | | | 54 | |
Solo Brands, Inc. - Class A(1) | | | 3 | | | | 16 | |
Sonos, Inc.(1) | | | 23 | | | | 371 | |
Steven Madden Ltd. | | | 227 | | | | 7,415 | |
Stitch Fix, Inc. - Class A(1) | | | 7 | | | | 28 | |
Stoneridge, Inc.(1) | | | 1 | | | | 18 | |
Stride, Inc.(1) | | | 8 | | | | 282 | |
Sturm Ruger & Co., Inc. | | | 3 | | | | 153 | |
Super Group SGHC Ltd.(1) | | | 24 | | | | 69 | |
Sweetgreen, Inc. - Class A(1) | | | 14 | | | | 176 | |
Tapestry, Inc. | | | 2 | | | | 94 | |
Target Hospitality Corp.(1) | | | 5 | | | | 74 | |
Tempur Sealy International, Inc. | | | 5 | | | | 195 | |
Texas Roadhouse, Inc. - Class A | | | 233 | | | | 26,211 | |
ThredUp, Inc. - Class A(1) | | | 1 | | | | 4 | |
TopBuild Corp.(1) | | | 109 | | | | 29,115 | |
Torrid Holdings, Inc.(1) | | | 1 | | | | 3 | |
Tractor Supply Co. | | | 137 | | | | 30,250 | |
Travel + Leisure Co. | | | 5 | | | | 196 | |
| | | | | | | | |
Udemy, Inc.(1) | | | 15 | | | | 162 | |
Ulta Beauty, Inc.(1) | | | 52 | | | | 24,398 | |
Under Armour, Inc. - Class C(1) | | | 845 | | | | 5,673 | |
Universal Technical Institute, Inc.(1) | | | 1 | | | | 7 | |
Upbound Group, Inc. | | | 9 | | | | 288 | |
Urban Outfitters, Inc.(1) | | | 4 | | | | 125 | |
Vail Resorts, Inc. | | | 1 | | | | 145 | |
Valvoline, Inc. | | | 7 | | | | 245 | |
Victoria’s Secret & Co.(1) | | | 5 | | | | 88 | |
Visteon Corp.(1) | | | 101 | | | | 14,462 | |
Vizio Holding Corp. - Class A(1) | | | 12 | | | | 81 | |
Warby Parker, Inc. - Class A(1) | | | 15 | | | | 174 | |
Wayfair, Inc. - Class A(1) | | | 4 | | | | 271 | |
Wendy’s Co. | | | 25 | | | | 543 | |
Williams-Sonoma, Inc. | | | 1 | | | | 153 | |
Wingstop, Inc. | | | 167 | | | | 33,524 | |
Winmark Corp. | | | 19 | | | | 6,464 | |
Wolverine World Wide, Inc. | | | 12 | | | | 181 | |
Workhorse Group, Inc.(1) | | | 4 | | | | 3 | |
Wyndham Hotels & Resorts, Inc. | | | 1 | | | | 60 | |
Wynn Resorts Ltd. | | | 1 | | | | 97 | |
XPEL, Inc.(1) | | | 4 | | | | 342 | |
Xponential Fitness, Inc. - Class A(1) | | | 4 | | | | 64 | |
YETI Holdings, Inc.(1) | | | 12 | | | | 485 | |
Yum! Brands, Inc. | | | 36 | | | | 4,957 | |
| | | | | | | | |
Total Consumer Discretionary | | | | 721,775 | |
| | | | | |
Consumer Staples – 4.85% | | | | | | | | |
Albertsons Companies, Inc. - Class A | | | 5 | | | | 112 | |
Beauty Health Co.(1) | | | 14 | | | | 120 | |
BellRing Brands, Inc.(1) | | | 786 | | | | 28,756 | |
Beyond Meat, Inc.(1) | | | 11 | | | | 139 | |
BJ’s Wholesale Club Holdings, Inc.(1) | | | 205 | | | | 12,907 | |
Boston Beer Co., Inc. - Class A(1) | | | 1 | | | | 387 | |
BRC, Inc. - Class A(1) | | | 6 | | | | 31 | |
Brown-Forman Corp. - Class A | | | 5 | | | | 373 | |
Brown-Forman Corp. - Class B | | | 354 | | | | 23,666 | |
Calavo Growers, Inc. | | | 3 | | | | 89 | |
Cal-Maine Foods, Inc. | | | 6 | | | | 281 | |
Casey’s General Stores, Inc. | | | 1 | | | | 189 | |
Celsius Holdings, Inc.(1) | | | 292 | | | | 43,538 | |
Chefs’ Warehouse, Inc.(1) | | | 6 | | | | 222 | |
Church & Dwight Co., Inc. | | | 32 | | | | 3,186 | |
Clorox Co. | | | 179 | | | | 28,463 | |
Coca-Cola Consolidated, Inc. | | | 1 | | | | 539 | |
Dole Plc | | | 7 | | | | 96 | |
Duckhorn Portfolio, Inc.(1) | | | 2 | | | | 25 | |
elf Beauty, Inc.(1) | | | 77 | | | | 8,774 | |
Energizer Holdings, Inc. | | | 13 | | | | 435 | |
Freshpet, Inc.(1) | | | 368 | | | | 24,206 | |
Grocery Outlet Holding Corp.(1) | | | 249 | | | | 7,632 | |
Herbalife Ltd.(1) | | | 13 | | | | 168 | |
Hormel Foods Corp. | | | 605 | | | | 24,333 | |
Hostess Brands, Inc. - Class A(1) | | | 4 | | | | 106 | |
Ingredion, Inc. | | | 89 | | | | 9,465 | |
Inter Parfums, Inc. | | | 89 | | | | 11,972 | |
J&J Snack Foods Corp. | | | 3 | | | | 417 | |
J.M. Smucker Co. | | | 134 | | | | 19,788 | |
John B Sanfilippo & Son, Inc. | | | 2 | | | | 185 | |
Lamb Weston Holdings, Inc. | | | 323 | | | | 37,160 | |
Lancaster Colony Corp. | | | 3 | | | | 698 | |
McCormick & Co., Inc. | | | 291 | | | | 25,384 | |
Medifast, Inc. | | | 2 | | | | 182 | |
MGP Ingredients, Inc. | | | 101 | | | | 10,774 | |
| | | | | | | | |
Mission Produce, Inc.(1) | | | 1 | | | | 15 | |
Molson Coors Beverage Co. - Class B | | | 117 | | | | 7,714 | |
National Beverage Corp.(1) | | | 4 | | | | 200 | |
Oil-Dri Corp. of America(2) | | | 0 | | | | 13 | |
Performance Food Group Co.(1) | | | 11 | | | | 639 | |
PriceSmart, Inc. | | | 3 | | | | 234 | |
Primo Water Corp. | | | 4 | | | | 45 | |
Simply Good Foods Co.(1) | | | 126 | | | | 4,613 | |
Sovos Brands, Inc.(1) | | | 7 | | | | 135 | |
Sprouts Farmers Market, Inc.(1) | | | 18 | | | | 676 | |
SunOpta, Inc.(1) | | | 15 | | | | 100 | |
The Fresh Market, Inc.(1)(2)(4) | | | 7 | | | | – | |
Thorne HealthTech, Inc.(1) | | | 1 | | | | 4 | |
TreeHouse Foods, Inc.(1) | | | 1 | | | | 54 | |
Turning Point Brands, Inc. | | | 3 | | | | 72 | |
USANA Health Sciences, Inc.(1) | | | 2 | | | | 134 | |
Utz Brands, Inc. | | | 13 | | | | 205 | |
Vector Group Ltd. | | | 5 | | | | 58 | |
Vita Coco Co., Inc.(1) | | | 5 | | | | 135 | |
Vital Farms, Inc.(1) | | | 5 | | | | 64 | |
WD-40 Co. | | | 26 | | | | 4,894 | |
Westrock Coffee Co.(1) | | | 5 | | | | 54 | |
Zevia PBC - Class A(1) | | | 3 | | | | 11 | |
| | | | | | | | |
Total Consumer Staples | | | | 344,867 | |
| | | | | |
Energy – 2.21% | | | | | | | | |
Antero Midstream Corp. | | | 16 | | | | 187 | |
APA Corp. | | | 40 | | | | 1,370 | |
Archrock, Inc. | | | 4 | | | | 45 | |
Atlas Energy Solutions, Inc. - Class A(2) | | | 0 | | | | 8 | |
Borr Drilling Ltd.(1) | | | 41 | | | | 309 | |
Cactus, Inc. - Class A | | | 143 | | | | 6,040 | |
Cameco Corp. | | | 937 | | | | 29,342 | |
ChampionX Corp. | | | 502 | | | | 15,579 | |
Cheniere Energy, Inc. | | | 35 | | | | 5,369 | |
Core Laboratories, Inc. | | | 3 | | | | 62 | |
Coterra Energy, Inc. | | | 184 | | | | 4,644 | |
Crescent Energy Co. - Class A | | | 3 | | | | 32 | |
CVR Energy, Inc. | | | 5 | | | | 153 | |
Denbury, Inc.(1) | | | 96 | | | | 8,272 | |
DMC Global, Inc.(1) | | | 1 | | | | 19 | |
Dorian LPG Ltd. | | | 3 | | | | 84 | |
Empire Petroleum Corp.(1) | | | 2 | | | | 16 | |
Energy Fuels, Inc.(1) | | | 24 | | | | 148 | |
Enerplus Corp. | | | 820 | | | | 11,865 | |
Enviva, Inc. | | | 6 | | | | 63 | |
Equitrans Midstream Corp. | | | 23 | | | | 220 | |
Evolution Petroleum Corp. | | | 5 | | | | 44 | |
Excelerate Energy, Inc. - Class A | | | 2 | | | | 50 | |
Expro Group Holdings NV(1) | | | 6 | | | | 103 | |
FLEX LNG Ltd. | | | 4 | | | | 108 | |
Golar LNG Ltd. | | | 1 | | | | 15 | |
Halliburton Co. | | | 27 | | | | 875 | |
Hess Corp. | | | 23 | | | | 3,065 | |
HighPeak Energy, Inc. | | | 2 | | | | 17 | |
Kinetik Holdings, Inc. - Class A(2) | | | 0 | | | | 15 | |
Kosmos Energy Ltd.(1) | | | 82 | | | | 489 | |
Liberty Energy, Inc. - Class A | | | 2 | | | | 25 | |
Magnolia Oil & Gas Corp. - Class A | | | 422 | | | | 8,816 | |
Matador Resources Co. | | | 178 | | | | 9,320 | |
Nabors Industries Ltd.(1) | | | 1 | | | | 136 | |
New Fortress Energy, Inc. - Class A | | | 9 | | | | 250 | |
NextDecade Corp.(1) | | | 6 | | | | 46 | |
NexTier Oilfield Solutions, Inc.(1) | | | 5 | | | | 43 | |
| | | | | | | | |
Noble Corp. Plc(1) | | | 16 | | | | 654 | |
Northern Oil & Gas, Inc. | | | 12 | | | | 409 | |
Oceaneering International, Inc.(1) | | | 18 | | | | 339 | |
ONEOK, Inc. | | | 4 | | | | 221 | |
Ovintiv, Inc. | | | 16 | | | | 592 | |
Par Pacific Holdings, Inc.(1) | | | 4 | | | | 109 | |
Permian Resources Corp. - Class A | | | 917 | | | | 10,045 | |
Pioneer Natural Resources Co. | | | 17 | | | | 3,518 | |
ProFrac Holding Corp. - Class A(1) | | | 1 | | | | 12 | |
REX American Resources Corp.(1) | | | 1 | | | | 24 | |
Riley Exploration Permian, Inc. | | | 2 | | | | 55 | |
SilverBow Resources, Inc.(1)(2) | | | 0 | | | | 10 | |
Sitio Royalties Corp. - Class A | | | 6 | | | | 166 | |
Solaris Oilfield Infrastructure, Inc. - Class A | | | 1 | | | | 4 | |
Southwestern Energy Co.(1) | | | 1,193 | | | | 7,167 | |
Targa Resources Corp. | | | 33 | | | | 2,477 | |
TechnipFMC Plc(1) | | | 1,274 | | | | 21,180 | |
Tellurian, Inc.(1) | | | 6 | | | | 8 | |
TETRA Technologies, Inc.(1) | | | 21 | | | | 72 | |
Texas Pacific Land Corp. | | | 1 | | | | 1,098 | |
Tidewater, Inc.(1) | | | 8 | | | | 470 | |
VAALCO Energy, Inc. | | | 2 | | | | 9 | |
Valaris Ltd.(1) | | | 11 | | | | 687 | |
Vertex Energy, Inc.(1) | | | 12 | | | | 74 | |
W&T Offshore, Inc.(1) | | | 17 | | | | 67 | |
Weatherford International Plc(1) | | | 13 | | | | 839 | |
| | | | | | | | |
Total Energy | | | | 157,550 | |
| | | | | |
Financials – 8.86% | | | | | | | | |
AlTi Global, Inc.(1) | | | 4 | | | | 29 | |
Ameriprise Financial, Inc. | | | 15 | | | | 5,075 | |
AMERISAFE, Inc. | | | 70 | | | | 3,707 | |
Apollo Global Management, Inc. | | | 76 | | | | 5,827 | |
Arch Capital Group Ltd.(1) | | | 7 | | | | 547 | |
Ares Management Corp. - Class A | | | 23 | | | | 2,245 | |
Arthur J. Gallagher & Co. | | | 191 | | | | 41,989 | |
Artisan Partners Asset Management, Inc. - Class A | | | 6 | | | | 255 | |
Assetmark Financial Holdings, Inc.(1) | | | 4 | | | | 116 | |
Atlanticus Holdings Corp.(1)(2) | | | 0 | | | | 5 | |
Avantax, Inc.(1) | | | 7 | | | | 145 | |
AvidXchange Holdings, Inc.(1) | | | 25 | | | | 257 | |
Axos Financial, Inc.(1) | | | 1 | | | | 47 | |
B. Riley Financial, Inc. | | | 3 | | | | 158 | |
BancFirst Corp. | | | 1 | | | | 59 | |
Bancorp, Inc.(1) | | | 6 | | | | 200 | |
Bank of NT Butterfield & Son Ltd. | | | 1 | | | | 25 | |
Bank7 Corp.(2) | | | 0 | | | | 9 | |
BayCom Corp. | | | 1 | | | | 11 | |
BGC Partners, Inc. - Class A | | | 27 | | | | 118 | |
Block, Inc. - Class A(1) | | | 29 | | | | 1,954 | |
Blue Owl Capital, Inc. - Class A | | | 10 | | | | 114 | |
Brighthouse Financial, Inc.(1) | | | 1 | | | | 46 | |
Brightsphere Investment Group, Inc. | | | 3 | | | | 52 | |
Brown & Brown, Inc. | | | 13 | | | | 919 | |
BRP Group, Inc. - Class A(1) | | | 10 | | | | 258 | |
Burke & Herbert Financial Services Corp.(2) | | | 0 | | | | 9 | |
Cantaloupe, Inc.(1) | | | 7 | | | | 55 | |
Capital City Bank Group, Inc. | | | 1 | | | | 34 | |
Cass Information Systems, Inc. | | | 2 | | | | 82 | |
Citizens Financial Services, Inc.(2) | | | 0 | | | | 13 | |
Coastal Financial Corp.(1) | | | 2 | | | | 77 | |
Cohen & Steers, Inc. | | | 165 | | | | 9,540 | |
Columbia Banking System, Inc. | | | 330 | | | | 6,683 | |
Columbia Financial, Inc.(1) | | | 3 | | | | 44 | |
| | | | | | | | |
Crawford & Co. - Class A | | | 3 | | | | 29 | |
Cullen/Frost Bankers, Inc. | | | 150 | | | | 16,130 | |
Diamond Hill Investment Group, Inc. | | | 1 | | | | 93 | |
Donnelley Financial Solutions, Inc.(1) | | | 3 | | | | 142 | |
eHealth, Inc.(1) | | | 2 | | | | 13 | |
Equitable Holdings, Inc. | | | 52 | | | | 1,400 | |
Esquire Financial Holdings, Inc. | | | 1 | | | | 56 | |
Euronet Worldwide, Inc.(1) | | | 75 | | | | 8,836 | |
Everest Re Group Ltd. | | | 143 | | | | 48,827 | |
EVERTEC, Inc. | | | 12 | | | | 431 | |
FactSet Research Systems, Inc. | | | 66 | | | | 26,276 | |
Federal Agricultural Mortgage Corp. - Class C(2) | | | 0 | | | | 45 | |
First Bancorp | | | 1 | | | | 16 | |
First Citizens BancShares, Inc. - Class A(2) | | | 0 | | | | 219 | |
First Financial Bankshares, Inc. | | | 24 | | | | 671 | |
First Interstate BancSystem, Inc. - Class A | | | 261 | | | | 6,215 | |
First Merchants Corp. | | | 186 | | | | 5,256 | |
FirstCash Holdings, Inc. | | | 244 | | | | 22,777 | |
Five Star Bancorp | | | 1 | | | | 28 | |
FleetCor Technologies, Inc.(1) | | | 10 | | | | 2,442 | |
Flywire Corp.(1) | | | 433 | | | | 13,442 | |
Focus Financial Partners, Inc. - Class A(1) | | | 32 | | | | 1,680 | |
FS Bancorp, Inc.(2) | | | 0 | | | | 12 | |
GCM Grosvenor, Inc. - Class A | | | 7 | | | | 53 | |
Global Payments, Inc. | | | 268 | | | | 26,442 | |
Goosehead Insurance, Inc. - Class A(1) | | | 4 | | | | 245 | |
Greene County Bancorp, Inc. | | | 1 | | | | 22 | |
Hamilton Lane, Inc. - Class A | | | 4 | | | | 313 | |
Hannon Armstrong Sustainable Infrastructure Capital, Inc. | | | 1 | | | | 36 | |
HCI Group, Inc. | | | 1 | | | | 71 | |
HomeTrust Bancshares, Inc. | | | 1 | | | | 21 | |
Houlihan Lokey, Inc. - Class A | | | 95 | | | | 9,339 | |
I3 Verticals, Inc. - Class A(1) | | | 4 | | | | 95 | |
International Money Express, Inc.(1) | | | 5 | | | | 133 | |
Investors Title Co.(2) | | | 0 | | | | 5 | |
Jack Henry & Associates, Inc. | | | 3 | | | | 559 | |
Kingsway Financial Services, Inc.(1) | | | 2 | | | | 14 | |
Kinsale Capital Group, Inc. | | | 101 | | | | 37,817 | |
KKR & Co., Inc. - Class Miscella | | | 23 | | | | 1,298 | |
Lakeland Financial Corp. | | | 49 | | | | 2,355 | |
Lemonade, Inc.(1) | | | 2 | | | | 27 | |
LendingTree, Inc.(1) | | | 1 | | | | 12 | |
Lincoln National Corp. | | | 2 | | | | 59 | |
LPL Financial Holdings, Inc. | | | 11 | | | | 2,466 | |
MarketAxess Holdings, Inc. | | | 83 | | | | 21,786 | |
Marqeta, Inc. - Class A(1) | | | 12 | | | | 57 | |
Metropolitan Bank Holding Corp.(1)(2) | | | 0 | | | | 13 | |
Moelis & Co. - Class A | | | 6 | | | | 270 | |
Morningstar, Inc. | | | 4 | | | | 740 | |
MSCI, Inc. - Class A | | | 51 | | | | 23,880 | |
MVB Financial Corp.(2) | | | 0 | | | | 8 | |
NBT Bancorp, Inc. | | | 166 | | | | 5,299 | |
NerdWallet, Inc. - Class A(1) | | | 6 | | | | 58 | |
NMI Holdings, Inc. - Class A(1) | | | 1 | | | | 32 | |
Northern Trust Corp. | | | 215 | | | | 15,940 | |
NU Holdings Ltd. - Class A(1) | | | 1,790 | | | | 14,127 | |
Open Lending Corp. - Class A(1) | | | 16 | | | | 170 | |
Oscar Health, Inc. - Class A(1) | | | 2 | | | | 18 | |
P10, Inc. - Class A | | | 7 | | | | 75 | |
Pagseguro Digital Ltd. - Class A(1) | | | 22 | | | | 206 | |
Palomar Holdings, Inc. - Class A(1) | | | 122 | | | | 7,104 | |
Pathward Financial, Inc. | | | 1 | | | | 48 | |
Patria Investments Ltd. - Class A | | | 10 | | | | 145 | |
| | | | | | | | |
Payoneer Global, Inc.(1) | | | 1,234 | | | | 5,937 | |
Paysign, Inc.(1) | | | 6 | | | | 14 | |
PennyMac Financial Services, Inc.(2) | | | 0 | | | | 28 | |
Perella Weinberg Partners - Class A | | | 8 | | | | 65 | |
Piper Sandler Companies | | | 57 | | | | 7,372 | |
PJT Partners, Inc. - Class A | | | 93 | | | | 6,496 | |
Plumas Bancorp(2) | | | 0 | | | | 15 | |
Primerica, Inc. | | | 3 | | | | 683 | |
Priority Technology Holdings, Inc.(1) | | | 3 | | | | 11 | |
PROG Holdings, Inc.(1) | | | 2 | | | | 50 | |
Regional Management Corp.(2) | | | 0 | | | | 11 | |
Remitly Global, Inc.(1) | | | 15 | | | | 285 | |
RenaissanceRe Holdings Ltd. | | | 2 | | | | 351 | |
RLI Corp. | | | 1 | | | | 174 | |
Rocket Companies, Inc. - Class A(1) | | | 6 | | | | 57 | |
Ryan Specialty Holdings, Inc. - Class A(1) | | | 946 | | | | 42,453 | |
Sculptor Capital Management, Inc. - Class A | | | 3 | | | | 24 | |
Selective Insurance Group, Inc. | | | 108 | | | | 10,352 | |
ServisFirst Bancshares, Inc. | | | 3 | | | | 133 | |
Shift4 Payments, Inc. - Class A(1) | | | 341 | | | | 23,135 | |
Silvercrest Asset Management Group, Inc. - Class A | | | 2 | | | | 36 | |
SiriusPoint Ltd.(1) | | | 2 | | | | 16 | |
Skyward Specialty Insurance Group, Inc.(1) | | | 1 | | | | 15 | |
SLM Corp. | | | 14 | | | | 223 | |
Stellar Bancorp, Inc. | | | 1 | | | | 19 | |
StepStone Group, Inc. - Class A | | �� | 10 | | | | 249 | |
Stock Yards Bancorp, Inc. | | | 4 | | | | 199 | |
StoneCo Ltd. - Class A(1) | | | 32 | | | | 402 | |
StoneX Group, Inc.(1)(2) | | | 0 | | | | 31 | |
Third Coast Bancshares, Inc.(1)(2) | | | 0 | | | | 4 | |
Tiptree, Inc. | | | 1 | | | | 20 | |
Toast, Inc. - Class A(1) | | | 1,645 | | | | 37,131 | |
TPG, Inc. - Class A | | | 3 | | | | 78 | |
Tradeweb Markets, Inc. - Class A | | | 961 | | | | 65,774 | |
Trupanion, Inc.(1) | | | 7 | | | | 138 | |
Universal Insurance Holdings, Inc. | | | 1 | | | | 15 | |
Upstart Holdings, Inc.(1) | | | 13 | | | | 463 | |
UWM Holdings Corp. | | | 5 | | | | 28 | |
Value Line, Inc.(2) | | | 0 | | | | 6 | |
Victory Capital Holdings, Inc. - Class A | | | 5 | | | | 150 | |
Virtus Investment Partners, Inc.(2) | | | 0 | | | | 39 | |
Westamerica BanCorp | | | 1 | | | | 32 | |
Western Union Co. | | | 8 | | | | 94 | |
WEX, Inc.(1) | | | 46 | | | | 8,403 | |
Willis Towers Watson Plc | | | 2 | | | | 452 | |
Wintrust Financial Corp. | | | 55 | | | | 4,020 | |
WisdomTree, Inc. | | | 19 | | | | 132 | |
World Acceptance Corp.(1)(2) | | | 0 | | | | 8 | |
WSFS Financial Corp. | | | 195 | | | | 7,374 | |
XP, Inc. - Class A(1) | | | 4 | | | | 93 | |
| | | | | | | | |
Total Financials | | | | 630,388 | |
| | | | | |
Healthcare – 21.28% | | | | | | | | |
10X Genomics, Inc. - Class A(1) | | | 13 | | | | 740 | |
4D Molecular Therapeutics, Inc.(1)(2) | | | 0 | | | | 9 | |
89bio, Inc.(1) | | | 210 | | | | 3,980 | |
Abcam Plc - ADR(1) | | | 451 | | | | 11,046 | |
Acadia Healthcare Co., Inc.(1) | | | 264 | | | | 21,016 | |
ACADIA Pharmaceuticals, Inc.(1) | | | 22 | | | | 517 | |
Accolade, Inc.(1) | | | 11 | | | | 148 | |
Accuray, Inc.(1) | | | 15 | | | | 60 | |
ACELYRIN, Inc.(1) | | | 60 | | | | 1,260 | |
Aclaris Therapeutics, Inc.(1) | | | 12 | | | | 126 | |
Actinium Pharmaceuticals, Inc.(1) | | | 4 | | | | 32 | |
| | | | | | | | |
AdaptHealth Corp. - Class A(1) | | | 7 | | | | 81 | |
Adaptive Biotechnologies Corp.(1) | | | 15 | | | | 99 | |
Addus HomeCare Corp.(1) | | | 1 | | | | 120 | |
ADMA Biologics, Inc.(1) | | | 19 | | | | 72 | |
Aduro Biotech, Inc.(1)(4) | | | 5 | | | | 13 | |
Aerovate Therapeutics, Inc.(1) | | | 2 | | | | 30 | |
Agenus, Inc.(1) | | | 10 | | | | 15 | |
Agilent Technologies, Inc. | | | 301 | | | | 36,220 | |
Agiliti, Inc.(1) | | | 5 | | | | 75 | |
agilon health, Inc.(1) | | | 945 | | | | 16,391 | |
AirSculpt Technologies, Inc. | | | 2 | | | | 20 | |
Akero Therapeutics, Inc.(1) | | | 88 | | | | 4,113 | |
Akoya Biosciences, Inc.(1) | | | 3 | | | | 24 | |
Aldeyra Therapeutics, Inc.(1) | | | 8 | | | | 68 | |
Alector, Inc.(1) | | | 11 | | | | 69 | |
Align Technology, Inc.(1) | | | 92 | | | | 32,569 | |
Alignment Healthcare, Inc.(1) | | | 15 | | | | 86 | |
Alkermes Plc(1) | | | 29 | | | | 923 | |
Alnylam Pharmaceuticals, Inc.(1) | | | 52 | | | | 9,945 | |
Alphatec Holdings, Inc.(1) | | | 6 | | | | 101 | |
Alpine Immune Sciences, Inc.(1) | | | 3 | | | | 30 | |
AmerisourceBergen Corp. - Class A | | | 23 | | | | 4,516 | |
Amicus Therapeutics, Inc.(1) | | | 50 | | | | 627 | |
AMN Healthcare Services, Inc.(1) | | | 7 | | | | 788 | |
Amphastar Pharmaceuticals, Inc.(1) | | | 7 | | | | 388 | |
Amylyx Pharmaceuticals, Inc.(1) | | | 9 | | | | 192 | |
AnaptysBio, Inc.(1) | | | 3 | | | | 55 | |
Anavex Life Sciences Corp.(1) | | | 12 | | | | 100 | |
ANI Pharmaceuticals, Inc.(1) | | | 2 | | | | 93 | |
Apellis Pharmaceuticals, Inc.(1) | | | 95 | | | | 8,643 | |
Apollo Medical Holdings, Inc.(1) | | | 8 | | | | 244 | |
Arbutus Biopharma Corp.(1) | | | 13 | | | | 31 | |
Arcellx, Inc.(1) | | | 7 | | | | 215 | |
Arcturus Therapeutics Holdings, Inc.(1)(2) | | | 0 | | | | 10 | |
Arcus Biosciences, Inc.(1) | | | 3 | | | | 57 | |
Arcutis Biotherapeutics, Inc.(1) | | | 9 | | | | 86 | |
Ardelyx, Inc.(1) | | | 24 | | | | 83 | |
Argenx SE - ADR(1) | | | 162 | | | | 63,271 | |
Arrowhead Pharmaceuticals, Inc.(1) | | | 175 | | | | 6,233 | |
ARS Pharmaceuticals, Inc.(1) | | | 1 | | | | 6 | |
Artivion, Inc.(1) | | | 1 | | | | 18 | |
Arvinas, Inc.(1) | | | 8 | | | | 210 | |
Ascendis Pharma - ADR(1) | | | 372 | | | | 33,210 | |
Astria Therapeutics, Inc.(1) | | | 4 | | | | 33 | |
Atara Biotherapeutics, Inc.(1) | | | 1 | | | | 2 | |
AtriCure, Inc.(1) | | | 69 | | | | 3,408 | |
Atrion Corp.(2) | | | 0 | | | | 139 | |
Aurinia Pharmaceuticals, Inc.(1) | | | 24 | | | | 236 | |
Aveanna Healthcare Holdings, Inc.(1) | | | 3 | | | | 6 | |
Avid Bioservices, Inc.(1) | | | 11 | | | | 151 | |
Avita Medical, Inc.(1) | | | 4 | | | | 75 | |
Axogen, Inc.(1) | | | 7 | | | | 63 | |
Axonics, Inc.(1) | | | 63 | | | | 3,173 | |
Axsome Therapeutics, Inc.(1) | | | 6 | | | | 421 | |
Azenta, Inc.(1) | | | 92 | | | | 4,280 | |
Babylon Holdings Ltd. - Class A(1)(2) | | | 1 | | | | 0 | |
Beam Therapeutics, Inc.(1) | | | 11 | | | | 356 | |
Beyond Air, Inc.(1) | | | 4 | | | | 17 | |
BioCryst Pharmaceuticals, Inc.(1) | | | 25 | | | | 176 | |
BioLife Solutions, Inc.(1) | | | 6 | | | | 123 | |
BioMarin Pharmaceutical, Inc.(1) | | | 3 | | | | 277 | |
Biomea Fusion, Inc.(1) | | | 3 | | | | 76 | |
BioNTech SE - ADR(1) | | | 125 | | | | 13,448 | |
| | | | | | | | |
Bio-Rad Laboratories, Inc. - Class A(1) | | | 36 | | | | 13,648 | |
Biote Corp. - Class A(1) | | | 1 | | | | 7 | |
Bio-Techne Corp. | | | 386 | | | | 31,479 | |
BioVie, Inc. - Class A(1) | | | 1 | | | | 4 | |
Bioxcel Therapeutics, Inc.(1) | | | 3 | | | | 22 | |
Blueprint Medicines Corp.(1) | | | 11 | | | | 685 | |
Bridgebio Pharma, Inc.(1) | | | 162 | | | | 2,789 | |
Bright Green Corp.(1) | | | 11 | | | | 11 | |
Bruker Corp. | | | 16 | | | | 1,146 | |
Cabaletta Bio, Inc.(1) | | | 4 | | | | 52 | |
Cano Health, Inc.(1) | | | 4 | | | | 5 | |
Cardinal Health, Inc. | | | 19 | | | | 1,817 | |
Cassava Sciences, Inc.(1) | | | 7 | | | | 177 | |
Castle Biosciences, Inc.(1) | | | 2 | | | | 23 | |
Catalent, Inc.(1) | | | 103 | | | | 4,467 | |
Catalyst Pharmaceuticals, Inc.(1) | | | 17 | | | | 226 | |
Celldex Therapeutics, Inc.(1) | | | 2 | | | | 71 | |
Cerevel Therapeutics Holdings, Inc.(1) | | | 11 | | | | 352 | |
Certara, Inc.(1) | | | 6 | | | | 114 | |
Cerus Corp.(1) | | | 31 | | | | 77 | |
Chemed Corp. | | | 2 | | | | 833 | |
Chinook Therapeutics, Inc.(1) | | | 3 | | | | 111 | |
Citius Pharmaceuticals, Inc.(1) | | | 4 | | | | 5 | |
ClearPoint Neuro, Inc.(1) | | | 4 | | | | 27 | |
Codexis, Inc.(1) | | | 2 | | | | 5 | |
Cogent Biosciences, Inc.(1) | | | 7 | | | | 78 | |
Coherus Biosciences, Inc.(1) | | | 11 | | | | 46 | |
Collegium Pharmaceutical, Inc.(1) | | | 6 | | | | 129 | |
Compass Therapeutics, Inc.(1) | | | 2 | | | | 5 | |
CONMED Corp. | | | 99 | | | | 13,417 | |
Cooper Companies, Inc. | | | 93 | | | | 35,634 | |
Corcept Therapeutics, Inc.(1) | | | 14 | | | | 319 | |
CorMedix, Inc.(1) | | | 7 | | | | 29 | |
CorVel Corp.(1) | | | 2 | | | | 293 | |
Crinetics Pharmaceuticals, Inc.(1) | | | 485 | | | | 8,740 | |
Cross Country Healthcare, Inc.(1) | | | 1 | | | | 29 | |
CryoPort, Inc.(1) | | | 6 | | | | 112 | |
Cue Biopharma, Inc.(1) | | | 6 | | | | 22 | |
Cutera, Inc.(1)(2) | | | 0 | | | | 6 | |
CVRx, Inc.(1) | | | 2 | | | | 26 | |
Cymabay Therapeutics, Inc.(1) | | | 17 | | | | 187 | |
Cytek Biosciences, Inc.(1) | | | 21 | | | | 181 | |
Cytokinetics, Inc.(1) | | | 15 | | | | 500 | |
DaVita, Inc.(1) | | | 8 | | | | 783 | |
Day One Biopharmaceuticals, Inc.(1) | | | 8 | | | | 94 | |
Deciphera Pharmaceuticals, Inc.(1) | | | 3 | | | | 45 | |
Definitive Healthcare Corp. - Class A(1) | | | 514 | | | | 5,656 | |
Denali Therapeutics, Inc.(1) | | | 21 | | | | 622 | |
Dentsply Sirona, Inc. | | | 543 | | | | 21,731 | |
DexCom, Inc.(1) | | | 650 | | | | 83,532 | |
DICE Therapeutics, Inc.(1) | | | 6 | | | | 265 | |
Discount Medicine, Inc. - Class A(1) | | | 1 | | | | 56 | |
DocGo, Inc.(1) | | | 14 | | | | 129 | |
Doximity, Inc. - Class A(1) | | | 7 | | | | 233 | |
Dynavax Technologies Corp. - Class A(1) | | | 20 | | | | 252 | |
Dyne Therapeutics, Inc.(1) | | | 2 | | | | 24 | |
Edwards Lifesciences Corp.(1) | | | 388 | | | | 36,600 | |
Embecta Corp. | | | 1 | | | | 23 | |
Enanta Pharmaceuticals, Inc.(1) | | | 1 | | | | 11 | |
Encompass Health Corp. | | | 1 | | | | 66 | |
Ensign Group, Inc. | | | 10 | | | | 930 | |
Envista Holdings Corp.(1) | | | 216 | | | | 7,300 | |
Evolent Health, Inc. - Class A(1) | | | 262 | | | | 7,947 | |
| | | | | | | | |
Evolus, Inc.(1) | | | 7 | | | | 52 | |
Exact Sciences Corp.(1) | | | 498 | | | | 46,723 | |
Exelixis, Inc.(1) | | | 530 | | | | 10,125 | |
Eyenovia, Inc.(1) | | | 5 | | | | 11 | |
EyePoint Pharmaceuticals, Inc.(1) | | | 2 | | | | 21 | |
Fennec Pharmaceuticals, Inc.(1) | | | 1 | | | | 7 | |
Figs, Inc. - Class A(1) | | | 20 | | | | 164 | |
Foghorn Therapeutics, Inc.(1) | | | 4 | | | | 25 | |
Genelux Corp.(1)(2) | | | 0 | | | | 4 | |
Geron Corp.(1) | | | 68 | | | | 217 | |
Glaukos Corp.(1) | | | 121 | | | | 8,651 | |
Globus Medical, Inc. - Class A(1) | | | 161 | | | | 9,592 | |
GTX, Inc.(1)(2)(4) | | | 0 | | | | 0 | |
Guardant Health, Inc.(1) | | | 20 | | | | 709 | |
Haemonetics Corp.(1) | | | 9 | | | | 758 | |
Halozyme Therapeutics, Inc.(1) | | | 695 | | | | 25,064 | |
Harmony Biosciences Holdings, Inc.(1) | | | 6 | | | | 209 | |
Harrow Health, Inc.(1) | | | 5 | | | | 86 | |
Harvard Bioscience, Inc.(1) | | | 7 | | | | 37 | |
Health Catalyst, Inc.(1) | | | 5 | | | | 67 | |
HealthEquity, Inc.(1) | | | 255 | | | | 16,079 | |
HealthStream, Inc. | | | 2 | | | | 42 | |
Heron Therapeutics, Inc.(1) | | | 17 | | | | 20 | |
HilleVax, Inc.(1) | | | 1 | | | | 15 | |
Hims & Hers Health, Inc.(1) | | | 21 | | | | 201 | |
Hologic, Inc.(1) | | | 121 | | | | 9,815 | |
Horizon Therapeutics Plc(1) | | | 29 | | | | 2,959 | |
Humacyte, Inc.(1) | | | 10 | | | | 27 | |
ICON Plc(1) | | | 65 | | | | 16,196 | |
Ideaya Biosciences, Inc.(1) | | | 6 | | | | 144 | |
IDEXX Laboratories, Inc.(1) | | | 59 | | | | 29,710 | |
Illumina, Inc.(1) | | | 29 | | | | 5,447 | |
Immuneering Corp. - Class A(1) | | | 3 | | | | 28 | |
ImmunityBio, Inc.(1) | | | 16 | | | | 44 | |
ImmunoGen, Inc.(1) | | | 25 | | | | 475 | |
Immunovant, Inc.(1) | | | 165 | | | | 3,128 | |
Inari Medical, Inc.(1) | | | 9 | | | | 500 | |
Incyte Corp.(1) | | | 20 | | | | 1,236 | |
InfuSystem Holdings, Inc.(1) | | | 3 | | | | 29 | |
Inhibrx, Inc.(1) | | | 4 | | | | 104 | |
Inmode Ltd.(1) | | | 14 | | | | 517 | |
Innovage Holding Corp.(1) | | | 3 | | | | 25 | |
Innoviva, Inc.(1) | | | 1 | | | | 10 | |
Insmed, Inc.(1) | | | 24 | | | | 498 | |
Inspire Medical Systems, Inc.(1) | | | 133 | | | | 43,282 | |
Insulet Corp.(1) | | | 34 | | | | 9,763 | |
Integra LifeSciences Holdings Corp.(1) | | | 388 | | | | 15,955 | |
Intellia Therapeutics, Inc.(1) | | | 2 | | | | 92 | |
Intercept Pharmaceuticals, Inc.(1) | | | 4 | | | | 48 | |
Intra-Cellular Therapies, Inc.(1) | | | 17 | | | | 1,055 | |
Invitae Corp.(1) | | | 40 | | | | 46 | |
Ionis Pharmaceuticals, Inc.(1) | | | 18 | | | | 727 | |
IQVIA Holdings, Inc.(1) | | | 25 | | | | 5,585 | |
iRadimed Corp. | | | 1 | | | | 58 | |
iRhythm Technologies, Inc.(1) | | | 205 | | | | 21,334 | |
Ironwood Pharmaceuticals, Inc. - Class A(1) | | | 9 | | | | 101 | |
IVERIC bio, Inc.(1) | | | 25 | | | | 966 | |
Jazz Pharmaceuticals Plc(1) | | | 5 | | | | 578 | |
Joint Corp.(1) | | | 3 | | | | 35 | |
Karuna Therapeutics, Inc.(1) | | | 32 | | | | 7,012 | |
Karyopharm Therapeutics, Inc.(1) | | | 20 | | | | 36 | |
Keros Therapeutics, Inc.(1) | | | 4 | | | | 158 | |
KORU Medical Systems, Inc.(1) | | | 6 | | | | 20 | |
| | | | | | | | |
Krystal Biotech, Inc.(1) | | | 58 | | | | 6,807 | |
Kymera Therapeutics, Inc.(1) | | | 7 | | | | 153 | |
Lantheus Holdings, Inc.(1) | | | 131 | | | | 10,990 | |
LeMaitre Vascular, Inc. | | | 4 | | | | 238 | |
Lexicon Pharmaceuticals, Inc.(1) | | | 7 | | | | 16 | |
LifeStance Health Group, Inc.(1) | | | 10 | | | | 93 | |
Ligand Pharmaceuticals, Inc.(1) | | | 57 | | | | 4,077 | |
Lineage Cell Therapeutics, Inc.(1) | | | 22 | | | | 31 | |
Liquidia Corp.(1) | | | 6 | | | | 46 | |
LivaNova Plc(1) | | | 59 | | | | 3,042 | |
Longboard Pharmaceuticals, Inc.(1) | | | 1 | | | | 7 | |
MacroGenics, Inc.(1) | | | 3 | | | | 17 | |
Madrigal Pharmaceuticals, Inc.(1) | | | 2 | | | | 559 | |
MannKind Corp.(1) | | | 36 | | | | 148 | |
Maravai LifeSciences Holdings, Inc. - Class A(1) | | | 9 | | | | 115 | |
Marinus Pharmaceuticals, Inc.(1) | | | 9 | | | | 95 | |
Masimo Corp.(1) | | | 7 | | | | 1,142 | |
MaxCyte, Inc.(1) | | | 1 | | | | 5 | |
Medpace Holdings, Inc.(1) | | | 40 | | �� | | 9,539 | |
MeiraGTx Holdings Plc(1) | | | 4 | | | | 28 | |
Merit Medical Systems, Inc.(1) | | | 10 | | | | 845 | |
Merrimack Pharmaceuticals, Inc.(1) | | | 2 | | | | 22 | |
Mersana Therapeutics, Inc.(1) | | | 11 | | | | 36 | |
Mesa Laboratories, Inc. | | | 76 | | | | 9,788 | |
Mettler-Toledo International, Inc.(1) | | | 3 | | | | 4,151 | |
Mineralys Therapeutics, Inc.(1) | | | 1 | | | | 13 | |
Mirum Pharmaceuticals, Inc.(1) | | | 5 | | | | 121 | |
ModivCare, Inc.(1) | | | 2 | | | | 101 | |
Molina Healthcare, Inc.(1) | | | 5 | | | | 1,382 | |
Morphic Holding, Inc.(1) | | | 95 | | | | 5,433 | |
NanoString Technologies, Inc.(1) | | | 8 | | | | 33 | |
Nano-X Imaging Ltd.(1) | | | 1 | | | | 12 | |
Natera, Inc.(1) | | | 138 | | | | 6,716 | |
National Research Corp. | | | 3 | | | | 112 | |
Neogen Corp.(1) | | | 266 | | | | 5,791 | |
NeoGenomics, Inc.(1) | | | 2 | | | | 32 | |
Neurocrine Biosciences, Inc.(1) | | | 88 | | | | 8,275 | |
Nevro Corp.(1) | | | 2 | | | | 54 | |
NextGen Healthcare, Inc.(1) | | | 6 | | | | 95 | |
Novavax, Inc.(1) | | | 13 | | | | 93 | |
Novocure Ltd.(1) | | | 15 | | | | 629 | |
Nuvalent, Inc. - Class A(1) | | | 4 | | | | 183 | |
NuVasive, Inc.(1) | | | 113 | | | | 4,715 | |
Nuvectis Pharma, Inc.(1) | | | 1 | | | | 19 | |
Ocular Therapeutix, Inc.(1) | | | 14 | | | | 72 | |
Omega Therapeutics, Inc.(1) | | | 4 | | | | 24 | |
Omeros Corp.(1) | | | 4 | | | | 24 | |
OmniAb, Inc. - Class CR3(1)(2)(4)(5) | | | 19 | | | | – | |
OmniAb, Inc. - Class CR4(1)(2)(4)(5) | | | 19 | | | | – | |
Omnicell, Inc.(1) | | | 137 | | | | 10,056 | |
Opthea Ltd. - ADR(1) | | | 166 | | | | 465 | |
OptimizeRx Corp.(1) | | | 3 | | | | 46 | |
Optinose, Inc.(1) | | | 12 | | | | 15 | |
Option Care Health, Inc.(1) | | | 30 | | | | 986 | |
Orchestra BioMed Holdings, Inc.(1) | | | 1 | | | | 4 | |
Organogenesis Holdings, Inc. - Class A(1) | | | 2 | | | | 5 | |
OrthoPediatrics Corp.(1) | | | 3 | | | | 114 | |
Outlook Therapeutics, Inc.(1) | | | 27 | | | | 46 | |
Outset Medical, Inc.(1) | | | 9 | | | | 190 | |
P3 Health Partners, Inc.(1) | | | 7 | | | | 21 | |
Pacific Biosciences of California, Inc.(1) | | | 531 | | | | 7,065 | |
Pacira BioSciences, Inc.(1) | | | 171 | | | | 6,866 | |
Paragon 28, Inc.(1) | | | 8 | | | | 136 | |
| | | | | | | | |
Patterson Companies, Inc. | | | 3 | | | | 111 | |
PDS Biotechnology Corp.(1) | | | 5 | | | | 24 | |
Pennant Group, Inc.(1) | | | 5 | | | | 62 | |
Penumbra, Inc.(1) | | | 96 | | | | 33,088 | |
PepGen, Inc.(1)(2) | | | 0 | | | | 4 | |
PetIQ, Inc. - Class A(1) | | | 4 | | | | 62 | |
Phathom Pharmaceuticals, Inc.(1) | | | 1 | | | | 16 | |
Phibro Animal Health Corp. - Class A | | | 1 | | | | 13 | |
Phreesia, Inc.(1) | | | 9 | | | | 285 | |
Pliant Therapeutics, Inc.(1) | | | 10 | | | | 185 | |
Prestige Consumer Healthcare, Inc.(1) | | | 198 | | | | 11,783 | |
Prime Medicine, Inc.(1) | | | 7 | | | | 102 | |
Privia Health Group, Inc.(1) | | | 12 | | | | 310 | |
PROCEPT BioRobotics Corp.(1) | | | 93 | | | | 3,286 | |
Progyny, Inc.(1) | | | 14 | | | | 550 | |
ProKidney Corp. - Class A(1) | | | 3 | | | | 31 | |
Protagonist Therapeutics, Inc.(1) | | | 6 | | | | 165 | |
Prothena Corp. Plc(1) | | | 7 | | | | 504 | |
PTC Therapeutics, Inc.(1) | | | 88 | | | | 3,584 | |
Pulmonx Corp.(1) | | | 316 | | | | 4,146 | |
Pulse Biosciences, Inc.(1) | | | 1 | | | | 6 | |
Quanterix Corp.(1) | | | 1 | | | | 24 | |
Quipt Home Medical Corp.(1) | | | 7 | | | | 36 | |
RadNet, Inc.(1) | | | 9 | | | | 282 | |
RAPT Therapeutics, Inc.(1) | | | 4 | | | | 73 | |
Reata Pharmaceuticals, Inc. - Class A(1) | | | 54 | | | | 5,548 | |
Reneo Pharmaceuticals, Inc.(1) | | | 1 | | | | 7 | |
Repligen Corp.(1) | | | 331 | | | | 46,842 | |
ResMed, Inc. | | | 63 | | | | 13,683 | |
Revance Therapeutics, Inc.(1) | | | 350 | | | | 8,863 | |
REVOLUTION Medicines, Inc.(1) | | | 18 | | | | 486 | |
Rhythm Pharmaceuticals, Inc.(1) | | | 9 | | | | 148 | |
Rigel Pharmaceuticals, Inc.(1) | | | 25 | | | | 32 | |
Rocket Pharmaceuticals, Inc.(1) | | | 9 | | | | 173 | |
Roivant Sciences Ltd.(1) | | | 375 | | | | 3,779 | |
RxSight, Inc.(1) | | | 5 | | | | 137 | |
Sage Therapeutics, Inc.(1) | | | 9 | | | | 417 | |
Sana Biotechnology, Inc.(1) | | | 1 | | | | 7 | |
Sanara Medtech, Inc.(1) | | | 1 | | | | 26 | |
Sarepta Therapeutics, Inc.(1) | | | 69 | | | | 7,903 | |
Savara, Inc.(1) | | | 2 | | | | 5 | |
Schrodinger, Inc.(1) | | | 85 | | | | 4,248 | |
Scilex Holding Co.(1) | | | 1 | | | | 6 | |
scPharmaceuticals, Inc.(1) | | | 5 | | | | 51 | |
Seagen, Inc.(1) | | | 20 | | | | 3,920 | |
Select Medical Holdings Corp. | | | 19 | | | | 592 | |
Selecta Biosciences, Inc.(1) | | | 5 | | | | 6 | |
Semler Scientific, Inc.(1) | | | 1 | | | | 23 | |
Seres Therapeutics, Inc.(1) | | | 12 | | | | 56 | |
Sharecare, Inc.(1) | | | 3 | | | | 6 | |
Shockwave Medical, Inc.(1) | | | 144 | | | | 41,023 | |
SI-BONE, Inc.(1) | | | 6 | | | | 170 | |
SIGA Technologies, Inc. | | | 8 | | | | 40 | |
Sight Sciences, Inc.(1) | | | 4 | | | | 31 | |
Silk Road Medical, Inc.(1) | | | 7 | | | | 225 | |
Simulations Plus, Inc. | | | 3 | | | | 127 | |
Sotera Health Co.(1) | | | 10 | | | | 189 | |
SpringWorks Therapeutics, Inc.(1) | | | 10 | | | | 273 | |
STAAR Surgical Co.(1) | | | 9 | | | | 456 | |
STERIS Plc | | | 151 | | | | 33,972 | |
Summit Therapeutics, Inc.(1) | | | 20 | | | | 51 | |
Supernus Pharmaceuticals, Inc.(1) | | | 222 | | | | 6,685 | |
Surgery Partners, Inc.(1) | | | 193 | | | | 8,664 | |
| | | | | | | | |
Surmodics, Inc.(1) | | | 2 | | | | 76 | |
Syndax Pharmaceuticals, Inc.(1) | | | 10 | | | | 210 | |
Tactile Systems Technology, Inc.(1) | | | 4 | | | | 102 | |
Tandem Diabetes Care, Inc.(1) | | | 114 | | | | 2,798 | |
Tela Bio, Inc.(1) | | | 3 | | | | 28 | |
Terns Pharmaceuticals, Inc.(1) | | | 5 | | | | 43 | |
TG Therapeutics, Inc.(1) | | | 209 | | | | 5,199 | |
TransMedics Group, Inc.(1) | | | 6 | | | | 475 | |
Travere Therapeutics, Inc. - Class Preferre(1) | | | 12 | | | | 188 | |
Treace Medical Concepts, Inc.(1) | | | 8 | | | | 201 | |
Tyra Biosciences, Inc.(1) | | | 1 | | | | 15 | |
U.S. Physical Therapy, Inc. | | | 2 | | | | 276 | |
UFP Technologies, Inc.(1) | | | 1 | | | | 241 | |
Ultragenyx Pharmaceutical, Inc.(1) | | | 10 | | | | 451 | |
UroGen Pharma Ltd.(1) | | | 3 | | | | 29 | |
Utah Medical Products, Inc.(2) | | | 0 | | | | 46 | |
Vaxcyte, Inc.(1) | | | 397 | | | | 19,846 | |
Vaxxinity, Inc. - Class A(1) | | | 8 | | | | 19 | |
Veeva Systems, Inc. - Class A(1) | | | 599 | | | | 118,473 | |
Ventyx Biosciences, Inc.(1) | | | 97 | | | | 3,168 | |
Vera Therapeutics, Inc. - Class A(1) | | | 3 | | | | 47 | |
Vericel Corp.(1) | | | 146 | | | | 5,494 | |
Verrica Pharmaceuticals, Inc.(1) | | | 4 | | | | 21 | |
Vicarious Surgical, Inc.(1) | | | 6 | | | | 11 | |
Viemed Healthcare, Inc.(1) | | | 6 | | | | 56 | |
ViewRay, Inc.(1) | | | 19 | | | | 7 | |
Viking Therapeutics, Inc.(1) | | | 241 | | | | 3,905 | |
Vir Biotechnology, Inc.(1) | | | 1 | | | | 18 | |
Viridian Therapeutics, Inc.(1) | | | 6 | | | | 139 | |
Voyager Therapeutics, Inc.(1) | | | 6 | | | | 64 | |
Waters Corp.(1) | | | 114 | | | | 30,257 | |
West Pharmaceutical Services, Inc. | | | 189 | | | | 72,185 | |
X4 Pharmaceuticals, Inc.(1) | | | 11 | | | | 21 | |
Xencor, Inc.(1) | | | 5 | | | | 137 | |
Xenon Pharmaceuticals, Inc.(1) | | | 603 | | | | 23,197 | |
Xeris Biopharma Holdings, Inc.(1) | | | 24 | | | | 63 | |
Y-mAbs Therapeutics, Inc.(1) | | | 3 | | | | 21 | |
Zentalis Pharmaceuticals, Inc.(1) | | | 9 | | | | 249 | |
Zynex, Inc.(1) | | | 3 | | | | 32 | |
| | | | | | | | |
Total Healthcare | | | | 1,513,705 | |
| | | | | |
Industrials – 19.36% | | | | | | | | |
374Water, Inc.(1) | | | 10 | | | | 25 | |
AAON, Inc. | | | 125 | | | | 11,828 | |
AAR Corp.(1) | | | 101 | | | | 5,822 | |
ACV Auctions, Inc. - Class A(1) | | | 23 | | | | 392 | |
Advanced Drainage Systems, Inc. | | | 9 | | | | 1,036 | |
Aerojet Rocketdyne Holdings, Inc.(1) | | | 14 | | | | 777 | |
Aerovironment, Inc.(1) | | | 108 | | | | 11,047 | |
Alamo Group, Inc. | | | 2 | | | | 323 | |
Albany International Corp. - Class A | | | 109 | | | | 10,181 | |
Allegiant Travel Co. - Class A(1)(2) | | | 0 | | | | 38 | |
Allegion Plc | | | 12 | | | | 1,419 | |
Allied Motion Technologies, Inc. | | | 2 | | | | 96 | |
Allison Transmission Holdings, Inc. | | | 1 | | | | 73 | |
Alta Equipment Group, Inc. | | | 3 | | | | 58 | |
Ameresco, Inc. - Class A(1) | | | 103 | | | | 5,030 | |
American Airlines Group, Inc.(1) | | | 35 | | | | 636 | |
American Woodmark Corp.(1)(2) | | | 0 | | | | 16 | |
AMETEK, Inc. | | | 348 | | | | 56,335 | |
Amprius Technologies, Inc.(1) | | | 1 | | | | 7 | |
AO Smith Corp. | | | 232 | | | | 16,868 | |
API Group Corp.(1) | | | 25 | | | | 683 | |
Apogee Enterprises, Inc. | | | 1 | | | | 70 | |
| | | | | | | | |
Applied Industrial Technologies, Inc. | | | 65 | | | | 9,457 | |
ArcBest Corp. | | | 2 | | | | 165 | |
Aris Water Solutions, Inc. - Class A(2) | | | 0 | | | | 4 | |
Armstrong World Industries, Inc. | | | 2 | | | | 139 | |
Array Technologies, Inc.(1) | | | 27 | | | | 609 | |
ASGN, Inc.(1) | | | 2 | | | | 172 | |
Asure Software, Inc.(1)(2) | | | 0 | | | | 5 | |
Atkore, Inc.(1) | | | 43 | | | | 6,706 | |
Avis Budget Group, Inc.(1) | | | 1 | | | | 232 | |
Axon Enterprise, Inc.(1) | | | 226 | | | | 44,014 | |
AZEK Co., Inc. - Class A(1) | | | 836 | | | | 25,325 | |
Babcock & Wilcox Enterprises, Inc.(1) | | | 1 | | | | 6 | |
Barrett Business Services, Inc. | | | 1 | | | | 99 | |
Beacon Roofing Supply, Inc.(1) | | | 119 | | | | 9,907 | |
Berkshire Grey, Inc.(1) | | | 13 | | | | 19 | |
Blink Charging Co.(1) | | | 5 | | | | 27 | |
Bloom Energy Corp. - Class A(1) | | | 315 | | | | 5,144 | |
Blue Bird Corp.(1)(2) | | | 0 | | | | 5 | |
Booz Allen Hamilton Holding Corp. - Class A | | | 19 | | | | 2,109 | |
Bowman Consulting Group Ltd. - Class A(1) | | | 2 | | | | 55 | |
Brink’s Co. | | | 8 | | | | 558 | |
Broadridge Financial Solutions, Inc. | | | 14 | | | | 2,361 | |
Brookfield Business Corp. - Class A | | | 4 | | | | 85 | |
Builders FirstSource, Inc.(1) | | | 273 | | | | 37,163 | |
BWX Technologies, Inc. | | | 2 | | | | 162 | |
CACI International, Inc. - Class A(1) | | | 22 | | | | 7,663 | |
Cadre Holdings, Inc. | | | 3 | | | | 76 | |
Casella Waste Systems, Inc. - Class A(1) | | | 10 | | | | 897 | |
CBIZ, Inc.(1) | | | 9 | | | | 460 | |
Ceridian HCM Holding, Inc.(1) | | | 307 | | | | 20,528 | |
CH Robinson Worldwide, Inc. | | | 13 | | | | 1,232 | |
ChargePoint Holdings, Inc.(1) | | | 40 | | | | 355 | |
Chart Industries, Inc.(1) | | | 176 | | | | 28,061 | |
Cimpress Plc(1) | | | 2 | | | | 107 | |
Cintas Corp. | | | 11 | | | | 5,567 | |
CIRCOR International, Inc.(1) | | | 3 | | | | 161 | |
Clean Harbors, Inc.(1) | | | 149 | | | | 24,566 | |
Comfort Systems USA, Inc. | | | 40 | | | | 6,534 | |
Commercial Vehicle Group, Inc.(1) | | | 1 | | | | 7 | |
Concrete Pumping Holdings, Inc.(1) | | | 2 | | | | 19 | |
Construction Partners, Inc. - Class A(1) | | | 7 | | | | 229 | |
Copart, Inc.(1) | | | 62 | | | | 5,683 | |
Core & Main, Inc. - Class A(1) | | | 745 | | | | 23,356 | |
CRA International, Inc. | | | 1 | | | | 130 | |
CSG Systems International, Inc. | | | 5 | | | | 289 | |
CSW Industrials, Inc. | | | 3 | | | | 457 | |
Curtiss-Wright Corp. | | | 59 | | | | 10,754 | |
Custom Truck One Source, Inc.(1) | | | 10 | | | | 66 | |
Daseke, Inc.(1) | | | 7 | | | | 53 | |
Delta Air Lines, Inc.(1) | | | 5 | | | | 227 | |
Distribution Solutions Group, Inc.(1) | | | 1 | | | | 40 | |
Donaldson Co., Inc. | | | 7 | | | | 463 | |
Douglas Dynamics, Inc. | | | 4 | | | | 120 | |
Dragonfly Energy Holdings Corp.(1) | | | 3 | | | | 5 | |
Dycom Industries, Inc.(1) | | | 5 | | | | 579 | |
EMCOR Group, Inc. | | | 2 | | | | 431 | |
Energy Recovery, Inc.(1) | | | 10 | | | | 279 | |
Enerpac Tool Group Corp. - Class A | | | 10 | | | | 279 | |
EnerSys | | | 7 | | | | 744 | |
Enovix Corp.(1) | | | 24 | | | | 442 | |
Eos Energy Enterprises, Inc.(1) | | | 17 | | | | 75 | |
Equifax, Inc. | | | 12 | | | | 2,887 | |
Esab Corp. | | | 95 | | | | 6,341 | |
| | | | | | | | |
ESCO Technologies, Inc. | | | 3 | | | | 266 | |
Eve Holding, Inc.(1) | | | 3 | | | | 33 | |
EVI Industries, Inc.(1) | | | 1 | | | | 15 | |
ExlService Holdings, Inc.(1) | | | 68 | | | | 10,220 | |
Expeditors International of Washington, Inc. | | | 3 | | | | 364 | |
Exponent, Inc. | | | 9 | | | | 844 | |
Fastenal Co. | | | 62 | | | | 3,667 | |
Federal Signal Corp. | | | 11 | | | | 679 | |
Ferguson Plc | | | 2 | | | | 252 | |
First Advantage Corp.(1) | | | 1 | | | | 16 | |
FiscalNote Holdings, Inc.(1) | | | 3 | | | | 9 | |
Fluence Energy, Inc. - Class A(1) | | | 7 | | | | 191 | |
Fluor Corp.(1) | | | 24 | | | | 702 | |
Forrester Research, Inc.(1) | | | 2 | | | | 61 | |
Fortive Corp. | | | 1,122 | | | | 83,866 | |
Forward Air Corp. | | | 5 | | | | 497 | |
Franklin Covey Co.(1) | | | 2 | | | | 92 | |
Franklin Electric Co., Inc. | | | 8 | | | | 842 | |
Frontier Group Holdings, Inc.(1) | | | 7 | | | | 66 | |
FTAI Aviation Ltd. | | | 18 | | | | 567 | |
FTC Solar, Inc.(1) | | | 11 | | | | 36 | |
FTI Consulting, Inc.(1) | | | 122 | | | | 23,215 | |
GATX Corp.(2) | | | 0 | | | | 50 | |
Generac Holdings, Inc.(1) | | | 173 | | | | 25,799 | |
Genpact Ltd. | | | 6 | | | | 243 | |
Gibraltar Industries, Inc.(1) | | | 3 | | | | 201 | |
Global Industrial Co. | | | 2 | | | | 51 | |
GMS, Inc.(1) | | | 2 | | | | 159 | |
Gorman-Rupp Co. | | | 1 | | | | 22 | |
Graco, Inc. | | | 259 | | | | 22,355 | |
GrafTech International Ltd. | | | 19 | | | | 97 | |
Granite Construction, Inc. | | | 1 | | | | 50 | |
Griffon Corp. | | | 5 | | | | 186 | |
GXO Logistics, Inc.(1) | | | 168 | | | | 10,548 | |
H&E Equipment Services, Inc. | | | 6 | | | | 267 | |
Healthcare Services Group, Inc. | | | 13 | | | | 194 | |
HEICO Corp. | | | 48 | | | | 8,555 | |
HEICO Corp. - Class A | | | 80 | | | | 11,299 | |
Helios Technologies, Inc. | | | 6 | | | | 388 | |
Herc Holdings, Inc. | | | 38 | | | | 5,254 | |
Heritage-Crystal Clean, Inc.(1)(2) | | | 0 | | | | 19 | |
Hillenbrand, Inc. | | | 12 | | | | 629 | |
Hillman Solutions Corp.(1) | | | 496 | | | | 4,467 | |
Himalaya Shipping Ltd.(1) | | | 1 | | | | 5 | |
HireQuest, Inc. | | | 1 | | | | 25 | |
HNI Corp. | | | 1 | | | | 26 | |
Howmet Aerospace, Inc. | | | 458 | | | | 22,710 | |
Hubbell, Inc. - Class B | | | 117 | | | | 38,835 | |
Hudson Technologies, Inc.(1) | | | 1 | | | | 12 | |
Huron Consulting Group, Inc.(1) | | | 3 | | | | 291 | |
Hyster-Yale Materials Handling, Inc. | | | 2 | | | | 106 | |
IBEX Holdings Ltd.(1) | | | 2 | | | | 41 | |
ICF International, Inc. | | | 3 | | | | 420 | |
IDEX Corp. | | | 151 | | | | 32,480 | |
IES Holdings, Inc.(1) | | | 1 | | | | 80 | |
Ingersoll Rand, Inc. | | | 763 | | | | 49,854 | |
Innodata, Inc.(1) | | | 4 | | | | 50 | |
INNOVATE Corp.(1) | | | 3 | | | | 6 | |
Insperity, Inc. | | | 7 | | | | 776 | |
Janus International Group, Inc.(1) | | | 15 | | | | 157 | |
JB Hunt Transport Services, Inc. | | | 27 | | | | 4,873 | |
Joby Aviation, Inc.(1) | | | 16 | | | | 169 | |
John Bean Technologies Corp. | | | 6 | | | | 689 | |
| | | | | | | | |
Kadant, Inc. | | | 2 | | | | 453 | |
Karat Packaging, Inc. | | | 1 | | | | 20 | |
KBR, Inc. | | | 181 | | | | 11,746 | |
Kforce, Inc. | | | 3 | | | | 215 | |
Kornit Digital Ltd.(1) | | | 131 | | | | 3,857 | |
Kratos Defense & Security Solutions, Inc.(1) | | | 485 | | | | 6,955 | |
Landstar System, Inc. | | | 36 | | | | 6,901 | |
LanzaTech Global, Inc.(1) | | | 4 | | | | 25 | |
Legalzoom.com, Inc.(1) | | | 19 | | | | 227 | |
Leonardo DRS, Inc.(1) | | | 9 | | | | 153 | |
Limbach Holdings, Inc.(1)(2) | | | 0 | | | | 7 | |
Lincoln Electric Holdings, Inc. | | | 64 | | | | 12,659 | |
Lindsay Corp. | | | 2 | | | | 239 | |
Liquidity Services, Inc.(1) | | | 2 | | | | 39 | |
LSI Industries, Inc. | | | 3 | | | | 43 | |
Lyft, Inc. - Class A(1) | | | 44 | | | | 425 | |
Marten Transport Ltd. | | | 8 | | | | 175 | |
Masonite International Corp.(1) | | | 4 | | | | 407 | |
Matthews International Corp. - Class A | | | 1 | | | | 63 | |
MAXIMUS, Inc. | | | 117 | | | | 9,904 | |
Mayville Engineering Co., Inc.(1)(2) | | | 0 | | | | 4 | |
McGrath RentCorp | | | 83 | | | | 7,635 | |
Miller Industries, Inc.(2) | | | 0 | | | | 3 | |
Montrose Environmental Group, Inc.(1) | | | 5 | | | | 214 | |
Moog, Inc. - Class A | | | 19 | | | | 2,048 | |
MRC Global, Inc.(1) | | | 5 | | | | 51 | |
MSA Safety, Inc. | | | 60 | | | | 10,477 | |
MSC Industrial Direct Co., Inc. - Class A | | | 103 | | | | 9,833 | |
Mueller Industries, Inc. | | | 4 | | | | 371 | |
Mueller Water Products, Inc. - Class A | | | 28 | | | | 449 | |
MYR Group, Inc.(1) | | | 3 | | | | 406 | |
NEXTracker, Inc. - Class A(1) | | | 5 | | | | 217 | |
Nordson Corp. | | | 139 | | | | 34,497 | |
NuScale Power Corp.(1) | | | 9 | | | | 64 | |
NV5 Global, Inc.(1) | | | 2 | | | | 245 | |
Old Dominion Freight Line, Inc. | | | 13 | | | | 4,933 | |
Omega Flex, Inc. | | | 1 | | | | 57 | |
Otis Worldwide Corp. | | | 4 | | | | 315 | |
PAM Transportation Services, Inc.(1)(2) | | | 0 | | | | 5 | |
Parsons Corp.(1) | | | 3 | | | | 161 | |
Paychex, Inc. | | | 47 | | | | 5,242 | |
Paycom Software, Inc. | | | 8 | | | | 2,413 | |
Paycor HCM, Inc.(1) | | | 194 | | | | 4,588 | |
Paylocity Holding Corp.(1) | | | 30 | | | | 5,451 | |
Performant Financial Corp.(1) | | | 9 | | | | 24 | |
PGT Innovations, Inc.(1) | | | 10 | | | | 303 | |
Pitney Bowes, Inc. | | | 8 | | | | 30 | |
Planet Labs PBC(1) | | | 30 | | | | 97 | |
Preformed Line Products Co.(2) | | | 0 | | | | 31 | |
Primoris Services Corp. | | | 211 | | | | 6,443 | |
Quanta Services, Inc. | | | 169 | | | | 33,237 | |
RB Global, Inc. | | | 20 | | | | 1,217 | |
RBC Bearings, Inc.(1) | | | 83 | | | | 17,953 | |
Red Violet, Inc.(1) | | | 2 | | | | 40 | |
Redwire Corp.(1) | | | 2 | | | | 5 | |
Rocket Lab USA, Inc.(1) | | | 49 | | | | 294 | |
Rockwell Automation, Inc. | | | 186 | | | | 61,242 | |
Rollins, Inc. | | | 32 | | | | 1,380 | |
RXO, Inc.(1) | | | 18 | | | | 412 | |
Saia, Inc.(1) | | | 120 | | | | 40,929 | |
SES AI Corp.(1) | | | 2 | | | | 6 | |
Shoals Technologies Group, Inc. - Class A(1) | | | 402 | | | | 10,283 | |
Shyft Group, Inc. | | | 6 | | | | 134 | |
| | | | | | | | |
Simpson Manufacturing Co., Inc. | | | 117 | | | | 16,258 | |
SiteOne Landscape Supply, Inc.(1) | | | 168 | | | | 28,072 | |
SKYX Platforms Corp.(1) | | | 10 | | | | 26 | |
SP Plus Corp.(1) | | | 4 | | | | 147 | |
Spirit AeroSystems Holdings, Inc. - Class A | | | 2 | | | | 46 | |
SPX Technologies, Inc.(1) | | | 6 | | | | 549 | |
Standex International Corp. | | | 2 | | | | 244 | |
Stericycle, Inc.(1) | | | 187 | | | | 8,679 | |
Sterling Check Corp.(1)(2) | | | 0 | | | | 5 | |
Sterling Infrastructure, Inc.(1) | | | 5 | | | | 263 | |
Sun Country Airlines Holdings, Inc.(1) | | | 4 | | | | 83 | |
SunPower Corp. - Class A(1) | | | 15 | | | | 150 | |
Symbotic, Inc. - Class A(1) | | | 261 | | | | 11,153 | |
Tecnoglass, Inc. | | | 139 | | | | 7,164 | |
Tennant Co. | | | 2 | | | | 143 | |
Terex Corp. | | | 7 | | | | 411 | |
Tetra Tech, Inc. | | | 1 | | | | 228 | |
Thermon Group Holdings, Inc.(1) | | | 1 | | | | 17 | |
Toro Co. | | | 364 | | | | 37,016 | |
TPI Composites, Inc.(1) | | | 7 | | | | 77 | |
Trane Technologies Plc | | | 10 | | | | 1,870 | |
Transcat, Inc.(1) | | | 1 | | | | 112 | |
TransDigm Group, Inc. | | | 1 | | | | 1,146 | |
Trex Co., Inc.(1) | | | 393 | | | | 25,769 | |
TriNet Group, Inc.(1) | | | 7 | | | | 638 | |
Trinity Industries, Inc. | | | 3 | | | | 68 | |
Triton International Ltd. | | | 1 | | | | 121 | |
TTEC Holdings, Inc. | | | 4 | | | | 125 | |
UFP Industries, Inc. | | | 2 | | | | 156 | |
U-Haul Holding Co. | | | 1 | | | | 30 | |
U-Haul Holding Co. - Class B | | | 4 | | | | 223 | |
UniFirst Corp. | | | 37 | | | | 5,662 | |
United Rentals, Inc. | | | 2 | | | | 906 | |
Upwork, Inc.(1) | | | 23 | | | | 213 | |
Valmont Industries, Inc. | | | 21 | | | | 6,152 | |
Velo3D, Inc.(1) | | | 16 | | | | 34 | |
Verisk Analytics, Inc. - Class A | | | 199 | | | | 44,997 | |
Verra Mobility Corp. - Class A(1) | | | 25 | | | | 490 | |
Vertiv Holdings Co. - Class A | | | 296 | | | | 7,344 | |
Viad Corp.(1) | | | 4 | | | | 98 | |
Vicor Corp.(1) | | | 4 | | | | 217 | |
Virgin Galactic Holdings, Inc.(1) | | | 25 | | | | 97 | |
Wabash National Corp. | | | 9 | | | | 219 | |
Watsco, Inc. | | | 30 | | | | 11,452 | |
Watts Water Technologies, Inc. - Class A | | | 5 | | | | 891 | |
Werner Enterprises, Inc. | | | 2 | | | | 68 | |
WESCO International, Inc. | | | 92 | | | | 16,514 | |
WillScot Mobile Mini Holdings Corp. - Class A(1) | | | 306 | | | | 14,608 | |
WNS Holdings Ltd. - ADR(1) | | | 87 | | | | 6,424 | |
WW Grainger, Inc. | | | 6 | | | | 5,114 | |
Xometry, Inc. - Class A(1) | | | 1 | | | | 16 | |
Xylem, Inc. | | | 94 | | | | 10,596 | |
Zurn Elkay Water Solutions Corp. | | | 5 | | | | 140 | |
| | | | | | | | |
Total Industrials | | | | 1,377,881 | |
| | | | | | | | |
Information Technology – 25.19% | | | | | | | | |
8x8, Inc.(1) | | | 20 | | | | 84 | |
A10 Networks, Inc. | | | 12 | | | | 182 | |
ACI Worldwide, Inc.(1) | | | 17 | | | | 387 | |
ACM Research, Inc. - Class A(1) | | | 1 | | | | 17 | |
Adeia, Inc. | | | 17 | | | | 187 | |
Advanced Energy Industries, Inc. | | | 96 | | | | 10,704 | |
Aehr Test Systems(1) | | | 5 | | | | 194 | |
Agilysys, Inc.(1) | | | 4 | | | | 248 | |
| | | | | | | | |
Akamai Technologies, Inc.(1) | | | 347 | | | | 31,185 | |
Akoustis Technologies, Inc.(1) | | | 13 | | | | 40 | |
Alarm.com Holdings, Inc.(1) | | | 9 | | | | 447 | |
Alkami Technology, Inc.(1) | | | 7 | | | | 121 | |
Allegro MicroSystems, Inc.(1) | | | 10 | | | | 436 | |
Altair Engineering, Inc. - Class A(1) | | | 187 | | | | 14,216 | |
Alteryx, Inc. - Class A(1) | | | 9 | | | | 402 | |
Ambarella, Inc.(1) | | | 72 | | | | 5,998 | |
American Software, Inc. - Class A | | | 217 | | | | 2,276 | |
Amphenol Corp. - Class A | | | 43 | | | | 3,626 | |
Amplitude, Inc. - Class A(1) | | | 13 | | | | 138 | |
ANSYS, Inc.(1) | | | 70 | | | | 23,100 | |
Appfolio, Inc. - Class A(1) | | | 3 | | | | 591 | |
Appian Corp. - Class A(1) | | | 7 | | | | 344 | |
Applied Digital Corp.(1) | | | 12 | | | | 113 | |
AppLovin Corp. - Class A(1) | | | 8 | | | | 218 | |
Arista Networks, Inc.(1) | | | 383 | | | | 61,994 | |
Arlo Technologies, Inc.(1) | | | 13 | | | | 146 | |
Asana, Inc. - Class A(1) | | | 528 | | | | 11,642 | |
Aspen Technology, Inc.(1) | | | 20 | | | | 3,283 | |
Atlassian Corp. - Class A(1) | | | 276 | | | | 46,373 | |
Atomera, Inc.(1) | | | 3 | | | | 24 | |
Autodesk, Inc.(1) | | | 150 | | | | 30,692 | |
AvePoint, Inc.(1) | | | 27 | | | | 155 | |
Avid Technology, Inc.(1) | | | 4 | | | | 108 | |
Axcelis Technologies, Inc.(1) | | | 209 | | | | 38,260 | |
Badger Meter, Inc. | | | 49 | | | | 7,203 | |
Bel Fuse, Inc. - Class B(2) | | | 0 | | | | 9 | |
Belden, Inc. | | | 56 | | | | 5,333 | |
Bentley Systems, Inc. - Class B | | | 455 | | | | 24,668 | |
BigBear.ai Holdings, Inc.(1) | | | 5 | | | | 12 | |
BigCommerce Holdings, Inc.(1) | | | 12 | | | | 119 | |
BILL Holdings, Inc.(1) | | | 30 | | | | 3,523 | |
Bit Digital, Inc.(1) | | | 2 | | | | 9 | |
Blackbaud, Inc.(1) | | | 8 | | | | 553 | |
BlackLine, Inc.(1) | | | 10 | | | | 543 | |
Box, Inc. - Class A(1) | | | 371 | | | | 10,913 | |
Braze, Inc. - Class A(1) | | | 133 | | | | 5,806 | |
C3.ai, Inc. - Class A(1) | | | 8 | | | | 293 | |
Cadence Design Systems, Inc.(1) | | | 63 | | | | 14,823 | |
Calix, Inc.(1) | | | 148 | | | | 7,393 | |
Cambium Networks Corp.(1) | | | 2 | | | | 33 | |
CDW Corp. | | | 19 | | | | 3,397 | |
CEVA, Inc.(1) | | | 4 | | | | 92 | |
Cleanspark, Inc.(1) | | | 2 | | | | 7 | |
Clear Secure, Inc. - Class A | | | 15 | | | | 346 | |
Clearfield, Inc.(1) | | | 2 | | | | 109 | |
Climb Global Solutions, Inc. | | | 1 | | | | 30 | |
Cloudflare, Inc. - Class A(1) | | | 42 | | | | 2,733 | |
Cognex Corp. | | | 74 | | | | 4,172 | |
CommScope Holding Co., Inc.(1) | | | 38 | | | | 213 | |
CommVault Systems, Inc.(1) | | | 8 | | | | 546 | |
CompoSecure, Inc.(1) | | | 2 | | | | 17 | |
Confluent, Inc. - Class A(1) | | | 149 | | | | 5,258 | |
Consensus Cloud Solutions, Inc.(1) | | | 2 | | | | 61 | |
CoreCard Corp.(1) | | | 1 | | | | 32 | |
Corsair Gaming, Inc.(1) | | | 7 | | | | 124 | |
Couchbase, Inc.(1) | | | 6 | | | | 95 | |
CPI Card Group, Inc.(1) | | | 1 | | | | 18 | |
Credo Technology Group Holding Ltd.(1) | | | 17 | | | | 297 | |
Crowdstrike Holdings, Inc. - Class A(1) | | | 31 | | | | 4,496 | |
CTS Corp. | | | 5 | | | | 234 | |
CyberArk Software Ltd.(1) | | | 169 | | | | 26,345 | |
| | | | | | | | |
Datadog, Inc. - Class A(1) | | | 252 | | | | 24,756 | |
Digi International, Inc.(1) | | | 77 | | | | 3,042 | |
Digimarc Corp.(1) | | | 3 | | | | 74 | |
Digital Turbine, Inc.(1) | | | 4 | | | | 41 | |
DigitalOcean Holdings, Inc.(1) | | | 190 | | | | 7,613 | |
Diodes, Inc.(1) | | | 6 | | | | 583 | |
DocuSign, Inc. - Class A(1) | | | 29 | | | | 1,505 | |
Domo, Inc. - Class B(1) | | | 5 | | | | 80 | |
DoubleVerify Holdings, Inc. - Class Rights(1) | | | 16 | | | | 632 | |
Dropbox, Inc. - Class A(1) | | | 34 | | | | 896 | |
Dynatrace, Inc.(1) | | | 482 | | | | 24,827 | |
Ebix, Inc. | | | 1 | | | | 31 | |
eGain Corp.(1) | | | 4 | | | | 28 | |
Elastic NV(1) | | | 11 | | | | 733 | |
Endava Plc - ADR(1) | | | 114 | | | | 5,903 | |
Enfusion, Inc. - Class A(1) | | | 5 | | | | 54 | |
EngageSmart, Inc.(1) | | | 9 | | | | 170 | |
Enphase Energy, Inc.(1) | | | 19 | | | | 3,240 | |
Entegris, Inc. | | | 1 | | | | 125 | |
Envestnet, Inc.(1) | | | 163 | | | | 9,695 | |
EPAM Systems, Inc.(1) | | | 8 | | | | 1,818 | |
ePlus, Inc.(1)(2) | | | 0 | | | | 17 | |
Everbridge, Inc.(1) | | | 7 | | | | 193 | |
EverCommerce, Inc.(1) | | | 3 | | | | 38 | |
Evolv Technologies Holdings, Inc.(1) | | | 4 | | | | 22 | |
Expensify, Inc. - Class A(1) | | | 10 | | | | 78 | |
Extreme Networks, Inc.(1) | | | 22 | | | | 584 | |
Fabrinet(1) | | | 7 | | | | 851 | |
Fair Isaac Corp.(1) | | | 34 | | | | 27,139 | |
FARO Technologies, Inc.(1)(2) | | | 0 | | | | 4 | |
Fastly, Inc. - Class A(1) | | | 18 | | | | 281 | |
First Solar, Inc.(1) | | | 125 | | | | 23,734 | |
Five9, Inc.(1) | | | 165 | | | | 13,608 | |
ForgeRock, Inc. - Class A(1) | | | 9 | | | | 177 | |
FormFactor, Inc.(1) | | | 14 | | | | 472 | |
Fortinet, Inc.(1) | | | 110 | | | | 8,318 | |
Freshworks, Inc. - Class A(1) | | | 29 | | | | 513 | |
Gartner, Inc.(1) | | | 11 | | | | 3,907 | |
Gen Digital, Inc. | | | 13 | | | | 233 | |
Gitlab, Inc. - Class A(1) | | | 7 | | | | 361 | |
Globant SA(1) | | | 62 | | | | 11,096 | |
GoDaddy, Inc. - Class A(1) | | | 14 | | | | 1,026 | |
Grid Dynamics Holdings, Inc.(1) | | | 8 | | | | 73 | |
Guidewire Software, Inc.(1) | | | 110 | | | | 8,337 | |
Hackett Group, Inc. | | | 4 | | | | 93 | |
Harmonic, Inc.(1) | | | 20 | | | | 319 | |
HashiCorp, Inc. - Class A(1) | | | 9 | | | | 240 | |
HP, Inc. | | | 25 | | | | 783 | |
HubSpot, Inc.(1) | | | 143 | | | | 76,280 | |
Impinj, Inc.(1) | | | 45 | | | | 4,024 | |
indie Semiconductor, Inc. - Class A(1) | | | 23 | | | | 212 | |
Infinera Corp.(1) | | | 35 | | | | 169 | |
Informatica, Inc. - Class A(1) | | | 1 | | | | 11 | |
Information Services Group, Inc. | | | 3 | | | | 17 | |
Insight Enterprises, Inc.(1) | | | 5 | | | | 755 | |
Instructure Holdings, Inc.(1) | | | 3 | | | | 86 | |
Intapp, Inc.(1) | | | 3 | | | | 116 | |
InterDigital, Inc. | | | 5 | | | | 466 | |
inTEST Corp.(1) | | | 2 | | | | 49 | |
IonQ, Inc.(1) | | | 5 | | | | 61 | |
Iteris, Inc.(1) | | | 4 | | | | 15 | |
Itron, Inc.(1) | | | 1 | | | | 56 | |
Jabil, Inc. | | | 12 | | | | 1,266 | |
| | | | | | | | |
Jamf Holding Corp.(1) | | | 12 | | | | 242 | |
Kaltura, Inc.(1) | | | 15 | | | | 31 | |
Keysight Technologies, Inc.(1) | | | 85 | | | | 14,243 | |
Kimball Electronics, Inc.(1) | | | 1 | | | | 25 | |
Kulicke & Soffa Industries, Inc. | | | 7 | | | | 414 | |
Lattice Semiconductor Corp.(1) | | | 962 | | | | 92,391 | |
Lightwave Logic, Inc.(1) | | | 20 | | | | 141 | |
Littelfuse, Inc. | | | 26 | | | | 7,466 | |
LivePerson, Inc.(1) | | | 11 | | | | 51 | |
LiveVox Holdings, Inc.(1) | | | 4 | | | | 11 | |
Luna Innovations, Inc.(1) | | | 6 | | | | 51 | |
MACOM Technology Solutions Holdings, Inc.(1) | | | 241 | | | | 15,802 | |
Manhattan Associates, Inc.(1) | | | 133 | | | | 26,581 | |
Marathon Digital Holdings, Inc.(1) | | | 30 | | | | 418 | |
Maxeon Solar Technologies Ltd.(1) | | | 3 | | | | 84 | |
MaxLinear, Inc. - Class A(1) | | | 13 | | | | 422 | |
MeridianLink, Inc.(1) | | | 3 | | | | 66 | |
Microchip Technology, Inc. | | | 157 | | | | 14,106 | |
MicroStrategy, Inc. - Class A(1) | | | 2 | | | | 675 | |
MicroVision, Inc.(1) | | | 31 | | | | 143 | |
Mitek Systems, Inc.(1) | | | 7 | | | | 77 | |
Model N, Inc.(1) | | | 7 | | | | 240 | |
Monday.com Ltd.(1) | | | 140 | | | | 23,999 | |
MongoDB, Inc. - Class A(1) | | | 154 | | | | 63,132 | |
Monolithic Power Systems, Inc. | | | 91 | | | | 48,891 | |
N-able, Inc.(1) | | | 11 | | | | 165 | |
Napco Security Technologies, Inc. | | | 6 | | | | 192 | |
National Instruments Corp. | | | 115 | | | | 6,607 | |
Navitas Semiconductor Corp. - Class A(1) | | | 3 | | | | 30 | |
nCino, Inc.(1) | | | 250 | | | | 7,541 | |
NetApp, Inc. | | | 12 | | | | 953 | |
New Relic, Inc.(1) | | | 8 | | | | 520 | |
NextNav, Inc.(1) | | | 9 | | | | 26 | |
Novanta, Inc.(1) | | | 6 | | | | 1,174 | |
Nutanix, Inc. - Class A(1) | | | 818 | | | | 22,947 | |
NVE Corp. | | | 1 | | | | 71 | |
Okta, Inc. - Class A(1) | | | 577 | | | | 40,042 | |
Olo, Inc. - Class A(1) | | | 11 | | | | 68 | |
ON Semiconductor Corp.(1) | | | 972 | | | | 91,901 | |
OneSpan, Inc.(1) | | | 7 | | | | 98 | |
Onto Innovation, Inc.(1) | | | 140 | | | | 16,271 | |
OSI Systems, Inc.(1) | | | 3 | | | | 335 | |
PagerDuty, Inc.(1) | | | 129 | | | | 2,899 | |
Palantir Technologies, Inc. - Class A(1) | | | 272 | | | | 4,174 | |
Palo Alto Networks, Inc.(1) | | | 163 | | | | 41,669 | |
PAR Technology Corp.(1)(2) | | | 0 | | | | 13 | |
PDF Solutions, Inc.(1) | | | 5 | | | | 242 | |
Pegasystems, Inc. | | | 6 | | | | 298 | |
Perficient, Inc.(1) | | | 6 | | | | 511 | |
Plexus Corp.(1) | | | 4 | | | | 428 | |
Power Integrations, Inc. | | | 87 | | | | 8,249 | |
PowerSchool Holdings, Inc. - Class A(1) | | | 10 | | | | 189 | |
Presto Automation, Inc.(1) | | | 1 | | | | 6 | |
Procore Technologies, Inc.(1) | | | 417 | | | | 27,163 | |
Progress Software Corp. | | | 8 | | | | 446 | |
PROS Holdings, Inc.(1) | | | 135 | | | | 4,156 | |
PTC, Inc.(1) | | | 75 | | | | 10,661 | |
Pure Storage, Inc. - Class A(1) | | | 1,287 | | | | 47,376 | |
Q2 Holdings, Inc.(1) | | | 10 | | | | 319 | |
Qualys, Inc.(1) | | | 95 | | | | 12,210 | |
Rambus, Inc.(1) | | | 206 | | | | 13,204 | |
Rapid7, Inc.(1) | | | 132 | | | | 5,997 | |
Rimini Street, Inc.(1) | | | 9 | | | | 41 | |
| | | | | | | | |
RingCentral, Inc. - Class A(1) | | | 99 | | | | 3,243 | |
Riot Platforms, Inc.(1) | | | 20 | | | | 238 | |
Rogers Corp.(1) | | | 2 | | | | 366 | |
Sanmina Corp.(1)(2) | | | 0 | | | | 30 | |
Sapiens International Corp. NV | | | 5 | | | | 145 | |
SEMrush Holdings, Inc. - Class A(1) | | | 6 | | | | 53 | |
SentinelOne, Inc. - Class A(1) | | | 4 | | | | 55 | |
Shopify, Inc. - Class A(1) | | | 343 | | | | 22,131 | |
Silicon Laboratories, Inc.(1) | | | 115 | | | | 18,084 | |
SiTime Corp.(1) | | | 74 | | | | 8,781 | |
SkyWater Technology, Inc.(1) | | | 3 | | | | 29 | |
SMART Global Holdings, Inc.(1) | | | 2 | | | | 57 | |
Smartsheet, Inc. - Class A(1) | | | 102 | | | | 3,884 | |
SoundHound AI, Inc. - Class A(1) | | | 25 | | | | 113 | |
SoundThinking, Inc.(1) | | | 2 | | | | 33 | |
Splunk, Inc.(1) | | | 23 | | | | 2,483 | |
Sprinklr, Inc. - Class A(1) | | | 16 | | | | 219 | |
Sprout Social, Inc. - Class A(1) | | | 223 | | | | 10,300 | |
SPS Commerce, Inc.(1) | | | 157 | | | | 30,176 | |
Squarespace, Inc. - Class A(1) | | | 2 | | | | 76 | |
Super Micro Computer, Inc.(1) | | | 184 | | | | 45,795 | |
Synaptics, Inc.(1) | | | 1 | | | | 51 | |
Synopsys, Inc.(1) | | | 152 | | | | 66,336 | |
Teledyne Technologies, Inc.(1) | | | 53 | | | | 21,765 | |
Tenable Holdings, Inc.(1) | | | 141 | | | | 6,155 | |
Teradata Corp.(1) | | | 15 | | | | 784 | |
Teradyne, Inc. | | | 19 | | | | 2,104 | |
Thoughtworks Holding, Inc.(1) | | | 16 | | | | 124 | |
Transphorm, Inc.(1) | | | 5 | | | | 17 | |
Tucows, Inc. - Class A(1) | | | 1 | | | | 20 | |
Twilio, Inc. - Class A(1) | | | 4 | | | | 257 | |
Tyler Technologies, Inc.(1) | | | 106 | | | | 44,114 | |
Ubiquiti, Inc. | | | 1 | | | | 89 | |
UiPath, Inc. - Class A(1) | | | 42 | | | | 689 | |
Unity Software, Inc.(1) | | | 16 | | | | 711 | |
Universal Display Corp. | | | 3 | | | | 441 | |
Varonis Systems, Inc. - Class B(1) | | | 360 | | | | 9,596 | |
Verint Systems, Inc.(1) | | | 11 | | | | 371 | |
VeriSign, Inc.(1) | | | 1 | | | | 157 | |
Veritone, Inc.(1) | | | 5 | | | | 19 | |
Viant Technology, Inc. - Class A(1) | | | 3 | | | | 12 | |
Viavi Solutions, Inc.(1) | | | 33 | | | | 376 | |
Vontier Corp. | | | 8 | | | | 245 | |
Weave Communications, Inc.(1) | | | 6 | | | | 65 | |
Workday, Inc. - Class A(1) | | | 235 | | | | 53,084 | |
Workiva, Inc. - Class A(1) | | | 9 | | | | 887 | |
Yext, Inc.(1) | | | 19 | | | | 214 | |
Zebra Technologies Corp. - Class A(1) | | | 1 | | | | 395 | |
Zeta Global Holdings Corp. - Class A(1) | | | 24 | | | | 202 | |
Zscaler, Inc.(1) | | | 463 | | | | 67,695 | |
Zuora, Inc. - Class A(1) | | | 22 | | | | 246 | |
| | | | | | | | |
Total Information Technology | | | | 1,792,118 | |
| | | | | |
Materials – 1.34% | | | | | | | | |
5E Advanced Materials, Inc.(1) | | | 7 | | | | 22 | |
Alpha Metallurgical Resources, Inc.(2) | | | 0 | | | | 26 | |
American Vanguard Corp. | | | 1 | | | | 14 | |
Amyris, Inc.(1) | | | 8 | | | | 8 | |
Ardagh Metal Packaging SA | | | 19 | | | | 71 | |
ATI, Inc.(1) | | | 504 | | | | 22,307 | |
Avery Dennison Corp. | | | 4 | | | | 662 | |
Avient Corp. | | | 104 | | | | 4,254 | |
Axalta Coating Systems Ltd.(1) | | | 3 | | | | 113 | |
Balchem Corp. | | | 43 | | | | 5,739 | |
| | | | | | | | |
Berry Global Group, Inc. | | | 96 | | | | 6,180 | |
Cabot Corp. | | | 10 | | | | 659 | |
Century Aluminum Co.(1) | | | 9 | | | | 81 | |
Chase Corp. | | | 45 | | | | 5,438 | |
Compass Minerals International, Inc. | | | 6 | | | | 204 | |
Constellium SE - Class A(1) | | | 14 | | | | 241 | |
Contango ORE, Inc.(1)(2) | | | 0 | | | | 7 | |
Dakota Gold Corp.(1) | | | 6 | | | | 18 | |
Diversey Holdings Ltd.(1) | | | 14 | | | | 116 | |
Eagle Materials, Inc. | | | 3 | | | | 639 | |
Ecovyst, Inc.(1) | | | 3 | | | | 39 | |
FMC Corp. | | | 3 | | | | 281 | |
Ginkgo Bioworks Holdings, Inc.(1) | | | 24 | | | | 45 | |
Graphic Packaging Holding Co. | | | 384 | | | | 9,229 | |
Hawkins, Inc. | | | 3 | | | | 161 | |
HB Fuller Co. | | | 9 | | | | 612 | |
Hecla Mining Co. | | | 22 | | | | 113 | |
i-80 Gold Corp.(1) | | | 2 | | | | 5 | |
Ingevity Corp.(1) | | | 107 | | | | 6,238 | |
Innospec, Inc. | | | 100 | | | | 10,033 | |
Ivanhoe Electric, Inc.(1) | | | 10 | | | | 127 | |
Kaiser Aluminum Corp. | | | 3 | | | | 191 | |
Livent Corp.(1) | | | 196 | | | | 5,389 | |
Materion Corp. | | | 4 | | | | 418 | |
Myers Industries, Inc. | | | 6 | | | | 125 | |
Novagold Resources, Inc.(1) | | | 43 | | | | 173 | |
O-I Glass, Inc.(1) | | | 24 | | | | 503 | |
Orion SA | | | 10 | | | | 211 | |
Perpetua Resources Corp.(1) | | | 6 | | | | 24 | |
Piedmont Lithium, Inc.(1) | | | 1 | | | | 62 | |
PPG Industries, Inc. | | | 9 | | | | 1,264 | |
PureCycle Technologies, Inc.(1) | | | 5 | | | | 50 | |
Quaker Chemical Corp. | | | 2 | | | | 483 | |
RPM International, Inc. | | | 3 | | | | 314 | |
Ryerson Holding Corp.(2) | | | 0 | | | | 9 | |
Scotts Miracle-Gro Co. | | | 6 | | | | 373 | |
Sealed Air Corp. | | | 12 | | | | 461 | |
Sensient Technologies Corp. | | | 7 | | | | 532 | |
Silgan Holdings, Inc. | | | 59 | | | | 2,778 | |
Stepan Co.(2) | | | 0 | | | | 41 | |
Summit Materials, Inc. - Class A(1) | | | 194 | | | | 7,329 | |
Sylvamo Corp. | | | 6 | | | | 258 | |
United States Lime & Minerals, Inc.(2) | | | 0 | | | | 74 | |
Vulcan Materials Co. | | | 4 | | | | 952 | |
| | | | | | | | |
Total Materials | | | | 95,696 | |
| | | | | |
Real Estate – 1.11% | | | | | | | | |
Agree Realty Corp. | | | 87 | | | | 5,657 | |
Alexander’s, Inc.(2) | | | 0 | | | | 71 | |
Anywhere Real Estate, Inc.(1) | | | 2 | | | | 13 | |
CareTrust REIT, Inc. | | | 2 | | | | 40 | |
CBL & Associates Properties, Inc. | | | 4 | | | | 78 | |
Clipper Realty, Inc. | | | 2 | | | | 12 | |
Community Healthcare Trust, Inc. | | | 3 | | | | 106 | |
Compass, Inc. - Class A(1) | | | 47 | | | | 164 | |
Corporate Office Properties Trust | | | 242 | | | | 5,741 | |
CoStar Group, Inc.(1) | | | 404 | | | | 35,984 | |
DigitalBridge Group, Inc. | | | 9 | | | | 135 | |
Douglas Elliman, Inc.(2) | | | 0 | | | | 0 | |
Easterly Government Properties, Inc. - Class A | | | 231 | | | | 3,352 | |
Equity LifeStyle Properties, Inc. | | | 8 | | | | 564 | |
Essential Properties Realty Trust, Inc. | | | 3 | | | | 69 | |
eXp World Holdings, Inc. | | | 13 | | | | 254 | |
Extra Space Storage, Inc. | | | 1 | | | | 166 | |
| | | | | | | | |
FirstService Corp. | | | 68 | | | | 10,404 | |
Four Corners Property Trust, Inc. | | | 1 | | | | 37 | |
Gladstone Commercial Corp. | | | 2 | | | | 20 | |
Iron Mountain, Inc. | | | 21 | | | | 1,178 | |
Lamar Advertising Co. - Class A | | | 10 | | | | 972 | |
Marcus & Millichap, Inc. | | | 2 | | | | 52 | |
Maui Land & Pineapple Co., Inc.(1) | | | 1 | | | | 16 | |
National Health Investors, Inc. | | | 1 | | | | 38 | |
NexPoint Residential Trust, Inc. | | | 1 | | | | 56 | |
Opendoor Technologies, Inc.(1) | | | 6 | | | | 22 | |
Outfront Media, Inc. | | | 12 | | | | 196 | |
Pebblebrook Hotel Trust | | | 262 | | | | 3,655 | |
Phillips Edison & Co., Inc. | | | 4 | | | | 120 | |
Redfin Corp.(1) | | | 19 | | | | 240 | |
RMR Group, Inc. - Class A | | | 2 | | | | 41 | |
Ryman Hospitality Properties, Inc. | | | 10 | | | | 956 | |
Saul Centers, Inc. | | | 2 | | | | 75 | |
SBA Communications Corp. - Class A | | | 2 | | | | 364 | |
Simon Property Group, Inc. | | | 10 | | | | 1,182 | |
St Joe Co. | | | 6 | | | | 290 | |
Sun Communities, Inc. | | | 4 | | | | 516 | |
Tanger Factory Outlet Centers, Inc. | | | 8 | | | | 187 | |
Terreno Realty Corp. | | | 101 | | | | 6,063 | |
UDR, Inc. | | | 3 | | | | 112 | |
UMH Properties, Inc. | | | 2 | | | | 26 | |
Universal Health Realty Income Trust | | | 2 | | | | 116 | |
| | | | | | | | |
Total Real Estate | | | | 79,340 | |
| | | | | |
Utilities – 0.07% | | | | | | | | |
AES Corp. | | | 60 | | | | 1,234 | |
American States Water Co. | | | 7 | | | | 572 | |
Artesian Resources Corp. - Class A | | | 1 | | | | 55 | |
Brookfield Infrastructure Corp. - Class A | | | 2 | | | | 78 | |
Cadiz, Inc.(1) | | | 7 | | | | 29 | |
California Water Service Group | | | 3 | | | | 159 | |
Chesapeake Utilities Corp. | | | 2 | | | | 233 | |
Consolidated Water Co. Ltd. | | | 1 | | | | 19 | |
Genie Energy Ltd. - Class B | | | 2 | | | | 25 | |
Global Water Resources, Inc. | | | 2 | | | | 27 | |
MGE Energy, Inc. | | | 3 | | | | 257 | |
Middlesex Water Co. | | | 3 | | | | 255 | |
Montauk Renewables, Inc.(1) | | | 12 | | | | 89 | |
New Jersey Resources Corp. | | | 9 | | | | 431 | |
Ormat Technologies, Inc. | | | 6 | | | | 493 | |
Otter Tail Corp. | | | 4 | | | | 302 | |
PNM Resources, Inc. | | | 2 | | | | 71 | |
Pure Cycle Corp.(1) | | | 3 | | | | 38 | |
Sunnova Energy International, Inc.(1) | | | 9 | | | | 158 | |
Unitil Corp. | | | 1 | | | | 38 | |
Vistra Corp. | | | 16 | | | | 415 | |
York Water Co. | | | 3 | | | | 110 | |
| | | | | | | | |
Total Utilities | | | | 5,088 | |
| | | | | |
Total Common Stocks (Cost: $5,488,790) | | | | 6,912,411 | |
| | | | | |
SHORT-TERM INVESTMENTS – 2.98% | | | | | | | | |
Money Market Funds – 2.94% | | | | | | | | |
Goldman Sachs Financial Square Government Fund - Class I, 5.02%(3) | | | 209,776 | | | | 209,776 | |
| | | | | | | | |
Total Money Market Funds (Cost: $209,776) | | | | | | | 209,776 | |
| | | | | | | | |
| | | Principal
Amount
(000s) | | | Value
(000s) | |
Time Deposits – 0.04% | | | | | | | | |
ANZ, London, 4.57% due 07/03/2023 | | $ | 362 | | | | 362 | |
Citibank, New York, 4.57% due 07/03/2023 | | | 479 | | | | 479 | |
| | | | | | | | |
JP Morgan, New York, 4.57% due 07/03/2023 | | | 1,637 | | | | 1,637 | |
Sumitomo Trust Bank, London, 4.57% due 07/03/2023 | | | 80 | | | | 80 | |
| | | | | | | | |
Total Time Deposits (Cost: $2,558) | | | | | | | 2,558 | |
| | | | | | | | |
Total Short-Term Investments (Cost: $212,334) | | | | 212,334 | |
| | | | | |
TOTAL INVESTMENTS IN SECURITIES – 100.12%
(Cost: $5,701,124) | | | | | | | 7,124,745 | |
| | | | | | | | |
LIABILITIES IN EXCESS OF OTHER ASSETS – (0.12)% | | | | | | | (8,399 | ) |
| | | | | | | | |
TOTAL NET ASSETS – 100.00% | | | | | | $ | 7,116,346 | |
| | | | | | | | |
Percentages are stated as a percent of net assets.
ADR American Depositary Receipt
REIT Real Estate Investment Trust
| (1) | Non-income producing security. |
| (2) | A zero balance may reflect actual amounts rounding to less than one thousand. |
| (3) | Represents annualized seven-day yield as of the close of the reporting period. |
| (4) | Security that is categorized as Level 3 per the Trust’s fair value hierarchy. The value of these securities totals $13, which represents 0.00% of total net assets. |
| (5) | Security that is restricted at June 30, 2023. The value of these securities totals $0, which represents 0.00% of total net assets. |
The accompanying notes are an integral part of this Schedule of Investments.
Open Futures Contracts
| | | | | | | | | | | | | | | | | | |
Number of Contracts
Purchased | | Reference Entity | | Expiration Date | | | Notional
Amount | | | Value | | | Unrealized
Appreciation/
(Depreciation) | |
13 | | E-mini Russell 2000 Future | | | Sep. 2023 | | | $ | 1,192 | | | $ | 1,236 | | | $ | 44 | |
4 | | S&P 500 E-mini Future | | | Sep. 2023 | | | | 878 | | | | 898 | | | | 20 | |
1 | | S&P MidCap 400 E-mini Future | | | Sep. 2023 | | | | 254 | | | | 265 | | | | 11 | |
| | | | | | | | | | | | | | | | | | |
| | | | | | | | | | | | | | | | $ | 75 | |
| | | | | | | | | | | | | | | | | | |
Bridge Builder Small/Mid Cap Value Fund
Schedule of Investments
June 30, 2023
(Amounts in thousands, except number of contracts)
| | | | | | | | |
| | | Shares
(000s) | | | Value
(000s) | |
COMMON STOCKS – 96.92% | | | | | | | | |
Communication Services – 1.41% | | | | | | | | |
Advantage Solutions, Inc.(1) | | | 40 | | | $ | 93 | |
AMC Entertainment Holdings, Inc. - Class A(1) | | | 14 | | | | 63 | |
AMC Networks, Inc. - Class A(1) | | | 79 | | | | 942 | |
Anterix, Inc.(1) | | | 1 | | | | 18 | |
ATN International, Inc. | | | 4 | | | | 143 | |
Bandwidth, Inc. - Class A(1) | | | 8 | | | | 111 | |
Boston Omaha Corp. - Class A(1) | | | 8 | | | | 154 | |
Bumble, Inc. - Class A(1) | | | 42 | | | | 707 | |
Cable One, Inc. | | | 5 | | | | 3,477 | |
Cardlytics, Inc.(1) | | | 14 | | | | 89 | |
Cinemark Holdings, Inc.(1) | | | 8 | | | | 128 | |
Clear Channel Outdoor Holdings, Inc. - Class A(1) | | | 157 | | | | 216 | |
Cogent Communications Holdings, Inc. | | | 6 | | | | 428 | |
Consolidated Communications Holdings, Inc.(1) | | | 26 | | | | 98 | |
Daily Journal Corp.(1)(2) | | | 0 | | | | 91 | |
DHI Group, Inc.(1) | | | 17 | | | | 64 | |
DISH Network Corp. - Class A(1) | | | 7 | | | | 45 | |
EchoStar Corp. - Class A(1) | | | 13 | | | | 233 | |
Electronic Arts, Inc. | | | 8 | | | | 993 | |
Emerald Holding, Inc.(1) | | | 5 | | | | 21 | |
Entravision Communications Corp. - Class A | | | 446 | | | | 1,957 | |
ESC GCI Liberty, Inc.(1)(2)(4) | | | 3 | | | | — | |
Eventbrite, Inc. - Class A(1) | | | 3 | | | | 28 | |
EW Scripps Co. - Class A(1) | | | 14 | | | | 128 | |
Fox Corp. - Class A | | | 227 | | | | 7,712 | |
Fox Corp. - Class B | | | 4 | | | | 122 | |
Frontier Communications Parent, Inc.(1) | | | 7 | | | | 127 | |
fuboTV, Inc.(1) | | | 88 | | | | 183 | |
Gannett Co., Inc.(1) | | | 59 | | | | 132 | |
Globalstar, Inc.(1) | | | 31 | | | | 33 | |
Gogo, Inc.(1) | | | 24 | | | | 415 | |
Gray Television, Inc. | | | 33 | | | | 263 | |
IAC, Inc.(1) | | | 2 | | | | 134 | |
IDT Corp. - Class B(1) | | | 1 | | | | 27 | |
iHeartMedia, Inc. - Class A(1) | | | 43 | | | | 158 | |
Interpublic Group of Companies, Inc. | | | 223 | | | | 8,603 | |
Iridium Communications, Inc.(2) | | | 0 | | | | 13 | |
John Wiley & Sons, Inc. - Class A | | | 19 | | | | 631 | |
Liberty Broadband Corp. - Class A(1)(2) | | | 0 | | | | 30 | |
Liberty Broadband Corp. - Class C(1) | | | 3 | | | | 205 | |
Liberty Latin America Ltd. - Class A(1) | | | 10 | | | | 86 | |
Liberty Latin America Ltd. - Class C(1) | | | 62 | | | | 537 | |
Liberty Media Corp.-Liberty Formula One - Class A(1) | | | 1 | | | | 44 | |
Liberty Media Corp.-Liberty Formula One - Class C(1) | | | 123 | | | | 9,295 | |
Liberty Media Corp.-Liberty SiriusXM - Class A(1) | | | 2 | | | | 66 | |
Liberty Media Corp.-Liberty SiriusXM - Class C(1) | | | 4 | | | | 139 | |
Lions Gate Entertainment Corp. - Class A(1) | | | 11 | | | | 98 | |
Lions Gate Entertainment Corp. - Class B(1) | | | 11 | | | | 95 | |
Live Nation Entertainment, Inc.(1) | | | 3 | | | | 306 | |
Lumen Technologies, Inc. | | | 412 | | | | 931 | |
Madison Square Garden Entertainment Corp. - Class A(1) | | | 3 | | | | 92 | |
Madison Square Garden Sports Corp. - Class A | | | 1 | | | | 96 | |
| | | | | | | | |
Magnite, Inc.(1) | | | 31 | | | | 427 | |
Marcus Corp. | | | 9 | | | | 139 | |
Match Group, Inc.(1) | | | 1 | | | | 32 | |
MediaAlpha, Inc. - Class A(1) | | | 2 | | | | 21 | |
New York Times Co. - Class A | | | 4 | | | | 177 | |
News Corp. - Class A | | | 11 | | | | 206 | |
News Corp. - Class B | | | 3 | | | | 64 | |
Nexstar Media Group, Inc. - Class A | | | 137 | | | | 22,867 | |
Nextdoor Holdings, Inc.(1) | | | 25 | | | | 80 | |
Omnicom Group, Inc. | | | 5 | | | | 522 | |
Outbrain, Inc.(1) | | | 16 | | | | 78 | |
Paramount Global - Class A(2) | | | 0 | | | | 3 | |
Paramount Global - Class B | | | 112 | | | | 1,777 | |
Playstudios, Inc.(1) | | | 34 | | | | 168 | |
Playtika Holding Corp.(1) | | | 49 | | | | 571 | |
PubMatic, Inc. - Class A(1) | | | 15 | | | | 270 | |
Quotient Technology, Inc.(1) | | | 38 | | | | 147 | |
Radius Global Infrastructure, Inc. - Class A(1) | | | 34 | | | | 503 | |
Reservoir Media, Inc.(1) | | | 6 | | | | 38 | |
Roku, Inc. - Class A(1) | | | 3 | | | | 191 | |
Scholastic Corp. | | | 11 | | | | 446 | |
Shenandoah Telecommunications Co. | | | 19 | | | | 377 | |
Sinclair, Inc. | | | 13 | | | | 184 | |
Sirius XM Holdings, Inc. | | | 18 | | | | 82 | |
Sphere Entertainment Co.(1) | | | 11 | | | | 295 | |
Spok Holdings, Inc. | | | 6 | | | | 80 | |
Stagwell, Inc. - Class A(1) | | | 44 | | | | 314 | |
System1, Inc.(1) | | | 10 | | | | 45 | |
Take-Two Interactive Software, Inc.(1) | | | 79 | | | | 11,573 | |
TEGNA, Inc. | | | 584 | | | | 9,479 | |
Telephone & Data Systems, Inc. | | | 41 | | | | 339 | |
Thryv Holdings, Inc.(1) | | | 13 | | | | 309 | |
Townsquare Media, Inc. - Class A | | | 37 | | | | 442 | |
TripAdvisor, Inc.(1) | | | 3 | | | | 52 | |
TrueCar, Inc.(1) | | | 36 | | | | 81 | |
Urban One, Inc.(1) | | | 5 | | | | 30 | |
Urban One, Inc. - Class A(1) | | | 3 | | | | 19 | |
Vimeo, Inc.(1) | | | 19 | | | | 77 | |
Vivid Seats, Inc. - Class A(1) | | | 7 | | | | 52 | |
Warner Bros Discovery, Inc.(1) | | | 62 | | | | 773 | |
WideOpenWest, Inc.(1) | | | 21 | | | | 180 | |
Ziff Davis, Inc.(1) | | | 15 | | | | 1,038 | |
ZoomInfo Technologies, Inc. - Class A(1) | | | 4 | | | | 106 | |
| | | | | | | | |
Total Communication Services | | | | 95,454 | |
| | | | | | | | |
Consumer Discretionary – 12.12% | | | | | | | | |
1-800-Flowers.com, Inc. - Class A(1) | | | 10 | | | | 79 | |
2U, Inc.(1) | | | 30 | | | | 122 | |
Aaron’s Co., Inc. | | | 38 | | | | 537 | |
Abercrombie & Fitch Co. - Class A(1) | | | 9 | | | | 358 | |
Accel Entertainment, Inc. - Class A(1) | | | 198 | | | | 2,095 | |
Adient Plc(1) | | | 39 | | | | 1,511 | |
ADT, Inc. | | | 6 | | | | 38 | |
Adtalem Global Education, Inc.(1) | | | 18 | | | | 624 | |
Advance Auto Parts, Inc. | | | 2 | | | | 116 | |
Allbirds, Inc. - Class A(1) | | | 40 | | | | 51 | |
American Axle & Manufacturing Holdings, Inc.(1) | | | 256 | | | | 2,121 | |
American Eagle Outfitters, Inc. | | | 58 | | | | 685 | |
America’s Car-Mart, Inc.(1) | | | 2 | | | | 248 | |
AMMO, Inc.(1) | | | 39 | | | | 83 | |
Aptiv Plc(1) | | | 8 | | | | 773 | |
Aramark | | | 143 | | | | 6,138 | |
| | | | | | | | |
Asbury Automotive Group, Inc.(1) | | | 53 | | | | 12,823 | |
Atmus Filtration Technologies, Inc.(1) | | | 49 | | | | 1,084 | |
AutoNation, Inc.(1) | | | 1 | | | | 139 | |
AutoZone, Inc.(1) | | | 23 | | | | 58,078 | |
Bally’s Corp.(1) | | | 6 | | | | 87 | |
BARK, Inc.(1) | | | 45 | | | | 59 | |
Bath & Body Works, Inc. | | | 6 | | | | 239 | |
Beazer Homes USA, Inc.(1) | | | 11 | | | | 315 | |
Best Buy Co., Inc. | | | 72 | | | | 5,908 | |
Big 5 Sporting Goods Corp. | | | 9 | | | | 83 | |
Big Lots, Inc. | | | 12 | | | | 107 | |
Biglari Holdings, Inc. - Class B(1)(2) | | | 0 | | | | 49 | |
BJ’s Restaurants, Inc.(1) | | | 4 | | | | 120 | |
Bloomin’ Brands, Inc. | | | 154 | | | | 4,144 | |
Bluegreen Vacations Holding Corp. - Class A | | | 1 | | | | 29 | |
BorgWarner, Inc. | | | 160 | | | | 7,803 | |
Bowlero Corp.(1) | | | 2 | | | | 26 | |
Boyd Gaming Corp. | | | 126 | | | | 8,709 | |
Bright Horizons Family Solutions, Inc.(1) | | | 101 | | | | 9,383 | |
Brinker International, Inc.(1) | | | 246 | | | | 8,990 | |
Brunswick Corp. | | | 213 | | | | 18,473 | |
Build-A-Bear Workshop, Inc. | | | 1 | | | | 27 | |
Caesars Entertainment, Inc.(1) | | | 3 | | | | 171 | |
Caleres, Inc. | | | 14 | | | | 337 | |
Canada Goose Holdings, Inc.(1) | | | 535 | | | | 9,519 | |
Capri Holdings Ltd.(1) | | | 188 | | | | 6,730 | |
CarMax, Inc.(1) | | | 66 | | | | 5,494 | |
Carnival Corp.(1) | | | 28 | | | | 519 | |
Carrols Restaurant Group, Inc.(1) | | | 14 | | | | 70 | |
Carter’s, Inc. | | | 1 | | | | 74 | |
Carvana Co. - Class A(1) | | | 3 | | | | 80 | |
Cato Corp. - Class A | | | 5 | | | | 41 | |
Cavco Industries, Inc.(1) | | | 4 | | | | 1,163 | |
Century Casinos, Inc.(1) | | | 2 | | | | 12 | |
Century Communities, Inc. | | | 12 | | | | 884 | |
Chegg, Inc.(1) | | | 7 | | | | 61 | |
Chico’s FAS, Inc.(1) | | | 49 | | | | 261 | |
Children’s Place, Inc.(1) | | | 5 | | | | 112 | |
Chuy’s Holdings, Inc.(1) | | | 1 | | | | 42 | |
Clarus Corp. | | | 5 | | | | 45 | |
Columbia Sportswear Co. | | | 1 | | | | 77 | |
ContextLogic, Inc. - Class A(1) | | | 9 | | | | 61 | |
Cooper-Standard Holdings, Inc.(1) | | | 1 | | | | 11 | |
Dana, Inc. | | | 55 | | | | 932 | |
Darden Restaurants, Inc. | | | 61 | | | | 10,133 | |
Dave & Buster’s Entertainment, Inc.(1) | | | 85 | | | | 3,774 | |
Denny’s Corp.(1) | | | 4 | | | | 48 | |
Designer Brands, Inc. - Class A | | | 192 | | | | 1,938 | |
Destination XL Group, Inc.(1) | | | 23 | | | | 112 | |
Dick’s Sporting Goods, Inc. | | | 39 | | | | 5,135 | |
Dine Brands Global, Inc. | | | 26 | | | | 1,508 | |
Domino’s Pizza, Inc. | | | 18 | | | | 6,069 | |
DoorDash, Inc. - Class A(1) | | | 2 | | | | 139 | |
DR Horton, Inc. | | | 9 | | | | 1,057 | |
Dream Finders Homes, Inc. - Class A(1) | | | 5 | | | | 129 | |
Duluth Holdings, Inc. - Class B(1) | | | 5 | | | | 34 | |
eBay, Inc. | | | 368 | | | | 16,446 | |
El Pollo Loco Holdings, Inc. | | | 10 | | | | 84 | |
Escalade, Inc. | | | 3 | | | | 33 | |
Ethan Allen Interiors, Inc. | | | 9 | | | | 250 | |
Etsy, Inc.(1) | | | 1 | | | | 126 | |
| | | | | | | | |
European Wax Center, Inc. - Class A(1) | | | 1 | | | | 12 | |
Everi Holdings, Inc.(1) | | | 109 | | | | 1,578 | |
EVgo, Inc. - Class A(1) | | | 27 | | | | 109 | |
Expedia Group, Inc.(1) | | | 102 | | | | 11,204 | |
Fiesta Restaurant Group, Inc.(1) | | | 6 | | | | 45 | |
Figs, Inc. - Class A(1) | | | 6 | | | | 51 | |
First Watch Restaurant Group, Inc.(1) | | | 2 | | | | 39 | |
Foot Locker, Inc. | | | 121 | | | | 3,284 | |
Ford Motor Co. | | | 316 | | | | 4,787 | |
Fossil Group, Inc.(1) | | | 23 | | | | 59 | |
Franchise Group, Inc. | | | 1 | | | | 34 | |
Frontdoor, Inc.(1) | | | 276 | | | | 8,797 | |
Full House Resorts, Inc.(1) | | | 1 | | | | 5 | |
Funko, Inc. - Class A(1) | | | 277 | | | | 2,999 | |
GameStop Corp. - Class A(1) | | | 7 | | | | 180 | |
Gap, Inc. | | | 5 | | | | 48 | |
Garmin Ltd. | | | 84 | | | | 8,728 | |
Genesco, Inc.(1) | | | 5 | | | | 123 | |
Gentex Corp. | | | 327 | | | | 9,581 | |
Genuine Parts Co. | | | 4 | | | | 659 | |
G-III Apparel Group Ltd.(1) | | | 77 | | | | 1,481 | |
Goodyear Tire & Rubber Co.(1) | | | 259 | | | | 3,548 | |
GoPro, Inc. - Class A(1) | | | 56 | | | | 232 | |
Graham Holdings Co. - Class B | | | 2 | | | | 893 | |
Grand Canyon Education, Inc.(1) | | | 136 | | | | 14,081 | |
Green Brick Partners, Inc.(1) | | | 7 | | | | 396 | |
Group 1 Automotive, Inc. | | | 32 | | | | 8,150 | |
GrowGeneration Corp.(1) | | | 27 | | | | 91 | |
Guess?, Inc. | | | 11 | | | | 221 | |
H&R Block, Inc. | | | 278 | | | | 8,850 | |
Hanesbrands, Inc. | | | 812 | | | | 3,684 | |
Harley-Davidson, Inc. | | | 382 | | | | 13,455 | |
Hasbro, Inc. | | | 110 | | | | 7,140 | |
Haverty Furniture Companies, Inc. | | | 6 | | | | 180 | |
Helen of Troy Ltd.(1) | | | 80 | | | | 8,624 | |
Hibbett, Inc. | | | 32 | | | | 1,157 | |
Hilton Worldwide Holdings, Inc. | | | 4 | | | | 563 | |
Holley, Inc.(1) | | | 21 | | | | 86 | |
Hooker Furnishings Corp. | | | 4 | | | | 71 | |
Hovnanian Enterprises, Inc. - Class A(1) | | | 2 | | | | 185 | |
Hyatt Hotels Corp. - Class A | | | 1 | | | | 148 | |
Installed Building Products, Inc. | | | 89 | | | | 12,485 | |
International Game Technology Plc | | | 469 | | | | 14,948 | |
iRobot Corp.(1) | | | 1 | | | | 54 | |
J Jill, Inc.(1) | | | 1 | | | | 23 | |
Jack in the Box, Inc. | | | 103 | | | | 10,093 | |
JAKKS Pacific, Inc.(1) | | | 3 | | | | 53 | |
Johnson Outdoors, Inc. - Class A | | | 2 | | | | 120 | |
KB Home | | | 30 | | | | 1,554 | |
Kohl’s Corp. | | | 74 | | | | 1,703 | |
Krispy Kreme, Inc. | | | 24 | | | | 352 | |
Lands’ End, Inc.(1) | | | 6 | | | | 46 | |
Landsea Homes Corp.(1) | | | 3 | | | | 33 | |
Las Vegas Sands Corp.(1) | | | 168 | | | | 9,772 | |
Latham Group, Inc.(1) | | | 16 | | | | 59 | |
Laureate Education, Inc. - Class A | | | 6 | | | | 78 | |
La-Z-Boy, Inc. | | | 441 | | | | 12,636 | |
Lazydays Holdings, Inc.(1) | | | 4 | | | | 42 | |
LCI Industries | | | 6 | | | | 806 | |
Lear Corp. | | | 61 | | | | 8,781 | |
Legacy Housing Corp.(1) | | | 3 | | | | 81 | |
| | | | | | | | |
Leggett & Platt, Inc. | | | 4 | | | | 110 | |
Lennar Corp. - Class A | | | 7 | | | | 869 | |
Lennar Corp. - Class B(2) | | | 0 | | | | 49 | |
Leslie’s, Inc.(1) | | | 67 | | | | 629 | |
LGI Homes, Inc.(1) | | | 8 | | | | 1,074 | |
Life Time Group Holdings, Inc.(1) | | | 12 | | | | 243 | |
Light & Wonder, Inc.(1) | | | 20 | | | | 1,368 | |
Lincoln Educational Services Corp.(1) | | | 6 | | | | 43 | |
Lindblad Expeditions Holdings, Inc.(1) | | | 13 | | | | 145 | |
Lithia Motors, Inc. - Class A | | | 1 | | | | 228 | |
LKQ Corp. | | | 334 | | | | 19,449 | |
Lucid Group, Inc.(1) | | | 21 | | | | 142 | |
M/I Homes, Inc.(1) | | | 12 | | | | 1,020 | |
Macy’s, Inc. | | | 141 | | | | 2,269 | |
Malibu Boats, Inc. - Class A(1) | | | 58 | | | | 3,393 | |
MarineMax, Inc.(1) | | | 102 | | | | 3,472 | |
Marriott International, Inc. - Class A | | | 72 | | | | 13,223 | |
Marriott Vacations Worldwide Corp. | | | 1 | | | | 125 | |
Mattel, Inc.(1) | | | 10 | | | | 191 | |
MDC Holdings, Inc. | | | 24 | | | | 1,120 | |
Meritage Homes Corp. | | | 15 | | | | 2,077 | |
MGM Resorts International | | | 8 | | | | 367 | |
Mister Car Wash, Inc.(1) | | | 2 | | | | 19 | |
Modine Manufacturing Co.(1) | | | 8 | | | | 249 | |
Mohawk Industries, Inc.(1) | | | 69 | | | | 7,133 | |
Mondee Holdings, Inc. - Class A(1) | | | 2 | | | | 17 | |
Monro, Inc. | | | 149 | | | | 6,066 | |
Movado Group, Inc. | | | 6 | | | | 170 | |
Murphy USA, Inc.(2) | | | 0 | | | | 9 | |
National Vision Holdings, Inc.(1) | | | 29 | | | | 708 | |
Newell Brands, Inc. | | | 764 | | | | 6,644 | |
Nordstrom, Inc. | | | 78 | | | | 1,600 | |
Norwegian Cruise Line Holdings Ltd.(1) | | | 9 | | | | 194 | |
NVR, Inc.(1) | | | 5 | | | | 33,201 | |
ODP Corp.(1) | | | 83 | | | | 3,883 | |
Ollie’s Bargain Outlet Holdings, Inc.(1) | | | 1 | | | | 67 | |
OneWater Marine, Inc. - Class A(1) | | | 85 | | | | 3,089 | |
Overstock.com, Inc.(1) | | | 19 | | | | 612 | |
Oxford Industries, Inc. | | | 165 | | | | 16,238 | |
Papa John’s International, Inc. | | | 3 | | | | 236 | |
Patrick Industries, Inc. | | | 8 | | | | 642 | |
Penn Entertainment, Inc.(1) | | | 89 | | | | 2,137 | |
Penske Automotive Group, Inc. | | | 48 | | | | 7,952 | |
Perdoceo Education Corp.(1) | | | 26 | | | | 315 | |
Petco Health & Wellness Co., Inc. - Class A(1) | | | 2 | | | | 21 | |
PetMed Express, Inc. | | | 8 | | | | 113 | |
Planet Fitness, Inc. - Class A(1) | | | 1 | | | | 83 | |
Playa Hotels & Resorts NV(1) | | | 292 | | | | 2,380 | |
Polaris, Inc. | | | 103 | | | | 12,438 | |
PulteGroup, Inc. | | | 117 | | | | 9,070 | |
Purple Innovation, Inc. - Class A | | | 26 | | | | 71 | |
PVH Corp. | | | 168 | | | | 14,304 | |
QuantumScape Corp. - Class A(1) | | | 8 | | | | 65 | |
Ralph Lauren Corp. - Class A | | | 1 | | | | 139 | |
Red Robin Gourmet Burgers, Inc.(1) | | | 32 | | | | 448 | |
Red Rock Resorts, Inc. - Class A | | | 643 | | | | 30,088 | |
Rent the Runway, Inc. - Class A(1) | | | 18 | | | | 36 | |
RH(1)(2) | | | 0 | | | | 128 | |
Rivian Automotive, Inc. - Class A(1) | | | 14 | | | | 238 | |
Rocky Brands, Inc. | | | 3 | | | | 62 | |
Ross Stores, Inc. | | | 143 | | | | 15,992 | |
| | | | | | | | |
Royal Caribbean Cruises Ltd.(1) | | | 5 | | | | 477 | |
Sabre Corp.(1) | | | 104 | | | | 331 | |
Sally Beauty Holdings, Inc.(1) | | | 2 | | | | 30 | |
SeaWorld Entertainment, Inc.(1) | | | 1 | | | | 65 | |
Service Corp. International | | | 3 | | | | 171 | |
Shoe Carnival, Inc. | | | 7 | | | | 167 | |
Signet Jewelers Ltd. | | | 18 | | | | 1,173 | |
Six Flags Entertainment Corp.(1) | | | 6 | | | | 163 | |
Skechers USA, Inc. - Class A(1) | | | 313 | | | | 16,497 | |
Skyline Champion Corp.(1) | | | 230 | | | | 15,071 | |
Sleep Number Corp.(1) | | | 5 | | | | 126 | |
Smith & Wesson Brands, Inc. | | | 19 | | | | 246 | |
Snap One Holdings Corp.(1) | | | 8 | | | | 91 | |
Solid Power, Inc.(1) | | | 63 | | | | 161 | |
Solo Brands, Inc. - Class A(1) | | | 167 | | | | 948 | |
Sonic Automotive, Inc. - Class A | | | 7 | | | | 312 | |
Sportsman’s Warehouse Holdings, Inc.(1) | | | 13 | | | | 72 | |
Standard Motor Products, Inc. | | | 8 | | | | 317 | |
Stitch Fix, Inc. - Class A(1) | | | 20 | | | | 75 | |
Stoneridge, Inc.(1) | | | 8 | | | | 159 | |
Strategic Education, Inc. | | | 9 | | | | 618 | |
Sturm Ruger & Co., Inc.(2) | | | 0 | | | | 23 | |
Sweetgreen, Inc. - Class A(1) | | | 8 | | | | 105 | |
Tapestry, Inc. | | | 115 | | | | 4,937 | |
Taylor Morrison Home Corp. - Class A(1) | | | 42 | | | | 2,034 | |
Tempur Sealy International, Inc. | | | 309 | | | | 12,374 | |
Thor Industries, Inc. | | | 66 | | | | 6,875 | |
ThredUp, Inc. - Class A(1) | | | 26 | | | | 63 | |
Tile Shop Holdings, Inc.(1) | | | 10 | | | | 54 | |
Tilly’s, Inc. - Class A(1) | | | 8 | | | | 55 | |
Toll Brothers, Inc. | | | 245 | | | | 19,360 | |
TopBuild Corp.(1) | | | 1 | | | | 218 | |
Topgolf Callaway Brands Corp.(1) | | | 58 | | | | 1,149 | |
Traeger, Inc.(1) | | | 16 | | | | 66 | |
Travel + Leisure Co. | | | 57 | | | | 2,305 | |
TRI Pointe Homes, Inc.(1) | | | 39 | | | | 1,280 | |
Ulta Beauty, Inc.(1) | | | 25 | | | | 11,779 | |
Under Armour, Inc. - Class A(1) | | | 5 | | | | 39 | |
Under Armour, Inc. - Class C(1) | | | 792 | | | | 5,313 | |
United Homes Group, Inc.(1) | | | 1 | | | | 15 | |
Universal Technical Institute, Inc.(1) | | | 7 | | | | 51 | |
Upbound Group, Inc. | | | 1 | | | | 41 | |
Urban Outfitters, Inc.(1) | | | 17 | | | | 572 | |
Vail Resorts, Inc. | | | 19 | | | | 4,894 | |
Valvoline, Inc. | | | 191 | | | | 7,157 | |
Vera Bradley, Inc.(1) | | | 10 | | | | 61 | |
VF Corp. | | | 153 | | | | 2,917 | |
Victoria’s Secret & Co.(1) | | | 1 | | | | 21 | |
Vista Outdoor, Inc.(1) | | | 23 | | | | 626 | |
Visteon Corp.(1) | | | 44 | | | | 6,366 | |
Vizio Holding Corp. - Class A(1) | | | 120 | | | | 809 | |
VOXX International Corp. - Class A(1) | | | 5 | | | | 61 | |
Wayfair, Inc. - Class A(1) | | | 1 | | | | 96 | |
Weyco Group, Inc. | | | 2 | | | | 41 | |
Whirlpool Corp. | | | 123 | | | | 18,290 | |
Williams-Sonoma, Inc. | | | 30 | | | | 3,776 | |
Winmark Corp. | | | 1 | | | | 354 | |
Winnebago Industries, Inc. | | | 12 | | | | 819 | |
Wolverine World Wide, Inc. | | | 3 | | | | 47 | |
Workhorse Group, Inc.(1) | | | 70 | | | | 61 | |
WW International, Inc.(1) | | | 23 | | | | 156 | |
| | | | | | | | |
Wyndham Hotels & Resorts, Inc. | | | 138 | | | | 9,452 | |
Wynn Resorts Ltd. | | | 3 | | | | 286 | |
Xponential Fitness, Inc. - Class A(1) | | | 1 | | | | 22 | |
Yum! Brands, Inc. | | | 1 | | | | 133 | |
Zumiez, Inc.(1) | | | 294 | | | | 4,904 | |
| | | | | | | | |
Total Consumer Discretionary | | | | 821,032 | |
| | | | | |
Consumer Staples – 4.09% | | | | | | | | |
Albertsons Companies, Inc. - Class A | | | 103 | | | | 2,240 | |
Alico, Inc. | | | 3 | | | | 83 | |
Andersons, Inc. | | | 13 | | | | 617 | |
Archer-Daniels-Midland Co. | | | 161 | | | | 12,135 | |
B&G Foods, Inc. | | | 29 | | | | 405 | |
BellRing Brands, Inc.(1) | | | 127 | | | | 4,643 | |
Benson Hill, Inc.(1) | | | 70 | | | | 90 | |
BJ’s Wholesale Club Holdings, Inc.(1) | | | 2 | | | | 152 | |
Boston Beer Co., Inc. - Class A(1)(2) | | | 0 | | | | 5 | |
Brown-Forman Corp. - Class A(2) | | | 0 | | | | 21 | |
Brown-Forman Corp. - Class B | | | 1 | | | | 69 | |
Bunge Ltd. | | | 4 | | | | 391 | |
Cal-Maine Foods, Inc. | | | 1 | | | | 44 | |
Campbell Soup Co. | | | 5 | | | | 243 | |
Casey’s General Stores, Inc. | | | 1 | | | | 216 | |
Central Garden & Pet Co. - Class A(1) | | | 5 | | | | 213 | |
Central Garden & Pet Co. - Class A(1) | | | 231 | | | | 8,412 | |
Church & Dwight Co., Inc. | | | 266 | | | | 26,646 | |
Coca-Cola Consolidated, Inc. | | | 2 | | | | 1,116 | |
Coca-Cola Europacific Partners Plc | | | 149 | | | | 9,605 | |
Conagra Brands, Inc. | | | 217 | | | | 7,311 | |
Coty, Inc. - Class A(1) | | | 10 | | | | 123 | |
Darling Ingredients, Inc.(1) | | | 4 | | | | 281 | |
Dole Plc | | | 12 | | | | 157 | |
Dollar General Corp. | | | 35 | | | | 5,878 | |
Dollar Tree, Inc.(1) | | | 6 | | | | 837 | |
Duckhorn Portfolio, Inc.(1) | | | 13 | | | | 173 | |
Edgewell Personal Care Co. | | | 146 | | | | 6,019 | |
Flowers Foods, Inc. | | | 5 | | | | 130 | |
Fresh Del Monte Produce, Inc. | | | 14 | | | | 348 | |
Freshpet, Inc.(1) | | | 1 | | | | 60 | |
Grocery Outlet Holding Corp.(1) | | | 3 | | | | 83 | |
Hain Celestial Group, Inc.(1) | | | 37 | | | | 460 | |
Herbalife Ltd.(1) | | | 11 | | | | 144 | |
HF Foods Group, Inc.(1) | | | 13 | | | | 61 | |
Hormel Foods Corp. | | | 8 | | | | 323 | |
Hostess Brands, Inc. - Class A(1) | | | 345 | | | | 8,727 | |
Ingles Markets, Inc. - Class A | | | 6 | | | | 462 | |
Ingredion, Inc. | | | 60 | | | | 6,318 | |
J.M. Smucker Co. | | | 3 | | | | 423 | |
Kellogg Co. | | | 7 | | | | 491 | |
Kenvue, Inc.(1) | | | 202 | | | | 5,344 | |
Kroger Co. | | | 173 | | | | 8,129 | |
Lamb Weston Holdings, Inc.(2) | | | 0 | | | | 25 | |
Lancaster Colony Corp. | | | 134 | | | | 27,036 | |
Limoneira Co. | | | 6 | | | | 92 | |
McCormick & Co., Inc. | | | 7 | | | | 614 | |
Mission Produce, Inc.(1) | | | 16 | | | | 193 | |
Molson Coors Beverage Co. - Class B | | | 163 | | | | 10,705 | |
Natural Grocers by Vitamin Cottage, Inc. | | | 3 | | | | 37 | |
Nature’s Sunshine Products, Inc.(1) | | | 5 | | | | 61 | |
Nomad Foods Ltd.(1) | | | 743 | | | | 13,022 | |
Nu Skin Enterprises, Inc. - Class A | | | 22 | | | | 721 | |
Oil-Dri Corp. of America | | | 1 | | | | 88 | |
| | | | | | | | |
Olaplex Holdings, Inc.(1) | | | 4 | | | | 13 | |
Performance Food Group Co.(1) | | | 482 | | | | 29,064 | |
Pilgrim’s Pride Corp.(1) | | | 1 | | | | 24 | |
Post Holdings, Inc.(1) | | | 252 | | | | 21,813 | |
PriceSmart, Inc. | | | 3 | | | | 220 | |
Primo Water Corp. | | | 54 | | | | 681 | |
Reynolds Consumer Products, Inc. | | | 1 | | | | 42 | |
Seaboard Corp.(2) | | | 0 | | | | 28 | |
Seneca Foods Corp. - Class A(1) | | | 2 | | | | 56 | |
Simply Good Foods Co.(1) | | | 329 | | | | 12,033 | |
SpartanNash Co. | | | 15 | | | | 329 | |
Spectrum Brands Holdings, Inc. | | | 67 | | | | 5,214 | |
Sprouts Farmers Market, Inc.(1) | | | 106 | | | | 3,897 | |
SunOpta, Inc.(1) | | | 2 | | | | 15 | |
Thorne HealthTech, Inc.(1) | | | 3 | | | | 14 | |
TreeHouse Foods, Inc.(1) | | | 18 | | | | 920 | |
Turning Point Brands, Inc. | | | 40 | | | | 951 | |
Tyson Foods, Inc. - Class A | | | 63 | | | | 3,232 | |
U.S. Foods Holding Corp.(1) | | | 429 | | | | 18,863 | |
United Natural Foods, Inc.(1) | | | 67 | | | | 1,318 | |
Universal Corp. | | | 10 | | | | 479 | |
Vector Group Ltd. | | | 49 | | | | 621 | |
Village Super Market, Inc. - Class A | | | 3 | | | | 66 | |
Waldencast Plc - Class A(1) | | | 6 | | | | 49 | |
Walgreens Boots Alliance, Inc. | | | 166 | | | | 4,725 | |
Weis Markets, Inc. | | | 7 | | | | 427 | |
Zevia PBC - Class A(1) | | | 3 | | | | 15 | |
| | | | | | | | |
Total Consumer Staples | | | | 277,331 | |
| | | | | |
Energy – 5.20% | | | | | | | | |
Amplify Energy Corp.(1) | | | 14 | | | | 94 | |
Antero Midstream Corp. | | | 6 | | | | 73 | |
Antero Resources Corp.(1) | | | 8 | | | | 181 | |
APA Corp. | | | 109 | | | | 3,725 | |
Arch Resources, Inc. | | | 7 | | | | 836 | |
Archrock, Inc. | | | 46 | | | | 469 | |
Ardmore Shipping Corp. | | | 16 | | | | 200 | |
Atlas Energy Solutions, Inc. - Class A | | | 5 | | | | 93 | |
Baker Hughes Co. - Class A | | | 28 | | | | 895 | |
Berry Corp. | | | 32 | | | | 222 | |
Bristow Group, Inc.(1) | | | 10 | | | | 273 | |
Cactus, Inc. - Class A | | | 87 | | | | 3,684 | |
California Resources Corp. | | | 163 | | | | 7,361 | |
Callon Petroleum Co.(1) | | | 26 | | | | 910 | |
Centrus Energy Corp. - Class A(1) | | | 5 | | | | 148 | |
ChampionX Corp. | | | 572 | | | | 17,755 | |
Chesapeake Energy Corp. | | | 4 | | | | 295 | |
Chord Energy Corp. | | | 17 | | | | 2,606 | |
Civitas Resources, Inc. | | | 86 | | | | 5,994 | |
Clean Energy Fuels Corp.(1) | | | 71 | | | | 350 | |
CNX Resources Corp.(1) | | | 647 | | | | 11,472 | |
Comstock Resources, Inc. | | | 38 | | | | 439 | |
CONSOL Energy, Inc. | | | 14 | | | | 928 | |
Core Laboratories, Inc. | | | 13 | | | | 301 | |
Coterra Energy, Inc. | | | 564 | | | | 14,257 | |
Crescent Energy Co. - Class A | | | 12 | | | | 121 | |
CVR Energy, Inc. | | | 2 | | | | 71 | |
Delek U.S. Holdings, Inc. | | | 29 | | | | 687 | |
Devon Energy Corp. | | | 189 | | | | 9,151 | |
DHT Holdings, Inc. | | | 55 | | | | 471 | |
Diamond Offshore Drilling, Inc.(1) | | | 41 | | | | 577 | |
Diamondback Energy, Inc. | | | 139 | | | | 18,218 | |
| | | | | | | | |
DMC Global, Inc.(1) | | | 5 | | | | 84 | |
Dorian LPG Ltd. | | | 4 | | | | 113 | |
Dril-Quip, Inc.(1) | | | 14 | | | | 316 | |
DT Midstream, Inc. | | | 3 | | | | 133 | |
Earthstone Energy, Inc. - Class A(1) | | | 115 | | | | 1,648 | |
Encore Energy Corp.(1) | | | 54 | | | | 131 | |
Energy Fuels, Inc.(1) | | | 10 | | | | 61 | |
Enviva, Inc. | | | 64 | | | | 690 | |
EQT Corp. | | | 10 | | | | 412 | |
Equitrans Midstream Corp. | | | 125 | | | | 1,193 | |
Excelerate Energy, Inc. - Class A | | | 1 | | | | 28 | |
Expro Group Holdings NV(1) | | | 461 | | | | 8,165 | |
FLEX LNG Ltd. | | | 4 | | | | 111 | |
Forum Energy Technologies, Inc.(1) | | | 3 | | | | 88 | |
Gevo, Inc.(1) | | | 103 | | | | 157 | |
Golar LNG Ltd. | | | 39 | | | | 790 | |
Granite Ridge Resources, Inc. | | | 8 | | | | 54 | |
Green Plains, Inc.(1) | | | 14 | | | | 456 | |
Gulfport Energy Corp.(1) | | | 4 | | | | 436 | |
Hallador Energy Co.(1) | | | 8 | | | | 69 | |
Halliburton Co. | | | 601 | | | | 19,824 | |
Helix Energy Solutions Group, Inc.(1) | | | 58 | | | | 425 | |
Helmerich & Payne, Inc. | | | 278 | | | | 9,863 | |
Hess Corp. | | | 88 | | | | 11,902 | |
HF Sinclair Corp. | | | 148 | | | | 6,585 | |
HighPeak Energy, Inc. | | | 1 | | | | 12 | |
International Seaways, Inc. | | | 16 | | | | 625 | |
Kinetik Holdings, Inc. - Class A | | | 7 | | | | 232 | |
KLX Energy Services Holdings, Inc.(1) | | | 4 | | | | 41 | |
Liberty Energy, Inc. - Class A | | | 67 | | | | 893 | |
Magnolia Oil & Gas Corp. - Class A | | | 730 | | | | 15,260 | |
Mammoth Energy Services, Inc.(1) | | | 8 | | | | 40 | |
Marathon Oil Corp. | | | 371 | | | | 8,540 | |
Marathon Petroleum Corp. | | | 138 | | | | 16,054 | |
Matador Resources Co. | | | 481 | | | | 25,182 | |
Murphy Oil Corp. | | | 61 | | | | 2,320 | |
Nabors Industries Ltd.(1)(2) | | | 0 | | | | 37 | |
NACCO Industries, Inc. - Class A | | | 2 | | | | 63 | |
Newpark Resources, Inc.(1) | | | 29 | | | | 152 | |
NexTier Oilfield Solutions, Inc.(1) | | | 69 | | | | 613 | |
Noble Corp. Plc(1) | | | 7 | | | | 302 | |
Nordic American Tankers Ltd. | | | 82 | | | | 302 | |
Northern Oil & Gas, Inc. | | | 62 | | | | 2,132 | |
NOV, Inc. | | | 11 | | | | 175 | |
Oil States International, Inc.(1) | | | 26 | | | | 194 | |
ONEOK, Inc. | | | 12 | | | | 730 | |
Overseas Shipholding Group, Inc. - Class A(1) | | | 16 | | | | 65 | |
Ovintiv, Inc. | | | 4 | | | | 143 | |
Par Pacific Holdings, Inc.(1) | | | 14 | | | | 384 | |
Patterson-UTI Energy, Inc. | | | 85 | | | | 1,015 | |
PBF Energy, Inc. - Class A | | | 170 | | | | 6,953 | |
PDC Energy, Inc. | | | 2 | | | | 171 | |
Peabody Energy Corp. | | | 51 | | | | 1,099 | |
Permian Resources Corp. - Class A | | | 516 | | | | 5,661 | |
Phillips 66 | | | 70 | | | | 6,674 | |
Pioneer Natural Resources Co. | | | 98 | | | | 20,219 | |
Plains GP Holdings LP - Class A(1) | | | 769 | | | | 11,407 | |
PrimeEnergy Resources Corp.(1)(2) | | | 0 | | | | 14 | |
ProFrac Holding Corp. - Class A(1) | | | 8 | | | | 87 | |
ProPetro Holding Corp.(1) | | | 42 | | | | 345 | |
Range Resources Corp. | | | 6 | | | | 191 | |
| | | | | | | | |
Ranger Energy Services, Inc. - Class A(1) | | | 5 | | | | 53 | |
REX American Resources Corp.(1) | | | 5 | | | | 166 | |
Ring Energy, Inc.(1) | | | 46 | | | | 79 | |
RPC, Inc. | | | 34 | | | | 245 | |
SandRidge Energy, Inc. | | | 4 | | | | 55 | |
Schlumberger NV | | | 252 | | | | 12,380 | |
Scorpio Tankers, Inc. | | | 21 | | | | 1,004 | |
SEACOR Marine Holdings, Inc.(1) | | | 8 | | | | 95 | |
Seadrill Ltd.(1) | | | 21 | | | | 850 | |
Select Water Solutions, Inc. - Class A | | | 33 | | | | 266 | |
SFL Corp. Ltd. | | | 46 | | | | 425 | |
SilverBow Resources, Inc.(1) | | | 6 | | | | 189 | |
Sitio Royalties Corp. - Class A | | | 18 | | | | 475 | |
SM Energy Co. | | | 49 | | | | 1,557 | |
Solaris Oilfield Infrastructure, Inc. - Class A | | | 11 | | | | 90 | |
Southwestern Energy Co.(1) | | | 31 | | | | 183 | |
Talos Energy, Inc.(1) | | | 46 | | | | 635 | |
TechnipFMC Plc(1) | | | 481 | | | | 7,993 | |
Teekay Corp.(1) | | | 25 | | | | 153 | |
Teekay Tankers Ltd. - Class A | | | 9 | | | | 360 | |
Tellurian, Inc.(1) | | | 203 | | | | 287 | |
U.S. Silica Holdings, Inc.(1) | | | 30 | | | | 369 | |
Uranium Energy Corp.(1) | | | 148 | | | | 503 | |
VAALCO Energy, Inc. | | | 38 | | | | 144 | |
Valero Energy Corp. | | | 78 | | | | 9,183 | |
Verde Clean Fuels, Inc.(1) | | | 2 | | | | 11 | |
Viper Energy Partners LP | | | 342 | | | | 9,181 | |
Vital Energy, Inc.(1) | | | 7 | | | | 320 | |
Vitesse Energy, Inc. | | | 10 | | | | 217 | |
Weatherford International Plc(1) | | | 99 | | | | 6,547 | |
Williams Companies, Inc. | | | 34 | | | | 1,110 | |
World Kinect Corp. | | | 91 | | | | 1,889 | |
| | | | | | | | |
Total Energy | | | | 351,932 | |
| | | | | |
Financials – 17.76% | | | | | | | | |
1st Source Corp. | | | 8 | | | | 342 | |
Acacia Research Corp.(1) | | | 12 | | | | 50 | |
ACNB Corp. | | | 4 | | | | 134 | |
AFC Gamma, Inc. | | | 6 | | | | 80 | |
Affiliated Managers Group, Inc. | | | 29 | | | | 4,292 | |
Affirm Holdings, Inc. - Class A(1) | | | 6 | | | | 93 | |
Aflac, Inc. | | | 228 | | | | 15,948 | |
AGNC Investment Corp. | | | 16 | | | | 160 | |
Alerus Financial Corp. | | | 9 | | | | 166 | |
Allstate Corp. | | | 385 | | | | 41,989 | |
Ally Financial, Inc. | | | 189 | | | | 5,097 | |
Amalgamated Financial Corp. | | | 11 | | | | 173 | |
A-Mark Precious Metals, Inc. | | | 76 | | | | 2,849 | |
Ambac Financial Group, Inc.(1) | | | 19 | | | | 266 | |
Amerant Bancorp, Inc. - Class A | | | 14 | | | | 242 | |
American Equity Investment Life Holding Co. | | | 31 | | | | 1,622 | |
American Financial Group, Inc. | | | 36 | | | | 4,326 | |
American International Group, Inc. | | | 484 | | | | 27,835 | |
American National Bankshares, Inc. | | | 6 | | | | 171 | |
Ameriprise Financial, Inc. | | | 133 | | | | 44,171 | |
Ameris Bancorp | | | 115 | | | | 3,944 | |
AMERISAFE, Inc. | | | 5 | | | | 271 | |
Ames National Corp. | | | 4 | | | | 66 | |
Angel Oak Mortgage REIT, Inc. | | | 7 | | | | 54 | |
Annaly Capital Management, Inc. | | | 86 | | | | 1,716 | |
Aon Plc - Class A | | | 47 | | | | 16,267 | |
Apollo Commercial Real Estate Finance, Inc. | | | 57 | | | | 648 | |
| | | | | | | | |
Apollo Global Management, Inc. | | | 41 | | | | 3,149 | |
Arbor Realty Trust, Inc. | | | 71 | | | | 1,046 | |
Arch Capital Group Ltd.(1) | | | 104 | | | | 7,799 | |
Ares Commercial Real Estate Corp. | | | 22 | | | | 221 | |
Ares Management Corp. - Class A | | | 143 | | | | 13,813 | |
Argo Group International Holdings Ltd. | | | 14 | | | | 403 | |
ARMOUR Residential REIT, Inc. | | | 77 | | | | 411 | |
Arrow Financial Corp. | | | 9 | | | | 181 | |
Arthur J. Gallagher & Co. | | | 188 | | | | 41,258 | |
Artisan Partners Asset Management, Inc. - Class A | | | 8 | | | | 301 | |
Associated Banc-Corp. | | | 312 | | | | 5,065 | |
Assurant, Inc. | | | 34 | | | | 4,333 | |
Assured Guaranty Ltd. | | | 2 | | | | 88 | |
Atlantic Union Bankshares Corp. | | | 23 | | | | 591 | |
Atlanticus Holdings Corp.(1) | | | 2 | | | | 71 | |
Avantax, Inc.(1) | | | 2 | | | | 39 | |
AvidXchange Holdings, Inc.(1) | | | 6 | | | | 58 | |
Axis Capital Holdings Ltd. | | | 187 | | | | 10,084 | |
Axos Financial, Inc.(1) | | | 22 | | | | 854 | |
Bakkt Holdings, Inc.(1) | | | 35 | | | | 43 | |
Banc of California, Inc. | | | 14 | | | | 161 | |
BancFirst Corp. | | | 8 | | | | 751 | |
Banco Latinoamericano de Comercio Exterior SA - Class E | | | 10 | | | | 221 | |
Bank First Corp. | | | 4 | | | | 341 | |
Bank of Hawaii Corp. | | | 102 | | | | 4,200 | |
Bank of Marin Bancorp | | | 9 | | | | 158 | |
Bank of New York Mellon Corp. | | | 130 | | | | 5,778 | |
Bank of NT Butterfield & Son Ltd. | | | 287 | | | | 7,840 | |
Bank OZK | | | 197 | | | | 7,905 | |
Bank7 Corp. | | | 2 | | | | 42 | |
BankUnited, Inc. | | | 119 | | | | 2,554 | |
Bankwell Financial Group, Inc. | | | 5 | | | | 127 | |
Banner Corp. | | | 11 | | | | 477 | |
Bar Harbor Bankshares | | | 8 | | | | 205 | |
BayCom Corp. | | | 7 | | | | 111 | |
BCB Bancorp, Inc. | | | 10 | | | | 116 | |
Berkshire Hills Bancorp, Inc. | | | 12 | | | | 245 | |
BGC Partners, Inc. - Class A | | | 67 | | | | 297 | |
Blackstone Mortgage Trust, Inc. - Class A | | | 71 | | | | 1,478 | |
Block, Inc. - Class A(1) | | | 9 | | | | 629 | |
Blue Foundry Bancorp(1) | | | 12 | | | | 122 | |
Blue Owl Capital, Inc. - Class A | | | 11 | | | | 128 | |
Blue Ridge Bankshares, Inc. | | | 11 | | | | 99 | |
BOK Financial Corp. | | | 77 | | | | 6,250 | |
Bread Financial Holdings, Inc. | | | 13 | | | | 421 | |
Bridgewater Bancshares, Inc.(1) | | | 13 | | | | 125 | |
Brighthouse Financial, Inc.(1) | | | 58 | | | | 2,757 | |
Brightsphere Investment Group, Inc. | | | 718 | | | | 15,048 | |
BrightSpire Capital, Inc. - Class A | | | 55 | | | | 372 | |
Brookline Bancorp, Inc. | | | 678 | | | | 5,928 | |
Brown & Brown, Inc. | | | 4 | | | | 277 | |
Burke & Herbert Financial Services Corp. | | | 3 | | | | 173 | |
Business First Bancshares, Inc. | | | 14 | | | | 210 | |
Byline Bancorp, Inc. | | | 14 | | | | 246 | |
C&F Financial Corp. | | | 1 | | | | 55 | |
Cadence Bank | | | 730 | | | | 14,329 | |
Cambridge Bancorp | | | 4 | | | | 220 | |
Camden National Corp. | | | 8 | | | | 245 | |
Cannae Holdings, Inc.(1) | | | 32 | | | | 655 | |
Cantaloupe, Inc.(1) | | | 8 | | | | 61 | |
Capital Bancorp, Inc. | | | 6 | | | | 113 | |
| | | | | | | | |
Capital City Bank Group, Inc. | | | 5 | | | | 158 | |
Capitol Federal Financial, Inc. | | | 52 | | | | 321 | |
Capstar Financial Holdings, Inc. | | | 11 | | | | 141 | |
Carlyle Group, Inc. | | | 6 | | | | 187 | |
Carter Bankshares, Inc.(1) | | | 12 | | | | 177 | |
Cass Information Systems, Inc.(2) | | | 0 | | | | 13 | |
Cathay General Bancorp | | | 377 | | | | 12,135 | |
CBOE Global Markets, Inc. | | | 133 | | | | 18,312 | |
Central Pacific Financial Corp. | | | 7 | | | | 114 | |
Central Valley Community Bancorp | | | 3 | | | | 52 | |
Chemung Financial Corp. | | | 1 | | | | 52 | |
Chicago Atlantic Real Estate Finance, Inc. | | | 5 | | | | 81 | |
Chimera Investment Corp. | | | 249 | | | | 1,438 | |
ChoiceOne Financial Services, Inc. | | | 2 | | | | 48 | |
Cincinnati Financial Corp. | | | 4 | | | | 415 | |
Citizens & Northern Corp. | | | 8 | | | | 160 | |
Citizens Financial Group, Inc. | | | 230 | | | | 5,989 | |
Citizens Financial Services, Inc. | | | 1 | | | | 101 | |
City Holding Co. | | | 6 | | | | 530 | |
Civista Bancshares, Inc. | | | 9 | | | | 155 | |
Claros Mortgage Trust, Inc. | | | 38 | | | | 425 | |
CNA Financial Corp. | | | 76 | | | | 2,922 | |
CNB Financial Corp. | | | 12 | | | | 214 | |
CNO Financial Group, Inc. | | | 390 | | | | 9,228 | |
Codorus Valley Bancorp, Inc. | | | 3 | | | | 59 | |
Coinbase Global, Inc. - Class A(1) | | | 5 | | | | 331 | |
Colony Bankcorp, Inc. | | | 13 | | | | 123 | |
Columbia Banking System, Inc. | | | 551 | | | | 11,167 | |
Columbia Financial, Inc.(1) | | | 8 | | | | 143 | |
Comerica, Inc. | | | 4 | | | | 155 | |
Commerce Bancshares, Inc. | | | 3 | | | | 154 | |
Community Bank System, Inc. | | | 15 | | | | 712 | |
Community Financial Corp. | | | 2 | | | | 49 | |
Community Trust Bancorp, Inc. | | | 8 | | | | 284 | |
Compass Diversified Holdings | | | 286 | | | | 6,206 | |
ConnectOne Bancorp, Inc. | | | 54 | | | | 901 | |
Consumer Portfolio Services, Inc.(1) | | | 3 | | | | 37 | |
Credit Acceptance Corp.(1)(2) | | | 0 | | | | 90 | |
CrossFirst Bankshares, Inc.(1) | | | 23 | | | | 226 | |
Cullen/Frost Bankers, Inc. | | | 2 | | | | 176 | |
Customers Bancorp, Inc.(1) | | | 8 | | | | 245 | |
CVB Financial Corp. | | | 915 | | | | 12,148 | |
Dime Community Bancshares, Inc. | | | 17 | | | | 306 | |
Discover Financial Services | | | 226 | | | | 26,419 | |
Donegal Group, Inc. - Class A | | | 9 | | | | 123 | |
Donnelley Financial Solutions, Inc.(1) | | | 114 | | | | 5,182 | |
Dynex Capital, Inc. | | | 18 | | | | 223 | |
Eagle Bancorp, Inc. | | | 8 | | | | 176 | |
East West Bancorp, Inc. | | | 277 | | | | 14,641 | |
Eastern Bankshares, Inc. | | | 67 | | | | 823 | |
eHealth, Inc.(1) | | | 8 | | | | 66 | |
Element Fleet Management Corp. | | | 468 | | | | 7,123 | |
Ellington Financial, Inc. | | | 24 | | | | 332 | |
Employers Holdings, Inc. | | | 7 | | | | 273 | |
Enact Holdings, Inc. | | | 36 | | | | 916 | |
Encore Capital Group, Inc.(1) | | | 9 | | | | 459 | |
Enova International, Inc.(1) | | | 13 | | | | 681 | |
Enstar Group Ltd.(1) | | | 5 | | | | 1,225 | |
Enterprise Bancorp, Inc. | | | 5 | | | | 145 | |
Enterprise Financial Services Corp. | | | 16 | | | | 636 | |
Equity Bancshares, Inc. - Class A | | | 9 | | | | 196 | |
| | | | | | | | |
Esquire Financial Holdings, Inc. | | | 1 | | | | 38 | |
ESSA Bancorp, Inc. | | | 3 | | | | 42 | |
Essent Group Ltd. | | | 112 | | | | 5,255 | |
Euronet Worldwide, Inc.(1) | | | 32 | | | | 3,800 | |
Evans Bancorp, Inc. | | | 2 | | | | 45 | |
Evercore, Inc. - Class A | | | 60 | | | | 7,440 | |
Everest Re Group Ltd. | | | 51 | | | | 17,534 | |
EVERTEC, Inc. | | | 179 | | | | 6,576 | |
F&G Annuities & Life, Inc. | | | 7 | | | | 175 | |
FactSet Research Systems, Inc. | | | 82 | | | | 32,681 | |
Farmers & Merchants Bancorp, Inc. | | | 7 | | | | 149 | |
Farmers National Banc Corp. | | | 18 | | | | 228 | |
FB Financial Corp. | | | 17 | | | | 467 | |
Federal Agricultural Mortgage Corp. - Class C | | | 3 | | | | 416 | |
Fidelis Insurance Holdings Ltd.(1) | | | 94 | | | | 1,287 | |
Fidelity D&D Bancorp, Inc. | | | 2 | | | | 79 | |
Fidelity National Financial, Inc. | | | 7 | | | | 260 | |
Fidelity National Information Services, Inc. | | | 251 | | | | 13,714 | |
Fifth Third Bancorp | | | 604 | | | | 15,834 | |
Finance Of America Companies, Inc. - Class A(1) | | | 24 | | | | 46 | |
Financial Institutions, Inc. | | | 7 | | | | 103 | |
First American Financial Corp. | | | 257 | | | | 14,652 | |
First Bancorp | | | 15 | | | | 459 | |
First Bancorp | | | 504 | | | | 6,158 | |
First Bancorp, Inc. | | | 6 | | | | 151 | |
First Bancshares, Inc. | | | 15 | | | | 377 | |
First Bank | | | 9 | | | | 95 | |
First Busey Corp. | | | 24 | | | | 488 | |
First Business Financial Services, Inc. | | | 4 | | | | 132 | |
First Citizens BancShares, Inc. - Class A(2) | | | 0 | | | | 350 | |
First Commonwealth Financial Corp. | | | 29 | | | | 369 | |
First Community Bankshares, Inc. | | | 9 | | | | 255 | |
First Community Corp. | | | 3 | | | | 50 | |
First Financial Bancorp | | | 30 | | | | 615 | |
First Financial Corp. | | | 7 | | | | 220 | |
First Foundation, Inc. | | | 26 | | | | 103 | |
First Hawaiian, Inc. | | | 323 | | | | 5,818 | |
First Horizon Corp. | | | 15 | | | | 167 | |
First Interstate BancSystem, Inc. - Class A | | | 438 | | | | 10,451 | |
First Merchants Corp. | | | 65 | | | | 1,834 | |
First Mid Bancshares, Inc. | | | 15 | | | | 361 | |
First of Long Island Corp. | | | 14 | | | | 169 | |
First Western Financial, Inc.(1) | | | 6 | | | | 113 | |
Five Star Bancorp | | | 4 | | | | 95 | |
FleetCor Technologies, Inc.(1) | | | 31 | | | | 7,735 | |
Flushing Financial Corp. | | | 14 | | | | 174 | |
FNB Corp. | | | 499 | | | | 5,708 | |
Forge Global Holdings, Inc.(1) | | | 45 | | | | 110 | |
Franklin BSP Realty Trust, Inc. | | | 31 | | | | 443 | |
Franklin Resources, Inc. | | | 8 | | | | 211 | |
FS Bancorp, Inc. | | | 2 | | | | 71 | |
FS KKR Capital Corp. | | | 122 | | | | 2,342 | |
Fulton Financial Corp. | | | 71 | | | | 844 | |
FVCBankcorp, Inc.(1) | | | 9 | | | | 100 | |
GCM Grosvenor, Inc. - Class A | | | 2 | | | | 12 | |
Genworth Financial, Inc. - Class A(1) | | | 131 | | | | 655 | |
German American Bancorp, Inc. | | | 14 | | | | 373 | |
Glacier Bancorp, Inc. | | | 551 | | | | 17,186 | |
Global Payments, Inc. | | | 48 | | | | 4,713 | |
Globe Life, Inc. | | | 106 | | | | 11,660 | |
GoHealth, Inc. - Class A(1) | | | 2 | | | | 41 | |
| | | | | | | | |
Granite Point Mortgage Trust, Inc. | | | 22 | | | | 119 | |
Great Southern Bancorp, Inc. | | | 5 | | | | 247 | |
Green Dot Corp. - Class A(1) | | | 11 | | | | 215 | |
Greene County Bancorp, Inc. | | | 1 | | | | 44 | |
Greenlight Capital Re Ltd. - Class A(1) | | | 11 | | | | 120 | |
Guaranty Bancshares, Inc. | | | 5 | | | | 139 | |
Hamilton Lane, Inc. - Class A | | | 6 | | | | 503 | |
Hancock Whitney Corp. | | | 37 | | | | 1,401 | |
Hanmi Financial Corp. | | | 249 | | | | 3,724 | |
Hannon Armstrong Sustainable Infrastructure Capital, Inc. | | | 39 | | | | 986 | |
Hanover Insurance Group, Inc. | | | 64 | | | | 7,270 | |
HarborOne Bancorp, Inc. | | | 20 | | | | 175 | |
Hartford Financial Services Group, Inc. | | | 315 | | | | 22,710 | |
HBT Financial, Inc. | | | 8 | | | | 147 | |
Heartland Financial USA, Inc. | | | 19 | | | | 538 | |
Heritage Commerce Corp. | | | 32 | | | | 267 | |
Heritage Financial Corp. | | | 14 | | | | 229 | |
Hilltop Holdings, Inc. | | | 21 | | | | 659 | |
Hingham Institution for Savings | | | 1 | | | | 173 | |
Hippo Holdings, Inc.(1) | | | 5 | | | | 87 | |
Home Bancorp, Inc. | | | 4 | | | | 141 | |
Home Bancshares, Inc. | | | 326 | | | | 7,435 | |
Home Point Capital, Inc.(1) | | | 3 | | | | 6 | |
HomeStreet, Inc. | | | 9 | | | | 56 | |
HomeTrust Bancshares, Inc. | | | 7 | | | | 145 | |
Hope Bancorp, Inc. | | | 36 | | | | 305 | |
Horace Mann Educators Corp. | | | 15 | | | | 446 | |
Horizon Bancorp, Inc. | | | 22 | | | | 224 | |
Houlihan Lokey, Inc. - Class A | | | 1 | | | | 131 | |
Huntington Bancshares, Inc. | | | 961 | | | | 10,362 | |
Independent Bank Corp. | | | 12 | | | | 204 | |
Independent Bank Corp. | | | 239 | | | | 10,659 | |
Independent Bank Group, Inc. | | | 58 | | | | 2,005 | |
Interactive Brokers Group, Inc. - Class A | | | 3 | | | | 230 | |
International Bancshares Corp. | | | 23 | | | | 1,020 | |
Invesco Ltd. | | | 10 | | | | 173 | |
Invesco Mortgage Capital, Inc. | | | 17 | | | | 196 | |
Investors Title Co. | | | 1 | | | | 92 | |
Jack Henry & Associates, Inc. | | | 1 | | | | 231 | |
Jackson Financial, Inc. - Class A | | | 34 | | | | 1,037 | |
James River Group Holdings Ltd. | | | 10 | | | | 180 | |
Janus Henderson Group Plc | | | 4 | | | | 101 | |
Jefferies Financial Group, Inc. | | | 6 | | | | 186 | |
John Marshall Bancorp, Inc. | | | 5 | | | | 105 | |
Kearny Financial Corp. | | | 30 | | | | 209 | |
Kemper Corp. | | | 2 | | | | 80 | |
KeyCorp | | | 298 | | | | 2,750 | |
KKR & Co., Inc. - Class Miscella | | | 14 | | | | 763 | |
KKR Real Estate Finance Trust, Inc. | | | 23 | | | | 285 | |
Ladder Capital Corp. - Class A | | | 47 | | | | 512 | |
Lakeland Bancorp, Inc. | | | 30 | | | | 400 | |
Lakeland Financial Corp. | �� | | 175 | | | | 8,503 | |
Lazard Ltd. - Class A | | | 58 | | | | 1,844 | |
LCNB Corp. | | | 3 | | | | 51 | |
Lemonade, Inc.(1) | | | 18 | | | | 308 | |
LendingClub Corp.(1) | | | 45 | | | | 442 | |
LendingTree, Inc.(1) | | | 4 | | | | 79 | |
Lincoln National Corp. | | | 84 | | | | 2,158 | |
Live Oak Bancshares, Inc. | | | 16 | | | | 428 | |
Loews Corp. | | | 61 | | | | 3,643 | |
LPL Financial Holdings, Inc. | | | 45 | | | | 9,867 | |
| | | | | | | | |
Luther Burbank Corp. | | | 12 | | | | 105 | |
M&T Bank Corp. | | | 5 | | | | 568 | |
Macatawa Bank Corp. | | | 15 | | | | 136 | |
Maiden Holdings Ltd.(1) | | | 31 | | | | 66 | |
MainStreet Bancshares, Inc. | | | 3 | | | | 62 | |
Markel Group, Inc.(1)(2) | | | 0 | | | | 509 | |
MarketWise, Inc. | | | 14 | | | | 27 | |
Marqeta, Inc. - Class A(1) | | | 175 | | | | 851 | |
MBIA, Inc.(1) | | | 21 | | | | 184 | |
Mercantile Bank Corp. | | | 9 | | | | 242 | |
Merchants Bancorp | | | 8 | | | | 194 | |
Mercury General Corp. | | | 13 | | | | 385 | |
Metrocity Bankshares, Inc. | | | 10 | | | | 177 | |
Metropolitan Bank Holding Corp.(1) | | | 4 | | | | 150 | |
MFA Financial, Inc. | | | 41 | | | | 456 | |
MGIC Investment Corp. | | | 218 | | | | 3,441 | |
Mid Penn Bancorp, Inc. | | | 7 | | | | 163 | |
Middlefield Banc Corp. | | | 3 | | | | 77 | |
Midland States Bancorp, Inc. | | | 9 | | | | 172 | |
MidWestOne Financial Group, Inc. | | | 9 | | | | 184 | |
Moelis & Co. - Class A | | | 12 | | | | 528 | |
Mr Cooper Group, Inc.(1) | | | 256 | | | | 12,977 | |
MSCI, Inc. - Class A | | | 19 | | | | 8,748 | |
MVB Financial Corp. | | | 6 | | | | 122 | |
Nasdaq, Inc. | | | 607 | | | | 30,242 | |
National Bank Holdings Corp. - Class A | | | 11 | | | | 325 | |
National Bankshares, Inc. | | | 2 | | | | 56 | |
National Western Life Group, Inc. - Class A | | | 1 | | | | 430 | |
Navient Corp. | | | 263 | | | | 4,886 | |
NBT Bancorp, Inc. | | | 11 | | | | 357 | |
Nelnet, Inc. - Class A | | | 6 | | | | 577 | |
New York Community Bancorp, Inc. | | | 20 | | | | 222 | |
New York Mortgage Trust, Inc. | | | 37 | | | | 364 | |
NewtekOne, Inc. | | | 10 | | | | 159 | |
Nexpoint Real Estate Finance, Inc. | | | 4 | | | | 58 | |
NI Holdings, Inc.(1) | | | 4 | | | | 64 | |
Nicolet Bankshares, Inc. | | | 6 | | | | 385 | |
NMI Holdings, Inc. - Class A(1) | | | 33 | | | | 843 | |
Northeast Bank | | | 3 | | | | 145 | |
Northeast Community Bancorp, Inc. | | | 6 | | | | 83 | |
Northern Trust Corp. | | | 6 | | | | 422 | |
Northfield Bancorp, Inc. | | | 13 | | | | 141 | |
Northwest Bancshares, Inc. | | | 37 | | | | 397 | |
Norwood Financial Corp. | | | 3 | | | | 78 | |
NU Holdings Ltd. - Class A(1) | | | 20 | | | | 159 | |
Oak Valley Bancorp | | | 3 | | | | 66 | |
OceanFirst Financial Corp. | | | 28 | | | | 433 | |
Ocwen Financial Corp.(1) | | | 3 | | | | 78 | |
OFG Bancorp | | | 13 | | | | 352 | |
Old National Bancorp | | | 600 | | | | 8,359 | |
Old Republic International Corp. | | | 141 | | | | 3,539 | |
Old Second Bancorp, Inc. | | | 21 | | | | 276 | |
OneMain Holdings, Inc. - Class A | | | 3 | | | | 136 | |
Open Lending Corp. - Class A(1) | | | 4 | | | | 38 | |
OppFi, Inc.(1) | | | 5 | | | | 9 | |
Orange County Bancorp, Inc. | | | 2 | | | | 81 | |
Orchid Island Capital, Inc. - Class A | | | 15 | | | | 155 | |
Origin Bancorp, Inc. | | | 55 | | | | 1,598 | |
Orrstown Financial Services, Inc. | | | 7 | | | | 133 | |
Oscar Health, Inc. - Class A(1) | | | 63 | | | | 508 | |
Pacific Premier Bancorp, Inc. | | | 551 | | | | 11,388 | |
| | | | | | | | |
PacWest Bancorp | | | 51 | | | | 415 | |
Pagseguro Digital Ltd. - Class A(1) | | | 32 | | | | 300 | |
Park National Corp. | | | 6 | | | | 661 | |
Parke Bancorp, Inc. | | | 7 | | | | 126 | |
Pathward Financial, Inc. | | | 5 | | | | 244 | |
Patria Investments Ltd. - Class A | | | 71 | | | | 1,020 | |
Paysafe Ltd.(1) | | | 13 | | | | 133 | |
PCB Bancorp | | | 8 | | | | 111 | |
Peapack Gladstone Financial Corp. | | | 9 | | | | 252 | |
PennantPark Investment Corp. | | | 164 | | | | 963 | |
Penns Woods Bancorp, Inc. | | | 2 | | | | 44 | |
PennyMac Financial Services, Inc. | | | 10 | | | | 718 | |
PennyMac Mortgage Investment Trust | | | 35 | | | | 476 | |
Peoples Bancorp, Inc. | | | 16 | | | | 432 | |
Peoples Financial Services Corp. | | | 4 | | | | 180 | |
Pinnacle Financial Partners, Inc. | | | 2 | | | | 118 | |
Pioneer Bancorp, Inc.(1) | | | 7 | | | | 58 | |
Piper Sandler Companies | | | 1 | | | | 174 | |
Plumas Bancorp | | | 2 | | | | 54 | |
Ponce Financial Group, Inc.(1) | | | 8 | | | | 73 | |
Popular, Inc. | | | 42 | | | | 2,570 | |
PRA Group, Inc.(1) | | | 16 | | | | 356 | |
Preferred Bank | | | 4 | | | | 195 | |
Premier Financial Corp. | | | 46 | | | | 741 | |
Primerica, Inc.(2) | | | 0 | | | | 72 | |
Primis Financial Corp. | | | 16 | | | | 135 | |
Princeton Bancorp, Inc. | | | 2 | | | | 47 | |
Principal Financial Group, Inc. | | | 46 | | | | 3,483 | |
ProAssurance Corp. | | | 14 | | | | 218 | |
PROG Holdings, Inc.(1) | | | 15 | | | | 487 | |
Prospect Capital Corp. | | | 296 | | | | 1,833 | |
Prosperity Bancshares, Inc. | | | 171 | | | | 9,642 | |
Provident Financial Services, Inc. | | | 87 | | | | 1,419 | |
Prudential Financial, Inc. | | | 10 | | | | 905 | |
QCR Holdings, Inc. | | | 26 | | | | 1,047 | |
Radian Group, Inc. | | | 47 | | | | 1,190 | |
Raymond James Financial, Inc. | | | 51 | | | | 5,286 | |
RBB Bancorp | | | 10 | | | | 123 | |
Ready Capital Corp. | | | 67 | | | | 750 | |
Red River Bancshares, Inc. | | | 2 | | | | 99 | |
Redwood Trust, Inc. | | | 45 | | | | 290 | |
Regional Management Corp. | | | 3 | | | | 89 | |
Regions Financial Corp. | | | 504 | | | | 8,983 | |
Reinsurance Group of America, Inc. - Class A | | | 150 | | | | 20,767 | |
RenaissanceRe Holdings Ltd. | | | 33 | | | | 6,152 | |
Renasant Corp. | | | 15 | | | | 403 | |
Repay Holdings Corp. - Class A(1) | | | 33 | | | | 258 | |
Republic Bancorp, Inc. - Class A | | | 4 | | | | 190 | |
Rithm Capital Corp. | | | 2,028 | | | | 18,959 | |
RLI Corp. | | | 1 | | | | 118 | |
Robinhood Markets, Inc. - Class A(1) | | | 18 | | | | 184 | |
Rocket Companies, Inc. - Class A(1) | | | 2 | | | | 20 | |
S&T Bancorp, Inc. | | | 11 | | | | 312 | |
Safety Insurance Group, Inc. | | | 4 | | | | 293 | |
Sandy Spring Bancorp, Inc. | | | 179 | | | | 4,069 | |
Sculptor Capital Management, Inc. - Class A | | | 5 | | | | 45 | |
Seacoast Banking Corp. of Florida | | | 29 | | | | 651 | |
Security National Financial Corp. - Class A(1) | | | 5 | | | | 40 | |
SEI Investments Co. | | | 3 | | | | 168 | |
Selective Insurance Group, Inc. | | | 201 | | | | 19,282 | |
Selectquote, Inc.(1) | | | 84 | | | | 165 | |
| | | | | | | | |
ServisFirst Bancshares, Inc. | | | 14 | | | | 553 | |
Shore Bancshares, Inc. | | | 12 | | | | 139 | |
Sierra Bancorp | | | 9 | | | | 150 | |
Simmons First National Corp. - Class A | | | 33 | | | | 568 | |
SiriusPoint Ltd.(1) | | | 35 | | | | 318 | |
Skyward Specialty Insurance Group, Inc.(1) | | | 5 | | | | 135 | |
SLM Corp. | | | 800 | | | | 13,054 | |
SmartFinancial, Inc. | | | 9 | | | | 191 | |
SoFi Technologies, Inc.(1) | | | 26 | | | | 214 | |
South Plains Financial, Inc. | | | 7 | | | | 161 | |
South State Corp. | | | 306 | | | | 20,139 | |
Southern First Bancshares, Inc.(1) | | | 5 | | | | 124 | |
Southern Missouri Bancorp, Inc. | | | 4 | | | | 172 | |
Southern States Bancshares, Inc. | | | 2 | | | | 47 | |
Southside Bancshares, Inc. | | | 8 | | | | 214 | |
Starwood Property Trust, Inc. | | | 8 | | | | 159 | |
State Street Corp. | | | 149 | | | | 10,931 | |
Stellar Bancorp, Inc. | | | 21 | | | | 486 | |
Sterling Bancorp, Inc.(1) | | | 13 | | | | 71 | |
Stewart Information Services Corp. | | | 8 | | | | 345 | |
Stifel Financial Corp. | | | 216 | | | | 12,860 | |
Stock Yards Bancorp, Inc. | | | 3 | | | | 124 | |
StoneCo Ltd. - Class A(1) | | | 47 | | | | 605 | |
StoneX Group, Inc.(1) | | | 7 | | | | 560 | |
Summit Financial Group, Inc. | | | 7 | | | | 148 | |
SWK Holdings Corp.(1) | | | 1 | | | | 18 | |
Synchrony Financial | | | 114 | | | | 3,869 | |
Synovus Financial Corp. | | | 4 | | | | 122 | |
T Rowe Price Group, Inc. | | | 6 | | | | 687 | |
Texas Capital Bancshares, Inc.(1) | | | 129 | | | | 6,623 | |
TFS Financial Corp. | | | 1 | | | | 18 | |
Third Coast Bancshares, Inc.(1) | | | 5 | | | | 87 | |
Timberland Bancorp, Inc. | | | 4 | | | | 90 | |
Tiptree, Inc. | | | 8 | | | | 117 | |
Tompkins Financial Corp. | | | 6 | | | | 318 | |
Towne Bank | | | 69 | | | | 1,597 | |
TPG RE Finance Trust, Inc. | | | 28 | | | | 208 | |
TPG, Inc. - Class A | | | 1 | | | | 36 | |
Tradeweb Markets, Inc. - Class A | | | 2 | | | | 142 | |
Travelers Companies, Inc. | | | 27 | | | | 4,678 | |
TriCo Bancshares | | | 14 | | | | 478 | |
Triumph Financial, Inc.(1) | | | 7 | | | | 440 | |
Truist Financial Corp. | | | 141 | | | | 4,270 | |
TrustCo Bank Corp. NY | | | 5 | | | | 144 | |
Trustmark Corp. | | | 16 | | | | 348 | |
Two Harbors Investment Corp. | | | 458 | | | | 6,351 | |
USCB Financial Holdings, Inc.(1) | | | 6 | | | | 61 | |
UMB Financial Corp. | | | 141 | | | | 8,588 | |
United Bankshares, Inc. | | | 405 | | | | 12,004 | |
United Community Banks, Inc. | | | 264 | | | | 6,593 | |
United Fire Group, Inc. | | | 9 | | | | 207 | |
United Insurance Holdings Corp.(1) | | | 8 | | | | 35 | |
Unity Bancorp, Inc. | | | 5 | | | | 125 | |
Universal Insurance Holdings, Inc. | | | 35 | | | | 546 | |
Univest Financial Corp. | | | 15 | | | | 270 | |
Unum Group | | | 103 | | | | 4,917 | |
UWM Holdings Corp. | | | 2 | | | | 9 | |
Valley National Bancorp | | | 686 | | | | 5,318 | |
Value Line, Inc.(2) | | | 0 | | | | 1 | |
Velocity Financial, Inc.(1) | | | 3 | | | | 36 | |
Veritex Holdings, Inc. | | | 50 | | | | 894 | |
| | | | | | | | |
Victory Capital Holdings, Inc. - Class A | | | 2 | | | | 52 | |
Virginia National Bankshares Corp. | | | 2 | | | | 70 | |
Virtu Financial, Inc. - Class A | | | 3 | | | | 43 | |
Virtus Investment Partners, Inc. | | | 3 | | | | 506 | |
Voya Financial, Inc. | | | 65 | | | | 4,658 | |
Walker & Dunlop, Inc. | | | 14 | | | | 1,079 | |
Washington Federal, Inc. | | | 23 | | | | 611 | |
Washington Trust Bancorp, Inc. | | | 9 | | | | 250 | |
Waterstone Financial, Inc. | | | 10 | | | | 142 | |
Webster Financial Corp. | | | 370 | | | | 13,956 | |
WesBanco, Inc. | | | 81 | | | | 2,062 | |
West BanCorp, Inc. | | | 9 | | | | 162 | |
Westamerica BanCorp | | | 6 | | | | 222 | |
Western Alliance Bancorp | | | 42 | | | | 1,524 | |
Western Union Co. | | | 191 | | | | 2,240 | |
WEX, Inc.(1) | | | 1 | | | | 117 | |
White Mountains Insurance Group Ltd.(2) | | | 0 | | | | 96 | |
Willis Towers Watson Plc | | | 51 | | | | 12,118 | |
Wintrust Financial Corp. | | | 58 | | | | 4,201 | |
World Acceptance Corp.(1) | | | 1 | | | | 191 | |
WR Berkley Corp. | | | 6 | | | | 352 | |
WSFS Financial Corp. | | | 19 | | | | 722 | |
XP, Inc. - Class A(1) | | | 8 | | | | 198 | |
Zions Bancorp N.A. | | | 265 | | | | 7,106 | |
| | | | | | | | |
Total Financials | | | | 1,202,588 | |
| | | | | |
Healthcare – 8.19% | | | | | | | | |
23andMe Holding Co. - Class A(1) | | | 105 | | | | 184 | |
2seventy bio, Inc.(1) | | | 21 | | | | 209 | |
4D Molecular Therapeutics, Inc.(1) | | | 12 | | | | 213 | |
Aadi Bioscience, Inc.(1) | | | 7 | | | | 45 | |
Acadia Healthcare Co., Inc.(1) | | | 2 | | | | 198 | |
Accolade, Inc.(1) | | | 1 | | | | 20 | |
Acrivon Therapeutics, Inc.(1) | | | 3 | | | | 45 | |
AdaptHealth Corp. - Class A(1) | | | 402 | | | | 4,889 | |
Adaptive Biotechnologies Corp.(1) | | | 13 | | | | 90 | |
Addus HomeCare Corp.(1) | | | 133 | | | | 12,326 | |
Adicet Bio, Inc.(1) | | | 13 | | | | 31 | |
ADMA Biologics, Inc.(1) | | | 38 | | | | 140 | |
Aduro Bioteech, Inc.(1)(4) | | | 1 | | | | 3 | |
Agenus, Inc.(1) | | | 117 | | | | 187 | |
Agilent Technologies, Inc. | | | 39 | | | | 4,734 | |
Agiliti, Inc.(1) | | | 246 | | | | 4,051 | |
agilon health, Inc.(1) | | | 1 | | | | 14 | |
Agios Pharmaceuticals, Inc.(1) | | | 22 | | | | 636 | |
Allakos, Inc.(1) | | | 26 | | | | 114 | |
Allogene Therapeutics, Inc.(1) | | | 36 | | | | 178 | |
Allovir, Inc.(1) | | | 17 | | | | 59 | |
Alnylam Pharmaceuticals, Inc.(1) | | | 1 | | | | 128 | |
Alphatec Holdings, Inc.(1) | | | 18 | | | | 323 | |
Alpine Immune Sciences, Inc.(1) | | | 5 | | | | 56 | |
Altimmune, Inc.(1) | | | 20 | | | | 71 | |
ALX Oncology Holdings, Inc.(1) | | | 10 | | | | 76 | |
Amedisys, Inc.(1) | | | 1 | | | | 81 | |
American Well Corp. - Class A(1) | | | 104 | | | | 218 | |
AmerisourceBergen Corp. - Class A | | | 405 | | | | 77,955 | |
AMN Healthcare Services, Inc.(1) | | | 172 | | | | 18,738 | |
Amneal Pharmaceuticals, Inc.(1) | | | 49 | | | | 152 | |
AnaptysBio, Inc.(1) | | | 1 | | | | 25 | |
AngioDynamics, Inc.(1) | | | 16 | | | | 165 | |
ANI Pharmaceuticals, Inc.(1) | | | 1 | | | | 55 | |
Anika Therapeutics, Inc.(1) | | | 5 | | | | 143 | |
| | | | | | | | |
Annexon, Inc.(1) | | | 17 | | | | 60 | |
Arbutus Biopharma Corp.(1) | | | 17 | | | | 40 | |
Arcturus Therapeutics Holdings, Inc.(1) | | | 8 | | | | 244 | |
Arcus Biosciences, Inc.(1) | | | 15 | | | | 306 | |
Ardelyx, Inc.(1) | | | 28 | | | | 95 | |
ARS Pharmaceuticals, Inc.(1) | | | 7 | | | | 45 | |
Artivion, Inc.(1) | | | 13 | | | | 223 | |
Arvinas, Inc.(1) | | | 1 | | | | 32 | |
Assertio Holdings, Inc.(1) | | | 22 | | | | 118 | |
Astria Therapeutics, Inc.(1) | | | 1 | | | | 12 | |
Atara Biotherapeutics, Inc.(1) | | | 36 | | | | 58 | |
Atea Pharmaceuticals, Inc.(1) | | | 30 | | | | 111 | |
AtriCure, Inc.(1) | | | 5 | | | | 252 | |
Aura Biosciences, Inc.(1) | | | 11 | | | | 136 | |
Avanos Medical, Inc.(1) | | | 19 | | | | 479 | |
Avantor, Inc.(1) | | | 745 | | | | 15,312 | |
Aveanna Healthcare Holdings, Inc.(1) | | | 15 | | | | 26 | |
Avidity Biosciences, Inc.(1) | | | 29 | | | | 319 | |
Azenta, Inc.(1) | | | 2 | | | | 88 | |
Baxter International, Inc. | | | 14 | | | | 645 | |
Beam Therapeutics, Inc.(1) | | | 3 | | | | 88 | |
Beyond Air, Inc.(1) | | | 2 | | | | 10 | |
BioAtla, Inc.(1) | | | 18 | | | | 54 | |
BioCryst Pharmaceuticals, Inc.(1) | | | 18 | | | | 129 | |
Biogen, Inc.(1) | | | 4 | | | | 1,146 | |
Biohaven Ltd.(1) | | | 23 | | | | 561 | |
BioLife Solutions, Inc.(1) | | | 1 | | | | 26 | |
BioMarin Pharmaceutical, Inc.(1) | | | 5 | | | | 397 | |
Bio-Rad Laboratories, Inc. - Class A(1) | | | 1 | | | | 221 | |
Biote Corp. - Class A(1) | | | 2 | | | | 14 | |
Bio-Techne Corp.(2) | | | 0 | | | | 20 | |
Bluebird Bio, Inc.(1) | | | 43 | | | | 141 | |
Boston Scientific Corp.(1) | | | 257 | | | | 13,915 | |
Bridgebio Pharma, Inc.(1) | | | 14 | | | | 241 | |
Brookdale Senior Living, Inc.(1) | | | 69 | | | | 291 | |
Butterfly Network, Inc.(1) | | | 54 | | | | 124 | |
Cabaletta Bio, Inc.(1) | | | 1 | | | | 15 | |
Cano Health, Inc.(1) | | | 89 | | | | 124 | |
Cara Therapeutics, Inc.(1) | | | 21 | | | | 60 | |
Cardinal Health, Inc. | | | 90 | | | | 8,558 | |
CareDx, Inc.(1) | | | 22 | | | | 187 | |
CareMax, Inc.(1) | | | 30 | | | | 94 | |
Caribou Biosciences, Inc.(1) | | | 25 | | | | 106 | |
Carisma Therapeutics, Inc. | | | 11 | | | | 93 | |
Castle Biosciences, Inc.(1) | | | 6 | | | | 82 | |
Catalent, Inc.(1) | | | 5 | | | | 216 | |
Celcuity, Inc.(1) | | | 6 | | | | 69 | |
Celldex Therapeutics, Inc.(1) | | | 14 | | | | 471 | |
Centene Corp.(1) | | | 240 | | | | 16,188 | |
Century Therapeutics, Inc.(1) | | | 10 | | | | 31 | |
Certara, Inc.(1) | | | 2 | | | | 38 | |
Charles River Laboratories International, Inc.(1) | | | 1 | | | | 296 | |
Chemed Corp.(2) | | | 0 | | | | 63 | |
Chinook Therapeutics, Inc.(1) | | | 17 | | | | 639 | |
Cigna Group | | | 15 | | | | 4,319 | |
Citius Pharmaceuticals, Inc.(1) | | | 40 | | | | 49 | |
Codexis, Inc.(1) | | | 25 | | | | 70 | |
Cogent Biosciences, Inc.(1) | | | 13 | | | | 152 | |
Coherus Biosciences, Inc.(1) | | | 7 | | | | 28 | |
Community Health Systems, Inc.(1) | | | 53 | | | | 234 | |
Compass Therapeutics, Inc.(1) | | | 31 | | | | 99 | |
| | | | | | | | |
Computer Programs & Systems, Inc.(1) | | | 5 | | | | 117 | |
Cooper Companies, Inc. | | | 44 | | | | 16,955 | |
Crinetics Pharmaceuticals, Inc.(1) | | | 18 | | | | 318 | |
Cross Country Healthcare, Inc.(1) | | | 12 | | | | 331 | |
CryoPort, Inc.(1) | | | 3 | | | | 44 | |
Cullinan Oncology, Inc.(1) | | | 10 | | | | 103 | |
Cutera, Inc.(1) | | | 6 | | | | 91 | |
Cytokinetics, Inc.(1) | | | 3 | | | | 84 | |
DaVita, Inc.(1) | | | 65 | | | | 6,531 | |
Day One Biopharmaceuticals, Inc.(1) | | | 2 | | | | 23 | |
Deciphera Pharmaceuticals, Inc.(1) | | | 14 | | | | 190 | |
Definitive Healthcare Corp. - Class A(1) | | | 13 | | | | 145 | |
Dentsply Sirona, Inc. | | | 6 | | | | 235 | |
Design Therapeutics, Inc.(1) | | | 14 | | | | 87 | |
DICE Therapeutics, Inc.(1) | | | 3 | | | | 129 | |
Disc Medicine, Inc. - Class A(1)(2) | | | 0 | | | | 12 | |
Doximity, Inc. - Class A(1) | | | 2 | | | | 61 | |
Dynavax Technologies Corp. - Class A(1) | | | 8 | | | | 108 | |
Dyne Therapeutics, Inc.(1) | | | 12 | | | | 136 | |
Eagle Pharmaceuticals, Inc.(1) | | | 4 | | | | 80 | |
Edgewise Therapeutics, Inc.(1) | | | 18 | | | | 139 | |
Editas Medicine, Inc. - Class A(1) | | | 29 | | | | 237 | |
Elanco Animal Health, Inc.(1) | | | 14 | | | | 141 | |
Embecta Corp. | | | 119 | | | | 2,569 | |
Emergent BioSolutions, Inc.(1) | | | 21 | | | | 156 | |
Enanta Pharmaceuticals, Inc.(1) | | | 7 | | | | 157 | |
Encompass Health Corp. | | | 3 | | | | 173 | |
Enhabit, Inc.(1) | | | 20 | | | | 229 | |
Enliven Therapeutics, Inc.(1) | | | 9 | | | | 189 | |
Enovis Corp.(1) | | | 288 | | | | 18,493 | |
Entrada Therapeutics, Inc.(1) | | | 8 | | | | 126 | |
Envista Holdings Corp.(1) | | | 311 | | | | 10,528 | |
EQRx, Inc.(1) | | | 130 | | | | 242 | |
Erasca, Inc.(1) | | | 34 | | | | 94 | |
Exact Sciences Corp.(1) | | | 3 | | | | 304 | |
Exelixis, Inc.(1) | | | 2 | | | | 44 | |
EyePoint Pharmaceuticals, Inc.(1) | | | 5 | | | | 43 | |
Fate Therapeutics, Inc.(1) | | | 35 | | | | 169 | |
Fennec Pharmaceuticals, Inc.(1) | | | 5 | | | | 46 | |
FibroGen, Inc.(1) | | | 36 | | | | 98 | |
Fortrea Holdings, Inc.(1) | | | 57 | | | | 1,947 | |
Fulgent Genetics, Inc.(1) | | | 8 | | | | 308 | |
Genelux Corp.(1) | | | 1 | | | | 21 | |
Generation Bio Co.(1) | | | 19 | | | | 103 | |
Geron Corp.(1) | | | 48 | | | | 153 | |
Globus Medical, Inc. - Class A(1) | | | 2 | | | | 135 | |
Graphite Bio, Inc.(1) | | | 14 | | | | 37 | |
Gritstone bio, Inc.(1) | | | 35 | | | | 69 | |
HCA Healthcare, Inc. | | | 38 | | | | 11,663 | |
Health Catalyst, Inc.(1) | | | 10 | | | | 129 | |
HealthStream, Inc. | | | 6 | | | | 136 | |
Henry Schein, Inc.(1) | | | 4 | | | | 294 | |
HilleVax, Inc.(1) | | | 6 | | | | 109 | |
Hologic, Inc.(1) | | | 190 | | | | 15,363 | |
Horizon Therapeutics Plc(1) | | | 1 | | | | 74 | |
Humacyte, Inc.(1) | | | 5 | | | | 14 | |
Humana, Inc. | | | 16 | | | | 7,030 | |
ICON Plc(1) | | | 128 | | | | 32,047 | |
Icosavax, Inc.(1) | | | 11 | | | | 112 | |
ICU Medical, Inc.(1) | | | 41 | | | | 7,304 | |
Ideaya Biosciences, Inc.(1) | | | 8 | | | | 181 | |
| | | | | | | | |
IGM Biosciences, Inc.(1) | | | 5 | | | | 47 | |
Ikena Oncology, Inc.(1) | | | 8 | | | | 53 | |
Illumina, Inc.(1) | | | 3 | | | | 583 | |
Immuneering Corp. - Class A(1) | | | 2 | | | | 20 | |
ImmunityBio, Inc.(1) | | | 7 | | | | 20 | |
ImmunoGen, Inc.(1) | | | 41 | | | | 768 | |
Inari Medical, Inc.(1) | | | 1 | | | | 81 | |
Incyte Corp.(1) | | | 1 | | | | 83 | |
Inhibrx, Inc.(1) | | | 5 | | | | 121 | |
Innoviva, Inc.(1) | | | 169 | | | | 2,151 | |
Inogen, Inc.(1) | | | 10 | | | | 114 | |
Inozyme Pharma, Inc.(1) | | | 13 | | | | 72 | |
Integer Holdings Corp.(1) | | | 182 | | | | 16,134 | |
Integra LifeSciences Holdings Corp.(1) | | | 2 | | | | 82 | |
Intellia Therapeutics, Inc.(1) | | | 31 | | | | 1,254 | |
Invitae Corp.(1) | | | 19 | | | | 22 | |
Ionis Pharmaceuticals, Inc.(1) | | | 1 | | | | 22 | |
Iovance Biotherapeutics, Inc.(1) | | | 86 | | | | 605 | |
IQVIA Holdings, Inc.(1) | | | 131 | | | | 29,430 | |
Ironwood Pharmaceuticals, Inc. - Class A(1) | | | 401 | | | | 4,264 | |
iTeos Therapeutics, Inc.(1) | | | 10 | | | | 135 | |
Janux Therapeutics, Inc.(1) | | | 7 | | | | 79 | |
Jazz Pharmaceuticals Plc(1) | | | 82 | | | | 10,111 | |
KalVista Pharmaceuticals, Inc.(1) | | | 10 | | | | 92 | |
Karuna Therapeutics, Inc.(1)(2) | | | 0 | | | | 23 | |
Kezar Life Sciences, Inc.(1) | | | 30 | | | | 73 | |
Kiniksa Pharmaceuticals Ltd. - Class A(1) | | | 13 | | | | 177 | |
Kodiak Sciences, Inc.(1) | | | 14 | | | | 95 | |
Kura Oncology, Inc.(1) | | | 26 | | | | 280 | |
Laboratory Corp. of America Holdings | | | 53 | | | | 12,777 | |
Lantheus Holdings, Inc.(1) | | | 144 | | | | 12,105 | |
Larimar Therapeutics, Inc.(1) | | | 9 | | | | 30 | |
Lexicon Pharmaceuticals, Inc.(1) | | | 20 | | | | 45 | |
LifeStance Health Group, Inc.(1) | | | 19 | | | | 175 | |
Ligand Pharmaceuticals, Inc.(1) | | | 6 | | | | 418 | |
Liquidia Corp.(1) | | | 6 | | | | 44 | |
LivaNova Plc(1) | | | 21 | | | | 1,059 | |
Longboard Pharmaceuticals, Inc.(1) | | | 4 | | | | 26 | |
Lyell Immunopharma, Inc.(1) | | | 74 | | | | 234 | |
MacroGenics, Inc.(1) | | | 17 | | | | 92 | |
MannKind Corp.(1) | | | 18 | | | | 74 | |
Maravai LifeSciences Holdings, Inc. - Class A(1) | | | 282 | | | | 3,506 | |
MaxCyte, Inc.(1) | | | 31 | | | | 144 | |
McKesson Corp. | | | 20 | | | | 8,546 | |
MeiraGTx Holdings Plc(1) | | | 4 | | | | 25 | |
Mersana Therapeutics, Inc.(1) | | | 16 | | | | 54 | |
MiMedx Group, Inc.(1) | | | 45 | | | | 299 | |
Mineralys Therapeutics, Inc.(1) | | | 4 | | | | 68 | |
Mirati Therapeutics, Inc.(1) | | | 1 | | | | 46 | |
ModivCare, Inc.(1) | | | 118 | | | | 5,333 | |
Molina Healthcare, Inc.(1) | | | 39 | | | | 11,625 | |
Monte Rosa Therapeutics, Inc.(1) | | | 12 | | | | 82 | |
Morphic Holding, Inc.(1) | | | 1 | | | | 81 | |
Multiplan Corp.(1) | | | 156 | | | | 328 | |
Myriad Genetics, Inc.(1) | | | 33 | | | | 755 | |
NanoString Technologies, Inc.(1) | | | 1 | | | | 6 | |
Nano-X Imaging Ltd.(1) | | | 17 | | | | 256 | |
National HealthCare Corp. | | | 5 | | | | 290 | |
Nautilus Biotechnology, Inc. - Class A(1) | | | 22 | | | | 85 | |
Neogen Corp.(1) | | | 88 | | | | 1,922 | |
NeoGenomics, Inc.(1) | | | 47 | | | | 750 | |
| | | | | | | | |
Nevro Corp.(1) | | | 10 | | | | 243 | |
NextGen Healthcare, Inc.(1) | | | 9 | | | | 142 | |
NGM Biopharmaceuticals, Inc.(1) | | | 19 | | | | 50 | |
Nkarta, Inc.(1) | | | 12 | | | | 26 | |
Novavax, Inc.(1) | | | 8 | | | | 56 | |
Nurix Therapeutics, Inc.(1) | | | 19 | | | | 193 | |
NuVasive, Inc.(1) | | | 3 | | | | 135 | |
Nuvation Bio, Inc.(1) | | | 59 | | | | 106 | |
Ocean Biomedical, Inc.(1) | | | 3 | | | | 16 | |
Olema Pharmaceuticals, Inc.(1) | | | 11 | | | | 97 | |
Omeros Corp.(1) | | | 14 | | | | 76 | |
OmniAb, Inc.(1) | | | 37 | | | | 185 | |
OmniAb, Inc. - Class CR3(1)(2)(4)(5) | | | 2 | | | | — | |
OmniAb, Inc. - Class CR4(1)(2)(4)(5) | | | 2 | | | | — | |
Omnicell, Inc.(1) | | | 9 | | | | 691 | |
OPKO Health, Inc.(1) | | | 165 | | | | 357 | |
OraSure Technologies, Inc.(1) | | | 30 | | | | 149 | |
Organogenesis Holdings, Inc. - Class A(1) | | | 25 | | | | 84 | |
Organon & Co. | | | 227 | | | | 4,715 | |
ORIC Pharmaceuticals, Inc.(1) | | | 16 | | | | 121 | |
Orthofix Medical, Inc.(1) | | | 14 | | | | 259 | |
OrthoPediatrics Corp.(1)(2) | | | 0 | | | | 15 | |
Ovid therapeutics, Inc.(1) | | | 22 | | | | 73 | |
Owens & Minor, Inc.(1) | | | 30 | | | | 573 | |
Pacific Biosciences of California, Inc.(1) | | | 46 | | | | 607 | |
Patterson Companies, Inc. | | | 28 | | | | 926 | |
Pediatrix Medical Group, Inc.(1) | | | 34 | | | | 487 | |
PepGen, Inc.(1) | | | 3 | | | | 24 | |
Perrigo Co. Plc | | | 4 | | | | 127 | |
PetIQ, Inc. - Class A(1) | | | 2 | | | | 30 | |
Phathom Pharmaceuticals, Inc.(1) | | | 7 | | | | 102 | |
Phibro Animal Health Corp. - Class A | | | 5 | | | | 75 | |
PMV Pharmaceuticals, Inc.(1) | | | 16 | | | | 100 | |
Point Biopharma Global, Inc. - Class A(1) | | | 36 | | | | 325 | |
Poseida Therapeutics, Inc. - Class A(1) | | | 28 | | | | 48 | |
Precigen, Inc.(1) | | | 56 | | | | 65 | |
Prelude Therapeutics, Inc.(1) | | | 3 | | | | 15 | |
Premier, Inc. - Class A | | | 280 | | | | 7,737 | |
Prestige Consumer Healthcare, Inc.(1) | | | 263 | | | | 15,659 | |
ProKidney Corp. - Class A(1) | | | 18 | | | | 202 | |
Protagonist Therapeutics, Inc.(1) | | | 8 | | | | 224 | |
Protalix BioTherapeutics, Inc.(1) | | | 20 | | | | 39 | |
PTC Therapeutics, Inc.(1) | | | 5 | | | | 218 | |
Pulse Biosciences, Inc.(1) | | | 4 | | | | 28 | |
QIAGEN NV(1) | | | 6 | | | | 285 | |
Quanterix Corp.(1) | | | 12 | | | | 269 | |
Quantum-Si, Inc.(1) | | | 44 | | | | 79 | |
Quest Diagnostics, Inc. | | | 3 | | | | 437 | |
QuidelOrtho Corp.(1) | | | 126 | | | | 10,452 | |
R1 RCM, Inc.(1) | | | 4 | | | | 78 | |
Rain Oncology, Inc.(1) | | | 11 | | | | 13 | |
Rallybio Corp.(1) | | | 12 | | | | 70 | |
RAPT Therapeutics, Inc.(1) | | | 3 | | | | 55 | |
Reata Pharmaceuticals, Inc. - Class A(1) | | | 12 | | | | 1,182 | |
Recursion Pharmaceuticals, Inc. - Class A(1) | | | 55 | | | | 414 | |
REGENXBIO, Inc.(1) | | | 17 | | | | 343 | |
Relay Therapeutics, Inc.(1) | | | 37 | | | | 464 | |
Repligen Corp.(1) | | | 1 | | | | 121 | |
Replimune Group, Inc.(1) | | | 16 | | | | 382 | |
Revvity, Inc. | | | 4 | | | | 417 | |
Rigel Pharmaceuticals, Inc.(1) | | | 11 | | | | 14 | |
| | | | | | | | |
Rocket Pharmaceuticals, Inc.(1) | | | 3 | | | | 55 | |
Roivant Sciences Ltd.(1) | | | 1 | | | | 6 | |
Royalty Pharma Plc - Class A | | | 10 | | | | 317 | |
Sage Therapeutics, Inc.(1) | | | 1 | | | | 60 | |
Sana Biotechnology, Inc.(1) | | | 35 | | | | 211 | |
Sangamo Therapeutics, Inc.(1) | | | 63 | | | | 81 | |
Savara, Inc.(1) | | | 27 | | | | 87 | |
Scholar Rock Holding Corp.(1) | | | 11 | | | | 85 | |
Scilex Holding Co.(1) | | | 16 | | | | 91 | |
Seer, Inc. - Class A(1) | | | 25 | | | | 108 | |
Selecta Biosciences, Inc.(1) | | | 34 | | | | 38 | |
Seres Therapeutics, Inc.(1) | | | 13 | | | | 61 | |
Sharecare, Inc.(1) | | | 119 | | | | 208 | |
SomaLogic, Inc.(1) | | | 64 | | | | 148 | |
Sotera Health Co.(1) | | | 195 | | | | 3,669 | |
STERIS Plc | | | 3 | | | | 620 | |
Stoke Therapeutics, Inc.(1) | | | 11 | | | | 120 | |
Surgery Partners, Inc.(1) | | | 3 | | | | 118 | |
Sutro Biopharma, Inc.(1) | | | 24 | | | | 112 | |
Syndax Pharmaceuticals, Inc.(1) | | | 4 | | | | 88 | |
Syneos Health, Inc. - Class A(1) | | | 3 | | | | 121 | |
Tandem Diabetes Care, Inc.(1) | | | 2 | | | | 38 | |
Tango Therapeutics, Inc.(1) | | | 19 | | | | 64 | |
Taro Pharmaceutical Industries Ltd.(1) | | | 3 | | | | 123 | |
Tarsus Pharmaceuticals, Inc.(1) | | | 9 | | | | 161 | |
Teladoc Health, Inc.(1) | | | 5 | | | | 117 | |
Teleflex, Inc. | | | 1 | | | | 316 | |
Tenaya Therapeutics, Inc.(1) | | | 19 | | | | 113 | |
Tenet Healthcare Corp.(1) | | | 3 | | | | 228 | |
Terns Pharmaceuticals, Inc.(1) | | | 6 | | | | 49 | |
Theravance Biopharma, Inc.(1) | | | 23 | | | | 240 | |
Theseus Pharmaceuticals, Inc.(1) | | | 8 | | | | 71 | |
Third Harmonic Bio, Inc.(1) | | | 7 | | | | 35 | |
Travere Therapeutics, Inc. - Class Preferre(1) | | | 2 | | | | 32 | |
Trevi Therapeutics, Inc.(1) | | | 16 | | | | 39 | |
Twist Bioscience Corp.(1) | | | 24 | | | | 483 | |
Tyra Biosciences, Inc.(1) | | | 4 | | | | 60 | |
United Therapeutics Corp.(1) | | | 31 | | | | 6,921 | |
Universal Health Services, Inc. - Class B | | | 35 | | | | 5,503 | |
UroGen Pharma Ltd.(1) | | | 1 | | | | 13 | |
Utah Medical Products, Inc.(2) | | | 0 | | | | 6 | |
Vanda Pharmaceuticals, Inc.(1) | | | 23 | | | | 153 | |
Varex Imaging Corp.(1) | | | 15 | | | | 357 | |
Vera Therapeutics, Inc. - Class A(1) | | | 7 | | | | 113 | |
Veracyte, Inc.(1) | | | 29 | | | | 748 | |
Veradigm, Inc.(1) | | | 44 | | | | 549 | |
Verve Therapeutics, Inc.(1) | | | 21 | | | | 386 | |
Viatris, Inc. | | | 443 | | | | 4,417 | |
Vicarious Surgical, Inc.(1) | | | 15 | | | | 27 | |
ViewRay, Inc.(1) | | | 38 | | | | 13 | |
Vigil Neuroscience, Inc.(1) | | | 7 | | | | 62 | |
Vir Biotechnology, Inc.(1) | | | 32 | | | | 788 | |
Viridian Therapeutics, Inc.(1) | | | 3 | | | | 83 | |
Vor BioPharma, Inc.(1) | | | 15 | | | | 45 | |
WaVe Life Sciences Ltd.(1) | | | 23 | | | | 82 | |
X4 Pharmaceuticals, Inc.(1) | | | 25 | | | | 48 | |
Xencor, Inc.(1) | | | 11 | | | | 267 | |
XOMA Corp.(1) | | | 3 | | | | 49 | |
Y-mAbs Therapeutics, Inc.(1) | | | 8 | | | | 54 | |
Zevra Therapeutics, Inc.(1) | | | 13 | | | | 69 | |
Zimmer Biomet Holdings, Inc. | | | 98 | | | | 14,263 | |
| | | | | | | | |
Zimvie, Inc.(1) | | | 11 | | | | 119 | |
Zura Bio Ltd. - Class A(1) | | | 3 | | | | 23 | |
Zymeworks, Inc.(1) | | | 21 | | | | 182 | |
| | | | | | | | |
Total Healthcare | | | | 554,657 | |
| | | | | | | | |
Industrials – 20.92% | | | | |
3D Systems Corp.(1) | | | 53 | | | | 530 | |
AAR Corp.(1) | | | 15 | | | | 840 | |
ABM Industries, Inc. | | | 266 | | | | 11,345 | |
ACCO Brands Corp. | | | 39 | | | | 201 | |
Acuity Brands, Inc. | | | 1 | | | | 144 | |
Advanced Drainage Systems, Inc. | | | 48 | | | | 5,434 | |
AECOM | | | 4 | | | | 308 | |
AerSale Corp.(1) | | | 10 | | | | 149 | |
AGCO Corp. | | | 89 | | | | 11,701 | |
Air Lease Corp. - Class A | | | 303 | | | | 12,682 | |
Air Transport Services Group, Inc.(1) | | | 23 | | | | 437 | |
Alaska Air Group, Inc.(1) | | | 425 | | | | 22,591 | |
Albany International Corp. - Class A | | | 1 | | | | 122 | |
Alight, Inc. - Class A(1) | | | 161 | | | | 1,486 | |
Allegiant Travel Co. - Class A(1) | | | 83 | | | | 10,484 | |
Allegion Plc | | | 187 | | | | 22,450 | |
Allison Transmission Holdings, Inc. | | | 112 | | | | 6,316 | |
American Airlines Group, Inc.(1) | | | 123 | | | | 2,215 | |
American Woodmark Corp.(1) | | | 6 | | | | 478 | |
AMETEK, Inc. | | | 333 | | | | 53,924 | |
AO Smith Corp. | | | 3 | | | | 224 | |
API Group Corp.(1) | | | 28 | | | | 756 | |
Apogee Enterprises, Inc. | | | 5 | | | | 251 | |
ArcBest Corp. | | | 50 | | | | 4,937 | |
Archer Aviation, Inc. - Class A(1) | | | 63 | | | | 258 | |
Arcosa, Inc. | | | 159 | | | | 12,039 | |
Argan, Inc. | | | 4 | | | | 174 | |
Aris Water Solutions, Inc. - Class A | | | 11 | | | | 115 | |
Armstrong World Industries, Inc. | | | 1 | | | | 64 | |
ASGN, Inc.(1) | | | 72 | | | | 5,477 | |
Astec Industries, Inc. | | | 9 | | | | 418 | |
Astronics Corp.(1) | | | 11 | | | | 215 | |
Asure Software, Inc.(1) | | | 4 | | | | 52 | |
Atkore, Inc.(1) | | | 62 | | | | 9,731 | |
Avis Budget Group, Inc.(1)(2) | | | 0 | | | | 85 | |
Axon Enterprise, Inc.(1) | | | 71 | | | | 13,866 | |
AZEK Co., Inc. - Class A(1) | | | 212 | | | | 6,426 | |
AZZ, Inc. | | | 10 | | | | 424 | |
Babcock & Wilcox Enterprises, Inc.(1) | | | 21 | | | | 126 | |
Barnes Group, Inc. | | | 20 | | | | 848 | |
Barrett Business Services, Inc. | | | 18 | | | | 1,556 | |
Beacon Roofing Supply, Inc.(1) | | | 78 | | | | 6,467 | |
BlackSky Technology, Inc.(1) | | | 49 | | | | 108 | |
Blade Air Mobility, Inc.(1) | | | 24 | | | | 95 | |
Blink Charging Co.(1) | | | 10 | | | | 60 | |
Blue Bird Corp.(1) | | | 6 | | | | 144 | |
BlueLinx Holdings, Inc.(1) | | | 4 | | | | 335 | |
Boise Cascade Co. | | | 107 | | | | 9,654 | |
BrightView Holdings, Inc.(1) | | | 18 | | | | 132 | |
Brink’s Co. | | | 268 | | | | 18,151 | |
Broadridge Financial Solutions, Inc. | | | 1 | | | | 88 | |
Builders FirstSource, Inc.(1) | | | 88 | | | | 11,948 | |
BWX Technologies, Inc. | | | 173 | | | | 12,384 | |
CACI International, Inc. - Class A(1) | | | 119 | | | | 40,495 | |
Carlisle Companies, Inc. | | | 1 | | | | 361 | |
Carrier Global Corp. | | | 23 | | | | 1,157 | |
| | | | | | | | |
Casella Waste Systems, Inc. - Class A(1) | | | 157 | | | | 14,192 | |
CBIZ, Inc.(1) | | | 294 | | | | 15,643 | |
CECO Environmental Corp.(1) | | | 46 | | | | 608 | |
Ceridian HCM Holding, Inc.(1) | | | 4 | | | | 250 | |
CH Robinson Worldwide, Inc. | | | 1 | | | | 67 | |
Chart Industries, Inc.(1) | | | 7 | | | | 1,054 | |
Cimpress Plc(1) | | | 3 | | | | 190 | |
Cintas Corp.(2) | | | 0 | | | | 131 | |
CIRCOR International, Inc.(1) | | | 1 | | | | 47 | |
Clarivate Plc(1) | | | 13 | | | | 125 | |
Clean Harbors, Inc.(1) | | | 1 | | | | 234 | |
CNH Industrial NV | | | 27 | | | | 390 | |
Columbus McKinnon Corp. | | | 12 | | | | 469 | |
Commercial Vehicle Group, Inc.(1) | | | 11 | | | | 123 | |
CompX International, Inc. | | | 1 | | | | 11 | |
Concentrix Corp. | | | 1 | | | | 99 | |
Concrete Pumping Holdings, Inc.(1) | | | 2 | | | | 17 | |
Conduent, Inc.(1) | | | 73 | | | | 250 | |
Core & Main, Inc. - Class A(1) | | | 2 | | | | 73 | |
CoreCivic, Inc.(1) | | | 204 | | | | 1,920 | |
Costamare, Inc. | | | 20 | | | | 194 | |
Covenant Logistics Group, Inc. - Class A | | | 3 | | | | 151 | |
Crane Co. | | | 108 | | | | 9,581 | |
Crane NXT Co. | | | 1 | | | | 76 | |
Cummins, Inc. | | | 55 | | | | 13,372 | |
Curtiss-Wright Corp. | | | 69 | | | | 12,655 | |
Delta Air Lines, Inc.(1) | | | 137 | | | | 6,518 | |
Deluxe Corp. | | | 208 | | | | 3,638 | |
Desktop Metal, Inc. - Class A(1) | | | 113 | | | | 200 | |
DIRTT Environmental Solutions(1) | | | 126 | | | | 33 | |
Distribution Solutions Group, Inc.(1)(2) | | | 0 | | | | 14 | |
Donaldson Co., Inc. | | | 2 | | | | 124 | |
Dover Corp. | | | 166 | | | | 24,452 | |
Driven Brands Holdings, Inc.(1) | | | 2 | | | | 49 | |
Ducommun, Inc.(1) | | | 4 | | | | 179 | |
Dun & Bradstreet Holdings, Inc. | | | 803 | | | | 9,288 | |
DXP Enterprises, Inc.(1) | | | 43 | | | | 1,551 | |
Dycom Industries, Inc.(1) | | | 12 | | | | 1,359 | |
Eagle Bulk Shipping, Inc. | | | 6 | | | | 273 | |
Eaton Corp. Plc | | | 91 | | | | 18,362 | |
EMCOR Group, Inc. | | | 30 | | | | 5,626 | |
Encore Wire Corp. | | | 37 | | | | 6,929 | |
Energy Vault Holdings, Inc.(1) | | | 41 | | | | 111 | |
EnerSys | | | 1 | | | | 137 | |
Eneti, Inc. | | | 11 | | | | 127 | |
Ennis, Inc. | | | 10 | | | | 206 | |
EnPro Industries, Inc. | | | 8 | | | | 1,127 | |
Enviri Corp.(1) | | | 32 | | | | 319 | |
Eos Energy Enterprises, Inc.(1) | | | 5 | | | | 22 | |
Equifax, Inc. | | | 22 | | | | 5,153 | |
Esab Corp. | | | 436 | | | | 29,019 | |
ESCO Technologies, Inc. | | | 144 | | | | 14,921 | |
ESS Tech, Inc.(1) | | | 40 | | | | 59 | |
EVI Industries, Inc.(1) | | | 1 | | | | 14 | |
Expeditors International of Washington, Inc. | | | 122 | | | | 14,826 | |
Fastenal Co. | | | 4 | | | | 239 | |
Federal Signal Corp. | | | 274 | | | | 17,544 | |
Ferguson Plc | | | 132 | | | | 20,783 | |
First Advantage Corp.(1) | | | 20 | | | | 314 | |
FiscalNote Holdings, Inc.(1) | | | 21 | | | | 76 | |
Flowserve Corp. | | | 272 | | | | 10,098 | |
| | | | | | | | |
Fluor Corp.(1) | | | 5 | | | | 139 | |
Fortive Corp. | | | 130 | | | | 9,706 | |
Fortune Brands Innovations, Inc. | | | 4 | | | | 252 | |
Forward Air Corp. | | | 156 | | | | 16,511 | |
FTAI Infrastructure, Inc. | | | 36 | | | | 132 | |
FTI Consulting, Inc.(1) | | | 1 | | | | 143 | |
FuelCell Energy, Inc.(1) | | | 167 | | | | 361 | |
Gates Industrial Corp. Plc(1) | | | 321 | | | | 4,328 | |
GATX Corp. | | | 13 | | | | 1,697 | |
Genco Shipping & Trading Ltd. | | | 18 | | | | 250 | |
Gencor Industries, Inc.(1) | | | 3 | | | | 42 | |
Generac Holdings, Inc.(1) | | | 2 | | | | 252 | |
Genpact Ltd. | | | 4 | | | | 140 | |
GEO Group, Inc.(1) | | | 48 | | | | 344 | |
Gibraltar Industries, Inc.(1) | | | 279 | | | | 17,532 | |
Global Industrial Co. | | | 1 | | | | 34 | |
GMS, Inc.(1) | | | 76 | | | | 5,274 | |
Golden Ocean Group Ltd. | | | 51 | | | | 383 | |
Gorman-Rupp Co. | | | 6 | | | | 163 | |
Graco, Inc. | | | 3 | | | | 242 | |
GrafTech International Ltd. | | | 36 | | | | 182 | |
Granite Construction, Inc. | | | 16 | | | | 648 | |
Great Lakes Dredge & Dock Corp.(1) | | | 26 | | | | 216 | |
Greenbrier Companies, Inc. | | | 13 | | | | 556 | |
Griffon Corp. | | | 7 | | | | 292 | |
GXO Logistics, Inc.(1) | | | 3 | | | | 204 | |
Hawaiian Holdings, Inc.(1) | | | 22 | | | | 238 | |
Hayward Holdings, Inc.(1) | | | 655 | | | | 8,416 | |
Healthcare Services Group, Inc. | | | 3 | | | | 39 | |
Heartland Express, Inc. | | | 17 | | | | 273 | |
HEICO Corp.(2) | | | 0 | | | | 23 | |
HEICO Corp. - Class A(2) | | | 0 | | | | 30 | |
Heidrick & Struggles International, Inc. | | | 8 | | | | 222 | |
Herc Holdings, Inc. | | | 42 | | | | 5,724 | |
Heritage-Crystal Clean, Inc.(1) | | | 5 | | | | 204 | |
Hertz Global Holdings, Inc.(1) | | | 4 | | | | 69 | |
Hexcel Corp. | | | 140 | | | | 10,633 | |
Hillenbrand, Inc. | | | 102 | | | | 5,205 | |
Hillman Solutions Corp.(1) | | | 437 | | | | 3,939 | |
Himalaya Shipping Ltd.(1) | | | 7 | | | | 36 | |
HireRight Holdings Corp.(1) | | | 383 | | | | 4,334 | |
HNI Corp. | | | 18 | | | | 511 | |
Howmet Aerospace, Inc. | | | 455 | | | | 22,575 | |
Hub Group, Inc. - Class A(1) | | | 13 | | | | 1,066 | |
Hubbell, Inc. - Class B | | | 19 | | | | 6,422 | |
Hudson Technologies, Inc.(1) | | | 14 | | | | 136 | |
Huntington Ingalls Industries, Inc. | | | 24 | | | | 5,369 | |
Hyliion Holdings Corp.(1) | | | 63 | | | | 105 | |
IBEX Holdings Ltd.(1) | | | 46 | | | | 969 | |
ICF International, Inc. | | | 120 | | | | 14,973 | |
IDEX Corp. | | | 2 | | | | 418 | |
Ingersoll Rand, Inc. | | | 11 | | | | 740 | |
INNOVATE Corp.(1) | | | 17 | | | | 30 | |
Insteel Industries, Inc. | | | 7 | | | | 232 | |
Interface, Inc. - Class A | | | 23 | | | | 205 | |
ITT, Inc. | | | 125 | | | | 11,628 | |
Jacobs Solutions, Inc. | | | 4 | | | | 416 | |
JB Hunt Transport Services, Inc. | | | 2 | | | | 332 | |
JELD-WEN Holding, Inc.(1) | | | 35 | | | | 610 | |
JetBlue Airways Corp.(1) | | | 137 | | | | 1,212 | |
Joby Aviation, Inc.(1) | | | 75 | | | | 769 | |
| | | | | | | | |
Kaman Corp. | | | 11 | | | | 278 | |
Karat Packaging, Inc. | | | 20 | | | | 360 | |
KBR, Inc. | | | 216 | | | | 14,024 | |
Kelly Services, Inc. - Class A | | | 14 | | | | 238 | |
Kennametal, Inc. | | | 35 | | | | 988 | |
Kirby Corp.(1) | | | 105 | | | | 8,048 | |
Knight-Swift Transportation Holdings, Inc. - Class A | | | 4 | | | | 242 | |
Korn Ferry | | | 104 | | | | 5,136 | |
Kratos Defense & Security Solutions, Inc.(1) | | | 52 | | | | 739 | |
L3Harris Technologies, Inc. | | | 23 | | | | 4,445 | |
Landstar System, Inc. | | | 65 | | | | 12,586 | |
Leidos Holdings, Inc. | | | 79 | | | | 6,986 | |
Lennox International, Inc. | | | 1 | | | | 290 | |
Leonardo DRS, Inc.(1) | | | 583 | | | | 10,118 | |
Li-Cycle Holdings Corp.(1) | | | 57 | | | | 315 | |
Limbach Holdings, Inc.(1) | | | 3 | | | | 66 | |
Lincoln Electric Holdings, Inc.(2) | | | 0 | | | | 19 | |
Liquidity Services, Inc.(1) | | | 3 | | | | 54 | |
Loomis AB - Class B | | | 57 | | | | 1,660 | |
LSI Industries, Inc. | | | 2 | | | | 23 | |
Luxfer Holdings Plc | | | 47 | | | | 670 | |
Manitowoc Co., Inc.(1) | | | 14 | | | | 264 | |
ManpowerGroup, Inc. | | | 75 | | | | 5,916 | |
Marten Transport Ltd. | | | 4 | | | | 89 | |
Masco Corp. | | | 281 | | | | 16,127 | |
MasTec, Inc.(1) | | | 2 | | | | 203 | |
Masterbrand, Inc.(1) | | | 53 | | | | 619 | |
Matson, Inc. | | | 14 | | | | 1,120 | |
Matthews International Corp. - Class A | | | 9 | | | | 391 | |
MAXIMUS, Inc. | | | 350 | | | | 29,543 | |
Mayville Engineering Co., Inc.(1) | | | 4 | | | | 46 | |
MDU Resources Group, Inc. | | | 154 | | | | 3,225 | |
Mercury Systems, Inc.(1) | | | 1 | | | | 47 | |
Microvast Holdings, Inc.(1) | | | 43 | | | | 69 | |
Middleby Corp.(1) | | | 1 | | | | 218 | |
Miller Industries, Inc. | | | 4 | | | | 145 | |
MillerKnoll, Inc. | | | 32 | | | | 470 | |
Mistras Group, Inc.(1) | | | 8 | | | | 59 | |
Moog, Inc. - Class A | | | 61 | | | | 6,581 | |
MRC Global, Inc.(1) | | | 23 | | | | 229 | |
MSA Safety, Inc. | | | 1 | | | | 147 | |
MSC Industrial Direct Co., Inc. - Class A | | | 1 | | | | 121 | |
Mueller Industries, Inc. | | | 47 | | | | 4,137 | |
National Presto Industries, Inc. | | | 2 | | | | 134 | |
Nikola Corp.(1) | | | 242 | | | | 334 | |
NL Industries, Inc. | | | 3 | | | | 15 | |
Nordson Corp. | | | 2 | | | | 399 | |
Norfolk Southern Corp. | | | 58 | | | | 13,248 | |
Northwest Pipe Co.(1) | | | 3 | | | | 101 | |
NOW, Inc.(1) | | | 45 | | | | 471 | |
NV5 Global, Inc.(1) | | | 9 | | | | 986 | |
nVent Electric Plc | | | 602 | | | | 31,095 | |
Old Dominion Freight Line, Inc.(2) | | | 0 | | | | 69 | |
OPENLANE, Inc.(1) | | | 123 | | | | 1,871 | |
Oshkosh Corp. | | | 2 | | | | 157 | |
Otis Worldwide Corp. | | | 356 | | | | 31,685 | |
Owens Corning | | | 66 | | | | 8,626 | |
PACCAR, Inc. | | | 87 | | | | 7,255 | |
PAM Transportation Services, Inc.(1) | | | 2 | | | | 52 | |
Pangaea Logistics Solutions Ltd. | | | 10 | | | | 71 | |
Park Aerospace Corp. | | | 6 | | | | 88 | |
| | | | | | | | |
Parker-Hannifin Corp. | | | 131 | | | | 51,015 | |
Park-Ohio Holdings Corp. | | | 3 | | | | 61 | |
Parsons Corp.(1) | | | 9 | | | | 437 | |
Paycor HCM, Inc.(1) | | | 1 | | | | 20 | |
Pentair Plc | | | 5 | | | | 295 | |
Performant Financial Corp.(1) | | | 6 | | | | 17 | |
Planet Labs PBC(1) | | | 9 | | | | 30 | |
Plug Power, Inc.(1) | | | 14 | | | | 149 | |
Powell Industries, Inc. | | | 4 | | | | 229 | |
Preformed Line Products Co.(2) | | | 0 | | | | 77 | |
Primoris Services Corp. | | | 20 | | | | 613 | |
Proterra, Inc.(1) | | | 91 | | | | 109 | |
Proto Labs, Inc.(1) | | | 11 | | | | 376 | |
Quad/Graphics, Inc.(1) | | | 14 | | | | 54 | |
Quanex Building Products Corp. | | | 13 | | | | 359 | |
Quanta Services, Inc. | | | 3 | | | | 583 | |
Radiant Logistics, Inc.(1) | | | 14 | | | | 95 | |
RB Global, Inc. | | | 194 | | | | 11,667 | |
RBC Bearings, Inc.(1) | | | 1 | | | | 170 | |
Regal Rexnord Corp. | | | 177 | | | | 27,183 | |
Republic Services, Inc. - Class A | | | 329 | | | | 50,327 | |
Resideo Technologies, Inc.(1) | | | 379 | | | | 6,688 | |
Resources Connection, Inc. | | | 14 | | | | 219 | |
REV Group, Inc. | | | 13 | | | | 171 | |
Robert Half International, Inc. | | | 70 | | | | 5,277 | |
Rush Enterprises, Inc. - Class A | | | 17 | | | | 1,005 | |
Rush Enterprises, Inc. - Class B | | | 3 | | | | 171 | |
RXO, Inc.(1) | | | 371 | | | | 8,400 | |
Ryder System, Inc. | | | 40 | | | | 3,416 | |
Safe Bulkers, Inc. | | | 27 | | | | 89 | |
Saia, Inc.(1) | | | 1 | | | | 224 | |
Schneider National, Inc. - Class B | | | 310 | | | | 8,900 | |
Science Applications International Corp. | | | 96 | | | | 10,791 | |
Sensata Technologies Holding Plc | | | 286 | | | | 12,885 | |
SES AI Corp.(1) | | | 48 | | | | 116 | |
SiteOne Landscape Supply, Inc.(1) | | | 1 | | | | 139 | |
Skillsoft Corp.(1) | | | 38 | | | | 47 | |
SkyWest, Inc.(1) | | | 19 | | | | 793 | |
Snap-on, Inc. | | | 29 | | | | 8,256 | |
Southwest Airlines Co. | | | 17 | | | | 598 | |
Spirit AeroSystems Holdings, Inc. - Class A | | | 3 | | | | 76 | |
Spirit Airlines, Inc. | | | 45 | | | | 779 | |
SPX Technologies, Inc.(1) | | | 3 | | | | 254 | |
SS&C Technologies Holdings, Inc. | | | 6 | | | | 368 | |
Standex International Corp. | | | 128 | | | | 18,059 | |
Stanley Black & Decker, Inc. | | | 4 | | | | 398 | |
Steelcase, Inc. - Class A | | | 37 | | | | 287 | |
Stem, Inc.(1) | | | 59 | | | | 335 | |
Stericycle, Inc.(1) | | | 99 | | | | 4,615 | |
Sterling Check Corp.(1) | | | 9 | | | | 113 | |
Sterling Infrastructure, Inc.(1) | | | 1 | | | | 62 | |
Sun Country Airlines Holdings, Inc.(1) | | | 7 | | | | 159 | |
Sunrun, Inc.(1) | | | 6 | | | | 105 | |
TaskUS, Inc. - Class A(1) | | | 261 | | | | 2,950 | |
Tecnoglass, Inc. | | | 52 | | | | 2,664 | |
Tennant Co. | | | 3 | | | | 276 | |
Terex Corp. | | | 12 | | | | 695 | |
Terran Orbital Corp.(1) | | | 32 | | | | 47 | |
Tetra Tech, Inc. | | | 1 | | | | 197 | |
Textainer Group Holdings Ltd. | | | 181 | | | | 7,110 | |
Textron, Inc. | | | 389 | | | | 26,330 | |
| | | | | | | | |
Thermon Group Holdings, Inc.(1) | | | 12 | | | | 307 | |
Timken Co. | | | 253 | | | | 23,160 | |
Titan International, Inc.(1) | | | 210 | | | | 2,406 | |
Titan Machinery, Inc.(1) | | | 17 | | | | 490 | |
Trane Technologies Plc | | | 4 | | | | 858 | |
TransDigm Group, Inc. | | | 1 | | | | 1,088 | |
TransUnion | | | 135 | | | | 10,548 | |
Trinity Industries, Inc. | | | 27 | | | | 699 | |
Triton International Ltd. | | | 19 | | | | 1,557 | |
Triumph Group, Inc.(1) | | | 27 | | | | 335 | |
TrueBlue, Inc.(1) | | | 13 | | | | 227 | |
TuSimple Holdings, Inc. - Class A(1) | | | 69 | | | | 114 | |
Tutor Perini Corp.(1) | | | 19 | | | | 138 | |
U.S. Xpress Enterprises, Inc. - Class A(1) | | | 12 | | | | 76 | |
UFP Industries, Inc. | | | 21 | | | | 1,994 | |
U-Haul Holding Co.(2) | | | 0 | | | | 8 | |
U-Haul Holding Co. - Class B | | | 1 | | | | 71 | |
UniFirst Corp. | | | 6 | | | | 952 | |
United Airlines Holdings, Inc.(1) | | | 100 | | | | 5,480 | |
United Rentals, Inc. | | | 12 | | | | 5,224 | |
Univar Solutions, Inc.(1) | | | 4 | | | | 154 | |
Universal Logistics Holdings, Inc. | | | 3 | | | | 85 | |
V2X, Inc.(1) | | | 5 | | | | 226 | |
Valmont Industries, Inc. | | | 1 | | | | 157 | |
Veritiv Corp. | | | 6 | | | | 695 | |
Vertiv Holdings Co. - Class A | | | 279 | | | | 6,901 | |
Virgin Galactic Holdings, Inc.(1) | | | 45 | | | | 176 | |
VSE Corp. | | | 4 | | | | 225 | |
Watsco, Inc. | | | 1 | | | | 269 | |
Werner Enterprises, Inc. | | | 23 | | | | 1,023 | |
WESCO International, Inc. | | | 241 | | | | 43,205 | |
Westinghouse Air Brake Technologies Corp. | | | 5 | | | | 544 | |
Willdan Group, Inc.(1) | | | 5 | | | | 96 | |
Willis Lease Finance Corp.(1) | | | 1 | | | | 34 | |
WillScot Mobile Mini Holdings Corp. - Class A(1) | | | 394 | | | | 18,811 | |
WNS Holdings Ltd. - ADR(1) | | | 64 | | | | 4,728 | |
Woodward, Inc. | | | 2 | | | | 195 | |
Xometry, Inc. - Class A(1) | | | 13 | | | | 266 | |
XPO, Inc.(1) | | | 200 | | | | 11,780 | |
Xylem, Inc. | | | 6 | | | | 659 | |
Zurn Elkay Water Solutions Corp. | | | 48 | | | | 1,282 | |
| | | | | | | | |
Total Industrials | | | | 1,416,077 | |
| | | | | | | | |
Information Technology – 8.63% | | | | | | | | |
908 Devices, Inc.(1) | | | 9 | | | | 63 | |
ACI Worldwide, Inc.(1) | | | 379 | | | | 8,771 | |
ACM Research, Inc. - Class A(1) | | | 17 | | | | 216 | |
Adeia, Inc. | | | 5 | | | | 58 | |
ADTRAN Holdings, Inc. | | | 32 | | | | 339 | |
Aeva Technologies, Inc.(1) | | | 34 | | | | 43 | |
Akamai Technologies, Inc.(1) | | | 4 | | | | 385 | |
Alpha & Omega Semiconductor Ltd.(1) | | | 10 | | | | 319 | |
Ambarella, Inc.(1) | | | 6 | | | | 478 | |
Amdocs Ltd. | | | 54 | | | | 5,301 | |
American Software, Inc. - Class A | | | 2 | | | | 26 | |
Amkor Technology, Inc. | | | 339 | | | | 10,090 | |
Amphenol Corp. - Class A | | | 8 | | | | 688 | |
ANSYS, Inc.(1)(2) | | | 0 | | | | 139 | |
AppLovin Corp. - Class A(1) | | | 5 | | | | 121 | |
Arlo Technologies, Inc.(1) | | | 4 | | | | 41 | |
Arrow Electronics, Inc.(1) | | | 100 | | | | 14,322 | |
Aspen Technology, Inc.(1) | | | 1 | | | | 130 | |
| | | | | | | | |
Atomera, Inc.(1) | | | 2 | | | | 22 | |
Aurora Innovation, Inc.(1) | | | 125 | | | | 367 | |
Aviat Networks, Inc.(1) | | | 4 | | | | 138 | |
Avid Technology, Inc.(1) | | | 4 | | | | 111 | |
Avnet, Inc. | | | 209 | | | | 10,521 | |
Bel Fuse, Inc. - Class B | | | 4 | | | | 221 | |
Belden, Inc. | | | 212 | | | | 20,310 | |
Benchmark Electronics, Inc. | | | 15 | | | | 382 | |
Bentley Systems, Inc. - Class B(2) | | | 0 | | | | 21 | |
BILL Holdings, Inc.(1) | | | 3 | | | | 333 | |
Bit Digital, Inc.(1) | | | 25 | | | | 101 | |
Black Knight, Inc.(1) | | | 4 | | | | 261 | |
Brightcove, Inc.(1) | | | 16 | | | | 66 | |
C3.ai, Inc. - Class A(1) | | | 6 | | | | 210 | |
CCC Intelligent Solutions Holdings, Inc.(1) | | | 6 | | | | 62 | |
CDW Corp. | | | 74 | | | | 13,580 | |
Cerence, Inc.(1) | | | 17 | | | | 485 | |
CEVA, Inc.(1) | | | 1 | | | | 24 | |
Check Point Software Technologies Ltd.(1) | | | 228 | | | | 28,701 | |
Ciena Corp.(1) | | | 208 | | | | 8,848 | |
Cipher Mining, Inc.(1) | | | 17 | | | | 50 | |
Cirrus Logic, Inc.(1) | | | 46 | | | | 3,705 | |
Cleanspark, Inc.(1) | | | 27 | | | | 118 | |
Cognex Corp. | | | 5 | | | | 268 | |
Cognizant Technology Solutions Corp. - Class A | | | 294 | | | | 19,173 | |
Coherent Corp.(1) | | | 341 | | | | 17,388 | |
Cohu, Inc.(1) | | | 256 | | | | 10,633 | |
CommVault Systems, Inc.(1) | | | 1 | | | | 90 | |
CompoSecure, Inc.(1) | | | 1 | | | | 6 | |
Comtech Telecommunications Corp. | | | 12 | | | | 109 | |
Consensus Cloud Solutions, Inc.(1) | | | 15 | | | | 469 | |
Corning, Inc. | | | 21 | | | | 741 | |
CS Disco, Inc.(1) | | | 11 | | | | 86 | |
Daktronics, Inc.(1) | | | 15 | | | | 94 | |
Dell Technologies, Inc. - Class C | | | 218 | | | | 11,808 | |
Digi International, Inc.(1) | | | 1 | | | | 52 | |
Digital Turbine, Inc.(1) | | | 135 | | | | 1,254 | |
Diodes, Inc.(1) | | | 43 | | | | 3,955 | |
Dolby Laboratories, Inc. - Class A | | | 2 | | | | 138 | |
Dropbox, Inc. - Class A(1) | | | 113 | | | | 3,019 | |
DXC Technology Co.(1) | | | 121 | | | | 3,231 | |
DZS, Inc.(1) | | | 9 | | | | 36 | |
E2open Parent Holdings, Inc.(1) | | | 82 | | | | 458 | |
Eastman Kodak Co.(1) | | | 25 | | | | 114 | |
Ebix, Inc. | | | 8 | | | | 208 | |
Endava Plc - ADR(1) | | | 84 | | | | 4,370 | |
Entegris, Inc. | | | 4 | | | | 435 | |
ePlus, Inc.(1) | | | 11 | | | | 593 | |
EverCommerce, Inc.(1) | | | 2 | | | | 25 | |
Evolv Technologies Holdings, Inc.(1) | | | 36 | | | | 219 | |
F5, Inc.(1) | | | 2 | | | | 245 | |
FARO Technologies, Inc.(1) | | | 8 | | | | 125 | |
Fastly, Inc. - Class A(1) | | | 8 | | | | 128 | |
First Solar, Inc.(1) | | | 3 | | | | 562 | |
Flex Ltd.(1) | | | 261 | | | | 7,203 | |
FormFactor, Inc.(1) | | | 231 | | | | 7,906 | |
Gen Digital, Inc. | | | 436 | | | | 8,088 | |
GLOBALFOUNDRIES, Inc.(1) | | | 2 | | | | 140 | |
GoDaddy, Inc. - Class A(1) | | | 2 | | | | 128 | |
Grid Dynamics Holdings, Inc.(1) | | | 5 | | | | 42 | |
Guidewire Software, Inc.(1) | | | 2 | | | | 173 | |
| | | | | | | | |
Hackett Group, Inc. | | | 1 | | | | 23 | |
HashiCorp, Inc. - Class A(1) | | | 1 | | | | 21 | |
Hewlett Packard Enterprise Co. | | | 469 | | | | 7,873 | |
HP, Inc. | | | 435 | | | | 13,368 | |
Ichor Holdings Ltd.(1) | | | 12 | | | | 440 | |
Immersion Corp. | | | 8 | | | | 55 | |
indie Semiconductor, Inc. - Class A(1) | | | 3 | | | | 26 | |
Informatica, Inc. - Class A(1) | | | 1 | | | | 22 | |
Information Services Group, Inc. | | | 5 | | | | 27 | |
Intevac, Inc.(1) | | | 8 | | | | 32 | |
IonQ, Inc.(1) | | | 55 | | | | 744 | |
IPG Photonics Corp.(1) | | | 1 | | | | 113 | |
Iteris, Inc.(1) | | | 5 | | | | 21 | |
Itron, Inc.(1) | | | 17 | | | | 1,197 | |
Jabil, Inc. | | | 94 | | | | 10,112 | |
Juniper Networks, Inc. | | | 9 | | | | 277 | |
Keysight Technologies, Inc.(1) | | | 65 | | | | 10,930 | |
Kimball Electronics, Inc.(1) | | | 6 | | | | 179 | |
KLA Corp. | | | 11 | | | | 5,569 | |
Knowles Corp.(1) | | | 37 | | | | 661 | |
Kulicke & Soffa Industries, Inc. | | | 91 | | | | 5,408 | |
KVH Industries, Inc.(1) | | | 5 | | | | 44 | |
Kyndryl Holdings, Inc.(1) | | | 6 | | | | 76 | |
Littelfuse, Inc. | | | 1 | | | | 196 | |
LiveRamp Holdings, Inc.(1) | | | 26 | | | | 748 | |
Lumentum Holdings, Inc.(1) | | | 2 | | | | 108 | |
Marvell Technology, Inc. | | | 24 | | | | 1,424 | |
Matterport, Inc.(1) | | | 105 | | | | 332 | |
Maxeon Solar Technologies Ltd.(1) | | | 3 | | | | 92 | |
MeridianLink, Inc.(1) | | | 3 | | | | 59 | |
Methode Electronics, Inc. | | | 252 | | | | 8,437 | |
Microchip Technology, Inc. | | | 188 | | | | 16,805 | |
Mirion Technologies, Inc. - Class A(1) | | | 80 | | | | 678 | |
Mitek Systems, Inc.(1) | | | 1 | | | | 9 | |
MKS Instruments, Inc. | | | 19 | | | | 2,033 | |
Monolithic Power Systems, Inc. | | | 26 | | | | 13,911 | |
Motorola Solutions, Inc. | | | 132 | | | | 38,857 | |
N-able, Inc.(1) | | | 2 | | | | 35 | |
National Instruments Corp. | | | 1 | | | | 46 | |
Navitas Semiconductor Corp. - Class A(1) | | | 34 | | | | 363 | |
nCino, Inc.(1) | | | 2 | | | | 55 | |
NCR Corp.(1) | | | 82 | | | | 2,068 | |
NetApp, Inc. | | | 142 | | | | 10,886 | |
NETGEAR, Inc.(1) | | | 12 | | | | 164 | |
NetScout Systems, Inc.(1) | | | 28 | | | | 873 | |
nLight, Inc.(1) | | | 17 | | | | 269 | |
Nutanix, Inc. - Class A(1) | | | 5 | | | | 135 | |
NVE Corp.(2) | | | 0 | | | | 15 | |
NXP Semiconductors NV | | | 79 | | | | 16,228 | |
Okta, Inc. - Class A(1) | | | 4 | | | | 271 | |
Olo, Inc. - Class A(1) | | | 19 | | | | 122 | |
ON Semiconductor Corp.(1) | | | 12 | | | | 1,138 | |
ON24, Inc. | | | 14 | | | | 115 | |
OneSpan, Inc.(1) | | | 1 | | | | 18 | |
Onto Innovation, Inc.(1) | | | 3 | | | | 321 | |
PAR Technology Corp.(1) | | | 10 | | | | 328 | |
PC Connection, Inc. | | | 5 | | | | 211 | |
Perficient, Inc.(1) | | | 160 | | | | 13,357 | |
Photronics, Inc.(1) | | | 24 | | | | 628 | |
Plexus Corp.(1) | | | 187 | | | | 18,374 | |
PROS Holdings, Inc.(1) | | | 5 | | | | 159 | |
| | | | | | | | |
PTC, Inc.(1) | | | 1 | | | | 205 | |
Pure Storage, Inc. - Class A(1) | | | 2 | | | | 62 | |
Qorvo, Inc.(1) | | | 96 | | | | 9,808 | |
Rackspace Technology, Inc.(1) | | | 36 | | | | 97 | |
Rambus, Inc.(1) | | | 197 | | | | 12,644 | |
Ribbon Communications, Inc.(1) | | | 35 | | | | 98 | |
Richardson Electronics Ltd. | | | 5 | | | | 75 | |
Riot Platforms, Inc.(1) | | | 20 | | | | 234 | |
Rogers Corp.(1) | | | 2 | | | | 302 | |
Sanmina Corp.(1) | | | 104 | | | | 6,249 | |
ScanSource, Inc.(1) | | | 10 | | | | 307 | |
Seagate Technology Holdings Plc | | | 15 | | | | 957 | |
Semtech Corp.(1) | | | 27 | | | | 683 | |
SentinelOne, Inc. - Class A(1) | | | 5 | | | | 68 | |
Skyworks Solutions, Inc. | | | 38 | | | | 4,252 | |
SMART Global Holdings, Inc.(1) | | | 15 | | | | 448 | |
SmartRent, Inc. - Class A(1) | | | 74 | | | | 285 | |
Softchoice Corp. | | | 421 | | | | 5,750 | |
SolarWinds Corp.(1) | | | 22 | | | | 226 | |
Squarespace, Inc. - Class A(1) | | | 12 | | | | 392 | |
Synaptics, Inc.(1) | | | 15 | | | | 1,271 | |
TD SYNNEX Corp. | | | 32 | | | | 2,966 | |
TE Connectivity Ltd. | | | 101 | | | | 14,125 | |
Teledyne Technologies, Inc.(1) | | | 1 | | | | 533 | |
Teradata Corp.(1) | | | 99 | | | | 5,265 | |
Teradyne, Inc. | | | 97 | | | | 10,781 | |
Terawulf, Inc.(1) | | | 26 | | | | 45 | |
Thoughtworks Holding, Inc.(1) | | | 674 | | | | 5,091 | |
Tingo Group, Inc.(1) | | | 43 | | | | 52 | |
Trimble, Inc.(1) | | | 7 | | | | 363 | |
TTM Technologies, Inc.(1) | | | 41 | | | | 566 | |
Tucows, Inc. - Class A(1) | | | 2 | | | | 65 | |
Turtle Beach Corp.(1) | | | 6 | | | | 75 | |
Twilio, Inc. - Class A(1) | | | 4 | | | | 249 | |
Tyler Technologies, Inc.(1) | | | 84 | | | | 34,927 | |
Ubiquiti, Inc.(2) | | | 0 | | | | 3 | |
UiPath, Inc. - Class A(1) | | | 2 | | | | 40 | |
Ultra Clean Holdings, Inc.(1) | | | 18 | | | | 689 | |
Unisys Corp.(1) | | | 28 | | | | 110 | |
Unity Software, Inc.(1) | | | 5 | | | | 210 | |
Universal Display Corp. | | | 1 | | | | 102 | |
Veeco Instruments, Inc.(1) | | | 20 | | | | 506 | |
Verint Systems, Inc.(1) | | | 172 | | | | 6,038 | |
VeriSign, Inc.(1) | | | 2 | | | | 540 | |
Viasat, Inc.(1) | | | 2 | | | | 82 | |
Viavi Solutions, Inc.(1) | | | 17 | | | | 188 | |
Vishay Intertechnology, Inc. | | | 179 | | | | 5,264 | |
Vishay Precision Group, Inc.(1) | | | 4 | | | | 160 | |
Vontier Corp. | | | 60 | | | | 1,919 | |
Vuzix Corp.(1) | | | 25 | | | | 125 | |
Western Digital Corp.(1) | | | 130 | | | | 4,913 | |
Wolfspeed, Inc.(1) | | | 3 | | | | 191 | |
Xerox Holdings Corp. | | | 139 | | | | 2,071 | |
Xperi, Inc.(1) | | | 17 | | | | 226 | |
Zebra Technologies Corp. - Class A(1) | | | 1 | | | | 344 | |
Zoom Video Communications, Inc. - Class A(1) | | | 7 | | | | 466 | |
| | | | | | | | |
Total Information Technology | | | | 584,668 | |
| | | | | | | | |
Materials – 7.00% | | | | | | | | |
5E Advanced Materials, Inc.(1) | | | 3 | | | | 11 | |
AdvanSix, Inc. | | | 11 | | | | 388 | |
Albemarle Corp. | | | 3 | | | | 731 | |
| | | | | | | | |
Alcoa Corp. | | | 5 | | | | 167 | |
Alpha Metallurgical Resources, Inc. | | | 5 | | | | 812 | |
Amcor Plc | | | 41 | | | | 412 | |
American Vanguard Corp. | | | 9 | | | | 152 | |
Amyris, Inc.(1) | | | 87 | | | | 90 | |
AptarGroup, Inc. | | | 2 | | | | 210 | |
Arconic Corp.(1) | | | 40 | | | | 1,172 | |
Ardagh Group SA - Class A(1)(2)(4) | | | 0 | | | | 4 | |
Ardagh Metal Packaging SA | | | 1,193 | | | | 4,484 | |
Ashland, Inc. | | | 221 | | | | 19,203 | |
Aspen Aerogels, Inc.(1) | | | 21 | | | | 165 | |
Avery Dennison Corp. | | | 71 | | | | 12,195 | |
Avient Corp. | | | 572 | | | | 23,404 | |
Axalta Coating Systems Ltd.(1) | | | 855 | | | | 28,048 | |
Ball Corp. | | | 9 | | | | 498 | |
Berry Global Group, Inc. | | | 287 | | | | 18,451 | |
Caledonia Mining Corp. Plc | | | 5 | | | | 58 | |
Carpenter Technology Corp. | | | 20 | | | | 1,106 | |
Celanese Corp. - Class A | | | 3 | | | | 318 | |
CF Industries Holdings, Inc. | | | 5 | | | | 377 | |
Chase Corp.(2) | | | 0 | | | | 15 | |
Chemours Co. | | | 275 | | | | 10,139 | |
Clearwater Paper Corp.(1) | | | 6 | | | | 201 | |
Cleveland-Cliffs, Inc.(1) | | | 14 | | | | 237 | |
Coeur Mining, Inc.(1) | | | 129 | | | | 367 | |
Commercial Metals Co. | | | 48 | | | | 2,505 | |
Constellium SE - Class A(1) | | | 362 | | | | 6,225 | |
Contango ORE, Inc.(1) | | | 1 | | | | 15 | |
Core Molding Technologies, Inc.(1) | | | 2 | | | | 55 | |
Corteva, Inc. | | | 293 | | | | 16,792 | |
Crown Holdings, Inc. | | | 122 | | | | 10,641 | |
Dakota Gold Corp.(1) | | | 5 | | | | 14 | |
Danimer Scientific, Inc.(1) | | | 35 | | | | 83 | |
Dow, Inc. | | | 54 | | | | 2,865 | |
DuPont de Nemours, Inc. | | | 224 | | | | 15,997 | |
Eagle Materials, Inc.(2) | | | 0 | | | | 62 | |
Eastman Chemical Co. | | | 64 | | | | 5,399 | |
Ecovyst, Inc.(1) | | | 197 | | | | 2,259 | |
Element Solutions, Inc. | | | 1,093 | | | | 20,990 | |
FMC Corp. | | | 196 | | | | 20,441 | |
Freeport-McMoRan, Inc. | | | 515 | | | | 20,613 | |
FutureFuel Corp. | | | 10 | | | | 91 | |
Ginkgo Bioworks Holdings, Inc.(1) | | | 39 | | | | 72 | |
Glatfelter Corp.(1) | | | 20 | | | | 60 | |
Graphic Packaging Holding Co. | | | 658 | | | | 15,812 | |
Greif, Inc. - Class A | | | 96 | | | | 6,605 | |
Greif, Inc. - Class B | | | 2 | | | | 142 | |
Haynes International, Inc. | | | 5 | | | | 247 | |
HB Fuller Co. | | | 191 | | | | 13,681 | |
Hecla Mining Co. | | | 193 | | | | 993 | |
Huntsman Corp. | | | 170 | | | | 4,600 | |
i-80 Gold Corp.(1) | | | 66 | | | | 150 | |
Ingevity Corp.(1) | | | 74 | | | | 4,282 | |
Innospec, Inc. | | | 1 | | | | 108 | |
International Flavors & Fragrances, Inc. | | | 7 | | | | 570 | |
International Paper Co. | | | 10 | | | | 307 | |
Intrepid Potash, Inc.(1) | | | 5 | | | | 105 | |
Kaiser Aluminum Corp. | | | 51 | | | | 3,679 | |
Knife River Corp.(1) | | | 260 | | | | 11,310 | |
Koppers Holdings, Inc. | | | 92 | | | | 3,135 | |
Kronos Worldwide, Inc. | | | 11 | | | | 92 | |
| | | | | | | | |
Louisiana-Pacific Corp. | | | 2 | | | | 134 | |
LSB Industries, Inc.(1) | | | 22 | | | | 218 | |
LyondellBasell Industries NV - Class A | | | 66 | | | | 6,090 | |
Martin Marietta Materials, Inc. | | | 2 | | | | 797 | |
Materion Corp. | | | 121 | | | | 13,859 | |
Mativ Holdings, Inc. | | | 72 | | | | 1,092 | |
Minerals Technologies, Inc. | | | 69 | | | | 3,982 | |
Mosaic Co. | | | 140 | | | | 4,893 | |
MP Materials Corp.(1) | | | 3 | | | | 66 | |
NewMarket Corp. | | | 3 | | | | 1,285 | |
Nucor Corp. | | | 7 | | | | 1,153 | |
O-I Glass, Inc.(1) | | | 233 | | | | 4,967 | |
Olin Corp. | | | 4 | | | | 185 | |
Olympic Steel, Inc. | | | 4 | | | | 200 | |
Origin Materials, Inc.(1) | | | 42 | | | | 178 | |
Packaging Corp. of America | | | 2 | | | | 325 | |
Pactiv Evergreen, Inc. | | | 253 | | | | 1,919 | |
Perimeter Solutions SA(1) | | | 63 | | | | 385 | |
Piedmont Lithium, Inc.(1) | | | 5 | | | | 277 | |
PolyMet Mining Corp.(1) | | | 17 | | | | 13 | |
PPG Industries, Inc. | | | 123 | | | | 18,218 | |
PureCycle Technologies, Inc.(1) | | | 37 | | | | 397 | |
Quaker Chemical Corp. | | | 31 | | | | 6,069 | |
Ramaco Resources, Inc. - Class A | | | 9 | | | | 76 | |
Ramaco Resources, Inc. - Class B(1) | | | 2 | | | | 19 | |
Ranpak Holdings Corp. - Class A(1) | | | 18 | | | | 81 | |
Rayonier Advanced Materials, Inc.(1) | | | 27 | | | | 116 | |
Reliance Steel & Aluminum Co. | | | 32 | | | | 8,751 | |
Royal Gold, Inc. | | | 2 | | | | 209 | |
RPM International, Inc. | | | 3 | | | | 256 | |
Ryerson Holding Corp. | | | 9 | | | | 382 | |
Schnitzer Steel Industries, Inc. - Class A | | | 11 | | | | 322 | |
Sealed Air Corp. | | | 88 | | | | 3,507 | |
Silgan Holdings, Inc. | | | 332 | | | | 15,590 | |
Sonoco Products Co. | | | 3 | | | | 161 | |
SSR Mining, Inc. | | | 6 | | | | 81 | |
Steel Dynamics, Inc. | | | 97 | | | | 10,529 | |
Stepan Co. | | | 8 | | | | 721 | |
Summit Materials, Inc. - Class A(1) | | | 48 | | | | 1,827 | |
SunCoke Energy, Inc. | | | 32 | | | | 250 | |
Sylvamo Corp. | | | 103 | | | | 4,178 | |
Teck Resources Ltd. - Class B | | | 139 | | | | 5,861 | |
TimkenSteel Corp.(1) | | | 18 | | | | 381 | |
Tredegar Corp. | | | 9 | | | | 61 | |
TriMas Corp. | | | 317 | | | | 8,726 | |
Trinseo Plc | | | 38 | | | | 479 | |
Tronox Holdings Plc - Class A | | | 51 | | | | 652 | |
United States Steel Corp. | | | 6 | | | | 157 | |
Valhi, Inc. | | | 2 | | | | 23 | |
Vulcan Materials Co. | | | 113 | | | | 25,559 | |
Warrior Met Coal, Inc. | | | 21 | | | | 819 | |
Westlake Corp. | | | 1 | | | | 108 | |
Westrock Co. | | | 76 | | | | 2,223 | |
Worthington Industries, Inc. | | | 12 | | | | 867 | |
| | | | | | | | |
Total Materials | | | | 474,086 | |
| | | | | | | | |
Real Estate – 6.18% | | | | | | | | |
Acadia Realty Trust | | | 27 | | | | 394 | |
Agree Realty Corp. | | | 3 | | | | 165 | |
Alexander & Baldwin, Inc. | | | 31 | | | | 576 | |
Alexandria Real Estate Equities, Inc. | | | 5 | | | | 541 | |
Alpine Income Property Trust, Inc. | | | 5 | | | | 78 | |
| | | | | | | | |
American Assets Trust, Inc. | | | 21 | | | | 406 | |
American Homes 4 Rent - Class A | | | 217 | | | | 7,675 | |
American Realty Investors, Inc.(1) | | | 1 | | | | 14 | |
Americold Realty Trust, Inc. | | | 7 | | | | 242 | |
Anywhere Real Estate, Inc.(1) | | | 42 | | | | 278 | |
Apartment Income REIT Corp. | | | 4 | | | | 152 | |
Apartment Investment & Management Co. - Class A | | | 60 | | | | 509 | |
Apple Hospitality REIT, Inc. | | | 347 | | | | 5,250 | |
Armada Hoffler Properties, Inc. | | | 29 | | | | 335 | |
AvalonBay Communities, Inc. | | | 4 | | | | 740 | |
Boston Properties, Inc. | | | 4 | | | | 251 | |
Braemar Hotels & Resorts, Inc. | | | 28 | | | | 111 | |
Brandywine Realty Trust | | | 292 | | | | 1,360 | |
Brixmor Property Group, Inc. | | | 554 | | | | 12,195 | |
Broadstone Net Lease, Inc. - Class A | | | 717 | | | | 11,063 | |
BRT Apartments Corp. | | | 4 | | | | 86 | |
Camden Property Trust | | | 3 | | | | 314 | |
CareTrust REIT, Inc. | | | 109 | | | | 2,161 | |
CBL & Associates Properties, Inc. | | | 3 | | | | 59 | |
CBRE Group, Inc. - Class A(1) | | | 9 | | | | 700 | |
Centerspace | | | 7 | | | | 410 | |
Chatham Lodging Trust | | | 126 | | | | 1,175 | |
City Office REIT, Inc. | | | 135 | | | | 753 | |
Clipper Realty, Inc. | | | 1 | | | | 3 | |
Community Healthcare Trust, Inc. | | | 3 | | | | 96 | |
Compass, Inc. - Class A(1) | | | 20 | | | | 69 | |
Corporate Office Properties Trust | | | 47 | | | | 1,113 | |
CoStar Group, Inc.(1) | | | 6 | | | | 570 | |
Cousins Properties, Inc. | | | 4 | | | | 96 | |
CTO Realty Growth, Inc. | | | 8 | | | | 141 | |
CubeSmart | | | 454 | | | | 20,265 | |
Cushman & Wakefield Plc(1) | | | 459 | | | | 3,755 | |
DiamondRock Hospitality Co. | | | 90 | | | | 722 | |
Digital Realty Trust, Inc. | | | 8 | | | | 925 | |
DigitalBridge Group, Inc. | | | 48 | | | | 700 | |
Diversified Healthcare Trust | | | 365 | | | | 821 | |
Douglas Elliman, Inc. | | | 37 | | | | 81 | |
Douglas Emmett, Inc. | | | 410 | | | | 5,151 | |
Easterly Government Properties, Inc. - Class A | | | 111 | | | | 1,614 | |
EastGroup Properties, Inc. | | | 32 | | | | 5,542 | |
Elme Communities | | | 37 | | | | 615 | |
Empire State Realty Trust, Inc. - Class A | | | 1,044 | | | | 7,819 | |
EPR Properties | | | 104 | | | | 4,860 | |
Equity Commonwealth | | | 44 | | | | 886 | |
Equity LifeStyle Properties, Inc. | | | 96 | | | | 6,440 | |
Equity Residential | | | 162 | | | | 10,695 | |
Essential Properties Realty Trust, Inc. | | | 55 | | | | 1,305 | |
Essex Property Trust, Inc. | | | 42 | | | | 9,812 | |
Extra Space Storage, Inc. | | | 3 | | | | 519 | |
Farmland Partners, Inc. | | | 20 | | | | 246 | |
Federal Realty Investment Trust | | | 2 | | | | 218 | |
First Industrial Realty Trust, Inc. | | | 4 | | | | 193 | |
Forestar Group, Inc.(1) | | | 7 | | | | 156 | |
Four Corners Property Trust, Inc. | | | 140 | | | | 3,555 | |
Franklin Street Properties Corp. | | | 117 | | | | 170 | |
FRP Holdings, Inc.(1) | | | 2 | | | | 142 | |
Gaming & Leisure Properties, Inc. | | | 7 | | | | 339 | |
Getty Realty Corp. | | | 19 | | | | 652 | |
Gladstone Commercial Corp. | | | 16 | | | | 200 | |
Gladstone Land Corp. | | | 14 | | | | 222 | |
Global Medical REIT, Inc. | | | 28 | | | | 259 | |
| | | | | | | | |
Global Net Lease, Inc. | | | 327 | | | | 3,362 | |
Healthcare Realty Trust, Inc. - Class A | | | 11 | | | | 199 | |
Healthpeak Properties, Inc. | | | 366 | | | | 7,356 | |
Hersha Hospitality Trust - Class A | | | 17 | | | | 101 | |
Highwoods Properties, Inc. | | | 98 | | | | 2,340 | |
Host Hotels & Resorts, Inc. | | | 336 | | | | 5,651 | |
Howard Hughes Corp.(1) | | | 1 | | | | 74 | |
Hudson Pacific Properties, Inc. | | | 19 | | | | 80 | |
Independence Realty Trust, Inc. | | | 92 | | | | 1,679 | |
Industrial Logistics Properties Trust | | | 114 | | | | 375 | |
Innovative Industrial Properties, Inc. - Class A | | | 12 | | | | 846 | |
InvenTrust Properties Corp. | | | 30 | | | | 704 | |
Invitation Homes, Inc. | | | 17 | | | | 584 | |
Iron Mountain, Inc. | | | 4 | | | | 230 | |
JBG SMITH Properties | | | 45 | | | | 673 | |
Jones Lang LaSalle, Inc.(1) | | | 46 | | | | 7,188 | |
Kennedy-Wilson Holdings, Inc. | | | 50 | | | | 810 | |
Kilroy Realty Corp. | | | 3 | | | | 98 | |
Kimco Realty Corp. | | | 17 | | | | 332 | |
Kite Realty Group Trust | | | 212 | | | | 4,737 | |
Lamar Advertising Co. - Class A | | | 128 | | | | 12,707 | |
Life Storage, Inc. | | | 2 | | | | 313 | |
LTC Properties, Inc. | | | 18 | | | | 602 | |
LXP Industrial Trust | | | 888 | | | | 8,660 | |
Macerich Co. | | | 92 | | | | 1,038 | |
Marcus & Millichap, Inc. | | | 7 | | | | 219 | |
Medical Properties Trust, Inc. | | | 335 | | | | 3,099 | |
Mid-America Apartment Communities, Inc. | | | 3 | | | | 490 | |
National Health Investors, Inc. | | | 43 | | | | 2,258 | |
National Storage Affiliates Trust | | | 203 | | | | 7,070 | |
Necessity Retail REIT, Inc. | | | 55 | | | | 371 | |
NETSTREIT Corp. | | | 83 | | | | 1,490 | |
Newmark Group, Inc. - Class A | | | 61 | | | | 377 | |
NexPoint Diversified Real Estate Trust | | | 13 | | | | 163 | |
NexPoint Residential Trust, Inc. | | | 7 | | | | 327 | |
NNN REIT, Inc. | | | 5 | | | | 216 | |
Office Properties Income Trust | | | 118 | | | | 908 | |
Omega Healthcare Investors, Inc. | | | 195 | | | | 5,985 | |
One Liberty Properties, Inc. | | | 6 | | | | 123 | |
Opendoor Technologies, Inc.(1) | | | 217 | | | | 871 | |
Orion Office REIT, Inc. | | | 26 | | | | 175 | |
Outfront Media, Inc. | | | 36 | | | | 568 | |
Paramount Group, Inc. | | | 481 | | | | 2,129 | |
Park Hotels & Resorts, Inc. | | | 6 | | | | 78 | |
Peakstone Realty Trust | | | 12 | | | | 322 | |
Pebblebrook Hotel Trust | | | 536 | | | | 7,468 | |
Phillips Edison & Co., Inc. | | | 423 | | | | 14,415 | |
Physicians Realty Trust | | | 246 | | | | 3,448 | |
Piedmont Office Realty Trust, Inc. - Class A | | | 252 | | | | 1,828 | |
Plymouth Industrial REIT, Inc. | | | 584 | | | | 13,434 | |
Postal Realty Trust, Inc. - Class A | | | 6 | | | | 88 | |
PotlatchDeltic Corp. | | | 337 | | | | 17,785 | |
Rayonier, Inc. | | | 259 | | | | 8,125 | |
RE/MAX Holdings, Inc. - Class A | | | 7 | | | | 137 | |
Realty Income Corp. | | | 18 | | | | 1,103 | |
Regency Centers Corp. | | | 239 | | | | 14,786 | |
Retail Opportunity Investments Corp. | | | 55 | | | | 738 | |
Rexford Industrial Realty, Inc. | | | 104 | | | | 5,426 | |
RLJ Lodging Trust | | | 70 | | | | 724 | |
RMR Group, Inc. - Class A | | | 3 | | | | 63 | |
RPT Realty | | | 36 | | | | 378 | |
| | | | | | | | |
Ryman Hospitality Properties, Inc. | | | 116 | | | | 10,821 | |
Sabra Health Care REIT, Inc. | | | 387 | | | | 4,560 | |
Safehold, Inc. | | | 13 | | | | 310 | |
Saul Centers, Inc. | | | 1 | | | | 30 | |
SBA Communications Corp. - Class A | | | 20 | | | | 4,705 | |
Service Properties Trust | | | 224 | | | | 1,946 | |
Simon Property Group, Inc. | | | 175 | | | | 20,163 | |
SITE Centers Corp. | | | 82 | | | | 1,081 | |
SL Green Realty Corp. | | | 5 | | | | 163 | |
Spirit Realty Capital, Inc. | | | 4 | | | | 154 | |
STAG Industrial, Inc. | | | 5 | | | | 177 | |
Star Holdings(1) | | | 6 | | | | 83 | |
Stratus Properties, Inc. | | | 2 | | | | 59 | |
Summit Hotel Properties, Inc. | | | 124 | | | | 808 | |
Sun Communities, Inc. | | | 3 | | | | 348 | |
Sunstone Hotel Investors, Inc. | | | 89 | | | | 903 | |
Tanger Factory Outlet Centers, Inc. | | | 250 | | | | 5,517 | |
Tejon Ranch Co.(1) | | | 5 | | | | 90 | |
Terreno Realty Corp. | | | 33 | | | | 1,955 | |
Transcontinental Realty Investors, Inc.(1)(2) | | | 0 | | | | 17 | |
UDR, Inc. | | | 226 | | | | 9,718 | |
UMH Properties, Inc. | | | 109 | | | | 1,745 | |
Uniti Group, Inc. | | | 402 | | | | 1,856 | |
Urban Edge Properties | | | 51 | | | | 783 | |
Urstadt Biddle Properties, Inc. - Class A | | | 12 | | | | 247 | |
Ventas, Inc. | | | 11 | | | | 524 | |
Veris Residential, Inc.(1) | | | 33 | | | | 523 | |
VICI Properties, Inc. - Class A | | | 288 | | | | 9,059 | |
Vornado Realty Trust | | | 5 | | | | 88 | |
Welltower, Inc. | | | 163 | | | | 13,173 | |
Weyerhaeuser Co. | | | 262 | | | | 8,769 | |
Whitestone REIT - Class B | | | 21 | | | | 204 | |
WP Carey, Inc. | | | 6 | | | | 398 | |
Xenia Hotels & Resorts, Inc. | | | 36 | | | | 440 | |
Zillow Group, Inc. - Class A(1) | | | 2 | | | | 77 | |
Zillow Group, Inc. - Class C(1) | | | 4 | | | | 220 | |
| | | | | | | | |
Total Real Estate | | | | 418,598 | |
| | | | | | | | |
Utilities – 5.42% | | | | | | | | |
AES Corp. | | | 7 | | | | 150 | |
ALLETE, Inc. | | | 43 | | | | 2,470 | |
Alliant Energy Corp. | | | 524 | | | | 27,523 | |
Altus Power, Inc. - Class A(1) | | | 25 | | | | 138 | |
Ameren Corp. | | | 326 | | | | 26,612 | |
American Electric Power Co., Inc. | | | 158 | | | | 13,325 | |
American Water Works Co., Inc. | | | 5 | | | | 777 | |
Artesian Resources Corp. - Class A(2) | | | 0 | | | | 21 | |
Atmos Energy Corp. | | | 4 | | | | 471 | |
Avangrid, Inc. | | | 2 | | | | 75 | |
Avista Corp. | | | 29 | | | | 1,128 | |
Black Hills Corp. | | | 212 | | | | 12,780 | |
Brookfield Infrastructure Corp. - Class A | | | 36 | | | | 1,624 | |
Brookfield Renewable Corp. - Class A | | | 4 | | | | 112 | |
California Water Service Group | | | 15 | | | | 793 | |
CenterPoint Energy, Inc. | | | 920 | | | | 26,827 | |
Chesapeake Utilities Corp. | | | 2 | | | | 278 | |
Clearway Energy, Inc. - Class A | | | 1 | | | | 28 | |
Clearway Energy, Inc. - Class C | | | 2 | | | | 69 | |
CMS Energy Corp. | | | 459 | | | | 26,937 | |
Consolidated Edison, Inc. | | | 10 | | | | 877 | |
Consolidated Water Co. Ltd. | | | 4 | | | | 104 | |
Constellation Energy Corp. | | | 9 | | | | 838 | |
| | | | | | | | |
DTE Energy Co. | | | 94 | | | | 10,331 | |
Edison International | | | 11 | | | | 735 | |
Entergy Corp. | | | 163 | | | | 15,883 | |
Essential Utilities, Inc. | | | 7 | | | | 269 | |
Evergy, Inc. | | | 457 | | | | 26,717 | |
Eversource Energy | | | 10 | | | | 687 | |
FirstEnergy Corp. | | | 269 | | | | 10,474 | |
Genie Energy Ltd. - Class B | | | 4 | | | | 58 | |
Hawaiian Electric Industries, Inc. | | | 3 | | | | 110 | |
IDACORP, Inc. | | | 1 | | | | 143 | |
MGE Energy, Inc. | | | 92 | | | | 7,298 | |
National Fuel Gas Co. | | | 140 | | | | 7,181 | |
New Jersey Resources Corp. | | | 208 | | | | 9,798 | |
NiSource, Inc. | | | 12 | | | | 315 | |
Northwest Natural Holding Co. | | | 27 | | | | 1,163 | |
NorthWestern Corp. | | | 25 | | | | 1,394 | |
NRG Energy, Inc. | | | 231 | | | | 8,634 | |
OGE Energy Corp. | | | 6 | | | | 200 | |
ONE Gas, Inc. | | | 263 | | | | 20,179 | |
Ormat Technologies, Inc. | | | 8 | | | | 640 | |
Otter Tail Corp. | | | 8 | | | | 629 | |
PG&E Corp.(1) | | | 50 | | | | 871 | |
Pinnacle West Capital Corp. | | | 3 | | | | 255 | |
PNM Resources, Inc. | | | 31 | | | | 1,383 | |
Portland General Electric Co. | | | 283 | | | | 13,264 | |
PPL Corp. | | | 20 | | | | 542 | |
Public Service Enterprise Group, Inc. | | | 14 | | | | 870 | |
RGC Resources, Inc. | | | 2 | | | | 41 | |
SJW Group | | | 13 | | | | 904 | |
Southwest Gas Holdings, Inc. | | | 69 | | | | 4,372 | |
Spire, Inc. | | | 21 | | | | 1,308 | |
Sunnova Energy International, Inc.(1) | | | 21 | | | | 386 | |
UGI Corp. | | | 560 | | | | 15,097 | |
Unitil Corp. | | | 4 | | | | 214 | |
Vistra Corp. | | | 1,253 | | | | 32,899 | |
WEC Energy Group, Inc. | | | 308 | | | | 27,196 | |
Xcel Energy, Inc. | | | 15 | | | | 958 | |
| | | | | | | | |
Total Utilities | | | | 367,355 | |
| | | | | |
Total Common Stocks (Cost: $5,141,057) | | | | 6,563,778 | |
| | | | | |
EXCHANGE TRADED FUNDS – 0.42% | | | | | | | | |
iShares Russell Mid-Capital Value ETF | | | 260 | | | | 28,513 | |
| | | | | | | | |
Total Exchange Traded Funds (Cost: $29,658) | | | | 28,513 | |
| | | | | |
SHORT-TERM INVESTMENTS – 3.16% | | | | | | | | |
Money Market Funds – 3.12% | | | | | | | | |
Goldman Sachs Financial Square Government Fund - Class I, 5.02%(3) | | | 211,376 | | | | 211,376 | |
| | | | | | | | |
Total Money Market Funds (Cost: $211,376) | | | | | | | 211,376 | |
| | | | | | | | |
| | |
| | | Principal
Amount
(000s) | | | Value
(000s) | |
Time Deposits – 0.04% | | | | | | | | |
ANZ, London, 4.57% due 07/03/2023 | | $ | 845 | | | | 845 | |
Brown Brothers Harriman, 2.47% due 07/03/2023(2) | | SEK | 0 | | | | 0 | |
JP Morgan, New York, 4.57% due 07/03/2023 | | $ | 1,717 | | | | 1,717 | |
Sumitomo, Tokyo, 4.57% due 07/03/2023 | | | 321 | | | | 321 | |
| | | | | | | | |
Total Time Deposits (Cost: $2,883) | | | | | | | 2,883 | |
| | | | | | | | |
Total Short-Term Investments (Cost: $214,259) | | | | | | | 214,259 | |
| | | | | |
TOTAL INVESTMENTS IN SECURITIES – 100.50%
(Cost: $5,384,974) | | | | | | | 6,806,550 | |
| | | | | | | | |
| | | | | | |
LIABILITIES IN EXCESS OF OTHER ASSETS – (0.50)% | | | | | (34,061 | ) |
| | | | | | |
TOTAL NET ASSETS – 100.00% | | | | $ | 6,772,489 | |
| | | | | | |
Percentages are stated as a percent of net assets.
Principal amounts are denominated in the currency in which the security was purchased.
ADR American Depositary Receipt
REIT Real Estate Investment Trust
SEK Swedish Krona
| (1) | Non-income producing security. |
| (2) | A zero balance may reflect actual amounts rounding to less than one thousand. |
| (3) | Represents annualized seven-day yield as of the close of the reporting period. |
| (4) | Security that is categorized as Level 3 per the Trust’s fair value hierarchy. The value of these securities totals $7, which represents 0.00% of total net assets. |
| (5) | Security that is restricted at June 30, 2023. The value of these securities totals $0, which represents 0.00% of total net assets. |
The accompanying notes are an integral part of this Schedule of Investments.
Open Futures Contracts
| | | | | | | | | | | | | | | | |
Number of Contracts
Purchased | | Reference Entity | | Expiration Date | | Notional
Amount | | | Value | | | Unrealized
Appreciation/
(Depreciation) | |
| 38 | | E-mini Russell 2000 Future | | Sep. 2023 | | $ | 3,528 | | | $ | 3,617 | | | $ | 89 | |
| 6 | | S&P 500 E-mini Future | | Sep. 2023 | | | 1,313 | | | | 1,347 | | | | 34 | |
| | | | | | | | | | | | | | | | |
| | | | | | | | | | | | | | $ | 123 | |
| | | | | | | | | | | | | | | | |
Bridge Builder Tax Managed Small/Mid Cap Fund
Schedule of Investments
June 30, 2023
(Amounts in thousands, except number of contracts)
| | | | | | | | |
| | | Shares
(000s) | | | Value
(000s) | |
COMMON STOCKS – 97.02% | | | | | | | | |
Communication Services – 2.32% | | | | | | | | |
AMC Networks, Inc. - Class A(1) | | | 16 | | | $ | 191 | |
Cable One, Inc. | | | 4 | | | | 2,399 | |
Cogent Communications Holdings, Inc. | | | 1 | | | | 45 | |
Criteo SA - ADR(1) | | | 59 | | | | 2,007 | |
Daily Journal Corp.(1) | | | 1 | | | | 168 | |
EW Scripps Co. - Class A(1) | | | 20 | | | | 185 | |
Gray Television, Inc. | | | 17 | | | | 135 | |
Iridium Communications, Inc. | | | 4 | | | | 271 | |
John Wiley & Sons, Inc. - Class A | | | 7 | | | | 226 | |
Liberty Broadband Corp. - Class A(1) | | | 3 | | | | 247 | |
Liberty Broadband Corp. - Class C(1) | | | 1 | | | | 90 | |
Liberty Latin America Ltd. - Class A(1) | | | 10 | | | | 90 | |
Liberty Latin America Ltd. - Class C(1) | | | 18 | | | | 152 | |
Liberty Media Corp.-Liberty Formula One - Class C(1) | | | 21 | | | | 1,608 | |
Lumen Technologies, Inc. | | | 86 | | | | 194 | |
Madison Square Garden Entertainment Corp. - Class A(1) | | | 1 | | | | 39 | |
Madison Square Garden Sports Corp. - Class A | | | 1 | | | | 96 | |
Match Group, Inc.(1) | | | 27 | | | | 1,145 | |
News Corp. - Class B | | | 1 | | | | 28 | |
Nexstar Media Group, Inc. - Class A | | | 20 | | | | 3,319 | |
Omnicom Group, Inc.(2) | | | 0 | | | | 32 | |
Pinterest, Inc. - Class A(1) | | | 8 | | | | 212 | |
Radius Global Infrastructure, Inc. - Class A(1) | | | 12 | | | | 179 | |
ROBLOX Corp. - Class A(1) | | | 1 | | | | 54 | |
Roku, Inc. - Class A(1) | | | 4 | | | | 239 | |
Shutterstock, Inc. | | | 3 | | | | 158 | |
Sphere Entertainment Co.(1) | | | 1 | | | | 32 | |
Spotify Technology SA(1) | | | 2 | | | | 350 | |
Take-Two Interactive Software, Inc.(1) | | | 9 | | | | 1,375 | |
TEGNA, Inc. | | | 12 | | | | 199 | |
Telephone & Data Systems, Inc. | | | 23 | | | | 185 | |
Trade Desk, Inc. - Class A(1) | | | 23 | | | | 1,756 | |
TrueCar, Inc.(1) | | | 33 | | | | 73 | |
Vivid Seats, Inc. - Class A(1) | | | 9 | | | | 74 | |
Warner Bros Discovery, Inc.(1) | | | 16 | | | | 196 | |
Yelp, Inc. - Class A(1) | | | 6 | | | | 235 | |
Ziff Davis, Inc.(1) | | | 5 | | | | 340 | |
ZoomInfo Technologies, Inc. - Class A(1) | | | 39 | | | | 985 | |
| | | | | | | | |
Total Communication Services | | | | 19,309 | |
| | | | | |
Consumer Discretionary – 11.80% | | | | | | | | |
Abercrombie & Fitch Co. - Class A(1) | | | 2 | | | | 69 | |
Academy Sports & Outdoors, Inc. | | | 3 | | | | 184 | |
Accel Entertainment, Inc. - Class A(1) | | | 10 | | | | 106 | |
Adient Plc(1) | | | 2 | | | | 80 | |
ADT, Inc. | | | 165 | | | | 994 | |
Adtalem Global Education, Inc.(1) | | | 1 | | | | 26 | |
Advance Auto Parts, Inc. | | | 2 | | | | 176 | |
American Axle & Manufacturing Holdings, Inc.(1) | | | 4 | | | | 33 | |
Aptiv Plc(1) | | | 16 | | | | 1,595 | |
Aramark | | | 24 | | | | 1,054 | |
Asbury Automotive Group, Inc.(1) | | | 1 | | | | 270 | |
| | | | | | | | |
AutoZone, Inc.(1) | | | 1 | | | | 1,521 | |
Bath & Body Works, Inc. | | | 43 | | | | 1,618 | |
Best Buy Co., Inc. | | | 6 | | | | 479 | |
Booking Holdings, Inc.(1)(2) | | | 0 | | | | 367 | |
BorgWarner, Inc.(2) | | | 0 | | | | 20 | |
Bright Horizons Family Solutions, Inc.(1) | | | 7 | | | | 620 | |
Burlington Stores, Inc.(1) | | | 6 | | | | 1,018 | |
Caesars Entertainment, Inc.(1) | | | 1 | | | | 67 | |
CarMax, Inc.(1) | | | 2 | | | | 194 | |
Carriage Services, Inc. - Class A | | | 6 | | | | 206 | |
Century Communities, Inc. | | | 3 | | | | 249 | |
Chipotle Mexican Grill, Inc. - Class A(1) | | | 1 | | | | 2,503 | |
Choice Hotels International, Inc.(2) | | | 0 | | | | 51 | |
Churchill Downs, Inc. | | | 8 | | | | 1,054 | |
Coursera, Inc.(1) | | | 2 | | | | 28 | |
Cracker Barrel Old Country Store, Inc. | | | 1 | | | | 49 | |
Crocs, Inc.(1) | | | 17 | | | | 1,877 | |
Dana, Inc. | | | 58 | | | | 984 | |
Darden Restaurants, Inc.(2) | | | 0 | | | | 29 | |
Dave & Buster’s Entertainment, Inc.(1) | | | 1 | | | | 30 | |
Deckers Outdoor Corp.(1) | | | 5 | | | | 2,722 | |
Dine Brands Global, Inc. | | | 21 | | | | 1,247 | |
Domino’s Pizza, Inc. | | | 4 | | | | 1,260 | |
DoorDash, Inc. - Class A(1) | | | 3 | | | | 214 | |
Dorman Products, Inc.(1) | | | 1 | | | | 101 | |
DR Horton, Inc. | | | 21 | | | | 2,605 | |
eBay, Inc. | | | 2 | | | | 86 | |
Etsy, Inc.(1) | | | 4 | | | | 316 | |
Expedia Group, Inc.(1) | | | 2 | | | | 247 | |
Five Below, Inc.(1) | | | 14 | | | | 2,790 | |
Floor & Decor Holdings, Inc. - Class A(1) | | | 34 | | | | 3,513 | |
Foot Locker, Inc. | | | 30 | | | | 826 | |
Fox Factory Holding Corp.(1) | | | 33 | | | | 3,578 | |
Frontdoor, Inc.(1) | | | 10 | | | | 309 | |
Garmin Ltd. | | | 4 | | | | 414 | |
Genesco, Inc.(1) | | | 1 | | | | 17 | |
Gentex Corp. | | | 2 | | | | 48 | |
G-III Apparel Group Ltd.(1) | | | 14 | | | | 263 | |
Goodyear Tire & Rubber Co.(1) | | | 126 | | | | 1,721 | |
Graham Holdings Co. - Class B(2) | | | 0 | | | | 34 | |
Green Brick Partners, Inc.(1) | | | 1 | | | | 72 | |
Group 1 Automotive, Inc. | | | 1 | | | | 387 | |
Helen of Troy Ltd.(1) | | | 5 | | | | 553 | |
Hilton Grand Vacations, Inc.(1) | | | 46 | | | | 2,104 | |
Hilton Worldwide Holdings, Inc. | | | 14 | | | | 1,991 | |
International Game Technology Plc | | | 1 | | | | 46 | |
Jack in the Box, Inc. | | | 3 | | | | 258 | |
KB Home | | | 26 | | | | 1,359 | |
Kontoor Brands, Inc. | | | 4 | | | | 171 | |
Krispy Kreme, Inc. | | | 2 | | | | 35 | |
Las Vegas Sands Corp.(1) | | | 10 | | | | 596 | |
La-Z-Boy, Inc. | | | 1 | | | | 18 | |
LCI Industries | | | 1 | | | | 114 | |
Lear Corp. | | | 8 | | | | 1,149 | |
Lennar Corp. - Class A | | | 1 | | | | 99 | |
LGI Homes, Inc.(1) | | | 1 | | | | 171 | |
Light & Wonder, Inc.(1) | | | 4 | | | | 253 | |
Lithia Motors, Inc. - Class A | | | 1 | | | | 189 | |
LKQ Corp. | | | 90 | | | | 5,257 | |
Lululemon Athletica, Inc.(1) | | | 4 | | | | 1,507 | |
Luminar Technologies, Inc. - Class A(1) | | | 26 | | | | 177 | |
| | | | | | | | |
Meritage Homes Corp. | | | 2 | | | | 269 | |
MGM Resorts International | | | 6 | | | | 260 | |
Monro, Inc. | | | 1 | | | | 23 | |
National Vision Holdings, Inc.(1) | | | 16 | | | | 394 | |
Nordstrom, Inc. | | | 1 | | | | 30 | |
Norwegian Cruise Line Holdings Ltd.(1) | | | 29 | | | | 622 | |
NVR, Inc.(1)(2) | | | 0 | | | | 108 | |
Oxford Industries, Inc.(2) | | | 0 | | | | 45 | |
Papa John’s International, Inc. | | | 17 | | | | 1,264 | |
Patrick Industries, Inc. | | | 1 | | | | 61 | |
Penske Automotive Group, Inc.(2) | | | 0 | | | | 55 | |
Planet Fitness, Inc. - Class A(1) | | | 25 | | | | 1,663 | |
Pool Corp. | | | 12 | | | | 4,460 | |
PulteGroup, Inc. | | | 36 | | | | 2,803 | |
PVH Corp. | | | 21 | | | | 1,810 | |
Ralph Lauren Corp. - Class A | | | 18 | | | | 2,219 | |
Red Rock Resorts, Inc. - Class A | | | 1 | | | | 41 | |
RH(1) | | | 3 | | | | 1,051 | |
Rivian Automotive, Inc. - Class A(1) | | | 11 | | | | 181 | |
Ross Stores, Inc. | | | 8 | | | | 846 | |
Royal Caribbean Cruises Ltd.(1) | | | 9 | | | | 982 | |
Sally Beauty Holdings, Inc.(1) | | | 105 | | | | 1,297 | |
SeaWorld Entertainment, Inc.(1) | | | 2 | | | | 136 | |
Shoe Carnival, Inc. | | | 2 | | | | 53 | |
Signet Jewelers Ltd. | | | 2 | | | | 143 | |
Six Flags Entertainment Corp.(1) | | | 4 | | | | 114 | |
Sonic Automotive, Inc. - Class A | | | 1 | | | | 55 | |
Sonos, Inc.(1) | | | 2 | | | | 28 | |
Steven Madden Ltd. | | | 3 | | | | 92 | |
Strategic Education, Inc. | | | 2 | | | | 106 | |
Tapestry, Inc. | | | 56 | | | | 2,389 | |
Taylor Morrison Home Corp. - Class A(1) | | | 39 | | | | 1,893 | |
Tempur Sealy International, Inc. | | | 1 | | | | 45 | |
Texas Roadhouse, Inc. - Class A | | | 21 | | | | 2,372 | |
Topgolf Callaway Brands Corp.(1) | | | 8 | | | | 156 | |
Tractor Supply Co. | | | 20 | | | | 4,324 | |
Travel + Leisure Co. | | | 1 | | | | 39 | |
Ulta Beauty, Inc.(1)(2) | | | 0 | | | | 48 | |
Urban Outfitters, Inc.(1) | | | 2 | | | | 68 | |
Vail Resorts, Inc. | | | 6 | | | | 1,514 | |
VF Corp. | | | 12 | | | | 236 | |
Visteon Corp.(1) | | | 1 | | | | 197 | |
Wendy’s Co. | | | 45 | | | | 986 | |
Whirlpool Corp. | | | 1 | | | | 139 | |
Williams-Sonoma, Inc. | | | 12 | | | | 1,504 | |
Wingstop, Inc. | | | 10 | | | | 1,934 | |
Wyndham Hotels & Resorts, Inc. | | | 12 | | | | 792 | |
YETI Holdings, Inc.(1) | | | 5 | | | | 210 | |
Yum China Holdings, Inc. | | | 34 | | | | 1,938 | |
Yum! Brands, Inc.(2) | | | 0 | | | | 23 | |
| | | | | | | | |
Total Consumer Discretionary | | | | 98,386 | |
| | | | | |
Consumer Staples – 3.40% | | | | | | | | |
Albertsons Companies, Inc. - Class A | | | 11 | | | | 235 | |
Andersons, Inc. | | | 4 | | | | 206 | |
BellRing Brands, Inc.(1) | | | 1 | | | | 39 | |
BJ’s Wholesale Club Holdings, Inc.(1) | | | 31 | | | | 1,924 | |
Cal-Maine Foods, Inc. | | | 1 | | | | 41 | |
Campbell Soup Co. | | | 4 | | | | 197 | |
Casey’s General Stores, Inc. | | | 6 | | | | 1,385 | |
Celsius Holdings, Inc.(1) | | | 4 | | | | 558 | |
Central Garden & Pet Co. - Class A(1) | | | 6 | | | | 235 | |
| | | | | | | | |
Church & Dwight Co., Inc. | | | 64 | | | | 6,429 | |
Clorox Co. | | | 1 | | | | 218 | |
Coca-Cola Consolidated, Inc.(2) | | | 0 | | | | 44 | |
Constellation Brands, Inc. - Class A | | | 4 | | | | 943 | |
Darling Ingredients, Inc.(1) | | | 3 | | | | 170 | |
Dollar Tree, Inc.(1) | | | 1 | | | | 209 | |
Edgewell Personal Care Co. | | | 5 | | | | 202 | |
elf Beauty, Inc.(1) | | | 1 | | | | 151 | |
Energizer Holdings, Inc. | | | 1 | | | | 17 | |
Flowers Foods, Inc. | | | 2 | | | | 43 | |
Hain Celestial Group, Inc.(1) | | | 48 | | | | 606 | |
Herbalife Ltd.(1) | | | 12 | | | | 153 | |
Hostess Brands, Inc. - Class A(1) | | | 54 | | | | 1,367 | |
Ingles Markets, Inc. - Class A | | | 1 | | | | 52 | |
John B Sanfilippo & Son, Inc. | | | 1 | | | | 96 | |
Kellogg Co. | | | 6 | | | | 387 | |
Keurig Dr Pepper, Inc. | | | 111 | | | | 3,460 | |
Kroger Co. | | | 5 | | | | 244 | |
Lancaster Colony Corp. | | | 1 | | | | 139 | |
Medifast, Inc. | | | 2 | | | | 203 | |
MGP Ingredients, Inc. | | | 1 | | | | 81 | |
Mission Produce, Inc.(1) | | | 14 | | | | 164 | |
Nature’s Sunshine Products, Inc.(1) | | | 12 | | | | 168 | |
Nomad Foods Ltd.(1) | | | 115 | | | | 2,012 | |
Nu Skin Enterprises, Inc. - Class A | | | 10 | | | | 322 | |
Performance Food Group Co.(1) | | | 1 | | | | 65 | |
PriceSmart, Inc. | | | 1 | | | | 98 | |
Primo Water Corp. | | | 13 | | | | 157 | |
Reynolds Consumer Products, Inc. | | | 133 | | | | 3,746 | |
Simply Good Foods Co.(1) | | | 5 | | | | 179 | |
Sprouts Farmers Market, Inc.(1) | | | 2 | | | | 57 | |
TreeHouse Foods, Inc.(1) | | | 3 | | | | 146 | |
United Natural Foods, Inc.(1) | | | 7 | | | | 132 | |
Universal Corp. | | | 2 | | | | 75 | |
Vector Group Ltd. | | | 15 | | | | 191 | |
Village Super Market, Inc. - Class A | | | 1 | | | | 15 | |
WD-40 Co. | | | 2 | | | | 471 | |
Weis Markets, Inc. | | | 4 | | | | 288 | |
| | | | | | | | |
Total Consumer Staples | | | | 28,320 | |
| | | | | |
Energy – 4.50% | | | | | | | | |
Antero Resources Corp.(1) | | | 8 | | | | 189 | |
APA Corp. | | | 6 | | | | 215 | |
Arch Resources, Inc. | | | 1 | | | | 122 | |
Baker Hughes Co. - Class A | | | 61 | | | | 1,913 | |
Berry Corp. | | | 3 | | | | 23 | |
Bristow Group, Inc.(1) | | | 1 | | | | 28 | |
California Resources Corp. | | | 10 | | | | 454 | |
Callon Petroleum Co.(1) | | | 4 | | | | 153 | |
Cameco Corp. | | | 77 | | | | 2,409 | |
ChampionX Corp. | | | 69 | | | | 2,133 | |
Cheniere Energy, Inc. | | | 11 | | | | 1,645 | |
Chesapeake Energy Corp. | | | 4 | | | | 299 | |
Chord Energy Corp. | | | 2 | | | | 374 | |
Civitas Resources, Inc. | | | 3 | | | | 242 | |
CNX Resources Corp.(1) | | | 13 | | | | 237 | |
CONSOL Energy, Inc.(2) | | | 0 | | | | 25 | |
Coterra Energy, Inc. | | | 11 | | | | 271 | |
Crescent Energy Co. - Class A | | | 15 | | | | 156 | |
CVR Energy, Inc. | | | 5 | | | | 162 | |
Delek U.S. Holdings, Inc. | | | 7 | | | | 163 | |
Denbury, Inc.(1) | | | 12 | | | | 1,071 | |
| | | | | | | | |
Devon Energy Corp. | | | 20 | | | | 950 | |
Diamondback Energy, Inc. | | | 3 | | | | 365 | |
Dorian LPG Ltd. | | | 5 | | | | 139 | |
Dril-Quip, Inc.(1) | | | 1 | | | | 24 | |
EOG Resources, Inc. | | | 24 | | | | 2,730 | |
EQT Corp. | | | 67 | | | | 2,758 | |
Equitrans Midstream Corp. | | | 18 | | | | 174 | |
Expro Group Holdings NV(1) | | | 4 | | | | 65 | |
Green Plains, Inc.(1) | | | 6 | | | | 180 | |
Halliburton Co. | | | 12 | | | | 408 | |
Helmerich & Payne, Inc. | | | 9 | | | | 303 | |
Hess Corp. | | | 4 | | | | 554 | |
HF Sinclair Corp. | | | 31 | | | | 1,370 | |
International Seaways, Inc. | | | 6 | | | | 217 | |
Kosmos Energy Ltd.(1) | | | 34 | | | | 204 | |
Liberty Energy, Inc. - Class A | | | 13 | | | | 170 | |
Magnolia Oil & Gas Corp. - Class A | | | 100 | | | | 2,098 | |
Marathon Oil Corp. | | | 13 | | | | 290 | |
Murphy Oil Corp. | | | 8 | | | | 291 | |
NexTier Oilfield Solutions, Inc.(1) | | | 4 | | | | 35 | |
Noble Corp. Plc(1) | | | 5 | | | | 215 | |
NOV, Inc. | | | 40 | | | | 646 | |
ONEOK, Inc.(2) | | | 0 | | | | 23 | |
Patterson-UTI Energy, Inc. | | | 20 | | | | 236 | |
PBF Energy, Inc. - Class A | | | 4 | | | | 164 | |
PDC Energy, Inc. | | | 3 | | | | 242 | |
Peabody Energy Corp. | | | 5 | | | | 114 | |
Permian Resources Corp. - Class A | | | 21 | | | | 228 | |
Phillips 66 | | | 2 | | | | 192 | |
ProPetro Holding Corp.(1) | | | 32 | | | | 261 | |
REX American Resources Corp.(1) | | | 3 | | | | 117 | |
Ring Energy, Inc.(1) | | | 77 | | | | 132 | |
RPC, Inc. | | | 4 | | | | 32 | |
Scorpio Tankers, Inc. | | | 1 | | | | 50 | |
Sitio Royalties Corp. - Class A | | | 43 | | | | 1,118 | |
SM Energy Co. | | | 10 | | | | 307 | |
Solaris Oilfield Infrastructure, Inc. - Class A | | | 2 | | | | 19 | |
Southwestern Energy Co.(1) | | | 28 | | | | 169 | |
Targa Resources Corp. | | | 3 | | | | 245 | |
TechnipFMC Plc(1) | | | 37 | | | | 615 | |
Teekay Corp.(1) | | | 35 | | | | 212 | |
Texas Pacific Land Corp.(2) | | | 0 | | | | 130 | |
Tidewater, Inc.(1) | | | 57 | | | | 3,134 | |
Valaris Ltd.(1) | | | 3 | | | | 206 | |
Valero Energy Corp. | | | 17 | | | | 2,005 | |
Vitesse Energy, Inc. | | | 16 | | | | 356 | |
Williams Companies, Inc. | | | 20 | | | | 643 | |
World Kinect Corp. | | | 4 | | | | 79 | |
| | | | | | | | |
Total Energy | | | | 37,499 | |
| | | | | |
Financials – 13.08% | | | | | | | | |
1st Source Corp. | | | 1 | | | | 30 | |
Affiliated Managers Group, Inc. | | | 1 | | | | 117 | |
Aflac, Inc. | | | 2 | | | | 148 | |
AGNC Investment Corp. | | | 15 | | | | 151 | |
Allstate Corp. | | | 31 | | | | 3,401 | |
Ally Financial, Inc. | | | 9 | | | | 235 | |
American Equity Investment Life Holding Co. | | | 4 | | | | 187 | |
American Financial Group, Inc. | | | 11 | | | | 1,260 | |
Ameriprise Financial, Inc.(2) | | | 0 | | | | 52 | |
AMERISAFE, Inc. | | | 4 | | | | 213 | |
Annaly Capital Management, Inc. | | | 167 | | | | 3,348 | |
| | | | | | | | |
Apollo Commercial Real Estate Finance, Inc. | | | 10 | | | | 118 | |
Apollo Global Management, Inc. | | | 4 | | | | 310 | |
Arbor Realty Trust, Inc. | | | 6 | | | | 84 | |
Arch Capital Group Ltd.(1) | | | 75 | | | | 5,607 | |
Ares Management Corp. - Class A | | | 15 | | | | 1,413 | |
Argo Group International Holdings Ltd. | | | 2 | | | | 59 | |
ARMOUR Residential REIT, Inc. | | | 21 | | | | 112 | |
Arrow Financial Corp. | | | 9 | | | | 176 | |
Arthur J. Gallagher & Co. | | | 4 | | | | 986 | |
Associated Banc-Corp. | | | 2 | | | | 29 | |
Atlantic Union Bankshares Corp. | | | 1 | | | | 18 | |
Axis Capital Holdings Ltd. | | | 10 | | | | 546 | |
Axos Financial, Inc.(1) | | | 6 | | | | 238 | |
BancFirst Corp. | | | 5 | | | | 432 | |
Banco Latinoamericano de Comercio Exterior SA - Class E | | | 9 | | | | 206 | |
Bank First Corp. | | | 1 | | | | 56 | |
Bank of Hawaii Corp. | | | 7 | | | | 303 | |
Bank of Marin Bancorp | | | 17 | | | | 296 | |
BankUnited, Inc. | | | 23 | | | | 486 | |
Blackstone Mortgage Trust, Inc. - Class A | | | 16 | | | | 333 | |
Bread Financial Holdings, Inc. | | | 5 | | | | 171 | |
Bridgewater Bancshares, Inc.(1) | | | 19 | | | | 192 | |
BrightSpire Capital, Inc. - Class A | | | 13 | | | | 88 | |
Brookline Bancorp, Inc. | | | 30 | | | | 260 | |
Brown & Brown, Inc. | | | 59 | | | | 4,097 | |
BRP Group, Inc. - Class A(1) | | | 17 | | | | 413 | |
Byline Bancorp, Inc. | | | 1 | | | | 19 | |
Cadence Bank | | | 8 | | | | 148 | |
Cambridge Bancorp | | | 5 | | | | 249 | |
Cannae Holdings, Inc.(1) | | | 2 | | | | 45 | |
Capital City Bank Group, Inc. | | | 6 | | | | 189 | |
CBOE Global Markets, Inc. | | | 13 | | | | 1,843 | |
Central Pacific Financial Corp. | | | 11 | | | | 174 | |
Chimera Investment Corp. | | | 9 | | | | 52 | |
Cincinnati Financial Corp.(2) | | | 0 | | | | 41 | |
Citizens Financial Group, Inc. | | | 13 | | | | 337 | |
City Holding Co. | | | 1 | | | | 100 | |
Claros Mortgage Trust, Inc. | | | 4 | | | | 49 | |
CNA Financial Corp. | | | 1 | | | | 32 | |
CNO Financial Group, Inc. | | | 7 | | | | 160 | |
Cohen & Steers, Inc. | | | 1 | | | | 38 | |
Coinbase Global, Inc. - Class A(1) | | | 4 | | | | 291 | |
Columbia Financial, Inc.(1) | | | 2 | | | | 35 | |
Comerica, Inc. | | | 48 | | | | 2,038 | |
Commerce Bancshares, Inc. | | | 8 | | | | 407 | |
Community Bank System, Inc. | | | 37 | | | | 1,716 | |
Community Trust Bancorp, Inc.(2) | | | 0 | | | | 1 | |
Compass Diversified Holdings | | | 9 | | | | 193 | |
Cullen/Frost Bankers, Inc. | | | 16 | | | | 1,745 | |
Customers Bancorp, Inc.(1) | | | 9 | | | | 262 | |
CVB Financial Corp. | | | 21 | | | | 274 | |
Diamond Hill Investment Group, Inc.(2) | | | 0 | | | | 24 | |
Dime Community Bancshares, Inc. | | | 17 | | | | 302 | |
Discover Financial Services | | | 18 | | | | 2,113 | |
Eastern Bankshares, Inc. | | | 18 | | | | 226 | |
Employers Holdings, Inc. | | | 4 | | | | 134 | |
Enact Holdings, Inc. | | | 11 | | | | 276 | |
Enstar Group Ltd.(1) | | | 1 | | | | 256 | |
Essent Group Ltd. | | | 5 | | | | 234 | |
Euronet Worldwide, Inc.(1) | | | 31 | | | | 3,605 | |
Evercore, Inc. - Class A(2) | | | 0 | | | | 31 | |
| | | | | | | | |
Everest Re Group Ltd. | | | 6 | | | | 2,166 | |
EVERTEC, Inc. | | | 3 | | | | 100 | |
FactSet Research Systems, Inc. | | | 4 | | | | 1,620 | |
Farmers National Banc Corp. | | | 3 | | | | 35 | |
Fifth Third Bancorp | | | 86 | | | | 2,257 | |
Financial Institutions, Inc. | | | 18 | | | | 290 | |
First Bancorp | | | 146 | | | | 1,790 | |
First Bancshares, Inc. | | | 1 | | | | 33 | |
First Citizens BancShares, Inc. - Class A | | | 3 | | | | 3,254 | |
First Commonwealth Financial Corp. | | | 12 | | | | 155 | |
First Community Bankshares, Inc. | | | 1 | | | | 39 | |
First Financial Bancorp | | | 2 | | | | 40 | |
First Financial Bankshares, Inc. | | | 10 | | | | 294 | |
First Financial Corp. | | | 1 | | | | 28 | |
First Hawaiian, Inc. | | | 60 | | | | 1,089 | |
First Interstate BancSystem, Inc. - Class A | | | 10 | | | | 244 | |
First of Long Island Corp. | | | 16 | | | | 195 | |
FirstCash Holdings, Inc. | | | 1 | | | | 133 | |
FleetCor Technologies, Inc.(1) | | | 1 | | | | 321 | |
Flushing Financial Corp. | | | 19 | | | | 229 | |
FNB Corp. | | | 2 | | | | 23 | |
Franklin BSP Realty Trust, Inc. | | | 8 | | | | 111 | |
Fulton Financial Corp. | | | 31 | | | | 374 | |
Genworth Financial, Inc. - Class A(1) | | | 39 | | | | 193 | |
German American Bancorp, Inc. | | | 1 | | | | 37 | |
Glacier Bancorp, Inc. | | | 28 | | | | 868 | |
Global Payments, Inc. | | | 5 | | | | 458 | |
Hamilton Lane, Inc. - Class A(2) | | | 0 | | | | 21 | |
Hancock Whitney Corp. | | | 4 | | | | 152 | |
Hannon Armstrong Sustainable Infrastructure Capital, Inc. | | | 8 | | | | 189 | |
Hanover Insurance Group, Inc. | | | 12 | | | | 1,302 | |
HBT Financial, Inc. | | | 4 | | | | 78 | |
Heartland Financial USA, Inc. | | | 12 | | | | 339 | |
Heritage Commerce Corp. | | | 19 | | | | 160 | |
Home Bancshares, Inc. | | | 12 | | | | 266 | |
Horace Mann Educators Corp. | | | 1 | | | | 37 | |
Horizon Bancorp, Inc. | | | 23 | | | | 242 | |
Houlihan Lokey, Inc. - Class A | | | 10 | | | | 988 | |
Independent Bank Corp. | | | 3 | | | | 48 | |
Independent Bank Corp. | | | 3 | | | | 147 | |
Independent Bank Group, Inc. | | | 10 | | | | 350 | |
Invesco Mortgage Capital, Inc. | | | 18 | | | | 201 | |
Jack Henry & Associates, Inc. | | | 3 | | | | 419 | |
Jackson Financial, Inc. - Class A | | | 1 | | | | 21 | |
Kemper Corp. | | | 30 | | | | 1,458 | |
KeyCorp | | | 55 | | | | 511 | |
Kinsale Capital Group, Inc. | | | 4 | | | | 1,423 | |
KKR & Co., Inc. - Class Miscella | | | 1 | | | | 62 | |
Ladder Capital Corp. - Class A | | | 21 | | | | 224 | |
Lakeland Bancorp, Inc. | | | 8 | | | | 109 | |
Loews Corp. | | | 31 | | | | 1,829 | |
LPL Financial Holdings, Inc. | | | 10 | | | | 2,148 | |
M&T Bank Corp. | | | 3 | | | | 344 | |
Macatawa Bank Corp. | | | 15 | | | | 136 | |
Marqeta, Inc. - Class A(1) | | | 32 | | | | 154 | |
MBIA, Inc.(1) | | | 8 | | | | 66 | |
Metropolitan Bank Holding Corp.(1) | | | 4 | | | | 122 | |
MFA Financial, Inc. | | | 6 | | | | 72 | |
Moelis & Co. - Class A | | | 34 | | | | 1,538 | |
Morningstar, Inc. | | | 3 | | | | 644 | |
Mr Cooper Group, Inc.(1) | | | 2 | | | | 80 | |
| | | | | | | | |
MSCI, Inc. - Class A | | | 3 | | | | 1,397 | |
National Western Life Group, Inc. - Class A | | | 1 | | | | 276 | |
NBT Bancorp, Inc. | | | 1 | | | | 34 | |
New York Community Bancorp, Inc. | | | 30 | | | | 335 | |
New York Mortgage Trust, Inc. | | | 10 | | | | 95 | |
NMI Holdings, Inc. - Class A(1) | | | 2 | | | | 61 | |
Northfield Bancorp, Inc. | | | 3 | | | | 36 | |
OFG Bancorp | | | 2 | | | | 65 | |
Old Second Bancorp, Inc. | | | 5 | | | | 63 | |
Open Lending Corp. - Class A(1) | | | 29 | | | | 304 | |
Orchid Island Capital, Inc. - Class A | | | 15 | | | | 157 | |
Pacific Premier Bancorp, Inc. | | | 17 | | | | 353 | |
PacWest Bancorp | | | 22 | | | | 178 | |
Park National Corp. | | | 2 | | | | 230 | |
Peapack Gladstone Financial Corp. | | | 1 | | | | 31 | |
Pinnacle Financial Partners, Inc. | | | 3 | | | | 145 | |
Premier Financial Corp. | | | 12 | | | | 200 | |
Primis Financial Corp. | | | 44 | | | | 374 | |
PROG Holdings, Inc.(1) | | | 1 | | | | 35 | |
Progressive Corp. | | | 8 | | | | 1,099 | |
Prosperity Bancshares, Inc. | | | 7 | | | | 379 | |
Provident Financial Services, Inc. | | | 4 | | | | 71 | |
Prudential Financial, Inc.(2) | | | 0 | | | | 29 | |
QCR Holdings, Inc.(2) | | | 0 | | | | 18 | |
Radian Group, Inc. | | | 10 | | | | 252 | |
RBB Bancorp | | | 19 | | | | 231 | |
Ready Capital Corp. | | | 14 | | | | 155 | |
Redwood Trust, Inc. | | | 9 | | | | 55 | |
Regions Financial Corp. | | | 72 | | | | 1,282 | |
Reinsurance Group of America, Inc. - Class A | | | 12 | | | | 1,692 | |
Remitly Global, Inc.(1) | | | 45 | | | | 849 | |
Republic Bancorp, Inc. - Class A | | | 8 | | | | 321 | |
RLI Corp. | | | 24 | | | | 3,222 | |
Rocket Companies, Inc. - Class A(1) | | | 4 | | | | 33 | |
Ryan Specialty Holdings, Inc. - Class A(1) | | | 14 | | | | 628 | |
S&P Global, Inc. | | | 2 | | | | 843 | �� |
S&T Bancorp, Inc. | | | 3 | | | | 90 | |
Safety Insurance Group, Inc.(2) | | | 0 | | | | 31 | |
Sandy Spring Bancorp, Inc. | | | 8 | | | | 170 | |
Seacoast Banking Corp. of Florida | | | 12 | | | | 268 | |
SEI Investments Co.(2) | | | 0 | | | | 20 | |
Selective Insurance Group, Inc. | | | 19 | | | | 1,846 | |
Shift4 Payments, Inc. - Class A(1) | | | 14 | | | | 966 | |
Shore Bancshares, Inc. | | | 1 | | | | 13 | |
SiriusPoint Ltd.(1) | | | 20 | | | | 184 | |
Southern First Bancshares, Inc.(1) | | | 8 | | | | 196 | |
Stellar Bancorp, Inc. | | | 12 | | | | 265 | |
Stewart Information Services Corp. | | | 2 | | | | 73 | |
Stifel Financial Corp. | | | 33 | | | | 1,944 | |
StoneCo Ltd. - Class A(1) | | | 14 | | | | 174 | |
StoneX Group, Inc.(1) | | | 3 | | | | 242 | |
Synchrony Financial | | | 1 | | | | 48 | |
Synovus Financial Corp. | | | 27 | | | | 802 | |
T Rowe Price Group, Inc.(2) | | | 0 | | | | 42 | |
Texas Capital Bancshares, Inc.(1) | | | 33 | | | | 1,718 | |
TFS Financial Corp. | | | 18 | | | | 223 | |
Toast, Inc. - Class A(1) | | | 60 | | | | 1,355 | |
Tompkins Financial Corp. | | | 4 | | | | 247 | |
Tradeweb Markets, Inc. - Class A | | | 14 | | | | 965 | |
Triumph Financial, Inc.(1) | | | 4 | | | | 218 | |
TrustCo Bank Corp. NY | | | 1 | | | | 34 | |
| | | | | | | | |
Two Harbors Investment Corp. | | | 13 | | | | 180 | |
UMB Financial Corp. | | | 5 | | | | 283 | |
Universal Insurance Holdings, Inc. | | | 12 | | | | 178 | |
Virtu Financial, Inc. - Class A | | | 14 | | | | 234 | |
Washington Federal, Inc. | | | 2 | | | | 52 | |
Washington Trust Bancorp, Inc. | | | 11 | | | | 305 | |
Waterstone Financial, Inc. | | | 10 | | | | 145 | |
Webster Financial Corp. | | | 22 | | | | 834 | |
Westamerica BanCorp | | | 4 | | | | 149 | |
WEX, Inc.(1) | | | 6 | | | | 1,164 | |
White Mountains Insurance Group Ltd.(2) | | | 0 | | | | 22 | |
Wintrust Financial Corp. | | | 16 | | | | 1,181 | |
Zions Bancorp N.A. | | | 21 | | | | 571 | |
| | | | | | | | |
Total Financials | | | | 109,026 | |
| | | | | |
Healthcare – 12.60% | | | | | | | | |
10X Genomics, Inc. - Class A(1) | | | 27 | | | | 1,534 | |
Abiomed, Inc.(1)(2)(4) | | | 0 | | | | — | |
Acadia Healthcare Co., Inc.(1) | | | 32 | | | | 2,585 | |
ACADIA Pharmaceuticals, Inc.(1) | | | 1 | | | | 30 | |
Adaptive Biotechnologies Corp.(1) | | | 14 | | | | 92 | |
Addus HomeCare Corp.(1) | | | 1 | | | | 49 | |
Agilent Technologies, Inc. | | | 10 | | | | 1,181 | |
agilon health, Inc.(1) | | | 9 | | | | 163 | |
Agios Pharmaceuticals, Inc.(1) | | | 6 | | | | 180 | |
Akero Therapeutics, Inc.(1) | | | 2 | | | | 89 | |
Alcon, Inc. | | | 49 | | | | 4,045 | |
Alector, Inc.(1) | | | 21 | | | | 124 | |
Align Technology, Inc.(1) | | | 3 | | | | 940 | |
Alkermes Plc(1) | | | 6 | | | | 189 | |
Alnylam Pharmaceuticals, Inc.(1) | | | 5 | | | | 1,006 | |
Amedisys, Inc.(1) | | | 4 | | | | 396 | |
American Well Corp. - Class A(1) | | | 65 | | | | 137 | |
AmerisourceBergen Corp. - Class A(2) | | | 0 | | | | 54 | |
Amicus Therapeutics, Inc.(1) | | | 3 | | | | 37 | |
Amphastar Pharmaceuticals, Inc.(1) | | | 3 | | | | 157 | |
Apellis Pharmaceuticals, Inc.(1) | | | 12 | | | | 1,103 | |
Arrowhead Pharmaceuticals, Inc.(1) | | | 7 | | | | 252 | |
AtriCure, Inc.(1) | | | 4 | | | | 220 | |
Avanos Medical, Inc.(1) | | | 4 | | | | 102 | |
Avantor, Inc.(1) | | | 80 | | | | 1,644 | |
Axonics, Inc.(1) | | | 21 | | | | 1,053 | |
Azenta, Inc.(1) | | | 3 | | | | 158 | |
Beam Therapeutics, Inc.(1) | | | 15 | | | | 483 | |
BioCryst Pharmaceuticals, Inc.(1) | | | 2 | | | | 14 | |
Biogen, Inc.(1) | | | 1 | | | | 211 | |
Biohaven Ltd.(1)(2) | | | 0 | | | | 5 | |
BioMarin Pharmaceutical, Inc.(1) | | | 2 | | | | 190 | |
Bio-Rad Laboratories, Inc. - Class A(1)(2) | | | 0 | | | | 40 | |
Bio-Techne Corp. | | | 60 | | | | 4,873 | |
Bridgebio Pharma, Inc.(1) | | | 20 | | | | 337 | |
Bruker Corp. | | | 26 | | | | 1,900 | |
Catalent, Inc.(1) | | | 7 | | | | 284 | |
Celldex Therapeutics, Inc.(1) | | | 1 | | | | 23 | |
Centene Corp.(1) | | | 10 | | | | 708 | |
Charles River Laboratories International, Inc.(1) | | | 19 | | | | 4,045 | |
Chemed Corp. | | | 5 | | | | 2,741 | |
Computer Programs & Systems, Inc.(1) | | | 3 | | | | 74 | |
Cooper Companies, Inc. | | | 6 | | | | 2,441 | |
CorVel Corp.(1) | | | 2 | | | | 303 | |
Crinetics Pharmaceuticals, Inc.(1) | | | 6 | | | | 107 | |
Cymabay Therapeutics, Inc.(1) | | | 12 | | | | 135 | |
| | | | | | | | |
Cytokinetics, Inc.(1) | | | 8 | | | | 255 | |
DaVita, Inc.(1) | | | 2 | | | | 215 | |
Deciphera Pharmaceuticals, Inc.(1) | | | 2 | | | | 23 | |
Denali Therapeutics, Inc.(1) | | | 1 | | | | 25 | |
Dentsply Sirona, Inc. | | | 4 | | | | 165 | |
DexCom, Inc.(1) | | | 19 | | | | 2,449 | |
Enanta Pharmaceuticals, Inc.(1) | | | 7 | | | | 153 | |
Ensign Group, Inc. | | | 2 | | | | 162 | |
Envista Holdings Corp.(1) | | | 64 | | | | 2,151 | |
Erasca, Inc.(1) | | | 59 | | | | 163 | |
Evolent Health, Inc. - Class A(1) | | | 32 | | | | 971 | |
Exact Sciences Corp.(1) | | | 25 | | | | 2,340 | |
Exelixis, Inc.(1) | | | 49 | | | | 932 | |
Geron Corp.(1) | | | 8 | | | | 26 | |
Glaukos Corp.(1) | | | 4 | | | | 254 | |
Globus Medical, Inc. - Class A(1) | | | 3 | | | | 152 | |
Haemonetics Corp.(1) | | | 2 | | | | 203 | |
Halozyme Therapeutics, Inc.(1) | | | 24 | | | | 879 | |
HealthEquity, Inc.(1) | | | 3 | | | | 220 | |
Hologic, Inc.(1) | | | 12 | | | | 998 | |
Horizon Therapeutics Plc(1) | | | 10 | | | | 1,069 | |
ICON Plc(1) | | | 13 | | | | 3,159 | |
IDEXX Laboratories, Inc.(1) | | | 2 | | | | 1,046 | |
ImmunoGen, Inc.(1) | | | 11 | | | | 213 | |
Inari Medical, Inc.(1) | | | 23 | | | | 1,334 | |
Insmed, Inc.(1) | | | 7 | | | | 151 | |
Inspire Medical Systems, Inc.(1) | | | 4 | | | | 1,354 | |
Insulet Corp.(1) | | | 7 | | | | 2,102 | |
Integer Holdings Corp.(1) | | | 2 | | | | 205 | |
Integra LifeSciences Holdings Corp.(1) | | | 36 | | | | 1,475 | |
Intellia Therapeutics, Inc.(1) | | | 4 | | | | 155 | |
Intra-Cellular Therapies, Inc.(1) | | | 3 | | | | 186 | |
Ionis Pharmaceuticals, Inc.(1) | | | 4 | | | | 163 | |
Iovance Biotherapeutics, Inc.(1) | | | 24 | | | | 170 | |
IQVIA Holdings, Inc.(1) | | | 3 | | | | 734 | |
iRhythm Technologies, Inc.(1) | | | 10 | | | | 992 | |
Ironwood Pharmaceuticals, Inc. - Class A(1) | | | 5 | | | | 53 | |
IVERIC bio, Inc.(1) | | | 2 | | | | 84 | |
Jazz Pharmaceuticals Plc(1) | | | 5 | | | | 574 | |
Karuna Therapeutics, Inc.(1) | | | 1 | | | | 161 | |
Krystal Biotech, Inc.(1) | | | 2 | | | | 188 | |
Laboratory Corp. of America Holdings(2) | | | 0 | | | | 47 | |
Lantheus Holdings, Inc.(1) | | | 3 | | | | 246 | |
LeMaitre Vascular, Inc. | | | 3 | | | | 233 | |
Ligand Pharmaceuticals, Inc.(1)(2) | | | 0 | | | | 18 | |
Madrigal Pharmaceuticals, Inc.(1) | | | 2 | | | | 369 | |
Maravai LifeSciences Holdings, Inc. - Class A(1) | | | 12 | | | | 146 | |
Masimo Corp.(1) | | | 1 | | | | 173 | |
McKesson Corp. | | | 2 | | | | 1,029 | |
Medpace Holdings, Inc.(1) | | | 1 | | | | 181 | |
Merit Medical Systems, Inc.(1) | | | 5 | | | | 397 | |
Mettler-Toledo International, Inc.(1) | | | 1 | | | | 1,611 | |
Molina Healthcare, Inc.(1) | | | 1 | | | | 370 | |
Myriad Genetics, Inc.(1) | | | 1 | | | | 21 | |
Natera, Inc.(1) | | | 30 | | | | 1,436 | |
Neogen Corp.(1) | | | 11 | | | | 242 | |
NeoGenomics, Inc.(1) | | | 18 | | | | 282 | |
Neurocrine Biosciences, Inc.(1) | | | 16 | | | | 1,512 | |
NGM Biopharmaceuticals, Inc.(1) | | | 47 | | | | 123 | |
OmniAb, Inc. - Class CR3(1)(2)(4)(5) | | | 0 | | | | — | |
OmniAb, Inc. - Class CR4(1)(2)(4)(5) | | | 0 | | | | — | |
| | | | | | | | |
Omnicell, Inc.(1) | | | 7 | | | | 533 | |
Option Care Health, Inc.(1) | | | 15 | | | | 476 | |
Organon & Co. | | | 9 | | | | 193 | |
Orthofix Medical, Inc.(1) | | | 9 | | | | 161 | |
OrthoPediatrics Corp.(1) | | | 4 | | | | 187 | |
Pacific Biosciences of California, Inc.(1) | | | 28 | | | | 369 | |
Pacira BioSciences, Inc.(1) | | | 4 | | | | 174 | |
Patterson Companies, Inc. | | | 2 | | | | 52 | |
Pediatrix Medical Group, Inc.(1) | | | 127 | | | | 1,800 | |
Phibro Animal Health Corp. - Class A | | | 4 | | | | 55 | |
Phreesia, Inc.(1) | | | 6 | | | | 193 | |
Prestige Consumer Healthcare, Inc.(1) | | | 3 | | | | 156 | |
Progyny, Inc.(1) | | | 5 | | | | 199 | |
Prothena Corp. Plc(1) | | | 1 | | | | 99 | |
PTC Therapeutics, Inc.(1) | | | 5 | | | | 202 | |
QIAGEN NV(1) | | | 23 | | | | 1,039 | |
Quest Diagnostics, Inc.(2) | | | 0 | | | | 31 | |
R1 RCM, Inc.(1) | | | 14 | | | | 259 | |
Reata Pharmaceuticals, Inc. - Class A(1) | | | 2 | | | | 165 | |
Relay Therapeutics, Inc.(1) | | | 13 | | | | 166 | |
Repligen Corp.(1) | | | 9 | | | | 1,320 | |
Replimune Group, Inc.(1) | | | 8 | | | | 182 | |
ResMed, Inc. | | | 6 | | | | 1,209 | |
Revance Therapeutics, Inc.(1) | | | 1 | | | | 34 | |
REVOLUTION Medicines, Inc.(1) | | | 3 | | | | 71 | |
Royalty Pharma Plc - Class A | | | 16 | | | | 503 | |
Sage Therapeutics, Inc.(1) | | | 4 | | | | 189 | |
Sangamo Therapeutics, Inc.(1) | | | 133 | | | | 173 | |
Sarepta Therapeutics, Inc.(1) | | | 11 | | | | 1,240 | |
Seagen, Inc.(1) | | | 4 | | | | 782 | |
Select Medical Holdings Corp. | | | 2 | | | | 74 | |
Shockwave Medical, Inc.(1) | | | 7 | | | | 2,031 | |
Silk Road Medical, Inc.(1) | | | 1 | | | | 22 | |
SomaLogic, Inc.(1) | | | 59 | | | | 136 | |
SpringWorks Therapeutics, Inc.(1) | | | 7 | | | | 179 | |
STAAR Surgical Co.(1) | | | 3 | | | | 182 | |
Stevanato Group SpA | | | 65 | | | | 2,092 | |
Supernus Pharmaceuticals, Inc.(1) | | | 2 | | | | 46 | |
Surgery Partners, Inc.(1) | | | 27 | | | | 1,222 | |
Surmodics, Inc.(1) | | | 9 | | | | 296 | |
Syneos Health, Inc. - Class A(1) | | | 23 | | | | 961 | |
Teleflex, Inc. | | | 11 | | | | 2,734 | |
Tenet Healthcare Corp.(1) | | | 3 | | | | 205 | |
Travere Therapeutics, Inc. - Class Preferre(1) | | | 8 | | | | 125 | |
Twist Bioscience Corp.(1) | | | 12 | | | | 246 | |
U.S. Physical Therapy, Inc.(2) | | | 0 | | | | 50 | |
Ultragenyx Pharmaceutical, Inc.(1) | | | 15 | | | | 695 | |
Universal Health Services, Inc. - Class B | | | 5 | | | | 865 | |
Vaxcyte, Inc.(1) | | | 2 | | | | 115 | |
Veeva Systems, Inc. - Class A(1) | | | 1 | | | | 211 | |
Veracyte, Inc.(1) | | | 1 | | | | 31 | |
Veradigm, Inc.(1) | | | 3 | | | | 41 | |
Vir Biotechnology, Inc.(1) | | | 4 | | | | 89 | |
West Pharmaceutical Services, Inc. | | | 11 | | | | 4,212 | |
Xencor, Inc.(1) | | | 3 | | | | 74 | |
Zimmer Biomet Holdings, Inc. | | | 19 | | | | 2,722 | |
| | | | | | | | |
Total Healthcare | | | | 105,042 | |
| | | | | |
Industrials – 23.36% | | | | | | | | |
AAON, Inc. | | | 25 | | | | 2,349 | |
AAR Corp.(1) | | | 1 | | | | 56 | |
ABM Industries, Inc. | | | 5 | | | | 209 | |
| | | | | | | | |
Advanced Drainage Systems, Inc. | | | 2 | | | | 272 | |
AECOM | | | 21 | | | | 1,755 | |
AerCap Holdings NV(1) | | | 85 | | | | 5,415 | |
Aerojet Rocketdyne Holdings, Inc.(1) | | | 3 | | | | 174 | |
Aerovironment, Inc.(1) | | | 2 | | | | 185 | |
AGCO Corp.(2) | | | 0 | | | | 65 | |
Air Lease Corp. - Class A | | | 16 | | | | 673 | |
Alamo Group, Inc.(2) | | | 0 | | | | 37 | |
Alaska Air Group, Inc.(1) | | | 42 | | | | 2,227 | |
Albany International Corp. - Class A | | | 1 | | | | 125 | |
Alight, Inc. - Class A(1) | | | 24 | | | | 222 | |
Allegion Plc | | | 17 | | | | 1,981 | |
Ameresco, Inc. - Class A(1) | | | 3 | | | | 150 | |
American Airlines Group, Inc.(1) | | | 13 | | | | 225 | |
American Woodmark Corp.(1) | | | 2 | | | | 142 | |
AMETEK, Inc. | | | 8 | | | | 1,257 | |
AO Smith Corp. | | | 1 | | | | 98 | |
API Group Corp.(1) | | | 63 | | | | 1,712 | |
Applied Industrial Technologies, Inc. | | | 1 | | | | 203 | |
ArcBest Corp. | | | 3 | | | | 252 | |
Arcosa, Inc. | | | 29 | | | | 2,193 | |
Array Technologies, Inc.(1) | | | 5 | | | | 121 | |
ASGN, Inc.(1) | | | 2 | | | | 178 | |
Atkore, Inc.(1)(2) | | | 0 | | | | 45 | |
Axon Enterprise, Inc.(1) | | | 1 | | | | 136 | |
AZEK Co., Inc. - Class A(1) | | | 21 | | | | 630 | |
AZZ, Inc. | | | 3 | | | | 133 | |
Barnes Group, Inc. | | | 3 | | | | 140 | |
Beacon Roofing Supply, Inc.(1) | | | 2 | | | | 134 | |
Bloom Energy Corp. - Class A(1) | | | 1 | | | | 18 | |
Boise Cascade Co. | | | 4 | | | | 350 | |
Booz Allen Hamilton Holding Corp. - Class A | | | 8 | | | | 936 | |
BrightView Holdings, Inc.(1) | | | 27 | | | | 192 | |
Builders FirstSource, Inc.(1) | | | 14 | | | | 1,939 | |
CACI International, Inc. - Class A(1) | | | 4 | | | | 1,295 | |
Carlisle Companies, Inc. | | | 17 | | | | 4,458 | |
Carrier Global Corp. | | | 6 | | | | 275 | |
Casella Waste Systems, Inc. - Class A(1) | | | 1 | | | | 88 | |
CBIZ, Inc.(1) | | | 4 | | | | 233 | |
Ceridian HCM Holding, Inc.(1) | | | 3 | | | | 203 | |
Chart Industries, Inc.(1) | | | 11 | | | | 1,770 | |
Cintas Corp. | | | 1 | | | | 608 | |
Clarivate Plc(1) | | | 28 | | | | 264 | |
Columbus McKinnon Corp. | | | 2 | | | | 81 | |
Comfort Systems USA, Inc. | | | 2 | | | | 319 | |
Copart, Inc.(1) | | | 31 | | | | 2,823 | |
Core & Main, Inc. - Class A(1) | | | 98 | | | | 3,067 | |
Crane Co. | | | 5 | | | | 481 | |
Crane NXT Co. | | | 18 | | | | 1,034 | |
CSG Systems International, Inc. | | | 2 | | | | 81 | |
CSW Industrials, Inc.(2) | | | 0 | | | | 30 | |
Cummins, Inc.(2) | | | 0 | | | | 24 | |
Delta Air Lines, Inc.(1) | | | 21 | | | | 996 | |
Donaldson Co., Inc. | | | 40 | | | | 2,512 | |
Ducommun, Inc.(1) | | | 1 | | | | 36 | |
Dun & Bradstreet Holdings, Inc. | | | 127 | | | | 1,465 | |
Dycom Industries, Inc.(1) | | | 25 | | | | 2,788 | |
EMCOR Group, Inc. | | | 9 | | | | 1,662 | |
Encore Wire Corp. | | | 1 | | | | 247 | |
Energy Recovery, Inc.(1) | | | 5 | | | | 148 | |
EnerSys | | | 2 | | | | 240 | |
| | | | | | | | |
Ennis, Inc. | | | 6 | | | | 119 | |
Equifax, Inc. | | | 4 | | | | 908 | |
ESCO Technologies, Inc.(2) | | | 0 | | | | 28 | |
ExlService Holdings, Inc.(1) | | | 1 | | | | 117 | |
Expeditors International of Washington, Inc. | | | 3 | | | | 387 | |
Exponent, Inc. | | | 25 | | | | 2,314 | |
Fastenal Co. | | | 8 | | | | 454 | |
Federal Signal Corp. | | | 1 | | | | 70 | |
Ferguson Plc | | | 6 | | | | 1,022 | |
Fluor Corp.(1) | | | 65 | | | | 1,937 | |
Fortune Brands Innovations, Inc. | | | 1 | | | | 92 | |
Forward Air Corp.(2) | | | 0 | | | | 47 | |
Franklin Electric Co., Inc. | | | 1 | | | | 149 | |
FTI Consulting, Inc.(1) | | | 14 | | | | 2,745 | |
Gates Industrial Corp. Plc(1) | | | 117 | | | | 1,581 | |
GATX Corp.(2) | | | 0 | | | | 23 | |
Generac Holdings, Inc.(1) | | | 2 | | | | 248 | |
Genpact Ltd. | | | 55 | | | | 2,067 | |
Gibraltar Industries, Inc.(1) | | | 1 | | | | 55 | |
Global Industrial Co. | | | 6 | | | | 177 | |
Graco, Inc. | | | 43 | | | | 3,748 | |
Granite Construction, Inc. | | | 1 | | | | 30 | |
GXO Logistics, Inc.(1) | | | 4 | | | | 230 | |
Heartland Express, Inc. | | | 2 | | | | 26 | |
HEICO Corp. | | | 9 | | | | 1,667 | |
HEICO Corp. - Class A | | | 7 | | | | 917 | |
Heidrick & Struggles International, Inc. | | | 3 | | | | 74 | |
Helios Technologies, Inc. | | | 1 | | | | 56 | |
Herc Holdings, Inc. | | | 21 | | | | 2,896 | |
Hillenbrand, Inc. | | | 6 | | | | 308 | |
Hillman Solutions Corp.(1) | | | 21 | | | | 191 | |
HNI Corp. | | | 2 | | | | 65 | |
Hub Group, Inc. - Class A(1) | | | 2 | | | | 143 | |
Hubbell, Inc. - Class B | | | 8 | | | | 2,622 | |
Hyliion Holdings Corp.(1) | | | 87 | | | | 146 | |
IDEX Corp. | | | 4 | | | | 848 | |
Ingersoll Rand, Inc. | | | 15 | | | | 978 | |
Insperity, Inc. | | | 1 | | | | 105 | |
ITT, Inc. | | | 29 | | | | 2,725 | |
Jacobs Solutions, Inc. | | | 40 | | | | 4,738 | |
JB Hunt Transport Services, Inc.(2) | | | 0 | | | | 51 | |
JetBlue Airways Corp.(1) | | | 26 | | | | 230 | |
John Bean Technologies Corp. | | | 1 | | | | 66 | |
Kaman Corp. | | | 7 | | | | 178 | |
KBR, Inc. | | | 1 | | | | 61 | |
Kelly Services, Inc. - Class A | | | 2 | | | | 35 | |
Kennametal, Inc. | | | 3 | | | | 86 | |
Kirby Corp.(1) | | | 28 | | | | 2,188 | |
Knight-Swift Transportation Holdings, Inc. - Class A | | | 63 | | | | 3,525 | |
Korn Ferry | | | 21 | | | | 1,025 | |
L3Harris Technologies, Inc. | | | 15 | | | | 2,848 | |
Landstar System, Inc. | | | 2 | | | | 321 | |
Lincoln Electric Holdings, Inc. | | | 26 | | | | 5,232 | |
Luxfer Holdings Plc | | | 5 | | | | 73 | |
Masonite International Corp.(1) | | | 17 | | | | 1,701 | |
MasTec, Inc.(1) | | | 56 | | | | 6,643 | |
Masterbrand, Inc.(1) | | | 1 | | | | 15 | |
Matson, Inc. | | | 3 | | | | 197 | |
MAXIMUS, Inc. | | | 1 | | | | 56 | |
Miller Industries, Inc. | | | 8 | | | | 288 | |
Moog, Inc. - Class A | | | 1 | | | | 59 | |
| | | | | | | | |
Mueller Industries, Inc. | | | 3 | | | | 222 | |
MYR Group, Inc.(1) | | | 1 | | | | 155 | |
National Presto Industries, Inc. | | | 1 | | | | 108 | |
Nordson Corp. | | | 22 | | | | 5,442 | |
nVent Electric Plc | | | 1 | | | | 34 | |
Old Dominion Freight Line, Inc. | | | 3 | | | | 1,024 | |
OPENLANE, Inc.(1) | | | 14 | | | | 219 | |
Oshkosh Corp. | | | 22 | | | | 1,895 | |
Parker-Hannifin Corp.(2) | | | 0 | | | | 43 | |
Paychex, Inc. | | | 2 | | | | 215 | |
Paycom Software, Inc. | | | 1 | | | | 252 | |
Paylocity Holding Corp.(1) | | | 1 | | | | 248 | |
Pentair Plc | | | 1 | | | | 46 | |
Quanex Building Products Corp. | | | 2 | | | | 65 | |
Quanta Services, Inc. | | | 21 | | | | 4,204 | |
RB Global, Inc. | | | 9 | | | | 530 | |
RBC Bearings, Inc.(1) | | | 21 | | | | 4,629 | |
Regal Rexnord Corp. | | | 18 | | | | 2,702 | |
Republic Services, Inc. - Class A | | | 36 | | | | 5,472 | |
Resideo Technologies, Inc.(1) | | | 13 | | | | 238 | |
Resources Connection, Inc. | | | 1 | | | | 13 | |
Robert Half International, Inc. | | | 26 | | | | 1,921 | |
Rockwell Automation, Inc.(2) | | | 0 | | | | 150 | |
Rollins, Inc. | | | 28 | | | | 1,214 | |
Rush Enterprises, Inc. - Class A(2) | | | 0 | | | | 28 | |
RXO, Inc.(1) | | | 23 | | | | 527 | |
Saia, Inc.(1)(2) | | | 0 | | | | 72 | |
Schneider National, Inc. - Class B | | | 2 | | | | 71 | |
Sensata Technologies Holding Plc | | | 42 | | | | 1,900 | |
Shoals Technologies Group, Inc. - Class A(1) | | | 38 | | | | 963 | |
Simpson Manufacturing Co., Inc. | | | 1 | | | | 88 | |
SiteOne Landscape Supply, Inc.(1) | | | 12 | | | | 1,944 | |
Spirit AeroSystems Holdings, Inc. - Class A | | | 53 | | | | 1,560 | |
SPX Technologies, Inc.(1) | | | 2 | | | | 140 | |
Standex International Corp.(2) | | | 0 | | | | 59 | |
Stanley Black & Decker, Inc. | | | 1 | | | | 93 | |
Star Bulk Carriers Corp. | | | 68 | | | | 1,208 | |
Steelcase, Inc. - Class A | | | 8 | | | | 58 | |
Stericycle, Inc.(1) | | | 1 | | | | 47 | |
Terex Corp. | | | 5 | | | | 287 | |
Tetra Tech, Inc. | | | 30 | | | | 4,929 | |
Timken Co. | | | 37 | | | | 3,347 | |
Toro Co. | | | 61 | | | | 6,215 | |
Trane Technologies Plc | | | 12 | | | | 2,239 | |
TransDigm Group, Inc.(2) | | | 0 | | | | 51 | |
Triton International Ltd. | | | 3 | | | | 223 | |
TrueBlue, Inc.(1) | | | 3 | | | | 45 | |
TTEC Holdings, Inc. | | | 5 | | | | 157 | |
Uber Technologies, Inc.(1) | | | 12 | | | | 522 | |
UFP Industries, Inc. | | | 1 | | | | 73 | |
U-Haul Holding Co. | | | 4 | | | | 245 | |
U-Haul Holding Co. - Class B | | | 10 | | | | 493 | |
UniFirst Corp. | | | 2 | | | | 264 | |
United Airlines Holdings, Inc.(1) | | | 1 | | | | 73 | |
United Rentals, Inc.(2) | | | 0 | | | | 67 | |
Upwork, Inc.(1) | | | 14 | | | | 131 | |
Valmont Industries, Inc. | | | 14 | | | | 4,138 | |
Verisk Analytics, Inc. - Class A | | | 1 | | | | 184 | |
Verra Mobility Corp. - Class A(1) | | | 8 | | | | 157 | |
Vertiv Holdings Co. - Class A | | | 138 | | | | 3,423 | |
Vicor Corp.(1) | | | 3 | | | | 185 | |
| | | | | | | | |
VSE Corp. | | | 3 | | | | 169 | |
Watsco, Inc. | | | 11 | | | | 4,351 | |
Watts Water Technologies, Inc. - Class A | | | 10 | | | | 1,792 | |
Werner Enterprises, Inc. | | | 5 | | | | 220 | |
WillScot Mobile Mini Holdings Corp. - Class A(1) | | | 13 | | | | 638 | |
WW Grainger, Inc.(2) | | | 0 | | | | 82 | |
XPO, Inc.(1) | | | 52 | | | | 3,042 | |
Xylem, Inc. | | | 8 | | | | 873 | |
Zurn Elkay Water Solutions Corp. | | | 8 | | | | 210 | |
| | | | | | | | |
Total Industrials | | | | 194,712 | |
| | | | | |
Information Technology – 15.52% | | | | | | | | |
ACI Worldwide, Inc.(1) | | | 60 | | | | 1,386 | |
Advanced Energy Industries, Inc. | | | 2 | | | | 272 | |
Advanced Micro Devices, Inc.(1) | | | 6 | | | | 735 | |
Akamai Technologies, Inc.(1) | | | 3 | | | | 228 | |
Allegro MicroSystems, Inc.(1) | | | 57 | | | | 2,557 | |
Altair Engineering, Inc. - Class A(1) | | | 5 | | | | 378 | |
Amdocs Ltd. | | | 49 | | | | 4,839 | |
Amkor Technology, Inc. | | | 55 | | | | 1,623 | |
Amphenol Corp. - Class A | | | 3 | | | | 227 | |
Amplitude, Inc. - Class A(1) | | | 58 | | | | 635 | |
ANSYS, Inc.(1) | | | 1 | | | | 314 | |
AppLovin Corp. - Class A(1) | | | 16 | | | | 407 | |
Arista Networks, Inc.(1) | | | 8 | | | | 1,305 | |
Arrow Electronics, Inc.(1)(2) | | | 0 | | | | 55 | |
Aspen Technology, Inc.(1) | | | 3 | | | | 463 | |
AvePoint, Inc.(1) | | | 6 | | | | 35 | |
Avnet, Inc. | | | 42 | | | | 2,100 | |
Axcelis Technologies, Inc.(1) | | | 1 | | | | 274 | |
Belden, Inc. | | | 20 | | | | 1,938 | |
Benchmark Electronics, Inc. | | | 3 | | | | 87 | |
Bentley Systems, Inc. - Class B | | | 32 | | | | 1,760 | |
Black Knight, Inc.(1) | | | 3 | | | | 158 | |
Blackbaud, Inc.(1) | | | 3 | | | | 221 | |
Box, Inc. - Class A(1) | | | 5 | | | | 155 | |
C3.ai, Inc. - Class A(1) | | | 13 | | | | 476 | |
Cadence Design Systems, Inc.(1) | | | 10 | | | | 2,336 | |
Calix, Inc.(1)(2) | | | 0 | | | | 23 | |
CDW Corp.(2) | | | 0 | | | | 37 | |
Ciena Corp.(1) | | | 18 | | | | 764 | |
Clear Secure, Inc. - Class A | | | 6 | | | | 146 | |
Cloudflare, Inc. - Class A(1) | | | 3 | | | | 206 | |
Cognex Corp. | | | 1 | | | | 37 | |
Coherent Corp.(1) | | | 4 | | | | 224 | |
Cohu, Inc.(1) | | | 7 | | | | 282 | |
CommScope Holding Co., Inc.(1) | | | 4 | | | | 23 | |
CommVault Systems, Inc.(1) | | | 21 | | | | 1,540 | |
Comtech Telecommunications Corp. | | | 2 | | | | 17 | |
Confluent, Inc. - Class A(1) | | | 23 | | | | 825 | |
Crowdstrike Holdings, Inc. - Class A(1) | | | 9 | | | | 1,322 | |
CyberArk Software Ltd.(1) | | | 6 | | | | 957 | |
Datadog, Inc. - Class A(1) | | | 3 | | | | 306 | |
Dell Technologies, Inc. - Class C | | | 1 | | | | 40 | |
Diodes, Inc.(1) | | | 5 | | | | 490 | |
DocuSign, Inc. - Class A(1) | | | 6 | | | | 301 | |
DoubleVerify Holdings, Inc. - Class Rights(1) | | | 35 | | | | 1,373 | |
DXC Technology Co.(1) | | | 1 | | | | 36 | |
Dynatrace, Inc.(1) | | | 50 | | | | 2,585 | |
Ebix, Inc. | | | 1 | | | | 33 | |
Elastic NV(1) | | | 16 | | | | 1,023 | |
Entegris, Inc. | | | 36 | | | | 3,955 | |
| | | | | | | | |
Envestnet, Inc.(1)(2) | | | 0 | | | | 24 | |
ePlus, Inc.(1) | | | 2 | | | | 114 | |
EverCommerce, Inc.(1) | | | 31 | | | | 370 | |
Evolv Technologies Holdings, Inc.(1) | | | 32 | | | | 191 | |
Extreme Networks, Inc.(1) | | | 6 | | | | 148 | |
F5, Inc.(1) | | | 3 | | | | 404 | |
Fabrinet(1) | | | 1 | | | | 67 | |
Fair Isaac Corp.(1) | | | 6 | | | | 4,469 | |
FARO Technologies, Inc.(1) | | | 1 | | | | 11 | |
Fastly, Inc. - Class A(1) | | | 5 | | | | 86 | |
Five9, Inc.(1) | | | 8 | | | | 670 | |
FormFactor, Inc.(1) | | | 55 | | | | 1,890 | |
Gartner, Inc.(1)(2) | | | 0 | | | | 101 | |
Gen Digital, Inc. | | | 41 | | | | 763 | |
Globant SA(1) | | | 2 | | | | 286 | |
HashiCorp, Inc. - Class A(1) | | | 21 | | | | 539 | |
HP, Inc. | | | 9 | | | | 273 | |
HubSpot, Inc.(1) | | | 3 | | | | 1,348 | |
Ichor Holdings Ltd.(1) | | | 6 | | | | 236 | |
Insight Enterprises, Inc.(1) | | | 1 | | | | 155 | |
IPG Photonics Corp.(1) | | | 1 | | | | 170 | |
Itron, Inc.(1) | | | 3 | | | | 190 | |
Jabil, Inc. | | | 7 | | | | 751 | |
Juniper Networks, Inc. | | | 13 | | | | 411 | |
Keysight Technologies, Inc.(1) | | | 5 | | | | 816 | |
Kulicke & Soffa Industries, Inc. | | | 39 | | | | 2,311 | |
Lam Research Corp. | | | 1 | | | | 468 | |
Lattice Semiconductor Corp.(1) | | | 93 | | | | 8,962 | |
LiveVox Holdings, Inc.(1) | | | 12 | | | | 33 | |
Lumentum Holdings, Inc.(1) | | | 27 | | | | 1,529 | |
MACOM Technology Solutions Holdings, Inc.(1) | | | 23 | | | | 1,521 | |
Manhattan Associates, Inc.(1) | | | 15 | | | | 2,916 | |
Marvell Technology, Inc. | | | 12 | | | | 706 | |
MaxLinear, Inc. - Class A(1) | | | 1 | | | | 32 | |
Methode Electronics, Inc. | | | 1 | | | | 26 | |
Microchip Technology, Inc. | | | 5 | | | | 456 | |
MicroStrategy, Inc. - Class A(1) | | | 1 | | | | 222 | |
MKS Instruments, Inc. | | | 36 | | | | 3,906 | |
Model N, Inc.(1) | | | 5 | | | | 194 | |
MongoDB, Inc. - Class A(1) | | | 5 | | | | 2,044 | |
Monolithic Power Systems, Inc. | | | 1 | | | | 748 | |
Motorola Solutions, Inc.(2) | | | 0 | | | | 26 | |
nCino, Inc.(1) | | | 4 | | | | 124 | |
NCR Corp.(1) | | | 26 | | | | 666 | |
NetApp, Inc. | | | 4 | | | | 285 | |
Novanta, Inc.(1) | | | 14 | | | | 2,559 | |
Okta, Inc. - Class A(1) | | | 18 | | | | 1,228 | |
ON Semiconductor Corp.(1) | | | 19 | | | | 1,782 | |
Onto Innovation, Inc.(1) | | | 6 | | | | 735 | |
OSI Systems, Inc.(1)(2) | | | 0 | | | | 55 | |
Palantir Technologies, Inc. - Class A(1) | | | 23 | | | | 353 | |
Palo Alto Networks, Inc.(1) | | | 7 | | | | 1,752 | |
Pegasystems, Inc. | | | 1 | | | | 42 | |
Photronics, Inc.(1) | | | 2 | | | | 55 | |
Power Integrations, Inc. | | | 30 | | | | 2,803 | |
Procore Technologies, Inc.(1) | | | 34 | | | | 2,236 | |
PTC, Inc.(1) | | | 6 | | | | 901 | |
Pure Storage, Inc. - Class A(1) | | | 46 | | | | 1,690 | |
Q2 Holdings, Inc.(1) | | | 6 | | | | 193 | |
Qualys, Inc.(1) | | | 18 | | | | 2,308 | |
Rambus, Inc.(1) | | | 6 | | | | 399 | |
| | | | | | | | |
Rapid7, Inc.(1) | | | 9 | | | | 413 | |
Rogers Corp.(1) | | | 1 | | | | 233 | |
Samsara, Inc. - Class A(1) | | | 55 | | | | 1,519 | |
Sanmina Corp.(1) | | | 4 | | | | 252 | |
ScanSource, Inc.(1) | | | 4 | | | | 104 | |
SentinelOne, Inc. - Class A(1) | | | 11 | | | | 161 | |
Silicon Laboratories, Inc.(1) | | | 1 | | | | 139 | |
Smartsheet, Inc. - Class A(1) | | | 30 | | | | 1,152 | |
Snowflake, Inc. - Class A(1) | | | 2 | | | | 333 | |
SolarEdge Technologies, Inc.(1) | | | 3 | | | | 800 | |
Splunk, Inc.(1) | | | 2 | | | | 188 | |
Sprout Social, Inc. - Class A(1)(2) | | | 0 | | | | 21 | |
SPS Commerce, Inc.(1) | | | 14 | | | | 2,643 | |
Super Micro Computer, Inc.(1) | | | 1 | | | | 212 | |
Synaptics, Inc.(1) | | | 15 | | | | 1,320 | |
Synopsys, Inc.(1) | | | 10 | | | | 4,445 | |
Teledyne Technologies, Inc.(1) | | | 3 | | | | 1,170 | |
Tenable Holdings, Inc.(1) | | | 5 | | | | 239 | |
Teradyne, Inc. | | | 17 | | | | 1,856 | |
Trimble, Inc.(1) | | | 6 | | | | 294 | |
Tucows, Inc. - Class A(1) | | | 7 | | | | 189 | |
Turtle Beach Corp.(1) | | | 29 | | | | 335 | |
Twilio, Inc. - Class A(1) | | | 3 | | | | 217 | |
Tyler Technologies, Inc.(1) | | | 6 | | | | 2,348 | |
Ubiquiti, Inc. | | | 1 | | | | 255 | |
UiPath, Inc. - Class A(1) | | | 33 | | | | 546 | |
Ultra Clean Holdings, Inc.(1) | | | 1 | | | | 47 | |
Unity Software, Inc.(1) | | | 5 | | | | 227 | |
Varonis Systems, Inc. - Class B(1) | | | 7 | | | | 174 | |
Veeco Instruments, Inc.(1) | | | 11 | | | | 275 | |
Viavi Solutions, Inc.(1) | | | 22 | | | | 246 | |
Vishay Intertechnology, Inc. | | | 3 | | | | 74 | |
Vishay Precision Group, Inc.(1) | | | 2 | | | | 75 | |
Workday, Inc. - Class A(1) | | | 2 | | | | 489 | |
Workiva, Inc. - Class A(1) | | | 2 | | | | 231 | |
Xerox Holdings Corp. | | | 12 | | | | 173 | |
Zebra Technologies Corp. - Class A(1) | | | 9 | | | | 2,724 | |
Zoom Video Communications, Inc. - Class A(1) | | | 10 | | | | 710 | |
Zscaler, Inc.(1) | | | 2 | | | | 222 | |
| | | | | | | | |
Total Information Technology | | | | 129,309 | |
| | | | | |
Materials – 4.22% | | | | | | | | |
5E Advanced Materials, Inc.(1) | | | 38 | | | | 124 | |
AdvanSix, Inc. | | | 1 | | | | 52 | |
Alpha Metallurgical Resources, Inc.(2) | | | 0 | | | | 27 | |
AptarGroup, Inc. | | | 9 | | | | 1,090 | |
Arconic Corp.(1) | | | 5 | | | | 146 | |
Ashland, Inc. | | | 22 | | | | 1,910 | |
ATI, Inc.(1) | | | 55 | | | | 2,434 | |
Avery Dennison Corp. | | | 8 | | | | 1,400 | |
Avient Corp. | | | 7 | | | | 285 | |
Axalta Coating Systems Ltd.(1) | | | 2 | | | | 68 | |
Ball Corp. | | | 21 | | | | 1,235 | |
Berry Global Group, Inc. | | | 42 | | | | 2,718 | |
Cabot Corp. | | | 2 | | | | 108 | |
Carpenter Technology Corp. | | | 4 | | | | 214 | |
CF Industries Holdings, Inc. | | | 2 | | | | 164 | |
Coeur Mining, Inc.(1) | | | 7 | | | | 19 | |
Commercial Metals Co. | | | 4 | | | | 228 | |
Compass Minerals International, Inc. | | | 1 | | | | 23 | |
Constellium SE - Class A(1) | | | 9 | | | | 155 | |
Corteva, Inc. | | | 1 | | | | 71 | |
| | | | | | | | |
Crown Holdings, Inc. | | | 3 | | | | 240 | |
Eagle Materials, Inc. | | | 20 | | | | 3,761 | |
Ecovyst, Inc.(1) | | | 17 | | | | 191 | |
FMC Corp. | | | 1 | | | | 149 | |
Freeport-McMoRan, Inc. | | | 66 | | | | 2,647 | |
HB Fuller Co. | | | 1 | | | | 55 | |
Hecla Mining Co. | | | 11 | | | | 55 | |
Huntsman Corp. | | | 131 | | | | 3,534 | |
Ingevity Corp.(1) | | | 1 | | | | 47 | |
Innospec, Inc. | | | 8 | | | | 757 | |
International Flavors & Fragrances, Inc. | | | 4 | | | | 333 | |
International Paper Co. | | | 2 | | | | 66 | |
Ivanhoe Electric, Inc.(1) | | | 13 | | | | 176 | |
Louisiana-Pacific Corp. | | | 1 | | | | 48 | |
LyondellBasell Industries NV - Class A | | | 1 | | | | 57 | |
Martin Marietta Materials, Inc. | | | 1 | | | | 473 | |
Minerals Technologies, Inc. | | | 1 | | | | 76 | |
Mosaic Co. | | | 1 | | | | 30 | |
Novagold Resources, Inc.(1) | | | 6 | | | | 25 | |
Nucor Corp.(2) | | | 0 | | | | 62 | |
O-I Glass, Inc.(1) | | | 5 | | | | 114 | |
Packaging Corp. of America(2) | | | 0 | | | | 18 | |
PPG Industries, Inc. | | | 1 | | | | 189 | |
Reliance Steel & Aluminum Co. | | | 3 | | | | 787 | |
Royal Gold, Inc.(2) | | | 0 | | | | 40 | |
RPM International, Inc. | | | 21 | | | | 1,871 | |
Schnitzer Steel Industries, Inc. - Class A | | | 2 | | | | 50 | |
Scotts Miracle-Gro Co. | | | 3 | | | | 197 | |
Silgan Holdings, Inc. | | | 1 | | | | 49 | |
Sonoco Products Co.(2) | | | 0 | | | | 15 | |
SSR Mining, Inc. | | | 4 | | | | 60 | |
Steel Dynamics, Inc. | | | 2 | | | | 234 | |
Stepan Co. | | | 1 | | | | 53 | |
Summit Materials, Inc. - Class A(1) | | | 6 | | | | 232 | |
TriMas Corp. | | | 8 | | | | 231 | |
Trinseo Plc | | | 13 | | | | 169 | |
Vulcan Materials Co. | | | 25 | | | | 5,534 | |
Westlake Corp.(2) | | | 0 | | | | 36 | |
Worthington Industries, Inc.(2) | | | 0 | | | | 32 | |
| | | | | | | | |
Total Materials | | | | 35,164 | |
| | | | | |
Real Estate – 3.93% | | | | | | | | |
Acadia Realty Trust | | | 5 | | | | 73 | |
Agree Realty Corp. | | | 6 | | | | 390 | |
Alexander & Baldwin, Inc. | | | 3 | | | | 59 | |
Alexandria Real Estate Equities, Inc.(2) | | | 0 | | | | 14 | |
American Assets Trust, Inc. | | | 8 | | | | 159 | |
American Homes 4 Rent - Class A | | | 12 | | | | 434 | |
Apartment Income REIT Corp. | | | 31 | | | | 1,114 | |
Apartment Investment & Management Co. - Class A | | | 6 | | | | 53 | |
Apple Hospitality REIT, Inc. | | | 12 | | | | 176 | |
Boston Properties, Inc. | | | 44 | | | | 2,548 | |
Brixmor Property Group, Inc. | | | 2 | | | | 44 | |
Broadstone Net Lease, Inc. - Class A | | | 72 | | | | 1,118 | |
Camden Property Trust | | | 11 | | | | 1,175 | |
CBRE Group, Inc. - Class A(1) | | | 52 | | | | 4,223 | |
Corporate Office Properties Trust | | | 5 | | | | 117 | |
CoStar Group, Inc.(1) | | | 1 | | | | 111 | |
Cousins Properties, Inc. | | | 23 | | | | 513 | |
CubeSmart | | | 70 | | | | 3,147 | |
DiamondRock Hospitality Co. | | | 14 | | | | 112 | |
EastGroup Properties, Inc.(2) | | | 0 | | | | 48 | |
| | | | | | | | |
Empire State Realty Trust, Inc. - Class A | | | 12 | | | | 90 | |
Equity Commonwealth | | | 7 | | | | 151 | |
Essential Properties Realty Trust, Inc. | | | 2 | | | | 53 | |
eXp World Holdings, Inc. | | | 12 | | | | 247 | |
Extra Space Storage, Inc. | | | 1 | | | | 196 | |
FirstService Corp. | | | 4 | | | | 662 | |
Four Corners Property Trust, Inc. | | | 6 | | | | 156 | |
FRP Holdings, Inc.(1) | | | 1 | | | | 29 | |
Gaming & Leisure Properties, Inc. | | | 51 | | | | 2,494 | |
Getty Realty Corp. | | | 1 | | | | 48 | |
Global Medical REIT, Inc. | | | 11 | | | | 103 | |
Global Net Lease, Inc. | | | 64 | | | | 660 | |
Hersha Hospitality Trust - Class A | | | 2 | | | | 12 | |
Howard Hughes Corp.(1)(2) | | | 0 | | | | 28 | |
Independence Realty Trust, Inc. | | | 15 | | | | 275 | |
InvenTrust Properties Corp. | | | 10 | | | | 223 | |
Kennedy-Wilson Holdings, Inc. | | | 11 | | | | 180 | |
Kilroy Realty Corp. | | | 5 | | | | 148 | |
Kite Realty Group Trust | | | 15 | | | | 336 | |
Lamar Advertising Co. - Class A | | | 4 | | | | 419 | |
LXP Industrial Trust | | | 18 | | | | 171 | |
Macerich Co. | | | 9 | | | | 99 | |
Marcus & Millichap, Inc. | | | 1 | | | | 19 | |
National Health Investors, Inc. | | | 3 | | | | 173 | |
Necessity Retail REIT, Inc. | | | 11 | | | | 73 | |
NETSTREIT Corp. | | | 12 | | | | 210 | |
Office Properties Income Trust | | | 21 | | | | 161 | |
One Liberty Properties, Inc.(2) | | | 0 | | | | 1 | |
Orion Office REIT, Inc. | | | 27 | | | | 180 | |
Outfront Media, Inc. | | | 6 | | | | 88 | |
Phillips Edison & Co., Inc. | | | 2 | | | | 63 | |
Physicians Realty Trust | | | 119 | | | | 1,668 | |
Plymouth Industrial REIT, Inc. | | | 4 | | | | 86 | |
Postal Realty Trust, Inc. - Class A | | | 7 | | | | 103 | |
PotlatchDeltic Corp. | | | 4 | | | | 215 | |
Redfin Corp.(1) | | | 28 | | | | 344 | |
Retail Opportunity Investments Corp. | | | 14 | | | | 188 | |
RLJ Lodging Trust | | | 7 | | | | 77 | |
RPT Realty | | | 20 | | | | 212 | |
Ryman Hospitality Properties, Inc. | | | 10 | | | | 968 | |
Sabra Health Care REIT, Inc. | | | 8 | | | | 89 | |
SBA Communications Corp. - Class A | | | 3 | | | | 684 | |
Service Properties Trust | | | 15 | | | | 126 | |
Simon Property Group, Inc.(2) | | | 0 | | | | 41 | |
SITE Centers Corp. | | | 5 | | | | 64 | |
SL Green Realty Corp. | | | 7 | | | | 225 | |
STAG Industrial, Inc. | | | 66 | | | | 2,385 | |
Sunstone Hotel Investors, Inc. | | | 23 | | | | 229 | |
Terreno Realty Corp. | | | 4 | | | | 240 | |
Veris Residential, Inc.(1) | | | 8 | | | | 121 | |
Vornado Realty Trust | | | 9 | | | | 163 | |
Welltower, Inc. | | | 2 | | | | 160 | |
Weyerhaeuser Co. | | | 27 | | | | 910 | |
Xenia Hotels & Resorts, Inc. | | | 5 | | | | 67 | |
| | | | | | | | |
Total Real Estate | | | | 32,741 | |
| | | | | |
Utilities – 2.29% | | | | | | | | |
ALLETE, Inc. | | | 4 | | | | 235 | |
American Electric Power Co., Inc. | | | 40 | | | | 3,366 | |
American States Water Co. | | | 1 | | | | 122 | |
American Water Works Co., Inc. | | | 19 | | | | 2,719 | |
Avangrid, Inc. | | | 6 | | | | 224 | |
| | | | | | | | |
Avista Corp. | | | 4 | | | | 150 | |
Black Hills Corp. | | | 1 | | | | 73 | |
Brookfield Infrastructure Corp. - Class A | | | 3 | | | | 139 | |
California Water Service Group | | | 3 | | | | 134 | |
Clearway Energy, Inc. - Class C | | | 5 | | | | 152 | |
Consolidated Edison, Inc. | | | 2 | | | | 159 | |
Constellation Energy Corp. | | | 1 | | | | 82 | |
DTE Energy Co. | | | 2 | | | | 227 | |
Edison International | | | 2 | | | | 119 | |
Essential Utilities, Inc. | | | 1 | | | | 31 | |
Evergy, Inc. | | | 5 | | | | 272 | |
Eversource Energy | | | 4 | | | | 294 | |
FirstEnergy Corp. | | | 86 | | | | 3,334 | |
Hawaiian Electric Industries, Inc. | | | 1 | | | | 19 | |
IDACORP, Inc. | | | 21 | | | | 2,189 | |
MGE Energy, Inc. | | | 5 | | | | 402 | |
National Fuel Gas Co. | | | 6 | | | | 324 | |
New Jersey Resources Corp. | | | 6 | | | | 302 | |
NRG Energy, Inc. | | | 5 | | | | 193 | |
ONE Gas, Inc. | | | 6 | | | | 432 | |
Ormat Technologies, Inc. | | | 1 | | | | 96 | |
PNM Resources, Inc. | | | 7 | | | | 333 | |
Portland General Electric Co. | | | 42 | | | | 1,990 | |
Pure Cycle Corp.(1) | | | 6 | | | | 69 | |
SJW Group(2) | | | 0 | | | | 15 | |
Southwest Gas Holdings, Inc. | | | 13 | | | | 853 | |
WEC Energy Group, Inc.(2) | | | 0 | | | | 15 | |
York Water Co. | | | 1 | | | | 38 | |
| | | | | | | | |
Total Utilities | | | | 19,102 | |
| | | | | |
Total Common Stocks (Cost: $708,464) | | | | 808,610 | |
| | | | | |
SHORT-TERM INVESTMENTS – 2.61% | | | | | | | | |
Money Market Funds – 2.59% | | | | | | | | |
Goldman Sachs Financial Square Government Fund - Class I, 5.02%(3) | | | 21,587 | | | | 21,587 | |
| | | | | | | | |
Total Money Market Funds (Cost: $21,587) | | | | | | | 21,587 | |
| | | | | | | | |
| | |
| | | Principal
Amount
(000s) | | | Value
(000s) | |
Time Deposits – 0.02% | | | | | | | | |
ANZ, London, 4.57% due 07/03/2023 | | $ | 156 | | | | 156 | |
| | | | | | | | |
Total Time Deposits (Cost: $156) | | | | | | | 156 | |
| | | | | | | | |
Total Short-Term Investments (Cost: $21,743) | | | | 21,743 | |
| | | | | |
TOTAL INVESTMENTS IN SECURITIES – 99.63%
(Cost: $730,207) | | | | | | | 830,353 | |
| | | | | | | | |
OTHER ASSETS IN EXCESS OF LIABILITIES – 0.37% | | | | | | | 3,078 | |
| | | | | | | | |
TOTAL NET ASSETS – 100.00% | | | | | | $ | 833,431 | |
| | | | | | | | |
Percentages are stated as a percent of net assets.
ADR American Depositary Receipt
REIT Real Estate Investment Trust
| (1) | Non-income producing security. |
| (2) | A zero balance may reflect actual amounts rounding to less than one thousand. |
| (3) | Represents annualized seven-day yield as of the close of the reporting period. |
| (4) | Security that is categorized as Level 3 per the Trust’s fair value hierarchy. The value of these securities totals $0, which represents 0.00% of total net assets. |
| (5) | Security that is restricted at June 30, 2023. The value of these securities totals $0, which represents 0.00% of total net assets. |
The accompanying notes are an integral part of this Schedule of Investments.
Bridge Builder International Equity Fund
Schedule of Investments
June 30, 2023
(Amounts in thousands, except number of contracts)
| | | | | | | | |
| | | Shares
(000s) | | | Value
(000s) | |
COMMON STOCKS – 97.93% | | | | | | | | |
Australia – 2.03% | | | | | | | | |
ALS Ltd. | | | 334 | | | $ | 2,497 | |
AMP Ltd. | | | 2,231 | | | | 1,686 | |
Ampol Ltd. | | | 13 | | | | 252 | |
ANZ Group Holdings Ltd. | | | 592 | | | | 9,363 | |
APA Group | | | 62 | | | | 401 | |
Aristocrat Leisure Ltd. | | | 172 | | | | 4,458 | |
ASX Ltd. | | | 10 | | | | 427 | |
Atlassian Corp. - Class A(1) | | | 408 | | | | 68,507 | |
Aurizon Holdings Ltd. | | | 98 | | | | 255 | |
Beach Energy Ltd. | | | 2,147 | | | | 1,936 | |
BHP Group Ltd. | | | 878 | | | | 26,388 | |
BlueScope Steel Ltd. | | | 251 | | | | 3,456 | |
Brambles Ltd. | | | 398 | | | | 3,832 | |
carsales.com Ltd. | | | 124 | | | | 1,984 | |
Challenger Ltd. | | | 205 | | | | 888 | |
Cleanaway Waste Management Ltd. | | | 2,247 | | | | 3,888 | |
Cochlear Ltd. | | | 262 | | | | 40,079 | |
Coles Group Ltd. | | | 70 | | | | 858 | |
Commonwealth Bank of Australia | | | 88 | | | | 5,898 | |
Computershare Ltd. | | | 29 | | | | 457 | |
CSL Ltd. | | | 411 | | | | 76,028 | |
Dexus | | | 57 | | | | 297 | |
EBOS Group Ltd. | | | 8 | | | | 190 | |
Endeavour Group Ltd. | | | 75 | | | | 314 | |
Evolution Mining Ltd. | | | 1,022 | | | | 2,224 | |
Fortescue Metals Group Ltd. | | | 91 | | | | 1,349 | |
Goodman Group | | | 88 | | | | 1,177 | |
GPT Group | | | 100 | | | | 278 | |
GWA Group Ltd. | | | 320 | | | | 373 | |
IDP Education Ltd. | | | 13 | | | | 194 | |
IGO Ltd. | | | 35 | | | | 360 | |
Insurance Australia Group Ltd. | | | 129 | | | | 489 | |
IPH Ltd. | | | 283 | | | | 1,484 | |
Lendlease Corp. Ltd. | | | 35 | | | | 183 | |
Lottery Corp. Ltd. | | | 115 | | | | 395 | |
Macquarie Group Ltd. | | | 79 | | | | 9,353 | |
Medibank Pvt Ltd. | | | 142 | | | | 335 | |
Metcash Ltd. | | | 804 | | | | 2,017 | |
Mineral Resources Ltd. | | | 9 | | | | 424 | |
Mirvac Group | | | 210 | | | | 318 | |
National Australia Bank Ltd. | | | 168 | | | | 2,947 | |
Newcrest Mining Ltd. | | | 284 | | | | 5,067 | |
Northern Star Resources Ltd. | | | 62 | | | | 504 | |
Orica Ltd. | | | 24 | | | | 236 | |
Origin Energy Ltd. | | | 92 | | | | 514 | |
Pilbara Minerals Ltd. | | | 682 | | | | 2,241 | |
Qantas Airways Ltd.(1) | | | 931 | | | | 3,860 | |
QBE Insurance Group Ltd. | | | 982 | | | | 10,250 | |
Ramsay Health Care Ltd. | | | 10 | | | | 358 | |
REA Group Ltd. | | | 3 | | | | 261 | |
Reece Ltd. | | | 13 | | | | 157 | |
Rio Tinto Ltd. | | | 19 | | | | 1,479 | |
Santos Ltd. | | | 1,755 | | | | 8,782 | |
Scentre Group | | | 276 | | | | 488 | |
Seek Ltd. | | | 18 | | | | 269 | |
Sonic Healthcare Ltd. | | | 24 | | | | 559 | |
South32 Ltd. | | | 244 | | | | 615 | |
Stockland | | | 132 | | | | 355 | |
Suncorp Group Ltd. | | | 67 | | | | 600 | |
Telstra Group Ltd. | | | 212 | | | | 608 | |
Transurban Group | | | 164 | | | | 1,565 | |
Treasury Wine Estates Ltd. | | | 38 | | | | 286 | |
Vicinity Ltd. | | | 205 | | | | 252 | |
Washington H Soul Pattinson & Co. Ltd. | | | 13 | | | | 266 | |
Wesfarmers Ltd. | | | 59 | | | | 1,952 | |
Westpac Banking Corp. | | | 188 | | | | 2,671 | |
WiseTech Global Ltd. | | | 9 | | | | 464 | |
Woodside Energy Group Ltd. | | | 379 | | | | 8,764 | |
Woolworths Group Ltd. | | | 64 | | | | 1,688 | |
| | | | | | | | |
Total Australia | | | | | | | 333,350 | |
| | | | | | | | |
Austria – 0.18% | | | | | | | | |
Andritz AG | | | 148 | | | | 8,254 | |
Erste Group Bank AG | | | 18 | | | | 638 | |
Oesterreichische Post AG | | | 132 | | | | 4,724 | |
OMV AG | | | 8 | | | | 323 | |
| | | | | | | | |
Verbund AG | | | 4 | | | | 286 | |
Voestalpine AG | | | 6 | | | | 230 | |
Wienerberger AG | | | 470 | | | | 14,400 | |
| | | | | | | | |
Total Austria | | | | | | | 28,855 | |
| | | | | | | | |
Belgium – 0.30% | | | | | | | | |
Ageas SA | | | 9 | | | | 347 | |
Anheuser-Busch InBev SA | | | 798 | | | | 45,239 | |
D’ieteren Group | | | 1 | | | | 200 | |
Elia Group SA | | | 2 | | | | 194 | |
Groupe Bruxelles Lambert NV | | | 5 | | | | 419 | |
KBC Group NV | | | 13 | | | | 928 | |
Sofina SA | | | 1 | | | | 169 | |
Solvay SA | | | 4 | | | | 454 | |
UCB SA | | | 7 | | | | 583 | |
Umicore SA | | | 11 | | | | 311 | |
Warehouses de Pauw CVA | | | 8 | | | | 227 | |
| | | | | | | | |
Total Belgium | | | | | | | 49,071 | |
| | | | | | | | |
Bermuda – 0.40% | | | | | | | | |
Arch Capital Group Ltd.(1) | | | 739 | | | | 55,315 | |
Hiscox Ltd. | | | 726 | | | | 10,061 | |
| | | | | | | | |
Total Bermuda | | | | | | | 65,376 | |
| | | | | | | | |
Brazil – 0.80% | | | | | | | | |
Ambev SA | | | 17,413 | | | | 56,040 | |
B3 SA – Brasil Bolsa Balcao | | | 1,665 | | | | 5,080 | |
Banco do Brasil SA | | | 1,221 | | | | 12,596 | |
Localiza Rent a Car SA | | | 344 | | | | 4,928 | |
Raia Drogasil SA | | | 8,450 | | | | 52,234 | |
| | | | | | | | |
Total Brazil | | | | | | | 130,878 | |
| | | | | | | | |
Canada – 1.95% | | | | | | | | |
Canadian Pacific Kansas City Ltd. | | | 1,762 | | | | 142,299 | |
First Quantum Minerals Ltd. | | | 105 | | | | 2,485 | |
Magna International, Inc. | | | 396 | | | | 22,349 | |
Shopify, Inc. - Class A(1) | | | 940 | | | | 60,756 | |
Thomson Reuters Corp. | | | 328 | | | | 44,298 | |
Waste Connections, Inc. | | | 330 | | | | 47,224 | |
| | | | | | | | |
Total Canada | | | | | | | 319,411 | |
| | | | | | | | |
Chile – 0.00%(2) | | | | | | | | |
Antofagasta Plc | | | 21 | | | | 385 | |
| | | | | | | | |
Total Chile | | | | | | | 385 | |
| | | | | | | | |
China – 1.80% | | | | | | | | |
Alibaba Group Holding Ltd.(1) | | | 7,664 | | | | 79,778 | |
Baidu, Inc. - ADR(1) | | | 49 | | | | 6,693 | |
Baidu, Inc. - Class A(1) | | | 1,479 | | | | 25,221 | |
Contemporary Amperex Technology Co. Ltd. - Class A | | | 922 | | | | 29,111 | |
Li Ning Co. Ltd. | | | 4,221 | | | | 22,795 | |
LONGi Green Energy Technology Co. Ltd. - Class A | | | 4,898 | | | | 19,364 | |
Meituan – Class B(1)(3) | | | 1,862 | | | | 29,200 | |
Ping An Insurance Group Co. of China Ltd. - Class H | | | 6,216 | | | | 39,699 | |
Shenzhou International Group Holdings Ltd. | | | 266 | | | | 2,559 | |
Tingyi Cayman Islands Holding Corp. | | | 1,366 | | | | 2,127 | |
Trip.com Group Ltd. - ADR(1) | | | 697 | | | | 24,406 | |
Vipshop Holdings Ltd. - ADR(1) | | | 213 | | | | 3,520 | |
Weichai Power Co. Ltd. - Class H | | | 1,808 | | | | 2,660 | |
Yum China Holdings, Inc. | | | 80 | | | | 4,515 | |
Zhongsheng Group Holdings Ltd. | | | 861 | | | | 3,305 | |
| | | | | | | | |
Total China | | | | | | | 294,953 | |
| | | | | | | | |
Denmark – 2.86% | | | | | | | | |
AP Moller - Maersk - Class A(4) | | | 0 | | | | 284 | |
AP Moller - Maersk - Class B(4) | | | 0 | | | | 464 | |
Carlsberg AS - Class B | | | 107 | | | | 17,179 | |
Chr Hansen Holding | | | 6 | | | | 393 | |
Coloplast - Class B | | | 234 | | | | 29,239 | |
Danske Bank(1) | | | 1,361 | | | | 33,154 | |
Demant(1) | | | 340 | | | | 14,395 | |
DSV | | | 493 | | | | 103,598 | |
Genmab(1) | | | 3 | | | | 1,309 | |
GN Store Nord AS(1) | | | 262 | | | | 6,550 | |
Novo Nordisk - Class B | | | 1,315 | | | | 212,438 | |
Novozymes - Class B | | | 11 | | | | 501 | |
Orsted AS(3) | | | 109 | | | | 10,297 | |
Pandora | | | 5 | | | | 422 | |
ROCKWOOL - Class B(4) | | | 0 | | | | 118 | |
Tryg | | | 19 | | | | 403 | |
Vestas Wind Systems(1) | | | 1,415 | | | | 37,619 | |
| | | | | | | | |
Total Denmark | | | | | | | 468,363 | |
| | | | | | | | |
Finland – 0.60% | | | | | | | | |
Elisa OYJ | | | 7 | | | | 396 | |
Fortum OYJ | | | 24 | | | | 327 | |
Kesko OYJ - Class B | | | 14 | | | | 263 | |
Kone OYJ - Class B | | | 18 | | | | 930 | |
Metso OYJ | | | 34 | | | | 416 | |
Neste OYJ | | | 22 | | | | 859 | |
Nokia OYJ | | | 15,019 | | | | 62,928 | |
| | | | | | | | |
Nordea Bank Abp – Class A | | | 174 | | | | 1,894 | |
Orion OYJ – Class B | | | 6 | | | | 264 | |
Sampo OYJ – Class A | | | 518 | | | | 23,278 | |
Stora Enso OYJ – Class R | | | 31 | | | | 359 | |
UPM-Kymmene OYJ | | | 29 | | | | 853 | |
Wartsila OYJ Abp | | | 503 | | | | 5,671 | |
| | | | | | | | |
Total Finland | | | | | | | 98,438 | |
| | | | | | | | |
France – 8.82% | | | | | | | | |
Accor SA | | | 1,403 | | | | 52,194 | |
Aeroports de Paris | | | 2 | | | | 221 | |
Air Liquide SA | | | 27 | | | | 4,900 | |
Airbus SE | | | 123 | | | | 17,728 | |
Alstom SA | | | 17 | | | | 511 | |
Alten SA(1) | | | 60 | | | | 9,478 | |
Amundi SA(3) | | | 1,083 | | | | 63,956 | |
Arkema SA | | | 3 | | | | 299 | |
AXA SA | | | 98 | | | | 2,899 | |
BioMerieux | | | 2 | | | | 232 | |
BNP Paribas SA | | | 625 | | | | 39,471 | |
Bollore SE | | | 47 | | | | 293 | |
Bouygues SA | | | 4,053 | | | | 136,144 | |
Bureau Veritas SA | | | 15 | | | | 422 | |
Capgemini SE | | | 9 | | | | 1,626 | |
Carrefour SA | | | 31 | | | | 579 | |
Cie de Saint-Gobain | | | 1,652 | | | | 100,609 | |
Cie Generale des Etablissements Michelin SCA | | | 2,433 | | | | 71,982 | |
Covivio | | | 2 | | | | 115 | |
Credit Agricole SA | | | 65 | | | | 773 | |
Danone SA | | | 34 | | | | 2,107 | |
Dassault Aviation SA | | | 1 | | | | 260 | |
Dassault Systemes SE | | | 35 | | | | 1,549 | |
Edenred | | | 474 | | | | 31,766 | |
Eiffage SA | | | 4 | | | | 419 | |
Elis SA | | | 334 | | | | 6,503 | |
Engie SA | | | 98 | | | | 1,631 | |
EssilorLuxottica SA | | | 144 | | | | 27,110 | |
Eurazeo SE | | | 2 | | | | 171 | |
Gecina SA | | | 2 | | | | 256 | |
Getlink SE | | | 341 | | | | 5,808 | |
Hermes International | | | 2 | | | | 3,593 | |
Ipsen SA | | | 2 | | | | 239 | |
JCDecaux SE(1) | | | 370 | | | | 7,371 | |
Kering SA | | | 60 | | | | 33,113 | |
Klepierre SA | | | 11 | | | | 285 | |
La Francaise des Jeux SAEM(3) | | | 6 | | | | 224 | |
Legrand SA | | | 235 | | | | 23,299 | |
L’Oreal SA | | | 13 | | | | 5,868 | |
LVMH Moet Hennessy Louis Vuitton SE | | | 167 | | | | 157,526 | |
Orange SA | | | 99 | | | | 1,154 | |
Pernod Ricard SA | | | 264 | | | | 58,343 | |
Publicis Groupe SA | | | 308 | | | | 24,749 | |
Quadient SA | | | 67 | | | | 1,388 | |
Remy Cointreau SA | | | 291 | | | | 46,781 | |
Renault SA | | | 10 | | | | 427 | |
Rexel SA | | | 3,193 | | | | 78,910 | |
Safran SA | | | 18 | | | | 2,787 | |
Sanofi | | | 1,928 | | | | 207,528 | |
Sartorius Stedim Biotech | | | 226 | | | | 56,553 | |
Schneider Electric SE | | | 640 | | | | 116,346 | |
SEB SA | | | 1 | | | | 132 | |
Societe Generale SA | | | 38 | | | | 997 | |
Sodexo SA | | | 5 | | | | 510 | |
Technip Energies NV | | | 273 | | | | 6,295 | |
Teleperformance | | | 33 | | | | 5,471 | |
Thales SA | | | 5 | | | | 822 | |
TotalEnergies SE | | | 126 | | | | 7,243 | |
Ubisoft Entertainment SA(1) | | | 409 | | | | 11,559 | |
Unibail-Rodamco-Westfield(1) | | | 6 | | | | 328 | |
Valeo | | | 11 | | | | 229 | |
Veolia Environnement SA | | | 37 | | | | 1,160 | |
Vinci SA | | | 28 | | | | 3,302 | |
Vivendi SE | | | 38 | | | | 345 | |
Wendel SE | | | 1 | | | | 144 | |
Worldline SA(1)(3) | | | 13 | | | | 460 | |
| | | | | | | | |
Total France | | | | | | | 1,447,493 | |
| | | | | | | | |
Germany – 5.58% | | | | | | | | |
Adidas AG | | | 240 | | | | 46,512 | |
Allianz SE | | | 552 | | | | 128,516 | |
Auto1 Group SE(1)(3) | | | 1,592 | | | | 14,787 | |
BASF SE | | | 1,549 | | | | 75,264 | |
Bayer AG | | | 489 | | | | 27,057 | |
Bayerische Motoren Werke AG | | | 182 | | | | 22,414 | |
Bechtle AG | | | 5 | | | | 179 | |
| | | | | | | | |
Beiersdorf AG | | | 5 | | | | 703 | |
Brenntag SE | | | 271 | | | | 21,124 | |
Carl Zeiss Meditec AG | | | 2 | | | | 235 | |
Commerzbank AG | | | 56 | | | | 624 | |
Continental AG | | | 908 | | | | 68,607 | |
Covestro AG(1)(3) | | | 1,728 | | | | 89,906 | |
CTS Eventim AG & Co. KGaA | | | 86 | | | | 5,445 | |
Daimler Truck Holding AG | | | 1,922 | | | | 69,267 | |
Delivery Hero SE(1)(3) | | | 9 | | | | 388 | |
Deutsche Bank AG | | | 103 | | | | 1,081 | |
Deutsche Boerse AG | | | 10 | | | | 1,830 | |
Deutsche Lufthansa AG(1) | | | 33 | | | | 334 | |
Deutsche Post AG | | | 54 | | | | 2,629 | |
Deutsche Telekom AG | | | 173 | | | | 3,771 | |
E.ON SE | | | 120 | | | | 1,532 | |
Evonik Industries AG | | | 5,113 | | | | 97,433 | |
Fresenius Medical Care AG & Co. KGaA | | | 1,525 | | | | 72,864 | |
Fresenius SE & Co. KGaA | | | 23 | | | | 632 | |
GEA Group AG | | | 152 | | | | 6,352 | |
Gerresheimer AG | | | 72 | | | | 8,105 | |
Hannover Rueck SE | | | 58 | | | | 12,221 | |
Heidelberg Materials AG | | | 8 | | | | 631 | |
HelloFresh SE(1) | | | 361 | | | | 8,921 | |
Henkel AG & Co. KGaA | | | 6 | | | | 390 | |
Infineon Technologies AG | | | 68 | | | | 2,806 | |
Knorr-Bremse AG | | | 4 | | | | 291 | |
LEG Immobilien SE(1) | | | 4 | | | | 222 | |
Mercedes-Benz Group AG – Class REGISTERED | | | 46 | | | | 3,695 | |
Merck KGaA | | | 7 | | | | 1,125 | |
MTU Aero Engines AG | | | 3 | | | | 730 | |
Muenchener Rueckversicherungs-Gesellschaft AG in Muenchen | | | 7 | | | | 2,737 | |
Nemetschek SE | | | 371 | | | | 27,684 | |
Puma SE | | | 6 | | | | 342 | |
Rational AG(4) | | | 0 | | | | 199 | |
Rheinmetall AG | | | 2 | | | | 624 | |
RWE AG | | | 33 | | | | 1,458 | |
SAP SE | | | 54 | | | | 7,444 | |
Scout24 SE(3) | | | 4 | | | | 262 | |
Siemens AG | | | 117 | | | | 19,578 | |
Siemens Energy AG(1) | | | 27 | | | | 481 | |
Siemens Healthineers AG(3) | | | 15 | | | | 827 | |
Stabilus SE | | | 116 | | | | 6,953 | |
Symrise AG – Class A | | | 7 | | | | 716 | |
Talanx AG | | | 3 | | | | 193 | |
Telefonica Deutschland Holding AG | | | 57 | | | | 161 | |
TUI AG(1) | | | 1,099 | | | | 7,825 | |
Volkswagen AG | | | 2 | | | | 277 | |
Vonovia SE | | | 38 | | | | 749 | |
Wacker Chemie AG | | | 1 | | | | 133 | |
Zalando SE(1)(3) | | | 1,349 | | | | 38,896 | |
| | | | | | | | |
Total Germany | | | | | | | 916,162 | |
| | | | | | | | |
Hong Kong – 2.85% | | | | | | | | |
AIA Group Ltd. | | | 13,291 | | | | 134,990 | |
Ajisen China Holdings Ltd. | | | 2,154 | | | | 247 | |
ASMPT Ltd. | | | 235 | | | | 2,326 | |
BOC Hong Kong Holdings Ltd. | | | 194 | | | | 593 | |
Budweiser Brewing Co. APAC Ltd.(3) | | | 90 | | | | 232 | |
China Mengniu Dairy Co. Ltd.(1) | | | 195 | | | | 737 | |
CK Asset Holdings Ltd. | | | 106 | | | | 589 | |
CK Hutchison Holdings Ltd. | | | 19,535 | | | | 119,227 | |
CK Infrastructure Holdings Ltd. | | | 36 | | | | 188 | |
CLP Holdings Ltd. | | | 89 | | | | 689 | |
Esprit Holdings Ltd.(1) | | | 3,613 | | | | 278 | |
ESR Group Ltd.(3) | | | 111 | | | | 190 | |
First Pacific Co. Ltd. | | | 2,326 | | | | 806 | |
Futu Holdings Ltd. - ADR(1) | | | 3 | | | | 128 | |
Galaxy Entertainment Group Ltd.(1) | | | 7,911 | | | | 50,399 | |
Hang Lung Properties Ltd. | | | 106 | | | | 164 | |
Hang Seng Bank Ltd. | | | 40 | | | | 575 | |
Henderson Land Development Co. Ltd. | | | 78 | | | | 232 | |
HKT Trust & HKT Ltd. - Class Miscella | | | 209 | | | | 243 | |
Hong Kong & China Gas Co. Ltd. | | | 611 | | | | 529 | |
Hong Kong Exchanges & Clearing Ltd. | | | 62 | | | | 2,364 | |
Hongkong Land Holdings Ltd. | | | 57 | | | | 224 | |
Jardine Matheson Holdings Ltd. | | | 137 | | | | 6,932 | |
Johnson Electric Holdings Ltd. | | | 684 | | | | 878 | |
Link Real Estate Investment Trust | | | 134 | | | | 746 | |
MTR Corp. Ltd. | | | 85 | | | | 391 | |
New World Development Co. Ltd. | | | 83 | | | | 205 | |
Power Assets Holdings Ltd. | | | 77 | | | | 402 | |
Prudential Plc | | | 49 | | | | 680 | |
Prudential Plc | | | 1,025 | | | | 14,482 | |
Sino Land Co. Ltd. | | | 190 | | | | 235 | |
| | | | | | | | |
SITC International Holdings Co. Ltd. | | | 69 | | | | 126 | |
Stella International Holdings Ltd. | | | 862 | | | | 814 | |
Sun Hung Kai Properties Ltd. | | | 78 | | | | 985 | |
Swire Pacific Ltd. - Class A | | | 654 | | | | 5,024 | |
Swire Properties Ltd. | | | 60 | | | | 149 | |
Techtronic Industries Co. Ltd. | | | 4,857 | | | | 53,118 | |
WH Group Ltd.(3) | | | 124,926 | | | | 66,533 | |
Wharf Real Estate Investment Co. Ltd. | | | 86 | | | | 431 | |
Xinyi Glass Holdings Ltd. | | | 106 | | | | 166 | |
| | | | | | | | |
Total Hong Kong | | | | | | | 468,247 | |
| | | | | | | | |
Hungary – 0.04% | | | | | | | | |
OTP Bank Nyrt | | | 177 | | | | 6,294 | |
| | | | | | | | |
Total Hungary | | | | | | | 6,294 | |
| | | | | | | | |
India – 1.51% | | | | | | | | |
Axis Bank Ltd. | | | 151 | | | | 1,821 | |
Dabur India Ltd. | | | 318 | | | | 2,225 | |
Havells India Ltd. | | | 139 | | | | 2,176 | |
HDFC Bank Ltd. - ADR | | | 123 | | | | 8,552 | |
Housing Development Finance Corp. Ltd. | | | 2,148 | | | | 74,054 | |
ICICI Bank Ltd. - ADR | | | 2,770 | | | | 63,939 | |
Infosys Ltd. - ADR | | | 179 | | | | 2,877 | |
MakeMyTrip Ltd.(1) | �� | | 498 | | | | 13,432 | |
Marico Ltd. | | | 345 | | | | 2,239 | |
Reliance Industries Ltd. | | | 1,256 | | | | 39,206 | |
Tata Consultancy Services Ltd. | | | 103 | | | | 4,171 | |
United Spirits Ltd.(1) | | | 2,927 | | | | 32,614 | |
| | | | | | | | |
Total India | | | | | | | 247,306 | |
| | | | | | | | |
Indonesia – 0.04% | | | | | | | | |
Bank Central Asia Tbk PT | | | 11,916 | | | | 7,308 | |
| | | | | | | | |
Total Indonesia | | | | | | | 7,308 | |
| | | | | | | | |
Ireland – 2.34% | | | | | | | | |
Accenture Plc – Class A | | | 176 | | | | 54,288 | |
AerCap Holdings NV(1) | | | 9 | | | | 567 | |
AIB Group Plc | | | 71 | | | | 298 | |
Bank of Ireland Group Plc | | | 5,925 | | | | 56,571 | |
CRH Plc | | | 198 | | | | 10,911 | |
DCC Plc | | | 209 | | | | 11,707 | |
Experian Plc | | | 2,912 | | | | 111,771 | |
Flutter Entertainment Plc(1) | | | 253 | | | | 50,829 | |
ICON Plc(1) | | | 313 | | | | 78,198 | |
Irish Continental Group Plc | | | 1,029 | | | | 5,256 | |
James Hardie Industries Plc(1) | | | 81 | | | | 2,171 | |
Kerry Group Plc - Class A | | | 8 | | | | 813 | |
Kingspan Group Plc | | | 8 | | | | 530 | |
Smurfit Kappa Group Plc | | | 14 | | | | 460 | |
| | | | | | | | |
Total Ireland | | | | | | | 384,370 | |
| | | | | | | | |
Isle of Man – 0.03% | | | | | | | | |
Playtech Plc(1) | | | 687 | | | | 5,146 | |
| | | | | | | | |
Total Isle of Man | | | | | | | 5,146 | |
| | | | | | | | |
Israel – 0.03% | | | | | | | | |
Azrieli Group Ltd. | | | 2 | | | | 125 | |
Bank Hapoalim BM | | | 68 | | | | 560 | |
Bank Leumi Le-Israel BM | | | 82 | | | | 617 | |
Check Point Software Technologies Ltd.(1) | | | 5 | | | | 630 | |
CyberArk Software Ltd.(1) | | | 2 | | | | 328 | |
Elbit Systems Ltd. | | | 1 | | | | 283 | |
ICL Group Ltd. | | | 41 | | | | 225 | |
Israel Discount Bank Ltd. - Class A | | | 67 | | | | 337 | |
Mizrahi Tefahot Bank Ltd. | | | 8 | | | | 274 | |
Monday.com Ltd.(1) | | | 1 | | | | 170 | |
Nice Ltd.(1) | | | 3 | | | | 671 | |
Teva Pharmaceutical Industries Ltd. - ADR(1) | | | 59 | | | | 441 | |
Tower Semiconductor Ltd.(1) | | | 6 | | | | 206 | |
Wix.com Ltd.(1) | | | 3 | | | | 232 | |
| | | | | | | | |
Total Israel | | | | | | | 5,099 | |
| | | | | | | | |
Italy – 3.76% | | | | | | | | |
Amplifon SpA | | | 273 | | | | 10,030 | |
Assicurazioni Generali SpA | | | 54 | | | | 1,093 | |
Davide Campari-Milano NV | | | 1,275 | | | | 17,676 | |
DiaSorin SpA | | | 1 | | | | 132 | |
Enel SpA | | | 32,406 | | | | 218,496 | |
ENI SpA | | | 4,840 | | | | 69,673 | |
Ferrari NV | | | 351 | | | | 114,869 | |
FinecoBank Banca Fineco SpA | | | 32 | | | | 425 | |
Infrastrutture Wireless Italiane SpA(3) | | | 18 | | | | 241 | |
Intesa Sanpaolo SpA | | | 860 | | | | 2,254 | |
Iveco Group NV(1) | | | 539 | | | | 4,864 | |
Mediobanca Banca di Credito Finanziario SpA | | | 30 | | | | 365 | |
Moncler SpA | | | 11 | | | | 751 | |
Nexi SpA(1)(3) | | | 30 | | | | 235 | |
Poste Italiane SpA(3) | | | 28 | | | | 304 | |
Prysmian SpA | | | 13 | | | | 552 | |
Recordati Industria Chimica e Farmaceutica SpA | | | 5 | | | | 262 | |
| | | | | | | | |
Reply SpA | | | 21 | | | | 2,369 | |
Snam SpA | | | 24,451 | | | | 127,787 | |
Telecom Italia SpA(1) | | | 528 | | | | 149 | |
Terna – Rete Elettrica Nazionale | | | 74 | | | | 633 | |
UniCredit SpA | | | 1,890 | | | | 43,950 | |
| | | | | | | | |
Total Italy | | | | | | | 617,110 | |
| | | | | | | | |
Japan – 19.38% | | | | | | | | |
ABC-Mart, Inc. | | | 104 | | | | 5,646 | |
Advantest Corp. | | | 127 | | | | 17,064 | |
Aeon Co. Ltd. | | | 34 | | | | 702 | |
Aeon Delight Co. Ltd. | | | 34 | | | | 726 | |
AGC, Inc. | | | 11 | | | | 392 | |
Air Water, Inc. | | | 958 | | | | 13,305 | |
Aisin Corp. | | | 8 | | | | 247 | |
Ajinomoto Co., Inc. | | | 23 | | | | 935 | |
ANA Holdings, Inc.(1) | | | 9 | | | | 202 | |
Asahi Group Holdings Ltd. | | | 273 | | | | 10,608 | |
Asahi Intecc Co. Ltd. | | | 12 | | | | 234 | |
Asahi Kasei Corp. | | | 67 | | | | 456 | |
Astellas Pharma, Inc. | | | 96 | | | | 1,427 | |
Azbil Corp. | | | 6 | | | | 193 | |
Bandai Namco Holdings, Inc. | | | 31 | | | | 723 | |
BayCurrent Consulting, Inc. | | | 7 | | | | 259 | |
Bridgestone Corp. | | | 832 | | | | 34,168 | |
Brother Industries Ltd. | | | 12 | | | | 173 | |
Canon, Inc. | | | 54 | | | | 1,406 | |
Capcom Co. Ltd. | | | 9 | | | | 361 | |
Central Japan Railway Co. | | | 8 | | | | 965 | |
Chiba Bank Ltd. | | | 28 | | | | 168 | |
Chubu Electric Power Co., Inc. | | | 35 | | | | 425 | |
Chugai Pharmaceutical Co. Ltd. | | | 35 | | | | 1,000 | |
Concordia Financial Group Ltd. | | | 58 | | | | 227 | |
Cosmos Pharmaceutical Corp. | | | 342 | | | | 34,667 | |
CyberAgent, Inc. | | | 22 | | | | 162 | |
Dai Nippon Printing Co. Ltd. | | | 12 | | | | 335 | |
Daiei Kankyo Co. Ltd. | | | 201 | | | | 3,549 | |
Daifuku Co. Ltd. | | | 375 | | | | 7,732 | |
Dai-ichi Life Holdings, Inc. | | | 1,084 | | | | 20,616 | |
Daiichi Sankyo Co. Ltd. | | | 96 | | | | 3,060 | |
Daikin Industries Ltd. | | | 14 | | | | 2,848 | |
Daito Trust Construction Co. Ltd. | | | 3 | | | | 334 | |
Daiwa House Industry Co. Ltd. | | | 829 | | | | 21,896 | |
Daiwa House REIT Investment Corp.(4) | | | 0 | | | �� | 226 | |
Daiwa Securities Group, Inc. | | | 69 | | | | 356 | |
Denso Corp. | | | 493 | | | | 33,222 | |
Dentsu Group, Inc. | | | 11 | | | | 345 | |
Disco Corp. | | | 5 | | | | 761 | |
Dowa Holdings Co. Ltd. | | | 178 | | | | 5,639 | |
East Japan Railway Co. | | | 149 | | | | 8,268 | |
Eisai Co. Ltd. | | | 13 | | | | 895 | |
ENEOS Holdings, Inc. | | | 162 | | | | 557 | |
FANUC Corp. | | | 50 | | | | 1,769 | |
Fast Retailing Co. Ltd. | | | 9 | | | | 2,334 | |
Fuji Electric Co. Ltd. | | | 7 | | | | 295 | |
Fuji Media Holdings, Inc. | | | 952 | | | | 9,980 | |
FUJIFILM Holdings Corp. | | | 2,069 | | | | 123,272 | |
Fujitsu Ltd. | | | 9 | | | | 1,191 | |
Fukuoka Financial Group, Inc. | | | 1,080 | | | | 22,312 | |
GLP J-REIT(4) | | | 0 | | | | 230 | |
GMO Payment Gateway, Inc. | | | 2 | | | | 180 | |
Hakuhodo DY Holdings, Inc. | | | 399 | | | | 4,209 | |
Hamamatsu Photonics KK | | | 7 | | | | 358 | |
Hankyu Hanshin Holdings, Inc. | | | 12 | | | | 400 | |
Hikari Tsushin, Inc. | | | 1 | | | | 144 | |
Hirose Electric Co. Ltd. | | | 2 | | | | 200 | |
Hitachi Construction Machinery Co. Ltd. | | | 6 | | | | 155 | |
Hitachi Ltd. | | | 1,986 | | | | 123,495 | |
Honda Motor Co. Ltd. | | | 4,298 | | | | 130,209 | |
Hoshizaki Corp. | | | 6 | | | | 205 | |
Hoya Corp. | | | 19 | | | | 2,238 | |
Hulic Co. Ltd. | | | 21 | | | | 183 | |
Ibiden Co. Ltd. | | | 6 | | | | 353 | |
Idemitsu Kosan Co. Ltd. | | | 11 | | | | 214 | |
Iida Group Holdings Co. Ltd. | | | 965 | | | | 16,311 | |
INFRONEER Holdings, Inc. | | | 890 | | | | 8,395 | |
Inpex Corp. | | | 1,087 | | | | 11,940 | |
Isuzu Motors Ltd. | | | 2,591 | | | | 31,437 | |
ITOCHU Corp. | | | 378 | | | | 15,023 | |
Itochu Techno-Solutions Corp. | | | 5 | | | | 127 | |
Japan Airlines Co. Ltd. | | | 8 | | | | 165 | |
Japan Exchange Group, Inc. | | | 27 | | | | 464 | |
Japan Metropolitan Fund Invest(4) | | | 0 | | | | 246 | |
Japan Post Bank Co. Ltd. | | | 79 | | | | 615 | |
| | | | | | | | |
Japan Post Holdings Co. Ltd. | | | 1,023 | | | | 7,355 | |
Japan Post Insurance Co. Ltd. | | | 10 | | | | 156 | |
Japan Real Estate Investment Corp.(4) | | | 0 | | | | 270 | |
Japan Tobacco, Inc. | | | 64 | | | | 1,404 | |
JFE Holdings, Inc. | | | 26 | | | | 375 | |
JSR Corp. | | | 9 | | | | 267 | |
Kajima Corp. | | | 23 | | | | 343 | |
Kansai Electric Power Co., Inc. | | | 37 | | | | 469 | |
Kao Corp. | | | 2,178 | | | | 79,041 | |
Kawasaki Kisen Kaisha Ltd. | | | 7 | | | | 179 | |
KDDI Corp. | | | 227 | | | | 7,017 | |
Keio Corp. | | | 5 | | | | 167 | |
Keisei Electric Railway Co. Ltd. | | | 7 | | | | 286 | |
Keyence Corp. | | | 251 | | | | 119,104 | |
Kikkoman Corp. | | | 8 | | | | 428 | |
Kintetsu Group Holdings Co. Ltd. | | | 10 | | | | 332 | |
Kirin Holdings Co. Ltd. | | | 2,040 | | | | 29,784 | |
Kobayashi Pharmaceutical Co. Ltd. | | | 3 | | | | 141 | |
Kobe Bussan Co. Ltd. | | | 8 | | | | 202 | |
Koei Tecmo Holdings Co. Ltd. | | | 6 | | | | 111 | |
Koito Manufacturing Co. Ltd. | | | 11 | | | | 200 | |
Komatsu Ltd. | | | 2,656 | | | | 71,834 | |
Konami Group Corp. | | | 5 | | | | 257 | |
Kose Corp. | | | 2 | | | | 173 | |
Kubota Corp. | | | 392 | | | | 5,743 | |
Kurita Water Industries Ltd. | | | 5 | | | | 207 | |
Kyocera Corp. | | | 1,475 | | | | 80,195 | |
Kyowa Kirin Co. Ltd. | | | 14 | | | | 259 | |
Lasertec Corp. | | | 4 | | | | 589 | |
Lixil Corp. | | | 15 | | | | 188 | |
M3, Inc. | | | 23 | | | | 497 | |
Makita Corp. | | | 12 | | | | 334 | |
Marubeni Corp. | | | 82 | | | | 1,396 | |
Marui Group Co. Ltd. | | | 420 | | | | 7,342 | |
MatsukiyoCocokara & Co. | | | 79 | | | | 4,460 | |
Mazda Motor Corp. | | | 31 | | | | 298 | |
McDonald’s Holdings Co. Japan Ltd. | | | 5 | | | | 177 | |
Medipal Holdings Corp. | | | 480 | | | | 7,849 | |
Megmilk Snow Brand Co. Ltd. | | | 285 | | | | 3,873 | |
MEIJI Holdings Co. Ltd. | | | 12 | | | | 264 | |
Minebea Mitsumi, Inc. | | | 1,951 | | | | 36,998 | |
MISUMI Group, Inc. | | | 15 | | | | 304 | |
Mitsubishi Chemical Group Corp. | | | 67 | | | | 402 | |
Mitsubishi Corp. | | | 66 | | | | 3,196 | |
Mitsubishi Electric Corp. | | | 9,121 | | | | 128,941 | |
Mitsubishi Estate Co. Ltd. | | | 60 | | | | 715 | |
Mitsubishi HC Capital, Inc. | | | 47 | | | | 277 | |
Mitsubishi Heavy Industries Ltd. | | | 466 | | | | 21,755 | |
Mitsubishi Logistics Corp. | | | 259 | | | | 6,400 | |
Mitsubishi UFJ Financial Group, Inc. | | | 611 | | | | 4,507 | |
Mitsui & Co. Ltd. | | | 70 | | | | 2,634 | |
Mitsui Chemicals, Inc. | | | 10 | | | | 280 | |
Mitsui Fudosan Co. Ltd. | | | 48 | | | | 953 | |
Mitsui OSK Lines Ltd. | | | 19 | | | | 452 | |
Miura Co. Ltd. | | | 178 | | | | 4,647 | |
Mizuho Financial Group, Inc. | | | 128 | | | | 1,963 | |
Monotaro Co. Ltd. | | | 13 | | | | 163 | |
MS&AD Insurance Group Holdings, Inc. | | | 398 | | | | 14,081 | |
Murata Manufacturing Co. Ltd. | | | 826 | | | | 47,424 | |
NEC Corp. | | | 405 | | | | 19,662 | |
NET One Systems Co. Ltd. | | | 243 | | | | 5,332 | |
Nexon Co. Ltd. | | | 20 | | | | 389 | |
NGK Insulators Ltd. | | | 12 | | | | 147 | |
NH Foods Ltd. | | | 258 | | | | 6,985 | |
Nidec Corp. | | | 638 | | | | 35,143 | |
Nintendo Co. Ltd. | | | 54 | | | | 2,466 | |
Nippon Building Fund, Inc.(4) | | | 0 | | | | 319 | |
Nippon Express Holdings, Inc. | | | 4 | | | | 220 | |
Nippon Paint Holdings Co. Ltd. | | | 3,856 | | | | 31,911 | |
Nippon Prologis Real Estate Investment Trust, Inc.(4) | | | 0 | | | | 245 | |
Nippon Sanso Holdings Corp. | | | 9 | | | | 204 | |
Nippon Shinyaku Co. Ltd. | | | 3 | | | | 102 | |
Nippon Steel Corp. | | | 43 | | | | 904 | |
Nippon Telegraph & Telephone Corp. | | | 53,853 | | | | 63,724 | |
Nippon Television Holdings, Inc. | | | 648 | | | | 6,177 | |
Nippon Yusen KK | | | 26 | | | | 577 | |
Nissan Chemical Corp. | | | 182 | | | | 7,826 | |
Nissan Motor Co. Ltd. | | | 124 | | | | 511 | |
Nisshin Seifun Group, Inc. | | | 10 | | | | 127 | |
Nisshinbo Holdings, Inc. | | | 778 | | | | 6,455 | |
Nissin Foods Holdings Co. Ltd. | | | 3 | | | | 273 | |
Nitori Holdings Co. Ltd. | | | 4 | | | | 472 | |
Nitto Denko Corp. | | | 8 | | | | 579 | |
| | | | | | | | |
Nomura Co. Ltd. | | | 138 | | | | 947 | |
Nomura Holdings, Inc. | | | 2,958 | | | | 11,276 | |
Nomura Real Estate Holdings, Inc. | | | 6 | | | | 140 | |
Nomura Real Estate Master Fund, Inc.(4) | | | 0 | | | | 258 | |
Nomura Research Institute Ltd. | | | 21 | | | | 567 | |
NS Solutions Corp. | | | 191 | | | | 5,337 | |
NSK Ltd. | | | 493 | | | | 3,157 | |
NTT Data Corp. | | | 280 | | | | 3,922 | |
Obayashi Corp. | | | 1,899 | | | | 16,421 | |
Obic Co. Ltd. | | | 4 | | | | 594 | |
Odakyu Electric Railway Co. Ltd. | | | 15 | | | | 202 | |
Oji Holdings Corp. | | | 2,434 | | | | 9,101 | |
Olympus Corp. | | | 3,106 | | | | 49,148 | |
Omron Corp. | | | 68 | | | | 4,145 | |
Ono Pharmaceutical Co. Ltd. | | | 20 | | | | 354 | |
Open House Group Co. Ltd. | | | 4 | | | | 152 | |
Oracle Corp. | | | 97 | | | | 7,184 | |
Oriental Land Co. Ltd. | | | 57 | | | | 2,234 | |
ORIX Corp. | | | 63 | | | | 1,143 | |
Osaka Gas Co. Ltd. | | | 20 | | | | 302 | |
Otsuka Corp. | | | 6 | | | | 226 | |
Otsuka Holdings Co. Ltd. | | | 21 | | | | 752 | |
Pan Pacific International Holdings Corp. | | | 20 | | | | 362 | |
Panasonic Holdings Corp. | | | 118 | | | | 1,443 | |
Penta-Ocean Construction Co. Ltd. | | | 1,260 | | | | 6,771 | |
Persol Holdings Co. Ltd. | | | 209 | | | | 3,775 | |
Pigeon Corp. | | | 979 | | | | 13,515 | |
Rakuten Group, Inc. | | | 82 | | | | 286 | |
Recruit Holdings Co. Ltd. | | | 948 | | | | 30,261 | |
Renesas Electronics Corp.(1) | | | 1,034 | | | | 19,505 | |
Resona Holdings, Inc. | | | 13,528 | | | | 64,774 | |
Ricoh Co. Ltd. | | | 31 | | | | 261 | |
Rohm Co. Ltd. | | | 5 | | | | 426 | |
Sawai Group Holdings Co. Ltd. | | | 56 | | | | 1,399 | |
SBI Holdings, Inc. | | | 13 | | | | 249 | |
SCSK Corp. | | | 530 | | | | 8,337 | |
Secom Co. Ltd. | | | 1,349 | | | | 91,312 | |
Sega Sammy Holdings, Inc. | | | 621 | | | | 13,293 | |
Seiko Epson Corp. | | | 16 | | | | 245 | |
Sekisui Chemical Co. Ltd. | | | 322 | | | | 4,651 | |
Sekisui House Ltd. | | | 33 | | | | 675 | |
Senko Group Holdings Co. Ltd. | | | 520 | | | | 3,740 | |
Seven & i Holdings Co. Ltd. | | | 206 | | | | 8,878 | |
SG Holdings Co. Ltd. | | | 17 | | | | 238 | |
Sharp Corp. | | | 12 | | | | 68 | |
Shimadzu Corp. | | | 13 | | | | 386 | |
Shimano, Inc. | | | 220 | | | | 36,863 | |
Shimizu Corp. | | | 28 | | | | 174 | |
Shin-Etsu Chemical Co. Ltd. | | | 95 | | | | 3,167 | |
Shionogi & Co. Ltd. | | | 14 | | | | 574 | |
Ship Healthcare Holdings, Inc. | | | 234 | | | | 3,871 | |
Shiseido Co. Ltd. | | | 1,538 | | | | 69,702 | |
Shizuoka Financial Group, Inc. | | | 23 | | | | 163 | |
SMC Corp. | | | 111 | | | | 61,952 | |
SoftBank Corp. | | | 154 | | | | 1,640 | |
SoftBank Group Corp. | | | 54 | | | | 2,523 | |
Sompo Holdings, Inc. | | | 16 | | | | 736 | |
Sony Group Corp. | | | 1,821 | | | | 164,356 | |
Square Enix Holdings Co. Ltd. | | | 5 | | | | 214 | |
Subaru Corp. | | | 3,131 | | | | 58,976 | |
Sugi Holdings Co. Ltd. | | | 300 | | | | 13,392 | |
Sumco Corp. | | | 18 | | | | 254 | |
Sumitomo Bakelite Co. Ltd. | | | 135 | | | | 5,623 | |
Sumitomo Chemical Co. Ltd. | | | 74 | | | | 225 | |
Sumitomo Corp. | | | 60 | | | | 1,279 | |
Sumitomo Electric Industries Ltd. | | | 39 | | | | 474 | |
Sumitomo Metal Mining Co. Ltd. | | | 308 | | | | 9,933 | |
Sumitomo Mitsui Financial Group, Inc. | | | 501 | | | | 21,477 | |
Sumitomo Mitsui Trust Holdings, Inc. | | | 616 | | | | 21,846 | |
Sumitomo Realty & Development Co. Ltd. | | | 16 | | | | 399 | |
Suntory Beverage & Food Ltd. | | | 7 | | | | 261 | |
Suzuki Motor Corp. | | | 20 | | | | 725 | |
Sysmex Corp. | | | 666 | | | | 45,601 | |
T&D Holdings, Inc. | | | 855 | | | | 12,533 | |
Taiheiyo Cement Corp. | | | 708 | | | | 13,990 | |
Taisei Corp. | | | 134 | | | | 4,686 | |
Takeda Pharmaceutical Co. Ltd. | | | 5,336 | | | | 167,672 | |
TBS Holdings, Inc. | | | 424 | | | | 7,743 | |
TDK Corp. | | | 313 | | | | 12,189 | |
TechnoPro Holdings, Inc. | | | 111 | | | | 2,408 | |
Terumo Corp. | | | 35 | | | | 1,115 | |
TIS, Inc. | | | 11 | | | | 283 | |
Tobu Railway Co. Ltd. | | | 10 | | | | 266 | |
| | | | | | | | |
Toho Co. Ltd. | | | 6 | | | | 232 | |
Tokio Marine Holdings, Inc. | | | 3,884 | | | | 89,538 | |
Tokyo Electric Power Co. Holdings, Inc.(1) | | | 84 | | | | 307 | |
Tokyo Electron Ltd. | | | 24 | | | | 3,385 | |
Tokyo Gas Co. Ltd. | | | 21 | | | | 467 | |
Tokyu Corp. | | | 28 | | | | 338 | |
Topcon Corp. | | | 164 | | | | 2,422 | |
TOPPAN, Inc. | | | 14 | | | | 300 | |
Toray Industries, Inc. | | | 6,194 | | | | 34,534 | |
Toshiba Corp. | | | 22 | | | | 675 | |
Tosoh Corp. | | | 14 | | | | 169 | |
TOTO Ltd. | | | 8 | | | | 227 | |
Toyo Seikan Group Holdings Ltd. | | | 754 | | | | 11,111 | |
Toyo Suisan Kaisha Ltd. | | | 262 | | | | 11,801 | |
Toyota Industries Corp. | | | 1,995 | | | | 142,894 | |
Toyota Motor Corp. | | | 567 | | | | 9,114 | |
Toyota Tsusho Corp. | | | 11 | | | | 571 | |
Trend Micro, Inc. | | | 7 | | | | 334 | |
Tsumura & Co. | | | 320 | | | | 5,927 | |
USS Co. Ltd. | | | 346 | | | | 5,735 | |
Unicharm Corp. | | | 1,048 | | | | 38,973 | |
Welcia Holdings Co. Ltd. | | | 5 | | | | 106 | |
West Japan Railway Co. | | | 12 | | | | 482 | |
Yakult Honsha Co. Ltd. | | | 7 | | | | 424 | |
Yamaha Corp. | | | 7 | | | | 285 | |
Yamaha Motor Co. Ltd. | | | 16 | | | | 451 | |
Yamato Holdings Co. Ltd. | | | 15 | | | | 272 | |
Yaskawa Electric Corp. | | | 13 | | | | 576 | |
Yokogawa Electric Corp. | | | 12 | | | | 222 | |
Z Holdings Corp. | | | 7,227 | | | | 17,418 | |
ZOZO, Inc. | | | 536 | | | | 11,113 | |
| | | | | | | | |
Total Japan | | | | | | | 3,178,637 | |
| | | | | | | | |
Jordan – 0.00%(2) | | | | | | | | |
Hikma Pharmaceuticals Plc | | | 8 | | | | 203 | |
| | | | | | | | |
Total Jordan | | | | | | | 203 | |
| | | | | | | | |
Luxembourg – 0.54% | | | | | | | | |
ArcelorMittal SA | | | 2,489 | | | | 67,917 | |
Befesa SA(3) | | | 127 | | | | 4,865 | |
Eurofins Scientific SE | | | 202 | | | | 12,820 | |
L’Occitane International SA | | | 800 | | | | 1,930 | |
Tenaris SA | | | 25 | | | | 371 | |
| | | | | | | | |
Total Luxembourg | | | | | | | 87,903 | |
| | | | | | | | |
Macau – 0.00%(2) | | | | | | | | |
Sands China Ltd.(1) | | | 125 | | | | 429 | |
| | | | | | | | |
Total Macau | | | | | | | 429 | |
| | | | | | | | |
Mexico – 0.24% | | | | | | | | |
Arca Continental SAB de CV | | | 255 | | | | 2,617 | |
Grupo Aeroportuario del Pacifico SAB de CV – Class B | | | 195 | | | | 3,502 | |
Grupo Financiero Banorte SAB de CV – Class O | | | 561 | | | | 4,619 | |
Wal-Mart de Mexico SAB de CV | | | 7,321 | | | | 29,037 | |
| | | | | | | | |
Total Mexico | | | | | | | 39,775 | |
| | | | | | | | |
Netherlands – 6.25% | | | | | | | | |
ABN AMRO Bank NV(3) | | | 22 | | | | 342 | |
Adyen NV(1)(3) | | | 90 | | | | 155,055 | |
Aegon NV | | | 97 | | | | 490 | |
Akzo Nobel NV | | | 9 | | | | 725 | |
Argenx SE(1) | | | 3 | | | | 1,130 | |
ASM International NV | | | 160 | | | | 67,849 | |
ASML Holding NV | | | 189 | | | | 136,943 | |
ASML Holding NV – Class REG | | | 101 | | | | 73,185 | |
Euronext NV(3) | | | 4 | | | | 298 | |
EXOR NV | | | 411 | | | | 36,735 | |
Ferrovial SE | | | 27 | | | | 843 | |
Heineken Holding NV | | | 6 | | | | 528 | |
Heineken NV | | | 267 | | | | 27,456 | |
IMCD NV | | | 287 | | | | 41,241 | |
ING Groep NV | | | 4,376 | | | | 58,994 | |
JDE Peet’s NV | | | 7 | | | | 198 | |
Just Eat Takeaway.com NV(1)(3) | | | 11 | | | | 167 | |
Koninklijke Ahold Delhaize NV | | | 676 | | | | 23,045 | |
Koninklijke KPN NV | | | 5,405 | | | | 19,295 | |
Koninklijke Philips NV | | �� | 9,362 | | | | 202,856 | |
NN Group NV | | | 13 | | | | 492 | |
OCI NV | | | 6 | | | | 133 | |
Prosus NV(1) | | | 1,052 | | | | 77,018 | |
QIAGEN NV(1) | | | 12 | | | | 529 | |
Randstad NV | | | 1,361 | | | | 71,764 | |
Stellantis NV | | | 121 | | | | 2,119 | |
Topicus.com, Inc.(1) | | | 283 | | | | 23,213 | |
Universal Music Group NV | | | 43 | | | | 947 | |
Wolters Kluwer NV | | | 13 | | | | 1,701 | |
| | | | | | | | |
Total Netherlands | | | | | | | 1,025,291 | |
| | | | | | | | |
New Zealand – 0.32% | | | | | | | | |
| | | | | | | | |
Auckland International Airport Ltd.(1) | | | 66 | | | | 347 | |
Fisher & Paykel Healthcare Corp. Ltd. | | | 30 | | | | 458 | |
Fletcher Building Ltd. | | | 867 | | | | 2,889 | |
Mercury NZ Ltd. | | | 35 | | | | 141 | |
Meridian Energy Ltd. | | | 66 | | | | 228 | |
Spark New Zealand Ltd. | | | 98 | | | | 306 | |
Xero Ltd.(1) | | | 608 | | | | 48,700 | |
| | | | | | | | |
Total New Zealand | | | | | | | 53,069 | |
| | | | | | | | |
Norway – 0.31% | | | | | | | | |
Adevinta ASA – Class B(1) | | | 14 | | | | 94 | |
Aker BP ASA | | | 17 | | | | 400 | |
DNB Bank ASA | | | 910 | | | | 17,023 | |
Equinor ASA | | | 1,000 | | | | 29,113 | |
Gjensidige Forsikring ASA | | | 10 | | | | 165 | |
Kongsberg Gruppen ASA | | | 5 | | | | 214 | |
Mowi ASA | | | 23 | | | | 370 | |
Norsk Hydro ASA | | | 72 | | | | 431 | |
Orkla ASA | | | 41 | | | | 292 | |
Salmar ASA | | | 4 | | | | 155 | |
Schibsted ASA – Class A | | | 84 | | | | 1,472 | |
Schibsted ASA – Class B | | | 38 | | | | 631 | |
Telenor ASA | | | 36 | | | | 369 | |
Yara International ASA | | | 9 | | | | 302 | |
| | | | | | | | |
Total Norway | | | | | | | 51,031 | |
| | | | | | | | |
Portugal – 0.36% | | | | | | | | |
EDP – Energias de Portugal SA | | | 157 | | | | 767 | |
Galp Energia SGPS SA | | | 26 | | | | 301 | |
Jeronimo Martins SGPS SA | | | 2,080 | | | | 57,310 | |
| | | | | | | | |
Total Portugal | | | | | | | 58,378 | |
| | | | | | | | |
Russia – 0.00%(2) | | | | | | | | |
Severstal PAO – GDR(1)(4)(6)(7) | | | 147 | | | | — | |
X5 Retail Group NV – GDR(1)(4)(6)(7) | | | 65 | | | | — | |
| | | | | | | | |
Total Russia | | | | | | | — | |
| | | | | | | | |
Singapore – 1.83% | | | | | | | | |
BOC Aviation Ltd.(3) | | | 309 | | | | 2,506 | |
CapitaLand Ascendas REIT | | | 175 | | | | 353 | |
CapitaLand Integrated Commercial Trust | | | 285 | | | | 404 | |
Capitaland Investment Ltd. | | | 138 | | | | 338 | |
City Developments Ltd. | | | 22 | | | | 110 | |
DBS Group Holdings Ltd. | | | 522 | | | | 12,188 | |
Genting Singapore Ltd. | | | 360 | | | | 251 | |
Grab Holdings Ltd. – Class A(1) | | | 97 | | | | 333 | |
Jardine Cycle & Carriage Ltd. | | | 5 | | | | 132 | |
Keppel Corp. Ltd. | | | 76 | | | | 377 | |
Mapletree Logistics Trust | | | 180 | | | | 216 | |
Mapletree Pan Asia Commercial Trust | | | 132 | | | | 159 | |
Oversea-Chinese Banking Corp. Ltd. | | | 180 | | | | 1,633 | |
Sea Ltd. - ADR(1) | | | 19 | | | | 1,111 | |
Seatrium Ltd.(1) | | | 2,131 | | | | 198 | |
Singapore Airlines Ltd. | | | 71 | | | | 377 | |
Singapore Exchange Ltd. | | | 39 | | | | 279 | |
Singapore Technologies Engineering Ltd. | | | 81 | | | | 220 | |
Singapore Telecommunications Ltd. | | | 34,894 | | | | 64,629 | |
United Overseas Bank Ltd. | | | 10,309 | | | | 213,928 | |
UOL Group Ltd. | | | 24 | | | | 115 | |
Venture Corp. Ltd. | | | 14 | | | | 157 | |
Wilmar International Ltd. | | | 103 | | | | 289 | |
| | | | | | | | |
Total Singapore | | | | | | | 300,303 | |
| | | | | | | | |
South Africa – 0.09% | | | | | | | | |
African Rainbow Minerals Ltd. | | | 226 | | | | 2,383 | |
Bid Corp. Ltd. | | | 163 | | | | 3,572 | |
Capitec Bank Holdings Ltd. | | | 32 | | | | 2,649 | |
Naspers Ltd. - Class N | | | 32 | | | | 5,748 | |
| | | | | | | | |
Total South Africa | | | | | | | 14,352 | |
| | | | | | | | |
South Korea – 0.37% | | | | | | | | |
Amorepacific Group | | | 19 | | | | 376 | |
Hana Financial Group, Inc. | | | 106 | | | | 3,161 | |
Hankook Tire & Technology Co. Ltd. | | | 69 | | | | 1,802 | |
Hyundai Motor Co. | | | 8 | | | | 1,203 | |
LG Corp. | | | 19 | | | | 1,285 | |
Samsung Electronics Co. Ltd. | | | 686 | | | | 37,790 | |
Shinhan Financial Group Co. Ltd. | | | 587 | | | | 15,185 | |
| | | | | | | | |
Total South Korea | | | | | | | 60,802 | |
| | | | | | | | |
Spain – 1.70% | | | | | | | | |
Acciona SA | | | 1 | | | | 214 | |
Acerinox SA | | | 457 | | | | 4,862 | |
ACS Actividades de Construccion y Servicios SA | | | 12 | | | | 422 | |
Aena SME SA(3) | | | 4 | | | | 617 | |
Amadeus IT Group SA(1) | | | 24 | | | | 1,798 | |
Banco Bilbao Vizcaya Argentaria SA | | | 323 | | | | 2,479 | |
Banco Santander SA | | | 41,559 | | | | 153,856 | |
CaixaBank SA | | | 17,865 | | | | 74,000 | |
Cellnex Telecom SA(3) | | | 29 | | | | 1,188 | |
| | | | | | | | |
Corp. ACCIONA Energias Renovables SA | | | 3 | | | | 114 | |
EDP Renovaveis SA | | | 15 | | | | 300 | |
Enagas SA | | | 9 | | | | 174 | |
Endesa SA | | | 18 | | | | 379 | |
Fluidra SA | | | 791 | | | | 15,421 | |
Gestamp Automocion SA(3) | | | 1,206 | | | | 5,662 | |
Grifols SA(1) | | | 15 | | | | 198 | |
Iberdrola SA | | | 312 | | | | 4,073 | |
Industria de Diseno Textil SA | | | 57 | | | | 2,208 | |
Naturgy Energy Group SA | | | 8 | | | | 233 | |
Redeia Corp. SA | | | 18 | | | | 300 | |
Repsol SA | | | 72 | | | | 1,044 | |
Telefonica SA | | | 277 | | | | 1,124 | |
Viscofan SA | | | 121 | | | | 8,388 | |
| | | | | | | | |
Total Spain | | | | | | | 279,054 | |
| | | | | | | | |
Sweden – 2.89% | | | | | | | | |
Alfa Laval AB | | | 166 | | | | 6,071 | |
Assa Abloy AB – Class B | | | 1,121 | | | | 26,940 | |
Atlas Copco AB – Class A | | | 8,400 | | | | 121,270 | |
Atlas Copco AB – Class B | | | 81 | | | | 1,007 | |
Beijer Ref AB – Class B | | | 18 | | | | 224 | |
Boliden AB | | | 15 | | | | 421 | |
Embracer Group AB – Class B(1) | | | 35 | | | | 87 | |
Epiroc AB – Class A | | | 2,025 | | | | 38,365 | |
Epiroc AB – Class B | | | 20 | | | | 319 | |
EQT AB | | | 18 | | | | 356 | |
Essity AB – Class B | | | 32 | | | | 857 | |
Evolution AB(3) | | | 622 | | | | 78,817 | |
Fastighets AB Balder – Class B(1) | | | 43 | | | | 158 | |
Getinge AB – Class B | | | 208 | | | | 3,648 | |
H & M Hennes & Mauritz AB – Class B | | | 34 | | | | 588 | |
Hexagon AB – Class B | | | 108 | | | | 1,329 | |
Holmen AB – Class B | | | 5 | | | | 173 | |
Husqvarna AB – Class B | | | 22 | | | | 198 | |
Industrivarden AB – Class A | | | 8 | | | | 214 | |
Industrivarden AB – Class C | | | 8 | | | | 224 | |
Indutrade AB | | | 14 | | | | 316 | |
Investment AB Latour – Class B | | | 7 | | | | 143 | |
Investor AB – Class A | | | 23 | | | | 463 | |
Investor AB – Class B | | | 2,958 | | | | 59,177 | |
Kinnevik AB – Class B(1) | | | 13 | | | | 182 | |
L E Lundbergforetagen AB – Class B | | | 4 | | | | 172 | |
Lifco AB – Class B | | | 13 | | | | 274 | |
MIPS AB | | | 45 | | | | 2,216 | |
Modern Times Group MTG AB – Class B(1) | | | 160 | | | | 1,023 | |
Nibe Industrier AB – Class B | | | 1,564 | | | | 14,875 | |
Saab AB – Class B | | | 4 | | | | 226 | |
Sagax AB – Class B | | | 10 | | | | 199 | |
Sandvik AB | | | 642 | | | | 12,536 | |
Securitas AB – Class B | | | 26 | | | | 212 | |
Skandinaviska Enskilda Banken AB – Class A | | | 85 | | | | 943 | |
Skanska AB – Class B | | | 17 | | | | 242 | |
SKF AB – Class B | | | 20 | | | | 356 | |
Spotify Technology SA(1) | | | 221 | | | | 35,529 | |
Svenska Cellulosa AB SCA – Class B | | | 32 | | | | 410 | |
Svenska Handelsbanken AB – Class A | | | 1,894 | | | | 15,854 | |
Swedbank AB | | | 47 | | | | 797 | |
Swedish Orphan Biovitrum AB(1) | | | 9 | | | | 175 | |
Tele2 AB – Class B | | | 30 | | | | 248 | |
Telefonaktiebolaget LM Ericsson – Class B | | | 153 | | | | 830 | |
Telia Co. AB | | | 18,722 | | | | 41,073 | |
Viaplay Group AB – Class B(1) | | | 321 | | | | 1,841 | |
Volvo AB – Class A | | | 10 | | | | 218 | |
Volvo AB – Class B | | | 80 | | | | 1,665 | |
Volvo Car AB – Class B(1) | | | 30 | | | | 121 | |
| | | | | | | | |
Total Sweden | | | | | | | 473,582 | |
| | | | | | | | |
Switzerland – 5.46% | | | | | | | | |
ABB Ltd. | | | 843 | | | | 33,181 | |
Adecco Group AG | | | 8 | | | | 278 | |
Alcon, Inc. | | | 26 | | | | 2,166 | |
Bachem Holding AG – Class B | | | 2 | | | | 156 | |
Baloise Holding AG | | | 2 | | | | 351 | |
Banque Cantonale Vaudoise | | | 2 | | | | 163 | |
Barry Callebaut AG(4) | | | 0 | | | | 365 | |
BKW AG | | | 1 | | | | 193 | |
Chocoladefabriken Lindt & Spruengli AG(4) | | | 0 | | | | 666 | |
Chocoladefabriken Lindt & Spruengli AG – REG(4) | | | 0 | | | | 745 | |
Cie Financiere Richemont SA | | | 21 | | | | 3,589 | |
Cie Financiere Richemont SA | | | 756 | | | | 128,455 | |
Clariant AG(1) | | | 11 | | | | 166 | |
Coca-Cola HBC AG | | | 12 | | | | 371 | |
DSM-Firmenich AG(1) | | | 9 | | | | 992 | |
Dufry AG(1) | | | 5 | | | | 236 | |
| | | | | | | | |
EMS-Chemie Holding AG(4) | | | 0 | | | | 280 | |
Geberit AG | | | 35 | | | | 18,207 | |
Givaudan SA(4) | | | 0 | | | | 1,585 | |
Glencore Plc | | | 6,992 | | | | 39,643 | |
Helvetia Holding AG | | | 2 | | | | 267 | |
Holcim AG(1) | | | 327 | | | | 22,055 | |
Julius Baer Group Ltd. | | | 659 | | | | 41,583 | |
Kuehne & Nagel International AG | | | 3 | | | | 838 | |
Logitech International SA | | | 91 | | | | 5,452 | |
Lonza Group AG | | | 123 | | | | 73,401 | |
Nestle SA | | | 706 | | | | 84,931 | |
Novartis AG | | | 1,484 | | | | 149,585 | |
Partners Group Holding AG | | | 1 | | | | 1,124 | |
Roche Holding AG | | | 2 | | | | 547 | |
Roche Holding AG | | | 415 | | | | 126,896 | |
Schindler Holding AG | | | 1 | | | | 277 | |
Schindler Holding AG | | | 2 | | | | 501 | |
SGS SA | | | 8 | | | | 759 | |
SIG Group AG(1) | | | 16 | | | | 431 | |
Sika AG | | | 270 | | | | 77,250 | |
Sonova Holding AG | | | 49 | | | | 13,019 | |
STMicroelectronics NV | | | 36 | | | | 1,785 | |
Straumann Holding AG | | | 6 | | | | 954 | |
Swatch Group AG – BR | | | 2 | | | | 458 | |
Swatch Group AG – REG | | | 3 | | | | 147 | |
Swiss Life Holding AG | | | 2 | | | | 962 | |
Swiss Prime Site AG | | | 4 | | | | 347 | |
Swiss Re AG | | | 16 | | | | 1,586 | |
Swisscom AG | | | 1 | | | | 860 | |
Temenos AG | | | 3 | | | | 266 | |
UBS Group AG | | | 2,620 | | | | 53,099 | |
VAT Group AG(3) | | | 1 | | | | 592 | |
Zurich Insurance Group AG | | | 8 | | | | 3,816 | |
| | | | | | | | |
Total Switzerland | | | | | | | 895,576 | |
| | | | | | | | |
Taiwan – 1.53% | | | | | | | | |
Advantech Co. Ltd. | | | 347 | | | | 4,568 | |
Chailease Holding Co. Ltd.(1) | | | 405 | | | | 2,663 | |
Delta Electronics, Inc. | | | 389 | | | | 4,311 | |
Hon Hai Precision Industry Co. Ltd. | | | 13,744 | | | | 49,971 | |
MediaTek, Inc. | | | 85 | | | | 1,882 | |
Taiwan Semiconductor Manufacturing Co. Ltd. | | | 3,160 | | | | 58,373 | |
Taiwan Semiconductor Manufacturing Co. Ltd. - ADR | | | 1,287 | | | | 129,850 | |
| | | | | | | | |
Total Taiwan | | | | | | | 251,618 | |
| | | | | | | | |
Thailand – 0.02% | | | | | | | | |
Kasikornbank PCL | | | 272 | | | | 1,001 | |
Thai Beverage PCL | | | 6,458 | | | | 2,773 | |
| | | | | | | | |
Total Thailand | | | | | | | 3,774 | |
| | | | | | | | |
United Kingdom – 17.67% | | | | | | | | |
3i Group Plc | | | 1,757 | | | | 43,555 | |
Abrdn Plc | | | 111 | | | | 308 | |
Admiral Group Plc | | | 345 | | | | 9,131 | |
Anglo American Plc | | | 68 | | | | 1,930 | |
Ashtead Group Plc | | | 581 | | | | 40,282 | |
Associated British Foods Plc | | | 19 | | | | 471 | |
AstraZeneca Plc | | | 594 | | | | 85,084 | |
Auto Trader Group Plc(3) | | | 8,787 | | | | 68,228 | |
Aviva Plc | | | 3,315 | | | | 16,679 | |
BAE Systems Plc | | | 6,310 | | | | 74,408 | |
Barclays Plc | | | 31,583 | | | | 61,699 | |
Barratt Developments Plc | | | 919 | | | | 4,828 | |
Berkeley Group Holdings Plc | | | 6 | | | | 277 | |
BP Plc | | | 31,697 | | | | 184,554 | |
British American Tobacco Plc | | | 114 | | | | 3,774 | |
British Land Co. Plc | | | 48 | | | | 185 | |
BT Group Plc – Class A | | | 365 | | | | 567 | |
Bunzl Plc | | | 468 | | | | 17,836 | |
Burberry Group Plc | | | 1,168 | | | | 31,528 | |
Capita Plc(1) | | | 7,880 | | | | 2,746 | |
Centrica Plc | | | 302 | | | | 475 | |
Close Brothers Group Plc | | | 371 | | | | 4,167 | |
CNH Industrial NV | | | 1,861 | | | | 26,846 | |
Coca-Cola Europacific Partners Plc | | | 178 | | | | 11,473 | |
Compass Group Plc | | | 3,264 | | | | 91,402 | |
ConvaTec Group Plc(3) | | | 5,596 | | | | 14,595 | |
Croda International Plc | | | 7 | | | | 519 | |
Diageo Plc | | | 889 | | | | 38,207 | |
Dowlais Group Plc(1) | | | 538 | | | | 868 | |
DS Smith Plc | | | 1,681 | | | | 5,818 | |
easyJet Plc(1) | | | 1,558 | | | | 9,575 | |
Endeavour Mining Plc | | | 10 | | | | 236 | |
Entain Plc | | | 1,439 | | | | 23,271 | |
Farfetch Ltd. - Class A(1) | | | 1,890 | | | | 11,413 | |
Ferguson Plc | | | 411 | | | | 64,918 | |
| | | | | | | | |
Future Plc | | | 523 | | | | 4,481 | |
Games Workshop Group Plc | | | 314 | | | | 43,627 | |
GSK Plc | | | 7,493 | | | | 132,788 | |
Haleon Plc | | | 266 | | | | 1,092 | |
Halma Plc | | | 19 | | | | 563 | |
Hargreaves Lansdown Plc | | | 2,686 | | | | 27,841 | |
Hays Plc | | | 5,822 | | | | 7,560 | |
HSBC Holdings Plc | | | 344 | | | | 2,705 | |
HSBC Holdings Plc | | | 8,086 | | | | 64,022 | |
IG Group Holdings Plc | | | 484 | | | | 4,161 | |
Imperial Brands Plc | | | 5,904 | | | | 130,675 | |
Inchcape Plc | | | 1,568 | | | | 15,518 | |
Informa Plc | | | 72 | | | | 669 | |
InterContinental Hotels Group Plc | | | 127 | | | | 8,763 | |
International Personal Finance Plc | | | 1,571 | | | | 2,237 | |
Intertek Group Plc | | | 949 | | | | 51,435 | |
ITV Plc | | | 10,350 | | | | 8,997 | |
J Sainsbury Plc | | | 17,903 | | | | 61,201 | |
JD Sports Fashion Plc | | | 139 | | | | 258 | |
John Wood Group Plc(1) | | | 2,835 | | | | 4,884 | |
Johnson Matthey Plc | | | 9 | | | | 208 | |
Jupiter Fund Management Plc | | | 2,208 | | | | 3,023 | |
Kingfisher Plc | | | 27,243 | | | | 80,292 | |
Land Securities Group Plc | | | 36 | | | | 262 | |
Legal & General Group Plc | | | 319 | | | | 923 | |
Lloyds Banking Group Plc | | | 267,899 | | | | 148,509 | |
London Stock Exchange Group Plc | | | 21 | | | | 2,234 | |
M&G Plc | | | 129 | | | | 314 | |
Melrose Industries Plc | | | 538 | | | | 3,467 | |
Mobico Group Plc | | | 3,173 | | | | 3,926 | |
Mondi Plc | | | 26 | | | | 400 | |
National Grid Plc | | | 197 | | | | 2,606 | |
NatWest Group Plc | | | 6,777 | | | | 20,712 | |
Next Plc | | | 7 | | | | 602 | |
Ocado Group Plc(1) | | | 33 | | | | 240 | |
Pagegroup Plc | | | 1,732 | | | | 8,831 | |
Pearson Plc | | | 34 | | | | 352 | |
Persimmon Plc | | | 17 | | | | 219 | |
Pets at Home Group Plc | | | 1,456 | | | | 6,980 | |
Phoenix Group Holdings Plc | | | 40 | | | | 269 | |
Rathbones Group Plc | | | 192 | | | | 4,532 | |
Reckitt Benckiser Group Plc | | | 901 | | | | 67,679 | |
RELX Plc | | | 1,076 | | | | 35,882 | |
Rentokil Initial Plc | | | 132 | | | | 1,036 | |
Rightmove Plc | | | 10,210 | | | | 67,828 | |
Rio Tinto Plc | | | 399 | | | | 25,347 | |
Rolls-Royce Holdings Plc(1) | | | 6,385 | | | | 12,278 | |
Rotork Plc | | | 1,276 | | | | 4,943 | |
RWS Holdings Plc | | | 558 | | | | 1,668 | |
Sage Group Plc | | | 53 | | | | 619 | |
Schroders Plc | | | 46 | | | | 256 | |
Segro Plc | | | 64 | | | | 585 | |
Serco Group Plc | | | 5,533 | | | | 10,940 | |
Severn Trent Plc | | | 13 | | | | 430 | |
Shell Plc | | | 3,066 | | | | 92,346 | |
Shell Plc | | | 4,687 | | | | 139,818 | |
Smith & Nephew Plc | | | 388 | | | | 6,259 | |
Smiths Group Plc | | | 19 | | | | 391 | |
Softcat Plc | | | 193 | | | | 3,473 | |
Spirax-Sarco Engineering Plc | | | 4 | | | | 500 | |
SSE Plc | | | 3,674 | | | | 86,149 | |
SSP Group Plc(1) | | | 6,114 | | | | 19,475 | |
St James’s Place Plc | | | 485 | | | | 6,704 | |
Standard Chartered Plc | | | 5,946 | | | | 51,734 | |
Taylor Wimpey Plc | | | 2,658 | | | | 3,472 | |
Tesco Plc | | | 52,309 | | | | 165,012 | |
Trainline Plc(1)(3) | | | 6,411 | | | | 21,252 | |
Travis Perkins Plc | | | 3,071 | | | | 31,803 | |
Unilever Plc | | | 134 | | | | 6,968 | |
United Utilities Group Plc | | | 36 | | | | 439 | |
Vanquis Banking Group Plc | | | 1,057 | | | | 2,553 | |
Vodafone Group Plc | | | 9,647 | | | | 9,095 | |
Weir Group Plc | | | 1,729 | | | | 38,604 | |
WH Smith Plc | | | 437 | | | | 8,607 | |
Whitbread Plc | | | 11 | | | | 461 | |
Wise Plc – Class A(1) | | | 3,376 | | | | 28,222 | |
WPP Plc | | | 12,588 | | | | 131,948 | |
| | | | | | | | |
Total United Kingdom | | | | | | | 2,899,007 | |
| | | | | | | | |
United States – 2.68% | | | | | | | | |
Aon Plc – Class A | | | 271 | | | | 93,656 | |
BeiGene Ltd.(1) | | | 1,363 | | | | 18,695 | |
Coupang, Inc. - Class A(1) | | | 1,124 | | | | 19,549 | |
EPAM Systems, Inc.(1) | | | 142 | | | | 31,912 | |
| | | | | | | | |
Linde Plc | | | 133 | | | | 50,710 | |
Mettler-Toledo International, Inc.(1) | | | 84 | | | | 110,092 | |
ResMed, Inc. | | | 188 | | | | 41,074 | |
Samsonite International SA(1)(3) | | | 824 | | | | 2,330 | |
Southern Copper Corp. | | | 69 | | | | 4,958 | |
STERIS Plc | | | 295 | | | | 66,394 | |
| | | | | | | | |
Total United States | | | | | | | 439,370 | |
| | | | | | | | |
Uruguay – 0.37% | | | | | | | | |
MercadoLibre, Inc.(1) | | | 51 | | | | 60,160 | |
| | | | | | | | |
Total Uruguay | | | | | | | 60,160 | |
| | | | | | | | |
Total Common Stocks (Cost: $14,443,231) | | | | | | | 16,065,929 | |
| | | | | | | | |
PREFERRED STOCKS – 0.33% | | | | | | | | |
Germany – 0.33% | | | | | | | | |
Bayerische Motoren Werke AG | | | 3 | | | | 351 | |
Dr Ing hc F Porsche AG(3) | | | 6 | | | | 732 | |
Henkel AG & Co. KGaA | | | 9 | | | | 720 | |
Porsche Automobil Holding SE(1) | | | 8 | | | | 475 | |
Sartorius AG | | | 1 | | | | 474 | |
Volkswagen AG | | | 380 | | | | 51,052 | |
| | | | | | | | |
Total Germany | | | | | | | 53,804 | |
| | | | | | | | |
South Korea – 0.00%(2) | | | | | | | | |
Amorepacific Group | | | 7 | | | | 111 | |
| | | | | | | | |
Total South Korea | | | | | | | 111 | |
| | | | | | | | |
Total Preferred Stocks (Cost: $75,616) | | | | | | | 53,915 | |
| | | | | | | | |
SHORT-TERM INVESTMENTS – 1.56% | | | | | | | | |
Money Market Funds – 1.39% | | | | | | | | |
Goldman Sachs Financial Square Government Fund—Class I, 5.02%(5) | | | 227,347 | | | | 227,347 | |
| | | | | | | | |
Total Money Market Funds (Cost: $227,347) | | | | | | | 227,347 | |
| | | | | | | | |
| | | | | | | | |
| | | Principal
Amount
(000s)
| | | Value
(000s) | |
Time Deposits – 0.17% | | | | | | | | |
ANZ, Hong Kong, 3.02% due 07/03/2023 | | AUD | 149 | | | | 99 | |
Brown Brothers Harriman, 2.22% due 07/03/2023 | | DKK | 393 | | | | 58 | |
Brown Brothers Harriman, 2.47% due 07/03/2023 | | SEK | 635 | | | | 59 | |
Brown Brothers Harriman, 2.85% due 07/03/2023 | | NOK | 626 | | | | 58 | |
Brown Brothers Harriman, 4.15% due 07/03/2023 | | NZD | 190 | | | | 116 | |
Brown Brothers Harriman, 6.42% due 07/03/2023(4) | | ZAR | 2 | | | | 0 | |
Citibank, London, 2.62% due 07/03/2023 | | EUR | 1,189 | | | | 1,298 | |
HSBC, Hong Kong, 3.72% due 07/03/2023 | | HKD | 2,995 | | | | 382 | |
HSBC, Singapore, 3.05% due 07/03/2023 | | SGD | 74 | | | | 55 | |
JP Morgan, New York, 4.57% due 07/03/2023 | | $ | 971 | | | | 971 | |
Royal Bank of Canada, Toronto, 3.79% due 07/04/2023(4) | | CAD | 0 | | | | 0 | |
Skandinaviska Enskilda Banken AB, Stockholm, 0.65% due 07/03/2023 | | CHF | 24 | | | | 27 | |
Skandinaviska Enskilda Banken AB, Stockholm, 2.62% due 07/03/2023 | | EUR | 673 | | | | 735 | |
Skandinaviska Enskilda Banken AB, Stockholm, 4.17% due 07/03/2023 | | GBP | 1,325 | | | | 1,683 | |
Sumitomo Trust Bank, London, 4.57% due 07/03/2023 | | $ | 483 | | | | 483 | |
Sumitomo, Tokyo, -0.37% due 07/03/2023 | | JPY | 3,111,453 | | | | 21,563 | |
Sumitomo, Tokyo, 4.57% due 07/03/2023 | | $ | 447 | | | | 447 | |
| | | | | | | | |
Total Time Deposits (Cost: $28,034) | | | | | | | 28,034 | |
| | | | | | | | |
Total Short-Term Investments (Cost: $255,381) | | | | | | | 255,381 | |
| | | | | | | | |
TOTAL INVESTMENTS IN SECURITIES – 99.82% | | | | | | | | |
(Cost: $14,774,228) | | | | | | | 16,375,225 | |
| | | | | | | | |
OTHER ASSETS IN EXCESS OF LIABILITIES – 0.18% | | | | | | | 28,959 | |
| | | | | | | | |
TOTAL NET ASSETS – 100.00% | | | | | | $ | 16,404,184 | |
| | | | | | | | |
Percentages are stated as a percent of net assets.
Principal amounts are denominated in the currency in which the security was purchased.
ADR American Depositary Receipt
GDR Global Depositary Receipt
REIT Real Estate Investment Trust
AUD Australian Dollar
CAD Canadian Dollar
CHF Swiss Franc
DKK Danish Krone
EUR Euro
GBP British Pound
HKD Hong Kong Dollar
JPY Japanese Yen
NOK Norwegian Krone
NZD New Zealand Dollar
SEK Swedish Krona
SGD Singapore Dollar
ZAR South African Rand
| (1) | Non-income producing security. |
| (2) | Amount calculated is less than 0.005%. |
| (3) | Security was purchased exempt from registration in the U.S. pursuant to Rule 144(A) under the Securities Act of 1933. The value of these securities totals $674,184, which represents 4.11% of total net assets. |
| (4) | A zero balance may reflect actual amounts rounding to less than one thousand. |
| (5) | Represents annualized seven-day yield as of the close of the reporting period. |
| (6) | Security that is categorized as Level 3 per the Trust’s fair value hierarchy. The value of these securities totals $0, which represents 0.00% of total net assets. |
| (7) | Security that is restricted at June 30, 2023. The value of these securities totals $0, which represents 0.00% of total net assets. |
The accompanying notes are an integral part of this Schedule of Investments.
Open Futures Contracts
| | | | | | | | | | | | | | |
Number of
Contracts
Purchased | | Reference Entity | | Expiration
Date | | Notional
Amount | | Value | | | Unrealized
Appreciation/
(Depreciation) | |
| 41 | | Euro Stoxx 50 Future | | Sep. 2023 | | EUR 1,784 | | $ | 1,981 | | | $ | 34 | |
| 14 | | FTSE 100 INDEX Future | | Sep. 2023 | | GBP 1,063 | | | 1,341 | | | | (9 | ) |
| 7 | | TOPIX INDEX Future | | Sep. 2023 | | JPY 155,149 | | | 1,110 | | | | 35 | |
| | | | | | | | | | | | | | |
| | | | | | | | | | | | $ | 60 | |
| | | | | | | | | | | | | | |
| | | | |
| COMMON STOCKS | | Percentage of Net
Assets | |
Communication Services | | | 4.14 | % |
Consumer Discretionary | | | 14.04 | |
Consumer Staples | | | 9.08 | |
Energy | | | 3.71 | |
Financials | | | 16.97 | |
Healthcare | | | 13.56 | |
Industrials | | | 19.23 | |
Information Technology | | | 9.16 | |
Materials | | | 4.93 | |
Real Estate | | | 0.27 | |
Utilities | | | 2.84 | |
| | | | |
Total Common Stocks | | | 97.93 | |
| | | | |
PREFERRED STOCKS | | | | |
Consumer Discretionary | | | 0.32 | |
Consumer Staples | | | 0.01 | |
Healthcare | | | 0.00 | (1) |
| | | | |
Total Preferred Stocks | | | 0.33 | |
| | | | |
SHORT-TERM INVESTMENTS | | | 1.56 | |
| | | | |
TOTAL INVESTMENTS | | | 99.82 | |
OTHER ASSETS IN EXCESS OF LIABILITIES | | | 0.18 | |
| | | | |
TOTAL NET ASSETS | | | 100.00 | % |
| | | | |
| (1) | Amount calculated is less than 0.005%. |
The accompanying notes are an integral part of this Schedule of Investments.
Bridge Builder Tax Managed International Equity Fund
Schedule of Investments
June 30, 2023
(Amounts in thousands, except number of contracts)
| | | | | | | | |
| | | Shares
(000s) | | | Value
(000s) | |
COMMON STOCKS – 96.07% | | | | | | | | |
Australia – 3.16% | | | | | | | | |
Ampol Ltd. | | | 9 | | | $ | 179 | |
ANZ Group Holdings Ltd. | | | 102 | | | | 1,620 | |
ASX Ltd. | | | 5 | | | | 201 | |
BHP Group Ltd. | | | 61 | | | | 1,824 | |
BHP Group Ltd. | | | 62 | | | | 1,874 | |
Brambles Ltd. | | | 30 | | | | 288 | |
Challenger Ltd. | | | 53 | | | | 230 | |
Cochlear Ltd. | | | 33 | | | | 5,126 | |
Coles Group Ltd. | | | 10 | | | | 120 | |
Commonwealth Bank of Australia | | | 16 | | | | 1,067 | |
Computershare Ltd. | | | 5 | | | | 77 | |
CSL Ltd. | | | 45 | | | | 8,317 | |
Dexus Property Group | | | 31 | | | | 161 | |
Goodman Group | | | 19 | | | | 249 | |
IGO Ltd. | | | 393 | | | | 4,013 | |
Macquarie Group Ltd. | | | 17 | | | | 2,051 | |
Medibank Pvt Ltd. | | | 57 | | | | 134 | |
Mineral Resources Ltd. | | | 4 | | | | 171 | |
Newcrest Mining Ltd. | | | 13 | | | | 237 | |
Northern Star Resources Ltd. | | | 11 | | | | 87 | |
Qantas Airways Ltd.(1) | | | 17 | | | | 72 | |
REA Group Ltd.(2) | | | 0 | | | | 32 | |
Rio Tinto Ltd. | | | 10 | | | | 790 | |
Scentre Group | | | 744 | | | | 1,316 | |
Seek Ltd. | | | 7 | | | | 108 | |
Sonic Healthcare Ltd. | | | 46 | | | | 1,094 | |
South32 Ltd. | | | 411 | | | | 1,035 | |
Telstra Group Ltd. | | | 87 | | | | 249 | |
Transurban Group | | | 42 | | | | 397 | |
Washington H Soul Pattinson & Co. Ltd. | | | 4 | | | | 75 | |
Wesfarmers Ltd. | | | 15 | | | | 504 | |
Westpac Banking Corp. | | | 19 | | | | 270 | |
Woodside Energy Group Ltd. | | | 9 | | | | 205 | |
Worley Ltd. | | | 165 | | | | 1,743 | |
| | | | | | | | |
Total Australia | | | | 35,916 | |
| | | | | |
Austria – 0.15% | | | | | | | | |
Erste Group Bank AG | | | 26 | | | | 902 | |
OMV AG | | | 1 | | | | 42 | |
Verbund AG | | | 9 | | | | 755 | |
| | | | | | | | |
Total Austria | | | | 1,699 | |
| | | | | |
Belgium – 0.16% | | | | | | | | |
Anheuser-Busch InBev SA | | | 7 | | | | 374 | |
Groupe Bruxelles Lambert NV | | | 1 | | | | 65 | |
KBC Group NV | | | 1 | | | | 86 | |
Umicore SA | | | 48 | | | | 1,336 | |
| | | | | | | | |
Total Belgium | | | | 1,861 | |
| | | | | |
Brazil – 0.76% | | | | | | | | |
Ambev SA – ADR | | | 2,074 | | | | 6,597 | |
Banco do Brasil SA | | | 159 | | | | 1,641 | |
XP, Inc. – Class A(1) | | | 15 | | | | 343 | |
| | | | | | | | |
Total Brazil | | | | 8,581 | |
| | | | | |
Canada – 3.00% | | | | | | | | |
Alimentation Couche-Tard, Inc. | | | 177 | | | | 9,067 | |
Brookfield Corp. | | | 39 | | | | 1,311 | |
Canadian National Railway Co. | | | 68 | | | | 8,291 | |
Definity Financial Corp. | | | 19 | | | | 517 | |
Element Fleet Management Corp. | | | 180 | | | | 2,740 | |
Magna International, Inc. | | | 80 | | | | 4,542 | |
Manulife Financial Corp. | | | 67 | | | | 1,276 | |
National Bank of Canada | | | 43 | | | | 3,237 | |
Sun Life Financial, Inc. | | | 59 | | | | 3,077 | |
| | | | | | | | |
Total Canada | | | | 34,058 | |
| | | | | |
Chile – 0.15% | | | | | | | | |
Antofagasta Plc | | | 92 | | | | 1,707 | |
| | | | | | | | |
Total Chile | | | | 1,707 | |
| | | | | |
China – 1.00% | | | | | | | | |
Alibaba Group Holding Ltd. – ADR(1) | | | 3 | | | | 213 | |
Alibaba Group Holding Ltd.(1) | | | 432 | | | | 4,492 | |
Meituan – Class B(1)(3) | | | 1 | | | | 17 | |
PICC Property & Casualty Co. Ltd. – Class H | | | 1,338 | | | | 1,490 | |
| | | | | | | | |
Ping An Insurance Group Co. of China Ltd. – Class H | | | 98 | | | | 623 | |
Tencent Holdings Ltd. | | | 18 | | | | 776 | |
Trip.com Group Ltd. – ADR(1) | | | 106 | | | | 3,698 | |
| | | | | | | | |
Total China | | | | 11,309 | |
| | | | | |
Denmark – 3.44% | | | | | | | | |
AP Moller – Maersk – Class B(2) | | | 0 | | | | 218 | |
Carlsberg AS – Class B(2) | | | 0 | | | | 66 | |
CHR Hansen Holding | | | 70 | | | | 4,883 | |
Coloplast – Class B | | | 55 | | | | 6,852 | |
Danske Bank(1) | | | 179 | | | | 4,362 | |
DSV | | | 2 | | | | 354 | |
Genmab(1) | | | 3 | | | | 983 | |
Novo Nordisk – Class B | | | 112 | | | | 18,043 | |
Novozymes – Class B | | | 62 | | | | 2,903 | |
Orsted AS(3) | | | 3 | | | | 254 | |
Tryg | | | 1 | | | | 19 | |
Vestas Wind Systems(1) | | | 5 | | | | 132 | |
| | | | | | | | |
Total Denmark | | | | 39,069 | |
| | | | | |
Finland – 1.70% | | | | | | | | |
Elisa OYJ | | | 2 | | | | 80 | |
Fortum OYJ | | | 3 | | | | 43 | |
Kone OYJ – Class B | | | 149 | | | | 7,778 | |
Nokia OYJ | | | 1,661 | | | | 6,959 | |
Nordea Bank Abp – Class A | | | 63 | | | | 687 | |
Orion OYJ – Class B | | | 1 | | | | 46 | |
Sampo OYJ – Class A | | | 59 | | | | 2,628 | |
Stora Enso OYJ – Class R | | | 98 | | | | 1,140 | |
| | | | | | | | |
Total Finland | | | | 19,361 | |
| | | | | |
France – 13.08% | | | | | | | | |
Accor SA | | | 206 | | | | 7,673 | |
Air Liquide SA | | | 70 | | | | 12,558 | |
Airbus SE | | | 6 | | | | 848 | |
Amundi SA(3) | | | 139 | | | | 8,203 | |
AXA SA | | | 161 | | | | 4,763 | |
BNP Paribas SA | | | 41 | | | | 2,572 | |
Bouygues SA | | | 80 | | | | 2,704 | |
Bureau Veritas SA | | | 8 | | | | 226 | |
Capgemini SE | | | 1 | | | | 163 | |
Carrefour SA | | | 5 | | | | 103 | |
Cie de Saint-Gobain | | | 3 | | | | 153 | |
Cie Generale des Etablissements Michelin SCA | | | 282 | | | | 8,337 | |
Covivio | | | 2 | | | | 78 | |
Credit Agricole SA | | | 8 | | | | 90 | |
Danone SA | | | 10 | | | | 599 | |
Dassault Systemes SE | | | 166 | | | | 7,365 | |
Eiffage SA(2) | | | 0 | | | | 24 | |
Engie SA | | | 226 | | | | 3,757 | |
EssilorLuxottica SA | | | 13 | | | | 2,487 | |
Gecina SA | | | 1 | | | | 96 | |
Hermes International | | | 3 | | | | 6,595 | |
Ipsen SA | | | 4 | | | | 515 | |
Kering SA | | | 4 | | | | 1,987 | |
Legrand SA | | | 26 | | | | 2,626 | |
L’Oreal SA | | | 28 | | | | 12,833 | |
LVMH Moet Hennessy Louis Vuitton SE | | | 14 | | | | 13,550 | |
Orange SA | | | 18 | | | | 206 | |
Pernod Ricard SA | | | 2 | | | | 373 | |
Publicis Groupe SA | | | 67 | | | | 5,403 | |
Renault SA | | | 2 | | | | 101 | |
Rexel SA | | | 369 | | | | 9,132 | |
Safran SA | | | 18 | | | | 2,748 | |
Sanofi | | | 136 | | | | 14,652 | |
Schneider Electric SE | | | 3 | | | | 527 | |
SCOR SE | | | 36 | | | | 1,053 | |
Societe Generale SA | | | 13 | | | | 346 | |
Teleperformance | | | 7 | | | | 1,149 | |
TotalEnergies SE | | | 198 | | | | 11,346 | |
Veolia Environnement SA | | | 4 | | | | 134 | |
Vinci SA | | | 4 | | | | 440 | |
Vivendi SE | | | 31 | | | | 283 | |
| | | | | | | | |
Total France | | | | 148,798 | |
| | | | | |
Germany – 8.72% | | | | | | | | |
Adidas AG | | | 39 | | | | 7,542 | |
Allianz SE | | | 3 | | | | 783 | |
BASF SE | | | 159 | | | | 7,744 | |
Bayer AG | | | 105 | | | | 5,836 | |
Bayerische Motoren Werke AG | | | 5 | | | | 585 | |
Beiersdorf AG | | | 1 | | | | 178 | |
Carl Zeiss Meditec AG | | | 3 | | | | 272 | |
| | | | | | | | |
Covestro AG(1)(3) | | | 245 | | | | 12,742 | |
Daimler Truck Holding AG | | | 259 | | | | 9,322 | |
Delivery Hero SE(1)(3) | | | 6 | | | | 257 | |
Deutsche Bank AG | | | 22 | | | | 234 | |
Deutsche Boerse AG | | | 2 | | | | 352 | |
Deutsche Post AG | | | 15 | | | | 713 | |
Deutsche Telekom AG | | | 16 | | | | 356 | |
E.ON SE | | | 23 | | | | 290 | |
Evonik Industries AG | | | 23 | | | | 447 | |
Evotec SE(1) | | | 39 | | | | 873 | |
Fresenius Medical Care AG & Co. KGaA | | | 121 | | | | 5,793 | |
Fresenius SE & Co. KGaA | | | 56 | | | | 1,546 | |
Hannover Rueck SE | | | 1 | | | | 132 | |
Infineon Technologies AG | | | 11 | | | | 465 | |
KION Group AG | | | 27 | | | | 1,084 | |
Mercedes-Benz Group AG—Class REGISTERED | | | 5 | | | | 367 | |
Merck KGaA | | | 40 | | | | 6,558 | |
Muenchener Rueckversicherungs-Gesellschaft AG in Muenchen | | | 13 | | | | 5,031 | |
RWE AG | | | 5 | | | | 226 | |
SAP SE | | | 103 | | | | 14,070 | |
Siemens AG | | | 67 | | | | 11,241 | |
Siemens Healthineers AG(3) | | | 44 | | | | 2,507 | |
Stroeer SE & Co. KGaA(1) | | | 8 | | | | 404 | |
Vonovia SE | | | 13 | | | | 245 | |
Zalando SE(1)(3) | | | 33 | | | | 954 | |
| | | | | | | | |
Total Germany | | | | 99,149 | |
| | | | | |
Hong Kong – 3.05% | | | | | | | | |
AIA Group Ltd. | | | 1,089 | | | | 11,063 | |
Beijing Enterprises Holdings Ltd. | | | 113 | | | | 410 | |
CK Hutchison Holdings Ltd. | | | 81 | | | | 494 | |
CLP Holdings Ltd. | | | 596 | | | | 4,638 | |
ESR Group Ltd.(3) | | | 236 | | | | 406 | |
Galaxy Entertainment Group Ltd.(1) | | | 953 | | | | 6,071 | |
Hang Seng Bank Ltd. | | | 32 | | | | 455 | |
Hong Kong & China Gas Co. Ltd. | | | 237 | | | | 205 | |
Hong Kong Exchanges & Clearing Ltd. | | | 13 | | | | 500 | |
Jardine Matheson Holdings Ltd. | | | 55 | | | | 2,789 | |
Link Real Estate Investment Trust | | | 51 | | | | 283 | |
Power Assets Holdings Ltd. | | | 50 | | | | 262 | |
Prudential Plc | | | 501 | | | | 7,081 | |
Sun Hung Kai Properties Ltd. | | | 4 | | | | 51 | |
| | | | | | | | |
Total Hong Kong | | | | 34,708 | |
| | | | | |
Hungary – 0.09% | | | | | | | | |
OTP Bank Nyrt | | | 28 | | | | 1,002 | |
| | | | | | | | |
Total Hungary | | | | 1,002 | |
| | | | | |
Ireland – 1.19% | | | | | | | | |
AerCap Holdings NV(1) | | | 1 | | | | 72 | |
Bank of Ireland Group Plc | | | 354 | | | | 3,378 | |
CRH Plc | | | 12 | | | | 636 | |
DCC Plc | | | 23 | | | | 1,304 | |
Experian Plc | | | 201 | | | | 7,709 | |
Flutter Entertainment Plc(1) | | | 2 | | | | 308 | |
James Hardie Industries Plc(1) | | | 5 | | | | 145 | |
| | | | | | | | |
Total Ireland | | | | 13,552 | |
| | | | | |
Israel – 0.11% | | | | | | | | |
Azrieli Group Ltd. | | | 6 | | | | 344 | |
Check Point Software Technologies Ltd.(1) | | | 6 | | | | 731 | |
Nice Ltd.(1)(2) | | | 0 | | | | 84 | |
Wix.com Ltd.(1) | | | 1 | | | | 41 | |
| | | | | | | | |
Total Israel | | | | 1,200 | |
| | | | | |
Italy – 1.80% | | | | | | | | |
Assicurazioni Generali SpA | | | 6 | | | | 124 | |
DiaSorin SpA | | | 3 | | | | 294 | |
Enel SpA | | | 1,183 | | | | 7,977 | |
ENI SpA | | | 23 | | | | 338 | |
Ferrari NV | | | 14 | | | | 4,705 | |
FinecoBank Banca Fineco SpA | | | 6 | | | | 79 | |
Intesa Sanpaolo SpA | | | 468 | | | | 1,226 | |
Moncler SpA | | | 30 | | | | 2,051 | |
Nexi SpA(1)(3) | | | 3 | | | | 23 | |
Poste Italiane SpA(3) | | | 3 | | | | 35 | |
Prysmian SpA | | | 65 | | | | 2,728 | |
Recordati SpA | | | 5 | | | | 232 | |
Snam SpA | | | 18 | | | | 96 | |
Terna—Rete Elettrica Nazionale | | | 13 | | | | 112 | |
UniCredit SpA | | | 18 | | | | 420 | |
| | | | | | | | |
Total Italy | | | | 20,440 | |
| | | | | |
Japan – 19.33% | | | | | | | | |
Advantest Corp. | | | 1 | | | | 162 | |
| | | | | | | | |
Aeon Co. Ltd. | | | 10 | | | | 203 | |
Aisin Corp. | | | 7 | | | | 201 | |
Ajinomoto Co., Inc. | | | 5 | | | | 191 | |
ANA Holdings, Inc.(1) | | | 14 | | | | 324 | |
Asahi Kasei Corp. | | | 177 | | | | 1,200 | |
Astellas Pharma, Inc. | | | 255 | | | | 3,801 | |
Azbil Corp. | | | 3 | | | | 79 | |
Bandai Namco Holdings, Inc. | | | 14 | | | | 320 | |
Bridgestone Corp. | | | 38 | | | | 1,557 | |
Brother Industries Ltd. | | | 15 | | | | 218 | |
Canon, Inc. | | | 14 | | | | 363 | |
Central Japan Railway Co. | | | 10 | | | | 1,253 | |
Chugai Pharmaceutical Co. Ltd. | | | 8 | | | | 228 | |
CyberAgent, Inc. | | | 74 | | | | 544 | |
Daifuku Co. Ltd. | | | 13 | | | | 266 | |
Dai-ichi Life Holdings, Inc. | | | 18 | | | | 344 | |
Daiichi Sankyo Co. Ltd. | | | 14 | | | | 445 | |
Daikin Industries Ltd. | | | 52 | | | | 10,738 | |
Denso Corp. | | | 36 | | | | 2,401 | |
Disco Corp. | | | 3 | | | | 476 | |
East Japan Railway Co. | | | 4 | | | | 216 | |
Eisai Co. Ltd. | | | 2 | | | | 115 | |
Electric Power Development Co. Ltd. | | | 56 | | | | 830 | |
ENEOS Holdings, Inc. | | | 54 | | | | 186 | |
FANUC Corp. | | | 201 | | | | 7,039 | |
Fast Retailing Co. Ltd. | | | 2 | | | | 385 | |
FUJIFILM Holdings Corp. | | | 4 | | | | 238 | |
Fujitsu Ltd. | | | 2 | | | | 259 | |
Fukuoka Financial Group, Inc. | | | 127 | | | | 2,615 | |
GMO Payment Gateway, Inc. | | | 3 | | | | 204 | |
Hamamatsu Photonics KK | | | 30 | | | | 1,458 | |
Hankyu Hanshin Holdings, Inc. | | | 1 | | | | 23 | |
Hikari Tsushin, Inc. | | | 1 | | | | 86 | |
Hitachi Ltd. | | | 8 | | | | 466 | |
Honda Motor Co. Ltd. | | | 105 | | | | 3,166 | |
Hoya Corp. | | | 69 | | | | 8,270 | |
Ibiden Co. Ltd. | | | 2 | | | | 102 | |
Iida Group Holdings Co. Ltd. | | | 87 | | | | 1,462 | |
Inpex Corp. | | | 8 | | | | 83 | |
Isuzu Motors Ltd. | | | 338 | | | | 4,103 | |
ITOCHU Corp. | | | 12 | | | | 457 | |
Japan Post Bank Co. Ltd. | | | 5 | | | | 36 | |
Japan Post Holdings Co. Ltd. | | | 15 | | | | 108 | |
Japan Tobacco, Inc. | | | 16 | | | | 350 | |
Kao Corp. | | | 3 | | | | 105 | |
KDDI Corp. | | | 13 | | | | 401 | |
Keyence Corp. | | | 23 | | | | 11,072 | |
Kirin Holdings Co. Ltd. | | | 107 | | | | 1,568 | |
Komatsu Ltd. | | | 317 | | | | 8,583 | |
Kubota Corp. | | | 24 | | | | 347 | |
Marubeni Corp. | | | 7 | | | | 114 | |
McDonald’s Holdings Co. Japan Ltd. | | | 1 | | | | 39 | |
Minebea Co. Ltd. | | | 236 | | | | 4,470 | |
MISUMI Group, Inc. | | | 140 | | | | 2,821 | |
Mitsubishi Corp. | | | 59 | | | | 2,872 | |
Mitsubishi Electric Corp. | | | 217 | | | | 3,065 | |
Mitsubishi HC Capital, Inc. | | | 193 | | | | 1,147 | |
Mitsubishi UFJ Financial Group, Inc. | | | 418 | | | | 3,083 | |
Mitsui & Co. Ltd. | | | 67 | | | | 2,524 | |
Mitsui Fudosan Co. Ltd. | | | 123 | | | | 2,446 | |
Mizuho Financial Group, Inc. | | | 9 | | | | 131 | |
MS&AD Insurance Group Holdings, Inc. | | | 40 | | | | 1,431 | |
Murata Manufacturing Co. Ltd. | | | 150 | | | | 8,594 | |
Nintendo Co. Ltd. | | | 8 | | | | 365 | |
Nippon Building Fund, Inc.(2) | | | 0 | | | | 377 | |
Nippon Telegraph & Telephone Corp. | | | 4,775 | | | | 5,650 | |
Nissan Motor Co. Ltd. | | | 55 | | | | 226 | |
Nomura Research Institute Ltd. | | | 9 | | | | 254 | |
NTT Data Corp. | | | 180 | | | | 2,524 | |
Oji Holdings Corp. | | | 43 | | | | 162 | |
Omron Corp. | | | 20 | | | | 1,216 | |
Oracle Corp. | | | 6 | | | | 446 | |
Oriental Land Co. Ltd. | | | 13 | | | | 507 | |
ORIX Corp. | | | 25 | | | | 449 | |
Otsuka Holdings Co. Ltd. | | | 32 | | | | 1,188 | |
Panasonic Holdings Corp. | | | 198 | | | | 2,425 | |
Pola Orbis Holdings, Inc. | | | 6 | | | | 90 | |
Recruit Holdings Co. Ltd. | | | 67 | | | | 2,148 | |
Renesas Electronics Corp.(1) | | | 99 | | | | 1,866 | |
| | | | | | | | |
Resona Holdings, Inc. | | | 964 | | | | 4,614 | |
Ricoh Co. Ltd. | | | 8 | | | | 68 | |
Secom Co. Ltd. | | | 9 | | | | 616 | |
Seiko Epson Corp. | | | 2 | | | | 33 | |
Seven & i Holdings Co. Ltd. | | | 73 | | | | 3,145 | |
SG Holdings Co. Ltd. | | | 6 | | | | 81 | |
Shin-Etsu Chemical Co. Ltd. | | | 288 | | | | 9,609 | |
Shionogi & Co. Ltd. | | | 8 | | | | 337 | |
Shiseido Co. Ltd. | | | 3 | | | | 131 | |
SMC Corp. – ADR | | | 30 | | | | 839 | |
SMC Corp. | | | 16 | | | | 9,004 | |
Softbank Corp. | | | 18 | | | | 189 | |
SoftBank Group Corp. | | | 6 | | | | 274 | |
Sony Group Corp. | | | 46 | | | | 4,125 | |
Stanley Electric Co. Ltd. | | | 46 | | | | 922 | |
Subaru Corp. | | | 366 | | | | 6,886 | |
Sumitomo Corp. | | | 113 | | | | 2,399 | |
Sumitomo Metal Mining Co. Ltd. | | | 5 | | | | 145 | |
Sumitomo Mitsui Financial Group, Inc. | | | 57 | | | | 2,452 | |
Sumitomo Mitsui Trust Holdings, Inc. | | | 30 | | | | 1,064 | |
Sumitomo Rubber Industries Ltd. | | | 24 | | | | 228 | |
Suzuki Motor Corp. | | | 29 | | | | 1,059 | |
Sysmex Corp. | | | 106 | | | | 7,268 | |
T&D Holdings, Inc. | | | 113 | | | | 1,651 | |
Takeda Pharmaceutical Co. Ltd. | | | 146 | | | | 4,600 | |
TDK Corp. | | | 2 | | | | 74 | |
TechnoPro Holdings, Inc. | | | 57 | | | | 1,244 | |
Terumo Corp. | | | 200 | | | | 6,376 | |
THK Co. Ltd. | | | 36 | | | | 743 | |
Tokio Marine Holdings, Inc. | | | 144 | | | | 3,324 | |
Tokyo Electron Ltd. | | | 20 | | | | 2,938 | |
Toray Industries, Inc. | | | 823 | | | | 4,586 | |
Toshiba Corp. | | | 11 | | | | 342 | |
Tosoh Corp. | | | 28 | | | | 330 | |
Toyota Motor Corp. | | | 262 | | | | 4,217 | |
Welcia Holdings Co. Ltd. | | | 31 | | | | 652 | |
Yamaha Corp. | | | 4 | | | | 162 | |
Yamato Holdings Co. Ltd. | | | 7 | | | | 121 | |
Yokogawa Electric Corp. | | | 4 | | | | 76 | |
Z Holdings Corp. | | | 225 | | | | 543 | |
| | | | | | | | |
Total Japan | | | | 219,744 | |
| | | | | |
Luxembourg – 0.48% | | | | | | | | |
ArcelorMittal | | | 195 | | | | 5,330 | |
Eurofins Scientific SE(2) | | | 0 | | | | 31 | |
Tenaris SA | | | 10 | | | | 149 | |
| | | | | | | | |
Total Luxembourg | | | | 5,510 | |
| | | | | |
Netherlands – 5.73% | | | | | | | | |
Adyen NV(1)(3) | | | 1 | | | | 1,103 | |
Aegon NV | | | 14 | | | | 72 | |
Akzo Nobel NV | | | 25 | | | | 2,040 | |
Argenx SE(1) | | | 1 | | | | 296 | |
ASM International NV | | | 16 | | | | 6,760 | |
ASML Holding NV | | | 25 | | | | 18,339 | |
EXOR NV | | | 3 | | | | 309 | |
Ferrovial SE | | | 6 | | | | 176 | |
Heineken NV | | | 21 | | | | 2,190 | |
ING Groep NV | | | 841 | | | | 11,337 | |
JDE Peet’s NV | | | 17 | | | | 498 | |
Just Eat Takeaway.com NV(1)(3) | | | 12 | | | | 186 | |
Koninklijke Ahold Delhaize NV | | | 14 | | | | 480 | |
Koninklijke KPN NV | | | 29 | | | | 102 | |
Koninklijke Philips NV | | | 406 | | | | 8,804 | |
NN Group NV | | | 14 | | | | 512 | |
NXP Semiconductors NV | | | 15 | | | | 3,139 | |
Prosus NV(1) | | | 6 | | | | 444 | |
QIAGEN NV(1) | | | 5 | | | | 222 | |
Randstad NV | | | 140 | | | | 7,402 | |
Stellantis NV | | | 19 | | | | 340 | |
Wolters Kluwer NV | | | 3 | | | | 390 | |
| | | | | | | | |
Total Netherlands | | | | 65,141 | |
| | | | | |
New Zealand – 0.03% | | | | | | | | |
Xero Ltd.(1) | | | 4 | | | | 297 | |
| | | | | | | | |
Total New Zealand | | | | 297 | |
| | | | | |
Norway – 0.82% | | | | | | | | |
Aker BP ASA | | | 9 | | | | 211 | |
DNB Bank ASA | | | 162 | | | | 3,038 | |
Equinor ASA | | | 122 | | | | 3,566 | |
Gjensidige Forsikring ASA | | | 29 | | | | 467 | |
Norsk Hydro ASA | | | 23 | | | | 135 | |
| | | | | | | | |
Storebrand ASA | | | 201 | | | | 1,569 | |
Telenor ASA | | | 31 | | | | 310 | |
| | | | | | | | |
Total Norway | | | | 9,296 | |
| | | | | |
Portugal – 0.03% | | | | | | | | |
EDP – Energias de Portugal SA | | | 69 | | | | 337 | |
| | | | | | | | |
Total Portugal | | | | 337 | |
| | | | | |
Singapore – 0.84% | | | | | | | | |
CapitaLand Ascendas REIT | | | 35 | | | | 71 | |
DBS Group Holdings Ltd. | | | 134 | | | | 3,134 | |
Oversea-Chinese Banking Corp. Ltd. | | | 78 | | | | 708 | |
Sea Ltd. – ADR(1) | | | 3 | | | | 189 | |
Singapore Airlines Ltd. | | | 54 | | | | 285 | |
Singapore Exchange Ltd. | | | 44 | | | | 310 | |
Singapore Telecommunications Ltd. | | | 41 | | | | 76 | |
United Overseas Bank Ltd. | | | 134 | | | | 2,785 | |
Wilmar International Ltd. | | | 692 | | | | 1,950 | |
| | | | | | | | |
Total Singapore | | | | 9,508 | |
| | | | | |
South Korea – 0.93% | | | | | | | | |
NAVER Corp. | | | 7 | | | | 922 | |
POSCO Holdings, Inc. | | | 1 | | | | 333 | |
POSCO Holdings, Inc. – ADR | | | 6 | | | | 420 | |
Samsung Electronics Co. Ltd. | | | 135 | | | | 7,416 | |
Shinhan Financial Group Co. Ltd. | | | 58 | | | | 1,490 | |
| | | | | | | | |
Total South Korea | | | | 10,581 | |
| | | | | |
Spain – 2.12% | | | | | | | | |
ACS Actividades Co. | | | 3 | | | | 99 | |
Aena SME SA(3) | | | 1 | | | | 243 | |
Amadeus IT Group SA(1) | | | 77 | | | | 5,859 | |
Banco Bilbao Vizcaya Argentaria SA | | | 44 | | | | 337 | |
Banco Santander SA | | | 131 | | | | 486 | |
CaixaBank SA | | | 1,161 | | | | 4,811 | |
Cellnex Telecom SA(3) | | | 7 | | | | 291 | |
Corp. ACCIONA Energias Renovables SA | | | 6 | | | | 209 | |
EDP Renovaveis SA | | | 4 | | | | 83 | |
Iberdrola SA | | | 43 | | | | 561 | |
Industria de Diseno Textil SA | | | 272 | | | | 10,555 | |
Repsol SA | | | 21 | | | | 306 | |
Telefonica SA | | | 50 | | | | 203 | |
| | | | | | | | |
Total Spain | | | | 24,043 | |
| | | | | |
Sweden – 1.26% | | | | | | | | |
Alleima AB | | | 1 | | | | 3 | |
Assa Abloy AB – Class B | | | 15 | | | | 362 | |
Atlas Copco AB – Class A | | | 44 | | | | 637 | |
Atlas Copco AB – Class B | | | 299 | | | | 3,722 | |
Autoliv, Inc. | | | 17 | | | | 1,474 | |
Boliden AB | | | 4 | | | | 126 | |
Elekta AB – Class B | | | 134 | | | | 1,035 | |
Essity AB – Class B | | | 10 | | | | 262 | |
Evolution AB(3) | | | 1 | | | | 182 | |
Fastighets AB Balder – Class B(1) | | | 54 | | | | 198 | |
Hexagon AB – Class B | | | 18 | | | | 225 | |
Industrivarden AB – Class C | | | 4 | | | | 105 | |
Investment AB Latour – Class B | | | 11 | | | | 221 | |
Investor AB – Class B | | | 20 | | | | 391 | |
Sagax AB – Class B | | | 13 | | | | 263 | |
Sandvik AB | | | 8 | | | | 154 | |
Securitas AB – Class B | | | 6 | | | | 45 | |
Skandinaviska Enskilda Banken AB – Class A | | | 45 | | | | 496 | |
Svenska Handelsbanken AB – Class A | | | 223 | | | | 1,870 | |
Tele2 AB – Class B | | | 12 | | | | 99 | |
Telefonaktiebolaget LM Ericsson – Class B | | | 359 | | | | 1,953 | |
Telia Co. AB | | | 96 | | | | 210 | |
Volvo AB – Class B | | | 13 | | | | 275 | |
| | | | | | | | |
Total Sweden | | | | 14,308 | |
| | | | | |
Switzerland – 8.83% | | | | | | | | |
ABB Ltd. | | | 101 | | | | 3,973 | |
Accelleron Industries AG | | | 1 | | | | 24 | |
Adecco Group AG | | | 6 | | | | 203 | |
Alcon, Inc. | | | 23 | | | | 1,882 | |
Barry Callebaut AG | | | 1 | | | | 1,439 | |
Cie Financiere Richemont SA | | | 3 | | | | 466 | |
Clariant AG(1) | | | 19 | | | | 272 | |
DSM-Firmenich AG(1) | | | 2 | | | | 177 | |
EMS-Chemie Holding AG(2) | | | 0 | | | | 107 | |
Geberit AG(2) | | | 0 | | | | 133 | |
Givaudan SA(2) | | | 0 | | | | 325 | |
Glencore Plc | | | 96 | | | | 546 | |
Holcim AG(1) | | | 3 | | | | 175 | |
Julius Baer Group Ltd. | | | 103 | | | | 6,512 | |
| | | | | | | | |
Kuehne & Nagel International AG | | | 18 | | | | 5,211 | |
Lonza Group AG | | | 12 | | | | 6,900 | |
Nestle SA | | | 163 | | | | 19,628 | |
Novartis AG | | | 137 | | | | 13,801 | |
Partners Group Holding AG(2) | | | 0 | | | | 437 | |
Roche Holding AG | | | 1 | | | | 209 | |
Roche Holding AG | | | 66 | | | | 20,199 | |
SGS SA | | | 63 | | | | 5,952 | |
Sika AG | | | 1 | | | | 416 | |
Sonova Holding AG | | | 1 | | | | 318 | |
STMicroelectronics NV | | | 8 | | | | 408 | |
Straumann Holding AG | | | 2 | | | | 294 | |
Swisscom AG(2) | | | 0 | | | | 101 | |
UBS Group AG | | | 324 | | | | 6,564 | |
VAT Group AG(2)(3) | | | 0 | | | | 99 | |
Zurich Insurance Group AG | | | 7 | | | | 3,521 | |
| | | | | | | | |
Total Switzerland | | | | 100,292 | |
| | | | | |
Taiwan – 2.12% | | | | | | | | |
Hon Hai Precision Industry Co. Ltd. | | | 2,053 | | | | 7,464 | |
Largan Precision Co. Ltd. | | | 5 | | | | 343 | |
Taiwan Semiconductor Manufacturing Co. Ltd. | | | 372 | | | | 6,872 | |
Taiwan Semiconductor Manufacturing Co. Ltd. – ADR | | | 93 | | | | 9,428 | |
| | | | | | | | |
Total Taiwan | | | | 24,107 | |
| | | | | |
United Kingdom – 11.46% | | | | | | | | |
3i Group Plc | | | 4 | | | | 102 | |
Amcor Plc | | | 21 | | | | 207 | |
Anglo American Plc | | | 14 | | | | 410 | |
Ashtead Group Plc | | | 38 | | | | 2,632 | |
AstraZeneca Plc | | | 11 | | | | 1,576 | |
AstraZeneca Plc – ADR | | | 67 | | | | 4,829 | |
Aviva Plc | | | 566 | | | | 2,850 | |
BAE Systems Plc | | | 29 | | | | 345 | |
Barclays Plc | | | 1,847 | | | | 3,609 | |
Barratt Developments Plc | | | 63 | | | | 331 | |
BP Plc | | | 152 | | | | 883 | |
Bridgepoint Group Plc(3) | | | 291 | | | | 750 | |
British American Tobacco Plc | | | 12 | | | | 383 | |
BT Group Plc – Class A | | | 230 | | | | 358 | |
Bunzl Plc | | | 38 | | | | 1,449 | |
Compass Group Plc | | | 479 | | | | 13,416 | �� |
Croda International Plc | | | 1 | | | | 49 | |
Diageo Plc | | | 254 | | | | 10,936 | |
Dowlais Group Plc(1) | | | 331 | | | | 534 | |
Dr Martens Plc | | | 208 | | | | 323 | |
Great Portland Estates Plc | | | 151 | | | | 796 | |
GSK Plc | | | 28 | | | | 490 | |
GSK Plc – ADR | | | 43 | | | | 1,517 | |
Haleon Plc | | | 35 | | | | 142 | |
Haleon Plc – ADR | | | 52 | | | | 434 | |
HSBC Holdings Plc | | | 1,051 | | | | 8,321 | |
Imperial Brands Plc | | | 13 | | | | 278 | |
Intertek Group Plc | | | 2 | | | | 127 | |
J Sainsbury Plc | | | 2,348 | | | | 8,025 | |
Johnson Matthey Plc | | | 61 | | | | 1,351 | |
Kingfisher Plc | | | 777 | | | | 2,289 | |
Land Securities Group Plc | | | 16 | | | | 117 | |
Lloyds Banking Group Plc | | | 3,685 | | | | 2,043 | |
London Stock Exchange Group Plc | | | 3 | | | | 367 | |
Melrose Industries Plc | | | 331 | | | | 2,133 | |
National Grid Plc | | | 172 | | | | 2,275 | |
NatWest Group Plc | | | 961 | | | | 2,938 | |
Next Plc | | | 20 | | | | 1,741 | |
Ocado Group Plc(1) | | | 41 | | | | 299 | |
Persimmon Plc | | | 74 | | | | 965 | |
Reckitt Benckiser Group Plc | | | 62 | | | | 4,696 | |
RELX Plc | | | 21 | | | | 684 | |
Rentokil Initial Plc | | | 51 | | | | 397 | |
Rio Tinto Plc | | | 10 | | | | 608 | |
Sage Group Plc | | | 7 | | | | 86 | |
Schroders Plc | | | 5 | | | | 30 | |
Segro Plc | | | 31 | | | | 286 | |
Severn Trent Plc | | | 4 | | | | 132 | |
Shell Plc | | | 48 | | | | 1,446 | |
Shell Plc – ADR | | | 38 | | | | 2,277 | |
Shell Plc | | | 282 | | | | 8,504 | |
Smith & Nephew Plc | | | 14 | | | | 227 | |
Smiths Group Plc | | | 3 | | | | 67 | |
SSE Plc | | | 15 | | | | 349 | |
St James’s Place Plc | | | 9 | | | | 131 | |
| | | | | | | | |
Standard Chartered Plc | | | 596 | | | | 5,188 | |
Taylor Wimpey Plc | | | 245 | | | | 320 | |
TechnipFMC Plc(1) | | | 76 | | | | 1,260 | |
Tesco Plc | | | 1,775 | | | | 5,601 | |
Travis Perkins Plc | | | 380 | | | | 3,935 | |
Unilever Plc | | | 124 | | | | 6,448 | |
United Utilities Group Plc | | | 11 | | | | 133 | |
Vodafone Group Plc – ADR | | | 101 | | | | 954 | |
Vodafone Group Plc | | | 1,739 | | | | 1,640 | |
Whitbread Plc | | | 6 | | | | 273 | |
WPP Plc | | | 180 | | | | 1,891 | |
| | | | | | | | |
Total United Kingdom | | | | 130,183 | |
| | | | | |
United States – 0.53% | | | | | | | | |
Broadcom, Inc. | | | 6 | | | | 5,047 | |
Coupang, Inc. – Class A(1) | | | 13 | | | | 222 | |
Samsonite International SA(1)(3) | | | 260 | | | | 736 | |
| | | | | | | | |
Total United States | | | | 6,005 | |
| | | | | |
Total Common Stocks (Cost: $948,231) | | | | 1,091,762 | |
| | | | | |
PREFERRED STOCKS – 0.67% | | | | | | | | |
Germany – 0.67% | | | | | | | | |
Dr Ing hc F Porsche AG(3) | | | 15 | | | | 1,908 | |
Henkel AG & Co. KGaA | | | 1 | | | | 63 | |
Porsche Automobil Holding SE(1) | | | 4 | | | | 255 | |
Volkswagen AG | | | 40 | | | | 5,372 | |
| | | | | | | | |
Total Germany | | | | 7,598 | |
| | | | | |
Total Preferred Stocks (Cost: $7,520) | | | | 7,598 | |
| | | | | |
SHORT-TERM INVESTMENTS – 3.19% | | | | | | | | |
Money Market Funds – 2.97% | | | | | | | | |
Goldman Sachs Financial Square Government Fund – Class I, 5.02%(4) | | | 33,739 | | | | 33,739 | |
| | | | | | | | |
Total Money Market Funds (Cost: $33,739) | | | | | | | 33,739 | |
| | | | | | | | |
| | | | | | | | |
| | | Principal
Amount
(000s) | | | Value
(000s) | |
Time Deposits – 0.22% | | | | | | | | |
ANZ, Hong Kong, 3.02% due 07/03/2023 | | AUD | 36 | | | | 24 | |
Brown Brothers Harriman, 2.22% due 07/03/2023(2) | | DKK | 0 | | | | 0 | |
Brown Brothers Harriman, 2.47% due 07/03/2023(2) | | SEK | 3 | | | | 0 | |
Brown Brothers Harriman, 2.85% due 07/03/2023 | | NOK | 3,252 | | | | 303 | |
Brown Brothers Harriman, 4.15% due 07/03/2023(2) | | NZD | 0 | | | | 0 | |
HSBC, Hong Kong, 3.72% due 07/03/2023 | | HKD | 691 | | | | 88 | |
HSBC, Singapore, 3.05% due 07/03/2023 | | SGD | 14 | | | | 11 | |
Royal Bank of Canada, Toronto, 3.79% due 07/04/2023 | | CAD | 110 | | | | 83 | |
Skandinaviska Enskilda Banken AB, Stockholm, 0.65% due 07/03/2023 | | CHF | 1 | | | | 1 | |
Skandinaviska Enskilda Banken AB, Stockholm, 2.62% due 07/03/2023 | | EUR | 344 | | | | 376 | |
Skandinaviska Enskilda Banken AB, Stockholm, 4.17% due 07/03/2023 | | GBP | 228 | | | | 289 | |
Sumitomo, Tokyo, -0.37% due 07/03/2023 | | JPY | 192,244 | | | | 1,333 | |
| | | | | | | | |
Total Time Deposits (Cost: $2,508) | | | | | | | 2,508 | |
| | | | | | | | |
Total Short-Term Investments (Cost: $36,247) | | | | 36,247 | |
| | | | | |
TOTAL INVESTMENTS IN SECURITIES – 99.93% | | | | | | | | |
(Cost: $991,998) | | | | | | | 1,135,607 | |
| | | | | | | | |
OTHER ASSETS IN EXCESS OF LIABILITIES – 0.07% | | | | | | | 759 | |
| | | | | | | | |
TOTAL NET ASSETS – 100.00% | | | | | | $
|
1,136,366 |
|
| | | | | | | | |
Percentages are stated as a percent of net assets.
Principal amounts are denominated in the currency in which the security was purchased.
ADR American Depositary Receipt
REIT Real Estate Investment Trust
AUD Australian Dollar
CAD Canadian Dollar
CHF Swiss Franc
DKK Danish Krone
EUR Euro
GBP British Pound
HKD Hong Kong Dollar
JPY Japanese Yen
NOK Norwegian Krone
NZD New Zealand Dollar
SEK Swedish Krona
SGD Singapore Dollar
| (1) | Non-income producing security. |
| (2) | A zero balance may reflect actual amounts rounding to less than one thousand. |
| (3) | Security was purchased exempt from registration in the U.S. pursuant to Rule 144(A) under the Securities Act of 1933. The value of these securities totals $30,896, which represents 2.72% of total net assets. |
| (4) | Represents annualized seven-day yield as of the close of the reporting period. |
The accompanying notes are an integral part of this Schedule of Investments.
| | | | |
| COMMON STOCKS | | Percentage of Net
Assets | |
Communication Services | | | 2.04 | % |
Consumer Discretionary | | | 13.16 | |
Consumer Staples | | | 8.84 | |
Energy | | | 2.73 | |
Financials | | | 15.92 | |
Healthcare | | | 15.60 | |
Industrials | | | 16.01 | |
Information Technology | | | 11.46 | |
Materials | | | 7.51 | |
Real Estate | | | 0.68 | |
Utilities | | | 2.12 | |
| | | | |
Total Common Stocks | | | 96.07 | |
| | | | |
PREFERRED STOCKS | | | | |
Consumer Discretionary | | | 0.66 | |
Consumer Staples | | | 0.01 | |
| | | | |
Total Preferred Stocks | | | 0.67 | |
| | | | |
SHORT-TERM INVESTMENTS | | | 3.19 | |
| | | | |
TOTAL INVESTMENTS | | | 99.93 | |
OTHER ASSETS IN EXCESS OF LIABILITIES | | | 0.07 | |
| | | | |
TOTAL NET ASSETS | | | 100.00 | % |
| | | | |
The accompanying notes are an integral part of this Schedule of Investments.

Report of Independent Registered Public Accounting Firm
To the Board of Trustees of Bridge Builder Trust and Shareholders of Bridge Builder Core Bond Fund, Bridge Builder Core Plus Bond Fund, Bridge Builder Municipal Bond Fund, Bridge Builder Municipal High-Income Bond Fund, Bridge Builder Large Cap Growth Fund, Bridge Builder Large Cap Value Fund, Bridge Builder Tax Managed Large Cap Fund, Bridge Builder Small/Mid Cap Growth Fund, Bridge Builder Small/Mid Cap Value Fund, Bridge Builder Tax Managed Small/Mid Cap Fund, Bridge Builder International Equity Fund, and Bridge Builder Tax Managed International Equity Fund.
Opinions on the Financial Statements
We have audited the accompanying statements of assets and liabilities, including the summary schedules of investments, of each of the funds listed in the table below (twelve of the funds constituting Bridge Builder Trust, hereafter collectively referred to as the “Funds”) as of June 30, 2023, the related statements of operations and of changes in net assets for each of the periods indicated in the table below, including the related notes, and the financial highlights for each of the periods indicated therein (included in Item 1 of this Form N-CSR) and the schedules of investments (included in Item 6 of this Form N-CSR) as of June 30, 2023 (collectively referred to as the “financial statements”). In our opinion, the financial statements present fairly, in all material respects, the financial position of each of the Funds as of June 30, 2023, the results of each of their operations and the changes in each of their net assets for the periods indicated in the table below, and each of the financial highlights for each of the periods indicated therein, in conformity with accounting principles generally accepted in the United States of America.
Bridge Builder Core Bond Fund (1)
Bridge Builder Core Plus Bond Fund (1)
Bridge Builder Municipal Bond Fund (1)
Bridge Builder Large Cap Growth Fund (1)
Bridge Builder Large Cap Value Fund (1)
Bridge Builder Tax Managed Large Cap Fund (2)
Bridge Builder Small/Mid Cap Growth Fund (1)
Bridge Builder Small/Mid Cap Value Fund (1)
Bridge Builder Tax Managed Small/Mid Cap Fund (2)
Bridge Builder International Equity Fund (1)
Bridge Builder Tax Managed International Equity Fund (2)
Bridge Builder Municipal High- Income Bond Fund (3)
(1) Statement of operations for the year ended June 30, 2023 and statements of changes in net assets for the years ended June 30, 2023 and 2022
(2) Statement of operations for the year ended June 30, 2023 and statements of changes in net assets for the year ended June 30, 2023 and the period June 1, 2022 (inception date) through June 30, 2022
(3) Statement of operations and statement of changes in net assets for the period April 13, 2023 (inception date) through June 30, 2023
PricewaterhouseCoopers LLP, One North Wacker, Chicago, IL 60606
T: (312) 298 2000, www.pwc.com/us
Basis for Opinions
These financial statements are the responsibility of the Funds’ management. Our responsibility is to express an opinion on the Funds’ financial statements based on our audits. We are a public accounting firm registered with the Public Company Accounting Oversight Board (United States) (PCAOB) and are required to be independent with respect to the Funds in accordance with the U.S. federal securities laws and the applicable rules and regulations of the Securities and Exchange Commission and the PCAOB.
We conducted our audits of these financial statements in accordance with the standards of the PCAOB. Those standards require that we plan and perform the audit to obtain reasonable assurance about whether the financial statements are free of material misstatement, whether due to error or fraud.
Our audits included performing procedures to assess the risks of material misstatement of the financial statements, whether due to error or fraud, and performing procedures that respond to those risks. Such procedures included examining, on a test basis, evidence regarding the amounts and disclosures in the financial statements. Our audits also included evaluating the accounting principles used and significant estimates made by management, as well as evaluating the overall presentation of the financial statements. Our procedures included confirmation of securities owned as of June 30, 2023 by correspondence with the custodian, brokers, and agent banks; when replies were not received from brokers, we performed other auditing procedures. We believe that our audits provide a reasonable basis for our opinions.

Chicago, Illinois
August 25, 2023
We have served as the auditor of one or more investment companies in the Bridge Builder Trust since 2013.
2
ITEM 7. DISCLOSURE OF PROXY VOTING POLICIES AND PROCEDURES FOR CLOSED-END MANAGEMENT INVESTMENT COMPANIES.
Not applicable to open-end investment companies.
ITEM 8. PORTFOLIO MANAGERS OF CLOSED-END MANAGEMENT INVESTMENT COMPANIES.
Not applicable to open-end investment companies.
ITEM 9. PURCHASES OF EQUITY SECURITIES BY CLOSED-END MANAGEMENT INVESTMENT COMPANIES AND AFFILIATED PURCHASERS.
Not applicable to open-end investment companies.
ITEM 10. SUBMISSION OF MATTERS TO A VOTE OF SECURITY HOLDERS.
There have been no material changes to the procedures by which shareholders may recommend nominees to the registrant’s board of trustees.
ITEM 11. CONTROLS AND PROCEDURES.
| (a) | The Registrant’s Principal Executive Officer and Principal Financial Officer have reviewed the Registrant’s disclosure controls and procedures (as defined in Rule 30a-3(c) under the Investment Company Act of 1940 (the “Act”)) as of a date within 90 days of the filing of this report, as required by Rule 30a-3(b) under the Act and Rules 13a-15(b) or 15d-15(b) under the Securities Exchange Act of 1934. Based on their review, such officers have concluded that the disclosure controls and procedures are effective in ensuring that information required to be disclosed in this report is appropriately recorded, processed, summarized and reported and made known to them by others within the Registrant and by the Registrant’s service provider. |
| (b) | There were no changes in the Registrant’s internal control over financial reporting (as defined in Rule 30a-3(d) under the Act) that occurred during the period covered by this report that has materially affected, or is reasonably likely to materially affect, the Registrant’s internal control over financial reporting. |
ITEM 12. DISCLOSURE OF SECURITIES LENDING ACTIVITIES FOR CLOSED-END MANAGEMENT INVESTMENT COMPANIES.
Not applicable to open-end investment companies.
ITEM 13. EXHIBITS.
SIGNATURES
Pursuant to the requirements of the Securities Exchange Act of 1934 and the Investment Company Act of 1940, the registrant has duly caused this report to be signed on its behalf by the undersigned, thereunto duly authorized.
| | |
| Bridge Builder Trust |
| |
| By: | | /s/ Colleen R. Dean |
| Name: | | Colleen R. Dean |
| Title: | | Principal Executive Officer |
| |
| Date: | | August 25, 2023 |
Pursuant to the requirements of the Securities Exchange Act of 1934 and the Investment Company Act of 1940, this report has been signed below by the following persons on behalf of the registrant and in the capacities and on the dates indicated.
| | |
| Bridge Builder Trust |
| |
| By: | | /s/ Colleen R. Dean |
| Name: | | Colleen R. Dean |
| Title: | | Principal Executive Officer |
| |
| Date: | | August 25, 2023 |
| | |
| By: | | /s/ Aaron J. Masek |
| Name: | | Aaron J. Masek |
| Title: | | Principal Financial Officer |
| |
| Date: | | August 25, 2023 |