Exhibit 99.2

*As of June 30, 2019 unless otherwise noted. 1 AFIN definition of Service Retail includes single-tenant retail properties leased to tenants in the retail banking, restaurant, grocery, pharmacy, gas/convenience, fitness, and auto services sectors. 2 Represents percentage of square footage of which the tenant has taken possession divided by the respective total rentable square feet as of June 30, 2019. 3 Based on annualized straight-line rent as of June 30, 2019. 4 Contractual rent increases include fixed percent or actual increases, or CPI-indexed increases. 5 Investment Grade Rating includes both actual investment grade ratings of the tenant or implied investment grade. Implied investment grade includes ratings of tenant parent (regardless of whether or not the parent has guaranteed the tenant’s obligation under the lease) or lease guarantor. Implied investment grade ratings are determined using a proprietary Moody’s analytical tool, which compares the risk metrics of the non-rated company to those of a company with an actual rating. Ratings information is as of June 30, 2019. AFIN’s top 10 tenants are 53% actual investment grade rated and 29% implied investment grade. 6 Represents total debt less cash and cash equivalents divided by total assets plus accumulated depreciation and amortization as of June 30, 2019. 7 Executed Occupancy includes occupancy as of June 30, 2019, as defined in footnote 2 above, as well as all leases executed by both parties as of June 30, 2019 that have yet to take possession as of such date. 8 As of July 15, 2019, the remaining acquisitions in the pipeline are currently under definitive purchase and sale agreements which are subject to conditions and LOIs that are non-binding. There can be no assurance these pipeline acquisitions will be completed on their current terms, or at all. Dividend Rate (annualized, per share) common/preferred $1.10/$1.88 Dividend Frequency - common/preferred Monthly/Quarterly Real Estate Investments, at cost $3.6 billion # of Properties 704 Square Feet (millions) 17.7 Annualized Straight-Line Rent (SLR) $250 million Occupancy(2) 93.4% Weighted-Average Remaining Lease Term(3) 9.0 years Average Annual Rent Escalator(3)(4) 1.3% American Finance Trust, Inc. (Nasdaq: AFIN(common); Nasdaq: AFINP(preferred)) is a real estate investment trust that acquires, owns and manages a high-quality single and multi-tenant portfolio that is Service-Retail(1) focused. The portfolio consists of a strong, creditworthy tenant base and is well positioned for growth through strong occupancy and long-term leases with embedded rent escalators. PROPERTY MAP ANNUALIZED SLR BY PROPERTY TYPE ($) ANNUALIZED SLR BY SECTOR (%) COMPANY DESCRIPTION PORTFOLIO AT A GLANCE* American Finance Trust FACTSHEET June 30, 2019 Single-Tenant Multi-Tenant HIGH-QUALITY PORTFOLIO 93% portfolio occupancy with a balance of single-tenant assets with long-term leases and retail centers focused on experiential tenants SIGNIFICANT LEASING ACTIVITY Executed leases that have yet to commence of over 210,000 square feet as of quarter end. Second quarter multi-tenant Executed Occupancy(7) of 88.0% provides ample lease potential. CREDITWORTHY & DIVERSIFIED TENANTS 82% of top-ten tenants are Investment Grade Rated(5) AFIN's top ten tenants account for 41% of total SLR POSITIONED FOR GROWTH Rent Escalators(4) in 81% of existing leases $183 million has closed as of June 30, 2019 and currently have a $38 million pipeline(8) CONSERVATIVE BALANCE SHEET Ample liquidity with modest Net Leverage(6) of 39% SERVICE RETAIL FOCUS Service retail properties make up 56%(3) of our single-tenant portfolio and these property types are more resistant to e-commerce vs. traditional retail DIVIDEND INFORMATION COMPANY HIGHLIGHTS Retail Distribution Retail Office Distribution Office Multi-Tenant $88 $26 $107 $29 Multi-Tenant 35% Single-Tenant 65% 78% 12% 10%
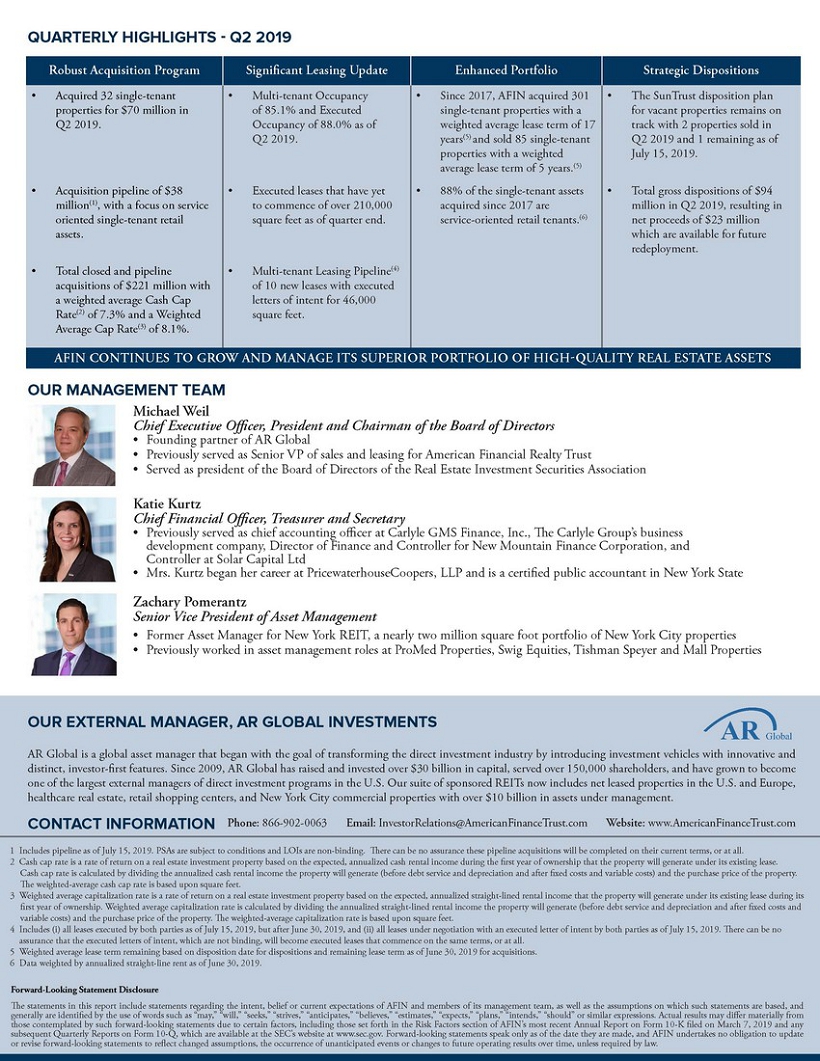
OUR MANAGEMENT TEAM • Founding partner of AR Global • Previously served as Senior VP of sales and leasing for American Financial Realty Trust • Served as president of the Board of Directors of the Real Estate Investment Securities Association • Previously served as chief accounting officer at Carlyle GMS Finance, Inc., The Carlyle Group’s business development company, Director of Finance and Controller for New Mountain Finance Corporation, and Controller at Solar Capital Ltd • Mrs. Kurtz began her career at PricewaterhouseCoopers, LLP and is a certified public accountant in New York State Katie Kurtz Chief Financial Officer, Treasurer and Secretary Michael Weil Chief Executive Officer, President and Chairman of the Board of Directors • Former Asset Manager for New York REIT, a nearly two million square foot portfolio of New York City properties • Previously worked in asset management roles at ProMed Properties, Swig Equities, Tishman Speyer and Mall Properties Zachary Pomerantz Senior Vice President of Asset Management QUARTERLY HIGHLIGHTS - Q2 2019 1 Includes pipeline as of July 15, 2019. PSAs are subject to conditions and LOIs are non-binding. There can be no assurance these pipeline acquisitions will be completed on their current terms, or at all. 2 Cash cap rate is a rate of return on a real estate investment property based on the expected, annualized cash rental income during the first year of ownership that the property will generate under its existing lease. Cash cap rate is calculated by dividing the annualized cash rental income the property will generate (before debt service and depreciation and after fixed costs and variable costs) and the purchase price of the property. The weighted-average cash cap rate is based upon square feet. 3 Weighted average capitalization rate is a rate of return on a real estate investment property based on the expected, annualized straight-lined rental income that the property will generate under its existing lease during its first year of ownership. Weighted average capitalization rate is calculated by dividing the annualized straight-lined rental income the property will generate (before debt service and depreciation and after fixed costs and variable costs) and the purchase price of the property. The weighted-average capitalization rate is based upon square feet. 4 Includes (i) all leases executed by both parties as of July 15, 2019, but after June 30, 2019, and (ii) all leases under negotiation with an executed letter of intent by both parties as of July 15, 2019. There can be no assurance that the executed letters of intent, which are not binding, will become executed leases that commence on the same terms, or at all. 5 Weighted average lease term remaining based on disposition date for dispositions and remaining lease term as of June 30, 2019 for acquisitions. 6 Data weighted by annualized straight-line rent as of June 30, 2019. OUR EXTERNAL MANAGER, AR GLOBAL INVESTMENTS AR Global is a global asset manager that began with the goal of transforming the direct investment industry by introducing investment vehicles with innovative and distinct, investor-first features. Since 2009, AR Global has raised and invested over $30 billion in capital, served over 150,000 shareholders, and have grown to become one of the largest external managers of direct investment programs in the U.S. Our suite of sponsored REITs now includes net leased properties in the U.S. and Europe, healthcare real estate, retail shopping centers, and New York City commercial properties with over $10 billion in assets under management. AR Global Forward-Looking Statement Disclosure The statements in this report include statements regarding the intent, belief or current expectations of AFIN and members of its management team, as well as the assumptions on which such statements are based, and generally are identified by the use of words such as “may,” “will,” “seeks,” “strives,” “anticipates,” “believes,” “estimates,” “expects,” “plans,” “intends,” “should” or similar expressions. Actual results may differ materially from those contemplated by such forward-looking statements due to certain factors, including those set forth in the Risk Factors section of AFIN’s most recent Annual Report on Form 10-K filed on March 7, 2019 and any subsequent Quarterly Reports on Form 10-Q, which are available at the SEC’s website at www.sec.gov. Forward-looking statements speak only as of the date they are made, and AFIN undertakes no obligation to update or revise forward-looking statements to reflect changed assumptions, the occurrence of unanticipated events or changes to future operating results over time, unless required by law. CONTACT INFORMATION Phone: 866-902-0063 Email: InvestorRelations@AmericanFinanceTrust.com Website: www.AmericanFinanceTrust.com Robust Acquisition Program Significant Leasing Update Enhanced Portfolio Strategic Dispositions • Acquired 32 single-tenant properties for $70 million in Q2 2019. • Multi-tenant Occupancy of 85.1% and Executed Occupancy of 88.0% as of Q2 2019. • Since 2017, AFIN acquired 301 single-tenant properties with a weighted average lease term of 17 years(5) and sold 85 single-tenant properties with a weighted average lease term of 5 years.(5) • The SunTrust disposition plan for vacant properties remains on track with 2 properties sold in Q2 2019 and 1 remaining as of July 15, 2019. • Acquisition pipeline of $38 million(1), with a focus on service oriented single-tenant retail assets. • Executed leases that have yet to commence of over 210,000 square feet as of quarter end. • 88% of the single-tenant assets acquired since 2017 are service-oriented retail tenants.(6) • Total gross dispositions of $94 million in Q2 2019, resulting in net proceeds of $23 million which are available for future redeployment. • Total closed and pipeline acquisitions of $221 million with a weighted average Cash Cap Rate(2) of 7.3% and a Weighted Average Cap Rate(3) of 8.1%. • Multi-tenant Leasing Pipeline(4) of 10 new leases with executed letters of intent for 46,000 square feet. AFIN CONTINUES TO GROW AND MANAGE ITS SUPERIOR PORTFOLIO OF HIGH-QUALITY REAL ESTATE ASSETS