UNITED STATES
SECURITIES AND EXCHANGE COMMISSION
Washington, D.C. 20549
FORMN-CSR
CERTIFIED SHAREHOLDER REPORT OF REGISTERED
MANAGEMENT INVESTMENT COMPANIES
Investment Company Act file number811-22800
IVY HIGH INCOME OPPORTUNITIES FUND
(Exact name of registrant as specified in charter)
6300 Lamar Avenue, Overland Park, Kansas 66202
(Address of principal executive offices) (Zip code)
Jennifer K. Dulski
6300 Lamar Avenue
Overland Park, Kansas 66202
(Name and address of agent for service)
Registrant’s telephone number, including area code: (913)236-2000
Date of fiscal year end: September 30
Date of reporting period: March 31, 2020
ITEM 1. REPORTS TO STOCKHOLDERS.
1
| | |
 | | Semiannual Report MARCH 31, 2020 |
|
Ivy High Income Opportunities Fund |
|
| The Fund’s common shares are listed on the New York |
|
| Stock Exchange and trade under the ticker symbol IVH |
Beginning on January 1, 2021, as permitted by regulations adopted by the U.S. Securities and Exchange Commission (SEC), paper copies of the Fund’s Annual and Semiannual Shareholder Reports no longer will be sent by mail, unless you specifically request paper copies of the reports. Instead, the reports will be made available on the Ivy Investments website (www.ivyinvestments.com), and you will be notified by mail each time a report is posted, and provided with a website link to access the report.
If you have already elected to receive shareholder reports electronically, you will not be affected by this change and you need not take any action. You may elect to receive shareholder reports and other communications from the Fund electronically anytime by contacting your financial intermediary (e.g., a broker-dealer or bank).
You may elect to receive all future reports in paper format free of charge. You can contact your financial intermediary to request that you continue to receive paper copies of your shareholder reports.
The Fund is a non-diversified, closed-end management investment company designed primarily as a long-term investment and not as a trading vehicle.
IVY INVESTMENTSSM refers to the financial services offered by Ivy Distributors, Inc., a FINRA member broker dealer and the distributor of IVY FUNDS® mutual funds, and those financial services offered by its affiliates.
| | |
| CONTENTS | | IVY HIGH INCOME OPPORTUNITIES FUND |
2
| | |
| PRESIDENT’S LETTER | | IVY HIGH INCOME OPPORTUNITIES FUND |
| | |

| | MARCH 31, 2020 (UNAUDITED) |
| Philip J. Sanders, CFA | | |
Dear Shareholder,
Financial markets had been positive in late 2019 and early 2020, as political conflicts, trade uncertainty and global economic growth concerns waned. However, that upward trajectory suddenly reversed in late February 2020 and markets declined in response to two exogenous shocks: theCOVID-19 pandemic and the collapse in energy markets. TheCOVID-19 pandemic has caused one of the most rapid and dramatic global economic downturns in history. We may not realize the totality of the tragic human consequences for several months. The U.S. stock markets dropped approximately 35% from peak in February to trough in late March. Global economic activity hit a full stop around the world, as countries and businesses implemented plans to isolate and protect each other. The pause on economic activity, along with a conflict between Russia and Saudi Arabia, caused a historic rout in oil markets. Remarkably, within about 30 days, we moved from a relatively strong domestic economy with financial market indexes hitting record highs, to a global recession.
Governments and central banks have taken unprecedented steps to mitigate the economic blow of social distancing. The U.S. Federal Reserve (Fed) carried out two emergency cuts to its policy rate, launched yet another quantitative easing program and rolled out bond-buying programs in an effort to stabilize markets. In a matter of two weeks, the Fed’s balance sheet expanded by $2 trillion. In addition to monetary easing, Congress passed a $2.2 trillion rescue package, the CARES (Coronavirus Aid, Relief and Economic Security) Act, which we believe should provide meaningful support for a recovery.
The economic landscape is evolving and market volatility reflects that uncertainty. Unlike previous recessionary periods, we had an economy performing at record pace before theCOVID-19 outbreak. Looking ahead, there are key questions to be answered. Mainly, how long withCOVID-19 dampen economic activity and how long will oil stay depressed?
As we examine the investment landscape, we continue to put greater emphasis on the fundamentals and quality of asset classes and sectors. We believe it is important to stay focused on the merits of individual market sectors,
industries and company business models when making investment decisions. Those fundamentals historically have tended to outweigh external factors. In today’s environment, we believe there are many high-quality businesses offering attractive entry points and cyclicals that will likely be key beneficiaries in an eventual recovery. Importantly, through this uncertain time, we remain focused on the innovation and management skill within individual companies, the ultimate drivers of long-term stock prices.
Economic Snapshot
| | | | | | | | |
| | | 3/31/2020 | | | 9/30/2019 | |
S&P 500 Index | | | 2,584.59 | | | | 2,976.74 | |
MSCI EAFE Index | | | 1,559.59 | | | | 1,889.36 | |
10-Year Treasury Yield | | | 0.70% | | | | 1.68% | |
U.S. unemployment rate | | | 4.4% | | | | 3.5% | |
30-year fixed mortgage rate | | | 3.50% | | | | 3.64% | |
Oil price per barrel | | $ | 20.48 | | | $ | 54.07 | |
Sources: Bloomberg, U.S. Department of Labor, MBA, CME
All government statistics shown are subject to periodic revision. The S&P 500 Index is an unmanaged index that tracks the stocks of 500 primarilylarge-cap U.S. companies. MSCI EAFE Index is an unmanaged index comprised of securities that represent the securities markets in Europe, Australasia and the Far East. It is not possible to invest directly in any of these indexes. Mortgage rates are from BankRate and reflect the overnight national average rate on a conventional30-year fixed loan. Oil prices reflect the market price of West Texas intermediate grade crude.
Respectfully,

Philip J. Sanders, CFA
President
The opinions expressed in this letter are those of the President of the Ivy High Income Opportunities Fund and are current only through the end of the period of the report, as stated on the cover. The President’s views are subject to change at any time, based on market and other conditions, and no forecasts can be guaranteed.
| | |
| PORTFOLIO HIGHLIGHTS | | IVY HIGH INCOME OPPORTUNITIES FUND |
ALL DATA IS AS OF MARCH 31, 2020 (UNAUDITED)
| | | | | | | | |
| Total Return(1) | | Market Price | | | NAV | |
6-month period ended3-31-20 | | | -20.30% | | | | -18.32% | |
1-year period ended3-31-20 | | | -15.54% | | | | -15.76% | |
5-year period ended3-31-20 | | | 1.29% | | | | 1.58% | |
Commencement of operations(5-29-13) through3-31-20 | | | 0.69% | | | | 3.13% | |
|
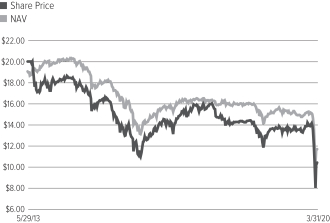
| Market Price/NAV Performance |
Commencement of operations(5-29-13) through3-31-19 |
| | | | |
| Market Price/NAV | | | |
Market Price | | $ | 10.40 | |
NAV | | $ | 11.70 | |
Discount to NAV(3) | | | -11.11% | |
Market Price Yield(4) | | | 11.54% | |
Structural Leverage Ratio(5) | | | 30.98% | |
Effective Leverage Ratio(6) | | | 30.98% | |
Net asset value or “NAV” is the value of one share of a fund as calculated in accordance with the standard formula for valuing mutual fund shares. The price used to calculate market return (“Market Price”) is determined by using the midpoint between the highest bid and the lowest ask on the primary stock exchange on which shares of a fund are listed for trading, as of the time that such fund’s NAV is calculated. Market and NAV returns assume that dividends and capital gain distributions have been reinvested according to the Fund’s dividend reinvestment plan.
Asset Allocation (%’s based on total investments)
| | | | |
Stocks | | | 1.5% | |
Energy | | | 0.7% | |
Consumer Discretionary | | | 0.8% | |
Health Care | | | 0.0% | |
Industrials | | | 0.0% | |
Consumer Staples | | | 0.0% | |
Warrants | | | 0.0% | |
Bonds | | | 94.2% | |
Corporate Debt Securities | | | 66.3% | |
Loans | | | 27.9% | |
Borrowings(2) | | | -31.4% | |
Cash Equivalents+ | | | 4.3% | |
Quality Weightings (%’s based on total investments)
| | | | |
Non-Investment Grade | | | 94.2% | |
BB | | | 9.3% | |
B | | | 52.0% | |
CCC | | | 27.1% | |
Below CCC | | | 1.0% | |
Non-rated | | | 4.8% | |
Borrowings(2) | | | -31.4% | |
Cash Equivalents+ and Equities | | | 5.8% | |
Our preference is to always use ratings obtained from Standard & Poor’s, Moody’s, and Fitch. It is each Portfolio’s general policy to classify such security at the lower rating level if only two ratings are available. If more than two ratings are available and a median exists, the median is used. If more than two ratings exist without a median, the lower of the two middle ratings is used. We do not evaluate these ratings, but simply assign them to the appropriate credit quality category as determined by the rating agency.
| + | Cash equivalents are defined as highly liquid securities with maturities of less than three months. Cash equivalents may include U.S. Government Treasury bills, bank certificates of deposit, bankers’ acceptances, corporate commercial paper and other money market instruments. |
| (1) | Past performance is not necessarily indicative of future performance.Total return is calculated by determining the percentage change in NAV or market price (as applicable) in the specified period. The calculation assumes that all dividends and distributions, if any, have been reinvested. Performance at market price will differ from results at NAV. Returns at market price can be influenced by factors such as changing views about the Fund, market conditions, supply and demand for the Fund’s stock, or changes in the Fund’s dividends. An investment in the Fund involves risk, including the loss of principal. Total return, market price, market price yield and NAV will fluctuate with changes in market conditions. This data is provided for information purposes only and is not intended for trading purposes.Closed-end funds, unlikeopen-end funds, are not continuously offered. There is a one time public offering and, once issued, shares ofclosed-end funds are traded in the open market through a stock exchange. NAV is equal to total assets less total liabilities divided by the total number of shares outstanding. Holdings are subject to change daily. |
| (2) | The Fund has entered into a borrowing arrangement with Pershing LLC as a means of financial leverage. See Note 7 in the Notes to Financial Statements for additional information. |
| (3) | The premium/discount is calculated as (most recent market price/most recent NAV)-1. |
| (4) | Market price yield is determined by dividing the annualized current monthly dividend per share (comprised of net investment income) by the market price per share at March 31, 2020. |
| (5) | Structural leverage consists of borrowings outstanding as a percentage of managed assets. Managed assets are the Fund’s total assets, including the assets attributable to the proceeds from any borrowings, minus liabilities other than the aggregate indebtedness entered into for the purpose of leverage. |
| (6) | The Fund’s effective leverage ratio includes both structural leverage and the leveraging effects of certain derivative instruments in the Fund’s portfolio (referred to as “portfolio leverage”), expressed as a percentage of managed assets. Portfolio leverage from the Fund’s use of forward foreign currency contracts is included in the Fund’s effective leverage values. |
| | |
| SCHEDULE OF INVESTMENTS | | IVY HIGH INCOME OPPORTUNITIES FUND (in thousands) |
MARCH 31, 2020 (UNAUDITED)
| | | | | | | | |
| COMMON STOCKS | | Shares | | | Value | |
Consumer Discretionary | |
| |
Apparel Retail – 0.0% | |
True Religion Apparel, Inc. (A)(B) | | | 34 | | | $ | — | * |
| | | | | | | | |
| |
Hotels, Resorts & Cruise Lines – 1.1% | |
Studio City International Holdings Ltd. ADR (A) | | | 108 | | | | 2,188 | |
| | | | | | | | |
| |
Total Consumer Discretionary – 1.1% | | | | 2,188 | |
Energy | |
| | |
Coal & Consumable Fuels – 0.1% | | | | | | | | |
Westmoreland Coal Co. (A) | | | 13 | | | | 163 | |
| | | | | | | | |
| |
Oil & Gas Equipment & Services – 0.1% | |
Larchmont Resources LLC (A)(B)(C)(D)(E) | | | 2 | | | | 291 | |
McDermott International, Inc. (A)(B) | | | 9 | | | | — | * |
| | | | | | | | |
| | | | | | | 291 | |
| | | | | | | | |
| |
Oil & Gas Exploration & Production – 0.0% | |
Bellatrix Exploration Ltd. (A)(B)(D) | | | 179 | | | | — | * |
| | | | | | | | |
| |
Total Energy – 0.2% | | | | 454 | |
Health Care | |
| |
Pharmaceuticals – 0.0% | |
Advanz Pharma Corp. (A)(D)(F) | | | 9 | | | | 36 | |
| | | | | | | | |
| |
Total Health Care – 0.0% | | | | 36 | |
Industrials | |
| |
Air Freight & Logistics – 0.0% | |
BIS Industries Ltd. (B)(C) | | | 804 | | | | — | * |
| | | | | | | | |
| |
Total Industrials – 0.0% | | | | — | * |
| |
TOTAL COMMON STOCKS – 1.3% | | | $ | 2,678 | |
(Cost: $2,720) | |
| | |
| PREFERRED STOCKS | | | | | | |
Consumer Staples | |
| |
Agricultural Products – 0.0% | |
Pinnacle Agriculture Enterprises LLC (A)(B)(C) | | | 1,358 | | | | — | * |
| | | | | | | | |
| |
Total Consumer Staples – 0.0% | | | | — | * |
Energy | |
| |
Oil & Gas Exploration & Production – 0.9% | |
Targa Resources Corp., 9.500% (A)(C) | | | 3 | | | | 1,749 | |
| | | | | | | | |
| |
Total Energy – 0.9% | | | | 1,749 | |
| |
TOTAL PREFERRED STOCKS – 0.9% | | | $ | 1,749 | |
(Cost: $3,909) | |
| | | | | | | | |
| WARRANTS | | Shares | | | Value | |
Oil & Gas Exploration & Production – 0.0% | |
Ultra Resources, Inc., expires7-14-25 (G) | | | 8 | | | $ | — | * |
| | | | | | | | |
| |
TOTAL WARRANTS – 0.0% | | | $ | — | * |
(Cost: $2) | |
| | |
| CORPORATE DEBT SECURITIES | | Principal | | | | |
Communication Services | |
| |
Broadcasting – 3.8% | |
Clear Channel Outdoor Holdings, Inc., 5.125%,8-15-27 (H)(I) | | $ | 4,496 | | | | 4,210 | |
Clear Channel Worldwide Holdings, Inc., 9.250%,2-15-24 (H)(I) | | | 3,627 | | | | 3,119 | |
| | | | | | | | |
| | | | | | | 7,329 | |
| | | | | | | | |
| |
Cable & Satellite – 16.5% | |
Altice Financing S.A.: | | | | | | | | |
7.500%,5-15-26 (H)(I) | | | 1,425 | | | | 1,386 | |
5.000%,1-15-28 (H)(I) | | | 580 | | | | 513 | |
Altice France Holding S.A.: | | | | | | | | |
10.500%,5-15-27 (H)(I) | | | 4,582 | | | | 4,834 | |
6.000%,2-15-28 (H)(I) | | | 2,605 | | | | 2,292 | |
Altice France S.A.: | | | | | | | | |
7.375%,5-1-26 (H)(I) | | | 3,100 | | | | 3,131 | |
8.125%,2-1-27 (H)(I) | | | 2,659 | | | | 2,772 | |
CCO Holdings LLC and CCO Holdings Capital Corp.: | | | | | | | | |
5.500%,5-1-26 (H)(I) | | | 485 | | | | 491 | |
5.000%,2-1-28 (H)(I) | | | 1,642 | | | | 1,649 | |
CSC Holdings LLC: | | | | | | | | |
5.500%,5-15-26 (H)(I) | | | 810 | | | | 838 | |
5.375%,2-1-28 (H)(I) | | | 1,940 | | | | 1,979 | |
5.750%,1-15-30 (H)(I) | | | 555 | | | | 559 | |
DISH DBS Corp.: | | | | | | | | |
5.875%,7-15-22 (H) | | | 2,000 | | | | 1,948 | |
5.875%,11-15-24 (H) | | | 748 | | | | 728 | |
7.750%,7-1-26 (H) | | | 1,032 | | | | 1,060 | |
Neptune Finco Corp., | | | | | | | | |
6.625%,10-15-25 (H)(I) | | | 394 | | | | 414 | |
VTR Finance B.V., | | | | | | | | |
6.875%,1-15-24 (H)(I) | | | 8,172 | | | | 7,416 | |
| | | | | | | | |
| | | | | | | 32,010 | |
| | | | | | | | |
| |
Integrated Telecommunication Services – 7.5% | |
Frontier Communications Corp.: | | | | | | | | |
6.875%,1-15-25 (H)(L) | | | 2,776 | | | | 694 | |
11.000%,9-15-25 (H)(L) | | | 3,876 | | | | 1,008 | |
8.500%,4-1-26 (H)(I) | | | 8,400 | | | | 7,677 | |
West Corp., | | | | | | | | |
8.500%,10-15-25 (H)(I) | | | 7,035 | | | | 5,133 | |
| | | | | | | | |
| | | | | | | 14,512 | |
| | | | | | | | |
| |
Publishing – 0.6% | |
MDC Partners, Inc., | | | | | | | | |
6.500%,5-1-24 (H)(I) | | | 1,471 | | | | 1,103 | |
| | | | | | | | |
| | | | | | | | |
CORPORATE DEBT SECURITIES
(Continued) | | Principal | | | Value | |
Wireless Telecommunication Service – 4.4% | |
Digicel Group Ltd.: | | | | | | | | |
6.000%,4-15-21 (H)(I)(L) | | $ | 795 | | | $ | 453 | |
8.250%,9-30-22 (I)(L) | | | 349 | | | | 54 | |
8.250%,12-30-22 (H)(I)(L) | | | 1,560 | | | | 741 | |
Digicel Group Ltd.
(7.125% Cash and 2.000% PIK), | | | | | | | | |
9.125%,4-1-24 (I)(J)(L) | | | 1,220 | | | | 152 | |
Digicel International Finance Ltd., | | | | | | | | |
8.750%,5-25-24 (H)(I) | | | 6,862 | | | | 6,142 | |
Digicel Ltd., | | | | | | | | |
6.750%,3-1-23 (H)(I) | | | 2,128 | | | | 958 | |
| | | | | | | | |
| | | | | | | 8,500 | |
| | | | | | | | |
| |
Total Communication Services – 32.8% | | | | 63,454 | |
Consumer Discretionary | |
| |
Automotive Retail – 1.4% | |
Allison Transmission, Inc., | | | | | | | | |
5.000%,10-1-24 (I) | | | 315 | | | | 306 | |
Asbury Automotive Group, Inc.: | | | | | | | | |
4.500%,3-1-28 (H)(I) | | | 772 | | | | 656 | |
4.750%,3-1-30 (H)(I) | | | 772 | | | | 656 | |
Dealer Tire LLC and DT Issuer LLC, | | | | | | | | |
8.000%,2-1-28 (I) | | | 288 | | | | 230 | |
Lithia Motors, Inc., | | | | | | | | |
4.625%,12-15-27 (H)(I) | | | 463 | | | | 417 | |
Sonic Automotive, Inc., | | | | | | | | |
6.125%,3-15-27 (H) | | | 489 | | | | 430 | |
| | | | | | | | |
| | | | | | | 2,695 | |
| | | | | | | | |
| |
Casinos & Gaming – 2.7% | |
Boyd Gaming Corp., | | | | | | | | |
4.750%,12-1-27 (H)(I) | | | 863 | | | | 712 | |
Everi Payments, Inc., | | | | | | | | |
7.500%,12-15-25 (H)(I) | | | 1,304 | | | | 991 | |
Gateway Casinos & Entertainment Ltd., | | | | | | | | |
8.250%,3-1-24 (H)(I) | | | 927 | | | | 806 | |
Golden Nugget, Inc., | | | | | | | | |
6.750%,10-15-24 (H)(I) | | | 2,111 | | | | 1,330 | |
Scientific Games International, Inc. (GTD by Scientific Games Corp.): | | | | | | | | |
7.000%,5-15-28 (I) | | | 115 | | | | 71 | |
7.250%,11-15-29 (I) | | | 115 | | | | 71 | |
Wynn Macau Ltd.: | | | | | | | | |
4.875%,10-1-24 (I) | | | 340 | | | | 319 | |
5.500%,10-1-27 (H)(I) | | | 964 | | | | 855 | |
5.125%,12-15-29 (F)(I) | | | 174 | | | | 146 | |
| | | | | | | | |
| | | | | | | 5,301 | |
| | | | | | | | |
| |
Education Services – 3.6% | |
Laureate Education, Inc., | | | | | | | | |
8.250%,5-1-25 (H)(I) | | | 7,040 | | | | 7,005 | |
| | | | | | | | |
| |
Hotels, Resorts & Cruise Lines – 0.5% | |
Boyne USA, Inc., | | | | | | | | |
7.250%,5-1-25 (H)(I) | | | 1,019 | | | | 973 | |
| | | | | | | | |
| | |
| SCHEDULE OF INVESTMENTS | | IVY HIGH INCOME OPPORTUNITIES FUND (in thousands) |
MARCH 31, 2020 (UNAUDITED)
| | | | | | | | |
CORPORATE DEBT SECURITIES
(Continued) | | Principal | | | Value | |
Leisure Facilities – 0.4% | |
Cedar Fair L.P., Magnum Management Corp., Canada’s Wonderland Co. and Millennium Operations LLC, | | | | | | | | |
5.375%,4-15-27 (H) | | $ | 877 | | | $ | 754 | |
| | | | | | | | |
| |
Specialized Consumer Services – 0.7% | |
Nielsen Co. (Luxembourg) S.a.r.l. (The), | | | | | | | | |
5.500%,10-1-21 (H)(I) | | | 1,071 | | | | 1,049 | |
Nielsen Finance LLC and Nielsen Finance Co., | | | | | | | | |
5.000%,4-15-22 (I) | | | 375 | | | | 346 | |
| | | | | | | | |
| | | | | | | 1,395 | |
| | | | | | | | |
| |
Specialty Stores – 4.4% | |
Party City Holdings, Inc., | | | | | | | | |
6.625%,8-1-26 (I) | | | 750 | | | | 75 | |
Staples, Inc.: | | | | | | | | |
7.500%,4-15-26 (H)(I) | | | 6,900 | | | | 6,038 | |
10.750%,4-15-27 (H)(I) | | | 2,982 | | | | 2,288 | |
| | | | | | | | |
| | | | | | | 8,401 | |
| | | | | | | | |
| |
Total Consumer Discretionary – 13.7% | | | | 26,524 | |
Consumer Staples | |
| |
Food Retail – 0.3% | |
Albertsons Cos. LLC, Safeway, Inc., New Albertson’s, Inc. and Albertson’s LLC, | | | | | | | | |
4.875%,2-15-30 (H)(I) | | | 579 | | | | 573 | |
| | | | | | | | |
| |
Packaged Foods & Meats – 7.2% | |
JBS USA LLC and JBS USA Finance, Inc.: | | | | | | | | |
5.875%,7-15-24 (H)(I) | | | 2,002 | | | | 2,027 | |
5.750%,6-15-25 (H)(I) | | | 1,904 | | | | 1,923 | |
JBS USA Lux S.A. and JBS USA Finance, Inc., | | | | | | | | |
6.750%,2-15-28 (H)(I) | | | 1,282 | | | | 1,369 | |
JBS USA, JBS USA Food Co. and JBS USA Finance, Inc. (GTD by JBS S.A.): | | | | | | | | |
6.500%,4-15-29 (I) | | | 221 | | | | 237 | |
5.500%,1-15-30 (H)(I) | | | 838 | | | | 865 | |
Pilgrim’s Pride Corp.: | | | | | | | | |
5.750%,3-15-25 (I) | | | 357 | | | | 359 | |
5.875%,9-30-27 (H)(I) | | | 1,275 | | | | 1,270 | |
Post Holdings, Inc.: | | | | | | | | |
5.000%,8-15-26 (H)(I) | | | 523 | | | | 538 | |
5.750%,3-1-27 (H)(I) | | | 2,222 | | | | 2,277 | |
Simmons Foods, Inc.: | | | | | | | | |
7.750%,1-15-24 (H)(I) | | | 701 | | | | 701 | |
5.750%,11-1-24 (H)(I) | | | 2,549 | | | | 2,314 | |
| | | | | | | | |
| | | | | | | 13,880 | |
| | | | | | | | |
| |
Total Consumer Staples – 7.5% | | | | 14,453 | |
| | | | | | | | |
CORPORATE DEBT SECURITIES
(Continued) | | Principal | | | Value | |
Energy | |
| |
Oil & Gas Drilling – 0.7% | |
KCA Deutag UK Finance plc, | | | | | | | | |
7.250%,5-15-21 (H)(I) | | $ | 1,793 | | | $ | 637 | |
Offshore Drilling Holding S.A., | | | | | | | | |
8.375%,9-20-20 (H)(I)(K) | | | 3,385 | | | | 795 | |
Valaris plc, | | | | | | | | |
7.750%,2-1-26 | | | 1,017 | | | | 94 | |
| | | | | | | | |
| | | | | | | 1,526 | |
| | | | | | | | |
| |
Oil & Gas Equipment & Services – 0.1% | |
Nine Energy Service, Inc., | | | | | | | | |
8.750%,11-1-23 (I) | | | 806 | | | | 201 | |
| | | | | | | | |
Oil & Gas Exploration & Production – 4.1% | |
Bellatrix Exploration Ltd., | | | | | | | | |
8.500%,9-11-23 (L) | | | 418 | | | | 253 | |
Bellatrix Exploration Ltd.
(3.000% Cash or 9.500% PIK), | | | | | | | | |
9.500%,12-15-23 (J)(L) | | | 456 | | | | 254 | |
Chesapeake Energy Corp., | | | | | | | | |
11.500%,1-1-25 (H)(I) | | | 1,266 | | | | 203 | |
Crownrock L.P., | | | | | | | | |
5.625%,10-15-25 (H)(I) | | | 2,927 | | | | 1,522 | |
Endeavor Energy Resources L.P.: | | | | | | | | |
5.500%,1-30-26 (H)(I) | | | 1,014 | | | | 700 | |
5.750%,1-30-28 (H)(I) | | | 728 | | | | 495 | |
Extraction Oil & Gas, Inc., | | | | | | | | |
5.625%,2-1-26 (H)(I) | | | 1,490 | | | | 246 | |
Laredo Petroleum, Inc.: | | | | | | | | |
9.500%,1-15-25 (H) | | | 3,242 | | | | 1,297 | |
10.125%,1-15-28 (H) | | | 1,161 | | | | 441 | |
QEP Resources, Inc.: | | | | | | | | |
6.875%,3-1-21 | | | 289 | | | | 147 | |
5.250%,5-1-23 | | | 586 | | | | 217 | |
5.625%,3-1-26 (F) | | | 426 | | | | 156 | |
Sanchez Energy Corp., | | | | | | | | |
7.250%,2-15-23 (F)(I)(L) | | | 257 | | | | 39 | |
Seven Generations Energy Ltd.: | | | | | | | | |
6.750%,5-1-23 (H)(I) | | | 1,866 | | | | 1,306 | |
5.375%,9-30-25 (H)(I) | | | 975 | | | | 536 | |
Ultra Resources, Inc.
(9.000% Cash and 2.000% PIK), | | | | | | | | |
11.000%,7-12-24 (J) | | | 415 | | | | 23 | |
| | | | | | | | |
| | | | | | | 7,835 | |
| | | | | | | | |
| |
Oil & Gas Refining & Marketing – 2.0% | |
Callon Petroleum Co. (GTD by Callon Petroleum Operating Co.): | | | | | | | | |
6.125%,10-1-24 | | | 468 | | | | 83 | |
6.375%,7-1-26 | | | 158 | | | | 25 | |
Comstock Escrow Corp., | | | | | | | | |
9.750%,8-15-26 (H) | | | 4,556 | | | | 3,235 | |
EP Energy LLC and Everest Acquisition Finance, Inc.: | | | | | | | | |
9.375%,5-1-24 (I)(L) | | | 550 | | | | 1 | |
8.000%,2-15-25 (I)(L) | | | 588 | | | | 1 | |
7.750%,5-15-26 (I)(L) | | | 793 | | | | 95 | |
| | | | | | | | |
CORPORATE DEBT SECURITIES
(Continued) | | Principal | | | Value | |
Oil & Gas Refining & Marketing(Continued) | |
PBF Holding Co. LLC, | | | | | | | | |
6.000%,2-15-28 (H)(I) | | $ | 578 | | | $ | 389 | |
| | | | | | | | |
| | | | | | | 3,829 | |
| | | | | | | | |
| |
Total Energy – 6.9% | | | | 13,391 | |
Financials | |
| |
Consumer Finance – 0.4% | |
CURO Group Holdings Corp., | | | | | | | | |
8.250%,9-1-25 (H)(I) | | | 1,192 | | | | 840 | |
| | | | | | | | |
| |
Financial Exchanges & Data – 1.3% | |
Refinitiv U.S. Holdings, Inc., | | | | | | | | |
8.250%,11-15-26 (H)(I) | | | 2,458 | | | | 2,593 | |
| | | | | | | | |
Insurance Brokers – 2.8% | |
NFP Corp.: | | | | | | | | |
6.875%,7-15-25 (H)(I) | | | 4,647 | | | | 4,577 | |
8.000%,7-15-25 (H)(I) | | | 1,000 | | | | 915 | |
| | | | | | | | |
| | | | | | | 5,492 | |
| | | | | | | | |
| |
Other Diversified Financial Services – 1.5% | |
New Cotai LLC and New Cotai Capital Corp.
(10.625% Cash or 10.625% PIK), | | | | | | | | |
10.625%,5-1-19 (I)(J)(L) | | | 8,251 | | | | 2,888 | |
| | | | | | | | |
| |
Property & Casualty Insurance – 1.9% | |
Amwins Group, Inc., | | | | | | | | |
7.750%,7-1-26 (H)(I) | | | 1,697 | | | | 1,657 | |
Hub International Ltd., | | | | | | | | |
7.000%,5-1-26 (H)(I) | | | 1,941 | | | | 1,922 | |
| | | | | | | | |
| | | | | | | 3,579 | |
| | | | | | | | |
| |
Specialized Finance – 1.5% | |
BCPE Cycle Merger Sub II, Inc., | | | | | | | | |
10.625%,7-15-27 (H)(I) | | | 2,224 | | | | 1,868 | |
Compass Group Diversified Holdings LLC, | | | | | | | | |
8.000%,5-1-26 (H)(I) | | | 1,050 | | | | 1,008 | |
| | | | | | | | |
| | | | | | | 2,876 | |
| | | | | | | | |
| |
Thrifts & Mortgage Finance – 0.5% | |
Provident Funding Associates L.P. and PFG Finance Corp., | | | | | | | | |
6.375%,6-15-25 (H)(I) | | | 1,220 | | | | 1,022 | |
| | | | | | | | |
| |
Total Financials – 9.9% | | | | 19,290 | |
Health Care | |
| |
Health Care Facilities – 2.1% | |
RegionalCare Hospital Partners Holdings, Inc. and Legend Merger Sub, Inc., | | | | | | | | |
9.750%,12-1-26 (H)(I) | | | 2,429 | | | | 2,301 | |
Surgery Center Holdings, Inc., | | | | | | | | |
10.000%,4-15-27 (H)(I) | | | 2,469 | | | | 1,728 | |
| | | | | | | | |
| | | | | | | 4,029 | |
| | | | | | | | |
| | |
| SCHEDULE OF INVESTMENTS | | IVY HIGH INCOME OPPORTUNITIES FUND (in thousands) |
MARCH 31, 2020 (UNAUDITED)
| | | | | | | | |
CORPORATE DEBT SECURITIES
(Continued) | | Principal | | | Value | |
Health Care Services – 0.7% | |
Heartland Dental LLC, | | | | | | | | |
8.500%,5-1-26 (H)(I) | | $ | 1,931 | | | $ | 1,439 | |
| | | | | | | | |
| |
Health Care Technology – 2.1% | |
Verscend Holding Corp., | | | | | | | | |
9.750%,8-15-26 (H)(I) | | | 3,957 | | | | 3,949 | |
| | | | | | | | |
| |
Pharmaceuticals – 3.1% | |
Advanz Pharma Corp., | | | | | | | | |
8.000%,9-6-24 | | | 177 | | | | 154 | |
Bausch Health Cos., Inc.: | | | | | | | | |
6.125%,4-15-25 (H)(I) | | | 715 | | | | 704 | |
9.000%,12-15-25( I) | | | 351 | | | | 370 | |
9.250%,4-1-26 (H)(I) | | | 1,042 | | | | 1,088 | |
8.500%,1-31-27 (I) | | | 2,141 | | | | 2,237 | |
Par Pharmaceutical, Inc., | | | | | | | | |
7.500%,4-1-27 (H)(I) | | | 1,475 | | | | 1,468 | |
| | | | | | | | |
| | | | | | | 6,021 | |
| | | | | | | | |
| |
Total Health Care – 8.0% | | | | 15,438 | |
Industrials | |
| |
Aerospace & Defense – 7.9% | |
Arconic Rolled Products Corp., | | | | | | | | |
6.125%,2-15-28 (I) | | | 231 | | | | 236 | |
TransDigm UK Holdings plc, | | | | | | | | |
6.875%,5-15-26 (H) | | | 893 | | | | 831 | |
TransDigm, Inc. (GTD by TransDigm Group, Inc.): | | | | | | | | |
6.500%,7-15-24 (H) | | | 2,260 | | | | 2,152 | |
6.500%,5-15-25 | | | 471 | | | | 448 | |
6.250%,3-15-26 (H)(I) | | | 1,529 | | | | 1,521 | |
7.500%,3-15-27 (H) | | | 1,094 | | | | 1,054 | |
5.500%,11-15-27 (H)(I) | | | 2,821 | | | | 2,532 | |
Wolverine Escrow LLC: | | | | | | | | |
8.500%,11-15-24 (H)(I) | | | 3,116 | | | | 2,485 | |
9.000%,11-15-26 (H)(I) | | | 4,546 | | | | 3,694 | |
13.125%,11-15-27 (I) | | | 343 | | | | 274 | |
| | | | | | | | |
| | | | | | | 15,227 | |
| | | | | | | | |
| |
Diversified Support Services – 0.7% | |
Ahern Rentals, Inc., | | | | | | | | |
7.375%,5-15-23 (H)(I) | | | 2,037 | | | | 1,161 | |
United Rentals (North America), Inc. (GTD by United Rentals, Inc.), | | | | | | | | |
5.875%,9-15-26 | | | 217 | | | | 220 | |
| | | | | | | | |
| | | | | | | 1,381 | |
| | | | | | | | |
| |
Environmental & Facilities Services – 0.2% | |
GFL Environmental, Inc., | | | | | | | | |
8.500%,5-1-27 (I) | | | 232 | | | | 233 | |
Waste Pro USA, Inc., | | | | | | | | |
5.500%,2-15-26 (I) | | | 198 | | | | 184 | |
| | | | | | | | |
| | | | | | | 417 | |
| | | | | | | | |
| | | | | | | | |
CORPORATE DEBT SECURITIES
(Continued) | | Principal | | | Value | |
Security & Alarm Services – 0.4% | |
Prime Security Services Borrower LLC and Prime Finance, Inc., | | | | | | | | |
6.250%,1-15-28 (H)(I) | | $ | 867 | | | $ | 748 | |
| | | | | | | | |
| |
Total Industrials – 9.2% | | | | 17,773 | |
Information Technology | |
| |
Application Software – 1.5% | |
Kronos Acquisition Holdings, Inc., | | | | | | | | |
9.000%,8-15-23 (H)(I) | | | 3,668 | | | | 3,008 | |
| | | | | | | | |
| |
Data Processing & Outsourced Services – 1.3% | |
j2 Cloud Services LLC and j2 Global, Inc., | | | | | | | | |
6.000%,7-15-25 (H)(I) | | | 2,468 | | | | 2,449 | |
| | | | | | | | |
| |
Electronic Equipment & Instruments – 0.3% | |
NCR Corp.: | | | | | | | | |
5.750%,9-1-27 (I) | | | 307 | | | | 280 | |
6.125%,9-1-29 (I) | | | 393 | | | | 367 | |
| | | | | | | | |
| | | | | | | 647 | |
| | | | | | | | |
| |
IT Consulting & Other Services – 0.7% | |
NCR Escrow Corp., | | | | | | | | |
6.375%,12-15-23 (H) | | | 1,289 | | | | 1,273 | |
| | | | | | | | |
| |
Total Information Technology – 3.8% | | | | 7,377 | |
Materials | |
| |
Aluminum – 0.6% | |
Constellium N.V., | | | | | | | | |
5.875%,2-15-26 (H)(I) | | | 911 | | | | 792 | |
Novelis Corp. (GTD by Novelis, Inc.), | | | | | | | | |
4.750%,1-30-30 (H)(I) | | | 465 | | | | 414 | |
| | | | | | | | |
| | | | | | | 1,206 | |
| | | | | | | | |
| |
Commodity Chemicals – 0.8% | |
NOVA Chemicals Corp.: | | | | | | | | |
4.875%,6-1-24 (H)(I) | | | 1,215 | | | | 1,066 | |
5.250%,6-1-27 (H)(I) | | | 486 | | | | 410 | |
| | | | | | | | |
| | | | | | | 1,476 | |
| | | | | | | | |
| |
Construction Materials – 1.0% | |
Hillman Group, Inc. (The), | | | | | | | | |
6.375%,7-15-22 (H)(I) | | | 2,401 | | | | 1,864 | |
| | | | | | | | |
| |
Metal & Glass Containers – 0.6% | |
ARD Finance S.A. (6.500% Cash or 7.250% PIK), | | | | | | | | |
6.500%,6-30-27 (H)(I)(J) | | | 859 | | | | 738 | |
HudBay Minerals, Inc.: | | | | | | | | |
7.250%,1-15-23 (I) | | | 188 | | | | 164 | |
7.625%,1-15-25 (I) | | | 282 | | | | 245 | |
| | | | | | | | |
| | | | | | | 1,147 | |
| | | | | | | | |
| |
Total Materials – 3.0% | | | | 5,693 | |
| | |
TOTAL CORPORATE DEBT SECURITIES – 94.8% | | | | | | $ | 183,393 | |
(Cost: $227,189) | |
| | | | | | | | |
| LOANS (M) | | Principal | | | Value | |
Communication Services | |
| |
Advertising – 0.6% | |
Advantage Sales & Marketing, Inc. (ICE LIBOR plus 325 bps), | | | | | | | | |
4.700%,7-25-21 | | $ | 324 | | | $ | 260 | |
Advantage Sales & Marketing, Inc. (ICE LIBOR plus 650 bps), | | | | | | | | |
7.950%,7-25-22 | | | 1,196 | | | | 849 | |
| | | | | | | | |
| | | | | | | 1,109 | |
| | | | | | | | |
| |
Broadcasting – 1.2% | |
Clear Channel Outdoor Holdings, Inc. (ICE LIBOR plus 350 bps), | | | | | | | | |
4.489%,8-1-26 (B) | | | 2,679 | | | | 2,250 | |
| | | | | | | | |
| |
Integrated Telecommunication Services – 2.5% | |
West Corp.(3-Month ICE LIBOR plus 400 bps), | | | | | | | | |
5.450%,10-10-24 | | | 6,530 | | | | 4,870 | |
| | | | | | | | |
| |
Publishing – 0.4% | |
Recorded Books, Inc., | | | | | | | | |
0.000%,8-31-25 (N) | | | 542 | | | | 467 | |
Recorded Books, Inc. (ICE LIBOR plus 425 bps), | | | | | | | | |
4.960%,8-31-25 | | | 475 | | | | 410 | |
| | | | | | | | |
| | | | | | | 877 | |
| | | | | | | | |
| |
Wireless Telecommunication Service – 1.2% | |
Digicel International Finance Ltd. (ICE LIBOR plus 325 bps), | | | | | | | | |
4.870%,5-27-24 | | | 3,090 | | | | 2,391 | |
| | | | | | | | |
| |
Total Communication Services – 5.9% | | | | 11,497 | |
Consumer Discretionary | |
| |
Apparel Retail – 2.6% | |
Talbots, Inc. (The) (ICE LIBOR plus 700 bps), | | | | | | | | |
8.450%,11-28-22 | | | 1,636 | | | | 1,227 | |
TRLG Intermediate Holdings LLC, | | | | | | | | |
10.000%,10-27-22 (L) | | | 4,059 | | | | 3,829 | |
| | | | | | | | |
| | | | | | | 5,056 | |
| | | | | | | | |
| |
Automotive Retail – 0.0% | |
Dealer Tire LLC(1-Month ICE LIBOR plus 425 bps), | | | | | | | | |
5.239%,12-19-25 | | | 81 | | | | 66 | |
| | | | | | | | |
| |
Department Stores – 0.1% | |
Belk, Inc. (ICE LIBOR plus 675 bps), | | | | | | | | |
7.750%,7-31-25 | | | 257 | | | | 142 | |
| | | | | | | | |
| |
Housewares & Specialties – 0.5% | |
KIK Custom Products, Inc. (ICE LIBOR plus 400 bps), | | | | | | | | |
5.000%,5-15-23 | | | 1,162 | | | | 1,034 | |
| | | | | | | | |
| | |
| SCHEDULE OF INVESTMENTS | | IVY HIGH INCOME OPPORTUNITIES FUND (in thousands) |
MARCH 31, 2020 (UNAUDITED)
| | | | | | | | |
| LOANS (M)(Continued) | | Principal | | | Value | |
Leisure Facilities – 0.6% | |
United PF Holdings LLC, | | | | | | | | |
0.000%,1-6-27 (B)(N) | | $ | 179 | | | $ | 129 | |
United PF Holdings LLC (ICE LIBOR plus 400 bps), | | | | | | | | |
5.450%,1-6-27 (B) | | | 1,447 | | | | 1,042 | |
| | | | | | | | |
| | | | | | | 1,171 | |
| | | | | | | | |
| |
Restaurants – 0.4% | |
CEC Entertainment, Inc. (ICE LIBOR plus 650 bps), | | | | | | | | |
7.572%,8-30-26 | | | 1,401 | | | | 743 | |
NPC International, Inc. (ICE LIBOR plus 750 bps), | | | | | | | | |
9.277%,4-18-25 (L) | | | 1,346 | | | | 15 | |
| | | | | | | | |
| | | | | | | 758 | |
| | | | | | | | |
| |
Specialized Consumer Services – 0.4% | |
Asurion LLC (ICE LIBOR plus 600 bps), | | | | | | | | |
7.489%,8-4-25 | | | 765 | | | | 697 | |
| | | | | | | | |
| |
Specialty Stores – 1.5% | |
Jo-Ann Stores, Inc., | | | | | | | | |
0.000%,10-16-23 (N) | | | 116 | | | | 42 | |
Jo-Ann Stores, Inc. (ICE LIBOR plus 500 bps), | | | | | | | | |
6.000%,10-16-23 | | | 1,500 | | | | 542 | |
Jo-Ann Stores, Inc. (ICE LIBOR plus 925 bps), | | | | | | | | |
10.250%,5-21-24 | | | 1,660 | | | | 351 | |
Party City Holdings, Inc., | | | | | | | | |
0.000%,8-19-22 (N) | | | 116 | | | | 56 | |
Party City Holdings, Inc. (ICE LIBOR plus 250 bps), | | | | | | | | |
4.110%,8-19-22 | | | 174 | | | | 84 | |
Staples, Inc. (ICE LIBOR plus 500 bps), | | | | | | | | |
6.515%,4-12-26 | | | 2,464 | | | | 1,935 | |
| | | | | | | | |
| | | | | | | 3,010 | |
| | | | | | | | |
Textiles – 0.8% | |
SIWF Holdings, Inc. (ICE LIBOR plus 425 bps), | | | | | | | | |
5.322%,6-15-25 (B) | | | 1,725 | | | | 1,500 | |
| | | | | | | | |
| |
Total Consumer Discretionary – 6.9% | | | | 13,434 | |
Consumer Staples | |
| |
Packaged Foods & Meats – 0.5% | |
Bellring Brands LLC (ICE LIBOR plus 500 bps), | | | | | | | | |
6.000%,10-21-24 | | | 1,113 | | | | 1,038 | |
| | | | | | | | |
| |
Total Consumer Staples – 0.5% | | | | 1,038 | |
Energy | |
| |
Coal & Consumable Fuels – 0.8% | |
Foresight Energy LLC, | | | | | | | | |
0.000%,9-10-20 (N) | | | 187 | | | | 180 | |
| | | | | | | | |
| LOANS (M)(Continued) | | Principal | | | Value | |
Coal & Consumable Fuels(Continued) | |
Foresight Energy LLC(1-Month ICE LIBOR plus 1,100 bps), | | | | | | | | |
13.000%,9-10-20 | | $ | 229 | | | $ | 221 | |
Foresight Energy LLC (ICE LIBOR plus 725 bps), | | | | | | | | |
7.363%,3-28-22 (L) | | | 2,775 | | | | 361 | |
Westmoreland Coal Co. (ICE LIBOR plus 650 bps), | | | | | | | | |
9.093%,3-15-22 | | | 241 | | | | 234 | |
Westmoreland Mining Holdings LLC
(15.000% Cash or 15.000% PIK), | | | | | | | | |
15.000%,3-15-29 (B)(J) | | | 886 | | | | 531 | |
| | | | | | | | |
| | | | | | | 1,527 | |
| | | | | | | | |
| |
Oil & Gas Drilling – 0.1% | |
KCA Deutag U.S. Finance LLC (ICE LIBOR plus 675 bps), | | | | | | | | |
8.200%,2-28-23 | | | 372 | | | | 130 | |
| | | | | | | | |
| |
Oil & Gas Equipment & Services – 0.6% | |
Larchmont Resources LLC
(8.000% Cash or 8.000% PIK), | | | | | | | | |
8.000%,8-7-20 (B)(E)(J) | | | 1,249 | | | | 1,124 | |
| | | | | | | | |
| |
Oil & Gas Exploration & Production – 0.1% | |
California Resources Corp. (ICE LIBOR plus 1,037.50 bps), | | | | | | | | |
11.988%,12-31-21 | | | 1,170 | | | | 55 | |
California Resources Corp. (ICE LIBOR plus 475 bps), | | | | | | | | |
6.363%,12-31-22 | | | 761 | | | | 167 | |
| | | | | | | | |
| | | | | | | 222 | |
| | | | | | | | |
| |
Oil & Gas Storage & Transportation – 0.9% | |
EPIC Crude Services L.P. (ICE LIBOR plus 500 bps), | | | | | | | | |
6.620%,3-1-26 | | | 2,400 | | | | 1,568 | |
Oryx Midstream Holdings LLC (ICE LIBOR plus 400 bps), | | | | | | | | |
4.989%,5-22-26 (B) | | | 281 | | | | 169 | |
| | | | | | | | |
| | | | | | | 1,737 | |
| | | | | | | | |
| |
Total Energy – 2.5% | | | | 4,740 | |
Financials | |
| |
Asset Management & Custody Banks – 0.7% | |
Edelman Financial Holdings II, Inc. (ICE LIBOR plus 675 bps), | | | | | | | | |
7.679%,7-20-26 | | | 1,703 | | | | 1,277 | |
| | | | | | | | |
| |
Financial Exchanges & Data – 0.4% | |
Hudson River Trading LLC (ICE LIBOR plus 300 bps), | | | | | | | | |
3.941%,2-18-27 | | | 851 | | | | 753 | |
| | | | | | | | |
| |
Insurance Brokers – 0.5% | |
NFP Corp. (ICE LIBOR plus 325 bps), | | | | | | | | |
4.239%,2-13-27 | | | 986 | | | | 841 | |
| | | | | | | | |
| | | | | | | | |
| LOANS (M)(Continued) | | Principal | | | Value | |
Investment Banking & Brokerage – 0.7% | |
Jane Street Group LLC (ICE LIBOR plus 300 bps), | | | | | | | | |
4.613%,1-7-25 | | $ | 1,491 | | | $ | 1,327 | |
| | | | | | | | |
| |
Other Diversified Financial Services – 0.0% | |
New Cotai LLC, | | | | | | | | |
0.000%,7-20-20 (N) | | | 14 | | | | 14 | |
New Cotai LLC(1-Month U.S. LIBOR plus 25 bps): | | | | | | | | |
2.250%,7-20-20 | | | 23 | | | | 23 | |
3.500%,7-20-20 | | | 23 | | | | 22 | |
| | | | | | | | |
| | | | | | | 59 | |
| | | | | | | | |
| |
Property & Casualty Insurance – 1.3% | |
Amynta Agency Borrower, Inc. (ICE LIBOR plus 400 bps), | | | | | | | | |
5.489%,2-28-25 | | | 3,321 | | | | 2,623 | |
| | | | | | | | |
| |
Specialized Finance – 0.6% | |
Gulf Finance LLC (ICE LIBOR plus 525 bps): | | | | | | | | |
6.710%,8-25-23 | | | 919 | | | | 459 | |
6.840%,8-25-23 | | | 1,527 | | | | 762 | |
| | | | | | | | |
| | | | | | | 1,221 | |
| | | | | | | | |
| |
Total Financials – 4.2% | | | | 8,101 | |
Health Care | |
| |
Health Care Equipment – 0.1% | |
LifeScan Global Corp.(3-Month ICE LIBOR plus 950 bps), | | | | | | | | |
11.556%,10-1-25 | | | 266 | | | | 169 | |
| | | | | | | | |
| |
Health Care Facilities – 1.5% | |
Gentiva Health Services, Inc. (ICE LIBOR plus 325 bps), | | | | | | | | |
4.250%,7-2-25 (B) | | | 3,080 | | | | 2,880 | |
| | | | | | | | |
| |
Health Care Services – 4.7% | |
Heartland Dental LLC (ICE LIBOR plus 375 bps), | | | | | | | | |
4.739%,4-30-25 | | | 1,663 | | | | 1,270 | |
LifePoint Health, Inc. (ICE LIBOR plus 375 bps), | | | | | | | | |
4.739%,11-16-25 | | | 1,550 | | | | 1,430 | |
U.S. Renal Care, Inc.(3-Month ICE LIBOR plus 500 bps), | | | | | | | | |
6.000%,6-26-26 | | | 7,418 | | | | 6,411 | |
| | | | | | | | |
| | | | | | | 9,111 | |
| | | | | | | | |
| |
Health Care Technology – 1.5% | |
Verscend Holding Corp. (ICE LIBOR plus 450 bps), | | | | | | | | |
5.489%,8-27-25 (B) | | | 3,160 | | | | 2,971 | |
| | | | | | | | |
| |
Pharmaceuticals – 0.2% | |
Concordia International Corp. (ICE LIBOR plus 550 bps), | | | | | | | | |
6.568%,9-6-24 | | | 473 | | | | 404 | |
| | | | | | | | |
| |
Total Health Care – 8.0% | | | | 15,535 | |
| | |
| SCHEDULE OF INVESTMENTS | | IVY HIGH INCOME OPPORTUNITIES FUND (in thousands) |
MARCH 31, 2020 (UNAUDITED)
| | | | | | | | |
| LOANS (M)(Continued) | | Principal | | | Value | |
Industrials | |
| |
Building Products – 0.3% | |
Hampton Rubber Co. & SEI Holding Corp. (ICE LIBOR plus 800 bps), | | | | | | | | |
9.072%,3-27-22 | | $ | 857 | | | $ | 557 | |
| | | | | | | | |
| |
Construction & Engineering – 2.5% | |
Maverick Purchaser Sub LLC (ICE LIBOR plus 400 bps), | | | | | | | | |
4.989%,1-23-27 | | | 1,087 | | | | 1,000 | |
McDermott Technology Americas, Inc.: | | | | | | | | |
0.000%,10-21-20 (N) | | | 257 | | | | 232 | |
0.000%,5-10-25 (L)(N) | | | 1,245 | | | | 353 | |
McDermott Technology Americas, Inc. (ICE LIBOR plus 500 bps), | | | | | | | | |
7.250%,5-10-25 (L) | | | 2,292 | | | | 650 | |
McDermott Technology Americas, Inc. (ICE LIBOR plus 900 bps): | | | | | | | | |
10.647%,10-21-20 | | | 1,561 | | | | 1,410 | |
10.806%,10-21-20 | | | 826 | | | | 746 | |
Tensar International Corp. (ICE LIBOR plus 850 bps), | | | | | | | | |
9.950%,7-10-22 | | | 603 | | | | 499 | |
| | | | | | | | |
| | | | | | | 4,890 | |
| | | | | | | | |
| |
Diversified Support Services – 0.1% | |
Creative Artists Agency LLC (ICE LIBOR plus 375 bps), | | | | | | | | |
4.739%,11-26-26 | | | 282 | | | | 244 | |
| | | | | | | | |
| |
Industrial Conglomerates – 0.9% | |
PAE Holding Corp. (ICE LIBOR plus 550 bps), | | | | | | | | |
6.500%,10-20-22 | | | 1,786 | | | | 1,607 | |
PAE Holding Corp. (ICE LIBOR plus 950 bps), | | | | | | | | |
10.500%,10-20-23 (B) | | | 169 | | | | 161 | |
| | | | | | | | |
| | | | | | | 1,768 | |
| | | | | | | | |
| |
Industrial Machinery – 2.9% | |
Form Technologies LLC (ICE LIBOR plus 850 bps), | | | | | | | | |
9.950%,1-30-23 (B) | | | 5,469 | | | | 5,141 | |
Form Technologies LLC (ICE LIBOR plus 325 bps), | | | | | | | | |
4.700%,1-28-22 (B) | | | 681 | | | | 442 | |
| | | | | | | | |
| | | | | | | 5,583 | |
| | | | | | | | |
| |
Total Industrials – 6.7% | | | | 13,042 | |
| | | | | | | | |
| LOANS (M)(Continued) | | Principal | | | Value | |
Information Technology | |
| |
Application Software – 0.5% | |
Applied Systems, Inc. (ICE LIBOR plus 700 bps), | | | | | | | | |
8.450%,9-19-25 | | $ | 788 | | | $ | 710 | |
Kronos Acquisition Holdings, Inc. (ICE LIBOR plus 700 bps), | | | | | | | | |
7.959%,5-15-23 (B) | | | 217 | | | | 193 | |
| | | | | | | | |
| | | | | | | 903 | |
| | | | | | | | |
| |
Communications Equipment – 1.2% | |
MLN U.S. Holdco LLC (ICE LIBOR plus 450 bps), | | | | | | | | |
6.015%,11-30-25 | | | 2,397 | | | | 1,643 | |
MLN U.S. Holdco LLC (ICE LIBOR plus 875 bps), | | | | | | | | |
10.265%,11-30-26 | | | 1,214 | | | | 680 | |
| | | | | | | | |
| | | | | | | 2,323 | |
| | | | | | | | |
| |
Data Processing & Outsourced Services – 1.5% | |
CommerceHub, Inc. (ICE LIBOR plus 375 bps), | | | | | | | | |
4.489%,5-21-25 (B) | | | 1,291 | | | | 1,072 | |
Cyxtera DC Holdings, Inc. (ICE LIBOR plus 300 bps), | | | | | | | | |
8.250%,5-1-25 | | | 1,434 | | | | 508 | |
Cyxtera DC Holdings, Inc. (ICE LIBOR plus 325 bps), | | | | | | | | |
3.620%,5-1-24 | | | 2,166 | | | | 1,389 | |
| | | | | | | | |
| | | | | | | 2,969 | |
| | | | | | | | |
| |
Internet Services & Infrastructure – 1.0% | |
Informatica LLC: | | | | | | | | |
7.125%,2-14-25 (B)(R) | | | 1,629 | | | | 1,433 | |
0.000%,2-14-27 (N) | | | 652 | | | | 562 | |
| | | | | | | | |
| | | | | | | 1,995 | |
| | | | | | | | |
| |
Total Information Technology – 4.2% | | | | 8,190 | |
| | | | | | | | |
| LOANS (M)(Continued) | | Principal | | | Value | |
Materials | |
| |
Construction Materials – 0.8% | |
Hillman Group, Inc. (The), | | | | | | | | |
0.000%,5-31-25 (N) | | $ | 286 | | | $ | 222 | |
Hillman Group, Inc. (The) (ICE LIBOR plus 350 bps), | | | | | | | | |
5.072%,5-31-25 | | | 1,788 | | | | 1,388 | |
| | | | | | | | |
| | | | | | | 1,610 | |
| | | | | | | | |
| |
Total Materials – 0.8% | | | | 1,610 | |
| |
TOTAL LOANS – 39.7% | | | $ | 77,187 | |
(Cost: $103,062) | |
| | |
| SHORT-TERM SECURITIES | | Shares | | | | |
| |
Money Market Funds (P) – 6.2% | |
Dreyfus Institutional Preferred Government Money Market Fund – Institutional Shares, | | | | | | | | |
0.390% (O) | | | 325 | | | | 325 | |
State Street Institutional U.S. Government Money Market Fund – Premier Class, | | | | | | | | |
0.310% | | | 11,618 | | | | 11,618 | |
| | | | | | | | |
| | | | | | | 11,943 | |
| | | | | | | | |
| |
TOTAL SHORT-TERM SECURITIES – 6.2% | | | $ | 11,943 | |
(Cost: $11,943) | |
| |
TOTAL INVESTMENT SECURITIES – 142.9% | | | $ | 276,950 | |
(Cost: $348,825) | |
| |
BORROWINGS (Q) – (44.9)% | | | | (87,000 | ) |
| |
CASH AND OTHER ASSETS, NET OF LIABILITIES – 2.0% | | | | 3,858 | |
| |
NET ASSETS – 100.0% | | | $ | 193,808 | |
Notes to Schedule of Investments
| * | Not shown due to rounding. |
| (A) | No dividends were paid during the preceding 12 months. |
| (B) | Securities whose value was determined using significant unobservable inputs. |
| | |
| SCHEDULE OF INVESTMENTS | | IVY HIGH INCOME OPPORTUNITIES FUND (in thousands) |
MARCH 31, 2020 (UNAUDITED)
| (C) | Restricted securities. At March 31, 2020, the Fund owned the following restricted securities: |
| | | | | | | | | | | | | | | | | | | | |
| Security | | Acquisition Date(s) | | | Shares | | | Cost | | | Value | |
BIS Industries Ltd. | | | 12-22-17 | | | | 804 | | | $ | 76 | | | $ | – | * | | | | |
Larchmont Resources LLC | | | 12-8-16 | | | | 2 | | | | 561 | | | | 291 | | | | | |
Pinnacle Agriculture Enterprises LLC | | | 3-10-17 | | | | 1,358 | | | | 617 | | | | – | * | | | | |
Targa Resources Corp., 9.500% | | | 10-24-17 | | | | 3 | | | | 3,292 | | | | 1,750 | | | | | |
| | | | | | | | | | | | |
| | | | | | | | | | $ | 4,546 | | | $ | 2,041 | | | | | |
| | | | | | | | | | | | |
The total value of these securities represented 1.1% of net assets at March 31, 2020.
| (D) | Listed on an exchange outside the United States. |
| (E) | Deemed to be an affiliate due to the Fund owning at least 5% of the voting securities. |
| (F) | All or a portion of securities with an aggregate value of $314 are on loan. |
| (G) | Warrants entitle the Fund to purchase a predetermined number of shares of common stock and arenon-income producing. The purchase price and number of shares are subject to adjustment under certain conditions until the expiration date, if any. |
| (H) | All or a portion of securities with an aggregate value of $116,761 have been pledged as collateral on open borrowings. |
| (I) | Securities were purchased pursuant to an exemption from registration available under Rule 144A under the Securities Act of 1933 and may only be resold in transactions exempt from registration, normally to qualified institutional buyers. At March 31, 2020 the total value of these securities amounted to $164,414 or 84.9% of net assets. |
| (J) | Payment-in-kind bond which may pay interest in additional par and/or in cash. Rates shown are the current rate and possible payment rates. |
| (K) | Step bond that pays an initial coupon rate for the first period and then a higher or lower coupon rate for the following periods. Interest rate disclosed is that which is in effect at March 31, 2020. |
| (L) | Non-income producing as the issuer has either missed its most recent interest payment or declared bankruptcy. |
| (M) | Variable rate security. Interest rate disclosed is that which is in effect at March 31, 2020. Description of the reference rate and spread, if applicable, are included in the security description. |
| (N) | All or a portion of this position has not settled. Full contract rates do not take effect until settlement date. |
| (O) | Investment made with cash collateral received from securities on loan. |
| (P) | Rate shown is the annualized7-day yield at March 31, 2020. |
| (Q) | Borrowings payable as a percentage of total investment securities is 31.4%. |
| (R) | At March 31, 2020, the rate shown is a fixed interest rate. |
The following table is a summary of the valuation of the Fund’s investments by the fair value hierarchy levels as of March 31, 2020. See Note 3 to the Financial Statements for further information regarding fair value measurement.
| | | | | | | | | | | | |
| | | Level 1 | | | Level 2 | | | Level 3 | |
Assets | | | | | | | | | | | | |
Investments in Securities | | | | | | | | | | | | |
Common Stocks | | | | | | | | | | | | |
Consumer Discretionary | | $ | — | | | $ | 2,188 | | | $ | — | * |
Energy | | | — | | | | 163 | | | | 291 | |
Health Care | | | — | | | | — | | | | — | |
Industrials | | | — | | | | 36 | | | | — | * |
Total Common Stocks | | $ | — | | | $ | 2,387 | | | $ | 291 | |
Preferred Stocks | | | — | | | | 1,749 | | | | — | * |
Warrants | | | — | | | | — | * | | | — | |
Corporate Debt Securities | | | — | | | | 183,393 | | | | — | |
Loans | | | — | | | | 56,149 | | | | 21,038 | |
Short-Term Securities | | | 11,943 | | | | — | | | | — | |
Total | | $ | 11,943 | | | $ | 243,678 | | | $ | 21,329 | |
| | | |
Liabilities | | | | | | | | | | | | |
Payable for Borrowing | | $ | — | | | $ | 87,000 | | | $ | — | |
| | | | | | |
| 10 | | SEMIANNUAL REPORT | | 2020 | | |
| | |
| SCHEDULE OF INVESTMENTS | | IVY HIGH INCOME OPPORTUNITIES FUND (in thousands) |
MARCH 31, 2020 (UNAUDITED)
The following table is a reconciliation of Level 3 investments for which significant unobservable inputs were used to determine fair value:
| | | | | | | | | | | | |
| | | Common
Stocks | | | Preferred
Stocks | | | Loans | |
Beginning Balance10-1-19 | | $ | 447 | | | $ | 57 | | | $ | 12,704 | |
Net realized gain (loss) | | | — | | | | — | | | | (7 | ) |
Net change in unrealized appreciation (depreciation) | | | (210 | ) | | | (57 | ) | | | (2,505 | ) |
Purchases | | | — | | | | — | | | | 3,303 | |
Sales | | | — | | | | — | | | | (790 | ) |
Amortization/Accretion of premium/discount | | | — | | | | — | | | | (13 | ) |
Transfers into Level 3 during the period | | | 54 | | | | — | | | | 14,369 | |
Transfers out of Level 3 during the period | | | — | * | | | — | | | | (6,023 | ) |
| | | | |
Ending Balance3-31-20 | | $ | 291 | | | $ | — | * | | $ | 21,038 | |
| | | | |
Net change in unrealized appreciation (depreciation) for all Level 3 investments still held as of3-31-20 | | $ | (210 | ) | | $ | (57 | ) | | $ | (2,504 | ) |
| | | | |
Transfers from Level 2 to Level 3 occurred primarily due to the lack of observable market data due to decreased market activity or information for these securities. Transfers from Level 3 to Level 2 occurred primarily due to the increased availability of observable market data due to increased market activity or information.
Information about Level 3 fair value measurements:
| | | | | | | | | | | | |
| | | Fair Value at 3-31-20 | | | Valuation Technique(s) | | Unobservable Input(s) | | Input
Value(s) | |
Assets | | | | | | | | | | | | |
| | | | |
Common Stocks | | $ | — | * | | Market comparable approach | | Adjusted EBITDA multiple | | | 3.10x | |
| | | 291 | | | Third-party valuation service | | Broker quote | | | N/A | |
| | | | |
Preferred Stocks | | | — | * | | Transaction | | Price | | | $0 | |
| | | | |
Loans | | | 21,038 | | | Third-party vendor pricing service | | Broker quotes | | | N/A | |
Significant increases (decreases) in the adjusted EBITDA multiple inputs as of the reporting date would result in a higher (lower) fair value measurement.
The following acronyms are used throughout this schedule:
GTD = Guaranteed
ICE = Intercontinental Exchange
LIBOR = London Interbank Offered Rate
PIK = Payment in kind
See Accompanying Notes to Financial Statements.
| | | | | | | | | | | | |
| | | 2020 | | | | SEMIANNUAL REPORT | | | | 11 | |
| | |
| STATEMENT OF ASSETS AND LIABILITIES | | IVY HIGH INCOME OPPORTUNITIES FUND |
AS OF MARCH 31, 2020 (UNAUDITED)
| | | | |
| (In thousands, except per share amounts) | | | |
ASSETS | | | | |
Investments in unaffiliated securities at value+^ | | $ | 275,535 | |
Investments in affiliated securities at market value+ | | | 1,415 | |
Investments at Value | | | 276,950 | |
Investment securities sold receivable | | | 1,969 | |
Dividends and interest receivable | | | 5,543 | |
Receivable from securities lending income — net | | | 3 | |
Prepaid and other assets | | | 2 | |
Total Assets | | | 284,467 | |
| |
LIABILITIES | | | | |
Cash collateral on securities loaned at value | | | 325 | |
Investment securities purchased payable | | | 3,099 | |
Independent Trustees and Chief Compliance Officer fees payable | | | 11 | |
Overdraft due to custodian | | | 100 | |
Shareholder servicing payable | | | 6 | |
Investment management fee payable | | | 8 | |
Accounting services fee payable | | | 10 | |
Payable for borrowing | | | 87,000 | |
Interest payable for borrowing | | | 50 | |
Other liabilities | | | 50 | |
Total Liabilities | | | 90,659 | |
Commitments and Contingencies (See Note 2 and Note 10) | | | | |
Total Net Assets | | $ | 193,808 | |
| |
NET ASSETS | | | | |
Capital paid in | | $ | 315,820 | |
Accumulated earnings (loss) | | | (122,012 | ) |
Total Net Assets | | $ | 193,808 | |
| |
CAPITAL SHARES OUTSTANDING | | | 16,570 | |
| |
NET ASSET VALUE PER SHARE | | | $11.70 | |
| |
+COST | | | | |
Investments in unaffiliated securities at cost | | $ | 347,023 | |
Investments in affiliated securities at cost | | $ | 1,802 | |
| |
^Securities loaned at value | | $ | 314 | |
See Accompanying Notes to Financial Statements.
| | | | | | |
| 12 | | SEMIANNUAL REPORT | | 2020 | | |
| | |
| STATEMENT OF OPERATIONS | | IVY HIGH INCOME OPPORTUNITIES FUND |
FOR THE SIX MONTHS ENDED MARCH 31, 2020 (UNAUDITED)
| | | | |
| (In thousands) | | | |
INVESTMENT INCOME | | | | |
Dividends from unaffiliated securities | | $ | 140 | |
Interest and amortization from unaffiliated securities | | | 13,461 | |
Interest and amortization from affiliated securities | | | 57 | |
Securities lending income — net | | | 12 | |
Total Investment Income | | | 13,670 | |
| |
EXPENSES | | | | |
Investment management fee | | | 1,762 | |
Interest expense for borrowing | | | 1,321 | |
Shareholder servicing | | | 24 | |
Custodian fees | | | 6 | |
Independent Trustees and Chief Compliance Officer fees | | | 10 | |
Accounting services fee | | | 59 | |
Professional fees | | | 356 | |
Other | | | 47 | |
Total Expenses | | | 3,585 | |
Net Investment Income | | | 10,085 | |
| |
REALIZED AND UNREALIZED GAIN (LOSS) | | | | |
Net realized gain (loss) on: | | | | |
Investments in unaffiliated securities | | | 329 | |
Net change in unrealized appreciation (depreciation) on: | | | | |
Investments in unaffiliated securities | | | (55,107 | ) |
Investments in affiliated securities | | | (160 | ) |
Net Realized and Unrealized Loss | | | (54,938 | ) |
Net Decrease in Net Assets Resulting from Operations | | $ | (44,853 | ) |
See Accompanying Notes to Financial Statements.
| | | | | | | | | | | | |
| | | 2020 | | | | SEMIANNUAL REPORT | | | | 13 | |
| | |
| STATEMENTS OF CHANGES IN NET ASSETS | | IVY HIGH INCOME OPPORTUNITIES FUND |
| | | | | | | | |
| (In thousands) | | Six-month
period ended
3-31-2020
(unaudited) | | | Year ended
9-30-19 | |
INCREASE (DECREASE) IN NET ASSETS | | | | | | | | |
Operations: | | | | | | | | |
Net investment income | | $ | 10,085 | | | $ | 20,795 | |
Net realized gain on investments | | | 329 | | | | 590 | |
Net change in unrealized depreciation | | | (55,267 | ) | | | (14,494 | ) |
Net Increase (Decrease) in Net Assets Resulting from Operations | | | (44,853 | ) | | | 6,891 | |
| | |
Distributions to Shareholders From: | | | | | | | | |
Accumulated earnings (combined net investment income and net realized gains) | | | (10,771 | ) | | | (21,873 | ) |
Total Distributions to Shareholders | | | (10,771 | ) | | | (21,873 | ) |
| | |
Capital Share Transactions: | | | | | | | | |
Net proceeds from the sale of shares | | | — | | | | — | |
Net Increase In net assets from share transactions | | | — | | | | — | |
Net Decrease in Net Assets | | | (55,624 | ) | | | (14,982 | ) |
Net Assets, Beginning of Period | | | 249,432 | | | | 264,414 | |
Net Assets, End of Period | | $ | 193,808 | | | $ | 249,432 | |
See Accompanying Notes to Financial Statements.
| | | | | | |
| 14 | | SEMIANNUAL REPORT | | 2020 | | |
| | |
| STATEMENT OF CASH FLOWS | | IVY HIGH INCOME OPPORTUNITIES FUND |
FOR THE SIX MONTHS ENDED MARCH 31, 2020 (UNAUDITED)
| | | | |
| (In thousands) | | | |
Cash flows provided by operating activities: | | | | |
Net decrease in net assets resulting from operations | | $ | (44,853 | ) |
Adjustments to reconcile net decrease in net assets from operations to net cash provided by operating activities: | | | | |
Purchases of long-term investment securities | | | (68,446 | ) |
Proceeds from sales of long-term investment securities | | | 83,283 | |
Proceeds from sales of short-term portfolio investment securities, net | | | 10,821 | |
Decrease in dividends and interest receivable | | | 623 | |
Increase in receivable from securities lending income | | | (1 | ) |
Decrease in prepaid and other assets | | | 5 | |
Decrease in cash collateral on securities loaned at value | | | (890 | ) |
Increase in independent trustees and chief compliance officer fees payable | | | 1 | |
Increase in shareholder servicing payable | | | 1 | |
Decrease in investment management fee payable | | | (2 | ) |
Decrease in interest payable for borrowing | | | (45 | ) |
Decrease in other liabilities | | | (22 | ) |
Net realized gain on investments in unaffiliated securities | | | (329 | ) |
Net change in unrealized depreciation on investments in unaffiliated securities | | | 55,107 | |
Net change in unrealized depreciation on investments in affiliated securities | | | 160 | |
Net accretion and payment in kind income on investment securities | | | (778 | ) |
Net cash provided by operating activities | | | 34,635 | |
Cash flows used for financing activities: | | | | |
Cash dividends paid | | | (10,771 | ) |
Payments for borrowing | | | (25,000 | ) |
Net cash used for financing activities | | | (35,771 | ) |
Net decrease in cash and foreign currency | | | (1,136 | ) |
Cash and foreign currency, at beginning of period | | | 1,036 | |
Cash and foreign currency, at end of period | | | (100 | ) |
Supplemental disclosure of cash flow information: | | | | |
Interest expense paid during the period | | | 1,367 | |
See Accompanying Notes to Financial Statements.
| | | | | | | | | | | | |
| | | 2020 | | | | SEMIANNUAL REPORT | | | | 15 | |
| | |
| FINANCIAL HIGHLIGHTS | | IVY HIGH INCOME OPPORTUNITIES FUND |
FOR A SHARE OF CAPITAL STOCK OUTSTANDING THROUGHOUT EACH PERIOD
| | | | | | | | | | | | | | | | | | | | | | | | |
| | | Six-month
period ended
3-31-2020
(unaudited) | | | Year ended
9-30-2019 | | | Year ended
9-30-2018 | | | Year ended
9-30-2017 | | | Year ended
9-30-2016 | | | Year ended
9-30-2015 | |
Net Asset Value, Beginning of Period | | $ | 15.05 | | | $ | 15.96 | | | $ | 16.34 | | | $ | 15.65 | | | $ | 15.60 | | | $ | 19.35 | |
Net Investment Income(1) | | | 0.61 | | | | 1.25 | | | | 1.36 | | | | 1.51 | | | | 1.57 | | | | 1.62 | |
Net Realized and Unrealized Gain (Loss) on Investments | | | (3.31 | ) | | | (0.84 | ) | | | (0.46 | ) | | | 0.66 | | | | 0.08 | | | | (3.41 | ) |
Total from Investment Operations | | | (2.70 | ) | | | 0.41 | | | | 0.90 | | | | 2.17 | | | | 1.65 | | | | (1.79 | ) |
Distributions From Net Investment Income | | | (0.65 | ) | | | (1.32 | ) | | | (1.28 | ) | | | (1.48 | ) | | | (1.60 | ) | | | (1.66 | ) |
Distributions From Net Realized Gains | | | — | | | | — | | | | — | | | | — | | | | — | | | | (0.30 | ) |
Total Distributions | | | (0.65 | ) | | | (1.32 | ) | | | (1.28 | ) | | | (1.48 | ) | | | (1.60 | ) | | | (1.96 | ) |
Net Asset Value, End of Period | | $ | 11.70 | | | $ | 15.05 | | | $ | 15.96 | | | $ | 16.34 | | | $ | 15.65 | | | $ | 15.60 | |
Market Price, End of Period | | $ | 10.40 | | | $ | 13.71 | | | $ | 14.26 | | | $ | 15.97 | | | $ | 14.38 | | | $ | 12.97 | |
Total Return(2) — Net Asset Value | | | (18.32 | )% | | | 4.10 | % | | | 6.68 | % | | | 15.14 | % | | | 13.71 | % | | | (8.76 | )% |
Total Return(2) — Market Price(3) | | | (20.30 | )% | | | 6.07 | % | | | (2.47 | )% | | | 22.55 | % | | | 25.67 | % | | | (15.11 | )% |
Net Assets, End of Period (in millions) | | $ | 194 | | | $ | 249 | | | $ | 264 | | | $ | 271 | | | $ | 259 | | | $ | 258 | |
Managed Assets(4), End of Period (in millions) | | $ | 281 | | | $ | 361 | | | $ | 386 | | | $ | 399 | | | $ | 370 | | | $ | 383 | |
Ratio of Expenses to Average Net Assets | | | 2.97 | %(5) | | | 3.16 | % | | | 2.77 | % | | | 2.35 | % | | | 2.09 | % | | | 1.98 | % |
Ratio of Expenses to Average Net Assets Excluding Interest Expense | | | 1.88 | %(5) | | | 1.73 | % | | | 1.59 | % | | | 1.58 | % | | | 1.56 | % | | | 1.55 | % |
Ratio of Net Investment Income to Average Net Assets | | | 8.35 | %(5) | | | 8.27 | % | | | 8.50 | % | | | 9.31 | % | | | 10.59 | % | | | 9.07 | % |
Ratio of Expenses to Average Managed Assets(4) | | | 2.04 | %(5) | | | 2.17 | % | | | 1.90 | % | | | 1.62 | % | | | 1.44 | % | | | 1.36 | % |
Ratio of Expenses to Average Managed Assets(4) Excluding Interest Expense | | | 1.29 | %(5) | | | 1.19 | % | | | 1.09 | % | | | 1.09 | % | | | 1.08 | % | | | 1.07 | % |
Ratio of Net Investment Income to Average Managed Assets(4) | | | 5.74 | %(5) | | | 5.69 | % | | | 5.81 | % | | | 6.43 | % | | | 7.28 | % | | | 6.24 | % |
Portfolio Turnover Rate | | | 23 | % | | | 34 | % | | | 46 | % | | | 39 | % | | | 39 | % | | | 47 | % |
| (1) | Based on average weekly shares outstanding. |
| (2) | Total investment return is calculated assuming a purchase of common stock on the opening of the first day and a sale on the closing of the last day of each period reported. Dividends and distributions, if any, are assumed, for purposes of this calculation, to be reinvested at prices obtained under the Fund’s dividend reinvestment plan. Total returns based on Net Asset Value and Market Price do not reflect a sales charge or contingent deferred sales charge, if applicable. Total returns for periods less than one year are not annualized. |
| (3) | Total investment return at market price will differ from results at NAV. Returns at market price can be influenced by factors such as changing views about the Fund, market conditions, supply and demand for the Fund’s stock, or changes in the Fund’s dividends. |
| (4) | The term Managed Assets means the Fund’s total assets, including the assets attributable to the proceeds from any borrowings or other forms of structural leverage, minus liabilities, other than the aggregate indebtedness entered into for purposes of leverage. |
See Accompanying Notes to Financial Statements.
| | | | | | |
| 16 | | SEMIANNUAL REPORT | | 2020 | | |
| | |
| NOTES TO FINANCIAL STATEMENTS | | IVY HIGH INCOME OPPORTUNITIES FUND |
MARCH 31, 2020 (UNAUDITED)
Ivy High Income Opportunities Fund (the “Fund”) is registered under the Investment Company Act of 1940, as amended (the “1940 Act”) as anon-diversified,closed-end management investment company. The Fund was organized as a Delaware statutory trust on January 30, 2013, pursuant to an Agreement and Declaration of Trust, as amended and restated on March 28, 2013, governed by the laws of the State of Delaware. The Fund commenced operations on May 29, 2013. Prior to that date, the Fund had no operations other than matters relating to its organization and the sale and issuance of 5,236 common shares of beneficial interest to Ivy Investment Management Company (“IICO” or the “Adviser”), the Fund’s investment adviser. The Fund’s common shares are listed on the New York Stock Exchange (the “NYSE”) and trade under the ticker symbol “IVH”.
The Fund’s investment objective is to seek to provide total return through a combination of a high level of current income and capital appreciation. The Fund will seek to achieve its investment objective by investing primarily in a portfolio of high yield corporate bonds of varying maturities and other fixed income instruments of predominantly corporate issuers, including secured and unsecured loan assignments, loan participations and other loan instruments (“Loans”). Under normal circumstances, the Fund will invest at least 80% of its Managed Assets (as defined in the prospectus) in a portfolio of U.S. and foreign bonds, loans and other fixed income instruments, as well as other investments (including derivatives) with similar economic characteristics. The Fund will invest primarily in instruments that are, at the time of purchase, rated below investment grade (below Baa3 by Moody’s Investors Service, Inc. (“Moody’s”) or belowBBB- by either Standard & Poor’s Rating Services (“S&P”) or Fitch, Inc. (“Fitch”), or comparably rated by another nationally recognized statistical rating organization (“NRSRO”)), or unrated but judged by the Adviser to be of comparable quality.
| 2. | | SIGNIFICANT ACCOUNTING POLICIES |
The following is a summary of significant accounting policies consistently followed by the Fund.
Security Transactions and Related Investment Income.Security transactions are accounted for on the trade date (date the order to buy or sell is executed). Realized gains and losses are calculated on the identified cost basis. Interest income is recorded on the accrual basis and includes paydown gain (loss) and accretion of discounts and amortization of premiums. Dividend income is recorded on theex-dividend date, except certain dividends from foreign securities where theex-dividend date may have passed, which are recorded as soon as the Fund is informed of theex-dividend date. All or a portion of the distributions received from a real estate investment trust or publicly traded partnership may be designated as a reduction of cost of the related investment or realized gain.
Foreign Currency Translation. The Fund’s accounting records are maintained in U.S. dollars. All assets and liabilities denominated in foreign currencies are translated into U.S. dollars daily, using foreign exchange rates obtained from an independent pricing service approved by the Board of Trustees of the Fund (the “Board”). Purchases and sales of investment securities and accruals of income and expenses are translated at the rate of exchange prevailing on the date of the transaction. For assets and liabilities other than investments in securities, net realized and unrealized gains and losses from foreign currency translation arise from changes in currency exchange rates. The Fund combines fluctuations from currency exchange rates and fluctuations in value when computing net realized gain (loss) and net change in unrealized appreciation (depreciation) on investments. Foreign exchange rates are typically valued as of the close of the NYSE, normally 4:00 P.M. Eastern time, on each day the NYSE is open for trading.
Dividends and Distributions to Shareholders.Dividends to shareholders are declared monthly. Distributions from net realized capital gains from investment transactions, if any, are declared and distributed to shareholders at least annually. Net investment income dividends and capital gains distributions are determined in accordance with income tax regulations, which may differ from accounting principles generally accepted in the United States of America (“U.S. GAAP”). If the total dividends and distributions made in any tax year exceed net investment income and accumulated realized capital gains, a portion of the total distribution may be treated as a return of capital for tax purposes.
Income Taxes.It is the policy of the Fund to distribute all of its taxable income and capital gains to its shareholders and to otherwise qualify as a regulated investment company under Subchapter M of the Internal Revenue Code. In addition, the Fund intends to pay distributions as required to avoid imposition of excise tax. Accordingly, no provision has been made for Federal income taxes. The Fund files income tax returns in U.S. federal and applicable state jurisdictions. The Fund’s tax returns are subject to examination by the relevant taxing authority until expiration of the applicable statute of limitations, which is generally three years after the filing of the tax returns. Management of the Fund periodically reviews all tax positions to assess whether it is more likely than not that the position would be sustained upon examination by the relevant tax authority based on the technical merits of each position. As of the date of these financial statements, management believes that no liability for unrecognized tax positions is required.
Segregation and Collateralization. In cases in which the 1940 Act and the interpretive positions of the Securities and Exchange Commission (“SEC”), the Dodd Frank Wall Street Reform and Consumer Protection Act, or the interpretive rules
| | | | | | | | | | | | |
| | | 2020 | | | | SEMIANNUAL REPORT | | | | 17 | |
and regulations of the U.S. Commodities Futures Trading Commission require that the Fund either deliver collateral or segregate assets in connection with certain investments (e.g., dollar rolls, financial futures contracts, foreign currency exchange contracts, options written, securities with extended settlement periods, and swaps), the Fund will segregate collateral or designate on its books and records, cash or other liquid securities having a value at least equal to the amount that is required to be physically segregated for the benefit of the counterparty. Furthermore, based on requirements and agreements with certain exchanges and third party broker-dealers, each party has requirements to deliver/deposit cash or securities as collateral for certain investments. Certain countries require that cash reserves be held while investing in companies incorporated in that country. These cash reserves and cash collateral that has been pledged to cover obligations of the Fund under derivative contracts, if any, will be reported separately on the Statement of Assets and Liabilities as “Restricted cash”. Securities collateral pledged for the same purpose, if any, is noted on the Schedule of Investments.
Concentration of Market and Credit Risk.In the normal course of business, the Fund invests in securities and enters into transactions where risks exist due to fluctuations in the market (market risk) or failure of the issuer of a security to meet all its obligations (issuer credit risk). The value of securities held by the Fund may decline in response to certain events, including those directly involving the issuers whose securities are owned by the Fund; conditions affecting the general economy; overall market changes; local, regional or global political, social or economic instability; and currency and interest rate and price fluctuations. Similar to issuer credit risk, the Fund may be exposed to counterparty credit risk, or the risk that an entity with which the Fund has unsettled or open transactions may fail to or be unable to perform on its commitments. The Fund manages counterparty credit risk by entering into transactions only with counterparties that it believes have the financial resources to honor their obligations and by monitoring the financial stability of those counterparties. Financial assets, which potentially expose the Fund to market, issuer and counterparty credit risks, consist principally of financial instruments and receivables due from counterparties. The extent of the Fund’s exposure to market, issuer and counterparty credit risks with respect to these financial assets is generally approximated by their value recorded on the Fund’s Statement of Assets and Liabilities, less any collateral held by the Fund.
The Fund may hold high-yield ornon-investment-grade bonds, that may be subject to a greater degree of credit risk. Credit risk relates to the ability of the issuer to meet interest or principal payments or both as they become due. While the Fund may not invest in issues (such as secured debt issues or corporate debt issues) that are in default at the time of purchase, issuers in which the Fund may invest may become subject to a bankruptcy reorganization proceeding, subject to some other form of a public or private debt restructuring or otherwise become in default or in significant risk of default in the payment of interest or repayment of principal or trading at prices substantially below other below-investment grade debt securities of companies in similar industries.
The Fund may enter into financial instrument transactions (such as swaps, futures, options and other derivatives) that may haveoff-balance sheet market risk.Off-balance sheet market risk exists when the maximum potential loss on a particular financial instrument is greater than the value of such financial instrument, as reflected on the Statement of Assets and Liabilities.
If the Fund invests directly in foreign currencies or in securities that trade in, and receive revenues in, foreign currencies, or in financial derivatives that provide exposure to foreign currencies, it will be subject to the risk that those currencies will decline in value relative to the base currency of the Fund, or, in the case of hedging positions, that the Fund’s base currency will decline in value relative to the currency being hedged. Currency rates in foreign countries may fluctuate significantly over short periods of time for a number of reasons, including changes in interest rates, intervention (or the failure to intervene) by U.S. or foreign governments, central banks or supranational entities such as the International Monetary Fund, or by the imposition of currency controls or other political developments in the United States or abroad.
The London Interbank Offered Rate “LIBOR” is an indicative measure of the average interest rate at which major global banks could borrow from one another. LIBOR is quoted in multiple currencies and multiple time frames using data reported by private-sector banks. LIBOR is used extensively in the United States and globally as a “benchmark” or “reference rate” for various commercial and financial contracts, including corporate and municipal bonds and loans, floating rate mortgages, asset-backed securities, consumer loans, and interest rate swaps and other derivatives.
It is expected that a number of private-sector banks currently reporting information used to set LIBOR will stop doing so after 2021 when their current reporting commitment ends, which could either cause LIBOR to stop publication immediately or cause LIBOR’s regulator to determine that its quality has degraded to the degree that it is no longer representative of its underlying market.
Management believes that, with respect to any significant investments by the Fund in instruments linked to LIBOR, the impact on investments and discontinuation of LIBOR may represent a significant risk.
However, management acknowledges that the anticipated transition away from LIBOR will occur after 2021 and certain of the current investments will mature prior to that time. Furthermore, the ways in which LIBOR’s discontinuation potentially could impact the Fund’s’ investments is not fully known. The extent of that impact may vary depending on various factors, which include, but are not limited to: (i) existing fallback or termination provisions in individual contracts and (ii) whether, how, and when industry participants develop and adopt new successor reference rates and/or fallbacks for both legacy and new instruments.
| | | | | | |
| 18 | | SEMIANNUAL REPORT | | 2020 | | |
In addition, the transition to a successor rate could potentially cause (i) increased volatility or illiquidity in markets for instruments that currently rely on LIBOR, (ii) a reduction in the value of certain instruments held by the Fund, or (iii) reduced effectiveness of related Fund transactions, such as hedging.
As the impacts of the transition become clearer during the next year, Management will be evaluating the impacts of these changes.
An outbreak of infectious respiratory illness caused by a novel coronavirus known asCOVID-19 was first detected in China in December 2019 and has now been detected globally. This coronavirus has resulted in travel restrictions, closed international borders, enhanced health screenings at ports of entry and elsewhere, disruption of and delays in healthcare service preparation and delivery, prolonged quarantines, cancellations, supply chain disruptions, and lower consumer demand, as well as general concern and uncertainty. The impact ofCOVID-19, and other infectious illness outbreaks that may arise in the future, could adversely affect the economies of many nations or the entire global economy, individual issuers and capital markets in ways that cannot necessarily be foreseen. In addition, the impact of infectious illnesses in emerging market countries may be greater due to generally less established healthcare systems. Public health crises caused by theCOVID-19 outbreak may exacerbate otherpre-existing political, social and economic risks in certain countries or globally. The duration of theCOVID-19 outbreak and its effects cannot be determined with certainty.
Leverage Risk.The Fund’s use of leverage creates the possibility of higher volatility for the Fund’s Net Asset Value (“NAV”), market price and distributions. Leverage risk can be introduced through structural leverage (borrowings) or portfolio leverage through the use of certain derivative instruments held in the Fund’s portfolio. Leverage typically magnifies the total return of the Fund’s portfolio, whether that return is positive or negative. The use of leverage creates an opportunity for increased net income per share, but there is no assurance that the Fund’s leveraging strategy will be successful.
Loans.The Fund may invest in loans, the interest rates of which float or adjust periodically based upon a specified adjustment schedule, benchmark indicator, or prevailing interest rates, the debtor of which may be a domestic or foreign corporation, partnership or other entity (“Borrower”). Loans generally pay interest at rates which are periodically redetermined by reference to a base lending rate plus a premium. These base lending rates generally include prime rates of one or more major U.S. banks, the LIBOR or certificates of deposit rates. Loans often require prepayments from excess cash flow or permit the Borrower to repay at its election. The degree to which Borrowers repay cannot be predicted with accuracy. As a result, the actual maturity may be substantially less than the stated maturities. Loans are exempt from registration under the Securities Act of 1933, as amended, may contain certain restrictions on resale, and cannot be sold publicly. The Fund’s investment in loans may be in the form of participations in loans or assignments of all or a portion of loans from third parties.
When the Fund purchases assignments, it acquires all the rights and obligations under the loan agreement of the assigning lender. Assignments may, however, be arranged through private negotiations between potential assignees and potential assignors, and the rights and obligations acquired by the purchaser of an assignment may differ from, and be more limited than those held by the assigning lender. When the Fund purchases a participation of a loan interest, the Fund typically enters into a contractual agreement with the lender or other third party selling the participation. A participation interest in loans includes the right to receive payments of principal, interest and any fees to which it is entitled from the lender and only upon receipt by the lender of payments from the Borrower, but not from the Borrower directly. When investing in a participation interest, if a Borrower is unable to meet its obligations under a loan agreement, the Fund generally has no direct right to enforce compliance with the terms of the loan agreement. As a result, the Fund assumes the credit risk of the Borrower, the selling participant, and any other persons that are interpositioned between the Fund and the Borrower. If the lead lender in a typical lending syndicate becomes insolvent, enters Federal Deposit Insurance Corporation (“FDIC”) receivership or, if not FDIC insured, enters into bankruptcy, the Fund may incur certain costs and delays in receiving payment or may suffer a loss of principal and interest.
PaymentIn-Kind Securities. The Fund may invest in paymentin-kind securities (“PIKs”). PIKs give the issuer the option at each interest payment date of making interest payments in cash or in additional debt securities. Those additional debt securities usually have the same terms, including maturity dates and interest rates, and associated risks as the original bonds. The daily market quotations of the original bonds may include the accrued interest (referred to as a dirty price) and require apro-rata adjustment from the unrealized appreciation or depreciation on investments to interest receivable on the Statement of Assets and Liabilities.
Securities on a When-Issued or Delayed Delivery Basis.The Fund may purchase securities on a “when-issued” basis, and may purchase or sell securities on a “delayed delivery” basis. “When-issued” or “delayed delivery” refers to securities whose terms and indenture are available and for which a market exists, but which are not available for immediate delivery. Delivery and payment for securities that have been purchased by the Fund on a when-issued basis normally take place within six months and possibly as long as two years or more after the trade date. During this period, such securities do not earn interest, are subject to market fluctuation and may increase or decrease in value prior to their delivery. The purchase of securities on a when-issued basis may increase the volatility of the Fund’s NAV to the extent the Fund executes such transactions while remaining substantially fully invested. When the Fund engages in when-issued or delayed delivery
| | | | | | | | | | | | |
| | | 2020 | | | | SEMIANNUAL REPORT | | | | 19 | |
transactions, it relies on the buyer or seller, as the case may be, to complete the transaction. Their failure to do so may cause the Fund to lose the opportunity to obtain or dispose of the security at a price and yield IICO considers advantageous. The Fund maintains internally designated assets with a value equal to or greater than the amount of its purchase commitments. The Fund may also sell securities that it purchased on a when-issued or delayed delivery basis prior to settlement of the original purchase.
Custodian Fees.“Custodian fees” on the Statement of Operations may include interest expense incurred by the Fund on any cash overdrafts of its custodian account during the period. Such cash overdrafts may result from the effects of failed trades in portfolio securities. The Fund pays interest to its custodian on such cash overdrafts, to the extent they are not offset by positive cash balances maintained by the Fund. The “Earnings credit” line item, if shown, represents earnings on cash balances maintained by the Fund during the period. Such interest expense and other custodian fees may be paid with these earnings.
Indemnification.The Fund’s organizational documents provide current and former Trustees and Officers with a limited indemnification against liabilities arising in connection with the performance of their duties to the Fund. In the normal course of business, the Fund may also enter into contracts that provide general indemnification. The Fund’s maximum exposure under these arrangements is unknown and is dependent on future claims that may be made against the Fund. The risk of material loss from such claims is considered remote.
Basis of Preparation. The Fund is an investment company and follows accounting and reporting guidance in the Financial Accounting Standards Board (“FASB”) Accounting Standards Codification Topic 946 (“ASC 946”). The accompanying financial statements were prepared in accordance with U.S. GAAP, including but not limited to ASC 946. U.S. GAAP requires the use of estimates made by management. Management believes that estimates and valuations are appropriate; however, actual results may differ from those estimates, and the valuations reflected in the accompanying financial statements may differ from the value ultimately realized upon sale or maturity.
Statement of Cash Flows. U.S. GAAP requires entities providing financial statements that report both financial position and results of operations to also provide a statement of cash flows for each period for which results of operations are provided, but exempts investment companies meeting certain conditions. One of the conditions is that the enterprise had little or no debt, based on the average debt outstanding during the period, in relation to average total assets. Funds with certain degrees of borrowing activity, typically through the use of borrowing arrangements, have been determined to be at a level requiring a Statement of Cash Flows. The Statement of Cash Flows has been prepared using the indirect method which requires net increase/decrease in net assets resulting from operations to be adjusted to reconcile to net cash flows from operating activities.
Subsequent Events. Management has performed a review for subsequent events through the date this report was issued.
| 3. | | INVESTMENT VALUATION AND FAIR VALUE MEASUREMENTS |
The Fund’s investments are reported at fair value. Fair value is defined as the price that the Fund would receive upon selling an asset or would pay upon satisfying a liability in an orderly transaction between market participants at the measurement date. The Fund calculates the NAV of its shares as of the close of the NYSE, normally 4:00 P.M. Eastern time, on each day the NYSE is open for trading.
For purposes of calculating the NAV, the portfolio securities and financial instruments are valued on each business day using pricing and valuation methods as adopted by the Board. Where market quotes are readily available, fair value is generally determined on the basis of the last reported sales price, or if no sales are reported, based on quotes obtained from a quotation reporting system, established market makers, or pricing services.
Prices for fixed-income securities are typically based on quotes that are obtained from an independent pricing service approved by the Board. To determine values of fixed-income securities, the independent pricing service utilizes such factors as current quotations by broker/dealers, coupon, maturity, quality, type of issue, trading characteristics, and other yield and risk factors it deems relevant in determining valuations. Securities that cannot be valued by the independent pricing service may be valued using quotes obtained from dealers that make markets in the securities.
Short-term securities with maturities of 60 days or less are valued based on quotes that are obtained from an independent pricing service approved by the Board as described in the preceding paragraph above.
Because many foreign markets close before the NYSE, events may occur between the close of the foreign market and the close of the NYSE that could have a material impact on the valuation of foreign securities. Waddell & Reed Services Company (“WRSCO”), pursuant to procedures adopted by the Board, evaluates the impact of these events and may adjust the valuation of foreign securities to reflect the fair value as of the close of the NYSE. In addition, all securities for which values are not readily available or are deemed unreliable are appraised at fair value as determined in good faith under the supervision of the Board.
Where market quotes are not readily available, portfolio securities or financial instruments are valued at fair value, as determined in good faith by the Board or Valuation Committee pursuant to procedures approved by the Board.
| | | | | | |
| 20 | | SEMIANNUAL REPORT | | 2020 | | |
Market quotes are considered not readily available in circumstances where there is an absence of current or reliable market-based data (e.g., trade information or broker quotes), including where events occur after the close of the relevant market, but prior to the NYSE close, that materially affect the values of the Fund’s securities or financial instruments. In addition, market quotes are considered not readily available when, due to extraordinary circumstances, the exchanges or markets on which the securities trade do not open for trading for the entire day and no other market prices are available.
The Board has delegated to WRSCO the responsibility for monitoring significant events that may materially affect the values of the Fund’s securities or financial instruments and for determining whether the value of the applicable securities or financial instruments should bere-evaluated in light of such significant events. IICO, pursuant to authority delegated by the Board, has established a Valuation Committee to administer and oversee the valuation process, including the use of third party pricing vendors.
The Board has adopted methods for valuing securities and financial instruments in circumstances where market quotes are not readily available. For instances in which daily market quotes are not readily available, investments may be valued, pursuant to procedures established by the Board, with reference to other securities or indices. In the event that the security or financial instrument cannot be valued pursuant to one of the valuation methods established by the Board, the value of the security or financial instrument will be determined in good faith by the Valuation Committee in accordance with the procedures adopted by the Board.
When the Fund uses these fair valuation methods applied by WRSCO that use significant unobservable inputs to determine its NAV, securities will be priced by a method that the Board or persons acting at its direction believe accurately reflects fair value and are categorized as Level 3 of the fair value hierarchy. These methods may require subjective determinations about the value of a security. The prices used by the Fund may differ from the value that will ultimately be realized at the time the securities are sold.
WRSCO is responsible for monitoring the implementation of the pricing and valuation policies through a series of activities to provide reasonable comfort of the accuracy of prices including: 1) periodic vendor due diligence meetings to review methodologies, new developments, and process at vendors, 2) daily and monthly multi-source pricing comparisons reviewed and submitted to the Valuation Committee, and 3) daily review of unpriced, stale, and variance reports with exceptions reviewed by management and the Valuation Committee.
Accounting standards establish a framework for measuring fair value and a three-level hierarchy for fair value measurements based upon the transparency of inputs to the valuation of an asset or liability. Inputs may be observable or unobservable and refer broadly to the assumptions that market participants would use in pricing the asset or liability. Observable inputs reflect the assumptions market participants would use in pricing the asset or liability based on market data obtained from sources independent of the reporting entity. Unobservable inputs reflect the reporting entity’s own assumptions about the factors that market participants would use in pricing the asset or liability developed based on the best information available in the circumstances.
An individual investment’s fair value measurement is assigned a level based upon the observability of the inputs which are significant to the overall valuation.
The three-tier hierarchy of inputs is summarized as follows:
| • | | Level 1 – Observable inputs such as quoted prices, available in active markets, for identical assets or liabilities. |
| • | | Level 2 – Significant other observable inputs, which may include, but are not limited to, quoted prices for similar assets or liabilities in markets that are active, quoted prices for identical or similar assets or liabilities in markets that are not active, inputs other than quoted prices that are observable for the assets or liabilities (such as interest rates, yield curves, volatilities, prepayment speeds, loss severities, credit risks and default rates) or other market corroborated inputs. |
| • | | Level 3 – Significant unobservable inputs based on the best information available in the circumstances, to the extent observable inputs are not available, which may include assumptions made by the Board or persons acting at its direction that are used in determining the fair value of investments. |
A description of the valuation techniques applied to the Fund’s major classes of assets and liabilities measured at fair value on a recurring basis follows:
Corporate Bonds.The fair value of corporate bonds, as obtained from an independent pricing service, is estimated using various techniques, which consider recently executed transactions in securities of the issuer or comparable issuers, market price quotations (where observable), bond spreads, fundamental data relating to the issuer, and credit default swap spreads adjusted for any basis difference between cash and derivative instruments. While most corporate bonds are categorized in Level 2 of the fair value hierarchy, in instances where lower relative weight is placed on transaction prices, quotations, or similar observable inputs, they are categorized in Level 3 of the fair value hierarchy.
Derivative Instruments.Forward foreign currency contracts are valued based upon the closing prices of the forward currency rates determined at the close of the NYSE, which values are provided by an independent pricing service. Forward
| | | | | | | | | | | | |
| | | 2020 | | | | SEMIANNUAL REPORT | | | | 21 | |
contract values are categorized in Level 2 of the fair value hierarchy. Swaps derive their value from underlying asset prices, indices, reference rates and other inputs or a combination of these factors. Swaps are valued by an independent pricing service unless the price is unavailable, in which case they are valued at the price provided by a dealer in that security. Swap values are categorized in Level 2 of the fair value hierarchy.
Loans. Loans are valued using a price or composite price from one or more brokers or dealers as obtained from an independent pricing service. The fair value of loans is estimated using recently executed transactions, market price quotations, credit/market events, and cross-asset pricing. Inputs are generally observable market inputs obtained from independent sources. Loans are generally categorized in Level 2 of the fair value hierarchy, unless key inputs are unobservable in which case they would be categorized as Level 3.
Municipal Bonds. Municipal bonds are fair valued based on pricing models used by and obtained from an independent pricing service that take into account, among other factors, information received from market makers and broker-dealers, current trades,bid-wants lists, offerings, market movements, the callability of the bond, state of issuance, benchmark yield curves, and bond insurance. To the extent that these inputs are observable and timely, the fair values of municipal bonds would be categorized as Level 2; otherwise the fair values would be categorized as Level 3.
Overdraft due to custodian. Due to the short-term nature of overdraft due to custodian, the carrying value approximates fair value and the liability is categorized as Level 2 in the fair value hierarchy.
Payable for Borrowings.The Fund uses a market yield approach, which utilizes expected future cash flows that are discounted using estimated current market rates. Discounted cash flow calculations may be adjusted to reflect current market conditions or the perceived credit risk of the Fund, as applicable. Consideration may also include an evaluation of collateral.
Restricted Securities. Restricted securities that are deemed to be Rule 144A securities and illiquid, as well as restricted securities held innon-public entities, are included in Level 3 of the fair value hierarchy to the extent that significant inputs to valuation are unobservable, because they trade infrequently, if at all and, therefore, the inputs are unobservable. Restricted securities that are valued at a discount to similar publicly traded securities may be categorized as Level 2 of the fair value hierarchy to the extent that the discount is considered to be insignificant to the fair value measurement in its entirety; otherwise they may be categorized as Level 3.
Transfers from Level 2 to Level 3 occurred primarily due to the lack of observable market data due to decreased market activity or information for these securities. Transfers from Level 3 to Level 2 occurred primarily due to the increased availability of observable market data due to increased market activity or information. Transfers between levels represent the values as of the beginning of the reporting period.
For fair valuations using unobservable inputs, U.S. GAAP requires a reconciliation of the beginning to ending balances for reported fair values that presents changes attributable to total realized and unrealized gains or losses, purchases and sales, and transfers in or out of the Level 3 category during the period. In accordance with the requirements of U.S. GAAP, a fair value hierarchy and Level 3 reconciliation, if any, have been included in the Notes to the Schedule of Investments for the Fund.
Net realized gain (loss) and net unrealized appreciation (depreciation), shown on the reconciliation of Level 3 investments, if applicable, are included on the Statement of Operations in net realized gain (loss) on investments in unaffiliated securities and in net change in unrealized appreciation (depreciation) on investments in unaffiliated securities, respectively. Additionally, the net change in unrealized appreciation (depreciation) for all Level 3 investments still held as of March 31, 2020, if applicable, is included on the Statement of Operations in net change in unrealized appreciation (depreciation) on investments in unaffiliated securities.
| 4. | | INVESTMENT MANAGEMENT AND PAYMENTS TO AFFILIATED PERSONS ($ amounts in thousands unless indicated otherwise) |
Management Fees. IICO serves as the Fund’s investment manager. The Fund has agreed to pay the Adviser a management fee at an annual rate of 1.00% of the average daily value of the Fund’s ”Managed Assets.” The term Managed Assets means the Fund’s total assets, including the assets attributable to the proceeds from any borrowings or other forms of structural leverage, minus liabilities, other than the aggregate indebtedness entered into for purposes of leverage.
Independent Trustees and Chief Compliance Officer Fees.Fees paid to the Independent Trustees can be paid in cash or deferred to a later date, at the election of the Trustees according to the Trust’s Deferred Fee Agreement entered into between the Fund and the Trustee(s). The Fund records the deferred fees as a liability on the Statement of Assets and Liabilities. All fees paid in cash plus any appreciation (depreciation) in the underlying deferred plan are shown on the Statement of Operations. Additionally, fees paid to the Chief Compliance Officer of the Fund are shown on the Statement of Operations.
Accounting Services Fees. The Fund has an Accounting and Administrative Services Agreement with WRSCO, doing business as WI Services Company (“WISC”). Under the agreement, WISC acts as the agent in providing bookkeeping and
| | | | | | |
| 22 | | SEMIANNUAL REPORT | | 2020 | | |
accounting services and assistance to the Fund, including maintenance of Fund records, pricing of Fund shares and preparation of certain shareholder reports. For these services, the Fund pays WISC a monthly fee ofone-twelfth of the annual fee based on the average managed asset levels shown in the following table:
| | | | | | | | | | | | | | | | | | | | | | | | | | | | | | | | | | | | | | | | |
| (M - Millions) | | $0 to
$10M | | | $10 to
$25M | | | $25 to
$50M | | | $50 to
$100M | | | $100 to
$200M | | | $200 to
$350M | | | $350 to
$550M | | | $550 to
$750M | | | $750 to
$1,000M | | | Over
$1,000M | |
Annual Fee Rate | | $ | 0.00 | | | $ | 11.50 | | | $ | 23.10 | | | $ | 35.50 | | | $ | 48.40 | | | $ | 63.20 | | | $ | 82.50 | | | $ | 96.30 | | | $ | 121.60 | | | $ | 148.50 | |
The Fund also pays WISC a monthly administrative fee at the annual rate of 0.01%, or one basis point, for the first $1 billion of managed assets with no fee charged for managed assets in excess of $1 billion. This fee is voluntarily waived by WISC until the Fund’s managed assets are at least $10 million and is included in “Accounting services fee” on the Statement of Operations.
Other Fees.The Fund pays all costs and expenses of its operations, including, but not limited to, compensation of its Trustees (other than those affiliated with the Adviser), custodian, administrator, leveraging expenses, transfer and dividend disbursing agent expenses, legal fees, rating agency fees, listing fees and expenses, expenses of independent auditors, expenses of repurchasing shares, expenses of preparing, printing and distributing shareholder reports, notices, proxy statements and reports to governmental agencies and taxes, if any.
| 5. | | AFFILIATED COMPANY TRANSACTIONS (All amounts in thousands) |
A summary of the transactions in affiliated companies during the period ended March 31, 2020 follows:
| | | | | | | | | | | | | | | | | | | | | | | | | | | | | | | | |
| | | 9-30-19
Share
Balance | | | Gross
Additions | | | Gross
Reductions | | | Realized
Gain/(Loss) | | | Distributions
Received | | | 3-31-20
Share
Balance | | | 3-31-20
Value | | | Net Change in
Unrealized
Depreciation | |
Larchmont Resources LLC(1)(2)(3) | | | 2 | | | $ | – | | | $ | – | | | $ | – | | | $ | – | | | | 2 | | | $ | 291 | | | $ | (124 | ) |
| | | | | | | | |
| | | 9-30-19
Principal
Balance | | | | | | | | | | | | Interest
Received | | | 3-31-20
Principal
Balance | | | | | | Net Change in
Unrealized
Depreciation | |
Larchmont Resources LLC (8.000% Cash or 8.000% PIK), 8.000%,8-7-20(2)(4) | | $ | 1,249 | | | $ | – | | | $ | – | | | $ | – | | | $ | 57 | | | $ | 1,249 | | | $ | 1,124 | | | $ | (36 | ) |
| (1) | No dividends were paid in the preceding 12 months. |
| (2) | Securities whose value was determined using significant unobservable inputs. |
| (3) | Restricted securities. |
| 6. | | INVESTMENT SECURITIES TRANSACTIONS ($ amounts in thousands) |
The cost of purchases and the proceeds from maturities and sales of investment securities (excluding short-term securities) for the period ended March 31, 2020, were as follows:
| | | | | | |
Purchases | | Sales |
| U.S. Government | | Other Issuers | | U.S. Government | | Other Issuers |
| $— | | $73,040 | | $— | | $82,107 |
The Fund entered into a $160 million (“Facility Limit”) prime brokerage facility (“Borrowings”) with Pershing LLC as a means of financial leverage. Interest was charged on the Borrowings at one month LIBOR plus 0.75% on the amount borrowed. There are no other fees associated with this borrowing arrangement. During the period ended March 31, 2020, the average daily balance outstanding and weighted interest rate on the Borrowings were $110,032,787 and 2.040%, respectively.
In order to maintain the Borrowings, the Fund must meet certain collateral, asset coverage and other requirements. Borrowings outstanding are secured by securities held by the Fund as noted in the Schedule of Investments.
Borrowings outstanding are recognized as “Payable for borrowing” on the Statement of Assets and Liabilities. Interest charged on the amount borrowed is recognized as a component of “Interest expense for borrowing” on the Statement of Operations.
| | | | | | | | | | | | |
| | | 2020 | | | | SEMIANNUAL REPORT | | | | 23 | |
| 8. | | LOANS OF PORTFOLIO SECURITIES ($ amounts in thousands) |
The Fund may lend its portfolio securities only to borrowers that are approved by the Fund’s securities lending agent, The Bank of New York Mellon (“BNYM”). The borrower pledges and maintains with the Fund collateral consisting of cash or securities issued or guaranteed by the U.S. government. The collateral received by the Fund is required to have a value of at least 102% of the market value of the loaned securities for securities traded on U.S. exchanges and a value of at least 105% of the market value for all other securities, except in the case of loans of foreign securities which are denominated and payable in U.S. dollars, in which case the collateral is required to have a value of at least 102% of the market value of the loaned securities. The market value of the loaned securities is determined at the close of each business day and any additional required collateral is delivered to the Fund and any excess collateral is returned by the Fund on the next business day. During the term of the loan, the Fund is entitled to all distributions made on or in respect of the loaned securities but does not receive interest income on securities received as collateral. Loans of securities are terminable at any time and the borrower, after notice, is required to return borrowed securities within the standard time period for settlement of securities transactions.
Cash received as collateral for securities on loan may be reinvested in the Dreyfus Institutional Preferred Government Money Market Fund — Institutional Shares or certain other registered money market funds and are disclosed in the Fund’s Schedule of Investments and are reflected in the Statement of Assets and Liabilities as cash collateral on securities loaned at value.Non-cash collateral, in the form of securities issued or guaranteed by the U.S. government or its agencies or instrumentalities, is not disclosed in the Fund’s Statement of Assets and Liabilities as it is held by the lending agent on behalf of the Fund and the Fund does not have the ability tore-hypothecate these securities. The securities on loan for the Fund are also disclosed in its Schedule of Investments. The total value of any securities on loan as of March 31, 2020 and the total value of the related cash collateral are disclosed in the Statement of Assets and Liabilities. Income earned by the Fund from securities lending activity is disclosed in the Statements of Operations.
The following is a summary of the Fund’s securities lending positions and related cash andnon-cash collateral received as of March 31, 2020:
| | | | | | | | | | | | | | | | | | |
Market Value
of Securities
on Loan | | Cash
Collateral
Received | | Non-Cash
Collateral
Received | | Total
Collateral
Received |
| | | $314 | | | | $ | 325 | | | | $ | — | | | | $ | 325 | |
The cash collateral received amounts presented in the table above are transactions accounted for as secured borrowings and have an overnight and continuous maturity. The proceeds from the cash collateral received is invested in registered money market funds.
The Board has approved the Fund’s participation in a securities lending program, whereby the Fund lends certain of its portfolio securities to borrowers to receive additional income and increase the rate of return of its portfolio. BNYM serves as the securities lending agent for the program. As securities lending agent, BNYM is responsible for (i) selecting borrowers from apre-approved list of borrowers and executing a securities lending agreement as agent on behalf of the Fund with each such borrower; (ii) negotiating the terms of securities loans, including the amount of fees or rebates; (iii) receiving and investing collateral in connection with any loaned securities inpre-approved investment vehicles; (iv) monitoring the daily value of the loaned securities and demanding the payment of additional collateral, as necessary; (v) terminating securities loans and arranging for the return of loaned securities and collateral at such termination; and (vi) in the event of default by a borrower with respect to any securities loan, using the collateral or the proceeds of the liquidation of collateral to purchase replacement securities. The following table shows the dollar amounts of income and fees/compensation related to the securities lending activities of the Fund during the period ended March 31, 2020.
| | | | |
| | | Securities Lending Activities | |
Gross income from securities lending activities | | $ | 7 | |
| |
Securities lending income paid to BNYM for services as securities lending agent. | | | 1 | |
Cash collateral management fees not included in securities lending income paid to BNYM | | | 0 | |
Administrative fees not included in securities lending income paid to BNYM | | | 0 | |
Indemnification fees not included in securities lending income paid to BNYM | | | 0 | |
Rebates (paid to borrowers) | | | (6 | ) |
Other fees not included in securities lending income paid to BNYM. | | | 0 | |
| |
Aggregate fees/compensation for securities lending activities | | | (5 | ) |
| |
Net income from securities lending activities | | $ | 12 | |
| | | | | | |
| 24 | | SEMIANNUAL REPORT | | 2020 | | |
The risks of securities lending include the risk that the borrower may not provide additional collateral when required or may not return the securities when due. To mitigate these risks, the Fund benefits from a borrower indemnity provided by BNYM. BNYM’s indemnity allows for full replacement of securities lent wherein BNYM will purchase the unreturned loaned securities on the open market by applying the proceeds of the collateral or to the extent such proceeds are insufficient or the collateral is unavailable, BNYM will purchase the unreturned loan securities at BNYM’s expense. However, the Fund could suffer a loss if the value of the investments purchased with cash collateral falls below the value of the cash collateral received.
| 9. | | CAPITAL SHARE TRANSACTIONS ($ amounts in thousands) |
The Fund has authorized 18,750,000 of $0.001 par value common shares of beneficial interest. There were no transactions in shares of beneficial interest during the period ended March 31, 2020.
Bridge loan commitments may obligate the Fund to furnish temporary financing to a borrower until permanent financing can be arranged. In connection with these commitments, the Fund earns a commitment fee, typically set as a percentage of the commitment amount. Such fee income is included in interest income on the Statement of Operations. At period ended March 31, 2020, the Fund did not have any bridge loan commitments outstanding.
| 11. | | FEDERAL INCOME TAX MATTERS ($ amounts in thousands) |
For Federal income tax purposes, cost of investments owned at March 31, 2020 and the related unrealized appreciation (depreciation) were as follows:
| | | | | | | | | | | | | | | | | | |
Cost of
Investments | | Gross
Appreciation | | Gross
Depreciation | | Net Unrealized
Depreciation |
| | | $361,468 | | | | $ | 2,350 | | | | $ | 86,868 | | | | $ | (84,518 | ) |
For Federal income tax purposes, the Fund’s undistributed earnings and profit for the year ended September 30, 2019 and the post-October and late-year ordinary activity were as follows:
| | | | | | | | | | | | | | | | | | | | | | | |
Undistributed
Ordinary
Income | | Undistributed
Long-Term
Capital Gains | | Tax Return
of Capital | | Post-October
Capital
Losses
Deferred | | Late-Year
Ordinary
Losses
Deferred |
| | | $702 | | | | $ | — | | | | $ | — | | | | $ | — | | | | $ | — | |
Internal Revenue Code regulations permit the Fund to elect to defer into its next fiscal year capital losses and certain specified ordinary items incurred between each November 1 and the end of its fiscal year. The Fund is also permitted to defer into its next fiscal certain ordinary losses that generated between each January 1 and the end of its fiscal year.
The tax character of dividends and distributions paid during the two fiscal years ended September 30, 2019 and 2018 were as follows:
| | | | | | | | | | | | | | | | | | |
| September 30, 2019 | | September 30, 2018 |
Distributed
Ordinary
Income(1) | | Distributed
Long-Term
Capital Gains | | Distributed
Ordinary
Income(1) | | Distributed
Long-Term
Capital
Gains |
| | | $21,873 | | | | $ | — | | | | $ | 21,210 | | | | $ | — | |
| (1) | Includes short-term capital gains distributed, if any. |
Dividends from net investment income and short-term capital gains are treated as ordinary income dividends for federal income tax purposes.
Accumulated capital losses represent net capital loss carryovers as of September 30, 2019 that may be available to offset future realized capital gains and thereby reduce future capital gain distributions. As of September 30, 2019, the capital loss carryovers were as follows:
| | | | | | | | |
Short-Term Capital
Loss Carryover | | Long-Term Capital
Loss Carryover |
| $5,082 | | $32,746 |
| | | | | | | | | | | | |
| | | 2020 | | | | SEMIANNUAL REPORT | | | | 25 | |
| | |
| DIVIDEND REINVESTMENT PLAN | | IVY HIGH INCOME OPPORTUNITIES FUND |
(UNAUDITED)
Pursuant to the Fund’s Dividend Reinvestment Plan (the “DRIP”), unless you elect to receive distributions in cash (i.e.,opt-out), all dividends, including any capital gain dividends, on your common shares will be automatically reinvested by Computershare Trust Company, N.A., as agent for the shareholders (the “DRIP Agent”), in additional common shares under the DRIP. You may elect not to participate in the DRIP by contacting the DRIP Agent. If you do not participate, you will receive all cash distributions paid by check mailed directly to you by Computershare, Inc. as dividend paying agent.
If you participate in the DRIP, the number of common shares you will receive will be determined as follows:
(1) If the market price of the common shares on the record date (or, if the record date is not a New York Stock Exchange (“NYSE”) trading day, the immediately preceding trading day) for determining shareholders eligible to receive the relevant dividend or distribution (the “determination date”) is equal to or exceeds 98% of the net asset value per share of the common shares, the Fund will issue new common shares at a price equal to the greater of:
(a) 98% of the net asset value per share at the close of trading on the NYSE on the determination date or
(b) 95% of the market price of the common shares on the determination date.
(2) If 98% of the net asset value per share of the common shares exceeds the market price of the common shares on the determination date, the DRIP Agent will receive the dividend or distribution in cash and will buy common shares in the open market, on the NYSE or elsewhere, for your account as soon as practicable commencing on the trading day following the determination date and terminating no later than the earlier of (a) 30 days after the dividend or distribution payment date, or (b) the record date for the next succeeding dividend or distribution to be made to the shareholders; except when necessary to comply with applicable provisions of the federal securities laws. If during this period: (i) the market price rises so that it equals or exceeds 98% of the net asset value per share of the common shares at the close of trading on the NYSE on the determination date before the DRIP Agent has completed the open market purchases, or (ii) if the DRIP Agent is unable to invest the full amount eligible to be reinvested in open market purchases, the DRIP Agent will cease purchasing common shares in the open market and the Fund shall issue the remaining common shares at a price per share equal to the greater of (a) 98% of the net asset value per share at the close of trading on the NYSE on the determination date, or (b) 95% of the then-current market price per share.
Common shares in your account will be held by the DRIP Agent innon-certificated form. Any proxy you receive will include all shares of common shares you have received under the DRIP.
You may withdraw from the DRIP (i.e.,opt-out) by notifying the DRIP Agent in writing at P.O. Box 43078, Providence, Rhode Island 02940-3078. Such withdrawal will be effective immediately if notice is received by the DRIP Agent prior to any dividend or distribution record date; otherwise such withdrawal will be effective as soon as practicable after the DRIP Agent’s investment of the most recently declared dividend or distribution on the common shares. The DRIP may be amended or supplemented by the Fund upon notice in writing mailed to shareholders at least 30 days prior to the record date for the payment of any dividend or distribution by the Fund for which the termination is to be effective. Upon any termination, the DRIP Agent will continue to hold whole shares for you innon-certificated form until otherwise notified by you, and will cause a cash adjustment for any fractional shares to be delivered to you after deducting brokerage commissions actually incurred. You may elect to notify the DRIP Agent in advance of such termination, or at any time following termination, to have the DRIP Agent sell part or all of your common shares on your behalf. You will be charged a service charge and the DRIP Agent is authorized to deduct brokerage charges actually incurred for this transaction from the proceeds.
There is no service charge for reinvestment of your dividends or distributions in common shares. However, all participants will pay a per share processing fee, which includes any brokerage commissions incurred by the DRIP Agent when it makes open market purchases. Because all dividends and distributions will be automatically reinvested in additional common shares, this allows you to add to your investment through dollar cost averaging, which may lower the average cost of your common shares over time. Dollar cost averaging is a technique for lowering the average cost per share over time if the Fund’s net asset value declines. While dollar cost averaging has definite advantages, it cannot assure profit or protect against loss in declining markets.
Automatically reinvesting dividends and distributions does not mean that you do not have to pay income taxes due upon receiving dividends and distributions. Investors will be subject to income tax on amounts reinvested under the DRIP.
The Fund reserves the right to amend or terminate the DRIP if, in the judgment of the Board, the change is warranted. There is no direct service charge to participants in the DRIP; however, the Fund reserves the right to amend the DRIP to include a service charge payable by the participants.
Additional information about the DRIP and your account may be obtained from the DRIP Agent at P.O. Box 43078, Providence, Rhode Island 02940-3078 or by calling the DRIP Agent at(800)-426-5523.
| | | | | | |
| 26 | | SEMIANNUAL REPORT | | 2020 | | |
| | |
| PROXY VOTING INFORMATION | | IVY HIGH INCOME OPPORTUNITIES FUND |
(UNAUDITED)
Proxy Voting Guidelines
A description of the policies and procedures the Fund uses to determine how to vote proxies relating to portfolio securities is available (i) without charge, upon request, by calling 1.888.923.3355 and (ii) on the Securities and Exchange Commission’s (“SEC”) website at www.sec.gov.
Proxy Voting Records
Information regarding how the Fund voted proxies relating to portfolio securities during the most recent12-month period ended June 30 is available on FormN-PX through the Ivy Investments’ website at www.ivyinvestments.com and on the SEC’s website at www.sec.gov.
| | |
| QUARTERLY PORTFOLIO SCHEDULE INFORMATION | | IVY HIGH INCOME OPPORTUNITIES FUND |
Portfolio holdings can be found on the Fund’s website at www.ivyinvestments.com. Alternatively, a complete schedule of portfolio holdings of the Fund for the first and third quarters of each fiscal year is filed with the SEC and can be found on the Fund’s FormN-Q and/or FormNPORT-EX. These holdings may be viewed in the following ways:
| • | | On the SEC’s website at www.sec.gov. |
| • | | For review and copy at the SEC’s Public Reference Room in Washington, DC. Information on the operations of the Public Reference Room may be obtained by calling 1.800.SEC.0330. |
Visit us online at www.ivyinvestments.com
The Fund is managed by Ivy Investment Management Company.
| | | | | | | | | | | | |
| | | 2020 | | | | SEMIANNUAL REPORT | | | | 27 | |
SEMIANN-IVH (3-20)
ITEM 2. CODE OF ETHICS
Required in annual report only.
ITEM 3. AUDIT COMMITTEE FINANCIAL EXPERT
Required in annual report only.
ITEM 4. PRINCIPAL ACCOUNTANT FEES AND SERVICES.
Required in annual report only.
ITEM 5. AUDIT COMMITTEE OF LISTED REGISTRANTS
Not applicable.
ITEM 6. SCHEDULE OF INVESTMENTS.
See Item 1 Shareholder Report.
ITEM 7. DISCLOSURE OF PROXY VOTING POLICIES AND PROCEDURES FORCLOSED-END MANAGEMENT INVESTMENT COMPANIES
Not applicable.
ITEM 8. PORTFOLIO MANAGERS OFCLOSED-END MANAGEMENT INVESTMENT COMPANIES.
Not applicable.
ITEM 9. PURCHASES OF EQUITY SECURITIES BYCLOSED-END MANAGEMENT INVESTMENT COMPANY AND AFFILIATED PURCHASERS
| | | | | | | | | | | | | | | | |
Period* | | (a)
TOTAL
NUMBER OF
SHARES (OR
UNITS)
PURCHASED | | | (b)
AVERAGE
PRICE
PAID PER
SHARE
(OR UNIT) | | | (c)
TOTAL NUMBER OF
SHARES (OR UNITS)
PURCHASED AS
PART OF PUBLICLY
ANNOUNCED PLANS
OR PROGRAMS | | | (d)*
MAXIMUM NUMBER (OR
APPROXIMATE DOLLAR
VALUE) OF SHARES (OR
UNITS) THAT MAY YET BE
PURCHASED UNDER THE
PLANS OR PROGRAMS | |
10-1-19 –10-31-19 | | | 6,521 | | | $ | 13.57 | | | | 6,521 | | | | 2,179,765 | |
11-1-19 –11-30-19 | | | 6,492 | | | $ | 13.44 | | | | 6,492 | | | | 2,179,765 | |
12-1-19 –12-31-19 | | | 9,304 | | | $ | 13.89 | | | | 9,304 | | | | 2,179,765 | |
1-1-20 –1-31-20 | | | 6,040 | | | $ | 14.17 | | | | 6,040 | | | | 2,179,765 | |
2-1-20 –2-29-20 | | | 6,144 | | | $ | 14.18 | | | | 6,144 | | | | 2,179,765 | |
3-1-20 –3-31-20 | | | 10,744 | | | $ | 9.07 | | | | 10,744 | | | | 2,179,765 | |
TOTAL | | | 45,245 | | | | | | | | | | | | | |
* The registrant’s repurchase program, for the repurchase of 2,182,912 shares, was authorized May 29, 2013. On October 16, 2017, the Fund issued 3,147 new shares from the Fund’s reserve account. All other repurchases made by the registrant pursuant to the program were made through open-market transactions and not through the issuance of new shares.
2
ITEM 10. SUBMISSION OF MATTERS TO A VOTE OF SECURITY HOLDERS
There have been no material changes to the procedures by which shareholders may recommend nominees to the Registrant’s board of directors.
ITEM 11. CONTROLS AND PROCEDURES.
| (a) | The Registrant’s Principal Executive Officer and Principal Financial Officer, or persons performing similar functions, based on their evaluation of the Registrant’s disclosure controls and procedures as of a date within 90 days of the filing date of this report, have concluded that such controls and procedures (as defined in Rule30a-3(c) under the Investment Company Act of 1940, as amended) are effective and adequately designed to ensure that information required to be disclosed by the Registrant in its reports that it files or submits is accumulated and communicated to the Registrant’s management, including the Principal Executive Officer and Principal Financial Officer, or persons performing similar functions, as appropriate, to allow timely decisions regarding required disclosure. |
| (b) | There were no significant changes in the registrant’s internal controls over financial reporting (as defined in Rule30a-3(d) under the Investment Company Act of 1940, as amended) that occurred during the registrant’s second fiscal half-year that has materially affected, or is reasonably likely to materially affect, the registrant’s internal control over financial reporting. |
ITEM 12. DISCLOSURE OF SECURITIES LENDING ACTIVITIES FORCLOSED-END MANAGEMENT INVESTMENT COMPANIES.
(a)
| | | | |
| | | SECURITIES LENDING ACTIVITIES (AMOUNTS IN THOUSANDS) | |
Gross income from securities lending activities | | | $7 | |
Securities lending income paid to BNY for services as securities lending agent | | | 1 | |
Cash collateral management fees not included in securities lending income paid to BNY | | | 0 | |
Administrative fees not included in securities lending income paid to BNY | | | 0 | |
Indemnification fees not included in securities lending income paid to BNY | | | 0 | |
Rebates (paid to borrowers) | | | (6 | ) |
Other fees not included in securities lending income paid to BNY | | | 0 | |
Aggregate fees/compensation for securities lending activities | | | (5 | ) |
Net income from securities lending activities | | | $12 | |
(b)
Bank of New York Mellon (BNY) serves as the securities lending agent for the registrant. As securities lending agent, BNY is responsible for providing the following services to the registrant: (i) selecting borrowers from a
3
pre-approved list of borrowers and executing a securities lending agreement as agent on behalf of the registrant with each such borrower; (ii) negotiating the terms of securities loans, including the amount of fees or rebates; (iii) receiving and investing collateral in connection with any loaned securities inpre-approved investment vehicles; (iv) monitoring the daily value of the loaned securities and demanding the payment of additional collateral, as necessary; (v) terminating securities loans and arranging for the return of loaned securities and collateral at such termination; and (vi) in the event of default by a borrower with respect to any securities loan, using the collateral or the proceeds of the liquidation of collateral to purchase replacement securities.
ITEM 13. EXHIBITS.
(a)(1) Required in annual report only.
(a)(2) A separate certification for each principal executive officer and principal financial officer of the registrant as required by Rule30a-2(a) under the Investment Company Act of 1940 (17 CFR270.30a-2(a)).
Attached hereto as Exhibit 99.CERT.
(b) A separate certification for each principal executive officer and principal financial officer of the registrant as required by Rule30a-2(b) under the Investment Company Act of 1940 (17 CFR270.30a-2(b)).
Attached hereto as Exhibit 99.906CERT.
4
SIGNATURES
Pursuant to the requirements of the Securities Exchange Act of 1934 and the Investment Company Act of 1940, the registrant has duly caused this report to be signed on its behalf by the undersigned, thereunto duly authorized.
IVY HIGH INCOME OPPORTUNITIES FUND
(Registrant)
| | |
| By | | /s/ Jennifer K. Dulski |
| | Jennifer K. Dulski, Secretary |
| |
| Date: | | June 5, 2020 |
Pursuant to the requirements of the Securities Exchange Act of 1934 and the Investment Company Act of 1940, this report has been signed below by the following persons on behalf of the registrant and in the capacities and on the dates indicated.
| | |
| By | | /s/ Philip J. Sanders |
| | Philip J. Sanders, President and Principal Executive Officer |
| |
| Date: | | June 5, 2020 |
| |
| By | | /s/ Joseph W. Kauten |
| | Joseph W. Kauten, Vice President and Principal Financial Officer |
| |
| Date: | | June 5, 2020 |