Exhibit 99.2

American Realty Capital 1 August 2014 Pro Forma Second Quarter 2014 Financial & Operating Results
2 CEO’s Comments We posted strong operating results for the quarter driven by solid performance across all of our key business segments, including our Retail Advice, Wholesale Distribution, Investment Banking and Capital Markets businesses . Pro forma revenues for the second quarter increased 22 % from the first quarter to $ 825 . 7 1 million , and pro forma adjusted net income increased 12 % quarter - over - quarter to $ 42 . 6 million, or $ 0 . 49 per fully diluted share . In addition, pro forma assets under administration for our Retail Advice Segment rose to $ 214 . 2 billion . Retail Advice Segment pro forma revenues grew 7 % quarter - over - quarter, driven by strong performance across all revenue categories and we continue to see strong retention as evidenced by our 97 % advisor retention rate . Equity capital raised from Wholesale Distribution in the quarter increased to $ 2 . 6 billion from $ 1 . 6 billion in the first quarter, up $ 1 . 0 billion or 63 % from the first quarter and remained on - track subsequent to quarter - end with $ 5 . 2 billion total equity capital raised through the end of July . Capital Markets revenues were again strong for the second quarter at $ 39 . 1 million, and nearly $ 90 million for the first half of the year, exceeding full year 2013 Capital Markets revenues . Our solid balance sheet shows $ 475 million of cash and cash equivalents on hand, which we believe will enable us to continue to make strategic investments in human capital and technologies to further support the growth of our business lines . - William M. Kahane 1 Excludes $58.5 million non - cash revenue recognized from fair market value accounting of embedded derivatives in securities issue d in connection with the Luxor/Cetera financing.
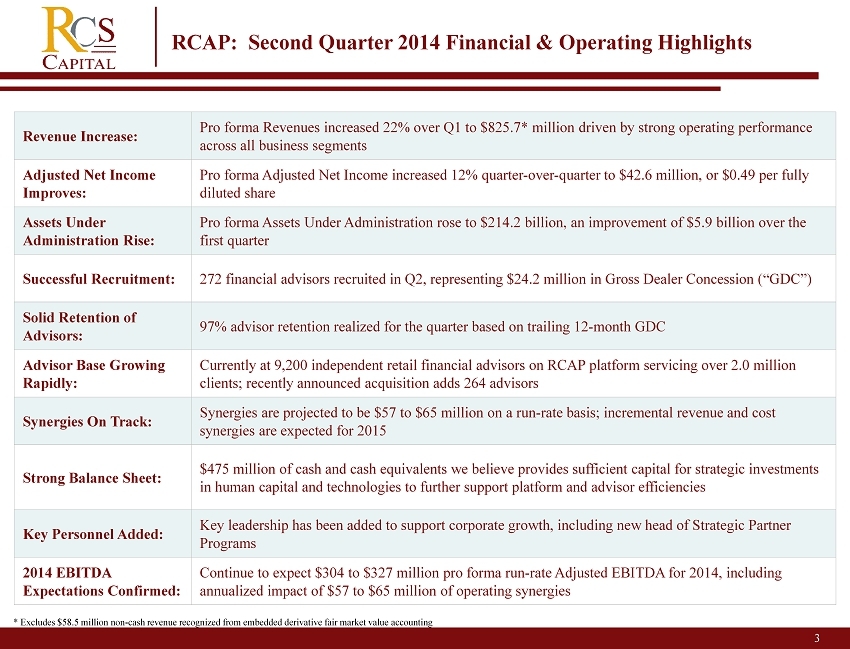
3 RCAP: Second Quarter 2014 Financial & Operating Highlights Revenue Increase: Pro forma Revenues increased 22% over Q1 to $825.7* million driven by strong operating performance across all business segments Adjusted Net Income Improves: Pro forma Adjusted Net Income increased 12% quarter - over - quarter to $42.6 million, or $0.49 per fully diluted share Assets Under Administration Rise: Pro forma Assets Under Administration rose to $214.2 billion, an improvement of $5.9 billion over the first quarter Successful Recruitment: 272 financial advisors recruited in Q2, representing $24.2 million in Gross Dealer Concession (“GDC”) Solid Retention of Advisors: 97% advisor retention realized for the quarter based on trailing 12 - month GDC Advisor Base Growing Rapidly : Currently at 9,200 independent retail financial advisors on RCAP platform servicing over 2.0 million clients; recently announced acquisition adds 264 advisors Synergies On Track: Synergies are projected to be $57 to $65 million on a run - rate basis; incremental revenue and cost synergies are expected for 2015 Strong Balance Sheet: $475 million of cash and cash equivalents we believe provides sufficient capital for strategic investments in human capital and technologies to further support platform and advisor efficiencies Key Personnel Added: Key leadership has been added to support corporate growth, including new head of Strategic Partner Programs 2014 EBITDA Expectations Confirmed: Continue to expect $304 to $327 million pro forma run - rate Adjusted EBITDA for 2014, including annualized impact of $57 to $65 million of operating synergies * Excludes $58.5 million non - cash revenue recognized from embedded derivative fair market value accounting

American Realty Capital Operational Review 4 2

5 2 Accretively Adding to Leading Retail Franchise Integration + Synergy Targets On - Track Balance Sheet • Closed all five retail broker dealer acquisitions ahead of schedule • The integration of announced acquisitions is ahead of expectations • $475 million in cash • Provides opportunity to execute accretive acquisitions, including smaller “tuck - in” transactions like the recently announced acquisition of VSR Group, Inc., as well as strategic technology plays like our recently announced acquisition of Trupoly • Net debt/annualized Adjusted EBITDA less than 1.5x • Provides solid capital base and financial flexibility

American Realty Capital Retail Advice 6 2
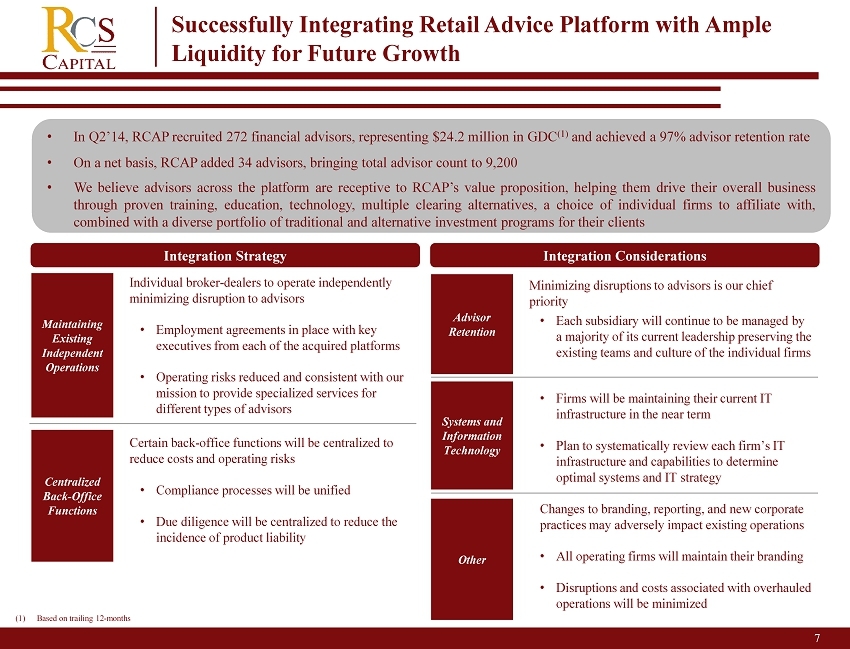
7 2 Successfully Integrating Retail Advice Platform with Ample Liquidity for Future Growth Integration Considerations • Minimizing disruptions to advisors is our chief priority • Each subsidiary will continue to be managed by a majority of its current leadership preserving the existing teams and culture of the individual firms • Firms will be maintaining their current IT infrastructure in the near term • Plan to systematically review each firm’s IT infrastructure and capabilities to determine optimal systems and IT strategy Changes to branding, reporting, and new corporate practices may adversely impact existing operations • All operating firms will maintain their branding • Disruptions and costs associated with overhauled operations will be minimized Integration Strategy • Individual broker - dealers to operate independently minimizing disruption to advisors • Employment agreements in place with key executives from each of the acquired platforms • O perating risks reduced and consistent with our mission to provide specialized services for different types of advisors • Certain back - office functions will be centralized to reduce costs and operating risks • Compliance processes will be unified • Due diligence will be centralized to reduce the incidence of product liability • In Q2’14 , RCAP recruited 272 financial advisors, representing $24.2 million in GDC (1) and achieved a 97% advisor retention rate • On a net basis, RCAP added 34 advisors, bringing total advisor count to 9 , 200 • We believe advisors across the platform are receptive to RCAP’s value proposition, helping them drive their overall business through proven training, education, technology, multiple clearing alternatives, a choice of individual firms to affiliate with, combined with a diverse portfolio of traditional and alternative investment programs for their clients Maintaining Existing Independent Operations Centralized Back - Office Functions Advisor Retention Systems and Information Technology Other (1) Based on trailing 12 - months
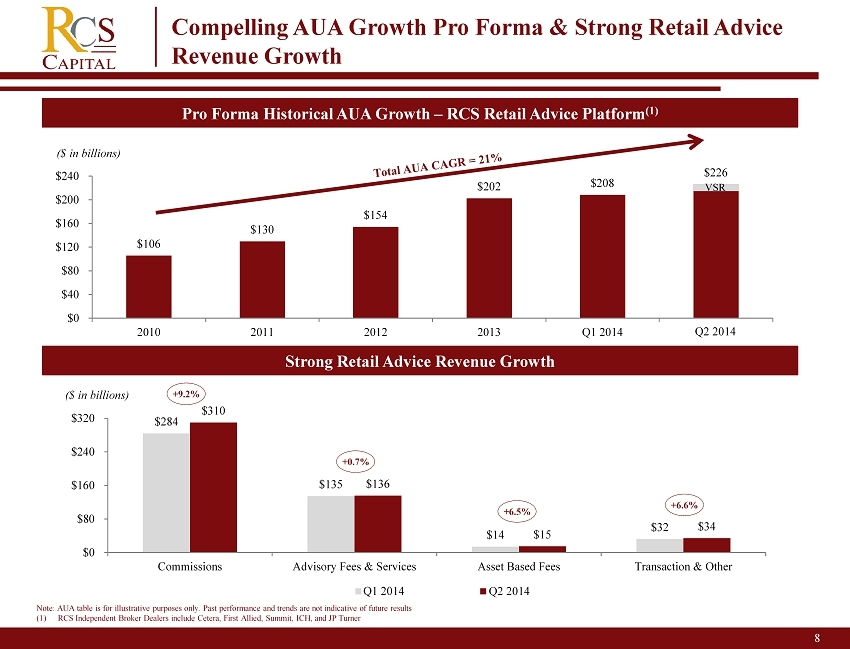
American Realty Capital 8 2 Pro Forma Historical AUA Growth – RCS Retail Advice Platform (1) Compelling AUA Growth Pro Forma & Strong Retail Advice Revenue Growth Note: AUA table is for illustrative purposes only. Past performance and trends are not indicative of future results (1) RCS Independent Broker Dealers include Cetera, First Allied, Summit, ICH, and JP Turner +9.2% +0.7% +6.5% +6.6% Strong Retail Advice Revenue Growth $106 $130 $154 $202 $208 $226 $0 $40 $80 $120 $160 $200 $240 2010 2011 2012 2013 Q1 2014 Q1 2014 ($ in billions) VSR $284 $135 $14 $32 $310 $136 $15 $34 $0 $80 $160 $240 $320 Commissions Advisory Fees & Services Asset Based Fees Transaction & Other Q1'2014 Q2'2014 ($ in billions) Q2 2014 Q2 2014 Q1 2014
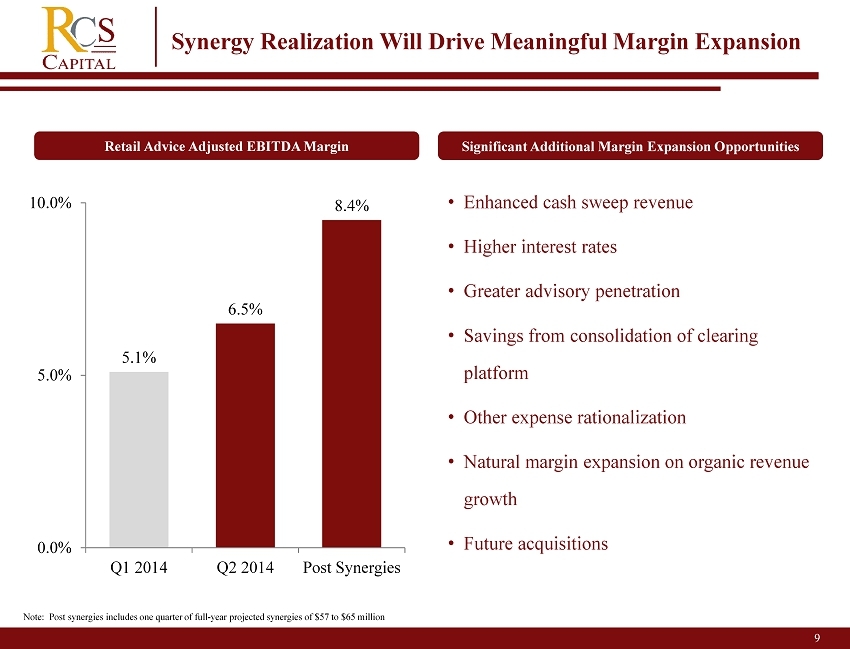
9 2 Synergy Realization Will Drive Meaningful Margin Expansion 5.1% 6.5% 8.4% 0.0% 5.0% 10.0% Q1 2014 Q2 2014 Post Synergies Significant Additional Margin Expansion Opportunities • Enhanced cash sweep revenue • H igher interest rates • Greater advisory penetration • Savings from consolidation of clearing platform • Other e xpense rationalization • Natural margin expansion on organic revenue growth • Future acquisitions Retail Advice Adjusted EBITDA Margin Note: Post synergies includes one quarter of full - year projected synergies of $57 to $65 million

10 Business Positively Levered to Rising Interest Rates Note: Cash sweep assets as of June 30, 2014. Assumes realizing 75% of the 100 basis point rate rise as incremental revenue / EB ITDA. • Currently, less than 4% of AUA is in client cash sweep accounts earning approximately 10 basis points • As interest rates rise, money market allocations have the potential to increase to historic levels of approximately 8% of AUA • Revenue / EBITDA contribution for six months ended June 30, 2014 from sweep income is approximately $7.6 million • We anticipate realizing between 60% and 80 % of the 100 basis point rate rise as incremental revenue / EBITDA (before any benefit from an increase in assets) A 100 Basis Point Increase in Interest Rates Would Result in Approximately $45 Million to $120 Million Annual EBITDA Improvement $7.6 $19.0 $30.4 $41.8 $53.2 $64.6 $15.2 $38.0 $60.8 $83.6 $106.4 $129.2 $0 $30 $60 $90 $120 $150 10 bps 30 bps 50 bps 70 bps 90 bps 110 bps 4% Cash Sweep / AUA 8% Cash Sweep / AUA Fed Funds Effective Rate Sweep Income ($mm) (current rate)
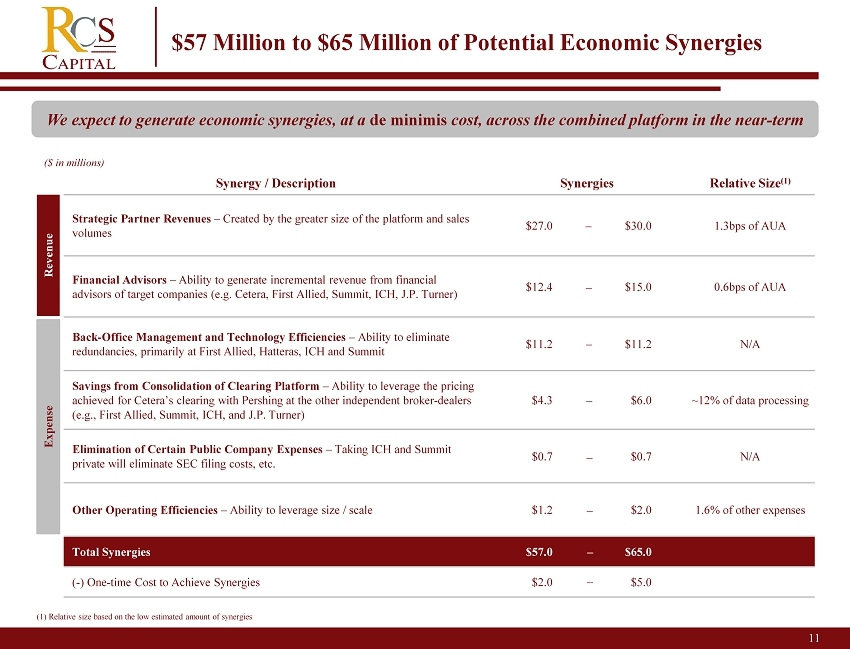
11 $57 Million to $65 Million of Potential Economic Synergies Synergy / Description Synergies Relative Size (1) Strategic Partner Revenues – Created by the greater size of the platform and sales volumes $27.0 $30.0 1.3bps of AUA Financial Advisors – Ability to generate incremental revenue from financial advisors of target companies (e.g. Cetera, First Allied, Summit, ICH, J.P. Turner) $12.4 $15.0 0.6bps of AUA Back - Office Management and Technology Efficiencies – Ability to eliminate redundancies, primarily at First Allied, Hatteras, ICH and Summit $11.2 $11.2 N/A Savings from Consolidation of Clearing Platform – Ability to leverage the pricing achieved for Cetera’s clearing with Pershing at the other independent broker - dealers (e.g., First Allied , Summit, ICH, and J.P. Turner) $4.3 $6.0 ~12% of data processing Elimination of Certain Public Company Expenses – Taking ICH and Summit private will eliminate SEC filing costs, etc. $0.7 $0.7 N/A Other Operating Efficiencies – Ability to leverage size / scale $1.2 $2.0 1.6% of other expenses Total Synergies $57.0 $65.0 ( - ) One - time C ost to Achieve Synergies $2.0 $5.0 Revenue Expense We expect to generate economic synergies, at a de minimis cost, across the combined platform in the near - term ($ in millions) (1) Relative size based on the low estimated amount of synergies – – – – – – – –

American Realty Capital Wholesale Distribution 12 2
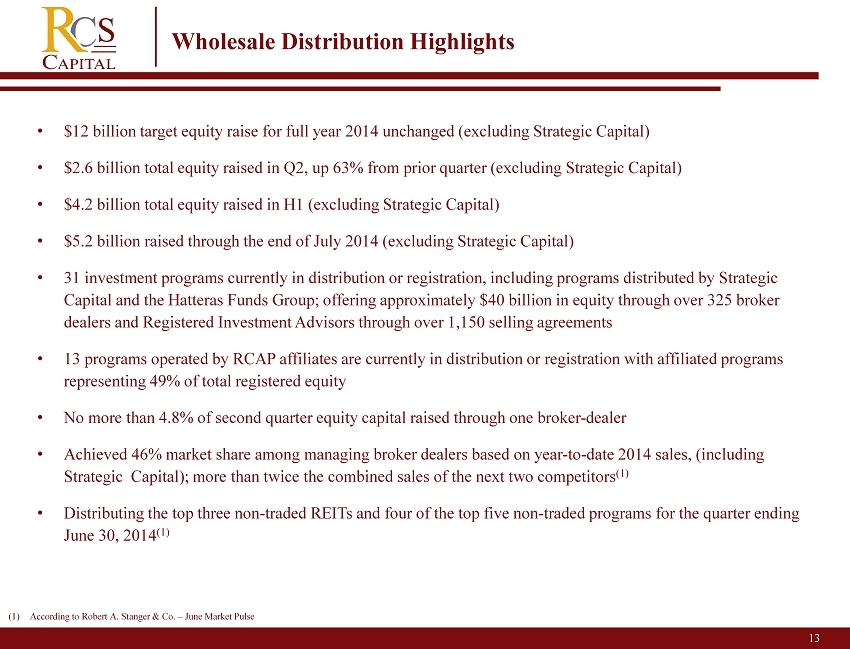
13 2 Wholesale Distribution Highlights • $12 billion target equity raise for full year 2014 unchanged (excluding Strategic Capital) • $2.6 billion total equity raised in Q2, up 63% from prior quarter (excluding Strategic Capital) • $4.2 billion total equity raised in H1 (excluding Strategic Capital) • $5.2 billion raised through the end of July 2014 (excluding Strategic Capital) • 31 investment programs currently in distribution or registration, including programs distributed by Strategic Capital and the Hatteras Funds Group; offering approximately $40 billion in equity through over 325 broker dealers and Registered Investment Advisors through over 1,150 selling agreements • 13 programs operated by RCAP affiliates are currently in distribution or registration with affiliated programs representing 49% of total registered equity • No more than 4.8% of second quarter equity capital raised through one broker - dealer • Achieved 46% market share among managing broker dealers based on year - to - date 2014 sales, (including Strategic Capital); more than twice the combined sales of the next two competitors (1) • Distributing the top three non - traded REITs and four of the top five non - traded programs for the quarter ending June 30, 2014 (1) (1) According to Robert A. Stanger & Co. – June Market Pulse
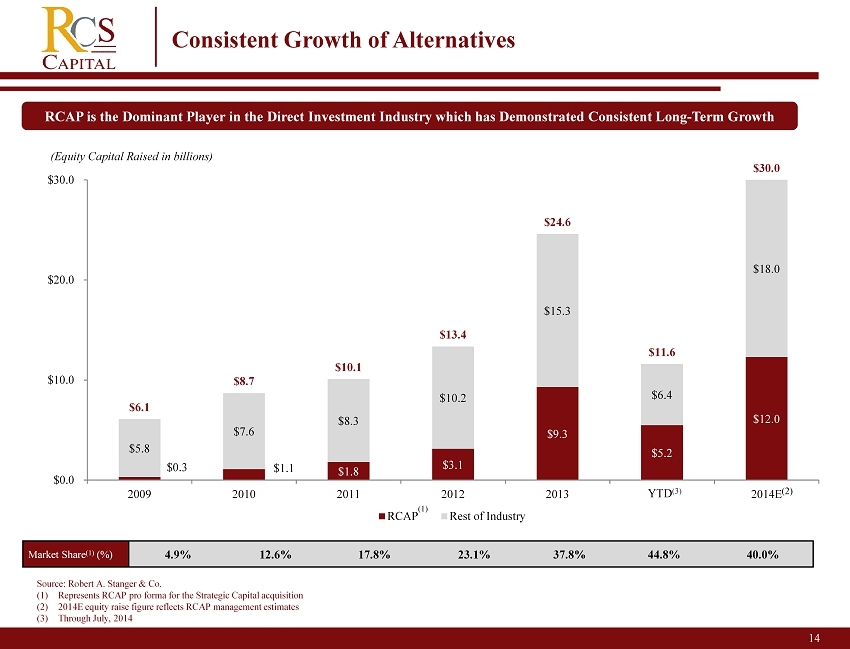
Source: Robert A. Stanger & Co. (1) Represents RCAP pro forma for the Strategic Capital acquisition (2) 2014E equity raise figure reflects RCAP management estimates (3) Through July, 2014 14 2 Consistent Growth of Alternatives RCAP is the Dominant Player in the Direct Investment Industry which has Demonstrated Consistent Long - Term Growth Market Share (1) (%) 4.9% 12.6% 17.8% 23.1% 37.8% 44.8% 40.0% (1) (2) $0.3 $1.1 $1.8 $3.1 $9.3 $ 5.2 $ 12.0 $5.8 $7.6 $8.3 $10.2 $15.3 $ 6.4 $ 18.0 $6.1 $8.7 $10.1 $13.4 $24.6 $11.6 $ 30.0 $0.0 $10.0 $20.0 $30.0 2009 2010 2011 2012 2013 2014 1H 2014E RCAP Rest of Industry (Equity Capital Raised in billions) YTD (3)
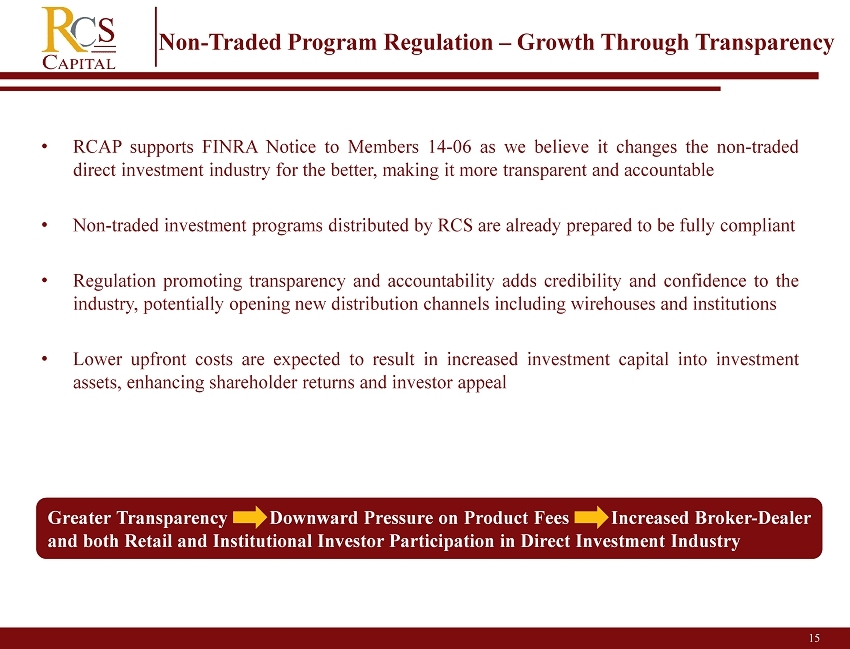
15 2 Non - Traded Program Regulation – Growth Through Transparency • RCAP supports FINRA Notice to Members 14 - 06 as we believe it changes the non - traded direct investment industry for the better, making it more transparent and accountable • Non - traded investment programs distributed by RCS are already prepared to be fully compliant • Regulation promoting transparency and accountability adds credibility and confidence to the industry, potentially opening new distribution channels including wirehouses and institutions • Lower upfront costs are expected to result in increased investment capital into investment assets, enhancing shareholder returns and investor appeal Greater T ransparency Downward Pressure on Product Fees Increased Broker - Dealer and both Retail and Institutional Investor Participation in Direct Investment Industry

American Realty Capital Investment Management 16 2
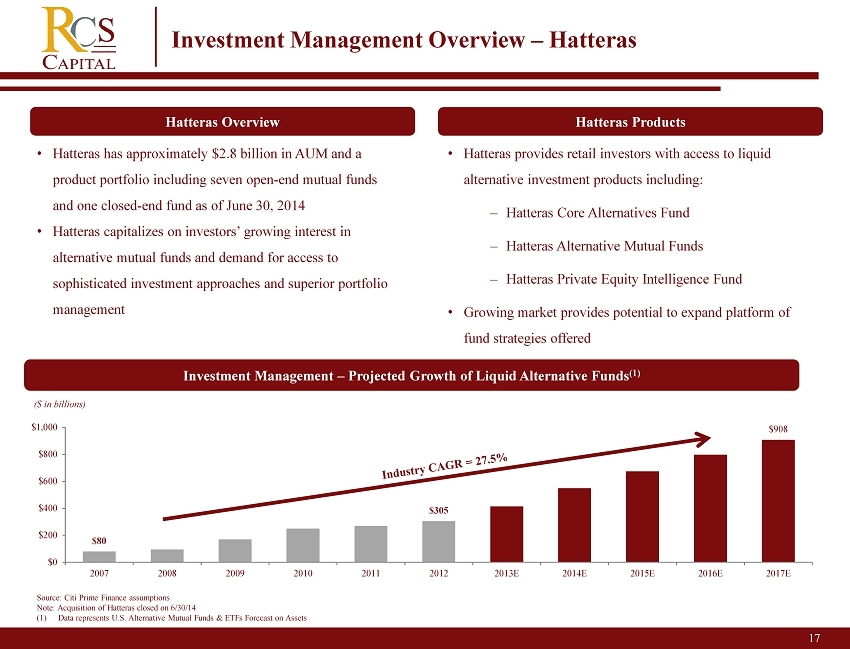
17 2 Investment Management Overview – Hatteras Hatteras Overview Hatteras Products • Hatteras has approximately $ 2.8 billion in AUM and a product portfolio including seven open - end mutual funds and one closed - end fund as of June 30, 2014 • Hatteras capitalizes on investors’ growing interest in alternative mutual funds and demand for access to sophisticated investment approaches and superior portfolio management Source: Citi Prime Finance assumptions Note: Acquisition of Hatteras closed on 6/30/14 (1) Data represents U.S. Alternative Mutual Funds & ETFs Forecast on Assets Investment Management – Projected Growth of Liquid Alternative Funds (1) 44% 2% $80 $305 $908 $0 $200 $400 $600 $800 $1,000 2007 2008 2009 2010 2011 2012 2013E 2014E 2015E 2016E 2017E ($ in billions) • Hatteras provides retail investors with access to liquid alternative investment products including: ‒ Hatteras Core Alternatives Fund ‒ Hatteras Alternative Mutual Funds ‒ Hatteras Private Equity Intelligence Fund • Growing market provides potential to expand platform of fund strategies offered
18 Combined Operating Results
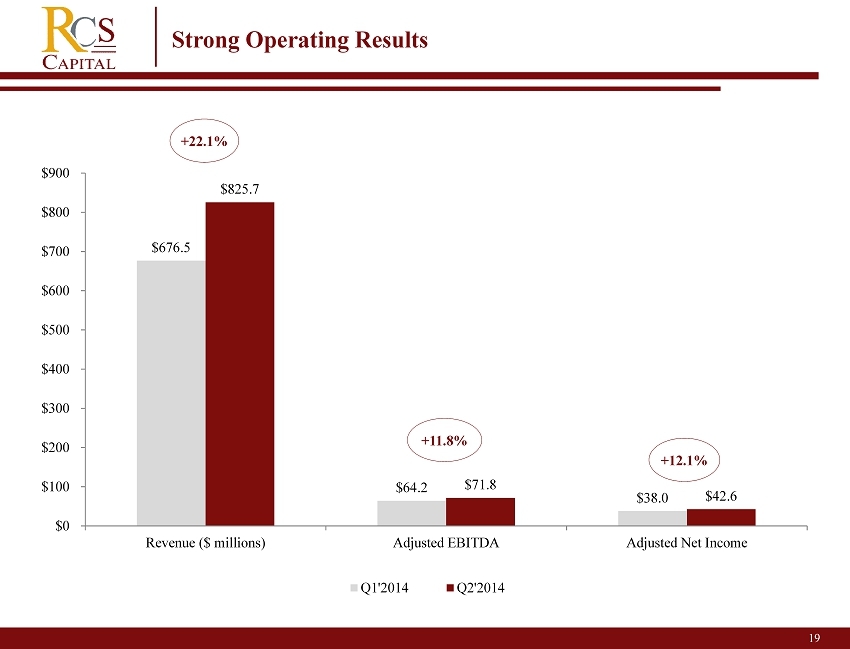
19 2 Strong Operating Results +22.1% +11.8% +12.1% $676.5 $64.2 $ 38.0 $825.7 $71.8 $42.6 $0 $100 $200 $300 $400 $500 $600 $700 $800 $900 Revenue ($ millions) Adjusted EBITDA Adjusted Net Income Q1'2014 Q2'2014
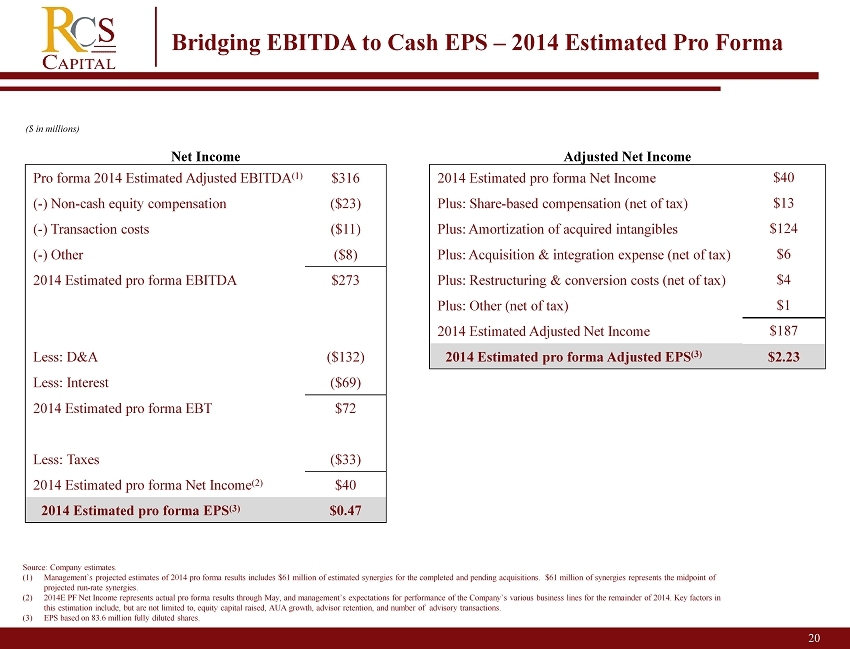
Color Scheme 0 31 97 114 49 177 90 175 30 61 69 82 64 165 217 0 90 130 20 Bridging EBITDA to Cash EPS – 2014 Estimated Pro Forma Source: Company estimates. (1) Management’s projected estimates of 2014 pro forma results includes $61 million of estimated synergies for the completed and pen ding acquisitions. $61 million of synergies represents the midpoint of projected run - rate synergies. (2) 2014E PF Net Income represents actual pro forma results through May, and management’s expectations for performance of the Com pan y’s various business lines for the remainder of 2014. Key factors in this estimation include, but are not limited to, equity capital raised, AUA growth, advisor retention, and number of advisor y t ransactions. (3) EPS based on 83.6 million fully diluted shares. ($ in m illions ) Net Income Adjusted Net Income Pro forma 2014 Estimated Adjusted EBITDA (1) $ 316 2014 Estimated pro forma Net Income $ 40 ( - ) Non - cash equity compensation ($23) Plus: Share - based compensation (net of tax) $ 13 ( - ) Transaction costs ($11) Plus: Amortization of acquired intangibles $124 ( - ) Other ($8) Plus: Acquisition & integration expense (net of tax) $6 2014 Estimated pro forma EBITDA $ 273 Plus: Restructuring & conversion costs (net of tax) $4 Plus: Other (net of tax) $1 2014 Estimated Adjusted Net Income $187 Less: D&A ($ 132) 2014 Estimated pro forma Adjusted EPS (3) $2.23 Less: Interest ($69) 2014 Estimated pro forma EBT $72 Less: Taxes ($33) 2014 Estimated pro forma Net Income (2) $ 40 2014 Estimated pro forma EPS (3) $ 0.47
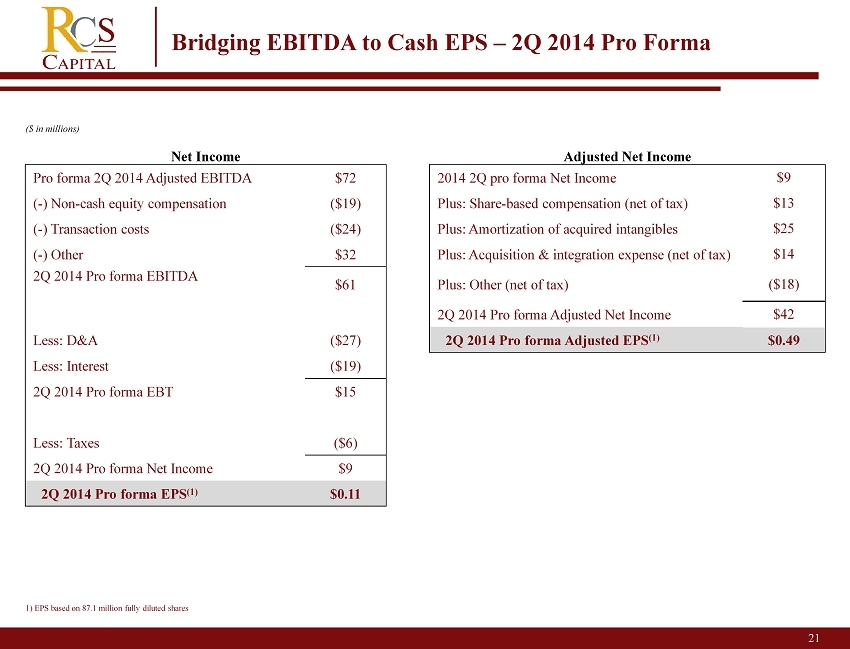
Color Scheme 0 31 97 114 49 177 90 175 30 61 69 82 64 165 217 0 90 130 21 Bridging EBITDA to Cash EPS – 2Q 2014 Pro Forma 1) EPS based on 87.1 million fully diluted shares ($ in m illions ) Net Income Adjusted Net Income Pro forma 2Q 2014 Adjusted EBITDA $72 2014 2Q p ro forma Net Income $9 ( - ) Non - cash equity compensation ($19) Plus: Share - based compensation (net of tax) $ 13 ( - ) Transaction costs ($24) Plus: Amortization of acquired intangibles $25 ( - ) Other $32 Plus: Acquisition & integration expense (net of tax) $14 2Q 2014 Pro forma EBITDA $61 Plus: Other (net of tax) ($18) 2Q 2014 Pro forma Adjusted Net Income $42 Less: D&A ($27) 2Q 2014 P ro forma Adjusted EPS (1) $0.49 Less: Interest ($19) 2Q 2014 Pro forma EBT $15 Less: Taxes ($6) 2Q 2014 Pro forma Net Income $9 2Q 2014 Pro forma EPS (1) $ 0.11

American Realty Capital Appendix 22 2
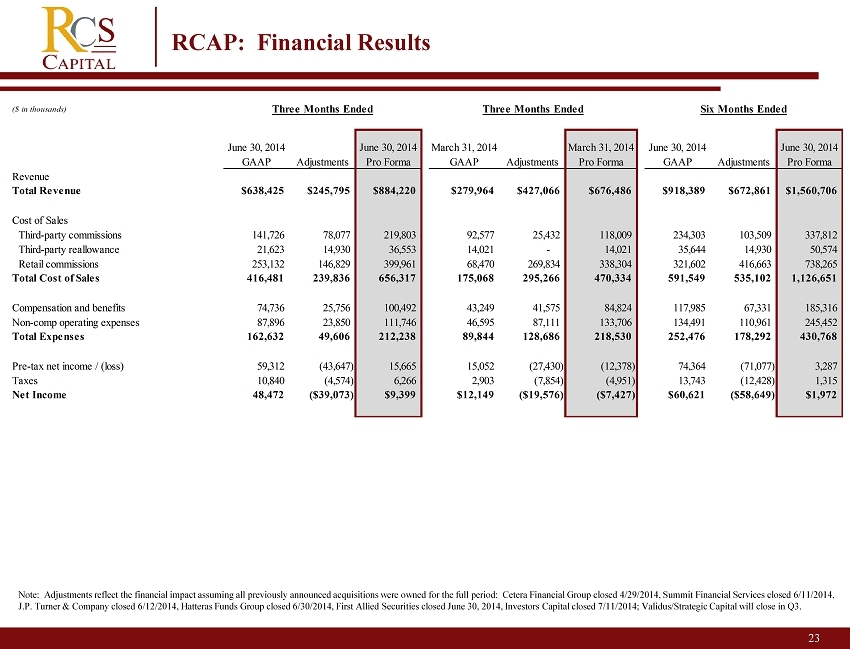
23 RCAP: Financial Results Note: Adjustments reflect the financial impact assuming all previously announced acquisitions were owned for the full period : Cetera Financial Group closed 4/29/2014, Summit Financial Services closed 6/11/2014, J.P. Turner & Company closed 6/12/2014, Hatteras Funds Group closed 6/30/2014, First Allied Securities closed June 30, 2014, Inv estors Capital closed 7/11/2014; Validus /Strategic Capital will close in Q3. ($ in thousands) June 30, 2014 GAAP Adjustments June 30, 2014 Pro Forma March 31, 2014 GAAP Adjustments March 31, 2014 Pro Forma June 30, 2014 GAAP Adjustments June 30, 2014 Pro Forma Revenue Total Revenue $638,425 $245,795 $884,220 $279,964 $427,066 $676,486 $918,389 $672,861 $1,560,706 Cost of Sales Third-party commissions 141,726 78,077 219,803 92,577 25,432 118,009 234,303 103,509 337,812 Third-party reallowance 21,623 14,930 36,553 14,021 - 14,021 35,644 14,930 50,574 Retail commissions 253,132 146,829 399,961 68,470 269,834 338,304 321,602 416,663 738,265 Total Cost of Sales 416,481 239,836 656,317 175,068 295,266 470,334 591,549 535,102 1,126,651 Compensation and benefits 74,736 25,756 100,492 43,249 41,575 84,824 117,985 67,331 185,316 Non-comp operating expenses 87,896 23,850 111,746 46,595 87,111 133,706 134,491 110,961 245,452 Total Expenses 162,632 49,606 212,238 89,844 128,686 218,530 252,476 178,292 430,768 Pre-tax net income / (loss) 59,312 (43,647) 15,665 15,052 (27,430) (12,378) 74,364 (71,077) 3,287 Taxes 10,840 (4,574) 6,266 2,903 (7,854) (4,951) 13,743 (12,428) 1,315 Net Income 48,472 ($39,073) $9,399 $12,149 ($19,576) ($7,427) $60,621 ($58,649) $1,972 Three Months Ended Three Months Ended Six Months Ended
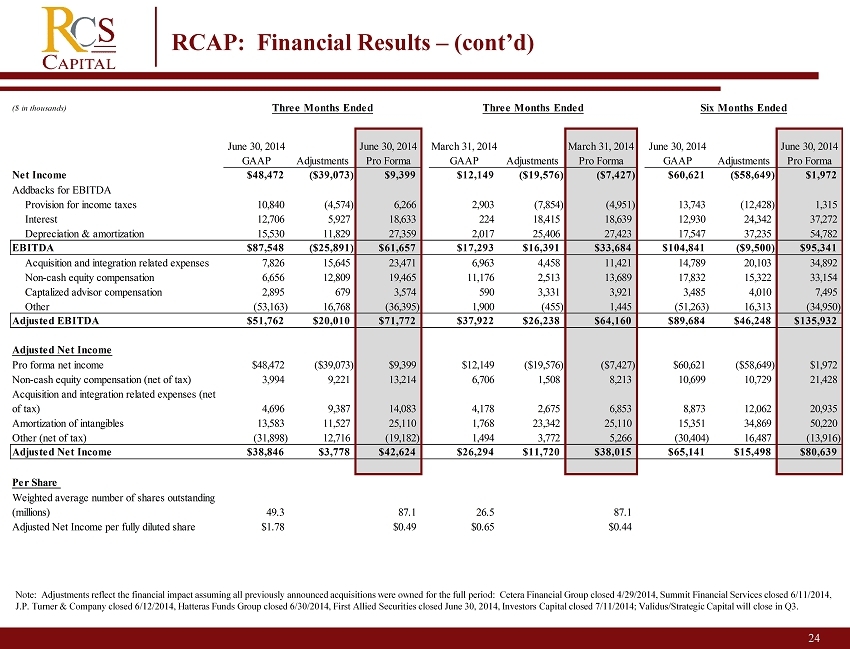
24 RCAP: Financial Results – (cont’d) Note: Adjustments reflect the financial impact assuming all previously announced acquisitions were owned for the full period : Cetera Financial Group closed 4/29/2014, Summit Financial Services closed 6/11/2014, J.P. Turner & Company closed 6/12/2014, Hatteras Funds Group closed 6/30/2014, First Allied Securities closed June 30, 2014, Inv estors Capital closed 7/11/2014; Validus /Strategic Capital will close in Q3. ($ in thousands) June 30, 2014 GAAP Adjustments June 30, 2014 Pro Forma March 31, 2014 GAAP Adjustments March 31, 2014 Pro Forma June 30, 2014 GAAP Adjustments June 30, 2014 Pro Forma Net Income $48,472 ($39,073) $9,399 $12,149 ($19,576) ($7,427) $60,621 ($58,649) $1,972 Addbacks for EBITDA Provision for income taxes 10,840 (4,574) 6,266 2,903 (7,854) (4,951) 13,743 (12,428) 1,315 Interest 12,706 5,927 18,633 224 18,415 18,639 12,930 24,342 37,272 Depreciation & amortization 15,530 11,829 27,359 2,017 25,406 27,423 17,547 37,235 54,782 EBITDA $87,548 ($25,891) $61,657 $17,293 $16,391 $33,684 $104,841 ($9,500) $95,341 Acquisition and integration related expenses 7,826 15,645 23,471 6,963 4,458 11,421 14,789 20,103 34,892 Non-cash equity compensation 6,656 12,809 19,465 11,176 2,513 13,689 17,832 15,322 33,154 Captalized advisor compensation 2,895 679 3,574 590 3,331 3,921 3,485 4,010 7,495 Other (53,163) 16,768 (36,395) 1,900 (455) 1,445 (51,263) 16,313 (34,950) Adjusted EBITDA $51,762 $20,010 $71,772 $37,922 $26,238 $64,160 $89,684 $46,248 $135,932 Adjusted Net Income Pro forma net income $48,472 ($39,073) $9,399 $12,149 ($19,576) ($7,427) $60,621 ($58,649) $1,972 Non-cash equity compensation (net of tax) 3,994 9,221 13,214 6,706 1,508 8,213 10,699 10,729 21,428 Acquisition and integration related expenses (net of tax) 4,696 9,387 14,083 4,178 2,675 6,853 8,873 12,062 20,935 Amortization of intangibles 13,583 11,527 25,110 1,768 23,342 25,110 15,351 34,869 50,220 Other (net of tax) (31,898) 12,716 (19,182) 1,494 3,772 5,266 (30,404) 16,487 (13,916) Adjusted Net Income $38,846 $3,778 $42,624 $26,294 $11,720 $38,015 $65,141 $15,498 $80,639 Per Share Weighted average number of shares outstanding (millions) 49.3 87.1 26.5 87.1 Adjusted Net Income per fully diluted share $1.78 $0.49 $0.65 $0.44 Three Months Ended Three Months Ended Six Months Ended
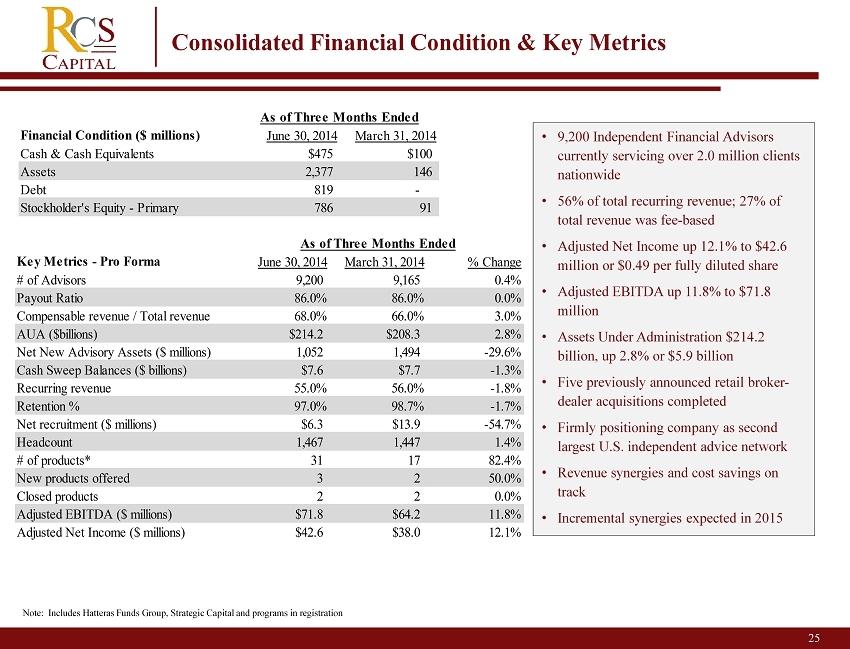
25 Consolidated Financial Condition & Key Metrics • 9,200 Independent Financial Advisors currently servicing over 2.0 million clients nationwide • 56% of total recurring revenue; 27% of total revenue was fee - based • Adjusted Net Income up 12.1% to $ 42.6 million or $ 0.49 per fully diluted share • Adjusted EBITDA up 11.8 % to $ 71.8 million • Assets Under Administration $214.2 billion, up 2.8% or $5.9 billion • F ive previously announced retail broker - dealer acquisitions completed • Firmly positioning company as second largest U.S. independent advice network • Revenue synergies and cost savings on track • Incremental synergies expected in 2015 Note: Includes Hatteras Funds Group, Strategic Capital and programs in registration Key Metrics - Pro Forma June 30, 2014 March 31, 2014 % Change # of Advisors 9,200 9,165 0.4% Payout Ratio 86.0% 86.0% 0.0% Compensable revenue / Total revenue 68.0% 66.0% 3.0% AUA ($billions) $214.2 $208.3 2.8% Net New Advisory Assets ($ millions) 1,052 1,494 -29.6% Cash Sweep Balances ($ billions) $7.6 $7.7 -1.3% Recurring revenue 55.0% 56.0% -1.8% Retention % 97.0% 98.7% -1.7% Net recruitment ($ millions) $6.3 $13.9 -54.7% Headcount 1,467 1,447 1.4% # of products* 31 17 82.4% New products offered 3 2 50.0% Closed products 2 2 0.0% Adjusted EBITDA ($ millions) $71.8 $64.2 11.8% Adjusted Net Income ($ millions) $42.6 $38.0 12.1% As of Three Months Ended Financial Condition ($ millions) June 30, 2014 March 31, 2014 Cash & Cash Equivalents $475 $100 Assets 2,377 146 Debt 819 - Stockholder's Equity - Primary 786 91 As of Three Months Ended
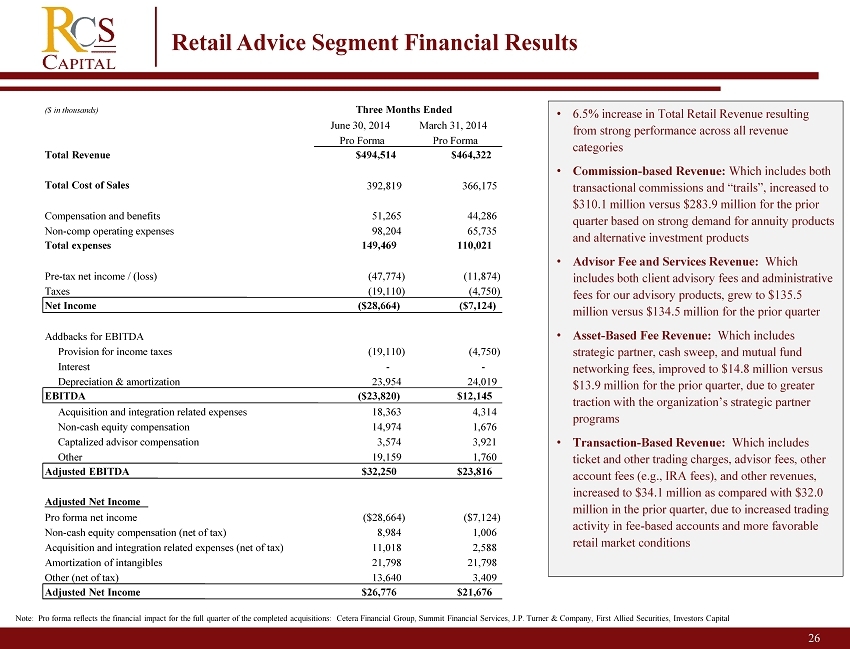
26 Retail Advice Segment Financial Results • 6.5% increase in Total Retail Revenue resulting from strong performance across all revenue categories • Commission - based Revenue: Which includes both transactional commissions and “trails”, increased to $ 310.1 million versus $ 283.9 million for the prior quarter based on strong demand for annuity products and alternative investment products • Advisor Fee and Services Revenue: Which includes both client advisory fees and administrative fees for our advisory products, grew to $ 135.5 million versus $ 134.5 million for the prior quarter • Asset - Based Fee Revenue: Which includes strategic partner, cash sweep, and mutual fund networking fees, improved to $ 14.8 million versus $ 13.9 million for the prior quarter, due to greater traction with the organization’s strategic partner programs • Transaction - Based Revenue: Which includes ticket and other trading charges, advisor fees, other account fees (e.g., IRA fees), and other revenues, increased to $ 34.1 million as compared with $ 32.0 million in the prior quarter, due to increased trading activity in fee - based accounts and more favorable retail market conditions Note: Pro forma reflects the financial impact for the full quarter of the completed acquisitions: Cetera Financial Group, S umm it Financial Services, J.P. Turner & Company, First Allied Securities, Investors Capital ($ in thousands) June 30, 2014 Pro Forma March 31, 2014 Pro Forma Total Revenue $494,514 $464,322 Total Cost of Sales 392,819 366,175 Compensation and benefits 51,265 44,286 Non - comp operating expenses 98,204 65,735 Total expenses 149,469 110,021 Pre - tax net income / (loss) (47,774) (11,874) Taxes (19,110) (4,750) Net Income ($28,664) ($7,124) Addbacks for EBITDA Provision for income taxes (19,110) (4,750) Interest - - Depreciation & amortization 23,954 24,019 EBITDA ($23,820) $12,145 Acquisition and integration related expenses 18,363 4,314 Non - cash equity compensation 14,974 1,676 Captalized advisor compensation 3,574 3,921 Other 19,159 1,760 Adjusted EBITDA $32,250 $23,816 Adjusted Net Income Pro forma net income ($28,664) ($7,124) Non - cash equity compensation (net of tax) 8,984 1,006 Acquisition and integration related expenses (net of tax) 11,018 2,588 Amortization of intangibles 21,798 21,798 Other (net of tax) 13,640 3,409 Adjusted Net Income $26,776 $21,676 Three Months Ended
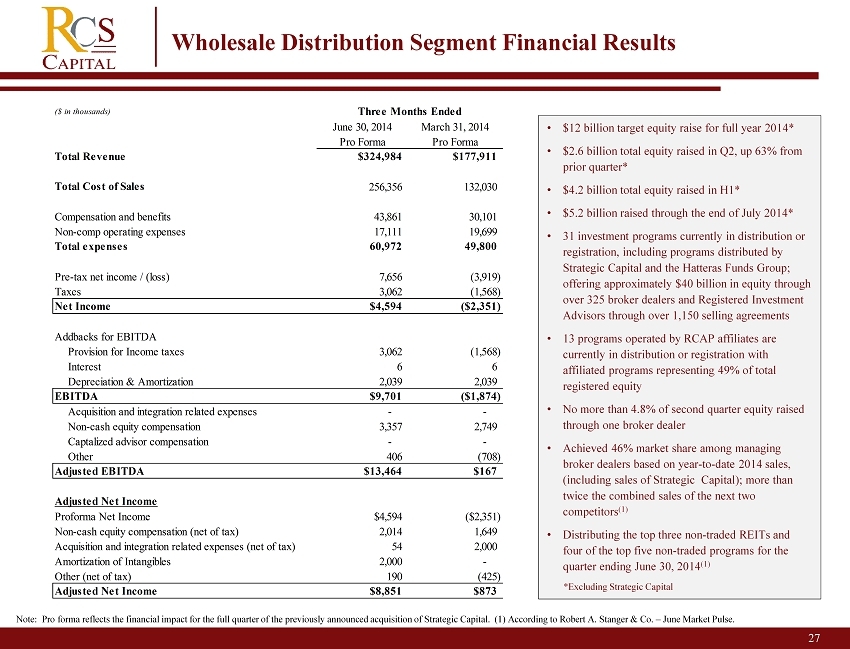
27 Wholesale Distribution Segment Financial Results • $ 12 billion target equity raise for full year 2014* • $ 2.6 billion total equity raised in Q2, up 63% from prior quarter* • $ 4.2 billion total equity raised in H1* • $5.2 billion raised through the end of July 2014* • 31 investment programs currently in distribution or registration, including programs distributed by Strategic Capital and the Hatteras Funds Group; offering approximately $40 billion in equity through over 325 broker dealers and Registered Investment Advisors through over 1,150 selling agreements • 13 programs operated by RCAP affiliates are currently in distribution or registration with affiliated programs representing 49% of total registered equity • No more than 4.8% of second quarter equity raised through one broker dealer • Achieved 46% market share among managing broker dealers based on year - to - date 2014 sales, (including sales of Strategic Capital); more than twice the combined sales of the next two competitors (1) • Distributing the top three non - traded REITs and four of the top five non - traded programs for the quarter ending June 30, 2014 (1) Note: Pro forma reflects the financial impact for the full quarter of the previously announced acquisition of Strategic Capital. (1) According to Robert A. Stanger & Co. – June Market Pulse. *Excluding Strategic Capital ($ in thousands) June 30, 2014 Pro Forma March 31, 2014 Pro Forma Total Revenue $324,984 $177,911 Total Cost of Sales 256,356 132,030 Compensation and benefits 43,861 30,101 Non-comp operating expenses 17,111 19,699 Total expenses 60,972 49,800 Pre-tax net income / (loss) 7,656 (3,919) Taxes 3,062 (1,568) Net Income $4,594 ($2,351) Addbacks for EBITDA Provision for Income taxes 3,062 (1,568) Interest 6 6 Depreciation & Amortization 2,039 2,039 EBITDA $9,701 ($1,874) Acquisition and integration related expenses - - Non-cash equity compensation 3,357 2,749 Captalized advisor compensation - - Other 406 (708) Adjusted EBITDA $13,464 $167 Adjusted Net Income Proforma Net Income $4,594 ($2,351) Non-cash equity compensation (net of tax) 2,014 1,649 Acquisition and integration related expenses (net of tax) 54 2,000 Amortization of Intangibles 2,000 - Other (net of tax) 190 (425) Adjusted Net Income $8,851 $873 Three Months Ended
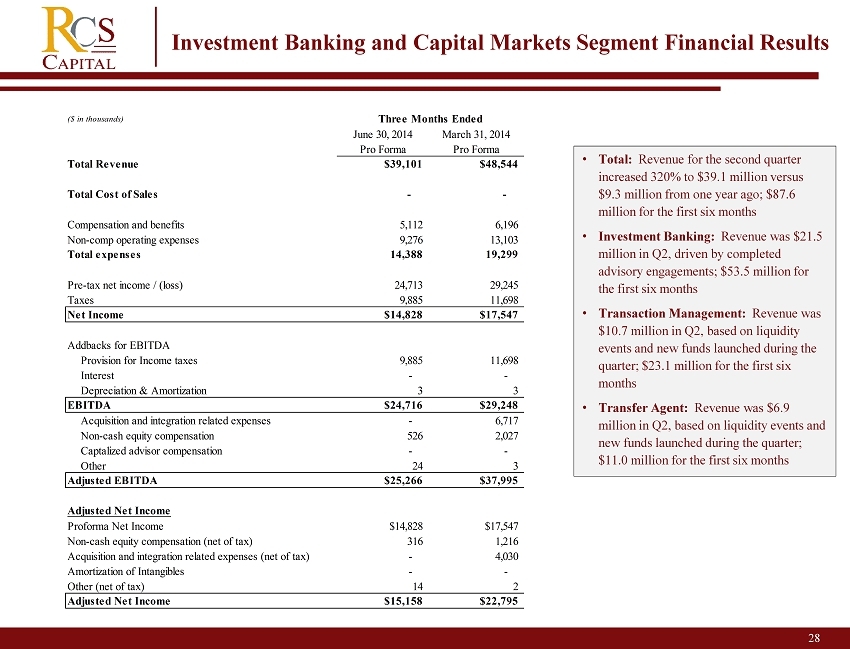
28 Investment Banking and Capital Markets Segment Financial Results • Total: Revenue for the second quarter increased 320% to $ 39.1 million versus $9.3 million from one year ago; $87.6 million for the first six months • Investment Banking: Revenue was $21.5 million in Q2, driven by completed advisory engagements; $53.5 million for the first six months • Transaction Management: Revenue was $10.7 million in Q2, based on liquidity events and new funds launched during the quarter; $23.1 million for the first six months • Transfer Agent: Revenue was $6.9 million in Q2, based on liquidity events and new funds launched during the quarter; $11.0 million for the first six months ($ in thousands) June 30, 2014 Pro Forma March 31, 2014 Pro Forma Total Revenue $39,101 $48,544 Total Cost of Sales - - Compensation and benefits 5,112 6,196 Non-comp operating expenses 9,276 13,103 Total expenses 14,388 19,299 Pre-tax net income / (loss) 24,713 29,245 Taxes 9,885 11,698 Net Income $14,828 $17,547 Addbacks for EBITDA Provision for Income taxes 9,885 11,698 Interest - - Depreciation & Amortization 3 3 EBITDA $24,716 $29,248 Acquisition and integration related expenses - 6,717 Non-cash equity compensation 526 2,027 Captalized advisor compensation - - Other 24 3 Adjusted EBITDA $25,266 $37,995 Adjusted Net Income Proforma Net Income $14,828 $17,547 Non-cash equity compensation (net of tax) 316 1,216 Acquisition and integration related expenses (net of tax) - 4,030 Amortization of Intangibles - - Other (net of tax) 14 2 Adjusted Net Income $15,158 $22,795 Three Months Ended
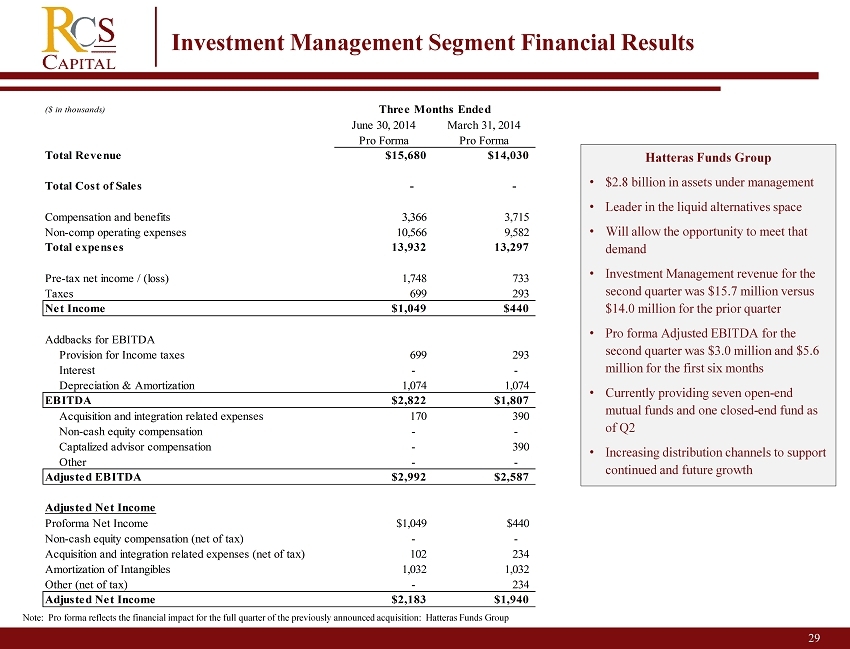
29 Investment Management Segment Financial Results Hatteras Funds Group • $2.8 billion in assets under management • Leader in the liquid alternatives space • Will allow the opportunity to meet that demand • Investment Management revenue for the second quarter was $15.7 million versus $14.0 million for the prior quarter • Pro forma Adjusted EBITDA for the second quarter was $3.0 million and $5.6 million for the first six months • Currently providing seven open - end mutual funds and one closed - end fund as of Q2 • Increasing distribution channels to support continued and future growth Note: Pro forma reflects the financial impact for the full quarter of the previously announced acquisition: Hatteras Funds Gro up ($ in thousands) June 30, 2014 Pro Forma March 31, 2014 Pro Forma Total Revenue $15,680 $14,030 Total Cost of Sales - - Compensation and benefits 3,366 3,715 Non-comp operating expenses 10,566 9,582 Total expenses 13,932 13,297 Pre-tax net income / (loss) 1,748 733 Taxes 699 293 Net Income $1,049 $440 Addbacks for EBITDA Provision for Income taxes 699 293 Interest - - Depreciation & Amortization 1,074 1,074 EBITDA $2,822 $1,807 Acquisition and integration related expenses 170 390 Non-cash equity compensation - - Captalized advisor compensation - 390 Other - - Adjusted EBITDA $2,992 $2,587 Adjusted Net Income Proforma Net Income $1,049 $440 Non-cash equity compensation (net of tax) - - Acquisition and integration related expenses (net of tax) 102 234 Amortization of Intangibles 1,032 1,032 Other (net of tax) - 234 Adjusted Net Income $2,183 $1,940 Three Months Ended
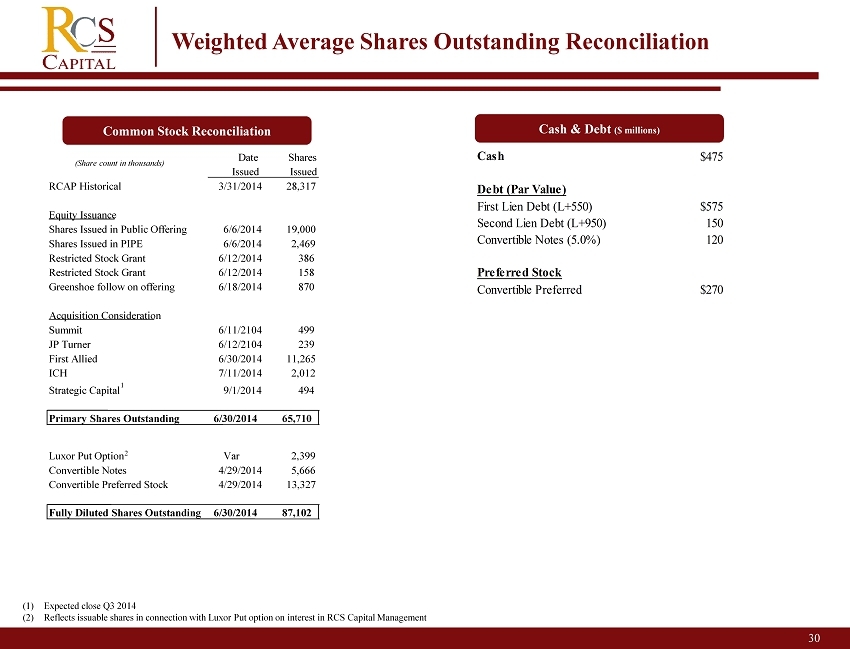
30 Weighted Average Shares Outstanding Reconciliation (1) Expected close Q3 2014 (2) Reflects issuable shares in connection with Luxor Put option on interest in RCS Capital Management Common Stock Reconciliation (Share count in thousands) Cash & Debt ($ millions) Date Issued Shares Issued RCAP Historical 3/31/2014 28,317 Equity Issuance Shares Issued in Public Offering 6/6/2014 19,000 Shares Issued in PIPE 6/6/2014 2,469 Restricted Stock Grant 6/12/2014 386 Restricted Stock Grant 6/12/2014 158 Greenshoe follow on offering 6/18/2014 870 Acquisition Consideration Summit 6/11/2104 499 JP Turner 6/12/2104 239 First Allied 6/30/2014 11,265 ICH 7/11/2014 2,012 Strategic Capital 1 9/1/2014 494 Primary Shares Outstanding 6/30/2014 65,710 Luxor Put Option Var 2,399 Convertible Notes 4/29/2014 5,666 Convertible Preferred Stock 4/29/2014 13,327 Fully Diluted Shares Outstanding 6/30/2014 87,102 2 Cash $475 Debt (Par Value) First Lien Debt (L+550) $575 Second Lien Debt (L+950) 150 Convertible Notes (5.0%) 120 Preferred Stock Convertible Preferred $270
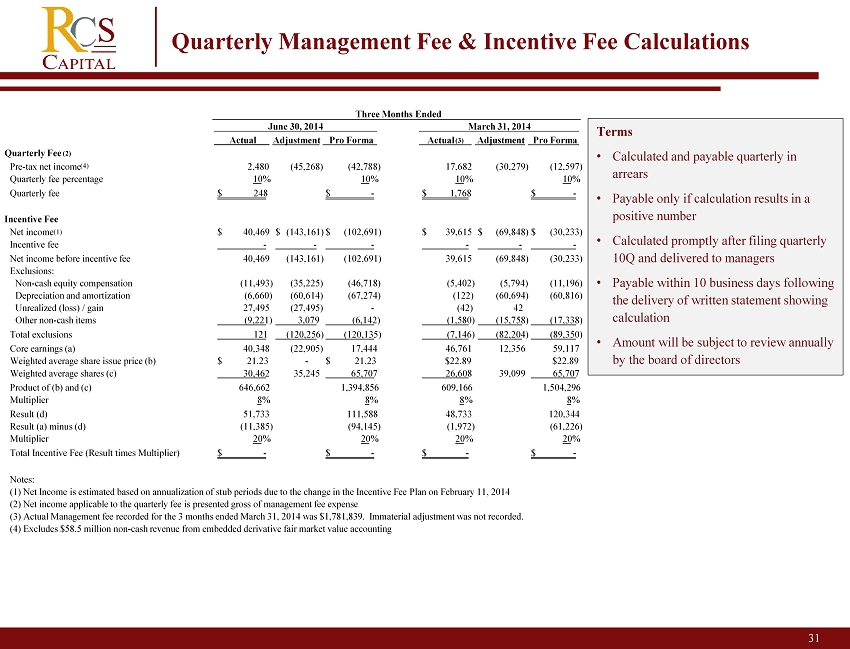
31 Quarterly Management Fee & Incentive Fee Calculations Terms • Calculated and payable quarterly in arrears • Payable only if calculation results in a positive number • Calculated promptly after filing quarterly 10Q and delivered to managers • Payable within 10 business days following the delivery of written statement showing calculation • Amount will be subject to review annually by the board of directors Actual Adjustment Pro Forma Actual (3) Adjustment Pro Forma Quarterly Fee (2) Pre - tax net income (4) 2,480 (45,268) (42,788) 17,682 (30,279) (12,597) Quarterly fee percentage 10% 10% 10% 10% Quarterly fee 248 $ - $ 1,768 $ - $ Incentive Fee Net income (1) 40,469 $ (143,161) $ (102,691) $ 39,615 $ (69,848) $ (30,233) $ Incentive fee - - - - - - Net income before incentive fee 40,469 (143,161) (102,691) 39,615 (69,848) (30,233) Exclusions: Non - cash equity compensation (11,493) (35,225) (46,718) (5,402) (5,794) (11,196) Depreciation and amortization (6,660) (60,614) (67,274) (122) (60,694) (60,816) Unrealized (loss) / gain 27,495 (27,495) - (42) 42 Other non - cash items (9,221) 3,079 (6,142) (1,580) (15,758) (17,338) Total exclusions 121 (120,256) (120,135) (7,146) (82,204) (89,350) Core earnings (a) 40,348 (22,905) 17,444 46,761 12,356 59,117 Weighted average share issue price (b) 21.23 $ - 21.23 $ $22.89 $22.89 Weighted average shares © 30,462 35,245 65,707 26,608 39,099 65,707 Product of (b) and © 646,662 1,394,856 609,166 1,504,296 Multiplier 8% 8% 8% 8% Result (d) 51,733 111,588 48,733 120,344 Result (a) minus (d) (11,385) (94,145) (1,972) (61,226) Multiplier 20% 20% 20% 20% Total Incentive Fee (Result times Multiplier) - $ - $ - $ - $ Notes: (1) Net Income is estimated based on annualization of stub periods due to the change in the Incentive Fee Plan on February 11 , 2 014 (2) Net income applicable to the quarterly fee is presented gross of management fee expense (3) Actual Management fee recorded for the
3 months ended March 31, 2014 was $1,781,839. Immaterial adjustment was not recor ded . (4) Excludes $58.5 million non - cash revenue from embedded derivative fair market value accounting Three Months Ended June 30, 2014 March 31, 2014
32 2 Forward - Looking Statements Certain statements made in this presentation are forward - looking statements . Those statements include statements regarding the intent, belief or current expectations of RCS Capital Corporation (“us,” “our,” “RCAP ” or the “Company”) and members of its management team, as well as the assumptions on which such statements are based, and generally are identified by the use of words such as “may,” “will,” “seeks,” “anticipates,” “believes,” “estimates,” “expects,” “plans,” “intends,” “should” or similar expressions . Actual results may differ materially from those contemplated by such forward - looking statements . Further, forward - looking statements speak only as of the date they are made, and we undertake no obligation to update or revise forward - looking statements to reflect changed assumptions, the occurrence of unanticipated events or changes to future operating results over time, unless required by law . The following are some of the possible risks and uncertainties, although not all risks and uncertainties, that could cause our actual results to differ materially from those presented in our forward - looking statements : our ability to integrate our recently acquired businesses into our existing businesses ; our ability to complete our pending acquisitions on the anticipated terms, in the anticipated timeframes or at all ; whether and when we will be able to realize the anticipated benefits from our recent and pending acquisitions ; significant dilution could result from future issuances of our Class A common stock ; future sales of our Class A common stock could lower the market price of our Class A common stock ; adverse developments in the direct investment program industry ; deterioration in the business environment in the specific sectors of the economy in which we focus or a decline in the market for securities of companies within these sectors ; substantial fluctuations in our financial results ; our ability to retain our senior professionals and key management personnel of our recently acquired businesses ; pricing and other competitive pressures ; changes in laws and regulations and industry practices that adversely affect our business ; incurrence of losses in the future ; competition from larger firms ; limitations on our access to capital ; malfunctioning or failure in our operations and infrastructure ; failure to achieve and maintain effective internal controls ; and the factors included in our most recent Annual Report on Form 10 - K and any subsequent Quarterly Reports on Form 10 - Q or Current Reports on Form 8 - K .

33 2 Disclaimer This presentation includes estimated projections of 2014 operating results . These projections were not prepared in accordance with published guidelines of the SEC or the guidelines established by the American Institute of Certified Public Accountants for preparation and presentation of financial projections . This information is not fact and should not be relied upon as being necessarily indicative of future results ; the projections were prepared in good faith by management and are based on numerous assumptions that may prove to be wrong . Important factors that may affect actual results and cause the projections to not be achieved include, but are not limited to, risks and uncertainties relating to the company and other factors described under “Risk Factors” section of the Company’s Annual Report on Form 10 - K and any subsequent Quarterly Reports on Form 10 - Q or Current Reports on Form 8 - K and “Forward - Looking Statements . ” The projections also reflect assumptions as to certain business decisions that are subject to change . As a result, actual results may differ materially from those contained in the estimates . Accordingly, there can be no assurance that the estimates will be realized . This presentation also contains estimates and information concerning our industry, including market position, market size, and growth rates of the markets in which we participate, that are based on industry publications and reports . This information involves a number of assumptions and limitations, and you are cautioned not to give undue weight to these estimates . We have not independently verified the accuracy or completeness of the data contained in these industry publications and reports . The industry in which we operate is subject to a high degree of uncertainty and risk due to variety of factors, including those described in the “Risk Factors” section of the Company’s Annual Report on Form 10 - K and any subsequent Quarterly Reports on Form 10 - Q or Current Reports on Form 8 - K . These and other factors could cause results to differ materially from those expressed in these publications and reports .
34 2 Non - GAAP Measure Disclosure We use earnings before interest, taxes, depreciation and amortization, or EBITDA, adjusted EBITDA and adjusted net income, which are non - GAAP measures, as supplemental measures of our performance that are not required by, or presented in accordance with GAAP. None of the non - GAAP measures should be considered as an alternative to any other performance measure derived in accordance with GAAP. We use EBITDA, adjusted EBITDA and adjusted net income as an integral part of our report and planning processes and as one of the primary measures to, among other things: our ability to integrate the acquired businesses into our existing businesses; • monitor and evaluate the performance of our business operations; • facilitate management’s internal comparisons of the historical operating performance of our business operations; • facilitate management’s external comparisons of the results of our overall business to the historical operating performance o f o ther companies that may have different capital structures and debt levels; • analyze and evaluate financial and strategic planning decisions regarding future operating investments; • provide useful information to investors regarding financial and business trends related to our results of operations; and • plan for and prepare future annual operating budgets and determine appropriate levels of operating investments. We define EBITDA as earnings before non - controlling interest, interest, taxes, depreciation and amortization. We define adjusted EBITDA as earnings before non - controlling interest, interest, taxes, depreciation and amortization, adjusted to exclude equity - based compensation, acquisition - related ex penses, amortization of capitalized advisor costs and other items. We define adjusted net income as net income attributable to the Company (using a 40% tax rate to illustrate the tax impact for comparative purposes) and adjusted to exclude acquisition related expenses and equity - based compensation and other items . We believe similarly titled measures are frequently used by securities analysts, investors and other interested parties in the evaluation of companies in our industry, many of which present EBITDA, adjusted EBITDA, adjusted net income and other similar metrics when reporting their financial results. Our presentation of EBITDA, adjusted EBITDA and adjusted net income should not be construed to imply that our future results will be unaffected by unusual or nonrecurring items. The non - GAAP measures have limitations as analytical tools, and you should not consider any of these measures in isolation or as a s ubstitute for analyses of our income or cash flows as reported under GAAP. Some of these limitations are: • they do not reflect our cash expenditures, or future requirements for capital expenditures, or contractual commitments; • they do not reflect changes in, or cash requirements for, our working capital needs; • they do not reflect the significant interest expense, or the cash requirements necessary to service interest or principal payments , o n our debt; and • depreciation and amortization are non - cash expense items that are reflected in our statements of cash flows. In addition, other companies in our industry may calculate these measures differently than we do, limiting their usefulness a s a comparative measure. We compensate for these limitations by relying primarily on our GAAP results and using the non - GAAP measures only for supplemental purposes. Please see our financial statements and the related notes thereto.