Exhibit 99.2

American Realty Capital 1 October 1, 2014 RCS Capital to Acquire Cole Capital
2 2 Forward - Looking Statements Certain statements made in this presentation are forward - looking statements . Those statements include statements regarding the intent, belief or current expectations of RCS Capital Corporation (“us,” “our,” “RCAP ” or the “Company”) and members of its management team, as well as the assumptions on which such statements are based, and generally are identified by the use of words such as “may,” “will,” “seeks,” “anticipates,” “believes,” “estimates,” “expects,” “plans,” “intends,” “should” or similar expressions . Actual results may differ materially from those contemplated by such forward - looking statements . Further, forward - looking statements speak only as of the date they are made, and we undertake no obligation to update or revise forward - looking statements to reflect changed assumptions, the occurrence of unanticipated events or changes to future operating results over time, unless required by law . The following are some of the possible risks and uncertainties, although not all risks and uncertainties, that could cause our actual results to differ materially from those presented in our forward - looking statements : our ability to integrate our recently acquired businesses into our existing businesses ; our ability to complete our pending acquisitions on the anticipated terms, in the anticipated timeframes or at all ; whether and when we will be able to realize the anticipated benefits from our recent and pending acquisitions ; significant dilution could result from future issuances of our Class A common stock ; future sales of our Class A common stock could lower the market price of our Class A common stock ; adverse developments in the direct investment program industry ; deterioration in the business environment in the specific sectors of the economy in which we focus or a decline in the market for securities of companies within these sectors ; substantial fluctuations in our financial results ; our ability to retain our senior professionals and key management personnel of our recently acquired businesses ; pricing and other competitive pressures ; changes in laws and regulations and industry practices that adversely affect our business ; incurrence of losses in the future ; competition from larger firms ; limitations on our access to capital ; malfunctioning or failure in our operations and infrastructure ; failure to achieve and maintain effective internal controls ; and the factors included in our most recent Annual Report on Form 10 - K and any subsequent Quarterly Reports on Form 10 - Q or Current Reports on Form 8 - K .
3 2 Disclaimer This presentation includes estimated projections of 2014 , 2015 and 2016 operating results . These projections were not prepared in accordance with published guidelines of the SEC or the guidelines established by the American Institute of Certified Public Accountants for preparation and presentation of financial projections . This information is not fact and should not be relied upon as being necessarily indicative of future results ; the projections were prepared in good faith by management and are based on numerous assumptions that may prove to be wrong . Important factors that may affect actual results and cause the projections to not be achieved include, but are not limited to, risks and uncertainties relating to the company and other factors described under “Risk Factors” section of the Company’s Annual Report on Form 10 - K and any subsequent Quarterly Reports on Form 10 - Q or Current Reports on Form 8 - K and “Forward - Looking Statements . ” The projections also reflect assumptions as to certain business decisions that are subject to change . As a result, actual results may differ materially from those contained in the estimates . Accordingly, there can be no assurance that the estimates will be realized . This presentation also contains estimates and information concerning our industry, including market position, market size, and growth rates of the markets in which we participate, that are based on industry publications and reports . This information involves a number of assumptions and limitations, and you are cautioned not to give undue weight to these estimates . We have not independently verified the accuracy or completeness of the data contained in these industry publications and reports . The industry in which we operate is subject to a high degree of uncertainty and risk due to variety of factors, including those described in the “Risk Factors” section of the Company’s Annual Report on Form 10 - K and any subsequent Quarterly Reports on Form 10 - Q or Current Reports on Form 8 - K . These and other factors could cause results to differ materially from those expressed in these publications and reports .

4 2 Non - GAAP Measure Disclosure We use earnings before interest, taxes, depreciation and amortization, or EBITDA, adjusted EBITDA and adjusted net income, which are non - GAAP measures, as supplemental measures of our performance that are not required by, or presented in accordance with GAAP. None of the non - GAAP measures should be considered as an alternative to any other performance measure derived in accordance with GAAP. We use EBITDA, adjusted EBITDA and adjusted net income as an integral part of our report and planning processes and as one of the primary measures to, among other things: our ability to integrate the acquired businesses into our existing businesses; • monitor and evaluate the performance of our business operations; • facilitate management’s internal comparisons of the historical operating performance of our business operations; • facilitate management’s external comparisons of the results of our overall business to the historical operating performance o f o ther companies that may have different capital structures and debt levels; • analyze and evaluate financial and strategic planning decisions regarding future operating investments; • provide useful information to investors regarding financial and business trends related to our results of operations; and • plan for and prepare future annual operating budgets and determine appropriate levels of operating investments. We define EBITDA as earnings before non - controlling interest, interest, taxes, depreciation and amortization. We define adjusted EBITDA as earnings before non - controlling interest, interest, taxes, depreciation and amortization, adjusted to exclude equity - based compensation, acquisition - related ex penses, amortization of capitalized advisor costs and other items. We define adjusted net income as net income attributable to the Company (using a 40% tax rate to illustrate the tax impact for comparative purposes) and adjusted to exclude acquisition related expenses and equity - based compensation and other items . We believe similarly titled measures are frequently used by securities analysts, investors and other interested parties in the evaluation of companies in our industry, many of which present EBITDA, adjusted EBITDA, adjusted net income and other similar metrics when reporting their financial results. Our presentation of EBITDA, adjusted EBITDA and adjusted net income should not be construed to imply that our future results will be unaffected by unusual or nonrecurring items. The non - GAAP measures have limitations as analytical tools, and you should not consider any of these measures in isolation or as a s ubstitute for analyses of our income or cash flows as reported under GAAP. Some of these limitations are: • they do not reflect our cash expenditures, or future requirements for capital expenditures, or contractual commitments; • they do not reflect changes in, or cash requirements for, our working capital needs; • they do not reflect the significant interest expense, or the cash requirements necessary to service interest or principal payments , o n our debt; and • depreciation and amortization are non - cash expense items that are reflected in our statements of cash flows. In addition, other companies in our industry may calculate these measures differently than we do, limiting their usefulness a s a comparative measure. We compensate for these limitations by relying primarily on our GAAP results and using the non - GAAP measures only for supplemental purposes. Please see our financial statements and the related notes thereto.

American Realty Capital Transaction Overview and Benefits 5 2
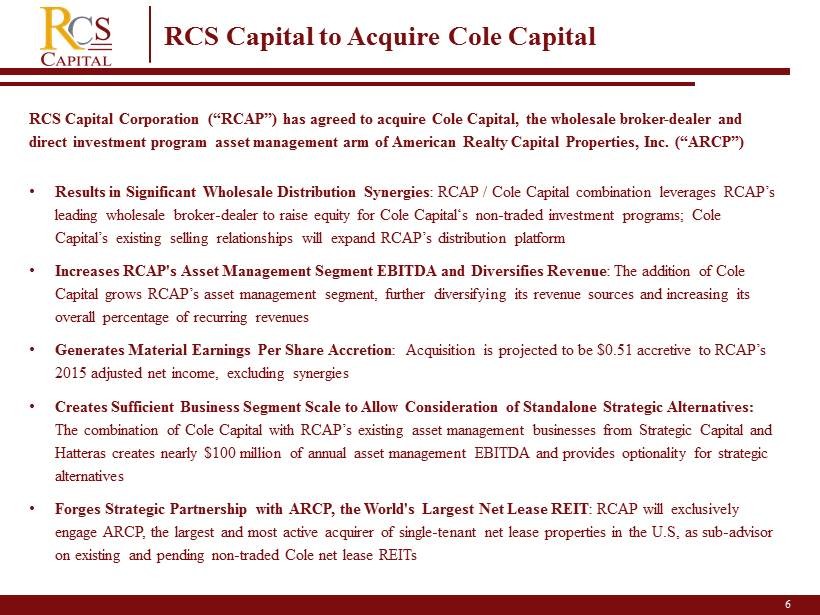
RCS Capital Corporation (“RCAP”) has agreed to acquire Cole Capital, the wholesale broker - dealer and direct investment program asset management arm of American Realty Capital Properties, Inc. (“ARCP”) • Results in Significant Wholesale Distribution Synergies : RCAP / Cole Capital combination leverages RCAP’s leading wholesale broker - dealer to raise equity for Cole Capital‘s non - traded investment programs; Cole Capital’s existing selling relationships will expand RCAP’s distribution platform • Increases RCAP's Asset Management Segment EBITDA and Diversifies Revenue : The addition of Cole Capital grows RCAP’s asset management segment, further diversifying its revenue sources and increasing its overall percentage of recurring revenues • Generates Material Earnings Per Share Accretion : Acquisition is projected to be $0.51 accretive to RCAP’s 2015 adjusted net income, excluding synergies • Creates Sufficient Business Segment Scale to Allow Consideration of Standalone Strategic Alternatives: The combination of Cole Capital with RCAP’s existing asset management businesses from Strategic Capital and Hatteras creates nearly $100 million of annual asset management EBITDA and provides optionality for strategic alternatives • Forges Strategic Partnership with ARCP, the World's Largest Net Lease REIT : RCAP will exclusively engage ARCP, the largest and most active acquirer of single - tenant net lease properties in the U.S, as sub - advisor on existing and pending non - traded Cole net lease REITs 6 RCS Capital to Acquire Cole Capital
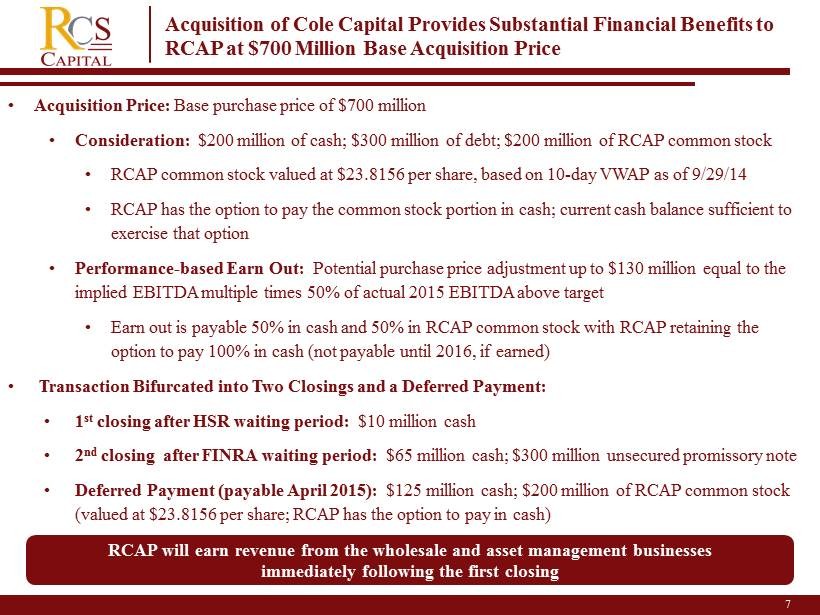
• Acquisition Price: Base purchase price of $700 million • Consideration: $200 million of cash; $300 million of debt; $200 million of RCAP common stock • RCAP common stock valued at $23.8156 per share, based on 10 - day VWAP as of 9/29/14 • RCAP has the option to pay the common stock portion in cash; current cash balance sufficient to exercise that option • Performance - based Earn Out: Potential purchase price adjustment up to $130 million equal to the implied EBITDA multiple times 50% of actual 2015 EBITDA above target • Earn out is payable 50% in cash and 50% in RCAP common stock with RCAP retaining the option to pay 100% in cash (not payable until 2016, if earned) • Transaction Bifurcated into Two Closings and a Deferred Payment: • 1 st closing after HSR waiting period: $10 million cash • 2 nd closing after FINRA waiting period: $65 million cash; $300 million unsecured promissory note • Deferred Payment (payable April 2015): $125 million cash; $200 million of RCAP common stock (valued at $ 23.8156 per share; RCAP has the option to pay in cash) 7 Acquisition of Cole Capital Provides Substantial Financial Benefits to RCAP at $700 Million Base Acquisition Price RCAP will earn revenue from the wholesale and asset management businesses immediately following the first closing
• Consistent and Substantial Capital Raising Capabilities : RCAP and Cole Capital have collectively raised over $20 billion combined in equity capital since 2013 and over $12 billion for net lease real estate programs in the last five years, demonstrating a consistent and reliable track record • Exceptional Leadership, Team and Product Offerings: Addition of Cole Capital’s management, wholesaling team and net lease investment programs is expected to accelerate capital raising for the Cole Capital programs, expand RCAP’s wholesale network and increase RCAP’s overall market penetration – RCAP currently does not have active selling agreements with half of Cole Capital’s Top 10 independent broker - dealer relationships • Unique and Powerful Sub - Advisory Relationship: Exclusive sub - advisor relationship with ARCP is expected to create a significant competitive advantage in the net lease sector: – ARCP is the largest player in the net lease REIT sector having acquired or placed under contract approximately $8 billion of assets for its own balance sheet and Cole Capital programs YTD – RCS and Cole are two of the most recognized names in non - traded REITs 8 Enhanced Combined Wholesale Equity Raising Capabilities RCAP and Cole have raised over $20 billion of equity capital since 2013 (1) (1) Source: Robert A. Stanger. Represents RCAP pro forma for the Strategic Capital acquisition.
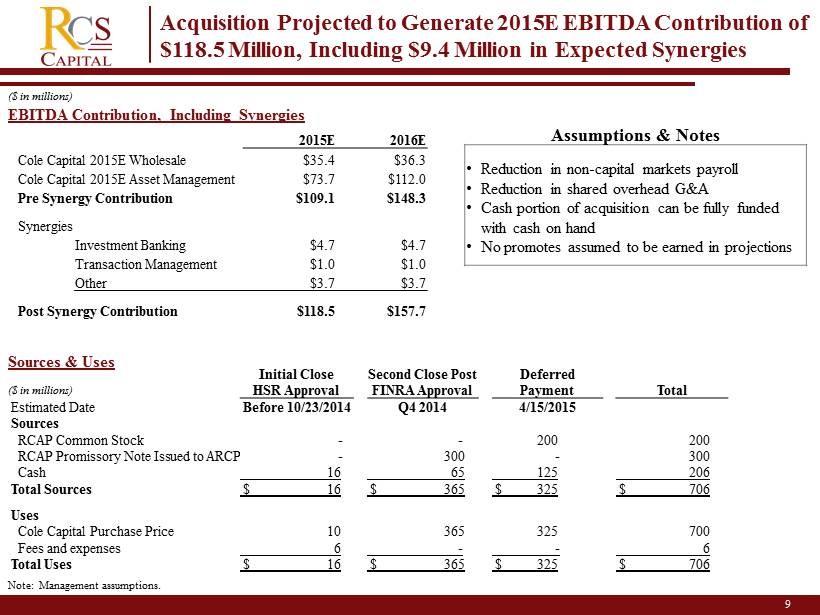
9 2015E 2016E Cole Capital 2015E Wholesale $35.4 $36.3 Cole Capital 2015E Asset Management $73.7 $112.0 Pre Synergy Contribution $109.1 $148.3 Synergies Investment Banking $4.7 $4.7 Transaction Management $1.0 $1.0 Other $3.7 $3.7 Post Synergy Contribution $118.5 $157.7 EBITDA Contribution, Including Synergies ($ in millions) Acquisition Projected to Generate 2015E EBITDA Contribution of $118.5 Million, Including $9.4 Million in Expected Synergies Assumptions & Notes • Reduction in non - capital markets payroll • Reduction in shared overhead G&A • Cash portion of acquisition can be fully funded with cash on hand • No promotes assumed to be earned in projections Sources & Uses Initial Close Second Close Post Deferred HSR Approval FINRA Approval Payment Total Estimated Date Before 10/23/2014 Q4 2014 4/15/2015 Sources RCAP Common Stock - - 200 200 RCAP Promissory Note Issued to ARCP - 300 - 300 Cash 16 65 125 206 Total Sources $ 16 $ 365 $ 325 $ 706 Uses Cole Capital Purchase Price 10 365 325 700 Fees and expenses 6 - - 6 Total Uses $ 16 $ 365 $ 325 $ 706 ($ in millions) Note: Management assumptions.
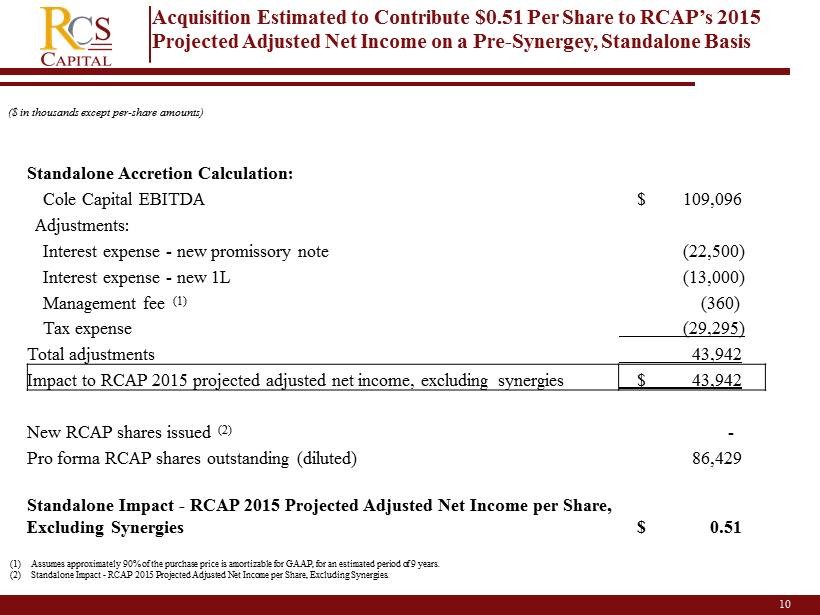
10 2 ($ in thousands except per - share amounts) Acquisition E stimated to Contribute $0.51 Per Share to RCAP’s 2015 Projected Adjusted Net Income on a Pre - Synergey , Standalone Basis (1) Assumes approximately 90% of the purchase price is amortizable for GAAP, for an estimated period of 9 years. (2) Standalone Impact - RCAP 2015 Projected Adjusted Net Income per Share, Excluding Synergies. Standalone Accretion Calculation: Cole Capital EBITDA $ 109,096 Adjustments: Interest expense - new promissory note (22,500) Interest expense - new 1L (13,000) Management fee (1) (360) Tax expense (29,295) Total adjustments 43,942 Impact to RCAP 2015 projected adjusted net income, excluding synergies $ 43,942 New RCAP shares issued (2) - Pro forma RCAP shares outstanding (diluted) 86,429 Standalone Impact - RCAP 2015 Projected Adjusted Net Income per Share, Excluding Synergies $ 0.51

American Realty Capital Cole Capital Highlights 11 2
Wholesale Distribution : • Distributes Cole Capital non - traded products through a network of over 200 broker - dealers • Cole Capital receives a commission for equity capital raised and certain expense reimbursements • Highly complementary to RCAP’s existing wholesale distribution business Asset Management : • Cole Capital serves as the asset manager on its distributed non - traded funds • As asset manager, Cole Capital receives management fees (1) , asset acquisition fees (1 ) and in certain cases, performance - based incentive payments (1 ) • Highly recurring, high margin, growing revenue stream that provides scale to RCAP’s existing asset managers at Hatteras and Strategic Capital 12 Cole Capital Has Two Business Lines (1) A portion of which are paid to ARCP as sub - advisor.
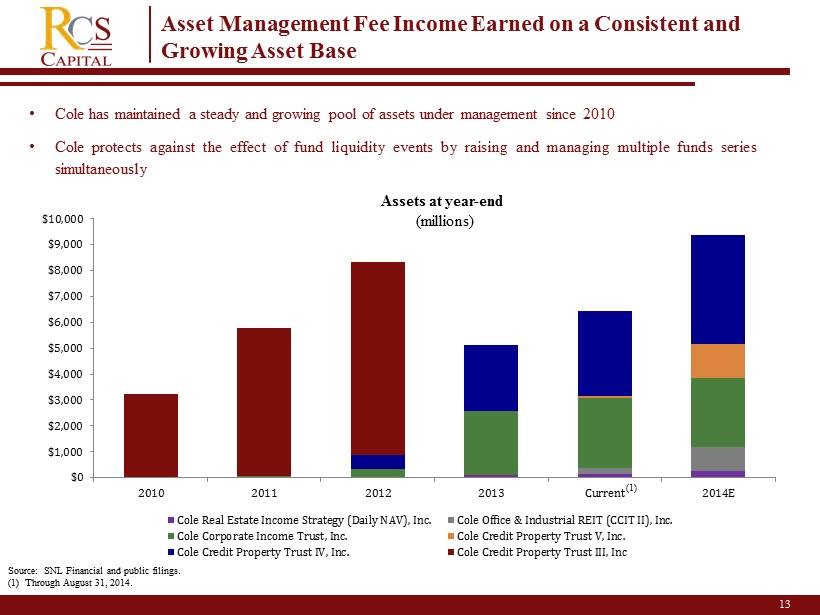
13 Asset Management Fee Income Earned on a Consistent and Growing Asset Base • Cole has maintained a steady and growing pool of assets under management since 2010 • Cole protects against the effect of fund liquidity events by raising and managing multiple funds series simultaneously Assets at year - end (millions) Source: SNL Financial and public filings. (1) Through August 31, 2014. $0 $1,000 $2,000 $3,000 $4,000 $5,000 $6,000 $7,000 $8,000 $9,000 $10,000 2010 2011 2012 2013 Current 2014E Cole Real Estate Income Strategy (Daily NAV), Inc. Cole Office & Industrial REIT (CCIT II), Inc. Cole Corporate Income Trust, Inc. Cole Credit Property Trust V, Inc. Cole Credit Property Trust IV, Inc. Cole Credit Property Trust III, Inc (1)
• The Cole Capital wholesale team will join the RCS wholesale team to enhance RCAP’s position as the industry leading wholesale distribution platform • The Cole Capital wholesale team is well respected in the industry and will remain in place to service existing relationships and deliver additional value as an integrated component of RCAP’s distribution business • The combination of RCAP and Cole Capital is also a win for its distribution partners who will benefit from increased market coverage and access to more innovative investment solutions for their financial advisors 14 Cole Capital Wholesale Distribution Capabilities are Essential The Cole Capital team, with the existing RCAP wholesale distribution platform, will create a combined network of 245 wholesalers including 77 joining from Cole Capital

American Realty Capital Financial Highlights and Segmented Business Lines 15 2
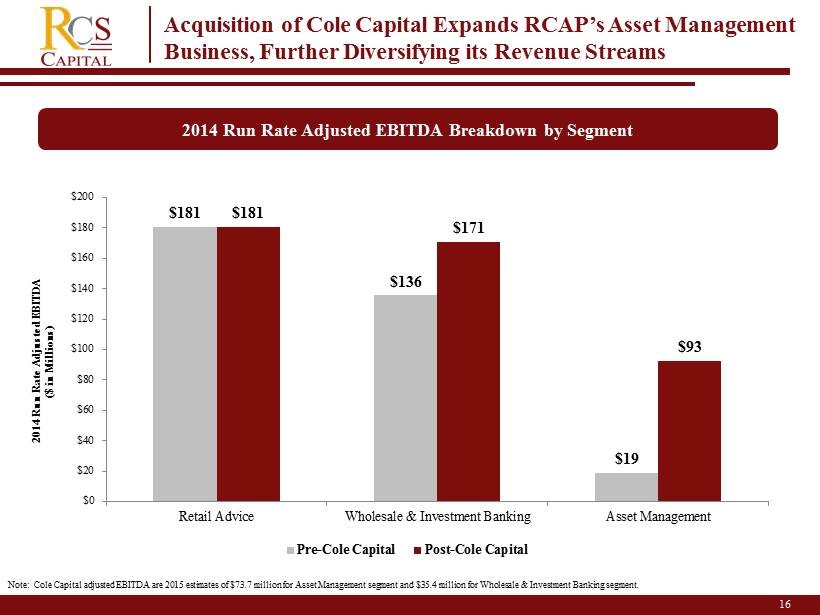
16 2014 Run Rate Adjusted EBITDA Breakdown by Segment Acquisition of Cole Capital Expands RCAP’s Asset M anagement Business, Further Diversifying its Revenue Streams Note: Cole Capital adjusted EBITDA are 2015 estimates of $73.7 million for Asset Management segment and $35.4 million for Wh ole sale & Investment Banking segment. $181 $136 $19 $181 $171 $ 93 $0 $20 $40 $60 $80 $100 $120 $140 $160 $180 $200 Retail Advice Wholesale & Investment Banking Asset Management 2014 Run Rate Adjusted EBITDA ($ in Millions) Pre-Cole Capital Post-Cole Capital
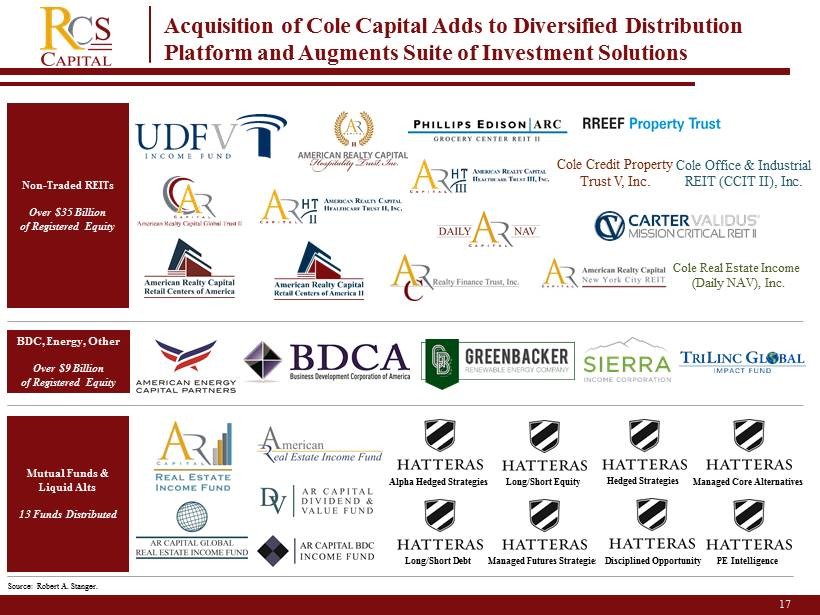
17 Acquisition of Cole Capital Adds to Diversified Distribution Platform and Augments Suite of Investment Solutions Non - Traded REITs Over $ 35 Billion of Registered Equity BDC, Energy, Other Over $9 Billion of Registered Equity Mutual Funds & Liquid Alts 13 Funds Distributed Source: Robert A. Stanger. Long/Short Debt Long/Short Equity Managed Futures Strategies Alpha Hedged Strategies PE Intelligence Hedged Strategies Disciplined Opportunity Managed Core Alternatives Cole Credit Property Trust V, Inc. Cole Office & Industrial REIT (CCIT II), Inc. Cole Real Estate Income (Daily NAV), Inc.
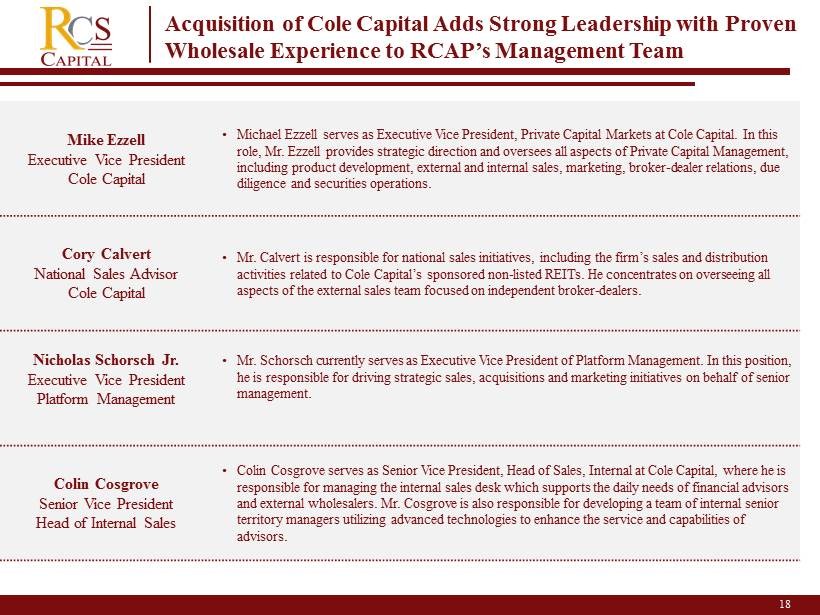
18 Acquisition of Cole Capital Adds Strong Leadership with Proven Wholesale Experience to RCAP’s Management Team 2 Mike Ezzell Executive Vice President Cole Capital • Michael Ezzell serves as Executive Vice President, Private Capital Markets at Cole Capital. In this role, Mr. Ezzell provides strategic direction and oversees all aspects of Private Capital Management, including product development, external and internal sales, marketing, broker - dealer relations, due diligence and securities operations. Cory Calvert National Sales Advisor Cole Capital • Mr. Calvert is responsible for national sales initiatives, including the firm’s sales and distribution activities related to Cole Capital’s sponsored non - listed REITs. He concentrates on overseeing all aspects of the external sales team focused on independent broker - dealers. Nicholas Schorsch Jr. Executive Vice President Platform Management • Mr. Schorsch currently serves as Executive Vice President of Platform Management. In this position, he is responsible for driving strategic sales, acquisitions and marketing initiatives on behalf of senior management. Colin Cosgrove Senior Vice President Head of Internal Sales • Colin Cosgrove serves as Senior Vice President, Head of Sales, Internal at Cole Capital, where he is responsible for managing the internal sales desk which supports the daily needs of financial advisors and external wholesalers. Mr. Cosgrove is also responsible for developing a team of internal senior territory managers utilizing advanced technologies to enhance the service and capabilities of advisors.
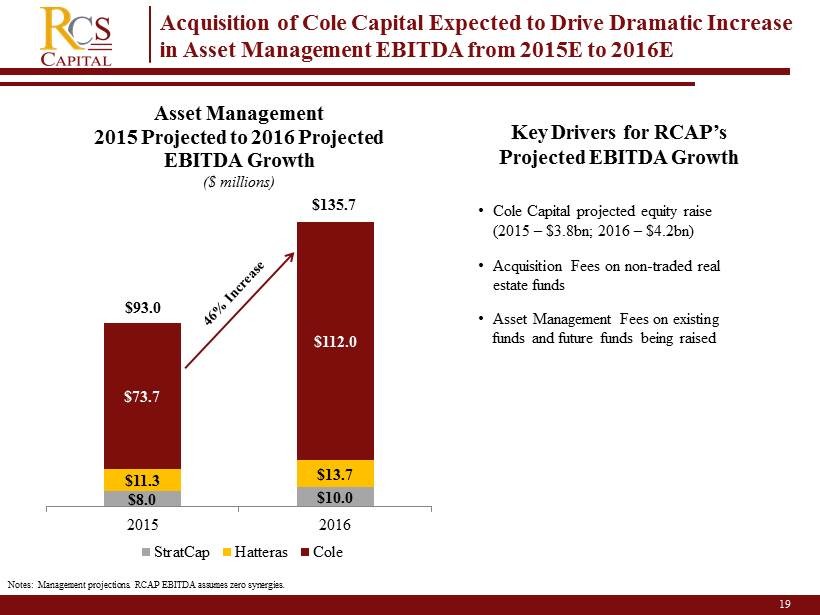
19 $8.0 $10.0 $11.3 $13.7 $73.7 $ 112.0 2015 2016 Asset Management 2015 Projected to 2016 Projected EBITDA Growth ($ millions) StratCap Hatteras Cole Acquisition of Cole Capital Expected to Drive Dramatic Increase in Asset Management EBITDA from 2015E to 2016E $93.0 $ 135.7 Key Drivers for RCAP’s Projected EBITDA Growth • Cole Capital projected equity raise (2015 – $3.8bn; 2016 – $4.2bn) • Acquisition Fees on non - traded real estate funds • Asset Management Fees on existing funds and future funds being raised Notes: Management projections. RCAP EBITDA assumes zero synergies.
20 Acquisition Adds Third Significant Distinct Business Segment, i.e., Asset Management, to Retail Advice and Wholesale Distribution • At nearly $100 million in 2015 EBITDA, RCAP has a large and growing standalone asset manager • RCAP has the second largest independent retail advice platform in the United States • RCAP has the dominant wholesale distribution platform for non - traded products RCAP’s Board Will Actively Evaluate the Strategic Fit of These Independent Lines of Business with an Eye Toward Maximizing Shareholder Value.
21 Summary of Strategic Benefits to RCAP • Creates Accretion to RCAP’s Adjusted Net Income • Increases RCAP’s Asset Management Business Segment • Forges Strategic Partnership with ARCP, the Largest Net Lease REIT • Combines Two of the Largest Distributors of Net Lease Real Estate Investment Programs • Increases RCAP’s Recurring Revenues while Diversifying its Income Stream • Adds Strong Leadership and Wholesale Experience to R CAP’s Management Team • Generates Opportunity for Synergies