Exhibit 99.2

American Realty Capital 1 February 2015 Fourth Quarter & Full Year Pro Forma 2014 Financial & Operating Results 11:00PM 2/23/2015
2 2 Forward - Looking Statements Certain statements made in this presentation are forward - looking statements . Those statements include statements regarding the intent, belief or current expectations of RCS Capital Corporation (“us,” “our,” “RCAP ” or the “Company”) and members of its management team, as well as the assumptions on which such statements are based, and generally are identified by the use of words such as “may,” “will,” “seeks,” “anticipates,” “believes,” “estimates,” “expects,” “plans,” “intends,” “should” or similar expressions . Actual results may differ materially from those contemplated by such forward - looking statements . Further, forward - looking statements speak only as of the date they are made, and we undertake no obligation to update or revise forward - looking statements to reflect changed assumptions, the occurrence of unanticipated events or changes to future operating results over time, unless required by law . The following are some of the possible risks and uncertainties, although not all risks and uncertainties, that could cause our actual results to differ materially from those presented in our forward - looking statements : the impact on our business of the events relating to American Realty Capital Properties, Inc . announcement concerning errors in its financial statements our ability to integrate our recently acquired businesses into our existing businesses ; our ability to complete our pending acquisitions on the anticipated terms, in the anticipated timeframes or at all ; whether and when we will be able to realize the anticipated benefits from our recent and pending acquisitions ; significant dilution could result from future issuances of our Class A common stock ; future sales of our Class A common stock could lower the market price of our Class A common stock ; adverse developments in the direct investment program industry ; deterioration in the business environment in the specific sectors of the economy in which we focus or a decline in the market for securities of companies within these sectors ; substantial fluctuations in our financial results ; our ability to retain our senior professionals and key management personnel of our recently acquired businesses ; pricing and other competitive pressures ; changes in laws and regulations and industry practices that adversely affect our business ; incurrence of losses in the future ; competition from larger firms ; limitations on our access to capital ; malfunctioning or failure in our operations and infrastructure ; failure to achieve and maintain effective internal controls ; and the factors included in our most recent Annual Report on Form 10 - K and any subsequent Quarterly Reports on Form 10 - Q or Current Reports on Form 8 - K .
3 2 Disclaimer This presentation includes estimated projections of 2014 and 2015 operating results . These projections were not prepared in accordance with published guidelines of the SEC or the guidelines established by the American Institute of Certified Public Accountants for preparation and presentation of financial projections . This information is not fact and should not be relied upon as being necessarily indicative of future results ; the projections were prepared in good faith by management and are based on numerous assumptions that may prove to be wrong . Important factors that may affect actual results and cause the projections to not be achieved include, but are not limited to, risks and uncertainties relating to the company and other factors described under “Risk Factors” section of the Company’s Annual Report on Form 10 - K and any subsequent Quarterly Reports on Form 10 - Q or Current Reports on Form 8 - K and “Forward - Looking Statements . ” The projections also reflect assumptions as to certain business decisions that are subject to change . As a result, actual results may differ materially from those contained in the estimates . Accordingly, there can be no assurance that the estimates will be realized . This presentation also contains estimates and information concerning our industry, including market position, market size, and growth rates of the markets in which we participate, that are based on industry publications and reports . This information involves a number of assumptions and limitations, and you are cautioned not to give undue weight to these estimates . We have not independently verified the accuracy or completeness of the data contained in these industry publications and reports . The industry in which we operate is subject to a high degree of uncertainty and risk due to variety of factors, including those described in the “Risk Factors” section of the Company’s Annual Report on Form 10 - K and any subsequent Quarterly Reports on Form 10 - Q or Current Reports on Form 8 - K and “Forward Looking Statements” . These and other factors could cause results to differ materially from those expressed in these publications and reports .
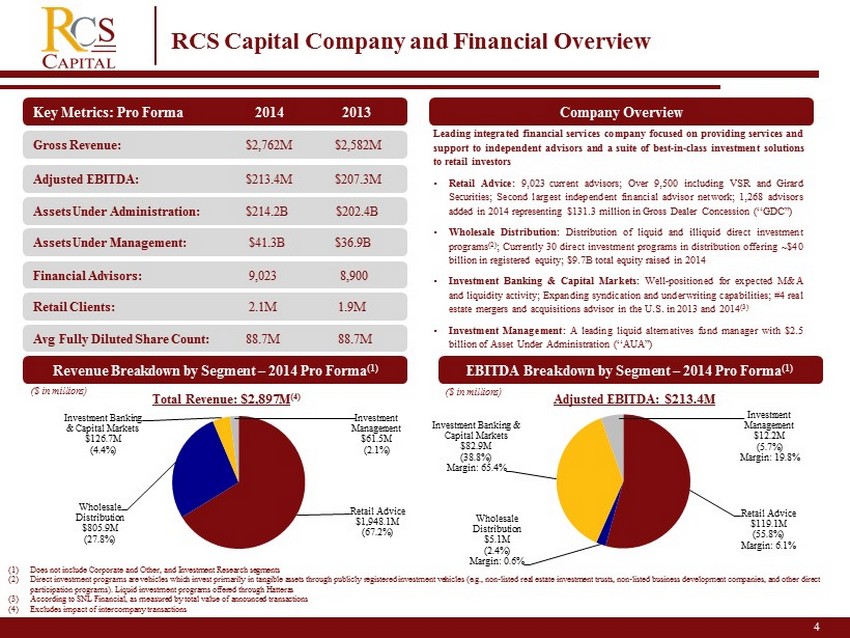
4 RCS Capital Company and Financial Overview (1) Does not include Corporate and Other, and Investment Research segments (2) Direct investment programs are vehicles which invest primarily in tangible assets through publicly registered investment vehicles (e .g. , non - listed real estate investment trusts, non - listed business development companies, and other direct participation programs). Liquid investment programs offered through Hatteras (3) According to SNL Financial, as measured by total value of announced transactions (4) Excludes impact of intercompany transactions Key Metrics: Pro Forma 2014 2013 Revenue Breakdown by Segment – 2014 Pro Forma (1) ($ in millions) Total Revenue: $2,897M (4) Gross Revenue: $2,762M $2,582M Adjusted EBITDA: $213.4M $207.3M Assets Under Administration: $214.2B $202.4B Financial Advisors: 9,023 8,900 Retail Clients: 2.1M 1.9M Company Overview Leading integrated financial services company focused on providing services and support to independent advisors and a suite of best - in - class investment solutions to retail investors • Retail Advice : 9 , 023 current advisors ; Over 9 , 500 including VSR and Girard Securities ; S econd largest independent financial advisor network ; 1 , 268 advisors added in 2014 representing $ 131 . 3 million in Gross Dealer Concession (“GDC”) • Wholesale Distribution : D istribution of liquid and illiquid direct investment programs ( 2 ) ; Currently 30 direct investment programs in distribution offering ~ $ 40 billion in registered equity ; $ 9 . 7 B total equity raised in 2014 • Investment Banking & Capital Markets : Well - positioned for expected M&A and liquidity activity ; Expanding syndication and underwriting capabilities ; # 4 real estate mergers and acquisitions advisor in the U . S . in 2013 and 2014 ( 3 ) • Investment Management : A leading liquid alternatives fund manager with $ 2 . 5 billion of Asset Under Administration (“AUA”) Avg Fully Diluted Share Count: 88.7M 88.7M EBITDA Breakdown by Segment – 2014 Pro Forma (1) ($ in millions) Adjusted EBITDA: $213.4M 62% Retail Advice $ 1,948.1M (67.2%) Wholesale Distribution $805.9M (27.8%) Investment Banking & Capital Markets $126.7M (4.4%) Investment Management $61.5M (2.1%) Retail Advice $ 119.1M ( 55.8%) Margin: 6.1% Wholesale Distribution $5.1M (2.4%) Margin: 0.6% Investment Banking & Capital Markets $82.9M (38.8%) Margin: 65.4% Investment Management $ 12.2M ( 5.7%) Margin: 19.8% Assets Under Management : $41.3B $36.9B
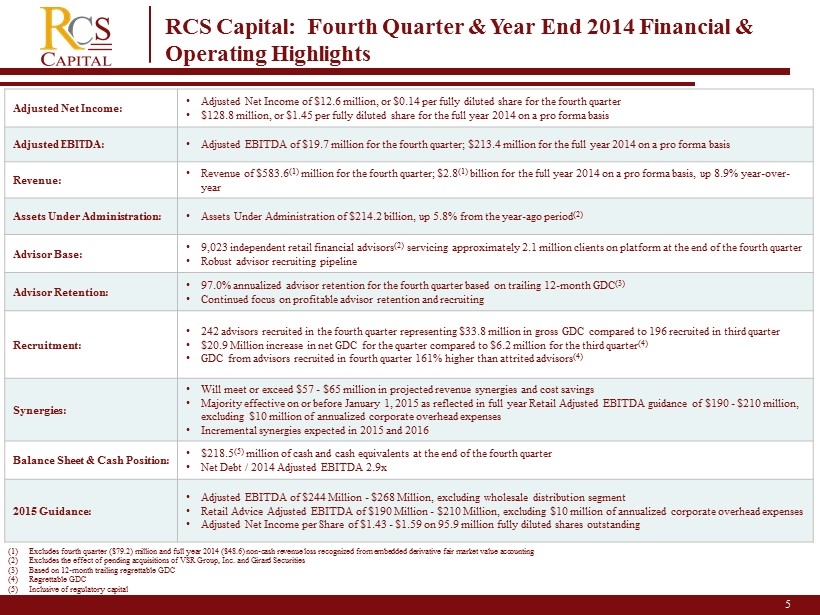
5 RCS Capital: Fourth Quarter & Year End 2014 Financial & Operating Highlights (1) Excludes fourth quarter ($79.2) million and full year 2014 ($48.6) non - cash revenue loss recognized from embedded derivative fai r market value accounting (2) Excludes the effect of pending acquisitions of VSR Group, Inc. and Girard Securities (3) Based on 12 - month trailing regrettable GDC (4) Regrettable GDC (5) Inclusive of regulatory capital Adjusted Net Income: • Adjusted Net Income of $12.6 million, or $0.14 per fully diluted share for the fourth quarter • $128.8 million, or $1.45 per fully diluted share for the full year 2014 on a pro forma basis Adjusted EBITDA: • Adjusted EBITDA of $19.7 million for the fourth quarter; $213.4 million for the full year 2014 on a pro forma basis Revenue: • Revenue of $583.6 (1) million for the fourth quarter; $2.8 (1) billion for the full year 2014 on a pro forma basis , up 8.9% year - over - year Assets Under Administration: • Assets Under Administration of $214.2 billion, u p 5.8% from the year - ago period (2) Advisor Base : • 9,023 independent retail financial advisors (2) servicing approximately 2.1 million clients on platform at the end of the fourth quarter • Robust advisor recruiting pipeline Advisor Retention: • 97.0% annualized advisor retention for the fourth quarter based on trailing 12 - month GDC (3) • Continued focus on profitable advisor retention and recruiting Recruitment: • 242 advisors recruited in the fourth quarter representing $33.8 million in gross GDC compared to 196 recruited in third quarter • $20.9 Million increase in net GDC for the quarter compared to $6.2 million for the third quarter (4) • GDC from advisors recruited in fourth quarter 161% higher than attrited advisors (4) Synergies: • Will meet or exceed $57 - $65 million in projected revenue synergies and cost savings • Majority effective on or before January 1, 2015 as reflected in full year Retail Adjusted EBITDA guidance of $190 - $210 million, excluding $10 million of annualized corporate overhead expenses • Incremental synergies expected in 2015 and 2016 Balance Sheet & Cash Position: • $218.5 (5) million of cash and cash equivalents at the end of the fourth quarter • Net Debt / 2014 Adjusted EBITDA < 2.9x 2015 Guidance: • Adjusted EBITDA of $244 Million - $268 Million, excluding wholesale distribution segment • Retail Advice Adjusted EBITDA of $190 Million - $210 Million, excluding $10 million of annualized corporate overhead expenses • Adjusted Net Income per Share of $1.43 - $1.59 on 95.9 million fully diluted shares outstanding
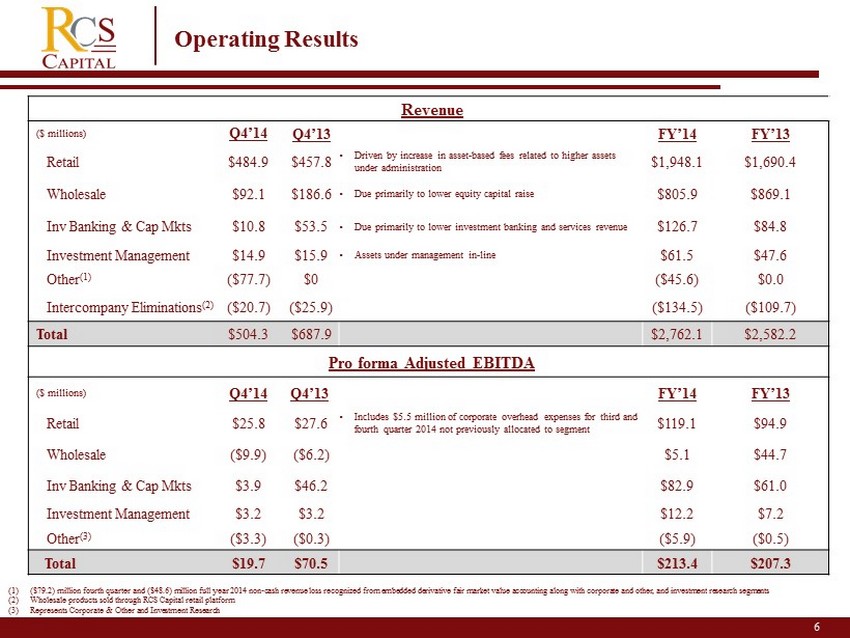
6 Revenue ($ millions) Q4’14 Q4’13 FY’14 FY’13 Retail $484.9 $457.8 • Driven by increase in asset - based fees related to higher assets under administration $1,948.1 $1,690.4 Wholesale $92.1 $186.6 • Due primarily to lower equity capital raise $805.9 $869.1 Inv Banking & Cap Mkts $10.8 $53.5 • Due primarily to lower investment banking and services revenue $126.7 $84.8 Investment Management $14.9 $15.9 • Assets under management in - line $61.5 $47.6 Other (1) ($77.7) $0 ($45.6) $0.0 Intercompany Eliminations (2) ($20.7) ($25.9) ($134.5) ($109.7) Total $504.3 $687.9 $2,762.1 $2,582.2 Pro forma Adjusted EBITDA ($ millions) Q4’14 Q4’13 FY’14 FY’13 Retail $25.8 $27.6 • Includes $5.5 million of corporate overhead expenses for third and fourth quarter 2014 not previously allocated to segment $119.1 $94.9 Wholesale ($9.9) ($6.2) $5.1 $44.7 Inv Banking & Cap Mkts $3.9 $46.2 $82.9 $61.0 Investment Management $3.2 $3.2 $12.2 $7.2 Other (3) ($3.3) ($0.3) ($5.9) ($0.5) Total $19.7 $70.5 $213.4 $207.3 Operating Results (1) ($79.2) million fourth quarter and ($48.6) million full year 2014 non - cash revenue loss recognized from embedded derivative fair market value accounting along with corporate and other, and investment research segments (2) Wholesale products sold through RCS Capital retail platform (3) Represents Corporate & Other and Investment Research
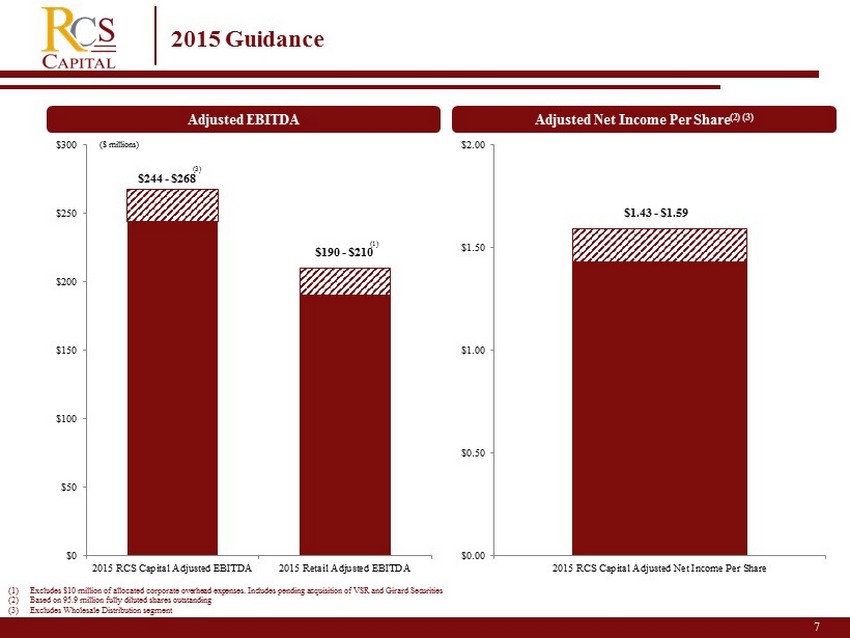
7 2 2015 Guidance Adjusted EBITDA (1) Excludes $10 million of allocated corporate overhead expenses. Includes pending acquisition of VSR and Girard Securities (2) Based on 95.9 million fully diluted shares outstanding (3) Excludes Wholesale Distribution segment (1) ($ millions) Adjusted Net Income Per Share (2 ) (3) (3) $ 244 - $268 $ 190 - $210 $0 $50 $100 $150 $200 $250 $300 2015 RCS Capital Adjusted EBITDA 2015 Retail Adjusted EBITDA $ 1.43 - $1.59 $0.00 $0.50 $1.00 $1.50 $2.00 2015 RCS Capital Adjusted Net Income Per Share
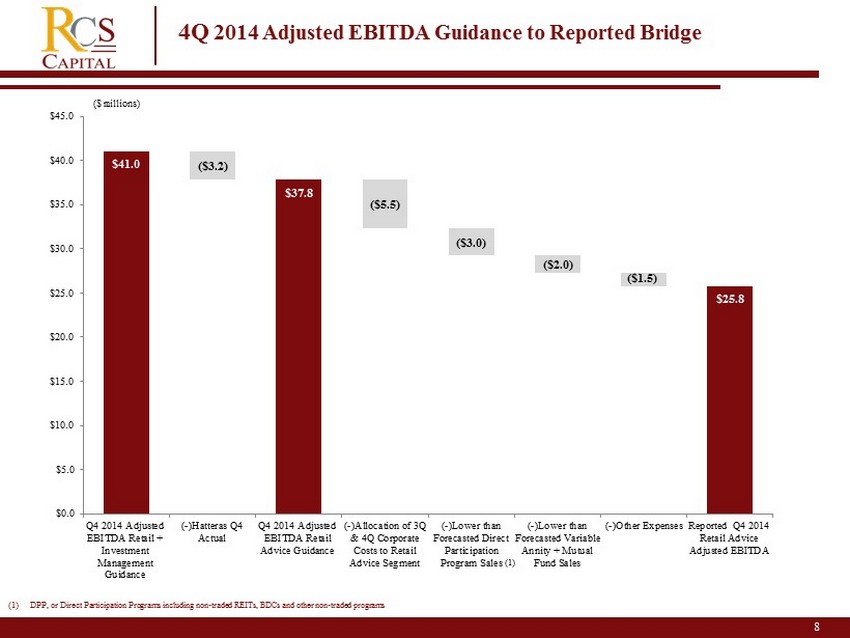
8 4Q 2014 Adjusted EBITDA Guidance to Reported Bridge ($ millions) (1) DPP , or Direct Participation Programs including non - traded REITs, BDCs and other non - traded programs (1) $41.0 $37.8 $37.8 $32.3 $29.3 $27.3 $25.8 $25.8 ($3.2) ($5.5) ($3.0) ($2.0) ($1.5) $0.0 $5.0 $10.0 $15.0 $20.0 $25.0 $30.0 $35.0 $40.0 $45.0 Q4 2014 Adjusted EBITDA Retail + Investment Management Guidance (-)Hatteras Q4 Actual Q4 2014 Adjusted EBITDA Retail Advice Guidance (-)Allocation of 3Q & 4Q Corporate Costs to Retail Advice Segment (-)Lower than Forecasted Direct Participation Program Sales (-)Lower than Forecasted Variable Annity + Mutual Fund Sales (-)Other Expenses Reported Q4 2014 Retail Advice Adjusted EBITDA

9 Reported 4Q 2014 Retail Adjusted EBITDA to 2015 Retail Adjusted EBITDA Guidance Bridge ($ millions) $8 $4 - $ 7 $7 - $12 $43 - $55 (3) (1) (1) Excludes $10 million of allocated corporate overhead expenses. Includes pending acquisition of VSR and Girard Securities (2) Includes $10 million of annualized synergies realized in fourth quarter 2014 (3) Incremental to the $10 million of annualized synergies realized in fourth quarter 2014 (4) DPP, or Direct Participation Programs including non - traded REITs, BDCs and other non - traded programs (2) (4) $26 $26 $34 $136 $136 $143 $155 $ 190 - $210 $0 $50 $100 $150 $200 $250 Q4 2014 Retail Advice Adjusted EBITDA (+) Q3 & Q4 Corporate Expense Allocation + Normalized DPP, VA, and Mutual Fund Sales Normalized Q4 2014 Retail Advice Adjusted EBITDA Q4 2014 Annualized (+) Organic Growth (+) VSR / Girard Impact (+) Incremental 2015 Synergies & Cost Saves Comparable FY2015 Retail Advice Adjusted EBITDA Guidance

10 RCS Capital is Positioned to Create V alue for Shareholders A cross its Core B usiness Lines • Retail Advice: Second largest independent broker dealer with over 9,000 Independent financial advisors; 9,500+ with the pending acquisitions of VSR and Girard, and $214 billion in client assets • Building the most innovative independent financial advisor platform in the industry • Maintain industry leading retention levels • Focus on recruiting and retaining profitable advisors • Rollout widest possible array of practice management platform tools to help support advisor growth • Higher margin FDIC cash sweep programs to be introduced in 2015 • Wholesale Distribution: Largest distributor of direct investment and liquid alternative solutions with 30 investment products representing ~$40 billion in equity • Industry leading 1,568 active selling agreements compared to 1,151 in January 2014; 36.2% year - over - year increase • Realty Capital Securities 1,132 active selling agreements compared to 1,151 in January 2014 • $50 billion in equity expected to monetize industry wide over the next 36 months • $10 billion of equity in RCS distributed closed offerings currently awaiting liquidity events 2015 Outlook
11 • Investment Banking and Capital Markets: Leading Real Estate Advisory firm advising on 21 real estate related transactions for a total transaction value of over $36 billion since 2012 • $4.5 million fee revenue recognized in the first quarter due to a timing delay associated with the closing of the ARC Healthcare Trust acquisition • Currently engaged on six strategic advisory transactions within positive M&A environment • Three engagements added in the fourth quarter • Expect 8 - 10 transactions to close in 2015 • Well - positioned for expected $50 billion liquidity events within industry • Strategically adding underwriting and syndication capabilities that leverage retail network providing advisors access to new issuances • Investment Management: Leader in Liquid Alternatives Space • Includes The Hatteras Funds • Currently $2.5 billion assets under management • Investment platform currently providing eleven open - end mutual funds and two closed - end funds • Significant growth opportunities with penetration in new distribution channels including independent broker dealers , banks and registered investment advisors • Ongoing product development to increase liquid alternative platform 2015 Outlook Cont.
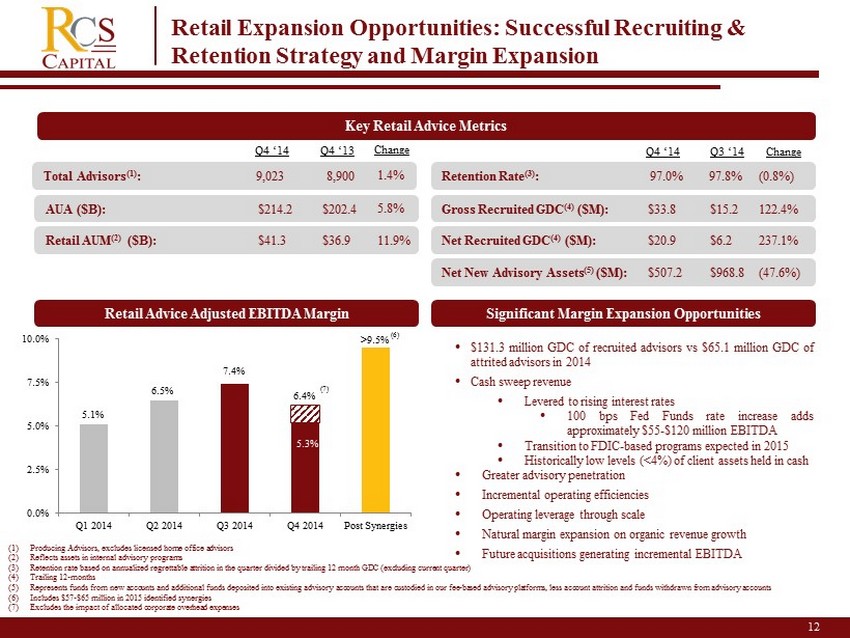
12 2 (1) Producing Advisors, excludes licensed home office advisors (2) Reflects assets in internal advisory programs (3) Retention rate based on annualized regrettable attrition in the quarter divided by trailing 12 month GDC (excluding current q uar ter) (4) Trailing 12 - months (5) Represents funds from new accounts and additional funds deposited into existing advisory accounts that are custodied in our fee - based advisory platfor ms, less account attrition and funds withdrawn from advisory accounts (6) Includes $57 - $65 million in 2015 identified synergies (7) Excludes the impact of allocated corporate overhead expenses Key Retail Advice Metrics Gross Recruited GDC (4) ($M): $33.8 $15.2 122.4% Retention Rate (3) : 97.0% 97.8% (0.8%) Total Advisors (1) : 9,023 8,900 AUA ($B): $214.2 $202.4 Net New Advisory Assets (5) ($M): $507.2 $968.8 (47.6%) Retail AUM (2) ($B): $41.3 $36.9 Net Recruited GDC (4) ($M): $20.9 $6.2 237.1% Q4 ‘14 Q4 ‘13 Change Retail Advice Adjusted EBITDA Margin Significant Margin Expansion Opportunities • $ 131 . 3 million GDC of recruited advisors vs $ 65 . 1 million GDC of attrited advisors in 2014 • Cash sweep revenue • Levered to rising interest rates • 100 bps Fed Funds rate increase adds approximately $ 55 - $ 120 million EBITDA • Transition to FDIC - based programs expected in 2015 • Historically low levels (< 4 % ) of client assets held in cash • Greater advisory penetration • Incremental operating efficiencies • Operating leverage through scale • Natural margin expansion on organic revenue growth • Future acquisitions generating incremental EBITDA 1.4% 5.8% 11.9% Retail Expansion Opportunities: Successful Recruiting & Retention Strategy and Margin Expansion 5.1% 6.5% 7.4% 6.4% >9.5 % 0.0% 2.5% 5.0% 7.5% 10.0% Q1 2014 Q2 2014 Q3 2014 Q4 2014 Post Synergies 5.3% Q4 ‘14 (7) (6) Q3 ‘14 Change
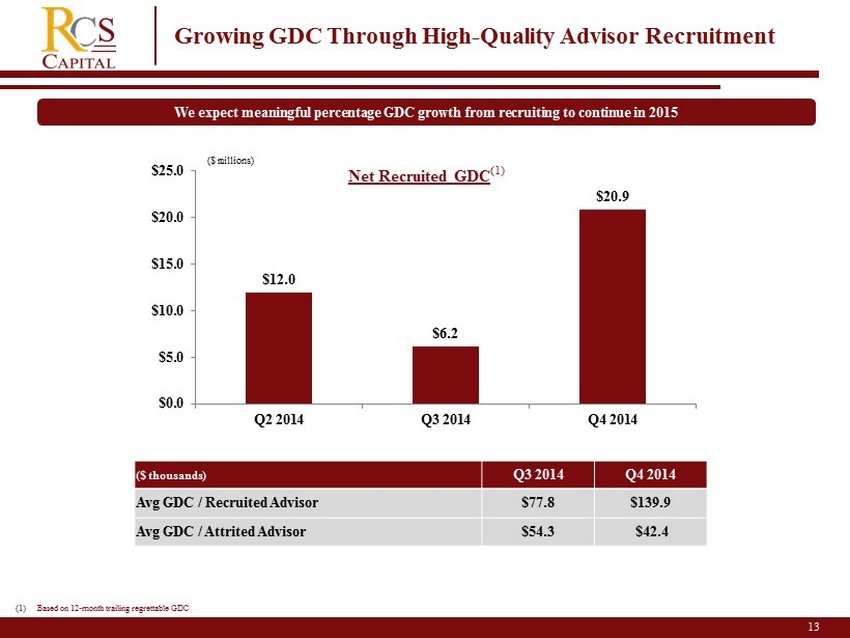
13 Growing GDC Through High - Quality Advisor Recruitment We expect meaningful percentage GDC growth from recruiting to continue in 2015 $12.0 $6.2 $20.9 $0.0 $5.0 $10.0 $15.0 $20.0 $25.0 Q2 2014 Q3 2014 Q4 2014 Net Recruited GDC (1) ($ millions) ($ thousands) Q3 20 14 Q4 2014 Avg GDC / Recruited Advisor $ 77.8 $ 139.9 Avg GDC / Attrited Advisor $ 54.3 $ 42.4 (1) Based on 12 - month trailing regrettable GDC
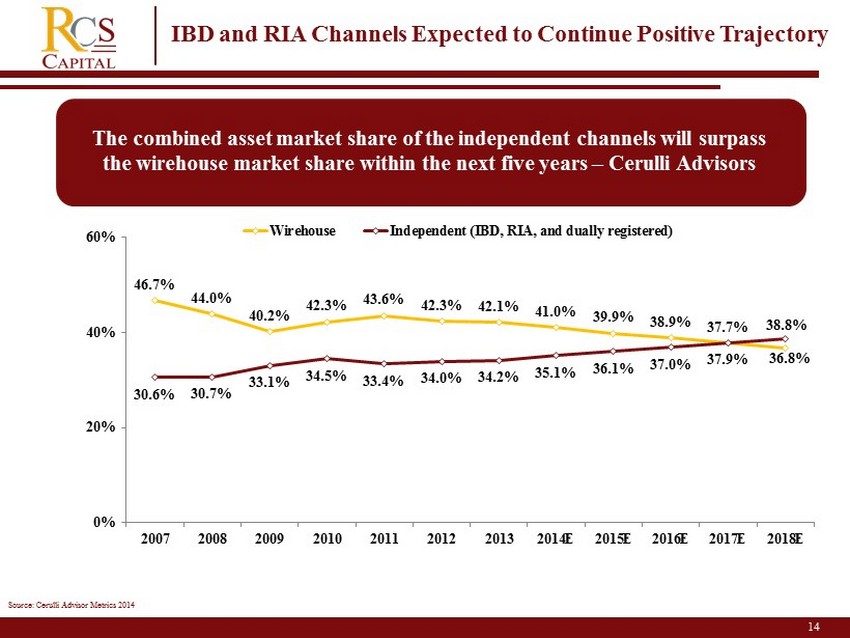
14 IBD and RIA Channels Expected to Continue Positive Trajectory The combined asset market share of the independent channels will surpass the wirehouse market share within the next five years – Cerulli Advisors 46.7% 44.0% 40.2% 42.3% 43.6% 42.3% 42.1% 41.0% 39.9% 38.9% 37.7% 36.8% 30.6% 30.7% 33.1% 34.5% 33.4% 34.0% 34.2% 35.1% 36.1% 37.0% 37.9% 38.8% 0% 20% 40% 60% 2007 2008 2009 2010 2011 2012 2013 2014E 2015E 2016E 2017E 2018E Wirehouse Independent (IBD, RIA, and dually registered) Source: Cerulli Advisor Metrics 2014
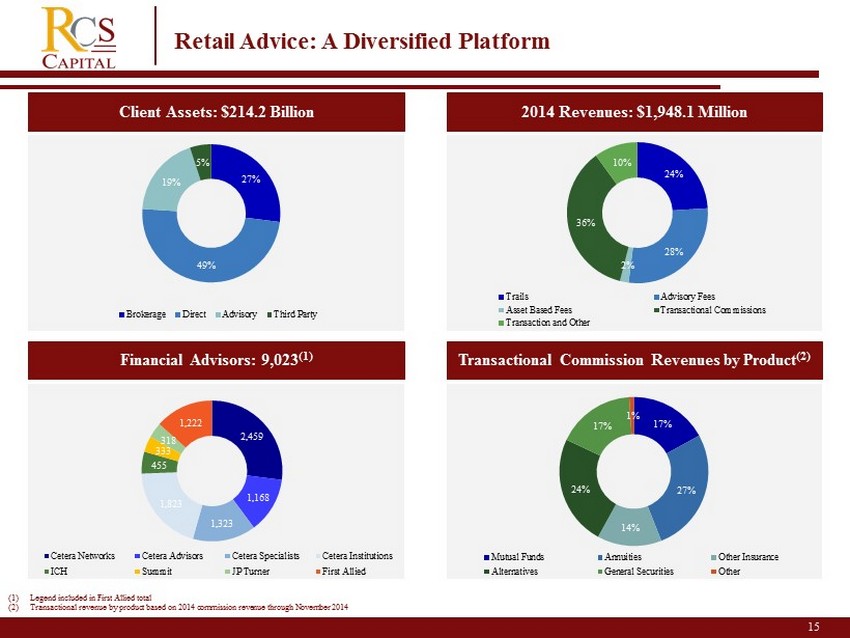
15 S Retail Advice: A Diversified Platform Financial Advisors: 9,023 (1) 2014 Revenues: $1,948.1 Million Client Assets: $214.2 Billion Transactional Commission Revenues by Product (2) 24% 28% 2% 36% 10% Trails Advisory Fees Asset Based Fees Transactional Commissions Transaction and Other (1) Legend included in First Allied total (2) Transactional revenue by product based on 2014 commission revenue through November 2014 2,459 1,168 1,323 1,823 455 333 318 1,222 Cetera Networks Cetera Advisors Cetera Specialists Cetera Institutions ICH Summit JP Turner First Allied 27% 49% 19% 5% Brokerage Direct Advisory Third Party 17% 27% 14% 24% 17% 1% Mutual Funds Annuities Other Insurance Alternatives General Securities Other
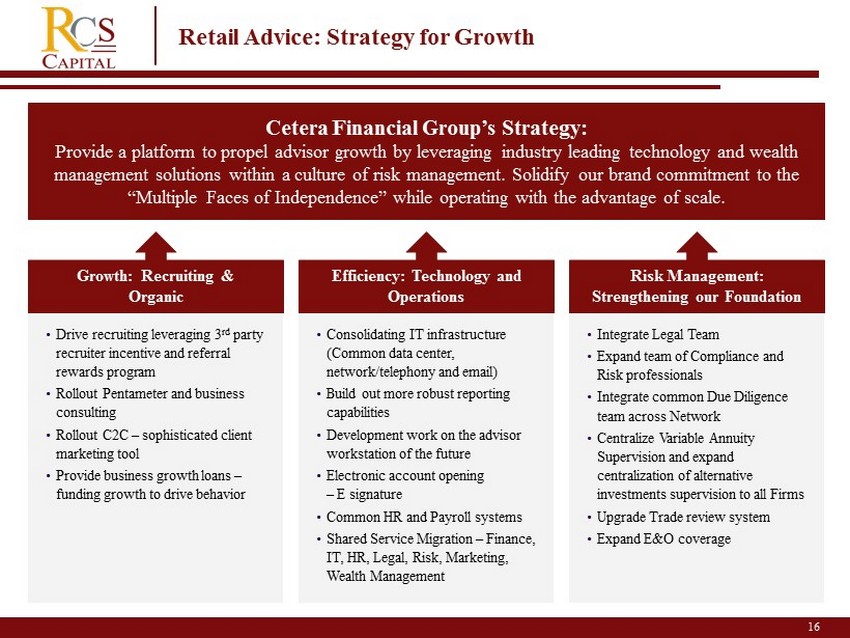
16 Retail Advice: Strategy for Growth Growth: Recruiting & Organic Efficiency: Technology and Operations Risk Management: Strengthening our Foundation Cetera Financial Group’s Strategy: Provide a platform to propel advisor growth by leveraging industry leading technology and wealth management solutions within a culture of risk management. Solidify our brand commitment to the “Multiple Faces of Independence” while operating with the advantage of scale. • Drive recruiting leveraging 3 rd party recruiter incentive and referral rewards program • Rollout Pentameter and business consulting • Rollout C2C – sophisticated client marketing tool • Provide business g rowth l oans – funding growth to drive behavior • Consolidating IT infrastructure (Common data center , network/telephony and email) • Build out more robust reporting capabilities • Development work on the advisor workstation of the future • Electronic account opening – E signature • Common HR and Payroll systems • Shared Service Migration – Finance, IT, HR, Legal, Risk, Marketing, Wealth Management • Integrate Legal Team • Expand team of Compliance and Risk professionals • Integrate common Due Diligence team across Network • Centralize Variable Annuity Supervision and expand centralization of alternative investments supervision to all Firms • Upgrade Trade review system • Expand E&O coverage
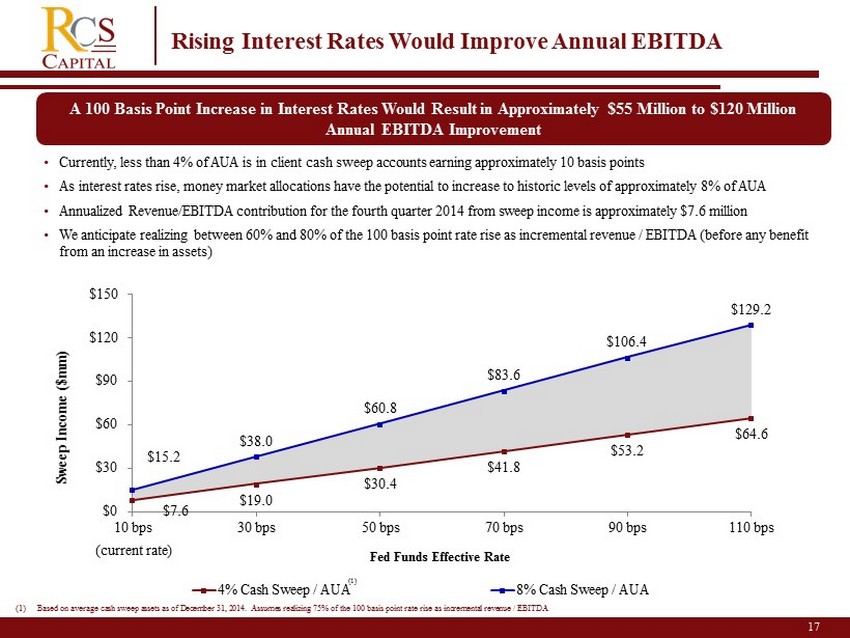
17 Rising Interest Rates Would Improve Annual EBITDA • Currently, less than 4% of AUA is in client cash sweep accounts earning approximately 10 basis points • As interest rates rise, money market allocations have the potential to increase to historic levels of approximately 8% of AUA • Annualized Revenue/EBITDA contribution for the fourth quarter 2014 from sweep income is approximately $7.6 million • We anticipate realizing between 60% and 80 % of the 100 basis point rate rise as incremental revenue / EBITDA (before any benefit from an increase in assets) A 100 Basis Point Increase in Interest Rates Would Result in Approximately $55 Million to $120 Million Annual EBITDA Improvement $ 7.6 $19.0 $ 30.4 $ 41.8 $53.2 $64.6 $ 15.2 $38.0 $ 60.8 $83.6 $ 106.4 $ 129.2 $0 $30 $60 $90 $120 $150 10 bps 30 bps 50 bps 70 bps 90 bps 110 bps 4% Cash Sweep / AUA 8% Cash Sweep / AUA Fed Funds Effective Rate Sweep Income ($mm) (current rate) (1) (1) Based on average cash sweep assets as of December 31, 2014. Assumes realizing 75% of the 100 basis point rate rise as increm ent al revenue / EBITDA

18 2 Wholesale Distribution (1) According to Robert A. Stanger & Co. – December Market Pulse Report Equity Capital Raised – Diversifying Sales Channels 30 investment programs currently in distribution or registration offering approximately $ 40 billion in equity Distributing 14 programs that are sponsored by AR Capital representing approximately 62% of total equity registered or in distribution No more than 6.9% of 2014 equity capital raised through any one broker - dealer; Remaining 93.1% raised through 325 unaffiliated broker - dealers and RIAs Achieved 40.4% market share among managing broker dealers based on 2014 sales (1 ) Over $50 billion of equity expected to monetize through liquidity events industry wide over the next 36 months; $10 billion from RCS Capital distributed programs awaiting liquidity Distributed the top three non - traded REITs and four of the top five non - traded programs in 2014 ; Nearly two times the combined sales of the next two competitors (1) $10.2B $9.7B ($ billions) $8.6 $7.1 $0.7 $1.5 $0.9 $1.1 $0.0 $2.0 $4.0 $6.0 $8.0 $10.0 $12.0 2013 2014 RCS Capital Strategic Capital Hatteras & ARC Income Funds
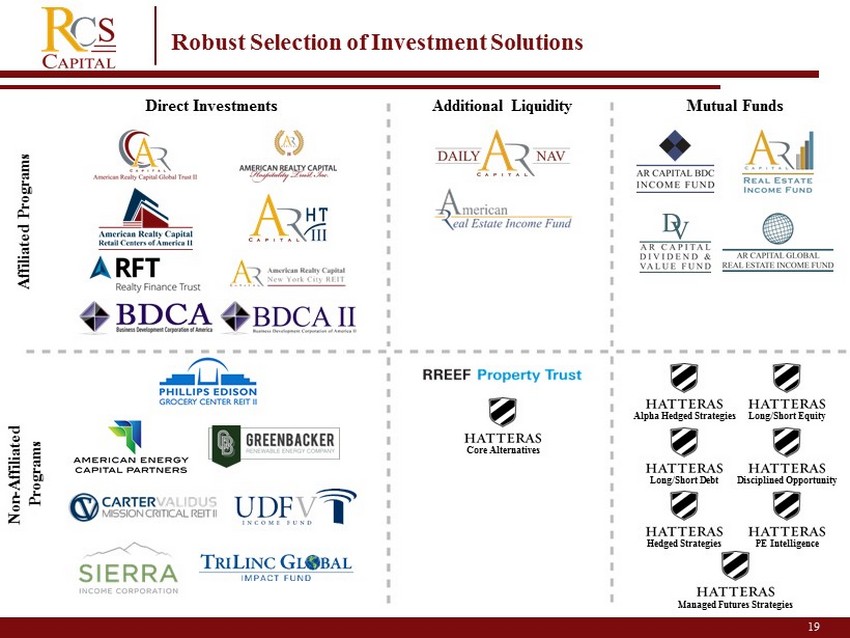
American Realty Capital 19 2 Direct Investments Additional Liquidity Mutual Funds Robust Selection of Investment Solutions Affiliated Programs Non - Affiliated Programs Core Alternatives Alpha Hedged Strategies Long/Short Equity Long/Short Debt Disciplined Opportunity Managed Futures Strategies PE Intelligence Hedged Strategies
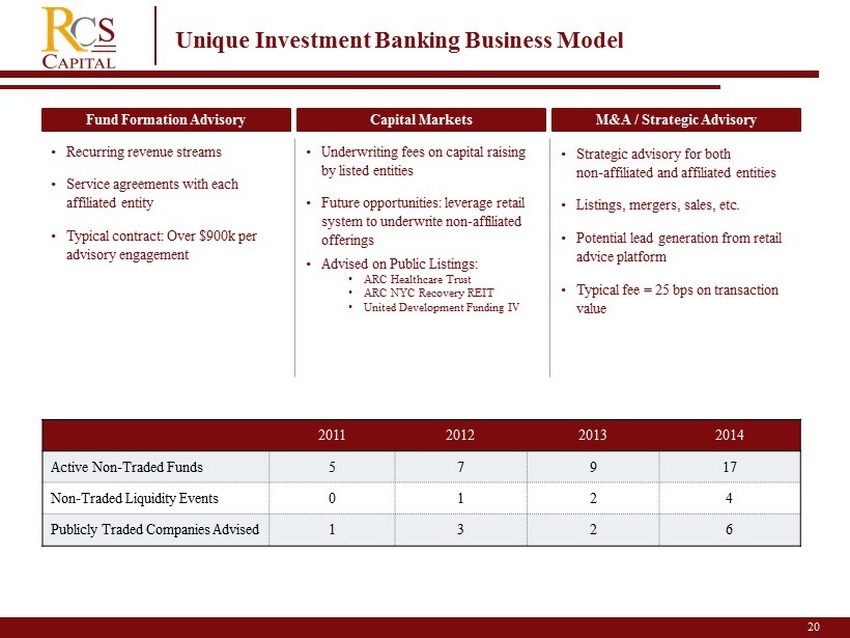
20 2 Unique Investment Banking Business Model Fund Formation Advisory Capital Markets M&A / Strategic Advisory • Recurring revenue streams • Service agreements with each affiliated entity • Typical contract: Over $900k per advisory engagement • Underwriting fees on capital raising by listed entities • Future opportunities: leverage retail system to underwrite non - affiliated offerings • Advised on Public Listings: • ARC Healthcare Trust • ARC NYC Recovery REIT • United Development Funding IV • Strategic advisory for both non - affiliated and affiliated entities • Listings, mergers, sales, etc. • Potential lead generation from retail advice platform • Typical fee = 25 bps on transaction value 2011 2012 2013 2014 Active Non - Traded Funds 5 7 9 17 Non - Traded Liquidity Events 0 1 2 4 Publicly Traded Companies Advised 1 3 2 6
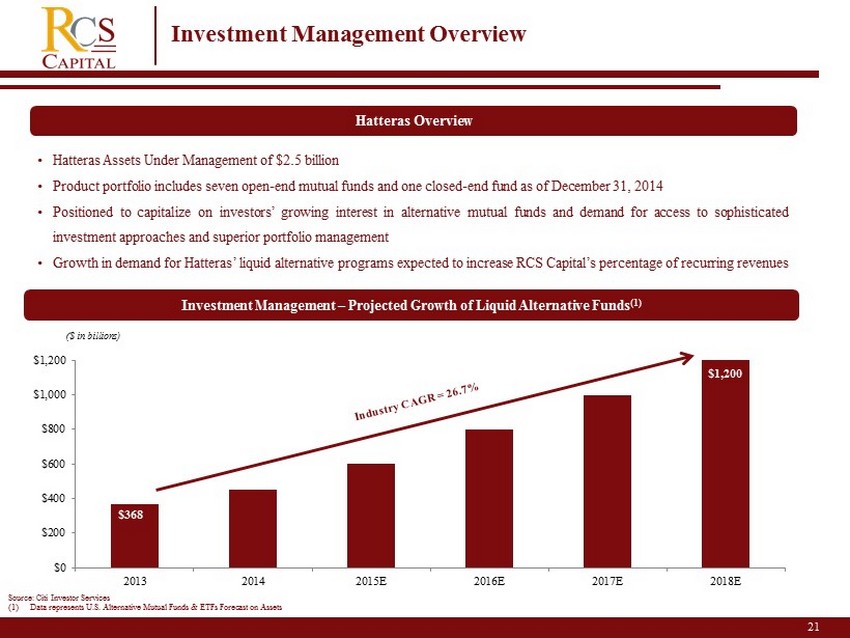
21 Investment Management Overview Hatteras Overview • Hatteras Assets Under Management of $ 2 . 5 billion • Product portfolio includes seven open - end mutual funds and one closed - end fund as of December 31 , 2014 • Positioned to capitalize on investors’ growing interest in alternative mutual funds and demand for access to sophisticated investment approaches and superior portfolio management • Growth in demand for Hatteras’ liquid alternative programs expected to increase RCS Capital’s percentage of recurring revenues Source: Citi Investor Services (1) Data represents U.S. Alternative Mutual Funds & ETFs Forecast on Assets Investment Management – Projected Growth of Liquid Alternative Funds (1) ($ in billions) $0 $200 $400 $600 $800 $1,000 $1,200 2013 2014 2015E 2016E 2017E 2018E $1,200 $368
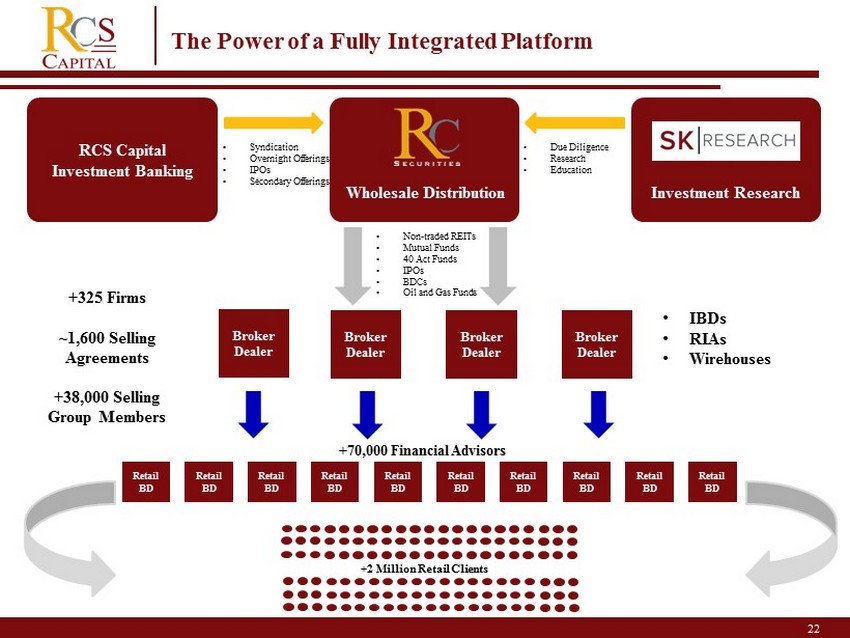
22 2 The Power of a Fully Integrated Platform +325 Firms ~ 1,600 Selling Agreements +38,000 Selling Group Members Wholesale Distribution RCS Capital Investment Banking Broker Dealer Broker Dealer Broker Dealer Broker Dealer Retail BD Retail BD Retail BD Retail BD Retail BD Retail BD Retail BD Retail BD Retail BD Retail BD +2 Million Retail Clients • Syndication • Overnight Offerings • IPOs • Secondary Offerings • Due Diligence • Research • Education • Non - traded REITs • Mutual Funds • 40 Act Funds • IPOs • BDCs • Oil and Gas Funds Investment Research • IBDs • RIAs • Wirehouses +70,000 Financial Advisors
American Realty Capital Appendix 23 2
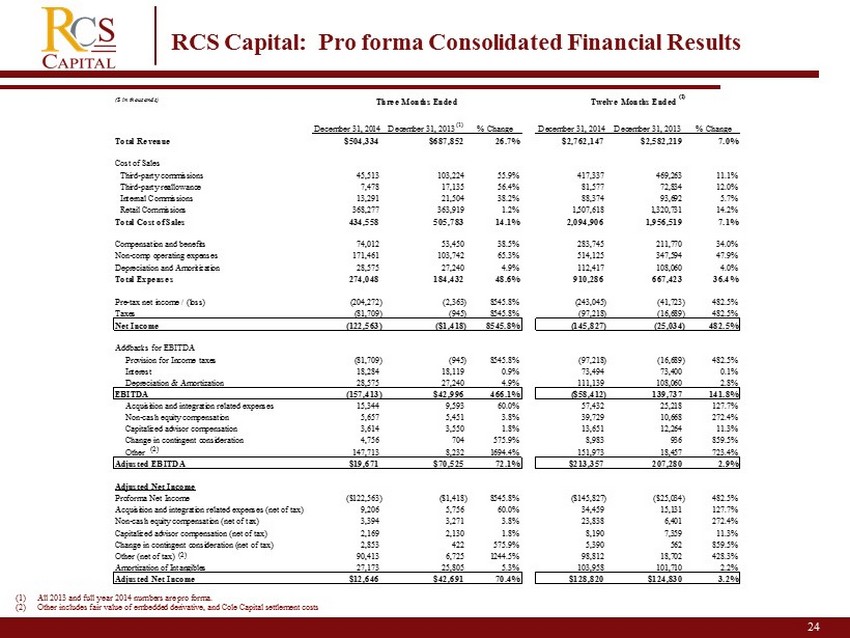
24 RCS Capital: Pro forma Consolidated Financial Results (1) All 2013 and full year 2014 numbers are pro forma. (2) Other includes fair value of embedded derivative, and Cole Capital settlement costs ($ in thousands) December 31, 2014 December 31, 2013 (1) % Change December 31, 2014 December 31, 2013 % Change Total Revenue $504,334 $687,852 26.7% $2,762,147 $2,582,219 7.0% Cost of Sales Third-party commissions 45,513 103,224 55.9% 417,337 469,263 11.1% Third-party reallowance 7,478 17,135 56.4% 81,577 72,834 12.0% Internal Commissions 13,291 21,504 38.2% 88,374 93,692 5.7% Retail Commissions 368,277 363,919 1.2% 1,507,618 1,320,731 14.2% Total Cost of Sales 434,558 505,783 14.1% 2,094,906 1,956,519 7.1% Compensation and benefits 74,012 53,450 38.5% 283,745 211,770 34.0% Non-comp operating expenses 171,461 103,742 65.3% 514,125 347,594 47.9% Depreciation and Amoritization 28,575 27,240 4.9% 112,417 108,060 4.0% Total Expenses 274,048 184,432 48.6% 910,286 667,423 36.4% Pre-tax net income / (loss) (204,272) (2,363) 8545.8% (243,045) (41,723) 482.5% Taxes (81,709) (945) 8545.8% (97,218) (16,689) 482.5% Net Income (122,563) ($1,418) 8545.8% (145,827) (25,034) 482.5% Addbacks for EBITDA Provision for Income taxes (81,709) (945) 8545.8% (97,218) (16,689) 482.5% Interest 18,284 18,119 0.9% 73,494 73,400 0.1% Depreciation & Amortization 28,575 27,240 4.9% 111,139 108,060 2.8% EBITDA (157,413) $42,996 466.1% ($58,412) 139,737 141.8% Acquisition and integration related expenses 15,344 9,593 60.0% 57,432 25,218 127.7% Non-cash equity compensation 5,657 5,451 3.8% 39,729 10,668 272.4% Capitalized advisor compensation 3,614 3,550 1.8% 13,651 12,264 11.3% Change in contingent consideration 4,756 704 575.9% 8,983 936 859.5% Other 147,713 8,232 1694.4% 151,973 18,457 723.4% Adjusted EBITDA $19,671 $70,525 72.1% $213,357 207,280 2.9% Adjusted Net Income Proforma Net Income ($122,563) ($1,418) 8545.8% ($145,827) ($25,034) 482.5% Acquisition and integration related expenses (net of tax) 9,206 5,756 60.0% 34,459 15,131 127.7% Non-cash equity compensation (net of tax) 3,394 3,271 3.8% 23,838 6,401 272.4% Capitalized advisor compensation (net of tax) 2,169 2,130 1.8% 8,190 7,359 11.3% Change in contingent consideration (net of tax) 2,853 422 575.9% 5,390 562 859.5% Other (net of tax) 90,413 6,725 1244.5% 98,812 18,702 428.3% Amortization of Intangibles 27,173 25,805 5.3% 103,958 101,710 2.2% Adjusted Net Income $12,646 $42,691 70.4% $128,820 $124,830 3.2% Three Months Ended Twelve Months Ended (1) (2) (2)
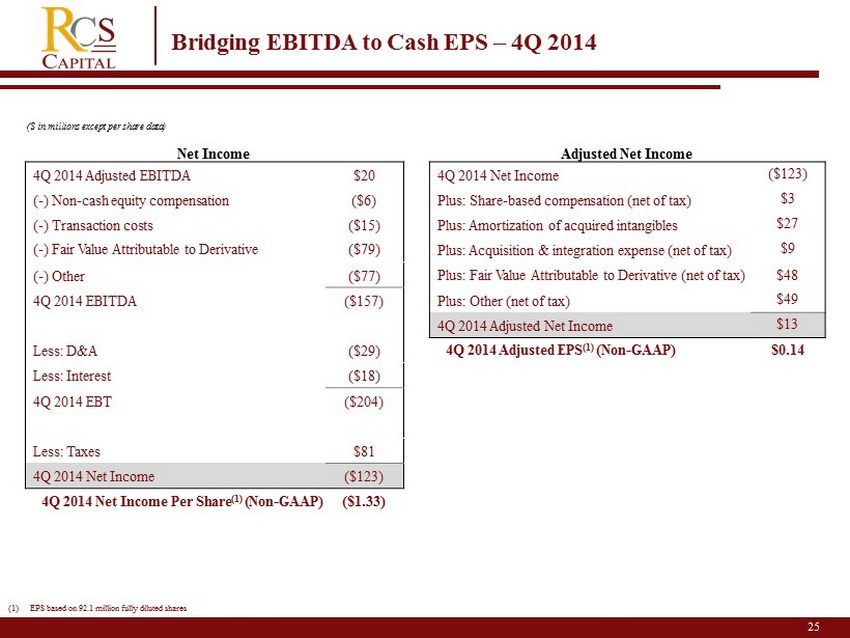
25 Bridging EBITDA to Cash EPS – 4Q 2014 (1) EPS based on 92.1 million fully diluted shares ($ in millions except per share data) Net Income Adjusted Net Income 4Q 2014 Adjusted EBITDA $20 4Q 2014 Net Income ($123) ( - ) Non - cash equity compensation ($6) Plus: Share - based compensation (net of tax) $3 ( - ) Transaction costs ($15) Plus: Amortization of acquired intangibles $27 ( - ) Fair Value Attributable to Derivative ($79) Plus: Acquisition & integration expense (net of tax) $9 ( - ) Other ($77) Plus: Fair Value Attributable to Derivative (net of tax) $48 4Q 2014 EBITDA ($157) Plus: Other (net of tax) $49 4Q 2014 Adjusted Net Income $13 Less: D&A ($29) 4Q 2014 Adjusted EPS (1) (Non - GAAP) $0.14 Less: Interest ($18) 4Q 2014 EBT ($204) Less: Taxes $81 4Q 2014 Net Income ($123) 4Q 2014 Net Income Per Share (1) (Non - GAAP) ($1.33)
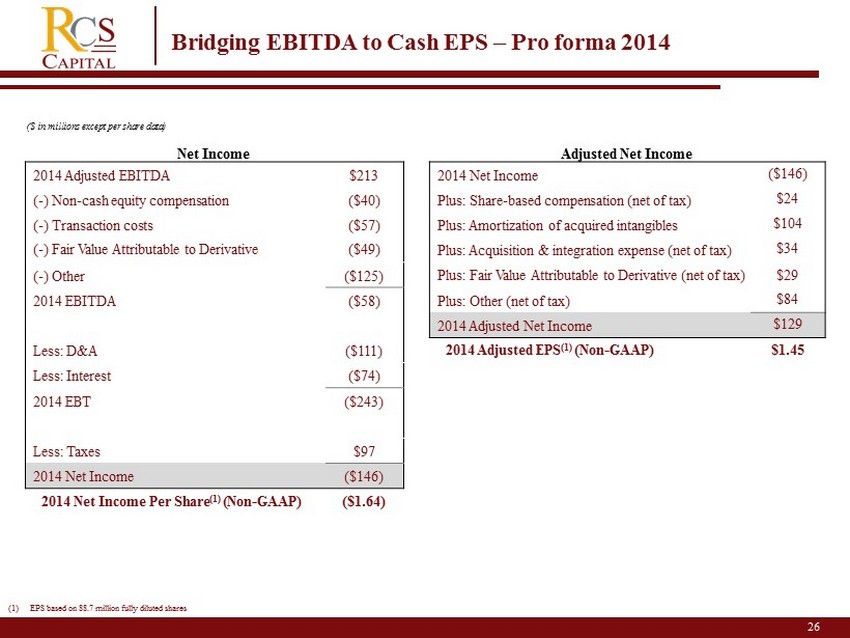
26 Bridging EBITDA to Cash EPS – Pro forma 2014 (1) EPS based on 88.7 million fully diluted shares ($ in millions except per share data) Net Income Adjusted Net Income 2014 Adjusted EBITDA $213 2014 Net Income ($146) ( - ) Non - cash equity compensation ($40) Plus: Share - based compensation (net of tax) $24 ( - ) Transaction costs ($57) Plus: Amortization of acquired intangibles $104 ( - ) Fair Value Attributable to Derivative ($49) Plus: Acquisition & integration expense (net of tax) $34 ( - ) Other ($125) Plus: Fair Value Attributable to Derivative (net of tax) $29 2014 EBITDA ($58) Plus: Other (net of tax) $84 2014 Adjusted Net Income $129 Less: D&A ($111) 2014 Adjusted EPS (1) (Non - GAAP) $1.45 Less: Interest ($74) 2014 EBT ($243) Less: Taxes $97 2014 Net Income ($146) 2014 Net Income Per Share (1) (Non - GAAP) ($1.64)

27 Consolidated Financial Condition & Key Metrics (1) Excludes deferred compensation hedge revenues (2) Based on 12 - month trailing regrettable GDC (3) Includes Strategic Capital, Hatteras Funds, and programs in registration (2) (3) Key Metrics December 31, 2014 September 30, 2014 # of Advisors 9,023 9,139 Payout Ratio 85.9% 86.2% AUA ($ billions) $214.2 $212.8 Retail Asset Under Management ($ billions) $41.3 $40.3 Average Cash Sweep Balances ($ billions) $7.6 $7.5 Recurring Revenue 60.2% 57.5% Retention % 97.0% 97.8% Net Recruitment ($ millions) $20.9 $6.2 # of Products 30 31 Adjusted EBITDA ($ millions) $19.7 $57.8 Adjusted Net Income ($ millions) $12.6 $35.5 As of Three Months Ended (1)
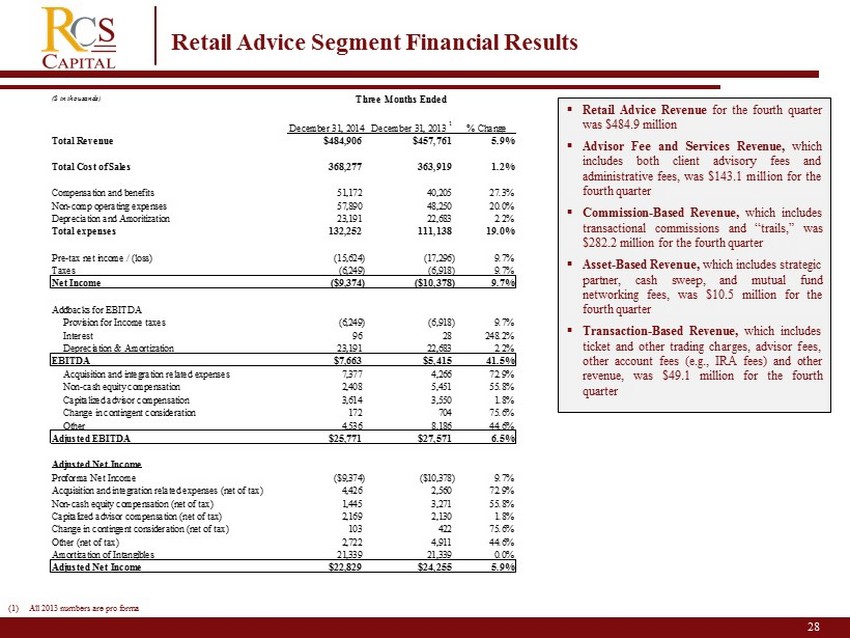
28 Retail Advice Segment Financial Results ▪ Retail Advice Revenue for the fourth quarter was $ 484 . 9 million ▪ Advisor Fee and Services Revenue, which includes both client advisory fees and administrative fees, was $ 143 . 1 million for the fourth quarter ▪ Commission - Based Revenue, which includes transactional commissions and “trails,” was $ 282 . 2 million for the fourth quarter ▪ Asset - Based Revenue, which includes strategic partner, cash sweep, and mutual fund networking fees, was $ 10 . 5 million for the fourth quarter ▪ Transaction - Based Revenue, which includes ticket and other trading charges, advisor fees, other account fees (e . g . , IRA fees) and other revenue, was $ 49 . 1 million for the fourth quarter ($ in thousands) December 31, 2014 December 31, 2013 1 % Change Total Revenue $484,906 $457,761 5.9% Total Cost of Sales 368,277 363,919 1.2% Compensation and benefits 51,172 40,205 27.3% Non-comp operating expenses 57,890 48,250 20.0% Depreciation and Amoritization 23,191 22,683 2.2% Total expenses 132,252 111,138 19.0% Pre-tax net income / (loss) (15,624) (17,296) 9.7% Taxes (6,249) (6,918) 9.7% Net Income ($9,374) ($10,378) 9.7% Addbacks for EBITDA Provision for Income taxes (6,249) (6,918) 9.7% Interest 96 28 248.2% Depreciation & Amortization 23,191 22,683 2.2% EBITDA $7,663 $5,415 41.5% Acquisition and integration related expenses 7,377 4,266 72.9% Non-cash equity compensation 2,408 5,451 55.8% Capitalized advisor compensation 3,614 3,550 1.8% Change in contingent consideration 172 704 75.6% Other 4,536 8,186 44.6% Adjusted EBITDA $25,771 $27,571 6.5% Adjusted Net Income Proforma Net Income ($9,374) ($10,378) 9.7% Acquisition and integration related expenses (net of tax) 4,426 2,560 72.9% Non-cash equity compensation (net of tax) 1,445 3,271 55.8% Capitalized advisor compensation (net of tax) 2,169 2,130 1.8% Change in contingent consideration (net of tax) 103 422 75.6% Other (net of tax) 2,722 4,911 44.6% Amortization of Intangibles 21,339 21,339 0.0% Adjusted Net Income $22,829 $24,255 5.9% Three Months Ended (1) All 2013 numbers are pro forma
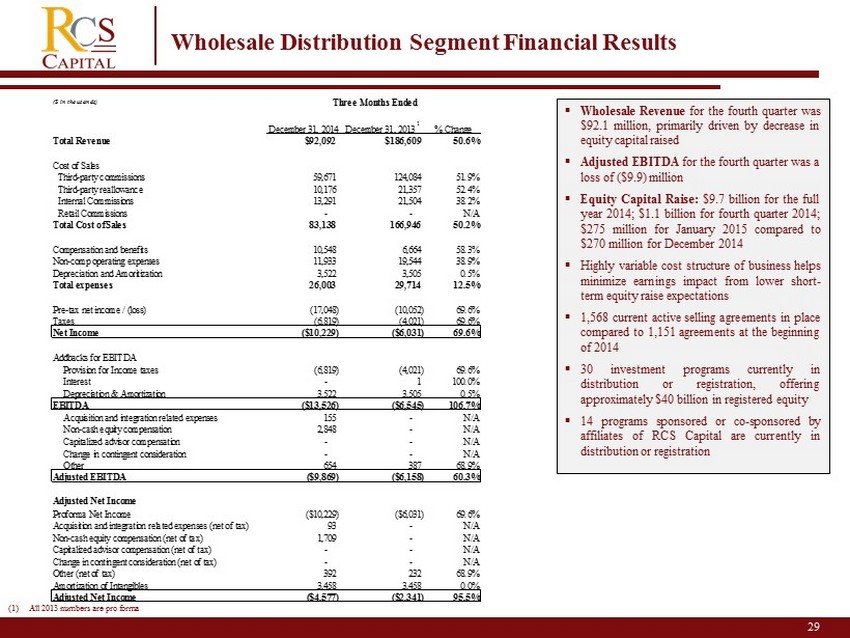
29 Wholesale Distribution Segment Financial Results ▪ Wholesale Revenue for the fourth quarter was $ 92 . 1 million, primarily driven by decrease in equity capital raised ▪ Adjusted EBITDA for the fourth quarter was a loss of ( $ 9 . 9 ) million ▪ Equity Capital Raise : $ 9 . 7 billion for the full year 2014 ; $ 1 . 1 billion for fourth quarter 2014 ; $ 275 million for January 2015 compared to $ 270 million for December 2014 ▪ Highly variable cost structure of business helps minimize earnings impact from lower short - term equity raise expectations ▪ 1 , 568 current active selling agreements in place compared to 1 , 151 agreements at the beginning of 2014 ▪ 30 investment programs currently in distribution or registration, offering approximately $ 40 billion in registered equity ▪ 14 programs sponsored or co - sponsored by affiliates of RCS Capital are currently in distribution or registration ($ in thousands) December 31, 2014 December 31, 2013 1 % Change Total Revenue $92,092 $186,609 50.6% Cost of Sales Third-party commissions 59,671 124,084 51.9% Third-party reallowance 10,176 21,357 52.4% Internal Commissions 13,291 21,504 38.2% Retail Commissions - - N/A Total Cost of Sales 83,138 166,946 50.2% Compensation and benefits 10,548 6,664 58.3% Non-comp operating expenses 11,933 19,544 38.9% Depreciation and Amoritization 3,522 3,505 0.5% Total expenses 26,003 29,714 12.5% Pre-tax net income / (loss) (17,048) (10,052) 69.6% Taxes (6,819) (4,021) 69.6% Net Income ($10,229) ($6,031) 69.6% Addbacks for EBITDA Provision for Income taxes (6,819) (4,021) 69.6% Interest - 1 100.0% Depreciation & Amortization 3,522 3,505 0.5% EBITDA ($13,526) ($6,545) 106.7% Acquisition and integration related expenses 155 - N/A Non-cash equity compensation 2,848 - N/A Capitalized advisor compensation - - N/A Change in contingent consideration - - N/A Other 654 387 68.9% Adjusted EBITDA ($9,869) ($6,158) 60.3% Adjusted Net Income Proforma Net Income ($10,229) ($6,031) 69.6% Acquisition and integration related expenses (net of tax) 93 - N/A Non-cash equity compensation (net of tax) 1,709 - N/A Capitalized advisor compensation (net of tax) - - N/A Change in contingent consideration (net of tax) - - N/A Other (net of tax) 392 232 68.9% Amortization of Intangibles 3,458 3,458 0.0% Adjusted Net Income ($4,577) ($2,341) 95.5% Three Months Ended (1) All 2013 numbers are pro forma
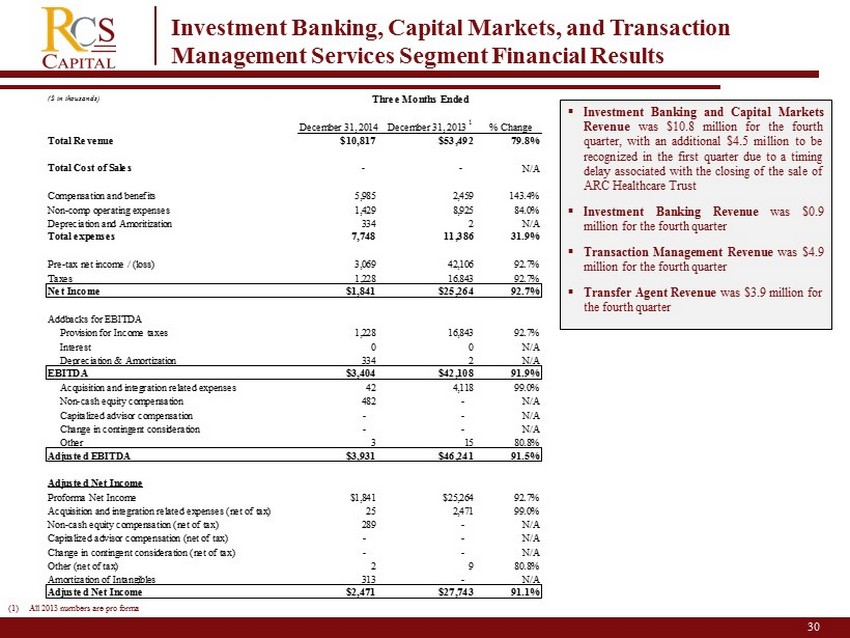
30 Investment Banking, Capital Markets, and Transaction Management Services Segment Financial Results ▪ Investment Banking and Capital Markets Revenue was $ 10 . 8 million for the fourth quarter, with an additional $ 4 . 5 million to be recognized in the first quarter due to a timing delay associated with the closing of the sale of ARC Healthcare Trust ▪ Investment Banking Revenue was $ 0 . 9 million for the fourth quarter ▪ Transaction Management Revenue was $ 4 . 9 million for the fourth quarter ▪ Transfer Agent Revenue was $ 3 . 9 million for the fourth quarter ($ in thousands) December 31, 2014 December 31, 2013 1 % Change Total Revenue $10,817 $53,492 79.8% Total Cost of Sales - - N/A Compensation and benefits 5,985 2,459 143.4% Non-comp operating expenses 1,429 8,925 84.0% Depreciation and Amoritization 334 2 N/A Total expenses 7,748 11,386 31.9% Pre-tax net income / (loss) 3,069 42,106 92.7% Taxes 1,228 16,843 92.7% Net Income $1,841 $25,264 92.7% Addbacks for EBITDA Provision for Income taxes 1,228 16,843 92.7% Interest 0 0 N/A Depreciation & Amortization 334 2 N/A EBITDA $3,404 $42,108 91.9% Acquisition and integration related expenses 42 4,118 99.0% Non-cash equity compensation 482 - N/A Capitalized advisor compensation - - N/A Change in contingent consideration - - N/A Other 3 15 80.8% Adjusted EBITDA $3,931 $46,241 91.5% Adjusted Net Income Proforma Net Income $1,841 $25,264 92.7% Acquisition and integration related expenses (net of tax) 25 2,471 99.0% Non-cash equity compensation (net of tax) 289 - N/A Capitalized advisor compensation (net of tax) - - N/A Change in contingent consideration (net of tax) - - N/A Other (net of tax) 2 9 80.8% Amortization of Intangibles 313 - N/A Adjusted Net Income $2,471 $27,743 91.1% Three Months Ended (1) All 2013 numbers are pro forma

31 Investment Management Segment Financial Results • Investment Management Revenue for the fourth quarter was $14.9 million • Pro forma Adjusted EBITDA for the fourth quarter was $ 3 . 2 million • Hatteras Funds Assets Under Management was $ 2 . 5 billion in the fourth quarter, up 3 . 8 % from the year - ago quarter • Investment Management platform currently providing eleven open - end mutual funds and two closed - end fund as of year - end 2014 ($ in thousands) December 31, 2014 December 31, 2013 1 % Change Total Revenue $14,857 $15,940 6.8% Total Cost of Sales - - N/A Compensation and benefits 2,999 4,121 27.2% Non-comp operating expenses 8,902 9,849 9.6% Depreciation and Amoritization 1,063 1,049 1.3% Total expenses 12,964 15,019 13.7% Pre-tax net income / (loss) 1,894 921 105.7% Taxes 757 368 105.7% Net Income $1,136 $552 105.7% Addbacks for EBITDA Provision for Income taxes 757 368 105.7% Interest - 46 N/A Depreciation & Amortization 1,063 1,049 1.3% EBITDA $2,956 $2,016 46.7% Acquisition and integration related expenses 71 1,214 94.1% Non-cash equity compensation - - N/A Capitalized advisor compensation - - N/A Change in contingent consideration - - N/A Other 126 - N/A Adjusted EBITDA $3,154 $3,230 2.4% Adjusted Net Income Proforma Net Income $1,136 $552 105.7% Acquisition and integration related expenses (net of tax) 43 728 N/A Non-cash equity compensation (net of tax) - - N/A Capitalized advisor compensation (net of tax) - - N/A Change in contingent consideration (net of tax) - - N/A Other (net of tax) 76 - N/A Amortization of Intangibles 1,009 1,009 0.0% Adjusted Net Income $2,263 $2,290 1.1% Three Months Ended (1) All 2013 numbers are pro forma
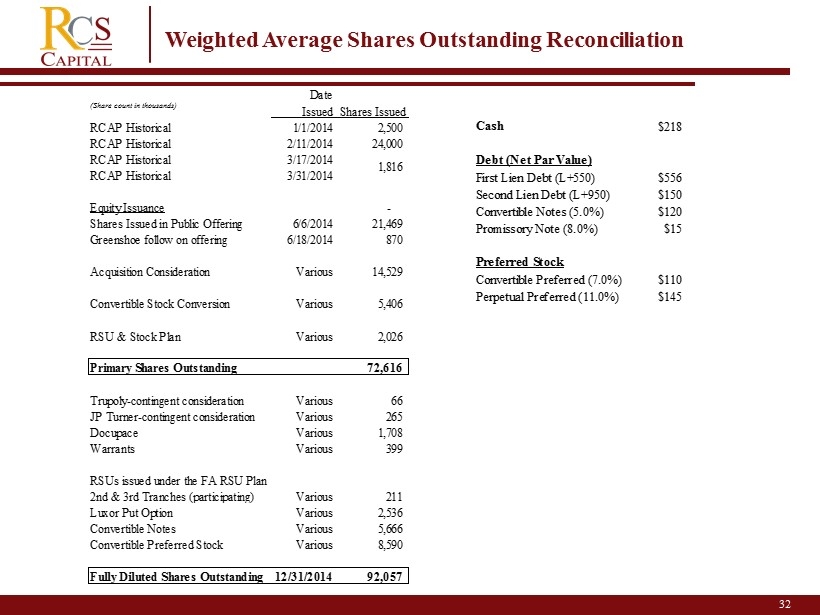
32 Weighted Average Shares Outstanding Reconciliation (Share count in thousands) Date Issued Shares Issued RCAP Historical 1/1/2014 2,500 RCAP Historical 2/11/2014 24,000 RCAP Historical 3/17/2014 RCAP Historical 3/31/2014 Equity Issuance - Shares Issued in Public Offering 6/6/2014 21,469 Greenshoe follow on offering 6/18/2014 870 Acquisition Consideration Various 14,529 Convertible Stock Conversion Various 5,406 RSU & Stock Plan Various 2,026 Primary Shares Outstanding 72,616 Trupoly-contingent consideration Various 66 JP Turner-contingent consideration Various 265 Docupace Various 1,708 Warrants Various 399 RSUs issued under the FA RSU Plan 2nd & 3rd Tranches (participating) Various 211 Luxor Put Option Various 2,536 Convertible Notes Various 5,666 Convertible Preferred Stock Various 8,590 Fully Diluted Shares Outstanding 12/31/2014 92,057 1,816 Cash $218 Debt (Par Value) First Lien Debt (L+550) $556 Second Lien Debt (L+950) $150 Convertible Notes (5.0%) $120 Promissory Note (8.0%) $15 Preferred Stock Convertible Preferred (7.0%) $110 Perpetual Preferred (11.0%) $145

33 2 Non - GAAP Measure Disclosure We use earnings before interest, taxes, depreciation and amortization, or EBITDA, adjusted EBITDA and adjusted net income, which are non - GAAP measures, as supplemental measures of our performance that are not required by, or presented in accordance with GAAP. None of the non - GAAP measures should be considered as an alternative to any other performance measure derived in accordance with GAAP. We use EBITDA, adjusted EBITDA and adjusted net income as an integral part of our report and planning processes and as one of the primary measures to, among other things: • our ability to integrate the acquired businesses into our existing businesses; • monitor and evaluate the performance of our business operations; • facilitate management’s internal comparisons of the historical operating performance of our business operations; • facilitate management’s external comparisons of the results of our overall business to the historical operating performance o f o ther companies that may have different capital structures and debt levels; • analyze and evaluate financial and strategic planning decisions regarding future operating investments; • provide useful information to investors regarding financial and business trends related to our results of operations; and • plan for and prepare future annual operating budgets and determine appropriate levels of operating investments. Pro forma Adjusted EBITDA represents earnings on a pro forma basis before interest, taxes, depreciation and amortization, sha re - based compensation, acquisition and integration related costs (including integration - related employee compensation and related costs) and other non - recurring charge s. Pro forma Adjusted Net Income represents net operating income before non - controlling interest, share - based compensation, acquisition related costs, and non - recurring cos ts. We define adjusted net income as net income attributable to the Company (using a 40% tax rate to illustrate the tax impact for comparative purposes) and adjusted to excl ude acquisition related expenses and equity - based compensation and other items. We believe similarly titled measures are frequently used by securities analysts, investors and other interested parties in th e e valuation of companies in our industry, many of which present EBITDA, adjusted EBITDA, adjusted net income and other similar metrics when rep orting their financial results. Our presentation of EBITDA, adjusted EBITDA and adjusted net income should not be construed to imply that our future results will be unaffected by unusual or nonrecurring items. The non - GAAP measures have limitations as analytical tools, and you should not consider any of these measures in isolation or as a s ubstitute for analyses of our income or cash flows as reported under GAAP. Some of these limitations are: • they do not reflect our cash expenditures, or future requirements for capital expenditures, or contractual commitments; • they do not reflect changes in, or cash requirements for, our working capital needs; • they do not reflect the significant interest expense, or the cash requirements necessary to service interest or principal payments , o n our debt; and • depreciation and amortization are non - cash expense items that are reflected in our statements of cash flows. In addition, other companies in our industry may calculate these measures differently than we do, limiting their usefulness a s a comparative measure. We compensate for these limitations by relying primarily on our GAAP results and using the non - GAAP measures only for supplemental purposes. Please see our financial statements and the related notes thereto.