united states
securities and exchange commission
washington, d.c. 20549
form n-csr
certified shareholder report of registered management
investment companies
Investment Company Act file number 811-22808
PREDEX
(Exact name of registrant as specified in charter)
17645 Wright Street, Suite 200, Omaha, NE 68130
(Address of principal executive offices) (Zip code)
Michael Achterberg, PREDEX
18500 Von Karman Ave, Suite 350 Irvine, CA 92612
(Name and address of agent for service)
Registrant's telephone number, including area code: 949-336-3445
Date of fiscal year end: 4/30
Date of reporting period:4/30/19
Item 1. Reports to Stockholders.
Annual Report
April 30, 2019

INVESTOR INFORMATION: (877) 940-7202
This report and the financial statements contained herein are submitted for the general information of shareholders and are not authorized for distribution to prospective investors unless preceded or accompanied by an effective prospectus. Nothing herein contained is to be considered an offer of sale or solicitation of an offer to buy shares of PREDEX. Such offering is made only by prospectus, which includes details as to offering price and other material information.
Distributed by Northern Lights Distributors, LLC
Member FINRA
| Beginning on January 1, 2021, as permitted by regulations adopted by the Securities and Exchange Commission, paper copies of the Fund’s shareholder reports like this one will no longer be sent by mail, unless you specifically request paper copies of the reports. Instead, the reports will be made available on the Fund’s websitepredexfund.com, and you will be notified by mail each time a report is posted and provided with a website link to access the report. |
| |
| If you already elected to receive shareholder reports electronically, you will not be affected by this change and you need not take any action. You may elect to receive shareholder reports and other communications from the Fund electronically or to continue receiving paper copies of shareholder reports, which are available free of charge, by contacting your financial intermediary (such as a broker-dealer or bank) or, if you are a direct investor, by following the instructions included with paper Fund documents that have been mailed to you. |

Dear Fellow Shareholders,
We are pleased to provide you with the PREDEX (the “Fund”) annual report. The Fund is now invested in 21 private and non-listed institutional real estate funds representing more than 2,100 properties in $149 billion of real estate. We remain committed to utilizing a low-cost, passive investment strategy to invest in the flagship U.S. core property funds managed by the leading institutional real estate sponsors.
| Portfolio | | Gross Asset | |
| Allocation | | Value ($B) | Properties |
| 4.3% | AEW Core Property Trust | $ 9.0 | 155 |
| 4.6% | American Core Realty Fund | 7.2 | 73 |
| 5.1% | Barings Core Property Fund | 3.8 | 51 |
| 1.8% | Bentall Kennedy Daily Value Fund | 0.1 | — |
| 3.7% | Black Creek Diversified Property Fund | 2.1 | 47 |
| 7.5% | BlackRock US Core Property Fund | 2.8 | 32 |
| 7.7% | CBRE U.S. Core Partners | 3.3 | 39 |
| 7.7% | Clarion Lion Properties Fund | 12.5 | 143 |
| 6.1% | GWL U.S. Property Fund | 1.1 | 40 |
| 7.4% | Invesco Core Real Estate-U.S.A. | 13.7 | 102 |
| 4.1% | Invesco U.S. Income Fund | 1.8 | 24 |
| 4.1% | JLL Income Property Trust | 2.7 | 70 |
| 4.1% | MEPT Edgemoor LP | 9.8 | 89 |
| 8.2% | PRISA LP | 25.0 | 267 |
| 1.4% | Prologis Targeted U.S. Logistics Holdings, LP | 10.8 | 566 |
| 3.0% | RREEF America REIT II | 13.8 | 108 |
| 3.0% | RREEF Core Plus Industrial Fund | 0.7 | 15 |
| 4.1% | Sentinel Real Estate Fund | 1.7 | 28 |
| 3.0% | Stockbridge Smart Markets Fund | 2.3 | 60 |
| 5.1% | UBS Trumbull Property Fund | 22.7 | 202 |
| 4.0% | USAA US Government Building Fund | 2.4 | 11 |
| 100% | TOTAL | $149.3 | 2,122 |
Information is unaudited and holdings are subject to change. The underlying fund data is as of December 31, 2018 based on allocations by the Fund as of April 30, 2019.

Performance has been very consistent, and the Fund has continued to generate a positive return every quarter. Class I shares returned +5.01% for the fiscal year ended April 30, 2019. The maximum drawdown at any time since inception is only 0.27%.
PREDEX seeks to continue to provide low volatility and relatively low correlation to the other major asset classes. The Fund is well diversified by fund manager, property type and geography.
| SECTOR | GEOGRAPHIC |
| DIVERSIFICATION | DIVERSIFICATION |
| (unaudited) | (unaudited) |
| | |
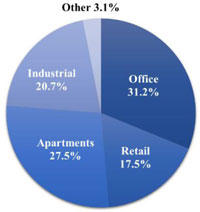 | 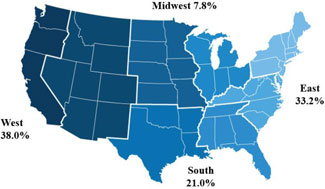 |
The charts represent the underlying fund holdings. Allocation, Sector and Geographic Diversification are subject to change. Diversification does not eliminate the risk of experiencing losses.
The Fund experienced an increase in net assets of $140 million for the fiscal year ended April 30, 2019. The Fund subsequently surpassed $200 million in net assets in mid-June and will be completing its third year of operations on June 30, 2019. We will strive to further diversify and strengthen our capital base with other investors committed to incorporating private core real estate as a long-term component of their investment portfolios.
We thank you for your investment and continued confidence in the Fund.
Sincerely,
 |  |
| | |
| Michael Achterberg, CAIA | J. Grayson Sanders |
| Portfolio Manager | Chief Investment Officer |
5530-NLD-6/25/2019
| PREDEX |
| PORTFOLIO REVIEW (Unaudited) |
| April 30, 2019 |
The Fund’s performance compared to its benchmarks for the periods ended April 30, 2019:
| | | | Since |
| | | Since | Inception |
| | | Inception | Class T and |
| | One Year | Class I(1) | Class W(2) |
| PREDEX: | | | |
| Class I | + 5.01% | + 4.38% | — |
| Class W | + 4.84% | — | + 5.59% |
| Class T – without load | + 4.84% | — | + 5.59% |
| Class T – with load(3) | + 0.38% | — | + 1.73% |
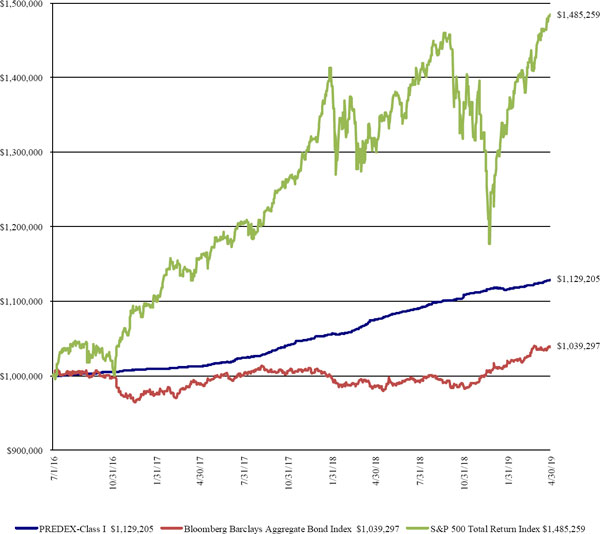
| Bloomberg Barclays Aggregate Bond Index | + 5.29% | + 1.37% | + 4.42% |
| S&P 500 Total Return Index | +13.49% | +14.99% | + 9.39% |
(1) Annualized total return since July 1, 2016 when the class commenced operations.
(2) Annualized total return since March 1, 2018 when the class commenced operations.
(3) Adjusted for initial maximum sales charge of 4.25%.
The Bloomberg Barclays Aggregate Bond Index is an unmanaged index which represents the U.S. investment-grade fixed-rate bond market (including government and corporate securities, mortgage pass-through securities and asset-backed securities). The S&P 500 Total Return Index is an unmanaged market capitalization-weighted index which is comprised of 500 of the largest U.S. domiciled companies and includes the reinvestment of all dividends. Investors cannot invest directly in an index or benchmark.
Past performance is not predictive of future results. The investment return and principal value of an investment will fluctuate. An investor’s shares, when redeemed, may be worth more or less than the original cost. Total return is calculated assuming reinvestment of all dividends and distributions. The chart does not reflect the deduction of taxes that a shareholder may have to pay on Fund distributions or the redemption of the Fund shares. For performance information current to the most recent month end, please call 877-940-7202.
Class I and Class W shares are offered at net asset value. Class T shares are offered subject to a maximum load of 4.25% of the offering price. The Fund’s investment adviser has contractually agreed to reduce its fees and absorb expenses of the Fund at least until August 31, 2020 so that the annual operating expenses (including offering expenses, but excluding taxes, interest, brokerage commissions, acquired fund fees and expenses and extraordinary expenses) will not exceed 1.15%, 1.40% and 1.40% per annum of the average daily net assets of Class I, Class T and Class W, respectively. Without the waiver the expenses would be 1.75% for Class I and 2.05% for Class T and Class W per the Fund’s November 13, 2018 supplement to the prospectus dated September 1, 2018. Please review the accompanying Financial Highlights and the Fund’s Prospectus for more details regarding the Fund’s fees and expenses.
| PREDEX |
| PORTFOLIO REVIEW (Unaudited) (Continued) |
| April 30, 2019 |
Comparison of the Change in Value of a $1,000,000 Investment (since inception through April 30, 2019):
| Portfolio Composition as of April 30, 2019 (Unaudited) |
| | | | |
| | | Percent of | |
| | | Net Assets | |
| Real Estate Investments | | | 93.9 | % |
| Short-Term Investment | | | 5.7 | % |
| Total Investments | | | 99.6 | % |
| Other Assets in Excess of Liabilities | | | 0.4 | % |
| Total Net Assets | | | 100.0 | % |
See the Portfolio of Investments in this annual report for a more detailed account of the Fund’s holdings.
| PREDEX |
| PORTFOLIO OF INVESTMENTS |
| April 30, 2019 |
| Shares | | | | | Fair Value | |
| | | | | REAL ESTATE INVESTMENTS (93.9%) | | | | |
| | | | | | | | | |
| | | | | Private Investment Funds * (86.7%) | | | | |
| | 7,193 | | | AEW Core Property Trust (U.S.), Inc. | | $ | 7,396,539 | |
| | 63 | | | American Core Realty Fund, LP | | | 7,977,629 | |
| | 66,790 | | | Barings Core Property Fund LP | | | 8,876,436 | |
| | 281,199 | | | Bentall Kennedy Daily Value Fund, LP ** | | | 3,110,567 | |
| | n/a | | | BlackRock US Core Property Fund, LP | | | 12,977,849 | |
| | 9,328,037 | | | CBRE U.S. Core Partners, LP | | | 13,324,168 | |
| | 8,790 | | | Clarion Lion Properties Fund, LP | | | 13,366,938 | |
| | n/a | | | GWL U.S. Property Fund LP | | | 10,561,757 | |
| | 69 | | | Invesco Core Real Estate-U.S.A., LP | | | 12,856,988 | |
| | 5,139 | | | Invesco U.S. Income Fund, LP | | | 7,000,903 | |
| | 3,260 | | | MEPT Edgemoor LP | | | 7,120,362 | |
| | 8,375 | | | PRISA LP | | | 14,086,415 | |
| | 1,505 | | | Prologis Targeted U.S. Logistics Holdings, LP | | | 2,454,107 | |
| | 41,638 | | | RREEF America REIT II, Inc. | | | 5,204,696 | |
| | 41,264 | | | RREEF Core Plus Industrial Fund LP | | | 5,167,104 | |
| | 79 | | | Sentinel Real Estate Fund, LP | | | 7,025,871 | |
| | 3,288 | | | Stockbridge Smart Markets Fund, LP | | | 5,125,478 | |
| | 791 | | | UBS Trumbull Property Fund LP | | | 8,873,509 | |
| | n/a | | | USAA US Government Building Fund | | | 6,932,078 | |
| | | | | Total Private Investment Funds (Cost $154,881,101) | | | 159,439,394 | |
| | | | | | | | | |
| | | | | Public Non-Traded Funds (7.2%) | | | | |
| | 863,001 | | | Black Creek Diversified Property Fund (Class I) | | | 6,311,130 | |
| | 575,443 | | | Jones Lang LaSalle Income Property Trust, Inc. (Class M-I) | | | 7,003,144 | |
| | | | | Total Public Non-Traded Funds (Cost $12,837,836) | | | 13,314,274 | |
| | | | | | | | | |
| | | | | TOTAL REAL ESTATE INVESTMENTS (Cost $167,718,937) | | | 172,753,668 | |
| | | | | | | | | |
| | | | | SHORT-TERM INVESTMENT (5.7%) | | | | |
| | 10,465,827 | | | Dreyfus Treasury & Agency Cash Management, Institutional Shares, 2.33% + | | | | |
| | | | | (Cost $10,465,827) | | | 10,465,827 | |
| | | | | | | | | |
| | | | | TOTAL INVESTMENTS (99.6%) | | | | |
| | | | | (Cost $178,184,764) | | | 183,219,495 | |
| | | | | | | | | |
| | | | | OTHER ASSETS IN EXCESS OF LIABILITIES (0.4%) | | | 702,841 | |
| | | | | | | | | |
| | | | | NET ASSETS (100.0%) | | $ | 183,922,336 | |
LP - Limited Partnership
| + | Money market fund; interest rate reflects seven-day effective yield on April 30, 2019. |
| * | Fair value estimated using Fair Valuation Procedures adopted by the Board of Trustees as discussed in the notes. |
| ** | Bentall Kennedy Daily Value Fund, L.P. (“DVF”) was designed to allow limited partners to invest in MEPT Edgemoor LP (“MEPT”) through a vehicle that provides daily valuation and enhanced liquidity. DVF targets an allocation of approximately 85% to MEPT, 10% to liquid real estate related securities and 5% to cash equivalents. |
See Notes to Financial Statements.
| PREDEX |
| STATEMENT OF ASSETS AND LIABILITIES |
| April 30, 2019 |
| ASSETS | | | | |
| Investments at fair value (identified cost $178,184,764) | | $ | 183,219,495 | |
| Cash | | | 1,198 | |
| Dividends and interest receivable | | | 493,730 | |
| Receivable for fund shares sold | | | 374,764 | |
| Prepaid expenses and other assets | | | 27,530 | |
| Total Assets | | | 184,116,717 | |
| | | | | |
| LIABILITIES | | | | |
| Accrued advisory fee | | | 110,318 | |
| Distribution fees payable | | | 21 | |
| Accrued expenses and other liabilities | | | 84,042 | |
| Total Liabilities | | | 194,381 | |
| NET ASSETS | | $ | 183,922,336 | |
| | | | | |
| COMPONENTS OF NET ASSETS | | | | |
| Paid-in capital | | $ | 176,277,555 | |
| Accumulated earnings | | | 7,644,781 | |
| NET ASSETS | | $ | 183,922,336 | |
| | | | | |
| Class I | | | | |
| Net assets | | $ | 183,803,396 | |
| Shares of beneficial interest outstanding (no par value; unlimited shares authorized) | | | 6,993,509 | |
| Net asset value, offering and redemption price per share | | $ | 26.28 | |
| | | | | |
| Class T | | | | |
| Net assets | | $ | 93,145 | |
| Shares of beneficial interest outstanding (no par value; unlimited shares authorized) | | | 3,543 | |
| Net asset value and redemption price per share | | $ | 26.29 | |
| Maximum offering price per share (maximum sales charge of 4.25%) | | $ | 27.46 | |
| | | | | |
| Class W | | | | |
| Net assets | | $ | 25,795 | |
| Shares of beneficial interest outstanding (no par value; unlimited shares authorized) | | | 981 | |
| Net asset value, offering and redemption price per share | | $ | 26.29 | |
See Notes to Financial Statements.
| PREDEX |
| STATEMENT OF OPERATIONS |
| For the Year Ended April 30, 2019 |
| INVESTMENT INCOME | | | | |
| Dividend income | | $ | 3,191,266 | |
| Interest income | | | 248,281 | |
| Total Investment Income | | | 3,439,547 | |
| | | | | |
| EXPENSES | | | | |
| Investment advisory fees | | | 635,065 | |
| Distribution fees: | | | | |
| Class T | | | 33 | |
| Class W | | | 61 | |
| Shareholder service fees | | | 118,667 | |
| Administration fees | | | 100,714 | |
| Trustees fees | | | 74,836 | |
| Transfer agent fees | | | 57,820 | |
| Legal fees | | | 54,397 | |
| Audit and tax fees | | | 48,197 | |
| Fund accounting fees | | | 48,138 | |
| Registration fees | | | 44,673 | |
| Professional fees | | | 37,324 | |
| Printing fees | | | 29,163 | |
| Insurance fees | | | 19,781 | |
| Custodian fees | | | 2,231 | |
| Miscellaneous expenses | | | 4,500 | |
| Total Expenses | | | 1,275,600 | |
| | | | | |
| Net expenses recouped (waived) by Advisor | | | 72,469 | |
| Net Expenses | | | 1,348,069 | |
| Net Investment Income | | | 2,091,478 | |
| | | | | |
| REALIZED AND UNREALIZED GAIN ON INVESTMENTS | | | | |
| Net realized gain from distributions of long-term capital gain from investment funds | | | 50,824 | |
| Net change in unrealized appreciation on investments | | | 3,115,510 | |
| Net Realized and Unrealized Gain on Investments | | | 3,166,334 | |
| Net Increase in Net Assets Resulting from Operations | | $ | 5,257,812 | |
See Notes to Financial Statements.
| PREDEX |
| STATEMENTS OF CHANGES IN NET ASSETS |
| | | For the | | | For the | |
| | | Year Ended | | | Year Ended | |
| | | April 30, 2019 | | | April 30, 2018 | |
| INCREASE IN NET ASSETS FROM OPERATIONS | | | | | | | | |
| Net investment income | | $ | 2,091,478 | | | $ | 700,603 | |
| Net realized gain from distributions of long-term capital gain from investment funds | | | 50,824 | | | | 20,805 | |
| Net change in unrealized appreciation on investments | | | 3,115,510 | | | | 1,779,979 | |
| Net Increase in Net Assets Resulting from Operations | | | 5,257,812 | | | | 2,501,387 | |
| | | | | | | | | |
| DISTRIBUTIONS TO SHAREHOLDERS(i) | | | | | | | | |
| Class I: | | | | | | | | |
| From distributable earnings | | | (66,611 | ) | | | (349,135 | ) (ii) |
| From return of capital | | | (4,355,324 | ) | | | (676,677 | ) |
| Class T(a): | | | | | | | | |
| From distributable earnings | | | (2 | ) | | | — | |
| From return of capital | | | (104 | ) | | | (22 | ) |
| Class W(a): | | | | | | | | |
| From distributable earnings | | | (15 | ) | | | — | |
| From return of capital | | | (981 | ) | | | (22 | ) |
| Total Distributions to Shareholders | | | (4,423,037 | ) | | | (1,025,856 | ) |
| | | | | | | | | |
| BENEFICIAL INTEREST TRANSACTIONS | | | | | | | | |
| Class I: | | | | | | | | |
| Proceeds from shares issued | | | 156,366,671 | | | | 4,877,762 | |
| Distributions reinvested | | | 1,146,661 | | | | 22,094 | |
| Payments for shares redeemed | | | (18,578,738 | ) | | | (2,211,165 | ) |
| Class T(a): | | | | | | | | |
| Proceeds from shares issued | | | 89,712 | | | | 2,589 | |
| Distributions reinvested | | | 106 | | | | 22 | |
| Class W(a): | | | | | | | | |
| Proceeds from shares issued | | | 22,000 | | | | 2,589 | |
| Distributions reinvested | | | 996 | | | | 22 | |
| Total Beneficial Interest Transactions | | | 139,047,408 | | | | 2,693,913 | |
| Increase in Net Assets | | | 139,882,183 | | | | 4,169,444 | |
| | | | | | | | | |
| NET ASSETS | | | | | | | | |
| Beginning of year | | | 44,040,153 | | | | 39,870,709 | |
| End of year | | $ | 183,922,336 | | | $ | 44,040,153 | (iii) |
| (i) | The Distributions to Shareholders for the prior year ended April 30, 2018 have been reclassified to conform to the current year presentation. See “Recent Accounting Pronouncements” in the Notes to Financial Statements for more information. |
| (ii) | For the year ended April 30, 2018, distributions from distributable earnings consisted of $349,135 net investment income and $0 net realized gains. |
| (iii) | Net Assets - End of year includes accumulated net investment income of $524,331 as of April 30, 2018. |
| SHARE ACTIVITY | | | | | | | | |
| Class I: | | | | | | | | |
| Shares issued | | | 5,970,937 | | | | 189,537 | |
| Shares reinvested | | | 43,863 | | | | 858 | |
| Shares redeemed | | | (708,288 | ) | | | (86,130 | ) |
| Net increase in shares of beneficial interest outstanding | | | 5,306,512 | | | | 104,265 | |
| Class T(a): | | | | | | | | |
| Shares issued | | | 3,438 | | | | 100 | |
| Shares reinvested | | | 4 | | | | 1 | |
| Net increase in shares of beneficial interest outstanding | | | 3,442 | | | | 101 | |
| Class W(a): | | | | | | | | |
| Shares issued | | | 842 | | | | 100 | |
| Shares reinvested | | | 38 | | | | 1 | |
| Net increase in shares of beneficial interest outstanding | | | 880 | | | | 101 | |
| (a) | Class T and Class W commenced operations on March 1, 2018. |
See Notes to Financial Statements.
| PREDEX |
| STATEMENT OF CASH FLOWS |
| For the Year Ended April 30, 2019 |
| Cash Flows from Operating Activities | | | | |
| Net increase in net assets resulting from operations | | $ | 5,257,812 | |
| Adjustments to reconcile net increase in net assets resulting from operations to net cash used in operating activities: | | | | |
| Purchases of real estate investments | | | (128,917,568 | ) |
| Net purchase of short term investments | | | (7,624,370 | ) |
| Net realized gain from distributions of long-term capital gain from investment funds | | | (50,824 | ) |
| Net change in unrealized appreciation on investments | | | (3,115,510 | ) |
| | | | | |
| (Increase)/Decrease in assets: | | | | |
| Advance contribution to private investment fund | | | 400,000 | |
| Due from advisor, net | | | 26,123 | |
| Dividends and interest receivable | | | (390,615 | ) |
| Prepaid expenses and other assets | | | 29,564 | |
| Increase/(Decrease) in liabilities: | | | | |
| Accrued advisory fee | | | 110,318 | |
| Distribution fees payable | | | 19 | |
| Accrued expenses and other liabilities | | | 25,811 | |
| Net cash used in operating activities | | | (134,249,240 | ) |
| | | | | |
| Cash Flows from Financing Activities | | | | |
| Proceeds from shares issued (net of change in receivable for fund shares sold) | | | 156,103,619 | |
| Payments for shares redeemed | | | (18,578,738 | ) |
| Cash distributions paid | | | (3,275,274 | ) |
| Net cash provided by financing activities | | | 134,249,607 | |
| | | | | |
| Net increase in cash | | | 367 | |
| Cash at beginning of year | | | 831 | |
| Cash at end of year | | $ | 1,198 | |
| | | | | |
| Supplemental disclosure of non-cash activity: | | | | |
| Non-cash financing activities not included herein consists of reinvestment of dividends | | $ | 1,147,763 | |
See Notes to Financial Statements.
| PREDEX |
| FINANCIAL HIGHLIGHTS |
The table below sets forth financial data for one share of capital stock outstanding throughout each year presented.
| | | Class I | |
| | | For the | | | For the | | | For the | | | For the | | | For the | |
| | | Year Ended | | | Year Ended | | | Year Ended | | | Year Ended | | | Year Ended | |
| | | April 30, | | | April 30, | | | April 30, | | | April 30, | | | April 30, | |
| | | 2019 | | | 2018 | | | 2017 (1) | | | 2016 | | | 2015 | |
| | | | | | | | | | | | | | | | |
| Net Asset Value, Beginning of Year | | $ | 26.10 | | | $ | 25.19 | | | $ | 25.00 | | | $ | 25.00 | | | $ | 25.00 | |
| From Operations: | | | | | | | | | | | | | | | | | | | | |
| Net investment income (a) | | | 0.48 | | | | 0.43 | | | | 0.00 | | | | — | | | | — | |
| Net gain from investments (both realized and unrealized) | | | 0.80 | | | | 1.11 | | | | 0.31 | | | | — | | | | — | |
| Total from operations | | | 1.28 | | | | 1.54 | | | | 0.31 | | | | — | | | | — | |
| Less Distributions: | | | | | | | | | | | | | | | | | | | | |
| From distributable earnings | | | (0.02 | ) | | | (0.21 | ) | | | (0.11 | ) | | | — | | | | — | |
| From net realized gain | | | — | | | | — | | | | (0.01 | ) | | | — | | | | — | |
| From return of capital | | | (1.08 | ) | | | (0.42 | ) | | | — | | | | — | | | | — | |
| Total distributions | | | (1.10 | ) | | | (0.63 | ) | | | (0.12 | ) | | | — | | | | — | |
| Net Asset Value, End of Year | | $ | 26.28 | | | $ | 26.10 | | | $ | 25.19 | | | $ | 25.00 | | | $ | 25.00 | |
| Total Return (b) | | | 5.01 | % | | | 6.18 | % | | | 1.27 | % | | | 0.00 | % | | | 0.00 | % |
| Ratios/Supplemental Data: | | | | | | | | | | | | | | | | | | | | |
| Net assets, end of year (in 000’s) | | $ | 183,803 | | | $ | 44,034 | | | $ | 39,871 | | | $ | 100 | | | $ | 100 | |
| Ratio of expenses to average net assets (c): | | | | | | | | | | | | | | | | | | | | |
| before reimbursement/recapture | | | 1.10 | % | | | 1.73 | % | | | 3.63 | % (e) | | | 57.26 | % | | | 2.25 | % |
| after reimbursement/recapture | | | 1.16 | % | | | 1.20 | % | | | 1.20 | % (e) | | | 0.00 | % | | | 0.00 | % |
| Ratio of net investment income to average net assets (c) (d) | | | 1.81 | % | | | 1.70 | % | | | 0.02 | % (e) | | | 0.00 | % | | | 0.00 | % |
| Portfolio turnover rate | | | 0 | % | | | 0 | % | | | 0 | % | | | 0 | % | | | 0 | % |
| (1) | Commencement of operations was July 1, 2016. |
| (a) | Per share amounts calculated using the average shares method, which more appropriately presents the per share data for the year. |
| (b) | Total returns are historical in nature and assume changes in share price, reinvestment of dividends and capital gain distributions, if any. Had the advisor not recouped historically waived fees or absorbed a portion of the expenses, total return would have been higher and lower, respectively. |
| (c) | Does not include expenses of investment companies in which the Fund invests. The Fund’s Total Return is reported net of all fees and expenses. |
| (d) | Recognition of net investment income by the Fund is affected by the timing and declaration of dividends by the underlying investment companies in which the Fund invests. |
| (e) | Recurring expenses that were not charged until the Fund commenced operations on July 1, 2016 have been annualized. |
See Notes to Financial Statements.
| PREDEX |
| FINANCIAL HIGHLIGHTS (Continued) |
The table below sets forth financial data for one share of capital stock outstanding throughout each year/period presented.
| | | Class T | | | Class W | |
| | | For the | | | For the | | | For the | | | For the | |
| | | Year Ended | | | Period Ended | | | Year Ended | | | Period Ended | |
| | | April 30, | | | April 30, | | | April 30, | | | April 30, | |
| | | 2019 | | | 2018 (1) | | | 2019 | | | 2018 (1) | |
| | | | | | | | | | | | | |
| Net Asset Value, Beginning of Period | | $ | 26.09 | | | $ | 25.89 | | | $ | 26.09 | | | $ | 25.89 | |
| From Operations: | | | | | | | | | | | | | | | | |
| Net investment income (a) | | | 0.58 | | | | 0.08 | | | | 0.47 | | | | 0.08 | |
| Net gain from investments (both realized and unrealized) | | | 0.66 | | | | 0.34 | | | | 0.77 | | | | 0.34 | |
| Total from operations | | | 1.24 | | | | 0.42 | | | | 1.24 | | | | 0.42 | |
| Less Distributions: | | | | | | | | | | | | | | | | |
| From distributable earnings | | | (0.02 | ) | | | — | | | | (0.02 | ) | | | — | |
| From return of capital | | | (1.02 | ) | | | (0.22 | ) | | | (1.02 | ) | | | (0.22 | ) |
| Total distributions | | | (1.04 | ) | | | (0.22 | ) | | | (1.04 | ) | | | (0.22 | ) |
| Net Asset Value, End of Period | | $ | 26.29 | | | $ | 26.09 | | | $ | 26.29 | | | $ | 26.09 | |
| Total Return (b) | | | 4.84 | % | | | 1.63 | % (f) | | | 4.84 | % | | | 1.63 | % (f) |
| Ratios/Supplemental Data: | | | | | | | | | | | | | | | | |
| Net assets, end of period (in 000’s) | | $ | 93 | | | $ | 3 | | | $ | 26 | | | $ | 3 | |
| Ratio of expenses to average net assets (c): | | | | | | | | | | | | | | | | |
| before reimbursement | | | 1.20 | % | | | 2.41 | % (e) | | | 1.32 | % | | | 2.41 | % (e) |
| after reimbursement | | | 1.19 | % | | | 1.45 | % (e) | | | 1.29 | % | | | 1.45 | % (e) |
| Ratio of net investment income to average net assets (c) (d) | | | 2.19 | % | | | 1.87 | % (e) | | | 1.77 | % | | | 1.87 | % (e) |
| Portfolio turnover rate | | | 0 | % | | | 0 | % (f) | | | 0 | % | | | 0 | % (f) |
| (1) | Commencement of operations was March 1, 2018. |
| (a) | Per share amounts calculated using the average shares method, which more appropriately presents the per share data for the period. |
| (b) | Total returns are historical in nature and assume changes in share price, reinvestment of dividends and capital gain distributions, if any. Had the advisor not recaptured historically waived fees or absorbed a portion of the expenses, total return would have been higher and lower, respectively. |
| (c) | Does not include expenses of investment companies in which the Fund invests. The Fund’s Total Return is reported net of all fees and expenses. |
| (d) | Recognition of net investment income by the Fund is affected by the timing and declaration of dividends by the underlying investment companies in which the Fund invests. |
See Notes to Financial Statements.
| PREDEX |
| NOTES TO FINANCIAL STATEMENTS |
| April 30, 2019 |
PREDEX (the “Fund”) is registered under the Investment Company Act of 1940, as amended (the “1940 Act”), as a closed-end management investment company. The Fund is non-diversified, engages in a continuous offering of shares and operates as an interval fund that offers to make quarterly repurchases of shares at net asset value. The Fund’s investment advisor is PREDEX Capital Management, LLC (the “Advisor”).
The primary investment objective of the Fund is to seek consistent current income while secondarily seeking long-term capital appreciation with moderate volatility.
The Fund was organized as a statutory trust on February 5, 2013 under the laws of the State of Delaware.
The Fund currently offers Class I, Class T and Class W shares. The Fund commenced operations July 1, 2016 with a single class of shares which was renamed Class I on March 1, 2018. Class T and Class W shares commenced operations on March 1, 2018. Class T shares are offered at net asset value plus a maximum sales charge of 4.25%. Class I and Class W shares are offered at net asset value. Each class represents an interest in the same assets of the Fund and classes are identical except for differences in their sales charge structures and ongoing service and distribution charges. All classes of shares have equal voting privileges except that each class has exclusive voting rights with respect to its service and/or distribution plans. The Fund’s income, expenses (other than class specific distribution fees) and realized and unrealized gains and losses are allocated proportionately each day based upon the relative net assets of each class.
| (2) | SIGNIFICANT ACCOUNTING POLICIES |
The following is a summary of significant accounting policies followed by the Fund in preparation of its financial statements. These policies are in conformity with accounting principles generally accepted in the United States of America (“GAAP”). The Fund is an investment company and accordingly follows the investment company accounting and reporting guidance of the Financial Accounting Standards Board (FASB) Accounting Standard Codification Topic 946 “Financial Services Investment Companies” including FASB Accounting Standard Update ASU 2013-08. The preparation of financial statements requires management to make estimates and assumptions that affect the reported amounts of assets and liabilities and disclosure of contingent assets and liabilities at the date of the financial statements and the reported amounts of income and expenses for the period. Actual results could differ from those estimates.
Security Valuation –The Fund uses fair valuation procedures to value a substantial portion of its assets. The Fund uses the fair value of a security to calculate its net asset value (“NAV”) when, for example, (1) a portfolio security is not traded in a public market or the principal market in which the security trades is closed, (2) trading in a portfolio security is suspended and not resumed prior to the normal market close, (3) a portfolio security is not traded in significant volume for a substantial period, or (4) the Advisor determines that the quotation or price for a portfolio security provided by a broker-dealer or independent pricing service is inaccurate. Short-term investments having 60 days or less remaining until maturity, at time of purchase, are valued at amortized cost.
Valuation of Private Investment Funds –The Fund invests a significant portion of its assets in Private Investment Funds (each a “Private Fund” and collectively, the “Private Funds”). The Private Funds measure their real estate investments at fair value, and report a NAV per share on typically a calendar quarter basis. The Fund estimates the fair value of each Private Fund by adjusting the most recent NAV for each Private Fund by the change in a proprietary benchmark that the Fund has deemed to be representative of the entire Private Fund market. If an underlying fund manager reports the NAV per share (or its equivalent) to the Fund on a daily basis, then that unadjusted NAV per share is used to value the investment. Use of a NAV
| PREDEX |
| NOTES TO FINANCIAL STATEMENTS (Continued) |
| April 30, 2019 |
per share is commonly used as an acceptable valuation technique for investments in private investment companies, and is referred to as the “practical expedient” by ASC 820 Fair Value Measurement.
Fair Value Process – The “fair value” of securities may be difficult to determine and thus judgment plays a greater role in the valuation process. The fair valuation methodology may include or consider the following guidelines, as appropriate: (1) evaluation of all relevant factors, including but not limited to, pricing history, current market level, supply and demand of the respective security; (2) comparison to the values and current pricing of securities that have comparable characteristics; (3) knowledge of historical market information with respect to the security; (4) other factors relevant to the security which would include, but not be limited to, duration, yield, fundamental analytical data, the Treasury yield curve, and credit quality.
The values assigned to fair valued investments will be based on available information and will not necessarily represent amounts that might ultimately be realized, since such amounts depend on future developments inherent in long-term investments. Changes in the fair valuation of portfolio securities may be less frequent and of greater magnitude than changes in the price of portfolio securities valued at their last sale price, by an independent pricing service, or based on market quotations. Imprecision in estimating fair value can also impact the amount of unrealized appreciation or depreciation recorded for a particular portfolio security and differences in the assumptions used could result in a different determination of fair value, and those differences could be material.
The Fund utilizes various methods to measure the fair value of its investments on a recurring basis. GAAP establishes a hierarchy that prioritizes inputs to valuation methods. The three levels of input are:
Level 1 – Unadjusted quoted prices in active markets for identical assets and liabilities that the Fund has the ability to access.
Level 2 – Observable inputs other than quoted prices included in Level 1 that are observable for the asset or liability, either directly or indirectly. These inputs may include quoted prices for the identical instrument on an inactive market, prices for similar instruments, interest rates, prepayment speeds, credit risk, yield curves, default rates and similar data.
Level 3 –Unobservable inputs for the asset or liability, to the extent relevant observable inputs are not available, representing the Fund’s own assumptions about the assumptions a market participant would use in valuing the asset or liability, and would be based on the best information available.
The availability of observable inputs can vary from security to security and is affected by a wide variety of factors, including, for example, the type of security, whether the security is new and not yet established in the marketplace, the liquidity of markets, and other characteristics particular to the security. To the extent that valuation is based on models or inputs that are less observable or unobservable in the market, the determination of fair value requires more judgment. Accordingly, the degree of judgment exercised in determining fair value is greatest for instruments categorized in Level 3.
The inputs used to measure fair value may fall into different levels of the fair value hierarchy. In such cases, for disclosure purposes, the level in the fair value hierarchy within which the fair value measurement falls in its entirety, is determined based on the lowest level input that is significant to the fair value measurement in its entirety.
| PREDEX |
| NOTES TO FINANCIAL STATEMENTS (Continued) |
| April 30, 2019 |
The inputs or methodology used for valuing securities are not necessarily an indication of the risk associated with investing in those securities. The following tables summarize the inputs used as of April 30, 2019 for the Fund’s assets and liabilities measured at fair value:
| Investments* | | Level 1 | | | Level 2 | | | Level 3 | | | Total Value | |
| Real Estate Investments | | $ | 13,314,274 | | | $ | — | | | $ | 156,328,827 | | | $ | 169,643,101 | |
| Short-Term Investment | | | 10,465,827 | | | | — | | | | — | | | | 10,465,827 | |
| Subtotal | | $ | 23,780,101 | | | $ | — | | | $ | 156,328,827 | | | $ | 180,108,928 | |
| Private Investment Fund** | | | | | | | | | | | | | | $ | 3,110,567 | |
| Total Investments | | | | | | | | | | | | | | $ | 183,219,495 | |
| * | Refer to the Portfolio of Investments for a more detailed account of the Fund’s holdings. |
| ** | A private fund investment that is daily measured at fair value using the NAV per share (or its equivalent) practical expedient has not been categorized in the fair value hierarchy. |
It is the Fund’s policy to recognize transfers into or out of Level 1, Level 2, or Level 3 at the end of the reporting period. There were no transfers into or out of Level 1, Level 2, or Level 3 during the current year.
The following is a reconciliation of assets in which Level 3 inputs were used in determining fair value:
| | | Level 3 | |
| | | Investments | |
| Beginning balance | | $ | 37,387,232 | |
| Cost of purchases | | | 116,217,880 | |
| Change in unrealized appreciation | | | 2,723,715 | |
| Proceeds from sales | | | — | |
| Realized gain (loss) | | | — | |
| Net transfers in/out of Level 3 | | | — | |
| Ending balance | | $ | 156,328,827 | |
Security Transactions and Investment Income – Investment security transactions are accounted for on a trade date basis. Cost is determined and gains and losses are based upon the specific identification method for both financial statement and federal income tax purposes. Dividend income is recorded on the ex-dividend date and interest income is recorded on the accrual basis. Purchase discounts and premiums on securities are accreted and amortized over the life of the respective securities.
Federal Income Taxes – The Fund intends to qualify as a “regulated investment company” under Subchapter M of the Internal Revenue Code of 1986, as amended, and, if so qualified, will not be liable for federal income taxes to the extent earnings are distributed to shareholders on a timely basis. Accordingly, no provision for Federal income taxes is required in the financial statements.
As of April 30, 2019, the Fund had no uncertain tax positions that would require financial statement recognition, de-recognition or disclosure. Management has analyzed the Fund’s tax positions and has concluded that no liability for unrecognized tax benefits should be recorded related to uncertain tax positions for open tax years ended April 30, 2017 and April 30, 2018 or expected to be taken in the Fund’s April 30, 2019 year-end tax return. The Fund’s federal tax returns are subject to examination by the Internal Revenue Service for a period of three years after filing.
| PREDEX |
| NOTES TO FINANCIAL STATEMENTS (Continued) |
| April 30, 2019 |
Distributions to Shareholders – Distributions from investment income, if any, are declared and paid quarterly. Distributions from net realized capital gains, if any, are declared and paid annually and are recorded on the ex-dividend date. The character of income and gains to be distributed is determined in accordance with income tax regulations, which may differ from GAAP.
Indemnification– The Fund indemnifies its officers and trustees for certain liabilities that may arise from the performance of their duties to the Fund. Additionally, in the normal course of business, the Fund enters into contracts that contain a variety of representations and warranties which provide general indemnities. The Fund’s maximum exposure under these arrangements is unknown, as this would involve future claims that may be made against the Fund that have not yet occurred. However, the Fund expects the risk of loss due to these warranties and indemnities to be remote.
| (3) | INVESTMENT ADVISORY AGREEMENT AND TRANSACTIONS WITH RELATED PARTIES |
Advisory Fees – Pursuant to an investment advisory agreement with the Trust, with respect to the Fund (the “Advisory Agreement”), investment advisory services are provided to the Fund by the Advisor. Under the terms of the Advisory Agreement, the Advisor receives monthly fees calculated at an annual rate of 0.55% of the average daily net assets of the Fund. For the year ended April 30, 2019, the Advisor earned advisory fees of $635,065.
The Advisor, pursuant to an Expense Limitation Agreement (the “Agreement”) has contractually agreed to reduce its fees and/or absorb expenses of the Fund at least until August 31, 2020 so that Net Annual Operating Expenses (including organizational and offering expenses, but excluding taxes, interest, brokerage commissions, acquired fund fees and expenses and extraordinary expenses) will not exceed 1.15%, 1.40% and 1.40% per annum (1.20%, 1.45% and 1.45% per annum through October 31, 2018) of the average daily net assets of Class I, Class T and Class W, respectively.
The Agreement allows the Advisor to recover amounts previously reimbursed for operating expenses to the Fund to the extent that the Fund’s expense ratio falls below the above indicated expense limitation. The amount that can be recovered will be limited to the difference between the actual expense ratio and the amount of the expense limitation. Under the Agreement, the Advisor can only recover such amounts for a period of up to three fiscal years subsequent to the fiscal year fees were waived or reimbursed by the Advisor. During the year ended April 30, 2019, the Advisor recovered net expenses of $72,469 per the Agreement. As of April 30, 2019, the amount recoverable by the Advisor under the Agreement was $508,477, which consists of $288,576 and $219,901 that are subject to recapture by April 30, 2020 and April 30, 2021, respectively.
Northern Lights Distributors, LLC (the “Distributor”) is serving as the Fund’s principal underwriter and acts as the distributor of the Fund’s shares on a best efforts basis, subject to various conditions. The Fund’s Board of Trustees (the “Board”) has adopted, on behalf of the Fund, a Shareholder Services Plan (the “Plan”), under which the Fund may compensate financial industry professionals for providing ongoing services in respect of clients with whom they have distributed shares of the Fund. Under the Plan, the Fund may pay 0.25% per year of its average daily net assets attributed to Class I, Class T and Class W shares, respectively, for such services. For the year ended April 30, 2019, the Fund incurred shareholder servicing fees of $118,667 for Class I. The Class T and Class W shares pay to the Distributor a distribution fee, payable under distribution plans adopted by the Board (“Distribution Plans”), for certain activities relating to the distribution of shares to investors and maintenance of shareholder accounts. These activities include marketing and other activities to support the distribution of the Class T and Class W shares. Under the Distribution Plans, the Fund pays 0.25% per year of its average daily net assets for such services for Class
| PREDEX |
| NOTES TO FINANCIAL STATEMENTS (Continued) |
| April 30, 2019 |
T and Class W shares, respectively. For the year ended April 30, 2019, the Fund incurred distribution fees of $33 and $61 for Class T and Class W shares, respectively.
In addition, certain affiliates of the Distributor provide services to the Fund as follows:
Gemini Fund Services, LLC(“GFS”) – GFS, an affiliate of the Distributor, provides administration, fund accounting, and transfer agent services to the Trust. Pursuant to a separate servicing agreement with GFS, the Fund pays GFS customary fees for providing administration, fund accounting and transfer agency services to the Fund. Certain officers of the Fund are also officers of GFS, and are not paid any fees directly by the Fund for servicing in such capacities.
Northern Lights Compliance Services, LLC (“NLCS”) – NLCS, an affiliate of GFS and the Distributor, provides a Chief Compliance Officer to the Fund, as well as related compliance services, pursuant to a consulting agreement between NLCS and the Fund. Under the terms of such agreement, NLCS receives customary fees from the Fund.
Blu Giant, LLC (“Blu Giant”) – Blu Giant, an affiliate of GFS and the Distributor, provides EDGAR conversion and filing services as well as print management services for the Fund on an ad-hoc basis. For the provision of these services, Blu Giant receives customary fees from the Fund.
Effective February 1, 2019, NorthStar Financial Services Group, LLC, the parent company of the Distributor and its affiliated companies including GFS, NLCS and Blu Giant (collectively, the “Gemini Companies”), sold its interest in the Gemini Companies to a third party private equity firm that contemporaneously acquired Ultimus Fund Solutions, LLC (an independent mutual fund administration firm) and its affiliates (collectively, the “Ultimus Companies”). As a result of these separate transactions, the Gemini Companies and the Ultimus Companies are now indirectly owned through a common parent entity, The Ultimus Group, LLC.
Trustees –The Fund pays each Trustee who is not affiliated with the Fund or Advisor an annual fee of $20,000, as well as reimbursement for any reasonable expenses incurred attending the meetings. The Trustee who serves as Chairperson of the Board receives an additional annual fee of $2,000. The Trustee who serves a Chairperson of the Audit Committee receives an additional annual fee of $5,000. None of the executive officers receive compensation from the Fund.
| (4) | INVESTMENT TRANSACTIONS |
The cost of purchases and proceeds from the sale of securities, other than short-term securities, for the year ended April 30, 2019 amounted to $128,917,568 and $0, respectively.
| (5) | AGGREGATE UNREALIZED APPRECIATION AND DEPRECIATION – TAX BASIS |
The identified cost of investments for federal income tax purposes, and its respective unrealized appreciation and depreciation at April 30, 2019, were as follows:
| | | | Gross Unrealized | | | Gross Unrealized | | | Net Unrealized | |
| Tax Cost | | | Appreciation | | | Depreciation | | | Appreciation | |
| $ | 175,564,310 | | | $ | 7,813,884 | | | $ | (158,699 | ) | | $ | 7,655,185 | |
| PREDEX |
| NOTES TO FINANCIAL STATEMENTS (Continued) |
| April 30, 2019 |
| (6) | DISTRIBUTIONS TO SHAREHOLDERS AND TAX COMPONENTS OF CAPITAL |
The tax character of distributions paid for the year ending April 30, 2019 and April 30, 2018 are as follows:
| | | Fiscal Year Ended | | | Fiscal Year Ended | |
| | | April 30, 2019 | | | April 30, 2018 | |
| Ordinary income | | $ | 66,628 | | | $ | — | |
| Long-term capital gain | | | — | | | | 349,135 | |
| Return of capital | | | 4,356,409 | | | | 676,721 | |
| | | $ | 4,423,037 | | | $ | 1,025,856 | |
As of April 30, 2019, the components of accumulated earnings/(deficit) on a tax basis were as follows:
| Undistributed | | | Post October | | | | | | | | | Total | |
| Long-Term | | | Loss and Late | | | Other Book/Tax | | | Net Unrealized | | | Accumulated | |
| Gains | | | Year Loss | | | Differences | | | Appreciation | | | Earnings | |
| $ | 514,132 | | | $ | (452,921 | ) | | $ | (71,615 | ) | | $ | 7,655,185 | | | $ | 7,644,781 | |
The difference between book basis and tax basis accumulated net investment income/loss and unrealized appreciation from investments is primarily attributable to tax adjustments for partnerships and amortization of certain organization costs for tax purposes.
Late year losses incurred after December 31 within the fiscal year are deemed to arise on the first business day of the following fiscal year for tax purposes. The Fund incurred and elected to defer such late year losses of $452,921.
For the year ended April 30, 2019, the following reclassifications, which had no impact on results of operations or net assets, were recorded to reflect tax character.
| Paid-in Capital | | | Accumulated Earnings | |
| $ | (10,045 | ) | | $ | 10,045 | |
Pursuant to Rule 23c-3 under the Investment Company Act of 1940, as amended, the Fund offers shareholders on a quarterly basis the option of redeeming shares, at net asset value, of no less than 5% and no more than 25% of the shares outstanding. There is no guarantee that shareholders will be able to sell all of the shares they desire in a quarterly repurchase offer, although each shareholder will have the right to require the Fund to purchase up to and including 5% of such shareholder’s shares in each quarterly repurchase. Liquidity will be provided to shareholders only through the Fund’s quarterly repurchases.
| PREDEX |
| NOTES TO FINANCIAL STATEMENTS (Continued) |
| April 30, 2019 |
During the year ended April 30, 2019, the Fund completed four repurchase offers. In each offer, the Fund offered to repurchase up to 5% (and an additional 2% at the Fund’s discretion) of the number of its outstanding shares as of the Repurchase Pricing Date. The result of the repurchase offers were as follows:
| | Repurchase | Repurchase | Repurchase | Repurchase |
| | Offer #1 | Offer #2 | Offer #3 | Offer #4 |
| Commencement Date | 6/28/2018 | 9/20/2018 | 12/21/2018 | 3/22/2019 |
| Repurchase Request Deadline | 7/30/2018 | 10/23/2018 | 1/23/2019 | 4/23/2019 |
| Repurchase Pricing Date | 7/30/2018 | 10/23/2018 | 1/23/2019 | 4/23/2019 |
| Net Asset Value as of Repurchase Pricing Date | $ 26.17 | $ 26.23 | $ 26.23 | $ 26.26 |
| Amount Repurchased | $ 233,030 | $10,428,442 | $3,665,266 | $4,252,010 |
| (8) | COMMITMENTS AND CONTINGENCIES |
As of April 30, 2019, the Fund had the following unfunded commitments for its current Real Estate Investments:
| | Unfunded | Redemption |
| | Commitment | Frequency |
| AEW Core Property Trust (U.S.), Inc. | — | Quarterly |
| American Core Realty Fund, LP | — | Quarterly |
| Barings Core Property Fund LP | — | Quarterly |
| Bentall Kennedy Daily Value Fund, LP | — | Daily |
| Black Creek Diversified Property Fund | — | Monthly |
| BlackRock US Core Property Fund, LP | — | Quarterly |
| CBRE U.S. Core Partners, LP | — | Quarterly |
| Clarion Lion Properties Fund, LP | — | Quarterly |
| GWL U.S. Property Fund LP | — | Quarterly |
| Invesco Core Real Estate-U.S.A., LP | — | Quarterly |
| Invesco U.S. Income Fund, LP | — | Quarterly |
| JLL Income Property Trust, Inc. | — | Daily |
| MEPT Edgemoor LP | — | Quarterly |
| PRISA LP | — | Quarterly |
| Prologis Targeted U.S. Logistics Holdings, LP | — | Quarterly |
| RREEF America REIT II, Inc. | $3,000,000 * | Quarterly |
| RREEF Core Plus Industrial Fund LP | — | Quarterly |
| Sentinel Real Estate Fund, LP | — | Daily |
| Stockbridge Smart Markets Fund, LP | — | Quarterly |
| UBS Trumbull Property Fund LP | — | Quarterly |
| USAA US Government Building Fund | — | Quarterly |
| * | The Fund maintains cash and liquid short-term investments to cover the remaining unfunded commitment of this investment. |
The Fund has also made a revocable initial commitment to the Morgan Stanley Prime Property Fund, LLC (“PPF”) for $15,000,000. On June 27, 2019 the Fund remitted $7,500,000 for an initial 50% drawdown. The remaining unfunded commitment is revocable up to five business days following receipt of the next drawdown notice.
| PREDEX |
| NOTES TO FINANCIAL STATEMENTS (Continued) |
| April 30, 2019 |
| (9) | RECENT ACCOUNTING PRONOUNCEMENTS |
In August 2018, the FASB issued Accounting Standards Update (“ASU”) No. 2018-13, which changes certain fair value measurement disclosure requirements. The new ASU, in addition to other modifications and additions, removes the requirement to disclose the amount and reasons for transfers between Level 1 and Level 2 of the fair value hierarchy, and the policy for the timing of transfers between levels. For investment companies, the amendments are effective for financial statements issued for fiscal years beginning after December 15, 2019, and interim periods within those fiscal years. Early adoption is allowed. The Fund early adopted ASU 2018-13 and the related changes have been incorporated into these financial statements.
On October 4, 2018, the Securities and Exchange Commission adopted amendments to certain disclosure requirements under Regulation S-X to conform to US GAAP, including: (i) an amendment to require presentation of the total, rather than the components, of distributable earnings on the Statement of Assets and Liabilities; and (ii) an amendment to require presentation of the total, rather than the components, of distributions to shareholders, except for tax return of capital distributions, if any, on the Statement of Changes in Net Assets. The amendments also removed the requirement for parenthetical disclosure of undistributed net investment income on the Statement of Changes in Net Assets. These amendments have been adopted with these financial statements and had no effect on the Fund’s net assets or results of operations.
Subsequent events after the date of the Statement of Assets and Liabilities have been evaluated through the date the financial statements were issued. Management has determined that no events or transactions occurred requiring adjustment or disclosure in the financial statements.
Report of Independent Registered Public Accounting Firm
To the Board of Trustees and Shareholders of PREDEX
Opinion on the Financial Statements
We have audited the accompanying statement of assets and liabilities, including the portfolio of investments, of PREDEX (the Fund) as of April 30, 2019, the related statements of operations and cash flows for the year then ended, the statements of changes in net assets for each of the two years in the period then ended, including the related notes, and the financial highlights for each of the five years in the period then ended (collectively, the financial statements). In our opinion, the financial statements present fairly, in all material respects, the financial position of the Fund as of April 30, 2019, and the results of its operations and cash flows for the year then ended, the changes in its net assets for each of the two years in the period then ended, and the financial highlights for each of the five years in the period then ended, in conformity with accounting principles generally accepted in the United States of America.
Basis for Opinion
These financial statements are the responsibility of the Fund’s management. Our responsibility is to express an opinion on the Fund’s financial statements based on our audits. We are a public accounting firm registered with the Public Company Accounting Oversight Board (United States) (PCAOB) and are required to be independent with respect to the Fund in accordance with U.S. federal securities laws and the applicable rules and regulations of the Securities and Exchange Commission and the PCAOB.
We conducted our audits in accordance with the standards of the PCAOB. Those standards require that we plan and perform the audit to obtain reasonable assurance about whether the financial statements are free of material misstatement, whether due to error or fraud. The Fund is not required to have, nor were we engaged to perform, an audit of their internal control over financial reporting. As part of our audits, we are required to obtain an understanding of internal control over financial reporting but not for the purpose of expressing an opinion on the effectiveness of the Fund’s internal control over financial reporting. Accordingly, we express no such opinion.
Our audits included performing procedures to assess the risks of material misstatement of the financial statements, whether due to error or fraud, and performing procedures that respond to those risks. Such procedures included examining, on a test basis, evidence regarding the amounts and disclosures in the financial statements. Our audits also included evaluating the accounting principles used and significant estimates made by management, as well as evaluating the overall presentation of the financial statements. Our procedures included confirmation of investments owned as of April 30, 2019, by correspondence with the custodians, brokers and underlying fund managers. We believe that our audits provides a reasonable basis for our opinion.
/s/ RSM US LLP
We have served as the auditor to PREDEX since 2013.
Denver, Colorado
July 1, 2019
| PREDEX |
| SUPPLEMENTAL INFORMATION (Unaudited) |
| April 30, 2019 |
Trustees and Officers. The Trustees and the officers of the Trust are listed below with their addresses, present positions with the Trust and principal occupations over at least the last five years. Unless otherwise noted, the address of each Trustee and Officer is 17645 Wright Street, Suite 200, Omaha, NE 68130.
Independent Trustees *
| Name, Age | Position/Term
of Office* | Principal Occupation
During the Past Five
Years | Number of
Portfolios in
Fund
Complex**
Overseen by
Trustee | Other
Directorships
held by Trustee |
Carol A. Broad
Born: 1955 | Trustee since March 2013 | Trustee, San Diego City Employees’ Retirement System, April 2015 to present; Retired, March 2011 to March 2015. | 1 | None |
Addison Piper
Born: 1946 | Trustee since May 2013 | Director, Piper Jaffray Companies 2006 to present. | 1 | Leuthold Funds, Inc. (5 portfolios), Piper Jaffray Companies |
Dr. Kerry Vandell
Born: 1947 | Trustee since March 2016 | Founder and Principal, KDV Associates (economic and financial consulting), 1980 to present; Professor Emeritus, University of California – Irvine, July 2017 to present; Professor and Director, Center for Real Estate, Merage School of Business, University of California – Irvine, July 2006 to June 2017. | 1 | Steadfast Apt. REIT (Oct. 2013 to present) |
4/30/19 – NLII v1
| PREDEX |
| SUPPLEMENTAL INFORMATION (Unaudited)(Continued) |
| April 30, 2019 |
Interested Trustees and Officers
| Name, Age | Position/Term of
Office* | Principal Occupation
During the Past Five
Years | Number of
Portfolios in
Fund
Complex
Overseen by
Trustee | Other
Directorships
held by Trustee |
J. Grayson Sanders
Born: 1940 | President since March 2013 | CEO and Chief Investment Officer, PREDEX Capital Management, LLC, Jan. 2013 to present. | n/a | n/a |
Michael Achterberg
Born: 1963 | Treasurer since July 2013, Secretary since March 2017 | President, PREDEX Capital Management, LLC, June 2018 to present; Chief Operating Officer, PREDEX Capital Management, LLC, Mar. 2013 to May 2018. | n/a | n/a |
William Kimme
Born: 1962 | Chief Compliance Officer since March 2013 | Senior Compliance Officer of Northern Lights Compliance Services, LLC (since 2011); | n/a | n/a |
| * | The term of office for each Trustee and officer listed will continue indefinitely. |
| ** | The term “Fund Complex” refers to the Fund. |
The Fund’s Statement of Additional Information (“SAI”) includes additional information about the Trustees and is available free of charge, upon request, by calling toll-free at 1-877-940-7202.
4/30/19 – NLII v1
| PRIVACY NOTICE |
| |
| FACTS | WHAT DOES PREDEX DO WITH YOUR PERSONAL INFORMATION? |
| | |
| Why? | Financial companies choose how they share your personal information. Federal law gives consumers the right to limit some but not all sharing. Federal law also requires us to tell you how we collect, share, and protect your personal information. Please read this notice carefully to understand what we do. |
| | |
| What? | The types of personal information we collect and share depend on the product or service you have with us. This information can include: |
| | ■ Social Security number ■ Assets ■ Retirement Assets ■ Transaction History ■ Checking Account Information | ■ Purchase History ■ Account Balances ■ Account Transactions ■ Wire Transfer Instructions |
| | | |
| | When you areno longer our customer, we continue to share your information as described in this notice. |
| | |
| How? | All financial companies need to share customers’ personal information to run their everyday business. In the section below, we list the reasons financial companies can share their customers’ personal information; the reasons PREDEX chooses to share; and whether you can limit this sharing. |
| | | |
| Reasons we can share your personal information | Does PREDEX
share? | Can you limit this
sharing? |
For our everyday business purposes –
such as to process your transactions, maintain your account(s), respond to court orders and legal investigations, or report to credit bureaus | Yes | No |
For our marketing purposes –
to offer our products and services to you | No | We don’t share |
| For joint marketing with other financial companies | No | We don’t share |
For our affiliates’ everyday business purposes –
information about your transactions and experiences | No | We don’t share |
For our affiliates’ everyday business purposes –
information about your creditworthiness | No | We don’t share |
| For nonaffiliates to market to you | No | We don’t share |
| Questions? | Call 1-877-940-7202 |
| Who we are |
| Who is providing this notice? | PREDEX |
| What we do |
| How does PREDEX protect my personal information? | To protect your personal information from unauthorized access and use, we use security measures that comply with federal law. These measures include computer safeguards and secured files and buildings. Our service providers are held accountable for adhering to strict policies and procedures to prevent any misuse of your nonpublic personal information. |
| How does PREDEX collect my personal information? | We collect your personal information, for example, when you ■ Open an account ■ Provide account information ■ Give us your contact information ■ Make deposits or withdrawals from your account ■ Make a wire transfer ■ Tell us where to send the money ■ Tells us who receives the money ■ Show your government-issued ID ■ Show your driver’s license We also collect your personal information from other companies. |
| Why can’t I limit all sharing? | Federal law gives you the right to limit only ■ Sharing for affiliates’ everyday business purposes – information about your creditworthiness ■ Affiliates from using your information to market to you ■ Sharing for nonaffiliates to market to you State laws and individual companies may give you additional rights to limit sharing. |
| Definitions |
| Affiliates | Companies related by common ownership or control. They can be financial and nonfinancial companies. ■ PREDEX does not share with our affiliates. |
| Nonaffiliates | Companies not related by common ownership or control. They can be financial and nonfinancial companies ■ PREDEX does not share with nonaffiliates so they can market to you. |
| Joint marketing | A formal agreement between nonaffiliated financial companies that together market financial products or services to you. ■ PREDEX doesn’t jointly market. |
| Investment Advisor |
| PREDEX Capital Management, LLC |
| 18500 Von Karman Ave, Suite 350 |
| Irvine, CA 92612 |
| |
| Distributor |
| Northern Lights Distributors, LLC |
| 17645 Wright Street, Suite 200 |
| Omaha, NE 68130 |
| |
| Legal Counsel |
| Thompson Hine LLP |
| 41 South High Street, Suite 1700 |
| Columbus, OH 43215 |
| |
| Independent Registered Public Accounting Firm |
| RSM US LLP |
| 555 Seventeenth Street, Suite 1200 |
| Denver, CO 80202 |
How to Obtain Proxy Voting Information
Information regarding how the Fund voted proxies relating to portfolio securities for the 12 month period ended June 30th as well as a description of the policies and procedures that the Fund used to determine how to vote proxies is available without charge, upon request, by calling (877) 940-7202 or by referring to the Securities and Exchange Commission’s (“SEC”) website athttp://www.sec.gov.
How to Obtain 1st and 3rd Fiscal Quarter Portfolio Holdings
The Fund files its complete schedule of portfolio holdings with the SEC for the first and third quarters of each fiscal year on Form N-Q. Form N-Q is available on the SEC’s website athttp://www.sec.gov). The information on Form N-Q is available without charge, upon request, by calling (877) 940-7202.
| |
| |
| |
| |
| |
| |
| |
| |
| |
| |
| |
| |
| |
| |
| |
| |
| |
| |
| |
| |
| |
| |
| |
| |
| |
 |
| |
| |
| PREDEX Capital Management, LLC |
| 18500 Von Karman Avenue, Suite 350 |
| Irvine, CA 92612 |
| |
| To learn more about PREDEX or for any general inquiries, contact us. |
| Email: info@predexcapital.com |
| Phone: 949-336-3445 |
| |
| |
| |
| |
| |
| |
| |
| |
| |
| |
| |
| |
| |
| |
| |
| |
| |
| |
| |
| |
| |
| |
| |
| |
| |
Item 2. Code of Ethics.Attached
(a) As of the end of the period covered by this report, the registrant has adopted a code of ethics that applies to the registrant's principal executive officer, principal financial officer, principal accounting officer or controller, or persons performing similar functions, regardless of whether these individuals are employed by the registrant or a third party.
(b) For purposes of this item, “code of ethics” means written standards that are reasonably designed to deter wrongdoing and to promote:
| (1) | Honest and ethical conduct, including the ethical handling of actual or apparent conflicts of interest between personal and professional relationships; |
| (2) | Full, fair, accurate, timely, and understandable disclosure in reports and documents that a registrant files with, or submits to, the Commission and in other public communications made by the registrant; |
(3) Compliance with applicable governmental laws, rules, and regulations;
| (4) | The prompt internal reporting of violations of the code to an appropriate person or persons identified in the code; and |
(5) Accountability for adherence to the code.
(c) Amendments: During the period covered by the report, there have not been any amendments to the provisions of the code of ethics.
(d) Waivers: During the period covered by the report, the registrant has not granted any express or implicit waivers from the provisions of the code of ethics.
(e) The Code of Ethics is not posted on Registrant’ website.
(f) A copy of the Code of Ethics is attached as an exhibit.
Item 3. Audit Committee Financial Expert.
(a) The Registrant’s board of trustees has determined that Carol A. Broad is a financial expert, as defined in Item 3 of Form N-CSR. Carol A. Broad is independent for purposes of this Item.
Item 4. Principal Accountant Fees and Services.
2019 - $42,000
2018 - $36,750
2019 - $0
2018 - $0
2019 - $6,300
2018 - $5,250
Preparation of Federal & State income tax returns, assistance with calculation of required income, capital gain and excise distributions and preparation of Federal excise tax returns.
2019 - $0
2018 - $0
| (e) | (1)Audit Committee’s Pre-Approval Policies |
The registrant’s Audit Committee is required to pre-approve all audit services and, when appropriate, any non-audit services (including audit-related, tax and all other services) to the registrant. The registrant’s Audit Committee also is required to pre-approve, when appropriate, any non-audit services (including audit-related, tax and all other services) to its adviser, or any entity controlling, controlled by or under common control with the adviser that provides ongoing services to the registrant, to the extent that the services may be determined to have an impact on the operations or financial reporting of the registrant. Services are reviewed on an engagement by engagement basis by the Audit Committee.
| (2) | Percentages of Services Approved by the Audit Committee |
20192018
Audit-Related Fees: 0.00% 0.00%
Tax Fees: 0.00% 0.00%
All Other Fees: 0.00% 0.00%
| (f) | During the audit of registrant's financial statements for the most recent fiscal year, less than 50 percent of the hours expended on the principal accountant's engagement were attributed to work performed by persons other than the principal accountant's full-time, permanent employees. |
| (g) | The aggregate non-audit fees billed by the registrant's accountant for services rendered to the registrant, and rendered to the registrant's investment adviser (not including any sub-adviser whose role is primarily portfolio management and is subcontracted with or overseen by another investment adviser), and any entity controlling, controlled by, or under common control with the adviser that provides ongoing services to the registrant: |
2019 - $6,300
2018 - $5,250
(h) The registrant's audit committee has considered whether the provision of non-audit services to the registrant's investment adviser (not including any sub-adviser whose role is primarily portfolio management and is subcontracted with or overseen by another investment adviser), and any entity controlling, controlled by, or under common control with the investment adviser that provides ongoing services to the registrant, that were not pre-approved pursuant to paragraph (c)(7)(ii) of Rule 2-01 of Regulation S-X, is compatible with maintaining the principal accountant's independence.
Item 5. Audit Committee of Listed Companies.Not applicable
Item 6. Schedule of Investments.Schedule of investments in securities of unaffiliated issuers is included under Item 1.
Item 7. Disclosure of Proxy Voting Policies and Procedures for Closed-End Funds.
A copy of the proxy voting policies and procedures is attached as an exhibit.
Item 8. Portfolio Managers of Closed-End Management Investment Companies.
The management of the Registrant’s investment portfolio will be the responsibility of the Adviser and its Co-Portfolio Managers Grayson Sanders and Michael Achterberg.
J. Grayson Sanders
J. Grayson Sanders serves as Chief Executive Officer and Chief Investment Officer of the Adviser, a position he has held since the inception of the Adviser. Additionally, Mr. Sanders serves as Managing Principal of Mission Realty Advisors, LLC, a position held since he founded the company in February 2011. Mr. Sanders served as President of CNL Fund Advisors, Co., from 2004 to 2009 where he created and managed a global REIT mutual fund. He served from 2000 to 2004 as a Managing Director with AIG Global Real Estate Investment Corp. in New York, where he managed product development and capital formation for several international, opportunistic real estate funds for large institutional investors, investing in Europe, Asia and Mexico. Prior to AIG, Mr. Sanders was Executive Managing Director for CB Richard Ellis Investors where he was involved in product development and placement with institutional investors.
From 1991 to 1996 Mr. Sanders served as Director of Real Estate for the Ameritech Pension Trust in Chicago, where he managed the $1.5 billion real estate portfolio within the $13 billion defined benefit plan. In 1972, Mr. Sanders co-founded a real estate investment and consulting firm, The Landsing Corporation, which sponsored finite-life REITs and private partnerships. It grew to employ over 200 professionals. After serving as an officer in the U.S. Navy for four years, Mr. Sanders began his business career at Alex Brown & Sons, the Baltimore based investment banking firm.
Mr. Sanders served on the Boards of both the Pension Real Estate Association (PREA) and the National Association of Real Estate Investment Trusts (NAREIT) where he was co-chairman of its Institutional Investor Committee. He has also served on the boards of several non-profits. He was a lecturer at Stanford Business School in 1985 where he taught a course entitled, "Essentials of Real Estate Investment and Development". He has been a frequent speaker at trade association events and other forums over his entire career.
Mr. Sanders received a BA from the University of Virginia and an MBA from Stanford Business School where he was later President of the Alumni Association.
Michael Achterberg, CAIA
Michael Achterberg serves as President of the Adviser, a position held since June 2018. He served as Chief Operating Officer of the Adviser from March 2013 through May 2018. Mr. Achterberg has 29 years of experience in the investment industry. He has extensive experience in fund management including due diligence, allocation of capital and general supervision for multi-manager funds.
Previously, Mr. Achterberg served as Chief Financial Officer for more than two years at CITIC Securities International Partners which conducted China focused investment banking and private equity from offices in Los Angeles, New York, Hong Kong and Beijing. Prior to that he was a partner for fifteen years at Strome Investment Management whose principal products were funds-of-funds and a global macro multi-manager strategy. Until 1994 he was a CPA and Audit Manager for Coopers & Lybrand working exclusively in the investment industry with advisers and funds. While there he served on the national quality review program for the Investment Company practice.
Other accounts managed by Portfolio Managers:
| | | | | |
| Other Accounts By Type | Total Number of Accounts by Account Type | Total Assets By Account Type | Number of Accounts by Type Subject to a Performance Fee | Total Assets By Account Type Subject to a Performance Fee |
| Registered Investment Companies | 0 | $0 | 0 | $0 |
| Other Pooled Investment Vehicles | 0 | $0 | 0 | $0 |
| Other Accounts | 0 | $0 | 0 | $0 |
Both Portfolio Managers receive a fixed salary from the Adviser.
As of April 30, 2019, the Portfolio Managers’ ownership of the Fund was as follows:
| Portfolio Manager | Dollar Range of Shares Owned |
| J. Grayson Sanders | $10,001 to $50,000 |
| Michael Achterberg | over $100,000 |
Item 9. Purchases of Equity Securities by Closed-End Funds. Not applicable
Item 10. Submission of Matters to a Vote of Security Holders. None
Item 11. Controls and Procedures.
(a) Based on an evaluation of the Registrant’s disclosure controls and procedures as of a date within 90 days of filing date of this Form N-CSR, the principal executive officer and principal financial officer of the Registrant have concluded that the disclosure controls and procedures of the Registrant are reasonably designed to ensure that the information required in filings on Form N-CSR is recorded, processed, summarized, and reported by the filing date, including that information required to be disclosed is accumulated and communicated to the Registrant’s management, including the Registrant’s principal executive officer and principal financial officer, as appropriate to allow timely decisions regarding required disclosure.
(b) There were no significant changes in the Registrant’s internal control over financial reporting that occurred during the Registrant’s last fiscal half-year that have materially affected, or are reasonably likely to materially affect, the Registrant’s internal control over financial reporting.
Item 12. Disclosure of Securities Lending Activities for Closed-End Management Investment Companies.Not applicable.
Item 13. Exhibits.
(a)(1) Code of Ethics filed herewith.
(a)(2) Certifications required by Section 302 of the Sarbanes-Oxley Act of 2002 (and Item 11(a)(2) of Form N-CSR) are filed herewith.
(a)(3) Not applicable.
(b) Certifications required by Section 906 of the Sarbanes-Oxley Act of 2002 (and Item 11(b) of Form N-CSR) are filed herewith.
SIGNATURES
Pursuant to the requirements of the Securities Exchange Act of 1934 and the Investment Company Act of 1940, the registrant has duly caused this report to be signed on its behalf by the undersigned, thereunto duly authorized.
(Registrant)PREDEX
By (Signature and Title)
/s/ J. Grayson Sanders
J. Grayson Sanders, Principal Executive Officer/President
Date 7/8/19
Pursuant to the requirements of the Securities Exchange Act of 1934 and the Investment Company Act of 1940, this report has been signed below by the following persons on behalf of the registrant and in the capacities and on the dates indicated.
By (Signature and Title)
/s/ J. Grayson Sanders
J. Grayson Sanders, Principal Executive Officer/President
Date 7/8/19
By (Signature and Title)
/s/ Michael Achterberg
Michael Achterberg, Principal Financial Officer/Treasurer
Date 7/8/19