UNITED STATES
SECURITIES AND EXCHANGE COMMISSION
Washington, D.C. 20549
FORM N-CSRS
CERTIFIED SHAREHOLDER REPORT OF REGISTERED
MANAGEMENT INVESTMENT COMPANIES
Investment Company Act file number 811-22807
Pathway Energy Infrastructure Fund, Inc.
(Exact name of registrant as specified in charter)
10 East 40th Street, 42nd Floor
New York, NY 10016
(Address of principal executive offices)
M. Grier Eliasek
Chief Executive Officer
Pathway Energy Infrastructure Fund, Inc.
10 East 40th Street, 42nd Floor
New York, NY 10016
(Name and address of agent for service)
Registrant’s telephone number, including area code: (212) 448-0702
Date of fiscal year end: June 30
Date of reporting period: December 31, 2016
Item 1. Report to Stockholders.
The semi-annual report to stockholders for the six months ended December 31, 2016 is filed herewith pursuant to Rule 30e-1 under the Investment Company Act of 1940, as amended.
Pathway Energy Infrastructure Fund, Inc. (the “Company”) is an externally managed, non-diversified, closed-end management investment company registered under the Investment Company Act of 1940, as amended. The Company intends to elect to be treated for tax purposes as a regulated investment company under Subchapter M of the Internal Revenue Code of 1986, as amended.
INVESTMENT OBJECTIVE
The Company’s investment objective is to generate current income, and as a secondary objective, long-term capital appreciation. The Company intends to invest at least 80% of its total assets in securities of companies that operate primarily in energy and related infrastructure and industrial sectors (“Energy Companies”). The Company anticipates that its portfolio will be comprised primarily of income-oriented securities, which includes debt securities and income-focused preferred and common equity interests, of private or public Energy Companies within North America. The Company considers Energy Companies to be (a) those companies that engage in the exploration, development, production, gathering, transportation, processing, storage, refining, supply, distribution, mining, transmission, servicing, industrial products and services, energy efficiency, management, generation or marketing of natural gas, natural gas liquids, crude oil, liquefied natural gas, refined petroleum products, gasoline, diesel fuel, electricity, renewable energy, coal or power, as well as (b) other energy related industrial companies defined as businesses engaged in, but not limited to, manufacturing, refined products, chemicals, infrastructure, materials, logistics, marketing, waste, environmental, equipment rental, contracting, staffing, software, and other products and services that derive more than 50% of their revenues, gross or net profit or EBITDA from companies defined in (a) above. The Company’s primary area of focus will be energy companies in the upstream, midstream, downstream, service and equipment and power sub-sectors of the energy industry.
TABLE OF CONTENTS
|
| |
| |
| | |
| Index to Financial Statements | |
| |
| |
| |
| |
| |
| |
| | |
| |
| |
| |
2017 SEMI-ANNUAL REPORT
Pathway Energy Infrastructure Fund, Inc 3
Letter to Stockholders
Dear Stockholders,
We are pleased to present this semi-annual report of Pathway Energy Infrastructure Fund, Inc. (“we,” “us,” “our,” the “Company” or “Pathway”) for the six months ended December 31, 2016. Pathway paid distributions of approximately $0.47 per share during the six months ended December 31, 2016, representing an annualized distribution rate of approximately 6.0% based on our average gross offering price of our class R shares during this period.
Market Commentary
Despite credit market volatility in the energy sector, we continue to identify investment opportunities which we believe can deliver attractive risk-adjusted returns for the Company’s stockholders. We believe Pathway is favorably positioned to pursue an investment strategy that will both exploit the attractive longer term trends influencing the energy sector, and take advantage of current capital dislocation, by investing in fundamentally sound energy companies.
On November 30, 2016, the Organization of the Petroleum Exporting Countries (“OPEC”) agreed to reduce crude oil production by about 1.2 million barrels per day (b/d), effective January 1, 2017, to 32.5 million b/d. Since then, several non-OPEC producers have also announced their intentions to freeze or reduce production. We believe these supply reductions result in an approximate trading floor on crude prices in the range of $50 per barrel. We expect the resulting underlying global supply and demand fundamentals to improve, providing further positive support for the macro price environment.
According to the U.S. Energy Information Administration (“EIA”), total U.S. liquid fuels consumption is forecast to increase 1.3% in 2017 and 1.9% in 2018. U.S. crude production declined in 2016, which we believe should aid in the rebalancing of the market. U.S. crude oil production averaged 9.4 million b/d in 2015, averaged 8.9 million b/d in 2016 (5.9% decline year-over-year), and is forecasted to average 9.0 million b/d in 2017 (1.2% increase year-over-year).1
While commodity prices have been volatile during the course of 2016, we believe North American energy companies must invest substantial capital to continue to sustain and build out necessary domestic production and infrastructure. Total North American energy production is projected to increase by more than 20% from 2016 through 2040, led by increases in renewables, natural gas, and crude oil production.2 Upstream, midstream, and downstream companies, as well as other energy service and energy-related companies, may benefit from a potential resurgence in domestic resource investment. After the prior decade of accelerated drilling development, we believe the current large inventory of existing wells will require re-completion services to maintain production over the life of the well. This capital investment, along with the development of new wells to replace the high early life production decline characteristic of today’s current shale wells, may result in increased demand for the energy equipment and services needed to support the production component of the value chain. We believe this demand is likely to continue to be supplied in significant part by U.S. independent oil field services companies. As new resources are developed, we anticipate new infrastructure will be required to build the transportation links to areas of processing, refining, and distribution that allow the final products to reach key end markets. The U.S. has been a net energy importer since 1953, but declining energy imports and growing energy exports are projected to make the U.S. a net energy exporter by around 2026.2
Pathway’s net asset value (“NAV”) as of December 31, 2016 was $13.86. The 8.2% increase in NAV from $12.81 as of June 30, 2016, is primarily due to an increase in the fair market value of its portfolio holdings as energy based securities have increased in value.
Despite the challenged commodity price environment, none of Pathway’s portfolio holdings have defaulted on their payment obligations to Pathway. Zero Pathway debt investments were on non-accrual as of December 31, 2016.
Given the volatility in commodity prices and ongoing oversupply concerns, senior secured debt, unsecured debt and master limited partnership values have experienced pressure. According to Bank of America Merrill Lynch (“BAML”), as of December 29, 2016, the U.S. high-yield energy index had an average value of 99.3% of par compared to 101.5% for the broader U.S. high-yield index.3 We believe this opportunity to purchase assets at a discount provides us with “pull to par” upside potential while earning an attractive current yield.
2017 SEMI-ANNUAL REPORT
Pathway Energy Infrastructure Fund, Inc 4
We believe that long term investment strategies in the energy sector continue to be supported by strong long term fundamentals. The U.S. energy sector continues to seek out capital to help fund the infrastructure required to bring new energy supplies to their end markets. While oil prices have fallen due to a temporary oversupply of crude oil, global energy demand continues to increase. We are optimistic that these long term favorable drivers will continue to create attractive opportunities to deploy capital in the near term. We expect Pathway will benefit from low entry point energy security valuations to generate attractive current yield and total returns for our investors. Our investment strategy allows Pathway to invest in senior secured debt, unsecured debt, and dividend-paying equities. Consequently, we believe we are well positioned to meet our investment objectives of delivering current income and secondarily capital appreciation, but with an intense focus on capital preservation.
Sincerely,
M. Grier Eliasek
Chief Executive Officer
This letter may contain certain forward-looking statements within the meaning of the Private Securities Litigation Reform Act of 1995, including statements regarding the future performance of Pathway Energy Infrastructure Fund, Inc. Words such as “believes,” “expects,” and “future” or similar expressions are intended to identify forward-looking statements. Any such statements, other than statements of historical fact, are highly likely to be affected by unknowable future events and conditions, including elements of the future that are or are not under the control of Pathway Energy Infrastructure Fund, Inc., and that Pathway Energy Infrastructure Fund, Inc. may or may not have considered. Accordingly, such statements cannot be guarantees or assurances of any aspect of future performance. Actual developments and results may vary materially from any forward-looking statements. Such statements speak only as of the time when made. Pathway Energy Infrastructure Fund, Inc. undertakes no obligation to publicly update or revise any forward-looking statements, whether as a result of new information, future events or otherwise.
We caution investors that the past performance described above is not indicative of future returns and the results do not include fees, expenses or taxes that a stockholder may incur. The results described above may not be representative of our portfolio.
_____________________________________
1U.S. Energy Information Administration / Short-Term Energy Outlook January 2017.
2U.S. Energy Information Administration / Annual Energy Outlook 2017
3Bank of America Merrill Lynch, US High Yield Energy, Weekly Update, December 30, 2016.
2017 SEMI-ANNUAL REPORT
Pathway Energy Infrastructure Fund, Inc 5
|
| | | | | | | | | | | |
| Portfolio Composition - At a Glance | | | |
| Top Ten Holdings | | | | | | | | |
| December 31, 2016 | | | | |
| Portfolio Company | | Investments | | Fair Value | | % of Net Assets |
| Archrock Partners, LP | | Senior Unsecured Bond (6.00%, due 4/1/2021) | | $ | 735,000 |
| | 9.6 | % |
| Laredo Petroleum, Inc. | | Senior Unsecured Bond (7.38%, due 5/1/2022) | | 519,530 |
| | 6.8 | % |
| Brand Energy & Infrastructure Services, Inc. | | Senior Unsecured Bond (8.50%, due 12/1/2021) | | 513,750 |
| | 6.7 | % |
| NGL Energy Partners LP | | Senior Unsecured Bond (6.88%, due 10/15/2021) | | 512,083 |
| | 6.7 | % |
| Martin Midstream Partners LP | | Senior Unsecured Bond (7.25%, due 2/15/2021) | | 496,250 |
| | 6.5 | % |
| Ferrellgas Partners LP | | Senior Unsecured Bond (8.63%, due 6/15/2020) | | 444,750 |
| | 5.8 | % |
| Western Refining Logistics LP | | Senior Unsecured Bond (7.50%, due 2/15/2023) | | 433,000 |
| | 5.7 | % |
| WPX Energy, Inc. | | Senior Unsecured Bond (7.50%, due 8/1/2020) | | 430,250 |
| | 5.6 | % |
| Westmoreland Coal Co. | | Senior Secured Bond (8.75%, due 11/1/2022) | | 412,313 |
| | 5.4 | % |
| Gardener Driver, Inc. | | Senior Unsecured Bond (6.88%, due 8/15/2021) | | 399,500 |
| | 5.2 | % |
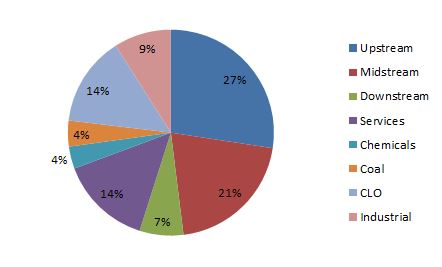
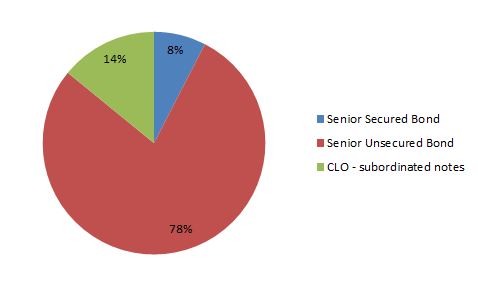
Portfolio Composition
Based on Fair Value
Security Type
Based on Fair Value
2017 SEMI-ANNUAL REPORT
Pathway Energy Infrastructure Fund, Inc 6
|
| | | | | | | | |
Statement of Assets and Liabilities (unaudited) |
| As of December 31, 2016 |
| | | | | | | |
| Assets | | | |
| Investments, at fair value (amortized cost $9,559,276) | $ | 10,143,511 |
|
| Cash | 267,695 |
|
| Deferred offering costs (Note 6) | 187,550 |
|
| Due from Adviser (Note 6) | 168,916 |
|
| Interest receivable | 166,626 |
|
| Prepaid expenses | 93,056 |
|
| Receivable for Shares Sold | 27,600 |
|
| | | | | Total assets | 11,054,954 |
|
| Liabilities | |
| Due to Adviser (Note 6) | 1,632,905 |
|
| Revolving credit facility (Note 5) | 1,550,000 |
|
| Accrued expenses | 158,189 |
|
| Due to Administrator (Note 6) | 48,769 |
|
| Distributions payable | 46,827 |
|
| Interest payable | 284 |
|
| | | | | Total liabilities | 3,436,974 |
|
| Commitments and contingencies (Note 10) | |
| Net assets | $ | 7,617,980 |
|
| | | | | | | |
| Components of net assets: | |
| Common stock, $0.01 par value; 200,000,000 shares authorized; 518,874 Class R shares, | |
| | 4,535 Class RIA shares and 26,305 Class I shares issued and outstanding (Note 4) | $ | 5,497 |
|
| Additional paid-in capital | 8,069,384 |
|
| Accumulated net investment loss | (965,684 | ) |
| Net unrealized gain on investments | 584,235 |
|
| Accumulated net realized loss on investments | (75,452 | ) |
| Net assets | $ | 7,617,980 |
|
| | | | | | | |
Net asset value per share(1) | $ | 13.86 |
|
| |
(1)Net asset value per share disclosed is the net asset value per share for Class R, Class RIA and Class I shares. |
| See accompanying notes to financial statements. |
2017 SEMI-ANNUAL REPORT
Pathway Energy Infrastructure Fund, Inc 7
|
| | | | | | | | |
Statement of Operations (unaudited) |
| For the six months ended December 31, 2016 |
| | |
| Investment income | |
| Interest income from bonds | $ | 348,824 |
|
| Interest income from CLOs | 154,425 |
|
| | | | | Total investment income | 503,249 |
|
| Expenses | |
| Base management fees (Note 6) | 92,093 |
|
| Administrator costs (Note 6) | 234,146 |
|
| Audit and tax expense | 157,500 |
|
| Adviser shared service expense (Note 6) | 83,461 |
|
| Amortization of offering costs (Note 6) | 76,880 |
|
| Valuation Services | 66,170 |
|
| Insurance expense | 54,076 |
|
| Report and notice to shareholders | 21,123 |
|
| General and administrative | 16,791 |
|
| Interest expense | 11,591 |
|
| Legal expense | 8,552 |
|
| Transfer agent fees and expenses | 6,823 |
|
| Due diligence expense | 3,232 |
|
| Excise tax expense | (4,106 | ) |
| | | | | Total expenses | 828,332 |
|
| | | | | Expense support reimbursement (Note 6) | (542,246 | ) |
| | | | | Net expenses | 286,086 |
|
| | | | | Net investment income | 217,163 |
|
| Net realized and unrealized gain (loss) on investments | |
| Net realized loss on investments | (75,452 | ) |
| Net increase in unrealized gain on investments | 593,663 |
|
| | | | | Net realized and unrealized gain on investments | 518,211 |
|
| Net increase in net assets resulting from operations | $ | 735,374 |
|
| |
| See accompanying notes to financial statements. |
2017 SEMI-ANNUAL REPORT
Pathway Energy Infrastructure Fund, Inc 8
|
| | | | | | | | | | | | |
| Statements of Changes in Net Assets |
| | | | | | | | | |
| | | | | | | Six Month Ended | | Year Ended |
| | | | | | | December 31, 2016 | | June 30, 2016 |
| | | | | | | (Unaudited) | | |
| Net increase in net assets resulting from operations: | | | |
| Net investment income | $ | 217,163 |
| | $ | 413,947 |
|
| Net realized loss on investments | (75,452 | ) | | — |
|
| Net increase in unrealized gain (loss) on investments | 593,663 |
| | (9,428 | ) |
| | | | | Net increase in net assets resulting from operations | 735,374 |
| | 404,519 |
|
| Distributions to shareholders: | | | |
| Return of capital distributions (Note 7) | (238,514 | ) | | (279,850 | ) |
| | | | | Total distributions to shareholders | (238,514 | ) | | (279,850 | ) |
| Capital transactions: | | | |
| Gross proceeds from shares sold (Note 4) | 1,134,803 |
| | 6,542,454 |
|
| Commissions and fees on shares sold (Note 6) | (87,755 | ) | | (461,367 | ) |
| Reinvestment of distributions (Note 4) | 97,717 |
| | 128,886 |
|
| Offering costs (Note 6) | — |
| | (211,321 | ) |
| | | | | Net increase in net assets from capital transactions | 1,144,765 |
| | 5,998,652 |
|
| | | | | Total increase in net assets | 1,641,625 |
| | 6,123,321 |
|
| Net assets (liabilities): | | | |
| Beginning of year or period | 5,976,355 |
| | (146,966 | ) |
End of year or period(a) | $ | 7,617,980 |
| | $ | 5,976,355 |
|
| | | | | | | | | |
(a) Includes accumulated net investment loss of: | $ | (965,684 | ) | | $ | (1,182,847 | ) |
| |
| See accompanying notes to financial statements. |
2017 SEMI-ANNUAL REPORT
Pathway Energy Infrastructure Fund, Inc 9
|
| | | | | | | | |
Statement of Cash Flows (unaudited) |
| For the six months ended December 31, 2016 |
| | | | | | | |
| Cash flows provided by (used in) operating activities: | |
| Net increase in net assets resulting from operations | $ | 735,374 |
|
| Adjustments to reconcile net increase in net assets resulting from operations to | |
| net cash used in operating activities: | |
| Amortization of offering costs | 76,880 |
|
| Purchase of investments | (2,159,426 | ) |
| Proceeds from sale and redemption of investments | 942,456 |
|
| Net realized loss on investments | 75,452 |
|
| Net increase in unrealized gain on investments | (593,663 | ) |
| Accretion of purchase discount on investments, net | (29,464 | ) |
| (Increase) in operating assets: | |
| Due from Adviser (Note 6) | (87,904 | ) |
| Deferred offering costs (Note 6) | (181,360 | ) |
| Prepaid expenses | (71,398 | ) |
| Interest receivable | (16,029 | ) |
| Increase (Decrease) in operating liabilities: | |
| Due to Adviser (Note 6) | 158,665 |
|
| Accrued expenses | 36,439 |
|
| Due to Administrator (Note 6) | 18,621 |
|
| Interest payable | 156 |
|
| Taxes payable | (12,432 | ) |
| Net cash used in operating activities | (1,107,633 | ) |
| Cash flows provided by (used in) financing activities: | |
| Gross proceeds from shares sold (Note 4) | 1,107,203 |
|
| Commissions and fees on shares sold (Note 6) | (87,755 | ) |
| Distributions paid to stockholders | (93,970 | ) |
| Borrowings under Revolving Credit Facility (Note 5) | 850,000 |
|
| Repayments under Revolving Credit Facility (Note 5) | (550,000 | ) |
| Net cash provided by financing activities | 1,225,478 |
|
| Net increase in cash | 117,845 |
|
| Cash, beginning of period | 149,850 |
|
| Cash, end of period | $ | 267,695 |
|
| | |
| Supplemental information | |
| Value of shares issued through reinvestment of distributions | $ | 97,717 |
|
| Interest paid during the period | $ | 11,435 |
|
| Taxes paid during the period | $ | 8,326 |
|
| |
| See accompanying notes to financial statements. |
2017 SEMI-ANNUAL REPORT
Pathway Energy Infrastructure Fund, Inc 10
|
| | | | | | | | | | | | | | |
Schedule of Investments (unaudited) |
| As of December 31, 2016 |
|
| | | | | | | | | | | | | | | | | | | | | | | |
| | | | | | | December 31, 2016 |
| Portfolio Investments | Industry | | Sector (1) | | Coupon/Yield | | Legal Maturity | | Principal Amount | | Amortized Cost | | Fair Value(2) | | % of Net Assets |
| |
| LEVEL 2 PORTFOLIO INVESTMENTS |
| | | | | | | | | | | | | | | | |
| Senior Unsecured Bonds | | | | | | | | | | | | | | | |
| | | | | | | | | | | | | | | | |
Archrock Partners, LP (3) | Energy | | Services | | 6.00 | % | | 4/1/2021 | | $ | 750,000 |
| | $ | 722,420 |
| | $ | 735,000 |
| | 9.6 | % |
Bill Barrett Corp.(3) | Energy | | Upstream | | 7.63 | % | | 10/1/2019 | | 400,000 |
| | 349,801 |
| | 398,750 |
| | 5.2 | % |
Brand Energy & Infrastructure Services, Inc.(3) | Energy | | Industrial | | 8.50 | % | | 12/1/2021 | | 500,000 |
| | 484,232 |
| | 513,750 |
| | 6.7 | % |
Calumet Specialty Products (3) | Energy | | Downstream | | 7.75 | % | | 4/15/2023 | | 300,000 |
| | 279,927 |
| | 253,050 |
| | 3.3 | % |
Carrizo Oil and Gas, Inc.(3) | Energy | | Upstream | | 7.50 | % | | 9/15/2020 | | 352,000 |
| | 341,530 |
| | 366,960 |
| | 4.8 | % |
CSI Compressco LP (3) | Energy | | Services | | 7.25 | % | | 8/15/2022 | | 400,000 |
| | 328,133 |
| | 378,500 |
| | 5.0 | % |
Ferrellgas Partners LP (3) | Energy | | Downstream | | 8.63 | % | | 6/15/2020 | | 450,000 |
| | 448,753 |
| | 444,750 |
| | 5.8 | % |
Gardener Denver, Inc.(3) | Energy | | Industrial | | 6.88 | % | | 8/15/2021 | | 400,000 |
| | 370,657 |
| | 399,500 |
| | 5.2 | % |
Global Partners LP (3) | Energy | | Midstream | | 7.00 | % | | 6/15/2023 | | 350,000 |
| | 326,563 |
| | 340,113 |
| | 4.5 | % |
Holly Energy Partners LP (3) | Energy | | Midstream | | 6.50 | % | | 3/1/2020 | | 300,000 |
| | 295,796 |
| | 311,135 |
| | 4.1 | % |
Laredo Petroleum, Inc.(3) | Energy | | Upstream | | 7.38 | % | | 5/1/2022 | | 500,000 |
| | 497,724 |
| | 519,530 |
| | 6.8 | % |
Martin Midstream Partners LP (3) | Energy | | Midstream | | 7.25 | % | | 2/15/2021 | | 500,000 |
| | 477,710 |
| | 496,250 |
| | 6.5 | % |
NGL Energy Partners LP (3) | Energy | | Midstream | | 6.88 | % | | 10/15/2021 | | 500,000 |
| | 495,501 |
| | 512,083 |
| | 6.7 | % |
PDC Energy, Inc.(3) | Energy | | Upstream | | 7.75 | % | | 10/15/2022 | | 350,000 |
| | 351,344 |
| | 374,500 |
| | 4.9 | % |
Rice Energy, Inc.(3) | Energy | | Upstream | | 7.25 | % | | 5/1/2023 | | 350,000 |
| | 332,919 |
| | 372,677 |
| | 4.9 | % |
RSP Permian, Inc.(3) | Energy | | Upstream | | 6.63 | % | | 10/1/2022 | | 300,000 |
| | 290,201 |
| | 317,624 |
| | 4.2 | % |
Weatherford International(3) | Energy | | Services | | 9.88 | % | | 3/1/2039 | | 350,000 |
| | 322,395 |
| | 348,250 |
| | 4.6 | % |
Western Refining Logistics LP (3) | Energy | | Midstream | | 7.50 | % | | 2/15/2023 | | 400,000 |
| | 403,464 |
| | 433,000 |
| | 5.7 | % |
WPX Energy, Inc.(3) | Energy | | Upstream | | 7.50 | % | | 8/1/2020 | | 400,000 |
| | 392,716 |
| | 430,250 |
| | 5.6 | % |
| | | | Total Senior Unsecured Bonds | | | $ | 7,511,786 |
| | $ | 7,945,672 |
| | 104.3 | % |
| Senior Secured Bonds | | | | | | | | | | | | | | | |
| | | | | | | | | | | | | | | | |
Hexion Inc.(3) | Energy | | Chemicals | | 6.63 | % | | 4/15/2020 | | $ | 400,000 |
| | $ | 366,279 |
| | $ | 354,500 |
| | 4.7 | % |
Westmoreland Coal Co.(3) | Energy | | Coal | | 8.75 | % | | 11/1/2022 | | 450,000 |
| | 369,911 |
| | 412,313 |
| | 5.4 | % |
| | | | Total Senior Secured Bonds | | | $ | 736,190 |
| | $ | 766,813 |
| | 10.1 | % |
| | | | | | | | | | | | | | | | |
| | | | Total Level 2 Portfolio Investments | | | $ | 8,247,976 |
| | $ | 8,712,485 |
| | 114.4 | % |
2017 SEMI-ANNUAL REPORT
Pathway Energy Infrastructure Fund, Inc 11
|
| | | | | | | | | | | | | | | | | | | | | | | |
| | | | | | | December 31, 2016 |
| Portfolio Investments | Industry | | Sector (1) | | Coupon/Yield | | Legal Maturity | | Principal Amount | | Amortized Cost | | Fair Value(2) | | % of Net Assets |
| | | | | | | | | |
| LEVEL 3 PORTFOLIO INVESTMENTS |
| | | | | | | | | | | | | | | | |
CLO - subordinated notes(4) | | | | | | | | | | | | | | | |
| | | | | | | | | | | | | | | | |
Carlyle Global Market Strategies CLO 2012-4, Ltd. (5) | Structured Finance | | N/A | | 28.93 | % | | 1/20/2029 | | $ | 150,000 |
| | $ | 91,420 |
| | $ | 86,956 |
| | 1.1 | % |
Galaxy XIX CLO, Ltd. (5) | Structured Finance | | N/A | | 24.83 | % | | 1/24/2027 | | 250,000 |
| | 167,036 |
| | 164,801 |
| | 2.2 | % |
GoldenTree 2013-7A (5) | Structured Finance | | N/A | | 29.23 | % | | 4/25/2025 | | 250,000 |
| | 164,620 |
| | 157,339 |
| | 2.1 | % |
Madison Park Funding XIII, Ltd.(5) | Structured Finance | | N/A | | 31.52 | % | | 1/19/2025 | | 250,000 |
| | 166,004 |
| | 202,071 |
| | 2.7 | % |
Madison Park Funding XIV, Ltd.(5) | Structured Finance | | N/A | | 23.85 | % | | 7/20/2026 | | 250,000 |
| | 186,694 |
| | 213,759 |
| | 2.8 | % |
Octagon Investment Partners XXI, Ltd.(5) | Structured Finance | | N/A | | 33.79 | % | | 11/14/2026 | | 300,000 |
| | 179,591 |
| | 222,581 |
| | 2.9 | % |
Voya IM CLO 2013-1, Ltd. (formerly, ING IM CLO 2013-1, Ltd.)(5) | Structured Finance | | N/A | | 26.25 | % | | 4/15/2024 | | 250,000 |
| | 156,616 |
| | 159,480 |
| | 2.1 | % |
Voya 2016-1, Ltd.(5) | Structured Finance | | N/A | | 19.96 | % | | 1/20/2027 | | 250,000 |
| | 199,319 |
| | 224,039 |
| | 2.9 | % |
| | | | Total CLO - subordinated notes | | | $ | 1,311,300 |
| | $ | 1,431,026 |
| | 18.8 | % |
| | | | | | | | | | | | | | | | |
| Total Level 3 Portfolio Investments | | | $ | 1,311,300 |
| | $ | 1,431,026 |
| | 18.8 | % |
| | | | | | | |
| Total Portfolio Investments | | $ | 9,559,276 |
| | $ | 10,143,511 |
| | 133.2 | % |
| Liabilities in excess of other assets | | | | (2,525,531 | ) | | (33.2 | )% |
| Net Assets | | | | $ | 7,617,980 |
| | 100.0 | % |
| | | | | | | |
(1) The upstream sector includes businesses that locate, develop or extract energy in its most basic, raw form. The midstream sector includes businesses that process, gather, transport, ship, transmit or store raw energy resources or by-products in a form suitable for refining or power generation. The downstream sector includes businesses that refine, market or distribute energy to end-user customers. |
(2) Fair value is determined in good faith by the board of directors of the Company (See Note 2). |
(3) Security is pledged as collateral supporting the amounts outstanding under the revolving credit facility with BNP Paribas Prime Brokerage International, Ltd. (see Note 5). |
(4) The CLO subordinated notes/securities, income notes and preference/preferred shares are considered equity positions in the Collateralized Loan Obligations (“CLOs”). Equity investments are entitled to distributions, which are generally equal to the remaining cash flow of the payments made by the underlying loans less contractual payments to debt holders and expenses. The estimated yield indicated is based upon the current projection (as of December 31, 2016) of the amount and timing of these distributions and the estimated amount of repayment of the investment. Such projections are periodically reviewed and adjusted, and the estimated yield may not ultimately be realized. |
(5) Co-investment with another fund managed by an affiliate of the Adviser (See Note 6). |
| |
| See accompanying notes to financial statements. |
2017 SEMI-ANNUAL REPORT
Pathway Energy Infrastructure Fund, Inc 12
Notes to Financial Statements
December 31, 2016
Note 1. Principal Business and Organization
Pathway Energy Infrastructure Fund, Inc. (the “Company,” “us,” “our,” or “we”) was incorporated under the general corporation laws of the State of Maryland on February 19, 2013 and was inactive from that date to August 25, 2015 except for matters relating to its organization and registration as an externally managed, non-diversified, closed-end management investment company under the Investment Company Act of 1940, as amended (“1940 Act”). In addition, the Company intends to elect to be treated for tax purposes as a regulated investment company, or “RIC,” under Subchapter M of the Internal Revenue Code of 1986, as amended (the “Code”). On August 25, 2015, the Company satisfied its minimum offering requirement by raising over $2.5 million from selling shares to persons not affiliated with the Company or the Adviser (the “Minimum Offering Requirement”), and as a result, broke escrow and commenced making investments. The Company’s investment objective is to generate current income, and as a secondary objective, long-term capital appreciation. The Company intends to invest at least 80% of its total assets in securities of companies that operate primarily in energy and related infrastructure and industrial sectors (“Energy Companies”). The Company anticipates that its portfolio and will be comprised primarily of income-oriented securities, which includes debt securities and income-focused preferred and common equity interests, of private or public Energy Companies within North America. The Company considers Energy Companies to be (a) those companies that engage in the exploration, development, production, gathering, transportation, processing, storage, refining, supply, distribution, mining, transmission, servicing, industrial products and services, energy efficiency, management, generation or marketing of natural gas, natural gas liquids, crude oil, liquefied natural gas, refined petroleum products, gasoline, diesel fuel, electricity, renewable energy, coal or power, as well as (b) other energy related industrial companies defined as businesses engaged in, but not limited to, manufacturing, refined products, chemicals, infrastructure, materials, logistics, marketing, waste, environmental, equipment rental, contracting, staffing, software, and other products and services that derive more than 50% of their revenues, gross or net profit, or earnings before interest, taxes, depreciation and amortization (“EBITDA”) from companies defined in (a) above. The Company’s primary area of focus will be energy companies in the upstream, midstream, downstream, service and equipment and power sub-sectors of the energy industry.
The Company is managed by Pathway Energy Infrastructure Management, LLC (the “Adviser”), an affiliate of the Company that is registered as an investment adviser under the Investment Advisers Act of 1940, as amended. The Adviser is 50% owned by Prospect Capital Management L.P. and 50% by Stratera Holdings, LLC (“Stratera Holdings,” formerly known as Behringer Harvard Holdings, LLC).
The Company is offering up to 100,000,000 shares of its common stock, on a best efforts basis, at an initial offering price of $15.00 per share and expects the share offering period to last for up to 36 months from the date of the commencement of the offering (September 2, 2014).
Note 2. Summary of Significant Accounting Policies
The following is a summary of significant accounting policies followed by the Company in the preparation of its financial statements.
Basis of Presentation
The accompanying financial statements have been prepared in accordance with U.S. generally accepted accounting principles (“U.S. GAAP”) pursuant to the requirements of ASC 946, Financial Services - Investment Companies (“ASC 946”), and Articles 6 and 12 of Regulation S-X.
Going Concern Matters
The Company’s financial statements have been prepared using accounting principles generally accepted in the United States of America applicable to a going concern, which contemplates the realization of assets and liquidation of liabilities in the normal course of business for the foreseeable future. Because many of the costs of operating the Company are not proportional to the size of the Company’s investment portfolio; including accounting/auditing, legal, insurance and the reimbursement of the compensation of our chief financial officer, chief compliance officer, treasurer, secretary and other administrative personnel of our Administrator, the Company must raise sufficient capital in order to build a portfolio that generates sufficient revenue to cover the Company’s expenses. As of December 31, 2016, the Company has not raised sufficient capital to build a large enough portfolio to generate sufficient revenue to cover its operating expenses and has only been able to fund distributions to shareholders through Expense Payments from the Adviser.
2017 SEMI-ANNUAL REPORT
Pathway Energy Infrastructure Fund, Inc 13
The periods during which the Company is offering common stock and where the Adviser is obligated to provide Expense Payments under the Expense Support Agreement, as defined in Note 6, are scheduled to expire on September 2, 2017. Without extension of the Expense Support Agreement and potentially an extension of the offering period beyond September 2, 2017 to reach an efficient scale, there can be no assurance that the Company will be able to continue operating. The preceding circumstances combine to raise substantial doubt about the Company’s ability to continue as a going concern. The financial statements do not include any adjustments that might result from the outcome of this uncertainty.
Use of Estimates
The preparation of financial statements in conformity with U.S. GAAP requires management to make estimates and assumptions that affect the reported amounts of assets and liabilities and disclosure of contingent assets and liabilities at the date of the financial statements and the reported amounts of income, expenses and gains or losses during the reporting period. Actual results could differ from those estimates and those differences could be material.
Cash
Cash represents funds deposited with financial institutions.
Investment Valuation
The Company follows guidance under U.S. GAAP, which classifies the inputs used to measure fair values into the following hierarchy:
Level 1. Unadjusted quoted prices in active markets for identical assets or liabilities that the Company has the ability to access at the measurement date.
Level 2. Quoted prices for similar assets or liabilities in active markets, or quoted prices for identical or similar assets or liabilities on an inactive market, or other observable inputs other than quoted prices.
Level 3. Unobservable inputs for the asset or liability.
In all cases, the level in the fair value hierarchy within which the fair value measurement in its entirety falls is determined based
on the lowest level input that is significant to the fair value measurement in its entirety. The assessment of the significance of a particular input to the fair value measurement in its entirety requires judgment and considers factors specific to each investment.
Investments for which market quotations are readily available are valued at such market quotations and are classified in Level 1 of the fair value hierarchy.
Securities traded on a national securities exchange are valued at the last sale price on such exchange on the date of valuation or, if there was no sale on such day, at the mean between the last bid and asked prices on such day or at the last bid price on such day in the absence of an asked price. Securities traded on the Nasdaq market are valued at the Nasdaq official closing price (“NOCP”) on the day of valuation or, if there was no NOCP issued, at the last sale price on such day. Securities traded on the Nasdaq market for which there is no NOCP and no last sale price on the day of valuation are valued at the mean between the last bid and asked prices on such day or at the last bid price on such day in the absence of an asked price.
Securities traded in the over-the-counter market are valued by an independent pricing agent or more than one principal market maker, if available, otherwise a principal market maker or a primary market dealer. The Company valued over-the-counter securities by using the midpoint of the prevailing bid and ask prices from dealers on the date of the relevant period end, which were provided by an independent pricing agent and screened for validity by such service. Such securities are categorized in Level 2 of the fair value hierarchy.
With respect to investments for which market quotations are not readily available, or when such market quotations are deemed not to represent fair value, the board of directors (the “Board”) has approved a multi-step valuation process for each quarter, as described below, and such investments are classified in Level 3 of the fair value hierarchy:
| |
| 1. | each portfolio investment is reviewed by investment professionals of the Adviser with an independent valuation firm engaged by the Board; |
| |
| 2. | the independent valuation firm conducts independent valuations and makes its own independent assessments; |
| |
| 3. | the audit committee of the Board (the “Audit Committee”) reviews and discusses the preliminary valuation of the |
Adviser and that of the independent valuation firm; and
2017 SEMI-ANNUAL REPORT
Pathway Energy Infrastructure Fund, Inc 14
| |
| 4. | the Board discusses valuations and determines the fair value of such investments in the Company’s portfolio, in good faith based on the input of the Adviser, the independent valuation firm and the Audit Committee. |
The types of factors that are taken into account in fair value determination include, as relevant, market changes in expected returns for similar investments, performance improvement or deterioration, the nature and realizable value of any collateral, the issuer’s ability to make payments and its earnings and cash flows, the markets in which the issuer does business, comparisons to traded securities, and other relevant factors.
Securities Transactions
Securities transactions are recorded on trade date. Realized gains or losses on investments are calculated by using the specific
identification method.
Revenue Recognition
Interest income, adjusted for amortization of premium and accretion of discount, is recorded on an accrual basis. Accretion of such purchase discounts or amortization of such premiums is calculated by the effective interest method as of the settlement date and adjusted only for material amendments or prepayments. Upon the prepayment of a bond, any unamortized discount or premium is recorded as interest income.
Interest income from investments in the “equity” positions of CLOs (typically income notes or subordinated notes) is recorded based on an estimation of an effective yield to expected maturity utilizing assumed future cash flows. The Company monitors the expected cash inflows from CLO equity investments, including the expected residual payments, and the estimated effective yield is determined and updated periodically, as needed.
Due to and from Adviser
Amounts are due from the Adviser for expense support and due to the Adviser for base management fees, routine non-compensation overhead, operating expenses paid on behalf of the Company and offering and organization expenses paid on behalf of the Company. The due to and due from Adviser balances are presented net on the Statement of Assets and Liabilities in accordance with ASC 210-20-45-1 because the amounts owed between the two parties are determinable, the Company has the right to offset the amount owed from the Adviser against the amount that it owes the Adviser and the Company intends to offset these balances. Amounts included on the Statement of Assets and Liabilities are presented net only to the extent that the Company or the Adviser have a current obligation to pay the amounts. All balances due from the Adviser are settled quarterly.
Offering Costs
Offering costs prior to the commencement of operations were capitalized on the Company’s Statement of Assets and Liabilities as deferred charges until operations began. Thereafter, deferred offering costs were amortized as an expense over a twelve month period on a straight-line basis. The Company charged all offering costs incurred after the commencement of operations and through December 31, 2015 against additional paid-in capital on the Statement of Assets and Liabilities. After discussions with the Staff of the Division of Investment Management of the SEC, the Company decided to change its accounting treatment of offering costs, effective January 1, 2016, and capitalize such costs on the Statement of Assets and Liabilities and amortize them to expense over the 12 month period following such capitalization on a straight line basis. The Company evaluated this change in accounting treatment of offering costs and determined that it did not have a material impact on the Company’s financial statements.
Offering expenses consist of costs for the registration, certain marketing and distribution of the Company’s shares. These expenses include, but are not limited to, expenses for legal, accounting, printing and certain marketing, and include salaries and direct expenses of the Adviser’s employees, employees of its affiliates and others for providing these services.
Dividends and Distributions
Dividends and distributions to stockholders, which are determined in accordance with federal income tax regulations, are recorded on the record date. The amount to be paid out as a dividend or distribution is approved by the Board. Net realized capital gains, if any, are generally distributed or deemed distributed at least annually.
Income Taxes
The Company intends to elect to be treated as a RIC for U.S. federal income tax purposes and intends to comply with the requirement of the Code applicable to RICs. The Company is required to distribute at least 90% of its investment company taxable income and intends to distribute (or retain through a deemed distribution) all of the Company’s investment company taxable income and net capital gain to stockholders; therefore, the Company has made no provision for income taxes. The character of income and gains that the Company will distribute is determined in accordance with income tax regulations that may differ from U.S. GAAP. Book
2017 SEMI-ANNUAL REPORT
Pathway Energy Infrastructure Fund, Inc 15
and tax basis differences relating to stockholders’ dividends and distributions and other permanent book and tax differences are reclassified to paid-in capital.
As of December 31, 2016, the cost basis of investments for tax purposes was $9,472,984 resulting in estimated gross unrealized appreciation and depreciation of $715,265 and $44,738, respectively.
If the Company does not distribute (or is not deemed to have distributed) at least 98% of its annual ordinary income and 98.2% of its capital gains in the calendar year earned, the Company will generally be required to pay an excise tax equal to 4% of the amount by which 98% of its annual ordinary income and 98.2% of its capital gains exceed the distributions from such taxable income for the calendar year. To the extent that the Company determines that its estimated current calendar year taxable income will be in excess of estimated current calendar year dividend distributions from such taxable income, the Company accrues excise taxes, if any, on estimated excess taxable income. As of and for the calendar year ended December 31, 2016, we determined that the Company met the distribution requirements and therefore is not required to pay excise tax. For the six months ended December 31, 2016, we reversed our previous excise tax accrual of $11,106.
If the Company fails to satisfy the annual distribution requirement or otherwise fails to qualify as a RIC in any taxable year, the
Company would be subject to tax on all of its taxable income at regular corporate rates. The Company would not be able to deduct distributions to stockholders, nor would the Company be required to make distributions. Distributions would generally be taxable to the Company’s individual and other non-corporate taxable stockholders as ordinary dividend income to the extent of the Company’s current and accumulated earnings and profits, provided certain holding period and other requirements are met. However, such ordinary dividends would not be eligible for the reduced tax rate applicable to qualified dividend income. Subject to certain limitations under the Code, corporate distributions would be eligible for the dividends-received deduction. To qualify again to be taxed as a RIC in a subsequent year, the Company would be required to distribute to its stockholders the Company’s accumulated earnings and profits attributable to non-RIC years reduced by an interest charge of 50% of such earnings and profits payable by us as an additional tax. In addition, if the Company failed to qualify as a RIC for a period greater than two taxable years, then, in order to qualify as a RIC in a subsequent year, the Company would be required to elect to recognize and pay tax on any net built-in gain (the excess of aggregate gain, including items of income, over aggregate loss that would have been realized if the Company had been liquidated) or, alternatively, be subject to taxation on such built-in gain recognized for a period of ten years.
The Company follows ASC 740, Income Taxes (“ASC 740”). ASC 740 provides guidance for how uncertain tax positions should be recognized, measured, presented, and disclosed in the financial statements. ASC 740 requires the evaluation of tax positions taken or expected to be taken in the course of preparing the Company’s tax returns to determine whether the tax positions are “more-likely-than-not” of being sustained by the applicable tax authority. Tax positions not deemed to meet the more-likely-than not threshold are recorded as a tax benefit or expense in the current period. As of December 31, 2016 and for the six months then ended, the Company did not have a liability for any unrecognized tax benefits. Management has analyzed the Company’s positions expected to be taken on its income tax return for the year ended June 30, 2017 and has concluded that as of December 31, 2016 no provision for uncertain tax position is required in the Company’s financial statements. Management’s determinations regarding ASC 740 may be subject to review and adjustment at a later date based upon factors including, but not limited to, an on-going analysis of tax laws, regulations and interpretations thereof. All federal and state income tax returns for each tax year in the three-year period ended June 30, 2016 remain subject to examination by the Internal Revenue Service and state departments of revenue.
Recent Accounting Pronouncement
In August 2014, the Financial Accounting Standards Board (“FASB”) issued Accounting Standards Update 2014-15, Disclosure
of Uncertainties about an Entity’s Ability to Continue as a Going Concern (“ASU 2014-15”). ASU 2014-15 will explicitly require management to assess an entity’s ability to continue as a going concern, and to provide related footnote disclosure in certain circumstances. ASU 2014-15 is effective for annual and interim periods ending after December 15, 2016. Early application is permitted. The adoption of the amended guidance in ASU 2014-15 is not expected to have a significant effect on the Company’s financial statements and disclosures.
In April 2015, the FASB issued ASU 2015-03, Simplifying the Presentation of Debt Issuance Costs (“ASU 2015-03”), which requires debt issuance costs related to a recognized debt liability to be presented in the balance sheet as a direct deduction from the debt liability rather than as an asset. The new guidance will make the presentation of debt issuance costs consistent with the presentation of debt discounts or premiums. ASU 2015-03 is effective for financial statements issued for fiscal years beginning after December 15, 2015, and interim periods within those fiscal years. Early adoption is permitted for financial statements that have not been previously issued. The new guidance must be applied on a retrospective basis to all prior periods presented in the financial statements. The adoption of the amended guidance in ASU 2015-03 is not expected to have any significant effect on the Company’s financial statements.
2017 SEMI-ANNUAL REPORT
Pathway Energy Infrastructure Fund, Inc 16
In June 2016, the FASB issued ASU 2016-13, Financial Instruments-Credit Losses (Topic 326): Measurement of Credit Losses on Financial Instruments (“ASU 2016-13”), which amends the financial instruments impairment guidance so that an entity is required to measure expected credit losses for financial assets based on historical experience, current conditions and reasonable and supportable forecasts. As such, an entity will use forward-looking information to estimate credit losses. ASU 2016-13 also amends the guidance in FASB ASC Subtopic No. 325-40, Investments-Other, Beneficial Interests in Securitized Financial Assets, related to the subsequent measurement of accretable yield recognized as interest income over the life of a beneficial interest in securitized financial assets under the effective yield method. ASU 2016-13 is effective for financial statements issued for fiscal years beginning after December 15, 2019, including interim periods within those fiscal years. Early adoption is permitted as of the fiscal years beginning after December 15, 2018, including interim periods within those fiscal years. We are currently evaluating the impact, if any, of adopting this ASU on our financial statements.
In August 2016, the FASB issued ASU 2016-15, Statement of Cash Flows (Topic 230): Classification of Certain Cash Receipts and Cash Payments (“ASU 2016-15”), which addresses certain aspects of cash flow statement classification. One such amendment requires cash payments for debt prepayment or debt extinguishment costs to be classified as cash outflows for financing activities. ASU 2016-15 is effective for financial statements issued for fiscal years beginning after December 15, 2017, and interim periods within those fiscal years. Early adoption is permitted, including adoption in an interim period. If an entity early adopts the amendments in an interim period, any adjustments should be reflected as of the beginning of the fiscal year that includes that interim period. An entity that elects early adoption must adopt all of the amendments in the same period. The adoption of the amended guidance in ASU 2016-15 is not expected to have a significant effect on our financial statements and disclosures.
Note 3. Portfolio Investments
Purchases of investment securities (excluding short-term securities) for six months ended December 31, 2016 were $2,159,426.
Sales and redemptions of investment securities (excluding short-term securities) for the six months ended December 31, 2016 were $942,456
The following table summarizes the inputs used to value the Company’s investments measured at fair value as of December 31, 2016:
|
| | | | | | | | | | | | | | | |
| | Quoted Prices in | | | | Significant | | |
| | Active Markets for | | Significant Other | | Unobservable | | |
| | Identical Securities | | Observable Inputs | | Inputs | | |
| | (Level 1) | | (Level 2) | | (Level 3) | | Total |
| Assets | | | | | | | |
| Senior secured and unsecured bonds | $ | — |
| | $ | 8,712,485 |
| | $ | — |
| | $ | 8,712,485 |
|
| CLO - subordinated notes | — |
| | — |
| | 1,431,026 |
| | 1,431,026 |
|
| Total Investments | $ | — |
| | $ | 8,712,485 |
| | $ | 1,431,026 |
| | $ | 10,143,511 |
|
The following is a reconciliation of investments for which Level 3 inputs were used in determining fair value:
|
| | | |
| | CLO - subordinated notes |
| Fair Value at June 30, 2016 | $ | 1,264,203 |
|
| Net increase in unrealized gain on investments | 29,449 |
|
| Purchases of investments | 164,425 |
|
| Amortization of purchase discount, net | (27,051 | ) |
Transfers into Level 3(1) | — |
|
Transfers out of Level 3(1) | — |
|
| Fair Value at December 31, 2016 | $ | 1,431,026 |
|
| | |
| Net increase in unrealized gain attributable to Level 3 investments still held at the end of the period | $ | 29,449 |
|
| | |
(1) There were no transfers between Level 1 and Level 2 during the period. |
2017 SEMI-ANNUAL REPORT
Pathway Energy Infrastructure Fund, Inc 17
The following table provides quantitative information about significant unobservable inputs used in the fair value measurement of Level 3 investments as of December 31, 2016:
|
| | | | | | | | | | | | |
| | | | | | | Unobservable Input |
| Asset Category | | Fair Value | | Primary Valuation Technique | | Input | | Range | | Weighted Average |
| CLO - subordinated notes | | $ | 1,431,026 |
| | Discounted Cash Flow | | Discount Rate | | 16.32% - 32.23% | | 23.32% |
In determining the range of values for the Company’s investments in CLOs, management and the independent valuation firm used a discounted cash flow model. The valuations were accomplished through the analysis of the CLO deal structures to identify the risk exposures from the modeling point of view as well as to determine an appropriate call date. For each CLO security, the most appropriate valuation approach was chosen from alternative approaches to ensure the most accurate valuation for such security. To value a CLO, both the assets and the liabilities of the CLO capital structure are modeled. The Company’s valuation agent utilizes additional methods to validate the results from the discounted cash flow method, such as Monte Carlo simulations of key model variables, analysis of relevant data observed in the CLO market, and review of certain benchmark credit indices. A waterfall engine was used to store the collateral data, generate collateral cash flows from the assets based on various assumptions for the risk factors, distribute the cash flows to the liability structure based on the payment priorities, and discount them back using proper discount rates to expected maturity or call date.
The fair value calculations for the CLOs are sensitive to the key model inputs, including amongst other things, default and recovery rates. The default rate, recovery rate and other assumptions are determined by reference to a variety of observable market sources and applied according to the quality and asset class mix of the underlying collateral and the historical track record of each particular collateral manager. The model assumptions are reviewed on a regular basis and adjusted as appropriate to factor in historic, current and potential market developments.
The significant unobservable input used to value the CLOs is the discount rate applied to the estimated future cash flows expected to be received from the underlying investment, which includes both future principal and interest payments. Included in the consideration and selection of the discount rate are the following factors: risk of default, comparable investments, and call provisions. An increase or decrease in the discount rate applied to projected cash flows, where all other inputs remain constant, would result in a decrease or increase, respectively, in the fair value measurement.
The Company is not responsible for and has no influence over the management of the portfolios underlying the CLO investments the Company holds as those portfolios are managed by non-affiliated third party CLO collateral managers. CLO investments may be riskier and less transparent to the Company than direct investments in underlying companies. CLOs typically will have no significant assets other than their underlying senior secured loans. Therefore, payments on CLO investments are and will be payable solely from the cash flows from such senior secured loans.
The Company��s portfolio consists of residual interests investments in CLOs, which involve a number of significant risks. CLOs are typically very highly levered (10 - 14 times), and therefore the residual interest tranches that the Company invest in are subject to a higher degree of risk of total loss. In particular, investors in CLO residual interests indirectly bear risks of the underlying loan investments held by such CLOs. The Company generally has the right to receive payments only from the CLOs, and generally does not have direct rights against the underlying borrowers or the entity that sponsored the CLO. While the CLOs the Company targets generally enable the investor to acquire interests in a pool of senior loans without the expenses associated with directly holding the same investments, the Company’s prices of indices and securities underlying CLOs will rise or fall. These prices (and, therefore, the prices of the CLOs) will be influenced by the same types of political and economic events that affect issuers of securities and capital markets generally. The failure by a CLO investment in which the Company invests to satisfy financial covenants, including with respect to adequate collateralization and/or interest coverage tests, could lead to a reduction in its payments to the Company. In the event that a CLO fails certain tests, holders of debt senior to the Company may be entitled to additional payments that would, in turn, reduce the payments the Company would otherwise be entitled to receive. Separately, the Company may incur expenses to the extent necessary to seek recovery upon default or to negotiate new terms with a defaulting CLO or any other investment the Company may make. If any of these occur, it could materially and adversely affect the Company’s operating results and cash flows.
The interests the Company has acquired in CLOs are generally thinly traded or have only a limited trading market. CLOs are typically privately offered and sold, even in the secondary market. As a result, investments in CLOs may be characterized as illiquid securities. In addition to the general risks associated with investing in debt securities, CLO residual interests carry additional risks, including, but not limited to: (i) the possibility that distributions from collateral securities will not be adequate to make
2017 SEMI-ANNUAL REPORT
Pathway Energy Infrastructure Fund, Inc 18
interest or other payments; (ii) the quality of the collateral may decline in value or default; (iii) the fact that the Company’s investments in CLO tranches will likely be subordinate to other senior classes of note tranches thereof; and (iv) the complex structure of the security may not be fully understood at the time of investment and may produce disputes with the CLO investment or unexpected investment results. The Company’s net asset value may also decline over time if the Company’s principal recovery with respect to CLO residual interests is less than the price that the Company paid for those investments. The Company’s CLO investments and/or the underlying senior secured loans may prepay more quickly than expected, which could have an adverse impact on its value.
An increase in LIBOR would materially increase the CLO’s financing costs. Since most of the collateral positions within the CLOs have LIBOR floors, there may not be corresponding increases in investment income (if LIBOR increases but stays below the LIBOR floor rate of such investments) resulting in materially smaller distribution payments to the residual interest investors.
If the Company acquires more than 10% of the shares in a foreign corporation that is treated as a controlled foreign corporation (“CFC”) (including residual interest tranche investments in a CLO investment treated as a CFC), for which the Company is treated as receiving a deemed distribution (taxable as ordinary income) each year from such foreign corporation in an amount equal to its pro rata share of the corporation’s income for the tax year (including both ordinary earnings and capital gains), the Company is required to include such deemed distributions from a CFC in its income and the Company is required to distribute such income to maintain its RIC status regardless of whether or not the CFC makes an actual distribution during such year.
If the Company acquires shares in “passive foreign investment companies” (“PFICs”) (including residual interest tranche investments in CLOs that are PFICs), the Company may be subject to federal income tax on a portion of any “excess distribution” or gain from the disposition of such shares even if such income is distributed as a taxable dividend to its stockholders. Certain elections may be available to mitigate or eliminate such tax on excess distributions, but such elections (if available) will generally require the Company to recognize its share of the PFICs income for each year regardless of whether the Company receives any distributions from such PFICs. The Company must nonetheless distribute such income to maintain its status as a RIC.
Due to the inherent uncertainty of determining the fair value of investments that do not have a readily available market value, the fair value of the Company’s investments may fluctuate from period to period. Additionally, the fair value of the Company’s investments may differ significantly from the values that would have been used had a ready market existed for such investments and may differ materially from the values that we may ultimately realize. Further, such investments are generally subject to legal and other restrictions on resale or otherwise are less liquid than publicly traded securities. If the Company was required to liquidate a portfolio investment in a forced or liquidation sale, the Company could realize significantly less than the value at which the Company has recorded it.
Note 4. Capital
The Company offers three classes of shares: Class R shares, Class RIA shares and Class I shares. Class R shares are available to the general public. Class RIA shares are only available to accounts managed by registered investment advisers. Class I shares are available for purchase only through (1) fee-based programs, also known as wrap accounts, of investment dealers, (2) participating broker-dealers that have alternative fee arrangements with their clients, (3) certain registered investment advisers or (4) bank trust departments or any other organization or person authorized to act in a fiduciary capacity for its clients or customers. These classes of shares differ only with respect to the sales load purchasers in the offering must pay, as follows:
•For Class R shares, purchasers pay selling commissions of up to 6.0% and dealer manager fees of 2.0%;
•For Class RIA shares, purchasers pay dealer manager fees of 2.0%, but no selling commissions; and
•For Class I shares, purchasers pay no selling commissions or dealer manager fees.
The Company’s authorized stock consists of 200,000,000 shares of stock, par value $0.01 per share, all of which are initially designated as common stock comprising 180,000,000 of Class R shares, 10,000,000 of Class RIA shares and 10,000,000 of Class I shares. Each class of shares has identical voting and distributions rights, and bears its own pro rata portion of the Company’s expenses and has the same net asset value.
2017 SEMI-ANNUAL REPORT
Pathway Energy Infrastructure Fund, Inc 19
Transactions in shares of common stock were as follows during the six months ended December 31, 2016 and the year ended June 30, 2016:
|
| | | | | | | | | | | | | | | | | | | | | | | | | | | |
Six months ended December 31, 2016: | Class R Shares | | Class RIA Shares | | Class I Shares | | Total |
| Shares | | Amount | | Shares | | Amount | | Shares | | Amount | | Shares | | Amount |
| Shares sold | 72,082 |
| | $ | 1,085,803 |
| | 3,468 |
| | $ | 49,000 |
| | — |
| | $ | — |
| | 75,550 |
| | $ | 1,134,803 |
|
| Shares issued from reinvestment of distributions | 7,193 |
| | 94,300 |
| | 36 |
| | 470 |
| | 225 |
| | 2,947 |
| | 7,454 |
| | 97,717 |
|
| Net increase from capital transactions | 79,275 |
| | $ | 1,180,103 |
| | 3,504 |
| | $ | 49,470 |
| | 225 |
| | $ | 2,947 |
| | 83,004 |
| | $ | 1,232,520 |
|
|
| | | | | | | | | | | | | | | | | | | | | | | | | | | | |
| | Year ended June 30, 2016: | |
| |
| | Shares sold | 430,231 |
| | $ | 6,398,454 |
| | 993 |
| | $ | 14,000 |
| | 9,420 |
| | $ | 130,000 |
| | 440,644 |
| | $ | 6,542,454 |
|
| | Shares issued from reinvestment of distributions | 9,368 |
| | 122,908 |
| | 38 |
| | 386 |
| | 427 |
| | 5,592 |
| | 9,833 |
| | 128,886 |
|
| | Net increase from capital transactions | 439,599 |
| | $ | 6,521,362 |
| | 1,031 |
| | $ | 14,386 |
| | 9,847 |
| | $ | 135,592 |
| | 450,477 |
| | $ | 6,671,340 |
|
At December 31, 2016, the Company has 518,874, 4,535 and 26,305 of Class R shares, Class RIA shares and Class I shares issued and outstanding, respectively.
Share Repurchase Program
The Company conducts quarterly tender offers pursuant to its share repurchase program. The Company’s Board considers the following factors, among others, in making its determination regarding whether to cause us to offer to repurchase shares and under what terms:
| |
| • | the effect of such repurchases on our qualification as a RIC (including the consequences of any necessary asset sales); |
| |
| • | the liquidity of the Company’s assets (including fees and costs associated with disposing of assets); |
| |
| • | the Company’s investment plans and working capital requirements; |
| |
| • | the relative economies of scale with respect to the Company’s size; |
| |
| • | the Company’s history in repurchasing shares or portions thereof; and |
| |
| • | the condition of the securities markets. |
The Company limits the number of shares to be repurchased in any calendar year to 20% of the weighted average number of shares outstanding in the prior calendar year, or 5% in each quarter, though the actual number of shares that the Company offer to repurchase may be less in light of the limitations noted below. At the discretion of the Company’s Board, the Company may use cash on hand, and cash from the sale of investments as of the end of the applicable period to repurchase shares. In addition, the Company currently limits the number of shares to be repurchased during any calendar year to the number of shares the Company can repurchase with the proceeds the Company receives from the sale of its shares under its distribution reinvestment plan. The Company will offer to repurchase such shares at a price equal to the net asset value per share of our common stock specified in the tender offer. The Company’s Board may suspend or terminate the share repurchase program at any time. The first such tender offer commenced in September 2016.
On September 14, 2016, the Company made an offer to purchase up to $50,274 in aggregate amount of the Company’s issued and outstanding common shares. The offer began on September 22, 2016 and expired at 12:00 Midnight, Eastern Time, on October 19, 2016. No shares were tendered pursuant to the offer.
On December 15, 2016, the Company made an offer to purchase up to $61,131 in aggregate amount of the Company’s issued and outstanding common shares. The offer began on December 22, 2016 and expired at 12:00 Midnight, Eastern Time, on January 23, 2017. Payment was made on January 26, 2017 at a purchase price of $14.00 per share, and a total of 772 class R shares were validly tendered and not withdrawn pursuant to the offer.
2017 SEMI-ANNUAL REPORT
Pathway Energy Infrastructure Fund, Inc 20
Note 5. Revolving Credit Facility
On August 25, 2015, we closed on a credit facility with BNP Paribas Prime Brokerage International, Ltd. (the “Revolving Credit Facility”). The Revolving Credit Facility included an accordion feature which allowed commitments to be increased up to $25,000,000 in the aggregate. Interest on borrowings under the Revolving Credit Facility is three-month LIBOR plus 120 basis points with no minimum LIBOR floor.
As of December 31, 2016, we had $2,152,030 available to us for borrowing under the Revolving Credit Facility, of which the amount outstanding was $1,550,000. As additional eligible investments are pledged under the Revolving Credit Facility, we will generate additional availability up to the current commitment amount of $25,000,000. As of December 31, 2016, the investments, used as collateral for the Revolving Credit Facility had an aggregate fair value of $8,712,485, which represents 86%, of our total investments.
The agreement governing our Revolving Credit Facility requires us to comply with certain financial and operational covenants. These covenants include:
| |
| • | Restrictions on the level of indebtedness that we are permitted to incur in relation to the value of our assets; |
| |
| • | Restrictions on our ability to incur liens; and |
| |
| • | Maintenance of a minimum level of stockholders’ equity. |
As of December 31, 2016, we were in compliance with these covenants. However, our continued compliance with these covenants depends on many factors, some of which are beyond our control. Accordingly, there are no assurances that we will continue to comply with the covenants in our credit facility. Failure to comply with these covenants would result in a default under this facility which, if we were unable to obtain a waiver from the lenders thereunder, could result in an acceleration of repayments under the facility and thereby have a material adverse impact on our business, financial condition and results of operations.
During the six months ended December 31, 2016, we recorded $11,591 of interest expense related to our revolving credit facility.
Note 6. Transactions with Affiliates
Investment Advisory Agreement
On September 2, 2014, the Company entered into an investment advisory agreement (the “Investment Advisory Agreement”) with the Adviser. The Adviser manages the day-to-day investment operations of, and provides investment advisory services to, the Company. For providing these services, the Adviser is paid a base management fee and an incentive fee. The base management fee, payable quarterly in arrears, is calculated at an annual rate of 2.0% based on the average of the total assets as of the end of the two most recently completed calendar quarters. The Company also pays routine non-compensation overhead expenses of the Adviser in an amount up to 0.0625% per quarter (0.25% annualized) of the Company’s average total assets. The incentive fee is calculated and payable quarterly in arrears based on the Company’s pre-incentive fee net investment income for the immediately preceding quarter. For this purpose, pre-incentive fee net investment income means interest income, dividend income and any other income (including any other fees, such as commitment, origination, structuring, diligence and consulting fees or other fees received) accrued during the calendar quarter, minus operating expenses for the quarter (including the base management fee, expenses reimbursed under the Investment Advisory Agreement, the administration agreement and the investor services agreement, any interest expense and dividends paid on any issued and outstanding preferred shares, but excluding the organization and offering expenses and incentive fee). Pre-incentive fee net investment income includes, in the case of investments with a deferred interest feature (such as original issue discount, debt instruments with payment-in-kind interest and zero coupon securities), accrued income that we have not yet received in cash. Pre-incentive fee net investment income does not include any realized capital gains, realized capital losses or unrealized capital appreciation or depreciation. Pre-incentive fee net investment income, expressed as a rate of return on the value of the Company’s net assets at the end of the immediately preceding calendar quarter, is compared to the preferred return rate of 1.5% per quarter (6.0% annualized). The Company pays the Adviser an incentive fee with respect to its pre-incentive fee net investment income in each calendar quarter as follows: (1) no incentive fee in any calendar quarter in which the pre-incentive fee net investment income does not exceed the preferred return rate; (2) 100% of the pre-incentive fee net investment income, if any, that exceeds the preferred return rate but is less than 1.875% in any calendar quarter (7.5% annualized); and (3) 20.0% of the pre-incentive fee net investment income, if any, that exceeds 1.875% in any calendar quarter. These calculations are appropriately pro-rated for any period of less than three months. For the six months ended December 31, 2016, there was $92,093 of base management fees charged and no incentive fees charged.
2017 SEMI-ANNUAL REPORT
Pathway Energy Infrastructure Fund, Inc 21
For the six months ended December 31, 2016, expenses incurred by the Company in connection with the Investment Advisory Agreement were as follows:
|
| | | | | | | | |
| Description | | Expense | | Payable |
Base management fee(1) | | $ | 92,093 |
| | $ | 50,565 |
|
Routine non-compensation overhead expenses(2) | | 12,016 |
| | 6,321 |
|
| | | | | |
(1) Presented net as part of Due from Adviser on the Statement of Assets and Liabilities. |
| | | | | |
(2) Presented net as part of Due from Adviser on the Statement of Assets and Liabilities and as part of Adviser shared service expense in the Statement of Operations. |
Expense Support and Conditional Reimbursement Agreement
We have entered into an expense support and conditional reimbursement agreement (the “Expense Support Agreement”) with our Adviser, whereby our Adviser has agreed to reimburse us for operating expenses in an amount equal to the difference between distributions to our stockholders for which a record date has occurred in each quarter less the sum of our net investment income, the net realized capital gains/losses and dividends and other distributions paid to us from our portfolio investments during such period (“Expense Support Reimbursement”). To the extent that there are no dividends or other distributions to our stockholders for which a record date has occurred in any given quarter, then the Expense Support Reimbursement for such quarter is equal to such amount necessary in order for Available Operating Funds (as defined below) for the quarter to equal zero. The Expense Support Agreement will remain in effect until the date on which our public offering of shares of common stock ends, unless extended mutually by us and our Adviser. Any payments required to be made by our Adviser under the Expense Support Agreement (an “Expense Payment”) for any quarter shall be paid by our Adviser to us in any combination of cash or other immediately available funds, and/or offsets against amounts otherwise due from us to our Adviser, no later than the earlier of (i) the date on which we close our books for such quarter and (ii) sixty days after the end of such quarter, or at such later date as determined by us (the “Expense Payment Date”). We have a conditional obligation to reimburse our Adviser for any amounts funded by our Adviser under the Expense Support Agreement. Following any calendar quarter in which Available Operating Funds in such calendar quarter exceed the cumulative distributions to stockholders for which a record date has occurred in such calendar quarter (“Excess Operating Funds”) on a date mutually agreed upon by our Adviser and us (each such date, a “Reimbursement Date”), we shall pay such Excess Operating Funds, or a portion thereof, to the extent that we have cash available for such payment, to our Adviser until such time as all Expense Payments made by our Adviser to us have been reimbursed; provided that (i) the operating expense ratio as of such Reimbursement Date is equal to or less than the operating expense ratio as of the Expense Payment Date attributable to such specified Expense Payment; (ii) the annualized distribution rate, which includes all regular cash distributions paid and excludes special distributions or the effect of any stock dividends paid, as of such Reimbursement Date is equal to or greater than the annualized distribution rate as of the Expense Payment Date attributable to such specified Expense Payment; and (iii) such specified Expense Payment Date is not earlier than three years prior to the Reimbursement Date.
On March 29, 2016, we amended and restated the Expense Support Agreement to revise the definition on Available Operating Funds. Available Operating Funds is defined under the current version of the Expense Support Agreement as the sum of (i) our net investment income (minus any reimbursement payments payable to our Adviser), (ii) our net realized capital gains/losses and (iii) dividends and other distributions paid to us on account of our portfolio investments. However, for Expense Payments made under the prior version of the Expense Support Agreement, we will calculate Available Operating Funds for the purpose of determining whether we are obligated to make reimbursements as the sum of (i) our net investment income, (ii) the net realized capital gains/losses, (iii) the changes in unrealized losses, and (iv) dividends and other distributions paid to us from our portfolio investments. The calculation of changes in unrealized losses shall only reflect further reduction in value of individual investments from the largest previously recorded unrealized loss for such individual investment. Realized losses will only include the amount in excess of the largest previously recorded unrealized loss for the same investment.
The purpose of the Expense Support Agreement is to minimize such distributions from us being characterized as returns of capital for U.S. GAAP purposes and to reduce operating expenses until we have raised sufficient capital to be able to absorb such expenses. However, such distributions may still be characterized as a return of capital for U.S. federal income tax purposes.
2017 SEMI-ANNUAL REPORT
Pathway Energy Infrastructure Fund, Inc 22
The following table provides information regarding liabilities incurred by the Adviser pursuant to the Expense Support Agreement:
|
| | | | | | | | | | | | | | |
| Period Ended | Expense Support Payments Due
from Adviser | Expense Support Payments Reimbursed to Adviser | Unreimbursed Expense Support Payments | Operating Expense Ratio(1) | Annualized Distribution Rate(2) | Eligible to be Repaid Through |
| September 30, 2014 | $ | 161,671 |
| $ | — |
| $ | 161,671 |
| N/A |
| N/A |
| September 30, 2017 |
| December 31, 2014 | 470,161 |
| — |
| 470,161 |
| N/A |
| N/A |
| December 31, 2017 |
| March 31, 2015 | 401,480 |
| — |
| 401,480 |
| N/A |
| N/A |
| March 31, 2018 |
| June 30, 2015 | 288,510 |
| — |
| 288,510 |
| 16.39 | % | N/A |
| June 30, 2018 |
| September 30, 2015 | 397,382 |
| — |
| 397,382 |
| 8.52 | % | 6.00 | % | September 30, 2018 |
| December 31, 2015 | 320,756 |
| — |
| 320,755 |
| 8.66 | % | 6.00 | % | December 31, 2018 |
| March 31, 2016 | 344,176 |
| — |
| 334,176 |
| 7.36 | % | 6.00 | % | March 31, 2019 |
| June 30, 2016 | 126,468 |
| — |
| 126,468 |
| 3.52 | % | 6.00 | % | June 30, 2019 |
| September 30, 2016 | 235,836 |
| — |
| 235,836 |
| 4.78 | % | 6.00 | % | September 30, 2019 |
| December 31, 2016 | 306,410 |
| — |
| 306,410 |
| 4.80 | % | 5.84 | % | December 31, 2019 |
| | | Total |
| $ | 3,042,849 |
| | | |
| | | | | | | |
(1) Operating expense ratio is as of the date the expense support payment obligation was incurred by the Adviser and includes all expenses borne by the Company, except for organizational and offering expenses, base management fees, and any interest expense attributable to indebtedness incurred by the Company. |
(2)Annualized distribution rate equals the annualized rate of distributions to stockholders based on the amount of the regular distributions paid immediately prior to the date the expense support payment obligation was incurred by the Adviser. Annualized distribution rate does not include bonus distributions paid to stockholders. |
During the six months ended December 31, 2016, the Adviser paid the Company $362,304 for expense support pursuant to the Expense Support Agreement. As of December 31, 2016, $306,410 of expense support is due from the Adviser to the Company, which is presented net of amounts due to the Adviser on the Statement of Assets and Liabilities.
Administration Agreement
On September 2, 2014, the Company entered into an administration agreement (the “Administration Agreement”) with Prospect Administration LLC (the “Administrator”), an affiliate of the Adviser. The Administrator performs, oversees and arranges for the performance of administrative services necessary for the operation of the Company. These services include, but are not limited to, accounting, finance and legal services. For providing these services, facilities and personnel, the Company reimburses the Administrator for the Company’s actual and allocable portion of expenses and overhead incurred by the Administrator in performing its obligations under the Administration Agreement, including rent and the Company’s allocable portion of the costs of its Chief Financial Officer and Chief Compliance Officer and his staff. For the six months ended December 31, 2016, administrative costs incurred by the Company to the Administrator were $234,146. As of December 31, 2016, $48,769 was payable to the Administrator.
Commissions and fees on shares sold
Provasi Securities, LP (the “Dealer Manager”), an indirect wholly-owned subsidiary of Stratera Holdings, acts as dealer manager for the offering and manages a group of participating broker-dealers, including other unaffiliated broker-dealers who enter into participating broker-dealer agreements with the Dealer Manager. The Company has agreed to pay the Dealer Manager selling commissions in the amount of 6.0% of the selling price of each Class R share for which a sale is completed from the shares offered in the offering.
As compensation for acting as the Dealer Manager, the Company has agreed to pay the Dealer Manager a dealer manager fee in the amount of 2.0% of the selling price of each Class R share for which a sale is completed from the Class R or RIA Shares offered in the offering. The Dealer Manager is expected to re-allow the full amount of selling commissions to participating broker-dealers and may re-allow up to 1.15% of the dealer manager fee to participating broker-dealers for reimbursement of marketing expenses.
During the six months ended December 31, 2016 the total sales load incurred through the offering of our common stock was $87,755, which includes $65,058 of selling commissions and $22,697 of dealer manager fees. These fees are charged against additional paid-in capital on the Statement of Assets and Liabilities.
2017 SEMI-ANNUAL REPORT
Pathway Energy Infrastructure Fund, Inc 23
Investor Services Agreement
The Company also entered into an investor services agreement (the “Investor Services Agreement”) under which the Company reimburses Stratera Holdings for providing investor relations support and related back-office services with respect to the Company’s investors. During the six months ended December 31, 2016 Stratera Holdings incurred $71,445 of operating expenses in connection with the Investor Services Agreement, which were recorded as part of Adviser shared service expense in the Statement of Operations. During the six months ended December 31, 2016 Stratera Holdings incurred $34,400 of offering costs in connection with the Investor Services Agreement, which, in conjunction with other offering costs incurred by the Adviser on behalf of the Company, are deferred as an asset and amortized, on a straight-line basis, as an expense over the 12-month period immediately following the deferral. See the Offering Costs section below for a summary of all organization and offering costs and operating expenses incurred by and payable to the Adviser on behalf of the Company.
Offering Costs
The Adviser, on behalf of the Company, paid or incurred offering costs of $181,360 during the six months ended December 31, 2016. As of January 1, 2016 the Company changed its accounting policy related to offering costs and they are deferred to assets when incurred and amortized over a 12 month period on a straight line basis. As of December 31, 2016, $187,550 remains as a deferred asset on the Statement of Assets and Liabilities, while $76,880 has been amortized to expense in the Statement of Operations during the six months ended December 31, 2016.
As of December 31, 2016, the total due to the Adviser for organization and offering costs and operating expenses paid on behalf of the Company was $1,713,514, which is broken out as follows:
|
| | | | | | | | | | | | |
| Fiscal Year Ended | | Organization and Offering Costs | | Operating Expenses paid on behalf of the Company | | Total Due to Adviser for O&O and OpEx paid on behalf of the Company |
| June 30, 2013 | | $ | 597,784 |
| | $ | — |
| | $ | 597,784 |
|
| June 30, 2014 | | 339,610 |
| | — |
| | 339,610 |
|
| June 30, 2015 | | 364,065 |
| | 430,164 |
| | 794,229 |
|
| June 30, 2016 | | 302,774 |
| | 352,918 |
| | 655,692 |
|
| June 30, 2017 | | 181,360 |
| | 107,746 |
| | 289,106 |
|
| | | 1,785,593 |
| | 890,828 |
| | 2,676,421 |
|
| | | | | | | |
| Reimbursements made to the Adviser | | (142,003 | ) | | (820,904 | ) | | (962,907 | ) |
| | | | | | | |
| Unreimbursed costs and expenses paid on behalf of the Company | | $ | 1,643,590 |
| | $ | 69,924 |
| | $ | 1,713,514 |
|
Upon achieving the Minimum Offering Requirement, the Adviser was entitled to receive up to 5.0% of the gross proceeds from the offering as reimbursement for organization and offering costs that it has funded, until all of the organization and offering costs incurred and/or paid by the Adviser have been recovered. On September 2, 2014, the Adviser agreed to reduce such reimbursement and accept a maximum of 2.0% of the gross proceeds of the offering of the Company’s securities until all of the organization and offering costs incurred and/or paid by the Adviser have been recovered.
Co-Investments
On February 10, 2014, the Company received an exemptive order from the SEC (the “Order”) that gave it the ability to negotiate terms other than price and quantity of co-investment transactions with other funds managed by the Adviser or certain affiliates, including Prospect Capital Corporation and Priority Income Fund, Inc. (“PRIS”), a closed-end fund managed by an affiliate of Prospect Capital Management, subject to the conditions included therein. Under the terms of the relief permitting the Company to co-invest with other funds managed by the Adviser or its affiliates, a “required majority” (as defined in Section 57(o) of the 1940 Act) of the Company’s independent directors must make certain conclusions in connection with a co-investment transaction, including that (1) the terms of the proposed transaction, including the consideration to be paid, are reasonable and fair to the Company and its stockholders and do not involve overreaching of the Company or its stockholders on the part of any person concerned and (2) the transaction is consistent with the interests of the Company’s stockholders and is consistent with the Company’s investment objective and strategies. In certain situations where co-investment with one or more funds managed by the Adviser or its affiliates is not covered by the Order, such as when there is an opportunity to invest in different securities of the same issuer, the personnel of the Adviser or its affiliates will need to decide which fund will proceed with the investment. Such personnel will make these determinations based on policies and procedures, which are designed to reasonably ensure that investment opportunities are allocated fairly and equitably among affiliated funds over time and in a manner that is consistent with applicable laws, rules
2017 SEMI-ANNUAL REPORT
Pathway Energy Infrastructure Fund, Inc 24
and regulations. Moreover, except in certain circumstances, when relying on the Order, the Company will be unable to invest in any issuer in which one or more funds managed by the Adviser or its affiliates has previously invested.
As of December 31, 2016, the Company and PRIS both hold Carlyle Global Market Strategies CLO 2012-4, Ltd., Galaxy XIX, Ltd., GoldenTree 2013-7A, Madison Park Funding XIII, Ltd., Madison Park Funding XIV, Ltd., Octagon Investment Partners XXI, Ltd., Voya IM CLO 2013-1, Ltd., and Voya CLO 2016-1, Ltd.; however only Voya CLO 2016-1, Ltd. is a co-investment pursuant to the Order because all the others were purchased on the secondary market.
Allocation of Expenses
The cost of valuation services for CLOs is initially borne by PRIS, which then allocates to the Company its proportional share of such expense. During the six months ended December 31, 2016, PRIS has incurred $9,327 in expenses related to valuation services that are attributable to the Company. The Company reimbursed PRIS for these expenses and includes them as part of valuation services in the Statement of Operations.
Officers and Directors
Certain officers and directors of the Company are also officers and directors of the Adviser and its affiliates. There were no fees paid to the independent directors of the Company as the Company did not exceed the minimum net asset value required (i.e., greater than $100 million) to receive a fee for the six months ended December 31, 2016. The officers do not receive any direct compensation from the Company.
Note 7. Distributions to Shareholders
Dividends from net investment income and capital gain distributions are determined in accordance with U.S. federal income tax regulations, which differ from U.S. GAAP.
The following tables reflect the distributions per share that the Company declared and paid or are payable to its stockholders during the year ended June 30, 2016 and six months ended December 31, 2016, respectively. Stockholders of record as of each respective record date were or will be entitled to receive the distribution.
|
| | | | | | | | | | |
| Record Date | | Payment Date | | Total Amount per Share(a) | | Amount Distributed |
| October 2, 2015 | | October 5, 2015 | | $ | 0.09616 |
| | $ | 25,464 |
|
| October 6, 16, 23, and 30, 2015 | | November 2, 2015 | | 0.06904 |
| | 19,320 |
|
| November 6, 13, 20, and 27, 2015 | | November 30, 2015 | | 0.06904 |
| | 21,701 |
|
| December 4, 11, 18, and 28, 2015 | | December 29, 2015 | | 0.06904 |
| | 24,756 |
|
| January 4, 8, 15, 22, and 29, 2016 | | February 1, 2016 | | 0.08630 |
| | 32,022 |
|
| February 5, 12, 19 and 26, 2016 | | February 29, 2016 | | 0.06904 |
| | 27,338 |
|
| March 4, 11, 18 and 28, 2016 | | March 29, 2016 | | 0.06904 |
| | 28,793 |
|
| April 1, 8, 15, 22, and 29, 2016 | | May 2, 2016 | | 0.08630 |
| | 37,652 |
|
| May 6, 13, 20, and 27, 2016 | | May 31, 2016 | | 0.06904 |
| | 30,950 |
|
| June 3, 10, 17 and 24, 2016 | | June 27, 2016 | | 0.06904 |
| | 31,854 |
|
| Total declared and distributed for the year ended June 30, 2016 | | $ | 279,850 |
|
|
| | | | | | | | | | |
| Record Date | | Payment Date | | Total Amount per Share(a) | | Amount Distributed |
| July 1, 8, 15, 22 and 29, 2016 | | August 1, 2016 | | $ | 0.08630 |
| | $ | 41,416 |
|
| August 5, 12, 19 and 26, 2016 | | August 29, 2016 | | 0.06904 |
| | 33,895 |
|
| September 2, 9, 16, 23 and 30, 2016 | | October 3, 2016 | | 0.08630 |
| | 43,735 |
|
| October 7, 14, 21 and 28, 2016 | | October 31, 2016 | | 0.06904 |
| | 35,973 |
|
| November 4, 11, 18 and 25, 2016 | | November 28, 2016 | | 0.06904 |
| | 36,668 |
|
| December 2, 9, 16, 23 and 30, 2016 | | January 3, 2017 | | 0.08630 |
| | 46,827 |
|
| Total declared and distributed for the six months ended December 31, 2016 | | $ | 238,514 |
|
| |
(a)Total amount per share represents the total distribution rate for the record dates indicated. |
2017 SEMI-ANNUAL REPORT
Pathway Energy Infrastructure Fund, Inc 25
Dividends and distributions to stockholders are recorded on the record date. The table above includes distributions with record dates during the six months ended December 31, 2016 and does not include distributions previously declared to stockholders of record on any future dates, as those amounts are not yet determinable. The following distributions were previously declared and have record dates subsequent to December 31, 2016 universally for Class R, Class RIA, and Class I shares:
|
| | | | | |
| Record Date | | Payment Date | | Total Amount per Share(a) |
| January 6, 13, 20 and 27, 2017 | | January 30, 2017 | | 0.06904 |
|
| February 3, 10, 17 and 24, 2017 | | February 27, 2017 | | 0.06904 |
|
| | | | | |
(a)Total amount per share represents the total distribution rate for the record dates indicated. |
The Company may fund its distributions to stockholders from any sources of funds available, including offering proceeds, borrowings, net investment income from operations, capital gains proceeds from the sale of assets, non-capital gains proceeds from the sale of assets and expense reimbursements from the Adviser, which may constitute a return of capital and reduce the amount of capital available to the Company for investment. Any capital returned to stockholders through distributions will be distributed after payment of fees and expenses.
Following commencement of the Company’s continuous public offering, substantial portions of the Company’s distributions to stockholders have been funded through Expense Payments that are subject to repayment by the Company. The purpose of this arrangement was to ensure that no portion of the Company’s distributions to stockholders was paid from offering proceeds. Any such distributions funded through Expense Payments were not based on the Company’s investment performance. The reimbursement of these Expense Payments owed to the Adviser will reduce the future distributions to which stockholders would otherwise be entitled. For the six months ended December 31, 2016, the Company was not obligated to repay any amounts to the Adviser for Expense Payments. There can be no assurance that the Company will achieve the performance necessary to sustain its dividends or that the Company will be able to pay dividends at a specific rate or at all.
The Company has adopted an “opt in” distribution reinvestment plan pursuant to which stockholders may elect to have the full amount of distributions reinvested in additional shares. Stockholders will receive distributions in cash unless specifically “opting in” to the distribution reinvestment plan to have cash distributions reinvested in additional shares of the Company. Reinvested distributions will purchase shares at a price equal to 95% of the price that shares are sold in the offering at the closing immediately following the distribution payment date. There will be no selling commissions, dealer manager fees or other sales charges for shares issued under the distribution reinvestment plan.
Note 8. Income Taxes
The information presented in this footnote is based on our most recent tax year end, which is June 30, 2016.
For income tax purposes, dividends paid and distributions made to shareholders are reported as ordinary income, capital gains, non-taxable return of capital, or a combination thereof. The likely and expected tax character of distributions declared and paid to shareholders during the year ended June 30, 2016 was as follows:
|
| | | |
| | Year ended June 30, 2016 |
| Ordinary income | $ | — |
|
| Capital gain | — |
|
| Return of capital | 279,850 |
|
Total dividends declared and paid to shareholders
| $ | 279,850 |
|
While the tax character of dividends paid to shareholders for the year ended June 30, 2016 is expected to be characterized as return of capital, the final determination of the tax character of distributions for this period will not be made until we file our tax returns for the tax year ended June 30, 2016.
2017 SEMI-ANNUAL REPORT
Pathway Energy Infrastructure Fund, Inc 26
As of June 30, 2016. the estimated components of accumulated losses on a tax basis were as follows:
|
| | | |
| Accumulated ordinary loss | $ | (624,627 | ) |
| Temporary differences | (570,816 | ) |
| Net unrealized gain on investments | 3,169 |
|
In general, we may make certain adjustments to the classification of net assets as a result of permanent book-to-tax differences, which may include differences in the book and tax basis of certain assets and liabilities, amortization of offering costs, Expense Payments and nondeductible federal excise taxes, among other items. For the year ended June 30, 2016, we increased accumulated net investment loss by $1,512,350 and increased additional paid in capital by $1,512,350.
Note 9. Concentration and Credit Risk
We anticipate that our portfolio will be comprised primarily of income-oriented securities, which includes debt securities and income-focused preferred and common equity interests, of private or public Energy Companies within North America. We will dynamically allocate our assets in varying types of investments based on our analysis of the credit markets, which may result in our portfolio becoming more concentrated in particular types of credit instruments (such as senior secured floating rate loans) and less invested in other types of credit instruments. These securities will be generally rated below investment grade by rating agencies or would be rated below investment grade if they were rated. Below investment grade securities, which are often referred to as “high yield” or “junk,” have predominantly speculative characteristics with respect to the issuer’s capacity to pay interest and repay principal. We currently intend to initially weight our portfolio towards senior secured and unsecured debt.
Cash held at financial institutions, at times, may exceed the amount insured by the Federal Deposit Insurance Corporation. The Company’s portfolio may be concentrated in a limited number of investments in CLO vehicles, which is subject to a risk of loss if that sector experiences a market downturn. The Company is subject to credit risk in the normal course of pursuing its investment objectives. The Company’s maximum risk of loss from credit risk for portfolio investments is the inability of the CLO collateral managers to return up to the cost value due to loan defaults occurring in the underlying CLOs.
As the interest rate on our revolving credit facility is at a variable rate based on an index, an increase in interest rates would make it more expensive to use debt to finance our investments. As a result, an increase in market interest rates could both reduce the value of our portfolio investments and increase our cost of capital, which could reduce our net investment income or net increase in net assets resulting from operations.
If one of our portfolio companies were to go bankrupt, even though we may have structured our interest as senior debt, depending on the facts and circumstances, a bankruptcy court might recharacterize our debt holding as an equity investment and subordinate all or a portion of our claim to that of other creditors. In addition, lenders can be subject to lender liability claims for actions taken by them where they become too involved in the borrower’s business or exercise control over the borrower. For example, we could become subject to a lender’s liability claim, if, among other things, we actually render significant managerial assistance.
Note 10. Commitments and Contingencies
The Company has a conditional obligation to reimburse the Adviser for any amounts funded by the Adviser under the Expense Support Agreement if (and only to the extent that), following any fiscal quarter occurring within three years of the date on which the Adviser incurred the liability for such amount, Available Operating Funds exceeds the distributions paid by the Company to stockholders to the extent that the Company has cash available for such payment. The Company will only make reimbursement payments if its operating expense ratio is equal to or less than its operating expense ratio at the time the corresponding Expense Payment was incurred and if the annualized rate of the Company’s regular cash distributions to stockholders is equal to or greater than the annualized rate of its regular cash distributions to stockholders at the time the corresponding Expense Payment was incurred. No reimbursement will be paid to the Adviser more than three years after such corresponding Expense Payment was incurred. The Company is unable to estimate the amount that would be reimbursable to the Adviser at the time the above event occurs. However, the maximum exposure to the Company is the total of the Expense Payments from the Adviser. As of December 31, 2016, the amount of expense support that is conditionally reimbursable by the Company to the Adviser is $3,042,849
The Company is not currently subject to any material legal proceedings and, to the Company’s knowledge, no material legal proceedings are threatened against the Company. From time to time, the Company may be a party to certain legal proceedings in the ordinary course of business, including proceedings relating to the enforcement of the Company’s rights under contracts with its portfolio companies. While the outcome of any legal proceedings cannot be predicted with certainty, the Company does not expect that any such proceedings will have a material adverse effect upon its financial condition or results of operations.
2017 SEMI-ANNUAL REPORT
Pathway Energy Infrastructure Fund, Inc 27
Note 11. Financial Highlights
The following is a schedule of financial highlights for the six months ended December 31, 2016 and the period from August 25, 2015 (the date non-affiliate stockholders were admitted into the Company) to June 30, 2016. Although the Company offers three classes of shares, the difference is only with respect to the sales load purchasers in the offering must pay. Each class of shares has identical voting and distributions rights, and bears its own pro rata portion of the Company’s expenses and has the same net asset value. As such, the financial highlights is presented for the Company as a whole.
|
| | | | | | |
| | Six months ended | Period Ended |
| | December 31, 2016 | June 30, 2016 (a)
|
| Per share data: | (Unaudited) | |
| Net asset value, beginning of year or period | $ | 12.81 |
| $ | 13.80 |
|
| | | |
Net investment income(b) | 0.42 |
| 1.21 |
|
Net realized and unrealized gain (loss) on investments(b) | 1.00 |
| (0.03 | ) |
| Net increase in net assets resulting from operations | 1.42 |
| 1.18 |
|
Return of capital distributions(c) | (0.47 | ) | (0.75 | ) |
Offering costs(b) | — |
| (0.62 | ) |
Other(d) | 0.10 |
| (0.80 | ) |
| Net asset value, end of year or period | $ | 13.86 |
| $ | 12.81 |
|
| | | |
Total return, based on NAV(e) | 12.11 | % | (1.75 | )% |
| Supplemental Data: | | |
| Net assets, end of year or period | $ | 7,617,980 |
| $ | 5,976,355 |
|
| Ratio to average net assets: | | |
Expenses without reimbursements(f) | 24.10 | % | 36.65 | % |
Expenses after reimbursements(f) | 8.33 | % | 3.41 | % |
Net investment income(f) | 6.32 | % | 11.50 | % |
| | | |
| Portfolio turnover | 10.49 | % | 4.27 | % |
| | | |
(a) The net asset value at the beginning of the year is the net offering price as of August 25, 2015, which is the date that the Company satisfied its minimum offering requirement by raising over $2.5 million from selling shares to persons not affiliated with the Company or the Adviser (the “Minimum Offering Requirement”), and as a result, broke escrow and commenced making investments. |
(b) Calculated based on weighted average shares outstanding. |
(c) The per share data for distributions is the actual amount of distributions paid or payable per share of common stock outstanding during the period. Distributions per share are rounded to the nearest $0.01. |
(d) The amount shown represents the balancing figure derived from the other figures in the schedule. |
(e) Total return is based upon the change in net asset value per share between the opening and ending net asset values per share during the period and assumes that distributions are reinvested in accordance with the Company’s dividend reinvestment plan. The computation does not reflect the sales load for any class of shares. Total return based on market value is not presented since the Company’s shares are not publicly traded. For periods less than one year, total return is not annualized. |
(f) Annualized for the six months ended December 31, 2016. |
Note 12. Subsequent Events
During the period from January 1, 2017 through March 1, 2017, we raised $144,954 of capital, net of offering proceeds, through the issuance of 10,231 shares.
During the period from January 1, 2017 through March 1, 2017, we made two additional investments in existing bonds totaling $346,750.
During the period from January 1, 2017 through March 1, 2017, we made one new CLO equity investment totaling $224,125. This is a co-investment with PRIS.
2017 SEMI-ANNUAL REPORT
Pathway Energy Infrastructure Fund, Inc 28
During the period from January 1, 2017 through March 1, 2017, we made one new second-lien term loan investment totaling $975,000.
On December 15, 2016, the Company made an offer to purchase up to $61,131 in aggregate amount of the Company’s issued and outstanding common shares. The offer began on December 22, 2016 and expired at 12:00 Midnight, Eastern Time, on January 23, 2017. Payment was made on January 26, 2017 at a purchase price of $14.00 per share, and a total of 772 class R shares were validly tendered and not withdrawn pursuant to the offer.
2017 SEMI-ANNUAL REPORT
Pathway Energy Infrastructure Fund, Inc 29
DISTRIBUTION REINVESTMENT PLAN
Subject to the Company’s Board of Directors’ discretion and applicable legal restrictions, the Company has and intends to continue to authorize and declare ordinary cash distributions on a quarterly basis and pay such distributions on a monthly basis. The Company has adopted an “opt in” distribution reinvestment plan pursuant to which stockholders may elect to have the full amount of their cash distributions reinvested in additional shares. Any distributions of the Company’s shares pursuant to the Company’s distribution reinvestment plan are dependent on the continued registration of the Company’s securities or the availability of an exemption from registration in the recipient’s home state. Participants in the Company’s distribution reinvestment plan are free to elect or revoke reinstatement in the distribution plan within a reasonable time as specified in the plan. If stockholders do not elect to participate in the plan, stockholders will automatically receive any distributions the Company declares in cash. For example, if the Company’s Board of Directors authorizes, and the Company declares, a cash distribution, then if stockholders have “opted in” to the Company’s distribution reinvestment plan, those stockholders will have their cash distributions reinvested in additional shares, rather than receiving cash distributions. During this offering, the Company generally intends to coordinate distribution payment dates so that the same price that is used for the closing date immediately following such distribution payment date will be used to calculate the purchase price for purchasers under the distribution reinvestment plan. In such case, stockholders reinvested distributions will purchase shares at a price equal to 95% of the price that shares are sold in the offering at the closing immediately following the distribution payment date. Shares issued pursuant to the Company’s distribution reinvestment plan will have the same voting rights as shares offered pursuant to the prospectus.
If stockholders wish to receive their distribution in cash, no action will be required on their part to do so. If stockholders are a registered stockholders, they may elect to have their entire distribution reinvested in shares by notifying DST Systems, Inc., the
reinvestment agent, and the Company’s transfer agent and registrar, in writing so that such notice is received by the reinvestment agent no later than the record date for distributions to stockholders. If stockholders elect to reinvest their distributions in additional shares, the reinvestment agent will set up an account for shares stockholders acquire through the plan and will hold such shares in non-certificated form. If stockholders shares are held by a broker or other financial intermediary, stockholders may “opt in” to the Company’s distribution reinvestment plan by notifying their broker or other financial intermediary of their election.
The Company has and intends to use newly issued shares to implement the plan and determine the number of shares the Company will issue to stockholders as follows:
To the extent the Company’s shares are not listed on a national stock exchange or quoted on an over-the-counter market or a national market system (collectively, an “Exchange”):
| |
| • | during any period when the Company is making a “best-efforts” public offering of the Company’s shares, the number of shares to be issued to stockholders shall be determined by dividing the total dollar amount of the distribution payable to stockholders by a price equal to 95% of the price that the shares are sold in the offering at the closing immediately following the distribution payment date; and |
| |
| • | during any period when the Company is not making a “best-efforts” offering of the Company’s shares, the number of shares to be issued to stockholders shall be determined by dividing the total dollar amount of the distribution payable to stockholders by a price equal to the net asset value as determined by the Company’s Board of Directors. |
To the extent the Company’s shares are listed on an Exchange, the number of shares to be issued to stockholders shall be
determined by dividing the total dollar amount of the distribution payable to stockholders by the market price per share of
the Company’s shares at the close of regular trading on such Exchange on the valuation date fixed by the Company’s Board
of Directors for such distribution.
There will be no selling commissions, dealer manager fees or other sales charges to stockholders if they elect to participate
in the distribution reinvestment plan. The Company will pay the reinvestment agent’s fees under the plan.
If stockholders receive their ordinary cash distributions in the form of shares, stockholders generally are subject to the same federal, state and local tax consequences as they would be had they elected to receive their distributions in cash. stockholders’ basis for determining gain or loss upon the sale of shares received in a distribution from the Company will be equal to the total dollar amount of the distribution payable in cash. Any shares received in a distribution will have a holding period for tax purposes commencing on the day following the day on which the shares are credited to stockholders’ account.
2017 SEMI-ANNUAL REPORT
Pathway Energy Infrastructure Fund, Inc 30
MANAGEMENT
Our Board of Directors oversees our management. Our Board of Directors currently consists of five members, three of whom are not “interested persons” of us as defined in Section 2(a)(19) of the 1940 Act. We refer to these individuals as our independent directors. M. Grier Eliasek is considered an interested person of us as a result of his position as President and Chief Executive Officer of us and President and Chief Operating Officer of our Adviser, and his executive positions at certain affiliates of our Adviser, and Robert S. Aisner is considered an interested person of us as a result of his executive positions at certain affiliates of our Adviser. Our Board of Directors elects our officers, who serve at the discretion of our Board of Directors. The responsibilities of each director will include, among other things, the oversight of our investment activity, the quarterly valuation of our assets, and oversight of our financing arrangements. Our Board of Directors has also established an Audit Committee and a Nominating and Corporate Governance Committee and may establish additional committees in the future.
Our directors and officers and their principal occupations during the past five years are set forth below. Our prospectus includes additional information about our directors and is available, without charge, upon request by calling (212) 448-0702.
Board of Directors and Executive Officers
Directors
Information regarding the Board of Directors is as follows:
|
| | | | | | |
Name (Age) Position(s) with the Funds (Since) Address(1) | | Priority: Class Term Expires(2) | | Pathway: Class Term Expires(2) | | Principal
Occupation(s) and Other Public Company Directorships Held During the Past 5 Years(3) |
Interested Directors(4) | | | | | | |
M. Grier Eliasek (43) Chairman of the Board, Director, Chief Executive Officer and President (February 2013) | | Class III Continuing 2018 | | Class III Nominee Director 2019 | | President and Chief Executive Officer of PSSIM and PEIM, President and Chief Operating Officer of the Funds, Managing Director of PCM and Prospect Administration, President and Chief Operating Officer of Prospect Capital Corporation. Director of Prospect Capital Corporation (June 2004-present). |
Robert S. Aisner (70) Director (February 2013) | | Class II Continuing Director 2017 | | Class II Continuing 2018 | | Executive positions of the following entities: TIER REIT, Inc., Behringer Harvard Opportunity REIT I, Inc., Behringer Harvard Opportunity REIT II, Inc., Monogram Residential Trust, Inc. and Behringer. Director of TIER REIT, Inc. (June 2003-February 2016), Behringer Harvard Opportunity REIT I, Inc. (November 2004-May 2014), Behringer Harvard Opportunity REIT II, Inc. (January 2007-present), and Monogram Residential Trust, Inc. (August 2006-present) |
| Independent Directors | | | | | | |
Andrew C. Cooper (54) Director (February 2013) | | Class III Continuing 2018 | | Class III Nominee Director 2019 | | Mr. Cooper is an entrepreneur, who over the last 15 years has founded, built, run and sold three companies. He is Co-Chief Executive Officer of Unison Energy, LLC, a company that develops, owns and operates, distributed combined heat and power co-generation solutions. Director of Prospect Capital Corporation (February 2009-present). |
William J. Gremp (73) Director (February 2013) | | Class II Continuing Director 2017 | | Class II Continuing 2018 | | Mr. Gremp is responsible for traditional banking services, credit and lending, private equity and corporate cash management with Merrill Lynch & Co. from 1999 to present. Director of Prospect Capital Corporation. (June 2006-present) |
Eugene S. Stark (58) Director (February 2013) | | Class I Nominee Director 2019 | | Class I Continuing Director 2017 | | Principal Financial Officer, Chief Compliance Officer and Vice President—Administration of General American Investors Company, Inc. from May 2005 to present. Director of Prospect Capital Corporation (September 2008-present). |
2017 SEMI-ANNUAL REPORT
Pathway Energy Infrastructure Fund, Inc 31
| |
| (1) | The business address of each director of the Funds is c/o Priority Senior Fund, Inc. or Pathway Energy Infrastructure Fund, Inc., as applicable, 10 East 40th Street, 42nd Floor, New York, New York 10016. |
| |
| (2) | For the Nominees, the term stated assumes election by stockholders at the Annual Meeting. |
| |
| (3) | The Fund Complex consists of the Funds and Prospect Capital Corporation. Each of Messrs. Eliasek, Cooper, Gremp and Stark are directors of all three entities in the Fund Complex. Mr. Aisner is a director of two entities in the Fund Complex. |
| |
| (4) | Mr. Eliasek is an interested director as defined in the 1940 Act because of his positions with PCM and the Funds. Mr. Aisner is an interested director as defined in the 1940 Act because of his position as an officer of Behringer. |
The address for each of our directors is c/o Pathway Energy Infrastructure Fund, Inc, 10 East 40th Street, 42nd Floor, New York, NY 10016.
Executive Officers Who Are Not Directors
|
| | | | | | |
| Name, Address and Age | | Position(s) Held with the Funds | | Term at Office and Length of Time Served | | Principal Occupation(s) During Past 5 Years |
Brian H. Oswald, 55(1) | | Chief Financial Officer, Chief Compliance Officer, Treasurer and Secretary | | Since December 2014 | | Mr. Oswald is the Chief Financial Officer, Chief Compliance Officer, Treasurer and Secretary of Prospect Capital Corporation and a Managing Director of Prospect Administration since November 2008. Mr. Oswald is also the Chief Financial Officer, Chief Compliance Officer, Treasurer and Secretary of PSSIM and PEIM. |
Michael D. Cohen, 42(1) | | Executive Vice President | | Since July 2012 | | Mr. Cohen is also the Executive Vice President of PSSIM and PEIM and has served in numerous executive roles with other entities affiliated with Behringer since 2005. |
| |
| (1) | The business address of Messrs. Oswald and Cohen is c/o Priority Income Fund, Inc. and Pathway Energy Infrastructure Fund, Inc., as applicable, 10 East 40th Street, 42nd Floor, New York, New York 10016. |
Compensation of Directors
The following table sets forth compensation of our directors for the six months ended December 31, 2016.
|
| | | | | | | | | | | | | | | |
| Name | | Fees Earned(1) | | All Other Compensation(2) | | Total |
| Interested Directors | | | | | | | | | |
| M. Grier Eliasek | | $ | — |
| | | $ | — |
| | | $ | — |
| |
| Robert S. Aisner | | — |
| | | — |
| | | — |
| |
| Independent Directors | | | | | | | | | |
| Andrew C. Cooper | | — |
| | | — |
| | | — |
| |
| William J. Gremp | | — |
| | | — |
| | | — |
| |
| Eugene S. Stark | | — |
| | | — |
| | | — |
| |
(1)For a discussion of the independent directors’ compensation, see below.
(2)We do not maintain a stock or option plan, non-equity incentive plan or pension plan for our directors.
Prior to meeting our minimum offering requirement, our directors are not entitled to compensation. Subsequent to meeting our minimum offering requirement, our directors who do not also serve in an executive officer capacity for us or our Adviser will be entitled to receive annual cash retainer fees, determined based on our net asset value as of the end of each fiscal quarter. These directors will be Messrs. Cooper, Gremp and Stark. Amounts payable under this arrangement have been and will be determined and paid quarterly in arrears as follows:
|
| | | | |
| Net Asset Value | | Annual Cash Retainer |
| $0 - $100,000,000 | | $ | — |
|
| $100,000,001 - $300,000,000 | | 35,000 |
|
| $300,000,001 - $500,000,000 | | 50,000 |
|
| $500,000,001 - $1 billion | | 75,000 |
|
| >$1 billion | | 100,000 |
|
2017 SEMI-ANNUAL REPORT
Pathway Energy Infrastructure Fund, Inc 32
We will also reimburse each of the above directors for all reasonable and authorized business expenses in accordance with our policies as in effect from time to time, including reimbursement of reasonable out-of-pocket expenses incurred in connection with attending each board meeting and each committee meeting not held concurrently with a board meeting.
We do not pay compensation to our directors who also serve in an executive officer capacity for us or our Adviser.
Compensation of Executive Officers
Our executive officers will not receive any direct compensation from us. We do not currently have any employees and do not expect to have any employees. Services necessary for our business are provided by individuals who are employees of Prospect Capital Management, Prospect Administration or Stratera Holdings or by individuals who were contracted by such entities to work on behalf of us, pursuant to the terms of the Investment Advisory Agreement between the Company and our Adviser, the Administration Agreement between the Company and Prospect Administration or the Investor Services Agreement between the Company and Behringer Harvard Priority Investor Services LLC, an affiliate of Behringer Harvard. Each of our executive officers is an employee of our Adviser, Prospect Capital Management, Prospect Administration, Stratera Holdings or an outside contractor, and the day-to-day investment operations and administration of our portfolio are managed by our Adviser. In addition, we reimburse Prospect Administration for our actual and allocable portion of expenses incurred by Prospect Administration, as applicable, in performing its obligations under the Administration Agreement, including the allocable portion of the cost of our chief financial officer, chief compliance officer, treasurer and secretary and other administrative support personnel under the Administration Agreement. We also reimburse Behringer Harvard Pathway Investor Services for the costs and expenses incurred by Behringer Harvard Pathway Investor Services in performing its obligations and providing personnel and facilities under the Investor Services Agreement.
2017 SEMI-ANNUAL REPORT
Pathway Energy Infrastructure Fund, Inc 33
ADDITIONAL INFORMATION
Portfolio Information
The Company files its complete schedule of portfolio holdings with the Securities and Exchange Commission for the first and third quarters of each fiscal year on Form N-Q, within 60 days after the end of the relevant period. Form N-Q filings of the Company are available on the Commission’s website at http://www.sec.gov and may be reviewed and copied at the Commission’s Public Reference Room in Washington, DC. Information on the operation of the Public Reference Room may be obtained by calling 1-800-SEC-0330. This information will also be available free of charge by contacting the Company by mail at 10 East 40th Street, 42nd Floor, New York, NY 10016, by telephone at (212) 448-0702 or on its website at http://www.pathway-energyfund.com.
Proxy Information
A description of the policies and procedures that the Company uses to determine how to vote proxies relating to portfolio securities is available (i) without charge, upon request, by calling collect (212) 448-0702; (ii) on the Company’s website at http://www.pathway-energyfund.com (iii) on the SEC’s website at http://www.sec.gov and (iv) included in Item 7 of this Form N-CSRS.
The Company did not hold any voting securities and accordingly did not vote any proxies during the most recent 12-month period ended June 30, 2016. You may obtain information, without charge, regarding how the Company voted proxies with respect to its portfolio securities by making a written request for proxy voting information to: Chief Compliance Officer, Pathway Energy Infrastructure Fund, Inc., 10 East 40th Street, 42nd Floor, New York, New York 10016.
Tax Information
For tax purposes, distributions to stockholders during the six months ended December 31, 2016 were $238,514.
Privacy Policy
We are committed to protecting your privacy. This privacy notice, which is required by federal law, explains our privacy policies and our affiliated companies. This notice supersedes any other privacy notice you may have received from us.
We will safeguard, according to strict standards of security and confidentiality, all information we receive about you. The only information we collect from you is your name, date of birth, address, citizenship status (and country of origin, if applicable), number of shares you hold and your social security number. This information is used only so that we can register your shares, send you periodic reports and other information about us, and send you proxy statements or other information required by law.
We do not share this information with any non-affiliated third-party except as described below:
| |
| • | Authorized personnel of our Adviser. It is our policy that only authorized personnel of our Adviser who need to know your personal information will have access to it. |
| |
| • | Service providers. We may disclose your personal information to companies that provide services on our behalf, such as record keeping, processing your trades and mailing you information. These companies are required to protect your information and use it solely for the purpose for which they received it. |
| |
| • | Courts and government officials. If required by law, we may disclose your personal information in accordance with a court order or at the request of government regulators. Only that information required by law, subpoena or court order will be disclosed. |
2017 SEMI-ANNUAL REPORT
Pathway Energy Infrastructure Fund, Inc 34
BOARD OF DIRECTORS
Independent Directors
Andrew C. Cooper
William J. Gremp
Eugene S. Stark
Interested Directors(1)
M. Grier Eliasek
Robert S. Aisner
EXECUTIVE OFFICERS WHO ARE NOT DIRECTORS
Brian H. Oswald, Chief Financial Officer, Chief Compliance Officer, Treasurer and Secretary
Michael D. Cohen, Executive Vice President
ADVISER
Pathway Energy Infrastructure Fund, Inc
10 East 40th Street, 42nd Floor
New York, NY 10016
____________
(1)As defined under the Investment Company Act of 1940, as amended.
2017 SEMI-ANNUAL REPORT
Pathway Energy Infrastructure Fund, Inc 35
Item 2. Code of Ethics.
The information required by this item is not required in a semi-annual report on this Form N-CSRS.
Item 3. Audit Committee Financial Expert.
The information required by this item is not required in a semi-annual report on this Form N-CSRS.
Item 4. Principal Accountant Fees and Services.
The information required by this item is not required in a semi-annual report on this Form N-CSRS.
Item 5. Audit Committee of Listed Registrant.
The information required by this item is not required in a semi-annual report on this Form N-CSRS.
Item 6. Schedule of Investments.
Please see the schedule of investments contained in this report to Shareholders included under Item 1 of this Form N-CSRS.
Item 7. Disclosure of Proxy Voting Policies and Procedures for Closed-End Management Investment Companies.
The information required by this item is not required in a semi-annual report on this Form N-CSRS.
Item 8. Portfolio Managers of Closed-End Investment Companies.
| |
| (a) | The information required by this item is not required in a semi-annual report on this Form N-CSRS. |
| |
| (b) | There has been no change, as of the date of the filing of the semi-annual report on this Form N-CSRS, to any of the portfolio managers identified in response to paragraph (a)(1) of this item in the Registrant's most recent annual report on Form N-CSR. |
Item 9. Purchases of Equity Securities by Closed-End Management Investment Company and Affiliated Purchasers.
Neither the Registrant nor any affiliated purchasers, as defined in Rule 10b-18(a)(3) under the Securities Exchange Act of 1934, purchased any shares of the Registrant that are registered by the Registrant pursuant to Section 12 of the Securities Exchange Act of 1934, other than the 10,435, 2,899 and 2,899 Class I common shares that our Adviser purchased on July 30, 2013, February 13, 2014 and July 24, 2014, respectively, for $144,003, $40,006 and $40,006, respectively at $13.80 per share.
Item 10. Submission of Matters to a Vote of Security Holders.
Not applicable.
Item 11. Controls and Procedures.
| |
| (a) | Based on an evaluation of the Disclosure Controls and Procedures (as defined in Rule 30a-3(c) under the Investment Company Act of 1940, the “Disclosure Controls”) as of a date within 90 days prior to the filing date (the “Filing Date”) of this Form N-CSRS (the “Report”), the Chief Executive Officer (its principal executive officer) and Chief Financial Officer (its principal financial officer) have concluded that the Disclosure Controls are reasonably designed to ensure that information required to be disclosed by the Registrant in the Report is recorded, processed, summarized and reported by the Filing Date, including ensuring that information required to be disclosed in the Report is accumulated and communicated to the Registrant’s management, including the Registrant’s principal executive officer and principal financial officer, as appropriate to allow timely decisions regarding required disclosure. |
| |
| (b) | There was no change in the Registrant’s internal control over financial reporting (as defined in Rule 30a-3(d) under the 1940 Act) over the second fiscal quarter of the period covered by this report that has materially affected, or is reasonably likely to materially affect, the Registrant’s internal control over financial reporting. |
Item 12. Exhibits.
(a)(1) Not applicable.
(a)(2) Certifications of principal executive officer and principal financial officer as required by Rule 30a-2(a) under the Investment Company Act of 1940.
(a)(3) Not applicable.
(b) Certifications of principal executive officer and principal financial officer as required by Rule 30a-2(b) under the Investment Company Act of 1940.
SIGNATURES
Pursuant to the requirements of the Securities Exchange Act of 1934 and the Investment Company Act of 1940, the Registrant has duly caused this report to be signed on its behalf by the undersigned, thereunto duly authorized.
PATHWAY ENERGY INFRASTRUCTURE FUND, INC.
By: /s/ M. Grier Eliasek
M. Grier Eliasek
Chief Executive Officer and President
Date: March 1, 2017
Pursuant to the requirements of the Securities Exchange Act of 1934 and the Investment Company Act of 1940, this report has been signed below by the following persons on behalf of the Registrant and in the capacities and on the dates indicated.
By: /s/ M. Grier Eliasek
M. Grier Eliasek
Chief Executive Officer and President
Date: March 1, 2017
By: /s/ Brian H. Oswald
Brian H. Oswald
Chief Financial Officer, Chief Compliance Officer
Treasurer and Secretary
Date: March 1, 2017