UNITED STATES
SECURITIES AND EXCHANGE COMMISSION
WASHINGTON, D.C. 20549
FORM N-CSR
CERTIFIED SHAREHOLDER REPORT OF REGISTERED
MANAGEMENT INVESTMENT COMPANIES
Investment Company Act file number 811-22806
Oppenheimer Main Street Small Cap Fund
(Exact name of registrant as specified in charter)
6803 South Tucson Way, Centennial, Colorado 80112-3924
(Address of principal executive offices) (Zip code)
Arthur S. Gabinet
OFI Global Asset Management, Inc.
Two World Financial Center, New York, New York 10281-1008
(Name and address of agent for service)
Registrant’s telephone number, including area code: (303) 768-3200
Date of fiscal year end: April 30
Date of reporting period: 4/30/2014
Item 1. Reports to Stockholders.

Table of Contents
Class A Shares
CUMULATIVE TOTAL RETURNS AT 4/30/14
| | | | | | | | |
| | | Class A Shares of the Fund | | |
| | | Without Sales Charge | | With Sales Charge | | | | Russell 2000 Index |
Since Inception (5/17/13) | | 16.33% | | 9.65% | | | | 15.28% |
Performance data quoted represents past performance, which does not guarantee future results. The investment return and principal value of an investment in the Fund will fluctuate so that an investor’s shares, when redeemed, may be worth more or less than their original cost. Fund returns include changes in share price, reinvested distributions, and a 5.75% maximum applicable sales charge except where “without sales charge” is indicated. Current performance may be lower or higher than the performance quoted. Returns do not consider capital gains or income taxes on an individual’s investment. For performance data current to the most recent month-end, visit oppenheimerfunds.com or call 1.800.CALL OPP (225.5677).
2 OPPENHEIMER MAIN STREET SMALL CAP FUND
Fund Performance Discussion
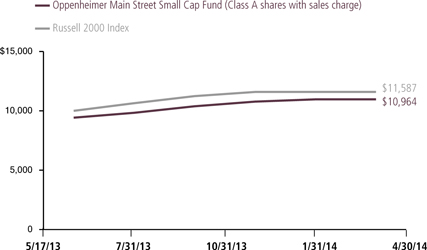
Since the Fund’s inception on May 17, 2013 through April 30, 2014, its Class A shares (without sales charge) produced a return of 16.33%. In comparison, the Russell 2000 Index (the “Index”) returned 15.28% during the same period. The Fund outperformed the Index in nine out of ten sectors, led by stronger relative stock selection in the financials, industrials, health care and energy sectors. The Fund underperformed the Index in information technology, where less favorable stock selection and an underweight position hurt results.
MARKET OVERVIEW
The global economy finished 2013 with slow and steady growth throughout the developed world. U.S. growth improved during the reporting period driven by continued strength in manufacturing, reasonable employment gains and moderating housing activity. In May 2013, market volatility picked up measurably as remarks from former Federal Reserve (“Fed”) Chairman Ben Bernanke indicated a possible tapering of the Fed’s asset purchase program if the economy
continued to show improvement. However, when the Fed actually announced in December that it would reduce its asset purchases by $10 billion a month from $85 billion to $75 billion, its decision to “taper” was met with relative calm in financial markets.
In January 2014, investors worried that ongoing downturns in the emerging markets might dampen the U.S. economic recovery,
COMPARISON OF CHANGE IN VALUE OF $10,000 HYPOTHETICAL INVESTMENTS IN:
3 OPPENHEIMER MAIN STREET SMALL CAP FUND
leading to renewed volatility in stock and bond markets. In addition, over the first four months of 2014, financial headlines were full of discussion of Fed policy, turmoil in Ukraine, and the implications of a slowdown in China. The U.S. continued to grow at a moderate pace, but slowed over the first quarter of 2014, partly due to severe winter weather. The Eurozone also grew at a slightly faster pace than 2013, but has continued to struggle with very low inflation and weak bank lending. The Fed continued its program of “tapering” asset purchases by $10 billion per month for the first three months of the year, bringing its current monthly purchases to $55 billion in March (in January 2014, Janet Yellen was confirmed as next Fed chairman, succeeding Ben Bernanke).
FUND REVIEW
Top contributors to performance this reporting period included Finisar Corp., Nu Skin Enterprises, Inc. and Korn/Ferry International. Finisar is a manufacturer of optical communication components and subsystems used to connect networks. The stock rallied early in the reporting period as management reported improved profitability and increased guidance due to rising higher margin data communication sales. Nu Skin Enterprises, a distributor of personal care products and nutritional supplements, rallied over the first half of the reporting period after it reported quarterly results above expectations due to strong sales of their core product lines and the successful launch of a weight maintenance product. However, early in 2014, the market reacted quite negatively
when it was announced that a Chinese state agency had begun an investigation into the company’s selling practices. China is a significant contributor to Nu Skin’s growth, and was a key element of our investment thesis. Having previously sold the majority of our shares into strength during 2013, we chose to fully exit the stock upon this news.
Korn/Ferry International provides talent management solutions globally. Sequential quarterly beats – with the third quarter especially strong – have led to rising estimates, increased price targets, and improved market sentiment. Strong execution across “executive search” led to better than expected revenues and we believe an improving macro environment should keep the momentum positive. Additionally, with high level senior executive turnover rising, we believe “executive search” can realize a further boost to revenues and margins. The company has also experienced strong growth in its Futurestep middle management recruiting business.
The most significant detractors from performance this reporting period were Infoblox Inc., Hatteras Financial Corp. and Semtech Corp. Infoblox is a leader in “automated network control” solutions and security – allowing companies to manage large and complex data networks, and the proliferation of mobile devices connected to them. The stock suffered a setback after management preannounced a deceleration in growth and guided to a further slowdown for the full fiscal year. As a result, analyst
4 OPPENHEIMER MAIN STREET SMALL CAP FUND
estimates have been revised down significantly, putting selling pressure on the company’s stock. The disappointing guidance for both revenues and earnings was largely attributable to a “slippage” of large deal signings and ongoing weakness in business with the U.S. federal government. We exited the position subsequent to the reporting period’s end after another disappointing report and the CEO’s unexpected departure, as we lost confidence in our thesis. Hatteras Financial, a real estate investment trust (REIT) focused on investing in mortgage-backed securities guaranteed by the U.S. government and government sponsored agencies, reported disappointing earnings during the period. The firm’s book value declined as its investment portfolio fell in value, driven by the increase in interest rates following the Fed’s remarks about the potential tapering of its quantitative easing program. Hatteras also announced that it was decreasing its dividend, which was not well received by the market. We exited our position. Semtech is a supplier of analog and mixed-signal semiconductor products. In mid-December, the company negatively pre-announced revenues and earnings reflecting ongoing delays primarily in service provider capital spending that has plagued this stock throughout 2013. A push-out in new product revenue for touch sensing platforms in consumer applications was also a cause for the disappointing guidance. The company has been executing well on issues that it can influence; however, it is highly exposed to smartphones, especially Samsung’s Galaxy, whose next generation product has been
disappointing in the marketplace. As a consequence, visibility has been reduced and we have trimmed our holdings. We maintained exposure because of Semtech’s technological leadership and management’s demonstrated ability to execute.
STRATEGY & OUTLOOK
While the domestic economy continues to muddle along, fundamental company results — both top- and bottom-line growth — have slowed year-over-year. Additionally, profit margins are at, or near, historic peak levels. As we look forward, future earnings increases will likely result from an improved revenue outlook due to a pick-up in global Gross Domestic Product growth, rising pricing power, and/or market share gains. Effective allocation of capital may also contribute to higher earnings. The cash that has been built-up on balance sheets affords “Corporate America” considerable flexibility. We expect managements, which have generally demonstrated a commitment to enhancing shareholder value, to use this cash in a manner that may lead to rising returns.
Given this backdrop, our approach remains consistent. We aim to construct an “all weather” portfolio by targeting companies we believe have: 1) sustainable competitive advantages; 2) skilled management with a proven track record of executing effectively; and 3) financial resources with the potential to generate improving profitability, gain market share, and/or return significant cash to shareholders. During times of volatile or slow economic growth such companies
5 OPPENHEIMER MAIN STREET SMALL CAP FUND
frequently widen their lead over weaker competitors. We seek to invest in companies, characterized by these qualities, at compelling valuations and believe this disciplined approach is essential in seeking to generate superior long-term performance.
| | |
 | |  |
| | Matthew P. Ziehl, CFA Portfolio Manager |
Matthew P. Ziehl, CFA and Lead Portfolio Manager, on behalf of the Portfolio Management team: Raymond Anello, CFA, Raman Vardharaj, CFA, Joy Budzinski, Kristin Ketner Pak, Magnus Krantz and Adam Weiner.
6 OPPENHEIMER MAIN STREET SMALL CAP FUND
Top Holdings and Allocations
TOP TEN COMMON STOCK HOLDINGS
| | |
LaSalle Hotel Properties | | 2.5% |
EPL Oil & Gas, Inc. | | 2.4 |
Finisar Corp. | | 2.3 |
Korn/Ferry International | | 2.3 |
Dana Holding Corp. | | 2.3 |
KAR Auction Services, Inc. | | 2.3 |
Redwood Trust, Inc. | | 1.9 |
WellCare Health Plans, Inc. | | 1.8 |
Cavium, Inc. | | 1.7 |
P.H. Glatfelter Co. | | 1.7 |
Portfolio holdings and allocations are subject to change. Percentages are as of April 30, 2014, and are based on net assets. For more current Fund holdings, please visit oppenheimerfunds.com.
TOP TEN COMMON STOCK INDUSTRIES
| | |
Real Estate Investment Trusts
(REITs) | | 11.5% |
Commercial Banks | | 8.0 |
Commercial Services & Supplies | | 6.0 |
Oil, Gas & Consumable Fuels | | 5.7 |
Software | | 5.1 |
Hotels, Restaurants & Leisure | | 4.3 |
Professional Services | | 4.2 |
Health Care Equipment &
Supplies | | 4.0 |
Health Care Providers &
Services | | 3.9 |
Chemicals | | 3.7 |
Portfolio holdings and allocations are subject to change. Percentages are as of April 30, 2014, and are based on net assets.
SECTOR ALLOCATION
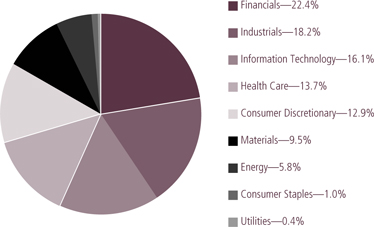
Portfolio holdings and allocations are subject to change. Percentages are as of April 30, 2014, and are based on the total market value of common stocks.
7 OPPENHEIMER MAIN STREET SMALL CAP FUND
Share Class Performance
CUMULATIVE TOTAL RETURNS WITHOUT SALES CHARGE AS OF 4/30/14
| | | | | | | | | | | | | | | | |
| | | Inception Date | | Since Inception | | | | | | | | | | |
Class A (OSCAX) | | 5/17/13 | | 16.33% | | | | | | | | | | | | |
Class C (OSCCX) | | 5/17/13 | | 15.29% | | | | | | | | | | | | |
Class I (OSSIX) | | 5/17/13 | | 16.73% | | | | | | | | | | | | |
Class N (OSCNX) | | 5/17/13 | | 15.82% | | | | | | | | | | | | |
Class Y (OSCYX) | | 5/17/13 | | 16.76% | | | | | | | | | | | | |
CUMULATIVE TOTAL RETURNS WITH SALES CHARGE AS OF 4/30/14 | | | | |
| | | Inception Date | | Since Inception | | | | | | | | | | |
Class A (OSCAX) | | 5/17/13 | | 9.65% | | | | | | | | | | | | |
Class C (OSCCX) | | 5/17/13 | | 14.29% | | | | | | | | | | | | |
Class I (OSSIX) | | 5/17/13 | | 16.73% | | | | | | | | | | | | |
Class N (OSCNX) | | 5/17/13 | | 14.82% | | | | | | | | | | | | |
Class Y (OSCYX) | | 5/17/13 | | 16.76% | | | | | | | | | | | | |
Performance data quoted represents past performance, which does not guarantee future results. The investment return and principal value of an investment in the Fund will fluctuate so that an investor’s shares, when redeemed, may be worth more or less than their original cost. Current performance may be lower or higher than the performance quoted. Returns do not consider capital gains or income taxes on an individual’s investment. For performance data current to the most recent month-end, visit oppenheimerfunds.com or call 1.800.CALL OPP (225.5677). Fund returns include changes in share price, reinvested distributions, and the applicable sales charge: for Class A shares, the current maximum initial sales charge of 5.75% and for Class C and N shares, the contingent deferred sales charge of 1% for the 1-year period. There is no sales charge for Class I and Y shares.
The Fund’s performance is compared to the performance of the Russell 2000 Index, which measures the performance of the small-cap segment of the U.S. equity universe a broad-based index featuring 2,500 stocks that cover the small- and mid-cap market capitalizations. The Index is unmanaged and cannot be purchased directly by investors. While index comparisons may be useful to provide a benchmark for the Fund’s performance, it must be noted that the Fund’s investments are not limited to the investments comprising the Index. Index performance includes reinvestment of income, but does not reflect transaction costs, fees, expenses or taxes. Index performance is shown for illustrative purposes only as a benchmark for the Fund’s performance, and does not predict or depict performance of the Fund. The Fund’s performance reflects the effects of the Fund’s business and operating expenses.
The Fund’s investment strategy and focus can change over time. The mention of specific fund holdings does not constitute a recommendation by OppenheimerFunds, Inc. or its affiliates.
8 OPPENHEIMER MAIN STREET SMALL CAP FUND
Before investing in any of the Oppenheimer funds, investors should carefully consider a fund’s investment objectives, risks, charges and expenses. Fund prospectuses and summary prospectuses contain this and other information about the funds, and may be obtained by asking your financial advisor, visiting oppenheimerfunds.com, or calling 1.800.CALL OPP (225.5677). Read prospectuses and summary prospectuses carefully before investing.
Shares of Oppenheimer funds are not deposits or obligations of any bank, are not guaranteed by any bank, are not insured by the FDIC or any other agency, and involve investment risks, including the possible loss of the principal amount invested.
9 OPPENHEIMER MAIN STREET SMALL CAP FUND
Fund Expenses
Fund Expenses. As a shareholder of the Fund, you incur two types of costs: (1) transaction costs, which may include sales charges (loads) on purchase payments, contingent deferred sales charges on redemptions; and (2) ongoing costs, including management fees; distribution and service fees; and other Fund expenses. These examples are intended to help you understand your ongoing costs (in dollars) of investing in the Fund and to compare these costs with the ongoing costs of investing in other mutual funds.
The examples are based on an investment of $1,000.00 invested at the beginning of the period and held for the entire 6-month period ended April 30, 2014.
Actual Expenses. The first section of the table provides information about actual account values and actual expenses. You may use the information in this section for the class of shares you hold, together with the amount you invested, to estimate the expense that you paid over the period. Simply divide your account value by $1,000.00 (for example, an $8,600.00 account value divided by $1,000.00 = 8.60), then multiply the result by the number in the first section under the heading entitled “Expenses Paid During Period” to estimate the expenses you paid on your account during this period.
Hypothetical Example for Comparison Purposes. The second section of the table provides information about hypothetical account values and hypothetical expenses based on the Fund’s actual expense ratio for each class of shares, and an assumed rate of return of 5% per year for each class before expenses, which is not the actual return. The hypothetical account values and expenses may not be used to estimate the actual ending account balance or expenses you paid for the period. You may use this information to compare the ongoing costs of investing in the Fund and other funds. To do so, compare this 5% hypothetical example for the class of shares you hold with the 5% hypothetical examples that appear in the shareholder reports of the other funds.
Please note that the expenses shown in the table are meant to highlight your ongoing costs only and do not reflect any transactional costs, such as front-end or contingent deferred sales charges (loads). Therefore, the “hypothetical” section of the table is useful in comparing ongoing costs only, and will not help you determine the relative total costs of owning different funds. In addition, if these transactional costs were included, your costs would have been higher.
10 OPPENHEIMER MAIN STREET SMALL CAP FUND
| | | | | | | | | | | | | | | | | | |
| Actual | | Beginning Account Value
November 1, 2013 | | Ending Account Value
April 30, 2014 | | Expenses Paid During 6 Months Ended April 30, 2014 |
Class A | | $ | 1,000.00 | | | | | $ | 1,055.70 | | | | | $ | 6.39 | | | |
Class C | | | 1,000.00 | | | | | | 1,050.00 | | | | | | 11.40 | | | |
Class I | | | 1,000.00 | | | | | | 1,057.30 | | | | | | 4.09 | | | |
Class N | | | 1,000.00 | | | | | | 1,052.90 | | | | | | 8.69 | | | |
Class Y | | | 1,000.00 | | | | | | 1,057.60 | | | | | | 4.60 | | | |
| | | | | | |
| Hypothetical | | | | | | | | | | | | | | | | | | |
(5% return before expenses) | | | | | | | | | | | | | | | | | | |
Class A | | | 1,000.00 | | | | | | 1,018.60 | | | | | | 6.28 | | | |
Class C | | | 1,000.00 | | | | | | 1,013.74 | | | | | | 11.20 | | | |
Class I | | | 1,000.00 | | | | | | 1,020.83 | | | | | | 4.02 | | | |
Class N | | | 1,000.00 | | | | | | 1,016.36 | | | | | | 8.53 | | | |
Class Y | | | 1,000.00 | | | | | | 1,020.33 | | | | | | 4.52 | | | |
Expenses are equal to the Fund’s annualized expense ratio for that class, multiplied by the average account value over the period, multiplied by 181/365 (to reflect the one-half year period). Those annualized expense ratios, excluding indirect expenses from affiliated funds, based on the 6-month period ended April 30, 2014 are as follows:
| | | | | | |
| Class | | Expense Ratios | | | |
Class A | | | 1.25 | % | | |
Class C | | | 2.23 | | | |
Class I | | | 0.80 | | | |
Class N | | | 1.70 | | | |
Class Y | | | 0.90 | | | |
The expense ratios reflect voluntary and/or contractual waivers and/or reimbursements of expenses by the Fund’s Manager. Some of these undertakings may be modified or terminated at any time, as indicated in the Fund’s prospectus. The “Financial Highlights” tables in the Fund’s financial statements, included in this report, also show the gross expense ratios, without such waivers or reimbursements and reduction to custodian expenses, if applicable.
11 OPPENHEIMER MAIN STREET SMALL CAP FUND
|
|
| STATEMENT OF INVESTMENTS April 30, 2014 |
|
| | | | | | | | | | |
| | | Shares | | | Value | | | |
| | |
Common Stocks—98.4% | | |
| | |
Consumer Discretionary—12.7% | | |
| | |
Auto Components—2.3% | | |
Dana Holding Corp. | | | 27,358 | | | $ | 579,169 | | |
| | |
Diversified Consumer Services—1.9% | | | | | | |
LifeLock, Inc.1 | | | 23,104 | | | | 362,733 | | |
| | |
Matthews | | | | | | | | | |
International Corp., Cl. A | | | 3,143 | | | | 126,820 | | |
| | | | | | | | | |
| | | | | | | 489,553 | | |
| | |
Hotels, Restaurants & Leisure—4.3% | | | | | | |
Brinker | | | | | | | | | |
International, Inc. | | | 6,469 | | | | 317,887 | | |
| | |
Dunkin’ Brands Group, Inc. | | | 3,392 | | | | 154,370 | | |
| | |
| Popeyes Louisiana Kitchen, Inc.1 | | | 6,432 | | | | 245,059 | | |
| | |
Texas Roadhouse, Inc. | | | 14,372 | | | | 355,563 | | |
| | | | | | | | | |
| | | | | | | 1,072,879 | | |
| | |
Household Durables—0.7% | | | | | | |
KB Home | | | 11,144 | | | | 183,987 | | |
| | |
Specialty Retail—3.5% | | | | | | |
Mattress Firm Holding Corp.1 | | | 7,650 | | | | 345,704 | | |
| | |
Monro Muffler Brake, Inc. | | | 2,278 | | | | 128,479 | | |
| | |
Pier 1 Imports, Inc. | | | 12,111 | | | | 221,147 | | |
| | |
Signet Jewelers Ltd. | | | 1,739 | | | | 176,195 | | |
| | | | | | | | | |
| | | | | | | | 871,525 | | |
Consumer Staples—1.0% | | | | | | |
Food Products—1.0% | | | | | | |
Flowers Foods, Inc. | | | 11,745 | | | | 241,007 | | |
| | |
Energy—5.7% | | | | | | |
| | |
Oil, Gas & Consumable Fuels—5.7% | | | | | | |
EPL Oil & Gas, Inc.1 | | | 15,719 | | | | 615,242 | | |
| | |
| Renewable Energy Group, Inc.1 | | | 21,804 | | | | 256,633 | | |
| | |
Valero Energy Partners LP | | | 7,085 | | | | 291,973 | | |
| | |
Western Refining, Inc. | | | 6,363 | | | | 276,790 | | |
| | | | | | | | | |
| | | | | | | 1,440,638 | | |
| | |
Financials—22.1% | | | | | | |
| | |
Capital Markets—0.8% | | | | | | |
| WisdomTree Investments, Inc.1 | | | 19,186 | | | | 216,610 | | |
| | | | | | | | |
| | | Shares | | | Value | |
| |
Commercial Banks—8.0% | |
BancorpSouth, Inc. | | | 13,248 | | | $ | 309,473 | |
| |
BankUnited, Inc. | | | 10,607 | | | | 349,925 | |
| |
First Niagara Financial Group, Inc. | | | 39,645 | | | | 353,634 | |
| |
FirstMerit Corp. | | | 14,803 | | | | 287,030 | |
| |
MB Financial, Inc. | | | 10,726 | | | | 287,886 | |
| |
Talmer Bancorp, Inc., Cl. A1 | | | 9,553 | | | | 128,106 | |
| |
Webster Financial Corp. | | | 9,960 | | | | 300,194 | |
| | | | | | | | |
| | | | | | | 2,016,248 | |
| |
Insurance—1.0% | |
AmTrust Financial Services, Inc. | | | 6,450 | | | | 249,421 | |
| |
Real Estate Investment Trusts (REITs)—11.5% | |
Apollo Commercial Real Estate Finance, Inc. | | | 19,549 | | | | 332,528 | |
| |
Chatham Lodging Trust | | | 15,526 | | | | 315,643 | |
| |
DuPont Fabros Technology, Inc. | | | 10,112 | | | | 245,014 | |
| |
LaSalle Hotel Properties | | | 18,753 | | | | 620,349 | |
| |
| Mid-America Apartment Communities, Inc. | | | 5,101 | | | | 355,285 | |
| |
Redwood Trust, Inc. | | | 22,222 | | | | 484,440 | |
| |
STAG Industrial, Inc. | | | 14,448 | | | | 339,961 | |
| |
Starwood Property Trust, Inc. | | | 8,552 | | | | 205,676 | |
| | | | | | | | |
| | | | | | | 2,898,896 | |
| |
Thrifts & Mortgage Finance—0.8% | |
Oritani Financial Corp. | | | 12,926 | | | | 191,693 | |
| |
Health Care—13.4% | |
| |
Biotechnology—1.3% | |
Celldex Therapeutics, Inc.1 | | | 5,204 | | | | 78,060 | |
| |
Keryx Biopharmaceuticals, Inc.1 | | | 12,757 | | | | 188,421 | |
| |
Ultragenyx Pharmaceutical, Inc.1 | | | 1,576 | | | | 61,117 | |
| | | | | | | | |
| | | | | | | 327,598 | |
12 OPPENHEIMER MAIN STREET SMALL CAP FUND
| | | | | | | | | | |
| | | Shares | | | Value | | | |
| | |
Health Care Equipment & Supplies—4.0% | | |
DexCom, Inc.1 | | | 5,944 | | | $ | 192,823 | | |
| | |
Endologix, Inc.1 | | | 11,769 | | | | 149,231 | | |
| | |
Greatbatch, Inc.1 | | | 5,014 | | | | 230,795 | | |
| | |
| Integra LifeSciences Holdings Corp.1 | | | 4,504 | | | | 205,292 | | |
| | |
Spectranetics Corp.1 | | | 10,736 | | | | 228,247 | | |
| | | | | | | | | |
| | | | | | | 1,006,388 | | |
| | |
Health Care Providers & Services—3.9% | | |
HealthSouth Corp. | | | 9,751 | | | | 337,775 | | |
| | |
Team Health Holdings, Inc.1 | | | 4,113 | | | | 199,398 | | |
| | |
WellCare Health Plans, Inc.1 | | | 6,596 | | | | 445,032 | | |
| | | | | | | | | |
| | | | | | | 982,205 | | |
| | |
Health Care Technology—0.6% | | |
HMS Holdings Corp.1 | | | 9,316 | | | | 150,640 | | |
| | |
Life Sciences Tools & Services—0.8% | | |
Fluidigm Corp.1 | | | 2,238 | | | | 84,059 | | |
| | |
MorphoSys AG1 | | | 1,412 | | | | 120,947 | | |
| | | | | | | | | |
| | | | | | | 205,006 | | |
| | |
Pharmaceuticals—2.8% | | |
AcelRx Pharmaceuticals, Inc.1 | | | 5,597 | | | | 60,560 | | |
| | |
Aratana Therapeutics, Inc.1 | | | 5,243 | | | | 72,249 | | |
| | |
Horizon Pharma, Inc.1 | | | 10,555 | | | | 149,670 | | |
| | |
Prestige Brands Holdings, Inc.1 | | | 13,022 | | | | 436,497 | | |
| | | | | | | | | |
| | | | | | | 718,976 | | |
| | |
Industrials—17.9% | | |
| | |
Aerospace & Defense—1.0% | | |
Orbital Sciences Corp.1 | | | 8,807 | | | | 258,926 | | |
| | |
Air Freight & Couriers—0.7% | | |
XPO Logistics, Inc.1 | | | 6,668 | | | | 180,969 | | |
| | |
Airlines—0.8% | | |
Spirit Airlines, Inc.1 | | | 3,432 | | | | 195,075 | | |
| | |
Commercial Services & Supplies—6.0% | | |
ABM Industries, Inc. | | | 6,582 | | | | 178,306 | | |
| | |
ACCO Brands Corp.1 | | | 39,278 | | | | 240,774 | | |
| | | | | | | | |
| | | Shares | | | Value | |
| |
Commercial Services & Supplies (Continued) | |
| |
KAR Auction Services, Inc. | | | 19,234 | | | $ | 572,789 | |
| |
Mobile Mini, Inc. | | | 5,089 | | | | 224,832 | |
| |
Waste Connections, Inc. | | | 6,652 | | | | 297,078 | |
| | | | | | | | |
| | | | | | | 1,513,779 | |
| |
Construction & Engineering—0.9% | |
AECOM Technology Corp.1 | | | 6,721 | | | | 217,895 | |
| |
Machinery—1.6% | |
Greenbrier Cos., Inc. (The)1 | | | 2,770 | | | | 145,259 | |
| |
Titan International, Inc. | | | 7,234 | | | | 126,667 | |
| |
Wabash National Corp.1 | | | 9,253 | | | | 123,620 | |
| | | | | | | | |
| | | | | | | 395,546 | |
| |
Professional Services—4.2% | |
Korn/Ferry International1 | | | 20,152 | | | | 585,416 | |
| |
Paylocity Holding Corp.1 | | | 2,600 | | | | 49,166 | |
| |
Robert Half International, Inc. | | | 9,474 | | | | 424,435 | |
| | | | | | | | |
| | | | | | | 1,059,017 | |
| |
Road & Rail—1.8% | |
Saia, Inc.1 | | | 5,591 | | | | 230,182 | |
| |
Swift Transportation Co.1 | | | 9,884 | | | | 237,710 | |
| | | | | | | | |
| | | | | | | 467,892 | |
| |
Transportation Infrastructure—0.9% | |
Wesco Aircraft Holdings, Inc.1 | | | 11,858 | | | | 240,243 | |
| |
Information Technology—15.9% | |
| |
Communications Equipment—2.3% | |
Finisar Corp.1 | | | 22,507 | | | | 588,558 | |
| |
Internet Software & Services—2.1% | |
j2 Global, Inc. | | | 4,568 | | | | 211,772 | |
| |
Web.com Group, Inc.1 | | | 10,635 | | | | 326,601 | |
| | | | | | | | |
| | | | | | | 538,373 | |
| |
IT Services—2.9% | |
Booz Allen Hamilton Holding Corp. | | | 9,493 | | | | 220,618 | |
13 OPPENHEIMER MAIN STREET SMALL CAP FUND
|
|
| STATEMENTOF INVESTMENTS Continued |
|
| | | | | | | | | | |
| | | Shares | | | Value | | | |
| | |
IT Services (Continued) | | |
| | |
MAXIMUS, Inc. | | | 6,590 | | | $ | 280,536 | | |
| | |
Unisys Corp.1 | | | 8,987 | | | | 219,013 | | |
| | | | | | | | | |
| | | | | | | 720,167 | | |
| | |
Semiconductors & Semiconductor Equipment—3.5% | | |
Cavium, Inc.1 | | | 10,368 | | | | 439,292 | | |
| | |
Semtech Corp.1 | | | 8,172 | | | | 195,965 | | |
| | |
Skyworks Solutions, Inc.1 | | | 5,685 | | | | 233,369 | | |
| | | | | | | | | |
| | | | | | | 868,626 | | |
| | |
Software—5.1% | | |
FleetMatics Group plc1 | | | 3,471 | | | | 104,234 | | |
| | |
Fortinet, Inc.1 | | | 17,779 | | | | 390,782 | | |
| | |
Guidewire Software, Inc.1 | | | 8,905 | | | | 336,253 | | |
| | |
Imperva, Inc.1 | | | 3,730 | | | | 85,342 | | |
| | |
Infoblox, Inc.1 | | | 11,522 | | | | 226,062 | | |
| | |
Proofpoint, Inc.1 | | | 5,879 | | | | 149,562 | | |
| | | | | | | | | |
| | | | | | | 1,292,235 | | |
| | |
Materials—9.3% | | |
| | |
Chemicals—3.7% | | |
| | |
A. Schulman, Inc. | | | 7,107 | | | | 255,284 | | |
| | |
Cytec Industries, Inc. | | | 2,703 | | | | 257,650 | | |
| | |
Intrepid Potash, Inc.1 | | | 11,828 | | | | 192,796 | | |
| | |
Tronox Ltd., Cl. A | | | 8,759 | | | | 214,596 | | |
| | | | | | | | | |
| | | | | | | 920,326 | | |
| | |
Containers & Packaging—0.6% | | |
Packaging Corp. of America | | | 2,408 | | | | 160,445 | | |
| | | | | | | | |
| | | Shares | | | Value | |
Metals & Mining—2.2% | |
Century Aluminum Co.1 | | | 16,192 | | | $ | 222,640 | |
| |
Kaiser Aluminum Corp. | | | 4,615 | | | | 324,896 | |
| | | | | | | | |
| | | | | | | 547,536 | |
| |
Paper & Forest Products—2.8% | |
Boise Cascade Co.1 | | | 11,254 | | | | 281,575 | |
| |
P.H. Glatfelter Co. | | | 17,108 | | | | 436,596 | |
| | | | | | | | |
| | | | | | | 718,171 | |
| |
Utilities—0.4% | |
| |
Water Utilities—0.4% | |
Aqua America, Inc. | | | 4,242 | | | | 106,432 | |
| | | | | | | | |
Total Common Stocks (Cost $23,681,340) | | | | | | | 24,832,650 | |
Investment Company—2.7% | |
| |
Oppenheimer Institutional Money Market Fund, Cl. E, 0.08%2,3 (Cost $682,204) | | | 682,204 | | | | 682,204 | |
| |
Total Investments, at Value (Cost $24,363,544) | | | 101.1 | % | | | 25,514,854 | |
| |
Liabilities in Excess of Other Assets | | | (1.1 | ) | | | (276,523 | ) |
| | | | |
Net Assets | | | 100.0 | % | | $ | 25,238,331 | |
| | | | |
Footnotes to Statement of Investments
1. Non-income producing security.
2. Rate shown is the 7-day yield as of April 30, 2014.
14 OPPENHEIMER MAIN STREET SMALL CAP FUND
Footnotes to Statement of Investments (Continued)
3. Is or was an affiliate, as defined in the Investment Company Act of 1940, at or during the period ended April 30, 2014, by virtue of the Fund owning at least 5% of the voting securities of the issuer or as a result of the Fund and the issuer having the same investment adviser. Transactions during the period in which the issuer was an affiliate are as follows:
| | | | | | | | | | | | | | | | |
| | | Shares May 17, 2013
(Commencement
of Operations) | | | Gross
Additions | | | Gross
Reductions | | | Shares
April 30, 2014 | |
Oppenheimer Institutional Money Market Fund, Cl. E | | | — | | | | 10,598,313 | | | | 9,916,109 | | | | 682,204 | |
| | | | |
| | | | | | | | | Value | | | Income | |
Oppenheimer Institutional Money Market Fund, Cl. E | | | | | | | $ | 682,204 | | | $ | 380 | |
See accompanying Notes to Financial Statements.
15 OPPENHEIMER MAIN STREET SMALL CAP FUND
|
|
| STATEMENT OF ASSETS AND LIABILITIES April 30, 2014 |
|
| | | | |
Assets | | | | |
Investments, at value—see accompanying statement of investments: | | | | |
Unaffiliated companies (cost $23,681,340) | | $ | 24,832,650 | |
Affiliated companies (cost $682,204) | | | 682,204 | |
| | | | |
| | | 25,514,854 | |
| |
Receivables and other assets: | | | | |
Shares of beneficial interest sold | | | 184,634 | |
Investments sold | | | 34,818 | |
Dividends | | | 14,243 | |
Other | | | 6,052 | |
| | | | |
Total assets | | | 25,754,601 | |
|
| |
Liabilities | | | | |
Payables and other liabilities: | | | | |
Investments purchased | | | 330,973 | |
Shares of beneficial interest redeemed | | | 157,038 | |
Distribution and service plan fees | | | 5,023 | |
Trustees’ compensation | | | 1,022 | |
Shareholder communications | | | 789 | |
Other | | | 21,425 | |
| | | | |
Total liabilities | | | 516,270 | |
|
| |
Net Assets | | $ | 25,238,331 | |
| | | | |
| | | | |
Composition of Net Assets | | | | |
Par value of shares of beneficial interest | | $ | 2,183 | |
| |
Additional paid-in capital | | | 23,305,032 | |
| |
Accumulated net investment income | | | 48,645 | |
| |
Accumulated net realized gain on investments and foreign currency transactions | | | 731,161 | |
| |
Net unrealized appreciation on investments and translation of assets and liabilities denominated in foreign currencies | | | 1,151,310 | |
| | | | |
Net Assets | | $ | 25,238,331 | |
| | | | |
16 OPPENHEIMER MAIN STREET SMALL CAP FUND
| | | | |
Net Asset Value Per Share | | | | |
Class A Shares: | | | | |
| |
| Net asset value and redemption price per share (based on net assets of $21,891,983 and 1,891,895 shares of beneficial interest outstanding) | | $ | 11.57 | |
| Maximum offering price per share (net asset value plus sales charge of 5.75% of offering price) | | $ | 12.28 | |
| |
| |
| Class C Shares: | | | | |
| |
| Net asset value, redemption price (excludes applicable contingent deferred sales charge) and offering price per share (based on net assets of $2,252,122 and 195,949 shares of beneficial interest outstanding) | | $ | 11.49 | |
| |
| |
| Class I Shares: | | | | |
| |
| Net asset value, redemption price and offering price per share (based on net assets of $11,585 and 1,000 shares of beneficial interest outstanding) | | $ | 11.58 | |
| |
| |
| Class N Shares: | | | | |
| |
| Net asset value, redemption price (excludes applicable contingent deferred sales charge) and offering price per share (based on net assets of $650,282 and 56,389 shares of beneficial interest outstanding) | | $ | 11.53 | |
| |
| |
| Class Y Shares: | | | | |
| |
| Net asset value, redemption price and offering price per share (based on net assets of $432,359 and 37,314 shares of beneficial interest outstanding) | | $ | 11.59 | |
See accompanying Notes to Financial Statements.
17 OPPENHEIMER MAIN STREET SMALL CAP FUND
|
|
| STATEMENT OF OPERATIONS For the Period Ended April 30, 20141 |
| | | | |
Investment Income | | | | |
| |
Dividends: | | | | |
Unaffiliated companies | | $ | 285,512 | |
Affiliated companies | | | 380 | |
| |
Interest | | | 11 | |
| | | | |
Total investment income | | | 285,903 | |
Expenses | | | | |
Management fees | | | 117,445 | |
| |
Distribution and service plan fees: | | | | |
Class A | | | 11,759 | |
Class C | | | 8,316 | |
Class N | | | 1,267 | |
| |
Transfer and shareholder servicing agent fees: | | | | |
Class A | | | 31,279 | |
Class C | | | 1,830 | |
Class I | | | 4 | |
Class N | | | 565 | |
Class Y | | | 751 | |
| |
Shareholder communications: | | | | |
Class A | | | 3,444 | |
Class C | | | 773 | |
Class N | | | 134 | |
Class Y | | | 52 | |
| |
Legal, auditing and other professional fees | | | 37,178 | |
| |
Trustees’ compensation | | | 8,252 | |
| |
Custodian fees and expenses | | | 537 | |
| |
Other | | | 5,031 | |
| | | | |
Total expenses | | | 228,617 | |
Less waivers and reimbursements of expenses | | | (24,596) | |
| | | | |
Net expenses | | | 204,021 | |
Net Investment Income | | | 81,882 | |
Realized and Unrealized Gain | | | | |
Net realized gain on: | | | | |
Investments from unaffiliated companies | | | 867,919 | |
Foreign currency transactions | | | 53 | |
| | | | |
Net realized gain | | | 867,972 | |
| |
Net change in unrealized appreciation/depreciation on: | | | | |
Investments | | | 1,150,464 | |
Translation of assets and liabilities denominated in foreign currencies | | | 846 | |
| | | | |
Net change in unrealized appreciation/depreciation | | | 1,151,310 | |
Net Increase in Net Assets Resulting from Operations | | $ | 2,101,164 | |
| | | | |
1. For the period from May 17, 2013 (commencement of operations) to April 30, 2014.
See accompanying Notes to Financial Statements.
18 OPPENHEIMER MAIN STREET SMALL CAP FUND
|
|
| STATEMENT OF CHANGES IN NET ASSETS |
| | | | |
| | | Period Ended
April 30, 20141 | |
| |
Operations | | | | |
Net investment income | | $ | 81,882 | |
| |
Net realized gain | | | 867,972 | |
| |
Net change in unrealized appreciation/depreciation | | | 1,151,310 | |
| | | | |
Net increase in net assets resulting from operations | | | 2,101,164 | |
Dividends and/or Distributions to Shareholders | | | | |
Dividends from net investment income: | | | | |
Class A | | | (30,606 | ) |
Class C | | | — | |
Class I | | | (50 | ) |
Class N | | | (381 | ) |
Class Y | | | (1,463 | ) |
| | | | |
| | | (32,500 | ) |
| |
Distributions from net realized gain: | | | | |
Class A | | | (50,616 | ) |
Class C | | | (3,263 | ) |
Class I | | | (37 | ) |
Class N | | | (1,209 | ) |
Class Y | | | (1,245 | ) |
| | | | |
| | | (56,370 | ) |
Beneficial Interest Transactions | | | | |
Net increase (decrease) in net assets resulting from beneficial interest transactions: | | | | |
Class A | | | 19,964,080 | |
Class C | | | 2,174,405 | |
Class I | | | (1,429 | ) |
Class N | | | 617,205 | |
Class Y | | | 371,776 | |
| | | | |
| | | 23,126,037 | |
Net Assets | | | | |
Total increase | | | 25,138,331 | |
| |
Beginning of period | | | 100,000 | 2 |
| | | | |
End of period (including accumulated net investment income of $48,645) | | $ | 25,238,331 | |
| | | | |
1. For the period from May 17, 2013 (commencement of operations) to April 30, 2014.
2. Reflects the value of the Manager’s seed money invested on February 21, 2013.
See accompanying Notes to Financial Statements.
19 OPPENHEIMER MAIN STREET SMALL CAP FUND
| | | | |
| Class A | | Period Ended
April 30,
20141 | |
| |
Per Share Operating Data | | | | |
| Net asset value, beginning of period | | $ | 10.00 | |
| |
| Income (loss) from investment operations: | | | | |
| Net investment income2 | | | 0.06 | |
| Net realized and unrealized gain | | | 1.57 | |
| | | | |
| Total from investment operations | | | 1.63 | |
| |
| Dividends and/or distributions to shareholders: | | | | |
| Dividends from net investment income | | | (0.02) | |
| Distributions from net realized gain | | | (0.04) | |
| | | | |
| Total dividends and/or distributions to shareholders | | | (0.06) | |
| |
| Net asset value, end of period | | $ | 11.57 | |
| | | | |
| | | | |
| |
| Total Return, at Net Asset Value3 | | | 16.33% | |
| |
| Ratios/Supplemental Data | | | | |
| Net assets, end of period (in thousands) | | $ | 21,892 | |
| |
| Average net assets (in thousands) | | $ | 14,944 | |
| |
| Ratios to average net assets:4 | | | | |
| Net investment income | | | 0.57% | |
| Total expenses5 | | | 1.40% | |
| Expenses after payments, waivers and/or reimbursements and reduction to custodian expenses | | | 1.24% | |
| |
| Portfolio turnover rate | | | 52% | |
1. For the period from May 17, 2013 (commencement of operations) to April 30, 2014.
2. Per share amounts calculated based on the average shares outstanding during the period.
3. Assumes an initial investment on the business day before the first day of the fiscal period, with all dividends and distributions reinvested in additional shares on the reinvestment date, and redemption at the net asset value calculated on the last business day of the fiscal period. Sales charges are not reflected in the total returns. Total returns are not annualized for periods less than one full year. Returns do not reflect the deduction of taxes that a shareholder would pay on fund distributions or the redemption of fund shares.
4. Annualized for periods less than one full year.
5. Total expenses including indirect expenses from affiliated fund were as follows:
| | | | | | | | |
| | Period Ended April 30, 2014 | | | 1.40 | % | | |
See accompanying Notes to Financial Statements.
20 OPPENHEIMER MAIN STREET SMALL CAP FUND
| | | | |
| Class C | | Period Ended
April 30,
20141 | |
| |
Per Share Operating Data | | | | |
| Net asset value, beginning of period | | $ | 10.00 | |
| |
| Income (loss) from investment operations: | | | | |
| Net investment loss2 | | | (0.04) | |
| Net realized and unrealized gain | | | 1.57 | |
| | | | |
| Total from investment operations | | | 1.53 | |
| |
| Dividends and/or distributions to shareholders: | | | | |
| Dividends from net investment income | | | (0.00) | |
| Distributions from net realized gain | | | (0.04) | |
| | | | |
| Total dividends and/or distributions to shareholders | | | (0.04) | |
| |
| Net asset value, end of period | | $ | 11.49 | |
| | | | |
| | | | |
| |
| Total Return, at Net Asset Value3 | | | 15.29% | |
| |
| Ratios/Supplemental Data | | | | |
| Net assets, end of period (in thousands) | | $ | 2,252 | |
| |
| Average net assets (in thousands) | | $ | 879 | |
| |
| Ratios to average net assets:4 | | | | |
| Net investment loss | | | (0.34)% | |
| Total expenses5 | | | 2.31% | |
| Expenses after payments, waivers and/or reimbursements and reduction to custodian expenses | | | 2.23% | |
| |
| Portfolio turnover rate | | | 52% | |
1. For the period from May 17, 2013 (commencement of operations) to April 30, 2014.
2. Per share amounts calculated based on the average shares outstanding during the period.
3. Assumes an initial investment on the business day before the first day of the fiscal period, with all dividends and distributions reinvested in additional shares on the reinvestment date, and redemption at the net asset value calculated on the last business day of the fiscal period. Sales charges are not reflected in the total returns. Total returns are not annualized for periods less than one full year. Returns do not reflect the deduction of taxes that a shareholder would pay on fund distributions or the redemption of fund shares.
4. Annualized for periods less than one full year.
5. Total expenses including indirect expenses from affiliated fund were as follows:
| | | | | | | | |
| | Period Ended April 30, 2014 | | | 2.31 | % | | |
See accompanying Notes to Financial Statements.
21 OPPENHEIMER MAIN STREET SMALL CAP FUND
|
|
| FINANCIAL HIGHLIGHTS Continued |
|
| | | | |
| Class I | | Period Ended
April 30,
20141 | |
| |
Per Share Operating Data | | | | |
| Net asset value, beginning of period | | $ | 10.00 | |
| |
| Income (loss) from investment operations: | | | | |
| Net investment income2 | | | 0.09 | |
| Net realized and unrealized gain | | | 1.58 | |
| | | | |
| Total from investment operations | | | 1.67 | |
| |
| Dividends and/or distributions to shareholders: | | | | |
| Dividends from net investment income | | | (0.05) | |
| Distributions from net realized gain | | | (0.04) | |
| | | | |
| Total dividends and/or distributions to shareholders | | | (0.09) | |
| |
| Net asset value, end of period | | $ | 11.58 | |
| | | | |
| | | | |
| |
| Total Return, at Net Asset Value3 | | | 16.73% | |
| |
| Ratios/Supplemental Data | | | | |
| Net assets, end of period (in thousands) | | $ | 12 | |
| |
| Average net assets (in thousands) | | $ | 12 | |
| |
| Ratios to average net assets:4 | | | | |
| Net investment income | | | 0.86% | |
| Total expenses5 | | | 1.09% | |
| Expenses after payments, waivers and/or reimbursements and reduction to custodian expenses | | | 0.80% | |
| |
| Portfolio turnover rate | | | 52% | |
1. For the period from May 17, 2013 (commencement of operations) to April 30, 2014.
2. Per share amounts calculated based on the average shares outstanding during the period.
3. Assumes an initial investment on the business day before the first day of the fiscal period, with all dividends and distributions reinvested in additional shares on the reinvestment date, and redemption at the net asset value calculated on the last business day of the fiscal period. Sales charges are not reflected in the total returns. Total returns are not annualized for periods less than one full year. Returns do not reflect the deduction of taxes that a shareholder would pay on fund distributions or the redemption of fund shares.
4. Annualized for periods less than one full year.
5. Total expenses including indirect expenses from affiliated fund were as follows:
| | | | | | | | |
| | Period Ended April 30, 2014 | | | 1.09 | % | | |
See accompanying Notes to Financial Statements.
22 OPPENHEIMER MAIN STREET SMALL CAP FUND
| | | | |
| Class N | | Period Ended
April 30,
20141 | |
| |
Per Share Operating Data | | | | |
| Net asset value, beginning of period | | $ | 10.00 | |
| |
| Income (loss) from investment operations: | | | | |
| Net investment income2 | | | 0.02 | |
| Net realized and unrealized gain | | | 1.56 | |
| | | | |
| Total from investment operations | | | 1.58 | |
| |
| Dividends and/or distributions to shareholders: | | | | |
| Dividends from net investment income | | | (0.01) | |
| Distributions from net realized gain | | | (0.04) | |
| | | | |
| Total dividends and/or distributions to shareholders | | | (0.05) | |
| |
| Net asset value, end of period | | $ | 11.53 | |
| | | | |
| | | | |
| |
| Total Return, at Net Asset Value3 | | | 15.82% | |
| |
| Ratios/Supplemental Data | | | | |
| Net assets, end of period (in thousands) | | $ | 650 | |
| |
| Average net assets (in thousands) | | $ | 271 | |
| |
| Ratios to average net assets:4 | | | | |
| Net investment income | | | 0.19% | |
| Total expenses5 | | | 1.76% | |
| Expenses after payments, waivers and/or reimbursements and reduction to custodian expenses | | | 1.71% | |
| |
| Portfolio turnover rate | | | 52% | |
1. For the period from May 17, 2013 (commencement of operations) to April 30, 2014.
2. Per share amounts calculated based on the average shares outstanding during the period.
3. Assumes an initial investment on the business day before the first day of the fiscal period, with all dividends and distributions reinvested in additional shares on the reinvestment date, and redemption at the net asset value calculated on the last business day of the fiscal period. Sales charges are not reflected in the total returns. Total returns are not annualized for periods less than one full year. Returns do not reflect the deduction of taxes that a shareholder would pay on fund distributions or the redemption of fund shares.
4. Annualized for periods less than one full year.
5. Total expenses including indirect expenses from affiliated fund were as follows:
| | | | | | | | |
| | Period Ended April 30, 2014 | | | 1.76 | % | | |
See accompanying Notes to Financial Statements.
23 OPPENHEIMER MAIN STREET SMALL CAP FUND
|
|
| FINANCIAL HIGHLIGHTS Continued |
| | | | |
| Class Y | | Period Ended
April 30,
20141 | |
| |
Per Share Operating Data | | | | |
| Net asset value, beginning of period | | $ | 10.00 | |
| |
| Income (loss) from investment operations: | | | | |
| Net investment income2 | | | 0.09 | |
| Net realized and unrealized gain | | | 1.58 | |
| | | | |
| Total from investment operations | | | 1.67 | |
| |
| Dividends and/or distributions to shareholders: | | | | |
| Dividends from net investment income | | | (0.04) | |
| Distributions from net realized gain | | | (0.04) | |
| | | | |
| Total dividends and/or distributions to shareholders | | | (0.08) | |
| |
| Net asset value, end of period | | $ | 11.59 | |
| | | | |
| | | | |
| |
| Total Return, at Net Asset Value3 | | | 16.76% | |
| |
| Ratios/Supplemental Data | | | | |
| Net assets, end of period (in thousands) | | $ | 432 | |
| |
| Average net assets (in thousands) | | $ | 358 | |
| |
| Ratios to average net assets:4 | | | | |
| Net investment income | | | 0.89% | |
| Total expenses5 | | | 1.33% | |
| Expenses after payments, waivers and/or reimbursements and reduction to custodian expenses | | | 0.90% | |
| |
| Portfolio turnover rate | | | 52% | |
1. For the period from May 17, 2013 (commencement of operations) to April 30, 2014.
2. Per share amounts calculated based on the average shares outstanding during the period.
3. Assumes an initial investment on the business day before the first day of the fiscal period, with all dividends and distributions reinvested in additional shares on the reinvestment date, and redemption at the net asset value calculated on the last business day of the fiscal period. Sales charges are not reflected in the total returns. Total returns are not annualized for periods less than one full year. Returns do not reflect the deduction of taxes that a shareholder would pay on fund distributions or the redemption of fund shares.
4. Annualized for periods less than one full year.
5. Total expenses including indirect expenses from affiliated fund were as follows:
| | | | | | | | |
| | Period Ended April 30, 2014 | | | 1.33 | % | | |
See accompanying Notes to Financial Statements.
24 OPPENHEIMER MAIN STREET SMALL CAP FUND
|
|
| NOTES TO FINANCIAL STATEMENTS April 30, 2014 |
|
1. Significant Accounting Policies
Oppenheimer Main Street Small Cap Fund (the “Fund”) is registered under the Investment Company Act of 1940, as amended, as a diversified open-end management investment company. The Fund’s investment objective is to seek capital appreciation. The Fund’s investment adviser is OFI Global Asset Management, Inc. (“OFI Global” or the “Manager”), a wholly-owned subsidiary of OppenheimerFunds, Inc. (“OFI” or the “Sub-Adviser”). The Manager has entered into a sub-advisory agreement with OFI. As of April 30, 2014, approximately 46% of the shares of the Fund were owned by the Manager, other funds advised or sub-advised by the Manager or an affiliate of the Manager.
The Fund offers Class A, Class C, Class I, Class N and Class Y shares. Class A shares are sold at their offering price, which is normally net asset value plus a front-end sales charge. Class C and Class N shares are sold without a front-end sales charge but may be subject to a contingent deferred sales charge (“CDSC”). Class N shares are sold only through retirement plans. Retirement plans that offer Class N shares may impose charges on those accounts. Class I and Class Y shares are sold to certain institutional investors or intermediaries without either a front-end sales charge or a CDSC, however, the intermediaries may impose charges on their accountholders who beneficially own Class I and Class Y shares. All classes of shares have identical rights and voting privileges with respect to the Fund in general and exclusive voting rights on matters that affect that class alone. Earnings, net assets and net asset value per share may differ due to each class having its own expenses, such as transfer and shareholder servicing agent fees and shareholder communications, directly attributable to that class. Class A, C and N shares have separate distribution and/or service plans under which they pay fees. Class I and Class Y shares do not pay such fees.
The following is a summary of significant accounting policies consistently followed by the Fund.
Investment in Oppenheimer Institutional Money Market Fund. The Fund is permitted to invest daily available cash balances in an affiliated money market fund. The Fund may invest the available cash in Class E shares of Oppenheimer Institutional Money Market Fund (“IMMF”) to seek current income while preserving liquidity. IMMF is a registered open-end management investment company, regulated as a money market fund under the Investment Company Act of 1940, as amended. The Manager is the investment adviser of IMMF, and the Sub-Adviser provides investment and related advisory services to IMMF. When applicable, the Fund’s investment in IMMF is included in the Statement of Investments. Shares of IMMF are valued at their net asset value per share. As a shareholder, the Fund is subject to its proportional share of IMMF’s Class E expenses, including its management fee. The Manager will waive fees and/or reimburse Fund expenses in an amount equal to the indirect management fees incurred through the Fund’s investment in IMMF.
Foreign Currency Translation. The Fund’s accounting records are maintained in U.S. dollars. The values of securities denominated in foreign currencies and amounts related to the purchase and sale of foreign securities and foreign investment income are translated into U.S. dollars as of the close of the New York Stock Exchange (the “Exchange”), normally 4:00 P.M.
25 OPPENHEIMER MAIN STREET SMALL CAP FUND
|
|
| NOTES TO FINANCIAL STATEMENTS Continued |
|
| 1. Significant Accounting Policies (Continued) |
Eastern time, on each day the Exchange is open for trading. Foreign exchange rates may be valued primarily using a reliable bank, dealer or service authorized by the Board of Trustees.
Reported net realized gains and losses from foreign currency transactions arise from sales of portfolio securities, sales and maturities of short-term securities, sales of foreign currencies, exchange rate fluctuations between the trade and settlement dates on securities transactions, and the difference between the amounts of dividends, interest, and foreign withholding taxes recorded on the Fund’s books and the U.S. dollar equivalent of the amounts actually received or paid. Net unrealized appreciation and depreciation on the translation of assets and liabilities denominated in foreign currencies arise from changes in the values of assets and liabilities, including investments in securities at fiscal period end, resulting from changes in exchange rates.
The effect of changes in foreign currency exchange rates on investments is separately identified from the fluctuations arising from changes in market values of securities held and reported with all other foreign currency gains and losses in the Fund’s Statement of Operations.
Allocation of Income, Expenses, Gains and Losses. Income, expenses (other than those attributable to a specific class), gains and losses are allocated on a daily basis to each class of shares based upon the relative proportion of net assets represented by such class. Operating expenses directly attributable to a specific class are charged against the operations of that class.
Federal Taxes. The Fund intends to comply with provisions of the Internal Revenue Code applicable to regulated investment companies and to distribute substantially all of its investment company taxable income, including any net realized gain on investments not offset by capital loss carryforwards, if any, to shareholders. Therefore, no federal income or excise tax provision is required. The Fund files income tax returns in U.S. federal and applicable state jurisdictions. The statute of limitations on the Fund’s tax return filings generally remain open for the three preceding fiscal reporting period ends.
The tax components of capital shown in the following table represent distribution requirements the Fund must satisfy under the income tax regulations, losses the Fund may be able to offset against income and gains realized in future years and unrealized appreciation or depreciation of securities and other investments for federal income tax purposes.
| | | | | | | | | | | | |
Undistributed Net Investment Income | | Undistributed
Long-Term
Gain | | | Accumulated
Loss
Carryforward1 | | | Net Unrealized
Appreciation
Based on cost of
Securities and
Other Investments
for Federal Income
Tax Purposes | |
$790,828 | | | $712 | | | | $— | | | | $1,140,598 | |
1. During the fiscal period ended April 30, 2014, the Fund did not utilize any capital loss carryforward.
26 OPPENHEIMER MAIN STREET SMALL CAP FUND
|
|
|
|
| 1. Significant Accounting Policies (Continued) |
Net investment income (loss) and net realized gain (loss) may differ for financial statement and tax purposes. The character of dividends and distributions made during the fiscal year from net investment income or net realized gains may differ from their ultimate characterization for federal income tax purposes. Also, due to timing of dividends and distributions, the fiscal year in which amounts are distributed may differ from the fiscal year in which the income or net realized gain was recorded by the Fund.
Accordingly, the following amounts have been reclassified for April 30, 2014. Net assets of the Fund were unaffected by the reclassifications.
| | | | | | | | |
Increase to Paid-in Capital | | Reduction to Accumulated
Net Investment
Income | | | Reduction
to Accumulated Net
Realized Gain on Investments2 | |
$81,178 | | | $737 | | | | $80,441 | |
2. $83,675, including $80 of long-term capital gain, was distributed in connection with Fund share redemptions.
The tax character of distributions paid during the period ended April 30, 2014 was as follows:
| | | | |
| | | Period Ended April 30, 2014 | |
Distributions paid from: | | | | |
Ordinary income | | $ | 88,870 | |
The aggregate cost of securities and other investments and the composition of unrealized appreciation and depreciation of securities and other investments for federal income tax purposes as of April 30, 2014 are noted in the following table. The primary difference between book and tax appreciation or depreciation of securities and other investments, if applicable, is attributable to the tax deferral of losses or tax realization of financial statement unrealized gain or loss.
| | | | |
Federal tax cost of securities | | $ | 24,374,256 | |
| | | | |
| |
Gross unrealized appreciation | | $ | 2,320,280 | |
Gross unrealized depreciation | | | (1,179,682) | |
| | | | |
Net unrealized appreciation | | $ | 1,140,598 | |
| | | | |
Trustees’ Compensation. The Board of Trustees has adopted a compensation deferral plan for independent trustees that enables trustees to elect to defer receipt of all or a portion of the annual compensation they are entitled to receive from the Fund. For purposes of determining the amount owed to the Trustee under the plan, deferred amounts are treated as though equal dollar amounts had been invested in shares of the Fund or in other Oppenheimer funds selected by the Trustee. The Fund purchases shares of the funds selected
27 OPPENHEIMER MAIN STREET SMALL CAP FUND
|
|
| NOTES TO FINANCIAL STATEMENTS Continued |
|
| 1. Significant Accounting Policies (Continued) |
for deferral by the Trustee in amounts equal to his or her deemed investment, resulting in a Fund asset equal to the deferred compensation liability. Such assets are included as a component of “Other” within the asset section of the Statement of Assets and Liabilities. Deferral of trustees’ fees under the plan will not affect the net assets of the Fund, and will not materially affect the Fund’s assets, liabilities or net investment income per share. Amounts will be deferred until distributed in accordance with the compensation deferral plan.
Dividends and Distributions to Shareholders. Dividends and distributions to shareholders, which are determined in accordance with income tax regulations and may differ from U.S. generally accepted accounting principles, are recorded on the ex-dividend date. Income and capital gain distributions, if any, are declared and paid annually or at other times as deemed necessary by the Manager.
Investment Income. Dividend income is recorded on the ex-dividend date or upon ex-dividend notification in the case of certain foreign dividends where the ex-dividend date may have passed. Non-cash dividends included in dividend income, if any, are recorded at the fair market value of the securities received. Interest income is recognized on an accrual basis. Discount and premium, which are included in interest income on the Statement of Operations, are amortized or accreted daily.
Custodian Fees. “Custodian fees and expenses” in the Statement of Operations may include interest expense incurred by the Fund on any cash overdrafts of its custodian account during the period. Such cash overdrafts may result from the effects of failed trades in portfolio securities and from cash outflows resulting from unanticipated shareholder redemption activity. The Fund pays interest to its custodian on such cash overdrafts, to the extent they are not offset by positive cash balances maintained by the Fund, at a rate equal to the Federal Funds Rate plus 0.50%. The “Reduction to custodian expenses” line item, if applicable, represents earnings on cash balances maintained by the Fund during the period. Such interest expense and other custodian fees may be paid with these earnings.
Security Transactions. Security transactions are recorded on the trade date. Realized gains and losses on securities sold are determined on the basis of identified cost.
Indemnifications. The Fund’s organizational documents provide current and former trustees and officers with a limited indemnification against liabilities arising in connection with the performance of their duties to the Fund. In the normal course of business, the Fund may also enter into contracts that provide general indemnifications. The Fund’s maximum exposure under these arrangements is unknown as this would be dependent on future claims that may be made against the Fund. The risk of material loss from such claims is considered remote.
Other. The preparation of financial statements in conformity with accounting principles generally accepted in the United States of America requires management to make estimates
28 OPPENHEIMER MAIN STREET SMALL CAP FUND
|
|
|
|
| 1. Significant Accounting Policies (Continued) |
and assumptions that affect the reported amounts of assets and liabilities and disclosure of contingent assets and liabilities at the date of the financial statements and the reported amounts of increases and decreases in net assets from operations during the reporting period. Actual results could differ from those estimates.
2. Securities Valuation
The Fund calculates the net asset value of its shares as of the close of the New York Stock Exchange (the “Exchange”), normally 4:00 P.M. Eastern time, on each day the Exchange is open for trading.
The Fund’s Board has adopted procedures for the valuation of the Fund’s securities and has delegated the day-to-day responsibility for valuation determinations under those procedures to the Manager. The Manager has established a Valuation Committee which is responsible for determining a “fair valuation” for any security for which market quotations are not “readily available.” The Valuation Committee’s fair valuation determinations are subject to review, approval and ratification by the Fund’s Board at its next regularly scheduled meeting covering the calendar quarter in which the fair valuation was determined.
Valuation Methods and Inputs
Securities are valued using unadjusted quoted market prices, when available, as supplied primarily by third party pricing services or dealers.
The following methodologies are used to determine the market value or the fair value of the types of securities described below:
Securities traded on a registered U.S. securities exchange (including exchange-traded derivatives other than futures and futures options) are valued based on the last sale price of the security reported on the principal exchange on which it is traded, prior to the time when the Fund’s assets are valued. In the absence of a sale, the security is valued at the last sale price on the prior trading day, if it is within the spread of the current day’s closing “bid” and “asked” prices, and if not, at the current day’s closing bid price. A security of a foreign issuer traded on a foreign exchange, but not listed on a registered U.S. securities exchange, is valued based on the last sale price on the principal exchange on which the security is traded, as identified by the third party pricing service used by the Manager, prior to the time when the Fund’s assets are valued. If the last sale price is unavailable, the security is valued at the most recent official closing price on the principal exchange on which it is traded. If the last sales price or official closing price for a foreign security is not available, the security is valued at the mean between the bid and asked price per the exchange or, if not available from the exchange, obtained from two dealers. If bid and asked prices are not available from either the exchange or two dealers, the security is valued by using one of the following methodologies (listed in order of priority): (1) using a bid from the exchange, (2) the mean between the bid and asked price as provided by a single dealer, or (3) a bid from a single dealer.
Shares of a registered investment company that are not traded on an exchange are valued at that investment company’s net asset value per share.
Corporate and government debt securities (of U.S. or foreign issuers) and municipal debt securities, event-linked bonds, loans, mortgage-backed securities, collateralized mortgage
29 OPPENHEIMER MAIN STREET SMALL CAP FUND
|
|
| NOTES TO FINANCIAL STATEMENTS Continued |
|
| 2. Securities Valuation (Continued) |
obligations, and asset-backed securities are valued at the mean between the “bid” and “asked” prices utilizing evaluated prices obtained from third party pricing services or broker-dealers who may use matrix pricing methods to determine the evaluated prices.
Short-term money market type debt securities with a remaining maturity of sixty days or less are valued at cost adjusted by the amortization of discount or premium to maturity (amortized cost), which approximates market value. Short-term debt securities with a remaining maturity in excess of sixty days are valued at the mean between the “bid” and “asked” prices utilizing evaluated prices obtained from third party pricing services or broker-dealers.
A description of the standard inputs that may generally be considered by the third party pricing vendors in determining their evaluated prices is provided below.
| | |
| Security Type | | Standard inputs generally considered by third-party pricing vendors |
| Corporate debt, government debt, municipal, mortgage-backed and asset-backed securities | | Reported trade data, broker-dealer price quotations, benchmark yields, issuer spreads on comparable securities, the credit quality, yield, maturity, and other appropriate factors. |
| Loans | | Information obtained from market participants regarding reported trade data and broker-dealer price quotations. |
| Event-linked bonds | | Information obtained from market participants regarding reported trade data and broker-dealer price quotations. |
If a market value or price cannot be determined for a security using the methodologies described above, or if, in the “good faith” opinion of the Manager, the market value or price obtained does not constitute a “readily available market quotation,” or a significant event has occurred that would materially affect the value of the security the security is fair valued either (i) by a standardized fair valuation methodology applicable to the security type or the significant event as previously approved by the Valuation Committee and the Fund’s Board or (ii) as determined in good faith by the Manager’s Valuation Committee. The Valuation Committee considers all relevant facts that are reasonably available, through either public information or information available to the Manager, when determining the fair value of a security. Fair value determinations by the Manager are subject to review, approval and ratification by the Fund’s Board at its next regularly scheduled meeting covering the calendar quarter in which the fair valuation was determined. Those fair valuation standardized methodologies include, but are not limited to, valuing securities at the last sale price or initially at cost and subsequently adjusting the value based on: changes in company specific fundamentals, changes in an appropriate securities index, or changes in the value of similar securities which may be further adjusted for any discounts related to security-specific resale restrictions. When possible, such methodologies use observable market inputs such as unadjusted quoted prices of similar securities, observable interest rates, currency rates and yield curves. The methodologies used for valuing securities are not necessarily an indication of the risks associated with investing in those securities nor can it be assured that the Fund can obtain the fair value assigned to a security if it were to sell the security.
To assess the continuing appropriateness of security valuations, the Manager, or its third party service provider who is subject to oversight by the Manager, regularly compares prior
30 OPPENHEIMER MAIN STREET SMALL CAP FUND
|
|
|
|
| 2. Securities Valuation (Continued) |
day prices, prices on comparable securities, and sale prices to the current day prices and challenges those prices exceeding certain tolerance levels with the third party pricing service or broker source. For those securities valued by fair valuations, whether through a standardized fair valuation methodology or a fair valuation determination, the Valuation Committee reviews and affirms the reasonableness of the valuations based on such methodologies and fair valuation determinations on a regular basis after considering all relevant information that is reasonably available.
Classifications
Each investment asset or liability of the Fund is assigned a level at measurement date based on the significance and source of the inputs to its valuation. Various data inputs are used in determining the value of each of the Fund’s investments as of the reporting period end. These data inputs are categorized in the following hierarchy under applicable financial accounting standards:
1) Level 1-unadjusted quoted prices in active markets for identical assets or liabilities (including securities actively traded on a securities exchange)
2) Level 2-inputs other than unadjusted quoted prices that are observable for the asset or liability (such as unadjusted quoted prices for similar assets and market corroborated inputs such as interest rates, prepayment speeds, credit risks, etc.)
3) Level 3-significant unobservable inputs (including the Manager’s own judgments about assumptions that market participants would use in pricing the asset or liability).
The inputs used for valuing securities are not necessarily an indication of the risks associated with investing in those securities.
The table below categorizes amounts that are included in the Fund’s Statement of Assets and Liabilities as of April 30, 2014 based on valuation input level:
| | | | | | | | | | | | | | | | |
| | | Level 1—
Unadjusted
Quoted Prices | | | Level 2—
Other Significant
Observable Inputs | | | Level 3—
Significant
Unobservable
Inputs | | | Value | |
Assets Table | | | | | | | | | | | | | | | | |
Investments, at Value: | | | | | | | | | | | | | | | | |
Common Stocks | | | | | | | | | | | | | | | | |
Consumer Discretionary | | $ | 3,197,113 | | | $ | — | | | $ | — | | | $ | 3,197,113 | |
Consumer Staples | | | 241,007 | | | | — | | | | — | | | | 241,007 | |
Energy | | | 1,440,638 | | | | — | | | | — | | | | 1,440,638 | |
Financials | | | 5,572,868 | | | | — | | | | — | | | | 5,572,868 | |
Health Care | | | 3,269,866 | | | | 120,947 | | | | — | | | | 3,390,813 | |
Industrials | | | 4,529,342 | | | | — | | | | — | | | | 4,529,342 | |
Information Technology | | | 4,007,959 | | | | — | | | | — | | | | 4,007,959 | |
Materials | | | 2,346,478 | | | | — | | | | — | | | | 2,346,478 | |
Utilities | | | 106,432 | | | | — | | | | — | | | | 106,432 | |
Investment Company | | | 682,204 | | | | — | | | | — | | | | 682,204 | |
Total Assets | | $ | 25,393,907 | | | $ | 120,947 | | | $ | — | | | $ | 25,514,854 | |
31 OPPENHEIMER MAIN STREET SMALL CAP FUND
|
|
| NOTES TO FINANCIAL STATEMENTS Continued |
|
| 2. Securities Valuation (Continued) |
Currency contracts and forwards, if any, are reported at their unrealized appreciation/depreciation at measurement date, which represents the change in the contract’s value from trade date. Futures, if any, are reported at their variation margin at measurement date, which represents the amount due to/from the Fund at that date. All additional assets and liabilities included in the above table are reported at their market value at measurement date.
3. Shares of Beneficial Interest
The Fund has authorized an unlimited number of $0.001 par value shares of beneficial interest of each class. Transactions in shares of beneficial interest were as follows:
| | | | | | | | |
| | | Period Ended April 30, 20141,2 | |
| | | Shares | | | Amount | |
Class A | | | | | | | | |
Sold | | | 2,013,937 | | | $ | 21,441,242 | |
Dividends and/or distributions reinvested | | | 1,963 | | | | 21,472 | |
Redeemed | | | (130,005 | ) | | | (1,498,634) | |
| | | | |
Net increase | | | 1,885,895 | | | $ | 19,964,080 | |
| | | | |
| | | | | | | |
Class C | | | | | | | | |
Sold | | | 216,755 | | | $ | 2,412,429 | |
Dividends and/or distributions reinvested | | | 296 | | | | 3,225 | |
Redeemed | | | (22,102 | ) | | | (241,249) | |
| | | | |
Net increase | | | 194,949 | | | $ | 2,174,405 | |
| | | | |
| | | | | | | |
Class I | | | | | | | | |
Sold | | | 4,704 | | | $ | 53,377 | |
Dividends and/or distributions reinvested | | | — | | | | — | |
Redeemed | | | (4,704 | ) | | | (54,806) | |
| | | | |
Net decrease | | | — | | | $ | (1,429) | |
| | | | |
| | | | | | | |
Class N | | | | | | | | |
Sold | | | 57,841 | | | $ | 645,832 | |
Dividends and/or distributions reinvested | | | 141 | | | | 1,541 | |
Redeemed | | | (2,593 | ) | | | (30,168) | |
| | | | |
Net increase | | | 55,389 | | | $ | 617,205 | |
| | | | |
| | | | | | | |
Class Y | | | | | | | | |
Sold | | | 49,740 | | | $ | 505,486 | |
Dividends and/or distributions reinvested | | | 240 | | | | 2,627 | |
Redeemed | | | (13,666 | ) | | | (136,337) | |
| | | | |
Net increase | | | 36,314 | | | $ | 371,776 | |
| | | | |
32 OPPENHEIMER MAIN STREET SMALL CAP FUND
3. Shares of Beneficial Interest (Continued)
1. For the period ended May 17, 2013 (commencement of operations) to April 30, 2014.
2. The Fund sold 6,000 shares of Class A at a value of $60,000 and 1,000 shares of Class C, Class I, Class N and Class Y at a value of $10,000, respectively, to the Manager upon seeding of the Fund on February 21, 2013.
4. Purchases and Sales of Securities
The aggregate cost of purchases and proceeds from sales of securities, other than short-term obligations and investments in IMMF, for the period ended April 30, 2014 were as follows:
| | | | | | | | | | |
| | | Purchases | | | | | Sales | |
| |
Investment securities | | $ | 31,406,423 | | | | | $ | 8,640,464 | |
5. Fees and Other Transactions with Affiliates
Management Fees. Under the investment advisory agreement, the Fund pays the Manager a management fee based on the daily net assets of the Fund at an annual rate as shown in the following table:
| | |
| Fee Schedule | | |
Up to $200 million | | 0.75% |
Next $200 million | | 0.72 |
Next $200 million | | 0.69 |
Next $200 million | | 0.66 |
Next $4.2 billion | | 0.60 |
Over $5 billion | | 0.58 |
Sub-Adviser Fees. The Manager has retained the Sub-Adviser to provide the day-to-day portfolio management of the Fund. Under the Sub-Advisory Agreement, the Manager pays the Sub-Adviser an annual fee in monthly installments, equal to a percentage of the investment management fee collected by the Manager from the Fund, which shall be calculated after any investment management fee waivers. The fee paid to the Sub-Adviser is paid by the Manager, not by the Fund.
Transfer Agent Fees. OFI Global (the “Transfer Agent”) serves as the transfer and shareholder servicing agent for the Fund. The Fund pays the Transfer Agent a fee based on annual net assets. Fees incurred by the Fund with respect to these services are detailed in the Statement of Operations.
Sub-Transfer Agent Fees. The Transfer Agent has retained Shareholder Services, Inc., a wholly-owned subsidiary of OFI (the “Sub-Transfer Agent”), to provide the day-to-day transfer agent and shareholder servicing of the Fund. Under the Sub-Transfer Agency Agreement, the Transfer Agent pays the Sub-Transfer Agent an annual fee in monthly installments, equal to a percentage of the transfer agent fee collected by the Transfer Agent from the Fund, which shall be calculated after any applicable fee waivers. The fee paid to the Sub-Transfer Agent is paid by the Transfer Agent, not by the Fund.
33 OPPENHEIMER MAIN STREET SMALL CAP FUND
|
|
| NOTES TO FINANCIAL STATEMENTS Continued |
5. Fees and Other Transactions with Affiliates (Continued)
Distribution and Service Plan (12b-1) Fees. Under its General Distributor’s Agreement with the Fund, OppenheimerFunds Distributor, Inc. (the “Distributor”) acts as the Fund’s principal underwriter in the continuous public offering of the Fund’s classes of shares.
Service Plan for Class A Shares. The Fund has adopted a Service Plan (the “Plan”) for Class A shares under Rule 12b-1 of the Investment Company Act of 1940. Under the Plan, the Fund reimburses the Distributor for a portion of its costs incurred for services provided to accounts that hold Class A shares. Reimbursement is made periodically at an annual rate of up to 0.25% of the daily net assets of Class A shares of the Fund. The Distributor currently uses all of those fees to pay dealers, brokers, banks and other financial institutions periodically for providing personal service and maintenance of accounts of their customers that hold Class A shares. Any unreimbursed expenses the Distributor incurs with respect to Class A shares in any fiscal year cannot be recovered in subsequent periods. Fees incurred by the Fund under the Plan are detailed in the Statement of Operations.
Distribution and Service Plans for Class C and Class N Shares. The Fund has adopted Distribution and Service Plans (the “Plans”) for Class C and Class N shares under Rule 12b-1 of the Investment Company Act of 1940 to compensate the Distributor for its services in connection with the distribution of those shares and servicing accounts. Under the Plans, the Fund pays the Distributor an annual asset-based sales charge of 0.75% on Class C shares daily net assets and 0.25% on Class N shares daily net assets. The Distributor also receives a service fee of 0.25% per year under each plan. If either the Class C or Class N plan is terminated by the Fund or by the shareholders of a class, the Board of Trustees and its independent trustees must determine whether the Distributor shall be entitled to payment from the Fund of all or a portion of the service fee and/or asset-based sales charge in respect to shares sold prior to the effective date of such termination. Fees incurred by the Fund under the Plans are detailed in the Statement of Operations. The Distributor determines its uncompensated expenses under the Plans at calendar quarter ends. The Distributor’s aggregate uncompensated expenses under the Plans at March 31, 2014 were as follows:
| | | | |
Class C | | $ | 21,365 | |
Class N | | | 6,192 | |
Sales Charges. Front-end sales charges and contingent deferred sales charges (“CDSC”) do not represent expenses of the Fund. They are deducted from the proceeds of sales of Fund shares prior to investment or from redemption proceeds prior to remittance, as applicable. The sales charges retained by the Distributor from the sale of shares and the CDSC retained by the Distributor on the redemption of shares is shown in the following table for the period indicated.
34 OPPENHEIMER MAIN STREET SMALL CAP FUND
5. Fees and Other Transactions with Affiliates (Continued)
| | | | | | | | | | | | | | | | |
| Period Ended | | Class A
Front-End
Sales Charges
Retained by
Distributor | | | Class A
Contingent
Deferred Sales
Charges
Retained by
Distributor | | | Class C
Contingent
Deferred Sales
Charges
Retained by
Distributor | | | Class N
Contingent
Deferred Sales
Charges
Retained by
Distributor | |
April 30, 2014 | | | $30,261 | | | | $— | | | | $655 | | | | $21 | |
Waivers and Reimbursements of Expenses. The Manager has contractually agreed to waive fees and/or reimburse certain expenses so that “Expenses after payments, waivers and/or reimbursements and reduction to custodian expenses”, excluding expenses incurred directly or indirectly by the Fund as a result of investments in other investment companies, wholly-owned subsidiaries and pooled investment vehicles; will not exceed 1.25% for Class A shares, 2.25% for Class C shares, 0.80% for Class I shares, 1.75% for Class N shares and 0.90% for Class Y shares. During the period ended April 30, 2014, the Manager waived $21,849, $648, $34, $138 and $1,459 for Class A, Class C, Class I, Class N and Class Y shares, respectively.
The Manager will waive fees and/or reimburse the Fund expenses in an amount equal to the indirect management fees incurred through the Fund’s investment in IMMF. During the period ended April 30, 2014, the Manager waived fees and/or reimbursed the Fund $468 for IMMF management fees.
Some of these undertakings may be modified or terminated at any time; some may not be modified or terminated until after one year from the date of the current prospectus, as indicated therein.
6. Pending Litigation
Since 2009, seven class action lawsuits have been pending in the U.S. District Court for the District of Colorado against OppenheimerFunds, Inc. (“OFI”), OppenheimerFunds Distributor, Inc., the Fund’s principal underwriter and distributor (the “Distributor”), and certain funds (but not including the Fund) advised by OFI Global Asset Management, Inc. and distributed by the Distributor (the “Defendant Funds”). The lawsuits also name as defendants certain officers and current and former trustees of the respective Defendant Funds. The lawsuits raise claims under federal securities law and allege, among other things, that the disclosure documents of the respective Defendant Funds contained misrepresentations and omissions and that the respective Defendant Funds’ investment policies were not followed. The plaintiffs in these actions seek unspecified damages, equitable relief and awards of attorneys’ fees and litigation expenses. The Defendant Funds’ Boards of Trustees have also engaged counsel to represent the Funds and the present and former Independent Trustees named in those suits. On March 5, 2014, the parties in six of these lawsuits executed stipulations and agreements of settlement resolving those actions. The settlements are subject to a variety of contingencies, including approval by the court. The settlements do not resolve a seventh outstanding lawsuit relating to Oppenheimer Rochester California Municipal Fund.
35 OPPENHEIMER MAIN STREET SMALL CAP FUND
|
|
| NOTES TO FINANCIAL STATEMENTS Continued |
6. Pending Litigation (Continued)
Other class action and individual lawsuits have been filed since 2008 in various state and federal courts against OFI and certain of its affiliates by investors seeking to recover investments they allegedly lost as a result of the “Ponzi” scheme run by Bernard L. Madoff and his firm, Bernard L. Madoff Investment Securities, LLC (“BLMIS”). Plaintiffs in these suits allege that they suffered losses as a result of their investments in several funds managed by an affiliate of OFI and assert a variety of claims, including breach of fiduciary duty, fraud, negligent misrepresentation, unjust enrichment, and violation of federal and state securities laws and regulations, among others. They seek unspecified damages, equitable relief and awards of attorneys’ fees and litigation expenses. Neither the Distributor, nor any of the Oppenheimer mutual funds, their independent trustees or directors are named as defendants in these lawsuits. None of the Oppenheimer mutual funds invested in any funds or accounts managed by Madoff or BLMIS. On February 28, 2011, a stipulation of partial settlement of three groups of consolidated putative class action lawsuits relating to these matters was filed in the U.S. District Court for the Southern District of New York. On August 19, 2011, the court entered an order and final judgment approving the settlement as fair, reasonable and adequate. In September 2011, certain parties filed notices of appeal from the court’s order approving the settlement. The settlement does not resolve other outstanding lawsuits against OFI and its affiliates relating to BLMIS.
OFI believes the lawsuits and appeals described above are without legal merit and, with the exception of actions it has settled, is defending against them vigorously. While it is premature to render any opinion as to the outcome in these lawsuits, or whether any costs that the Defendant Funds may bear in defending the suits might not be reimbursed by insurance, OFI believes that these suits should not impair the ability of OFI or the Distributor to perform their respective duties to the Fund, and that the outcome of all of the suits together should not have any material effect on the operations of any of the Oppenheimer mutual funds.
36 OPPENHEIMER MAIN STREET SMALL CAP FUND
REPORTOF INDEPENDENT REGISTERED PUBLIC ACCOUNTING FIRM
The Board of Trustees and Shareholders of Oppenheimer Main Street Small Cap Fund:
We have audited the accompanying statement of assets and liabilities of Oppenheimer Main Street Small Cap Fund, including the statement of investments, as of April 30, 2014, and the related statement of operations, the statement of changes in net assets and the financial highlights for the period from May 17, 2013 (commencement of operations) to April 30, 2014. These financial statements and financial highlights are the responsibility of the Fund’s management. Our responsibility is to express an opinion on these financial statements and financial highlights based on our audit.
We conducted our audit in accordance with the standards of the Public Company Accounting Oversight Board (United States). Those standards require that we plan and perform the audit to obtain reasonable assurance about whether the financial statements and financial highlights are free of material misstatement. An audit includes examining, on a test basis, evidence supporting the amounts and disclosures in the financial statements. Our procedures included confirmation of securities owned as of April 30, 2014, by correspondence with the custodian, transfer agent and brokers, or by other appropriate auditing procedures where replies from brokers were not received. An audit also includes assessing the accounting principles used and significant estimates made by management, as well as evaluating the overall financial statement presentation. We believe that our audit provides a reasonable basis for our opinion.
In our opinion, the financial statements and financial highlights referred to above present fairly, in all material respects, the financial position of Oppenheimer Main Street Small Cap Fund as of April 30, 2014, the results of its operations, the changes in its net assets and the financial highlights for the period from May 17, 2013, (commencement of operations) to April 30, 2014, in conformity with U.S. generally accepted accounting principles.
KPMGLLP
Denver, Colorado
June 16, 2014
37 OPPENHEIMER MAIN STREET SMALL CAP FUND
|
|
| FEDERAL INCOME TAX INFORMATION Unaudited |
In early 2014, if applicable, shareholders of record received information regarding all dividends and distributions paid to them by the Fund during calendar year 2013.
Dividends, if any, paid by the Fund during the fiscal year ended April 30, 2014 which are not designated as capital gain distributions should be multiplied by the maximum amount allowable but not less than 11.94% to arrive at the amount eligible for the corporate dividend-received deduction.
A portion, if any, of the dividends paid by the Fund during the fiscal year ended April 30, 2014 which are not designated as capital gain distributions are eligible for lower individual income tax rates to the extent that the Fund has received qualified dividend income as stipulated by recent tax legislation. The maximum amount allowable but not less than $116,005 of the Fund’s fiscal year taxable income may be eligible for the lower individual income tax rates. In early 2014, shareholders of record received information regarding the percentage of distributions that are eligible for lower individual income tax rates.
Recent tax legislation allows a regulated investment company to designate distributions not designated as capital gain distributions, as either interest related dividends or short-term capital gain dividends, both of which are exempt from the U.S. withholding tax applicable to non U.S. taxpayers. For the fiscal year ended April 30, 2014, the maximum amount allowable but not less than $109 of the ordinary distributions to be paid by the Fund qualifies as an interest related dividend and the maximum amount allowable but not less than $882,902 of the short-term capital gain distribution to be paid by the Fund qualifies as a short-term capital gain dividend.
The foregoing information is presented to assist shareholders in reporting distributions received from the Fund to the Internal Revenue Service. Because of the complexity of the federal regulations which may affect your individual tax return and the many variations in state and local tax regulations, we recommend that you consult your tax advisor for specific guidance.
38 OPPENHEIMER MAIN STREET SMALL CAP FUND
|
|
| PORTFOLIO PROXY VOTING POLICIESAND PROCEDURES; UPDATES TO STATEMENTS OF INVESTMENTS Unaudited |
The Fund has adopted Portfolio Proxy Voting Policies and Procedures under which the Fund votes proxies relating to securities (“portfolio proxies”) held by the Fund. A description of the Fund’s Portfolio Proxy Voting Policies and Procedures is available (i) without charge, upon request, by calling the Fund toll-free at 1.800.CALL OPP (225.5677), (ii) on the Fund’s website at oppenheimerfunds.com, and (iii) on the SEC’s website at www.sec.gov. In addition, the Fund is required to file Form N-PX, with its complete proxy voting record for the 12 months ended June 30th, no later than August 31st of each year. The Fund’s voting record is available (i) without charge, upon request, by calling the Fund toll-free at 1.800.CALL OPP (225.5677), and (ii) in the Form N-PX filing on the SEC’s website at www.sec.gov.
The Fund files its complete schedule of portfolio holdings with the SEC for the first quarter and the third quarter of each fiscal year on Form N-Q. The Fund’s Form N-Q filings are available on the SEC’s website at www.sec.gov. Those forms may be reviewed and copied at the SEC’s Public Reference Room in Washington, D.C. Information on the operation of the Public Reference Room may be obtained by calling 1-800-SEC-0330.
Householding—Delivery of Shareholder Documents
This is to inform you about OppenheimerFunds’ “householding” policy. If more than one member of your household maintains an account in a particular fund, OppenheimerFunds will mail only one copy of the fund’s prospectus (or, if available, the fund’s summary prospectus), annual and semiannual report and privacy policy. The consolidation of these mailings, called householding, benefits your fund through reduced mailing expense, and benefits you by reducing the volume of mail you receive from OppenheimerFunds. Householding does not affect the delivery of your account statements.
Please note that we will continue to household these mailings for as long as you remain an OppenheimerFunds shareholder, unless you request otherwise. If you prefer to receive multiple copies of these materials, please call us at 1.800.CALL-OPP (225-5677). You may also notify us in writing or via email. We will begin sending you individual copies of the prospectus (or, if available, the summary prospectus), reports and privacy policy within 30 days of receiving your request to stop householding.
39 OPPENHEIMER MAIN STREET SMALL CAP FUND
|
|
| TRUSTEES AND OFFICERS Unaudited |
|
| | |
| Name, Position(s) Held with the Fund, Length of Service, Year of Birth | | Principal Occupation(s) During the Past 5 Years; Other Trusteeships/Directorships Held; Number of Portfolios in the Fund Complex Currently Overseen |
| |
| INDEPENDENT TRUSTEES | | The address of each Trustee in the chart below is 6803 S. Tucson Way, Centennial, Colorado 80112-3924. Each Trustee serves for an indefinite term, or until his or her resignation, retirement, death or removal. |
| |
Sam Freedman, Chairman of the Board of Trustees and Trustee (since 2013) Year of Birth: 1940 | | Director of Colorado UpLIFT (charitable organization) (since September 1984). Mr. Freedman held several positions with the Sub-Adviser and with subsidiary or affiliated companies of the Sub-Adviser (until October 1994). Oversees 39 portfolios in the OppenheimerFunds complex. Mr. Freedman has served on the Boards of certain Oppenheimer funds since 1996, during which time he has become familiar with the Fund’s (and other Oppenheimer funds’) financial, accounting, regulatory and investment matters and has contributed to the Boards’ deliberations. |
| |
Edward L. Cameron, Trustee (since 2013) Year of Birth: 1938 | | Member of The Life Guard of Mount Vernon (George Washington historical site) (June 2000-June 2006); Partner of PricewaterhouseCoopers LLP (accounting firm) (July 1974-June 1999); Chairman of Price Waterhouse LLP Global Investment Management Industry Services Group (accounting firm) (July 1994-June 1998). Oversees 39 portfolios in the OppenheimerFunds complex. Mr. Cameron has served on the Boards of certain Oppenheimer funds since 1999, during which time he has become familiar with the Fund’s (and other Oppenheimer funds’) financial, accounting, regulatory and investment matters and has contributed to the Boards’ deliberations. |
| |
Jon S. Fossel, Trustee (since 2013) Year of Birth: 1942 | | Chairman of the Board (2006-December 2011) and Director (June 2002-December 2011) of UNUMProvident (insurance company); Director of Northwestern Energy Corp. (public utility corporation) (November 2004-December 2009); Director of P.R. Pharmaceuticals (October 1999-October 2003); Director of Rocky Mountain Elk Foundation (non-profit organization) (February 1998-February 2003 and February 2005-February 2007); Chairman and Director (until October 1996) and President and Chief Executive Officer (until October 1995) of the Sub-Adviser; President, Chief Executive Officer and Director of the following: Oppenheimer Acquisition Corp. (“OAC”) (parent holding company of the Sub-Adviser), Shareholders Services, Inc. and Shareholder Financial Services, Inc. (until October 1995). Oversees 39 portfolios in the OppenheimerFunds complex. Mr. Fossel has served on the Boards of certain Oppenheimer funds since 1990, during which time he has become familiar with the Fund’s (and other Oppenheimer funds’) financial, accounting, regulatory and investment matters and has contributed to the Boards’ deliberations. |
| |
Richard F. Grabish, Trustee (since 2013) Year of Birth: 1948 | | Formerly Senior Vice President and Assistant Director of Sales and Marketing (March 1997-December 2007), Director (March 1987-December 2007) and Manager of Private Client Services (June 1985-June 2005) of A.G. Edwards & Sons, Inc. (broker/dealer and investment firm); Chairman and Chief Executive Officer of A.G. Edwards Trust Company, FSB (March 2001-December 2007); President and Vice Chairman of A.G. Edwards Trust Company, FSB (investment adviser) (April 1987-March 2001); President of A.G. Edwards Trust Company, FSB (investment adviser) (June 2005-December 2007). Oversees 39 portfolios in the OppenheimerFunds complex. Mr. Grabish has served on the Boards of certain Oppenheimer funds since 2001, during which time he has become familiar with the Fund’s (and other Oppenheimer funds’) financial, accounting, regulatory and investment matters and has contributed to the Boards’ deliberations. |
40 OPPENHEIMER MAIN STREET SMALL CAP FUND
| | |
Beverly L. Hamilton, Trustee (since 2013) Year of Birth: 1946 | | Trustee of Monterey Institute for International Studies (educational organization) (since February 2000); Board Member of Middlebury College (educational organization) (December 2005-June 2011); Chairman (since 2010) of American Funds’ Emerging Markets Growth Fund, Inc. (mutual fund); Director of The California Endowment (philanthropic organization) (April 2002-April 2008); Director (February 2002-2005) and Chairman of Trustees (2006-2007) of the Community Hospital of Monterey Peninsula; Director (October 1991-2005); Vice Chairman (2006-2009) of American Funds’ Emerging Markets Growth Fund, Inc. (mutual fund); President of ARCO Investment Management Company (February 1991-April 2000); Member of the investment committees of The Rockefeller Foundation (2001-2006) and The University of Michigan (since 2000); Advisor at Credit Suisse First Boston’s Sprout venture capital unit (venture capital fund) (1994-January 2005); Trustee of MassMutual Institutional Funds (investment company) (1996-June 2004); Trustee of MML Series Investment Fund (investment company) (April 1989-June 2004); Member of the investment committee of Hartford Hospital (2000-2003); and Advisor to Unilever (Holland) pension fund (2000-2003). Oversees 39 portfolios in the OppenheimerFunds complex. Ms. Hamilton has served on the Boards of certain Oppenheimer funds since 2002, during which time she has become familiar with the Fund’s (and other Oppenheimer funds’) financial, accounting, regulatory and investment matters and has contributed to the Boards’ deliberations. |
| |
Victoria J. Herget, Trustee (since 2013) Year of Birth:1951 | | Independent Director of the First American Funds (mutual fund family) (2003-2011); former Managing Director (1993-2001), Principal (1985-1993), Vice President (1978-1985) and Assistant Vice President (1973-1978) of Zurich Scudder Investments (and its predecessor firms); Board Chair (2008-Present) and Director (2004-Present), United Educators (insurance company); Trustee (1992-2007), Chair of the Board of Trustees (1999-2007), Investment Committee Chair (1994-1999) and Investment Committee member (2007-2010) of Wellesley College; Trustee (since 2000) and Chair (since 2010), Newberry Library; Trustee, Mather LifeWays (since 2001); Trustee, BoardSource (2006-2009) and Chicago City Day School (1994-2005). Oversees 39 portfolios in the OppenheimerFunds complex. Ms. Herget has served on the Boards of certain Oppenheimer funds since 2012, during which time she has become familiar with the Fund’s (and other Oppenheimer funds’) financial, accounting, regulatory and investment matters and has contributed to the Boards’ deliberations. |
| |
Robert J. Malone, Trustee (since 2013) Year of Birth: 1944 | | Chairman of the Board (since 2012) and Director (since August 2005) of Jones International University (educational organization) (since August 2005); Chairman, Chief Executive Officer and Director of Steele Street Bank Trust (commercial banking) (since August 2003); Trustee of the Gallagher Family Foundation (non-profit organization) (since 2000); Board of Directors of Opera Colorado Foundation (non-profit organization) (2008-2012); Director of Colorado UpLIFT (charitable organization) (1986-2010); Director of Jones Knowledge, Inc. (2006-2010); Former Chairman of U.S. Bank-Colorado (subsidiary of U.S. Bancorp and formerly Colorado National Bank) (July 1996-April 1999); Director of Commercial Assets, Inc. (real estate investment trust) (1993-2000); Director of U.S. Exploration, Inc. (oil and gas exploration) (1997-February 2004); Chairman of the Board (1991-1994) and Trustee (1985-1994) of Regis University; and Chairman of the Board (1990-1991 and Trustee (1984-1999) of Young Presidents Organization. Oversees 39 portfolios in the OppenheimerFunds complex. Mr. Malone has served on the Boards of certain Oppenheimer funds since 2002, during which time he has become familiar with the Fund’s (and other Oppenheimer funds’) financial, accounting, regulatory and investment matters and has contributed to the Boards’ deliberations. |
41 OPPENHEIMER MAIN STREET SMALL CAP FUND
|
|
| TRUSTEES AND OFFICERS Unaudited / Continued |
|
| | |
F. William Marshall, Jr., Trustee (since 2013) Year of Birth: 1942 | | Trustee Emeritus of Worcester Polytech Institute (WPI) (private university) (since 2009); Trustee of MassMutual Select Funds (formerly MassMutual Institutional Funds) (investment company) (since 1996), MML Series Investment Fund (investment company) (since 1996) and Mass Mutual Premier Funds (investment company) (since January 2012); President and Treasurer of the SIS Fund (private charitable fund) (January 1999 – March 2011); Former Trustee of WPI (1985-2008); Former Chairman of the Board (2004-2006) and Former Chairman of the Investment Committee of WPI (1994-2008); Chairman of SIS & Family Bank, F.S.B. (formerly SIS Bank) (commercial bank) (January 1999-July 1999); Executive Vice President of Peoples Heritage Financial Group, Inc. (commercial bank) (January 1999-July 1999); and Former President and Chief Executive Officer of SIS Bancorp. (1993-1999). Oversees 43 portfolios in the OppenheimerFunds complex. Mr. Marshall has served on the Boards of certain Oppenheimer funds since 2000, during which time he has become familiar with the Fund’s (and other Oppenheimer funds’) financial, accounting, regulatory and investment matters and has contributed to the Boards’ deliberations. |
| |
Karen L. Stuckey, Trustee (since 2013) Year of Birth: 1953 | | Partner (1990-2012) of PricewaterhouseCoopers LLP (held various positions 1975-1990); Emeritus Trustee (since 2006), Trustee (1992-2006) and member of Executive, Nominating and Audit Committees and Chair of Finance Committee of Lehigh University; and member, Women’s Investment Management Forum since inception. Oversees 39 portfolios in the OppenheimerFunds complex. Ms. Stuckey has served on the Boards of certain Oppenheimer funds since 2012, during which time she has become familiar with the Fund’s (and other Oppenheimer funds’) financial, accounting, regulatory and investment matters and has contributed to the Boards’ deliberations. |
| |
James D. Vaughn, Trustee (since 2013) Year of Birth: 1945 | | Retired; former managing partner (1994-2001) of Denver office of Deloitte & Touche LLP, (held various positions 1969-1993); Trustee and Chairman of the Audit Committee of Schroder Funds (2003-2012); Board member and Chairman of Audit Committee of AMG National Trust Bank (since 2005); Trustee and Investment Committee member, University of South Dakota Foundation (since 1996); Board member, Audit Committee Member and past Board Chair, Junior Achievement (since 1993); former Board member, Mile High United Way, Boys and Girls Clubs, Boy Scouts, Colorado Business Committee for the Arts, Economic Club of Colorado and Metro Denver Network. Oversees 39 portfolios in the OppenheimerFunds complex. Mr. Vaughn has served on the Boards of certain Oppenheimer funds since 2012, during which time he has become familiar with the Fund’s (and other Oppenheimer funds’) financial, accounting, regulatory and investment matters and has contributed to the Boards’ deliberations. |
| | |
| INTERESTED TRUSTEE AND OFFICER | | Mr. Glavin is an “Interested Trustee” because he is affiliated with the Manager and the Sub-Adviser by virtue of his positions as an officer and director of the Manager and a director of the Sub-Adviser, and as a shareholder of the Sub-Adviser’s parent company. Both as a Trustee and as an officer, he serves for an indefinite term, or until his resignation, retirement, death or removal. Mr. Glavin’s address is 225 Liberty Street, 11th Floor, New York, New York 10281-1008. |
| |
William F. Glavin, Jr., Trustee, President and Principal Executive Officer (since 2013) Year of Birth: 1958 | | Director, Chairman and Chief Executive Officer of the Manager (since January 2013); President of the Manager (January 2013-May 2013); Chairman of the Sub-Adviser (December 2009-December 2012); Chief Executive Officer (January 2009-December 2012) and Director of the Sub-Adviser (since January 2009); President of the Sub-Adviser (May 2009-December 2012); Management Director (since June 2009), President (since December 2009) and Chief Executive Officer (since January 2011) of Oppenheimer Acquisition Corp. (“OAC”) (the Sub-Adviser’s parent holding company); Director of Oppenheimer Real Asset Management, Inc. (since March 2010); Executive |
42 OPPENHEIMER MAIN STREET SMALL CAP FUND
| | |
William F. Glavin, Jr., Continued | | Vice President (March 2006-February 2009) and Chief Operating Officer (July 2007-February 2009) of Massachusetts Mutual Life Insurance Company (OAC’s parent company); Director (May 2004-March 2006) and Chief Operating Officer and Chief Compliance Officer (May 2004-January 2005), President (January 2005-March 2006) and Chief Executive Officer (June 2005-March 2006) of Babson Capital Management LLC; Director (March 2005-March 2006), President (May 2003-March 2006) and Chief Compliance Officer (July 2005-March 2006) of Babson Capital Securities, Inc. (a broker-dealer); President (May 2003-March 2006) of Babson Investment Company, Inc.; Director (May 2004-August 2006) of Babson Capital Europe Limited; Director (May 2004-October 2006) of Babson Capital Guernsey Limited; Director (May 2004-March 2006) of Babson Capital Management LLC; Non-Executive Director (March 2005-March 2007) of Baring Asset Management Limited; Director (February 2005-June 2006) Baring Pension Trustees Limited; Director and Treasurer (December 2003-November 2006) of Charter Oak Capital Management, Inc.; Director (May 2006-September 2006) of C.M. Benefit Insurance Company; Director (May 2008-June 2009) and Executive Vice President (June 2007-July 2009) of C.M. Life Insurance Company; President (March 2006-May 2007) of MassMutual Assignment Company; Director (January 2005-December 2006), Deputy Chairman (March 2005-December 2006) and President (February 2005-March 2005) of MassMutual Holdings (Bermuda) Limited; Director (May 2008-June 2009) and Executive Vice President (June 2007-July 2009) of MML Bay State Life Insurance Company; Chief Executive Officer and President (April 2007-January 2009) of MML Distributors, LLC; and Chairman (March 2006-December 2008) and Chief Executive Officer (May 2007-December 2008) of MML Investors Services, Inc. An officer of 91 portfolios in the OppenheimerFunds complex. |
| | |
| OTHER OFFICERS OF THE FUND | | The addresses of the Officers in the chart below are as follows: for Messrs. Ziehl, Vardharaj, Anello, Krantz, Weiner, Gabinet and Mss. Budzinski, Ketner Pak, Nasta and Picciotto, 225 Liberty Street, New York, New York 10281-1008, for Mr. Wixted, 6803 S. Tucson Way, Centennial, Colorado 80112-3924. Each Officer serves for an indefinite term or until his or her resignation, retirement, death or removal. |
| |
Matthew P. Ziehl, Vice President (since 2013) Year of Birth: 1967 | | Vice President and Senior Portfolio Manager of the Sub-Adviser (since May 2009). Portfolio manager with RS Investment Management Co. LLC (October 2006-May 2009); Managing Director at The Guardian Life Insurance Company (December 2001-October 2006) when Guardian Life Insurance acquired an interest in RS Investment Management Co. LLC. Team leader and co portfolio manager with Salomon Brothers Asset Management, Inc. for small growth portfolios (January 2001-December 2001). A portfolio manager and officer of other portfolios in the OppenheimerFunds complex. |
| |
Raman Vardharaj, Vice President (since 2013) Year of Birth: 1971 | | Vice President and portfolio manager of the Sub-Adviser (since May 2009). Sector manager and a senior quantitative analyst creating stock selection models, monitoring portfolio risks and analyzing portfolio performance across the RS Core Equity Team of RS Investment Management Co. LLC (October 2006-May 2009). Quantitative analyst at The Guardian Life Insurance Company of America (1998-October 2006) when Guardian Life Insurance acquired an interest in RS Investment Management Co. LLC. A portfolio manager and officer of other portfolios in the OppenheimerFunds complex. |
| |
Raymond Anello, Vice President (since 2013) Year of Birth: 1964 | | Vice President of the Sub-Adviser (since May 2009) and a portfolio manager of the Sub-Adviser (since April 2011). Sector manager for energy and utilities for the Sub-Adviser’s Main Street Investment Team (since May 2009). Portfolio Manager of the RS All Cap Dividend product (from its inception in July 2007-April 2009) and served as a sector manager for energy and utilities for various other RS Investments products. Guardian Life Insurance Company (October 1999) and transitioned to RS Investments (October 2006) in connection with Guardian Life Insurance Company’s acquisition of an interest in RS Investments. Mr. Anello served as an equity portfolio |
43 OPPENHEIMER MAIN STREET SMALL CAP FUND
|
|
| TRUSTEES AND OFFICERS Unaudited / Continued |
|
| | |
Raymond Anello, Continued | | manager/analyst and high yield analyst at Orion Capital (1995-1998) and an assistant portfolio manager at the Garrison Bradford portfolio management firm (1988-1995). A portfolio manager and officer of other portfolios in the OppenheimerFunds complex. |
| |
Joy Budzinski, Vice President (since 2013) Year of Birth: 1968 | | Vice President of the Sub-Adviser (since May 2009) and a portfolio manager of the Sub-Adviser (since November 2012). Sector manager for healthcare for the Sub-Adviser’s Main Street Investment Team (since May 2009). Healthcare sector manager at RS Investment and Guardian Life Insurance Company. Guardian Life Insurance Company (August 2006) and transitioned to RS Investments (October 2006) in connection with Guardian Life Insurance Company’s acquisition of an interest in RS Investments. Senior equity analyst at Bank of New York BNY Asset Management (2001 -2006); portfolio manager and analyst at Alliance of America (1999-2001); portfolio manager and analyst at JP Morgan Chase (1993-1997); analyst at Prudential Investments (1997-1998). A portfolio manager and officer of other portfolios in the OppenheimerFunds complex. |
| |
Kristin Ketner Pak, Vice President (since 2013) Year of Birth: 1965 | | Vice President of the Sub-Adviser (since June 2009) and a portfolio manager of the Sub-Adviser (since November 2012). Sector manager for consumer discretionary and consumer staples for the Sub-Adviser’s Main Street Investment Team (since May 2009). Sector manager at RS Investment and Guardian Life Insurance Company. Guardian Life Insurance Company in February 2006 and transitioned to RS Investments in October 2006 in connection with Guardian Life Insurance Company’s acquisition of an interest in RS Investments. Portfolio Manager at Solstice Equity Management (2002-2005); retail analyst at Goldman Sachs (1999-2001); Director of Strategy and Integration at Staples (1997-1999); investment banker at Merrill Lynch (1987-1992 and 1995-1997) and Montgomery Securities (1994-1995). A portfolio manager and officer of other portfolios in the OppenheimerFunds complex. |
| |
Magnus Krantz, Vice President (since 2013) Year of Birth: 1967 | | Vice President of the Sub-Adviser (since May 2009) and a portfolio manager of the Sub-Adviser (since November 2012); sector manager for technology for the Sub-Adviser’s Main Street Investment Team (since May 2009). Prior to joining the Sub-Adviser, Mr. Krantz was a sector manager at RS Investment and Guardian Life Insurance Company. Mr. Krantz joined Guardian Life Insurance Company in December 2005 and transitioned to RS Investments in October 2006 in connection with Guardian Life Insurance Company’s acquisition of an interest in RS Investments. Portfolio manager and analyst at Citigroup Asset Management (1998-2005) and as a consultant at Price Waterhouse (1997-1998). He also served as product development engineer at Newbridge Networks (1993-1996) and as a software engineer at Mitel Corporation (1990-1993). A portfolio manager and officer of other portfolios in the OppenheimerFunds complex. |
| |
Adam Weiner, Vice President (since 2013) Year of Birth: 1969 | | Vice President of the Sub-Adviser (since May 2009) and a portfolio manager of the Sub-Adviser (since November 2012). Sector manager for industrials and materials for the Sub-Adviser’s Main Street Investment Team (since May 2009). Sector manager at RS Investment for industrials and materials (January 2007-April 2009). Director and senior equity analyst at Credit Suisse Asset Management (CSAM) (September 2004-December 2006). Equity analyst at Credit Suisse First Boston 2004-2006 (buy-side) and 1999-2004 (sell-side) and Morgan Stanley (1996-1999); internal auditor at Dun and Bradstreet (1992-1996). Budget analyst, Information Resources Division of the Executive Office of the President (1990-1992). A portfolio manager and officer of other portfolios in the OppenheimerFunds complex. |
44 OPPENHEIMER MAIN STREET SMALL CAP FUND
| | |
Arthur S. Gabinet, Secretary and Chief Legal Officer (since 2013) Year of Birth: 1958 | | Executive Vice President, Secretary and General Counsel of the Manager (since January 2013); General Counsel OFI SteelPath, Inc. (since January 2013); Executive Vice President (May 2010-December 2012) and General Counsel (since January 2011) of the Sub-Adviser; General Counsel of the Distributor (since January 2011); General Counsel of Centennial Asset Management Corporation (January 2011-December 2012); Executive Vice President (January 2011-December 2012) and General Counsel of HarbourView Asset Management Corporation (since January 2011); Assistant Secretary (since January 2011) and Director (since January 2011) of OppenheimerFunds International Ltd. and OppenheimerFunds plc; Director of Oppenheimer Real Asset Management, Inc. (January 2011-December 2012) and General Counsel (since January 2011); Executive Vice President (January 2011-December 2011) and General Counsel of Shareholder Financial Services, Inc. and Shareholder Services, Inc. (since January 2011); Executive Vice President (January 2011-December 2012) and General Counsel of OFI Private Investments Inc. (since January 2011); Vice President of OppenheimerFunds Legacy Program (January 2011-December 2011); Executive Vice President (January 2011-December 2012) and General Counsel of OFI Institutional Asset Management, Inc. (since January 2011); General Counsel, Asset Management of the Sub-Adviser (May 2010-December 2010); Principal, The Vanguard Group (November 2005-April 2010); District Administrator, U.S. Securities and Exchange Commission (January 2003-October 2005). An officer of 91 portfolios in the OppenheimerFunds complex. |
| |
Christina M. Nasta, Vice President and Chief Business Officer
(since 2013) Year of Birth: 1973 | | Senior Vice President of OppenheimerFunds Distributor, Inc. (since January 2013); Senior Vice President of the Sub-Adviser (July 2010-December 2012); Vice President of the Sub-Adviser (January 2003-July 2010); Vice President of OppenheimerFunds Distributor, Inc. (January 2003-July 2010). An officer of 91 portfolios in the OppenheimerFunds complex. |
| |
Mary Ann Picciotto, Chief Compliance Officer and Chief Anti-Money Laundering Officer
(since 2014) Year of Birth: 1973 | | Senior Vice President and Chief Compliance Officer of the Manager (since March 2014); Chief Compliance Officer of the Sub-Adviser, OFI SteelPath, Inc., OFI Global Trust Company, OFI Global Institutional, Inc., Oppenheimer Real Asset Management, Inc., OFI Private Investments, Inc., Harborview Asset Management Corporation, Trinity Investment Management Corporation, and Shareholder Services, Inc. (since March 2014); Managing Director of Morgan Stanley Investment Management Inc. and certain of its various affiliated entities; Chief Compliance Officer of various Morgan Stanley Funds (May 2010-January 2014); Chief Compliance Officer of Morgan Stanley Investment Management Inc. (April 2007-January 2014). An officer of 91 portfolios in the OppenheimerFunds complex. |
| |
Brian W. Wixted, Treasurer and Principal Financial & Accounting Officer (since 2013) Year of Birth: 1959 | | Senior Vice President of the Manager (since January 2013); Treasurer of the Sub-Adviser, HarbourView Asset Management Corporation, Shareholder Financial Services, Inc., Shareholder Services, Inc., and Oppenheimer Real Asset Management, Inc. (March 1999-June 2008), OFI Private Investments, Inc. (March 2000-June 2008), OppenheimerFunds International Ltd. and OppenheimerFunds plc (since May 2000), OFI Institutional Asset Management, Inc. (November 2000-June 2008), and OppenheimerFunds Legacy Program (charitable trust program established by the Sub-Adviser) (June 2003-December 2011); Treasurer and Chief Financial Officer of OFI Trust Company (since May 2000); Assistant Treasurer of Oppenheimer Acquisition Corporation (March 1999-June 2008). An officer of 91 portfolios in the OppenheimerFunds complex. |
The Fund’s Statement of Additional Information contains additional information about the Fund’s Trustees and Officers and is available without charge upon request, by calling 1.800.CALL OPP (225.5677).
45 OPPENHEIMER MAIN STREET SMALL CAP FUND
|
|
| OPPENHEIMER MAIN STREET SMALL CAP FUND |
| | |
| Manager | | OFI Global Asset Management, Inc. |
| |
| Sub-Adviser | | OppenheimerFunds, Inc. |
| |
| Distributor | | OppenheimerFunds Distributor, Inc. |
| |
| Transfer and Shareholder Servicing Agent | | OFI Global Asset Management, Inc. |
| |
| Sub-Transfer Agent | | Shareholder Services, Inc. DBA OppenheimerFunds Services |
| |
| Independent Registered Public Accounting Firm | | KPMGLLP |
| |
| Counsel | | K&L Gates LLP |
© 2014 OppenheimerFunds, Inc. All rights reserved.
46 OPPENHEIMER MAIN STREET SMALL CAP FUND
As an Oppenheimer fund shareholder, you are entitled to know how we protect your personal information and how we limit its disclosure.
Information Sources
We obtain nonpublic personal information about our shareholders from the following sources:
| — | | Applications or other forms |
| — | | When you create a user ID and password for online account access |
| — | | When you enroll in eDocs Direct, our electronic document delivery service |
| — | | Your transactions with us, our affiliates or others |
| — | | A software program on our website, often referred to as a “cookie,” which indicates which parts of our site you’ve visited |
| — | | When you set up challenge questions to reset your password online |
If you visit oppenheimerfunds.com and do not log on to the secure account information areas, we do not obtain any personal information about you. When you do log on to a secure area, we do obtain your user ID and password to identify you. We also use this information to provide you with products and services you have requested, to inform you about products and services that you may be interested in and assist you in other ways.
We do not collect personal information through our website unless you willingly provide it to us, either directly by email or in those areas of the website that request information. In order to update your personal information (including your mailing address, email address and phone number) you must first log on and visit your user profile.
If you have set your browser to warn you before accepting cookies, you will receive the warning message with each cookie. You can refuse cookies by turning them off in your browser. However, doing so may limit your access to certain sections of our website.
We use cookies to help us improve and manage our website. For example, cookies help us recognize new versus repeat visitors to the site, track the pages visited, and enable some special features on the website. This data helps us provide a better service for our website visitors.
Protection of Information
We do not disclose any non-public personal information (such as names on a customer list) about current or former customers to anyone, except as permitted by law.
Disclosure of Information
We send your financial advisor (as designated by you) copies of confirmations, account statements and other documents reporting activity in your fund accounts. We may also use details about you and your investments to help us, our financial service affiliates, or firms that jointly market their financial products and services with ours, to better serve your investment needs or suggest financial services or educational material that may be of interest to you. If this requires us to provide you with an opportunity to “opt in” or “opt out” of such information sharing with a firm not affiliated with us, you will receive notification on how to do so, before any such sharing takes place.
Right of Refusal
We will not disclose your personal information to unaffiliated third parties (except as permitted by law), unless we first offer you a reasonable opportunity to refuse or “opt out” of such disclosure.
47 OPPENHEIMER MAIN STREET SMALL CAP FUND
|
|
| PRIVACY POLICY NOTICE Continued |
Internet Security and Encryption
In general, the email services provided by our website are encrypted and provide a secure and private means of communication with us. To protect your own privacy, confidential and/or personal information should only be communicated via email when you are advised that you are using a secure website. As a security measure, we do not include personal or account information in non-secure emails, and we advise you not to send such information to us in non-secure emails. Instead, you may take advantage of the secure features of our website to encrypt your email correspondence. To do this, you will need to use a browser that supports Secure Sockets Layer (SSL) protocol.
We do not guarantee or warrant that any part of our website, including files available for download, are free of viruses or other harmful code. It is your responsibility to take appropriate precautions, such as use of an anti-virus software package, to protect your computer hardware and software.
| — | | All transactions, including redemptions, exchanges and purchases, are secured by SSL and 128-bit encryption. SSL is used to establish a secure connection between your PC and OppenheimerFunds’ server. It transmits information in an encrypted and scrambled format. |
| — | | Encryption is achieved through an electronic scrambling technology that uses a “key” to code and then decode the data. Encryption acts like the cable converter box you may have on your television set. It scrambles data with a secret code so that no one can make sense of it while it is being transmitted. When the data reaches its destination, the same software unscrambles the data. |
| — | | You can exit the secure area by either closing your browser, or for added security, you can use the Log Out button before you close your browser. |
Other Security Measures
We maintain physical, electronic and procedural safeguards to protect your personal account information. Our employees and agents have access to that information only so that they may offer you products or provide services, for example, when responding to your account questions.
How You Can Help
You can also do your part to keep your account information private and to prevent unauthorized transactions. If you obtain a user ID and password for your account, do not allow it to be used by anyone else. Also, take special precautions when accessing your account on a computer used by others.
Who We Are
This joint notice describes the privacy policies of the Oppenheimer funds, OppenheimerFunds, Inc., and each of its investment adviser subsidiaries, OppenheimerFunds Distributor, Inc. and OFI Global Trust Co. It applies to all Oppenheimer fund accounts you presently have, or may open in the future, using your Social Security number—whether or not you remain a shareholder of our funds. This notice was last updated November 2013. In the event it is updated or changed, we will post an updated notice on our website at oppenheimerfunds.com. If you have any questions about these privacy policies, write to us at P.O. Box 5270, Denver, CO 80217-5270, email us by clicking on the Contact Us section of our website at oppenheimerfunds.com or call us at 1.800.CALL OPP (225.5677).
48 OPPENHEIMER MAIN STREET SMALL CAP FUND
THIS PAGE INTENTIONALLY LEFT BLANK.
49 OPPENHEIMER MAIN STREET SMALL CAP FUND
THIS PAGE INTENTIONALLY LEFT BLANK.
50 OPPENHEIMER MAIN STREET SMALL CAP FUND
THIS PAGE INTENTIONALLY LEFT BLANK.
51 OPPENHEIMER MAIN STREET SMALL CAP FUND
THIS PAGE INTENTIONALLY LEFT BLANK.
52 OPPENHEIMER MAIN STREET SMALL CAP FUND
THIS PAGE INTENTIONALLY LEFT BLANK.
53 OPPENHEIMER MAIN STREET SMALL CAP FUND
THIS PAGE INTENTIONALLY LEFT BLANK.
54 OPPENHEIMER MAIN STREET SMALL CAP FUND
THIS PAGE INTENTIONALLY LEFT BLANK.
55 OPPENHEIMER MAIN STREET SMALL CAP FUND

Item 2. Code of Ethics.
The registrant has adopted a code of ethics that applies to the registrant’s principal executive officer, principal financial officer, principal accounting officer or controller or persons performing similar functions.
Item 3. Audit Committee Financial Expert.
The Board of Trustees of the registrant has determined that F. William Marshall, Jr., the Chairman of the Board’s Audit Committee, is the audit committee financial expert and that Mr. Marshall is “independent” for purposes of this Item 3.
Item 4. Principal Accountant Fees and Services.
The principal accountant for the audit of the registrant’s annual financial statements billed $19,300 in fiscal 2014 and no such fees in fiscal 2013.
The principal accountant for the audit of the registrant’s annual financial statements billed $5,700 in fiscal 2014 and no such fees in fiscal 2013.
The principal accountant for the audit of the registrant’s annual financial statements billed $883,775 in fiscal 2014 and no such fees in fiscal 2013 to the registrant’s investment adviser or any entity controlling, controlled by, or under common control with the adviser that provides ongoing services to the registrant.
Such services include: Internal control reviews, GIPS attestation procedures, internal audit training, surprise exams, company reorganization, and system conversion testing.
The principal accountant for the audit of the registrant’s annual financial statements billed no such fees in fiscal 2014 and no such fees in fiscal 2013.
The principal accountant for the audit of the registrant’s annual financial statements billed $343,117 in fiscal 2014 and no such fees in fiscal 2013 to the registrant’s investment adviser or any entity controlling, controlled by, or under common control with the adviser that provides ongoing services to the registrant.
Such services include: tax compliance, tax planning and tax advice. Tax compliance generally involves preparation of original and amended tax returns, claims for a refund and tax payment-planning services. Tax planning and tax advice includes assistance with tax audits and appeals, tax advice related to mergers and acquisitions and requests for rulings or technical advice from taxing authorities.
The principal accountant for the audit of the registrant’s annual financial statements billed no such fees in fiscal 2014 and no such fees in fiscal 2013.
The principal accountant for the audit of the registrant’s annual financial statements billed no such fees in fiscal 2014 and no such fees in fiscal 2013 to the registrant’s investment adviser or any entity controlling, controlled by, or under common control with the adviser that provides ongoing services to the registrant.
Such fees would include the cost to the principal accountant of attending audit committee meetings and consultations regarding the registrant’s retirement plan with respect to its Trustees.
| (e) | (1) During its regularly scheduled periodic meetings, the registrant’s audit committee will pre-approve all audit, audit-related, tax and other services to be provided by the principal accountants of the registrant. |
The audit committee has delegated pre-approval authority to its Chairman for any subsequent new engagements that arise between regularly scheduled meeting dates provided that any fees such pre-approved are presented to the audit committee at its next regularly scheduled meeting.
Under applicable laws, pre-approval of non-audit services may be waived provided that: 1) the aggregate amount of all such services provided constitutes no more than five percent of the total amount of fees paid by the registrant to its principal accountant during the fiscal year in which services are provided 2) such services were not recognized by the registrant at the time of engagement as non-audit services and 3) such services are promptly brought to the attention of the audit committee of the registrant and approved prior to the completion of the audit.
| (f) | Not applicable as less than 50%. |
| (g) | The principal accountant for the audit of the registrant’s annual financial statements billed $1,232,592 in fiscal 2014 and no such fees in fiscal 2013 to the registrant and the registrant’s investment adviser or any entity controlling, controlled by, or under common control with the adviser that provides ongoing services to the registrant related to non-audit fees. Those billings did not include any prohibited non-audit services as defined by the Securities Exchange Act of 1934. |
| (h) | The registrant’s audit committee of the board of Trustees has considered whether the provision of non-audit services that were rendered to the registrant’s investment adviser, and any entity controlling, controlled by, or under common control with the investment adviser that provides ongoing services to the registrant that were not pre-approved pursuant to paragraph (c)(7)(ii) of Rule 2-01 of Regulation S-X is compatible with maintaining the principal accountant’s independence. No such services were rendered. |
Item 5. Audit Committee of Listed Registrants
Not applicable.
Item 6. Schedule of Investments.
a) Not applicable. The complete schedule of investments is included in Item 1 of this Form N-CSR.
b) Not applicable.
Item 7. Disclosure of Proxy Voting Policies and Procedures for Closed-End Management Investment Companies.
Not applicable.
Item 8. Portfolio Managers of Closed-End Management Investment Companies.
Not applicable.
Item 9. Purchases of Equity Securities by Closed-End Management Investment Company and Affiliated Purchasers.
Not applicable.
Item 10. Submission of Matters to a Vote of Security Holders.
The Fund’s Governance Committee Provisions with Respect to Nominations of Directors/Trustees to the Respective Boards
None
Item 11. Controls and Procedures.
Based on their evaluation of the registrant’s disclosure controls and procedures (as defined in rule 30a-3(c) under the Investment Company Act of 1940 (17 CFR 270.30a-3(c)) as of 4/30/2014, the registrant’s principal executive officer and principal financial officer found the registrant’s disclosure controls and procedures to provide reasonable assurances that information required to be disclosed by the registrant in the reports that it files under the Securities Exchange Act of 1934 (a) is accumulated and communicated to registrant’s management, including its principal executive officer and principal financial officer, to allow timely decisions regarding required disclosure, and (b) is recorded, processed, summarized and reported, within the time periods specified in the rules and forms adopted by the U.S. Securities and Exchange Commission.
There have been no changes in the registrant’s internal controls over financial reporting that occurred during the registrant’s second fiscal quarter of the period covered by this report that have materially affected, or are reasonably likely to materially affect, the registrant’s internal control over financial reporting.
Item 12. Exhibits.
| (a) | (1) Exhibit attached hereto. |
(2) Exhibits attached hereto.
(3) Not applicable.
| (b) | Exhibit attached hereto. |
SIGNATURES
Pursuant to the requirements of the Securities Exchange Act of 1934 and the Investment Company Act of 1940, the registrant has duly caused this report to be signed on its behalf by the undersigned, thereunto duly authorized.
Oppenheimer Main Street Small Cap Fund
| | |
| By: | | /s/ William F. Glavin, Jr. |
| | William F. Glavin, Jr. |
| | Principal Executive Officer |
| |
| Date: | | 6/9/2014 |
Pursuant to the requirements of the Securities Exchange Act of 1934 and the Investment Company Act of 1940, this report has been signed below by the following persons on behalf of the registrant and in the capacities and on the dates indicated.
| | |
| By: | | /s/ William F. Glavin, Jr. |
| | William F. Glavin, Jr. |
| | Principal Executive Officer |
| |
| Date: | | 6/9/2014 |
| | |
| By: | | /s/ Brian W. Wixted |
| | Brian W. Wixted |
| | Principal Financial Officer |
| |
| Date: | | 6/9/2014 |