UNITED STATES
SECURITIES AND EXCHANGE COMMISSION
WASHINGTON, D.C. 20549
FORM N-CSR
CERTIFIED SHAREHOLDER REPORT OF REGISTERED MANAGEMENT
INVESTMENT COMPANIES
Investment Company Act file number 811-22806
Oppenheimer Main Street Small Cap Fund
(Exact name of registrant as specified in charter)
6803 South Tucson Way, Centennial, Colorado 80112-3924
(Address of principal executive offices) (Zip code)
Cynthia Lo Bessette
OFI Global Asset Management, Inc.
225 Liberty Street, New York, New York 10281-1008
(Name and address of agent for service)
Registrant’s telephone number, including area code: (303) 768-3200
Date of fiscal year end: April 30
Date of reporting period: 4/29/2016
Item 1. Reports to Stockholders.
Class A Shares
AVERAGE ANNUAL TOTAL RETURNS AT 4/29/16*
| | | | | | | | | | | | | | | |
| | | Class A Shares of the Fund | | |
| | | Without Sales Charge | | With Sales Charge | | Russell 2000 Index |
1-Year | | | | -5.06 | % | | | | -10.52 | % | | | | -5.94 | % |
Since Inception (5/17/13) | | | | 7.04 | | | | | 4.91 | | | | | 5.81 | |
Performance data quoted represents past performance, which does not guarantee future results. The investment return and principal value of an investment in the Fund will fluctuate so that an investor’s shares, when redeemed, may be worth more or less than their original cost. Fund returns include changes in share price, reinvested distributions, and a 5.75% maximum applicable sales charge except where “without sales charge” is indicated. Current performance may be lower or higher than the performance quoted. Returns do not consider capital gains or income taxes on an individual’s investment. For performance data current to the most recent month-end, visit oppenheimerfunds.com or call 1.800.CALL OPP (225.5677).
* April 29, 2016, was the last business day of the Fund’s fiscal year. See Note 2 of the accompanying Notes to Financial Statements. Index returns are calculated through April 30, 2016.
2 OPPENHEIMER MAIN STREET SMALL CAP FUND
Fund Performance Discussion
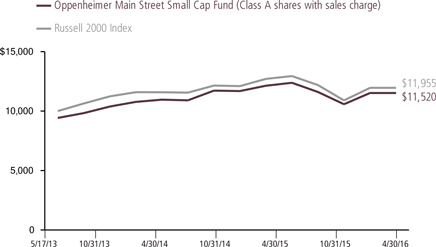
In what was a volatile environment for equities throughout the globe, the Fund’s Class A shares (without sales charge) returned -5.06% during the reporting period. In comparison, the Russell 2000 Index (the “Index”) returned -5.94% during the same period. The Fund’s outperformance was driven largely by stronger relative stock selection in the energy, financials and information technology sectors. The Fund underperformed the Index within the materials, industrials, and consumer discretionary sectors, due primarily to weaker relative stock selection.
MARKET OVERVIEW
Mid-2015 saw significant volatility return to the markets after several years of relative tranquility. Large-cap stocks barely eked-out a positive total return for calendar 2015 and the Fund’s reporting period, due mainly to the contribution from dividends. Stock prices were down overall. Meanwhile, both mid- and small-cap stocks generally declined. The worst performing sector for the reporting period was energy, thanks to ongoing weakness in
commodity prices. Telling of the risk-aversion behavior during the period, the best performing sectors for the Index were utilities, telecommunication services and consumer staples.
The markets in 2015 and early 2016 have been driven by several important macroeconomic trends:
COMPARISON OF CHANGE IN VALUE OF $10,000 HYPOTHETICAL INVESTMENTS IN:
3 OPPENHEIMER MAIN STREET SMALL CAP FUND
| ● | | Uncertainty over when or if the Federal Reserve (the “Fed”) would raise interest rates, an especially important issue for financials. |
| ● | | Continued slow but steady recovery in domestic consumer employment and consumption. |
| ● | | Plummeting commodity energy prices, causing outright recessionary conditions in the energy sector. Oil prices appear to have stabilized recently. |
| ● | | Decelerating emerging markets growth, contributing to the weakness in export demand for commodities and other industrial products. |
| ● | | Competitive currency devaluations, including negative interest rates in a growing number of jurisdictions, thrusting the world economy into uncharted territory. |
FUND REVIEW
Top contributors to performance this reporting period included Prestige Brands Holdings, Inc., WellCare Health Plans, Inc. and National Storage Affiliates Trust.
Sales at Prestige Brands Holdings, a distributor of over-the-counter healthcare and household products, improved as destocking by retailers — which had hurt prior quarter results for Prestige Brands — came to an end. Consequently, revenues topped expectations, propelling the stock higher. Management also provided further “color” on its planned integration of the recently closed Insight acquisition, which added the $100 million Monistat brand — now Prestige’s largest
product line. This information helped to improve visibility and boost investor sentiment.
WellCare is a managed care company for government-sponsored healthcare coverage with a focus on Medicare and Medicaid programs. Investors reacted favorably when the company updated its longer term growth goals of doubling its revenue within five years. WellCare also has a strong cash position and this, combined with a new credit facility, has increased deployable cash for potential acquisitions and accelerating growth. (With two big pending mergers—Aetna/Humana and Anthem/Cigna—divestitures are likely, resulting in possible acquisition opportunities for WellCare.) Additionally, the Center for Medicare and Medicaid (CMS) announced its preliminary 2017 rates which should bode well for the company’s Medicare Advantage business. This continues to be our largest holding in health care as our confidence in the company’s margin recovery is strengthened by both CMS’ rate outlook as well as expected growth in both Medicare and Medicaid spending.
National Storage Affiliates (NSA) is a real estate investment trust (REIT) focused on ownership and operation of self-storage properties within the U.S. We purchased the holding at the company’s initial public offering (“IPO”) in April of 2015. The IPO was priced at a substantial discount to existing publicly traded peers, due in part to NSA’s lower property-level occupancy. As a private organization, NSA was slower to implement
4 OPPENHEIMER MAIN STREET SMALL CAP FUND
sophisticated (and rather expensive) leasing optimization systems that the “big guys” have utilized for a number of years. With these systems coming online in 2015, NSA reported positive occupancy gains during the reporting period, significantly narrowing the gap versus peers on this critical metric. Perhaps more importantly, NSA added a seventh operating platform via acquisition, joining its existing six operators dating back to the IPO. In addition to driving future growth, this acquisition validates NSA’s proposition to storage asset owners, who otherwise could sell to a number of other public operators who are all competing aggressively for acquisitions.
Detractors from performance included Dana Holding Corp., Party City Holdco, Inc. and Intrepid Potash, Inc.
Dana is a supplier of automotive and other vehicle, i.e., trucks and off-highway, parts and systems primarily to Original Equipment Manufacturers (OEMs). The company disappointed investors in October with below expectations third quarter 2015 results and a weak outlook for fourth quarter of 2015, then missed and guided down again in January. While some of the company’s end-markets have become more challenging (e.g. Class 8 trucks), at least some of the company’s issues have been self-inflicted as production issues led to market share losses. After significantly reducing our position in January, we were in the process of completely exiting at the end of the reporting period in April as we do not expect near-term improvement.
Party City is a designer, manufacturer and retailer of party goods such as tableware, balloons, costumes and novelties that went public in April 2015. We like the diversified and profitable nature of the company’s vertically integrated retail & wholesale business structure, which helps to insulate Party City from the competitive threat of Amazon (in fact, the company manufactures product that is sold in the Amazon channel). However, after two straight disappointing sales results, we recognized that management needs to build investor confidence that they can deliver on guidance as a public company. We reduced our position in late 2015 and subsequently exited the stock in February.
Intrepid Potash is the largest U.S. producer of potassium chloride (potash), which is used as an essential nutrient ingredient for farming. The outlook for potash volumes and pricing has deteriorated over the past several months, as typical pick-up in seasonal demand did not materialize. In addition, the company temporarily suspended production at its West mine due to unanticipated maintenance. We exited our position in October.
STRATEGY & OUTLOOK
While bottom-up company research and stock selection continue to be central to our process and strategy, we do have some observations about the current environment. First, the U.S. is experiencing a bifurcated economy. Consumers are generally healthy, with employment rising and spending (which constitutes approximately 70% of
5 OPPENHEIMER MAIN STREET SMALL CAP FUND
domestic GDP) growing slowly, but steadily. By contrast, industrials and materials have been in a recession, but began to show signs of “green shoots” in the closing months of the reporting period. For this to continue, however, we believe the dollar needs to weaken further.
Economic observations and opinions aside, as always, we seek to construct an “all-weather” small-cap portfolio that can deliver competitive results in any economic scenario. Therefore we hold a diversified collection of stocks balanced across the spectrum from growth to value, and also remain close to neutral in terms of sector weights versus benchmark – with one key exception. We are significantly overweight the industrials sector, but the composition of that overweight bears discussion. It is the result of significant positions in commercial and professional services (such as staffing and other services directed at businesses) that have a higher
dependency on employment in the domestic U.S. economy than on manufacturing activity or export demand related to the dollar or foreign economic strength.
Traditionally, during periods of economic uncertainty and heightened market volatility, investors favor stocks of higher quality companies—with greater consistency and stability of revenue and earnings—leading to relatively better stock performance of those companies. We think focusing on companies with economic moats and skilled management teams positions us well, should this environment come to pass. During times of economic volatility such companies frequently widen their lead over weaker competitors. We seek to invest in companies, characterized by these qualities, at compelling valuations and believe this disciplined approach is essential to generating superior long-term performance.
| | | | |
 | | 
Matthew P. Ziehl, CFA Portfolio Manager |
Matthew P. Ziehl, CFA on behalf of the Portfolio Management team: Raymond Anello, CFA, Raman Vardharaj, CFA, Joy Budzinski, Kristin Ketner, Magnus Krantz and Adam Weiner. Mr. Ziehl and Mr. Weiner serve as co-lead Portfolio Managers of the Fund
6 OPPENHEIMER MAIN STREET SMALL CAP FUND
Top Holdings and Allocations*
TOP TEN COMMON STOCK HOLDINGS
| | | | |
WellCare Health Plans, Inc. | | | 2.2 | % |
FirstMerit Corp. | | | 2.1 | |
Pinnacle Foods, Inc. | | | 2.1 | |
MB Financial, Inc. | | | 2.0 | |
BankUnited, Inc. | | | 2.0 | |
Prestige Brands Holdings, Inc. | | | 2.0 | |
Kaiser Aluminum Corp. | | | 1.9 | |
j2 Global, Inc. | | | 1.8 | |
MKS Instruments, Inc. | | | 1.8 | |
Burlington Stores, Inc. | | | 1.8 | |
Portfolio holdings and allocations are subject to change. Percentages are as of April 29, 2016, and are based on net assets. For more current Fund holdings, please visit oppenheimerfunds. com.
TOP TEN COMMON STOCK INDUSTRIES
| | | | |
Commercial Banks | | | 9.4 | % |
Real Estate Investment Trusts (REITs) | | | 7.2 | |
Software | | | 7.0 | |
Commercial Services & Supplies | | | 6.3 | |
Health Care Providers & Services | | | 5.6 | |
Hotels, Restaurants & Leisure | | | 4.6 | |
IT Services | | | 4.0 | |
Specialty Retail | | | 3.7 | |
| Semiconductors & Semiconductor Equipment | | | 3.3 | |
Electric Utilities | | | 3.0 | |
Portfolio holdings and allocations are subject to change. Percentages are as of April 29, 2016, and are based on net assets.
SECTOR ALLOCATION
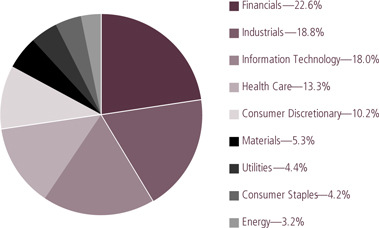
Portfolio holdings and allocations are subject to change. Percentages are as of April 29, 2016, and are based on the total market value of common stocks.
*April 29, 2016, was the last business day of the Fund’s fiscal year. See Note 2 of the accompanying Notes to Financial Statements.
7 OPPENHEIMER MAIN STREET SMALL CAP FUND
Share Class Performance
AVERAGE ANNUAL TOTAL RETURNS WITHOUT SALES CHARGE AS OF 4/29/16
| | | | | | | | | | | | |
| | | Inception | | | | | | Since | |
| | | Date | | | 1-Year | | | Inception | |
Class A (OSCAX) | | | 5/17/13 | | | | -5.06 | % | | | 7.04 | % |
Class C (OSCCX) | | | 5/17/13 | | | | -5.81 | % | | | 6.13 | % |
Class I (OSSIX) | | | 5/17/13 | | | | -4.63 | % | | | 7.51 | % |
Class R (OSCNX) | | | 5/17/13 | | | | -5.31 | % | | | 6.67 | % |
Class Y (OSCYX) | | | 5/17/13 | | | | -4.72 | % | | | 7.42 | % |
AVERAGE ANNUAL TOTAL RETURNS WITH SALES CHARGE AS OF 4/29/16
| | | | | | | | | | | | |
| | | Inception | | | | | | Since | |
| | | Date | | | 1-Year | | | Inception | |
Class A (OSCAX) | | | 5/17/13 | | | | -10.52 | % | | | 4.91 | % |
Class C (OSCCX) | | | 5/17/13 | | | | -6.75 | % | | | 6.13 | % |
Class I (OSSIX) | | | 5/17/13 | | | | -4.63 | % | | | 7.51 | % |
Class R (OSCNX) | | | 5/17/13 | | | | -5.31 | % | | | 6.67 | % |
Class Y (OSCYX) | | | 5/17/13 | | | | -4.72 | % | | | 7.42 | % |
Performance data quoted represents past performance, which does not guarantee future results. The investment return and principal value of an investment in the Fund will fluctuate so that an investor’s shares, when redeemed, may be worth more or less than their original cost. Current performance may be lower or higher than the performance quoted. Returns do not consider capital gains or income taxes on an individual’s investment. For performance data current to the most recent month-end, visit oppenheimerfunds.com or call 1.800.CALL OPP (225.5677). Fund returns include changes in share price, reinvested distributions, and the applicable sales charge: for Class A shares, the current maximum initial sales charge of 5.75% and for Class C shares, the contingent deferred sales charge (“CDSC”) of 1% for the 1-year period. Prior to 7/1/14, Class R shares were named Class N shares. Beginning 7/1/14, new purchases of Class R shares will no longer be subject to a CDSC upon redemption (any CDSC will remain in effect for purchases prior to 7/1/14). There is no sales charge for Class I and Y shares.
The Fund’s performance is compared to the performance of the Russell 2000 Index, which measures the performance of the small-cap segment of the U.S. equity universe. The Index is unmanaged and cannot be purchased directly by investors. While index comparisons may be useful to provide a benchmark for the Fund’s performance, it must be noted that the Fund’s investments are not limited to the investments comprising the indices. Index performance includes reinvestment of income, but does not reflect transaction costs, fees, expenses or taxes. Index performance is shown for illustrative purposes only as a benchmark for the Fund’s performance, and does not predict or depict performance of the Fund. The Fund’s performance reflects the effects of the Fund’s business and operating expenses.
The Fund’s investment strategy and focus can change over time. The mention of specific fund holdings does not constitute a recommendation by OppenheimerFunds, Inc. or its affiliates.
8 OPPENHEIMER MAIN STREET SMALL CAP FUND
Before investing in any of the Oppenheimer funds, investors should carefully consider a fund’s investment objectives, risks, charges and expenses. Fund prospectuses and summary prospectuses contain this and other information about the funds, and may be obtained by asking your financial advisor, visiting oppenheimerfunds.com, or calling 1.800.CALL OPP (225.5677). Read prospectuses and summary prospectuses carefully before investing.
Shares of Oppenheimer funds are not deposits or obligations of any bank, are not guaranteed by any bank, are not insured by the FDIC or any other agency, and involve investment risks, including the possible loss of the principal amount invested.
9 OPPENHEIMER MAIN STREET SMALL CAP FUND
Fund Expenses
Fund Expenses. As a shareholder of the Fund, you incur two types of costs: (1) transaction costs, which may include sales charges (loads) on purchase payments and/or contingent deferred sales charges on redemptions; and (2) ongoing costs, including management fees; distribution and service fees; and other Fund expenses. These examples are intended to help you understand your ongoing costs (in dollars) of investing in the Fund and to compare these costs with the ongoing costs of investing in other mutual funds.
The examples are based on an investment of $1,000.00 invested at the beginning of the period and held for the entire 6-month period ended April 29, 2016.
Actual Expenses. The first section of the table provides information about actual account values and actual expenses. You may use the information in this section for the class of shares you hold, together with the amount you invested, to estimate the expense that you paid over the period. Simply divide your account value by $1,000.00 (for example, an $8,600.00 account value divided by $1,000.00 = 8.60), then multiply the result by the number in the first section under the heading entitled “Expenses Paid During 6 Months Ended April 29, 2016” to estimate the expenses you paid on your account during this period.
Hypothetical Example for Comparison Purposes. The second section of the table provides information about hypothetical account values and hypothetical expenses based on the Fund’s actual expense ratio for each class of shares, and an assumed rate of return of 5% per year for each class before expenses, which is not the Fund’s actual return. The hypothetical account values and expenses may not be used to estimate the actual ending account balance or expenses you paid for the period. You may use this information to compare the ongoing costs of investing in the Fund and other funds. To do so, compare this 5% hypothetical example for the class of shares you hold with the 5% hypothetical examples that appear in the shareholder reports of the other funds.
Please note that the expenses shown in the table are meant to highlight your ongoing costs only and do not reflect any transactional costs, such as front-end or contingent deferred sales charges (loads). Therefore, the “hypothetical” section of the table is useful in comparing ongoing costs only, and will not help you determine the relative total costs of owning different funds. In addition, if these transactional costs were included, your costs would have been higher.
10 OPPENHEIMER MAIN STREET SMALL CAP FUND
| | | | | | | | | | | | | | | | | | |
| Actual | | Beginning Account Value November 1, 2015 | | Ending Account Value April 29, 2016 | | Expenses Paid During 6 Months Ended April 29, 2016 |
Class A | | $ | 1,000.00 | | | | | $ | 992.20 | | | | | $ | 6.18 | | | |
Class C | | | 1,000.00 | | | | | | 988.30 | | | | | | 9.88 | | | |
Class I | | | 1,000.00 | | | | | | 994.80 | | | | | | 3.95 | | | |
Class R | | | 1,000.00 | | | | | | 990.70 | | | | | | 7.46 | | | |
Class Y | | | 1,000.00 | | | | | | 994.00 | | | | | | 4.45 | | | |
| | | | | | |
| Hypothetical | | | | | | | | | | | | | | | | | | |
(5% return before expenses) | | | | | | | | | | | | | | | | | | |
Class A | | | 1,000.00 | | | | | | 1,018.55 | | | | | | 6.26 | | | |
Class C | | | 1,000.00 | | | | | | 1,014.84 | | | | | | 10.01 | | | |
Class I | | | 1,000.00 | | | | | | 1,020.77 | | | | | | 4.01 | | | |
Class R | | | 1,000.00 | | | | | | 1,017.26 | | | | | | 7.56 | | | |
Class Y | | | 1,000.00 | | | | | | 1,020.28 | | | | | | 4.51 | | | |
Expenses are equal to the Fund’s annualized expense ratio for that class, multiplied by the average account value over the period, multiplied by 181/366 (to reflect the one-half year period). Those annualized expense ratios, excluding indirect expenses from affiliated funds, based on the 6-month period ended April 29, 2016 are as follows:
| | | | | | |
| Class | | Expense Ratios | | | |
Class A | | | 1.25 | % | | |
Class C | | | 2.00 | | | |
Class I | | | 0.80 | | | |
Class R | | | 1.51 | | | |
Class Y | | | 0.90 | | | |
The expense ratios reflect voluntary and/or contractual waivers and/or reimbursements of expenses by the Fund’s Manager. Some of these undertakings may be modified or terminated at any time, as indicated in the Fund’s prospectus. The “Financial Highlights” tables in the Fund’s financial statements, included in this report, also show the gross expense ratios, without such waivers or reimbursements and reduction to custodian expenses, if applicable.
11 OPPENHEIMER MAIN STREET SMALL CAP FUND
STATEMENT OF INVESTMENTS April 29, 2016*
| | | | | | | | |
| | | Shares | | | Value | |
Common Stocks—97.5% | |
Consumer Discretionary—10.0% | |
Auto Components—1.2% | |
Dana Holding Corp. | | | 134,480 | | | $ | 1,738,826 | |
Visteon Corp. | | | 41,665 | | | | 3,319,451 | |
| | | | | | | 5,058,277 | |
| | |
| | | | | | | | | |
Hotels, Restaurants & Leisure—4.6% | |
International Speedway Corp., Cl. A | | | 97,164 | | | | 3,254,022 | |
Popeyes Louisiana Kitchen, Inc.1 | | | 94,845 | | | | 5,098,867 | |
Sonic Corp. | | | 142,658 | | | | 4,903,156 | |
Texas Roadhouse, Inc., Cl. A | | | 145,601 | | | | 5,928,873 | |
| | | | | | | 19,184,918 | |
| | |
| | | | | | | | | |
Media—0.5% | |
Madison Square Garden Co. (The), Cl. A1 | | | 13,899 | | | | 2,181,865 | |
| | |
| | | | | | | | | |
Specialty Retail—3.7% | |
Burlington Stores, Inc.1 | | | 130,678 | | | | 7,444,726 | |
Rent-A-Center, Inc. | | | 215,340 | | | | 3,165,498 | |
Sally Beauty Holdings, Inc.1 | | | 160,949 | | | | 5,053,798 | |
| | | | | | | 15,664,022 | |
| | |
| | | | | | | | | |
Consumer Staples—4.1% | |
Food Products—2.1% | |
Pinnacle Foods, Inc. | | | 205,214 | | | | 8,740,064 | |
Household Products—0.6% | |
Energizer Holdings, Inc. | | | 55,235 | | | | 2,402,170 | |
Tobacco—1.4% | |
Universal Corp. | | | 110,628 | | | | 6,034,758 | |
Energy—3.2% | |
Energy Equipment & Services—0.5% | |
RigNet, Inc.1 | | | 114,484 | | | | 1,957,676 | |
Oil, Gas & Consumable Fuels—2.7% | |
Cone Midstream Partners LP2 | | | 222,970 | | | | 3,157,255 | |
Renewable Energy Group, Inc.1 | | | 422,002 | | | | 4,101,860 | |
Western Refining, Inc. | | | 152,869 | | | | 4,090,774 | |
| | | | | | | 11,349,889 | |
| | | | | | | | |
| | | Shares | | | Value | |
Financials—22.0% | |
Capital Markets—1.4% | |
Evercore Partners, Inc., Cl. A | | | 59,869 | | | $ | 3,091,635 | |
Stifel Financial Corp.1 | | | 82,088 | | | | 2,701,516 | |
| | | | | | | 5,793,151 | |
| | |
| | | | | | | | | |
Commercial Banks—9.4% | |
BancorpSouth, Inc. | | | 187,925 | | | | 4,414,358 | |
BankUnited, Inc. | | | 244,002 | | | | 8,418,069 | |
FirstMerit Corp. | | | 407,476 | | | | 9,029,668 | |
MB Financial, Inc. | | | 245,131 | | | | 8,520,754 | |
Talmer Bancorp, Inc., Cl. A | | | 136,763 | | | | 2,653,202 | |
Webster Financial Corp. | | | 185,370 | | | | 6,791,957 | |
| | | | | | | 39,828,008 | |
| | |
| | | | | | | | | |
Insurance—3.0% | |
Endurance Specialty Holdings Ltd. | | | 78,855 | | | | 5,045,143 | |
James River Group Holdings Ltd. | | | 129,520 | | | | 4,009,939 | |
Old Republic International Corp. | | | 196,833 | | | | 3,639,442 | |
| | | | | | | 12,694,524 | |
| | |
| | | | | | | | | |
Real Estate Investment Trusts (REITs)—7.2% | |
Brandywine Realty Trust | | | 375,876 | | | | 5,619,346 | |
Chatham Lodging Trust | | | 243,950 | | | | 5,198,574 | |
DiamondRock Hospitality Co. | | | 525,266 | | | | 4,680,120 | |
DuPont Fabros Technology, Inc. | | | 102,347 | | | | 4,075,458 | |
Four Corners Property Trust, Inc. | | | 227,002 | | | | 4,029,285 | |
National Storage Affiliates Trust | | | 225,607 | | | | 4,403,849 | |
Seritage Growth Properties | | | 40,653 | | | | 2,169,651 | |
| | | | | | | 30,176,283 | |
| | |
| | | | | | | | | |
Thrifts & Mortgage Finance—1.0% | |
Oritani Financial Corp. | | | 256,971 | | | | 4,453,308 | |
Health Care—13.0% | |
Biotechnology—2.2% | |
ACADIA Pharmaceuticals, Inc.1 | | | 90,622 | | | | 2,927,091 | |
12 OPPENHEIMER MAIN STREET SMALL CAP FUND
| | | | | | | | |
| | | Shares | | | Value | |
Biotechnology (Continued) | |
Anacor Pharmaceuticals, Inc.1 | | | 18,679 | | | $ | 1,171,920 | |
Axovant Sciences Ltd.1 | | | 54,169 | | | | 704,197 | |
Sage Therapeutics, Inc.1 | | | 32,696 | | | | 1,232,312 | |
Santhera Pharmaceutical Holding AG1 | | | 14,470 | | | | 1,060,139 | |
Ultragenyx Pharmaceutical, Inc.1 | | | 31,595 | | | | 2,136,454 | |
| | | | | | | 9,232,113 | |
| | |
| | | | | | | | | |
Health Care Equipment & Supplies—1.4% | |
NxStage Medical, Inc.1 | | | 171,517 | | | | 2,764,854 | |
Spectranetics Corp. (The)1 | | | 196,763 | | | | 3,344,971 | |
| | | | | | | 6,109,825 | |
| | | | | | | | | |
Health Care Providers & Services—5.6% | |
Acadia Healthcare Co., Inc.1 | | | 74,166 | | | | 4,686,549 | |
Addus HomeCare Corp.1 | | | 44,013 | | | | 814,240 | |
Diplomat Pharmacy, Inc.1 | | | 85,278 | | | | 2,583,071 | |
HealthSouth Corp. | | | 147,998 | | | | 6,135,997 | |
WellCare Health Plans, Inc.1 | | | 104,018 | | | | 9,360,580 | |
| | | | | | | 23,580,437 | |
| | |
| | | | | | | | | |
Life Sciences Tools & Services—0.8% | |
VWR Corp.1 | | | 130,531 | | | | 3,477,346 | |
Pharmaceuticals—3.0% | |
Akorn, Inc.1 | | | 57,363 | | | | 1,459,888 | |
Impax Laboratories, Inc.1 | | | 52,173 | | | | 1,739,970 | |
Prestige Brands Holdings, Inc.1 | | | 144,997 | | | | 8,232,930 | |
TherapeuticsMD, Inc.1 | | | 126,268 | | | | 1,041,711 | |
| | | | | | | 12,474,499 | |
| | |
| | | | | | | | | |
Industrials—18.3% | |
Aerospace & Defense—2.0% | |
AAR Corp. | | | 121,721 | | | | 2,926,173 | |
Curtiss-Wright Corp. | | | 44,709 | | | | 3,423,815 | |
| | | | | | | | |
| | | Shares | | | Value | |
Aerospace & Defense (Continued) | |
Hexcel Corp. | | | 48,961 | | | $ | 2,216,465 | |
| | | | 8,566,453 | |
| | |
| | | | | | | | | |
Airlines—1.0% | |
Spirit Airlines, Inc.1 | | | 93,213 | | | | 4,094,847 | |
| | |
| | | | | | | | | |
Building Products—1.2% | |
Masonite International Corp.1 | | | 77,206 | | | | 5,223,758 | |
Commercial Services & Supplies—6.3% | |
ABM Industries, Inc. | | | 150,630 | | | | 4,845,767 | |
ACCO Brands Corp.1 | | | 457,879 | | | | 4,368,166 | |
KAR Auction Services, Inc. | | | 193,710 | | | | 7,283,496 | |
Matthews International Corp., Cl. A | | | 73,236 | | | | 3,855,143 | |
Pitney Bowes, Inc. | | | 196,523 | | | | 4,121,087 | |
Progressive Waste Solutions Ltd. | | | 65,918 | | | | 2,123,219 | |
| | | | | | | 26,596,878 | |
| | |
| | | | | | | | | |
Construction & Engineering—1.8% | |
AECOM1 | | | 151,363 | | | | 4,917,784 | |
Dycom Industries, Inc.1 | | | 41,657 | | | | 2,940,984 | |
| | | | | | | 7,858,768 | |
| | |
| | | | | | | | | |
Electrical Equipment—1.0% | |
Generac Holdings, Inc.1 | | | 106,821 | | | | 4,072,016 | |
| | |
| | | | | | | | | |
Professional Services—3.0% | |
Korn/Ferry International | | | 268,276 | | | | 7,281,011 | |
On Assignment, Inc.1 | | | 145,002 | | | | 5,228,772 | |
| | | | | | | 12,509,783 | |
| | |
| | | | | | | | | |
Road & Rail—1.3% | |
Saia, Inc.1 | | | 77,478 | | | | 2,240,664 | |
Swift Transportation Co., Cl. A1 | | | 187,046 | | | | 3,108,704 | |
| | | | | | | 5,349,368 | |
| | |
| | | | | | | | | |
Transportation Infrastructure—0.7% | |
Wesco Aircraft Holdings, Inc.1 | | | 203,497 | | | | 2,936,462 | |
Information Technology—17.5% | |
Electronic Equipment, Instruments, & | |
Components—1.4% | |
SYNNEX Corp. | | | 71,635 | | | | 5,914,902 | |
13 OPPENHEIMER MAIN STREET SMALL CAP FUND
| | |
| |
| STATEMENT OF INVESTMENTS Continued | | |
| | | | | | | | |
| | | Shares | | | Value | |
Internet Software & Services—1.8% | |
j2 Global, Inc. | | | 120,808 | | | $ | 7,673,724 | |
| | |
| | | | | | | | | |
IT Services—4.0% | |
Black Knight Financial Services, Inc., Cl. A1 | | | 137,705 | | | | 4,403,806 | |
Booz Allen Hamilton Holding Corp., Cl. A | | | 192,419 | | | | 5,304,992 | |
CACI International, Inc., Cl. A1 | | | 76,189 | | | | 7,325,572 | |
| | | | | | | 17,034,370 | |
| | |
| | | | | | | | | |
Semiconductors & Semiconductor | |
Equipment—3.3% | |
Cavium, Inc.1 | | | 70,176 | | | | 3,464,589 | |
Cypress Semiconductor Corp. | | | 324,159 | | | | 2,927,156 | |
MKS Instruments, Inc. | | | 207,676 | | | | 7,447,261 | |
| | | | | | | 13,839,006 | |
| | |
| | | | | | | | | |
Software—7.0% | |
FleetMatics Group plc1 | | | 86,119 | | | | 3,121,814 | |
Fortinet, Inc.1 | | | 128,477 | | | | 4,176,787 | |
Guidewire Software, Inc.1 | | | 96,145 | | | | 5,477,381 | |
Imperva, Inc.1 | | | 90,254 | | | | 4,195,006 | |
Paylocity Holding Corp.1 | | | 130,316 | | | | 4,987,193 | |
Proofpoint, Inc.1 | | | 77,598 | | | | 4,520,860 | |
Zynga, Inc., Cl. A1 | | | 1,265,995 | | | | 3,013,068 | |
| | | | | | | 29,492,109 | |
| | |
| | | | | | | | | |
Materials—5.2% | |
Construction Materials—0.5% | |
| Summit Materials, Inc., Cl. A1 | | | 99,890 | | | | 2,087,701 | |
| | | | | | | | |
| | | Shares | | | Value | |
Metals & Mining—1.9% | |
Kaiser Aluminum Corp. | | | 83,088 | | | $ | 7,879,235 | |
| | |
| | | | | | | | | |
Paper & Forest Products—2.8% | |
Boise Cascade Co.1 | | | 217,357 | | | | 4,536,240 | |
PH Glatfelter Co. | | | 277,105 | | | | 6,354,018 | |
| Schweitzer-Mauduit International, Inc. | | | 26,005 | | | | 894,312 | |
| | | | | | | 11,784,570 | |
| | |
| | | | | | | | | |
Utilities—4.2% | |
Electric Utilities—3.0% | |
ALLETE, Inc. | | | 113,772 | | | | 6,392,849 | |
| Portland General Electric Co. | | | 159,476 | | | | 6,334,387 | |
| | | | | | | 12,727,236 | |
| | | | | | | | | |
Gas Utilities—1.2% | |
| Suburban Propane Partners LP2 | | | 171,211 | | | | 5,168,860 | |
Total Common Stocks (Cost $391,133,320) | | | | | | | 411,203,179 | |
| | |
| | | | | | | | | |
Investment Company—2.9% | |
Oppenheimer Institutional Money Market Fund, Cl. E, 0.48%3,4 (Cost $12,209,334) | | | 12,209,334 | | | | 12,209,334 | |
| | |
| | | | | | | | | |
Total Investments,at Value (Cost $403,342,654) | | | 100.4% | | | | 423,412,513 | |
| Net Other Assets (Liabilities) | | | (0.4 | ) | | | (1,887,845 | ) |
| | | | |
Net Assets | | | 100.0% | | | $ | 421,524,668 | |
| | | | |
Footnotes to Statement of Investments
| * | April 29, 2016 represents the last business day of the Fund’s reporting period. See Note 2 of the accompanying Notes. |
1. Non-income producing security.
2. Security is a Master Limited Partnership.
3. Rate shown is the 7-day yield at period end.
4. Is or was an affiliate, as defined in the Investment Company Act of 1940, as amended, at or during the reporting period, by virtue of the Fund owning at least 5% of the voting securities of the issuer or as a result of the Fund and the issuer having the same investment adviser. Transactions during the reporting period in which the issuer was an affiliate are as follows:
14 OPPENHEIMER MAIN STREET SMALL CAP FUND
Footnotes to Statement of Investments (Continued)
| | | | | | | | | | | | | | | | |
| | | Shares
April 30, 2015 | | | Gross
Additions | | | Gross Reductions | | | Shares
April 29, 2016a | |
Oppenheimer Institutional Money Market Fund, Cl. E | | | 9,779,460 | | | | 208,883,510 | | | | 206,453,636 | | | | 12,209,334 | |
| | | | | | | | | Value | | | Income | |
Oppenheimer Institutional Money Market Fund, Cl. E | | | | | | | | | | $ | 12,209,334 | | | $ | 25,638 | |
a. Represents the last business day of the Fund’s reporting period. See Note 2 of the accompanying Notes.
See accompanying Notes to Financial Statements.
15 OPPENHEIMER MAIN STREET SMALL CAP FUND
| | |
| |
| STATEMENT OF ASSETS AND LIABILITIES April 29, 20161 | | |
| | | | |
| |
Assets | | | | |
Investments, at value—see accompanying statement of investments: | | | | |
Unaffiliated companies (cost $391,133,320) | | $ | 411,203,179 | |
Affiliated companies (cost $12,209,334) | | | 12,209,334 | |
| | | | |
| | | 423,412,513 | |
| |
Cash | | | 192,254 | |
| |
Receivables and other assets: | | | | |
Investments sold | | | 2,480,468 | |
Shares of beneficial interest sold | | | 714,959 | |
Dividends | | | 408,447 | |
Other | | | 17,832 | |
| | | | |
Total assets | | | 427,226,473 | |
| | | | |
| |
Liabilities | | | | |
Payables and other liabilities: | | | | |
Investments purchased | | | 5,109,183 | |
Shares of beneficial interest redeemed | | | 534,442 | |
Distribution and service plan fees | | | 13,758 | |
Shareholder communications | | | 7,966 | |
Trustees’ compensation | | | 4,415 | |
Other | | | 32,041 | |
| | | | |
Total liabilities | | | 5,701,805 | |
|
| |
Net Assets | | $ | 421,524,668 | |
| | | | |
| | | | |
| |
Composition of Net Assets | | | | |
Par value of shares of beneficial interest | | $ | 34,785 | |
| |
Additional paid-in capital | | | 427,419,961 | |
| |
Accumulated net investment income | | | 749,343 | |
| |
Accumulated net realized loss on investments and foreign currency transactions | | | (26,749,280) | |
| |
Net unrealized appreciation on investments and translation of assets and liabilities denominated in foreign currencies | | | 20,069,859 | |
| | | | |
Net Assets | | $ | 421,524,668 | |
| | | | |
16 OPPENHEIMER MAIN STREET SMALL CAP FUND
| | | | |
Net Asset Value Per Share | | | | |
Class A Shares: | | | | |
| |
| Net asset value and redemption price per share (based on net assets of $49,493,568 and 4,096,114 shares of beneficial interest outstanding) | | $ | 12.08 | |
| |
| Maximum offering price per share (net asset value plus sales charge of 5.75% of offering price) | | $ | 12.82 | |
| |
| |
| Class C Shares: | | | | |
| |
| Net asset value, redemption price (excludes applicable contingent deferred sales charge) and offering price per share (based on net assets of $14,440,555 and 1,219,292 shares of beneficial interest outstanding) | | $ | 11.84 | |
| |
| |
| Class I Shares: | | | | |
| |
| Net asset value, redemption price and offering price per share (based on net assets of $294,108,314 and 24,231,409 shares of beneficial interest outstanding) | | $ | 12.14 | |
| |
| |
| Class R Shares: | | | | |
| |
| Net asset value, redemption price (excludes applicable contingent deferred sales charge) and offering price per share (based on net assets of $4,060,549 and 338,421 shares of beneficial interest outstanding) | | $ | 12.00 | |
| |
| |
| Class Y Shares: | | | | |
| |
| Net asset value, redemption price and offering price per share (based on net assets of $59,421,682 and 4,899,567 shares of beneficial interest outstanding) | | $ | 12.13 | |
1. April 29, 2016 represents the last business day of the Fund’s reporting period. See Note 2 of the accompanying Notes.
See accompanying Notes to Financial Statements.
17 OPPENHEIMER MAIN STREET SMALL CAP FUND
| | |
| |
| STATEMENT OF OPERATIONS For the Year Ended April 29, 20161 | | |
| | | | |
| |
Investment Income | | | | |
Dividends: | | | | |
Unaffiliated companies (net of foreign withholding taxes of $4,745) | | $ | 6,241,717 | |
Affiliated companies | | | 25,638 | |
| |
Interest | | | 71 | |
| | | | |
Total investment income | | | 6,267,426 | |
| | | | |
| |
Expenses | | | | |
Management fees | | | 2,721,137 | |
| |
Distribution and service plan fees: | | | | |
Class A | | | 106,231 | |
Class C | | | 120,887 | |
Class R | | | 17,656 | |
| |
Transfer and shareholder servicing agent fees: | | | | |
Class A | | | 96,557 | |
Class C | | | 26,618 | |
Class I | | | 76,928 | |
Class R | | | 7,789 | |
Class Y | | | 118,786 | |
| |
Shareholder communications: | | | | |
Class A | | | 11,162 | |
Class C | | | 3,031 | |
Class I | | | 20 | |
Class R | | | 761 | |
Class Y | | | 6,692 | |
| |
Trustees’ compensation | | | 19,533 | |
| |
Borrowing fees | | | 4,585 | |
| |
Custodian fees and expenses | | | 3,004 | |
| |
Other | | | 90,998 | |
| | | | |
Total expenses | | | 3,432,375 | |
Less reduction to custodian expenses | | | (70) | |
Less waivers and reimbursements of expenses | | | (62,953) | |
| | | | |
Net expenses | | | 3,369,352 | |
| | | | |
| |
Net Investment Income | | | 2,898,074 | |
18 OPPENHEIMER MAIN STREET SMALL CAP FUND
| | | | |
| |
Realized and Unrealized Gain (Loss) | | | | |
Net realized loss on: | | | | |
Investments from unaffiliated companies | | $ | (25,016,897) | |
Foreign currency transactions | | | (4,043) | |
| | | | |
Net realized loss | | | (25,020,940) | |
| |
Net change in unrealized appreciation/depreciation on: | | | | |
Investments | | | 6,249,732 | |
Translation of assets and liabilities denominated in foreign currencies | | | 92,413 | |
| | | | |
Net change in unrealized appreciation/depreciation | | | 6,342,145 | |
| | | | |
| |
Net Decrease in Net Assets Resulting from Operations | | $ | (15,780,721) | |
| | | | |
1. April 29, 2016 represents the last business day of the Fund’s reporting period. See Note 2 of the accompanying Notes.
See accompanying Notes to Financial Statements.
19 OPPENHEIMER MAIN STREET SMALL CAP FUND
| | |
| |
| STATEMENTS OF CHANGES IN NET ASSETS | | |
| | | | | | | | |
| | | Year Ended
April 29, 20161 | | | Year Ended
April 30, 2015 | |
| |
Operations | | | | | | | | |
Net investment income | | $ | 2,898,074 | | | $ | 820,609 | |
| |
Net realized loss | | | (25,020,940) | | | | (1,683,332) | |
| |
Net change in unrealized appreciation/depreciation | | | 6,342,145 | | | | 12,576,404 | |
| | | | |
Net increase (decrease) in net assets resulting from operations | | | (15,780,721) | | | | 11,713,681 | |
| | | | | | | | |
| |
Dividends and/or Distributions to Shareholders | | | | | | | | |
Dividends from net investment income: | | | | | | | | |
Class A | | | (135,493) | | | | (2,640) | |
Class C | | | — | | | | — | |
Class I | | | (2,213,988) | | | | (321,854) | |
Class R2 | | | (2,189) | | | | — | |
Class Y | | | (367,390) | | | | (3,252) | |
| | | | |
| | | (2,719,060) | | | | (327,746) | |
| | | | | | | | |
| |
Distributions from net realized gain: | | | | | | | | |
Class A | | | — | | | | (64,218) | |
Class C | | | — | | | | (21,247) | |
Class I | | | — | | | | (649,200) | |
Class R2 | | | — | | | | (5,337) | |
Class Y | | | — | | | | (7,520) | |
| | | | |
| | | — | | | | (747,522) | |
| | | | | | | | |
| |
Beneficial Interest Transactions | | | | | | | | |
Net increase in net assets resulting from beneficial interest transactions: | | | | | | | | |
Class A | | | 18,471,290 | | | | 10,087,548 | |
Class C | | | 5,263,567 | | | | 7,212,208 | |
Class I | | | 117,733,894 | | | | 179,346,780 | |
Class R2 | | | 1,228,864 | | | | 2,290,784 | |
Class Y | | | 14,953,452 | | | | 47,559,318 | |
| | | | |
| | | 157,651,067 | | | | 246,496,638 | |
| | | | | | | | |
| |
Net Assets | | | | | | | | |
Total increase | | | 139,151,286 | | | | 257,135,051 | |
| |
Beginning of period | | | 282,373,382 | | | | 25,238,331 | |
| | | | |
End of period (including accumulated net investment income of $749,343 and $566,433, respectively) | | $ | 421,524,668 | | | $ | 282,373,382 | |
| | | | |
1. April 29, 2016 represents the last business day of the Fund’s reporting period. See Note 2 of the accompanying Notes.
2. Effective July 1, 2014, Class N shares were renamed Class R. See Note 1 of the accompanying Notes.
See accompanying Notes to Financial Statements.
20 OPPENHEIMER MAIN STREET SMALL CAP FUND
| | | | | | | | |
| Class A | | Year Ended
April 29,
20161 | | Year Ended
April 30,
2015 | | Period Ended
April 30,
20142 |
|
Per Share Operating Data | | | | | | | | |
Net asset value, beginning of period | | $12.76 | | $11.57 | | $10.00 | | |
|
Income (loss) from investment operations: | | | | | | | | |
Net investment income3 | | 0.05 | | 0.03 | | 0.06 | | |
Net realized and unrealized gain (loss) | | (0.69) | | 1.20 | | 1.57 | | |
| | |
Total from investment operations | | (0.64) | | 1.23 | | 1.63 | | |
|
Dividends and/or distributions to shareholders: | | | | | | | | |
Dividends from net investment income | | (0.04) | | (0.00)4 | | (0.02) | | |
Distributions from net realized gain | | 0.00 | | (0.04) | | (0.04) | | |
| | |
Total dividends and/or distributions to shareholders | | (0.04) | | (0.04) | | (0.06) | | |
|
Net asset value, end of period | | $12.08 | | $12.76 | | $11.57 | | |
| | |
| | | | |
|
Total Return, at Net Asset Value5 | | (5.06)% | | 10.67% | | 16.33% | | |
| | | | |
|
Ratios/Supplemental Data | | | | | | | | |
Net assets, end of period (in thousands) | | $49,494 | | $34,343 | | $21,892 | | |
|
Average net assets (in thousands) | | $43,949 | | $26,518 | | $14,944 | | |
|
Ratios to average net assets:6 | | | | | | | | |
Net investment income | | 0.44% | | 0.25% | | 0.57% | | |
Expenses excluding specific expenses listed below | | 1.25% | | 1.30% | | 1.40% | | |
Interest and fees from borrowings | | 0.00%7 | | 0.00% | | 0.00% | | |
| | |
Total expenses8 | | 1.25% | | 1.30% | | 1.40% | | |
Expenses after payments, waivers and/or reimbursements and reduction to custodian expenses | | 1.25% | | 1.25% | | 1.24% | | |
|
Portfolio turnover rate | | 53% | | 55% | | 52% | | |
1. April 29, 2016 represents the last business day of the Fund’s reporting period. See Note 2 of the accompanying Notes.
2. For the period from May 17, 2013 (commencement of operations) to April 30, 2014.
3. Per share amounts calculated based on the average shares outstanding during the period.
4. Less than $0.005 per share.
5. Assumes an initial investment on the business day before the first day of the fiscal period, with all dividends and distributions reinvested in additional shares on the reinvestment date, and redemption at the net asset value calculated on the last business day of the fiscal period. Sales charges are not reflected in the total returns. Total returns are not annualized for periods less than one full year. Returns do not reflect the deduction of taxes that a shareholder would pay on fund distributions or the redemption of fund shares.
6. Annualized for periods less than one full year.
7. Less than 0.005%.
8. Total expenses including indirect expenses from affiliated fund fees and expenses were as follows:
| | | | | | |
| | Year Ended April 29, 2016 | | | 1.25 | % |
| | Year Ended April 30, 2015 | | | 1.30 | % |
| | Period Ended April 30, 2014 | | | 1.40 | % |
See accompanying Notes to Financial Statements.
21 OPPENHEIMER MAIN STREET SMALL CAP FUND
| | |
| |
| FINANCIAL HIGHLIGHTS Continued | | |
| | | | | | | | |
| Class C | | Year Ended
April 29,
20161 | | Year Ended
April 30,
2015 | | Period
Ended
April 30,
20142 |
|
Per Share Operating Data | | | | | | | | |
Net asset value, beginning of period | | $12.57 | | $11.49 | | $10.00 | | |
|
Income (loss) from investment operations: | | | | | | | | |
Net investment loss3 | | (0.04) | | (0.07) | | (0.04) | | |
Net realized and unrealized gain (loss) | | (0.69) | | 1.19 | | 1.57 | | |
| | |
Total from investment operations | | (0.73) | | 1.12 | | 1.53 | | |
|
Dividends and/or distributions to shareholders: | | | | | | | | |
Dividends from net investment income | | 0.00 | | 0.00 | | 0.00 | | |
Distributions from net realized gain | | 0.00 | | (0.04) | | (0.04) | | |
| | |
Total dividends and/or distributions to shareholders | | 0.00 | | (0.04) | | (0.04) | | |
|
Net asset value, end of period | | $11.84 | | $12.57 | | $11.49 | | |
| | |
| | | | |
|
Total Return, at Net Asset Value4 | | (5.81)% | | 9.77% | | 15.29% | | |
| | | | |
|
Ratios/Supplemental Data | | | | | | | | |
Net assets, end of period (in thousands) | | $14,441 | | $9,878 | | $2,252 | | |
|
Average net assets (in thousands) | | $12,117 | | $5,461 | | $879 | | |
|
Ratios to average net assets:5 | | | | | | | | |
Net investment loss | | (0.34)% | | (0.59)% | | (0.34)% | | |
Expenses excluding specific expenses listed below | | 2.01% | | 2.13% | | 2.31% | | |
Interest and fees from borrowings | | 0.00%6 | | 0.00% | | 0.00% | | |
| | |
Total expenses7 | | 2.01% | | 2.13% | | 2.31% | | |
Expenses after payments, waivers and/or reimbursements and reduction to custodian expenses | | 2.01% | | 2.13% | | 2.23% | | |
|
Portfolio turnover rate | | 53% | | 55% | | 52% | | |
1. April 29, 2016 represents the last business day of the Fund’s reporting period. See Note 2 of the accompanying Notes.
2. For the period from May 17, 2013 (commencement of operations) to April 30, 2014.
3. Per share amounts calculated based on the average shares outstanding during the period.
4. Assumes an initial investment on the business day before the first day of the fiscal period, with all dividends and distributions reinvested in additional shares on the reinvestment date, and redemption at the net asset value calculated on the last business day of the fiscal period. Sales charges are not reflected in the total returns. Total returns are not annualized for periods less than one full year. Returns do not reflect the deduction of taxes that a shareholder would pay on fund distributions or the redemption of fund shares.
5. Annualized for periods less than one full year.
6. Less than 0.005%.
7. Total expenses including indirect expenses from affiliated fund fees and expenses were as follows:
| | | | | | |
| | Year Ended April 29, 2016 | | | 2.01 | % |
| | Year Ended April 30, 2015 | | | 2.13 | % |
| | Period Ended April 30, 2014 | | | 2.31 | % |
See accompanying Notes to Financial Statements.
22 OPPENHEIMER MAIN STREET SMALL CAP FUND
| | | | | | | | |
| Class I | | Year Ended
April 29,
20161 | | Year Ended
April 30,
2015 | | Period
Ended
April 30,
20142 |
|
Per Share Operating Data | | | | | | | | |
Net asset value, beginning of period | | $12.82 | | $11.58 | | $10.00 | | |
|
Income (loss) from investment operations: | | | | | | | | |
Net investment income3 | | 0.11 | | 0.10 | | 0.09 | | |
Net realized and unrealized gain (loss) | | (0.70) | | 1.20 | | 1.58 | | |
| | |
Total from investment operations | | (0.59) | | 1.30 | | 1.67 | | |
|
Dividends and/or distributions to shareholders: | | | | | | | | |
Dividends from net investment income | | (0.09) | | (0.02) | | (0.05) | | |
Distributions from net realized gain | | 0.00 | | (0.04) | | (0.04) | | |
| | |
Total dividends and/or distributions to shareholders | | (0.09) | | (0.06) | | (0.09) | | |
|
Net asset value, end of period | | $12.14 | | $12.82 | | $11.58 | | |
| | |
| | | | |
|
Total Return, at Net Asset Value4 | | (4.63)% | | 11.26% | | 16.73% | | |
| | | | |
|
Ratios/Supplemental Data | | | | | | | | |
Net assets, end of period (in thousands) | | $294,108 | | $187,997 | | $12 | | |
|
Average net assets (in thousands) | | $256,727 | | $95,238 | | $12 | | |
|
Ratios to average net assets:5 | | | | | | | | |
Net investment income | | 0.91% | | 0.80% | | 0.86% | | |
Expenses excluding specific expenses listed below | | 0.80% | | 0.80% | | 1.09% | | |
Interest and fees from borrowings | | 0.00%6 | | 0.00% | | 0.00% | | |
| | |
Total expenses7 | | 0.80% | | 0.80% | | 1.09% | | |
Expenses after payments, waivers and/or reimbursements and reduction to custodian expenses | | 0.80% | | 0.79% | | 0.80% | | |
|
Portfolio turnover rate | | 53% | | 55% | | 52% | | |
1. April 29, 2016 represents the last business day of the Fund’s reporting period. See Note 2 of the accompanying Notes.
2. For the period from May 17, 2013 (commencement of operations) to April 30, 2014.
3. Per share amounts calculated based on the average shares outstanding during the period.
4. Assumes an initial investment on the business day before the first day of the fiscal period, with all dividends and distributions reinvested in additional shares on the reinvestment date, and redemption at the net asset value calculated on the last business day of the fiscal period. Sales charges are not reflected in the total returns. Total returns are not annualized for periods less than one full year. Returns do not reflect the deduction of taxes that a shareholder would pay on fund distributions or the redemption of fund shares.
5. Annualized for periods less than one full year.
6. Less than 0.005%.
7. Total expenses including indirect expenses from affiliated fund fees and expenses were as follows:
| | | | | | |
| | Year Ended April 29, 2016 | | | 0.80 | % |
| | Year Ended April 30, 2015 | | | 0.80 | % |
| | Period Ended April 30, 2014 | | | 1.09 | % |
See accompanying Notes to Financial Statements.
23 OPPENHEIMER MAIN STREET SMALL CAP FUND
| | |
| |
| FINANCIAL HIGHLIGHTS Continued | | |
| | | | | | | | |
| Class R | | Year Ended
April 29,
20161 | | Year Ended
April 30,
2015 | | Period
Ended
April 30,
20142 |
|
Per Share Operating Data | | | | | | | | |
Net asset value, beginning of period | | $12.68 | | $11.53 | | $10.00 | | |
|
Income (loss) from investment operations: | | | | | | | | |
Net investment income (loss)3 | | 0.02 | | (0.01) | | 0.02 | | |
Net realized and unrealized gain (loss) | | (0.69) | | 1.20 | | 1.56 | | |
| | |
Total from investment operations | | (0.67) | | 1.19 | | 1.58 | | |
|
Dividends and/or distributions to shareholders: | | | | | | | | |
Dividends from net investment income | | (0.01) | | 0.00 | | (0.01) | | |
Distributions from net realized gain | | 0.00 | | (0.04) | | (0.04) | | |
| | |
Total dividends and/or distributions to shareholders | | (0.01) | | (0.04) | | (0.05) | | |
|
Net asset value, end of period | | $12.00 | | $12.68 | | $11.53 | | |
| | |
| | | | |
|
Total Return, at Net Asset Value4 | | (5.31)% | | 10.34% | | 15.82% | | |
| | | | |
|
Ratios/Supplemental Data | | | | | | | | |
Net assets, end of period (in thousands) | | $4,060 | | $3,027 | | $650 | | |
|
Average net assets (in thousands) | | $3,544 | | $1,403 | | $271 | | |
|
Ratios to average net assets:5 | | | | | | | | |
Net investment income (loss) | | 0.15% | | (0.09)% | | 0.19% | | |
Expenses excluding specific expenses listed below | | 1.51% | | 1.61% | | 1.76% | | |
Interest and fees from borrowings | | 0.00%6 | | 0.00% | | 0.00% | | |
| | |
Total expenses7 | | 1.51% | | 1.61% | | 1.76% | | |
Expenses after payments, waivers and/or reimbursements and reduction to custodian expenses | | 1.51% | | 1.60% | | 1.71% | | |
|
Portfolio turnover rate | | 53% | | 55% | | 52% | | |
1. April 29, 2016 represents the last business day of the Fund’s reporting period. See Note 2 of the accompanying Notes.
2. For the period from May 17, 2013 (commencement of operations) to April 30, 2014.
3. Per share amounts calculated based on the average shares outstanding during the period.
4. Assumes an initial investment on the business day before the first day of the fiscal period, with all dividends and distributions reinvested in additional shares on the reinvestment date, and redemption at the net asset value calculated on the last business day of the fiscal period. Sales charges are not reflected in the total returns. Total returns are not annualized for periods less than one full year. Returns do not reflect the deduction of taxes that a shareholder would pay on fund distributions or the redemption of fund shares.
5. Annualized for periods less than one full year.
6. Less than 0.005%.
7. Total expenses including indirect expenses from affiliated fund fees and expenses were as follows:
| | | | | | |
| | Year Ended April 29, 2016 | | | 1.51 | % |
| | Year Ended April 30, 2015 | | | 1.61 | % |
| | Period Ended April 30, 2014 | | | 1.76 | % |
See accompanying Notes to Financial Statements.
24 OPPENHEIMER MAIN STREET SMALL CAP FUND
| | | | | | | | |
| Class Y | | Year Ended April 29, 20161 | | Year Ended
April 30,
2015 | | Period
Ended
April 30,
20142 |
|
Per Share Operating Data | | | | | | | | |
Net asset value, beginning of period | | $12.81 | | $11.59 | | $10.00 | | |
|
Income (loss) from investment operations: | | | | | | | | |
Net investment income3 | | 0.09 | | 0.04 | | 0.09 | | |
Net realized and unrealized gain (loss) | | (0.69) | | 1.24 | | 1.58 | | |
| | |
Total from investment operations | | (0.60) | | 1.28 | | 1.67 | | |
|
Dividends and/or distributions to shareholders: | | | | | | | | |
Dividends from net investment income | | (0.08) | | (0.02) | | (0.04) | | |
Distributions from net realized gain | | 0.00 | | (0.04) | | (0.04) | | |
| | |
Total dividends and/or distributions to shareholders | | (0.08) | | (0.06) | | (0.08) | | |
|
Net asset value, end of period | | $12.13 | | $12.81 | | $11.59 | | |
| | |
| | | | |
|
Total Return, at Net Asset Value4 | | (4.72)% | | 11.05% | | 16.76% | | |
| | | | |
|
Ratios/Supplemental Data | | | | | | | | |
Net assets, end of period (in thousands) | | $59,422 | | $47,128 | | $432 | | |
|
Average net assets (in thousands) | | $54,043 | | $6,437 | | $358 | | |
|
Ratios to average net assets:5 | | | | | | | | |
Net investment income | | 0.76% | | 0.33% | | 0.89% | | |
Expenses excluding specific expenses listed below | | 1.00% | | 1.01% | | 1.33% | | |
Interest and fees from borrowings | | 0.00%6 | | 0.00% | | 0.00% | | |
| | |
Total expenses7 | | 1.00% | | 1.01% | | 1.33% | | |
Expenses after payments, waivers and/or reimbursements and reduction to custodian expenses | | 0.90% | | 0.88% | | 0.90% | | |
|
Portfolio turnover rate | | 53% | | 55% | | 52% | | |
1. April 29, 2016 represents the last business day of the Fund’s reporting period. See Note 2 of the accompanying Notes.
2. For the period from May 17, 2013 (commencement of operations) to April 30, 2014.
3. Per share amounts calculated based on the average shares outstanding during the period.
4. Assumes an initial investment on the business day before the first day of the fiscal period, with all dividends and distributions reinvested in additional shares on the reinvestment date, and redemption at the net asset value calculated on the last business day of the fiscal period. Sales charges are not reflected in the total returns. Total returns are not annualized for periods less than one full year. Returns do not reflect the deduction of taxes that a shareholder would pay on fund distributions or the redemption of fund shares.
5. Annualized for periods less than one full year.
6. Less than 0.005%.
7. Total expenses including indirect expenses from affiliated fund fees and expenses were as follows:
| | | | | | |
| | Year Ended April 29, 2016 | | | 1.00 | % |
| | Year Ended April 30, 2015 | | | 1.01 | % |
| | Period Ended April 30, 2014 | | | 1.33 | % |
See accompanying Notes to Financial Statements.
25 OPPENHEIMER MAIN STREET SMALL CAP FUND
| | |
| NOTES TO FINANCIAL STATEMENTS April 29, 2016 | | |
| | |
1. Organization
Oppenheimer Main Street Small Cap Fund (the “Fund”) is registered under the Investment Company Act of 1940 (“1940 Act”), as amended, as a diversified open-end management investment company. The Fund’s investment objective is to seek capital appreciation. The Fund’s investment adviser is OFI Global Asset Management, Inc. (“OFI Global” or the “Manager”), a wholly-owned subsidiary of OppenheimerFunds, Inc. (“OFI” or the “Sub-Adviser”). The Manager has entered into a sub-advisory agreement with OFI. At period end, approximately 69.9% of the shares of the Fund were owned by the Manager, other funds advised or sub-advised by the Manager or an affiliate of the Manager
The Fund offers Class A, Class C, Class I, Class R and Class Y shares. As of July 1, 2014, Class N shares were renamed Class R shares. Class N shares subject to a contingent deferred sales charge (“CDSC”) on July 1, 2014, continue to be subject to a CDSC after the shares were renamed. Purchases of Class R shares occurring on or after July 1, 2014, are not subject to a CDSC upon redemption. Class A shares are sold at their offering price, which is normally net asset value plus a front-end sales charge. Class C and Class R shares are sold without a front-end sales charge but may be subject to a CDSC. Class R shares are sold only through retirement plans. Retirement plans that offer Class R shares may impose charges on those accounts. Class I and Class Y shares are sold to certain institutional investors or intermediaries without either a front-end sales charge or a CDSC, however, the intermediaries may impose charges on their accountholders who beneficially own Class I and Class Y shares. All classes of shares have identical rights and voting privileges with respect to the Fund in general and exclusive voting rights on matters that affect that class alone. Earnings, net assets and net asset value per share may differ due to each class having its own expenses, such as transfer and shareholder servicing agent fees and shareholder communications, directly attributable to that class. Class A, C and R shares have separate distribution and/or service plans under which they pay fees. Class I and Class Y shares do not pay such fees.
The following is a summary of significant accounting policies followed in the Fund’s preparation of financial statements in accordance with accounting principles generally accepted in the United States (“U.S. GAAP”).
2. Significant Accounting Policies
Security Valuation. All investments in securities are recorded at their estimated fair value, as described in Note 3.
Reporting Period End Date. The last day of the Fund’s reporting period is the last day the New York Stock Exchange was open for trading during the period. The Fund’s financial statements have been presented through that date to maintain consistency with the Fund’s net asset value calculations used for shareholder transactions.
Foreign Currency Translation. The Fund’s accounting records are maintained in U.S. dollars. The values of securities denominated in foreign currencies and amounts related to the purchase and sale of foreign securities and foreign investment income are translated into U.S.
26 OPPENHEIMER MAIN STREET SMALL CAP FUND
2. Significant Accounting Policies (Continued)
dollars as of the close of the New York Stock Exchange (the “Exchange”), normally 4:00 P.M. Eastern time, on each day the Exchange is open for trading. Foreign exchange rates may be valued primarily using a reliable bank, dealer or service authorized by the Board of Trustees.
Reported net realized gains and losses from foreign currency transactions arise from sales of portfolio securities, sales and maturities of short-term securities, sales of foreign currencies, exchange rate fluctuations between the trade and settlement dates on securities transactions, and the difference between the amounts of dividends, interest, and foreign withholding taxes recorded on the Fund’s books and the U.S. dollar equivalent of the amounts actually received or paid. Net unrealized appreciation and depreciation on the translation of assets and liabilities denominated in foreign currencies arise from changes in the values of assets and liabilities, including investments in securities at fiscal period end, resulting from changes in exchange rates.
The effect of changes in foreign currency exchange rates on investments is separately identified from the fluctuations arising from changes in market values of securities held and reported with all other foreign currency gains and losses in the Fund’s Statement of Operations.
Allocation of Income, Expenses, Gains and Losses. Income, expenses (other than those attributable to a specific class), gains and losses are allocated on a daily basis to each class of shares based upon the relative proportion of net assets represented by such class. Operating expenses directly attributable to a specific class are charged against the operations of that class.
Dividends and Distributions to Shareholders. Dividends and distributions to shareholders, which are determined in accordance with income tax regulations and may differ from U.S. GAAP, are recorded on the ex-dividend date. Income and capital gain distributions, if any, are declared and paid annually or at other times as deemed necessary by the Manager.
Investment Income. Dividend income is recorded on the ex-dividend date or upon ex-dividend notification in the case of certain foreign dividends where the ex-dividend date may have passed. Non-cash dividends included in dividend income, if any, are recorded at the fair market value of the securities received. Interest income is recognized on an accrual basis. Discount and premium, which are included in interest income on the Statement of Operations, are amortized or accreted daily.
Return of Capital Estimates. Distributions received from the Fund’s investments in Master Limited Partnerships (MLPs) and Real Estate Investments Trusts (REITs), generally are comprised of income and return of capital. The Fund records investment income and return of capital based on estimates. Such estimates are based on historical information available from each MLP, REIT and other industry sources. These estimates may subsequently be revised based on information received from MLPs and REITs after their tax reporting periods are concluded.
27 OPPENHEIMER MAIN STREET SMALL CAP FUND
| | |
| NOTES TO FINANCIAL STATEMENTS Continued | | |
| | |
2. Significant Accounting Policies (Continued)
Custodian Fees. “Custodian fees and expenses” in the Statement of Operations may include interest expense incurred by the Fund on any cash overdrafts of its custodian account during the period. Such cash overdrafts may result from the effects of failed trades in portfolio securities and from cash outflows resulting from unanticipated shareholder redemption activity. The Fund pays interest to its custodian on such cash overdrafts, to the extent they are not offset by positive cash balances maintained by the Fund, at a rate equal to the Federal Funds Rate plus 0.50%. The “Reduction to custodian expenses” line item, if applicable, represents earnings on cash balances maintained by the Fund during the period. Such interest expense and other custodian fees may be paid with these earnings.
Security Transactions. Security transactions are recorded on the trade date. Realized gains and losses on securities sold are determined on the basis of identified cost.
Indemnifications. The Fund’s organizational documents provide current and former Trustees and officers with a limited indemnification against liabilities arising in connection with the performance of their duties to the Fund. In the normal course of business, the Fund may also enter into contracts that provide general indemnifications. The Fund’s maximum exposure under these arrangements is unknown as this would be dependent on future claims that may be made against the Fund. The risk of material loss from such claims is considered remote.
Federal Taxes. The Fund intends to comply with provisions of the Internal Revenue Code applicable to regulated investment companies and to distribute substantially all of its investment company taxable income, including any net realized gain on investments not offset by capital loss carryforwards, if any, to shareholders. Therefore, no federal income or excise tax provision is required. The Fund files income tax returns in U.S. federal and applicable state jurisdictions. The statute of limitations on the Fund’s tax return filings generally remains open for the three preceding fiscal reporting period ends. The Fund has analyzed its tax positions for the fiscal year ended April 29, 2016, including open tax years, and does not believe there are any uncertain tax positions requiring recognition in the Fund’s financial statements.
The tax components of capital shown in the following table represent distribution requirements the Fund must satisfy under the income tax regulations, losses the Fund may be able to offset against income and gains realized in future years and unrealized appreciation or depreciation of securities and other investments for federal income tax purposes.
| | | | | | | | | | | | |
Undistributed Net Investment Income | | Undistributed
Long-Term
Gain | | | Accumulated
Loss
Carryforward1,2,3 | | | Net Unrealized
Appreciation
Based on cost of
Securities and
Other Investments
for Federal Income
Tax Purposes | |
$782,073 | | | $— | | | | $25,450,099 | | | | $18,718,678 | |
28 OPPENHEIMER MAIN STREET SMALL CAP FUND
2. Significant Accounting Policies (Continued)
1. At period end, the Fund had $25,450,099 of net capital loss carryforward available to offset future realized capital gains, if any, and thereby reduce future taxable gain distributions. Details of the capital loss carryforwards are included in the table below. Capital loss carryovers with no expiration, if any, must be utilized prior to those with expiration dates.
| | | | |
| Expiring | |
No expiration | | $ | 25,450,099 | |
2. During the reporting period, the Fund did not utilize any capital loss carryforward.
3. During the prior reporting period, the Fund did not utilize any capital loss carryforward.
Net investment income (loss) and net realized gain (loss) may differ for financial statement and tax purposes. The character of dividends and distributions made during the fiscal year from net investment income or net realized gains are determined in accordance with federal income tax requirements, which may differ from the character of net investment income or net realized gains presented in those financial statements in accordance with U.S. GAAP. Also, due to timing of dividends and distributions, the fiscal year in which amounts are distributed may differ from the fiscal year in which the income or net realized gain was recorded by the Fund.
Accordingly, the following amounts have been reclassified for the reporting period. Net assets of the Fund were unaffected by the reclassifications.
| | | | |
Increase to Accumulated Net Investment Income | | Increase to Accumulated Net
Realized Loss on Investments | |
| $3,896 | | | $3,896 | |
The tax character of distributions paid during the reporting periods:
| | | | | | | | |
| | | Year Ended April 30, 2016 | | | Year Ended April 30, 2015 | |
Distributions paid from: | | | | | | | | |
Ordinary income | | $ | 2,719,060 | | | $ | 1,074,548 | |
Long-term capital gain | | | — | | | | 720 | |
| | | | |
Total | | $ | 2,719,060 | | | $ | 1,075,268 | |
| | | | |
The aggregate cost of securities and other investments and the composition of unrealized appreciation and depreciation of securities and other investments for federal income tax purposes at period end are noted in the following table. The primary difference between book and tax appreciation or depreciation of securities and other investments, if applicable, is attributable to the tax deferral of losses or tax realization of financial statement unrealized gain or loss.
29 OPPENHEIMER MAIN STREET SMALL CAP FUND
| | |
| NOTES TO FINANCIAL STATEMENTS Continued | | |
| | |
2. Significant Accounting Policies (Continued)
| | | | |
Federal tax cost of securities | | $ | 404,693,835 | |
| | | | |
Gross unrealized appreciation | | $ | 35,779,175 | |
Gross unrealized depreciation | | | (17,060,497) | |
| | | | |
Net unrealized appreciation | | $ | 18,718,678 | |
| | | | |
Use of Estimates. The preparation of financial statements in conformity with U.S. GAAP requires management to make estimates and assumptions that affect the reported amounts of assets and liabilities and disclosure of contingent assets and liabilities at the date of the financial statements and the reported amounts of increases and decreases in net assets from operations during the reporting period. Actual results could differ from those estimates.
3. Securities Valuation
The Fund calculates the net asset value of its shares as of 4:00 P.M. Eastern time, on each day the New York Stock Exchange (the “Exchange”) is open for trading, except in the case of a scheduled early closing of the Exchange, in which case the Fund will calculate net asset value of the shares as of the scheduled early closing time of the Exchange.
The Fund’s Board has adopted procedures for the valuation of the Fund’s securities and has delegated the day-to-day responsibility for valuation determinations under those procedures to the Manager. The Manager has established a Valuation Committee which is responsible for determining a “fair valuation” for any security for which market quotations are not “readily available.” The Valuation Committee’s fair valuation determinations are subject to review, approval and ratification by the Fund’s Board at its next regularly scheduled meeting covering the calendar quarter in which the fair valuation was determined.
Valuation Methods and Inputs
Securities are valued using unadjusted quoted market prices, when available, as supplied primarily by third party pricing services or dealers.
The following methodologies are used to determine the market value or the fair value of the types of securities described below:
Securities traded on a registered U.S. securities exchange (including exchange-traded derivatives other than futures and futures options) are valued based on the last sale price of the security reported on the principal exchange on which it is traded, prior to the time when the Fund’s assets are valued. In the absence of a sale, the security is valued at the mean between the bid and asked price on the principal exchange or, if not available from the principal exchange, obtained from two dealers. If bid and asked prices are not available from either the exchange or two dealers, the security is valued by using one of the following methodologies (listed in order of priority): (1) a bid from the principal exchange, (2) the mean between the bid and asked price as provided by a single dealer, or (3) a bid from a single dealer. A security of a foreign issuer traded on a foreign exchange, but not listed on a registered U.S. securities exchange, is valued based on the last sale price on the principal exchange on which the security is traded, as identified by the third party pricing service used by the Manager, prior to the time when the Fund’s assets are valued. If the last sale price is
30 OPPENHEIMER MAIN STREET SMALL CAP FUND
3. Securities Valuation (Continued)
unavailable, the security is valued at the most recent official closing price on the principal exchange on which it is traded. If the last sales price or official closing price for a foreign security is not available, the security is valued at the mean between the bid and asked price per the exchange or, if not available from the exchange, obtained from two dealers. If bid and asked prices are not available from either the exchange or two dealers, the security is valued by using one of the following methodologies (listed in order of priority): (1) a bid from the exchange, (2) the mean between the bid and asked price as provided by a single dealer, or (3) a bid from a single dealer.
Shares of a registered investment company that are not traded on an exchange are valued at that investment company’s net asset value per share.
Corporate and government debt securities (of U.S. or foreign issuers) and municipal debt securities, event-linked bonds, loans, mortgage-backed securities, collateralized mortgage obligations, and asset-backed securities are valued at the mean between the “bid” and “asked” prices utilizing evaluated prices obtained from third party pricing services or broker-dealers who may use matrix pricing methods to determine the evaluated prices.
Short-term money market type debt securities with a remaining maturity of sixty days or less are valued at cost adjusted by the amortization of discount or premium to maturity (amortized cost), which approximates market value. Short-term debt securities with a remaining maturity in excess of sixty days are valued at the mean between the “bid” and “asked” prices utilizing evaluated prices obtained from third party pricing services or broker-dealers.
A description of the standard inputs that may generally be considered by the third party pricing vendors in determining their evaluated prices is provided below.
| | |
| Security Type | | Standard inputs generally considered by third-party pricing vendors |
|
| Corporate debt, government debt, municipal, mortgage-backed and asset-backed securities | | Reported trade data, broker-dealer price quotations, benchmark yields, issuer spreads on comparable securities, the credit quality, yield, maturity, and other appropriate factors. |
|
| Loans | | Information obtained from market participants regarding reported trade data and broker-dealer price quotations. |
|
| Event-linked bonds | | Information obtained from market participants regarding reported trade data and broker-dealer price quotations. |
If a market value or price cannot be determined for a security using the methodologies described above, or if, in the “good faith” opinion of the Manager, the market value or price obtained does not constitute a “readily available market quotation,” or a significant event has occurred that would materially affect the value of the security, the security is fair valued either (i) by a standardized fair valuation methodology applicable to the security type or the significant event as previously approved by the Valuation Committee and the Fund’s Board or (ii) as determined in good faith by the Manager’s Valuation Committee. The Valuation Committee considers all relevant facts that are reasonably available, through either public information or information available to the Manager, when determining the fair value of a security. Fair value determinations by the Manager are subject to review, approval
31 OPPENHEIMER MAIN STREET SMALL CAP FUND
| | |
| NOTES TO FINANCIAL STATEMENTS Continued | | |
| | |
3. Securities Valuation (Continued)
and ratification by the Fund’s Board at its next regularly scheduled meeting covering the calendar quarter in which the fair valuation was determined. Those fair valuation standardized methodologies include, but are not limited to, valuing securities at the last sale price or initially at cost and subsequently adjusting the value based on: changes in company specific fundamentals, changes in an appropriate securities index, or changes in the value of similar securities which may be further adjusted for any discounts related to security-specific resale restrictions. When possible, such methodologies use observable market inputs such as unadjusted quoted prices of similar securities, observable interest rates, currency rates and yield curves. The methodologies used for valuing securities are not necessarily an indication of the risks associated with investing in those securities nor can it be assured that the Fund can obtain the fair value assigned to a security if it were to sell the security.
To assess the continuing appropriateness of security valuations, the Manager, or its third party service provider who is subject to oversight by the Manager, regularly compares prior day prices, prices on comparable securities, and sale prices to the current day prices and challenges those prices exceeding certain tolerance levels with the third party pricing service or broker source. For those securities valued by fair valuations, whether through a standardized fair valuation methodology or a fair valuation determination, the Valuation Committee reviews and affirms the reasonableness of the valuations based on such methodologies and fair valuation determinations on a regular basis after considering all relevant information that is reasonably available.
Classifications
Each investment asset or liability of the Fund is assigned a level at measurement date based on the significance and source of the inputs to its valuation. Various data inputs are used in determining the value of each of the Fund’s investments as of the reporting period end. These data inputs are categorized in the following hierarchy under applicable financial accounting standards:
1) Level 1-unadjusted quoted prices in active markets for identical assets or liabilities (including securities actively traded on a securities exchange)
2) Level 2-inputs other than unadjusted quoted prices that are observable for the asset or liability (such as unadjusted quoted prices for similar assets and market corroborated inputs such as interest rates, prepayment speeds, credit risks, etc.)
3) Level 3-significant unobservable inputs (including the Manager’s own judgments about assumptions that market participants would use in pricing the asset or liability).
The inputs used for valuing securities are not necessarily an indication of the risks associated with investing in those securities.
The Fund classifies each of its investments in those investment companies which are publicly offered and reported on an exchange as Level 1, and those investment companies which are not publicly offered are not assigned a level, without consideration as to the classification level of the specific investments held by those investment companies.
32 OPPENHEIMER MAIN STREET SMALL CAP FUND
3. Securities Valuation (Continued)
The table below categorizes amounts that are included in the Fund’s Statement of Assets and Liabilities at period end based on valuation input level:
| | | | | | | | | | | | | | | | |
| | | Level 1—
Unadjusted
Quoted Prices | | | Level 2—
Other Significant
Observable Inputs | | | Level 3—
Significant
Unobservable
Inputs | | | Value | |
| |
Assets Table | | | | | | | | | | | | | | | | |
Investments, at Value: | | | | | | | | | | | | | | | | |
Common Stocks | | | | | | | | | | | | | | | | |
Consumer Discretionary | | $ | 42,089,082 | | | $ | — | | | $ | — | | | $ | 42,089,082 | |
Consumer Staples | | | 17,176,992 | | | | — | | | | — | | | | 17,176,992 | |
Energy | | | 13,307,565 | | | | — | | | | — | | | | 13,307,565 | |
Financials | | | 92,945,274 | | | | — | | | | — | | | | 92,945,274 | |
Health Care | | | 53,814,081 | | | | 1,060,139 | | | | — | | | | 54,874,220 | |
Industrials | | | 77,208,333 | | | | — | | | | — | | | | 77,208,333 | |
Information Technology | | | 73,954,111 | | | | — | | | | — | | | | 73,954,111 | |
Materials | | | 21,751,506 | | | | — | | | | — | | | | 21,751,506 | |
Utilities | | | 17,896,096 | | | | — | | | | — | | | | 17,896,096 | |
Investment Company | | | 12,209,334 | | | | — | | | | — | | | | 12,209,334 | |
| | | | |
Total Assets | | $ | 422,352,374 | | | $ | 1,060,139 | | | $ | — | | | $ | 423,412,513 | |
| | | | |
Forward currency exchange contracts and futures contracts, if any, are reported at their unrealized appreciation/depreciation at measurement date, which represents the change in the contract’s value from trade date. All additional assets and liabilities included in the above table are reported at their market value at measurement date.
4. Investments and Risks
Investments in Affiliated Funds. The Fund is permitted to invest in other mutual funds advised by the Manager (“Affiliated Funds”). Affiliated Funds are open-end management investment companies registered under the 1940 Act, as amended. The Manager is the investment adviser of, and the Sub-Adviser provides investment and related advisory services to, the Affiliated Funds. When applicable, the Fund’s investments in Affiliated Funds are included in the Statement of Investments. Shares of Affiliated Funds are valued at their net asset value per share. As a shareholder, the Fund is subject to its proportional share of the Affiliated Funds’ expenses, including their management fee. The Manager will waive fees and/ or reimburse Fund expenses in an amount equal to the indirect management fees incurred through the Fund’s investment in the Affiliated Funds.
Each of the Affiliated Funds in which the Fund invests has its own investment risks, and those risks can affect the value of the Fund’s investments and therefore the value of the Fund’s shares. To the extent that the Fund invests more of its assets in one Affiliated Fund than in another, the Fund will have greater exposure to the risks of that Affiliated Fund.
Investment in Oppenheimer Institutional Money Market Fund. The Fund is permitted to invest daily available cash balances in a money market Affiliated Fund. The Fund may
33 OPPENHEIMER MAIN STREET SMALL CAP FUND
| | |
| NOTES TO FINANCIAL STATEMENTS Continued | | |
| | |
4. Investments and Risks (Continued)
invest the available cash in Class E shares of Oppenheimer Institutional Money Market Fund (“IMMF”) to seek current income while preserving liquidity or for defensive purposes. IMMF is regulated as a money market fund under the Investment Company Act of 1940, as amended.
Master Limited Partnerships (“MLPs”). MLPs issue common units that represent an equity ownership interest in a partnership and provide limited voting rights. MLP common units are registered with the Securities and Exchange Commission (“SEC”), and are freely tradable on securities exchanges such as the NYSE and the NASDAQ Stock Market (“NASDAQ”), or in the over-the-counter (“OTC”) market. An MLP consists of one or more general partners, who conduct the business, and one or more limited partners, who contribute capital. MLP common unit holders have a limited role in the partnership’s operations and management. The Fund, as a limited partner, normally would not be liable for the debts of the MLP beyond the amounts the Fund has contributed, but would not be shielded to the same extent that a shareholder of a corporation would be. In certain circumstances creditors of an MLP would have the right to seek return of capital distributed to a limited partner. This right of an MLP’s creditors would continue after the Fund sold its investment in the MLP.
Equity Security Risk. Stocks and other equity securities fluctuate in price. The value of the Fund’s portfolio may be affected by changes in the equity markets generally. Equity markets may experience significant short-term volatility and may fall sharply at times. Different markets may behave differently from each other and U.S. equity markets may move in the opposite direction from one or more foreign stock markets. Adverse events in any part of the equity or fixed-income markets may have unexpected negative effects on other market segments.
The prices of individual equity securities generally do not all move in the same direction at the same time and a variety of factors can affect the price of a particular company’s securities. These factors may include, but are not limited to, poor earnings reports, a loss of customers, litigation against the company, general unfavorable performance of the company’s sector or industry, or changes in government regulations affecting the company or its industry.
Shareholder Concentration. At period end, two shareholders each owned 20% or more of the Fund’s total outstanding shares comprising 51% of the Fund.
The shareholders are related parties of the Fund. Related parties may include, but are not limited to, the investment manager and its affiliates, affiliated broker dealers, fund of funds, and directors or employees.
5. Market Risk Factors
The Fund’s investments in securities and/or financial derivatives may expose the Fund to various market risk factors:
Commodity Risk. Commodity risk relates to the change in value of commodities or commodity indexes as they relate to increases or decreases in the commodities market. Commodities are physical assets that have tangible properties. Examples of these types of
34 OPPENHEIMER MAIN STREET SMALL CAP FUND
5. Market Risk Factors (Continued)
assets are crude oil, heating oil, metals, livestock, and agricultural products.
Credit Risk. Credit risk relates to the ability of the issuer of debt to meet interest and principal payments, or both, as they come due. In general, lower-grade, higher-yield debt securities are subject to credit risk to a greater extent than lower-yield, higher-quality securities.
Equity Risk. Equity risk relates to the change in value of equity securities as they relate to increases or decreases in the general market.
Foreign Exchange Rate Risk. Foreign exchange rate risk relates to the change in the U.S. dollar value of a security held that is denominated in a foreign currency. The U.S. dollar value of a foreign currency denominated security will decrease as the dollar appreciates against the currency, while the U.S. dollar value will increase as the dollar depreciates against the currency.
Interest Rate Risk. Interest rate risk refers to the fluctuations in value of fixed-income securities resulting from the inverse relationship between price and yield. For example, an increase in general interest rates will tend to reduce the market value of already issued fixed-income investments, and a decline in general interest rates will tend to increase their value. In addition, debt securities with longer maturities, which tend to have higher yields, are subject to potentially greater fluctuations in value from changes in interest rates than obligations with shorter maturities.
Volatility Risk. Volatility risk refers to the magnitude of the movement, but not the direction of the movement, in a financial instrument’s price over a defined time period. Large increases or decreases in a financial instrument’s price over a relative time period typically indicate greater volatility risk, while small increases or decreases in its price typically indicate lower volatility risk.
6. Shares of Beneficial Interest
The Fund has authorized an unlimited number of $0.001 par value shares of beneficial interest of each class. Transactions in shares of beneficial interest were as follows:
| | | | | | | | | | | | | | | | |
| | | Year Ended April 29, 20161 | | | Year Ended April 30, 2015 | |
| | | Shares | | | Amount | | | Shares | | | Amount | |
| |
Class A | | | | | | | | | | | | | | | | |
Sold | | | 3,133,948 | | | $ | 38,354,256 | | | | 2,958,539 | | | $ | 36,913,879 | |
Dividends and/or distributions reinvested | | | 10,627 | | | | 133,978 | | | | 5,309 | | | | 66,240 | |
Redeemed | | | (1,738,889 | ) | | | (20,016,944 | ) | | | (2,165,315 | ) | | | (26,892,571 | ) |
| | | | |
Net increase | | | 1,405,686 | | | $ | 18,471,290 | | | | 798,533 | | | $ | 10,087,548 | |
| | | | |
| | | | | | | | | | | | | | | | |
| |
Class C | | | | | | | | | | | | | | | | |
Sold | | | 633,134 | | | $ | 7,582,742 | | | | 678,542 | | | $ | 8,294,886 | |
Dividends and/or distributions reinvested | | | — | | | | — | | | | 1,722 | | | | 21,200 | |
Redeemed | | | (199,634 | ) | | | (2,319,175 | ) | | | (90,421 | ) | | | (1,103,878 | ) |
| | | | |
Net increase | | | 433,500 | | | $ | 5,263,567 | | | | 589,843 | | | $ | 7,212,208 | |
| | | | |
35 OPPENHEIMER MAIN STREET SMALL CAP FUND
| | |
| NOTES TO FINANCIAL STATEMENTS Continued | | |
| | |
6. Shares of Beneficial Interest (Continued)
| | | | | | | | | | | | | | | | |
| | | Year Ended April 29, 20161 | | | Year Ended April 30, 2015 | |
| | | Shares | | | Amount | | | Shares | | | Amount | |
| |
Class I | | | | | | | | | | | | | | | | |
Sold | | | 17,020,185 | | | $ | 208,714,134 | | | | 15,901,785 | | | $ | 195,599,189 | |
Dividends and/or distributions reinvested | | | 175,055 | | | | 2,213,898 | | | | 77,551 | | | | 970,992 | |
Redeemed | | | (7,631,606 | ) | | | (93,194,138 | ) | | | (1,312,561 | ) | | | (17,223,401 | ) |
| | | | |
Net increase | | | 9,563,634 | | | $ | 117,733,894 | | | | 14,666,775 | | | $ | 179,346,780 | |
| | | | |
| | | | | | | | | | | | | | | | |
| |
Class R2 | | | | | | | | | | | | | | | | |
Sold | | | 199,157 | | | $ | 2,408,288 | | | | 199,770 | | | $ | 2,504,991 | |
Dividends and/or distributions reinvested | | | 174 | | | | 2,181 | | | | 427 | | | | 5,296 | |
Redeemed | | | (99,675 | ) | | | (1,181,605 | ) | | | (17,821 | ) | | | (219,503 | ) |
| | | | |
Net increase | | | 99,656 | | | $ | 1,228,864 | | | | 182,376 | | | $ | 2,290,784 | |
| | | | |
| | | | | | | | | | | | | | | | |
| |
Class Y | | | | | | | | | | | | | | | | |
Sold | | | 2,871,766 | | | $ | 35,020,262 | | | | 3,720,787 | | | $ | 48,575,285 | |
Dividends and/or distributions reinvested | | | 29,060 | | | | 367,311 | | | | 856 | | | | 10,713 | |
Redeemed | | | (1,680,066 | ) | | | (20,434,121 | ) | | | (80,150 | ) | | | (1,026,680 | ) |
| | | | |
Net increase | | | 1,220,760 | | | $ | 14,953,452 | | | | 3,641,493 | | | $ | 47,559,318 | |
| | | | |
1. April 29, 2016 represents the last business day of the Fund’s reporting period. See Note 2.
2. Effective July 1, 2014, Class N shares were renamed Class R. See Note 1.
7. Purchases and Sales of Securities
The aggregate cost of purchases and proceeds from sales of securities, other than short-term obligations and investments in IMMF, for the reporting period were as follows:
| | | | | | | | | | |
| | | Purchases | | | | | Sales | |
| |
Investment securities | | $ | 344,658,238 | | | | | $ | 188,893,650 | |
8. Fees and Other Transactions with Affiliates
Management Fees. Under the investment advisory agreement, the Fund pays the Manager a management fee based on the daily net assets of the Fund at an annual rate as shown in the following table:
| | |
| Fee Schedule |
|
Up to $200 million | | 0.75% |
Next $200 million | | 0.72 |
Next $200 million | | 0.69 |
Next $200 million | | 0.66 |
Next $4.2 billion | | 0.60 |
Over $5 billion | | 0.58 |
The Fund’s effective management fee for the reporting period was 0.73% of average annual net assets before any applicable waivers.
36 OPPENHEIMER MAIN STREET SMALL CAP FUND
8. Fees and Other Transactions with Affiliates (Continued)
Sub-Adviser Fees. The Manager has retained the Sub-Adviser to provide the day-to-day portfolio management of the Fund. Under the Sub-Advisory Agreement, the Manager pays the Sub-Adviser an annual fee in monthly installments, equal to a percentage of the investment management fee collected by the Manager from the Fund, which shall be calculated after any investment management fee waivers. The fee paid to the Sub-Adviser is paid by the Manager, not by the Fund.
Transfer Agent Fees. OFI Global (the “Transfer Agent”) serves as the transfer and shareholder servicing agent for the Fund. The Fund pays the Transfer Agent a fee based on annual net assets. Fees incurred and average net assets for each class with respect to these services are detailed in the Statement of Operations and Financial Highlights, respectively.
Sub-Transfer Agent Fees. The Transfer Agent has retained Shareholder Services, Inc., a wholly-owned subsidiary of OFI (the “Sub-Transfer Agent”), to provide the day-to-day transfer agent and shareholder servicing of the Fund. Under the Sub-Transfer Agency Agreement, the Transfer Agent pays the Sub-Transfer Agent an annual fee in monthly installments, equal to a percentage of the transfer agent fee collected by the Transfer Agent from the Fund, which shall be calculated after any applicable fee waivers. The fee paid to the Sub-Transfer Agent is paid by the Transfer Agent, not by the Fund.
Trustees’ Compensation. The Fund’s Board of Trustees (“Board”) has adopted a compensation deferral plan for Independent Trustees that enables Trustees to elect to defer receipt of all or a portion of the annual compensation they are entitled to receive from the Fund. For purposes of determining the amount owed to the Trustees under the plan, deferred amounts are treated as though equal dollar amounts had been invested in shares of the Fund or in other Oppenheimer funds selected by the Trustees. The Fund purchases shares of the funds selected for deferral by the Trustees in amounts equal to his or her deemed investment, resulting in a Fund asset equal to the deferred compensation liability. Such assets are included as a component of “Other” within the asset section of the Statement of Assets and Liabilities. Deferral of Trustees’ fees under the plan will not affect the net assets of the Fund and will not materially affect the Fund’s assets, liabilities or net investment income per share. Amounts will be deferred until distributed in accordance with the compensation deferral plan.
Distribution and Service Plan (12b-1) Fees. Under its General Distributor’s Agreement with the Fund, OppenheimerFunds Distributor, Inc. (the “Distributor”) acts as the Fund’s principal underwriter in the continuous public offering of the Fund’s classes of shares.
Service Plan for Class A Shares. The Fund has adopted a Service Plan (the “Plan”) for Class A shares pursuant to Rule 12b-1 under the 1940 Act. Under the Plan, the Fund reimburses the Distributor for a portion of its costs incurred for services provided to accounts that hold Class A shares. Reimbursement is made periodically at an annual rate of up to 0.25% of the daily net assets of Class A shares of the Fund. The Distributor currently uses all
37 OPPENHEIMER MAIN STREET SMALL CAP FUND
| | |
| NOTES TO FINANCIAL STATEMENTS Continued | | |
| | |
8. Fees and Other Transactions with Affiliates (Continued)
of those fees to pay dealers, brokers, banks and other financial institutions periodically for providing personal service and maintenance of accounts of their customers that hold Class A shares. Any unreimbursed expenses the Distributor incurs with respect to Class A shares in any fiscal year cannot be recovered in subsequent periods. Fees incurred by the Fund under the Plan are detailed in the Statement of Operations.
Distribution and Service Plans for Class C and Class R Shares. The Fund has adopted Distribution and Service Plans (the “Plans”) for Class C and Class R shares pursuant to Rule 12b-1 under the 1940 Act to compensate the Distributor for distributing those share classes, maintaining accounts and providing shareholder services. Under the Plans, the Fund pays the Distributor an annual asset-based sales charge of 0.75% on Class C shares’ daily net assets and 0.25% on Class R shares’ daily net assets. The Fund also pays a service fee under the Plans at an annual rate of 0.25% of daily net assets. The Plans continue in effect from year to year only if the Fund’s Board of Trustees votes annually to approve their continuance at an in person meeting called for that purpose. Fees incurred by the Fund under the Plans are detailed in the Statement of Operations.
Sales Charges. Front-end sales charges and CDSC do not represent expenses of the Fund. They are deducted from the proceeds of sales of Fund shares prior to investment or from redemption proceeds prior to remittance, as applicable. The sales charges retained by the Distributor from the sale of shares and the CDSC retained by the Distributor on the redemption of shares is shown in the following table for the period indicated.
| | | | | | | | | | | | | | | | |
| Year Ended | | Class A Front-End
Sales Charges
Retained by
Distributor | | | Class A
Contingent
Deferred
Sales Charges
Retained by
Distributor | | | Class C
Contingent
Deferred
Sales Charges
Retained by
Distributor | | | Class R
Contingent
Deferred
Sales Charges
Retained by
Distributor | |
April 29, 2016 | | | $84,848 | | | | $— | | | | $1,972 | | | | $4 | |
Waivers and Reimbursements of Expenses. The Manager has contractually agreed to waive fees and/or reimburse certain expenses so that “Expenses after payments, waivers and/ or reimbursements and reduction to custodian expenses”, excluding expenses incurred directly or indirectly by the Fund as a result of investments in other investment companies, wholly-owned subsidiaries pooled investment vehicles and interest and fees from borrowings; will not exceed 1.25% for Class A shares, 2.25% for Class C shares, 0.80% for Class I shares, 1.75% for Class R shares and 0.90% for Class Y shares. During the reporting period, the Manager waived $1,173 and $51,534 for Class A and Class Y shares, respectively.
The Manager will waive fees and/or reimburse Fund expenses in an amount equal to the indirect management fees incurred through the Fund’s investment in IMMF. During the reporting period, the Manager waived fees and/or reimbursed the Fund $10,246 for IMMF management fees.
Waivers and/or reimbursements may be modified or terminated as set forth according to
38 OPPENHEIMER MAIN STREET SMALL CAP FUND
8. Fees and Other Transactions with Affiliates (Continued)
the terms in the prospectus.
9. Borrowing and Other Financing
Joint Credit Facility. A number of mutual funds managed by the Manager participate in a $1.28 billion revolving credit facility (the “Facility”) intended to provide short-term financing, if necessary, subject to certain restrictions in connection with atypical redemption activity. Expenses and fees related to the Facility are paid by the participating funds and are disclosed separately or as other expenses on the Statement of Operations. The Fund did not utilize the Facility during the reporting period.
10. Pending Litigation
In 2009, several putative class action lawsuits were filed and later consolidated before the U.S. District Court for the District of Colorado against OppenheimerFunds, Inc. (“OFI”), OppenheimerFunds Distributor, Inc. (“OFDI”), and Oppenheimer Rochester California Municipal Fund, a fund advised by OFI Global Asset Management, Inc. and distributed by the Distributor (the “California Fund”), in connection with the California Fund’s investment performance. The plaintiffs asserted claims against OFI, OFDI and certain present and former trustees and officers of the California Fund under the federal securities laws, alleging, among other things, that the disclosure documents of the California Fund contained misrepresentations and omissions and the investment policies of the California Fund were not followed. Plaintiffs in the suit filed an amended complaint and defendants filed a motion to dismiss. In 2011, the court issued an order which granted in part and denied in part the defendants’ motion to dismiss. In 2012, plaintiffs filed a motion, which defendants opposed, to certify a class and appoint class representatives and class counsel. In March 2015, the court granted plaintiffs’ motion for class certification. In May 2015, the U.S. Court of Appeals for the Tenth Circuit vacated the class certification order and remanded the matter to the district court for further proceedings. In October 2015, the district court reaffirmed its order and determined that the suit will proceed as a class action. In December 2015, the Tenth Circuit denied defendants’ petition to appeal the district court’s reaffirmed class certification order.
OFI and OFDI believe the suit is without merit; that it is premature to render any opinion as to the likelihood of an outcome unfavorable to them in the suit; and that no estimate can yet be made as to the amount or range of any potential loss. Furthermore, OFI believes that the suit should not impair the ability of OFI or OFDI to perform their respective duties to the Fund and that the outcome of the suit should not have any material effect on the operations of any of the Oppenheimer funds.
39 OPPENHEIMER MAIN STREET SMALL CAP FUND
REPORT OF INDEPENDENT REGISTERED PUBLIC ACCOUNTING FIRM
The Board of Trustees and Shareholders of Oppenheimer Main Street Small Cap Fund:
We have audited the accompanying statement of assets and liabilities of Oppenheimer Main Street Small Cap Fund, including the statement of investments, as of April 29, 2016, and the related statement of operations for the year then ended, the statements of changes in net assets for each of the years in the two-year period then ended, and the financial highlights for each of the years or periods in the three-year period then ended. These financial statements and financial highlights are the responsibility of the Fund’s management. Our responsibility is to express an opinion on these financial statements and financial highlights based on our audits.
We conducted our audits in accordance with the standards of the Public Company Accounting Oversight Board (United States). Those standards require that we plan and perform the audit to obtain reasonable assurance about whether the financial statements and financial highlights are free of material misstatement. An audit includes examining, on a test basis, evidence supporting the amounts and disclosures in the financial statements. Our procedures included confirmation of securities owned as of April 29, 2016, by correspondence with the custodian, transfer agent and brokers, or by other appropriate auditing procedures where replies from brokers were not received. An audit also includes assessing the accounting principles used and significant estimates made by management, as well as evaluating the overall financial statement presentation. We believe that our audits provide a reasonable basis for our opinion.
In our opinion, the financial statements and financial highlights referred to above present fairly, in all material respects, the financial position of Oppenheimer Main Street Small Cap Fund as of April 29, 2016, the results of its operations for the year then ended, the changes in its net assets for each of the years in the two-year period then ended, and the financial highlights for each of the years or periods in the three-year period then ended, in conformity with U.S. generally accepted accounting principles.
KPMG LLP
Denver, Colorado
June 24, 2016
40 OPPENHEIMER MAIN STREET SMALL CAP FUND
FEDERAL INCOME TAX INFORMATION Unaudited
In early 2016, if applicable, shareholders of record received information regarding all dividends and distributions paid to them by the Fund during calendar year 2015.
Dividends, if any, paid by the Fund during the reporting period which are not designated as capital gain distributions should be multiplied by the maximum amount allowable but not less than 100% to arrive at the amount eligible for the corporate dividend-received deduction.
A portion, if any, of the dividends paid by the Fund during the reporting period which are not designated as capital gain distributions are eligible for lower individual income tax rates to the extent that the Fund has received qualified dividend income as stipulated by recent tax legislation. The maximum amount allowable but not less than $4,056,173 of the Fund’s fiscal year taxable income may be eligible for the lower individual income tax rates. In early 2016, shareholders of record received information regarding the percentage of distributions that are eligible for lower individual income tax rates.
Recent tax legislation allows a regulated investment company to designate distributions not designated as capital gain distributions, as either interest related dividends or short-term capital gain dividends, both of which are exempt from the U.S. withholding tax applicable to non U.S. taxpayers. For the reporting period, the maximum amount allowable but not less than $11,909 of the ordinary distributions to be paid by the Fund qualifies as an interest related dividend.
The foregoing information is presented to assist shareholders in reporting distributions received from the Fund to the Internal Revenue Service. Because of the complexity of the federal regulations which may affect your individual tax return and the many variations in state and local tax regulations, we recommend that you consult your tax advisor for specific guidance.
41 OPPENHEIMER MAIN STREET SMALL CAP FUND
PORTFOLIO PROXY VOTING POLICIES AND GUIDELINES;
UPDATES TO STATEMENTS OF INVESTMENTS Unaudited
The Fund has adopted Portfolio Proxy Voting Policies and Guidelines under which the Fund votes proxies relating to securities (“portfolio proxies”) held by the Fund. A description of the Fund’s Portfolio Proxy Voting Policies and Guidelines is available (i) without charge, upon request, by calling the Fund toll-free at 1.800.CALL OPP (225.5677), (ii) on the Fund’s website at www.oppenheimerfunds.com, and (iii) on the SEC’s website at www.sec.gov. In addition, the Fund is required to file Form N-PX, with its complete proxy voting record for the 12 months ended June 30th, no later than August 31st of each year. The Fund’s voting record is available (i) without charge, upon request, by calling the Fund toll-free at 1.800.CALL OPP (225.5677), and (ii) in the Form N-PX filing on the SEC’s website at www.sec.gov.
The Fund files its complete schedule of portfolio holdings with the SEC for the first quarter and the third quarter of each fiscal year on Form N-Q. The Fund’s Form N-Q filings are available on the SEC’s website at www.sec.gov. Those forms may be reviewed and copied at the SEC’s Public Reference Room in Washington, D.C. Information on the operation of the Public Reference Room may be obtained by calling 1-800-SEC-0330.
Householding—Delivery of Shareholder Documents
This is to inform you about OppenheimerFunds’ “householding” policy. If more than one member of your household maintains an account in a particular fund, OppenheimerFunds will mail only one copy of the fund’s prospectus (or, if available, the fund’s summary prospectus), annual and semiannual report and privacy policy. The consolidation of these mailings, called householding, benefits your fund through reduced mailing expense, and benefits you by reducing the volume of mail you receive from OppenheimerFunds. Householding does not affect the delivery of your account statements.
Please note that we will continue to household these mailings for as long as you remain an OppenheimerFunds shareholder, unless you request otherwise. If you prefer to receive multiple copies of these materials, please call us at 1.800.CALL-OPP (225-5677). You may also notify us in writing or via email. We will begin sending you individual copies of the prospectus (or, if available, the summary prospectus), reports and privacy policy within 30 days of receiving your request to stop householding.
42 OPPENHEIMER MAIN STREET SMALL CAP FUND
DISTRIBUTION SOURCES Unaudited
For any distribution that took place over the last six months of the Fund’s reporting period, the table below details on a per-share basis the percentage of the Fund’s total distribution payment amount that was derived from the following sources: net income, net profit from the sale of securities, and other capital sources. This information is based upon income and capital gains using generally accepted accounting principles as of the date of each distribution. Because the Fund is actively managed, the relative amount of the Fund’s total distributions derived from various sources over the calendar year may change. Please note that this information should not be used for tax reporting purposes as the tax character of distributable income may differ from the amounts used for this notification. You will receive IRS tax forms in the first quarter of each calendar year detailing the actual amount of the taxable and non-taxable portion of distributions paid to you during the tax year.
For the most current information, please go to oppenheimerfunds.com. Select your Fund, then the ‘Detailed’ tab; where ‘Dividends’ are shown, the Fund’s latest pay date will be followed by the sources of any distribution, updated daily.
| | | | | | | | | | | | | | | | |
| Fund Name | | Pay
Date | | | Net Income | | | Net Profit
from Sale | | | Other
Capital
Sources | |
Oppenheimer Main Street Small Cap Fund | | | 12/1/15 | | | | 75.5% | | | | 0.0% | | | | 24.5% | |
43 OPPENHEIMER MAIN STREET SMALL CAP FUND
TRUSTEES AND OFFICERS Unaudited
| | |
| Name, Position(s) Held with the Fund, Length of Service, Year of Birth | | Principal Occupation(s) During the Past 5 Years; Other Trusteeships/Directorships Held; Number of Portfolios in the Fund Complex Currently Overseen |
| |
| INDEPENDENT TRUSTEES | | The address of each Trustee in the chart below is 6803 S. Tucson Way, Centennial, Colorado 80112-3924. Each Trustee serves for an indefinite term, or until his or her resignation, retirement, death or removal. |
| |
Sam Freedman, Chairman of the Board of Trustees and Trustee
(since 2013)
Year of Birth: 1940 | | Director of Colorado UpLIFT (charitable organization) (since September 1984). Mr. Freedman held several positions with the Sub-Adviser and with subsidiary or affiliated companies of the Sub-Adviser (until October 1994). Oversees 46 portfolios in the OppenheimerFunds complex. Mr. Freedman has served on the Boards of certain Oppenheimer funds since 1996, during which time he has become familiar with the Fund’s (and other Oppenheimer funds’) financial, accounting, regulatory and investment matters and has contributed to the Boards’ deliberations. |
| |
Jon S. Fossel,
Trustee (since 2013)
Year of Birth: 1942 | | Director Jack Creek Preserve Foundation (non-profit organization) (since December 2014); Chairman of the Board (2006-December 2011) and Director (June 2002-December 2011) of UNUMProvident (insurance company); Director of Northwestern Energy Corp. (public utility corporation) (November 2004-December 2009); Director of P.R. Pharmaceuticals (October 1999-October 2003); Director of Rocky Mountain Elk Foundation (non-profit organization) (February 1998-February 2003 and February 2005-February 2007); Chairman and Director (until October 1996) and President and Chief Executive Officer (until October 1995) of the Sub-Adviser; President, Chief Executive Officer and Director of the following: Oppenheimer Acquisition Corp. (“OAC”) (parent holding company of the Sub-Adviser), Shareholders Services, Inc. and Shareholder Financial Services, Inc. (until October 1995). Oversees 46 portfolios in the OppenheimerFunds complex. Mr. Fossel has served on the Boards of certain Oppenheimer funds since 1990, during which time he has become familiar with the Fund’s (and other Oppenheimer funds’) financial, accounting, regulatory and investment matters and has contributed to the Boards’ deliberations. |
| |
Richard F. Grabish,
Trustee (since 2013)
Year of Birth: 1948 | | Formerly Senior Vice President and Assistant Director of Sales and Marketing (March 1997-December 2007), Director (March 1987-December 2007) and Manager of Private Client Services (June 1985-June 2005) of A.G. Edwards & Sons, Inc. (broker/dealer and investment firm); Chairman and Chief Executive Officer of A.G. Edwards Trust Company, FSB (March 2001-December 2007); President and Vice Chairman of A.G. Edwards Trust Company, FSB (investment adviser) (April 1987-March 2001); President of A.G. Edwards Trust Company, FSB (investment adviser) (June 2005-December 2007). Oversees 46 portfolios in the OppenheimerFunds complex. Mr. Grabish has served on the Boards of certain Oppenheimer funds since 2001, during which time he has become familiar with the Fund’s (and other Oppenheimer funds’) financial, accounting, regulatory and investment matters and has contributed to the Boards’ deliberations. |
| |
Beverly L. Hamilton,
Trustee (since 2013)
Year of Birth: 1946 | | Trustee of Monterey Institute for International Studies (educational organization) (2000-2014); Board Member of Middlebury College (educational organization) (December 2005-June 2011); Chairman (since 2010) of American Funds’ Emerging Markets Growth Fund, Inc. (mutual fund); Director of The California Endowment (philanthropic organization) (April 2002-April 2008); Director (February 2002-2005) and Chairman of Trustees (2006-2007) of the Community Hospital of Monterey Peninsula; Director (October 1991-2005); Vice Chairman (2006-2009) of American Funds’ Emerging Markets Growth Fund, Inc. (mutual fund); President of ARCO Investment Management Company (February 1991-April 2000); Member |
44 OPPENHEIMER MAIN STREET SMALL CAP FUND
| | |
Beverly L. Hamilton,
Continued | | of the investment committees of The Rockefeller Foundation (2001-2006) and The University of Michigan (since 2000); Advisor at Credit Suisse First Boston’s Sprout venture capital unit (venture capital fund) (1994-January 2005); Trustee of MassMutual Institutional Funds (investment company) (1996-June 2004); Trustee of MML Series Investment Fund (investment company) (April 1989-June 2004); Member of the investment committee of Hartford Hospital (2000-2003); and Advisor to Unilever (Holland) pension fund (2000-2003). Oversees 46 portfolios in the OppenheimerFunds complex. Ms. Hamilton has served on the Boards of certain Oppenheimer funds since 2002, during which time she has become familiar with the Fund’s (and other Oppenheimer funds’) financial, accounting, regulatory and investment matters and has contributed to the Boards’ deliberations. |
| |
Victoria J. Herget,
Trustee (since 2013)
Year of Birth: 1951 | | Board Chair (2008-2015) and Director (2004-Present), United Educators (insurance company); Trustee (since 2000) and Chair (since 2010), Newberry Library (independent research library); Trustee, Mather LifeWays (senior living organization) (since 2001); Independent Director of the First American Funds (mutual fund family) (2003-2011); former Managing Director (1993-2001), Principal (1985-1993), Vice President (1978-1985) and Assistant Vice President (1973-1978) of Zurich Scudder Investments (investment adviser) (and its predecessor firms); Trustee (1992-2007), Chair of the Board of Trustees (1999-2007), Investment Committee Chair (1994-1999) and Investment Committee member (2007-2010) of Wellesley College; Trustee, BoardSource (non-profit organization) (2006-2009) and Chicago City Day School (K-8 School) (1994-2005). Oversees 46 portfolios in the OppenheimerFunds complex. Ms. Herget has served on the Boards of certain Oppenheimer funds since 2012, during which time she has become familiar with the Fund’s (and other Oppenheimer funds’) financial, accounting, regulatory and investment matters and has contributed to the Boards’ deliberations. |
| |
Robert J. Malone,
Trustee (since 2013)
Year of Birth: 1944 | | Chairman - Colorado Market of MidFirst Bank (since January 2015); Chairman of the Board (since 2012) and Director of Jones International University (educational organization) (August 2005-January 2016); Trustee of the Gallagher Family Foundation (non-profit organization) (since 2000); Chairman, Chief Executive Officer and Director of Steele Street Bank Trust (commercial banking) (August 2003-January 2015); Board of Directors of Opera Colorado Foundation (non-profit organization) (2008-2012); Director of Colorado UpLIFT (charitable organization) (1986-2010); Director of Jones Knowledge, Inc. (2006-2010); Former Chairman of U.S. Bank-Colorado (subsidiary of U.S. Bancorp and formerly Colorado National Bank) (July 1996-April 1999); Director of Commercial Assets, Inc. (real estate investment trust) (1993-2000); Director of U.S. Exploration, Inc. (oil and gas exploration) (1997-February 2004); Chairman of the Board (1991-1994) and Trustee (1985-1994) of Regis University; and Chairman of the Board (1990-1991) and Trustee (1984-1999) of Young Presidents Organization. Oversees 46 portfolios in the OppenheimerFunds complex. Mr. Malone has served on the Boards of certain Oppenheimer funds since 2002, during which time he has become familiar with the Fund’s (and other Oppenheimer funds’) financial, accounting, regulatory and investment matters and has contributed to the Boards’ deliberations. |
| |
F. William Marshall, Jr.,
Trustee (since 2013)
Year of Birth: 1942 | | Trustee Emeritus of Worcester Polytech Institute (WPI) (private university) (since 2009); Formerly, Trustee of MassMutual Select Funds (formerly MassMutual Institutional Funds) (investment company) (1996-2015), MML Series Investment Fund (investment company) (1996-2015) and Mass Mutual Premier Funds (investment company) (January 2012-December 2015); President and Treasurer of the SIS Funds (private charitable fund) (January 1999-March 2011); Former Trustee of WPI (1985-2008); Former Chairman of the Board (2004-2006) and Former Chairman of the Investment Committee of WPI (1994-2008); Chairman of SIS |
45 OPPENHEIMER MAIN STREET SMALL CAP FUND
TRUSTEES AND OFFICERS Unaudited / Continued
| | |
F. William Marshall, Jr.,
Continued | | Family Bank, F.S.B. (formerly SIS Bank) (commercial bank) (January 1999-July 1999); Executive Vice President of Peoples Heritage Financial Group, Inc. (commercial bank) (January 1999-July 1999); and Former President and Chief Executive Officer of SIS Bancorp.(1993-1999). Oversees 46 portfolios in the OppenheimerFunds complex. Mr. Marshall has served on the Boards of certain Oppenheimer funds since 2000, during which time he has become familiar with the Fund’s (and other Oppenheimer funds’) financial, accounting, regulatory and investment matters and has contributed to the Boards’ deliberations. |
| |
Karen L. Stuckey,
Trustee (since 2013)
Year of Birth: 1953 | | Partner (1990-2012) of PricewaterhouseCoopers LLP (professional services firm) (held various positions 1975-1990); Trustee (1992-2006) and member of Executive, Nominating and Audit Committees and Chair of Finance Committee (1992-2006), and Emeritus Trustee (since 2006) of Lehigh University; and member, Women’s Investment Management Forum (professional organization) since inception; Trustee of Jennie’s School for Little Children (non-profit nursery school) (2011-2014); and member of Desert Mountain Community Foundation Advisory Board (nonprofit organization affiliated with Arizona Community Foundation)(since May 2015). Oversees 46 portfolios in the OppenheimerFunds complex. Ms. Stuckey has served on the Boards of certain Oppenheimer funds since 2012, during which time she has become familiar with the Fund’s (and other Oppenheimer funds’) financial, accounting, regulatory and investment matters and has contributed to the Boards’ deliberations. |
| |
James D. Vaughn,
Trustee (since 2013)
Year of Birth: 1945 | | Retired; former managing partner (1994-2001) of Denver office of Deloitte & Touche LLP, (held various positions 1969-1993); Trustee and Chairman of the Audit Committee of Schroder Funds (2003-2012); Board member and Chairman of Audit Committee of AMG National Trust Bank (since 2005); Trustee and Investment Committee member, University of South Dakota Foundation (since 1996); Board member, Audit Committee Member and past Board Chair, Junior Achievement (since 1993); former Board member, Mile High United Way, Boys and Girls Clubs, Boy Scouts, Colorado Business Committee for the Arts, Economic Club of Colorado and Metro Denver Network. Oversees 46 portfolios in the OppenheimerFunds complex. Mr. Vaughn has served on the Boards of certain Oppenheimer funds since 2012, during which time he has become familiar with the Fund’s (and other Oppenheimer funds’) financial, accounting, regulatory and investment matters and has contributed to the Boards’ deliberations. |
| | |
| | |
| INTERESTED TRUSTEE AND OFFICER | | Mr. Steinmetz is an “Interested Trustee” because he is affiliated with the Manager and the Sub-Adviser by virtue of his positions as Chairman of the Sub-Adviser and officer and director of the Manager. Both as a Trustee and as an officer, Mr. Steinmetz serves for an indefinite term, or until his resignation, retirement, death or removal. Mr. Steinmetz’s address is 225 Liberty Street, 16th Floor, New York, New York 10281-1008. |
| |
Arthur P. Steinmetz,
Trustee (since 2015), President
and Principal Executive Officer (since
2014)
Year of Birth: 1958 | | Chairman of the Sub-Adviser (since January 2015); CEO and Chairman of the Manager (since July 2014), President of the Manager (since May 2013), a Director of the Manager (since January 2013), Director of the Sub-Adviser (since July 2014), President, Management Director and CEO of Oppenheimer Acquisition Corp. (the Sub-Adviser’s parent holding company) (since July 2014), and President and Director of OFI SteelPath, Inc. (since January 2013). Chief Investment Officer of the OppenheimerFunds advisory entities from (January 2013-December 2013); Executive Vice President of the Manager (January 2013-May 2013); Chief Investment Officer of the Sub-Adviser (October 2010-December 2012); Chief Investment Officer, Fixed-Income, of the Sub-Adviser (April 2009-October 2010); Executive Vice President of the Sub-Adviser (October 2009-December 2012); |
46 OPPENHEIMER MAIN STREET SMALL CAP FUND
| | |
| |
Arthur P. Steinmetz,
Continued | | Director of Fixed Income of the Sub-Adviser (January 2009-April 2009); and a Senior Vice President of the Sub-Adviser (March 1993-September 2009). An officer of 101 portfolios in the OppenheimerFunds complex. |
| | |
| OTHER OFFICERS OF THE FUND | | The addresses of the Officers in the chart below are as follows: for Messrs. Ziehl, Anello, Vardharaj, Krantz, Weiner, Mss. Budzinski, Ketner, Lo Bessette, Sexton and Picciotto, 225 Liberty Street, New York, New York 10281-1008, for Mr. Petersen, 6803 S. Tucson Way, Centennial, Colorado 80112-3924. Each Officer serves for an indefinite term or until his or her resignation, retirement, death or removal. |
| |
Matthew P. Ziehl,
Vice President (since 2013)
Year of Birth: 1967 | | Vice President and Senior Portfolio Manager of the Sub-Adviser (since May 2009). Portfolio manager with RS Investment Management Co. LLC (October 2006-May 2009); Managing Director at The Guardian Life Insurance Company (December 2001-October 2006) when Guardian Life Insurance acquired an interest in RS Investment Management Co. LLC. Team leader and co portfolio manager with Salomon Brothers Asset Management, Inc. for small growth portfolios (January 2001-December 2001). A portfolio manager and officer of other portfolios in the OppenheimerFunds complex. |
| |
Raymond Anello,
Vice President (since 2013)
Year of Birth: 1964 | | Vice President of the Sub-Adviser (since May 2009) and a portfolio manager of the Sub-Adviser (since April 2011). Sector manager for energy and utilities for the Sub-Adviser’s Main Street Investment Team (since May 2009). Portfolio Manager of the RS All Cap Dividend product (from its inception in July 2007-April 2009) and served as a sector manager for energy and utilities for various other RS Investments products. Guardian Life Insurance Company (October 1999) and transitioned to RS Investments (October 2006) in connection with Guardian Life Insurance Company’s acquisition of an interest in RS Investments. Mr. Anello served as an equity portfolio manager/analyst and high yield analyst at Orion Capital (1995-1998) and an assistant portfolio manager at the Garrison Bradford portfolio management firm (1988-1995). A portfolio manager and officer of other portfolios in the OppenheimerFunds complex. |
| |
Raman Vardharaj,
Vice President (since 2013)
Year of Birth: 1971 | | Vice President and portfolio manager of the Sub-Adviser (since May 2009). Sector manager and a senior quantitative analyst creating stock selection models, monitoring portfolio risks and analyzing portfolio performance across the RS Core Equity Team of RS Investment Management Co. LLC (October 2006-May 2009). Quantitative analyst at The Guardian Life Insurance Company of America (1998-October 2006) when Guardian Life Insurance acquired an interest in RS Investment Management Co. LLC. A portfolio manager and officer of other portfolios in the OppenheimerFunds complex. |
| |
Joy Budzinski,
Vice President (since 2013)
Year of Birth: 1968 | | Vice President of the Sub-Adviser (since May 2009) and a portfolio manager of the Sub-Adviser (since November 2012). Sector manager for healthcare for the Sub-Adviser’s Main Street Investment Team (since May 2009). Healthcare sector manager at RS Investment and Guardian Life Insurance Company. Guardian Life Insurance Company (August 2006) and transitioned to RS Investments (October 2006) in connection with Guardian Life Insurance Company’s acquisition of an interest in RS Investments. Senior equity analyst at Bank of New York BNY Asset Management (2001 -2006); portfolio manager and analyst at Alliance of America (1999-2001); portfolio manager and analyst at JP Morgan Chase (1993-1997); analyst at Prudential Investments (1997-1998). A portfolio manager and officer of other portfolios in the OppenheimerFunds complex. |
47 OPPENHEIMER MAIN STREET SMALL CAP FUND
TRUSTEES AND OFFICERS Unaudited / Continued
| | |
Kristin Ketner,
Vice President (since 2013)
Year of Birth: 1965 | | Vice President of the Sub-Adviser (since June 2009) and a portfolio manager of the Sub-Adviser (since November 2012). Sector manager for consumer discretionary and consumer staples for the Sub-Adviser’s Main Street Investment Team (since May 2009). Sector manager at RS Investment and Guardian Life Insurance Company. Guardian Life Insurance Company in February 2006 and transitioned to RS Investments in October 2006 in connection with Guardian Life Insurance Company’s acquisition of an interest in RS Investments. Portfolio Manager at Solstice Equity Management (2002-2005); retail analyst at Goldman Sachs (1999-2001); Director of Strategy and Integration at Staples (1997-1999); investment banker at Merrill Lynch (1987-1992 and 1995-1997) and Montgomery Securities (1994-1995). A portfolio manager and officer of other portfolios in the OppenheimerFunds complex. |
| |
Magnus Krantz,
Vice President (since 2013)
Year of Birth: 1967 | | Vice President of the Sub-Adviser (since May 2009) and a portfolio manager of the Sub-Adviser (since November 2012); sector manager for technology for the Sub-Adviser’s Main Street Investment Team (since May 2009). Prior to joining the Sub-Adviser, Mr. Krantz was a sector manager at RS Investment and Guardian Life Insurance Company. Mr. Krantz joined Guardian Life Insurance Company in December 2005 and transitioned to RS Investments in October 2006 in connection with Guardian Life Insurance Company’s acquisition of an interest in RS Investments. Portfolio manager and analyst at Citigroup Asset Management (1998-2005) and as a consultant at Price Waterhouse (1997-1998). He also served as product development engineer at Newbridge Networks (1993-1996) and as a software engineer at Mitel Corporation (1990-1993). A portfolio manager and officer of other portfolios in the OppenheimerFunds complex. |
| |
Adam Weiner,
Vice President (since 2013)
Year of Birth: 1969 | | Vice President of the Sub-Adviser (since May 2009) and a portfolio manager of the Sub-Adviser (since November 2012). Sector manager for industrials and materials for the Sub-Adviser’s Main Street Investment Team (since May 2009). Sector manager at RS Investment for industrials and materials (January 2007-April 2009). Director and senior equity analyst at Credit Suisse Asset Management (CSAM) (September 2004-December 2006). Equity analyst at Credit Suisse First Boston 2004-2006 (buy-side) and 1999-2004 (sell-side) and Morgan Stanley (1996-1999); internal auditor at Dun and Bradstreet (1992-1996). Budget analyst, Information Resources Division of the Executive Office of the President (1990-1992). A portfolio manager and officer of other portfolios in the OppenheimerFunds complex. |
| |
Cynthia Lo Bessette,
Secretary and Chief Legal Officer (since 2016)
Year of Birth: 1969 | | Senior Vice President and Deputy General Counsel (March 2015 to February 2016) and Executive Vice President, General Counsel and Secretary of the Manager (since February 2016); Chief Legal Officer of the Sub-Adviser and the Distributor (since February 2016); Vice President, General Counsel and Secretary of Oppenheimer Acquisition Corp. (since February 2016); General Counsel of OFI SteelPath, Inc., VTL Associates, LLC and Index Management Solutions, LLC (since February 2016); Chief Legal Officer of OFI Global Institutional, Inc., HarbourView Asset Management Corporation, OFI Global Trust Company, Oppenheimer Real Asset Management, Inc., OFI Private Investments Inc., Shareholder Services, Inc. and Trinity Investment Management Corporation (since February 2016); Vice President, Corporate Counsel (February 2012 – March 2015) and Deputy Chief Legal Officer (April 2013 – March 2015) of Jennison Associates LLC; Assistant General Counsel (April 2008 – September 2009) and Deputy General Counsel (October 2009 – February 2012) of Lord Abbett & Co. LLC. An officer of 101 portfolios in the OppenheimerFunds complex. |
48 OPPENHEIMER MAIN STREET SMALL CAP FUND
| | |
Jennifer Sexton,
Vice President and Chief Business Officer (since 2014)
Year of Birth: 1969 | | Senior Vice President of OppenheimerFunds Distributor, Inc. (since June 2014); Vice President of OppenheimerFunds Distributor, Inc. (April 2006-June 2014); Vice President of the Sub-Adviser (January 1998-March 2006); Assistant Vice President of the Sub-Adviser (October 1991-December 1998). An officer of 101 portfolios in the OppenheimerFunds complex. |
| |
Mary Ann Picciotto,
Chief Compliance Officer and Chief Anti-Money Laundering Officer (since 2014)
Year of Birth: 1973 | | Senior Vice President and Chief Compliance Officer of the Manager (since March 2014); Chief Compliance Officer of the Sub-Adviser, OFI SteelPath, Inc., OFI Global Trust Company, OFI Global Institutional, Inc., Oppenheimer Real Asset Management, Inc., OFI Private Investments, Inc., Harborview Asset Management Corporation, Trinity Investment Management Corporation, and Shareholder Services, Inc. (since March 2014); Managing Director of Morgan Stanley Investment Management Inc. and certain of its various affiliated entities; Chief Compliance Officer of various Morgan Stanley Funds (May 2010-January 2014); Chief Compliance Officer of Morgan Stanley Investment Management Inc. (April 2007-January 2014). An officer of 101 portfolios in the OppenheimerFunds complex. |
| |
Brian S. Petersen,
Treasurer and Principal Financial & Accounting Officer (since 2016)
Year of Birth: 1970 | | Vice President of the Manager (since January 2013); Vice President of the Sub-Adviser (February 2007-December 2012); Assistant Vice President of the Sub-Adviser (August 2002-2007). An officer of 101 portfolios in the OppenheimerFunds complex. |
The Fund’s Statement of Additional Information contains additional information about the Fund’s Trustees and Officers and is available without charge upon request, by calling 1.800.CALL OPP (225.5677).
49 OPPENHEIMER MAIN STREET SMALL CAP FUND
OPPENHEIMER MAIN STREET SMALL CAP FUND
| | |
| Manager | | OFI Global Asset Management, Inc. |
| |
| Sub-Adviser | | OppenheimerFunds, Inc. |
| |
| Distributor | | OppenheimerFunds Distributor, Inc. |
| |
| Transfer and Shareholder Servicing Agent | | OFI Global Asset Management, Inc. |
| |
| Sub-Transfer Agent | | Shareholder Services, Inc. |
| | DBA OppenheimerFunds Services |
| |
| Independent Registered Public Accounting Firm | | KPMG LLP |
| |
| Legal Counsel | | Ropes & Gray LLP |
© 2016 OppenheimerFunds, Inc. All rights reserved.
50 OPPENHEIMER MAIN STREET SMALL CAP FUND
PRIVACY POLICY NOTICE
As an Oppenheimer fund shareholder, you are entitled to know how we protect your personal information and how we limit its disclosure.
Information Sources
We obtain nonpublic personal information about our shareholders from the following sources:
| ● | | Applications or other forms |
| ● | | When you create a user ID and password for online account access |
| ● | | When you enroll in eDocs Direct, our electronic document delivery service |
| ● | | Your transactions with us, our affiliates or others |
| ● | | A software program on our website, often referred to as a “cookie,” which indicates which parts of our site you’ve visited |
| ● | | When you set up challenge questions to reset your password online |
If you visit oppenheimerfunds.com and do not log on to the secure account information areas, we do not obtain any personal information about you. When you do log on to a secure area, we do obtain your user ID and password to identify you. We also use this information to provide you with products and services you have requested, to inform you about products and services that you may be interested in and assist you in other ways.
We do not collect personal information through our website unless you willingly provide it to us, either directly by email or in those areas of the website that request information. In order to update your personal information (including your mailing address, email address and phone number) you must first log on and visit your user profile.
If you have set your browser to warn you before accepting cookies, you will receive the warning message with each cookie. You can refuse cookies by turning them off in your browser. However, doing so may limit your access to certain sections of our website.
We use cookies to help us improve and manage our website. For example, cookies help us recognize new versus repeat visitors to the site, track the pages visited, and enable some special features on the website. This data helps us provide a better service for our website visitors.
Protection of Information
We do not disclose any non-public personal information (such as names on a customer list) about current or former customers to anyone, except as permitted by law.
Disclosure of Information
Copies of confirmations, account statements and other documents reporting activity in your fund accounts are made available to your financial advisor (as designated by you). We may also use details about you and your investments to help us, our financial service affiliates, or firms that jointly market their financial products and services with ours, to better serve your investment needs or suggest financial services or educational material that may be of interest to you. If this requires us to provide you with an opportunity to “opt in” or “opt out” of such information sharing with a firm not affiliated with us, you will receive notification on how to do so, before any such sharing takes place.
Right of Refusal
We will not disclose your personal information to unaffiliated third parties (except as permitted by law), unless we first offer you a reasonable opportunity to refuse or “opt out” of such disclosure.
51 OPPENHEIMER MAIN STREET SMALL CAP FUND
PRIVACY POLICY NOTICE Continued
Internet Security and Encryption
In general, the email services provided by our website are encrypted and provide a secure and private means of communication with us. To protect your own privacy, confidential and/or personal information should only be communicated via email when you are advised that you are using a secure website.
As a security measure, we do not include personal or account information in non-secure emails, and we advise you not to send such information to us in non-secure emails. Instead, you may take advantage of the secure features of our website to encrypt your email correspondence. To do this, you will need to use a browser that supports Secure Sockets Layer (SSL) protocol.
We do not guarantee or warrant that any part of our website, including files available for download, are free of viruses or other harmful code. It is your responsibility to take appropriate precautions, such as use of an anti-virus software package, to protect your computer hardware and software.
| ● | | All transactions, including redemptions, exchanges and purchases, are secured by SSL and 256-bit encryption. SSL is used to establish a secure connection between your PC and OppenheimerFunds’ server. It transmits information in an encrypted and scrambled format. |
| ● | | Encryption is achieved through an electronic scrambling technology that uses a “key” to code and then decode the data. Encryption acts like the cable converter box you may have on your television set. It scrambles data with a secret code so that no one can make sense of it while it is being transmitted. When the data reaches its destination, the same software unscrambles the data. |
| ● | | You can exit the secure area by either closing your browser, or for added security, you can use the Log Out button before you close your browser. |
Other Security Measures
We maintain physical, electronic and procedural safeguards to protect your personal account information. Our employees and agents have access to that information only so that they may offer you products or provide services, for example, when responding to your account questions.
How You Can Help
You can also do your part to keep your account information private and to prevent unauthorized transactions. If you obtain a user ID and password for your account, do not allow it to be used by anyone else. Also, take special precautions when accessing your account on a computer used by others.
Who We Are
This joint notice describes the privacy policies of the Oppenheimer funds, OppenheimerFunds, Inc., each of its investment adviser subsidiaries, OppenheimerFunds Distributor, Inc. and OFI Global Trust Co. It applies to all Oppenheimer fund accounts you presently have, or may open in the future, using your Social Security number—whether or not you remain a shareholder of our funds. This notice was last updated March 2015. In the event it is updated or changed, we will post an updated notice on our website at oppenheimerfunds.com. If you have any questions about this privacy policy, write to us at P.O. Box 5270, Denver, CO 80217-5270, email us by clicking on the Contact Us section of our website at oppenheimerfunds.com or call us at 1.800.CALL OPP (225.5677).
52 OPPENHEIMER MAIN STREET SMALL CAP FUND
THIS PAGE INTENTIONALLY LEFT BLANK.
53 OPPENHEIMER MAIN STREET SMALL CAP FUND
THIS PAGE INTENTIONALLY LEFT BLANK.
54 OPPENHEIMER MAIN STREET SMALL CAP FUND
THIS PAGE INTENTIONALLY LEFT BLANK.
55 OPPENHEIMER MAIN STREET SMALL CAP FUND

Item 2. Code of Ethics.
The registrant has adopted a code of ethics that applies to the registrant’s principal executive officer, principal financial officer, principal accounting officer or controller or persons performing similar functions.
Item 3. Audit Committee Financial Expert.
The Board of Trustees of the registrant has determined that F. William Marshall, Jr., the Chairman of the Board’s Audit Committee, is the audit committee financial expert and that Mr. Marshall is “independent” for purposes of this Item 3.
Item 4. Principal Accountant Fees and Services.
The principal accountant for the audit of the registrant’s annual financial statements billed $20,600 in fiscal 2016 and $19,700 in fiscal 2015.
The principal accountant for the audit of the registrant’s annual financial statements billed $233 in fiscal 2016 and no such fees in fiscal 2015.
The principal accountant for the audit of the registrant’s annual financial statements billed $445,440 in fiscal 2016 and $1,015,688 in fiscal 2015 to the registrant’s investment adviser or any entity controlling, controlled by, or under common control with the adviser that provides ongoing services to the registrant.
Such services include: Internal control reviews, GIPS attestation procedures, additional audit services, and system conversion testing.
The principal accountant for the audit of the registrant’s annual financial statements billed no such fees in fiscal 2016 and no such fees in fiscal 2015.
The principal accountant for the audit of the registrant’s annual financial statements billed $468,498 in fiscal 2016 and $550,189 in fiscal 2015 to the registrant’s investment adviser or any entity controlling, controlled by, or under common control with the adviser that provides ongoing services to the registrant.
Such services include: tax compliance, tax planning and tax advice. Tax compliance generally involves preparation of original and amended tax returns, claims for a refund and tax payment-planning services. Tax planning and tax advice includes assistance with tax audits and appeals, tax advice related to mergers and acquisitions and requests for rulings or technical advice from taxing authorities.
The principal accountant for the audit of the registrant’s annual financial statements billed no such fees in fiscal 2016 and no such fees in fiscal 2015.
The principal accountant for the audit of the registrant’s annual financial statements billed no such fees in fiscal 2016 and no such fees in fiscal 2015 to the registrant’s investment adviser or any entity controlling, controlled by, or under common control with the adviser that provides ongoing services to the registrant.
Such fees would include the cost to the principal accountant of attending audit committee meetings and consultations regarding the registrant’s retirement plan with respect to its Trustees.
| (e) | (1) During its regularly scheduled periodic meetings, the registrant’s audit committee will pre-approve all audit, audit-related, tax and other services to be provided by the principal accountants of the registrant. |
| | The audit committee has delegated pre-approval authority to its Chairman for any subsequent new engagements that arise between regularly scheduled meeting dates provided that any fees such pre-approved are presented to the audit committee at its next regularly scheduled meeting. |
| | Under applicable laws, pre-approval of non-audit services may be waived provided that: 1) the aggregate amount of all such services provided constitutes no more than five percent of the total amount of fees paid by the registrant to its principal accountant during the fiscal year in which services are provided 2) such services were not recognized by the registrant at the time of engagement as non-audit services and 3) such services are promptly brought to the attention of the audit committee of the registrant and approved prior to the completion of the audit. |
| (f) | Not applicable as less than 50%. |
| (g) | The principal accountant for the audit of the registrant’s annual financial statements billed $914,171 in fiscal 2016 and $1,565,877 in fiscal 2015 to the registrant and the registrant’s investment adviser or any entity controlling, controlled by, or under common control with the adviser that provides ongoing services to the registrant related to non-audit fees. Those billings did not include any prohibited non-audit services as defined by the Securities Exchange Act of 1934. |
| (h) | The registrant’s audit committee of the board of Trustees has considered whether the provision of non-audit services that were rendered to the registrant’s investment adviser, and any entity controlling, controlled by, or under common control with the investment adviser that provides ongoing services to the registrant that were not pre-approved pursuant to paragraph (c)(7)(ii) of Rule 2-01 of Regulation S-X is compatible with maintaining the principal accountant’s independence. No such services were rendered. |
Item 5. Audit Committee of Listed Registrants
Not applicable.
Item 6. Schedule of Investments.
a) Not applicable. The complete schedule of investments is included in Item 1 of this Form N-CSR.
b) Not applicable.
Item 7. Disclosure of Proxy Voting Policies and Procedures for Closed-End Management Investment Companies.
Not applicable.
Item 8. Portfolio Managers of Closed-End Management Investment Companies.
Not applicable.
Item 9. Purchases of Equity Securities by Closed-End Management Investment Company and Affiliated Purchasers.
Not applicable.
Item 10. Submission of Matters to a Vote of Security Holders.
The Fund’s Governance Committee Provisions with Respect to Nominations of Directors/Trustees to the Respective Boards
None
Item 11. Controls and Procedures.
Based on their evaluation of the registrant’s disclosure controls and procedures (as defined in rule 30a-3(c) under the Investment Company Act of 1940 (17 CFR 270.30a-3(c)) as of 4/29/2016, the registrant’s principal executive officer and principal financial officer found the registrant’s disclosure controls and procedures to provide reasonable assurances that information required to be disclosed by the registrant in the reports that it files under the Securities Exchange Act of 1934 (a) is accumulated and communicated to registrant’s management, including its principal executive officer and principal financial officer, to allow timely decisions regarding required disclosure, and (b) is recorded, processed, summarized and reported, within the time periods specified in the rules and forms adopted by the U.S. Securities and Exchange Commission.
There have been no changes in the registrant’s internal controls over financial reporting that occurred during the registrant’s second fiscal quarter of the period covered by this report that
have materially affected, or are reasonably likely to materially affect, the registrant’s internal control over financial reporting.
Item 12. Exhibits.
| (a) | (1) Exhibit attached hereto. |
| | (2) Exhibits attached hereto. |
| (b) | Exhibit attached hereto. |
SIGNATURES
Pursuant to the requirements of the Securities Exchange Act of 1934 and the Investment Company Act of 1940, the registrant has duly caused this report to be signed on its behalf by the undersigned, thereunto duly authorized.
Oppenheimer Main Street Small Cap Fund
| | |
| By: | | /s/ Arthur P. Steinmetz |
| | Arthur P. Steinmetz |
| | Principal Executive Officer |
| Date: | | 6/15/2016 |
Pursuant to the requirements of the Securities Exchange Act of 1934 and the Investment Company Act of 1940, this report has been signed below by the following persons on behalf of the registrant and in the capacities and on the dates indicated.
| | |
| By: | | /s/ Arthur P. Steinmetz |
| | Arthur P. Steinmetz |
| | Principal Executive Officer |
| Date: | | 6/15/2016 |
| | |
| By: | | /s/ Brian S. Petersen |
| | Brian S. Petersen |
| | Principal Financial Officer |
| Date: | | 6/15/2016 |