UNITED STATES
SECURITIES AND EXCHANGE COMMISSION
Washington, D.C. 20549
FORM 10-Q
(Mark One)
| x | QUARTERLY REPORT PURSUANT TO SECTION 13 OR 15(d) OF THE SECURITIES EXCHANGE ACT OF 1934 |
For the quarterly period ended June 29, 2013
OR
| ¨ | TRANSITION REPORT PURSUANT TO SECTION 13 OR 15(d) OF THE SECURITIES EXCHANGE ACT OF 1934 |
For the transition period from to
Commission file number 333-187556
SUMMIT MATERIALS, LLC
(Exact name of registrant as specified in its charter)
| | |
| Delaware | | 24-4138486 |
(State or other jurisdiction of incorporation or organization) | | (I.R.S. Employer Identification No.) |
| |
1550 Wynkoop Street, 3rd Floor Denver, CO | | 80202 |
| (Address of principal executive offices) | | (Zip Code) |
Registrant’s telephone number, including area code: (303) 893-0012
2900 K Street NW, Suite 100, Harbourside North Tower Building, Washington, D.C. 20007
(Former name, former address and former fiscal year, if changed since last report)
Indicate by check mark whether the registrant (1) has filed all reports required to be filed by Section 13 or 15(d) of the Securities Exchange Act of 1934 during the preceding 12 months (or for such shorter period that the registrant was required to file such reports), and (2) has been subject to such filing requirements for the past 90 days. Yes ¨ No x
Indicate by check mark whether the registrant has submitted electronically and posted on its corporate Web site, if any, every Interactive Data File required to be submitted and posted pursuant to Rule 405 of Regulation S-T (§232.405 of this chapter) during the preceding 12 months (or for such shorter period that the registrant was required to submit and post such files). Yes x No ¨
Indicate by check mark whether the registrant is a large accelerated filer, an accelerated filer, a non-accelerated filer, or a smaller reporting company. See the definitions of “large accelerated filer,” “accelerated filer” and “smaller reporting company” in Rule 12b-2 of the Exchange Act.
| | | | | | |
| Large accelerated filer | | ¨ | | Accelerated filer ¨ | | |
| | | |
| Non-accelerated filer | | x (Do not check if a smaller reporting company) | | Smaller reporting company | | ¨ |
Indicate by check mark whether the registrant is a shell company (as defined in Rule 12b-2 of the Exchange Act). Yes ¨ No x
As of August 7, 2013, 100% of the registrant’s outstanding limited liability company interests were held by Summit Materials Intermediate Holdings, LLC.
CAUTIONARY NOTE REGARDING FORWARD-LOOKING STATEMENTS
This quarterly report on Form 10-Q (this “report”) includes “forward-looking statements” within the meaning of the federal securities laws, which involve risks and uncertainties. Forward-looking statements include all statements that do not relate solely to historical or current facts, and you can identify forward-looking statements because they contain words such as “believes,” “expects,” “may,” “will,” “should,” “seeks,” “intends,” “plans,” “estimates,” “projects” or “anticipates” or similar expressions that concern our strategy, plans or intentions. All statements made relating to our estimated and projected earnings, margins, costs, expenditures, cash flows, growth rates and financial results are forward-looking statements. These forward-looking statements are subject to risks, uncertainties and other factors which may cause our actual results, performance or achievements to be materially different from future results, performance or achievements expressed or implied by such forward-looking statements. We derive many of our forward-looking statements from our operating budgets and forecasts, which are based upon many detailed assumptions. While we believe that our assumptions are reasonable, it is very difficult to predict the impact of known factors, and, of course, it is impossible to anticipate all factors that could affect our actual results. In light of the significant uncertainties inherent in the forward-looking statements included herein, the inclusion of such information should not be regarded as a representation by us or any other person that the results or conditions described in such statements or our objectives and plans will be achieved. Important factors could affect our results and could cause results to differ materially from those expressed in our forward-looking statements, including but not limited to the factors discussed in the section entitled “Risk Factors” in our prospectus dated June 10, 2013 (the “Prospectus”), filed with the Securities and Exchange Commission (the “SEC”) in accordance with Rule 424(b) of the Securities Act of 1933, as amended, on June 10, 2013, any factors discussed in the section entitled “Risk Factors” of this report, and the following:
| | • | | our substantial current level of indebtedness; |
| | • | | our dependence on the construction industry and the strength of the local economies in which we operate; |
| | • | | our ability to acquire other businesses in our industry, successfully integrate them with our existing operations and retain key employees of such acquired businesses; |
| | • | | the cyclical nature of our business; |
| | • | | declines in public sector construction and reductions in governmental funding, including the funding of transportation authorities and other state agencies; |
| | • | | conditions in the credit markets; |
| | • | | our ability to accurately estimate the overall risks, requirements or costs when we bid on or negotiate a contract that is ultimately awarded to us; |
| | • | | risks related to weather and seasonality; |
| | • | | competition within our local markets; |
| | • | | our dependence on securing and permitting aggregate reserves in strategically located areas; |
| | • | | risks associated with our capital-intensive business; |
| | • | | any failure to meet schedule or performance requirements of our contracts; |
| | • | | changes in environmental, health, safety and climate change laws or governmental requirements or policies concerning zoning and land use; |
| | • | | our dependence on senior management and inability to attract and retain qualified management personnel; |
| | • | | special hazards related to our operations that may cause personal injury or property damage not covered by insurance; |
| | • | | material costs and losses as a result of claims that our products do not meet regulatory requirements or contractual specifications; |
| | • | | cancellation of significant contracts or our disqualification from bidding for new contracts; |
| | • | | our status as an “emerging growth company” which permits us to rely on exemptions from certain disclosure requirements; |
| | • | | interruptions in our information technology systems and infrastructure; and |
| | • | | other factors as described in the Prospectus. |
All subsequent written and oral forward-looking statements attributable to us, or persons acting on our behalf, are expressly qualified in their entirety by these cautionary statements.
Any forward-looking statement that we make speaks only as of the date of this report. We undertake no obligation to publicly update or revise any forward-looking statement as a result of new information, future events or otherwise, except as otherwise required by law.
As used in this report, unless otherwise noted or the context otherwise requires,
| | • | | “we,” “our,” “us,” and “the Company” refer to Summit Materials, LLC and its subsidiaries as a combined entity; |
| | • | | “Summit Materials” refers only to Summit Materials, LLC and not its subsidiaries; |
| | • | | “Sponsors” refers to Blackstone Capital Partners V L.P. and Silverhawk Summit, L.P.; |
| | • | | “Lafarge” refers to Lafarge North America, Inc.; and |
| | • | | “Westroc” refers to Westroc, LLC. |
SUMMIT MATERIALS, LLC
FORM 10-Q
TABLE OF CONTENTS
PART I—FINANCIAL INFORMATION
| ITEM 1. | FINANCIAL STATEMENTS |
SUMMIT MATERIALS, LLC AND SUBSIDIARIES
Consolidated Balance Sheets
(In thousands)
| | | | | | | | |
| | | June 29,
2013
(unaudited) | | | December 29,
2012
(audited) | |
| Assets | | | | | | | | |
Current assets: | | | | | | | | |
Cash | | $ | 7,655 | | | $ | 27,431 | |
Accounts receivable, net | | | 119,557 | | | | 100,298 | |
Costs and estimated earnings in excess of billings | | | 24,356 | | | | 11,575 | |
Inventories | | | 110,153 | | | | 92,977 | |
Other current assets | | | 11,996 | | | | 10,068 | |
| | | | | | | | |
Total current assets | | | 273,717 | | | | 242,349 | |
Property, plant and equipment, less accumulated depreciation, depletion and amortization (June 29, 2013 - $183,094 and December 29, 2012 - $156,313) | | | 858,519 | | | | 813,607 | |
Goodwill | | | 192,505 | | | | 179,120 | |
Intangible assets, less accumulated amortization (June 29, 2013 - $1,712 and December 29, 2012 - $1,354) | | | 15,595 | | | | 8,606 | |
Other assets | | | 36,429 | | | | 37,531 | |
| | | | | | | | |
Total assets | | $ | 1,376,765 | | | $ | 1,281,213 | |
| | | | | | | | |
| Liabilities, Redeemable Noncontrolling Interest and Member’s Interest | | | | | | | | |
Current liabilities: | | | | | | | | |
Current portion of debt | | $ | 108,165 | | | $ | 4,000 | |
Current portion of acquisition-related liabilities | | | 11,115 | | | | 9,525 | |
Accounts payable | | | 75,828 | | | | 61,634 | |
Accrued expenses | | | 56,263 | | | | 49,822 | |
Billings in excess of costs and estimated earnings | | | 5,583 | | | | 6,926 | |
| | | | | | | | |
Total current liabilities | | | 256,954 | | | | 131,907 | |
Long-term debt | | | 660,241 | | | | 635,843 | |
Acquisition-related liabilities | | | 28,052 | | | | 23,919 | |
Other noncurrent liabilities | | | 81,133 | | | | 84,266 | |
| | | | | | | | |
Total liabilities | | | 1,026,380 | | | | 875,935 | |
| | | | | | | | |
Commitments and contingencies (see note 9) | | | | | | | | |
Redeemable noncontrolling interest | | | 23,150 | | | | 22,850 | |
Member’s interest: | | | | | | | | |
Member’s equity | | | 485,698 | | | | 484,584 | |
Accumulated deficit | | | (150,362 | ) | | | (94,085 | ) |
Accumulated other comprehensive loss | | | (9,130 | ) | | | (9,130 | ) |
| | | | | | | | |
Member’s interest | | | 326,206 | | | | 381,369 | |
Noncontrolling interest | | | 1,029 | | | | 1,059 | |
| | | | | | | | |
Total member’s interest | | | 327,235 | | | | 382,428 | |
| | | | | | | | |
Total liabilities, redeemable noncontrolling interest and member’s interest | | $ | 1,376,765 | | | $ | 1,281,213 | |
| | | | | | | | |
See notes to unaudited consolidated financial statements.
1
SUMMIT MATERIALS, LLC AND SUBSIDIARIES
Unaudited Consolidated Statements of Operations
(In thousands)
| | | | | | | | | | | | | | | | |
| | | Three months ended | | | Six months ended | |
| | | June 29,
2013 | | | June 30,
2012 | | | June 29,
2013 | | | June 30,
2012 | |
Revenue: | | | | | | | | | | | | | | | | |
Product | | $ | 169,041 | | | $ | 166,436 | | | $ | 237,181 | | | $ | 233,996 | |
Service | | | 85,801 | | | | 89,120 | | | | 124,490 | | | | 141,443 | |
| | | | | | | | | | | | | | | | |
Total revenue | | | 254,842 | | | | 255,556 | | | | 361,671 | | | | 375,439 | |
| | | | | | | | | | | | | | | | |
Cost of revenue (exclusive of items shown separately below): | | | | | | | | | | | | | | | | |
Product | | | 115,960 | | | | 123,655 | | | | 181,932 | | | | 186,967 | |
Service | | | 65,883 | | | | 71,126 | | | | 95,984 | | | | 118,576 | |
| | | | | | | | | | | | | | | | |
Total cost of revenue | | | 181,843 | | | | 194,781 | | | | 277,916 | | | | 305,543 | |
| | | | | | | | | | | | | | | | |
General and administrative expenses | | | 39,392 | | | | 34,923 | | | | 73,395 | | | | 65,917 | |
Depreciation, depletion, amortization and accretion | | | 18,894 | | | | 17,240 | | | | 36,026 | | | | 33,603 | |
Transaction costs | | | 982 | | | | (403 | ) | | | 2,464 | | | | 1,532 | |
| | | | | | | | | | | | | | | | |
Operating income (loss) | | | 13,731 | | | | 9,015 | | | | (28,130 | ) | | | (31,156 | ) |
Other (income) expense, net | | | (269 | ) | | | 587 | | | | 163 | | | | 941 | |
(Gain) loss on debt financings | | | — | | | | (879 | ) | | | 3,115 | | | | 8,160 | |
Interest expense | | | 14,482 | | | | 14,713 | | | | 27,849 | | | | 28,826 | |
| | | | | | | | | | | | | | | | |
Loss from continuing operations before taxes | | | (482 | ) | | | (5,406 | ) | | | (59,257 | ) | | | (69,083 | ) |
Income tax (benefit) expense | | | (726 | ) | | | 215 | | | | (3,347 | ) | | | (1,963 | ) |
| | | | | | | | | | | | | | | | |
Income (loss) from continuing operations | | | 244 | | | | (5,621 | ) | | | (55,910 | ) | | | (67,120 | ) |
Income (loss) from discontinued operations | | | 26 | | | | (2,221 | ) | | | (97 | ) | | | (1,724 | ) |
| | | | | | | | | | | | | | | | |
Net income (loss) | | | 270 | | | | (7,842 | ) | | | (56,007 | ) | | | (68,844 | ) |
Net income (loss) attributable to noncontrolling interest | | | 1,939 | | | | (175 | ) | | | (1,518 | ) | | | (519 | ) |
| | | | | | | | | | | | | | | | |
Net loss attributable to member of Summit Materials, LLC | | $ | (1,669 | ) | | $ | (7,667 | ) | | $ | (54,489 | ) | | $ | (68,325 | ) |
| | | | | | | | | | | | | | | | |
See notes to unaudited consolidated financial statements.
2
SUMMIT MATERIALS, LLC AND SUBSIDIARIES
Unaudited Consolidated Statements of Cash Flows
(In thousands)
| | | | | | | | |
| | | Six months ended | |
| | | June 29,
2013 | | | June 30,
2012 | |
Cash flow from operating activities: | | | | | | | | |
Net loss | | $ | (56,007 | ) | | $ | (68,844 | ) |
Adjustments to reconcile net loss to net cash used in operating activities: | | | | | | | | |
Depreciation, depletion, amortization and accretion | | | 39,033 | | | | 37,512 | |
Share-based compensation expense | | | 1,114 | | | | 1,419 | |
Deferred income tax benefit | | | (2,969 | ) | | | (540 | ) |
Loss on property, plant and equipment disposals and revaluations | | | 5,574 | | | | 340 | |
Loss on debt financings | | | 2,989 | | | | 8,160 | |
Other | | | 755 | | | | 1,194 | |
(Increase) decrease in operating assets, net of acquisitions: | | | | | | | | |
Account receivable | | | (11,610 | ) | | | (23,788 | ) |
Inventories | | | (13,222 | ) | | | (6,044 | ) |
Costs and estimated earnings in excess of billings | | | (13,688 | ) | | | (10,247 | ) |
Other current assets | | | (491 | ) | | | (1,701 | ) |
Other assets | | | (118 | ) | | | 2,226 | |
Increase (decrease) in operating liabilities, net of acquisitions: | | | | | | | | |
Accounts payable | | | 6,691 | | | | 15,736 | |
Accrued expenses | | | (4,722 | ) | | | 16,787 | |
Billings in excess of costs and estimated earnings | | | (1,493 | ) | | | 1,133 | |
Other liabilities | | | 404 | | | | (1,796 | ) |
| | | | | | | | |
Net cash used in operating activities | | | (47,760 | ) | | | (28,453 | ) |
| | | | | | | | |
Cash flow from investing activities: | | | | | | | | |
Acquisitions, net of cash acquired | | | (60,779 | ) | | | (42,933 | ) |
Purchases of property, plant and equipment | | | (40,528 | ) | | | (24,669 | ) |
Proceeds from the sale of property, plant and equipment | | | 7,086 | | | | 2,946 | |
| | | | | | | | |
Net cash used for investing activities | | | (94,221 | ) | | | (64,656 | ) |
| | | | | | | | |
Cash flow from financing activities: | | | | | | | | |
Net proceeds from debt issuance | | | 186,974 | | | | 693,434 | |
Payments on long-term debt | | | (61,343 | ) | | | (618,441 | ) |
Payments on acquisition-related liabilities | | | (3,426 | ) | | | (2,670 | ) |
Other | | | — | | | | (701 | ) |
| | | | | | | | |
Net cash provided by financing activities | | | 122,205 | | | | 71,622 | |
| | | | | | | | |
Net decrease in cash | | | (19,776 | ) | | | (21,487 | ) |
Cash – beginning of period | | | 27,431 | | | | 42,790 | |
| | | | | | | | |
Cash – end of period | | $ | 7,655 | | | $ | 21,303 | |
| | | | | | | | |
See notes to unaudited consolidated financial statements.
3
SUMMIT MATERIALS, LLC AND SUBSIDIARIES
Unaudited Consolidated Statements of Changes in Redeemable Noncontrolling Interest and Member’s Interest
(In thousands)
| | | | | | | | | | | | | | | | | | | | | | | | |
| | | Total Member’s Interest | | | | | | | | | | |
| | | Member’s
Equity | | | Accumulated
deficit | | | Accumulated
other
comprehensive
loss (AOCI) | | | Noncontrolling
interest | | | Total
member’s
interest | | | Redeemable
noncontrolling
interest | |
Balance — December 29, 2012 | | $ | 484,584 | | | $ | (94,085 | ) | | $ | (9,130 | ) | | $ | 1,059 | | | $ | 382,428 | | | $ | 22,850 | |
Accretion | | | — | | | | (300 | ) | | | — | | | | — | | | | (300 | ) | | | 300 | |
Redemption value adjustment | | | — | | | | (1,488 | ) | | | — | | | | — | | | | (1,488 | ) | | | 1,488 | |
Net loss | | | — | | | | (54,489 | ) | | | — | | | | (30 | ) | | | (54,519 | ) | | | (1,488 | ) |
Share-based compensation | | | 1,114 | | | | — | | | | — | | | | — | | | | 1,114 | | | | — | |
| | | | | | | | | | | | | | | | | | | | | | | | |
Balance — June 29, 2013 | | $ | 485,698 | | | $ | (150,362 | ) | | $ | (9,130 | ) | | $ | 1,029 | | | $ | 327,235 | | | $ | 23,150 | |
| | | | | | | | | | | | | | | | | | | | | | | | |
| | | | | | |
| | | | | | | | | | | | | | | | | | | | | | | | | |
| | | | | | |
Balance — December 31, 2011 | | $ | 482,707 | | | $ | (40,932 | ) | | $ | (6,577 | ) | | $ | 1,174 | | | $ | 436,372 | | | $ | 21,300 | |
Accretion | | | — | | | | (400 | ) | | | — | | | | — | | | | (400 | ) | | | 400 | |
Net loss | | | — | | | | (68,325 | ) | | | — | | | | (119 | ) | | | (68,444 | ) | | | (400 | ) |
Repurchase of member’s interest | | | (656 | ) | | | — | | | | — | | | | — | | | | (656 | ) | | | — | |
Share-based compensation | | | 1,419 | | | | — | | | | — | | | | — | | | | 1,419 | | | | — | |
Payment of dividends | | | — | | | | — | | | | — | | | | (45 | ) | | | (45 | ) | | | — | |
| | | | | | | | | | | | | | | | | | | | | | | | |
Balance — June 30, 2012 | | $ | 483,470 | | | $ | (109,657 | ) | | $ | (6,577 | ) | | $ | 1,010 | | | $ | 368,246 | | | $ | 21,300 | |
| | | | | | | | | | | | | | | | | | | | | | | | |
See notes to unaudited consolidated financial statements.
4
SUMMIT MATERIALS, LLC
NOTES TO UNAUDITED CONSOLIDATED FINANCIAL STATEMENTS
(In Thousands)
| 1. | SUMMARY OF ORGANIZATION AND SIGNIFICANT ACCOUNTING POLICIES |
Summit Materials, LLC (the “Company”) is a vertically integrated heavy-side building materials company. Across its subsidiaries, it is engaged in the manufacturing and sale of aggregate material,hot-mix asphalt, cement and ready mixed concrete. It is also engaged in road paving and related construction services. The Company owns and operates stone quarries, asphalt plants, ready mix plants and landfill sites. Most of the Company’s construction work is performed under fixed unit-price contracts with state and local governmental entities.
The Company is a wholly owned subsidiary of Summit Materials Holdings L.P. whose major indirect owners are certain investment funds affiliated with Blackstone Capital Partners V L.P. (“BCP”). The Company has several subsidiaries, which have individually made a number of acquisitions since the Company was formed in August 2009.
The consolidated financial statements of the Company include the accounts of Summit Materials, LLC, its wholly owned subsidiaries and its noncontrolling interests. Noncontrolling interests represent a 30% redeemable ownership in Continental Cement Company, L.L.C. (“Continental Cement”) and a 20% ownership of Ohio Valley Asphalt, LLC. All significant intercompany balances and transactions have been eliminated.
Basis of Presentation—Management prepared these consolidated interim financial statements in accordance with U.S. generally accepted accounting principles (“GAAP”) for interim financial information. The consolidated interim financial statements of the Company included herein have been prepared, without audit, pursuant to the rules and regulations of the Securities and Exchange Commission. Certain information and footnote disclosures normally included in financial statements prepared in accordance with GAAP have been condensed or omitted pursuant to such rules and regulations. These unaudited consolidated interim financial statements should be read in conjunction with the Company’s audited consolidated financial statements and the notes thereto as of and for the year ended December 29, 2012. The Company continues to follow the accounting policies set forth in those consolidated financial statements. Management believes that these consolidated interim financial statements include all adjustments, normal and recurring in nature, that are necessary to present fairly the financial position of the Company as of June 29, 2013, the results of operations for the three and six month periods ended June 29, 2013 and June 30, 2012 and cash flows for the six month periods ended June 29, 2013 and June 30, 2012.
The Company’s fiscal quarters are based on a 4-4-5 schedule; each quarter is comprised of 13 weeks and ends on a Saturday. The Company’s second quarter ended on June 29 and June 30 in 2013 and 2012, respectively. In 2013, Continental Cement changed its fiscal year to be consistent with the Company’s fiscal year. Prior to fiscal 2013, Continental Cement’s fiscal year was based on the calendar with quarter-end dates of March 31, June 30, September 30 and December 31. The impact of this change to the Company’s financial position, results of operations and liquidity is immaterial.
Substantially all of the Company’s products and services are produced, consumed and performed outdoors primarily in the spring, summer and fall. Seasonal changes and other weather-related conditions can affect the production and sales volumes of its products and delivery of its services. Therefore, the financial results for any interim period do not necessarily indicate the results expected for the year. Furthermore, the Company’s sales and earnings are sensitive to national, regional and local economic conditions and to cyclical swings in construction spending. The level of construction spending is affected by changing interest rates and demographic and population fluctuations among other factors.
Use of Estimates—Preparation of these consolidated interim financial statements in conformity with GAAP requires management to make estimates and assumptions that affect the reported amounts and disclosures herein. These estimates and the underlying assumptions affect the amounts of assets and liabilities reported, disclosures about contingent assets and liabilities and reported amounts of revenues and expenses. Such estimates include the valuation of accounts receivable, inventories, goodwill, intangibles and otherlong-lived assets, pension and other postretirement obligations and asset retirement obligations. Estimates also include revenue earned on contracts and of costs to complete contracts. Management evaluates its estimates and assumptions on an ongoing basis using historical experience and other factors, including the current economic environment. Management adjusts such estimates and assumptions when circumstances dictate. As future events and their effects cannot be determined with precision, actual results could differ significantly from estimates made. Changes in estimates, including those resulting from continuing changes in the economic environment, will be reflected in the Company’s consolidated financial statements in the period in which the change in estimate occurs.
5
Business and Credit Concentrations—The operations of the Company are conducted primarily across 20 states, with the most significant revenues generated in Texas, Kansas, Kentucky, Missouri and Utah. The Company’s accounts receivable consist primarily of amounts due from individuals, corporations and governmental entities within these areas. Collection of these accounts is, therefore, dependent on the economic conditions in the aforementioned states, as well as specific situations affecting individual customers. However, credit granted within the Company’s trade areas has been granted to a wide variety of customers and management does not believe that any significant concentrations of credit exist with respect to individual customers or groups of customers. No single customer accounted for more than 10% of total revenue.
Fair Value Measurements—Certain acquisitions made by the Company require the payment of contingent amounts of purchase consideration. These payments are contingent on specified operating results being achieved in periods subsequent to the acquisition date. As of June 29, 2013 and December 29, 2012, contingent consideration obligations in the current portion of acquisition-related liabilities was $0.6 million and $0.7 million, respectively, and the portion included in long term acquisition-related liabilities was $1.3 million and $1.9 million, respectively. Contingent consideration obligations are measured at fair value each reporting period and any adjustments to fair value are recognized in earnings in the period identified. These payments will not be made if earn-out thresholds are not achieved. In the six month period ended June 29, 2013, earn-out payments of $0.7 million were made.
The fair value of the contingent consideration obligations approximate their carrying value of $1.9 million and $2.6 million as of June 29, 2013 and December 29, 2012, respectively. The fair values are based on unobservable inputs, or Level 3 inputs, including projected probability-weighted cash payments and a 9.1% discount rate, which reflects the Company’s credit risk. Changes in fair value may occur as a result of a change in actual or projected cash payments, the probability weightings applied by the Company to projected payments or a change in the discount rate. Significant increases or decreases in any of these inputs in isolation could result in a lower, or higher, fair value measurement. There were no adjustments to the fair value of contingent consideration in the three or six month periods ended June 29, 2013 and June 30, 2012.
Financial Instruments—The Company’s financial instruments include certain acquisition-related liabilities (deferred consideration and noncompete obligations) and debt. The fair value of the deferred consideration and noncompete obligations approximate their carrying value of $30.5 million and $6.8 million, respectively, as of June 29, 2013, and $23.4 million and $7.4 million, respectively, as of December 29, 2012. The fair value was determined based on unobservable inputs, or Level 3 inputs, including the cash payment terms in the purchase agreements and a discount rate reflecting the Company’s credit risk.
The fair value of long-term debt approximates $688.4 million and $670.7 million as of June 29, 2013 and December 29, 2012, respectively, compared to its carrying value of $663.4 million and $639.8 million, respectively. Fair value was determined based on observable inputs, or Level 2 inputs, such as interest rates, bond yields and quoted prices in inactive markets.
Redeemable Noncontrolling Interest—The Company owns Class A Units of Continental Cement, which represent a 69.7% economic interest. Continental Cement’s Class B Units, which represent a 30.3% economic interest, are subordinate to the Class A Units. The Class B Units are puttable in the future based on the passage of time, which can be accelerated upon the occurrence of a contingent event; therefore, the Company’s noncontrolling interest is classified in temporary equity. The redemption value was based upon the estimated fair value of Continental Cement at the date of acquisition and the Company has elected to accrete changes in the redemption value of the noncontrolling interest over the period from the date of issuance to the earliest anticipated redemption date, which is currently May 2016, using an interest method. The accretion is as an adjustment to accumulated deficit. The redemption value of the redeemable noncontrolling interest as of June 29, 2013 approximated its carrying value.
2013 Acquisitions—The following describes the acquisitions that occurred in 2013 by region.
Central region
| | • | | On April 1, 2013, the Company acquired certain assets of Lafarge North America, Inc. in Wichita, Kansas, with borrowings under the Company’s revolving credit facility. |
West region
| | • | | On April 1, 2013, the Company acquired the membership interest of Westroc, LLC near Salt Lake City, Utah, with borrowings under the Company’s revolving credit facility. |
6
2012 Acquisitions—The following describes the acquisitions that occurred in 2012 by region.
Central region
| | • | | On February 29, 2012, the Company acquired certain assets of Norris Quarries, LLC (“Norris”), an aggregates business in northwest Missouri, with proceeds from debt, including the Company’s revolving credit facility. |
West region
| | • | | On November 30, 2012, the Company acquired the stock of Sandco, Inc., an aggregates and ready-mix business in Colorado, with cash on-hand. |
East region
| | • | | On October 5, 2012, the Company acquired certain assets of Kay & Kay Contracting, LLC, an aggregates, asphalt and paving business in Kentucky, with cash on-hand. |
The operating results of each acquisition have been included in the Company’s results of operations since the respective dates of the acquisitions. Assets acquired and liabilities assumed are measured at their acquisition-date fair value. The goodwill recognized in connection with the Company’s acquisitions is primarily attributable to the expected profitability, assembled workforces and operational infrastructure of the acquired businesses and the synergies expected to arise after the acquisition of those businesses.
The purchase price allocation for the Norris acquisition has been finalized. However, the purchase price allocation for the other 2012 acquisitions and the 2013 acquisitions has not been finalized due to the recent timing of the acquisitions. The following table summarizes the fair value of the assets acquired and liabilities assumed in conjunction with the 2013 and 2012 acquisitions:
| | | | | | | | |
| | | Six months ended
June 29, 2013 | | | Year ended
December 29, 2012 | |
Financial assets | | $ | 8,149 | | | $ | 1,403 | |
Inventories | | | 3,954 | | | | 6,988 | |
Plant and equipment | | | 42,930 | | | | 21,508 | |
Intangible assets | | | 7,356 | | | | 3,172 | |
Other assets | | | 51 | | | | 1,330 | |
Financial liabilities | | | (6,056 | ) | | | (944 | ) |
Other long term liabilities | | | (1,221 | ) | | | (364 | ) |
| | | | | | | | |
Net assets acquired | | | 55,163 | | | | 33,093 | |
Goodwill from current period acquisitions and working capital adjustments | | | 13,385 | | | | 26,259 | |
| | | | | | | | |
Purchase price | | | 68,548 | | | | 59,352 | |
| | | | | | | | |
Noncash transactions: | | | | | | | | |
Acquisition related liabilities | | | (7,769 | ) | | | (10,547 | ) |
Other | | | — | | | | (48 | ) |
| | | | | | | | |
Total noncash transactions | | | (7,769 | ) | | | (10,595 | ) |
| | | | | | | | |
Net cash paid for acquisitions | | $ | 60,779 | | | $ | 48,757 | |
| | | | | | | | |
Pro forma Financial Information (Unaudited)—The following unaudited supplemental pro forma information presents the financial results as if the 2012 acquisitions occurred on January 1, 2011. This supplemental pro forma information has been prepared for comparative purposes and does not purport to be indicative of what would have occurred had the acquisitions been made on January 1, 2011, nor is it indicative of any future results. The 2013 acquisitions were not material individually or in the aggregate.
7
| | | | | | | | |
| | | Three months ended
June 30, 2012 | | | Six months ended
June 30, 2012 | |
Revenue | | $ | 258,152 | | | $ | 381,276 | |
Net income (loss) | | | (7,681 | ) | | | (67,314 | ) |
Changes in the carrying amount of goodwill, by reportable segment, from December 29, 2012 to June 29, 2013 are summarized as follows:
| | | | | | | | | | | | | | | | |
| | | Central | | | West | | | East | | | Total | |
Balance, December 29, 2012 | | $ | 72,789 | | | $ | 91,393 | | | $ | 14,938 | | | $ | 179,120 | |
Acquisitions(i) | | | — | | | | 13,385 | | | | — | | | | 13,385 | |
| | | | | | | | | | | | | | | | |
Balance, June 29, 2013 | | $ | 72,789 | | | $ | 104,778 | | | $ | 14,938 | | | $ | 192,505 | |
| | | | | | | | | | | | | | | | |
| | (i) | Includes goodwill from a 2013 acquisition, a working capital settlement of $1.9 million that is clearly and directly associated with the purchase price consideration and working capital adjustments. |
| 4. | DISCONTINUED OPERATIONS |
The Company’s discontinued operations include railroad construction and repair business (referred to herein as railroad), environmental operations and certain concrete paving operations. The concrete paving operations were wound down in the second quarter of 2013; management expects the related assets to be sold within the next twelve months. The environmental operations primarily involved building retaining walls and removal and remediation of underground fuel storage tanks. The railroad and environmental operations were sold in 2012 in separate transactions for an aggregate $3.1 million. Prior to recognition as discontinued operations, these businesses were included in the East region’s operations.
Debt and interest expense were not allocated to discontinued operations since there was no debt specifically attributable to the operations. The businesses included in discontinued operations are organized within a limited liability company and pass their tax attributes for Federal and state tax purposes to their parent company. Revenue and loss before income tax expense included in discontinued operations for the three and six month periods ended June 29, 2013 and June 30, 2012 are summarized below:
| | | | | | | | | | | | | | | | |
| | | Three months ended | | | Six months ended | |
| | | June 29,
2013(1) | | | June 30,
2012(2) | | | June 29,
2013(1) | | | June 30,
2012(2) | |
Revenue | | $ | 304 | | | $ | 16,681 | | | $ | 3,805 | | | $ | 25,900 | |
Income (loss) from discontinued operations before income tax expense | | | 26 | | | | (2,221 | ) | | | (97 | ) | | | (1,724 | ) |
| | (1) | Consists of concrete paving operations (rail and environmental operations were sold in 2012) |
| | (2) | Consists of concrete paving, railroad and environmental operations |
8
| 5. | ACCOUNTS RECEIVABLE, NET |
Accounts receivable, net consists of the following:
| | | | | | | | |
| | | June 29,
2013 | | | December 29,
2012 | |
Trade accounts receivable | | $ | 107,514 | | | $ | 88,637 | |
Retention receivables | | | 13,861 | | | | 13,181 | |
Receivables from related parties | | | 1,292 | | | | 1,871 | |
| | | | | | | | |
Accounts receivable | | | 122,667 | | | | 103,689 | |
Less: Allowance for doubtful accounts | | | (3,110 | ) | | | (3,391 | ) |
| | | | | | | | |
Accounts receivable, net | | $ | 119,557 | | | $ | 100,298 | |
| | | | | | | | |
Retention receivables are amounts earned by the Company but held by customers until construction contracts and projects have been fully completed or near completion. Amounts are expected to be billed and collected within a year.
Inventories consist of the following:
| | | | | | | | |
| | | June 29,
2013 | | | December 29,
2012 | |
Aggregate stockpiles | | $ | 72,905 | | | $ | 62,872 | |
Finished goods | | | 12,668 | | | | 9,342 | |
Work in process | | | 4,153 | | | | 2,679 | |
Raw materials | | | 20,427 | | | | 18,084 | |
| | | | | | | | |
Total | | $ | 110,153 | | | $ | 92,977 | |
| | | | | | | | |
Debt consists of the following:
| | | | | | | | |
| | | June 29,
2013 | | | December 29,
2012 | |
Senior Secured Credit Facility, revolver(1) | | $ | 105,000 | | | $ | — | |
| | | | | | | | |
Long-term debt: | | | | | | | | |
$250.0 million senior notes, net of discount of $4.4 million at June 29, 2013 and $4.7 million at December 29, 2012 | | | 245,633 | | | | 245,303 | |
$420.9 million senior secured credit facility, term loan net of discount of $3.2 million at June 29, 2013 and $3.5 million at December 29, 2012 | | | 417,773 | | | | 394,540 | |
| | | | | | | | |
Total | | | 663,406 | | | | 639,843 | |
Current portion of long-term debt | | | 3,165 | | | | 4,000 | |
| | | | | | | | |
Long-term debt | | $ | 660,241 | | | $ | 635,843 | |
| | | | | | | | |
| | (1) | Five-year revolving Senior Secured Credit Facility due in 2017. |
9
The contractual payments of long-term debt, including current maturities and excluding the revolver, for the five years subsequent to June 29, 2013, are as follows:
| | | | |
2013 (six months) | | $ | 1,055 | |
2014 | | | 4,220 | |
2015 | | | 4,220 | |
2016 | | | 5,275 | |
2017 | | | 4,220 | |
2018 | | | 3,165 | |
Thereafter | | | 648,790 | |
| | | | |
Total | | | 670,945 | |
Less: Original issue discount | | | (7,539 | ) |
| | | | |
Total debt | | $ | 663,406 | |
| | | | |
Accrued interest on long term debt as of June 29, 2013 and December 29, 2012 was $12.5 million and $19.7 million, respectively. Interest expense related to debt totaled $12.8 million and $24.6 million for the three and six month periods ended June 29, 2013, respectively, and $13.4 million and $25.6 million for the three and six month periods ended June 30, 2012, respectively.
In January 2012, the Company and Summit Materials Finance Corp. issued $250.0 million aggregate principal amount of 10.5% Senior Notes due January 31, 2020 (“Senior Notes”) under an indenture (the “Indenture”). In addition to the Senior Notes, the Company has a credit facility which provides for term loans in an aggregate amount of $422.0 million and revolving credit commitments in an aggregate amount of $150.0 million (the “Senior Secured Credit Facility”). The debt was initially issued with an original issuance discount of $9.5 million, which was recorded as a reduction to debt and is being accreted with a charge to earnings over the term of the debt.
Senior Notes—The Senior Notes bear interest at 10.5% per year, payable semi-annually in arrears; interest payments commenced on July 31, 2012. The Indenture contains covenants limiting, among other things, the Company and its restricted subsidiaries’ ability to incur additional indebtedness or issue certain preferred shares, pay dividends, redeem stock or make other distributions, make certain investments, sell or transfer certain assets, create liens, consolidate, merge, sell or otherwise dispose of all or substantially all of the Company’s assets, enter into certain transactions with affiliates, and designate subsidiaries as unrestricted subsidiaries. The Indenture also contains customary events of default. As of June 29, 2013 and December 29, 2012, the Company was in compliance with all covenants.
Senior Secured Credit Facility—Under the Senior Secured Credit Facility, the Company has entered into term loans totaling $422.0 million with required principal repayments of 0.25% of term debt due on the last business day of each March, June, September and December. In February 2013, the Company consummated a repricing, which included additional borrowings of $25.0 million, an interest rate reduction on the term loan by 1.0% and a deferral of the March 2013 principal payment. The unpaid principal balance is due in full on the maturity date, which is January 30, 2019.
Under the Senior Secured Credit Facility, the Company has revolving credit commitments of $150.0 million. The revolving credit facility matures on January 30, 2017 and bears interest per annum equal to an applicable margin of 3.5% plus, at the Company’s option, either (i) a base rate determined by reference to the highest of (a) the Federal Funds rate plus 0.50%, (b) the prime rate of Bank of America, N.A. and (c) the British Bankers Association London Interbank Offered Rate (“LIBOR”) plus 1.00% or (ii) a British Bankers Association LIBOR rate determined by reference to Reuters prior to the interest period relevant to such borrowing adjusted for certain additional costs. The interest rate in effect at June 29, 2013 was 3.7%.
There was a $105.0 million outstanding balance under the revolver facility as of June 29, 2013, leaving remaining borrowing capacity, net of $14.5 million of outstanding letters of credit, of $30.5 million.
The Company must adhere to certain financial covenants related to its debt and interest leverage ratios, as defined in the Senior Secured Credit Facility. The consolidated first lien net leverage ratio, reported each quarter should be no greater than 4.75:1.0 from April 1, 2012 through June 30, 2014; 4.50:1.0 from July 1, 2014 to June 30, 2015, and 4.25:1.0 thereafter. The interest coverage ratio must be at least 1.70:1.0 from January 1, 2013 to December 31, 2014 and 1.85:1.0 thereafter. As of June 29, 2013 and December 29, 2012, the Company was in compliance with all covenants. The Company, along with all of its wholly-owned subsidiary companies and its non wholly-owned subsidiary, Continental Cement, are named as guarantors of the Senior Notes and the Senior Secured Credit Facility. In addition, the Company has pledged substantially all of its assets as collateral for the Senior Secured Credit Facility.
As of June 29, 2013 and December 29, 2012, $11.9 million and $12.6 million, respectively, of deferred financing fees were being amortized over the term of the debt using the effective interest method.
10
The Company is a limited liability company and passes its tax attributes for Federal and state tax purposes to its parent company and is generally not subject to Federal or state income tax. However, there are certain subsidiary entities that file Federal and state income tax returns due to their status as C corporations. The provision for income taxes is composed of Federal, state and local income taxes for the subsidiary entities that have C corporation status.
The effective income tax rate for these entities differs from the statutory Federal rate primarily due to (1) depletion expense and domestic production activities deduction, which are allowed as deductions for tax purposes but not recorded under GAAP, (2) state income taxes and the effect of graduated tax rates and (3) certain non-recurring items, such as differences in the treatment of transaction costs, which are often not deductible for tax purposes.
As of June 29, 2013 and December 29, 2012, the Company has not recognized a liability for uncertain tax positions. The Company records interest and penalties as a component of the income tax provision. No material interest or penalties were recognized in income tax expense for the three and six month periods ended June 29, 2013 and June 30, 2012.
| 9. | COMMITMENTS AND CONTINGENCIES |
Litigation and Claims—The Company is party to certain legal actions, claims and regulatory matters arising from the normal course of business. In the opinion of management, these actions are without merit or the ultimate disposition, if any, resulting from them will not have a material effect on the Company’s consolidated financial position, results of operations or liquidity. The Company records legal fees as incurred.
The Company is obligated under an indemnification agreement entered into with the sellers of Harper Contracting, Inc., Harper Sand and Gravel, Inc., Harper Ready Mix Company, Inc. and Harper Investments, Inc. (collectively, “Harper”) for the sellers’ ownership interests in a joint venture agreement. The Company has the rights to any benefits under the joint venture as well as the assumption of any obligations, but does not own equity interests in the joint venture. The joint venture has incurred significant losses on a highway project in Utah, which have resulted in requests for funding from the joint venture partners and, ultimately, from the Company. Through June 29, 2013, the Company has funded $8.8 million, $4.0 million of which was funded in the three and six month periods ended June 30, 2012. As of June 29, 2013 and December 29, 2012, an accrual of $4.3 million is recorded in other noncurrent liabilities as management’s best estimate of future funding obligations.
In 2013, a dispute with the sellers of Harper related to the calculation of working capital in connection with the August 2010 acquisition of Harper was settled. The working capital dispute was submitted to binding arbitration, the outcome of which resulted in the payment of $1.9 million to the sellers. In addition, various other acquisition-related disputes with Harper were settled in 2013 for approximately $0.8 million. The total payments of $2.7 million were made in the second quarter of 2013. There was no material impact to 2013 earnings as a result of these settlements.
During the course of business, there may be revisions to project costs and conditions that can give rise to change orders. Revisions can also result in claims made against a customer or subcontractor to recover project variances that have not been satisfactorily addressed through change orders with a customer. As of June 29, 2013 and December 29, 2012, unapproved change orders and claims totaled $3.7 million ($0.1 million in costs and estimated earnings in excess of billings and $3.6 million in other assets) and $4.8 million ($1.6 million in costs and estimated earnings in excess of billings and $3.2 million in other assets), respectively.
Environmental Remediation—The Company’s mining operations are subject to and affected by Federal, state and local laws and regulations relating to the environment, health and safety and other regulatory matters. These operations require environmental operating permits, which are subject to modification, renewal and revocation. Management regularly monitors and reviews its operations, procedures and policies for compliance with these laws and regulations. Despite these compliance efforts, risk of environmental liability is inherent in the operation of the Company’s business, as it is with other companies engaged in similar businesses, and there can be no assurance that environmental liabilities will not have a material adverse effect on the Company’s consolidated financial position, results of operations or liquidity in the future.
Other—In February 2011, the Company incurred a property loss related to a sunken barge with cement product aboard. Through June 29, 2013, the Company has recognized $3.3 million of charges for lost product aboard the barge and costs to remove the barge from the waterway. As of June 29, 2013, $1.8 million is included in accrued expenses as management’s best estimate of the remaining costs to remove the barge, which was recognized in earnings in the six months ended June 29, 2013.
The Company is obligated under various firm purchase commitments for certain raw materials and services that are in the ordinary course of business. Management does not expect any significant changes in the market value of these goods and services during the commitment period that would have a material adverse affect on the financial position, results of operations or liquidity of the Company.
11
| 10. | SUPPLEMENTAL CASH FLOW INFORMATION |
Supplemental cash flow information is as follows:
| | | | | | | | |
| | | Six months ended | |
| | | June 29,
2013 | | | June 30,
2012 | |
Cash payments: | | | | | | | | |
Interest | | $ | 31,439 | | | $ | 15,722 | |
Income taxes | | | 653 | | | | 670 | |
The Company has determined that it has three operating segments, which are its reportable segments: Central region, West region and East region. These segments are consistent with the Company’s management reporting structure. The operating results of each segment are regularly reviewed and evaluated separately by the Chief Executive Officer, the Company’s Chief Operating Decision Maker (“CODM”). The CODM evaluates the performance of its segments and allocates resources to them based on several factors, including a measurement of segment profit, which is computed as earnings before interest, taxes, depreciation, depletion, amortization and accretion. In addition, certain items such as management fees are excluded from the calculation of segment profit.
Each region has several acquired subsidiaries that are engaged in various activities related to the production, distribution and sale of construction materials and the provision of construction services. Assets employed by segment include assets directly identified with those operations. Corporate assets consist primarily of cash, property, plant and equipment for corporate operations and other assets not directly identifiable with a reportable business segment. The accounting policies applicable to each segment are consistent with those used in the consolidated financial statements. The following tables display selected financial data for the Company’s reportable business segments:
| | | | | | | | | | | | | | | | |
| | | Three months ended | | | Six months ended | |
| | | June 29,
2013 | | | June 30,
2012 | | | June 29,
2013 | | | June 30,
2012 | |
Revenue by region: | | | | | | | | | | | | | | | | |
Central region | | $ | 92,780 | | | $ | 86,006 | | | $ | 128,680 | | | $ | 128,497 | |
West region | | | 119,656 | | | | 128,867 | | | | 179,719 | | | | 196,125 | |
East region | | | 42,406 | | | | 40,683 | | | | 53,272 | | | | 50,817 | |
| | | | | | | | | | | | | | | | |
Total revenue | | $ | 254,842 | | | $ | 255,556 | | | $ | 361,671 | | | $ | 375,439 | |
| | | | | | | | | | | | | | | | |
12
| | | | | | | | | | | | | | | | |
| | | Three months ended | | | Six months ended | |
| | | June 29,
2013 | | | June 30,
2012 | | | June 29,
2013 | | | June 30,
2012 | |
Segment profit (loss): | | | | | | | | | | | | | | | | |
Central region | | $ | 25,136 | | | $ | 23,901 | | | $ | 19,182 | | | $ | 22,617 | |
West region | | | 6,807 | | | | 980 | | | | 85 | | | | (9,650 | ) |
East region | | | 7,155 | | | | 5,575 | | | | (2,377 | ) | | | (8,573 | ) |
Corporate and other (1) | | | (6,204 | ) | | | (3,909 | ) | | | (12,272 | ) | | | (11,048 | ) |
| | | | | | | | | | | | | | | | |
Total reportable segments and corporate | | | 32,894 | | | | 26,547 | | | | 4,618 | | | | (6,654 | ) |
Interest expense | | | 14,482 | | | | 14,713 | | | | 27,849 | | | | 28,826 | |
Depreciation, depletion, amortization and accretion | | | 18,894 | | | | 17,240 | | | | 36,026 | | | | 33,603 | |
| | | | | | | | | | | | | | | | |
Loss from continuing operations before taxes | | $ | (482 | ) | | $ | (5,406 | ) | | $ | (59,257 | ) | | $ | (69,083 | ) |
| | | | | | | | | | | | | | | | |
| | (1) | Corporate results primarily consist of compensation and office expenses for employees included in the Company’s headquarters and transactions costs. The increase in cost is primarily attributable to increased transaction costs in 2013 as a result of the Lafarge and Westroc acquisitions. |
| | | | | | | | |
| | | Six months ended | |
| | | June 29,
2013 | | | June 30,
2012 | |
Cash paid for capital expenditures: | | | | | | | | |
Central region | | $ | 19,826 | | | $ | 13,817 | |
West region | | | 14,194 | | | | 7,033 | |
East region | | | 5,742 | | | | 3,755 | |
| | | | | | | | |
Total reportable segments | | | 39,762 | | | | 24,605 | |
Corporate and other | | | 766 | | | | 64 | |
| | | | | | | | |
Total capital expenditures | | $ | 40,528 | | | $ | 24,669 | |
| | | | | | | | |
| | | | | | | | | | | | | | | | |
| | | Three months ended | | | Six months ended | |
| | | June 29,
2013 | | | June 30,
2012 | | | June 29,
2013 | | | June 30,
2012 | |
Depreciation, depletion, amortization and accretion: | | | | | | | | | | | | | | | | |
Central region | | $ | 8,687 | | | $ | 7,684 | | | $ | 16,329 | | | $ | 14,877 | |
West region | | | 6,456 | | | | 5,980 | | | | 12,291 | | | | 11,662 | |
East region | | | 3,729 | | | | 3,552 | | | | 7,362 | | | | 7,023 | |
| | | | | | | | | | | | | | | | |
Total reportable segments | | | 18,872 | | | | 17,216 | | | | 35,982 | | | | 33,562 | |
Corporate and other | | | 22 | | | | 24 | | | | 44 | | | | 41 | |
| | | | | | | | | | | | | | | | |
Total depreciation, depletion, amortization and accretion | | $ | 18,894 | | | $ | 17,240 | | | $ | 36,026 | | | $ | 33,603 | |
| | | | | | | | | | | | | | | | |
13
| | | | | | | | |
| | | June 29,
2013 | | | December 29,
2012 | |
Total assets: | | | | | | | | |
Central region | | $ | 675,270 | | | $ | 610,003 | |
West region | | | 472,032 | | | | 428,115 | |
East region | | | 226,024 | | | | 224,603 | |
| | | | | | | | |
Total reportable segments | | | 1,373,326 | | | | 1,262,721 | |
Corporate and other | | | 3,439 | | | | 18,492 | |
| | | | | | | | |
Total | | $ | 1,376,765 | | | $ | 1,281,213 | |
| | | | | | | | |
| | | | | | | | | | | | | | | | |
| | | Three months ended | | | Six months ended | |
| | | June 29,
2013 | | | June 30,
2012 | | | June 29,
2013 | | | June 30,
2012 | |
Revenue by product:* | | | | | | | | | | | | | | | | |
Aggregates | | $ | 47,439 | | | $ | 42,735 | | | $ | 68,304 | | | $ | 66,681 | |
Asphalt | | | 55,857 | | | | 62,960 | | | | 75,208 | | | | 82,166 | |
Ready mix | | | 33,279 | | | | 30,942 | | | | 46,412 | | | | 46,537 | |
Cement | | | 21,474 | | | | 21,096 | | | | 30,914 | | | | 31,377 | |
Construction and paving | | | 125,536 | | | | 130,750 | | | | 171,946 | | | | 184,087 | |
Other | | | (28,743 | ) | | | (32,927 | ) | | | (31,113 | ) | | | (35,409 | ) |
| | | | | | | | | | | | | | | | |
Total revenue | | $ | 254,842 | | | $ | 255,556 | | | $ | 361,671 | | | $ | 375,439 | |
| | | | | | | | | | | | | | | | |
| | * | Revenue by product includes intercompany sales transferred at market value. The elimination of intercompany transactions is included in Other |
| 12. | RELATED PARTY TRANSACTIONS |
The Company incurred certain management fees due to Blackstone Management Partners L.L.C. (“BMP”) totaling $0.6 million and $1.2 million during the three and six month periods ended June 29, 2013, respectively, and $0.3 million and $0.9 million during the three and six month periods ended June 30, 2012, respectively, under terms of an agreement with Summit Materials Holdings L.P., and BMP. Under the terms of the agreement, BMP is permitted to, and has, assigned a portion of the fees to which it is entitled to receive to Silverhawk Summit, L.P. and to certain equity-holding members of management. The fees were paid for consultancy services related to acquisition activities and are included in general and administrative expenses.
The Company had $0.4 million of revenue from unconsolidated affiliates during both the three and six month periods ended June 29, 2013 and $0.8 million and $3.1 million during the three and six month periods ended June 30, 2012, respectively. As of June 29, 2013 and December 29, 2012, accounts receivable from affiliates was $0.1 million and $1.9 million, respectively.
Cement sales to companies owned by a noncontrolling member of Continental Cement were approximately $3.5 million and $5.1 million during the three and six month periods ended June 29, 2013, respectively, and $3.0 million and $5.2 million during the three and six month periods ended June 30, 2012, respectively. Accounts receivables due from the noncontrolling member were $1.3 million and $1.0 million as of June 29, 2013 and December 29, 2012, respectively. In addition, as of June 29, 2013 and December 29, 2012, the Company owed $1.0 million and $2.1 million, respectively, to a noncontrolling member of Continental Cement for accrued interest on a related party note. The principal balance on the note was repaid in January 2012.
| 13. | GUARANTOR AND NON GUARANTOR FINANCIAL INFORMATION |
The Company, along with its domestic wholly-owned subsidiary companies (“Wholly-owned Guarantors”) and non wholly-owned subsidiary, Continental Cement (“Non Wholly-owned Guarantor”), are named as guarantors (collectively, the “Guarantors”) of the Senior Notes and the Senior Secured Credit Facility. Certain other partially owned subsidiaries, do not guarantee the Senior Notes (collectively, the “Non-Guarantors”), which includes a subsidiary of Continental Cement. The Guarantors provide a joint and several, full and unconditional guarantee of the Senior Notes. There are no significant restrictions on the Company’s ability to obtain funds from any of the Guarantor Subsidiaries in the form of a dividend or loan. Additionally, there are no significant restrictions on a Guarantor Subsidiary’s ability to obtain funds from the Company or its direct or indirect subsidiaries.
14
The following condensed consolidating balance sheets, statements of operations and cash flows are provided for the Company (referred to as “Parent” in the condensed financial statements below), the Non-Wholly-owned Guarantor, the Wholly-owned Guarantors and the Non-Guarantors. Summit Materials Finance Corp. as a co-issuer of the Senior Notes had no transactions during the respective periods or assets as of June 29, 2013 and December 29, 2012. Earnings from subsidiaries are included in other (income) expense in the condensed consolidated statements of operations below. The financial information may not necessarily be indicative of results of operations, cash flows or financial position had the guarantor or non-guarantor subsidiaries operated as independent entities.
15
Condensed Consolidating Balance Sheets
June 29, 2013
| | | | | | | | | | | | | | | | | | | | | | | | |
| | | Summit
Materials
LLC
(Parent) | | | Non-
Wholly-
owned
Guarantor | | | Wholly-
owned
Guarantors | | | Non-
Guarantors | | | Eliminations | | | Consolidated | |
| Assets | | | | | | | | | | | | | | | | | | | | | | | | |
Current assets: | | | | | | | | | | | | | | | | | | | | | | | | |
Cash | | $ | 947 | | | $ | 8 | | | $ | 11,329 | | | $ | 107 | | | $ | (4,736 | ) | | $ | 7,655 | |
Accounts receivable, net | | | — | | | | 10,492 | | | | 107,362 | | | | 3,320 | | | | (1,617 | ) | | | 119,557 | |
Intercompany receivables | | | 13,887 | | | | — | | | | 59,863 | | | | — | | | | (73,750 | ) | | | — | |
Cost and estimated earnings in excess of billings | | | — | | | | — | | | | 24,070 | | | | 286 | | | | — | | | | 24,356 | |
Inventories | | | — | | | | 9,634 | | | | 98,066 | | | | 2,453 | | | | — | | | | 110,153 | |
Other current assets | | | 834 | | | | 713 | | | | 10,912 | | | | 261 | | | | (724 | ) | | | 11,996 | |
| | | | | | | | | | | | | | | | | | | | | | | | |
Total current assets | | | 15,668 | | | | 20,847 | | | | 311,602 | | | | 6,427 | | | | (80,827 | ) | | | 273,717 | |
Property, plant and equipment, net | | | 1,796 | | | | 298,939 | | | | 550,389 | | | | 7,395 | | | | — | | | | 858,519 | |
Goodwill | | | — | | | | 23,124 | | | | 168,409 | | | | 972 | | | | — | | | | 192,505 | |
Intangible assets, net | | | — | | | | 692 | | | | 14,903 | | | | — | | | | — | | | | 15,595 | |
Other assets | | | 321,569 | | | | 13,401 | | | | 154,857 | | | | 1,232 | | | | (454,630 | ) | | | 36,429 | |
| | | | | | | | | | | | | | | | | | | | | | | | |
Total assets | | $ | 339,033 | | | $ | 357,003 | | | $ | 1,200,160 | | | $ | 16,026 | | | $ | (535,457 | ) | | $ | 1,376,765 | |
| | | | | | | | | | | | | | | | | | | | | | | | |
| Liabilities, Redeemable Noncontrolling Interest and Member’s Interest | | | | | | | | | | | | | | | | | | | | | | | | |
Current liabilities: | | | | | | | | | | | | | | | | | | | | | | | | |
Current portion of debt | | $ | — | | | $ | 763 | | | $ | 107,402 | | | $ | — | | | $ | — | | | $ | 108,165 | |
Current portion of acquisition-related liabilities | | | — | | | | — | | | | 11,115 | | | | — | | | | — | | | | 11,115 | |
Accounts payable | | | 2,512 | | | | 8,815 | | | | 65,104 | | | | 1,014 | | | | (1,617 | ) | | | 75,828 | |
Accrued expenses | | | 10,031 | | | | 8,667 | | | | 41,745 | | | | 1,280 | | | | (5,460 | ) | | | 56,263 | |
Intercompany payables | | | — | | | | 8,788 | | | | 60,212 | | | | 4,750 | | | | (73,750 | ) | | | — | |
Billings in excess of costs and estimated earnings | | | — | | | | — | | | | 5,476 | | | | 107 | | | | — | | | | 5,583 | |
| | | | | | | | | | | | | | | | | | | | | | | | |
Total current liabilities | | | 12,543 | | | | 27,033 | | | | 291,054 | | | | 7,151 | | | | (80,827 | ) | | | 256,954 | |
Long-term debt | | | — | | | | 155,100 | | | | 505,141 | | | | — | | | | — | | | | 660,241 | |
Acquisition-related liabilities | | | — | | | | — | | | | 28,052 | | | | — | | | | — | | | | 28,052 | |
Other noncurrent liabilities | | | 353 | | | | 26,098 | | | | 54,682 | | | | — | | | | — | | | | 81,133 | |
| | | | | | | | | | | | | | | | | | | | | | | | |
Total liabilities | | | 12,896 | | | | 208,231 | | | | 878,929 | | | | 7,151 | | | | (80,827 | ) | | | 1,026,380 | |
Redeemable noncontrolling interest | | | — | | | | — | | | | — | | | | — | | | | 23,150 | | | | 23,150 | |
Redeemable members’ interest | | | — | | | | 23,150 | | | | — | | | | — | | | | (23,150 | ) | | | — | |
Total member’s interest | | | 326,137 | | | | 125,622 | | | | 321,231 | | | | 8,875 | | | | (454,630 | ) | | | 327,235 | |
| | | | | | | | | | | | | | | | | | | | | | | | |
Total liabilities, redeemable noncontrolling interest and member’s interest | | $ | 339,033 | | | $ | 357,003 | | | $ | 1,200,160 | | | $ | 16,026 | | | $ | (535,457 | ) | | $ | 1,376,765 | |
| | | | | | | | | | | | | | | | | | | | | | | | |
16
Condensed Consolidating Balance Sheets
December 29, 2012
| | | | | | | | | | | | | | | | | | | | | | | | |
| | | Summit
Materials
LLC
(Parent) | | | Non-
Wholly-
owned
Guarantor | | | Wholly-
owned
Guarantors | | | Non-
Guarantors | | | Eliminations | | | Consolidated | |
| Assets | | | | | | | | | | | | | | | | | | | | | | | | |
Current assets: | | | | | | | | | | | | | | | | | | | | | | | | |
Cash | | $ | 697 | | | $ | 397 | | | $ | 30,981 | | | $ | 680 | | | $ | (5,324 | ) | | $ | 27,431 | |
Accounts receivable, net | | | — | | | | 7,421 | | | | 90,765 | | | | 3,255 | | | | (1,143 | ) | | | 100,298 | |
Intercompany receivables | | | 14,931 | | | | 15,557 | | | | 9,018 | | | | — | | | | (39,506 | ) | | | — | |
Cost and estimated earnings in excess of billings | | | — | | | | — | | | | 11,428 | | | | 147 | | | | — | | | | 11,575 | |
Inventories | | | — | | | | 7,073 | | | | 84,555 | | | | 1,349 | | | | — | | | | 92,977 | |
Other current assets | | | 25 | | | | 726 | | | | 8,447 | | | | 2,409 | | | | (1,539 | ) | | | 10,068 | |
| | | | | | | | | | | | | | | | | | | | | | | | |
Total current assets | | | 15,653 | | | | 31,174 | | | | 235,194 | | | | 7,840 | | | | (47,512 | ) | | | 242,349 | |
Property, plant and equipment, net | | | 1,074 | | | | 287,677 | | | | 517,994 | | | | 6,862 | | | | — | | | | 813,607 | |
Goodwill | | | — | | | | 23,124 | | | | 155,024 | | | | 972 | | | | — | | | | 179,120 | |
Intangible assets, net | | | — | | | | 742 | | | | 7,864 | | | | — | | | | — | | | | 8,606 | |
Other assets | | | 374,581 | | | | 11,891 | | | | 161,442 | | | | 1,315 | | | | (511,698 | ) | | | 37,531 | |
| | | | | | | | | | | | | | | | | | | | | | | | |
Total assets | | $ | 391,308 | | | $ | 354,608 | | | $ | 1,077,518 | | | $ | 16,989 | | | $ | (559,210 | ) | | $ | 1,281,213 | |
| | | | | | | | | | | | | | | | | | | | | | | | |
| Liabilities, Redeemable Noncontrolling Interest and Member’s Interest | | | | | | | | | | | | | | | | | | | | | | | | |
Current liabilities: | | | | | | | | | | | | | | | | | | | | | | | | |
Current portion of debt | | $ | — | | | $ | 965 | | | $ | 3,035 | | | $ | — | | | $ | — | | | $ | 4,000 | |
Current portion of acquisition-related liabilities | | | — | | | | — | | | | 9,525 | | | | — | | | | — | | | | 9,525 | |
Accounts payable | | | 2,745 | | | | 6,715 | | | | 51,179 | | | | 2,138 | | | | (1,143 | ) | | | 61,634 | |
Accrued expenses | | | 6,877 | | | | 10,742 | | | | 38,050 | | | | 1,015 | | | | (6,862 | ) | | | 49,822 | |
Intercompany payables | | | — | | | | — | | | | 33,396 | | | | 6,110 | | | | (39,506 | ) | | | — | |
Billings in excess of costs and estimated earnings | | | — | | | | — | | | | 6,656 | | | | 270 | | | | — | | | | 6,926 | |
| | | | | | | | | | | | | | | | | | | | | | | | |
Total current liabilities | | | 9,622 | | | | 18,422 | | | | 141,841 | | | | 9,533 | | | | (47,511 | ) | | | 131,907 | |
Long-term debt | | | — | | | | 155,394 | | | | 480,449 | | | | — | | | | — | | | | 635,843 | |
Acquisition-related liabilities | | | — | | | | — | | | | 23,919 | | | | — | | | | — | | | | 23,919 | |
Other noncurrent liabilities | | | 395 | | | | 27,091 | | | | 56,780 | | | | — | | | | — | | | | 84,266 | |
| | | | | | | | | | | | | | | | | | | | | | | | |
Total liabilities | | | 10,017 | | | | 200,907 | | | | 702,989 | | | | 9,533 | | | | (47,511 | ) | | | 875,935 | |
Redeemable noncontrolling interest | | | — | | | | — | | | | — | | | | — | | | | 22,850 | | | | 22,850 | |
Redeemable members’ interest | | | — | | | | 22,850 | | | | — | | | | — | | | | (22,850 | ) | | | — | |
Total member’s interest | | | 381,291 | | | | 130,851 | | | | 374,529 | | | | 7,456 | | | | (511,699 | ) | | | 382,428 | |
| | | | | | | | | | | | | | | | | | | | | | | | |
Total liabilities, redeemable noncontrolling interest and member’s interest | | $ | 391,308 | | | $ | 354,608 | | | $ | 1,077,518 | | | $ | 16,989 | | | $ | (559,210 | ) | | $ | 1,281,213 | |
| | | | | | | | | | | | | | | | | | | | | | | | |
17
Condensed Consolidating Statements of Operations
For the three months ended June 29, 2013
| | | | | | | | | | | | | | | | | | | | | | | | |
| | | Summit
Materials
LLC
(Parent) | | | Non-
Wholly-
owned
Guarantor | | | Wholly-
owned
Guarantors | | | Non-
Guarantors | | | Eliminations | | | Consolidated | |
Revenue | | $ | — | | | $ | 22,888 | | | $ | 221,141 | | | $ | 14,559 | | | $ | (3,746 | ) | | $ | 254,842 | |
| | | | | | | | | | | | | | | | | | | | | | | | |
Cost of revenue (exclusive of items shown separately below) | | | — | | | | 13,328 | | | | 162,633 | | | | 9,628 | | | | (3,746 | ) | | | 181,843 | |
General and administrative expenses | | | 1,244 | | | | 1,695 | | | | 36,139 | | | | 314 | | | | — | | | | 39,392 | |
Depreciation, depletion, amortization and accretion | | | 22 | | | | 2,868 | | | | 15,743 | | | | 261 | | | | — | | | | 18,894 | |
Transaction costs | | | — | | | | — | | | | 982 | | | | — | | | | — | | | | 982 | |
| | | | | | | | | | | | | | | | | | | | | | | | |
Operating (loss) income | | | (1,266 | ) | | | 4,997 | | | | 5,644 | | | | 4,356 | | | | — | | | | 13,731 | |
Other expense (income), net | | | 403 | | | | (1,240 | ) | | | (1,632 | ) | | | 47 | | | | 2,153 | | | | (269 | ) |
Interest expense | | | — | | | | 2,692 | | | | 12,825 | | | | 114 | | | | (1,149 | ) | | | 14,482 | |
| | | | | | | | | | | | | | | | | | | | | | | | |
(Loss) income from continuing operations before taxes | | | (1,669 | ) | | | 3,545 | | | | (5,549 | ) | | | 4,195 | | | | (1,004 | ) | | | (482 | ) |
Income tax expense | | | — | | | | — | | | | (726 | ) | | | — | | | | — | | | | (726 | ) |
| | | | | | | | | | | | | | | | | | | | | | | | |
(Loss) income from continuing operations | | | (1,669 | ) | | | 3,545 | | | | (4,823 | ) | | | 4,195 | | | | (1,004 | ) | | | 244 | |
Income from discontinued operations | | | — | | | | — | | | | 26 | | | | — | | | | — | | | | 26 | |
| | | | | | | | | | | | | | | | | | | | | | | | |
Net (loss) income | | | (1,669 | ) | | | 3,545 | | | | (4,797 | ) | | | 4,195 | | | | (1,004 | ) | | | 270 | |
Net income attributable to noncontrolling interest | | | — | | | | — | | | | — | | | | — | | | | 1,939 | | | | 1,939 | |
| | | | | | | | | | | | | | | | | | | | | | | | |
Net (loss) income attributable to member of Summit Materials, LLC | | $ | (1,669 | ) | | $ | 3,545 | | | $ | (4,797 | ) | | $ | 4,195 | | | $ | (2,943 | ) | | $ | (1,669 | ) |
| | | | | | | | | | | | | | | | | | | | | | | | |
18
Condensed Consolidating Statements of Operations
For the three months ended June 30, 2012
| | | | | | | | | | | | | | | | | | | | | | | | |
| | | Summit
Materials
LLC
(Parent) | | | Non-
Wholly-
owned
Guarantor | | | Wholly-
owned
Guarantors | | | Non-
Guarantors | | | Eliminations | | | Consolidated | |
Revenue | | | — | | | | 22,157 | | | | 226,682 | | | | 8,339 | | | | (1,622 | ) | | | 255,556 | |
| | | | | | | | | | | | | | | | | | | | | | | | |
Cost of revenue (exclusive of items shown separately below) | | | — | | | | 12,836 | | | | 179,661 | | | | 3,906 | | | | (1,622 | ) | | | 194,781 | |
General and administrative expenses | | | 1,563 | | | | 1,515 | | | | 31,581 | | | | 264 | | | | — | | | | 34,923 | |
Depreciation, depletion, amortization and accretion | | | 23 | | | | 2,555 | | | | 14,404 | | | | 258 | | | | — | | | | 17,240 | |
Transaction costs | | | — | | | | — | | | | (403 | ) | | | — | | | | — | | | | (403 | ) |
| | | | | | | | | | | | | | | | | | | | | | | | |
Operating (loss) income | | | (1,586 | ) | | | 5,251 | | | | 1,439 | | | | 3,911 | | | | — | | | | 9,015 | |
Other expense (income), net | | | 6,076 | | | | (1,140 | ) | | | (672 | ) | | | — | | | | (4,556 | ) | | | (292 | ) |
Interest expense | | | — | | | | 2,955 | | | | 11,935 | | | | 155 | | | | (332 | ) | | | 14,713 | |
| | | | | | | | | | | | | | | | | | | | | | | | |
(Loss) income from continuing operations before taxes | | | (7,662 | ) | | | 3,436 | | | | (9,824 | ) | | | 3,756 | | | | 4,888 | | | | (5,406 | ) |
Income tax expense | | | 5 | | | | — | | | | 210 | | | | — | | | | — | | | | 215 | |
| | | | | | | | | | | | | | | | | | | | | | | | |
(Loss) income from continuing operations | | | (7,667 | ) | | | 3,436 | | | | (10,034 | ) | | | 3,756 | | | | 4,888 | | | | (5,621 | ) |
Loss from discontinued operations | | | — | | | | — | | | | (2,221 | ) | | | — | | | | — | | | | (2,221 | ) |
| | | | | | | | | | | | | | | | | | | | | | | | |
Net (loss) income | | | (7,667 | ) | | | 3,436 | | | | (12,255 | ) | | | 3,756 | | | | 4,888 | | | | (7,842 | ) |
Net loss attributable to noncontrolling interest | | | — | | | | — | | | | — | | | | — | | | | (175 | ) | | | (175 | ) |
| | | | | | | | | | | | | | | | | | | | | | | | |
Net (loss) income attributable to member of Summit Materials, LLC | | | (7,667 | ) | | | 3,436 | | | | (12,255 | ) | | | 3,756 | | | | 5,063 | | | | (7,667 | ) |
| | | | | | | | | | | | | | | | | | | | | | | | |
19
Condensed Consolidating Statements of Operations
For the six months ended June 29, 2013
| | | | | | | | | | | | | | | | | | | | | | | | |
| | | Summit
Materials
LLC
(Parent) | | | Non-
Wholly-
owned
Guarantor | | | Wholly-
owned
Guarantors | | | Non-
Guarantors | | | Eliminations | | | Consolidated | |
Revenue | | $ | — | | | $ | 32,799 | | | $ | 314,895 | | | $ | 20,486 | | | $ | (6,509 | ) | | $ | 361,671 | |
| | | | | | | | | | | | | | | | | | | | | | | | |
Cost of revenue (exclusive of items shown separately below) | | | — | | | | 27,833 | | | | 243,357 | | | | 13,235 | | | | (6,509 | ) | | | 277,916 | |
General and administrative expenses | | | 2,896 | | | | 5,083 | | | | 64,832 | | | | 584 | | | | — | | | | 73,395 | |
Depreciation, depletion, amortization and accretion | | | 44 | | | | 5,532 | | | | 29,938 | | | | 512 | | | | — | | | | 36,026 | |
Transaction costs | | | — | | | | — | | | | 2,464 | | | | — | | | | — | | | | 2,464 | |
| | | | | | | | | | | | | | | | | | | | | | | | |
Operating (loss) income | | | (2,940 | ) | | | (5,649 | ) | | | (25,696 | ) | | | 6,155 | | | | — | | | | (28,130 | ) |
Other expense (income), net | | | 51,549 | | | | (1,295 | ) | | | 1,529 | | | | 174 | | | | (48,679 | ) | | | 3,278 | |
Interest expense | | | — | | | | 5,423 | | | | 24,095 | | | | 239 | | | | (1,908 | ) | | | 27,849 | |
| | | | | | | | | | | | | | | | | | | | | | | | |
(Loss) income from continuing operations before taxes | | | (54,489 | ) | | | (9,777 | ) | | | (51,320 | ) | | | 5,742 | | | | 50,587 | | | | (59,257 | ) |
Income tax benefit | | | — | | | | — | | | | (3,347 | ) | | | — | | | | — | | | | (3,347 | ) |
| | | | | | | | | | | | | | | | | | | | | | | | |
(Loss) income from continuing operations | | | (54,489 | ) | | | (9,777 | ) | | | (47,973 | ) | | | 5,742 | | | | 50,587 | | | | (55,910 | ) |
Loss from discontinued operations | | | — | | | | — | | | | (97 | ) | | | — | | | | — | | | | (97 | ) |
| | | | | | | | | | | | | | | | | | | | | | | | |
Net (loss) income | | | (54,489 | ) | | | (9,777 | ) | | | (48,070 | ) | | | 5,742 | | | | 50,587 | | | | (56,007 | ) |
Net loss attributable to noncontrolling interest | | | — | | | | — | | | | — | | | | — | | | | (1,518 | ) | | | (1,518 | ) |
| | | | | | | | | | | | | | | | | | | | | | | | |
Net (loss) income attributable to member of Summit Materials, LLC | | $ | (54,489 | ) | | $ | (9,777 | ) | | $ | (48,070 | ) | | $ | 5,742 | | | $ | 52,105 | | | $ | (54,489 | ) |
| | | | | | | | | | | | | | | | | | | | | | | | |
20
Condensed Consolidating Statements of Operations
For the six months ended June 30, 2012
| | | | | | | | | | | | | | | | | | | | | | | | |
| | | Summit
Materials
LLC
(Parent) | | | Non-
Wholly-
owned
Guarantor | | | Wholly-
owned
Guarantors | | | Non-
Guarantors | | | Eliminations | | | Consolidated | |
Revenue | | $ | — | | | $ | 33,002 | | | $ | 335,871 | | | $ | 12,852 | | | $ | (6,286 | ) | | $ | 375,439 | |
| | | | | | | | | | | | | | | | | | | | | | | | |
Cost of revenue (exclusive of items shown separately below) | | | — | | | | 26,290 | | | | 279,063 | | | | 6,476 | | | | (6,286 | ) | | | 305,543 | |
General and administrative expenses | | | 2,822 | | | | 2,912 | | | | 59,633 | | | | 550 | | | | — | | | | 65,917 | |
Depreciation, depletion, amortization and accretion | | | 41 | | | | 4,992 | | | | 28,052 | | | | 518 | | | | — | | | | 33,603 | |
Transaction costs | | | — | | | | — | | | | 1,532 | | | | — | | | | — | | | | 1,532 | |
| | | | | | | | | | | | | | | | | | | | | | | | |
Operating (loss) income | | | (2,863 | ) | | | (1,192 | ) | | | (32,409 | ) | | | 5,308 | | | | — | | | | (31,156 | ) |
Other expense (income), net | | | 65,457 | | | | (495 | ) | | | 8,454 | | | | 80 | | | | (64,395 | ) | | | 9,101 | |
Interest expense | | | — | | | | 6,121 | | | | 23,203 | | | | 309 | | | | (807 | ) | | | 28,826 | |
| | | | | | | | | | | | | | | | | | | | | | | | |
(Loss) income from conitnuing operations before taxes | | | (68,320 | ) | | | (6,818 | ) | | | (64,066 | ) | | | 4,919 | | | | 65,202 | | | | (69,083 | ) |
Income tax expense (benefit) | | | 5 | | | | — | | | | (1,968 | ) | | | — | | | | — | | | | (1,963 | ) |
| | | | | | | | | | | | | | | | | | | | | | | | |
(Loss) income from continuing operations | | | (68,325 | ) | | | (6,818 | ) | | | (62,098 | ) | | | 4,919 | | | | 65,202 | | | | (67,120 | ) |
Loss from discontinued operations | | | — | | | | — | | | | (1,724 | ) | | | — | | | | — | | | | (1,724 | ) |
| | | | | | | | | | | | | | | | | | | | | | | | |
Net (loss) income | | | (68,325 | ) | | | (6,818 | ) | | | (63,822 | ) | | | 4,919 | | | | 65,202 | | | | (68,844 | ) |
Net loss attributable to noncontrolling interest | | | — | | | | — | | | | — | | | | — | | | | (519 | ) | | | (519 | ) |
| | | | | | | | | | | | | | | | | | | | | | | | |
Net (loss) income attributable to member of Summit Materials, LLC | | $ | (68,325 | ) | | $ | (6,818 | ) | | $ | (63,822 | ) | | $ | 4,919 | | | $ | 65,721 | | | $ | (68,325 | ) |
| | | | | | | | | | | | | | | | | | | | | | | | |
21
Condensed Consolidating Statements of Cash Flows
For the six months ended June 29, 2013
| | | | | | | | | | | | | | | | | | | | | | | | |
| | | Summit
Materials
LLC
(Parent) | | | Non-
Wholly-
owned
Guarantors | | | Wholly-
owned
Guarantors | | | Non-
Guarantors | | | Eliminations | | | Consolidated | |
Net cash (used in) provided by operating activities | | $ | (28 | ) | | $ | (12,542 | ) | | $ | (39,989 | ) | | $ | 4,799 | | | $ | — | | | $ | (47,760 | ) |
| | | | | | | | | | | | | | | | | | | | | | | | |
Cash flow from investing activities: | | | | | | | | | | | | | | | | | | | | | | | | |
Acquisitions, net of cash acquired | | | — | | | | — | | | | (60,779 | ) | | | — | | | | — | | | | (60,779 | ) |
Purchase of property, plant and equipment | | | (766 | ) | | | (15,214 | ) | | | (23,514 | ) | | | (1,034 | ) | | | — | | | | (40,528 | ) |
Proceeds from the sale of property, plant, and equipment | | | — | | | | — | | | | 7,086 | | | | — | | | | — | | | | 7,086 | |
| | | | | | | | | | | | | | | | | | | | | | | | |
Net cash used for investing activities | | | (766 | ) | | | (15,214 | ) | | | (77,207 | ) | | | (1,034 | ) | | | — | | | | (94,221 | ) |
| | | | | | | | | | | | | | | | | | | | | | | | |
Cash flow from financing activities: | | | | | | | | | | | | | | | | | | | | | | | | |
Net proceeds from debt issuance | | | 186,974 | | | | — | | | | — | | | | — | | | | — | | | | 186,974 | |
Loans received from and payments made on loans from other Summit Companies | | | (124,587 | ) | | | 27,367 | | | | 100,970 | | | | (4,338 | ) | | | 588 | | | | — | |
Payments on long-term debt | | | (61,343 | ) | | | — | | | | — | | | | — | | | | — | | | | (61,343 | ) |
Payments on acquisition-related liabilities | | | — | | | | — | | | | (3,426 | ) | | | — | | | | — | | | | (3,426 | ) |
| | | | | | | | | | | | | | | | | | | | | | | | |
Net cash provided by (used for) financing activities | | | 1,044 | | | | 27,367 | | | | 97,544 | | | | (4,338 | ) | | | 588 | | | | 122,205 | |
| | | | | | | | | | | | | | | | | | | | | | | | |
Net increase (decrease) in cash | | | 250 | | | | (389 | ) | | | (19,652 | ) | | | (573 | ) | | | 588 | | | | (19,776 | ) |
Cash — Beginning of period | | | 697 | | | | 397 | | | | 30,981 | | | | 680 | | | | (5,324 | ) | | | 27,431 | |
| | | | | | | | | | | | | | | | | | | | | | | | |
Cash— End of period | | $ | 947 | | | $ | 8 | | | $ | 11,329 | | | $ | 107 | | | $ | (4,736 | ) | | $ | 7,655 | |
| | | | | | | | | | | | | | | | | | | | | | | | |
22
Condensed Consolidating Statements of Cash Flows
For the six months ended June 30, 2012
| | | | | | | | | | | | | | | | | | | | | | | | |
| | | Summit
Materials
LLC
(Parent) | | | Non-
Wholly-
owned
Guarantors | | | Wholly-
owned
Guarantors | | | Non-
Guarantors | | | Eliminations | | | Consolidated | |
Net cash (used in) provided by operating activities | | $ | (3,455 | ) | | $ | (2,191 | ) | | $ | (26,415 | ) | | $ | 3,608 | | | $ | — | | | $ | (28,453 | ) |
| | | | | | | | | | | | | | | | | | | | | | | | |
Cash flow from investing activities: | | | | | | | | | | | | | | | | | | | | | | | | |
Acquisitions, net of cash acquired | | | — | | | | — | | | | (42,933 | ) | | | — | | | | — | | | | (42,933 | ) |
Purchase of property, plant and equipment | | | (63 | ) | | | (7,403 | ) | | | (16,954 | ) | | | (249 | ) | | | — | | | | (24,669 | ) |
Proceeds from the sale of property, plant, and equipment | | | — | | | | 66 | | | | 2,806 | | | | 74 | | | | — | | | | 2,946 | |
| | | | | | | | | | | | | | | | | | | | | | | | |
Net cash used for investing activities | | | (63 | ) | | | (7,337 | ) | | | (57,081 | ) | | | (175 | ) | | | — | | | | (64,656 | ) |
| | | | | | | | | | | | | | | | | | | | | | | | |
Cash flow from financing activities: | | | | | | | | | | | | | | | | | | | | | | | | |
Net proceeds from debt issuance | | | — | | | | 7,000 | | | | 686,434 | | | | — | | | | — | | | | 693,434 | |
Loans received from and payments made on loans from other Summit Companies | | | — | | | | 3,354 | | | | 1,100 | | | | (4,454 | ) | | | — | | | | — | |
Payments on long-term debt | | | — | | | | (3,042 | ) | | | (615,399 | ) | | | — | | | | — | | | | (618,441 | ) |
Payments on acquisition-related liabilities | | | — | | | | — | | | | (2,670 | ) | | | — | | | | — | | | | (2,670 | ) |
Other | | | (656 | ) | | | 2,600 | | | | (2,363 | ) | | | (282 | ) | | | — | | | | (701 | ) |
| | | | | | | | | | | | | | | | | | | | | | | | |
Net cash (used for) provided by financing activities | | | (656 | ) | | | 9,912 | | | | 67,102 | | | | (4,736 | ) | | | — | | | | 71,622 | |
| | | | | | | | | | | | | | | | | | | | | | | | |
Net decrease (increase) in cash | | | (4,174 | ) | | | 384 | | | | (16,394 | ) | | | (1,303 | ) | | | — | | | | (21,487 | ) |
Cash — Beginning of period | | | 6,701 | | | | 8 | | | | 33,997 | | | | 2,084 | | | | — | | | | 42,790 | |
| | | | | | | | | | | | | | | | | | | | | | | | |
Cash— End of period | | $ | 2,527 | | | $ | 392 | | | $ | 17,603 | | | $ | 781 | | | $ | — | | | $ | 21,303 | |
| | | | | | | | | | | | | | | | | | | | | | | | |
* * *
23
| ITEM 2. | MANAGEMENT’S DISCUSSION AND ANALYSIS OF FINANCIAL CONDITION AND RESULTS OF OPERATIONS |
This Management’s Discussion and Analysis of Financial Condition and Results of Operations is intended to assist in understanding and assessing the trends and significant changes in our results of operations and financial condition. Historical results may not be indicative of future performance. Our forward-looking statements reflect our current views about future events, are based on assumptions and are subject to known and unknown risks and uncertainties that could cause actual results to differ materially from those contemplated by these statements. Factors that may cause differences between actual results and those contemplated by forward-looking statements include, but are not limited to, those discussed in the section entitled “Risk Factors” in the Prospectus and any factors discussed in the sections entitled “Cautionary Note Regarding Forward-Looking Statements” and “Risk Factors” of this report. This Management’s Discussion and Analysis of Financial Condition and Results of Operations should be read in conjunction with our consolidated interim financial statements and the related notes and other information included in this report.
Overview
We are a leading, vertically-integrated, geographically-diverse, heavy-side building materials company. We supply aggregates, cement and related downstream products such as asphalt paving mix, ready mixed concrete, concrete products and paving and related construction services to a variety of end-uses in the U.S. construction industry, including public infrastructure projects, as well as private residential and non-residential construction. We have organized the business by geographic region and have three operating segments, which are also our reporting segments: Central, West and East regions. Across the three regions, we believe, by volume, we are a top 15 supplier of aggregates, a top 20 supplier of cement, a top 10 producer of asphalt paving mix and a major producer of ready mixed concrete in the United States. As of June 29, 2013, we had 1.2 billion tons and 0.4 billion tons of proven and probable aggregates reserves serving our aggregates and cement businesses, respectively, and operated over 120 sites and plants.
Since July 2009, the Sponsors and certain of our officers, directors and employees have made $794.5 million of funding commitments to our parent company. We have grown rapidly as a result of our disciplined acquisition strategy, utilizing approximately $457.3 million for acquisitions of the $463.9 million of equity commitments. Today, our nine operating companies make up our three distinct geographic segments that span 20 states and 23 metropolitan areas.
Of the 20 states in which we operate, we currently have assets in 14 states across our three geographic regions. The map below illustrates the geographic footprint of our assets:
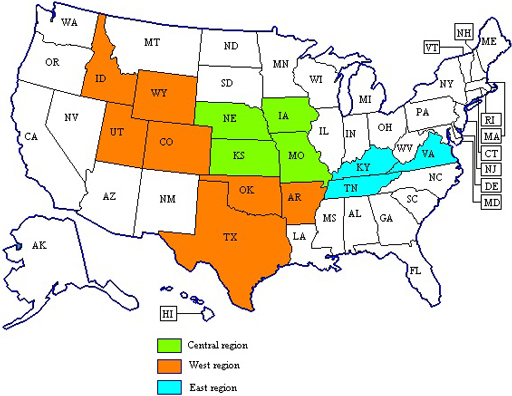
Our revenue is derived from multiple end-use markets including public infrastructure construction as well as private residential and non-residential construction. Our aggregates and asphalt paving mix and paving serve both the public and private construction markets. Public construction includes spending by Federal, state and local governments for roads, highways, bridges, airports and other public infrastructure construction projects. Public construction projects are a historically more stable portion of state and Federal budgets. Our acquisitions to date are focused in states with constitutionally-protected transportation funding sources, which we
24
believe serves to limit our exposure to state and local budgetary uncertainties. Private construction includes both residential and non-residential new construction and repair and remodel markets, which have been significantly impacted by the downturn in the overall economy and the construction industry, in particular. We believe exposure to multiple markets affords us greater stability through economic cycles and positions us to capitalize on upside opportunities as the residential and non-residential construction recovery occurs.
Business Trends and Conditions
The U.S. heavy-side building materials industry is comprised of four primary sectors: (i) aggregates, (ii) cement, (iii) asphalt paving mix and (iv) ready-mixed concrete, one or more of which is widely used in most forms of construction activity. Participants in these sectors typically range from small, privately-held companies focused on a single product or market to multinational corporations that offer a wide array of construction materials and services. Markets are defined in part by the distance materials may be efficiently transported, resulting in largely local or regional operations.
Transportation infrastructure projects, driven by both state and Federal funding programs, represent a significant share of the U.S. heavy-side building materials market. In July 2012, Moving Ahead for Progress in the 21st Century (MAP-21) was enacted and took effect in October 2012. MAP-21 is a 27-month, approximately $105 billion transportation funding program that provides for $40.4 billion and $41.0 billion in highway infrastructure investments in fiscal years 2013 and 2014, respectively. The spending levels are consistent with the preceding Federal transportation funding program. In addition to Federal funding, highway construction and maintenance funding is also available through state, county and local agencies. Our five largest states by revenue (Texas, Kansas, Kentucky, Missouri and Utah, each represented approximately 28%, 18%, 14%, 13% and 10%, respectively, of our total revenue for the six month period ended June 29, 2013) each have funds whose revenue sources are constitutionally protected and may only be spent on transportation projects:
| | • | | Texas’ 2012-2013 Department of Transportation budget is $19.8 billion, a $3.9 billion increase from the previous 2010-2011 biennium budget |
| | • | | Kansas has a 10-year $8.2 billion highway bill that was passed in May 2010 |
| | • | | Kentucky has a two-year $4.5 billion highway bill that was passed in April 2012 |
| | • | | Missouri has an estimated $700.0 million in annual construction funding committed to essential road and bridge programs |
| | • | | Utah’s fiscal year 2013 transportation fund increased to $12.0 billion |
Despite the economic challenges of recent years, we believe that the enacted Federal transportation funding program extending through fiscal 2014 is a positive development, reducing the uncertainty that existed with the previous funding program that had been subject to 10 short-term extensions. Within many of our markets, the Federal, state and local governments have taken actions to maintain or grow highway funding during a time in which many areas of spending are facing significant cuts. However, we could still be impacted by any economic improvement or slowdown, which could vary by local region and market. Our sales and earnings are sensitive to national, regional and local economic conditions and particularly to cyclical swings in construction spending, especially in the private sector. From a macroeconomic view, the Company sees positive indicators, including upward trends in housing starts, construction employment and highway obligations. All of these factors should result in increased construction activity in the relatively near future as compared to the recently preceding years.
Our products sold externally are generally delivered upon receipt of orders or requests from customers. Accordingly, the backlog associated with external product sales is converted into revenue within a relatively short period of time. Inventory for products is generally maintained in sufficient quantities to meet rapid delivery requirements of customers.
Our construction services backlog represents our estimate of the revenues that will be realized under the portion of the construction contracts remaining to be performed. We generally include a project in our contract backlog at the time a contract is awarded and funding is in place. Substantially all of the contracts in our contract backlog may be canceled or modified at the election of the customer, subject to contractual terms. However, we have not been materially adversely affected by contract cancellations or modifications in the past. Many of our construction services are awarded and completed within one year and therefore may not be reflected in our beginning or year-end contract backlog.
As a vertically-integrated business, approximately 26% of our aggregates production is further processed and sold as a downstream product, such as asphalt paving mix or ready mixed concrete, or used in our construction services business. Approximately 75% of the asphalt paving mix we produce is installed by our own paving crews. A quarterly increase or decrease of backlog does not necessarily result in an improvement or deterioration of our business. Our backlog includes only those products and projects for which we have obtained a purchase order or a signed contract with the customer. The following table sets forth, by product, our backlog as of the indicated dates:
25
| | | | | | | | |
| (in thousands) | | June 29,
2013 | | | June 30,
2012 | |
Aggregate (in tons) | | | 5,740 | | | | 4,214 | |
Asphalt (in tons) | | | 3,263 | | | | 3,386 | |
Ready mixed concrete (in cubic yards) | | | 259 | | | | 223 | |
Construction services | | $ | 444,243 | | | $ | 431,732 | |
Approximately 90%, 75%, 94% and 72% of our June 29, 2013 aggregate, asphalt, ready mixed concrete and construction backlog, respectively, are expected to be completed and converted into revenue in 2013.
In addition to being subject to cyclical swings in the economy, our business is seasonal in nature. Almost all of our products are produced and consumed outdoors. Severe weather, seasonal changes and other weather-related conditions can significantly affect the production and sales volumes of our products. Normally, the highest sales and earnings are in the second and third quarters and the lowest are in the first and fourth quarters. Winter weather months are generally periods of lower sales as we, and our customers, normally cannot cost-effectively mobilize and demobilize equipment and manpower under adverse weather conditions. Periods of heavy rainfall also adversely affect our work patterns and therefore demand for our products. Our working capital may vary greatly during these peak periods, but generally return to comparable levels as our operating cycle is completed each fiscal year.
We are subject to commodity price risk with respect to price changes in liquid asphalt and energy, including fossil fuels and electricity for aggregates, cement, asphalt paving mix and ready mix concrete production, natural gas for hot mix asphalt production and diesel fuel for distribution vehicles and production related mobile equipment. Liquid asphalt escalators in most of our public contracts, other than those in Texas, limit our exposure to price fluctuations in this commodity. We often obtain similar escalators on private and commercial contracts. In addition, we enter into various firm purchase commitments, with terms generally less than one year, for certain raw materials, including commodities, in the ordinary course of business. As a result of the contract escalation clauses and effective use of the firm purchase commitments, commodity prices did not have a material effect on our results of operations in 2013, as compared to 2012.
2013 Results
The principal factors in evaluating our financial condition and operating results for the three and six month periods ended June 29, 2013 are:
| | • | | Revenue declined slightly in 2013 as a result of the colder, wetter weather in the first half of 2013, as compared to 2012. Although weather issues impact all of our operations, the construction and paving services were most directly affected. Pricing increases across our aggregates and asphalt products somewhat offset these declines. |
| | • | | In the six months ended June 29, 2013, our aggregate volumes were flat, asphalt and ready mix volumes decreased 18% and 2%, respectively, and cement volumes increased 6%. Offsetting these movements, average selling prices (“ASP”) of aggregates, asphalt and ready-mix increased from the comparative 2012 period. The ASP of cement decreased 7% due to customer mix effects. |
| | • | | Our operating earnings improved $4.7 million and $3.0 million in the three and six month periods ended June 29, 2013, respectively, from the comparative periods in 2012. This improvement in earnings was largely driven by the price increases discussed above and the completion of low margin projects, including grading and structural work in the West region. |
| | • | | Cash used for operations of $47.8 million increased from $28.5 million in 2012 due primarily to $15.7 million of additional interest payments in 2013, as certain interest payments were deferred or refinanced into long-term debt in conjunction with the January 2012 refinancing. |
Acquisitions
On April 1, 2013, we acquired certain assets of Lafarge in Wichita, Kansas, which expands our existing footprint in the Wichita market across our lines of business.
On April 1, 2013, we acquired the membership interests of Westroc in Utah. The Westroc acquisition expands our market coverage for aggregates and ready-mixed concrete in Utah.
26
On February 29, 2012, we acquired certain assets of Norris. The Norris acquisition expanded our market position in the Central region. It is a 100% aggregates company geographically situated between existing businesses in Missouri and Kansas.
Discontinued Operations
As part of our strategy to focus on our core business as a heavy-side building materials company, we have exited certain activities, including certain concrete paving operations, our railroad construction and maintenance business (referred to herein as the “railroad business”) and our environmental business, which primarily involved building retaining walls and removal and remediation of underground fuel storage tanks. The concrete paving operations were wound down in the second quarter of 2013; management expects the related assets to be sold within the next twelve months. The railroad and environmental businesses were sold in 2012 in separate transactions for an aggregate of $3.1 million. Prior to recognition as discontinued operations, all of these businesses were included as components of the East region’s operations.
Results of Operations
The following discussion of our results of operations is focused on the material financial measures we use to evaluate the performance of our business from both a consolidated and operating segment perspective. We have three operating segments, which are also our reporting segments: Central, West and East regions. Operating income and margins are discussed in terms of changes in volume, pricing and mix of revenue source (e.g., type of product sales or service revenue). The majority of our service revenue is generated by contracts that extend across multiple reporting periods, for which we generally account for using the percentage of completion method of accounting. Under this method, revenue is recognized as work progresses. Performance on service contracts refers to changes in contract earnings rates during the term of the contract based on revisions to estimates of profit at completion on individual contracts. These revisions result from increases or decreases to the estimated value of the contract and/or the estimated costs required to complete the contract. The following discussion of results of operations provides additional disclosure to the extent that a significant or unusual event causes a material change in the profitability of a contract.
Operating income (loss) reflects our profit from continuing operations after taking into consideration cost of revenue, general and administrative expenses, depreciation, depletion, amortization and accretion and transaction costs. The components of cost of revenue generally increase ratably with revenue, as labor, transportation costs and subcontractor costs are recorded in cost of revenue. As a result of our revenue growth occurring primarily through acquisitions, our general and administrative costs and depreciation, depletion, amortization and accretion generally have grown ratably with revenue. As volumes increase, we expect these costs, as a percentage of revenue, to decrease. Our transaction costs fluctuate with the number and size of acquisitions consummated each year. The table below includes revenue and operating loss by segment for the three and six month periods ended June 29, 2013 and June 30, 2012.
| | | | | | | | | | | | | | | | | | | | | | | | | | | | | | | | |
| | | Three Months Ended | | | Six Months Ended | |
| | | June 29, 2013 | | | June 30, 2012 | | | June 29, 2013 | | | June 30, 2012 | |
| (in thousands) | | Revenue | | | Operating
income (loss) | | | Revenue | | | Operating
income (loss) | | | Revenue | | | Operating
income (loss) | | | Revenue | | | Operating
income (loss) | |
Central | | $ | 92,780 | | | $ | 16,332 | | | $ | 86,006 | | | $ | 16,129 | | | $ | 128,680 | | | $ | 3,314 | | | $ | 128,497 | | | $ | 9,780 | |
West | | | 119,656 | | | | 279 | | | | 128,867 | | | | (5,029 | ) | | | 179,719 | | | | (10,736 | ) | | | 196,125 | | | | (18,098 | ) |
East | | | 42,406 | | | | 3,364 | | | | 40,683 | | | | 2,500 | | | | 53,272 | | | | (8,013 | ) | | | 50,817 | | | | (11,209 | ) |
Corporate(1) | | | — | | | | (6,244 | ) | | | — | | | | (4,585 | ) | | | — | | | | (12,695 | ) | | | — | | | | (11,629 | ) |
| | | | | | | | | | | | | | | | | | | | | | | | | | | | | | | | |
Total | | $ | 254,842 | | | $ | 13,731 | | | $ | 255,556 | | | $ | 9,015 | | | $ | 361,671 | | | $ | (28,130 | ) | | $ | 375,439 | | | $ | (31,156 | ) |
| | | | | | | | | | | | | | | | | | | | | | | | | | | | | | | | |
| (1) | Corporate results consist primarily of compensation and office expenses for employees included in our headquarters, as well as transaction fees, which was the primary cause of the increase at Corporate in 2013 from the comparative 2012 periods. |
Non-GAAP Performance Measures
Our chief operating decision maker evaluates the performance of our segments and allocates resources to them based on several factors including a measure we call segment profit, or Adjusted EBITDA by segment. We define Adjusted EBITDA as net income (loss) before loss (income) from discontinued operations, income tax expense (benefit), interest expense and depreciation, depletion, amortization and accretion. Accretion expense is recognized on our asset retirement obligations and reflects the time value of money. Given that accretion is similar in nature to interest expense, it is treated consistently with interest expense in determining Adjusted EBITDA. Adjusted EBITDA is determined before considering the loss from discontinued operations as results from discontinued operations are not viewed by management as part of our core business when assessing the performance of our segments or allocation of resources.
27
Adjusted EBITDA reflects an additional way of viewing aspects of our business that, when viewed with our GAAP results and the accompanying reconciliation to a GAAP financial measure included in the table below, may provide a more complete understanding of factors and trends affecting our business. However, it should not be construed as being more important than other comparable GAAP measures and must be considered in conjunction with the GAAP measures. In addition, non-GAAP financial measures are not standardized; therefore, it may not be possible to compare such financial measures with other companies’ non-GAAP financial measures having the same or similar names. We strongly encourage investors to review our consolidated interim financial statements in their entirety and not rely on any single financial measure.
The tables below reconcile our net income (loss) to Adjusted EBITDA and illustrate Adjusted EBITDA by segment for the three and six month periods ended June 29, 2013 and June 30, 2012.
| | | | | | | | | | | | | | | | |
| | | Three Months Ended | | | Six Months Ended | |
| (in thousands) | | June 29,
2013 | | | June 30,
2012 | | | June 29,
2013 | | | June 30,
2012 | |
Reconciliation of Net Income (Loss) to Adjusted EBITDA | | | | | | | | | | | | | | | | |
Net income (loss) | | $ | 270 | | | $ | (7,842 | ) | | $ | (56,007 | ) | | $ | (68,844 | ) |
Income (benefit) tax expense | | | (726 | ) | | | 215 | | | | (3,347 | ) | | | (1,963 | ) |
Interest expense | | | 14,482 | | | | 14,713 | | | | 27,849 | | | | 28,826 | |
Depreciation, depletion and amortization | | | 18,714 | | | | 17,098 | | | | 35,674 | | | | 33,354 | |
Accretion | | | 180 | | | | 142 | | | | 352 | | | | 249 | |
(Income) loss from discontinued operations | | | (26 | ) | | | 2,221 | | | | 97 | | | | 1,724 | |
| | | | | | | | | | | | | | | | |
Adjusted EBITDA | | $ | 32,894 | | | $ | 26,547 | | | $ | 4,618 | | | $ | (6,654 | ) |
| | | | | | | | | | | | | | | | |
| | | | |
| (in thousands) | | | | | | | | | | | | |
Adjusted EBITDA by Segment | | | | | | | | | | | | | | | | |
Central | | $ | 25,136 | | | $ | 23,901 | | | $ | 19,182 | | | $ | 22,617 | |
West | | | 6,807 | | | | 980 | | | | 85 | | | | (9,650 | ) |
East | | | 7,155 | | | | 5,575 | | | | (2,377 | ) | | | (8,573 | ) |
Corporate | | | (6,204 | ) | | | (3,909 | ) | | | (12,272 | ) | | | (11,048 | ) |
| | | | | | | | | | | | | | | | |
Adjusted EBITDA | | $ | 32,894 | | | $ | 26,547 | | | $ | 4,618 | | | $ | (6,654 | ) |
| | | | | | | | | | | | | | | | |
28
Consolidated Results of Operations
The table below sets forth our consolidated results of operations for the three and six month periods ended June 29, 2013 and June 30, 2012.
| | | | | | | | | | | | | | | | |
| | | Three Months Ended | | | Six Months Ended | |
| | | June 29,
2013 | | | June 30,
2012 | | | June 29,
2013 | | | June 30,
2012 | |
| (in thousands) | | | | | | | | | | | | |
Revenue | | $ | 254,842 | | | $ | 255,556 | | | $ | 361,671 | | | $ | 375,439 | |
Cost of revenue (exclusive of items shown separately below) | | | 181,843 | | | | 194,781 | | | | 277,916 | | | | 305,543 | |
General and administrative expenses | | | 39,392 | | | | 34,923 | | | | 73,395 | | | | 65,917 | |
Depreciation, depletion, amortization and accretion | | | 18,894 | | | | 17,240 | | | | 36,026 | | | | 33,603 | |
Transaction costs | | | 982 | | | | (403 | ) | | | 2,464 | | | | 1,532 | |
| | | | | | | | | | | | | | | | |
Operating income (loss) | | | 13,731 | | | | 9,015 | | | | (28,130 | ) | | | (31,156 | ) |
Other (income) expense, net | | | (269 | ) | | | 587 | | | | 163 | | | | 941 | |
(Gain) loss on debt financings | | | — | | | | (879 | ) | | | 3,115 | | | | 8,160 | |
Interest expense | | | 14,482 | | | | 14,713 | | | | 27,849 | | | | 28,826 | |
| | | | | | | | | | | | | | | | |
Loss from continuing operations before taxes | | | (482 | ) | | | (5,406 | ) | | | (59,257 | ) | | | (69,083 | ) |
Income tax (benefit) expense | | | (726 | ) | | | 215 | | | | (3,347 | ) | | | (1,963 | ) |
| | | | | | | | | | | | | | | | |
Income (loss) from continuing operations | | | 244 | | | | (5,621 | ) | | | (55,910 | ) | | | (67,120 | ) |
Income (loss) from discontinued operations | | | 26 | | | | (2,221 | ) | | | (97 | ) | | | (1,724 | ) |
| | | | | | | | | | | | | | | | |
Net income (loss) | | | 270 | | | | (7,842 | ) | | | (56,007 | ) | | | (68,844 | ) |
Net income (loss) attributable to noncontrolling interest | | | 1,939 | | | | (175 | ) | | | (1,518 | ) | | | (519 | ) |
| | | | | | | | | | | | | | | | |
Net loss attributable to member of Summit Materials, LLC | | $ | (1,669 | ) | | $ | (7,667 | ) | | $ | (54,489 | ) | | $ | (68,325 | ) |
| | | | | | | | | | | | | | | | |
Three and six month periods ended June 29, 2013 and June 30, 2012
| | | | | | | | | | | | | | | | | | | | | | | | |
| | | Three Months Ended | | | | | | Six Months Ended | | | | |
| | | June 29,
2013 | | | June 30,
2012 | | | Variance | | | June 29,
2013 | | | June 30,
2012 | | | Variance | |
| (in thousands) | | | | | | | | | | | | | | | | | | |
Revenue | | $ | 254,842 | | | $ | 255,556 | | | | (0.3 | )% | | $ | 361,671 | | | $ | 375,439 | | | | (3.7 | )% |
Operating income (loss) | | | 13,731 | | | | 9,015 | | | | 52.3 | % | | | (28,130 | ) | | | (31,156 | ) | | | 9.7 | % |
Operating margin | | | 5.4 | % | | | 3.5 | % | | | 54.3 | % | | | (7.8 | )% | | | (8.3 | )% | | | 6.0 | % |
Adjusted EBITDA | | $ | 32,894 | | | $ | 26,547 | | | | 23.9 | % | | $ | 4,618 | | | $ | (6,654 | ) | | | 169.4 | % |
Revenue in 2013 was down slightly from the comparative periods in 2012 as a result of the colder, wetter weather in the first half of 2013, partially offset by price increases and the results of acquired entities. Detail of consolidated volumes and ASP by product in the first half of 2013 and 2012 follows:
| | | | | | | | | | | | | | | | | | | | | | | | |
| | | Six Months Ended
June 29, 2013 | | | Six Months Ended
June 30, 2012 | | | Percentage Change in | |
| | | Volume (1)
(in thousands) | | | Average Selling
Price (2) | | | Volume (1)
(in thousands) | | | Average Selling
Price (2) | | | Volume | | | Average Selling
Price | |
Aggregate | | | 7,542 | | | $ | 9.06 | | | | 7,556 | | | $ | 8.45 | | | | (0.2 | %) | | | 7.2 | % |
Asphalt | | | 1,366 | | | | 54.65 | | | | 1,670 | | | | 49.23 | | | | (18.2 | %) | | | 11.0 | % |
Ready mix | | | 500 | | | | 92.76 | | | | 512 | | | | 90.91 | | | | (2.3 | %) | | | 2.0 | % |
Cement | | | 407 | | | | 80.61 | | | | 383 | | | | 86.18 | | | | 6.3 | % | | | (6.5 | %) |
| (1) | Volumes are shown in tons for aggregates, asphalt and cement and in cubic yards for ready mix. |
| (2) | Average selling prices are shown on a per ton basis for aggregates, asphalt and cement and on a per cubic yard basis for ready mix. |
29
The adverse weather compared to much dryer weather in 2012 drove volume declines among our aggregate, asphalt and ready mix products, as well as in our construction services businesses. The volume decreases impacted revenue by $5.1 million and $16.2 million in the three and six month periods ended June 29, 2013, respectively. Higher ASPs across these products offset the volume declines, benefiting revenue by $8.7 million and $14.6 million in the three and six month periods ended June 29, 2013, respectively.
Our cement volumes increased 6.3% in association with sales to a new high-volume customer, which more than offset the impact from adverse weather, but also is the primary factor behind the ASP decrease. The volume and pricing movements nearly offset each other resulting in minimal impact to cement revenue in the three and six month periods ended June 29, 2013 from the comparative periods in 2012.
Also impacting revenue was a decrease in grading and structural projects in the West region resulting from a strategic business decision to reduce our exposure to such lower margin projects and a project in Austin, TX that was completed in the fourth quarter of 2012, which contributed $9.5 million and $16.5 million of revenue in the three and six month periods ended June 30, 2012, respectively.
Operating income (loss)
Our operating income (loss) improved $4.7 million and $3.0 million in the three and six month periods ended June 29, 2013, respectively, from the comparative periods in 2012. In addition, operating margin, which we define as operating income (loss) as a percentage of revenue, improved 190 and 50 basis points in the three and six month periods ended June 29, 2013, respectively, from the comparative periods in 2012. These profit improvements were driven by higher prices across our aggregates, asphalt and ready mix products as well as improved performance on our construction projects. The pricing improvements benefited earnings by $8.7 million and $14.6 million in the three and six month periods ended June 29, 2013, respectively. In the three and six month periods ended June 30, 2012, we recognized $5.0 million loss on an indemnification agreement and $1.9 million of cost overruns on grading and structural projects in the West region.
These improvements to operating income (loss) were offset primarily by volume decreases in our asphalt and ready mix products and increases in general and administrative expenses (“G&A”) and depreciation, depletion, amortization and accretion (collectively, referred to as depreciation). G&A and depreciation were generally consistent as a percentage of revenue in the 2013 and 2012 periods, with the exception of a $4.5 million and $5.2 million increase in the loss on the disposition of property, plant and equipment in the three and six month periods ended June 29, 2013, respectively. In addition, transaction costs increased $1.4 million and $0.9 million in the three and six month periods ended June 29, 2013, respectively, as a result of the April 1, 2013 acquisitions.
Adjusted EBITDA
We experienced an increase in Adjusted EBITDA of $6.3 million and $11.3 million in the three and six month periods ended June 29, 2013, respectively, from the comparative periods in 2012, related to the following:
| | • | | Operating income (loss) improved $4.7 million and $3.0 million in the three and six month periods ended June 29, 2013, respectively, primarily as a result of the margin improvement discussed above. |
| | • | | In the six month period ended June 29, 2013, we recognized a $3.1 million loss on the February 2013 debt repricing compared to a $0.9 million gain and $8.2 million loss in the three and six month periods ended June 30, 2012, respectively. |
Other Financial Information
Loss on debt financings
In February 2013, we completed a repricing of our Senior Secured Credit Facilities, which reduced our stated interest rate by 1.0% and raised an additional $25.0 million in debt. As a result of the repricing, we recognized a loss of $3.1 million for related bank fees in the six month period ended June 29, 2013. In January 2012, we refinanced our debt existing at that time, resulting in a net gain of $0.9 million and a net loss of $8.2 million in the three and six month periods ended June 30, 2012, respectively.
Discontinued operations
As part of our strategy to focus on our core business as a heavy-side building materials company, we have exited certain activities, including concrete paving in the East region, our railroad business and our environmental business, which primarily involved building retaining walls and removal and remediation of underground fuel storage tanks. The concrete paving operations were wound down in the second quarter of 2013; management expects the related assets to be sold within the next twelve months. The railroad and environmental businesses were sold in 2012 in separate transactions for an aggregate $3.1 million. Prior to recognition as discontinued operations, all of these businesses were reported as components of the East region’s operations. The East region’s concrete paving activities, the railroad and the environmental businesses’ revenue were $0.3 million and $3.8 million in the three and six month periods ended June 29, 2013, respectively, and $16.7 million and $25.9 million in the three and six month periods ended June 30, 2012, respectively. The loss from discontinued operations was $2.2 million and $1.7 million in the three and six month periods ended June 30, 2012, respectively.
30
Segment results of operations
Central Region
| | | | | | | | | | | | | | | | | | | | | | | | |
| | | Three Months Ended | | | | | | Six Months Ended | | | | |
| | | June 29,
2013 | | | June 30,
2012 | | | Variance | | | June 29,
2013 | | | June 30,
2012 | | | Variance | |
| (in thousands) | | | | | | | | | | | | | | | | | | |
Revenue | | $ | 92,780 | | | $ | 86,006 | | | | 7.9 | % | | $ | 128,680 | | | $ | 128,497 | | | | 0.1 | % |
Operating income | | | 16,332 | | | | 16,129 | | | | 1.3 | % | | | 3,314 | | | | 9,780 | | | | (66.1 | )% |
Operating margin | | | 17.6 | % | | | 18.8 | % | | | (6.4 | )% | | | 2.6 | % | | | 7.6 | % | | | (65.8 | )% |
Adjusted EBITDA | | $ | 25,136 | | | $ | 23,901 | | | | 5.2 | % | | $ | 19,182 | | | $ | 22,617 | | | | (15.2 | )% |
Revenue in the Central region increased $6.8 million, or 7.9%, and $0.2 million, or 0.1%, in the three and six month periods ended June 29, 2013, respectively, from the comparative periods in 2012. Acquisitions in the region offset revenue declines that were a result of colder, wetter weather in the first half of 2013 compared to 2012, evidenced by lower aggregate, asphalt and ready mix volumes. From a shift in product mix, asphalt prices decreased 12.4% from the six months ended June 30, 2012. Cement volumes increased; however, the increased volumes were associated with sales to a new, high-volume customer, which caused a 6.5% decrease in the ASP during the six month period ended June 29, 2013. The volume and pricing movements in cement resulted in minimal impact in cement revenue during the three and six month periods ended June 29, 2013. The Central region’s production volumes and average selling prices in the first half of 2013 and 2012 were as follows:
| | | | | | | | | | | | | | | | | | | | | | | | |
| | | Six Months Ended
June 29, 2013 | | | Six Months Ended
June 30, 2012 | | | Percentage Change in | |
| | | Volume (1)
(in thousands) | | | Average Selling
Price (2) | | | Volume (1)
(in thousands) | | | Average Selling
Price (2) | | | Volume | | | Average Selling
Price | |
Aggregate | | | 3,213 | | | $ | 9.64 | | | | 3,276 | | | $ | 9.62 | | | | (1.9 | %) | | | 0.2 | % |
Asphalt | | | 136 | | | | 50.97 | | | | 142 | | | | 58.20 | | | | (4.2 | %) | | | (12.4 | %) |
Ready mix | | | 233 | | | | 89.03 | | | | 254 | | | | 89.87 | | | | (8.3 | %) | | | (0.9 | %) |
Cement | | | 407 | | | | 80.61 | | | | 383 | | | | 86.18 | | | | 6.3 | % | | | (6.5 | %) |
| (1) | Volumes are shown in tons for aggregates, asphalt and cement and in cubic yards for ready mix. |
| (2) | Average selling prices are shown on a per ton basis for aggregates, asphalt and cement and on a per cubic yard basis for ready mix. |
Asphalt pricing in 2012, and to a lesser extent in 2013, was aided by one project in the Central region, which comprised 35% of the region’s volumes in the six month period ended June 30, 2012 at an ASP of $75.07. Absent this project, ASP in 2012 would have been consistent with 2013.
Operating income
The Central region’s operating income increased $0.2 million and decreased $6.5 million in the three and six month periods ended June 29, 2013, respectively, from the comparative periods in 2012. However, operating margin declined 120 and 500 basis points in the three and six month periods ended June 29, 2013, respectively. The margin decline was impacted by the asphalt project noted above, which had an ASP of $75.07 in 2012, compared to recent averages in the mid-$50 range, as well as the higher proportion of cement sales attributable to a high-volume customer. In addition, we recognized a $1.8 million charge in the six months ended June 29, 2013 for costs to remove a sunken barge from the Mississippi River. In the second quarter, the ASP declines were somewhat offset by increased volumes as a result of acquisition of Lafarge assets in Wichita, KS.
Adjusted EBITDA
Adjusted EBITDA improved by $1.2 million in the three months ended June 29, 2013 from the comparative 2012 period due to increased volume in cement and as a result of the acquisition of the Lafarge assets in the Wichita, KS market. These volume increases were partially offset by the completion of the asphalt project noted above and the higher proportion of cement sales to a high-volume customer discussed above. The decline in ASPs was offset by volume increases in the three months ended June 29, 2013 from the Lafarge acquisition.
31
Adjusted EBITDA declined by $3.4 million in the six month period ended June 29, 2013 as a result of the completion of the asphalt project discussed above and the higher proportion of cement sales to a high-volume customer. In addition, a $1.8 million charge to remove a sunken barge from the Mississippi River was recognized in the six month period ended June 29, 2013.
West Region
| | | | | | | | | | | | | | | | | | | | | | | | |
| | | Three Months Ended | | | | | | Six Months Ended | | | | |
| | | June 29,
2013 | | | June 30,
2012 | | | Variance | | | June 29,
2013 | | | June 30,
2012 | | | Variance | |
| (in thousands) | | | | | | | | | | | | | | | | | | |
Revenue | | $ | 119,656 | | | $ | 128,867 | | | | (7.1 | )% | | $ | 179,719 | | | $ | 196,125 | | | | (8.4 | )% |
Operating income (loss) | | | 279 | | | | (5,029 | ) | | | 105.5 | % | | | (10,736 | ) | | | (18,098 | ) | | | 40.7 | % |
Operating margin | | | 0.2 | % | | | (3.9 | )% | | | 105.1 | % | | | (6.0 | )% | | | (9.2 | )% | | | 34.8 | % |
Adjusted EBITDA | | $ | 6,807 | | | $ | 980 | | | | 594.6 | % | | $ | 85 | | | $ | (9,650 | ) | | | 100.9 | % |
Revenue in the West region decreased 7.1% and 8.4%, in the three and six month periods ended June 29, 2013, respectively, from the comparative periods in 2012. The decrease was attributable to colder, wetter weather in 2013, as compared to 2012 and a strategic business decision to reduce our exposure to grading and structural projects. In addition, we had a significant project in Austin, TX that was completed in the fourth quarter of 2012, which contributed $9.5 million and $16.5 million of revenue in the three and six month periods ended June 30, 2012, respectively.
These revenue declines were offset by increased aggregate and ready mix volumes partially from the Westroc acquisition, as well as changes in the product and geographic mixes across our product lines. The West region’s production volumes and average selling prices in the first half of 2013 and 2012 were as follows:
| | | | | | | | | | | | | | | | | | | | | | | | |
| | | Six Months Ended
June 29, 2013 | | | Six Months Ended
June 30, 2012 | | | Percentage Change in | |
| | | Volume (1)
(in thousands) | | | Average Selling
Price (2) | | | Volume (1)
(in thousands) | | | Average Selling
Price (2) | | | Volume | | | Average Selling
Price | |
Aggregate | | | 2,428 | | | $ | 8.01 | | | | 2,209 | | | $ | 6.73 | | | | 9.9 | % | | | 19.0 | % |
Asphalt | | | 1,026 | | | | 54.43 | | | | 1,329 | | | | 47.81 | | | | (22.8 | %) | | | 13.8 | % |
Ready mix | | | 267 | | | | 96.01 | | | | 258 | | | | 91.94 | | | | 3.5 | % | | | 4.4 | % |
| (1) | Volumes are shown in tons for aggregates and asphalt and in cubic yards for ready mix. |
| (2) | Average selling prices are shown on a per ton basis for aggregates and asphalt and on a per cubic yard basis for ready mix. |
Operating income (loss)
Operating margin improved 410 basis points and 320 basis points in the three and six months ended June 29, 2013, respectively. The West region recognized operating income of $0.3 million in the three months ended June 29, 2013 compared to an operating loss of $5.0 million in 2012. Similar improvement was seen in the six month period with a $7.4 million reduction of the operating loss. The earnings improvement was primarily driven by higher ASPs in aggregates, asphalt and ready mix and improved performance in Texas due to the completion of low margin grading and structural work and strategic price increases. In addition, in the three months ended June 30, 2012, we recognized a $5.0 million loss on an indemnification agreement. These profit improvements were offset by the 22.8% decline in asphalt volumes, primarily as a result of the wetter weather in 2013, completing a significant project in Austin, TX in the fourth quarter of 2012, and a $3.8 million loss on the disposition of certain property and equipment in Colorado recognized in the three and six month periods ended June 29, 2013, respectively
Adjusted EBITDA
Adjusted EBITDA improved $5.8 million to $6.8 million in the three months ended June 29, 2013 from $1.0 million in the comparative 2012 period primarily due the following:
| | • | | Increases in ASP in our aggregate, asphalt and ready mix products, partially offset by asphalt volume declines. |
| | • | | In the three months ended June 30, 2012, we recognized a $5.0 million loss on an indemnification agreement. |
32
Adjusted EBITDA improved $9.7 million to $0.1 million in the six months ended June 29, 2013 from ($9.7) million in the comparative 2012 period primarily due the following:
| | • | | Increases in ASP in our aggregate, asphalt and ready mix products, partially offset by asphalt volume declines. |
| | • | | In the six months ended June 30, 2012, we recognized a $5.0 million loss on an indemnification agreement. |
| | • | | A $1.7 million decrease in the loss on debt financings, which decreased from $3.3 million in 2012 from the January 2012 refinancing to $1.6 million from the February 2013 repricing. |
East Region
| | | | | | | | | | | | | | | | | | | | | | | | |
| | | Three Months Ended | | | | | | Six Months Ended | | | | |
| | | June 29,
2013 | | | June 30,
2012 | | | Variance | | | June 29,
2013 | | | June 30,
2012 | | | Variance | |
| (in thousands) | | | | | | | | | | | | | | | | | | |
Revenue | | $ | 42,406 | | | $ | 40,683 | | | | 4.2 | % | | $ | 53,272 | | | $ | 50,817 | | | | 4.8 | % |
Operating (loss) income | | | 3,364 | | | | 2,500 | | | | 34.6 | % | | | (8,013 | ) | | | (11,209 | ) | | | 28.5 | % |
Operating margin | | | 7.9 | % | | | 6.1 | % | | | 29.5 | % | | | (15.0 | )% | | | (22.1 | )% | | | 32.1 | % |
Adjusted EBITDA | | $ | 7,155 | | | $ | 5,575 | | | | 28.3 | % | | $ | (2,377 | ) | | $ | (8,573 | ) | | | 72.3 | % |
Our East region’s revenue increased 4.2% and 4.8% in the three and six month periods ended June 29, 2013, respectively, from the comparative 2012 periods primarily as a result of improved aggregate and asphalt pricing, increased asphalt volumes, partially offset by aggregate volume declines. The East region’s production volumes and average selling prices in the first half of 2013 and 2012 were as follows:
| | | | | | | | | | | | | | | | | | | | | | | | |
| | | Six Months Ended
June 29, 2013 | | | Six Months Ended
June 30, 2012 | | | Percentage Change in | |
| | | Volume (1)
(in thousands) | | | Average Selling
Price (2) | | | Volume (1)
(in thousands) | | | Average Selling
Price (2) | | | Volume | | | Average Selling
Price | |
Aggregate | | | 1,901 | | | $ | 9.43 | | | | 2,071 | | | $ | 8.45 | | | | (8.2 | %) | | | 11.6 | % |
Asphalt | | | 204 | | | | 58.22 | | | | 199 | | | | 52.30 | | | | 2.5 | % | | | 11.3 | % |
| (1) | Volumes are shown in tons for aggregates and asphalt. |
| (2) | Average selling prices are shown on a per ton basis for aggregates and asphalt. |
Operating income (loss)
Operating margin in the East region improved 180 basis points and 710 basis points in the three and six month periods ended June 29, 2013, respectively, from the comparative periods in 2012. This improvement in 2013 was primarily a result of the improved pricing noted above and certain cost savings initiatives implemented in 2012, including headcount reductions of approximately 60 salaried employees.
Adjusted EBITDA
Adjusted EBITDA improved consistent with operating income in the East region. In addition, the East region benefited from a $2.5 million decrease in the loss on debt financings, which decreased from $3.7 million in 2012 from the January 2012 refinancing to $1.2 million from the February 2013 repricing.
Liquidity and Capital Resources
Our primary sources of liquidity include cash on-hand, cash provided by our operations and amounts available for borrowing under our credit facilities. As of June 29, 2013, we had $7.7 million in cash and working capital of $124.9 million as compared to cash and working capital of $27.4 million and $114.4 million at December 29, 2012, respectively. Working capital is calculated as current assets less current liabilities, excluding the current portion of long term debt and outstanding borrowings on our revolver facility. There were no restricted cash balances as of June 29, 2013 or December 29, 2012.
33
Given the seasonality of our business, we typically experience significant fluctuations in working capital needs and balances throughout the year; these amounts are converted to cash as our operating cycle is completed each fiscal year. Our working capital requirements generally increase during the first half of the year as we build-up inventory and focus on repair and maintenance and other set up costs for the upcoming season. Working capital levels then decrease as we wind down the construction season and enter the winter months, which is when we see significant inflows of cash from the collection of receivables.
We believe we have sufficient financial resources from our liquidity sources to fund our business and operations, including contractual obligations, capital expenditures, debt service obligations and potential future acquisitions, for at least the next twelve months. Our growth strategy contemplates future acquisitions for which we believe we have sufficient capital through committed funds from our Sponsors and our borrowing capacity. Our remaining borrowing capacity on our revolving credit facility, net of $14.5 million of outstanding letters of credit, as of June 29, 2013 was $30.5 million, which is below normal levels as a result of funding the 2013 acquisitions with the revolver.
On April 1, 2013, we acquired certain assets of Lafarge in Wichita, Kansas and membership interests of Westroc near Salt Lake City, Utah. These acquisitions and related transaction fees were funded entirely from borrowings under the Company’s senior secured revolving credit facility.
Credit Facilities
Refer to the notes to the consolidated interim financial statements for detailed information on our long-term debt and revolving credit facility, scheduled maturities of long-term debt and affirmative and negative covenants, including the maximum allowable consolidated leverage ratios.
At June 29, 2013 and December 29, 2012, $775.9 million and $648.0 million, respectively, of total debt, without giving effect to original issuance discount, was outstanding under the respective debt agreements, including the revolving credit facility, and the Company was in compliance with all debt covenants.
On January 30, 2012, the Company and its wholly-owned subsidiary, Summit Materials Finance Corp., issued $250.0 million aggregate principal amount of 10.5% Senior Notes due January 31, 2020 (the “Senior Notes”) under an indenture (as amended and supplemented, the “Indenture”). In addition to the Senior Notes, the Company has a credit facility which provides for term loans in an aggregate amount of $422.0 million and revolving credit commitments in an aggregate amount of $150.0 million (the “Senior Secured Credit Facility”). The Company, along with all of its wholly-owned subsidiary companies and its non wholly-owned subsidiary, Continental Cement, are named as guarantors of the Senior Notes and the Senior Secured Credit Facility. In addition, Summit has pledged substantially all of its assets as collateral for the Senior Secured Credit Facility.
Cash Flows
The following table summarizes our net cash used for or provided by operating, investing and financing activities and our capital expenditures in the six month periods ended June 29, 2013 and June 30, 2012:
| | | | | | | | |
| | | Six Months Ended | |
| (in thousands) | | June 29,
2013 | | | June 30,
2012 | |
Net cash (used for) provided by | | | | | | | | |
Operating activities | | $ | (47,760 | ) | | $ | (28,453 | ) |
Investing activities | | | (94,221 | ) | | | (64,656 | ) |
Financing activities | | | 122,205 | | | | 71,622 | |
Cash paid for capital expenditures | | $ | (40,528 | ) | | $ | (24,669 | ) |
Operating activities
The seasonal nature of our industry impacts quarterly operating cash flow when compared with the full year. Full year 2012 net cash provided by operating activities was $62.3 million compared with net cash used in operating activities of $47.8 million in the first half of 2013.
34
For the six month period ended June 29, 2013, cash used for operating activities was $47.8 million primarily as a result of:
| | • | | Net loss of $56.0 million, offset by $46.5 million of non-cash expenses, including $39.0 million of depreciation, depletion, amortization and accretion, $5.6 million of losses on asset dispositions, a $3.0 million loss on the February 2013 debt repricing, partially offset by $3.0 million of deferred tax benefit. |
| | • | | Accounts receivables and costs and estimated earnings in excess of billings utilized $25.3 million of cash from December 29, 2012 to June 29, 2013. In conjunction with the seasonality of our business, for which the majority of our sales occur in the spring, summer and fall, we typically incur an increase in accounts receivable (billed and unbilled) in the second and third quarters of each year. These amounts are typically converted to cash in the fourth and first quarters. |
| | • | | Inventory utilized $13.2 million of cash from December 29, 2012 to June 29, 2013. This increase is driven by the seasonality of our business for which our inventory levels typically decrease in the fourth quarter in preparation for the winter slowdown and are then increased at the end of the second quarter in preparation for the increased sales volumes in the spring and summer. |
| | • | | The timing of payments associated with accounts payable and accrued expenses provided $2.0 million of cash in conjunction with the build-up of inventory levels to prepare the business for increased sales volumes in the summer, partially offset by increased interest payments. In the six months ended June 29, 2013, we made interest payments of $31.4 million, compared to $15.7 million in the comparative 2012 period. The additional interest payments in 2013 is a result of certain 2012 interest payments being deferred or refinanced into long-term debt in conjunction with the January 2012 refinancing. |
For the six month period ended June 30, 2012, cash used for operating activities was $28.5 million primarily as a result of:
| | • | | Net loss of $68.8 million, offset by $48.1 million of non-cash expenses, including $37.5 million of depreciation, depletion, amortization and accretion and an $8.2 million loss on the January 2012 debt refinancing. |
| | • | | Accounts receivables and costs and estimated earnings in excess of billings utilized $34.0 million of cash from December 31, 2011 to June 30, 2012. In conjunction with the seasonality of our business, for which the majority of our sales occur in the spring, summer and fall, we typically incur an increase in accounts receivable (billed and unbilled) in the second and third quarters of each year. These amounts are converted to cash in the fourth and first quarters. |
| | • | | Inventory utilized $6.0 million of cash from December 31, 2011 to June 30, 2012, driven by the seasonality of our business for which our inventory levels typically decrease in the fourth quarter in preparation for the winter slowdown and are then increased the first half of the year in preparation for the increased sales volumes in the spring and summer. |
| | • | | We made a $4.0 million advance funding payment under an indemnification agreement entered into with the former owners of an acquired company related to their interests in a joint venture. |
| | • | | The timing of payments associated with accounts payable and accrued expenses provided $32.5 million of additional cash as a result of the increased inventory levels and preparing the business for increased sales volumes in the spring and summer, additional payments made in the fourth quarter of 2011; accrued expenses at December 31, 2011 were $15.8 million less than the balance at December 29, 2012. In addition, in conjunction with our January 2012 refinancing transaction, $4.2 million of accrued interest was refinanced into long-term debt. |
Investing activities
For the six month period ended June 29, 2013, cash used for investing activities was $94.2 million, $60.8 million of which related to the acquisitions discussed above. In addition, we invested $40.5 million in capital expenditures, offset by $7.1 million of proceeds from asset sales. Approximately $15.9 million of the capital expenditures were invested in our cement business in Hannibal, Missouri, which related to continued development of an underground mine ($7.8 million), a dome to store additional cement product in St. Louis, Missouri ($2.6 million), as well as improvements made to the cement plant during the annual scheduled winter shutdown in February 2013. We are also investing in the Texas market, which is showing signs of a strong recovery. In 2013, we have invested $3.5 million in a new hot mix asphalt plant in Austin, Texas.
For the six month period ended June 30, 2012, cash used for investing activities was $64.7 million. We paid $42.9 million for the February 2012 acquisition and $24.7 million for capital expenditures, less $2.9 million of asset sales. Approximately $7.6 million of the capital expenditures were incurred at our cement plant in Hannibal, Missouri, which primarily were a result of enhancement costs incurred during its annual scheduled winter shutdown.
35
Financing activities
For the six month period ended June 29, 2013, cash provided by financing activities was $122.2 million, which is primarily comprised of $105.0 million net borrowings on the revolving credit facility and proceeds from the February 2013 repricing transaction, through which our outstanding borrowings increased $25.0 million. Approximately $60.8 million of the funds from the borrowings were used on April 1, 2013 to purchase certain assets of Lafarge in Wichita, Kansas and of Westroc near Salt Lake City, Utah. The remaining funds have been used to fund seasonal working capital fluctuations.
For the six month period ended June 30, 2012, cash provided by financing activities was $71.6 million, which is primarily comprised of $75.0 million of net proceeds from borrowings, including the January 2012 refinancing transaction, which were primarily used for the acquisition of Norris in February 2012 ($42.9 million) and working capital needs.
Cash paid for capital expenditures
We expended approximately $40.5 million in capital expenditures in the six months ended June 29, 2013 compared to $24.7 million in the six months ended June 30, 2012. A portion of the increase in capital expenditures from 2012 relates to developing an underground mine to extract limestone on our Hannibal, Missouri property where our cement plant is located. We spent $7.8 million on the underground mine development in 2013.
We estimate that we will incur between $62.0 million and $67.0 million in capital expenditures in 2013, which we have funded or expect to fund through our cash on hand, cash from operations, outside financing and available borrowings under our credit facilities. A portion of our anticipated future capital expenditures relates to development of the underground mine referred to above. We expect to spend approximately $16.3 million in total during 2013 and 2014 on this project. This project will eliminate the need to strip away overburden that covers the historical source of limestone for our cement plant and position the facility to access over 200 years of limestone reserves.
Commitments and contingencies
In the normal course of business, we have commitments, lawsuits, claims, and contingent liabilities. In the opinion of management, the ultimate disposition of these matters will not have a material adverse effect on our consolidated financial position, results of operations or liquidity.
We are obligated under an indemnification agreement entered into with the sellers of Harper Contracting, Inc., Harper Sand and Gravel, Inc., Harper Ready Mix Company, Inc. and Harper Investments, Inc. (collectively, “Harper”) for the sellers’ ownership interests in a joint venture agreement. We have the rights to any benefits under the joint venture as well as the assumption of any obligations, but do not own equity interests in the joint venture. The joint venture has incurred significant losses on a highway project in Utah, which have resulted in requests for funding from the joint venture partners and, ultimately, from the Company. Through June 29, 2013, we have funded $8.8 million, $4.0 million of which was funded in the three and six month periods ended June 30, 2012. As of June 29, 2013 and December 29, 2012, an accrual of $4.3 million is recorded in other noncurrent liabilities as our best estimate of future funding obligations.
In 2013, a dispute with the sellers of Harper related to the calculation of working capital in connection with the August 2010 acquisition of Harper was settled. The working capital dispute was submitted to binding arbitration, the outcome of which resulted in the payment of $1.9 million to the sellers. In addition, various other acquisition-related disputes with Harper were settled in 2013 for approximately $0.8 million. The total payments of $2.7 million were made in the three and six month periods ended June 29, 2013. There was no material impact to 2013 earnings as a result of these settlements.
The Company’s mining operations are subject to and affected by Federal, state and local laws and regulations relating to the environment, health and safety and other regulatory matters. These operations require environmental operating permits, which are subject to modification, renewal and revocation. Management regularly monitors and reviews its operations, procedures and policies for compliance with these laws and regulations. Despite these compliance efforts, risk of environmental liability is inherent in the operation of the Company’s business, as it is with other companies engaged in similar businesses, and there can be no assurance that environmental liabilities will not have a material adverse effect on our consolidated financial position, results of operations or liquidity in the future.
In February 2011, we incurred a property loss related to a sunken barge with cement product aboard. Through June 29, 2013, we have recognized $3.3 million of charges for lost product aboard the barge and costs to remove the barge from the waterway. As of June 29, 2013, $1.8 million is included in accrued expenses as our best estimate of the remaining costs to remove the barge.
36
We are obligated under various firm purchase commitments for certain raw materials and services that are in the ordinary course of business. Management does not expect any significant changes in the market value of these goods and services during the commitment period that would have a material adverse effect on the financial position, results of operations or liquidity of the Company. We are obligated under an indemnification agreement entered into with the sellers of Harper for the sellers’ ownership interests in a joint venture agreement. Summit has the rights to any benefits under the joint venture as well as the assumption of any obligations, but does not own equity interests in the joint venture. The joint venture has incurred significant losses on a highway project in Utah, which have resulted in requests for funding from the joint venture partners and, ultimately, from us. Through June 29, 2013, we have funded $8.8 million, $4.0 million of which was funded in 2012. As of June 29, 2013 and December 29, 2012, an accrual of $4.3 million is recorded in other noncurrent liabilities as our best estimate of future funding obligations.
Off-Balance sheet arrangements
As of June 29, 2013, we had no material off-balance sheet arrangements, such as financing or unconsolidated variable interest entities, that either have or are reasonably likely to have a current or future material effect on our results of operations, financial position, liquidity, capital expenditures or capital resources.
37
| ITEM 3. | QUANTITATIVE AND QUALITATIVE DISCLOSURES ABOUT MARKET RISK |
We are exposed to certain market risks arising from transactions that are entered into in the normal course of business. Our operations are highly dependent upon the interest rate-sensitive construction industry as well as the general economic environment. Consequently, these marketplaces could experience lower levels of economic activity in an environment of rising interest rates or escalating costs.
Management has considered the current economic environment and its potential impact to our business. Demand for aggregates products, particularly in the nonresidential and residential construction markets, could decline if companies and consumers are unable to obtain financing for construction projects or if the economic recession causes delays or cancellations to capital projects. Additionally, declining tax revenue and state budget deficits have negatively affected states’ abilities to finance infrastructure construction projects.
Pension expense
Our subsidiary, Continental Cement, sponsors two non-contributory defined benefit pension plans for hourly and salaried employees, as well as healthcare and life insurance benefits for certain eligible retired employees. As of January 1, 2012, the pension and postretirement plans have been frozen to new entrants. Our results of operations are affected by our net periodic benefit cost from these plans, which totaled $0.6 million in the first half of 2013. Assumptions that affect this expense include the discount rate and, for the pension plans only, the expected long-term rate of return on assets. Therefore, we have interest rate risk associated with these factors. A one percentage-point increase or decrease in assumed health care cost trend rates would have affected accumulated postretirement benefit obligation by an estimated $1.6 million or ($1.3) million, respectively, at December 29, 2012.
Commodity and energy price risk
We are subject to commodity price risk with respect to price changes in liquid asphalt and energy, including fossil fuels and electricity for aggregates, cement, asphalt paving mix and ready mix concrete production, natural gas for hot mix asphalt production and diesel fuel for distribution vehicles and production related mobile equipment. Liquid asphalt escalators in most of our public contracts, other than those in Texas, limit our exposure to price fluctuations in this commodity and we seek to obtain escalators on private and commercial contracts.
Inflation risk
Overall inflation rates in recent years have not been a significant factor in our revenue or earnings due to our ability to recover increasing costs by obtaining higher prices for our products through sale price escalators in place for most public sector contracts. Inflation risk varies with the level of activity in the construction industry, the number, size and strength of competitors and the availability of products to supply a local market.
Variable-Rate borrowing facilities
We have $150.0 million revolving credit commitments under the Senior Secured Credit Facility, which bear interest at a variable rate. A hypothetical 100-basis-point increase or decrease in interest rates on borrowings of $105.0 million, which is the outstanding balance at June 29, 2013, would increase or decrease interest expense by $1.1 million on an annual basis.
38
| ITEM 4. | CONTROLS AND PROCEDURES |
Disclosure Controls and Procedures
We maintain disclosure controls and procedures that are designed to ensure that information required to be disclosed in the Company’s reports under the Securities and Exchange Act of 1934, as amended (the “Exchange Act”) is recorded, processed, summarized and reported within the time periods specified in the SEC’s rules and forms, and that such information is accumulated and communicated to the Company’s management, including the Company’s Chief Executive Officer and the Company’s Interim Chief Financial Officer, as appropriate, to allow timely decisions regarding required disclosure. Any controls and procedures, no matter how well designed and operated, can provide only reasonable assurance of achieving the desired control objectives. The Company’s management, with the participation of the Company’s Chief Executive Officer and Interim Chief Financial Officer, has evaluated the effectiveness of the Company’s disclosure controls and procedures (as such term is defined in Rules 13a-15(e) and 15d-15(e) under the Exchange Act) as of June 29, 2013. Based upon that evaluation, the Company’s Chief Executive Officer and Interim Chief Financial Officer concluded that, as of June 29, 2013, the Company’s disclosure controls and procedures were effective to accomplish their objectives at the reasonable assurance level.
Changes in Internal Control over Financial Reporting
There was no change in the Company’s internal control over financial reporting (as such term is defined in Rules 13a-15(f) and 15d-15(f) under the Exchange Act) that occurred during the Company’s last fiscal quarter that has materially affected, or is reasonably likely to materially affect, the Company’s internal control over financial reporting.
39
PART II—OTHER INFORMATION
We are a party from time to time to legal proceedings relating to our operations. Our ultimate legal and financial liability in respect to all legal proceedings in which we are involved at any given time cannot be estimated with any certainty. However, based upon examination of such matters and consultation with counsel, management currently believes that the ultimate outcome of these contingencies, net of liabilities already accrued on our consolidated balance sheet, will not have a material adverse effect on our consolidated financial position, although the resolution in any reporting period of one or more of these matters could have a significant impact on our results of operations and/or cash flows for that period.
In addition to the other information set forth in this report, you should carefully consider the factors discussed in the section entitled “Risk Factors” in the Prospectus, which could materially affect the Company’s business, financial condition or future results. The risks described in the Prospectus are not the only risks facing the Company. Additional risks and uncertainties not currently known to the Company or that it currently deems to be immaterial also may materially adversely affect its business, financial condition and/or operating results. There have been no material changes to the risk factors disclosed in the Prospectus.
| ITEM 2. | UNREGISTERED SALES OF EQUITY SECURITIES AND USE OF PROCEEDS |
None.
| ITEM 3. | DEFAULTS UPON SENIOR SECURITIES |
None.
| ITEM 4. | MINE SAFETY DISCLOSURES |
The information concerning mine safety violations and other regulatory matters required by Section 1503(a) of the Dodd-Frank Wall Street Reform and Consumer Protection Act and Item 104 of Regulation S-K (17 CFR 229.104) is included in Exhibit 95.1 to this report.
Pursuant to Section 219 of the Iran Threat Reduction and Syria Human Rights Act of 2012, which added Section 13(r) of the Exchange Act, the Company hereby incorporates by reference herein Exhibit 99.1 of this report, which includes disclosures publicly filed and/or provided to The Blackstone Group L.P., an affiliate of certain investment funds that own a majority of the equity interests of the Company, by Hilton Worldwide, Inc. and Travelport Limited, which may be considered the Company’s affiliates. We are not presently aware that we and our subsidiaries have knowingly engaged in any transaction or dealing reportable under Section 13(r) of the Exchange Act during the quarter ended June 29, 2013.
40
| | |
| 3.1 | | Certificate of Formation of Summit Materials, LLC, as amended (incorporated by reference from Exhibit 3.1 to the Registration Statement on Form S-4, filed on March 27, 2013 (File No. 333-187556)). |
| |
| 3.2 | | Amended and Restated Limited Liability Company Agreement of Summit Materials, LLC (incorporated by reference from Exhibit 3.2 to the Registration Statement on Form S-4, filed on March 27, 2013 (File No. 333-187556)). |
| |
| 31.1* | | Certification of the Chief Executive Officer pursuant to Rule 13a-14(a) or 15d-14(a) of the Securities Exchange Act of 1934, as adopted pursuant to Section 302 of the Sarbanes-Oxley Act of 2002. |
| |
| 31.2* | | Certification of the Interim Chief Financial Officer pursuant to Rule 13a-14(a) or 15d-14(a) of the Securities Exchange Act of 1934, as adopted pursuant to Section 302 of the Sarbanes-Oxley Act of 2002. |
| |
| 32.1** | | Certification of the Chief Executive Officer pursuant to 18 U.S.C. Section 1350, as adopted pursuant to Section 906 of the Sarbanes-Oxley Act of 2002. |
| |
| 32.2** | | Certification of the Interim Chief Financial Officer pursuant to 18 U.S.C. Section 1350, as adopted pursuant to Section 906 of the Sarbanes-Oxley Act of 2002. |
| |
| 95.1* | | Mine Safety Disclosures. |
| |
| 99.1* | | Section 13(r) Disclosure. |
| |
| 101.1 | | The following materials from Summit Materials, LLC’s Quarterly Report on Form 10-Q for the quarter ended June 29, 2013, filed on August 8, 2013, formatted in XBRL (eXtensible Business Reporting Language): (i) Consolidated Balance Sheets, (ii) Consolidated Statements of Operations, (iii) Consolidated Statements of Cash Flows, (iv) Consolidated Statements of Changes in Redeemable Noncontrolling Interest and Member’s Interest and (iv) Notes to Unaudited Consolidated Financial Statements. |
The agreements and other documents filed as exhibits to this report are not intended to provide factual information or other disclosure other than with respect to the terms of the agreements or other documents themselves, and you should not rely on them for that purpose. In particular, any representations and warranties made by us in these agreements or other documents were made solely within the specific context of the relevant agreement or document and may not describe the actual state of affairs as of the date they were made or at any other time.
41
SIGNATURES
Pursuant to the requirements of the Securities Exchange Act of 1934, the registrant has duly caused this report to be signed on its behalf by the undersigned, thereunto duly authorized.
| | | | | | |
| | | | SUMMIT MATERIALS, LLC |
| | | |
| Date: August 8, 2013 | | | | By: | | /s/ Thomas Hill |
| | | | | | Thomas Hill |
| | | | | | Chief Executive Officer (Principal Executive Officer) |
| | | |
| Date: August 8, 2013 | | | | By: | | /s/ John Murphy |
| | | | | | John Murphy |
| | | | | | Interim Chief Financial Officer (Principal Financial and Accounting Officer) |
42