UNITED STATES
SECURITIES AND EXCHANGE COMMISSION
Washington, D.C. 20549
FORM N-CSR
CERTIFIED SHAREHOLDER REPORT OF REGISTERED
MANAGEMENT INVESTMENT COMPANIES
Investment Company Act File Number: 811-22810
| T. Rowe Price Global Allocation Fund, Inc. |
| (Exact name of registrant as specified in charter) |
| 100 East Pratt Street, Baltimore, MD 21202 |
| (Address of principal executive offices) |
| David Oestreicher |
| 100 East Pratt Street, Baltimore, MD 21202 |
| (Name and address of agent for service) |
Registrant’s telephone number, including area code: (410) 345-2000
Date of fiscal year end: October 31
Date of reporting period: October 31, 2017
 |
| Global Allocation Fund | October 31, 2017 |
The views and opinions in this report were current as of October 31, 2017. They are not guarantees of performance or investment results and should not be taken as investment advice. Investment decisions reflect a variety of factors, and the managers reserve the right to change their views about individual stocks, sectors, and the markets at any time. As a result, the views expressed should not be relied upon as a forecast of the fund’s future investment intent. The report is certified under the Sarbanes-Oxley Act, which requires mutual funds and other public companies to affirm that, to the best of their knowledge, the information in their financial reports is fairly and accurately stated in all material respects.
REPORTS ON THE WEB
Sign up for our Email Program, and you can begin to receive updated fund reports and prospectuses online rather than through the mail. Log in to your account at troweprice.com for more information.
Manager’s Letter
Fellow Shareholders
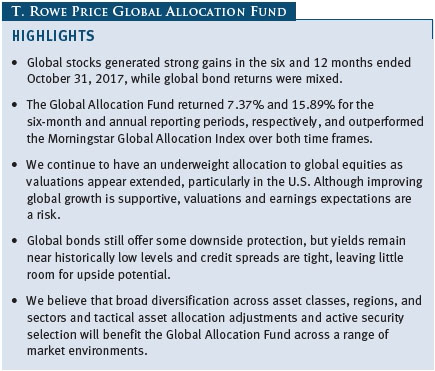
Global stocks generated strong gains in the 12 months ended October 31, 2017, supported by positive economic growth, stabilizing political trends, and solid corporate earnings. Global bond returns were mixed. Returns for developed markets investment-grade debt were modestly positive, while high yield and emerging markets debt performed well.
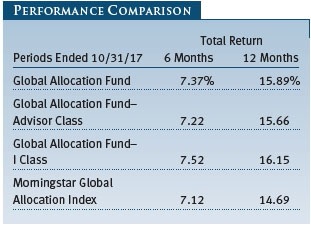
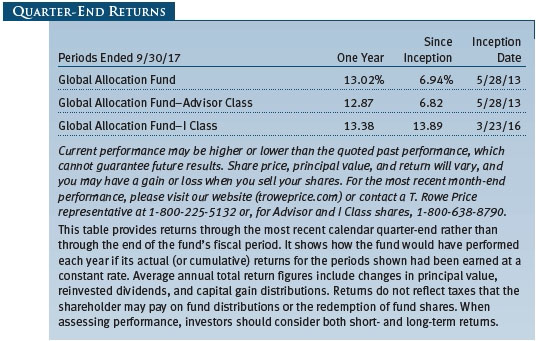
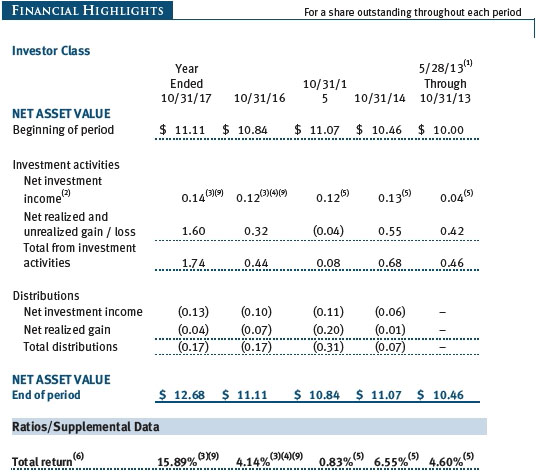
As shown in the Performance Comparison table, the Global Allocation Fund returned 7.37% and 15.89% for the 6- and 12-month periods ended October 31, 2017, respectively. (Results for the Advisor Class and I Class shares may vary due to their different fee structures and other factors.) The fund outperformed the Morningstar Global Allocation Index for both periods.
STRATEGY OVERVIEW
Our investment approach seeks to add value in three primary areas:
| ● | Strategic portfolio design: Diversification across asset classes, geography, strategies, and styles provides a breadth of investments that can contribute to portfolio performance across a range of market environments. |
| ● | Tactical allocations: Overweighting and underweighting of underlying portfolios versus the benchmark reflects our view of market conditions over a 6- to 18-month horizon. |
| ● | Security selection: Many component strategies are actively managed by experienced investment professionals supported by T. Rowe Price’s global research platform. |
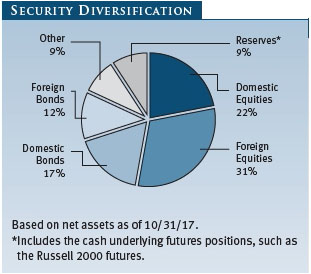
The fund’s broadly diversified portfolio seeks long-term total return through both capital appreciation and income from investments in global stocks, bonds, cash, and alternative investments. The portfolio also includes asset classes and strategies intended to moderate risk and provide diversification through exposure to less correlated returns. These include a hedge fund of funds managed externally by Blackstone Hedge Fund Solutions, and an equity index option strategy that principally sells call options on the S&P 500 Index. We also have an allocation to currency-hedged international equities intended to moderate the currency volatility associated with international securities.
Please note the following changes to the fund’s underlying investment options:
| ● | Effective May 1, 2017, the Global Unconstrained Bond Fund was renamed the Dynamic Global Bond Fund to better align it with the broader marketplace and T. Rowe Price’s family of funds. The fund’s investment strategy has not changed. |
| ● | We introduced an allocation to frontier markets equities, which are not represented in the fund’s benchmark. Frontier markets offer attractive growth opportunities for long-term investors willing to accept potentially higher volatility, lower liquidity, and other risks associated with less developed markets. Frontier markets are generally less efficient than developed or even emerging markets, meaning that incomplete or unequal access to information and analysis can result in mispriced securities. As a result, they offer opportunities to add meaningful value through our independent research platform and professional analysis. |
MARKET ENVIRONMENT
Major U.S. stock indexes registered strong gains for the 12 months ended October 31, 2017. Donald Trump’s election victory sparked a sharp rally early in the period amid optimism about the potential for stimulative monetary and economic policies. Although progress on Mr. Trump’s promised initiatives was limited, the domestic economy expanded at a modest pace, supported by broadly accommodative monetary policy and solid economic growth overseas. Corporate revenues and earnings reflected the positive economic backdrop and continued to grow.
For U.S. dollar-based investors, international developed markets stocks performed roughly in line with U.S. equities as foreign currency appreciation contributed positively to performance. European stocks gained as the region’s political environment stabilized and its economic recovery continued, while monetary policy stayed broadly supportive. Japanese stocks advanced amid signs of gradual economic improvement and progress on the government’s structural reform efforts, including more shareholder-friendly corporate governance standards. Emerging markets stocks outpaced most developed markets, benefiting from global economic growth, a modest rise in commodities prices, and reduced concerns about protectionism and interest rate policies in key developed markets.
U.S. bond returns were narrowly mixed over the annual reporting period. In the investment-grade universe, long-term corporate bonds fared best as credit spreads—the yield difference between Treasuries and bonds with some credit risk—narrowed. Asset- and mortgage-backed securities were modestly positive, while long-term Treasuries declined slightly. High yield bonds outperformed investment-grade issues, while floating rate bank loans also generated solid gains amid rising interest rates and ongoing demand for low-duration, higher-yielding assets.
Overseas developed markets debt gained modestly in U.S. dollar terms, driven largely by the depreciation of the U.S. dollar versus other currencies. Emerging markets debt produced good returns in dollar terms, as economic growth in the emerging markets universe improved. Dollar-denominated emerging markets debt generally outpaced local currency bonds.
Most major currencies appreciated versus the U.S. dollar for the 12-month period. The euro and the UK pound gained 6.2% and 8.7% against the dollar, respectively, while the Japanese yen lost 7.5%. Among emerging markets, China’s yuan and the Indian rupee gained 2.1% and 3.1%, respectively.
ASSET ALLOCATION STRATEGY
We continue to have an underweight allocation to global equities as valuations appear extended, particularly in the U.S. Although improving global growth is supportive, valuations and earnings expectations are a risk. Despite low yields and extended duration profiles, bonds still offer some downside protection. Interest rates should rise gradually, but inflationary pressures remain subdued. Yields are modestly higher over the last year due to Federal Reserve rate hikes but are not attractive by historical measures.
Stocks
On a regional basis, U.S. equity valuations appear extended against a backdrop of modest economic growth, tighter monetary policy, and uncertainty regarding fiscal policy. Corporate earnings momentum is positive, but expectations appear elevated and at risk of disappointment. We favor international developed markets stocks, where valuations are modestly more attractive. They are supported by improving global economic growth, positive earnings trends, and greater exposure to international trade. Attractive relative valuations, improving global growth, and positive earnings trends offer support to emerging markets equities, but they may be challenged by the potential for higher developed market interest rates, by protectionist trade policies, and if energy prices were to fade from recent high levels.
In the U.S., we have a neutral position between U.S. growth and value stocks. Following persistent strong performance from U.S. growth stocks, the relative valuations between growth and value are more in line with historical levels. Secular growers should continue to benefit from a low-growth economy. In contrast, value stocks are often more cyclical and would characteristically benefit from a sustained improvement in U.S. economic growth and higher interest rates. We are underweight U.S. large-caps as valuations appear extended amid modest economic growth. Small-cap valuations are also extended but remain reasonable relative to their historical relationship to large-caps. Because small-caps tend to be more domestically focused, pro-growth economic policies and lower corporate taxes could benefit small-caps more than large-caps.
Among international equities, we prefer value stocks over growth stocks. Valuations for overseas growth stocks are above historical averages, while value stocks are more attractively priced. Economic recoveries in Europe and Japan are in earlier stages than the U.S., which should also benefit more cyclical components within value. Improving global trade has been a tailwind to recent earnings growth momentum in international large-cap and multinational stocks; however, international small-cap stocks may stand to gain more as broadening global growth contributes to improvement in local economies. European and Japanese small-cap valuations are reasonable and offer attractive potential earnings upside.
We remain underweight to inflation-sensitive real assets equities given concerns about the impact of slowing Chinese growth rates on near-term demand. In addition, we note our ongoing concerns about long-term structural supply and demand imbalances affecting the global natural resources and commodities complex, particularly the energy sector. Real estate investment trusts (REITs) appear fairly valued but could be pressured by rising interest rates and late-cycle economic trends.
Bonds
Despite low yields and extended duration profiles, yields for U.S. investment-grade debt are the most attractive among developed markets. We have a modest overweight to Treasury inflation protected securities (TIPS) given attractive levels of break-even inflation. We are underweight high yield bonds given limited upside potential at current valuations. Fundamentals for high yield and floating rate loans are broadly positive, and we currently favor floating rate loans as the segment has less energy exposure and also provides protection against rising interest rates.
Low yields and long duration create a less attractive outlook for investment-grade debt outside of the U.S., where European bonds are also at risk from rising interest rates as the European Central Bank tapers its stimulus policies. Fundamentals for emerging markets debt remain supportive, but valuations are extended and appear vulnerable to tighter monetary policies in developed markets. We favor emerging markets bonds denominated in local currencies over dollar-denominated government bonds due to their higher real yields and shorter duration. Many of the local currencies remain cheap even after this year’s appreciation.
PORTFOLIO REVIEW
U.S. Stocks
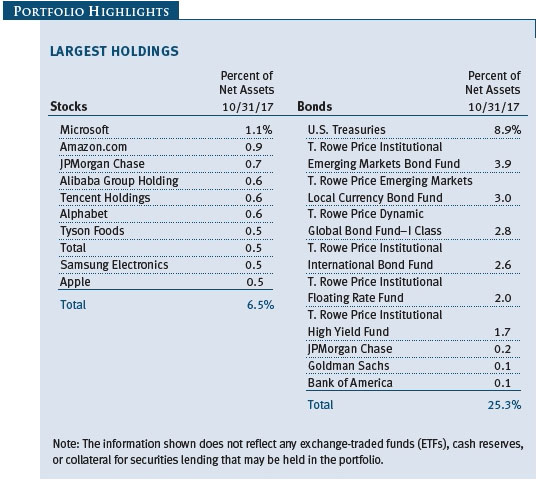
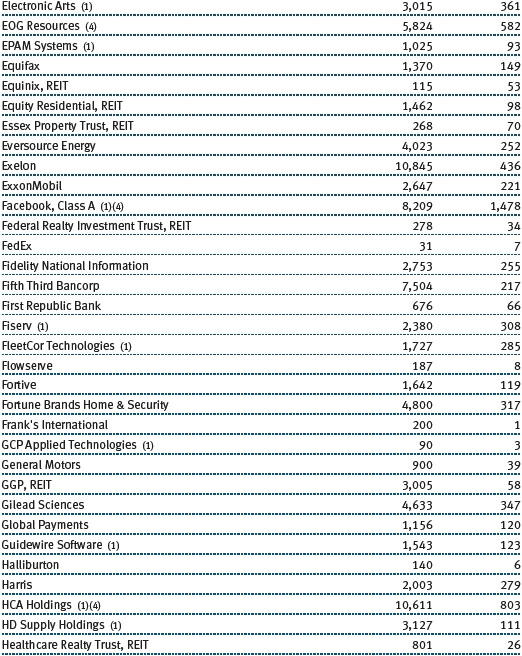
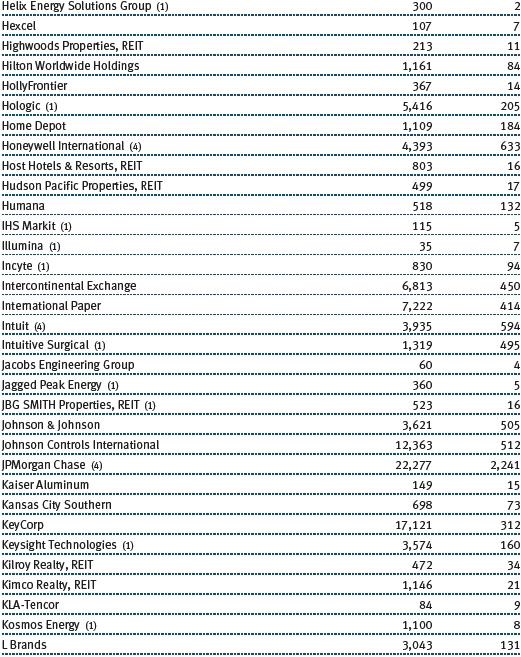
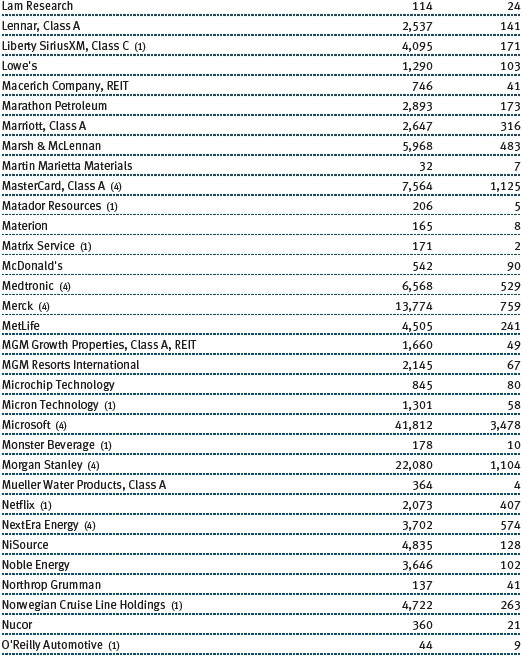
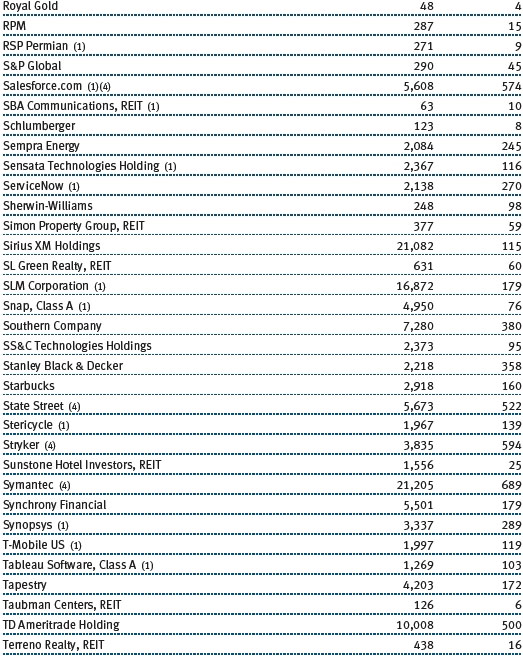
Our U.S. stocks gained roughly 28% overall in absolute terms for the 12-month reporting period, and all underlying portfolios were positive. Security selection helped the fund’s relative performance as strong results in our large-cap growth and value portfolios offset weaker results in our small-cap exposure. Information technology shares performed very well as a number of leading companies recorded strong revenues and earnings growth. Among our biggest absolute contributors were global software giant Microsoft, payment processors Visa and MasterCard, and hardware manufacturer Apple. Our small-cap energy stocks generally weighed on results, including oil and gas producers Rice Energy, Parsley Energy, and SM Energy. (Please refer to the fund’s portfolio of investments for a complete list of holdings and the amount each represents in the portfolio.)
International Stocks
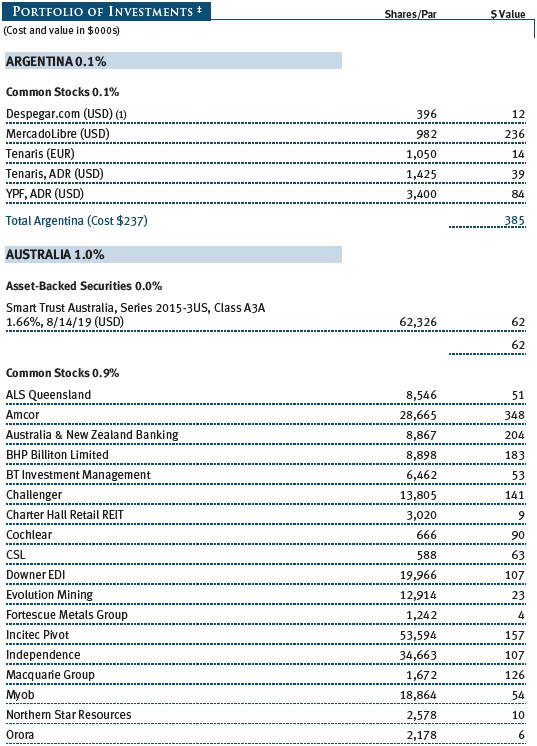
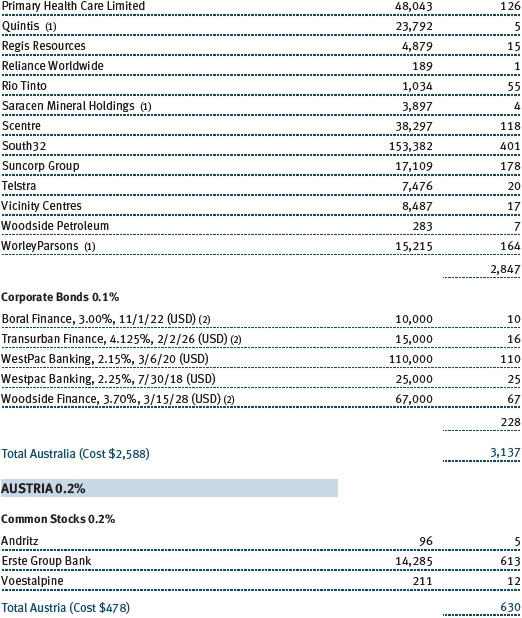
Our international stocks also posted strong absolute gains for the period, although they generally trailed our U.S. equities. Security selection was mixed, with positive results in our small-cap portfolios offset by underperformance in international value stocks. European banks were among the fund’s best absolute contributors, benefiting from improving growth and optimism about rising interest rates in the U.S. and, when they eventually come to pass, in Europe. Some of our biggest contributors included Erste Group Bank (Austria), BNP Paribas (France), and Nordea Bank (Sweden). On the other hand, several of our consumer staples stocks weighed on results, including tobacco companies KT&G (South Korea) and Japan Tobacco (Japan), as well as generic drug manufacturer Teva Pharmaceutical Industries (Israel).
U.S. Bonds
The portfolio’s U.S. fixed income allocation was modestly positive in absolute terms for the 12-month reporting period, but security selection weighed on relative results. The fund’s U.S. investment-grade bond allocation consists of a conservative core component to provide ballast as well as an allocation to TIPS to provide some inflation protection. Returns for both investment-grade components were roughly flat for the period. However, allocations to high yield bonds and floating rate bank loans boosted performance and helped to lift the broader fixed income portfolio into positive territory.
International Bonds
The portfolio also has an allocation to international bonds, which include developed and emerging markets sovereign and corporate bonds denominated in both the U.S. dollar and local currencies. The fund’s international bonds weighed slightly on performance. Our overseas developed markets debt rose modestly in U.S. dollar terms, due largely to a sharp rise in the value of major currencies versus the U.S. dollar. Emerging markets debt denominated in both U.S. dollars and local currencies generated solid gains as investors continued to search for higher-yielding securities.
Diversifying Strategies
The portfolio incorporates several diversifying components to moderate volatility and diversify risk over a full market cycle. Our currency-hedged international equities recorded strong gains for the period, helped by steady global economic growth, although the decision to hedge the currency was a modest headwind given a weaker U.S. dollar. Our equity index option overlay strategy also recorded healthy gains, and our diversified hedge fund-of-funds allocation generated favorable risk-adjusted returns. We also have an allocation to real assets equities as a complement to more traditional equity investments. Our real assets equities were modestly positive over the period but trailed the broader equities markets.
The fund’s exposure to derivatives benefited absolute performance during the period; U.S. small-cap equity futures and equity options and futures within the options overlay strategy were the principal contributors.
INVESTMENT OUTLOOK
The global economy should continue to grow over the next several quarters as improving global trade boosts export-oriented economies, although overall growth is likely to remain relatively modest. The U.S. economy could benefit from lower taxes, increased fiscal spending, and deregulation, but the likelihood and ultimate scale of each remain uncertain. Although Japan’s economic growth remains tepid, improving global trade and still-accommodative monetary policies should be supportive. Europe’s economic growth continues and has been supported by stronger global trade as well as a moderation in political uncertainty. Broad emerging markets growth also shows signs of improvement as concerns about low energy prices have receded and China’s growth has stabilized, albeit at lower levels.
Corporate earnings for the third quarter of 2017 grew in the mid-single digits. Expectations are for earnings to pick up in the coming quarters, supported by a positive contribution from the energy sector and broader strength in revenues. While corporate leverage has increased, credit fundamentals remain broadly supportive.
Valuations remain broadly expensive versus their historical norms across asset classes. Equity bargains are scarce across region, style, and capitalization, and U.S. large-caps stand out as particularly expensive among developed markets. Within fixed income, yields remain near historically low levels and credit spreads are tight, leaving little room for upside—particularly if interest rates trend higher. At current levels, the risk/return trade-off for risk assets appears skewed to the downside and could be vulnerable if corporate or geopolitical events disrupt the extended period of low volatility.
We believe the broad diversification of our portfolios across asset classes, investment styles, and geography, combined with fundamental research, active security selection, and our ability to make tactical adjustments to the fund’s asset allocation, will help us generate attractive risk-adjusted returns in an uncertain market environment.
Thank you for investing with T. Rowe Price.
Respectfully submitted,
Charles M. Shriver
Chairman of the fund’s Investment Advisory Committee
November 17, 2017
The committee chairman has day-to-day responsibility for managing the portfolio and works with committee members in developing and executing the fund’s investment program.
RISKS OF INVESTING IN STOCKS
As with all stock and bond mutual funds, the fund’s share price can fall because of weakness in the stock or bond markets, a particular industry, or specific holdings. Stock markets can decline for many reasons, including adverse political or economic developments, changes in investor psychology, or heavy institutional selling. The prospects for an industry or company may deteriorate because of a variety of factors, including disappointing earnings or changes in the competitive environment. In addition, the investment manager’s assessment of companies held in a fund may prove incorrect, resulting in losses or poor performance even in rising markets. A sizable cash or fixed income position may hinder the fund from participating fully in a strong, rapidly rising bull market. In addition, significant exposure to bonds increases the risk that the fund’s share value could be hurt by rising interest rates or credit downgrades or defaults. Convertible securities are also exposed to price fluctuations of the company’s stock.
RISKS OF INTERNATIONAL INVESTING
Funds that invest overseas generally carry more risk than funds that invest strictly in U.S. assets. Funds investing in a single country or in a limited geographic region tend to be riskier than more diversified funds. Risks can result from varying stages of economic and political development; differing regulatory environments, trading days, and accounting standards; and higher transaction costs of non-U.S. markets. Non-U.S. investments are also subject to currency risk, or a decline in the value of a foreign currency versus the U.S. dollar, which reduces the dollar value of securities denominated in that currency.
RISKS OF INVESTING IN BONDS
Funds that invest in bonds are subject to interest rate risk, the decline in bond prices that usually accompanies a rise in interest rates. Longer-maturity bonds typically decline more than those with shorter maturities. Funds that invest in bonds are also subject to credit risk, the chance that any fund holding could have its credit rating downgraded or that a bond issuer will default (fail to make timely payments of interest or principal), potentially reducing the fund’s income level and share price.
GLOSSARY
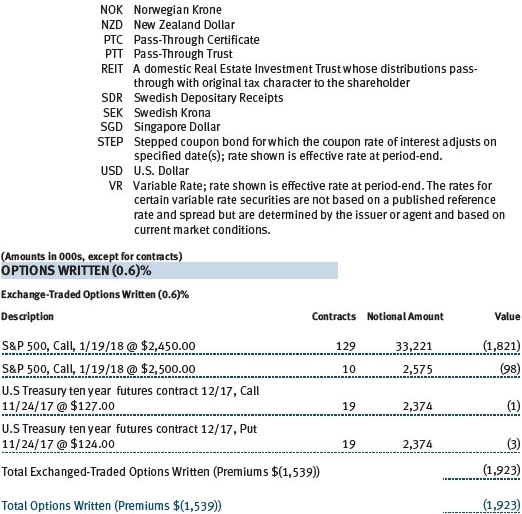
Call option: Gives the holder the right but not the obligation to buy a security or index at a specified price on or before a specified date. Writing a call option means selling it to collect the price, or premium.
Duration: A measure of a bond’s sensitivity to changes in interest rates. For example, a bond with a duration of five years would fall about 5% in price in response to a one-percentage-point rise in interest rates, and vice versa.
Morningstar Global Allocation Index: An index that represents the performance of a portfolio of 60% global equities and 40% global bonds, with the allocation within each broad asset class determined by Morningstar’s asset allocation methodology and represented by Morningstar core equity and fixed income indexes.
Real estate investment trusts (REITs): Publicly traded companies that own, develop, and operate apartment complexes, hotels, office buildings, and other commercial properties.
S&P 500 Index: An unmanaged index that tracks the stocks of 500 primarily large-cap U.S. companies.
Treasury inflation protected securities (TIPS): Income-generating bonds that are issued by the federal government and whose interest and principal payments are adjusted for inflation. The inflation adjustment, which is typically applied monthly to the principal of the bond, follows a designated inflation index, such as the consumer price index.
Performance and Expenses
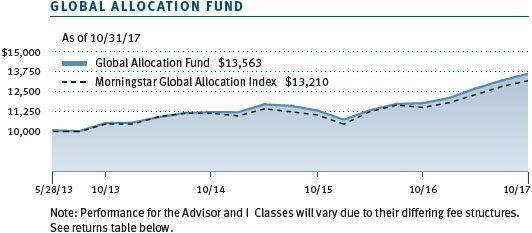
| Growth of $10,000 |
This chart shows the value of a hypothetical $10,000 investment in the fund over the past 10 fiscal year periods or since inception (for funds lacking 10-year records). The result is compared with benchmarks, which may include a broad-based market index and a peer group average or index. Market indexes do not include expenses, which are deducted from fund returns as well as mutual fund averages and indexes.

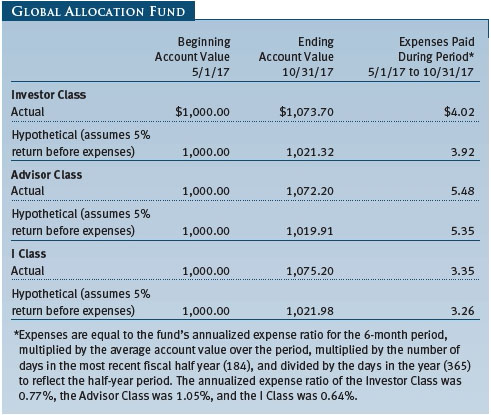
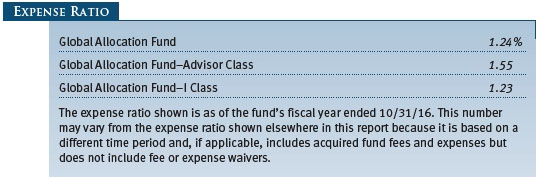
| Fund Expense Example |
As a mutual fund shareholder, you may incur two types of costs: (1) transaction costs, such as redemption fees or sales loads, and (2) ongoing costs, including management fees, distribution and service (12b-1) fees, and other fund expenses. The following example is intended to help you understand your ongoing costs (in dollars) of investing in the fund and to compare these costs with the ongoing costs of investing in other mutual funds. The example is based on an investment of $1,000 invested at the beginning of the most recent six-month period and held for the entire period.
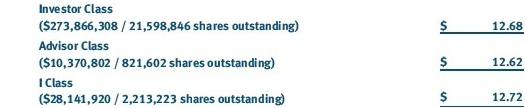
Please note that the fund has three share classes: The original share class (Investor Class) charges no distribution and service (12b-1) fee, the Advisor Class shares are offered only through unaffiliated brokers and other financial intermediaries and charge a 0.25% 12b-1 fee, and I Class shares are available to institutionally oriented clients and impose no 12b-1 or administrative fee payment. Each share class is presented separately in the table.
Actual Expenses
The first line of the following table (Actual) provides information about actual account values and expenses based on the fund’s actual returns. You may use the information on this line, together with your account balance, to estimate the expenses that you paid over the period. Simply divide your account value by $1,000 (for example, an $8,600 account value divided by $1,000 = 8.6), then multiply the result by the number on the first line under the heading “Expenses Paid During Period” to estimate the expenses you paid on your account during this period.
Hypothetical Example for Comparison Purposes
The information on the second line of the table (Hypothetical) is based on hypothetical account values and expenses derived from the fund’s actual expense ratio and an assumed 5% per year rate of return before expenses (not the fund’s actual return). You may compare the ongoing costs of investing in the fund with other funds by contrasting this 5% hypothetical example and the 5% hypothetical examples that appear in the shareholder reports of the other funds. The hypothetical account values and expenses may not be used to estimate the actual ending account balance or expenses you paid for the period.
Note: T. Rowe Price charges an annual account service fee of $20, generally for accounts with less than $10,000. The fee is waived for any investor whose T. Rowe Price mutual fund accounts total $50,000 or more; accounts electing to receive electronic delivery of account statements, transaction confirmations, prospectuses, and shareholder reports; or accounts of an investor who is a T. Rowe Price Personal Services or Enhanced Personal Services client (enrollment in these programs generally requires T. Rowe Price assets of at least $250,000). This fee is not included in the accompanying table. If you are subject to the fee, keep it in mind when you are estimating the ongoing expenses of investing in the fund and when comparing the expenses of this fund with other funds.
You should also be aware that the expenses shown in the table highlight only your ongoing costs and do not reflect any transaction costs, such as redemption fees or sales loads. Therefore, the second line of the table is useful in comparing ongoing costs only and will not help you determine the relative total costs of owning different funds. To the extent a fund charges transaction costs, however, the total cost of owning that fund is higher.
The accompanying notes are an integral part of these financial statements.
The accompanying notes are an integral part of these financial statements.
The accompanying notes are an integral part of these financial statements.

The accompanying notes are an integral part of these financial statements.

The accompanying notes are an integral part of these financial statements.
The accompanying notes are an integral part of these financial statements.

The accompanying notes are an integral part of these financial statements.
| Notes to Financial Statements |
T. Rowe Price Global Allocation Fund, Inc. (the fund) is registered under the Investment Company Act of 1940 (the 1940 Act) as a diversified, open-end management investment company. The fund seeks long-term capital appreciation and income. The fund has three classes of shares: the Global Allocation Fund (Investor Class), the Global Allocation Fund–Advisor Class (Advisor Class), and the Global Allocation Fund–I Class (I Class). Advisor Class shares are sold only through unaffiliated brokers and other unaffiliated financial intermediaries. I Class shares generally are available only to investors meeting a $1,000,000 minimum investment or certain other criteria. The Advisor Class operates under a Board-approved Rule 12b-1 plan pursuant to which the class compensates financial intermediaries for distribution, shareholder servicing, and/or certain administrative services; the Investor and I Classes do not pay Rule 12b-1 fees. Each class has exclusive voting rights on matters related solely to that class; separate voting rights on matters that relate to all classes; and, in all other respects, the same rights and obligations as the other classes.
NOTE 1 - SIGNIFICANT ACCOUNTING POLICIES
Basis of Preparation The fund is an investment company and follows accounting and reporting guidance in the Financial Accounting Standards Board (FASB) Accounting Standards Codification Topic 946 (ASC 946). The accompanying financial statements were prepared in accordance with accounting principles generally accepted in the United States of America (GAAP), including, but not limited to, ASC 946. GAAP requires the use of estimates made by management. Management believes that estimates and valuations are appropriate; however, actual results may differ from those estimates, and the valuations reflected in the accompanying financial statements may differ from the value ultimately realized upon sale or maturity.
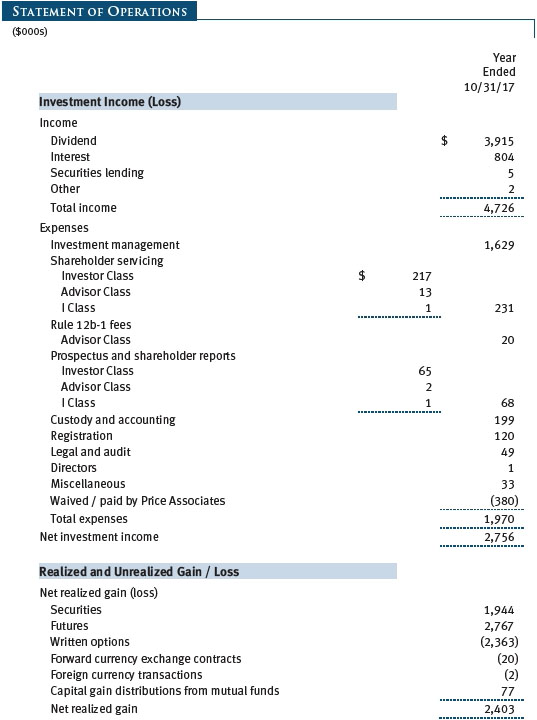
Investment Transactions, Investment Income, and Distributions Investment transactions are accounted for on the trade date basis. Income and expenses are recorded on the accrual basis. Realized gains and losses are reported on the identified cost basis. Premiums and discounts on debt securities are amortized for financial reporting purposes. Paydown gains and losses are recorded as an adjustment to interest income. Inflation adjustments to the principal amount of inflation-indexed bonds are reflected as interest income. Dividends received from mutual fund investments are reflected as dividend income; capital gain distributions are reflected as realized gain/loss. Earnings on investments recognized as partnerships for federal income tax purposes reflect the tax character of such earnings. Dividend income and capital gain distributions are recorded on the ex-dividend date. Income tax-related interest and penalties, if incurred, are recorded as income tax expense. Distributions from REITs are initially recorded as dividend income and, to the extent such represent a return of capital or capital gain for tax purposes, are reclassified when such information becomes available. Income distributions are declared and paid by each class annually. Distributions to shareholders are recorded on the ex-dividend date. A capital gain distribution may also be declared and paid by the fund annually.
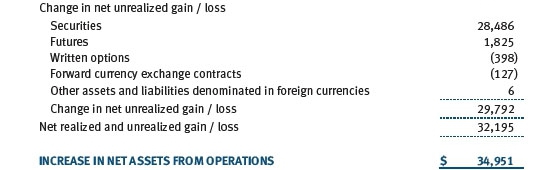
Currency Translation Assets, including investments, and liabilities denominated in foreign currencies are translated into U.S. dollar values each day at the prevailing exchange rate, using the mean of the bid and asked prices of such currencies against U.S. dollars as quoted by a major bank. Purchases and sales of securities, income, and expenses are translated into U.S. dollars at the prevailing exchange rate on the respective date of such transaction. The portion of the results of operations attributable to changes in foreign exchange rates on investments is not bifurcated from the portion attributable to changes in market prices. The effect of changes in foreign currency exchange rates on realized and unrealized security gains and losses is reflected as a component of security gains and losses.
Class Accounting Shareholder servicing, prospectus, and shareholder report expenses incurred by each class are charged directly to the class to which they relate. Expenses common to all classes, investment income, and realized and unrealized gains and losses are allocated to the classes based upon the relative daily net assets of each class. To the extent any expenses are waived or reimbursed in accordance with an expense limitation (see Note 7), the waiver or reimbursement is charged to the applicable class or allocated across the classes in the same manner as the related expense. The Advisor Class pays Rule 12b-1 fees, in an amount not exceeding 0.25% of the class’s average daily net.
Rebates Subject to best execution, the fund may direct certain security trades to brokers who have agreed to rebate a portion of the related brokerage commission to the fund in cash. Commission rebates are reflected as realized gain on securities in the accompanying financial statements and totaled $3,000 for the year ended October 31, 2017.
New Accounting Guidance In March 2017, the FASB issued amended guidance to shorten the amortization period for certain callable debt securities, held at a premium. The guidance is effective for fiscal years and interim periods beginning after December 15, 2018. Adoption will have no effect on the fund’s net assets or results of operations.
On August 1, 2017, the fund implemented amendments to Regulation S-X, issued by the Securities and Exchange Commission, which require standardized, enhanced disclosures, particularly related to derivatives, in investment company financial statements. Adoption had no effect on the fund’s net assets or results of operations.
Indemnification In the normal course of business, the fund may provide indemnification in connection with its officers and directors, service providers, and/or private company investments. The fund’s maximum exposure under these arrangements is unknown; however, the risk of material loss is currently considered to be remote.
NOTE 2 - VALUATION
The fund’s financial instruments are valued and each class’s net asset value (NAV) per share is computed at the close of the New York Stock Exchange (NYSE), normally 4 p.m. ET, each day the NYSE is open for business. However, the NAV per share may be calculated at a time other than the normal close of the NYSE if trading on the NYSE is restricted, if the NYSE closes earlier, or as may be permitted by the SEC.
Fair Value The fund’s financial instruments are reported at fair value, which GAAP defines as the price that would be received to sell an asset or paid to transfer a liability in an orderly transaction between market participants at the measurement date. The T. Rowe Price Valuation Committee (the Valuation Committee) is an internal committee that has been delegated certain responsibilities by the fund’s Board of Directors (the Board) to ensure that financial instruments are appropriately priced at fair value in accordance with GAAP and the 1940 Act. Subject to oversight by the Board, the Valuation Committee develops and oversees pricing-related policies and procedures and approves all fair value determinations. Specifically, the Valuation Committee establishes procedures to value securities; determines pricing techniques, sources, and persons eligible to effect fair value pricing actions; oversees the selection, services, and performance of pricing vendors; oversees valuation-related business continuity practices; and provides guidance on internal controls and valuation-related matters. The Valuation Committee reports to the Board and has representation from legal, portfolio management and trading, operations, risk management, and the fund’s treasurer.
Various valuation techniques and inputs are used to determine the fair value of financial instruments. GAAP establishes the following fair value hierarchy that categorizes the inputs used to measure fair value:
Level 1 – quoted prices (unadjusted) in active markets for identical financial instruments that the fund can access at the reporting date
Level 2 – inputs other than Level 1 quoted prices that are observable, either directly or indirectly (including, but not limited to, quoted prices for similar financial instruments in active markets, quoted prices for identical or similar financial instruments in inactive markets, interest rates and yield curves, implied volatilities, and credit spreads)
Level 3 – unobservable inputs
Observable inputs are developed using market data, such as publicly available information about actual events or transactions, and reflect the assumptions that market participants would use to price the financial instrument. Unobservable inputs are those for which market data are not available and are developed using the best information available about the assumptions that market participants would use to price the financial instrument. GAAP requires valuation techniques to maximize the use of relevant observable inputs and minimize the use of unobservable inputs. When multiple inputs are used to derive fair value, the financial instrument is assigned to the level within the fair value hierarchy based on the lowest-level input that is significant to the fair value of the financial instrument. Input levels are not necessarily an indication of the risk or liquidity associated with financial instruments at that level but rather the degree of judgment used in determining those values.
Valuation Techniques Equity securities listed or regularly traded on a securities exchange or in the over-the-counter (OTC) market are valued at the last quoted sale price or, for certain markets, the official closing price at the time the valuations are made. OTC Bulletin Board securities are valued at the mean of the closing bid and asked prices. A security that is listed or traded on more than one exchange is valued at the quotation on the exchange determined to be the primary market for such security. Listed securities not traded on a particular day are valued at the mean of the closing bid and asked prices for domestic securities and the last quoted sale or closing price for international securities.
For valuation purposes, the last quoted prices of non-U.S. equity securities may be adjusted to reflect the fair value of such securities at the close of the NYSE. If the fund determines that developments between the close of a foreign market and the close of the NYSE will affect the value of some or all of its portfolio securities, the fund will adjust the previous quoted prices to reflect what it believes to be the fair value of the securities as of the close of the NYSE. In deciding whether it is necessary to adjust quoted prices to reflect fair value, the fund reviews a variety of factors, including developments in foreign markets, the performance of U.S. securities markets, and the performance of instruments trading in U.S. markets that represent foreign securities and baskets of foreign securities. The fund may also fair value securities in other situations, such as when a particular foreign market is closed but the fund is open. The fund uses outside pricing services to provide it with quoted prices and information to evaluate or adjust those prices. The fund cannot predict how often it will use quoted prices and how often it will determine it necessary to adjust those prices to reflect fair value. As a means of evaluating its security valuation process, the fund routinely compares quoted prices, the next day’s opening prices in the same markets, and adjusted prices.
Actively traded equity securities listed on a domestic exchange generally are categorized in Level 1 of the fair value hierarchy. Non-U.S. equity securities generally are categorized in Level 2 of the fair value hierarchy despite the availability of quoted prices because, as described above, the fund evaluates and determines whether those quoted prices reflect fair value at the close of the NYSE or require adjustment. OTC Bulletin Board securities, certain preferred securities, and equity securities traded in inactive markets generally are categorized in Level 2 of the fair value hierarchy.
Debt securities generally are traded in the OTC market. Securities with remaining maturities of one year or more at the time of acquisition are valued at prices furnished by dealers who make markets in such securities or by an independent pricing service, which considers the yield or price of bonds of comparable quality, coupon, maturity, and type, as well as prices quoted by dealers who make markets in such securities. Generally, debt securities are categorized in Level 2 of the fair value hierarchy; however, to the extent the valuations include significant unobservable inputs, the securities would be categorized in Level 3.
Investments in mutual funds are valued at the mutual fund’s closing NAV per share on the day of valuation and are categorized in Level 1 of the fair value hierarchy. Investments in private investment companies are valued at the investee’s NAV per share as of the valuation date, if available. If the investee’s NAV is not available as of the valuation date or is not calculated in accordance with GAAP, the Valuation Committee may adjust the investee’s NAV to reflect fair value at the valuation date. Investments in private investment companies generally are categorized either in Level 2 or 3, depending on the significance of unobservable inputs. Listed options, and OTC options with a listed equivalent, are valued at the mean of the closing bid and asked prices and generally are categorized in Level 2 of the fair value hierarchy. Exchange-traded options on futures contracts are valued at closing settlement prices and generally are categorized in Level 1 of the fair value hierarchy. Financial futures contracts are valued at closing settlement prices and are categorized in Level 1 of the fair value hierarchy. Forward currency exchange contracts are valued using the prevailing forward exchange rate and are categorized in Level 2 of the fair value hierarchy. Assets and liabilities other than financial instruments, including short-term receivables and payables, are carried at cost, or estimated realizable value, if less, which approximates fair value.
Thinly traded financial instruments and those for which the above valuation procedures are inappropriate or are deemed not to reflect fair value are stated at fair value as determined in good faith by the Valuation Committee. The objective of any fair value pricing determination is to arrive at a price that could reasonably be expected from a current sale. Financial instruments fair valued by the Valuation Committee are primarily private placements, restricted securities, warrants, rights, and other securities that are not publicly traded.
Subject to oversight by the Board, the Valuation Committee regularly makes good faith judgments to establish and adjust the fair valuations of certain securities as events occur and circumstances warrant. For instance, in determining the fair value of an equity investment with limited market activity, such as a private placement or a thinly traded public company stock, the Valuation Committee considers a variety of factors, which may include, but are not limited to, the issuer’s business prospects, its financial standing and performance, recent investment transactions in the issuer, new rounds of financing, negotiated transactions of significant size between other investors in the company, relevant market valuations of peer companies, strategic events affecting the company, market liquidity for the issuer, and general economic conditions and events. In consultation with the investment and pricing teams, the Valuation Committee will determine an appropriate valuation technique based on available information, which may include both observable and unobservable inputs. The Valuation Committee typically will afford greatest weight to actual prices in arm’s length transactions, to the extent they represent orderly transactions between market participants, transaction information can be reliably obtained, and prices are deemed representative of fair value. However, the Valuation Committee may also consider other valuation methods such as market-based valuation multiples; a discount or premium from market value of a similar, freely traded security of the same issuer; or some combination. Fair value determinations are reviewed on a regular basis and updated as information becomes available, including actual purchase and sale transactions of the issue. Because any fair value determination involves a significant amount of judgment, there is a degree of subjectivity inherent in such pricing decisions, and fair value prices determined by the Valuation Committee could differ from those of other market participants. Depending on the relative significance of unobservable inputs, including the valuation technique(s) used, fair valued securities may be categorized in Level 2 or 3 of the fair value hierarchy.
Valuation Inputs The following table summarizes the fund’s financial instruments, based on the inputs used to determine their fair values on October 31, 2017:
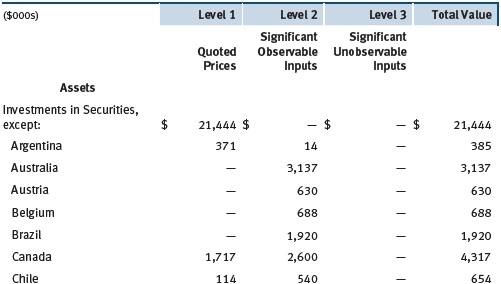
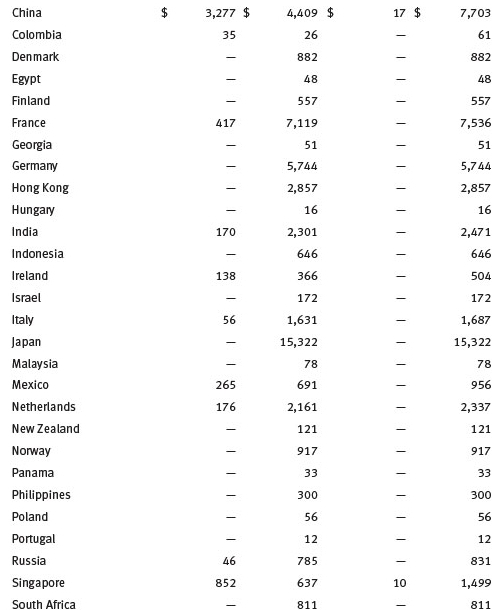
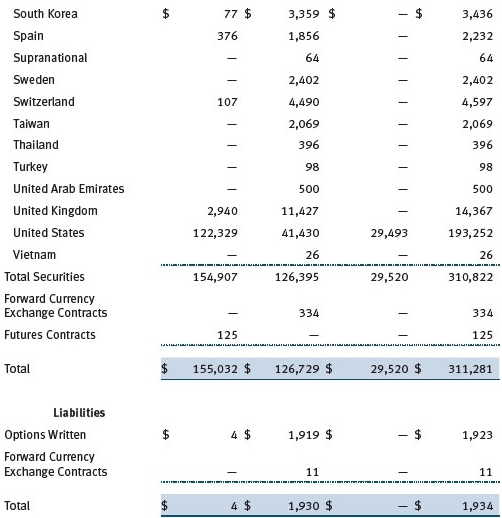
There were no material transfers between Levels 1 and 2 during the year ended October 31, 2017.
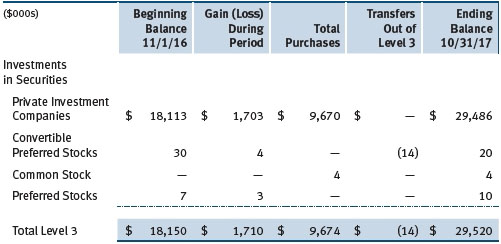
Following is a reconciliation of the fund’s Level 3 holdings for the year ended October 31, 2017. Gain (loss) reflects both realized and change in unrealized gain/loss on Level 3 holdings during the period, if any, and is included on the accompanying Statement of Operations. The change in unrealized gain/loss on Level 3 instruments held at October 31, 2017, totaled 1,710,000 for the year ended October 31, 2017. Transfers into and out of Level 3 are reflected at the value of the financial instrument at the beginning of the period. During the year, transfers out of Level 3 were because observable market data became available for the security.
In accordance with GAAP, the following table provides quantitative information about significant unobservable inputs used to determine the fair valuations of the fund’s Level 3 assets, by class of financial instrument; it also indicates the sensitivity of the Level 3 valuations to changes in those significant unobservable inputs. Because the Valuation Committee considers a wide variety of factors and inputs, both observable and unobservable, in determining fair values, the unobservable inputs presented do not reflect all inputs significant to the fair value determination.
NOTE 3 - DERIVATIVE INSTRUMENTS
During the year ended October 31, 2017, the fund invested in derivative instruments. As defined by GAAP, a derivative is a financial instrument whose value is derived from an underlying security price, foreign exchange rate, interest rate, index of prices or rates, or other variable; it requires little or no initial investment and permits or requires net settlement. The fund invests in derivatives only if the expected risks and rewards are consistent with its investment objectives, policies, and overall risk profile, as described in its prospectus and Statement of Additional Information. The fund may use derivatives for a variety of purposes, such as seeking to hedge against declines in principal value, increase yield, invest in an asset with greater efficiency and at a lower cost than is possible through direct investment, or to adjust credit exposure. The risks associated with the use of derivatives are different from, and potentially much greater than, the risks associated with investing directly in the instruments on which the derivatives are based. The fund at all times maintains sufficient cash reserves, liquid assets, or other SEC-permitted asset types to cover its settlement obligations under open derivative contracts.
The fund values its derivatives at fair value and recognizes changes in fair value currently in its results of operations. Accordingly, the fund does not follow hedge accounting, even for derivatives employed as economic hedges. Generally, the fund accounts for its derivatives on a gross basis. It does not offset the fair value of derivative liabilities against the fair value of derivative assets on its financial statements, nor does it offset the fair value of derivative instruments against the right to reclaim or obligation to return collateral.
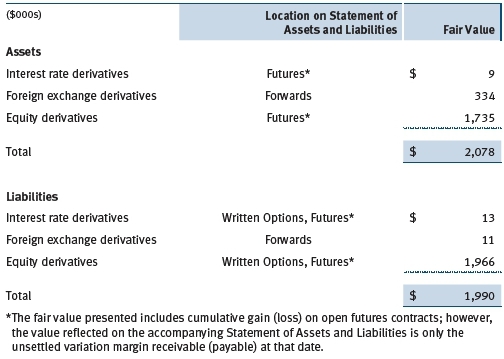
The following table summarizes the fair value of the fund’s derivative instruments held as of October 31, 2017, and the related location on the accompanying Statement of Assets and Liabilities, presented by primary underlying risk exposure:
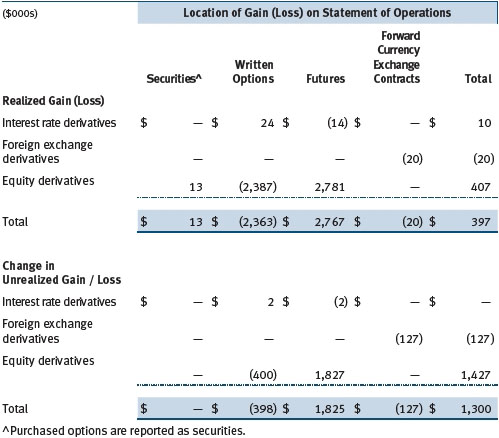
Additionally, the amount of gains and losses on derivative instruments recognized in fund earnings during the year ended October 31, 2017, and the related location on the accompanying Statement of Operations is summarized in the following table by primary underlying risk exposure:
Counterparty Risk and Collateral The fund invests in derivatives in various markets, which expose it to differing levels of counterparty risk. Counterparty risk on exchange-traded and centrally cleared derivative contracts, such as futures, exchange-traded options, and centrally cleared swaps, is minimal because the clearinghouse provides protection against counterparty defaults. For futures and centrally cleared swaps, the fund is required to deposit collateral in an amount specified by the clearinghouse and the clearing firm (margin requirement), and the margin requirement must be maintained over the life of the contract. Each clearinghouse and clearing firm, in its sole discretion, may adjust the margin requirements applicable to the fund.
Derivatives, such as bilateral swaps, forward currency exchange contracts, and OTC options, that are transacted and settle directly with a counterparty (bilateral derivatives) expose the fund to greater counterparty risk. To mitigate this risk, the fund has entered into master netting arrangements (MNAs) with certain counterparties that permit net settlement under specified conditions and, for certain counterparties, also require the exchange of collateral to cover mark-to-market exposure. MNAs may be in the form of International Swaps and Derivatives Association master agreements (ISDAs) or foreign exchange letter agreements (FX letters).
MNAs provide the ability to offset amounts the fund owes a counterparty against amounts the counterparty owes the fund (net settlement). Both ISDAs and FX letters generally allow termination of transactions and net settlement upon the occurrence of contractually specified events, such as failure to pay or bankruptcy. In addition, ISDAs specify other events, the occurrence of which would allow one of the parties to terminate. For example, a downgrade in credit rating of a counterparty would allow the fund to terminate, while a decline in the fund’s net assets of more than a specified percentage would allow the counterparty to terminate. Upon termination, all transactions with that counterparty would be liquidated and a net termination amount settled. ISDAs include collateral agreements whereas FX letters do not. Collateral requirements are determined daily based on the net aggregate unrealized gain or loss on all bilateral derivatives with a counterparty, subject to minimum transfer amounts that typically range from $100,000 to $250,000. Any additional collateral required due to changes in security values is typically transferred the same business day.
Collateral may be in the form of cash or debt securities issued by the U.S. government or related agencies. Cash posted by the fund is reflected as cash deposits in the accompanying financial statements and generally is restricted from withdrawal by the fund; securities posted by the fund are so noted in the accompanying Portfolio of Investments; both remain in the fund’s assets. Collateral pledged by counterparties is not included in the fund’s assets because the fund does not obtain effective control over those assets. For bilateral derivatives, collateral posted or received by the fund is held in a segregated account at the fund’s custodian. While typically not sold similar to equity or fixed income securities, exchange-traded or centrally cleared derivatives may be closed out only on the exchange or clearinghouse where the contracts were traded, and OTC and bilateral derivatives may be unwound with counterparties or transactions assigned to other counterparties to allow the fund to exit the transaction. This ability is subject to the liquidity of underlying positions. As of October 31, 2017, no collateral had been posted by the fund to counterparties for bilateral derivatives. As of October 31, 2017, collateral pledged by counterparties to the fund for bilateral derivatives consisted of $320,000 cash. As of October 31, 2017, cash of $1,230,000 had been posted by the fund for exchange-traded and/or centrally cleared derivatives.
Forward Currency Exchange Contracts The fund is subject to foreign currency exchange rate risk in the normal course of pursuing its investment objectives. It uses forward currency exchange contracts (forwards) primarily to protect its non-U.S. dollar-denominated securities from adverse currency movements. A forward involves an obligation to purchase or sell a fixed amount of a specific currency on a future date at a price set at the time of the contract. Although certain forwards may be settled by exchanging only the net gain or loss on the contract, most forwards are settled with the exchange of the underlying currencies in accordance with the specified terms. Forwards are valued at the unrealized gain or loss on the contract, which reflects the net amount the fund either is entitled to receive or obligated to deliver, as measured by the difference between the forward exchange rates at the date of entry into the contract and the forward rates at the reporting date. Appreciated forwards are reflected as assets and depreciated forwards are reflected as liabilities on the accompanying Statement of Assets and Liabilities. Risks related to the use of forwards include the possible failure of counterparties to meet the terms of the agreements; that anticipated currency movements will not occur, thereby reducing the fund’s total return; and the potential for losses in excess of the fund’s initial investment. During the year ended October 31, 2017, the volume of the fund’s activity in forwards, based on underlying notional amounts, was generally between 7% and 8% of net assets.
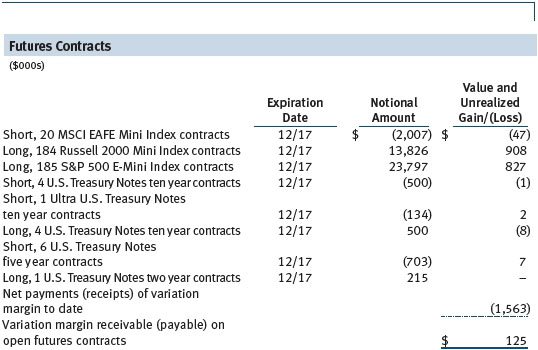
Futures Contracts The fund is subject to interest rate risk and equity price risk in the normal course of pursuing its investment objectives and uses futures contracts to help manage such risks. The fund may enter into futures contracts to manage exposure to interest rates, security prices, foreign currencies, and credit quality; as an efficient means of adjusting exposure to all or part of a target market; to enhance income; as a cash management tool; or to adjust credit exposure. A futures contract provides for the future sale by one party and purchase by another of a specified amount of a specific underlying financial instrument at an agreed-upon price, date, time, and place. The fund currently invests only in exchange-traded futures, which generally are standardized as to maturity date, underlying financial instrument, and other contract terms. Payments are made or received by the fund each day to settle daily fluctuations in the value of the contract (variation margin), which reflect changes in the value of the underlying financial instrument. Variation margin is recorded as unrealized gain or loss until the contract is closed. The value of a futures contract included in net assets is the amount of unsettled variation margin; net variation margin receivable is reflected as an asset and net variation margin payable is reflected as a liability on the accompanying Statement of Assets and Liabilities. Risks related to the use of futures contracts include possible illiquidity of the futures markets, contract prices that can be highly volatile and imperfectly correlated to movements in hedged security values and/or interest rates, and potential losses in excess of the fund’s initial investment. During the year ended October 31, 2017, the volume of the fund’s activity in futures, based on underlying notional amounts, was generally between 10% and 19% of net assets.
Options The fund is subject to interest rate risk and equity price risk in the normal course of pursuing its investment objectives and uses options to help manage such risks. The fund may use options to manage exposure to security prices, interest rates, foreign currencies, and credit quality; as an efficient means of adjusting exposure to all or a part of a target market; to enhance income; as a cash management tool; or to adjust credit exposure. Options are included in net assets at fair value, purchased options are included in Investments in Securities, and written options are separately reflected as a liability on the accompanying Statement of Assets and Liabilities. Premiums on unexercised, expired options are recorded as realized gains or losses; premiums on exercised options are recorded as an adjustment to the proceeds from the sale or cost of the purchase. The difference between the premium and the amount received or paid in a closing transaction is also treated as realized gain or loss. In return for a premium paid, call and put options give the holder the right, but not the obligation, to purchase or sell, respectively, a security at a specified exercise price. In return for a premium paid, call and put options on futures give the holder the right, but not the obligation, to purchase or sell, respectively, a position in a particular futures contract at a specified exercise price. In return for a premium paid, call and put index options give the holder the right, but not the obligation, to receive cash equal to the difference between the value of the reference index on the exercise date and the exercise price of the option. Risks related to the use of options include possible illiquidity of the options markets; trading restrictions imposed by an exchange or counterparty; movements in the underlying asset values and interest rates; and, for written options, potential losses in excess of the fund’s initial investment. During the year ended October 31, 2017, the volume of the fund’s activity in options, based on underlying notional amounts, was generally between 6% and 13% of net assets.
NOTE 4 - OTHER INVESTMENT TRANSACTIONS
Consistent with its investment objective, the fund engages in the following practices to manage exposure to certain risks and/or to enhance performance. The investment objective, policies, program, and risk factors of the fund are described more fully in the fund’s prospectus and Statement of Additional Information.
Emerging and Frontier Markets The fund may invest, either directly or through investments in T. Rowe Price institutional funds, in securities of companies located in, issued by governments of, or denominated in or linked to the currencies of emerging and frontier market countries; at period-end, approximately 14% of the fund’s net assets were invested in emerging markets and 3% in frontier markets. Emerging markets, and to a greater extent frontier markets, generally have economic structures that are less diverse and mature, and political systems that are less stable, than developed countries. These markets may be subject to greater political, economic, and social uncertainty and differing regulatory environments that may potentially impact the fund’s ability to buy or sell certain securities or repatriate proceeds to U.S. dollars. Such securities are often subject to greater price volatility, less liquidity, and higher rates of inflation than U.S. securities. Investing in frontier markets is significantly riskier than investing in other countries, including emerging markets.
Restricted Securities The fund may invest in securities that are subject to legal or contractual restrictions on resale. Prompt sale of such securities at an acceptable price may be difficult and may involve substantial delays and additional costs.
Securities Lending The fund may lend its securities to approved borrowers to earn additional income. Its securities lending activities are administered by a lending agent in accordance with a securities lending agreement. Security loans generally do not have stated maturity dates, and the fund may recall a security at any time. The fund receives collateral in the form of cash or U.S. government securities, valued at 102% to 105% of the value of the securities on loan. Collateral is maintained over the life of the loan in an amount not less than the value of loaned securities; any additional collateral required due to changes in security values is delivered to the fund the next business day. Cash collateral is invested in accordance with investment guidelines approved by fund management. Additionally, the lending agent indemnifies the fund against losses resulting from borrower default. Although risk is mitigated by the collateral and indemnification, the fund could experience a delay in recovering its securities and a possible loss of income or value if the borrower fails to return the securities, collateral investments decline in value, and the lending agent fails to perform. Securities lending revenue consists of earnings on invested collateral and borrowing fees, net of any rebates to the borrower, compensation to the lending agent, and other administrative costs. In accordance with GAAP, investments made with cash collateral are reflected in the accompanying financial statements, but collateral received in the form of securities is not. At October 31, 2017, there were no securities on loan.
Mortgage-Backed Securities The fund may invest in mortgage-backed securities (MBS or pass-through certificates) that represent an interest in a pool of specific underlying mortgage loans and entitle the fund to the periodic payments of principal and interest from those mortgages. MBS may be issued by government agencies or corporations, or private issuers. Most MBS issued by government agencies are guaranteed; however, the degree of protection differs based on the issuer. MBS are sensitive to changes in economic conditions that affect the rate of prepayments and defaults on the underlying mortgages; accordingly, the value, income, and related cash flows from MBS may be more volatile than other debt instruments.
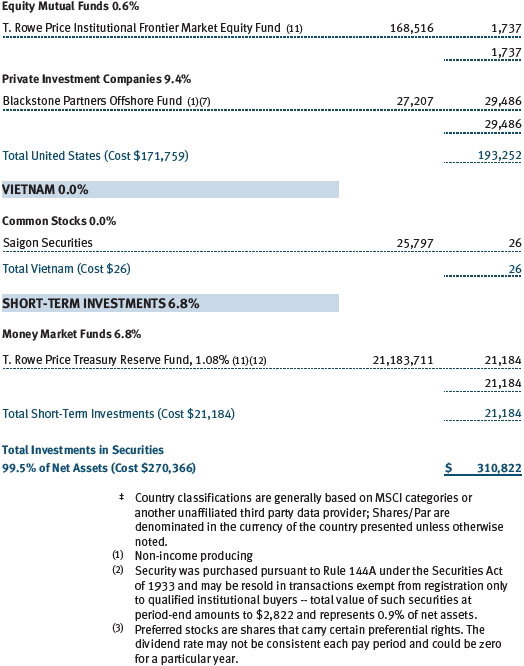
Investment in Blackstone Partners Offshore Fund The fund invested in Blackstone Partners Offshore Fund Ltd. (Blackstone Partners), a multi-strategy hedge fund-of-funds offered by Blackstone Alternative Asset Management (BAAM), a unit of Blackstone Group L.P. (Blackstone). Blackstone Partners provides the fund exposure to alternative investments primarily through Blackstone Partners’ investments in underlying private investment funds, and the underlying funds are mostly managed by investment managers unaffiliated with BAAM or Blackstone. Blackstone Partners and the underlying funds may use leverage, engage in short-selling, and invest in commodities or other speculative investments, which may increase the risk of investment loss. Blackstone Partners and the underlying funds are not subject to the same regulatory requirements as open-end mutual funds, and, therefore, their investments and related valuations may not be as transparent. Ownership interests in Blackstone Partners are not transferable and are subject to various redemption restrictions, such as advance notice requirements, limited redemption dates, and possible suspension of redemption rights. In addition, Blackstone Partners’ ownership in the underlying funds may also be subject to transfer and redemption restrictions, such as advance notice requirements, limited redemption dates, and possible suspension of redemption rights. All of these restrictions are subject to change at the sole discretion of Blackstone Partners or an underlying fund’s management. As of October 31, 2017, the fund’s investment in Blackstone Partners is subject to semi-annual redemption with 95 days’ prior written notice and is considered an illiquid asset.
Other Purchases and sales of portfolio securities other than short-term and U.S. government securities aggregated $135,304,000 and $67,865,000, respectively, for the year ended October 31, 2017. Purchases and sales of U.S. government securities aggregated $26,497,000 and $11,534,000, respectively, for the year ended October 31, 2017.
NOTE 5 - FEDERAL INCOME TAXES
No provision for federal income taxes is required since the fund intends to continue to qualify as a regulated investment company under Subchapter M of the Internal Revenue Code and distribute to shareholders all of its taxable income and gains. Distributions determined in accordance with federal income tax regulations may differ in amount or character from net investment income and realized gains for financial reporting purposes. Financial reporting records are adjusted for permanent book/tax differences to reflect tax character but are not adjusted for temporary differences.
The fund files U.S. federal, state, and local tax returns as required. The fund’s tax returns are subject to examination by the relevant tax authorities until expiration of the applicable statute of limitations, which is generally three years after the filing of the tax return but which can be extended to six years in certain circumstances. Tax returns for open years have incorporated no uncertain tax positions that require a provision for income taxes.
Reclassifications between income and gain relate primarily to the character of paydown gains and losses on asset-backed securities. For the year ended October 31, 2017, the following reclassifications were recorded to reflect tax character (there was no impact on results of operations or net assets):
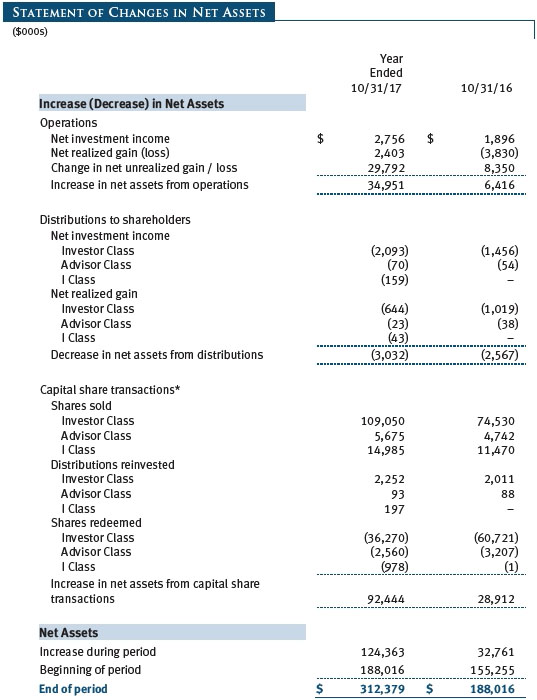
Distributions during the years ended October 31, 2017 and October 31, 2016, totaled $3,032,000 and $2,567,000, respectively, and were characterized as ordinary income for tax purposes. At October 31, 2017, the tax-basis cost of investments, including derivatives, and components of net assets were as follows:
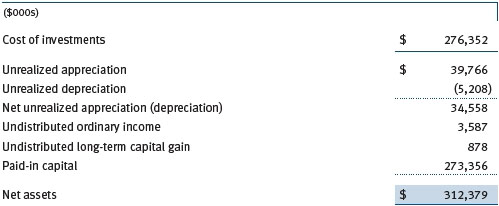
The difference between book-basis and tax-basis net unrealized appreciation (depreciation) is attributable to the deferral of losses from wash sales and certain derivative contracts, and the realization of gains/losses on passive foreign investment companies and certain open derivative contracts for tax purposes. The fund intends to retain realized gains to the extent of available capital loss carryforwards. Net realized capital losses may be carried forward indefinitely to offset future realized capital gains. During the year ended October 31, 2017, the fund utilized $3,240,000 of capital loss carryforwards.
NOTE 6 - FOREIGN TAXES
The fund is subject to foreign income taxes imposed by certain countries in which it invests. Additionally, certain foreign currency transactions are subject to tax, and capital gains realized upon disposition of securities issued in or by certain foreign countries are subject to capital gains tax imposed by those countries. All taxes are computed in accordance with the applicable foreign tax law, and, to the extent permitted, capital losses are used to offset capital gains. Taxes attributable to income are accrued by the fund as a reduction of income. Taxes incurred on the purchase of foreign currencies are recorded as realized loss on foreign currency transactions. Current and deferred tax expense attributable to capital gains is reflected as a component of realized or change in unrealized gain/loss on securities in the accompanying financial statements. At October 31, 2017, the fund had no deferred tax liability attributable to foreign securities and $3,000 of foreign capital loss carryforwards, including $3,000 that expire in 2026.
NOTE 7 - RELATED PARTY TRANSACTIONS
The fund is managed by T. Rowe Price Associates, Inc. (Price Associates), a wholly owned subsidiary of T. Rowe Price Group, Inc. (Price Group). The investment management agreement between the fund and Price Associates provides for an annual investment management fee, which is computed daily and paid monthly. The fee consists of an individual fund fee, equal to 0.40% of the fund’s average daily net assets, and a group fee. The group fee rate is calculated based on the combined net assets of certain mutual funds sponsored by Price Associates (the group) applied to a graduated fee schedule, with rates ranging from 0.48% for the first $1 billion of assets to 0.265% for assets in excess of $650 billion. The fund’s group fee is determined by applying the group fee rate to the fund’s average daily net assets. At October 31, 2017, the effective annual group fee rate was 0.29%.
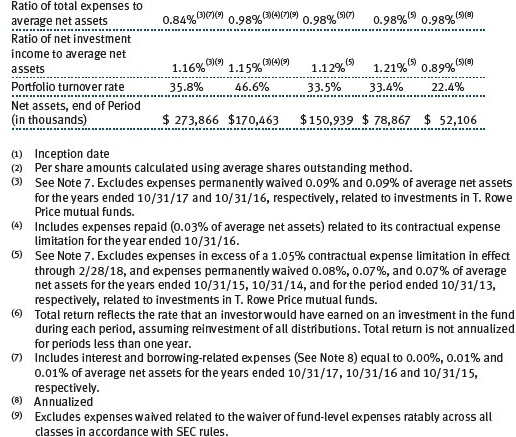
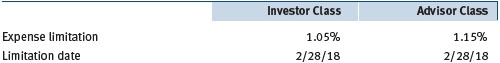
The Investor Class and Advisor Class are each subject to a contractual expense limitation through the limitation dates indicated in the table below. During the limitation period, Price Associates is required to waive its management fee or pay any expenses (excluding interest, expenses related to borrowings, taxes, brokerage, and other non-recurring expenses permitted by the investment management agreement) that would otherwise cause the class’s ratio of annualized total expenses to average net assets (expense ratio) to exceed its expense limitation. Each class is required to repay Price Associates for expenses previously waived/paid to the extent the class’s net assets grow or expenses decline sufficiently to allow repayment without causing the class’s expense ratio (after the repayment is taken into account) to exceed both: (1) the expense limitation in place at the time such amounts were waived; and (2) the class’s current expense limitation. However, no repayment will be made more than three years after the date of a payment or waiver.
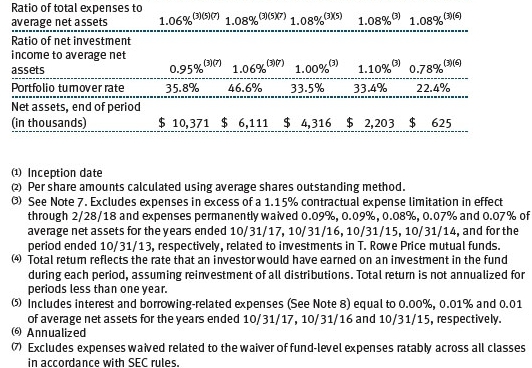
The I Class is also subject to an operating expense limitation (I Class limit) pursuant to which Price Associates is contractually required to pay all operating expenses of the I Class, excluding management fees, interest, expenses related to borrowings, taxes, brokerage, and other non-recurring expenses permitted by the investment management agreement, to the extent such operating expenses, on an annualized basis, exceed 0.05% of average net assets. This agreement will continue until February 28, 2018, and may be renewed, revised, or revoked only with approval of the fund’s Board. The I Class is required to repay Price Associates for expenses previously paid to the extent the class’s net assets grow or expenses decline sufficiently to allow repayment without causing the class’s operating expenses (after the repayment is taken into account) to exceed both: (1) the expense limitation in place at the time such amounts were paid; and (2) the class’s current expense limitation. However, no repayment will be made more than three years after the date of a payment or waiver.
Pursuant to these agreements, $157,000 of expenses were waived/paid by Price Associates during the year ended October 31, 2017. Including this amount, expenses previously waived/paid by Price Associates in the amount of $543,000 remain subject to repayment by the fund at October 31, 2017.
In addition, the fund has entered into service agreements with Price Associates and two wholly owned subsidiaries of Price Associates (collectively, Price). Price Associates provides certain accounting and administrative services to the fund. T. Rowe Price Services, Inc. provides shareholder and administrative services in its capacity as the fund’s transfer and dividend-disbursing agent. T. Rowe Price Retirement Plan Services, Inc. provides subaccounting and recordkeeping services for certain retirement accounts invested in the Investor Class and I Class. For the year ended October 31, 2017, expenses incurred pursuant to these service agreements were $86,000 for Price Associates; $83,000 for T. Rowe Price Services, Inc.; and less than $1,000 for T. Rowe Price Retirement Plan Services, Inc. The total amount payable at period-end pursuant to these service agreements is reflected as Due to Affiliates in the accompanying financial statements.
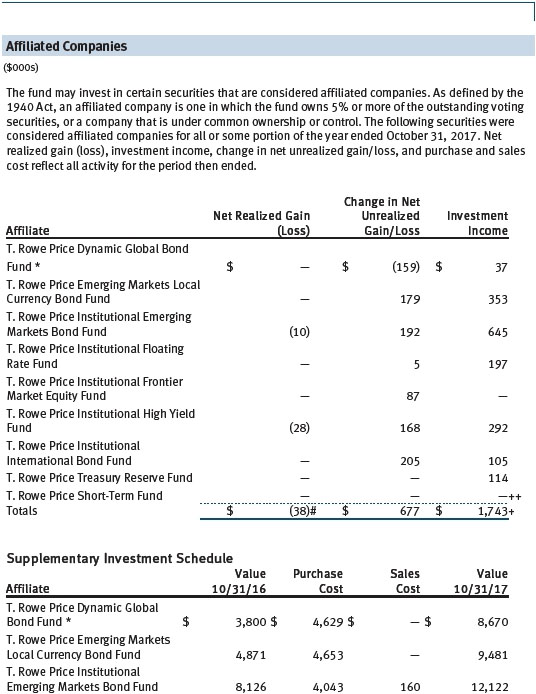
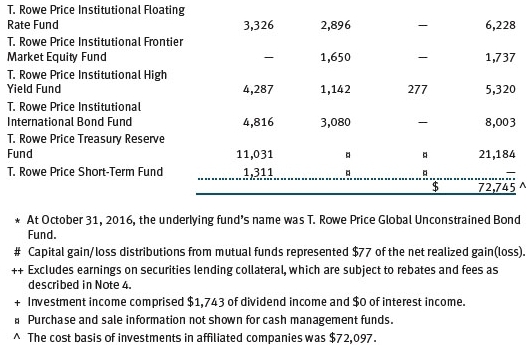
The fund may invest in certain open-end management investment companies managed by Price Associates and considered affiliates of the fund: the T. Rowe Price Government Reserve Fund or the T. Rowe Price Treasury Reserve Fund, organized as money market funds, or the T. Rowe Price Short-Term Fund, a short-term bond fund (collectively, the Price Reserve Funds). The Price Reserve Funds are offered as short-term investment options to mutual funds, trusts, and other accounts managed by Price Associates or its affiliates and are not available for direct purchase by members of the public. The Price Reserve Funds pay no investment management fees.
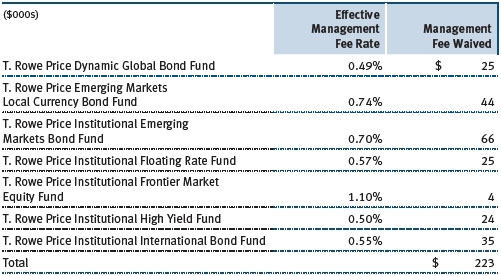
The fund may also invest in certain other T. Rowe Price funds (Price Funds) as a means of gaining efficient and cost-effective exposure to certain markets. The fund does not invest for the purpose of exercising management or control; however, investments by the fund may represent a significant portion of an underlying Price Fund’s net assets. Each underlying Price Fund is an open-end management investment company managed by Price Associates and is considered an affiliate of the fund. To ensure that the fund does not incur duplicate management fees (paid by the underlying Price Fund(s) and the fund), Price Associates has agreed to permanently waive a portion of its management fee charged to the fund in an amount sufficient to fully offset that portion of management fees paid by each underlying Price Fund related to the fund’s investment therein. Annual management fee rates and amounts waived related to investments in the underlying Price Fund(s) for the year ended October 31, 2017, are as follows:
As of October 31, 2017, T. Rowe Price Group, Inc., or its wholly owned subsidiaries owned 2,475,000 shares of the Investor Class, representing 11% of the Investor Class’s net assets.
The fund may participate in securities purchase and sale transactions with other funds or accounts advised by Price Associates (cross trades), in accordance with procedures adopted by the fund’s Board and Securities and Exchange Commission rules, which require, among other things, that such purchase and sale cross trades be effected at the independent current market price of the security. During the year ended October 31, 2017, the aggregate value of purchases and sales cross trades with other funds or accounts advised by Price Associates was less than 1% of the fund’s net assets as of October 31, 2017.
NOTE 8 - BORROWING
The fund may borrow to provide temporary liquidity. The fund, along with several other T. Rowe Price-sponsored mutual funds (collectively, the participating funds), has entered into a $575 million, 364-day, syndicated credit facility (the facility) pursuant to which the participating funds may borrow on a first-come, first-served basis up to the full amount of the facility. Interest is charged to the borrowing fund at a rate equal to 1.00% plus the Federal Funds rate. A commitment fee, equal to 0.15% per annum of the average daily undrawn commitment is accrued daily and paid quarterly; legal and administrative fees are recognized as incurred. All fees are allocated to the participating funds based on each fund’s relative net assets and are reflected as a component of miscellaneous in the accompanying financial statements. Loans are generally unsecured; however, the fund must collateralize any borrowings under the facility on an equivalent basis if it has other collateralized borrowings. Effective January 9, 2017, the fund is no longer a participating fund in the facility. During the year ended October 31, 2017, the fund incurred $4,000 in commitment fees. At October 31, 2017, the fund had no borrowings outstanding under the facility, and the undrawn amount of the facility was $500,000,000.
| Report of Independent Registered Public Accounting Firm |
To the Board of Directors and Shareholders of T. Rowe Price Global
Allocation Fund, Inc.
In our opinion, the accompanying statement of assets and liabilities, including the portfolio of investments, and the related statements of operations and of changes in net assets and the financial highlights present fairly, in all material respects, the financial position of the T. Rowe Price Global Allocation Fund, Inc. (hereafter referred to as the “Fund”) as of October 31, 2017, the results of its operations for the year then ended, the changes in its net assets for each of the two years in the period then ended and the financial highlights for each of the periods indicated therein, in conformity with accounting principles generally accepted in the United States of America. These financial statements and financial highlights (hereafter referred to as “financial statements”) are the responsibility of the Fund’s management. Our responsibility is to express an opinion on these financial statements based on our audits. We conducted our audits of these financial statements in accordance with the standards of the Public Company Accounting Oversight Board (United States). Those standards require that we plan and perform the audit to obtain reasonable assurance about whether the financial statements are free of material misstatement. An audit includes examining, on a test basis, evidence supporting the amounts and disclosures in the financial statements, assessing the accounting principles used and significant estimates made by management, and evaluating the overall financial statement presentation. We believe that our audits, which included confirmation of securities as of October 31, 2017 by correspondence with the custodian, brokers, and transfer agent, provide a reasonable basis for our opinion.
PricewaterhouseCoopers LLP
Baltimore, Maryland
December 15, 2017
| Tax Information (Unaudited) for the Tax Year Ended 10/31/17 |
We are providing this information as required by the Internal Revenue Code. The amounts shown may differ from those elsewhere in this report because of differences between tax and financial reporting requirements.
The fund’s distributions to shareholders included $709,000 from short-term capital gains.
For taxable non-corporate shareholders, $2,375,000 of the fund’s income represents qualified dividend income subject to a long-term capital gains tax rate of not greater than 20%.
For corporate shareholders, $724,000 of the fund’s income qualifies for the dividends-received deduction.
| Information on Proxy Voting Policies, Procedures, and Records |
A description of the policies and procedures used by T. Rowe Price funds and portfolios to determine how to vote proxies relating to portfolio securities is available in each fund’s Statement of Additional Information. You may request this document by calling 1-800-225-5132 or by accessing the SEC’s website, sec.gov.
The description of our proxy voting policies and procedures is also available on our corporate website. To access it, please visit the following Web page:
https://www3.troweprice.com/usis/corporate/en/utility/policies.html
Scroll down to the section near the bottom of the page that says, “Proxy Voting Policies.” Click on the Proxy Voting Policies link in the shaded box.
Each fund’s most recent annual proxy voting record is available on our website and through the SEC’s website. To access it through T. Rowe Price, visit the website location shown above, and scroll down to the section near the bottom of the page that says, “Proxy Voting Records.” Click on the Proxy Voting Records link in the shaded box.
| How to Obtain Quarterly Portfolio Holdings |
The fund files a complete schedule of portfolio holdings with the Securities and Exchange Commission for the first and third quarters of each fiscal year on Form N-Q. The fund’s Form N-Q is available electronically on the SEC’s website (sec.gov); hard copies may be reviewed and copied at the SEC’s Public Reference Room, 100 F St. N.E., Washington, DC 20549. For more information on the Public Reference Room, call 1-800-SEC-0330.
| About the Fund’s Directors and Officers |
Your fund is overseen by a Board of Directors (Board) that meets regularly to review a wide variety of matters affecting or potentially affecting the fund, including performance, investment programs, compliance matters, advisory fees and expenses, service providers, and business and regulatory affairs. The Board elects the fund’s officers, who are listed in the final table. At least 75% of the Board’s members are independent of T. Rowe Price Associates, Inc. (T. Rowe Price), and its affiliates; “inside” or “interested” directors are employees or officers of T. Rowe Price. The business address of each director and officer is 100 East Pratt Street, Baltimore, Maryland 21202. The Statement of Additional Information includes additional information about the fund directors and is available without charge by calling a T. Rowe Price representative at 1-800-638-5660.
| Independent Directors | ||
| Name | ||
| (Year of Birth) | ||
| Year Elected* | ||
| [Number of T. Rowe Price | Principal Occupation(s) and Directorships of Public Companies and | |
| Portfolios Overseen] | Other Investment Companies During the Past Five Years | |
| Anthony W. Deering | Chairman, Exeter Capital, LLC, a private investment firm (2004 to | |
| (1945) | present); Director and Advisory Board Member, Deutsche Bank North | |
| 2013 | America (2004 to present); Director, Vornado Real Estate Investment | |
| [191] | Trust (2004 to 2012); Director, Under Armour (2008 to present); | |
| Director, Brixmor Real Estate Investment Trust (2012 to present) | ||
| Bruce W. Duncan | Chief Executive Officer and Director (2009 to December 2016), | |
| (1951) | Chairman of the Board (January 2016 to present), and President | |
| 2013 | (2009 to September 2016), First Industrial Realty Trust, an owner | |
| [191] | and operator of industrial properties; Chairman of the Board | |
| (2005 to September 2016) and Director (1999 to September | ||
| 2016), Starwood Hotels & Resorts, a hotel and leisure company; | ||
| Director, Boston Properties (May 2016 to present); Director, | ||
| Marriott International, Inc. (September 2016 to present) | ||
| Robert J. Gerrard, Jr. | Advisory Board Member, Pipeline Crisis/Winning Strategies, a | |
| (1952) | collaborative working to improve opportunities for young African | |
| 2013 | Americans (1997 to present) | |
| [191] | ||
| Paul F. McBride | Advisory Board Member, Vizzia Technologies (2015 to present) | |
| (1956) | ||
| 2013 | ||
| [191] | ||
| Cecilia E. Rouse, Ph.D. | Dean, Woodrow Wilson School (2012 to present); Professor and | |
| (1963) | Researcher, Princeton University (1992 to present); Member of | |
| 2013 | National Academy of Education (2010 to present); Director, MDRC, a | |
| [191] | nonprofit education and social policy research organization (2011 to | |
| present); Research Associate of Labor Studies Program (2011 to | ||
| 2015) and Board Member (2015 to present), National Bureau of | ||
| Economic Research (2011 to present); Chair of Committee on the | ||
| Status of Minority Groups in the Economic Profession (2012 to | ||
| present); Vice President, American Economic Association (2015 | ||
| to present) | ||
| John G. Schreiber | Owner/President, Centaur Capital Partners, Inc., a real estate | |
| (1946) | investment company (1991 to present); Cofounder, Partner, and | |
| 2013 | Cochairman of the Investment Committee, Blackstone Real Estate | |
| [191] | Advisors, L.P. (1992 to 2015); Director, General Growth Properties, | |
| Inc. (2010 to 2013); Director, Blackstone Mortgage Trust, a real | ||
| estate finance company (2012 to 2016); Director and Chairman of | ||
| the Board, Brixmor Property Group, Inc. (2013 to present); Director, | ||
| Hilton Worldwide (2013 to present); Director, Hudson Pacific | ||
| Properties (2014 to 2016) | ||
| Mark R. Tercek | President and Chief Executive Officer, The Nature Conservancy | |
| (1957) | (2008 to present) | |
| 2013 | ||
| [191] | ||
| *Each independent director serves until retirement, resignation, or election of a successor. | ||
| Inside Directors | ||
| Name | ||
| (Year of Birth) | ||
| Year Elected* | ||
| [Number of T. Rowe Price | Principal Occupation(s) and Directorships of Public Companies and | |
| Portfolios Overseen] | Other Investment Companies During the Past Five Years | |
| Edward C. Bernard | Director and Vice President, T. Rowe Price; Vice Chairman of the | |
| (1956) | Board, Director, and Vice President, T. Rowe Price Group, Inc.; | |
| 2013 | Chairman of the Board, Director, and Vice President, T. Rowe Price | |
| [191] | Investment Services, Inc., and T. Rowe Price Services, Inc.; Chairman | |
| of the Board and Director, T. Rowe Price Retirement Plan Services, | ||
| Inc.; Chairman of the Board, Chief Executive Officer, Director, and | ||
| President, T. Rowe Price International and T. Rowe Price Trust | ||
| Company; Chairman of the Board, all funds | ||
| Robert W. Sharps, CFA, CPA** | Vice President, T. Rowe Price, T. Rowe Price Group, Inc., and T. Rowe | |
| (1971) | Price Trust Company | |
| 2017 | ||
| [135] | ||
| *Each inside director serves until retirement, resignation, or election of a successor. | ||
| **Effective April 1, 2017, Brian C. Rogers was replaced by Robert W. Sharps as an inside director of certain Price Funds. | ||
| Officers | ||
| Name (Year of Birth) | ||
| Position Held With Global Allocation Fund | Principal Occupation(s) | |
| Stephen L. Bartolini, CFA (1977) | Vice President, T. Rowe Price and T. Rowe Price | |
| Vice President | Group, Inc. | |
| Darrell N. Braman (1963) | Vice President, Price Hong Kong, Price | |
| Vice President and Secretary | Singapore, T. Rowe Price, T. Rowe Price Group, | |
| Inc., T. Rowe Price International, T. Rowe Price | ||
| Investment Services, Inc., and T. Rowe Price | ||
| Services, Inc. | ||
| John R. Gilner (1961) | Chief Compliance Officer and Vice President, | |
| Chief Compliance Officer | T. Rowe Price; Vice President, T. Rowe Price | |
| Group, Inc., and T. Rowe Price Investment | ||
| Services, Inc. | ||
| Robert L. Harlow, CAIA, CFA (1986) | Vice President, T. Rowe Price and T. Rowe Price | |
| Vice President | Group, Inc. | |
| Steven C. Huber, CFA, FSA (1958) | Vice President, T. Rowe Price, T. Rowe Price | |
| Vice President | Group, Inc., and T. Rowe Price International | |
| Stefan Hubrich, Ph.D., CFA (1974) | Vice President, T. Rowe Price and T. Rowe Price | |
| Vice President | Group, Inc. | |
| Paul J. Krug, CPA (1964) | Vice President, T. Rowe Price, T. Rowe Price | |
| Vice President | Group, Inc., and T. Rowe Price Trust Company | |
| Robert M. Larkins, CFA (1973) | Vice President, T. Rowe Price, T. Rowe Price | |
| Vice President | Group, Inc., and T. Rowe Price Trust Company | |
| Catherine D. Mathews (1963) | Vice President, T. Rowe Price, T. Rowe Price | |
| Treasurer and Vice President | Group, Inc., and T. Rowe Price Trust Company | |
| Sean McWilliams (1988) | Vice President, T. Rowe Price | |
| Vice President | ||
| David Oestreicher (1967) | Director, Vice President, and Secretary, T. Rowe | |
| Vice President | Price Investment Services, Inc., T. Rowe | |
| Price Retirement Plan Services, Inc., T. Rowe | ||
| Price Services, Inc., and T. Rowe Price Trust | ||
| Company; Chief Legal Officer, Vice President, | ||
| and Secretary, T. Rowe Price Group, Inc.; Vice | ||
| President and Secretary, T. Rowe Price and | ||
| T. Rowe Price International; Vice President, | ||
| Price Hong Kong and Price Singapore | ||
| Sebastien Page (1977) | Vice President, T. Rowe Price and T. Rowe Price | |
| Vice President | Group, Inc. | |
| Robert A. Panariello (1983) | Vice President, T. Rowe Price and T. Rowe Price | |
| Vice President | Group, Inc. | |
| John W. Ratzesberger (1975) | Vice President, T. Rowe Price, T. Rowe Price | |
| Vice President | Group, Inc., and T. Rowe Price Trust Company; | |
| formerly, North American Head of Listed | ||
| Derivatives Operation, Morgan Stanley | ||
| (to 2013) | ||
| Shannon H. Rauser (1987) | Employee, T. Rowe Price | |
| Assistant Secretary | ||
| Darrell M. Riley (1958) | Vice President, T. Rowe Price and T. Rowe Price | |
| Vice President | Group, Inc. | |
| Deborah D. Seidel (1962) | Vice President, T. Rowe Price, T. Rowe Price | |
| Vice President | Group, Inc., T. Rowe Price Investment Services, | |
| Inc., and T. Rowe Price Services, Inc. | ||
| Charles M. Shriver, CFA (1967) | Vice President, T. Rowe Price, T. Rowe Price | |
| President | Group, Inc., T. Rowe Price International, and | |
| T. Rowe Price Trust Company | ||
| Toby M. Thompson, CAIA, CFA (1971) | Vice President, T. Rowe Price and T. Rowe Price | |
| Vice President | Group, Inc. | |
| Megan Warren (1968) | Vice President, T. Rowe Price, T. Rowe Price | |
| Vice President | Retirement Plan Services, Inc., T. Rowe | |
| Price Services, Inc., and T. Rowe Price Trust | ||
| Company; formerly, Executive Director, JP | ||
| Morgan Chase (to 2017) | ||
| Unless otherwise noted, officers have been employees of T. Rowe Price or T. Rowe Price International for at least 5 years. | ||
Item 2. Code of Ethics.
The registrant has adopted a code of ethics, as defined in Item 2 of Form N-CSR, applicable to its principal executive officer, principal financial officer, principal accounting officer or controller, or persons performing similar functions. A copy of this code of ethics is filed as an exhibit to this Form N-CSR. No substantive amendments were approved or waivers were granted to this code of ethics during the period covered by this report.
Item 3. Audit Committee Financial Expert.
The registrant’s Board of Directors/Trustees has determined that Mr. Bruce W. Duncan qualifies as an audit committee financial expert, as defined in Item 3 of Form N-CSR. Mr. Duncan is considered independent for purposes of Item 3 of Form N-CSR.
Item 4. Principal Accountant Fees and Services.
(a) – (d) Aggregate fees billed for the last two fiscal years for professional services rendered to, or on behalf of, the registrant by the registrant’s principal accountant were as follows:
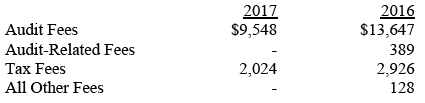
Audit fees include amounts related to the audit of the registrant’s annual financial statements and services normally provided by the accountant in connection with statutory and regulatory filings. Audit-related fees include amounts reasonably related to the performance of the audit of the registrant’s financial statements and specifically include the issuance of a report on internal controls and, if applicable, agreed-upon procedures related to fund acquisitions. Tax fees include amounts related to services for tax compliance, tax planning, and tax advice. The nature of these services specifically includes the review of distribution calculations and the preparation of Federal, state, and excise tax returns. All other fees include the registrant’s pro-rata share of amounts for agreed-upon procedures in conjunction with service contract approvals by the registrant’s Board of Directors/Trustees.
(e)(1) The registrant’s audit committee has adopted a policy whereby audit and non-audit services performed by the registrant’s principal accountant for the registrant, its investment adviser, and any entity controlling, controlled by, or under common control with the investment adviser that provides ongoing services to the registrant require pre-approval in advance at regularly scheduled audit committee meetings. If such a service is required between regularly scheduled audit committee meetings, pre-approval may be authorized by one audit committee member with ratification at the next scheduled audit committee meeting. Waiver of pre-approval for audit or non-audit services requiring fees of a de minimis amount is not permitted.
(2) No services included in (b) – (d) above were approved pursuant to paragraph (c)(7)(i)(C) of Rule 2-01 of Regulation S-X.
(f) Less than 50 percent of the hours expended on the principal accountant’s engagement to audit the registrant’s financial statements for the most recent fiscal year were attributed to work performed by persons other than the principal accountant’s full-time, permanent employees.
(g) The aggregate fees billed for the most recent fiscal year and the preceding fiscal year by the registrant’s principal accountant for non-audit services rendered to the registrant, its investment adviser, and any entity controlling, controlled by, or under common control with the investment adviser that provides ongoing services to the registrant were $1,432,000 and $1,890,000, respectively.
(h) All non-audit services rendered in (g) above were pre-approved by the registrant’s audit committee. Accordingly, these services were considered by the registrant’s audit committee in maintaining the principal accountant’s independence.
Item 5. Audit Committee of Listed Registrants.
Not applicable.
Item 6. Investments.
(a) Not applicable. The complete schedule of investments is included in Item 1 of this Form N-CSR.
(b) Not applicable.
Item 7. Disclosure of Proxy Voting Policies and Procedures for Closed-End Management Investment Companies.
Not applicable.
Item 8. Portfolio Managers of Closed-End Management Investment Companies.
Not applicable.
Item 9. Purchases of Equity Securities by Closed-End Management Investment Company and Affiliated Purchasers.
Not applicable.
Item 10. Submission of Matters to a Vote of Security Holders.
Not applicable.
Item 11. Controls and Procedures.
(a) The registrant’s principal executive officer and principal financial officer have evaluated the registrant’s disclosure controls and procedures within 90 days of this filing and have concluded that the registrant’s disclosure controls and procedures were effective, as of that date, in ensuring that information required to be disclosed by the registrant in this Form N-CSR was recorded, processed, summarized, and reported timely.
(b) The registrant’s principal executive officer and principal financial officer are aware of no change in the registrant’s internal control over financial reporting that occurred during the registrant’s second fiscal quarter covered by this report that has materially affected, or is reasonably likely to materially affect, the registrant’s internal control over financial reporting.
Item 12. Exhibits.
(a)(1) The registrant’s code of ethics pursuant to Item 2 of Form N-CSR is attached.
(2) Separate certifications by the registrant's principal executive officer and principal financial officer, pursuant to Section 302 of the Sarbanes-Oxley Act of 2002 and required by Rule 30a-2(a) under the Investment Company Act of 1940, are attached.
(3) Written solicitation to repurchase securities issued by closed-end companies: not applicable.
(b) A certification by the registrant's principal executive officer and principal financial officer, pursuant to Section 906 of the Sarbanes-Oxley Act of 2002 and required by Rule 30a-2(b) under the Investment Company Act of 1940, is attached.
SIGNATURES
Pursuant to the requirements of the Securities Exchange Act of 1934 and the Investment Company Act of 1940, the registrant has duly caused this report to be signed on its behalf by the undersigned, thereunto duly authorized.
T. Rowe Price Global Allocation Fund, Inc.
| By | /s/ Edward C. Bernard | |||||
| Edward C. Bernard | ||||||
| Principal Executive Officer | ||||||
| Date | December 15, 2017 | |||||
Pursuant to the requirements of the Securities Exchange Act of 1934 and the Investment Company Act of 1940, this report has been signed below by the following persons on behalf of the registrant and in the capacities and on the dates indicated.
| By | /s/ Edward C. Bernard | |||||
| Edward C. Bernard | ||||||
| Principal Executive Officer | ||||||
| Date | December 15, 2017 | |||||
| By | /s/ Catherine D. Mathews | |||||
| Catherine D. Mathews | ||||||
| Principal Financial Officer | ||||||
| Date | December 15, 2017 | |||||