UNITED STATES
SECURITIES AND EXCHANGE COMMISSION
Washington, D.C. 20549
FORM N-CSR
CERTIFIED SHAREHOLDER REPORT OF REGISTERED
MANAGEMENT INVESTMENT COMPANIES
Investment Company Act File Number: 811-22810
| T. Rowe Price Global Allocation Fund, Inc. |
|
| (Exact name of registrant as specified in charter) |
| |
| 100 East Pratt Street, Baltimore, MD 21202 |
|
| (Address of principal executive offices) |
| |
| David Oestreicher |
| 100 East Pratt Street, Baltimore, MD 21202 |
|
| (Name and address of agent for service) |
Registrant’s telephone number, including area code: (410) 345-2000
Date of fiscal year end: October 31
Date of reporting period: October 31, 2019
Item 1. Reports to Shareholders
(a) Report pursuant to Rule 30e-1.
| Global Allocation Fund | October 31, 2019 |
| RPGAX | Investor Class |
| PAFGX | Advisor Class |
| TGAFX | I Class |
Beginning on January 1, 2021, as permitted by SEC regulations, paper copies of the T. Rowe Price funds’ annual and semiannual shareholder reports will no longer be mailed, unless you specifically request them. Instead, shareholder reports will be made available on the funds’ website (troweprice.com/prospectus), and you will be notified by mail with a website link to access the reports each time a report is posted to the site.
If you already elected to receive reports electronically, you will not be affected by this change and need not take any action. At any time, shareholders who invest directly in T. Rowe Price funds may generally elect to receive reports or other communications electronically by enrolling attroweprice.com/paperlessor, if you are a retirement plan sponsor or invest in the funds through a financial intermediary (such as an investment advisor, broker-dealer, insurance company, or bank), by contacting your representative or your financial intermediary.
You may elect to continue receiving paper copies of future shareholder reports free of charge. To do so, if you invest directly with T. Rowe Price, please call T. Rowe Price as follows: IRA, nonretirement account holders, and institutional investors,1-800-225-5132; small business retirement accounts,1-800-492-7670. If you are a retirement plan sponsor or invest in the T. Rowe Price funds through a financial intermediary, please contact your representative or financial intermediary or follow additional instructions if included with this document. Your election to receive paper copies of reports will apply to all funds held in your account with your financial intermediary or, if you invest directly in the T. Rowe Price funds, with T. Rowe Price. Your election can be changed at any time in the future.
| T. ROWE PRICE GLOBAL ALLOCATION FUND |
|
HIGHLIGHTS
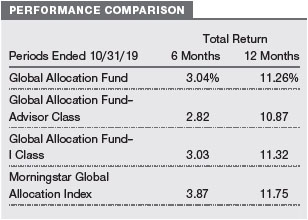
| ■ | The Global Allocation Fund returned 11.26% in the 12 months ended October 31, 2019, and underperformed the Morningstar Global Allocation Index. |
| | |
| ■ | Exposure to diversifying sectors and security selection weighed on relative performance. Tactical decisions in the fund produced mixed results. |
| | |
| ■ | We ended the period with a neutral allocation to equities relative to bonds, as global growth appears to be stabilizing and bond yields remain near recent lows. Among international stocks, we reduced our position in growth equities and now have a neutral allocation relative to value equities. We increased our allocation to high yield bonds and are finding opportunity to add back to floating rate loans after reducing our position due to declining interest rates earlier in the period. |
| | |
| ■ | We believe that broad diversification across asset classes, regions, and sectors, as well as our ability to actively adjust allocations to enhance the portfolio’s risk/reward profile, should benefit the Global Allocation Fund across a range of market environments. |

Log in to your account attroweprice.comfor more information.
*Certain mutual fund accounts that are assessed an annual account service fee can also save money by switching to e-delivery.
CIO Market Commentary
Dear Shareholder
Global markets recovered from a tumultuous start to deliver solid results for your fund’s fiscal year, the 12-month period ended October 31, 2019. The U.S. Federal Reserve switched course and joined other dovish central banks around the world to support markets following a sharp sell-off in December. This action, combined with better-than-feared corporate earnings, helped propel many equity indices during the year to double-digit gains. The S&P 500 Index reached an all-time high, and Europe’s Stoxx 600 Index was trading near a record close at the end of the period. Growth stocks in the U.S. were the strongest performers, but nearly all developed markets and most emerging markets also delivered strong gains.
The U.S. dollar finished with mixed results versus other currencies during the 12-month reporting period. A relatively strong greenback versus the euro weighed on returns for U.S. investors in European securities, for example, while a stronger yen boosted the returns of Japanese stocks in U.S. dollar terms.
During the period, investors faced worries about the U.S.-China trade dispute, Brexit, and a slowdown in global manufacturing. However, stocks were resilient, and the worst-case geopolitical scenarios failed to play out. Trade rhetoric has become more conciliatory and negotiators have made modest progress; the UK received another Brexit extension until January 31 to work out the terms of its departure from the European Union; and our economists believe that some manufacturing indicators, while still weak, appear poised for a recovery.
The actions by the Federal Reserve and other central banks to stimulate economic growth played a key role in sustaining market sentiment during the period. As evidence of slowing global growth began to mount, the Fed signaled early in the year that it would take steps to sustain the economic expansion, and central bank policymakers followed through with quarter-percentage-point rate cuts in July, September, and October and took steps to maintain liquidity in short-term lending markets.
The European Central Bank (ECB) also acted to address flagging growth. The ECB lowered its benchmark deposit rate deeper into negative territory and announced that it plans to buy €20 billion of bonds per month starting in November 2019 as it restarts its quantitative easing program.
Falling yields fueled a strong rally in the bond market and also aided equity results as companies benefited from lower borrowing costs and investors sought higher returns. Dividend-paying stocks in sectors such as real estate outperformed as investors searched for higher-income opportunities.
The yield on the 30-year Treasury bond hit a record low in August, falling below the 2% mark for the first time, and the benchmark 10-year Treasury note’s yield dipped to its lowest level since 2016. Despite being at or near record lows, Treasuries offered higher yields than bonds in many foreign markets, especially in Europe and Japan, where government bond yields were often in negative territory. (Bond prices and yields move in opposite directions.)
Looking ahead to 2020, we remain optimistic that the U.S. will avoid a recession in the new year, but we believe that further progress in U.S.-China trade talks will be a key factor in sustaining positive market sentiment. A reduction in trade barriers could help corporate earnings rebound and provide a lift to the manufacturing sector.
In the months ahead, our team of portfolio managers, analysts, and economists will be following the trade talks and the U.S. presidential elections, along with other developments that could affect market performance. Our teams in London and Hong Kong have provided us with important insights into Brexit and the protests in the Chinese territory over the past 12 months. We expect twists and turns along the way with each of these events, but we believe our approach to fundamental research around the globe will continue to add value in the year ahead.
Thank you for your continued confidence in T. Rowe Price.
Sincerely,

Robert Sharps
Group Chief Investment Officer
Management’s Discussion of Fund Performance
INVESTMENT OBJECTIVE
The fund seeks long-term capital appreciation and income.
FUND COMMENTARY
How did the fund perform in the past 12 months?
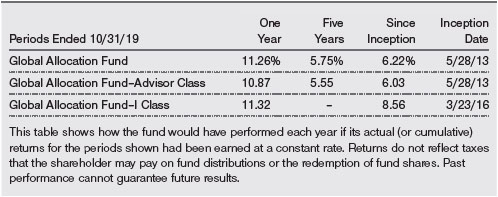
The Global Allocation Fund returned 11.26% in the 12 months endedOctober 31, 2019. The fund underperformed the Morningstar Global Allocation Index. (Returns for the Advisor and I Class shares varied slightly, reflecting their different fee structures.Pastperformance cannot guarantee future results.)
What factors influenced the fund’s performance?
Allocations to diversifying sectors, which are not included in the benchmark, detracted from relative performance. Fixed income sectors with a short duration posture (lower sensitivity to interest rate changes), suchas short-term Treasury inflation protected securities or floating rate loans, underperformed in a period where Treasury yields plummeted. However, the fund benefited from exposure to nondollar bonds. Bond yields in many developed markets declined and prices rose as central bank policies turned accommodative after a period of tightening monetary policy.
Overall, security selection weighed on relative results. Within fixed income, the Emerging Markets Bond and Dynamic Global Bond Funds were negatively impacted by a massive sell-off in Argentine securities, which was triggered by an unexpected outcome in the presidential election. Incumbent President Mauricio Macri was soundly defeated, and investors feared that the new administration would terminate recent market-friendly steps and return to a Peronist government characterized by populist policies, currency and capital controls, and debt defaults. Among equities, the U.S. large-cap growth equity strategy trailed its benchmark and hurt returns, while positive security selection in the emerging markets, European, and international large-cap value equity strategies added value.
Tactical decisions to overweight and underweight various asset classes within the fund produced mixed results. Our positioning in equities relative to fixed income proved beneficial, but the positive impact was partially offset by our allocation to cash during a period of strong performance by both equities and bonds. An overweight allocation to U.S. small-cap equities, which lagged U.S. large-caps, hurt returns.
How is the fund positioned?
The fund currently has a neutral allocation to stocks relative to bonds. In late 2018, we moved from an underweight in equities to neutral after the meaningful downturn in equity markets. We subsequently reduced our exposure following a strong rebound during the first quarter of 2019, as valuations became less compelling amid a potentially volatile equity market environment. More recently, we have moved back to neutral as bond valuations have become extended following a decline in interest rates due to concerns over slowing growth. We expect growth to remain low over the next year and do not anticipate a recession in the near term. Stabilizing global growth may be supportive for equities.
Stocks
Within equities, we are overweight to international stocks. While a slowdown in manufacturing and trade uncertainty pose challenges, international equities have attractive valuations relative to the U.S. and are supported by accommodative central banks. Outside the U.S., we prefer emerging markets equities. Although unresolved trade concerns and earnings weakness are headwinds, less restrictive financial conditions from a dovish Federal Reserve, cheap local currencies, and additional stimulus measures in China, should they materialize, may benefit emerging markets equities.
In the U.S., we are overweight to growth stocks relative to value stocks. Secular growth companies are less sensitive to broad economic events, and while growing regulatory concerns and their extended valuations are challenges, we believe that favorable fundamentals reflected in their ability to deliver above-market earnings growth in a low-growth environment should benefit the sector. Further, despite being fairly priced, value stocks lack a durable catalyst to advance. We are overweight to U.S. small-cap stocks relative to large-cap stocks. U.S. small-cap valuations are attractive and smaller companies benefit from low interest rates, but headwinds include risks from higher leverage and wage pressures.
Among international equities, we moved to a neutral allocation between growth and value stocks. Although growth stocks outside the U.S. are generally defensive and have a quality bias, their valuations are stretched. Valuations for value stocks are compelling, but there is not a clear catalyst for an upward inflection in economic growth or interest rates that would help support higher earnings and outperformance in the value sector. We are neutral tointernational small-cap stocks relative to international large-cap stocks. Although valuations for small-cap stocks have become more interesting relative to large-cap stocks, a prevailing low global growth environment and heightened political uncertainty in key markets remain risks.
We maintain an underweight to inflation-sensitive real assets equities. In our view, sluggish global growth and excess supply have created achallenging outlook for energy and commodity prices longer term. Real estate investment trusts are supported by reasonable fundamentals and low interest rates, though their valuations are stretched.
Bonds
Yields for U.S. investment-grade bonds remain near all-time lows but are anchored by a muted outlook for inflation. We added to high yield bonds, which offer reasonably attractive yields in a generally low-yield environment. Near-term default expectations in the sector remain low given prospects for modest growth without a recession. We reduced our allocation to floating rate bank loans in late 2018 and early 2019 due to the potential adverse impact of lower short-term interest rates on yields. However, we have more recently added to our loan allocation as valuations are attractive relative to both investment-grade and high yield bonds, given declining expectations for further rate cuts, against a stabilizing backdrop for economic growth.
Extended duration creates a less attractive outlook for international investment-grade debt, but for U.S. dollar-based investors, short-term rate differentials between the U.S. and other developed markets have led to morecompetitive hedged yields on bonds in Europe and Japan. Despite supportive central bank policies, interest rate risk remains a concern. Consequently, we are underweight international bonds but have a neutral allocation to U.S. dollar currency hedged international bonds. We are overweight to emerging markets debt given compelling yield levels, with a modest overweight to U.S. dollar-denominated debt, and a more meaningful tilt toward local currency emerging markets bonds as currency valuations are attractive. Risks from trade tensions, the potential for persistent U.S. dollar strength, and country-specific risks are prospective sources of volatility, which reinforce the role of active management and research investing in emerging markets debt.
What is portfolio management’s outlook?
Markets have endured a turbulent period as investors weigh the competing impacts of slowing global growth against a widespread pivot toward accommodative monetary policy.
Manufacturing data, a commonly monitored indicator of economic conditions, has shown persistent weakness, stoking fears of a looming recession. The bond market has also reflected this bearish sentiment, as investors have favored the relative safety of higher-quality debt, which sent Treasury yields sharply lower in 2019. Conversely, global stock markets have shrugged off bouts of volatility and remain near all-time highs. With markets sending mixed signals, we believe that the trends in trade and how the tenor of trade negotiations influence capital expenditure decisions will be key drivers of the direction of growth in the global economy and markets. Given the heightened uncertainty, we are cautious and have positioned the fund broadly neutral from a risk perspective. While the current economic cycle is aging, we expect the strong labor environment to continue supporting consumer spending and underpin economic growth.
The dovish shift in central bank policies and a broader easing of financial and liquidity conditions have tempered near-term recession fears, but it leaves global central banks ill-equipped to respond to a more pronounced downturn. While this step back from tightening policies may help to stabilize global growth, it will not, in our view, be sufficient to ignite a reacceleration in growth.
The current environment of sustained volatility and above-average valuations in many asset classes, against a backdrop filled with geopolitical and monetary policy risks, underscores the value of our strategic investment approach. Given the many crosscurrents that can influence global financial markets, we believe that the Global Allocation Fund’s broad diversification, combined with strengths in our fundamental research, can add value over the long term and help mitigate downside risk in an uncertain market environment.
The views expressed reflect the opinions of T. Rowe Price as of the date of this report and are subject to change based on changes in market, economic, or other conditions. These views are not intended to be a forecast of future events and are no guarantee of future results.
RISKS OF INVESTING
As with all stock and bond mutual funds, the fund’s share price can fall because of weakness in the stock or bond markets, a particular industry, or specific holdings. Stock markets can decline for many reasons, including adverse political or economic developments, changes in investor psychology, or heavy institutional selling. The prospects for an industry or company may deteriorate because of a variety of factors, including disappointing earnings or changes in the competitive environment. In addition, the investment manager’s assessment of companies held in a fund may prove incorrect, resulting in losses or poor performance even in rising markets. A sizable cash or fixed income position may hinder the fund from participating fully in a strong, rapidly rising bull market. In addition, significant exposure to bonds increases the risk that the fund’s share value could be hurt by rising interest rates or credit downgrades or defaults. Convertible securities are also exposed to price fluctuations of the company’s stock.
RISKS OF INTERNATIONAL INVESTING
Funds that invest overseas generally carry more risk than funds that invest strictly in U.S. assets. Funds investing in a single country or in a limited geographic region tend to be riskier than more diversified funds. Risks can result from varying stages of economic and political development; differing regulatory environments, trading days, and accounting standards; and higher transaction costs of non-U.S. markets. Non-U.S. investments are also subject to currency risk, or a decline in the value of a foreign currency versus the U.S. dollar, which reduces the dollar value of securities denominated in that currency.
The risks of international investing are heightened for securities of issuers in emerging market countries. Emerging market countries tend to have economic structures that are less diverse and mature, and political systems that are less stable, than those of developed countries. In addition to all of the risks of investing in international developed markets, emerging markets are more susceptible to governmental interference, local taxes being imposed on international investments, restrictions on gaining access to sales proceeds, and less liquid and less efficient trading markets.
RISKS OF INVESTING IN BONDS
Funds that invest in bonds are subject to interest rate risk, the decline in bond prices that usually accompanies a rise in interest rates. Longer-maturity bonds typically decline more than those with shorter maturities. Funds that invest in bonds are also subject to credit risk, the chance that any fund holding could have its credit rating downgraded or that a bond issuer will default (fail to make timely payments of interest or principal), potentially reducing the fund’s income level and share price.

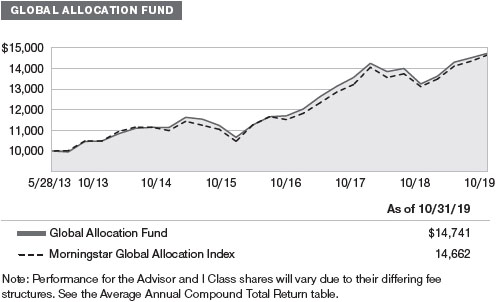
GROWTH OF $10,000
This chart shows the value of a hypothetical $10,000 investment in the fund over the past 10 fiscal year periods or since inception (for funds lacking 10-year records). The result is compared with benchmarks, which include a broad-based market index and may also include a peer group average or index. Market indexes do not include expenses, which are deducted from fund returns as well as mutual fund averages and indexes.
AVERAGE ANNUAL COMPOUND TOTAL RETURN
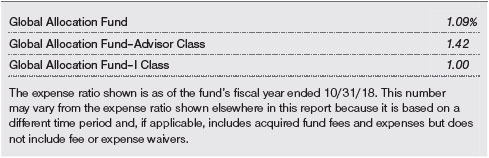
EXPENSE RATIO
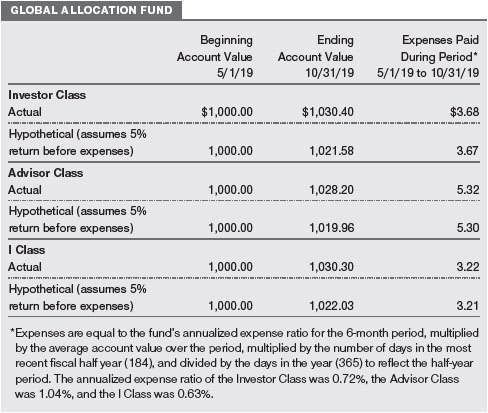
FUND EXPENSE EXAMPLE
As a mutual fund shareholder, you may incur two types of costs: (1) transaction costs, such as redemption fees or sales loads, and (2) ongoing costs, including management fees, distribution and service (12b-1) fees, and other fund expenses. The following example is intended to help you understand your ongoing costs (in dollars) of investing in the fund and to compare these costs with the ongoing costs of investing in other mutual funds. The example is based on an investment of $1,000 invested at the beginning of the most recent six-month period and held for the entire period.
Please note that the fund has three share classes: The original share class (Investor Class) charges no distribution and service (12b-1) fee, the Advisor Class shares are offered only through unaffiliated brokers and other financial intermediaries and charge a 0.25% 12b-1 fee, and I Class shares are available to institutionally oriented clients and impose no 12b-1 or administrative fee payment. Each share class is presented separately in the table.
Actual Expenses
The first line of the following table (Actual) provides information about actual account values and expenses based on the fund’s actual returns. You may use the information on this line, together with your account balance, to estimate the expenses that you paid over the period. Simply divide your account value by $1,000 (for example, an $8,600 account value divided by $1,000 = 8.6), then multiply the result by the number on the first line under the heading “Expenses Paid During Period” to estimate the expenses you paid on your account during this period.
Hypothetical Example for Comparison Purposes
The information on the second line of the table (Hypothetical) is based on hypothetical account values and expenses derived from the fund’s actual expense ratio and an assumed 5% per year rate of return before expenses (not the fund’s actual return). You may compare the ongoing costs of investing in the fund with other funds by contrasting this 5% hypothetical example and the 5% hypothetical examples that appear in the shareholder reports of the other funds. The hypothetical account values and expenses may not be used to estimate the actual ending account balance or expenses you paid for the period.
Note:T. Rowe Price charges an annual account service fee of $20, generally for accounts with less than $10,000. The fee is waived for any investor whose T. Rowe Price mutual fund accounts total $50,000 or more; accounts electing to receive electronic delivery of account statements, transaction confirmations, prospectuses, and shareholder reports; or accounts of an investor who is a T. Rowe Price Personal Services or Enhanced Personal Services client (enrollment in these programs generally requires T. Rowe Price assets of at least $250,000). This fee is not included in the accompanying table. If you are subject to the fee, keep it in mind when you are estimating the ongoing expenses of investing in the fund and when comparing the expenses of this fund with other funds.
You should also be aware that the expenses shown in the table highlight only your ongoing costs and do not reflect any transaction costs, such as redemption fees or sales loads. Therefore, the second line of the table is useful in comparing ongoing costs only and will not help you determine the relative total costs of owning different funds. To the extent a fund charges transaction costs, however, the total cost of owning that fund is higher.
QUARTER-END RETURNS


The accompanying notes are an integral part of these financial statements.

The accompanying notes are an integral part of these financial statements.
The accompanying notes are an integral part of these financial statements.


The accompanying notes are an integral part of these financial statements.
The accompanying notes are an integral part of these financial statements.

The accompanying notes are an integral part of these financial statements.
The accompanying notes are an integral part of these financial statements.
| NOTES TO FINANCIAL STATEMENTS |
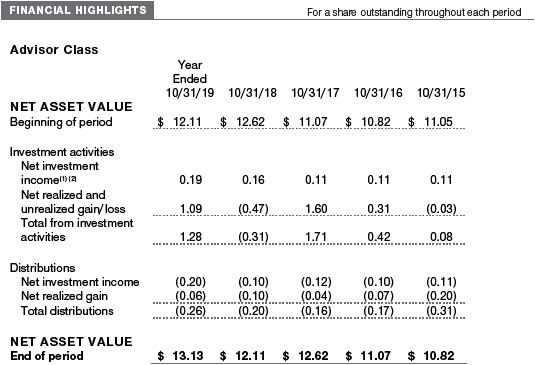
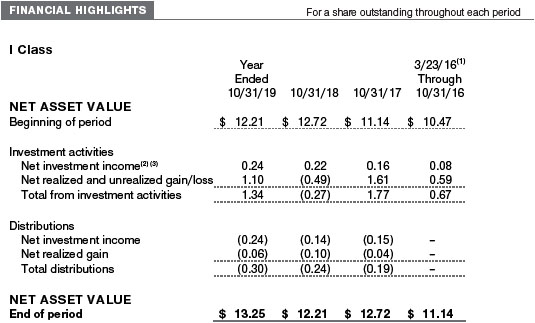
T. Rowe Price Global Allocation Fund, Inc. (the fund) is registered under the Investment Company Act of 1940 (the 1940 Act) as a diversified, open-end management investment company. The fund seeks long-term capital appreciation and income. The fund has three classes of shares: the Global Allocation Fund (Investor Class), the Global Allocation Fund–Advisor Class (Advisor Class), and the Global Allocation Fund–I Class (I Class). Advisor Class shares are sold only through various brokers and other financial intermediaries. I Class shares require a $1 million initial investment minimum, although the minimum generally is waived for retirement plans, financial intermediaries, and certain other accounts. The Advisor Class operates under a Board-approved Rule 12b-1 plan pursuant to which the class compensates financial intermediaries for distribution, shareholder servicing, and/or certain administrative services; the Investor and I Classes do not pay Rule 12b-1 fees. Each class has exclusive voting rights on matters related solely to that class; separate voting rights on matters that relate to all classes; and, in all other respects, the same rights and obligations as the other classes.
NOTE 1 - SIGNIFICANT ACCOUNTING POLICIES
Basis of PreparationThe fund is an investment company and follows accounting and reporting guidance in the Financial Accounting Standards Board (FASB)Accounting Standards CodificationTopic 946 (ASC 946). The accompanying financial statements were prepared in accordance with accounting principles generally accepted in the United States of America (GAAP), including, but not limited to, ASC 946. GAAP requires the use of estimates made by management. Management believes that estimates and valuations are appropriate; however, actual results may differ from those estimates, and the valuations reflected in the accompanying financial statements may differ from the value ultimately realized upon sale or maturity. Certain prior year amounts in the accompanying financial statements and financial highlights have been restated to conform to current year presentation.
Investment Transactions, Investment Income, and Distributions Investment transactions are accounted for on the trade date basis. Income and expenses are recorded on the accrual basis. Realized gains and losses are reported on the identified cost basis. Premiums and discounts on debt securities are amortized for financial reporting purposes. Paydown gains and losses are recorded as an adjustment to interest income. Inflation adjustments to the principal amount of inflation-indexed bonds are reflected as interest income. Income tax-related interest and penalties, if incurred, are recorded asincome tax expense. Dividends received from mutual fund investments are reflected as dividend income; capital gain distributions are reflected as realized gain/loss. Dividend income and capital gain distributions are recorded on the ex-dividend date. Earnings on investments recognized as partnerships for federal income tax purposes reflect the tax character of such earnings. Distributions from REITs are initially recorded as dividend income and, to the extent such represent a return of capital or capital gain for tax purposes, are reclassified when such information becomes available. Non-cash dividends, if any, are recorded at the fair market value of the asset received. Distributions to shareholders are recorded on the ex-dividend date. Income distributions, if any, are declared and paid by each class annually. A capital gain distribution may also be declared and paid by the fund annually.
Currency TranslationAssets, including investments, and liabilities denominated in foreign currencies are translated into U.S. dollar values each day at the prevailing exchange rate, using the mean of the bid and asked prices of such currencies against U.S. dollars as quoted by a major bank. Purchases and sales of securities, income, and expenses are translated into U.S. dollars at the prevailing exchange rate on the respective date of such transaction. The effect of changes in foreign currency exchange rates on realized and unrealized security gains and losses is not bifurcated from the portion attributable to changes in market prices.
Class Accounting Shareholder servicing, prospectus, and shareholder report expenses incurred by each class are charged directly to the class to which they relate. Expenses common to all classes, investment income, and realized and unrealized gains and losses are allocated to the classes based upon the relative daily net assets of each class. The Advisor Class pays Rule 12b-1 fees, in an amount not exceeding 0.25% of the class’s average daily net assets.
New Accounting GuidanceIn March 2017, the FASB issued amended guidance to shorten the amortization period for certain callable debt securities held at a premium. The guidance is effective for fiscal years and interim periods beginning after December 15, 2018. Adoption will have no effect on the fund’s net assets or results of operations.
Indemnification In the normal course of business, the fund may provide indemnification in connection with its officers and directors, service providers, and/or private company investments. The fund’s maximum exposure under these arrangements is unknown; however, the risk of material loss is currently considered to be remote.
NOTE 2 - VALUATION
The fund’s financial instruments are valued and each class’s net asset value (NAV) per share is computed at the close of the New York Stock Exchange (NYSE), normally 4 p.m. ET, each day the NYSE is open for business. However, the NAV per share may be calculated at a time other than the normal close of the NYSE if trading on the NYSE is restricted, if the NYSE closes earlier, or as may be permitted by the SEC.
Fair Value The fund’s financial instruments are reported at fair value, which GAAP defines as the price that would be received to sell an asset or paid to transfer a liability in an orderly transaction between market participants at the measurement date. The T. Rowe Price Valuation Committee (the Valuation Committee) is an internal committee that has been delegated certain responsibilities by the fund’s Board of Directors (the Board) to ensure that financial instruments are appropriately priced at fair value in accordance with GAAP and the 1940 Act. Subject to oversight by the Board, the Valuation Committee develops and oversees pricing-related policies and procedures and approves all fair value determinations. Specifically, the Valuation Committee establishes procedures to value securities; determines pricing techniques, sources, and persons eligible to effect fair value pricing actions; oversees the selection, services, and performance of pricing vendors; oversees valuation-related business continuity practices; and provides guidance on internal controls and valuation-related matters. The Valuation Committee reports to the Board and has representation from legal, portfolio management and trading, operations, risk management, and the fund’s treasurer.
Various valuation techniques and inputs are used to determine the fair value of financial instruments. GAAP establishes the following fair value hierarchy that categorizes the inputs used to measure fair value:
Level 1 – quoted prices (unadjusted) in active markets for identical financial instruments that the fund can access at the reporting date
Level 2 – inputs other than Level 1 quoted prices that are observable, either directly or indirectly (including, but not limited to, quoted prices for similar financial instruments in active markets, quoted prices for identical or similar financial instruments in inactive markets, interest rates and yield curves, implied volatilities, and credit spreads)
Level 3 – unobservable inputs
Observable inputs are developed using market data, such as publicly available information about actual events or transactions, and reflect the assumptions that market participants would use to price the financial instrument. Unobservable inputs are thosefor which market data are not available and are developed using the best information available about the assumptions that market participants would use to price the financial instrument. GAAP requires valuation techniques to maximize the use of relevant observable inputs and minimize the use of unobservable inputs. When multiple inputs are used to derive fair value, the financial instrument is assigned to the level within the fair value hierarchy based on the lowest-level input that is significant to the fair value of the financial instrument. Input levels are not necessarily an indication of the risk or liquidity associated with financial instruments at that level but rather the degree of judgment used in determining those values.
Valuation TechniquesEquity securities listed or regularly traded on a securities exchange or in the over-the-counter (OTC) market are valued at the last quoted sale price or, for certain markets, the official closing price at the time the valuations are made. OTC Bulletin Board securities are valued at the mean of the closing bid and asked prices. A security that is listed or traded on more than one exchange is valued at the quotation on the exchange determined to be the primary market for such security. Listed securities not traded on a particular day are valued at the mean of the closing bid and asked prices for domestic securities and the last quoted sale or closing price for international securities.
For valuation purposes, the last quoted prices of non-U.S. equity securities may be adjusted to reflect the fair value of such securities at the close of the NYSE. If the fund determines that developments between the close of a foreign market and the close of the NYSE will affect the value of some or all of its portfolio securities, the fund will adjust the previous quoted prices to reflect what it believes to be the fair value of the securities as of the close of the NYSE. In deciding whether it is necessary to adjust quoted prices to reflect fair value, the fund reviews a variety of factors, including developments in foreign markets, the performance of U.S. securities markets, and the performance of instruments trading in U.S. markets that represent foreign securities and baskets of foreign securities. The fund may also fair value securities in other situations, such as when a particular foreign market is closed but the fund is open. The fund uses outside pricing services to provide it with quoted prices and information to evaluate or adjust those prices. The fund cannot predict how often it will use quoted prices and how often it will determine it necessary to adjust those prices to reflect fair value. As a means of evaluating its security valuation process, the fund routinely compares quoted prices, the next day’s opening prices in the same markets, and adjusted prices.
Actively traded equity securities listed on a domestic exchange generally are categorized in Level 1 of the fair value hierarchy. Non-U.S. equity securities generally are categorized in Level 2 of the fair value hierarchy despite the availability of quoted prices because, asdescribed above, the fund evaluates and determines whether those quoted prices reflect fair value at the close of the NYSE or require adjustment. OTC Bulletin Board securities, certain preferred securities, and equity securities traded in inactive markets generally are categorized in Level 2 of the fair value hierarchy.
Debt securities generally are traded in the OTC market and are valued at prices furnished by independent pricing services or by broker dealers who make markets in such securities. When valuing securities, the independent pricing services consider the yield or price of bonds of comparable quality, coupon, maturity, and type, as well as prices quoted by dealers who make markets in such securities. Generally, debt securities are categorized in Level 2 of the fair value hierarchy; however, to the extent the valuations include significant unobservable inputs, the securities would be categorized in Level 3.
Investments in mutual funds are valued at the mutual fund’s closing NAV per share on the day of valuation and are categorized in Level 1 of the fair value hierarchy. Investments in private investment companies are valued at the investee’s NAV per share as of the valuation date, if available. If the investee’s NAV is not available as of the valuation date or is not calculated in accordance with GAAP, the Valuation Committee may adjust the investee’s NAV to reflect fair value at the valuation date. Investments in private investment companies generally are categorized either in Level 2 or 3, depending on the significance of unobservable inputs. Listed options, and OTC options with a listed equivalent, are valued at the mean of the closing bid and asked prices and generally are categorized in Level 2 of the fair value hierarchy. Exchange-traded options on futures contracts are valued at closing settlement prices and generally are categorized in Level 1 of the fair value hierarchy. Financial futures contracts are valued at closing settlement prices and are categorized in Level 1 of the fair value hierarchy. Forward currency exchange contracts are valued using the prevailing forward exchange rate and are categorized in Level 2 of the fair value hierarchy. Assets and liabilities other than financial instruments, including short-term receivables and payables, are carried at cost, or estimated realizable value, if less, which approximates fair value.
Thinly traded financial instruments and those for which the above valuation procedures are inappropriate or are deemed not to reflect fair value are stated at fair value as determined in good faith by the Valuation Committee. The objective of any fair value pricing determination is to arrive at a price that could reasonably be expected from a current sale. Financial instruments fair valued by the Valuation Committee are primarily private placements, restricted securities, warrants, rights, and other securities that are not publicly traded.
Subject to oversight by the Board, the Valuation Committee regularly makes good faith judgments to establish and adjust the fair valuations of certain securities as events occur and circumstances warrant. For instance, in determining the fair value of an equity investment with limited market activity, such as a private placement or a thinly traded public company stock, the Valuation Committee considers a variety of factors, which may include, but are not limited to, the issuer’s business prospects, its financial standing and performance, recent investment transactions in the issuer, new rounds of financing, negotiated transactions of significant size between other investors in the company, relevant market valuations of peer companies, strategic events affecting the company, market liquidity for the issuer, and general economic conditions and events. In consultation with the investment and pricing teams, the Valuation Committee will determine an appropriate valuation technique based on available information, which may include both observable and unobservable inputs. The Valuation Committee typically will afford greatest weight to actual prices in arm’s length transactions, to the extent they represent orderly transactions between market participants, transaction information can be reliably obtained, and prices are deemed representative of fair value. However, the Valuation Committee may also consider other valuation methods such as market-based valuation multiples; a discount or premium from market value of a similar, freely traded security of the same issuer; or some combination. Fair value determinations are reviewed on a regular basis and updated as information becomes available, including actual purchase and sale transactions of the issue. Because any fair value determination involves a significant amount of judgment, there is a degree of subjectivity inherent in such pricing decisions, and fair value prices determined by the Valuation Committee could differ from those of other market participants. Depending on the relative significance of unobservable inputs, including the valuation technique(s) used, fair valued securities may be categorized in Level 2 or 3 of the fair value hierarchy.
Valuation InputsThe following table summarizes the fund’s financial instruments, based on the inputs used to determine their fair values on October 31, 2019 (for further detail by category, please refer to the accompanying Portfolio of Investments):

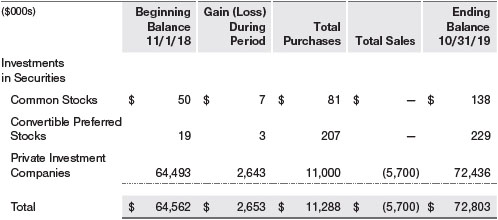
Following is a reconciliation of the fund’s Level 3 holdings for the year ended October 31, 2019. Gain (loss) reflects both realized and change in unrealized gain/loss on Level 3 holdings during the period, if any, and is included on the accompanying Statement of Operations. The change in unrealized gain/loss on Level 3 instruments held at October 31, 2019, totaled $2,704,000 for the year ended October 31, 2019.
In accordance with GAAP, the following table provides quantitative information about significant unobservable inputs used to determine the fair valuations of the fund’s Level 3 assets, by class of financial instrument. Because the Valuation Committee considers a wide variety of factors and inputs, both observable and unobservable, in determining fair value, the unobservable inputs presented do not reflect all inputs significant to the fair value determination.

NOTE 3 - DERIVATIVE INSTRUMENTS
During the year ended October 31, 2019, the fund invested in derivative instruments. As defined by GAAP, a derivative is a financial instrument whose value is derived from an underlying security price, foreign exchange rate, interest rate, index of prices or rates, or other variable; it requires little or no initial investment and permits or requires net settlement. The fund invests in derivatives only if the expected risks and rewards are consistent with its investment objectives, policies, and overall risk profile, as described in its prospectus and Statement of Additional Information. The fund may use derivatives for a variety of purposes, such as seeking to hedge against declines in principal value, increase yield, invest in an asset with greater efficiency and at a lower cost than is possible through direct investment, to enhance return, or to adjust credit exposure. The risks associated with the use of derivatives are different from, and potentially much greater than, the risks associated with investing directly in the instruments on which the derivatives are based. The fund at all times maintains sufficient cash reserves, liquid assets, or other SEC-permitted asset types to cover its settlement obligations under open derivative contracts.
The fund values its derivatives at fair value and recognizes changes in fair value currently in its results of operations. Accordingly, the fund does not follow hedge accounting, even for derivatives employed as economic hedges. Generally, the fund accounts for its derivatives on a gross basis. It does not offset the fair value of derivative liabilities against the fair value of derivative assets on its financial statements, nor does it offset the fair value of derivative instruments against the right to reclaim or obligation to return collateral.
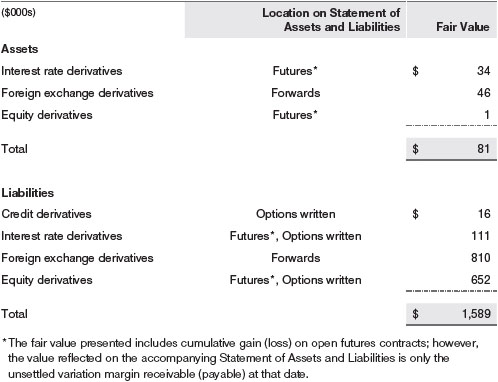
The following table summarizes the fair value of the fund’s derivative instruments held as of October 31, 2019, and the related location on the accompanying Statement of Assets and Liabilities, presented by primary underlying risk exposure:
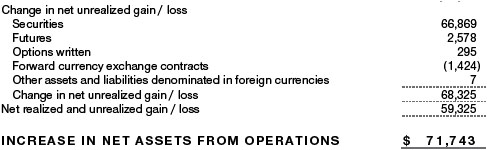
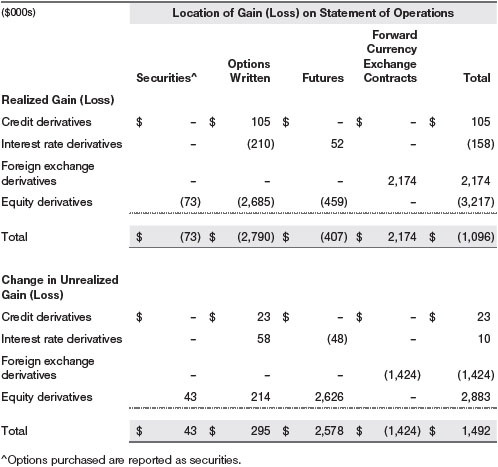
Additionally, the amount of gains and losses on derivative instruments recognized in fund earnings during the year ended October 31, 2019, and the related location on the accompanying Statement of Operations is summarized in the following table by primary underlying risk exposure:
Counterparty Risk and CollateralThe fund invests in derivatives in various markets, which expose it to differing levels of counterparty risk. Counterparty risk on exchange-traded and centrally cleared derivative contracts, such as futures, exchange-traded options, and centrally cleared swaps, is minimal because the clearinghouse provides protection against counterparty defaults. For futures and centrally cleared swaps, the fund is required to deposit collateral in an amount specified by the clearinghouse and the clearing firm (margin requirement), and the margin requirement must be maintained over the life of the contract. Each clearinghouse and clearing firm, in its sole discretion, may adjust the margin requirements applicable to the fund.
Derivatives, such as bilateral swaps, forward currency exchange contracts, and OTC options, that are transacted and settle directly with a counterparty (bilateral derivatives) may expose the fund to greater counterparty risk. To mitigate this risk, the fund has entered into master netting arrangements (MNAs) with certain counterparties that permit net settlement under specified conditions and, for certain counterparties, also require the exchange of collateral to cover mark-to-market exposure. MNAs may be in the form of International Swaps and Derivatives Association master agreements (ISDAs) or foreign exchange letter agreements (FX letters).
MNAs provide the ability to offset amounts the fund owes a counterparty against amounts the counterparty owes the fund (net settlement). Both ISDAs and FX letters generally allow termination of transactions and net settlement upon the occurrence of contractually specified events, such as failure to pay or bankruptcy. In addition, ISDAs specify other events, the occurrence of which would allow one of the parties to terminate. For example, a downgrade in credit rating of a counterparty below a specified rating would allow the fund to terminate, while a decline in the fund’s net assets of more than a specified percentage would allow the counterparty to terminate. Upon termination, all transactions with that counterparty would be liquidated and a net termination amount settled. ISDAs include collateral agreements whereas FX letters do not. Collateral requirements are determined daily based on the net aggregate unrealized gain or loss on all bilateral derivatives with a counterparty, subject to minimum transfer amounts that typically range from $100,000 to $250,000. Any additional collateral required due to changes in security values is typically transferred the next business day.
Collateral may be in the form of cash or debt securities issued by the U.S. government or related agencies. Cash posted by the fund is reflected as cash deposits in the accompanying financial statements and generally is restricted from withdrawal by the fund; securities posted by the fund are so noted in the accompanying Portfolio of Investments; both remain in the fund’s assets. Collateral pledged by counterparties is not included in the fund’s assets because the fund does not obtain effective control over those assets. For bilateral derivatives, collateral posted or received by the fund is held in a segregated account at the fund’s custodian. While typically not sold in the same manner as equity or fixed income securities, exchange-traded or centrally cleared derivatives may be closed out only on the exchange or clearinghouse where the contracts were traded, and OTC and bilateral derivatives may be unwound with counterparties or transactions assigned to other counterparties to allow the fund to exit the transaction. This ability is subject to the liquidity of underlying positions. As of October 31, 2019, securities valued at $685,000 had been posted by the fund to counterparties for bilateral derivatives. As of October 31, 2019, no collateral was pledged by counterparties to the fund for bilateral derivatives. As of October 31, 2019, securities valued at $9,627,000 had been posted by the fund for exchange-traded and/or centrally cleared derivatives.
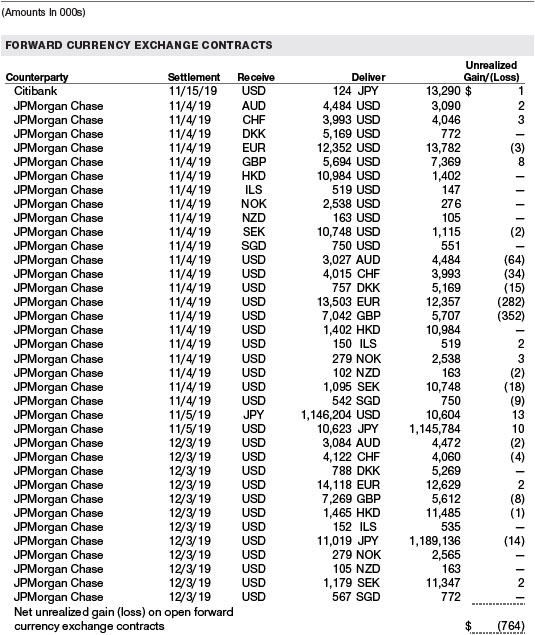
Forward Currency Exchange ContractsThe fund is subject to foreign currency exchange rate risk in the normal course of pursuing its investment objectives. It uses forward currency exchange contracts (forwards) primarily to protect its non-U.S. dollar-denominated securities from adverse currency movements. A forward involves an obligation to purchase or sell a fixed amount of a specific currency on a future date at a price set at the time of the contract. Although certain forwards may be settled by exchanging only the net gain or loss on the contract, most forwards are settled with the exchange of the underlying currencies in accordance with the specified terms. Forwards are valued at the unrealized gain or loss on the contract, which reflects the net amount the fund either is entitled to receive or obligated to deliver, as measured by the difference between the forward exchange rates at the date of entry into the contract and the forward rates at the reporting date. Appreciated forwards are reflected as assets and depreciated forwards are reflected as liabilities on the accompanying Statement of Assets and Liabilities. Risks related to the use of forwards include the possible failure of counterparties to meet the terms of the agreements; that anticipated currency movements will not occur, thereby reducing the fund’s total return; and the potential for losses in excess of the fund’s initial investment. During the year ended October 31, 2019, the volume of the fund’s activity in forwards, based on underlying notional amounts, was generally between 5% and 7% of net assets.
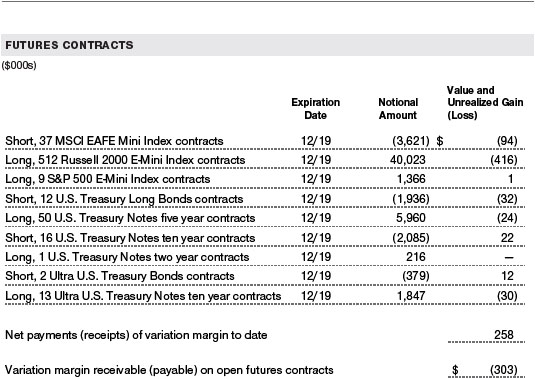
Futures ContractsThe fund is subject to interest rate risk and equity price risk in the normal course of pursuing its investment objectives and uses futures contracts to help manage such risks. The fund may enter into futures contracts to manage exposure to interest rates, security prices, foreign currencies, and credit quality; as an efficient means of adjusting exposure to all or part of a target market; to enhance income; as a cash management tool; or to adjust credit exposure. A futures contract provides for the future sale by one party and purchase by another of a specified amount of a specific underlying financial instrument at an agreed upon price, date, time, and place. The fund currently invests only in exchange-traded futures, which generally are standardized as to maturity date, underlying financial instrument, and other contract terms. Payments are made or received by the fund each day to settle daily fluctuations in the value of the contract (variation margin), which reflect changes in the value of the underlying financial instrument. Variation margin is recorded as unrealized gain or loss until the contract is closed. The value of a futures contract included in net assets is the amount of unsettled variation margin; net variation margin receivable is reflected as an asset and net variation margin payable is reflected as a liability on the accompanying Statement of Assets and Liabilities. Risks related to the use of futures contracts include possible illiquidity of the futures markets, contract prices that can be highly volatile and imperfectly correlated to movements in hedged security values and/or interest rates, and potential losses in excessof the fund’s initial investment. During the year ended October 31, 2019, the volume of the fund’s activity in futures, based on underlying notional amounts, was generally between 7% and 10% of net assets.
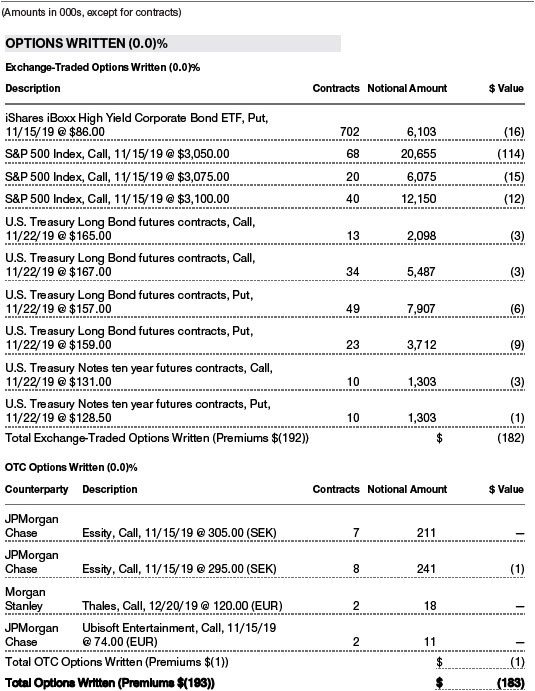
OptionsThe fund is subject to interest rate risk, credit risk and equity price risk in the normal course of pursuing its investment objectives and uses options to help manage such risks. The fund may use options to manage exposure to security prices, interest rates, foreign currencies, and credit quality; as an efficient means of adjusting exposure to all or a part of a target market; to enhance income; as a cash management tool; or to adjust credit exposure. Options are included in net assets at fair value, options purchased are included in Investments in Securities, and Options written are separately reflected as a liability on the accompanying Statement of Assets and Liabilities. Premiums on unexercised, expired options are recorded as realized gains or losses; premiums on exercised options are recorded as an adjustment to the proceeds from the sale or cost of the purchase. The difference between the premium and the amount received or paid in a closing transaction is also treated as realized gain or loss. In return for a premium paid, call and put options give the holder the right, but not the obligation, to purchase or sell, respectively, a security at a specified exercise price. In return for a premium paid, call and put options on futures give the holder the right, but not the obligation, to purchase or sell, respectively, a position in a particular futures contract at a specified exercise price. In return for a premium paid, call and put index options give the holder the right, but not the obligation, to receive cash equal to the difference between the value of the reference index on the exercise date and the exercise price of the option. Risks related to the use of options include possible illiquidity of the options markets; trading restrictions imposed by an exchange or counterparty; movements in the underlying asset values and interest rates and, for options written, potential losses in excess of the fund’s initial investment. During the year ended October 31, 2019, the volume of the fund’s activity in options, based on underlying notional amounts, was generally between 8% and 13% of net assets.
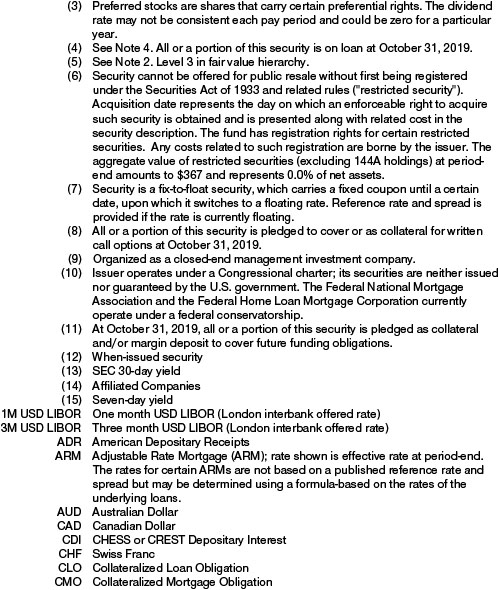
NOTE 4 - OTHER INVESTMENT TRANSACTIONS
Consistent with its investment objective, the fund engages in the following practices to manage exposure to certain risks and/or to enhance performance. The investment objective, policies, program, and risk factors of the fund are described more fully in the fund’s prospectus and Statement of Additional Information.
Emerging and Frontier Markets The fund may invest, either directly or through investments in other T. Rowe Price funds, in securities of companies located in, issued by governments of, or denominated in or linked to the currencies of emerging andfrontier market countries. Emerging markets, and to a greater extent frontier markets, generally have economic structures that are less diverse and mature, and political systems that are less stable, than developed countries. These markets may be subject to greater political, economic, and social uncertainty and differing regulatory environments that may potentially impact the fund’s ability to buy or sell certain securities or repatriate proceeds to U.S. dollars. Such securities are often subject to greater price volatility, less liquidity, and higher rates of inflation than U.S. securities. Investing in frontier markets is significantly riskier than investing in other countries, including emerging markets.
Restricted SecuritiesThe fund may invest in securities that are subject to legal or contractual restrictions on resale. Prompt sale of such securities at an acceptable price may be difficult and may involve substantial delays and additional costs.
Collateralized Loan Obligations The fund may invest in collateralized loan obligations (CLOs) which are entities backed by a diversified pool of syndicated bank loans. The cash flows of the CLO can be split into multiple segments, called “tranches” or “classes”, which will vary in risk profile and yield. The riskiest segments, which are the subordinate or “equity” tranches, bear the greatest risk of loss from defaults in the underlying assets of the CLO and serve to protect the other, more senior, tranches. Senior tranches will typically have higher credit ratings and lower yields than the securities underlying the CLO. Despite the protection from the more junior tranches, senior tranches can experience substantial losses.
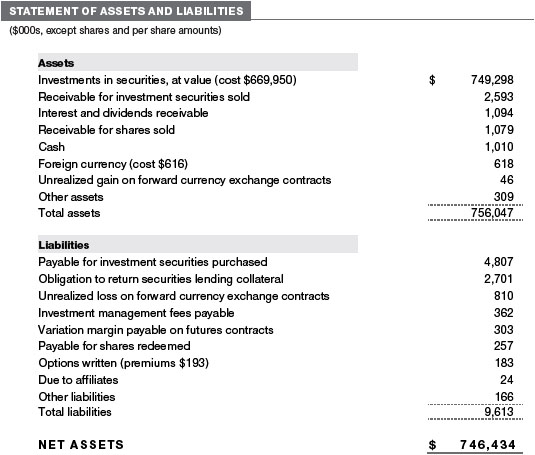
Securities LendingThe fund may lend its securities to approved borrowers to earn additional income. Its securities lending activities are administered by a lending agent in accordance with a securities lending agreement. Security loans generally do not have stated maturity dates, and the fund may recall a security at any time. The fund receives collateral in the form of cash or U.S. government securities. Collateral is maintained over the life of the loan in an amount not less than the value of loaned securities; any additional collateral required due to changes in security values is delivered to the fund the next business day. Cash collateral is invested in accordance with investment guidelines approved by fund management. Additionally, the lending agent indemnifies the fund against losses resulting from borrower default. Although risk is mitigated by the collateral and indemnification, the fund could experience a delay in recovering its securities and a possible loss of income or value if the borrower fails to return the securities, collateral investments decline in value, and the lending agent fails to perform. Securities lending revenue consists of earnings on invested collateral and borrowing fees, net of any rebates to the borrower, compensation to the lending agent, and other administrative costs. In accordance with GAAP, investments made with cash collateralare reflected in the accompanying financial statements, but collateral received in the form of securities is not. At October 31, 2019, the value of loaned securities was $2,570,000; the value of cash collateral and related investments was $2,701,000.
When-Issued SecuritiesThe fund may enter into when-issued purchase or sale commitments, pursuant to which it agrees to purchase or sell, respectively, an authorized but not yet issued security for a fixed unit price, with payment and delivery not due until issuance of the security on a scheduled future date. When-issued securities may be new securities or securities issued through a corporate action, such as a reorganization or restructuring. Until settlement, the fund maintains liquid assets sufficient to settle its commitment to purchase a when-issued security or, in the case of a sale commitment, the fund maintains an entitlement to the security to be sold. Amounts realized on when-issued transactions are included in realized gain/loss on securities in the accompanying financial statements.
Mortgage-Backed SecuritiesThe fund may invest in mortgage-backed securities (MBS or pass-through certificates) that represent an interest in a pool of specific underlying mortgage loans and entitle the fund to the periodic payments of principal and interest from those mortgages. MBS may be issued by government agencies or corporations, or private issuers. Most MBS issued by government agencies are guaranteed; however, the degree of protection differs based on the issuer. MBS are sensitive to changes in economic conditions that affect the rate of prepayments and defaults on the underlying mortgages; accordingly, the value, income, and related cash flows from MBS may be more volatile than other debt instruments.
Investment in Blackstone Partners Offshore FundThe fund invested in Blackstone Partners Offshore Fund Ltd. (Blackstone Partners), a multi-strategy hedge fund-of-funds offered by Blackstone Alternative Asset Management (BAAM), a unit of Blackstone Group L.P. (Blackstone). Blackstone Partners provides fund exposure to alternative investments primarily through Blackstone Partners’ investments in underlying private investment funds, and the underlying funds are mostly managed by investment managers unaffiliated with BAAM or Blackstone. Blackstone Partners and the underlying funds may use leverage, engage in short-selling, and invest in commodities or other speculative investments, which may increase the risk of investment loss. Blackstone Partners and the underlying funds are not subject to the same regulatory requirements as open-end mutual funds, and, therefore, their investments and related valuations may not be as transparent. Ownership interests in Blackstone Partners are not transferable and are subject to various redemption restrictions, such as advance notice requirements, limited redemption dates, and possible suspension of redemption rights. In addition, Blackstone Partners’ ownership in the underlying funds may also be subject to transfer and redemption restrictions, such as advance notice requirements, limited redemption dates, and possiblesuspension of redemption rights. All of these restrictions are subject to change at the sole discretion of Blackstone Partners or an underlying fund’s management. As of October 31, 2019, the fund’s investment in Blackstone Partners is subject to semi-annual redemption with 95 days prior written notice and is considered an illiquid asset.
OtherPurchases and sales of portfolio securities other than short-term and U.S. government securities aggregated $334,484,000 and $228,072,000, respectively, for the year ended October 31, 2019. Purchases and sales of U.S. government securities aggregated $48,938,000 and $54,407,000, respectively, for the year ended October 31, 2019.
NOTE 5 - FEDERAL INCOME TAXES
No provision for federal income taxes is required since the fund intends to continue to qualify as a regulated investment company under Subchapter M of the Internal Revenue Code and distribute to shareholders all of its taxable income and gains. Distributions determined in accordance with federal income tax regulations may differ in amount or character from net investment income and realized gains for financial reporting purposes.
The fund files U.S. federal, state, and local tax returns as required. The fund’s tax returns are subject to examination by the relevant tax authorities until expiration of the applicable statute of limitations, which is generally three years after the filing of the tax return but which can be extended to six years in certain circumstances. Tax returns for open years have incorporated no uncertain tax positions that require a provision for income taxes.
Financial reporting records are adjusted for permanent book/tax differences to reflect tax character but are not adjusted for temporary differences.
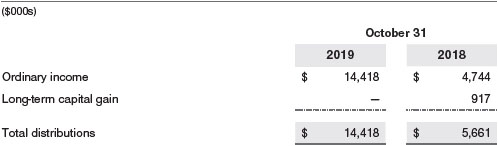
Distributions during the years ended October 31, 2019 and October 31, 2018, were characterized for tax purposes as follows:
At October 31, 2019, the tax-basis cost of investments, including derivatives, and components of net assets were as follows:
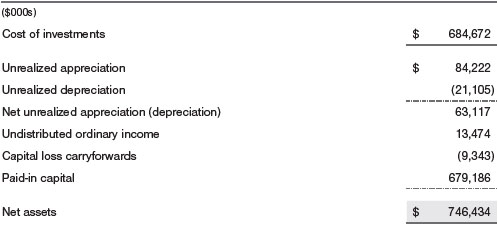
The difference between book-basis and tax-basis net unrealized appreciation (depreciation) is attributable to the deferral of losses from wash sales and the realization of gains/losses on passive foreign investment companies and/or certain open derivative contracts for tax purposes. The fund intends to retain realized gains to the extent of available capital loss carryforwards. Net realized capital losses may be carried forward indefinitely to offset future realized capital gains.
NOTE 6 - FOREIGN TAXES
The fund is subject to foreign income taxes imposed by certain countries in which it invests. Additionally, capital gains realized upon disposition of securities issued in or by certain foreign countries are subject to capital gains tax imposed by those countries. All taxes are computed in accordance with the applicable foreign tax law, and, to the extent permitted, capital losses are used to offset capital gains. Taxes attributable to income are accrued by the fund as a reduction of income. Current and deferred tax expense attributable to capital gains is reflected as a component of realized or change in unrealized gain/loss on securities in the accompanying financial statements. To the extent that the fund has country specific capital loss carryforwards, such carryforwards are applied against net unrealized gains when determining the deferred tax liability. Any deferred tax liability incurred by the fund is included in either Other liabilities or Deferred tax liability on the accompanying Statement of Assets and Liabilities.
NOTE 7 - RELATED PARTY TRANSACTIONS
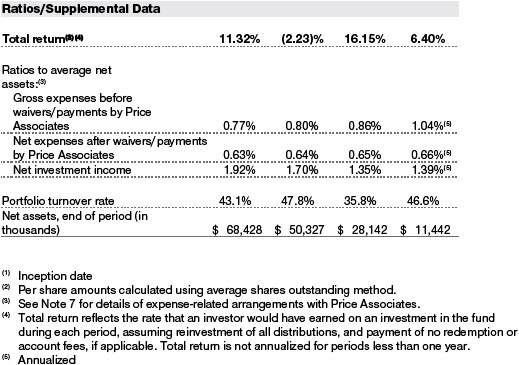
The fund is managed by T. Rowe Price Associates, Inc. (Price Associates), a wholly owned subsidiary of T. Rowe Price Group, Inc. (Price Group). The investment management agreement between the fund and Price Associates provides for an annual investment management fee, which is computed daily and paid monthly. The fee consists of an individual fund fee, equal to 0.40% of the fund’s average daily net assets, and a group fee. The group fee rate is calculated based on the combined net assets of certain mutual funds sponsored by Price Associates (the group) applied to a graduated fee schedule, with rates ranging from 0.48% for the first $1 billion of assets to 0.265% for assets in excess of $650 billion. The fund’s group fee is determined by applying the group fee rate to the fund’s average daily net assets. At October 31, 2019, the effective annual group fee rate was 0.29%.
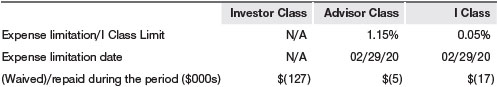
The Advisor Class is subject to a contractual expense limitation through the expense limitation date indicated in the table below. During the limitation period, Price Associates is required to waive its management fee or pay any expenses (excluding interest; expenses related to borrowings, taxes, and brokerage; and other non-recurring expenses permitted by the investment management agreement) that would otherwise cause the class’s ratio of annualized total expenses to average net assets (net expense ratio) to exceed its expense limitation. The class is required to repay Price Associates for expenses previously waived/paid to the extent the class’s net assets grow or expenses decline sufficiently to allow repayment without causing the class’s net expense ratio (after the repayment is taken into account) to exceed the lesser of: (1) the expense limitation in place at the time such amounts were waived; or (2) the class’s current expense limitation. However, no repayment will be made more than three years after the date of a payment or waiver.
The I Class is also subject to an operating expense limitation (I Class Limit) pursuant to which Price Associates is contractually required to pay all operating expenses of the I Class, excluding management fees; interest; expenses related to borrowings, taxes, and brokerage; and other non-recurring expenses permitted by the investment management agreement, to the extent such operating expenses, on an annualized basis, exceed the I Class Limit. This agreement will continue through the expense limitation date indicated in the table below, and may be renewed, revised, or revoked only with approval of the fund’s Board. The I Class is required to repay Price Associates for expenses previously paid to the extent the class’s net assets grow or expenses decline sufficiently to allow repayment without causing the class’s operating expenses (after the repayment is taken into account) to exceed the lesser of: (1) the I Class Limit in place at the time such amounts were paid; or (2) the current I Class Limit. However, no repayment will be made more than three years after the date of a payment or waiver.
Pursuant to these agreements, expenses were waived/paid by and/or repaid to Price Associates during the year ended October 31, 2019 as indicated in the table below. Including these amounts, expenses previously waived/paid by Price Associates in the amount of $16,000 remain subject to repayment by the fund at October 31, 2019. Any repayment of expenses previously waived/paid by Price Associates during the period would be included in the net investment income and expense ratios presented on the accompanying Financial Highlights.
In addition, the fund has entered into service agreements with Price Associates and two wholly owned subsidiaries of Price Associates, each an affiliate of the fund (collectively, Price). Price Associates provides certain accounting and administrative services to the fund. T. Rowe Price Services, Inc. provides shareholder and administrative services in its capacity as the fund’s transfer and dividend-disbursing agent. T. Rowe Price Retirement Plan Services, Inc. provides subaccounting and recordkeeping services for certain retirement accounts invested in the Investor Class and Advisor Class. For the year ended October 31, 2019, expenses incurred pursuant to these service agreements were $70,000 for Price Associates; $109,000 for T. Rowe Price Services, Inc.; and $2,000 for T. Rowe Price Retirement Plan Services, Inc. All amounts due to and due from Price, exclusive of investment management fees payable, are presented net on the accompanying Statement of Assets and Liabilities.
The fund may invest its cash reserves in certain open-end management investment companies managed by Price Associates and considered affiliates of the fund: the T. Rowe Price Government Reserve Fund or the T. Rowe Price Treasury Reserve Fund, organized as money market funds, or the T. Rowe Price Short-Term Fund, a short-term bond fund (collectively, the Price Reserve Funds). The Price Reserve Funds are offered as short-term investment options to mutual funds, trusts, and other accounts managed by Price Associates or its affiliates and are not available for direct purchase by members of the public. Cash collateral from securities lending is invested in the T. Rowe Price Short-Term Fund. The Price Reserve Funds pay no investment management fees.
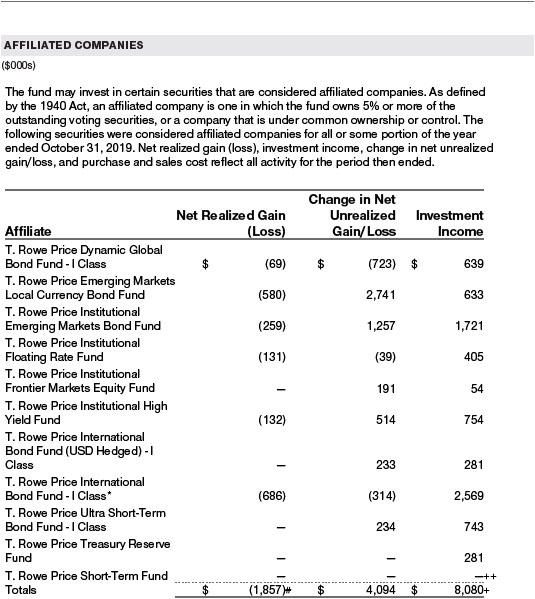
The fund may also invest in certain other T. Rowe Price funds (Price Funds) as a means of gaining efficient and cost-effective exposure to certain markets. The fund does not invest for the purpose of exercising management or control; however, investments by the fund may represent a significant portion of an underlying Price Fund’s net assets. Each underlying Price Fund is an open-end management investment company managed by Price Associates and is considered an affiliate of the fund. To ensure that the fund does not incur duplicate management fees (paid by the underlying Price Fund(s) and the fund), Price Associates has agreed to permanently waive a portion of its management fee charged to the fund in an amount sufficient to fully offset that portion of management fees paid by each underlying Price Fund related to the fund’s investment therein. Annual management fee rates and amounts waived related to investments in the underlying Price Fund(s) for the year ended October 31, 2019, are as follows:
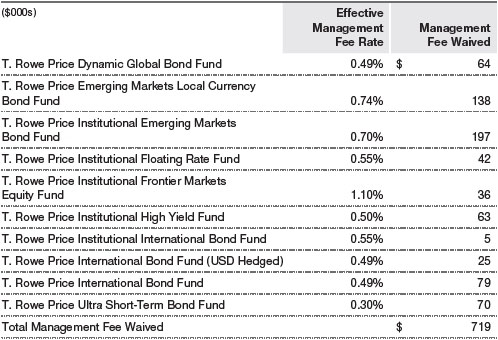
Total management fee waived was allocated ratably in the amounts of $647,000, $13,000 and $59,000 for the Investor Class, Advisor Class and I Class, respectively, for the year ended October 31, 2019.
As of October 31, 2019, T. Rowe Price Group, Inc., or its wholly owned subsidiaries owned 15,533,000 shares of the Investor Class, representing 31% of the Investor Class’s net assets.
The fund may participate in securities purchase and sale transactions with other funds or accounts advised by Price Associates (cross trades), in accordance with procedures adopted by the fund’s Board and Securities and Exchange Commission rules, which require, among other things, that such purchase and sale cross trades be effected at the independent current market price of the security. During the year ended October 31, 2019, the fund had no purchases or sales cross trades with other funds or accounts advised by Price Associates.
REPORT OF INDEPENDENT REGISTERED PUBLIC ACCOUNTING FIRM
To the Board of Directors and Shareholders of T. Rowe Price Global Allocation Fund, Inc.
Opinion on the Financial Statements
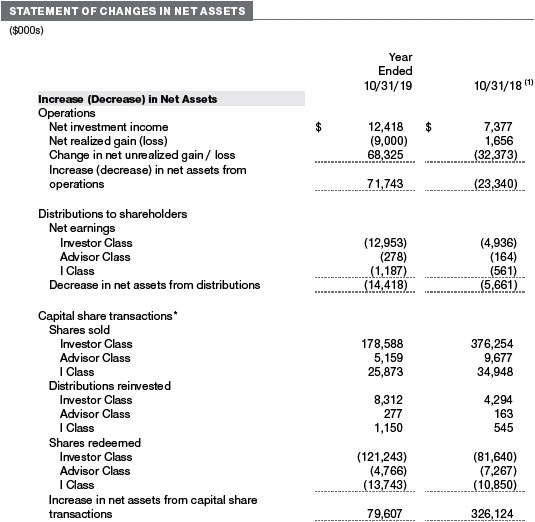
We have audited the accompanying statement of assets and liabilities, including the portfolio of investments, of T. Rowe Price Global Allocation Fund, Inc. (the “Fund”) as of October 31, 2019, the related statement of operations for the year ended October 31, 2019, the statement of changes in net assets for each of the two years in the period ended October 31, 2019, including the related notes, and the financial highlights for each of the periods indicated therein (collectively referred to as the “financial statements”). In our opinion, the financial statements present fairly, in all material respects, the financial position of the Fund as of October 31, 2019, the results of its operations for the year then ended, the changes in its net assets for each of the two years in the period ended October 31, 2019 and the financial highlights for each of the periods indicated therein, in conformity with accounting principles generally accepted in the United States of America.
Basis for Opinion
These financial statements are the responsibility of the Fund’s management. Our responsibility is to express an opinion on the Fund’s financial statements based on our audits. We are a public accounting firm registered with the Public Company Accounting Oversight Board (United States) (PCAOB) and are required to be independent with respect to the Fund in accordance with the U.S. federal securities laws and the applicable rules and regulations of the Securities and Exchange Commission and the PCAOB.
We conducted our audits of these financial statements in accordance with the standards of the PCAOB. Those standards require that we plan and perform the audit to obtain reasonable assurance about whether the financial statements are free of material misstatement, whether due to error or fraud.
Our audits included performing procedures to assess the risks of material misstatement of the financial statements, whether due to error or fraud, and performing procedures that respond to those risks. Such procedures included examining, on a test basis, evidence regarding the amounts and disclosures in the financial statements. Our audits also included evaluating the accounting principles used and significant estimates made by management, as well as evaluating the overall presentation of the financial statements. Our procedures included confirmation of securities owned as of October 31, 2019 by correspondence with the custodians, transfer agent, investment manager and brokers; when replies were not received from brokers, we performed other auditing procedures. We believe that our audits provide a reasonable basis for our opinion.
PricewaterhouseCoopers LLP
Baltimore, Maryland
December 17, 2019
We have served as the auditor of one or more investment companies in the T. Rowe Price group of investment companies since 1973.
TAX INFORMATION (UNAUDITED) FOR THE TAX YEAR ENDED 10/31/19
We are providing this information as required by the Internal Revenue Code. The amounts shown may differ from those elsewhere in this report because of differences between tax and financial reporting requirements.
The fund’s distributions to shareholders included $2,982,000 from short-term capital gains.
For taxable non-corporate shareholders, $7,404,000 of the fund’s income represents qualified dividend income subject to a long-term capital gains tax rate of not greater than 20%.
For corporate shareholders, $2,886,000 of the fund’s income qualifies for the dividends received deduction.
For individuals and certain trusts and estates which are entitled to claim a deduction of up to 20% of their combined qualified real estate investment trust (REIT) dividends, $70,000 of the fund’s income qualifies as qualified real estate investment trust (REIT) dividends.
INFORMATION ON PROXY VOTING POLICIES, PROCEDURES, AND RECORDS
A description of the policies and procedures used by T. Rowe Price funds and portfolios to determine how to vote proxies relating to portfolio securities is available in each fund’s Statement of Additional Information. You may request this document by calling 1-800-225-5132 or by accessing the SEC’s website, sec.gov.
The description of our proxy voting policies and procedures is also available on our corporate website. To access it, please visit the following Web page:
https://www.troweprice.com/corporate/en/utility/policies.html
Scroll down to the section near the bottom of the page that says, “Proxy Voting Policies.” Click on the Proxy Voting Policies link in the shaded box.
Each fund’s most recent annual proxy voting record is available on our website and through the SEC’s website. To access it through T. Rowe Price, visit the website location shown above, and scroll down to the section near the bottom of the page that says, “Proxy Voting Records.” Click on the Proxy Voting Records link in the shaded box.
HOW TO OBTAIN QUARTERLY PORTFOLIO HOLDINGS
Effective for reporting periods on or after March 1, 2019, a fund, except a money market fund, files a complete schedule of portfolio holdings with the Securities and Exchange Commission (SEC) for the first and third quarters of each fiscal year as an exhibit to its reports on Form N-PORT. Prior to March 1, 2019, a fund, including a money market fund, filed a complete schedule of portfolio holdings with the SEC for the first and third quarters of each fiscal year on Form N-Q. A money market fund files detailed month-end portfolio holdings information on Form N-MFP with the SEC each month and posts a complete schedule of portfolio holdings on its website (troweprice.com) as of each month-end for the previous six months. A fund’s Forms N-PORT, N-MFP, and N-Q are available electronically on the SEC’s website (sec.gov).
ABOUT THE FUND’S DIRECTORS AND OFFICERS
Your fund is overseen by a Board of Directors (Board) that meets regularly to review a wide variety of matters affecting or potentially affecting the fund, including performance, investment programs, compliance matters, advisory fees and expenses, service providers, and business and regulatory affairs. The Board elects the fund’s officers, who are listed in the final table. At least 75% of the Board’s members are independent of T. Rowe Price Associates, Inc. (T. Rowe Price), and its affiliates; “inside” or “interested” directors are employees or officers of T. Rowe Price. The business address of each director and officer is 100 East Pratt Street, Baltimore, Maryland 21202. The Statement of Additional Information includes additional information about the fund directors and is available without charge by calling a T. Rowe Price representative at 1-800-638-5660.
| INDEPENDENT DIRECTORS(a) |
| |
Name
(Year of Birth)
Year Elected
[Number of T. Rowe Price
Portfolios Overseen] | | Principal Occupation(s) and Directorships of Public Companies and Other Investment Companies During the Past Five Years |
| | | |
Teresa Bryce Bazemore
(1959)
2018
[188] | | President, Radian Guaranty (2008 to 2017); Chief Executive Officer, Bazemore Consulting LLC (2018 to present); Director, Chimera Investment Corporation (2017 to present); Director, Federal Home Loan Bank of Pittsburgh (2017 to present) |
| | | |
Ronald J. Daniels
(1959)
2018
[188] | | President, The Johns Hopkins University(b) and Professor, Political Science Department, The Johns Hopkins University (2009 to present); Director, Lyndhurst Holdings (2015 to present) |
| | | |
Bruce W. Duncan
(1951)
2013
[188] | | Chief Executive Officer and Director (January 2009 to December 2016), Chairman of the Board (January 2016 to present), and President (January 2009 to September 2016), First Industrial Realty Trust, an owner and operator of industrial properties; Chairman of the Board (2005 to September 2016) and Director (1999 to September 2016), Starwood Hotels & Resorts, a hotel and leisure company; Member, Investment Company Institute Board of Governors (2017 to present); Member, Independent Directors Council Governing Board (2017 to present); Senior Advisor, KKR (November 2018 to present); Director, Boston Properties (May 2016 to present); Director, Marriott International, Inc. (September 2016 to present) |
| | | |
Robert J. Gerrard, Jr.
(1952)
2013
[188] | | Advisory Board Member, Pipeline Crisis/Winning Strategies, a collaborative working to improve opportunities for young African Americans (1997 to 2016); Chairman of the Board, all funds (July 2018 to present) |
| | | |
Paul F. McBride
(1956)
2013
[188] | | Advisory Board Member, Vizzia Technologies (2015 to present); Board Member, Dunbar Armored (2012 to 2018) |
| | | |
Cecilia E. Rouse, Ph.D.
(1963)
2013
[188] | | Dean, Woodrow Wilson School (2012 to present); Professor and Researcher, Princeton University (1992 to present); Director, MDRC, a nonprofit education and social policy research organization (2011 to present); Member, National Academy of Education (2010 to present); Research Associate of Labor Studies Program at the National Bureau of Economic Research (2011 to 2015); Board Member, National Bureau of Economic Research (2011 to present); Chair of Committee on the Status of Minority Groups in the Economic Profession of the American Economic Association (2012 to 2018); Vice President (2015 to 2016), Board Member, American Economic Association (2018 to present) |
| | | |
John G. Schreiber
(1946)
2013
[188] | | Owner/President, Centaur Capital Partners, Inc., a real estate investment company (1991 to present); Cofounder, Partner, and Cochairman of the Investment Committee, Blackstone Real Estate Advisors, L.P. (1992 to 2015); Director, Blackstone Mortgage Trust, a real estate finance company (2012 to 2016); Director and Chairman of the Board, Brixmor Property Group, Inc. (2013 to present); Director, Hilton Worldwide (2007 to present); Director, Hudson Pacific Properties (2014 to 2016); Director, Invitation Homes (2014 to 2017); Director, JMB Realty Corporation (1980 to present) |
| | | |
Mark R. Tercek(c)
(1957)
2013
[0] | | President and Chief Executive Officer, The Nature Conservancy (2008 to present) |
| | | |
| (a)All information about the independent directors was current as of February 19, 2019, unless otherwise indicated, except for the number of portfolios overseen, which is current as of the date of this report. |
| (b)William J. Stromberg, president and chief executive officer of T. Rowe Price Group, Inc., the parent company of the Price Funds’ investment advisor, has served on the Board of Trustees of Johns Hopkins University since 2014 and is a member of the Johns Hopkins University Board’s Compensation Committee. |
| (c)Effective February 15, 2019, Mr. Tercek resigned from his role as independent director of the Price Funds. |
| INSIDE DIRECTORS |
| |
Name
(Year of Birth)
Year Elected*
[Number of T. Rowe Price
Portfolios Overseen] | | Principal Occupation(s) and Directorships of Public Companies and Other Investment Companies During the Past Five Years |
| | | |
David Oestreicher
(1967)
2018
[188] | | Chief Legal Officer, Vice President, and Secretary, T. Rowe Price Group, Inc.; Director, Vice President, and Secretary, T. Rowe Price Investment Services, Inc., T. Rowe Price Retirement Plan Services, Inc., T. Rowe Price Services, Inc., and T. Rowe Price Trust Company; Vice President and Secretary, T. Rowe Price, T. Rowe Price Hong Kong (Price Hong Kong), and T. Rowe Price International; Vice President, T. Rowe Price Japan and T. Rowe Price Singapore (Price Singapore); Principal Executive Officer and Executive Vice President, all funds |
| | | |
Robert W. Sharps, CFA,
CPA**
(1971)
2017
[188] | | Director and Vice President, T. Rowe Price; Vice President, T. Rowe Price Group, Inc., and T. Rowe Price Trust Company |
| | | |
| *Each inside director serves until retirement, resignation, or election of a successor. |
| **Mr. Sharps replaced Edward A. Wiese as director of the domestic fixed income Price Funds effective January 1, 2019. |
| OFFICERS |
| |
Name (Year of Birth)
Position Held With Global Allocation Fund | | Principal Occupation(s) |
| | | |
Stephen L. Bartolini, CFA (1977)
Vice President | | Vice President, T. Rowe Price, T. Rowe Price Group, Inc., and T. Rowe Price Trust Company |
| | | |
Darrell N. Braman (1963)
Vice President and Secretary | | Vice President, Price Hong Kong, Price Singapore, T. Rowe Price, T. Rowe Price Group, Inc., T. Rowe Price International, T. Rowe Price Retirement Plan Services, Inc., and T. Rowe Price Services, Inc. |
| | | |
Alan S. Dupski, CPA (1982)
Assistant Treasurer | | Vice President, T. Rowe Price and T. Rowe Price Group, Inc. |
| | | |
John R. Gilner (1961)
Chief Compliance Officer | | Chief Compliance Officer and Vice President, T. Rowe Price; Vice President, T. Rowe Price Group, Inc., and T. Rowe Price Investment Services, Inc. |
| | | |
Gary J. Greb (1961)
Vice President | | Vice President, T. Rowe Price, T. Rowe Price International, and T. Rowe Price Trust Company |
| | | |
Robert L. Harlow, CAIA, CFA (1986)
Vice President | | Vice President, T. Rowe Price and T. Rowe Price Group, Inc. |
| | | |
Stefan Hubrich, Ph.D., CFA (1974)
Vice President | | Vice President, T. Rowe Price and T. Rowe Price Group, Inc. |
| | | |
Paul J. Krug, CPA (1964)
Vice President | | Vice President, T. Rowe Price, T. Rowe Price Group, Inc., and T. Rowe Price Trust Company |
| | | |
Robert M. Larkins, CFA (1973)
Vice President | | Vice President, T. Rowe Price, T. Rowe Price Group, Inc., and T. Rowe Price Trust Company |
| | | |
Catherine D. Mathews (1963)
Principal Financial Officer, Vice President, and Treasurer | | Vice President, T. Rowe Price, T. Rowe Price Group, Inc., and T. Rowe Price Trust Company |
| | | |
Sean P. McWilliams (1988)
Vice President | | Vice President, T. Rowe Price and T. Rowe Price Group, Inc. |
| | | |
Robert A. Panariello (1983)
Vice President | | Vice President, T. Rowe Price and T. Rowe Price Group, Inc. |
| | | |
John W. Ratzesberger (1975)
Vice President | | Vice President, T. Rowe Price, T. Rowe Price Group, Inc., and T. Rowe Price Trust Company |
| | | |
Shannon H. Rauser (1987)
Assistant Secretary | | Assistant Vice President, T. Rowe Price |
| | | |
Charles M. Shriver, CFA (1967)
President | | Vice President, T. Rowe Price, T. Rowe Price Group, Inc., T. Rowe Price International, and T. Rowe Price Trust Company |
| | | |
Toby M. Thompson, CAIA, CFA (1971)
Vice President | | Vice President, T. Rowe Price, T. Rowe Price Group, Inc., and T. Rowe Price Trust Company |
| | | |
Megan Warren (1968)
Vice President | | Vice President, T. Rowe Price, T. Rowe Price Group, Inc., T. Rowe Price Retirement Plan Services, Inc., T. Rowe Price Services, Inc., and T. Rowe Price Trust Company; formerly, Executive Director, JPMorgan Chase (to 2017) |
Unless otherwise noted, officers have been employees of T. Rowe Price or T. Rowe Price International for at least 5 years.
Item 1. (b) Notice pursuant to Rule 30e-3.
Not applicable.
Item 2. Code of Ethics.
The registrant has adopted a code of ethics, as defined in Item 2 of Form N-CSR, applicable to its principal executive officer, principal financial officer, principal accounting officer or controller, or persons performing similar functions. A copy of this code of ethics is filed as an exhibit to this Form N-CSR. No substantive amendments were approved or waivers were granted to this code of ethics during the period covered by this report.
Item 3. Audit Committee Financial Expert.
The registrant’s Board of Directors/Trustees has determined that Mr. Bruce W. Duncan qualifies as an audit committee financial expert, as defined in Item 3 of Form N-CSR. Mr. Duncan is considered independent for purposes of Item 3 of Form N-CSR.
Item 4. Principal Accountant Fees and Services.
(a) – (d) Aggregate fees billed for the last two fiscal years for professional services rendered to, or on behalf of, the registrant by the registrant’s principal accountant were as follows:

Audit fees include amounts related to the audit of the registrant’s annual financial statements and services normally provided by the accountant in connection with statutory and regulatory filings. Audit-related fees include amounts reasonably related to the performance of the audit of the registrant’s financial statements and specifically include the issuance of a report on internal controls and, if applicable, agreed-upon procedures related to fund acquisitions. Tax fees include amounts related to services for tax compliance, tax planning, and tax advice. The nature of these services specifically includes the review of distribution calculations and the preparation of Federal, state, and excise tax returns. All other fees include the registrant’s pro-rata share of amounts for agreed-upon procedures in conjunction with service contract approvals by the registrant’s Board of Directors/Trustees.
(e)(1) The registrant’s audit committee has adopted a policy whereby audit and non-audit services performed by the registrant’s principal accountant for the registrant, its investment adviser, and any entity controlling, controlled by, or under common control with the investment adviser that provides ongoing services to the registrant require pre-approval in advance at regularly scheduled audit committee meetings. If such a service is required between regularly scheduled audit committee meetings, pre-approval may be authorized by one audit committee member with ratification at the next scheduled audit committee meeting. Waiver of pre-approval for audit or non-audit services requiring fees of a de minimis amount is not permitted.
(2) No services included in (b) – (d) above were approved pursuant to paragraph (c)(7)(i)(C) of Rule 2-01 of Regulation S-X.
(f) Less than 50 percent of the hours expended on the principal accountant’s engagement to audit the registrant’s financial statements for the most recent fiscal year were attributed to work performed by persons other than the principal accountant’s full-time, permanent employees.
(g) The aggregate fees billed for the most recent fiscal year and the preceding fiscal year by the registrant’s principal accountant for non-audit services rendered to the registrant, its investment adviser, and any entity controlling, controlled by, or under common control with the investment adviser that provides ongoing services to the registrant were $2,330,000 and $2,767,000, respectively.
(h) All non-audit services rendered in (g) above were pre-approved by the registrant’s audit committee. Accordingly, these services were considered by the registrant’s audit committee in maintaining the principal accountant’s independence.
Item 5. Audit Committee of Listed Registrants.
Not applicable.
Item 6. Investments.
(a) Not applicable. The complete schedule of investments is included in Item 1 of this Form N-CSR.
(b) Not applicable.
Item 7. Disclosure of Proxy Voting Policies and Procedures for Closed-End Management Investment Companies.
Not applicable.
Item 8. Portfolio Managers of Closed-End Management Investment Companies.
Not applicable.
Item 9. Purchases of Equity Securities by Closed-End Management Investment Company and Affiliated Purchasers.
Not applicable.
Item 10. Submission of Matters to a Vote of Security Holders.
Not applicable.
Item 11. Controls and Procedures.
(a) The registrant’s principal executive officer and principal financial officer have evaluated the registrant’s disclosure controls and procedures within 90 days of this filing and have concluded that the registrant’s disclosure controls and procedures were effective, as of that date, in ensuring that information required to be disclosed by the registrant in this Form N-CSR was recorded, processed, summarized, and reported timely.
(b) The registrant’s principal executive officer and principal financial officer are aware of no change in the registrant’s internal control over financial reporting that occurred during the period covered by this report that has materially affected, or is reasonably likely to materially affect, the registrant’s internal control over financial reporting.
Item 12. Disclosure of Securities Lending Activities for Closed-End Management Investment Companies.
Not applicable.
Item 13. Exhibits.
(a)(1) The registrant’s code of ethics pursuant to Item 2 of Form N-CSR is attached.
(2) Separate certifications by the registrant's principal executive officer and principal financial officer, pursuant to Section 302 of the Sarbanes-Oxley Act of 2002 and required by Rule 30a-2(a) under the Investment Company Act of 1940, are attached.
(3) Written solicitation to repurchase securities issued by closed-end companies: not applicable.
(b) A certification by the registrant's principal executive officer and principal financial officer, pursuant to Section 906 of the Sarbanes-Oxley Act of 2002 and required by Rule 30a-2(b) under the Investment Company Act of 1940, is attached.
SIGNATURES
Pursuant to the requirements of the Securities Exchange Act of 1934 and the Investment Company Act of 1940, the registrant has duly caused this report to be signed on its behalf by the undersigned, thereunto duly authorized.
T. Rowe Price Global Allocation Fund, Inc.
| By | | /s/ David Oestreicher |
| | | David Oestreicher |
| | | Principal Executive Officer |
| |
| Date | | December 17, 2019 | | | | |
Pursuant to the requirements of the Securities Exchange Act of 1934 and the Investment Company Act of 1940, this report has been signed below by the following persons on behalf of the registrant and in the capacities and on the dates indicated.
| By | | /s/ David Oestreicher |
| | | David Oestreicher |
| | | Principal Executive Officer |
| |
| Date | | December 17, 2019 | | | | |
| |
| |
| By | | /s/ Catherine D. Mathews |
| | | Catherine D. Mathews |
| | | Principal Financial Officer |
| |
| Date | | December 17, 2019 | | | | |