UNITED STATES
SECURITIES AND EXCHANGE COMMISSION
Washington, D.C. 20549
Form N-CSR
CERTIFIED SHAREHOLDER REPORT OF REGISTERED
MANAGEMENT INVESTMENT COMPANIES
Investment Company Act File Number: 811-22982
Eaton Vance NextShares Trust
(Exact Name of Registrant as Specified in Charter)
Two International Place, Boston, Massachusetts 02110
(Address of Principal Executive Offices)
Maureen A. Gemma
Two International Place, Boston, Massachusetts 02110
(Name and Address of Agent for Services)
(617) 482-8260
(Registrant’s Telephone Number)
December 31
Date of Fiscal Year End
December 31, 2016
Date of Reporting Period
Item 1. Reports to Stockholders

Eaton Vance
Stock NextShares (EVSTC)
Listing Exchange: The NASDAQ Stock Market LLC
Annual Report
December 31, 2016

NextSharesTM is a trademark of NextShares Solutions LLC. Used with permission.

Commodity Futures Trading Commission Registration. Effective December 31, 2012, the Commodity Futures Trading Commission (“CFTC”) adopted certain regulatory changes that subject registered investment companies and advisers to regulation by the CFTC if a fund invests more than a prescribed level of its assets in certain CFTC-regulated instruments (including futures, certain options and swap agreements) or markets itself as providing investment exposure to such instruments. The Fund has claimed an exclusion from the definition of the term “commodity pool operator” under the Commodity Exchange Act. Accordingly, neither the Fund nor the adviser with respect to the operation of the Fund is subject to CFTC regulation. Because of its management of other strategies, the Fund’s adviser is registered with the CFTC as a commodity pool operator and a commodity trading advisor.
Fund shares are not insured by the FDIC and are not deposits or other obligations of, or guaranteed by, any depository institution. Shares are subject to investment risks, including possible loss of principal invested.
This report must be preceded or accompanied by a current summary prospectus or prospectus. Before investing in NextShares, investors should consider carefully the investment objectives, risks, charges and expenses. This and other important information is contained in the prospectus and summary prospectus, which can be obtained from a financial advisor. Prospective investors should read the prospectus carefully before investing. For further information, please call 1-800-262-1122.
Annual Report December 31, 2016
Eaton Vance
Stock NextShares
Table of Contents
| | | | |
Management’s Discussion of Fund Performance | | | 2 | |
| |
Performance | | | 3 | |
| |
Fund Profile | | | 4 | |
| |
Endnotes and Additional Disclosures | | | 5 | |
| |
Fund Expenses | | | 6 | |
| |
Financial Statements | | | 7 | |
| |
Report of Independent Registered Public Accounting Firm | | | 14 and 27 | |
| |
Federal Tax Information | | | 15 | |
| |
Management and Organization | | | 28 | |
| |
Important Notices | | | 31 | |
Eaton Vance
Stock NextShares
December 31, 2016
Management’s Discussion of Fund Performance1
Economic and Market Conditions
U.S. stock markets rose in the 12-month period ended December 31, 2016, as the nation’s economy continued to strengthen and the outcome of the U.S. presidential election gave stocks a late-period boost.
U.S. stocks as well as international markets opened the period on the downside amid worries about falling oil prices, declining interest rates and slowing global growth, particularly in China. The pullback began in early January 2016 and continued into mid-February, when stocks turned around and soon overcame the earlier losses. Coinciding with the move was a reversal in crude oil prices, which rose following a prolonged decline.
In June 2016, U.S. stocks plunged along with international markets following Britain’s “Brexit” vote to leave the European Union. However, equity markets, led by the U.S., quickly rallied from the two-day tailspin and recovered the lost ground. Helped by stronger U.S. economic indicators, major U.S. stock indexes reached multiple record highs during July and August 2016.
U.S. equity markets retreated in late August 2016 amid falling oil prices and fears about a possible interest rate increase. The U.S. Federal Reserve’s (the Fed’s) decision at its September 2016 meeting to leave rates unchanged, along with an agreement by the Organization of the Petroleum Exporting Countries (OPEC) to curb oil production, sent stocks briefly higher. In November 2016, stocks rallied sharply following the victory of Donald Trump in the U.S. presidential election. The broad-based “Trump Bump” was led by financial stocks as well as the aerospace & defense industry. Financial stocks got another boost in mid-December 2016 when the Fed raised its benchmark interest rate amid stronger economic growth reports.
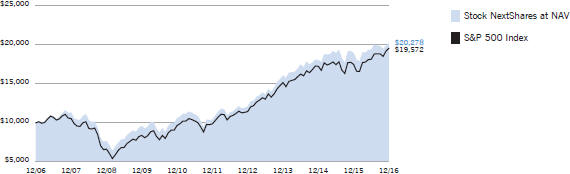
For the 12-month period, the blue-chip Dow Jones Industrial Average2 advanced 16.50%, while the broader U.S. equity market, as represented by the S&P 500 Index, returned 11.96%. The technology-laden NASDAQ Composite Index delivered an 8.87% gain. Small-cap U.S. stocks, as measured by the Russell 2000® Index outperformed their large-cap counterparts, as measured by the S&P 500 Index during the period. Value stocks as a group outpaced growth stocks in both the large- and small-cap categories, as measured by the Russell value and growth indexes.
Fund Performance
For the period from its inception on February 25, 2016 through December 31, 2016, Eaton Vance Stock NextShares (the Fund) had a total return of 12.19% at net asset value (NAV), underperforming the 18.17% return of the
Fund’s benchmark, the S&P 500 Index (the Index), over the same period.
Stock selection in the financials, health care, and information technology sectors detracted from Fund performance versus the Index. Within financials, not owning Index component Bank of America Corp. hurt performance relative to the Index, as the bank’s stock price appreciated during the period. The Fund’s out-of-Index holding in Teva Pharmaceutical Industries, Ltd. ADR and overweight positions, relative to the Index, in drug makers Gilead Sciences, Inc. and Allergan PLC detracted from performance versus the Index in the health care sector. All three stocks were hurt by headline news about high drug prices, which raised concerns during an election year that a new administration might press for increased scrutiny of drug prices. Disappointing sales of two of its key drugs, Restasis and Namenda, put Allergan’s stock under additional pressure.
In information technology, the Fund’s position in Microsoft Corp. was sold during the period when management believed the stock had become richly valued. Nonetheless, the stock continued to appreciate in price, and selling the position hurt performance relative to the Index. Elsewhere in information technology, the Fund’s out-of-Index positions in Convergys Corp. and Genpact, Ltd., two providers of technology support services to businesses, declined in price and detracted from Fund performance versus the Index. Both firms were hurt by client delays in committing to new projects, due in part to election-year uncertainty about future government regulation, particularly in the financial and health care areas. Teva Pharmaceutical and Allergan were sold during the period.
In contrast, stock selection in the consumer staples and materials sectors contributed to performance versus the Index. Not owning Index component CVS Health Corp., a pharmacy operator and pharmaceutical benefits manager whose stock declined, helped relative performance in the consumer staples sector. Like the pharmaceutical firms mentioned earlier, CVS was hurt by election-year concerns that a new administration might put downward pressure on drug prices. Elsewhere in consumer staples, the Fund’s out-of-Index position in Pinnacle Foods, Inc., a packaged foods company with brands that include Birds Eye, Vlasic and Log Cabin, aided relative Fund performance as the company reported strong sales and earnings growth, in part due to its acquisition of food company Boulder Brands during the period. Overweighting International Paper Co, a paper and cardboard box manufacturer in the materials sector, contributed to performance versus the Index as well. The firm benefited from increased sales of shipping boxes to online retailers, whose share of retail sales continued to climb in 2016.
See Endnotes and Additional Disclosures in this report.
Past performance is no guarantee of future results. Investment return and principal value will fluctuate so that shares, when sold, may be worth more or less than their original cost. Performance is for the stated time period only; due to market volatility, the Fund current performance may be lower or higher than indicated. The Fund performance at market price will differ from its results at net asset value (NAV). The market price used to calculate the Market Price return is the midpoint between the highest bid and the lowest offer on the exchange on which the shares of the Fund are listed for trading, as of the time that the Fund’s NAV is calculated. If you trade your shares at another time during the day, your return may differ. Returns are historical and are calculated by determining the percentage change in NAV or market price (as applicable) with all distributions reinvested at NAV or closing market price (as applicable) on the payment date of the distribution, and are net of management fees and other expenses. Returns are before taxes unless otherwise noted. Performance less than or equal to one year is cumulative. For performance as of the most recent month-end, including historical trading premiums/discounts relative to NAV, please refer to eatonvance.com.
Eaton Vance
Stock NextShares
December 31, 2016
Performance2,3,4
Portfolio Manager Charles B. Gaffney
| | | | | | | | | | | | | | | | | | | | | | | | |
| % Average Annual Total Returns | | Fund
Inception Date | | | Performance
Inception Date | | | One Year | | | Five Years | | | Ten Years | | | Since
Fund Inception | |
Fund at NAV | | | 02/25/2016 | | | | 11/01/2001 | | | | 7.16 | % | | | 14.22 | % | | | 7.32 | % | | | 12.19 | % |
Fund at Market Price | | | 02/25/2016 | | | | 02/25/2016 | | | | — | | | | — | | | | — | | | | 12.19 | |
S&P 500 Index | | | — | | | | — | | | | 11.96 | % | | | 14.64 | % | | | 6.94 | % | | | 18.17 | % |
| | | | | | |
| | | | | | | | | | | | | | | | | | | | | | | | |
| % Total Annual Operating Expense Ratios5 | | | | | | | | | | | | | | | | | | |
Gross | | | | | | | | | | | | | | | | | | | | | | | 0.83 | % |
Net | | | | | | | | | | | | | | | | | | | | | | | 0.65 | |
Growth of $10,0004
This graph shows the change in value of a hypothetical investment of $10,000 in Stock NextShares for the period indicated. For comparison, the same investment is shown in the indicated index.
See Endnotes and Additional Disclosures in this report.
Past performance is no guarantee of future results. Investment return and principal value will fluctuate so that shares, when sold, may be worth more or less than their original cost. Performance is for the stated time period only; due to market volatility, the Fund current performance may be lower or higher than indicated. The Fund performance at market price will differ from its results at net asset value (NAV). The market price used to calculate the Market Price return is the midpoint between the highest bid and the lowest offer on the exchange on which the shares of the Fund are listed for trading, as of the time that the Fund’s NAV is calculated. If you trade your shares at another time during the day, your return may differ. Returns are historical and are calculated by determining the percentage change in NAV or market price (as applicable) with all distributions rein-vested at NAV or closing market price (as applicable) on the payment date of the distribution, and are net of management fees and other expenses. Returns are before taxes unless otherwise noted. Performance less than or equal to one year is cumulative. For performance as of the most recent month-end, including historical trading premiums/discounts relative to NAV, please refer to eatonvance.com.
Eaton Vance
Stock NextShares
December 31, 2016
Fund Profile6
Sector Allocation (% of net assets)7
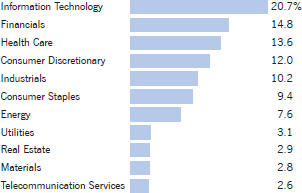
Top 10 Holdings (% of net assets)7
| | | | |
Apple, Inc. | | | 4.2 | % |
| |
JPMorgan Chase & Co. | | | 3.7 | |
| |
Wells Fargo & Co. | | | 3.3 | |
| |
Johnson & Johnson | | | 3.1 | |
| |
General Electric Co. | | | 3.1 | |
| |
Alphabet, Inc., Class C | | | 3.0 | |
| |
Pfizer, Inc. | | | 2.8 | |
| |
Verizon Communications, Inc. | | | 2.7 | |
| |
Chevron Corp. | | | 2.5 | |
| |
United Technologies Corp. | | | 2.4 | |
| |
Total | | | 30.8 | % |
See Endnotes and Additional Disclosures in this report.
Eaton Vance
Stock NextShares
December 31, 2016
Endnotes and Additional Disclosures
| 1 | The views expressed in this report are those of the portfolio manager(s) and are current only through the date stated at the top of this page. These views are subject to change at any time based upon market or other conditions, and Eaton Vance and the Fund(s) disclaim any responsibility to update such views. These views may not be relied upon as investment advice and, because investment decisions are based on many factors, may not be relied upon as an indication of trading intent on behalf of any Eaton Vance fund. This commentary may contain statements that are not historical facts, referred to as “forward looking statements”. The Fund’s actual future results may differ significantly from those stated in any forward looking statement, depending on factors such as changes in securities or financial markets or general economic conditions, the volume of sales and purchases of Fund shares, the continuation of investment advisory, administrative and service contracts, and other risks discussed from time to time in the Fund’s filings with the Securities and Exchange Commission. |
| 2 | Dow Jones Industrial Average is a price-weighted average of 30 blue-chip stocks that are generally the leaders in their industry. S&P 500 Index is an unmanaged index of large-cap stocks commonly used as a measure of U.S. stock market performance. NASDAQ Composite Index is a market capitalization-weighted index of all domestic and international securities listed on NASDAQ. Russell 2000® Index is an unmanaged index of 2,000 U.S. small- cap stocks. Unless otherwise stated, index returns do not reflect the effect of any applicable sales charges, commissions, expenses, taxes or leverage, as applicable. It is not possible to invest directly in an index. |
| 3 | Shares of NextShares funds are traded in the secondary market through a broker, and may not be individually purchased or redeemed from the fund. Buyers and sellers of shares normally transact with each other, rather than with the fund. Market trading prices of NextShares are linked to the fund’s next-computed net asset value (NAV) and will vary from NAV by a market-determined premium or discount, which may be zero. Buyers and sellers of NextShares will not know the value of their purchases and sales until after the fund’s NAV is determined at the end of the trading day. Market trading prices may vary significantly from anticipated levels. NextShares do not offer investors the opportunity to buy and sell intraday based on current (versus end-of-day) determinations of fund value. NextShares trade execution prices will fluctuate based on changes in NAV. Although limit orders may be used to control trading costs, they cannot be used to control or limit trade execution prices. As a new type of fund, NextShares do not have an operating history and may initially be available through a limited number of brokers. There can be no guarantee that an active trading market for NextShares will develop or be maintained, or that their listing will continue unchanged. |
| | Buying and selling NextShares may require payment of brokerage commissions and expose transacting shareholders to other trading costs. Frequent trading may detract from realized investment returns. The return on a shareholder’s NextShares investment will be reduced if the shareholder sells shares at a greater discount or narrower premium to NAV than he or she acquired the shares. NextShares funds issue and redeem shares only in specified creation unit quantities in transactions by or through authorized participants. In such transactions, a fund issues and redeems shares in exchange for the basket of securities, other instruments and/or cash that the fund specifies each business day. The basket is not intended to be representative of the fund’s current portfolio positions and may vary significantly from current positions. |
| 4 | The Fund pursues its investment objective by investing in a separate investment fund (the Portfolio). The returns at NAV for periods before the date the Fund commenced operations are for a mutual fund that invests in the Portfolio (the Portfolio Investor). The performance during such period does not represent the performance of the Fund. The prior investment performance of the Portfolio Investor (rather than the Portfolio itself) is shown because it reflects the expenses typically borne by a retail fund investing in the Portfolio. The Portfolio Investor returns are not adjusted to reflect differences between the total net operating expenses of the Fund and the Portfolio Investor during the periods shown. If such an adjustment were made, the performance presented below would be higher, because the Fund’s total net operating expenses are lower than those of the Portfolio Investor. Performance is for a share class of the Portfolio Investor offered at net asset value. Performance presented in the Financial Highlights included in the financial statements is not linked. |
| 5 | Source: Fund prospectus. Net expense ratios reflect a contractual expense reimbursement that continues through 4/30/17. Without the reimbursement, performance would have been lower. The expense ratios for the current reporting period can be found in the Financial Highlights section of this report. |
| 6 | Fund primarily invests in an affiliated investment company (Portfolio) with substantially the same objective(s) and policies as the Fund and may also invest directly. Unless otherwise noted, references to investments are to the aggregate holdings of the Fund and the Portfolio. |
| 7 | Excludes cash and cash equivalents. |
| | Fund profile subject to change due to active management. |
Eaton Vance
Stock NextShares
December 31, 2016
Fund Expenses
Example: As a Fund shareholder, you incur two types of costs: (1) transaction costs, including brokerage commissions on purchases and sales of Fund shares; and (2) ongoing costs, including management fees and other Fund expenses. This Example is intended to help you understand your ongoing costs (in dollars) of Fund investing and to compare these costs with the ongoing costs of investing in other funds. The Example is based on an investment of $1,000 invested at the beginning of the period and held for the entire period (July 1, 2016 – December 31, 2016).
Actual Expenses: The first section of the table below provides information about actual account values and actual expenses. You may use the information in this section, together with the amount you invested, to estimate the expenses that you paid over the period. Simply divide your account value by $1,000 (for example, an $8,600 account value divided by $1,000 = 8.6), then multiply the result by the number in the first section under the heading entitled “Expenses Paid During Period” to estimate the expenses you paid on your account during this period.
Hypothetical Example for Comparison Purposes: The second section of the table below provides information about hypothetical account values and hypothetical expenses based on the actual Fund expense ratio and an assumed rate of return of 5% per year (before expenses), which is not the actual Fund return. The hypothetical account values and expenses may not be used to estimate the actual ending account balance or expenses you paid for the period. You may use this information to compare the ongoing costs of investing in your Fund and other funds. To do so, compare this 5% hypothetical example with the 5% hypothetical examples that appear in the shareholder reports of the other funds.
Please note that the expenses shown in the table are meant to highlight your ongoing costs only and do not reflect any transactional costs, such as brokerage commissions on purchases and sales of Fund shares. Therefore, the second section of the table is useful in comparing ongoing costs only, and will not help you determine the relative total costs of owning different funds. In addition, if these transactional costs were included, your costs would be higher.
| | | | | | | | | | | | | | | | |
| | | Beginning
Account Value
(7/1/16) | | | Ending
Account Value
(12/31/16) | | | Expenses Paid
During Period*
(7/1/16 – 12/31/16) | | | Annualized
Expense
Ratio | |
| | | | |
| | | | | | | | | | | | | | | | |
Actual | | | | | | | | | | | | | |
| | $ | 1,000.00 | | | $ | 1,045.50 | | | $ | 3.34 | ** | | | 0.65 | % |
| | | | | | | | | | | | | | | | | |
| | | | |
| | | | | | | | | | | | | | | | |
Hypothetical | | | | | | | | | | | | | |
(5% return per year before expenses) | | | | | | | | | | | | | |
| | $ | 1,000.00 | | | $ | 1,021.90 | | | $ | 3.30 | ** | | | 0.65 | % |
| * | Expenses are equal to the Fund’s annualized expense ratio, multiplied by the average account value over the period, multiplied by 184/366 (to reflect the one-half year period). The Example assumes that the $1,000 was invested at the net asset value per share determined at the close of business on June 30, 2016. The Example reflects the expenses of both the Fund and the Portfolio. |
| ** | Absent an allocation of certain expenses to an affiliate, expenses would be higher. |
Eaton Vance
Stock NextShares
December 31, 2016
Statement of Assets and Liabilities
| | | | |
| Assets | | December 31, 2016 | |
Investment in Stock Portfolio, at value (identified cost, $24,817,300) | | $ | 25,135,389 | |
Cash | | | 34 | |
Receivable from affiliate | | | 13,267 | |
Total assets | | $ | 25,148,690 | |
| |
| Liabilities | | | | |
Payable to affiliates: | | | | |
Operations agreement fee | | $ | 1,012 | |
Trustees’ fees | | | 125 | |
Accrued expenses | | | 49,187 | |
Total liabilities | | $ | 50,324 | |
Net Assets | | $ | 25,098,366 | |
| |
| Sources of Net Assets | | | | |
Paid-in capital | | $ | 24,216,595 | |
Accumulated net realized gain from Portfolio | | | 559,712 | |
Accumulated undistributed net investment income | | | 3,970 | |
Net unrealized appreciation from Portfolio | | | 318,089 | |
Total | | $ | 25,098,366 | |
| |
| Net Asset Value Per Share | | | | |
($25,098,366 ÷ 1,125,000 shares issued and outstanding) | | $ | 22.31 | |
| | | | |
| | 7 | | See Notes to Financial Statements. |
Eaton Vance
Stock NextShares
December 31, 2016
Statement of Operations
| | | | |
| Investment Income | | Period Ended
December 31, 2016(1) | |
Dividends allocated from Portfolio (net of foreign taxes, $399) | | $ | 243,882 | |
Interest allocated from Portfolio | | | 618 | |
Expenses allocated from Portfolio | | | (70,317 | ) |
Total investment income from Portfolio | | $ | 174,183 | |
| |
| Expenses | | | | |
Operations agreement fee | | $ | 5,375 | |
Trustees’ fees and expenses | | | 375 | |
Custodian fee | | | 10,375 | |
Transfer and dividend disbursing agent fees | | | 18,218 | |
Legal and accounting services | | | 22,519 | |
Printing and postage | | | 6,901 | |
Registration fees | | | 2,340 | |
Listing fee | | | 18,175 | |
Intraday pricing fee | | | 4,206 | |
Miscellaneous | | | 2,638 | |
Total expenses | | $ | 91,122 | |
Deduct — | | | | |
Allocation of expenses to affiliate | | $ | 91,063 | |
Total expense reductions | | $ | 91,063 | |
| |
Net expenses | | $ | 59 | |
| |
Net investment income | | $ | 174,124 | |
| |
| Realized and Unrealized Gain (Loss) from Portfolio | | | | |
Net realized gain (loss) — | | | | |
Investment transactions | | $ | 517,345 | |
Foreign currency transactions | | | (360 | ) |
Net realized gain | | $ | 516,985 | |
Change in unrealized appreciation (depreciation) — | | | | |
Investments | | $ | 318,146 | |
Foreign currency | | | (57 | ) |
Net change in unrealized appreciation (depreciation) | | $ | 318,089 | |
| |
Net realized and unrealized gain | | $ | 835,074 | |
| |
Net increase in net assets from operations | | $ | 1,009,198 | |
| (1) | For the period from the start of business, February 25, 2016, to December 31, 2016. |
| | | | |
| | 8 | | See Notes to Financial Statements. |
Eaton Vance
Stock NextShares
December 31, 2016
Statement of Changes in Net Assets
| | | | |
| Increase (Decrease) in Net Assets | | Period Ended December 31, 2016(1) | |
From operations — | | | | |
Net investment income | | $ | 174,124 | |
Net realized gain from investment and foreign currency transactions | | | 516,985 | |
Net change in unrealized appreciation (depreciation) from investments and foreign currency | | | 318,089 | |
Net increase in net assets from operations | | $ | 1,009,198 | |
Distributions to shareholders — | | | | |
From net investment income | | $ | (134,610 | ) |
Total distributions to shareholders | | $ | (134,610 | ) |
Transactions in Fund shares — | | | | |
Proceeds from sale of shares | | $ | 24,214,867 | |
Transaction fees | | | 1,860 | |
Net increase in net assets from Fund share transactions | | $ | 24,216,727 | |
Other capital — | | | | |
Portfolio transaction fee contributed to Portfolio | | $ | (1,322 | ) |
Portfolio transaction fee allocated from Portfolio | | | 8,373 | |
Net increase in net assets from other capital | | $ | 7,051 | |
| |
Net increase in net assets | | $ | 25,098,366 | |
| |
| Net Assets | | | | |
At beginning of period | | $ | — | |
At end of period | | $ | 25,098,366 | |
| |
Accumulated undistributed net investment income
included in net assets | | | | |
At end of period | | $ | 3,970 | |
| |
| Changes in shares outstanding | | | | |
Shares outstanding, beginning of period | | | — | |
Shares sold | | | 1,125,000 | |
Shares outstanding, end of period | | | 1,125,000 | |
| (1) | For the period from the start of business, February 25, 2016, to December 31, 2016. |
| | | | |
| | 9 | | See Notes to Financial Statements. |
Eaton Vance
Stock NextShares
December 31, 2016
Financial Highlights
| | | | |
| | | Period Ended December 31, 2016(1) | |
Net asset value — Beginning of period | | $ | 20.000 | |
|
| Income (Loss) From Operations | |
Net investment income(2) | | $ | 0.298 | |
Net realized and unrealized gain | | | 2.128 | |
| |
Total income from operations | | $ | 2.426 | |
|
| Less Distributions | |
From net investment income | | $ | (0.128 | ) |
| |
Total distributions | | $ | (0.128 | ) |
| |
Portfolio transaction fee, net(2) | | $ | 0.012 | |
| |
Net asset value — End of period | | $ | 22.310 | |
| |
Total Return on Net Asset Value(3) | | | 12.19 | %(4)(5) |
|
| Ratios/Supplemental Data | |
Net assets, end of period (000’s omitted) | | $ | 25,098 | |
Ratios (as a percentage of average daily net assets):(6) | | | | |
Expenses | | | 0.65 | %(5)(7) |
Net investment income | | | 1.61 | %(7) |
Portfolio Turnover of the Portfolio | | | 118 | %(8) |
| (1) | For the period from the start of business, February 25, 2016, to December 31, 2016. |
| (2) | Computed using average shares outstanding. |
| (3) | Returns are historical and are calculated by determining the percentage change in net asset value with all distributions reinvested and do not reflect the effect of a market-determined premium or discount. Investment returns assume that all distributions have been reinvested at net asset value. |
| (5) | The investment adviser and administrator reimbursed certain operating expenses (equal to 0.84% of average daily net assets for the period ended December 31, 2016). Absent this reimbursement, total return would be lower. |
| (6) | Includes the Fund’s share of the Portfolio’s allocated expenses. |
| (8) | For the Portfolio’s year ended December 31, 2016. |
| | | | |
| | 10 | | See Notes to Financial Statements. |
Eaton Vance
Stock NextShares
December 31, 2016
Notes to Financial Statements
1 Significant Accounting Policies
Eaton Vance Stock NextShares (the Fund) is a diversified series of Eaton Vance NextShares Trust (the Trust), a Massachusetts business trust registered under the Investment Company Act of 1940, as amended (the 1940 Act). The Fund is an exchange-traded managed fund operating pursuant to an order issued by the SEC granting an exemption from certain provisions of the 1940 Act. Individual shares of the Fund may be purchased and sold only on a national securities exchange or alternative trading system through a broker-dealer that offers NextShares, and may not be directly purchased or redeemed from the Fund. Market trading prices for the Fund are directly linked to the Fund’s next-computed net asset value per share (NAV) and will vary from NAV by a market-determined premium or discount, which may be zero. The Fund commenced operations on February 25, 2016. The Fund invests all of its investable assets in interests in Stock Portfolio (the Portfolio), a Massachusetts business trust having the same investment objective and policies as the Fund. The value of the Fund’s investment in the Portfolio reflects the Fund’s proportionate interest in the net assets of the Portfolio (3.9% at December 31, 2016). The performance of the Fund is directly affected by the performance of the Portfolio. The financial statements of the Portfolio, including the portfolio of investments, are included elsewhere in this report and should be read in conjunction with the Fund’s financial statements.
The following is a summary of significant accounting policies of the Fund. The policies are in conformity with accounting principles generally accepted in the United States of America (U.S. GAAP). The Fund is an investment company and follows accounting and reporting guidance in the Financial Accounting Standards Board (FASB) Accounting Standards Codification Topic 946.
A Investment Valuation — Valuation of securities by the Portfolio is discussed in Note 1A of the Portfolio’s Notes to Financial Statements, which are included elsewhere in this report.
B Income — The Fund’s net investment income or loss consists of the Fund’s pro-rata share of the net investment income or loss of the Portfolio, less all actual and accrued expenses of the Fund.
C Federal Taxes — The Fund’s policy is to comply with the provisions of the Internal Revenue Code applicable to regulated investment companies and to distribute to shareholders each year substantially all of its net investment income, and all or substantially all of its net realized capital gains. Accordingly, no provision for federal income or excise tax is necessary.
As of December 31, 2016, the Fund had no uncertain tax positions that would require financial statement recognition, de-recognition, or disclosure. The Fund files a U.S. federal income tax return annually after its fiscal year-end, which is subject to examination by the Internal Revenue Service for a period of three years from the date of filing.
D Expenses — The majority of expenses of the Trust are directly identifiable to an individual fund. Expenses which are not readily identifiable to a specific fund are allocated taking into consideration, among other things, the nature and type of expense and the relative size of the funds.
E Use of Estimates — The preparation of the financial statements in conformity with U.S. GAAP requires management to make estimates and assumptions that affect the reported amounts of assets and liabilities at the date of the financial statements and the reported amounts of income and expense during the reporting period. Actual results could differ from those estimates.
F Indemnifications — Under the Trust’s organizational documents, its officers and Trustees may be indemnified against certain liabilities and expenses arising out of the performance of their duties to the Fund. Under Massachusetts law, if certain conditions prevail, shareholders of a Massachusetts business trust (such as the Trust) could be deemed to have personal liability for the obligations of the Trust. However, the Trust’s Declaration of Trust contains an express disclaimer of liability on the part of Fund shareholders and the By-laws provide that the Trust shall assume the defense on behalf of any Fund shareholders. Moreover, the By-laws also provide for indemnification out of Fund property of any shareholder held personally liable solely by reason of being or having been a shareholder for all loss or expense arising from such liability. Additionally, in the normal course of business, the Fund enters into agreements with service providers that may contain indemnification clauses. The Fund’s maximum exposure under these arrangements is unknown as this would involve future claims that may be made against the Fund that have not yet occurred.
G Other — Investment transactions are accounted for on a trade date basis.
2 Distributions to Shareholders and Income Tax Information
It is the present policy of the Fund to make at least one distribution annually (normally in December) of all or substantially all of its net investment income and to distribute annually all or substantially all of its net realized capital gains. Distributions are paid in cash and cannot be automatically reinvested in additional shares of the Fund. Distributions to shareholders are recorded on the ex-dividend date. Distributions to shareholders are determined in accordance with income tax regulations, which may differ from U.S. GAAP. As required by U.S. GAAP, only distributions in excess of tax basis earnings and profits are reported in the financial statements as a return of capital. Permanent differences between book and tax accounting relating to distributions are reclassified to paid-in capital. For tax purposes, distributions from short-term capital gains are considered to be from ordinary income.
Eaton Vance
Stock NextShares
December 31, 2016
Notes to Financial Statements — continued
The tax character of distributions declared for the period ended December 31, 2016 was as follows:
| | | | |
| | | Period Ended
December 31, 2016 | |
| |
Distributions declared from: | | | | |
Ordinary income | | $ | 134,610 | |
During the period ended December 31, 2016, accumulated net realized gain was increased by $42,727, accumulated undistributed net investment income was decreased by $35,544 and paid-in capital was decreased by $7,183 due to differences between book and tax accounting, primarily for the Fund’s investment in the Portfolio and non-deductible expenses. These reclassifications had no effect on the net assets or net asset value per share of the Fund.
As of December 31, 2016, the components of distributable earnings (accumulated losses) on a tax basis were as follows:
| | | | |
Undistributed ordinary income | | $ | 104,438 | |
Net unrealized appreciation | | $ | 777,333 | |
The differences between components of distributable earnings (accumulated losses) on a tax basis and the amounts reflected in the Statement of Assets and Liabilities are primarily due to the Fund’s investment in the Portfolio and the tax treatment of short-term capital gains.
3 Investment Adviser Fee and Other Transactions with Affiliates
The investment adviser fee is earned by Eaton Vance Management (EVM) as compensation for investment advisory services rendered to the Fund. The fee is computed at an annual rate of 0.60% of the Fund’s average daily net assets that are not invested in other investment companies for which EVM or its affiliates serve as investment adviser and receive an advisory fee (“Direct Assets”) up to $500 million and is payable monthly. On Direct Assets of $500 million and over, the annual fee is reduced. For the period ended December 31, 2016, the Fund incurred no investment adviser fee on Direct Assets. To the extent the Fund’s assets are invested in the Portfolio, the Fund is allocated its share of the Portfolio’s investment adviser fee. The Portfolio has engaged Boston Management and Research (BMR), a subsidiary of EVM, to render investment advisory services. See Note 2 of the Portfolio’s Notes to Financial Statements which are included elsewhere in this report. EVM also serves as the administrator of the Fund, but receives no compensation.
The Trust, on behalf of the Fund, has entered into an operations agreement with EVM pursuant to which EVM provides the Fund with services required for it to operate as a NextShares exchange-traded managed fund in accordance with the exemptive order obtained by EVM and the Trust. Pursuant to the agreement, the Fund pays EVM a monthly fee at an annual rate of 0.05% of the Fund’s average daily net assets provided the average net assets of NextShares funds sponsored by EVM (“Covered Assets”) are less than $10 billion. The annual rate is reduced if Covered Assets are $10 billion and above. For the period ended December 31, 2016, the operations agreement fee amounted to $5,375 or 0.05% (annualized) of the Fund’s average daily net assets.
EVM has agreed to reimburse the Fund’s expenses to the extent that total annual operating expenses (relating to ordinary operating expenses only) exceed 0.65% of the Fund’s average daily net assets through April 30, 2017. Thereafter, the reimbursement may be changed or terminated at any time. Pursuant to this agreement, EVM was allocated $91,063 of the Fund’s operating expenses for the period ended December 31, 2016.
Trustees and officers of the Fund who are members of EVM’s or BMR’s organizations receive remuneration for their services to the Fund out of the investment adviser fee. Certain officers and Trustees of the Fund and the Portfolio are officers of the above organizations.
4 Investment Transactions
For the period ended December 31, 2016, increases and decreases in the Fund’s investment in the Portfolio aggregated $24,157,333 and $38,252, respectively. In addition, a Portfolio transaction fee is imposed by the Portfolio on the combined daily inflows or outflows of the Fund and the Portfolio’s other investors as more fully described at Note 1H of the Portfolio’s financial statements included herein. Such fee is allocated to the Fund based on its pro-rata interest in the Portfolio. The amount of the Portfolio transaction fee imposed on the Fund, if any, and the allocation of such fee are presented as other capital on the Statement of Changes in Net Assets.
5 Capital Share Transactions
The Trust may issue an unlimited number of shares of capital stock (no par value per share) in one or more series (such as the Fund). The Fund issues and redeems shares only in blocks of 25,000 shares or multiples thereof (“Creation Units”). The Fund issues and redeems Creation Units in return for the
Eaton Vance
Stock NextShares
December 31, 2016
Notes to Financial Statements — continued
securities, other instruments and/or cash (the “Basket”) that the Fund specifies each business day. Creation Units may be purchased or redeemed only by or through Authorized Participants, which are broker-dealers or institutional investors that have entered into agreements with the Fund’s distributor for this purpose. The Fund imposes a transaction fee on Creation Units issued and redeemed to offset the estimated cost to the Fund of processing the transaction, which is paid by the Authorized Participants directly to a third-party administrator. In addition, Authorized Participants pay the Fund a variable charge for converting the Basket to or from the desired portfolio composition. Such variable charges are reflected as transaction fees on the Statement of Changes in Net Assets.
Eaton Vance
Stock NextShares
December 31, 2016
Report of Independent Registered Public Accounting Firm
To the Trustees of Eaton Vance NextShares Trust and Shareholders of Eaton Vance Stock NextShares:
We have audited the accompanying statement of assets and liabilities of Eaton Vance Stock NextShares (the “Fund”) (one of the funds constituting Eaton Vance NextShares Trust), as of December 31, 2016, and the related statement of operations, the statement of changes in net assets, and the financial highlights for the period from the start of business, February 25, 2016, to December 31, 2016. These financial statements and financial highlights are the responsibility of the Fund’s management. Our responsibility is to express an opinion on these financial statements and financial highlights based on our audit.
We conducted our audit in accordance with the standards of the Public Company Accounting Oversight Board (United States). Those standards require that we plan and perform the audit to obtain reasonable assurance about whether the financial statements and financial highlights are free of material misstatement. The Fund is not required to have, nor were we engaged to perform, an audit of its internal control over financial reporting. Our audit included consideration of internal control over financial reporting as a basis for designing audit procedures that are appropriate in the circumstances, but not for the purpose of expressing an opinion on the effectiveness of the Fund’s internal control over financial reporting. Accordingly, we express no such opinion. An audit also includes examining, on a test basis, evidence supporting the amounts and disclosures in the financial statements, assessing the accounting principles used and significant estimates made by management, as well as evaluating the overall financial statement presentation. We believe that our audit provide a reasonable basis for our opinion.
In our opinion, such financial statements and financial highlights referred to above present fairly, in all material respects, the financial position of Eaton Vance Stock NextShares as of December 31, 2016, the results of its operations, the changes in its net assets and the financial highlights for the period from the start of business, February 25, 2016, to December 31, 2016, in conformity with accounting principles generally accepted in the United States of America.
DELOITTE & TOUCHE LLP
Boston, Massachusetts
February 22, 2017
Eaton Vance
Stock NextShares
December 31, 2016
Federal Tax Information (Unaudited)
The Form 1099-DIV you received in February 2017 showed the tax status of all distributions paid to your account in calendar year 2016. Shareholders are advised to consult their own tax adviser with respect to the tax consequences of their investment in the Fund. As required by the Internal Revenue Code and/or regulations, shareholders must be notified regarding the status of qualified dividend income for individuals and the dividends received deduction for corporations.
Qualified Dividend Income. For the fiscal year ended December 31, 2016, the Fund designates approximately $184,588, or up to the maximum amount of such dividends allowable pursuant to the Internal Revenue Code, as qualified dividend income eligible for the reduced tax rate of 15%.
Dividends Received Deduction. Corporate shareholders are generally entitled to take the dividends received deduction on the portion of the Fund’s dividend distribution that qualifies under tax law. For the Fund’s fiscal 2016 ordinary income dividends, 73.25% qualifies for the corporate dividends received deduction.
Stock Portfolio
December 31, 2016
Portfolio of Investments
| | | | | | | | |
| Common Stocks — 99.7% | |
| | |
| | | | | | | | |
| Security | | Shares | | | Value | |
| | | | | | | | |
| | |
Aerospace & Defense — 2.7% | | | | | | | | |
Hexcel Corp. | | | 30,263 | | | $ | 1,556,729 | |
United Technologies Corp. | | | 143,171 | | | | 15,694,405 | |
| | | | | | | | | |
| | | $ | 17,251,134 | |
| | | | | | | | | |
|
Banks — 7.0% | |
JPMorgan Chase & Co. | | | 270,869 | | | $ | 23,373,286 | |
Wells Fargo & Co. | | | 384,482 | | | | 21,188,803 | |
| | | | | | | | | |
| | | $ | 44,562,089 | |
| | | | | | | | | |
|
Beverages — 3.3% | |
Constellation Brands, Inc., Class A | | | 30,636 | | | $ | 4,696,805 | |
Diageo PLC | | | 377,000 | | | | 9,783,087 | |
PepsiCo, Inc. | | | 61,585 | | | | 6,443,639 | |
| | | | | | | | | |
| | | $ | 20,923,531 | |
| | | | | | | | | |
|
Biotechnology — 2.5% | |
Biogen, Inc.(1) | | | 7,373 | | | $ | 2,090,835 | |
Celgene Corp.(1) | | | 25,474 | | | | 2,948,616 | |
Gilead Sciences, Inc. | | | 132,886 | | | | 9,515,966 | |
Incyte Corp.(1) | | | 17,356 | | | | 1,740,286 | |
| | | | | | | | | |
| | | $ | 16,295,703 | |
| | | | | | | | | |
|
Building Products — 1.7% | |
Johnson Controls International PLC | | | 262,500 | | | $ | 10,812,375 | |
| | | | | | | | | |
| | | $ | 10,812,375 | |
| | | | | | | | | |
|
Capital Markets — 1.7% | |
Credit Suisse Group AG ADR(1) | | | 308,127 | | | $ | 4,409,297 | |
Goldman Sachs Group, Inc. (The) | | | 13,000 | | | | 3,112,850 | |
Lazard, Ltd., Class A | | | 86,407 | | | | 3,550,464 | |
| | | | | | | | | |
| | | $ | 11,072,611 | |
| | | | | | | | | |
|
Chemicals — 1.4% | |
Monsanto Co. | | | 27,910 | | | $ | 2,936,411 | |
RPM International, Inc. | | | 105,973 | | | | 5,704,527 | |
| | | | | | | | | |
| | | $ | 8,640,938 | |
| | | | | | | | | |
|
Containers & Packaging — 1.5% | |
International Paper Co. | | | 181,602 | | | $ | 9,635,802 | |
| | | | | | | | | |
| | | $ | 9,635,802 | |
| | | | | | | | | |
| | | | | | | | |
| Security | | Shares | | | Value | |
| | | | | | | | |
|
Distributors — 1.4% | |
LKQ Corp.(1) | | | 301,622 | | | $ | 9,244,714 | |
| | | | | | | | | |
| | | $ | 9,244,714 | |
| | | | | | | | | |
|
Diversified Consumer Services — 1.6% | |
Bright Horizons Family Solutions, Inc.(1) | | | 73,535 | | | $ | 5,148,921 | |
ServiceMaster Global Holdings, Inc.(1) | | | 132,163 | | | | 4,978,580 | |
| | | | | | | | | |
| | | $ | 10,127,501 | |
| | | | | | | | | |
|
Diversified Financial Services — 1.6% | |
Berkshire Hathaway, Inc., Class B(1) | | | 62,493 | | | $ | 10,185,109 | |
| | | | | | | | | |
| | | $ | 10,185,109 | |
| | | | | | | | | |
|
Diversified Telecommunication Services — 2.7% | |
Verizon Communications, Inc. | | | 318,366 | | | $ | 16,994,377 | |
| | | | | | | | | |
| | | $ | 16,994,377 | |
| | | | | | | | | |
|
Electric Utilities — 1.0% | |
NextEra Energy, Inc. | | | 55,658 | | | $ | 6,648,905 | |
| | | | | | | | | |
| | | $ | 6,648,905 | |
| | | | | | | | | |
|
Electronic Equipment, Instruments & Components — 0.7% | |
Avnet, Inc. | | | 96,707 | | | $ | 4,604,220 | |
| | | | | | | | | |
| | | $ | 4,604,220 | |
| | | | | | | | | |
|
Energy Equipment & Services — 1.9% | |
Oceaneering International, Inc. | | | 187,558 | | | $ | 5,291,011 | |
Schlumberger, Ltd. | | | 85,566 | | | | 7,183,266 | |
| | | | | | | | | |
| | | $ | 12,474,277 | |
| | | | | | | | | |
|
Equity Real Estate Investment Trusts (REITs) — 2.9% | |
Equity Residential | | | 178,794 | | | $ | 11,507,182 | |
Federal Realty Investment Trust | | | 49,642 | | | | 7,054,625 | |
| | | | | | | | | |
| | | $ | 18,561,807 | |
| | | | | | | | | |
|
Food & Staples Retailing — 2.1% | |
Costco Wholesale Corp. | | | 45,360 | | | $ | 7,262,590 | |
Kroger Co. (The) | | | 115,437 | | | | 3,983,731 | |
Sprouts Farmers Market, Inc.(1) | | | 128,045 | | | | 2,422,611 | |
| | | | | | | | | |
| | | $ | 13,668,932 | |
| | | | | | | | | |
|
Food Products — 2.5% | |
Blue Buffalo Pet Products, Inc.(1) | | | 117,176 | | | $ | 2,816,911 | |
Pinnacle Foods, Inc. | | | 247,252 | | | | 13,215,619 | |
| | | | | | | | | |
| | | $ | 16,032,530 | |
| | | | | | | | | |
| | | | |
| | 16 | | See Notes to Financial Statements. |
Stock Portfolio
December 31, 2016
Portfolio of Investments — continued
| | | | | | | | |
| Security | | Shares | | | Value | |
| | | | | | | | |
|
Health Care Equipment & Supplies — 2.6% | |
Medtronic PLC | | | 88,000 | | | $ | 6,268,240 | |
Zimmer Biomet Holdings, Inc. | | | 101,222 | | | | 10,446,110 | |
| | | | | | | | | |
| | | $ | 16,714,350 | |
| | | | | | | | | |
|
Health Care Providers & Services — 1.5% | |
Aetna, Inc. | | | 78,025 | | | $ | 9,675,880 | |
| | | | | | | | | |
| | | $ | 9,675,880 | |
| | | | | | | | | |
|
Household Durables — 1.7% | |
Newell Brands, Inc. | | | 242,923 | | | $ | 10,846,512 | |
| | | | | | | | | |
| | | $ | 10,846,512 | |
| | | | | | | | | |
|
Industrial Conglomerates — 3.1% | |
General Electric Co. | | | 618,086 | | | $ | 19,531,518 | |
| | | | | | | | | |
| | | $ | 19,531,518 | |
| | | | | | | | | |
|
Insurance — 4.5% | |
American Financial Group, Inc. | | | 149,589 | | | $ | 13,181,783 | |
Chubb, Ltd. | | | 118,563 | | | | 15,664,543 | |
| | | | | | | | | |
| | | $ | 28,846,326 | |
| | | | | | | | | |
|
Internet & Direct Marketing Retail — 1.5% | |
Amazon.com, Inc.(1) | | | 12,991 | | | $ | 9,741,561 | |
| | | | | | | | | |
| | | $ | 9,741,561 | |
| | | | | | | | | |
|
Internet Software & Services — 8.1% | |
Alphabet, Inc., Class C(1) | | | 24,975 | | | $ | 19,276,204 | |
eBay, Inc.(1) | | | 426,803 | | | | 12,671,781 | |
Facebook, Inc., Class A(1) | | | 119,673 | | | | 13,768,379 | |
GoDaddy, Inc., Class A(1) | | | 184,203 | | | | 6,437,895 | |
| | | | | | | | | |
| | | $ | 52,154,259 | |
| | | | | | | | | |
|
IT Services — 3.1% | |
Convergys Corp. | | | 369,504 | | | $ | 9,075,018 | |
Genpact, Ltd.(1) | | | 258,241 | | | | 6,285,586 | |
International Business Machines Corp. | | | 28,711 | | | | 4,765,739 | |
| | | | | | | | | |
| | | $ | 20,126,343 | |
| | | | | | | | | |
|
Machinery — 1.6% | |
Dover Corp. | | | 47,000 | | | $ | 3,521,710 | |
Fortive Corp. | | | 127,322 | | | | 6,828,279 | |
| | | | | | | | | |
| | | $ | 10,349,989 | |
| | | | | | | | | |
| | | | | | | | |
| Security | | Shares | | | Value | |
| | | | | | | | |
|
Media — 3.1% | |
Interpublic Group of Cos., Inc. | | | 154,579 | | | $ | 3,618,695 | |
Time Warner, Inc. | | | 97,423 | | | | 9,404,242 | |
Walt Disney Co. (The) | | | 64,110 | | | | 6,681,544 | |
| | | | | | | | | |
| | | $ | 19,704,481 | |
| | | | | | | | | |
|
Multi-Utilities — 2.1% | |
National Grid PLC | | | 578,000 | | | $ | 6,753,200 | |
Sempra Energy | | | 63,645 | | | | 6,405,233 | |
| | | | | | | | | |
| | | $ | 13,158,433 | |
| | | | | | | | | |
|
Multiline Retail — 0.9% | |
Macy’s, Inc. | | | 169,513 | | | $ | 6,070,261 | |
| | | | | | | | | |
| | | $ | 6,070,261 | |
| | | | | | | | | |
|
Oil, Gas & Consumable Fuels — 5.7% | |
Anadarko Petroleum Corp. | | | 93,223 | | | $ | 6,500,440 | |
Chevron Corp. | | | 133,965 | | | | 15,767,680 | |
EOG Resources, Inc. | | | 52,151 | | | | 5,272,466 | |
Occidental Petroleum Corp. | | | 122,791 | | | | 8,746,403 | |
| | | | | | | | | |
| | | $ | 36,286,989 | |
| | | | | | | | | |
|
Pharmaceuticals — 7.0% | |
Eli Lilly & Co. | | | 94,000 | | | $ | 6,913,700 | |
Johnson & Johnson | | | 173,779 | | | | 20,021,079 | |
Pfizer, Inc. | | | 546,492 | | | | 17,750,060 | |
| | | | | | | | | |
| | | $ | 44,684,839 | |
| | | | | | | | | |
|
Road & Rail — 1.1% | |
Norfolk Southern Corp. | | | 67,852 | | | $ | 7,332,766 | |
| | | | | | | | | |
| | | $ | 7,332,766 | |
| | | | | | | | | |
|
Semiconductors & Semiconductor Equipment — 4.5% | |
Broadcom, Ltd. | | | 19,169 | | | $ | 3,388,504 | |
Intel Corp. | | | 387,683 | | | | 14,061,262 | |
NXP Semiconductors NV(1) | | | 65,547 | | | | 6,424,262 | |
Texas Instruments, Inc. | | | 71,237 | | | | 5,198,164 | |
| | | | | | | | | |
| | | $ | 29,072,192 | |
| | | | | | | | | |
|
Specialty Retail — 1.7% | |
Advance Auto Parts, Inc. | | | 19,099 | | | $ | 3,230,023 | |
Lowe’s Cos., Inc. | | | 109,922 | | | | 7,817,653 | |
| | | | | | | | | |
| | | $ | 11,047,676 | |
| | | | | | | | | |
| | | | |
| | 17 | | See Notes to Financial Statements. |
Stock Portfolio
December 31, 2016
Portfolio of Investments — continued
| | | | | | | | |
| Security | | Shares | | | Value | |
|
Technology Hardware, Storage & Peripherals — 4.2% | |
Apple, Inc. | | | 233,420 | | | $ | 27,034,704 | |
| | | | | | | | | |
| | | $ | 27,034,704 | |
| | | | | | | | | |
|
Tobacco — 1.5% | |
Altria Group, Inc. | | | 65,000 | | | $ | 4,395,300 | |
Philip Morris International, Inc. | | | 54,017 | | | | 4,942,015 | |
| | | | | | | | | |
| | | $ | 9,337,315 | |
| | | | | | | | | |
| |
Total Common Stocks
(identified cost $581,883,169) | | | $ | 639,452,949 | |
| | | | | | | | | |
| | |
| Short-Term Investments — 0.7% | | | | | | | | |
| | |
| | | | | | | | |
| Description | | Units | | | Value | |
Eaton Vance Cash Reserves Fund, LLC, 0.81%(2) | | | 4,270,417 | | | $ | 4,270,844 | |
| | | | | | | | | |
| |
Total Short-Term Investments
(identified cost $4,271,248) | | | $ | 4,270,844 | |
| | | | | | | | | |
| |
Total Investments — 100.4%
(identified cost $586,154,417) | | | $ | 643,723,793 | |
| | | | | | | | | |
| |
Other Assets, Less Liabilities — (0.4)% | | | $ | (2,750,963 | ) |
| | | | | | | | | |
| |
Net Assets — 100.0% | | | $ | 640,972,830 | |
| | | | | | | | | |
The percentage shown for each investment category in the Portfolio of Investments is based on net assets.
| (1) | Non-income producing security. |
| (2) | Affiliated investment company, available to Eaton Vance portfolios and funds, which invests in high quality, U.S. dollar denominated money market instruments. The rate shown is the annualized seven-day yield as of December 31, 2016. |
| | | | |
| Abbreviations: |
| | |
| ADR | | – | | American Depositary Receipt |
| | | | |
| | 18 | | See Notes to Financial Statements. |
Stock Portfolio
December 31, 2016
Statement of Assets and Liabilities
| | | | |
| Assets | | December 31, 2016 | |
Unaffiliated investments, at value (identified cost, $581,883,169) | | $ | 639,452,949 | |
Affiliated investment, at value (identified cost, $4,271,248) | | | 4,270,844 | |
Dividends receivable | | | 1,233,112 | |
Dividends receivable from affiliated investment | | | 4,135 | |
Contributions receivable | | | 16,056 | |
Tax reclaims receivable | | | 121,541 | |
Total assets | | $ | 645,098,637 | |
|
| Liabilities | |
Payable for investments purchased | | $ | 3,700,203 | |
Payable to affiliates: | | | | |
Investment adviser fee | | | 321,690 | |
Trustees’ fees | | | 7,050 | |
Accrued expenses | | | 96,864 | |
Total liabilities | | $ | 4,125,807 | |
Net Assets applicable to investors’ interest in Portfolio | | $ | 640,972,830 | |
|
| Sources of Net Assets | |
Investors’ capital | | $ | 583,406,445 | |
Net unrealized appreciation | | | 57,566,385 | |
Total | | $ | 640,972,830 | |
| | | | |
| | 19 | | See Notes to Financial Statements. |
Stock Portfolio
December 31, 2016
Statement of Operations
| | | | |
| Investment Income | | Year Ended December 31, 2016 | |
Dividends (net of foreign taxes, $38,967) | | $ | 11,732,102 | |
Interest allocated from/dividends from affiliated investment | | | 56,163 | |
Expenses allocated from affiliated investment | | | (1,158 | ) |
Total investment income | | $ | 11,787,107 | |
|
| Expenses | |
Investment adviser fee | | $ | 3,137,544 | |
Trustees’ fees and expenses | | | 27,993 | |
Custodian fee | | | 151,079 | |
Legal and accounting services | | | 51,092 | |
Miscellaneous | | | 22,714 | |
| |
Total expenses | | $ | 3,390,422 | |
| |
Net investment income | | $ | 8,396,685 | |
|
| Realized and Unrealized Gain (Loss) | |
Net realized gain (loss) — | | | | |
Investment transactions | | $ | 12,690,200 | |
Investment transactions in/allocated from affiliated investment | | | 1,681 | |
Foreign currency transactions | | | (13,834 | ) |
Net realized gain | | $ | 12,678,047 | |
Change in unrealized appreciation (depreciation) — | | | | |
Investments | | $ | 20,173,024 | |
Investments — affiliated investment | | | (404 | ) |
Foreign currency | | | (91 | ) |
Net change in unrealized appreciation (depreciation) | | $ | 20,172,529 | |
| |
Net realized and unrealized gain | | $ | 32,850,576 | |
| |
Net increase in net assets from operations | | $ | 41,247,261 | |
| | | | |
| | 20 | | See Notes to Financial Statements. |
Stock Portfolio
December 31, 2016
Statements of Changes in Net Assets
| | | | | | | | |
| | | Year Ended December 31, | |
| Increase (Decrease) in Net Assets | | 2016 | | | 2015 | |
From operations — | | | | | | | | |
Net investment income | | $ | 8,396,685 | | | $ | 3,469,200 | |
Net realized gain from investment and foreign currency transactions | | | 12,678,047 | | | | 15,815,449 | |
Net change in unrealized appreciation (depreciation) from investments and foreign currency | | | 20,172,529 | | | | (5,535,887 | ) |
Net increase in net assets from operations | | $ | 41,247,261 | | | $ | 13,748,762 | |
Capital transactions — | | | | | | | | |
Contributions | | $ | 255,687,315 | | | $ | 140,928,255 | |
Withdrawals | | | (51,820,934 | ) | | | (12,114,450 | ) |
Portfolio transaction fee | | | 367,287 | | | | — | |
Net increase in net assets from capital transactions | | $ | 204,233,668 | | | $ | 128,813,805 | |
| | |
Net increase in net assets | | $ | 245,480,929 | �� | | $ | 142,562,567 | |
|
| Net Assets | |
At beginning of year | | $ | 395,491,901 | | | $ | 252,929,334 | |
At end of year | | $ | 640,972,830 | | | $ | 395,491,901 | |
| | | | |
| | 21 | | See Notes to Financial Statements. |
Stock Portfolio
December 31, 2016
Financial Highlights
| | | | | | | | | | | | | | | | | | | | |
| | | Year Ended December 31, | |
| Ratios/Supplemental Data | | 2016 | | | 2015 | | | 2014 | | | 2013 | | | 2012 | |
Ratios (as a percentage of average daily net assets): | | | | | | | | | | | | | | | | | | | | |
Expenses(1) | | | 0.65 | % | | | 0.70 | % | | | 0.71 | % | | | 0.73 | % | | | 0.73 | % |
Net investment income | | | 1.60 | % | | | 1.16 | % | | | 1.07 | % | | | 0.93 | % | | | 1.21 | % |
Portfolio Turnover | | | 118 | % | | | 96 | % | | | 109 | % | | | 90 | % | | | 91 | % |
| | | | | |
Total Return | | | 7.14 | % | | | 4.88 | % | | | 12.56 | % | | | 33.50 | % | | | 16.18 | % |
| | | | | |
Net assets, end of year (000’s omitted) | | $ | 640,973 | | | $ | 395,492 | | | $ | 252,929 | | | $ | 237,133 | | | $ | 188,806 | |
| (1) | Excludes the effect of custody fee credits, if any, of less than 0.005%. Effective September 1, 2015, custody fee credits, which were earned on cash deposit balances, were discontinued by the custodian. |
| | | | |
| | 22 | | See Notes to Financial Statements. |
Stock Portfolio
December 31, 2016
Notes to Financial Statements
1 Significant Accounting Policies
Stock Portfolio (the Portfolio) is a Massachusetts business trust registered under the Investment Company Act of 1940, as amended (the 1940 Act), as a diversified, open-end management investment company. The Portfolio’s investment objective is to achieve long-term capital appreciation by investing in a diversified portfolio of equity securities. The Declaration of Trust permits the Trustees to issue interests in the Portfolio. At December 31, 2016, Eaton Vance Stock Fund, Eaton Vance Stock NextShares and Eaton Vance Balanced Fund held an interest of 15.9%, 3.9% and 80.2%, respectively, in the Portfolio.
The following is a summary of significant accounting policies of the Portfolio. The policies are in conformity with accounting principles generally accepted in the United States of America (U.S. GAAP). The Portfolio is an investment company and follows accounting and reporting guidance in the Financial Accounting Standards Board (FASB) Accounting Standards Codification Topic 946.
A Investment Valuation — The following methodologies are used to determine the market value or fair value of investments.
Equity Securities. Equity securities listed on a U.S. securities exchange generally are valued at the last sale or closing price on the day of valuation or, if no sales took place on such date, at the mean between the closing bid and asked prices therefore on the exchange where such securities are principally traded. Equity securities listed on the NASDAQ Global or Global Select Market generally are valued at the NASDAQ official closing price. Unlisted or listed securities for which closing sales prices or closing quotations are not available are valued at the mean between the latest available bid and asked prices.
Foreign Securities and Currencies. Foreign securities and currencies are valued in U.S. dollars, based on foreign currency exchange rate quotations supplied by a third party pricing service. The pricing service uses a proprietary model to determine the exchange rate. Inputs to the model include reported trades and implied bid/ask spreads. The daily valuation of exchange-traded foreign securities generally is determined as of the close of trading on the principal exchange on which such securities trade. Events occurring after the close of trading on foreign exchanges may result in adjustments to the valuation of foreign securities to more accurately reflect their fair value as of the close of regular trading on the New York Stock Exchange. When valuing foreign equity securities that meet certain criteria, the Portfolio’s Trustees have approved the use of a fair value service that values such securities to reflect market trading that occurs after the close of the applicable foreign markets of comparable securities or other instruments that have a strong correlation to the fair-valued securities.
Affiliated Fund. The Portfolio may invest in Eaton Vance Cash Reserves Fund, LLC (Cash Reserves Fund), an affiliated investment company managed by Eaton Vance Management (EVM). While Cash Reserves Fund is not a registered money market mutual fund, it conducts all of its investment activities in accordance with the requirements of Rule 2a-7 under the 1940 Act. Investments in Cash Reserves Fund are valued at the closing net asset value per unit on the valuation day. Cash Reserves Fund generally values its investment securities based on available market quotations provided by a third party pricing service. Prior to Cash Reserves Fund’s issuance of units in October 2016, the value of the Portfolio’s investment in Cash Reserves Fund reflected the Portfolio’s proportionate interest in its net assets and the Portfolio recorded its pro-rata share of Cash Reserves Fund’s income, expenses and realized gain or loss.
Fair Valuation. Investments for which valuations or market quotations are not readily available or are deemed unreliable are valued at fair value using methods determined in good faith by or at the direction of the Trustees of the Portfolio in a manner that fairly reflects the security’s value, or the amount that the Portfolio might reasonably expect to receive for the security upon its current sale in the ordinary course. Each such determination is based on a consideration of relevant factors, which are likely to vary from one pricing context to another. These factors may include, but are not limited to, the type of security, the existence of any contractual restrictions on the security’s disposition, the price and extent of public trading in similar securities of the issuer or of comparable companies or entities, quotations or relevant information obtained from broker/dealers or other market participants, information obtained from the issuer, analysts, and/or the appropriate stock exchange (for exchange-traded securities), an analysis of the company’s or entity’s financial condition, and an evaluation of the forces that influence the issuer and the market(s) in which the security is purchased and sold.
B Investment Transactions — Investment transactions for financial statement purposes are accounted for on a trade date basis. Realized gains and losses on investments sold are determined on the basis of identified cost.
C Income — Dividend income is recorded on the ex-dividend date for dividends received in cash and/or securities. However, if the ex-dividend date has passed, certain dividends from foreign securities are recorded as the Portfolio is informed of the ex-dividend date. Withholding taxes on foreign dividends and capital gains have been provided for in accordance with the Portfolio’s understanding of the applicable countries’ tax rules and rates. Interest income is recorded on the basis of interest accrued, adjusted for amortization of premium or accretion of discount.
D Federal Taxes — The Portfolio has elected to be treated as a partnership for federal tax purposes. No provision is made by the Portfolio for federal or state taxes on any taxable income of the Portfolio because each investor in the Portfolio is ultimately responsible for the payment of any taxes on its share of taxable income. Since at least one of the Portfolio’s investors is a regulated investment company that invests all or substantially all of its assets in the Portfolio, the Portfolio normally must satisfy the applicable source of income and diversification requirements (under the Internal Revenue Code) in order for its investors to satisfy them. The Portfolio will allocate, at least annually among its investors, each investor’s distributive share of the Portfolio’s net investment income, net realized capital gains and losses and any other items of income, gain, loss, deduction or credit.
As of December 31, 2016, the Portfolio had no uncertain tax positions that would require financial statement recognition, de-recognition, or disclosure. The Portfolio files a U.S. federal income tax return annually after its fiscal year-end, which is subject to examination by the Internal Revenue Service for a period of three years from the date of filing.
Stock Portfolio
December 31, 2016
Notes to Financial Statements — continued
E Foreign Currency Translation — Investment valuations, other assets, and liabilities initially expressed in foreign currencies are translated each business day into U.S. dollars based upon current exchange rates. Purchases and sales of foreign investment securities and income and expenses denominated in foreign currencies are translated into U.S. dollars based upon currency exchange rates in effect on the respective dates of such transactions. Recognized gains or losses on investment transactions attributable to changes in foreign currency exchange rates are recorded for financial statement purposes as net realized gains and losses on investments. That portion of unrealized gains and losses on investments that results from fluctuations in foreign currency exchange rates is not separately disclosed.
F Use of Estimates — The preparation of the financial statements in conformity with U.S. GAAP requires management to make estimates and assumptions that affect the reported amounts of assets and liabilities at the date of the financial statements and the reported amounts of income and expense during the reporting period. Actual results could differ from those estimates.
G Indemnifications — Under the Portfolio’s organizational documents, its officers and Trustees may be indemnified against certain liabilities and expenses arising out of the performance of their duties to the Portfolio. Under Massachusetts law, if certain conditions prevail, interestholders in the Portfolio could be deemed to have personal liability for the obligations of the Portfolio. However, the Portfolio’s Declaration of Trust contains an express disclaimer of liability on the part of Portfolio interestholders and the By-laws provide that the Portfolio shall assume the defense on behalf of any Portfolio interestholder. Moreover, the By-laws also provide for indemnification out of Portfolio property of any interestholder held personally liable solely by reason of being or having been an interestholder for all loss or expense arising from such liability. Additionally, in the normal course of business, the Portfolio enters into agreements with service providers that may contain indemnification clauses. The Portfolio’s maximum exposure under these arrangements is unknown as this would involve future claims that may be made against the Portfolio that have not yet occurred.
H Capital Transactions — To seek to protect the Portfolio (and, indirectly, other investors in the Portfolio) against the costs of accommodating investor inflows and outflows, effective February 26, 2016, the Portfolio imposes a fee (“Portfolio transaction fee”) on inflows and outflows by Portfolio investors. The Portfolio transaction fee is sized to cover the estimated cost to the Portfolio of, in connection with issuing interests, converting the cash and/or other instruments it receives to the desired composition and, in connection with redeeming its interests, converting Portfolio holdings to cash and/or other instruments to be distributed. Such fee, which may vary over time, is limited to amounts that have been authorized by the Board of Trustees and determined by EVM to be appropriate. The maximum Portfolio transaction fee is 2% of the amount of net contributions or withdrawals. The Portfolio transaction fee is recorded as a component of capital transactions on the Statements of Changes in Net Assets.
2 Investment Adviser Fee and Other Transactions with Affiliates
The investment adviser fee is earned by Boston Management and Research (BMR), a subsidiary of EVM, as compensation for investment advisory services rendered to the Portfolio. Pursuant to the investment advisory agreement and subsequent fee reduction agreement between the Portfolio and BMR effective January 1, 2016, the fee is computed at an annual rate of 0.60% of the Portfolio’s average daily net assets up to $500 million and 0.575% from $500 million but less than $1 billion, and is payable monthly. On net assets of $1 billion or over, the annual fee is reduced. The fee reduction cannot be terminated or reduced without the approval of a majority vote of the Trustees of the Portfolio who are not interested persons of BMR or the Portfolio and by the vote of a majority of the holders of interest in the Portfolio. For the year ended December 31, 2016, the Portfolio’s investment adviser fee amounted to $3,137,544 or 0.60% of the Portfolio’s average daily net assets. The Portfolio invests its cash in Cash Reserves Fund. EVM does not currently receive a fee for advisory services provided to Cash Reserves Fund.
Trustees and officers of the Portfolio who are members of EVM’s or BMR’s organizations receive remuneration for their services to the Portfolio out of the investment adviser fee. Trustees of the Portfolio who are not affiliated with the investment adviser may elect to defer receipt of all or a percentage of their annual fees in accordance with the terms of the Trustees Deferred Compensation Plan. For the year ended December 31, 2016, no significant amounts have been deferred. Certain officers and Trustees of the Portfolio are officers of the above organizations.
3 Purchases and Sales of Investments
Purchases and sales of investments, other than short-term obligations and in-kind transactions, aggregated $801,751,385 and $611,941,019, respectively, for the year ended December 31, 2016. In-kind purchases and sales for the year ended December 31, 2016 aggregated $23,297,197 and none, respectively.
Stock Portfolio
December 31, 2016
Notes to Financial Statements — continued
4 Federal Income Tax Basis of Investments
The cost and unrealized appreciation (depreciation) of investments of the Portfolio at December 31, 2016, as determined on a federal income tax basis, were as follows:
| | | | |
| |
Aggregate cost | | $ | 587,779,026 | |
| |
Gross unrealized appreciation | | $ | 66,445,337 | |
Gross unrealized depreciation | | | (10,500,570 | ) |
| |
Net unrealized appreciation | | $ | 55,944,767 | |
The net unrealized depreciation on foreign currency transactions at December 31, 2016 on a federal income tax basis was $2,991.
5 Line of Credit
The Portfolio participates with other portfolios and funds managed by EVM and its affiliates in a $625 million unsecured line of credit agreement with a group of banks, which is in effect through September 1, 2017. Borrowings are made by the Portfolio solely to facilitate the handling of unusual and/or unanticipated short-term cash requirements. Interest is charged to the Portfolio based on its borrowings at an amount above either the Eurodollar rate or Federal Funds rate. In addition, a fee computed at an annual rate of 0.15% on the daily unused portion of the line of credit is allocated among the participating portfolios and funds at the end of each quarter. Because the line of credit is not available exclusively to the Portfolio, it may be unable to borrow some or all of its requested amounts at any particular time. The Portfolio did not have any significant borrowings or allocated fees during the year ended December 31, 2016.
6 Fair Value Measurements
Under generally accepted accounting principles for fair value measurements, a three-tier hierarchy to prioritize the assumptions, referred to as inputs, is used in valuation techniques to measure fair value. The three-tier hierarchy of inputs is summarized in the three broad levels listed below.
| • | | Level 1 – quoted prices in active markets for identical investments |
| • | | Level 2 – other significant observable inputs (including quoted prices for similar investments, interest rates, prepayment speeds, credit risk, etc.) |
| • | | Level 3 – significant unobservable inputs (including a fund’s own assumptions in determining the fair value of investments) |
In cases where the inputs used to measure fair value fall in different levels of the fair value hierarchy, the level disclosed is determined based on the lowest level input that is significant to the fair value measurement in its entirety. The inputs or methodology used for valuing securities are not necessarily an indication of the risk associated with investing in those securities.
Stock Portfolio
December 31, 2016
Notes to Financial Statements — continued
At December 31, 2016, the hierarchy of inputs used in valuing the Portfolio’s investments, which are carried at value, were as follows:
| | | | | | | | | | | | | | | | |
| Asset Description | | Level 1 | | | Level 2 | | | Level 3 | | | Total | |
| | | | |
Common Stocks | | | | | | | | | | | | | | | | |
Consumer Discretionary | | $ | 76,782,706 | | | $ | — | | | $ | — | | | $ | 76,782,706 | |
Consumer Staples | | | 50,179,221 | | | | 9,783,087 | | | | — | | | | 59,962,308 | |
Energy | | | 48,761,266 | | | | — | | | | — | | | | 48,761,266 | |
Financials | | | 94,666,135 | | | | — | | | | — | | | | 94,666,135 | |
Health Care | | | 87,370,772 | | | | — | | | | — | | | | 87,370,772 | |
Industrials | | | 65,277,782 | | | | — | | | | — | | | | 65,277,782 | |
Information Technology | | | 132,991,718 | | | | — | | | | — | | | | 132,991,718 | |
Materials | | | 18,276,740 | | | | — | | | | — | | | | 18,276,740 | |
Real Estate | | | 18,561,807 | | | | — | | | | — | | | | 18,561,807 | |
Telecommunication Services | | | 16,994,377 | | | | — | | | | — | | | | 16,994,377 | |
Utilities | | | 13,054,138 | | | | 6,753,200 | | | | — | | | | 19,807,338 | |
| | | | |
Total Common Stocks | | $ | 622,916,662 | | | $ | 16,536,287 | * | | $ | — | | | $ | 639,452,949 | |
| | | | |
Short-Term Investments | | $ | — | | | $ | 4,270,844 | | | $ | — | | | $ | 4,270,844 | |
| | | | |
Total Investments | | $ | 622,916,662 | | | $ | 20,807,131 | | | $ | — | | | $ | 643,723,793 | |
| * | Includes foreign equity securities whose values were adjusted to reflect market trading of comparable securities or other correlated instruments that occurred after the close of trading in their applicable foreign markets. |
The Portfolio held no investments or other financial instruments as of December 31, 2015 whose fair value was determined using Level 3 inputs. At December 31, 2016, there were no investments transferred between Level 1 and Level 2 during the year then ended.
Stock Portfolio
December 31, 2016
Report of Independent Registered Public Accounting Firm
To the Trustees and Investors of Stock Portfolio:
We have audited the accompanying statement of assets and liabilities of Stock Portfolio (the “Portfolio”), including the portfolio of investments, as of December 31, 2016, and the related statement of operations for the year then ended, the statements of changes in net assets for each of the two years in the period then ended, and the financial highlights for each of the five years in the period then ended. These financial statements and financial highlights are the responsibility of the Portfolio’s management. Our responsibility is to express an opinion on these financial statements and financial highlights based on our audits.
We conducted our audits in accordance with the standards of the Public Company Accounting Oversight Board (United States). Those standards require that we plan and perform the audit to obtain reasonable assurance about whether the financial statements and financial highlights are free of material misstatement. The Portfolio is not required to have, nor were we engaged to perform, an audit of its internal control over financial reporting. Our audits included consideration of internal control over financial reporting as a basis for designing audit procedures that are appropriate in the circumstances, but not for the purpose of expressing an opinion on the effectiveness of the Portfolio’s internal control over financial reporting. Accordingly, we express no such opinion. An audit also includes examining, on a test basis, evidence supporting the amounts and disclosures in the financial statements, assessing the accounting principles used and significant estimates made by management, as well as evaluating the overall financial statement presentation. Our procedures included confirmation of securities owned as of December 31, 2016 by correspondence with the custodian and brokers; where replies were not received from brokers, we performed other auditing procedures. We believe that our audits provide a reasonable basis for our opinion.
In our opinion, such financial statements and financial highlights referred to above present fairly, in all material respects, the financial position of Stock Portfolio as of December 31, 2016, the results of its operations for the year then ended, the changes in its net assets for each of the two years in the period then ended, and the financial highlights for each of the five years in the period then ended, in conformity with accounting principles generally accepted in the United States of America.
DELOITTE & TOUCHE LLP
Boston, Massachusetts
February 22, 2017
Eaton Vance
Stock NextShares
December 31, 2016
Management and Organization
Fund Management. The Trustees of Eaton Vance NextShares Trust (the Trust) and Stock Portfolio (the Portfolio) are responsible for the overall management and supervision of the Trust’s and Portfolio’s affairs. The Trustees and officers of the Trust and the Portfolio are listed below. Except as indicated, each individual has held the office shown or other offices in the same company for the last five years. Trustees and officers of the Trust and the Portfolio hold indefinite terms of office. The “Noninterested Trustees” consist of those Trustees who are not “interested persons” of the Trust and the Portfolio, as that term is defined under the 1940 Act. The business address of each Trustee and officer is Two International Place, Boston, Massachusetts 02110. As used below, “EVC” refers to Eaton Vance Corp., “EV” refers to Eaton Vance, Inc., “EVM” refers to Eaton Vance Management, “BMR” refers to Boston Management and Research, “EVMI” refers to Eaton Vance Management (International) Limited and “EVD” refers to Eaton Vance Distributors, Inc. EVC and EV are the corporate parent and trustee, respectively, of EVM and BMR. EVMI is an indirect, wholly-owned subsidiary of EVC. EVD is the Fund’s principal underwriter, the Portfolio’s placement agent and a wholly-owned subsidiary of EVC. Each officer affiliated with Eaton Vance may hold a position with other Eaton Vance affiliates that is comparable to his or her position with EVM listed below. Each Trustee oversees 177 portfolios in the Eaton Vance Complex (including all master and feeder funds in a master feeder structure). Each officer serves as an officer of certain other Eaton Vance funds. Each Trustee and officer serves until his or her successor is elected.
| | | | | | |
| Name and Year of Birth | | Position(s) with the Trust and the Portfolio | | Trustee Since(1) | | Principal Occupation(s) and Directorships During Past Five Years and Other Relevant Experience |
Interested Trustee |
| | | |
Thomas E. Faust Jr. 1958 | | Trustee | | 2007 | | Chairman, Chief Executive Officer and President of EVC, Director and President of EV, Chief Executive Officer and President of EVM and BMR, and Director of EVD and EVMI. Trustee and/or officer of 177 registered investment companies. Mr. Faust is an interested person because of his positions with EVM, BMR, EVD, EVMI, EVC and EV, which are affiliates of the Trust and the Portfolio. Directorships in the Last Five Years.(2) Director of EVC and Hexavest Inc. (investment management firm). |
| | | |
| | | | | | |
Noninterested Trustees |
| | | |
Scott E. Eston 1956 | | Trustee | | 2011 | | Private investor. Formerly held various positions at Grantham, Mayo, Van Otterloo and Co., LLC (investment management firm) (1997-2009), including Chief Operating Officer (2002-2009), Chief Financial Officer (1997-2009) and Chairman of the Executive Committee (2002-2008); President and Principal Executive Officer, GMO Trust (open-end registered investment company) (2006-2009). Former Partner, Coopers and Lybrand LLP (now PricewaterhouseCoopers) (a registered public accounting firm) (1987-1997). Mr. Eston has apprised the Board of Trustees that he intends to retire as a Trustee of all Eaton Vance funds effective September 30, 2017. Directorships in the Last Five Years.(2) None. |
| | | |
Mark R. Fetting(3) 1954 | | Trustee | | 2016 | | Private investor. Formerly held various positions at Legg Mason, Inc. (investment management firm) (2000-2012), including President, Chief Executive Officer, Director and Chairman (2008-2012), Senior Executive Vice President (2004-2008) and Executive Vice President (2001-2004). Formerly, President of Legg Mason family of funds (2001-2008). Formerly, Division President and Senior Officer of Prudential Financial Group, Inc. and related companies (investment management firm) (1991-2000). Directorships in the Last Five Years. Formerly, Director and Chairman of Legg Mason, Inc. (2008-2012); Director/Trustee and Chairman of Legg Mason family of funds (14 funds) (2008-2012); and Director/Trustee of the Royce family of funds (35 funds) (2001-2012). |
| | | |
Cynthia E. Frost 1961 | | Trustee | | 2014 | | Private investor. Formerly, Chief Investment Officer of Brown University (university endowment) (2000-2012); Portfolio Strategist for Duke Management Company (university endowment manager) (1995-2000); Managing Director, Cambridge Associates (investment consulting company) (1989-1995); Consultant, Bain and Company (management consulting firm) (1987-1989); Senior Equity Analyst, BA Investment Management Company (1983-1985). Directorships in the Last Five Years. None. |
| | | |
George J. Gorman 1952 | | Trustee | | 2014 | | Principal at George J. Gorman LLC (consulting firm). Formerly, Senior Partner at Ernst & Young LLP (a registered public accounting firm) (1974-2009). Directorships in the Last Five Years. Formerly, Trustee of the BofA Funds Series Trust (11 funds) (2011-2014) and of the Ashmore Funds (9 funds) (2010-2014). |
Eaton Vance
Stock NextShares
December 31, 2016
Management and Organization — continued
| | | | | | |
| Name and Year of Birth | | Position(s) with the Trust and the Portfolio | | Trustee Since(1) | | Principal Occupation(s) and Directorships During Past Five Years and Other Relevant Experience |
Noninterested Trustees (continued) |
| | | |
Valerie A. Mosley 1960 | | Trustee | | 2014 | | Chairwoman and Chief Executive Officer of Valmo Ventures (a consulting and investment firm). Former Partner and Senior Vice President, Portfolio Manager and Investment Strategist at Wellington Management Company, LLP (investment management firm) (1992-2012). Former Chief Investment Officer, PG Corbin Asset Management (1990-1992). Formerly worked in institutional corporate bond sales at Kidder Peabody (1986-1990). Directorships in the Last Five Years.(2) Director of Dynex Capital, Inc. (mortgage REIT) (since 2013). |
| | | |
William H. Park 1947 | | Chairperson of the Board and Trustee | | 2016 (Chairperson) 2003 (Trustee) | | Private investor. Formerly, Consultant (management and transactional) (2012-2014). Formerly, Chief Financial Officer, Aveon Group L.P. (investment management firm) (2010-2011). Formerly, Vice Chairman, Commercial Industrial Finance Corp. (specialty finance company) (2006-2010). Formerly, President and Chief Executive Officer, Prizm Capital Management, LLC (investment management firm) (2002-2005). Formerly, Executive Vice President and Chief Financial Officer, United Asset Management Corporation (investment management firm) (1982-2001). Formerly, Senior Manager, Price Waterhouse (now PricewaterhouseCoopers) (a registered public accounting firm) (1972-1981). Directorships in the Last Five Years.(2) None. |
| | | |
Helen Frame Peters 1948 | | Trustee | | 2008 | | Professor of Finance, Carroll School of Management, Boston College. Formerly, Dean, Carroll School of Management, Boston College (2000-2002). Formerly, Chief Investment Officer, Fixed Income, Scudder Kemper Investments (investment management firm) (1998-1999). Formerly, Chief Investment Officer, Equity and Fixed Income, Colonial Management Associates (investment management firm) (1991-1998). Directorships in the Last Five Years.(2) Formerly, Director of BJ’s Wholesale Club, Inc. (wholesale club retailer) (2004-2011). Formerly, Trustee of SPDR Index Shares Funds and SPDR Series Trust (exchange traded funds) (2000-2009). Formerly, Director of Federal Home Loan Bank of Boston (a bank for banks) (2007-2009). |
| | | |
Susan J. Sutherland 1957 | | Trustee | | 2015 | | Private investor. Formerly, Associate, Counsel and Partner at Skadden, Arps, Slate, Meagher & Flom LLP (law firm) (1982-2013). Directorships in the Last Five Years. Formerly, Director of Montpelier Re Holdings Ltd. (global provider of customized insurance and reinsurance products) (2013-2015). |
| | | |
Harriett Tee Taggart 1948 | | Trustee | | 2011 | | Managing Director, Taggart Associates (a professional practice firm). Formerly, Partner and Senior Vice President, Wellington Management Company, LLP (investment management firm) (1983-2006). Directorships in the Last Five Years.(2) Director of Albemarle Corporation (chemicals manufacturer) (since 2007) and The Hanover Group (specialty property and casualty insurance company) (since 2009). Formerly, Director of Lubrizol Corporation (specialty chemicals) (2007-2011). |
| | | |
Ralph F. Verni 1943 | | Trustee | | 2005 | | Consultant and private investor. Formerly, Chief Investment Officer (1982-1992), Chief Financial Officer (1988-1990) and Director (1982-1992), New England Life. Formerly, Chairperson, New England Mutual Funds (1982-1992). Formerly, President and Chief Executive Officer, State Street Management & Research (1992-2000). Formerly, Chairperson, State Street Research Mutual Funds (1992-2000). Formerly, Director, W.P. Carey, LLC (1998-2004) and First Pioneer Farm Credit Corp. (financial services cooperative) (2002-2006). Consistent with the Trustee retirement policy, Mr. Verni is currently expected to retire as a Trustee of all Eaton Vance funds effective July 1, 2017. Directorships in the Last Five Years.(2) None. |
| | | |
Scott E. Wennerholm(3) 1959 | | Trustee | | 2016 | | Consultant at GF Parish Group (executive recruiting firm). Trustee at Wheelock College (postsecondary institution) (since 2012). Formerly, Chief Operating Officer and Executive Vice President at BNY Mellon Asset Management (investment management firm) (2005-2011). Formerly, Chief Operating Officer and Chief Financial Officer at Natixis Global Asset Management (investment management firm) (1997-2004). Formerly, Vice President at Fidelity Investments Institutional Services (investment management firm) (1994-1997). Directorships in the Last Five Years. None. |
Eaton Vance
Stock NextShares
December 31, 2016
Management and Organization — continued
| | | | | | |
| Name and Year of Birth | | Position(s) with the Trust and the Portfolio | | Officer
Since(4) | | Principal Occupation(s) During Past Five Years |
Principal Officers who are not Trustees |
| | | |
Edward J. Perkin 1972 | | President | | 2014 | | Vice President and Chief Equity Investment Officer of EVM and BMR. Prior to joining EVM in 2014, Mr. Perkin was Chief Investment Officer, International and Emerging Markets Equity, and Managing Director, Portfolio Manager, Europe, EAFE and Global, at Goldman Sachs Asset Management. |
| | | |
Maureen A. Gemma 1960 | | Vice President, Secretary and Chief Legal Officer | | 2005 | | Vice President of EVM and BMR. Also Vice President of Calvert Research and Management (“CRM”). |
| | | |
James F. Kirchner 1967 | | Treasurer | | 2007 | | Vice President of EVM and BMR. Also Vice President of CRM. |
| | | |
Paul M. O’Neil 1953 | | Chief Compliance Officer | | 2004 | | Vice President of EVM and BMR. |
| (1) | Year first appointed to serve as Trustee for a fund in the Eaton Vance family of funds. Each Trustee has served continuously since appointment unless indicated otherwise. |
| (2) | During their respective tenures, the Trustees (except for Mmes. Frost and Sutherland and Messrs. Fetting, Gorman and Wennerholm) also served as Board members of one or more of the following funds (which operated in the years noted): eUnitsTM 2 Year U.S. Market Participation Trust: Upside to Cap / Buffered Downside (launched in 2012 and terminated in 2014); eUnitsTM 2 Year U.S. Market Participation Trust II: Upside to Cap / Buffered Downside (launched in 2012 and terminated in 2014); and Eaton Vance National Municipal Income Trust (launched in 1998 and terminated in 2009). However, Ms. Mosley did not serve as a Board member of eUnitsTM 2 Year U.S. Market Participation Trust: Upside to Cap / Buffered Downside (launched in 2012 and terminated in 2014). |
| (3) | Messrs. Fetting and Wennerholm began serving as Trustees effective September 1, 2016. |
| (4) | Year first elected to serve as officer of a fund in the Eaton Vance family of funds when the officer has served continuously. Otherwise, year of most recent election as an officer of a fund in the Eaton Vance family of funds. Titles may have changed since initial election. |
The SAI for the Fund includes additional information about the Trustees and officers of the Fund and the Portfolio and can be obtained without charge on Eaton Vance’s website at www.eatonvance.com or by calling 1-800-262-1122.
Eaton Vance Funds
IMPORTANT NOTICES
Privacy. The Eaton Vance organization is committed to ensuring your financial privacy. Each of the financial institutions identified below has in effect the following policy (“Privacy Policy”) with respect to nonpublic personal information about its customers:
| • | | Only such information received from you, through application forms or otherwise, and information about your Eaton Vance fund transactions will be collected. This may include information such as name, address, social security number, tax status, account balances and transactions. |
| • | | None of such information about you (or former customers) will be disclosed to anyone, except as permitted by law (which includes disclosure to employees necessary to service your account). In the normal course of servicing a customer’s account, Eaton Vance may share information with unaffiliated third parties that perform various required services such as transfer agents, custodians and broker-dealers. |
| • | | Policies and procedures (including physical, electronic and procedural safeguards) are in place that are designed to protect the confidentiality of such information. |
| • | | We reserve the right to change our Privacy Policy at any time upon proper notification to you. Customers may want to review our Privacy Policy periodically for changes by accessing the link on our homepage: www.eatonvance.com. |
Our pledge of privacy applies to the following entities within the Eaton Vance organization: the Eaton Vance Family of Funds, Eaton Vance Management, Eaton Vance Investment Counsel, Eaton Vance Distributors, Inc., Eaton Vance Trust Company, Eaton Vance Management (International) Limited, Eaton Vance Management’s Real Estate Investment Group and Boston Management and Research. In addition, our Privacy Policy applies only to those Eaton Vance customers who are individuals and who have a direct relationship with us. If a customer’s account (i.e., fund shares) is held in the name of a third-party financial advisor/broker-dealer, it is likely that only such advisor’s privacy policies apply to the customer. This notice supersedes all previously issued privacy disclosures. For more information about Eaton Vance’s Privacy Policy, please call 1-800-262-1122.
Delivery of Shareholder Documents. The Securities and Exchange Commission (SEC) permits funds to deliver only one copy of shareholder documents, including prospectuses, proxy statements and shareholder reports, to fund investors with multiple accounts at the same residential or post office box address. This practice is often called “householding” and it helps eliminate duplicate mailings to shareholders. Your financial advisor may household the mailing of your documents indefinitely unless you instruct your financial advisor otherwise. If you would prefer that your Eaton Vance documents not be householded, please contact your financial advisor. Your instructions that householding not apply to delivery of your Eaton Vance documents will typically be effective within 30 days of receipt by your financial advisor.
Portfolio Holdings. Each Eaton Vance Fund and its underlying Portfolio(s) (if applicable) will file a schedule of portfolio holdings on Form N-Q with the SEC for the first and third quarters of each fiscal year. The Form N-Q will be available on the Eaton Vance website at www.eatonvance.com, by calling Eaton Vance at 1-800-262-1122 or in the EDGAR database on the SEC’s website at www.sec.gov. Form N-Q may also be reviewed and copied at the SEC’s public reference room in Washington, D.C. (call 1-800-732-0330 for information on the operation of the public reference room).
Proxy Voting. From time to time, funds are required to vote proxies related to the securities held by the funds. The Eaton Vance Funds or their underlying Portfolios (if applicable) vote proxies according to a set of policies and procedures approved by the Funds’ and Portfolios’ Boards. You may obtain a description of these policies and procedures and information on how the Funds or Portfolios voted proxies relating to portfolio securities during the most recent 12-month period ended June 30, without charge, upon request, by calling 1-800-262-1122 and by accessing the SEC’s website at www.sec.gov.
This Page Intentionally Left Blank
Investment Adviser of Stock Portfolio
Boston Management and Research
Two International Place
Boston, MA 02110
Investment Adviser and Administrator of Eaton Vance Stock NextShares
Eaton Vance Management
Two International Place
Boston, MA 02110
Distributor*
Foreside Fund Services, LLC
Three Canal Plaza, Suite 100
Portland, ME 04101
Custodian
State Street Bank and Trust Company
State Street Financial Center, One Lincoln Street
Boston, MA 02111
Transfer and Dividend Disbursing Agent
State Street Bank and Trust Company
State Street Financial Center, One Lincoln Street
Boston, MA 02111
Independent Registered Public Accounting Firm
Deloitte & Touche LLP
200 Berkeley Street
Boston, MA 02116-5022
Fund Offices
Two International Place
Boston, MA 02110
| * | FINRA BrokerCheck. Investors may check the background of their Investment Professional by contacting the Financial Industry Regulatory Authority (FINRA). FINRA BrokerCheck is a free tool to help investors check the professional background of current and former FINRA-registered securities firms and brokers. FINRA BrokerCheck is available by calling 1-800-289-9999 and at www.FINRA.org. The FINRA BrokerCheck brochure describing this program is available to investors at www.FINRA.org. |
23212 12.31.16
Item 2. Code of Ethics
The registrant has adopted a code of ethics applicable to its Principal Executive Officer, Principal Financial Officer and Principal Accounting Officer. The registrant undertakes to provide a copy of such code of ethics to any person upon request, without charge, by calling 1-800-262-1122. The registrant has amended the code of ethics as described in Form N-CSR during the period covered by this report to make clarifying changes consistent with Rule 21F-17 of the Securities Exchange Act of 1934, as amended . The registrant has not granted any waiver, including an implicit waiver, from a provision of the code of ethics as described in Form N-CSR during the period covered by this report.
Item 3. Audit Committee Financial Expert
The registrant’s Board has designated William H. Park, an independent trustee, as its audit committee financial expert. Mr. Park is a certified public accountant who is a private investor. Previously, he served as a consultant, as the Chief Financial Officer of Aveon Group, L.P. (an investment management firm), as the Vice
Chairman of Commercial Industrial Finance Corp. (specialty finance company), as President and Chief Executive Officer of Prizm Capital Management, LLC (investment management firm), as Executive Vice President and Chief Financial Officer of United Asset Management Corporation (an institutional investment management firm) and as a Senior Manager at Price Waterhouse (now PricewaterhouseCoopers) (an independent registered public accounting firm).
Item 4. Principal Accountant Fees and Services
Eaton Vance Stock NextShares (the “Fund”) is a series of Eaton Vance NextShares Trust (the “Trust”), a Massachusetts business trust, which, including the fund, contains a total of 2 series (the “Series”). The Trust is registered under the Investment Company Act of 1940 as an open-end management investment company. This Form N-CSR relates to the Fund’s annual report.
Rule 2-01(c)(1)(ii)(A) of Regulation S-X (the “Loan Rule”) prohibits an accounting firm, such as the Trust’s principal accountant, Deloitte & Touche LLP (“D&T”), from having certain financial relationships with their audit clients and affiliated entities. Specifically, the Loan Rule provides, in relevant part, that an accounting firm generally would not be independent if it receives a loan from a lender that is a “record or beneficial owner of more than ten percent of the audit client’s equity securities.” Based on information provided to the Audit Committee of the Board of Trustees (the “Audit Committee”) of the Eaton Vance family of funds by D&T, certain relationships between D&T and its affiliates (“Deloitte Entities”) and its lenders who are record owners of shares of one or more funds within the Eaton Vance family of funds (the “Funds”) implicate the Loan Rule, calling into question D&T’s independence with respect to the Funds. The Funds are providing this disclosure to explain the facts and circumstances as well as D&T’s conclusions concerning D&T’s objectivity and impartiality with respect to the audits of the Funds.
D&T advised the Audit Committee of its conclusion that, in light of the facts surrounding its lending relationships, D&T’s objectivity and impartiality in the planning and conduct of the audits of the Funds financial statements will not be compromised, D&T is in a position to continue as the auditor for the Funds and no actions need to be taken with respect to previously issued reports by D&T. D&T has advised the Audit Committee that these conclusions were based in part on the following considerations: (1) Deloitte Entity personnel responsible for managing the lending relationships have had no interactions with the audit engagement team; (2) the lending relationships are in good standing and the principal and interest payments are up-to-date; (3) the lending relationships are not significant to the Deloitte Entities or to D&T.
On June 20, 2016, the U.S. Securities and Exchange Commission (the “SEC”) issued no-action relief to another mutual fund complex (see Fidelity Management & Research Company et al., No-Action Letter (June 20, 2016) (the “No-Action Letter”)) related to the auditor independence issue described above. In the No-Action Letter, the SEC indicated that it would not recommend enforcement action against the fund group if the auditor is not in compliance with the Loan Rule provided that: (1) the auditor has complied with PCAOB Rule 3526(b)(1) and 3526(b)(2); (2) the auditor’s non-compliance under the Loan Rule is with respect to certain lending relationships; and (3) notwithstanding such non-compliance, the auditor has concluded that it is objective and impartial with respect to the issues encompassed within its engagement as auditor of the funds. Based on information provided by D&T, the requirements of the No-Action Letter appear to be met with respect to D&T’s lending relationships described above. After giving consideration to the guidance provided in the No-Action Letter, D&T affirmed to the Audit Committee that D&T is an independent accountant with respect to the Funds within the meaning of the rules and standards of the PCAOB and the securities laws and regulations administered by the SEC. The SEC has indicated that the no-action relief will expire 18 months from its issuance.
(a)-(d)
The following table presents the aggregate fees billed to the Fund for the Fund’s fiscal year ended December 31, 2016 (initial fiscal period from the commencement of operations on February 25, 2016 to December 31, 2016) by D&T for professional services rendered for the audit of the Fund’s annual financial statements and fees billed for other services rendered by D&T during such periods.
Eaton Vance Stock NextShares
| | | | |
Fiscal Period Ended* | | 12/31/16 | |
Audit Fees | | $ | 12,000 | |
Audit-Related Fees(1) | | $ | 0 | |
Tax Fees(2) | | $ | 8,314 | |
All Other Fees(3) | | $ | 0 | |
| | | | |
Total | | $ | 20,314 | |
| | | | |
| * | Fund commenced operations on February 25, 2016. |
| (1) | Audit-related fees consist of the aggregate fees billed for assurance and related services that are reasonably related to the performance of the audit of the registrant’s financial statements and are not reported under the category of audit fees. |
| (2) | Tax fees consist of the aggregate fees billed for professional services rendered by the principal accountant relating to tax compliance, tax advice, and tax planning and specifically include fees for tax return preparation and other related tax compliance/planning matters. |
| (3) | All other fees consist of the aggregate fees billed for products and services provided by the principal accountant other than audit, audit-related, and tax services. |
The various Series comprising the Trust have differing fiscal year ends (October 31 or December 31). The following table presents the aggregate audit, audit-related, tax, and other fees billed to all of the Series in the Trust by D&T for the last two fiscal years of each Series.
| | | | | | | | |
Fiscal Years Ended* | | 10/31/16(1) | | | 12/31/16(2) | |
Audit Fees | | $ | 14,000 | | | $ | 12,000 | |
Audit-Related Fees(1) | | $ | 0 | | | $ | 0 | |
Tax Fees(2) | | $ | 10,000 | | | $ | 8,314 | |
All Other Fees(3) | | $ | 0 | | | $ | 0 | |
| | | | | | | | |
Total | | $ | 24,000 | | | $ | 20,314 | |
| | | | | | | | |
| * | Information is not presented for fiscal years ended 10/31/15 or 12/31/15, as no Series in the Trust with such fiscal year ends was in operation during such periods. |
| (1) | This Series of the Trust commenced operations on March 30, 2016. |
| (2) | Registrant commenced operations on February 25, 2016. |
(e)(1) The registrant’s audit committee has adopted policies and procedures relating to the pre-approval of services provided by the registrant’s principal accountant (the “Pre-Approval Policies”). The Pre-Approval Policies establish a framework intended to assist the audit committee in the proper discharge of its pre-approval responsibilities. As a general matter, the Pre-Approval Policies (i) specify certain types of audit, audit-related, tax, and other services determined to be pre-approved by the audit committee; and (ii) delineate specific
procedures governing the mechanics of the pre-approval process, including the approval and monitoring of audit and non-audit service fees. Unless a service is specifically pre-approved under the Pre-Approval Policies, it must be separately pre-approved by the audit committee.
The Pre-Approval Policies and the types of audit and non-audit services pre-approved therein must be reviewed and ratified by the registrant’s audit committee at least annually. The registrant’s audit committee maintains full responsibility for the appointment, compensation, and oversight of the work of the registrant’s principal accountant.
(e)(2) No services described in paragraphs (b)-(d) above were approved by the registrant’s audit committee pursuant to the “de minimis exception” set forth in Rule 2-01 (c)(7)(i)(C) of Regulation S-X.
(f) Not applicable.
(g) The following table presents (i) the aggregate non-audit fees (i.e., fees for audit-related, tax, and other services) billed to the Fund (the only series of the Trust) by D&T for the last two fiscal years of the Fund; and (ii) the aggregate non-audit fees (i.e., fees for audit-related, tax, and other services) billed to the Eaton Vance organization by D&T for the last two fiscal years of each Series.
| | | | | | | | |
Fiscal Years Ended* | | 10/31/16 | | | 12/31/16 | |
Registrant(1) | | $ | 10,000 | | | $ | 8,314 | |
Eaton Vance(2) | | $ | 56,434 | | | $ | 46,000 | |
| * | Information is not presented for fiscal years ended 10/31/15 or 12/31/15, as no Series in the Trust with such fiscal year ends was in operation during such periods. Registrant commenced operations on February 25, 2016. |
| (1) | Includes all of the Series of the Trust. During the fiscal years reported above, certain of the Funds were “feeder” funds in a “master-feeder” fund structure or funds of funds. |
| (2) | Various subsidiaries of Eaton Vance Corp. act in either an investment advisory and/or service provider capacity with respect to the Series and/or their respective “master” funds (if applicable). |
(h) The registrant’s audit committee has considered whether the provision by the registrant’s principal accountant of non-audit services to the registrant’s investment adviser and any entity controlling, controlled by, or under common control with the adviser that provides ongoing services to the registrant that were not pre-approved pursuant to Rule 2-01(c)(7)(ii) of Regulation S-X is compatible with maintaining the principal accountant’s independence.
Item 5. Audit Committee of Listed Registrants
Not applicable.
Item 6. Schedule of Investments
Please see schedule of investments contained in the Report to Stockholders included under Item 1 of this Form N-CSR.
Item 7. Disclosure of Proxy Voting Policies and Procedures for Closed-End Management Investment Companies
Not applicable.
Item 8. Portfolio Managers of Closed-End Management Investment Companies
Not applicable.
Item 9. Purchases of Equity Securities by Closed-End Management Investment Company and Affiliated Purchasers
Not applicable.
Item 10. Submission of Matters to a Vote of Security Holders
No material changes.
Item 11. Controls and Procedures
(a) It is the conclusion of the registrant’s principal executive officer and principal financial officer that the effectiveness of the registrant’s current disclosure controls and procedures (such disclosure controls and procedures having been evaluated within 90 days of the date of this filing) provide reasonable assurance that the information required to be disclosed by the registrant has been recorded, processed, summarized and reported within the time period specified in the Commission’s rules and forms and that the information required to be disclosed by the registrant has been accumulated and communicated to the registrant’s principal executive officer and principal financial officer in order to allow timely decisions regarding required disclosure.
(b) There have been no changes in the registrant’s internal controls over financial reporting during the second fiscal quarter of the period covered by this report that has materially affected, or is reasonably likely to materially affect, the registrant’s internal control over financial reporting.
Item 12. Exhibits
| | |
| |
| (a)(1) | | Registrant’s Code of Ethics – Not applicable (please see Item 2). |
| |
| (a)(2)(i) | | Treasurer’s Section 302 certification. |
| |
| (a)(2)(ii) | | President’s Section 302 certification. |
| |
| (b) | | Combined Section 906 certification. |
Signatures
Pursuant to the requirements of the Securities Exchange Act of 1934 and the Investment Company Act of 1940, the registrant has duly caused this report to be signed on its behalf by the undersigned, thereunto duly authorized.
Eaton Vance NextShares Trust
| | |
| By: | | /s/ Edward J. Perkin |
| | Edward J. Perkin |
| | President |
| |
| Date: | | February 27, 2017 |
Pursuant to the requirements of the Securities Exchange Act of 1934 and the Investment Company Act of 1940, this report has been signed below by the following persons on behalf of the registrant and in the capacities and on the dates indicated.
| | |
| By: | | /s/ James F. Kirchner |
| | James F. Kirchner |
| | Treasurer |
| |
| Date: | | February 27, 2017 |
| | |
| By: | | /s/ Edward J. Perkin |
| | Edward J. Perkin |
| | President |
| |
| Date: | | February 27, 2017 |