UNITED STATES
SECURITIES AND EXCHANGE COMMISSION
Washington, D.C. 20549
Form N-CSR
CERTIFIED SHAREHOLDER REPORT OF REGISTERED
MANAGEMENT INVESTMENT COMPANIES
Investment Company Act File Number: 811-22982
Eaton Vance NextShares Trust
(Exact Name of Registrant as Specified in Charter)
Two International Place, Boston, Massachusetts 02110
(Address of Principal Executive Offices)
Maureen A. Gemma
Two International Place, Boston, Massachusetts 02110
(Name and Address of Agent for Services)
(617) 482-8260
(Registrant’s Telephone Number)
October 31
Date of Fiscal Year End
October 31, 2017
Date of Reporting Period
Item 1. Reports to Stockholders

Eaton Vance
Global Income Builder NextShares (EVGBC)
Listing Exchange: The NASDAQ Stock Market LLC
Annual Report
October 31, 2017

NextSharesTM is a trademark of NextShares Solutions LLC. Used with permission.

Commodity Futures Trading Commission Registration. Effective December 31, 2012, the Commodity Futures Trading Commission (“CFTC”) adopted certain regulatory changes that subject registered investment companies and advisers to regulation by the CFTC if a fund invests more than a prescribed level of its assets in certain CFTC-regulated instruments (including futures, certain options and swap agreements) or markets itself as providing investment exposure to such instruments. The Fund has claimed an exclusion from the definition of the term “commodity pool operator” under the Commodity Exchange Act. Accordingly, neither the Fund nor the adviser with respect to the operation of the Fund is subject to CFTC regulation. Because of its management of other strategies, the Fund’s adviser is registered with the CFTC as a commodity pool operator and a commodity trading advisor.
Fund shares are not insured by the FDIC and are not deposits or other obligations of, or guaranteed by, any depository institution. Shares are subject to investment risks, including possible loss of principal invested.
This report must be preceded or accompanied by a current summary prospectus or prospectus. Before investing in NextShares, investors should consider carefully the investment objectives, risks, charges and expenses. This and other important information is contained in the prospectus and summary prospectus, which can be obtained from a financial advisor. Prospective investors should read the prospectus carefully before investing. For further information, please call 1-800-262-1122.
Annual Report October 31, 2017
Eaton Vance
Global Income Builder NextShares
Table of Contents
| | | | |
Management’s Discussion of Fund Performance | | | 2 | |
| |
Performance | | | 3 | |
| |
Fund Profile | | | 4 | |
| |
Endnotes and Additional Disclosures | | | 5 | |
| |
Fund Expenses | | | 6 | |
| |
Financial Statements | | | 7 | |
| |
Report of Independent Registered Public Accounting Firm | | | 14 and 39 | |
| |
Federal Tax Information | | | 15 | |
| |
Management and Organization | | | 40 | |
| |
Important Notices | | | 43 | |
Eaton Vance
Global Income Builder NextShares
October 31, 2017
Management’s Discussion of Fund Performance1
Economic and Market Conditions
Non-U.S. stocks delivered strong returns in the 12-month period ended October 31, 2017, behind an extended rally that began with Donald Trump’s victory in the U.S. presidential election.
U.S. stocks moved sharply higher following President Trump’s election on November 8, 2016. While its effect was broad-based, the rally particularly favored financial stocks, which received another boost in mid-December when the U.S. Federal Reserve (the Fed) raised its benchmark interest rate amid continued economic growth. After a brief pullback in the final weeks of 2016, U.S. equities resumed their advance early in the new year. Stocks slipped in March 2017, following the failure of President Trump’s health care bill in Congress. However, U.S. stocks quickly regained their upward momentum, advancing steadily despite two more Fed rate hikes in March 2017 and June 2017.
Non-U.S. stocks retreated in August 2017 amid mounting tensions with North Korea. Stocks soon rebounded, with major worldwide indexes reaching record highs in the final two months of the period ended October 31, 2017.
Positive economic indicators across a broad geographic range benefited non-U.S. stocks, similar to U.S. stocks. National elections in France, Britain and Germany set a new political course for Europe, helping to boost equity markets across Europe. In the Asia-Pacific region, key equity indexes also rose during the period despite tensions with North Korea. In the three months ended September 30, 2017, China’s stock market recorded its best quarterly performance in two years. China’s strong economic growth also helped many emerging market stocks achieve solid gains in the period.
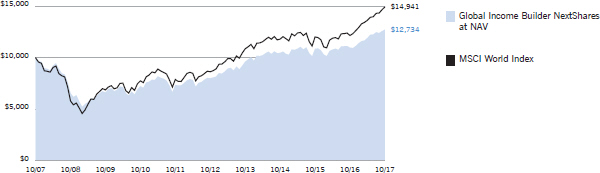
For the 12-month period ended October 31, 2017, the MSCI World Index,2 a proxy for global equities, advanced 22.77% while reaching multiple all-time highs. The MSCI EAFE Index of developed-market international equities rose 23.44%, while the MSCI Emerging Markets Index returned 26.45%. In the U.S., the blue-chip Dow Jones Industrial Average soared 32.07%, while the broader U.S. equity market, as represented by the S&P 500 Index, gained 23.63%.
Fund Performance
For the 12-month period ended October 31, 2017, Eaton Vance Global Income Builder NextShares (the Fund) had a total return of 15.89% at net asset value (NAV), underperforming the 22.77% return of the Fund’s primary benchmark, the MSCI World Index (the Index), and the 18.30% return of its Blended Index consisting of 65% the Index and 35% ICE BofAML Developed Markets High Yield Ex-Subordinated Financial Index.
The Fund’s common stock allocation underperformed the Index during the period. Stock selection in the health care and consumer discretionary sectors and an underweight, relative to the Index, in the information technology sector detracted from performance versus the Index. Within the health care sector, the Fund’s overweight position in biopharmaceutical firm Shire PLC declined in value on concerns about the ongoing market value of its hemophilia treatments, downgrades to earnings estimates, and the sudden departure of its chief financial officer.
In contrast, stock selection and an underweight, relative to the Index, in the consumer staples, utilities and telecommunication services sectors aided Fund performance versus the Index. In the consumer staples sector, relative performance was helped by underweighting the food & staples retailing industry and not owning two Index components in that industry: drug store operators CVS Health Corp. and Walgreens Boots Alliance. Both stocks declined on uncertainty in the U.S. about the status of the Affordable Care Act, and potential negative effects on prescription drug distributors and retailers.
The Fund’s allocation to high yield securities outperformed the broad high yield market, as measured by the ICE BofAML Developed Markets High Yield Ex-Subordinated Financial Index, but underperformed the Fund’s primary Index for the 12-month period. The outperformance of the high yield allocation versus the broad high yield market was driven mainly by security selection, particularly in non-U.S. issues, and overweights in B-rated9 securities and European securities versus the ICE BofAML Developed Markets High Yield Ex-Subordinated Financial Index. As of period end, the Fund had 29.45% of its total investments in high yield securities (income instruments rated below investment grade).
For the 12-month period, the Fund’s preferred securities allocation (i.e., preferred stocks and corporate bonds and notes with preferred characteristics) detracted from Fund performance versus the Index. The preferred securities allocation underperformed the Index, but outperformed the overall preferred market, as measured by the ICE BofAML Fixed Rate Preferred Securities Index (ICE BofAML Preferred Index). That outperformance versus the ICE BofAML Preferred Index was driven by an allocation to lower-quality securities that were not held by the ICE BofAML Preferred Index, greater exposure to non-U.S. issuers than the ICE BofAML Preferred Index, and exposure to several securities with floating rates that were not held by the ICE BofAML Preferred Index.
See Endnotes and Additional Disclosures in this report.
Past performance is no guarantee of future results. Investment return and principal value will fluctuate so that shares, when sold, may be worth more or less than their original cost. Performance is for the stated time period only; due to market volatility, the Fund current performance may be lower or higher than indicated. The Fund performance at market price will differ from its results at net asset value (NAV). The market price used to calculate the Market Price return is the midpoint between the highest bid and the lowest offer on the exchange on which the shares of the Fund are listed for trading, as of the time that the Fund’s NAV is calculated. If you trade your shares at another time during the day, your return may differ. Returns are historical and are calculated by determining the percentage change in NAV or market price (as applicable) with all distributions reinvested at NAV or closing market price (as applicable) on the payment date of the distribution, and are net of management fees and other expenses. Returns are before taxes unless otherwise noted. Performance less than or equal to one year is cumulative. For performance as of the most recent month-end, including historical trading premiums/discounts relative to NAV, please refer to eatonvance.com
Eaton Vance
Global Income Builder NextShares
October 31, 2017
Performance2,3,4
Portfolio Managers Christopher M. Dyer, CFA and Jeffrey D. Mueller, of Eaton Vance Advisers International Ltd.; Michael A. Allison, CFA and John H. Croft, CFA, of Boston Management and Research
| | | | | | | | | | | | | | | | | | | | | | | | |
| % Average Annual Total Returns | | Fund Inception Date | | | Performance Inception Date | | | One Year | | | Five Years | | | Ten Years | | | Since
Fund
Inception | |
Fund at NAV | | | 03/30/2016 | | | | 11/30/2005 | | | | 15.89 | % | | | 9.70 | % | | | 2.45 | % | | | 11.71 | % |
Fund at Market Price | | | 03/30/2016 | | | | 03/30/2016 | | | | — | | | | 15.83 | | | | — | | | | 5.07 | |
MSCI World Index | | | — | | | | — | | | | 22.77 | % | | | 11.55 | % | | | 4.09 | % | | | 16.33 | % |
Blended Index | | | — | | | | — | | | | 18.30 | | | | 9.57 | | | | 5.28 | | | | 15.18 | |
| | | | | | |
| | | | | | | | | | | | | | | | | | | | | | | | |
| % Total Annual Operating Expense Ratios5 | | | | | | | | | | | | | | | | | | |
Gross | | | | | | | | | | | | | | | | | | | | | | | 2.99 | % |
Net | | | | | | | | | | | | | | | | | | | | | | | 0.91 | |
Growth of $10,0004
This graph shows the change in value of a hypothetical investment of $10,000 in Global Income Builder NextShares for the period indicated. For comparison, the same investment is shown in the indicated index.
See Endnotes and Additional Disclosures in this report.
Past performance is no guarantee of future results. Investment return and principal value will fluctuate so that shares, when sold, may be worth more or less than their original cost. Performance is for the stated time period only; due to market volatility, the Fund current performance may be lower or higher than indicated. The Fund performance at market price will differ from its results at net asset value (NAV). The market price used to calculate the Market Price return is the midpoint between the highest bid and the lowest offer on the exchange on which the shares of the Fund are listed for trading, as of the time that the Fund’s NAV is calculated. If you trade your shares at another time during the day, your return may differ. Returns are historical and are calculated by determining the percentage change in NAV or market price (as applicable) with all distributions reinvested at NAV or closing market price (as applicable) on the payment date of the distribution, and are net of management fees and other expenses. Returns are before taxes unless otherwise noted. Performance less than or equal to one year is cumulative. For performance as of the most recent month-end, including historical trading premiums/discounts relative to NAV, please refer to eatonvance.com
Eaton Vance
Global Income Builder NextShares
October 31, 2017
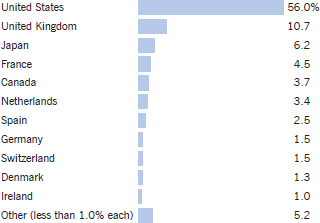
Fund Profile6
Country Allocation (% of net assets)
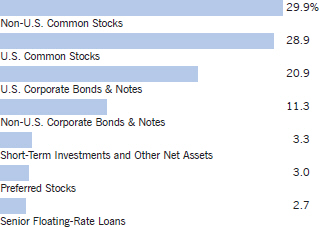
Asset Allocation (% of net assets)8
Top 10 Holdings (% of net assets)7
| | | | |
Alphabet, Inc., Class C | | | 2.1 | % |
| |
Johnson & Johnson | | | 1.6 | |
| |
Amazon.com, Inc. | | | 1.4 | |
| |
Royal Dutch Shell PLC, Class B | | | 1.2 | |
| |
ASML Holding NV | | | 1.2 | |
| |
Facebook, Inc., Class A | | | 1.2 | |
| |
Nippon Telegraph & Telephone Corp. | | | 1.2 | |
| |
Wells Fargo & Co. | | | 1.1 | |
| |
Melrose Industries PLC | | | 1.1 | |
| |
Unilever PLC | | | 1.0 | |
| |
Total | | | 13.1 | % |
See Endnotes and Additional Disclosures in this report.
Eaton Vance
Global Income Builder NextShares
October 31, 2017
Endnotes and Additional Disclosures
| 1 | The views expressed in this report are those of the portfolio manager(s) and are current only through the date stated at the top of this page. These views are subject to change at any time based upon market or other conditions, and Eaton Vance and the Fund(s) disclaim any responsibility to update such views. These views may not be relied upon as investment advice and, because investment decisions are based on many factors, may not be relied upon as an indication of trading intent on behalf of any Eaton Vance fund. This commentary may contain statements that are not historical facts, referred to as “forward looking statements”. The Fund’s actual future results may differ significantly from those stated in any forward looking statement, depending on factors such as changes in securities or financial markets or general economic conditions, the volume of sales and purchases of Fund shares, the continuation of investment advisory, administrative and service contracts, and other risks discussed from time to time in the Fund’s filings with the Securities and Exchange Commission. |
| 2 | Shares of NextShares funds are normally bought and sold in the secondary market through a broker, and may not be individually purchased or redeemed from the fund. In the secondary market, buyers and sellers transact with each other, rather than with the fund. Market trading prices of NextShares are linked to the fund’s next-computed net asset value (NAV) and will vary from NAV by a market-determined premium or discount, which may be zero. Buyers and sellers of NextShares will not know the value of their purchases and sales until after the fund’s NAV is determined at the end of the trading day. Market trading prices may vary significantly from anticipated levels. NextShares do not offer investors the opportunity to buy and sell intraday based on current (versus end-of-day) determinations of fund value. NextShares trade execution prices will fluctuate based on changes in NAV. Although limit orders may be used to control trading costs, they cannot be used to control or limit trade execution prices. As a new type of fund, NextShares have a limited operating history and may initially be available through a limited number of brokers. There can be no guarantee that an active trading market for NextShares will develop or be maintained, or that their listing will continue unchanged. Buying and selling NextShares may require payment of brokerage commissions and expose transacting shareholders to other trading costs. Frequent trading may detract from realized investment returns. The return on a shareholder’s NextShares investment will be reduced if the shareholder sells shares at a greater discount or narrower premium to NAV than he or she acquired the shares. NextShares funds issue and redeem shares only in specified creation unit quantities in transactions by or through authorized participants. In such transactions, a fund issues and redeems shares in exchange for the basket of securities, other instruments and/or cash that the fund specifies each business day. A fund’s basket is not intended to be representative of the fund’s current portfolio positions and may vary significantly from current positions. |
| 3 | MSCI World Index is an unmanaged index of equity securities in the developed markets. MSCI indexes are net of foreign withholding taxes. Source: MSCI. MSCI data may not be reproduced or used for any other purpose. MSCI provides no warranties, has not prepared or approved this report, and has no liability hereunder. ICE BofAML Developed Markets High Yield Ex-Subordinated Financial Index is an unmanaged index of global developed market, below investment grade corporate bonds. ICE BofAML Fixed Rate Preferred Securities Index is an unmanaged index of fixed-rate, preferred securities issued in the U.S. ICE Data Indices, LLC indices not for redistribution or other uses; provided “as is”, without warranties, and with no liability. Eaton Vance has prepared this report, ICE Data Indices, LLC does not endorse it, or guarantee, review, or endorse Eaton Vance’s products. The Blended Index consists of 65% MSCI World Index and 35% ICE BofAML Developed Markets High Yield Ex-Subordinated Financial Index. |
| | Unless otherwise stated, index returns do not reflect the effect of any applicable sales charges, commissions, expenses, taxes or leverage, as applicable. It is not possible to invest directly in an index. Performance since inception for an index, if presented, is the performance since the Fund’s or oldest share class’ inception, as applicable. |
| 4 | The Fund pursues its investment objective by investing in a separate investment fund (the Portfolio). The returns at NAV for periods before the date the Fund commenced operations are for a mutual fund that invests in the Portfolio (the Portfolio Investor). The performance during such period does not represent the performance of the Fund. The prior investment performance of the Portfolio Investor (rather than the Portfolio itself) is shown because it reflects the expenses typically borne by a retail fund investing in the Portfolio. The Portfolio Investor returns are not adjusted to reflect differences between the total net operating expenses of the Fund and the Portfolio Investor during the periods shown. If such an adjustment were made, the performance presented would be higher, because the Fund’s total net operating expenses are lower than those of the Portfolio Investor. Performance is for a share class of the Portfolio Investor offered at net asset value. Performance presented in the Financial Highlights included in the financial statements is not linked. |
| | Prior to December 7, 2015, the Portfolio Investor invested at least 80% of net assets in dividend-paying common and preferred stocks. Effective December 7, 2015, the Portfolio Investor changed its name and its principal investment strategies to invest in common stocks, preferred stocks and other hybrid securities and income instruments of U.S. and foreign issuers. As of such date, the Portfolio Investor was no longer required to invest at least 80% of its net assets in dividend-paying common and preferred stocks. |
| 5 | Source: Fund prospectus. Net expense ratio reflects a contractual expense reimbursement that continues through 2/28/18. Without the reimbursement, performance would have been lower. The expense ratios for the current reporting period can be found in the Financial Highlights section of this report. |
| 6 | Fund primarily invests in an affiliated investment company (Portfolio) with substantially the same objective(s) and policies as the Fund and may also invest directly. Unless otherwise noted, references to investments are to the aggregate holdings of the Fund and the Portfolio. |
| 7 | Excludes cash and cash equivalents. |
| 8 | Other Net Assets represents other assets less liabilities and includes any investment type that represents less than 1% of net assets. |
| 9 | Credit ratings are categorized using S&P. If S&P does not publish a rating, then the Moody’s rating is applied. Ratings, which are subject to change, apply to the creditworthiness of the issuers of the underlying securities and not to the Fund or its shares. Credit ratings measure the quality of a bond based on the issuer’s creditworthiness, with ratings ranging from AAA, being the highest, to D, being the lowest based on S&P’s measures. Ratings of BBB or higher by S&P or Baa or higher by Moody’s are considered to be investment- grade quality. Credit ratings are based largely on the ratings agency’s analysis at the time of rating. The rating assigned to any particular security is not necessarily a reflection of the issuer’s current financial condition and does not necessarily reflect its assessment of the volatility of a security’s market value or of the liquidity of an investment in the security. |
| | Fund profile subject to change due to active management. |
Important Notice to Shareholders
Effective October 23, 2017, the BofA Merrill Lynch Indices have been rebranded as Intercontinental Exchange’s (“ICE”) BofAML indices.
Eaton Vance
Global Income Builder NextShares
October 31, 2017
Fund Expenses
Example: As a Fund shareholder, you incur two types of costs: (1) transaction costs, including brokerage commissions on purchases and sales of Fund shares; and (2) ongoing costs, including management fees and other Fund expenses. This Example is intended to help you understand your ongoing costs (in dollars) of Fund investing and to compare these costs with the ongoing costs of investing in other funds. The Example is based on an investment of $1,000 invested at the beginning of the period and held for the entire period (May 1, 2017 – October 31, 2017).
Actual Expenses: The first section of the table below provides information about actual account values and actual expenses. You may use the information in this section, together with the amount you invested, to estimate the expenses that you paid over the period. Simply divide your account value by $1,000 (for example, an $8,600 account value divided by $1,000 = 8.6), then multiply the result by the number in the first section under the heading entitled “Expenses Paid During Period” to estimate the expenses you paid on your account during this period.
Hypothetical Example for Comparison Purposes: The second section of the table below provides information about hypothetical account values and hypothetical expenses based on the actual Fund expense ratio and an assumed rate of return of 5% per year (before expenses), which is not the actual Fund return. The hypothetical account values and expenses may not be used to estimate the actual ending account balance or expenses you paid for the period. You may use this information to compare the ongoing costs of investing in your Fund and other funds. To do so, compare this 5% hypothetical example with the 5% hypothetical examples that appear in the shareholder reports of the other funds.
Please note that the expenses shown in the table are meant to highlight your ongoing costs only and do not reflect any transactional costs, such as brokerage commissions on purchases and sales of Fund shares. Therefore, the second section of the table is useful in comparing ongoing costs only, and will not help you determine the relative total costs of owning different funds. In addition, if these transactional costs were included, your costs would be higher.
| | | | | | | | | | | | | | | | |
| | | Beginning
Account Value
(5/1/17) | | | Ending
Account Value
(10/31/17) | | | Expenses Paid
During Period*
(5/1/17 – 10/31/17) | | | Annualized
Expense
Ratio | |
| | | | |
| | | | | | | | | | | | | | | | |
Actual | | | | | | | | | | | | | | | | |
| | $ | 1,000.00 | | | $ | 1,067.10 | | | $ | 4.79 | ** | | | 0.92 | % |
| | | | | | | | | | | | | | | | | |
| | | | |
| | | | | | | | | | | | | | | | |
Hypothetical | | | | | | | | | | | | | | | | |
(5% return per year before expenses) | | | | | | | | | | | | | | | | |
| | $ | 1,000.00 | | | $ | 1,020.60 | | | $ | 4.69 | ** | | | 0.92 | % |
| * | Expenses are equal to the Fund’s annualized expense ratio, multiplied by the average account value over the period, multiplied by 184/365 (to reflect the one-half year period). The Example assumes that the $1,000 was invested at the net asset value per share determined at the close of business on April 30, 2017. The Example reflects the expenses of both the Fund and the Portfolio. |
| ** | Absent an allocation of certain expenses to affiliates, expenses would be higher. |
Eaton Vance
Global Income Builder NextShares
October 31, 2017
Statement of Assets and Liabilities
| | | | |
| Assets | | October 31, 2017 | |
Investment in Global Income Builder Portfolio, at value (identified cost, $6,285,563) | | $ | 6,778,245 | |
Receivable from affiliates | | | 4,894 | |
Total assets | | $ | 6,783,139 | |
| |
| Liabilities | | | | |
Payable to affiliates: | | | | |
Administration fee | | $ | 947 | |
Operations agreement fee | | | 316 | |
Trustees’ fees | | | 42 | |
Accrued expenses | | | 62,085 | |
Total liabilities | | $ | 63,390 | |
Net Assets | | $ | 6,719,749 | |
| |
| Sources of Net Assets | | | | |
Paid-in capital | | $ | 7,797,148 | |
Accumulated net realized loss from Portfolio | | | (1,625,404 | ) |
Accumulated undistributed net investment income | | | 55,323 | |
Net unrealized appreciation from Portfolio | | | 492,682 | |
Total | | $ | 6,719,749 | |
| |
| Net Asset Value Per Share | | | | |
($6,719,749 ÷ 300,000 shares issued and outstanding) | | $ | 22.40 | |
| | | | |
| | 7 | | See Notes to Financial Statements. |
Eaton Vance
Global Income Builder NextShares
October 31, 2017
Statement of Operations
| | | | |
| Investment Income | | Year Ended
October 31, 2017 | |
Dividends allocated from Portfolio (net of foreign taxes, $123,811) | | $ | 598,703 | |
Interest allocated from Portfolio (net of foreign taxes, $445) | | | 342,063 | |
Other income allocated from Portfolio | | | 6,425 | |
Expenses allocated from Portfolio | | | (127,062 | ) |
Total investment income from Portfolio | | $ | 820,129 | |
| |
| Expenses | | | | |
Administration fee | | $ | 24,895 | |
Operations agreement fee | | | 8,298 | |
Trustees’ fees and expenses | | | 500 | |
Custodian fee | | | 20,201 | |
Transfer and dividend disbursing agent fees | | | 15,023 | |
Legal and accounting services | | | 26,184 | |
Printing and postage | | | 6,141 | |
Registration fees | | | 35 | |
Listing fee | | | 7,100 | |
Intraday pricing fee | | | 12,000 | |
Miscellaneous | | | 3,008 | |
Total expenses | | $ | 123,385 | |
Deduct — | | | | |
Allocation of expenses to affiliates | | $ | 96,728 | |
Total expense reductions | | $ | 96,728 | |
| |
Net expenses | | $ | 26,657 | |
| |
Net investment income | | $ | 793,472 | |
| |
| Realized and Unrealized Gain (Loss) from Portfolio | | | | |
Net realized gain (loss) — | | | | |
Investment transactions | | $ | 1,083,254 | (1) |
Financial futures contracts | | | (84,083 | ) |
Foreign currency transactions | | | 2,971 | |
Forward foreign currency exchange contracts | | | (20 | ) |
Net realized gain | | $ | 1,002,122 | |
Change in unrealized appreciation (depreciation) — | | | | |
Investments | | $ | 844,952 | |
Foreign currency | | | 4,247 | |
Net change in unrealized appreciation (depreciation) | | $ | 849,199 | |
| |
Net realized and unrealized gain | | $ | 1,851,321 | |
| |
Net increase in net assets from operations | | $ | 2,644,793 | |
| (1) | Includes $95,897 of net realized gains from redemptions in-kind. |
| | | | |
| | 8 | | See Notes to Financial Statements. |
Eaton Vance
Global Income Builder NextShares
October 31, 2017
Statements of Changes in Net Assets
| | | | | | | | |
| Increase (Decrease) in Net Assets | | Year Ended
October 31, 2017 | | | Period Ended
October 31, 2016(1) | |
From operations — | | | | | | | | |
Net investment income | | $ | 793,472 | | | $ | 147,076 | |
Net realized gain | | | 1,002,122 | (2) | | | 269,949 | (3) |
Net change in unrealized appreciation (depreciation) | | | 849,199 | | | | (356,517 | ) |
Net increase in net assets from operations | | $ | 2,644,793 | | | $ | 60,508 | |
Distributions to shareholders — | | | | | | | | |
From net investment income | | $ | (764,893 | ) | | $ | (105,980 | ) |
Total distributions to shareholders | | $ | (764,893 | ) | | $ | (105,980 | ) |
Transactions in Fund shares — | | | | | | | | |
Proceeds from sale of shares | | $ | 8,202,093 | | | $ | 14,738,676 | |
Cost of shares redeemed | | | (18,073,335 | ) | | | — | |
Transaction fees | | | 4,479 | | | | 2,640 | |
Net increase (decrease) in net assets from Fund share transactions | | $ | (9,866,763 | ) | | $ | 14,741,316 | |
Other capital — | | | | | | | | |
Portfolio transaction fee contributed to Portfolio | | $ | (5,426 | ) | | $ | (416 | ) |
Portfolio transaction fee allocated from Portfolio | | | 11,700 | | | | 4,910 | |
Net increase in net assets from other capital | | $ | 6,274 | | | $ | 4,494 | |
| | |
Net increase (decrease) in net assets | | $ | (7,980,589 | ) | | $ | 14,700,338 | |
| | |
| Net Assets | | | | | | | | |
At beginning of period | | $ | 14,700,338 | | | $ | — | |
At end of period | | $ | 6,719,749 | | | $ | 14,700,338 | |
| | |
Accumulated undistributed net investment income included in net assets | | | | | | | | |
At end of period | | $ | 55,323 | | | $ | 100,228 | |
| | |
| Changes in shares outstanding | | | | | | | | |
Shares outstanding, beginning of period | | | 725,000 | | | | — | |
Shares sold | | | 400,000 | | | | 725,000 | |
Shares redeemed | | | (825,000 | ) | | | — | |
Shares outstanding, end of period | | | 300,000 | | | | 725,000 | |
| (1) | For the period from the start of business, March 30, 2016, to October 31, 2016. |
| (2) | Includes $95,897 of net realized gains from redemptions in-kind. |
| (3) | Includes $230,274 of net realized gains from redemptions in-kind. |
| | | | |
| | 9 | | See Notes to Financial Statements. |
Eaton Vance
Global Income Builder NextShares
October 31, 2017
Financial Highlights
| | | | | | | | |
| | | Year Ended
October 31, 2017 | | | Period Ended
October 31, 2016(1) | |
Net asset value — Beginning of period | | $ | 20.280 | | | $ | 20.000 | |
| | |
| Income (Loss) From Operations | | | | | | | | |
Net investment income(2) | | $ | 1.003 | | | $ | 0.386 | |
Net realized and unrealized gain | | | 2.147 | | | | 0.181 | |
| | |
Total income from operations | | $ | 3.150 | | | $ | 0.567 | |
| | |
| Less Distributions | | | | | | | | |
From net investment income | | $ | (1.038 | ) | | $ | (0.299 | ) |
| | |
Total distributions | | $ | (1.038 | ) | | $ | (0.299 | ) |
| | |
Portfolio transaction fee, net(2) | | $ | 0.008 | | | $ | 0.012 | |
| | |
Net asset value — End of period | | $ | 22.400 | | | $ | 20.280 | |
| | |
Total Return on Net Asset Value(3)(4) | | | 15.89 | % | | | 2.90 | %(5) |
| | |
| Ratios/Supplemental Data | | | | | | | | |
Net assets, end of period (000’s omitted) | | $ | 6,720 | | | $ | 14,700 | |
Ratios (as a percentage of average daily net assets):(6) | | | | | | | | |
Expenses(4) | | | 0.91 | %(7) | | | 0.90 | %(8) |
Net investment income | | | 4.71 | % | | | 3.22 | %(8) |
Portfolio Turnover of the Portfolio | | | 143 | % | | | 66 | %(5)(9) |
| (1) | For the period from the start of business, March 30, 2016, to October 31, 2016. |
| (2) | Computed using average shares outstanding. |
| (3) | Returns are historical and are calculated by determining the percentage change in net asset value with all distributions reinvested and do not reflect the effect of a market-determined premium or discount. Investment returns assume that all distributions have been reinvested at net asset value. |
| (4) | The administrator and sub-adviser reimbursed certain operating expenses (equal to 0.57% and 2.08% of average daily net assets for the year ended October 31, 2017 and the period ended October 31, 2016, respectively). Absent this reimbursement, total return would be lower. |
| (6) | Includes the Fund’s share of the Portfolio’s allocated expenses. |
| (7) | Includes interest expense including allocated from the Portfolio, of 0.01% |
| (9) | For the period from the Portfolio’s start of business, March 28, 2016, to October 31, 2016. |
| | | | |
| | 10 | | See Notes to Financial Statements. |
Eaton Vance
Global Income Builder NextShares
October 31, 2017
Notes to Financial Statements
1 Significant Accounting Policies
Eaton Vance Global Income Builder NextShares (the Fund) is a diversified series of Eaton Vance NextShares Trust (the Trust), a Massachusetts business trust registered under the Investment Company Act of 1940, as amended (the 1940 Act). The Fund is an exchange-traded managed fund operating pursuant to an order issued by the SEC granting an exemption from certain provisions of the 1940 Act. Individual shares of the Fund may be purchased and sold only on a national securities exchange or alternative trading system through a broker-dealer that offers NextShares, and may not be directly purchased or redeemed from the Fund. Market trading prices for the Fund are directly linked to the Fund’s next-computed net asset value per share (NAV) and will vary from NAV by a market-determined premium or discount, which may be zero. The Fund commenced operations on March 30, 2016. The Fund invests all of its investable assets in interests in Global Income Builder Portfolio (the Portfolio), a Massachusetts business trust having the same investment objective and policies as the Fund. The value of the Fund’s investment in the Portfolio reflects the Fund’s proportionate interest in the net assets of the Portfolio (1.9% at October 31, 2017). The performance of the Fund is directly affected by the performance of the Portfolio. The financial statements of the Portfolio, including the portfolio of investments, are included elsewhere in this report and should be read in conjunction with the Fund’s financial statements.
The following is a summary of significant accounting policies of the Fund. The policies are in conformity with accounting principles generally accepted in the United States of America (U.S. GAAP). The Fund is an investment company and follows accounting and reporting guidance in the Financial Accounting Standards Board (FASB) Accounting Standards Codification Topic 946.
A Investment Valuation — Valuation of securities by the Portfolio is discussed in Note 1A of the Portfolio’s Notes to Financial Statements, which are included elsewhere in this report.
B Income — The Fund’s net investment income or loss consists of the Fund’s pro-rata share of the net investment income or loss of the Portfolio, less all actual and accrued expenses of the Fund.
C Federal Taxes — The Fund’s policy is to comply with the provisions of the Internal Revenue Code applicable to regulated investment companies and to distribute to shareholders each year substantially all of its net investment income, and all or substantially all of its net realized capital gains. Accordingly, no provision for federal income or excise tax is necessary.
As of October 31, 2017, the Fund had no uncertain tax positions that would require financial statement recognition, de-recognition, or disclosure. The Fund files a U.S. federal income tax return annually after its fiscal year-end, which is subject to examination by the Internal Revenue Service for a period of three years from the date of filing.
D Expenses — The majority of expenses of the Trust are directly identifiable to an individual fund. Expenses which are not readily identifiable to a specific fund are allocated taking into consideration, among other things, the nature and type of expense and the relative size of the funds.
E Use of Estimates — The preparation of the financial statements in conformity with U.S. GAAP requires management to make estimates and assumptions that affect the reported amounts of assets and liabilities at the date of the financial statements and the reported amounts of income and expense during the reporting period. Actual results could differ from those estimates.
F Indemnifications — Under the Trust’s organizational documents, its officers and Trustees may be indemnified against certain liabilities and expenses arising out of the performance of their duties to the Fund. Under Massachusetts law, if certain conditions prevail, shareholders of a Massachusetts business trust (such as the Trust) could be deemed to have personal liability for the obligations of the Trust. However, the Trust’s Declaration of Trust contains an express disclaimer of liability on the part of Fund shareholders and the By-laws provide that the Trust shall assume the defense on behalf of any Fund shareholders. Moreover, the By-laws also provide for indemnification out of Fund property of any shareholder held personally liable solely by reason of being or having been a shareholder for all loss or expense arising from such liability. Additionally, in the normal course of business, the Fund enters into agreements with service providers that may contain indemnification clauses. The Fund’s maximum exposure under these arrangements is unknown as this would involve future claims that may be made against the Fund that have not yet occurred.
G Other — Investment transactions are accounted for on a trade date basis.
2 Distributions to Shareholders and Income Tax Information
It is the present policy of the Fund to make monthly distributions of all or substantially all of its net investment income and to distribute annually all or substantially all of its net realized capital gains. Distributions are paid in cash and cannot be automatically reinvested in additional shares of the Fund. Distributions to shareholders are recorded on the ex-dividend date. Distributions to shareholders are determined in accordance with income tax regulations, which may differ from U.S. GAAP. As required by U.S. GAAP, only distributions in excess of tax basis earnings and profits are reported in the financial statements as a return of capital. Permanent differences between book and tax accounting relating to distributions are reclassified to paid-in capital. For tax purposes, distributions from short-term capital gains are considered to be from ordinary income.
Eaton Vance
Global Income Builder NextShares
October 31, 2017
Notes to Financial Statements — continued
The tax character of distributions declared for the year ended October 31, 2017 and the period ended October 31, 2016 was as follows:
| | | | | | | | |
| | | Year Ended
October 31, 2017 | | | Period Ended
October 31, 2016 | |
| | |
Distributions declared from: | | | | | | | | |
Ordinary income | | $ | 764,893 | | | $ | 105,980 | |
During the year ended October 31, 2017, accumulated net realized gain was decreased by $2,838,340, accumulated undistributed net investment income was decreased by $73,484 and paid-in capital was increased by $2,911,824 due to the Fund’s use of equalization accounting and differences between book and tax accounting, primarily for the Fund’s investment in the Portfolio and redemptions in-kind from the Portfolio. Tax equalization accounting allows the Fund to treat as a distribution that portion of redemption proceeds representing a redeeming shareholder’s portion of undistributed taxable income and net capital gains. These reclassifications had no effect on the net assets or net asset value per share of the Fund.
As of October 31, 2017, the components of distributable earnings (accumulated losses) on a tax basis were as follows:
| | | | |
Undistributed ordinary income | | $ | 346,280 | |
Net unrealized depreciation | | $ | (1,423,679 | ) |
The differences between components of distributable earnings (accumulated losses) on a tax basis and the amounts reflected in the Statement of Assets and Liabilities are due to the Fund’s investment in the Portfolio.
3 Investment Adviser and Administration Fee and Other Transactions with Affiliates
The investment adviser fee is earned by Eaton Vance Management (EVM) as compensation for investment advisory services rendered to the Fund. The fee is computed at an annual rate of 0.65% of the Fund’s average daily net assets that are not invested in other investment companies for which EVM or its affiliates serve as investment adviser and receive an advisory fee (“Direct Assets”) up to $500 million and is payable monthly. On Direct Assets of $500 million and over, the annual fee is reduced. Pursuant to an investment sub-advisory agreement, EVM pays Eaton Vance Management (International) Limited (EVMI), an indirect, wholly-owned subsidiary of Eaton Vance Corp., a portion of its investment adviser fee for sub-advisory services provided to the Fund. Effective November 1, 2017, Eaton Vance Advisers International Ltd. (EVAIL), an affiliate of EVM, assumed the sub-advisory responsibilities for the Fund from EVMI. For the year ended October 31, 2017, the Fund incurred no investment adviser fee on Direct Assets. To the extent the Fund’s assets are invested in the Portfolio, the Fund is allocated its share of the Portfolio’s investment adviser fee. The Portfolio has engaged Boston Management and Research (BMR), a subsidiary of EVM, to render investment advisory services. See Note 2 of the Portfolio’s Notes to Financial Statements which are included elsewhere in this report. EVM also serves as the administrator of the Fund. The administration fee is earned by EVM as compensation for administrative services rendered to the Fund. The fee is computed at an annual rate of 0.15% of the Fund’s average daily net assets. For the year ended October 31, 2017, the administration fee amounted to $24,895.
The Trust, on behalf of the Fund, has entered into an operations agreement with EVM pursuant to which EVM provides the Fund with services required for it to operate as a NextShares exchange-traded managed fund in accordance with the exemptive order obtained by EVM and the Trust. Pursuant to the agreement, the Fund pays EVM a monthly fee at an annual rate of 0.05% of the Fund’s average daily net assets provided the average net assets of NextShares funds sponsored by EVM (“Covered Assets”) are less than $10 billion. The annual rate is reduced if Covered Assets are $10 billion and above. For the year ended October 31, 2017, the operations agreement fee amounted to $8,298 or 0.05% of the Fund’s average daily net assets.
EVM and EVMI have agreed to reimburse the Fund’s expenses to the extent that total annual operating expenses (relating to ordinary operating expenses only and excluding such expenses as interest, taxes or litigation expenses) exceed 0.90% of the Fund’s average daily net assets through February 28, 2018. Thereafter, the reimbursement may be changed or terminated at any time. Pursuant to this agreement, EVM and EVMI were allocated $96,728 in total of the Fund’s operating expenses for the year ended October 31, 2017.
Trustees and officers of the Fund who are members of EVM’s or BMR’s organizations receive remuneration for their services to the Fund out of the investment adviser fee. Certain officers and Trustees of the Fund and the Portfolio are officers of the above organizations.
4 Investment Transactions
For the year ended October 31, 2017, increases and decreases in the Fund’s investment in the Portfolio aggregated $8,279,803 and $18,925,042, respectively. In addition, a Portfolio transaction fee is imposed by the Portfolio on the combined daily inflows or outflows of the Fund and the Portfolio’s other investors as more fully described at Note 1K of the Portfolio’s financial statements included herein. Such fee is allocated to the Fund based on its
Eaton Vance
Global Income Builder NextShares
October 31, 2017
Notes to Financial Statements — continued
pro-rata interest in the Portfolio. The amount of the Portfolio transaction fee imposed on the Fund, if any, and the allocation of such fee are presented as Other capital on the Statements of Changes in Net Assets.
5 Capital Share Transactions
The Trust may issue an unlimited number of shares of capital stock (no par value per share) in one or more series (such as the Fund). The Fund issues and redeems shares only in blocks of 25,000 shares or multiples thereof (“Creation Units”). The Fund issues and redeems Creation Units in return for the securities, other instruments and/or cash (the “Basket”) that the Fund specifies each business day. Creation Units may be purchased or redeemed only by or through Authorized Participants, which are broker-dealers or institutional investors that have entered into agreements with the Fund’s distributor for this purpose. The Fund imposes a transaction fee on Creation Units issued and redeemed to offset the estimated cost to the Fund of processing the transaction, which is paid by the Authorized Participants directly to a third-party administrator. In addition, Authorized Participants pay the Fund a variable charge for converting the Basket to or from the desired portfolio composition. Such variable charges are reflected as Transaction fees on the Statements of Changes in Net Assets.
At October 31, 2017, EVM owned approximately 97% of the outstanding shares of the Fund.
Eaton Vance
Global Income Builder NextShares
October 31, 2017
Report of Independent Registered Public Accounting Firm
To the Trustees of Eaton Vance NextShares Trust and Shareholders of Eaton Vance Global Income Builder NextShares:
We have audited the accompanying statement of assets and liabilities of Eaton Vance Global Income Builder NextShares (the “Fund”) (one of the funds constituting Eaton Vance NextShares Trust), as of October 31, 2017, and the related statement of operations for the year then ended, and the statements of changes in net assets and the financial highlights for the year ended October 31, 2017 and for the period from the start of business, March 30, 2016, through October 31, 2016. These financial statements and financial highlights are the responsibility of the Fund’s management. Our responsibility is to express an opinion on these financial statements and financial highlights based on our audits.
We conducted our audits in accordance with the standards of the Public Company Accounting Oversight Board (United States). Those standards require that we plan and perform the audit to obtain reasonable assurance about whether the financial statements and financial highlights are free of material misstatement. The Fund is not required to have, nor were we engaged to perform, an audit of its internal control over financial reporting. Our audits included consideration of internal control over financial reporting as a basis for designing audit procedures that are appropriate in the circumstances, but not for the purpose of expressing an opinion on the effectiveness of the Fund’s internal control over financial reporting. Accordingly, we express no such opinion. An audit also includes examining, on a test basis, evidence supporting the amounts and disclosures in the financial statements, assessing the accounting principles used and significant estimates made by management, as well as evaluating the overall financial statement presentation. We believe that our audits provide a reasonable basis for our opinion.
In our opinion, such financial statements and financial highlights referred to above present fairly, in all material respects, the financial position of Eaton Vance Global Income Builder NextShares as of October 31, 2017, the results of its operations for the year then ended, and the changes in its net assets and the financial highlights for the year ended October 31, 2017 and for the period from the start of business, March 30, 2016, through October 31, 2016, in conformity with accounting principles generally accepted in the United States of America.
DELOITTE & TOUCHE LLP
Boston, Massachusetts
December 21, 2017
Eaton Vance
Global Income Builder NextShares
October 31, 2017
Federal Tax Information (Unaudited)
The Form 1099-DIV you receive in February 2018 will show the tax status of all distributions paid to your account in calendar year 2017. Shareholders are advised to consult their own tax adviser with respect to the tax consequences of their investment in the Fund. As required by the Internal Revenue Code and/or regulations, shareholders must be notified regarding the status of qualified dividend income for individuals and the dividends received deduction for corporations.
Qualified Dividend Income. For the fiscal year ended October 31, 2017, the Fund designates approximately $672,767, or up to the maximum amount of such dividends allowable pursuant to the Internal Revenue Code, as qualified dividend income eligible for the reduced tax rate of 15%.
Dividends Received Deduction. Corporate shareholders are generally entitled to take the dividends received deduction on the portion of the Fund’s dividend distribution that qualifies under tax law. For the Fund’s fiscal 2017 ordinary income dividends, 8.50% qualifies for the corporate dividends received deduction.
Global Income Builder Portfolio
October 31, 2017
Portfolio of Investments
| | | | | | | | |
| Common Stocks — 58.8% | |
| | |
| | | | | | | | |
| Security | | Shares | | | Value | |
| | | | | | | | |
|
Aerospace & Defense — 0.6% | |
CAE, Inc. | | | 128,010 | | | $ | 2,268,280 | |
| | | | | | | | | |
| | | $ | 2,268,280 | |
| | | | | | | | | |
| | |
Air Freight & Logistics — 0.6% | | | | | | | | |
C.H. Robinson Worldwide, Inc. | | | 26,739 | | | $ | 2,099,814 | |
| | | | | | | | | |
| | | $ | 2,099,814 | |
| | | | | | | | | |
| | |
Auto Components — 0.4% | | | | | | | | |
Goodyear Tire & Rubber Co. (The) | | | 48,299 | | | $ | 1,477,466 | |
| | | | | | | | | |
| | | $ | 1,477,466 | |
| | | | | | | | | |
| | |
Automobiles — 0.5% | | | | | | | | |
Peugeot SA | | | 74,576 | | | $ | 1,769,357 | |
| | | | | | | | | |
| | | $ | 1,769,357 | |
| | | | | | | | | |
| | |
Banks — 5.2% | | | | | | | | |
BNP Paribas SA | | | 38,383 | | | $ | 2,995,771 | |
Canadian Imperial Bank of Commerce | | | 27,564 | | | | 2,426,299 | |
ING Groep NV | | | 157,092 | | | | 2,902,976 | |
JPMorgan Chase & Co. | | | 26,213 | | | | 2,637,290 | |
KeyCorp | | | 52,918 | | | | 965,753 | |
Mitsubishi UFJ Financial Group, Inc. | | | 427,942 | | | | 2,902,791 | |
Wells Fargo & Co. | | | 74,243 | | | | 4,168,002 | |
| | | | | | | | | |
| | | $ | 18,998,882 | |
| | | | | | | | | |
| | |
Beverages — 1.9% | | | | | | | | |
Anheuser-Busch InBev SA/NV | | | 19,430 | | | $ | 2,382,528 | |
Constellation Brands, Inc., Class A | | | 10,607 | | | | 2,323,888 | |
Diageo PLC | | | 67,732 | | | | 2,312,967 | |
| | | | | | | | | |
| | | $ | 7,019,383 | |
| | | | | | | | | |
| | |
Biotechnology — 1.6% | | | | | | | | |
BioMarin Pharmaceutical, Inc.(1) | | | 8,617 | | | $ | 707,370 | |
Celgene Corp.(1) | | | 21,891 | | | | 2,210,334 | |
Shire PLC | | | 59,643 | | | | 2,937,751 | |
| | | | | | | | | |
| | | $ | 5,855,455 | |
| | | | | | | | | |
| | |
Building Products — 0.6% | | | | | | | | |
Assa Abloy AB, Class B | | | 104,742 | | | $ | 2,208,260 | |
| | | | | | | | | |
| | | $ | 2,208,260 | |
| | | | | | | | | |
| | | | | | | | |
| Security | | Shares | | | Value | |
| | | | | | | | |
| | |
Capital Markets — 1.1% | | | | | | | | |
Credit Suisse Group AG | | | 129,103 | | | $ | 2,034,511 | |
St. James’s Place PLC | | | 119,048 | | | | 1,860,709 | |
| | | | | | | | | |
| | | $ | 3,895,220 | |
| | | | | | | | | |
| | |
Chemicals — 1.6% | | | | | | | | |
Arkema SA | | | 19,311 | | | $ | 2,439,585 | |
Ecolab, Inc. | | | 15,008 | | | | 1,960,945 | |
Novozymes A/S, Class B | | | 22,312 | | | | 1,232,800 | |
| | | | | | | | | |
| | | $ | 5,633,330 | |
| | | | | | | | | |
|
Commercial Services & Supplies — 0.5% | |
SECOM Co., Ltd. | | | 23,400 | | | $ | 1,781,725 | |
| | | | | | | | | |
| | | $ | 1,781,725 | |
| | | | | | | | | |
| | |
Consumer Finance — 0.7% | | | | | | | | |
Discover Financial Services | | | 27,233 | | | $ | 1,811,811 | |
Navient Corp. | | | 7,317 | | | | 91,170 | |
OneMain Holdings, Inc.(1) | | | 20,528 | | | | 652,175 | |
| | | | | | | | | |
| | | $ | 2,555,156 | |
| | | | | | | | | |
| | |
Containers & Packaging — 0.9% | | | | | | | | |
Sealed Air Corp. | | | 71,592 | | | $ | 3,166,514 | |
| | | | | | | | | |
| | | $ | 3,166,514 | |
| | | | | | | | | |
| | |
Diversified Financial Services — 1.0% | | | | | | | | |
ORIX Corp. | | | 213,500 | | | $ | 3,670,834 | |
| | | | | | | | | |
| | | $ | 3,670,834 | |
| | | | | | | | | |
|
Diversified Telecommunication Services — 1.2% | |
Nippon Telegraph & Telephone Corp. | | | 88,479 | | | $ | 4,277,740 | |
| | | | | | | | | |
| | | $ | 4,277,740 | |
| | | | | | | | | |
| | |
Electric Utilities — 2.1% | | | | | | | | |
American Electric Power Co., Inc. | | | 16,916 | | | $ | 1,258,719 | |
Iberdrola SA | | | 438,247 | | | | 3,541,477 | |
NextEra Energy, Inc. | | | 18,246 | | | | 2,829,407 | |
| | | | | | | | | |
| | | $ | 7,629,603 | |
| | | | | | | | | |
| | |
Electrical Equipment — 2.3% | | | | | | | | |
Legrand SA | | | 35,472 | | | $ | 2,632,394 | |
Melrose Industries PLC | | | 1,389,286 | | | | 4,057,900 | |
Zhuzhou CRRC Times Electric Co., Ltd., Class H | | | 307,091 | | | | 1,797,387 | |
| | | | | | | | | |
| | | $ | 8,487,681 | |
| | | | | | | | | |
| | | | |
| | 16 | | See Notes to Financial Statements. |
Global Income Builder Portfolio
October 31, 2017
Portfolio of Investments — continued
| | | | | | | | |
| Security | | Shares | | | Value | |
| | | | | | | | |
|
Electronic Equipment, Instruments & Components — 1.6% | |
CDW Corp. | | | 51,493 | | | $ | 3,604,510 | |
Keyence Corp. | | | 3,776 | | | | 2,096,529 | |
| | | | | | | | | |
| | | $ | 5,701,039 | |
| | | | | | | | | |
|
Energy Equipment & Services — 0.3% | |
Halliburton Co. | | | 28,570 | | | $ | 1,221,082 | |
| | | | | | | | | |
| | | $ | 1,221,082 | |
| | | | | | | | | |
|
Equity Real Estate Investment Trusts (REITs) — 1.9% | |
American Tower Corp. | | | 20,271 | | | $ | 2,912,335 | |
Equity Residential | | | 40,457 | | | | 2,721,138 | |
Simon Property Group, Inc. | | | 8,698 | | | | 1,351,060 | |
| | | | | | | | | |
| | | $ | 6,984,533 | |
| | | | | | | | | |
| | |
Food Products — 0.4% | | | | | | | | |
Pinnacle Foods, Inc. | | | 24,628 | | | $ | 1,340,256 | |
| | | | | | | | | |
| | | $ | 1,340,256 | |
| | | | | | | | | |
|
Health Care Equipment & Supplies — 0.5% | |
Boston Scientific Corp.(1) | | | 11,477 | | | $ | 322,963 | |
ConvaTec Group PLC(2) | | | 490,644 | | | | 1,276,564 | |
Danaher Corp. | | | 3,512 | | | | 324,052 | |
| | | | | | | | | |
| | | $ | 1,923,579 | |
| | | | | | | | | |
| | |
Household Durables — 0.7% | | | | | | | | |
Newell Brands, Inc. | | | 65,812 | | | $ | 2,683,813 | |
| | | | | | | | | |
| | | $ | 2,683,813 | |
| | | | | | | | | |
| | |
Household Products — 0.6% | | | | | | | | |
Reckitt Benckiser Group PLC | | | 25,458 | | | $ | 2,277,642 | |
| | | | | | | | | |
| | | $ | 2,277,642 | |
| | | | | | | | | |
| | |
Insurance — 2.1% | | | | | | | | |
AIA Group, Ltd. | | | 311,167 | | | $ | 2,344,792 | |
Chubb, Ltd. | | | 15,559 | | | | 2,346,608 | |
Prudential PLC | | | 119,534 | | | | 2,934,006 | |
| | | | | | | | | |
| | | $ | 7,625,406 | |
| | | | | | | | | |
|
Internet & Direct Marketing Retail — 1.4% | |
Amazon.com, Inc.(1) | | | 4,472 | | | $ | 4,942,812 | |
| | | | | | | | | |
| | | $ | 4,942,812 | |
| | | | | | | | | |
| | | | | | | | |
| Security | | Shares | | | Value | |
| | | | | | | | |
| | |
Internet Software & Services — 3.3% | | | | | | | | |
Alphabet, Inc., Class C(1) | | | 7,590 | | | $ | 7,716,298 | |
Facebook, Inc., Class A(1) | | | 23,806 | | | | 4,286,508 | |
| | | | | | | | | |
| | | $ | 12,002,806 | |
| | | | | | | | | |
| | |
IT Services — 0.9% | | | | | | | | |
Visa, Inc., Class A | | | 31,077 | | | $ | 3,417,849 | |
| | | | | | | | | |
| | | $ | 3,417,849 | |
| | | | | | | | | |
|
Machinery — 2.1% | |
Fortive Corp. | | | 31,208 | | | $ | 2,255,090 | |
Komatsu, Ltd. | | | 111,971 | | | | 3,658,737 | |
Xylem, Inc. | | | 26,066 | | | | 1,734,171 | |
| | | | | | | | | |
| | | $ | 7,647,998 | |
| | | | | | | | | |
| | |
Media — 0.9% | | | | | | | | |
Interpublic Group of Cos., Inc. (The) | | | 161,963 | | | $ | 3,117,788 | |
| | | | | | | | | |
| | | $ | 3,117,788 | |
| | | | | | | | | |
| | |
Metals & Mining — 0.6% | | | | | | | | |
Rio Tinto, Ltd. | | | 43,900 | | | $ | 2,339,267 | |
| | | | | | | | | |
| | | $ | 2,339,267 | |
| | | | | | | | | |
|
Oil, Gas & Consumable Fuels — 3.2% | |
BP PLC | | | 376,448 | | | $ | 2,553,318 | |
ConocoPhillips | | | 41,061 | | | | 2,100,270 | |
Phillips 66 | | | 15,939 | | | | 1,451,724 | |
Royal Dutch Shell PLC, Class B | | | 135,672 | | | | 4,368,268 | |
Seven Generations Energy, Ltd., Class A(1) | | | 88,424 | | | | 1,335,167 | |
| | | | | | | | | |
| | | $ | 11,808,747 | |
| | | | | | | | | |
|
Personal Products — 1.4% | |
Estee Lauder Cos., Inc. (The), Class A | | | 11,268 | | | $ | 1,259,875 | |
Unilever PLC | | | 67,019 | | | | 3,798,231 | |
| | | | | | | | | |
| | | $ | 5,058,106 | |
| | | | | | | | | |
| | |
Pharmaceuticals — 5.2% | | | | | | | | |
Allergan PLC | | | 12,680 | | | $ | 2,247,276 | |
Bayer AG | | | 12,570 | | | | 1,635,091 | |
Eli Lilly & Co. | | | 33,552 | | | | 2,749,251 | |
Johnson & Johnson | | | 42,525 | | | | 5,928,410 | |
Novo Nordisk A/S, Class B | | | 47,517 | | | | 2,365,816 | |
Roche Holding AG PC | | | 10,117 | | | | 2,338,352 | |
Zoetis, Inc. | | | 28,110 | | | | 1,793,980 | |
| | | | | | | | | |
| | | $ | 19,058,176 | |
| | | | | | | | | |
| | | | |
| | 17 | | See Notes to Financial Statements. |
Global Income Builder Portfolio
October 31, 2017
Portfolio of Investments — continued
| | | | | | | | |
| Security | | Shares | | | Value | |
| | | | | | | | |
| | |
Professional Services — 0.6% | | | | | | | | |
Verisk Analytics, Inc.(1) | | | 26,221 | | | $ | 2,230,096 | |
| | | | | | | | | |
| | | $ | 2,230,096 | |
| | | | | | | | | |
| | |
Road & Rail — 0.5% | | | | | | | | |
CSX Corp. | | | 36,037 | | | $ | 1,817,346 | |
| | | | | | | | | |
| | | $ | 1,817,346 | |
| | | | | | | | | |
|
Semiconductors & Semiconductor Equipment — 2.4% | |
ASML Holding NV | | | 24,037 | | | $ | 4,336,978 | |
Renesas Electronics Corp.(1) | | | 16,181 | | | | 209,205 | |
Sumco Corp. | | | 77,682 | | | | 1,711,068 | |
Taiwan Semiconductor Manufacturing Co., Ltd. ADR | | | 57,789 | | | | 2,446,208 | |
| | | | | | | | | |
| | | $ | 8,703,459 | |
| | | | | | | | | |
| | |
Specialty Retail — 1.8% | | | | | | | | |
Home Depot, Inc. (The) | | | 19,330 | | | $ | 3,204,527 | |
Industria de Diseno Textil SA | | | 89,010 | | | | 3,327,019 | |
| | | | | | | | | |
| | | $ | 6,531,546 | |
| | | | | | | | | |
|
Technology Hardware, Storage & Peripherals — 1.3% | |
Apple, Inc. | | | 14,090 | | | $ | 2,381,773 | |
HP, Inc. | | | 109,243 | | | | 2,354,187 | |
| | | | | | | | | |
| | | $ | 4,735,960 | |
| | | | | | | | | |
|
Textiles, Apparel & Luxury Goods — 1.0% | |
Lululemon Athletica, Inc.(1) | | | 18,631 | | | $ | 1,145,993 | |
LVMH Moet Hennessy Louis Vuitton SE | | | 7,706 | | | | 2,298,415 | |
| | | | | | | | | |
| | | $ | 3,444,408 | |
| | | | | | | | | |
| | |
Tobacco — 0.7% | | | | | | | | |
British American Tobacco PLC | | | 40,349 | | | $ | 2,606,942 | |
| | | | | | | | | |
| | | $ | 2,606,942 | |
| | | | | | | | | |
|
Trading Companies & Distributors — 0.6% | |
MISUMI Group, Inc. | | | 83,891 | | | $ | 2,298,407 | |
| | | | | | | | | |
| | | $ | 2,298,407 | |
| | | | | | | | | |
| |
Total Common Stocks
(identified cost $196,286,315) | | | $ | 214,313,763 | |
| | | | | | | | | |
| | | | | | | | |
| Preferred Stocks — 3.0% | | | | | | | | |
| | |
| | | | | | | | |
| Security | | Shares | | | Value | |
| | | | | | | | |
| | |
Banks — 1.4% | | | | | | | | |
AgriBank FCB, 6.875% to 1/1/24(4) | | | 9,798 | | | $ | 1,085,741 | |
CoBank ACB, Series F, 6.25% to 10/1/22(2)(4) | | | 8,600 | | | | 928,800 | |
Farm Credit Bank of Texas, 6.75% to 9/15/23(2)(4) | | | 1,115 | | | | 122,929 | |
Farm Credit Bank of Texas, Series 1, 10.00%(2) | | | 230 | | | | 281,175 | |
First Republic Bank, Series G, 5.50% | | | 2,950 | | | | 75,933 | |
IBERIABANK Corp., Series C, 6.60% to 5/1/26(4) | | | 14,080 | | | | 391,987 | |
KeyCorp, Series E, 6.125% to 12/15/26(4) | | | 10,050 | | | | 293,360 | |
Regions Financial Corp., Series A, 6.375% | | | 18,416 | | | | 467,766 | |
SunTrust Banks, Inc., Series E, 5.875% | | | 34,002 | | | | 870,111 | |
Texas Capital Bancshares, Inc., Series A, 6.50% | | | 14,549 | | | | 372,454 | |
Wells Fargo & Co., Series L, 7.50% (Convertible) | | | 154 | | | | 201,740 | |
Wells Fargo & Co., Series Y, 5.625% | | | 4,650 | | | | 119,970 | |
| | | | | | | | | |
| | | $ | 5,211,966 | |
| | | | | | | | | |
| | |
Capital Markets — 0.1% | | | | | | | | |
KKR & Co., LP, Series A, 6.75% | | | 7,197 | | | $ | 197,845 | |
Legg Mason, Inc., 5.45% | | | 12,825 | | | | 322,549 | |
| | | | | | | | | |
| | | $ | 520,394 | |
| | | | | | | | | |
| | |
Electric Utilities — 0.3% | | | | | | | | |
NextEra Energy Capital Holdings, Inc., Series I, 5.125% | | | 9,163 | | | $ | 231,641 | |
SCE Trust VI, 5.00% | | | 15,350 | | | | 386,820 | |
Southern Co. (The), 6.25% | | | 22,549 | | | | 608,372 | |
| | | | | | | | | |
| | | $ | 1,226,833 | |
| | | | | | | | | |
|
Equity Real Estate Investment Trusts (REITs) — 0.5% | |
CBL & Associates Properties, Inc., Series D, 7.375% | | | 18,075 | | | $ | 446,091 | |
DDR Corp., Series J, 6.50% | | | 13,275 | | | | 334,928 | |
DDR Corp., Series K, 6.25% | | | 6,500 | | | | 163,540 | |
Spirit Realty Capital, Inc., Series A, 6.00% | | | 9,250 | | | | 227,920 | |
Vornado Realty Trust, Series K, 5.70% | | | 21,500 | | | | 546,960 | |
| | | | | | | | | |
| | | $ | 1,719,439 | |
| | | | | | | | | |
|
Food Products — 0.2% | |
Dairy Farmers of America, Inc., 7.875%(2) | | | 4,700 | | | $ | 500,403 | |
Ocean Spray Cranberries, Inc., 6.25%(2) | | | 540 | | | | 49,815 | |
| | | | | | | | | |
| | | $ | 550,218 | |
| | | | | | | | | |
| | |
Insurance — 0.1% | | | | | | | | |
Arch Capital Group, Ltd., Series E, 5.25% | | | 9,125 | | | $ | 227,304 | |
PartnerRe, Ltd., Series I, 5.875% | | | 5,061 | | | | 135,736 | |
| | | | | | | | | |
| | | $ | 363,040 | |
| | | | | | | | | |
| | | | |
| | 18 | | See Notes to Financial Statements. |
Global Income Builder Portfolio
October 31, 2017
Portfolio of Investments — continued
| | | | | | | | |
| Security | | Shares | | | Value | |
| | | | | | | | |
| | |
Machinery — 0.1% | | | | | | | | |
Stanley Black & Decker, Inc., 5.75% | | | 17,150 | | | $ | 435,267 | |
| | | | | | | | | |
| | | $ | 435,267 | |
| | | | | | | | | |
| | |
Multi-Utilities — 0.1% | | | | | | | | |
DTE Energy Co., Series C, 5.25% | | | 9,407 | | | $ | 237,527 | |
| | | | | | | | | |
| | | $ | 237,527 | |
| | | | | | | | | |
| | |
Oil, Gas & Consumable Fuels — 0.2% | | | | | | | | |
NuStar Energy, LP, Series B, 7.625% to 6/15/22(4) | | | 23,750 | | | $ | 604,438 | |
| | | | | | | | | |
| | | $ | 604,438 | |
| | | | | | | | | |
| |
Total Preferred Stocks
(identified cost $10,343,605) | | | $ | 10,869,122 | |
| | | | | | | | | |
| | | | | | | | | | | | |
|
| Corporate Bonds & Notes — 32.2% | |
| | | |
| | | | | | | | | | | | |
| Security | | | | | Principal Amount* (000’s omitted) | | | Value | |
| | | | | | | | | | | | |
| | | |
Aerospace & Defense — 0.2% | | | | | | | | | | | | |
TransDigm, Inc., 5.50%, 10/15/20 | | | | | | | 70 | | | $ | 71,211 | |
TransDigm, Inc., 6.00%, 7/15/22 | | | | | | | 500 | | | | 522,400 | |
| | | | | | | | | | | | | |
| | | $ | 593,611 | |
| | | | | | | | | | | | | |
| | | |
Airlines — 0.0%(3) | | | | | | | | | | | | |
United Continental Holdings, Inc.,
4.25%, 10/1/22 | | | | | | | 145 | | | $ | 145,906 | |
| | | | | | | | | | | | | |
| | | $ | 145,906 | |
| | | | | | | | | | | | | |
| | | |
Auto Components — 0.1% | | | | | | | | | | | | |
American Axle & Manufacturing, Inc., 6.25%, 4/1/25(2) | | | | | | | 45 | | | $ | 46,237 | |
American Axle & Manufacturing, Inc., 6.50%, 4/1/27(2) | | | | | | | 45 | | | | 46,069 | |
Deck Chassis Acquisition, Inc.,
10.00%, 6/15/23(2) | | | | | | | 205 | | | | 230,625 | |
Wabash National Corp., 5.50%, 10/1/25(2) | | | | | | | 145 | | | | 148,277 | |
| | | | | | | | | | | | | |
| | | $ | 471,208 | |
| | | | | | | | | | | | | |
| | | |
Automobiles — 0.1% | | | | | | | | | | | | |
General Motors Financial Co., Inc., Series A, 5.75% to 9/30/27(4)(5) | | | | | | | 320 | | | $ | 334,800 | |
| | | | | | | | | | | | | |
| | | $ | 334,800 | |
| | | | | | | | | | | | | |
| | | |
Banks — 2.4% | | | | | | | | | | | | |
Australia and New Zealand Banking Group, Ltd., 6.75% to 6/15/26(2)(4)(5) | | | | | | | 200 | | | $ | 230,280 | |
Banco do Brasil SA, 6.25% to 4/15/24(2)(4)(5) | | | | | | | 859 | | | | 811,755 | |
| | | | | | | | | | | | |
| Security | | | | | Principal Amount* (000’s omitted) | | | Value | |
| | | | | | | | | | | | |
| | | |
Banks (continued) | | | | | | | | | | | | |
Bank of America Corp., Series AA, 6.10% to 3/17/25(4)(5) | | | | | | | 1,018 | | | $ | 1,137,615 | |
CIT Group, Inc., 5.375%, 5/15/20 | | | | | | | 33 | | | | 35,475 | |
Citigroup, Inc., Series M, 6.30% to 5/15/24(4)(5) | | | | | | | 570 | | | | 620,325 | |
Credit Agricole SA, 7.875% to
1/23/24(2)(4)(5) | | | | | | | 327 | | | | 373,005 | |
Fifth Third Bancorp, Series H, 5.10% to 6/30/23(4)(5) | | | | | | | 460 | | | | 471,500 | |
JPMorgan Chase & Co., Series S, 6.75% to 2/1/24(4)(5) | | | | | | | 215 | | | | 246,713 | |
JPMorgan Chase & Co., Series X, 6.10% to 10/1/24(4)(5) | | | | | | | 353 | | | | 394,036 | |
JPMorgan Chase & Co., Series Z, 5.30% to 5/1/20(4)(5) | | | | | | | 768 | | | | 809,395 | |
Lloyds Banking Group PLC, 7.50% to 6/27/24(4)(5) | | | | | | | 290 | | | | 331,688 | |
M&T Bank Corp., Series F, 5.125% to 11/1/26(4)(5) | | | | | | | 280 | | | | 299,110 | |
PNC Financial Services Group, Inc. (The), Series S, 5.00% to
11/1/26(4)(5) | | | | | | | 170 | | | | 180,625 | |
Royal Bank of Scotland Group PLC, 8.00% to 8/10/25(4)(5) | | | | | | | 804 | | | | 921,143 | |
Standard Chartered PLC, 7.75% to 4/2/23(2)(4)(5) | | | | | | | 320 | | | | 355,648 | |
UniCredit SpA, 8.00% to 6/3/24(4)(5)(6) | | | | | | | 610 | | | | 676,669 | |
Zions Bancorporation, Series I, 5.80% to 9/15/23(4)(5) | | | | | | | 88 | | | | 90,849 | |
Zions Bancorporation, Series J, 7.20% to 9/15/23(4)(5) | | | | | | | 619 | | | | 707,208 | |
| | | | | | | | | | | | | |
| | | $ | 8,693,039 | |
| | | | | | | | | | | | | |
|
Biotechnology — 0.3% | |
Grifols S.A., 3.20%, 5/1/25(6) | | | EUR | | | | 1,075 | | | $ | 1,274,252 | |
| | | | | | | | | | | | | |
| | | $ | 1,274,252 | |
| | | | | | | | | | | | | |
| | | |
Building Products — 0.9% | | | | | | | | | | | | |
Builders FirstSource, Inc.,
5.625%, 9/1/24(2) | | | | | | | 105 | | | $ | 111,300 | |
LSF9 Balta Issuer S.A.,
7.75%, 9/15/22(6) | | | EUR | | | | 718 | | | | 916,149 | |
Reliance Intermediate Holdings, L.P., 6.50%, 4/1/23(2) | | | | | | | 1,000 | | | | 1,067,500 | |
Standard Industries, Inc.,
5.50%, 2/15/23(2) | | | | | | | 115 | | | | 121,612 | |
Standard Industries, Inc.,
6.00%, 10/15/25(2) | | | | | | | 495 | | | | 537,694 | |
TRI Pointe Group, Inc./TRI Pointe Homes, Inc., 5.875%, 6/15/24 | | | | | | | 600 | | | | 652,500 | |
| | | | | | | | | | | | | |
| | | $ | 3,406,755 | |
| | | | | | | | | | | | | |
| | | |
Capital Markets — 0.5% | | | | | | | | | | | | |
Banco BTG Pactual SA/Cayman Islands, 5.75%, 9/28/22(2) | | | | | | | 400 | | | $ | 393,000 | |
Charles Schwab Corp. (The), 5.00% to 12/1/27(4)(5) | | | | | | | 450 | | | | 455,625 | |
UBS Group AG, 6.875% to
8/7/25(4)(5)(6) | | | | | | | 833 | | | | 936,858 | |
| | | | | | | | | | | | | |
| | | $ | 1,785,483 | |
| | | | | | | | | | | | | |
| | | |
Casino & Gaming — 0.1% | | | | | | | | | | | | |
GLP Capital, L.P./GLP Financing II, Inc., 4.375%, 4/15/21 | | | | | | | 30 | | | $ | 31,425 | |
| | | | |
| | 19 | | See Notes to Financial Statements. |
Global Income Builder Portfolio
October 31, 2017
Portfolio of Investments — continued
| | | | | | | | | | | | |
| Security | | | | | Principal Amount* (000’s omitted) | | | Value | |
| | | | | | | | | | | | |
| | | |
Casino & Gaming (continued) | | | | | | | | | | | | |
GLP Capital, L.P./GLP Financing II, Inc., 5.375%, 4/15/26 | | | | | | | 110 | | | $ | 119,350 | |
Sugarhouse HSP Gaming Prop Mezz, L.P./Sugarhouse HSP Gaming Finance Corp.,
5.875%, 5/15/25(2) | | | | | | | 165 | | | | 161,288 | |
| | | | | | | | | | | | | |
| | | $ | 312,063 | |
| | | | | | | | | | | | | |
| | | |
Chemicals — 0.7% | | | | | | | | | | | | |
Chemours Co. (The), 7.00%, 5/15/25 | | | | | | | 70 | | | $ | 78,400 | |
Platform Specialty Products Corp., 6.50%, 2/1/22(2) | | | | | | | 1,000 | | | | 1,038,750 | |
SPCM SA/Cayman Islands,
4.875%, 9/15/25(2) | | | | | | | 65 | | | | 66,950 | |
Tronox Finance PLC,
5.75%, 10/1/25(2) | | | | | | | 220 | | | | 230,450 | |
Tronox Finance, LLC,
7.50%, 3/15/22(2) | | | | | | | 15 | | | | 15,806 | |
Valvoline, Inc., 5.50%, 7/15/24(2) | | | | | | | 45 | | | | 47,813 | |
Venator Finance S.a.r.l./Venator Materials, LLC, 5.75%, 7/15/25(2) | | | | | | | 115 | | | | 121,900 | |
W.R. Grace & Co., 5.125%, 10/1/21(2) | | | | | | | 750 | | | | 808,125 | |
| | | | | | | | | | | | | |
| | | $ | 2,408,194 | |
| | | | | | | | | | | | | |
|
Commercial Services & Supplies — 1.6% | |
Advanced Disposal Services, Inc., 5.625%, 11/15/24(2) | | | | | | | 170 | | | $ | 177,225 | |
Clean Harbors, Inc., 5.125%, 6/1/21 | | | | | | | 400 | | | | 406,500 | |
Covanta Holding Corp.,
5.875%, 3/1/24 | | | | | | | 500 | | | | 502,500 | |
Covanta Holding Corp.,
5.875%, 7/1/25 | | | | | | | 95 | | | | 94,288 | |
Covanta Holding Corp.,
6.375%, 10/1/22 | | | | | | | 35 | | | | 36,225 | |
GFL Environmental, Inc.,
9.875%, 2/1/21(2) | | | | | | | 450 | | | | 480,937 | |
Hertz Corp. (The), 5.50%, 10/15/24(2) | | | | | | | 75 | | | | 67,875 | |
Iron Mountain UK PLC,
3.875%, 11/15/25(6)(7) | | | GBP | | | | 550 | | | | 730,482 | |
KAR Auction Services, Inc.,
5.125%, 6/1/25(2) | | | | | | | 260 | | | | 269,750 | |
Prime Security Services Borrower, LLC/Prime Finance, Inc.,
9.25%, 5/15/23(2) | | | | | | | 270 | | | | 299,889 | |
RAC Bond Co. PLC,
5.00%, 11/6/22(6) | | | GBP | | | | 1,105 | | | | 1,470,140 | |
ServiceMaster Co., LLC (The), 7.45%, 8/15/27 | | | | | | | 550 | | | | 600,875 | |
Team Health Holdings, Inc.,
6.375%, 2/1/25(2) | | | | | | | 240 | | | | 222,000 | |
Tervita Escrow Corp.,
7.625%, 12/1/21(2) | | | | | | | 195 | | | | 198,413 | |
TMS International Corp.,
7.25%, 8/15/25(2) | | | | | | | 195 | | | | 203,775 | |
United Rentals North America, Inc., 5.50%, 5/15/27 | | | | | | | 35 | | | | 37,538 | |
Wrangler Buyer Corp.,
6.00%, 10/1/25(2) | | | | | | | 40 | | | | 41,100 | |
| | | | | | | | | | | | | |
| | | $ | 5,839,512 | |
| | | | | | | | | | | | | |
| | | |
Communications Equipment — 0.2% | | | | | | | | | | | | |
CommScope Technologies, LLC, 6.00%, 6/15/25(2) | | | | | | | 35 | | | $ | 37,100 | |
Riverbed Technology, Inc.,
8.875%, 3/1/23(2) | | | | | | | 630 | | | | 566,213 | |
| | | | | | | | | | | | | |
| | | $ | 603,313 | |
| | | | | | | | | | | | | |
| | | | | | | | | | | | |
| Security | | | | | Principal Amount* (000’s omitted) | | | Value | |
| | | | | | | | | | | | |
| | | |
Construction & Engineering — 0.3% | | | | | | | | | | | | |
ABG Orphan Holdco S.a.r.l., 14.00% , (5.00% Cash, 9.00% PIK),
2/28/21(2) | | | | | | | 900 | | | $ | 942,300 | |
| | | | | | | | | | | | | |
| | | $ | 942,300 | |
| | | | | | | | | | | | | |
| | | |
Consumer Finance — 0.5% | | | | | | | | | | | | |
Ally Financial, Inc., 8.00%, 12/31/18 | | | | | | | 550 | | | $ | 585,062 | |
CPUK Finance, Ltd.,
4.875%, 2/28/47(6) | | | GBP | | | | 895 | | | | 1,218,224 | |
| | | | | | | | | | | | | |
| | | $ | 1,803,286 | |
| | | | | | | | | | | | | |
| | | |
Containers & Packaging — 0.4% | | | | | | | | | | | | |
Ardagh Packaging Finance PLC/Ardagh Holdings USA, Inc., 6.00%, 2/15/25(2) | | | | | | | 200 | | | $ | 212,750 | |
BWAY Holding Co., 5.50%, 4/15/24(2) | | | | | | | 240 | | | | 250,500 | |
BWAY Holding Co., 7.25%, 4/15/25(2) | | | | | | | 165 | | | | 171,600 | |
Reynolds Group Issuer, Inc./Reynolds Group Issuer, LLC,
5.125%, 7/15/23(2) | | | | | | | 120 | | | | 125,100 | |
Reynolds Group Issuer, Inc./Reynolds Group Issuer, LLC,
5.75%, 10/15/20 | | | | | | | 500 | | | | 509,380 | |
Reynolds Group Issuer, Inc./Reynolds Group Issuer, LLC,
7.00%, 7/15/24(2) | | | | | | | 140 | | | | 149,712 | |
| | | | | | | | | | | | | |
| | | $ | 1,419,042 | |
| | | | | | | | | | | | | |
| | | |
Distributors — 0.0%(3) | | | | | | | | | | | | |
H&E Equipment Services, Inc., 5.625%, 9/1/25(2) | | | | | | | 55 | | | $ | 58,231 | |
HD Supply, Inc., 5.75%, 4/15/24(2) | | | | | | | 105 | | | | 113,532 | |
| | | | | | | | | | | | | |
| | | $ | 171,763 | |
| | | | | | | | | | | | | |
|
Diversified Consumer Services — 0.1% | |
Laureate Education, Inc.,
8.25%, 5/1/25(2) | | | | | | | 315 | | | $ | 339,806 | |
| | | | | | | | | | | | | |
| | | $ | 339,806 | |
| | | | | | | | | | | | | |
|
Diversified Financial Services — 0.9% | |
Cadence Financial Corp.,
4.875%, 6/28/19(2) | | | | | | | 508 | | | $ | 515,217 | |
DAE Funding, LLC, 4.50%, 8/1/22(2) | | | | | | | 155 | | | | 157,519 | |
DAE Funding, LLC, 5.00%, 8/1/24(2) | | | | | | | 255 | | | | 261,056 | |
Exela Intermediate, LLC/Exela Finance, Inc., 10.00%, 7/15/23(2) | | | | | | | 180 | | | | 173,250 | |
FBM Finance, Inc., 8.25%, 8/15/21(2) | | | | | | | 165 | | | | 176,344 | |
Icahn Enterprises, L.P./Icahn Enterprises Finance Corp.,
6.25%, 2/1/22 | | | | | | | 115 | | | | 120,462 | |
Louvre Bidco SAS, 4.25%, 9/30/24(6) | | | EUR | | | | 285 | | | | 335,935 | |
Mercury Bondco PLC, 8.25%, (8.25% Cash or 9.00% PIK), 5/30/21(6)(8) | | | EUR | | | | 530 | | | | 652,746 | |
Park Aerospace Holdings, Ltd.,
5.25%, 8/15/22(2) | | | | | | | 455 | | | | 474,906 | |
| | | | |
| | 20 | | See Notes to Financial Statements. |
Global Income Builder Portfolio
October 31, 2017
Portfolio of Investments — continued
| | | | | | | | | | | | |
| Security | | | | | Principal Amount* (000’s omitted) | | | Value | |
| | | | | | | | | | | | |
|
Diversified Financial Services (continued) | |
Park Aerospace Holdings, Ltd., 5.50%, 2/15/24(2) | | | | | | | 150 | | | $ | 156,000 | |
West Corp., 8.50%, 10/15/25(2) | | | | | | | 240 | | | | 235,950 | |
| | | | | | | | | | | | | |
| | | $ | 3,259,385 | |
| | | | | | | | | | | | | |
|
Diversified Telecommunication Services — 0.2% | |
CenturyLink, Inc., 5.80%, 3/15/22 | | | | | | | 500 | | | $ | 509,375 | |
CenturyLink, Inc., 7.50%, 4/1/24 | | | | | | | 100 | | | | 106,500 | |
Cincinnati Bell, Inc., 7.00%, 7/15/24(2) | | | | | | | 55 | | | | 55,000 | |
Frontier Communications Corp., 6.25%, 9/15/21 | | | | | | | 65 | | | | 53,788 | |
Frontier Communications Corp., 10.50%, 9/15/22 | | | | | | | 30 | | | | 26,391 | |
Level 3 Financing, Inc., 5.25%, 3/15/26 | | | | | | | 90 | | | | 93,235 | |
| | | | | | | | | | | | | |
| | | $ | 844,289 | |
| | | | | | | | | | | | | |
|
Electric Utilities — 1.3% | |
AES Corp. (The), 5.125%, 9/1/27 | | | | | | | 25 | | | $ | 25,725 | |
AES Corp. (The), 5.50%, 3/15/24 | | | | | | | 580 | | | | 609,000 | |
AES Corp. (The), 5.50%, 4/15/25 | | | | | | | 15 | | | | 15,938 | |
AES Corp. (The), 6.00%, 5/15/26 | | | | | | | 15 | | | | 16,238 | |
AES Gener SA, 8.375% to 6/18/19, 12/18/73(2)(4) | | | | | | | 515 | | | | 546,775 | |
Dynegy, Inc., 7.375%, 11/1/22 | | | | | | | 450 | | | | 483,187 | |
Dynegy, Inc., 7.625%, 11/1/24 | | | | | | | 45 | | | | 49,388 | |
Dynegy, Inc., 8.00%, 1/15/25(2) | | | | | | | 115 | | | | 126,356 | |
Dynegy, Inc., 8.125%, 1/30/26(2) | | | | | | | 80 | | | | 88,900 | |
Electricite de France S.A., 6.00% to 1/29/26(4)(5)(6) | | | GBP | | | | 800 | | | | 1,154,264 | |
Melton Renewable Energy UK PLC, 6.75%, 2/1/20(6) | | | GBP | | | | 168 | | | | 228,707 | |
NextEra Energy Operating Partners, L.P., 4.25%, 9/15/24(2) | | | | | | | 95 | | | | 96,188 | |
NextEra Energy Operating Partners, L.P., 4.50%, 9/15/27(2) | | | | | | | 145 | | | | 146,269 | |
NRG Yield Operating, LLC, 5.375%, 8/15/24 | | | | | | | 395 | | | | 413,762 | |
Pattern Energy Group, Inc., 5.875%, 2/1/24(2) | | | | | | | 115 | | | | 122,763 | |
Southern Co. (The), Series B, 5.50% to 3/15/22, 3/15/57(4) | | | | | | | 580 | | | | 617,520 | |
TerraForm Power Operating, LLC, 6.625%, 6/15/25(2) | | | | | | | 90 | | | | 98,100 | |
| | | | | | | | | | | | | |
| | | $ | 4,839,080 | |
| | | | | | | | | | | | | |
| | | |
Electrical Equipment — 0.2% | | | | | | | | | | | | |
Senvion Holding GmbH,
3.875%, 10/25/22(6) | | | EUR | | | | 575 | | | $ | 690,036 | |
| | | | | | | | | | | | | |
| | | $ | 690,036 | |
| | | | | | | | | | | | | |
|
Electronic Equipment, Instruments & Components — 0.0%(3) | |
Zebra Technologies Corp.,
7.25%, 10/15/22 | | | | | | | 79 | | | $ | 83,592 | |
| | | | | | | | | | | | | |
| | | $ | 83,592 | |
| | | | | | | | | | | | | |
| | | | | | | | | | | | |
| Security | | | | | Principal Amount* (000’s omitted) | | | Value | |
| | | | | | | | | | | | |
| | | |
Energy Equipment & Services — 0.1% | | | | | | | | | | | | |
Abengoa Finance S.A.U., 7.75%, 2/1/20(2)(9) | | | | | | | 467 | | | $ | 5,838 | |
Novafives SAS, 4.50%, 6/30/21(6) | | | EUR | | | | 225 | | | | 267,970 | |
| | | | | | | | | | | | | |
| | | $ | 273,808 | |
| | | | | | | | | | | | | |
|
Equity Real Estate Investment Trusts (REITs) — 0.2% | |
Equinix, Inc., 5.375%, 5/15/27 | | | | | | | 115 | | | $ | 123,481 | |
MGM Growth Properties Operating Partnership, L.P./MGP Finance Co-Issuer, Inc., 4.50%, 9/1/26 | | | | | | | 120 | | | | 121,050 | |
MGM Growth Properties Operating Partnership, L.P./MGP Finance Co-Issuer, Inc., 4.50%, 1/15/28(2) | | | | | | | 30 | | | | 30,000 | |
MGM Growth Properties Operating Partnership, L.P./MGP Finance Co-Issuer, Inc., 5.625%, 5/1/24 | | | | | | | 95 | | | | 103,075 | |
SBA Communications Corp., 4.00%, 10/1/22(2) | | | | | | | 150 | | | | 153,000 | |
SBA Communications Corp., 4.875%, 9/1/24 | | | | | | | 55 | | | | 56,650 | |
VICI Properties 1, LLC/VICI FC, Inc., 8.00%, 10/15/23 | | | | | | | 140 | | | | 156,450 | |
| | | | | | | | | | | | | |
| | | $ | 743,706 | |
| | | | | | | | | | | | | |
|
Food Products — 1.2% | |
Albertsons Cos., LLC/Safeway, Inc./New Albertson’s, Inc./Albertson’s, LLC, 5.75%, 3/15/25 | | | | | | | 115 | | | $ | 101,775 | |
Albertsons Cos., LLC/Safeway, Inc./New Albertson’s, Inc./Albertson’s, LLC,
6.625%, 6/15/24 | | | | | | | 95 | | | | 89,775 | |
Dean Foods Co., 6.50%, 3/15/23(2) | | | | | | | 320 | | | | 321,600 | |
Dole Food Co., Inc., 7.25%, 6/15/25(2) | | | | | | | 225 | | | | 244,125 | |
Iceland Bondco PLC,
4.625%, 3/15/25(6) | | | GBP | | | | 1,095 | | | | 1,414,147 | |
Land O’ Lakes, Inc., 8.00%(2)(5) | | | | | | | 875 | | | | 975,625 | |
Pilgrim’s Pride Corp., 5.75%, 3/15/25(2) | | | | | | | 70 | | | | 74,288 | |
Pilgrim’s Pride Corp.,
5.875%, 9/30/27(2) | | | | | | | 95 | | | | 99,037 | |
Post Holdings, Inc., 5.00%, 8/15/26(2) | | | | | | | 85 | | | | 85,637 | |
Post Holdings, Inc., 5.50%, 3/1/25(2) | | | | | | | 230 | | | | 239,775 | |
TreeHouse Foods, Inc., 6.00%, 2/15/24(2) | | | | | | | 180 | | | | 193,500 | |
US Foods, Inc., 5.875%, 6/15/24(2) | | | | | | | 395 | | | | 419,194 | |
| | | | | | | | | | | | | |
| | | $ | 4,258,478 | |
| | | | | | | | | | | | | |
|
Health Care Equipment & Supplies — 1.3% | |
Alere, Inc., 6.50%, 6/15/20 | | | | | | | 40 | | | $ | 40,850 | |
Avantor, Inc., 6.00%, 10/1/24(2) | | | | | | | 100 | | | | 102,125 | |
Centene Corp., 4.75%, 1/15/25 | | | | | | | 300 | | | | 310,500 | |
Centene Corp., 5.625%, 2/15/21 | | | | | | | 90 | | | | 93,600 | |
Centene Corp., 6.125%, 2/15/24 | | | | | | | 340 | | | | 366,350 | |
Envision Healthcare Corp., 5.625%, 7/15/22 | | | | | | | 620 | | | | 633,175 | |
Envision Healthcare Corp., 6.25%, 12/1/24(2) | | | | | | | 620 | | | | 645,575 | |
Hologic, Inc., 4.375%, 10/15/25(2) | | | | | | | 70 | | | | 71,295 | |
| | | | |
| | 21 | | See Notes to Financial Statements. |
Global Income Builder Portfolio
October 31, 2017
Portfolio of Investments — continued
| | | | | | | | | | | | |
| Security | | | | | Principal Amount* (000’s omitted) | | | Value | |
| | | | | | | | | | | | |
|
Health Care Equipment & Supplies (continued) | |
Jaguar Holding Co. II/Pharmaceutical Product Development, LLC, 6.375%, 8/1/23(2) | | | | | | | 610 | | | $ | 638,212 | |
Kinetic Concepts, Inc./KCI USA, Inc., 7.875%, 2/15/21(2) | | | | | | | 320 | | | | 334,400 | |
Kinetic Concepts, Inc./KCI USA, Inc., 12.50%, 11/1/21(2) | | | | | | | 275 | | | | 307,313 | |
MPH Acquisition Holdings, LLC, 7.125%, 6/1/24(2) | | | | | | | 1,230 | | | | 1,326,862 | |
| | | | | | | | | | | | | |
| | | $ | 4,870,257 | |
| | | | | | | | | | | | | |
|
Health Care Providers & Services — 0.6% | |
CHS/Community Health Systems, Inc., 6.25%, 3/31/23 | | | | | | | 555 | | | $ | 534,881 | |
Eagle Holding Co. II, LLC, 7.625%, (7.625% Cash or 8.375% PIK), 5/15/22(2)(8) | | | | | | | 165 | | | | 170,775 | |
HCA, Inc., 4.50%, 2/15/27 | | | | | | | 40 | | | | 40,500 | |
HCA, Inc., 5.875%, 2/15/26 | | | | | | | 750 | | | | 790,313 | |
Tenet Healthcare Corp., 6.75%, 6/15/23 | | | | | | | 260 | | | | 245,050 | |
Tenet Healthcare Corp., 7.50%, 1/1/22(2) | | | | | | | 85 | | | | 89,781 | |
WellCare Health Plans, Inc., 5.25%, 4/1/25 | | | | | | | 375 | | | | 395,625 | |
| | | | | | | | | | | | | |
| | | $ | 2,266,925 | |
| | | | | | | | | | | | | |
| | |
Hotels, Restaurants & Leisure — 1.5% | | | | | | | | | |
1011778 B.C. Unlimited Liability Company/New Red Finance, Inc., 4.25%, 5/15/24(2) | | | | | | | 325 | | | $ | 328,152 | |
1011778 B.C. Unlimited Liability Company/New Red Finance, Inc., 5.00%, 10/15/25(2) | | | | | | | 540 | | | | 550,800 | |
Carlson Travel, Inc.,
6.75%, 12/15/23(2) | | | | | | | 200 | | | | 198,500 | |
CRC Escrow Issuer, LLC Co./ CRC Finco, Inc., 5.25%, 10/15/25(2) | | | | | | | 485 | | | | 489,365 | |
Eldorado Resorts, Inc., 6.00%, 4/1/25 | | | | | | | 220 | | | | 233,200 | |
Gateway Casinos & Entertainment, Ltd., 8.25%, 3/1/24(2) | | | | | | | 490 | | | | 520,625 | |
Golden Nugget, Inc., 6.75%, 10/15/24(2) | | | | | | | 595 | | | | 606,900 | |
Golden Nugget, Inc.,
8.75%, 10/1/25(2) | | | | | | | 295 | | | | 303,850 | |
Jack Ohio Finance, LLC/Jack Ohio Finance 1 Corp.,
6.75%, 11/15/21(2) | | | | | | | 555 | | | | 593,850 | |
MGM Resorts International, 6.00%, 3/15/23 | | | | | | | 550 | | | | 604,395 | |
NCL Corp., Ltd., 4.75%, 12/15/21(2) | | | | | | | 150 | | | | 156,000 | |
Scientific Games International, Inc., 7.00%, 1/1/22(2) | | | | | | | 115 | | | | 121,900 | |
Scientific Games International, Inc., 10.00%, 12/1/22 | | | | | | | 420 | | | | 465,675 | |
Viking Cruises, Ltd.,
5.875%, 9/15/27(2) | | | | | | | 220 | | | | 222,200 | |
| | | | | | | | | | | | | |
| | | $ | 5,395,412 | |
| | | | | | | | | | | | | |
| | | |
Household Products — 0.4% | | | | | | | | | | | | |
Bormioli Rocco Holdings S.A., 10.00%, 8/1/18(6) | | | EUR | | | | 850 | | | $ | 997,548 | |
Central Garden & Pet Co., 6.125%, 11/15/23 | | | | | | | 500 | | | | 535,625 | |
| | | | | | | | | | | | | |
| | | $ | 1,533,173 | |
| | | | | | | | | | | | | |
| | | | | | | | | | | | |
| Security | | | | | Principal Amount* (000’s omitted) | | | Value | |
| | | | | | | | | | | | |
|
Independent Power and Renewable Electricity Producers — 0.1% | |
Calpine Corp., 5.75%, 1/15/25 | | | | | | | 145 | | | $ | 138,384 | |
NRG Energy, Inc., 7.25%, 5/15/26 | | | | | | | 350 | | | | 381,063 | |
| | | | | | | | | | | | | |
| | | $ | 519,447 | |
| | | | | | | | | | | | | |
| | | |
Industrial Conglomerates — 0.3% | | | | | | | | | | | | |
Wittur International Holding GmbH, 8.50%, 2/15/23(6) | | | EUR | | | | 1,030 | | | $ | 1,265,712 | |
| | | | | | | | | | | | | |
| | | $ | 1,265,712 | |
| | | | | | | | | | | | | |
| | | |
Insurance — 0.5% | | | | | | | | | | | | |
Alliant Holdings Intermediate, LLC, 8.25%, 8/1/23(2) | | | | | | | 60 | | | $ | 64,050 | |
Hub International, Ltd., 7.875%, 10/1/21(2) | | | | | | | 500 | | | | 521,040 | |
KIRS Midco 3 PLC, 8.375%, 7/15/23(6) | | | GBP | | | | 910 | | | | 1,256,961 | |
| | | | | | | | | | | | | |
| | | $ | 1,842,051 | |
| | | | | | | | | | | | | |
|
Internet & Direct Marketing Retail — 0.3% | |
Netflix, Inc., 3.625%, 5/15/27(6) | | | EUR | | | | 675 | | | $ | 808,800 | |
Netflix, Inc., 4.875%, 4/15/28(2) | | | | | | | 245 | | | | 243,824 | |
| | | | | | | | | | | | | |
| | | $ | 1,052,624 | |
| | | | | | | | | | | | | |
|
Internet Software & Services — 0.5% | |
EIG Investors Corp., 10.875%, 2/1/24 | | | | | | | 480 | | | $ | 532,800 | |
Match Group, Inc., 6.375%, 6/1/24 | | | | | | | 505 | | | | 550,450 | |
Zayo Group, LLC/Zayo Capital, Inc., 5.75%, 1/15/27(2) | | | | | | | 75 | | | | 79,219 | |
Zayo Group, LLC/Zayo Capital, Inc., 6.375%, 5/15/25 | | | | | | | 465 | | | | 502,251 | |
| | | | | | | | | | | | | |
| | | $ | 1,664,720 | |
| | | | | | | | | | | | | |
| | | |
IT Services — 0.1% | | | | | | | | | | | | |
Booz Allen Hamilton, Inc., 5.125%, 5/1/25(2) | | | | | | | 40 | | | $ | 40,900 | |
Gartner, Inc., 5.125%, 4/1/25(2) | | | | | | | 160 | | | | 169,600 | |
| | | | | | | | | | | | | |
| | | $ | 210,500 | |
| | | | | | | | | | | | | |
| | | |
Machinery — 0.5% | | | | | | | | | | | | |
BlueLine Rental Finance Corp./BlueLine Rental, LLC, 9.25%, 3/15/24(2) | | | | | | | 150 | | | $ | 163,500 | |
Cloud Crane, LLC, 10.125%, 8/1/24(2) | | | | | | | 190 | | | | 215,175 | |
Navistar International Corp., 8.25%, 11/1/21 | | | | | | | 235 | | | | 235,975 | |
Norican A/S, 4.50%, 5/15/23(6) | | | EUR | | | | 865 | | | | 1,024,372 | |
Welbilt, Inc., 9.50%, 2/15/24 | | | | | | | 295 | | | | 338,881 | |
| | | | | | | | | | | | | |
| | | $ | 1,977,903 | |
| | | | | | | | | | | | | |
| | | |
Media — 2.6% | | | | | | | | | | | | |
Altice Luxembourg S.A., 7.25%, 5/15/22(6) | | | EUR | | | | 546 | | | $ | 678,938 | |
Altice Luxembourg S.A., 7.75%, 5/15/22(2) | | | | | | | 315 | | | | 333,900 | |
| | | | |
| | 22 | | See Notes to Financial Statements. |
Global Income Builder Portfolio
October 31, 2017
Portfolio of Investments — continued
| | | | | | | | | | | | |
| Security | | | | | Principal Amount* (000’s omitted) | | | Value | |
| | | | | | | | | | | | |
| | | |
Media (continued) | | | | | | | | | | | | |
Altice US Finance I Corp.,
5.50%, 5/15/26(2) | | | | | | | 200 | | | $ | 208,500 | |
AMC Entertainment Holdings, Inc., 6.375%, 11/15/24 | | | GBP | | | | 345 | | | | 472,902 | |
Cablevision Systems Corp., 5.875%, 9/15/22 | | | | | | | 55 | | | | 56,719 | |
Cablevision Systems Corp., 8.00%, 4/15/20 | | | | | | | 70 | | | | 77,700 | |
CBS Radio, Inc., 7.25%, 11/1/24(2) | | | | | | | 120 | | | | 126,150 | |
CCO Holdings, LLC/CCO Holdings Capital Corp., 5.875%, 4/1/24(2) | | | | | | | 1,130 | | | | 1,206,275 | |
Cequel Communications Holdings I, LLC/Cequel Capital Corp., 5.125%, 12/15/21(2) | | | | | | | 10 | | | | 10,238 | |
Cequel Communications Holdings I, LLC/Cequel Capital Corp., 6.375%, 9/15/20(2) | | | | | | | 294 | | | | 300,650 | |
CSC Holdings, LLC, 6.75%, 11/15/21 | | | | | | | 500 | | | | 552,500 | |
CSC Holdings, LLC, 10.875%, 10/15/25(2) | | | | | | | 422 | | | | 518,005 | |
DISH DBS Corp., 7.75%, 7/1/26 | | | | | | | 155 | | | | 170,113 | |
McGraw-Hill Global Education Holdings, LLC/McGraw-Hill Global Education Finance, 7.875%, 5/15/24(2) | | | | | | | 140 | | | | 141,400 | |
MDC Partners, Inc., 6.50%, 5/1/24(2) | | | | | | | 240 | | | | 246,000 | |
MHGE Parent, LLC/MHGE Parent Finance, Inc., 8.50%, (8.50% Cash or 9.25% PIK), 8/1/19(2)(8) | | | | | | | 35 | | | | 35,131 | |
Salem Media Group, Inc., 6.75%, 6/1/24(2) | | | | | | | 295 | | | | 309,750 | |
SFR Group S.A., 7.375%, 5/1/26(2) | | | | | | | 1,010 | | | | 1,089,537 | |
Sirius XM Radio, Inc., 5.00%, 8/1/27(2) | | | | | | | 185 | | | | 187,544 | |
Sirius XM Radio, Inc., 6.00%, 7/15/24(2) | | | | | | | 500 | | | | 535,000 | |
Unitymedia Hessen GmbH & Co. KG/Unitymedia NRW GmbH, 4.00%, 1/15/25(6) | | | EUR | | | | 850 | | | | 1,057,638 | |
UPC Holding B.V., 5.50%, 1/15/28(2) | | | | | | | 260 | | | | 259,350 | |
Virgin Media Receivables Financing Notes I DAC, 5.50%, 9/15/24(6) | | | GBP | | | | 475 | | | | 658,748 | |
Ziggo Secured Finance B.V., 5.50%, 1/15/27(2) | | | | | | | 150 | | | | 153,375 | |
| | | | | | | | | | | | | |
| | | $ | 9,386,063 | |
| | | | | | | | | | | | | |
| | | |
Metals & Mining — 1.3% | | | | | | | | | | | | |
Allegheny Ludlum, LLC, 6.95%, 12/15/25 | | | | | | | 450 | | | $ | 456,750 | |
Allegheny Technologies, Inc., 5.95%, 1/15/21 | | | | | | | 50 | | | | 51,688 | |
Allegheny Technologies, Inc., 7.875%, 8/15/23 | | | | | | | 205 | | | | 224,987 | |
BHP Billiton Finance USA, Ltd., 6.75% to 10/19/25, 10/19/75(2)(4) | | | | | | | 270 | | | | 318,600 | |
Big River Steel, LLC/BRS Finance Corp., 7.25%, 9/1/25(2) | | | | | | | 160 | | | | 172,000 | |
Eldorado Gold Corp., 6.125%, 12/15/20(2) | | | | | | | 45 | | | | 44,775 | |
Ferroglobe PLC/Globe Specialty Metals, Inc., 9.375%, 3/1/22(2) | | | | | | | 750 | | | | 817,500 | |
First Quantum Minerals, Ltd., 7.00%, 2/15/21(2) | | | | | | | 75 | | | | 78,094 | |
First Quantum Minerals, Ltd., 7.25%, 4/1/23(2) | | | | | | | 415 | | | | 440,937 | |
First Quantum Minerals, Ltd., 7.50%, 4/1/25(2) | | | | | | | 445 | | | | 472,812 | |
| | | | | | | | | | | | |
| Security | | | | | Principal Amount* (000’s omitted) | | | Value | |
| | | | | | | | | | | | |
| | | |
Metals & Mining (continued) | | | | | | | | | | | | |
Freeport-McMoRan, Inc., 3.10%, 3/15/20 | | | | | | | 40 | | | $ | 40,200 | |
Freeport-McMoRan, Inc., 4.55%, 11/14/24 | | | | | | | 75 | | | | 75,188 | |
Hudbay Minerals, Inc.,
7.25%, 1/15/23(2) | | | | | | | 115 | | | | 124,487 | |
Hudbay Minerals, Inc., 7.625%, 1/15/25(2) | | | | | | | 200 | | | | 221,500 | |
New Gold, Inc., 6.25%, 11/15/22(2) | | | | | | | 155 | | | | 160,425 | |
New Gold, Inc., 6.375%, 5/15/25(2) | | | | | | | 85 | | | | 90,525 | |
Northwest Acquisitions ULC/Dominion Finco, Inc., 7.125%, 11/1/22(2) | | | | | | | 70 | | | | 72,975 | |
Novelis Corp., 5.875%, 9/30/26(2) | | | | | | | 180 | | | | 185,962 | |
Novelis Corp., 6.25%, 8/15/24(2) | | | | | | | 125 | | | | 132,187 | |
SunCoke Energy Partners, L.P./SunCoke Energy Partners Finance Corp., 7.50%, 6/15/25(2) | | | | | | | 165 | | | | 174,075 | |
Teck Resources, Ltd., 5.20%, 3/1/42 | | | | | | | 40 | | | | 40,300 | |
Teck Resources, Ltd., 5.40%, 2/1/43 | | | | | | | 85 | | | | 87,125 | |
Teck Resources, Ltd., 6.00%, 8/15/40 | | | | | | | 45 | | | | 50,119 | |
Teck Resources, Ltd., 8.50%, 6/1/24(2) | | | | | | | 130 | | | | 149,175 | |
United States Steel Corp., 8.375%, 7/1/21(2) | | | | | | | 85 | | | | 92,969 | |
Zekelman Industries, Inc., 9.875%, 6/15/23(2) | | | | | | | 15 | | | | 16,988 | |
| | | | | | | | | | | | | |
| | | $ | 4,792,343 | |
| | | | | | | | | | | | | |
| | | |
Multi-Utilities — 0.4% | | | | | | | | | | | | |
Dominion Resources, Inc., 5.75% to 10/1/24, 10/1/54(4) | | | | | | | 114 | | | $ | 123,963 | |
Thames Water Kemble Finance PLC, 5.875%, 7/15/22(6) | | | GBP | | | | 900 | | | | 1,336,858 | |
| | | | | | | | | | | | | |
| | | $ | 1,460,821 | |
| | | | | | | | | | | | | |
| | | |
Multiline Retail — 0.1% | | | | | | | | | | | | |
Dollar Tree, Inc., 5.75%, 3/1/23 | | | | | | | 330 | | | $ | 348,563 | |
| | | | | | | | | | | | | |
| | | $ | 348,563 | |
| | | | | | | | | | | | | |
|
Oil, Gas & Consumable Fuels — 2.8% | |
AmeriGas Partners, L.P./AmeriGas Finance Corp., 5.50%, 5/20/25 | | | | | | | 120 | | | $ | 123,300 | |
AmeriGas Partners, L.P./AmeriGas Finance Corp., 5.625%, 5/20/24 | | | | | | | 30 | | | | 31,763 | |
AmeriGas Partners, L.P./AmeriGas Finance Corp., 5.75%, 5/20/27 | | | | | | | 55 | | | | 56,444 | |
AmeriGas Partners, L.P./AmeriGas Finance Corp., 5.875%, 8/20/26 | | | | | | | 55 | | | | 57,475 | |
Antero Resources Corp., 5.375%, 11/1/21 | | | | | | | 1,000 | | | | 1,030,000 | |
Canbriam Energy, Inc., 9.75%, 11/15/19(2) | | | | | | | 305 | | | | 311,862 | |
Cheniere Energy Partners, L.P., 5.25%, 10/1/25(2) | | | | | | | 330 | | | | 340,725 | |
Chesapeake Energy Corp., 8.00%, 12/15/22(2) | | | | | | | 31 | | | | 33,470 | |
Continental Resources, Inc., 4.50%, 4/15/23 | | | | | | | 145 | | | | 147,175 | |
| | | | |
| | 23 | | See Notes to Financial Statements. |
Global Income Builder Portfolio
October 31, 2017
Portfolio of Investments — continued
| | | | | | | | | | | | |
| Security | | | | | Principal Amount* (000’s omitted) | | | Value | |
| | | | | | | | | | | | |
|
Oil, Gas & Consumable Fuels (continued) | |
CrownRock, L.P./CrownRock Finance, Inc., 5.625%, 10/15/25(2) | | | | | | | 585 | | | $ | 595,460 | |
CVR Refining, LLC/Coffeyville Finance, Inc., 6.50%, 11/1/22 | | | | | | | 200 | | | | 206,500 | |
Denbury Resources, Inc., 9.00%, 5/15/21(2) | | | | | | | 110 | | | | 108,075 | |
Diamondback Energy, Inc., 4.75%, 11/1/24 | | | | | | | 60 | | | | 61,350 | |
Diamondback Energy, Inc., 5.375%, 5/31/25 | | | | | | | 155 | | | | 161,781 | |
Endeavor Energy Resources, L.P./EER Finance, Inc., 7.00%, 8/15/21(2) | | | | | | | 40 | | | | 41,475 | |
Endeavor Energy Resources, L.P./EER Finance, Inc., 8.125%, 9/15/23(2) | | | | | | | 500 | | | | 540,000 | |
EnLink Midstream Partners, LP, Series C, 6.00% to 12/15/22(4)(5) | | | | | | | 392 | | | | 395,823 | |
EP Energy, LLC/Everest Acquisition Finance, Inc., 8.00%, 11/29/24(2) | | | | | | | 110 | | | | 112,750 | |
Extraction Oil & Gas, Inc.,
7.375%, 5/15/24(2) | | | | | | | 195 | | | | 208,650 | |
Extraction Oil & Gas, Inc./Extraction Finance Corp., 7.875%, 7/15/21(2) | | | | | | | 208 | | | | 221,520 | |
Great Western Petroleum, LLC/Great Western Finance Corp.,
9.00%, 9/30/21(2) | | | | | | | 360 | | | | 370,800 | |
Gulfport Energy Corp., 6.00%, 10/15/24 | | | | | | | 49 | | | | 49,245 | |
Gulfport Energy Corp., 6.625%, 5/1/23 | | | | | | | 350 | | | | 360,500 | |
Murphy Oil Corp., 6.875%, 8/15/24 | | | | | | | 55 | | | | 59,262 | |
Murphy Oil USA, Inc., 5.625%, 5/1/27 | | | | | | | 65 | | | | 69,144 | |
Murphy Oil USA, Inc., 6.00%, 8/15/23 | | | | | | | 500 | | | | 526,875 | |
Newfield Exploration Co., 5.375%, 1/1/26 | | | | | | | 45 | | | | 48,038 | |
Newfield Exploration Co., 5.625%, 7/1/24 | | | | | | | 65 | | | | 70,606 | |
Oasis Petroleum, Inc., 6.50%, 11/1/21 | | | | | | | 50 | | | | 51,125 | |
Oasis Petroleum, Inc., 6.875%, 3/15/22 | | | | | | | 45 | | | | 46,463 | |
Oasis Petroleum, Inc., 6.875%, 1/15/23 | | | | | | | 235 | | | | 241,462 | |
Odebrecht Oil & Gas Finance, Ltd., 7.00% to 6/17/24(2)(4)(5)(9) | | | | | | | 783 | | | | 37,193 | |
Parsley Energy, LLC/Parsley Finance Corp., 5.25%, 8/15/25(2) | | | | | | | 75 | | | | 76,125 | |
Parsley Energy, LLC/Parsley Finance Corp., 5.375%, 1/15/25(2) | | | | | | | 140 | | | | 142,800 | |
Parsley Energy, LLC/Parsley Finance Corp., 5.625%, 10/15/27(2) | | | | | | | 185 | | | | 191,360 | |
Parsley Energy, LLC/Parsley Finance Corp., 6.25%, 6/1/24(2) | | | | | | | 150 | | | | 159,750 | |
PBF Holding Co., LLC/PBF Finance Corp., 7.00%, 11/15/23 | | | | | | | 50 | | | | 52,250 | |
PBF Holding Co., LLC/PBF Finance Corp., 7.25%, 6/15/25(2) | | | | | | | 90 | | | | 93,262 | |
Plains All American Pipeline, LP, Series B, 6.125% to 11/15/22(4)(5) | | | | | | | 560 | | | | 572,208 | |
Precision Drilling Corp., 6.50%, 12/15/21 | | | | | | | 25 | | | | 25,375 | |
| | | | | | | | | | | | |
| Security | | | | | Principal Amount* (000’s omitted) | | | Value | |
| | | | | | | | | | | | |
|
Oil, Gas & Consumable Fuels (continued) | |
Precision Drilling Corp., 6.625%, 11/15/20 | | | | | | | 18 | | | $ | 18,162 | |
Precision Drilling Corp., 7.75%, 12/15/23 | | | | | | | 10 | | | | 10,300 | |
Resolute Energy Corp., 8.50%, 5/1/20 | | | | | | | 210 | | | | 214,200 | |
Seven Generations Energy, Ltd., 5.375%, 9/30/25(2) | | | | | | | 255 | | | | 258,187 | |
Seven Generations Energy, Ltd., 6.75%, 5/1/23(2) | | | | | | | 25 | | | | 26,688 | |
SM Energy Co., 5.625%, 6/1/25 | | | | | | | 85 | | | | 83,087 | |
SM Energy Co., 6.125%, 11/15/22 | | | | | | | 435 | | | | 439,350 | |
SM Energy Co., 6.75%, 9/15/26 | | | | | | | 175 | | | | 180,469 | |
Trinidad Drilling, Ltd., 6.625%, 2/15/25(2) | | | | | | | 165 | | | | 161,287 | |
Weatherford International, Ltd., 8.25%, 6/15/23 | | | | | | | 40 | | | | 40,300 | |
Weatherford International, Ltd., 9.875%, 2/15/24 | | | | | | | 95 | | | | 102,125 | |
Whiting Petroleum Corp., 5.00%, 3/15/19 | | | | | | | 45 | | | | 45,619 | |
Whiting Petroleum Corp., 5.75%, 3/15/21 | | | | | | | 25 | | | | 25,250 | |
WildHorse Resource Development Corp., 6.875%, 2/1/25(2) | | | | | | | 370 | | | | 368,150 | |
WPX Energy, Inc., 7.50%, 8/1/20 | | | | | | | 64 | | | | 69,760 | |
| | | | | | | | | | | | | |
| | | $ | 10,072,375 | |
| | | | | | | | | | | | | |
| | | |
Pharmaceuticals — 0.4% | | | | | | | | | | | | |
Catalent Pharma Solutions, Inc., 4.875%, 1/15/26(2) | | | | | | | 195 | | | $ | 198,412 | |
inVentiv Group Holdings, Inc./inVentiv Health, Inc./inVentiv Health Clinical, Inc., 7.50%, 10/1/24(2) | | | | | | | 198 | | | | 219,285 | |
PRA Holdings, Inc., 9.50%, 10/1/23(2) | | | | | | | 80 | | | | 86,600 | |
Valeant Pharmaceuticals International, Inc., 5.50%, 11/1/25(2) | | | | | | | 195 | | | | 199,631 | |
Valeant Pharmaceuticals International, Inc., 5.875%, 5/15/23(2) | | | | | | | 130 | | | | 110,013 | |
Valeant Pharmaceuticals International, Inc., 6.375%, 10/15/20(2) | | | | | | | 167 | | | | 166,374 | |
Valeant Pharmaceuticals International, Inc., 6.50%, 3/15/22(2) | | | | | | | 155 | | | | 164,881 | |
Valeant Pharmaceuticals International, Inc., 7.00%, 3/15/24(2) | | | | | | | 315 | | | | 341,775 | |
Vizient, Inc., 10.375%, 3/1/24(2) | | | | | | | 125 | | | | 142,813 | |
| | | | | | | | | | | | | |
| | | $ | 1,629,784 | |
| | | | | | | | | | | | | |
| | | |
Pipelines — 0.8% | | | | | | | | | | | | |
Andeavor Logistics, L.P./Tesoro Logistics Finance Corp., 6.25%, 10/15/22 | | | | | | | 1,000 | | | $ | 1,070,000 | |
Andeavor Logistics, L.P./Tesoro Logistics Finance Corp., 6.375%, 5/1/24 | | | | | | | 105 | | | | 115,500 | |
Antero Midstream Partners, L.P./Antero Midstream Finance Corp., 5.375%, 9/15/24 | | | | | | | 80 | | | | 83,800 | |
Cheniere Corpus Christi Holdings, LLC, 5.125%, 6/30/27(2) | | | | | | | 175 | | | | 180,906 | |
| | | | |
| | 24 | | See Notes to Financial Statements. |
Global Income Builder Portfolio
October 31, 2017
Portfolio of Investments — continued
| | | | | | | | | | | | |
| Security | | | | | Principal Amount* (000’s omitted) | | | Value | |
| | | | | | | | | | | | |
| | | |
Pipelines (continued) | | | | | | | | | | | | |
Cheniere Corpus Christi Holdings, LLC, 5.875%, 3/31/25 | | | | | | | 230 | | | $ | 249,837 | |
Cheniere Corpus Christi Holdings, LLC, 7.00%, 6/30/24 | | | | | | | 170 | | | | 194,863 | |
Energy Transfer Equity, L.P., 5.875%, 1/15/24 | | | | | | | 20 | | | | 21,800 | |
Holly Energy Partners, L.P./Holly Energy Finance Corp., 6.00%, 8/1/24(2) | | | | | | | 60 | | | | 63,150 | |
NGPL PipeCo, LLC,
4.375%, 8/15/22(2) | | | | | | | 50 | | | | 51,563 | |
NGPL PipeCo, LLC,
4.875%, 8/15/27(2) | | | | | | | 50 | | | | 51,875 | |
Tallgrass Energy Partners, L.P./Tallgrass Energy Finance Corp., 5.50%, 1/15/28(2) | | | | | | | 385 | | | | 395,587 | |
Williams Cos., Inc. (The), 3.70%, 1/15/23 | | | | | | | 230 | | | | 233,163 | |
Williams Cos., Inc. (The), 4.55%, 6/24/24 | | | | | | | 125 | | | | 131,250 | |
Williams Cos., Inc. (The), 5.75%, 6/24/44 | | | | | | | 140 | | | | 149,100 | |
| | | | | | | | | | | | | |
| | | $ | 2,992,394 | |
| | | | | | | | | | | | | |
|
Real Estate Investment Trusts (REITs) — 1.2% | |
Equinix, Inc., 2.875%, 10/1/25 | | | EUR | | | | 705 | | | $ | 843,954 | |
ESH Hospitality, Inc., 5.25%, 5/1/25(2) | | | | | | | 160 | | | | 165,800 | |
Greystar Real Estate Partners, LLC, 8.25%, 12/1/22(2) | | | | | | | 35 | | | | 37,333 | |
Kennedy Wilson Europe Real Estate PLC, 3.25%, 11/12/25(6) | | | EUR | | | | 1,100 | | | | 1,358,809 | |
Mattamy Group Corp., 6.50%, 10/1/25(2) | | | | | | | 180 | | | | 188,550 | |
Mattamy Group Corp., 6.875%, 12/15/23(2) | | | | | | | 250 | | | | 263,750 | |
Miller Homes Group Holdings PLC, 5.50%, 10/15/24(6) | | | GBP | | | | 1,095 | | | | 1,505,771 | |
| | | | | | | | | | | | | |
| | | $ | 4,363,967 | |
| | | | | | | | | | | | | |
|
Semiconductors & Semiconductor Equipment — 0.3% | |
Micron Technology, Inc., 5.25%, 8/1/23(2) | | | | | | | 55 | | | $ | 57,844 | |
Microsemi Corp., 9.125%, 4/15/23(2) | | | | | | | 575 | | | | 655,500 | |
NXP B.V./NXP Funding, LLC, 4.125%, 6/1/21(2) | | | | | | | 200 | | | | 209,500 | |
Versum Materials, Inc., 5.50%, 9/30/24(2) | | | | | | | 145 | | | | 154,787 | |
| | | | | | | | | | | | | |
| | | $ | 1,077,631 | |
| | | | | | | | | | | | | |
| | | |
Software — 0.7% | | | | | | | | | | | | |
Camelot Finance S.A., 7.875%, 10/15/24(2) | | | | | | | 130 | | | $ | 140,075 | |
Infor (US), Inc., 5.75%, 8/15/20(2) | | | | | | | 160 | | | | 164,880 | |
j2 Cloud Services, LLC/j2 Global Co-Obligor, Inc., 6.00%, 7/15/25(2) | | | | | | | 195 | | | | 206,212 | |
Solera, LLC/Solera Finance, Inc., 10.50%, 3/1/24(2) | | | | | | | 545 | | | | 624,025 | |
SS&C Technologies Holdings, Inc., 5.875%, 7/15/23 | | | | | | | 775 | | | | 822,469 | |
Symantec Corp., 5.00%, 4/15/25(2) | | | | | | | 115 | | | | 120,463 | |
Veritas US, Inc./Veritas Bermuda, Ltd., 7.50%, 2/1/23(2) | | | | | | | 200 | | | | 213,000 | |
Veritas US, Inc./Veritas Bermuda, Ltd., 10.50%, 2/1/24(2) | | | | | | | 260 | | | | 278,200 | |
| | | | | | | | | | | | | |
| | | $ | 2,569,324 | |
| | | | | | | | | | | | | |
| | | | | | | | | | | | |
| Security | | | | | Principal Amount* (000’s omitted) | | | Value | |
| | | | | | | | | | | | |
| | | |
Specialty Retail — 0.1% | | | | | | | | | | | | |
Beacon Escrow Corp., 4.875%, 11/1/25(2) | | | | | | | 190 | | | $ | 193,563 | |
Hot Topic, Inc., 9.25%, 6/15/21(2) | | | | | | | 195 | | | | 162,581 | |
| | | | | | | | | | | | | |
| | | $ | 356,144 | |
| | | | | | | | | | | | | |
|
Technology Hardware, Storage & Peripherals — 0.6% | |
Dell International, LLC/EMC Corp., 5.45%, 6/15/23(2) | | | | | | | 135 | | | $ | 148,072 | |
Dell International, LLC/EMC Corp., 5.875%, 6/15/21(2) | | | | | | | 205 | | | | 215,199 | |
Dell International, LLC/EMC Corp., 6.02%, 6/15/26(2) | | | | | | | 355 | | | | 396,945 | |
Dell International, LLC/EMC Corp., 7.125%, 6/15/24(2) | | | | | | | 235 | | | | 259,477 | |
Western Digital Corp.,
7.375%, 4/1/23(2) | | | | | | | 590 | | | | 647,525 | |
Western Digital Corp., 10.50%, 4/1/24 | | | | | | | 475 | | | | 558,600 | |
| | | | | | | | | | | | | |
| | | $ | 2,225,818 | |
| | | | | | | | | | | | | |
| | | |
Telecommunications — 1.4% | | | | | | | | | | | | |
Avaya, Inc., 9.00%, 4/1/19(2)(9) | | | | | | | 400 | | | $ | 337,000 | |
Hughes Satellite Systems Corp., 5.25%, 8/1/26 | | | | | | | 145 | | | | 148,818 | |
Hughes Satellite Systems Corp., 6.625%, 8/1/26 | | | | | | | 195 | | | | 206,213 | |
Intelsat Jackson Holdings S.A., 5.50%, 8/1/23 | | | | | | | 45 | | | | 38,531 | |
Intelsat Jackson Holdings S.A., 7.25%, 10/15/20 | | | | | | | 85 | | | | 82,212 | |
Intelsat Jackson Holdings S.A., 8.00%, 2/15/24(2) | | | | | | | 200 | | | | 213,500 | |
Intelsat Jackson Holdings S.A., 9.75%, 7/15/25(2) | | | | | | | 185 | | | | 186,850 | |
Qualitytech, L.P./QTS Finance Corp., 4.75%, 11/15/25(2)(7) | | | | | | | 150 | | | | 153,525 | |
Sprint Capital Corp., 6.875%, 11/15/28 | | | | | | | 730 | | | | 780,644 | |
Sprint Corp., 7.875%, 9/15/23 | | | | | | | 1,800 | | | | 2,016,000 | |
T-Mobile USA, Inc., 6.625%, 4/1/23 | | | | | | | 1,025 | | | | 1,078,812 | |
| | | | | | | | | | | | | |
| | | $ | 5,242,105 | |
| | | | | | | | | | | | | |
|
Textiles, Apparel & Luxury Goods — 0.3% | |
CBR Fashion Finance BV, 5.125%, 10/1/22(6)(7) | | | EUR | | | | 815 | | | $ | 957,880 | |
| | | | | | | | | | | | | |
| | | $ | 957,880 | |
| | | | | | | | | | | | | |
|
Thrifts & Mortgage Finance — 0.1% | |
Flagstar Bancorp, Inc., 6.125%, 7/15/21 | | | | | | | 235 | | | $ | 249,552 | |
| | | | | | | | | | | | | |
| | | $ | 249,552 | |
| | | | | | | | | | | | | |
| | | |
Transportation — 0.5% | | | | | | | | | | | | |
CEVA Group PLC, 7.00%, 3/1/21(2) | | | | | | | 75 | | | $ | 72,188 | |
CMA CGM S.A., 5.25%, 1/15/25(6) | | | EUR | | | | 700 | | | | 835,242 | |
Watco Cos., LLC/Watco Finance Corp., 6.375%, 4/1/23(2) | | | | | | | 260 | | | | 271,050 | |
| | | | |
| | 25 | | See Notes to Financial Statements. |
Global Income Builder Portfolio
October 31, 2017
Portfolio of Investments — continued
| | | | | | | | | | | | |
| Security | | | | | Principal Amount* (000’s omitted) | | | Value | |
| | | | | | | | | | | | |
| | | |
Transportation (continued) | | | | | | | | | | | | |
XPO Logistics, Inc.,
6.125%, 9/1/23(2) | | | | | | | 80 | | | $ | 84,500 | |
XPO Logistics, Inc.,
6.50%, 6/15/22(2) | | | | | | | 500 | | | | 526,965 | |
| | | | | | | | | | | | | |
| | | $ | 1,789,945 | |
| | | | | | | | | | | | | |
| |
Total Corporate Bonds & Notes
(identified cost $112,327,142) | | | $ | 117,650,140 | |
| | | | | | | | | | | | | |
|
| Senior Floating-Rate Loans — 2.7%(10) | |
| | | |
| | | | | | | | | | | | |
| Borrower/Tranche Description | | | Principal Amount (000’s omitted) | | | Value | |
|
Business Equipment and Services — 0.1% | |
EIG Investors Corp., Term Loan, 5.32%, (3 mo. USD LIBOR + 4.00%), Maturing 2/9/23 | | | $ | 492 | | | $ | 497,744 | |
| | | | | | | | | | | | | |
| | | $ | 497,744 | |
| | | | | | | | | | | | | |
| |
Chemicals and Plastics — 0.0%(3) | | | | | |
Avantor, Inc., Term Loan, Maturing 9/7/24(11) | | | $ | 115 | | | $ | 115,413 | |
| | | | | | | | | | | | | |
| | | $ | 115,413 | |
| | | | | | | | | | | | | |
|
Containers and Glass Products — 0.3% | |
BWAY Holding Company, Term Loan, 4.60%, (USD LIBOR + 3.25%), Maturing
4/3/24(12) | | | $ | 998 | | | $ | 1,001,685 | |
| | | | | | | | | | | | | |
| | | $ | 1,001,685 | |
| | | | | | | | | | | | | |
|
Electronics / Electrical — 0.5% | |
Applied Systems, Inc., Term Loan, 4.57%, (3 mo. USD LIBOR + 3.25%), Maturing 9/19/24 | | | $ | 180 | | | $ | 182,450 | |
Cortes NP Acquisition Corporation, Term Loan, 5.69%, (USD LIBOR + 4.00%), Maturing 11/30/23(12) | | | | 635 | | | | 638,445 | |
Riverbed Technology, Inc., Term Loan, 4.50%, (1 mo. USD LIBOR + 3.25%), Maturing 4/24/22 | | | | 500 | | | | 484,553 | |
Solera, LLC, Term Loan, 4.49%, (1 mo. USD LIBOR + 3.25%), Maturing 3/3/23 | | | | | | | 686 | | | | 691,658 | |
| | | | | | | | | | | | | |
| | | $ | 1,997,106 | |
| | | | | | | | | | | | | |
|
Food / Drug Retailers — 0.3% | |
Albertsons, LLC, Term Loan, 4.32%, (3 mo. USD LIBOR + 3.00%), Maturing 6/22/23 | | | | | | $ | 998 | | | $ | 968,466 | |
| | | | | | | | | | | | | |
| | | $ | 968,466 | |
| | | | | | | | | | | | | |
| | | | | | | | | | | | |
| Borrower/Tranche Description | | | Principal Amount (000’s omitted) | | | Value | |
| | | | | | | | | | | | |
| | | |
Health Care — 0.4% | | | | | | | | | | | | |
MPH Acquisition Holdings, LLC, Term Loan, 4.33%, (3 mo. USD LIBOR + 3.00%), Maturing 6/7/23 | | | | | | $ | 909 | | | $ | 917,291 | |
Press Ganey Holdings, Inc., Term Loan, 4.24%, (1 mo. USD LIBOR + 3.00%), Maturing 10/23/23 | | | | | | | 189 | | | | 189,990 | |
Press Ganey Holdings, Inc., Term Loan - Second Lien, 7.74%, (1 mo. USD LIBOR + 6.50%), Maturing 10/21/24 | | | | | | | 428 | | | | 432,903 | |
| | | | | | | | | | | | | |
| | | $ | 1,540,184 | |
| | | | | | | | | | | | | |
| | | |
Insurance — 0.2% | | | | | | | | | | | | |
Asurion, LLC, Term Loan - Second Lien, 7.24%, (1 mo. USD LIBOR + 6.00%), Maturing 8/4/25 | | | | | | $ | 555 | | | $ | 573,471 | |
| | | | | | | | | | | | | |
| | | $ | 573,471 | |
| | | | | | | | | | | | | |
| | | |
Lodging and Casinos — 0.3% | | | | | | | | | | | | |
Gateway Casinos & Entertainment Limited, Term Loan, 5.08%, (3 mo. USD LIBOR + 3.75%), Maturing 2/22/23 | | | | | | $ | 998 | | | $ | 1,011,008 | |
| | | | | | | | | | | | | |
| | | $ | 1,011,008 | |
| | | | | | | | | | | | | |
| | | |
Oil and Gas — 0.1% | | | | | | | | | | | | |
Chesapeake Energy Corporation, Term Loan, 8.81%, (3 mo. USD LIBOR + 7.50%), Maturing 8/23/21 | | | | | | $ | 365 | | | $ | 393,014 | |
| | | | | | | | | | | | | |
| | | $ | 393,014 | |
| | | | | | | | | | | | | |
| | | |
Publishing — 0.1% | | | | | | | | | | | | |
McGraw-Hill Global Education Holdings, LLC, Term Loan, 5.24%, (1 mo. USD LIBOR + 4.00%), Maturing 5/4/22 | | | | | | $ | 517 | | | $ | 515,161 | |
| | | | | | | | | | | | | |
| | | $ | 515,161 | |
| | | | | | | | | | | | | |
| | | |
Steel — 0.1% | | | | | | | | | | | | |
Big River Steel, LLC, Term Loan, 6.33%, (3 mo. USD LIBOR + 5.00%), Maturing 8/23/23 | | | | | | $ | 175 | | | $ | 178,937 | |
| | | | | | | | | | | | | |
| | | $ | 178,937 | |
| | | | | | | | | | | | | |
| | | |
Telecommunications — 0.3% | | | | | | | | | | | | |
CenturyLink, Inc., Term Loan, 2.75%, Maturing 1/31/25(13) | | | | | | $ | 990 | | | $ | 978,141 | |
| | | | | | | | | | | | | |
| | | $ | 978,141 | |
| | | | | | | | | | | | | |
| |
Total Senior Floating-Rate Loans
(identified cost $9,771,060) | | | $ | 9,770,330 | |
| | | | | | | | | | | | | |
| | | | |
| | 26 | | See Notes to Financial Statements. |
Global Income Builder Portfolio
October 31, 2017
Portfolio of Investments — continued
| | | | | | | | | | | | |
| Convertible Bonds — 0.1% | |
| | | |
| | | | | | | | | | | | |
| Security | | | | | Principal Amount (000’s omitted) | | | Value | |
| | | | | | | | | | | | |
| | | |
Utilities — 0.1% | | | | | | | | | | | | |
NRG Yield, Inc., 3.25%, 6/1/20(2) | | | | | | $ | 300 | | | $ | 300,750 | |
| | | | | | | | | | | | | |
| |
Total Convertible Bonds
(identified cost $284,647) | | | $ | 300,750 | |
| | | | | | | | | | | | | |
|
| Short-Term Investments — 0.7% | |
| | | |
| | | | | | | | | | | | |
| Description | | | | | Units | | | Value | |
Eaton Vance Cash Reserves Fund, LLC, 1.35%(14) | | | | | | | 2,642,068 | | | $ | 2,642,332 | |
| | | | | | | | | | | | | |
| |
Total Short-Term Investments
(identified cost $2,642,332) | | | $ | 2,642,332 | |
| | | | | | | | | | | | | |
| |
Total Investments — 97.5%
(identified cost $331,655,101) | | | $ | 355,546,437 | |
| | | | | | | | | | | | | |
| |
Other Assets, Less Liabilities — 2.5% | | | $ | 8,929,779 | |
| | | | | | | | | | | | | |
| |
Net Assets — 100.0% | | | $ | 364,476,216 | |
| | | | | | | | | | | | | |
The percentage shown for each investment category in the Portfolio of Investments is based on net assets.
| �� | * | In U.S. dollars unless otherwise indicated. |
| | (1) | Non-income producing security. |
| | (2) | Security exempt from registration pursuant to Rule 144A under the Securities Act of 1933, as amended. These securities may be sold in certain transactions in reliance on an exemption from registration (normally to qualified institutional buyers). At October 31, 2017, the aggregate value of these securities is $54,448,432 or 14.9% of the Portfolio’s net assets. |
| | (3) | Amount is less than 0.05%. |
| | (4) | Security converts to floating rate after the indicated fixed-rate coupon period. |
| | (5) | Perpetual security with no stated maturity date but may be subject to calls by the issuer. |
| | (6) | Security exempt from registration under Regulation S of the Securities Act of 1933, which exempts from registration securities offered and sold outside the United States. Security may not be offered or sold in the United States except pursuant to an exemption from, or in a transaction not subject to, the registration requirements of the Securities Act of 1933. At October 31, 2017, the aggregate value of these securities is $25,709,856 or 7.1% of the Portfolio’s net assets. |
| | (7) | When-issued security. |
| | (8) | Represents a payment-in-kind security which may pay interest in additional principal at the issuer’s discretion. |
| | (9) | Issuer is in default with respect to interest and/or principal payments. |
| (10) | Senior floating-rate loans (Senior Loans) often require prepayments from excess cash flows or permit the borrowers to repay at their election. The degree to which borrowers repay, whether as a contractual requirement or at their election, cannot be predicted with accuracy. As a result, the actual remaining maturity may be substantially less than the stated maturities shown. However, Senior Loans will typically have an expected average life of approximately two to four years. Senior Loans typically have rates of interest which are redetermined periodically by reference to a base lending rate, plus a spread. These base lending rates are primarily the London Interbank Offered Rate (“LIBOR”) and secondarily, the prime rate offered by one or more major United States banks (the “Prime Rate”). Base lending rates may be subject to a floor, or minimum rate. |
| (11) | This Senior Loan will settle after October 31, 2017, at which time the interest rate will be determined. |
| (12) | The stated interest rate represents the weighted average interest rate at October 31, 2017 of contracts within the senior loan facility. Interest rates on contracts are primarily redetermined either weekly, monthly or quarterly by reference to the indicated base lending rate and spread and the reset period. |
| (14) | Affiliated investment company, available to Eaton Vance portfolios and funds, which invests in high quality, U.S. dollar denominated money market instruments. The rate shown is the annualized seven-day yield as of October 31, 2017. |
| | | | | | | | |
| Country Concentration of Portfolio | |
| | |
| | | | | | | | |
| Country | | Percentage of Total Investments | | | Value | |
United States | | | 57.4 | % | | $ | 203,978,095 | |
United Kingdom | | | 10.9 | | | | 38,877,060 | |
Japan | | | 6.4 | | | | 22,607,036 | |
France | | | 4.6 | | | | 16,258,425 | |
Canada | | | 3.8 | | | | 13,411,616 | |
Netherlands | | | 3.4 | | | | 12,230,447 | |
Spain | | | 2.6 | | | | 9,090,886 | |
Germany | | | 1.6 | | | | 5,606,357 | |
Switzerland | | | 1.5 | | | | 5,445,457 | |
Denmark | | | 1.3 | | | | 4,622,988 | |
Ireland | | | 1.1 | | | | 3,781,407 | |
Luxembourg | | | 0.7 | | | | 2,590,155 | |
Taiwan | | | 0.7 | | | | 2,446,208 | |
Belgium | | | 0.7 | | | | 2,382,528 | |
Hong Kong | | | 0.7 | | | | 2,344,792 | |
Italy | | | 0.7 | | | | 2,326,963 | |
Sweden | | | 0.6 | | | | 2,208,260 | |
China | | | 0.5 | | | | 1,797,387 | |
Brazil | | | 0.3 | | | | 1,241,948 | |
New Zealand | | | 0.2 | | | | 784,192 | |
Australia | | | 0.1 | | | | 548,880 | |
Chile | | | 0.1 | | | | 546,775 | |
United Arab Emirates | | | 0.1 | | | | 418,575 | |
| | | | | | | | | |
Total Investments | | | 100.0 | % | | $ | 355,546,437 | |
| | | | | | | | | |
| | | | |
| | 27 | | See Notes to Financial Statements. |
Global Income Builder Portfolio
October 31, 2017
Portfolio of Investments — continued
Abbreviations:
| | | | |
| ADR | | – | | American Depositary Receipt |
| LIBOR | | – | | London Interbank Offered Rate |
| PC | | – | | Participation Certificate |
| PIK | | – | | Payment In Kind |
Currency Abbreviations:
| | | | |
| EUR | | – | | Euro |
| GBP | | – | | British Pound Sterling |
| USD | | – | | United States Dollar |
| | | | |
| | 28 | | See Notes to Financial Statements. |
Global Income Builder Portfolio
October 31, 2017
Statement of Assets and Liabilities
| | | | |
| Assets | | October 31, 2017 | |
Unaffiliated investments, at value (identified cost, $329,012,769) | | $ | 352,904,105 | |
Affiliated investment, at value (identified cost, $2,642,332) | | | 2,642,332 | |
Foreign currency, at value (identified cost, $8,401,473) | | | 8,333,520 | |
Interest and dividends receivable | | | 2,085,723 | |
Dividends receivable from affiliated investment | | | 2,428 | |
Receivable for investments sold | | | 6,090,983 | |
Tax reclaims receivable | | | 1,202,697 | |
Total assets | | $ | 373,261,788 | |
| |
| Liabilities | | | | |
Payable for investments purchased | | $ | 6,317,304 | |
Payable for when-issued securities | | | 1,835,186 | |
Due to broker | | | 4,234 | |
Due to custodian | | | 249,251 | |
Payable to affiliates: | | | | |
Investment adviser fee | | | 201,835 | |
Trustees’ fees | | | 1,761 | |
Accrued expenses | | | 176,001 | |
Total liabilities | | $ | 8,785,572 | |
Net Assets applicable to investors’ interest in Portfolio | | $ | 364,476,216 | |
| |
| Sources of Net Assets | | | | |
Investors’ capital | | $ | 340,590,620 | |
Net unrealized appreciation | | | 23,885,596 | |
Total | | $ | 364,476,216 | |
| | | | |
| | 29 | | See Notes to Financial Statements. |
Global Income Builder Portfolio
October 31, 2017
Statement of Operations
| | | | |
| Investment Income | | Year Ended October 31, 2017 | |
Dividends (net of foreign taxes, $2,350,856) | | $ | 12,181,478 | |
Interest (net of foreign taxes, $7,547) | | | 7,707,248 | |
Other income | | | 91,614 | |
Dividends from affiliated investment | | | 47,750 | |
Total investment income | | $ | 20,028,090 | |
| |
| Expenses | | | | |
Investment adviser fee | | $ | 2,450,256 | |
Trustees’ fees and expenses | | | 21,927 | |
Custodian fee | | | 238,343 | |
Legal and accounting services | | | 65,925 | |
Miscellaneous | | | 55,834 | |
Total expenses | | $ | 2,832,285 | |
| |
Net investment income | | $ | 17,195,805 | |
| |
| Realized and Unrealized Gain (Loss) | | | | |
Net realized gain (loss) — | | | | |
Investment transactions | | $ | 22,162,540 | (1) |
Investment transactions — affiliated investment | | | (585 | ) |
Financial futures contracts | | | (1,186,875 | ) |
Foreign currency transactions | | | 83,130 | |
Forward foreign currency exchange contracts | | | (570 | ) |
Net realized gain | | $ | 21,057,640 | |
Change in unrealized appreciation (depreciation) — | | | | |
Investments | | $ | 17,734,611 | |
Investments — affiliated investment | | | (855 | ) |
Foreign currency | | | (13,441 | ) |
Net change in unrealized appreciation (depreciation) | | $ | 17,720,315 | |
| |
Net realized and unrealized gain | | $ | 38,777,955 | |
| |
Net increase in net assets from operations | | $ | 55,973,760 | |
| (1) | Includes $2,455,461 of net realized gains from redemptions in-kind. |
| | | | |
| | 30 | | See Notes to Financial Statements. |
Global Income Builder Portfolio
October 31, 2017
Statements of Changes in Net Assets
| | | | | | | | |
| Increase (Decrease) in Net Assets | | Year Ended October 31, 2017 | | | Period Ended October 31, 2016(1) | |
From operations — | | | | | | | | |
Net investment income | | $ | 17,195,805 | | | $ | 8,694,605 | |
Net realized gain | | | 21,057,640 | (2) | | | 9,411,663 | (3) |
Net change in unrealized appreciation (depreciation) | | | 17,720,315 | | | | (2,448,246 | ) |
Net increase in net assets from operations | | $ | 55,973,760 | | | $ | 15,658,022 | |
Capital transactions — | | | | | | | | |
Contributions | | $ | 16,973,536 | | | $ | 30,069,851 | |
Withdrawals | | | (85,428,038 | ) | | | (55,132,472 | ) |
Portfolio transaction fee | | | 258,836 | | | | 198,179 | |
Assets contributed by Eaton Vance Global Income Builder Fund | | | — | | | | 385,904,542 | |
Net increase (decrease) in net assets from capital transactions | | $ | (68,195,666 | ) | | $ | 361,040,100 | |
| | |
Net increase (decrease) in net assets | | $ | (12,221,906 | ) | | $ | 376,698,122 | |
|
| Net Assets | |
At beginning of period | | $ | 376,698,122 | | | $ | — | |
At end of period | | $ | 364,476,216 | | | $ | 376,698,122 | |
| (1) | For the period from the start of business, March 28, 2016, to October 31, 2016. |
| (2) | Includes $2,455,461 of net realized gains from redemptions in-kind. |
| (3) | Includes $6,101,499 of net realized gains from redemptions in-kind. |
| | | | |
| | 31 | | See Notes to Financial Statements. |
Global Income Builder Portfolio
October 31, 2017
Financial Highlights
| | | | | | | | |
| Ratios/Supplemental Data | | Year Ended
October 31, 2017 | | | Period Ended October 31, 2016(1) | |
Ratios (as a percentage of average daily net assets): | | | | | | | | |
Expenses | | | 0.75 | % | | | 0.80 | %(2) |
Net investment income | | | 4.56 | % | | | 3.75 | %(2) |
Portfolio Turnover | | | 143 | % | | | 66 | %(3) |
| | |
Total Return | | | 15.99 | % | | | 3.65 | %(3) |
| | |
Net assets, end of period (000’s omitted) | | $ | 364,476 | | | $ | 376,698 | |
| (1) | For the period from the start of business, March 28, 2016, to October 31, 2016. |
| | | | |
| | 32 | | See Notes to Financial Statements. |
Global Income Builder Portfolio
October 31, 2017
Notes to Financial Statements
1 Significant Accounting Policies
Global Income Builder Portfolio (the Portfolio) is a Massachusetts business trust registered under the Investment Company Act of 1940, as amended (the 1940 Act), as a diversified, open-end management investment company. The Portfolio commenced operations on March 28, 2016. The Portfolio’s investment objective is to achieve total return. The Declaration of Trust permits the Trustees to issue interests in the Portfolio. At October 31, 2017, Eaton Vance Global Income Builder Fund and Eaton Vance Global Income Builder NextShares held an interest of 98.1% and 1.9%, respectively, in the Portfolio.
The following is a summary of significant accounting policies of the Portfolio. The policies are in conformity with accounting principles generally accepted in the United States of America (U.S. GAAP). The Portfolio is an investment company and follows accounting and reporting guidance in the Financial Accounting Standards Board (FASB) Accounting Standards Codification Topic 946.
A Investment Valuation — The following methodologies are used to determine the market value or fair value of investments.
Equity Securities. Equity securities listed on a U.S. securities exchange generally are valued at the last sale or closing price on the day of valuation or, if no sales took place on such date, at the mean between the closing bid and asked prices therefore on the exchange where such securities are principally traded. Equity securities listed on the NASDAQ Global or Global Select Market generally are valued at the NASDAQ official closing price. Unlisted or listed securities for which closing sales prices or closing quotations are not available are valued at the mean between the latest available bid and asked prices or, in the case of preferred equity securities that are not listed or traded in the over-the-counter market, by a third party pricing service that uses various techniques that consider factors including, but not limited to, prices or yields of securities with similar characteristics, benchmark yields, broker/dealer quotes, quotes of underlying common stock, issuer spreads, as well as industry and economic events.
Debt Obligations. Debt obligations are generally valued on the basis of valuations provided by third party pricing services, as derived from such services’ pricing models. Inputs to the models may include, but are not limited to, reported trades, executable bid and asked prices, broker/dealer quotations, prices or yields of securities with similar characteristics, interest rates, anticipated prepayments, benchmark curves or information pertaining to the issuer, as well as industry and economic events. The pricing services may use a matrix approach, which considers information regarding securities with similar characteristics to determine the valuation for a security. Short-term obligations purchased with a remaining maturity of sixty days or less for which a valuation from a third party pricing service is not readily available may be valued at amortized cost, which approximates fair value.
Senior Floating-Rate Loans. Interests in senior floating-rate loans (Senior Loans) for which reliable market quotations are readily available are valued generally at the average mean of bid and ask quotations obtained from a third party pricing service.
Derivatives. Financial futures contracts are valued at the closing settlement price established by the board of trade or exchange on which they are traded, with adjustments for fair valuation for certain foreign financial futures contracts as described below. Forward foreign currency exchange contracts are generally valued at the mean of the average bid and average asked prices that are reported by currency dealers to a third party pricing service at the valuation time. Such third party pricing service valuations are supplied for specific settlement periods and the Portfolio’s forward foreign currency exchange contracts are valued at an interpolated rate between the closest preceding and subsequent settlement period reported by the third party pricing service.
Foreign Securities, Financial Futures Contracts and Currencies. Foreign securities, financial futures contracts and currencies are valued in U.S. dollars, based on foreign currency exchange rate quotations supplied by a third party pricing service. The pricing service uses a proprietary model to determine the exchange rate. Inputs to the model include reported trades and implied bid/ask spreads. The daily valuation of exchange-traded foreign securities and certain exchange-traded foreign financial futures contracts generally is determined as of the close of trading on the principal exchange on which such securities and contracts trade. Events occurring after the close of trading on foreign exchanges may result in adjustments to the valuation of foreign securities and certain foreign financial futures contracts to more accurately reflect their fair value as of the close of regular trading on the New York Stock Exchange. When valuing foreign equity securities and foreign financial futures contracts that meet certain criteria, the Portfolio’s Trustees have approved the use of a fair value service that values such securities and foreign financial futures contracts to reflect market trading that occurs after the close of the applicable foreign markets of comparable securities or other instruments that have a strong correlation to the fair-valued securities and foreign financial futures contracts.
Affiliated Fund. The Portfolio may invest in Eaton Vance Cash Reserves Fund, LLC (Cash Reserves Fund), an affiliated investment company managed by Eaton Vance Management (EVM). While Cash Reserves Fund is not a registered money market mutual fund, it conducts all of its investment activities in accordance with the requirements of Rule 2a-7 under the 1940 Act. Investments in Cash Reserves Fund are valued at the closing net asset value per unit on the valuation day. Cash Reserves Fund generally values its investment securities based on available market quotations provided by a third party pricing service.
Fair Valuation. Investments for which valuations or market quotations are not readily available or are deemed unreliable are valued at fair value using methods determined in good faith by or at the direction of the Trustees of the Portfolio in a manner that fairly reflects the security’s value, or the amount that the Portfolio might reasonably expect to receive for the security upon its current sale in the ordinary course. Each such determination is based on a consideration of relevant factors, which are likely to vary from one pricing context to another. These factors may include, but are not limited to, the type of security, the existence of any contractual restrictions on the security’s disposition, the price and extent of public trading in similar securities of the issuer or of comparable companies or entities, quotations or relevant information obtained from broker/dealers or other market participants, information obtained from the issuer, analysts, and/or the appropriate stock exchange (for exchange-traded securities), an analysis of the company’s or entity’s financial condition, and an evaluation of the forces that influence the issuer and the market(s) in which the security is purchased and sold.
Global Income Builder Portfolio
October 31, 2017
Notes to Financial Statements — continued
B Investment Transactions — Investment transactions for financial statement purposes are accounted for on a trade date basis. Realized gains and losses on investments sold are determined on the basis of identified cost.
C Income — Dividend income is recorded on the ex-dividend date for dividends received in cash and/or securities. However, if the ex-dividend date has passed, certain dividends from foreign securities are recorded as the Portfolio is informed of the ex-dividend date. Withholding taxes on foreign dividends, interest and capital gains have been provided for in accordance with the Portfolio’s understanding of the applicable countries’ tax rules and rates. In consideration of recent decisions rendered by European courts, the Portfolio has filed additional tax reclaims for previously withheld taxes on dividends earned in certain European Union countries. These filings are subject to various administrative and judicial proceedings within these countries. During the year ended October 31, 2017, the Portfolio received approximately $92,000 from Poland for previously withheld foreign taxes and interest thereon. Such amount is reflected as Other income in the Statement of Operations. No other amounts for additional tax reclaims are reflected in the financial statements due to the uncertainty as to the ultimate resolution of proceedings, the likelihood of receipt of these reclaims, and the potential timing of payment. Interest income is recorded on the basis of interest accrued, adjusted for amortization of premium or accretion of discount. Distributions from investment companies are recorded as dividend income, capital gains or return of capital based on the nature of the distribution.
D Federal Taxes — The Portfolio has elected to be treated as a partnership for federal tax purposes. No provision is made by the Portfolio for federal or state taxes on any taxable income of the Portfolio because each investor in the Portfolio is ultimately responsible for the payment of any taxes on its share of taxable income. Since at least one of the Portfolio’s investors is a regulated investment company that invests all or substantially all of its assets in the Portfolio, the Portfolio normally must satisfy the applicable source of income and diversification requirements (under the Internal Revenue Code) in order for its investors to satisfy them. The Portfolio will allocate, at least annually among its investors, each investor’s distributive share of the Portfolio’s net investment income, net realized capital gains and losses and any other items of income, gain, loss, deduction or credit.
As of October 31, 2017, the Portfolio had no uncertain tax positions that would require financial statement recognition, de-recognition, or disclosure. The Portfolio files a U.S. federal income tax return annually after its fiscal year-end, which is subject to examination by the Internal Revenue Service for a period of three years from the date of filing.
E Foreign Currency Translation — Investment valuations, other assets, and liabilities initially expressed in foreign currencies are translated each business day into U.S. dollars based upon current exchange rates. Purchases and sales of foreign investment securities and income and expenses denominated in foreign currencies are translated into U.S. dollars based upon currency exchange rates in effect on the respective dates of such transactions. Recognized gains or losses on investment transactions attributable to changes in foreign currency exchange rates are recorded for financial statement purposes as net realized gains and losses on investments. That portion of unrealized gains and losses on investments that results from fluctuations in foreign currency exchange rates is not separately disclosed.
F Use of Estimates — The preparation of the financial statements in conformity with U.S. GAAP requires management to make estimates and assumptions that affect the reported amounts of assets and liabilities at the date of the financial statements and the reported amounts of income and expense during the reporting period. Actual results could differ from those estimates.
G Indemnifications — Under the Portfolio’s organizational documents, its officers and Trustees may be indemnified against certain liabilities and expenses arising out of the performance of their duties to the Portfolio. Under Massachusetts law, if certain conditions prevail, interestholders in the Portfolio could be deemed to have personal liability for the obligations of the Portfolio. However, the Portfolio’s Declaration of Trust contains an express disclaimer of liability on the part of Portfolio interestholders and the By-laws provide that the Portfolio shall assume the defense on behalf of any Portfolio interestholder. Moreover, the By-laws also provide for indemnification out of Portfolio property of any interestholder held personally liable solely by reason of being or having been an interestholder for all loss or expense arising from such liability. Additionally, in the normal course of business, the Portfolio enters into agreements with service providers that may contain indemnification clauses. The Portfolio’s maximum exposure under these arrangements is unknown as this would involve future claims that may be made against the Portfolio that have not yet occurred.
H Financial Futures Contracts — Upon entering into a financial futures contract, the Portfolio is required to deposit with the broker, either in cash or securities, an amount equal to a certain percentage of the contract amount (initial margin). Subsequent payments, known as variation margin, are made or received by the Portfolio each business day, depending on the daily fluctuations in the value of the underlying security or index, and are recorded as unrealized gains or losses by the Portfolio. Gains (losses) are realized upon the expiration or closing of the financial futures contracts. Should market conditions change unexpectedly, the Portfolio may not achieve the anticipated benefits of the financial futures contracts and may realize a loss. Futures contracts have minimal counterparty risk as they are exchange traded and the clearinghouse for the exchange is substituted as the counterparty, guaranteeing counterparty performance.
I Forward Foreign Currency Exchange Contracts — The Portfolio may enter into forward foreign currency exchange contracts for the purchase or sale of a specific foreign currency at a fixed price on a future date. The forward foreign currency exchange contracts are adjusted by the daily exchange rate of the underlying currency and any gains or losses are recorded as unrealized until such time as the contracts have been closed. Risks may arise upon entering these contracts from the potential inability of counterparties to meet the terms of their contracts and from movements in the value of a foreign currency relative to the U.S. dollar.
Global Income Builder Portfolio
October 31, 2017
Notes to Financial Statements — continued
J When-Issued Securities and Delayed Delivery Transactions — The Portfolio may purchase or sell securities on a delayed delivery or when-issued basis. Payment and delivery may take place after the customary settlement period for that security. At the time the transaction is negotiated, the price of the security that will be delivered is fixed. The Portfolio maintains cash and/or security positions for these commitments such that sufficient liquid assets will be available to make payments upon settlement. Securities purchased on a delayed delivery or when-issued basis are marked-to-market daily and begin earning interest on settlement date. Losses may arise due to changes in the market value of the underlying securities or if the counterparty does not perform under the contract.
K Capital Transactions — To seek to protect the Portfolio (and, indirectly, other investors in the Portfolio) against the costs of accommodating investor inflows and outflows, the Portfolio imposes a fee (“Portfolio transaction fee”) on inflows and outflows by Portfolio investors. The Portfolio transaction fee is sized to cover the estimated cost to the Portfolio of, in connection with issuing interests, converting the cash and/or other instruments it receives to the desired composition and, in connection with redeeming its interests, converting Portfolio holdings to cash and/or other instruments to be distributed. Such fee, which may vary over time, is limited to amounts that have been authorized by the Board of Trustees and determined by EVM to be appropriate. The maximum Portfolio transaction fee is 2% of the amount of net contributions or withdrawals. The Portfolio transaction fee is recorded as a component of capital transactions on the Statements of Changes in Net Assets.
2 Investment Adviser Fee and Other Transactions with Affiliates
The investment adviser fee is earned by Boston Management and Research (BMR), a subsidiary of EVM, as compensation for investment advisory services rendered to the Portfolio. The fee is computed at an annual rate of 0.65% of the Portfolio’s average daily net assets up to $500 million, and is payable monthly. On net assets of $500 million and over, the annual fee is reduced. For the year ended October 31, 2017, the Portfolio’s investment adviser fee amounted to $2,450,256 or 0.65% of the Portfolio’s average daily net assets. Pursuant to a sub-advisory agreement, BMR pays Eaton Vance Management (International) Limited (EVMI), an indirect, wholly-owned subsidiary of Eaton Vance Corp., a portion of its investment adviser fee for sub-advisory services provided to the Portfolio. Effective November 1, 2017, Eaton Vance Advisers International Ltd. (EVAIL), an affiliate of EVM, assumed the sub-advisory responsibilities for the Portfolio from EVMI. The Portfolio invests its cash in Cash Reserves Fund. EVM does not currently receive a fee for advisory services provided to Cash Reserves Fund.
Trustees and officers of the Portfolio who are members of EVM’s or BMR’s organizations receive remuneration for their services to the Portfolio out of the investment adviser fee. Trustees of the Portfolio who are not affiliated with the investment adviser may elect to defer receipt of all or a percentage of their annual fees in accordance with the terms of the Trustees Deferred Compensation Plan. For the year ended October 31, 2017, no significant amounts have been deferred. Certain officers and Trustees of the Portfolio are officers of the above organizations.
3 Purchases and Sales of Investments
Purchases and sales of investments, other than short-term obligations and in-kind transactions, and including maturities and principal repayments on Senior Loans, aggregated $520,191,540 and $565,262,166, respectively, for the year ended October 31, 2017. In-kind contributions and withdrawals for the year ended October 31, 2017 aggregated $7,792,930 and $17,163,479, respectively.
4 Federal Income Tax Basis of Investments
The cost and unrealized appreciation (depreciation) of investments of the Portfolio at October 31, 2017, as determined on a federal income tax basis, were as follows:
| | | | |
| |
Aggregate cost | | $ | 332,241,315 | |
| |
Gross unrealized appreciation | | $ | 31,276,968 | |
Gross unrealized depreciation | | | (7,971,846 | ) |
| |
Net unrealized appreciation | | $ | 23,305,122 | |
5 Financial Instruments
The Portfolio may trade in financial instruments with off-balance sheet risk in the normal course of its investing activities. These financial instruments may include forward foreign currency exchange contracts and financial futures contracts and may involve, to a varying degree, elements of risk in excess of the amounts recognized for financial statement purposes. The notional or contractual amounts of these instruments represent the investment the Portfolio has in particular classes of financial instruments and do not necessarily represent the amounts potentially subject to risk. The measurement of the risks associated with these instruments is meaningful only when all related and offsetting transactions are considered. At October 31, 2017, there were no obligations outstanding under these financial instruments.
Global Income Builder Portfolio
October 31, 2017
Notes to Financial Statements — continued
In the normal course of pursuing its investment objective, the Portfolio is subject to the following risks:
Equity Price Risk: The Portfolio entered into equity futures contracts on securities indices to gain or limit exposure to certain markets, particularly in connection with engaging in the dividend capture trading strategy during the year ended October 31, 2017.
Foreign Exchange Risk: Because the Portfolio holds foreign currency denominated investments, the value of these investments and related receivables and payables may change due to future changes in foreign currency exchange rates. To hedge against this risk, the Portfolio entered into forward foreign currency exchange contracts during the year ended October 31, 2017.
The effect of derivative instruments (not considered to be hedging instruments for accounting disclosure purposes) on the Statement of Operations by risk exposure for the year ended October 31, 2017 was as follows:
| | | | | | | | | | |
| Risk | | Derivative | | Realized Gain (Loss)
on Derivatives Recognized
in Income(1) | | | Change in Unrealized Appreciation (Depreciation) on Derivatives Recognized in Income | |
| | | |
Equity Price | | Financial futures contracts | | $ | (1,186,875 | ) | | $ | — | |
Foreign Exchange | | Forward foreign currency exchange contracts | | | (570 | ) | | | — | |
| | | |
Total | | | | $ | (1,187,445 | ) | | $ | — | |
| (1) | Statement of Operations location: Net realized gain (loss) – Financial futures contracts and Forward foreign currency exchange contracts, respectively. |
The average notional cost of futures contracts and average notional amounts of other derivative contracts outstanding during the year ended October 31, 2017, which are indicative of the volume of these derivative types, were approximately as follows:
| | | | | | | | | | |
Futures
Contracts — Long | | | Futures
Contracts — Short | | | Forward Foreign Currency
Exchange Contracts* | |
| | |
| | $18,128,000 | | | $ | 18,442,000 | | | $ | 587,000 | |
| * | The average notional amount for forward foreign currency exchange contracts is based on the absolute value of notional amounts of currency purchased and currency sold. |
6 Line of Credit
The Portfolio participates with other portfolios and funds managed by EVM and its affiliates in a $625 million unsecured line of credit agreement with a group of banks, which is in effect through October 30, 2018. Borrowings are made by the Portfolio solely to facilitate the handling of unusual and/or unanticipated short-term cash requirements. Interest is charged to the Portfolio based on its borrowings at an amount above either the Eurodollar rate or Federal Funds rate. In addition, a fee computed at an annual rate of 0.15% on the daily unused portion of the line of credit is allocated among the participating portfolios and funds at the end of each quarter. Because the line of credit is not available exclusively to the Portfolio, it may be unable to borrow some or all of its requested amounts at any particular time. The Portfolio did not have any significant borrowings or allocated fees during the year ended October 31, 2017.
7 Overdraft Advances
Pursuant to the custodian agreement, State Street Bank and Trust Company (SSBT) may, in its discretion, advance funds to the Portfolio to make properly authorized payments. When such payments result in an overdraft, the Portfolio is obligated to repay SSBT at the current rate of interest charged by SSBT for secured loans (currently, the Federal Funds rate plus 2%). This obligation is payable on demand to SSBT. SSBT has a lien on the Portfolio’s assets to the extent of any overdraft. At October 31, 2017, the Portfolio had a payment due to SSBT pursuant to the foregoing arrangement of $249,251. Based on the short-term nature of these payments and the variable interest rate, the carrying value of the overdraft advances approximated its fair value at October 31, 2017. If measured at fair value, overdraft advances would have been considered as Level 2 in the fair value hierarchy (see Note 9) at October 31, 2017. The Portfolio’s average overdraft advances during the year ended October 31, 2017 were not significant.
Global Income Builder Portfolio
October 31, 2017
Notes to Financial Statements — continued
8 Risks Associated with Foreign Investments
Investing in securities issued by companies whose principal business activities are outside the United States may involve significant risks not present in domestic investments. For example, there is generally less publicly available information about foreign companies, particularly those not subject to the disclosure and reporting requirements of the U.S. securities laws. Certain foreign issuers are generally not bound by uniform accounting, auditing, and financial reporting requirements and standards of practice comparable to those applicable to domestic issuers. Investments in foreign securities also involve the risk of possible adverse changes in investment or exchange control regulations, expropriation or confiscatory taxation, limitation on the removal of funds or other assets of the Portfolio, political or financial instability or diplomatic and other developments which could affect such investments. Foreign securities markets, while growing in volume and sophistication, are generally not as developed as those in the United States, and securities of some foreign issuers (particularly those located in developing countries) may be less liquid and more volatile than securities of comparable U.S. companies. In general, there is less overall governmental supervision and regulation of foreign securities markets, broker/dealers and issuers than in the United States.
9 Fair Value Measurements
Under generally accepted accounting principles for fair value measurements, a three-tier hierarchy to prioritize the assumptions, referred to as inputs, is used in valuation techniques to measure fair value. The three-tier hierarchy of inputs is summarized in the three broad levels listed below.
| • | | Level 1 – quoted prices in active markets for identical investments |
| • | | Level 2 – other significant observable inputs (including quoted prices for similar investments, interest rates, prepayment speeds, credit risk, etc.) |
| • | | Level 3 – significant unobservable inputs (including a fund’s own assumptions in determining the fair value of investments) |
In cases where the inputs used to measure fair value fall in different levels of the fair value hierarchy, the level disclosed is determined based on the lowest level input that is significant to the fair value measurement in its entirety. The inputs or methodology used for valuing securities are not necessarily an indication of the risk associated with investing in those securities.
At October 31, 2017, the hierarchy of inputs used in valuing the Portfolio’s investments, which are carried at value, were as follows:
| | | | | | | | | | | | | | | | |
| Asset Description | | Level 1 | | | Level 2 | | | Level 3 | | | Total | |
| | | | |
Common Stocks | | | | | | | | | | | | | | | | |
Consumer Discretionary | | $ | 16,572,399 | | | $ | 7,394,791 | | | $ | — | | | $ | 23,967,190 | |
Consumer Staples | | | 4,924,019 | | | | 13,378,310 | | | | — | | | | 18,302,329 | |
Energy | | | 6,108,243 | | | | 6,921,586 | | | | — | | | | 13,029,829 | |
Financials | | | 15,099,108 | | | | 21,646,390 | | | | — | | | | 36,745,498 | |
Health Care | | | 16,283,636 | | | | 10,553,574 | | | | — | | | | 26,837,210 | |
Industrials | | | 12,404,797 | | | | 18,434,810 | | | | — | | | | 30,839,607 | |
Information Technology | | | 26,207,333 | | | | 8,353,780 | | | | — | | | | 34,561,113 | |
Materials | | | 5,127,459 | | | | 6,011,652 | | | | — | | | | 11,139,111 | |
Real Estate | | | 6,984,533 | | | | — | | | | — | | | | 6,984,533 | |
Telecommunication Services | | | — | | | | 4,277,740 | | | | — | | | | 4,277,740 | |
Utilities | | | 4,088,126 | | | | 3,541,477 | | | | — | | | | 7,629,603 | |
| | | | |
Total Common Stocks | | $ | 113,799,653 | | | $ | 100,514,110 | * | | $ | — | | | $ | 214,313,763 | |
| | | | |
Preferred Stocks | | | | | | | | | | | | | | | | |
Consumer Staples | | $ | — | | | $ | 550,218 | | | $ | — | | | $ | 550,218 | |
Energy | | | 604,438 | | | | — | | | | — | | | | 604,438 | |
Financials | | | 3,676,755 | | | | 2,418,645 | | | | — | | | | 6,095,400 | |
Industrials | | | 435,267 | | | | — | | | | — | | | | 435,267 | |
Real Estate | | | 1,719,439 | | | | — | | | | — | | | | 1,719,439 | |
Utilities | | | 1,464,360 | | | | — | | | | — | | | | 1,464,360 | |
| | | | |
Total Preferred Stocks | | $ | 7,900,259 | | | $ | 2,968,863 | | | $ | — | | | $ | 10,869,122 | |
Global Income Builder Portfolio
October 31, 2017
Notes to Financial Statements — continued
| | | | | | | | | | | | | | | | |
| Asset Description | | Level 1 | | | Level 2 | | | Level 3 | | | Total | |
| | | | |
Corporate Bonds & Notes | | $ | — | | | $ | 117,650,140 | | | $ | — | | | $ | 117,650,140 | |
Senior Floating-Rate Loans | | | — | | | | 9,770,330 | | | | — | | | | 9,770,330 | |
Convertible Bonds | | | — | | | | 300,750 | | | | — | | | | 300,750 | |
Short-Term Investments | | | — | | | | 2,642,332 | | | | — | | | | 2,642,332 | |
| | | | |
Total Investments | | $ | 121,699,912 | | | $ | 233,846,525 | | | $ | — | | | $ | 355,546,437 | |
| * | Includes foreign equity securities whose values were adjusted to reflect market trading of comparable securities or other correlated instruments that occurred after the close of trading in their applicable foreign markets. |
The Portfolio held no investments or other financial instruments as of October 31, 2016 whose fair value was determined using Level 3 inputs. At October 31, 2017, the value of investments transferred between Level 1 and Level 2 during the year then ended was not significant.
Global Income Builder Portfolio
October 31, 2017
Report of Independent Registered Public Accounting Firm
To the Trustees and Investors of Global Income Builder Portfolio:
We have audited the accompanying statement of assets and liabilities of Global Income Builder Portfolio (the “Portfolio”), including the portfolio of investments, as of October 31, 2017, and the related statement of operations for the year then ended, and the statements of changes in net assets and the financial highlights for the year ended October 31, 2017 and for the period from the start of business, March 28, 2016, through October 31, 2016. These financial statements and financial highlights are the responsibility of the Portfolio’s management. Our responsibility is to express an opinion on these financial statements and financial highlights based on our audits.
We conducted our audits in accordance with the standards of the Public Company Accounting Oversight Board (United States). Those standards require that we plan and perform the audit to obtain reasonable assurance about whether the financial statements and financial highlights are free of material misstatement. The Portfolio is not required to have, nor were we engaged to perform, an audit of its internal control over financial reporting. Our audits included consideration of internal control over financial reporting as a basis for designing audit procedures that are appropriate in the circumstances, but not for the purpose of expressing an opinion on the effectiveness of the Portfolio’s internal control over financial reporting. Accordingly, we express no such opinion. An audit also includes examining, on a test basis, evidence supporting the amounts and disclosures in the financial statements, assessing the accounting principles used and significant estimates made by management, as well as evaluating the overall financial statement presentation. Our procedures included confirmation of securities and senior loans owned as of October 31, 2017, by correspondence with the custodian, brokers, and selling or agent banks; where replies were not received from brokers and selling or agent banks, we performed other auditing procedures. We believe that our audits provide a reasonable basis for our opinion.
In our opinion, such financial statements and financial highlights referred to above present fairly, in all material respects, the financial position of Global Income Builder Portfolio as of October 31, 2017, the results of its operations for the year then ended, and the changes in its net assets and the financial highlights for the year ended October 31, 2017 and for the period from the start of business, March 28, 2016, through October 31, 2016, in conformity with accounting principles generally accepted in the United States of America.
DELOITTE & TOUCHE LLP
Boston, Massachusetts
December 21, 2017
Eaton Vance
Global Income Builder NextShares
October 31, 2017
Management and Organization
Fund Management. The Trustees of Eaton Vance NextShares Trust (the Trust) and Global Income Builder Portfolio (the Portfolio) are responsible for the overall management and supervision of the Trust’s and Portfolio’s affairs. The Trustees and officers of the Trust and the Portfolio are listed below. Except as indicated, each individual has held the office shown or other offices in the same company for the last five years. Trustees and officers of the Trust and the Portfolio hold indefinite terms of office. The “Noninterested Trustees” consist of those Trustees who are not “interested persons” of the Trust and the Portfolio, as that term is defined under the 1940 Act. The business address of each Trustee and officer is Two International Place, Boston, Massachusetts 02110. As used below, “EVC” refers to Eaton Vance Corp., “EV” refers to Eaton Vance, Inc., “EVM” refers to Eaton Vance Management, “BMR” refers to Boston Management and Research and “EVD” refers to Eaton Vance Distributors, Inc. EVC and EV are the corporate parent and trustee, respectively, of EVM and BMR. EVD is the Fund’s principal underwriter, the Portfolio’s placement agent and a wholly-owned subsidiary of EVC. Each officer affiliated with Eaton Vance may hold a position with other Eaton Vance affiliates that is comparable to his or her position with EVM listed below. Each Trustee oversees 176 portfolios in the Eaton Vance Complex (including all master and feeder funds in a master feeder structure). Each officer serves as an officer of certain other Eaton Vance funds. Each Trustee and officer serves until his or her successor is elected.
| | | | | | |
| Name and Year of Birth | | Position(s) with the Trust
and the Portfolio | | Trustee Since(1) | | Principal Occupation(s) and Directorships During Past Five Years and Other Relevant Experience |
Interested Trustee |
| | | |
Thomas E. Faust Jr. 1958 | | Trustee | | 2007 | | Chairman, Chief Executive Officer and President of EVC, Director and President of EV, Chief Executive Officer and President of EVM and BMR, and Director of EVD. Trustee and/or officer of 176 registered investment companies. Mr. Faust is an interested person because of his positions with EVM, BMR, EVD, EVC and EV, which are affiliates of the Trust and the Portfolio. Directorships in the Last Five Years.(2) Director of EVC and Hexavest Inc. (investment management firm). |
| | | |
| | | | | | |
Noninterested Trustees |
| | | |
Mark R. Fetting 1954 | | Trustee | | 2016 | | Private investor. Formerly held various positions at Legg Mason, Inc. (investment management firm) (2000-2012), including President, Chief Executive Officer, Director and Chairman (2008-2012), Senior Executive Vice President (2004-2008) and Executive Vice President (2001-2004). Formerly, President of Legg Mason family of funds (2001-2008). Formerly, Division President and Senior Officer of Prudential Financial Group, Inc. and related companies (investment management firm) (1991-2000). Directorships in the Last Five Years. Formerly, Director and Chairman of Legg Mason, Inc. (2008-2012); Director/Trustee and Chairman of Legg Mason family of funds (14 funds) (2008-2012); and Director/Trustee of the Royce family of funds (35 funds) (2001-2012). |
| | | |
Cynthia E. Frost 1961 | | Trustee | | 2014 | | Private investor. Formerly, Chief Investment Officer of Brown University (university endowment) (2000-2012); Formerly, Portfolio Strategist for Duke Management Company (university endowment manager) (1995-2000); Formerly, Managing Director, Cambridge Associates (investment consulting company) (1989-1995); Formerly, Consultant, Bain and Company (management consulting firm) (1987-1989); Formerly, Senior Equity Analyst, BA Investment Management Company (1983-1985). Directorships in the Last Five Years. None. |
| | | |
George J. Gorman 1952 | | Trustee | | 2014 | | Principal at George J. Gorman LLC (consulting firm). Formerly, Senior Partner at Ernst & Young LLP (a registered public accounting firm) (1974-2009). Directorships in the Last Five Years. Formerly, Trustee of the BofA Funds Series Trust (11 funds) (2011-2014) and of the Ashmore Funds (9 funds) (2010-2014). |
| | | |
Valerie A. Mosley 1960 | | Trustee | | 2014 | | Chairwoman and Chief Executive Officer of Valmo Ventures (a consulting and investment firm). Former Partner and Senior Vice President, Portfolio Manager and Investment Strategist at Wellington Management Company, LLP (investment management firm) (1992-2012). Former Chief Investment Officer, PG Corbin Asset Management (1990-1992). Formerly worked in institutional corporate bond sales at Kidder Peabody (1986-1990). Directorships in the Last Five Years.(2) Director of Dynex Capital, Inc. (mortgage REIT) (since 2013). |
Eaton Vance
Global Income Builder NextShares
October 31, 2017
Management and Organization — continued
| | | | | | |
| Name and Year of Birth | | Position(s) with the Trust
and the Portfolio | | Trustee Since(1) | | Principal Occupation(s) and Directorships During Past Five Years and Other Relevant Experience |
Noninterested Trustees (continued) |
| | | |
William H. Park 1947 | | Chairperson of
the Board
and Trustee | | 2016 (Chairperson); 2003 (Trustee) | | Private investor. Formerly, Consultant (management and transactional) (2012-2014). Formerly, Chief Financial Officer, Aveon Group L.P. (investment management firm) (2010-2011). Formerly, Vice Chairman, Commercial Industrial Finance Corp. (specialty finance company) (2006-2010). Formerly, President and Chief Executive Officer, Prizm Capital Management, LLC (investment management firm) (2002-2005). Formerly, Executive Vice President and Chief Financial Officer, United Asset Management Corporation (investment management firm) (1982-2001). Formerly, Senior Manager, Price Waterhouse (now PricewaterhouseCoopers) (a registered public accounting firm) (1972-1981). Directorships in the Last Five Years.(2) None. |
| | | |
Helen Frame Peters 1948 | | Trustee | | 2008 | | Professor of Finance, Carroll School of Management, Boston College. Formerly, Dean, Carroll School of Management, Boston College (2000-2002). Formerly, Chief Investment Officer, Fixed Income, Scudder Kemper Investments (investment management firm) (1998-1999). Formerly, Chief Investment Officer, Equity and Fixed Income, Colonial Management Associates (investment management firm) (1991-1998). Directorships in the Last Five Years.(2) Formerly, Director of BJ’s Wholesale Club, Inc. (wholesale club retailer) (2004-2011). Formerly, Trustee of SPDR Index Shares Funds and SPDR Series Trust (exchange traded funds) (2000-2009). Formerly, Director of Federal Home Loan Bank of Boston (a bank for banks) (2007-2009). |
| | | |
Susan J. Sutherland 1957 | | Trustee | | 2015 | | Private investor. Formerly, Associate, Counsel and Partner at Skadden, Arps, Slate, Meagher & Flom LLP (law firm) (1982-2013). Directorships in the Last Five Years. Formerly, Director of Montpelier Re Holdings Ltd. (global provider of customized insurance and reinsurance products) (2013-2015). |
| | | |
Harriett Tee Taggart 1948 | | Trustee | | 2011 | | Managing Director, Taggart Associates (a professional practice firm). Formerly, Partner and Senior Vice President, Wellington Management Company, LLP (investment management firm) (1983-2006). Directorships in the Last Five Years.(2) Director of Albemarle Corporation (chemicals manufacturer) (since 2007) and The Hanover Group (specialty property and casualty insurance company) (since 2009). Formerly, Director of Lubrizol Corporation (specialty chemicals) (2007-2011). |
| | | |
Scott E. Wennerholm 1959 | | Trustee | | 2016 | | Trustee at Wheelock College (postsecondary institution) (since 2012). Formerly, Consultant at GF Parish Group (executive recruiting firm) (2016-2017). Formerly, Chief Operating Officer and Executive Vice President at BNY Mellon Asset Management (investment management firm) (2005-2011). Formerly, Chief Operating Officer and Chief Financial Officer at Natixis Global Asset Management (investment management firm) (1997-2004). Formerly, Vice President at Fidelity Investments Institutional Services (investment management firm) (1994-1997). Directorships in the Last Five Years. None. |
| | | |
| | | | | | |
Principal Officers who are not Trustees |
| Name and Year of Birth | | Position(s) with the Trust and the Portfolio | | Officer
Since(3) | | Principal Occupation(s) During Past Five Years |
| | | |
Edward J. Perkin 1972 | | President | | 2014 | | Chief Equity Investment Officer and Vice President of EVM and BMR since 2014. Formerly, Chief Investment Officer, International and Emerging Markets Equity, and Managing Director, Portfolio Manager, Europe, EAFE and Global at Goldman Sachs Asset Management (2002-2014). Also Vice President of Calvert Research and Management (“CRM”). |
Eaton Vance
Global Income Builder NextShares
October 31, 2017
Management and Organization — continued
| | | | | | |
| Name and Year of Birth | | Position(s) with the Trust and the Portfolio | | Officer Since(3) | | Principal Occupation(s) During Past Five Years |
Principal Officers who are not Trustees (continued) |
| | | |
Maureen A. Gemma 1960 | | Vice President, Secretary and Chief Legal Officer | | 2005 | | Vice President of EVM and BMR. Also Vice President of CRM. |
| | | |
James F. Kirchner 1967 | | Treasurer | | 2007 | | Vice President of EVM and BMR. Also Vice President of CRM. |
| | | |
Richard F. Froio 1968 | | Chief Compliance Officer | | 2017 | | Vice President of EVM and BMR since 2017. Formerly Deputy Chief Compliance Officer (Adviser/Funds) and Chief Compliance Officer (Distribution) at PIMCO (2012-2017) and Managing Director at BlackRock/Barclays Global Investors (2009-2012). |
| (1) | Year first appointed to serve as Trustee for a fund in the Eaton Vance family of funds. Each Trustee has served continuously since appointment unless indicated otherwise. |
| (2) | During their respective tenures, the Trustees (except for Mmes. Frost and Sutherland and Messrs. Fetting, Gorman and Wennerholm) also served as Board members of one or more of the following funds (which operated in the years noted): eUnitsTM 2 Year U.S. Market Participation Trust: Upside to Cap / Buffered Downside (launched in 2012 and terminated in 2014); eUnitsTM 2 Year U.S. Market Participation Trust II: Upside to Cap / Buffered Downside (launched in 2012 and terminated in 2014); and Eaton Vance National Municipal Income Trust (launched in 1998 and terminated in 2009). However, Ms. Mosley did not serve as a Board member of eUnitsTM 2 Year U.S. Market Participation Trust: Upside to Cap / Buffered Downside (launched in 2012 and terminated in 2014). |
| (3) | Year first elected to serve as officer of a fund in the Eaton Vance family of funds when the officer has served continuously. Otherwise, year of most recent election as an officer of a fund in the Eaton Vance family of funds. Titles may have changed since initial election. |
The SAI for the Fund includes additional information about the Trustees and officers of the Fund and the Portfolio and can be obtained without charge on Eaton Vance’s website at www.eatonvance.com or by calling 1-800-262-1122.
Eaton Vance Funds
IMPORTANT NOTICES
Privacy. The Eaton Vance organization is committed to ensuring your financial privacy. Each of the financial institutions identified below has in effect the following policy (“Privacy Policy”) with respect to nonpublic personal information about its customers:
| • | | Only such information received from you, through application forms or otherwise, and information about your Eaton Vance fund transactions will be collected. This may include information such as name, address, social security number, tax status, account balances and transactions. |
| • | | None of such information about you (or former customers) will be disclosed to anyone, except as permitted by law (which includes disclosure to employees necessary to service your account). In the normal course of servicing a customer’s account, Eaton Vance may share information with unaffiliated third parties that perform various required services such as transfer agents, custodians and broker-dealers. |
| • | | Policies and procedures (including physical, electronic and procedural safeguards) are in place that are designed to protect the confidentiality of such information. |
| • | | We reserve the right to change our Privacy Policy at any time upon proper notification to you. Customers may want to review our Privacy Policy periodically for changes by accessing the link on our homepage: www.eatonvance.com. |
Our pledge of privacy applies to the following entities within the Eaton Vance organization: the Eaton Vance Family of Funds, Eaton Vance Management, Eaton Vance Investment Counsel, Eaton Vance Distributors, Inc., Eaton Vance Trust Company, Eaton Vance Management (International) Limited, Eaton Vance Advisers International Ltd., Eaton Vance Management’s Real Estate Investment Group and Boston Management and Research. In addition, our Privacy Policy applies only to those Eaton Vance customers who are individuals and who have a direct relationship with us. If a customer’s account (i.e., fund shares) is held in the name of a third-party financial advisor/broker-dealer, it is likely that only such advisor’s privacy policies apply to the customer. This notice supersedes all previously issued privacy disclosures. For more information about Eaton Vance’s Privacy Policy, please call 1-800-262-1122.
Delivery of Shareholder Documents. The Securities and Exchange Commission (SEC) permits funds to deliver only one copy of shareholder documents, including prospectuses, proxy statements and shareholder reports, to fund investors with multiple accounts at the same residential or post office box address. This practice is often called “householding” and it helps eliminate duplicate mailings to shareholders. Your financial advisor may household the mailing of your documents indefinitely unless you instruct your financial advisor otherwise. If you would prefer that your Eaton Vance documents not be householded, please contact your financial advisor. Your instructions that householding not apply to delivery of your Eaton Vance documents will typically be effective within 30 days of receipt by your financial advisor.
Portfolio Holdings. Each Eaton Vance Fund and its underlying Portfolio(s) (if applicable) will file a schedule of portfolio holdings on Form N-Q with the SEC for the first and third quarters of each fiscal year. The Form N-Q will be available on the Eaton Vance website at www.eatonvance.com, by calling Eaton Vance at 1-800-262-1122 or in the EDGAR database on the SEC’s website at www.sec.gov. Form N-Q may also be reviewed and copied at the SEC’s public reference room in Washington, D.C. (call 1-800-732-0330 for information on the operation of the public reference room).
Proxy Voting. From time to time, funds are required to vote proxies related to the securities held by the funds. The Eaton Vance Funds or their underlying Portfolios (if applicable) vote proxies according to a set of policies and procedures approved by the Funds’ and Portfolios’ Boards. You may obtain a description of these policies and procedures and information on how the Funds or Portfolios voted proxies relating to portfolio securities during the most recent 12-month period ended June 30, without charge, upon request, by calling 1-800-262-1122 and by accessing the SEC’s website at www.sec.gov.
This Page Intentionally Left Blank
Investment Adviser of Global Income Builder Portfolio
Boston Management and Research
Two International Place
Boston, MA 02110
Investment Sub-Adviser of Eaton Vance Global Income Builder NextShares and Global Income Builder Portfolio
Eaton Vance Advisers International Ltd.
125 Old Broad Street
London, EC2N 1AR
United Kingdom
Investment Adviser and Administrator of Eaton Vance Global Income Builder NextShares
Eaton Vance Management
Two International Place
Boston, MA 02110
Distributor*
Foreside Fund Services, LLC
Three Canal Plaza, Suite 100
Portland, ME 04101
Custodian
State Street Bank and Trust Company
State Street Financial Center, One Lincoln Street
Boston, MA 02111
Transfer and Dividend Disbursing Agent
State Street Bank and Trust Company
State Street Financial Center, One Lincoln Street
Boston, MA 02111
Independent Registered Public Accounting Firm
Deloitte & Touche LLP
200 Berkeley Street
Boston, MA 02116-5022
Fund Offices
Two International Place
Boston, MA 02110
| * | FINRA BrokerCheck. Investors may check the background of their Investment Professional by contacting the Financial Industry Regulatory Authority (FINRA). FINRA BrokerCheck is a free tool to help investors check the professional background of current and former FINRA-registered securities firms and brokers. FINRA BrokerCheck is available by calling 1-800-289-9999 and at www.FINRA.org. The FINRA BrokerCheck brochure describing this program is available to investors at www.FINRA.org. |
23214 10.31.17
Item 2. Code of Ethics
The registrant has adopted a code of ethics applicable to its Principal Executive Officer, Principal Financial Officer and Principal Accounting Officer. The registrant undertakes to provide a copy of such code of ethics to any person upon request, without charge, by calling 1-800-262-1122. The registrant has amended the code of ethics as described in Form N-CSR during the period covered by this report to make clarifying changes consistent with Rule 21F-17 of the Securities Exchange Act of 1934, as amended. The registrant has not granted any waiver, including an implicit waiver, from a provision of the code of ethics as described in Form N-CSR during the period covered by this report.
Item 3. Audit Committee Financial Expert
The registrant’s Board has designated William H. Park, an independent trustee, as its audit committee financial expert. Mr. Park is a certified public accountant who is a private investor. Previously, he served as a consultant, as the Chief Financial Officer of Aveon Group, L.P. (an investment management firm), as the Vice Chairman of Commercial Industrial Finance Corp. (specialty finance company), as President and Chief Executive Officer of Prizm Capital Management, LLC (investment management firm), as Executive Vice President and Chief Financial Officer of United Asset Management Corporation (an institutional investment management firm) and as a Senior Manager at Price Waterhouse (now PricewaterhouseCoopers) (an independent registered public accounting firm).
Item 4. Principal Accountant Fees and Services
Eaton Vance Global Income Builder NextShares (the “Fund”) is a series of Eaton Vance NextShares Trust (the “Trust”), a Massachusetts business trust, which, including the Fund, contains a total of 2 series (the “Series”). The Trust is registered under the Investment Company Act of 1940 as an open-end management investment company. This Form N-CSR relates to the Fund’s annual report.
Rule 2-01(c)(1)(ii)(A) of Regulation S-X (the “Loan Rule”) prohibits an accounting firm, such as the Trust’s principal accountant, Deloitte & Touche LLP (“D&T”), from having certain financial relationships with their audit clients and affiliated entities. Specifically, the Loan Rule provides, in relevant part, that an accounting firm generally would not be independent if it or a “covered person” of the accounting firm (within the meaning of applicable SEC rules relating to auditor independence) receives a loan from a lender that is a “record or beneficial owner of more than ten percent of the audit client’s equity securities.” Based on information provided to the Audit Committee of the Board of Trustees (the “Audit Committee”) of the Eaton Vance family of funds by D&T, certain relationships between D&T and its affiliates (“Deloitte Entities”) and one or more lenders who are record owners of shares of one or more funds within the Eaton Vance family of funds (the “Funds”) implicate the Loan Rule, calling into question D&T’s independence with respect to the Funds. The Funds are providing this disclosure to explain the facts and circumstances as well as D&T’s conclusions concerning D&T’s objectivity and impartiality with respect to the audits of the Funds notwithstanding the existence of one or more breaches of the Loan Rule.
On June 20, 2016, the U.S. Securities and Exchange Commission (the “SEC”) issued no-action relief to another mutual fund complex (see Fidelity Management & Research Company et al., No-Action Letter (June 20, 2016) (the “No-Action Letter”)) related to an auditor independence issue arising under the Loan Rule. In the No-Action Letter, the SEC indicated that it would not recommend enforcement action against the fund group if the auditor is not in compliance with the Loan Rule provided that: (1) the auditor has complied with PCAOB Rule 3526(b)(1) and 3526(b)(2); (2) the auditor’s non-compliance under the Loan Rule is with respect to certain lending relationships; and (3) notwithstanding such non-compliance, the auditor has concluded that it is objective and impartial with respect to the issues encompassed within its engagement as auditor of the funds. The SEC has indicated that the no-action relief will expire 18 months from its issuance.
Based on information provided by D&T to the Audit Committee, the requirements of the No-Action Letter appear to be met with respect to D&T’s lending relationships described above. Among other things, D&T has advised the Audit Committee of its conclusion that the consequences of the breach of the Loan Rule have been satisfactorily addressed, that D&T’s objectivity and impartiality in the planning and conduct of the audits of the Fund’s financial statements has not been compromised and that, notwithstanding the breach, D&T is in a position to continue as the auditor for the Funds and D&T does not believe any actions need to be taken with respect to previously issued reports by D&T. D&T has advised the Audit Committee that these conclusions were based in part on its consideration of the No-Action Letter and other relevant information communicated to the Audit Committee.
(a)-(d)
The following table presents the aggregate fees billed to the Fund for the Fund’s fiscal year ended October 31, 2016 (initial fiscal period from the commencement of operations on March 30, 2016 to October 31, 2016) and October 31, 2017 by D&T for professional services rendered for the audit of the Fund’s annual financial statements and fees billed for other services rendered by D&T during such periods.
Eaton Vance Global Income Builder NextShares
| | | | | | | | |
Fiscal Period Ended* | | 10/31/16 | | | 10/31/17 | |
Audit Fees | | $ | 14,000 | | | $ | 14,000 | |
Audit-Related Fees(1) | | $ | 0 | | | $ | 0 | |
Tax Fees(2) | | $ | 10,000 | | | $ | 10,150 | |
All Other Fees(3) | | $ | 0 | | | $ | 0 | |
| | | | | | | | |
Total | | $ | 24,000 | | | $ | 24,150 | |
| | | | | | | | |
| * | Fund commenced operations on March 30, 2016. |
| (1) | Audit-related fees consist of the aggregate fees billed for assurance and related services that are reasonably related to the performance of the audit of the registrant’s financial statements and are not reported under the category of audit fees. |
| (2) | Tax fees consist of the aggregate fees billed for professional services rendered by the principal accountant relating to tax compliance, tax advice, and tax planning and specifically include fees for tax return preparation and other related tax compliance/planning matters. |
| (3) | All other fees consist of the aggregate fees billed for products and services provided by the principal accountant other than audit, audit-related, and tax services. |
(e)(1) The registrant’s audit committee has adopted policies and procedures relating to the pre-approval of services provided by the registrant’s principal accountant (the “Pre-Approval Policies”). The Pre-Approval Policies establish a framework intended to assist the audit committee in the proper discharge of its pre-approval responsibilities. As a general matter, the Pre-Approval Policies (i) specify certain types of audit, audit-related, tax, and other services determined to be pre-approved by the audit committee; and (ii) delineate specific procedures governing the mechanics of the pre-approval process, including the approval and monitoring of audit and non-audit service fees. Unless a service is specifically pre-approved under the Pre-Approval Policies, it must be separately pre-approved by the audit committee.
The Pre-Approval Policies and the types of audit and non-audit services pre-approved therein must be reviewed and ratified by the registrant’s audit committee at least annually. The registrant’s audit committee maintains full responsibility for the appointment, compensation, and oversight of the work of the registrant’s principal accountant.
(e)(2) No services described in paragraphs (b)-(d) above were approved by the registrant’s audit committee pursuant to the “de minimis exception” set forth in Rule 2-01 (c)(7)(i)(C) of Regulation S-X.
(f) Not applicable.
(g) The following table presents (i) the aggregate non-audit fees (i.e., fees for audit-related, tax, and other services) billed to the Fund (the only series of the Trust) by D&T for the last two fiscal periods of the Fund; and (ii) the aggregate non-audit fees (i.e., fees for audit-related, tax, and other services) billed to the Eaton Vance organization by D&T for the last two fiscal years of each Series.
| | | | | | | | | | | | |
Fiscal Period Ended* | | 10/31/16** | | | 12/31/16*** | | | 10/31/17** | |
Registrant(1) | | $ | 10,000 | | | $ | 8,314 | | | $ | 10,150 | |
Eaton Vance(2) | | $ | 56,434 | | | $ | 46,000 | | | $ | 148,018 | |
| * | Information is not presented for fiscal year ended 12/31/15, as no Series in the Trust with such fiscal year end was in operation during such period. |
| ** | Registrant commenced operations on March 30, 2016. |
| *** | Registrant commenced operations on February 25, 2016. |
| (1) | Includes all of the Series of the Trust. During the fiscal years reported above, certain of the Funds were “feeder” funds in a “master-feeder” fund structure or funds of funds. |
| (2) | Various subsidiaries of Eaton Vance Corp. act in either an investment advisory and/or service provider capacity with respect to the Series and/or their respective “master” funds (if applicable). |
(h) The registrant’s audit committee has considered whether the provision by the registrant’s principal accountant of non-audit services to the registrant’s investment adviser and any entity controlling, controlled by, or under common control with the adviser that provides ongoing services to the registrant that were not pre-approved pursuant to Rule 2-01(c)(7)(ii) of Regulation S-X is compatible with maintaining the principal accountant’s independence.
Item 5. Audit Committee of Listed Registrants
Not applicable.
Item 6. Schedule of Investments
Please see schedule of investments contained in the Report to Stockholders included under Item 1 of this Form N-CSR.
Item 7. Disclosure of Proxy Voting Policies and Procedures for Closed-End Management Investment Companies
Not applicable.
Item 8. Portfolio Managers of Closed-End Management Investment Companies
Not applicable.
Item 9. Purchases of Equity Securities by Closed-End Management Investment Company and Affiliated Purchasers
Not applicable.
Item 10. Submission of Matters to a Vote of Security Holders
No material changes.
Item 11. Controls and Procedures
(a) It is the conclusion of the registrant’s principal executive officer and principal financial officer that the effectiveness of the registrant’s current disclosure controls and procedures (such disclosure controls and procedures having been evaluated within 90 days of the date of this filing) provide reasonable assurance that the information required to be disclosed by the registrant has been recorded, processed, summarized and reported within the time period specified in the Commission’s rules and forms and that the information required to be disclosed by the registrant has been accumulated and communicated to the registrant’s principal executive officer and principal financial officer in order to allow timely decisions regarding required disclosure.
(b) There have been no changes in the registrant’s internal controls over financial reporting during the second fiscal quarter of the period covered by this report that has materially affected, or is reasonably likely to materially affect, the registrant’s internal control over financial reporting.
Item 12. Exhibits
| | |
| (a)(1) | | Registrant’s Code of Ethics – Not applicable (please see Item 2). |
| |
| (a)(2)(i) | | Treasurer’s Section 302 certification. |
| |
| (a)(2)(ii) | | President’s Section 302 certification. |
| |
| (b) | | Combined Section 906 certification. |
Signatures
Pursuant to the requirements of the Securities Exchange Act of 1934 and the Investment Company Act of 1940, the registrant has duly caused this report to be signed on its behalf by the undersigned, thereunto duly authorized.
| | |
| Eaton Vance NextShares Trust |
| |
| By: | | /s/ Edward J. Perkin |
| | Edward J. Perkin |
| | President |
| |
| Date: | | December 22, 2017 |
Pursuant to the requirements of the Securities Exchange Act of 1934 and the Investment Company Act of 1940, this report has been signed below by the following persons on behalf of the registrant and in the capacities and on the dates indicated.
| | |
| By: | | /s/ James F. Kirchner |
| | James F. Kirchner |
| | Treasurer |
| |
| Date: | | December 22, 2017 |
| |
| By: | | /s/ Edward J. Perkin |
| | Edward J. Perkin |
| | President |
| |
| Date: | | December 22, 2017 |