UNITED STATES
SECURITIES AND EXCHANGE COMMISSION
Washington, D.C. 20549
FormN-CSR
CERTIFIED SHAREHOLDER REPORT OF REGISTERED
MANAGEMENT INVESTMENT COMPANIES
Investment Company Act File Number: 811-22982
Eaton Vance NextShares Trust
(Exact Name of Registrant as Specified in Charter)
Two International Place, Boston, Massachusetts 02110
(Address of Principal Executive Offices)
Maureen A. Gemma
Two International Place, Boston, Massachusetts 02110
(Name and Address of Agent for Services)
(617)482-8260
(Registrant’s Telephone Number)
December 31
Date of Fiscal Year End
June 30, 2019
Date of Reporting Period
Item 1. Reports to Stockholders

Eaton Vance
Stock NextShares (EVSTC)
Listing Exchange: The NASDAQ Stock Market LLC
Semiannual Report
June 30, 2019
Important Note. Beginning on January 1, 2021, as permitted by regulations adopted by the Securities and Exchange Commission, paper copies of the Fund’s annual and semi-annual shareholder reports will no longer be sent by mail unless you specifically request paper copies of the reports. Instead, the reports will be made available on the Fund’s website (eatonvance.com/nextsharesdocuments), and you will be notified by mail each time a report is posted and provided with a website address to access the report.
If you already elected to receive shareholder reports electronically, you will not be affected by this change and you need not take any action. You may elect to receive shareholder reports and other communications from the Fund electronically by contacting your financial intermediary (such as a financial advisor, broker-dealer or bank).
You may elect to receive all future Fund shareholder reports in paper free of charge. You can contact your financial intermediary or follow instructions included with this disclosure, if applicable, to elect to continue to receive paper copies of your shareholder reports. Your election to receive reports in paper will apply to all funds held through your financial intermediary.
NextShares® is a registered trademark of NextShares Solutions LLC. All rights reserved.
Commodity Futures Trading Commission Registration. Effective December 31, 2012, the Commodity Futures Trading Commission (“CFTC”) adopted certain regulatory changes that subject registered investment companies and advisers to regulation by the CFTC if a fund invests more than a prescribed level of its assets in certain CFTC-regulated instruments (including futures, certain options and swap agreements) or markets itself as providing investment exposure to such instruments. The Fund has claimed an exclusion from the definition of the term “commodity pool operator” under the Commodity Exchange Act. Accordingly, neither the Fund nor the adviser with respect to the operation of the Fund is subject to CFTC regulation. Because of its management of other strategies, the Fund’s adviser is registered with the CFTC as a commodity pool operator and a commodity trading advisor.
Fund shares are not insured by the FDIC and are not deposits or other obligations of, or guaranteed by, any depository institution. Shares are subject to investment risks, including possible loss of principal invested.
This report must be preceded or accompanied by a current summary prospectus or prospectus. Before investing in NextShares, investors should consider carefully the investment objectives, risks, charges and expenses. This and other important information is contained in the prospectus and summary prospectus, which can be obtained from a financial intermediary. Prospective investors should read the prospectus carefully before investing. For further information, please call 1-800-262-1122.
Semiannual ReportJune 30, 2019
Eaton Vance
Stock NextShares
Table of Contents
| | | | |
Performance | | | 2 | |
| |
Fund Profile | | | 2 | |
| |
Endnotes and Additional Disclosures | | | 3 | |
| |
Fund Expenses | | | 4 | |
| |
Financial Statements | | | 5 | |
| |
Board of Trustees’ Contract Approval | | | 21 | |
| |
Officers and Trustees | | | 24 | |
| |
Important Notices | | | 25 | |
Eaton Vance
Stock NextShares
June 30, 2019
Performance1,2,3
Portfolio ManagerCharles B. Gaffney
| | | | | | | | | | | | | | | | | | | | | | | | | | | | |
| % Average Annual Total Returns | | Fund
Inception Date | | | Performance
Inception Date | | | Six Months | | | One Year | | | Five Years | | | Ten Years | | | Since
Fund
Inception | |
Fund at NAV | | | 02/25/2016 | | | | 11/01/2001 | | | | 22.79 | % | | | 12.95 | % | | | 10.13 | % | | | 13.60 | %�� | | | 14.38 | % |
Fund at Market Price | | | 02/25/2016 | | | | 02/25/2016 | | | | 22.79 | | | | 12.95 | | | | — | | | | — | | | | 14.38 | |
S&P 500® Index | | | — | | | | — | | | | 18.54 | % | | | 10.42 | % | | | 10.71 | % | | | 14.69 | % | | | 15.75 | % |
| | | | | | | | | | | | | | | | | | | | | | | | | | | | |
| % Total Annual Operating Expense Ratios4 | | | | | | | | | | | | | | | | | | | |
Gross | | | | | | | | | | | | | | | | | | | | | | | | | | | 1.60 | % |
Net | | | | | | | | | | | | | | | | | | | | | | | | | | | 0.65 | |
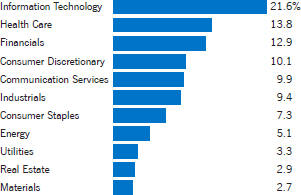
Fund Profile5
Sector Allocation (% of net assets)6
Top 10 Holdings (% of net assets)6
| | | | |
| |
Microsoft Corp. | | | 4.8 | % |
| |
Apple, Inc. | | | 3.5 | |
| |
Alphabet, Inc., Class C | | | 3.5 | |
| |
Visa, Inc., Class A | | | 3.1 | |
| |
Amazon.com, Inc. | | | 2.7 | |
| |
Procter & Gamble Co. (The) | | | 2.4 | |
| |
Bank of America Corp. | | | 2.3 | |
| |
Facebook, Inc., Class A | | | 2.3 | |
| |
Danaher Corp. | | | 2.2 | |
| |
Verizon Communications, Inc. | | | 2.1 | |
| |
Total | | | 28.9 | % |
See Endnotes and Additional Disclosures in this report.
Past performance is no guarantee of future results. Investment return and principal value will fluctuate so that shares, when sold, may be worth more or less than their original cost. Performance is for the stated time period only; due to market volatility, the Fund’s current performance may be lower or higher than indicated. The Fund’s performance at market price will differ from its results at net asset value (NAV). The market price used to calculate the Market Price return is the midpoint between the highest bid and the lowest offer on the exchange on which the shares of the Fund are listed for trading, as of the time that the Fund’s NAV is calculated. If you trade your shares at another time during the day, your return may differ. Returns are historical and are calculated by determining the percentage change in NAV or market price (as applicable) with all distributions reinvested at NAV or closing market price (as applicable) on the payment date of the distribution, and are net of management fees and other expenses. Returns are before taxes unless otherwise noted. Performance less than or equal to one year is cumulative. For performance as of the most recentmonth-end, including historical trading premiums/discounts relative to NAV, please refer to eatonvance.com
Eaton Vance
Stock NextShares
June 30, 2019
Endnotes and Additional Disclosures
| 1 | Shares of NextShares funds are normally bought and sold in the secondary market through a broker, and may not be individually purchased or redeemed from the fund. In the secondary market, buyers and sellers transact with each other, rather than with the fund. NextShares funds issue and redeem shares only in specified creation unit quantities in transactions by or through Authorized Participants. In such transactions, a fund issues and redeems shares in exchange for the basket of securities, other instruments and/or cash that the fund specifies each business day. By transacting in kind, a NextShares fund can lower its trading costs and enhance fund tax efficiency by avoiding forced sales of securities to meet redemptions. Redemptions may be effected partially or entirely in cash whenin-kind delivery is not practicable or deemed not in the best interests of shareholders. A fund’s basket is not intended to be representative of the fund’s current portfolio positions and may vary significantly from current positions. As exchange-traded securities, NextShares can operate with low transfer agency expenses by utilizing the same highly efficient share processing system as used for exchange-listed stocks and ETFs. |
| | Market trading prices of NextShares are linked to the fund’s next-computed net asset value (NAV) and will vary from NAV by amarket-determined premium or discount, which may be zero. Buyers and sellers of NextShares will not know the value of their purchases and sales until after the fund’s NAV is determined at the end of the trading day. Market trading prices may vary significantly from anticipated levels. NextShares do not offer investors the opportunity to buy and sell intraday based on current (versusend-of-day) determinations of fund value. NextShares trade execution prices will fluctuate based on changes in NAV. Although limit orders may be used to control trading costs, they cannot be used to control or limit trade execution prices. As a new type of fund, NextShares have a limited operating history and may initially be available through a limited number of brokers. There can be no guarantee that an active trading market for NextShares will develop or be maintained, or that their listing will continue unchanged. Buying and selling NextShares may require payment of brokerage commissions and expose transacting shareholders to other trading costs. Frequent trading may detract from realized investment returns. The return on a shareholder’s NextShares investment will be reduced if the shareholder sells shares at a greater discount or narrower premium to NAV than he or she acquired the shares. |
| 2 | S&P 500® Index is an unmanaged index oflarge-cap stocks commonly used as a measure of U.S. stock market performance. S&P Dow Jones Indices are a product of S&P Dow Jones Indices LLC (“S&P DJI”) and have been licensed for use. S&P® and S&P 500® are registered trademarks of S&P DJI; Dow Jones® is a registered trademark of Dow Jones Trademark Holdings LLC (“Dow Jones”); S&P DJI, Dow Jones and their respective affiliates do not sponsor, endorse, sell or promote the Fund, will not have any liability with respect thereto and do not have any liability for any errors, omissions, or interruptions of the S&P Dow Jones Indices. Unless otherwise stated, index returns do not reflect the effect of any applicable sales charges, commissions, expenses, taxes or leverage, as applicable. It is not possible to invest directly in an index. |
| 3 | The Fund pursues its investment objective by investing in a separate investment fund (the Portfolio). The returns at NAV for periods before the date the Fund commenced operations are for a mutual fund that invests in the Portfolio (the Portfolio Investor). The performance during such period does not represent the performance of the Fund. The prior investment performance of the Portfolio Investor (rather than the Portfolio itself) is shown because it reflects the expenses typically borne by a retail fund investing in the Portfolio. The Portfolio Investor returns are not adjusted to reflect differences between the total net operating expenses of the Fund and the Portfolio Investor during the periods shown. If such an adjustment were made, the performance presented would be higher, because the Fund’s total net operating expenses are lower than those of the Portfolio Investor. Performance is for a share class of the Portfolio Investor offered at net asset value. Performance presented in the Financial Highlights included in the financial statements is not linked. |
| 4 | Source: Fund prospectus. Net expense ratios reflect a contractual expense reimbursement that continues through 4/30/20. Without the reimbursement, performance would have been lower. The expense ratios for the current reporting period can be found in the Financial Highlights section of this report. |
| 5 | Fund primarily invests in an affiliated investment company (Portfolio) with substantially the same objective(s) and policies as the Fund and may also invest directly. Unless otherwise noted, references to investments are to the aggregate holdings of the Fund and the Portfolio. |
| 6 | Excludes cash and cash equivalents. |
| | Fund profile subject to change due to active management. |
Eaton Vance
Stock NextShares
June 30, 2019
Fund Expenses
Example: As a Fund shareholder, you incur two types of costs: (1) transaction costs, including brokerage commissions on purchases and sales of Fund shares; and (2) ongoing costs, including management fees and other Fund expenses. This Example is intended to help you understand your ongoing costs (in dollars) of Fund investing and to compare these costs with the ongoing costs of investing in other funds. The Example is based on an investment of $1,000 invested at the beginning of the period and held for the entire period (January 1, 2019 – June 30, 2019).
Actual Expenses: The first section of the table below provides information about actual account values and actual expenses. You may use the information in this section, together with the amount you invested, to estimate the expenses that you paid over the period. Simply divide your account value by $1,000 (for example, an $8,600 account value divided by $1,000 = 8.6), then multiply the result by the number in the first section under the heading entitled “Expenses Paid During Period” to estimate the expenses you paid on your account during this period.
Hypothetical Example for Comparison Purposes: The second section of the table below provides information about hypothetical account values and hypothetical expenses based on the actual Fund expense ratio and an assumed rate of return of 5% per year (before expenses), which is not the actual Fund return. The hypothetical account values and expenses may not be used to estimate the actual ending account balance or expenses you paid for the period. You may use this information to compare the ongoing costs of investing in your Fund and other funds. To do so, compare this 5% hypothetical example with the 5% hypothetical examples that appear in the shareholder reports of the other funds.
Please note that the expenses shown in the table are meant to highlight your ongoing costs only and do not reflect any transactional costs, such as brokerage commissions on purchases and sales of Fund shares. Therefore, the second section of the table is useful in comparing ongoing costs only, and will not help you determine the relative total costs of owning different funds. In addition, if these transactional costs were included, your costs would be higher.
| | | | | | | | | | | | | | | | |
| | | Beginning
Account Value
(1/1/19) | | | Ending
Account Value
(6/30/19) | | | Expenses Paid
During Period*
(1/1/19 – 6/30/19) | | | Annualized
Expense
Ratio | |
| | | | |
Actual | | | | | | | | | | | | | | | | |
| | $ | 1,000.00 | | | $ | 1,227.90 | | | $ | 3.59 | ** | | | 0.65 | % |
| | | | | |
Hypothetical | | | | | | | | | | | | | | | | |
(5% return per year before expenses) | | | | | | | | | | | | | | | | |
| | $ | 1,000.00 | | | $ | 1,021.60 | | | $ | 3.26 | ** | | | 0.65 | % |
| * | Expenses are equal to the Fund’s annualized expense ratio, multiplied by the average account value over the period, multiplied by 181/365 (to reflect the one-half year period). The Example assumes that the $1,000 was invested at the net asset value per share determined at the close of business on December 31, 2018. The Example reflects the expenses of both the Fund and the Portfolio. |
| ** | Absent an allocation of certain expenses to an affiliate, expenses would be higher. |
Eaton Vance
Stock NextShares
June 30, 2019
Statement of Assets and Liabilities (Unaudited)
| | | | |
| Assets | | June 30, 2019 | |
| |
Investment in Stock Portfolio, at value (identified cost, $4,503,028) | | $ | 6,541,421 | |
| |
Receivable from affiliate | | | 9,252 | |
| |
Total assets | | $ | 6,550,673 | |
|
| Liabilities | |
| |
Payable to affiliates: | | | | |
| |
Operations agreement fee | | $ | 260 | |
| |
Trustees’ fees | | | 125 | |
| |
Accrued expenses | | | 100,741 | |
| |
Total liabilities | | $ | 101,126 | |
| |
Net Assets | | $ | 6,449,547 | |
|
| Sources of Net Assets | |
| |
Paid-in capital | | $ | 12,011,797 | |
| |
Accumulated loss | | | (5,562,250 | ) |
| |
Total | | $ | 6,449,547 | |
| |
| Net Asset Value Per Share | | | | |
| |
($6,449,547 ÷ 450,000 shares issued and outstanding) | | $ | 14.33 | |
| | | | |
| | 5 | | See Notes to Financial Statements. |
Eaton Vance
Stock NextShares
June 30, 2019
Statement of Operations (Unaudited)
| | | | |
| Investment Income | | Six Months Ended
June 30, 2019 | |
| |
Dividends allocated from Portfolio (net of foreign taxes, $580) | | $ | 47,863 | |
| |
Expenses allocated from Portfolio | | | (19,198 | ) |
| |
Total investment income from Portfolio | | $ | 28,665 | |
| |
| Expenses | | | | |
| |
Operations agreement fee | | $ | 1,485 | |
| |
Trustees’ fees and expenses | | | 250 | |
| |
Custodian fee | | | 14,403 | |
| |
Transfer and dividend disbursing agent fees | | | 6,808 | |
| |
Legal and accounting services | | | 8,110 | |
| |
Printing and postage | | | 4,738 | |
| |
Listing fee | | | 3,521 | |
| |
Intraday pricing fee | | | 2,589 | |
| |
Miscellaneous | | | 1,260 | |
| |
Total expenses | | $ | 43,164 | |
| |
Deduct — | | | | |
| |
Allocation of expenses to affiliate | | $ | 43,030 | |
| |
Total expense reductions | | $ | 43,030 | |
| |
Net expenses | | $ | 134 | |
| |
Net investment income | | $ | 28,531 | |
| |
| Realized and Unrealized Gain (Loss) from Portfolio | | | | |
| |
Net realized gain (loss) — | | | | |
| |
Investment transactions | | $ | 160,292 | |
| |
Net realized gain | | $ | 160,292 | |
| |
Change in unrealized appreciation (depreciation) — | | | | |
| |
Investments | | $ | 1,008,752 | |
| |
Foreign currency | | | 13 | |
| |
Net change in unrealized appreciation (depreciation) | | $ | 1,008,765 | |
| |
Net realized and unrealized gain | | $ | 1,169,057 | |
| |
Net increase in net assets from operations | | $ | 1,197,588 | |
| | | | |
| | 6 | | See Notes to Financial Statements. |
Eaton Vance
Stock NextShares
June 30, 2019
Statements of Changes in Net Assets
| | | | | | | | |
| Increase (Decrease) in Net Assets | | Six Months Ended
June 30, 2019
(Unaudited) | | | Year Ended
December 31, 2018 | |
| | |
From operations — | | | | | | | | |
| | |
Net investment income | | $ | 28,531 | | | $ | 123,769 | |
| | |
Net realized gain | | | 160,292 | | | | 877,475 | (1) |
| | |
Net change in unrealized appreciation (depreciation) | | | 1,008,765 | | | | (664,132 | ) |
| | |
Net increase in net assets from operations | | $ | 1,197,588 | | | $ | 337,112 | |
| | |
Distributions to shareholders | | $ | — | | | $ | (268,650 | ) |
| | |
Transactions in Fund shares — | | | | | | | | |
| | |
Cost of shares redeemed | | $ | — | | | $ | (7,174,943 | ) |
| | |
Transaction fees | | | — | | | | 201 | |
| | |
Net decrease in net assets from Fund share transactions | | $ | — | | | $ | (7,174,742 | ) |
| | |
Other capital — | | | | | | | | |
| | |
Portfolio transaction fee contributed to Portfolio | | $ | (167 | ) | | $ | (834 | ) |
| | |
Portfolio transaction fee allocated from Portfolio | | | 1,815 | | | | 3,740 | |
| | |
Net increase in net assets from other capital | | $ | 1,648 | | | $ | 2,906 | |
| | |
Net increase (decrease) in net assets | | $ | 1,199,236 | | | $ | (7,103,374 | ) |
|
| Net Assets | |
| | |
At beginning of period | | $ | 5,250,311 | | | $ | 12,353,685 | |
| | |
At end of period | | $ | 6,449,547 | | | $ | 5,250,311 | |
| | |
| Changes in shares outstanding | | | | | | | | |
| | |
Shares outstanding, beginning of period | | | 450,000 | | | | 950,000 | |
| | |
Shares redeemed | | | — | | | | (500,000 | ) |
| | |
Shares outstanding, end of period | | | 450,000 | | | | 450,000 | |
| (1) | Includes $21,237 of net realized gains from redemptions in-kind. |
| | | | |
| | 7 | | See Notes to Financial Statements. |
Eaton Vance
Stock NextShares
June 30, 2019
Financial Highlights
| | | | | | | | | | | | | | | | |
| | | |
| | | Six Months Ended
June 30, 2019
(Unaudited) | | | Year Ended December 31, | | | Period Ended
December 31, 2016(1)(2) | |
| | | 2018 | | | 2017(1) | |
| | | | | |
Net asset value — Beginning of period | | $ | 11.670 | | | $ | 13.010 | | | $ | 11.160 | | | $ | 10.000 | |
| | | | |
| Income (Loss) From Operations | | | | | | | | | | | | | | | | |
| | | | |
Net investment income(3) | | $ | 0.063 | | | $ | 0.153 | | | $ | 0.170 | | | $ | 0.149 | |
| | | | |
Net realized and unrealized gain (loss) | | | 2.593 | | | | (0.900 | ) | | | 2.098 | | | | 1.069 | |
| | | | |
Total income (loss) from operations | | $ | 2.656 | | | $ | (0.747 | ) | | $ | 2.268 | | | $ | 1.218 | |
| | | | |
| Less Distributions | | | | | | | | | | | | | | | | |
| | | | |
From net investment income | | $ | — | | | $ | (0.269 | ) | | $ | (0.068 | ) | | $ | (0.064 | ) |
| | | | |
From net realized gain | | | — | | | | (0.328 | ) | | | (0.352 | ) | | | — | |
| | | | |
Total distributions | | $ | — | | | $ | (0.597 | ) | | $ | (0.420 | ) | | $ | (0.064 | ) |
| | | | |
Portfolio transaction fee, net(3) | | $ | 0.004 | | | $ | 0.004 | | | $ | 0.002 | | | $ | 0.006 | |
| | | | |
Net asset value — End of period | | $ | 14.330 | | | $ | 11.670 | | | $ | 13.010 | | | $ | 11.160 | |
| | | | |
Total Return on Net Asset Value(4)(5) | | | 22.79 | %(6) | | | (5.50 | )% | | | 20.43 | % | | | 12.19 | %(6) |
| | | | |
| Ratios/Supplemental Data | | | | | | | | | | | | | | | | |
| | | | |
Net assets, end of period (000’s omitted) | | $ | 6,450 | | | $ | 5,250 | | | $ | 12,354 | | | $ | 25,098 | |
| | | | |
Ratios (as a percentage of average daily net assets):(7) | | | | | | | | | | | | | | | | |
| | | | |
Expenses(5) | | | 0.65 | %(8) | | | 0.65 | % | | | 0.65 | % | | | 0.65 | %(8) |
| | | | |
Net investment income | | | 0.96 | %(8) | | | 1.14 | % | | | 1.42 | % | | | 1.61 | %(8) |
| | | | |
Portfolio Turnover of the Portfolio | | | 35 | %(6) | | | 90 | % | | | 101 | % | | | 118 | %(9) |
| (1) | Per share data reflect a 2-for-1 share split effective March 9, 2018. |
| (2) | For the period from the start of business, February 25, 2016, to December 31, 2016. |
| (3) | Computed using average shares outstanding. |
| (4) | Returns are historical and are calculated by determining the percentage change in net asset value with all distributions reinvested and do not reflect the effect of a market-determined premium or discount. Investment returns assume that all distributions have been reinvested at net asset value. |
| (5) | The investment adviser and administrator reimbursed certain operating expenses (equal to 1.45%, 0.95%, 0.61% and 0.84% of average daily net assets for the six months ended June 30, 2019, the years ended December 31, 2018 and 2017 and the period ended December 31, 2016, respectively). Absent this reimbursement, total return would be lower. |
| (7) | Includes the Fund’s share of the Portfolio’s allocated expenses. |
| (9) | For the Portfolio’s year ended December 31, 2016. |
| | | | |
| | 8 | | See Notes to Financial Statements. |
Eaton Vance
Stock NextShares
June 30, 2019
Notes to Financial Statements (Unaudited)
1 Significant Accounting Policies
Eaton Vance Stock NextShares (the Fund) is a diversified series of Eaton Vance NextShares Trust (the Trust), a Massachusetts business trust registered under the Investment Company Act of 1940, as amended (the 1940 Act). The Fund is an exchange-traded managed fund operating pursuant to an order issued by the SEC granting an exemption from certain provisions of the 1940 Act. Individual shares of the Fund may be purchased and sold only on a national securities exchange or alternative trading system through a broker-dealer that offers NextShares, and may not be directly purchased or redeemed from the Fund. Market trading prices for the Fund are directly linked to the Fund’s next-computed net asset value per share (NAV) and will vary from NAV by a market-determined premium or discount, which may be zero. The Fund invests all of its investable assets in interests in Stock Portfolio (the Portfolio), a Massachusetts business trust having substantially the same investment objective and policies as the Fund. The value of the Fund’s investment in the Portfolio reflects the Fund’s proportionate interest in the net assets of the Portfolio (1.0% at June 30, 2019). The performance of the Fund is directly affected by the performance of the Portfolio. The financial statements of the Portfolio, including the portfolio of investments, are included elsewhere in this report and should be read in conjunction with the Fund’s financial statements.
The following is a summary of significant accounting policies of the Fund. The policies are in conformity with accounting principles generally accepted in the United States of America (U.S. GAAP). The Fund is an investment company and follows accounting and reporting guidance in the Financial Accounting Standards Board (FASB) Accounting Standards Codification Topic 946.
A Investment Valuation — Valuation of securities by the Portfolio is discussed in Note 1A of the Portfolio’s Notes to Financial Statements, which are included elsewhere in this report.
B Income — The Fund’s net investment income or loss consists of the Fund’s pro-rata share of the net investment income or loss of the Portfolio, less all actual and accrued expenses of the Fund.
C Federal Taxes — The Fund’s policy is to comply with the provisions of the Internal Revenue Code applicable to regulated investment companies and to distribute to shareholders each year substantially all of its net investment income, and all or substantially all of its net realized capital gains. Accordingly, no provision for federal income or excise tax is necessary.
As of June 30, 2019, the Fund had no uncertain tax positions that would require financial statement recognition, de-recognition, or disclosure. The Fund files a U.S. federal income tax return annually after its fiscal year-end, which is subject to examination by the Internal Revenue Service for a period of three years from the date of filing.
D Expenses — The majority of expenses of the Trust are directly identifiable to an individual fund. Expenses which are not readily identifiable to a specific fund are allocated taking into consideration, among other things, the nature and type of expense and the relative size of the funds.
E Use of Estimates — The preparation of the financial statements in conformity with U.S. GAAP requires management to make estimates and assumptions that affect the reported amounts of assets and liabilities at the date of the financial statements and the reported amounts of income and expense during the reporting period. Actual results could differ from those estimates.
F Indemnifications — Under the Trust’s organizational documents, its officers and Trustees may be indemnified against certain liabilities and expenses arising out of the performance of their duties to the Fund. Under Massachusetts law, if certain conditions prevail, shareholders of a Massachusetts business trust (such as the Trust) could be deemed to have personal liability for the obligations of the Trust. However, the Trust’s Declaration of Trust contains an express disclaimer of liability on the part of Fund shareholders and the By-laws provide that the Trust shall assume, upon request by the shareholder, the defense on behalf of any Fund shareholders. Moreover, the By-laws also provide for indemnification out of Fund property of any shareholder held personally liable solely by reason of being or having been a shareholder for all loss or expense arising from such liability. Additionally, in the normal course of business, the Fund enters into agreements with service providers that may contain indemnification clauses. The Fund’s maximum exposure under these arrangements is unknown as this would involve future claims that may be made against the Fund that have not yet occurred.
G Other — Investment transactions are accounted for on a trade date basis.
H Interim Financial Statements — The interim financial statements relating to June 30, 2019 and for the six months then ended have not been audited by an independent registered public accounting firm, but in the opinion of the Fund’s management, reflect all adjustments, consisting only of normal recurring adjustments, necessary for the fair presentation of the financial statements.
2 Distributions to Shareholders and Income Tax Information
It is the present policy of the Fund to make at least one distribution annually (normally in December) of all or substantially all of its net investment income and to distribute annually all or substantially all of its net realized capital gains. Distributions are paid in cash and cannot be automatically reinvested in additional shares of the Fund. Distributions to shareholders are recorded on the ex-dividend date. Distributions to shareholders are determined in accordance with income tax regulations, which may differ from U.S. GAAP. As required by U.S. GAAP, only distributions in excess of tax basis earnings and profits are reported in the financial statements as a return of capital. Permanent differences between book and tax accounting relating to distributions are reclassified to paid-in capital. For tax purposes, distributions from short-term capital gains are considered to be from ordinary income.
Eaton Vance
Stock NextShares
June 30, 2019
Notes to Financial Statements (Unaudited) — continued
At December 31, 2018, the Fund had a net capital loss of $43,994 attributable to security transactions incurred after October 31, 2018 that it has elected to defer. This net capital loss is treated as arising on the first day of the Fund’s taxable year ending December 31, 2019.
3 Investment Adviser Fee and Other Transactions with Affiliates
The investment adviser fee is earned by Eaton Vance Management (EVM) as compensation for investment advisory services rendered to the Fund. The fee is computed at an annual rate of 0.60% of the Fund’s average daily net assets that are not invested in other investment companies for which EVM or its affiliates serve as investment adviser and receive an advisory fee (“Direct Assets”) up to $500 million and is payable monthly. On Direct Assets of $500 million and over, the annual fee is reduced. For the six months ended June 30, 2019, the Fund incurred no investment adviser fee on Direct Assets. To the extent the Fund’s assets are invested in the Portfolio, the Fund is allocated its share of the Portfolio’s investment adviser fee. The Portfolio has engaged Boston Management and Research (BMR), a subsidiary of EVM, to render investment advisory services. See Note 2 of the Portfolio’s Notes to Financial Statements which are included elsewhere in this report. EVM also serves as the administrator of the Fund, but receives no compensation.
The Trust, on behalf of the Fund, has entered into an operations agreement with EVM pursuant to which EVM provides the Fund with services required for it to operate as a NextShares exchange-traded managed fund in accordance with the exemptive order obtained by EVM and the Trust. Pursuant to the agreement, the Fund pays EVM a monthly fee at an annual rate of 0.05% of the Fund’s average daily net assets provided the average net assets of NextShares funds sponsored by EVM (“Covered Assets”) are less than $10 billion. The annual rate is reduced if Covered Assets are $10 billion and above. For the six months ended June 30, 2019, the operations agreement fee amounted to $1,485 or 0.05% (annualized) of the Fund’s average daily net assets.
EVM has agreed to reimburse the Fund’s expenses to the extent that total annual operating expenses (relating to ordinary operating expenses only) exceed 0.65% of the Fund’s average daily net assets through April 30, 2020. Thereafter, the reimbursement may be changed or terminated at any time. Pursuant to this agreement, EVM was allocated $43,030 of the Fund’s operating expenses for the six months ended June 30, 2019.
Trustees and officers of the Fund who are members of EVM’s or BMR’s organizations receive remuneration for their services to the Fund out of the investment adviser fee. Certain officers and Trustees of the Fund and the Portfolio are officers of the above organizations.
4 Investment Transactions
For the six months ended June 30, 2019, increases and decreases in the Fund’s investment in the Portfolio aggregated $88,190 and $75,109, respectively. In addition, a Portfolio transaction fee is imposed by the Portfolio on the combined daily inflows or outflows of the Fund and the Portfolio’s other investors as more fully described at Note 1H of the Portfolio’s financial statements included herein. Such fee is allocated to the Fund based on its pro-rata interest in the Portfolio. The amount of the Portfolio transaction fee imposed on the Fund, if any, and the allocation of such fee are presented as Other capital on the Statements of Changes in Net Assets.
5 Capital Share Transactions
The Trust may issue an unlimited number of shares of capital stock (no par value per share) in one or more series (such as the Fund). The Fund issues and redeems shares only in blocks of 25,000 shares or multiples thereof (“Creation Units”). The Fund issues and redeems Creation Units in return for the securities, other instruments and/or cash (the “Basket”) that the Fund specifies each business day. Creation Units may be purchased or redeemed only by or through Authorized Participants, which are broker-dealers or institutional investors that have entered into agreements with the Fund’s distributor for this purpose. The Fund imposes a transaction fee on Creation Units issued and redeemed to offset the estimated cost to the Fund of processing the transaction, which is paid by the Authorized Participants directly to a third-party administrator. In addition, Authorized Participants pay the Fund a variable charge for converting the Basket to or from the desired portfolio composition. Such variable charges are reflected as Transaction fees on the Statements of Changes in Net Assets.
At June 30, 2019, EVM owned approximately 96% of the outstanding shares of the Fund.
Stock Portfolio
June 30, 2019
Portfolio of Investments (Unaudited)
| | | | | | | | |
| Common Stocks — 99.0% | |
| Security | | Shares | | | Value | |
|
| Aerospace & Defense — 2.5% | |
| | |
CAE, Inc. | | | 281,400 | | | $ | 7,566,030 | |
| | |
Hexcel Corp. | | | 106,000 | | | | 8,573,280 | |
| |
| | | | $ | 16,139,310 | |
|
| Banks — 5.4% | |
| | |
Bank of America Corp. | | | 509,040 | | | $ | 14,762,160 | |
| | |
JPMorgan Chase & Co. | | | 107,620 | | | | 12,031,916 | |
| | |
PNC Financial Services Group, Inc. (The) | | | 52,140 | | | | 7,157,779 | |
| |
| | | | $ | 33,951,855 | |
|
| Beverages — 2.1% | |
| | |
PepsiCo, Inc. | | | 102,100 | | | $ | 13,388,373 | |
| |
| | | | $ | 13,388,373 | |
|
| Biotechnology — 0.8% | |
| | |
Gilead Sciences, Inc. | | | 71,933 | | | $ | 4,859,794 | |
| |
| | | | $ | 4,859,794 | |
|
| Capital Markets — 1.8% | |
| | |
S&P Global, Inc. | | | 34,200 | | | $ | 7,790,418 | |
| | |
Tradeweb Markets, Inc., Class A | | | 78,068 | | | | 3,420,159 | |
| |
| | | | $ | 11,210,577 | |
|
| Chemicals — 1.4% | |
| | |
DuPont de Nemours, Inc. | | | 62,773 | | | $ | 4,712,369 | |
| | |
Ecolab, Inc. | | | 21,600 | | | | 4,264,704 | |
| |
| | | | $ | 8,977,073 | |
|
| Commercial Services & Supplies — 2.0% | |
| | |
Waste Management, Inc. | | | 107,082 | | | $ | 12,354,050 | |
| |
| | | | $ | 12,354,050 | |
|
| Consumer Finance — 1.3% | |
| | |
American Express Co. | | | 68,760 | | | $ | 8,487,734 | |
| |
| | | | $ | 8,487,734 | |
|
| Containers & Packaging — 1.3% | |
| | |
Ball Corp. | | | 119,018 | | | $ | 8,330,070 | |
| |
| | | | $ | 8,330,070 | |
| | | | | | | | |
| Security | | Shares | | | Value | |
|
| Diversified Consumer Services — 1.2% | |
| | |
Grand Canyon Education, Inc.(1) | | | 63,306 | | | $ | 7,408,068 | |
| |
| | | | $ | 7,408,068 | |
|
| Diversified Telecommunication Services — 2.1% | |
| | |
Verizon Communications, Inc. | | | 235,090 | | | $ | 13,430,692 | |
| |
| | | | $ | 13,430,692 | |
|
| Electric Utilities — 1.4% | |
| | |
NextEra Energy, Inc. | | | 42,596 | | | $ | 8,726,217 | |
| |
| | | | $ | 8,726,217 | |
|
| Electrical Equipment — 2.7% | |
| | |
AMETEK, Inc. | | | 126,600 | | | $ | 11,500,344 | |
| | |
Emerson Electric Co. | | | 86,842 | | | | 5,794,098 | |
| |
| | | | $ | 17,294,442 | |
|
| Entertainment — 2.0% | |
| | |
Walt Disney Co. (The) | | | 89,026 | | | $ | 12,431,591 | |
| |
| | | | $ | 12,431,591 | |
|
| Equity Real Estate Investment Trusts (REITs) — 2.9% | |
| | |
American Tower Corp. | | | 56,600 | | | $ | 11,571,870 | |
| | |
AvalonBay Communities, Inc. | | | 34,580 | | | | 7,025,964 | |
| |
| | | | $ | 18,597,834 | |
|
| Food & Staples Retailing — 1.0% | |
| | |
Performance Food Group Co.(1) | | | 156,698 | | | $ | 6,272,621 | |
| |
| | | | $ | 6,272,621 | |
|
| Food Products — 1.8% | |
| | |
Mondelez International, Inc., Class A | | | 207,720 | | | $ | 11,196,108 | |
| |
| | | | $ | 11,196,108 | |
|
| Health Care Equipment & Supplies — 3.5% | |
| | |
Boston Scientific Corp.(1) | | | 196,420 | | | $ | 8,442,131 | |
| | |
Danaher Corp. | | | 97,866 | | | | 13,987,009 | |
| |
| | | | $ | 22,429,140 | |
|
| Health Care Providers & Services — 1.9% | |
| | |
Anthem, Inc. | | | 42,860 | | | $ | 12,095,521 | |
| |
| | | | $ | 12,095,521 | |
| | | | |
| | 11 | | See Notes to Financial Statements. |
Stock Portfolio
June 30, 2019
Portfolio of Investments (Unaudited) — continued
| | | | | | | | |
| Security | | Shares | | | Value | |
|
| Household Products — 2.4% | |
| | |
Procter & Gamble Co. (The) | | | 138,600 | | | $ | 15,197,490 | |
| |
| | | | $ | 15,197,490 | |
|
| Insurance — 4.5% | |
| | |
American International Group, Inc. | | | 159,340 | | | $ | 8,489,635 | |
| | |
Assurant, Inc. | | | 59,600 | | | | 6,340,248 | |
| | |
First American Financial Corp. | | | 109,972 | | | | 5,905,497 | |
| | |
Progressive Corp. (The) | | | 93,200 | | | | 7,449,476 | |
| |
| | | | $ | 28,184,856 | |
|
| Interactive Media & Services — 5.8% | |
| | |
Alphabet, Inc., Class C(1) | | | 20,329 | | | $ | 21,973,819 | |
| | |
Facebook, Inc., Class A(1) | | | 74,844 | | | | 14,444,892 | |
| |
| | | | $ | 36,418,711 | |
|
| Internet & Direct Marketing Retail — 2.7% | |
| | |
Amazon.com, Inc.(1) | | | 9,022 | | | $ | 17,084,330 | |
| |
| | | | $ | 17,084,330 | |
|
| IT Services — 7.9% | |
| | |
Amdocs, Ltd. | | | 104,142 | | | $ | 6,466,177 | |
| | |
Cognizant Technology Solutions Corp., Class A | | | 146,812 | | | | 9,306,412 | |
| | |
Fidelity National Information Services, Inc. | | | 99,700 | | | | 12,231,196 | |
| | |
GoDaddy, Inc., Class A(1) | | | 38,239 | | | | 2,682,466 | |
| | |
Visa, Inc., Class A | | | 112,400 | | | | 19,507,020 | |
| |
| | | | $ | 50,193,271 | |
|
| Life Sciences Tools & Services — 1.7% | |
| | |
Thermo Fisher Scientific, Inc. | | | 37,600 | | | $ | 11,042,368 | |
| |
| | | | $ | 11,042,368 | |
|
| Machinery — 2.1% | |
| | |
Gardner Denver Holdings, Inc.(1) | | | 226,220 | | | $ | 7,827,212 | |
| | |
Parker-Hannifin Corp. | | | 32,320 | | | | 5,494,723 | |
| |
| | | | $ | 13,321,935 | |
|
| Multi-Utilities — 1.9% | |
| | |
CMS Energy Corp. | | | 108,800 | | | $ | 6,300,608 | |
| | |
Sempra Energy | | | 43,042 | | | | 5,915,693 | |
| |
| | | | $ | 12,216,301 | |
| | | | | | | | |
| Security | | Shares | | | Value | |
|
| Oil, Gas & Consumable Fuels — 5.1% | |
| | |
ConocoPhillips | | | 104,486 | | | $ | 6,373,646 | |
| | |
Exxon Mobil Corp. | | | 160,844 | | | | 12,325,476 | |
| | |
Phillips 66 | | | 75,525 | | | | 7,064,608 | |
| | |
Pioneer Natural Resources Co. | | | 40,700 | | | | 6,262,102 | |
| |
| | | | $ | 32,025,832 | |
|
| Pharmaceuticals — 5.9% | |
| | |
Bristol-Myers Squibb Co. | | | 170,500 | | | $ | 7,732,175 | |
| | |
Catalent, Inc.(1) | | | 89,300 | | | | 4,840,953 | |
| | |
GlaxoSmithKline PLC ADR | | | 91,600 | | | | 3,665,832 | |
| | |
Jazz Pharmaceuticals PLC(1) | | | 59,073 | | | | 8,421,447 | |
| | |
Merck & Co., Inc. | | | 147,900 | | | | 12,401,415 | |
| |
| | | | $ | 37,061,822 | |
|
| Semiconductors & Semiconductor Equipment — 2.3% | |
| | |
Taiwan Semiconductor Manufacturing Co., Ltd. ADR | | | 131,823 | | | $ | 5,163,507 | |
| | |
Texas Instruments, Inc. | | | 83,779 | | | | 9,614,478 | |
| |
| | | | $ | 14,777,985 | |
|
| Software — 7.8% | |
| | |
Adobe, Inc.(1) | | | 23,478 | | | $ | 6,917,793 | |
| | |
CrowdStrike Holdings, Inc., Class A(1) | | | 23,257 | | | | 1,588,220 | |
| | |
Intuit, Inc. | | | 17,936 | | | | 4,687,215 | |
| | |
Microsoft Corp. | | | 226,520 | | | | 30,344,619 | |
| | |
salesforce.com, Inc.(1) | | | 38,101 | | | | 5,781,065 | |
| |
| | | | $ | 49,318,912 | |
|
| Specialty Retail — 5.0% | |
| | |
Home Depot, Inc. (The) | | | 60,388 | | | $ | 12,558,892 | |
| | |
Lowe’s Cos., Inc. | | | 127,006 | | | | 12,816,176 | |
| | |
TJX Cos., Inc. (The) | | | 113,740 | | | | 6,014,571 | |
| |
| | | | $ | 31,389,639 | |
|
| Technology Hardware, Storage & Peripherals — 3.5% | |
| | |
Apple, Inc. | | | 111,697 | | | $ | 22,107,070 | |
| |
| | | | $ | 22,107,070 | |
|
| Textiles, Apparel & Luxury Goods — 1.3% | |
| | |
Gildan Activewear, Inc. | | | 208,544 | | | $ | 8,066,482 | |
| |
| | | | $ | 8,066,482 | |
| |
Total Common Stocks
(identified cost $490,660,104) | | | $ | 625,988,074 | |
| | | | |
| | 12 | | See Notes to Financial Statements. |
Stock Portfolio
June 30, 2019
Portfolio of Investments (Unaudited) — continued
| | | | | | | | |
| Short-Term Investments— 0.9% | |
| Description | | Units | | | Value | |
| | |
Eaton Vance Cash Reserves Fund, LLC, 2.40%(2) | | | 5,529,629 | | | $ | 5,529,629 | |
| |
Total Short-Term Investments
(identified cost $5,529,629) | | | $ | 5,529,629 | |
| |
Total Investments — 99.9%
(identified cost $496,189,733) | | | $ | 631,517,703 | |
| |
Other Assets, Less Liabilities — 0.1% | | | $ | 343,987 | |
| |
Net Assets — 100.0% | | | $ | 631,861,690 | |
The percentage shown for each investment category in the Portfolio of Investments is based on net assets.
| (1) | Non-income producing security. |
| (2) | Affiliated investment company, available to Eaton Vance portfolios and funds, which invests in high quality, U.S. dollar denominated money market instruments. The rate shown is the annualizedseven-day yield as of June 30, 2019. |
Abbreviations:
| | | | |
| | |
| ADR | | – | | American Depositary Receipt |
| | | | |
| | 13 | | See Notes to Financial Statements. |
Stock Portfolio
June 30, 2019
Statement of Assets and Liabilities (Unaudited)
| | | | |
| Assets | | June 30, 2019 | |
| |
Unaffiliated investments, at value (identified cost, $490,660,104) | | $ | 625,988,074 | |
| |
Affiliated investment, at value (identified cost, $5,529,629) | | | 5,529,629 | |
| |
Foreign currency, at value (identified cost, $16,108) | | | 16,116 | |
| |
Dividends receivable | | | 511,512 | |
| |
Dividends receivable from affiliated investment | | | 4,648 | |
| |
Tax reclaims receivable | | | 198,699 | |
| |
Total assets | | $ | 632,248,678 | |
| |
| Liabilities | | | | |
| |
Payable to affiliates: | | | | |
| |
Investment adviser fee | | $ | 301,564 | |
| |
Trustees’ fees | | | 7,385 | |
| |
Accrued expenses | | | 78,039 | |
| |
Total liabilities | | $ | 386,988 | |
| |
Net Assets applicable to investors’ interest in Portfolio | | $ | 631,861,690 | |
| | | | |
| | 14 | | See Notes to Financial Statements. |
Stock Portfolio
June 30, 2019
Statement of Operations (Unaudited)
| | | | |
| Investment Income | | Six Months Ended
June 30, 2019 | |
| |
Dividends (net of foreign taxes, $56,007) | | $ | 4,626,661 | |
| |
Dividends from affiliated investment | | | 21,154 | |
| |
Total investment income | | $ | 4,647,815 | |
| |
| Expenses | | | | |
| |
Investment adviser fee | | $ | 1,745,919 | |
| |
Trustees’ fees and expenses | | | 15,341 | |
| |
Custodian fee | | | 71,331 | |
| |
Legal and accounting services | | | 23,608 | |
| |
Miscellaneous | | | 10,232 | |
| |
Total expenses | | $ | 1,866,431 | |
| |
Net investment income | | $ | 2,781,384 | |
| |
| Realized and Unrealized Gain (Loss) | | | | |
| |
Net realized gain (loss) — | | | | |
| |
Investment transactions | | $ | 15,589,401 | |
| |
Investment transactions — affiliated investment | | | 114 | |
| |
Foreign currency transactions | | | (37 | ) |
| |
Net realized gain | | $ | 15,589,478 | |
| |
Change in unrealized appreciation (depreciation) — | | | | |
| |
Investments | | $ | 98,831,430 | |
| |
Investments — affiliated investment | | | (2 | ) |
| |
Foreign currency | | | 1,144 | |
| |
Net change in unrealized appreciation (depreciation) | | $ | 98,832,572 | |
| |
Net realized and unrealized gain | | $ | 114,422,050 | |
| |
Net increase in net assets from operations | | $ | 117,203,434 | |
| | | | |
| | 15 | | See Notes to Financial Statements. |
Stock Portfolio
June 30, 2019
Statements of Changes in Net Assets
| | | | | | | | |
| Increase (Decrease) in Net Assets | | Six Months Ended
June 30, 2019
(Unaudited) | | | Year Ended
December 31, 2018 | |
| | |
From operations — | | | | | | | | |
| | |
Net investment income | | $ | 2,781,384 | | | $ | 7,128,802 | |
| | |
Net realized gain | | | 15,589,478 | | | | 50,384,018 | (1) |
| | |
Net change in unrealized appreciation (depreciation) | | | 98,832,572 | | | | (84,773,096 | ) |
| | |
Net increase (decrease) in net assets from operations | | $ | 117,203,434 | | | $ | (27,260,276 | ) |
| | |
Capital transactions — | | | | | | | | |
| | |
Contributions | | $ | 36,752,002 | | | $ | 19,957,986 | |
| | |
Withdrawals | | | (38,884,419 | ) | | | (123,729,807 | ) |
| | |
Portfolio transaction fee | | | 175,450 | | | | 242,333 | |
| | |
Net decrease in net assets from capital transactions | | $ | (1,956,967 | ) | | $ | (103,529,488 | ) |
| | |
Net increase (decrease) in net assets | | $ | 115,246,467 | | | $ | (130,789,764 | ) |
|
| Net Assets | |
| | |
At beginning of period | | $ | 516,615,223 | | | $ | 647,404,987 | |
| | |
At end of period | | $ | 631,861,690 | | | $ | 516,615,223 | |
| (1) | Includes $2,091,763 of net realized gains from redemptionsin-kind. |
| | | | |
| | 16 | | See Notes to Financial Statements. |
Stock Portfolio
June 30, 2019
Financial Highlights
| | | | | | | | | | | | | | | | | | | | | | | | |
| | |
| | | Six Months Ended
June 30, 2019
(Unaudited) | | | Year Ended December 31, | |
| Ratios/Supplemental Data | | 2018 | | | 2017 | | | 2016 | | | 2015 | | | 2014 | |
| | | | | | | |
Ratios (as a percentage of average daily net assets): | | | | | | | | | | | | | | | | | | | | | | | | |
| | | | | | |
Expenses(1) | | | 0.64 | %(2) | | | 0.64 | % | | | 0.64 | % | | | 0.65 | % | | | 0.70 | % | | | 0.71 | % |
| | | | | | |
Net investment income | | | 0.95 | %(2) | | | 1.14 | % | | | 1.38 | % | | | 1.60 | % | | | 1.16 | % | | | 1.07 | % |
| | | | | | |
Portfolio Turnover | | | 35 | %(3) | | | 90 | % | | | 101 | % | | | 118 | % | | | 96 | % | | | 109 | % |
| | | | | | |
Total Return | | | 22.55 | %(3) | | | (5.57 | )% | | | 20.31 | % | | | 7.14 | % | | | 4.88 | % | | | 12.56 | % |
| | | | | | |
Net assets, end of period (000’s omitted) | | $ | 631,862 | | | $ | 516,615 | | | $ | 647,405 | | | $ | 640,973 | | | $ | 395,492 | | | $ | 252,929 | |
| (1) | Excludes the effect of custody fee credits, if any, of less than 0.005%. Effective September 1, 2015, custody fee credits, which were earned on cash deposit balances, were discontinued by the custodian. |
| | | | |
| | 17 | | See Notes to Financial Statements. |
Stock Portfolio
June 30, 2019
Notes to Financial Statements (Unaudited)
1 Significant Accounting Policies
Stock Portfolio (the Portfolio) is a Massachusetts business trust registered under the Investment Company Act of 1940, as amended (the 1940 Act), as a diversified,open-end management investment company. The Portfolio’s investment objective is to achieve long-term capital appreciation by investing in a diversified portfolio of equity securities. The Declaration of Trust permits the Trustees to issue interests in the Portfolio. At June 30, 2019, Eaton Vance Stock Fund, Eaton Vance Stock NextShares and Eaton Vance Balanced Fund held an interest of 15.0%, 1.0% and 83.9%, respectively, in the Portfolio.
The following is a summary of significant accounting policies of the Portfolio. The policies are in conformity with accounting principles generally accepted in the United States of America (U.S. GAAP). The Portfolio is an investment company and follows accounting and reporting guidance in the Financial Accounting Standards Board (FASB) Accounting Standards Codification Topic 946.
A Investment Valuation — The following methodologies are used to determine the market value or fair value of investments.
Equity Securities.Equity securities listed on a U.S. securities exchange generally are valued at the last sale or closing price on the day of valuation or, if no sales took place on such date, at the mean between the closing bid and ask prices on the exchange where such securities are principally traded. Equity securities listed on the NASDAQ Global or Global Select Market generally are valued at the NASDAQ official closing price. Unlisted or listed securities for which closing sales prices or closing quotations are not available are valued at the mean between the latest available bid and ask prices.
Foreign Securities and Currencies.Foreign securities and currencies are valued in U.S. dollars, based on foreign currency exchange rate quotations supplied by a third party pricing service. The pricing service uses a proprietary model to determine the exchange rate. Inputs to the model include reported trades and implied bid/ask spreads. The daily valuation of exchange-traded foreign securities generally is determined as of the close of trading on the principal exchange on which such securities trade. Events occurring after the close of trading on foreign exchanges may result in adjustments to the valuation of foreign securities to more accurately reflect their fair value as of the close of regular trading on the New York Stock Exchange. When valuing foreign equity securities that meet certain criteria, the Portfolio’s Trustees have approved the use of a fair value service that values such securities to reflect market trading that occurs after the close of the applicable foreign markets of comparable securities or other instruments that have a strong correlation to the fair-valued securities.
Affiliated Fund.The Portfolio may invest in Eaton Vance Cash Reserves Fund, LLC (Cash Reserves Fund), an affiliated investment company managed by Eaton Vance Management (EVM). While Cash Reserves Fund is not a registered money market mutual fund, it conducts all of its investment activities in accordance with the requirements of Rule2a-7 under the 1940 Act. Investments in Cash Reserves Fund are valued at the closing net asset value per unit on the valuation day. Cash Reserves Fund generally values its investment securities based on available market quotations provided by a third party pricing service.
Fair Valuation.Investments for which valuations or market quotations are not readily available or are deemed unreliable are valued at fair value using methods determined in good faith by or at the direction of the Trustees of the Portfolio in a manner that most fairly reflects the security’s “fair value”, which is the amount that the Portfolio might reasonably expect to receive for the security upon its current sale in the ordinary course. Each such determination is based on a consideration of relevant factors, which are likely to vary from one pricing context to another. These factors may include, but are not limited to, the type of security, the existence of any contractual restrictions on the security’s disposition, the price and extent of public trading in similar securities of the issuer or of comparable companies or entities, quotations or relevant information obtained from broker/dealers or other market participants, information obtained from the issuer, analysts, and/or the appropriate stock exchange (for exchange-traded securities), an analysis of the company’s or entity’s financial statements, and an evaluation of the forces that influence the issuer and the market(s) in which the security is purchased and sold.
B Investment Transactions — Investment transactions for financial statement purposes are accounted for on a trade date basis. Realized gains and losses on investments sold are determined on the basis of identified cost.
C Income — Dividend income is recorded on theex-dividend date for dividends received in cash and/or securities. However, if theex-dividend date has passed, certain dividends from foreign securities are recorded as the Portfolio is informed of theex-dividend date. Withholding taxes on foreign dividends and capital gains have been provided for in accordance with the Portfolio’s understanding of the applicable countries’ tax rules and rates.
D Federal Taxes — The Portfolio has elected to be treated as a partnership for federal tax purposes. No provision is made by the Portfolio for federal or state taxes on any taxable income of the Portfolio because each investor in the Portfolio is ultimately responsible for the payment of any taxes on its share of taxable income. Since at least one of the Portfolio’s investors is a regulated investment company that invests all or substantially all of its assets in the Portfolio, the Portfolio normally must satisfy the applicable source of income and diversification requirements (under the Internal Revenue Code) in order for its investors to satisfy them. The Portfolio will allocate, at least annually among its investors, each investor’s distributive share of the Portfolio’s net investment income, net realized capital gains and losses and any other items of income, gain, loss, deduction or credit.
As of June 30, 2019, the Portfolio had no uncertain tax positions that would require financial statement recognition,de-recognition, or disclosure. The Portfolio files a U.S. federal income tax return annually after its fiscalyear-end, which is subject to examination by the Internal Revenue Service for a period of three years from the date of filing.
E Foreign Currency Translation — Investment valuations, other assets, and liabilities initially expressed in foreign currencies are translated each business day into U.S. dollars based upon current exchange rates. Purchases and sales of foreign investment securities and income and expenses denominated in foreign currencies are translated into U.S. dollars based upon currency exchange rates in effect on the respective dates of such transactions. Recognized
Stock Portfolio
June 30, 2019
Notes to Financial Statements (Unaudited) — continued
gains or losses on investment transactions attributable to changes in foreign currency exchange rates are recorded for financial statement purposes as net realized gains and losses on investments. That portion of unrealized gains and losses on investments that results from fluctuations in foreign currency exchange rates is not separately disclosed.
F Use of Estimates — The preparation of the financial statements in conformity with U.S. GAAP requires management to make estimates and assumptions that affect the reported amounts of assets and liabilities at the date of the financial statements and the reported amounts of income and expense during the reporting period. Actual results could differ from those estimates.
G Indemnifications — Under the Portfolio’s organizational documents, its officers and Trustees may be indemnified against certain liabilities and expenses arising out of the performance of their duties to the Portfolio. Under Massachusetts law, if certain conditions prevail, interestholders in the Portfolio could be deemed to have personal liability for the obligations of the Portfolio. However, the Portfolio’s Declaration of Trust contains an express disclaimer of liability on the part of Portfolio interestholders. Additionally, in the normal course of business, the Portfolio enters into agreements with service providers that may contain indemnification clauses. The Portfolio’s maximum exposure under these arrangements is unknown as this would involve future claims that may be made against the Portfolio that have not yet occurred.
H Capital Transactions — To seek to protect the Portfolio (and, indirectly, other investors in the Portfolio) against the costs of accommodating investor inflows and outflows, the Portfolio imposes a fee (“Portfolio transaction fee”) on inflows and outflows by Portfolio investors. The Portfolio transaction fee is sized to cover the estimated cost to the Portfolio of, in connection with issuing interests, converting the cash and/or other instruments it receives to the desired composition and, in connection with redeeming its interests, converting Portfolio holdings to cash and/or other instruments to be distributed. Such fee, which may vary over time, is limited to amounts that have been authorized by the Board of Trustees and determined by EVM to be appropriate. The maximum Portfolio transaction fee is 2% of the amount of net contributions or withdrawals. The Portfolio transaction fee is recorded as a component of capital transactions on the Statements of Changes in Net Assets.
I Interim Financial Statements — The interim financial statements relating to June 30, 2019 and for the six months then ended have not been audited by an independent registered public accounting firm, but in the opinion of the Portfolio’s management, reflect all adjustments, consisting only of normal recurring adjustments, necessary for the fair presentation of the financial statements.
2 Investment Adviser Fee and Other Transactions with Affiliates
The investment adviser fee is earned by Boston Management and Research (BMR), a subsidiary of EVM, as compensation for investment advisory services rendered to the Portfolio. Pursuant to the investment advisory agreement and subsequent fee reduction agreement between the Portfolio and BMR, the fee is computed at an annual rate of 0.60% of the Portfolio’s average daily net assets up to $500 million and 0.575% from $500 million but less than $1 billion, and is payable monthly. On net assets of $1 billion or over, the annual fee is reduced. The fee reduction cannot be terminated or reduced without the approval of a majority vote of the Trustees of the Portfolio who are not interested persons of BMR or the Portfolio and by the vote of a majority of the holders of interest in the Portfolio. For the six months ended June 30, 2019, the Portfolio’s investment adviser fee amounted to $1,745,919 or 0.59% (annualized) of the Portfolio’s average daily net assets. The Portfolio invests its cash in Cash Reserves Fund. EVM does not currently receive a fee for advisory services provided to Cash Reserves Fund.
Trustees and officers of the Portfolio who are members of EVM’s or BMR’s organizations receive remuneration for their services to the Portfolio out of the investment adviser fee. Trustees of the Portfolio who are not affiliated with the investment adviser may elect to defer receipt of all or a percentage of their annual fees in accordance with the terms of the Trustees Deferred Compensation Plan. For the six months ended June 30, 2019, no significant amounts have been deferred. Certain officers and Trustees of the Portfolio are officers of the above organizations.
3 Purchases and Sales of Investments
Purchases and sales of investments, other than short-term obligations, aggregated $205,295,565 and $208,112,059, respectively, for the six months ended June 30, 2019.
4 Federal Income Tax Basis of Investments
The cost and unrealized appreciation (depreciation) of investments of the Portfolio at June 30, 2019, as determined on a federal income tax basis, were as follows:
| | | | |
| |
Aggregate cost | | $ | 496,952,141 | |
| |
Gross unrealized appreciation | | $ | 136,735,046 | |
| |
Gross unrealized depreciation | | | (2,169,484 | ) |
| |
Net unrealized appreciation | | $ | 134,565,562 | |
Stock Portfolio
June 30, 2019
Notes to Financial Statements (Unaudited) — continued
5 Line of Credit
The Portfolio participates with other portfolios and funds managed by EVM and its affiliates in a $625 million unsecured line of credit agreement with a group of banks, which is in effect through October 29, 2019. Borrowings are made by the Portfolio solely to facilitate the handling of unusual and/or unanticipated short-term cash requirements. Interest is charged to the Portfolio based on its borrowings at an amount above either the Eurodollar rate or Federal Funds rate. In addition, a fee computed at an annual rate of 0.15% on the daily unused portion of the line of credit is allocated among the participating portfolios and funds at the end of each quarter. Because the line of credit is not available exclusively to the Portfolio, it may be unable to borrow some or all of its requested amounts at any particular time. The Portfolio did not have any significant borrowings or allocated fees during the six months ended June 30, 2019.
6 Fair Value Measurements
Under generally accepted accounting principles for fair value measurements, a three-tier hierarchy to prioritize the assumptions, referred to as inputs, is used in valuation techniques to measure fair value. The three-tier hierarchy of inputs is summarized in the three broad levels listed below.
| • | | Level 1 – quoted prices in active markets for identical investments |
| • | | Level 2 – other significant observable inputs (including quoted prices for similar investments, interest rates, prepayment speeds, credit risk, etc.) |
| • | | Level 3 – significant unobservable inputs (including a fund’s own assumptions in determining the fair value of investments) |
In cases where the inputs used to measure fair value fall in different levels of the fair value hierarchy, the level disclosed is determined based on the lowest level input that is significant to the fair value measurement in its entirety. The inputs or methodology used for valuing securities are not necessarily an indication of the risk associated with investing in those securities.
At June 30, 2019, the hierarchy of inputs used in valuing the Portfolio’s investments, which are carried at value, were as follows:
| | | | | | | | | | | | | | | | |
| Asset Description | | Level 1 | | | Level 2 | | | Level 3 | | | Total | |
| | | | |
Common Stocks | | $ | 625,988,074 | * | | $ | — | | | $ | — | | | $ | 625,988,074 | |
| | | | |
Short-Term Investments | | | — | | | | 5,529,629 | | | | — | | | | 5,529,629 | |
| | | | |
Total Investments | | $ | 625,988,074 | | | $ | 5,529,629 | | | $ | — | | | $ | 631,517,703 | |
| * | The level classification by major category of investments is the same as the category presentation in the Portfolio of Investments. |
Eaton Vance
Stock NextShares
June 30, 2019
Board of Trustees’ Contract Approval
Overview of the Contract Review Process
The Investment Company Act of 1940, as amended (the “1940 Act”), provides, in substance, that the investment advisory agreement between a fund and its investment adviser will continue in effect from year-to-year only if its continuation is approved on an annual basis by a vote of the fund’s board of trustees, including a majority of the trustees who are not “interested persons” of the fund (“independent trustees”), cast in person at a meeting called for the purpose of considering such approval.
At a meeting held on April 24, 2019, the Boards of Trustees/Directors (collectively, the “Board”) of the registered investment companies advised by Eaton Vance Management or its affiliate, Boston Management and Research (the “Eaton Vance Funds”), including a majority of the independent trustees (the “Independent Trustees”), voted to approve the continuation of existing investment advisory and sub-advisory agreements for each of the Eaton Vance Funds for an additional one-year period. In voting its approval, the Board relied upon the affirmative recommendation of its Contract Review Committee, which is a committee exclusively comprised of Independent Trustees. Prior to making its recommendation, the Contract Review Committee reviewed information furnished by the adviser and sub-adviser (where applicable) to each of the Eaton Vance Funds (including information specifically requested by the Board) for a series of meetings held between February and April 2019. Members of the Contract Review Committee also considered information received at prior meetings of the Board and its committees, to the extent such information was relevant to the Contract Review Committee’s annual evaluation of the investment advisory and sub-advisory agreements.
Among other things, the information the Board considered included the following (for funds that invest through one or more underlying portfolios, references to “each fund” in this section may include information that was considered at the portfolio-level):
Information about Fees, Performance and Expenses
| | • | | A report from an independent data provider comparing advisory and related fees paid by each fund to such fees paid by comparable funds, as identified by the independent data provider (“comparable funds”); |
| | • | | A report from an independent data provider comparing each fund’s total expense ratio (and its components) to those of comparable funds; |
| | • | | A report from an independent data provider comparing the investment performance of each fund (including, where relevant, yield data, Sharpe ratios and information ratios) to the investment performance of comparable funds over various time periods; |
| | • | | Data regarding investment performance relative to benchmark indices and, in certain instances, to customized groups of peer funds and blended indices identified by the adviser in consultation with the Portfolio Management Committee of the Board; |
| | • | | Comparative information concerning the fees charged and services provided by the adviser and sub-adviser (where applicable) to each fund in managing other accounts (including mutual funds, other collective investment funds and institutional accounts) using investment strategies and techniques similar to those used in managing such fund(s), if any; |
| | • | | Profitability analyses with respect to the adviser and sub-adviser (where applicable) to each of the funds; |
Information about Portfolio Management and Trading
| | • | | Descriptions of the investment management services provided to each fund, as well as each of the funds’ investment strategies and policies; |
| | • | | The procedures and processes used to determine the fair value of fund assets, when necessary, and actions taken to monitor and test the effectiveness of such procedures and processes; |
| | • | | Information about the policies and practices of each fund’s adviser and sub-adviser (where applicable and in the context of a sub-adviser with trading responsibilities) with respect to trading, including their processes for seeking best execution of portfolio transactions; |
| | • | | Information about the allocation of brokerage transactions and the benefits, if any, received by the adviser and sub-adviser (where applicable and in the context of a sub-adviser with trading responsibilities) to each fund as a result of brokerage allocation, including information concerning the acquisition of research through client commission arrangements and policies with respect to “soft dollars”; |
| | • | | Data relating to the portfolio turnover rate of each fund; |
Information about each Adviser and Sub-adviser
| | • | | Reports detailing the financial results and condition of the adviser and sub-adviser (where applicable) to each fund; |
| | • | | Information regarding the individual investment professionals whose responsibilities include portfolio management and investment research for the funds, and, for portfolio managers and certain other investment professionals, information relating to their responsibilities with respect to managing other mutual funds and investment accounts, if applicable; |
| | • | | The Code of Ethics of the adviser and its affiliates and the sub-adviser (where applicable) of each fund, together with information relating to compliance with, and the administration of, such codes; |
| | • | | Policies and procedures relating to proxy voting and the handling of corporate actions and class actions; |
| | • | | Information concerning the resources devoted to compliance efforts undertaken by the adviser and its affiliates and the sub-adviser (where applicable) of each fund, if any, including descriptions of their various compliance programs and their record of compliance; |
| | • | | Information concerning the business continuity and disaster recovery plans of the adviser and its affiliates and the sub-adviser (where applicable) of each fund, if any; |
Eaton Vance
Stock NextShares
June 30, 2019
Board of Trustees’ Contract Approval — continued
| | • | | A description of Eaton Vance Management’s and Boston Management and Research’s oversight of sub-advisers, including with respect to regulatory and compliance issues, investment management and other matters; |
Other Relevant Information
| | • | | Information concerning the nature, cost and character of the administrative and other non-investment advisory services provided by Eaton Vance Management and its affiliates; |
| | • | | Information concerning management of the relationship with the custodian, subcustodians and fund accountants by the adviser or administrator to each of the funds; and |
| | • | | The terms of each investment advisory agreement. |
During the various meetings of the Board and its committees throughout the twelve months ended April 2019, the Trustees received information from portfolio managers and other investment professionals of the advisers and sub-advisers (where applicable) of the funds regarding investment and performance matters, and considered various investment and trading strategies used in pursuing the funds’ investment objectives. The Trustees also received information regarding risk management techniques employed in connection with the management of the funds. The Board and its Committees evaluated issues pertaining to industry and regulatory developments, compliance procedures, fund governance and other issues with respect to the funds, and received and participated in reports and presentations provided by Eaton Vance Management, Boston Management and Research and fund sub-advisers (as applicable), with respect to such matters. In addition to the formal meetings of the Board and its committees, the Independent Trustees held regular teleconferences to discuss, among other topics, matters relating to the continuation of investment advisory and sub-advisory agreements.
The Contract Review Committee was advised throughout the contract review process by Goodwin Procter LLP, independent legal counsel for the Independent Trustees. The members of the Contract Review Committee, with the advice of such counsel, exercised their own business judgment in determining the material factors to be considered in evaluating each investment advisory and sub-advisory agreement and the weight to be given to each such factor. The conclusions reached with respect to each investment advisory and sub-advisory agreement were based on a comprehensive evaluation of all the information provided and not any single factor. Moreover, each member of the Contract Review Committee may have placed varying emphasis on particular factors in reaching conclusions with respect to each investment advisory and sub-advisory agreement. In evaluating each investment advisory and sub-advisory agreement, including the fee structures and other terms contained in such agreements, the members of the Contract Review Committee were also informed by multiple years of analysis and discussion with the adviser and sub-adviser (where applicable) to each of the Eaton Vance Funds.
Results of the Process
Based on its consideration of the foregoing, and such other information as it deemed relevant, including the factors and conclusions described below, the Contract Review Committee concluded that the continuation of the investment advisory and administrative agreement between Eaton Vance Stock NextShares (the “Fund”) and Eaton Vance Management (“EVM”), as well as the investment advisory agreement between Stock Portfolio (the “Portfolio”), the portfolio in which the Fund invests, and Boston Management and Research (“BMR”) (EVM, with respect to the Fund, and BMR, with respect to the Portfolio, are each referred to herein as the “Adviser”), including their respective fee structures, are in the interests of shareholders and, therefore, recommended to the Board approval of each agreement. Based on the recommendation of the Contract Review Committee, the Board, including a majority of the Independent Trustees, voted to approve continuation of the investment advisory and administrative agreement for the Fund and the investment advisory agreement for the Portfolio (together, the “investment advisory agreements”).
Nature, Extent and Quality of Services
In considering whether to approve the investment advisory agreements for the Fund and the Portfolio, the Board evaluated the nature, extent and quality of services provided to the Fund and the Portfolio by the applicable Adviser.
The Board considered each Adviser’s management capabilities and investment processes in light of the types of investments held by the Fund and the Portfolio, including the education, experience and number of investment professionals and other personnel who provide portfolio management, investment research, and similar services to the Fund and the Portfolio. The Board specifically noted that each Adviser has devoted extensive resources to in-house equity research and also draws upon independent research available from third-party sources. The Board also took into account the resources dedicated to portfolio management and other services, the compensation methods of each Adviser and other factors, including the reputation and resources of the Adviser to recruit and retain highly qualified research, advisory and supervisory investment professionals. In addition, the Board considered the time and attention devoted to the Eaton Vance Funds, including the Fund and the Portfolio, by senior management, as well as the infrastructure, operational capabilities and support staff in place to assist in the portfolio management and operations of the Fund and the Portfolio, including the provision of administrative services. The Board also considered the business-related and other risks to which each Adviser or its affiliates may be subject in managing the Fund and the Portfolio.
The Board considered the special attributes of the Fund relative to a traditional mutual fund and the benefits that are expected to be realized from an investment in the Fund, rather than a traditional mutual fund. The Board also considered the resources devoted by the applicable Adviser and its affiliates in developing and maintaining an infrastructure necessary to support the on-going operations of the Fund.
Eaton Vance
Stock NextShares
June 30, 2019
Board of Trustees’ Contract Approval — continued
The Board noted that under the terms of the investment advisory agreement of the Fund, EVM may invest assets of the Fund directly in securities, for which it would receive a fee, or in the Portfolio, for which it receives no separate fee but for which BMR receives an advisory fee from the Portfolio.
The Board considered the compliance programs of each Adviser and relevant affiliates thereof. The Board considered compliance and reporting matters regarding, among other things, personal trading by investment professionals, disclosure of portfolio holdings, late trading, frequent trading, portfolio valuation, business continuity and the allocation of investment opportunities. The Board also considered the responses of each Adviser and its affiliates to requests in recent years from regulatory authorities, such as the Securities and Exchange Commission and the Financial Industry Regulatory Authority.
The Board considered shareholder and other administrative services provided or managed by Eaton Vance Management and its affiliates, including transfer agency and accounting services. The Board evaluated the benefits to shareholders of investing in a fund that is a part of a large fund complex offering exposure to a variety of asset classes and investment disciplines.
After consideration of the foregoing factors, among others, the Board concluded that the nature, extent and quality of services provided by each Adviser, taken as a whole, are appropriate and consistent with the terms of the applicable investment advisory agreement.
Fund Performance
The Board compared the Fund’s investment performance to that of comparable funds and appropriate benchmark indices, as well as a customized peer group of similarly managed funds. In light of the Fund’s relatively brief operating history, the Board concluded that additional time is required to evaluate Fund performance.
Management Fees and Expenses
The Board considered contractual fee rates payable by the Fund and by the Portfolio for advisory and administrative services (referred to collectively as “management fees”). As part of its review, the Board considered the Fund’s management fees and total expense ratio for the one-year period ended September 30, 2018, as compared to those of comparable funds, before and after giving effect to any undertaking to waive fees or reimburse expenses. The Board also received and considered information about the services offered and the fee rates charged by the Adviser to other types of accounts with investment objectives and strategies that are substantially similar to and/or managed in a similar investment style as the Fund. In this regard, the Board received information about the differences in the nature and scope of services the Adviser provides to the Fund as compared to other types of accounts and the material differences in compliance, reporting and other legal burdens and risks to the Adviser as between the Fund and other types of accounts. The Board also considered factors that had an impact on the Fund’s total expense ratio relative to comparable funds.
After considering the foregoing information, and in light of the nature, extent and quality of the services provided by each Adviser, the Board concluded that the management fees charged for advisory and related services are reasonable.
Profitability and “Fall-Out” Benefits
The Board considered the level of profits realized by each Adviser and relevant affiliates thereof in providing investment advisory and administrative services to the Fund, to the Portfolio and to all Eaton Vance Funds as a group. The Board considered the level of profits realized without regard to marketing support or other payments by each Adviser and its affiliates to third parties in respect of distribution services.
The Board concluded that, in light of the foregoing factors and the nature, extent and quality of the services rendered, the profits realized by each Adviser and its affiliates are deemed not to be excessive.
The Board also considered direct or indirect fall-out benefits received by each Adviser and its affiliates in connection with their respective relationships with the Fund and the Portfolio, including the benefits of research services that may be available to each Adviser as a result of securities transactions effected for the Fund and the Portfolio and other investment advisory clients.
Economies of Scale
In reviewing management fees and profitability, the Board also considered the extent to which the applicable Adviser and its affiliates, on the one hand, and the Fund and the Portfolio, on the other hand, can expect to realize benefits from economies of scale as the assets of the Fund and the Portfolio increase. The Board acknowledged the difficulty in accurately measuring the benefits resulting from economies of scale, if any, with respect to the management of any specific fund or group of funds. The Board reviewed data summarizing the increases and decreases in the assets of the Fund and of all Eaton Vance Funds as a group over various time periods, and evaluated the extent to which the total expense ratio of the Fund and the profitability of each Adviser and its affiliates may have been affected by such increases or decreases. Based upon the foregoing, the Board concluded that the Fund currently shares in the benefits from economies of scale, if any, when they are realized by the Adviser. The Board also concluded that the structure of the advisory fees, which include breakpoints at several asset levels, will allow the Fund and the Portfolio to continue to benefit from any economies of scale in the future.
Eaton Vance
Stock NextShares
June 30, 2019
Officers and Trustees
Officers of Eaton Vance Stock NextShares and Stock Portfolio
Edward J. Perkin
President
Maureen A. Gemma
Vice President, Secretary and Chief Legal Officer
James F. Kirchner
Treasurer
Richard F. Froio
Chief Compliance Officer
Trustees of Eaton Vance Stock NextShares and Stock Portfolio
William H. Park
Chairperson
Thomas E. Faust Jr.*
Mark R. Fetting
Cynthia E. Frost
George J. Gorman
Valerie A. Mosley
Helen Frame Peters
Keith Quinton(1)
Marcus L. Smith(1)
Susan J. Sutherland
Scott E. Wennerholm
| (1) | Messrs. Quinton and Smith began serving as Trustees effective October 1, 2018. |
Eaton Vance Funds
IMPORTANT NOTICES
Privacy. The Eaton Vance organization is committed to ensuring your financial privacy. Each of the financial institutions identified below has in effect the following policy (“Privacy Policy”) with respect to nonpublic personal information about its customers:
| • | | Only such information received from you, through application forms or otherwise, and information about your Eaton Vance fund transactions will be collected. This may include information such as name, address, social security number, tax status, account balances and transactions. |
| • | | None of such information about you (or former customers) will be disclosed to anyone, except as permitted by law (which includes disclosure to employees necessary to service your account). In the normal course of servicing a customer’s account, Eaton Vance may share information with unaffiliated third parties that perform various required services such as transfer agents, custodians and broker-dealers. |
| • | | Policies and procedures (including physical, electronic and procedural safeguards) are in place that are designed to protect the confidentiality of such information. |
| • | | We reserve the right to change our Privacy Policy at any time upon proper notification to you. Customers may want to review our Privacy Policy periodically for changes by accessing the link on our homepage: www.eatonvance.com. |
Our pledge of privacy applies to the following entities within the Eaton Vance organization: the Eaton Vance Family of Funds, Eaton Vance Management, Eaton Vance Investment Counsel, Eaton Vance Distributors, Inc., Eaton Vance Trust Company, Eaton Vance Management (International) Limited, Eaton Vance Advisers International Ltd., Eaton Vance Management’s Real Estate Investment Group and Boston Management and Research. In addition, our Privacy Policy applies only to those Eaton Vance customers who are individuals and who have a direct relationship with us. If a customer’s account (i.e., fund shares) is held in the name of a third-party financial advisor/broker-dealer, it is likely that only such advisor’s privacy policies apply to the customer. This notice supersedes all previously issued privacy disclosures. For more information about Eaton Vance’s Privacy Policy, please call 1-800-262-1122.
Delivery of Shareholder Documents. The Securities and Exchange Commission (SEC) permits funds to deliver only one copy of shareholder documents, including prospectuses, proxy statements and shareholder reports, to fund investors with multiple accounts at the same residential or post office box address. This practice is often called “householding” and it helps eliminate duplicate mailings to shareholders.Eaton Vance, or your financial intermediary, may household the mailing of your documents indefinitely unless you instruct Eaton Vance, or your financial intermediary, otherwise.If you would prefer that your Eaton Vance documents not be householded, please contact Eaton Vance at1-800-262-1122, or contact your financial intermediary. Your instructions that householding not apply to delivery of your Eaton Vance documents will typically be effective within 30 days of receipt by Eaton Vance or your financial intermediary.
Portfolio Holdings. Each Eaton Vance Fund and its underlying Portfolio(s) (if applicable) files a schedule of portfolio holdings on Part F toForm N-PORT with the SEC for the first and third quarters of each fiscal year. The Form N-PORT will be available on the Eaton Vance website at www.eatonvance.com, by calling Eaton Vance at 1-800-262-1122 or in the EDGAR database on the SEC’s website at www.sec.gov.
Proxy Voting. From time to time, funds are required to vote proxies related to the securities held by the funds. The Eaton Vance Funds or their underlying Portfolios (if applicable) vote proxies according to a set of policies and procedures approved by the Funds’ and Portfolios’ Boards. You may obtain a description of these policies and procedures and information on how the Funds or Portfolios voted proxies relating to portfolio securities during the most recent 12-month period ended June 30, without charge, upon request, by calling 1-800-262-1122 and by accessing the SEC’s website at www.sec.gov.
This Page Intentionally Left Blank
This Page Intentionally Left Blank
This Page Intentionally Left Blank
Investment Adviser of Stock Portfolio
Boston Management and Research
Two International Place
Boston, MA 02110
Investment Adviser and Administrator of Eaton Vance Stock NextShares
Eaton Vance Management
Two International Place
Boston, MA 02110
Distributor*
Foreside Fund Services, LLC
Three Canal Plaza, Suite 100
Portland, ME 04101
Custodian
State Street Bank and Trust Company
State Street Financial Center, One Lincoln Street
Boston, MA 02111
Transfer and Dividend Disbursing Agent
State Street Bank and Trust Company
State Street Financial Center, One Lincoln Street
Boston, MA 02111
Fund Offices
Two International Place
Boston, MA 02110
| * | FINRA BrokerCheck. Investors may check the background of their Investment Professional by contacting the Financial Industry Regulatory Authority (FINRA). FINRA BrokerCheck is a free tool to help investors check the professional background of current and former FINRA-registered securities firms and brokers. FINRA BrokerCheck is available by calling 1-800-289-9999 and at www.FINRA.org. The FINRA BrokerCheck brochure describing this program is available to investors at www.FINRA.org. |


22456 06.30.19
Item 2. Code of Ethics
Not required in this filing.
Item 3. Audit Committee Financial Expert
Not required in this filing.
Item 4. Principal Accountant Fees and Services
Not required in this filing.
Item 5. Audit Committee of Listed Registrants
Not applicable.
Item 6. Schedule of Investments
Please see schedule of investments contained in the Report to Stockholders included under Item 1 of this FormN-CSR.
Item 7. Disclosure of Proxy Voting Policies and Procedures forClosed-End Management Investment Companies
Not applicable.
Item 8. Portfolio Managers ofClosed-End Management Investment Companies
Not applicable.
Item 9. Purchases of Equity Securities byClosed-End Management Investment Company and Affiliated Purchasers
Not applicable.
Item 10. Submission of Matters to a Vote of Security Holders
No material changes.
Item 11. Controls and Procedures
(a) It is the conclusion of the registrant’s principal executive officer and principal financial officer that the effectiveness of the registrant’s current disclosure controls and procedures (such disclosure controls and procedures having been evaluated within 90 days of the date of this filing) provide reasonable assurance that the information required to be disclosed by the registrant has been recorded, processed, summarized and reported within the time period specified in the Commission’s rules and forms and that the information required to be disclosed by the registrant has been accumulated and communicated to the registrant’s principal executive officer and principal financial officer in order to allow timely decisions regarding required disclosure.
(b) There have been no changes in the registrant’s internal controls over financial reporting during the period covered by this report that has materially affected, or is reasonably likely to materially affect, the registrant’s internal control over financial reporting.
Item 12. Disclosure of Securities Lending Activities forClosed-End Management Investment Companies
Not applicable.
Item 13. Exhibits
| | |
| |
| (a)(1) | | Registrant’s Code of Ethics – Not applicable (please see Item 2). |
| |
| (a)(2)(i) | | Treasurer’s Section 302 certification. |
| |
| (a)(2)(ii) | | President’s Section 302 certification. |
| |
| (b) | | Combined Section 906 certification. |
Signatures
Pursuant to the requirements of the Securities Exchange Act of 1934 and the Investment Company Act of 1940, the registrant has duly caused this report to be signed on its behalf by the undersigned, thereunto duly authorized.
Eaton Vance NextShares Trust
| | |
| By: | | /s/ Edward J. Perkin |
| | Edward J. Perkin |
| | President |
| |
| Date: | | August 26, 2019 |
Pursuant to the requirements of the Securities Exchange Act of 1934 and the Investment Company Act of 1940, this report has been signed below by the following persons on behalf of the registrant and in the capacities and on the dates indicated.
| | |
| By: | | /s/ James F. Kirchner |
| | James F. Kirchner |
| | Treasurer |
| |
| Date: | | August 26, 2019 |
| |
| By: | | /s/ Edward J. Perkin |
| | Edward J. Perkin |
| | President |
| |
| Date: | | August 26, 2019 |