UNITED STATES
SECURITIES AND EXCHANGE COMMISSION
Washington, D.C. 20549
Form N-CSR
CERTIFIED SHAREHOLDER REPORT OF REGISTERED
MANAGEMENT INVESTMENT COMPANIES
Investment Company Act File Number: 811-22982
Eaton Vance NextShares Trust
(Exact Name of Registrant as Specified in Charter)
Two International Place, Boston, Massachusetts 02110
(Address of Principal Executive Offices)
Maureen A. Gemma
Two International Place, Boston, Massachusetts 02110
(Name and Address of Agent for Services)
(617) 482-8260
(Registrant’s Telephone Number)
October 31
Date of Fiscal Year End
April 30, 2021
Date of Reporting Period
| Item 1. | Reports to Stockholders |

Eaton Vance
Global Income Builder NextShares (EVGBC)
Listing Exchange: The NASDAQ Stock Market LLC
Semiannual Report
April 30, 2021
NextShares® is a registered trademark of NextShares Solutions LLC. All rights reserved.
Commodity Futures Trading Commission Registration. The Commodity Futures Trading Commission (“CFTC”) has adopted regulations that subject registered investment companies and advisers to regulation by the CFTC if a fund invests more than a prescribed level of its assets in certain CFTC-regulated instruments (including futures, certain options and swap agreements) or markets itself as providing investment exposure to such instruments. The investment adviser has claimed an exclusion from the definition of “commodity pool operator” under the Commodity Exchange Act with respect to its management of the Fund. Accordingly, neither the Fund nor the adviser with respect to the operation of the Fund is subject to CFTC regulation. Because of its management of other strategies, the Fund’s adviser is registered with the CFTC as a commodity pool operator. The adviser is also registered as a commodity trading advisor.
Fund shares are not insured by the FDIC and are not deposits or other obligations of, or guaranteed by, any depository institution. Shares are subject to investment risks, including possible loss of principal invested.
This report must be preceded or accompanied by a current summary prospectus or prospectus. Before investing in NextShares, investors should consider carefully the investment objectives, risks, charges and expenses. This and other important information is contained in the prospectus and summary prospectus, which can be obtained from a financial advisor. Prospective investors should read the prospectus carefully before investing. For further information, please call 1-800-262-1122.
Semiannual Report April 30, 2021
Eaton Vance
Global Income Builder NextShares
Eaton Vance
Global Income Builder NextShares
April 30, 2021
Performance1,2,3
Portfolio Managers Christopher M. Dyer, CFA and Jeffrey D. Mueller, of Eaton Vance Advisers International Ltd.; Michael A. Allison, CFA and John H. Croft, CFA, of Eaton Vance Management and Boston Management and Research
| | | | | | | | | | | | | | | | | | | | | | | | | | | | |
| % Average Annual Total Returns | | Fund Inception Date | | | Performance Inception Date | | | Six Months | | | One Year | | | Five Years | | | Ten Years | | | Since Fund Inception | |
| | | | | | | |
Fund at NAV | | | 03/30/2016 | | | | 11/30/2005 | | | | 22.76 | % | | | 37.44 | % | | | 10.35 | % | | | 7.98 | % | | | 10.42 | % |
Fund at Market Price | | | 03/30/2016 | | | | 03/30/2016 | | | | 22.76 | | | | 37.45 | | | | 10.33 | | | | — | | | | 10.42 | |
| |
| | | | | |
| | | | | | | |
MSCI World Index | | | — | | | | — | | | | 29.10 | % | | | 45.33 | % | | | 14.02 | % | | | 9.92 | % | | | 14.06 | % |
ICE BofA Developed Markets High Yield Ex-Subordinated Financial Index | | | — | | | | — | | | | 8.89 | | | | 21.56 | | | | 6.96 | | | | 5.81 | | | | 7.68 | |
Blended Index | | | — | | | | — | | | | 21.75 | | | | 36.73 | | | | 11.62 | | | | 8.56 | | | | 11.90 | |
| | | | | | | |
| % Total Annual Operating Expense Ratios4 | | | | | | | | | | | | | | | | | | | | | |
| | | | | | | |
Gross | | | | | | | | | | | | | | | | | | | | | | | | | | | 2.93 | % |
Net | | | | | | | | | | | | | | | | | | | | | | | | | | | 0.85 | |
See Endnotes and Additional Disclosures in this report.
Past performance is no guarantee of future results. Investment return and principal value will fluctuate so that shares, when sold, may be worth more or less than their original cost. Performance is for the stated time period only; due to market volatility, Fund performance may be lower or higher than the quoted return. The Fund’s performance at market price will differ from its results at net asset value (NAV). The market price used to calculate the Market Price return is the midpoint between the highest bid and the lowest offer on the exchange on which the shares of the Fund are listed for trading, as of the time that the Fund’s NAV is calculated. If you trade your shares at another time during the day, your return may differ. Returns are historical and are calculated by determining the percentage change in NAV or market price (as applicable) with all distributions reinvested at NAV or closing market price (as applicable) on the payment date of the distribution, and are net of management fees and other expenses. Performance for periods less than or equal to one year is cumulative. For performance as of the most recent month-end, including historical trading premiums/discounts relative to NAV, please refer to eatonvance.com
Eaton Vance
Global Income Builder NextShares
April 30, 2021
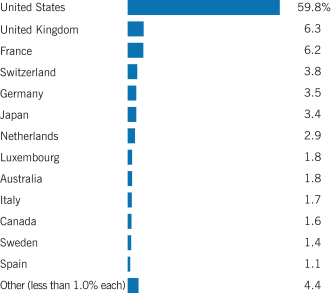
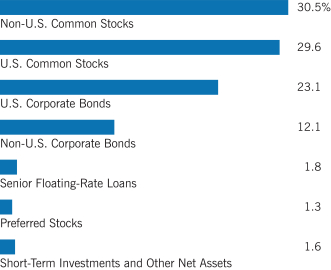
Fund Profile5
Country Allocation (% of net assets)
Asset Allocation (% of net assets)7
Top 10 Holdings (% of net assets)6
| | | | |
| |
Alphabet, Inc., Class C | | | 2.6 | % |
| |
Microsoft Corp. | | | 2.1 | |
| |
Amazon.com, Inc. | | | 2.1 | |
| |
Apple, Inc. | | | 1.2 | |
| |
ASML Holding NV | | | 1.1 | |
| |
Facebook, Inc., Class A | | | 1.1 | |
| |
Berkshire Hathaway, Inc., Class B | | | 1.0 | |
| |
Bank of New York Mellon Corp. (The) | | | 0.9 | |
| |
Boston Scientific Corp. | | | 0.9 | |
| |
AMETEK, Inc. | | | 0.9 | |
| |
Total | | | 13.9 | % |
See Endnotes and Additional Disclosures in this report.
Eaton Vance
Global Income Builder NextShares
April 30, 2021
Endnotes and Additional Disclosures
| 1 | MSCI World Index is an unmanaged index of equity securities in the developed markets. MSCI indexes are net of foreign withholding taxes. Source: MSCI. MSCI data may not be reproduced or used for any other purpose. MSCI provides no warranties, has not prepared or approved this report, and has no liability hereunder. ICE BofA Developed Markets High Yield Ex-Subordinated Financial Index is an unmanaged index of global developed market below investment grade corporate bonds. ICE® BofA® indices are not for redistribution or other uses; provided “as is”, without warranties, and with no liability. Eaton Vance has prepared this report and ICE Data Indices, LLC does not endorse it, or guarantee, review, or endorse Eaton Vance’s products. BofA® is a licensed registered trademark of Bank of America Corporation in the United States and other countries. The Blended Index consists of 65% MSCI World Index and 35% ICE BofA Developed Markets High Yield Ex-Subordinated Financial Index, rebalanced monthly. Unless otherwise stated, index returns do not reflect the effect of any applicable sales charges, commissions, expenses, taxes or leverage, as applicable. It is not possible to invest directly in an index. Performance since inception for an index, if presented, is the performance since the Fund’s or oldest share class’ inception, as applicable. |
| 2 | Shares of NextShares funds are normally bought and sold in the secondary market through a broker, and may not be individually purchased or redeemed from the fund. In the secondary market, buyers and sellers transact with each other, rather than with the fund. NextShares funds issue and redeem shares only in specified creation unit quantities in transactions by or through Authorized Participants. In such transactions, a fund issues and redeems shares in exchange for the basket of securities, other instruments and/or cash that the fund specifies each business day. By transacting in kind, a NextShares fund can lower its trading costs and enhance fund tax efficiency by avoiding forced sales of securities to meet redemptions. Redemptions may be effected partially or entirely in cash when in-kind delivery is not practicable or deemed not in the best interests of shareholders. A fund’s basket is not intended to be representative of the fund’s current portfolio positions and may vary significantly from current positions. As exchange-traded securities, NextShares can operate with low transfer agency expenses by utilizing the same highly efficient share processing system as used for exchange-listed stocks and ETFs. Market trading prices of NextShares are linked to the fund’s next-computed net asset value (NAV) and will vary from NAV by a market-determined premium or discount, which may be zero. Buyers and sellers of NextShares will not know the value of their purchases and sales until after the fund’s NAV is determined at the end of the trading day. Market trading prices may vary significantly from anticipated levels. NextShares do not offer investors the opportunity to buy and sell intraday based on current (versus end- of-day) determinations of fund value. NextShares trade execution prices will fluctuate based on changes in NAV. Although limit orders may be used to control trading costs, they cannot be used to control or limit trade execution prices. As a new type of fund, NextShares have a limited operating history and may initially be available through a limited number of brokers. There can be no guarantee that an active trading market for NextShares will develop or be maintained, or that their listing will continue unchanged. Buying and selling NextShares may require payment of brokerage commissions and expose transacting shareholders to other trading costs. Frequent trading may detract from realized investment returns. The return on a shareholder’s NextShares investment will be reduced if the shareholder sells shares at a greater discount or narrower premium to NAV than he or she acquired the shares. |
| 3 | The Fund pursues its investment objective by investing in a separate investment fund (the Portfolio). The returns at NAV for periods before the date the Fund commenced operations are for a mutual fund that invests in the Portfolio (the Portfolio Investor). The performance during such period does not represent the performance of the Fund. The prior investment performance of the Portfolio Investor (rather than the Portfolio itself) is shown because it reflects the expenses typically borne by a retail fund investing in the Portfolio. The Portfolio Investor returns are not adjusted to reflect differences between the total net operating expenses of the Fund and the Portfolio Investor during the periods shown. If such an adjustment were made, the performance presented would be higher, because the Fund’s total net operating expenses are lower than those of the Portfolio Investor. Performance is for a share class of the Portfolio Investor offered at net asset value. Performance presented in the Financial Highlights included in the financial statements is not linked. |
Prior to December 7, 2015, the Portfolio Investor invested at least 80% of net assets in dividend-paying common and preferred stocks. Effective December 7, 2015, the Portfolio Investor changed its name and principal investment strategies to invest in common stocks, preferred stocks and other hybrid securities and income instruments of U.S. and foreign issuers. As of such date, the Portfolio Investor was no longer required to invest at least 80% of its net assets in dividend-paying common and preferred stocks.
| 4 | Source: Fund prospectus. Net expense ratio reflects a contractual expense reimbursement that continues through 2/28/22. Without the reimbursement, performance would have been lower. The expense ratio for the current reporting period can be found in the Financial Highlights section of this report. |
| 5 | Fund primarily invests in an affiliated investment company (Portfolio) with substantially the same objective(s) and policies as the Fund and may also invest directly. Unless otherwise noted, references to investments are to the aggregate holdings of the Fund and the Portfolio. |
| 6 | Excludes cash and cash equivalents. |
| 7 | Other Net Assets represents other assets less liabilities and includes any investment type that represents less than 1% of net assets. |
Fund profile subject to change due to active management.
Important Notice to Shareholders
Effective July 1, 2021, the portfolio managers of the Fund will be Christopher M. Dyer, Jeffrey D. Mueller, John H. Croft and Derek J.V. DiGregorio.
Eaton Vance
Global Income Builder NextShares
April 30, 2021
Fund Expenses
Example: As a Fund shareholder, you incur two types of costs: (1) transaction costs, including brokerage commissions on purchases and sales of Fund shares; and (2) ongoing costs, including management fees and other Fund expenses. This Example is intended to help you understand your ongoing costs (in dollars) of Fund investing and to compare these costs with the ongoing costs of investing in other funds. The Example is based on an investment of $1,000 invested at the beginning of the period and held for the entire period (November 1, 2020 – April 30, 2021).
Actual Expenses: The first section of the table below provides information about actual account values and actual expenses. You may use the information in this section, together with the amount you invested, to estimate the expenses that you paid over the period. Simply divide your account value by $1,000 (for example, an $8,600 account value divided by $1,000 = 8.6), then multiply the result by the number in the first section under the heading entitled “Expenses Paid During Period” to estimate the expenses you paid on your account during this period.
Hypothetical Example for Comparison Purposes: The second section of the table below provides information about hypothetical account values and hypothetical expenses based on the actual Fund expense ratio and an assumed rate of return of 5% per year (before expenses), which is not the actual Fund return. The hypothetical account values and expenses may not be used to estimate the actual ending account balance or expenses you paid for the period. You may use this information to compare the ongoing costs of investing in your Fund and other funds. To do so, compare this 5% hypothetical example with the 5% hypothetical examples that appear in the shareholder reports of the other funds.
Please note that the expenses shown in the table are meant to highlight your ongoing costs only and do not reflect any transactional costs, such as brokerage commissions on purchases and sales of Fund shares. Therefore, the second section of the table is useful in comparing ongoing costs only, and will not help you determine the relative total costs of owning different funds. In addition, if these transactional costs were included, your costs would be higher.
| | | | | | | | | | | | | | | | |
| | | Beginning
Account Value
(11/1/20) | | | Ending
Account Value
(4/30/21) | | | Expenses Paid
During Period*
(11/1/20 – 4/30/21) | | | Annualized
Expense
Ratio | |
| |
Actual | | | | |
| | $ | 1,000.00 | | | $ | 1,227.60 | | | $ | 4.69 | ** | | | 0.85 | % |
| | |
Hypothetical | | | | |
(5% return per year before expenses) | | | | |
| | $ | 1,000.00 | | | $ | 1,020.60 | | | $ | 4.26 | ** | | | 0.85 | % |
| * | Expenses are equal to the Fund’s annualized expense ratio, multiplied by the average account value over the period, multiplied by 181/365 (to reflect the one-half year period). The Example assumes that the $1,000 was invested at the net asset value per share determined at the close of business on October 31, 2020. The Example reflects the expenses of both the Fund and the Portfolio. |
| ** | Absent an allocation of certain expenses to affiliates, expenses would be higher. |
Eaton Vance
Global Income Builder NextShares
April 30, 2021
Statement of Assets and Liabilities (Unaudited)
| | | | |
| Assets | | April 30, 2021 | |
| |
Investment in Global Income Builder Portfolio, at value (identified cost, $5,814,678) | | $ | 7,214,533 | |
| |
Receivable from affiliates | | | 9,570 | |
| |
Total assets | | $ | 7,224,103 | |
|
| Liabilities | |
| |
Payable to affiliates: | | | | |
| |
Administration fee | | $ | 863 | |
| |
Operations agreement fee | | | 288 | |
| |
Trustees’ fees | | | 42 | |
| |
Accrued expenses | | | 138,542 | |
| |
Total liabilities | | $ | 139,735 | |
| |
Net Assets | | $ | 7,084,368 | |
|
| Sources of Net Assets | |
| |
Paid-in capital | | $ | 7,946,767 | |
| |
Accumulated loss | | | (862,399 | ) |
| |
Total | | $ | 7,084,368 | |
|
| Net Asset Value Per Share | |
| |
($7,084,368 ÷ 600,000 shares issued and outstanding) | | $ | 11.81 | |
| | | | |
| | 6 | | See Notes to Financial Statements. |
Eaton Vance
Global Income Builder NextShares
April 30, 2021
Statement of Operations (Unaudited)
| | | | |
| Investment Income | | Six Months Ended April 30, 2021 | |
| |
Interest allocated from Portfolio (net of foreign taxes, $193) | | $ | 71,569 | |
| |
Dividends allocated from Portfolio (net of foreign taxes, $5,109) | | | 64,995 | |
| |
Expenses allocated from Portfolio | | | (21,829 | ) |
| |
Total investment income from Portfolio | | $ | 114,735 | |
|
| Expenses | |
| |
Administration fee | | $ | 4,977 | |
| |
Operations agreement fee | | | 1,659 | |
| |
Trustees’ fees and expenses | | | 250 | |
| |
Custodian fee | | | 18,781 | |
| |
Transfer and dividend disbursing agent fees | | | 6,778 | |
| |
Legal and accounting services | | | 8,889 | |
| |
Printing and postage | | | 3,556 | |
| |
Listing fee | | | 3,570 | |
| |
Intraday pricing fee | | | 5,951 | |
| |
Miscellaneous | | | 3,729 | |
| |
Total expenses | | $ | 58,140 | |
|
Deduct — | |
| |
Allocation of expenses to affiliates | | $ | 51,599 | |
| |
Total expense reductions | | $ | 51,599 | |
| |
Net expenses | | $ | 6,541 | |
| |
Net investment income | | $ | 108,194 | |
|
| Realized and Unrealized Gain (Loss) from Portfolio | |
|
Net realized gain (loss) — | |
| |
Investment transactions (net of foreign capital gains taxes of $76) | | $ | 258,415 | |
| |
Financial futures contracts | | | 1,734 | |
| |
Foreign currency transactions | | | (3,416 | ) |
| |
Forward foreign currency exchange contracts | | | 220 | |
| |
Net realized gain | | $ | 256,953 | |
|
Change in unrealized appreciation (depreciation) — | |
| |
Investments | | $ | 953,198 | |
| |
Financial futures contracts | | | 5,302 | |
| |
Foreign currency | | | 3,058 | |
| |
Forward foreign currency exchange contracts | | | 333 | |
| |
Net change in unrealized appreciation (depreciation) | | $ | 961,891 | |
| |
Net realized and unrealized gain | | $ | 1,218,844 | |
| |
Net increase in net assets from operations | | $ | 1,327,038 | |
| | | | |
| | 7 | | See Notes to Financial Statements. |
Eaton Vance
Global Income Builder NextShares
April 30, 2021
Statements of Changes in Net Assets
| | | | | | | | |
| Increase (Decrease) in Net Assets | | Six Months Ended April 30, 2021 (Unaudited) | | | Year Ended October 31, 2020 | |
|
From operations — | |
| | |
Net investment income | | $ | 108,194 | | | $ | 238,867 | |
| | |
Net realized gain (loss) | | | 256,953 | | | | (48,415 | ) |
| | |
Net change in unrealized appreciation (depreciation) | | | 961,891 | | | | (76,412 | ) |
| | |
Net increase in net assets from operations | | $ | 1,327,038 | | | $ | 114,040 | |
| | |
Distributions to shareholders | | $ | (116,040 | ) | | $ | (212,708 | ) |
|
Transactions in Fund shares — | |
| | |
Cost of shares redeemed | | $ | — | | | $ | (215,826 | ) |
| | |
Transaction fees | | | — | | | | 971 | |
| | |
Net increase (decrease) in net assets from Fund share transactions | | $ | — | | | $ | (214,855 | ) |
|
Other capital — | |
| | |
Portfolio transaction fee contributed to Portfolio | | $ | (438 | ) | | $ | (1,994 | ) |
| | |
Portfolio transaction fee allocated from Portfolio | | | 2,242 | | | | 4,665 | |
| | |
Net increase in net assets from other capital | | $ | 1,804 | | | $ | 2,671 | |
| | |
Net increase (decrease) in net assets | | $ | 1,212,802 | | | $ | (310,852 | ) |
| |
| Net Assets | | | | |
| | |
At beginning of period | | $ | 5,871,566 | | | $ | 6,182,418 | |
| | |
At end of period | | $ | 7,084,368 | | | $ | 5,871,566 | |
| |
| Changes in shares outstanding | | | | |
| | |
Shares outstanding, beginning of period | | | 600,000 | | | | 625,000 | |
| | |
Shares redeemed | | | — | | | | (25,000 | ) |
| | |
Shares outstanding, end of period | | | 600,000 | | | | 600,000 | |
| | | | |
| | 8 | | See Notes to Financial Statements. |
Eaton Vance
Global Income Builder NextShares
April 30, 2021
Financial Highlights
| | | | | | | | | | | | | | | | | | | | | | | | |
| | | |
| | | Six Months Ended
April 30, 2021
(Unaudited) | | | Year Ended October 31, | | | Period Ended
October 31, 2016(1)(2) | |
| | | 2020 | | | 2019 | | | 2018 | | | 2017(1) | |
| | | | | | | |
Net asset value — Beginning of period | | $ | 9.790 | | | $ | 9.890 | | | $ | 9.990 | | | $ | 11.200 | | | $ | 10.140 | | | $ | 10.000 | |
| | | | | | |
| Income (Loss) From Operations | | | | | | | | | | | | | | | | | | | | | | | | |
| | | | | | |
Net investment income(3) | | $ | 0.180 | | | $ | 0.390 | | | $ | 0.469 | | | $ | 0.358 | | | $ | 0.502 | | | $ | 0.193 | |
| | | | | | |
Net realized and unrealized gain (loss) | | | 2.030 | | | | (0.147 | ) | | | 0.535 | | | | (0.435 | ) | | | 1.073 | | | | 0.091 | |
| | | | | | |
Total income (loss) from operations | | $ | 2.210 | | | $ | 0.243 | | | $ | 1.004 | | | $ | (0.077 | ) | | $ | 1.575 | | | $ | 0.284 | |
| | | | | | |
| Less Distributions | | | | | | | | | | | | | | | | | | | | | | | | |
| | | | | | |
From net investment income | | $ | (0.193 | ) | | $ | (0.347 | ) | | $ | (0.369 | ) | | $ | (1.083 | ) | | $ | (0.519 | ) | | $ | (0.150 | ) |
| | | | | | |
From net realized gain | | | — | | | | — | | | | (0.608 | ) | | | (0.051 | ) | | | — | | | | — | |
| | | | | | |
Tax return of capital | | | — | | | | — | | | | (0.130 | ) | | | — | | | | — | | | | — | |
| | | | | | |
Total distributions | | $ | (0.193 | ) | | $ | (0.347 | ) | | $ | (1.107 | ) | | $ | (1.134 | ) | | $ | (0.519 | ) | | $ | (0.150 | ) |
| | | | | | |
Portfolio transaction fee, net(3) | | $ | 0.003 | | | $ | 0.004 | | | $ | 0.003 | | | $ | 0.001 | | | $ | 0.004 | | | $ | 0.006 | |
| | | | | | |
Net asset value — End of period | | $ | 11.810 | | | $ | 9.790 | | | $ | 9.890 | | | $ | 9.990 | | | $ | 11.200 | | | $ | 10.140 | |
| | | | | | |
Total Return on Net Asset Value(4)(5) | | | 22.76 | %(6) | | | 2.57 | % | | | 11.48 | % | | | (1.10 | )% | | | 15.89 | % | | | 2.90 | %(6) |
| | | | | | |
| Ratios/Supplemental Data | | | | | | | | | | | | | | | | | | | | | | | | |
| | | | | | |
Net assets, end of period (000’s omitted) | | $ | 7,084 | | | $ | 5,872 | | | $ | 6,182 | | | $ | 6,243 | | | $ | 6,720 | | | $ | 14,700 | |
| | | | | | |
Ratios (as a percentage of average daily net assets):(7) | | | | | | | | | | | | | | | | | | | | | | | | |
| | | | | | |
Expenses(5) | | | 0.85 | %(8) | | | 0.85 | % | | | 0.88 | % | | | 0.91 | %(9) | | | 0.91 | %(9) | | | 0.90 | %(8) |
| | | | | | |
Net investment income | | | 3.26 | %(8) | | | 4.02 | % | | | 4.91 | % | | | 3.32 | % | | | 4.71 | % | | | 3.22 | %(8) |
| | | | | | |
Portfolio Turnover of the Portfolio | | | 41 | %(6) | | | 118 | % | | | 86 | % | | | 102 | % | | | 143 | % | | | 66 | %(6)(10) |
| (1) | Per share data reflect a 2-for-1 share split effective March 9, 2018. |
| (2) | For the period from the start of business, March 30, 2016, to October 31, 2016. |
| (3) | Computed using average shares outstanding. |
| (4) | Returns are historical and are calculated by determining the percentage change in net asset value with all distributions reinvested and do not reflect the effect of a market-determined premium or discount. Investment returns assume that all distributions have been reinvested at net asset value. |
| (5) | The administrator and sub-adviser reimbursed certain operating expenses (equal to 1.55%, 2.08%, 1.70%, 1.57%, 0.57% and 2.08% of average daily net assets for the six months ended April 30, 2021, the years ended October 31, 2020, 2019, 2018 and 2017 and the period ended October 31, 2016, respectively). Absent this reimbursement, total return would be lower. |
| (7) | Includes the Fund’s share of the Portfolio’s allocated expenses. |
| (9) | Includes interest expense, including allocated from the Portfolio of 0.01% and 0.01% for the years ended October 31, 2018 and October 31, 2017, respectively. |
| (10) | For the period from the Portfolio’s start of business, March 28, 2016, to October 31, 2016. |
| | | | |
| | 9 | | See Notes to Financial Statements. |
Eaton Vance
Global Income Builder NextShares
April 30, 2021
Notes to Financial Statements (Unaudited)
1 Significant Accounting Policies
Eaton Vance Global Income Builder NextShares (the Fund) is a diversified series of Eaton Vance NextShares Trust (the Trust), a Massachusetts business trust registered under the Investment Company Act of 1940, as amended (the 1940 Act). The Fund is an exchange-traded managed fund operating pursuant to an order issued by the SEC granting an exemption from certain provisions of the 1940 Act. Individual shares of the Fund may be purchased and sold only on a national securities exchange or alternative trading system through a broker-dealer that offers NextShares, and may not be directly purchased or redeemed from the Fund. Market trading prices for the Fund are directly linked to the Fund’s next-computed net asset value per share (NAV) and will vary from NAV by a market-determined premium or discount, which may be zero. The Fund invests all of its investable assets in interests in Global Income Builder Portfolio (the Portfolio), a Massachusetts business trust having substantially the same investment objective and policies as the Fund. The value of the Fund’s investment in the Portfolio reflects the Fund’s proportionate interest in the net assets of the Portfolio (2.4% at April 30, 2021). The performance of the Fund is directly affected by the performance of the Portfolio. The financial statements of the Portfolio, including the portfolio of investments, are included elsewhere in this report and should be read in conjunction with the Fund’s financial statements.
The following is a summary of significant accounting policies of the Fund. The policies are in conformity with accounting principles generally accepted in the United States of America (U.S. GAAP). The Fund is an investment company and follows accounting and reporting guidance in the Financial Accounting Standards Board (FASB) Accounting Standards Codification Topic 946.
A Investment Valuation — Valuation of securities by the Portfolio is discussed in Note 1A of the Portfolio’s Notes to Financial Statements, which are included elsewhere in this report.
B Income — The Fund’s net investment income or loss consists of the Fund’s pro-rata share of the net investment income or loss of the Portfolio, less all actual and accrued expenses of the Fund.
C Federal Taxes — The Fund’s policy is to comply with the provisions of the Internal Revenue Code applicable to regulated investment companies and to distribute to shareholders each year substantially all of its net investment income, and all or substantially all of its net realized capital gains. Accordingly, no provision for federal income or excise tax is necessary.
As of April 30, 2021, the Fund had no uncertain tax positions that would require financial statement recognition, de-recognition, or disclosure. The Fund files a U.S. federal income tax return annually after its fiscal year-end, which is subject to examination by the Internal Revenue Service for a period of three years from the date of filing.
D Expenses — The majority of expenses of the Trust are directly identifiable to an individual fund. Expenses which are not readily identifiable to a specific fund are allocated taking into consideration, among other things, the nature and type of expense and the relative size of the funds.
E Use of Estimates — The preparation of the financial statements in conformity with U.S. GAAP requires management to make estimates and assumptions that affect the reported amounts of assets and liabilities at the date of the financial statements and the reported amounts of income and expense during the reporting period. Actual results could differ from those estimates.
F Indemnifications — Under the Trust’s organizational documents, its officers and Trustees may be indemnified against certain liabilities and expenses arising out of the performance of their duties to the Fund. Under Massachusetts law, if certain conditions prevail, shareholders of a Massachusetts business trust (such as the Trust) could be deemed to have personal liability for the obligations of the Trust. However, the Trust’s Declaration of Trust contains an express disclaimer of liability on the part of Fund shareholders and the By-laws provide that the Trust shall assume, upon request by the shareholder, the defense on behalf of any Fund shareholders. Moreover, the By-laws also provide for indemnification out of Fund property of any shareholder held personally liable solely by reason of being or having been a shareholder for all loss or expense arising from such liability. Additionally, in the normal course of business, the Fund enters into agreements with service providers that may contain indemnification clauses. The Fund’s maximum exposure under these arrangements is unknown as this would involve future claims that may be made against the Fund that have not yet occurred.
G Other — Investment transactions are accounted for on a trade date basis.
H Interim Financial Statements — The interim financial statements relating to April 30, 2021 and for the six months then ended have not been audited by an independent registered public accounting firm, but in the opinion of the Fund’s management, reflect all adjustments, consisting only of normal recurring adjustments, necessary for the fair presentation of the financial statements.
2 Distributions to Shareholders and Income Tax Information
It is the present policy of the Fund to make monthly distributions of all or substantially all of its net investment income and to distribute annually all or substantially all of its net realized capital gains. Distributions are paid in cash and cannot be automatically reinvested in additional shares of the Fund. Distributions to shareholders are recorded on the ex-dividend date. Distributions to shareholders are determined in accordance with income tax regulations, which may differ from U.S. GAAP. As required by U.S. GAAP, only distributions in excess of tax basis earnings and profits are reported in the financial statements as a return of capital. Permanent differences between book and tax accounting relating to distributions are reclassified to paid-in capital. For tax purposes, distributions from short-term capital gains are considered to be from ordinary income.
Eaton Vance
Global Income Builder NextShares
April 30, 2021
Notes to Financial Statements (Unaudited) — continued
At October 31, 2020, the Fund, for federal income tax purposes, had deferred capital losses of $110,579 which would reduce its taxable income arising from future net realized gains on investment transactions, if any, to the extent permitted by the Internal Revenue Code, and thus would reduce the amount of distributions to shareholders, which would otherwise be necessary to relieve the Fund of any liability for federal income or excise tax. The deferred capital losses are treated as arising on the first day of the Fund’s next taxable year and retain the same short-term or long-term character as when originally deferred. Of the deferred capital losses at October 31, 2020, $110,579 are short-term.
3 Investment Adviser Fee, Administration Fee and Other Transactions with Affiliates
The investment adviser fee is earned by Eaton Vance Management (EVM) as compensation for investment advisory services rendered to the Fund. On March 1, 2021, Morgan Stanley acquired Eaton Vance Corp. (the “Transaction”) and EVM became an indirect, wholly-owned subsidiary of Morgan Stanley. In connection with the Transaction, the Fund entered into a new investment advisory and administrative agreement (the “New Agreement”) with EVM, which took effect on March 1, 2021. The Fund’s prior fee reduction agreement was incorporated into the New Agreement. Pursuant to the New Agreement (and the Fund’s investment advisory and administrative agreement with EVM in effect prior to March 1, 2021), the investment advisory fee is computed at an annual rate of 0.550% of the Fund’s average daily net assets that are not invested in other investment companies for which EVM or its affiliates serve as investment adviser and receive an advisory fee (“Direct Assets”) up to $500 million, 0.525% of $500 million but less than $1 billion, 0.500% of $1 billion but less than $2.5 billion and 0.475% on Direct Assets of $2.5 billion and over, and is payable monthly. For the six months ended April 30, 2021, the Fund incurred no investment adviser fee on Direct Assets.
Pursuant to an investment sub-advisory agreement, EVM has delegated a portion of the investment management of the Fund to Eaton Vance Advisers International Ltd. (EVAIL), an affiliate of EVM and, effective March 1, 2021, an indirect, wholly-owned subsidiary of Morgan Stanley. In connection with the Transaction, EVM entered into a new sub-advisory agreement with EVAIL, which took effect on March 1, 2021. EVM pays EVAIL a portion of its investment adviser fee for sub-advisory services provided to the Fund. To the extent the Fund’s assets are invested in the Portfolio, the Fund is allocated its share of the Portfolio’s investment adviser fee. The Portfolio has engaged Boston Management and Research (BMR), a subsidiary of EVM, to render investment advisory services. See Note 2 of the Portfolio’s Notes to Financial Statements which are included elsewhere in this report. The administration fee is earned by EVM for administering the business affairs of the Fund. Pursuant to the New Agreement (and the Fund’s investment advisory and administrative agreement in effect prior to March 1, 2021), the administration fee is computed at an annual rate of 0.15% of the Fund’s average daily net assets. For the six months ended April 30, 2021, the administration fee amounted to $4,977.
The Trust, on behalf of the Fund, has entered into an operations agreement with EVM pursuant to which EVM provides the Fund with services required for it to operate as a NextShares exchange-traded managed fund in accordance with the exemptive order obtained by EVM and the Trust. Pursuant to the agreement, the Fund pays EVM a monthly fee at an annual rate of 0.05% of the Fund’s average daily net assets provided the average net assets of NextShares funds sponsored by EVM (“Covered Assets”) are less than $10 billion. The annual rate is reduced if Covered Assets are $10 billion and above. For the six months ended April 30, 2021, the operations agreement fee amounted to $1,659 or 0.05% (annualized) of the Fund’s average daily net assets.
EVM and EVAIL have agreed to reimburse the Fund’s expenses to the extent that total annual operating expenses (relating to ordinary operating expenses only and excluding such expenses as borrowing costs, taxes or litigation expenses) exceed 0.85% of the Fund’s average daily net assets through February 28, 2022. Thereafter, the reimbursement may be changed or terminated at any time. Pursuant to this agreement, EVM and EVAIL were allocated $51,599 in total of the Fund’s operating expenses for the six months ended April 30, 2021.
Trustees and officers of the Fund who are members of EVM’s or BMR’s organizations receive remuneration for their services to the Fund out of the investment adviser fee. Certain officers and Trustees of the Fund and the Portfolio are officers of the above organizations.
4 Investment Transactions
For the six months ended April 30, 2021, increases and decreases in the Fund’s investment in the Portfolio aggregated $139,031 and $161,662, respectively. In addition, a Portfolio transaction fee is imposed by the Portfolio on the combined daily inflows or outflows of the Fund and the Portfolio’s other investors as more fully described at Note 1L of the Portfolio’s financial statements included herein. Such fee is allocated to the Fund based on its pro-rata interest in the Portfolio. The amount of the Portfolio transaction fee imposed on the Fund, if any, and the allocation of such fee are presented as Other capital on the Statements of Changes in Net Assets.
5 Capital Share Transactions
The Trust may issue an unlimited number of shares of capital stock (no par value per share) in one or more series (such as the Fund). The Fund issues and redeems shares only in blocks of 25,000 shares or multiples thereof (“Creation Units”). The Fund issues and redeems Creation Units in return for the securities, other instruments and/or cash (the “Basket”) that the Fund specifies each business day. Creation Units may be purchased or redeemed only by or through Authorized Participants, which are broker-dealers or institutional investors that have entered into agreements with the Fund’s distributor for this purpose. The Fund imposes a transaction fee on Creation Units issued and redeemed to offset the estimated cost to the Fund of processing the transaction, which is paid by the Authorized Participants directly to a third-party administrator. In addition, Authorized Participants pay the Fund a variable charge for
Eaton Vance
Global Income Builder NextShares
April 30, 2021
Notes to Financial Statements (Unaudited) — continued
converting the Basket to or from the desired portfolio composition. Such variable charges are reflected as Transaction fees on the Statements of Changes in Net Assets.
At April 30, 2021, EVM owned approximately 97% of the outstanding shares of the Fund.
Global Income Builder Portfolio
April 30, 2021
Portfolio of Investments (Unaudited)
| | | | | | | | | | |
| Common Stocks — 60.1% | |
| Security | | | | Shares | | | Value | |
|
| Aerospace & Defense — 0.4% | |
| | | |
Safran S.A.(1) | | | | | 9,060 | | | $ | 1,352,736 | |
| |
| | | | $ | 1,352,736 | |
|
| Air Freight & Logistics — 0.5% | |
| | | |
PostNL NV | | | | | 301,543 | | | $ | 1,575,088 | |
| |
| | | | $ | 1,575,088 | |
|
| Banks — 4.6% | |
| | | |
Bank of New York Mellon Corp. (The) | | | | | 55,322 | | | $ | 2,759,461 | |
| | | |
Citigroup, Inc. | | | | | 31,658 | | | | 2,255,316 | |
| | | |
Credit Agricole S.A.(1) | | | | | 106,447 | | | | 1,646,544 | |
| | | |
HDFC Bank, Ltd.(1) | | | | | 57,776 | | | | 1,098,209 | |
| | | |
ING Groep NV | | | | | 136,623 | | | | 1,745,356 | |
| | | |
Mitsubishi UFJ Financial Group, Inc.(2) | | | | | 268,285 | | | | 1,427,302 | |
| | | |
Svenska Handelsbanken AB, Class A | | | | | 117,230 | | | | 1,357,555 | |
| | | |
Wells Fargo & Co. | | | | | 37,767 | | | | 1,701,403 | |
| |
| | | | $ | 13,991,146 | |
|
| Beverages — 1.1% | |
| | | |
Coca-Cola Co. (The) | | | | | 28,233 | | | $ | 1,524,017 | |
| | | |
Diageo PLC(1) | | | | | 42,058 | | | | 1,888,041 | |
| |
| | | | $ | 3,412,058 | |
|
| Biotechnology — 0.6% | |
| | | |
CSL, Ltd. | | | | | 8,140 | | | $ | 1,700,401 | |
| |
| | | | $ | 1,700,401 | |
|
| Building Products — 0.7% | |
| | | |
Assa Abloy AB, Class B | | | | | 52,807 | | | $ | 1,505,505 | |
| | | |
Kingspan Group PLC | | | | | 8,798 | | | | 782,538 | |
| |
| | | | $ | 2,288,043 | |
|
| Capital Markets — 0.3% | |
| | | |
Azimut Holding SpA | | | | | 43,175 | | | $ | 1,032,982 | |
| |
| | | | $ | 1,032,982 | |
|
| Chemicals — 0.4% | |
| | | |
Sika AG(1) | | | | | 4,143 | | | $ | 1,237,359 | |
| |
| | | | $ | 1,237,359 | |
| | | | | | | | | | |
| Security | | | | Shares | | | Value | |
|
| Construction & Engineering — 0.5% | |
| | | |
Abengoa S.A., Class A(1)(3) | | | | | 36,194 | | | $ | 0 | |
| | | |
Abengoa S.A., Class B(1)(3) | | | | | 374,261 | | | | 0 | |
| | | |
Bouygues S.A. | | | | | 34,234 | | | | 1,467,112 | |
| |
| | | | $ | 1,467,112 | |
|
| Construction Materials — 0.6% | |
| | | |
CRH PLC(1) | | | | | 37,741 | | | $ | 1,780,779 | |
| |
| | | | $ | 1,780,779 | |
|
| Consumer Finance — 0.4% | |
| | | |
Capital One Financial Corp. | | | | | 8,204 | | | $ | 1,223,052 | |
| |
| | | | $ | 1,223,052 | |
|
| Diversified Financial Services — 1.3% | |
| | | |
Berkshire Hathaway, Inc., Class B(1) | | | | | 10,704 | | | $ | 2,943,065 | |
| | | |
ORIX Corp. | | | | | 71,345 | | | | 1,151,784 | |
| |
| | | | $ | 4,094,849 | |
|
| Diversified Telecommunication Services — 0.6% | |
| | | |
Swisscom AG(1) | | | | | 680 | | | $ | 369,205 | |
| | | |
Telefonica Deutschland Holding AG | | | | | 527,971 | | | | 1,534,374 | |
| |
| | | | $ | 1,903,579 | |
|
| Electric Utilities — 1.3% | |
| | | |
Fortum Oyj | | | | | 47,740 | | | $ | 1,254,550 | |
| | | |
Iberdrola S.A. | | | | | 92,097 | | | | 1,244,594 | |
| | | |
NextEra Energy, Inc. | | | | | 18,310 | | | | 1,419,208 | |
| |
| | | | $ | 3,918,352 | |
|
| Electrical Equipment — 1.7% | |
| | | |
AMETEK, Inc. | | | | | 19,923 | | | $ | 2,688,210 | |
| | | |
Schneider Electric SE | | | | | 13,399 | | | | 2,137,888 | |
| | | |
Signify NV(1)(4) | | | | | 8,424 | | | | 478,391 | |
| |
| | | | $ | 5,304,489 | |
|
| Electronic Equipment, Instruments & Components — 2.6% | |
| | | |
CDW Corp. | | | | | 8,380 | | | $ | 1,494,405 | |
| | | |
Halma PLC | | | | | 31,661 | | | | 1,131,330 | |
| | | |
Keyence Corp. | | | | | 2,633 | | | | 1,263,979 | |
| | | |
Murata Manufacturing Co., Ltd. | | | | | 12,079 | | | | 960,370 | |
| | | |
TE Connectivity, Ltd. | | | | | 13,020 | | | | 1,750,799 | |
| | | |
Zebra Technologies Corp., Class A(1) | | | | | 3,088 | | | | 1,506,141 | |
| |
| | | | $ | 8,107,024 | |
| | | | |
| | 13 | | See Notes to Financial Statements. |
Global Income Builder Portfolio
April 30, 2021
Portfolio of Investments (Unaudited) — continued
| | | | | | | | | | |
| Security | | | | Shares | | | Value | |
|
| Entertainment — 1.2% | |
| | | |
Nintendo Co., Ltd. | | | | | 1,756 | | | $ | 1,007,334 | |
| | | |
Walt Disney Co. (The)(1) | | | | | 14,274 | | | | 2,655,250 | |
| |
| | | | $ | 3,662,584 | |
|
| Equity Real Estate Investment Trusts (REITs) — 0.7% | |
| | | |
American Tower Corp. | | | | | 3,987 | | | $ | 1,015,768 | |
| | | |
Equity Residential | | | | | 13,430 | | | | 996,909 | |
| |
| | | | $ | 2,012,677 | |
|
| Food Products — 1.5% | |
| | | |
Mondelez International, Inc., Class A | | | | | 40,179 | | | $ | 2,443,285 | |
| | | |
Nestle S.A.(1) | | | | | 18,762 | | | | 2,238,882 | |
| |
| | | | $ | 4,682,167 | |
|
| Health Care Equipment & Supplies — 2.5% | |
| | | |
Alcon, Inc. | | | | | 23,498 | | | $ | 1,764,952 | |
| | | |
Boston Scientific Corp.(1) | | | | | 62,337 | | | | 2,717,893 | |
| | | |
Intuitive Surgical, Inc.(1) | | | | | 2,180 | | | | 1,885,700 | |
| | | |
Straumann Holding AG | | | | | 971 | | | | 1,387,726 | |
| |
| | | | $ | 7,756,271 | |
|
| Health Care Providers & Services — 0.5% | |
| | | |
Anthem, Inc.(1) | | | | | 4,192 | | | $ | 1,590,403 | |
| |
| | | | $ | 1,590,403 | |
|
| Hotels, Restaurants & Leisure — 0.5% | |
| | | |
Compass Group PLC(1) | | | | | 65,010 | | | $ | 1,414,245 | |
| |
| | | | $ | 1,414,245 | |
|
| Industrial Conglomerates — 0.6% | |
| | | |
DCC PLC | | | | | 19,473 | | | $ | 1,689,653 | |
| |
| | | | $ | 1,689,653 | |
|
| Insurance — 2.8% | |
| | | |
Allianz SE | | | | | 5,155 | | | $ | 1,338,325 | |
| | | |
Allstate Corp. (The) | | | | | 12,375 | | | | 1,569,150 | |
| | | |
Assicurazioni Generali SpA(1) | | | | | 78,196 | | | | 1,565,205 | |
| | | |
Aviva PLC | | | | | 156,886 | | | | 867,351 | |
| | | |
AXA S.A. | | | | | 51,955 | | | | 1,467,470 | |
| | | |
Swiss Re AG(1) | | | | | 17,383 | | | | 1,613,857 | |
| |
| | | | $ | 8,421,358 | |
| | | | | | | | | | |
| Security | | | | Shares | | | Value | |
|
| Interactive Media & Services — 4.0% | |
| | | |
Alphabet, Inc., Class C(1) | | | | | 3,250 | | | $ | 7,832,890 | |
| | | |
Facebook, Inc., Class A(1) | | | | | 10,056 | | | | 3,269,005 | |
| | | |
Tencent Holdings, Ltd. | | | | | 13,937 | | | | 1,111,782 | |
| |
| | | | $ | 12,213,677 | |
|
| Internet & Direct Marketing Retail — 2.1% | |
| | | |
Amazon.com, Inc.(1)(5) | | | | | 1,861 | | | $ | 6,452,869 | |
| |
| | | | $ | 6,452,869 | |
|
| IT Services — 2.2% | |
| | | |
Amadeus IT Group S.A.(1) | | | | | 23,996 | | | $ | 1,634,080 | |
| | | |
Fidelity National Information Services, Inc. | | | | | 10,166 | | | | 1,554,382 | |
| | | |
Global Payments, Inc. | | | | | 4,813 | | | | 1,033,014 | |
| | | |
Visa, Inc., Class A | | | | | 10,446 | | | | 2,439,768 | |
| |
| | | | $ | 6,661,244 | |
|
| Leisure Products — 0.6% | |
| | | |
Yamaha Corp. | | | | | 31,555 | | | $ | 1,722,131 | |
| |
| | | | $ | 1,722,131 | |
|
| Life Sciences Tools & Services — 0.3% | |
| | | |
Lonza Group AG(1) | | | | | 1,508 | | | $ | 958,657 | |
| |
| | | | $ | 958,657 | |
|
| Machinery — 2.3% | |
| | | |
Alstom S.A.(1) | | | | | 25,422 | | | $ | 1,388,336 | |
| | | |
Ingersoll Rand, Inc.(1) | | | | | 24,552 | | | | 1,213,114 | |
| | | |
Sandvik AB(1) | | | | | 57,663 | | | | 1,425,974 | |
| | | |
SMC Corp. | | | | | 2,204 | | | | 1,280,694 | |
| | | |
Stanley Black & Decker, Inc. | | | | | 8,085 | | | | 1,671,735 | |
| |
| | | | $ | 6,979,853 | |
|
| Media — 0.0%(6) | |
| | | |
Clear Channel Outdoor Holdings, Inc.(1) | | | | | 3,408 | | | $ | 8,554 | |
| | | |
iHeartMedia, Inc., Class A(1) | | | | | 715 | | | | 13,685 | |
| |
| | | | $ | 22,239 | |
|
| Metals & Mining — 0.8% | |
| | | |
Rio Tinto, Ltd. | | | | | 25,959 | | | $ | 2,412,757 | |
| |
| | | | $ | 2,412,757 | |
| | | | |
| | 14 | | See Notes to Financial Statements. |
Global Income Builder Portfolio
April 30, 2021
Portfolio of Investments (Unaudited) — continued
| | | | | | | | | | |
| Security | | | | Shares | | | Value | |
|
| Mortgage Real Estate Investment Trusts (REITs) — 0.3% | |
| | | |
AGNC Investment Corp. | | | | | 48,311 | | | $ | 866,216 | |
| |
| | | | $ | 866,216 | |
|
| Multi-Utilities — 1.1% | |
| | | |
A2A SpA | | | | | 685,426 | | | $ | 1,340,674 | |
| | | |
CMS Energy Corp. | | | | | 10,882 | | | | 700,692 | |
| | | |
E.ON SE | | | | | 116,350 | | | | 1,402,928 | |
| |
| | | | $ | 3,444,294 | |
|
| Oil, Gas & Consumable Fuels — 1.7% | |
| | | |
Chevron Corp. | | | | | 14,063 | | | $ | 1,449,473 | |
| | | |
EOG Resources, Inc. | | | | | 30,347 | | | | 2,234,753 | |
| | | |
Extraction Oil & Gas, Inc.(1) | | | | | 8,474 | | | | 354,044 | |
| | | |
Extraction Oil & Gas, Inc.(1)(3)(7) | | | | | 425 | | | | 17,698 | |
| | | |
Phillips 66(1) | | | | | 15,200 | | | | 1,229,832 | |
| |
| | | | $ | 5,285,800 | |
|
| Personal Products — 0.7% | |
| | | |
Unilever PLC | | | | | 35,072 | | | $ | 2,054,415 | |
| |
| | | | $ | 2,054,415 | |
|
| Pharmaceuticals — 3.7% | |
| | | |
AstraZeneca PLC | | | | | 8,232 | | | $ | 876,246 | |
| | | |
Eli Lilly & Co. | | | | | 10,732 | | | | 1,961,488 | |
| | | |
Novo Nordisk A/S, Class B | | | | | 24,134 | | | | 1,780,303 | |
| | | |
Orion Oyj, Class B | | | | | 12,497 | | | | 553,184 | |
| | | |
Roche Holding AG PC(1) | | | | | 5,171 | | | | 1,686,551 | |
| | | |
Sanofi | | | | | 22,125 | | | | 2,319,635 | |
| | | |
Zoetis, Inc.(1) | | | | | 12,775 | | | | 2,210,458 | |
| |
| | | | $ | 11,387,865 | |
|
| Professional Services — 1.5% | |
| | | |
Recruit Holdings Co., Ltd. | | | | | 36,171 | | | $ | 1,630,859 | |
| | | |
RELX PLC | | | | | 83,641 | | | | 2,170,104 | |
| | | |
Verisk Analytics, Inc. | | | | | 4,453 | | | | 838,055 | |
| |
| | | | $ | 4,639,018 | |
|
| Semiconductors & Semiconductor Equipment — 3.3% | |
| | | |
ASML Holding NV | | | | | 5,128 | | | $ | 3,328,797 | |
| | | |
Infineon Technologies AG | | | | | 51,652 | | | | 2,071,273 | |
| | | |
Micron Technology, Inc.(1) | | | | | 26,684 | | | | 2,296,692 | |
| | | |
Taiwan Semiconductor Manufacturing Co., Ltd. ADR | | | | | 19,867 | | | | 2,319,274 | |
| |
| | | | $ | 10,016,036 | |
| | | | | | | | | | | | |
| Security | | | | | Shares | | | Value | |
|
| Software — 3.0% | |
| | | |
Dassault Systemes SE | | | | | | | 6,315 | | | $ | 1,464,906 | |
| | | |
Intuit, Inc. | | | | | | | 3,022 | | | | 1,245,548 | |
| | | |
Microsoft Corp. | | | | | | | 25,735 | | | | 6,489,852 | |
| |
| | | | $ | 9,200,306 | |
|
| Specialty Retail — 1.4% | |
| | | |
Lowe’s Cos., Inc. | | | | | | | 10,022 | | | $ | 1,966,817 | |
| | | |
TJX Cos., Inc. (The) | | | | | | | 31,461 | | | | 2,233,731 | |
| |
| | | | $ | 4,200,548 | |
|
| Technology Hardware, Storage & Peripherals — 1.2% | |
| | | |
Apple, Inc. | | | | | | | 28,477 | | | $ | 3,743,586 | |
| |
| | | | $ | 3,743,586 | |
|
| Textiles, Apparel & Luxury Goods — 2.0% | |
| | | |
adidas AG(1) | | | | | | | 8,039 | | | $ | 2,482,932 | |
| | | |
LVMH Moet Hennessy Louis Vuitton SE | | | | | | | 3,511 | | | | 2,645,013 | |
| | | |
VF Corp. | | | | | | | 10,505 | | | | 920,868 | |
| |
| | | | $ | 6,048,813 | |
| |
Total Common Stocks
(identified cost $124,567,336) | | | $ | 183,928,731 | |
|
| Convertible Bonds — 0.1% | |
| Security | | | | | Principal
Amount
(000’s omitted) | | | Value | |
|
| Air Transportation — 0.1% | |
| | | |
Air Transport Services Group, Inc., 1.125%, 10/15/24 | | | | | | $ | 137 | | | $ | 146,247 | |
| | | |
| | | | | | | | | | | $ | 146,247 | |
|
| Leisure — 0.0%(6) | |
| | | |
Royal Caribbean Cruises, Ltd., 4.25%, 6/15/23(4) | | | | | | $ | 29 | | | $ | 40,847 | |
| | | |
| | | | | | | | | | | $ | 40,847 | |
| |
Total Convertible Bonds
(identified cost $154,891) | | | $ | 187,094 | |
| | | | |
| | 15 | | See Notes to Financial Statements. |
Global Income Builder Portfolio
April 30, 2021
Portfolio of Investments (Unaudited) — continued
| | | | | | | | | | | | |
| Corporate Bonds — 35.2% | |
| Security | | | | | Principal
Amount*
(000’s omitted) | | | Value | |
|
| Aerospace & Defense — 0.8% | |
| | | |
BWX Technologies, Inc., 5.375%,
7/15/26(4) | | | | | | | 215 | | | $ | 221,945 | |
| | | |
Moog, Inc., 4.25%, 12/15/27(4) | | | | | | | 170 | | | | 175,102 | |
|
| Rolls-Royce PLC: | |
| | | |
5.75%, 10/15/27(4) | | | | | | | 492 | | | | 528,595 | |
| | | |
5.75%, 10/15/27(8) | | | GBP | | | | 161 | | | | 242,235 | |
| | | |
TransDigm UK Holdings PLC, 6.875%, 5/15/26 | | | | | | | 200 | | | | 210,875 | |
|
| TransDigm, Inc.: | |
| | | |
4.625%, 1/15/29(4) | | | | | | | 185 | | | | 182,619 | |
| | | |
5.50%, 11/15/27 | | | | | | | 106 | | | | 110,451 | |
| | | |
6.25%, 3/15/26(4) | | | | | | | 419 | | | | 444,140 | |
| | | |
6.50%, 5/15/25 | | | | | | | 30 | | | | 30,460 | |
| | | |
7.50%, 3/15/27 | | | | | | | 327 | | | | 350,730 | |
| | | |
| | | | | | | | | | | $ | 2,497,152 | |
|
| Airlines — 0.4% | |
|
| American Airlines, Inc./AAdvantage Loyalty IP, Ltd.: | |
| | | |
5.50%, 4/20/26(4) | | | | | | | 314 | | | $ | 330,093 | |
| | | |
5.75%, 4/20/29(4) | | | | | | | 314 | | | | 336,843 | |
| | | |
Delta Air Lines, Inc./SkyMiles IP, Ltd., 4.75%, 10/20/28(4) | | | | | | | 110 | | | | 120,882 | |
| | | |
Mileage Plus Holdings, LLC/Mileage Plus Intellectual Property Assets, Ltd., 6.50%, 6/20/27(4) | | | | | | | 151 | | | | 165,608 | |
|
| United Airlines, Inc.: | |
| | | |
4.375%, 4/15/26(4) | | | | | | | 136 | | | | 141,300 | |
| | | |
4.625%, 4/15/29(4) | | | | | | | 136 | | | | 141,501 | |
| | | |
| | | | | | | | | | | $ | 1,236,227 | |
|
| Auto Components — 0.6% | |
| | | |
Clarios Global, L.P., 6.75%, 5/15/25(4) | | | | | | | 81 | | | $ | 87,101 | |
|
| Clarios Global, L.P./Clarios US Finance Co.: | |
| | | |
4.375%, 5/15/26(8) | | | EUR | | | | 181 | | | | 225,224 | |
| | | |
8.50%, 5/15/27(4) | | | | | | | 765 | | | | 827,156 | |
| | | |
Real Hero Merger Sub 2, Inc., 6.25%, 2/1/29(4) | | | | | | | 234 | | | | 242,429 | |
| | | |
TI Automotive Finance PLC, 3.75%, 4/15/29(8) | | | EUR | | | | 400 | | | | 485,746 | |
| | | |
Wheel Pros, Inc., 6.50%, 5/15/29(4)(9) | | | | | | | 90 | | | | 90,347 | |
| |
| | | | $ | 1,958,003 | |
|
| Automobiles — 0.9% | |
|
| Ford Motor Co.: | |
| | | |
4.75%, 1/15/43 | | | | | | | 197 | | | $ | 198,955 | |
| | | |
8.50%, 4/21/23 | | | | | | | 202 | | | | 226,493 | |
| | | |
9.625%, 4/22/30 | | | | | | | 208 | | | | 291,981 | |
| | | | | | | | | | | | |
| Security | | | | | Principal
Amount*
(000’s omitted) | | | Value | |
|
| Automobiles (continued) | |
|
| Ford Motor Credit Co., LLC: | |
| | | |
3.087%, 1/9/23 | | | | | | | 231 | | | $ | 235,667 | |
| | | |
3.37%, 11/17/23 | | | | | | | 253 | | | | 260,906 | |
| | | |
3.815%, 11/2/27 | | | | | | | 327 | | | | 335,656 | |
| | | |
4.00%, 11/13/30 | | | | | | | 200 | | | | 204,518 | |
| | | |
4.125%, 8/17/27 | | | | | | | 555 | | | | 580,730 | |
| | | |
5.125%, 6/16/25 | | | | | | | 200 | | | | 218,730 | |
| | | |
General Motors Financial Co., Inc., Series C,
5.70% to 9/30/30(10)(11) | | | | | | | 85 | | | | 95,200 | |
| | | |
Jaguar Land Rover Automotive PLC,
6.875%, 11/15/26(8) | | | EUR | | | | 100 | | | | 137,417 | |
| |
| | | | $ | 2,786,253 | |
|
| Banks — 1.7% | |
| | | |
Banco Mercantil del Norte S.A./Grand Cayman,
7.625% to 1/10/28(4)(10)(11) | | | | | | | 200 | | | $ | 222,143 | |
|
| Citigroup, Inc.: | |
| | | |
5.95% to 1/30/23(10)(11) | | | | | | | 125 | | | | 132,266 | |
| | | |
Series M, 6.30% to 5/15/24(10)(11) | | | | | | | 200 | | | | 215,679 | |
| | | |
Comerica, Inc., 5.625% to 7/1/25(10)(11) | | | | | | | 125 | | | | 139,590 | |
| | | |
Credit Suisse Group AG, 7.50% to
7/17/23(4)(10)(11) | | | | | | | 208 | | | | 223,038 | |
| | | |
Farm Credit Bank of Texas, Series 3,
6.20% to 6/15/28(4)(10)(11) | | | | | | | 220 | | | | 237,325 | |
| | | |
HSBC Holdings PLC, 4.60% to
12/17/30(10)(11) | | | | | | | 200 | | | | 203,500 | |
| | | |
Huntington Bancshares, Inc., Series F,
5.625% to 7/15/30(10)(11) | | | | | | | 125 | | | | 145,969 | |
|
| JPMorgan Chase & Co.: | |
| | | |
Series HH, 4.60% to 2/1/25(10)(11) | | | | | | | 298 | | | | 307,685 | |
| | | |
Series S, 6.75%, to 2/1/24(10)(11) | | | | | | | 215 | | | | 239,053 | |
| | | |
Series X, 6.10% to 10/1/24(10)(11) | | | | | | | 329 | | | | 358,404 | |
| | | |
Lloyds Banking Group PLC, 7.50% to 9/27/25(10)(11) | | | | | | | 200 | | | | 231,750 | |
| | | |
Regions Financial Corp., Series D, 5.75% to 6/15/25(10)(11) | | | | | | | 63 | | | | 70,403 | |
| | | |
Societe Generale S.A., 5.375% to
11/18/30(4)(10)(11) | | | | | | | 200 | | | | 208,500 | |
| | | |
Standard Chartered PLC, 4.75% to
1/14/31(4)(10)(11) | | | | | | | 229 | | | | 232,624 | |
| | | |
SVB Financial Group, 4.10% to
2/15/31(10)(11) | | | | | | | 58 | | | | 58,471 | |
|
| Truist Financial Corp.: | |
| | | |
Series P, 4.95% to 9/1/25(10)(11) | | | | | | | 62 | | | | 68,355 | |
| | | |
Series Q, 5.10% to 3/1/30(10)(11) | | | | | | | 77 | | | | 85,860 | |
| | | |
Vivion Investments S.a.r.l., 3.00%, 8/8/24(8) | | | EUR | | | | 1,200 | | | | 1,414,078 | |
| | | |
Zions Bancorp NA, 5.80% to 6/15/23(10)(11) | | | | | | | 268 | | | | 277,380 | |
| |
| | | | $ | 5,072,073 | |
| | | | |
| | 16 | | See Notes to Financial Statements. |
Global Income Builder Portfolio
April 30, 2021
Portfolio of Investments (Unaudited) — continued
| | | | | | | | | | | | |
| Security | | | | | Principal
Amount*
(000’s omitted) | | | Value | |
|
| Biotechnology — 0.1% | |
| | | |
Emergent BioSolutions, Inc., 3.875%, 8/15/28(4) | | | | | | | 185 | | | $ | 173,677 | |
| |
| | | | $ | 173,677 | |
|
| Building Products — 1.3% | |
| | | |
Boise Cascade Co., 4.875%, 7/1/30(4) | | | | | | | 116 | | | $ | 123,178 | |
| | | |
Brookfield Residential Properties, Inc./Brookfield
Residential U.S. Corp.: | | | | | | | | | |
| | | |
4.875%, 2/15/30(4) | | | | | | | 121 | | | | 121,000 | |
| | | |
6.25%, 9/15/27(4) | | | | | | | 63 | | | | 66,959 | |
|
| Builders FirstSource, Inc.: | |
| | | |
5.00%, 3/1/30(4) | | | | | | | 90 | | | | 95,753 | |
| | | |
6.75%, 6/1/27(4) | | | | | | | 134 | | | | 144,271 | |
| | | |
Empire Communities Corp., 7.00%, 12/15/25(4) | | | | | | | 247 | | | | 264,957 | |
| | | |
HT Troplast GmbH, 9.25%, 7/15/25(8) | | | EUR | | | | 360 | | | | 475,507 | |
| | | |
M/I Homes, Inc., 4.95%, 2/1/28 | | | | | | | 82 | | | | 86,381 | |
| | | |
Masonite International Corp., 5.375%, 2/1/28(4) | | | | | | | 105 | | | | 110,908 | |
| | | |
Patrick Industries, Inc., 4.75%, 5/1/29(4) | | | | | | | 200 | | | | 200,825 | |
| | | |
PCF GmbH, 4.75%, 4/15/26(8) | | | EUR | | | | 175 | | | | 211,840 | |
|
| Shea Homes, L.P./Shea Homes Funding Corp.: | |
| | | |
4.75%, 2/15/28(4) | | | | | | | 253 | | | | 257,902 | |
| | | |
4.75%, 4/1/29(4) | | | | | | | 72 | | | | 72,992 | |
|
| Standard Industries, Inc.: | |
| | | |
4.375%, 7/15/30(4) | | | | | | | 192 | | | | 192,720 | |
| | | |
5.00%, 2/15/27(4) | | | | | | | 78 | | | | 80,535 | |
|
| Taylor Morrison Communities, Inc.: | |
| | | |
5.125%, 8/1/30(4) | | | | | | | 112 | | | | 123,511 | |
| | | |
5.75%, 1/15/28(4) | | | | | | | 196 | | | | 221,847 | |
| | | |
5.875%, 6/15/27(4) | | | | | | | 146 | | | | 166,043 | |
| | | |
TRI Pointe Group, Inc., 5.70%, 6/15/28 | | | | | | | 261 | | | | 290,527 | |
| | | |
Victoria PLC, 3.625%, 8/24/26(8) | | | EUR | | | | 514 | | | | 628,167 | |
| |
| | | | $ | 3,935,823 | |
|
| Capital Markets — 0.2% | |
| | | |
AerCap Holdings NV, 5.875% to 10/10/24, 10/10/79(10) | | | | | | | 150 | | | $ | 156,795 | |
| | | |
Charles Schwab Corp. (The), Series I, 4.00% to 6/1/26(10)(11) | | | | | | | 259 | | | | 266,786 | |
| | | |
UBS Group AG, 4.375% to
2/10/31(4)(10)(11) | | | | | | | 200 | | | | 199,752 | |
| |
| | | | $ | 623,333 | |
|
| Casino & Gaming — 0.4% | |
|
| Cinemark USA, Inc.: | |
| | | |
4.875%, 6/1/23 | | | | | | | 270 | | | $ | 269,986 | |
| | | |
5.875%, 3/15/26(4) | | | | | | | 67 | | | | 69,513 | |
| | | |
8.75%, 5/1/25(4) | | | | | | | 48 | | | | 52,320 | |
| | | | | | | | | | | | |
| Security | | | | | Principal
Amount*
(000’s omitted) | | | Value | |
|
| Casino & Gaming (continued) | |
| | | |
Peninsula Pacific Entertainment, LLC/Peninsula Pacific Entertainment Finance, Inc., 8.50%, 11/15/27(4) | | | | | | | 337 | | | $ | 358,821 | |
| | | |
Speedway Motorsports, LLC/Speedway Funding II, Inc., 4.875%, 11/1/27(4) | | | | | | | 215 | | | | 214,731 | |
| | | |
Stars Group Holdings B.V./Stars Group US Co-Borrower, LLC,
7.00%, 7/15/26(4) | | | | | | | 287 | | | | 300,805 | |
| |
| | | | $ | 1,266,176 | |
|
| Chemicals — 1.2% | |
| | | |
Herens Holdco S.a.r.l., 4.75%, 5/15/28(4)(9) | | | | | | | 201 | | | $ | 201,000 | |
| | | |
Herens Midco S.a.r.l., 5.25%, 5/15/29(8)(9) | | | EUR | | | | 1,240 | | | | 1,490,790 | |
| | | |
INEOS Quattro Finance 2 PLC, 2.50%, 1/15/26(8) | | | EUR | | | | 232 | | | | 280,269 | |
| | | |
K+S AG, 3.00%, 6/20/22(8) | | | EUR | | | | 400 | | | | 486,559 | |
| | | |
NOVA Chemicals Corp., 4.25%,
5/15/29(4)(9) | | | | | | | 133 | | | | 132,002 | |
| | | |
Nufarm Australia, Ltd./Nufarm Americas, Inc.,
5.75%, 4/30/26(4) | | | | | | | 310 | | | | 319,343 | |
| | | |
SCIH Salt Holdings, Inc., 6.625%, 5/1/29(4) | | | | | | | 151 | | | | 148,735 | |
| | | |
SPCM S.A., 4.875%, 9/15/25(4) | | | | | | | 200 | | | | 205,316 | |
|
| Valvoline, Inc.: | |
| | | |
3.625%, 6/15/31(4) | | | | | | | 128 | | | | 125,280 | |
| | | |
4.25%, 2/15/30(4) | | | | | | | 140 | | | | 143,674 | |
| | | |
W.R. Grace & Co., 4.875%, 6/15/27(4) | | | | | | | 245 | | | | 255,719 | |
| |
| | | | $ | 3,788,687 | |
|
| Commercial Services & Supplies — 1.4% | |
| | | |
Adtalem Global Education, Inc., 5.50%, 3/1/28(4) | | | | | | | 263 | | | $ | 263,986 | |
|
| Avis Budget Car Rental, LLC/Avis Budget Finance, Inc.: | |
| | | |
5.25%, 3/15/25(4) | | | | | | | 65 | | | | 66,097 | |
| | | |
5.375%, 3/1/29(4) | | | | | | | 127 | | | | 132,397 | |
| | | |
5.75%, 7/15/27(4) | | | | | | | 89 | | | | 94,343 | |
| | | |
5.75%, 7/15/27(4) | | | | | | | 110 | | | | 116,256 | |
|
| Clean Harbors, Inc.: | |
| | | |
4.875%, 7/15/27(4) | | | | | | | 101 | | | | 105,293 | |
| | | |
5.125%, 7/15/29(4) | | | | | | | 61 | | | | 65,930 | |
| | | |
Covanta Holding Corp., 5.875%, 7/1/25 | | | | | | | 95 | | | | 99,408 | |
|
| Gartner, Inc.: | |
| | | |
3.75%, 10/1/30(4) | | | | | | | 107 | | | | 107,451 | |
| | | |
4.50%, 7/1/28(4) | | | | | | | 151 | | | | 158,931 | |
|
| GFL Environmental, Inc.: | |
| | | |
3.50%, 9/1/28(4) | | | | | | | 240 | | | | 231,630 | |
| | | |
3.75%, 8/1/25(4) | | | | | | | 130 | | | | 132,523 | |
| | | |
8.50%, 5/1/27(4) | | | | | | | 313 | | | | 343,322 | |
| | | | |
| | 17 | | See Notes to Financial Statements. |
Global Income Builder Portfolio
April 30, 2021
Portfolio of Investments (Unaudited) — continued
| | | | | | | | | | | | |
| Security | | | | | Principal
Amount*
(000’s omitted) | | | Value | |
|
| Commercial Services & Supplies (continued) | |
|
| Hertz Corp. (The): | |
| | | |
5.50%, 10/15/24(4)(12) | | | | | | | 110 | | | $ | 114,697 | |
| | | |
6.00%, 1/15/28(4)(12) | | | | | | | 58 | | | | 63,161 | |
| | | |
6.25%, 10/15/22(12) | | | | | | | 167 | | | | 175,559 | |
| | | |
MPH Acquisition Holdings, LLC, 5.75%, 11/1/28(4) | | | | | | | 601 | | | | 593,439 | |
| | | |
NESCO Holdings II, Inc., 5.50%,
4/15/29(4) | | | | | | | 206 | | | | 212,437 | |
| | | |
ServiceMaster Co., LLC (The), 7.45%, 8/15/27 | | | | | | | 550 | | | | 645,458 | |
| | | |
Team Health Holdings, Inc., 6.375%, 2/1/25(4) | | | | | | | 413 | | | | 366,537 | |
| | | |
Tervita Corp., 11.00%, 12/1/25(4) | | | | | | | 171 | | | | 194,116 | |
| |
| | | | $ | 4,282,971 | |
|
| Construction Materials — 0.1% | |
| | | |
SRM Escrow Issuer, LLC, 6.00%,
11/1/28(4) | | | | | | | 275 | | | $ | 291,822 | |
| |
| | | | $ | 291,822 | |
|
| Consumer Finance — 0.3% | |
| | | |
CPUK Finance, Ltd., 4.875%, 2/28/47(8) | | | GBP | | | | 278 | | | $ | 390,103 | |
| | | |
PRA Group, Inc., 7.375%, 9/1/25(4) | | | | | | | 261 | | | | 280,086 | |
| | | |
William Carter Co. (The), 5.625%,
3/15/27(4) | | | | | | | 144 | | | | 151,560 | |
| |
| | | | $ | 821,749 | |
|
| Containers & Packaging — 0.5% | |
|
| Ardagh Packaging Finance PLC/Ardagh Holdings USA, Inc.: | |
| | | |
2.125%, 8/15/26(8) | | | EUR | | | | 410 | | | $ | 493,956 | |
| | | |
4.125%, 8/15/26(4) | | | | | | | 253 | | | | 260,590 | |
| | | |
Kleopatra Finco S.a.r.l., 4.25%, 3/1/26(8) | | | EUR | | | | 343 | | | | 406,445 | |
| | | |
Trivium Packaging Finance B.V., 3.75%, 8/15/26(8) | | | EUR | | | | 230 | | | | 284,225 | |
| | | |
| | | | | | | | | | | $ | 1,445,216 | |
| | | |
| Cosmetics/Personal Care — 0.1% | | | | | | | | | |
| | | |
Edgewell Personal Care Co., 5.50%, 6/1/28(4) | | | | | | | 180 | | | $ | 191,475 | |
| | | |
| | | | | | | | | | | $ | 191,475 | |
| | | |
| Distributors — 0.4% | | | | | | | | | |
| | | |
BCPE Empire Holdings, Inc., 7.625%, 5/1/27(4) | | | | | | | 416 | | | $ | 414,461 | |
| | | |
Parts Europe S.A., 4.375%, (3 mo. EURIBOR + 4.375%), 5/1/22(8)(13) | | | EUR | | | | 455 | | | | 546,837 | |
| | | |
Performance Food Group, Inc., 5.50%, 10/15/27(4) | | | | | | | 169 | | | | 178,408 | |
| | | |
| | | | | | | | | | | $ | 1,139,706 | |
| | | | | | | | | | | | |
| Security | | | | | Principal
Amount*
(000’s omitted) | | | Value | |
| | | |
| Diversified Consumer Services — 0.3% | | | | | | | | | |
| | | |
GEMS MENASA Cayman, Ltd./GEMS Education Delaware, LLC, 7.125%, 7/31/26(8) | | | | | | | 750 | | | $ | 792,079 | |
| | | |
| | | | | | | | | | | $ | 792,079 | |
| | | |
| Diversified Financial Services — 0.9% | | | | | | | | | |
| | | |
Alliance Data Systems Corp., 4.75%, 12/15/24(4) | | | | | | | 194 | | | $ | 199,515 | |
| | | |
Allied Universal Holdco, LLC, 6.625%, 7/15/26(4) | | | | | | | 226 | | | | 239,284 | |
| | | |
Allied Universal Holdco, LLC/Allied Universal Finance Corp., 9.75%, 7/15/27(4) | | | | | | | 203 | | | | 223,242 | |
| | | |
Ally Financial, Inc., Series B, 4.70% to 5/15/26(10)(11) | | | | | | | 237 | | | | 240,839 | |
| | | |
Alpha Holding S.A. de CV, 9.00%,
2/10/25(4) | | | | | | | 200 | | | | 50,500 | |
| | | |
Cabot Financial Luxembourg S.A., 7.50%, 10/1/23(8) | | | GBP | | | | 71 | | | | 99,624 | |
| | | |
Discover Financial Services, Series D,
6.125% to 6/23/25(10)(11) | | | | | | | 101 | | | | 114,256 | |
|
| Encore Capital Group, Inc.: | |
| | | |
4.25%, (3 mo. EURIBOR + 4.25%), 1/15/28(8)(13) | | | EUR | | | | 479 | | | | 590,036 | |
| | | |
5.375%, 2/15/26(8) | | | GBP | | | | 180 | | | | 260,277 | |
|
| Icahn Enterprises, L.P./Icahn Enterprises Finance Corp.: | |
| | | |
6.25%, 5/15/26 | | | | | | | 291 | | | | 307,238 | |
| | | |
6.375%, 12/15/25 | | | | | | | 120 | | | | 124,138 | |
| | | |
Louvre Bidco S.A.S., 6.50%, 9/30/24(8) | | | EUR | | | | 310 | | | | 386,348 | |
| | | |
| | | | | | | | | | | $ | 2,835,297 | |
|
| Diversified Telecommunication Services — 0.1% | |
|
| Level 3 Financing, Inc.: | |
| | | |
4.25%, 7/1/28(4) | | | | | | | 264 | | | $ | 266,339 | |
| | | |
5.25%, 3/15/26 | | | | | | | 90 | | | | 92,899 | |
| | | |
| | | | | | | | | | | $ | 359,238 | |
|
| Electric Utilities — 1.1% | |
| | | |
Enviva Partners, L.P./Enviva Partners Finance Corp.,
6.50%, 1/15/26(4) | | | | | | | 353 | | | $ | 370,650 | |
| | | |
FirstEnergy Corp., Series B, 4.40%, 7/15/27 | | | | | | | 257 | | | | 281,709 | |
| | | |
Imola Merger Corp., 4.75%, 5/15/29(4) | | | | | | | 452 | | | | 470,057 | |
| | | |
NextEra Energy Capital Holdings, Inc.,
5.65% to 5/1/29, 5/1/79(10) | | | | | | | 155 | | | | 180,587 | |
|
| NextEra Energy Operating Partners, L.P.: | |
| | | |
4.25%, 9/15/24(4) | | | | | | | 9 | | | | 9,518 | |
| | | |
4.50%, 9/15/27(4) | | | | | | | 150 | | | | 162,339 | |
|
| NRG Energy, Inc.: | |
| | | |
3.375%, 2/15/29(4) | | | | | | | 106 | | | | 104,005 | |
| | | |
3.625%, 2/15/31(4) | | | | | | | 177 | | | | 173,637 | |
| | | |
5.25%, 6/15/29(4) | | | | | | | 122 | | | | 130,981 | |
| | | | |
| | 18 | | See Notes to Financial Statements. |
Global Income Builder Portfolio
April 30, 2021
Portfolio of Investments (Unaudited) — continued
| | | | | | | | | | | | |
| Security | | | | | Principal
Amount*
(000’s omitted) | | | Value | |
|
| Electric Utilities (continued) | |
| | | |
Pattern Energy Operations, L.P./Pattern Energy Operations, Inc., 4.50%, 8/15/28(4) | | | | | | | 173 | | | $ | 175,595 | |
| | | |
Sempra Energy, 4.875% to 10/15/25(10)(11) | | | | | | | 235 | | | | 257,663 | |
| | | |
Southern California Edison Co., Series E,
6.25% to 2/1/22(10)(11) | | | | | | | 101 | | | | 103,045 | |
|
| Southern Co. (The), Series B: | |
| | | |
4.00% to 10/15/25, 1/15/51(10) | | | | | | | 56 | | | | 59,920 | |
| | | |
5.50% to 3/15/22, 3/15/57(10) | | | | | | | 192 | | | | 197,275 | |
|
| TerraForm Power Operating, LLC: | |
| | | |
4.25%, 1/31/23(4) | | | | | | | 95 | | | | 97,672 | |
| | | |
5.00%, 1/31/28(4) | | | | | | | 237 | | | | 254,627 | |
| | | |
Vistra Operations Co., LLC, 5.00%, 7/31/27(4) | | | | | | | 232 | | | | 240,649 | |
| | | |
| | | | | | | | | | | $ | 3,269,929 | |
|
| Electronic Equipment, Instruments & Components — 0.1% | |
| | | |
WESCO Distribution, Inc., 7.25%, 6/15/28(4) | | | | | | | 153 | | | $ | 170,021 | |
| | | |
| | | | | | | | | | | $ | 170,021 | |
|
| Entertainment — 1.1% | |
| | | |
AMC Entertainment Holdings, Inc., 10.50%, 4/15/25(4) | | | | | | | 202 | | | $ | 216,437 | |
| | | |
Banijay Group S.A.S., 6.50%, 3/1/26(8) | | | EUR | | | | 449 | | | | 555,330 | |
|
| Caesars Entertainment, Inc.: | |
| | | |
6.25%, 7/1/25(4) | | | | | | | 417 | | | | 443,876 | |
| | | |
8.125%, 7/1/27(4) | | | | | | | 271 | | | | 301,478 | |
| | | |
Gamma Bidco SpA, 6.25%, 7/15/25(8) | | | EUR | | | | 200 | | | | 252,185 | |
| | | |
Live Nation Entertainment, Inc., 3.75%, 1/15/28(4) | | | | | | | 69 | | | | 68,835 | |
|
| Netflix, Inc.: | |
| | | |
3.00%, 6/15/25(8) | | | EUR | | | | 370 | | | | 485,452 | |
| | | |
4.875%, 6/15/30(4) | | | | | | | 300 | | | | 348,421 | |
| | | |
5.875%, 11/15/28 | | | | | | | 300 | | | | 365,400 | |
| | | |
Powdr Corp., 6.00%, 8/1/25(4) | | | | | | | 253 | | | | 267,231 | |
| | | |
| | | | | | | | | | | $ | 3,304,645 | |
|
| Equity Real Estate Investment Trusts (REITs) — 0.1% | |
| | | |
MGM Growth Properties Operating Partnership, L.P./MGP
Finance Co-Issuer, Inc.: | | | | | | | | | |
| | | |
4.50%, 9/1/26 | | | | | | | 100 | | | $ | 105,875 | |
| | | |
5.625%, 5/1/24 | | | | | | | 200 | | | | 215,894 | |
| | | |
| | | | | | | | | | | $ | 321,769 | |
|
| Food Products — 0.9% | |
| | | |
Albertsons Cos., Inc./Safeway, Inc./New Albertsons, L.P./Albertsons, LLC, 5.875%, 2/15/28(4) | | | | | | | 181 | | | $ | 193,005 | |
| | | | | | | | | | | | |
| Security | | | | | Principal
Amount*
(000’s omitted) | | | Value | |
|
| Food Products (continued) | |
| | | |
Casino Guichard Perrachon S.A., 5.25%, 4/15/27(8) | | | EUR | | | | 125 | | | $ | 152,622 | |
| | | |
Chobani, LLC/Chobani Finance Corp., Inc.,
4.625%, 11/15/28(4) | | | | | | | 70 | | | | 72,275 | |
| | | |
JBS USA LUX S.A./JBS USA Food Co./JBS USA Finance, Inc.,
5.50%, 1/15/30(4) | | | | | | | 386 | | | | 425,086 | |
|
| Kraft Heinz Foods Co.: | |
| | | |
3.875%, 5/15/27 | | | | | | | 203 | | | | 221,245 | |
| | | |
4.25%, 3/1/31 | | | | | | | 203 | | | | 224,087 | |
| | | |
4.375%, 6/1/46 | | | | | | | 540 | | | | 579,937 | |
| | | |
4.625%, 10/1/39 | | | | | | | 68 | | | | 76,055 | |
| | | |
4.875%, 10/1/49 | | | | | | | 100 | | | | 114,971 | |
| | | |
5.50%, 6/1/50 | | | | | | | 203 | | | | 252,717 | |
| | | |
Land O’ Lakes, Inc., 8.00%(4)(11) | | | | | | | 330 | | | | 351,450 | |
| | | |
US Foods, Inc., 4.75%, 2/15/29(4) | | | | | | | 228 | | | | 230,280 | |
| |
| | | | $ | 2,893,730 | |
|
| Gas Utilities — 0.1% | |
| | | |
NiSource, Inc., 5.65% to 6/15/23(10)(11) | | | | | | | 280 | | | $ | 292,950 | |
| |
| | | | $ | 292,950 | |
|
| Health Care Equipment & Supplies — 1.1% | |
|
| Centene Corp.: | |
| | | |
2.50%, 3/1/31 | | | | | | | 311 | | | $ | 297,782 | |
| | | |
3.00%, 10/15/30 | | | | | | | 377 | | | | 374,644 | |
| | | |
3.375%, 2/15/30 | | | | | | | 308 | | | | 309,542 | |
| | | |
4.625%, 12/15/29 | | | | | | | 319 | | | | 345,747 | |
|
| CHS/Community Health Systems, Inc.: | |
| | | |
4.75%, 2/15/31(4) | | | | | | | 134 | | | | 133,172 | |
| | | |
6.875%, 4/15/29(4) | | | | | | | 256 | | | | 267,892 | |
| | | |
8.125%, 6/30/24(4) | | | | | | | 57 | | | | 59,636 | |
| | | |
Compass Minerals International, Inc., 6.75%, 12/1/27(4) | | | | | | | 182 | | | | 196,413 | |
| | | |
LifePoint Health, Inc., 5.375%, 1/15/29(4) | | | | | | | 400 | | | | 400,580 | |
| | | |
Molina Healthcare, Inc., 3.875%, 11/15/30(4) | | | | | | | 245 | | | | 252,656 | |
| | | |
US Acute Care Solutions, LLC, 6.375%, 3/1/26(4) | | | | | | | 274 | | | | 286,399 | |
| | | |
Varex Imaging Corp., 7.875%, 10/15/27(4) | | | | | | | 271 | | | | 303,368 | |
| |
| | | | $ | 3,227,831 | |
|
| Health Care Providers & Services — 1.0% | |
|
| Encompass Health Corp.: | |
| | | |
4.50%, 2/1/28 | | | | | | | 81 | | | $ | 84,138 | |
| | | |
4.625%, 4/1/31 | | | | | | | 127 | | | | 134,782 | |
| | | |
4.75%, 2/1/30 | | | | | | | 191 | | | | 200,789 | |
| | | | |
| | 19 | | See Notes to Financial Statements. |
Global Income Builder Portfolio
April 30, 2021
Portfolio of Investments (Unaudited) — continued
| | | | | | | | | | | | |
| Security | | | | | Principal
Amount*
(000’s omitted) | | | Value | |
|
| Health Care Providers & Services (continued) | |
|
| HCA, Inc.: | |
| | | |
5.375%, 9/1/26 | | | | | | | 270 | | | $ | 306,885 | |
| | | |
5.625%, 9/1/28 | | | | | | | 330 | | | | 385,275 | |
|
| Legacy LifePoint Health, LLC: | |
| | | |
4.375%, 2/15/27(4) | | | | | | | 248 | | | | 248,317 | |
| | | |
6.75%, 4/15/25(4) | | | | | | | 130 | | | | 138,450 | |
| | | |
ModivCare, Inc., 5.875%, 11/15/25(4) | | | | | | | 182 | | | | 193,806 | |
| | | |
Molina Healthcare, Inc., 4.375%,
6/15/28(4) | | | | | | | 103 | | | | 105,961 | |
| | | |
Synlab Bondco PLC, 4.75%, (3 mo. EURIBOR + 4.75%), 7/1/25(8)(13) | | | EUR | | | | 230 | | | | 279,663 | |
|
| Tenet Healthcare Corp.: | |
| | | |
4.625%, 9/1/24(4) | | | | | | | 49 | | | | 50,531 | |
| | | |
4.875%, 1/1/26(4) | | | | | | | 290 | | | | 301,675 | |
| | | |
5.125%, 11/1/27(4) | | | | | | | 290 | | | | 304,515 | |
| | | |
6.125%, 10/1/28(4) | | | | | | | 152 | | | | 160,588 | |
| | | |
6.75%, 6/15/23 | | | | | | | 71 | | | | 77,621 | |
| |
| | | | $ | 2,972,996 | |
|
| Home Builders — 0.1% | |
| | | |
WASH Multifamily Acquisition, Inc., 5.75%, 4/15/26(4) | | | | | | | 201 | | | $ | 209,040 | |
| |
| | | | $ | 209,040 | |
|
| Hotels, Restaurants & Leisure — 0.8% | |
|
| 1011778 B.C. Unlimited Liability Company/New Red Finance, Inc.: | |
| | | |
3.875%, 1/15/28(4) | | | | | | | 119 | | | $ | 120,750 | |
| | | |
4.375%, 1/15/28(4) | | | | | | | 182 | | | | 184,721 | |
| | | |
5.75%, 4/15/25(4) | | | | | | | 66 | | | | 70,098 | |
| | | |
Caesars Resort Collection, LLC/CRC Finco, Inc.,
5.25%, 10/15/25(4) | | | | | | | 232 | | | | 234,178 | |
| | | |
Gateway Casinos & Entertainment, Ltd., 8.25%, 3/1/24(4) | | | | | | | 583 | | | | 561,138 | |
|
| Lithia Motors, Inc.: | |
| | | |
4.375%, 1/15/31(4) | | | | | | | 131 | | | | 138,152 | |
| | | |
4.625%, 12/15/27(4) | | | | | | | 91 | | | | 95,664 | |
| | | |
MGM Resorts International, 4.75%, 10/15/28 | | | | | | | 264 | | | | 278,834 | |
| | | |
Viking Cruises, Ltd., 5.875%, 9/15/27(4) | | | | | | | 639 | | | | 627,009 | |
| | | |
Wynn Las Vegas, LLC/Wynn Las Vegas Capital Corp.,
5.25%, 5/15/27(4) | | | | | | | 266 | | | | 281,473 | |
| |
| | | | $ | 2,592,017 | |
|
| Household Durables — 0.0%(6) | |
| | | |
MDC Holdings, Inc., 6.00%, 1/15/43 | | | | | | | 115 | | | $ | 149,026 | |
| |
| | | | $ | 149,026 | |
| | | | | | | | | | | | |
| Security | | | | | Principal
Amount*
(000’s omitted) | | | Value | |
|
| Household Products — 0.0%(6) | |
| | | |
Spectrum Brands, Inc., 5.00%, 10/1/29(4) | | | | | | | 73 | | | $ | 77,380 | |
| |
| | | | $ | 77,380 | |
|
| Independent Power and Renewable Electricity Producers — 0.3% | |
|
| Calpine Corp.: | |
| | | |
5.125%, 3/15/28(4) | | | | | | | 273 | | | $ | 277,806 | |
| | | |
5.25%, 6/1/26(4) | | | | | | | 101 | | | | 103,892 | |
|
| NRG Energy, Inc.: | |
| | | |
5.75%, 1/15/28 | | | | | | | 210 | | | | 223,388 | |
| | | |
7.25%, 5/15/26 | | | | | | | 271 | | | | 280,951 | |
| |
| | | | $ | 886,037 | |
|
| Industrial Conglomerates — 0.4% | |
| | | |
Abertis Infraestructuras Finance B.V., 3.248% to 11/24/25(8)(10)(11) | | | EUR | | | | 400 | | | $ | 494,326 | |
| | | |
Brundage-Bone Concrete Pumping Holdings, Inc.,
6.00%, 2/1/26(4) | | | | | | | 165 | | | | 173,851 | |
| | | |
Dycom Industries, Inc., 4.50%, 4/15/29(4) | | | | | | | 224 | | | | 227,640 | |
| | | |
Gatwick Airport Finance PLC, 4.375%, 4/7/26(8) | | | GBP | | | | 145 | | | | 203,101 | |
| | | |
VM Consolidated, Inc., 5.50%, 4/15/29(4) | | | | | | | 272 | | | | 276,949 | |
| |
| | | | $ | 1,375,867 | |
|
| Insurance — 0.8% | |
| | | |
Alliant Holdings Intermediate, LLC/Alliant Holdings Co-Issuer, 6.75%, 10/15/27(4) | | | | | | | 501 | | | $ | 527,052 | |
| | | |
AmWINS Group, Inc., 7.75%, 7/1/26(4) | | | | | | | 272 | | | | 289,628 | |
| | | |
BroadStreet Partners, Inc., 5.875%,
4/15/29(4) | | | | | | | 226 | | | | 229,718 | |
| | | |
Galaxy Finco, Ltd., 9.25%, 7/31/27(8) | | | GBP | | | | 525 | | | | 771,775 | |
| | | |
Hub International, Ltd., 7.00%, 5/1/26(4) | | | | | | | 400 | | | | 414,964 | |
| | | |
QBE Insurance Group, Ltd., 5.875% to 5/12/25(4)(10)(11) | | | | | | | 222 | | | | 241,147 | |
| |
| | | | $ | 2,474,284 | |
|
| Internet — 0.1% | |
| | | |
Endure Digital, Inc., 6.00%, 2/15/29(4) | | | | | | | 208 | | | $ | 199,652 | |
| | | |
United Group B.V., 4.00%, 11/15/27(8) | | | EUR | | | | 125 | | | | 149,172 | |
| |
| | | | $ | 348,824 | |
|
| Internet & Direct Marketing Retail — 0.1% | |
| | | |
Cars.com, Inc., 6.375%, 11/1/28(4) | | | | | | | 185 | | | $ | 193,532 | |
| |
| | | | $ | 193,532 | |
| | | | |
| | 20 | | See Notes to Financial Statements. |
Global Income Builder Portfolio
April 30, 2021
Portfolio of Investments (Unaudited) — continued
| | | | | | | | | | | | |
| Security | | | | | Principal
Amount*
(000’s omitted) | | | Value | |
|
| Leisure Products — 1.1% | |
|
| Carnival Corp.: | |
| | | |
5.75%, 3/1/27(4) | | | | | | | 207 | | | $ | 218,515 | |
| | | |
7.625%, 3/1/26(4) | | | | | | | 87 | | | | 95,375 | |
| | | |
7.625%, 3/1/26(8) | | | EUR | | | | 390 | | | | 520,986 | |
| | | |
Carnival PLC, 1.00%, 10/28/29 | | | EUR | | | | 350 | | | | 347,876 | |
| | | |
Explorer II AS, 3.375%, 2/24/25 | | | EUR | | | | 465 | | | | 526,901 | |
|
| Life Time, Inc.: | |
| | | |
5.75%, 1/15/26(4) | | | | | | | 165 | | | | 170,597 | |
| | | |
8.00%, 4/15/26(4) | | | | | | | 208 | | | | 218,955 | |
|
| NCL Corp, Ltd.: | |
| | | |
3.625%, 12/15/24(4) | | | | | | | 189 | | | | 181,667 | |
| | | |
5.875%, 3/15/26(4) | | | | | | | 106 | | | | 110,928 | |
| | | |
10.25%, 2/1/26(4) | | | | | | | 155 | | | | 182,705 | |
| | | |
NCL Finance, Ltd., 6.125%, 3/15/28(4) | | | | | | | 55 | | | | 58,008 | |
|
| Royal Caribbean Cruises, Ltd.: | |
| | | |
3.70%, 3/15/28 | | | | | | | 111 | | | | 105,576 | |
| | | |
5.50%, 4/1/28(4) | | | | | | | 285 | | | | 299,236 | |
| | | |
Sabre GLBL, Inc., 9.25%, 4/15/25(4) | | | | | | | 86 | | | | 102,878 | |
| | | |
Viking Cruises, Ltd., 7.00%, 2/15/29(4) | | | | | | | 104 | | | | 108,030 | |
| | | |
Viking Ocean Cruises Ship VII, Ltd., 5.625%, 2/15/29(4) | | | | | | | 66 | | | | 67,277 | |
| |
| | | | $ | 3,315,510 | |
|
| Machinery — 0.3% | |
| | | |
Frigoglass Finance B.V., 6.875%,
2/12/25(8) | | | EUR | | | | 475 | | | $ | 519,807 | |
| | | |
Sofima Holding SpA, 3.75%, 1/15/28(8) | | | EUR | | | | 381 | | | | 460,988 | |
| |
| | | | $ | 980,795 | |
|
| Media — 2.9% | |
|
| Altice France S.A.: | |
| | | |
5.125%, 7/15/29(4) | | | | | | | 203 | | | $ | 203,508 | |
| | | |
7.375%, 5/1/26(4) | | | | | | | 202 | | | | 209,686 | |
| | | |
8.125%, 2/1/27(4) | | | | | | | 458 | | | | 502,655 | |
| | | |
Beasley Mezzanine Holdings, LLC, 8.625%, 2/1/26(4) | | | | | | | 308 | | | | 313,579 | |
|
| CCO Holdings, LLC/CCO Holdings Capital Corp.: | |
| | | |
4.25%, 2/1/31(4) | | | | | | | 286 | | | | 286,357 | |
| | | |
4.50%, 8/15/30(4) | | | | | | | 290 | | | | 295,406 | |
| | | |
4.50%, 5/1/32(4) | | | | | | | 136 | | | | 137,530 | |
| | | |
4.75%, 3/1/30(4) | | | | | | | 322 | | | | 336,490 | |
| | | |
5.375%, 6/1/29(4) | | | | | | | 110 | | | | 119,571 | |
| | | |
Clear Channel Outdoor Holdings, Inc., 7.75%, 4/15/28(4) | | | | | | | 240 | | | | 247,447 | |
| | | |
Clear Channel Worldwide Holdings, Inc., 9.25%, 2/15/24 | | | | | | | 194 | | | | 202,873 | |
|
| CSC Holdings, LLC: | |
| | | |
3.375%, 2/15/31(4) | | | | | | | 200 | | | | 187,800 | |
| | | |
5.75%, 1/15/30(4) | | | | | | | 616 | | | | 655,655 | |
| | | | | | | | | | | | |
| Security | | | | | Principal
Amount*
(000’s omitted) | | | Value | |
|
| Media (continued) | |
|
| CSC Holdings, LLC: (continued) | |
| | | |
7.50%, 4/1/28(4) | | | | | | | 200 | | | $ | 220,744 | |
| | | |
Diamond Sports Group, LLC/Diamond Sports Finance Co., 5.375%, 8/15/26(4) | | | | | | | 369 | | | | 269,831 | |
| | | |
Entercom Media Corp., 6.75%, 3/31/29(4) | | | | | | | 261 | | | | 269,691 | |
| | | |
iHeartCommunications, Inc., 8.375%, 5/1/27 | | | | | | | 140 | | | | 149,861 | |
| | | |
LCPR Senior Secured Financing DAC, 5.125%, 7/15/29(4) | | | | | | | 205 | | | | 210,574 | |
|
| National CineMedia, LLC: | |
| | | |
5.75%, 8/15/26 | | | | | | | 189 | | | | 165,103 | |
| | | |
5.875%, 4/15/28(4) | | | | | | | 245 | | | | 234,812 | |
| | | |
Outfront Media Capital, LLC/Outfront Media Capital Corp., 6.25%, 6/15/25(4) | | | | | | | 137 | | | | 145,648 | |
|
| Sirius XM Radio, Inc.: | |
| | | |
4.625%, 7/15/24(4) | | | | | | | 291 | | | | 299,002 | |
| | | |
5.00%, 8/1/27(4) | | | | | | | 218 | | | | 228,562 | |
| | | |
Summer (BC) Holdco A S.a.r.l., 9.25%, 10/31/27(8) | | | EUR | | | | 496 | | | | 632,303 | |
| | | |
Summer (BC) Holdco B S.a.r.l., 5.75%, 10/31/26(8) | | | EUR | | | | 400 | | | | 500,924 | |
|
| TEGNA, Inc.: | |
| | | |
4.75%, 3/15/26(4) | | | | | | | 72 | | | | 76,662 | |
| | | |
5.00%, 9/15/29 | | | | | | | 137 | | | | 142,374 | |
| | | |
Terrier Media Buyer, Inc., 8.875%,
12/15/27(4) | | | | | | | 237 | | | | 257,737 | |
| | | |
Townsquare Media, Inc., 6.875%, 2/1/26(4) | | | | | | | 275 | | | | 287,031 | |
| | | |
UPCB Finance VII, Ltd., 3.625%, 6/15/29(8) | | | EUR | | | | 116 | | | | 143,503 | |
| | | |
Urban One, Inc., 7.375%, 2/1/28(4) | | | | | | | 306 | | | | 317,146 | |
| | | |
Virgin Media Secured Finance PLC, 5.50%, 8/15/26(4) | | | | | | | 210 | | | | 218,161 | |
| | | |
Virgin Media Vendor Financing Notes III DAC, 4.875%, 7/15/28(8) | | | GBP | | | | 350 | | | | 497,264 | |
| |
| | | | $ | 8,965,490 | |
|
| Metals & Mining — 1.6% | |
| | | |
Allegheny Ludlum, LLC, 6.95%, 12/15/25 | | | | | | | 559 | | | $ | 608,553 | |
| | | |
Arconic Corp., 6.125%, 2/15/28(4) | | | | | | | 101 | | | | 107,439 | |
| | | |
Big River Steel, LLC/BRS Finance Corp., 6.625%, 1/31/29(4) | | | | | | | 233 | | | | 252,077 | |
|
| Bombardier, Inc.: | |
| | | |
7.50%, 12/1/24(4) | | | | | | | 53 | | | | 53,861 | |
| | | |
7.875%, 4/15/27(4) | | | | | | | 269 | | | | 268,664 | |
|
| BWX Technologies, Inc.: | |
| | | |
4.125%, 6/30/28(4) | | | | | | | 159 | | | | 162,233 | |
| | | |
4.125%, 4/15/29(4) | | | | | | | 118 | | | | 121,393 | |
| | | |
Centennial Resource Production, LLC, 5.375%, 1/15/26(4) | | | | | | | 320 | | | | 300,200 | |
|
| Cleveland-Cliffs, Inc.: | |
| | | |
6.75%, 3/15/26(4) | | | | | | | 360 | | | | 391,050 | |
| | | |
9.875%, 10/17/25(4) | | | | | | | 52 | | | | 61,100 | |
| | | |
Freeport-McMoRan, Inc., 5.45%, 3/15/43 | | | | | | | 297 | | | | 363,082 | |
| | | | |
| | 21 | | See Notes to Financial Statements. |
Global Income Builder Portfolio
April 30, 2021
Portfolio of Investments (Unaudited) — continued
| | | | | | | | | | | | |
| Security | | | | | Principal
Amount*
(000’s omitted) | | | Value | |
|
| Metals & Mining (continued) | |
|
| Hudbay Minerals, Inc.: | |
| | | |
4.50%, 4/1/26(4) | | | | | | | 174 | | | $ | 176,861 | |
| | | |
6.125%, 4/1/29(4) | | | | | | | 151 | | | | 160,749 | |
| | | |
Infrabuild Australia Pty, Ltd., 12.00%, 10/1/24(4) | | | | | | | 709 | | | | 719,635 | |
| | | |
Joseph T. Ryerson & Son, Inc., 8.50%, 8/1/28(4) | | | | | | | 191 | | | | 211,404 | |
|
| New Gold, Inc.: | |
| | | |
6.375%, 5/15/25(4) | | | | | | | 38 | | | | 39,164 | |
| | | |
7.50%, 7/15/27(4) | | | | | | | 491 | | | | 533,398 | |
| | | |
Novelis Corp., 5.875%, 9/30/26(4) | | | | | | | 180 | | | | 187,999 | |
| | | |
TMS International Corp., 6.25%, 4/15/29(4) | | | | | | | 101 | | | | 105,166 | |
| |
| | | | $ | 4,824,028 | |
|
| Multi-Utilities — 0.1% | |
| | | |
Centerpoint Energy, Inc., Series A, 6.125% to 9/1/23(10)(11) | | | | | | | 345 | | | $ | 368,072 | |
| |
| | | | $ | 368,072 | |
|
| Oil and Gas — 0.0%(6) | |
| | | |
TechnipFMC PLC, 6.50%, 2/1/26(4) | | | | | | | 134 | | | $ | 143,093 | |
| |
| | | | $ | 143,093 | |
|
| Oil, Gas & Consumable Fuels — 2.8% | |
| | | |
Aethon United BR, L.P./Aethon United Finance Corp., 8.25%, 2/15/26(4) | | | | | | | 130 | | | $ | 138,369 | |
| | | |
Archrock Partners, L.P./Archrock Partners Finance Corp., 6.25%, 4/1/28(4) | | | | | | | 135 | | | | 141,317 | |
| | | |
CNX Resources Corp., 6.00%, 1/15/29(4) | | | | | | | 210 | | | | 224,659 | |
| | | |
Colgate Energy Partners III, LLC, 7.75%, 2/15/26(4) | | | | | | | 215 | | | | 217,897 | |
|
| Continental Resources, Inc.: | |
| | | |
4.375%, 1/15/28 | | | | | | | 206 | | | | 224,498 | |
| | | |
4.90%, 6/1/44 | | | | | | | 8 | | | | 8,407 | |
| | | |
5.75%, 1/15/31(4) | | | | | | | 233 | | | | 270,579 | |
|
| CrownRock, L.P./CrownRock Finance, Inc.: | |
| | | |
5.00%, 5/1/29(4) | | | | | | | 194 | | | | 198,905 | |
| | | |
5.625%, 10/15/25(4) | | | | | | | 259 | | | | 268,389 | |
| | | |
CVR Energy, Inc., 5.75%, 2/15/28(4) | | | | | | | 439 | | | | 445,585 | |
| | | |
DCP Midstream, L.P., Series A, 7.375% to 12/15/22(10)(11) | | | | | | | 160 | | | | 146,800 | |
|
| Endeavor Energy Resources, L.P./EER Finance, Inc.: | |
| | | |
5.50%, 1/30/26(4) | | | | | | | 155 | | | | 160,916 | |
| | | |
5.75%, 1/30/28(4) | | | | | | | 40 | | | | 42,750 | |
| | | |
EnLink Midstream Partners, L.P., Series C, 6.00% to 12/15/22(10)(11) | | | | | | | 432 | | | | 300,240 | |
| | | | | | | | | | | | |
| Security | | | | | Principal
Amount*
(000’s omitted) | | | Value | |
|
| Oil, Gas & Consumable Fuels (continued) | |
|
| EQT Corp.: | |
| | | |
5.00%, 1/15/29 | | | | | | | 53 | | | $ | 58,020 | |
| | | |
7.625%, 2/1/25 | | | | | | | 69 | | | | 79,523 | |
| | | |
8.50%, 2/1/30 | | | | | | | 102 | | | | 130,560 | |
| | | |
Gran Tierra Energy, Inc., 7.75%, 5/23/27(4) | | | | | | | 250 | | | | 212,000 | |
| | | |
Great Western Petroleum, LLC/Great Western Finance Corp., 12.00%, 9/1/25(4) | | | | | | | 248 | | | | 215,760 | |
|
| Hilcorp Energy I, L.P./Hilcorp Finance Co.: | |
| | | |
5.75%, 2/1/29(4) | | | | | | | 109 | | | | 111,164 | |
| | | |
6.00%, 2/1/31(4) | | | | | | | 87 | | | | 89,830 | |
|
| Laredo Petroleum, Inc.: | |
| | | |
9.50%, 1/15/25 | | | | | | | 74 | | | | 76,324 | |
| | | |
10.125%, 1/15/28 | | | | | | | 112 | | | | 115,496 | |
| | | |
Matador Resources Co., 5.875%, 9/15/26 | | | | | | | 270 | | | | 269,662 | |
|
| MEG Energy Corp.: | |
| | | |
5.875%, 2/1/29(4) | | | | | | | 111 | | | | 113,919 | |
| | | |
7.125%, 2/1/27(4) | | | | | | | 262 | | | | 280,086 | |
|
| Murphy Oil USA, Inc.: | |
| | | |
4.75%, 9/15/29 | | | | | | | 131 | | | | 137,714 | |
| | | |
5.625%, 5/1/27 | | | | | | | 65 | | | | 68,344 | |
|
| Nabors Industries, Ltd.: | |
| | | |
7.25%, 1/15/26(4) | | | | | | | 110 | | | | 97,006 | |
| | | |
7.50%, 1/15/28(4) | | | | | | | 118 | | | | 103,029 | |
| | | |
Nine Energy Service, Inc., 8.75%, 11/1/23(4) | | | | | | | 92 | | | | 38,353 | |
|
| Occidental Petroleum Corp.: | |
| | | |
2.90%, 8/15/24 | | | | | | | 16 | | | | 15,980 | |
| | | |
3.40%, 4/15/26 | | | | | | | 76 | | | | 75,254 | |
| | | |
3.45%, 7/15/24 | | | | | | | 42 | | | | 42,105 | |
| | | |
3.50%, 8/15/29 | | | | | | | 101 | | | | 96,581 | |
| | | |
4.20%, 3/15/48 | | | | | | | 156 | | | | 131,658 | |
| | | |
4.40%, 8/15/49 | | | | | | | 125 | | | | 108,359 | |
| | | |
4.625%, 6/15/45 | | | | | | | 84 | | | | 76,296 | |
| | | |
6.125%, 1/1/31 | | | | | | | 193 | | | | 214,954 | |
| | | |
6.20%, 3/15/40 | | | | | | | 81 | | | | 86,265 | |
| | | |
6.375%, 9/1/28 | | | | | | | 93 | | | | 104,280 | |
| | | |
6.45%, 9/15/36 | | | | | | | 93 | | | | 105,789 | |
| | | |
6.625%, 9/1/30 | | | | | | | 254 | | | | 289,894 | |
| | | |
Odebrecht Oil & Gas Finance, Ltd., 0.0%(4)(11) | | | | | | | 862 | | | | 11,420 | |
|
| Ovintiv, Inc.: | |
| | | |
6.50%, 8/15/34 | | | | | | | 8 | | | | 10,220 | |
| | | |
6.50%, 2/1/38 | | | | | | | 261 | | | | 330,517 | |
| | | |
6.625%, 8/15/37 | | | | | | | 18 | | | | 22,771 | |
| | | |
8.125%, 9/15/30 | | | | | | | 40 | | | | 53,866 | |
| | | |
PBF Holding Co., LLC/PBF Finance Corp., 9.25%, 5/15/25(4) | | | | | | | 405 | | | | 424,744 | |
| | | | |
| | 22 | | See Notes to Financial Statements. |
Global Income Builder Portfolio
April 30, 2021
Portfolio of Investments (Unaudited) — continued
| | | | | | | | | | | | |
| Security | | | | | Principal
Amount*
(000’s omitted) | | | Value | |
|
| Oil, Gas & Consumable Fuels (continued) | |
| | | |
Plains All American Pipeline, L.P., Series B, 6.125% to 11/15/22(10)(11) | | | | | | | 747 | | | $ | 621,877 | |
|
| Precision Drilling Corp.: | |
| | | |
5.25%, 11/15/24 | | | | | | | 50 | | | | 48,156 | |
| | | |
7.125%, 1/15/26(4) | | | | | | | 99 | | | | 98,196 | |
| | | |
7.75%, 12/15/23 | | | | | | | 33 | | | | 33,268 | |
|
| Shelf Drilling Holdings, Ltd.: | |
| | | |
8.25%, 2/15/25(4) | | | | | | | 245 | | | | 186,659 | |
| | | |
8.875%, 11/15/24(4) | | | | | | | 71 | | | | 73,176 | |
| | | |
Targa Resources Partners, L.P./Targa Resources Partners
Finance Corp.: | | | | | | | | | |
| | | |
4.00%, 1/15/32(4) | | | | | | | 121 | | | | 119,034 | |
| | | |
5.50%, 3/1/30 | | | | | | | 36 | | | | 39,019 | |
| | | |
5.875%, 4/15/26 | | | | | | | 155 | | | | 162,649 | |
| | | |
Transocean Pontus, Ltd., 6.125%, 8/1/25(4) | | | | | | | 87 | | | | 84,988 | |
| | | |
Transocean Poseidon, Ltd., 6.875%, 2/1/27(4) | | | | | | | 65 | | | | 61,872 | |
| |
| | | | $ | 8,715,948 | |
|
| Pharmaceuticals — 0.8% | |
|
| AdaptHealth, LLC: | |
| | | |
4.625%, 8/1/29(4) | | | | | | | 103 | | | $ | 102,645 | |
| | | |
6.125%, 8/1/28(4) | | | | | | | 310 | | | | 326,275 | |
|
| Bausch Health Americas, Inc.: | |
| | | |
8.50%, 1/31/27(4) | | | | | | | 448 | | | | 499,520 | |
| | | |
9.25%, 4/1/26(4) | | | | | | | 105 | | | | 116,485 | |
|
| Bausch Health Companies, Inc.: | |
| | | |
5.50%, 11/1/25(4) | | | | | | | 129 | | | | 133,193 | |
| | | |
7.25%, 5/30/29(4) | | | | | | | 98 | | | | 108,719 | |
| | | |
9.00%, 12/15/25(4) | | | | | | | 245 | | | | 266,180 | |
| | | |
Endo Luxembourg Finance Co. I S.a.r.l./Endo US, Inc., 6.125%, 4/1/29(4) | | | | | | | 170 | | | | 168,513 | |
| | | |
Gruenenthal GmbH, 4.125%, 5/15/28(8)(9) | | | EUR | | | | 145 | | | | 178,038 | |
| | | |
Herbalife Nutrition, Ltd./HLF Financing, Inc., 7.875%, 9/1/25(4) | | | | | | | 198 | | | | 215,773 | |
| | | |
Jazz Securities DAC, 4.375%, 1/15/29(4) | | | | | | | 224 | | | | 229,320 | |
| | | |
Owens & Minor, Inc., 4.50%, 3/31/29(4) | | | | | | | 180 | | | | 181,991 | |
| |
| | | | $ | 2,526,652 | |
|
| Pipelines — 1.0% | |
|
| Antero Midstream Partners, L.P./Antero Midstream Finance Corp.: | |
| | | |
5.75%, 3/1/27(4) | | | | | | | 327 | | | $ | 331,087 | |
| | | |
7.875%, 5/15/26(4) | | | | | | | 139 | | | | 151,684 | |
|
| Cheniere Energy Partners, L.P.: | |
| | | |
4.00%, 3/1/31(4) | | | | | | | 519 | | | | 528,731 | |
| | | | | | | | | | | | |
| Security | | | | | Principal
Amount*
(000’s omitted) | | | Value | |
|
| Pipelines (continued) | |
|
| Cheniere Energy Partners, L.P.: (continued) | |
| | | |
4.50%, 10/1/29 | | | | | | | 199 | | | $ | 208,060 | |
| | | |
Cheniere Energy, Inc., 4.625%, 10/15/28(4) | | | | | | | 183 | | | | 191,034 | |
| | | |
Energy Transfer, L.P., Series B, 6.625% to 2/15/28(10)(11) | | | | | | | 188 | | | | 177,660 | |
|
| EQM Midstream Partners, L.P.: | |
| | | |
4.50%, 1/15/29(4) | | | | | | | 137 | | | | 136,320 | |
| | | |
4.75%, 1/15/31(4) | | | | | | | 137 | | | | 135,794 | |
| | | |
6.00%, 7/1/25(4) | | | | | | | 116 | | | | 126,875 | |
| | | |
6.50%, 7/1/27(4) | | | | | | | 116 | | | | 128,236 | |
| | | |
Five Point Operating Co., L.P./Five Point Capital Corp., 7.875%, 11/15/25(4) | | | | | | | 123 | | | | 130,303 | |
| | | |
Genesis Energy, L.P./Genesis Energy Finance Corp., 8.00%, 1/15/27 | | | | | | | 173 | | | | 178,449 | |
| | | |
New Fortress Energy, Inc., 6.50%, 9/30/26(4) | | | | | | | 382 | | | | 390,318 | |
|
| Western Midstream Operating, L.P.: | |
| | | |
4.50%, 3/1/28 | | | | | | | 27 | | | | 28,823 | |
| | | |
4.75%, 8/15/28 | | | | | | | 24 | | | | 25,860 | |
| | | |
5.30%, 2/1/30 | | | | | | | 207 | | | | 226,147 | |
| |
| | | | $ | 3,095,381 | |
|
| Real Estate Investment Trusts (REITs) — 0.8% | |
| | | |
ADLER Group S.A., 3.25%, 8/5/25(8) | | | EUR | | | | 500 | | | $ | 627,845 | |
| | | |
Brookfield Property REIT, Inc./BPR Cumulus, LLC/BPR Nimbus, LLC/GGSI Sellco, LLC, 5.75%, 5/15/26(4) | | | | | | | 287 | | | | 299,642 | |
| | | |
Diversified Healthcare Trust, 4.375%, 3/1/31 | | | | | | | 173 | | | | 167,530 | |
|
| HAT Holdings I, LLC/HAT Holdings II, LLC: | |
| | | |
3.75%, 9/15/30(4) | | | | | | | 151 | | | | 145,526 | |
| | | |
6.00%, 4/15/25(4) | | | | | | | 127 | | | | 134,620 | |
| | | |
IRB Holding Corp., 6.75%, 2/15/26(4) | | | | | | | 70 | | | | 72,608 | |
|
| Service Properties Trust: | |
| | | |
3.95%, 1/15/28 | | | | | | | 253 | | | | 234,499 | |
| | | |
4.95%, 10/1/29 | | | | | | | 23 | | | | 22,267 | |
| | | |
5.50%, 12/15/27 | | | | | | | 49 | | | | 51,640 | |
| | | |
7.50%, 9/15/25 | | | | | | | 167 | | | | 189,415 | |
|
| VICI Properties, L.P./VICI Note Co., Inc.: | |
| | | |
3.75%, 2/15/27(4) | | | | | | | 27 | | | | 27,251 | |
| | | |
4.125%, 8/15/30(4) | | | | | | | 198 | | | | 201,342 | |
| | | |
4.25%, 12/1/26(4) | | | | | | | 300 | | | | 309,750 | |
| | | |
4.625%, 12/1/29(4) | | | | | | | 66 | | | | 68,647 | |
| |
| | | | $ | 2,552,582 | |
|
| Real Estate Management & Development — 0.1% | |
| | | |
AT Securities B.V., 5.25% to
7/21/23(8)(10)(11) | | | | | | | 250 | | | $ | 264,470 | |
| |
| | | | $ | 264,470 | |
| | | | |
| | 23 | | See Notes to Financial Statements. |
Global Income Builder Portfolio
April 30, 2021
Portfolio of Investments (Unaudited) — continued
| | | | | | | | | | | | |
| Security | | | | | Principal
Amount*
(000’s omitted) | | | Value | |
|
| Semiconductors & Semiconductor Equipment — 0.1% | |
| | | |
ON Semiconductor Corp., 3.875%, 9/1/28(4) | | | | | | | 258 | | | $ | 265,915 | |
| |
| | | | $ | 265,915 | |
|
| Software — 0.2% | |
| | | |
Black Knight InfoServ, LLC, 3.625%, 9/1/28(4) | | | | | | | 216 | | | $ | 211,596 | |
| | | |
CDK Global, Inc., 5.25%, 5/15/29(4) | | | | | | | 96 | | | | 103,080 | |
| | | |
Playtika Holding Corp., 4.25%, 3/15/29(4) | | | | | | | 222 | | | | 220,890 | |
| | | |
SS&C Technologies, Inc., 5.50%, 9/30/27(4) | | | | | | | 95 | | | | 101,044 | |
| |
| | | | $ | 636,610 | |
|
| Specialty Retail — 1.4% | |
|
| Asbury Automotive Group, Inc.: | |
| | | |
4.50%, 3/1/28 | | | | | | | 53 | | | $ | 54,660 | |
| | | |
4.75%, 3/1/30 | | | | | | | 70 | | | | 73,237 | |
| | | |
Burlington Coat Factory Warehouse Corp., 6.25%, 4/15/25(4) | | | | | | | 177 | | | | 188,284 | |
| | | |
Dave & Buster’s, Inc., 7.625%, 11/1/25(4) | | | | | | | 371 | | | | 401,280 | |
| | | |
Dufry One B.V., 3.375%, 4/15/28(8) | | | EUR | | | | 379 | | | | 449,113 | |
| | | |
eG Global Finance PLC, 6.25%, 10/30/25(8) | | | EUR | | | | 350 | | | | 429,609 | |
|
| Entegris, Inc.: | |
| | | |
4.375%, 4/15/28(4) | | | | | | | 125 | | | | 131,566 | |
| | | |
4.625%, 2/10/26(4) | | | | | | | 77 | | | | 79,671 | |
| | | |
Group 1 Automotive, Inc., 4.00%, 8/15/28(4) | | | | | | | 145 | | | | 145,000 | |
| | | |
IRB Holding Corp., 7.00%, 6/15/25(4) | | | | | | | 77 | | | | 82,964 | |
| | | |
Ken Garff Automotive, LLC, 4.875%, 9/15/28(4) | | | | | | | 155 | | | | 156,647 | |
|
| L Brands, Inc.: | |
| | | |
6.625%, 10/1/30(4) | | | | | | | 144 | | | | 166,137 | |
| | | |
6.75%, 7/1/36 | | | | | | | 80 | | | | 96,572 | |
| | | |
6.875%, 11/1/35 | | | | | | | 289 | | | | 350,798 | |
| | | |
6.95%, 3/1/33 | | | | | | | 67 | | | | 78,725 | |
| | | |
7.60%, 7/15/37 | | | | | | | 45 | | | | 54,000 | |
| | | |
9.375%, 7/1/25(4) | | | | | | | 53 | | | | 67,310 | |
| | | |
LCM Investments Holdings II, LLC, 4.875%, 5/1/29(4) | | | | | | | 200 | | | | 204,834 | |
| | | |
Murphy Oil USA, Inc., 3.75%, 2/15/31(4) | | | | | | | 51 | | | | 50,299 | |
| | | |
PetSmart, Inc./PetSmart Finance Corp., 7.75%, 2/15/29(4) | | | | | | | 250 | | | | 271,215 | |
| | | |
Superior Plus, L.P./Superior General Partner, Inc., 4.50%, 3/15/29(4) | | | | | | | 171 | | | | 174,659 | |
| | | |
White Cap Buyer, LLC, 6.875%, 10/15/28(4) | | | | | | | 174 | | | | 184,877 | |
| | | |
White Cap Parent, LLC, 8.25%, (8.25% cash or 9.00% PIK), 3/15/26(4)(14) | | | | | | | 108 | | | | 112,372 | |
| | | |
Yum! Brands, Inc., 3.625%, 3/15/31 | | | | | | | 182 | | | | 179,896 | |
| |
| | | | $ | 4,183,725 | |
| | | | | | | | | | | | |
| Security | | | | | Principal
Amount*
(000’s omitted) | | | Value | |
| | | |
| Technology Hardware, Storage & Peripherals — 0.3% | | | | | | | | | |
| | | |
Booz Allen Hamilton, Inc., 3.875%, 9/1/28(4) | | | | | | | 223 | | | $ | 222,961 | |
| | | |
Dell International, LLC/EMC Corp., 6.02%, 6/15/26(4) | | | | | | | 315 | | | | 376,030 | |
| | | |
Science Applications International Corp., 4.875%, 4/1/28(4) | | | | | | | 160 | | | | 165,484 | |
| | | |
Seagate HDD Cayman, 3.125%, 7/15/29(4) | | | | | | | 139 | | | | 133,915 | |
| |
| | | | $ | 898,390 | |
| | | |
| Telecommunications — 1.4% | | | | | | | | | |
| | | |
Altice France Holding S.A., 10.50%, 5/15/27(4) | | | | | | | 200 | | | $ | 225,553 | |
| | | |
Connect Finco S.a.r.l./Connect US Finco, LLC, 6.75%, 10/1/26(4) | | | | | | | 281 | | | | 293,912 | |
|
| Hughes Satellite Systems Corp.: | |
| | | |
5.25%, 8/1/26 | | | | | | | 145 | | | | 159,935 | |
| | | |
6.625%, 8/1/26 | | | | | | | 95 | | | | 105,293 | |
| | | |
Level 3 Financing, Inc., 3.75%, 7/15/29(4) | | | | | | | 67 | | | | 65,409 | |
| | | |
LogMeIn, Inc., 5.50%, 9/1/27(4) | | | | | | | 431 | | | | 449,805 | |
| | | |
Sprint Corp., 7.875%, 9/15/23 | | | | | | | 659 | | | | 752,084 | |
|
| T-Mobile USA, Inc.: | |
| | | |
2.25%, 2/15/26 | | | | | | | 132 | | | | 133,001 | |
| | | |
2.625%, 2/15/29 | | | | | | | 165 | | | | 160,939 | |
| | | |
2.875%, 2/15/31 | | | | | | | 99 | | | | 96,772 | |
| | | |
4.50%, 2/1/26 | | | | | | | 155 | | | | 159,162 | |
| | | |
4.75%, 2/1/28 | | | | | | | 170 | | | | 181,900 | |
| | | |
Telecom Italia Capital S.A., 6.00%, 9/30/34 | | | | | | | 337 | | | | 379,850 | |
| | | |
Telecom Italia Finance S.A., 7.75%, 1/24/33 | | | EUR | | | | 26 | | | | 46,414 | |
| | | |
Telecom Italia SpA, 2.75%, 4/15/25(8) | | | EUR | | | | 140 | | | | 177,657 | |
| | | |
ViaSat, Inc., 5.625%, 4/15/27(4) | | | | | | | 143 | | | | 150,100 | |
| | | |
Vmed O2 UK Financing I PLC, 3.25%, 1/31/31(8) | | | EUR | | | | 100 | | | | 121,803 | |
|
| Vodafone Group PLC: | |
| | | |
2.625% to 5/27/26, 8/27/80(8)(10) | | | EUR | | | | 220 | | | | 273,432 | |
| | | |
4.875% to 7/3/25, 10/3/78(8)(10) | | | GBP | | | | 215 | | | | 323,270 | |
| |
| | | | $ | 4,256,291 | |
| | | |
| Transportation — 0.2% | | | | | | | | | |
| | | |
Cargo Aircraft Management, Inc., 4.75%, 2/1/28(4) | | | | | | | 247 | | | $ | 253,234 | |
| | | |
CMA CGM S.A., 5.25%, 1/15/25(8) | | | EUR | | | | 127 | | | | 156,213 | |
| | | |
XPO Logistics, Inc., 6.125%, 9/1/23(4) | | | | | | | 80 | | | | 81,210 | |
| |
| | | | $ | 490,657 | |
| | | |
| Water Utilities — 0.2% | | | | | | | | | |
| | | |
Anglian Water Osprey Financing PLC, 4.00%, 3/8/26(8) | | | GBP | | | | 475 | | | $ | 667,889 | |
| |
| | | | $ | 667,889 | |
| | | | |
| | 24 | | See Notes to Financial Statements. |
Global Income Builder Portfolio
April 30, 2021
Portfolio of Investments (Unaudited) — continued
| | | | | | | | | | | | |
| Security | | | | | Principal
Amount*
(000’s omitted) | | | Value | |
| | | |
| Wireless Telecommunication Services — 0.1% | | | | | | | | | |
| | | |
Sprint Corp., 7.625%, 3/1/26 | | | | | | | 157 | | | $ | 192,718 | |
| |
| | | | $ | 192,718 | |
| |
Total Corporate Bonds
(identified cost $103,633,003) | | | $ | 107,601,051 | |
|
| Exchange-Traded Funds — 0.1% | |
| Security | | | | | Shares | | | Value | |
| | | |
| Equity Funds — 0.1% | | | | | | | | | |
| | | |
Global X U.S. Preferred ETF | | | | | | | 8,835 | | | $ | 227,413 | |
| | | |
iShares Preferred & Income Securities ETF | | | | | | | 5,952 | | | | 230,342 | |
| |
Total Exchange-Traded Funds
(identified cost $428,952) | | | $ | 457,755 | |
|
| Preferred Stocks — 1.3% | |
| Security | | | | | Shares | | | Value | |
| | | |
| Banks — 0.2% | | | | | | | | | |
| | | |
Farm Credit Bank of Texas, 6.75% to 9/15/23(4)(10) | | | | | | | 1,115 | | | $ | 122,650 | |
| | | |
Huntington Bancshares, Inc., Series D, 6.25% | | | | | | | 3,450 | | | | 87,458 | |
| | | |
Signature Bank, Series A, 5.00% | | | | | | | 5,000 | | | | 128,250 | |
| | | |
Wells Fargo & Co.: | | | | | | | | | | | | |
| | | |
Series L, 7.50% | | | | | | | 103 | | | | 147,683 | |
| | | |
Series Z, 4.75% | | | | | | | 4,762 | | | | 122,526 | |
| |
| | | | $ | 608,567 | |
| | | |
| Capital Markets — 0.1% | | | | | | | | | |
| | | |
Affiliated Managers Group, Inc., 4.75% | | | | | | | 2,250 | | | $ | 57,667 | |
| | | |
KKR Group Finance Co. IX, LLC, 4.625% | | | | | | | 7,000 | | | | 180,075 | |
| |
| | | | $ | 237,742 | |
| | | |
| Electric Utilities — 0.2% | | | | | | | | | |
| | | |
Brookfield BRP Holdings Canada, Inc., 4.625% | | | | | | | 7,000 | | | $ | 172,200 | |
| | | |
SCE Trust III, Series H, 5.75% to
3/15/24(10) | | | | | | | 5,331 | | | | 135,408 | |
| | | |
SCE Trust IV, Series J, 5.375% to
9/15/25(10) | | | | | | | 1,911 | | | | 47,966 | |
| | | |
SCE Trust V, Series K, 5.45% to 3/15/26(10) | | | | | | | 3,551 | | | | 90,586 | |
| |
| | | | $ | 446,160 | |
| | | | | | | | | | |
| Security | | | | Shares | | | Value | |
|
| Equity Real Estate Investment Trusts (REITs) — 0.1% | |
| | | |
SITE Centers Corp., Series A, 6.375%(1) | | | | | 10,450 | | | $ | 276,507 | |
| |
| | | | $ | 276,507 | |
|
| Food Products — 0.1% | |
| | | |
Dairy Farmers of America, Inc., 7.875%(4) | | | | | 2,550 | | | $ | 256,275 | |
| | | |
Ocean Spray Cranberries, Inc., Series A, 6.25%(4) | | | | | 540 | | | | 50,287 | |
| |
| | | | $ | 306,562 | |
|
| Health Care Equipment & Supplies — 0.1% | |
| | | |
Becton Dickinson and Co., Series B, 6.00% | | | | | 3,268 | | | $ | 180,492 | |
| |
| | | | $ | 180,492 | |
|
| Independent Power and Renewable Electricity Producers — 0.0%(6) | |
| | | |
Algonquin Power & Utilities Corp., Series 19-A,
6.20% to 7/1/24(10) | | | | | 3,175 | | | $ | 88,178 | |
| |
| | | | $ | 88,178 | |
|
| Insurance — 0.1% | |
| | | |
American Equity Investment Life Holding Co., Series B, 6.625% to 9/1/25(10) | | | | | 7,517 | | | $ | 210,927 | |
| | | |
Athene Holding, Ltd., Series C, 6.375% to 6/30/25(10) | | | | | 5,920 | | | | 166,707 | |
| |
| | | | $ | 377,634 | |
|
| Oil, Gas & Consumable Fuels — 0.2% | |
|
| Energy Transfer, L.P.: | |
| | | |
Series C, 7.375% to 5/15/23(10) | | | | | 3,000 | | | $ | 72,090 | |
| | | |
Series E, 7.60% to 5/15/24(10) | | | | | 2,970 | | | | 72,112 | |
| | | |
NuStar Energy, L.P., Series B, 7.625% to 6/15/22(10) | | | | | 17,350 | | | | 360,880 | |
| |
| | | | $ | 505,082 | |
|
| Real Estate Management & Development — 0.1% | |
|
| Brookfield Property Partners, L.P.: | |
| | | |
Series A, 5.75% | | | | | 6,545 | | | $ | 155,116 | |
| | | |
Series A2, 6.375% | | | | | 8,191 | | | | 206,905 | |
| |
| | | | $ | 362,021 | |
|
| Trading Companies & Distributors — 0.1% | |
| | | |
WESCO International, Inc., Series A, 10.625%(10) | | | | | 12,788 | | | $ | 405,891 | |
| |
| | | | $ | 405,891 | |
| | | | |
| | 25 | | See Notes to Financial Statements. |
Global Income Builder Portfolio
April 30, 2021
Portfolio of Investments (Unaudited) — continued
| | | | | | | | | | |
| Security | | | | Shares | | | Value | |
|
| Wireless Telecommunication Services — 0.0%(6) | |
| | | |
United States Cellular Corp., 5.50% | | | | | 3,760 | | | $ | 96,181 | |
| |
| | | | $ | 96,181 | |
| |
Total Preferred Stocks
(identified cost $3,832,736) | | | $ | 3,891,017 | |
|
| Senior Floating-Rate Loans — 1.8%(15) | |
| Borrower/Description | | | | Principal
Amount
(000’s omitted) | | | Value | |
|
| Air Transport — 0.1% | |
| | | |
Mileage Plus Holdings, LLC, Term Loan, 6/21/27(16) | | | | $ | 274 | | | $ | 292,609 | |
| |
| | | | $ | 292,609 | |
|
| Automotive — 0.1% | |
| | | |
Truck Hero, Inc., Term Loan, 4.50%, (1 mo. USD LIBOR + 3.75%, Floor 0.75%), 1/31/28 | | | | $ | 236 | | | $ | 235,838 | |
| | | |
Wheel Pros, LLC, Term Loan, 4/23/28(16) | | | | | 198 | | | | 198,124 | |
| |
| | | | $ | 433,962 | |
|
| Business Equipment and Services — 0.2% | |
| | | |
AlixPartners, LLP, Term Loan, 3.25%, (1 mo. USD LIBOR + 2.75%, Floor 0.50%), 2/4/28 | | | | $ | 211 | | | $ | 210,282 | |
| | | |
ECL Entertainment, LLC, Term Loan, 3/31/28(16) | | | | | 75 | | | | 76,687 | |
| | | |
Endure Digital, Inc., Term Loan, 2/10/28(16) | | | | | 196 | | | | 194,805 | |
| | | |
Travelport Finance (Luxembourg) S.a.r.l., Term Loan, 2/28/25(16) | | | | | 200 | | | | 204,739 | |
| |
| | | | $ | 686,513 | |
|
| Electronics/Electrical — 0.3% | |
| | | |
LogMeIn, Inc., Term Loan, 4.86%, (1 mo. USD LIBOR + 4.75%), 8/31/27 | | | | $ | 447 | | | $ | 447,365 | |
| | | |
RealPage, Inc., Term Loan, 3.75%, (1 mo. USD LIBOR + 3.25%, Floor 0.50%), 4/24/28 | | | | | 223 | | | | 222,288 | |
| | | |
Riverbed Technology, Inc., Term Loan - Second Lien, 12.00%, (3 mo. USD LIBOR + 11.00%, Floor 1.00%), 7.50% cash, 4.50% PIK, 12/31/26 | | | | | 280 | | | | 220,224 | |
| |
| | | | $ | 889,877 | |
|
| Financial Intermediaries — 0.1% | |
|
| Spectacle Gary Holdings, LLC: | |
| | | |
Term Loan, 11.00%, (3 mo. USD LIBOR + 9.00%, Floor 2.00%), 12/23/25 | | | | $ | 162 | | | $ | 177,116 | |
| | | | | | | | | | |
| Borrower/Description | | | | Principal
Amount
(000’s omitted) | | | Value | |
|
| Financial Intermediaries (continued) | |
|
| Spectacle Gary Holdings, LLC: (continued) | |
| | | |
Term Loan, 11.00%, (3 mo. USD LIBOR + 9.00%, Floor 2.00%), 12/23/25 | | | | $ | 12 | | | $ | 12,834 | |
| |
| | | | $ | 189,950 | |
|
| Food Products — 0.0%(6) | |
| | | |
Post Holdings, Inc., Term Loan, 10/21/24(16) | | | | $ | 91 | | | $ | 91,916 | |
| |
| | | | $ | 91,916 | |
|
| Food Service — 0.1% | |
| | | |
IRB Holding Corp., Term Loan, 4.25%, (3 mo. USD LIBOR + 3.25%, Floor 1.00%), 12/15/27 | | | | $ | 241 | | | $ | 240,942 | |
| |
| | | | $ | 240,942 | |
|
| Health Care — 0.1% | |
| | | |
Verscend Holding Corp., Term Loan, 4.11%, (1 mo. USD LIBOR + 4.00%), 8/27/25 | | | | $ | 250 | | | $ | 250,911 | |
| |
| | | | $ | 250,911 | |
|
| Industrial Equipment — 0.0%(6) | |
| | | |
Hillman Group, Inc. (The), Term Loan, 4.11%, (1 mo. USD LIBOR + 4.00%), 5/31/25 | | | | $ | 114 | | | $ | 113,612 | |
| |
| | | | $ | 113,612 | |
|
| Insurance — 0.2% | |
|
| Asurion, LLC: | |
| | | |
Term Loan, 3.363%, (1 mo. USD LIBOR + 3.25%), 7/31/27 | | | | $ | 195 | | | $ | 193,802 | |
| | | |
Term Loan—Second Lien, 5.363%, (1 mo. USD LIBOR + 5.25%), 1/31/28 | | | | | 240 | | | | 243,840 | |
| |
| | | | $ | 437,642 | |
|
| Leisure Goods/Activities/Movies — 0.2% | |
| | | |
Playtika Holding Corp., Term Loan, 2.86%, (1 mo. USD LIBOR + 2.75%), 3/13/28 | | | | $ | 633 | | | $ | 630,375 | |
| |
| | | | $ | 630,375 | |
|
| Lodging and Casinos — 0.1% | |
| | | |
Playa Resorts Holding B.V., Term Loan, 3.75%, (1 mo. USD LIBOR + 2.75%, Floor 1.00%), 4/29/24 | | | | $ | 316 | | | $ | 302,684 | |
| | | |
Stars Group Holdings B.V. (The), Term Loan, 3.70%, (3 mo. USD LIBOR + 3.50%), 7/10/25 | | | | | 86 | | | | 86,308 | |
| |
| | | | $ | 388,992 | |
| | | | |
| | 26 | | See Notes to Financial Statements. |
Global Income Builder Portfolio
April 30, 2021
Portfolio of Investments (Unaudited) — continued
| | | | | | | | | | |
| Borrower/Description | | | | Principal
Amount
(000’s omitted) | | | Value | |
|
| Pharmaceuticals — 0.2% | |
| | | |
Jazz Financing Lux S.a.r.l., Term Loan, 4/21/28(16) | | | | $ | 570 | | | $ | 571,995 | |
| |
| | | | $ | 571,995 | |
|
| Retailers (Except Food and Drug) — 0.1% | |
| | | |
PetSmart, Inc., Term Loan, 4.50%, (3 mo. USD LIBOR + 3.75%, Floor 0.75%), 2/12/28 | | | | $ | 387 | | | $ | 388,596 | |
| |
| | | | $ | 388,596 | |
| |
Total Senior Floating-Rate Loans
(identified cost $5,680,047) | | | $ | 5,607,892 | |
|
| Warrants — 0.0%(6) | |
| Security | | | | Shares | | | Value | |
|
| Media — 0.0%(6) | |
| | | |
iHeartMedia, Inc., Exp. 5/1/39(1) | | | | | 3,627 | | | $ | 69,421 | |
| |
| | | | $ | 69,421 | |
| |
Total Warrants
(identified cost $60,111) | | | $ | 69,421 | |
|
| Short-Term Investments — 1.1% | |
| Description | | | | Units | | | Value | |
| | |
Eaton Vance Cash Reserves Fund, LLC, 0.10%(17) | | | 3,454,987 | | | $ | 3,454,987 | |
| |
Total Short-Term Investments
(identified cost $3,454,987) | | | $ | 3,454,987 | |
| |
Total Investments — 99.7%
(identified cost $241,812,063) | | | $ | 305,197,948 | |
| |
Other Assets, Less Liabilities — 0.3% | | | $ | 868,700 | |
| |
Net Assets — 100.0% | | | $ | 306,066,648 | |
The percentage shown for each investment category in the Portfolio of Investments is based on net assets.
| | * | In U.S. dollars unless otherwise indicated. |
| | (1) | Non-income producing security. |
| | (2) | Represents an investment in an issuer that may be deemed to be an affiliate effective March 1, 2021 (see Note 8). |
| | (3) | For fair value measurement disclosure purposes, security is categorized as Level 3 (see Note 9). |
| | (4) | Security exempt from registration under Rule 144A of the Securities Act of 1933, as amended. These securities may be sold in certain |
| | transactions in reliance on an exemption from registration (normally to qualified institutional buyers). At April 30, 2021, the aggregate value of these securities is $60,166,355 or 19.7% of the Portfolio’s net assets. |
| | (5) | Security (or a portion thereof) has been pledged to cover margin requirements on open futures contracts. |
| | (6) | Amount is less than 0.05%. |
| | (7) | Restricted security (see Note 5). |
| | (8) | Security exempt from registration under Regulation S of the Securities Act of 1933, as amended, which exempts from registration securities offered and sold outside the United States. Security may not be offered or sold in the United States except pursuant to an exemption from, or in a transaction not subject to, the registration requirements of the Securities Act of 1933, as amended. At April 30, 2021, the aggregate value of these securities is $20,616,502 or 6.7% of the Portfolio’s net assets. |
| | (9) | When-issued security. |
| (10) | Security converts to variable rate after the indicated fixed-rate coupon period. |
| (11) | Perpetual security with no stated maturity date but may be subject to calls by the issuer. |
| (12) | Issuer is in default with respect to interest and/or principal payments. |
| (13) | Variable rate security. The stated interest rate represents the rate in effect at April 30, 2021. |
| (14) | Represents a payment-in-kind security which may pay interest in additional principal at the issuer’s discretion. |
| (15) | Senior floating-rate loans (Senior Loans) often require prepayments from excess cash flows or permit the borrowers to repay at their election. The degree to which borrowers repay, whether as a contractual requirement or at their election, cannot be predicted with accuracy. As a result, the actual remaining maturity may be substantially less than the stated maturities shown. However, Senior Loans will typically have an expected average life of approximately two to four years. Senior Loans typically have rates of interest which are redetermined periodically by reference to a base lending rate, plus a spread. These base lending rates are primarily the London Interbank Offered Rate (“LIBOR”) and secondarily, the prime rate offered by one or more major United States banks (the “Prime Rate”). Base lending rates may be subject to a floor, or minimum rate. Senior Loans are generally subject to contractual restrictions that must be satisfied before they can be bought or sold. |
| (16) | This Senior Loan will settle after April 30, 2021, at which time the interest rate will be determined. |
| (17) | Affiliated investment company, available to Eaton Vance portfolios and funds, which invests in high quality, U.S. dollar denominated money market instruments. The rate shown is the annualized seven-day yield as of April 30, 2021. |
| | | | |
| | 27 | | See Notes to Financial Statements. |
Global Income Builder Portfolio
April 30, 2021
Portfolio of Investments (Unaudited) — continued
| | | | | | | | |
| Country Concentration of Portfolio | |
| Country | | Percentage of
Total Investments | | | Value | |
| | |
United States | | | 59.8 | % | | $ | 182,639,843 | |
| | |
United Kingdom | | | 6.3 | | | | 19,288,641 | |
| | |
France | | | 6.2 | | | | 19,016,655 | |
| | |
Switzerland | | | 3.8 | | | | 11,679,979 | |
| | |
Germany | | | 3.5 | | | | 10,809,621 | |
| | |
Japan | | | 3.4 | | | | 10,444,453 | |
| | |
Netherlands | | | 2.9 | | | | 8,937,922 | |
| | |
Luxembourg | | | 1.9 | | | | 5,647,827 | |
| | |
Australia | | | 1.8 | | | | 5,393,283 | |
| | |
Italy | | | 1.7 | | | | 5,255,955 | |
| | |
Canada | | | 1.6 | | | | 4,926,078 | |
| | |
Sweden | | | 1.4 | | | | 4,289,034 | |
| | |
Spain | | | 1.1 | | | | 3,373,000 | |
| | |
Ireland | | | 0.9 | | | | 2,720,112 | |
| | |
Taiwan | | | 0.8 | | | | 2,319,274 | |
| | |
Finland | | | 0.6 | | | | 1,807,734 | |
| | |
Denmark | | | 0.6 | | | | 1,780,303 | |
| | |
China | | | 0.4 | | | | 1,111,782 | |
| | |
India | | | 0.4 | | | | 1,098,209 | |
| | |
United Arab Emirates | | | 0.3 | | | | 1,051,914 | |
| | |
Norway | | | 0.2 | | | | 526,901 | |
| | |
Peru | | | 0.1 | | | | 337,610 | |
| | |
Mexico | | | 0.1 | | | | 272,643 | |
| | |
Brazil | | | 0.0 | (1) | | | 11,420 | |
| | |
Exchange-Traded Funds | | | 0.2 | | | | 457,755 | |
| | |
Total Investments | | | 100.0 | % | | $ | 305,197,948 | |
| (1) | Amount is less than 0.05%. |
| | | | | | | | | | | | | | | | | | | | | | | | |
| Forward Foreign Currency Exchange Contracts | |
| Currency Purchased | | | Currency Sold | | | Counterparty | | Settlement
Date | | | Unrealized
Appreciation | | | Unrealized
(Depreciation) | |
| | | | | | | |
| EUR | | | 145,000 | | | USD | | | 175,254 | | | Citibank, N.A. | | | 5/5/21 | | | $ | — | | | $ | (925 | ) |
| | | | | | | |
| USD | | | 237,511 | | | EUR | �� | | 195,170 | | | State Street Bank and Trust Company | | | 5/28/21 | | | | 2,758 | | | | — | |
| | |
| | | | $ | 2,758 | | | $ | (925 | ) |
| | | | |
| | 28 | | See Notes to Financial Statements. |
Global Income Builder Portfolio
April 30, 2021
Portfolio of Investments (Unaudited) — continued
| | | | | | | | | | | | | | | | |
| Futures Contracts | |
| | | | | |
| Description | | Number of
Contracts | | | Position | | Expiration
Date | | Notional
Amount | | | Value/Unrealized
Appreciation
(Depreciation) | |
|
Equity Futures | |
| | | | | |
| E-mini S&P 500 Index | | | 53 | | | Long | | 6/18/21 | | $ | 11,062,160 | | | $ | 479,679 | |
| | | | | |
| STOXX Europe 600 Index | | | 306 | | | Short | | 6/18/21 | | | (7,990,536 | ) | | | (140,208 | ) |
| | | | | |
| STOXX Europe 600 Insurance Index | | | 156 | | | Short | | 6/18/21 | | | (2,794,509 | ) | | | 55,126 | |
| |
| | | | $ | 394,597 | |
Abbreviations:
| | | | |
| | |
| ADR | | – | | American Depositary Receipt |
| | |
| EURIBOR | | – | | Euro Interbank Offered Rate |
| | |
| LIBOR | | – | | London Interbank Offered Rate |
| | |
| PC | | – | | Participation Certificate |
| | |
| PIK | | – | | Payment In Kind |
Currency Abbreviations:
| | | | |
| | |
| EUR | | – | | Euro |
| | |
| GBP | | – | | British Pound Sterling |
| | |
| USD | | – | | United States Dollar |
| | | | |
| | 29 | | See Notes to Financial Statements. |
Global Income Builder Portfolio
April 30, 2021
Statement of Assets and Liabilities (Unaudited)
| | | | |
| Assets | | April 30, 2021 | |
| |
Unaffiliated investments, at value (identified cost, $237,084,771) | | $ | 300,315,659 | |
| |
Affiliated investments, at value (identified cost, $4,727,292) | | | 4,882,289 | |
| |
Cash | | | 16,628 | |
| |
Foreign currency, at value (identified cost, $179,867) | | | 179,312 | |
| |
Interest and dividends receivable | | | 1,964,355 | |
| |
Dividends receivable from affiliated investments | | | 26,092 | |
| |
Receivable for investments sold | | | 1,785,398 | |
| |
Receivable for open forward foreign currency exchange contracts | | | 2,758 | |
| |
Tax reclaims receivable | | | 1,860,711 | |
| |
Total assets | | $ | 311,033,202 | |
| |
| Liabilities | | | | |
| |
Payable for investments purchased | | $ | 2,513,697 | |
| |
Payable for when-issued securities | | | 2,089,316 | |
| |
Payable for variation margin on open financial futures contracts | | | 54,252 | |
| |
Payable for open forward foreign currency exchange contracts | | | 925 | |
| |
Payable to affiliates: | | | | |
| |
Investment adviser fee | | | 136,591 | |
| |
Trustees’ fees | | | 1,240 | |
| |
Accrued expenses | | | 170,533 | |
| |
Total liabilities | | $ | 4,966,554 | |
| |
Net Assets applicable to investors’ interest in Portfolio | | $ | 306,066,648 | |
| | | | |
| | 30 | | See Notes to Financial Statements. |
Global Income Builder Portfolio
April 30, 2021
Statement of Operations (Unaudited)
| | | | |
| Investment Income | | Six Months Ended April 30, 2021 | |
| |
Interest (net of foreign taxes, $3,787) | | $ | 3,085,132 | |
| |
Dividends (net of foreign taxes, $216,830) | | | 2,742,214 | |
| |
Dividends from affiliated investments (net of foreign taxes, $4,656) | | | 26,806 | |
| |
Total investment income | | $ | 5,854,152 | |
| |
| Expenses | | | | |
| |
Investment adviser fee | | $ | 795,865 | |
| |
Trustees’ fees and expenses | | | 7,434 | |
| |
Custodian fee | | | 79,964 | |
| |
Legal and accounting services | | | 30,979 | |
| |
Miscellaneous | | | 26,764 | |
| |
Total expenses | | $ | 941,006 | |
| |
Net investment income | | $ | 4,913,146 | |
| |
| Realized and Unrealized Gain (Loss) | | | | |
| |
Net realized gain (loss) — | | | | |
| |
Investment transactions (net of foreign capital gains taxes of $3,277) | | $ | 11,233,950 | |
| |
Financial futures contracts | | | 80,786 | |
| |
Foreign currency transactions | | | (151,864 | ) |
| |
Forward foreign currency exchange contracts | | | 9,567 | |
| |
Net realized gain | | $ | 11,172,439 | |
| |
Change in unrealized appreciation (depreciation) — | | | | |
| |
Investments | | $ | 41,858,358 | |
| |
Investments — affiliated investments | | | 16,205 | |
| |
Financial futures contracts | | | 218,432 | |
| |
Foreign currency | | | 138,997 | |
| |
Forward foreign currency exchange contracts | | | 14,760 | |
| |
Net change in unrealized appreciation (depreciation) | | $ | 42,246,752 | |
| |
Net realized and unrealized gain | | $ | 53,419,191 | |
| |
Net increase in net assets from operations | | $ | 58,332,337 | |
| | | | |
| | 31 | | See Notes to Financial Statements. |
Global Income Builder Portfolio
April 30, 2021
Statements of Changes in Net Assets
| | | | | | | | |
| Increase (Decrease) in Net Assets | | Six Months Ended April 30, 2021
(Unaudited) | | | Year Ended October 31, 2020 | |
| | |
From operations — | | | | | | | | |
| | |
Net investment income | | $ | 4,913,146 | | | $ | 11,579,367 | |
| | |
Net realized gain (loss) | | | 11,172,439 | | | | (2,169,739 | ) |
| | |
Net change in unrealized appreciation (depreciation) | | | 42,246,752 | | | | (4,171,298 | ) |
| | |
Net increase in net assets from operations | | $ | 58,332,337 | | | $ | 5,238,330 | |
| | |
Capital transactions — | | | | | | | | |
| | |
Contributions | | $ | 7,263,772 | | | $ | 9,268,119 | |
| | |
Withdrawals | | | (22,721,403 | ) | | | (53,647,355 | ) |
| | |
Portfolio transaction fee | | | 96,914 | | | | 216,038 | |
| | |
Net decrease in net assets from capital transactions | | $ | (15,360,717 | ) | | $ | (44,163,198 | ) |
| | |
Net increase (decrease) in net assets | | $ | 42,971,620 | | | $ | (38,924,868 | ) |
|
| Net Assets | |
| | |
At beginning of period | | $ | 263,095,028 | | | $ | 302,019,896 | |
| | |
At end of period | | $ | 306,066,648 | | | $ | 263,095,028 | |
| | | | |
| | 32 | | See Notes to Financial Statements. |
Global Income Builder Portfolio
April 30, 2021
Financial Highlights
| | | | | | | | | | | | | | | | | | | | | | | | |
| | | Six Months Ended
April 30, 2021
(Unaudited) | | | Year Ended October 31, | | | Period Ended
October 31, 2016(1) | |
| Ratios/Supplemental Data | | 2020 | | | 2019 | | | 2018 | | | 2017 | |
| | | | | | | |
Ratios (as a percentage of average daily net assets): | | | | | | | | | | | | | | | | | | | | | | | | |
| | | | | | |
Expenses | | | 0.65 | %(2) | | | 0.66 | % | | | 0.70 | % | | | 0.75 | % | | | 0.75 | % | | | 0.80 | %(2) |
| | | | | | |
Net investment income | | | 3.39 | %(2) | | | 4.12 | % | | | 4.72 | % | | | 3.47 | % | | | 4.56 | % | | | 3.75 | %(2) |
| | | | | | |
Portfolio Turnover | | | 41 | %(3) | | | 118 | % | | | 86 | % | | | 102 | % | | | 143 | % | | | 66 | %(3) |
| | | | | | |
Total Return | | | 22.71 | %(3) | | | 2.64 | % | | | 11.57 | % | | | (1.00 | )% | | | 15.99 | % | | | 3.65 | %(3) |
| | | | | | |
Net assets, end of period (000’s omitted) | | $ | 306,067 | | | $ | 263,095 | | | $ | 302,020 | | | $ | 323,437 | | | $ | 364,476 | | | $ | 376,698 | |
| (1) | For the period from the start of business, March 28, 2016, to October 31, 2016. |
| | | | |
| | 33 | | See Notes to Financial Statements. |
Global Income Builder Portfolio
April 30, 2021
Notes to Financial Statements (Unaudited)
1 Significant Accounting Policies
Global Income Builder Portfolio (the Portfolio) is a Massachusetts business trust registered under the Investment Company Act of 1940, as amended (the 1940 Act), as a diversified, open-end management investment company. The Portfolio’s investment objective is to achieve total return. The Declaration of Trust permits the Trustees to issue interests in the Portfolio. At April 30, 2021, Eaton Vance Global Income Builder Fund and Eaton Vance Global Income Builder NextShares held an interest of 97.6% and 2.4%, respectively, in the Portfolio.
The following is a summary of significant accounting policies of the Portfolio. The policies are in conformity with accounting principles generally accepted in the United States of America (U.S. GAAP). The Portfolio is an investment company and follows accounting and reporting guidance in the Financial Accounting Standards Board (FASB) Accounting Standards Codification Topic 946.
A Investment Valuation — The following methodologies are used to determine the market value or fair value of investments.
Equity Securities. Equity securities listed on a U.S. securities exchange generally are valued at the last sale or closing price on the day of valuation or, if no sales took place on such date, at the mean between the closing bid and ask prices on the exchange where such securities are principally traded. Equity securities listed on the NASDAQ Global or Global Select Market generally are valued at the NASDAQ official closing price. Unlisted or listed securities for which closing sales prices or closing quotations are not available are valued at the mean between the latest available bid and ask prices or, in the case of preferred equity securities that are not listed or traded in the over-the-counter market, by a third party pricing service that uses various techniques that consider factors including, but not limited to, prices or yields of securities with similar characteristics, benchmark yields, broker/dealer quotes, quotes of underlying common stock, issuer spreads, as well as industry and economic events.
Debt Obligations. Debt obligations are generally valued on the basis of valuations provided by third party pricing services, as derived from such services’ pricing models. Inputs to the models may include, but are not limited to, reported trades, executable bid and ask prices, broker/dealer quotations, prices or yields of securities with similar characteristics, interest rates, anticipated prepayments, benchmark curves or information pertaining to the issuer, as well as industry and economic events. The pricing services may use a matrix approach, which considers information regarding securities with similar characteristics to determine the valuation for a security. Short-term debt obligations purchased with a remaining maturity of sixty days or less for which a valuation from a third party pricing service is not readily available may be valued at amortized cost, which approximates fair value.
Senior Floating-Rate Loans. Interests in senior floating-rate loans (Senior Loans) for which reliable market quotations are readily available are valued generally at the average mean of bid and ask quotations obtained from a third party pricing service.
Derivatives. Financial futures contracts are valued at the closing settlement price established by the board of trade or exchange on which they are traded, with adjustments for fair valuation for certain foreign financial futures contracts as described below. Forward foreign currency exchange contracts are generally valued at the mean of the average bid and average ask prices that are reported by currency dealers to a third party pricing service at the valuation time. Such third party pricing service valuations are supplied for specific settlement periods and the Portfolio’s forward foreign currency exchange contracts are valued at an interpolated rate between the closest preceding and subsequent settlement period reported by the third party pricing service.
Foreign Securities, Financial Futures Contracts and Currencies. Foreign securities, financial futures contracts and currencies are valued in U.S. dollars, based on foreign currency exchange rate quotations supplied by a third party pricing service. The pricing service uses a proprietary model to determine the exchange rate. Inputs to the model include reported trades and implied bid/ask spreads. The daily valuation of exchange-traded foreign securities and certain exchange-traded foreign financial futures contracts generally is determined as of the close of trading on the principal exchange on which such securities and contracts trade. Events occurring after the close of trading on foreign exchanges may result in adjustments to the valuation of foreign securities and certain foreign financial futures contracts to more accurately reflect their fair value as of the close of regular trading on the New York Stock Exchange. When valuing foreign equity securities and foreign financial futures contracts that meet certain criteria, the Portfolio’s Trustees have approved the use of a fair value service that values such securities and foreign financial futures contracts to reflect market trading that occurs after the close of the applicable foreign markets of comparable securities or other instruments that have a strong correlation to the fair-valued securities and foreign financial futures contracts.
Affiliated Fund. The Portfolio may invest in Eaton Vance Cash Reserves Fund, LLC (Cash Reserves Fund), an affiliated investment company managed by Eaton Vance Management (EVM). While Cash Reserves Fund is not a registered money market mutual fund, it conducts all of its investment activities in accordance with the requirements of Rule 2a-7 under the 1940 Act. Investments in Cash Reserves Fund are valued at the closing net asset value per unit on the valuation day. Cash Reserves Fund generally values its investment securities based on available market quotations provided by a third party pricing service.
Fair Valuation. Investments for which valuations or market quotations are not readily available or are deemed unreliable are valued at fair value using methods determined in good faith by or at the direction of the Trustees of the Portfolio in a manner that most fairly reflects the security’s “fair value”, which is the amount that the Portfolio might reasonably expect to receive for the security upon its current sale in the ordinary course. Each such determination is based on a consideration of relevant factors, which are likely to vary from one pricing context to another. These factors may include, but are not limited to, the type of security, the existence of any contractual restrictions on the security’s disposition, the price and extent of public trading in similar securities of the issuer or of comparable companies or entities, quotations or relevant information obtained from broker/dealers or other market participants, information obtained from the issuer, analysts, and/or the appropriate stock exchange (for exchange-traded securities), an analysis of the company’s or entity’s financial statements, and an evaluation of the forces that influence the issuer and the market(s) in which the security is purchased and sold.
Global Income Builder Portfolio
April 30, 2021
Notes to Financial Statements (Unaudited) — continued
B Investment Transactions — Investment transactions for financial statement purposes are accounted for on a trade date basis. Realized gains and losses on investments sold are determined on the basis of identified cost.
C Income — Dividend income is recorded on the ex-dividend date for dividends received in cash and/or securities. However, if the ex-dividend date has passed, certain dividends from foreign securities are recorded as the Portfolio is informed of the ex-dividend date. Withholding taxes on foreign dividends, interest and capital gains have been provided for in accordance with the Portfolio’s understanding of the applicable countries’ tax rules and rates. In consideration of recent decisions rendered by European courts, the Portfolio has filed additional tax reclaims for previously withheld taxes on dividends earned in certain European Union countries. These filings are subject to various administrative and judicial proceedings within these countries. Due to the uncertainty as to the ultimate resolution of these proceedings, the likelihood of receipt of these reclaims, and the potential timing of payment, no amounts are reflected in the financial statements for such outstanding reclaims. Interest income is recorded on the basis of interest accrued, adjusted for amortization of premium or accretion of discount. Distributions from investment companies are recorded as dividend income, capital gains or return of capital based on the nature of the distribution.
D Federal Taxes — The Portfolio has elected to be treated as a partnership for federal tax purposes. No provision is made by the Portfolio for federal or state taxes on any taxable income of the Portfolio because each investor in the Portfolio is ultimately responsible for the payment of any taxes on its share of taxable income. Since at least one of the Portfolio’s investors is a regulated investment company that invests all or substantially all of its assets in the Portfolio, the Portfolio normally must satisfy the applicable source of income and diversification requirements (under the Internal Revenue Code) in order for its investors to satisfy them. The Portfolio will allocate, at least annually among its investors, each investor’s distributive share of the Portfolio’s net investment income, net realized capital gains and losses and any other items of income, gain, loss, deduction or credit.
As of April 30, 2021, the Portfolio had no uncertain tax positions that would require financial statement recognition, de-recognition, or disclosure. The Portfolio files a U.S. federal income tax return annually after its fiscal year-end, which is subject to examination by the Internal Revenue Service for a period of three years from the date of filing.
E Foreign Currency Translation — Investment valuations, other assets, and liabilities initially expressed in foreign currencies are translated each business day into U.S. dollars based upon current exchange rates. Purchases and sales of foreign investment securities and income and expenses denominated in foreign currencies are translated into U.S. dollars based upon currency exchange rates in effect on the respective dates of such transactions. Recognized gains or losses on investment transactions attributable to changes in foreign currency exchange rates are recorded for financial statement purposes as net realized gains and losses on investments. That portion of unrealized gains and losses on investments that results from fluctuations in foreign currency exchange rates is not separately disclosed.
F Unfunded Loan Commitments — The Portfolio may enter into certain loan agreements all or a portion of which may be unfunded. The Portfolio is obligated to fund these commitments at the borrower’s discretion. These commitments are disclosed in the accompanying Portfolio of Investments.
G Use of Estimates — The preparation of the financial statements in conformity with U.S. GAAP requires management to make estimates and assumptions that affect the reported amounts of assets and liabilities at the date of the financial statements and the reported amounts of income and expense during the reporting period. Actual results could differ from those estimates.
H Indemnifications — Under the Portfolio’s organizational documents, its officers and Trustees may be indemnified against certain liabilities and expenses arising out of the performance of their duties to the Portfolio. Under Massachusetts law, if certain conditions prevail, interestholders in the Portfolio could be deemed to have personal liability for the obligations of the Portfolio. However, the Portfolio’s Declaration of Trust contains an express disclaimer of liability on the part of Portfolio interestholders. Additionally, in the normal course of business, the Portfolio enters into agreements with service providers that may contain indemnification clauses. The Portfolio’s maximum exposure under these arrangements is unknown as this would involve future claims that may be made against the Portfolio that have not yet occurred.
I Financial Futures Contracts — Upon entering into a financial futures contract, the Portfolio is required to deposit with the broker, either in cash or securities, an amount equal to a certain percentage of the contract amount (initial margin). Subsequent payments, known as variation margin, are made or received by the Portfolio each business day, depending on the daily fluctuations in the value of the underlying security or index, and are recorded as unrealized gains or losses by the Portfolio. Gains (losses) are realized upon the expiration or closing of the financial futures contracts. Should market conditions change unexpectedly, the Portfolio may not achieve the anticipated benefits of the financial futures contracts and may realize a loss. Futures contracts have minimal counterparty risk as they are exchange traded and the clearinghouse for the exchange is substituted as the counterparty, guaranteeing counterparty performance.
J Forward Foreign Currency Exchange Contracts — The Portfolio may enter into forward foreign currency exchange contracts for the purchase or sale of a specific foreign currency at a fixed price on a future date. The forward foreign currency exchange contracts are adjusted by the daily exchange rate of the underlying currency and any gains or losses are recorded as unrealized until such time as the contracts have been closed. Risks may arise upon entering these contracts from the potential inability of counterparties to meet the terms of their contracts and from movements in the value of a foreign currency relative to the U.S. dollar.
K When-Issued Securities and Delayed Delivery Transactions — The Portfolio may purchase securities on a delayed delivery or when-issued basis. Payment and delivery may take place after the customary settlement period for that security. At the time the transaction is negotiated, the price of the
Global Income Builder Portfolio
April 30, 2021
Notes to Financial Statements (Unaudited) — continued
security that will be delivered is fixed. The Portfolio maintains cash and/or security positions for these commitments such that sufficient liquid assets will be available to make payments upon settlement. Securities purchased on a delayed delivery or when-issued basis are marked-to-market daily and begin earning interest on settlement date. Securities purchased on a delayed delivery or when-issued basis are subject to the risk that when delivered they will be worth less than the agreed upon payment price. Losses may also arise if the counterparty does not perform under the contract.
L Capital Transactions — To seek to protect the Portfolio (and, indirectly, other investors in the Portfolio) against the costs of accommodating investor inflows and outflows, the Portfolio imposes a fee (“Portfolio transaction fee”) on inflows and outflows by Portfolio investors. The Portfolio transaction fee is sized to cover the estimated cost to the Portfolio of, in connection with issuing interests, converting the cash and/or other instruments it receives to the desired composition and, in connection with redeeming its interests, converting Portfolio holdings to cash and/or other instruments to be distributed. Such fee, which may vary over time, is limited to amounts that have been authorized by the Board of Trustees and determined by EVM to be appropriate. The maximum Portfolio transaction fee is 2% of the amount of net contributions or withdrawals. The Portfolio transaction fee is recorded as a component of capital transactions on the Statements of Changes in Net Assets.
M Interim Financial Statements — The interim financial statements relating to April 30, 2021 and for the six months then ended have not been audited by an independent registered public accounting firm, but in the opinion of the Portfolio’s management, reflect all adjustments, consisting only of normal recurring adjustments, necessary for the fair presentation of the financial statements.
2 Investment Adviser Fee and Other Transactions with Affiliates
The investment adviser fee is earned by Boston Management and Research (BMR) as compensation for investment advisory services rendered to the Portfolio. On March 1, 2021, Morgan Stanley acquired Eaton Vance Corp. (the “Transaction”) and BMR became an indirect, wholly-owned subsidiary of Morgan Stanley. In connection with the Transaction, the Portfolio entered into a new investment advisory agreement (the “New Agreement”) with BMR, which took effect on March 1, 2021. The Portfolio’s prior fee reduction agreement was incorporated into the New Agreement. Pursuant to the New Agreement (and the Portfolio’s investment advisory agreement with BMR in effect prior to March 1, 2021), the investment advisory fee is computed at an annual rate of 0.550% of the Portfolio’s average daily net assets up to $500 million, 0.525% on $500 million but less than $1 billion, 0.500% on $1 billion but less than $2.5 billion, and 0.475% on average daily net assets of $2.5 billion and over, and is payable monthly. For the six months ended April 30, 2021, the Portfolio’s investment adviser fee amounted to $795,865 or 0.55% (annualized) of the Portfolio’s average daily net assets.
Pursuant to an investment sub-advisory agreement, BMR has delegated a portion of the investment management of the Portfolio to Eaton Vance Advisers International Ltd. (EVAIL), an affiliate of BMR and, effective March 1, 2021, an indirect, wholly-owned subsidiary of Morgan Stanley. In connection with the Transaction, BMR entered into a new sub-advisory agreement with EVAIL, which took effect on March 1, 2021. BMR pays EVAIL a portion of its investment adviser fee for sub-advisory services provided to the Portfolio. The Portfolio may invest its cash in Cash Reserves Fund. EVM does not currently receive a fee for advisory services provided to Cash Reserves Fund.
Trustees and officers of the Portfolio who are members of EVM’s or BMR’s organizations receive remuneration for their services to the Portfolio out of the investment adviser fee. Trustees of the Portfolio who are not affiliated with the investment adviser may elect to defer receipt of all or a percentage of their annual fees in accordance with the terms of the Trustees Deferred Compensation Plan. For the six months ended April 30, 2021, no significant amounts have been deferred. Certain officers and Trustees of the Portfolio are officers of the above organizations.
3 Purchases and Sales of Investments
Purchases and sales of investments, other than short-term obligations and including maturities and principal repayments on Senior Loans, aggregated $115,893,112 and $124,843,175, respectively, for the six months ended April 30, 2021.
4 Federal Income Tax Basis of Investments
The cost and unrealized appreciation (depreciation) of investments, including open derivative contracts, of the Portfolio at April 30, 2021, as determined on a federal income tax basis, were as follows:
| | | | |
| |
Aggregate cost | | $ | 244,123,811 | |
| |
Gross unrealized appreciation | | $ | 63,684,096 | |
| |
Gross unrealized depreciation | | | (2,213,529 | ) |
| |
Net unrealized appreciation | | $ | 61,470,567 | |
Global Income Builder Portfolio
April 30, 2021
Notes to Financial Statements (Unaudited) — continued
5 Restricted Securities
At April 30, 2021, the Portfolio owned the following securities (representing less than 0.1% of net assets) which were restricted as to public resale and not registered under the Securities Act of 1933 (excluding Rule 144A securities). The Portfolio has various registration rights (exercisable under a variety of circumstances) with respect to these securities. The value of these securities is determined based on valuations provided by brokers when available, or if not available, they are valued at fair value using methods determined in good faith by or at the direction of the Trustees.
| | | | | | | | | | | | | | | | |
| Description | | Date of
Acquisition | | | Shares | | | Cost | | | Value | |
| | | | |
Common Stocks | | | | | | | | | | | | | | | | |
| | | | |
Extraction Oil & Gas, Inc. | | | 1/28/21 | | | | 425 | | | $ | 6,287 | | | $ | 17,698 | |
6 Financial Instruments
The Portfolio may trade in financial instruments with off-balance sheet risk in the normal course of its investing activities. These financial instruments may include forward foreign currency exchange contracts and financial futures contracts and may involve, to a varying degree, elements of risk in excess of the amounts recognized for financial statement purposes. The notional or contractual amounts of these instruments represent the investment the Portfolio has in particular classes of financial instruments and do not necessarily represent the amounts potentially subject to risk. The measurement of the risks associated with these instruments is meaningful only when all related and offsetting transactions are considered. A summary of obligations under these financial instruments at April 30, 2021 is included in the Portfolio of Investments. At April 30, 2021, the Portfolio had sufficient cash and/or securities to cover commitments under these contracts.
In the normal course of pursuing its investment objective, the Portfolio is subject to the following risks:
Equity Price Risk: The Portfolio enters into equity futures contracts on securities indices to gain or limit exposure to certain markets, particularly in connection with engaging in the dividend capture trading strategy.
Foreign Exchange Risk: Because the Portfolio holds foreign currency denominated investments, the value of these investments and related receivables and payables may change due to future changes in foreign currency exchange rates. To hedge against this risk, the Portfolio enters into forward foreign currency exchange contracts.
The Portfolio enters into forward foreign currency exchange contracts that may contain provisions whereby the counterparty may terminate the contract under certain conditions, including but not limited to a decline in the Portfolio’s net assets below a certain level over a certain period of time, which would trigger a payment by the Portfolio for those derivatives in a liability position. At April 30, 2021, the fair value of derivatives with credit-related contingent features in a net liability position was $925. At April 30, 2021, there were no assets pledged by the Portfolio for such liability.
The over-the-counter (OTC) derivatives in which the Portfolio invests are subject to the risk that the counterparty to the contract fails to perform its obligations under the contract. To mitigate this risk, the Portfolio has entered into an International Swaps and Derivatives Association, Inc. Master Agreement (“ISDA Master Agreement”) or similar agreement with substantially all its derivative counterparties. An ISDA Master Agreement is a bilateral agreement between the Portfolio and a counterparty that governs certain OTC derivatives and typically contains, among other things, set-off provisions in the event of a default and/or termination event as defined under the relevant ISDA Master Agreement. Under an ISDA Master Agreement, the Portfolio may, under certain circumstances, offset with the counterparty certain derivative financial instruments’ payables and/or receivables with collateral held and/or posted and create one single net payment. The provisions of the ISDA Master Agreement typically permit a single net payment in the event of default including the bankruptcy or insolvency of the counterparty. However, bankruptcy or insolvency laws of a particular jurisdiction may impose restrictions on or prohibitions against the right of offset in bankruptcy or insolvency. Certain ISDA Master Agreements allow counterparties to OTC derivatives to terminate derivative contracts prior to maturity in the event the Portfolio’s net assets decline by a stated percentage or the Portfolio fails to meet the terms of its ISDA Master Agreements, which would cause the counterparty to accelerate payment by the Portfolio of any net liability owed to it.
The collateral requirements for derivatives traded under an ISDA Master Agreement are governed by a Credit Support Annex to the ISDA Master Agreement. Collateral requirements are determined at the close of business each day and are typically based on changes in market values for each transaction under an ISDA Master Agreement and netted into one amount for such agreement. Generally, the amount of collateral due from or to a counterparty is subject to a minimum transfer threshold amount before a transfer is required, which may vary by counterparty. Collateral pledged for the benefit of the Portfolio and/or counterparty is held in segregated accounts by the Portfolio’s custodian and cannot be sold, re-pledged, assigned or otherwise used while pledged. The portion of such collateral representing cash, if any, is reflected as deposits for derivatives collateral and, in the case of cash pledged by a counterparty for the benefit of the Portfolio, a corresponding liability on the Statement of Assets and Liabilities. Securities pledged by the Portfolio as collateral, if any, are identified as such in the Portfolio of Investments.
Global Income Builder Portfolio
April 30, 2021
Notes to Financial Statements (Unaudited) — continued
The fair value of open derivative instruments (not considered to be hedging instruments for accounting disclosure purposes) by risk exposure at April 30, 2021 was as follows:
| | | | | | | | | | |
| | | | | Fair Value | |
| Risk | | Derivative | | Asset Derivative | | | Liability Derivative | |
| | | |
Equity Price | | Futures contracts | | $ | 534,805 | (1) | | $ | (140,208 | )(1) |
| | | |
Foreign Exchange | | Forward foreign currency exchange contracts | | | 2,758 | (2) | | | (925 | )(3) |
| | | |
Total | | | | $ | 537,563 | | | $ | (141,133 | ) |
| | |
Derivatives not subject to master netting or similar agreements | | $ | 534,805 | | | $ | (140,208 | ) |
| | |
Total Derivatives subject to master netting or similar agreements | | $ | 2,758 | | | $ | (925 | ) |
| (1) | Only the current day’s variation margin on open futures contracts is reported within the Statement of Assets and Liabilities as Receivable or Payable for variation margin on open financial futures contracts, as applicable. |
| (2) | Statement of Assets and Liabilities location: Receivable for open forward foreign currency exchange contracts. |
| (3) | Statement of Assets and Liabilities location: Payable for open forward foreign currency exchange contracts. |
The Portfolio’s derivative assets and liabilities at fair value by risk, which are reported gross in the Statement of Assets and Liabilities, are presented in the table above. The following tables present the Portfolio’s derivative assets and liabilities by counterparty, net of amounts available for offset under a master netting agreement and net of the related collateral received by the Portfolio for such assets and pledged by the Portfolio for such liabilities as of April 30, 2021.
| | | | | | | | | | | | | | | | | | | | |
| Counterparty | | Derivative Assets
Subject to
Master Netting
Agreement | | | Derivatives
Available
for Offset | | | Non-cash
Collateral
Received(a) | | | Cash
Collateral
Received(a) | | | Net Amount
of Derivative
Assets(b) | |
| | | | | |
State Street Bank and Trust Company | | $ | 2,758 | | | $ | — | | | $ | — | | | $ | — | | | $ | 2,758 | |
| | | | | |
| Counterparty | | Derivative Liabilities
Subject to
Master Netting
Agreement | | | Derivatives
Available
for Offset | | | Non-cash
Collateral
Pledged(a) | | | Cash
Collateral
Pledged(a) | | | Net Amount
of Derivative
Liabilities(c) | |
| | | | | |
Citibank, N.A. | | $ | (925 | ) | | $ | — | | | $ | — | | | $ | — | | | $ | (925 | ) |
| (a) | In some instances, the total collateral received and/or pledged may be more than the amount shown due to over collateralization. |
| (b) | Net amount represents the net amount due from the counterparty in the event of default. |
| (c) | Net amount represents the net amount payable to the counterparty in the event of default. |
The effect of derivative instruments (not considered to be hedging instruments for accounting disclosure purposes) on the Statement of Operations by risk exposure for the six months ended April 30, 2021 was as follows:
| | | | | | | | | | |
| Risk | | Derivative | | Realized Gain (Loss)
on Derivatives Recognized
in Income(1) | | | Change in Unrealized
Appreciation (Depreciation) on
Derivatives Recognized in Income(2) | |
| | | |
Equity Price | | Futures contracts | | $ | 80,786 | | | $ | 218,432 | |
| | | |
Foreign Exchange | | Forward foreign currency exchange contracts | | | 9,567 | | | | 14,760 | |
| | | |
Total | | | | $ | 90,353 | | | $ | 233,192 | |
Global Income Builder Portfolio
April 30, 2021
Notes to Financial Statements (Unaudited) — continued
| (1) | Statement of Operations location: Net realized gain (loss) – Financial futures contracts and Forward foreign currency exchange contracts, respectively. |
| (2) | Statement of Operations location: Change in unrealized appreciation (depreciation) – Financial futures contracts and Forward foreign currency exchange contracts, respectively. |
The average notional cost of futures contracts and average notional amounts of other derivative contracts outstanding during the six months ended April 30, 2021, which are indicative of the volume of these derivative types, were approximately as follows:
| | | | | | | | | | |
Futures
Contracts — Long | | | Futures
Contracts — Short | | | Forward
Foreign Currency
Exchange Contracts* | |
| | |
| | $5,650,000 | | | $ | 5,668,000 | | | $ | 551,000 | |
| * | The average notional amount for forward foreign currency exchange contracts is based on the absolute value of notional amounts of currency purchased and currency sold. |
7 Line of Credit
The Portfolio participates with other portfolios and funds managed by EVM and its affiliates in an $800 million unsecured line of credit agreement with a group of banks, which is in effect through October 26, 2021. Borrowings are made by the Portfolio solely for temporary purposes related to redemptions and other short-term cash needs. Interest is charged to the Portfolio based on its borrowings at an amount above either the Eurodollar rate or Federal
Funds rate. In addition, a fee computed at an annual rate of 0.15% on the daily unused portion of the line of credit is allocated among the participating portfolios and funds at the end of each quarter. In connection with the renewal of the agreement in October 2020, an upfront fee and arrangement fee totaling $950,000 was incurred that was allocated to the participating portfolios and funds. Because the line of credit is not available exclusively to the
Portfolio, it may be unable to borrow some or all of its requested amounts at any particular time. The Portfolio did not have any significant borrowings or allocated fees during the six months ended April 30, 2021.
8 Investments in Affiliated Issuers and Funds
The Portfolio invested in issuers that may be deemed to be affiliated with Morgan Stanley. At April 30, 2021, the value of the Portfolio’s investment in affiliated issuers and funds was $4,882,289, which represents 1.6% of the Portfolio’s net assets. Transactions in affiliated issuers and funds by the Portfolio for the six months ended April 30, 2021 were as follows:
| | | | | | | | | | | | | | | | | | | | | | | | | | | | | | | | |
| Name | | Value,
beginning of
period | | | Purchases | | | Sales
proceeds | | | Net
realized
gain (loss) | | | Change in
unrealized
appreciation
(depreciation) | | | Value, end
of period | | | Dividend
income | | | Shares/
Units, end
of period | |
|
Common Stocks | |
| | | | | | | | |
Mitsubishi UFJ Financial Group, Inc.(1) | | $ | — | | | $ | — | | | $ | — | | | $ | — | | | $ | 16,205 | | | $ | 1,427,302 | | | $ | 25,746 | | | | 268,285 | |
|
Short-Term Investments | |
| | | | | | | | |
Eaton Vance Cash Reserves Fund, LLC | | | 1,027,196 | | | | 36,794,803 | | | | (34,367,012 | ) | | | — | | | | — | | | | 3,454,987 | | | | 1,060 | | | | 3,454,987 | |
| | | | | | | | |
Totals | | | | | | | | | | | | | | $ | — | | | $ | 16,205 | | | $ | 4,882,289 | | | $ | 26,806 | | | | | |
| (1) | May be deemed to be an affiliated issuer as of March 1, 2021 (see Note 2). |
9 Fair Value Measurements
Under generally accepted accounting principles for fair value measurements, a three-tier hierarchy to prioritize the assumptions, referred to as inputs, is used in valuation techniques to measure fair value. The three-tier hierarchy of inputs is summarized in the three broad levels listed below.
| • | | Level 1 – quoted prices in active markets for identical investments |
| • | | Level 2 – other significant observable inputs (including quoted prices for similar investments, interest rates, prepayment speeds, credit risk, etc.) |
Global Income Builder Portfolio
April 30, 2021
Notes to Financial Statements (Unaudited) — continued
| • | | Level 3 – significant unobservable inputs (including a fund’s own assumptions in determining the fair value of investments) |
In cases where the inputs used to measure fair value fall in different levels of the fair value hierarchy, the level disclosed is determined based on the lowest level input that is significant to the fair value measurement in its entirety. The inputs or methodology used for valuing securities are not necessarily an indication of the risk associated with investing in those securities.
At April 30, 2021, the hierarchy of inputs used in valuing the Portfolio’s investments and open derivative instruments, which are carried at value, were as follows:
| | | | | | | | | | | | | | | | |
| Asset Description | | Level 1 | | | Level 2 | | | Level 3* | | | Total | |
| | | | |
Common Stocks | | | | | | | | | | | | | | | | |
| | | | |
Communication Services | | $ | 13,779,384 | | | $ | 4,022,695 | | | $ | — | | | $ | 17,802,079 | |
| | | | |
Consumer Discretionary | | | 11,574,285 | | | | 8,264,321 | | | | — | | | | 19,838,606 | |
| | | | |
Consumer Staples | | | 3,967,302 | | | | 6,181,338 | | | | — | | | | 10,148,640 | |
| | | | |
Energy | | | 5,268,102 | | | | — | | | | 17,698 | | | | 5,285,800 | |
| | | | |
Financials | | | 13,317,663 | | | | 16,311,940 | | | | — | | | | 29,629,603 | |
| | | | |
Health Care | | | 10,365,942 | | | | 13,027,655 | | | | — | | | | 23,393,597 | |
| | | | |
Industrials | | | 6,411,114 | | | | 18,884,878 | | | | 0 | | | | 25,295,992 | |
| | | | |
Information Technology | | | 25,873,461 | | | | 11,854,735 | | | | — | | | | 37,728,196 | |
| | | | |
Materials | | | — | | | | 5,430,895 | | | | — | | | | 5,430,895 | |
| | | | |
Real Estate | | | 2,012,677 | | | | — | | | | — | | | | 2,012,677 | |
| | | | |
Utilities | | | 2,119,900 | | | | 5,242,746 | | | | — | | | | 7,362,646 | |
| | | | |
Total Common Stocks | | $ | 94,689,830 | | | $ | 89,221,203 | ** | | $ | 17,698 | | | $ | 183,928,731 | |
| | | | |
Convertible Bonds | | $ | — | | | $ | 187,094 | | | $ | — | | | $ | 187,094 | |
| | | | |
Corporate Bonds | | | — | | | | 107,601,051 | | | | — | | | | 107,601,051 | |
| | | | |
Exchange-Traded Funds | | | 457,755 | | | | — | | | | — | | | | 457,755 | |
|
Preferred Stocks | |
| | | | |
Communication Services | | | 96,181 | | | | — | | | | — | | | | 96,181 | |
| | | | |
Consumer Staples | | | — | | | | 306,562 | | | | — | | | | 306,562 | |
| | | | |
Energy | | | 505,082 | | | | — | | | | — | | | | 505,082 | |
| | | | |
Financials | | | 921,218 | | | | 302,725 | | | | — | | | | 1,223,943 | |
| | | | |
Health Care | | | 180,492 | | | | — | | | | — | | | | 180,492 | |
| | | | |
Industrials | | | 405,891 | | | | — | | | | — | | | | 405,891 | |
| | | | |
Real Estate | | | 638,528 | | | | — | | | | — | | | | 638,528 | |
| | | | |
Utilities | | | 446,160 | | | | 88,178 | | | | — | | | | 534,338 | |
| | | | |
Total Preferred Stocks | | $ | 3,193,552 | | | $ | 697,465 | | | $ | — | | | $ | 3,891,017 | |
| | | | |
Senior Floating-Rate Loans | | $ | — | | | $ | 5,607,892 | | | $ | — | | | $ | 5,607,892 | |
| | | | |
Warrants | | | 69,421 | | | | — | | | | — | | | | 69,421 | |
| | | | |
Short-Term Investments | | | — | | | | 3,454,987 | | | | — | | | | 3,454,987 | |
| | | | |
Total Investments | | $ | 98,410,558 | | | $ | 206,769,692 | | | $ | 17,698 | | | $ | 305,197,948 | |
| | | | |
Forward Foreign Currency Exchange Contracts | | $ | — | | | $ | 2,758 | | | $ | — | | | $ | 2,758 | |
| | | | |
Futures Contracts | | | 534,805 | | | | — | | | | — | | | | 534,805 | |
| | | | |
Total | | $ | 98,945,363 | | | $ | 206,772,450 | | | $ | 17,698 | | | $ | 305,735,511 | |
| | | | |
Liability Description | | | | | | | | | | | | | | | | |
| | | | |
Forward Foreign Currency Exchange Contracts | | $ | — | | | $ | (925 | ) | | $ | — | | | $ | (925 | ) |
| | | | |
Futures Contracts | | | (140,208 | ) | | | — | | | | — | | | | (140,208 | ) |
| | | | |
Total | | $ | (140,208 | ) | | $ | (925 | ) | | $ | — | | | $ | (141,133 | ) |
Global Income Builder Portfolio
April 30, 2021
Notes to Financial Statements (Unaudited) — continued
| * | None of the unobservable inputs for Level 3 assets, individually or collectively, had a material impact on the Portfolio. |
| ** | Includes foreign equity securities whose values were adjusted to reflect market trading of comparable securities or other correlated instruments that occurred after the close of trading in their applicable foreign markets. |
Level 3 investments at the beginning and/or end of the period in relation to net assets were not significant and accordingly, a reconciliation of Level 3 assets for the six months ended April 30, 2021 is not presented.
10 Risks and Uncertainties
Risks Associated with Foreign Investments
Foreign investments can be adversely affected by political, economic and market developments abroad, including the imposition of economic and other sanctions by the United States or another country. There may be less publicly available information about foreign issuers because they may not be subject to reporting practices, requirements or regulations comparable to those to which United States companies are subject. Foreign markets may be smaller, less liquid and more volatile than the major markets in the United States. Trading in foreign markets typically involves higher expense than trading in the United States. The Portfolio may have difficulties enforcing its legal or contractual rights in a foreign country. Securities that trade or are denominated in currencies other than the U.S. dollar may be adversely affected by fluctuations in currency exchange rates.
Pandemic Risk
An outbreak of respiratory disease caused by a novel coronavirus was first detected in China in late 2019 and subsequently spread internationally. This coronavirus has resulted in closing borders, enhanced health screenings, changes to healthcare service preparation and delivery, quarantines, cancellations, disruptions to supply chains and customer activity, as well as general concern and uncertainty. Health crises caused by outbreaks, such as the coronavirus outbreak, may exacerbate other pre-existing political, social and economic risks and disrupt normal market conditions and operations. The impact of this outbreak has negatively affected the worldwide economy, the economies of individual countries, individual companies, and the market in general, and may continue to do so in significant and unforeseen ways, as may other epidemics and pandemics that may arise in the future. Any such impact could adversely affect the Portfolio’s performance, or the performance of the securities in which the Portfolio invests.
Eaton Vance
Global Income Builder NextShares
April 30, 2021
Joint Special Meeting of Shareholders (Unaudited)
Eaton Vance Global Income Builder NextShares (the “Fund”) held a Joint Special Meeting of Shareholders on February 18, 2021 for the following purposes: (1) to approve a new investment advisory and administrative agreement with Eaton Vance Management to serve as the Fund’s investment adviser (“Proposal 1”); (2) to approve a new investment sub-advisory agreement with Eaton Vance Advisers International Ltd. to serve as the Fund’s investment sub-adviser (“Proposal 2”); (3) to provide voting instructions to the Fund, which invests pursuant to a master-feeder arrangement, with respect to the approval of a new investment advisory agreement with Boston Management and Research (“BMR”) to serve as investment adviser to Global Income Builder Portfolio (“Proposal 3”); and (4) to provide voting instructions to the Fund, which invests pursuant to a master-feeder arrangement, with respect to the approval of a new investment sub-advisory agreement with Eaton Vance Advisers International Ltd. to serve as investment sub-adviser to Global Income Builder Portfolio (“Proposal 4”). The shareholder meeting results are as follows:
| | | | | | | | | | | | | | | | |
| | | Number of Shares(1) | |
| | | For | | | Against | | | Abstain(2) | | | Broker
Non-Votes(2) | |
| | | | | | | | | | | | | | | | |
| | | | |
Proposal 1 | | | 580,916.000 | | | | 0 | | | | 0 | | | | 0 | |
| | | | |
Proposal 2 | | | 580,916.000 | | | | 0 | | | | 0 | | | | 0 | |
| | | | |
Proposal 3 | | | 580,916.000 | | | | 0 | | | | 0 | | | | 0 | |
| | | | |
Proposal 4 | | | 580,916.000 | | | | 0 | | | | 0 | | | | 0 | |
| (1) | Fractional shares were voted proportionately. |
| (2) | Abstentions and broker non-votes (i.e., shares for which a broker returns a proxy but for which (i) the beneficial owner has not voted and (ii) the broker holding the shares does not have discretionary authority to vote on the particular matter) were treated as shares that were present at the meeting for purposes of establishing a quorum, but had the effect of a negative vote on Proposal 1, Proposal 2, Proposal 3 and Proposal 4. |
Interestholder Meeting
Global Income Builder Portfolio (the “Portfolio”) held a Joint Special Meeting of Interestholders on February 19, 2021 for the following purposes: (1) to approve a new investment advisory agreement with Boston Management and Research to serve as the Portfolio’s investment adviser (“Proposal 1”); and (2) to approve a new investment sub-advisory agreement with Eaton Vance Advisers International Ltd. to serve as investment sub-adviser to the Portfolio (“Proposal 2”). The interestholder meeting results are as follows:
| | | | | | | | | | | | | | | | |
| | | For | | | Against | | | Abstain(1) | | | | |
| | | | | | | | | | | | | | | | |
| | | | |
Proposal 1 | | | 91.772 | % | | | 2.584 | % | | | 5.644 | % | | | | |
| | | | |
Proposal 2 | | | 87.559 | % | | | 2.525 | % | | | 5.517 | % | | | | |
| | Results may not total 100% due to rounding. |
| (1) | Abstentions were treated as interests that were present at the meeting for purposes of establishing a quorum, but had the effect of a negative vote on Proposal 1 and Proposal 2. |
Eaton Vance
Global Income Builder NextShares
April 30, 2021
Board of Trustees’ Contract Approval
Overview of the Contract Review Process
Even though the following description of the Board’s (as defined below) consideration of investment advisory and, as applicable, sub-advisory agreements covers multiple funds, for purposes of this shareholder report, the description is only relevant as to Eaton Vance Global Income Builder NextShares and Global Income Builder Portfolio.
| | | | |
| Fund | | Investment Adviser | | Investment Sub-Adviser |
| | |
Eaton Vance Global Income Builder NextShares | | Eaton Vance Management | | Eaton Vance Advisers International Ltd. |
| | |
Global Income Builder Portfolio | | Boston Management and Research | | Eaton Vance Advisers International Ltd. |
At a meeting held on November 24, 2020 (the “November Meeting”), the Board of each Eaton Vance open-end Fund and portfolios in which each such Fund invests, as applicable (each, a “Fund” and, collectively, the “Funds”), including a majority of the Board members (the “Independent Trustees”) who are not “interested persons” (as defined in the Investment Company Act of 1940 (the “1940 Act”)) of the Funds, Eaton Vance Management (“EVM”) or Boston Management and Research (“BMR” and, together with EVM, the “Advisers”), voted to approve a new investment advisory agreement between each Fund and either EVM or BMR (the “New Investment Advisory Agreements”) and, for certain Funds, a new investment sub-advisory agreement between an Adviser and the applicable Sub-Adviser (the “New Investment Sub-Advisory Agreements”1 and, together with the New Investment Advisory Agreements, the “New Agreements”), each of which is intended to go into effect upon the completion of the Transaction (as defined below), as more fully described below. In voting its approval of the New Agreements at the November Meeting, the Board relied on an order issued by the Securities and Exchange Commission in response to the impacts of the COVID-19 pandemic that provided temporary relief from the in-person meeting requirements under Section 15 of the 1940 Act.
In voting its approval of the New Agreements, the Board of each Fund relied upon the recommendation of its Contract Review Committee, which is a committee comprised exclusively of Independent Trustees. Prior to and during meetings leading up to the November Meeting, the Contract Review Committee reviewed and discussed information furnished by the Advisers, the Sub-Advisers, and Morgan Stanley, as requested by the Independent Trustees, that the Contract Review Committee considered reasonably necessary to evaluate the terms of the New Agreements and to form its recommendation. Such information included, among other things, the terms and anticipated impacts of Morgan Stanley’s pending acquisition of Eaton Vance Corp. (the “Transaction”) on the Funds and their shareholders. In addition to considering information furnished specifically to evaluate the impact of the Transaction on the Funds and their respective shareholders, the Board and its Contract Review Committee also considered information furnished for prior meetings of the Board and its committees, including information provided in connection with the annual contract review process for the Funds, which most recently culminated in April 2020 (the “2020 Annual Approval Process”).
The Board of each Fund, including the Independent Trustees, concluded that the applicable New Investment Advisory Agreement and, as applicable, New Investment Sub-Advisory Agreement, including the fees payable thereunder, was fair and reasonable, and it voted to approve the New Investment Advisory Agreement and, as applicable, New Investment Sub-Advisory Agreement and to recommend that shareholders do so as well.
Shortly after the announcement of the Transaction, the Board, including all of the Independent Trustees, met with senior representatives from the Advisers and Morgan Stanley at its meeting held on October 13, 2020 to discuss certain aspects of the Transaction and the expected impacts of the Transaction on the Funds and their shareholders. As part of the Board’s evaluation process, counsel to the Independent Trustees, on behalf of the Contract Review Committee, requested additional information to assist the Independent Trustees in their evaluation of the New Agreements and the implications of the Transaction, as well as other contractual arrangements that may be affected by the Transaction. The Contract Review Committee considered information furnished by the Advisers and Morgan Stanley, their respective affiliates, and, as applicable, the Sub-Advisers during meetings on November 5, 2020, November 10, 2020, November 13, 2020, November 17, 2020 and November 24, 2020.
During its meetings on November 10, 2020 and November 17, 2020, the Contract Review Committee further discussed the approval of the New Agreements with senior representatives of the Advisers, the Affiliated Sub-Advisers, and Morgan Stanley. The representatives from the Advisers, the Affiliated Sub-Advisers, and Morgan Stanley each made presentations to, and responded to questions from, the Independent Trustees. The Contract Review Committee considered the Advisers’, the Affiliated Sub-Advisers’ and Morgan Stanley’s responses related to the Transaction and specifically to the Funds,
| 1 | With respect to certain of the Funds, the applicable Adviser is currently a party to a sub-advisory agreement (collectively, the “Current Sub-Advisory Agreements”) with Atlanta Capital Management Company, LLC (“Atlanta Capital”), BMO Global Asset Management (Asia) Limited, Eaton Vance Advisers International Ltd. (“EVAIL”), Goldman Sachs Asset Management, L.P., Hexavest Inc. (“Hexavest”), Parametric Portfolio Associates LLC (“Parametric”) or Richard Bernstein Advisors LLC (collectively, the “Sub-Advisers” and, with respect to Atlanta Capital, EVAIL, Hexavest and Parametric, each an affiliate of the Advisers, the “Affiliated Sub-Advisers”). Accordingly, references to the “Sub-Advisers,” the “Affiliated Sub-Advisers” or the “New Sub-Advisory Agreements” are not applicable to all Funds. |
Eaton Vance
Global Income Builder NextShares
April 30, 2021
Board of Trustees’ Contract Approval — continued
as well as information received in connection with the 2020 Annual Approval Process, with respect to its evaluation of the New Agreements. Among other information, the Board considered:
Information about the Transaction and its Terms
| | • | | Information about the material terms and conditions, and expected impacts, of the Transaction that relate to the Funds, including the expected impacts on the businesses conducted by the Advisers, the Affiliated Sub-Advisers and Eaton Vance Distributors, Inc., as the distributor of Fund shares; |
| | • | | Information about the advantages of the Transaction as they relate to the Funds and their shareholders; |
| | • | | A commitment that the Funds would not bear any expenses, directly or indirectly, in connection with the Transaction; |
| | • | | A commitment that, for a period of three years after the Closing, at least 75% of each Fund’s Board members must not be “interested persons” (as defined in the 1940 Act) of the investment adviser (or predecessor investment adviser, if applicable) pursuant to Section 15(f)(1)(A) of the 1940 Act; |
| | • | | A commitment that Morgan Stanley would use its reasonable best efforts to ensure that it did not impose any “unfair burden” (as that term is used in section 15(f)(1)(B) of the 1940 Act) on the Funds as a result of the Transaction; |
| | • | | Information with respect to personnel and/or other resources of the Advisers and their affiliates, including the Affiliated Sub-Advisers, as a result of the Transaction, as well as any expected changes to compensation, including any retention-based compensation intended to incentivize key personnel at the Advisers and their affiliates, including the Affiliated Sub-Advisers; |
| | • | | Information regarding any changes that are expected with respect to the Funds’ slate of officers as a result of the Transaction; |
Information about Morgan Stanley
| | • | | Information about Morgan Stanley’s overall business, including information about the advisory, brokerage and related businesses that Morgan Stanley operates; |
| | • | | Information about Morgan Stanley’s financial condition, including its access to capital and other resources required to support the investment advisory businesses related to the Funds; |
| | • | | Information on how the Funds are expected to fit within Morgan Stanley’s overall business strategy, and any changes that Morgan Stanley contemplates implementing to the Funds in the short- or long-term following the closing of the Transaction (the “Closing”); |
| | • | | Information regarding risk management functions at Morgan Stanley and its affiliates, including how existing risk management protocols and procedures may impact the Funds and/or the businesses of the Advisers and their affiliates, including the Affiliated Sub-Advisers, as they relate to the Funds; |
| | • | | Information on the anticipated benefits of the Transaction to the Funds with respect to potential additional distribution capabilities and the ability to access new markets and customer segments through Morgan Stanley’s distribution network, including, in particular, its institutional client base; |
| | • | | Information regarding the financial condition and reputation of Morgan Stanley, its worldwide presence, experience as a fund sponsor and manager, commitment to maintain a high level of cooperation with, and support to, the Funds, strong client service capabilities, and relationships in the asset management industry; |
Information about the New Agreements for Funds
| | • | | A representation that, after the Closing, all of the Funds will continue to be advised by their current Adviser and Sub-Adviser, as applicable; |
| | • | | Information regarding the terms of the New Agreements, including certain changes as compared to the current investment advisory agreement between each Fund and its Adviser (collectively, the “Current Advisory Agreements”) and, as applicable, the current investment sub-advisory agreement between a Fund and a Sub-Adviser (together with the Current Advisory Agreements, the “Current Agreements”); |
| | • | | Information confirming that the fee rates payable under the New Agreements are not changed as compared to the Current Agreements; |
| | • | | A representation that the New Agreements will not cause any diminution in the nature, extent and quality of services provided by the Advisers and the Sub-Advisers to the Funds and their respective shareholders, including with respect to compliance and other non-advisory services; |
Information about Fund Performance, Fees and Expenses
| | • | | A report from an independent data provider comparing the investment performance of each Fund (including, as relevant, total return data, income data, Sharpe ratios and information ratios) to the investment performance of comparable funds and, as applicable, benchmark indices, over various time periods as of the 2020 Annual Approval Process, as well as performance information as of a more recent date; |
| | • | | A report from an independent data provider comparing each Fund’s total expense ratio (and its components) to those of comparable funds as of the 2020 Annual Approval Process, as well as fee and expense information as of a more recent date; |
| | • | | In certain instances, data regarding investment performance relative to customized groups of peer funds and blended indices identified by the Advisers in consultation with the Portfolio Management Committee of the Board as of the 2020 Annual Approval Process, as well as corresponding performance information as of a more recent date; |
| | • | | Comparative information concerning the fees charged and services provided by the Adviser and the Sub-Adviser to each Fund in managing other accounts (which may include other mutual funds, collective investment funds and institutional accounts) using investment strategies and techniques similar to those used in managing such Fund(s), if any; |
Eaton Vance
Global Income Builder NextShares
April 30, 2021
Board of Trustees’ Contract Approval — continued
| | • | | Profitability analyses of the Advisers and the Affiliated Sub-Advisers, as applicable, with respect to each of the Funds as of the 2020 Annual Approval Process, as well as information regarding the impact of the Transaction on profitability; |
Information about Portfolio Management and Trading
| | • | | Descriptions of the investment management services currently provided and expected to be provided to each Fund after the Transaction, as well as each of the Funds’ investment strategies and policies; |
| | • | | The procedures and processes used to determine the fair value of Fund assets, when necessary, and actions taken to monitor and test the effectiveness of such procedures and processes; |
| | • | | Information about any changes to the policies and practices of the Advisers and, as applicable, each Fund’s Sub-Adviser with respect to trading, including their processes for seeking best execution of portfolio transactions; |
| | • | | Information regarding the impact on trading and access to capital markets associated with the Funds’ affiliations with Morgan Stanley and its affiliates, including potential restrictions with respect to the Funds’ ability to execute portfolio transactions with Morgan Stanley and its affiliates; |
Information about the Advisers and the Sub-Advisers
| | • | | Information about the financial results and condition of the Advisers and the Affiliated Sub-Advisers since the culmination of the 2020 Annual Approval Process and any material changes in financial condition that are reasonably expected to occur before and after the Closing; |
| | • | | Information regarding contemplated changes to the individual investment professionals whose responsibilities include portfolio management and investment research for the Funds, and, for portfolio managers and certain other investment professionals, information relating to their responsibilities with respect to managing other mutual funds and investment accounts, as applicable, post-Closing; |
| | • | | The Code of Ethics of the Advisers and their affiliates, including the Affiliated Sub-Advisers, together with information relating to compliance with, and the administration of, such codes; |
| | • | | Policies and procedures relating to proxy voting and the handling of corporate actions and class actions; |
| | • | | Information concerning the resources devoted to compliance efforts undertaken by the Advisers and their affiliates, including the Affiliated Sub-Advisers, including descriptions of their various compliance programs and their record of compliance; |
| | • | | Information concerning the business continuity and disaster recovery plans of the Advisers and their affiliates, including the Affiliated Sub-Advisers; |
| | • | | A description of the Advisers’ oversight of the Sub-Advisers, including with respect to regulatory and compliance issues, investment management and other matters; |
Other Relevant Information
| | • | | Information concerning the nature, cost and character of the administrative and other non-investment advisory services provided by the Advisers and their affiliates; |
| | • | | Information concerning oversight of the relationship with the custodian, subcustodians and fund accountants by EVM and/or administrator to each of the Funds; |
| | • | | Confirmation that the Advisers intend to continue to manage the Funds in a manner materially consistent with each Fund’s current investment objective(s) and principal investment strategies; |
| | • | | Information regarding Morgan Stanley’s commitment to maintaining competitive compensation arrangements to attract and retain highly qualified personnel; |
| | • | | Confirmation that the Advisers’ current senior management teams have indicated their strong support of the Transaction; and |
| | • | | Information regarding the fact that Morgan Stanley and Eaton Vance Corp. will each derive benefits from the Transaction and that, as a result, they have a financial interest in the matters that were being considered. |
As indicated above, the Board and its Contract Review Committee also considered information received at its regularly scheduled meetings throughout the year, which included information from portfolio managers and other investment professionals of the Advisers and the Sub-Advisers regarding investment and performance matters, and considered various investment and trading strategies used in pursuing the Funds’ investment objectives. The Board also received information regarding risk management techniques employed in connection with the management of the Funds. The Board and its committees evaluated issues pertaining to industry and regulatory developments, compliance procedures, fund governance and other issues with respect to the Funds, and received and participated in reports and presentations provided by the Advisers and their affiliates, including the Affiliated Sub-Advisers, with respect to such matters.
The Contract Review Committee was advised throughout the evaluation process by Goodwin Procter LLP, independent legal counsel for the Independent Trustees. The members of the Contract Review Committee, with the advice of such counsel, exercised their own business judgment in determining the material factors to be considered in evaluating the New Agreements and the weight to be given to each such factor. The conclusions reached with respect to the New Agreements were based on a comprehensive evaluation of all the information provided and not any single factor. Moreover, each Independent Trustee may have placed varying emphasis on particular factors in reaching conclusions with respect to the New Agreements.
Eaton Vance
Global Income Builder NextShares
April 30, 2021
Board of Trustees’ Contract Approval — continued
Nature, Extent and Quality of Services
In considering whether to approve the New Agreements, the Board evaluated the nature, extent and quality of services currently provided to each Fund by the Advisers and, as applicable, the Sub-Advisers under the Current Agreements. In evaluating the nature, extent and quality of services to be provided by the Advisers and the Sub-Advisers under the New Agreements, the Board considered, among other information, the expected impact, if any, of the Transaction on the operations, facilities, organization and personnel of the Advisers and the Sub-Advisers, and that Morgan Stanley and the Advisers have advised the Board that, following the Transaction, there is not expected to be any diminution in the nature, extent and quality of services provided by the Advisers and the Sub-Advisers, as applicable, to the Funds and their shareholders, including compliance and other non-advisory services, and that there are not expected to be any changes in portfolio management personnel as a result of the Transaction.
The Board also considered the financial resources of Morgan Stanley and the Advisers and the importance of having a Fund manager with, or with access to, significant organizational and financial resources. The Board considered the benefits to the Funds of being part of a larger combined organization with greater financial resources following the Transaction, particularly during periods of market disruptions and volatility. In this regard, the Board considered information provided by Morgan Stanley regarding its business and operating structure, scale of operation, leadership and reputation, distribution capabilities, and financial condition, as well as information on how the Funds are expected to fit within Morgan Stanley’s overall business strategy and any changes that Morgan Stanley contemplates in the short- or long-term following the Closing. The Board also noted Morgan Stanley’s and the Advisers’ commitment to keep the Board apprised of developments with respect to its long-term integration plans for the Advisers, the Affiliated Sub-Advisers, and existing Morgan Stanley affiliates and their respective personnel.
The Board considered the Advisers’ and the Sub-Advisers’ management capabilities and investment processes in light of the types of investments held by each Fund, including the education, experience and number of investment professionals and other personnel who provide portfolio management, investment research, and similar services to each Fund. In particular, the Board considered the abilities and experience of the Advisers’ and, as applicable, the Sub-Advisers’ investment professionals in implementing each Fund’s investment strategies. The Board also took into account the resources dedicated to portfolio management and other services, the compensation methods of the Advisers and other factors, including the reputation and resources of the Advisers to recruit and retain highly qualified research, advisory and supervisory investment professionals. With respect to the recruitment and retention of key personnel, the Board noted information from Morgan Stanley and the Advisers regarding the benefits of joining Morgan Stanley. In addition, the Board considered the time and attention devoted to the Funds by senior management, as well as the infrastructure, operational capabilities and support staff in place to assist in the portfolio management and operations of the Funds, including the provision of administrative services. With respect to the foregoing, the Board also considered information from the Advisers and Morgan Stanley regarding the anticipated impact of the Transaction on such matters. The Board also considered the business-related and other risks to which the Advisers or their affiliates may be subject in managing the Funds and in connection with the Transaction.
The Board considered the compliance programs of the Advisers and relevant affiliates thereof, including the Affiliated Sub-Advisers. The Board considered compliance and reporting matters regarding, among other things, personal trading by investment professionals, disclosure of portfolio holdings, late trading, frequent trading, portfolio valuation, business continuity and the allocation of investment opportunities. The Board also considered the responses of the Advisers and their affiliates to requests in recent years from regulatory authorities, such as the Securities and Exchange Commission and the Financial Industry Regulatory Authority. The Board also considered certain information relating to the compliance record of Morgan Stanley and its affiliates, including information requests in recent years from regulatory authorities. With respect to the foregoing, including the compliance programs of the Advisers and the Sub-Advisers, the Board noted information regarding the impacts of the Transaction, as well as the Advisers’ and Morgan Stanley’s commitment to keep the Board apprised of developments with respect to its long-term integration plans for the Advisers, the Affiliated Sub-Advisers and existing Morgan Stanley affiliates and their respective personnel.
The Board considered other administrative services provided and to be provided or overseen by the Advisers and their affiliates, including transfer agency and accounting services. The Board evaluated the benefits to shareholders of investing in a fund that is a part of a large fund complex offering exposure to a variety of asset classes and investment disciplines, as well as the ability, in many cases, to exchange an investment among different funds without incurring additional sales charges. The Board noted information that the Transaction was not expected to have any material impact on such matters in the near-term.
In evaluating the nature, extent and quality of the services to be provided under the New Agreements, the Board also considered investment performance information provided for each Fund in connection with the 2020 Annual Approval Process, as well as information provided as of a more recent date. In this regard, the Board compared each Fund’s investment performance to that of comparable funds identified by an independent data provider (the peer group), as well as appropriate benchmark indices and, for certain Funds, a custom peer group of similarly managed funds. The Board also considered, where applicable, Fund-specific performance explanations based on criteria established by the Board in connection with the 2020 Annual Approval Process and, where applicable, performance explanations as of a more recent date. In addition to the foregoing information, it was also noted that the Board has received and discussed with management information throughout the year at periodic intervals comparing each Fund’s performance against applicable benchmark indices and peer groups. In addition, the Board considered each Fund’s performance in light of overall financial market conditions. Where a Fund’s relative underperformance to its peers was significant during one or more specified periods, the Board noted the explanation from the applicable Adviser concerning the Fund’s relative performance versus its peer group.
Eaton Vance
Global Income Builder NextShares
April 30, 2021
Board of Trustees’ Contract Approval — continued
After consideration of the foregoing factors, among others, and based on their review of the materials provided and the assurances received from, and recommendations of, the Advisers and Morgan Stanley, the Board determined that the Transaction was not expected to adversely affect the nature, extent and quality of services provided to the Funds by the Advisers and their affiliates, including the Affiliated Sub-Advisers, and that the Transaction was not expected to have an adverse effect on the ability of the Advisers and their affiliates, including the Affiliated Sub-Advisers, to provide those services. The Board concluded that the nature, extent and quality of services expected to be provided by the Advisers and the Sub-Advisers, taken as a whole, are appropriate and expected to be consistent with the terms of the New Agreements.
Management Fees and Expenses
The Board considered contractual fee rates payable by each Fund for advisory and administrative services (referred to collectively as “management fees”) in connection with the 2020 Annual Approval Process, as well as information provided as of a more recent date. As part of its review, the Board considered each Fund’s management fees and total expense ratio over various periods, as compared to those of comparable funds, before and after giving effect to any undertaking to waive fees or reimburse expenses. The Board also considered factors, and, where applicable, certain Fund-specific factors, that had an impact on a Fund’s total expense ratio relative to comparable funds, as identified by the Advisers in response to inquiries from the Contract Review Committee. The Board considered that the New Agreements do not change a Fund’s management fee rate or the computation method for calculating such fees, including any separately executed permanent contractual management fee reduction currently in place for the Fund.
The Board also received and considered, where applicable, information about the services offered and the fee rates charged by the Advisers and the Sub-Advisers to other types of accounts with investment objectives and strategies that are substantially similar to and/or managed in a similar investment style as a Fund. In this regard, the Board received information about the differences in the nature and scope of services the Advisers and the Sub-Advisers, as applicable, provide to the Funds as compared to other types of accounts and the material differences in compliance, reporting and other legal burdens and risks to the Advisers and such Sub-Advisers as between each Fund and other types of accounts.
After considering the foregoing information, and in light of the nature, extent and quality of the services expected to be provided by the Advisers and the Sub-Advisers, the Board concluded that the management fees charged for advisory and related services are reasonable with respect to its approval of the New Agreements.
Profitability and “Fall-Out” Benefits
During the 2020 Annual Approval Process, the Board considered the level of profits realized by the Advisers and relevant affiliates thereof, including the Affiliated Sub-Advisers, in providing investment advisory and administrative services to the Funds and to all Eaton Vance funds as a group. The Board considered the level of profits realized without regard to marketing support or other payments by the Advisers and their affiliates to third parties in respect of distribution or other services. In light of the foregoing factors and the nature, extent and quality of the services rendered, the profits realized by the Advisers and their affiliates, including the Sub-Advisers, were not deemed to be excessive by the Board.
The Board noted that Morgan Stanley and the Advisers are expected to realize, over time, cost savings from the Transaction based on eliminating duplicate corporate overhead expenses. The Board considered, however, information from the Advisers and Morgan Stanley that such cost savings are not expected to be realized immediately upon the Closing and that, accordingly, there are currently no specific expected changes in the levels of profitability associated with the advisory and other services provided to the Funds that are contemplated as a result of the Transaction. The Board noted that it will continue to receive information regarding profitability during its annual contract review processes, including the extent to which cost savings and/or other efficiencies result in changes to profitability levels.
The Board also considered direct or indirect fall-out benefits received by the Advisers and their affiliates, including the Affiliated Sub-Advisers, in connection with their respective relationships with the Funds, including the benefits of research services that may be available to the Advisers and their affiliates as a result of securities transactions effected for the Funds and other investment advisory clients. In evaluating the fall-out benefits to be received by the Advisers and their affiliates under the New Agreements, the Board considered whether the Transaction would have an impact on the fall-out benefits currently realized by the Advisers and their affiliates in connection with services provided pursuant to the Current Advisory Agreements.
The Board of each Fund considered that Morgan Stanley may derive reputational and other benefits from its ability to use the names of the Advisers and their affiliates in connection with operating and marketing the Funds. The Board considered that the Transaction, if completed, would significantly increase Morgan Stanley’s assets under management and expand Morgan Stanley’s investment capabilities.
Economies of Scale
The Board also considered the extent to which the Advisers and their affiliates, on the one hand, and the Funds, on the other hand, can expect to realize benefits from economies of scale as the assets of the Funds increase. The Board acknowledged the difficulty in accurately measuring the benefits resulting from economies of scale, if any, with respect to the management of any specific Fund or group of funds. As part of the 2020 Annual Approval Process, the Board reviewed data summarizing the increases and decreases in the assets of the Funds and of all Eaton Vance funds as a group over various time periods, and evaluated the extent to which the total expense ratio of each Fund and the profitability of the Advisers and their affiliates may have been affected by such increases or decreases.
Eaton Vance
Global Income Builder NextShares
April 30, 2021
Board of Trustees’ Contract Approval — continued
The Board noted that Morgan Stanley and the Advisers are expected to benefit from possible growth of the Funds resulting from enhanced distribution capabilities, including with respect to the Funds’ potential access to Morgan Stanley’s institutional client base. Based upon the foregoing, the Board concluded that the Funds currently share in the benefits from economies of scale, if any, when they are realized by the Advisers, and that the Transaction is not expected to impede a Fund from continuing to benefit from any future economies of scale realized by its Adviser.
Conclusion
Based on its consideration of the foregoing, and such other information it deemed relevant, including the factors and conclusions described above, the Contract Review Committee recommended to the Board approval of the New Agreements. Based on the recommendation of the Contract Review Committee, the Board, including a majority of the Independent Trustees, unanimously voted to approve the New Agreements for the Funds and recommended that shareholders approve the New Agreements.
Eaton Vance
Global Income Builder NextShares
April 30, 2021
Officers and Trustees
Officers of Eaton Vance Global Income Builder NextShares
Edward J. Perkin
President
Deidre E. Walsh
Vice President
Maureen A. Gemma
Secretary and Chief Legal Officer
James F. Kirchner
Treasurer
Richard F. Froio
Chief Compliance Officer
Officers of Global Income Builder Portfolio
Edward J. Perkin
President
Deidre E. Walsh
Vice President
Maureen A. Gemma
Secretary and Chief Legal Officer
James F. Kirchner
Treasurer
Richard F. Froio
Chief Compliance Officer
Trustees of Eaton Vance Global Income Builder NextShares and Global Income Builder Portfolio
William H. Park
Chairperson
Thomas E. Faust Jr.*
Mark R. Fetting
Cynthia E. Frost
George J. Gorman
Valerie A. Mosley
Helen Frame Peters
Keith Quinton
Marcus L. Smith
Susan J. Sutherland
Scott E. Wennerholm
Eaton Vance Funds
| | |
| Privacy Notice | | April 2021 |
| | |
| |
| FACTS | | WHAT DOES EATON VANCE DO WITH YOUR
PERSONAL INFORMATION? |
| | | |
| |
| | |
| Why? | | Financial companies choose how they share your personal information. Federal law gives consumers the right to limit some but not all sharing. Federal law also requires us to tell you how we collect, share, and protect your personal information. Please read this notice carefully to understand what we do. |
| | |
| | | |
| What? | | The types of personal information we collect and share depend on the product or service you have with us. This information can include: ∎ Social Security number and income ∎ investment experience and risk tolerance ∎ checking account number and wire transfer instructions |
| | |
| | | |
| How? | | All financial companies need to share customers’ personal information to run their everyday business. In the section below, we list the reasons financial companies can share their customers’ personal information; the reasons Eaton Vance chooses to share; and whether you can limit this sharing. |
| | |
| | | |
| | | | |
Reasons we can share your
personal information | | Does Eaton Vance share? | | Can you limit this sharing? |
| For our everyday business purposes — such as to process your transactions, maintain your account(s), respond to court orders and legal investigations, or report to credit bureaus | | Yes | | No |
| For our marketing purposes — to offer our products and services to you | | Yes | | No |
| For joint marketing with other financial companies | | No | | We don’t share |
| For our investment management affiliates’ everyday business purposes — information about your transactions, experiences, and creditworthiness | | Yes | | Yes |
| For our affiliates’ everyday business purposes — information about your transactions and experiences | | Yes | | No |
| For our affiliates’ everyday business purposes — information about your creditworthiness | | No | | We don’t share |
| For our investment management affiliates to market to you | | Yes | | Yes |
| For our affiliates to market to you | | No | | We don’t share |
| For nonaffiliates to market to you | | No | | We don’t share |
| | |
| To limit our sharing | | Call toll-free 1-800-262-1122 or email: EVPrivacy@eatonvance.com Please note: If you are a new customer, we can begin sharing your information 30 days from the date we sent this notice. When you are no longer our customer, we continue to share your information as described in this notice. However, you can contact us at any time to limit our sharing. |
| | |
| | | |
| | |
| Questions? | | Call toll-free 1-800-262-1122 or email: EVPrivacy@eatonvance.com |
| | |
| | | |
Eaton Vance Funds
| | |
| Privacy Notice — continued | | April 2021 |
| | |
| Who we are |
| Who is providing this notice? | | Eaton Vance Management, Eaton Vance Distributors, Inc., Eaton Vance Trust Company, Eaton Vance Management (International) Limited, Eaton Vance Advisers International Ltd., Eaton Vance Global Advisors Limited, Eaton Vance Management’s Real Estate Investment Group, Boston Management and Research, Calvert Research and Management, Eaton Vance and Calvert Fund Families and our investment advisory affiliates (“Eaton Vance”) (see Investment Management Affiliates definition below) |
| What we do |
| How does Eaton Vance protect my personal information? | | To protect your personal information from unauthorized access and use, we use security measures that comply with federal law. These measures include computer safeguards and secured files and buildings. We have policies governing the proper handling of customer information by personnel and requiring third parties that provide support to adhere to appropriate security standards with respect to such information. |
| How does Eaton Vance collect my personal information? | | We collect your personal information, for example, when you ∎ open an account or make deposits or withdrawals from your account ∎ buy securities from us or make a wire transfer ∎ give us your contact information We also collect your personal information from others, such as credit bureaus, affiliates, or other companies. |
| Why can’t I limit all sharing? | | Federal law gives you the right to limit only ∎ sharing for affiliates’ everyday business purposes — information about your creditworthiness ∎ affiliates from using your information to market to you ∎ sharing for nonaffiliates to market to you State laws and individual companies may give you additional rights to limit sharing. See below for more on your rights under state law. |
| Definitions |
| Investment Management Affiliates | | Eaton Vance Investment Management Affiliates include registered investment advisers, registered broker-dealers, and registered and unregistered funds. Investment Management Affiliates does not include entities associated with Morgan Stanley Wealth Management, such as Morgan Stanley Smith Barney LLC and Morgan Stanley & Co. |
| Affiliates | | Companies related by common ownership or control. They can be financial and nonfinancial companies. ∎ Our affiliates include companies with a Morgan Stanley name and financial companies such as Morgan Stanley Smith Barney LLC and Morgan Stanley & Co. |
| Nonaffiliates | | Companies not related by common ownership or control. They can be financial and nonfinancial companies. ∎ Eaton Vance does not share with nonaffiliates so they can market to you. |
| Joint marketing | | A formal agreement between nonaffiliated financial companies that together market financial products or services to you. ∎ Eaton Vance doesn’t jointly market. |
| Other important information |
Vermont: Except as permitted by law, we will not share personal information we collect about Vermont residents with Nonaffiliates unless you provide us with your written consent to share such information. California: Except as permitted by law, we will not share personal information we collect about California residents with Nonaffiliates and we will limit sharing such personal information with our Affiliates to comply with California privacy laws that apply to us. |
Eaton Vance Funds
IMPORTANT NOTICES
Delivery of Shareholder Documents. The Securities and Exchange Commission (SEC) permits delivery of only one copy of fund shareholder documents, including prospectuses, proxy statements and shareholder reports, to fund investors with multiple accounts at the same residential or post office box address. This practice is often called “householding” and it helps eliminate duplicate mailings to shareholders. Your broker may household the mailing of your documents indefinitely unless you instruct your broker otherwise. If you would prefer that your Eaton Vance documents not be householded, please contact your broker. Your instructions that householding not apply to delivery of your Eaton Vance documents will typically be effective within 30 days of receipt by your broker.
Portfolio Holdings. Each Eaton Vance Fund and its underlying Portfolio(s) (if applicable) files a schedule of portfolio holdings on Part F to Form N-PORT with the SEC. Certain information filed on Form N-PORT may be viewed on the Eaton Vance website at www.eatonvance.com, by calling Eaton Vance at 1-800-262-1122 or in the EDGAR database on the SEC’s website at www.sec.gov.
Proxy Voting. From time to time, funds are required to vote proxies related to the securities held by the funds. The Eaton Vance Funds or their underlying Portfolios (if applicable) vote proxies according to a set of policies and procedures approved by the Funds’ and Portfolios’ Boards. You may obtain a description of these policies and procedures and information on how the Funds or Portfolios voted proxies relating to portfolio securities during the most recent 12-month period ended June 30, without charge, upon request, by calling 1-800-262-1122 and by accessing the SEC’s website at www.sec.gov.
Investment Adviser of Global Income Builder Portfolio
Boston Management and Research
Two International Place
Boston, MA 02110
Investment Sub-Adviser of Eaton Vance Global Income Builder NextShares and Global Income Builder Portfolio
Eaton Vance Advisers International Ltd.
125 Old Broad Street
London, EC2N 1AR
United Kingdom
Investment Adviser and Administrator of Eaton Vance Global Income Builder NextShares
Eaton Vance Management
Two International Place
Boston, MA 02110
Distributor*
Foreside Fund Services, LLC
Three Canal Plaza, Suite 100
Portland, ME 04101
Custodian
State Street Bank and Trust Company
State Street Financial Center, One Lincoln Street
Boston, MA 02111
Transfer and Dividend Disbursing Agent
State Street Bank and Trust Company
State Street Financial Center, One Lincoln Street
Boston, MA 02111
Fund Offices
Two International Place
Boston, MA 02110
| * | FINRA BrokerCheck. Investors may check the background of their Investment Professional by contacting the Financial Industry Regulatory Authority (FINRA). FINRA BrokerCheck is a free tool to help investors check the professional background of current and former FINRA-registered securities firms and brokers. FINRA BrokerCheck is available by calling 1-800-289-9999 and at www.FINRA.org. The FINRA BrokerCheck brochure describing this program is available to investors at www.FINRA.org. |


21984 4.30.21
Not required in this filing.
| Item 3. | Audit Committee Financial Expert |
Not required in this filing.
| Item 4. | Principal Accountant Fees and Services |
Not required in this filing.
| Item 5. | Audit Committee of Listed Registrants |
Not applicable.
| Item 6. | Schedule of Investments |
Please see schedule of investments contained in the Report to Stockholders included under Item 1 of this Form N-CSR.
| Item 7. | Disclosure of Proxy Voting Policies and Procedures for Closed-End Management Investment Companies |
Not applicable.
| Item 8. | Portfolio Managers of Closed-End Management Investment Companies |
Not applicable.
| Item 9. | Purchases of Equity Securities by Closed-End Management Investment Company and Affiliated Purchasers |
Not applicable.
| Item 10. | Submission of Matters to a Vote of Security Holders |
No material changes.
| Item 11. | Controls and Procedures |
(a) It is the conclusion of the registrant’s principal executive officer and principal financial officer that the effectiveness of the registrant’s current disclosure controls and procedures (such disclosure controls and procedures having been evaluated within 90 days of the date of this filing) provide reasonable assurance that the information required to be disclosed by the registrant has been recorded, processed, summarized and reported within the time period specified in the Commission’s rules and forms and that the information required to be disclosed by the registrant has been accumulated and communicated to the registrant’s principal executive officer and principal financial officer in order to allow timely decisions regarding required disclosure.
(b) There have been no changes in the registrant’s internal controls over financial reporting during the period covered by this report that has materially affected, or is reasonably likely to materially affect, the registrant’s internal control over financial reporting.
| Item 12. | Disclosure of Securities Lending Activities for Closed-End Management Investment Companies |
Not applicable.
Signatures
Pursuant to the requirements of the Securities Exchange Act of 1934 and the Investment Company Act of 1940, the registrant has duly caused this report to be signed on its behalf by the undersigned, thereunto duly authorized.
| | |
| Eaton Vance NextShares Trust |
| |
| By: | | /s/ Edward J. Perkin |
| | Edward J. Perkin |
| | President |
| |
| Date: | | June 24, 2021 |
Pursuant to the requirements of the Securities Exchange Act of 1934 and the Investment Company Act of 1940, this report has been signed below by the following persons on behalf of the registrant and in the capacities and on the dates indicated.
| | |
| By: | | /s/ James F. Kirchner |
| | James F. Kirchner |
| | Treasurer |
| |
| Date: | | June 24, 2021 |
| |
| By: | | /s/ Edward J. Perkin |
| | Edward J. Perkin |
| | President |
| |
| Date: | | June 24, 2021 |