UNITED STATES
SECURITIES AND EXCHANGE COMMISSION
Washington, D.C. 20549
Form N-CSR
CERTIFIED SHAREHOLDER REPORT OF REGISTERED
MANAGEMENT INVESTMENT COMPANIES
Investment Company Act File Number: 811-22982
Eaton Vance NextShares Trust
(Exact Name of Registrant as Specified in Charter)
Two International Place, Boston, Massachusetts 02110
(Address of Principal Executive Offices)
Deidre E. Walsh
Two International Place, Boston, Massachusetts 02110
(Name and Address of Agent for Services)
(617) 482-8260
(Registrant’s Telephone Number)
December 31
Date of Fiscal Year End
December 31, 2021
Date of Reporting Period
Item 1. Reports to Stockholders

Eaton Vance
Stock NextShares (EVSTC)
Listing Exchange: The NASDAQ Stock Market LLC
Annual Report
December 31, 2021
NextShares® is a registered trademark of NextShares Solutions LLC. All rights reserved.
Commodity Futures Trading Commission Registration. The Commodity Futures Trading Commission (“CFTC”) has adopted regulations that subject registered investment companies and advisers to regulation by the CFTC if a fund invests more than a prescribed level of its assets in certain CFTC-regulated instruments (including futures, certain options and swap agreements) or markets itself as providing investment exposure to such instruments. The investment adviser has claimed an exclusion from the definition of “commodity pool operator” under the Commodity Exchange Act with respect to its management of the Fund. Accordingly, neither the Fund nor the adviser with respect to the operation of the Fund is subject to CFTC regulation. Because of its management of other strategies, the Fund’s adviser is registered with the CFTC as a commodity pool operator. The adviser is also registered as a commodity trading advisor.
Fund shares are not insured by the FDIC and are not deposits or other obligations of, or guaranteed by, any depository institution. Shares are subject to investment risks, including possible loss of principal invested.
This report must be preceded or accompanied by a current summary prospectus or prospectus. Before investing in NextShares, investors should consider carefully the investment objectives, risks, charges and expenses. This and other important information is contained in the prospectus and summary prospectus, which can be obtained from a financial advisor. Prospective investors should read the prospectus carefully before investing. For further information, please call 1-800-262-1122.
Annual Report December 31, 2021
Eaton Vance
Stock NextShares
Eaton Vance
Stock NextShares
December 31, 2021
Management’s Discussion of Fund Performance1
Economic and Market Conditions
The 12-month period starting January 1, 2021, was notable for a U.S. equity rally that lasted for most of the period and resulted in U.S. stocks outperforming most other stock markets in developed economies. Except for temporary retreats in September and November, broad-market indexes generally posted strong returns during the period. Investors cheered the reopening of businesses that had been affected by the pandemic and the rollout of several highly effective COVID-19 vaccines.
COVID-19, however, continued to have a firm grip on the U.S. economy. Disease rates advanced and declined with second, third, and fourth waves of infections. Worker shortages led to global supply-chain disruptions. From computer chips to shipping containers, scarcities of key items led to temporary factory shutdowns and empty store shelves. Those shortages — combined with high demand from consumers eager to spend money saved earlier in the pandemic — led to higher year-over-year inflation than the U.S. had seen in decades.
Still, investor optimism about a recovering economy drove stock prices up during most of the period. A significant pullback, however, occurred in September 2021 when virtually every major U.S. stock index reported negative returns. Unexpectedly weak job creation in August and the U.S. Federal Reserve’s (the Fed’s) announcement that it might soon begin tapering its monthly bond purchases — which had stimulated the economy earlier — combined to drive stocks into negative territory. Rising COVID-19 infections also weighed on equity performance in September.
In the final quarter of 2021, however, stock prices came roaring back. Even the late-November news of a new and more transmissible COVID-19 variant — Omicron — caused only a temporary market retreat. The Fed’s actions to tamp down inflation were applauded by investors, with stocks gaining ground after the central bank announced that tapering would be accelerated and that three possible interest rate hikes were forecast for 2022. Just two trading days before year-end, the S&P 500® Index closed at its 70th new all-time high for the period, and the Dow Jones Industrial Average® (DJIA) closed at an all-time high as well.
For the period as a whole, the broad-market S&P 500® Index returned 28.71%; the blue-chip DJIA was up 20.95%; and the technology-laden Nasdaq Composite Index rose 22.18%. Large-cap U.S. stocks, as measured by the Russell 1000® Index, outperformed their small-cap counterparts, as measured by the Russell 2000® Index. In the large-cap space, growth stocks modestly outperformed value stocks, but in the small-cap space, value stocks strongly outperformed growth stocks during the period.
Fund Performance
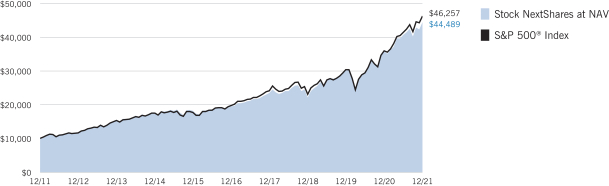
For the 12-month period ended December 31, 2021, Eaton Vance Stock NextShares (the Fund) returned 24.55% at net asset value (NAV), underperforming its benchmark, the S&P 500® Index (the Index), which returned 28.71%.
Stock selections in the information technology (IT) and consumer discretionary sectors, along with stock selections and an underweight position relative to the Index in the energy sector — the best-performing sector in the Index during the period — detracted from Fund performance versus the Index.
In the IT sector, underweighting NVIDIA Corp. (NVIDIA) — a maker of computer graphics processing units used in gaming, data center, and self-driving vehicle applications — and not owning the stock until late in the period hurt returns relative to the Index. NVIDIA’s stock price more than doubled during the period, driven by long-term tailwinds — growth in the gaming, artificial intelligence, and autonomous vehicle industries — and by a sharp increase in gaming and data center demand during the pandemic. By period-end, NVIDIA was sold from the Fund.
Elsewhere in the IT sector, the Fund’s overweight position in Cognizant Technology Solutions Corp. (Cognizant), a business consultant, declined in price during the early part of the period. Competition from other IT service providers as well as in-house management turnover weighed on Cognizant’s stock performance. By period-end, Cognizant was sold from the Fund.
In the consumer discretionary sector, the Fund’s overweight position in e-commerce giant Amazon.com, Inc. (Amazon) detracted from returns relative to the Index during the period. Early in the COVID-19 pandemic, Amazon benefited from a shift toward online shopping during a period when consumers were largely confined to their homes. As the global economy reopened, however, growth in online shopping began to slow as consumers returned to brick-and-mortar retailers. As a result, Amazon’s stock underperformed the Index during the period.
In contrast, stock selections in the health care and communication services sectors contributed to performance versus the Index during the period. In health care, performance relative to the Index benefited from the Fund’s overweight position in Anthem, Inc. (Anthem), a large provider of medical insurance. Anthem’s relationship as an exclusive Blue Cross Blue Shield licensee in numerous states, as well as its recent acquisition of a top-tier Medicare/Medicaid insurer, helped the company deliver strong earnings growth and stock performance during the period. Higher membership figures and a premium rate increase boosted Anthem’s earnings as well.
In the communication services sector, the Fund’s overweight position in Alphabet, Inc. (Alphabet), parent company of search engine Google, performed strongly as positive e-commerce trends drove increased demand for search engine advertising and engagement. In addition, growth in viewership and ad sales on video sharing platform YouTube, an Alphabet subsidiary, exceeded analyst expectations during the period and provided an additional tailwind for Alphabet’s stock price.
See Endnotes and Additional Disclosures in this report.
Past performance is no guarantee of future results. Investment return and principal value will fluctuate so that shares, when sold, may be worth more or less than their original cost. Performance is for the stated time period only; due to market volatility, Fund performance may be lower or higher than the quoted return. The Fund’s performance at market price will differ from its results at net asset value (NAV). The market price used to calculate the Market Price return is the midpoint between the highest bid and the lowest offer on the exchange on which the shares of the Fund are listed for trading, as of the time that the Fund’s NAV is calculated. If you trade your shares at another time during the day, your return may differ. Returns are historical and are calculated by determining the percentage change in NAV or market price (as applicable) with all distributions reinvested at NAV or closing market price (as applicable) on the payment date of the distribution, and are net of management fees and other expenses. Performance for periods less than or equal to one year is cumulative. For performance as of the most recent month-end, including historical trading premiums/discounts relative to NAV, please refer to eatonvance.com.
Eaton Vance
Stock NextShares
December 31, 2021
Performance2,3,4
Portfolio Manager(s) Charles B. Gaffney
| | | | | | | | | | | | | | | | | | | | | | | | |
| % Average Annual Total Returns | | Fund Inception Date | | | Performance Inception Date | | | One Year | | | Five Years | | | Ten Years | | | Since Fund Inception | |
| | | | | | |
Fund at NAV | | | 02/25/2016 | | | | 11/01/2001 | | | | 24.55 | % | | | 17.98 | % | | | 16.08 | % | | | 17.47 | % |
Fund at Market Price | | | 02/25/2016 | | | | 02/25/2016 | | | | 24.74 | | | | 18.02 | | | | — | | | | 17.50 | |
|
| |
| | | | | | |
S&P 500® Index | | | — | | | | — | | | | 28.71 | % | | | 18.46 | % | | | 16.54 | % | | | 18.70 | % |
| | | | | | |
| % Total Annual Operating Expense Ratios5 | | | | | | | | | | | | | | | | | | |
| | | | | | |
Gross | | | | | | | | | | | | | | | | | | | | | | | 2.08 | % |
Net | | | | | | | | | | | | | | | | | | | | | | | 0.65 | |
Growth of $10,000
This graph shows the change in value of a hypothetical investment of $10,000 in Stock NextShares for the period indicated. For comparison, the same investment is shown in the indicated index.
See Endnotes and Additional Disclosures in this report.
Past performance is no guarantee of future results. Investment return and principal value will fluctuate so that shares, when sold, may be worth more or less than their original cost. Performance is for the stated time period only; due to market volatility, Fund performance may be lower or higher than the quoted return. The Fund’s performance at market price will differ from its results at net asset value (NAV). The market price used to calculate the Market Price return is the midpoint between the highest bid and the lowest offer on the exchange on which the shares of the Fund are listed for trading, as of the time that the Fund’s NAV is calculated. If you trade your shares at another time during the day, your return may differ. Returns are historical and are calculated by determining the percentage change in NAV or market price (as applicable) with all distributions reinvested at NAV or closing market price (as applicable) on the payment date of the distribution, and are net of management fees and other expenses. Performance for periods less than or equal to one year is cumulative. For performance as of the most recent month-end, including historical trading premiums/discounts relative to NAV, please refer to eatonvance.com.
Eaton Vance
Stock NextShares
December 31, 2021
Fund Profile6
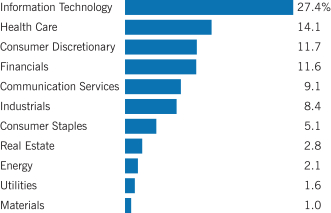
Sector Allocation (% of net assets)7
Top 10 Holdings (% of net assets)7
| | | | |
Microsoft Corp. | | | 7.2 | % |
| |
Apple, Inc. | | | 6.0 | |
| |
Alphabet, Inc., Class C | | | 5.5 | |
| |
Amazon.com, Inc. | | | 5.4 | |
| |
Wells Fargo & Co. | | | 2.3 | |
| |
AbbVie, Inc. | | | 2.2 | |
| |
S&P Global, Inc. | | | 2.2 | |
| |
PNC Financial Services Group, Inc. (The) | | | 2.1 | |
| |
ConocoPhillips | | | 2.1 | |
| |
Visa, Inc., Class A | | | 2.0 | |
| |
Total | | | 37.0 | % |
See Endnotes and Additional Disclosures in this report.
Eaton Vance
Stock NextShares
December 31, 2021
Endnotes and Additional Disclosures
| 1 | The views expressed in this report are those of the portfolio manager(s) and are current only through the date stated at the top of this page. These views are subject to change at any time based upon market or other conditions, and Eaton Vance and the Fund(s) disclaim any responsibility to update such views. These views may not be relied upon as investment advice and, because investment decisions are based on many factors, may not be relied upon as an indication of trading intent on behalf of any Eaton Vance fund. This commentary may contain statements that are not historical facts, referred to as “forward-looking statements.” The Fund’s actual future results may differ significantly from those stated in any forward-looking statement, depending on factors such as changes in securities or financial markets or general economic conditions, the volume of sales and purchases of Fund shares, the continuation of investment advisory, administrative and service contracts, and other risks discussed from time to time in the Fund’s filings with the Securities and Exchange Commission. |
| 2 | Shares of NextShares funds are normally bought and sold in the secondary market through a broker, and may not be individually purchased or redeemed from the fund. In the secondary market, buyers and sellers transact with each other, rather than with the fund. NextShares funds issue and redeem shares only in specified creation unit quantities in transactions by or through Authorized Participants. In such transactions, a fund issues and redeems shares in exchange for the basket of securities, other instruments and/or cash that the fund specifies each business day. By transacting in kind, a NextShares fund can lower its trading costs and enhance fund tax efficiency by avoiding forced sales of securities to meet redemptions. Redemptions may be effected partially or entirely in cash when in-kind delivery is not practicable or deemed not in the best interests of shareholders. A fund’s basket is not intended to be representative of the fund’s current portfolio positions and may vary significantly from current positions. As exchange-traded securities, NextShares can operate with low transfer agency expenses by utilizing the same highly efficient share processing system as used for exchange-listed stocks and exchange-traded funds. Market trading prices of NextShares are linked to the fund’s next-computed net asset value (NAV) and will vary from NAV by a market-determined premium or discount, which may be zero. Buyers and sellers of NextShares will not know the value of their purchases and sales until after the fund’s NAV is determined at the end of the trading day. Market trading prices may vary significantly from anticipated levels. NextShares do not offer investors the opportunity to buy and sell intraday based on current (versus end-of-day) determinations of fund value. NextShares trade execution prices will fluctuate based on changes in NAV. Although limit orders may be used to control trading costs, they cannot be used to control or limit trade execution prices. As a new type of fund, NextShares have a limited operating history and may initially be available through a limited number of brokers. There can be no guarantee that an active trading market for NextShares will develop or be maintained, or that their listing will continue unchanged. Buying and selling NextShares may require payment of brokerage commissions and expose transacting shareholders to other trading costs. Frequent trading may detract from realized investment returns. The return on a shareholder’s NextShares investment will be reduced if the shareholder sells shares at a greater discount or narrower premium to NAV than he or she acquired the shares. |
| 3 | S&P 500® Index is an unmanaged index of large-cap stocks commonly used as a measure of U.S. stock market performance. S&P Dow Jones Indices are a product of S&P Dow Jones Indices LLC (“S&P DJI”) and have been licensed for use. S&P® and S&P 500® are registered |
| | trademarks of S&P DJI; Dow Jones® is a registered trademark of Dow Jones Trademark Holdings LLC (“Dow Jones”); S&P DJI, Dow Jones and their respective affiliates do not sponsor, endorse, sell or promote the Fund, will not have any liability with respect thereto and do not have any liability for any errors, omissions, or interruptions of the S&P Dow Jones Indices. Unless otherwise stated, index returns do not reflect the effect of any applicable sales charges, commissions, expenses, taxes or leverage, as applicable. It is not possible to invest directly in an index. Performance since inception for an index, if presented, is the performance since the Fund’s or oldest share class’ inception, as applicable. |
| 4 | The Fund pursues its investment objective by investing in a separate investment fund (the Portfolio). The returns at NAV for periods before the date the Fund commenced operations are for a mutual fund that invests in the Portfolio (the Portfolio Investor). The performance during such period does not represent the performance of the Fund. The prior investment performance of the Portfolio Investor (rather than the Portfolio itself) is shown because it reflects the expenses typically borne by a retail fund investing in the Portfolio. The Portfolio Investor returns are not adjusted to reflect differences between the total net operating expenses of the Fund and the Portfolio Investor during the periods shown. If such an adjustment were made, the performance presented would be higher, because the Fund’s total net operating expenses are lower than those of the Portfolio Investor. Performance is for a share class of the Portfolio Investor offered at net asset value. Performance presented in the Financial Highlights included in the financial statements is not linked. |
| 5 | Source: Fund prospectus. Net expense ratio reflects a contractual expense reimbursement that continues through 4/30/22. The expense ratio for the current reporting period can be found in the Financial Highlights section of this report. Performance reflects expenses waived and/or reimbursed, if applicable. Without such waivers and/or reimbursements, performance would have been lower. |
| 6 | Fund primarily invests in an affiliated investment company (Portfolio) with substantially the same objective(s) and policies as the Fund and may also invest directly. Unless otherwise noted, references to investments are to the aggregate holdings of the Fund and the Portfolio. |
| 7 | Excludes cash and cash equivalents. |
Fund profile subject to change due to active management.
Additional Information
Dow Jones Industrial Average® is a price-weighted average of 30 blue-chip stocks that are generally the leaders in their industry. Nasdaq Composite Index is a market capitalization-weighted index of all domestic and international securities listed on Nasdaq. Source: Nasdaq, Inc. The information is provided by Nasdaq (with its affiliates, are referred to as the “Corporations”) and Nasdaq’s third party licensors on an “as is” basis and the Corporations make no guarantees and bear no liability of any kind with respect to the information or the Fund. Russell 1000® Index is an unmanaged index of 1,000 U.S. large-cap stocks. Russell 2000® Index is an unmanaged index of 2,000 U.S. small-cap stocks.
Eaton Vance
Stock NextShares
December 31, 2021
Fund Expenses
Example: As a Fund shareholder, you incur two types of costs: (1) transaction costs, including brokerage commissions on purchases and sales of Fund shares; and (2) ongoing costs, including management fees and other Fund expenses. This Example is intended to help you understand your ongoing costs (in dollars) of Fund investing and to compare these costs with the ongoing costs of investing in other funds. The Example is based on an investment of $1,000 invested at the beginning of the period and held for the entire period (July 1, 2021 – December 31, 2021).
Actual Expenses: The first section of the table below provides information about actual account values and actual expenses. You may use the information in this section, together with the amount you invested, to estimate the expenses that you paid over the period. Simply divide your account value by $1,000 (for example, an $8,600 account value divided by $1,000 = 8.6), then multiply the result by the number in the first section under the heading entitled “Expenses Paid During Period” to estimate the expenses you paid on your account during this period.
Hypothetical Example for Comparison Purposes: The second section of the table below provides information about hypothetical account values and hypothetical expenses based on the actual Fund expense ratio and an assumed rate of return of 5% per year (before expenses), which is not the actual Fund return. The hypothetical account values and expenses may not be used to estimate the actual ending account balance or expenses you paid for the period. You may use this information to compare the ongoing costs of investing in your Fund and other funds. To do so, compare this 5% hypothetical example with the 5% hypothetical examples that appear in the shareholder reports of the other funds.
Please note that the expenses shown in the table are meant to highlight your ongoing costs only and do not reflect any transactional costs, such as brokerage commissions on purchases and sales of Fund shares. Therefore, the second section of the table is useful in comparing ongoing costs only, and will not help you determine the relative total costs of owning different funds. In addition, if these transactional costs were included, your costs would be higher.
| | | | | | | | | | | | | | | | |
| | | Beginning
Account Value
(7/1/21) | | | Ending
Account Value
(12/31/21) | | | Expenses Paid
During Period*
(7/1/21 – 12/31/21) | | | Annualized
Expense
Ratio | |
| | | |
Actual | | | | | | | | | | | | | |
| | $ | 1,000.00 | | | $ | 1,096.60 | | | $ | 3.43 | ** | | | 0.65 | % |
| | | | |
Hypothetical | | | | | | | | | | | | | |
(5% return per year before expenses) | | | | | | | | | | | | | |
| | $ | 1,000.00 | | | $ | 1,021.93 | | | $ | 3.31 | ** | | | 0.65 | % |
| * | Expenses are equal to the Fund’s annualized expense ratio, multiplied by the average account value over the period, multiplied by 184/365 (to reflect the one-half year period). The Example assumes that the $1,000 was invested at the net asset value per share determined at the close of business on June 30, 2021. The Example reflects the expenses of both the Fund and the Portfolio. |
| ** | Absent an allocation of certain expenses to an affiliate, expenses would be higher. |
Eaton Vance
Stock NextShares
December 31, 2021
Statement of Assets and Liabilities
| | | | |
| Assets | | December 31, 2021 | |
| |
Investment in Stock Portfolio, at value (identified cost, $0) | | $ | 1,499,329 | |
| |
Receivable from affiliate | | | 2,050 | |
| |
Total assets | | $ | 1,501,379 | |
|
| Liabilities | |
| |
Payable to affiliates: | | | | |
| |
Operations agreement fee | | $ | 78 | |
| |
Trustees’ fees | | | 125 | |
| |
Accrued expenses | | | 29,201 | |
| |
Total liabilities | | $ | 29,404 | |
| |
Net Assets | | $ | 1,471,975 | |
|
| Sources of Net Assets | |
| |
Paid-in capital | | $ | 9,447,323 | |
| |
Accumulated loss | | | (7,975,348 | ) |
| |
Total | | $ | 1,471,975 | |
| |
| Net Asset Value Per Share | | | | |
| |
($1,471,975 ÷ 100,000 shares issued and outstanding) | | $ | 14.72 | |
| | | | |
| | 7 | | See Notes to Financial Statements. |
Eaton Vance
Stock NextShares
December 31, 2021
Statement of Operations
| | | | |
| Investment Income | | Year Ended
December 31, 2021 | |
| |
Dividends allocated from Portfolio (net of foreign taxes, $1,476) | | $ | 79,430 | |
| |
Expenses allocated from Portfolio | | | (44,053 | ) |
| |
Total investment income from Portfolio | | $ | 35,377 | |
| |
| Expenses | | | | |
| |
Operations agreement fee | | $ | 3,460 | |
| |
Trustees’ fees and expenses | | | 500 | |
| |
Custodian fee | | | 14,003 | |
| |
Transfer and dividend disbursing agent fees | | | 13,800 | |
| |
Legal and accounting services | | | 20,805 | |
| |
Printing and postage | | | 7,826 | |
| |
Listing fee | | | 5,280 | |
| |
Intraday pricing fee | | | 7,200 | |
| |
Miscellaneous | | | 4,115 | |
| |
Total expenses | | $ | 76,989 | |
| |
Deduct — | | | | |
| |
Allocation of expenses to affiliate | | $ | 75,785 | |
| |
Total expense reductions | | $ | 75,785 | |
| |
Net expenses | | $ | 1,204 | |
| |
Net investment income | | $ | 34,173 | |
| |
| Realized and Unrealized Gain (Loss) | | | | |
| |
Net realized gain (loss) — | | | | |
| |
Investment transactions — affiliated Portfolio | | $ | 2,270,895 | |
| |
Net realized gain (loss) allocated from affiliated Portfolio — | | | | |
| |
Investment transactions | | | 844,540 | (1) |
| |
Foreign currency transactions | | | (120 | ) |
| |
Net realized gain | | $ | 3,115,315 | |
| |
Change in unrealized appreciation (depreciation) — | | | | |
| |
Investments — affiliated Portfolio | | $ | (2,270,895 | ) |
| |
Change in unrealized appreciation (depreciation) allocated from affiliated Portfolio — | | | | |
| |
Investments | | | 328,261 | |
| |
Foreign currency | | | (61 | ) |
| |
Net change in unrealized appreciation (depreciation) | | $ | (1,942,695 | ) |
| |
Net realized and unrealized gain | | $ | 1,172,620 | |
| |
Net increase in net assets from operations | | $ | 1,206,793 | |
| (1) | Includes $32,272 of net realized gains from redemptions in-kind. |
| | | | |
| | 8 | | See Notes to Financial Statements. |
Eaton Vance
Stock NextShares
December 31, 2021
Statements of Changes in Net Assets
| | | | | | | | |
| | | Year Ended December 31, | |
| Increase (Decrease) in Net Assets | | 2021 | | | 2020 | |
| | |
From operations — | | | | | | | | |
| | |
Net investment income | | $ | 34,173 | | | $ | 56,580 | |
| | |
Net realized gain | | | 3,115,315 | (1) | | | 174,611 | |
| | |
Net change in unrealized appreciation (depreciation) | | | (1,942,695 | ) | | | 979,232 | |
| | |
Net increase in net assets from operations | | $ | 1,206,793 | | | $ | 1,210,423 | |
| | |
Distributions to shareholders | | $ | (593,010 | ) | | $ | (285,345 | ) |
| | |
Transactions in Fund shares — | | | | | | | | |
| | |
Cost of shares redeemed | | $ | (6,672,167 | ) | | $ | — | |
| | |
Transaction fees | | | 405 | | | | — | |
| | |
Net increase (decrease) in net assets from Fund share transactions | | $ | (6,671,762 | ) | | $ | — | |
| | |
Other capital — | | | | | | | | |
| | |
Portfolio transaction fee contributed to Portfolio | | $ | (3,412 | ) | | $ | (1,532 | ) |
| | |
Portfolio transaction fee allocated from Portfolio | | | 4,563 | | | | 2,716 | |
| | |
Net increase in net assets from other capital | | $ | 1,151 | | | $ | 1,184 | |
| | |
Net increase (decrease) in net assets | | $ | (6,056,828 | ) | | $ | 926,262 | |
|
| Net Assets | |
| | |
At beginning of year | | $ | 7,528,803 | | | $ | 6,602,541 | |
| | |
At end of year | | $ | 1,471,975 | | | $ | 7,528,803 | |
| | |
| Changes in shares outstanding | | | | | | | | |
| | |
Shares outstanding, beginning of year | | | 450,000 | | | | 450,000 | |
| | |
Shares redeemed | | | (350,000 | ) | | | — | |
| | |
Shares outstanding, end of year | | | 100,000 | | | | 450,000 | |
| (1) | Includes $32,272 of net realized gains from redemptions in-kind. |
| | | | |
| | 9 | | See Notes to Financial Statements. |
Eaton Vance
Stock NextShares
December 31, 2021
Financial Highlights
| | | | | | | | | | | | | | | | | | | | |
| |
| | | Year Ended December 31, | |
| | | 2021 | | | 2020 | | | 2019 | | | 2018 | | | 2017(1) | |
| | | | | |
Net asset value — Beginning of year | | $ | 16.730 | | | $ | 14.670 | | | $ | 11.670 | | | $ | 13.010 | | | $ | 11.160 | |
| | | | | |
| Income (Loss) From Operations | | | | | | | | | | | | | | | | | | | | |
| | | | | |
Net investment income(2) | | $ | 0.091 | | | $ | 0.126 | | | $ | 0.141 | | | $ | 0.153 | | | $ | 0.170 | |
| | | | | |
Net realized and unrealized gain (loss) | | | 3.825 | | | | 2.565 | | | | 4.035 | | | | (0.900 | ) | | | 2.098 | |
| | | | | |
Total income (loss) from operations | | $ | 3.916 | | | $ | 2.691 | | | $ | 4.176 | | | $ | (0.747 | ) | | $ | 2.268 | |
| | | | | |
| Less Distributions | | | | | | | | | | | | | | | | | | | | |
| | | | | |
From net investment income | | $ | (0.172 | ) | | $ | (0.132 | ) | | $ | (0.132 | ) | | $ | (0.269 | ) | | $ | (0.068 | ) |
| | | | | |
From net realized gain | | | (5.758 | ) | | | (0.502 | ) | | | (1.050 | ) | | | (0.328 | ) | | | (0.352 | ) |
| | | | | |
Total distributions | | $ | (5.930 | ) | | $ | (0.634 | ) | | $ | (1.182 | ) | | $ | (0.597 | ) | | $ | (0.420 | ) |
| | | | | |
Portfolio transaction fee, net(2) | | $ | 0.004 | | | $ | 0.003 | | | $ | 0.006 | | | $ | 0.004 | | | $ | 0.002 | |
| | | | | |
Net asset value — End of year | | $ | 14.720 | | | $ | 16.730 | | | $ | 14.670 | | | $ | 11.670 | | | $ | 13.010 | |
| | | | | |
Total Return on Net Asset Value(3)(4) | | | 24.55 | % | | | 18.68 | % | | | 35.95 | % | | | (5.50 | )% | | | 20.43 | % |
| | | | | |
| Ratios/Supplemental Data | | | | | | | | | | | | | | | | | | | | |
| | | | | |
Net assets, end of year (000’s omitted) | | $ | 1,472 | | | $ | 7,529 | | | $ | 6,603 | | | $ | 5,250 | | | $ | 12,354 | |
| | | | | |
Ratios (as a percentage of average daily net assets):(5) | | | | | | | | | | | | | | | | | | | | |
| | | | | |
Expenses(4) | | | 0.65 | % | | | 0.65 | % | | | 0.65 | % | | | 0.65 | % | | | 0.65 | % |
| | | | | |
Net investment income | | | 0.49 | % | | | 0.85 | % | | | 1.00 | % | | | 1.14 | % | | | 1.42 | % |
| | | | | |
Portfolio Turnover of the Portfolio | | | 44 | % | | | 70 | % | | | 55 | % | | | 90 | % | | | 101 | % |
| (1) | Per share data reflect a 2-for-1 share split effective March 9, 2018. |
| (2) | Computed using average shares outstanding. |
| (3) | Returns are historical and are calculated by determining the percentage change in net asset value with all distributions reinvested and do not reflect the effect of a market-determined premium or discount. Investment returns assume that all distributions have been reinvested at net asset value. |
| (4) | The investment adviser and administrator reimbursed certain operating expenses (equal to 1.10%, 1.43%, 1.45%, 0.95% and 0.61% of average daily net assets for the years ended December 31, 2021, 2020, 2019, 2018 and 2017, respectively). Absent this reimbursement, total return would be lower. |
| (5) | Includes the Fund’s share of the Portfolio’s allocated expenses. |
| | | | |
| | 10 | | See Notes to Financial Statements. |
Eaton Vance
Stock NextShares
December 31, 2021
Notes to Financial Statements
1 Significant Accounting Policies
Eaton Vance Stock NextShares (the Fund) is a diversified series of Eaton Vance NextShares Trust (the Trust), a Massachusetts business trust registered under the Investment Company Act of 1940, as amended (the 1940 Act). The Fund is an exchange-traded managed fund operating pursuant to an order issued by the SEC granting an exemption from certain provisions of the 1940 Act. Individual shares of the Fund may be purchased and sold only on a national securities exchange or alternative trading system through a broker-dealer that offers NextShares, and may not be directly purchased or redeemed from the Fund. Market trading prices for the Fund are directly linked to the Fund’s next-computed net asset value per share (NAV) and will vary from NAV by a market-determined premium or discount, which may be zero. The Fund invests all of its investable assets in interests in Stock Portfolio (the Portfolio), a Massachusetts business trust having substantially the same investment objective and policies as the Fund. The value of the Fund’s investment in the Portfolio reflects the Fund’s proportionate interest in the net assets of the Portfolio (0.2% at December 31, 2021). The performance of the Fund is directly affected by the performance of the Portfolio. The financial statements of the Portfolio, including the portfolio of investments, are included elsewhere in this report and should be read in conjunction with the Fund’s financial statements.
The following is a summary of significant accounting policies of the Fund. The policies are in conformity with accounting principles generally accepted in the United States of America (U.S. GAAP). The Fund is an investment company and follows accounting and reporting guidance in the Financial Accounting Standards Board (FASB) Accounting Standards Codification Topic 946.
A Investment Valuation — Valuation of securities by the Portfolio is discussed in Note 1A of the Portfolio’s Notes to Financial Statements, which are included elsewhere in this report.
B Income — The Fund’s net investment income or loss consists of the Fund’s pro-rata share of the net investment income or loss of the Portfolio, less all actual and accrued expenses of the Fund.
C Federal Taxes — The Fund’s policy is to comply with the provisions of the Internal Revenue Code applicable to regulated investment companies and to distribute to shareholders each year substantially all of its net investment income, and all or substantially all of its net realized capital gains. Accordingly, no provision for federal income or excise tax is necessary.
As of December 31, 2021, the Fund had no uncertain tax positions that would require financial statement recognition, de-recognition, or disclosure. The Fund files a U.S. federal income tax return annually after its fiscal year-end, which is subject to examination by the Internal Revenue Service for a period of three years from the date of filing.
D Expenses — The majority of expenses of the Trust are directly identifiable to an individual fund. Expenses which are not readily identifiable to a specific fund are allocated taking into consideration, among other things, the nature and type of expense and the relative size of the funds.
E Use of Estimates — The preparation of the financial statements in conformity with U.S. GAAP requires management to make estimates and assumptions that affect the reported amounts of assets and liabilities at the date of the financial statements and the reported amounts of income and expense during the reporting period. Actual results could differ from those estimates.
F Indemnifications — Under the Trust’s organizational documents, its officers and Trustees may be indemnified against certain liabilities and expenses arising out of the performance of their duties to the Fund. Under Massachusetts law, if certain conditions prevail, shareholders of a Massachusetts business trust (such as the Trust) could be deemed to have personal liability for the obligations of the Trust. However, the Trust’s Declaration of Trust contains an express disclaimer of liability on the part of Fund shareholders and the By-laws provide that the Trust shall assume, upon request by the shareholder, the defense on behalf of any Fund shareholders. Moreover, the By-laws also provide for indemnification out of Fund property of any shareholder held personally liable solely by reason of being or having been a shareholder for all loss or expense arising from such liability. Additionally, in the normal course of business, the Fund enters into agreements with service providers that may contain indemnification clauses. The Fund’s maximum exposure under these arrangements is unknown as this would involve future claims that may be made against the Fund that have not yet occurred.
G Other — Investment transactions are accounted for on a trade date basis.
2 Distributions to Shareholders and Income Tax Information
It is the present policy of the Fund to make at least one distribution annually (normally in December) of all or substantially all of its net investment income and to distribute annually all or substantially all of its net realized capital gains. Distributions are paid in cash and cannot be automatically reinvested in additional shares of the Fund. Distributions to shareholders are recorded on the ex-dividend date. Distributions to shareholders are determined in accordance with income tax regulations, which may differ from U.S. GAAP. As required by U.S. GAAP, only distributions in excess of tax basis earnings and profits are reported in the financial statements as a return of capital. Permanent differences between book and tax accounting relating to distributions are reclassified to paid-in capital. For tax purposes, distributions from short-term capital gains are considered to be from ordinary income.
Eaton Vance
Stock NextShares
December 31, 2021
Notes to Financial Statements — continued
The tax character of distributions declared for the years ended December 31, 2021 and December 31, 2020 was as follows:
| | | | | | | | |
| | | Year Ended December 31, | |
| | | 2021 | | | 2020 | |
| | |
Ordinary income | | $ | 57,570 | | | $ | 85,590 | |
| | |
Long-term capital gains | | $ | 535,440 | | | $ | 199,755 | |
During the year ended December 31, 2021, accumulated loss was increased by $3,873,406 and paid-in capital was increased by $3,873,406 due to the Fund’s use of equalization accounting and the Fund’s investment in the Portfolio. Tax equalization accounting allows the Fund to treat as a distribution that portion of redemption proceeds representing a redeeming shareholder’s portion of undistributed taxable income and net capital gains. These reclassifications had no effect on the net assets or net asset value per share of the Fund.
As of December 31, 2021, the components of distributable earnings (accumulated loss) on a tax basis were as follows:
| | | | |
| | |
Undistributed ordinary income | | $ | 15,322 | |
| |
Undistributed long-term capital gains | | | 239,556 | |
| |
Net unrealized depreciation | | | (8,230,226 | ) |
| |
Accumulated loss | | $ | (7,975,348 | ) |
3 Investment Adviser and Administrative Fee and Other Transactions with Affiliates
The investment adviser and administrative fee is earned by Eaton Vance Management (EVM) as compensation for investment advisory and administrative services rendered to the Fund. On March 1, 2021, Morgan Stanley acquired Eaton Vance Corp. (the “Transaction”) and EVM became an indirect, wholly-owned subsidiary of Morgan Stanley. In connection with the Transaction, the Fund entered into a new investment advisory and administrative agreement (the “New Agreement”) with EVM, which took effect on March 1, 2021. Pursuant to the New Agreement (and the Fund’s investment advisory and administrative agreement with EVM in effect prior to March 1, 2021), the investment adviser fee is computed at an annual rate as a percentage of the Fund’s average daily net assets that are not invested in other investment companies for which EVM or its affiliates serve as investment adviser and receive an advisory fee as follows and is payable monthly:
| | | | |
| Average Daily Net Assets | | Annual Fee Rate | |
| |
Up to $500 million | | | 0.600 | % |
| |
$500 million but less than $1 billion | | | 0.575 | % |
| |
$1 billion but less than $2.5 billion | | | 0.550 | % |
| |
$2.5 billion but less than $5 billion | | | 0.530 | % |
| |
$5 billion and over | | | 0.515 | % |
For the year ended December 31, 2021, the Fund incurred no investment adviser and administrative fee on such assets. To the extent the Fund’s assets are invested in the Portfolio, the Fund is allocated its pro rata share of the Portfolio’s investment adviser fee. The Portfolio has engaged Boston Management and Research (BMR), a subsidiary of EVM, to render investment advisory services. See Note 2 of the Portfolio’s Notes to Financial Statements which are included elsewhere in this report. EVM also serves as the administrator of the Fund, but receives no compensation.
The Trust, on behalf of the Fund, has entered into an operations agreement with EVM pursuant to which EVM provides the Fund with services required for it to operate as a NextShares exchange-traded managed fund in accordance with the exemptive order obtained by EVM and the Trust. Pursuant to the agreement, the Fund pays EVM a monthly fee at an annual rate of 0.05% of the Fund’s average daily net assets provided the average net assets of NextShares funds sponsored by EVM (“Covered Assets”) are less than $10 billion. The annual rate is reduced if Covered Assets are $10 billion and above. For the year ended December 31, 2021, the operations agreement fee amounted to $3,460 or 0.05% of the Fund’s average daily net assets.
EVM has agreed to reimburse the Fund’s expenses to the extent that total annual operating expenses (relating to ordinary operating expenses only) exceed 0.65% of the Fund’s average daily net assets through April 30, 2022. Thereafter, the reimbursement may be changed or terminated at any time. Pursuant to this agreement, EVM was allocated $75,785 of the Fund’s operating expenses for the year ended December 31, 2021.
Trustees and officers of the Fund who are members of EVM’s or BMR’s organizations receive remuneration for their services to the Fund out of the investment adviser fee. Certain officers and Trustees of the Fund and the Portfolio are officers of the above organizations.
Eaton Vance
Stock NextShares
December 31, 2021
Notes to Financial Statements — continued
4 Investment Transactions
For the year ended December 31, 2021, increases and decreases in the Fund’s investment in the Portfolio aggregated $174,260 and $7,446,859, respectively. In addition, a Portfolio transaction fee is imposed by the Portfolio on the combined daily inflows or outflows of the Fund and the Portfolio’s other investors as more fully described at Note 1H of the Portfolio’s financial statements included herein. Such fee is allocated to the Fund based on its pro-rata interest in the Portfolio. The amount of the Portfolio transaction fee imposed on the Fund, if any, and the allocation of such fee are presented as Other capital on the Statements of Changes in Net Assets.
5 Capital Share Transactions
The Trust may issue an unlimited number of shares of capital stock (no par value per share) in one or more series (such as the Fund). The Fund issues and redeems shares only in blocks of 25,000 shares or multiples thereof (“Creation Units”). The Fund issues and redeems Creation Units in return for the securities, other instruments and/or cash (the “Basket”) that the Fund specifies each business day. Creation Units may be purchased or redeemed only by or through Authorized Participants, which are broker-dealers or institutional investors that have entered into agreements with the Fund’s distributor for this purpose. The Fund imposes a transaction fee on Creation Units issued and redeemed to offset the estimated cost to the Fund of processing the transaction, which is paid by the Authorized Participants directly to a third-party administrator. In addition, Authorized Participants pay the Fund a variable charge for converting the Basket to or from the desired portfolio composition. Such variable charges, if any, are are reflected as Transaction fees on the Statements of Changes in Net Assets.
At December 31, 2021, EVM owned approximately 85% of the outstanding shares of the Fund.
Eaton Vance
Stock NextShares
December 31, 2021
Report of Independent Registered Public Accounting Firm
To the Trustees of Eaton Vance NextShares Trust and Shareholders of Eaton Vance Stock NextShares:
Opinion on the Financial Statements and Financial Highlights
We have audited the accompanying statement of assets and liabilities of Eaton Vance Stock NextShares (the “Fund”) (one of the funds constituting Eaton Vance NextShares Trust), as of December 31, 2021, the related statement of operations for the year then ended, the statements of changes in net assets for each of the two years in the period then ended, the financial highlights for each of the five years in the period then ended, and the related notes. In our opinion, the financial statements and financial highlights present fairly, in all material respects, the financial position of the Fund as of December 31, 2021, and the results of its operations for the year then ended, the changes in its net assets for each of the two years in the period then ended, and the financial highlights for each of the five years in the period then ended, in conformity with accounting principles generally accepted in the United States of America.
Basis for Opinion
These financial statements and financial highlights are the responsibility of the Fund’s management. Our responsibility is to express an opinion on the Fund’s financial statements and financial highlights based on our audits. We are a public accounting firm registered with the Public Company Accounting Oversight Board (United States) (PCAOB) and are required to be independent with respect to the Fund in accordance with the U.S. federal securities laws and the applicable rules and regulations of the Securities and Exchange Commission and the PCAOB.
We conducted our audits in accordance with the standards of the PCAOB. Those standards require that we plan and perform the audit to obtain reasonable assurance about whether the financial statements and financial highlights are free of material misstatement, whether due to error or fraud. The Fund is not required to have, nor were we engaged to perform, an audit of its internal control over financial reporting. As part of our audits, we are required to obtain an understanding of internal control over financial reporting but not for the purpose of expressing an opinion on the effectiveness of the Fund’s internal control over financial reporting. Accordingly, we express no such opinion.
Our audits included performing procedures to assess the risks of material misstatement of the financial statements and financial highlights, whether due to error or fraud, and performing procedures that respond to those risks. Such procedures included examining, on a test basis, evidence regarding the amounts and disclosures in the financial statements and financial highlights. Our audits also included evaluating the accounting principles used and significant estimates made by management, as well as evaluating the overall presentation of the financial statements and financial highlights. We believe that our audits provide a reasonable basis for our opinion.
/s/ Deloitte & Touche LLP
Boston, Massachusetts
February 23, 2022
We have served as the auditor of one or more Eaton Vance investment companies since 1959.
Eaton Vance
Stock NextShares
December 31, 2021
Federal Tax Information (Unaudited)
The Form 1099-DIV you received in February 2022 showed the tax status of all distributions paid to your account in calendar year 2021. Shareholders are advised to consult their own tax adviser with respect to the tax consequences of their investment in the Fund. As required by the Internal Revenue Code and/or regulations, shareholders must be notified regarding the status of qualified business income, qualified dividend income for individuals, the dividends received deduction for corporations and capital gains dividends.
Qualified Business Income. For the fiscal year ended December 31, 2021, the Fund designates $1,397, or up to the maximum amount of such dividends allowable pursuant to the Internal Revenue Code, as qualified business income.
Qualified Dividend Income. For the fiscal year ended December 31, 2021, the Fund designates approximately $75,659, or up to the maximum amount of such dividends allowable pursuant to the Internal Revenue Code, as qualified dividend income eligible for the reduced tax rate of 15%.
Dividends Received Deduction. Corporate shareholders are generally entitled to take the dividends received deduction on the portion of the Fund’s dividend distribution that qualifies under tax law. For the Fund’s fiscal 2021 ordinary income dividends, 53.76% qualifies for the corporate dividends received deduction.
Capital Gains Dividends. The Fund hereby designates as a capital gain dividend with respect to the taxable year ended December 31, 2021, $1,221,410 or, if subsequently determined to be different, the net capital gain of such year.
Stock Portfolio
December 31, 2021
Portfolio of Investments
| | | | | | | | |
| Common Stocks — 94.9% | |
| Security | | Shares | | | Value | |
|
| Auto Components — 1.6% | |
| | |
Aptiv PLC(1) | | | 86,456 | | | $ | 14,260,917 | |
| |
| | | | $ | 14,260,917 | |
|
| Automobiles — 0.9% | |
| | |
Tesla, Inc.(1) | | | 7,200 | | | $ | 7,608,816 | |
| |
| | | | $ | 7,608,816 | |
|
| Banks — 4.4% | |
| | |
PNC Financial Services Group, Inc. (The) | | | 90,970 | | | $ | 18,241,304 | |
| | |
Wells Fargo & Co. | | | 417,210 | | | | 20,017,736 | |
| |
| | | | $ | 38,259,040 | |
|
| Beverages — 3.4% | |
| | |
Coca-Cola Co. (The) | | | 257,246 | | | $ | 15,231,536 | |
| | |
Coca-Cola Europacific Partners PLC | | | 250,060 | | | | 13,985,856 | |
| |
| | | | $ | 29,217,392 | |
|
| Biotechnology — 3.1% | |
| | |
AbbVie, Inc. | | | 144,416 | | | $ | 19,553,926 | |
| | |
Neurocrine Biosciences, Inc.(1) | | | 89,416 | | | | 7,615,561 | |
| |
| | | | $ | 27,169,487 | |
|
| Building Products — 1.1% | |
| | |
AZEK Co., Inc. (The)(1) | | | 200,950 | | | $ | 9,291,928 | |
| |
| | | | $ | 9,291,928 | |
|
| Capital Markets — 7.3% | |
| | |
Goldman Sachs Group, Inc. (The) | | | 31,190 | | | $ | 11,931,735 | |
| | |
Intercontinental Exchange, Inc. | | | 110,204 | | | | 15,072,601 | |
| | |
S&P Global, Inc. | | | 40,636 | | | | 19,177,347 | |
| | |
Tradeweb Markets, Inc., Class A | | | 171,429 | | | | 17,166,900 | |
| |
| | | | $ | 63,348,583 | |
|
| Commercial Services & Supplies — 1.2% | |
| | |
Waste Management, Inc. | | | 61,978 | | | $ | 10,344,128 | |
| |
| | | | $ | 10,344,128 | |
|
| Containers & Packaging — 1.0% | |
| | |
AptarGroup, Inc. | | | 72,454 | | | $ | 8,874,166 | |
| |
| | | | $ | 8,874,166 | |
| | | | | | | | |
| Security | | Shares | | | Value | |
|
| Electric Utilities — 1.6% | |
| | |
NextEra Energy, Inc. | | | 148,440 | | | $ | 13,858,358 | |
| |
| | | | $ | 13,858,358 | |
|
| Electrical Equipment — 1.2% | |
| | |
AMETEK, Inc. | | | 73,256 | | | $ | 10,771,562 | |
| |
| | | | $ | 10,771,562 | |
|
| Electronic Equipment, Instruments & Components — 1.4% | |
| | |
TE Connectivity, Ltd. | | | 76,400 | | | $ | 12,326,376 | |
| |
| | | | $ | 12,326,376 | |
|
| Entertainment — 1.2% | |
| | |
Walt Disney Co. (The)(1) | | | 66,982 | | | $ | 10,374,842 | |
| |
| | | | $ | 10,374,842 | |
|
| Equity Real Estate Investment Trusts (REITs) — 2.8% | |
| | |
EastGroup Properties, Inc. | | | 46,522 | | | $ | 10,600,038 | |
| | |
Lamar Advertising Co., Class A | | | 112,290 | | | | 13,620,777 | |
| |
| | | | $ | 24,220,815 | |
|
| Food & Staples Retailing — 1.7% | |
| | |
Sysco Corp. | | | 189,990 | | | $ | 14,923,715 | |
| |
| | | | $ | 14,923,715 | |
|
| Health Care Equipment & Supplies — 1.9% | |
| | |
Boston Scientific Corp.(1) | | | 254,436 | | | $ | 10,808,441 | |
| | |
Teleflex, Inc. | | | 18,500 | | | | 6,076,880 | |
| |
| | | | $ | 16,885,321 | |
|
| Health Care Providers & Services — 1.8% | |
| | |
Anthem, Inc. | | | 33,224 | | | $ | 15,400,653 | |
| |
| | | | $ | 15,400,653 | |
|
| Hotels, Restaurants & Leisure — 1.3% | |
| | |
Marriott International, Inc., Class A(1) | | | 69,128 | | | $ | 11,422,711 | |
| |
| | | | $ | 11,422,711 | |
|
| Interactive Media & Services — 6.7% | |
| | |
Alphabet, Inc., Class C(1) | | | 16,589 | | | $ | 48,001,764 | |
| | |
Meta Platforms, Inc., Class A(1) | | | 32,076 | | | | 10,788,763 | |
| |
| | | | $ | 58,790,527 | |
| | | | |
| | 16 | | See Notes to Financial Statements. |
Stock Portfolio
December 31, 2021
Portfolio of Investments — continued
| | | | | | | | |
| Security | | Shares | | | Value | |
|
| Internet & Direct Marketing Retail — 5.4% | |
| | |
Amazon.com, Inc.(1) | | | 13,996 | | | $ | 46,667,423 | |
| |
| | | | $ | 46,667,423 | |
|
| IT Services — 3.7% | |
| | |
Automatic Data Processing, Inc. | | | 60,796 | | | $ | 14,991,078 | |
| | |
Visa, Inc., Class A | | | 81,030 | | | | 17,560,011 | |
| |
| | | | $ | 32,551,089 | |
|
| Life Sciences Tools & Services — 3.9% | |
| | |
Danaher Corp. | | | 51,992 | | | $ | 17,105,888 | |
| | |
Thermo Fisher Scientific, Inc. | | | 25,034 | | | | 16,703,686 | |
| |
| | | | $ | 33,809,574 | |
|
| Machinery — 1.1% | |
| | |
Stanley Black & Decker, Inc. | | | 51,938 | | | $ | 9,796,546 | |
| |
| | | | $ | 9,796,546 | |
|
| Oil, Gas & Consumable Fuels — 2.1% | |
| | |
ConocoPhillips | | | 251,256 | | | $ | 18,135,658 | |
| |
| | | | $ | 18,135,658 | |
|
| Pharmaceuticals — 3.4% | |
| | |
Eli Lilly & Co. | | | 49,100 | | | $ | 13,562,402 | |
| | |
Pfizer, Inc. | | | 96,400 | | | | 5,692,420 | |
| | |
Zoetis, Inc. | | | 41,922 | | | | 10,230,226 | |
| |
| | | | $ | 29,485,048 | |
|
| Professional Services — 2.2% | |
| | |
Booz Allen Hamilton Holding Corp. | | | 113,090 | | | $ | 9,588,901 | |
| | |
Clarivate PLC(1) | | | 421,188 | | | | 9,906,342 | |
| |
| | | | $ | 19,495,243 | |
|
| Road & Rail — 1.5% | |
| | |
Union Pacific Corp. | | | 52,424 | | | $ | 13,207,178 | |
| |
| | | | $ | 13,207,178 | |
|
| Semiconductors & Semiconductor Equipment — 6.3% | |
| | |
Analog Devices, Inc. | | | 91,086 | | | $ | 16,010,186 | |
| | |
Lam Research Corp. | | | 16,200 | | | | 11,650,230 | |
| | |
NVIDIA Corp. | | | 25,500 | | | | 7,499,805 | |
| | |
Taiwan Semiconductor Manufacturing Co., Ltd. ADR | | | 69,039 | | | | 8,306,082 | |
| | |
Texas Instruments, Inc. | | | 62,347 | | | | 11,750,539 | |
| |
| | | | $ | 55,216,842 | |
| | | | | | | | |
| Security | | Shares | | | Value | |
|
| Software — 9.9% | |
| | |
Bill.com Holdings, Inc.(1) | | | 31,200 | | | $ | 7,773,480 | |
| | |
Intuit, Inc. | | | 24,254 | | | | 15,600,658 | |
| | |
Microsoft Corp. | | | 187,598 | | | | 63,092,959 | |
| |
| | | | $ | 86,467,097 | |
|
| Specialty Retail — 1.7% | |
| | |
TJX Cos., Inc. (The) | | | 198,134 | | | $ | 15,042,333 | |
| |
| | | | $ | 15,042,333 | |
|
| Technology Hardware, Storage & Peripherals — 6.0% | |
| | |
Apple, Inc. | | | 293,484 | | | $ | 52,113,954 | |
| |
| | | | $ | 52,113,954 | |
|
| Textiles, Apparel & Luxury Goods — 0.9% | |
| | |
Deckers Outdoor Corp.(1) | | | 20,518 | | | $ | 7,515,949 | |
| |
| | | | $ | 7,515,949 | |
|
| Wireless Telecommunication Services — 1.2% | |
| | |
T-Mobile US, Inc.(1) | | | 86,208 | | | $ | 9,998,404 | |
| |
| | | | $ | 9,998,404 | |
| |
Total Common Stocks
(identified cost $507,783,336) | | | $ | 826,851,675 | |
|
| Short-Term Investments — 0.3% | |
| Description | | Units | | | Value | |
| | |
Eaton Vance Cash Reserves Fund, LLC, 0.08%(2) | | | 2,248,701 | | | $ | 2,248,476 | |
| |
Total Short-Term Investments
(identified cost $2,248,476) | | | $ | 2,248,476 | |
| |
Total Investments — 95.2%
(identified cost $510,031,812) | | | $ | 829,100,151 | |
| |
Other Assets, Less Liabilities — 4.8% | | | $ | 42,209,395 | |
| |
Net Assets — 100.0% | | | $ | 871,309,546 | |
The percentage shown for each investment category in the Portfolio of Investments is based on net assets.
| (1) | Non-income producing security. |
| (2) | Affiliated investment company, available to Eaton Vance portfolios and funds, which invests in high quality, U.S. dollar denominated money market instruments. The rate shown is the annualized seven-day yield as of December 31, 2021. |
Abbreviations:
| | | | |
| | |
| ADR | | – | | American Depositary Receipt |
| | | | |
| | 17 | | See Notes to Financial Statements. |
Stock Portfolio
December 31, 2021
Statement of Assets and Liabilities
| | | | |
| Assets | | December 31, 2021 | |
| |
Unaffiliated investments, at value (identified cost, $507,783,336) | | $ | 826,851,675 | |
| |
Affiliated investment, at value (identified cost, $2,248,476) | | | 2,248,476 | |
| |
Dividends receivable | | | 244,593 | |
| |
Dividends receivable from affiliated investment | | | 93 | |
| |
Receivable for investments sold | | | 42,354,951 | |
| |
Tax reclaims receivable | | | 135,816 | |
| |
Total assets | | $ | 871,835,604 | |
| |
| Liabilities | | | | |
| |
Payable to affiliates: | | | | |
| |
Investment adviser fee | | $ | 429,926 | |
| |
Trustees’ fees | | | 10,295 | |
| |
Accrued expenses | | | 85,837 | |
| |
Total liabilities | | $ | 526,058 | |
| |
Net Assets applicable to investors’ interest in Portfolio | | $ | 871,309,546 | |
| | | | |
| | 18 | | See Notes to Financial Statements. |
Stock Portfolio
December 31, 2021
Statement of Operations
| | | | |
| Investment Income | | Year Ended
December 31, 2021 | |
| |
Dividends (net of foreign taxes, $154,516) | | $ | 9,906,044 | |
| |
Dividends from affiliated investment | | | 1,479 | |
| |
Total investment income | | $ | 9,907,523 | |
| |
| Expenses | | | | |
| |
Investment adviser fee | | $ | 4,970,765 | |
| |
Trustees’ fees and expenses | | | 41,836 | |
| |
Custodian fee | | | 204,317 | |
| |
Legal and accounting services | | | 52,438 | |
| |
Miscellaneous | | | 24,624 | |
| |
Total expenses | | $ | 5,293,980 | |
| |
Net investment income | | $ | 4,613,543 | |
| |
| Realized and Unrealized Gain (Loss) | | | | |
| |
Net realized gain (loss) — | | | | |
| |
Investment transactions | | $ | 123,850,522 | (1) |
| |
Investment transactions — affiliated investment | | | (1,372 | ) |
| |
Foreign currency transactions | | | (11,938 | ) |
| |
Net realized gain | | $ | 123,837,212 | |
| |
Change in unrealized appreciation (depreciation) — | | | | |
| |
Investments | | $ | 46,450,706 | |
| |
Foreign currency | | | (7,691 | ) |
| |
Net change in unrealized appreciation (depreciation) | | $ | 46,443,015 | |
| |
Net realized and unrealized gain | | $ | 170,280,227 | |
| |
Net increase in net assets from operations | | $ | 174,893,770 | |
| (1) | Includes $3,096,043 of net realized gains from redemptions in-kind. |
| | | | |
| | 19 | | See Notes to Financial Statements. |
Stock Portfolio
December 31, 2021
Statements of Changes in Net Assets
| | | | | | | | |
| | | Year Ended December 31, | |
| Increase (Decrease) in Net Assets | | 2021 | | | 2020 | |
| | |
From operations — | | | | | | | | |
| | |
Net investment income | | $ | 4,613,543 | | | $ | 5,837,934 | |
| | |
Net realized gain | | | 123,837,212 | (1) | | | 18,275,199 | |
| | |
Net change in unrealized appreciation (depreciation) | | | 46,443,015 | | | | 96,276,139 | |
| | |
Net increase in net assets from operations | | $ | 174,893,770 | | | $ | 120,389,272 | |
| | |
Capital transactions — | | | | | | | | |
| | |
Contributions | | $ | 23,356,815 | | | $ | 78,327,454 | |
| | |
Withdrawals | | | (131,961,931 | ) | | | (78,095,172 | ) |
| | |
Portfolio transaction fee | | | 574,923 | | | | 276,897 | |
| | |
Net increase (decrease) in net assets from capital transactions | | $ | (108,030,193 | ) | | $ | 509,179 | |
| | |
Net increase in net assets | | $ | 66,863,577 | | | $ | 120,898,451 | |
| | |
| Net Assets | | | | | | | | |
| | |
At beginning of year | | $ | 804,445,969 | | | $ | 683,547,518 | |
| | |
At end of year | | $ | 871,309,546 | | | $ | 804,445,969 | |
| (1) | Includes $3,096,043 of net realized gains from redemptions in-kind. |
| | | | |
| | 20 | | See Notes to Financial Statements. |
Stock Portfolio
December 31, 2021
Financial Highlights
| | | | | | | | | | | | | | | | | | | | |
| | | Year Ended December 31, | |
| Ratios/Supplemental Data | | 2021 | | | 2020 | | | 2019 | | | 2018 | | | 2017 | |
| | | | | |
Ratios (as a percentage of average daily net assets): | | | | | | | | | | | | | | | | | | | | |
| | | | | |
Expenses | | | 0.63 | % | | | 0.64 | % | | | 0.63 | % | | | 0.64 | % | | | 0.64 | % |
| | | | | |
Net investment income | | | 0.55 | % | | | 0.84 | % | | | 0.99 | % | | | 1.14 | % | | | 1.38 | % |
| | | | | |
Portfolio Turnover | | | 44 | % | | | 70 | % | | | 55 | % | | | 90 | % | | | 101 | % |
| | | | | |
Total Return | | | 23.21 | % | | | 18.61 | % | | | 35.47 | % | | | (5.57 | )% | | | 20.31 | % |
| | | | | |
Net assets, end of year (000’s omitted) | | $ | 871,310 | | | $ | 804,446 | | | $ | 683,548 | | | $ | 516,615 | | | $ | 647,405 | |
| | | | |
| | 21 | | See Notes to Financial Statements. |
Stock Portfolio
December 31, 2021
Notes to Financial Statements
1 Significant Accounting Policies
Stock Portfolio (the Portfolio) is a Massachusetts business trust registered under the Investment Company Act of 1940, as amended (the 1940 Act), as a diversified, open-end management investment company. The Portfolio’s investment objective is to achieve long-term capital appreciation by investing in a diversified portfolio of equity securities. The Declaration of Trust permits the Trustees to issue interests in the Portfolio. At December 31, 2021, Eaton Vance Stock Fund, Eaton Vance Stock NextShares and Eaton Vance Balanced Fund held an interest of 12.8%, 0.2% and 87.1%, respectively, in the Portfolio.
The following is a summary of significant accounting policies of the Portfolio. The policies are in conformity with accounting principles generally accepted in the United States of America (U.S. GAAP). The Portfolio is an investment company and follows accounting and reporting guidance in the Financial Accounting Standards Board (FASB) Accounting Standards Codification Topic 946.
A Investment Valuation — The following methodologies are used to determine the market value or fair value of investments.
Equity Securities. Equity securities listed on a U.S. securities exchange generally are valued at the last sale or closing price on the day of valuation or, if no sales took place on such date, at the mean between the closing bid and ask prices on the exchange where such securities are principally traded. Equity securities listed on the NASDAQ National Market System are valued at the NASDAQ official closing price. Unlisted or listed securities for which closing sales prices or closing quotations are not available are valued at the mean between the latest available bid and ask prices.
Foreign Securities and Currencies. Foreign securities and currencies are valued in U.S. dollars, based on foreign currency exchange rate quotations supplied by a third party pricing service. The pricing service uses a proprietary model to determine the exchange rate. Inputs to the model include reported trades and implied bid/ask spreads. The daily valuation of exchange-traded foreign securities generally is determined as of the close of trading on the principal exchange on which such securities trade. Events occurring after the close of trading on foreign exchanges may result in adjustments to the valuation of foreign securities to more accurately reflect their fair value as of the close of regular trading on the New York Stock Exchange. When valuing foreign equity securities that meet certain criteria, the Portfolio’s Trustees have approved the use of a fair value service that values such securities to reflect market trading that occurs after the close of the applicable foreign markets of comparable securities or other instruments that have a strong correlation to the fair-valued securities.
Affiliated Fund. The Portfolio may invest in Eaton Vance Cash Reserves Fund, LLC (Cash Reserves Fund), an affiliated investment company managed by Eaton Vance Management (EVM). While Cash Reserves Fund is not a registered money market mutual fund, it conducts all of its investment activities in accordance with the requirements of Rule 2a-7 under the 1940 Act. Investments in Cash Reserves Fund are valued at the closing net asset value per unit on the valuation day. Cash Reserves Fund generally values its investment securities based on available market quotations provided by a third party pricing service.
Fair Valuation. Investments for which valuations or market quotations are not readily available or are deemed unreliable are valued at fair value using methods determined in good faith by or at the direction of the Trustees of the Portfolio in a manner that most fairly reflects the security’s “fair value”, which is the amount that the Portfolio might reasonably expect to receive for the security upon its current sale in the ordinary course. Each such determination is based on a consideration of relevant factors, which are likely to vary from one pricing context to another. These factors may include, but are not limited to, the type of security, the existence of any contractual restrictions on the security’s disposition, the price and extent of public trading in similar securities of the issuer or of comparable companies or entities, quotations or relevant information obtained from broker/dealers or other market participants, information obtained from the issuer, analysts, and/or the appropriate stock exchange (for exchange-traded securities), an analysis of the company’s or entity’s financial statements, and an evaluation of the forces that influence the issuer and the market(s) in which the security is purchased and sold.
B Investment Transactions — Investment transactions for financial statement purposes are accounted for on a trade date basis. Realized gains and losses on investments sold are determined on the basis of identified cost.
C Income — Dividend income is recorded on the ex-dividend date for dividends received in cash and/or securities. However, if the ex-dividend date has passed, certain dividends from foreign securities are recorded as the Portfolio is informed of the ex-dividend date. Withholding taxes on foreign dividends and capital gains have been provided for in accordance with the Portfolio’s understanding of the applicable countries’ tax rules and rates.
D Federal Taxes — The Portfolio has elected to be treated as a partnership for federal tax purposes. No provision is made by the Portfolio for federal or state taxes on any taxable income of the Portfolio because each investor in the Portfolio is ultimately responsible for the payment of any taxes on its share of taxable income. Since at least one of the Portfolio’s investors is a regulated investment company that invests all or substantially all of its assets in the Portfolio, the Portfolio normally must satisfy the applicable source of income and diversification requirements (under the Internal Revenue Code) in order for its investors to satisfy them. The Portfolio will allocate, at least annually among its investors, each investor’s distributive share of the Portfolio’s net investment income, net realized capital gains and losses and any other items of income, gain, loss, deduction or credit.
As of December 31, 2021, the Portfolio had no uncertain tax positions that would require financial statement recognition, de-recognition, or disclosure. The Portfolio files a U.S. federal income tax return annually after its fiscal year-end, which is subject to examination by the Internal Revenue Service for a period of three years from the date of filing.
E Foreign Currency Translation — Investment valuations, other assets, and liabilities initially expressed in foreign currencies are translated each business day into U.S. dollars based upon current exchange rates. Purchases and sales of foreign investment securities and income and expenses denominated in
Stock Portfolio
December 31, 2021
Notes to Financial Statements — continued
foreign currencies are translated into U.S. dollars based upon currency exchange rates in effect on the respective dates of such transactions. Recognized gains or losses on investment transactions attributable to changes in foreign currency exchange rates are recorded for financial statement purposes as net realized gains and losses on investments. That portion of unrealized gains and losses on investments that results from fluctuations in foreign currency exchange rates is not separately disclosed.
F Use of Estimates — The preparation of the financial statements in conformity with U.S. GAAP requires management to make estimates and assumptions that affect the reported amounts of assets and liabilities at the date of the financial statements and the reported amounts of income and expense during the reporting period. Actual results could differ from those estimates.
G Indemnifications — Under the Portfolio’s organizational documents, its officers and Trustees may be indemnified against certain liabilities and expenses arising out of the performance of their duties to the Portfolio. Under Massachusetts law, if certain conditions prevail, interestholders in the Portfolio could be deemed to have personal liability for the obligations of the Portfolio. However, the Portfolio’s Declaration of Trust contains an express disclaimer of liability on the part of Portfolio interestholders. Additionally, in the normal course of business, the Portfolio enters into agreements with service providers that may contain indemnification clauses. The Portfolio’s maximum exposure under these arrangements is unknown as this would involve future claims that may be made against the Portfolio that have not yet occurred.
H Capital Transactions — To seek to protect the Portfolio (and, indirectly, other investors in the Portfolio) against the costs of accommodating investor inflows and outflows, the Portfolio imposes a fee (“Portfolio transaction fee”) on inflows and outflows by Portfolio investors. The Portfolio transaction fee is sized to cover the estimated cost to the Portfolio of, in connection with issuing interests, converting the cash and/or other instruments it receives to the desired composition and, in connection with redeeming its interests, converting Portfolio holdings to cash and/or other instruments to be distributed. Such fee, which may vary over time, is limited to amounts that have been authorized by the Board of Trustees and determined by EVM to be appropriate. The maximum Portfolio transaction fee is 2% of the amount of net contributions or withdrawals. The Portfolio transaction fee is recorded as a component of capital transactions on the Statements of Changes in Net Assets.
2 Investment Adviser Fee and Other Transactions with Affiliates
The investment adviser fee is earned by Boston Management and Research (BMR) as compensation for investment advisory services rendered to the Portfolio. On March 1, 2021, Morgan Stanley acquired Eaton Vance Corp. (the “Transaction”) and BMR became an indirect, wholly-owned subsidiary of Morgan Stanley. In connection with the Transaction, the Portfolio entered into a new investment advisory agreement (the “New Agreement”) with BMR, which took effect on March 1, 2021. The Portfolio’s prior fee reduction agreement was incorporated into the New Agreement. Pursuant to the New Agreement (and the Portfolio’s investment advisory agreement and related fee reduction agreement with BMR in effect prior to March 1, 2021), the fee is computed at an annual rate as a percentage of the Portfolio’s average daily net assets as follows and is payable monthly:
| | | | |
| Average Daily Net Assets | | Annual Fee Rate | |
| |
Up to $500 million | | | 0.600 | % |
| |
$500 million but less than $1 billion | | | 0.575 | % |
| |
$1 billion but less than $2.5 billion | | | 0.550 | % |
| |
$2.5 billion but less than $5 billion | | | 0.530 | % |
| |
$5 billion and over | | | 0.515 | % |
For the year ended December 31, 2021, the Portfolio’s investment adviser fee amounted to $4,970,765 or 0.59% of the Portfolio’s average daily net assets. The Portfolio may invest its cash in Cash Reserves Fund. EVM does not currently receive a fee for advisory services provided to Cash Reserves Fund.
Trustees and officers of the Portfolio who are members of EVM’s or BMR’s organizations receive remuneration for their services to the Portfolio out of the investment adviser fee. Trustees of the Portfolio who are not affiliated with the investment adviser may elect to defer receipt of all or a percentage of their annual fees in accordance with the terms of the Trustees Deferred Compensation Plan. For the year ended December 31, 2021, no significant amounts have been deferred. Certain officers and Trustees of the Portfolio are officers of the above organizations.
3 Purchases and Sales of Investments
Purchases and sales of investments, other than short-term obligations and in-kind transactions, aggregated $368,242,025 and $508,852,092, respectively, for the year ended December 31, 2021. In-kind contributions and withdrawals for the year ended December 31, 2021 aggregated none and $6,582,209, respectively.
Stock Portfolio
December 31, 2021
Notes to Financial Statements — continued
4 Federal Income Tax Basis of Investments
The cost and unrealized appreciation (depreciation) of investments of the Portfolio at December 31, 2021, as determined on a federal income tax basis, were as follows:
| | | | |
| |
Aggregate cost | | $ | 511,667,420 | |
| |
Gross unrealized appreciation | | $ | 323,672,440 | |
| |
Gross unrealized depreciation | | | (6,239,709 | ) |
| |
Net unrealized appreciation | | $ | 317,432,731 | |
5 Line of Credit
The Portfolio participates with other portfolios and funds managed by EVM and its affiliates in an $800 million unsecured line of credit agreement with a group of banks, which is in effect through October 25, 2022. Borrowings are made by the Portfolio solely for temporary purposes related to redemptions and other short-term cash needs. Interest is charged to the Portfolio based on its borrowings at an amount above either the Secured Overnight Financing Rate (SOFR) or Federal Funds rate. In addition, a fee computed at an annual rate of 0.15% on the daily unused portion of the line of credit is allocated among the participating portfolios and funds at the end of each quarter. In connection with the renewal of the agreement in October 2021, an arrangement fee totaling $150,000 was incurred that was allocated to the participating portfolios and funds. Because the line of credit is not available exclusively to the Portfolio, it may be unable to borrow some or all of its requested amounts at any particular time. The Portfolio did not have any significant borrowings or allocated fees during the year ended December 31, 2021.
6 Investments in Affiliated Funds
At December 31, 2021, the value of the Portfolio’s investment in affiliated funds was $2,248,476, which represents 0.3% of the Portfolio’s net assets. Transactions in affiliated funds by the Portfolio for the year ended December 31, 2021 were as follows:
| | | | | | | | | | | | | | | | | | | | | | | | | | | | | | | | |
| Name | | Value,
beginning
of period | | | Purchases | | | Sales
proceeds | | | Net
realized
gain (loss) | | | Change in
unrealized
appreciation
(depreciation) | | | Value, end
of period | | | Dividend
income | | | Units, end
of period | |
|
Short-Term Investments | |
| | | | | | | | |
Eaton Vance Cash Reserves Fund, LLC | | $ | 6,475,259 | | | $ | 122,109,454 | | | $ | (126,334,865 | ) | | $ | (1,372 | ) | | $ | — | | | $ | 2,248,476 | | | $ | 1,479 | | | | 2,248,701 | |
7 Fair Value Measurements
Under generally accepted accounting principles for fair value measurements, a three-tier hierarchy to prioritize the assumptions, referred to as inputs, is used in valuation techniques to measure fair value. The three-tier hierarchy of inputs is summarized in the three broad levels listed below.
| • | | Level 1 – quoted prices in active markets for identical investments |
| • | | Level 2 – other significant observable inputs (including quoted prices for similar investments, interest rates, prepayment speeds, credit risk, etc.) |
| • | | Level 3 – significant unobservable inputs (including a fund’s own assumptions in determining the fair value of investments) |
In cases where the inputs used to measure fair value fall in different levels of the fair value hierarchy, the level disclosed is determined based on the lowest level input that is significant to the fair value measurement in its entirety. The inputs or methodology used for valuing securities are not necessarily an indication of the risk associated with investing in those securities.
Stock Portfolio
December 31, 2021
Notes to Financial Statements — continued
At December 31, 2021, the hierarchy of inputs used in valuing the Portfolio’s investments, which are carried at value, were as follows:
| | | | | | | | | | | | | | | | |
| Asset Description | | Level 1 | | | Level 2 | | | Level 3 | | | Total | |
| | | | |
Common Stocks | | $ | 826,851,675 | * | | $ | — | | | $ | — | | | $ | 826,851,675 | |
| | | | |
Short-Term Investments | | | — | | | | 2,248,476 | | | | — | | | | 2,248,476 | |
| | | | |
Total Investments | | $ | 826,851,675 | | | $ | 2,248,476 | | | $ | — | | | $ | 829,100,151 | |
| * | The level classification by major category of investments is the same as the category presentation in the Portfolio of Investments. |
8 Risks and Uncertainties
Pandemic Risk
An outbreak of respiratory disease caused by a novel coronavirus was first detected in China in late 2019 and subsequently spread internationally. This coronavirus has resulted in closing borders, enhanced health screenings, changes to healthcare service preparation and delivery, quarantines, cancellations, disruptions to supply chains and customer activity, as well as general concern and uncertainty. Health crises caused by outbreaks, such as the coronavirus outbreak, may exacerbate other pre-existing political, social and economic risks and disrupt normal market conditions and operations. The impact of this outbreak has negatively affected the worldwide economy, the economies of individual countries, individual companies, and the market in general, and may continue to do so in significant and unforeseen ways, as may other epidemics and pandemics that may arise in the future. Any such impact could adversely affect the Portfolio’s performance, or the performance of the securities in which the Portfolio invests.
Eaton Vance
Stock Portfolio
December 31, 2021
Report of Independent Registered Public Accounting Firm
To the Trustees and Investors of Stock Portfolio:
Opinion on the Financial Statements and Financial Highlights
We have audited the accompanying statement of assets and liabilities of Stock Portfolio (the “Portfolio”), including the portfolio of investments, as of December 31, 2021, the related statement of operations for the year then ended, the statements of changes in net assets for each of the two years in the period then ended, the financial highlights for each of the five years in the period then ended, and the related notes. In our opinion, the financial statements and financial highlights present fairly, in all material respects, the financial position of the Portfolio as of December 31, 2021, and the results of its operations for the year then ended, the changes in its net assets for each of the two years in the period then ended, and the financial highlights for each of the five years in the period then ended, in conformity with accounting principles generally accepted in the United States of America.
Basis for Opinion
These financial statements and financial highlights are the responsibility of the Portfolio’s management. Our responsibility is to express an opinion on the Portfolio’s financial statements and financial highlights based on our audits. We are a public accounting firm registered with the Public Company Accounting Oversight Board (United States) (PCAOB) and are required to be independent with respect to the Portfolio in accordance with the U.S. federal securities laws and the applicable rules and regulations of the Securities and Exchange Commission and the PCAOB.
We conducted our audits in accordance with the standards of the PCAOB. Those standards require that we plan and perform the audit to obtain reasonable assurance about whether the financial statements and financial highlights are free of material misstatement, whether due to error or fraud. The Portfolio is not required to have, nor were we engaged to perform, an audit of its internal control over financial reporting. As part of our audits, we are required to obtain an understanding of internal control over financial reporting but not for the purpose of expressing an opinion on the effectiveness of the Portfolio’s internal control over financial reporting. Accordingly, we express no such opinion.
Our audits included performing procedures to assess the risks of material misstatement of the financial statements and financial highlights, whether due to error or fraud, and performing procedures that respond to those risks. Such procedures included examining, on a test basis, evidence regarding the amounts and disclosures in the financial statements and financial highlights. Our audits also included evaluating the accounting principles used and significant estimates made by management, as well as evaluating the overall presentation of the financial statements and financial highlights. Our procedures included confirmation of securities owned as of December 31, 2021, by correspondence with the custodian and brokers; when replies were not received from brokers, we performed other auditing procedures. We believe that our audits provide a reasonable basis for our opinion.
/s/ Deloitte & Touche LLP
Boston, Massachusetts
February 23, 2022
We have served as the auditor of one or more Eaton Vance investment companies since 1959.
Eaton Vance
Stock NextShares
December 31, 2021
Management and Organization
Fund Management. The Trustees of Eaton Vance NextShares Trust (the Trust) and Stock Portfolio (the Portfolio) are responsible for the overall management and supervision of Trust’s and Portfolio’s affairs. The Board members and officers of the Trust and the Portfolio are listed below. Except as indicated, each individual has held the office shown or other offices in the same company for the last five years. Board members hold indefinite terms of office. Each Trustee holds office until his or her successor is elected and qualified, subject to a prior death, resignation, retirement, disqualification or removal. Under the terms of the Fund’s and the Portfolio’s current Trustee retirement policy, an Independent Trustee must retire and resign as a Trustee on the earlier of: (i) the first day of July following his or her 74th birthday; or (ii), with limited exception, December 31st of the 20th year in which he or she has served as a Trustee. However, if such retirement and resignation would cause the Fund or Portfolio to be out of compliance with Section 16 of the 1940 Act or any other regulations or guidance of the SEC, then such retirement and resignation will not become effective until such time as action has been taken for the Fund or Portfolio to be in compliance therewith. The “noninterested Trustees” consist of those Trustees who are not “interested persons” of the Trust and the Portfolio, as that term is defined under the 1940 Act. The business address of each Board member and officer is Two International Place, Boston, Massachusetts 02110. As used below, “BMR” refers to Boston Management and Research, “EVC” refers to Eaton Vance Corp., “EV” refers to EV LLC, “EVM” refers to Eaton Vance Management and “EVD” refers to Eaton Vance Distributors, Inc. EV is the trustee of each of EVM and BMR. Effective March 1, 2021, each of EVM, BMR, EVD and EV are indirect, wholly owned subsidiaries of Morgan Stanley. Each officer affiliated with EVM may hold a position with other EVM affiliates that is comparable to his or her position with EVM listed below. Each Trustee oversees 138 funds (with the exception of Messrs. Faust and Wennerholm and Ms. Frost who oversee 137 funds) in the Eaton Vance fund complex (including both funds and portfolios in a hub and spoke structure).
| | | | | | |
| Name and Year of Birth | | Trust/Portfolio
Position(s) | | Length of Service | | Principal Occupation(s) and Other Directorships
During Past Five Years and Other Relevant Experience |
|
| Interested Trustee |
| | | |
Thomas E. Faust Jr. 1958 | | Trustee | | Since 2007 | | Chairman of Morgan Stanley Investment Management, Inc. (MSIM), member of the Board of Managers and President of EV, Chief Executive Officer of EVM and BMR, and Director of EVD. Formerly, Chairman, Chief Executive Officer and President of EVC. Mr. Faust is an interested person because of his positions with MSIM, BMR, EVM, EVD, and EV, which are affiliates of the Trust and the Portfolio, and his former position with EVC, which was an affiliate of the Trust and the Portfolio prior to March 1, 2021. Other Directorships. Formerly, Director of EVC (2007-2021) and Hexavest Inc. (investment management firm) (2012-2021). |
|
| Noninterested Trustees |
| | | |
Mark R. Fetting 1954 | | Trustee | | Since 2016 | | Private investor. Formerly held various positions at Legg Mason, Inc. (investment management firm) (2000-2012), including President, Chief Executive Officer, Director and Chairman (2008-2012), Senior Executive Vice President (2004-2008) and Executive Vice President (2001-2004). Formerly, President of Legg Mason family of funds (2001-2008). Formerly, Division President and Senior Officer of Prudential Financial Group, Inc. and related companies (investment management firm) (1991-2000). Other Directorships. None. |
| | | |
Cynthia E. Frost 1961 | | Trustee | | Since 2014 | | Private investor. Formerly, Chief Investment Officer of Brown University (university endowment) (2000-2012). Formerly, Portfolio Strategist for Duke Management Company (university endowment manager) (1995-2000). Formerly, Managing Director, Cambridge Associates (investment consulting company) (1989-1995). Formerly, Consultant, Bain and Company (management consulting firm) (1987-1989). Formerly, Senior Equity Analyst, BA Investment Management Company (1983-1985). Other Directorships. None. |
| | | |
George J. Gorman 1952 | | Chairperson of the Board and Trustee | | Since 2021 (Chairperson) and 2014 (Trustee) | | Principal at George J. Gorman LLC (consulting firm). Formerly, Senior Partner at Ernst & Young LLP (a registered public accounting firm) (1974-2009). Other Directorships. None. |
| | | |
Valerie A. Mosley 1960 | | Trustee | | Since 2014 | | Chairwoman and Chief Executive Officer of Valmo Ventures (a consulting and investment firm). Founder of Upward Wealth, Inc., dba BrightUP, a fintech platform. Formerly, Partner and Senior Vice President, Portfolio Manager and Investment Strategist at Wellington Management Company, LLP (investment management firm) (1992-2012). Formerly, Chief Investment Officer, PG Corbin Asset Management (1990-1992). Formerly worked in institutional corporate bond sales at Kidder Peabody (1986-1990). Other Directorships. Director of DraftKings, Inc. (digital sports entertainment and gaming company) (since September 2020). Director of Groupon, Inc. (e-commerce provider) (since April 2020). Director of Envestnet, Inc. (provider of intelligent systems for wealth management and financial wellness) (since 2018). Formerly, Director of Dynex Capital, Inc. (mortgage REIT) (2013-2020). |
Eaton Vance
Stock NextShares
December 31, 2021
Management and Organization — continued
| | | | | | |
| Name and Year of Birth | | Trust/Portfolio
Position(s) | | Length of Service | | Principal Occupation(s) and Other Directorships
During Past Five Years and Other Relevant Experience |
|
| Noninterested Trustees (continued) |
| | | |
William H. Park 1947 | | Trustee | | Since 2003 | | Private investor. Formerly, Consultant (management and transactional) (2012-2014). Formerly, Chief Financial Officer, Aveon Group L.P. (investment management firm) (2010-2011). Formerly, Vice Chairman, Commercial Industrial Finance Corp. (specialty finance company) (2006-2010). Formerly, President and Chief Executive Officer, Prizm Capital Management, LLC (investment management firm) (2002-2005). Formerly, Executive Vice President and Chief Financial Officer, United Asset Management Corporation (investment management firm) (1982-2001). Formerly, Senior Manager, Price Waterhouse (now PricewaterhouseCoopers) (a registered public accounting firm) (1972-1981). Other Directorships. None. |
| | | |
Helen Frame Peters 1948 | | Trustee | | Since 2008 | | Professor of Finance, Carroll School of Management, Boston College. Formerly, Dean, Carroll School of Management, Boston College (2000-2002). Formerly, Chief Investment Officer, Fixed Income, Scudder Kemper Investments (investment management firm) (1998-1999). Formerly, Chief Investment Officer, Equity and Fixed Income, Colonial Management Associates (investment management firm) (1991-1998). Other Directorships. None. |
| | | |
Keith Quinton 1958 | | Trustee | | Since 2018 | | Private investor, researcher and lecturer. Formerly, Independent Investment Committee Member at New Hampshire Retirement System (2017-2021). Formerly, Portfolio Manager and Senior Quantitative Analyst at Fidelity Investments (investment management firm) (2001-2014). Other Directorships. Formerly, Director (2016-2021) and Chairman (2019-2021) of New Hampshire Municipal Bond Bank. |
| | | |
Marcus L. Smith 1966 | | Trustee | | Since 2018 | | Private investor. Formerly, Portfolio Manager at MFS Investment Management (investment management firm) (1994-2017). Other Directorships. Director of First Industrial Realty Trust, Inc. (an industrial REIT) (since 2021). Director of MSCI Inc. (global provider of investment decision support tools) (since 2017). Formerly, Director of DCT Industrial Trust Inc. (logistics real estate company) (2017-2018). |
| | | |
Susan J. Sutherland 1957 | | Trustee | | Since 2015 | | Private investor. Director of Ascot Group Limited and certain of its subsidiaries (insurance and reinsurance) (since 2017). Formerly, Director of Hagerty Holding Corp. (insurance) (2015-2018) and Montpelier Re Holdings Ltd. (insurance and reinsurance) (2013-2015). Formerly, Associate, Counsel and Partner at Skadden, Arps, Slate, Meagher & Flom LLP (law firm) (1982-2013). Other Directorships. Director of Kairos Acquisition Corp. (insurance/InsurTech acquisition company) (since 2021). |
| | | |
Scott E. Wennerholm 1959 | | Trustee | | Since 2016 | | Private investor. Formerly, Trustee at Wheelock College (postsecondary institution) (2012-2018). Formerly, Consultant at GF Parish Group (executive recruiting firm) (2016-2017). Formerly, Chief Operating Officer and Executive Vice President at BNY Mellon Asset Management (investment management firm) (2005-2011). Formerly, Chief Operating Officer and Chief Financial Officer at Natixis Global Asset Management (investment management firm) (1997-2004). Formerly, Vice President at Fidelity Investments Institutional Services (investment management firm) (1994-1997). Other Directorships. None. |
| | | | | | |
| Name and Year of Birth | | Trust/Portfolio
Position(s) | | Length of Service | | Principal Occupation(s)
During Past Five Years |
|
| Principal Officers who are not Trustees |
| | | |
Edward J. Perkin 1972 | | President | | Since 2014 | | Chief Equity Investment Officer and Vice President of EVM and BMR since 2014. Also Vice President of Calvert Research and Management (“CRM”). |
| | | |
Deidre E. Walsh 1971 | | Vice President and Chief Legal Officer | | Since 2009 | | Vice President of EVM and BMR. Also Vice President of CRM. |
| | | |
James F. Kirchner 1967 | | Treasurer | | Since 2007 | | Vice President of EVM and BMR. Also Vice President of CRM. |
Eaton Vance
Stock NextShares
December 31, 2021
Management and Organization — continued
| | | | | | |
| Name and Year of Birth | | Trust/Portfolio
Position(s) | | Length of Service | | Principal Occupation(s)
During Past Five Years |
|
| Principal Officers who are not Trustees (continued) |
| | | |
Jill R. Damon 1984 | | Secretary | | Since 2022 | | Vice President of EVM and BMR since 2017. Formerly, associate at Dechert LLP (2009-2017). |
| | | |
Richard F. Froio 1968 | | Chief Compliance Officer | | Since 2017 | | Vice President of EVM and BMR since 2017. Formerly, Deputy Chief Compliance Officer (Adviser/Funds) and Chief Compliance Officer (Distribution) at PIMCO (2012-2017) and Managing Director at BlackRock/Barclays Global Investors (2009-2012). |
The SAI for the Fund includes additional information about the Trustees and officers of the Trust and the Portfolio and can be obtained without charge on Eaton Vance’s website at www.eatonvance.com or by calling 1-800-262-1122.
Eaton Vance Funds
| | |
| Privacy Notice | | April 2021 |
| | |
| |
| FACTS | | WHAT DOES EATON VANCE DO WITH YOUR
PERSONAL INFORMATION? |
| | | |
| |
| | |
| Why? | | Financial companies choose how they share your personal information. Federal law gives consumers the right to limit some but not all sharing. Federal law also requires us to tell you how we collect, share, and protect your personal information. Please read this notice carefully to understand what we do. |
| | |
| | | |
| What? | | The types of personal information we collect and share depend on the product or service you have with us. This information can include: ∎ Social Security number and income ∎ investment experience and risk tolerance ∎ checking account number and wire transfer instructions |
| | |
| | | |
| How? | | All financial companies need to share customers’ personal information to run their everyday business. In the section below, we list the reasons financial companies can share their customers’ personal information; the reasons Eaton Vance chooses to share; and whether you can limit this sharing. |
| | |
| | | |
| | | | |
Reasons we can share your
personal information | | Does Eaton Vance share? | | Can you limit this sharing? |
| For our everyday business purposes — such as to process your transactions, maintain your account(s), respond to court orders and legal investigations, or report to credit bureaus | | Yes | | No |
| For our marketing purposes — to offer our products and services to you | | Yes | | No |
| For joint marketing with other financial companies | | No | | We don’t share |
| For our investment management affiliates’ everyday business purposes — information about your transactions, experiences, and creditworthiness | | Yes | | Yes |
| For our affiliates’ everyday business purposes — information about your transactions and experiences | | Yes | | No |
| For our affiliates’ everyday business purposes — information about your creditworthiness | | No | | We don’t share |
| For our investment management affiliates to market to you | | Yes | | Yes |
| For our affiliates to market to you | | No | | We don’t share |
| For nonaffiliates to market to you | | No | | We don’t share |
| | |
| To limit our sharing | | Call toll-free 1-800-262-1122 or email: EVPrivacy@eatonvance.com Please note: If you are a new customer, we can begin sharing your information 30 days from the date we sent this notice. When you are no longer our customer, we continue to share your information as described in this notice. However, you can contact us at any time to limit our sharing. |
| | |
| | | |
| | |
| Questions? | | Call toll-free 1-800-262-1122 or email: EVPrivacy@eatonvance.com |
| | |
| | | |
Eaton Vance Funds
| | |
| Privacy Notice — continued | | April 2021 |
| | |
| Who we are |
| Who is providing this notice? | | Eaton Vance Management, Eaton Vance Distributors, Inc., Eaton Vance Trust Company, Eaton Vance Management (International) Limited, Eaton Vance Advisers International Ltd., Eaton Vance Global Advisors Limited, Eaton Vance Management’s Real Estate Investment Group, Boston Management and Research, Calvert Research and Management, Eaton Vance and Calvert Fund Families and our investment advisory affiliates (“Eaton Vance”) (see Investment Management Affiliates definition below) |
| What we do |
| How does Eaton Vance protect my personal information? | | To protect your personal information from unauthorized access and use, we use security measures that comply with federal law. These measures include computer safeguards and secured files and buildings. We have policies governing the proper handling of customer information by personnel and requiring third parties that provide support to adhere to appropriate security standards with respect to such information. |
| How does Eaton Vance collect my personal information? | | We collect your personal information, for example, when you ∎ open an account or make deposits or withdrawals from your account ∎ buy securities from us or make a wire transfer ∎ give us your contact information We also collect your personal information from others, such as credit bureaus, affiliates, or other companies. |
| Why can’t I limit all sharing? | | Federal law gives you the right to limit only ∎ sharing for affiliates’ everyday business purposes — information about your creditworthiness ∎ affiliates from using your information to market to you ∎ sharing for nonaffiliates to market to you State laws and individual companies may give you additional rights to limit sharing. See below for more on your rights under state law. |
| Definitions |
| Investment Management Affiliates | | Eaton Vance Investment Management Affiliates include registered investment advisers, registered broker-dealers, and registered and unregistered funds. Investment Management Affiliates does not include entities associated with Morgan Stanley Wealth Management, such as Morgan Stanley Smith Barney LLC and Morgan Stanley & Co. |
| Affiliates | | Companies related by common ownership or control. They can be financial and nonfinancial companies. ∎ Our affiliates include companies with a Morgan Stanley name and financial companies such as Morgan Stanley Smith Barney LLC and Morgan Stanley & Co. |
| Nonaffiliates | | Companies not related by common ownership or control. They can be financial and nonfinancial companies. ∎ Eaton Vance does not share with nonaffiliates so they can market to you. |
| Joint marketing | | A formal agreement between nonaffiliated financial companies that together market financial products or services to you. ∎ Eaton Vance doesn’t jointly market. |
| Other important information |
Vermont: Except as permitted by law, we will not share personal information we collect about Vermont residents with Nonaffiliates unless you provide us with your written consent to share such information. California: Except as permitted by law, we will not share personal information we collect about California residents with Nonaffiliates and we will limit sharing such personal information with our Affiliates to comply with California privacy laws that apply to us. |
Eaton Vance Funds
IMPORTANT NOTICES
Delivery of Shareholder Documents. The Securities and Exchange Commission (SEC) permits funds to deliver only one copy of shareholder documents, including prospectuses, proxy statements and shareholder reports, to fund investors with multiple accounts at the same residential or post office box address. This practice is often called “householding” and it helps eliminate duplicate mailings to shareholders. Eaton Vance, or your financial intermediary, may household the mailing of your documents indefinitely unless you instruct Eaton Vance, or your financial intermediary, otherwise. If you would prefer that your Eaton Vance documents not be householded, please contact Eaton Vance at 1-800-262-1122, or contact your financial intermediary. Your instructions that householding not apply to delivery of your Eaton Vance documents will typically be effective within 30 days of receipt by Eaton Vance or your financial intermediary.
Portfolio Holdings. Each Eaton Vance Fund and its underlying Portfolio(s) (if applicable) files a schedule of portfolio holdings on Part F to Form N-PORT with the SEC. Certain information filed on Form N-PORT may be viewed on the Eaton Vance website at www.eatonvance.com, by calling Eaton Vance at 1-800-262-1122 or in the EDGAR database on the SEC’s website at www.sec.gov.
Proxy Voting. From time to time, funds are required to vote proxies related to the securities held by the funds. The Eaton Vance Funds or their underlying Portfolios (if applicable) vote proxies according to a set of policies and procedures approved by the Funds’ and Portfolios’ Boards. You may obtain a description of these policies and procedures and information on how the Funds or Portfolios voted proxies relating to portfolio securities during the most recent 12-month period ended June 30, without charge, upon request, by calling 1-800-262-1122 and by accessing the SEC’s website at www.sec.gov.
Investment Adviser of Stock Portfolio
Boston Management and Research
Two International Place
Boston, MA 02110
Investment Adviser and Administrator of Eaton Vance Stock NextShares
Eaton Vance Management
Two International Place
Boston, MA 02110
Distributor*
Foreside Fund Services, LLC
Three Canal Plaza, Suite 100
Portland, ME 04101
Custodian
State Street Bank and Trust Company
State Street Financial Center, One Lincoln Street
Boston, MA 02111
Transfer and Dividend Disbursing Agent
State Street Bank and Trust Company
State Street Financial Center, One Lincoln Street
Boston, MA 02111
Independent Registered Public Accounting Firm
Deloitte & Touche LLP
200 Berkeley Street
Boston, MA 02116-5022
Fund Offices
Two International Place
Boston, MA 02110
| * | FINRA BrokerCheck. Investors may check the background of their Investment Professional by contacting the Financial Industry Regulatory Authority (FINRA). FINRA BrokerCheck is a free tool to help investors check the professional background of current and former FINRA-registered securities firms and brokers. FINRA BrokerCheck is available by calling 1-800-289-9999 and at www.FINRA.org. The FINRA BrokerCheck brochure describing this program is available to investors at www.FINRA.org. |
23212 12.31.21
Item 2. Code of Ethics
The registrant (sometimes referred to as the “Fund”) has adopted a code of ethics applicable to its Principal Executive Officer, Principal Financial Officer and Principal Accounting Officer. The registrant undertakes to provide a copy of such code of ethics to any person upon request, without charge, by calling 1-800-262-1122. The registrant has not amended the code of ethics as described in Form N-CSR during the period covered by this report. The registrant has not granted any waiver, including an implicit waiver, from a provision of the code of ethics as described in Form N-CSR during the period covered by this report.
Item 3. Audit Committee Financial Expert
The registrant’s Board of Trustees (the “Board”) has designated George J. Gorman, William H. Park and Scott E. Wennerholm, each an independent trustee, as audit committee financial experts. Mr. Gorman is a certified public accountant who is the Principal at George J. Gorman LLC (a consulting firm). Previously, Mr. Gorman served in various capacities at Ernst & Young LLP (a registered public accounting firm), including as Senior
Partner. Mr. Gorman also has experience serving as an independent trustee and audit committee financial expert of other mutual fund complexes. Mr. Park is a certified public accountant who is a private investor. Previously, he served as a consultant, as the Chief Financial Officer of Aveon Group, L.P. (an investment management firm), as the Vice Chairman of Commercial Industrial Finance Corp. (specialty finance company), as President and Chief Executive Officer of Prizm Capital Management, LLC (investment management firm), as Executive Vice President and Chief Financial Officer of United Asset Management Corporation (an institutional investment management firm) and as a Senior Manager at Price Waterhouse (now PricewaterhouseCoopers) (a registered public accounting firm). Mr. Wennerholm is a private investor. Previously, Mr. Wennerholm served as a Trustee at Wheelock College (postsecondary institution), as a Consultant at GF Parish Group (executive recruiting firm), Chief Operating Officer and Executive Vice President at BNY Mellon Asset Management (investment management firm), Chief Operating Officer and Chief Financial Officer at Natixis Global Asset Management (investment management firm), and Vice President at Fidelity Investments Institutional Services (investment management firm).
Item 4. Principal Accountant Fees and Services
Eaton Vance Stock NextShares (the “Fund”) is a series of Eaton Vance NextShares Trust (the “Trust”), a Massachusetts business trust, which, including the Fund, offers a total of 2 series (the “Series”). The Trust is registered under the Investment Company Act of 1940 as an open-end management investment company. This Form N-CSR relates to the Fund’s annual report.
(a)-(d)
The following table presents the aggregate fees billed to the Fund for the Fund’s fiscal year ended December 31, 2020 and December 31, 2021 by the registrant’s principal accountant, Deloitte & Touche LLP (“D&T”), for professional services rendered for the audit of the Fund’s annual financial statements and fees billed for other services rendered by D&T during such periods.
Eaton Vance Stock NextShares
| | | | | | | | |
Fiscal Year Ended | | 12/31/20 | | | 12/31/21 | |
Audit Fees | | $ | 12,150 | | | $ | 12,150 | |
Audit-Related Fees(1) | | $ | 0 | | | $ | 0 | |
Tax Fees(2) | | $ | 6,656 | | | $ | 7,006 | |
All Other Fees(3) | | $ | 0 | | | $ | 0 | |
| | | | | | | | |
Total | | $ | 18,806 | | | $ | 19,156 | |
| | | | | | | | |
| (1) | Audit-related fees consist of the aggregate fees billed for assurance and related services that are reasonably related to the performance of the audit of the registrant’s financial statements and are not reported under the category of audit fees. |
| (2) | Tax fees consist of the aggregate fees billed for professional services rendered by the principal accountant relating to tax compliance, tax advice, and tax planning and specifically include fees for tax return preparation and other related tax compliance/planning matters. |
| (3) | All other fees consist of the aggregate fees billed for products and services provided by the principal accountant other than audit, audit-related, and tax services. |
The various Series comprising the Trust have differing fiscal year ends (October 31 or December 31). The following table presents the aggregate audit, audit-related, tax, and other fees billed to all of the Series in the Trust by D&T for the last two fiscal years of each Series.
| | | | | | | | | | | | | | | | |
Fiscal Years Ended | | 10/31/20 | | | 12/31/20 | | | 10/31/21 | | | 12/31/21 | |
Audit Fees | | $ | 14,150 | | | $ | 12,150 | | | $ | 14,150 | | | $ | 12,150 | |
Audit-Related Fees(1) | | $ | 0 | | | $ | 0 | | | $ | 0 | | | $ | 0 | |
Tax Fees(2) | | $ | 7,192 | | | $ | 6,656 | | | $ | 7,542 | | | $ | 7,006 | |
All Other Fees(3) | | $ | 0 | | | $ | 0 | | | $ | 0 | | | $ | 0 | |
| | | | | | | | | | | | | | | | |
Total | | $ | 21,342 | | | $ | 18,806 | | | $ | 21,692 | | | $ | 19,156 | |
| | | | | | | | | | | | | | | | |
| (1) | Audit-related fees consist of the aggregate fees billed for assurance and related services that are reasonably related to the performance of the audit of the registrant’s financial statements and are not reported under the category of audit fees. |
| (2) | Tax fees consist of the aggregate fees billed for professional services rendered by the principal accountant relating to tax compliance, tax advice, and tax planning and specifically include fees for tax return preparation and other related tax compliance/planning matters. |
| (3) | All other fees consist of the aggregate fees billed for products and services provided by the principal accountant other than audit, audit-related, and tax services. |
(e)(1) The registrant’s audit committee has adopted policies and procedures relating to the pre-approval of services provided by the registrant’s principal accountant (the “Pre-Approval Policies”). The Pre-Approval Policies establish a framework intended to assist the audit committee in the proper discharge of its pre-approval responsibilities. As a general matter, the Pre-Approval Policies (i) specify certain types of audit, audit-related, tax, and other services determined to be pre-approved by the audit committee; and (ii) delineate specific procedures governing the mechanics of the pre-approval process, including the approval and monitoring of audit and non-audit service fees. Unless a service is specifically pre-approved under the Pre-Approval Policies, it must be separately pre-approved by the audit committee.
The Pre-Approval Policies and the types of audit and non-audit services pre-approved therein must be reviewed and ratified by the registrant’s audit committee at least annually. The registrant’s audit committee maintains full responsibility for the appointment, compensation, and oversight of the work of the registrant’s principal accountant.
(e)(2) No services described in paragraphs (b)-(d) above were approved by the registrant’s audit committee pursuant to the “de minimis exception” set forth in Rule 2-01 (c)(7)(i)(C) of Regulation S-X.
(f) Not applicable.
(g) The following table presents (i) the aggregate non-audit fees (i.e., fees for audit-related, tax, and other services) billed to the Fund by D&T for the last two fiscal years of the Fund; and (ii) the aggregate non-audit fees (i.e., fees for audit-related, tax, and other services) billed to the Eaton Vance organization by D&T for the last two fiscal years of each Series.
| | | | | | | | | | | | | | | | |
Fiscal Years Ended | | 10/31/20 | | | 12/31/20 | | | 10/31/21 | | | 12/31/21 | |
Registrant(1) | | $ | 7,192 | | | $ | 6,656 | | | $ | 7,542 | | | $ | 7,006 | |
Eaton Vance(2) | | $ | 51,800 | | | $ | 150,300 | | | $ | 51,800 | | | $ | 51,800 | |
| (1) | Includes all of the Series of the Trust. During the fiscal years reported above, certain of the Funds were “feeder” funds in a “master-feeder” fund structure or funds of funds. |
| (2) | Various subsidiaries of Morgan Stanley act in either an investment advisory and/or service provider capacity with respect to the Series and/or their respective “master” funds (if applicable). |
(h) The registrant’s audit committee has considered whether the provision by the registrant’s principal accountant of non-audit services to the registrant’s investment adviser and any entity controlling, controlled by, or under common control with the adviser that provides ongoing services to the registrant that were not pre-approved pursuant to Rule 2-01(c)(7)(ii) of Regulation S-X is compatible with maintaining the principal accountant’s independence.
Item 5. Audit Committee of Listed Registrants
Not applicable.
Item 6. Schedule of Investments
Please see schedule of investments contained in the Report to Stockholders included under Item 1 of this Form N-CSR.
Item 7. Disclosure of Proxy Voting Policies and Procedures for Closed-End Management Investment Companies
Not applicable.
Item 8. Portfolio Managers of Closed-End Management Investment Companies
Not applicable.
Item 9. Purchases of Equity Securities by Closed-End Management Investment Company and Affiliated Purchasers
Not applicable.
Item 10. Submission of Matters to a Vote of Security Holders
No material changes.
Item 11. Controls and Procedures
(a) It is the conclusion of the registrant’s principal executive officer and principal financial officer that the effectiveness of the registrant’s current disclosure controls and procedures (such disclosure controls and procedures having been evaluated within 90 days of the date of this filing) provide reasonable assurance that the information required to be disclosed by the registrant has been recorded, processed, summarized and reported within the time year specified in the Commission’s rules and forms and that the information required to be disclosed by the registrant has been accumulated and communicated to the registrant’s principal executive officer and principal financial officer in order to allow timely decisions regarding required disclosure.
(b) There have been no changes in the registrant’s internal controls over financial reporting during the period covered by this report that has materially affected, or is reasonably likely to materially affect, the registrant’s internal control over financial reporting.
Item 12. Disclosure of Securities Lending Activities for Closed-End Management Investment Companies
Not applicable.
Item 13. Exhibits
Signatures
Pursuant to the requirements of the Securities Exchange Act of 1934 and the Investment Company Act of 1940, the registrant has duly caused this report to be signed on its behalf by the undersigned, thereunto duly authorized.
| | |
Eaton Vance NextShares Trust |
| |
| By: | | /s/ Edward J. Perkin |
| | Edward J. Perkin |
| | President |
Date: February 23, 2022
Pursuant to the requirements of the Securities Exchange Act of 1934 and the Investment Company Act of 1940, this report has been signed below by the following persons on behalf of the registrant and in the capacities and on the dates indicated.
| | |
| |
| By: | | /s/ James F. Kirchner |
| | James F. Kirchner |
| | Treasurer |
| |
| Date: | | February 23, 2022 |
| |
| By: | | /s/ Edward J. Perkin |
| | Edward J. Perkin |
| | President |
Date: February 23, 2022