UNITED STATES
SECURITIES AND EXCHANGE COMMISSION
Washington, D.C. 20549
Form N-CSR
CERTIFIED SHAREHOLDER REPORT OF REGISTERED
MANAGEMENT INVESTMENT COMPANIES
Investment Company Act File Number: 811-22821
Eaton Vance Floating-Rate Income Plus Fund
(Exact Name of Registrant as Specified in Charter)
Two International Place, Boston, Massachusetts 02110
(Address of Principal Executive Offices)
Maureen A. Gemma
Two International Place, Boston, Massachusetts 02110
(Name and Address of Agent for Services)
(617) 482-8260
(Registrant’s Telephone Number)
May 31
Date of Fiscal Year End
May 31, 2014
Date of Reporting Period
Item 1. Reports to Stockholders

Eaton Vance
Floating-Rate Income Plus Fund
(EFF)
Annual Report
May 31, 2014

Commodity Futures Trading Commission Registration. Effective December 31, 2012, the Commodity Futures Trading Commission (“CFTC”) adopted certain regulatory changes that subject registered investment companies and advisers to regulation by the CFTC if a fund invests more than a prescribed level of its assets in certain CFTC-regulated instruments (including futures, certain options and swap agreements) or markets itself as providing investment exposure to such instruments. The Fund has claimed an exclusion from the definition of the term “commodity pool operator” under the Commodity Exchange Act. Accordingly, neither the Fund nor the adviser with respect to the operation of the Fund is subject to CFTC regulation. Because of its management of other strategies, the Fund’s adviser is registered with the CFTC as a commodity pool operator and a commodity trading advisor.
Fund shares are not insured by the FDIC and are not deposits or other obligations of, or guaranteed by, any depository institution. Shares are subject to investment risks, including possible loss of principal invested.
Annual Report May 31, 2014
Eaton Vance
Floating-Rate Income Plus Fund
Table of Contents
| | | | |
Management’s Discussion of Fund Performance | | | 2 | |
| |
Performance | | | 3 | |
| |
Fund Profile | | | 4 | |
| |
Endnotes and Additional Disclosures | | | 5 | |
| |
Financial Statements | | | 6 | |
| |
Report of Independent Registered Public Accounting Firm | | | 29 | |
| |
Federal Tax Information | | | 30 | |
| |
Annual Meeting of Shareholders | | | 31 | |
| |
Dividend Reinvestment Plan | | | 32 | |
| |
Management and Organization | | | 34 | |
| |
Important Notices | | | 37 | |
Eaton Vance
Floating-Rate Income Plus Fund
May 31, 2014
Management’s Discussion of Fund Performance1
Economic and Market Conditions
The U.S. floating-rate loan market performed solidly during the fiscal year ended May 31, 2014, with the S&P/LSTA Leveraged Loan Index2, a broad barometer of the loan market, advancing 4.36% during the 12-month period. Returns were comprised mainly of interest income. Loan prices fluctuated during the year, generally within a 1% range, and ended modestly lower overall for the year. Technical conditions — i.e., the balance of supply and demand — were a key driver of loan prices. During the first eight months of the fiscal year, inflows into the asset class remained robust, with retail and institutional demand outstripping the net supply of new loans issued. Technical factors weakened somewhat during the final four months of the period.
As investors continued to search for yield and maintained a strong appetite for risk, loans remained in demand due to their near-par valuations, near-zero duration9 and floating income stream. That strong demand resulted in modest spread compression in the market, slightly lowering coupon income on new issue loans.
With the U.S. economy continuing its gradual recovery during the period, improving corporate fundamentals were also a key driver of loan performance. However, loan market default rates, a measure of corporate health and credit risk in the market, spiked as a result of the April 2014 default of one issuer: Energy Future Holdings, also known as TXU, a Texas-based electric utility that represented nearly 3.5% of the Index. TXU’s Chapter 11 bankruptcy filing caused the loan default rate to rise to 4.6% on a trailing 12-month basis as of period-end on May 31, 2014. Excluding TXU, the Index’s trailing one-year default rate was 1.1%, well below the market’s 10-year average of 3.4%, according to Standard & Poor’s Leveraged Commentary & Data. The Fund did not hold a position in TXU at the time of default. With many of the weakest issuers having been winnowed out of the market in the recent recession, surviving firms tended to be operating in a leaner manner, cutting expenses and generating higher operating margins. This helped produce generally strong cash flows for those issuers, another positive factor for loan market fundamentals.
Fund Performance
For the period from its inception on June 28, 2013 through the end of its fiscal period on May 31, 2014, Eaton Vance Floating-Rate Income Plus Fund (the Fund) shares at net asset value (NAV) had a total return of 8.00%, outperforming the 5.00% return of the S&P/LSTA Leveraged Loan Index (the Index).
Under normal market conditions, the Fund invests at least 80% of its total assets in senior loans. Management tends to underweight lower-quality loans, a strategy that may help the Fund experience limited credit losses over time but may detract from relative results versus the Index in times when senior loans perform well, as they did during the period ended May 31, 2014.
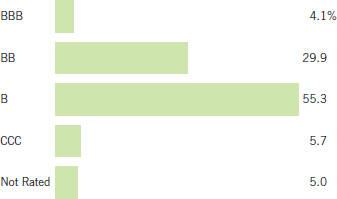
For the period from June 28, 2013 through May 31, 2014, BBB-rated7 loans in the Index returned 3.01%, BB-rated loans in the Index returned 3.52%, B-rated loans in the Index returned 5.21%, CCC-rated loans in the Index returned 10.00% and D-rated loans in the Index returned 27.66%. Across these ratings tiers, the Fund had overweight exposure to BB-rated loans and underweight exposure to B-rated, CCC-rated and D-rated loans. As a result, the Fund’s higher-quality positioning was a relative detractor from Fund performance versus the Index during the period.
Several other factors drove overall favorable Fund performance relative to the Index. The Fund’s out-of-Index holdings in high-yield bonds, investment-grade corporate bonds, convertible bonds and equities — all of which outperformed the loan market during the period — helped drive the Fund’s outperformance versus the Index. Additionally, the Fund’s employment of investment leverage6 was a contributor to relative performance versus the Index, which is unlevered, as leverage enhanced the performance of the Fund’s underlying portfolio during the period. Finally, credit selection was broadly beneficial across the Fund’s many sectors.
Within the Fund’s floating-rate loan holdings, the Fund’s underweight to the radio and television, utilities and telecommunications sectors detracted from the Fund’s relative results versus the Index, as those sectors outperformed the overall Index during the period. Similarly, the Fund’s overweight to cable and satellite television, leisure goods/activities/movies and food service hurt the Fund’s relative performance versus the Index, as those sectors trailed the overall loan market. In contrast, the Fund’s underweight to building and development and retailers (except food and drug) aided the Fund’s relative results versus the Index during the period.
See Endnotes and Additional Disclosures in this report.
Past performance is no guarantee of future results. Returns are historical and are calculated by determining the percentage change in net asset value (NAV) or market price (as applicable) with all distributions reinvested and includes management fees and other expenses. Fund performance at market price will differ from its results at NAV due to factors such as changing perceptions about the Fund, market conditions, fluctuations in supply and demand for Fund shares, or changes in Fund distributions. Investment return and principal value will fluctuate so that shares, when sold, may be worth more or less than their original cost. Performance less than one year is cumulative. Performance is for the stated time period only; due to market volatility, current Fund performance may be lower or higher than the quoted return. For performance as of the most recent month end, please refer to eatonvance.com.
Eaton Vance
Floating-Rate Income Plus Fund
May 31, 2014
Performance2,3
Portfolio Managers Scott H. Page, CFA, Craig P. Russ and Kathleen C. Gaffney, CFA
| | | | | | | | | | | | | | | | |
| % Cumulative Total Returns | | Inception Date | | | One Year | | | Five Years | | | Since
Inception | |
Fund at NAV | | | 06/28/2013 | | | | — | | | | — | | | | 8.00 | % |
Fund at Market Price | | | — | | | | — | | | | — | | | | –0.89 | |
S&P/LSTA Leveraged Loan Index | | | — | | | | 4.36 | % | | | 9.53 | % | | | 5.00 | % |
| | | | |
| | | | | | | | | | | | | | | | |
| % Premium/Discount to NAV4 | | | | | | | | | | | �� | |
| | | | | | | | | | | | | | | –8.23 | % |
| | | | |
| | | | | | | | | | | | | | | | |
| Distributions5 | | | | | | | | | | | | |
Total Distributions per share for the period | | | | | | | | | | | | | | $ | 0.974 | |
Distribution Rate at NAV | | | | | | | | | | | | | | | 5.71 | % |
Distribution Rate at Market Price | | | | | | | | | | | | | | | 6.22 | % |
| | | | |
| | | | | | | | | | | | | | | | |
| % Total Leverage6 | | | | | | | | | | | | |
Borrowings | | | | | | | | | | | | | | | 22.62 | % |
Variable Rate Term Preferred Shares (VRTP Shares) | | | | | | | | | | | | | | | 15.08 | |
See Endnotes and Additional Disclosures in this report.
Past performance is no guarantee of future results. Returns are historical and are calculated by determining the percentage change in net asset value (NAV) or market price (as applicable) with all distributions reinvested and includes management fees and other expenses. Fund performance at market price will differ from its results at NAV due to factors such as changing perceptions about the Fund, market conditions, fluctuations in supply and demand for Fund shares, or changes in Fund distributions. Investment return and principal value will fluctuate so that shares, when sold, may be worth more or less than their original cost. Performance less than one year is cumulative. Performance is for the stated time period only; due to market volatility, current Fund performance may be lower or higher than the quoted return. For performance as of the most recent month end, please refer to eatonvance.com.
Eaton Vance
Floating-Rate Income Plus Fund
May 31, 2014
Fund Profile
Credit Quality (% of bond and loan holdings)7
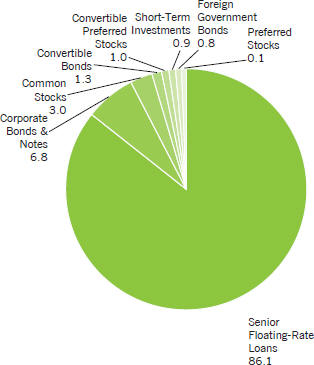
Asset Allocation (% of total investments)8
See Endnotes and Additional Disclosures in this report.
Eaton Vance
Floating-Rate Income Plus Fund
May 31, 2014
Endnotes and Additional Disclosures
| 1 | The views expressed in this report are those of the portfolio manager(s) and are current only through the date stated at the top of this page. These views are subject to change at any time based upon market or other conditions, and Eaton Vance and the Fund(s) disclaim any responsibility to update such views. These views may not be relied upon as investment advice and, because investment decisions are based on many factors, may not be relied upon as an indication of trading intent on behalf of any Eaton Vance fund. This commentary may contain statements that are not historical facts, referred to as “forward looking statements”. The Fund’s actual future results may differ significantly from those stated in any forward looking statement, depending on factors such as changes in securities or financial markets or general economic conditions, the volume of sales and purchases of Fund shares, the continuation of investment advisory, administrative and service contracts, and other risks discussed from time to time in the Fund’s filings with the Securities and Exchange Commission. |
| 2 | S&P/LSTA Leveraged Loan Index is an unmanaged index of the institutional leveraged loan market. Unless otherwise stated, index returns do not reflect the effect of any applicable sales charges, commissions, expenses, taxes or leverage, as applicable. It is not possible to invest directly in an index. |
| 3 | Performance results reflect the effects of leverage. Performance since inception for an index, if presented, is the performance since the Fund’s or oldest share class’ inception, as applicable. |
| 4 | The shares of the Fund often trade at a discount or premium from their net asset value. The discount or premium of the Fund may vary over time and may be higher or lower than what is quoted in this report. For up-to-date premium/discount information, please refer to http://eatonvance.com/closedend. |
| 5 | The Distribution Rate is based on the Fund’s last regular distribution per share in the period (annualized) divided by the Fund’s NAV or market price at the end of the period. The Fund’s distributions may be comprised of amounts characterized for federal income tax purposes as tax-exempt income, qualified and non-qualified ordinary dividends, capital gains and nondividend distributions, also known as return of capital. For additional information about nondividend distributions, please refer to Eaton Vance Closed-End Fund Distribution Notices (19a) posted on our website, eatonvance.com. The Fund will determine the federal income tax character of distributions paid to a shareholder after |
| | the end of the calendar year. This is reported on the IRS form 1099-DIV and provided to the shareholder shortly after each year-end. For information about the tax character of distributions made in prior calendar years, please refer to Performance-Tax Character of Distributions on the Fund’s webpage available at eatonvance.com. The Fund’s distributions are determined by the investment adviser based on its current assessment of the Fund’s long-term return potential. As portfolio and market conditions change, the rate of distributions paid by the Fund could change. |
| 6 | Leverage represents the liquidation value of the Fund’s VRTP Shares and borrowings outstanding as a percentage of Fund net assets applicable to common shares plus VRTP Shares and borrowings outstanding. Use of leverage creates an opportunity for income, but creates risks including greater price volatility. The cost of leverage rises and falls with changes in short-term interest rates. The Fund may be required to maintain prescribed asset coverage for its leverage and may be required to reduce its leverage at an inopportune time. |
| 7 | Ratings are based on Moody’s, S&P or Fitch, as applicable. If securities are rated differently by the rating agencies, the higher rating is applied. Ratings, which are subject to change, apply to the creditworthiness of the issuers of the underlying securities and not to the Fund or its shares. Credit ratings measure the quality of a bond based on the issuer’s creditworthiness, with ratings ranging from AAA, being the highest, to D, being the lowest based on S&P’s measures. Ratings of BBB or higher by S&P or Fitch (Baa or higher by Moody’s) are considered to be investment grade quality. Credit ratings are based largely on the rating agency’s analysis at the time of rating. The rating assigned to any particular security is not necessarily a reflection of the issuer’s current financial condition and does not necessarily reflect its assessment of the volatility of a security’s market value or of the liquidity of an investment in the security. Holdings designated as “Not Rated” are not rated by the national rating agencies stated above. |
| 8 | Asset allocation as a percentage of the Fund’s net assets amounted to 160.5%. |
| 9 | Duration is a measure of the expected change in price of a bond — in percentage terms — given a one percent change in interest rates, all else being constant. Securities with lower durations tend to be less sensitive to interest-rate changes. |
| | Fund profile subject to change due to active management. |
Eaton Vance
Floating-Rate Income Plus Fund
May 31, 2014
Portfolio of Investments
| | | | | | | | | | |
| Senior Floating-Rate Interests — 138.2%(1) | |
| | | |
| | | | | | | | | | |
| Borrower/Tranche Description | | | | Principal
Amount
(000’s omitted) | | | Value | |
| | | | | | | | | | |
| |
Aerospace and Defense — 3.3% | | | | | |
DAE Aviation Holdings, Inc. | | | | | | | | | | |
Term Loan, 5.00%, Maturing November 2, 2018 | | | | $ | 308 | | | $ | 312,181 | |
Term Loan, 5.00%, Maturing November 2, 2018 | | | | | 679 | | | | 688,633 | |
Silver II US Holdings, LLC | | | | | | | | | | |
Term Loan, 4.00%, Maturing December 13, 2019 | | | | | 1,454 | | | | 1,455,206 | |
Transdigm, Inc. | | | | | | | | | | |
Term Loan, 3.75%, Maturing February 28, 2020 | | | | | 2,481 | | | | 2,473,015 | |
| | | | | | | | | | | |
| | | | | | | | $ | 4,929,035 | |
| | | | | | | | | | | |
| |
Automotive — 4.1% | | | | | |
Affinia Group Intermediate Holdings Inc. | | | | | | | | | | |
Term Loan, 4.75%, Maturing April 27, 2020 | | | | $ | 704 | | | $ | 709,709 | |
Chrysler Group LLC | | | | | | | | | | |
Term Loan, 3.25%, Maturing December 31, 2018 | | | | | 550 | | | | 547,348 | |
CS Intermediate Holdco 2 LLC | | | | | | | | | | |
Term Loan, 4.00%, Maturing April 4, 2021 | | | | | 175 | | | | 175,328 | |
Federal-Mogul Holdings Corporation | | | | | | | | | | |
Term Loan, 4.75%, Maturing April 15, 2021 | | | | | 1,000 | | | | 997,813 | |
Metaldyne, LLC | | | | | | | | | | |
Term Loan, 4.25%, Maturing December 18, 2018 | | | | | 1,561 | | | | 1,566,236 | |
UCI International, Inc. | | | | | | | | | | |
Term Loan, 5.50%, Maturing July 26, 2017 | | | | | 987 | | | | 991,076 | |
Veyance Technologies, Inc. | | | | | | | | | | |
Term Loan, 5.25%, Maturing September 8, 2017 | | | | | 792 | | | | 793,852 | |
Visteon Corporation | | | | | | | | | | |
Term Loan, Maturing May 27, 2021(2) | | | | | 275 | | | | 273,066 | |
| | | | | | | | | | | |
| | | $ | 6,054,428 | |
| | | | | | | | | | | |
| |
Brokers, Dealers and Investment Houses — 0.1% | | | | | |
American Beacon Advisors, Inc. | | | | | | | | | | |
Term Loan, 4.75%, Maturing November 22, 2019 | | | | $ | 125 | | | $ | 125,074 | |
| | | | | | | | | | | |
| | | $ | 125,074 | |
| | | | | | | | | | | |
| |
Building and Development — 1.1% | | | | | |
CPG International Inc. | | | | | | | | | | |
Term Loan, 4.75%, Maturing September 30, 2020 | | | | $ | 149 | | | $ | 149,623 | |
Quikrete Holdings, Inc. | | | | | | | | | | |
Term Loan, 4.00%, Maturing September 28, 2020 | | | | | 249 | | | | 248,984 | |
Realogy Corporation | | | | | | | | | | |
Term Loan, 3.75%, Maturing March 5, 2020 | | | | | 794 | | | | 794,496 | |
| | | | | | | | | | |
| Borrower/Tranche Description | | | | Principal
Amount
(000’s omitted) | | | Value | |
| | | | | | | | | | |
| |
Building and Development (continued) | | | | | |
Summit Materials Companies I, LLC | | | | | | | | | | |
Term Loan, 5.00%, Maturing January 30, 2019 | | | | $ | 496 | | | $ | 499,032 | |
| | | | | | | | | | | |
| | | $ | 1,692,135 | |
| | | | | | | | | | | |
| |
Business Equipment and Services — 13.7% | | | | | |
Acosta, Inc. | | | | | | | | | | |
Term Loan, 4.25%, Maturing March 2, 2018 | | | | $ | 199 | | | $ | 200,412 | |
Advantage Sales & Marketing, Inc. | | | | | | | | | | |
Term Loan, 4.25%, Maturing December 17, 2017 | | | | | 1,684 | | | | 1,689,885 | |
AlixPartners, LLP | | | | | | | | | | |
Term Loan - Second Lien, 9.00%, Maturing July 10, 2021 | | | | | 200 | | | | 204,750 | |
AVSC Holding Corp. | | | | | | | | | | |
Term Loan, 4.50%, Maturing January 24, 2021 | | | | | 100 | | | | 100,229 | |
BakerCorp International, Inc. | | | | | | | | | | |
Term Loan, 4.25%, Maturing February 14, 2020 | | | | | 743 | | | | 733,692 | |
Brickman Group Ltd. LLC | | | | | | | | | | |
Term Loan, 4.00%, Maturing December 18, 2020 | | | | | 224 | | | | 223,836 | |
CCC Information Services, Inc. | | | | | | | | | | |
Term Loan, 4.00%, Maturing December 20, 2019 | | | | | 495 | | | | 494,261 | |
Ceridian Corp. | | | | | | | | | | |
Term Loan, 4.40%, Maturing May 9, 2017 | | | | | 291 | | | | 291,653 | |
Crossmark Holdings, Inc. | | | | | | | | | | |
Term Loan, 4.50%, Maturing December 20, 2019 | | | | | 511 | | | | 507,310 | |
Education Management LLC | | | | | | | | | | |
Term Loan, 8.25%, Maturing March 29, 2018 | | | | | 1,488 | | | | 1,108,299 | |
EIG Investors Corp. | | | | | | | | | | |
Term Loan, 5.00%, Maturing November 9, 2019 | | | | | 1,688 | | | | 1,698,047 | |
Expert Global Solutions, Inc. | | | | | | | | | | |
Term Loan, 8.50%, Maturing April 3, 2018 | | | | | 778 | | | | 752,767 | |
Extreme Reach, Inc. | | | | | | | | | | |
Term Loan, 6.75%, Maturing February 10, 2020 | | | | | 200 | | | | 203,000 | |
Garda World Security Corporation | | | | | | | | | | |
Term Loan, 4.00%, Maturing November 6, 2020 | | | | | 30 | | | | 30,336 | |
Term Loan, 4.00%, Maturing November 6, 2020 | | | | | 119 | | | | 118,587 | |
Information Resources, Inc. | | | | | | | | | | |
Term Loan, 4.75%, Maturing September 30, 2020 | | | | | 323 | | | | 324,183 | |
ION Trading Technologies S.a.r.l. | | | | | | | | | | |
Term Loan, 4.50%, Maturing May 22, 2020 | | | | | 750 | | | | 750,938 | |
Term Loan - Second Lien, 8.25%, Maturing May 21, 2021 | | | | | 1,000 | | | | 1,007,500 | |
Jason Incorporated | | | | | | | | | | |
Term Loan, 5.00%, Maturing February 28, 2019 | | | | | 794 | | | | 795,347 | |
| | | | |
| | 6 | | See Notes to Financial Statements. |
Eaton Vance
Floating-Rate Income Plus Fund
May 31, 2014
Portfolio of Investments — continued
| | | | | | | | | | |
| Borrower/Tranche Description | | | | Principal
Amount
(000’s omitted) | | | Value | |
| | | | | | | | | | |
| |
Business Equipment and Services (continued) | | | | | |
Kronos Incorporated | | | | | | | | | | |
Term Loan, 4.50%, Maturing October 30, 2019 | | | | $ | 2,251 | | | $ | 2,262,437 | |
MCS AMS Sub-Holdings LLC | | | | | | | | | | |
Term Loan, 7.00%, Maturing October 15, 2019 | | | | | 393 | | | | 381,706 | |
Quintiles Transnational Corp. | | | | | | | | | | |
Term Loan, 3.75%, Maturing June 8, 2018 | | | | | 2,000 | | | | 2,003,334 | |
RCS Capital Corporation | | | | | | | | | | |
Term Loan, 6.50%, Maturing March 31, 2019 | | | | | 275 | | | | 281,446 | |
ServiceMaster Company | | | | | | | | | | |
Term Loan, 4.40%, Maturing January 31, 2017 | | | | | 990 | | | | 993,172 | |
SunGard Data Systems, Inc. | | | | | | | | | | |
Term Loan, 4.00%, Maturing March 8, 2020 | | | | | 1,743 | | | | 1,749,625 | |
TransUnion, LLC | | | | | | | | | | |
Term Loan, 4.00%, Maturing March 17, 2021 | | | | | 1,050 | | | | 1,049,180 | |
WASH Multifamily Laundry Systems, LLC | | | | | | | | | | |
Term Loan, 4.50%, Maturing February 21, 2019 | | | | | 412 | | | | 412,189 | |
| | | | | | | | | | | |
| | | $ | 20,368,121 | |
| | | | | | | | | | | |
| |
Cable and Satellite Television — 0.7% | | | | | |
ION Media Networks, Inc. | | | | | | | | | | |
Term Loan, 5.00%, Maturing December 18, 2020 | | | | $ | 399 | | | $ | 401,743 | |
Ziggo B.V. | | | | | | | | | | |
Term Loan, 3.25%, Maturing January 15, 2022 | | | | | 149 | | | | 146,919 | |
Term Loan, 3.25%, Maturing January 15, 2022 | | | | | 231 | | | | 227,987 | |
Term Loan, Maturing January 15, 2022(2) | | | | | 245 | | | | 241,630 | |
| | | | | | | | | | | |
| | | $ | 1,018,279 | |
| | | | | | | | | | | |
| |
Chemicals and Plastics — 7.5% | | | | | |
Allnex (Luxembourg) & Cy S.C.A. | | | | | | | | | | |
Term Loan, 4.50%, Maturing October 3, 2019 | | | | $ | 523 | | | $ | 525,050 | |
Allnex USA, Inc. | | | | | | | | | | |
Term Loan, 4.50%, Maturing October 3, 2019 | | | | | 271 | | | | 272,423 | |
Arysta LifeScience Corporation | | | | | | | | | | |
Term Loan, 4.50%, Maturing May 29, 2020 | | | | | 794 | | | | 795,985 | |
Axalta Coating Systems US Holdings Inc. | | | | | | | | | | |
Term Loan, 4.00%, Maturing February 1, 2020 | | | | | 1,489 | | | | 1,489,913 | |
Huntsman International, LLC | | | | | | | | | | |
Term Loan, Maturing October 15, 2020(2) | | | | | 500 | | | | 500,938 | |
Ineos US Finance LLC | | | | | | | | | | |
Term Loan, 3.75%, Maturing May 4, 2018 | | | | | 1,982 | | | | 1,973,785 | |
Kronos Worldwide Inc. | | | | | | | | | | |
Term Loan, 4.75%, Maturing February 18, 2020 | | | | | 275 | | | | 277,320 | |
Minerals Technology Inc. | | | | | | | | | | |
Term Loan, 4.00%, Maturing May 9, 2021 | | | | | 525 | | | | 527,625 | |
| | | | | | | | | | |
| Borrower/Tranche Description | | | | Principal
Amount
(000’s omitted) | | | Value | |
| | | | | | | | | | |
| |
Chemicals and Plastics (continued) | | | | | |
OXEA Finance LLC | | | | | | | | | | |
Term Loan - Second Lien, 8.25%, Maturing July 15, 2020 | | | | $ | 1,000 | | | $ | 1,012,500 | |
Polarpak Inc. | | | | | | | | | | |
Term Loan, 4.50%, Maturing June 5, 2020 | | | | | 312 | | | | 313,385 | |
Tata Chemicals North America Inc. | | | | | | | | | | |
Term Loan, 3.75%, Maturing August 7, 2020 | | | | | 273 | | | | 273,190 | |
Tronox Pigments (Netherlands) B.V. | | | | | | | | | | |
Term Loan, 4.00%, Maturing March 19, 2020 | | | | | 1,982 | | | | 1,986,445 | |
Univar Inc. | | | | | | | | | | |
Term Loan, 5.00%, Maturing June 30, 2017 | | | | | 990 | | | | 991,909 | |
WNA Holdings Inc. | | | | | | | | | | |
Term Loan, 4.50%, Maturing June 7, 2020 | | | | | 171 | | | | 171,645 | |
| | | | | | | | | | | |
| | | | | | | | $ | 11,112,113 | |
| | | | | | | | | | | |
| |
Conglomerates — 0.4% | | | | | |
Spectrum Brands, Inc. | | | | | | | | | | |
Term Loan, 3.50%, Maturing September 4, 2019 | | | | $ | 647 | | | $ | 647,203 | |
| | | | | | | | | | | |
| | | | | | | | $ | 647,203 | |
| | | | | | | | | | | |
| |
Containers and Glass Products — 3.1% | | | | | |
Berry Plastics Holding Corporation | | | | | | | | | | |
Term Loan, 3.50%, Maturing February 8, 2020 | | | | $ | 1,980 | | | $ | 1,965,459 | |
Term Loan, 3.75%, Maturing January 6, 2021 | | | | | 175 | | | | 174,535 | |
Libbey Glass, Inc. | | | | | | | | | | |
Term Loan, 3.75%, Maturing April 9, 2021 | | | | | 100 | | | | 99,583 | |
Pelican Products, Inc. | | | | | | | | | | |
Term Loan, 5.25%, Maturing March 20, 2020 | | | | | 378 | | | | 381,841 | |
Reynolds Group Holdings Inc. | | | | | | | | | | |
Term Loan, 4.00%, Maturing December 1, 2018 | | | | | 1,990 | | | | 1,994,673 | |
| | | | | | | | | | | |
| | | | | | | | $ | 4,616,091 | |
| | | | | | | | | | | |
| |
Cosmetics / Toiletries — 0.7% | | | | | |
Revlon Consumer Products Corporation | | | | | | | | | | |
Term Loan, 4.00%, Maturing October 8, 2019 | | | | $ | 299 | | | $ | 299,998 | |
Sun Products Corporation (The) | | | | | | | | | | |
Term Loan, 5.50%, Maturing March 23, 2020 | | | | | 733 | | | | 708,511 | |
| | | | | | | | | | | |
| | | | | | | | $ | 1,008,509 | |
| | | | | | | | | | | |
| |
Drugs — 2.6% | | | | | |
Auxilium Pharmaceuticals, Inc. | | | | | | | | | | |
Term Loan, 6.25%, Maturing April 26, 2017 | | | | $ | 481 | | | $ | 474,031 | |
Endo Luxembourg Finance Company I S.a.r.l. | | | | | | | | | | |
Term Loan, 3.25%, Maturing February 28, 2021 | | | | | 100 | | | | 99,469 | |
| | | | |
| | 7 | | See Notes to Financial Statements. |
Eaton Vance
Floating-Rate Income Plus Fund
May 31, 2014
Portfolio of Investments — continued
| | | | | | | | | | |
| Borrower/Tranche Description | | | | Principal
Amount
(000’s omitted) | | | Value | |
| | | | | | | | | | |
| |
Drugs (continued) | | | | | |
Ikaria, Inc. | | | | | | | | | | |
Term Loan, 5.00%, Maturing February 12, 2021 | | | | $ | 225 | | | $ | 226,383 | |
Term Loan - Second Lien, 8.75%, Maturing February 14, 2022 | | | | | 500 | | | | 508,250 | |
Par Pharmaceutical Companies, Inc. | | | | | | | | | | |
Term Loan, 4.00%, Maturing September 30, 2019 | | | | | 200 | | | | 199,375 | |
Valeant Pharmaceuticals International, Inc. | | | | | | | | | | |
Term Loan, 3.75%, Maturing August 5, 2020 | | | | | 2,299 | | | | 2,299,085 | |
| | | | | | | | | | | |
| | | | | | | | $ | 3,806,593 | |
| | | | | | | | | | | |
| |
Ecological Services and Equipment — 0.8% | | | | | |
ADS Waste Holdings, Inc. | | | | | | | | | | |
Term Loan, 3.75%, Maturing October 9, 2019 | | | | $ | 995 | | | $ | 990,506 | |
EnergySolutions, LLC | | | | | | | | | | |
Term Loan, Maturing May 29, 2020(2) | | | | | 225 | | | | 225,844 | |
| | | | | | | | | | | |
| | | | | | | | $ | 1,216,350 | |
| | | | | | | | | | | |
| |
Electronics / Electrical — 15.1% | | | | | |
Aeroflex Incorporated | | | | | | | | | | |
Term Loan, 4.50%, Maturing November 11, 2019 | | | | $ | 459 | | | $ | 461,542 | |
Answers Corporation | | | | | | | | | | |
Term Loan - Second Lien, 11.00%, Maturing June 19, 2020 | | | | | 800 | | | | 808,000 | |
Attachmate Corporation | | | | | | | | | | |
Term Loan, 7.25%, Maturing November 22, 2017 | | | | | 701 | | | | 706,947 | |
Avago Technologies Cayman Ltd. | | | | | | | | | | |
Term Loan, 3.75%, Maturing May 6, 2021 | | | | | 1,625 | | | | 1,632,109 | |
Blue Coat Systems, Inc. | | | | | | | | | | |
Term Loan - Second Lien, 9.50%, Maturing June 28, 2020 | | | | | 1,000 | | | | 1,019,375 | |
Campaign Monitor Finance Pty Limited | | | | | | | | | | |
Term Loan, 6.25%, Maturing March 18, 2021 | | | | | 200 | | | | 197,000 | |
CompuCom Systems, Inc. | | | | | | | | | | |
Term Loan, 4.25%, Maturing May 11, 2020 | | | | | 478 | | | | 474,028 | |
Dell Inc. | | | | | | | | | | |
Term Loan, 4.50%, Maturing April 29, 2020 | | | | | 2,338 | | | | 2,337,983 | |
Electrical Components International, Inc. | | | | | | | | | | |
Term Loan, Maturing May 5, 2021(2) | | | | | 100 | | | | 100,875 | |
Entegris, Inc. | | | | | | | | | | |
Term Loan, 3.50%, Maturing April 30, 2021 | | | | | 125 | | | | 123,789 | |
Excelitas Technologies Corp. | | | | | | | | | | |
Term Loan, 6.00%, Maturing October 30, 2020 | | | | | 222 | | | | 222,885 | |
Eze Castle Software Inc. | | | | | | | | | | |
Term Loan, 4.00%, Maturing April 6, 2020 | | | | | 944 | | | | 945,180 | |
| | | | | | | | | | |
| Borrower/Tranche Description | | | | Principal
Amount
(000’s omitted) | | | Value | |
| | | | | | | | | | |
| |
Electronics / Electrical (continued) | | | | | |
FIDJI Luxembourg (BC4) S.A.R.L. | | | | | | | | | | |
Term Loan, 6.25%, Maturing December 24, 2020 | | | | $ | 200 | | | $ | 201,625 | |
Go Daddy Operating Company, LLC | | | | | | | | | | |
Term Loan, 4.75%, Maturing May 13, 2021 | | | | | 992 | | | | 997,331 | |
Hyland Software, Inc. | | | | | | | | | | |
Term Loan, 4.75%, Maturing February 19, 2021 | | | | | 725 | | | | 729,682 | |
Infor (US), Inc. | | | | | | | | | | |
Term Loan, 3.75%, Maturing June 3, 2020 | | | | | 2,186 | | | | 2,176,633 | |
M/A-COM Technology Solutions Holdings, Inc. | | | | | | | | | | |
Term Loan, 4.50%, Maturing April 14, 2021 | | | | | 125 | | | | 125,625 | |
Magic Newco LLC | | | | | | | | | | |
Term Loan, 5.00%, Maturing December 12, 2018 | | | | | 990 | | | | 999,111 | |
Renaissance Learning, Inc. | | | | | | | | | | |
Term Loan, 4.50%, Maturing March 20, 2021 | | | | | 175 | | | | 175,146 | |
RP Crown Parent, LLC | | | | | | | | | | |
Term Loan, 6.00%, Maturing December 21, 2018 | | | | | 1,017 | | | | 1,017,183 | |
Term Loan - Second Lien, 11.25%, Maturing December 20, 2019 | | | | | 1,000 | | | | 1,004,688 | |
Shield Finance Co. S.A.R.L. | | | | | | | | | | |
Term Loan, 5.00%, Maturing January 29, 2021 | | | | | 175 | | | | 176,021 | |
Sirius Computer Solutions, Inc. | | | | | | | | | | |
Term Loan, 7.00%, Maturing November 30, 2018 | | | | | 430 | | | | 436,115 | |
SkillSoft Corporation | | | | | | | | | | |
Term Loan, 4.50%, Maturing April 28, 2021 | | | | | 375 | | | | 375,391 | |
Smart Technologies ULC | | | | | | | | | | |
Term Loan, 10.50%, Maturing January 31, 2018 | | | | | 490 | | | | 507,611 | |
StoneRiver Holdings, L.P. | | | | | | | | | | |
Term Loan, 4.50%, Maturing November 29, 2019 | | | | | 233 | | | | 233,032 | |
SumTotal Systems LLC | | | | | | | | | | |
Term Loan, 6.25%, Maturing November 16, 2018 | | | | | 499 | | | | 487,444 | |
SunEdison Semiconductor B.V. | | | | | | | | | | |
Term Loan, Maturing May 22,
2019(2) | | | | | 225 | | | | 225,000 | |
SurveyMonkey.com, LLC | | | | | | | | | | |
Term Loan, 5.50%, Maturing February 5, 2019 | | | | | 487 | | | | 487,033 | |
Sybil Software LLC | | | | | | | | | | |
Term Loan, 5.00%, Maturing March 18, 2020 | | | | | 250 | | | | 250,052 | |
Vertafore, Inc. | | | | | | | | | | |
Term Loan, 4.25%, Maturing October 3, 2019 | | | | | 1,455 | | | | 1,459,126 | |
Wall Street Systems Dalaware, Inc. | | | | | | | | | | |
Term Loan, 4.50%, Maturing April 30, 2021 | | | | | 400 | | | | 400,250 | |
Web.com Group, Inc. | | | | | | | | | | |
Term Loan, 4.50%, Maturing October 27, 2017 | | | | | 422 | | | | 426,197 | |
Websense, Inc. | | | | | | | | | | |
Term Loan, 4.50%, Maturing June 25, 2020 | | | | | 496 | | | | 498,938 | |
| | | | | | | | | | | |
| | | | | | | | $ | 22,418,947 | |
| | | | | | | | | | | |
| | | | |
| | 8 | | See Notes to Financial Statements. |
Eaton Vance
Floating-Rate Income Plus Fund
May 31, 2014
Portfolio of Investments — continued
| | | | | | | | | | |
| Borrower/Tranche Description | | | | Principal
Amount
(000’s omitted) | | | Value | |
| | | | | | | | | | |
| |
Equipment Leasing — 0.4% | | | | | |
Delos Finance S.a.r.l. | | | | | | | | | | |
Term Loan, 3.50%, Maturing March 6, 2021 | | | | $ | 650 | | | $ | 650,987 | |
| | | | | | | | | | | |
| | | | | | | | $ | 650,987 | |
| | | | | | | | | | | |
| |
Financial Intermediaries — 7.4% | | | | | |
American Capital, Ltd. | | | | | | | | | | |
Term Loan, 3.50%, Maturing August 22, 2017 | | | | $ | 1,144 | | | $ | 1,144,465 | |
Corporate Capital Trust, Inc. | | | | | | | | | | |
Term Loan, 4.00%, Maturing May 15, 2019 | | | | | 250 | | | | 250,313 | |
First Data Corporation | | | | | | | | | | |
Term Loan, 4.15%, Maturing March 24, 2018 | | | | | 1,500 | | | | 1,504,062 | |
Grosvenor Capital Management Holdings, LLP | | | | | | | | | | |
Term Loan, 3.75%, Maturing January 4, 2021 | | | | | 324 | | | | 322,972 | |
Guggenheim Partners, LLC | | | | | | | | | | |
Term Loan, 4.25%, Maturing July 22, 2020 | | | | | 2,164 | | | | 2,175,623 | |
Moneygram International, Inc. | | | | | | | | | | |
Term Loan, 4.25%, Maturing March 27, 2020 | | | | | 1,486 | | | | 1,465,464 | |
Nuveen Investments, Inc. | | | | | | | | | | |
Term Loan, 4.15%, Maturing May 15, 2017 | | | | | 1,500 | | | | 1,504,922 | |
Ocwen Financial Corporation | | | | | | | | | | |
Term Loan, 5.00%, Maturing February 15, 2018 | | | | | 792 | | | | 797,321 | |
Sesac Holdco II, LLC | | | | | | | | | | |
Term Loan, 5.00%, Maturing February 8, 2019 | | | | | 794 | | | | 797,444 | |
Walker & Dunlop, Inc. | | | | | | | | | | |
Term Loan, 5.50%, Maturing December 11, 2020 | | | | | 175 | | | | 177,617 | |
Walter Investment Management Corp. | | | | | | | | | | |
Term Loan, 4.75%, Maturing December 11, 2020 | | | | | 891 | | | | 881,785 | |
| | | | | | | | | | | |
| | | | | | | | $ | 11,021,988 | |
| | | | | | | | | | | |
| |
Food Products — 3.7% | | | | | |
AdvancePierre Foods, Inc. | | | | | | | | | | |
Term Loan, 5.75%, Maturing July 10, 2017 | | | | $ | 995 | | | $ | 994,962 | |
Big Heart Pet Brands | | | | | | | | | | |
Term Loan, 3.50%, Maturing March 8, 2020 | | | | | 1,348 | | | | 1,339,277 | |
Del Monte Foods, Inc. | | | | | | | | | | |
Term Loan, 4.25%, Maturing February 18, 2021 | | | | | 175 | | | | 174,693 | |
Diamond Foods, Inc. | | | | | | | | | | |
Term Loan, 4.25%, Maturing August 20, 2018 | | | | | 50 | | | | 49,947 | |
Dole Food Company Inc. | | | | | | | | | | |
Term Loan, 4.50%, Maturing November 1, 2018 | | | | | 1,596 | | | | 1,598,187 | |
Hearthside Food Solutions, LLC | | | | | | | | | | |
Term Loan, 4.50%, Maturing June 7, 2018 | | | | | 496 | | | | 496,250 | |
High Liner Foods Incorporated | | | | | | | | | | |
Term Loan, 4.25%, Maturing April 24, 2021 | | | | | 225 | | | | 225,000 | |
| | | | | | | | | | |
| Borrower/Tranche Description | | | | Principal
Amount
(000’s omitted) | | | Value | |
| | | | | | | | | | |
| |
Food Products (continued) | | | | | |
JBS USA Holdings Inc. | | | | | | | | | | |
Term Loan, 3.75%, Maturing September 18, 2020 | | | | $ | 423 | | | $ | 423,404 | |
Post Holdings Inc. | | | | | | | | | | |
Term Loan, Maturing April 17, 2021(2) | | | | | 150 | | | | 151,359 | |
| | | | | | | | | | | |
| | | | | | | | $ | 5,453,079 | |
| | | | | | | | | | | |
| |
Food Service — 1.9% | | | | | |
CEC Entertainment Concepts, L.P. | | | | | | | | | | |
Term Loan, 4.25%, Maturing February 14, 2021 | | | | $ | 200 | | | $ | 198,667 | |
Landry’s, Inc. | | | | | | | | | | |
Term Loan, 4.00%, Maturing April 24, 2018 | | | | | 698 | | | | 700,065 | |
US Foods, Inc. | | | | | | | | | | |
Term Loan, 4.50%, Maturing March 29, 2019 | | | | | 1,489 | | | | 1,492,254 | |
Weight Watchers International, Inc. | | | | | | | | | | |
Term Loan, 4.00%, Maturing April 2, 2020 | | | | | 496 | | | | 395,132 | |
| | | | | | | | | | | |
| | | | | | | | $ | 2,786,118 | |
| | | | | | | | | | | |
| |
Food / Drug Retailers — 2.8% | | | | | |
Albertson’s, LLC | | | | | | | | | | |
Term Loan, 4.75%, Maturing March 21, 2019 | | | | $ | 896 | | | $ | 900,971 | |
Rite Aid Corporation | | | | | | | | | | |
Term Loan, 3.50%, Maturing February 21, 2020 | | | | | 2,481 | | | | 2,481,250 | |
Supervalu Inc. | | | | | | | | | | |
Term Loan, 4.50%, Maturing March 21, 2019 | | | | | 786 | | | | 787,051 | |
| | | | | | | | | | | |
| | | | | | | | $ | 4,169,272 | |
| | | | | | | | | | | |
| |
Health Care — 14.0% | | | | | |
Akorn, Inc. | | | | | | | | | | |
Term Loan, 4.50%, Maturing April 16, 2021 | | | | $ | 175 | | | $ | 175,948 | |
Amneal Pharmaceuticals LLC | | | | | | | | | | |
Term Loan, 5.75%, Maturing November 1, 2019 | | | | | 149 | | | | 150,649 | |
BioScrip, Inc. | | | | | | | | | | |
Term Loan, 6.50%, Maturing July 31, 2020 | | | | | 104 | | | | 105,070 | |
Term Loan, 6.50%, Maturing July 31, 2020 | | | | | 174 | | | | 175,117 | |
CeramTec Acquisition Corporation | | | | | | | | | | |
Term Loan, 4.25%, Maturing August 28, 2020 | | | | | 54 | | | | 54,247 | |
CHG Buyer Corporation | | | | | | | | | | |
Term Loan, 4.25%, Maturing November 19, 2019 | | | | | 797 | | | | 797,816 | |
Community Health Systems, Inc. | | | | | | | | | | |
Term Loan, 4.25%, Maturing January 27, 2021 | | | | | 648 | | | | 652,833 | |
DJO Finance LLC | | | | | | | | | | |
Term Loan, 4.25%, Maturing September 15, 2017 | | | | | 1,485 | | | | 1,491,227 | |
Envision Healthcare Corporation | | | | | | | | | | |
Term Loan, 4.00%, Maturing May 25, 2018 | | | | | 1,489 | | | | 1,490,841 | |
| | | | |
| | 9 | | See Notes to Financial Statements. |
Eaton Vance
Floating-Rate Income Plus Fund
May 31, 2014
Portfolio of Investments — continued
| | | | | | | | | | |
| Borrower/Tranche Description | | | | Principal
Amount
(000’s omitted) | | | Value | |
| | | | | | | | | | |
| |
Health Care (continued) | | | | | |
Faenza Acquisition GmbH | | | | | | | | | | |
Term Loan, 4.25%, Maturing August 28, 2020 | | | | $ | 166 | | | $ | 165,926 | |
Term Loan, 4.25%, Maturing August 31, 2020 | | | | | 546 | | | | 547,369 | |
Gentiva Health Services, Inc. | | | | | | | | | | |
Term Loan, 6.50%, Maturing October 18, 2019 | | | | | 349 | | | | 350,143 | |
Hologic Inc. | | | | | | | | | | |
Term Loan, 3.25%, Maturing August 1, 2019 | | | | | 1,607 | | | | 1,606,923 | |
Iasis Healthcare LLC | | | | | | | | | | |
Term Loan, 4.50%, Maturing May 3, 2018 | | | | | 794 | | | | 795,856 | |
inVentiv Health, Inc. | | | | | | | | | | |
Term Loan, 7.50%, Maturing August 4, 2016 | | | | | 800 | | | | 804,666 | |
JLL/Delta Dutch Newco B.V. | | | | | | | | | | |
Term Loan, 4.25%, Maturing March 11, 2021 | | | | | 225 | | | | 223,232 | |
Kindred Healthcare, Inc. | | | | | | | | | | |
Term Loan, 4.00%, Maturing April 9, 2021 | | | | | 375 | | | | 375,469 | |
Kinetic Concepts, Inc. | | | | | | | | | | |
Term Loan, 4.00%, Maturing May 4, 2018 | | | | | 1,489 | | | | 1,491,944 | |
Mallinckrodt International Finance S.A. | | | | | | | | | | |
Term Loan, 3.50%, Maturing March 19, 2021 | | | | | 400 | | | | 398,393 | |
Millennium Laboratories, Inc. | | | | | | | | | | |
Term Loan, 5.25%, Maturing April 16, 2021 | | | | | 550 | | | | 554,125 | |
MMM Holdings, Inc. | | | | | | | | | | |
Term Loan, 9.75%, Maturing December 12, 2017 | | | | | 409 | | | | 412,592 | |
MSO of Puerto Rico, Inc. | | | | | | | | | | |
Term Loan, 9.75%, Maturing December 12, 2017 | | | | | 298 | | | | 300,154 | |
National Mentor Holdings, Inc. | | | | | | | | | | |
Term Loan, 4.75%, Maturing January 31, 2021 | | | | | 150 | | | | 150,906 | |
Onex Carestream Finance LP | | | | | | | | | | |
Term Loan, 5.00%, Maturing June 7, 2019 | | | | | 747 | | | | 750,139 | |
Opal Acquisition, Inc. | | | | | | | | | | |
Term Loan, 5.00%, Maturing November 27, 2020 | | | | | 424 | | | | 425,262 | |
Ortho-Clinical Diagnostics, Inc. | | | | | | | | | | |
Term Loan, Maturing May 7, 2021(2) | | | | | 825 | | | | 829,564 | |
Pharmaceutical Product Development LLC | | | | | | | | | | |
Term Loan, 4.00%, Maturing December 5, 2018 | | | | | 1,933 | | | | 1,937,431 | |
PRA Holdings, Inc. | | | | | | | | | | |
Term Loan, 4.50%, Maturing September 23, 2020 | | | | | 348 | | | | 346,618 | |
Radnet Management, Inc. | | | | | | | | | | |
Term Loan, 4.28%, Maturing October 10, 2018 | | | | | 550 | | | | 550,258 | |
Regionalcare Hospital Partners, Inc. | | | | | | | | | | |
Term Loan, 6.00%, Maturing April 19, 2019 | | | | | 100 | | | | 99,687 | |
Salix Pharmaceuticals, Ltd. | | | | | | | | | | |
Term Loan, 4.25%, Maturing January 2, 2020 | | | | | 173 | | | | 173,928 | |
Steward Health Care System LLC | | | | | | | | | | |
Term Loan, 6.75%, Maturing April 12, 2020 | | | | | 497 | | | | 491,897 | |
| | | | | | | | | | |
| Borrower/Tranche Description | | | | Principal
Amount
(000’s omitted) | | | Value | |
| | | | | | | | | | |
| |
Health Care (continued) | | | | | |
TriZetto Group, Inc. (The) | | | | | | | | | | |
Term Loan, 4.75%, Maturing May 2, 2018 | | | | $ | 482 | | | $ | 483,605 | |
Truven Health Analytics Inc. | | | | | | | | | | |
Term Loan, 4.50%, Maturing June 6, 2019 | | | | | 495 | | | | 491,597 | |
U.S. Renal Care, Inc. | | | | | | | | | | |
Term Loan, 4.25%, Maturing July 3, 2019 | | | | | 1,045 | | | | 1,048,967 | |
| | | | | | | | | | | |
| | | | | | | | $ | 20,900,399 | |
| | | | | | | | | | | |
| |
Home Furnishings — 0.5% | | | | | |
Serta Simmons Holdings, LLC | | | | | | | | | | |
Term Loan, 4.25%, Maturing October 1, 2019 | | | | $ | 780 | | | $ | 781,709 | |
| | | | | | | | | | | |
| | | | | | | | $ | 781,709 | |
| | | | | | | | | | | |
| |
Industrial Equipment — 5.5% | | | | | |
Apex Tool Group, LLC | | | | | | | | | | |
Term Loan, 4.50%, Maturing January 31, 2020 | | | | $ | 1,485 | | | $ | 1,454,372 | |
Doosan Infracore International, Inc. | | | | | | | | | | |
Term Loan, Maturing May 6, 2021(2) | | | | | 275 | | | | 276,372 | |
Gardner Denver, Inc. | | | | | | | | | | |
Term Loan, 4.25%, Maturing July 30, 2020 | | | | | 896 | | | | 895,948 | |
Husky Injection Molding Systems Ltd. | | | | | | | | | | |
Term Loan, 4.25%, Maturing June 29, 2018 | | | | | 1,400 | | | | 1,405,031 | |
Milacron LLC | | | | | | | | | | |
Term Loan, 4.00%, Maturing March 30, 2020 | | | | | 990 | | | | 989,794 | |
Paladin Brands Holding, Inc. | | | | | | | | | | |
Term Loan, 6.75%, Maturing August 16, 2019 | | | | | 488 | | | | 491,342 | |
Rexnord LLC | | | | | | | | | | |
Term Loan, 4.00%, Maturing August 21, 2020 | | | | | 2,114 | | | | 2,113,053 | |
Signode Industrial Group US Inc. | | | | | | | | | | |
Term Loan, 4.00%, Maturing March 21, 2021 | | | | | 375 | | | | 374,590 | |
STS Operating, Inc. | | | | | | | | | | |
Term Loan, 4.75%, Maturing February 19, 2021 | | | | | 75 | | | | 75,258 | |
Virtuoso US LLC | | | | | | | | | | |
Term Loan, 4.75%, Maturing February 11, 2021 | | | | | 100 | | | | 100,750 | |
| | | | | | | | | | | |
| | | | | | | | $ | 8,176,510 | |
| | | | | | | | | | | |
| |
Insurance — 5.3% | | | | | |
Alliant Holdings I, Inc. | | | | | | | | | | |
Term Loan, 4.25%, Maturing December 20, 2019 | | | | $ | 785 | | | $ | 786,237 | |
AmWINS Group, LLC | | | | | | | | | | |
Term Loan, 5.00%, Maturing September 6, 2019 | | | | | 1,783 | | | | 1,789,316 | |
Applied Systems, Inc. | | | | | | | | | | |
Term Loan, 4.25%, Maturing January 25, 2021 | | | | | 224 | | | | 225,139 | |
| | | | |
| | 10 | | See Notes to Financial Statements. |
Eaton Vance
Floating-Rate Income Plus Fund
May 31, 2014
Portfolio of Investments — continued
| | | | | | | | | | |
| Borrower/Tranche Description | | | | Principal
Amount
(000’s omitted) | | | Value | |
| | | | | | | | | | |
| |
Insurance (continued) | | | | | |
Asurion LLC | | | | | | | | | | |
Term Loan, 5.00%, Maturing May 24, 2019 | | | | $ | 2,433 | | | $ | 2,442,862 | |
Term Loan, 4.25%, Maturing July 8, 2020 | | | | | 199 | | | | 197,852 | |
Term Loan - Second Lien, 8.50%, Maturing March 3, 2021 | | | | | 275 | | | | 282,562 | |
Cooper Gay Swett & Crawford Ltd. | | | | | | | | | | |
Term Loan, 5.00%, Maturing April 16, 2020 | | | | | 497 | | | | 487,336 | |
Hub International Limited | | | | | | | | | | |
Term Loan, 4.25%, Maturing October 2, 2020 | | | | | 746 | | | | 747,090 | |
USI, Inc. | | | | | | | | | | |
Term Loan, 4.25%, Maturing December 27, 2019 | | | | | 894 | | | | 895,676 | |
| | | | | | | | | | | |
| | | | | | | | $ | 7,854,070 | |
| | | | | | | | | | | |
| |
Leisure Goods / Activities / Movies — 5.2% | | | | | |
Bombardier Recreational Products, Inc. | | | | | | | | | | |
Term Loan, 4.00%, Maturing January 30, 2019 | | | | $ | 2,000 | | | $ | 2,001,072 | |
Delta 2 (LUX) S.a.r.l. | | | | | | | | | | |
Term Loan, 4.50%, Maturing April 30, 2019 | | | | | 1,485 | | | | 1,497,251 | |
Emerald Expositions Holding, Inc. | | | | | | | | | | |
Term Loan, 5.50%, Maturing June 17, 2020 | | | | | 75 | | | | 75,467 | |
Equinox Holdings, Inc. | | | | | | | | | | |
Term Loan, 4.25%, Maturing January 31, 2020 | | | | | 496 | | | | 496,861 | |
Nord Anglia Education Limited | | | | | | | | | | |
Term Loan, 4.50%, Maturing March 19, 2021 | | | | | 225 | | | | 225,281 | |
Sabre, Inc. | | | | | | | | | | |
Term Loan, 4.25%, Maturing February 19, 2019 | | | | | 794 | | | | 796,550 | |
Town Sports International Inc. | | | | | | | | | | |
Term Loan, 4.50%, Maturing November 16, 2020 | | | | | 324 | | | | 307,776 | |
US Finco LLC | | | | | | | | | | |
Term Loan - Second Lien, 8.25%, Maturing November 30, 2020 | | | | | 800 | | | | 820,000 | |
Zuffa LLC | | | | | | | | | | |
Term Loan, 3.75%, Maturing February 25, 2020 | | | | | 1,489 | | | | 1,492,884 | |
| | | | | | | | | | | |
| | | | | | | | $ | 7,713,142 | |
| | | | | | | | | | | |
| |
Lodging and Casinos — 1.8% | | | | | |
Boyd Gaming Corporation | | | | | | | | | | |
Term Loan, 4.00%, Maturing August 14, 2020 | | | | $ | 121 | | | $ | 121,613 | |
CityCenter Holdings, LLC | | | | | | | | | | |
Term Loan, 5.00%, Maturing October 16, 2020 | | | | | 224 | | | | 226,373 | |
Golden Nugget, Inc. | | | | | | | | | | |
Term Loan, 5.50%, Maturing November 21, 2019 | | | | | 30 | | | | 30,692 | |
Term Loan, 5.50%, Maturing November 21, 2019 | | | | | 70 | | | | 71,613 | |
| | | | | | | | | | |
| Borrower/Tranche Description | | | | Principal
Amount
(000’s omitted) | | | Value | |
| | | | | | | | | | |
| |
Lodging and Casinos (continued) | | | | | |
Hilton Worldwide Finance, LLC | | | | | | | | | | |
Term Loan, 3.50%, Maturing October 26, 2020 | | | | $ | 1,538 | | | $ | 1,533,870 | |
La Quinta Intermediate Holdings LLC | | | | | | | | | | |
Term Loan, 4.00%, Maturing April 14, 2021 | | | | | 300 | | | | 300,375 | |
Pinnacle Entertainment, Inc. | | | | | | | | | | |
Term Loan, 3.75%, Maturing August 13, 2020 | | | | | 192 | | | | 192,497 | |
Playa Resorts Holding B.V. | | | | | | | | | | |
Term Loan, 4.00%, Maturing August 6, 2019 | | | | | 100 | | | | 99,718 | |
Tropicana Entertainment Inc. | | | | | | | | | | |
Term Loan, 4.00%, Maturing November 27, 2020 | | | | | 100 | | | | 99,873 | |
| | | | | | | | | | | |
| | | | | | | | $ | 2,676,624 | |
| | | | | | | | | | | |
| |
Nonferrous Metals / Minerals — 4.2% | | | | | |
Alpha Natural Resources, LLC | | | | | | | | | | |
Term Loan, 3.50%, Maturing May 22, 2020 | | | | $ | 1,980 | | | $ | 1,921,837 | |
Arch Coal Inc. | | | | | | | | | | |
Term Loan, 6.25%, Maturing May 16, 2018 | | | | | 1,485 | | | | 1,463,827 | |
Fairmount Minerals LTD | | | | | | | | | | |
Term Loan, 4.50%, Maturing September 5, 2019 | | | | | 498 | | | | 503,408 | |
Murray Energy Corporation | | | | | | | | | | |
Term Loan, 5.25%, Maturing December 5, 2019 | | | | | 350 | | | | 354,521 | |
Noranda Aluminum Acquisition Corporation | | | | | | | | | | |
Term Loan, 5.75%, Maturing February 28, 2019 | | | | | 792 | | | | 762,222 | |
Oxbow Carbon LLC | | | | | | | | | | |
Term Loan, 4.25%, Maturing July 19, 2019 | | | | | 96 | | | | 96,531 | |
Term Loan - Second Lien, 8.00%, Maturing January 17, 2020 | | | | | 175 | | | | 179,047 | |
Walter Energy, Inc. | | | | | | | | | | |
Term Loan, 7.25%, Maturing April 2, 2018 | | | | | 1,000 | | | | 971,146 | |
| | | | | | | | | | | |
| | | | | | | | $ | 6,252,539 | |
| | | | | | | | | | | |
| |
Oil and Gas — 6.3% | | | | | |
Ameriforge Group, Inc. | | | | | | | | | | |
Term Loan - Second Lien, 8.75%, Maturing December 19, 2020 | | | | $ | 800 | | | $ | 816,000 | |
Bronco Midstream Funding LLC | | | | | | | | | | |
Term Loan, 5.00%, Maturing August 17, 2020 | | | | | 945 | | | | 952,092 | |
Fieldwood Energy LLC | | | | | | | | | | |
Term Loan, 3.88%, Maturing September 28, 2018 | | | | | 249 | | | | 249,386 | |
Term Loan - Second Lien, 8.38%, Maturing September 30, 2020 | | | | | 175 | | | | 180,814 | |
Floatel International, Ltd. | | | | | | | | | | |
Term Loan, Maturing May 2, 2020(2) | | | | | 275 | | | | 275,860 | |
| | | | |
| | 11 | | See Notes to Financial Statements. |
Eaton Vance
Floating-Rate Income Plus Fund
May 31, 2014
Portfolio of Investments — continued
| | | | | | | | | | |
| Borrower/Tranche Description | | | | Principal
Amount
(000’s omitted) | | | Value | |
| | | | | | | | | | |
| |
Oil and Gas (continued) | | | | | |
Samson Investment Company | | | | | | | | | | |
Term Loan - Second Lien, 5.00%, Maturing September 25, 2018 | | | | $ | 1,500 | | | $ | 1,502,946 | |
Seadrill Partners Finco LLC | | | | | | | | | | |
Term Loan, 4.00%, Maturing February 21, 2021 | | | | | 748 | | | | 745,729 | |
Sheridan Investment Partners II, L.P. | | | | | | | | | | |
Term Loan, 4.25%, Maturing December 16, 2020 | | | | | 10 | | | | 9,819 | |
Term Loan, 4.25%, Maturing December 16, 2020 | | | | | 26 | | | | 26,329 | |
Term Loan, 4.25%, Maturing December 16, 2020 | | | | | 188 | | | | 189,271 | |
Sheridan Production Partners I, LLC | | | | | | | | | | |
Term Loan, 4.25%, Maturing September 25, 2019 | | | | | 99 | | | | 99,532 | |
Term Loan, 4.25%, Maturing September 25, 2019 | | | | | 162 | | | | 162,952 | |
Term Loan, 4.25%, Maturing October 1, 2019 | | | | | 1,224 | | | | 1,229,750 | |
Tallgrass Operations, LLC | | | | | | | | | | |
Term Loan, 4.25%, Maturing November 13, 2018 | | | | | 2,093 | | | | 2,105,456 | |
Tervita Corporation | | | | | | | | | | |
Term Loan, 6.25%, Maturing May 15, 2018 | | | | | 792 | | | | 794,125 | |
| | | | | | | | | | | |
| | | | | | | | $ | 9,340,061 | |
| | | | | | | | | | | |
| |
Publishing — 3.5% | | | | | |
American Greetings Corporation | | | | | | | | | | |
Term Loan, 4.00%, Maturing August 9, 2019 | | | | $ | 239 | | | $ | 240,183 | |
Ascend Learning, Inc. | | | | | | | | | | |
Term Loan, 6.00%, Maturing July 31, 2019 | | | | | 324 | | | | 326,822 | |
Getty Images, Inc. | | | | | | | | | | |
Term Loan, 4.75%, Maturing October 18, 2019 | | | | | 1,980 | | | | 1,917,251 | |
Interactive Data Corporation | | | | | | | | | | |
Term Loan, 4.75%, Maturing May 2, 2021 | | | | | 400 | | | | 403,500 | |
Laureate Education, Inc. | | | | | | | | | | |
Term Loan, 5.00%, Maturing June 15, 2018 | | | | | 1,064 | | | | 1,051,185 | |
Merrill Communications, LLC | | | | | | | | | | |
Term Loan, 5.75%, Maturing March 8, 2018 | | | | | 469 | | | | 476,021 | |
Multi Packaging Solutions, Inc. | | | | | | | | | | |
Term Loan, 4.25%, Maturing September 30, 2020 | | | | | 75 | | | | 75,156 | |
Rentpath, Inc. | | | | | | | | | | |
Term Loan, 6.25%, Maturing May 29, 2020 | | | | | 496 | | | | 496,405 | |
Springer Science+Business Media Deutschland GmbH | | | | | | | | | | |
Term Loan, 5.00%, Maturing August 14, 2020 | | | | | 249 | | | | 249,216 | |
| | | | | | | | | | | |
| | | | | | | | $ | 5,235,739 | |
| | | | | | | | | | | |
| |
Radio and Television — 4.0% | | | | | |
Clear Channel Communications, Inc. | | | | | | | | | | |
Term Loan, 6.90%, Maturing January 30, 2019 | | | | $ | 1,000 | | | $ | 990,893 | |
| | | | | | | | | | |
| Borrower/Tranche Description | | | | Principal
Amount
(000’s omitted) | | | Value | |
| | | | | | | | | | |
| |
Radio and Television (continued) | | | | | |
Cumulus Media Holdings Inc. | | | | | | | | | | |
Term Loan, 4.25%, Maturing December 23, 2020 | | | | $ | 1,147 | | | $ | 1,150,749 | |
Entercom Radio, LLC | | | | | | | | | | |
Term Loan, 4.03%, Maturing November 23, 2018 | | | | | 343 | | | | 344,465 | |
Entravision Communications Corporation | | | | | | | | | | |
Term Loan, 3.50%, Maturing May 29, 2020 | | | | | 968 | | | | 956,229 | |
TWCC Holding Corp. | | | | | | | | | | |
Term Loan - Second Lien, 7.00%, Maturing June 26, 2020 | | | | | 1,000 | | | | 992,917 | |
Univision Communications Inc. | | | | | | | | | | |
Term Loan, 4.00%, Maturing March 1, 2020 | | | | | 1,489 | | | | 1,485,959 | |
| | | | | | | | | | | |
| | | | | | | | $ | 5,921,212 | |
| | | | | | | | | | | |
| |
Retailers (Except Food and Drug) — 7.2% | | | | | |
Bass Pro Group, LLC | | | | | | | | | | |
Term Loan, 3.75%, Maturing November 20, 2019 | | | | $ | 622 | | | $ | 623,366 | |
David’s Bridal, Inc. | | | | | | | | | | |
Term Loan, 5.00%, Maturing October 11, 2019 | | | | | 480 | | | | 465,120 | |
Harbor Freight Tools USA, Inc. | | | | | | | | | | |
Term Loan, 4.75%, Maturing July 26, 2019 | | | | | 248 | | | | 249,984 | |
Hudson’s Bay Company | | | | | | | | | | |
Term Loan, 4.75%, Maturing November 4, 2020 | | | | | 948 | | | | 958,525 | |
J.Crew Group, Inc. | | | | | | | | | | |
Term Loan, 4.08%, Maturing March 5, 2021 | | | | | 775 | | | | 771,803 | |
Jo-Ann Stores, Inc. | | | | | | | | | | |
Term Loan, 4.00%, Maturing March 16, 2018 | | | | | 1,980 | | | | 1,977,451 | |
Men’s Wearhouse, Inc. (The) | | | | | | | | | | |
Term Loan, Maturing March 11,
2021(2) | | | | | 375 | | | | 376,076 | |
Michaels Stores, Inc. | | | | | | | | | | |
Term Loan, 3.75%, Maturing January 28, 2020 | | | | | 1,485 | | | | 1,487,939 | |
Neiman Marcus Group, Inc. (The) | | | | | | | | | | |
Term Loan, 4.25%, Maturing October 26, 2020 | | | | | 1,095 | | | | 1,093,671 | |
Party City Holdings Inc. | | | | | | | | | | |
Term Loan, 4.00%, Maturing July 27, 2019 | | | | | 1,485 | | | | 1,481,907 | |
PFS Holding Corporation | | | | | | | | | | |
Term Loan, 4.50%, Maturing January 31, 2021 | | | | | 440 | | | | 441,375 | |
Pier 1 Imports (U.S.), Inc. | | | | | | | | | | |
Term Loan, 4.50%, Maturing April 30, 2021 | | | | | 125 | | | | 125,156 | |
Spin Holdco Inc. | | | | | | | | | | |
Term Loan, 4.25%, Maturing November 14, 2019 | | | | | 150 | | | | 149,812 | |
Toys ‘R’ Us Property Company I, LLC | | | | | | | | | | |
Term Loan, 6.00%, Maturing August 21, 2019 | | | | | 498 | | | | 478,689 | |
| | | | | | | | | | | |
| | | | | | | | $ | 10,680,874 | |
| | | | | | | | | | | |
| | | | |
| | 12 | | See Notes to Financial Statements. |
Eaton Vance
Floating-Rate Income Plus Fund
May 31, 2014
Portfolio of Investments — continued
| | | | | | | | | | |
| Borrower/Tranche Description | | | | Principal
Amount
(000’s omitted) | | | Value | |
| | | | | | | | | | |
| |
Steel — 3.9% | | | | | |
FMG Resources (August 2006) Pty Ltd. | | | | | | | | | | |
Term Loan, 3.75%, Maturing June 30, 2019 | | | | $ | 2,080 | | | $ | 2,079,662 | |
Grede Holdings, LLC | | | | | | | | | | |
Term Loan, Maturing May 7, 2021(2) | | | | | 225 | | | | 223,875 | |
JFB Firth Rixson Inc. | | | | | | | | | | |
Term Loan, 4.25%, Maturing June 30, 2017 | | | | | 792 | | | | 791,980 | |
JMC Steel Group, Inc. | | | | | | | | | | |
Term Loan, 4.75%, Maturing April 3, 2017 | | | | | 992 | | | | 997,921 | |
Neenah Foundry Company | | | | | | | | | | |
Term Loan, 6.75%, Maturing April 26, 2017 | | | | | 455 | | | | 455,431 | |
Patriot Coal Corporation | | | | | | | | | | |
Term Loan, 9.00%, Maturing December 15, 2018 | | | | | 524 | | | | 521,069 | |
Waupaca Foundry, Inc. | | | | | | | | | | |
Term Loan, 4.00%, Maturing June 29, 2017 | | | | | 769 | | | | 773,099 | |
| | | | | | | | | | | |
| | | | | | | | $ | 5,843,037 | |
| | | | | | | | | | | |
| |
Surface Transport — 0.3% | | | | | |
Stena International S.a.r.l. | | | | | | | | | | |
Term Loan, 4.00%, Maturing March 3, 2021 | | | | $ | 400 | | | $ | 400,000 | |
| | | | | | | | | | | |
| | | | | | | | $ | 400,000 | |
| | | | | | | | | | | |
| |
Telecommunications — 4.0% | | | | | |
Crown Castle Operating Company | | | | | | | | | | |
Term Loan, 3.00%, Maturing January 31, 2021 | | | | $ | 273 | | | $ | 272,214 | |
Intelsat Jackson Holdings S.A. | | | | | | | | | | |
Term Loan, 3.75%, Maturing June 30, 2019 | | | | | 1,950 | | | | 1,955,281 | |
IPC Systems, Inc. | | | | | | | | | | |
Term Loan, 6.00%, Maturing October 29, 2020 | | | | | 275 | | | | 274,312 | |
Syniverse Holdings, Inc. | | | | | | | | | | |
Term Loan, 4.00%, Maturing April 23, 2019 | | | | | 1,454 | | | | 1,456,555 | |
Windstream Corporation | | | | | | | | | | |
Term Loan, 3.50%, Maturing August 8, 2019 | | | | | 1,990 | | | | 1,986,231 | |
| | | | | | | | | | | |
| | | | | | | | $ | 5,944,593 | |
| | | | | | | | | | | |
| |
Utilities — 3.1% | | | | | |
Calpine Construction Finance Company, L.P. | | | | | | | | | | |
Term Loan, 3.25%, Maturing January 31, 2022 | | | | $ | 150 | | | $ | 147,866 | |
Calpine Corporation | | | | | | | | | | |
Term Loan, 4.00%, Maturing April 1, 2018 | | | | | 1,980 | | | | 1,988,305 | |
Dynegy Holdings Inc. | | | | | | | | | | |
Term Loan, 4.00%, Maturing April 23, 2020 | | | | | 794 | | | | 796,127 | |
EFS Cogen Holdings I LLC | | | | | | | | | | |
Term Loan, 3.75%, Maturing December 17, 2020 | | | | | 144 | | | | 144,405 | |
| | | | | | | | | | |
| Borrower/Tranche Description | | | | Principal
Amount
(000’s omitted) | | | Value | |
| | | | | | | | | | |
| |
Utilities (continued) | | | | | |
Equipower Resources Holdings LLC | | | | | | | | | | |
Term Loan, 4.25%, Maturing December 31, 2019 | | | | $ | 499 | | | $ | 502,018 | |
PowerTeam Services, LLC | | | | | | | | | | |
Term Loan, 4.25%, Maturing May 6, 2020 | | | | | 24 | | | | 23,258 | |
Term Loan, 4.25%, Maturing May 6, 2020 | | | | | 441 | | | | 435,597 | |
Raven Power Finance, LLC | | | | | | | | | | |
Term Loan, 5.25%, Maturing December 19, 2020 | | | | | 343 | | | | 348,214 | |
Texas Competitive Electric Holdings Company, LLC | | | | | | | | | | |
DIP Term Loan, 0.38%, Maturing May 5, 2016(3) | | | | | 87 | | | | 87,510 | |
DIP Term Loan, 1.84%, Maturing May 5, 2016(3) | | | | | 113 | | | | 113,365 | |
WTG Holdings III Corp. | | | | | | | | | | |
Term Loan, 4.75%, Maturing January 15, 2021 | | | | | 100 | | | | 99,999 | |
| | | | | | | | | | | |
| | | | | | | | $ | 4,686,664 | |
| | | | | | | | | | | |
| | | |
Total Senior Floating-Rate Interests
(identified cost $205,469,759) | | | | | | | | $ | 205,501,495 | |
| | | | | | | | | | | |
| |
| Corporate Bonds & Notes — 10.9% | | | | | |
| | | |
| | | | | | | | | | |
| Security | | | | Principal
Amount
(000’s omitted) | | | Value | |
| |
Aerospace and Defense — 0.3% | | | | | |
Bombardier, Inc. | | | | | | | | | | |
7.45%, 5/1/34(4) | | | | $ | 500 | | | $ | 502,500 | |
| | | | | | | | | | | |
| | | | | | | | $ | 502,500 | |
| | | | | | | | | | | |
| |
Chemicals and Plastics — 0.4% | | | | | |
Kissner Milling Co., Ltd. | | | | | | | | | | |
7.25%, 6/1/19(4) | | | | $ | 655 | | | $ | 673,013 | |
| | | | | | | | | | | |
| | | | | | | | $ | 673,013 | |
| | | | | | | | | | | |
| |
Commercial Services — 0.9% | | | | | |
ADT Corp. (The) | | | | | | | | | | |
3.50%, 7/15/22 | | | | $ | 600 | | | $ | 552,000 | |
Cielo SA/Cielo USA, Inc. | | | | | | | | | | |
3.75%, 11/16/22(4) | | | | | 575 | | | | 541,937 | |
ServiceMaster Co. (The) | | | | | | | | | | |
7.45%, 8/15/27 | | | | | 300 | | | | 305,250 | |
| | | | | | | | | | | |
| | | | | | | | $ | 1,399,187 | |
| | | | | | | | | | | |
| | | | |
| | 13 | | See Notes to Financial Statements. |
Eaton Vance
Floating-Rate Income Plus Fund
May 31, 2014
Portfolio of Investments — continued
| | | | | | | | | | |
| Security | | | | Principal
Amount
(000’s omitted) | | | Value | |
| | | | | | | | | | |
| |
Diversified Financial Services — 0.6% | | | | | |
SLM Corp. | | | | | | | | | | |
5.625%, 8/1/33 | | | | $ | 950 | | | $ | 831,250 | |
| | | | | | | | | | | |
| | | | | | | | $ | 831,250 | |
| | | | | | | | | | | |
| |
Electronics / Electrical — 0.9% | | | | | |
Dell, Inc. | | | | | | | | | | |
5.40%, 9/10/40 | | | | $ | 1,575 | | | $ | 1,295,437 | |
| | | | | | | | | | | |
| | | | | | | | $ | 1,295,437 | |
| | | | | | | | | | | |
| |
Industrial Equipment — 0.1% | | | | | |
Empresas ICA SAB de CV | | | | | | | | | | |
8.875%, 5/29/24(4) | | | | $ | 225 | | | $ | 223,875 | |
| | | | | | | | | | | |
| | | | | | | | $ | 223,875 | |
| | | | | | | | | | | |
| |
Metals / Mining — 0.6% | | | | | |
Newmont Mining Corp. | | | | | | | | | | |
4.875%, 3/15/42 | | | | $ | 1,030 | | | $ | 894,218 | |
| | | | | | | | | | | |
| | | | | | | | $ | 894,218 | |
| | | | | | | | | | | |
| |
Oil and Gas — 0.8% | | | | | |
Ecopetrol SA | | | | | | | | | | |
5.875%, 5/28/45 | | | | $ | 187 | | | $ | 193,545 | |
Forest Oil Corp. | | | | | | | | | | |
7.25%, 6/15/19 | | | | | 400 | | | | 400,000 | |
Petrobras Global Finance BV | | | | | | | | | | |
5.625%, 5/20/43 | | | | | 605 | | | | 545,533 | |
| | | | | | | | | | | |
| | | | | | | | $ | 1,139,078 | |
| | | | | | | | | | | |
| |
Retailers (Except Food and Drug) — 1.6% | | | | | |
JC Penney Corp., Inc. | | | | | | | | | | |
6.375%, 10/15/36 | | | | $ | 2,900 | | | $ | 2,312,750 | |
| | | | | | | | | | | |
| | | | | | | | $ | 2,312,750 | |
| | | | | | | | | | | |
| |
Software and Services — 0.8% | | | | | |
SunGard Availability Services Capital, Inc. | | | | | | | | | | |
8.75%, 4/1/22(4) | | | | $ | 1,305 | | | $ | 1,223,437 | |
| | | | | | | | | | | |
| | | | | | | | $ | 1,223,437 | |
| | | | | | | | | | | |
| |
Steel — 0.6% | | | | | |
Cliffs Natural Resources, Inc. | | | | | | | | | | |
6.25%, 10/1/40 | | | | $ | 950 | | | $ | 824,129 | |
| | | | | | | | | | | |
| | | | | | | | $ | 824,129 | |
| | | | | | | | | | | |
| | | | | | | | | | |
| Security | | | | Principal
Amount
(000’s omitted) | | | Value | |
| | | | | | | | | | |
| |
Telecommunications — 3.3% | | | | | |
Alcoa, Inc. | | | | | | | | | | |
5.95%, 2/1/37 | | | | $ | 885 | | | $ | 879,569 | |
Avaya, Inc. | | | | | | | | | | |
10.50%, 3/1/21(4) | | | | | 1,100 | | | | 1,001,000 | |
Bharti Airtel International Netherlands BV | | | | | | | | | | |
5.125%, 3/11/23(4) | | | | | 260 | | | | 270,634 | |
Sprint Capital Corp. | | | | | | | | | | |
6.875%, 11/15/28 | | | | | 250 | | | | 257,500 | |
Telecom Italia Capital SA | | | | | | | | | | |
6.00%, 9/30/34 | | | | | 2,490 | | | | 2,471,325 | |
| | | | | | | | | | | |
| | | | | | | | $ | 4,880,028 | |
| | | | | | | | | | | |
| | | |
Total Corporate Bonds & Notes
(identified cost $15,223,145) | | | | | | | | $ | 16,198,902 | |
| | | | | | | | | | | |
| |
| Foreign Government Bonds — 1.2% | | | | | |
| | | |
| | | | | | | | | | |
| Security | | | | Principal
Amount
(000’s omitted) | | | Value | |
| |
Mexico — 0.4% | | | | | |
Mexican Bonos | | | | | | | | | | |
7.75%, 5/29/31 | | MXN | | | 6,250 | | | $ | 547,542 | |
| | | | | | | | | | | |
| | | | | | | | $ | 547,542 | |
| | | | | | | | | | | |
| |
Supranational — 0.8% | | | | | |
International Finance Corp. | | | | | | | | | | |
7.80%, 6/3/19 | | INR | | | 54,990 | | | $ | 966,257 | |
8.25%, 6/10/21 | | INR | | | 18,100 | | | | 319,591 | |
| | | | | | | | | | | |
| | | | | | | | $ | 1,285,848 | |
| | | | | | | | | | | |
| | | |
Total Foreign Government Bonds
(identified cost $1,683,657) | | | | | | | | $ | 1,833,390 | |
| | | | | | | | | | | |
| | | |
| Convertible Bonds — 2.2% | | | | | | | | | | |
| | | |
| | | | | | | | | | |
| Security | | | | Principal
Amount
(000’s omitted) | | | Value | |
| |
Home Builders — 0.9% | | | | | |
KB Home | | | | | | | | | | |
1.375%, 2/1/19 | | | | $ | 510 | | | $ | 502,987 | |
Ryland Group, Inc. (The) | | | | | | | | | | |
0.25%, 6/1/19 | | | | | 535 | | | | 498,887 | |
| | | | |
| | 14 | | See Notes to Financial Statements. |
Eaton Vance
Floating-Rate Income Plus Fund
May 31, 2014
Portfolio of Investments — continued
| | | | | | | | | | |
| Security | | | | Principal
Amount
(000’s omitted) | | | Value | |
| | | | | | | | | | |
|
Home Builders (continued) | |
Standard Pacific Corp. | | | | | | | | | | |
1.25%, 8/1/32 | | | | $ | 210 | | | $ | 256,988 | |
| | | | | | | | | | | |
| | | | | | | | $ | 1,258,862 | |
| | | | | | | | | | | |
| |
Machinery – Diversified — 0.4% | | | | | |
Chart Industries, Inc. | | | | | | | | | | |
2.00%, 8/1/18 | | | | $ | 400 | | | $ | 514,500 | |
| | | | | | | | | | | |
| | | | | | | | $ | 514,500 | |
| | | | | | | | | | | |
| |
Oil & Gas — 0.1% | | | | | |
American Energy - Utica, LLC | | | | | | | | | | |
3.50%, 3/1/21(4)(5) | | | | $ | 200 | | | $ | 208,000 | |
| | | | | | | | | | | |
| | | | | | | | $ | 208,000 | |
| | | | | | | | | | | |
| |
Semiconductors — 0.6% | | | | | |
Novellus Systems, Inc. | | | | | | | | | | |
2.625%, 5/15/41 | | | | $ | 500 | | | $ | 947,812 | |
| | | | | | | | | | | |
| | | | | | | | $ | 947,812 | |
| | | | | | | | | | | |
| |
Telecommunications — 0.2% | | | | | |
Ciena Corp. | | | | | | | | | | |
3.75%, 10/15/18(4) | | | | $ | 250 | | | $ | 323,438 | |
| | | | | | | | | | | |
| | | | | | | | $ | 323,438 | |
| | | | | | | | | | | |
| | | |
Total Convertible Bonds
(identified cost $3,004,809) | | | | | | | | $ | 3,252,612 | |
| | | | | | | | | | | |
| |
| Common Stocks — 4.8% | | | | | |
| | | |
| | | | | | | | | | |
| Security | | | | Shares | | | Value | |
| |
Chemicals and Plastics — 0.4% | | | | | |
Arkema SA | | | | | 1,318 | | | $ | 134,889 | |
LyondellBasell Industries NV, Class A | | | | | 4,405 | | | | 438,606 | |
| | | | | | | | | | | |
| | | | | | | | $ | 573,495 | |
| | | | | | | | | | | |
| |
Diversified Financial Services — 0.6% | | | | | |
Medley Capital Corp. | | | | | 74,500 | | | $ | 923,055 | |
| | | | | | | | | | | |
| | | | | | | | $ | 923,055 | |
| | | | | | | | | | | |
| | | | | | | | | | |
| Security | | | | Shares | | | Value | |
| | | | | | | | | | |
| |
Electronics / Electrical — 0.7% | | | | | |
Applied Materials, Inc. | | | | | 19,530 | | | $ | 394,311 | |
Intel Corp. | | | | | 25,150 | | | | 687,098 | |
| | | | | | | | | | | |
| | | | | | | | $ | 1,081,409 | |
| | | | | | | | | | | |
| |
Investment Companies — 2.4% | | | | | |
Ares Capital Corp. | | | | | 59,000 | | | $ | 1,017,160 | |
PennantPark Investment Corp. | | | | | 71,000 | | | | 784,550 | |
Solar Capital, Ltd. | | | | | 43,000 | | | | 896,120 | |
THL Credit, Inc. | | | | | 67,000 | | | | 891,100 | |
| | | | | | | | | | | |
| | | | | | | | $ | 3,588,930 | |
| | | | | | | | | | | |
| |
Machinery — 0.1% | | | | | |
Donaldson Co., Inc. | | | | | 3,407 | | | $ | 138,767 | |
| | | | | | | | | | | |
| | | | | | | | $ | 138,767 | |
| | | | | | | | | | | |
| |
Oil and Gas — 0.2% | | | | | |
Occidental Petroleum Corp. | | | | | 3,312 | | | $ | 330,173 | |
| | | | | | | | | | | |
| | | | | | | | $ | 330,173 | |
| | | | | | | | | | | |
| |
Telecommunications — 0.4% | | | | | |
Corning, Inc. | | | | | 10,029 | | | $ | 213,618 | |
Telefonaktiebolaget LM Ericsson ADR | | | | | 25,000 | | | | 311,250 | |
| | | | | | | | | | | |
| | | | | | | | $ | 524,868 | |
| | | | | | | | | | | |
| | | |
Total Common Stocks
(identified cost $7,033,792) | | | | | | | | $ | 7,160,697 | |
| | | | | | | | | | | |
| |
| Convertible Preferred Stocks — 1.6% | | | | | |
| | | |
| | | | | | | | | | |
| Security | | | | Shares | | | Value | |
| | | | | | | | | | |
| |
Health Care – Products — 0.2% | | | | | |
Alere, Inc., 3.00% | | | | | 900 | | | $ | 282,825 | |
| | | | | | | | | | | |
| | | | | | | | $ | 282,825 | |
| | | | | | | | | | | |
| |
Iron & Steel — 0.6% | | | | | |
Cliffs Natural Resources, Inc., 7.00% | | | | | 50,000 | | | $ | 851,125 | |
| | | | | | | | | | | |
| | | | | | | | $ | 851,125 | |
| | | | | | | | | | | |
| |
Oil & Gas — 0.3% | | | | | |
Chesapeake Energy Corp., 5.75%(4) | | | | | 400 | | | $ | 489,750 | |
| | | | | | | | | | | |
| | | | | | | | $ | 489,750 | |
| | | | | | | | | | | |
| | | | |
| | 15 | | See Notes to Financial Statements. |
Eaton Vance
Floating-Rate Income Plus Fund
May 31, 2014
Portfolio of Investments — continued
| | | | | | | | | | |
| Security | | | | Shares | | | Value | |
| | | | | | | | | | |
| |
Real Estate Investment Trusts (REITs) — 0.5% | | | | | |
iStar Financial, Inc., 4.50% | | | | | 11,500 | | | $ | 721,683 | |
| | | | | | | | | | | |
| | | | | | | | $ | 721,683 | |
| | | | | | | | | | | |
| | | |
Total Convertible Preferred Stocks
(identified cost $2,142,188) | | | | | | | | $ | 2,345,383 | |
| | | | | | | | | | | |
| | | |
| Preferred Stocks — 0.1% | | | | | | | | | | |
| | | |
| | | | | | | | | | |
| Security | | | | Shares | | | Value | |
| |
Banks — 0.1% | | | | | |
First Tennessee Bank, 3.75%(4)(6) | | | | | 255 | | | $ | 186,230 | |
| | | | | | | | | | | |
| | | |
Total Preferred Stocks
(identified cost $201,450) | | | | | | | | $ | 186,230 | |
| | | | | | | | | | | |
| |
| Short-Term Investments — 1.5% | | | | | |
| | | |
| | | | | | | | | | |
| Description | | | | Interest
(000’s omitted) | | | Value | |
| | | | | | | | | | |
Eaton Vance Cash Reserves Fund, LLC, 0.13%(7) | | | | $ | 2,266 | | | $ | 2,265,776 | |
| | | | | | | | | | | |
| | | |
Total Short-Term Investments
(identified cost $2,265,776) | | | | | | | | $ | 2,265,776 | |
| | | | | | | | | | | |
| | | |
Total Investments — 160.5%
(identified cost $237,024,576) | | | | | | | | $ | 238,744,485 | |
| | | | | | | | | | | |
| | | |
Less Unfunded Loan
Commitments — (0.1)% | | | | | | | | $ | (144,554 | ) |
| | | | | | | | | | | |
| | | |
Net Investments — 160.4%
(identified cost $236,880,022) | | | | | | | | $ | 238,599,931 | |
| | | | | | | | | | | |
| | | |
Notes Payable — (36.3)% | | | | | | | | $ | (54,000,000 | ) |
| | | | | | | | | | | |
| |
Variable Rate Term Preferred Shares, at Liquidation Value — (24.2)% | | | $ | (36,000,000 | ) |
| | | | | | | | | | | |
| | | |
Other Assets, Less Liabilities — 0.1% | | | | | | | | $ | 170,195 | |
| | | | | | | | | | | |
| | | |
Net Assets Applicable to Common Shares — 100.0% | | | | | | | | $ | 148,770,126 | |
| | | | | | | | | | | |
The percentage shown for each investment category in the Portfolio of Investments is based on net assets applicable to common shares.
| | | | |
| ADR | | – | | American Depositary Receipt |
| DIP | | – | | Debtor In Possession |
| INR | | – | | Indian Rupee |
| MXN | | – | | Mexican Peso |
| (1) | Senior floating-rate interests (Senior Loans) often require prepayments from excess cash flows or permit the borrowers to repay at their election. The degree to which borrowers repay, whether as a contractual requirement or at their election, cannot be predicted with accuracy. As a result, the actual remaining maturity may be substantially less than the stated maturities shown. However, Senior Loans will have an expected average life of approximately two to four years. The stated interest rate represents the weighted average interest rate of all contracts within the senior loan facility and includes commitment fees on unfunded loan commitments, if any. Senior Loans typically have rates of interest which are redetermined either daily, monthly, quarterly or semi-annually by reference to a base lending rate, plus a premium. These base lending rates are primarily the London Interbank Offered Rate (“LIBOR”) and secondarily, the prime rate offered by one or more major United States banks (the “Prime Rate”) and the certificate of deposit (“CD”) rate or other base lending rates used by commercial lenders. |
| (2) | This Senior Loan will settle after May 31, 2014, at which time the interest rate will be determined. |
| (3) | Unfunded or partially unfunded loan commitments. See Note 1G for description. |
| (4) | Security exempt from registration pursuant to Rule 144A under the Securities Act of 1933. These securities may be sold in certain transactions (normally to qualified institutional buyers) and remain exempt from registration. At May 31, 2014, the aggregate value of these securities is $5,643,814 or 3.8% of the Fund’s net assets applicable to common shares. |
| (5) | Represents a payment-in-kind security which may pay interest in additional principal at the issuer’s discretion. |
| (6) | Variable rate security. The stated interest rate represents the rate in effect at May 31, 2014. |
| (7) | Affiliated investment company, available to Eaton Vance portfolios and funds, which invests in high quality, U.S. dollar denominated money market instruments. The rate shown is the annualized seven-day yield as of May 31, 2014. |
| | | | |
| | 16 | | See Notes to Financial Statements. |
Eaton Vance
Floating-Rate Income Plus Fund
May 31, 2014
Statement of Assets and Liabilities
| | | | |
| Assets | | May 31, 2014 | |
Unaffiliated investments, at value (identified cost, $234,614,246) | | $ | 236,334,155 | |
Affiliated investment, at value (identified cost, $2,265,776) | | | 2,265,776 | |
Foreign currency, at value (identified cost, $15,245) | | | 15,526 | |
Interest and dividends receivable | | | 1,406,941 | |
Interest receivable from affiliated investment | | | 260 | |
Receivable for investments sold | | | 2,959,400 | |
Deferred offering costs | | | 220,697 | |
Prepaid upfront fees on variable rate term preferred shares | | | 126,412 | |
Prepaid expenses | | | 3,553 | |
Total assets | | $ | 243,332,720 | |
|
| Liabilities | |
Notes payable | | $ | 54,000,000 | |
Variable rate term preferred shares, at liquidation value | | | 36,000,000 | |
Payable for investments purchased | | | 4,028,346 | |
Due to custodian | | | 202,486 | |
Payable to affiliates: | | | | |
Investment adviser fee | | | 151,939 | |
Trustees’ fees | | | 1,739 | |
Interest expense and fees payable | | | 95,907 | |
Accrued expenses | | | 82,177 | |
Total liabilities | | $ | 94,562,594 | |
Net assets applicable to common shares | | $ | 148,770,126 | |
|
| Sources of Net Assets | |
Common shares, $0.01 par value, unlimited number of shares authorized, 7,606,422 shares issued and outstanding | | $ | 76,064 | |
Additional paid-in capital | | | 144,760,465 | |
Accumulated net realized gain | | | 2,062,449 | |
Accumulated undistributed net investment income | | | 150,257 | |
Net unrealized appreciation | | | 1,720,891 | |
Net assets applicable to common shares | | $ | 148,770,126 | |
|
| Net Asset Value Per Common Share | |
($148,770,126 ÷ 7,606,422 common shares issued and outstanding) | | $ | 19.56 | |
| | | | |
| | 17 | | See Notes to Financial Statements. |
Eaton Vance
Floating-Rate Income Plus Fund
May 31, 2014
Statement of Operations
| | | | |
| Investment Income | | Period Ended
May 31, 2014(1) | |
Interest and other income | | $ | 9,942,145 | |
Dividends (net of foreign taxes, $2,113) | | | 560,892 | |
Interest income allocated from affiliated investment | | | 14,280 | |
Expenses allocated from affiliated investment | | | (1,954 | ) |
Total investment income | | $ | 10,515,363 | |
|
| Expenses | |
Investment adviser fee | | $ | 1,576,390 | |
Trustees’ fees and expenses | | | 8,540 | |
Custodian fee | | | 151,530 | |
Transfer and dividend disbursing agent fees | | | 22,000 | |
Legal and accounting services | | | 97,277 | |
Amortization of deferred offering costs | | | 93,141 | |
Printing and postage | | | 30,742 | |
Interest expense and fees | | | 1,027,328 | |
Miscellaneous | | | 92,012 | |
Total expenses | | $ | 3,098,960 | |
Deduct — | | | | |
Reduction of custodian fee | | $ | 90 | |
Total expense reductions | | $ | 90 | |
| |
Net expenses | | $ | 3,098,870 | |
| |
Net investment income | | $ | 7,416,493 | |
| |
| Realized and Unrealized Gain (Loss) | | | | |
Net realized gain (loss) — | | | | |
Investment transactions | | $ | 2,058,409 | |
Investment transactions allocated from affiliated investment | | | 78 | |
Foreign currency transactions | | | (674 | ) |
Net realized gain | | $ | 2,057,813 | |
Change in unrealized appreciation (depreciation) — | | | | |
Investments | | $ | 1,719,909 | |
Foreign currency | | | 982 | |
Net change in unrealized appreciation (depreciation) | | $ | 1,720,891 | |
| |
Net realized and unrealized gain | | $ | 3,778,704 | |
| |
Net increase in net assets from operations | | $ | 11,195,197 | |
| (1) | For the period from the start of business, June 28, 2013, to May 31, 2014. |
| | | | |
| | 18 | | See Notes to Financial Statements. |
Eaton Vance
Floating-Rate Income Plus Fund
May 31, 2014
Statement of Changes in Net Assets
| | | | |
| Increase (Decrease) in Net Assets | | Period Ended May 31, 2014(1) | |
From operations — | | | | |
Net investment income | | $ | 7,416,493 | |
Net realized gain from investment and foreign currency transactions | | | 2,057,813 | |
Net change in unrealized appreciation (depreciation) from investments and foreign currency | | | 1,720,891 | |
Net increase in net assets from operations | | $ | 11,195,197 | |
Distributions to common shareholders — | | | | |
From net investment income | | $ | (7,408,329 | ) |
Total distributions to common shareholders | | $ | (7,408,329 | ) |
Capital share transactions — | | | | |
Proceeds from sale of common shares(2) | | $ | 145,127,358 | |
Reinvestment of distributions to common shareholders | | | 59,990 | |
Offering costs on common shares | | | (304,090 | ) |
Net increase in net assets from capital share transactions | | $ | 144,883,258 | |
| |
Net increase in net assets | | $ | 148,670,126 | |
|
| Net Assets Applicable to Common Shares | |
At beginning of period | | $ | 100,000 | |
At end of period | | $ | 148,770,126 | |
|
Accumulated undistributed net investment income included in net assets applicable to common shares | |
At end of period | | $ | 150,257 | |
| (1) | For the period from the start of business, June 28, 2013, to May 31, 2014. |
| (2) | Proceeds from sale of common shares are net of sales load paid of $6,838,462 and include shares sold from the exercise of the underwriters’ over-allotment option of $16,202,358 (see Note 6). |
| | | | |
| | 19 | | See Notes to Financial Statements. |
Eaton Vance
Floating-Rate Income Plus Fund
May 31, 2014
Statement of Cash Flows
| | | | |
| Cash Flows From Operating Activities | | Period Ended May 31, 2014(1) | |
Net increase in net assets from operations | | $ | 11,195,197 | |
Adjustments to reconcile net increase in net assets from operations to net cash used in operating activities: | | | | |
Investments purchased | | | (311,971,908 | ) |
Investments sold and principal repayments | | | 80,469,691 | |
Increase in short-term investments, net | | | (2,265,776 | ) |
Net amortization/accretion of premium (discount) | | | (129,228 | ) |
Amortization of deferred offering costs and prepaid upfront fees on variable rate term preferred shares | | | 146,729 | |
Increase in interest and dividends receivable | | | (1,406,941 | ) |
Increase in interest receivable from affiliated investment | | | (260 | ) |
Increase in prepaid expenses | | | (3,553 | ) |
Increase in payable to affiliate for investment adviser fee | | | 151,939 | |
Increase in payable to affiliate for Trustees’ fees | | | 1,739 | |
Increase in interest expense and fees payable | | | 95,907 | |
Increase in accrued expenses | | | 82,177 | |
Increase in unfunded loan commitments | | | 144,554 | |
Net change in unrealized (appreciation) depreciation from investments | | | (1,719,909 | ) |
Net realized gain from investments | | | (2,058,409 | ) |
Net cash used in operating activities | | $ | (227,268,051 | ) |
| |
| Cash Flows From Financing Activities | | | | |
Distributions paid to common shareholders, net of reinvestments | | $ | (7,348,339 | ) |
Proceeds from common shares sold(2) | | | 145,127,358 | |
Offering costs on common shares | | | (304,090 | ) |
Proceeds from notes payable | | | 54,000,000 | |
Proceeds from variable rate term preferred shares issued | | | 36,000,000 | |
Payment of deferred offering costs on variable rate term preferred shares | | | (313,838 | ) |
Payment of prepaid upfront fees on variable rate term preferred shares | | | (180,000 | ) |
Increase in due to custodian | | | 202,486 | |
Net cash provided by financing activities | | $ | 227,183,577 | |
| |
Net decrease in cash* | | $ | (84,474 | ) |
| |
Cash at beginning of period | | $ | 100,000 | |
| |
Cash at end of period(3) | | $ | 15,526 | |
| |
| Supplemental disclosure of cash flow information: | | | | |
Noncash financing activities not included herein consist of: | | | | |
Reinvestment of dividends and distributions | | $ | 59,990 | |
Cash paid for interest and fees on borrowings and variable rate term preferred shares | | | 1,371,671 | |
| (1) | For the period from the start of business, June 28, 2013, to May 31, 2014. |
| (2) | Proceeds from sale of common shares are net of sales load paid of $6,838,462. |
| (3) | Balance includes foreign currency, at value. |
| * | Includes net change in unrealized appreciation (depreciation) on foreign currency of $281. |
| | | | |
| | 20 | | See Notes to Financial Statements. |
Eaton Vance
Floating-Rate Income Plus Fund
May 31, 2014
Financial Highlights
Selected data for a common share outstanding during the periods stated
| | | | |
| | | Period Ended May 31, 2014(1) | |
Net asset value — Beginning of period (Common shares) | | $ | 19.100 | (2) |
| |
| Income (Loss) From Operations | | | | |
Net investment income(3) | | $ | 0.989 | |
Net realized and unrealized gain | | | 0.511 | |
| |
Total income from operations | | $ | 1.500 | |
| |
| Less Distributions to Common Shareholders | | | | |
From net investment income | | $ | (0.974 | ) |
| |
Total distributions to common shareholders | | $ | (0.974 | ) |
| |
Common shares offering costs charged to paid-in capital(3) | | $ | (0.041 | ) |
| |
Discount related to exercise of underwriters’ over-allotment option(3) | | $ | (0.025 | ) |
| |
Net asset value — End of period (Common shares) | | $ | 19.560 | |
| |
Market value — End of period (Common shares) | | $ | 17.950 | |
| |
Total Investment Return on Net Asset Value(4) | | | 8.00 | %(5)(6) |
| |
Total Investment Return on Market Value(4) | | | (0.89 | )%(5)(6) |
| | | | |
| | 21 | | See Notes to Financial Statements. |
Eaton Vance
Floating-Rate Income Plus Fund
May 31, 2014
Financial Highlights — continued
Selected data for a common share outstanding during the periods stated
| | | | |
| Ratios/Supplemental Data | | Period Ended May 31, 2014(1) | |
Net assets applicable to common shares, end of period (000’s omitted) | | $ | 148,770 | |
Ratios (as a percentage of average daily net assets applicable to common shares): | | | | |
Expenses excluding interest and fees(7) | | | 1.54 | %(8) |
Interest and fee expense(9) | | | 0.76 | %(8) |
Total expenses(7) | | | 2.30 | %(8) |
Net investment income | | | 5.49 | %(8) |
Portfolio Turnover | | | 37 | %(6) |
The ratios reported above are based on net assets applicable solely to common shares. The ratios based on net assets, including amounts related to preferred shares and borrowings, are as follows: | | | | |
Ratios (as a percentage of average daily net assets applicable to common shares plus preferred shares and borrowings): | |
Expenses excluding interest and fees(7) | | | 0.98 | %(8) |
Interest and fee expense(9) | | | 0.49 | %(8) |
Total expenses(7) | | | 1.47 | %(8) |
Net investment income | | | 3.52 | %(8) |
Senior Securities: | | | | |
Total notes payable outstanding (in 000’s) | | $ | 54,000 | |
Asset coverage per $1,000 of notes payable(10) | | $ | 4,422 | |
Total preferred shares outstanding(11) | | | 360 | |
Asset coverage per preferred share(11)(12) | | $ | 265,300 | |
Involuntary liquidation preference per preferred share(11) | | $ | 100,000 | |
Approximate market value per preferred share(11) | | $ | 100,000 | |
| (1) | For the period from the start of business, June 28, 2013, to May 31, 2014. |
| (2) | Net asset value at beginning of period reflects the deduction of the sales load of $0.90 per share paid by the shareholders from the $20.00 offering price. |
| (3) | Computed using average common shares outstanding. |
| (4) | Returns are historical and are calculated by determining the percentage change in net asset value or market value with all distributions reinvested. Distributions are assumed to be reinvested at prices obtained under the Fund’s dividend reinvestment plan. |
| (5) | Total investment return on net asset value is calculated assuming a purchase at the offering price of $20.00 less the sales load of $0.90 per share paid by the shareholder on the first day and a sale at the net asset value on the last day of the period reported with all distributions reinvested. Total investment return on market value is calculated assuming a purchase at the offering price of $20.00 less the sales load of $0.90 per share paid by the shareholder on the first day and a sale at the current market price on the last day of the period reported with all distributions reinvested. |
| (7) | Excludes the effect of custody fee credits, if any, of less than 0.005%. |
| (9) | Interest and fee expense relates to variable rate term preferred shares and borrowings (see Note 2 and Note 9). |
| (10) | Calculated by subtracting the Fund’s total liabilities (not including the notes payable and preferred shares) from the Fund’s total assets, and dividing the result by the notes payable balance in thousands. |
| (11) | Preferred shares represent variable rate term preferred shares. |
| (12) | Calculated by subtracting the Fund’s total liabilities (not including the notes payable and preferred shares) from the Fund’s total assets, dividing the result by the sum of the value of the notes payable and liquidation value of the preferred shares, and multiplying the result by the liquidation value of one preferred share. Such amount equates to 265%. |
| | | | |
| | 22 | | See Notes to Financial Statements. |
Eaton Vance
Floating-Rate Income Plus Fund
May 31, 2014
Notes to Financial Statements
1 Significant Accounting Policies
Eaton Vance Floating-Rate Income Plus Fund (the Fund) is a Massachusetts business trust registered under the Investment Company Act of 1940, as amended (the 1940 Act), as a diversified, closed-end management investment company. The trust was organized on April 5, 2013 and remained inactive until June 28, 2013, except for matters related to its organization, including the sale of 5,000 initial shares to Eaton Vance Management (EVM) for $100,000. The Fund’s investment objective is total return, with an emphasis on income.
The following is a summary of significant accounting policies of the Fund. The policies are in conformity with accounting principles generally accepted in the United States of America.
A Investment Valuation — The following methodologies are used to determine the market value or fair value of investments.
Senior Floating-Rate Loans. Interests in senior floating-rate loans (Senior Loans) for which reliable market quotations are readily available are valued generally at the average mean of bid and ask quotations obtained from a third party pricing service. Other Senior Loans are valued at fair value by the investment adviser under procedures approved by the Trustees. In fair valuing a Senior Loan, the investment adviser utilizes one or more of the valuation techniques described in (i) through (iii) below to assess the likelihood that the borrower will make a full repayment of the loan underlying such Senior Loan relative to yields on other Senior Loans issued by companies of comparable credit quality. If the investment adviser believes that there is a reasonable likelihood of full repayment, the investment adviser will determine fair value using a matrix pricing approach that considers the yield on the Senior Loan. If the investment adviser believes there is not a reasonable likelihood of full repayment, the investment adviser will determine fair value using analyses that include, but are not limited to: (i) a comparison of the value of the borrower’s outstanding equity and debt to that of comparable public companies; (ii) a discounted cash flow analysis; or (iii) when the investment adviser believes it is likely that a borrower will be liquidated or sold, an analysis of the terms of such liquidation or sale. In certain cases, the investment adviser will use a combination of analytical methods to determine fair value, such as when only a portion of a borrower’s assets are likely to be sold. In conducting its assessment and analyses for purposes of determining fair value of a Senior Loan, the investment adviser will use its discretion and judgment in considering and appraising relevant factors. Fair value determinations are made by the portfolio managers of the Fund based on information available to such managers. The portfolio managers of other funds managed by the investment adviser that invest in Senior Loans may not possess the same information about a Senior Loan borrower as the portfolio managers of the Fund. At times, the fair value of a Senior Loan determined by the portfolio managers of other funds managed by the investment adviser that invest in Senior Loans may vary from the fair value of the same Senior Loan determined by the portfolio managers of the Fund. The fair value of each Senior Loan is periodically reviewed and approved by the investment adviser’s Valuation Committee and by the Trustees based upon procedures approved by the Trustees. Junior Loans (i.e., subordinated loans and second lien loans) are valued in the same manner as Senior Loans.
Debt Obligations. Debt obligations (including short-term obligations with a remaining maturity of more than sixty days) are generally valued on the basis of valuations provided by third party pricing services, as derived from such services’ pricing models. Inputs to the models may include, but are not limited to, reported trades, executable bid and asked prices, broker/dealer quotations, prices or yields of securities with similar characteristics, benchmark curves or information pertaining to the issuer, as well as industry and economic events. The pricing services may use a matrix approach, which considers information regarding securities with similar characteristics to determine the valuation for a security. Short-term obligations purchased with a remaining maturity of sixty days or less are generally valued at amortized cost, which approximates market value.
Equity Securities. Equity securities (including common shares of closed-end investment companies) listed on a U.S. securities exchange generally are valued at the last sale or closing price on the day of valuation or, if no sales took place on such date, at the mean between the closing bid and asked prices therefore on the exchange where such securities are principally traded. Equity securities listed on the NASDAQ Global or Global Select Market generally are valued at the NASDAQ official closing price. Unlisted or listed securities for which closing sales prices or closing quotations are not available are valued at the mean between the latest available bid and asked prices or, in the case of preferred equity securities that are not listed or traded in the over-the-counter market, by a third party pricing service that will use various techniques that consider factors including, but not limited to, prices or yields of securities with similar characteristics, benchmark yields, broker/dealer quotes, quotes of underlying common stock, issuer spreads, as well as industry and economic events. The value of preferred equity securities that are valued by a pricing service on a bond basis will be adjusted by an income factor, to be determined by the investment adviser, to reflect the next anticipated regular dividend.
Foreign Securities and Currencies. Foreign securities and currencies are valued in U.S. dollars, based on foreign currency exchange rate quotations supplied by a third party pricing service. The pricing service uses a proprietary model to determine the exchange rate. Inputs to the model include reported trades and implied bid/ask spreads.
Affiliated Fund. The Fund may invest in Eaton Vance Cash Reserves Fund, LLC (Cash Reserves Fund), an affiliated investment company managed by EVM. The value of the Fund’s investment in Cash Reserves Fund reflects the Fund’s proportionate interest in its net assets. Cash Reserves Fund generally values its investment securities utilizing the amortized cost valuation technique in accordance with Rule 2a-7 under the 1940 Act. This technique involves initially valuing a portfolio security at its cost and thereafter assuming a constant amortization to maturity of any discount or premium. If amortized cost is determined not to approximate fair value, Cash Reserves Fund may value its investment securities in the same manner as debt obligations described above.
Fair Valuation. Investments for which valuations or market quotations are not readily available or are deemed unreliable are valued at fair value using methods determined in good faith by or at the direction of the Trustees of the Fund in a manner that fairly reflects the security’s value, or the amount that the Fund might reasonably expect to receive for the security upon its current sale in the ordinary course. Each such determination is based on a consideration of relevant factors, which are likely to vary from one pricing context to another. These factors may include, but are not limited to, the type of
Eaton Vance
Floating-Rate Income Plus Fund
May 31, 2014
Notes to Financial Statements — continued
security, the existence of any contractual restrictions on the security’s disposition, the price and extent of public trading in similar securities of the issuer or of comparable companies or entities, quotations or relevant information obtained from broker/dealers or other market participants, information obtained from the issuer, analysts, and/or the appropriate stock exchange (for exchange-traded securities), an analysis of the company’s or entity’s financial condition, and an evaluation of the forces that influence the issuer and the market(s) in which the security is purchased and sold.
B Investment Transactions — Investment transactions for financial statement purposes are accounted for on a trade date basis. Realized gains and losses on investments sold are determined on the basis of identified cost.
C Income — Interest income is recorded on the basis of interest accrued, adjusted for amortization of premium or accretion of discount. Fees associated with loan amendments are recognized immediately. Dividend income is recorded on the ex-dividend date for dividends received in cash and/or securities. However, if the ex-dividend date has passed, certain dividends from foreign securities are recorded as the Fund is informed of the ex-dividend date.
D Federal Taxes — The Fund’s policy is to comply with the provisions of the Internal Revenue Code applicable to regulated investment companies and to distribute to shareholders each year substantially all of its net investment income, and all or substantially all of its net realized capital gains. Accordingly, no provision for federal income or excise tax is necessary.
As of May 31, 2014, the Fund had no uncertain tax positions that would require financial statement recognition, de-recognition, or disclosure. The Fund files a U.S. federal income tax return annually after its fiscal year-end, which is subject to examination by the Internal Revenue Service for a period of three years from the date of filing.
E Expense Reduction — State Street Bank and Trust Company (SSBT) serves as custodian of the Fund. Pursuant to the custodian agreement, SSBT receives a fee reduced by credits, which are determined based on the average daily cash balance the Fund maintains with SSBT. All credit balances, if any, used to reduce the Fund’s custodian fees are reported as a reduction of expenses in the Statement of Operations.
F Foreign Currency Translation — Investment valuations, other assets, and liabilities initially expressed in foreign currencies are translated each business day into U.S. dollars based upon current exchange rates. Purchases and sales of foreign investment securities and income and expenses denominated in foreign currencies are translated into U.S. dollars based upon currency exchange rates in effect on the respective dates of such transactions. Recognized gains or losses on investment transactions attributable to changes in foreign currency exchange rates are recorded for financial statement purposes as net realized gains and losses on investments. That portion of unrealized gains and losses on investments that results from fluctuations in foreign currency exchange rates is not separately disclosed.
G Unfunded Loan Commitments — The Fund may enter into certain credit agreements all or a portion of which may be unfunded. The Fund is obligated to fund these commitments at the borrower’s discretion. These commitments are disclosed in the accompanying Portfolio of Investments. At May 31, 2014, the Fund had sufficient cash and/or securities to cover these commitments.
H Organization and Offering Costs — Organization costs paid in connection with the organization of the Fund were borne directly by EVM, the Fund’s investment adviser. EVM agreed to pay all common share offering costs (other than sales loads) that exceed $0.04 per common share. Costs incurred by the Fund in connection with the offering of its common shares are recorded as a reduction of additional paid-in capital.
I Use of Estimates — The preparation of the financial statements in conformity with accounting principles generally accepted in the United States of America requires management to make estimates and assumptions that affect the reported amounts of assets and liabilities at the date of the financial statements and the reported amounts of income and expense during the reporting period. Actual results could differ from those estimates.
J Indemnifications — Under the Fund’s organizational documents, its officers and Trustees may be indemnified against certain liabilities and expenses arising out of the performance of their duties to the Fund. Under Massachusetts law, if certain conditions prevail, shareholders of a Massachusetts business trust (such as the Fund) could be deemed to have personal liability for the obligations of the Fund. However, the Fund’s Declaration of Trust contains an express disclaimer of liability on the part of Fund shareholders and the By-laws provide that the Fund shall assume the defense on behalf of any Fund shareholders. Moreover, the By-laws also provide for indemnification out of Fund property of any shareholder held personally liable solely by reason of being or having been a shareholder for all loss or expense arising from such liability. Additionally, in the normal course of business, the Fund enters into agreements with service providers that may contain indemnification clauses. The Fund’s maximum exposure under these arrangements is unknown as this would involve future claims that may be made against the Fund that have not yet occurred.
K Statement of Cash Flows — The cash amount shown in the Statement of Cash Flows of the Fund is the amount included in the Fund’s Statement of Assets and Liabilities and represents the unrestricted cash on hand at its custodian and does not include any short-term investments.
2 Variable Rate Term Preferred Shares
On July 10, 2013, the Fund issued 360 shares of Series C-1 Variable Rate Term Preferred Shares (VRTP Shares) in a private offering to a commercial paper conduit sponsored by a large financial institution (the Conduit), all of which are outstanding at May 31, 2014.
Eaton Vance
Floating-Rate Income Plus Fund
May 31, 2014
Notes to Financial Statements — continued
The VRTP Shares are a form of preferred shares that represent stock of the Fund. The VRTP Shares have a par value of $0.01 per share, a liquidation preference of $100,000 per share, and a mandatory redemption date of July 8, 2016, unless extended. Dividends on the VRTP Shares are determined each day based on a spread of 1.2% to the Conduit’s current cost of funding. Such spread to the cost of funding is determined based on the current credit rating of the VRTP Shares.
The VRTP Shares are redeemable at the option of the Fund at a redemption price equal to $100,000 per share, plus accumulated and unpaid dividends, on any business day and solely for the purpose of reducing the leverage of the Fund. The VRTP Shares are also subject to mandatory redemption at a redemption price equal to $100,000 per share, plus accumulated and unpaid dividends, if the Fund is in default for an extended period on its asset maintenance or leverage ratio requirements with respect to the VRTP Shares. The holders of the VRTP Shares, voting as a class, are entitled to elect two Trustees of the Fund. If the dividends on the VRTP Shares remain unpaid in an amount equal to two full years’ dividends, the holders of the VRTP Shares as a class have the right to elect a majority of the Board of Trustees.
For financial reporting purposes, the liquidation value of the VRTP Shares is presented as a liability on the Statement of Assets and Liabilities and unpaid dividends are included in interest expense and fees payable. Dividends accrued on VRTP Shares are treated as interest payments for financial reporting purposes and are included in interest expense and fees on the Statement of Operations. Costs incurred by the Fund in connection with its offering of VRTP Shares were capitalized as deferred offering costs and are being amortized over a period of three years to the mandatory redemption date of the VRTP Shares. In connection with the issuance of VRTP Shares, the Fund paid an initial upfront fee to the Conduit of $180,000 which is being amortized to interest expense and fees over a period of three years. The unamortized amount as of May 31, 2014 is presented as prepaid upfront fees on VRTP Shares on the Statement of Assets and Liabilities. The carrying amount of the VRTP Shares at May 31, 2014 represents its liquidation value, which approximates fair value. If measured at fair value, the VRTP Shares would have been considered as Level 2 in the fair value hierarchy (see Note 12) at May 31, 2014.
The average liquidation preference of the VRTP Shares during the portion of the period ended May 31, 2014 in which the VRTP Shares were outstanding was $36,000,000.
3 Distributions to Shareholders
The Fund intends to make monthly distributions of net investment income to common shareholders, after payment of any dividends on any outstanding VRTP Shares. In addition, at least annually, the Fund intends to distribute all or substantially all of its net realized capital gains. Distributions to common shareholders are recorded on the ex-dividend date. Dividends to VRTP shareholders are accrued daily and payable monthly. The dividend rate on the VRTP Shares at May 31, 2014 was 1.39%. The amount of dividends accrued and the average annual dividend rate of the VRTP Shares during the portion of the period ended May 31, 2014 in which the VRTP Shares were outstanding were $456,407 and 1.42%, respectively.
The Fund distinguishes between distributions on a tax basis and a financial reporting basis. Accounting principles generally accepted in the United States of America require that only distributions in excess of tax basis earnings and profits be reported in the financial statements as a return of capital. Permanent differences between book and tax accounting relating to distributions are reclassified to paid-in capital. For tax purposes, distributions from short-term capital gains are considered to be from ordinary income.
The tax character of distributions declared, including distributions on VRTP Shares that are treated as interest payments for financial reporting purposes, for the period ended May 31, 2014 was as follows:
| | | | |
| | | Period Ended
May 31, 2014 | |
| |
Distributions declared from: | | | | |
Ordinary income | | $ | 7,864,736 | |
During the period ended May 31, 2014, accumulated net realized gain was increased by $4,636, accumulated undistributed net investment income was increased by $142,093, and paid-in capital was decreased by $146,729 due to differences between book and tax accounting, primarily for investments in partnerships, foreign currency gain (loss) and the treatment of VRTP Shares as equity for tax purposes. These reclassifications had no effect on the net assets or net asset value per share of the Fund.
Eaton Vance
Floating-Rate Income Plus Fund
May 31, 2014
Notes to Financial Statements — continued
As of May 31, 2014, the components of distributable earnings (accumulated losses) and unrealized appreciation (depreciation) on a tax basis were as follows:
| | | | |
Undistributed ordinary income | | $ | 2,208,651 | |
Net unrealized appreciation | | $ | 1,724,946 | |
The differences between components of distributable earnings (accumulated losses) on a tax basis and the amounts reflected in the Statement of Assets and Liabilities are primarily due to investments in partnerships and the tax treatment of short-term capital gains.
4 Investment Adviser Fee and Other Transactions with Affiliates
The investment adviser fee is earned by EVM as compensation for investment advisory services rendered to the Fund. The fee is computed at an annual rate of 0.75% of the Fund’s average daily total managed assets and is payable monthly. Total managed assets as referred to herein represent total assets of the Fund (including assets attributable to borrowings, any outstanding preferred shares, or other forms of leverage) less accrued liabilities (other than liabilities representing borrowings or such other forms of leverage). For the period ended May 31, 2014, the investment adviser fee amounted to $1,576,390. The Fund invests its cash in Cash Reserves Fund. EVM does not currently receive a fee for advisory services provided to Cash Reserves Fund. EVM also serves as administrator of the Fund, but receives no compensation.
Trustees and officers of the Fund who are members of EVM’s organization receive remuneration for their services to the Fund out of the investment adviser fee. Trustees of the Fund who are not affiliated with EVM may elect to defer receipt of all or a percentage of their annual fees in accordance with the terms of the Trustees Deferred Compensation Plan. For the period ended May 31, 2014, no significant amounts have been deferred. Certain officers and Trustees of the Fund are officers of EVM.
5 Purchases and Sales of Investments
Purchases and sales of investments, other than short-term obligations and including maturities, paydowns and principal repayments on Senior Loans, aggregated $316,000,254 and $83,429,091, respectively, for the period ended May 31, 2014.
6 Common Shares of Beneficial Interest
In connection with the initial public offering of the Fund’s common shares, the underwriters were granted an option to purchase additional common shares at a price of $19.10 (after deduction of the sales load). Additional shares were issued by the Fund on August 9, 2013 pursuant to the exercise of the over-allotment option. The Fund’s net asset value per share on such date was $19.32, resulting in a discount of $186,624. The Fund may issue common shares pursuant to its dividend reinvestment plan. Transactions in common shares were as follows:
| | | | |
| | | Period Ended
May 31, 2014(1) | |
| |
Sales (initial public offering) | | | 6,750,000 | |
Exercise of over-allotment option by underwriters | | | 848,291 | |
Issued to shareholders electing to receive payments of distributions in Fund shares | | | 3,131 | |
| |
Net increase | | | 7,601,422 | |
| (1) | For the period from the start of business, June 28, 2013, to May 31, 2014. |
On November 11, 2013, the Board of Trustees of the Fund authorized the repurchase by the Fund of up to 10% of its then currently outstanding common shares in open-market transactions at a discount to net asset value. The repurchase program does not obligate the Fund to purchase a specific amount of shares. There were no repurchases of common shares by the Fund for the period ended May 31, 2014.
Eaton Vance
Floating-Rate Income Plus Fund
May 31, 2014
Notes to Financial Statements — continued
7 Federal Income Tax Basis of Investments
The cost and unrealized appreciation (depreciation) of investments of the Fund at May 31, 2014, as determined on a federal income tax basis, were as follows:
| | | | |
| |
Aggregate cost | | $ | 236,875,967 | |
| |
Gross unrealized appreciation | | $ | 3,221,414 | |
Gross unrealized depreciation | | | (1,497,450 | ) |
| |
Net unrealized appreciation | | $ | 1,723,964 | |
8 Overdraft Advances
Pursuant to the custodian agreement, SSBT may, in its discretion, advance funds to the Fund to make properly authorized payments. When such payments result in an overdraft, the Fund is obligated to repay SSBT at the current rate of interest charged by SSBT for secured loans (currently, the Federal Funds rate plus 2%). This obligation is payable on demand to SSBT. SSBT has a lien on the Fund’s assets to the extent of any overdraft. At May 31, 2014, the Fund had a payment due to SSBT pursuant to the foregoing arrangement of $202,486. Based on the short-term nature of these payments and the variable interest rate, the carrying value of the overdraft advances approximated its fair value at May 31, 2014. If measured at fair value, overdraft advances would have been considered as Level 2 in the fair value hierarchy (see Note 12) at May 31, 2014. The Fund’s average overdraft advances during the year ended May 31, 2014 were not significant.
9 Revolving Credit and Security Agreement
On July 10, 2013, the Fund entered into a Revolving Credit and Security Agreement (the Agreement) with conduit lenders and a bank to borrow up to $54 million. Borrowings under the Agreement are secured by the assets of the Fund. Interest is charged at a rate above the conduits’ commercial paper issuance rate and is payable monthly. Under the terms of the Agreement, which was renewed on July 9, 2014 and in effect through March 18, 2015, the Fund also pays a program fee of 0.80% per annum on its outstanding borrowings to administer the facility and a liquidity fee of 0.15% (0.25% if the outstanding loan amount is less than or equal to 50% of the total facility size) per annum on the borrowing limit under the Agreement. Program and liquidity fees for the period ended May 31, 2014 totaled $430,344 and are included in interest expense and fees on the Statement of Operations. The Fund is required to maintain certain net asset levels during the term of the Agreement. At May 31, 2014, the Fund had borrowings outstanding under the Agreement of $54,000,000 at an interest rate of 0.19%. Based on the short-term nature of the borrowings under the Agreement and the variable interest rate, the carrying amount of the borrowings at May 31, 2014 approximated its fair value. If measured at fair value, borrowings under the Agreement would have been considered as Level 2 in the fair value hierarchy (see Note 12) at May 31, 2014. For the period from July 10, 2013 through May 31, 2014, the average borrowings under the Agreement and the average annual interest rate (excluding fees) were $48,677,914 and 0.20%, respectively.
10 Risks Associated with Foreign Investments
Investing in securities issued by companies whose principal business activities are outside the United States may involve significant risks not present in domestic investments. For example, there is generally less publicly available information about foreign companies, particularly those not subject to the disclosure and reporting requirements of the U.S. securities laws. Certain foreign issuers are generally not bound by uniform accounting, auditing, and financial reporting requirements and standards of practice comparable to those applicable to domestic issuers. Investments in foreign securities also involve the risk of possible adverse changes in investment or exchange control regulations, expropriation or confiscatory taxation, limitation on the removal of funds or other assets of the Fund, political or financial instability or diplomatic and other developments which could affect such investments. Foreign securities markets, while growing in volume and sophistication, are generally not as developed as those in the United States, and securities of some foreign issuers (particularly those located in developing countries) may be less liquid and more volatile than securities of comparable U.S. companies. In general, there is less overall governmental supervision and regulation of foreign securities markets, broker/dealers and issuers than in the United States.
11 Credit Risk
The Fund invests primarily in below investment grade floating-rate loans, which are considered speculative because of the credit risk of their issuers. Changes in economic conditions or other circumstances are more likely to reduce the capacity of issuers of these securities to make principal and interest payments. Such companies are more likely to default on their payments of interest and principal owed than issuers of investment grade bonds. An economic downturn generally leads to a higher non-payment rate, and a loan or other debt obligation may lose significant value before a default occurs. Lower rated investments also may be subject to greater price volatility than higher rated investments. Moreover, the specific collateral used to secure a loan may decline in value or become illiquid, which would adversely affect the loan’s value.
Eaton Vance
Floating-Rate Income Plus Fund
May 31, 2014
Notes to Financial Statements — continued
12 Fair Value Measurements
Under generally accepted accounting principles for fair value measurements, a three-tier hierarchy to prioritize the assumptions, referred to as inputs, is used in valuation techniques to measure fair value. The three-tier hierarchy of inputs is summarized in the three broad levels listed below.
| Ÿ | | Level 1 – quoted prices in active markets for identical investments |
| Ÿ | | Level 2 – other significant observable inputs (including quoted prices for similar investments, interest rates, prepayment speeds, credit risk, etc.) |
| Ÿ | | Level 3 – significant unobservable inputs (including a fund’s own assumptions in determining the fair value of investments) |
In cases where the inputs used to measure fair value fall in different levels of the fair value hierarchy, the level disclosed is determined based on the lowest level input that is significant to the fair value measurement in its entirety. The inputs or methodology used for valuing securities are not necessarily an indication of the risk associated with investing in those securities.
At May 31, 2014, the hierarchy of inputs used in valuing the Fund’s investments, which are carried at value, were as follows:
| | | | | | | | | | | | | | | | |
| Asset Description | | Level 1 | | | Level 2 | | | Level 3 | | | Total | |
| | | | |
Senior Floating-Rate Interests (Less Unfunded Loan Commitments) | | $ | — | | | $ | 205,356,941 | | | $ | — | | | $ | 205,356,941 | |
Corporate Bonds & Notes | | | — | | | | 16,198,902 | | | | — | | | | 16,198,902 | |
Foreign Government Bonds | | | — | | | | 1,833,390 | | | | — | | | | 1,833,390 | |
Convertible Bonds | | | — | | | | 3,252,612 | | | | — | | | | 3,252,612 | |
Common Stocks | | | 7,025,808 | | | | 134,889 | * | | | — | | | | 7,160,697 | |
Convertible Preferred Stocks | | | — | | | | 2,345,383 | | | | — | | | | 2,345,383 | |
Preferred Stocks | | | — | | | | 186,230 | | | | — | | | | 186,230 | |
Short-Term Investments | | | — | | | | 2,265,776 | | | | — | | | | 2,265,776 | |
| | | | |
Total Investments | | $ | 7,025,808 | | | $ | 231,574,123 | | | $ | — | | | $ | 238,599,931 | |
| * | Includes foreign equity securities whose values were adjusted to reflect market trading of comparable securities or other correlated instruments that occurred after the close of trading in their applicable foreign markets. |
Floating-Rate Income Plus Fund
May 31, 2014
Report of Independent Registered Public Accounting Firm
To the Trustees and Shareholders of Eaton Vance Floating-Rate Income Plus Fund:
We have audited the accompanying statement of assets and liabilities of Eaton Vance Floating-Rate Income Plus Fund (the “Fund”), including the portfolio of investments, as of May 31, 2014, and the related statements of operations, cash flows, changes in net assets, and the financial highlights for the period from the start of business, June 28, 2013, to May 31, 2014. These financial statements and financial highlights are the responsibility of the Fund’s management. Our responsibility is to express an opinion on these financial statements and financial highlights based on our audit.
We conducted our audit in accordance with the standards of the Public Company Accounting Oversight Board (United States). Those standards require that we plan and perform the audit to obtain reasonable assurance about whether the financial statements and financial highlights are free of material misstatement. The Fund is not required to have, nor were we engaged to perform, an audit of its internal control over financial reporting. Our audit included consideration of internal control over financial reporting as a basis for designing audit procedures that are appropriate in the circumstances, but not for the purpose of expressing an opinion on the effectiveness of the Fund’s internal control over financial reporting. Accordingly, we express no such opinion. An audit also includes examining, on a test basis, evidence supporting the amounts and disclosures in the financial statements, assessing the accounting principles used and significant estimates made by management, as well as evaluating the overall financial statement presentation. Our procedures included confirmation of securities and senior loans owned as of May 31, 2014, by correspondence with the custodian, brokers, and selling or agent banks; where replies were not received from brokers and selling or agent banks, we performed other auditing procedures. We believe that our audit provides a reasonable basis for our opinion.
In our opinion, such financial statements and financial highlights referred to above present fairly, in all material respects, the financial position of Eaton Vance Floating-Rate Income Plus Fund as of May 31, 2014, the results of its operations and its cash flows, changes in its net assets, and the financial highlights for the period from the start of business, June 28, 2013, to May 31, 2014, in conformity with accounting principles generally accepted in the United States of America.
DELOITTE & TOUCHE LLP
Boston, Massachusetts
July 15, 2014
Eaton Vance
Floating-Rate Income Plus Fund
May 31, 2014
Federal Tax Information (Unaudited)
The Form 1099-DIV you receive in February 2015 will show the tax status of all distributions paid to your account in calendar year 2014. Shareholders are advised to consult their own tax adviser with respect to the tax consequences of their investment in the Fund. As required by the Internal Revenue Code and/or regulations, shareholders must be notified regarding the status of the dividends received deduction for corporations.
Dividends Received Deduction. Corporate shareholders are generally entitled to take the dividends received deduction on the portion of the Fund’s dividend distribution that qualifies under tax law. For the Fund’s fiscal 2014 ordinary income dividends, 5.34% qualifies for the corporate dividends received deduction.
Eaton Vance
Floating-Rate Income Plus Fund
May 31, 2014
Annual Meeting of Shareholders (Unaudited)
The Fund held its Annual Meeting of Shareholders on March 27, 2014(1). The following action was taken by the shareholders:
Item 1: The election of Scott E. Eston, Thomas E. Faust Jr. and Allen R. Freedman as Class I Trustees of the Fund for a three-year term expiring in 2017, and Valerie A. Mosley as a Class III Trustee for a two-year term expiring in 2016. Mr. Eston was designated the nominee to be elected by VRTP shareholders.
| | | | | | | | |
Nominee for Trustee Elected by All Shareholders | | Number of Shares | |
| | For | | | Withheld | |
Thomas E. Faust Jr. (Class I) | | | 6,985,729 | | | | 343,326 | |
Allen R. Freedman (Class I) | | | 6,985,950 | | | | 343,105 | |
Valerie A. Mosley (Class III) | | | 7,001,141 | | | | 327,914 | |
| | | | | | |
Nominee for Trustee Elected by VRTP Shareholders | | Number of Shares | |
| | For | | Withheld | |
Scott E. Eston (Class I) | | 360 | | | 0 | |
| (1) | The shareholder meeting for holders of the Fund’s VRTP Shares was adjourned until April 3, 2014. At such time, the requisite quorum for the conduct of business at the Annual Meeting was established. |
Eaton Vance
Floating-Rate Income Plus Fund
May 31, 2014
Dividend Reinvestment Plan
The Fund offers a dividend reinvestment plan (Plan) pursuant to which shareholders automatically have distributions reinvested in common shares (Shares) of the Fund unless they elect otherwise through their investment dealer. On the distribution payment date, if the NAV per Share is equal to or less than the market price per Share plus estimated brokerage commissions, then new Shares will be issued. The number of Shares shall be determined by the greater of the NAV per Share or 95% of the market price. Otherwise, Shares generally will be purchased on the open market by American Stock Transfer & Trust Company, LLC, the Plan agent (Agent). Distributions subject to income tax (if any) are taxable whether or not Shares are reinvested.
If your Shares are in the name of a brokerage firm, bank, or other nominee, you can ask the firm or nominee to participate in the Plan on your behalf. If the nominee does not offer the Plan, you will need to request that the Fund’s transfer agent re-register your Shares in your name or you will not be able to participate.
The Agent’s service fee for handling distributions will be paid by the Fund. Plan participants will be charged their pro rata share of brokerage commissions on all open-market purchases.
Plan participants may withdraw from the Plan at any time by writing to the Agent at the address noted on the following page. If you withdraw, you will receive Shares in your name for all Shares credited to your account under the Plan. If a participant elects by written notice to the Agent to sell part or all of his or her Shares and remit the proceeds, the Agent is authorized to deduct a $5.00 fee plus brokerage commissions from the proceeds.
If you wish to participate in the Plan and your Shares are held in your own name, you may complete the form on the following page and deliver it to the Agent. Any inquiries regarding the Plan can be directed to the Agent at 1-866-439-6787.
Eaton Vance
Floating-Rate Income Plus Fund
May 31, 2014
Application for Participation in Dividend Reinvestment Plan
This form is for shareholders who hold their common shares in their own names. If your common shares are held in the name of a brokerage firm, bank, or other nominee, you should contact your nominee to see if it will participate in the Plan on your behalf. If you wish to participate in the Plan, but your brokerage firm, bank, or nominee is unable to participate on your behalf, you should request that your common shares be re-registered in your own name which will enable your participation in the Plan.
The following authorization and appointment is given with the understanding that I may terminate it at any time by terminating my participation in the Plan as provided in the terms and conditions of the Plan.
Please print exact name on account:
Shareholder signature Date
Shareholder signature Date
Please sign exactly as your common shares are registered. All persons whose names appear on the share certificate must sign.
YOU SHOULD NOT RETURN THIS FORM IF YOU WISH TO RECEIVE YOUR DISTRIBUTIONS IN CASH. THIS IS NOT A PROXY.
This authorization form, when signed, should be mailed to the following address:
Eaton Vance Floating-Rate Income Plus Fund
c/o American Stock Transfer & Trust Company, LLC
P.O. Box 922
Wall Street Station
New York, NY 10269-0560
Number of Employees
The Fund is organized as a Massachusetts business trust and is registered under the Investment Company Act of 1940, as amended, as a closed-end management investment company and has no employees.
Number of Shareholders
As of May 31, 2014, Fund records indicate that there are 3 registered shareholders and approximately 4,611 shareholders owning the Fund shares in street name, such as through brokers, banks, and financial intermediaries.
If you are a street name shareholder and wish to receive Fund reports directly, which contain important information about the Fund, please write or call:
Eaton Vance Distributors, Inc.
Two International Place
Boston, MA 02110
1-800-262-1122
New York Stock Exchange symbol
The New York Stock Exchange symbol is EFF.
Eaton Vance
Floating-Rate Income Plus Fund
May 31, 2014
Management and Organization
Fund Management. The Trustees of Eaton Vance Floating-Rate Income Plus Fund (the Fund) are responsible for the overall management and supervision of the Trust’s affairs. The Trustees and officers of the Trust are listed below. Except as indicated, each individual has held the office shown or other offices in the same company for the last five years. The “Noninterested Trustees” consist of those Trustees who are not “interested persons” of the Trust, as that term is defined under the 1940 Act. The business address of each Trustee and officer is Two International Place, Boston, Massachusetts 02110. As used below, “EVC” refers to Eaton Vance Corp., “EV” refers to Eaton Vance, Inc., “EVM” refers to Eaton Vance Management, “BMR” refers to Boston Management and Research and “EVD” refers to Eaton Vance Distributors, Inc. EVC and EV are the corporate parent and trustee, respectively, of EVM and BMR. EVD is the Trust’s principal underwriter and a wholly-owned subsidiary of EVC. Each officer affiliated with Eaton Vance may hold a position with other Eaton Vance affiliates that is comparable to his or her position with EVM listed below. Each Trustee oversees 182 portfolios in the Eaton Vance Complex (including all master and feeder funds in a master feeder structure). Each officer serves as an officer of certain other Eaton Vance funds. Each Trustee serves for a three year term. Each officer serves until his or her successor is elected.
| | | | | | |
| Name and Year of Birth | | Position(s) with the Fund | | Term Expiring; Trustee Since(1) | | Principal Occupation(s) and Directorships During Past Five Years and Other Relevant Experience |
Interested Trustee |
| | | |
Thomas E. Faust Jr. 1958 | | Class I Trustee | | Until 2017.
Trustee since 2007. | | Chairman, Chief Executive Officer and President of EVC, Director and President of EV, Chief Executive Officer and President of EVM and BMR, and Director of EVD. Trustee and/or officer of 182 registered investment companies. Mr. Faust is an interested person because of his positions with EVM, BMR, EVD, EVC and EV, which are affiliates of the Fund. Directorships in the Last Five Years.(2) Director of EVC and Hexavest Inc. |
| | | |
| | | | | | |
Noninterested Trustees |
| | | |
Scott E. Eston(A) 1956 | | Class I Trustee | | Until 2017.
Trustee since 2011. | | Private investor. Formerly held various positions at Grantham, Mayo, Van Otterloo and Co., L.L.C. (investment management firm) (1997-2009), including Chief Operating Officer (2002-2009), Chief Financial Officer (1997-2009) and Chairman of the Executive Committee (2002-2008); President and Principal Executive Officer, GMO Trust (open-end registered investment company) (2006-2009). Former Partner, Coopers and Lybrand L.L.P. (now PricewaterhouseCoopers) (public accounting firm) (1987-1997). Directorships in the Last Five Years.(2) None. |
| | | |
Cynthia E. Frost(3) 1961 | | Class I Trustee | | Until 2017.
Trustee since 2014. | | Private investor. Formerly, Chief Investment Officer of Brown University (university endowment) (2000-2012); Portfolio Strategist for Duke Management Company (university endowment manager) (1995-2000); Managing Director, Cambridge Associates (1989-1995); Consultant, Bain and Company (1987-1989); Senior Equity Analyst, BA Investment Management Company (1983-1985). Directorships in the Last Five Years. None. |
| | | |
George J. Gorman(3) 1952 | | Class II Trustee | | Until 2015.
Trustee since 2014. | | Principal at George J. Gorman LLC (consulting firm). Formerly, Senior Partner at Ernst & Young LLP (public accounting firm) (1974-2009). Directorships in the Last Five Years. Trustee of the Bank of America Money Market Funds Series Trust (since 2011) and of the Ashmore Funds (since 2010). |
| | | |
Valerie A. Mosley(4) 1960 | | Class III Trustee | | Until 2016.
Trustee since 2014. | | Chairwoman and Chief Executive Officer of Valmo Ventures (a consulting and investment firm). Former Partner and Senior Vice President, Portfolio Manager and Investment Strategist at Wellington Management Company, LLP (investment management firm) (1992-2012). Former Chief Investment Officer, PG Corbin Asset Management (1990-1992). Formerly worked in institutional corporate bond sales at Kidder Peabody (1986-1990). Directorships in the Last Five Years.(2) Director of Dynex Capital, Inc. (mortgage REIT) (since 2013). |
| | | |
William H. Park 1947 | | Class II Trustee | | Until 2015.
Trustee since 2003. | | Consultant and private investor. Formerly, Chief Financial Officer, Aveon Group L.P. (investment management firm) (2010-2011). Formerly, Vice Chairman, Commercial Industrial Finance Corp. (specialty finance company) (2006-2010). Formerly, President and Chief Executive Officer, Prizm Capital Management, LLC (investment management firm) (2002-2005). Formerly, Executive Vice President and Chief Financial Officer, United Asset Management Corporation (investment management firm) (1982-2001). Formerly, Senior Manager, Price Waterhouse (now PricewaterhouseCoopers) (an independent registered public accounting firm) (1972-1981). Directorships in the Last Five Years.(2) None. |
Eaton Vance
Floating-Rate Income Plus Fund
May 31, 2014
Management and Organization — continued
| | | | | | |
| Name and Year of Birth | | Position(s) with the Fund | | Term Expiring; Trustee Since(1) | | Principal Occupation(s) and Directorships During Past Five Years and Other Relevant Experience |
Noninterested Trustees (continued) |
| | | |
Ronald A. Pearlman 1940 | | Class II Trustee | | Until 2015.
Trustee since 2003. | | Professor of Law, Georgetown University Law Center. Formerly, Deputy Assistant Secretary (Tax Policy) and Assistant Secretary (Tax Policy), U.S. Department of the Treasury (1983-1985). Formerly, Chief of Staff, Joint Committee on Taxation, U.S. Congress (1988-1990). Directorships in the Last Five Years.(2) None. |
| | | |
Helen Frame Peters 1948 | | Class III Trustee | | Until 2016.
Trustee since 2008. | | Professor of Finance, Carroll School of Management, Boston College. Formerly, Dean, Carroll School of Management, Boston College (2000-2002). Formerly, Chief Investment Officer, Fixed Income, Scudder Kemper Investments (investment management firm) (1998-1999). Formerly, Chief Investment Officer, Equity and Fixed Income, Colonial Management Associates (investment management firm) (1991-1998). Directorships in the Last Five Years.(2) Formerly, Director of BJ’s Wholesale Club, Inc. (wholesale club retailer) (2004-2011). Formerly, Trustee of SPDR Index Shares Funds and SPDR Series Trust (exchange traded funds) (2000-2009). Formerly, Director of Federal Home Loan Bank of Boston (a bank for banks) (2007-2009). |
| | | |
Harriett Tee Taggart 1948 | | Class II Trustee | | Until 2015.
Trustee since 2011. | | Managing Director, Taggart Associates (a professional practice firm). Formerly, Partner and Senior Vice President, Wellington Management Company, LLP (investment management firm) (1983-2006). Directorships in the Last Five Years.(2) Director of Albemarle Corporation (chemicals manufacturer) (since 2007) and The Hanover Group (specialty property and casualty insurance company) (since 2009). Formerly, Director of Lubrizol Corporation (specialty chemicals) (2007-2011). |
| | | |
Ralph F. Verni(A) 1943 | | Chairman of the Board and Class III Trustee | | Until 2016.
Trustee since 2005 and Chairman since 2007. | | Consultant and private investor. Formerly, Chief Investment Officer (1982-1992), Chief Financial Officer (1988-1990) and Director (1982-1992), New England Life. Formerly, Chairperson, New England Mutual Funds (1982-1992). Formerly, President and Chief Executive Officer, State Street Management & Research (1992-2000). Formerly, Chairperson, State Street Research Mutual Funds (1992-2000). Formerly, Director, W.P. Carey, LLC (1998-2004) and First Pioneer Farm Credit Corp. (2002-2006). Directorships in the Last Five Years.(2) None. |
| | | |
| | | | | | |
Principal Officers who are not Trustees |
| Name and Year of Birth | | Position(s)
with the Fund | | Officer Since(5) | | Principal Occupation(s) During Past Five Years |
Scott H. Page 1959 | | President | | Since 1998 | | Vice President of EVM and BMR. |
| | | |
Maureen A. Gemma 1960 | | Vice President, Secretary and Chief Legal Officer | | Since 2005 | | Vice President of EVM and BMR. |
| | | |
James F. Kirchner 1967 | | Treasurer | | Since 2007 | | Vice President of EVM and BMR. |
| | | |
Paul M. O’Neil 1953 | | Chief Compliance Officer | | Since 2004 | | Vice President of EVM and BMR. |
| (1) | Year first appointed to serve as Trustee for a fund in the Eaton Vance family of funds. Each Trustee has served continuously since appointment unless indicated otherwise. Each Trustee holds office until the annual meeting for the year in which his or her term expires and until his or her successor is elected and qualified, subject to a prior death, resignation, retirement, disqualification or removal. |
| (2) | During their respective tenures, the Trustees (except for Ms. Frost and Mr. Gorman) also served as Board members of one or more of the following funds (which operated in the years noted): eUnitsTM 2 Year U.S. Market Participation Trust: Upside to Cap / Buffered Downside (launched in 2012 and terminated in 2014); eUnitsTM 2 Year U.S. Market Participation Trust II: Upside to Cap / Buffered Downside (launched in 2012 and terminated in 2014); Eaton Vance Credit Opportunities Fund (launched in 2005 and terminated in 2010); Eaton Vance Insured Florida Plus Municipal Bond Fund (launched in 2002 and terminated in 2009); and Eaton Vance National Municipal Income Trust (launched in 1998 and terminated in 2009). However, Ms. Mosley did not serve as a Board member of eUnitsTM 2 Year U.S. Market Participation Trust: Upside to Cap / Buffered Downside (launched in 2012 and terminated in 2014). |
Eaton Vance
Floating-Rate Income Plus Fund
May 31, 2014
Management and Organization — continued
| (3) | Ms. Frost and Mr. Gorman were appointed as Trustees of the Fund on May 29, 2014. |
| (4) | Ms. Mosley was appointed as a Trustee of the Fund effective January 1, 2014. |
| (5) | Year first elected to serve as officer of a fund in the Eaton Vance family of funds when the officer has served continuously. Otherwise, year of most recent election as an officer of a fund in the Eaton Vance family of funds. Titles may have changed since initial election. |
Eaton Vance Funds
IMPORTANT NOTICES
Privacy. The Eaton Vance organization is committed to ensuring your financial privacy. Each of the financial institutions identified below has in effect the following policy (“Privacy Policy”) with respect to nonpublic personal information about its customers:
| Ÿ | | Only such information received from you, through application forms or otherwise, and information about your Eaton Vance fund transactions will be collected. This may include information such as name, address, social security number, tax status, account balances and transactions. |
| Ÿ | | None of such information about you (or former customers) will be disclosed to anyone, except as permitted by law (which includes disclosure to employees necessary to service your account). In the normal course of servicing a customer’s account, Eaton Vance may share information with unaffiliated third parties that perform various required services such as transfer agents, custodians and broker-dealers. |
| Ÿ | | Policies and procedures (including physical, electronic and procedural safeguards) are in place that are designed to protect the confidentiality of such information. |
| Ÿ | | We reserve the right to change our Privacy Policy at any time upon proper notification to you. Customers may want to review our Privacy Policy periodically for changes by accessing the link on our homepage: www.eatonvance.com. |
Our pledge of privacy applies to the following entities within the Eaton Vance organization: the Eaton Vance Family of Funds, Eaton Vance Management, Eaton Vance Investment Counsel, Eaton Vance Distributors, Inc., Eaton Vance Trust Company, Eaton Vance Management’s Real Estate Investment Group and Boston Management and Research. In addition, our Privacy Policy applies only to those Eaton Vance customers who are individuals and who have a direct relationship with us. If a customer’s account (i.e., fund shares) is held in the name of a third-party financial advisor/broker-dealer, it is likely that only such advisor’s privacy policies apply to the customer. This notice supersedes all previously issued privacy disclosures. For more information about Eaton Vance’s Privacy Policy, please call 1-800-262-1122.
Delivery of Shareholder Documents. The Securities and Exchange Commission (SEC) permits funds to deliver only one copy of shareholder documents, including prospectuses, proxy statements and shareholder reports, to fund investors with multiple accounts at the same residential or post office box address. This practice is often called “householding” and it helps eliminate duplicate mailings to shareholders. Eaton Vance, or your financial advisor, may household the mailing of your documents indefinitely unless you instruct Eaton Vance, or your financial advisor, otherwise. If you would prefer that your Eaton Vance documents not be householded, please contact Eaton Vance at 1-800-262-1122, or contact your financial advisor. Your instructions that householding not apply to delivery of your Eaton Vance documents will be effective within 30 days of receipt by Eaton Vance or your financial advisor.
Portfolio Holdings. Each Eaton Vance Fund and its underlying Portfolio(s) (if applicable) will file a schedule of portfolio holdings on Form N-Q with the SEC for the first and third quarters of each fiscal year. The Form N-Q will be available on the Eaton Vance website at www.eatonvance.com, by calling Eaton Vance at 1-800-262-1122 or in the EDGAR database on the SEC’s website at www.sec.gov. Form N-Q may also be reviewed and copied at the SEC’s public reference room in Washington, D.C. (call 1-800-732-0330 for information on the operation of the public reference room).
Proxy Voting. From time to time, funds are required to vote proxies related to the securities held by the funds. The Eaton Vance Funds or their underlying Portfolios (if applicable) vote proxies according to a set of policies and procedures approved by the Funds’ and Portfolios’ Boards. You may obtain a description of these policies and procedures and information on how the Funds or Portfolios voted proxies relating to portfolio securities during the most recent 12-month period ended June 30, without charge, upon request, by calling 1-800-262-1122 and by accessing the SEC’s website at www.sec.gov.
Share Repurchase Program. On November 11, 2013, the Fund’s Board of Trustees approved a share repurchase program authorizing the Fund to repurchase up to 10% of its currently outstanding common shares in open-market transactions at a discount to net asset value. The repurchase program does not obligate the Fund to purchase a specific amount of shares. The Fund’s repurchase activity, including the number of shares purchased, average price and average discount to net asset value, is disclosed in the Fund’s annual and semi-annual reports to shareholders.
Additional Notice to Shareholders. If applicable, a Fund may also redeem or purchase its outstanding preferred shares in order to maintain compliance with regulatory requirements, borrowing or rating agency requirements or for other purposes as it deems appropriate or necessary.
Closed-End Fund Information. Eaton Vance closed-end funds make fund performance data and certain information about portfolio characteristics available on the Eaton Vance website shortly after the end of each month. The funds’ net asset value per share is readily accessible on the Eaton Vance website. Portfolio holdings for the most recent month-end are also posted to the website approximately 30 days following the end of the month. This information is available at www.eatonvance.com on the fund information pages under “Individual Investors — Closed-End Funds”.
This Page Intentionally Left Blank
This Page Intentionally Left Blank
This Page Intentionally Left Blank
Investment Adviser and Administrator
Eaton Vance Management
Two International Place
Boston, MA 02110
Custodian
State Street Bank and Trust Company
State Street Financial Center, One Lincoln Street
Boston, MA 02111
Transfer Agent
American Stock Transfer & Trust Company, LLC
6201 15th Avenue
Brooklyn, NY 11219
Independent Registered Public Accounting Firm
Deloitte & Touche LLP
200 Berkeley Street
Boston, MA 02116-5022
Fund Offices
Two International Place
Boston, MA 02110
Item 2. Code of Ethics
The registrant has adopted a code of ethics applicable to its Principal Executive Officer, Principal Financial Officer and Principal Accounting Officer. The registrant undertakes to provide a copy of such code of ethics to any person upon request, without charge, by calling 1-800-262-1122.
Item 3. Audit Committee Financial Expert
The registrant’s Board has designated William H. Park, an independent trustee, as its audit committee financial expert. Mr. Park is a certified public accountant who is a consultant and private investor. Previously, he served as the Chief Financial Officer of Aveon Group, L.P. (an investment management firm), as the Vice Chairman of Commercial Industrial Finance Corp. (specialty finance company), as President and Chief Executive Officer of Prizm Capital Management, LLC (investment management firm), as Executive Vice President and Chief Financial Officer of United Asset Management Corporation (an institutional investment management firm) and as a Senior Manager at Price Waterhouse (now PricewaterhouseCoopers) (an independent registered public accounting firm).
Item 4. Principal Accountant Fees and Services
(a)–(d)
The following table presents the aggregate fees billed to the registrant for the registrant’s initial fiscal period from commencement of operations on June 28, 2013, to May 31, 2014 by the registrant’s principal accountant, Deloitte & Touche LLP (“D&T”), for professional services rendered for the audit of the registrant’s annual financial statements and fees billed for other services rendered by D&T during such period.
Eaton Vance Floating-Rate Income Plus Fund
| | | | |
Fiscal Year Ended | | 5/31/14* | |
Audit Fees | | $ | 30,300 | |
Audit-Related Fees(1) | | $ | 0 | |
Tax Fees(2) | | $ | 19,310 | |
All Other Fees(3) | | $ | 0 | |
| | | | |
Total | | $ | 49,610 | |
| | | | |
| * | Fund commenced operations on June 28, 2013. |
| (1) | Audit-related fees consist of the aggregate fees billed for assurance and related services that are reasonably related to the performance of the audit of financial statements and are not reported under the category of audit fees. |
| (2) | Tax fees consist of the aggregate fees billed for professional services rendered by the principal accountant relating to tax compliance, tax advice, and tax planning and specifically include fees for tax return preparation and other related tax compliance/planning matters. |
| (3) | All other fees consist of the aggregate fees billed for products and services provided by the principal accountant other than audit, audit-related, and tax services. |
(e)(1) The registrant’s audit committee has adopted policies and procedures relating to the pre-approval of services provided by the registrant’s principal accountant (the “Pre-Approval Policies”). The Pre-Approval Policies establish a framework intended to assist the audit committee in the proper discharge of its pre-approval responsibilities. As a general matter, the Pre-Approval Policies (i) specify certain types of audit, audit-related, tax, and other services determined to be pre-approved by the audit committee; and (ii) delineate specific procedures governing the mechanics of the pre-approval process, including the approval and monitoring of audit and non-audit service fees. Unless a service is specifically pre-approved under the Pre-Approval Policies, it must be separately pre-approved by the audit committee.
The Pre-Approval Policies and the types of audit and non-audit services pre-approved therein must be reviewed and ratified by the registrant’s audit committee at least annually. The registrant’s audit committee maintains full responsibility for the appointment, compensation, and oversight of the work of the registrant’s principal accountant.
(e)(2) No services described in paragraphs (b)-(d) above were approved by the registrant’s audit committee pursuant to the “de minimis exception” set forth in Rule 2-01(c)(7)(i)(C) of Regulation S-X.
(f) Not applicable.
(g) The following table presents (i) the aggregate non-audit fees (i.e., fees for audit-related, tax, and other services) billed to the registrant by D&T for the registrant’s initial fiscal period ended May 31, 2014; and (ii) the aggregate non-audit fees (i.e., fees for audit-related, tax, and other services) billed to the Eaton Vance organization by D&T for the same time period.
| | | | |
Fiscal Year Ended | | 5/31/14* | |
Registrant | | $ | 19,310 | |
Eaton Vance(1) | | $ | 380,973 | |
| * | Fund commenced operations on June 28, 2013. |
| (1) | The investment adviser to the registrant, as well as any of its affiliates that provide ongoing services to the registrant, are subsidiaries of Eaton Vance Corp. |
(h) The registrant’s audit committee has considered whether the provision by the registrant’s principal accountant of non-audit services to the registrant’s investment adviser and any entity controlling, controlled by, or under common control with the adviser that provides ongoing services to the registrant that were not pre-approved pursuant to Rule 2-01(c)(7)(ii) of Regulation S-X is compatible with maintaining the principal accountant’s independence.
Item 5. Audit Committee of Listed Registrants
The registrant has a separately-designated standing audit committee established in accordance with Section 3(a)(58)(A) of the Securities and Exchange Act of 1934, as amended. William H. Park (Chair), Scott E. Eston, Ronald A. Pearlman, Helen Frame Peters and Ralph F. Verni are the members of the registrant’s audit committee.
Item 6. Schedule of Investments
Please see schedule of investments contained in the Report to Stockholders included under Item 1 of this Form N-CSR.
Item 7. Disclosure of Proxy Voting Policies and Procedures for Closed-End Management Investment Companies
The Board of Trustees of the Trust has adopted a proxy voting policy and procedure (the “Fund Policy”), pursuant to which the Trustees have delegated proxy voting responsibility to the Fund’s investment adviser and adopted the investment adviser’s proxy voting policies and procedures (the “Policies”) which are described below. The Trustees will review the Fund’s proxy voting records from time to time and will annually consider approving the Policies for the upcoming year. In the event that a conflict of interest arises between the Fund’s shareholders and the investment adviser, the administrator, or any of their affiliates or any affiliate of the Fund, the investment adviser will generally refrain from voting the proxies related to the companies giving rise to such conflict until it consults with the Board’s Special Committee except as contemplated under the Fund Policy. The Board’s Special Committee will instruct the investment adviser on the appropriate course of action.
The Policies are designed to promote accountability of a company’s management to its shareholders and to align the interests of management with those shareholders. An independent proxy voting service (“Agent”), currently Institutional Shareholder Services, Inc., has been retained to assist in the voting of proxies through the provision of vote analysis, implementation and recordkeeping and disclosure services. The investment adviser will generally vote proxies through the Agent. The Agent is required
to vote all proxies and/or refer them back to the investment adviser pursuant to the Policies. It is generally the policy of the investment adviser to vote in accordance with the recommendation of the Agent. The Agent shall refer to the investment adviser proxies relating to mergers and restructurings, and the disposition of assets, termination, liquidation and mergers contained in mutual fund proxies. The investment adviser will normally vote against anti-takeover measures and other proposals designed to limit the ability of shareholders to act on possible transactions, except in the case of closed-end management investment companies. The investment adviser generally supports management on social and environmental proposals. The investment adviser may abstain from voting from time to time where it determines that the costs associated with voting a proxy outweighs the benefits derived from exercising the right to vote or the economic effect on shareholders interests or the value of the portfolio holding is indeterminable or insignificant.
In addition, the investment adviser will monitor situations that may result in a conflict of interest between the Fund’s shareholders and the investment adviser, the administrator, or any of their affiliates or any affiliate of the Fund by maintaining a list of significant existing and prospective corporate clients. The investment adviser’s personnel responsible for reviewing and voting proxies on behalf of the Fund will report any proxy received or expected to be received from a company included on that list to the personnel of the investment adviser identified in the Policies. If such personnel expects to instruct the Agent to vote such proxies in a manner inconsistent with the guidelines of the Policies or the recommendation of the Agent, the personnel will consult with members of senior management of the investment adviser to determine if a material conflict of interests exists. If it is determined that a material conflict does exist, the investment adviser will seek instruction on how to vote from the Special Committee.
Information on how the Fund voted proxies relating to portfolio securities during the most recent 12 month period ended June 30 is available (1) without charge, upon request, by calling 1-800-262-1122, and (2) on the Securities and Exchange Commission’s website at http://www.sec.gov.
Item 8. Portfolio Managers of Closed-End Management Investment Companies
Kathleen C. Gaffney, Scott H. Page and Craig P. Russ and other Eaton Vance Management (“EVM” or “Eaton Vance”) investment professionals comprise the investment team responsible for the overall management of the Fund’s investments as well as allocations of the Fund’s assets between common and preferred stocks. Messrs. Page and Russ and Ms. Gaffney are the portfolio managers responsible for the day-to-day management of specific segments of the Fund’s investment portfolio.
Ms. Gaffney has been an EVM portfolio manager since 2013 and is Co-Director of EVM’s Investment Grade Fixed Income Group. Prior to joining EVM in 2012, Ms. Gaffney was a Vice President of Loomis, Sayles & Company and portfolio manager for Loomis Sayles fixed income group (for more than five years). Mr. Page has been an EVM portfolio manager since 1996 and is Director of EVM’s Bank Loan Investment Group. Mr. Russ has been an EVM portfolio manager since 2003. Ms. Gaffney and Messrs. Paige and Russ are Vice Presidents of EVM. This information is provided as of the date of filing of this report.
The following tables show, as of the Fund’s most recent fiscal year end, the number of accounts each portfolio manager managed in each of the listed categories and the total assets (in millions of dollars) in the accounts managed within each category. The table also shows the number of accounts with respect to which the advisory fee is based on the performance of the account, if any, and the total assets (in millions of dollars) in those accounts.
| | | | | | | | | | | | | | | | |
| | | Number of
All
Accounts | | | Total Assets of
All Accounts | | | Number of
Accounts
Paying a
Performance Fee | | | Total Assets of
Accounts Paying
a Performance
Fee | |
Kathleen C. Gaffney | | | | | | | | | | | | | | | | |
Registered Investment Companies | | | 3 | | | $ | 955.6 | | | | 0 | | | $ | 0 | |
Other Pooled Investment Vehicles | | | 0 | | | $ | 0 | | | | 0 | | | $ | 0 | |
Other Accounts | | | 1 | | | $ | 22.7 | | | | 0 | | | $ | 0 | |
| | | | |
Scott H. Page | | | | | | | | | | | | | | | | |
Registered Investment Companies | | | 18 | | | $ | 37,348.1 | | | | 0 | | | $ | 0 | |
Other Pooled Investment Vehicles | | | 8 | | | $ | 10,213.5 | (1) | | | 1 | | | $ | 185.9 | |
Other Accounts | | | 2 | | | $ | 1,459.7 | | | | 0 | | | $ | 0 | |
| | | | |
Criag P. Russ | | | | | | | | | | | | | | | | |
Registered Investment Companies | | | 14 | | | $ | 32,220.9 | | | | 0 | | | $ | 0 | |
Other Pooled Investment Vehicles | | | 1 | | | $ | 6,893.6 | | | | 0 | | | $ | 0 | |
Other Accounts | | | 2 | | | $ | 1,459.7 | | | | 0 | | | $ | 0 | |
| (1) | Certain of these “Other Pooled Investment Vehicles” invest a substantial portion of their assets either in a registered investment company or in a separate pooled investment vehicle managed by this portfolio manager or another Eaton Vance portfolio manager. |
The following table shows the dollar range of Fund shares beneficially owned by each portfolio manager as of the Fund’s most recent fiscal year end.
| | |
| Portfolio Manager | | Dollar Range of Equity Securities Owned in the Fund |
Kathleen C. Gaffney | | $10,001 - $50,000 |
Scott H. Page | | $50,001 - $100,000 |
Craig P. Russ | | None |
Potential for Conflicts of Interest. It is possible that conflicts of interest may arise in connection with a portfolio manager’s management of a Fund’s investments on the one hand and the investments of other accounts for which the portfolio manager is responsible on the other. For example, a portfolio manager may have conflicts of interest in allocating management time, resources and investment opportunities among the Fund and other accounts he or she advises. In addition, due to differences in the investment strategies or restrictions between a Fund and the other accounts, a portfolio manager may take action with respect to another account that differs from the action taken with respect to the Fund. In some cases, another account managed by a portfolio manager may compensate the investment adviser or sub-adviser based on the performance of the securities held by that account. The existence of such a performance based fee may create additional conflicts of interest for the portfolio manager in the allocation of management time, resources and investment opportunities. Whenever conflicts of interest arise, the portfolio manager will endeavor to exercise his or her discretion in a
manner that he or she believes is equitable to all interested persons. EVM and the sub-adviser have adopted several policies and procedures designed to address these potential conflicts including: a code of ethics; and policies which govern the investment adviser or sub-adviser’s trading practices, including among other things the aggregation and allocation of trades among clients, brokerage allocation, cross trades and best execution.
Compensation Structure for EVM
Compensation of EVM’s portfolio managers and other investment professionals has three primary components: (1) a base salary, (2) an annual cash bonus, and (3) annual stock-based compensation consisting of options to purchase shares of EVC’s nonvoting common stock andr restricted shares of EVC’s nonvoting common stock. EVM’s investment professionals also receive certain retirement, insurance and other benefits that are broadly available to EVM’s employees. Compensation of EVM’s investment professionals is reviewed primarily on an annual basis. Cash bonuses, stock-based compensation awards, and adjustments in base salary are typically paid or put into effect at or shortly after the October 31st fiscal year end of EVC.
Method to Determine Compensation. EVM compensates its portfolio managers based primarily on the scale and complexity of their portfolio responsibilities and the total return performance of managed funds and accounts versus appropriate peer groups or benchmarks. In addition to rankings within peer groups of funds on the basis of absolute performance, consideration may also be given to relative risk-adjusted performance. Risk-adjusted performance measures include, but are not limited to, the Sharpe Ratio. Performance is normally based on periods ending on the September 30th preceding fiscal year end. Fund performance is normally evaluated primarily versus peer groups of funds as determined by Lipper Inc. and/or Morningstar, Inc. When a fund’s peer group as determined by Lipper or Morningstar is deemed by EVM’s management not to provide a fair comparison, performance may instead be evaluated primarily against a custom peer group or market index. In evaluating the performance of a fund and its manager, primary emphasis is normally placed on three-year performance, with secondary consideration of performance over longer and shorter periods. For funds that are tax-managed or otherwise have an objective of after-tax returns, performance is measured net of taxes. For other funds, performance is evaluated on a pre-tax basis. For funds with an investment objective other than total return (such as current income), consideration will also be given to the fund’s success in achieving its objective. For managers responsible for multiple funds and accounts, investment performance is evaluated on an aggregate basis, based on averages or weighted averages among managed funds and accounts. Funds and accounts that have performance-based advisory fees are not accorded disproportionate weightings in measuring aggregate portfolio manager performance.
The compensation of portfolio managers with other job responsibilities (such as heading an investment group or providing analytical support to other portfolios) will include consideration of the scope of such responsibilities and the managers’ performance in meeting them.
EVM seeks to compensate portfolio managers commensurate with their responsibilities and performance, and competitive with other firms within the investment management industry. EVM participates in investment-industry compensation surveys and utilizes survey data as a factor in determining salary, bonus and stock-based compensation levels for portfolio managers and other investment professionals. Salaries, bonuses and stock-based compensation are also influenced by the operating performance of EVM and its parent company. The overall annual cash bonus pool is based on a substantially fixed percentage of pre-bonus operating income. While the salaries of EVM’s portfolio managers are comparatively fixed, cash bonuses and stock-based compensation may fluctuate significantly from year to year, based on changes in manager performance and other factors as described herein. For a high performing portfolio manager, cash bonuses and stock-based compensation may represent a substantial portion of total compensation.
Item 9. Purchases of Equity Securities by Closed-End Management Investment Company and Affiliated Purchasers
No such purchases this period.
Item 10. Submission of Matters to a Vote of Security Holders
No material changes.
Item 11. Controls and Procedures
(a) It is the conclusion of the registrant’s principal executive officer and principal financial officer that the effectiveness of the registrant’s current disclosure controls and procedures (such disclosure controls and procedures having been evaluated within 90 days of the date of this filing) provide reasonable assurance that the information required to be disclosed by the registrant has been recorded, processed, summarized and reported within the time period specified in the Commission’s rules and forms and that the information required to be disclosed by the registrant has been accumulated and communicated to the registrant’s principal executive officer and principal financial officer in order to allow timely decisions regarding required disclosure.
(b) There have been no changes in the registrant’s internal controls over financial reporting during the second fiscal quarter of the period covered by this report that has materially affected, or is reasonably likely to materially affect, the registrant’s internal control over financial reporting.
Item 12. Exhibits
| | |
| (a)(1) | | Registrant’s Code of Ethics – Not applicable (please see Item 2). |
| |
| (a)(2)(i) | | Treasurer’s Section 302 certification. |
| |
| (a)(2)(ii) | | President’s Section 302 certification. |
| |
| (b) | | Combined Section 906 certification. |
Signatures
Pursuant to the requirements of the Securities Exchange Act of 1934 and the Investment Company Act of 1940, the registrant has duly caused this report to be signed on its behalf by the undersigned, thereunto duly authorized.
Eaton Vance Floating-Rate Income Plus Fund
| | |
By: | | /s/ Scott H. Page |
| | Scott H. Page |
| | President |
Date: July 8, 2014
Pursuant to the requirements of the Securities Exchange Act of 1934 and the Investment Company Act of 1940, this report has been signed below by the following persons on behalf of the registrant and in the capacities and on the dates indicated.
| | |
By: | | /s/ James F. Kirchner |
| | James F. Kirchner |
| | Treasurer |
Date: July 8, 2014
| | |
| By: | | /s/ Scott H. Page |
| | Scott H. Page |
| | President |
Date: July 8, 2014