UNITED STATES
SECURITIES AND EXCHANGE COMMISSION
Washington, D.C. 20549
Form N-CSR
CERTIFIED SHAREHOLDER REPORT OF REGISTERED
MANAGEMENT INVESTMENT COMPANIES
Investment Company Act File Number: 811-22821
Eaton Vance Floating-Rate Income Plus Fund
(Exact Name of Registrant as Specified in Charter)
Two International Place, Boston, Massachusetts 02110
(Address of Principal Executive Offices)
Maureen A. Gemma
Two International Place, Boston, Massachusetts 02110
(Name and Address of Agent for Services)
(617) 482-8260
(Registrant’s Telephone Number)
May 31
Date of Fiscal Year End
May 31, 2017
Date of Reporting Period
Item 1. Reports to Stockholders

Eaton Vance
Floating-Rate Income Plus Fund (EFF)
Annual Report
May 31, 2017

Commodity Futures Trading Commission Registration. Effective December 31, 2012, the Commodity Futures Trading Commission (“CFTC”) adopted certain regulatory changes that subject registered investment companies and advisers to regulation by the CFTC if a fund invests more than a prescribed level of its assets in certain CFTC-regulated instruments (including futures, certain options and swap agreements) or markets itself as providing investment exposure to such instruments. The Fund has claimed an exclusion from the definition of the term “commodity pool operator” under the Commodity Exchange Act. Accordingly, neither the Fund nor the adviser with respect to the operation of the Fund is subject to CFTC regulation. Because of its management of other strategies, the Fund’s adviser is registered with the CFTC as a commodity pool operator and a commodity trading advisor.
Fund shares are not insured by the FDIC and are not deposits or other obligations of, or guaranteed by, any depository institution. Shares are subject to investment risks, including possible loss of principal invested.
Annual Report May 31, 2017
Eaton Vance
Floating-Rate Income Plus Fund
Table of Contents
| | | | |
Management’s Discussion of Fund Performance | | | 2 | |
| |
Performance | | | 3 | |
| |
Fund Profile | | | 3 | |
| |
Endnotes and Additional Disclosures | | | 4 | |
| |
Financial Statements | | | 5 | |
| |
Report of Independent Registered Public Accounting Firm | | | 34 | |
| |
Federal Tax Information | | | 35 | |
| |
Annual Meeting of Shareholders | | | 36 | |
| |
Dividend Reinvestment Plan | | | 37 | |
| |
Board of Trustees’ Contract Approval | | | 39 | |
| |
Management and Organization | | | 43 | |
| |
Important Notices | | | 46 | |
Eaton Vance
Floating-Rate Income Plus Fund
May 31, 2017
Management’s Discussion of Fund Performance1
Economic and Market Conditions
The U.S. floating-rate loan market delivered strong performance during the fiscal year ended May 31, 2017, with the S&P/LSTA Leveraged Loan Index (the Index),2 a broad barometer of the loan market, returning 7.49% for the 12-month period. Positive returns were driven by coupon income as well as price appreciation.
As the period opened on June 1, 2016, the loan market was several months into a rally that would continue through the end of the period, with May 2017 marking the 15th straight month of positive returns for the asset class. Increasing anticipation of higher interest rates, culminating in rate hikes by the Federal Reserve Board in December 2016 and March 2017, made loans an appealing asset class. Lower-quality credit7 tiers in the Index outperformed higher quality tiers, as investors appeared to display an increased appetite for risk.
Technical factors contributed to the rally as well. Loan mutual funds experienced net inflows, and loan demand outstripped supply for most of the period. Significant inflows into high yield bond funds, which have also tended to own floating-rate loans, added to loan demand. Loan prices in the Index appreciated in most months of the period through February 2017, except for modest declines in June and November 2016, after the U.K.’s “Brexit” vote and the U.S. presidential election. In the closing months of the period, however, price appreciation waned as the asset class approached full valuation. By May 2017, nearly three-quarters of the loans in the Index were trading at or slightly above par value.
With the U.S. economy continuing its low-growth recovery during the period, continued health in corporate fundamentals kept the default rate fairly benign. The loan default rate, a measure of corporate health and credit risk in the overall market, was 1.29%, well below the market’s long-term average of 3.11%, according to Standard & Poor’s Leveraged Commentary & Data.
Fund Performance
For the 12-month period ended May 31, 2017, Eaton Vance Floating-Rate Income Plus Fund (the Fund) shares at net asset value (NAV) had a total return of 14.69%, outperforming the 7.49% return of the Index.
Under normal market conditions, the Fund invests at least 80% of its total assets in senior loans of domestic and foreign borrowers that are denominated in U.S. dollars and foreign currencies. In keeping with the Fund’s secondary objective
of preservation of capital, the Fund has historically tended to underweight lower-quality loans, a strategy that may help the Fund experience limited credit losses over time but may detract from relative performance versus the Index during periods when lower-quality issues outperform.
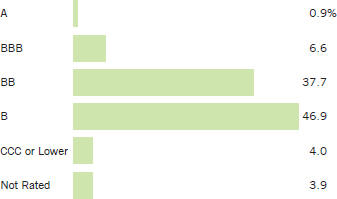
For the 12-month period, BBB-rated loans in the Index returned 3.99%, BB-rated loans in the Index returned 4.78%, B-rated loans in the Index returned 7.72%, CCC-rated loans in the Index returned 25.93%, and D-rated (defaulted) loans in the Index returned 26.90%. The Fund’s underweight to BBB-rated loans, which underperformed the Index, aided relative performance versus the Index. In contrast, the Fund’s underweight to loans rated CCC and below, which performed strongly during the period, detracted from relative results versus the Index.
On a sector-level basis, the Fund’s overweight to loans in the oil and gas and metals/mining sectors contributed to relative performance versus the Index, as those sectors outperformed the overall loan market during the period. Credit selection in both sectors aided relative results as well, as did underweights in the underperforming utilities and retailers (except food and drug) sectors. On the other hand, a slight overweight to the food products sector, and credit selection within that segment, hurt the Fund’s relative performance.
The Fund’s employment of investment leverage6 contributed to performance versus the Index. The use of leverage has the effect of achieving additional exposure to the loan market, and thus magnifying a fund’s exposure to its underlying investments in both up and down market environments. The use of leverage helped performance versus the Index, which does not employ leverage, as leverage amplified both coupon yield and price appreciation in the Fund’s loan portfolio during the period.
The Fund’s out-of-Index holdings in high-yield debt and equities were contributors to Fund performance versus the Index, as high-yield bonds and global equity markets in general outperformed the loan market during the period.
See Endnotes and Additional Disclosures in this report.
Past performance is no guarantee of future results. Returns are historical and are calculated by determining the percentage change in net asset value (NAV) or market price (as applicable) with all distributions reinvested and include management fees and other expenses. Fund performance at market price will differ from its results at NAV due to factors such as changing perceptions about the Fund, market conditions, fluctuations in supply and demand for Fund shares, or changes in Fund distributions. Investment return and principal value will fluctuate so that shares, when sold, may be worth more or less than their original cost. Performance less than or equal to one year is cumulative. Performance is for the stated time period only; due to market volatility, current Fund performance may be lower or higher than the quoted return. For performance as of the most recent month-end, please refer to eatonvance.com.
Eaton Vance
Floating-Rate Income Plus Fund
May 31, 2017
Performance2,3
Portfolio Managers Scott H. Page, CFA, Craig P. Russ and Kathleen C. Gaffney, CFA
| | | | | | | | | | | | | | | | |
| % Average Annual Total Returns | | Inception Date | | | One Year | | | Five Years | | | Since
Inception | |
Fund at NAV | | | 06/28/2013 | | | | 14.69 | % | | | — | | | | 5.47 | % |
Fund at Market Price | | | — | | | | 20.96 | | | | — | | | | 4.59 | |
S&P/LSTA Leveraged Loan Index | | | — | | | | 7.49 | % | | | 4.73 | % | | | 4.00 | % |
| | | | |
| | | | | | | | | | | | | | | | |
| % Premium/Discount to NAV4 | | | | | | | | | | | | |
| | | | | | | | | | | | | | | –3.23 | % |
| | | | |
| | | | | | | | | | | | | | | | |
| Distributions5 | | | | | | | | | | | | |
Total Distributions per share for the period | | | | | | | | | | | | | | $ | 0.993 | |
Distribution Rate at NAV | | | | | | | | | | | | | | | 5.29 | % |
Distribution Rate at Market Price | | | | | | | | | | | | | | | 5.46 | % |
| | | | |
| | | | | | | | | | | | | | | | |
| % Total Leverage6 | | | | | | | | | | | | |
Borrowings | | | | | | | | | | | | | | | 25.79 | % |
Variable Rate Term Preferred Shares (VRTP Shares) | | | | | | | | | | | | | | | 9.08 | |
Fund Profile
| | | | |
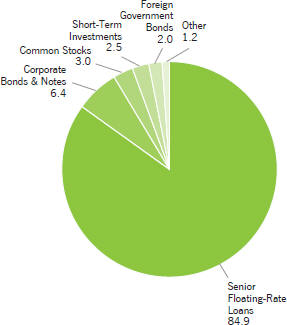
Credit Quality (% of bonds, loans and asset-backed securities)7 | | | | Asset Allocation (% of total investments)8 |
| | |
 | | | |  |
See Endnotes and Additional Disclosures in this report.
Past performance is no guarantee of future results. Returns are historical and are calculated by determining the percentage change in net asset value (NAV) or market price (as applicable) with all distributions reinvested and include management fees and other expenses. Fund performance at market price will differ from its results at NAV due to factors such as changing perceptions about the Fund, market conditions, fluctuations in supply and demand for Fund shares, or changes in Fund distributions. Investment return and principal value will fluctuate so that shares, when sold, may be worth more or less than their original cost. Performance less than or equal to one year is cumulative. Performance is for the stated time period only; due to market volatility, current Fund performance may be lower or higher than the quoted return. For performance as of the most recent month-end, please refer to eatonvance.com.
Eaton Vance
Floating-Rate Income Plus Fund
May 31, 2017
Endnotes and Additional Disclosures
| 1 | The views expressed in this report are those of the portfolio manager(s) and are current only through the date stated at the top of this page. These views are subject to change at any time based upon market or other conditions, and Eaton Vance and the Fund(s) disclaim any responsibility to update such views. These views may not be relied upon as investment advice and, because investment decisions are based on many factors, may not be relied upon as an indication of trading intent on behalf of any Eaton Vance fund. This commentary may contain statements that are not historical facts, referred to as “forward looking statements”. The Fund’s actual future results may differ significantly from those stated in any forward looking statement, depending on factors such as changes in securities or financial markets or general economic conditions, the volume of sales and purchases of Fund shares, the continuation of investment advisory, administrative and service contracts, and other risks discussed from time to time in the Fund’s filings with the Securities and Exchange Commission. |
| 2 | S&P/LSTA Leveraged Loan Index is an unmanaged index of the institutional leveraged loan market. Unless otherwise stated, index returns do not reflect the effect of any applicable sales charges, commissions, expenses, taxes or leverage, as applicable. It is not possible to invest directly in an index. |
| 3 | Performance results reflect the effects of leverage. Performance since inception for an index, if presented, is the performance since the Fund’s or oldest share class’ inception, as applicable. |
| 4 | The shares of the Fund often trade at a discount or premium from their net asset value. The discount or premium of the Fund may vary over time and may be higher or lower than what is quoted in this report. For up-to-date premium/discount information, please refer to http://eatonvance.com/closedend. |
| 5 | The Distribution Rate is based on the Fund’s last regular distribution per share in the period (annualized) divided by the Fund’s NAV or market price at the end of the period. The Fund’s distributions may be comprised of amounts characterized for federal income tax purposes as qualified and non-qualified ordinary dividends, capital gains and nondividend distributions, also known as return of capital. For additional information about nondividend distributions, please refer to Eaton Vance Closed-End Fund Distribution Notices (19a) posted on our website, eatonvance.com. The Fund will determine the federal income tax character of distributions paid to a shareholder after the end of the calendar year. This is reported on the IRS form 1099-DIV and provided to the shareholder shortly after each year-end. For information about the tax character of distributions made in prior calendar years, please refer to Performance-Tax Character of Distributions on the Fund’s webpage available at eatonvance. com. The Fund’s distributions are determined by the investment adviser based on its current assessment of the Fund’s long-term return potential. Fund distributions may be affected by numerous factors including changes in Fund performance, the cost of financing for leverage, portfolio holdings, realized and projected returns, and other factors. As portfolio and market conditions change, the rate of distributions paid by the Fund could change. |
| 6 | Leverage represents the liquidation value of the Fund’s VRTP Shares and borrowings outstanding as a percentage of Fund net assets applicable to common shares plus VRTP Shares and borrowings outstanding. Use of leverage creates an opportunity for income, but creates risks including greater price volatility. The cost of leverage rises and falls with changes in short-term interest rates. The Fund may be required to maintain prescribed asset coverage for its leverage and may be required to reduce its leverage at an inopportune time. |
| 7 | Credit ratings are categorized using S&P. Ratings, which are subject to change, apply to the creditworthiness of the issuers of the underlying securities and not to the Fund or its shares. Credit ratings measure the quality of a bond based on the issuer’s creditworthiness, with ratings ranging from AAA, being the highest, to D, being the lowest based on S&P’s measures. Ratings of BBB or higher by S&P are considered to be investment-grade quality. Credit ratings are based largely on the ratings agency’s analysis at the time of rating. The rating assigned to any particular security is not necessarily a reflection of the issuer’s current financial condition and does not necessarily reflect its assessment of the volatility of a security’s market value or of the liquidity of an investment in the security. Holdings designated as “Not Rated” are not rated by S&P. |
| 8 | Other represents any investment type less than 1.0% of total investments. Asset allocation as a percentage of the Fund’s net assets amounted to 156.9%. |
| | Fund profile subject to change due to active management. |
Eaton Vance
Floating-Rate Income Plus Fund
May 31, 2017
Portfolio of Investments
| | | | | | | | | | | | |
| Senior Floating-Rate Loans — 133.3%(1) | |
| | | |
| | | | | | | | | | | | |
| Borrower/Tranche Description | | | | | Principal
Amount
(000’s omitted) | | | Value | |
| | | | | | | | | | | | |
| |
Aerospace and Defense — 3.3% | | | | | |
Silver II US Holdings, LLC | | | | | | | | | | | | |
Term Loan, 4.15%, Maturing December 13, 2019 | | | | | | $ | 1,345 | | | $ | 1,341,548 | |
TransDigm, Inc. | | | | | | | | | | | | |
Term Loan, 4.13%, Maturing February 28, 2020 | | | | | | | 1,350 | | | | 1,357,227 | |
Term Loan, 4.14%, Maturing June 4, 2021 | | | | | | | 462 | | | | 464,103 | |
Term Loan, 4.04%, Maturing June 9, 2023 | | | | | | | 1,094 | | | | 1,097,673 | |
Wesco Aircraft Hardware Corp. | | | | | | | | | | | | |
Term Loan, 4.05%, Maturing October 4, 2021 | | | | | | | 219 | | | | 219,718 | |
| | | | | | | | | | | | | |
| | | $ | 4,480,269 | |
| | | | | | | | | | | | | |
|
Automotive — 3.3% | |
American Axle and Manufacturing, Inc. | | | | | | | | | | | | |
Term Loan, 3.28%, Maturing April 6, 2024 | | | | | | $ | 750 | | | $ | 749,250 | |
Bright Bidco B.V. | | | | | | | | | | | | |
Term Loan, Maturing February 27, 2024(2) | | | | | | | 275 | | | | 279,469 | |
CS Intermediate Holdco 2, LLC | | | | | | | | | | | | |
Term Loan, 3.90%, Maturing October 26, 2023 | | | | | | | 196 | | | | 196,747 | |
Dayco Products, LLC | | | | | | | | | | | | |
Term Loan, Maturing May 8, 2023(2) | | | | | | | 250 | | | | 249,688 | |
FCA US, LLC | | | | | | | | | | | | |
Term Loan, 2.99%, Maturing December 31, 2018 | | | | | | | 317 | | | | 318,681 | |
Federal-Mogul Holdings Corporation | | | | | | | | | | | | |
Term Loan, 4.77%, Maturing April 15, 2021 | | | | | | | 973 | | | | 975,337 | |
Horizon Global Corporation | | | | | | | | | | | | |
Term Loan, 5.54%, Maturing June 30, 2021 | | | | | | | 99 | | | | 100,437 | |
Sage Automotive Holdings, Inc. | | | | | | | | | | | | |
Term Loan, 6.04%, Maturing October 27, 2022 | | | | | | | 175 | | | | 175,654 | |
TI Group Automotive Systems, LLC | | | | | | | | | | | | |
Term Loan, 3.79%, Maturing June 30, 2022 | | | | | | | 296 | | | | 297,716 | |
Tower Automotive Holdings USA, LLC | | | | | | | | | | | | |
Term Loan, 3.75%, Maturing March 7, 2024 | | | | | | | 991 | | | | 992,982 | |
Visteon Corporation | | | | | | | | | | | | |
Term Loan, 3.33%, Maturing March 24, 2024 | | | | | | | 160 | | | | 161,670 | |
| | | | | | | | | | | | | |
| | | $ | 4,497,631 | |
| | | | | | | | | | | | | |
|
Beverage and Tobacco — 0.7% | |
9941762 Canada, Inc. | | | | | | | | | | | | |
Term Loan, 4.89%, Maturing December 15, 2023 | | | | | | $ | 524 | | | $ | 528,270 | |
Flavors Holdings, Inc. | | | | | | | | | | | | |
Term Loan - Second Lien, 11.15%, Maturing October 3, 2021(3) | | | | | | | 500 | | | | 362,500 | |
| | | | | | | | | | | | | |
| | | $ | 890,770 | |
| | | | | | | | | | | | | |
| | | | | | | | | | | | |
| Borrower/Tranche Description | | | | | Principal
Amount
(000’s omitted) | | | Value | |
| | | | | | | | | | | | |
|
Brokerage / Securities Dealers / Investment Houses — 0.7% | |
Aretec Group, Inc. | | | | | | | | | | | | |
Term Loan, 8.00%, Maturing November 23, 2020 | | | | | | $ | 198 | | | $ | 199,774 | |
Term Loan - Second Lien, 6.50%, (2.00% Cash, 4.50% PIK), Maturing May 23, 2021 | | | | | | | 504 | | | | 482,824 | |
Salient Partners L.P. | | | | | | | | | | | | |
Term Loan, 9.66%, Maturing May 19, 2021 | | | | | | | 182 | | | | 174,960 | |
Virtus Investment Partners, Inc. | | | | | | | | | | | | |
Term Loan, Maturing February 28, 2024(2) | | | | | | | 125 | | | | 127,031 | |
| | | | | | | | | | | | | |
| | | $ | 984,589 | |
| | | | | | | | | | | | | |
|
Building and Development — 2.6% | |
American Builders & Contractors Supply Co., Inc. | | | | | | | | | | | | |
Term Loan, 3.54%, Maturing October 31, 2023 | | | | | | $ | 600 | | | $ | 603,833 | |
Auction.com, LLC | | | | | | | | | | | | |
Term Loan, 6.05%, Maturing May 12, 2019 | | | | | | | 270 | | | | 272,195 | |
CPG International, Inc. | | | | | | | | | | | | |
Term Loan, 4.90%, Maturing May 3, 2024 | | | | | | | 539 | | | | 540,871 | |
DTZ U.S. Borrower, LLC | | | | | | | | | | | | |
Term Loan, 4.44%, Maturing November 4, 2021 | | | | | | | 738 | | | | 741,589 | |
Quikrete Holdings, Inc. | | | | | | | | | | | | |
Term Loan, 3.79%, Maturing November 15, 2023 | | | | | | | 623 | | | | 623,282 | |
Realogy Corporation | | | | | | | | | | | | |
Term Loan, 3.29%, Maturing July 20, 2022 | | | | | | | 456 | | | | 459,804 | |
Summit Materials Companies I, LLC | | | | | | | | | | | | |
Term Loan, 3.79%, Maturing July 17, 2022 | | | | | | | 147 | | | | 149,010 | |
WireCo WorldGroup, Inc. | | | | | | | | | | | | |
Term Loan, 6.70%, Maturing September 30, 2023 | | | | | | | 149 | | | | 150,836 | |
| | | | | | | | | | | | | |
| | | $ | 3,541,420 | |
| | | | | | | | | | | | | |
|
Business Equipment and Services — 10.8% | |
Acosta Holdco, Inc. | | | | | | | | | | | | |
Term Loan, 4.29%, Maturing September 26, 2021 | | | | | | $ | 750 | | | $ | 702,300 | |
AlixPartners, LLP | | | | | | | | | | | | |
Term Loan, 4.15%, Maturing April 4, 2024 | | | | | | | 475 | | | | 478,444 | |
Altisource Solutions S.a.r.l. | | | | | | | | | | | | |
Term Loan, 4.54%, Maturing December 9, 2020 | | | | | | | 352 | | | | 297,337 | |
Brickman Group Ltd., LLC | | | | | | | | | | | | |
Term Loan, 4.03%, Maturing December 18, 2020 | | | | | | | 214 | | | | 214,528 | |
Camelot UK Holdco Limited | | | | | | | | | | | | |
Term Loan, 4.54%, Maturing October 3, 2023 | | | | | | | 274 | | | | 275,421 | |
Cast and Crew Payroll, LLC | | | | | | | | | | | | |
Term Loan, 4.65%, Maturing August 12, 2022 | | | | | | | 100 | | | | 100,373 | |
CCC Information Services, Inc. | | | | | | | | | | | | |
Term Loan, 4.04%, Maturing April 27, 2024 | | | | | | | 325 | | | | 324,644 | |
| | | | |
| | 5 | | See Notes to Financial Statements. |
Eaton Vance
Floating-Rate Income Plus Fund
May 31, 2017
Portfolio of Investments — continued
| | | | | | | | | | | | |
| Borrower/Tranche Description | | | | | Principal
Amount
(000’s omitted) | | | Value | |
| | | | | | | | | | | | |
|
Business Equipment and Services (continued) | |
Change Healthcare Holdings, Inc. | | | | | | | | | | | | |
Term Loan, 3.79%, Maturing March 1, 2024 | | | | | | $ | 1,600 | | | $ | 1,607,000 | |
Corporate Capital Trust, Inc. | | | | | | | | | | | | |
Term Loan, 4.44%, Maturing May 20, 2019 | | | | | | | 243 | | | | 243,858 | |
CPM Holdings, Inc. | | | | | | | | | | | | |
Term Loan, 5.29%, Maturing April 11, 2022 | | | | | | | 322 | | | | 326,906 | |
Crossmark Holdings, Inc. | | | | | | | | | | | | |
Term Loan, 4.65%, Maturing December 20, 2019 | | | | | | | 496 | | | | 362,728 | |
Education Management, LLC | | | | | | | | | | | | |
Term Loan, 5.66%, Maturing July 2, 2020(3) | | | | | | | 195 | | | | 138,335 | |
Term Loan, 8.66%, Maturing July 2, 2020(3) | | | | | | | 370 | | | | 0 | |
EIG Investors Corp. | | | | | | | | | | | | |
Term Loan, 6.68%, Maturing November 9, 2019 | | | | | | | 1,584 | | | | 1,592,636 | |
Extreme Reach, Inc. | | | | | | | | | | | | |
Term Loan, 7.30%, Maturing February 7, 2020 | | | | | | | 654 | | | | 662,510 | |
First Data Corporation | | | | | | | | | | | | |
Term Loan, 4.03%, Maturing July 10, 2022 | | | | | | | 641 | | | | 646,201 | |
Garda World Security Corporation | | | | | | | | | | | | |
Term Loan, Maturing May 24, 2024(2) | | | | | | | 550 | | | | 552,177 | |
Global Payments, Inc. | |
Term Loan, 3.04%, Maturing April 22, 2023 | | | | | | | 77 | | | | 78,026 | |
IG Investment Holdings, LLC | | | | | | | | | | | | |
Term Loan, 5.18%, Maturing October 31, 2021 | | | | | | | 493 | | | | 498,689 | |
Information Resources, Inc. | | | | | | | | | | | | |
Term Loan, 5.26%, Maturing January 18, 2024 | | | | | | | 200 | | | | 202,188 | |
ION Trading Finance Limited | | | | | | | | | | | | |
Term Loan, 3.90%, Maturing August 11, 2023 | | | | | | | 769 | | | | 768,876 | |
J.D. Power and Associates | | | | | | | | | | | | |
Term Loan, 5.29%, Maturing September 7, 2023 | | | | | | | 473 | | | | 476,170 | |
Kronos Incorporated | | | | | | | | | | | | |
Term Loan, 4.68%, Maturing November 1, 2023 | | | | | | | 1,397 | | | | 1,410,993 | |
Monitronics International, Inc. | | | | | | | | | | | | |
Term Loan, 6.65%, Maturing September 30, 2022 | | | | | | | 224 | | | | 227,408 | |
PGX Holdings, Inc. | | | | | | | | | | | | |
Term Loan, 6.30%, Maturing September 29, 2020 | | | | | | | 270 | | | | 270,606 | |
Prime Security Services Borrower, LLC | | | | | | | | | | | | |
Term Loan, 4.29%, Maturing May 2, 2022 | | | | | | | 622 | | | | 628,190 | |
Spin Holdco, Inc. | | | | | | | | | | | | |
Term Loan, 4.40%, Maturing November 14, 2019 | | | | | | | 780 | | | | 781,017 | |
Tempo Acquisition, LLC | | | | | | | | | | | | |
Term Loan, Maturing May 1, 2024(2) | | | | | | | 200 | | | | 200,938 | |
Travelport Finance (Luxembourg) S.a.r.l. | | | | | | | | | | | | |
Term Loan, 4.43%, Maturing September 2, 2021 | | | | | | | 286 | | | | 287,808 | |
Vestcom Parent Holdings, Inc. | | | | | | | | | | | | |
Term Loan, 5.26%, Maturing December 19, 2023 | | | | | | | 125 | | | | 125,623 | |
| | | | | | | | | | | | |
| Borrower/Tranche Description | | | | | Principal
Amount
(000’s omitted) | | | Value | |
| | | | | | | | | | | | |
|
Business Equipment and Services (continued) | |
WASH Multifamily Laundry Systems, LLC | | | | | | | | | | | | |
Term Loan, 4.30%, Maturing May 14, 2022 | | | | | | $ | 231 | | | $ | 231,184 | |
| | | | | | | | | | | | | |
| | | $ | 14,713,114 | |
| | | | | | | | | | | | | |
|
Cable and Satellite Television — 4.4% | |
Charter Communications Operating, LLC | | | | | | | | | | | | |
Term Loan, 3.29%, Maturing January 15, 2024 | | | | | | $ | 520 | | | $ | 523,720 | |
CSC Holdings, LLC | | | | | | | | | | | | |
Term Loan, 3.25%, Maturing July 15, 2025 | | | | | | | 656 | | | | 656,763 | |
MCC Iowa, LLC | | | | | | | | | | | | |
Term Loan, 3.70%, Maturing June 30, 2021 | | | | | | | 219 | | | | 220,761 | |
Numericable Group S.A. | | | | | | | | | | | | |
Term Loan, 3.94%, Maturing July 31, 2025 | | | | | | | 450 | | | | 449,880 | |
Radiate Holdco, LLC | | | | | | | | | | | | |
Term Loan, 4.04%, Maturing February 1, 2024 | | | | | | | 175 | | | | 175,656 | |
Telenet International Finance S.a.r.l. | | | | | | | | | | | | |
Term Loan, 3.74%, Maturing June 30, 2025 | | | | | | | 600 | | | | 603,250 | |
Term Loan, Maturing June 30,
2025(2) | | | | | | | 150 | | | | 150,844 | |
UPC Financing Partnership | | | | | | | | | | | | |
Term Loan, 3.74%, Maturing April 15, 2025 | | | | | | | 650 | | | | 653,656 | |
Virgin Media Bristol, LLC | | | | | | | | | | | | |
Term Loan, 3.74%, Maturing January 31, 2025 | | | | | | | 1,650 | | | | 1,658,938 | |
Ziggo Secured Finance Partnership | | | | | | | | | | | | |
Term Loan, 3.49%, Maturing April 15, 2025 | | | | | | | 850 | | | | 850,910 | |
| | | | | | | | | | | | | |
| | | $ | 5,944,378 | |
| | | | | | | | | | | | | |
|
Chemicals and Plastics — 7.8% | |
Alpha 3 B.V. | | | | | | | | | | | | |
Term Loan, 4.15%, Maturing January 31, 2024 | | | | | | $ | 125 | | | $ | 125,875 | |
Aruba Investments, Inc. | | | | | | | | | | | | |
Term Loan, 4.65%, Maturing February 2, 2022 | | | | | | | 74 | | | | 74,347 | |
Ashland, Inc. | | | | | | | | | | | | |
Term Loan, Maturing May 24,
2024(2) | | | | | | | 150 | | | | 150,844 | |
Axalta Coating Systems US Holdings, Inc. | | | | | | | | | | | | |
Term Loan, 3.65%, Maturing February 1, 2023 | | | | | | | 1,005 | | | | 1,013,319 | |
Emerald Performance Materials, LLC | | | | | | | | | | | | |
Term Loan, 4.54%, Maturing August 1, 2021 | | | | | | | 120 | | | | 121,292 | |
Term Loan - Second Lien, 8.79%, Maturing August 1, 2022 | | | | | | | 150 | | | | 150,250 | |
Flint Group GmbH | | | | | | | | | | | | |
Term Loan, 4.15%, Maturing September 7, 2021 | | | | | | | 38 | | | | 37,870 | |
Flint Group US, LLC | | | | | | | | | | | | |
Term Loan, 4.15%, Maturing September 7, 2021 | | | | | | | 230 | | | | 229,082 | |
Gemini HDPE, LLC | | | | | | | | | | | | |
Term Loan, 4.17%, Maturing August 7, 2021 | | | | | | | 514 | | | | 517,043 | |
| | | | |
| | 6 | | See Notes to Financial Statements. |
Eaton Vance
Floating-Rate Income Plus Fund
May 31, 2017
Portfolio of Investments — continued
| | | | | | | | | | | | |
| Borrower/Tranche Description | | | | | Principal
Amount
(000’s omitted) | | | Value | |
| | | | | | | | | | | | |
|
Chemicals and Plastics (continued) | |
Huntsman International, LLC | | | | | | | | | | | | |
Term Loan, 3.87%, Maturing October 1, 2021 | | | | | | $ | 199 | | | $ | 200,741 | |
Term Loan, 4.12%, Maturing April 1, 2023 | | | | | | | 448 | | | | 451,478 | |
Ineos US Finance, LLC | | | | | | | | | | | | |
Term Loan, 3.79%, Maturing March 31, 2022 | | | | | | | 172 | | | | 172,886 | |
Term Loan, 3.79%, Maturing April 1, 2024 | | | | | | | 150 | | | | 150,817 | |
Kraton Polymers, LLC | | | | | | | | | | | | |
Term Loan, 5.04%, Maturing January 6, 2022 | | | | | | | 537 | | | | 544,979 | |
Kronos Worldwide, Inc. | | | | | | | | | | | | |
Term Loan, 4.15%, Maturing February 18, 2020 | | | | | | | 267 | | | | 268,306 | |
MacDermid, Inc. | | | | | | | | | | | | |
Term Loan, 4.54%, Maturing June 7, 2020 | | | | | | | 380 | | | | 383,758 | |
Term Loan, 4.04%, Maturing June 7, 2023 | | | | | | | 415 | | | | 418,318 | |
Minerals Technologies, Inc. | | | | | | | | | | | | |
Term Loan, 3.31%, Maturing February 14, 2024 | | | | | | | 258 | | | | 262,338 | |
Orion Engineered Carbons GmbH | | | | | | | | | | | | |
Term Loan, 4.15%, Maturing July 25, 2021 | | | | | | | 301 | | | | 301,845 | |
PolyOne Corporation | | | | | | | | | | | | |
Term Loan, 3.28%, Maturing November 12, 2022 | | | | | | | 123 | | | | 124,673 | |
PQ Corporation | | | | | | | | | | | | |
Term Loan, 5.29%, Maturing November 4, 2022 | | | | | | | 496 | | | | 501,617 | |
Solenis International L.P. | | | | | | | | | | | | |
Term Loan, 4.45%, Maturing July 31, 2021 | | | | | | | 335 | | | | 336,670 | |
Tata Chemicals North America, Inc. | | | | | | | | | | | | |
Term Loan, 3.94%, Maturing August 7, 2020 | | | | | | | 215 | | | | 215,499 | |
Trinseo Materials Operating S.C.A. | | | | | | | | | | | | |
Term Loan, 4.29%, Maturing November 5, 2021 | | | | | | | 1,056 | | | | 1,068,070 | |
Tronox Pigments (Netherlands) B.V. | | | | | | | | | | | | |
Term Loan, 4.65%, Maturing March 19, 2020 | | | | | | | 1,429 | | | | 1,442,221 | |
Unifrax Corporation | | | | | | | | | | | | |
Term Loan, 4.90%, Maturing April 4, 2024 | | | | | | | 125 | | | | 125,430 | |
Univar, Inc. | | | | | | | | | | | | |
Term Loan, 3.79%, Maturing July 1, 2022 | | | | | | | 837 | | | | 841,358 | |
Zep, Inc. | | | | | | | | | | | | |
Term Loan, 5.04%, Maturing June 26, 2022 | | | | | | | 393 | | | | 394,965 | |
| | | | | | | | | | | | | |
| | | $ | 10,625,891 | |
| | | | | | | | | | | | | |
|
Clothing / Textiles — 0.2% | |
Ascena Retail Group, Inc. | | | | | | | | | | | | |
Term Loan, 5.63%, Maturing August 21, 2022 | | | | | | $ | 393 | | | $ | 339,002 | |
| | | | | | | | | | | | | |
| | | $ | 339,002 | |
| | | | | | | | | | | | | |
|
Containers and Glass Products — 3.4% | |
Berry Plastics Group, Inc. | | | | | | | | | | | | |
Term Loan, 3.52%, Maturing October 1, 2022 | | | | | | $ | 237 | | | $ | 238,782 | |
| | | | | | | | | | | | |
| Borrower/Tranche Description | | | | | Principal
Amount
(000’s omitted) | | | Value | |
| | | | | | | | | | | | |
|
Containers and Glass Products (continued) | |
BWAY Holding Company | |
Term Loan, 4.25%, Maturing April 3, 2024 | | | | | | $ | 250 | | | $ | 249,866 | |
Consolidated Container Company, LLC | | | | | | | | | | | | |
Term Loan, 4.54%, Maturing May 22, 2024 | | | | | | | 100 | | | | 100,896 | |
Flex Acquisition Company, Inc. | | | | | | | | | | | | |
Term Loan, 4.40%, Maturing December 29, 2023 | | | | | | | 475 | | | | 478,325 | |
Libbey Glass, Inc. | | | | | | | | | | | | |
Term Loan, 3.99%, Maturing April 9, 2021 | | | | | | | 92 | | | | 87,219 | |
Pelican Products, Inc. | | | | | | | | | | | | |
Term Loan, 5.40%, Maturing April 11, 2020 | | | | | | | 362 | | | | 362,903 | |
Reynolds Group Holdings, Inc. | | | | | | | | | | | | |
Term Loan, 4.04%, Maturing February 5, 2023 | | | | | | | 2,417 | | | | 2,431,496 | |
SIG Combibloc US Acquisition, Inc. | | | | | | | | | | | | |
Term Loan, 4.04%, Maturing March 13, 2022 | | | | | | | 744 | | | | 749,456 | |
| | | | | | | | | | | | | |
| | | $ | 4,698,943 | |
| | | | | | | | | | | | | |
|
Cosmetics / Toiletries — 0.8% | |
Coty, Inc. | | | | | | | | | | | | |
Term Loan, 3.50%, Maturing October 27, 2022 | | | | | | $ | 223 | | | $ | 224,148 | |
Galleria Co. | | | | | | | | | | | | |
Term Loan, 4.00%, Maturing September 29, 2023 | | | | | | | 450 | | | | 453,516 | |
KIK Custom Products, Inc. | | | | | | | | | | | | |
Term Loan, 5.65%, Maturing August 26, 2022 | | | | | | | 359 | | | | 362,511 | |
| | | | | | | | | | | | | |
| | | $ | 1,040,175 | |
| | | | | | | | | | | | | |
|
Drugs — 6.8% | |
Amneal Pharmaceuticals, LLC | | | | | | | | | | | | |
Term Loan, 4.65%, Maturing November 1, 2019 | | | | | | $ | 994 | | | $ | 999,767 | |
Arbor Pharmaceuticals, Inc. | | | | | | | | | | | | |
Term Loan, 6.15%, Maturing July 5, 2023 | | | | | | | 743 | | | | 749,763 | |
Endo Luxembourg Finance Company I S.a.r.l. | | | | | | | | | | | | |
Term Loan, 5.31%, Maturing April 29, 2024 | | | | | | | 1,175 | | | | 1,190,055 | |
Horizon Pharma, Inc. | | | | | | | | | | | | |
Term Loan, 4.75%, Maturing March 15, 2024 | | | | | | | 832 | | | | 834,610 | |
Jaguar Holding Company II | | | | | | | | | | | | |
Term Loan, 3.79%, Maturing August 18, 2022 | | | | | | | 1,625 | | | | 1,633,723 | |
Mallinckrodt International Finance S.A. | | | | | | | | | | | | |
Term Loan, 3.90%, Maturing September 24, 2024 | | | | | | | 739 | | | | 739,786 | |
Patheon Holdings I B.V. | | | | | | | | | | | | |
Term Loan, 4.41%, Maturing April 20, 2024 | | | | | | | 650 | | | | 653,182 | |
Valeant Pharmaceuticals International, Inc. | | | | | | | | | | | | |
Term Loan, 5.75%, Maturing April 1, 2022 | | | | | | | 2,472 | | | | 2,515,539 | |
| | | | | | | | | | | | | |
| | | $ | 9,316,425 | |
| | | | | | | | | | | | | |
| | | | |
| | 7 | | See Notes to Financial Statements. |
Eaton Vance
Floating-Rate Income Plus Fund
May 31, 2017
Portfolio of Investments — continued
| | | | | | | | | | | | |
| Borrower/Tranche Description | | | | | Principal
Amount
(000’s omitted) | | | Value | |
| | | | | | | | | | | | |
|
Ecological Services and Equipment — 1.1% | |
Advanced Disposal Services, Inc. | | | | | | | | | | | | |
Term Loan, 3.70%, Maturing November 10, 2023 | | | | | | $ | 492 | | | $ | 496,301 | |
EnergySolutions, LLC | | | | | | | | | | | | |
Term Loan, 6.80%, Maturing May 29, 2020 | | | | | | | 793 | | | | 804,109 | |
GFL Environmental, Inc. | | | | | | | | | | | | |
Term Loan, 3.90%, Maturing September 29, 2023 | | | | | | | 199 | | | | 199,870 | |
| | | | | | | | | | | | | |
| | | $ | 1,500,280 | |
| | | | | | | | | | | | | |
|
Electronics / Electrical — 13.9% | |
Answers Finance, LLC | | | | | | | | | | | | |
Term Loan - Second Lien, 11.90%, Maturing September 15, 2021 | | | | | | $ | 77 | | | $ | 76,703 | |
Applied Systems, Inc. | | | | | | | | | | | | |
Term Loan, 4.40%, Maturing January 25, 2021 | | | | | | | 322 | | | | 324,941 | |
Aptean, Inc. | | | | | | | | | | | | |
Term Loan, 6.04%, Maturing December 20, 2022 | | | | | | | 500 | | | | 503,959 | |
Avast Software B.V. | | | | | | | | | | | | |
Term Loan, 4.40%, Maturing September 30, 2023 | | | | | | | 469 | | | | 474,633 | |
Campaign Monitor Finance Pty. Limited | | | | | | | | | | | | |
Term Loan, 6.40%, Maturing March 18, 2021 | | | | | | | 190 | | | | 178,421 | |
CommScope, Inc. | | | | | | | | | | | | |
Term Loan, 3.04%, Maturing December 29, 2022 | | | | | | | 219 | | | | 220,483 | |
Cypress Semiconductor Corporation | | | | | | | | | | | | |
Term Loan, 4.75%, Maturing July 5, 2021 | | | | | | | 265 | | | | 268,029 | |
Electrical Components International, Inc. | | | | | | | | | | | | |
Term Loan, 5.90%, Maturing May 28, 2021 | | | | | | | 121 | | | | 122,106 | |
Electro Rent Corporation | | | | | | | | | | | | |
Term Loan, 6.04%, Maturing January 19, 2024 | | | | | | | 299 | | | | 301,993 | |
Entegris, Inc. | | | | | | | | | | | | |
Term Loan, 3.79%, Maturing April 30, 2021 | | | | | | | 57 | | | | 57,232 | |
Excelitas Technologies Corp. | | | | | | | | | | | | |
Term Loan, 6.15%, Maturing October 31, 2020 | | | | | | | 214 | | | | 213,598 | |
Eze Castle Software, Inc. | | | | | | | | | | | | |
Term Loan, 4.15%, Maturing April 6, 2020 | | | | | | | 925 | | | | 932,109 | |
Go Daddy Operating Company, LLC | | | | | | | | | | | | |
Term Loan, 3.54%, Maturing February 15, 2024 | | | | | | | 1,300 | | | | 1,305,687 | |
Hyland Software, Inc. | | | | | | | | | | | | |
Term Loan, 4.29%, Maturing July 1, 2022 | | | | | | | 978 | | | | 983,584 | |
Infoblox, Inc. | | | | | | | | | | | | |
Term Loan, 6.04%, Maturing November 7, 2023 | | | | | | | 500 | | | | 505,938 | |
Infor (US), Inc. | | | | | | | | | | | | |
Term Loan, 3.90%, Maturing February 1, 2022 | | | | | | | 1,899 | | | | 1,895,993 | |
Informatica Corporation | | | | | | | | | | | | |
Term Loan, 4.65%, Maturing August 5, 2022 | | | | | | | 764 | | | | 764,277 | |
| | | | | | | | | | | | |
| Borrower/Tranche Description | | | | | Principal
Amount
(000’s omitted) | | | Value | |
| | | | | | | | | | | | |
|
Electronics / Electrical (continued) | |
Lattice Semiconductor Corporation | | | | | | | | | | | | |
Term Loan, 5.25%, Maturing March 10, 2021 | | | | | | $ | 487 | | | $ | 487,113 | |
M/A-COM Technology Solutions Holdings, Inc. | | | | | | | | | | | | |
Term Loan, 3.25%, Maturing May 17, 2024 | | | | | | | 296 | | | | 295,989 | |
MA FinanceCo., LLC | | | | | | | | | | | | |
Term Loan, 3.67%, Maturing November 20, 2021 | | | | | | | 507 | | | | 507,906 | |
Term Loan, Maturing April 29, 2024(2) | | | | | | | 119 | | | | 119,215 | |
Magic Newco, LLC | | | | | | | | | | | | |
Term Loan, 5.04%, Maturing December 12, 2018 | | | | | | | 913 | | | | 916,270 | |
MH Sub I, LLC | | | | | | | | | | | | |
Term Loan, 1.875%, Maturing July 8, 2021(4) | | | | | | | 53 | | | | 53,520 | |
Term Loan, 4.79%, Maturing July 8, 2021 | | | | | | | 97 | | | | 97,869 | |
Term Loan, 4.79%, Maturing July 8, 2021 | | | | | | | 317 | | | | 320,459 | |
MTS Systems Corporation | | | | | | | | | | | | |
Term Loan, 5.25%, Maturing July 5, 2023 | | | | | | | 323 | | | | 327,611 | |
Renaissance Learning, Inc. | | | | | | | | | | | | |
Term Loan, 4.90%, Maturing April 9, 2021 | | | | | | | 856 | | | | 861,224 | |
Rocket Software, Inc. | | | | | | | | | | | | |
Term Loan, 5.40%, Maturing October 14, 2023 | | | | | | | 274 | | | | 276,532 | |
SGS Cayman L.P. | | | | | | | | | | | | |
Term Loan, 6.52%, Maturing April 23, 2021 | | | | | | | 51 | | | | 48,825 | |
SkillSoft Corporation | | | | | | | | | | | | |
Term Loan, 5.75%, Maturing April 28, 2021 | | | | | | | 992 | | | | 940,188 | |
SS&C Technologies, Inc. | | | | | | | | | | | | |
Term Loan, 3.29%, Maturing July 8, 2022 | | | | | | | 30 | | | | 30,128 | |
Term Loan, 3.29%, Maturing July 8, 2022 | | | | | | | 430 | | | | 433,528 | |
SurveyMonkey, Inc. | | | | | | | | | | | | |
Term Loan, 5.66%, Maturing April 13, 2024 | | | | | | | 350 | | | | 351,750 | |
Sutherland Global Services, Inc. | | | | | | | | | | | | |
Term Loan, 6.52%, Maturing April 23, 2021 | | | | | | | 217 | | | | 209,748 | |
Synchronoss Technologies, Inc. | | | | | | | | | | | | |
Term Loan, 4.08%, Maturing January 19, 2024 | | | | | | | 200 | | | | 188,800 | |
Syncsort Incorporated | | | | | | | | | | | | |
Term Loan, 6.40%, Maturing December 9, 2022 | | | | | | | 175 | | | | 175,163 | |
Uber Technologies | | | | | | | | | | | | |
Term Loan, 5.01%, Maturing July 13, 2023 | | | | | | | 920 | | | | 916,694 | |
Veritas US, Inc. | | | | | | | | | | | | |
Term Loan, 6.77%, Maturing January 27, 2023 | | | | | | | 471 | | | | 471,805 | |
VF Holding Corp. | | | | | | | | | | | | |
Term Loan, 4.29%, Maturing June 30, 2023 | | | | | | | 572 | | | | 573,958 | |
Wall Street Systems Delaware, Inc. | | | | | | | | | | | | |
Term Loan, 4.54%, Maturing August 26, 2023 | | | | | | | 175 | | | | 175,381 | |
Western Digital Corporation | | | | | | | | | | | | |
Term Loan, 3.78%, Maturing April 29, 2023 | | | | | | | 734 | | | | 742,377 | |
| | | | |
| | 8 | | See Notes to Financial Statements. |
Eaton Vance
Floating-Rate Income Plus Fund
May 31, 2017
Portfolio of Investments — continued
| | | | | | | | | | | | |
| Borrower/Tranche Description | | | | | Principal
Amount
(000’s omitted) | | | Value | |
| | | | | | | | | | | | |
|
Electronics / Electrical (continued) | |
Zebra Technologies Corporation | | | | | | | | | | | | |
Term Loan, 3.60%, Maturing October 27, 2021 | | | | | | $ | 362 | | | $ | 365,470 | |
| | | | | | | | | | | | | |
| | | $ | 19,017,209 | |
| | | | | | | | | | | | | |
|
Equipment Leasing — 0.8% | |
Avolon TLB Borrower 1 (Luxembourg) S.a.r.l. | | | | | | | | | | | | |
Term Loan, 3.76%, Maturing March 20, 2022 | | | | | | $ | 1,025 | | | $ | 1,040,093 | |
| | | | | | | | | | | | | |
| | | $ | 1,040,093 | |
| | | | | | | | | | | | | |
|
Financial Intermediaries — 4.2% | |
Armor Holding II, LLC | | | | | | | | | | | | |
Term Loan, 5.75%, Maturing June 26, 2020 | | | | | | $ | 878 | | | $ | 880,175 | |
Donnelley Financial Solutions, Inc. | | | | | | | | | | | | |
Term Loan, 5.00%, Maturing September 30, 2023 | | | | | | | 83 | | | | 83,771 | |
Focus Financial Partners, LLC | | | | | | | | | | | | |
Term Loan, Maturing May 22, 2024(2) | | | | | | | 275 | | | | 277,750 | |
Freedom Mortgage Corporation | | | | | | | | | | | | |
Term Loan, 6.86%, Maturing February 23, 2022 | | | | | | | 125 | | | | 126,953 | |
Guggenheim Partners, LLC | | | | | | | | | | | | |
Term Loan, 3.78%, Maturing July 21, 2023 | | | | | | | 1,078 | | | | 1,087,154 | |
LPL Holdings, Inc. | | | | | | | | | | | | |
Term Loan, 3.77%, Maturing March 10, 2024 | | | | | | | 325 | | | | 327,184 | |
NXT Capital, Inc. | | | | | | | | | | | | |
Term Loan, 5.53%, Maturing November 22, 2022 | | | | | | | 624 | | | | 633,823 | |
Ocwen Financial Corporation | | | | | | | | | | | | |
Term Loan, 6.00%, Maturing December 5, 2020 | | | | | | | 99 | | | | 98,503 | |
Quality Care Properties, Inc. | | | | | | | | | | | | |
Term Loan, 6.29%, Maturing October 31, 2022 | | | | | | | 673 | | | | 683,833 | |
Walker & Dunlop, Inc. | | | | | | | | | | | | |
Term Loan, 5.29%, Maturing December 11, 2020 | | | | | | | 466 | | | | 470,227 | |
Walter Investment Management Corp. | | | | | | | | | | | | |
Term Loan, 4.79%, Maturing December 18, 2020 | | | | | | | 1,082 | | | | 990,838 | |
| | | | | | | | | | | | | |
| | | $ | 5,660,211 | |
| | | | | | | | | | | | | |
|
Food Products — 4.1% | |
AdvancePierre Foods, Inc. | | | | | | | | | | | | |
Term Loan, 6.00%, Maturing June 2, 2023 | | | | | | $ | 375 | | | $ | 375,408 | |
Blue Buffalo Company Ltd. | | | | | | | | | | | | |
Term Loan, Maturing May 18,
2024(2) | | | | | | | 250 | | | | 252,813 | |
Del Monte Foods, Inc. | | | | | | | | | | | | |
Term Loan, 4.43%, Maturing February 18, 2021 | | | | | | | 656 | | | | 561,791 | |
Dole Food Company, Inc. | | | | | | | | | | | | |
Term Loan, 4.12%, Maturing April 6, 2024 | | | | | | | 425 | | | | 427,315 | |
| | | | | | | | | | | | |
| Borrower/Tranche Description | | | | | Principal
Amount
(000’s omitted) | | | Value | |
| | | | | | | | | | | | |
|
Food Products (continued) | |
High Liner Foods Incorporated | | | | | | | | | | | | |
Term Loan, 4.31%, Maturing April 24, 2021 | | | | | | $ | 201 | | | $ | 201,698 | |
HLF Financing S.a.r.l. | | | | | | | | | | | | |
Term Loan, 6.54%, Maturing February 13, 2023 | | | | | | | 375 | | | | 377,437 | |
Jacobs Douwe Egberts International B.V. | | | | | | | | | | | | |
Term Loan, 3.44%, Maturing July 2, 2022 | | | | | | | 175 | | | | 176,258 | |
JBS USA, LLC | | | | | | | | | | | | |
Term Loan, 3.50%, Maturing October 30, 2022 | | | | | | | 1,575 | | | | 1,556,297 | |
Nature’s Bounty Co. (The) | | | | | | | | | | | | |
Term Loan, 4.65%, Maturing May 5, 2023 | | | | | | | 918 | | | | 919,336 | |
Nomad Foods Europe Midco Limited | | | | | | | | | | | | |
Term Loan, 3.76%, Maturing April 18, 2024 | | | | | | | 150 | | | | 150,906 | |
Pinnacle Foods Finance, LLC | | | | | | | | | | | | |
Term Loan, 3.00%, Maturing February 2, 2024 | | | | | | | 200 | | | | 200,747 | |
Post Holdings, Inc. | | | | | | | | | | | | |
Term Loan, 3.28%, Maturing May 24, 2024 | | | | | | | 400 | | | | 402,643 | |
| | | | | | | | | | | | | |
| | | $ | 5,602,649 | |
| | | | | | | | | | | | | |
|
Food Service — 2.8% | |
1011778 B.C. Unlimited Liability Company | | | | | | | | | | | | |
Term Loan, 3.31%, Maturing February 16, 2024 | | | | | | $ | 1,610 | | | $ | 1,613,435 | |
Landry’s, Inc. | | | | | | | | | | | | |
Term Loan, 3.75%, Maturing October 4, 2023 | | | | | | | 593 | | | | 593,418 | |
Manitowoc Foodservice, Inc. | | | | | | | | | | | | |
Term Loan, 4.03%, Maturing March 3, 2023 | | | | | | | 379 | | | | 383,027 | |
NPC International, Inc. | | | | | | | | | | | | |
Term Loan, 4.51%, Maturing April 19, 2024 | | | | | | | 225 | | | | 226,969 | |
TKC Holdings, Inc. | | | | | | | | | | | | |
Term Loan, 4.75%, Maturing February 1, 2023 | | | | | | | 250 | | | | 251,679 | |
Weight Watchers International, Inc. | | | | | | | | | | | | |
Term Loan, 4.34%, Maturing April 2, 2020 | | | | | | | 481 | | | | 466,617 | |
Yum! Brands, Inc. | | | | | | | | | | | | |
Term Loan, 3.00%, Maturing June 16, 2023 | | | | | | | 249 | | | | 250,434 | |
| | | | | | | | | | | | | |
| | | $ | 3,785,579 | |
| | | | | | | | | | | | | |
|
Food / Drug Retailers — 1.8% | |
Albertsons, LLC | | | | | | | | | | | | |
Term Loan, 4.04%, Maturing August 22, 2021 | | | | | | $ | 315 | | | $ | 316,572 | |
Term Loan, 4.40%, Maturing December 22, 2022 | | | | | | | 498 | | | | 500,536 | |
Term Loan, 4.45%, Maturing June 22, 2023 | | | | | | | 1,083 | | | | 1,090,006 | |
Supervalu, Inc. | | | | | | | | | | | | |
Term Loan, 5.54%, Maturing March 21, 2019 | | | | | | | 547 | | | | 549,407 | |
| | | | | | | | | | | | | |
| | | $ | 2,456,521 | |
| | | | | | | | | | | | | |
| | | | |
| | 9 | | See Notes to Financial Statements. |
Eaton Vance
Floating-Rate Income Plus Fund
May 31, 2017
Portfolio of Investments — continued
| | | | | | | | | | | | |
| Borrower/Tranche Description | | | | | Principal
Amount
(000’s omitted) | | | Value | |
| | | | | | | | | | | | |
|
Forest Products — 0.2% | |
Expera Specialty Solutions, LLC | | | | | | | | | | | | |
Term Loan, 5.79%, Maturing November 3, 2023 | | | | | | $ | 249 | | | $ | 250,460 | |
| | | | | | | | | | | | | |
| | | $ | 250,460 | |
| | | | | | | | | | | | | |
|
Health Care — 13.3% | |
ADMI Corp. | | | | | | | | | | | | |
Term Loan, 4.93%, Maturing April 30, 2022 | | | | | | $ | 247 | | | $ | 249,393 | |
Akorn, Inc. | | | | | | | | | | | | |
Term Loan, 5.31%, Maturing April 16, 2021 | | | | | | | 219 | | | | 221,936 | |
Alere, Inc. | | | | | | | | | | | | |
Term Loan, 4.30%, Maturing June 18, 2022 | | | | | | | 412 | | | | 413,734 | |
Ardent Legacy Acquisitions, Inc. | | | | | | | | | | | | |
Term Loan, 6.65%, Maturing August 4, 2021 | | | | | | | 123 | | | | 123,971 | |
Auris Luxembourg III S.a.r.l. | | | | | | | | | | | | |
Term Loan, 4.15%, Maturing January 17, 2022 | | | | | | | 196 | | | | 198,153 | |
Beaver-Visitec International, Inc. | | | | | | | | | | | | |
Term Loan, 6.15%, Maturing August 21, 2023 | | | | | | | 199 | | | | 199,000 | |
BioClinica, Inc. | | | | | | | | | | | | |
Term Loan, Maturing October 20, 2023(2) | | | | | | | 400 | | | | 390,500 | |
CareCore National, LLC | | | | | | | | | | | | |
Term Loan, 5.04%, Maturing March 5, 2021 | | | | | | | 687 | | | | 695,581 | |
CeramTec Acquisition Corporation | | | | | | | | | | | | |
Term Loan, 3.95%, Maturing August 30, 2020 | | | | | | | 53 | | | | 53,076 | |
CHG Healthcare Services, Inc. | | | | | | | | | | | | |
Term Loan, 4.92%, Maturing June 7, 2023 | | | | | | | 520 | | | | 524,630 | |
Community Health Systems, Inc. | | | | | | | | | | | | |
Term Loan, 3.90%, Maturing December 31, 2019 | | | | | | | 203 | | | | 203,291 | |
Term Loan, 4.15%, Maturing January 27, 2021 | | | | | | | 373 | | | | 373,848 | |
Convatec, Inc. | | | | | | | | | | | | |
Term Loan, 3.54%, Maturing October 31, 2023 | | | | | | | 150 | | | | 152,250 | |
CPI Holdco, LLC | | | | | | | | | | | | |
Term Loan, 5.15%, Maturing March 21, 2024 | | | | | | | 175 | | | | 176,312 | |
DJO Finance, LLC | | | | | | | | | | | | |
Term Loan, 4.27%, Maturing June 8, 2020 | | | | | | | 540 | | | | 535,562 | |
Envision Healthcare Corporation | | | | | | | | | | | | |
Term Loan, 4.15%, Maturing December 1, 2023 | | | | | | | 1,471 | | | | 1,488,555 | |
Faenza Acquisition GmbH | | | | | | | | | | | | |
Term Loan, 3.95%, Maturing August 30, 2020 | | | | | | | 133 | | | | 134,229 | |
Term Loan, 3.95%, Maturing August 30, 2020 | | | | | | | 436 | | | | 441,109 | |
Genoa, a QoL Healthcare Company, LLC | | | | | | | | | | | | |
Term Loan, 4.90%, Maturing October 28, 2023 | | | | | | | 498 | | | | 500,547 | |
Global Healthcare Exchange, LLC | | | | | | | | | | | | |
Term Loan, 5.29%, Maturing August 15, 2022 | | | | | | | 270 | | | | 273,575 | |
| | | | | | | | | | | | |
| Borrower/Tranche Description | | | | | Principal
Amount
(000’s omitted) | | | Value | |
| | | | | | | | | | | | |
|
Health Care (continued) | |
Greatbatch Ltd. | | | | | | | | | | | | |
Term Loan, 4.51%, Maturing October 27, 2022 | | | | | | $ | 431 | | | $ | 434,666 | |
Grifols Worldwide Operations USA, Inc. | | | | | | | | | | | | |
Term Loan, 3.20%, Maturing January 31, 2025 | | | | | | | 850 | | | | 853,153 | |
Iasis Healthcare, LLC | | | | | | | | | | | | |
Term Loan, 5.25%, Maturing February 16, 2021 | | | | | | | 690 | | | | 696,265 | |
Indivior Finance S.a.r.l. | | | | | | | | | | | | |
Term Loan, 7.04%, Maturing December 19, 2019 | | | | | | | 224 | | | | 226,306 | |
inVentiv Health, Inc. | | | | | | | | | | | | |
Term Loan, 4.95%, Maturing November 9, 2023 | | | | | | | 798 | | | | 803,343 | |
Kindred Healthcare, Inc. | | | | | | | | | | | | |
Term Loan, 4.69%, Maturing April 9, 2021 | | | | | | | 1,357 | | | | 1,365,243 | |
Kinetic Concepts, Inc. | | | | | | | | | | | | |
Term Loan, 4.40%, Maturing February 2, 2024 | | | | | | | 650 | | | | 644,990 | |
KUEHG Corp. | | | | | | | | | | | | |
Term Loan, 4.92%, Maturing August 13, 2022 | | | | | | | 495 | | | | 497,759 | |
Medical Depot Holdings, Inc. | | | | | | | | | | | | |
Term Loan, 6.65%, Maturing January 3, 2023 | | | | | | | 174 | | | | 169,611 | |
MMM Holdings, Inc. | | | | | | | | | | | | |
Term Loan, 10.25%, Maturing June 30, 2019 | | | | | | | 276 | | | | 270,191 | |
MPH Acquisition Holdings, LLC | | | | | | | | | | | | |
Term Loan, 4.90%, Maturing June 7, 2023 | | | | | | | 1,215 | | | | 1,222,173 | |
MSO of Puerto Rico, Inc. | | | | | | | | | | | | |
Term Loan, 10.25%, Maturing December 12, 2017 | | | | | | | 200 | | | | 196,427 | |
National Mentor Holdings, Inc. | | | | | | | | | | | | |
Term Loan, 4.15%, Maturing January 31, 2021 | | | | | | | 146 | | | | 146,182 | |
New Millennium Holdco, Inc. | | | | | | | | | | | | |
Term Loan, 7.54%, Maturing December 21, 2020 | | | | | | | 97 | | | | 58,182 | |
Onex Carestream Finance L.P. | | | | | | | | | | | | |
Term Loan, 5.15%, Maturing June 7, 2019 | | | | | | | 238 | | | | 233,929 | |
Opal Acquisition, Inc. | | | | | | | | | | | | |
Term Loan, 5.15%, Maturing November 27, 2020 | | | | | | | 404 | | | | 380,997 | |
Ortho-Clinical Diagnostics, Inc. | | | | | | | | | | | | |
Term Loan, 4.78%, Maturing June 30, 2021 | | | | | | | 803 | | | | 804,838 | |
Press Ganey Holdings, Inc. | | | | | | | | | | | | |
Term Loan, 4.29%, Maturing October 21, 2023 | | | | | | | 175 | | | | 175,163 | |
RadNet, Inc. | | | | | | | | | | | | |
Term Loan, 4.43%, Maturing June 30, 2023 | | | | | | | 341 | | | | 344,307 | |
Select Medical Corporation | | | | | | | | | | | | |
Term Loan, 4.65%, Maturing March 6, 2024 | | | | | | | 400 | | | | 403,917 | |
Sterigenics-Nordion Holdings, LLC | | | | | | | | | | | | |
Term Loan, 4.15%, Maturing May 15, 2022 | | | | | | | 172 | | | | 171,729 | |
Team Health Holdings, Inc. | | | | | | | | | | | | |
Term Loan, 3.79%, Maturing February 6, 2024 | | | | | | | 500 | | | | 499,125 | |
| | | | |
| | 10 | | See Notes to Financial Statements. |
Eaton Vance
Floating-Rate Income Plus Fund
May 31, 2017
Portfolio of Investments — continued
| | | | | | | | | | | | |
| Borrower/Tranche Description | | | | | Principal
Amount
(000’s omitted) | | | Value | |
| | | | | | | | | | | | |
|
Health Care (continued) | |
Tecomet, Inc. | | | | | | | | | | | | |
Term Loan, 4.92%, Maturing April 13, 2024 | | | | | | $ | 200 | | | $ | 201,500 | |
| | | | | | | | | | | | | |
| | | | | | | | | | $ | 18,149,248 | |
| | | | | | | | | | | | | |
|
Home Furnishings — 0.8% | |
Serta Simmons Bedding, LLC | | | | | | | | | | | | |
Term Loan, 4.59%, Maturing November 8, 2023 | | | | | | $ | 1,072 | | | $ | 1,078,344 | |
| | | | | | | | | | | | | |
| | | | | | | | | | $ | 1,078,344 | |
| | | | | | | | | | | | | |
|
Industrial Equipment — 6.9% | |
Apex Tool Group, LLC | | | | | | | | | | | | |
Term Loan, 4.50%, Maturing January 31, 2020 | | | | | | $ | 947 | | | $ | 926,195 | |
Clark Equipment Company | | | | | | | | | | | | |
Term Loan, 3.93%, Maturing May 18, 2024 | | | | | | | 550 | | | | 554,383 | |
Delachaux S.A. | | | | | | | | | | | | |
Term Loan, 4.65%, Maturing October 28, 2021 | | | | | | | 109 | | | | 109,350 | |
EWT Holdings III Corp. | | | | | | | | | | | | |
Term Loan, 4.90%, Maturing January 15, 2021 | | | | | | | 698 | | | | 701,924 | |
Term Loan, 5.65%, Maturing January 15, 2021 | | | | | | | 149 | | | | 149,799 | |
Filtration Group Corporation | | | | | | | | | | | | |
Term Loan, 4.29%, Maturing November 21, 2020 | | | | | | | 149 | | | | 150,881 | |
Gardner Denver, Inc. | | | | | | | | | | | | |
Term Loan, 4.57%, Maturing July 30, 2020 | | | | | | | 1,569 | | | | 1,577,826 | |
Gates Global, LLC | | | | | | | | | | | | |
Term Loan, 4.41%, Maturing April 1, 2024 | | | | | | | 983 | | | | 988,652 | |
Husky Injection Molding Systems Ltd. | | | | | | | | | | | | |
Term Loan, 4.29%, Maturing June 30, 2021 | | | | | | | 651 | | | | 656,319 | |
Milacron, LLC | | | | | | | | | | | | |
Term Loan, 4.04%, Maturing September 28, 2023 | | | | | | | 673 | | | | 676,258 | |
Paladin Brands Holding, Inc. | | | | | | | | | | | | |
Term Loan, 7.25%, Maturing August 16, 2019 | | | | | | | 400 | | | | 392,109 | |
Rexnord, LLC | | | | | | | | | | | | |
Term Loan, 3.89%, Maturing August 21, 2023 | | | | | | | 1,746 | | | | 1,755,546 | |
Signode Industrial Group US, Inc. | | | | | | | | | | | | |
Term Loan, 3.84%, Maturing May 4, 2021 | | | | | | | 420 | | | | 423,250 | |
STS Operating, Inc. | | | | | | | | | | | | |
Term Loan, 4.75%, Maturing February 12, 2021 | | | | | | | 351 | | | | 346,247 | |
| | | | | | | | | | | | | |
| | | | | | | | | | $ | 9,408,739 | |
| | | | | | | | | | | | | |
|
Insurance — 4.1% | |
Alliant Holdings I, Inc. | | | | | | | | | | | | |
Term Loan, 4.42%, Maturing August 12, 2022 | | | | | | $ | 491 | | | $ | 493,534 | |
AmWINS Group, Inc. | | | | | | | | | | | | |
Term Loan, 3.78%, Maturing January 25, 2024 | | | | | | | 349 | | | | 350,107 | |
| | | | | | | | | | | | |
| Borrower/Tranche Description | | | | | Principal
Amount
(000’s omitted) | | | Value | |
| | | | | | | | | | | | |
|
Insurance (continued) | |
AssuredPartners, Inc. | | | | | | | | | | | | |
Term Loan, 4.54%, Maturing October 21, 2022 | | | | | | $ | 322 | | | $ | 322,570 | |
Term Loan - Second Lien, 10.04%, Maturing October 20, 2023 | | | | | | | 175 | | | | 178,500 | |
Asurion, LLC | | | | | | | | | | | | |
Term Loan, 4.29%, Maturing July 8, 2020 | | | | | | | 70 | | | | 70,229 | |
Term Loan, 4.29%, Maturing August 4, 2022 | | | | | | | 1,387 | | | | 1,397,633 | |
Term Loan, 4.04%, Maturing November 3, 2023 | | | | | | | 417 | | | | 418,924 | |
Term Loan - Second Lien, 8.54%, Maturing March 3, 2021 | | | | | | | 275 | | | | 278,552 | |
Cunningham Lindsey U.S., Inc. | | | | | | | | | | | | |
Term Loan, 5.03%, Maturing December 10, 2019 | | | | | | | 584 | | | | 525,846 | |
Hub International Limited | | | | | | | | | | | | |
Term Loan, 4.17%, Maturing October 2, 2020 | | | | | | | 849 | | | | 854,378 | |
NFP Corp. | | | | | | | | | | | | |
Term Loan, 4.65%, Maturing January 8, 2024 | | | | | | | 100 | | | | 100,648 | |
USI, Inc. | | | | | | | | | | | | |
Term Loan, 4.18%, Maturing May 16, 2024 | | | | | | | 550 | | | | 549,175 | |
| | | | | | | | | | | | | |
| | | | | | | | | | $ | 5,540,096 | |
| | | | | | | | | | | | | |
|
Leisure Goods / Activities / Movies — 3.7% | |
AMC Entertainment, Inc. | | | | | | | | | | | | |
Term Loan, 3.28%, Maturing December 15, 2023 | | | | | | $ | 125 | | | $ | 125,506 | |
Ancestry.com Operations, Inc. | | | | | | | | | | | | |
Term Loan, 4.25%, Maturing October 19, 2023 | | | | | | | 520 | | | | 525,435 | |
Bombardier Recreational Products, Inc. | | | | | | | | | | | | |
Term Loan, 4.00%, Maturing June 30, 2023 | | | | | | | 1,095 | | | | 1,102,415 | |
Bright Horizons Family Solutions, Inc. | | | | | | | | | | | | |
Term Loan, 3.29%, Maturing November 7, 2023 | | | | | | | 125 | | | | 125,908 | |
CDS U.S. Intermediate Holdings, Inc. | | | | | | | | | | | | |
Term Loan, 5.15%, Maturing July 8, 2022 | | | | | | | 99 | | | | 99,620 | |
Delta 2 (LUX) S.a.r.l. | | | | | | | | | | | | |
Term Loan, 4.57%, Maturing February 1, 2024 | | | | | | | 475 | | | | 476,315 | |
Emerald Expositions Holding, Inc. | | | | | | | | | | | | |
Term Loan, 4.15%, Maturing May 17, 2024 | | | | | | | 275 | | | | 277,406 | |
Lindblad Expeditions, Inc. | | | | | | | | | | | | |
Term Loan, 5.82%, Maturing May 8, 2021 | | | | | | | 56 | | | | 56,564 | |
Term Loan, 5.82%, Maturing May 8, 2021 | | | | | | | 435 | | | | 438,371 | |
Match Group, Inc. | | | | | | | | | | | | |
Term Loan, 4.28%, Maturing November 16, 2022 | | | | | | | 131 | | | | 133,055 | |
Nord Anglia Education Finance, LLC | | | | | | | | | | | | |
Term Loan, 4.70%, Maturing March 31, 2021 | | | | | | | 292 | | | | 292,647 | |
Sabre GLBL, Inc. | | | | | | | | | | | | |
Term Loan, 3.79%, Maturing February 22, 2024 | | | | | | | 642 | | | | 648,754 | |
| | | | |
| | 11 | | See Notes to Financial Statements. |
Eaton Vance
Floating-Rate Income Plus Fund
May 31, 2017
Portfolio of Investments — continued
| | | | | | | | | | | | |
| Borrower/Tranche Description | | | | | Principal
Amount
(000’s omitted) | | | Value | |
| | | | | | | | | | | | |
|
Leisure Goods / Activities / Movies (continued) | |
SRAM, LLC | | | | | | | | | | | | |
Term Loan, 4.61%, Maturing March 15, 2024 | | | | | | $ | 284 | | | $ | 284,392 | |
UFC Holdings, LLC | | | | | | | | | | | | |
Term Loan, 4.26%, Maturing August 18, 2023 | | | | | | | 448 | | | | 450,868 | |
| | | | | | | | | | | | | |
| | | | | | | | | | $ | 5,037,256 | |
| | | | | | | | | | | | | |
|
Lodging and Casinos — 4.1% | |
Amaya Holdings B.V. | | | | | | | | | | | | |
Term Loan, 4.65%, Maturing August 1, 2021 | | | | | | $ | 1,353 | | | $ | 1,358,864 | |
Term Loan - Second Lien, 8.15%, Maturing August 1, 2022 | | | | | | | 53 | | | | 52,886 | |
Boyd Gaming Corporation | | | | | | | | | | | | |
Term Loan, 3.45%, Maturing September 15, 2023 | | | | | | | 248 | | | | 250,050 | |
CityCenter Holdings, LLC | | | | | | | | | | | | |
Term Loan, 3.50%, Maturing April 18, 2024 | | | | | | | 500 | | | | 502,709 | |
Eldorado Resorts, LLC | | | | | | | | | | | | |
Term Loan, 3.24%, Maturing April 17, 2024 | | | | | | | 300 | | | | 299,719 | |
ESH Hospitality, Inc. | | | | | | | | | | | | |
Term Loan, 3.54%, Maturing August 30, 2023 | | | | | | | 323 | | | | 325,889 | |
Four Seasons Hotels Limited | | | | | | | | | | | | |
Term Loan, 4.15%, Maturing November 30, 2023 | | | | | | | 224 | | | | 227,103 | |
Golden Nugget, Inc. | | | | | | | | | | | | |
Term Loan, 4.68%, Maturing November 21, 2019 | | | | | | | 26 | | | | 26,745 | |
Term Loan, 4.71%, Maturing November 21, 2019 | | | | | | | 61 | | | | 62,403 | |
Hilton Worldwide Finance, LLC | | | | | | | | | | | | |
Term Loan, 3.02%, Maturing October 25, 2023 | | | | | | | 1,109 | | | | 1,117,522 | |
La Quinta Intermediate Holdings, LLC | | | | | | | | | | | | |
Term Loan, 3.91%, Maturing April 14, 2021 | | | | | | | 246 | | | | 247,820 | |
MGM Growth Properties Operating Partnership L.P. | | | | | | | | | | | | |
Term Loan, 3.29%, Maturing April 25, 2023 | | | | | | | 470 | | | | 473,483 | |
Playa Resorts Holding B.V. | | | | | | | | | | | | |
Term Loan, 4.17%, Maturing April 5, 2024 | | | | | | | 550 | | | | 552,337 | |
Tropicana Entertainment, Inc. | | | | | | | | | | | | |
Term Loan, 4.04%, Maturing November 27, 2020 | | | | | | | 97 | | | | 97,344 | |
| | | | | | | | | | | | | |
| | | | | | | | | | $ | 5,594,874 | |
| | | | | | | | | | | | | |
|
Nonferrous Metals / Minerals — 1.3% | |
Dynacast International, LLC | | | | | | | | | | | | |
Term Loan, 4.40%, Maturing January 28, 2022 | | | | | | $ | 297 | | | $ | 298,231 | |
Fairmount Santrol, Inc. | | | | | | | | | | | | |
Term Loan, 4.65%, Maturing September 5, 2019 | | | | | | | 483 | | | | 470,839 | |
Global Brass & Copper, Inc. | | | | | | | | | | | | |
Term Loan, 5.31%, Maturing July 18, 2023 | | | | | | | 199 | | | | 201,731 | |
| | | | | | | | | | | | |
| Borrower/Tranche Description | | | | | Principal
Amount
(000’s omitted) | | | Value | |
| | | | | | | | | | | | |
|
Nonferrous Metals / Minerals (continued) | |
Murray Energy Corporation | | | | | | | | | | | | |
Term Loan, 8.40%, Maturing April 16, 2020 | | | | | | $ | 485 | | | $ | 458,509 | |
New Day Aluminum, LLC | | | | | | | | | | | | |
Term Loan, 10.00%, (4.00% Cash, 6.00% PIK), Maturing October 28, 2020(3) | | | | | | | 16 | | | | 0 | |
Noranda Aluminum Acquisition Corporation | | | | | | | | | | | | |
Term Loan, 0.00%, Maturing February 28, 2019(3)(5) | | | | | | | 266 | | | | 43,811 | |
Oxbow Carbon, LLC | | | | | | | | | | | | |
Term Loan, 4.54%, Maturing January 19, 2020 | | | | | | | 175 | | | | 177,187 | |
Term Loan - Second Lien, 8.04%, Maturing January 17, 2020 | | | | | | | 175 | | | | 176,094 | |
| | | | | | | | | | | | | |
| | | | | | | | | | $ | 1,826,402 | |
| | | | | | | | | | | | | |
|
Oil and Gas — 3.2% | |
Ameriforge Group, Inc. | | | | | | | | | | | | |
DIP Loan, 9.00%, Maturing October 30, 2017 | | | | | | $ | 112 | | | $ | 113,094 | |
Term Loan, 0.00%, Maturing December 19, 2019(5) | | | | | | | 566 | | | | 329,599 | |
Bronco Midstream Funding, LLC | | | | | | | | | | | | |
Term Loan, 5.17%, Maturing August 15, 2020 | | | | | | | 759 | | | | 767,319 | |
CITGO Holding, Inc. | | | | | | | | | | | | |
Term Loan, 9.65%, Maturing May 12, 2018 | | | | | | | 189 | | | | 191,224 | |
CITGO Petroleum Corporation | | | | | | | | | | | | |
Term Loan, 4.65%, Maturing July 29, 2021 | | | | | | | 244 | | | | 244,867 | |
Fieldwood Energy, LLC | | | | | | | | | | | | |
Term Loan, 3.92%, Maturing October 1, 2018 | | | | | | | 245 | | | | 238,693 | |
Term Loan, 8.04%, Maturing August 31, 2020 | | | | | | | 450 | | | | 439,594 | |
Term Loan, 8.38%, Maturing September 30, 2020 | | | | | | | 66 | | | | 60,135 | |
Term Loan - Second Lien, 8.38%, Maturing September 30, 2020 | | | | | | | 109 | | | | 81,688 | |
MEG Energy Corp. | | | | | | | | | | | | |
Term Loan, 4.63%, Maturing December 31, 2023 | | | | | | | 50 | | | | 49,977 | |
Paragon Offshore Finance Company | | | | | | | | | | | | |
Term Loan, 5.75%, Maturing July 18, 2021 | | | | | | | 222 | | | | 88,597 | |
Seadrill Partners Finco, LLC | | | | | | | | | | | | |
Term Loan, 4.15%, Maturing February 21, 2021 | | | | | | | 819 | | | | 568,213 | |
Sheridan Investment Partners II L.P. | | | | | | | | | | | | |
Term Loan, 4.71%, Maturing December 16, 2020 | | | | | | | 9 | | | | 7,863 | |
Term Loan, 4.71%, Maturing December 16, 2020 | | | | | | | 25 | | | | 21,082 | |
Term Loan, 4.71%, Maturing December 16, 2020 | | | | | | | 183 | | | | 151,554 | |
Sheridan Production Partners I, LLC | | | | | | | | | | | | |
Term Loan, 4.60%, Maturing October 1, 2019 | | | | | | | 55 | | | | 47,488 | |
Term Loan, 4.60%, Maturing October 1, 2019 | | | | | | | 90 | | | | 77,746 | |
Term Loan, 4.60%, Maturing October 1, 2019 | | | | | | | 676 | | | | 586,725 | |
| | | | |
| | 12 | | See Notes to Financial Statements. |
Eaton Vance
Floating-Rate Income Plus Fund
May 31, 2017
Portfolio of Investments — continued
| | | | | | | | | | | | |
| Borrower/Tranche Description | | | | | Principal
Amount
(000’s omitted) | | | Value | |
| | | | | | | | | | | | |
|
Oil and Gas (continued) | |
Southcross Holdings Borrower L.P. | | | | | | | | | | | | |
Term Loan, 9.00%, (3.50% Cash, 5.50% PIK), Maturing April 13, 2023 | | | | | | $ | 14 | | | $ | 12,629 | |
Ultra Resources, Inc. | | | | | | | | | | | | |
Term Loan, 4.00%, Maturing March 23, 2024 | | | | | | | 300 | | | | 299,344 | |
| | | | | | | | | | | | | |
| | | | | | | | | | $ | 4,377,431 | |
| | | | | | | | | | | | | |
|
Publishing — 2.0% | |
Ascend Learning, LLC | | | | | | | | | | | | |
Term Loan, 5.54%, Maturing July 31, 2019 | | | | | | $ | 314 | | | $ | 315,780 | |
Getty Images, Inc. | | | | | | | | | | | | |
Term Loan, 4.75%, Maturing October 18, 2019 | | | | | | | 1,123 | | | | 1,034,495 | |
Harland Clarke Holdings Corp. | | | | | | | | | | | | |
Term Loan, 6.63%, Maturing February 9, 2022 | | | | | | | 100 | | | | 100,225 | |
LSC Communications, Inc. | | | | | | | | | | | | |
Term Loan, 7.04%, Maturing September 30, 2022 | | | | | | | 229 | | | | 231,458 | |
Merrill Communications, LLC | | | | | | | | | | | | |
Term Loan, 6.42%, Maturing June 1, 2022 | | | | | | | 147 | | | | 147,818 | |
ProQuest, LLC | | | | | | | | | | | | |
Term Loan, 5.29%, Maturing October 24, 2021 | | | | | | | 419 | | | | 422,883 | |
Springer Science+Business Media Deutschland GmbH | | | | | | | | | | | | |
Term Loan, 4.62%, Maturing August 14, 2020 | | | | | | | 286 | | | | 286,811 | |
Tweddle Group, Inc. | | | | | | | | | | | | |
Term Loan, 7.17%, Maturing October 24, 2022 | | | | | | | 198 | | | | 198,981 | |
| | | | | | | | | | | | | |
| | | | | | | | | | $ | 2,738,451 | |
| | | | | | | | | | | | | |
|
Radio and Television — 4.5% | |
ALM Media Holdings, Inc. | | | | | | | | | | | | |
Term Loan, 5.65%, Maturing July 31, 2020 | | | | | | $ | 117 | | | $ | 108,984 | |
AP NMT Acquisition B.V. | | | | | | | | | | | | |
Term Loan, 6.90%, Maturing August 13, 2021 | | | | | | | 514 | | | | 457,955 | |
CBS Radio, Inc. | | | | | | | | | | | | |
Term Loan, 4.51%, Maturing October 17, 2023 | | | | | | | 294 | | | | 296,498 | |
Term Loan, Maturing October 17, 2023(2) | | | | | | | 100 | | | | 100,771 | |
Cumulus Media Holdings, Inc. | | | | | | | | | | | | |
Term Loan, 4.30%, Maturing December 23, 2020 | | | | | | | 1,081 | | | | 863,619 | |
Entercom Radio, LLC | | | | | | | | | | | | |
Term Loan, 4.55%, Maturing November 1, 2023 | | | | | | | 239 | | | | 240,092 | |
Entravision Communications Corporation | | | | | | | | | | | | |
Term Loan, 3.65%, Maturing May 31, 2020 | | | | | | | 778 | | | | 781,009 | |
Hubbard Radio, LLC | | | | | | | | | | | | |
Term Loan, 4.30%, Maturing May 27, 2022 | | | | | | | 138 | | | | 138,171 | |
| | | | | | | | | | | | |
| Borrower/Tranche Description | | | | | Principal
Amount
(000’s omitted) | | | Value | |
| | | | | | | | | | | | |
|
Radio and Television (continued) | |
iHeartCommunications, Inc. | | | | | | | | | | | | |
Term Loan, 7.79%, Maturing January 30, 2019 | | | | | | $ | 500 | | | $ | 414,844 | |
Mission Broadcasting, Inc. | | | | | | | | | | | | |
Term Loan, 4.00%, Maturing January 17, 2024 | | | | | | | 72 | | | | 72,247 | |
Nexstar Broadcasting, Inc. | | | | | | | | | | | | |
Term Loan, 4.00%, Maturing January 17, 2024 | | | | | | | 732 | | | | 737,417 | |
Univision Communications, Inc. | | | | | | | | | | | | |
Term Loan, 3.79%, Maturing March 15, 2024 | | | | | | | 1,940 | | | | 1,926,551 | |
| | | | | | | | | | | | | |
| | | | | | | | | | $ | 6,138,158 | |
| | | | | | | | | | | | | |
|
Retailers (Except Food and Drug) — 5.3% | |
Bass Pro Group, LLC | | | | | | | | | | | | |
Term Loan, 4.24%, Maturing June 5, 2020 | | | | | | $ | 564 | | | $ | 563,965 | |
Term Loan, 6.15%, Maturing December 16, 2023 | | | | | | | 300 | | | | 292,031 | |
BJ’s Wholesale Club, Inc. | | | | | | | | | | | | |
Term Loan, 4.75%, Maturing February 3, 2024 | | | | | | | 250 | | | | 249,755 | |
Coinamatic Canada, Inc. | | | | | | | | | | | | |
Term Loan, 4.29%, Maturing May 14, 2022 | | | | | | | 40 | | | | 40,487 | |
David’s Bridal, Inc. | | | | | | | | | | | | |
Term Loan, 5.25%, Maturing October 11, 2019 | | | | | | | 475 | | | | 379,782 | |
Evergreen Acqco 1 L.P. | | | | | | | | | | | | |
Term Loan, 5.00%, Maturing July 9, 2019 | | | | | | | 522 | | | | 480,919 | |
Harbor Freight Tools USA, Inc. | | | | | | | | | | | | |
Term Loan, 4.29%, Maturing August 19, 2023 | | | | | | | 421 | | | | 421,370 | |
J. Crew Group, Inc. | | | | | | | | | | | | |
Term Loan, 4.09%, Maturing March 5, 2021 | | | | | | | 752 | | | | 516,828 | |
LSF9 Atlantis Holdings, LLC | | | | | | | | | | | | |
Term Loan, 7.00%, Maturing May 1, 2023 | | | | | | | 250 | | | | 252,735 | |
Men’s Wearhouse, Inc. (The) | | | | | | | | | | | | |
Term Loan, 4.58%, Maturing June 18, 2021 | | | | | | | 218 | | | | 207,386 | |
Michaels Stores, Inc. | | | | | | | | | | | | |
Term Loan, 3.78%, Maturing January 30, 2023 | | | | | | | 749 | | | | 749,661 | |
Neiman Marcus Group Ltd., LLC | | | | | | | | | | | | |
Term Loan, 4.25%, Maturing October 25, 2020 | | | | | | | 516 | | | | 406,604 | |
Party City Holdings, Inc. | | | | | | | | | | | | |
Term Loan, 4.17%, Maturing August 19, 2022 | | | | | | | 638 | | | | 638,717 | |
PetSmart, Inc. | | | | | | | | | | | | |
Term Loan, 4.01%, Maturing March 11, 2022 | | | | | | | 802 | | | | 772,296 | |
PFS Holding Corporation | | | | | | | | | | | | |
Term Loan, 4.55%, Maturing January 31, 2021 | | | | | | | 525 | | | | 496,412 | |
Pier 1 Imports (U.S.), Inc. | | | | | | | | | | | | |
Term Loan, 4.54%, Maturing April 30, 2021 | | | | | | | 122 | | | | 117,460 | |
Toys ‘R’ Us Property Company I, LLC | | | | | | | | | | | | |
Term Loan, 6.04%, Maturing August 21, 2019 | | | | | | | 436 | | | | 421,628 | |
| | | | |
| | 13 | | See Notes to Financial Statements. |
Eaton Vance
Floating-Rate Income Plus Fund
May 31, 2017
Portfolio of Investments — continued
| | | | | | | | | | | | |
| Borrower/Tranche Description | | | | | Principal
Amount
(000’s omitted) | | | Value | |
| | | | | | | | | | | | |
|
Retailers (Except Food and Drug) (continued) | |
Vivid Seats Ltd. | | | | | | | | | | | | |
Term Loan, 6.75%, Maturing October 7, 2022 | | | | | | $ | 225 | | | $ | 226,219 | |
| | | | | | | | | | | | | |
| | | | | | | | | | $ | 7,234,255 | |
| | | | | | | | | | | | | |
|
Steel — 1.0% | |
Neenah Foundry Company | | | | | | | | | | | | |
Term Loan, 7.75%, Maturing April 26, 2019 | | | | | | $ | 367 | | | $ | 364,185 | |
Zekelman Industries, Inc. | | | | | | | | | | | | |
Term Loan, 4.66%, Maturing June 14, 2021 | | | | | | | 969 | | | | 981,499 | |
| | | | | | | | | | | | | |
| | | | | | | | | | $ | 1,345,684 | |
| | | | | | | | | | | | | |
|
Surface Transport — 0.6% | |
Hertz Corporation (The) | | | | | | | | | | | | |
Term Loan, 3.80%, Maturing June 30, 2023 | | | | | | $ | 248 | | | $ | 247,679 | |
Kenan Advantage Group, Inc. | | | | | | | | | | | | |
Term Loan, 4.04%, Maturing July 31, 2022 | | | | | | | 27 | | | | 27,532 | |
Term Loan, 4.04%, Maturing July 31, 2022 | | | | | | | 90 | | | | 90,537 | |
PODS, LLC | | | | | | | | | | | | |
Term Loan, 4.25%, Maturing February 2, 2022 | | | | | | | 75 | | | | 75,440 | |
Stena International S.a.r.l. | | | | | | | | | | | | |
Term Loan, 4.15%, Maturing March 3, 2021 | | | | | | | 388 | | | | 354,373 | |
| | | | | | | | | | | | | |
| | | | | | | | | | $ | 795,561 | |
| | | | | | | | | | | | | |
|
Technology — 0.6% | |
Seattle Spinco, Inc. | | | | | | | | | | | | |
Term Loan, Maturing April 19, 2024(2) | | | | | | $ | 806 | | | $ | 805,091 | |
| | | | | | | | | | | | | |
| | | | | | | | | | $ | 805,091 | |
| | | | | | | | | | | | | |
|
Telecommunications — 5.4% | |
CenturyLink, Inc. | | | | | | | | | | | | |
Term Loan, Maturing January 31, 2025(2) | | | | | | $ | 1,250 | | | $ | 1,248,326 | |
Colorado Buyer, Inc. | | | | | | | | | | | | |
Term Loan, 4.17%, Maturing May 1, 2024 | | | | | | | 200 | | | | 201,774 | |
Consolidated Communications, Inc. | | | | | | | | | | | | |
Term Loan, Maturing October 5, 2023(2) | | | | | | | 150 | | | | 150,975 | |
Digicel International Finance Limited | | | | | | | | | | | | |
Term Loan, Maturing May 8, 2024(2) | | | | | | | 175 | | | | 176,750 | |
Global Eagle Entertainment, Inc. | | | | | | | | | | | | |
Term Loan, 8.32%, Maturing January 6, 2023 | | | | | | | 300 | | | | 280,500 | |
Intelsat Jackson Holdings S.A. | | | | | | | | | | | | |
Term Loan, 3.89%, Maturing June 30, 2019 | | | | | | | 1,450 | | | | 1,435,349 | |
IPC Corp. | | | | | | | | | | | | |
Term Loan, 5.67%, Maturing August 6, 2021 | | | | | | | 417 | | | | 397,757 | |
| | | | | | | | | | | | |
| Borrower/Tranche Description | | | | | Principal
Amount
(000’s omitted) | | | Value | |
| | | | | | | | | | | | |
|
Telecommunications (continued) | |
Onvoy, LLC | | | | | | | | | | | | |
Term Loan, 5.65%, Maturing February 10, 2024 | | | | | | $ | 475 | | | $ | 476,386 | |
Sprint Communications, Inc. | | | | | | | | | | | | |
Term Loan, 3.56%, Maturing February 2, 2024 | | | | | | | 850 | | | | 852,277 | |
Syniverse Holdings, Inc. | | | | | | | | | | | | |
Term Loan, 4.15%, Maturing April 23, 2019 | | | | | | | 1,029 | | | | 985,919 | |
Telesat Canada | | | | | | | | | | | | |
Term Loan, 4.15%, Maturing November 17, 2023 | | | | | | | 1,169 | | | | 1,181,798 | |
| | | | | | | | | | | | | |
| | | | | | | | | | $ | 7,387,811 | |
| | | | | | | | | | | | | |
|
Utilities — 2.8% | |
Calpine Construction Finance Company L.P. | | | | | | | | | | | | |
Term Loan, 3.55%, Maturing January 31, 2022 | | | | | | $ | 145 | | | $ | 144,948 | |
Calpine Corporation | | | | | | | | | | | | |
Term Loan, 3.90%, Maturing January 15, 2024 | | | | | | | 811 | | | | 810,943 | |
Granite Acquisition, Inc. | | | | | | | | | | | | |
Term Loan, 5.15%, Maturing December 19, 2021 | | | | | | | 28 | | | | 28,575 | |
Term Loan, 5.15%, Maturing December 19, 2021 | | | | | | | 632 | | | | 634,826 | |
Helix Gen Funding, LLC | | | | | | | | | | | | |
Term Loan, Maturing February 23, 2024(2) | | | | | | | 225 | | | | 226,148 | |
Invenergy Thermal Operating I, LLC | | | | | | | | | | | | |
Term Loan, 6.65%, Maturing October 19, 2022 | | | | | | | 242 | | | | 233,494 | |
Lightstone Generation, LLC | | | | | | | | | | | | |
Term Loan, 5.54%, Maturing January 30, 2024 | | | | | | | 23 | | | | 22,841 | |
Term Loan, 5.54%, Maturing January 30, 2024 | | | | | | | 376 | | | | 370,231 | |
Lonestar Generation, LLC | | | | | | | | | | | | |
Term Loan, 5.45%, Maturing February 22, 2021 | | | | | | | 537 | | | | 445,527 | |
Longview Power, LLC | | | | | | | | | | | | |
Term Loan, 7.05%, Maturing April 13, 2021 | | | | | | | 565 | | | | 456,187 | |
Talen Energy Supply, LLC | | | | | | | | | | | | |
Term Loan, 5.05%, Maturing April 15, 2024 | | | | | | | 175 | | | | 165,229 | |
TPF II Power, LLC | | | | | | | | | | | | |
Term Loan, 5.04%, Maturing October 2, 2023 | | | | | | | 326 | | | | 326,370 | |
| | | | | | | | | | | | | |
| | | | | | | | | | $ | 3,865,319 | |
| | | | | | | | | | | | | |
| |
Total Senior Floating-Rate Loans
(identified cost $183,707,416) | | | $ | 181,708,329 | |
| | | | | | | | | | | | | |
| | | | |
| | 14 | | See Notes to Financial Statements. |
Eaton Vance
Floating-Rate Income Plus Fund
May 31, 2017
Portfolio of Investments — continued
| | | | | | | | | | | | |
| Commercial Mortgage-Backed Securities — 0.1% | |
| | | |
| | | | | | | | | | | | |
| Security | | | | | Principal
Amount
(000’s omitted) | | | Value | |
| | | | | | | | | | | | |
JPMBB Commercial Mortgage Securities Trust | |
Series 2014-C23, Class D, 3.96%, Maturing
9/15/47(6)(7) | | | | | | $ | 100 | | | $ | 85,625 | |
| | | | | | | | | | | | | |
| |
Total Commercial Mortgage-Backed Securities
(identified cost $88,356) | | | $ | 85,625 | |
| | | | | | | | | | | | | |
|
| Corporate Bonds & Notes — 10.1% | |
| | | |
| | | | | | | | | | | | |
| Security | | | | | Principal
Amount*
(000’s omitted) | | | Value | |
|
Aerospace and Defense — 0.5% | |
Bombardier, Inc. | | | | | | | | | | | | |
7.45%, 5/1/34(6) | | | | | | | 640 | | | $ | 638,400 | |
| | | | | | | | | | | | | |
| | | | | | | | | | $ | 638,400 | |
| | | | | | | | | | | | | |
|
Banks and Thrifts — 0.5% | |
Australia and New Zealand Banking Group, Ltd. | | | | | | | | | | | | |
3.75%, 7/25/19(8) | | | AUD | | | | 640 | | | $ | 489,788 | |
JPMorgan Chase & Co. | | | | | | | | | | | | |
4.25%, 11/2/18 | | | NZD | | | | 255 | | | | 183,497 | |
| | | | | | | | | | | | | |
| | | | | | | | | | $ | 673,285 | |
| | | | | | | | | | | | | |
|
Building and Development — 0.4% | |
MDC Holdings, Inc. | | | | | | | | | | | | |
6.00%, 1/15/43 | | | | | | | 533 | | | $ | 496,500 | |
| | | | | | | | | | | | | |
| | | | | | | | | | $ | 496,500 | |
| | | | | | | | | | | | | |
|
Capital Goods — 0.4% | |
Valmont Industries, Inc. | | | | | | | | | | | | |
5.00%, 10/1/44 | | | | | | | 550 | | | $ | 549,419 | |
| | | | | | | | | | | | | |
| | | | | | | | | | $ | 549,419 | |
| | | | | | | | | | | | | |
|
Chemicals and Plastics — 0.5% | |
CF Industries, Inc. | | | | | | | | | | | | |
4.95%, 6/1/43 | | | | | | | 820 | | | $ | 725,700 | |
| | | | | | | | | | | | | |
| | | | | | | | | | $ | 725,700 | |
| | | | | | | | | | | | | |
|
Computers — 0.6% | |
Seagate HDD Cayman | | | | | | | | | | | | |
4.875%, 6/1/27 | | | | | | | 830 | | | $ | 810,753 | |
| | | | | | | | | | | | | |
| | | $ | 810,753 | |
| | | | | | | | | | | | | |
| | | | | | | | | | | | |
| Security | | | | | Principal
Amount*
(000’s omitted) | | | Value | |
| | | | | | | | | | | | |
|
Diversified Financial Services — 0.7% | |
Och-Ziff Finance Co., LLC | | | | | | | | | | | | |
4.50%, 11/20/19(6) | | | | 1,080 | | | $ | 1,027,350 | |
| | | | | | | | | | | | | |
| | | $ | 1,027,350 | |
| | | | | | | | | | | | | |
|
Drugs — 0.3% | |
Valeant Pharmaceuticals International, Inc. | | | | | | | | | | | | |
6.50%, 3/15/22(6) | | | | 173 | | | $ | 182,048 | |
7.00%, 3/15/24(6) | | | | 225 | | | | 238,500 | |
| | | | | | | | | | | | | |
| | | $ | 420,548 | |
| | | | | | | | | | | | | |
|
Engineering & Construction — 0.1% | |
Odebrecht Offshore Drilling Finance, Ltd. | | | | | | | | | | | | |
6.75%, 10/1/23(6) | | | | 537 | | | $ | 213,650 | |
| | | | | | | | | | | | | |
| | | $ | 213,650 | |
| | | | | | | | | | | | | |
|
Food / Drug Retailers — 0.5% | |
ESAL GmbH | | | | | | | | | | | | |
6.25%, 2/5/23(6) | | | | 685 | | | $ | 628,916 | |
| | | | | | | | | | | | | |
| | | $ | 628,916 | |
| | | | | | | | | | | | | |
|
Forest Products — 0.4% | |
Suzano Austria GmbH | | | | | | | | | | | | |
7.00%, 3/16/47(6) | | | | 486 | | | $ | 490,131 | |
| | | | | | | | | | | | | |
| | | $ | 490,131 | |
| | | | | | | | | | | | | |
|
Metals / Mining — 0.5% | |
Freeport-McMoRan, Inc. | | | | | | | | | | | | |
5.45%, 3/15/43 | | | | 750 | | | $ | 637,965 | |
| | | | | | | | | | | | | |
| | | $ | 637,965 | |
| | | | | | | | | | | | | |
|
Nonferrous Metals / Minerals — 0.8% | |
Teck Resources, Ltd. | | | | | | | | | | | | |
5.20%, 3/1/42 | | | | 1,150 | | | $ | 1,075,250 | |
| | | | | | | | | | | | | |
| | | $ | 1,075,250 | |
| | | | | | | | | | | | | |
|
Oil and Gas — 1.9% | |
Ecopetrol S.A. | | | | | | | | | | | | |
5.875%, 5/28/45 | | | | 450 | | | $ | 415,687 | |
Ensco PLC | | | | | | | | | | | | |
5.20%, 3/15/25 | | | | 706 | | | | 600,100 | |
| | | | |
| | 15 | | See Notes to Financial Statements. |
Eaton Vance
Floating-Rate Income Plus Fund
May 31, 2017
Portfolio of Investments — continued
| | | | | | | | | | | | |
| Security | | | | | Principal
Amount*
(000’s omitted) | | | Value | |
| | | | | | | | | | | | |
|
Oil and Gas (continued) | |
Petrobras Global Finance B.V. | | | | | | | | | | | | |
5.625%, 5/20/43 | | | | 905 | | | $ | 760,200 | |
Rowan Cos., Inc. | | | | | | | | | | | | |
4.75%, 1/15/24 | | | | 415 | | | | 372,463 | |
5.40%, 12/1/42 | | | | 675 | | | | 509,625 | |
| | | | | | | | | | | | | |
| | | $ | 2,658,075 | |
| | | | | | | | | | | | | |
|
Real Estate Investment Trusts (REITs) — 0.4% | |
CBL & Associates L.P. | | | | | | | | | | | | |
4.60%, 10/15/24 | | | | 530 | | | $ | 494,477 | |
| | | | | | | | | | | | | |
| | | $ | 494,477 | |
| | | | | | | | | | | | | |
|
Retailers (Except Food and Drug) — 1.5% | |
JC Penney Corp., Inc. | | | | | | | | | | | | |
6.375%, 10/15/36 | | | | 670 | | | $ | 492,450 | |
Macy’s Retail Holdings, Inc. | | | | | | | | | | | | |
4.30%, 2/15/43 | | | | 970 | | | | 744,550 | |
Signet UK Finance PLC | | | | | | | | | | | | |
4.70%, 6/15/24 | | | | 915 | | | | 878,791 | |
| | | | | | | | | | | | | |
| | | $ | 2,115,791 | |
| | | | | | | | | | | | | |
|
Telecommunications — 0.1% | |
Oi Brasil Holdings Cooperatief UA | | | | | | | | | | | | |
5.75%, 2/10/22(5)(6) | | | | 425 | | | $ | 128,775 | |
| | | | | | | | | | | | | |
| | | $ | 128,775 | |
| | | | | | | | | | | | | |
| |
Total Corporate Bonds & Notes
(identified cost $13,362,071) | | | $ | 13,784,985 | |
| | | | | | | | | | | | | |
|
| Foreign Government Bonds — 3.1% | |
| | | |
| | | | | | | | | | | | |
| Security | | | | | Principal
Amount
(000’s omitted) | | | Value | |
|
Argentina — 0.3% | |
Republic of Argentina | | | | | | | | | | | | |
7.82%, 12/31/33 | | | EUR | | | | 413 | | | $ | 496,680 | |
| | | | | | | | | | | | | |
| | | $ | 496,680 | |
| | | | | | | | | | | | | |
|
Brazil — 0.5% | |
Nota do Tesouro Nacional | | | | | | | | | | | | |
10.00%, 1/1/25 | | | BRL | | | | 2,150 | | | $ | 643,349 | |
| | | | | | | | | | | | | |
| | | $ | 643,349 | |
| | | | | | | | | | | | | |
| | | | | | | | | | | | |
| Security | | | | | Principal
Amount
(000’s omitted) | | | Value | |
| | | | | | | | | | | | |
|
Canada — 0.5% | |
Canada Housing Trust | | | | | | | | | | | | |
3.80%, 6/15/21(6) | | | CAD | | | | 900 | | | $ | 734,031 | |
| | | | | | | | | | | | | |
| | | $ | 734,031 | |
| | | | | | | | | | | | | |
|
Mexico — 0.8% | |
Mexican Bonos | | | | | | | | | | | | |
7.75%, 5/29/31 | | | MXN | | | | 19,590 | | | $ | 1,080,255 | |
| | | | | | | | | | | | | |
| | | $ | 1,080,255 | |
| | | | | | | | | | | | | |
|
Supranational — 1.0% | |
European Investment Bank | | | | | | | | | | | | |
7.20%, 7/9/19(6) | | | IDR | | | | 4,080,000 | | | $ | 313,282 | |
International Bank for Reconstruction & Development | | | | | | | | | | | | |
3.50%, 1/22/21 | | | NZD | | | | 425 | | | | 308,411 | |
International Finance Corp. | | | | | | | | | | | | |
7.80%, 6/3/19 | | | INR | | | | 24,990 | | | | 403,504 | |
8.25%, 6/10/21 | | | INR | | | | 18,100 | | | | 303,035 | |
| | | | | | | | | | | | | |
| | | $ | 1,328,232 | |
| | | | | | | | | | | | | |
| |
Total Foreign Government Bonds
(identified cost $4,038,807) | | | $ | 4,282,547 | |
| | | | | | | | | | | | | |
|
| Convertible Bonds — 0.2% | |
| | | |
| | | | | | | | | | | | |
| Security | | | | | Principal
Amount
(000’s omitted) | | | Value | |
|
Home Builders — 0.1% | |
CalAtlantic Group, Inc. | | | | | | | | | | | | |
1.25%, 8/1/32 | | | | | | $ | 210 | | | $ | 212,231 | |
| | | | | | | | | | | | | |
| | | $ | 212,231 | |
| | | | | | | | | | | | | |
|
Oil & Gas — 0.1% | |
Ascent Resources Utica Holdings, LLC/ARU Finance Corp. | | | | | | | | | | | | |
3.50%, 3/1/21(6)(9) | | | | | | $ | 111 | | | $ | 112,214 | |
| | | | | | | | | | | | | |
| | | $ | 112,214 | |
| | | | | | | | | | | | | |
| |
Total Convertible Bonds
(identified cost $361,117) | | | $ | 324,445 | |
| | | | | | | | | | | | | |
| | | | |
| | 16 | | See Notes to Financial Statements. |
Eaton Vance
Floating-Rate Income Plus Fund
May 31, 2017
Portfolio of Investments — continued
| | | | | | | | | | | | |
| Common Stocks — 4.7% | | | | | | | | | | | | |
| | | |
| | | | | | | | | | | | |
| Security | | | | | Shares | | | Value | |
| | | | | | | | | | | | |
|
Business Equipment and Services — 0.1% | |
Education Management Corp.(3)(10)(11) | | | | | | | 2,334,705 | | | $ | 0 | |
RCS Capital Corp.(3)(10)(11) | | | | | | | 6,066 | | | | 87,957 | |
| | | | | | | | | | | | | |
| | | $ | 87,957 | |
| | | | | | | | | | | | | |
|
Diversified Financial Services — 0.3% | |
Medley Capital Corp. | | | | | | | 74,500 | | | $ | 453,705 | |
| | | | | | | | | | | | | |
| | | $ | 453,705 | |
| | | | | | | | | | | | | |
|
Electronics / Electrical — 0.3% | |
Answers Corp.(10)(11) | | | | | | | 14,876 | | | $ | 224,999 | |
Intel Corp. | | | | | | | 4,500 | | | | 162,495 | |
| | | | | | | | | | | | | |
| | | $ | 387,494 | |
| | | | | | | | | | | | | |
|
Financial Services — 0.2% | |
Bank of America Corp. | | | | | | | 7,600 | | | $ | 170,316 | |
Regions Financial Corp. | | | | | | | 10,000 | | | | 138,400 | |
| | | | | | | | | | | | | |
| | | $ | 308,716 | |
| | | | | | | | | | | | | |
|
Health Care — 0.0%(12) | |
New Millennium Holdco, Inc.(10)(11) | | | | | | | 10,394 | | | $ | 19,229 | |
| | | | | | | | | | | | | |
| | | $ | 19,229 | |
| | | | | | | | | | | | | |
|
Investment Companies — 2.3% | |
Ares Capital Corp. | | | | | | | 59,000 | | | $ | 982,350 | |
PennantPark Investment Corp. | | | | | | | 72,837 | | | | 544,821 | |
Solar Capital, Ltd. | | | | | | | 43,000 | | | | 929,230 | |
THL Credit, Inc. | | | | | | | 67,000 | | | | 667,320 | |
| | | | | | | | | | | | | |
| | | $ | 3,123,721 | |
| | | | | | | | | | | | | |
|
Miscellaneous Manufacturing — 0.3% | |
Toshiba Corp.(10) | | | | | | | 148,000 | | | $ | 337,023 | |
| | | | | | | | | | | | | |
| | | $ | 337,023 | |
| | | | | | | | | | | | | |
|
Nonferrous Metals / Minerals — 0.2% | |
Cliffs Natural Resources, Inc.(10) | | | | | | | 45,260 | | | $ | 266,581 | |
Freeport-McMoRan, Inc.(10) | | | | | | | 4,945 | | | | 56,818 | |
| | | | | | | | | | | | | |
| | | $ | 323,399 | |
| | | | | | | | | | | | | |
| | | | | | | | | | | | |
| Security | | | | | Shares | | | Value | |
| | | | | | | | | | | | |
|
Oil and Gas — 0.2% | |
Royal Dutch Shell PLC, Class B, ADR | | | | | | | 5,150 | | | $ | 289,482 | |
Southcross Holdings Group, LLC(3)(10)(11) | | | | | | | 15 | | | | 0 | |
Southcross Holdings L.P., Class A(10)(11) | | | | | | | 15 | | | | 8,250 | |
| | | | | | | | | | | | | |
| | | $ | 297,732 | |
| | | | | | | | | | | | | |
|
Retail — 0.2% | |
Signet Jewelers, Ltd. | | | | | | | 6,300 | | | $ | 303,030 | |
| | | | | | | | | | | | | |
| | | $ | 303,030 | |
| | | | | | | | | | | | | |
|
Semiconductors & Semiconductor Equipment — 0.1% | |
QUALCOMM, Inc. | | | | | | | 2,425 | | | $ | 138,880 | |
| | | | | | | | | | | | | |
| | | $ | 138,880 | |
| | | | | | | | | | | | | |
|
Transportation — 0.5% | |
A.P. Moller - Maersk A/S, Class B | | | | | | | 315 | | | $ | 600,350 | |
| | | | | | | | | | | | | |
| | | $ | 600,350 | |
| | | | | | | | | | | | | |
| |
Total Common Stocks
(identified cost $8,263,992) | | | $ | 6,381,236 | |
| | | | | | | | | | | | | |
|
| Convertible Preferred Stocks — 1.5% | |
| | | |
| | | | | | | | | | | | |
| Security | | | | | Shares | | | Value | |
|
Business Equipment and Services — 0.0% | |
Education Management Corp., Series A-1, 7.50%(3)(10)(11) | | | | | | | 2,597 | | | $ | 0 | |
| | | | | | | | | | | | | |
| | | $ | 0 | |
| | | | | | | | | | | | | |
|
Oil & Gas — 1.1% | |
Chesapeake Energy Corp., 5.75% | | | | | | | 2,240 | | | $ | 1,436,400 | |
| | | | | | | | | | | | | |
| | | $ | 1,436,400 | |
| | | | | | | | | | | | | |
|
Real Estate Investment Trusts (REITs) — 0.4% | |
iStar, Inc., Series J, 4.50% | | | | | | | 11,500 | | | $ | 590,295 | |
| | | | | | | | | | | | | |
| | | $ | 590,295 | |
| | | | | | | | | | | | | |
| |
Total Convertible Preferred Stocks
(identified cost $1,859,013) | | | $ | 2,026,695 | |
| | | | | | | | | | | | | |
| | | | |
| | 17 | | See Notes to Financial Statements. |
Eaton Vance
Floating-Rate Income Plus Fund
May 31, 2017
Portfolio of Investments — continued
| | | | | | | | | | | | |
| Preferred Stocks — 0.0%(12) | | | | | | | | | | | | |
| | | |
| | | | | | | | | | | | |
| Security | | | | | Shares | | | Value | |
| | | | | | | | | | | | |
|
Equity Real Estate Investment Trusts (REITs) — 0.0%(12) | |
CBL & Associates Properties, Inc., Series D, 7.375% | | | | | | | 575 | | | $ | 13,047 | |
| | | | | | | | | | | | | |
| | | |
Total Preferred Stocks
(identified cost $13,311) | | | | | | | | | | $ | 13,047 | |
| | | | | | | | | | | | | |
|
| Short-Term Investments — 3.9% | |
| | | |
| | | | | | | | | | | | |
| Description | | | | | Units | | | Value | |
Eaton Vance Cash Reserves Fund, LLC, 1.08%(13) | | | | | | | 5,362,980 | | | $ | 5,365,125 | |
| | | | | | | | | | | | | |
| |
Total Short-Term Investments
(identified cost $5,364,775) | | | $ | 5,365,125 | |
| | | | | | | | | | | | | |
| |
Total Investments — 156.9%
(identified cost $217,058,858) | | | $ | 213,972,034 | |
| | | | | | | | | | | | | |
| |
Less Unfunded Loan Commitments — (0.0)%(12) | | | $ | (52,941 | ) |
| | | | | | | | | | | | | |
| |
Net Investments — 156.9%
(identified cost $217,005,917) | | | $ | 213,919,093 | |
| | | | | | | | | | | | | |
| |
Notes Payable — (39.6)% | | | $ | (54,000,000 | ) |
| | | | | | | | | | | | | |
| |
Variable Rate Term Preferred Shares, at Liquidation Value (net of unamortized deferred debt issuance costs) — (13.9)% | | | $ | (18,916,076 | ) |
| | | | | | | | | | | | | |
| |
Other Assets, Less Liabilities — (3.4)% | | | $ | (4,652,054 | ) |
| | | | | | | | | | | | | |
| |
Net Assets Applicable to Common Shares — 100.0% | | | $ | 136,350,963 | |
| | | | | | | | | | | | | |
The percentage shown for each investment category in the Portfolio of Investments is based on net assets applicable to common shares.
| | * | In U.S. dollars unless otherwise indicated. |
| | (1) | Senior floating-rate loans (Senior Loans) often require prepayments from excess cash flows or permit the borrowers to repay at their election. The degree to which borrowers repay, whether as a contractual requirement or at their election, cannot be predicted with accuracy. As a result, the actual remaining maturity may be substantially less than the stated maturities |
| | shown. However, Senior Loans will typically have an expected average life of approximately two to four years. The stated interest rate represents the weighted average interest rate of all contracts within the senior loan facility and includes commitment fees on unfunded loan commitments, if any. Senior Loans typically have rates of interest which are redetermined either daily, monthly, quarterly or semi-annually by reference to a base lending rate, plus a premium. These base lending rates are primarily the London Interbank Offered Rate (“LIBOR”) and secondarily, the prime rate offered by one or more major United States banks (the “Prime Rate”) and the certificate of deposit (“CD”) rate or other base lending rates used by commercial lenders. |
| | (2) | This Senior Loan will settle after May 31, 2017, at which time the interest rate will be determined. |
| | (3) | For fair value measurement disclosure purposes, security is categorized as Level 3 (see Note 11). |
| | (4) | Unfunded or partially unfunded loan commitments. See Note 1F for description. |
| | (5) | Currently the issuer is in default with respect to interest and/or principal payments. For a variable rate security, interest rate has been adjusted to reflect non-accrual status. |
| | (6) | Security exempt from registration pursuant to Rule 144A under the Securities Act of 1933, as amended. These securities may be sold in certain transactions in reliance on an exemption from registration (normally to qualified institutional buyers). At May 31, 2017, the aggregate value of these securities is $4,792,922 or 3.5% of the Fund’s net assets applicable to common shares. |
| | (7) | Weighted average fixed-rate coupon that changes/updates monthly. Rate shown is the rate at May 31, 2017. |
| | (8) | Security exempt from registration under Regulation S of the Securities Act of 1933, which exempts from registration securities offered and sold outside the United States. Security may not be offered or sold in the United States except pursuant to an exemption from, or in a transaction not subject to, the registration requirements of the Securities Act of 1933. At May 31, 2017, the aggregate value of these securities is $489,788 or 0.4% of the Fund’s net assets applicable to common shares. |
| | (9) | Represents a payment-in-kind security which may pay interest in additional principal at the issuer’s discretion. For corporate bonds, the interest rate paid in additional principal is generally higher than the indicated cash rate. |
| (10) | Non-income producing security. |
| (11) | Security was acquired in connection with a restructuring of a Senior Loan and may be subject to restrictions on resale. |
| (12) | Amount is less than 0.05% or (0.05)%, as applicable. |
| (13) | Affiliated investment company, available to Eaton Vance portfolios and funds, which invests in high quality, U.S. dollar denominated money market instruments. The rate shown is the annualized seven-day yield as of May 31, 2017. |
| | | | | | | | | | | | | | | | | | | | | | | | |
| Forward Foreign Currency Exchange Contracts | |
| Currency Purchased | | | Currency Sold | | | Counterparty | | Settlement
Date | | | Unrealized Appreciation | | | Unrealized (Depreciation) | |
| | | | | | | |
| USD | | | 342,173 | | | JPY | | | 38,036,000 | | | Bank of America, N.A. | | | 6/30/17 | | | $ | — | | | $ | (1,699 | ) |
| | | | | | | |
| | | | | | | | | | | | | | | | | | | $ | — | | | $ | (1,699 | ) |
| | | | |
| | 18 | | See Notes to Financial Statements. |
Eaton Vance
Floating-Rate Income Plus Fund
May 31, 2017
Portfolio of Investments — continued
Abbreviations:
| | | | |
| ADR | | – | | American Depositary Receipt |
| DIP | | – | | Debtor In Possession |
| PIK | | – | | Payment In Kind |
Currency Abbreviations:
| | | | |
| AUD | | – | | Australian Dollar |
| BRL | | – | | Brazilian Real |
| CAD | | – | | Canadian Dollar |
| EUR | | – | | Euro |
| IDR | | – | | Indonesian Rupiah |
| INR | | – | | Indian Rupee |
| JPY | | – | | Japanese Yen |
| MXN | | – | | Mexican Peso |
| NZD | | – | | New Zealand Dollar |
| USD | | – | | United States Dollar |
| | | | |
| | 19 | | See Notes to Financial Statements. |
Eaton Vance
Floating-Rate Income Plus Fund
May 31, 2017
Statement of Assets and Liabilities
| | | | |
| Assets | | May 31, 2017 | |
Unaffiliated investments, at value (identified cost, $211,641,142) | | $ | 208,553,968 | |
Affiliated investment, at value (identified cost, $5,364,775) | | | 5,365,125 | |
Cash | | | 738,404 | |
Interest and dividends receivable | | | 1,031,350 | |
Dividends receivable from affiliated investment | | | 4,043 | |
Receivable for investments sold | | | 349,563 | |
Tax reclaims receivable | | | 856 | |
Prepaid upfront fees on variable rate term preferred shares | | | 74,306 | |
Prepaid upfront fees on notes payable | | | 50,352 | |
Prepaid expenses | | | 6,051 | |
Total assets | | $ | 216,174,018 | |
| |
| Liabilities | | | | |
Notes payable | | $ | 54,000,000 | |
Variable rate term preferred shares, at liquidation value (net of unamortized deferred debt issuance costs of $83,924) | | | 18,916,076 | |
Payable for investments purchased | | | 6,475,145 | |
Payable for open forward foreign currency exchange contracts | | | 1,699 | |
Due to custodian — foreign currency, at value (identified cost, $770) | | | 812 | |
Payable to affiliates: | | | | |
Investment adviser fee | | | 133,185 | |
Trustees’ fees | | | 2,099 | |
Interest expense and fees payable | | | 188,015 | |
Accrued foreign capital gains taxes | | | 276 | |
Accrued expenses | | | 105,748 | |
Total liabilities | | $ | 79,823,055 | |
Net assets applicable to common shares | | $ | 136,350,963 | |
| |
| Sources of Net Assets | | | | |
Common shares, $0.01 par value, unlimited number of shares authorized, 7,606,422 shares issued and outstanding | | $ | 76,064 | |
Additional paid-in capital | | | 144,209,718 | |
Accumulated net realized loss | | | (4,812,369 | ) |
Accumulated distributions in excess of net investment income | | | (35,318 | ) |
Net unrealized depreciation | | | (3,087,132 | ) |
Net assets applicable to common shares | | $ | 136,350,963 | |
|
| Net Asset Value Per Common Share | |
($136,350,963 ÷ 7,606,422 common shares issued and outstanding) | | $ | 17.93 | |
| | | | |
| | 20 | | See Notes to Financial Statements. |
Eaton Vance
Floating-Rate Income Plus Fund
May 31, 2017
Statement of Operations
| | | | |
| Investment Income | | Year Ended May 31, 2017 | |
Interest and other income | | $ | 10,050,640 | |
Dividends (net of foreign taxes, $1,024) | | | 663,488 | |
Interest allocated from/dividends from affiliated investment | | | 31,684 | |
Expenses allocated from affiliated investment | | | (195 | ) |
Total investment income | | $ | 10,745,617 | |
| |
| Expenses | | | | |
Investment adviser fee | | $ | 1,518,752 | |
Trustees’ fees and expenses | | | 11,982 | |
Custodian fee | | | 145,525 | |
Transfer and dividend disbursing agent fees | | | 18,115 | |
Legal and accounting services | | | 194,187 | |
Printing and postage | | | 24,057 | |
Interest expense and fees | | | 1,563,682 | |
Miscellaneous | | | 59,582 | |
Total expenses | | $ | 3,535,882 | |
| |
Net investment income | | $ | 7,209,735 | |
| |
| Realized and Unrealized Gain (Loss) | | | | |
Net realized gain (loss) — | | | | |
Investment transactions | | $ | (143,049 | ) |
Investment transactions in/allocated from affiliated investment | | | 1,565 | |
Foreign currency and forward foreign currency exchange contract transactions | | | 2,105 | |
Net realized loss | | $ | (139,379 | ) |
Change in unrealized appreciation (depreciation) — | | | | |
Investments (including net increase of $276 in accrued foreign capital gains taxes) | | $ | 10,501,411 | |
Investments — affiliated investment | | | 350 | |
Foreign currency and forward foreign currency exchange contracts | | | 1,103 | |
Net change in unrealized appreciation (depreciation) | | $ | 10,502,864 | |
| |
Net realized and unrealized gain | | $ | 10,363,485 | |
| |
Net increase in net assets from operations | | $ | 17,573,220 | |
| | | | |
| | 21 | | See Notes to Financial Statements. |
Eaton Vance
Floating-Rate Income Plus Fund
May 31, 2017
Statements of Changes in Net Assets
| | | | | | | | |
| | | Year Ended May 31, | |
| Increase (Decrease) in Net Assets | | 2017 | | | 2016 | |
From operations — | | | | | | | | |
Net investment income | | $ | 7,209,735 | | | $ | 8,050,267 | |
Net realized loss from investment, foreign currency and forward foreign currency exchange contract transactions | | | (139,379 | ) | | | (4,447,330 | ) |
Net change in unrealized appreciation (depreciation) from investments, foreign currency and forward foreign currency exchange contracts | | | 10,502,864 | | | | (8,700,773 | ) |
Net increase (decrease) in net assets from operations | | $ | 17,573,220 | | | $ | (5,097,836 | ) |
Distributions to common shareholders — | | | | | | | | |
From net investment income | | $ | (7,475,035 | ) | | $ | (8,473,554 | ) |
Tax return of capital | | | (78,142 | ) | | | — | |
Total distributions to common shareholders | | $ | (7,553,177 | ) | | $ | (8,473,554 | ) |
| | |
Net increase (decrease) in net assets | | $ | 10,020,043 | | | $ | (13,571,390 | ) |
| | |
| Net Assets Applicable to Common Shares | | | | | | | | |
At beginning of year | | $ | 126,330,920 | | | $ | 139,902,310 | |
At end of year | | $ | 136,350,963 | | | $ | 126,330,920 | |
| | |
Accumulated undistributed (distributions in excess of) net investment income
included in net assets applicable to common shares | | | | | | | | |
At end of year | | $ | (35,318 | ) | | $ | 112,436 | |
| | | | |
| | 22 | | See Notes to Financial Statements. |
Eaton Vance
Floating-Rate Income Plus Fund
May 31, 2017
Statement of Cash Flows
| | | | |
| Cash Flows From Operating Activities | | Year Ended May 31, 2017 | |
Net increase in net assets from operations | | $ | 17,573,220 | |
Adjustments to reconcile net increase in net assets from operations to net cash provided by operating activities: | | | | |
Investments purchased | | | (105,742,131 | ) |
Investments sold and principal repayments | | | 104,732,064 | |
Increase in short-term investments, net | | | (2,148,689 | ) |
Net amortization/accretion of premium (discount) | | | (425,491 | ) |
Amortization of prepaid upfront fees on variable rate term preferred shares | | | 107,421 | |
Amortization of deferred debt issuance costs on variable rate term preferred shares | | | 34,994 | |
Amortization of prepaid upfront fees on notes payable | | | 56,232 | |
Decrease in interest and dividends receivable | | | 344,780 | |
Increase in dividends receivable from affiliated investment | | | (2,366 | ) |
Increase in tax reclaims receivable | | | (856 | ) |
Increase in prepaid expenses | | | (725 | ) |
Increase in payable for open forward foreign currency exchange contracts | | | 1,699 | |
Increase in payable to affiliate for investment adviser fee | | | 8,668 | |
Increase in payable to affiliate for Trustees’ fees | | | 291 | |
Increase in interest expense and fees payable | | | 90,054 | |
Decrease in accrued expenses | | | (5,247 | ) |
Increase in unfunded loan commitments | | | 41,531 | |
Net change in unrealized (appreciation) depreciation from investments | | | (10,501,761 | ) |
Net realized loss from investments | | | 141,484 | |
Net cash provided by operating activities | | $ | 4,305,172 | |
| |
| Cash Flows From Financing Activities | | | | |
Distributions paid to common shareholders, net of reinvestments | | $ | (7,553,177 | ) |
Payment of prepaid upfront fees on variable rate term preferred shares | | | (122,000 | ) |
Payment of deferred debt issuance costs on variable rate term preferred shares | | | (107,733 | ) |
Redemption of variable rate term preferred shares | | | (17,000,000 | ) |
Proceeds from notes payable | | | 28,000,000 | |
Repayments of notes payable | | | (8,000,000 | ) |
Payment of prepaid upfront fees on notes payable | | | (64,000 | ) |
Increase in due to custodian — foreign currency | | | 812 | |
Net cash used in financing activities | | $ | (4,846,098 | ) |
| |
Net decrease in cash | | $ | (540,926 | ) |
| |
Cash at beginning of year | | $ | 1,279,330 | |
| |
Cash at end of year | | $ | 738,404 | |
| |
| Supplemental disclosure of cash flow information: | | | | |
Cash paid for interest and fees on borrowings and variable rate term preferred shares | | $ | 1,579,899 | |
| | | | |
| | 23 | | See Notes to Financial Statements. |
Eaton Vance
Floating-Rate Income Plus Fund
May 31, 2017
Financial Highlights
Selected data for a common share outstanding during the periods stated
| | | | | | | | | | | | | | | | |
| | | Year Ended May 31, | �� | | Period Ended May 31, 2014(1) | |
| | | 2017 | | | 2016 | | | 2015 | | |
Net asset value — Beginning of period (Common shares) | | $ | 16.610 | | | $ | 18.390 | | | $ | 19.560 | | | $ | 19.100 | (2) |
| | | | |
| Income (Loss) From Operations | | | | | | | | | | | | | | | | |
Net investment income(3) | | $ | 0.948 | | | $ | 1.058 | | | $ | 1.114 | | | $ | 0.989 | |
Net realized and unrealized gain (loss) | | | 1.365 | | | | (1.724 | ) | | | (0.867 | ) | | | 0.511 | |
| | | | |
Total income (loss) from operations | | $ | 2.313 | | | $ | (0.666 | ) | | $ | 0.247 | | | $ | 1.500 | |
| | | | |
| Less Distributions to Common Shareholders | | | | | | | | | | | | | | | | |
From net investment income | | $ | (0.983 | ) | | $ | (1.114 | ) | | $ | (1.134 | ) | | $ | (0.974 | ) |
From net realized gain | | | — | | | | — | | | | (0.283 | ) | | | — | |
Tax return of capital | | | (0.010 | ) | | | — | | | | — | | | | — | |
| | | | |
Total distributions to common shareholders | | $ | (0.993 | ) | | $ | (1.114 | ) | | $ | (1.417 | ) | | $ | (0.974 | ) |
| | | | |
Common shares offering costs charged to paid-in capital(3) | | $ | — | | | $ | — | | | $ | — | | | $ | (0.041 | ) |
| | | | |
Discount related to exercise of underwriters’ over-allotment option(3) | | $ | — | | | $ | — | | | $ | — | | | $ | (0.025 | ) |
| | | | |
Net asset value — End of period (Common shares) | | $ | 17.930 | | | $ | 16.610 | | | $ | 18.390 | | | $ | 19.560 | |
| | | | |
Market value — End of period (Common shares) | | $ | 17.350 | | | $ | 15.240 | | | $ | 16.970 | | | $ | 17.950 | |
| | | | |
Total Investment Return on Net Asset Value(4) | | | 14.69 | % | | | (2.60 | )% | | | 2.15 | % | | | 8.00 | %(5)(6) |
| | | | |
Total Investment Return on Market Value(4) | | | 20.96 | % | | | (3.15 | )% | | | 2.71 | % | | | (0.89 | )%(5)(6) |
| | | | |
| | 24 | | See Notes to Financial Statements. |
Eaton Vance
Floating-Rate Income Plus Fund
May 31, 2017
Financial Highlights — continued
Selected data for a common share outstanding during the periods stated
| | | | | | | | | | | | | | | | |
| | | Year Ended May 31, | | | Period Ended May 31, 2014(1) | |
| Ratios/Supplemental Data | | 2017 | | | 2016 | | | 2015 | | |
Net assets applicable to common shares, end of period (000’s omitted) | | $ | 136,351 | | | $ | 126,331 | | | $ | 139,902 | | | $ | 148,770 | |
Ratios (as a percentage of average daily net assets applicable to common shares):† | | | | | | | | | | | | | | | | |
Expenses excluding interest and fees(7) | | | 1.48 | % | | | 1.63 | % | | | 1.55 | % | | | 1.54 | %(8) |
Interest and fee expense(9) | | | 1.17 | % | | | 0.99 | % | | | 0.84 | % | | | 0.76 | %(8) |
Total expenses(7) | | | 2.65 | % | | | 2.62 | % | | | 2.39 | % | | | 2.30 | %(8) |
Net investment income | | | 5.40 | % | | | 6.35 | % | | | 5.91 | % | | | 5.49 | %(8) |
Portfolio Turnover | | | 52 | % | | | 29 | % | | | 28 | % | | | 37 | %(6) |
Senior Securities: | | | | | | | | | | | | | | | | |
Total notes payable outstanding (in 000’s) | | $ | 54,000 | | | $ | 34,000 | | | $ | 54,000 | | | $ | 54,000 | |
Asset coverage per $1,000 of notes payable(10) | | $ | 3,877 | | | $ | 5,774 | | | $ | 4,257 | | | $ | 4,422 | |
Total preferred shares outstanding(11) | | | 190 | | | | 360 | | | | 360 | | | | 360 | |
Asset coverage per preferred share(11)(12) | | $ | 286,782 | | | $ | 280,473 | | | $ | 255,447 | | | $ | 265,300 | |
Involuntary liquidation preference per preferred share(11) | | $ | 100,000 | | | $ | 100,000 | | | $ | 100,000 | | | $ | 100,000 | |
Approximate market value per preferred share(11) | | $ | 100,000 | | | $ | 100,000 | | | $ | 100,000 | | | $ | 100,000 | |
| (1) | For the period from the start of business, June 28, 2013, to May 31, 2014. |
| (2) | Net asset value at beginning of period reflects the deduction of the sales load of $0.90 per share paid by the shareholders from the $20.00 offering price. |
| (3) | Computed using average common shares outstanding. |
| (4) | Returns are historical and are calculated by determining the percentage change in net asset value or market value with all distributions reinvested. Distributions are assumed to be reinvested at prices obtained under the Fund’s dividend reinvestment plan. |
| (5) | Total investment return on net asset value is calculated assuming a purchase at the offering price of $20.00 less the sales load of $0.90 per share paid by the shareholders on the first day and a sale at the net asset value on the last day of the period reported with all distributions reinvested. Total investment return on market value is calculated assuming a purchase at the offering price of $20.00 less the sales load of $0.90 per share paid by the shareholders on the first day and a sale at the current market price on the last day of the period reported with all distributions reinvested. |
| (7) | Excludes the effect of custody fee credits, if any, of less than 0.005%. Effective September 1, 2015, custody fee credits, which were earned on cash deposit balances, were discontinued by the custodian. |
| (9) | Interest and fee expense relates to variable rate term preferred shares and borrowings (see Note 2 and Note 8). Effective June 1, 2016, the ratio includes amortization of deferred debt issuance costs. For periods prior to June 1, 2016, amortization of deferred debt issuance costs was included in the ratio of expenses excluding interest and fees. |
| (10) | Calculated by subtracting the Fund’s total liabilities (not including the notes payable and preferred shares) from the Fund’s total assets, and dividing the result by the notes payable balance in thousands. |
| (11) | Preferred shares represent variable rate term preferred shares. |
| (12) | Calculated by subtracting the Fund’s total liabilities (not including the notes payable and preferred shares) from the Fund’s total assets, dividing the result by the sum of the value of the notes payable and liquidation value of the preferred shares, and multiplying the result by the liquidation value of one preferred share. Such amount equates to 287%, 280%, 255% and 265% at May 31, 2017, 2016, 2015 and 2014, respectively. |
| † | Ratios based on net assets applicable to common shares plus preferred shares and borrowings are presented below. Ratios exclude the effect of custody fee credits, if any. Ratios for periods less than one year are annualized. |
| | | | | | | | | | | | | | | | |
| | | Year Ended May 31, | | | Period Ended May 31, 2014 | |
| | | 2017 | | | 2016 | | | 2015 | | |
Expenses excluding interest and fees | | | 0.98 | % | | | 0.99 | % | | | 0.95 | % | | | 0.98 | % |
Interest and fee expense | | | 0.77 | % | | | 0.60 | % | | | 0.52 | % | | | 0.49 | % |
Total expenses | | | 1.75 | % | | | 1.59 | % | | | 1.47 | % | | | 1.47 | % |
Net investment income | | | 3.56 | % | | | 3.87 | % | | | 3.63 | % | | | 3.52 | % |
| | | | |
| | 25 | | See Notes to Financial Statements. |
Eaton Vance
Floating-Rate Income Plus Fund
May 31, 2017
Notes to Financial Statements
1 Significant Accounting Policies
Eaton Vance Floating-Rate Income Plus Fund (the Fund) is a Massachusetts business trust registered under the Investment Company Act of 1940, as amended (the 1940 Act), as a diversified, closed-end management investment company. The Fund’s investment objective is total return, with an emphasis on income.
The following is a summary of significant accounting policies of the Fund. The policies are in conformity with accounting principles generally accepted in the United States of America (U.S. GAAP). The Fund is an investment company and follows accounting and reporting guidance in the Financial Accounting Standards Board (FASB) Accounting Standards Codification Topic 946.
A Investment Valuation — The following methodologies are used to determine the market value or fair value of investments.
Senior Floating-Rate Loans. Interests in senior floating-rate loans (Senior Loans) for which reliable market quotations are readily available are valued generally at the average mean of bid and ask quotations obtained from a third party pricing service. Other Senior Loans are valued at fair value by the investment adviser under procedures approved by the Trustees. In fair valuing a Senior Loan, the investment adviser utilizes one or more of the valuation techniques described in (i) through (iii) below to assess the likelihood that the borrower will make a full repayment of the loan underlying such Senior Loan relative to yields on other Senior Loans issued by companies of comparable credit quality. If the investment adviser believes that there is a reasonable likelihood of full repayment, the investment adviser will determine fair value using a matrix pricing approach that considers the yield on the Senior Loan. If the investment adviser believes there is not a reasonable likelihood of full repayment, the investment adviser will determine fair value using analyses that include, but are not limited to: (i) a comparison of the value of the borrower’s outstanding equity and debt to that of comparable public companies; (ii) a discounted cash flow analysis; or (iii) when the investment adviser believes it is likely that a borrower will be liquidated or sold, an analysis of the terms of such liquidation or sale. In certain cases, the investment adviser will use a combination of analytical methods to determine fair value, such as when only a portion of a borrower’s assets are likely to be sold. In conducting its assessment and analyses for purposes of determining fair value of a Senior Loan, the investment adviser will use its discretion and judgment in considering and appraising relevant factors. Fair value determinations are made by the portfolio managers of the Fund based on information available to such managers. The portfolio managers of other funds managed by the investment adviser that invest in Senior Loans may not possess the same information about a Senior Loan borrower as the portfolio managers of the Fund. At times, the fair value of a Senior Loan determined by the portfolio managers of other funds managed by the investment adviser that invest in Senior Loans may vary from the fair value of the same Senior Loan determined by the portfolio managers of the Fund. The fair value of each Senior Loan is periodically reviewed and approved by the investment adviser’s Valuation Committee and by the Trustees based upon procedures approved by the Trustees. Junior Loans (i.e., subordinated loans and second lien loans) are valued in the same manner as Senior Loans.
Debt Obligations. Debt obligations are generally valued on the basis of valuations provided by third party pricing services, as derived from such services’ pricing models. Inputs to the models may include, but are not limited to, reported trades, executable bid and asked prices, broker/dealer quotations, prices or yields of securities with similar characteristics, interest rates, anticipated prepayments, benchmark curves or information pertaining to the issuer, as well as industry and economic events. The pricing services may use a matrix approach, which considers information regarding securities with similar characteristics to determine the valuation for a security. Short-term obligations purchased with a remaining maturity of sixty days or less for which a valuation from a third party pricing service is not readily available may be valued at amortized cost, which approximates fair value.
Equity Securities. Equity securities listed on a U.S. securities exchange generally are valued at the last sale or closing price on the day of valuation or, if no sales took place on such date, at the mean between the closing bid and asked prices therefore on the exchange where such securities are principally traded. Equity securities listed on the NASDAQ Global or Global Select Market generally are valued at the NASDAQ official closing price. Unlisted or listed securities for which closing sales prices or closing quotations are not available are valued at the mean between the latest available bid and asked prices or, in the case of preferred equity securities that are not listed or traded in the over-the-counter market, by a third party pricing service that uses various techniques that consider factors including, but not limited to, prices or yields of securities with similar characteristics, benchmark yields, broker/dealer quotes, quotes of underlying common stock, issuer spreads, as well as industry and economic events.
Derivatives. Forward foreign currency exchange contracts are generally valued at the mean of the average bid and average asked prices that are reported by currency dealers to a third party pricing service at the valuation time. Such third party pricing service valuations are supplied for specific settlement periods and the Fund’s forward foreign currency exchange contracts are valued at an interpolated rate between the closest preceding and subsequent settlement period reported by the third party pricing service.
Foreign Securities and Currencies. Foreign securities and currencies are valued in U.S. dollars, based on foreign currency exchange rate quotations supplied by a third party pricing service. The pricing service uses a proprietary model to determine the exchange rate. Inputs to the model include reported trades and implied bid/ask spreads. The daily valuation of exchange-traded foreign securities generally is determined as of the close of trading on the principal exchange on which such securities trade. Events occurring after the close of trading on foreign exchanges may result in adjustments to the valuation of foreign securities to more accurately reflect their fair value as of the close of regular trading on the New York Stock Exchange. When valuing foreign equity securities that meet certain criteria, the Fund’s Trustees have approved the use of a fair value service that values such securities to reflect market trading that occurs after the close of the applicable foreign markets of comparable securities or other instruments that have a strong correlation to the fair-valued securities.
Affiliated Fund. The Fund may invest in Eaton Vance Cash Reserves Fund, LLC (Cash Reserves Fund), an affiliated investment company managed by Eaton Vance Management (EVM). While Cash Reserves Fund is not a registered money market mutual fund, it conducts all of its investment activities in accordance with the requirements of Rule 2a-7 under the 1940 Act. Investments in Cash Reserves Fund are valued at the closing net asset value per unit
Eaton Vance
Floating-Rate Income Plus Fund
May 31, 2017
Notes to Financial Statements — continued
on the valuation day. Cash Reserves Fund generally values its investment securities based on available market quotations provided by a third party pricing service. Prior to Cash Reserves Fund’s issuance of units in October 2016, the value of the Fund’s investment in Cash Reserves Fund reflected the Fund’s proportionate interest in its net assets and the Fund recorded its pro-rata share of Cash Reserves Fund’s income, expenses and realized gain or loss.
Fair Valuation. Investments for which valuations or market quotations are not readily available or are deemed unreliable are valued at fair value using methods determined in good faith by or at the direction of the Trustees of the Fund in a manner that fairly reflects the security’s value, or the amount that the Fund might reasonably expect to receive for the security upon its current sale in the ordinary course. Each such determination is based on a consideration of relevant factors, which are likely to vary from one pricing context to another. These factors may include, but are not limited to, the type of security, the existence of any contractual restrictions on the security’s disposition, the price and extent of public trading in similar securities of the issuer or of comparable companies or entities, quotations or relevant information obtained from broker/dealers or other market participants, information obtained from the issuer, analysts, and/or the appropriate stock exchange (for exchange-traded securities), an analysis of the company’s or entity’s financial condition, and an evaluation of the forces that influence the issuer and the market(s) in which the security is purchased and sold.
B Investment Transactions — Investment transactions for financial statement purposes are accounted for on a trade date basis. Realized gains and losses on investments sold are determined on the basis of identified cost.
C Income — Interest income is recorded on the basis of interest accrued, adjusted for amortization of premium or accretion of discount. Fees associated with loan amendments are recognized immediately. Dividend income is recorded on the ex-dividend date for dividends received in cash and/or securities. Withholding taxes on foreign interest, dividends and capital gains have been provided for in accordance with the Fund’s understanding of the applicable countries’ tax rules and rates.
D Federal Taxes — The Fund’s policy is to comply with the provisions of the Internal Revenue Code applicable to regulated investment companies and to distribute to shareholders each year substantially all of its net investment income, and all or substantially all of its net realized capital gains. Accordingly, no provision for federal income or excise tax is necessary.
In addition to the requirements of the Internal Revenue Code, the Fund may also be subject to local taxes on the recognition of capital gains in certain countries. In determining the daily net asset value, the Fund estimates the accrual for such taxes, if any, based on the unrealized appreciation on certain portfolio securities and the related tax rates. Taxes attributable to unrealized appreciation are included in the change in unrealized appreciation (depreciation) on investments. Capital gains taxes on securities sold are included in net realized gain (loss) on investments.
As of May 31, 2017, the Fund had no uncertain tax positions that would require financial statement recognition, de-recognition, or disclosure. The Fund files a U.S. federal income tax return annually after its fiscal year-end, which is subject to examination by the Internal Revenue Service for a period of three years from the date of filing.
E Foreign Currency Translation — Investment valuations, other assets, and liabilities initially expressed in foreign currencies are translated each business day into U.S. dollars based upon current exchange rates. Purchases and sales of foreign investment securities and income and expenses denominated in foreign currencies are translated into U.S. dollars based upon currency exchange rates in effect on the respective dates of such transactions. Recognized gains or losses on investment transactions attributable to changes in foreign currency exchange rates are recorded for financial statement purposes as net realized gains and losses on investments. That portion of unrealized gains and losses on investments that results from fluctuations in foreign currency exchange rates is not separately disclosed.
F Unfunded Loan Commitments — The Fund may enter into certain loan agreements all or a portion of which may be unfunded. The Fund is obligated to fund these commitments at the borrower’s discretion. These commitments are disclosed in the accompanying Portfolio of Investments. At May 31, 2017, the Fund had sufficient cash and/or securities to cover these commitments.
G Use of Estimates — The preparation of the financial statements in conformity with U.S. GAAP requires management to make estimates and assumptions that affect the reported amounts of assets and liabilities at the date of the financial statements and the reported amounts of income and expense during the reporting period. Actual results could differ from those estimates.
H Indemnifications — Under the Fund’s organizational documents, its officers and Trustees may be indemnified against certain liabilities and expenses arising out of the performance of their duties to the Fund. Under Massachusetts law, if certain conditions prevail, shareholders of a Massachusetts business trust (such as the Fund) could be deemed to have personal liability for the obligations of the Fund. However, the Fund’s Declaration of Trust contains an express disclaimer of liability on the part of Fund shareholders and the By-laws provide that the Fund shall assume the defense on behalf of any Fund shareholders. Moreover, the By-laws also provide for indemnification out of Fund property of any shareholder held personally liable solely by reason of being or having been a shareholder for all loss or expense arising from such liability. Additionally, in the normal course of business, the Fund enters into agreements with service providers that may contain indemnification clauses. The Fund’s maximum exposure under these arrangements is unknown as this would involve future claims that may be made against the Fund that have not yet occurred.
I Forward Foreign Currency Exchange Contracts — The Fund may enter into forward foreign currency exchange contracts for the purchase or sale of a specific foreign currency at a fixed price on a future date. The forward foreign currency exchange contracts are adjusted by the daily exchange rate of the underlying currency and any gains or losses are recorded as unrealized until such time as the contracts have been closed. Risks may arise upon entering
Eaton Vance
Floating-Rate Income Plus Fund
May 31, 2017
Notes to Financial Statements — continued
these contracts from the potential inability of counterparties to meet the terms of their contracts and from movements in the value of a foreign currency relative to the U.S. dollar.
J Statement of Cash Flows — The cash amount shown in the Statement of Cash Flows of the Fund is the amount included in the Fund’s Statement of Assets and Liabilities and represents the unrestricted cash on hand at its custodian and does not include any short-term investments.
K New Accounting Pronouncement — During the year ended May 31, 2017, the Fund adopted the FASB’s Accounting Standards Update No. 2015-03, which provides guidance to simplify the presentation of debt issuance costs and became effective for fiscal years beginning after December 15, 2015 and interim periods within those fiscal years. Pursuant to the new standard, the Fund is required to present debt issuance costs in its Statement of Assets and Liabilities as a direct deduction from the carrying value of the related debt liability. Prior to the change, such costs were presented by the Fund as a deferred asset. This change in accounting had no impact on the Fund’s net assets.
2 Variable Rate Term Preferred Shares
On July 10, 2013, the Fund issued 360 shares of Series C-1 Variable Rate Term Preferred Shares (Series C-1 VRTP Shares) in a private offering to a commercial paper conduit sponsored by a large financial institution (the Conduit). Variable rate term preferred shares are a form of preferred shares that represent stock of the Fund. They have a par value of $0.01 per share and a liquidation preference of $100,000 per share. The Series C-1 VRTP Shares also had an original mandatory redemption date of July 8, 2016 that had been extended on December 22, 2015 to January 8, 2017 upon consent of the holders of the Series C-1 VRTP Shares and approval of the Fund’s Board of Trustees. During the year ended May 31, 2017, the redemption date was further extended to April 8, 2017.
On September 30, 2016, the Fund made a partial redemption of its Series C-1 VRTP Shares at a liquidation price of $100,000 per share, the financing for which was provided by a committed financing arrangement (see Note 8). The number of Series C-1 VRTP Shares redeemed and redemption amount (excluding the final dividend payment) during the year ended May 31, 2017 are as follows:
| | | | |
Series C-1 VRTP Shares Redeemed During the Year | | | 170 | |
Redemption Amount | | $ | 17,000,000 | |
Upon completion of the partial redemption of the Series C-1 VRTP Shares, the remaining 190 Series C-1 VRTP Shares were transferred to another large financial institution (the Assignee) on September 30, 2016 as permitted by the Fund’s By-laws. The transferred Series C-1 VRTP Shares were then exchanged for an equal number of Series L-2 Variable Rate Term Preferred Shares (Series L-2 VRTP Shares), and the mandatory redemption date was extended to three years from the date of transfer. In addition, beginning one year after the date of the transfer, the Assignee is permitted to accelerate the redemption date of the Series L-2 VRTP Shares to 365 days following delivery of a redemption notice to the Fund. Dividends on the Series L-2 VRTP Shares are determined each day based on a spread of 1.85% to three-month LIBOR (spread of 1.20% to one-month LIBOR prior to September 30, 2016 for the Series C-1 VRTP Shares). Such spread to the cost of funding is determined based on the current credit rating of the Series L-2 VRTP Shares, which is provided by Moody’s Investors Service.
The Series L-2 VRTP Shares are redeemable at the option of the Fund at a redemption price equal to $100,000 per share, plus accumulated and unpaid dividends, on any business day and solely for the purpose of reducing the leverage of the Fund. The Series L-2 VRTP Shares are also subject to mandatory redemption at a redemption price equal to $100,000 per share, plus accumulated and unpaid dividends, if the Fund is in default for an extended period on its asset maintenance or leverage ratio requirements with respect to the Series L-2 VRTP Shares. Six months prior to the mandatory redemption date, the Fund is required to segregate in a liquidity account with its custodian investments equal to 110% of the Series L-2 VRTP Shares’ redemption price, and over the six month period execute a series of liquidation transactions to assure sufficient liquidity to redeem the Series L-2 VRTP Shares. The holders of the Series L-2 VRTP Shares, voting as a class, are entitled to elect two Trustees of the Fund. If the dividends on the Series L-2 VRTP Shares remain unpaid in an amount equal to two full years’ dividends, the holders of the Series L-2 VRTP Shares as a class have the right to elect a majority of the Board of Trustees.
For financial reporting purposes, the liquidation value of the Series L-2 VRTP Shares (net of unamortized deferred debt issuance costs) is presented as a liability on the Statement of Assets and Liabilities and unpaid dividends are included in interest expense and fees payable. Dividends accrued on each series of variable rate term preferred shares are treated as interest payments for financial reporting purposes and are included in interest expense and fees on the Statement of Operations.
In connection with the transfer of the Series C-1 VRTP Shares to the Assignee on September 30, 2016, the Fund paid an upfront fee of $95,000 and debt issuance costs of $107,733, both of which are being amortized to interest expense and fees over a period of three years to September 30, 2019. The unamortized amount of the debt issuance costs as of May 31, 2017 is presented as a deduction of the liability for variable rate term preferred shares on the Statement of Assets and Liabilities. Also included in interest expense and fees for the year ended May 31, 2017 is amortization of $97,912 of deferred debt issuance costs incurred in connection with the initial offering of the Series C-1 VRTP Shares and upfront fees paid in connection with the extensions of the redemption date prior to the transfer of the Series C-1 VRTP Shares to the Assignee which are fully amortized as of May 31, 2017.
Eaton Vance
Floating-Rate Income Plus Fund
May 31, 2017
Notes to Financial Statements — continued
The carrying amount of the Series L-2 VRTP Shares at May 31, 2017 represents its liquidation value, which approximates fair value. If measured at fair value, the Series L-2 VRTP Shares would have been considered as Level 2 in the fair value hierarchy (see Note 11) at May 31, 2017. The average liquidation preference of the variable rate term preferred shares during the year ended May 31, 2017 was $24,635,616.
3 Distributions to Shareholders and Income Tax Information
The Fund intends to make monthly distributions of net investment income to common shareholders, after payment of any dividends on any outstanding variable rate term preferred shares. In addition, at least annually, the Fund intends to distribute all or substantially all of its net realized capital gains. Distributions to common shareholders are recorded on the ex-dividend date. Dividends to variable rate term preferred shareholders are accrued daily and payable monthly. The dividend rate on the Series L-2 VRTP Shares at May 31, 2017 was 3.06%. The amount of dividends accrued and the average dividend rate of the variable rate term preferred shares during the year ended May 31, 2017 were $589,515 and 2.39%, respectively.
Distributions to shareholders are determined in accordance with income tax regulations, which may differ from U.S. GAAP. As required by U.S. GAAP, only distributions in excess of tax basis earnings and profits are reported in the financial statements as a return of capital. Permanent differences between book and tax accounting relating to distributions are reclassified to paid-in capital. For tax purposes, distributions from short-term capital gains are considered to be from ordinary income.
The tax character of distributions declared, including distributions on variable rate term preferred shares that are treated as interest expense for financial reporting purposes, for the years ended May 31, 2017 and May 31, 2016 was as follows:
| | | | | | | | |
| | | Year Ended May 31, | |
| | | 2017 | | | 2016 | |
| | |
Distributions declared from: | | | | | | | | |
Ordinary income | | $ | 8,064,550 | | | $ | 9,054,466 | |
Tax return of capital | | $ | 78,142 | | | $ | — | |
During the year ended May 31, 2017, accumulated net realized loss was decreased by $24,862, accumulated distributions in excess of net investment income was decreased by $117,546 and paid-in capital was decreased by $142,408 due to differences between book and tax accounting, primarily for foreign currency gain (loss), distributions from real estate investment trusts (REITs), non-deductible expenses, investments in partnerships, the treatment of VRTP Shares as equity for tax purposes and convertible debt securities. These reclassifications had no effect on the net assets or net asset value per share of the Fund.
As of May 31, 2017, the components of distributable earnings (accumulated losses) on a tax basis were as follows:
| | | | |
Deferred capital losses | | $ | (4,665,609 | ) |
Late year ordinary losses | | $ | (915 | ) |
Net unrealized depreciation | | $ | (3,169,147 | ) |
Other temporary differences | | $ | (99,148 | ) |
The differences between components of distributable earnings (accumulated losses) on a tax basis and the amounts reflected in the Statement of Assets and Liabilities are primarily due to wash sales, foreign currency transactions, investments in partnerships, distributions from REITs, the timing of recognizing distributions to shareholders and convertible debt securities.
At May 31, 2017, the Fund, for federal income tax purposes, had deferred capital losses of $4,665,609 which would reduce its taxable income arising from future net realized gains on investment transactions, if any, to the extent permitted by the Internal Revenue Code, and thus would reduce the amount of distributions to shareholders, which would otherwise be necessary to relieve the Fund of any liability for federal income or excise tax. The deferred capital losses are treated as arising on the first day of the Fund’s next taxable year and retain the same short-term or long-term character as when originally deferred. Of the deferred capital losses at May 31, 2017, $4,665,609 are long-term.
Additionally, at May 31, 2017, the Fund had a late year ordinary loss of $915 which it has elected to defer to the following taxable year pursuant to income tax regulations. Late year ordinary losses represent certain specified losses realized in that portion of a taxable year after October 31 that are treated as ordinary for tax purposes plus ordinary losses attributable to that portion of a taxable year after December 31.
Eaton Vance
Floating-Rate Income Plus Fund
May 31, 2017
Notes to Financial Statements — continued
The cost and unrealized appreciation (depreciation) of investments of the Fund at May 31, 2017, as determined on a federal income tax basis, were as follows:
| | | | |
| |
Aggregate cost | | $ | 217,089,199 | |
| |
Gross unrealized appreciation | | $ | 3,392,946 | |
Gross unrealized depreciation | | | (6,563,052 | ) |
| |
Net unrealized depreciation | | $ | (3,170,106 | ) |
4 Investment Adviser Fee and Other Transactions with Affiliates
The investment adviser fee is earned by EVM as compensation for investment advisory services rendered to the Fund. The fee is computed at an annual rate of 0.75% of the Fund’s average daily total managed assets and is payable monthly. Total managed assets as referred to herein represent total assets of the Fund (including assets attributable to borrowings, any outstanding preferred shares, or other forms of leverage) less accrued liabilities (other than liabilities representing borrowings or such other forms of leverage). For the year ended May 31, 2017, the Fund’s investment adviser fee amounted to $1,518,752. The Fund invests its cash in Cash Reserves Fund. EVM does not currently receive a fee for advisory services provided to Cash Reserves Fund. EVM also serves as administrator of the Fund, but receives no compensation.
Trustees and officers of the Fund who are members of EVM’s organization receive remuneration for their services to the Fund out of the investment adviser fee. Trustees of the Fund who are not affiliated with EVM may elect to defer receipt of all or a percentage of their annual fees in accordance with the terms of the Trustees Deferred Compensation Plan. For the year ended May 31, 2017, no significant amounts have been deferred. Certain officers and Trustees of the Fund are officers of EVM.
5 Purchases and Sales of Investments
Purchases and sales of investments, other than short-term obligations and including maturities, paydowns and principal repayments on Senior Loans, aggregated $108,720,647 and $104,400,807, respectively, for the year ended May 31, 2017.
6 Common Shares of Beneficial Interest
The Fund may issue common shares pursuant to its dividend reinvestment plan. There were no common shares issued by the Fund for the years ended May 31, 2017 and May 31, 2016.
On November 11, 2013, the Board of Trustees of the Fund authorized the repurchase by the Fund of up to 10% of its then currently outstanding common shares in open-market transactions at a discount to net asset value. The repurchase program does not obligate the Fund to purchase a specific amount of shares. There were no repurchases of common shares by the Fund for the years ended May 31, 2017 and May 31, 2016.
7 Financial Instruments
The Fund may trade in financial instruments with off-balance sheet risk in the normal course of its investing activities. These financial instruments may include forward foreign currency exchange contracts and may involve, to a varying degree, elements of risk in excess of the amounts recognized for financial statement purposes. The notional or contractual amounts of these instruments represent the investment the Fund has in particular classes of financial instruments and do not necessarily represent the amounts potentially subject to risk. The measurement of the risks associated with these instruments is meaningful only when all related and offsetting transactions are considered. A summary of obligations under these financial instruments at May 31, 2017 is included in the Portfolio of Investments. At May 31, 2017, the Fund had sufficient cash and/or securities to cover commitments under these contracts.
The Fund is subject to foreign exchange risk in the normal course of pursuing its investment objective. Because the Fund holds foreign currency denominated investments, the value of these investments and related receivables and payables may change due to future changes in foreign currency exchange rates. To hedge against this risk, the Fund enters into forward foreign currency exchange contracts.
The Fund enters into forward foreign currency exchange contracts that may contain provisions whereby the counterparty may terminate the contract under certain conditions, including but not limited to a decline in the Fund’s net assets below a certain level over a certain period of time, which would trigger a payment by the Fund for those derivatives in a liability position. At May 31, 2017, the fair value of derivatives with credit-related contingent features in a net liability position was $1,699.
Eaton Vance
Floating-Rate Income Plus Fund
May 31, 2017
Notes to Financial Statements — continued
The over-the-counter (OTC) derivatives in which the Fund invests are subject to the risk that the counterparty to the contract fails to perform its obligations under the contract. To mitigate this risk, the Fund has entered into an International Swaps and Derivatives Association, Inc. Master Agreement (“ISDA Master Agreement”) or similar agreement with substantially all its derivative counterparties. An ISDA Master Agreement is a bilateral agreement between the Fund and a counterparty that governs certain OTC derivatives and typically contains, among other things, set-off provisions in the event of a default and/or termination event as defined under the relevant ISDA Master Agreement. Under an ISDA Master Agreement, the Fund may, under certain circumstances, offset with the counterparty certain derivative financial instruments’ payables and/or receivables with collateral held and/or posted and create one single net payment. The provisions of the ISDA Master Agreement typically permit a single net payment in the event of default including the bankruptcy or insolvency of the counterparty. However, bankruptcy or insolvency laws of a particular jurisdiction may impose restrictions on or prohibitions against the right of offset in bankruptcy or insolvency. Certain ISDA Master Agreements allow counterparties to OTC derivatives to terminate derivative contracts prior to maturity in the event the Fund’s net assets decline by a stated percentage or the Fund fails to meet the terms of its ISDA Master Agreements, which would cause the counterparty to accelerate payment by the Fund of any net liability owed to it.
The collateral requirements for derivatives traded under an ISDA Master Agreement are governed by a Credit Support Annex to the ISDA Master Agreement. Collateral requirements are determined at the close of business each day and are typically based on changes in market values for each transaction under an ISDA Master Agreement and netted into one amount for such agreement. Generally, the amount of collateral due from or to a counterparty is subject to a minimum transfer threshold amount before a transfer is required, which may vary by counterparty. Collateral pledged for the benefit of the Fund and/or counterparty is held in segregated accounts by the Fund’s custodian and cannot be sold, re-pledged, assigned or otherwise used while pledged. The portion of such collateral representing cash, if any, is reflected as restricted cash and, in the case of cash pledged by a counterparty for the benefit of the Fund, a corresponding liability on the Statement of Assets and Liabilities. Securities pledged by the Fund as collateral, if any, are identified as such in the Portfolio of Investments.
The fair value of open derivative instruments (not considered to be hedging instruments for accounting disclosure purposes) and whose primary underlying risk exposure is foreign exchange risk at May 31, 2017 was as follows:
| | | | | | | | |
| | | Fair Value | |
| Derivative | | Asset Derivative | | | Liability Derivative(1) | |
| | |
Forward foreign currency exchange contracts | | $ | — | | | $ | (1,699 | ) |
| (1) | Statement of Assets and Liabilities location: Payable for open forward foreign currency exchange contracts; Net unrealized depreciation. |
The Fund’s derivative assets and liabilities at fair value by type, which are reported gross in the Statement of Assets and Liabilities, are presented in the table above. The following table presents the Fund’s derivative liabilities by counterparty, net of amounts available for offset under a master netting agreement and net of the related collateral pledged by the Fund for such liabilities as of May 31, 2017.
| | | | | | | | | | | | | | | | | | | | |
| Counterparty | | Derivative
Liabilities Subject to
Master Netting
Agreement | | | Derivatives
Available
for Offset | | | Non-cash
Collateral
Pledged(a) | | | Cash
Collateral
Pledged(a) | | | Net Amount
of Derivative
Liabilities(b) | |
| | | | | |
Bank of America, N.A. | | $ | (1,699 | ) | | $ | — | | | $ | — | | | $ | — | | | $ | (1,699 | ) |
| (a) | In some instances, the actual collateral pledged may be more than the amount shown due to overcollateralization. |
| (b) | Net amount represents the net amount payable to the counterparty in the event of default. |
The effect of derivative instruments (not considered to be hedging instruments for accounting disclosure purposes) on the Statement of Operations and whose primary underlying risk exposure is foreign exchange risk for the year ended May 31, 2017 was as follows:
| | | | | | | | |
| Derivative | | Realized Gain (Loss)
on Derivatives Recognized
in Income(1) | | | Change in Unrealized
Appreciation (Depreciation) on
Derivatives Recognized in Income(2) | |
| | |
Forward foreign currency exchange contracts | | $ | 449 | | | $ | (1,699 | ) |
| (1) | Statement of Operations location: Net realized gain (loss) – Foreign currency and forward foreign currency exchange contract transactions. |
| (2) | Statement of Operations location: Change in unrealized appreciation (depreciation) – Foreign currency and forward foreign currency exchange contracts. |
Eaton Vance
Floating-Rate Income Plus Fund
May 31, 2017
Notes to Financial Statements — continued
The average notional amount of forward foreign currency exchange contracts outstanding (based on the absolute value of notional amounts of currency purchased and currency sold) during the year ended May 31, 2017, which is indicative of the volume of this derivative type, was approximately $71,000.
8 Revolving Credit and Security Agreement
The Fund has entered into a Revolving Credit and Security Agreement, as amended (the Agreement) with conduit lenders and a bank to borrow up to $64 million ($54 million prior to September 30, 2016). Borrowings under the Agreement are secured by the assets of the Fund. Interest is charged at a rate above the conduits’ commercial paper issuance rate and is payable monthly. Under the terms of the Agreement, in effect through March 12, 2018, the Fund also pays a program fee of 0.67% per annum on its outstanding borrowings to administer the facility and a liquidity fee of 0.15% (0.25% if the outstanding loan amount is less than or equal to 60% of the total facility size) per annum on the borrowing limit under the Agreement. Program and liquidity fees for the year ended May 31, 2017 totaled $393,978 and are included in interest expense and fees on the Statement of Operations. The Fund also paid an upfront fee of $64,000, which is being amortized to interest expense over a period of one year through March 12, 2018. The unamortized balance at May 31, 2017 is approximately $50,000 and is included in prepaid upfront fees on notes payable on the Statement of Assets and Liabilities. The Fund is required to maintain certain net asset levels during the term of the Agreement. At May 31, 2017, the Fund had borrowings outstanding under the Agreement of $54,000,000 at an interest rate of 1.09%. Based on the short-term nature of the borrowings under the Agreement and the variable interest rate, the carrying amount of the borrowings at May 31, 2017 approximated its fair value. If measured at fair value, borrowings under the Agreement would have been considered as Level 2 in the fair value hierarchy (see Note 11) at May 31, 2017. For the year ended May 31, 2017, the average borrowings under the Agreement and the average interest rate (excluding fees) were $44,416,438 and 0.86%, respectively.
9 Risks Associated with Foreign Investments
Investing in securities issued by companies whose principal business activities are outside the United States may involve significant risks not present in domestic investments. For example, there is generally less publicly available information about foreign companies, particularly those not subject to the disclosure and reporting requirements of the U.S. securities laws. Certain foreign issuers are generally not bound by uniform accounting, auditing, and financial reporting requirements and standards of practice comparable to those applicable to domestic issuers. Investments in foreign securities also involve the risk of possible adverse changes in investment or exchange control regulations, expropriation or confiscatory taxation, limitation on the removal of funds or other assets of the Fund, political or financial instability or diplomatic and other developments which could affect such investments. Foreign securities markets, while growing in volume and sophistication, are generally not as developed as those in the United States, and securities of some foreign issuers (particularly those located in developing countries) may be less liquid and more volatile than securities of comparable U.S. companies. In general, there is less overall governmental supervision and regulation of foreign securities markets, broker/dealers and issuers than in the United States.
10 Credit Risk
The Fund invests primarily in below investment grade floating-rate loans, which are considered speculative because of the credit risk of their issuers. Changes in economic conditions or other circumstances are more likely to reduce the capacity of issuers of these securities to make principal and interest payments. Such companies are more likely to default on their payments of interest and principal owed than issuers of investment grade bonds. An economic downturn generally leads to a higher non-payment rate, and a loan or other debt obligation may lose significant value before a default occurs. Lower rated investments also may be subject to greater price volatility than higher rated investments. Moreover, the specific collateral used to secure a loan may decline in value or become illiquid, which would adversely affect the loan’s value.
11 Fair Value Measurements
Under generally accepted accounting principles for fair value measurements, a three-tier hierarchy to prioritize the assumptions, referred to as inputs, is used in valuation techniques to measure fair value. The three-tier hierarchy of inputs is summarized in the three broad levels listed below.
| • | | Level 1 – quoted prices in active markets for identical investments |
| • | | Level 2 – other significant observable inputs (including quoted prices for similar investments, interest rates, prepayment speeds, credit risk, etc.) |
| • | | Level 3 – significant unobservable inputs (including a fund’s own assumptions in determining the fair value of investments) |
In cases where the inputs used to measure fair value fall in different levels of the fair value hierarchy, the level disclosed is determined based on the lowest level input that is significant to the fair value measurement in its entirety. The inputs or methodology used for valuing securities are not necessarily an indication of the risk associated with investing in those securities.
Eaton Vance
Floating-Rate Income Plus Fund
May 31, 2017
Notes to Financial Statements — continued
At May 31, 2017, the hierarchy of inputs used in valuing the Fund’s investments and open derivative instruments, which are carried at value, were as follows:
| | | | | | | | | | | | | | | | |
| Asset Description | | Level 1 | | | Level 2 | | | Level 3* | | | Total | |
| | | | |
Senior Floating-Rate Loans (Less Unfunded Loan Commitments) | | $ | — | | | $ | 181,110,742 | | | $ | 544,646 | | | $ | 181,655,388 | |
Commercial Mortgage-Backed Securities | | | — | | | | 85,625 | | | | — | | | | 85,625 | |
Corporate Bonds & Notes | | | — | | | | 13,784,985 | | | | — | | | | 13,784,985 | |
Foreign Government Bonds | | | — | | | | 4,282,547 | | | | — | | | | 4,282,547 | |
Convertible Bonds | | | — | | | | 324,445 | | | | — | | | | 324,445 | |
Common Stocks | | | 5,103,428 | | | | 1,189,851 | ** | | | 87,957 | | | | 6,381,236 | |
Convertible Preferred Stocks | | | — | | | | 2,026,695 | | | | 0 | | | | 2,026,695 | |
Preferred Stocks | | | 13,047 | | | | — | | | | — | | | | 13,047 | |
Short-Term Investments | | | — | | | | 5,365,125 | | | | — | | | | 5,365,125 | |
| | | | |
Total Investments | | $ | 5,116,475 | | | $ | 208,170,015 | | | $ | 632,603 | | | $ | 213,919,093 | |
| | | | |
Liability Description | | | | | | | | | | | | | | | | |
| | | | |
Forward Foreign Currency Exchange Contracts | | $ | — | | | $ | (1,699 | ) | | $ | — | | | $ | (1,699 | ) |
| | | | |
Total | | $ | — | | | $ | (1,699 | ) | | $ | — | | | $ | (1,699 | ) |
| * | None of the unobservable inputs for Level 3 assets, individually or collectively, had a material impact on the Fund. |
| ** | Includes foreign equity securities whose values were adjusted to reflect market trading of comparable securities or other correlated instruments that occurred after the close of trading in their applicable foreign markets. |
Level 3 investments at the beginning and/or end of the period in relation to net assets were not significant and accordingly, a reconciliation of Level 3 assets for the year ended May 31, 2017 is not presented.
At May 31, 2017, there were no investments transferred between Level 1 and Level 2 during the year then ended.
Eaton Vance
Floating-Rate Income Plus Fund
May 31, 2017
Report of Independent Registered Public Accounting Firm
To the Trustees and Shareholders of Eaton Vance Floating-Rate Income Plus Fund:
We have audited the accompanying statement of assets and liabilities of Eaton Vance Floating-Rate Income Plus Fund (the “Fund”), including the portfolio of investments, as of May 31, 2017, and the related statements of operations and cash flows for the year then ended, the statements of changes in net assets for each of the two years in the period then ended, and the financial highlights for each of the periods presented. These financial statements and financial highlights are the responsibility of the Fund’s management. Our responsibility is to express an opinion on these financial statements and financial highlights based on our audits.
We conducted our audits in accordance with the standards of the Public Company Accounting Oversight Board (United States). Those standards require that we plan and perform the audit to obtain reasonable assurance about whether the financial statements and financial highlights are free of material misstatement. The Fund is not required to have, nor were we engaged to perform, an audit of its internal control over financial reporting. Our audits included consideration of internal control over financial reporting as a basis for designing audit procedures that are appropriate in the circumstances, but not for the purpose of expressing an opinion on the effectiveness of the Fund’s internal control over financial reporting. Accordingly, we express no such opinion. An audit also includes examining, on a test basis, evidence supporting the amounts and disclosures in the financial statements, assessing the accounting principles used and significant estimates made by management, as well as evaluating the overall financial statement presentation. Our procedures included confirmation of securities and senior loans owned as of May 31, 2017, by correspondence with the custodian, brokers, and selling or agent banks; where replies were not received from brokers and selling or agent banks, we performed other auditing procedures. We believe that our audits provide a reasonable basis for our opinion.
In our opinion, such financial statements and financial highlights referred to above present fairly, in all material respects, the financial position of Eaton Vance Floating-Rate Income Plus Fund as of May 31, 2017, the results of its operations and its cash flows for the year then ended, the changes in its net assets for each of the two years in the period then ended, and the financial highlights for each of the periods presented, in conformity with accounting principles generally accepted in the United States of America.
DELOITTE & TOUCHE LLP
Boston, Massachusetts
July 17, 2017
Eaton Vance
Floating-Rate Income Plus Fund
May 31, 2017
Federal Tax Information (Unaudited)
The Form 1099-DIV you receive in February 2018 will show the tax status of all distributions paid to your account in calendar year 2017. Shareholders are advised to consult their own tax adviser with respect to the tax consequences of their investment in the Fund. As required by the Internal Revenue Code and/or regulations, shareholders must be notified regarding the status of qualified dividend income for individuals and the dividends received deduction for corporations.
Qualified Dividend Income. For the fiscal year ended May 31, 2017, the Fund designates approximately $652,554, or up to the maximum amount of such dividends allowable pursuant to the Internal Revenue Code, as qualified dividend income eligible for the reduced tax rate of 15%.
Dividends Received Deduction. Corporate shareholders are generally entitled to take the dividends received deduction on the portion of the Fund’s dividend distribution that qualifies under tax law. For the Fund’s fiscal 2017 ordinary income dividends, 7.87% qualifies for the corporate dividends received deduction.
Eaton Vance
Floating-Rate Income Plus Fund
May 31, 2017
Annual Meeting of Shareholders (Unaudited)
The Fund held its Annual Meeting of Shareholders on March 23, 2017. The following action was taken by the shareholders:
Item 1: The election of Scott E. Eston, Thomas E. Faust Jr., Cynthia E. Frost and Scott E. Wennerholm as Class I Trustees of the Fund for a three-year term expiring in 2020. Mr. Eston was elected solely by VRTP shareholders.
| | | | | | | | |
Nominee for Trustee Elected by All Shareholders | | Number of Shares | |
| | For | | | Withheld | |
Thomas E. Faust Jr. | | | 6,970,010 | | | | 151,252 | |
Cynthia E. Frost | | | 6,981,669 | | | | 139,593 | |
Scott E. Wennerholm | | | 7,016,959 | | | | 104,303 | |
| | |
| | | | | | | | |
Nominee for Trustee Elected by VRTP Shareholders | | Number of Shares | |
| | For | | | Withheld | |
Scott E. Eston | | | 190 | | | | 0 | |
Eaton Vance
Floating-Rate Income Plus Fund
May 31, 2017
Dividend Reinvestment Plan
The Fund offers a dividend reinvestment plan (Plan) pursuant to which shareholders automatically have distributions reinvested in common shares (Shares) of the Fund unless they elect otherwise through their investment dealer. On the distribution payment date, if the NAV per Share is equal to or less than the market price per Share plus estimated brokerage commissions, then new Shares will be issued. The number of Shares shall be determined by the greater of the NAV per Share or 95% of the market price. Otherwise, Shares generally will be purchased on the open market by American Stock Transfer & Trust Company, LLC, the Plan agent (Agent). Distributions subject to income tax (if any) are taxable whether or not Shares are reinvested.
If your Shares are in the name of a brokerage firm, bank, or other nominee, you can ask the firm or nominee to participate in the Plan on your behalf. If the nominee does not offer the Plan, you will need to request that the Fund’s transfer agent re-register your Shares in your name or you will not be able to participate.
The Agent’s service fee for handling distributions will be paid by the Fund. Plan participants will be charged their pro rata share of brokerage commissions on all open-market purchases.
Plan participants may withdraw from the Plan at any time by writing to the Agent at the address noted on the following page. If you withdraw, you will receive Shares in your name for all Shares credited to your account under the Plan. If a participant elects by written notice to the Agent to sell part or all of his or her Shares and remit the proceeds, the Agent is authorized to deduct a $5.00 fee plus brokerage commissions from the proceeds.
If you wish to participate in the Plan and your Shares are held in your own name, you may complete the form on the following page and deliver it to the Agent. Any inquiries regarding the Plan can be directed to the Agent at 1-866-439-6787.
Eaton Vance
Floating-Rate Income Plus Fund
May 31, 2017
Application for Participation in Dividend Reinvestment Plan
This form is for shareholders who hold their common shares in their own names. If your common shares are held in the name of a brokerage firm, bank, or other nominee, you should contact your nominee to see if it will participate in the Plan on your behalf. If you wish to participate in the Plan, but your brokerage firm, bank, or nominee is unable to participate on your behalf, you should request that your common shares be re-registered in your own name which will enable your participation in the Plan.
The following authorization and appointment is given with the understanding that I may terminate it at any time by terminating my participation in the Plan as provided in the terms and conditions of the Plan.
Please print exact name on account
Shareholder signature Date
Shareholder signature Date
Please sign exactly as your common shares are registered. All persons whose names appear on the share certificate must sign.
YOU SHOULD NOT RETURN THIS FORM IF YOU WISH TO RECEIVE YOUR DISTRIBUTIONS IN CASH. THIS IS NOT A PROXY.
This authorization form, when signed, should be mailed to the following address:
Eaton Vance Floating-Rate Income Plus Fund
c/o American Stock Transfer & Trust Company, LLC
P.O. Box 922
Wall Street Station
New York, NY 10269-0560
Number of Employees
The Fund is organized as a Massachusetts business trust and is registered under the Investment Company Act of 1940, as amended, as a closed-end management investment company, and has no employees.
Number of Shareholders
As of May 31, 2017, Fund records indicate that there are 3 registered shareholders and approximately 3,520 shareholders owning the Fund shares in street name, such as through brokers, banks and financial intermediaries.
If you are a street name shareholder and wish to receive Fund reports directly, which contain important information about the Fund, please write or call:
Eaton Vance Distributors, Inc.
Two International Place
Boston, MA 02110
1-800-262-1122
New York Stock Exchange symbol
The New York Stock Exchange symbol is EFF.
Eaton Vance
Floating-Rate Income Plus Fund
May 31, 2017
Board of Trustees’ Contract Approval
Overview of the Contract Review Process
The Investment Company Act of 1940, as amended (the “1940 Act”), provides, in substance, that each investment advisory agreement between a fund and its investment adviser will continue in effect from year to year only if its continuation is approved at least annually by the fund’s board of trustees, including by a vote of a majority of the trustees who are not “interested persons” of the fund (“Independent Trustees”), cast in person at a meeting called for the purpose of considering such approval.
At a meeting of the Boards of Trustees (each a “Board”) of the registered investment companies advised by either Eaton Vance Management or its affiliate, Boston Management and Research, (the “Eaton Vance Funds”) held on April 25, 2017, the Board, including a majority of the Independent Trustees, voted to approve continuation of existing investment advisory and sub-advisory agreements for the Eaton Vance Funds for an additional one-year period. In voting its approval, the Board relied upon the affirmative recommendation of its Contract Review Committee, which is a committee comprised exclusively of Independent Trustees. Prior to making its recommendation, the Contract Review Committee reviewed information furnished by each adviser to the Eaton Vance Funds (including information specifically requested by the Board) for a series of meetings of the Contract Review Committee held between February and April 2017. The Contract Review Committee also considered information received at prior meetings of the Board and its committees, as relevant to its annual evaluation of the investment advisory and sub-advisory agreements.
The information that the Board considered included, among other things, the following (for funds that invest through one or more underlying portfolio(s), references to “each fund” in this section may include information that was considered at the portfolio-level):
Information about Fees, Performance and Expenses
| • | | A report from an independent data provider comparing the advisory and related fees paid by each fund with fees paid by comparable funds as identified by the independent data provider (“comparable funds”); |
| • | | A report from an independent data provider comparing each fund’s total expense ratio and its components to comparable funds; |
| • | | A report from an independent data provider comparing the investment performance of each fund (including, where relevant, yield data, Sharpe ratios and information ratios) to the investment performance of comparable funds over various time periods; |
| • | | Data regarding investment performance in comparison to benchmark indices, as well as customized groups of peer funds and blended indices identified by the adviser in consultation with the Board; |
| • | | For each fund, comparative information concerning the fees charged and the services provided by each adviser in managing other accounts (including mutual funds, other collective investment funds and institutional accounts) using investment strategies and techniques similar to those used in managing such fund; |
| • | | Profitability analyses for each adviser with respect to each fund; |
Information about Portfolio Management and Trading
| • | | Descriptions of the investment management services provided to each fund, including the investment strategies and processes it employs; |
| • | | The procedures and processes used to determine the fair value of fund assets and actions taken to monitor and test the effectiveness of such procedures and processes; |
| • | | Information about each adviser’s policies and practices with respect to trading, including each adviser’s processes for monitoring best execution of portfolio transactions; |
| • | | Information about the allocation of brokerage transactions and the benefits received by each adviser as a result of brokerage allocation, including information concerning the acquisition of research through client commission arrangements and policies with respect to “soft dollars”; |
| • | | Data relating to portfolio turnover rates of each fund; |
Information about each Adviser
| • | | Reports detailing the financial results and condition of each adviser; |
| • | | Descriptions of the qualifications, education and experience of the individual investment professionals whose responsibilities include portfolio management and investment research for the funds, and information relating to their compensation and responsibilities with respect to managing other mutual funds and investment accounts; |
| • | | The Code of Ethics of each adviser and its affiliates, together with information relating to compliance with and the administration of such codes; |
| • | | Policies and procedures relating to proxy voting and the handling of corporate actions and class actions; |
| • | | Information concerning the resources devoted to compliance efforts undertaken by each adviser and its affiliates (including descriptions of various compliance programs) and their record of compliance; |
| • | | Information concerning the business continuity and disaster recovery plans of each adviser and its affiliates; |
| • | | A description of Eaton Vance Management’s procedures for overseeing third party advisers and sub-advisers, including with respect to regulatory and compliance issues, investment management and other matters; |
Eaton Vance
Floating-Rate Income Plus Fund
May 31, 2017
Board of Trustees’ Contract Approval — continued
Other Relevant Information
| • | | Information concerning the nature, cost and character of the administrative and other non-investment advisory services provided by Eaton Vance Management and its affiliates; |
| • | | Information concerning management of the relationship with the custodian, subcustodians and fund accountants by each adviser or the funds’ administrator; and |
| • | | The terms of each investment advisory agreement. |
Over the course of the twelve-month period ended April 30, 2017, with respect to one or more funds, the Board met ten times and the Contract Review Committee, the Audit Committee, the Governance Committee, the Portfolio Management Committee and the Compliance Reports and Regulatory Matters Committee, each of which is a Committee comprised solely of Independent Trustees, met seven, thirteen, six, eight and ten times, respectively. At such meetings, the Trustees participated in investment and performance reviews with the portfolio managers and other investment professionals of each investment adviser relating to each fund, and considered various investment and trading strategies used in pursuing each fund’s investment objective, such as the use of derivative instruments, as well as risk management techniques. The Board and its Committees also evaluated issues pertaining to industry and regulatory developments, compliance procedures, fund governance and other issues with respect to the funds, and received and participated in reports and presentations provided by Eaton Vance Management and other fund advisers with respect to such matters. In addition to the formal meetings of the Board and its Committees, the Independent Trustees hold regular teleconferences in between meetings to discuss, among other topics, matters relating to the continuation of investment advisory and sub-advisory agreements.
For funds that invest through one or more underlying portfolios, the Board considered similar information about the portfolio(s) when considering the approval of investment advisory agreements. In addition, in cases where the fund’s investment adviser has engaged a sub-adviser, the Board considered similar information about the sub-adviser when considering the approval of any sub-advisory agreement.
The Contract Review Committee was assisted throughout the contract review process by Goodwin Procter LLP, independent legal counsel for the Independent Trustees. The members of the Contract Review Committee relied upon the advice of such counsel and their own business judgment in determining the material factors to be considered in evaluating each investment advisory and sub-advisory agreement and the weight to be given to each such factor. The conclusions reached with respect to each investment advisory and sub-advisory agreement were based on a comprehensive evaluation of all the information provided and not any single factor. Moreover, each member of the Contract Review Committee may have placed varying emphasis on particular factors in reaching conclusions with respect to each investment advisory and sub-advisory agreement. In evaluating each investment advisory and sub-advisory agreement, including the specific fee structures and other terms of the agreements, the Contract Review Committee was informed by multiple years of analysis and discussion among the Independent Trustees and the Eaton Vance Funds’ advisers and sub-advisers.
Results of the Process
Based on its consideration of the foregoing, and such other information as it deemed relevant, including the factors and conclusions described below, the Contract Review Committee concluded that the continuation of the investment advisory and administrative agreement of Eaton Vance Floating-Rate Income Plus Fund (the “Fund”) with Eaton Vance Management (the “Adviser”), including its fee structure, is in the interests of shareholders and, therefore, the Contract Review Committee recommended to the Board approval of the agreement. The Board accepted the recommendation of the Contract Review Committee based on the material factors considered and conclusions reached by the Contract Review Committee with respect to the agreement. Accordingly, the Board, including a majority of the Independent Trustees, voted to approve continuation of the investment advisory agreement for the Fund.
Nature, Extent and Quality of Services
In considering whether to approve the investment advisory agreement of the Fund, the Board evaluated the nature, extent and quality of services provided to the Fund by the Adviser.
The Board considered the Adviser’s management capabilities and investment process with respect to the types of investments held by the Fund, including the education, experience and number of its investment professionals and other personnel who provide portfolio management, investment research, and similar services to the Fund. In particular, the Board considered the abilities and experience of the Adviser’s investment professionals in analyzing special considerations relevant to investing in senior floating rate loans and other income producing investments. The Board considered the Adviser’s large group of bank loan investment professionals and other personnel who provide services to the Fund, including portfolio managers and analysts. The Board also took into account the resources dedicated to portfolio management and other services, as well as the compensation methods of the Adviser and other factors, such as the reputation and resources of the Adviser to recruit and retain highly qualified research, advisory and supervisory investment professionals. In addition, the Board considered the time and attention devoted to the Eaton Vance Funds, including the Fund, by senior management, as well as the infrastructure, operational capabilities and support staff in place to assist in the portfolio management and operations of the Fund, including the provision of administrative services. The Board also considered the business-related and other risks to which the Adviser or its affiliates may be subject in managing the Fund.
Eaton Vance
Floating-Rate Income Plus Fund
May 31, 2017
Board of Trustees’ Contract Approval — continued
The Board considered the compliance programs of the Adviser and relevant affiliates thereof. Among other matters, the Board considered compliance and reporting matters relating to personal trading by investment professionals, selective disclosure of portfolio holdings, late trading, frequent trading, portfolio valuation, business continuity and the allocation of investment opportunities. The Board also considered the responses of the Adviser and its affiliates to requests in recent years from regulatory authorities such as the Securities and Exchange Commission and the Financial Industry Regulatory Authority.
The Board was aware that on April 24, 2017 a former employee of the Adviser agreed to plead guilty to fraud charges arising from the individual’s prior activities as an equity options trader for certain Eaton Vance Funds. The Board was informed that the Adviser became aware of the matter on April 18, 2017, at which time management contacted federal authorities, alerted the Board and began an internal investigation. The Adviser represented to the Board that, based on information available as of April 25, 2017, management had no reason to believe that any other employee of the Adviser or its affiliates was involved in any wrongful activities or that any fund had been materially harmed. The Adviser agreed to keep the Board fully apprised as additional information is learned, and assured the Board that any fund harmed by the former employee’s wrongful activities will be made whole, as determined in consultation with the Board. The Board concluded that the Adviser’s actions in response to these events are appropriate and consistent with the Adviser’s commitment to protect and provide quality services to the Eaton Vance Funds.
The Board considered shareholder and other administrative services provided or managed by Eaton Vance Management and its affiliates, including transfer agency and accounting services. The Board evaluated the benefits to shareholders of investing in a fund that is a part of a large fund complex offering exposure to a variety of asset classes and investment disciplines.
After consideration of the foregoing factors, among others, the Board concluded that the nature, extent and quality of services provided by the Adviser, taken as a whole, are appropriate and consistent with the terms of the investment advisory agreement.
Fund Performance
The Board compared the Fund’s investment performance to that of comparable funds and appropriate benchmark indices, as well as a customized peer group of similarly managed funds. The Board’s review included comparative performance data for the one- and three-year periods ended September 30, 2016 for the Fund. On the basis of the foregoing and other relevant information provided by the Adviser in response to inquiries from the Contract Review Committee, the Board concluded that the performance of the Fund was satisfactory.
Management Fees and Expenses
The Board considered contractual fee rates payable by the Fund for advisory and administrative services (referred to collectively as “management fees”). As part of its review, the Board considered the Fund’s management fees and total expense ratio for the one year period ended September 30, 2016, as compared to those of comparable funds, before and after giving effect to any undertaking to waive fees or reimburse expenses. The Board also received and considered information about the services offered and the fee rates charged by the Adviser to other types of clients with investment objectives and strategies that are substantially similar to and/or managed in a similar investment style as the Fund. In this regard, the Board received information about the differences in the nature and scope of services the Adviser provides to the Fund as compared to other types of clients and the material differences in compliance, reporting and other legal burdens and risks to the Adviser as between the Fund and other types of clients. The Board also considered factors that had an impact on Fund expense ratios relative to comparable funds.
After considering the foregoing information, and in light of the nature, extent and quality of the services provided by the Adviser, the Board concluded that the management fees charged for advisory and related services are reasonable.
Profitability and Other “Fall-Out” Benefits
The Board considered the level of profits realized by the Adviser and relevant affiliates thereof in providing investment advisory and administrative services to the Fund and to all Eaton Vance Funds as a group. The Board considered the level of profits realized without regard to marketing support or other payments by the Adviser and its affiliates to third parties in respect of distribution services. The Board also considered other direct or indirect fall-out benefits received by the Adviser and its affiliates in connection with their relationships with the Fund, including the benefits of research services that may be available to the Adviser as a result of securities transactions effected for the Fund and other investment advisory clients.
The Board concluded that, in light of the foregoing factors and the nature, extent and quality of the services rendered, the profits realized by the Adviser and its affiliates are deemed not to be excessive.
Economies of Scale
In reviewing management fees and profitability, the Board also considered the extent to which the Adviser and its affiliates, on the one hand, and the Fund, on the other hand, can expect to realize benefits from economies of scale as the assets of the Fund increase. The Board acknowledged the difficulty in accurately measuring the benefits resulting from economies of scale, if any, with respect to the management of any specific fund or group of funds. The Board reviewed data summarizing the increases and decreases in the assets of the Fund and of all Eaton Vance Funds as a group over various time periods, and evaluated the extent to which the total expense ratio of the Fund and the profitability of the Adviser and its affiliates may have been affected
Eaton Vance
Floating-Rate Income Plus Fund
May 31, 2017
Board of Trustees’ Contract Approval — continued
by such increases or decreases. Based upon the foregoing, the Board concluded that the Fund currently shares in any benefits from economies of scale. The Board also considered the fact that the Fund is not continuously offered and that the Fund’s assets are not expected to increase materially in the foreseeable future. The Board concluded that, in light of the level of the Adviser’s profits with respect to the Fund, the implementation of breakpoints in the advisory fee schedule is not warranted at this time.
Eaton Vance
Floating-Rate Income Plus Fund
May 31, 2017
Management and Organization
Fund Management. The Trustees of Eaton Vance Floating-Rate Income Plus Fund (the Fund) are responsible for the overall management and supervision of the Fund’s affairs. The Trustees and officers of the Fund are listed below. Except as indicated, each individual has held the office shown or other offices in the same company for the last five years. The “Noninterested Trustees” consist of those Trustees who are not “interested persons” of the Fund, as that term is defined under the 1940 Act. The business address of each Trustee and officer is Two International Place, Boston, Massachusetts 02110. As used below, “EVC” refers to Eaton Vance Corp., “EV” refers to Eaton Vance, Inc., “EVM” refers to Eaton Vance Management, “BMR” refers to Boston Management and Research, “EVMI” refers to Eaton Vance Management (International) Limited and “EVD” refers to Eaton Vance Distributors, Inc. EVC and EV are the corporate parent and trustee, respectively, of EVM and BMR. EVMI is an indirect, wholly-owned subsidiary of EVC. EVD is the Fund’s principal underwriter and a wholly-owned subsidiary of EVC. Each officer affiliated with Eaton Vance may hold a position with other Eaton Vance affiliates that is comparable to his or her position with EVM listed below. Each Trustee oversees 175 portfolios in the Eaton Vance Complex (including all master and feeder funds in a master feeder structure). Each officer serves as an officer of certain other Eaton Vance funds. Each Trustee serves for a three year term. Each officer serves until his or her successor is elected.
| | | | | | |
| Name and Year of Birth | | Position(s) with the Trust | | Term Expiring; Trustee Since(1) | | Principal Occupation(s) and Directorships During Past Five Years and Other Relevant Experience |
Interested Trustee | | | | | | |
| | | |
Thomas E. Faust Jr. 1958 | | Class I
Trustee | | Until 2020.
Trustee since 2007. | | Chairman, Chief Executive Officer and President of EVC, Director and President of EV, Chief Executive Officer and President of EVM and BMR, and Director of EVD and EVMI. Trustee and/or officer of 175 registered investment companies. Mr. Faust is an interested person because of his positions with EVM, BMR, EVD, EVMI, EVC and EV, which are affiliates of the Fund. Directorships in the Last Five Years.(2) Director of EVC and Hexavest Inc. (investment management firm). |
| | | |
| | | | | | |
Noninterested Trustees | | | | | | |
| | | |
Scott E. Eston 1956 | | Class I
Trustee(3) | | Until 2020.
Trustee since 2011. | | Private investor. Formerly held various positions at Grantham, Mayo, Van Otterloo and Co., LLC (investment management firm) (1997-2009), including Chief Operating Officer (2002-2009), Chief Financial Officer (1997-2009) and Chairman of the Executive Committee (2002-2008); President and Principal Executive Officer, GMO Trust (open-end registered investment company) (2006-2009). Former Partner, Coopers and Lybrand LLP (now PricewaterhouseCoopers) (a registered public accounting firm) (1987-1997). Mr. Eston has apprised the Board of Trustees that he intends to retire as a Trustee of all Eaton Vance funds effective September 30, 2017. Directorships in the Last Five Years.(2) None. |
| | | |
Mark R. Fetting(4) 1954 | | Class III
Trustee | | Until 2019.
Trustee since 2016. | | Private investor. Formerly held various positions at Legg Mason, Inc. (investment management firm) (2000-2012), including President, Chief Executive Officer, Director and Chairman (2008-2012), Senior Executive Vice President (2004-2008) and Executive Vice President (2001-2004). Formerly, President of Legg Mason family of funds (2001-2008). Formerly, Division President and Senior Officer of Prudential Financial Group, Inc. and related companies (investment management firm) (1991-2000). Directorships in the Last Five Years. Formerly, Director and Chairman of Legg Mason, Inc. (2008-2012); Director/Trustee and Chairman of Legg Mason family of funds (14 funds) (2008-2012); and Director/Trustee of the Royce family of funds (35 funds) (2001-2012). |
| | | |
Cynthia E. Frost 1961 | | Class I Trustee | | Until 2020.
Trustee since 2014. | | Private investor. Formerly, Chief Investment Officer of Brown University (university endowment) (2000-2012); Portfolio Strategist for Duke Management Company (university endowment manager) (1995-2000); Managing Director, Cambridge Associates (investment consulting company) (1989-1995); Consultant, Bain and Company (management consulting firm) (1987-1989); Senior Equity Analyst, BA Investment Management Company (1983-1985). Directorships in the Last Five Years. None. |
| | | |
George J. Gorman 1952 | | Class II Trustee | | Until 2018.
Trustee since 2014. | | Principal at George J. Gorman LLC (consulting firm). Formerly, Senior Partner at Ernst & Young LLP (a registered public accounting firm) (1974-2009). Directorships in the Last Five Years. Formerly, Trustee of the BofA Funds Series Trust (11 funds) (2011-2014) and of the Ashmore Funds (9 funds) (2010-2014). |
Eaton Vance
Floating-Rate Income Plus Fund
May 31, 2017
Management and Organization — continued
| | | | | | |
| Name and Year of Birth | | Position(s) with the Trust | | Term Expiring; Trustee Since(1) | | Principal Occupation(s) and Directorships During Past Five Years and Other Relevant Experience |
Noninterested Trustees (continued) |
| | | |
Valerie A. Mosley 1960 | | Class III Trustee(3) | | Until 2019.
Trustee since 2014. | | Chairwoman and Chief Executive Officer of Valdo Ventures (a consulting and investment firm). Former Partner and Senior Vice President, Portfolio Manager and Investment Strategist at Wellington Management Company, LLP (investment management firm) (1992-2012). Former Chief Investment Officer, PG Corbin Asset Management (1990-1992). Formerly worked in institutional corporate bond sales at Kidder Peabody (1986-1990). Directorships in the Last Five Years.(2) Director of Dyne Capital, Inc. (mortgage REIT) (since 2013). |
| | | |
William H. Park 1947 | | Chairperson of the Board and Class II Trustee | | Until 2018.
Chairperson of the Board since 2016 and Trustee since 2003. | | Private investor. Formerly, Consultant (management and transactional) (2012-2014). Formerly, Chief Financial Officer, Aveon Group L.P. (investment management firm) (2010-2011). Formerly, Vice Chairman, Commercial Industrial Finance Corp. (specialty finance company) (2006-2010). Formerly, President and Chief Executive Officer, Prizm Capital Management, LLC (investment management firm) (2002-2005). Formerly, Executive Vice President and Chief Financial Officer, United Asset Management Corporation (investment management firm) (1982-2001). Formerly, Senior Manager, Price Waterhouse (now PricewaterhouseCoopers) (a registered public accounting firm) (1972-1981). Directorships in the Last Five Years.(2) None. |
| | | |
Helen Frame Peters 1948 | | Class III
Trustee | | Until 2019.
Trustee since 2008. | | Professor of Finance, Carroll School of Management, Boston College. Formerly, Dean, Carroll School of Management, Boston College (2000-2002). Formerly, Chief Investment Officer, Fixed Income, Scudder Kemper Investments (investment management firm) (1998-1999). Formerly, Chief Investment Officer, Equity and Fixed Income, Colonial Management Associates (investment management firm) (1991-1998). Directorships in the Last Five Years.(2) Formerly, Director of BJ’s Wholesale Club, Inc. (wholesale club retailer) (2004-2011). Formerly, Trustee of SPDR Index Shares Funds and SPDR Series Trust (exchange traded funds) (2000-2009). Formerly, Director of Federal Home Loan Bank of Boston (a bank for banks) (2007-2009). |
| | | |
Susan J. Sutherland 1957 | | Class II
Trustee | | Until 2018.
Trustee since 2015. | | Private investor. Formerly, Associate, Counsel and Partner at Skadden, Arps, Slate, Meagher & Flom LLP (law firm) (1982-2013). Directorships in the Last Five Years. Formerly, Director of Montpelier Re Holdings Ltd. (global provider of customized insurance and reinsurance products) (2013-2015). |
| | | |
Harriett Tee Taggart 1948 | | Class II
Trustee | | Until 2018.
Trustee since 2011. | | Managing Director, Taggart Associates (a professional practice firm). Formerly, Partner and Senior Vice President, Wellington Management Company, LLP (investment management firm) (1983-2006). Directorships in the Last Five Years.(2) Director of Albemarle Corporation (chemicals manufacturer) (since 2007) and The Hanover Group (specialty property and casualty insurance company) (since 2009). Formerly, Director of Lubrizol Corporation (specialty chemicals) (2007-2011). |
| | | |
Scott E. Wennerholm(4) 1959 | | Class I
Trustee | | Until 2020.
Trustee since 2016. | | Consultant at GF Parish Group (executive recruiting firm). Trustee at Wheelock College (postsecondary institution) (since 2012). Formerly, Chief Operating Officer and Executive Vice President at BNY Mellon Asset Management (investment management firm) (2005-2011). Formerly, Chief Operating Officer and Chief Financial Officer at Natixis Global Asset Management (investment management firm) (1997-2004). Formerly, Vice President at Fidelity Investments Institutional Services (investment management firm) (1994-1997). Directorships in the Last Five Years. None. |
| | | |
| | | | | | |
Principal Officers who are not Trustees |
| Name and Year of Birth | | Position(s) with the Fund | | Officer Since(5) | | Principal Occupation(s) During Past Five Years |
| | | |
Payson F. Swaffield 1956 | | President | | 2003 | | Vice President and Chief Income Investment Officer of EVM and BMR. Also Vice President of Calvert Research and Management (“CRM”). |
Eaton Vance
Floating-Rate Income Plus Fund
May 31, 2017
Management and Organization — continued
| | | | | | |
| Name and Year of Birth | | Position(s) with the Fund | | Officer
Since(5) | | Principal Occupation(s) During Past Five Years |
Principal Officers who are not Trustees (continued) |
| | | |
Maureen A. Gemma 1960 | | Vice President, Secretary and Chief Legal Officer | | 2005 | | Vice President of EVM and BMR. Also Vice President of CRM. |
| | | |
James F. Kirchner 1967 | | Treasurer | | 2007 | | Vice President of EVM and BMR. Also Vice President of CRM. |
| | | |
Paul M. O’Neil 1953 | | Chief Compliance Officer | | 2004 | | Vice President of EVM and BMR. |
| (1) | Year first appointed to serve as Trustee for a fund in the Eaton Vance family of funds. Each Trustee has served continuously since appointment unless indicated otherwise. Each Trustee holds office until the annual meeting for the year in which his or her term expires and until his or her successor is elected and qualified, subject to a prior death, resignation, retirement, disqualification or removal. |
| (2) | During their respective tenures, the Trustees (except for Mmes. Frost and Sutherland and Mr. Gorman) also served as Board members of one or more of the following funds (which operated in the years noted): eUnitsTM 2 Year U.S. Market Participation Trust: Upside to Cap / Buffered Downside (launched in 2012 and terminated in 2014); eUnitsTM 2 Year U.S. Market Participation Trust II: Upside to Cap / Buffered Downside (launched in 2012 and terminated in 2014); and Eaton Vance National Municipal Income Trust (launched in 1998 and terminated in 2009). However, Ms. Mosley did not serve as a Board member of eUnitsTM 2 Year U.S. Market Participation Trust: Upside to Cap / Buffered Downside (launched in 2012 and terminated in 2014). |
| (4) | Messrs. Fetting and Wennerholm began serving as Trustees effective September 1, 2016. |
| (5) | Year first elected to serve as officer of a fund in the Eaton Vance family of funds when the officer has served continuously. Otherwise, year of most recent election as an officer of a fund in the Eaton Vance family of funds. Titles may have changed since initial election. |
Eaton Vance Funds
IMPORTANT NOTICES
Privacy. The Eaton Vance organization is committed to ensuring your financial privacy. Each of the financial institutions identified below has in effect the following policy (“Privacy Policy”) with respect to nonpublic personal information about its customers:
| • | | Only such information received from you, through application forms or otherwise, and information about your Eaton Vance fund transactions will be collected. This may include information such as name, address, social security number, tax status, account balances and transactions. |
| • | | None of such information about you (or former customers) will be disclosed to anyone, except as permitted by law (which includes disclosure to employees necessary to service your account). In the normal course of servicing a customer’s account, Eaton Vance may share information with unaffiliated third parties that perform various required services such as transfer agents, custodians and broker-dealers. |
| • | | Policies and procedures (including physical, electronic and procedural safeguards) are in place that are designed to protect the confidentiality of such information. |
| • | | We reserve the right to change our Privacy Policy at any time upon proper notification to you. Customers may want to review our Privacy Policy periodically for changes by accessing the link on our homepage: www.eatonvance.com. |
Our pledge of privacy applies to the following entities within the Eaton Vance organization: the Eaton Vance Family of Funds, Eaton Vance Management, Eaton Vance Investment Counsel, Eaton Vance Distributors, Inc., Eaton Vance Trust Company, Eaton Vance Management (International) Limited, Eaton Vance Management’s Real Estate Investment Group and Boston Management and Research. In addition, our Privacy Policy applies only to those Eaton Vance customers who are individuals and who have a direct relationship with us. If a customer’s account (i.e., fund shares) is held in the name of a third-party financial advisor/broker-dealer, it is likely that only such advisor’s privacy policies apply to the customer. This notice supersedes all previously issued privacy disclosures. For more information about Eaton Vance’s Privacy Policy, please call 1-800-262-1122.
Delivery of Shareholder Documents. The Securities and Exchange Commission (SEC) permits funds to deliver only one copy of shareholder documents, including prospectuses, proxy statements and shareholder reports, to fund investors with multiple accounts at the same residential or post office box address. This practice is often called “householding” and it helps eliminate duplicate mailings to shareholders. American Stock Transfer & Trust Company, LLC (“AST”), the closed-end funds transfer agent, or your financial advisor, may household the mailing of your documents indefinitely unless you instruct AST, or your financial advisor, otherwise. If you would prefer that your Eaton Vance documents not be householded, please contact AST or your financial advisor. Your instructions that householding not apply to delivery of your Eaton Vance documents will typically be effective within 30 days of receipt by AST or your financial advisor.
Portfolio Holdings. Each Eaton Vance Fund and its underlying Portfolio(s) (if applicable) will file a schedule of portfolio holdings on Form N-Q with the SEC for the first and third quarters of each fiscal year. The Form N-Q will be available on the Eaton Vance website at www.eatonvance.com, by calling Eaton Vance at 1-800-262-1122 or in the EDGAR database on the SEC’s website at www.sec.gov. Form N-Q may also be reviewed and copied at the SEC’s public reference room in Washington, D.C. (call 1-800-732-0330 for information on the operation of the public reference room).
Proxy Voting. From time to time, funds are required to vote proxies related to the securities held by the funds. The Eaton Vance Funds or their underlying Portfolios (if applicable) vote proxies according to a set of policies and procedures approved by the Funds’ and Portfolios’ Boards. You may obtain a description of these policies and procedures and information on how the Funds or Portfolios voted proxies relating to portfolio securities during the most recent 12-month period ended June 30, without charge, upon request, by calling 1-800-262-1122 and by accessing the SEC’s website at www.sec.gov.
Share Repurchase Program. The Fund’s Board of Trustees has approved a share repurchase program authorizing the Fund to repurchase up to 10% of its outstanding common shares as of the approved date in open-market transactions at a discount to net asset value. The repurchase program does not obligate the Fund to purchase a specific amount of shares. The Fund’s repurchase activity, including the number of shares purchased, average price and average discount to net asset value, is disclosed in the Fund’s annual and semi-annual reports to shareholders.
Additional Notice to Shareholders. If applicable, a Fund may also redeem or purchase its outstanding preferred shares in order to maintain compliance with regulatory requirements, borrowing or rating agency requirements or for other purposes as it deems appropriate or necessary.
Closed-End Fund Information. Eaton Vance closed-end funds make fund performance data and certain information about portfolio characteristics available on the Eaton Vance website shortly after the end of each month. Other information about the funds is available on the website. The funds’ net asset value per share is readily accessible on the Eaton Vance website. Portfolio holdings for the most recent month-end are also posted to the website approximately 30 days following the end of the month. This information is available at www.eatonvance.com on the fund information pages under “Individual Investors — Closed-End Funds”.
This Page Intentionally Left Blank
This Page Intentionally Left Blank
Investment Adviser and Administrator
Eaton Vance Management
Two International Place
Boston, MA 02110
Custodian
State Street Bank and Trust Company
State Street Financial Center, One Lincoln Street
Boston, MA 02111
Transfer Agent
American Stock Transfer & Trust Company, LLC
6201 15th Avenue
Brooklyn, NY 11219
Independent Registered Public Accounting Firm
Deloitte & Touche LLP
200 Berkeley Street
Boston, MA 02116-5022
Fund Offices
Two International Place
Boston, MA 02110
15088 5.31.17
Item 2. Code of Ethics
The registrant has adopted a code of ethics applicable to its Principal Executive Officer, Principal Financial Officer and Principal Accounting Officer. The registrant undertakes to provide a copy of such code of ethics to any person upon request, without charge, by calling 1-800-262-1122. The registrant has amended the code of ethics as described in Form N-CSR during the period covered by this report to make clarifying changes consistent with Rule 21F-17 of the Securities Exchange Act of 1934, as amended. The registrant has not granted any waiver, including an implicit waiver, from a provision of the code of ethics as described in Form N-CSR during the period covered by this report.
Item 3. Audit Committee Financial Expert
The registrant’s Board has designated William H. Park, an independent trustee, as its audit committee financial expert. Mr. Park is a certified public accountant who is a private investor. Previously, he served as a consultant, as the Chief Financial Officer of Aveon Group, L.P. (an investment management firm), as the Vice Chairman of Commercial Industrial Finance Corp. (specialty finance company), as President and Chief Executive Officer of Prizm Capital Management, LLC (investment management firm), as Executive Vice President and Chief Financial Officer of United Asset Management Corporation (an institutional investment management firm) and as a Senior Manager at Price Waterhouse (now PricewaterhouseCoopers) (an independent registered public accounting firm).
Item 4. Principal Accountant Fees and Services
Rule 2-01(c)(1)(ii)(A) of Regulation S-X (the “Loan Rule”) prohibits an accounting firm, such as the Fund’s principal accountant, Deloitte & Touche LLP (“D&T”), from having certain financial relationships with their audit clients and affiliated entities. Specifically, the Loan Rule provides, in relevant part, that an accounting firm generally would not be independent if it or a “covered person” of the accounting firm (within the meaning of applicable SEC rules relating to auditor independence) receives a loan from a lender that is a “record or beneficial owner of more than ten percent of the audit client’s equity securities.” Based on information provided to the Audit Committee of the Board of Trustees (the “Audit Committee”) of the Eaton Vance family of funds by D&T, certain relationships between D&T and its affiliates (“Deloitte Entities”) and one or more lenders who are record owners of shares of one or more funds within the Eaton Vance family of funds (the “Funds”) implicate the Loan Rule, calling into question D&T’s independence with respect to the Funds. The Funds are providing this disclosure to explain the facts and circumstances as well as D&T’s conclusions concerning D&T’s objectivity and impartiality with respect to the audits of the Funds notwithstanding the existence of one or more breaches of the Loan Rule.
On June 20, 2016, the U.S. Securities and Exchange Commission (the “SEC”) issued no-action relief to another mutual fund complex (see Fidelity Management & Research Company et al., No-Action Letter (June 20, 2016) (the “No-Action Letter”)) related to an auditor independence issue arising under the Loan Rule. In the No-Action Letter, the SEC indicated that it would not recommend enforcement action against the fund group if the auditor is not in compliance with the Loan Rule provided that: (1) the auditor has complied with PCAOB Rule 3526(b)(1) and 3526(b)(2); (2) the auditor’s non-compliance under the Loan Rule is with respect to certain lending relationships; and (3) notwithstanding such non-compliance, the auditor has concluded that it is objective and impartial with respect to the issues encompassed within its engagement as auditor of the funds. The SEC has indicated that the no-action relief will expire 18 months from its issuance.
Based on information provided by D&T to the Audit Committee, the requirements of the No-Action Letter appear to be met with respect to D&T’s lending relationships described above. Among other things, D&T has advised the Audit Committee of its conclusion that the consequences of the breach of the Loan Rule have been satisfactorily addressed, that D&T’s objectivity and impartiality in the planning and conduct of the audits of the Fund’s financial statements has not been compromised and that, notwithstanding the breach, D&T is in a
position to continue as the auditor for the Funds and D&T does not believe any actions need to be taken with respect to previously issued reports by D&T. D&T has advised the Audit Committee that these conclusions were based in part on its consideration of the No-Action Letter and other relevant information communicated to the Audit Committee.
(a) –(d)
The following table presents the aggregate fees billed to the registrant for the registrant’s fiscal years ended May 31, 2016 and May 31, 2017 by D&T for professional services rendered for the audit of the registrant’s annual financial statements and fees billed for other services rendered by D&T during such periods.
Eaton Vance Floating-Rate Income Plus Fund
| | | | | | | | |
Fiscal Years Ended | | 5/31/16 | | | 5/31/17 | |
Audit Fees | | $ | 44,550 | | | $ | 50,025 | |
Audit-Related Fees(1) | | $ | 18,000 | | | $ | 18,000 | |
Tax Fees(2) | | $ | 20,549 | | | $ | 20,754 | |
All Other Fees(3) | | $ | 0 | | | $ | 0 | |
| | | | | | | | |
Total | | $ | 83,099 | | | $ | 88,779 | |
| | | | | | | | |
| | | | | | | | |
| (1) | Audit-related fees consist of the aggregate fees billed for assurance and related services that are reasonably related to the performance of the audit of financial statements and are not reported under the category of audit fees and specifically include fees for the performance of certain agreed-upon procedures relating to the registrant’s Revolving Credit and Security Agreement and Variable Rate Term Preferred Shares ratings. |
| (2) | Tax fees consist of the aggregate fees billed for professional services rendered by the principal accountant relating to tax compliance, tax advice, and tax planning and specifically include fees for tax return preparation and other related tax compliance/planning matters. |
| (3) | All other fees consist of the aggregate fees billed for products and services provided by the principal accountant other than audit, audit-related, and tax services. |
(e)(1) The registrant’s audit committee has adopted policies and procedures relating to the pre-approval of services provided by the registrant’s principal accountant (the “Pre-Approval Policies”). The Pre-Approval Policies establish a framework intended to assist the audit committee in the proper discharge of its pre-approval responsibilities. As a general matter, the Pre-Approval Policies (i) specify certain types of audit, audit-related, tax, and other services determined to be pre-approved by the audit committee; and (ii) delineate specific procedures governing the mechanics of the pre-approval process, including the approval and monitoring of audit and non-audit service fees. Unless a service is specifically pre-approved under the Pre-Approval Policies, it must be separately pre-approved by the audit committee.
The Pre-Approval Policies and the types of audit and non-audit services pre-approved therein must be reviewed and ratified by the registrant’s audit committee at least annually. The registrant’s audit committee maintains full responsibility for the appointment, compensation, and oversight of the work of the registrant’s principal accountant.
(e)(2) No services described in paragraphs (b)-(d) above were approved by the registrant’s audit committee pursuant to the “de minimis exception” set forth in Rule 2-01(c)(7)(i)(C) of Regulation S-X.
(f) Not applicable.
(g) The following table presents (i) the aggregate non-audit fees (i.e., fees for audit-related, tax, and other services) billed to the registrant by D&T for the registrant’s fiscal years ended May 31, 2016 and May 31, 2017; and (ii) the aggregate non-audit fees (i.e., fees for audit-related, tax, and other services) billed to the Eaton Vance organization by D&T for the same time periods.
| | | | | | | | |
Fiscal Years Ended | | 5/31/16 | | | 5/31/17 | |
Registrant | | $ | 38,549 | | | $ | 38,754 | |
Eaton Vance(1) | | $ | 10,434 | | | $ | 194,018 | |
| (1) | The investment adviser to the registrant, as well as any of its affiliates that provide ongoing services to the registrant, are subsidiaries of Eaton Vance Corp. |
(h) The registrant’s audit committee has considered whether the provision by the registrant’s principal accountant of non-audit services to the registrant’s investment adviser and any entity controlling, controlled by, or under common control with the adviser that provides ongoing services to the registrant that were not pre-approved pursuant to Rule 2-01(c)(7)(ii) of Regulation S-X is compatible with maintaining the principal accountant’s independence.
Item 5. Audit Committee of Listed Registrants
The registrant has a separately-designated standing audit committee established in accordance with Section 3(a)(58)(A) of the Securities and Exchange Act of 1934, as amended. George J. Gorman (Chair), Scott E. Eston, Valerie A. Mosley, William H. Park and Scott E. Wennerholm are the members of the registrant’s audit committee.
Item 6. Schedule of Investments
Please see schedule of investments contained in the Report to Stockholders included under Item 1 of this Form N-CSR.
Item 7. Disclosure of Proxy Voting Policies and Procedures for Closed-End Management Investment Companies
The Board of Trustees of the Trust has adopted a proxy voting policy and procedure (the “Fund Policy”), pursuant to which the Trustees have delegated proxy voting responsibility to the Fund’s investment adviser and adopted the investment adviser’s proxy voting policies and procedures (the “Policies”) which are described below. The Trustees will review the Fund’s proxy voting records from time to time and will annually consider approving the Policies for the upcoming year. In the event that a conflict of interest arises between the Fund’s shareholders and the investment adviser, the administrator, or any of their affiliates or any affiliate of the Fund, the investment adviser will generally refrain from voting the proxies related to the companies giving rise to such conflict until it consults with the Board’s Special Committee except as contemplated under the Fund Policy. The Board’s Special Committee will instruct the investment adviser on the appropriate course of action.
The Policies are designed to promote accountability of a company’s management to its shareholders and to align the interests of management with those shareholders. An independent proxy voting service (“Agent”), currently Institutional Shareholder Services, Inc., has been retained to assist in the voting of proxies through the provision of vote analysis, implementation and recordkeeping and disclosure services. The investment adviser will generally vote proxies through the Agent. The Agent is required to vote all proxies and/or refer them back to the investment adviser pursuant to the Policies. It is generally the policy of the investment adviser to vote in accordance with the recommendation of the Agent. The Agent shall refer to the investment adviser proxies relating to mergers and restructurings, and the disposition of assets, termination, liquidation and mergers contained in mutual fund proxies. The investment adviser will normally vote against anti-takeover measures
and other proposals designed to limit the ability of shareholders to act on possible transactions, except in the case of closed-end management investment companies. The investment adviser generally supports management on social and environmental proposals. The investment adviser may abstain from voting from time to time where it determines that the costs associated with voting a proxy outweighs the benefits derived from exercising the right to vote or the economic effect on shareholders interests or the value of the portfolio holding is indeterminable or insignificant.
In addition, the investment adviser will monitor situations that may result in a conflict of interest between the Fund’s shareholders and the investment adviser, the administrator, or any of their affiliates or any affiliate of the Fund by maintaining a list of significant existing and prospective corporate clients. The investment adviser’s personnel responsible for reviewing and voting proxies on behalf of the Fund will report any proxy received or expected to be received from a company included on that list to the personnel of the investment adviser identified in the Policies. If such personnel expects to instruct the Agent to vote such proxies in a manner inconsistent with the guidelines of the Policies or the recommendation of the Agent, the personnel will consult with members of senior management of the investment adviser to determine if a material conflict of interests exists. If it is determined that a material conflict does exist, the investment adviser will seek instruction on how to vote from the Special Committee.
Information on how the Fund voted proxies relating to portfolio securities during the most recent 12 month period ended June 30 is available (1) without charge, upon request, by calling 1-800-262-1122, and (2) on the Securities and Exchange Commission’s website at http://www.sec.gov.
Item 8. Portfolio Managers of Closed-End Management Investment Companies
Eaton Vance Management (“EVM” or “Eaton Vance”) is the investment adviser of the Fund. Kathleen C. Gaffney, Scott H. Page and Craig P. Russ comprise the investment team responsible for the overall management of the Fund’s investments.
Ms. Gaffney is a Vice President of EVM, has been a portfolio manager of the Fund since June 2013 and is Co-Director of EVM’s Diversified Fixed Income Group. Prior to joining EVM in 2012, Ms. Gaffney was a Vice President and portfolio manager at Loomis, Sayles & Company for more than five years. Mr. Page is a Vice President of EVM, has been a portfolio manager of the Fund since June 2013 and is Co-Director of EVM’s Floating Rate Loan Group. Mr. Russ is a Vice President of EVM, has been a portfolio manager of the Fund since June 2013 and is Co-Director of EVM’s Floating Rate Loan Group. Messrs. Paige and Russ have managed other Eaton Vance portfolios for more than five years. This information is provided as of the date of filing of this report.
The following table shows, as of the Fund’s most recent fiscal year end, the number of accounts each portfolio manager managed in each of the listed categories and the total assets (in millions of dollars) in the accounts managed within each category. The table also shows the number of accounts with respect to which the advisory fee is based on the performance of the account, if any, and the total assets (in millions of dollars) in those accounts.
| | | | | | | | | | | | |
| | | Number of All Accounts | | Total Assets of
All Accounts | | | Number of
Accounts Paying a Performance Fee | | Total Assets of
Accounts Paying a
Performance Fee | |
Kathleen C. Gaffney(1) | | | | | | | | | | | | |
Registered Investment Companies | | 4 | | $ | 1,373.1 | | | 0 | | $ | 0 | |
Other Pooled Investment Vehicles | | 0 | | $ | 0 | | | 0 | | $ | 0 | |
Other Accounts | | 3 | | $ | 213.5 | | | 0 | | $ | 0 | |
| | | | |
Scott H. Page | | | | | | | | | | | | |
Registered Investment Companies | | 12 | | $ | 28,063.6 | | | 0 | | $ | 0 | |
Other Pooled Investment Vehicles | | 12 | | $ | 8,727.0 | | | 1 | | $ | 2.4 | |
Other Accounts | | 8 | | $ | 4,791.8 | | | 0 | | $ | 0 | |
| | | | |
Craig P. Russ | | | | | | | | | | | | |
Registered Investment Companies | | 8 | | $ | 23,748.8 | | | 0 | | $ | 0 | |
Other Pooled Investment Vehicles | | 5 | | $ | 6,582.1 | | | 0 | | $ | 0 | |
Other Accounts | | 9 | | $ | 5,699.7 | | | 0 | | $ | 0 | |
| (1) | This portfolio manager serves as portfolio manager of one or more registered investment companies that invests or may invest in one or more underlying registered investment companies in the Eaton Vance family of funds or other pooled investment vehicles sponsored by Eaton Vance. The underlying investment companies may be managed by this portfolio manager or another portfolio manager. |
The following table shows the dollar range of Fund shares beneficially owned by each portfolio manager as of the Fund’s most recent fiscal year end.
| | |
Portfolio Manager | | Dollar Range of Equity
Securities Beneficially
Owned
in the Fund |
Kathleen C. Gaffney | | $10,001 - $50,000 |
Scott H. Page | | $50,001 - $100,000 |
Craig P. Russ | | None |
Potential for Conflicts of Interest. It is possible that conflicts of interest may arise in connection with a portfolio manager’s management of the Fund’s investments on the one hand and the investments of other accounts for which a portfolio manager is responsible on the other. For example, a portfolio manager may have conflicts of interest in allocating management time, resources and investment opportunities among the Fund and other accounts he or she advises. In addition, due to differences in the investment strategies or restrictions between the Fund and the other accounts, the portfolio manager may take action with respect to another account that differs from the action taken with respect to the Fund. In some cases, another account managed by a portfolio manager may compensate the investment adviser based on the performance of the securities held by that account. The existence of such a performance based fee may create additional conflicts of interest for the portfolio manager in the allocation of management time, resources and investment opportunities. Whenever conflicts of interest arise, the portfolio manager will endeavor to exercise his or her discretion in a manner that he or she believes is equitable to all interested persons. EVM has adopted several policies and procedures designed to address these potential conflicts including a code of ethics and policies that govern the investment adviser’s trading practices, including among other things the aggregation and allocation of trades among clients, brokerage allocations, cross trades and best execution.
Compensation Structure for EVM
Compensation of EVM’s portfolio managers and other investment professionals has three primary components: (1) a base salary, (2) an annual cash bonus, and (3) annual non-cash compensation consisting of options to
purchase shares of Eaton Vance Corp.’s (“EVC’s”) nonvoting common stock, restricted shares of EVC’s nonvoting common stock and a Deferred Alpha Incentive Plan, which pays a deferred cash award tied to future excess returns in certain equity strategy portfolios. EVM’s investment professionals also receive certain retirement, insurance and other benefits that are broadly available to EVM’s employees. Compensation of EVM’s investment professionals is reviewed primarily on an annual basis. Cash bonuses, stock-based compensation awards, and adjustments in base salary are typically paid or put into effect at or shortly after the October 31st fiscal year end of EVC.
Method to Determine Compensation. EVM compensates its portfolio managers based primarily on the scale and complexity of their portfolio responsibilities and the total return performance of managed funds and accounts versus the benchmark(s) stated in the prospectus, as well as an appropriate peer group (as described below). In addition to rankings within peer groups of funds on the basis of absolute performance, consideration may also be given to relative risk-adjusted performance. Risk-adjusted performance measures include, but are not limited to, the Sharpe ratio (Sharpe ratio uses standard deviation and excess return to determine reward per unit of risk). Performance is normally based on periods ending on the September 30th preceding fiscal year end. Fund performance is normally evaluated primarily versus peer groups of funds as determined by Lipper Inc. and/or Morningstar, Inc. When a fund’s peer group as determined by Lipper or Morningstar is deemed by EVM’s management not to provide a fair comparison, performance may instead be evaluated primarily against a custom peer group or market index. In evaluating the performance of a fund and its manager, primary emphasis is normally placed on three-year performance, with secondary consideration of performance over longer and shorter periods. A portion of the compensation payable to equity portfolio managers and investment professionals will be determined based on the ability of one or more accounts managed by such manager to achieve a specified target average annual gross return over a three year period in excess of the account benchmark. The cash bonus to be payable at the end of the three year term will be established at the inception of the term and will be adjusted positively or negatively to the extent that the average annual gross return varies from the specified target return. For funds that are tax-managed or otherwise have an objective of after-tax returns, performance is measured net of taxes. For other funds, performance is evaluated on a pre-tax basis. For funds with an investment objective other than total return (such as current income), consideration will also be given to the fund’s success in achieving its objective. For managers responsible for multiple funds and accounts, investment performance is evaluated on an aggregate basis, based on averages or weighted averages among managed funds and accounts. Funds and accounts that have performance-based advisory fees are not accorded disproportionate weightings in measuring aggregate portfolio manager performance.
The compensation of portfolio managers with other job responsibilities (such as heading an investment group or providing analytical support to other portfolios) will include consideration of the scope of such responsibilities and the managers’ performance in meeting them.
EVM seeks to compensate portfolio managers commensurate with their responsibilities and performance, and competitive with other firms within the investment management industry. EVM participates in investment-industry compensation surveys and utilizes survey data as a factor in determining salary, bonus and stock-based compensation levels for portfolio managers and other investment professionals. Salaries, bonuses and stock-based compensation are also influenced by the operating performance of EVM and its parent company. The overall annual cash bonus pool is generally based on a substantially fixed percentage of pre-bonus adjusted operating income. While the salaries of EVM’s portfolio managers are comparatively fixed, cash bonuses and stock-based compensation may fluctuate significantly from year to year, based on changes in manager performance and other factors as described herein. For a high performing portfolio manager, cash bonuses and stock-based compensation may represent a substantial portion of total compensation.
Item 9. Purchases of Equity Securities by Closed-End Management Investment Company and Affiliated Purchasers
No such purchases this period.
Item 10. Submission of Matters to a Vote of Security Holders
No material changes.
Item 11. Controls and Procedures
(a) It is the conclusion of the registrant’s principal executive officer and principal financial officer that the effectiveness of the registrant’s current disclosure controls and procedures (such disclosure controls and procedures having been evaluated within 90 days of the date of this filing) provide reasonable assurance that the information required to be disclosed by the registrant has been recorded, processed, summarized and reported within the time period specified in the Commission’s rules and forms and that the information required to be disclosed by the registrant has been accumulated and communicated to the registrant’s principal executive officer and principal financial officer in order to allow timely decisions regarding required disclosure.
(b) There have been no changes in the registrant’s internal controls over financial reporting during the second fiscal quarter of the period covered by this report that has materially affected, or is reasonably likely to materially affect, the registrant’s internal control over financial reporting.
Item 12. Exhibits
| | |
| |
(a)(1) | | Registrant’s Code of Ethics – Not applicable (please see Item 2). |
| |
(a)(2)(i) | | Treasurer’s Section 302 certification. |
| |
(a)(2)(ii) | | President’s Section 302 certification. |
| |
(b) | | Combined Section 906 certification. |
Signatures
Pursuant to the requirements of the Securities Exchange Act of 1934 and the Investment Company Act of 1940, the registrant has duly caused this report to be signed on its behalf by the undersigned, thereunto duly authorized.
Eaton Vance Floating-Rate Income Plus Fund
| | |
| By: | | /s/ Payson F. Swaffield |
| | Payson F. Swaffield |
| | President |
| |
| Date: | | July 21, 2017 |
Pursuant to the requirements of the Securities Exchange Act of 1934 and the Investment Company Act of 1940, this report has been signed below by the following persons on behalf of the registrant and in the capacities and on the dates indicated.
| | |
| By: | | /s/ James F. Kirchner |
| | James F. Kirchner |
| | Treasurer |
| |
| Date: | | July 21, 2017 |
| |
| By: | | /s/ Payson F. Swaffield |
| | Payson F. Swaffield |
| | President |
| |
| Date: | | July 21, 2017 |