UNITED STATES
SECURITIES AND EXCHANGE COMMISSION
Washington, D.C. 20549
FormN-CSR
CERTIFIED SHAREHOLDER REPORT OF REGISTERED
MANAGEMENT INVESTMENT COMPANIES
Investment Company Act File Number:811-22821
Eaton Vance Floating-Rate Income Plus Fund
(Exact Name of Registrant as Specified in Charter)
Two International Place, Boston, Massachusetts 02110
(Address of Principal Executive Offices)
Maureen A. Gemma
Two International Place, Boston, Massachusetts 02110
(Name and Address of Agent for Services)
(617)482-8260
(Registrant’s Telephone Number)
May 31
Date of Fiscal Year End
November 30, 2018
Date of Reporting Period
Item 1. Reports to Stockholders

Eaton Vance
Floating-Rate Income Plus Fund (EFF)
Semiannual Report
November 30, 2018
Important Note. Beginning on January 1, 2021, as permitted by regulations adopted by the Securities and Exchange Commission, paper copies of the Fund’s annual and semi-annual shareholder reports will no longer be sent by mail unless you specifically request paper copies of the reports. Instead, the reports will be made available on the Fund’s website (funds.eatonvance.com/closed-end-fund-and-term-trust-documents.php), and you will be notified by mail each time a report is posted and provided with a website address to access the report.
If you already elected to receive shareholder reports electronically, you will not be affected by this change and you need not take any action. If you hold shares at the Fund’s transfer agent, American Stock Transfer & Trust Company, LLC (“AST”), you may elect to receive shareholder reports and other communications from the Fund electronically by contacting AST. If you own your shares through a financial intermediary (such as a broker-dealer or bank), you must contact your financial intermediary to sign up.
You may elect to receive all future Fund shareholder reports in paper free of charge. If you hold shares at AST, you can inform AST that you wish to continue receiving paper copies of your shareholder reports by calling 1-866-439-6787. If you own these shares through a financial intermediary, you must contact your financial intermediary or follow instructions included with this disclosure, if applicable, to elect to continue to receive paper copies of your shareholder reports. Your election to receive reports in paper will apply to all funds held with AST or to all funds held through your financial intermediary, as applicable.

Commodity Futures Trading Commission Registration. Effective December 31, 2012, the Commodity Futures Trading Commission (“CFTC”) adopted certain regulatory changes that subject registered investment companies and advisers to regulation by the CFTC if a fund invests more than a prescribed level of its assets in certain CFTC-regulated instruments (including futures, certain options and swap agreements) or markets itself as providing investment exposure to such instruments. The Fund has claimed an exclusion from the definition of the term “commodity pool operator” under the Commodity Exchange Act. Accordingly, neither the Fund nor the adviser with respect to the operation of the Fund is subject to CFTC regulation. Because of its management of other strategies, the Fund’s adviser is registered with the CFTC as a commodity pool operator and a commodity trading advisor.
Fund shares are not insured by the FDIC and are not deposits or other obligations of, or guaranteed by, any depository institution. Shares are subject to investment risks, including possible loss of principal invested.
Semiannual ReportNovember 30, 2018
Eaton Vance
Floating-Rate Income Plus Fund
| | | | |
| Table of Contents | | | | |
| |
Performance | | | 2 | |
| |
Fund Profile | | | 2 | |
| |
Endnotes and Additional Disclosures | | | 3 | |
| |
Financial Statements | | | 4 | |
| |
Officers and Trustees | | | 36 | |
| |
Important Notices | | | 37 | |
Eaton Vance
Floating-Rate Income Plus Fund
November 30, 2018
Performance1,2
Portfolio ManagersScott H. Page, CFA, Craig P. Russ and Kathleen C. Gaffney, CFA
| | | | | | | | | | | | | | | | | | | | |
| % Average Annual Total Returns | | Inception Date | | | Six Months | | | One Year | | | Five Years | | | Since
Inception | |
Fund at NAV | | | 06/28/2013 | | | | –0.02 | % | | | 2.22 | % | | | 4.41 | % | | | 4.87 | % |
Fund at Market Price | | | — | | | | –8.03 | | | | –2.21 | | | | 3.12 | | | | 2.05 | |
S&P/LSTA Leveraged Loan Index | | | — | | | | 1.00 | % | | | 3.47 | % | | | 3.68 | % | | | 3.85 | % |
| | | | | |
| | | | | | | | | | | | | | | | | | | | |
| % Premium/Discount to NAV3 | | | | | | | | | | | | | | | |
| | | | | | | | | | | | | | | | | | | –13.74 | % |
| | | | | |
| | | | | | | | | | | | | | | | | | | | |
| Distributions4 | | | | | | | | | | | | | | | |
Total Distributions per share for the period | | | | | | | | | | | | | | | | | | $ | 0.458 | |
Distribution Rate at NAV | | | | | | | | | | | | | | | | | | | 5.47 | % |
Distribution Rate at Market Price | | | | | | | | | | | | | | | | | | | 6.35 | % |
| | | | | |
| | | | | | | | | | | | | | | | | | | | |
| % Total Leverage5 | | | | | | | | | | | | | | | |
Borrowings | | | | | | | | | | | | | | | | | | | 26.38 | % |
Variable Rate Term Preferred Shares (VRTP Shares) | | | | | | | | | | | | | | | | | | | 9.28 | |
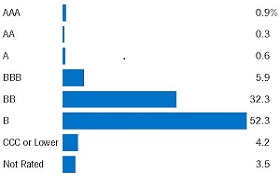
Fund Profile
Credit Quality (% of bonds, loans and mortgage-backed securities)6
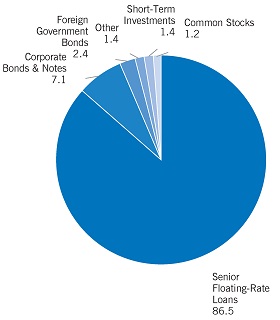
Asset Allocation (% of total investments)7
See Endnotes and Additional Disclosures in this report.
Past performance is no guarantee of future results. Returns are historical and are calculated by determining the percentage change in net asset value (NAV) or market price (as applicable) with all distributions reinvested and include management fees and other expenses. Fund performance at market price will differ from its results at NAV due to factors such as changing perceptions about the Fund, market conditions, fluctuations in supply and demand for Fund shares, or changes in Fund distributions. Investment return and principal value will fluctuate so that shares, when sold, may be worth more or less than their original cost. Performance less than or equal to one year is cumulative. Performance is for the stated time period only; due to market volatility, current Fund performance may be lower or higher than the quoted return. For performance as of the most recentmonth-end, please refer to eatonvance.com.
Eaton Vance
Floating-Rate Income Plus Fund
November 30, 2018
Endnotes and Additional Disclosures
| 1 | S&P/LSTA Leveraged Loan Index is an unmanaged index of the institutional leveraged loan market. Unless otherwise stated, index returns do not reflect the effect of any applicable sales charges, commissions, expenses, taxes or leverage, as applicable. It is not possible to invest directly in an index. |
| 2 | Performance results reflect the effects of leverage. Performance since inception for an index, if presented, is the performance since the Fund’s or oldest share class’ inception, as applicable. |
| 3 | The shares of the Fund often trade at a discount or premium from their net asset value. The discount or premium of the Fund may vary over time and may be higher or lower than what is quoted in this report. Forup-to-date premium/discount information, please refer to http://eatonvance.com/closedend. |
| 4 | The Distribution Rate is based on the Fund’s last regular distribution per share in the period (annualized) divided by the Fund’s NAV or market price at the end of the period. The Fund’s distributions may be comprised of amounts characterized for federal income tax purposes as qualified andnon-qualified ordinary dividends, capital gains and nondividend distributions, also known as return of capital. For additional information about nondividend distributions, please refer to Eaton Vance Closed- End Fund Distribution Notices (19a) posted on our website, eatonvance.com. The Fund will determine the federal income tax character of distributions paid to a shareholder after the end of the calendar year. This is reported on the IRS form1099-DIV and provided to the shareholder shortly after eachyear-end. For information about the tax character of distributions made in prior calendar years, please refer toPerformance-Tax Character of Distributions on the Fund’s webpage available at eatonvance.com. The Fund’s distributions are determined by the investment adviser based on its current assessment of the Fund’s long-term return potential. Fund distributions may be affected by numerous factors including changes in Fund performance, the cost of financing for leverage, portfolio holdings, realized and projected returns, and other factors. As portfolio and market conditions change, the rate of distributions paid by the Fund could change. |
| 5 | Leverage represents the liquidation value of the Fund’s VRTP Shares and borrowings outstanding as a percentage of Fund net assets applicable to common shares plus VRTP Shares and borrowings outstanding. Use of leverage creates an opportunity for income, but creates risks including greater price volatility. The cost of leverage rises and falls with changes in short-term interest rates. The Fund may be required to maintain prescribed asset coverage for its leverage and may be required to reduce its leverage at an inopportune time. |
| 6 | Credit ratings are categorized using S&P Global Ratings (“S&P”). Ratings, which are subject to change, apply to the creditworthiness of the issuers of the underlying securities and not to the Fund or its shares. Credit ratings measure the quality of a bond based on the issuer’s creditworthiness, with ratings ranging from AAA, being the highest, to D, being the lowest based on S&P’s measures. Ratings of BBB or higher by S&P are considered to be investment-grade quality. Credit ratings are based largely on the ratings agency’s analysis at the time of rating. The rating assigned to any particular security is not necessarily a reflection of the issuer’s current financial condition and does not necessarily reflect its assessment of the volatility of a security’s market value or of the liquidity of an investment in the security. Holdings designated as “Not Rated” (if any) are not rated by S&P. |
| 7 | Other represents any investment type less than 1.0% of total investments. Asset allocation as a percentage of the Fund’s net assets amounted to 156.1%. |
| | Fund profile subject to change due to active management. |
Eaton Vance
Floating-Rate Income Plus Fund
November 30, 2018
Portfolio of Investments (Unaudited)
| | | | | | | | | | | | |
| Senior Floating-Rate Loans — 135.0%(1) | |
| Borrower/Tranche Description | | | | | Principal Amount (000’s omitted) | | | Value | |
|
| Aerospace and Defense — 2.4% | |
| Accudyne Industries, LLC | | | | | | | | | |
Term Loan, 5.34%, (1 mo. USD LIBOR + 3.00%), Maturing August 18, 2024 | | | | | | $ | 157 | | | $ | 154,562 | |
| TransDigm, Inc. | | | | | | | | | |
Term Loan, 4.84%, (1 mo. USD LIBOR + 2.50%), Maturing June 9, 2023 | | | | | | | 1,533 | | | | 1,502,652 | |
Term Loan, 4.84%, (1 mo. USD LIBOR + 2.50%), Maturing August 22, 2024 | | | | | | | 1,330 | | | | 1,298,453 | |
| Wesco Aircraft Hardware Corp. | | | | | | | | | |
Term Loan, 5.35%, (1 mo. USD LIBOR + 3.00%), Maturing November 30, 2020 | | | | | | | 203 | | | | 201,994 | |
| | | | | | | | | | | $ | 3,157,661 | |
|
| Automotive — 2.7% | |
| American Axle and Manufacturing, Inc. | | | | | | | | | |
Term Loan, 4.64%, (USD LIBOR + 2.25%), Maturing April 6, 2024(2) | | | | | | $ | 731 | | | $ | 706,022 | |
| Belron Finance US, LLC | | | | | | | | | |
Term Loan, 4.84%, (3 mo. USD LIBOR + 2.25%), Maturing November 7, 2024 | | | | | | | 124 | | | | 122,822 | |
| Chassix, Inc. | | | | | | | | | |
Term Loan, 8.29%, (3 mo. USD LIBOR + 5.50%), Maturing November 15, 2023 | | | | | | | 347 | | | | 347,809 | |
| Dayco Products, LLC | | | | | | | | | |
Term Loan, 6.96%, (3 mo. USD LIBOR + 4.25%), Maturing May 19, 2023 | | | | | | | 245 | | | | 246,705 | |
| Horizon Global Corporation | | | | | | | | | |
Term Loan, 8.34%, (1 mo. USD LIBOR + 6.00%), Maturing June 30, 2021 | | | | | | | 92 | | | | 85,549 | |
| L&W, Inc. | | | | | | | | | |
Term Loan, 6.32%, (1 mo. USD LIBOR + 4.00%), Maturing May 22, 2025 | | | | | | | 175 | | | | 174,999 | |
| Tenneco, Inc. | | | | | | | | | |
Term Loan, 5.09%, (1 mo. USD LIBOR + 2.75%), Maturing October 1, 2025 | | | | | | | 825 | | | | 809,016 | |
| Thor Industries, Inc. | | | | | | | | | |
Term Loan, Maturing October 30, 2025(3) | | | | | | | 375 | | | | 371,016 | |
| TI Group Automotive Systems, LLC | | | | | | | | | |
Term Loan, 4.84%, (1 mo. USD LIBOR + 2.50%), Maturing June 30, 2022 | | | | | | | 239 | | | | 235,562 | |
| Tower Automotive Holdings USA, LLC | | | | | | | | | |
Term Loan, 5.13%, (1 mo. USD LIBOR + 2.75%), Maturing March 7, 2024 | | | | | | | 410 | | | | 405,826 | |
| | | | | | | | | | | $ | 3,505,326 | |
| | | | | | | | | | | | |
| Borrower/Tranche Description | | | | | Principal Amount (000’s omitted) | | | Value | |
|
| Beverage and Tobacco — 0.8% | |
| Arterra Wines Canada, Inc. | | | | | | | | | |
Term Loan, 5.09%, (3 mo. USD LIBOR + 2.75%), Maturing December 15, 2023 | | | | | | $ | 590 | | | $ | 586,005 | |
| Flavors Holdings, Inc. | | | | | | | | | |
Term Loan - Second Lien, 12.39%, (3 mo. USD LIBOR + 10.00%), Maturing October 3, 2021 | | | | | | | 500 | | | | 437,500 | |
| | | | | | | | | | | $ | 1,023,505 | |
|
| Brokerage / Securities Dealers / Investment Houses — 0.4% | |
| Advisor Group, Inc. | | | | | | | | | |
Term Loan, 6.05%, (1 mo. USD LIBOR + 3.75%), Maturing August 15, 2025 | | | | | | $ | 125 | | | $ | 125,078 | |
| Aretec Group, Inc. | | | | | | | | | |
Term Loan, 6.59%, (1 mo. USD LIBOR + 4.25%), Maturing October 1, 2025 | | | | | | | 275 | | | | 273,797 | |
| OZ Management L.P. | | | | | | | | | |
Term Loan, 7.25%, (2 mo. USD LIBOR + 4.75%), Maturing April 10, 2023 | | | | | | | 120 | | | | 118,800 | |
| | | | | | | | | | | $ | 517,675 | |
|
| Building and Development — 3.6% | |
| American Builders & Contractors Supply Co., Inc. | | | | | | | | | |
Term Loan, 4.34%, (1 mo. USD LIBOR + 2.00%), Maturing October 31, 2023 | | | | | | $ | 591 | | | $ | 576,277 | |
| Beacon Roofing Supply, Inc. | | | | | | | | | |
Term Loan, 4.57%, (1 mo. USD LIBOR + 2.25%), Maturing January 2, 2025 | | | | | | | 149 | | | | 145,519 | |
| Brookfield Property REIT, Inc. | | | | | | | | | |
Term Loan, 4.85%, (1 mo. USD LIBOR + 2.50%), Maturing August 27, 2025 | | | | | | | 225 | | | | 218,250 | |
| Core & Main L.P. | | | | | | | | | |
Term Loan, 5.53%, (3 mo. USD LIBOR + 3.00%), Maturing August 1, 2024 | | | | | | | 173 | | | | 171,842 | |
| CPG International, Inc. | | | | | | | | | |
Term Loan, 6.25%, (6 mo. USD LIBOR + 3.75%), Maturing May 5, 2024 | | | | | | | 532 | | | | 529,056 | |
| DTZ U.S. Borrower, LLC | | | | | | | | | |
Term Loan, 5.59%, (1 mo. USD LIBOR + 3.25%), Maturing August 21, 2025 | | | | | | | 1,275 | | | | 1,257,861 | |
| Ply Gem Midco, Inc. | | | | | | | | | |
Term Loan, 6.18%, (3 mo. USD LIBOR + 3.75%), Maturing April 12, 2025 | | | | | | | 175 | | | | 171,573 | |
| Quikrete Holdings, Inc. | | | | | | | | | |
Term Loan, 5.09%, (1 mo. USD LIBOR + 2.75%), Maturing November 15, 2023 | | | | | | | 601 | | | | 590,230 | |
| | | | |
| | 4 | | See Notes to Financial Statements. |
Eaton Vance
Floating-Rate Income Plus Fund
November 30, 2018
Portfolio of Investments (Unaudited) — continued
| | | | | | | | | | | | |
| Borrower/Tranche Description | | | | | Principal Amount (000’s omitted) | | | Value | |
|
| Building and Development (continued) | |
| Realogy Group, LLC | | | | | | | | | |
Term Loan, 4.56%, (1 mo. USD LIBOR + 2.25%), Maturing February 8, 2025 | | | | | | $ | 449 | | | $ | 440,983 | |
| Summit Materials Companies I, LLC | | | | | | | | | |
Term Loan, 4.34%, (1 mo. USD LIBOR + 2.00%), Maturing November 21, 2024 | | | | | | | 149 | | | | 146,177 | |
| Werner FinCo L.P. | | | | | | | | | |
Term Loan, 6.30%, (1 mo. USD LIBOR + 4.00%), Maturing July 24, 2024 | | | | | | | 347 | | | | 336,346 | |
| WireCo WorldGroup, Inc. | | | | | | | | | |
Term Loan, 7.34%, (1 mo. USD LIBOR + 5.00%), Maturing September 30, 2023 | | | | | | | 147 | | | | 147,490 | |
| | | | | | | | | | | $ | 4,731,604 | |
|
| Business Equipment and Services — 11.9% | |
| Acosta Holdco, Inc. | | | | | | | | | |
Term Loan, 5.59%, (1 mo. USD LIBOR + 3.25%), Maturing September 26, 2021 | | | | | | $ | 743 | | | $ | 518,018 | |
| Adtalem Global Education, Inc. | | | | | | | | | |
Term Loan, 5.34%, (1 mo. USD LIBOR + 3.00%), Maturing April 11, 2025 | | | | | | | 100 | | | | 99,625 | |
| AlixPartners, LLP | | | | | | | | | |
Term Loan, 5.09%, (1 mo. USD LIBOR + 2.75%), Maturing April 4, 2024 | | | | | | | 542 | | | | 538,315 | |
| AppLovin Corporation | | | | | | | | | |
Term Loan, 6.19%, (3 mo. USD LIBOR + 3.75%), Maturing August 15, 2025 | | | | | | | 350 | | | | 349,125 | |
| ASGN Incorporated | | | | | | | | | |
Term Loan, 4.34%, (1 mo. USD LIBOR + 2.00%), Maturing April 2, 2025 | | | | | | | 120 | | | | 118,855 | |
| Bracket Intermediate Holding Corp. | | | | | | | | | |
Term Loan, 6.57%, (3 mo. USD LIBOR + 4.25%), Maturing September 5, 2025 | | | | | | | 200 | | | | 200,750 | |
| Camelot UK Holdco Limited | | | | | | | | | |
Term Loan, 5.59%, (1 mo. USD LIBOR + 3.25%), Maturing October 3, 2023 | | | | | | | 264 | | | | 261,429 | |
| Cast and Crew Payroll, LLC | | | | | | | | | |
Term Loan, 5.10%, (1 mo. USD LIBOR + 2.75%), Maturing September 27, 2024 | | | | | | | 595 | | | | 585,825 | |
| Ceridian HCM Holding, Inc. | | | | | | | | | |
Term Loan, 5.59%, (1 mo. USD LIBOR + 3.25%), Maturing April 30, 2025 | | | | | | | 350 | | | | 348,250 | |
| Change Healthcare Holdings, LLC | | | | | | | | | |
Term Loan, 5.09%, (1 mo. USD LIBOR + 2.75%), Maturing March 1, 2024 | | | | | | | 1,544 | | | | 1,527,181 | |
| | | | | | | | | | |
| Borrower/Tranche Description | | | | Principal Amount (000’s omitted) | | | Value | |
|
| Business Equipment and Services (continued) | |
| Crossmark Holdings, Inc. | | | | | | | | |
Term Loan, 5.89%, (3 mo. USD LIBOR + 3.50%), Maturing December 20, 2019 | | | | $ | 488 | | | $ | 192,701 | |
| Cypress Intermediate Holdings III, Inc. | | | | | | | | |
Term Loan, 5.35%, (1 mo. USD LIBOR + 3.00%), Maturing April 26, 2024 | | | | | 321 | | | | 317,828 | |
| EAB Global, Inc. | | | | | | | | |
Term Loan, 6.41%, (USD LIBOR + 3.75%), Maturing November 15, 2024(2) | | | | | 323 | | | | 319,333 | |
| Education Management, LLC | | | | | | | | |
Term Loan, 0.00%, Maturing July 2,
2020(4)(5) | | | | | 370 | | | | 0 | |
Term Loan, 0.00%, Maturing July 2,
2020(4)(5) | | | | | 165 | | | | 31,045 | |
| EIG Investors Corp. | | | | | | | | |
Term Loan, 6.43%, (3 mo. USD LIBOR + 3.75%), Maturing February 9, 2023 | | | | | 789 | | | | 787,668 | |
| Extreme Reach, Inc. | | | | | | | | |
Term Loan, 8.60%, (1 mo. USD LIBOR + 6.25%), Maturing February 7, 2020 | | | | | 539 | | | | 538,343 | |
| First Data Corporation | | | | | | | | |
Term Loan, 4.32%, (1 mo. USD LIBOR + 2.00%), Maturing July 8, 2022 | | | | | 545 | | | | 536,831 | |
| Garda World Security Corporation | | | | | | | | |
Term Loan, 5.82%, (3 mo. USD LIBOR + 3.50%), Maturing May 24, 2024 | | | | | 464 | | | | 462,829 | |
| Global Payments, Inc. | | | | | | | | |
Term Loan, 4.09%, (1 mo. USD LIBOR + 1.75%), Maturing April 21, 2023 | | | | | 76 | | | | 75,839 | |
| IG Investment Holdings, LLC | | | | | | | | |
Term Loan, 5.86%, (USD LIBOR + 3.50%), Maturing May 23, 2025(2) | | | | | 588 | | | | 587,536 | |
| Information Resources, Inc. | | | | | | | | |
Term Loan, Maturing December 1, 2025(3) | | | | | 350 | | | | 346,500 | |
| Iron Mountain, Inc. | | | | | | | | |
Term Loan, 4.09%, (1 mo. USD LIBOR + 1.75%), Maturing January 2, 2026 | | | | | 199 | | | | 195,682 | |
| J.D. Power and Associates | | | | | | | | |
Term Loan, 6.09%, (1 mo. USD LIBOR + 3.75%), Maturing September 7, 2023 | | | | | 540 | | | | 539,555 | |
| Kronos Incorporated | | | | | | | | |
Term Loan, 5.54%, (USD LIBOR + 3.00%), Maturing November 1, 2023(2) | | | | | 1,379 | | | | 1,364,365 | |
| Monitronics International, Inc. | | | | | | | | |
Term Loan, 7.89%, (3 mo. USD LIBOR + 5.50%), Maturing September 30, 2022 | | | | | 221 | | | | 208,556 | |
| PGX Holdings, Inc. | | | | | | | | |
Term Loan, 7.60%, (1 mo. USD LIBOR + 5.25%), Maturing September 29, 2020 | | | | | 253 | | | | 246,714 | |
| | | | |
| | 5 | | See Notes to Financial Statements. |
Eaton Vance
Floating-Rate Income Plus Fund
November 30, 2018
Portfolio of Investments (Unaudited) — continued
| | | | | | | | | | | | |
| Borrower/Tranche Description | | | | | Principal Amount (000’s omitted) | | | Value | |
|
| Business Equipment and Services (continued) | |
| Ping Identity Corporation | | | | | | | | | |
Term Loan, 6.09%, (1 mo. USD LIBOR + 3.75%), Maturing January 24, 2025 | | | | | | $ | 75 | | | $ | 74,251 | |
| Pre-Paid Legal Services, Inc. | | | | | | | | | |
Term Loan, 5.34%, (1 mo. USD LIBOR + 3.00%), Maturing May 1, 2025 | | | | | | | 92 | | | | 91,291 | |
| Prime Security Services Borrower, LLC | | | | | | | | | |
Term Loan, 5.09%, (1 mo. USD LIBOR + 2.75%), Maturing May 2, 2022 | | | | | | | 614 | | | | 608,927 | |
| Red Ventures, LLC | | | | | | | | | |
Term Loan, 5.32%, (3 mo. USD LIBOR + 3.00%), Maturing November 8, 2024 | | | | | | | 245 | | | | 244,155 | |
| Solera, LLC | | | | | | | | | |
Term Loan, 5.09%, (1 mo. USD LIBOR + 2.75%), Maturing March 3, 2023 | | | | | | | 672 | | | | 664,506 | |
| Spin Holdco, Inc. | | | | | | | | | |
Term Loan, 5.69%, (3 mo. USD LIBOR + 3.25%), Maturing November 14, 2022 | | | | | | | 846 | | | | 831,792 | |
| Tempo Acquisition, LLC | | | | | | | | | |
Term Loan, 5.34%, (1 mo. USD LIBOR + 3.00%), Maturing May 1, 2024 | | | | | | | 198 | | | | 196,111 | |
| Trans Union, LLC | | | | | | | | | |
Term Loan, 4.34%, (1 mo. USD LIBOR + 2.00%), Maturing June 19, 2025 | | | | | | | 100 | | | | 98,797 | |
| Travelport Finance (Luxembourg) S.a.r.l. | | | | | | | | | |
Term Loan, 5.12%, (3 mo. USD LIBOR + 2.50%), Maturing March 17, 2025 | | | | | | | 470 | | | | 465,102 | |
| Vestcom Parent Holdings, Inc. | | | | | | | | | |
Term Loan, 6.34%, (1 mo. USD LIBOR + 4.00%), Maturing December 19, 2023 | | | | | | | 123 | | | | 121,589 | |
| WASH Multifamily Laundry Systems, LLC | | | | | | | | | |
Term Loan, 5.59%, (1 mo. USD LIBOR + 3.25%), Maturing May 14, 2022 | | | | | | | 228 | | | | 224,525 | |
| West Corporation | | | | | | | | | |
Term Loan, 6.53%, (USD LIBOR + 4.00%), Maturing October 10, 2024(2) | | | | | | | 273 | | | | 269,760 | |
| Worldpay, LLC | | | | | | | | | |
Term Loan, 4.06%, (1 mo. USD LIBOR + 1.75%), Maturing August 9, 2024 | | | | | | | 448 | | | | 445,107 | |
| | | | | | | | | | | $ | 15,634,611 | |
|
| Cable and Satellite Television — 5.0% | |
| Charter Communications Operating, LLC | | | | | | | | | |
Term Loan, 4.35%, (1 mo. USD LIBOR + 2.00%), Maturing April 30, 2025 | | | | | | $ | 868 | | | $ | 860,730 | |
| | | | | | | | | | | | |
| Borrower/Tranche Description | | | | | Principal Amount (000’s omitted) | | | Value | |
|
| Cable and Satellite Television (continued) | |
| CSC Holdings, LLC | | | | | | | | | |
Term Loan, 4.56%, (1 mo. USD LIBOR + 2.25%), Maturing July 17, 2025 | | | | | | $ | 646 | | | $ | 636,468 | |
Term Loan, Maturing January 15, 2026(3) | | | | | | | 225 | | | | 219,937 | |
Term Loan, 4.81%, (1 mo. USD LIBOR + 2.50%), Maturing January 25, 2026 | | | | | | | 299 | | | | 294,582 | |
| Numericable Group S.A. | | | | | | | | | |
Term Loan, 5.09%, (1 mo. USD LIBOR + 2.75%), Maturing July 31, 2025 | | | | | | | 443 | | | | 415,270 | |
| Radiate Holdco, LLC | | | | | | | | | |
Term Loan, 5.34%, (1 mo. USD LIBOR + 3.00%), Maturing February 1, 2024 | | | | | | | 445 | | | | 437,504 | |
| Telenet Financing USD, LLC | | | | | | | | | |
Term Loan, 4.56%, (1 mo. USD LIBOR + 2.25%), Maturing August 15, 2026 | | | | | | | 600 | | | | 591,125 | |
| Unitymedia Finance, LLC | | | | | | | | | |
Term Loan, 4.56%, (1 mo. USD LIBOR + 2.25%), Maturing January 15, 2026 | | | | | | | 225 | | | | 223,192 | |
| UPC Financing Partnership | | | | | | | | | |
Term Loan, 4.81%, (1 mo. USD LIBOR + 2.50%), Maturing January 15, 2026 | | | | | | | 500 | | | | 494,437 | |
| Virgin Media Bristol, LLC | | | | | | | | | |
Term Loan, 4.81%, (1 mo. USD LIBOR + 2.50%), Maturing January 15, 2026 | | | | | | | 1,650 | | | | 1,632,083 | |
| Ziggo Secured Finance Partnership | | | | | | | | | |
Term Loan, 4.81%, (1 mo. USD LIBOR + 2.50%), Maturing April 15, 2025 | | | | | | | 850 | | | | 831,406 | |
| | | | | | | | | | | $ | 6,636,734 | |
|
| Chemicals and Plastics — 8.3% | |
| Alpha 3 B.V. | | | | | | | | | |
Term Loan, 5.39%, (3 mo. USD LIBOR + 3.00%), Maturing January 31, 2024 | | | | | | $ | 146 | | | $ | 145,488 | |
| Aruba Investments, Inc. | | | | | | | | | |
Term Loan, 5.59%, (1 mo. USD LIBOR + 3.25%), Maturing February 2, 2022 | | | | | | | 73 | | | | 72,559 | |
| Ashland, Inc. | | | | | | | | | |
Term Loan, 4.07%, (1 mo. USD LIBOR + 1.75%), Maturing May 17, 2024 | | | | | | | 148 | | | | 147,792 | |
| Axalta Coating Systems US Holdings, Inc. | | | | | | | | | |
Term Loan, 4.14%, (3 mo. USD LIBOR + 1.75%), Maturing June 1, 2024 | | | | | | | 997 | | | | 985,011 | |
| Cabot Microelectronics Corporation | | | | | | | | | |
Term Loan, 4.63%, (1 mo. USD LIBOR + 2.25%), Maturing November 14, 2025 | | | | | | | 200 | | | | 199,497 | |
| | | | |
| | 6 | | See Notes to Financial Statements. |
Eaton Vance
Floating-Rate Income Plus Fund
November 30, 2018
Portfolio of Investments (Unaudited) — continued
| | | | | | | | | | |
| Borrower/Tranche Description | | | | Principal Amount (000’s omitted) | | | Value | |
|
| Chemicals and Plastics (continued) | |
| Emerald Performance Materials, LLC | | | | |
Term Loan, 5.84%, (1 mo. USD LIBOR + 3.50%), Maturing August 1, 2021 | | | | $ | 119 | | | $ | 118,748 | |
Term Loan - Second Lien, 10.09%, (1 mo. USD LIBOR + 7.75%), Maturing August 1, 2022 | | | | | 150 | | | | 150,094 | |
| Ferro Corporation | | | | | | | | |
Term Loan, 4.64%, (3 mo. USD LIBOR + 2.25%), Maturing February 14, 2024 | | | | | 74 | | | | 73,396 | |
Term Loan, 4.64%, (3 mo. USD LIBOR + 2.25%), Maturing February 14, 2024 | | | | | 75 | | | | 74,991 | |
| Flint Group GmbH | | | | | | | | |
Term Loan, 5.49%, (3 mo. USD LIBOR + 3.00%), Maturing September 7, 2021 | | | | | 37 | | | | 36,047 | |
| Flint Group US, LLC | | | | | | | | |
Term Loan, 5.49%, (3 mo. USD LIBOR + 3.00%), Maturing September 7, 2021 | | | | | 227 | | | | 218,053 | |
| Gemini HDPE, LLC | | | | | | | | |
Term Loan, 5.03%, (3 mo. USD LIBOR + 2.50%), Maturing August 7, 2024 | | | | | 494 | | | | 492,012 | |
| H.B. Fuller Company | | | | | | | | |
Term Loan, 4.30%, (1 mo. USD LIBOR + 2.00%), Maturing October 20, 2024 | | | | | 457 | | | | 450,450 | |
| Ineos US Finance, LLC | | | | | | | | |
Term Loan, 4.34%, (1 mo. USD LIBOR + 2.00%), Maturing March 31, 2024 | | | | | 794 | | | | 783,933 | |
| Invictus US, LLC | | | | | | | | |
Term Loan, 5.50%, (2 mo. USD LIBOR + 3.00%), Maturing March 28, 2025 | | | | | 124 | | | | 123,857 | |
| Kraton Polymers, LLC | | | | | | | | |
Term Loan, 4.84%, (1 mo. USD LIBOR + 2.50%), Maturing March 5, 2025 | | | | | 215 | | | | 214,332 | |
| MacDermid, Inc. | | | | | | | | |
Term Loan, 4.84%, (1 mo. USD LIBOR + 2.50%), Maturing June 7, 2020 | | | | | 350 | | | | 350,411 | |
Term Loan, 5.34%, (1 mo. USD LIBOR + 3.00%), Maturing June 7, 2023 | | | | | 383 | | | | 383,564 | |
| Messer Industries GmbH | | | | | | | | |
Term Loan, Maturing October 1, 2025(3) | | | | | 325 | | | | 321,262 | |
| Minerals Technologies, Inc. | | | | | | | | |
Term Loan, 4.58%, (USD LIBOR + 2.25%), Maturing February 14, 2024(2) | | | | | 221 | | | | 220,056 | |
| Orion Engineered Carbons GmbH | | | | | | | | |
Term Loan, 4.39%, (3 mo. USD LIBOR + 2.00%), Maturing July 25, 2024 | | | | | 295 | | | | 294,616 | |
| Platform Specialty Products Corporation | | | | |
Term Loan, Maturing November 15, 2025(3) | | | | | 150 | | | | 148,781 | |
| | | | | | | | | | | | |
| Borrower/Tranche Description | | | | | Principal Amount (000’s omitted) | | | Value | |
|
| Chemicals and Plastics (continued) | |
| PMHC II, Inc. | | | | | | | | | |
Term Loan, 6.15%, (USD LIBOR + 3.50%), Maturing March 31, 2025(2) | | | | | | $ | 430 | | | $ | 414,933 | |
| PQ Corporation | | | | | | | | | |
Term Loan, 5.03%, (3 mo. USD LIBOR + 2.50%), Maturing February 8, 2025 | | | | | | | 662 | | | | 654,567 | |
| Schenectady International Group, Inc. | | | | | | | | | |
Term Loan, 7.19%, (3 mo. USD LIBOR + 4.75%), Maturing October 15, 2025 | | | | | | | 200 | | | | 198,000 | |
| Spectrum Holdings III Corp. | | | | | | | | | |
Term Loan, 5.59%, (1 mo. USD LIBOR + 3.25%), Maturing January 31, 2025 | | | | | | | 136 | | | | 132,762 | |
| Starfruit Finco B.V. | | | | | | | | | |
Term Loan, 5.55%, (1 mo. USD LIBOR + 3.25%), Maturing October 1, 2025 | | | | | | | 675 | | | | 666,664 | |
| Tata Chemicals North America, Inc. | | | | | | | | | |
Term Loan, 5.19%, (3 mo. USD LIBOR + 2.75%), Maturing August 7, 2020 | | | | | | | 197 | | | | 195,707 | |
| Trinseo Materials Operating S.C.A. | | | | | | | | | |
Term Loan, 4.34%, (1 mo. USD LIBOR + 2.00%), Maturing September 9, 2024 | | | | | | | 1,043 | | | | 1,027,320 | |
| Tronox Blocked Borrower, LLC | | | | | | | | | |
Term Loan, 5.34%, (1 mo. USD LIBOR + 3.00%), Maturing September 23, 2024 | | | | | | | 255 | | | | 252,897 | |
| Tronox Finance, LLC | | | | | | | | | |
Term Loan, 5.34%, (1 mo. USD LIBOR + 3.00%), Maturing September 23, 2024 | | | | | | | 589 | | | | 583,609 | |
| Unifrax I, LLC | | | | | | | | | |
Term Loan, 5.89%, (3 mo. USD LIBOR + 3.50%), Maturing April 4, 2024 | | | | | | | 123 | | | | 122,052 | |
| Univar, Inc. | | | | | | | | | |
Term Loan, 4.59%, (1 mo. USD LIBOR + 2.25%), Maturing July 1, 2024 | | | | | | | 638 | | | | 627,278 | |
| | | | | | | | | | | $ | 10,880,739 | |
|
| Containers and Glass Products — 3.7% | |
| Berlin Packaging, LLC | | | | | | | | | |
Term Loan, 5.32%, (USD LIBOR + 3.00%), Maturing November 7, 2025(2) | | | | | | $ | 50 | | | $ | 49,210 | |
| Berry Global, Inc. | | | | | | | | | |
Term Loan, 4.32%, (1 mo. USD LIBOR + 2.00%), Maturing October 1, 2022 | | | | | | | 210 | | | | 208,153 | |
| BWAY Holding Company | | | | | | | | | |
Term Loan, 5.66%, (3 mo. USD LIBOR + 3.25%), Maturing April 3, 2024 | | | | | | | 247 | | | | 240,806 | |
| | | | |
| | 7 | | See Notes to Financial Statements. |
Eaton Vance
Floating-Rate Income Plus Fund
November 30, 2018
Portfolio of Investments (Unaudited) — continued
| | | | | | | | | | | | |
| Borrower/Tranche Description | | | | | Principal Amount (000’s omitted) | | | Value | |
|
| Containers and Glass Products (continued) | |
| Consolidated Container Company, LLC | | | | | | | | | |
Term Loan, 5.09%, (1 mo. USD LIBOR + 2.75%), Maturing May 22, 2024 | | | | | | $ | 99 | | | $ | 98,074 | |
| Flex Acquisition Company, Inc. | | | | | | | | | |
Term Loan, 5.30%, (1 mo. USD LIBOR + 3.00%), Maturing December 29, 2023 | | | | | | | 468 | | | | 458,751 | |
Term Loan, 5.55%, (1 mo. USD LIBOR + 3.25%), Maturing June 29, 2025 | | | | | | | 349 | | | | 344,499 | |
| Libbey Glass, Inc. | | | | | | | | | |
Term Loan, 5.32%, (1 mo. USD LIBOR + 3.00%), Maturing April 9, 2021 | | | | | | | 279 | | | | 273,618 | |
| Pelican Products, Inc. | | | | | | | | | |
Term Loan, 5.81%, (1 mo. USD LIBOR + 3.50%), Maturing May 1, 2025 | | | | | | | 150 | | | | 148,596 | |
| Reynolds Group Holdings, Inc. | | | | | | | | | |
Term Loan, 5.09%, (1 mo. USD LIBOR + 2.75%), Maturing February 5, 2023 | | | | | | | 2,380 | | | | 2,362,353 | |
| Ring Container Technologies Group, LLC | | | | | | | | | |
Term Loan, 5.09%, (1 mo. USD LIBOR + 2.75%), Maturing October 31, 2024 | | | | | | | 223 | | | | 221,265 | |
| Trident TPI Holdings, Inc. | | | | | | | | | |
Term Loan, 5.59%, (1 mo. USD LIBOR + 3.25%), Maturing October 17, 2024 | | | | | | | 521 | | | | 514,611 | |
| | | | | | | | | | | $ | 4,919,936 | |
|
| Cosmetics / Toiletries — 0.3% | |
| KIK Custom Products, Inc. | | | | | | | | | |
Term Loan, 6.34%, (1 mo. USD LIBOR + 4.00%), Maturing May 15, 2023 | | | | | | $ | 434 | | | $ | 415,814 | |
| | | | | | | | | | | $ | 415,814 | |
|
| Drugs — 6.1% | |
| Albany Molecular Research, Inc. | | | | | | | | | |
Term Loan, 5.59%, (1 mo. USD LIBOR + 3.25%), Maturing August 30, 2024 | | | | | | $ | 322 | | | $ | 319,096 | |
| Amneal Pharmaceuticals, LLC | | | | | | | | | |
Term Loan, 5.88%, (1 mo. USD LIBOR + 3.50%), Maturing May 4, 2025 | | | | | | | 823 | | | | 822,228 | |
| Arbor Pharmaceuticals, Inc. | | | | | | | | | |
Term Loan, 7.35%, (1 mo. USD LIBOR + 5.00%), Maturing July 5, 2023 | | | | | | | 715 | | | | 671,716 | |
| Bausch Health Companies, Inc. | | | | | | | | | |
Term Loan, 5.31%, (1 mo. USD LIBOR + 3.00%), Maturing June 2, 2025 | | | | | | | 1,501 | | | | 1,488,312 | |
| Endo Luxembourg Finance Company I S.a.r.l. | | | | | | | | | |
Term Loan, 6.63%, (1 mo. USD LIBOR + 4.25%), Maturing April 29, 2024 | | | | | | | 1,160 | | | | 1,159,436 | |
| | | | | | | | | | | | |
| Borrower/Tranche Description | | | | | Principal Amount (000’s omitted) | | | Value | |
|
| Drugs (continued) | |
| Horizon Pharma, Inc. | | | | | | | | | |
Term Loan, 5.38%, (1 mo. USD LIBOR + 3.00%), Maturing March 29, 2024 | | | | | | $ | 975 | | | $ | 970,281 | |
| Jaguar Holding Company II | | | | | | | | | |
Term Loan, 4.84%, (1 mo. USD LIBOR + 2.50%), Maturing August 18, 2022 | | | | | | | 1,600 | | | | 1,578,030 | |
| Mallinckrodt International Finance S.A. | | | | | | | | | |
Term Loan, 5.14%, (3 mo. USD LIBOR + 2.75%), Maturing September 24, 2024 | | | | | | | 639 | | | | 618,197 | |
Term Loan, 5.62%, (3 mo. USD LIBOR + 3.00%), Maturing February 24, 2025 | | | | | | | 199 | | | | 193,634 | |
| PharMerica Corporation | | | | | | | | | |
Term Loan, 5.81%, (1 mo. USD LIBOR + 3.50%), Maturing December 6, 2024 | | | | | | | 199 | | | | 198,005 | |
| | | | | | | | | | | $ | 8,018,935 | |
|
| Ecological Services and Equipment — 1.0% | |
| Advanced Disposal Services, Inc. | | | | | | | | | |
Term Loan, 4.47%, (1 week USD LIBOR + 2.25%), Maturing November 10, 2023 | | | | | | $ | 464 | | | $ | 459,257 | |
| EnergySolutions, LLC | | | | | | | | | |
Term Loan, 6.14%, (3 mo. USD LIBOR + 3.75%), Maturing May 9, 2025 | | | | | | | 274 | | | | 268,826 | |
| GFL Environmental, Inc. | | | | | | | | | |
Term Loan, 5.39%, (3 mo. USD LIBOR + 3.00%), Maturing May 30, 2025 | | | | | | | 510 | | | | 498,387 | |
Term Loan, 7.00%, (3 mo. USD Prime + 1.75%), Maturing May 30, 2025 | | | | | | | 64 | | | | 62,067 | |
| | | | | | | | | | | $ | 1,288,537 | |
|
| Electronics / Electrical — 17.8% | |
| Almonde, Inc. | | | | | | | | | |
Term Loan, 5.89%, (3 mo. USD LIBOR + 3.50%), Maturing June 13, 2024 | | | | | | $ | 836 | | | $ | 812,417 | |
| Answers Finance, LLC | | | | | | | | | |
Term Loan - Second Lien, 9.00%, (3 mo. USD Prime + 7.90%, Cap 1.10%), Maturing September 15, 2021(4) | | | | | | | 76 | | | | 61,052 | |
| Applied Systems, Inc. | | | | | | | | | |
Term Loan, 5.39%, (3 mo. USD LIBOR + 3.00%), Maturing September 19, 2024 | | | | | | | 695 | | | | 693,632 | |
| Aptean, Inc. | | | | | | | | | |
Term Loan, 6.64%, (3 mo. USD LIBOR + 4.25%), Maturing December 20, 2022 | | | | | | | 279 | | | | 278,448 | |
| Avast Software B.V. | | | | | | | | | |
Term Loan, 4.89%, (3 mo. USD LIBOR + 2.50%), Maturing September 30, 2023 | | | | | | | 326 | | | | 325,173 | |
| | | | |
| | 8 | | See Notes to Financial Statements. |
Eaton Vance
Floating-Rate Income Plus Fund
November 30, 2018
Portfolio of Investments (Unaudited) — continued
| | | | | | | | | | |
| Borrower/Tranche Description | | | | Principal Amount (000’s omitted) | | | Value | |
|
| Electronics / Electrical (continued) | |
| Barracuda Networks, Inc. | | | | | | | | |
Term Loan, 5.55%, (1 mo. USD LIBOR + 3.25%), Maturing February 12, 2025 | | | | $ | 348 | | | $ | 345,420 | |
| Blackhawk Network Holdings, Inc. | | | | | | | | |
Term Loan, 5.39%, (3 mo. USD LIBOR + 3.00%), Maturing June 15, 2025 | | | | | 175 | | | | 172,904 | |
| BMC Software Finance, Inc. | | | | | | | | |
Term Loan, 6.65%, (3 mo. USD LIBOR + 4.25%), Maturing October 2, 2025 | | | | | 825 | | | | 816,516 | |
| Campaign Monitor Finance Pty. Limited | | | | | | | | |
Term Loan, 7.64%, (3 mo. USD LIBOR + 5.25%), Maturing March 18, 2021 | | | | | 187 | | | | 169,147 | |
| Cohu, Inc. | | | | | | | | |
Term Loan, 5.40%, (3 mo. USD LIBOR + 3.00%), Maturing September 20, 2025 | | | | | 175 | | | | 172,375 | |
| CommScope, Inc. | | | | | | | | |
Term Loan, 4.35%, (1 mo. USD LIBOR + 2.00%), Maturing December 29, 2022 | | | | | 97 | | | | 95,912 | |
| CPI International, Inc. | | | | | | | | |
Term Loan, 5.84%, (1 mo. USD LIBOR + 3.50%), Maturing July 26, 2024 | | | | | 149 | | | | 147,572 | |
| Cypress Semiconductor Corporation | | | | | | | | |
Term Loan, 4.35%, (1 mo. USD LIBOR + 2.00%), Maturing July 5, 2021 | | | | | 252 | | | | 250,698 | |
| DigiCert, Inc. | | | | | | | | |
Term Loan, 6.34%, (1 mo. USD LIBOR + 4.00%), Maturing October 31, 2024 | | | | | 749 | | | | 745,846 | |
| Electro Rent Corporation | | | | | | | | |
Term Loan, 7.49%, (3 mo. USD LIBOR + 5.00%), Maturing January 31, 2024 | | | | | 295 | | | | 296,040 | |
| Energizer Holdings, Inc. | | | | | | | | |
Term Loan, Maturing June 20, 2025(3) | | | | | 125 | | | | 122,344 | |
| Epicor Software Corporation | | | | | | | | |
Term Loan, 5.60%, (1 mo. USD LIBOR + 3.25%), Maturing June 1, 2022 | | | | | 546 | | | | 539,743 | |
| Exact Merger Sub, LLC | | | | | | | | |
Term Loan, 6.64%, (3 mo. USD LIBOR + 4.25%), Maturing September 27, 2024 | | | | | 149 | | | | 148,593 | |
| EXC Holdings III Corp. | | | | | | | | |
Term Loan, 5.89%, (3 mo. USD LIBOR + 3.50%), Maturing December 2, 2024 | | | | | 124 | | | | 123,752 | |
| Financial & Risk US Holdings, Inc. | | | | | | | | |
Term Loan, 6.09%, (1 mo. USD LIBOR + 3.75%), Maturing October 1, 2025 | | | | | 275 | | | | 268,440 | |
| Flexera Software, LLC | | | | | | | | |
Term Loan, 5.60%, (1 mo. USD LIBOR + 3.25%), Maturing February 26, 2025 | | | | | 274 | | | | 272,832 | |
| | | | | | | | | | |
| Borrower/Tranche Description | | | | Principal Amount (000’s omitted) | | | Value | |
|
| Electronics / Electrical (continued) | |
| GlobalLogic Holdings, Inc. | | | | | | | | |
Term Loan, 1.63%, Maturing August 1, 2025(6) | | | | $ | 16 | | | $ | 15,566 | |
Term Loan, 5.59%, (1 mo. USD LIBOR + 3.25%), Maturing August 1, 2025 | | | | | 109 | | | | 108,962 | |
| Go Daddy Operating Company, LLC | | | | | | | | |
Term Loan, 4.59%, (1 mo. USD LIBOR + 2.25%), Maturing February 15, 2024 | | | | | 1,282 | | | | 1,270,734 | |
| GTCR Valor Companies, Inc. | | | | | | | | |
Term Loan, 5.14%, (3 mo. USD LIBOR + 2.75%), Maturing June 16, 2023 | | | | | 353 | | | | 350,780 | |
| Hyland Software, Inc. | | | | | | | | |
Term Loan, 5.84%, (1 mo. USD LIBOR + 3.50%), Maturing July 1, 2024 | | | | | 1,263 | | | | 1,256,721 | |
| Infoblox, Inc. | | | | | | | | |
Term Loan, 6.84%, (1 mo. USD LIBOR + 4.50%), Maturing November 7, 2023 | | | | | 482 | | | | 484,466 | |
| Infor (US), Inc. | | | | | | | | |
Term Loan, 5.14%, (3 mo. USD LIBOR + 2.75%), Maturing February 1, 2022 | | | | | 1,856 | | | | 1,835,307 | |
| Informatica, LLC | | | | | | | | |
Term Loan, 5.59%, (1 mo. USD LIBOR + 3.25%), Maturing August 5, 2022 | | | | | 644 | | | | 642,959 | |
| Lattice Semiconductor Corporation | | | | | | | | |
Term Loan, 6.57%, (1 mo. USD LIBOR + 4.25%), Maturing March 10, 2021 | | | | | 439 | | | | 440,729 | |
| MA FinanceCo., LLC | | | | | | | | |
Term Loan, 4.59%, (1 mo. USD LIBOR + 2.25%), Maturing November 19, 2021 | | | | | 503 | | | | 495,134 | |
Term Loan, 4.84%, (1 mo. USD LIBOR + 2.50%), Maturing June 21, 2024 | | | | | 118 | | | | 116,338 | |
| MACOM Technology Solutions Holdings, Inc. | | | | | | | | |
Term Loan, 4.59%, (1 mo. USD LIBOR + 2.25%), Maturing May 17, 2024 | | | | | 292 | | | | 282,180 | |
| Microchip Technology Incorporated | | | | | | | | |
Term Loan, 4.35%, (1 mo. USD LIBOR + 2.00%), Maturing May 29, 2025 | | | | | 543 | | | | 540,226 | |
| MTS Systems Corporation | | | | | | | | |
Term Loan, 5.56%, (1 mo. USD LIBOR + 3.25%), Maturing July 5, 2023 | | | | | 277 | | | | 275,507 | |
| Renaissance Holding Corp. | | | | | | | | |
Term Loan, 5.59%, (1 mo. USD LIBOR + 3.25%), Maturing May 30, 2025 | | | | | 274 | | | | 270,884 | |
| Seattle Spinco, Inc. | | | | | | | | |
Term Loan, 4.84%, (1 mo. USD LIBOR + 2.50%), Maturing June 21, 2024 | | | | | 800 | | | | 785,908 | |
| SGS Cayman L.P. | | | | | | | | |
Term Loan, 7.76%, (3 mo. USD LIBOR + 5.38%), Maturing April 23, 2021 | | | | | 50 | | | | 47,544 | |
| | | | |
| | 9 | | See Notes to Financial Statements. |
Eaton Vance
Floating-Rate Income Plus Fund
November 30, 2018
Portfolio of Investments (Unaudited) — continued
| | | | | | | | | | |
| Borrower/Tranche Description | | | | Principal Amount (000’s omitted) | | | Value | |
|
| Electronics / Electrical (continued) | |
| SkillSoft Corporation | | | | | | | | |
Term Loan, 7.09%, (1 mo. USD LIBOR + 4.75%), Maturing April 28, 2021 | | | | $ | 1,235 | | | $ | 1,131,755 | |
| SolarWinds Holdings, Inc. | | | | | | | | |
Term Loan, 5.09%, (1 mo. USD LIBOR + 2.75%), Maturing February 5, 2024 | | | | | 248 | | | | 247,474 | |
| Southwire Company | | | | | | | | |
Term Loan, 4.31%, (1 mo. USD LIBOR + 2.00%), Maturing May 19, 2025 | | | | | 125 | | | | 123,908 | |
| SS&C Technologies Holdings Europe S.a.r.l. | | | | | | | | |
Term Loan, 4.59%, (1 mo. USD LIBOR + 2.25%), Maturing April 16, 2025 | | | | | 315 | | | | 308,056 | |
| SS&C Technologies, Inc. | | | | | | | | |
Term Loan, 4.59%, (1 mo. USD LIBOR + 2.25%), Maturing April 16, 2025 | | | | | 826 | | | | 808,806 | |
| SurveyMonkey, Inc. | | | | | | | | |
Term Loan, 6.10%, (1 mo. USD LIBOR + 3.75%), Maturing October 10, 2025 | | | | | 257 | | | | 256,025 | |
| Sutherland Global Services, Inc. | | | | | | | | |
Term Loan, 7.76%, (3 mo. USD LIBOR + 5.38%), Maturing April 23, 2021 | | | | | 214 | | | | 204,246 | |
| Tibco Software, Inc. | | | | | | | | |
Term Loan, 5.85%, (1 mo. USD LIBOR + 3.50%), Maturing December 4, 2020 | | | | | 148 | | | | 147,707 | |
| TriTech Software Systems | | | | | | | | |
Term Loan, 6.09%, (1 mo. USD LIBOR + 3.75%), Maturing August 29, 2025 | | | | | 200 | | | | 198,688 | |
| Uber Technologies | | | | | | | | |
Term Loan, 5.81%, (1 mo. USD LIBOR + 3.50%), Maturing July 13, 2023 | | | | | 907 | | | | 894,318 | |
Term Loan, 6.32%, (1 mo. USD LIBOR + 4.00%), Maturing April 4, 2025 | | | | | 549 | | | | 543,977 | |
| Ultra Clean Holdings, Inc. | | | | | | | | |
Term Loan, 6.84%, (1 mo. USD LIBOR + 4.50%), Maturing August 27, 2025 | | | | | 200 | | | | 195,500 | |
| VeriFone Systems, Inc. | | | | | | | | |
Term Loan, 6.64%, (3 mo. USD LIBOR + 4.00%), Maturing August 20, 2025 | | | | | 225 | | | | 223,453 | |
| Veritas Bermuda Ltd. | | | | | | | | |
Term Loan, 6.85%, (USD LIBOR + 4.50%), Maturing January 27, 2023(2) | | | | | 464 | | | | 418,393 | |
| Vero Parent, Inc. | | | | | | | | |
Term Loan, 6.84%, (1 mo. USD LIBOR + 4.50%), Maturing August 16, 2024 | | | | | 569 | | | | 571,385 | |
| Wall Street Systems Delaware, Inc. | | | | | | | | |
Term Loan, 5.39%, (3 mo. USD LIBOR + 3.00%), Maturing November 21, 2024 | | | | | 521 | | | | 512,595 | |
| | | | | | | | | | | | |
| Borrower/Tranche Description | | | | | Principal Amount (000’s omitted) | | | Value | |
|
| Electronics / Electrical (continued) | |
| Western Digital Corporation | | | | | | | | | |
Term Loan, 4.06%, (3 mo. USD LIBOR + 1.75%), Maturing April 29, 2023 | | | | | | $ | 603 | | | $ | 587,148 | |
| | | | | | | | | | | $ | 23,452,235 | |
|
| Equipment Leasing — 0.9% | |
| Avolon TLB Borrower 1 (US), LLC | | | | | | | | | |
Term Loan, 4.30%, (1 mo. USD LIBOR + 2.00%), Maturing January 15, 2025 | | | | | | $ | 1,015 | | | $ | 1,006,154 | |
| IBC Capital Limited | | | | | | | | | |
Term Loan, 6.09%, (3 mo. USD LIBOR + 3.75%), Maturing September 11, 2023 | | | | | | | 124 | | | | 123,597 | |
| | | | | | | | | | | $ | 1,129,751 | |
|
| Financial Intermediaries — 4.1% | |
| Clipper Acquisitions Corp. | | | | | | | | | |
Term Loan, 4.06%, (1 mo. USD LIBOR + 1.75%), Maturing December 27, 2024 | | | | | | $ | 298 | | | $ | 296,944 | |
| Ditech Holding Corporation | | | | | | | | | |
Term Loan, 8.34%, (1 mo. USD LIBOR + 6.00%), Maturing June 30, 2022 | | | | | | | 767 | | | | 688,197 | |
| Donnelley Financial Solutions, Inc. | | | | | | | | | |
Term Loan, 5.22%, (1 week USD LIBOR + 3.00%), Maturing October 2, 2023 | | | | | | | 38 | | | | 38,249 | |
| Focus Financial Partners, LLC | | | | | | | | | |
Term Loan, 4.84%, (1 mo. USD LIBOR + 2.50%), Maturing July 3, 2024 | | | | | | | 424 | | | | 421,023 | |
| Fortress Investment Group, LLC | | | | | | | | | |
Term Loan, 4.34%, (1 mo. USD LIBOR + 2.00%), Maturing December 27, 2022 | | | | | | | 233 | | | | 231,251 | |
| Franklin Square Holdings L.P. | | | | | | | | | |
Term Loan, 4.81%, (1 mo. USD LIBOR + 2.50%), Maturing August 1, 2025 | | | | | | | 125 | | | | 124,453 | |
| Freedom Mortgage Corporation | | | | | | | | | |
Term Loan, 7.09%, (1 mo. USD LIBOR + 4.75%), Maturing February 23, 2022 | | | | | | | 266 | | | | 264,766 | |
| Greenhill & Co., Inc. | | | | | | | | | |
Term Loan, 6.21%, (USD LIBOR + 3.75%), Maturing October 12, 2022(2) | | | | | | | 241 | | | | 241,227 | |
| GreenSky Holdings, LLC | | | | | | | | | |
Term Loan, 5.63%, (1 mo. USD LIBOR + 3.25%), Maturing March 31, 2025 | | | | | | | 348 | | | | 346,944 | |
| Guggenheim Partners, LLC | | | | | | | | | |
Term Loan, 5.09%, (1 mo. USD LIBOR + 2.75%), Maturing July 21, 2023 | | | | | | | 1,459 | | | | 1,459,790 | |
| | | | |
| | 10 | | See Notes to Financial Statements. |
Eaton Vance
Floating-Rate Income Plus Fund
November 30, 2018
Portfolio of Investments (Unaudited) — continued
| | | | | | | | | | | | |
| Borrower/Tranche Description | | | | | Principal Amount (000’s omitted) | | | Value | |
|
| Financial Intermediaries (continued) | |
| Harbourvest Partners, LLC | | | | | | | | | |
Term Loan, 4.56%, (1 mo. USD LIBOR + 2.25%), Maturing March 1, 2025 | | | | | | $ | 116 | | | $ | 115,550 | |
| LPL Holdings, Inc. | | | | | | | | | |
Term Loan, 4.55%, (1 mo. USD LIBOR + 2.25%), Maturing September 23, 2024 | | | | | | | 321 | | | | 318,803 | |
| Ocwen Financial Corporation | | | | | | | | | |
Term Loan, 7.32%, (1 mo. USD LIBOR + 5.00%), Maturing December 5, 2020 | | | | | | | 70 | | | | 70,421 | |
| StepStone Group L.P. | | | | | | | | | |
Term Loan, 6.35%, (1 mo. USD LIBOR + 4.00%), Maturing March 14, 2025 | | | | | | | 149 | | | | 149,063 | |
| Virtus Investment Partners, Inc. | | | | | | | | | |
Term Loan, 4.91%, (3 mo. USD LIBOR + 2.50%), Maturing June 1, 2024 | | | | | | | 164 | | | | 163,928 | |
| Walker & Dunlop, Inc. | | | | | | | | | |
Term Loan, 4.59%, (1 mo. USD LIBOR + 2.25%), Maturing October 31, 2025 | | | | | | | 500 | | | | 499,375 | |
| | | | | | | | | | | $ | 5,429,984 | |
|
| Food Products — 4.2% | |
| Alphabet Holding Company, Inc. | | | | | | | | | |
Term Loan, 5.84%, (1 mo. USD LIBOR + 3.50%), Maturing September 26, 2024 | | | | | | $ | 569 | | | $ | 537,052 | |
| Badger Buyer Corp. | | | | | | | | | |
Term Loan, 5.84%, (1 mo. USD LIBOR + 3.50%), Maturing September 30, 2024 | | | | | | | 398 | | | | 389,533 | |
| CHG PPC Parent, LLC | | | | | | | | | |
Term Loan, 5.09%, (1 mo. USD LIBOR + 2.75%), Maturing March 31, 2025 | | | | | | | 100 | | | | 98,625 | |
| Del Monte Foods, Inc. | | | | | | | | | |
Term Loan, 5.91%, (3 mo. USD LIBOR + 3.25%), Maturing February 18, 2021 | | | | | | | 646 | | | | 554,695 | |
| Dole Food Company, Inc. | | | | | | | | | |
Term Loan, 5.09%, (USD LIBOR + 2.75%), Maturing April 6, 2024(2) | | | | | | | 412 | | | | 406,315 | |
| Hearthside Food Solutions, LLC | | | | | | | | | |
Term Loan, 6.03%, (1 mo. USD LIBOR + 3.69%), Maturing May 23, 2025 | | | | | | | 175 | | | | 170,417 | |
Term Loan, 6.32%, (1 mo. USD LIBOR + 4.00%), Maturing May 31, 2025 | | | | | | | 100 | | | | 99,125 | |
| High Liner Foods Incorporated | | | | | | | | | |
Term Loan, 5.65%, (3 mo. USD LIBOR + 3.25%), Maturing April 24, 2021 | | | | | | | 201 | | | | 188,385 | |
| HLF Financing S.a.r.l. | | | | | | | | | |
Term Loan, 5.59%, (1 mo. USD LIBOR + 3.25%), Maturing August 18, 2025 | | | | | | | 250 | | | | 249,583 | |
| | | | | | | | | | | | |
| Borrower/Tranche Description | | | | | Principal Amount (000’s omitted) | | | Value | |
|
| Food Products (continued) | |
| Jacobs Douwe Egberts International B.V. | | | | | | | | | |
Term Loan, 4.56%, (3 mo. USD LIBOR + 2.00%), Maturing November 1, 2025 | | | | | | $ | 147 | | | $ | 146,273 | |
| JBS USA, LLC | | | | | | | | | |
Term Loan, 4.84%, (3 mo. USD LIBOR + 2.50%), Maturing October 30, 2022 | | | | | | | 2,088 | | | | 2,068,002 | |
| Nomad Foods Europe Midco Limited | | | | | | | | | |
Term Loan, 4.56%, (1 mo. USD LIBOR + 2.25%), Maturing May 15, 2024 | | | | | | | 299 | | | | 293,463 | |
| Post Holdings, Inc. | | | | | | | | | |
Term Loan, 4.32%, (1 mo. USD LIBOR + 2.00%), Maturing May 24, 2024 | | | | | | | 238 | | | | 237,347 | |
| Restaurant Technologies, Inc. | | | | | | | | | |
Term Loan, 5.65%, (3 mo. USD LIBOR + 3.25%), Maturing October 1, 2025 | | | | | | | 50 | | | | 49,969 | |
| | | | | | | | | | | $ | 5,488,784 | |
|
| Food Service — 2.7% | |
| 1011778 B.C. Unlimited Liability Company | | | | | | | | | |
Term Loan, 4.59%, (1 mo. USD LIBOR + 2.25%), Maturing February 16, 2024 | | | | | | $ | 1,586 | | | $ | 1,553,662 | |
| Aramark Services, Inc. | | | | | | | | | |
Term Loan, 4.09%, (1 mo. USD LIBOR + 1.75%), Maturing March 11, 2025 | | | | | | | 210 | | | | 208,734 | |
| Del Frisco’s Restaurant Group, Inc. | | | | | | | | | |
Term Loan, 8.38%, (1 mo. USD LIBOR + 6.00%), Maturing June 27, 2025 | | | | | | | 150 | | | | 142,892 | |
| Dhanani Group, Inc. | | | | | | | | | |
Term Loan, 6.09%, (1 mo. USD LIBOR + 3.75%), Maturing July 20, 2025 | | | | | | | 150 | | | | 148,129 | |
| IRB Holding Corp. | | | | | | | | | |
Term Loan, 5.57%, (1 mo. USD LIBOR + 3.25%), Maturing February 5, 2025 | | | | | | | 449 | | | | 445,118 | |
| KFC Holding Co. | | | | | | | | | |
Term Loan, 4.05%, (1 mo. USD LIBOR + 1.75%), Maturing April 3, 2025 | | | | | | | 245 | | | | 243,671 | |
| NPC International, Inc. | | | | | | | | | |
Term Loan, 5.84%, (1 mo. USD LIBOR + 3.50%), Maturing April 19, 2024 | | | | | | | 222 | | | | 213,300 | |
| US Foods, Inc. | | | | | | | | | |
Term Loan, 4.34%, (1 mo. USD LIBOR + 2.00%), Maturing June 27, 2023 | | | | | | | 199 | | | | 196,930 | |
| Welbilt, Inc. | | | | | | | | | |
Term Loan, 4.84%, (1 mo. USD LIBOR + 2.50%), Maturing October 23, 2025 | | | | | | | 375 | | | | 370,344 | |
| | | | | | | | | | | $ | 3,522,780 | |
| | | | |
| | 11 | | See Notes to Financial Statements. |
Eaton Vance
Floating-Rate Income Plus Fund
November 30, 2018
Portfolio of Investments (Unaudited) — continued
| | | | | | | | | | | | |
| Borrower/Tranche Description | | | | | Principal Amount (000’s omitted) | | | Value | |
|
| Food / Drug Retailers — 1.4% | |
| Albertsons, LLC | | | | | | | | | |
Term Loan, 5.38%, (3 mo. USD LIBOR + 3.00%), Maturing December 21, 2022 | | | | | | $ | 491 | | | $ | 484,427 | |
Term Loan, 5.69%, (3 mo. USD LIBOR + 3.00%), Maturing June 22, 2023 | | | | | | | 1,070 | | | | 1,052,391 | |
Term Loan, 5.45%, (3 mo. USD LIBOR + 3.00%), Maturing November 17, 2025 | | | | | | | 243 | | | | 237,971 | |
| Diplomat Pharmacy, Inc. | | | | | | | | | |
Term Loan, 6.85%, (1 mo. USD LIBOR + 4.50%), Maturing December 20, 2024 | | | | | | | 121 | | | | 121,655 | |
| | | | | | | | | | | $ | 1,896,444 | |
|
| Health Care — 13.7% | |
| ADMI Corp. | | | | | | | | | |
Term Loan, 5.34%, (1 mo. USD LIBOR + 3.00%), Maturing April 30, 2025 | | | | | | $ | 399 | | | $ | 397,337 | |
| Akorn, Inc. | | | | | | | | | |
Term Loan, 7.88%, (1 mo. USD LIBOR + 5.50%), Maturing April 16, 2021 | | | | | | | 219 | | | | 185,726 | |
| Alliance Healthcare Services, Inc. | | | | | | | | | |
Term Loan, 6.84%, (1 mo. USD LIBOR + 4.50%), Maturing October 24, 2023 | | | | | | | 246 | | | | 246,250 | |
| Athletico Management, LLC | | | | | | | | | |
Term Loan, 5.80%, (1 mo. USD LIBOR + 3.50%), Maturing October 31, 2025 | | | | | | | 125 | | | | 125,625 | |
| Auris Luxembourg III S.a.r.l. | | | | | | | | | |
Term Loan, 5.39%, (3 mo. USD LIBOR + 3.00%), Maturing January 17, 2022 | | | | | | | 193 | | | | 192,534 | |
| Avantor, Inc. | | | | | | | | | |
Term Loan, 6.07%, (1 mo. USD LIBOR + 3.75%), Maturing November 21, 2024 | | | | | | | 794 | | | | 794,372 | |
| Beaver-Visitec International, Inc. | | | | | | | | | |
Term Loan, 6.39%, (3 mo. USD LIBOR + 4.00%), Maturing August 21, 2023 | | | | | | | 196 | | | | 196,009 | |
| BioClinica, Inc. | | | | | | | | | |
Term Loan, 6.75%, (3 mo. USD LIBOR + 4.25%), Maturing October 20, 2023 | | | | | | | 394 | | | | 372,316 | |
| BW NHHC Holdco, Inc. | | | | | | | | | |
Term Loan, 7.30%, (1 mo. USD LIBOR + 5.00%), Maturing May 15, 2025 | | | | | | | 224 | | | | 220,510 | |
| Carestream Dental Equipment, Inc. | | | | | | | | | |
Term Loan, 5.64%, (3 mo. USD LIBOR + 3.25%), Maturing September 1, 2024 | | | | | | | 396 | | | | 390,060 | |
| CHG Healthcare Services, Inc. | | | | | | | | | |
Term Loan, 5.46%, (USD LIBOR + 3.00%), Maturing June 7, 2023(2) | | | | | | | 764 | | | | 761,706 | |
| | | | | | | | | | |
| Borrower/Tranche Description | | | | Principal Amount (000’s omitted) | | | Value | |
|
| Health Care (continued) | |
| Community Health Systems, Inc. | | | | | | | | |
Term Loan, 5.96%, (3 mo. USD LIBOR + 3.25%), Maturing January 27, 2021 | | | | $ | 257 | | | $ | 251,585 | |
| Concentra, Inc. | | | | | | | | |
Term Loan, 5.07%, (1 mo. USD LIBOR + 2.75%), Maturing June 1, 2022 | | | | | 75 | | | | 74,390 | |
| Convatec, Inc. | | | | | | | | |
Term Loan, 4.64%, (3 mo. USD LIBOR + 2.25%), Maturing October 31, 2023 | | | | | 148 | | | | 146,734 | |
| CPI Holdco, LLC | | | | | | | | |
Term Loan, 5.89%, (1 mo. USD LIBOR + 3.50%), Maturing March 21, 2024 | | | | | 197 | | | | 196,326 | |
| CryoLife, Inc. | | | | | | | | |
Term Loan, 5.64%, (3 mo. USD LIBOR + 3.25%), Maturing November 14, 2024 | | | | | 124 | | | | 123,907 | |
| DJO Finance, LLC | | | | | | | | |
Term Loan, 5.62%, (USD LIBOR + 3.25%), Maturing June 8, 2020(2) | | | | | 532 | | | | 531,792 | |
| Envision Healthcare Corporation | | | | | | | | |
Term Loan, 6.09%, (1 mo. USD LIBOR + 3.75%), Maturing October 10, 2025 | | | | | 1,075 | | | | 1,034,419 | |
| Gentiva Health Services, Inc. | | | | | | | | |
Term Loan, 6.13%, (1 mo. USD LIBOR + 3.75%), Maturing July 2, 2025 | | | | | 464 | | | | 463,383 | |
| GHX Ultimate Parent Corporation | | | | | | | | |
Term Loan, 5.64%, (3 mo. USD LIBOR + 3.25%), Maturing June 28, 2024 | | | | | 198 | | | | 194,781 | |
| Greatbatch Ltd. | | | | | | | | |
Term Loan, 5.32%, (1 mo. USD LIBOR + 3.00%), Maturing October 27, 2022 | | | | | 292 | | | | 291,778 | |
| Grifols Worldwide Operations USA, Inc. | | | | | | | | |
Term Loan, 4.47%, (1 week USD LIBOR + 2.25%), Maturing January 31, 2025 | | | | | 837 | | | | 831,546 | |
| Hanger, Inc. | | | | | | | | |
Term Loan, 5.84%, (1 mo. USD LIBOR + 3.50%), Maturing March 6, 2025 | | | | | 249 | | | | 248,439 | |
| Indivior Finance S.a.r.l. | | | | | | | | |
Term Loan, 7.03%, (3 mo. USD LIBOR + 4.50%), Maturing December 18, 2022 | | | | | 412 | | | | 405,972 | |
| Inovalon Holdings, Inc. | | | | | | | | |
Term Loan, 5.88%, (1 mo. USD LIBOR + 3.50%), Maturing April 2, 2025 | | | | | 299 | | | | 297,629 | |
| IQVIA, Inc. | | | | | | | | |
Term Loan, 4.39%, (3 mo. USD LIBOR + 2.00%), Maturing January 17, 2025 | | | | | 173 | | | | 172,005 | |
| Kinetic Concepts, Inc. | | | | | | | | |
Term Loan, 5.64%, (3 mo. USD LIBOR + 3.25%), Maturing February 2, 2024 | | | | | 642 | | | | 640,270 | |
| | | | |
| | 12 | | See Notes to Financial Statements. |
Eaton Vance
Floating-Rate Income Plus Fund
November 30, 2018
Portfolio of Investments (Unaudited) — continued
| | | | | | | | | | |
| Borrower/Tranche Description | | | | Principal Amount (000’s omitted) | | | Value | |
|
| Health Care (continued) | |
| KUEHG Corp. | | | | | | | | |
Term Loan, 6.14%, (3 mo. USD LIBOR + 3.75%), Maturing February 21, 2025 | | | | $ | 834 | | | $ | 831,907 | |
| Medical Solutions, LLC | | | | | | | | |
Term Loan, 6.09%, (1 mo. USD LIBOR + 3.75%), Maturing June 9, 2024 | | | | | 174 | | | | 173,519 | |
| MedPlast Holdings, Inc. | | | | | | | | |
Term Loan, 6.15%, (3 mo. USD LIBOR + 3.75%), Maturing July 2, 2025 | | | | | 100 | | | | 100,063 | |
| MPH Acquisition Holdings, LLC | | | | | | | | |
Term Loan, 5.14%, (3 mo. USD LIBOR + 2.75%), Maturing June 7, 2023 | | | | | 1,078 | | | | 1,060,236 | |
| National Mentor Holdings, Inc. | | | | | | | | |
Term Loan, 5.39%, (3 mo. USD LIBOR + 3.00%), Maturing January 31, 2021 | | | | | 143 | | | | 143,116 | |
| Navicure, Inc. | | | | | | | | |
Term Loan, 6.09%, (1 mo. USD LIBOR + 3.75%), Maturing November 1, 2024 | | | | | 174 | | | | 172,509 | |
| New Millennium Holdco, Inc. | | | | | | | | |
Term Loan, 8.84%, (1 mo. USD LIBOR + 6.50%), Maturing December 21, 2020 | | | | | 95 | | | | 53,972 | |
| One Call Corporation | | | | | | | | |
Term Loan, 7.56%, (1 mo. USD LIBOR + 5.25%), Maturing November 25, 2022 | | | | | 316 | | | | 289,298 | |
| Ortho-Clinical Diagnostics S.A. | | | | | | | | |
Term Loan, 5.58%, (3 mo. USD LIBOR + 3.25%), Maturing June 30, 2025 | | | | | 785 | | | | 766,960 | |
| Parexel International Corporation | | | | | | | | |
Term Loan, 5.09%, (1 mo. USD LIBOR + 2.75%), Maturing September 27, 2024 | | | | | 1,092 | | | | 1,063,965 | |
| Press Ganey Holdings, Inc. | | | | | | | | |
Term Loan, 5.09%, (1 mo. USD LIBOR + 2.75%), Maturing October 23, 2023 | | | | | 172 | | | | 170,272 | |
| Prospect Medical Holdings, Inc. | | | | | | | | |
Term Loan, 7.88%, (1 mo. USD LIBOR + 5.50%), Maturing February 22, 2024 | | | | | 274 | | | | 274,651 | |
| R1 RCM, Inc. | | | | | | | | |
Term Loan, 7.65%, (3 mo. USD LIBOR + 5.25%), Maturing May 8, 2025 | | | | | 125 | | | | 124,220 | |
| RadNet, Inc. | | | | | | | | |
Term Loan, 6.22%, (3 mo. USD LIBOR + 3.75%), Maturing June 30, 2023 | | | | | 362 | | | | 361,904 | |
| Select Medical Corporation | | | | | | | | |
Term Loan, 4.81%, (1 mo. USD LIBOR + 2.50%), Maturing March 6, 2025 | | | | | 394 | | | | 392,276 | |
| Sotera Health Holdings, LLC | | | | | | | | |
Term Loan, 5.34%, (1 mo. USD LIBOR + 3.00%), Maturing May 15, 2022 | | | | | 195 | | | | 192,714 | |
| | | | | | | | | | | | |
| Borrower/Tranche Description | | | | | Principal Amount (000’s omitted) | | | Value | |
|
| Health Care (continued) | |
| Sound Inpatient Physicians | | | | | | | | | |
Term Loan, 5.34%, (1 mo. USD LIBOR + 3.00%), Maturing June 27, 2025 | | | | | | $ | 100 | | | $ | 99,563 | |
| Surgery Center Holdings, Inc. | | | | | | | | | |
Term Loan, 5.60%, (1 mo. USD LIBOR + 3.25%), Maturing September 2, 2024 | | | | | | | 248 | | | | 244,483 | |
| Syneos Health, Inc. | | | | | | | | | |
Term Loan, 4.34%, (1 mo. USD LIBOR + 2.00%), Maturing August 1, 2024 | | | | | | | 98 | | | | 97,042 | |
| Team Health Holdings, Inc. | | | | | | | | | |
Term Loan, 5.09%, (1 mo. USD LIBOR + 2.75%), Maturing February 6, 2024 | | | | | | | 493 | | | | 460,487 | |
| Tecomet, Inc. | | | | | | | | | |
Term Loan, 5.82%, (1 mo. USD LIBOR + 3.50%), Maturing May 1, 2024 | | | | | | | 197 | | | | 195,772 | |
| U.S. Anesthesia Partners, Inc. | | | | | | | | | |
Term Loan, 5.34%, (1 mo. USD LIBOR + 3.00%), Maturing June 23, 2024 | | | | | | | 396 | | | | 395,672 | |
| Universal Hospital Services, Inc. | | | | | | | | | |
Term Loan, Maturing October 18, 2025(3) | | | | | | | 100 | | | | 99,750 | |
| Verscend Holding Corp. | | | | | | | | | |
Term Loan, 6.84%, (1 mo. USD LIBOR + 4.50%), Maturing August 27, 2025 | | | | | | | 350 | | | | 348,797 | |
| Wink Holdco, Inc. | | | | | | | | | |
Term Loan, 5.34%, (1 mo. USD LIBOR + 3.00%), Maturing December 2, 2024 | | | | | | | 124 | | | | 122,512 | |
| | | | | | | | | | | $ | 18,023,061 | |
|
| Home Furnishings — 1.0% | |
| Bright Bidco B.V. | | | | | | | | | |
Term Loan, 5.87%, (USD LIBOR + 3.50%), Maturing June 30, 2024(2) | | | | | | $ | 395 | | | $ | 363,757 | |
| Serta Simmons Bedding, LLC | | | | | | | | | |
Term Loan, 5.81%, (1 mo. USD LIBOR + 3.50%), Maturing November 8, 2023 | | | | | | | 1,056 | | | | 943,088 | |
| | | | | | | | | | | $ | 1,306,845 | |
|
| Industrial Equipment — 6.1% | |
| AL Alpine AT Bidco GmbH | | | | | | | | | |
Term Loan, 5.81%, (3 mo. USD LIBOR + 3.25%), Maturing October 31, 2025 | | | | | | $ | 50 | | | $ | 49,375 | |
| Altra Industrial Motion Corp. | | | | | | | | | |
Term Loan, 4.34%, (1 mo. USD LIBOR + 2.00%), Maturing October 1, 2025 | | | | | | | 175 | | | | 173,961 | |
| Apex Tool Group, LLC | | | | | | | | | |
Term Loan, 6.09%, (1 mo. USD LIBOR + 3.75%), Maturing February 1, 2022 | | | | | | | 564 | | | | 549,055 | |
| | | | |
| | 13 | | See Notes to Financial Statements. |
Eaton Vance
Floating-Rate Income Plus Fund
November 30, 2018
Portfolio of Investments (Unaudited) — continued
| | | | | | | | | | |
| Borrower/Tranche Description | | | | Principal Amount (000’s omitted) | | | Value | |
|
| Industrial Equipment (continued) | |
| Clark Equipment Company | | | | | | | | |
Term Loan, 4.38%, (USD LIBOR + 2.00%), Maturing May 18, 2024(2) | | | | $ | 399 | | | $ | 392,980 | |
| CPM Holdings, Inc. | | | | | | | | |
Term Loan, 6.06%, (1 mo. USD LIBOR + 3.75%), Maturing November 15, 2025 | | | | | 75 | | | | 75,375 | |
| Delachaux SA | | | | | | | | |
Term Loan, 5.89%, (3 mo. USD LIBOR + 3.50%), Maturing October 28, 2021 | | | | | 99 | | | | 98,882 | |
| DexKo Global, Inc. | | | | | | | | |
Term Loan, 5.84%, (1 mo. USD LIBOR + 3.50%), Maturing July 24, 2024 | | | | | 497 | | | | 494,984 | |
| DXP Enterprises, Inc. | | | | | | | | |
Term Loan, 7.09%, (1 mo. USD LIBOR + 4.75%), Maturing August 29, 2023 | | | | | 124 | | | | 124,678 | |
| Engineered Machinery Holdings, Inc. | | | | | | | | |
Term Loan, 5.64%, (3 mo. USD LIBOR + 3.25%), Maturing July 19, 2024 | | | | | 372 | | | | 364,511 | |
| EWT Holdings III Corp. | | | | | | | | |
Term Loan, 5.34%, (1 mo. USD LIBOR + 3.00%), Maturing December 20, 2024 | | | | | 884 | | | | 880,682 | |
| Filtration Group Corporation | | | | | | | | |
Term Loan, 5.34%, (1 mo. USD LIBOR + 3.00%), Maturing March 29, 2025 | | | | | 373 | | | | 371,201 | |
| Gardner Denver, Inc. | | | | | | | | |
Term Loan, 5.09%, (1 mo. USD LIBOR + 2.75%), Maturing July 30, 2024 | | | | | 259 | | | | 258,455 | |
| Gates Global, LLC | | | | | | | | |
Term Loan, 5.09%, (1 mo. USD LIBOR + 2.75%), Maturing April 1, 2024 | | | | | 968 | | | | 953,871 | |
| Hamilton Holdco, LLC | | | | | | | | |
Term Loan, 4.40%, (3 mo. USD LIBOR + 2.00%), Maturing July 2, 2025 | | | | | 200 | | | | 197,505 | |
| Hayward Industries, Inc. | | | | | | | | |
Term Loan, 5.84%, (1 mo. USD LIBOR + 3.50%), Maturing August 5, 2024 | | | | | 99 | | | | 98,051 | |
| LTI Holdings, Inc. | | | | | | | | |
Term Loan, 5.84%, (1 mo. USD LIBOR + 3.50%), Maturing September 6, 2025 | | | | | 100 | | | | 96,750 | |
| Milacron, LLC | | | | | | | | |
Term Loan, 4.84%, (1 mo. USD LIBOR + 2.50%), Maturing September 28, 2023 | | | | | 604 | | | | 594,268 | |
| Paladin Brands Holding, Inc. | | | | | | | | |
Term Loan, 7.89%, (3 mo. USD LIBOR + 5.50%), Maturing August 15, 2022 | | | | | 311 | | | | 311,755 | |
| Pro Mach Group, Inc. | | | | | | | | |
Term Loan, 5.32%, (1 mo. USD LIBOR + 3.00%), Maturing March 7, 2025 | | | | | 50 | | | | 48,714 | |
| | | | | | | | | | | | |
| Borrower/Tranche Description | | | | | Principal Amount (000’s omitted) | | | Value | |
|
| Industrial Equipment (continued) | |
| Rexnord, LLC | | | | | | | | | |
Term Loan, 4.35%, (1 mo. USD LIBOR + 2.00%), Maturing August 21, 2024 | | | | | | $ | 872 | | | $ | 867,981 | |
| Robertshaw US Holding Corp. | | | | | | | | | |
Term Loan, 5.88%, (1 mo. USD LIBOR + 3.50%), Maturing February 28, 2025 | | | | | | | 249 | | | | 241,288 | |
| Thermon Industries, Inc. | | | | | | | | | |
Term Loan, 6.05%, (1 mo. USD LIBOR + 3.75%), Maturing October 24, 2024 | | | | | | | 88 | | | | 87,830 | |
| Titan Acquisition Limited | | | | | | | | | |
Term Loan, 5.34%, (1 mo. USD LIBOR + 3.00%), Maturing March 28, 2025 | | | | | | | 697 | | | | 654,493 | |
| | | | | | | | | | | $ | 7,986,645 | |
|
| Insurance — 4.6% | |
| Alliant Holdings I, Inc. | | | | | | | | | |
Term Loan, 5.06%, (1 mo. USD LIBOR + 2.75%), Maturing May 9, 2025 | | | | | | $ | 532 | | | $ | 523,188 | |
| AmWINS Group, Inc. | | | | | | | | | |
Term Loan, 5.09%, (1 mo. USD LIBOR + 2.75%), Maturing January 25, 2024 | | | | | | | 493 | | | | 489,617 | |
| Asurion, LLC | | | | | | | | | |
Term Loan, 5.34%, (1 mo. USD LIBOR + 3.00%), Maturing August 4, 2022 | | | | | | | 465 | | | | 461,056 | |
Term Loan, 5.34%, (1 mo. USD LIBOR + 3.00%), Maturing August 4, 2025 | | | | | | | 1,326 | | | | 1,317,662 | |
Term Loan - Second Lien, 8.84%, (1 mo. USD LIBOR + 6.50%), Maturing November 3, 2023 | | | | | | | 575 | | | | 587,938 | |
| FrontDoor, Inc. | | | | | | | | | |
Term Loan, 4.88%, (1 mo. USD LIBOR + 2.50%), Maturing August 14, 2025 | | | | | | | 100 | | | | 99,500 | |
| Hub International Limited | | | | | | | | | |
Term Loan, 5.49%, (3 mo. USD LIBOR + 3.00%), Maturing April 25, 2025 | | | | | | | 1,147 | | | | 1,129,759 | |
| NFP Corp. | | | | | | | | | |
Term Loan, 5.34%, (1 mo. USD LIBOR + 3.00%), Maturing January 8, 2024 | | | | | | | 544 | | | | 533,483 | |
| Sedgwick Claims Management Services, Inc. | | | | | | | | | |
Term Loan, 5.09%, (1 mo. USD LIBOR + 2.75%), Maturing March 1, 2021 | | | | | | | 274 | | | | 272,745 | |
| USI, Inc. | | | | | | | | | |
Term Loan, 5.39%, (3 mo. USD LIBOR + 3.00%), Maturing May 16, 2024 | | | | | | | 693 | | | | 677,581 | |
| | | | | | | | | | | $ | 6,092,529 | |
| | | | |
| | 14 | | See Notes to Financial Statements. |
Eaton Vance
Floating-Rate Income Plus Fund
November 30, 2018
Portfolio of Investments (Unaudited) — continued
| | | | | | | | | | | | |
| Borrower/Tranche Description | | | | | Principal Amount (000’s omitted) | | | Value | |
|
| Leisure Goods / Activities / Movies — 4.6% | |
| AMC Entertainment Holdings, Inc. | | | | | | | | | |
Term Loan, 4.56%, (1 mo. USD LIBOR + 2.25%), Maturing December 15, 2023 | | | | | | $ | 123 | | | $ | 122,026 | |
| Ancestry.com Operations, Inc. | | | | | | | | | |
Term Loan, 5.60%, (1 mo. USD LIBOR + 3.25%), Maturing October 19, 2023 | | | | | | | 711 | | | | 708,996 | |
| Bombardier Recreational Products, Inc. | | | | | | | | | |
Term Loan, 4.35%, (1 mo. USD LIBOR + 2.00%), Maturing May 23, 2025 | | | | | | | 1,081 | | | | 1,071,004 | |
| CDS U.S. Intermediate Holdings, Inc. | | | | | | | | | |
Term Loan, 6.14%, (3 mo. USD LIBOR + 3.75%), Maturing July 8, 2022 | | | | | | | 245 | | | | 234,741 | |
| ClubCorp Holdings, Inc. | | | | | | | | | �� |
Term Loan, 5.14%, (3 mo. USD LIBOR + 2.75%), Maturing September 18, 2024 | | | | | | | 441 | | | | 427,680 | |
| Crown Finance US, Inc. | | | | | | | | | |
Term Loan, 4.84%, (1 mo. USD LIBOR + 2.50%), Maturing February 28, 2025 | | | | | | | 473 | | | | 464,776 | |
| Delta 2 (LUX) S.a.r.l. | | | | | | | | | |
Term Loan, 4.84%, (1 mo. USD LIBOR + 2.50%), Maturing February 1, 2024 | | | | | | | 439 | | | | 425,511 | |
| Emerald Expositions Holding, Inc. | | | | | | | | | |
Term Loan, 5.09%, (1 mo. USD LIBOR + 2.75%), Maturing May 22, 2024 | | | | | | | 262 | | | | 259,864 | |
| Lindblad Expeditions, Inc. | | | | | | | | | |
Term Loan, 5.84%, (1 mo. USD LIBOR + 3.50%), Maturing March 21, 2025 | | | | | | | 97 | | | | 97,256 | |
Term Loan, 5.84%, (1 mo. USD LIBOR + 3.50%), Maturing March 21, 2025 | | | | | | | 389 | | | | 389,025 | |
| Match Group, Inc. | | | | | | | | | |
Term Loan, 4.81%, (1 mo. USD LIBOR + 2.50%), Maturing November 16, 2022 | | | | | | | 131 | | | | 131,414 | |
| Sabre GLBL, Inc. | | | | | | | | | |
Term Loan, 4.34%, (1 mo. USD LIBOR + 2.00%), Maturing February 22, 2024 | | | | | | | 632 | | | | 624,715 | |
| SRAM, LLC | | | | | | | | | |
Term Loan, 5.21%, (USD LIBOR + 2.75%), Maturing March 15, 2024(2) | | | | | | | 225 | | | | 224,398 | |
| Steinway Musical Instruments, Inc. | | | | | | | | | |
Term Loan, 6.06%, (1 mo. USD LIBOR + 3.75%), Maturing February 13, 2025 | | | | | | | 199 | | | | 198,005 | |
| Travel Leaders Group, LLC | | | | | | | | | |
Term Loan, 6.30%, (1 mo. USD LIBOR + 4.00%), Maturing January 25, 2024 | | | | | | | 224 | | | | 224,999 | |
| UFC Holdings, LLC | | | | | | | | | |
Term Loan, 5.60%, (1 mo. USD LIBOR + 3.25%), Maturing August 18, 2023 | | | | | | | 441 | | | | 440,265 | |
| | | | | | | | | | | $ | 6,044,675 | |
| | | | | | | | | | | | |
| Borrower/Tranche Description | | | | | Principal Amount (000’s omitted) | | | Value | |
|
| Lodging and Casinos — 6.2% | |
| Aristocrat Technologies, Inc. | | | | | | | | | |
Term Loan, 4.22%, (3 mo. USD LIBOR + 1.75%), Maturing October 19, 2024 | | | | | | $ | 278 | | | $ | 274,043 | |
| Boyd Gaming Corporation | | | | | | | | | |
Term Loan, 4.48%, (1 week USD LIBOR + 2.25%), Maturing September 15, 2023 | | | | | | | 228 | | | | 224,165 | |
| CityCenter Holdings, LLC | | | | | | | | | |
Term Loan, 4.59%, (1 mo. USD LIBOR + 2.25%), Maturing April 18, 2024 | | | | | | | 618 | | | | 608,076 | |
| Eldorado Resorts, LLC | | | | | | | | | |
Term Loan, 4.75%, (2 mo. USD LIBOR + 2.25%), Maturing April 17, 2024 | | | | | | | 198 | | | | 196,380 | |
| ESH Hospitality, Inc. | | | | | | | | | |
Term Loan, 4.34%, (1 mo. USD LIBOR + 2.00%), Maturing August 30, 2023 | | | | | | | 304 | | | | 300,814 | |
| Four Seasons Hotels Limited | | | | | | | | | |
Term Loan, 4.34%, (1 mo. USD LIBOR + 2.00%), Maturing November 30, 2023 | | | | | | | 221 | | | | 219,460 | |
| Golden Nugget, Inc. | | | | | | | | | |
Term Loan, 5.23%, (USD LIBOR + 2.75%), Maturing October 4, 2023(2) | | | | | | | 1,757 | | | | 1,736,049 | |
| GVC Holdings PLC | | | | | | | | | |
Term Loan, 4.84%, (1 mo. USD LIBOR + 2.50%), Maturing March 29, 2024 | | | | | | | 249 | | | | 247,506 | �� |
| Hanjin International Corp. | | | | | | | | | |
Term Loan, 4.94%, (3 mo. USD LIBOR + 2.50%), Maturing October 18, 2020 | | | | | | | 125 | | | | 124,063 | |
| Hilton Worldwide Finance, LLC | | | | | | | | | |
Term Loan, 4.07%, (1 mo. USD LIBOR + 1.75%), Maturing October 25, 2023 | | | | | | | 958 | | | | 950,229 | |
| Las Vegas Sands, LLC | | | | | | | | | |
Term Loan, 4.09%, (1 mo. USD LIBOR + 1.75%), Maturing March 27, 2025 | | | | | | | 249 | | | | 245,554 | |
| MGM Growth Properties Operating Partnership L.P. | | | | | | | | | |
Term Loan, 4.34%, (1 mo. USD LIBOR + 2.00%), Maturing March 21, 2025 | | | | | | | 463 | | | | 455,744 | |
| Playa Resorts Holding B.V. | | | | | | | | | |
Term Loan, 5.09%, (1 mo. USD LIBOR + 2.75%), Maturing April 29, 2024 | | | | | | | 840 | | | | 815,438 | |
| Stars Group Holdings B.V. (The) | | | | | | | | | |
Term Loan, 5.89%, (3 mo. USD LIBOR + 3.50%), Maturing July 10, 2025 | | | | | | | 948 | | | | 945,700 | |
| VICI Properties 1, LLC | | | | | | | | | |
Term Loan, 4.31%, (1 mo. USD LIBOR + 2.00%), Maturing December 20, 2024 | | | | | | | 525 | | | | 517,617 | |
| Wyndham Hotels & Resorts, Inc. | | | | | | | | | |
Term Loan, 4.09%, (1 mo. USD LIBOR + 1.75%), Maturing May 30, 2025 | | | | | | | 300 | | | | 297,422 | |
| | | | | | | | | | | $ | 8,158,260 | |
| | | | |
| | 15 | | See Notes to Financial Statements. |
Eaton Vance
Floating-Rate Income Plus Fund
November 30, 2018
Portfolio of Investments (Unaudited) — continued
| | | | | | | | | | | | |
| Borrower/Tranche Description | | | | | Principal Amount (000’s omitted) | | | Value | |
|
| Nonferrous Metals / Minerals — 0.9% | |
| Dynacast International, LLC | | | | | | | | | |
Term Loan, 5.64%, (3 mo. USD LIBOR + 3.25%), Maturing January 28, 2022 | | | | | | $ | 292 | | | $ | 289,641 | |
| Global Brass & Copper, Inc. | | | | | | | | | |
Term Loan, 4.88%, (1 mo. USD LIBOR + 2.50%), Maturing May 29, 2025 | | | | | | | 196 | | | | 195,510 | |
| Murray Energy Corporation | | | | | | | | | |
Term Loan, 9.78%, (3 mo. USD LIBOR + 7.25%), Maturing October 17, 2022 | | | | | | | 477 | | | | 416,761 | |
| Noranda Aluminum Acquisition Corporation | | | | | | | | | |
Term Loan, 0.00%, Maturing February 28, 2019(4)(5) | | | | | | | 238 | | | | 18,325 | |
| Oxbow Carbon, LLC | | | | | | | | | |
Term Loan, 5.84%, (1 mo. USD LIBOR + 3.50%), Maturing January 4, 2023 | | | | | | | 144 | | | | 144,375 | |
Term Loan - Second Lien, 9.84%, (1 mo. USD LIBOR + 7.50%), Maturing January 4, 2024 | | | | | | | 175 | | | | 178,937 | |
| | | | | | | | | | | $ | 1,243,549 | |
|
| Oil and Gas — 1.9% | |
| Ameriforge Group, Inc. | | | | | | | | | |
Term Loan, 9.39%, (3 mo. USD LIBOR + 7.00%), Maturing June 8, 2022 | | | | | | $ | 114 | | | $ | 115,052 | |
| Apergy Corporation | | | | | | | | | |
Term Loan, 4.88%, (1 mo. USD LIBOR + 2.50%), Maturing May 9, 2025 | | | | | | | 71 | | | | 70,136 | |
| CITGO Petroleum Corporation | | | | | | | | | |
Term Loan, 5.90%, (3 mo. USD LIBOR + 3.50%), Maturing July 29, 2021 | | | | | | | 240 | | | | 238,800 | |
| Fieldwood Energy, LLC | | | | | | | | | |
Term Loan, 7.59%, (1 mo. USD LIBOR + 5.25%), Maturing April 11, 2022 | | | | | | | 695 | | | | 683,215 | |
| McDermott Technology Americas, Inc. | | | | | | | | | |
Term Loan, 7.34%, (1 mo. USD LIBOR + 5.00%), Maturing May 10, 2025 | | | | | | | 299 | | | | 288,177 | |
| MEG Energy Corp. | | | | | | | | | |
Term Loan, 5.85%, (1 mo. USD LIBOR + 3.50%), Maturing December 31, 2023 | | | | | | | 9 | | | | 9,221 | |
| PSC Industrial Holdings Corp. | | | | | | | | | |
Term Loan, 6.06%, (1 mo. USD LIBOR + 3.75%), Maturing October 3, 2024 | | | | | | | 174 | | | | 174,339 | |
| Sheridan Investment Partners II L.P. | | | | | | | | | |
Term Loan, 6.21%, (USD LIBOR + 3.50%), Maturing December 16,
2020(2) | | | | | | | 9 | | | | 8,215 | |
Term Loan, 6.21%, (USD LIBOR + 3.50%), Maturing December 16,
2020(2) | | | | | | | 25 | | | | 22,028 | |
Term Loan, 6.21%, (USD LIBOR + 3.50%), Maturing December 16,
2020(2) | | | | | | | 180 | | | | 158,352 | |
| | | | | | | | | | | | |
| Borrower/Tranche Description | | | | | Principal Amount (000’s omitted) | | | Value | |
|
| Oil and Gas (continued) | |
| Sheridan Production Partners I, LLC | | | | | | | | | |
Term Loan, 5.83%, (3 mo. USD LIBOR + 3.50%), Maturing October 1, 2019 | | | | | | $ | 27 | | | $ | 24,245 | |
Term Loan, 5.83%, (3 mo. USD LIBOR + 3.50%), Maturing October 1, 2019 | | | | | | | 44 | | | | 39,694 | |
Term Loan, 5.83%, (3 mo. USD LIBOR + 3.50%), Maturing October 1, 2019 | | | | | | | 333 | | | | 299,557 | |
| Ultra Resources, Inc. | | | | | | | | | |
Term Loan, 5.47%, (3 mo. USD LIBOR + 3.00%), Maturing April 12, 2024 | | | | | | | 350 | | | | 326,959 | |
| | | | | | | | | | | $ | 2,457,990 | |
|
| Publishing — 1.6% | |
| Ascend Learning, LLC | | | | | | | | | |
Term Loan, 5.34%, (1 mo. USD LIBOR + 3.00%), Maturing July 12, 2024 | | | | | | $ | 272 | | | $ | 270,293 | |
| Getty Images, Inc. | | | | | | | | | |
Term Loan, 5.84%, (1 mo. USD LIBOR + 3.50%), Maturing October 18, 2019 | | | | | | | 808 | | | | 802,140 | |
| Harland Clarke Holdings Corp. | | | | | | | | | |
Term Loan, 7.14%, (3 mo. USD LIBOR + 4.75%), Maturing November 3, 2023 | | | | | | | 318 | | | | 293,975 | |
| LSC Communications, Inc. | | | | | | | | | |
Term Loan, 7.84%, (1 mo. USD LIBOR + 5.50%), Maturing September 30, 2022 | | | | | | | 202 | | | | 202,171 | |
| Merrill Communications, LLC | | | | | | | | | |
Term Loan, 7.78%, (3 mo. USD LIBOR + 5.25%), Maturing June 1, 2022 | | | | | | | 63 | | | | 63,096 | |
| Multi Color Corporation | | | | | | | | | |
Term Loan, 4.34%, (1 mo. USD LIBOR + 2.00%), Maturing October 31, 2024 | | | | | | | 74 | | | | 73,600 | |
| ProQuest, LLC | | | | | | | | | |
Term Loan, 5.59%, (1 mo. USD LIBOR + 3.25%), Maturing October 24, 2021 | | | | | | | 412 | | | | 411,357 | |
| Tweddle Group, Inc. | | | | | | | | | |
Term Loan, 6.80%, (1 mo. USD LIBOR + 4.50%), Maturing September 17, 2023 | | | | | | | 62 | | | | 60,057 | |
| | | | | | | | | | | $ | 2,176,689 | |
|
| Radio and Television — 3.2% | |
| ALM Media Holdings, Inc. | | | | | | | | | |
Term Loan, 6.89%, (3 mo. USD LIBOR + 4.50%), Maturing July 31, 2020 | | | | | | $ | 112 | | | $ | 101,508 | |
| CBS Radio, Inc. | | | | | | | | | |
Term Loan, 5.07%, (1 mo. USD LIBOR + 2.75%), Maturing November 18, 2024 | | | | | | | 352 | | | | 348,304 | |
| | | | |
| | 16 | | See Notes to Financial Statements. |
Eaton Vance
Floating-Rate Income Plus Fund
November 30, 2018
Portfolio of Investments (Unaudited) — continued
| | | | | | | | | | | | |
| Borrower/Tranche Description | | | | | Principal Amount (000’s omitted) | | | Value | |
|
| Radio and Television (continued) | |
| Cumulus Media New Holdings, Inc. | | | | | | | | | |
Term Loan, 6.85%, (1 mo. USD LIBOR + 4.50%), Maturing May 15, 2022 | | | | | | $ | 775 | | | $ | 747,883 | |
| Entravision Communications Corporation | | | | | | | | | |
Term Loan, 5.09%, (1 mo. USD LIBOR + 2.75%), Maturing November 29, 2024 | | | | | | | 272 | | | | 267,145 | |
| Hubbard Radio, LLC | | | | | | | | | |
Term Loan, 5.35%, (1 mo. USD LIBOR + 3.00%), Maturing March 28, 2025 | | | | | | | 138 | | | | 138,062 | |
| iHeartCommunications, Inc. | | | | | | | | | |
Term Loan, 0.00%, Maturing January 30, 2019(5) | | | | | | | 500 | | | | 357,709 | |
| Mission Broadcasting, Inc. | | | | | | | | | |
Term Loan, 4.57%, (1 mo. USD LIBOR + 2.25%), Maturing January 17, 2024 | | | | | | | 79 | | | | 78,603 | |
| Nexstar Broadcasting, Inc. | | | | | | | | | |
Term Loan, 4.57%, (1 mo. USD LIBOR + 2.25%), Maturing January 17, 2024 | | | | | | | 458 | | | | 453,531 | |
| Univision Communications, Inc. | | | | | | | | | |
Term Loan, 5.09%, (1 mo. USD LIBOR + 2.75%), Maturing March 15, 2024 | | | | | | | 1,909 | | | | 1,783,850 | |
| | | | | | | | | | | $ | 4,276,595 | |
|
| Retailers (Except Food and Drug) — 3.5% | |
| Ascena Retail Group, Inc. | | | | | | | | | |
Term Loan, 6.88%, (1 mo. USD LIBOR + 4.50%), Maturing August 21, 2022 | | | | | | $ | 337 | | | $ | 322,427 | |
| Bass Pro Group, LLC | | | | | | | | | |
Term Loan, 7.34%, (1 mo. USD LIBOR + 5.00%), Maturing September 25, 2024 | | | | | | | 297 | | | | 293,783 | |
| BJ’s Wholesale Club, Inc. | | | | | | | | | |
Term Loan, 5.32%, (1 mo. USD LIBOR + 3.00%), Maturing February 3, 2024 | | | | | | | 231 | | | | 230,491 | |
| Coinamatic Canada, Inc. | | | | | | | | | |
Term Loan, 5.59%, (1 mo. USD LIBOR + 3.25%), Maturing May 14, 2022 | | | | | | | 40 | | | | 39,321 | |
| David’s Bridal, Inc. | | | | | | | | | |
DIP Loan, 9.81%, (1 mo. USD LIBOR + 7.50%), Maturing May 19, 2019 | | | | | | | 69 | | | | 69,249 | |
Term Loan, 0.00%, Maturing October 11, 2019(5) | | | | | | | 465 | | | | 287,172 | |
| Evergreen Acqco 1 L.P. | | | | | | | | | |
Term Loan, 6.22%, (3 mo. USD LIBOR + 3.75%), Maturing July 9, 2019 | | | | | | | 514 | | | | 494,785 | |
| Global Appliance, Inc. | | | | | | | | | |
Term Loan, 6.35%, (1 mo. USD LIBOR + 4.00%), Maturing September 29, 2024 | | | | | | | 248 | | | | 240,694 | |
| Harbor Freight Tools USA, Inc. | | | | | | | | | |
Term Loan, 4.84%, (1 mo. USD LIBOR + 2.50%), Maturing August 18, 2023 | | | | | | | 98 | | | | 95,243 | |
| | | | | | | | | | | | |
| Borrower/Tranche Description | | | | | Principal Amount (000’s omitted) | | | Value | |
|
| Retailers (Except Food and Drug) (continued) | |
| Hoya Midco, LLC | | | | | | | | | |
Term Loan, 5.84%, (1 mo. USD LIBOR + 3.50%), Maturing June 30, 2024 | | | | | | $ | 247 | | | $ | 243,635 | |
| J. Crew Group, Inc. | | | | | | | | | |
Term Loan, 5.37%, (USD LIBOR + 3.00%), Maturing March 5, 2021(2)(4) | | | | | | | 737 | | | | 558,516 | |
| LSF9 Atlantis Holdings, LLC | | | | | | | | | |
Term Loan, 8.32%, (1 mo. USD LIBOR + 6.00%), Maturing May 1, 2023 | | | | | | | 242 | | | | 230,986 | |
| Party City Holdings, Inc. | | | | | | | | | |
Term Loan, 4.85%, (1 mo. USD LIBOR + 2.50%), Maturing August 19, 2022 | | | | | | | 199 | | | | 197,120 | |
| PetSmart, Inc. | | | | | | | | | |
Term Loan, 5.32%, (1 mo. USD LIBOR + 3.00%), Maturing March 11, 2022 | | | | | | | 789 | | | | 662,265 | |
| PFS Holding Corporation | | | | | | | | | |
Term Loan, 5.82%, (1 mo. USD LIBOR + 3.50%), Maturing January 31, 2021 | | | | | | | 518 | | | | 287,479 | |
| Pier 1 Imports (U.S.), Inc. | | | | | | | | | |
Term Loan, 5.89%, (3 mo. USD LIBOR + 3.50%), Maturing April 30, 2021 | | | | | | | 120 | | | | 89,466 | |
| Shutterfly, Inc. | | | | | | | | | |
Term Loan, 5.10%, (1 mo. USD LIBOR + 2.75%), Maturing August 17, 2024 | | | | | | | 125 | | | | 123,441 | |
| Staples, Inc. | | | | | | | | | |
Term Loan, 6.54%, (3 mo. USD LIBOR + 4.00%), Maturing September 12, 2024 | | | | | | | 149 | | | | 146,392 | |
| | | | | | | | | | | $ | 4,612,465 | |
|
| Steel — 1.5% | |
| Atkore International, Inc. | | | | | | | | | |
Term Loan, 5.14%, (3 mo. USD LIBOR + 2.75%), Maturing December 22, 2023 | | | | | | $ | 99 | | | $ | 98,009 | |
| GrafTech Finance, Inc. | | | | | | | | | |
Term Loan, 5.84%, (1 mo. USD LIBOR + 3.50%), Maturing February 12, 2025 | | | | | | | 642 | | | | 634,638 | |
| Neenah Foundry Company | | | | | | | | | |
Term Loan, 9.06%, (2 mo. USD LIBOR + 6.50%), Maturing December 13, 2022 | | | | | | | 193 | | | | 191,538 | |
| Phoenix Services International, LLC | | | | | | | | | |
Term Loan, 6.07%, (1 mo. USD LIBOR + 3.75%), Maturing March 1, 2025 | | | | | | | 174 | | | | 172,819 | |
| Zekelman Industries, Inc. | | | | | | | | | |
Term Loan, 4.62%, (3 mo. USD LIBOR + 2.25%), Maturing June 14, 2021 | | | | | | | 938 | | | | 929,306 | |
| | | | | | | | | | | $ | 2,026,310 | |
| | | | |
| | 17 | | See Notes to Financial Statements. |
Eaton Vance
Floating-Rate Income Plus Fund
November 30, 2018
Portfolio of Investments (Unaudited) — continued
| | | | | | | | | | | | |
| Borrower/Tranche Description | | | | | Principal Amount (000’s omitted) | | | Value | |
|
| Surface Transport — 0.8% | |
| Agro Merchants NAI Holdings, LLC | | | | | | | | | |
Term Loan, 6.14%, (3 mo. USD LIBOR + 3.75%), Maturing December 6, 2024 | | | | | | $ | 99 | | | $ | 99,271 | |
| Hertz Corporation (The) | | | | | | | | | |
Term Loan, 5.09%, (1 mo. USD LIBOR + 2.75%), Maturing June 30, 2023 | | | | | | | 242 | | | | 239,275 | |
| Kenan Advantage Group, Inc. | | | | | | | | | |
Term Loan, 5.34%, (1 mo. USD LIBOR + 3.00%), Maturing July 31, 2022 | | | | | | | 27 | | | | 26,814 | |
Term Loan, 5.34%, (1 mo. USD LIBOR + 3.00%), Maturing July 31, 2022 | | | | | | | 89 | | | | 88,174 | |
| PODS, LLC | | | | | | | | | |
Term Loan, 5.07%, (1 mo. USD LIBOR + 2.75%), Maturing December 6, 2024 | | | | | | | 149 | | | | 146,319 | |
| Stena International S.a.r.l. | | | | | | | | | |
Term Loan, 5.39%, (3 mo. USD LIBOR + 3.00%), Maturing March 3, 2021 | | | | | | | 382 | | | | 366,720 | |
| XPO Logistics, Inc. | | | | | | | | | |
Term Loan, 4.51%, (3 mo. USD LIBOR + 2.00%), Maturing February 24, 2025 | | | | | | | 150 | | | | 148,875 | |
| | | | | | | | | | | $ | 1,115,448 | |
|
| Telecommunications — 5.2% | |
| CenturyLink, Inc. | | | | | | | | | |
Term Loan, 5.09%, (1 mo. USD LIBOR + 2.75%), Maturing January 31, 2025 | | | | | | $ | 1,241 | | | $ | 1,208,059 | |
| Colorado Buyer, Inc. | | | | | | | | | |
Term Loan, 5.32%, (1 mo. USD LIBOR + 3.00%), Maturing May 1, 2024 | | | | | | | 198 | | | | 194,908 | |
| Digicel International Finance Limited | | | | | | | | | |
Term Loan, 5.96%, (3 mo. USD LIBOR + 3.25%), Maturing May 28, 2024 | | | | | | | 173 | | | | 163,288 | |
| Frontier Communications Corp. | | | | | | | | | |
Term Loan, 6.10%, (1 mo. USD LIBOR + 3.75%), Maturing June 15, 2024 | | | | | | | 469 | | | | 447,952 | |
| Global Eagle Entertainment, Inc. | | | | | | | | | |
Term Loan, 10.02%, (6 mo. USD LIBOR + 7.50%), Maturing January 6, 2023 | | | | | | | 484 | | | | 492,151 | |
| Intelsat Jackson Holdings S.A. | | | | | | | | | |
Term Loan, 6.07%, (1 mo. USD LIBOR + 3.75%), Maturing November 27, 2023 | | | | | | | 600 | | | | 597,094 | |
Term Loan, 6.82%, (1 mo. USD LIBOR + 4.50%), Maturing January 2, 2024 | | | | | | | 400 | | | | 408,625 | |
| IPC Corp. | | | | | | | | | |
Term Loan, 7.03%, (3 mo. USD LIBOR + 4.50%), Maturing August 6, 2021 | | | | | | | 220 | | | | 205,847 | |
| | | | | | | | | | | | |
| Borrower/Tranche Description | | | | | Principal Amount (000’s omitted) | | | Value | |
|
| Telecommunications (continued) | |
| Lumentum Holdings | | | | | | | | | |
Term Loan, Maturing August 7, 2025(3) | | | | | | $ | 125 | | | $ | 123,906 | |
| Onvoy, LLC | | | | | | | | | |
Term Loan, 6.89%, (3 mo. USD LIBOR + 4.50%), Maturing February 10, 2024 | | | | | | | 468 | | | | 428,106 | |
| Plantronics, Inc. | | | | | | | | | |
Term Loan, 4.84%, (1 mo. USD LIBOR + 2.50%), Maturing July 2, 2025 | | | | | | | 325 | | | | 320,531 | |
| Sprint Communications, Inc. | | | | | | | | | |
Term Loan, 4.88%, (1 mo. USD LIBOR + 2.50%), Maturing February 2, 2024 | | | | | | | 837 | | | | 827,133 | |
Term Loan, 5.38%, (1 mo. USD LIBOR + 3.00%), Maturing February 2, 2024 | | | | | | | 125 | | | | 124,180 | |
| Syniverse Holdings, Inc. | | | | | | | | | |
Term Loan, 7.31%, (1 mo. USD LIBOR + 5.00%), Maturing March 9, 2023 | | | | | | | 224 | | | | 216,319 | |
| Telesat Canada | | | | | | | | | |
Term Loan, 4.89%, (3 mo. USD LIBOR + 2.50%), Maturing November 17, 2023 | | | | | | | 1,102 | | | | 1,084,398 | |
| | | | | | | | | | | $ | 6,842,497 | |
|
| Utilities — 2.9% | |
| Brookfield WEC Holdings, Inc. | | | | | | | | | |
Term Loan, 6.09%, (1 mo. USD LIBOR + 3.75%), Maturing August 1, 2025 | | | | | | $ | 525 | | | $ | 523,851 | |
| Calpine Construction Finance Company L.P. | | | | | | | | | |
Term Loan, 4.84%, (1 mo. USD LIBOR + 2.50%), Maturing January 15, 2025 | | | | | | | 92 | | | | 90,581 | |
| Calpine Corporation | | | | | | | | | |
Term Loan, 4.89%, (3 mo. USD LIBOR + 2.50%), Maturing January 15, 2024 | | | | | | | 798 | | | | 784,656 | |
| Granite Acquisition, Inc. | | | | | | | | | |
Term Loan, 5.89%, (3 mo. USD LIBOR + 3.50%), Maturing December 19, 2021 | | | | | | | 28 | | | | 28,381 | |
Term Loan, 5.90%, (3 mo. USD LIBOR + 3.50%), Maturing December 19, 2021 | | | | | | | 625 | | | | 623,054 | |
| Lightstone Holdco, LLC | | | | | | | | | |
Term Loan, 6.09%, (1 mo. USD LIBOR + 3.75%), Maturing January 30, 2024 | | | | | | | 20 | | | | 19,102 | |
Term Loan, 6.09%, (1 mo. USD LIBOR + 3.75%), Maturing January 30, 2024 | | | | | | | 366 | | | | 355,663 | |
| Longview Power, LLC | | | | | | | | | |
Term Loan, 8.53%, (3 mo. USD LIBOR + 6.00%), Maturing April 13, 2021 | | | | | | | 556 | | | | 480,167 | |
| Talen Energy Supply, LLC | | | | | | | | | |
Term Loan, 6.34%, (1 mo. USD LIBOR + 4.00%), Maturing July 15, 2023 | | | | | | | 197 | | | | 197,741 | |
Term Loan, 6.34%, (1 mo. USD LIBOR + 4.00%), Maturing April 15, 2024 | | | | | | | 172 | | | | 171,765 | |
| | | | |
| | 18 | | See Notes to Financial Statements. |
Eaton Vance
Floating-Rate Income Plus Fund
November 30, 2018
Portfolio of Investments (Unaudited) — continued
| | | | | | | | | | | | |
| Borrower/Tranche Description | | | | | Principal Amount (000’s omitted) | | | Value | |
|
| Utilities (continued) | |
| USIC Holdings, Inc. | | | | | | | | | |
Term Loan, 5.59%, (1 mo. USD LIBOR + 3.25%), Maturing December 8, 2023 | | | | | | $ | 299 | | | $ | 294,426 | |
| Vistra Energy Corp. | | | | | | | | | |
Term Loan, 4.31%, (1 mo. USD LIBOR + 2.00%), Maturing December 31, 2025 | | | | | | | 249 | | | | 246,394 | |
| | | | | | | | | | | $ | 3,815,781 | |
| |
Total Senior Floating-Rate Loans
(identified cost $183,053,854) | | | $ | 177,830,394 | |
|
| Corporate Bonds & Notes — 11.0% | |
| Security | | | | | Principal Amount* (000’s omitted) | | | Value | |
|
| Air Transport — 0.5% | |
| Azul Investments LLP | | | | | | | | | |
5.875%, 10/26/24(7) | | | | | | | 710 | | | $ | 659,767 | |
| | | | | | | | | | | $ | 659,767 | |
|
| Banks and Thrifts — 0.6% | |
| Australia and New Zealand Banking Group, Ltd. | |
3.75%, 7/25/19(8) | | | AUD | | | | 640 | | | $ | 471,871 | |
| Banco Mercantil del Norte S.A./Grand Cayman | | | | | | | | | |
5.75% to 10/4/26, 10/4/31(7)(9) | | | | | | | 400 | | | | 350,004 | |
| | | | | | | | | | | $ | 821,875 | |
|
| Building and Development — 0.3% | |
| MDC Holdings, Inc. | | | | | | | | | |
6.00%, 1/15/43 | | | | | | | 533 | | | $ | 416,406 | |
| | | | | | | | | | | $ | 416,406 | |
|
| Chemicals and Plastics — 0.4% | |
| Cydsa SAB de CV | | | | | | | | | |
6.25%, 10/4/27(7) | | | | | | | 500 | | | $ | 453,755 | |
| | | | | | | | | | | $ | 453,755 | |
|
| Computers — 0.6% | |
| Seagate HDD Cayman | | | | | | | | | |
4.875%, 6/1/27 | | | | | | | 520 | | | $ | 464,250 | |
5.75%, 12/1/34 | | | | | | | 426 | | | | 353,592 | |
| | | | | | | | | | | $ | 817,842 | |
| | | | | | | | | | | | |
| Security | | | | | Principal Amount* (000’s omitted) | | | Value | |
|
| Diversified Financial Services — 1.0% | |
| Jefferies Finance, LLC/JFIN Co-Issuer Corp. | | | | | | | |
7.25%, 8/15/24(7) | | | | | | | 202 | | | $ | 195,435 | |
| Synchrony Financial | | | | | | | | | |
3.95%, 12/1/27 | | | | | | | 555 | | | | 469,553 | |
| UniCredit SpA | | | | | | | | | |
5.861% to 6/19/27, 6/19/32(7)(9) | | | | | | | 565 | | | | 480,053 | |
| Unifin Financiera SAB de CV | | | | | | | | | |
8.875% to 1/29/25(7)(9)(10) | | | | | | | 200 | | | | 165,502 | |
| | | | | | | | | | | $ | 1,310,543 | |
|
| Drugs — 0.3% | |
| Bausch Health Companies., Inc. | | | | | | | | | |
6.50%, 3/15/22(7) | | | | | | | 173 | | | $ | 179,271 | |
7.00%, 3/15/24(7) | | | | | | | 225 | | | | 235,969 | |
| | | | | | | | | | | $ | 415,240 | |
|
| Electronics / Electrical — 0.2% | |
| Ingram Micro, Inc. | | | | | | | | | |
5.45%, 12/15/24 | | | | | | | 310 | | | $ | 300,504 | |
| | | | | | | | | | | $ | 300,504 | |
|
| Food / Drug Retailers — 0.5% | |
| ESAL GmbH | | | | | | | | | |
6.25%, 2/5/23(7) | | | | | | | 685 | | | $ | 676,437 | |
| | | | | | | | | | | $ | 676,437 | |
|
| Forest Products — 0.2% | |
| Suzano Austria GmbH | | | | | | | | | |
6.00%, 1/15/29(7) | | | | | | | 235 | | | $ | 237,938 | |
| | | | | | | | | | | $ | 237,938 | |
|
| Homebuilders / Real Estate — 0.2% | |
| PulteGroup, Inc. | | | | | | | | | |
5.00%, 1/15/27 | | | | | | | 341 | | | $ | 317,983 | |
| | | | | | | | | | | $ | 317,983 | |
|
| Leisure Goods / Activities / Movies — 0.5% | |
| Mattel, Inc. | | | | | | | | | |
3.15%, 3/15/23 | | | | | | | 295 | | | $ | 252,225 | |
6.75%, 12/31/25(7) | | | | | | | 165 | | | | 155,925 | |
6.20%, 10/1/40 | | | | | | | 120 | | | | 94,800 | |
5.45%, 11/1/41 | | | | | | | 155 | | | | 121,675 | |
| | | | | | | | | | | $ | 624,625 | |
| | | | |
| | 19 | | See Notes to Financial Statements. |
Eaton Vance
Floating-Rate Income Plus Fund
November 30, 2018
Portfolio of Investments (Unaudited) — continued
| | | | | | | | | | | | |
| Security | | | | | Principal Amount* (000’s omitted) | | | Value | |
|
| Nonferrous Metals / Minerals — 0.6% | |
| First Quantum Minerals, Ltd. | | | | | | | | | |
6.875%, 3/1/26(7) | | | | | | | 975 | | | $ | 839,719 | |
| | | | | | | | | | | $ | 839,719 | |
|
| Oil and Gas — 2.8% | |
| Gran Tierra Energy International Holdings, Ltd. | | | | |
6.25%, 2/15/25(7) | | | | | | | 500 | | | $ | 471,250 | |
| Oceaneering International, Inc. | | | | | | | | | |
4.65%, 11/15/24 | | | | | | | 580 | | | | 510,558 | |
6.00%, 2/1/28 | | | | | | | 500 | | | | 452,060 | |
| Petrobras Global Finance B.V. | | | | | | | | | |
5.75%, 2/1/29 | | | | | | | 525 | | | | 481,950 | |
5.625%, 5/20/43 | | | | | | | 285 | | | | 236,188 | |
| Rowan Cos., Inc. | | | | | | | | | |
4.75%, 1/15/24 | | | | | | | 415 | | | | 340,300 | |
5.40%, 12/1/42 | | | | | | | 675 | | | | 435,375 | |
| YPF SA | | | | | | | | | |
7.00%, 12/15/47(7) | | | | | | | 900 | | | | 684,000 | |
| | | | | | | | | | | $ | 3,611,681 | |
|
| Pharmaceuticals — 0.2% | |
| Teva Pharmaceutical Finance Netherlands III B.V. | | | | | | | | | |
3.15%, 10/1/26 | | | | | | | 300 | | | $ | 244,946 | |
| | | | | | | | | | | $ | 244,946 | |
|
| Real Estate Investment Trusts (REITs) — 0.5% | |
| CBL & Associates, L.P. | | | | | | | | | |
4.60%, 10/15/24 | | | | | | | 465 | | | $ | 373,162 | |
5.95%, 12/15/26 | | | | | | | 280 | | | | 230,692 | |
| | | | | | | | | | | $ | 603,854 | |
| | | |
| Retailers (Except Food and Drug) — 1.2% | | | | | | | | | |
| JC Penney Corp., Inc. | | | | | | | | | |
6.375%, 10/15/36 | | | | | | | 670 | | | $ | 247,900 | |
| Macy’s Retail Holdings, Inc. | | | | | | | | | |
4.30%, 2/15/43 | | | | | | | 1,235 | | | | 894,815 | |
| Signet UK Finance PLC | | | | | | | | | |
4.70%, 6/15/24 | | | | | | | 519 | | | | 474,885 | |
| | | | | | | | | | | $ | 1,617,600 | |
| | | | | | | | | | | | |
| Security | | | | | Principal Amount* (000’s omitted) | | | Value | |
|
| Transportation — 0.4% | |
| JSL Europe SA | | | | | | | | | |
7.75%, 7/26/24(7) | | | | | | | 600 | | | $ | 558,054 | |
| | | | | | | | | | | $ | 558,054 | |
| |
Total Corporate Bonds & Notes
(identified cost $15,643,796) | | | $ | 14,528,769 | |
|
| Foreign Government Bonds — 3.8% | |
| Security | | | | | Principal Amount (000’s omitted) | | | Value | |
|
| Argentina — 0.4% | |
| Republic of Argentina | | | | | | | | | |
6.875%, 1/11/48 | | | USD | | | | 645 | | | $ | 467,625 | |
| | | | | | | | | | | $ | 467,625 | |
|
| Australia — 0.1% | |
| Queensland Treasury Corp. | | | | | | | | | |
5.50%, 6/21/21(8) | | | AUD | | | | 225 | | | $ | 177,655 | |
| | | | | | | | | | | $ | 177,655 | |
|
| Brazil — 0.7% | |
| Nota do Tesouro Nacional | | | | | | | | | |
10.00%, 1/1/25 | | | BRL | | | | 3,525 | | | $ | 934,594 | |
| | | | | | | | | | | $ | 934,594 | |
|
| Canada — 0.5% | |
| Canada Housing Trust | | | | | | | | | |
3.80%, 6/15/21(7) | | | CAD | | | | 900 | | | $ | 702,889 | |
| | | | | | | | | | | $ | 702,889 | |
|
| Malaysia — 0.2% | |
| Malaysia Government Bond | | | | | | | | | |
3.441%, 2/15/21 | | | MYR | | | | 1,200 | | | $ | 285,408 | |
| | | | | | | | | | | $ | 285,408 | |
|
| Mexico — 0.7% | |
| Mexican Bonos | | | | | | | | | |
7.75%, 5/29/31 | | | MXN | | | | 19,590 | | | $ | 849,183 | |
| | | | | | | | | | | $ | 849,183 | |
| | | | |
| | 20 | | See Notes to Financial Statements. |
Eaton Vance
Floating-Rate Income Plus Fund
November 30, 2018
Portfolio of Investments (Unaudited) — continued
| | | | | | | | | | | | |
| Security | | | | | Principal Amount (000’s omitted) | | | Value | |
|
| Supranational — 1.1% | |
| European Investment Bank | |
7.20%, 7/9/19(7) | | | IDR | | | | 4,080,000 | | | $ | 284,694 | |
| International Bank for Reconstruction & Development | |
3.50%, 1/22/21 | | | NZD | | | | 675 | | | | 475,190 | |
| International Finance Corp. | |
7.80%, 6/3/19 | | | INR | | | | 24,990 | | | | 360,427 | |
8.25%, 6/10/21 | | | INR | | | | 18,100 | | | | 266,344 | |
| | | | | | | | | | | $ | 1,386,655 | |
|
| Uruguay — 0.1% | |
| Republic of Uruguay | | | | | | | | | |
8.50%, 3/15/28(7) | | | UYU | | | | 6,900 | | | $ | 183,357 | |
| | | | | | | | | | | $ | 183,357 | |
| |
Total Foreign Government Bonds
(identified cost $5,287,374) | | | $ | 4,987,366 | |
|
| Commercial Mortgage-Backed Securities — 0.1% | |
| Security | | | | | Principal Amount (000’s omitted) | | | Value | |
| JPMBB Commercial Mortgage Securities Trust | |
Series 2014-C23, Class D, 4.13%, Maturing 9/15/47(7)(11) | | | | | | $ | 100 | | | $ | 88,912 | |
| | |
Total Commercial Mortgage-Backed Securities
(identified cost $91,246) | | | | | | | $ | 88,912 | |
|
| Convertible Bonds — 0.6% | |
| Security | | | | | Principal Amount (000’s omitted) | | | Value | |
|
| Oil & Gas — 0.6% | |
| Ascent Resources-Utica, LLC/ARU Finance Corp. | |
6.50%, 3/1/21(7)(12) | | | | | | $ | 120 | | | $ | 168,028 | |
| Nabors Industries, Inc. | | | | | | | | | |
0.75%, 1/15/24 | | | | | | | 890 | | | | 595,744 | |
| | |
Total Convertible Bonds
(identified cost $855,000) | | | | | | | $ | 763,772 | |
| | | | | | | | | | | | |
| Common Stocks — 1.9% | |
| Security | | | | | Shares | | | Value | |
|
| Business Equipment and Services — 0.0% | |
Education Management Corp.(4)(13)(14) | | | | | | | 2,334,705 | | | $ | 0 | |
| | | | | | | | | | | $ | 0 | |
|
| Consumer Discretionary — 0.2% | |
Lennar Corp., Class A | | | | | | | 6,815 | | | $ | 291,205 | |
| | | | | | | | | | | $ | 291,205 | |
|
| Electronics / Electrical — 0.2% | |
Answers Corp.(4)(13)(14) | | | | | | | 14,876 | | | $ | 40,016 | |
Intel Corp. | | | | | | | 4,500 | | | | 221,895 | |
| | | | | | | | | | | $ | 261,911 | |
|
| Entertainment — 0.2% | |
Walt Disney Co. (The) | | | | | | | 2,600 | | | $ | 300,274 | |
| | | | | | | | | | | $ | 300,274 | |
|
| Health Care — 0.0%(15) | |
New Millennium Holdco, Inc.(13)(14) | | | | | | | 10,394 | | | $ | 2,079 | |
| | | | | | | | | | | $ | 2,079 | |
|
| Metals / Mining — 0.2% | |
Newmont Mining Corp. | | | | | | | 9,260 | | | $ | 299,468 | |
| | | | | | | | | | | $ | 299,468 | |
|
| Oil and Gas — 0.6% | |
AFG Holdings, Inc.(4)(13)(14) | | | | | | | 4,525 | | | $ | 307,700 | |
Fieldwood Energy, Inc.(13)(14) | | | | | | | 2,148 | | | | 94,154 | |
Paragon Offshore Finance Company, Class A(13)(14) | | | | | | | 404 | | | | 429 | |
Paragon Offshore Finance Company, Class B(13)(14) | | | | | | | 202 | | | | 7,676 | |
Royal Dutch Shell PLC, Class B ADR | | | | | | | 5,150 | | | | 319,455 | |
Southcross Holdings Group, LLC(4)(13)(14) | | | | | | | 15 | | | | 0 | |
Southcross Holdings L.P., Class A(13)(14) | | | | | | | 15 | | | | 14,250 | |
| | | | | | | | | | | $ | 743,664 | |
|
| Publishing — 0.0%(15) | |
Tweddle Group, Inc.(4)(13) | | | | | | | 444 | | | $ | 24,780 | |
| | | | | | | | | | | $ | 24,780 | |
|
| Radio and Television — 0.1% | |
Cumulus Media, Inc.(13)(14) | | | | | | | 9,974 | | | $ | 112,706 | |
| | | | | | | | | | | $ | 112,706 | |
| | | | |
| | 21 | | See Notes to Financial Statements. |
Eaton Vance
Floating-Rate Income Plus Fund
November 30, 2018
Portfolio of Investments (Unaudited) — continued
| | | | | | | | | | | | |
| Security | | | | | Shares | | | Value | |
|
| Transportation — 0.4% | |
A.P. Moller - Maersk A/S, Class B | | | | | | | 315 | | | $ | 452,565 | |
| | | | | | | | | | | $ | 452,565 | |
| | |
Total Common Stocks
(identified cost $2,523,369) | | | | | | | $ | 2,488,652 | |
|
| Convertible Preferred Stocks — 1.3% | |
| Security | | | | | Shares | | | Value | |
|
| Business Equipment and Services — 0.0% | |
Education Management Corp., Series A-1,
7.50%(4)(13)(14) | | | | | | | 2,597 | | | $ | 0 | |
| | | | | | | | | | | $ | 0 | |
|
| Oil & Gas — 0.9% | |
Chesapeake Energy Corp., 5.75% | | | | | | | 2,240 | | | $ | 1,261,142 | |
| | | | | | | | | | | $ | 1,261,142 | |
|
| Pharmaceuticals — 0.4% | |
Teva Pharmaceutical Industries, Ltd., 7.00% | | | | | | | 1,165 | | | $ | 473,631 | |
| | | | | | | | | | | $ | 473,631 | |
| | |
Total Convertible Preferred Stocks
(identified cost $1,766,902) | | | | | | | $ | 1,734,773 | |
|
| Preferred Stocks — 0.3% | |
| Security | | | | | Shares | | | Value | |
|
| Equity Real Estate Investment Trusts (REITs) — 0.2% | |
CBL & Associates Properties, Inc., Series D, 7.375% | | | | | | | 10,475 | | | $ | 148,955 | |
CBL & Associates Properties, Inc., Series E, 6.625% | | | | | | | 7,600 | | | | 99,408 | |
| | | | | | | | | | | $ | 248,363 | |
|
| Oil, Gas & Consumable Fuels — 0.1% | |
NuStar Energy, L.P., Series B, 7.625% to 6/15/22(9) | | | | | | | 9,200 | | | $ | 178,480 | |
| | | | | | | | | | | $ | 178,480 | |
| | |
Total Preferred Stocks
(identified cost $542,614) | | | | | | | $ | 426,843 | |
| | | | | | | | | | |
| Short-Term Investments — 2.1% | |
| Description | | | | Units | | | Value | |
Eaton Vance Cash Reserves Fund, LLC, 2.33%(16) | | | | | 2,824,656 | | | $ | 2,824,374 | |
| | |
Total Short-Term Investments
(identified cost $2,824,374) | | | | | | $ | 2,824,374 | |
| | |
Total Investments — 156.1%
(identified cost $212,588,529) | | | | | | $ | 205,673,855 | |
| |
Less Unfunded Loan Commitments — (0.0)%(15) | | | $ | (15,625 | ) |
| | |
Net Investments — 156.1%
(identified cost $212,572,904) | | | | | | $ | 205,658,230 | |
| |
Notes Payable — (41.0)% | | | $ | (54,000,000 | ) |
| |
Variable Rate Term Preferred Shares, at Liquidation Value
(net of unamortized deferred debt issuance costs) — (14.4)% | | | $ | (18,969,992 | ) |
| |
Other Assets, Less Liabilities — (0.7)% | | | $ | (965,714 | ) |
| |
Net Assets Applicable to Common Shares — 100.0% | | | $ | 131,722,524 | |
The percentage shown for each investment category in the Portfolio of Investments is based on net assets applicable to common shares.
| | * | In U.S. dollars unless otherwise indicated. |
| | (1) | Senior floating-rate loans (Senior Loans) often require prepayments from excess cash flows or permit the borrowers to repay at their election. The degree to which borrowers repay, whether as a contractual requirement or at their election, cannot be predicted with accuracy. As a result, the actual remaining maturity may be substantially less than the stated maturities shown. However, Senior Loans will typically have an expected average life of approximately two to four years. Senior Loans typically have rates of interest which are redetermined periodically by reference to a base lending rate, plus a spread. These base lending rates are primarily the London Interbank Offered Rate (“LIBOR”) and secondarily, the prime rate offered by one or more major United States banks (the “Prime Rate”). Base lending rates may be subject to a floor, or minimum rate. |
| | (2) | The stated interest rate represents the weighted average interest rate at November 30, 2018 of contracts within the senior loan facility. Interest rates on contracts are primarily redetermined either weekly, monthly or quarterly by reference to the indicated base lending rate and spread and the reset period. |
| | (3) | This Senior Loan will settle after November 30, 2018, at which time the interest rate will be determined. |
| | (4) | For fair value measurement disclosure purposes, security is categorized as Level 3 (see Note 11). |
| | (5) | Issuer is in default with respect to interest and/or principal payments. For a variable rate security, interest rate has been adjusted to reflect non-accrual status. |
| | (6) | Unfunded or partially unfunded loan commitments. The stated interest rate reflects the weighted average of the reference rate and spread for the funded portion, if any, and the commitment fees on the portion of the loan that is unfunded. See Note 1F for description. |
| | | | |
| | 22 | | See Notes to Financial Statements. |
Eaton Vance
Floating-Rate Income Plus Fund
November 30, 2018
Portfolio of Investments (Unaudited) — continued
| | (7) | Security exempt from registration pursuant to Rule 144A under the Securities Act of 1933, as amended. These securities may be sold in certain transactions in reliance on an exemption from registration (normally to qualified institutional buyers). At November 30, 2018, the aggregate value of these securities is $7,770,959 or 5.9% of the Fund’s net assets applicable to common shares. |
| | (8) | Security exempt from registration under Regulation S of the Securities Act of 1933, which exempts from registration securities offered and sold outside the United States. Security may not be offered or sold in the United States except pursuant to an exemption from, or in a transaction not subject to, the registration requirements of the Securities Act of 1933. At November 30, 2018, the aggregate value of these securities is $649,526 or 0.5% of the Fund’s net assets applicable to common shares. |
| | (9) | Security converts to floating rate after the indicated fixed-rate coupon period. |
| (10) | Perpetual security with no stated maturity date but may be subject to calls by the issuer. |
| (11) | Weighted average fixed-rate coupon that changes/updates monthly. Rate shown is the rate at November 30, 2018. |
| (12) | Represents a payment-in-kind security which may pay interest in additional principal at the issuer’s discretion. |
| (13) | Non-income producing security. |
| (14) | Security was acquired in connection with a restructuring of a Senior Loan and may be subject to restrictions on resale. |
| (15) | Amount is less than 0.05% or (0.05)%, as applicable. |
| (16) | Affiliated investment company, available to Eaton Vance portfolios and funds, which invests in high quality, U.S. dollar denominated money market instruments. The rate shown is the annualized seven-day yield as of November 30, 2018. |
Abbreviations:
| | | | |
| ADR | | – | | American Depositary Receipt |
| DIP | | – | | Debtor In Possession |
| LIBOR | | – | | London Interbank Offered Rate |
Currency Abbreviations:
| | | | |
| AUD | | – | | Australian Dollar |
| BRL | | – | | Brazilian Real |
| CAD | | – | | Canadian Dollar |
| IDR | | – | | Indonesian Rupiah |
| INR | | – | | Indian Rupee |
| | | | |
| MXN | | – | | Mexican Peso |
| MYR | | – | | Malaysian Ringgit |
| NZD | | – | | New Zealand Dollar |
| USD | | – | | United States Dollar |
| UYU | | – | | Uruguayan Peso |
| | | | |
| | 23 | | See Notes to Financial Statements. |
Eaton Vance
Floating-Rate Income Plus Fund
November 30, 2018
Statement of Assets and Liabilities (Unaudited)
| | | | |
| Assets | | November 30, 2018 | |
Unaffiliated investments, at value (identified cost, $209,748,530) | | $ | 202,833,856 | |
Affiliated investment, at value (identified cost, $2,824,374) | | | 2,824,374 | |
Cash | | | 1,359,310 | |
Interest and dividends receivable | | | 1,058,508 | |
Dividends receivable from affiliated investment | | | 6,584 | |
Receivable for investments sold | | | 100,125 | |
Tax reclaims receivable | | | 1,720 | |
Prepaid upfront fees on variable rate term preferred shares | | | 32,672 | |
Prepaid upfront fees on notes payable | | | 20,725 | |
Prepaid expenses | | | 10,253 | |
Total assets | | $ | 208,248,127 | |
|
| Liabilities | |
Notes payable | | $ | 54,000,000 | |
Variable rate term preferred shares, at liquidation value (net of unamortized deferred debt issuance costs of $30,008) | | | 18,969,992 | |
Payable for investments purchased | | | 2,995,260 | |
Payable to affiliates: | | | | |
Investment adviser fee | | | 127,561 | |
Trustees’ fees | | | 1,598 | |
Interest expense and fees payable | | | 310,320 | |
Accrued expenses | | | 120,872 | |
Total liabilities | | $ | 76,525,603 | |
Net assets applicable to common shares | | $ | 131,722,524 | |
|
| Sources of Net Assets | |
Common shares, $0.01 par value, unlimited number of shares authorized, 7,606,422 shares issued and outstanding | | $ | 76,064 | |
Additional paid-in capital | | | 144,128,196 | |
Accumulated loss | | | (12,481,736 | ) |
Net assets applicable to common shares | | $ | 131,722,524 | |
| |
| Net Asset Value Per Common Share | | | | |
($131,722,524 ÷ 7,606,422 common shares issued and outstanding) | | $ | 17.32 | |
| | | | |
| | 24 | | See Notes to Financial Statements. |
Eaton Vance
Floating-Rate Income Plus Fund
November 30, 2018
Statement of Operations (Unaudited)
| | | | |
| Investment Income | | Six Months Ended November 30, 2018 | |
Interest and other income | | $ | 5,691,898 | |
Dividends | | | 256,344 | |
Dividends from affiliated investment | | | 40,457 | |
Total investment income | | $ | 5,988,699 | |
| |
| Expenses | | | | |
Investment adviser fee | | $ | 791,321 | |
Trustees’ fees and expenses | | | 4,900 | |
Custodian fee | | | 81,302 | |
Transfer and dividend disbursing agent fees | | | 10,002 | |
Legal and accounting services | | | 55,842 | |
Printing and postage | | | 13,806 | |
Interest expense and fees | | | 1,360,787 | |
Miscellaneous | | | 26,735 | |
Total expenses | | $ | 2,344,695 | |
| |
Net investment income | | $ | 3,644,004 | |
| |
| Realized and Unrealized Gain (Loss) | | | | |
Net realized gain (loss) — | | | | |
Investment transactions | | $ | (965,740 | ) |
Investment transactions — affiliated investment | | | 219 | |
Foreign currency transactions | | | (9,275 | ) |
Net realized loss | | $ | (974,796 | ) |
Change in unrealized appreciation (depreciation) — | | | | |
Investments | | $ | (3,118,469 | ) |
Investments — affiliated investment | | | (537 | ) |
Foreign currency | | | 6,097 | |
Net change in unrealized appreciation (depreciation) | | $ | (3,112,909 | ) |
| |
Net realized and unrealized loss | | $ | (4,087,705 | ) |
| |
Net decrease in net assets from operations | | $ | (443,701 | ) |
| | | | |
| | 25 | | See Notes to Financial Statements. |
Eaton Vance
Floating-Rate Income Plus Fund
November 30, 2018
Statements of Changes in Net Assets
| | | | | | | | |
| Increase (Decrease) in Net Assets | | Six Months Ended November 30, 2018
(Unaudited) | | | Year Ended May 31, 2018 | |
From operations — | | | | | | | | |
Net investment income | | $ | 3,644,004 | | | $ | 6,830,952 | |
Net realized gain (loss) | | | (974,796 | ) | | | 105,677 | |
Net change in unrealized appreciation (depreciation) | | | (3,112,909 | ) | | | (715,782 | ) |
Net increase (decrease) in net assets from operations | | $ | (443,701 | ) | | $ | 6,220,847 | |
| | |
Distributions to common shareholders(1) | | $ | (3,483,741 | ) | | $ | (6,921,844 | ) |
| | |
Net decrease in net assets | | $ | (3,927,442 | ) | | $ | (700,997 | ) |
|
| Net Assets Applicable to Common Shares | |
At beginning of period | | $ | 135,649,966 | | | $ | 136,350,963 | |
At end of period | | $ | 131,722,524 | | | $ | 135,649,966 | (2) |
| (1) | For the year ended May 31, 2018, the source of distributions was from net investment income. The current period presentation of distributions conforms with the Disclosure Update and Simplification Rule issued by the Securities and Exchange Commission, effective November 5, 2018. |
| (2) | Includes accumulated distributions in excess of net investment income of $(157,170) at May 31, 2018. The requirement to disclose the corresponding amount as of November 30, 2018 was eliminated. |
| | | | |
| | 26 | | See Notes to Financial Statements. |
Eaton Vance
Floating-Rate Income Plus Fund
November 30, 2018
Statement of Cash Flows (Unaudited)
| | | | |
| Cash Flows From Operating Activities | | Six Months Ended November 30, 2018 | |
Net decrease in net assets from operations | | $ | (443,701 | ) |
Adjustments to reconcile net decrease in net assets from operations to net cash provided by operating activities: | | | | |
Investments purchased | | | (33,043,229 | ) |
Investments sold and principal repayments | | | 34,394,020 | |
Decrease in short-term investments, net | | | 2,067,871 | |
Net amortization/accretion of premium (discount) | | | (77,839 | ) |
Amortization of prepaid upfront fees on variable rate term preferred shares | | | 10,021 | |
Amortization of deferred debt issuance costs on variable rate term preferred shares | | | 18,005 | |
Amortization of prepaid upfront fees on notes payable | | | 28,733 | |
Decrease in interest and dividends receivable | | | 19,580 | |
Decrease in dividends receivable from affiliated investment | | | 2,971 | |
Decrease in tax reclaims receivable | | | 61 | |
Increase in prepaid expenses | | | (1,145 | ) |
Decrease in payable to affiliate for investment adviser fee | | | (8,238 | ) |
Increase in payable to affiliate for Trustees’ fees | | | 68 | |
Increase in interest expense and fees payable | | | 5,205 | |
Decrease in accrued expenses | | | (31,813 | ) |
Decrease in unfunded loan commitments | | | (235,375 | ) |
Net change in unrealized (appreciation) depreciation from investments | | | 3,119,006 | |
Net realized loss from investments | | | 965,521 | |
Net cash provided by operating activities | | $ | 6,789,722 | |
| |
| Cash Flows From Financing Activities | | | | |
Cash distributions paid to common shareholders | | $ | (3,483,741 | ) |
Proceeds from notes payable | | | 3,000,000 | |
Repayments of notes payable | | | (7,000,000 | ) |
Decrease in due to custodian — foreign currency | | | (1,076 | ) |
Net cash used in financing activities | | $ | (7,484,817 | ) |
| |
Net decrease in cash | | $ | (695,095 | ) |
| |
Cash at beginning of period | | $ | 2,054,405 | |
| |
Cash at end of period | | $ | 1,359,310 | |
| |
| Supplemental disclosure of cash flow information: | | | | |
Cash paid for interest and fees on borrowings and variable rate term preferred shares | | $ | 1,298,823 | |
| | | | |
| | 27 | | See Notes to Financial Statements. |
Eaton Vance
Floating-Rate Income Plus Fund
November 30, 2018
Financial Highlights
Selected data for a common share outstanding during the periods stated
| | | | | | | | | | | | | | | | | | | | | | | | |
| | | Six Months Ended
November 30, 2018
(Unaudited) | | | Year Ended May 31, | | | Period Ended May 31, 2014(1) | |
| | | 2018 | | | 2017 | | | 2016 | | | 2015 | |
Net asset value — Beginning of period (Common shares) | | $ | 17.830 | | | $ | 17.930 | | | $ | 16.610 | | | $ | 18.390 | | | $ | 19.560 | | | $ | 19.100 | (2) |
| | | | | | |
| Income (Loss) From Operations | | | | | | | | | | | | | | | | | | | | | | | | |
Net investment income(3) | | $ | 0.479 | | | $ | 0.898 | | | $ | 0.948 | | | $ | 1.058 | | | $ | 1.114 | | | $ | 0.989 | |
Net realized and unrealized gain (loss) | | | (0.531 | ) | | | (0.088 | ) | | | 1.365 | | | | (1.724 | ) | | | (0.867 | ) | | | 0.511 | |
| | | | | | |
Total income (loss) from operations | | $ | (0.052 | ) | | $ | 0.810 | | | $ | 2.313 | | | $ | (0.666 | ) | | $ | 0.247 | | | $ | 1.500 | |
| | | | | | |
| Less Distributions to Common Shareholders | | | | | | | | | | | | | | | | | | | | | | | | |
From net investment income | | $ | (0.458 | ) | | $ | (0.910 | ) | | $ | (0.983 | ) | | $ | (1.114 | ) | | $ | (1.134 | ) | | $ | (0.974 | ) |
From net realized gain | | | — | | | | — | | | | — | | | | — | | | | (0.283 | ) | | | — | |
Tax return of capital | | | — | | | | — | | | | (0.010 | ) | | | — | | | | — | | | | — | |
| | | | | | |
Total distributions to common shareholders | | $ | (0.458 | ) | | $ | (0.910 | ) | | $ | (0.993 | ) | | $ | (1.114 | ) | | $ | (1.417 | ) | | $ | (0.974 | ) |
| | | | | | |
Common shares offering costs charged to paid-in capital(3) | | $ | — | | | $ | — | | | $ | — | | | $ | — | | | $ | — | | | $ | (0.041 | ) |
| | | | | | |
Discount related to exercise of underwriters’ over-allotment option(3) | | $ | — | | | $ | — | | | $ | — | | | $ | — | | | $ | — | | | $ | (0.025 | ) |
| | | | | | |
Net asset value — End of period (Common shares) | | $ | 17.320 | | | $ | 17.830 | | | $ | 17.930 | | | $ | 16.610 | | | $ | 18.390 | | | $ | 19.560 | |
| | | | | | |
Market value — End of period (Common shares) | | $ | 14.940 | | | $ | 16.720 | | | $ | 17.350 | | | $ | 15.240 | | | $ | 16.970 | | | $ | 17.950 | |
| | | | | | |
Total Investment Return on Net Asset Value(4) | | | (0.02 | )%(5) | | | 5.03 | % | | | 14.69 | % | | | (2.60 | )% | | | 2.15 | % | | | 8.00 | %(5)(6) |
| | | | | | |
Total Investment Return on Market Value(4) | | | (8.03 | )%(5) | | | 1.79 | % | | | 20.96 | % | | | (3.15 | )% | | | 2.71 | % | | | (0.89 | )%(5)(6) |
| | | | |
| | 28 | | See Notes to Financial Statements. |
Eaton Vance
Floating-Rate Income Plus Fund
November 30, 2018
Financial Highlights — continued
Selected data for a common share outstanding during the periods stated
| | | | | | | | | | | | | | | | | | | | | | | | |
| | | Six Months Ended
November 30, 2018
(Unaudited) | | | Year Ended May 31, | | | Period Ended May 31, 2014(1) | |
| Ratios/Supplemental Data | | 2018 | | | 2017 | | | 2016 | | | 2015 | |
Net assets applicable to common shares, end of period (000’s omitted) | | $ | 131,723 | | | $ | 135,650 | | | $ | 136,351 | | | $ | 126,331 | | | $ | 139,902 | | | $ | 148,770 | |
Ratios (as a percentage of average daily net assets applicable to common shares):† | | | | | | | | | | | | | | | | | | | | | | | | |
Expenses excluding interest and fees(7) | | | 1.45 | %(8) | | | 1.44 | % | | | 1.48 | % | | | 1.63 | % | | | 1.55 | % | | | 1.54 | %(8) |
Interest and fee expense(9) | | | 2.00 | %(8) | | | 1.57 | % | | | 1.17 | % | | | 0.99 | % | | | 0.84 | % | | | 0.76 | %(8) |
Total expenses(7) | | | 3.45 | %(8) | | | 3.01 | % | | | 2.65 | % | | | 2.62 | % | | | 2.39 | % | | | 2.30 | %(8) |
Net investment income | | | 5.36 | %(8) | | | 5.00 | % | | | 5.40 | % | | | 6.35 | % | | | 5.91 | % | | | 5.49 | %(8) |
Portfolio Turnover | | | 14 | %(5) | | | 33 | % | | | 52 | % | | | 29 | % | | | 28 | % | | | 37 | %(5) |
Senior Securities: | | | | | | | | | | | | | | | | | | | | | | | | |
Total notes payable outstanding (in 000’s) | | $ | 54,000 | | | $ | 58,000 | | | $ | 54,000 | | | $ | 34,000 | | | $ | 54,000 | | | $ | 54,000 | |
Asset coverage per $1,000 of notes payable(10) | | $ | 3,791 | | | $ | 3,666 | | | $ | 3,877 | | | $ | 5,774 | | | $ | 4,257 | | | $ | 4,422 | |
Total preferred shares outstanding(11) | | | 190 | | | | 190 | | | | 190 | | | | 360 | | | | 360 | | | | 360 | |
Asset coverage per preferred share(11)(12) | | $ | 280,442 | | | $ | 276,169 | | | $ | 286,782 | | | $ | 280,473 | | | $ | 255,447 | | | $ | 265,300 | |
Involuntary liquidation preference per preferred share(11) | | $ | 100,000 | | | $ | 100,000 | | | $ | 100,000 | | | $ | 100,000 | | | $ | 100,000 | | | $ | 100,000 | |
Approximate market value per preferred share(11) | | $ | 100,000 | | | $ | 100,000 | | | $ | 100,000 | | | $ | 100,000 | | | $ | 100,000 | | | $ | 100,000 | |
| (1) | For the period from the start of business, June 28, 2013, to May 31, 2014. |
| (2) | Net asset value at beginning of period reflects the deduction of the sales load of $0.90 per share paid by the shareholders from the $20.00 offering price. |
| (3) | Computed using average common shares outstanding. |
| (4) | Returns are historical and are calculated by determining the percentage change in net asset value or market value with all distributions reinvested. Distributions are assumed to be reinvested at prices obtained under the Fund’s dividend reinvestment plan. |
| (6) | Total investment return on net asset value is calculated assuming a purchase at the offering price of $20.00 less the sales load of $0.90 per share paid by the shareholders on the first day and a sale at the net asset value on the last day of the period reported with all distributions reinvested. Total investment return on market value is calculated assuming a purchase at the offering price of $20.00 less the sales load of $0.90 per share paid by the shareholders on the first day and a sale at the current market price on the last day of the period reported with all distributions reinvested. |
| (7) | Excludes the effect of custody fee credits, if any, of less than 0.005%. Effective September 1, 2015, custody fee credits, which were earned on cash deposit balances, were discontinued by the custodian. |
| (9) | Interest and fee expense relates to variable rate term preferred shares and borrowings (see Note 2 and Note 8). Effective June 1, 2016, the ratio includes amortization of deferred debt issuance costs. For periods prior to June 1, 2016, amortization of deferred debt issuance costs was included in the ratio of expenses excluding interest and fees. |
| (10) | Calculated by subtracting the Fund’s total liabilities (not including the notes payable and preferred shares) from the Fund’s total assets, and dividing the result by the notes payable balance in thousands. |
| (11) | Preferred shares represent variable rate term preferred shares. |
| (12) | Calculated by subtracting the Fund’s total liabilities (not including the notes payable and preferred shares) from the Fund’s total assets, dividing the result by the sum of the value of the notes payable and liquidation value of the preferred shares, and multiplying the result by the liquidation value of one preferred share. Such amount equates to 280%, 276%, 287%, 280%, 255% and 265% at November 30, 2018 and May 31, 2018, 2017, 2016, 2015 and 2014, respectively. |
| † | Ratios based on net assets applicable to common shares plus preferred shares and borrowings are presented below. Ratios exclude the effect of custody fee credits, if any. Ratios for periods less than one year are annualized. |
| | | | | | | | | | | | | | | | | | | | | | | | |
| | | Six Months Ended November 30, 2018 (Unaudited) | | | Year Ended May 31, | | | Period Ended May 31, 2014(1) | |
| | | 2018 | | | 2017 | | | 2016 | | | 2015 | |
Expenses excluding interest and fees | | | 0.93 | % | | | 0.94 | % | | | 0.98 | % | | | 0.99 | % | | | 0.95 | % | | | 0.98 | % |
Interest and fee expense | | | 1.29 | % | | | 1.01 | % | | | 0.77 | % | | | 0.60 | % | | | 0.52 | % | | | 0.49 | % |
Total expenses | | | 2.22 | % | | | 1.95 | % | | | 1.75 | % | | | 1.59 | % | | | 1.47 | % | | | 1.47 | % |
Net investment income | | | 3.45 | % | | | 3.24 | % | | | 3.56 | % | | | 3.87 | % | | | 3.63 | % | | | 3.52 | % |
| | | | |
| | 29 | | See Notes to Financial Statements. |
Eaton Vance
Floating-Rate Income Plus Fund
November 30, 2018
Notes to Financial Statements (Unaudited)
1 Significant Accounting Policies
Eaton Vance Floating-Rate Income Plus Fund (the Fund) is a Massachusetts business trust registered under the Investment Company Act of 1940, as amended (the 1940 Act), as a diversified, closed-end management investment company. The Fund’s investment objective is total return, with an emphasis on income.
The following is a summary of significant accounting policies of the Fund. The policies are in conformity with accounting principles generally accepted in the United States of America (U.S. GAAP). The Fund is an investment company and follows accounting and reporting guidance in the Financial Accounting Standards Board (FASB) Accounting Standards Codification Topic 946.
A Investment Valuation — The following methodologies are used to determine the market value or fair value of investments.
Senior Floating-Rate Loans. Interests in senior floating-rate loans (Senior Loans) for which reliable market quotations are readily available are valued generally at the average mean of bid and ask quotations obtained from a third party pricing service. Other Senior Loans are valued at fair value by the investment adviser under procedures approved by the Trustees. In fair valuing a Senior Loan, the investment adviser utilizes one or more of the valuation techniques described in (i) through (iii) below to assess the likelihood that the borrower will make a full repayment of the loan underlying such Senior Loan relative to yields on other Senior Loans issued by companies of comparable credit quality. If the investment adviser believes that there is a reasonable likelihood of full repayment, the investment adviser will determine fair value using a matrix pricing approach that considers the yield on the Senior Loan. If the investment adviser believes there is not a reasonable likelihood of full repayment, the investment adviser will determine fair value using analyses that include, but are not limited to: (i) a comparison of the value of the borrower’s outstanding equity and debt to that of comparable public companies; (ii) a discounted cash flow analysis; or (iii) when the investment adviser believes it is likely that a borrower will be liquidated or sold, an analysis of the terms of such liquidation or sale. In certain cases, the investment adviser will use a combination of analytical methods to determine fair value, such as when only a portion of a borrower’s assets are likely to be sold. In conducting its assessment and analyses for purposes of determining fair value of a Senior Loan, the investment adviser will use its discretion and judgment in considering and appraising relevant factors. Fair value determinations are made by the portfolio managers of the Fund based on information available to such managers. The portfolio managers of other funds managed by the investment adviser that invest in Senior Loans may not possess the same information about a Senior Loan borrower as the portfolio managers of the Fund. At times, the fair value of a Senior Loan determined by the portfolio managers of other funds managed by the investment adviser that invest in Senior Loans may vary from the fair value of the same Senior Loan determined by the portfolio managers of the Fund. The fair value of each Senior Loan is periodically reviewed and approved by the investment adviser’s Valuation Committee and by the Trustees based upon procedures approved by the Trustees. Junior Loans (i.e., subordinated loans and second lien loans) are valued in the same manner as Senior Loans.
Debt Obligations. Debt obligations are generally valued on the basis of valuations provided by third party pricing services, as derived from such services’ pricing models. Inputs to the models may include, but are not limited to, reported trades, executable bid and asked prices, broker/dealer quotations, prices or yields of securities with similar characteristics, interest rates, anticipated prepayments, benchmark curves or information pertaining to the issuer, as well as industry and economic events. The pricing services may use a matrix approach, which considers information regarding securities with similar characteristics to determine the valuation for a security. Short-term debt obligations purchased with a remaining maturity of sixty days or less for which a valuation from a third party pricing service is not readily available may be valued at amortized cost, which approximates fair value.
Equity Securities.Equity securities listed on a U.S. securities exchange generally are valued at the last sale or closing price on the day of valuation or, if no sales took place on such date, at the mean between the closing bid and asked prices on the exchange where such securities are principally traded. Equity securities listed on the NASDAQ Global or Global Select Market generally are valued at the NASDAQ official closing price. Unlisted or listed securities for which closing sales prices or closing quotations are not available are valued at the mean between the latest available bid and asked prices or, in the case of preferred equity securities that are not listed or traded in the over-the-counter market, by a third party pricing service that uses various techniques that consider factors including, but not limited to, prices or yields of securities with similar characteristics, benchmark yields, broker/dealer quotes, quotes of underlying common stock, issuer spreads, as well as industry and economic events.
Derivatives. Forward foreign currency exchange contracts are generally valued at the mean of the average bid and average asked prices that are reported by currency dealers to a third party pricing service at the valuation time. Such third party pricing service valuations are supplied for specific settlement periods and the Fund’s forward foreign currency exchange contracts are valued at an interpolated rate between the closest preceding and subsequent settlement period reported by the third party pricing service.
Foreign Securities and Currencies.Foreign securities and currencies are valued in U.S. dollars, based on foreign currency exchange rate quotations supplied by a third party pricing service. The pricing service uses a proprietary model to determine the exchange rate. Inputs to the model include reported trades and implied bid/ask spreads. The daily valuation of exchange-traded foreign securities generally is determined as of the close of trading on the principal exchange on which such securities trade. Events occurring after the close of trading on foreign exchanges may result in adjustments to the valuation of foreign securities to more accurately reflect their fair value as of the close of regular trading on the New York Stock Exchange. When valuing foreign equity securities that meet certain criteria, the Fund’s Trustees have approved the use of a fair value service that values such securities to reflect market trading that occurs after the close of the applicable foreign markets of comparable securities or other instruments that have a strong correlation to the fair-valued securities.
Affiliated Fund.The Fund may invest in Eaton Vance Cash Reserves Fund, LLC (Cash Reserves Fund), an affiliated investment company managed by Eaton Vance Management (EVM). While Cash Reserves Fund is not a registered money market mutual fund, it conducts all of its investment activities in accordance with the requirements of Rule 2a-7 under the 1940 Act. Investments in Cash Reserves Fund are valued at the closing net asset value per unit on the valuation day. Cash Reserves Fund generally values its investment securities based on available market quotations provided by a third party pricing service.
Eaton Vance
Floating-Rate Income Plus Fund
November 30, 2018
Notes to Financial Statements (Unaudited) — continued
Fair Valuation.Investments for which valuations or market quotations are not readily available or are deemed unreliable are valued at fair value using methods determined in good faith by or at the direction of the Trustees of the Fund in a manner that fairly reflects the security’s value, or the amount that the Fund might reasonably expect to receive for the security upon its current sale in the ordinary course. Each such determination is based on a consideration of relevant factors, which are likely to vary from one pricing context to another. These factors may include, but are not limited to, the type of security, the existence of any contractual restrictions on the security’s disposition, the price and extent of public trading in similar securities of the issuer or of comparable companies or entities, quotations or relevant information obtained from broker/dealers or other market participants, information obtained from the issuer, analysts, and/or the appropriate stock exchange (for exchange-traded securities), an analysis of the company’s or entity’s financial condition, and an evaluation of the forces that influence the issuer and the market(s) in which the security is purchased and sold.
B Investment Transactions — Investment transactions for financial statement purposes are accounted for on a trade date basis. Realized gains and losses on investments sold are determined on the basis of identified cost.
C Income — Interest income is recorded on the basis of interest accrued, adjusted for amortization of premium or accretion of discount. Fees associated with loan amendments are recognized immediately. Dividend income is recorded on the ex-dividend date for dividends received in cash and/or securities.
D Federal Taxes — The Fund’s policy is to comply with the provisions of the Internal Revenue Code applicable to regulated investment companies and to distribute to shareholders each year substantially all of its net investment income, and all or substantially all of its net realized capital gains. Accordingly, no provision for federal income or excise tax is necessary.
In addition to the requirements of the Internal Revenue Code, the Fund may also be subject to local taxes on the recognition of capital gains in certain countries. In determining the daily net asset value, the Fund estimates the accrual for such taxes, if any, based on the unrealized appreciation on certain portfolio securities and the related tax rates. Taxes attributable to unrealized appreciation are included in the change in unrealized appreciation (depreciation) on investments. Capital gains taxes on securities sold are included in net realized gain (loss) on investments.
As of November 30, 2018, the Fund had no uncertain tax positions that would require financial statement recognition, de-recognition, or disclosure. The Fund files a U.S. federal income tax return annually after its fiscal year-end, which is subject to examination by the Internal Revenue Service for a period of three years from the date of filing.
E Foreign Currency Translation — Investment valuations, other assets, and liabilities initially expressed in foreign currencies are translated each business day into U.S. dollars based upon current exchange rates. Purchases and sales of foreign investment securities and income and expenses denominated in foreign currencies are translated into U.S. dollars based upon currency exchange rates in effect on the respective dates of such transactions. Recognized gains or losses on investment transactions attributable to changes in foreign currency exchange rates are recorded for financial statement purposes as net realized gains and losses on investments. That portion of unrealized gains and losses on investments that results from fluctuations in foreign currency exchange rates is not separately disclosed.
F Unfunded Loan Commitments — The Fund may enter into certain loan agreements all or a portion of which may be unfunded. The Fund is obligated to fund these commitments at the borrower’s discretion. These commitments are disclosed in the accompanying Portfolio of Investments. At November 30, 2018, the Fund had sufficient cash and/or securities to cover these commitments.
G Use of Estimates — The preparation of the financial statements in conformity with U.S. GAAP requires management to make estimates and assumptions that affect the reported amounts of assets and liabilities at the date of the financial statements and the reported amounts of income and expense during the reporting period. Actual results could differ from those estimates.
H Indemnifications — Under the Fund’s organizational documents, its officers and Trustees may be indemnified against certain liabilities and expenses arising out of the performance of their duties to the Fund. Under Massachusetts law, if certain conditions prevail, shareholders of a Massachusetts business trust (such as the Fund) could be deemed to have personal liability for the obligations of the Fund. However, the Fund’s Declaration of Trust contains an express disclaimer of liability on the part of Fund shareholders and the By-laws provide that the Fund shall assume the defense on behalf of any Fund shareholders. Moreover, the By-laws also provide for indemnification out of Fund property of any shareholder held personally liable solely by reason of being or having been a shareholder for all loss or expense arising from such liability. Additionally, in the normal course of business, the Fund enters into agreements with service providers that may contain indemnification clauses. The Fund’s maximum exposure under these arrangements is unknown as this would involve future claims that may be made against the Fund that have not yet occurred.
I Forward Foreign Currency Exchange Contracts — The Fund may enter into forward foreign currency exchange contracts for the purchase or sale of a specific foreign currency at a fixed price on a future date. The forward foreign currency exchange contracts are adjusted by the daily exchange rate of the underlying currency and any gains or losses are recorded as unrealized until such time as the contracts have been closed. Risks may arise upon entering these contracts from the potential inability of counterparties to meet the terms of their contracts and from movements in the value of a foreign currency relative to the U.S. dollar.
J Interim Financial Statements — The interim financial statements relating to November 30, 2018 and for the six months then ended have not been audited by an independent registered public accounting firm, but in the opinion of the Fund’s management, reflect all adjustments, consisting only of normal recurring adjustments, necessary for the fair presentation of the financial statements.
Eaton Vance
Floating-Rate Income Plus Fund
November 30, 2018
Notes to Financial Statements (Unaudited) — continued
2 Variable Rate Term Preferred Shares
On July 10, 2013, the Fund issued 360 shares of Series C-1 Variable Rate Term Preferred Shares (Series C-1 VRTP Shares) in a private offering to a commercial paper conduit sponsored by a large financial institution (the Conduit). Variable rate term preferred shares are a form of preferred shares that represent stock of the Fund. They have a par value of $0.01 per share and a liquidation preference of $100,000 per share. The Series C-1 VRTP Shares also had an original mandatory redemption date of July 8, 2016 that had been extended on various dates through April 7, 2017 upon consent of the holders of the Series C-1 VRTP Shares and approval of the Fund’s Board of Trustees.
On September 30, 2016, the Fund made a partial redemption of its Series C-1 VRTP Shares at a liquidation price of $100,000 per share, the financing for which was provided by a committed financing arrangement (see Note 8). The number of Series C-1 VRTP Shares redeemed on September 30, 2016 and redemption amount (excluding the final dividend payment) were as follows:
| | | | |
Series C-1 VRTP Shares Redeemed | | | 170 | |
Redemption Amount | | $ | 17,000,000 | |
Upon completion of the partial redemption of the Series C-1 VRTP Shares, the remaining 190 Series C-1 VRTP Shares were transferred to another large financial institution (the Assignee) on September 30, 2016 as permitted by the Fund’s By-laws. The transferred Series C-1 VRTP Shares were then exchanged for an equal number of Series L-2 Variable Rate Term Preferred Shares (Series L-2 VRTP Shares), and the mandatory redemption date was extended to three years from the date of transfer. Dividends on the Series L-2 VRTP Shares are determined each day based on a spread of 1.85% to three-month LIBOR. Such spread to the cost of funding is determined based on the current credit rating of the Series L-2 VRTP Shares, which is provided by Moody’s Investors Service.
The Series L-2 VRTP Shares are redeemable at the option of the Fund at a redemption price equal to $100,000 per share, plus accumulated and unpaid dividends, on any business day and solely for the purpose of reducing the leverage of the Fund. The Series L-2 VRTP Shares are also subject to mandatory redemption at a redemption price equal to $100,000 per share, plus accumulated and unpaid dividends, if the Fund is in default for an extended period on its asset maintenance or leverage ratio requirements with respect to the Series L-2 VRTP Shares. Six months prior to the mandatory redemption date, the Fund is required to segregate in a liquidity account with its custodian investments equal to 110% of the Series L-2 VRTP Shares’ redemption price, and over the six month period execute a series of liquidation transactions to assure sufficient liquidity to redeem the Series L-2 VRTP Shares. The holders of the Series L-2 VRTP Shares, voting as a class, are entitled to elect two Trustees of the Fund. If the dividends on the Series L-2 VRTP Shares remain unpaid in an amount equal to two full years’ dividends, the holders of the Series L-2 VRTP Shares as a class have the right to elect a majority of the Board of Trustees.
For financial reporting purposes, the liquidation value of the Series L-2 VRTP Shares (net of unamortized deferred debt issuance costs) is presented as a liability on the Statement of Assets and Liabilities and unpaid dividends are included in interest expense and fees payable. Dividends accrued on the Series L-2 VRTP Shares are treated as interest payments for financial reporting purposes and are included in interest expense and fees on the Statement of Operations.
In connection with the transfer of the Series C-1 VRTP Shares to the Assignee on September 30, 2016, the Fund paid an upfront fee of $95,000 and debt issuance costs of $107,733, both of which are being amortized to interest expense and fees over a period of three years to September 30, 2019. The unamortized amount of the debt issuance costs as of November 30, 2018 is presented as a deduction of the liability for variable rate term preferred shares on the Statement of Assets and Liabilities.
The carrying amount of the Series L-2 VRTP Shares at November 30, 2018 represents its liquidation value, which approximates fair value. If measured at fair value, the Series L-2 VRTP Shares would have been considered as Level 2 in the fair value hierarchy (see Note 11) at November 30, 2018. The average liquidation preference of the Series L-2 VRTP Shares during the six months ended November 30, 2018 was $19,000,000.
3 Distributions to Shareholders and Income Tax Information
The Fund intends to make monthly distributions of net investment income to common shareholders, after payment of any dividends on any outstanding variable rate term preferred shares. In addition, at least annually, the Fund intends to distribute all or substantially all of its net realized capital gains. Distributions to common shareholders are recorded on the ex-dividend date. Dividends to variable rate term preferred shareholders are accrued daily and payable quarterly. The dividend rate on the Series L-2 VRTP Shares at November 30, 2018 was 4.59%. The amount of dividends accrued and the average annual dividend rate of the Series L-2 VRTP Shares during the six months ended November 30, 2018 were $411,204 and 4.32%, respectively.
Distributions to shareholders are determined in accordance with income tax regulations, which may differ from U.S. GAAP. As required by U.S. GAAP, only distributions in excess of tax basis earnings and profits are reported in the financial statements as a return of capital. Permanent differences between book and tax accounting relating to distributions are reclassified to paid-in capital. For tax purposes, distributions from short-term capital gains are considered to be from ordinary income.
Eaton Vance
Floating-Rate Income Plus Fund
November 30, 2018
Notes to Financial Statements (Unaudited) — continued
At May 31, 2018, the Fund, for federal income tax purposes, had deferred capital losses of $4,536,911 which would reduce its taxable income arising from future net realized gains on investment transactions, if any, to the extent permitted by the Internal Revenue Code, and thus would reduce the amount of distributions to shareholders, which would otherwise be necessary to relieve the Fund of any liability for federal income or excise tax. The deferred capital losses are treated as arising on the first day of the Fund’s next taxable year and retain the same short-term or long-term character as when originally deferred. Of the deferred capital losses at May 31, 2018, $4,536,911 are long-term.
The cost and unrealized appreciation (depreciation) of investments of the Fund at November 30, 2018, as determined on a federal income tax basis, were as follows:
| | | | |
| |
Aggregate cost | | $ | 212,628,994 | |
| |
Gross unrealized appreciation | | $ | 955,092 | |
Gross unrealized depreciation | | | (7,925,856 | ) |
| |
Net unrealized depreciation | | $ | (6,970,764 | ) |
4 Investment Adviser Fee and Other Transactions with Affiliates
The investment adviser fee is earned by EVM as compensation for investment advisory services rendered to the Fund. The fee is computed at an annual rate of 0.75% of the Fund’s average daily total managed assets and is payable monthly. Total managed assets as referred to herein represent total assets of the Fund (including assets attributable to borrowings, any outstanding preferred shares, or other forms of leverage) less accrued liabilities (other than liabilities representing borrowings or such other forms of leverage). For the six months ended November 30, 2018, the Fund’s investment adviser fee amounted to $791,321. The Fund invests its cash in Cash Reserves Fund. EVM does not currently receive a fee for advisory services provided to Cash Reserves Fund. EVM also serves as administrator of the Fund, but receives no compensation.
Trustees and officers of the Fund who are members of EVM’s organization receive remuneration for their services to the Fund out of the investment adviser fee. Trustees of the Fund who are not affiliated with EVM may elect to defer receipt of all or a percentage of their annual fees in accordance with the terms of the Trustees Deferred Compensation Plan. For the six months ended November 30, 2018, no significant amounts have been deferred. Certain officers and Trustees of the Fund are officers of EVM.
5 Purchases and Sales of Investments
Purchases and sales of investments, other than short-term obligations and including maturities, paydowns and principal repayments on Senior Loans, aggregated $29,845,980 and $34,297,145, respectively, for the six months ended November 30, 2018.
6 Common Shares of Beneficial Interest
The Fund may issue common shares pursuant to its dividend reinvestment plan. There were no common shares issued by the Fund for the six months ended November 30, 2018 and the year ended May 31, 2018.
On November 11, 2013, the Board of Trustees of the Fund authorized the repurchase by the Fund of up to 10% of its then currently outstanding common shares in open-market transactions at a discount to net asset value. The repurchase program does not obligate the Fund to purchase a specific amount of shares. There were no repurchases of common shares by the Fund for the six months ended November 30, 2018 and the year ended May 31, 2018.
7 Financial Instruments
The Fund may trade in financial instruments with off-balance sheet risk in the normal course of its investing activities. These financial instruments may include forward foreign currency exchange contracts and may involve, to a varying degree, elements of risk in excess of the amounts recognized for financial statement purposes. The notional or contractual amounts of these instruments represent the investment the Fund has in particular classes of financial instruments and do not necessarily represent the amounts potentially subject to risk. The measurement of the risks associated with these instruments is meaningful only when all related and offsetting transactions are considered. At November 30, 2018, there were no obligations outstanding under these financial instruments.
8 Revolving Credit and Security Agreement
The Fund has entered into a Revolving Credit and Security Agreement, as amended (the Agreement) with conduit lenders and a bank to borrow up to $64 million. Borrowings under the Agreement are secured by the assets of the Fund. Interest is charged at a rate above the conduits’ commercial paper
Eaton Vance
Floating-Rate Income Plus Fund
November 30, 2018
Notes to Financial Statements (Unaudited) — continued
issuance rate and is payable monthly. Under the terms of the Agreement, in effect through March 11, 2019, the Fund also pays a program fee of 0.67% per annum on its outstanding borrowings to administer the facility and a liquidity fee of 0.15% (0.25% if the outstanding loan amount is less than or equal to 60% of the total facility size) per annum on the borrowing limit under the Agreement. Program and liquidity fees for the six months ended November 30, 2018 totaled $239,229 and are included in interest expense and fees on the Statement of Operations. The Fund also paid an upfront fee of $64,000, which is being amortized to interest expense over a period of one year through March 11, 2019. The unamortized balance at November 30, 2018 is approximately $21,000 and is included in prepaid upfront fees on notes payable on the Statement of Assets and Liabilities. The Fund is required to maintain certain net asset levels during the term of the Agreement. At November 30, 2018, the Fund had borrowings outstanding under the Agreement of $54,000,000 at an interest rate of 2.45%. Based on the short-term nature of the borrowings under the Agreement and the variable interest rate, the carrying amount of the borrowings at November 30, 2018 approximated its fair value. If measured at fair value, borrowings under the Agreement would have been considered as Level 2 in the fair value hierarchy (see Note 11) at November 30, 2018. For the six months ended November 30, 2018, the average borrowings under the Agreement and the average annual interest rate (excluding fees) were $55,912,568 and 2.29%, respectively.
9 Risks Associated with Foreign Investments
Investing in securities issued by companies whose principal business activities are outside the United States may involve significant risks not present in domestic investments. For example, there is generally less publicly available information about foreign companies, particularly those not subject to the disclosure and reporting requirements of the U.S. securities laws. Certain foreign issuers are generally not bound by uniform accounting, auditing, and financial reporting requirements and standards of practice comparable to those applicable to domestic issuers. Investments in foreign securities also involve the risk of possible adverse changes in investment or exchange control regulations, expropriation or confiscatory taxation, limitation on the removal of funds or other assets of the Fund, political or financial instability or diplomatic and other developments which could affect such investments. Foreign securities markets, while growing in volume and sophistication, are generally not as developed as those in the United States, and securities of some foreign issuers (particularly those located in developing countries) may be less liquid and more volatile than securities of comparable U.S. companies. In general, there is less overall governmental supervision and regulation of foreign securities markets, broker/dealers and issuers than in the United States.
10 Credit Risk
The Fund invests primarily in below investment grade floating-rate loans, which are considered speculative because of the credit risk of their issuers. Changes in economic conditions or other circumstances are more likely to reduce the capacity of issuers of these securities to make principal and interest payments. Such companies are more likely to default on their payments of interest and principal owed than issuers of investment grade bonds. An economic downturn generally leads to a higher non-payment rate, and a loan or other debt obligation may lose significant value before a default occurs. Lower rated investments also may be subject to greater price volatility than higher rated investments. Moreover, the specific collateral used to secure a loan may decline in value or become illiquid, which would adversely affect the loan’s value.
11 Fair Value Measurements
Under generally accepted accounting principles for fair value measurements, a three-tier hierarchy to prioritize the assumptions, referred to as inputs, is used in valuation techniques to measure fair value. The three-tier hierarchy of inputs is summarized in the three broad levels listed below.
| • | | Level 1 – quoted prices in active markets for identical investments |
| • | | Level 2 – other significant observable inputs (including quoted prices for similar investments, interest rates, prepayment speeds, credit risk, etc.) |
| • | | Level 3 – significant unobservable inputs (including a fund’s own assumptions in determining the fair value of investments) |
In cases where the inputs used to measure fair value fall in different levels of the fair value hierarchy, the level disclosed is determined based on the lowest level input that is significant to the fair value measurement in its entirety. The inputs or methodology used for valuing securities are not necessarily an indication of the risk associated with investing in those securities.
Eaton Vance
Floating-Rate Income Plus Fund
November 30, 2018
Notes to Financial Statements (Unaudited) — continued
At November 30, 2018, the hierarchy of inputs used in valuing the Fund’s investments, which are carried at value, were as follows:
| | | | | | | | | | | | | | | | |
| Asset Description | | Level 1 | | | Level 2 | | | Level 3* | | | Total | |
| | | | |
Senior Floating-Rate Loans (Less Unfunded Loan Commitments) | | $ | — | | | $ | 177,145,831 | | | $ | 668,938 | | | $ | 177,814,769 | |
Corporate Bonds & Notes | | | — | | | | 14,528,769 | | | | — | | | | 14,528,769 | |
Foreign Government Bonds | | | — | | | | 4,987,366 | | | | — | | | | 4,987,366 | |
Commercial Mortgage-Backed Securities | | | — | | | | 88,912 | | | | — | | | | 88,912 | |
Convertible Bonds | | | — | | | | 763,772 | | | | — | | | | 763,772 | |
Common Stocks | | | 1,545,003 | | | | 571,153 | ** | | | 372,496 | | | | 2,488,652 | |
Convertible Preferred Stocks | | | — | | | | 1,734,773 | | | | 0 | | | | 1,734,773 | |
Preferred Stocks | | | 426,843 | | | | — | | | | — | | | | 426,843 | |
Short-Term Investments | | | — | | | | 2,824,374 | | | | — | | | | 2,824,374 | |
| | | | |
Total Investments | | $ | 1,971,846 | | | $ | 202,644,950 | | | $ | 1,041,434 | | | $ | 205,658,230 | |
| * | None of the unobservable inputs for Level 3 assets, individually or collectively, had a material impact on the Fund. |
| ** | Includes foreign equity securities whose values were adjusted to reflect market trading of comparable securities or other correlated instruments that occurred after the close of trading in their applicable foreign markets. |
Level 3 investments at the beginning and/or end of the period in relation to net assets were not significant and accordingly, a reconciliation of Level 3 assets for the six months ended November 30, 2018 is not presented.
Eaton Vance
Floating-Rate Income Plus Fund
November 30, 2018
Officers and Trustees
Officers of Eaton Vance Floating-Rate Income Plus Fund
Payson F. Swaffield
President
Maureen A. Gemma
Vice President, Secretary and Chief Legal Officer
James F. Kirchner
Treasurer
Richard F. Froio
Chief Compliance Officer
Trustees of Eaton Vance Floating-Rate Income Plus Fund
William H. Park
Chairperson
Thomas E. Faust Jr.*
Mark R. Fetting
Cynthia E. Frost
George J. Gorman
Valerie A. Mosley
Helen Frame Peters
Keith Quinton(1)
Marcus L. Smith(1)
Susan J. Sutherland
Scott E. Wennerholm
| (1) | Messrs. Quinton and Smith began serving as Trustees effective October 1, 2018. |
Eaton Vance Funds
IMPORTANT NOTICES
Privacy. The Eaton Vance organization is committed to ensuring your financial privacy. Each of the financial institutions identified below has in effect the following policy (“Privacy Policy”) with respect to nonpublic personal information about its customers:
| • | | Only such information received from you, through application forms or otherwise, and information about your Eaton Vance fund transactions will be collected. This may include information such as name, address, social security number, tax status, account balances and transactions. |
| • | | None of such information about you (or former customers) will be disclosed to anyone, except as permitted by law (which includes disclosure to employees necessary to service your account). In the normal course of servicing a customer’s account, Eaton Vance may share information with unaffiliated third parties that perform various required services such as transfer agents, custodians and broker-dealers. |
| • | | Policies and procedures (including physical, electronic and procedural safeguards) are in place that are designed to protect the confidentiality of such information. |
| • | | We reserve the right to change our Privacy Policy at any time upon proper notification to you. Customers may want to review our Privacy Policy periodically for changes by accessing the link on our homepage: www.eatonvance.com. |
Our pledge of privacy applies to the following entities within the Eaton Vance organization: the Eaton Vance Family of Funds, Eaton Vance Management, Eaton Vance Investment Counsel, Eaton Vance Distributors, Inc., Eaton Vance Trust Company, Eaton Vance Management (International) Limited, Eaton Vance Advisers International Ltd., Eaton Vance Management’s Real Estate Investment Group and Boston Management and Research. In addition, our Privacy Policy applies only to those Eaton Vance customers who are individuals and who have a direct relationship with us. If a customer’s account (i.e., fund shares) is held in the name of a third-party financial advisor/broker-dealer, it is likely that only such advisor’s privacy policies apply to the customer. This notice supersedes all previously issued privacy disclosures. For more information about Eaton Vance’s Privacy Policy, please call 1-800-262-1122.
Delivery of Shareholder Documents. The Securities and Exchange Commission (SEC) permits funds to deliver only one copy of shareholder documents, including prospectuses, proxy statements and shareholder reports, to fund investors with multiple accounts at the same residential or post office box address. This practice is often called “householding” and it helps eliminate duplicate mailings to shareholders. American Stock Transfer & Trust Company, LLC (“AST”), the closed-end funds transfer agent, or your financial advisor, may household the mailing of your documents indefinitely unless you instruct AST, or your financial advisor, otherwise. If you would prefer that your Eaton Vance documents not be householded, please contact AST or your financial advisor. Your instructions that householding not apply to delivery of your Eaton Vance documents will typically be effective within 30 days of receipt by AST or your financial advisor.
Portfolio Holdings. Each Eaton Vance Fund and its underlying Portfolio(s) (if applicable) will file a schedule of portfolio holdings on Form N-Q with the SEC for the first and third quarters of each fiscal year. The Form N-Q will be available on the Eaton Vance website at www.eatonvance.com, by calling Eaton Vance at 1-800-262-1122 or in the EDGAR database on the SEC’s website at www.sec.gov. Form N-Q may also be reviewed and copied at the SEC’s public reference room in Washington, D.C. (call 1-800-732-0330 for information on the operation of the public reference room).
Proxy Voting. From time to time, funds are required to vote proxies related to the securities held by the funds. The Eaton Vance Funds or their underlying Portfolios (if applicable) vote proxies according to a set of policies and procedures approved by the Funds’ and Portfolios’ Boards. You may obtain a description of these policies and procedures and information on how the Funds or Portfolios voted proxies relating to portfolio securities during the most recent 12-month period ended June 30, without charge, upon request, by calling 1-800-262-1122 and by accessing the SEC’s website at www.sec.gov.
Share Repurchase Program. The Fund’s Board of Trustees has approved a share repurchase program authorizing the Fund to repurchase up to 10% of its outstanding common shares as of the approved date in open-market transactions at a discount to net asset value. The repurchase program does not obligate the Fund to purchase a specific amount of shares. The Fund’s repurchase activity, including the number of shares purchased, average price and average discount to net asset value, is disclosed in the Fund’s annual and semi-annual reports to shareholders.
Additional Notice to Shareholders. If applicable, a Fund may also redeem or purchase its outstanding preferred shares in order to maintain compliance with regulatory requirements, borrowing or rating agency requirements or for other purposes as it deems appropriate or necessary.
Closed-End Fund Information. Eaton Vance closed-end funds make fund performance data and certain information about portfolio characteristics available on the Eaton Vance website shortly after the end of each month. Other information about the funds is available on the website. The funds’ net asset value per share is readily accessible on the Eaton Vance website. Portfolio holdings for the most recent month-end are also posted to the website approximately 30 days following the end of the month. This information is available at www.eatonvance.com on the fund information pages under “Individual Investors — Closed-End Funds”.
This Page Intentionally Left Blank
This Page Intentionally Left Blank
This Page Intentionally Left Blank
Investment Adviser and Administrator
Eaton Vance Management
Two International Place
Boston, MA 02110
Custodian
State Street Bank and Trust Company
State Street Financial Center, One Lincoln Street
Boston, MA 02111
Transfer Agent
American Stock Transfer & Trust Company, LLC
6201 15th Avenue
Brooklyn, NY 11219
Fund Offices
Two International Place
Boston, MA 02110

13724 11.30.18
Item 2. Code of Ethics
Not required in this filing.
Item 3. Audit Committee Financial Expert
Not required in this filing.
Item 4. Principal Accountant Fees and Services
Not required in this filing.
Item 5. Audit Committee of Listed Registrants
Not required in this filing.
Item 6. Schedule of Investments
Please see schedule of investments contained in the Report to Stockholders included under Item 1 of this FormN-CSR.
Item 7. Disclosure of Proxy Voting Policies and Procedures forClosed-End Management Investment Companies
Not required in this filing.
Item 8. Portfolio Managers ofClosed-End Management Investment Companies
Not required in this filing.
Item 9. Purchases of Equity Securities byClosed-End Management Investment Company and Affiliated Purchasers
No such purchases this period.
Item 10. Submission of Matters to a Vote of Security Holders
No material changes.
Item 11. Controls and Procedures
(a) It is the conclusion of the registrant’s principal executive officer and principal financial officer that the effectiveness of the registrant’s current disclosure controls and procedures (such disclosure controls and procedures having been evaluated within 90 days of the date of this filing) provide reasonable assurance that the information required to be disclosed by the registrant has been recorded, processed, summarized and reported within the time period specified in the Commission’s rules and forms and that the information required to be disclosed by the registrant has been accumulated and communicated to the registrant’s principal executive officer and principal financial officer in order to allow timely decisions regarding required disclosure.
(b) There have been no changes in the registrant’s internal controls over financial reporting during the second fiscal quarter of the period covered by this report that has materially affected, or is reasonably likely to materially affect, the registrant’s internal control over financial reporting.
Item 12. Disclosure of Securities Lending Activities forClosed-End Management Investment Companies
Not applicable.
Item 13. Exhibits
| | |
(a)(1) | | Registrant’s Code of Ethics – Not applicable (please see Item 2). |
| |
(a)(2)(i) | | Treasurer’s Section 302 certification. |
| |
(a)(2)(ii) | | President’s Section 302 certification. |
| |
(b) | | Combined Section 906 certification. |
Signatures
Pursuant to the requirements of the Securities Exchange Act of 1934 and the Investment Company Act of 1940, the registrant has duly caused this report to be signed on its behalf by the undersigned, thereunto duly authorized.
Eaton Vance Floating-Rate Income Plus Fund
| | |
| By: | | /s/ Payson F. Swaffield |
| | Payson F. Swaffield |
| | President |
| |
| Date: | | January 24, 2019 |
Pursuant to the requirements of the Securities Exchange Act of 1934 and the Investment Company Act of 1940, this report has been signed below by the following persons on behalf of the registrant and in the capacities and on the dates indicated.
| | |
| By: | | /s/ James F. Kirchner |
| | James F. Kirchner |
| | Treasurer |
| |
| Date: | | January 24, 2019 |
| | |
| By: | | /s/ Payson F. Swaffield |
| | Payson F. Swaffield |
| | President |
| |
| Date: | | January 24, 2019 |