UNITED STATES
SECURITIES AND EXCHANGE COMMISSION
Washington, D.C. 20549
Form N-CSR
CERTIFIED SHAREHOLDER REPORT OF REGISTERED
MANAGEMENT INVESTMENT COMPANIES
Investment Company Act File Number: 811-22821
Eaton Vance Floating-Rate Income Plus Fund
(Exact Name of Registrant as Specified in Charter)
Two International Place, Boston, Massachusetts 02110
(Address of Principal Executive Offices)
Maureen A. Gemma
Two International Place, Boston, Massachusetts 02110
(Name and Address of Agent for Services)
(617) 482-8260
(Registrant’s Telephone Number)
May 31
Date of Fiscal Year End
November 30, 2020
Date of Reporting Period
| Item 1. | Reports to Stockholders |

Eaton Vance
Floating-Rate Income Plus Fund (EFF)
Semiannual Report
November 30, 2020

Commodity Futures Trading Commission Registration. The Commodity Futures Trading Commission (“CFTC”) has adopted regulations that subject registered investment companies and advisers to regulation by the CFTC if a fund invests more than a prescribed level of its assets in certain CFTC-regulated instruments (including futures, certain options and swap agreements) or markets itself as providing investment exposure to such instruments. The investment adviser has claimed an exclusion from the definition of “commodity pool operator” under the Commodity Exchange Act with respect to its management of the Fund. Accordingly, neither the Fund nor the adviser with respect to the operation of the Fund is subject to CFTC regulation. Because of its management of other strategies, the Fund’s adviser is registered with the CFTC as a commodity pool operator. The adviser is also registered as a commodity trading advisor.
Fund shares are not insured by the FDIC and are not deposits or other obligations of, or guaranteed by, any depository institution. Shares are subject to investment risks, including possible loss of principal invested.
Semiannual Report November 30, 2020
Eaton Vance
Floating-Rate Income Plus Fund
Eaton Vance
Floating-Rate Income Plus Fund
November 30, 2020
Performance1,2
Portfolio Managers Craig P. Russ, Andrew N. Sveen, CFA, Catherine C. McDermott, William E. Holt, CFA and Daniel P. McElaney, CFA
| | | | | | | | | | | | | | | | | | | | |
| % Average Annual Total Returns | | Inception Date | | | Six Months | | | One Year | | | Five Years | | | Since
Inception | |
| | | | | |
Fund at NAV | | | 06/28/2013 | | | | 10.67 | % | | | 2.21 | % | | | 6.14 | % | | | 4.31 | % |
Fund at Market Price | | | — | | | | 13.00 | | | | 2.74 | | | | 7.64 | | | | 3.36 | |
|
| |
| | | | | |
S&P/LSTA Leveraged Loan Index | | | — | | | | 7.88 | % | | | 3.38 | % | | | 4.73 | % | | | 3.84 | % |
| | | | | |
| % Premium/Discount to NAV3 | | | | | | | | | | | | | | | |
| | | | | |
| | | | | | | | | | | | | | | | | | | –6.55 | % |
| | | | | |
| Distributions4 | | | | | | | | | | | | | | | |
| | | | | |
Total Distributions per share for the period | | | | | | | | | | | | | | | | | | $ | 0.363 | |
Distribution Rate at NAV | | | | | | | | | | | | | | | | | | | 4.45 | % |
Distribution Rate at Market Price | | | | | | | | | | | | | | | | | | | 4.76 | |
| | | | | |
| % Total Leverage5 | | | | | | | | | | | | | | | |
| | | | | |
Borrowings | | | | | | | | | | | | | | | | | | | 25.64 | % |
Variable Rate Term Preferred Shares (VRTP Shares) | | | | | | | | | | | | | | | | | | | 9.94 | |
Fund Profile
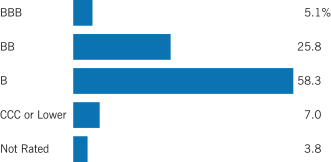
Credit Quality (% of bonds, loans and asset-backed securities)6
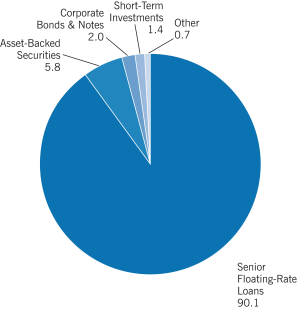
Asset Allocation (% of total investments)7
See Endnotes and Additional Disclosures in this report.
Past performance is no guarantee of future results. Returns are historical and are calculated net of management fees and other expenses by determining the percentage change in net asset value (NAV) or market price (as applicable) with all distributions reinvested in accordance with the Fund’s Dividend Reinvestment Plan. Performance at market price will differ from performance at NAV due to variations in the Fund’s market price versus NAV, which may reflect factors such as fluctuations in supply and demand for Fund shares, changes in Fund distributions, shifting market expectations for the Fund’s future returns and distribution rates, and other considerations affecting the trading prices of closed-end funds. Investment return and principal value will fluctuate so that shares, when sold, may be worth more or less than their original cost. Performance for periods less than or equal to one year is cumulative. Performance is for the stated time period only; due to market volatility, current Fund performance may be lower or higher than the quoted return. For performance as of the most recent month-end, please refer to eatonvance.com.
Eaton Vance
Floating-Rate Income Plus Fund
November 30, 2020
Endnotes and Additional Disclosures
| 1 | S&P/LSTA Leveraged Loan Index is an unmanaged index of the institutional leveraged loan market. S&P/LSTA Leveraged Loan indices are a product of S&P Dow Jones Indices LLC (“S&P DJI”) and have been licensed for use. S&P® is a registered trademark of S&P DJI; Dow Jones® is a registered trademark of Dow Jones Trademark Holdings LLC (“Dow Jones”); LSTA is a trademark of Loan Syndications and Trading Association, Inc. S&P DJI, Dow Jones, their respective affiliates and their third party licensors do not sponsor, endorse, sell or promote the Fund, will not have any liability with respect thereto and do not have any liability for any errors, omissions, or interruptions of the S&P Dow Jones Indices. Unless otherwise stated, index returns do not reflect the effect of any applicable sales charges, commissions, expenses, taxes or leverage, as applicable. It is not possible to invest directly in an index. |
| 2 | Performance results reflect the effects of leverage. Performance since inception for an index, if presented, is the performance since the Fund’s or oldest share class’ inception, as applicable. Pursuant to the Fund’s Dividend Reinvestment Plan, if the NAV per share on the distribution payment date is equal to or less than the market price per share plus estimated brokerage commissions, then new shares are issued. The number of shares shall be determined by the greater of the NAV per share or 95% of the market price. Otherwise, shares generally are purchased on the open market by the Plan’s agent. |
| 3 | The shares of the Fund often trade at a discount or premium to their net asset value. The discount or premium may vary over time and may be higher or lower than what is quoted in this report. For up-to-date premium/discount information, please refer to https://funds.eatonvance.com/closed-end-fund-prices.php. |
| 4 | The Distribution Rate is based on the Fund’s last regular distribution per share in the period (annualized) divided by the Fund’s NAV or market price at the end of the period. The Fund’s distributions may be comprised of amounts characterized for federal income tax purposes as qualified and non-qualified ordinary dividends, capital gains and nondividend distributions, also known as return of capital. For additional information about nondividend distributions, please refer to Eaton Vance Closed-End Fund Distribution Notices (19a) posted on our website, eatonvance.com. The Fund will determine the federal income tax character of distributions paid to a shareholder after the end of the calendar year. This is reported on the IRS form 1099-DIV and provided to the shareholder shortly after each year-end. For information about the tax character of distributions made in prior calendar years, please refer to Performance-Tax Character of Distributions on the Fund’s webpage available at eatonvance.com. The Fund’s distributions are determined by the investment adviser based on its current assessment of the Fund’s long-term return potential. Fund distributions may be affected by numerous factors including changes in Fund performance, the cost of financing for leverage, portfolio holdings, realized and projected returns, and other factors. As portfolio and market conditions change, the rate of distributions paid by the Fund could change. |
| 5 | Leverage represents the liquidation value of the Fund’s VRTP Shares and borrowings outstanding as a percentage of Fund net assets applicable to common shares plus VRTP Shares and borrowings outstanding. Use of leverage creates an opportunity for income, but creates risks including greater price volatility. The cost of leverage rises |
| | and falls with changes in short-term interest rates. The Fund may be required to maintain prescribed asset coverage for its leverage and may be required to reduce its leverage at an inopportune time. |
| 6 | Credit ratings are categorized using S&P Global Ratings (“S&P”). Ratings, which are subject to change, apply to the creditworthiness of the issuers of the underlying securities and not to the Fund or its shares. Credit ratings measure the quality of a bond based on the issuer’s creditworthiness, with ratings ranging from AAA, being the highest, to D, being the lowest based on S&P’s measures. Ratings of BBB or higher by S&P are considered to be investment-grade quality. Credit ratings are based largely on the ratings agency’s analysis at the time of rating. The rating assigned to any particular security is not necessarily a reflection of the issuer’s current financial condition and does not necessarily reflect its assessment of the volatility of a security’s market value or of the liquidity of an investment in the security. Holdings designated as “Not Rated” (if any) are not rated by S&P. |
| 7 | Other represents any investment type less than 1.0% of total investments. Asset allocation as a percentage of the Fund’s net assets amounted to 158.5%. |
| | Fund profile subject to change due to active management. |
Eaton Vance
Floating-Rate Income Plus Fund
November 30, 2020
Portfolio of Investments (Unaudited)
| | | | | | | | |
| Asset-Backed Securities — 9.2% | | | | | | | | |
| Security | | Principal
Amount
(000’s omitted) | | | Value | |
| | |
| AMMC CLO XII, Ltd. | | | | | | |
| | |
Series 2013-12A, Class ER, 6.386%, (3 mo. USD LIBOR + 6.18%), 11/10/30(1)(2) | | $ | 1,000 | | | $ | 814,898 | |
| | |
| Ares LII CLO, Ltd. | | | | | | |
| | |
Series 2019-52A, Class E, 6.766%, (3 mo. USD LIBOR + 6.55%), 4/22/31(1)(2) | | | 1,000 | | | | 968,855 | |
| | |
| Bain Capital Credit CLO, Ltd. | | | | | | |
| | |
Series 2017-2A, Class E, 6.565%, (3 mo. USD LIBOR + 6.35%), 7/25/30(1)(2) | | | 1,000 | | | | 937,695 | |
| | |
| Canyon Capital CLO, Ltd. | | | | | | |
| | |
Series 2019-2A, Class E, 7.387%, (3 mo. USD LIBOR + 7.15%), 10/15/32(1)(2) | | | 1,000 | | | | 1,006,461 | |
| | |
| Cedar Funding X CLO, Ltd. | | | | | | |
| | |
Series 2019-10A, Class E, 7.218%, (3 mo. USD LIBOR + 7.00%), 10/20/32(1)(2) | | | 1,000 | | | | 1,006,344 | |
| | |
| Cent CLO 17, Ltd. | | | | | | |
| | |
Series C17A, Class DR, 6.214%, (3 mo. USD LIBOR + 6.00%), 4/30/31(1)(2) | | | 1,000 | | | | 898,029 | |
| | |
| Kayne CLO 5, Ltd. | | | | | | |
| | |
Series 2019-5A, Class E, 6.915%, (3 mo. USD LIBOR + 6.70%), 7/24/32(1)(2) | | | 1,000 | | | | 998,540 | |
| | |
| Neuberger Berman Loan Advisers CLO 33, Ltd. | | | | | | |
| | |
Series 2019-33A, Class E, 7.03%, (3 mo. USD LIBOR + 6.80%), 10/16/32(1)(2) | | | 1,000 | | | | 1,002,059 | |
| | |
| Regatta XII Funding, Ltd. | | | | | | |
| | |
Series 2019-1A, Class E, 7.087%, (3 mo. USD LIBOR + 6.85%), 10/15/32(1)(2) | | | 1,000 | | | | 1,002,305 | |
| | |
| Vibrant CLO X, Ltd. | | | | | | |
| | |
Series 2018-10A, Class D, 6.408%, (3 mo. USD LIBOR + 6.19%), 10/20/31(1)(2) | | | 1,000 | | | | 842,368 | |
| | |
| Voya CLO, Ltd. | | | | | | |
| | |
Series 2016-3A, Class DR, 6.298%, (3 mo. USD LIBOR + 6.08%), 10/18/31(1)(2) | | | 1,000 | | | | 882,607 | |
| | |
| Webster Park CLO, Ltd. | | | | | | |
| | |
Series 2015-1A, Class DR, 5.718%, (3 mo. USD LIBOR + 5.50%), 7/20/30(1)(2) | | | 1,000 | | | | 920,393 | |
| |
Total Asset-Backed Securities
(identified cost $11,675,959) | | | $ | 11,280,554 | |
|
| Common Stocks — 1.0% | |
| Security | | Shares | | | Value | |
|
| Business Equipment and Services — 0.1% | |
| | |
Crossmark Holdings, Inc.(3)(4) | | | 1,216 | | | $ | 69,920 | |
| | |
| | | | | | | $ | 69,920 | |
| | | | | | | | |
| Security | | Shares | | | Value | |
|
| Containers and Glass Products — 0.0%(5) | |
| | |
LG Newco Holdco, Inc.(3)(4) | | $ | 6,775 | | | $ | 10,162 | |
| | |
| | | | | | | $ | 10,162 | |
|
| Electronics / Electrical — 0.5% | |
| | |
Answers Corp.(3)(4)(6) | | | 14,876 | | | $ | 8,628 | |
| | |
Software Luxembourg Holding S.A.(3)(4) | | | 2,725 | | | | 545,000 | |
| | |
| | | | | | | $ | 553,628 | |
|
| Health Care — 0.1% | |
| | |
Akorn Holding Company, LLC, Class A(3)(4) | | | 8,323 | | | $ | 110,280 | |
| | |
| | | | | | | $ | 110,280 | |
|
| Nonferrous Metals / Minerals — 0.0%(5) | |
| | |
ACNR Holdings, Inc., Class A(3)(4) | | | 797 | | | $ | 5,978 | |
| | |
| | | | | | | $ | 5,978 | |
|
| Oil and Gas — 0.1% | |
| | |
AFG Holdings, Inc.(3)(4)(6) | | | 4,525 | | | $ | 84,482 | |
| | |
Fieldwood Energy, Inc.(3)(4) | | | 2,148 | | | | 215 | |
| | |
McDermott International, Ltd.(3)(4) | | | 35,628 | | | | 39,547 | |
| | |
RDV Resources, Inc., Class A(3)(4)(6) | | | 7,016 | | | | 0 | |
| | |
Sunrise Oil & Gas, Inc., Class A(3)(4) | | | 3,200 | | | | 22,400 | |
| | |
| | | | | | | $ | 146,644 | |
|
| Publishing — 0.0%(5) | |
| | |
Tweddle Group, Inc.(3)(4)(6) | | | 444 | | | $ | 906 | |
| | |
| | | | | | | $ | 906 | |
|
| Radio and Television — 0.1% | |
| | |
Clear Channel Outdoor Holdings, Inc.(3)(4) | | | 12,499 | | | $ | 18,873 | |
| | |
Cumulus Media, Inc., Class A(3)(4) | | | 9,974 | | | | 87,472 | |
| | |
iHeartMedia, Inc., Class A(3)(4) | | | 5,315 | | | | 63,541 | |
| | |
| | | | | | | $ | 169,886 | |
|
| Retailers (Except Food and Drug) — 0.0%(5) | |
| | |
David’s Bridal, LLC(3)(4)(6) | | | 5,304 | | | $ | 37,128 | |
| | |
| | | | | | | $ | 37,128 | |
|
| Utilities — 0.1% | |
| | |
Longview Intermediate Holdings, LLC, Class A(3)(4)(6) | | | 17,629 | | | $ | 142,443 | |
| | |
| | | | | | | $ | 142,443 | |
| |
Total Common Stocks
(identified cost $1,735,122) | | | $ | 1,246,975 | |
| | | | |
| | 4 | | See Notes to Financial Statements. |
Eaton Vance
Floating-Rate Income Plus Fund
November 30, 2020
Portfolio of Investments (Unaudited) — continued
| | | | | | | | |
| Corporate Bonds & Notes — 3.1% | |
| Security | | Principal
Amount
(000’s omitted) | | | Value | |
|
| Aerospace and Defense — 0.1% | |
| | |
| TransDigm, Inc. | | | | | | |
| | |
7.50%, 3/15/27 | | $ | 125 | | | $ | 133,961 | |
| | |
| | | | | | | $ | 133,961 | |
|
| Automotive — 0.5% | |
| | |
| Clarios Global, L.P./Clarios US Finance Co. | | | | | | |
| | |
8.50%, 5/15/27(1) | | $ | 500 | | | $ | 538,950 | |
| | |
| | | | | | | $ | 538,950 | |
|
| Cable and Satellite Television — 0.2% | |
| | |
| Altice France S.A. | | | | | | |
| | |
8.125%, 2/1/27(1) | | $ | 250 | | | $ | 275,599 | |
| | |
| | | | | | | $ | 275,599 | |
|
| Ecological Services and Equipment — 0.1% | |
| | |
| GFL Environmental, Inc. | | | | | | |
| | |
8.50%, 5/1/27(1) | | $ | 150 | | | $ | 166,031 | |
| | |
| | | | | | | $ | 166,031 | |
|
| Electronics / Electrical — 0.1% | |
| | |
| Go Daddy Operating Co., LLC/GD Finance Co., Inc. | | | | | | |
| | |
5.25%, 12/1/27(1) | | $ | 121 | | | $ | 127,579 | |
| | |
| | | | | | | $ | 127,579 | |
|
| Food Products — 0.3% | |
| | |
| Post Holdings, Inc. | | | | | | |
| | |
5.625%, 1/15/28(1) | | $ | 375 | | | $ | 399,609 | |
| | |
| | | | | | | $ | 399,609 | |
|
| Health Care — 0.4% | |
| | |
| HCA, Inc. | | | | | | |
| | |
5.875%, 2/1/29 | | $ | 375 | | | $ | 448,892 | |
| | |
| | | | | | | $ | 448,892 | |
|
| Insurance — 0.4% | |
| | |
| USI, Inc. | | | | | | |
| | |
6.875%, 5/1/25(1) | | $ | 500 | | | $ | 514,058 | |
| | |
| | | | | | | $ | 514,058 | |
| | | | | | | | |
| Security | | Principal
Amount
(000’s omitted) | | | Value | |
|
| Internet Software & Services — 0.5% | |
| | |
| Netflix, Inc. | | | | | | |
| | |
5.375%, 11/15/29(1) | | $ | 500 | | | $ | 597,650 | |
| | |
| | | | | | | $ | 597,650 | |
|
| Lodging and Casinos — 0.2% | |
| | |
| Caesars Resort Collection, LLC/CRC Finco, Inc. | | | | | | |
| | |
5.25%, 10/15/25(1) | | $ | 250 | | | $ | 250,329 | |
| | |
| | | | | | | $ | 250,329 | |
|
| Radio and Television — 0.3% | |
| | |
| iHeartCommunications, Inc. | | | | | | |
| | |
6.375%, 5/1/26 | | $ | 30 | | | $ | 31,881 | |
| | |
8.375%, 5/1/27 | | | 304 | | | | 324,064 | |
| | |
| | | | | | | $ | 355,945 | |
| |
Total Corporate Bonds & Notes
(identified cost $3,609,278) | | | $ | 3,808,603 | |
|
| Preferred Stocks — 0.1% | |
| Security | | Shares | | | Value | |
|
| Containers and Glass Products — 0.0%(5) | |
| | |
LG Newco Holdco, Inc.(3)(4) | | | 1,020 | | | $ | 52,257 | |
| | |
| | | | | | | $ | 52,257 | |
|
| Financial Services — 0.0%(5) | |
| | |
DBI Investors, Inc., Series A-1(3)(4)(6) | | | 251 | | | $ | 20,163 | |
| | |
| | | | | | | $ | 20,163 | |
|
| Nonferrous Metals / Minerals — 0.0%(5) | |
| | |
ACNR Holdings, Inc., 15.00% (PIK)(3)(4) | | | 376 | | | $ | 12,220 | |
| | |
| | | | | | | $ | 12,220 | |
|
| Retailers (Except Food and Drug) — 0.1% | |
| | |
David’s Bridal, LLC, Series A, 8.00% (PIK)(3)(4)(6) | | | 148 | | | $ | 11,840 | |
| | |
David’s Bridal, LLC, Series B, 10.00% (PIK)(3)(4)(6) | | | 601 | | | | 48,657 | |
| | |
| | | | | | | $ | 60,497 | |
| |
Total Preferred Stocks
(identified cost $102,189) | | | $ | 145,137 | |
| | | | |
| | 5 | | See Notes to Financial Statements. |
Eaton Vance
Floating-Rate Income Plus Fund
November 30, 2020
Portfolio of Investments (Unaudited) — continued
| | | | | | | | |
| Senior Floating-Rate Loans — 142.9%(7) | |
| Borrower/Tranche Description | | Principal
Amount
(000’s omitted) | | | Value | |
|
| Aerospace and Defense — 3.4% | |
| | |
| AI Convoy (Luxembourg) S.a.r.l. | | | | | | |
| | |
Term Loan, 4.50%, (USD LIBOR + 3.50%, Floor 1.00%), Maturing January 17, 2027(8) | | $ | 149 | | | $ | 149,063 | |
| | |
| Dynasty Acquisition Co., Inc. | | | | | | |
| | |
Term Loan, 3.72%, (3 mo. USD LIBOR + 3.50%), Maturing April 6, 2026 | | | 217 | | | | 202,794 | |
| | |
Term Loan, 3.72%, (3 mo. USD LIBOR + 3.50%), Maturing April 6, 2026 | | | 404 | | | | 377,197 | |
| | |
| TransDigm, Inc. | | | | | | |
| | |
Term Loan, 2.40%, (1 mo. USD LIBOR + 2.25%), Maturing August 22, 2024 | | | 1,304 | | | | 1,267,466 | |
| | |
Term Loan, 2.40%, (1 mo. USD LIBOR + 2.25%), Maturing December 9, 2025 | | | 1,502 | | | | 1,459,688 | |
| | |
| WP CPP Holdings, LLC | | | | | | |
| | |
Term Loan, 4.75%, (USD LIBOR + 3.75%, Floor 1.00%), Maturing April 30, 2025(8) | | | 787 | | | | 739,602 | |
| | |
| | | | | | | $ | 4,195,810 | |
|
| Air Transport — 1.5% | |
| | |
| Delta Air Lines, Inc. | | | | | | |
| | |
Term Loan, 5.75%, (3 mo. USD LIBOR + 4.75%, Floor 1.00%), Maturing April 29, 2023 | | $ | 474 | | | $ | 479,143 | |
| | |
| JetBlue Airways Corporation | | | | | | |
| | |
Term Loan, 6.25%, (3 mo. USD LIBOR + 5.25%, Floor 1.00%), Maturing June 17, 2024 | | | 711 | | | | 724,479 | |
| | |
| Mileage Plus Holdings, LLC | | | | | | |
| | |
Term Loan, 6.25%, (3 mo. USD LIBOR + 5.25%, Floor 1.00%), Maturing June 25, 2027 | | | 175 | | | | 180,854 | |
| | |
| SkyMiles IP, Ltd. | | | | | | |
| | |
Term Loan, 4.75%, (3 mo. USD LIBOR + 3.75%, Floor 1.00%), Maturing October 20, 2027 | | | 475 | | | | 486,727 | |
| | |
| | | | | | | $ | 1,871,203 | |
|
| Automotive — 4.0% | |
| | |
| Adient US, LLC | | | | | | |
| | |
Term Loan, 4.41%, (USD LIBOR + 4.25%), Maturing May 6, 2024(8) | | $ | 296 | | | $ | 296,091 | |
| | |
| American Axle and Manufacturing, Inc. | | | | | | |
| | |
Term Loan, 3.00%, (3 mo. USD LIBOR + 2.25%, Floor 0.75%), Maturing April 6, 2024 | | | 913 | | | | 897,859 | |
| | |
| Autokiniton US Holdings, Inc. | | | | | | |
| | |
Term Loan, 6.52%, (1 mo. USD LIBOR + 6.38%), Maturing May 22, 2025 | | | 171 | | | | 170,207 | |
| | | | | | | | |
| Borrower/Tranche Description | | Principal
Amount
(000’s omitted) | | | Value | |
|
| Automotive (continued) | |
| | |
| Bright Bidco B.V. | | | | | | |
| | |
Term Loan, 4.50%, (6 mo. USD LIBOR + 3.50%, Floor 1.00%), Maturing June 30, 2024 | | $ | 387 | | | $ | 216,158 | |
| | |
| Chassix, Inc. | | | | | | |
| | |
Term Loan, 6.50%, (USD LIBOR + 5.50%, Floor 1.00%), Maturing November 15, 2023(8) | | | 340 | | | | 321,654 | |
| | |
| Clarios Global L.P. | | | | | | |
| | |
Term Loan, 3.65%, (1 mo. USD LIBOR + 3.50%), Maturing April 30, 2026 | | | 802 | | | | 795,000 | |
| | |
| Dayco Products, LLC | | | | | | |
| | |
Term Loan, 4.48%, (3 mo. USD LIBOR + 4.25%), Maturing May 19, 2023 | | | 241 | | | | 166,664 | |
| | |
| IAA, Inc. | | | | | | |
| | |
Term Loan, 2.44%, (1 mo. USD LIBOR + 2.25%), Maturing June 28, 2026 | | | 121 | | | | 119,879 | |
| | |
| Les Schwab Tire Centers | | | | | | |
| | |
Term Loan, 4.25%, (3 mo. USD LIBOR + 3.50%, Floor 0.75%), Maturing November 2, 2027 | | | 625 | | | | 620,313 | |
| | |
| Tenneco, Inc. | | | | | | |
| | |
Term Loan, 3.15%, (1 mo. USD LIBOR + 3.00%), Maturing October 1, 2025 | | | 811 | | | | 785,739 | |
| | |
| Thor Industries, Inc. | | | | | | |
| | |
Term Loan, 3.94%, (1 mo. USD LIBOR + 3.75%), Maturing February 1, 2026 | | | 236 | | | | 235,302 | |
| | |
| TI Group Automotive Systems, LLC | | | | | | |
| | |
Term Loan, 4.50%, (3 mo. USD LIBOR + 3.75%, Floor 0.75%), Maturing December 16, 2024 | | | 299 | | | | 298,108 | |
| |
| | | | $ | 4,922,974 | |
|
| Beverage and Tobacco — 0.2% | |
| | |
| Arterra Wines Canada, Inc. | | | | | | |
| | |
Term Loan, Maturing November 18, 2027(9) | | $ | 225 | | | $ | 225,366 | |
| |
| | | | $ | 225,366 | |
|
| Brokerage / Securities Dealers / Investment Houses — 0.8% | |
| | |
| Advisor Group, Inc. | | | | | | |
| | |
Term Loan, 5.15%, (1 mo. USD LIBOR + 5.00%), Maturing July 31, 2026 | | $ | 765 | | | $ | 739,824 | |
| | |
| Clipper Acquisitions Corp. | | | | | | |
| | |
Term Loan, 1.89%, (1 mo. USD LIBOR + 1.75%), Maturing December 27, 2024 | | | 292 | | | | 288,103 | |
| |
| | | | $ | 1,027,927 | |
| | | | |
| | 6 | | See Notes to Financial Statements. |
Eaton Vance
Floating-Rate Income Plus Fund
November 30, 2020
Portfolio of Investments (Unaudited) — continued
| | | | | | | | |
| Borrower/Tranche Description | | Principal
Amount
(000’s omitted) | | | Value | |
|
| Building and Development — 5.0% | |
| | |
| ACProducts, Inc. | | | | | | |
| | |
Term Loan, 7.50%, (3 mo. USD LIBOR + 6.50%, Floor 1.00%), Maturing August 18, 2025 | | $ | 99 | | | $ | 101,157 | |
| | |
| American Builders & Contractors Supply Co., Inc. | | | | | | |
| | |
Term Loan, 2.15%, (1 mo. USD LIBOR + 2.00%), Maturing January 15, 2027 | | | 545 | | | | 535,354 | |
| | |
| American Residential Services, LLC | | | | | | |
| | |
Term Loan, 4.25%, (2 mo. USD LIBOR + 3.50%, Floor 0.75%), Maturing October 15, 2027 | | | 150 | | | | 149,156 | |
| | |
| APi Group DE, Inc. | | | | | | |
| | |
Term Loan, 2.65%, (1 mo. USD LIBOR + 2.50%), Maturing October 1, 2026 | | | 347 | | | | 342,436 | |
| | |
| Beacon Roofing Supply, Inc. | | | | | | |
| | |
Term Loan, 2.40%, (1 mo. USD LIBOR + 2.25%), Maturing January 2, 2025 | | | 146 | | | | 143,348 | |
| | |
| Brookfield Property REIT, Inc. | | | | | | |
| | |
Term Loan, 2.65%, (1 mo. USD LIBOR + 2.50%), Maturing August 27, 2025 | | | 220 | | | | 204,238 | |
| | |
| Core & Main L.P. | | | | | | |
| | |
Term Loan, 3.75%, (3 mo. USD LIBOR + 2.75%, Floor 1.00%), Maturing August 1, 2024 | | | 244 | | | | 241,172 | |
| | |
| Cornerstone Building Brands, Inc. | | | | | | |
| | |
Term Loan, 3.88%, (1 mo. USD LIBOR + 3.75%), Maturing April 12, 2025 | | | 171 | | | | 170,634 | |
| | |
| CP Atlas Buyer, Inc. | | | | | | |
| | |
Term Loan, 5.25%, (3 mo. USD LIBOR + 4.50%, Floor 0.75%), Maturing November 23, 2027 | | | 69 | | | | 68,767 | |
| | |
Term Loan, 5.25%, (3 mo. USD LIBOR + 4.50%, Floor 0.75%), Maturing November 23, 2027 | | | 206 | | | | 206,301 | |
| | |
| CPG International, Inc. | | | | | | |
| | |
Term Loan, 4.75%, (12 mo. USD LIBOR + 3.75%, Floor 1.00%), Maturing May 5, 2024 | | | 302 | | | | 302,762 | |
| | |
| Cushman & Wakefield U.S. Borrower, LLC | | | | | | |
| | |
Term Loan, 2.90%, (1 mo. USD LIBOR + 2.75%), Maturing August 21, 2025 | | | 1,253 | | | | 1,217,533 | |
| | |
| LSF11 Skyscraper Holdco S.a.r.l. | | | | | | |
| | |
Term Loan, 5.67%, (2 mo. USD LIBOR + 5.50%), Maturing September 29, 2027 | | | 191 | | | | 191,243 | |
| | |
| Quikrete Holdings, Inc. | | | | | | |
| | |
Term Loan, 2.65%, (1 mo. USD LIBOR + 2.50%), Maturing February 1, 2027 | | | 596 | | | | 588,916 | |
| | |
| Realogy Group, LLC | | | | | | |
| | |
Term Loan, 3.00%, (1 mo. USD LIBOR + 2.25%, Floor 0.75%), Maturing February 8, 2025 | | | 440 | | | | 429,070 | |
| | |
| Werner FinCo L.P. | | | | | | |
| | |
Term Loan, 5.00%, (1 mo. USD LIBOR + 4.00%, Floor 1.00%), Maturing July 24, 2024 | | | 340 | | | | 339,743 | |
| | | | | | | | |
| Borrower/Tranche Description | | Principal
Amount
(000’s omitted) | | | Value | |
|
| Building and Development (continued) | |
| | |
| White Cap Buyer, LLC | | | | | | |
| | |
Term Loan, 4.50%, (6 mo. USD LIBOR + 4.00%, Floor 0.50%), Maturing October 19, 2027 | | $ | 525 | | | $ | 521,250 | |
| | |
| WireCo WorldGroup, Inc. | | | | | | |
| | |
Term Loan, 6.00%, (3 mo. USD LIBOR + 5.00%, Floor 1.00%), Maturing September 30, 2023 | | | 463 | | | | 423,912 | |
| | |
| | | | | | | $ | 6,176,992 | |
|
| Business Equipment and Services — 11.8% | |
| | |
| Adtalem Global Education, Inc. | | | | | | |
| | |
Term Loan, 3.15%, (1 mo. USD LIBOR + 3.00%), Maturing April 11, 2025 | | | 98 | | | | 96,895 | |
| | |
| Airbnb, Inc. | | | | | | |
| | |
Term Loan, 8.50%, (1 mo. USD LIBOR + 7.50%, Floor 1.00%), Maturing April 17, 2025 | | | 175 | | | | 189,400 | |
| | |
| AlixPartners, LLP | | | | | | |
| | |
Term Loan, 2.65%, (1 mo. USD LIBOR + 2.50%), Maturing April 4, 2024 | | | 631 | | | | 619,493 | |
| | |
| Allied Universal Holdco, LLC | | | | | | |
| | |
Term Loan, 4.40%, (1 mo. USD LIBOR + 4.25%), Maturing July 10, 2026 | | | 1,092 | | | | 1,086,966 | |
| | |
| Amentum Government Services Holdings, LLC | | | | | | |
| | |
Term Loan, 3.65%, (1 mo. USD LIBOR + 3.50%), Maturing February 1, 2027 | | | 224 | | | | 221,071 | |
| | |
| AppLovin Corporation | | | | | | |
| | |
Term Loan, 3.65%, (1 mo. USD LIBOR + 3.50%), Maturing August 15, 2025 | | | 1,132 | | | | 1,128,396 | |
| | |
Term Loan, 4.15%, (1 mo. USD LIBOR + 4.00%), Maturing August 15, 2025 | | | 149 | | | | 148,908 | |
| | |
| ASGN Incorporated | | | | | | |
| | |
Term Loan, 1.90%, (1 mo. USD LIBOR + 1.75%), Maturing April 2, 2025 | | | 75 | | | | 74,255 | |
| | |
| Asplundh Tree Expert, LLC | | | | | | |
| | |
Term Loan, 2.64%, (1 mo. USD LIBOR + 2.50%), Maturing September 7, 2027 | | | 275 | | | | 275,614 | |
| | |
| Belfor Holdings, Inc. | | | | | | |
| | |
Term Loan, 4.15%, (1 mo. USD LIBOR + 4.00%), Maturing April 6, 2026 | | | 123 | | | | 123,746 | |
| | |
| Bracket Intermediate Holding Corp. | | | | | | |
| | |
Term Loan, 4.48%, (3 mo. USD LIBOR + 4.25%), Maturing September 5, 2025 | | | 196 | | | | 194,040 | |
| | |
| Brand Energy & Infrastructure Services, Inc. | | | | | | |
| | |
Term Loan, 5.25%, (3 mo. USD LIBOR + 4.25%, Floor 1.00%), Maturing June 21, 2024 | | | 373 | | | | 359,948 | |
| | |
| Camelot U.S. Acquisition 1 Co. | | | | | | |
| | |
Term Loan, 4.00%, (1 mo. USD LIBOR + 3.00%, Floor 1.00%), Maturing October 30, 2026 | | | 275 | | | | 274,398 | |
| | | | |
| | 7 | | See Notes to Financial Statements. |
Eaton Vance
Floating-Rate Income Plus Fund
November 30, 2020
Portfolio of Investments (Unaudited) — continued
| | | | | | | | |
| Borrower/Tranche Description | | Principal
Amount
(000’s omitted) | | | Value | |
|
| Business Equipment and Services (continued) | |
| | |
| Cardtronics USA, Inc. | | | | | | |
| | |
Term Loan, 5.00%, (1 mo. USD LIBOR + 4.00%, Floor 1.00%), Maturing June 29, 2027 | | $ | 125 | | | $ | 125,062 | |
| | |
| CCC Information Services, Inc. | | | | | | |
| | |
Term Loan, 4.00%, (1 mo. USD LIBOR + 3.00%, Floor 1.00%), Maturing April 29, 2024 | | | 1,031 | | | | 1,027,172 | |
| | |
| Ceridian HCM Holding, Inc. | | | | | | |
| | |
Term Loan, 2.60%, (1 week USD LIBOR + 2.50%), Maturing April 30, 2025 | | | 343 | | | | 336,569 | |
| | |
| CM Acquisition Co. | | | | | | |
| | |
Term Loan, 11.00%, (3 mo. USD LIBOR + 10.00%, Floor 1.00%), Maturing July 26, 2023 | | | 65 | | | | 60,309 | |
| | |
| Deerfield Dakota Holding, LLC | �� | | | | | |
| | |
Term Loan, 4.75%, (1 mo. USD LIBOR + 3.75%, Floor 1.00%), Maturing April 9, 2027 | | | 474 | | | | 473,220 | |
| | |
| EAB Global, Inc. | | | | | | |
| | |
Term Loan, 4.75%, (USD LIBOR + 3.75%, Floor 1.00%), Maturing November 15, 2024(8) | | | 317 | | | | 312,386 | |
| | |
| EIG Investors Corp. | | | | | | |
| | |
Term Loan, 4.75%, (USD LIBOR + 3.75%, Floor 1.00%), Maturing February 9, 2023(8) | | | 696 | | | | 695,988 | |
| | |
| Garda World Security Corporation | | | | | | |
| | |
Term Loan, 4.91%, (1 mo. USD LIBOR + 4.75%), Maturing October 30, 2026 | | | 326 | | | | 326,220 | |
| | |
| Greeneden U.S. Holdings II, LLC | | | | | | |
| | |
Term Loan, Maturing October 8, 2027(9) | | | 200 | | | | 199,550 | |
| | |
| IG Investment Holdings, LLC | | | | | | |
| | |
Term Loan, 5.00%, (3 mo. USD LIBOR + 4.00%, Floor 1.00%), Maturing May 23, 2025 | | | 576 | | | | 570,891 | |
| | |
| Illuminate Buyer, LLC | | | | | | |
| | |
Term Loan, 4.15%, (1 mo. USD LIBOR + 4.00%), Maturing June 16, 2027 | | | 175 | | | | 174,854 | |
| | |
| Intrado Corp. | | | | | | |
| | |
Term Loan, 5.00%, (USD LIBOR + 4.00%, Floor 1.00%), Maturing October 10, 2024(8) | | | 267 | | | | 255,164 | |
| | |
| IRI Holdings, Inc. | | | | | | |
| | |
Term Loan, 4.40%, (1 mo. USD LIBOR + 4.25%), Maturing December 1, 2025 | | | 344 | | | | 339,863 | |
| | |
| Iron Mountain, Inc. | | | | | | |
| | |
Term Loan, 1.90%, (1 mo. USD LIBOR + 1.75%), Maturing January 2, 2026 | | | 195 | | | | 191,588 | |
| | |
| KAR Auction Services, Inc. | | | | | | |
| | |
Term Loan, 2.44%, (1 mo. USD LIBOR + 2.25%), Maturing September 19, 2026 | | | 149 | | | | 145,437 | |
| | |
| KUEHG Corp. | | | | | | |
| | |
Term Loan, 4.75%, (3 mo. USD LIBOR + 3.75%, Floor 1.00%), Maturing February 21, 2025 | | | 818 | | | | 781,730 | |
| | | | | | | | |
| Borrower/Tranche Description | | Principal
Amount
(000’s omitted) | | | Value | |
|
| Business Equipment and Services (continued) | |
| | |
| Monitronics International, Inc. | | | | | | |
| | |
Term Loan, 7.75%, (1 mo. USD LIBOR + 6.50%, Floor 1.25%), Maturing March 29, 2024 | | $ | 184 | | | $ | 163,478 | |
| | |
| Northstar Group Services, Inc. | | | | | | |
| | |
Term Loan, 6.50%, (1 mo. USD LIBOR + 5.50%, Floor 1.00%), Maturing November 9, 2026 | | | 300 | | | | 294,750 | |
| | |
| PGX Holdings, Inc. | | | | | | |
| | |
Term Loan, 10.50%, (12 mo. USD LIBOR + 9.50%, Floor 1.00%), 6.25% cash, 4.25% PIK, Maturing September 29, 2023 | | | 214 | | | | 200,738 | |
| | |
| Pre-Paid Legal Services, Inc. | | | | | | |
| | |
Term Loan, 3.40%, (1 mo. USD LIBOR + 3.25%), Maturing May 1, 2025 | | | 63 | | | | 61,856 | |
| | |
| Prime Security Services Borrower, LLC | | | | | | |
| | |
Term Loan, 4.25%, (6 mo. USD LIBOR + 3.25%, Floor 1.00%), Maturing September 23, 2026 | | | 528 | | | | 525,846 | |
| | |
| Red Ventures, LLC | | | | | | |
| | |
Term Loan, 2.65%, (1 mo. USD LIBOR + 2.50%), Maturing November 8, 2024 | | | 339 | | | | 329,216 | |
| | |
| Rockwood Service Corporation | | | | | | |
| | |
Term Loan, 4.40%, (1 mo. USD LIBOR + 4.25%), Maturing January 23, 2027 | | | 100 | | | | 99,313 | |
| | |
| Sabre GLBL, Inc. | | | | | | |
| | |
Term Loan, 2.15%, (1 mo. USD LIBOR + 2.00%), Maturing February 22, 2024 | | | 620 | | | | 592,291 | |
| | |
| Spin Holdco, Inc. | | | | | | |
| | |
Term Loan, 4.25%, (3 mo. USD LIBOR + 3.25%, Floor 1.00%), Maturing November 14, 2022 | | | 927 | | | | 915,990 | |
| | |
| Tempo Acquisition, LLC | | | | | | |
| | |
Term Loan, 3.75%, (1 mo. USD LIBOR + 3.25%, Floor 0.50%), Maturing November 2, 2026 | | | 170 | | | | 167,819 | |
| | |
| Vestcom Parent Holdings, Inc. | | | | | | |
| | |
Term Loan, 5.00%, (1 mo. USD LIBOR + 4.00%, Floor 1.00%), Maturing December 19, 2023 | | | 120 | | | | 117,931 | |
| | |
| WASH Multifamily Laundry Systems, LLC | | | | | | |
| | |
Term Loan, 4.25%, (1 mo. USD LIBOR + 3.25%, Floor 1.00%), Maturing May 14, 2022 | | | 223 | | | | 220,998 | |
| | |
| | | | | | | $ | 14,499,359 | |
|
| Cable and Satellite Television — 5.5% | |
| | |
| Altice France S.A. | | | | | | |
| | |
Term Loan, 4.24%, (3 mo. USD LIBOR + 4.00%), Maturing August 14, 2026 | | $ | 492 | | | $ | 488,769 | |
| | |
| Charter Communications Operating, LLC | | | | | | |
| | |
Term Loan, 1.90%, (1 mo. USD LIBOR + 1.75%), Maturing February 1, 2027 | | | 851 | | | | 842,580 | |
| | | | |
| | 8 | | See Notes to Financial Statements. |
Eaton Vance
Floating-Rate Income Plus Fund
November 30, 2020
Portfolio of Investments (Unaudited) — continued
| | | | | | | | |
| Borrower/Tranche Description | | Principal
Amount
(000’s omitted) | | | Value | |
|
| Cable and Satellite Television (continued) | |
| | |
| CSC Holdings, LLC | | | | | | |
| | |
Term Loan, 2.39%, (1 mo. USD LIBOR + 2.25%), Maturing July 17, 2025 | | $ | 633 | | | $ | 618,901 | |
| | |
Term Loan, 2.39%, (1 mo. USD LIBOR + 2.25%), Maturing January 15, 2026 | | | 221 | | | | 215,973 | |
| | |
Term Loan, 2.64%, (1 mo. USD LIBOR + 2.50%), Maturing April 15, 2027 | | | 294 | | | | 288,454 | |
| | |
| Numericable Group S.A. | | | | | | |
| | |
Term Loan, 2.90%, (1 mo. USD LIBOR + 2.75%), Maturing July 31, 2025 | | | 434 | | | | 423,032 | |
| | |
| Telenet Financing USD, LLC | | | | | | |
| | |
Term Loan, 2.14%, (1 mo. USD LIBOR + 2.00%), Maturing April 30, 2028 | | | 900 | | | | 884,320 | |
| | |
| UPC Broadband Holding B.V. | | | | | | |
| | |
Term Loan, 2.39%, (1 mo. USD LIBOR + 2.25%), Maturing April 30, 2028 | | | 200 | | | | 195,750 | |
| | |
Term Loan, 3.68%, (2 mo. USD LIBOR + 3.50%), Maturing January 31, 2029 | | | 450 | | | | 446,578 | |
| | |
Term Loan, 3.68%, (2 mo. USD LIBOR + 3.50%), Maturing January 31, 2029 | | | 450 | | | | 446,578 | |
| | |
| Virgin Media Bristol, LLC | | | | | | |
| | |
Term Loan, 2.64%, (1 mo. USD LIBOR + 2.50%), Maturing January 31, 2028 | | | 1,650 | | | | 1,620,817 | |
| | |
Term Loan, Maturing January 31, 2029(9) | | | 300 | | | | 298,275 | |
| | |
| | | | | | | $ | 6,770,027 | |
|
| Chemicals and Plastics — 5.6% | |
| | |
| Alpha 3 B.V. | | | | | | |
| | |
Term Loan, 4.00%, (3 mo. USD LIBOR + 3.00%, Floor 1.00%), Maturing January 31, 2024 | | $ | 130 | | | $ | 129,197 | |
| | |
| Aruba Investments, Inc. | | | | | | |
| | |
Term Loan, Maturing October 28, 2027(9) | | | 175 | | | | 174,563 | |
| | |
| Axalta Coating Systems US Holdings, Inc. | | | | | | |
| | |
Term Loan, 1.97%, (3 mo. USD LIBOR + 1.75%), Maturing June 1, 2024 | | | 853 | | | | 839,633 | |
| | |
| Emerald Performance Materials, LLC | | | | | | |
| | |
Term Loan, 5.00%, (1 mo. USD LIBOR + 4.00%, Floor 1.00%), Maturing August 12, 2025 | | | 86 | | | | 85,893 | |
| | |
| Ferro Corporation | | | | | | |
| | |
Term Loan, 2.47%, (3 mo. USD LIBOR + 2.25%), Maturing February 14, 2024 | | | 72 | | | | 71,463 | |
| | |
Term Loan, 2.47%, (3 mo. USD LIBOR + 2.25%), Maturing February 14, 2024 | | | 74 | | | | 73,016 | |
| | |
| Flint Group GmbH | | | | | | |
| | |
Term Loan, 6.00%, (USD LIBOR + 5.00%, Floor 1.00%), 5.25% cash, 0.75% PIK, Maturing September 21, 2023(8) | | | 37 | | | | 33,913 | |
| | | | | | | | |
| Borrower/Tranche Description | | Principal
Amount
(000’s omitted) | | | Value | |
|
| Chemicals and Plastics (continued) | |
| | |
| Flint Group US, LLC | | | | | | |
| | |
Term Loan, 6.00%, (USD LIBOR + 5.00%, Floor 1.00%), 5.25% cash, 0.75% PIK, Maturing September 21, 2023(8) | | $ | 222 | | | $ | 205,146 | |
| | |
| Gemini HDPE, LLC | | | | | | |
| | |
Term Loan, 2.72%, (3 mo. USD LIBOR + 2.50%), Maturing August 7, 2024 | | | 452 | | | | 445,405 | |
| | |
| H.B. Fuller Company | | | | | | |
| | |
Term Loan, 2.15%, (1 mo. USD LIBOR + 2.00%), Maturing October 20, 2024 | | | 271 | | | | 267,404 | |
| | |
| Hexion, Inc. | | | | | | |
| | |
Term Loan, 3.73%, (6 mo. USD LIBOR + 3.50%), Maturing July 1, 2026 | | | 568 | | | | 564,973 | |
| | |
| Messer Industries GmbH | | | | | | |
| | |
Term Loan, 2.72%, (3 mo. USD LIBOR + 2.50%), Maturing March 1, 2026 | | | 320 | | | | 316,095 | |
| | |
| Minerals Technologies, Inc. | | | | | | |
| | |
Term Loan, 3.00%, (USD LIBOR + 2.25%, Floor 0.75%), Maturing February 14, 2024(8) | | | 211 | | | | 211,346 | |
| | |
| Momentive Performance Materials, Inc. | | | | | | |
| | |
Term Loan, 3.40%, (1 mo. USD LIBOR + 3.25%), Maturing May 15, 2024 | | | 99 | | | | 95,911 | |
| | |
| Orion Engineered Carbons GmbH | | | | | | |
| | |
Term Loan, 2.22%, (3 mo. USD LIBOR + 2.00%), Maturing July 25, 2024 | | | 288 | | | | 284,534 | |
| | |
| PMHC II, Inc. | | | | | | |
| | |
Term Loan, 4.50%, (12 mo. USD LIBOR + 3.50%, Floor 1.00%), Maturing March 31, 2025 | | | 421 | | | | 395,357 | |
| | |
| PQ Corporation | | | | | | |
| | |
Term Loan, 2.46%, (3 mo. USD LIBOR + 2.25%), Maturing February 7, 2027 | | | 517 | | | | 507,431 | |
| | |
Term Loan, 4.00%, (3 mo. USD LIBOR + 3.00%, Floor 1.00%), Maturing February 7, 2027 | | | 449 | | | | 448,875 | |
| | |
| Pregis TopCo Corporation | | | | | | |
| | |
Term Loan, 3.90%, (1 mo. USD LIBOR + 3.75%), Maturing July 31, 2026 | | | 149 | | | | 147,169 | |
| | |
| Starfruit Finco B.V. | | | | | | |
| | |
Term Loan, 3.14%, (1 mo. USD LIBOR + 3.00%), Maturing October 1, 2025 | | | 439 | | | | 431,587 | |
| | |
| Tronox Finance, LLC | | | | | | |
| | |
Term Loan, 3.18%, (USD LIBOR + 3.00%), Maturing September 23, 2024(8) | | | 717 | | | | 709,118 | |
| | |
| Univar, Inc. | | | | | | |
| | |
Term Loan, 2.40%, (1 mo. USD LIBOR + 2.25%), Maturing July 1, 2024 | | | 461 | | | | 456,638 | |
| | |
| | | | | | | $ | 6,894,667 | |
| | | | |
| | 9 | | See Notes to Financial Statements. |
Eaton Vance
Floating-Rate Income Plus Fund
November 30, 2020
Portfolio of Investments (Unaudited) — continued
| | | | | | | | |
| Borrower/Tranche Description | | Principal
Amount
(000’s omitted) | | | Value | |
|
| Containers and Glass Products — 3.5% | |
| | |
| Berry Global, Inc. | | | | | | |
| | |
Term Loan, 2.13%, (1 mo. USD LIBOR + 2.00%), Maturing October 1, 2022 | | $ | 210 | | | $ | 209,108 | |
| | |
Term Loan, 2.13%, (1 mo. USD LIBOR + 2.00%), Maturing July 1, 2026 | | | 222 | | | | 218,674 | |
| | |
| BWAY Holding Company | | | | | | |
| | |
Term Loan, 3.48%, (3 mo. USD LIBOR + 3.25%), Maturing April 3, 2024 | | | 242 | | | | 230,969 | |
| | |
| Flex Acquisition Company, Inc. | | | | | | |
| | |
Term Loan, 4.00%, (USD LIBOR + 3.00%, Floor 1.00%), Maturing December 29, 2023(8) | | | 741 | | | | 732,548 | |
| | |
Term Loan, 3.23%, (3 mo. USD LIBOR + 3.00%), Maturing June 29, 2025 | | | 342 | | | | 334,510 | |
| | |
| Libbey Glass, Inc. | | | | | | |
| | |
Term Loan, 9.00%, (3 mo. USD LIBOR + 8.00%, Floor 1.00%), Maturing November 12, 2025 | | | 200 | | | | 191,763 | |
| | |
| Reynolds Consumer Products, LLC | | | | | | |
| | |
Term Loan, 1.90%, (1 mo. USD LIBOR + 1.75%), Maturing February 4, 2027 | | | 503 | | | | 497,463 | |
| | |
| Reynolds Group Holdings, Inc. | | | | | | |
| | |
Term Loan, 2.90%, (1 mo. USD LIBOR + 2.75%), Maturing February 5, 2023 | | | 885 | | | | 875,696 | |
| | |
Term Loan, 3.40%, (1 mo. USD LIBOR + 3.25%), Maturing February 5, 2026 | | | 325 | | | | 320,166 | |
| | |
| Ring Container Technologies Group, LLC | | | | | | |
| | |
Term Loan, 2.90%, (1 mo. USD LIBOR + 2.75%), Maturing October 31, 2024 | | | 219 | | | | 214,366 | |
| | |
| Trident TPI Holdings, Inc. | | | | | | |
| | |
Term Loan, 4.00%, (3 mo. USD LIBOR + 3.00%, Floor 1.00%), Maturing October 17, 2024 | | | 511 | | | | 502,805 | |
| | |
| | | | | | | $ | 4,328,068 | |
|
| Cosmetics / Toiletries — 0.4% | |
| | |
| Kronos Acquisition Holdings, Inc. | | | | | | |
| | |
Term Loan, 5.00%, (1 mo. USD LIBOR + 4.00%, Floor 1.00%), Maturing May 15, 2023 | | $ | 543 | | | $ | 543,277 | |
| | |
| | | | | | | $ | 543,277 | |
|
| Drugs — 7.2% | |
| | |
| Akorn, Inc. | | | | | | |
| | |
Term Loan, 8.50%, (3 mo. USD LIBOR + 7.50%, Floor 1.00%), Maturing October 1, 2025 | | $ | 98 | | | $ | 98,419 | |
| | |
| Albany Molecular Research, Inc. | | | | | | |
| | |
Term Loan, 4.25%, (USD LIBOR + 3.25%, Floor 1.00%), Maturing August 30, 2024(8) | | | 315 | | | | 314,777 | |
| | | | | | | | |
| Borrower/Tranche Description | | Principal
Amount
(000’s omitted) | | | Value | |
|
| Drugs (continued) | |
| | |
| Amneal Pharmaceuticals, LLC | | | | | | |
| | |
Term Loan, 3.69%, (1 mo. USD LIBOR + 3.50%), Maturing May 4, 2025 | | $ | 806 | | | $ | 782,816 | |
| | |
| Arbor Pharmaceuticals, Inc. | | | | | | |
| | |
Term Loan, 6.00%, (3 mo. USD LIBOR + 5.00%, Floor 1.00%), Maturing July 5, 2023 | | | 371 | | | | 339,767 | |
| | |
| Bausch Health Companies, Inc. | | | | | | |
| | |
Term Loan, 3.14%, (1 mo. USD LIBOR + 3.00%), Maturing June 2, 2025 | | | 1,180 | | | | 1,167,497 | |
| | |
| Catalent Pharma Solutions, Inc. | | | | | | |
| | |
Term Loan, 3.25%, (1 mo. USD LIBOR + 2.25%, Floor 1.00%), Maturing May 18, 2026 | | | 197 | | | | 197,369 | |
| | |
| Elanco Animal Health Incorporated | | | | | | |
| | |
Term Loan, 1.90%, (1 mo. USD LIBOR + 1.75%), Maturing August 1, 2027 | | | 259 | | | | 255,303 | |
| | |
| Endo Luxembourg Finance Company I S.a.r.l. | | | | | | |
| | |
Term Loan, 5.00%, (3 mo. USD LIBOR + 4.25%, Floor 0.75%), Maturing April 29, 2024 | | | 1,137 | | | | 1,106,971 | |
| | |
| Grifols Worldwide Operations USA, Inc. | | | | | | |
| | |
Term Loan, 2.10%, (1 week USD LIBOR + 2.00%), Maturing November 15, 2027 | | | 1,021 | | | | 1,007,208 | |
| | |
| Horizon Therapeutics USA, Inc. | | | | | | |
| | |
Term Loan, 2.19%, (1 mo. USD LIBOR + 2.00%), Maturing May 22, 2026 | | | 498 | | | | 494,367 | |
| | |
| Jaguar Holding Company II | | | | | | |
| | |
Term Loan, 3.50%, (1 mo. USD LIBOR + 2.50%, Floor 1.00%), Maturing August 18, 2022 | | | 1,567 | | | | 1,565,976 | |
| | |
| Mallinckrodt International Finance S.A. | | | | | | |
| | |
Term Loan, 5.50%, (3 mo. USD LIBOR + 4.75%, Floor 0.75%), Maturing September 24, 2024 | | | 695 | | | | 653,415 | |
| | |
Term Loan, 5.75%, (3 mo. USD LIBOR + 5.00%, Floor 0.75%), Maturing February 24, 2025 | | | 627 | | | | 588,146 | |
| | |
| Packaging Coordinators Midco, Inc. | | | | | | |
| | |
Term Loan, Maturing September 25, 2027(9) | | | 275 | | | | 273,281 | |
| | |
| | | | | | | $ | 8,845,312 | |
|
| Ecological Services and Equipment — 1.0% | |
| | |
| EnergySolutions, LLC | | | | | | |
| | |
Term Loan, 4.75%, (3 mo. USD LIBOR + 3.75%, Floor 1.00%), Maturing May 9, 2025 | | $ | 417 | | | $ | 409,516 | |
| | |
| GFL Environmental, Inc. | | | | | | |
| | |
Term Loan, 4.00%, (3 mo. USD LIBOR + 3.00%, Floor 1.00%), Maturing May 30, 2025 | | | 690 | | | | 689,156 | |
| | |
| TruGreen Limited Partnership | | | | | | |
| | |
Term Loan, 4.75%, (1 mo. USD LIBOR + 4.00%, Floor 0.75%), Maturing November 2, 2027 | | | 125 | | | | 124,844 | |
| | |
| | | | | | | $ | 1,223,516 | |
| | | | |
| | 10 | | See Notes to Financial Statements. |
Eaton Vance
Floating-Rate Income Plus Fund
November 30, 2020
Portfolio of Investments (Unaudited) — continued
| | | | | | | | |
| Borrower/Tranche Description | | Principal
Amount
(000’s omitted) | | | Value | |
|
| Electronics / Electrical — 26.8% | |
| | |
| Allegro Microsystems, Inc. | | | | | | |
| | |
Term Loan, 4.50%, (1 mo. USD LIBOR + 4.00%, Floor 0.50%), Maturing September 30, 2027 | | $ | 10 | | | $ | 9,603 | |
| | |
| Applied Systems, Inc. | | | | | | |
| | |
Term Loan, 4.00%, (3 mo. USD LIBOR + 3.00%, Floor 1.00%), Maturing September 19, 2024 | | | 878 | | | | 876,418 | |
| | |
Term Loan - Second Lien, 8.00%, (3 mo. USD LIBOR + 7.00%, Floor 1.00%), Maturing September 19, 2025 | | | 100 | | | | 100,583 | |
| | |
| Aptean, Inc. | | | | | | |
| | |
Term Loan, 4.40%, (1 mo. USD LIBOR + 4.25%), Maturing April 23, 2026 | | | 173 | | | | 168,968 | |
| | |
| AQA Acquisition Holding, Inc. | | | | | | |
| | |
Term Loan, Maturing November 19, 2027(9) | | | 200 | | | | 199,625 | |
| | |
| Astra Acquisition Corp. | | | | | | |
| | |
Term Loan, 6.50%, (1 mo. USD LIBOR + 5.50%, Floor 1.00%), Maturing March 1, 2027 | | | 199 | | | | 199,497 | |
| | |
| Avast Software B.V. | | | | | | |
| | |
Term Loan, 3.25%, (3 mo. USD LIBOR + 2.25%, Floor 1.00%), Maturing September 29, 2023 | | | 44 | | | | 44,338 | |
| | |
| Banff Merger Sub, Inc. | | | | | | |
| | |
Term Loan, 4.40%, (1 mo. USD LIBOR + 4.25%), Maturing October 2, 2025 | | | 1,309 | | | | 1,296,746 | |
| | |
| Barracuda Networks, Inc. | | | | | | |
| | |
Term Loan, 4.50%, (3 mo. USD LIBOR + 3.75%, Floor 0.75%), Maturing February 12, 2025 | | | 589 | | | | 584,528 | |
| | |
| Buzz Merger Sub, Ltd. | | | | | | |
| | |
Term Loan, 2.90%, (1 mo. USD LIBOR + 2.75%), Maturing January 29, 2027 | | | 124 | | | | 122,976 | |
| | |
| Cambium Learning Group, Inc. | | | | | | |
| | |
Term Loan, 4.72%, (2 mo. USD LIBOR + 4.50%), Maturing December 18, 2025 | | | 200 | | | | 196,812 | |
| | |
| Castle US Holding Corporation | | | | | | |
| | |
Term Loan, 3.97%, (3 mo. USD LIBOR + 3.75%), Maturing January 29, 2027 | | | 244 | | | | 236,666 | |
| | |
| CDW, LLC | | | | | | |
| | |
Term Loan, 1.90%, (1 mo. USD LIBOR + 1.75%), Maturing October 13, 2026 | | | 297 | | | | 297,363 | |
| | |
| CentralSquare Technologies, LLC | | | | | | |
| | |
Term Loan, 3.90%, (1 mo. USD LIBOR + 3.75%), Maturing August 29, 2025 | | | 197 | | | | 182,377 | |
| | |
| Cohu, Inc. | | | | | | |
| | |
Term Loan, 3.15%, (1 mo. USD LIBOR + 3.00%), Maturing October 1, 2025 | | | 171 | | | | 168,906 | |
| | |
| CommScope, Inc. | | | | | | |
| | |
Term Loan, 3.40%, (1 mo. USD LIBOR + 3.25%), Maturing April 6, 2026 | | | 396 | | | | 390,343 | |
| | | | | | | | |
| Borrower/Tranche Description | | Principal
Amount
(000’s omitted) | | | Value | |
|
| Electronics / Electrical (continued) | |
| | |
| Cornerstone OnDemand, Inc. | | | | | | |
| | |
Term Loan, 4.40%, (1 mo. USD LIBOR + 4.25%), Maturing April 22, 2027 | | $ | 380 | | | $ | 380,390 | |
| | |
| CPI International, Inc. | | | | | | |
| | |
Term Loan, 4.50%, (1 mo. USD LIBOR + 3.50%, Floor 1.00%), Maturing July 26, 2024 | | | 137 | | | | 133,879 | |
| | |
| E2open, LLC | | | | | | |
| | |
Term Loan, Maturing October 29, 2027(9) | | | 200 | | | | 198,875 | |
| | |
| ECI Macola Max Holdings, LLC | | | | | | |
| | |
Term Loan, 4.50%, (3 mo. USD LIBOR + 3.75%, Floor 0.75%), Maturing November 9, 2027 | | | 275 | | | | 273,152 | |
| | |
| Electro Rent Corporation | | | | | | |
| | |
Term Loan, 6.00%, (3 mo. USD LIBOR + 5.00%, Floor 1.00%), Maturing January 31, 2024 | | | 388 | | | | 386,522 | |
| | |
| Epicor Software Corporation | | | | | | |
| | |
Term Loan, 5.25%, (1 mo. USD LIBOR + 4.25%, Floor 1.00%), Maturing July 30, 2027 | | | 1,599 | | | | 1,602,733 | |
| | |
Term Loan - Second Lien, 8.75%, (1 mo. USD LIBOR + 7.75%, Floor 1.00%), Maturing July 31, 2028 | | | 200 | | | | 207,000 | |
| | |
| EXC Holdings III Corp. | | | | | | |
| | |
Term Loan, 4.50%, (3 mo. USD LIBOR + 3.50%, Floor 1.00%), Maturing December 2, 2024 | | | 967 | | | | 956,334 | |
| | |
| Finastra USA, Inc. | | | | | | |
| | |
Term Loan, 4.50%, (6 mo. USD LIBOR + 3.50%, Floor 1.00%), Maturing June 13, 2024 | | | 1,419 | | | | 1,377,961 | |
| | |
| Fiserv Investment Solutions, Inc. | | | | | | |
| | |
Term Loan, 4.97%, (3 mo. USD LIBOR + 4.75%), Maturing February 18, 2027 | | | 125 | | | | 124,532 | |
| | |
| GlobalLogic Holdings, Inc. | | | | | | |
| | |
Term Loan, 2.90%, (1 mo. USD LIBOR + 2.75%), Maturing August 1, 2025 | | | 107 | | | | 106,003 | |
| | |
Term Loan, 4.50%, (1 mo. USD LIBOR + 3.75%, Floor 0.75%), Maturing September 14, 2027 | | | 175 | | | | 175,219 | |
| | |
| Go Daddy Operating Company, LLC | | | | | | |
| | |
Term Loan, 1.90%, (1 mo. USD LIBOR + 1.75%), Maturing February 15, 2024 | | | 944 | | | | 932,045 | |
| | |
Term Loan, 2.65%, (1 mo. USD LIBOR + 2.50%), Maturing August 10, 2027 | | | 274 | | | | 273,312 | |
| | |
| Hyland Software, Inc. | | | | | | |
| | |
Term Loan, 4.25%, (1 mo. USD LIBOR + 3.50%, Floor 0.75%), Maturing July 1, 2024 | | | 2,307 | | | | 2,302,970 | |
| | |
| Imperva, Inc. | | | | | | |
| | |
Term Loan, 5.00%, (3 mo. USD LIBOR + 4.00%, Floor 1.00%), Maturing January 12, 2026 | | | 150 | | | | 149,063 | |
| | |
| Imprivata, Inc. | | | | | | |
| | |
Term Loan, Maturing November 24, 2027(9) | | | 275 | | | | 273,969 | |
| | | | |
| | 11 | | See Notes to Financial Statements. |
Eaton Vance
Floating-Rate Income Plus Fund
November 30, 2020
Portfolio of Investments (Unaudited) — continued
| | | | | | | | |
| Borrower/Tranche Description | | Principal
Amount
(000’s omitted) | | | Value | |
|
| Electronics / Electrical (continued) | |
| | |
| Infoblox, Inc. | | | | | | |
| | |
Term Loan, 6.75%, (USD Prime + 3.50%), Maturing November 7, 2023 | | $ | 357 | | | $ | 356,835 | |
| | |
Term Loan, Maturing October 7, 2027(9) | | | 350 | | | | 348,250 | |
| | |
Term Loan - Second Lien, Maturing October 6, 2028(9) | | | 475 | | | | 472,625 | |
| | |
| Informatica, LLC | | | | | | |
| | |
Term Loan, 3.40%, (1 mo. USD LIBOR + 3.25%), Maturing February 25, 2027 | | | 1,368 | | | | 1,348,458 | |
| | |
| Ivanti Software, Inc. | | | | | | |
| | |
Term Loan, Maturing November 20, 2027(9) | | | 320 | | | | 317,005 | |
| | |
Term Loan, Maturing November 22, 2027(9) | | | 123 | | | | 121,519 | |
| | |
Term Loan, Maturing November 22, 2027(9) | | | 183 | | | | 181,398 | |
| | |
| LogMeIn, Inc. | | | | | | |
| | |
Term Loan, 4.89%, (1 mo. USD LIBOR + 4.75%), Maturing August 31, 2027 | | | 375 | | | | 371,308 | |
| | |
| MA FinanceCo., LLC | | | | | | |
| | |
Term Loan, 2.65%, (1 mo. USD LIBOR + 2.50%), Maturing June 21, 2024 | | | 114 | | | | 111,267 | |
| | |
Term Loan, 5.25%, (3 mo. USD LIBOR + 4.25%, Floor 1.00%), Maturing June 5, 2025 | | | 422 | | | | 423,928 | |
| | |
| MACOM Technology Solutions Holdings, Inc. | | | | | | |
| | |
Term Loan, 2.40%, (1 mo. USD LIBOR + 2.25%), Maturing May 17, 2024 | | | 286 | | | | 279,568 | |
| | |
| Marcel LUX IV S.a.r.l. | | | | | | |
| | |
Term Loan, Maturing September 22, 2027(9) | | | 100 | | | | 99,750 | |
| | |
| MaxLinear, Inc. | | | | | | |
| | |
Term Loan, 4.40%, (1 mo. USD LIBOR + 4.25%), Maturing July 31, 2023 | | | 300 | | | | 299,625 | |
| | |
| Milano Acquisition Corp. | | | | | | |
| | |
Term Loan, 4.75%, (3 mo. USD LIBOR + 4.00%, Floor 0.75%), Maturing October 1, 2027 | | | 675 | | | | 670,500 | |
| | |
| Mirion Technologies, Inc. | | | | | | |
| | |
Term Loan, Maturing March 6, 2026(9) | | | 175 | | | | 174,344 | |
| | |
| MTS Systems Corporation | | | | | | |
| | |
Term Loan, 4.00%, (1 mo. USD LIBOR + 3.25%, Floor 0.75%), Maturing July 5, 2023 | | | 119 | | | | 119,170 | |
| | |
| NCR Corporation | | | | | | |
| | |
Term Loan, 2.65%, (1 mo. USD LIBOR + 2.50%), Maturing August 28, 2026 | | | 198 | | | | 195,772 | |
| | |
| Recorded Books, Inc. | | | | | | |
| | |
Term Loan, 4.40%, (1 mo. USD LIBOR + 4.25%), Maturing August 29, 2025 | | | 283 | | | | 277,377 | |
| | |
| Redstone Buyer, LLC | | | | | | |
| | |
Term Loan, 6.00%, (2 mo. USD LIBOR + 5.00%, Floor 1.00%), Maturing September 1, 2027 | | | 600 | | | | 599,625 | |
| | |
| Refinitiv US Holdings, Inc. | | | | | | |
| | |
Term Loan, 3.40%, (1 mo. USD LIBOR + 3.25%), Maturing October 1, 2025 | | | 270 | | | | 268,710 | |
| | | | | | | | |
| Borrower/Tranche Description | | Principal
Amount
(000’s omitted) | | | Value | |
|
| Electronics / Electrical (continued) | |
| | |
| Seattle Spinco, Inc. | | | | | | |
| | |
Term Loan, 2.65%, (1 mo. USD LIBOR + 2.50%), Maturing June 21, 2024 | | $ | 770 | | | $ | 751,416 | |
| | |
| SkillSoft Corporation | | | | | | |
| | |
Term Loan, 8.50%, (1 mo. USD LIBOR + 7.50%, Floor 1.00%), Maturing December 27, 2024 | | | 88 | | | | 88,714 | |
| | |
Term Loan - Second Lien, 8.50%, (1 mo. USD LIBOR + 7.50%, Floor 1.00%), Maturing April 27, 2025 | | | 291 | | | | 289,473 | |
| | |
| SolarWinds Holdings, Inc. | | | | | | |
| | |
Term Loan, 2.90%, (1 mo. USD LIBOR + 2.75%), Maturing February 5, 2024 | | | 243 | | | | 240,447 | |
| | |
| Solera, LLC | | | | | | |
| | |
Term Loan, 2.90%, (1 mo. USD LIBOR + 2.75%), Maturing March 3, 2023 | | | 659 | | | | 651,019 | |
| | |
| Sparta Systems, Inc. | | | | | | |
| | |
Term Loan, 4.50%, (3 mo. USD LIBOR + 3.50%, Floor 1.00%), Maturing August 21, 2024 | | | 520 | | | | 495,563 | |
| | |
| SS&C Technologies Holdings Europe S.a.r.l. | | | | | | |
| | |
Term Loan, 1.90%, (1 mo. USD LIBOR + 1.75%), Maturing April 16, 2025 | | | 242 | | | | 238,950 | |
| | |
| SS&C Technologies, Inc. | | | | | | |
| | |
Term Loan, 1.90%, (1 mo. USD LIBOR + 1.75%), Maturing April 16, 2025 | | | 320 | | | | 315,500 | |
| | |
| STG-Fairway Holdings, LLC | | | | | | |
| | |
Term Loan, 3.40%, (1 mo. USD LIBOR + 3.25%), Maturing January 31, 2027 | | | 753 | | | | 736,732 | |
| | |
| SurveyMonkey, Inc. | | | | | | |
| | |
Term Loan, 3.85%, (1 week USD LIBOR + 3.75%), Maturing October 10, 2025 | | | 252 | | | | 248,389 | |
| | |
| Symplr Software, Inc. | | | | | | |
| | |
Term Loan, Maturing November 23, 2027(9) | | | 175 | | | | 173,250 | |
| | |
| Tech Data Corporation | | | | | | |
| | |
Term Loan, 3.65%, (1 mo. USD LIBOR + 3.50%), Maturing June 30, 2025 | | | 275 | | | | 275,473 | |
| | |
| Tibco Software, Inc. | | | | | | |
| | |
Term Loan, 3.90%, (1 mo. USD LIBOR + 3.75%), Maturing June 30, 2026 | | | 815 | | | | 800,266 | |
| | |
| Uber Technologies, Inc. | | | | | | |
| | |
Term Loan, 3.65%, (1 mo. USD LIBOR + 3.50%), Maturing July 13, 2023 | | | 888 | | | | 885,317 | |
| | |
Term Loan, 5.00%, (1 mo. USD LIBOR + 4.00%, Floor 1.00%), Maturing April 4, 2025 | | | 1,032 | | | | 1,033,629 | |
| | |
| Ultimate Software Group, Inc. (The) | | | | | | |
| | |
Term Loan, 3.90%, (1 mo. USD LIBOR + 3.75%), Maturing May 4, 2026 | | | 371 | | | | 369,583 | |
| | |
Term Loan, 4.75%, (3 mo. USD LIBOR + 4.00%, Floor 0.75%), Maturing May 4, 2026 | | | 925 | | | | 927,948 | |
| | | | |
| | 12 | | See Notes to Financial Statements. |
Eaton Vance
Floating-Rate Income Plus Fund
November 30, 2020
Portfolio of Investments (Unaudited) — continued
| | | | | | | | |
| Borrower/Tranche Description | | Principal
Amount
(000’s omitted) | | | Value | |
|
| Electronics / Electrical (continued) | |
| | |
| Ultra Clean Holdings, Inc. | | | | | | |
| | |
Term Loan, 4.65%, (1 mo. USD LIBOR + 4.50%), Maturing August 27, 2025 | | $ | 163 | | | $ | 163,214 | |
| | |
| Valkyr Purchaser, LLC | | | | | | |
| | |
Term Loan, 4.75%, (3 mo. USD LIBOR + 4.00%, Floor 0.75%), Maturing October 29, 2027 | | | 175 | | | | 173,688 | |
| | |
| Verifone Systems, Inc. | | | | | | |
| | |
Term Loan, 4.22%, (3 mo. USD LIBOR + 4.00%), Maturing August 20, 2025 | | | 270 | | | | 256,749 | |
| | |
| Veritas US, Inc. | | | | | | |
| | |
Term Loan, 6.50%, (3 mo. USD LIBOR + 5.50%, Floor 1.00%), Maturing September 1, 2025 | | | 600 | | | | 593,625 | |
| | |
| Vero Parent, Inc. | | | | | | |
| | |
Term Loan, 6.48%, (3 mo. USD LIBOR + 6.25%), Maturing August 16, 2024 | | | 558 | | | | 549,497 | |
| | |
| VS Buyer, LLC | | | | | | |
| | |
Term Loan, 3.40%, (1 mo. USD LIBOR + 3.25%), Maturing February 28, 2027 | | | 274 | | | | 271,231 | |
| | |
| Vungle, Inc. | | | | | | |
| | |
Term Loan, 5.65%, (1 mo. USD LIBOR + 5.50%), Maturing September 30, 2026 | | | 149 | | | | 148,686 | |
| | |
| Western Digital Corporation | | | | | | |
| | |
Term Loan, 1.90%, (1 mo. USD LIBOR + 1.75%), Maturing April 29, 2023 | | | 344 | | | | 343,184 | |
| | |
| | | | | | | $ | 32,988,285 | |
|
| Equipment Leasing — 0.3% | |
| | |
| Avolon TLB Borrower 1 (US), LLC | | | | | | |
| | |
Term Loan, Maturing December 31, 2027(9) | | $ | 425 | | | $ | 423,495 | |
| | |
| | | | | | | $ | 423,495 | |
|
| Financial Intermediaries — 3.6% | |
| | |
| Apollo Commercial Real Estate Finance, Inc. | | | | | | |
| | |
Term Loan, 2.90%, (1 mo. USD LIBOR + 2.75%), Maturing May 15, 2026 | | $ | 99 | | | $ | 94,306 | |
| | |
| Aretec Group, Inc. | | | | | | |
| | |
Term Loan, 4.40%, (1 mo. USD LIBOR + 4.25%), Maturing October 1, 2025 | | | 838 | | | | 802,961 | |
| | |
| Claros Mortgage Trust, Inc. | | | | | | |
| | |
Term Loan, 3.38%, (1 mo. USD LIBOR + 3.25%), Maturing August 9, 2026 | | | 123 | | | | 121,247 | |
| | |
| Ditech Holding Corporation | | | | | | |
| | |
Term Loan, 0.00%, Maturing June 30, 2022(10) | | | 600 | | | | 190,366 | |
| | |
| FB Income Advisor, LLC | | | | | | |
| | |
Term Loan, 2.44%, (1 mo. USD LIBOR + 2.25%), Maturing August 1, 2025 | | | 122 | | | | 120,050 | |
| | | | | | | | |
| Borrower/Tranche Description | | Principal
Amount
(000’s omitted) | | | Value | |
|
| Financial Intermediaries (continued) | |
| | |
| FinCo I, LLC | | | | | | |
| | |
Term Loan, 2.65%, (1 mo. USD LIBOR + 2.50%), Maturing June 27, 2025 | | $ | 183 | | | $ | 181,553 | |
| | |
| Focus Financial Partners, LLC | | | | | | |
| | |
Term Loan, 2.15%, (1 mo. USD LIBOR + 2.00%), Maturing July 3, 2024 | | | 638 | | | | 627,794 | |
| | |
| Greenhill & Co., Inc. | | | | | | |
| | |
Term Loan, 3.39%, (1 mo. USD LIBOR + 3.25%), Maturing April 12, 2024 | | | 301 | | | | 297,619 | |
| | |
| GreenSky Holdings, LLC | | | | | | |
| | |
Term Loan, 5.50%, (1 mo. USD LIBOR + 4.50%, Floor 1.00%), Maturing March 29, 2025 | | | 100 | | | | 98,004 | |
| | |
Term Loan, 3.44%, (1 mo. USD LIBOR + 3.25%), Maturing March 31, 2025 | | | 489 | | | | 474,308 | |
| | |
| Guggenheim Partners, LLC | | | | | | |
| | |
Term Loan, 3.50%, (1 mo. USD LIBOR + 2.75%, Floor 0.75%), Maturing July 21, 2023 | | | 551 | | | | 550,691 | |
| | |
| Harbourvest Partners, LLC | | | | | | |
| | |
Term Loan, 2.39%, (1 mo. USD LIBOR + 2.25%), Maturing March 3, 2025 | | | 99 | | | | 97,956 | |
| | |
| LPL Holdings, Inc. | | | | | | |
| | |
Term Loan, 1.89%, (1 mo. USD LIBOR + 1.75%), Maturing November 12, 2026 | | | 298 | | | | 293,470 | |
| | |
| Starwood Property Trust, Inc. | | | | | | |
| | |
Term Loan, 2.65%, (1 mo. USD LIBOR + 2.50%), Maturing July 27, 2026 | | | 124 | | | | 121,584 | |
| | |
| Victory Capital Holdings, Inc. | | | | | | |
| | |
Term Loan, 2.73%, (3 mo. USD LIBOR + 2.50%), Maturing July 1, 2026 | | | 251 | | | | 248,908 | |
| | |
| Virtus Investment Partners, Inc. | | | | | | |
| | |
Term Loan, 3.00%, (3 mo. USD LIBOR + 2.25%, Floor 0.75%), Maturing June 1, 2024 | | | 103 | | | | 102,739 | |
| | |
| | | | | | | $ | 4,423,556 | |
|
| Food Products — 3.1% | |
| | |
| Alphabet Holding Company, Inc. | | | | | | |
| | |
Term Loan, 3.65%, (1 mo. USD LIBOR + 3.50%), Maturing September 26, 2024 | | $ | 558 | | | $ | 547,143 | |
| | |
| Atkins Nutritionals Holdings II, Inc. | | | | | | |
| | |
Term Loan, 4.75%, (1 mo. USD LIBOR + 3.75%, Floor 1.00%), Maturing July 7, 2024 | | | 89 | | | | 88,988 | |
| | |
| Badger Buyer Corp. | | | | | | |
| | |
Term Loan, 4.50%, (1 mo. USD LIBOR + 3.50%, Floor 1.00%), Maturing September 30, 2024 | | | 390 | | | | 369,965 | |
| | |
| CHG PPC Parent, LLC | | | | | | |
| | |
Term Loan, 2.90%, (1 mo. USD LIBOR + 2.75%), Maturing March 31, 2025 | | | 98 | | | | 96,223 | |
| | | | |
| | 13 | | See Notes to Financial Statements. |
Eaton Vance
Floating-Rate Income Plus Fund
November 30, 2020
Portfolio of Investments (Unaudited) — continued
| | | | | | | | |
| Borrower/Tranche Description | | Principal
Amount
(000’s omitted) | | | Value | |
|
| Food Products (continued) | |
| | |
| Froneri International, Ltd. | | | | | | |
| | |
Term Loan, 2.40%, (1 mo. USD LIBOR + 2.25%), Maturing January 31, 2027 | | $ | 474 | | | $ | 463,411 | |
| | |
| H Food Holdings, LLC | | | | | | |
| | |
Term Loan, 3.83%, (1 mo. USD LIBOR + 3.69%), Maturing May 23, 2025 | | | 368 | | | | 361,036 | |
| | |
Term Loan, 4.15%, (1 mo. USD LIBOR + 4.00%), Maturing May 23, 2025 | | | 98 | | | | 96,868 | |
| | |
| HLF Financing S.a.r.l. | | | | | | |
| | |
Term Loan, 2.90%, (1 mo. USD LIBOR + 2.75%), Maturing August 18, 2025 | | | 245 | | | | 244,191 | |
| | |
| JBS USA LUX S.A. | | | | | | |
| | |
Term Loan, 2.15%, (1 mo. USD LIBOR + 2.00%), Maturing May 1, 2026 | | | 1,207 | | | | 1,191,973 | |
| | |
| Nomad Foods Europe Midco Limited | | | | | | |
| | |
Term Loan, 2.39%, (1 mo. USD LIBOR + 2.25%), Maturing May 15, 2024 | | | 292 | | | | 288,324 | |
| | |
| Shearer’s Foods, Inc. | | | | | | |
| | |
Term Loan, 4.75%, (3 mo. USD LIBOR + 4.00%, Floor 0.75%), Maturing September 23, 2027 | | | 100 | | | | 99,927 | |
| | |
| | | | | | | $ | 3,848,049 | |
|
| Food Service — 2.4% | |
| | |
| 1011778 B.C. Unlimited Liability Company | | | | | | |
| | |
Term Loan, 1.90%, (1 mo. USD LIBOR + 1.75%), Maturing November 19, 2026 | | $ | 1,017 | | | $ | 991,698 | |
| | |
| Aramark Services, Inc. | | | | | | |
| | |
Term Loan, 1.90%, (1 mo. USD LIBOR + 1.75%), Maturing March 11, 2025 | | | 210 | | | | 204,177 | |
| | |
| IRB Holding Corp. | | | | | | |
| | |
Term Loan, 3.75%, (USD LIBOR + 2.75%, Floor 1.00%), Maturing February 5, 2025(8) | | | 440 | | | | 433,161 | |
| | |
Term Loan, Maturing November 18, 2027(9) | | | 500 | | | | 495,208 | |
| | |
| KFC Holding Co. | | | | | | |
| | |
Term Loan, 1.89%, (1 mo. USD LIBOR + 1.75%), Maturing April 3, 2025 | | | 240 | | | | 237,155 | |
| | |
| Restaurant Technologies, Inc. | | | | | | |
| | |
Term Loan, 3.40%, (1 mo. USD LIBOR + 3.25%), Maturing October 1, 2025 | | | 49 | | | | 47,774 | |
| | |
| US Foods, Inc. | | | | | | |
| | |
Term Loan, 1.90%, (1 mo. USD LIBOR + 1.75%), Maturing June 27, 2023 | | | 195 | | | | 189,551 | |
| | |
Term Loan, 2.15%, (1 mo. USD LIBOR + 2.00%), Maturing September 13, 2026 | | | 371 | | | | 358,836 | |
| | |
| | | | | | | $ | 2,957,560 | |
| | | | | | | | |
| Borrower/Tranche Description | | Principal
Amount
(000’s omitted) | | | Value | |
|
| Food / Drug Retailers — 0.1% | |
| | |
| BW Gas & Convenience Holdings, LLC | | | | | | |
| | |
Term Loan, 6.40%, (1 mo. USD LIBOR + 6.25%), Maturing November 18, 2024 | | $ | 112 | | | $ | 111,797 | |
| | |
| | | | | | | $ | 111,797 | |
|
| Forest Products — 0.2% | |
| | |
| Neenah, Inc. | | | | | | |
| | |
Term Loan, 5.00%, (3 mo. USD LIBOR + 4.00%, Floor 1.00%), Maturing June 25, 2027 | | $ | 224 | | | $ | 229,768 | |
| | |
| | | | | | | $ | 229,768 | |
|
| Health Care — 12.2% | |
| | |
| Accelerated Health Systems, LLC | | | | | | |
| | |
Term Loan, 3.65%, (1 mo. USD LIBOR + 3.50%), Maturing October 31, 2025 | | $ | 123 | | | $ | 119,665 | |
| | |
| ADMI Corp. | | | | | | |
| | |
Term Loan, 2.90%, (1 mo. USD LIBOR + 2.75%), Maturing April 30, 2025 | | | 391 | | | | 377,857 | |
| | |
| Alliance Healthcare Services, Inc. | | | | | | |
| | |
Term Loan, 5.50%, (1 mo. USD LIBOR + 4.50%, Floor 1.00%), Maturing October 24, 2023 | | | 182 | | | | 164,892 | |
| | |
| athenahealth, Inc. | | | | | | |
| | |
Term Loan, 4.75%, (3 mo. USD LIBOR + 4.50%), Maturing February 11, 2026 | | | 443 | | | | 441,588 | |
| | |
| Avantor Funding, Inc. | | | | | | |
| | |
Term Loan, 3.25%, (1 mo. USD LIBOR + 2.25%, Floor 1.00%), Maturing November 21, 2024 | | | 250 | | | | 249,834 | |
| | |
Term Loan, 3.50%, (1 mo. USD LIBOR + 2.50%, Floor 1.00%), Maturing November 8, 2027 | | | 100 | | | | 100,146 | |
| | |
| BioClinica Holding I L.P. | | | | | | |
| | |
Term Loan, 5.25%, (1 mo. USD LIBOR + 4.25%, Floor 1.00%), Maturing October 20, 2023 | | | 386 | | | | 382,105 | |
| | |
| BW NHHC Holdco, Inc. | | | | | | |
| | |
Term Loan, 5.22%, (3 mo. USD LIBOR + 5.00%), Maturing May 15, 2025 | | | 220 | | | | 192,823 | |
| | |
| Change Healthcare Holdings, LLC | | | | | | |
| | |
Term Loan, 3.50%, (USD LIBOR + 2.50%, Floor 1.00%), Maturing March 1, 2024(8) | | | 1,124 | | | | 1,115,111 | |
| | |
| CHG Healthcare Services, Inc. | | | | | | |
| | |
Term Loan, 4.00%, (6 mo. USD LIBOR + 3.00%, Floor 1.00%), Maturing June 7, 2023 | | | 747 | | | | 738,259 | |
| | |
| CryoLife, Inc. | | | | | | |
| | |
Term Loan, 4.25%, (3 mo. USD LIBOR + 3.25%, Floor 1.00%), Maturing December 1, 2024 | | | 122 | | | | 120,803 | |
| | |
| Ensemble RCM, LLC | | | | | | |
| | |
Term Loan, 3.96%, (3 mo. USD LIBOR + 3.75%), Maturing August 3, 2026 | | | 99 | | | | 98,691 | |
| | | | |
| | 14 | | See Notes to Financial Statements. |
Eaton Vance
Floating-Rate Income Plus Fund
November 30, 2020
Portfolio of Investments (Unaudited) — continued
| | | | | | | | |
| Borrower/Tranche Description | | Principal
Amount
(000’s omitted) | | | Value | |
|
| Health Care (continued) | |
| | |
| Envision Healthcare Corporation | | | | | | |
| | |
Term Loan, 3.90%, (1 mo. USD LIBOR + 3.75%), Maturing October 10, 2025 | | $ | 1,303 | | | $ | 1,072,162 | |
| | |
| Gentiva Health Services, Inc. | | | | | | |
| | |
Term Loan, 3.44%, (1 mo. USD LIBOR + 3.25%), Maturing July 2, 2025 | | | 499 | | | | 496,859 | |
| | |
| GHX Ultimate Parent Corporation | | | | | | |
| | |
Term Loan, 4.25%, (3 mo. USD LIBOR + 3.25%, Floor 1.00%), Maturing June 28, 2024 | | | 194 | | | | 190,790 | |
| | |
| Greatbatch, Ltd. | | | | | | |
| | |
Term Loan, 3.50%, (1 mo. USD LIBOR + 2.50%, Floor 1.00%), Maturing October 27, 2022 | | | 258 | | | | 257,469 | |
| | |
| Hanger, Inc. | | | | | | |
| | |
Term Loan, 3.65%, (1 mo. USD LIBOR + 3.50%), Maturing March 6, 2025 | | | 244 | | | | 243,065 | |
| | |
| Inovalon Holdings, Inc. | | | | | | |
| | |
Term Loan, 3.19%, (1 mo. USD LIBOR + 3.00%), Maturing April 2, 2025 | | | 278 | | | | 274,470 | |
| | |
| IQVIA, Inc. | | | | | | |
| | |
Term Loan, 1.90%, (1 mo. USD LIBOR + 1.75%), Maturing January 17, 2025 | | | 170 | | | | 168,035 | |
| | |
| Medical Solutions, LLC | | | | | | |
| | |
Term Loan, 5.50%, (6 mo. USD LIBOR + 4.50%, Floor 1.00%), Maturing June 14, 2024 | | | 269 | | | | 265,126 | |
| | |
| MPH Acquisition Holdings, LLC | | | | | | |
| | |
Term Loan, 3.75%, (3 mo. USD LIBOR + 2.75%, Floor 1.00%), Maturing June 7, 2023 | | | 682 | | | | 674,135 | |
| | |
| National Mentor Holdings, Inc. | | | | | | |
| | |
Term Loan, 4.40%, (1 mo. USD LIBOR + 4.25%), Maturing March 9, 2026 | | | 5 | | | | 5,351 | |
| | |
Term Loan, 4.40%, (1 mo. USD LIBOR + 4.25%), Maturing March 9, 2026 | | | 118 | | | | 117,218 | |
| | |
| Navicure, Inc. | | | | | | |
| | |
Term Loan, 4.15%, (1 mo. USD LIBOR + 4.00%), Maturing October 22, 2026 | | | 224 | | | | 220,797 | |
| | |
Term Loan, 4.75%, (1 mo. USD LIBOR + 4.00%, Floor 0.75%), Maturing October 22, 2026 | | | 125 | | | | 124,844 | |
| | |
| One Call Corporation | | | | | | |
| | |
Term Loan, 6.25%, (3 mo. USD LIBOR + 5.25%, Floor 1.00%), Maturing November 25, 2022 | | | 259 | | | | 247,427 | |
| | |
| Ortho-Clinical Diagnostics S.A. | | | | | | |
| | |
Term Loan, 3.39%, (1 mo. USD LIBOR + 3.25%), Maturing June 30, 2025 | | | 1,423 | | | | 1,396,778 | |
| | |
| Parexel International Corporation | | | | | | |
| | |
Term Loan, 2.90%, (1 mo. USD LIBOR + 2.75%), Maturing September 27, 2024 | | | 501 | | | | 490,950 | |
| | | | | | | | |
| Borrower/Tranche Description | | Principal
Amount
(000’s omitted) | | | Value | |
|
| Health Care (continued) | |
| | |
| Phoenix Guarantor, Inc. | | | | | | |
| | |
Term Loan, 3.40%, (1 mo. USD LIBOR + 3.25%), Maturing March 5, 2026 | | $ | 420 | | | $ | 414,719 | |
| | |
Term Loan, 4.25%, (1 mo. USD LIBOR + 3.75%, Floor 0.50%), Maturing March 5, 2026 | | | 125 | | | | 124,297 | |
| | |
| Radiology Partners, Inc | | | | | | |
| | |
Term Loan, 4.80%, (USD LIBOR + 4.25%), Maturing July 9, 2025(8) | | | 601 | | | | 581,567 | |
| | |
| RadNet, Inc. | | | | | | |
| | |
Term Loan, 4.75%, (3 mo. USD LIBOR + 3.75%, Floor 1.00%), Maturing June 30, 2023 | | | 344 | | | | 343,716 | |
| | |
| Select Medical Corporation | | | | | | |
| | |
Term Loan, 2.78%, (6 mo. USD LIBOR + 2.50%), Maturing March 6, 2025 | | | 558 | | | | 548,714 | |
| | |
| Sound Inpatient Physicians | | | | | | |
| | |
Term Loan, 2.90%, (1 mo. USD LIBOR + 2.75%), Maturing June 27, 2025 | | | 98 | | | | 96,662 | |
| | |
| Surgery Center Holdings, Inc. | | | | | | |
| | |
Term Loan, 4.25%, (1 mo. USD LIBOR + 3.25%, Floor 1.00%), Maturing September 3, 2024 | | | 760 | | | | 745,722 | |
| | |
| Team Health Holdings, Inc. | | | | | | |
| | |
Term Loan, 3.75%, (1 mo. USD LIBOR + 2.75%, Floor 1.00%), Maturing February 6, 2024 | | | 483 | | | | 424,600 | |
| | |
| Tecomet, Inc. | | | | | | |
| | |
Term Loan, 4.50%, (3 mo. USD LIBOR + 3.50%, Floor 1.00%), Maturing May 1, 2024 | | | 268 | | | | 260,883 | |
| | |
| U.S. Anesthesia Partners, Inc. | | | | | | |
| | |
Term Loan, 4.00%, (6 mo. USD LIBOR + 3.00%, Floor 1.00%), Maturing June 23, 2024 | | | 588 | | | | 570,387 | |
| | |
| Verscend Holding Corp. | | | | | | |
| | |
Term Loan, 4.65%, (1 mo. USD LIBOR + 4.50%), Maturing August 27, 2025 | | | 343 | | | | 342,855 | |
| | |
| Viant Medical Holdings, Inc. | | | | | | |
| | |
Term Loan, 3.90%, (1 mo. USD LIBOR + 3.75%), Maturing July 2, 2025 | | | 98 | | | | 91,728 | |
| | |
| Wink Holdco, Inc. | | | | | | |
| | |
Term Loan, 4.00%, (1 mo. USD LIBOR + 3.00%, Floor 1.00%), Maturing December 2, 2024 | | | 122 | | | | 121,543 | |
| | |
| | | | | | | $ | 15,014,643 | |
|
| Home Furnishings — 0.8% | |
| | |
| Serta Simmons Bedding, LLC | | | | | | |
| | |
Term Loan, 8.50%, (1 mo. USD LIBOR + 7.50%, Floor 1.00%), Maturing August 10, 2023 | | $ | 259 | | | $ | 261,295 | |
| | |
Term Loan - Second Lien, 8.50%, (1 mo. USD LIBOR + 7.50%, Floor 1.00%), Maturing August 10, 2023 | | | 859 | | | | 778,244 | |
| | |
| | | | | | | $ | 1,039,539 | |
| | | | |
| | 15 | | See Notes to Financial Statements. |
Eaton Vance
Floating-Rate Income Plus Fund
November 30, 2020
Portfolio of Investments (Unaudited) — continued
| | | | | | | | |
| Borrower/Tranche Description | | Principal
Amount
(000’s omitted) | | | Value | |
|
| Industrial Equipment — 7.1% | |
| | |
| AI Alpine AT Bidco GmbH | | | | | | |
| | |
Term Loan, 3.23%, (USD LIBOR + 3.00%), Maturing October 31, 2025(8) | | $ | 49 | | | $ | 45,993 | |
| | |
| Alliance Laundry Systems, LLC | | | | | | |
| | |
Term Loan, 4.25%, (3 mo. USD LIBOR + 3.50%, Floor 0.75%), Maturing October 8, 2027 | | | 275 | | | | 274,800 | |
| | |
| Altra Industrial Motion Corp. | | | | | | |
| | |
Term Loan, 2.15%, (1 mo. USD LIBOR + 2.00%), Maturing October 1, 2025 | | | 138 | | | | 136,962 | |
| | |
| Apex Tool Group, LLC | | | | | | |
| | |
Term Loan, 6.50%, (1 mo. USD LIBOR + 5.25%, Floor 1.25%), Maturing August 1, 2024 | | | 536 | | | | 525,051 | |
| | |
| CPM Holdings, Inc. | | | | | | |
| | |
Term Loan, 3.90%, (1 mo. USD LIBOR + 3.75%), Maturing November 17, 2025 | | | 483 | | | | 462,285 | |
| | |
| Delachaux Group S.A. | | | | | | |
| | |
Term Loan, 4.74%, (6 mo. USD LIBOR + 4.50%), Maturing April 16, 2026 | | | 99 | | | | 95,164 | |
| | |
| DexKo Global, Inc. | | | | | | |
| | |
Term Loan, 4.50%, (1 mo. USD LIBOR + 3.50%, Floor 1.00%), Maturing July 24, 2024 | | | 485 | | | | 478,505 | |
| | |
| DXP Enterprises, Inc. | | | | | | |
| | |
Term Loan, 5.75%, (1 mo. USD LIBOR + 4.75%, Floor 1.00%), Maturing August 29, 2023 | | | 109 | | | | 106,575 | |
| | |
| Dynacast International, LLC | | | | | | |
| | |
Term Loan, 4.25%, (3 mo. USD LIBOR + 3.25%, Floor 1.00%), Maturing January 28, 2022 | | | 286 | | | | 271,842 | |
| | |
| Engineered Machinery Holdings, Inc. | | | | | | |
| | |
Term Loan, 4.00%, (3 mo. USD LIBOR + 3.00%, Floor 1.00%), Maturing July 19, 2024 | | | 365 | | | | 359,521 | |
| | |
| EWT Holdings III Corp. | | | | | | |
| | |
Term Loan, 2.90%, (1 mo. USD LIBOR + 2.75%), Maturing December 20, 2024 | | | 772 | | | | 766,130 | |
| | |
| Filtration Group Corporation | | | | | | |
| | |
Term Loan, 3.15%, (1 mo. USD LIBOR + 3.00%), Maturing March 29, 2025 | | | 352 | | | | 345,190 | |
| | |
| Gardner Denver, Inc. | | | | | | |
| | |
Term Loan, 1.90%, (1 mo. USD LIBOR + 1.75%), Maturing March 1, 2027 | | | 283 | | | | 278,692 | |
| | |
| Gates Global, LLC | | | | | | |
| | |
Term Loan, 3.75%, (1 mo. USD LIBOR + 2.75%, Floor 1.00%), Maturing April 1, 2024 | | | 949 | | | | 942,278 | |
| | |
| Hayward Industries, Inc. | | | | | | |
| | |
Term Loan, 3.65%, (1 mo. USD LIBOR + 3.50%), Maturing August 5, 2024 | | | 96 | | | | 94,099 | |
| | |
| Ingersoll-Rand Services Company | | | | | | |
| | |
Term Loan, 1.90%, (1 mo. USD LIBOR + 1.75%), Maturing March 1, 2027 | | | 299 | | | | 293,862 | |
| | | | | | | | |
| Borrower/Tranche Description | | Principal
Amount
(000’s omitted) | | | Value | |
|
| Industrial Equipment (continued) | |
| | |
| LTI Holdings, Inc. | | | | | | |
| | |
Term Loan, 3.65%, (1 mo. USD LIBOR + 3.50%), Maturing September 6, 2025 | | $ | 371 | | | $ | 352,922 | |
| | |
Term Loan, 4.90%, (1 mo. USD LIBOR + 4.75%), Maturing July 24, 2026 | | | 50 | | | | 47,293 | |
| | |
| Pro Mach Group, Inc. | | | | | | |
| | |
Term Loan, 3.50%, Maturing March 7, 2025(11) | | | 50 | | | | 51,272 | |
| | |
Term Loan, 4.50%, (USD LIBOR + 3.50%, Floor 1.00%), Maturing March 7, 2025(8) | | | 150 | | | | 146,859 | |
| | |
| Rexnord, LLC | | | | | | |
| | |
Term Loan, 1.90%, (1 mo. USD LIBOR + 1.75%), Maturing August 21, 2024 | | | 681 | | | | 680,725 | |
| | |
| Robertshaw US Holding Corp. | | | | | | |
| | |
Term Loan, 4.50%, (1 mo. USD LIBOR + 3.50%, Floor 1.00%), Maturing February 28, 2025 | | | 244 | | | | 229,049 | |
| | |
| Thermon Industries, Inc. | | | | | | |
| | |
Term Loan, 4.75%, (1 mo. USD LIBOR + 3.75%, Floor 1.00%), Maturing October 30, 2024 | | | 70 | | | | 69,476 | |
| | |
| Titan Acquisition Limited | | | | | | |
| | |
Term Loan, 3.36%, (6 mo. USD LIBOR + 3.00%), Maturing March 28, 2025 | | | 682 | | | | 657,972 | |
| | |
| Vertical Midco GmbH | | | | | | |
| | |
Term Loan, 4.57%, (6 mo. USD LIBOR + 4.25%), Maturing July 30, 2027 | | | 300 | | | | 299,672 | |
| | |
| Welbilt, Inc. | | | | | | |
| | |
Term Loan, 2.65%, (1 mo. USD LIBOR + 2.50%), Maturing October 23, 2025 | | | 760 | | | | 720,412 | |
| | |
| | | | | | | $ | 8,732,601 | |
|
| Insurance — 6.9% | |
| | |
| Alliant Holdings Intermediate, LLC | | | | | | |
| | |
Term Loan, 3.40%, (1 mo. USD LIBOR + 3.25%), Maturing May 9, 2025 | | $ | 521 | | | $ | 509,733 | |
| | |
Term Loan, 3.40%, (1 mo. USD LIBOR + 3.25%), Maturing May 9, 2025 | | | 99 | | | | 96,551 | |
| | |
Term Loan, 4.25%, (1 mo. USD LIBOR + 3.75%, Floor 0.50%), Maturing October 8, 2027 | | | 125 | | | | 124,668 | |
| | |
| AmWINS Group, Inc. | | | | | | |
| | |
Term Loan, 3.75%, (1 mo. USD LIBOR + 2.75%, Floor 1.00%), Maturing January 25, 2024 | | | 979 | | | | 976,973 | |
| | |
| AssuredPartners Capital, Inc. | | | | | | |
| | |
Term Loan, 5.50%, (1 mo. USD LIBOR + 4.50%, Floor 1.00%), Maturing February 12, 2027 | | | 100 | | | | 99,699 | |
| | |
| AssuredPartners, Inc. | | | | | | |
| | |
Term Loan, 3.65%, (1 mo. USD LIBOR + 3.50%), Maturing February 12, 2027 | | | 546 | | | | 535,835 | |
| | | | |
| | 16 | | See Notes to Financial Statements. |
Eaton Vance
Floating-Rate Income Plus Fund
November 30, 2020
Portfolio of Investments (Unaudited) — continued
| | | | | | | | |
| Borrower/Tranche Description | | Principal
Amount
(000’s omitted) | | | Value | |
|
| Insurance (continued) | |
| | |
| Asurion, LLC | | | | | | |
| | |
Term Loan, 3.15%, (1 mo. USD LIBOR + 3.00%), Maturing August 4, 2022 | | $ | 1,078 | | | $ | 1,075,350 | |
| | |
Term Loan, 3.15%, (1 mo. USD LIBOR + 3.00%), Maturing November 3, 2023 | | | 455 | | | | 451,642 | |
| | |
Term Loan - Second Lien, 6.65%, (1 mo. USD LIBOR + 6.50%), Maturing August 4, 2025 | | | 540 | | | | 544,945 | |
| | |
| FrontDoor, Inc. | | | | | | |
| | |
Term Loan, 2.69%, (1 mo. USD LIBOR + 2.50%), Maturing August 16, 2025 | | | 98 | | | | 97,510 | |
| | |
| Hub International Limited | | | | | | |
| | |
Term Loan, 2.96%, (3 mo. USD LIBOR + 2.75%), Maturing April 25, 2025 | | | 1,124 | | | | 1,098,422 | |
| | |
Term Loan, 5.00%, (3 mo. USD LIBOR + 4.00%, Floor 1.00%), Maturing April 25, 2025 | | | 422 | | | | 423,131 | |
| | |
| NFP Corp. | | | | | | |
| | |
Term Loan, 3.40%, (1 mo. USD LIBOR + 3.25%), Maturing February 15, 2027 | | | 780 | | | | 760,405 | |
| | |
| Ryan Specialty Group, LLC | | | | | | |
| | |
Term Loan, 4.00%, (1 mo. USD LIBOR + 3.25%, Floor 0.75%), Maturing September 1, 2027 | | | 425 | | | | 424,291 | |
| | |
| Sedgwick Claims Management Services, Inc. | | | | | | |
| | |
Term Loan, 3.40%, (1 mo. USD LIBOR + 3.25%), Maturing December 31, 2025 | | | 270 | | | | 264,319 | |
| | |
| USI, Inc. | | | | | | |
| | |
Term Loan, 3.22%, (3 mo. USD LIBOR + 3.00%), Maturing May 16, 2024 | | | 679 | | | | 665,844 | |
| | |
Term Loan, 4.22%, (3 mo. USD LIBOR + 4.00%), Maturing December 2, 2026 | | | 323 | | | | 321,877 | |
| | |
| | | | | | | $ | 8,471,195 | |
|
| Leisure Goods / Activities / Movies — 5.2% | |
| | |
| Ancestry.com Operations, Inc. | | | | | | |
| | |
Term Loan, 4.15%, (1 mo. USD LIBOR + 4.00%), Maturing August 27, 2026 | | $ | 691 | | | $ | 691,381 | |
| | |
| Bombardier Recreational Products, Inc. | | | | | | |
| | |
Term Loan, 2.15%, (1 mo. USD LIBOR + 2.00%), Maturing May 24, 2027 | | | 1,059 | | | | 1,031,224 | |
| | |
Term Loan, 6.00%, (3 mo. USD LIBOR + 5.00%, Floor 1.00%), Maturing May 24, 2027 | | | 150 | | | | 152,169 | |
| | |
| Carnival Corporation | | | | | | |
| | |
Term Loan, 8.50%, (1 mo. USD LIBOR + 7.50%, Floor 1.00%), Maturing June 30, 2025 | | | 299 | | | | 310,098 | |
| | |
| ClubCorp Holdings, Inc. | | | | | | |
| | |
Term Loan, 2.97%, (3 mo. USD LIBOR + 2.75%), Maturing September 18, 2024 | | | 437 | | | | 392,086 | |
| | | | | | | | |
| Borrower/Tranche Description | | Principal
Amount
(000’s omitted) | | | Value | |
|
| Leisure Goods / Activities / Movies (continued) | |
| | |
| Crown Finance US, Inc. | | | | | | |
| | |
Term Loan, 2.77%, (6 mo. USD LIBOR + 2.50%), Maturing February 28, 2025 | | $ | 385 | | | $ | 296,793 | |
| | |
Term Loan, 3.02%, (6 mo. USD LIBOR + 2.75%), Maturing September 30, 2026 | | | 322 | | | | 245,536 | |
| | |
| Delta 2 (LUX) S.a.r.l. | | | | | | |
| | |
Term Loan, 3.50%, (1 mo. USD LIBOR + 2.50%, Floor 1.00%), Maturing February 1, 2024 | | | 439 | | | | 429,512 | |
| | |
| Lindblad Expeditions, Inc. | | | | | | |
| | |
Term Loan, 5.50%, (1 mo. USD LIBOR + 4.75%, Floor 0.75%), 4.25% cash, 1.25% PIK, Maturing March 27, 2025 | | | 96 | | | | 89,947 | |
| | |
Term Loan, 5.50%, (1 mo. USD LIBOR + 4.75%, Floor 0.75%), 4.25% cash, 1.25% PIK, Maturing March 27, 2025 | | | 383 | | | | 359,786 | |
| | |
| Match Group, Inc. | | | | | | |
| | |
Term Loan, 1.96%, (3 mo. USD LIBOR + 1.75%), Maturing February 13, 2027 | | | 175 | | | | 172,886 | |
| | |
| Playtika Holding Corp. | | | | | | |
| | |
Term Loan, 7.00%, (6 mo. USD LIBOR + 6.00%, Floor 1.00%), Maturing December 10, 2024 | | | 746 | | | | 750,832 | |
| | |
| SRAM, LLC | | | | | | |
| | |
Term Loan, 3.75%, (USD LIBOR + 2.75%, Floor 1.00%), Maturing March 15, 2024(8) | | | 144 | | | | 144,312 | |
| | |
| Steinway Musical Instruments, Inc. | | | | | | |
| | |
Term Loan, 4.75%, (1 mo. USD LIBOR + 3.75%, Floor 1.00%), Maturing February 14, 2025 | | | 111 | | | | 107,769 | |
| | |
| Travel Leaders Group, LLC | | | | | | |
| | |
Term Loan, 4.15%, (1 mo. USD LIBOR + 4.00%), Maturing January 25, 2024 | | | 220 | | | | 199,868 | |
| | |
| UFC Holdings, LLC | | | | | | |
| | |
Term Loan, 4.25%, (6 mo. USD LIBOR + 3.25%, Floor 1.00%), Maturing April 29, 2026 | | | 1,028 | | | | 1,020,413 | |
| | |
| | | | | | | $ | 6,394,612 | |
|
| Lodging and Casinos — 3.6% | |
| | |
| Aristocrat Technologies, Inc. | | | | | | |
| | |
Term Loan, 1.96%, (3 mo. USD LIBOR + 1.75%), Maturing October 19, 2024 | | $ | 245 | | | $ | 239,115 | |
| | |
| Boyd Gaming Corporation | | | | | | |
| | |
Term Loan, 2.35%, (1 week USD LIBOR + 2.25%), Maturing September 15, 2023 | | | 151 | | | | 148,837 | |
| | |
| CityCenter Holdings, LLC | | | | | | |
| | |
Term Loan, 3.00%, (1 mo. USD LIBOR + 2.25%, Floor 0.75%), Maturing April 18, 2024 | | | 705 | | | | 682,084 | |
| | |
| ESH Hospitality, Inc. | | | | | | |
| | |
Term Loan, 2.15%, (1 mo. USD LIBOR + 2.00%), Maturing September 18, 2026 | | | 162 | | | | 158,914 | |
| | | | |
| | 17 | | See Notes to Financial Statements. |
Eaton Vance
Floating-Rate Income Plus Fund
November 30, 2020
Portfolio of Investments (Unaudited) — continued
| | | | | | | | |
| Borrower/Tranche Description | | Principal
Amount
(000’s omitted) | | | Value | |
|
| Lodging and Casinos (continued) | |
| | |
| Golden Nugget, Inc. | | | | | | |
| | |
Term Loan, 3.25%, (2 mo. USD LIBOR + 2.50%, Floor 0.75%), Maturing October 4, 2023 | | $ | 1,614 | | | $ | 1,539,258 | |
| | |
| GVC Holdings (Gibraltar) Limited | | | | | | |
| | |
Term Loan, 3.25%, (3 mo. USD LIBOR + 2.25%, Floor 1.00%), Maturing March 29, 2024 | | | 244 | | | | 241,313 | |
| | |
| Playa Resorts Holding B.V. | | | | | | |
| | |
Term Loan, 3.75%, (1 mo. USD LIBOR + 2.75%, Floor 1.00%), Maturing April 29, 2024 | | | 823 | | | | 757,843 | |
| | |
| Stars Group Holdings B.V. (The) | | | | | | |
| | |
Term Loan, 3.72%, (3 mo. USD LIBOR + 3.50%), Maturing July 10, 2025 | | | 389 | | | | 390,590 | |
| | |
| Wyndham Hotels & Resorts, Inc. | | | | | | |
| | |
Term Loan, 1.90%, (1 mo. USD LIBOR + 1.75%), Maturing May 30, 2025 | | | 294 | | | | 287,691 | |
| | |
| | | | | | | $ | 4,445,645 | |
|
| Nonferrous Metals / Minerals — 0.2% | |
| | |
| American Consolidated Natural Resources, Inc. | | | | | | |
| | |
Term Loan, 14.00%, (3 mo. USD LIBOR + 13.00%, Floor 1.00%), Maturing September 16, 2025 | | $ | 154 | | | $ | 138,700 | |
| | |
| Noranda Aluminum Acquisition Corporation | | | | | | |
| | |
Term Loan, 0.00%, Maturing February 28, 2021(10) | | | 238 | | | | 21,391 | |
| | |
| Oxbow Carbon, LLC | | | | | | |
| | |
Term Loan, 5.00%, (1 mo. USD LIBOR + 4.25%, Floor 0.75%), Maturing October 13, 2025 | | | 75 | | | | 74,812 | |
| | |
| | | | | | | $ | 234,903 | |
|
| Oil and Gas — 3.8% | |
| | |
| Ameriforge Group, Inc. | | | | | | |
| | |
Term Loan, 14.00%, (3 mo. USD LIBOR + 13.00%, Floor 1.00%), 9.00% cash, 5.00% PIK, Maturing June 8, 2022 | | $ | 114 | | | $ | 99,846 | |
| | |
| Apergy Corporation | | | | | | |
| | |
Term Loan, 2.69%, (1 mo. USD LIBOR + 2.50%), Maturing May 9, 2025 | | | 34 | | | | 33,679 | |
| | |
| Blackstone CQP Holdco L.P. | | | | | | |
| | |
Term Loan, 3.73%, (3 mo. USD LIBOR + 3.50%), Maturing September 30, 2024 | | | 620 | | | | 614,358 | |
| | |
| Buckeye Partners L.P. | | | | | | |
| | |
Term Loan, 2.90%, (1 mo. USD LIBOR + 2.75%), Maturing November 1, 2026 | | | 622 | | | | 616,725 | |
| | |
| Centurion Pipeline Company, LLC | | | | | | |
| | |
Term Loan, 4.15%, (1 mo. USD LIBOR + 4.00%), Maturing September 28, 2025 | | | 50 | | | | 49,438 | |
| | | | | | | | |
| Borrower/Tranche Description | | Principal
Amount
(000’s omitted) | | | Value | |
|
| Oil and Gas (continued) | |
| | |
| CITGO Holding, Inc. | | | | | | |
| | |
Term Loan, 8.00%, (3 mo. USD LIBOR + 7.00%, Floor 1.00%), Maturing August 1, 2023 | | $ | 249 | | | $ | 218,615 | |
| | |
| CITGO Petroleum Corporation | | | | | | |
| | |
Term Loan, 7.25%, (3 mo. USD LIBOR + 6.25%, Floor 1.00%), Maturing March 28, 2024 | | | 1,113 | | | | 1,066,779 | |
| | |
| Delek US Holdings, Inc. | | | | | | |
| | |
Term Loan, 6.50%, (1 mo. USD LIBOR + 5.50%, Floor 1.00%), Maturing March 31, 2025 | | | 124 | | | | 122,665 | |
| | |
| Fieldwood Energy, LLC | | | | | | |
| | |
DIP Loan, 3.68%, (1 mo. USD LIBOR + 8.75%), Maturing August 4, 2021(11) | | | 103 | | | | 102,344 | |
| | |
Term Loan, 0.00%, Maturing April 11, 2022(10) | | | 695 | | | | 156,263 | |
| | |
| Lealand Finance Company B.V. | | | | | | |
| | |
Term Loan, 3.15%, (1 mo. USD LIBOR + 3.00%), Maturing June 30, 2024 | | | 6 | | | | 5,038 | |
| | |
Term Loan, 4.15%, (1 mo. USD LIBOR + 4.00%), 1.15% cash, 3.00% PIK, Maturing June 30, 2025 | | | 81 | | | | 55,273 | |
| | |
| Prairie ECI Acquiror L.P. | | | | | | |
| | |
Term Loan, 4.90%, (1 mo. USD LIBOR + 4.75%), Maturing March 11, 2026 | | | 904 | | | | 850,132 | |
| | |
| PSC Industrial Holdings Corp. | | | | | | |
| | |
Term Loan, 4.75%, (1 mo. USD LIBOR + 3.75%, Floor 1.00%), Maturing October 11, 2024 | | | 410 | | | | 394,213 | |
| | |
| RDV Resources Properties, LLC | | | | | | |
| | |
Term Loan, 15.50%, (1 mo. USD LIBOR + 14.50%, Floor 1.00%), Maturing March 29, 2024(6) | | | 116 | | | | 76,089 | |
| | |
| Sunrise Oil & Gas Properties, LLC | | | | | | |
| | |
Term Loan - 8.00%, (1 mo. USD LIBOR + 7.00%, Floor 1.00%), Maturing January 17, 2023 | | | 21 | | | | 19,273 | |
| | |
Term Loan - Second Lien, 8.00%, (1 mo. USD LIBOR + 7.00%, Floor 1.00%), Maturing January 17, 2023 | | | 22 | | | | 17,168 | |
| | |
Term Loan - Third Lien, 8.00%, (1 mo. USD LIBOR + 7.00%, Floor 1.00%), Maturing January 17, 2023 | | | 25 | | | | 12,760 | |
| | |
| UGI Energy Services, LLC | | | | | | |
| | |
Term Loan, 3.90%, (1 mo. USD LIBOR + 3.75%), Maturing August 13, 2026 | | | 222 | | | | 222,465 | |
| | |
| | | | | | | $ | 4,733,123 | |
|
| Publishing — 1.2% | |
| | |
| Alchemy Copyrights, LLC | | | | | | |
| | |
Term Loan, 4.00%, (1 mo. USD LIBOR + 3.25%, Floor 0.75%), Maturing August 16, 2027 | | $ | 125 | | | $ | 125,156 | |
| | |
| Ascend Learning, LLC | | | | | | |
| | |
Term Loan, 4.00%, (1 mo. USD LIBOR + 3.00%, Floor 1.00%), Maturing July 12, 2024 | | | 267 | | | | 263,916 | |
| | |
Term Loan, 4.75%, (1 mo. USD LIBOR + 3.75%, Floor 1.00%), Maturing July 12, 2024 | | | 100 | | | | 100,031 | |
| | | | |
| | 18 | | See Notes to Financial Statements. |
Eaton Vance
Floating-Rate Income Plus Fund
November 30, 2020
Portfolio of Investments (Unaudited) — continued
| | | | | | | | |
| Borrower/Tranche Description | | Principal
Amount
(000’s omitted) | | | Value | |
|
| Publishing (continued) | |
| | |
| Getty Images, Inc. | | | | | | |
| | |
Term Loan, 4.69%, (1 mo. USD LIBOR + 4.50%), Maturing February 19, 2026 | | $ | 389 | | | $ | 376,458 | |
| | |
| LSC Communications, Inc. | | | | | | |
| | |
Term Loan, 0.00%, Maturing September 30, 2022(10) | | | 163 | | | | 26,643 | |
| | |
| Nielsen Finance, LLC | | | | | | |
| | |
Term Loan, 4.75%, (1 mo. USD LIBOR + 3.75%, Floor 1.00%), Maturing June 4, 2025 | | | 199 | | | | 199,846 | |
| | |
| ProQuest, LLC | | | | | | |
| | |
Term Loan, 3.65%, (1 mo. USD LIBOR + 3.50%), Maturing October 23, 2026 | | | 330 | | | | 328,509 | |
| | |
| Tweddle Group, Inc. | | | | | | |
| | |
Term Loan, 5.50%, (1 mo. USD LIBOR + 4.50%, Floor 1.00%), Maturing September 17, 2023 | | | 47 | | | | 43,150 | |
| | |
| | | | | | | $ | 1,463,709 | |
|
| Radio and Television — 3.7% | |
| | |
| Cumulus Media New Holdings, Inc. | | | | | | |
| | |
Term Loan, 4.75%, (3 mo. USD LIBOR + 3.75%, Floor 1.00%), Maturing March 31, 2026 | | $ | 112 | | | $ | 108,435 | |
| | |
| Diamond Sports Group, LLC | | | | | | |
| | |
Term Loan, 3.40%, (1 mo. USD LIBOR + 3.25%), Maturing August 24, 2026 | | | 668 | | | | 564,671 | |
| | |
| Entercom Media Corp. | | | | | | |
| | |
Term Loan, 2.64%, (1 mo. USD LIBOR + 2.50%), Maturing November 18, 2024 | | | 201 | | | | 195,201 | |
| | |
| Entravision Communications Corporation | | | | | | |
| | |
Term Loan, 2.90%, (1 mo. USD LIBOR + 2.75%), Maturing November 29, 2024 | | | 198 | | | | 191,039 | |
| | |
| Gray Television, Inc. | | | | | | |
| | |
Term Loan, 2.65%, (1 mo. USD LIBOR + 2.50%), Maturing January 2, 2026 | | | 127 | | | | 125,823 | |
| | |
| Hubbard Radio, LLC | | | | | | |
| | |
Term Loan, 5.25%, (3 mo. USD LIBOR + 4.25%, Floor 1.00%), Maturing March 28, 2025 | | | 124 | | | | 120,602 | |
| | |
| iHeartCommunications, Inc. | | | | | | |
| | |
Term Loan, 3.15%, (1 mo. USD LIBOR + 3.00%), Maturing May 1, 2026 | | | 447 | | | | 432,575 | |
| | |
| Nexstar Broadcasting, Inc. | | | | | | |
| | |
Term Loan, 2.40%, (1 mo. USD LIBOR + 2.25%), Maturing January 17, 2024 | | | 304 | | | | 299,743 | |
| | |
Term Loan, 2.90%, (1 mo. USD LIBOR + 2.75%), Maturing September 18, 2026 | | | 108 | | | | 106,794 | |
| | |
| Sinclair Television Group, Inc. | | | | | | |
| | |
Term Loan, 2.65%, (1 mo. USD LIBOR + 2.50%), Maturing September 30, 2026 | | | 149 | | | | 145,468 | |
| | | | | | | | |
| Borrower/Tranche Description | | Principal
Amount
(000’s omitted) | | | Value | |
|
| Radio and Television (continued) | |
| | |
| Terrier Media Buyer, Inc. | | | | | | |
| | |
Term Loan, 4.40%, (1 mo. USD LIBOR + 4.25%), Maturing December 17, 2026 | | $ | 566 | | | $ | 559,779 | |
| | |
| Univision Communications, Inc. | | | | | | |
| | |
Term Loan, 4.75%, (1 mo. USD LIBOR + 3.75%, Floor 1.00%), Maturing March 15, 2026 | | | 1,701 | | | | 1,687,982 | |
| | |
| | | | | | | $ | 4,538,112 | |
|
| Retailers (Except Food and Drug) — 2.8% | |
| | |
| Ascena Retail Group, Inc. | | | | | | |
| | |
DIP Loan, 12.75%, (1 mo. USD LIBOR + 11.75%, Floor 1.00%), Maturing March 16, 2021 | | $ | 155 | | | $ | 172,689 | |
| | |
Term Loan, 0.00%, Maturing August 21, 2022(10) | | | 448 | | | | 142,678 | |
| | |
| Bass Pro Group, LLC | | | | | | |
| | |
Term Loan, 5.75%, (3 mo. USD LIBOR + 5.00%, Floor 0.75%), Maturing September 25, 2024 | | | 639 | | | | 640,226 | |
| | |
| BJ’s Wholesale Club, Inc. | | | | | | |
| | |
Term Loan, 2.14%, (1 mo. USD LIBOR + 2.00%), Maturing February 3, 2024 | | | 121 | | | | 120,652 | |
| | |
| CNT Holdings I Corp. | | | | | | |
| | |
Term Loan, 4.50%, (6 mo. USD LIBOR + 3.75%, Floor 0.75%), Maturing November 8, 2027 | | | 175 | | | | 173,947 | |
| | |
| Coinamatic Canada, Inc. | | | | | | |
| | |
Term Loan, 4.25%, (1 mo. USD LIBOR + 3.25%, Floor 1.00%), Maturing May 14, 2022 | | | 39 | | | | 38,703 | |
| | |
| David’s Bridal, Inc. | | | | | | |
| | |
Term Loan, 11.00%, (3 mo. USD LIBOR + 10.00%, Floor 1.00%), 6.00% cash, 5.00% PIK, Maturing June 23, 2023 | | | 67 | | | | 62,892 | |
| | |
Term Loan, 7.00%, (3 mo. USD LIBOR + 6.00%, Floor 1.00%), Maturing June 30, 2023 | | | 79 | | | | 65,427 | |
| | |
| Harbor Freight Tools USA, Inc. | | | | | | |
| | |
Term Loan, 4.00%, (1 mo. USD LIBOR + 3.25%, Floor 0.75%), Maturing October 19, 2027 | | | 350 | | | | 348,219 | |
| | |
| Hoya Midco, LLC | | | | | | |
| | |
Term Loan, 4.50%, (6 mo. USD LIBOR + 3.50%, Floor 1.00%), Maturing June 30, 2024 | | | 242 | | | | 221,283 | |
| | |
| LSF9 Atlantis Holdings, LLC | | | | | | |
| | |
Term Loan, 7.00%, (1 mo. USD LIBOR + 6.00%, Floor 1.00%), Maturing May 1, 2023 | | | 228 | | | | 225,630 | |
| | |
| Mattress Firm, Inc. | | | | | | |
| | |
Term Loan, Maturing November 24, 2027(9) | | | 200 | | | | 199,000 | |
| | |
| PetSmart, Inc. | | | | | | |
| | |
Term Loan, 4.50%, (6 mo. USD LIBOR + 3.50%, Floor 1.00%), Maturing March 11, 2022 | | | 974 | | | | 970,542 | |
| | |
| PFS Holding Corporation | | | | | | |
| | |
Term Loan, 0.00%, Maturing January 31, 2021(6)(10) | | | 511 | | | | 0 | |
| | | | |
| | 19 | | See Notes to Financial Statements. |
Eaton Vance
Floating-Rate Income Plus Fund
November 30, 2020
Portfolio of Investments (Unaudited) — continued
| | | | | | | | |
| Borrower/Tranche Description | | Principal
Amount
(000’s omitted) | | | Value | |
|
| Retailers (Except Food and Drug) (continued) | |
| | |
| Pier 1 Imports (U.S.), Inc. | | | | | | |
| | |
Term Loan, 0.00%, Maturing April 30, 2021(10) | | $ | 99 | | | $ | 61,777 | |
| |
| | | | $ | 3,443,665 | |
|
| Steel — 1.4% | |
| | |
| Atkore International, Inc. | | | | | | |
| | |
Term Loan, 3.75%, (3 mo. USD LIBOR + 2.75%, Floor 1.00%), Maturing December 22, 2023 | | $ | 88 | | | $ | 88,180 | |
| | |
| GrafTech Finance, Inc. | | | | | | |
| | |
Term Loan, 4.50%, (1 mo. USD LIBOR + 3.50%, Floor 1.00%), Maturing February 12, 2025 | | | 463 | | | | 460,583 | |
| | |
| Neenah Foundry Company | | | | | | |
| | |
Term Loan, 10.00%, (2 mo. USD LIBOR + 9.00%, Floor 1.00%), Maturing December 13, 2022 | | | 162 | | | | 142,029 | |
| | |
| Phoenix Services International, LLC | | | | | | |
| | |
Term Loan, 4.75%, (1 mo. USD LIBOR + 3.75%, Floor 1.00%), Maturing March 1, 2025 | | | 171 | | | | 167,106 | |
| | |
| Zekelman Industries, Inc. | | | | | | |
| | |
Term Loan, 2.15%, (1 mo. USD LIBOR + 2.00%), Maturing January 24, 2027 | | | 821 | | | | 807,365 | |
| |
| | | | $ | 1,665,263 | |
|
| Surface Transport — 0.6% | |
| | |
| Hertz Corporation (The) | | | | | | |
| | |
Term Loan, 3.50%, (1 mo. USD LIBOR + 2.75%, Floor 0.75%), Maturing June 30, 2023 | | $ | 234 | | | $ | 228,340 | |
| | |
DIP Loan, 4.62%, (USD Prime + 6.25%), Maturing December 31, 2020(11) | | | 199 | | | | 205,496 | |
| | |
| Kenan Advantage Group, Inc. | | | | | | |
| | |
Term Loan, 4.00%, (1 mo. USD LIBOR + 3.00%, Floor 1.00%), Maturing July 31, 2022 | | | 27 | | | | 25,898 | |
| | |
Term Loan, 4.00%, (1 mo. USD LIBOR + 3.00%, Floor 1.00%), Maturing July 31, 2022 | | | 87 | | | | 85,166 | |
| | |
| XPO Logistics, Inc. | | | | | | |
| | |
Term Loan, 2.15%, (1 mo. USD LIBOR + 2.00%), Maturing February 24, 2025 | | | 150 | | | | 148,688 | |
| |
| | | | $ | 693,588 | |
|
| Telecommunications — 5.2% | |
| | |
| CenturyLink, Inc. | | | | | | |
| | |
Term Loan, 2.40%, (1 mo. USD LIBOR + 2.25%), Maturing March 15, 2027 | | $ | 1,638 | | | $ | 1,604,771 | |
| | |
| Colorado Buyer, Inc. | | | | | | |
| | |
Term Loan, 4.00%, (6 mo. USD LIBOR + 3.00%, Floor 1.00%), Maturing May 1, 2024 | | | 194 | | | | 179,552 | |
| | | | | | | | |
| Borrower/Tranche Description | | Principal
Amount
(000’s omitted) | | | Value | |
|
| Telecommunications (continued) | |
| | |
| Digicel International Finance Limited | | | | | | |
| | |
Term Loan, 3.51%, (6 mo. USD LIBOR + 3.25%), Maturing May 28, 2024 | | $ | 170 | | | $ | 150,760 | |
| | |
| Global Eagle Entertainment, Inc. | | | | | | |
| | |
DIP Loan, 11.25%, (1 mo. USD LIBOR + 10.00%, Floor 1.25%), Maturing January 22, 2021 | | | 71 | | | | 70,017 | |
| | |
Term Loan, 0.00%, Maturing January 6, 2023(10) | | | 475 | | | | 359,338 | |
| | |
| Intelsat Jackson Holdings S.A. | | | | | | |
| | |
DIP Loan, 5.78%, (USD LIBOR + 5.50%, Floor 1.00%), Maturing July 13, 2022(8)(11) | | | 296 | | | | 303,298 | |
| | |
Term Loan, 8.00%, (USD Prime + 4.75%), Maturing November 27, 2023 | | | 600 | | | | 607,687 | |
| | |
Term Loan, 8.75%, (USD Prime + 5.50%), Maturing January 2, 2024 | | | 400 | | | | 406,000 | |
| | |
| IPC Corp. | | | | | | |
| | |
Term Loan, 5.50%, (3 mo. USD LIBOR + 4.50%, Floor 1.00%), Maturing August 6, 2021(6) | | | 220 | | | | 158,596 | |
| | |
| Onvoy, LLC | | | | | | |
| | |
Term Loan, 5.50%, (1 mo. USD LIBOR + 4.50%, Floor 1.00%), Maturing February 10, 2024 | | | 458 | | | | 445,770 | |
| | |
| Plantronics, Inc. | | | | | | |
| | |
Term Loan, 2.65%, (1 mo. USD LIBOR + 2.50%), Maturing July 2, 2025 | | | 292 | | | | 283,121 | |
| | |
| Syniverse Holdings, Inc. | | | | | | |
| | |
Term Loan, 6.00%, (3 mo. USD LIBOR + 5.00%, Floor 1.00%), Maturing March 9, 2023 | | | 219 | | | | 191,313 | |
| | |
| Telesat Canada | | | | | | |
| | |
Term Loan, 2.90%, (1 mo. USD LIBOR + 2.75%), Maturing December 7, 2026 | | | 323 | | | | 315,574 | |
| | |
| Zayo Group Holdings, Inc. | | | | | | |
| | |
Term Loan, 3.15%, (1 mo. USD LIBOR + 3.00%), Maturing March 9, 2027 | | | 547 | | | | 538,562 | |
| | |
| Ziggo Financing Partnership | | | | | | |
| | |
Term Loan, 2.64%, (1 mo. USD LIBOR + 2.50%), Maturing April 30, 2028 | | | 850 | | | | 833,076 | |
| |
| | | | $ | 6,447,435 | |
|
| Utilities — 1.8% | |
| | |
| Brookfield WEC Holdings, Inc. | | | | | | |
| | |
Term Loan, 3.75%, (1 mo. USD LIBOR + 3.00%, Floor 0.75%), Maturing August 1, 2025 | | $ | 762 | | | $ | 755,306 | |
| | |
| Calpine Construction Finance Company L.P. | | | | | | |
| | |
Term Loan, 2.15%, (1 mo. USD LIBOR + 2.00%), Maturing January 15, 2025 | | | 90 | | | | 88,903 | |
| | |
| Calpine Corporation | | | | | | |
| | |
Term Loan, 2.40%, (1 mo. USD LIBOR + 2.25%), Maturing January 15, 2024 | | | 782 | | | | 776,979 | |
| | |
Term Loan, 2.40%, (1 mo. USD LIBOR + 2.25%), Maturing April 5, 2026 | | | 198 | | | | 195,994 | |
| | | | |
| | 20 | | See Notes to Financial Statements. |
Eaton Vance
Floating-Rate Income Plus Fund
November 30, 2020
Portfolio of Investments (Unaudited) — continued
| | | | | | | | |
| Borrower/Tranche Description | | Principal
Amount
(000’s omitted) | | | Value | |
|
| Utilities (continued) | |
| | |
| Longview Power, LLC | | | | | | |
| | |
Term Loan, 11.50%, (3 mo. USD LIBOR + 10.00%, Floor 1.50%), Maturing July 30, 2025(6) | | $ | 70 | | | $ | 56,270 | |
| | |
| USIC Holdings, Inc. | | | | | | |
| | |
Term Loan, 4.00%, (1 mo. USD LIBOR + 3.00%, Floor 1.00%), Maturing December 8, 2023 | | | 293 | | | | 289,360 | |
| |
| | | | $ | 2,162,812 | |
| |
Total Senior Floating-Rate Loans
(identified cost $180,579,550) | | | $ | 175,987,853 | |
|
| Warrants — 0.0%(5) | |
| Security | | Shares | | | Value | |
|
| Health Care — 0.0%(5) | |
| | |
THAIHOT Investment Company US Limited, Exp. 10/13/27 (3)(4)(6) | | | 5 | | | $ | 1,491 | |
| | |
THAIHOT Investment Company US Limited, Exp. 10/13/27 (Contingent Warrants) (3)(4)(6) | | | 299 | | | | 0 | |
| |
| | | | $ | 1,491 | |
|
| Retailers (Except Food and Drug) — 0.0% | |
| | |
David’s Bridal, LLC, Exp. 11/26/22 (3)(4)(6) | | | 1,024 | | | $ | 0 | |
| |
| | | | $ | 0 | |
| |
Total Warrants
(identified cost $0) | | | $ | 1,491 | |
|
| Miscellaneous — 0.0%(5) | |
| Security | | Shares | | | Value | |
|
| Oil and Gas — 0.0%(5) | |
| | |
Paragon Offshore Finance Company, Class A(3)(4) | | | 404 | | | $ | 121 | |
| | |
Paragon Offshore Finance Company, Class B(3)(4) | | | 202 | | | | 2,475 | |
| |
Total Miscellaneous
(identified cost $4,394) | | | $ | 2,596 | |
| | | | | | | | |
| Short-Term Investments — 2.2% | |
| Description | | Units | | | Value | |
| | |
Eaton Vance Cash Reserves Fund, LLC, 0.10%(12) | | | 2,756,462 | | | $ | 2,756,462 | |
| |
Total Short-Term Investments
(identified cost $2,756,462) | | | $ | 2,756,462 | |
| |
Total Investments — 158.5%
(identified cost $200,462,954) | | | $ | 195,229,671 | |
| |
Less Unfunded Loan Commitments — (0.3)% | | | $ | (385,124 | ) |
| |
Net Investments — 158.2%
(identified cost $200,077,830) | | | $ | 194,844,547 | |
| |
Notes Payable — (39.8)% | | | $ | (49,000,000 | ) |
| |
Variable Rate Term Preferred Shares, at Liquidation Value
(net of unamortized deferred debt issuance costs) — (15.4)% | | | $ | (18,968,482 | ) |
| |
Other Assets, Less Liabilities — (3.0)% | | | $ | (3,731,705 | ) |
| |
Net Assets Applicable to Common Shares — 100.0% | | | $ | 123,144,360 | |
The percentage shown for each investment category in the Portfolio of Investments is based on net assets applicable to common shares.
| | (1) | Security exempt from registration under Rule 144A of the Securities Act of 1933, as amended. These securities may be sold in certain transactions in reliance on an exemption from registration (normally to qualified institutional buyers). At November 30, 2020, the aggregate value of these securities is $14,150,359 or 11.5% of the Fund’s net assets applicable to common shares. |
| | (2) | Variable rate security. The stated interest rate represents the rate in effect at November 30, 2020. |
| | (3) | Non-income producing security. |
| | (4) | Security was acquired in connection with a restructuring of a Senior Loan and may be subject to restrictions on resale. |
| | (5) | Amount is less than 0.05%. |
| | (6) | For fair value measurement disclosure purposes, security is categorized as Level 3 (see Note 9). |
| | (7) | Senior floating-rate loans (Senior Loans) often require prepayments from excess cash flows or permit the borrowers to repay at their election. The degree to which borrowers repay, whether as a contractual requirement or at their election, cannot be predicted with accuracy. As a result, the actual remaining maturity may be substantially less than the stated maturities shown. However, Senior Loans will typically have an expected average life of approximately two to four years. Senior Loans typically have rates of interest which are redetermined periodically by reference to a base lending rate, plus a spread. These base lending rates are primarily the London Interbank Offered Rate (“LIBOR”) and secondarily, the prime rate offered by one or more major United States banks (the “Prime Rate”). Base lending rates may be subject to a floor, or minimum rate. Senior Loans are generally subject to contractual restrictions that must be satisfied before they can be bought or sold. |
| | | | |
| | 21 | | See Notes to Financial Statements. |
Eaton Vance
Floating-Rate Income Plus Fund
November 30, 2020
Portfolio of Investments (Unaudited) — continued
| | (8) | The stated interest rate represents the weighted average interest rate at November 30, 2020 of contracts within the senior loan facility. Interest rates on contracts are primarily redetermined either weekly, monthly or quarterly by reference to the indicated base lending rate and spread and the reset period. |
| | (9) | This Senior Loan will settle after November 30, 2020, at which time the interest rate will be determined. |
| (10) | Issuer is in default with respect to interest and/or principal payments or has declared bankruptcy. For a variable rate security, interest rate has been adjusted to reflect non-accrual status. |
| (11) | Unfunded or partially unfunded loan commitments. The stated interest rate reflects the weighted average of the reference rate and spread for the funded portion, if any, and the commitment fees on the portion of the loan that is unfunded. At November 30, 2020, the total value of unfunded loan commitments is $393,566. See Note 1F for description. |
| (12) | Affiliated investment company, available to Eaton Vance portfolios and funds, which invests in high quality, U.S. dollar denominated money market instruments. The rate shown is the annualized seven-day yield as of November 30, 2020. |
Abbreviations:
| | | | |
| | |
| DIP | | – | | Debtor In Possession |
| | |
| LIBOR | | – | | London Interbank Offered Rate |
| | |
| PIK | | – | | Payment In Kind |
Currency Abbreviations:
| | | | |
| | |
| USD | | – | | United States Dollar |
| | | | |
| | 22 | | See Notes to Financial Statements. |
Eaton Vance
Floating-Rate Income Plus Fund
November 30, 2020
Statement of Assets and Liabilities (Unaudited)
| | | | |
| Assets | | November 30, 2020 | |
| |
Unaffiliated investments, at value (identified cost, $197,321,368) | | $ | 192,088,085 | |
| |
Affiliated investment, at value (identified cost, $2,756,462) | | | 2,756,462 | |
| |
Cash | | | 819,280 | |
| |
Interest receivable | | | 596,264 | |
| |
Dividends receivable from affiliated investment | | | 152 | |
| |
Receivable for investments sold | | | 72,969 | |
| |
Tax reclaims receivable | | | 2,726 | |
| |
Prepaid upfront fees on variable rate term preferred shares | | | 13,550 | |
| |
Prepaid upfront fees and other fees on notes payable | | | 46,060 | |
| |
Prepaid expenses | | | 6,102 | |
| |
Total assets | | $ | 196,401,650 | |
| |
| Liabilities | | | | |
| |
Notes payable | | $ | 49,000,000 | |
| |
Variable rate term preferred shares, at liquidation value (net of unamortized deferred debt issuance costs of $31,518) | | | 18,968,482 | |
| |
Payable for investments purchased | | | 4,949,451 | |
| |
Payable to affiliates: | | | | |
| |
Investment adviser fee | | | 116,073 | |
| |
Trustees’ fees | | | 1,805 | |
| |
Interest expense and fees payable | | | 106,812 | |
| |
Accrued expenses | | | 114,667 | |
| |
Total liabilities | | $ | 73,257,290 | |
| |
Net assets applicable to common shares | | $ | 123,144,360 | |
| |
| Sources of Net Assets | | | | |
| |
Common shares, $0.01 par value, unlimited number of shares authorized, 7,606,422 shares issued and outstanding | | $ | 76,064 | |
| |
Additional paid-in capital | | | 143,348,251 | |
| |
Accumulated loss | | | (20,279,955 | ) |
| |
Net assets applicable to common shares | | $ | 123,144,360 | |
| |
| Net Asset Value Per Common Share | | | | |
| |
($123,144,360 ÷ 7,606,422 common shares issued and outstanding) | | $ | 16.19 | |
| | | | |
| | 23 | | See Notes to Financial Statements. |
Eaton Vance
Floating-Rate Income Plus Fund
November 30, 2020
Statement of Operations (Unaudited)
| | | | |
| Investment Income | | Six Months Ended November 30, 2020 | |
| |
Interest and other income | | $ | 4,243,011 | |
| |
Dividends from affiliated investment | | | 1,691 | |
| |
Total investment income | | $ | 4,244,702 | |
| |
| Expenses | | | | |
| |
Investment adviser fee | | $ | 687,420 | |
| |
Trustees’ fees and expenses | | | 5,567 | |
| |
Custodian fee | | | 43,414 | |
| |
Transfer and dividend disbursing agent fees | | | 9,102 | |
| |
Legal and accounting services | | | 220,077 | |
| |
Printing and postage | | | 19,749 | |
| |
Interest expense and fees | | | 571,244 | |
| |
Miscellaneous | | | 29,683 | |
| |
Total expenses | | $ | 1,586,256 | |
| |
Net investment income | | $ | 2,658,446 | |
| |
| Realized and Unrealized Gain (Loss) | | | | |
| |
Net realized gain (loss) — | | | | |
| |
Investment transactions | | $ | (2,261,173 | ) |
| |
Investment transactions — affiliated investment | | | (269 | ) |
| |
Net realized loss | | $ | (2,261,442 | ) |
| |
Change in unrealized appreciation (depreciation) — | | | | |
| |
Investments | | $ | 11,425,537 | |
| |
Investments — affiliated investment | | | 141 | |
| |
Foreign currency | | | 193 | |
| |
Net change in unrealized appreciation (depreciation) | | $ | 11,425,871 | |
| |
Net realized and unrealized gain | | $ | 9,164,429 | |
| |
Net increase in net assets from operations | | $ | 11,822,875 | |
| | | | |
| | 24 | | See Notes to Financial Statements. |
Eaton Vance
Floating-Rate Income Plus Fund
November 30, 2020
Statements of Changes in Net Assets
| | | | | | | | |
| Increase (Decrease) in Net Assets | | Six Months Ended
November 30, 2020
(Unaudited) | | | Year Ended
May 31, 2020 | |
| | |
From operations — | | | | | | | | |
| | |
Net investment income | | $ | 2,658,446 | | | $ | 6,645,714 | |
| | |
Net realized loss | | | (2,261,442 | ) | | | (5,892,328 | ) |
| | |
Net change in unrealized appreciation (depreciation) | | | 11,425,871 | | | | (9,849,114 | ) |
| | |
Net increase (decrease) in net assets from operations | | $ | 11,822,875 | | | $ | (9,095,728 | ) |
| | |
Distributions to common shareholders | | $ | (2,761,131 | ) | | $ | (6,623,737 | ) |
| | |
Tax return of capital to common shareholders | | $ | — | | | $ | (708,854 | ) |
| | |
Net increase (decrease) in net assets | | $ | 9,061,744 | | | $ | (16,428,319 | ) |
| | |
| Net Assets Applicable to Common Shares | | | | | | | | |
| | |
At beginning of period | | $ | 114,082,616 | | | $ | 130,510,935 | |
| | |
At end of period | | $ | 123,144,360 | | | $ | 114,082,616 | |
| | | | |
| | 25 | | See Notes to Financial Statements. |
Eaton Vance
Floating-Rate Income Plus Fund
November 30, 2020
Statement of Cash Flows (Unaudited)
| | | | |
| Cash Flows From Operating Activities | | Six Months Ended
November 30, 2020 | |
| |
Net increase in net assets from operations | | $ | 11,822,875 | |
| |
Adjustments to reconcile net increase in net assets from operations to net cash used in operating activities: | | | | |
| |
Investments purchased | | | (26,519,924 | ) |
| |
Investments sold and principal repayments | | | 17,102,061 | |
| |
Increase in short-term investments, net | | | (1,291,912 | ) |
| |
Net amortization/accretion of premium (discount) | | | (289,845 | ) |
| |
Amortization of prepaid upfront fees on variable rate term preferred shares | | | 2,190 | |
| |
Amortization of deferred debt issuance costs on variable rate term preferred shares | | | 4,947 | |
| |
Amortization of prepaid upfront fees and other fees on notes payable | | | 75,038 | |
| |
Decrease in interest receivable | | | 68,212 | |
| |
Decrease in dividends receivable from affiliated investment | | | 341 | |
| |
Increase in tax reclaims receivable | | | (193 | ) |
| |
Decrease in prepaid expenses | | | 2,471 | |
| |
Increase in payable to affiliate for investment adviser fee | | | 9,788 | |
| |
Increase in payable to affiliate for Trustees’ fees | | | 99 | |
| |
Decrease in interest expense and fees payable | | | (56,598 | ) |
| |
Decrease in accrued expenses | | | (58,891 | ) |
| |
Increase in unfunded loan commitments | | | 385,124 | |
| |
Net change in unrealized (appreciation) depreciation from investments | | | (11,425,678 | ) |
| |
Net realized loss from investments | | | 2,261,442 | |
| |
Net cash used in operating activities | | $ | (7,908,453 | ) |
| |
| Cash Flows From Financing Activities | | | | |
| |
Cash distributions paid to common shareholders | | $ | (2,761,131 | ) |
| |
Proceeds from notes payable | | | 10,500,000 | |
| |
Net cash provided by financing activities | | $ | 7,738,869 | |
| |
Net decrease in cash | | $ | (169,584 | ) |
| |
Cash at beginning of period | | $ | 988,864 | |
| |
Cash at end of period | | $ | 819,280 | |
| |
| Supplemental disclosure of cash flow information: | | | | |
| |
Cash paid for interest and fees on borrowings and variable rate term preferred shares | | $ | 545,667 | |
| | | | |
| | 26 | | See Notes to Financial Statements. |
Eaton Vance
Floating-Rate Income Plus Fund
November 30, 2020
Financial Highlights
Selected data for a common share outstanding during the periods stated
| | | | | | | | | | | | | | | | | | | | | | | | |
| | | Six Months Ended
November 30, 2020
(Unaudited) | | | Year Ended May 31, | |
| | | 2020 | | | 2019 | | | 2018 | | | 2017 | | | 2016 | |
| | | | | | |
Net asset value — Beginning of period (Common shares) | | $ | 15.000 | | | $ | 17.160 | | | $ | 17.830 | | | $ | 17.930 | | | $ | 16.610 | | | $ | 18.390 | |
| | | | | | |
| Income (Loss) From Operations | | | | | | | | | | | | | | | | | | | | | | | | |
| | | | | | |
Net investment income(1) | | $ | 0.350 | | | $ | 0.874 | | | $ | 0.974 | | | $ | 0.898 | | | $ | 0.948 | | | $ | 1.058 | |
| | | | | | |
Net realized and unrealized gain (loss) | | | 1.203 | | | | (2.070 | ) | | | (0.694 | ) | | | (0.088 | ) | | | 1.365 | | | | (1.724 | ) |
| | | | | | |
Total income (loss) from operations | | $ | 1.553 | | | $ | (1.196 | ) | | $ | 0.280 | | | $ | 0.810 | | | $ | 2.313 | | | $ | (0.666 | ) |
| | | | | | |
| Less Distributions to Common Shareholders | | | | | | | | | | | | | | | | | | | | | | | | |
| | | | | | |
From net investment income | | $ | (0.363 | ) | | $ | (0.871 | ) | | $ | (0.950 | ) | | $ | (0.910 | ) | | $ | (0.983 | ) | | $ | (1.114 | ) |
| | | | | | |
Tax return of capital | | | — | | | | (0.093 | ) | | | — | | | | — | | | | (0.010 | ) | | | — | |
| | | | | | |
Total distributions to common shareholders | | $ | (0.363 | ) | | $ | (0.964 | ) | | $ | (0.950 | ) | | $ | (0.910 | ) | | $ | (0.993 | ) | | $ | (1.114 | ) |
| | | | | | |
Net asset value — End of period (Common shares) | | $ | 16.190 | | | $ | 15.000 | | | $ | 17.160 | | | $ | 17.830 | | | $ | 17.930 | | | $ | 16.610 | |
| | | | | | |
Market value — End of period (Common shares) | | $ | 15.130 | | | $ | 13.730 | | | $ | 14.890 | | | $ | 16.720 | | | $ | 17.350 | | | $ | 15.240 | |
| | | | | | |
Total Investment Return on Net Asset Value(2) | | | 10.67 | %(3) | | | (6.71 | )% | | | 2.35 | % | | | 5.03 | % | | | 14.69 | % | | | (2.60 | )% |
| | | | | | |
Total Investment Return on Market Value(2) | | | 13.00 | %(3) | | | (1.60 | )% | | | (5.29 | )% | | | 1.79 | % | | | 20.96 | % | | | (3.15 | )% |
| | | | |
| | 27 | | See Notes to Financial Statements. |
Eaton Vance
Floating-Rate Income Plus Fund
November 30, 2020
Financial Highlights — continued
Selected data for a common share outstanding during the periods stated
| | | | | | | | | | | | | | | | | | | | | | | | |
| | | Six Months Ended
November 30, 2020
(Unaudited) | | | Year Ended May 31, | |
| Ratios/Supplemental Data | | 2020 | | | 2019 | | | 2018 | | | 2017 | | | 2016 | |
| | | | | | |
Net assets applicable to common shares, end of period (000’s omitted) | | $ | 123,144 | | | $ | 114,083 | | | $ | 130,511 | | | $ | 135,650 | | | $ | 136,351 | | | $ | 126,331 | |
| | | | | | |
Ratios (as a percentage of average daily net assets applicable to common shares):† | | | | | | | | | | | | | | | | | | | | | | | | |
| | | | | | |
Expenses excluding interest and fees(4) | | | 1.70 | %(5) | | | 1.57 | % | | | 1.44 | % | | | 1.44 | % | | | 1.48 | % | | | 1.63 | % |
| | | | | | |
Interest and fee expense(6) | | | 0.95 | %(5) | | | 1.83 | % | | | 2.09 | % | | | 1.57 | % | | | 1.17 | % | | | 0.99 | % |
| | | | | | |
Total expenses(4) | | | 2.65 | %(5) | | | 3.40 | % | | | 3.53 | % | | | 3.01 | % | | | 2.65 | % | | | 2.62 | % |
| | | | | | |
Net investment income | | | 4.43 | %(5) | | | 5.33 | % | | | 5.56 | % | | | 5.00 | % | | | 5.40 | % | | | 6.35 | % |
| | | | | | |
Portfolio Turnover | | | 9 | %(3) | | | 37 | % | | | 24 | % | | | 33 | % | | | 52 | % | | | 29 | % |
| | | | | | |
Senior Securities: | | | | | | | | | | | | | | | | | | | | | | | | |
| | | | | | |
Total notes payable outstanding (in 000’s) | | $ | 49,000 | | | $ | 38,500 | | | $ | 54,000 | | | $ | 58,000 | | | $ | 54,000 | | | $ | 34,000 | |
| | | | | | |
Asset coverage per $1,000 of notes payable(7) | | $ | 3,901 | | | $ | 4,457 | | | $ | 3,769 | | | $ | 3,666 | | | $ | 3,877 | | | $ | 5,774 | |
| | | | | | |
Total preferred shares outstanding | | | 190 | | | | 190 | | | | 190 | | | | 190 | | | | 190 | | | | 360 | |
| | | | | | |
Asset coverage per preferred share(8) | | $ | 281,095 | | | $ | 298,405 | | | $ | 278,782 | | | $ | 276,169 | | | $ | 286,782 | | | $ | 280,473 | |
| | | | | | |
Involuntary liquidation preference per preferred share(9) | | $ | 100,000 | | | $ | 100,000 | | | $ | 100,000 | | | $ | 100,000 | | | $ | 100,000 | | | $ | 100,000 | |
| | | | | | |
Approximate market value per preferred share(9) | | $ | 100,000 | | | $ | 100,000 | | | $ | 100,000 | | | $ | 100,000 | | | $ | 100,000 | | | $ | 100,000 | |
| (1) | Computed using average common shares outstanding. |
| (2) | Returns are historical and are calculated by determining the percentage change in net asset value or market value with all distributions reinvested. Distributions are assumed to be reinvested at prices obtained under the Fund’s dividend reinvestment plan. |
| (4) | Excludes the effect of custody fee credits, if any, of less than 0.005%. Effective September 1, 2015, custody fee credits, which were earned on cash deposit balances, were discontinued by the custodian. |
| (6) | Interest and fee expense relates to variable rate term preferred shares (see Note 2) and the notes payable (see Note 7). Effective June 1, 2016, the ratio includes amortization of deferred debt issuance costs. For periods prior to June 1, 2016, amortization of deferred debt issuance costs was included in the ratio of expenses excluding interest and fees. |
| (7) | Calculated by subtracting the Fund’s total liabilities (not including the notes payable and preferred shares) from the Fund’s total assets, and dividing the result by the notes payable balance in thousands. |
| (8) | Calculated by subtracting the Fund’s total liabilities (not including the notes payable and preferred shares) from the Fund’s total assets, dividing the result by the sum of the value of the notes payable and liquidation value of the preferred shares, and multiplying the result by the liquidation value of one preferred share. Such amount equates to 281%, 298%, 279%, 276%, 287% and 280% at November 30, 2020 and May 31, 2020, 2019, 2018, 2017 and 2016, respectively. |
| (9) | Plus accumulated and unpaid dividends. |
| † | Ratios based on net assets applicable to common shares plus preferred shares and borrowings are presented below. Ratios exclude the effect of custody fee credits, if any. Ratios for periods less than one year are annualized. |
| | | | | | | | | | | | | | | | | | | | | | | | |
| | | Six Months Ended
November 30, 2020
(Unaudited) | | | Year Ended May 31, | |
| | | 2020 | | | 2019 | | | 2018 | | | 2017 | | | 2016 | |
| | | | | | |
Expenses excluding interest and fees | | | 1.11 | % | | | 1.02 | % | | | 0.92 | % | | | 0.94 | % | | | 0.98 | % | | | 0.99 | % |
| | | | | | |
Interest and fee expense | | | 0.62 | % | | | 1.18 | % | | | 1.35 | % | | | 1.01 | % | | | 0.77 | % | | | 0.60 | % |
| | | | | | |
Total expenses | | | 1.73 | % | | | 2.20 | % | | | 2.27 | % | | | 1.95 | % | | | 1.75 | % | | | 1.59 | % |
| | | | | | |
Net investment income | | | 2.90 | % | | | 3.46 | % | | | 3.58 | % | | | 3.24 | % | | | 3.56 | % | | | 3.87 | % |
| | | | |
| | 28 | | See Notes to Financial Statements. |
Eaton Vance
Floating-Rate Income Plus Fund
November 30, 2020
Notes to Financial Statements (Unaudited)
1 Significant Accounting Policies
Eaton Vance Floating-Rate Income Plus Fund (the Fund) is a Massachusetts business trust registered under the Investment Company Act of 1940, as amended (the 1940 Act), as a diversified, closed-end management investment company. The Fund’s investment objective is total return, with an emphasis on income.
The following is a summary of significant accounting policies of the Fund. The policies are in conformity with accounting principles generally accepted in the United States of America (U.S. GAAP). The Fund is an investment company and follows accounting and reporting guidance in the Financial Accounting Standards Board (FASB) Accounting Standards Codification Topic 946.
A Investment Valuation — The following methodologies are used to determine the market value or fair value of investments.
Senior Floating-Rate Loans. Interests in senior floating-rate loans (Senior Loans) for which reliable market quotations are readily available are valued generally at the average mean of bid and ask quotations obtained from a third party pricing service. Other Senior Loans are valued at fair value by the investment adviser under procedures approved by the Trustees. In fair valuing a Senior Loan, the investment adviser utilizes one or more of the valuation techniques described in (i) through (iii) below to assess the likelihood that the borrower will make a full repayment of the loan underlying such Senior Loan relative to yields on other Senior Loans issued by companies of comparable credit quality. If the investment adviser believes that there is a reasonable likelihood of full repayment, the investment adviser will determine fair value using a matrix pricing approach that considers the yield on the Senior Loan. If the investment adviser believes there is not a reasonable likelihood of full repayment, the investment adviser will determine fair value using analyses that include, but are not limited to: (i) a comparison of the value of the borrower’s outstanding equity and debt to that of comparable public companies; (ii) a discounted cash flow analysis; or (iii) when the investment adviser believes it is likely that a borrower will be liquidated or sold, an analysis of the terms of such liquidation or sale. In certain cases, the investment adviser will use a combination of analytical methods to determine fair value, such as when only a portion of a borrower’s assets are likely to be sold. In conducting its assessment and analyses for purposes of determining fair value of a Senior Loan, the investment adviser will use its discretion and judgment in considering and appraising relevant factors. Fair value determinations are made by the portfolio managers of the Fund based on information available to such managers. The portfolio managers of other funds managed by the investment adviser that invest in Senior Loans may not possess the same information about a Senior Loan borrower as the portfolio managers of the Fund. At times, the fair value of a Senior Loan determined by the portfolio managers of other funds managed by the investment adviser that invest in Senior Loans may vary from the fair value of the same Senior Loan determined by the portfolio managers of the Fund. The fair value of each Senior Loan is periodically reviewed and approved by the investment adviser’s Valuation Committee and by the Trustees based upon procedures approved by the Trustees. Junior Loans (i.e., subordinated loans and second lien loans) are valued in the same manner as Senior Loans.
Debt Obligations. Debt obligations are generally valued on the basis of valuations provided by third party pricing services, as derived from such services’ pricing models. Inputs to the models may include, but are not limited to, reported trades, executable bid and ask prices, broker/dealer quotations, prices or yields of securities with similar characteristics, interest rates, anticipated prepayments, benchmark curves or information pertaining to the issuer, as well as industry and economic events. The pricing services may use a matrix approach, which considers information regarding securities with similar characteristics to determine the valuation for a security. Short-term debt obligations purchased with a remaining maturity of sixty days or less for which a valuation from a third party pricing service is not readily available may be valued at amortized cost, which approximates fair value.
Equity Securities. Equity securities listed on a U.S. securities exchange generally are valued at the last sale or closing price on the day of valuation or, if no sales took place on such date, at the mean between the closing bid and ask prices on the exchange where such securities are principally traded. Equity securities listed on the NASDAQ Global or Global Select Market generally are valued at the NASDAQ official closing price. Unlisted or listed securities for which closing sales prices or closing quotations are not available are valued at the mean between the latest available bid and ask prices or, in the case of preferred equity securities that are not listed or traded in the over-the-counter market, by a third party pricing service that uses various techniques that consider factors including, but not limited to, prices or yields of securities with similar characteristics, benchmark yields, broker/dealer quotes, quotes of underlying common stock, issuer spreads, as well as industry and economic events.
Affiliated Fund. The Fund may invest in Eaton Vance Cash Reserves Fund, LLC (Cash Reserves Fund), an affiliated investment company managed by Eaton Vance Management (EVM). While Cash Reserves Fund is not a registered money market mutual fund, it conducts all of its investment activities in accordance with the requirements of Rule 2a-7 under the 1940 Act. Investments in Cash Reserves Fund are valued at the closing net asset value per unit on the valuation day. Cash Reserves Fund generally values its investment securities based on available market quotations provided by a third party pricing service.
Fair Valuation. Investments for which valuations or market quotations are not readily available or are deemed unreliable are valued at fair value using methods determined in good faith by or at the direction of the Trustees of the Fund in a manner that most fairly reflects the security’s “fair value”, which is the amount that the Fund might reasonably expect to receive for the security upon its current sale in the ordinary course. Each such determination is based on a consideration of relevant factors, which are likely to vary from one pricing context to another. These factors may include, but are not limited to, the type of security, the existence of any contractual restrictions on the security’s disposition, the price and extent of public trading in similar securities of the issuer or of comparable companies or entities, quotations or relevant information obtained from broker/dealers or other market participants, information obtained from the issuer, analysts, and/or the appropriate stock exchange (for exchange-traded securities), an analysis of the company’s or entity’s financial statements, and an evaluation of the forces that influence the issuer and the market(s) in which the security is purchased and sold.
B Investment Transactions — Investment transactions for financial statement purposes are accounted for on a trade date basis. Realized gains and losses on investments sold are determined on the basis of identified cost.
Eaton Vance
Floating-Rate Income Plus Fund
November 30, 2020
Notes to Financial Statements (Unaudited) — continued
C Income — Interest income is recorded on the basis of interest accrued, adjusted for amortization of premium or accretion of discount. Fees associated with loan amendments are recognized immediately. Dividend income is recorded on the ex-dividend date for dividends received in cash and/or securities. However, if the ex-dividend date has passed, certain dividends from foreign securities are recorded as the Fund is informed of the ex-dividend date. Withholding taxes on foreign dividends and capital gains have been provided for in accordance with the Fund’s understanding of the applicable countries’ tax rules and rates.
D Federal Taxes — The Fund’s policy is to comply with the provisions of the Internal Revenue Code applicable to regulated investment companies and to distribute to shareholders each year substantially all of its net investment income, and all or substantially all of its net realized capital gains. Accordingly, no provision for federal income or excise tax is necessary.
As of November 30, 2020, the Fund had no uncertain tax positions that would require financial statement recognition, de-recognition, or disclosure. The Fund files a U.S. federal income tax return annually after its fiscal year-end, which is subject to examination by the Internal Revenue Service for a period of three years from the date of filing.
E Unfunded Loan Commitments — The Fund may enter into certain loan agreements all or a portion of which may be unfunded. The Fund is obligated to fund these commitments at the borrower’s discretion. These commitments, if any, are disclosed in the accompanying Portfolio of Investments. At November 30, 2020, the Fund had sufficient cash and/or securities to cover these commitments.
F Use of Estimates — The preparation of the financial statements in conformity with U.S. GAAP requires management to make estimates and assumptions that affect the reported amounts of assets and liabilities at the date of the financial statements and the reported amounts of income and expense during the reporting period. Actual results could differ from those estimates.
G Indemnifications — Under the Fund’s organizational documents, its officers and Trustees may be indemnified against certain liabilities and expenses arising out of the performance of their duties to the Fund. Under Massachusetts law, if certain conditions prevail, shareholders of a Massachusetts business trust (such as the Fund) could be deemed to have personal liability for the obligations of the Fund. However, the Fund’s Declaration of Trust contains an express disclaimer of liability on the part of Fund shareholders and the By-laws provide that the Fund shall assume, upon request by the shareholder, the defense on behalf of any Fund shareholders. Moreover, the By-laws also provide for indemnification out of Fund property of any shareholder held personally liable solely by reason of being or having been a shareholder for all loss or expense arising from such liability. Additionally, in the normal course of business, the Fund enters into agreements with service providers that may contain indemnification clauses. The Fund’s maximum exposure under these arrangements is unknown as this would involve future claims that may be made against the Fund that have not yet occurred.
H Interim Financial Statements — The interim financial statements relating to November 30, 2020 and for the six months then ended have not been audited by an independent registered public accounting firm, but in the opinion of the Fund’s management, reflect all adjustments, consisting only of normal recurring adjustments, necessary for the fair presentation of the financial statements.
2 Variable Rate Term Preferred Shares
Variable rate term preferred shares are a form of preferred shares that represent stock of the Fund. They have a par value of $0.01 per share and a liquidation preference of $100,000 per share.
On July 10, 2013, the Fund issued 360 shares of Series C-1 Variable Rate Term Preferred Shares (Series C-1 VRTP Shares) in a private offering to a commercial paper conduit sponsored by a large financial institution. The Series C-1 VRTP Shares had an original mandatory redemption date of July 8, 2016 that had been extended on various dates through April 7, 2017 upon consent of the holders of the Series C-1 VRTP Shares and approval of the Fund’s Board of Trustees. On September 30, 2016, the Fund redeemed 170 Series C-1 VRTP Shares at a liquidation price of $100,000 per share, the financing for which was provided by a committed financing arrangement (see Note 7).
Upon completion of the partial redemption of the Series C-1 VRTP Shares, the remaining 190 Series C-1 VRTP Shares were transferred to another large financial institution (the Assignee) on September 30, 2016 as permitted by the Fund’s By-laws. The transferred Series C-1 VRTP Shares were then exchanged for an equal number of Series L-2 Variable Rate Term Preferred Shares (Series L-2 VRTP Shares), and the mandatory redemption date was extended to three years from the date of transfer. Effective January 24, 2019, the mandatory redemption date of the Series L-2 VRTP Shares was extended to January 24, 2024. Dividends on the Series L-2 VRTP Shares are determined each day based on a spread of 1.75% to three-month LIBOR. Such spread is determined based on the current credit rating of the Series L-2 VRTP Shares, which is provided by Moody’s Investors Service.
The Series L-2 VRTP Shares are redeemable at the option of the Fund at a redemption price equal to $100,000 per share, plus accumulated and unpaid dividends, on any business day and solely for the purpose of reducing the leverage of the Fund. The Series L-2 VRTP Shares are also subject to mandatory redemption at a redemption price equal to $100,000 per share, plus accumulated and unpaid dividends, if the Fund is in default for an extended period on its asset maintenance or leverage ratio requirements with respect to the Series L-2 VRTP Shares. Six months prior to the mandatory redemption date, the Fund is required to segregate in a liquidity account with its custodian investments equal to 110% of the Series L-2 VRTP Shares’ redemption price, and over the six-month period execute a series of liquidation transactions to assure sufficient liquidity to redeem the Series L-2 VRTP Shares. The holders
Eaton Vance
Floating-Rate Income Plus Fund
November 30, 2020
Notes to Financial Statements (Unaudited) — continued
of the Series L-2 VRTP Shares, voting as a class, are entitled to elect two Trustees of the Fund. If the dividends on the Series L-2 VRTP Shares remain unpaid in an amount equal to two full years’ dividends, the holders of the Series L-2 VRTP Shares as a class have the right to elect a majority of the Board of Trustees.
For financial reporting purposes, the liquidation value of the Series L-2 VRTP Shares (net of unamortized deferred debt issuance costs) is presented as a liability on the Statement of Assets and Liabilities and unpaid dividends are included in interest expense and fees payable. Dividends accrued on Series L-2 VRTP Shares are treated as interest payments for financial reporting purposes and are included in interest expense and fees on the Statement of Operations.
In connection with the transfer of the Series C-1 VRTP Shares to the Assignee on September 30, 2016, the Fund paid an upfront fee of $95,000 and debt issuance costs of $107,733. The Fund paid additional debt issuance costs of $23,000 in connection with the extension of the mandatory redemption date of the Series L-2 VRTP Shares. These amounts are being amortized to interest expense and fees through January 24, 2024. The unamortized amount of the debt issuance costs as of November 30, 2020 is presented as a reduction of the liability for variable rate term preferred shares on the Statement of Assets and Liabilities.
The carrying amount of the Series L-2 VRTP Shares at November 30, 2020 represents its liquidation value, which approximates fair value. If measured at fair value, the Series L-2 VRTP Shares would have been considered as Level 2 in the fair value hierarchy (see Note 9) at November 30, 2020. The average liquidation preference of the Series L-2 VRTP Shares during the six months ended November 30, 2020 was $19,000,000.
3 Distributions to Shareholders and Income Tax Information
The Fund intends to make monthly distributions of net investment income to common shareholders, after payment of any dividends on any outstanding variable rate term preferred shares. In addition, at least annually, the Fund intends to distribute all or substantially all of its net realized capital gains. Distributions to common shareholders are recorded on the ex-dividend date. Dividends to variable rate term preferred shareholders are accrued daily and payable quarterly. The dividend rate on the Series L-2 VRTP Shares at November 30, 2020 was 1.97%. The amount of dividends accrued and the average annual dividend rate of the Series L-2 VRTP Shares during the six months ended November 30, 2020 were $212,938 and 2.24%, respectively.
Distributions to shareholders are determined in accordance with income tax regulations, which may differ from U.S. GAAP. As required by U.S. GAAP, only distributions in excess of tax basis earnings and profits are reported in the financial statements as a return of capital. Permanent differences between book and tax accounting relating to distributions are reclassified to paid-in capital. For tax purposes, distributions from short-term capital gains are considered to be from ordinary income.
At May 31, 2020, the Fund, for federal income tax purposes, had deferred capital losses of $12,582,036 which would reduce its taxable income arising from future net realized gains on investment transactions, if any, to the extent permitted by the Internal Revenue Code, and thus would reduce the amount of distributions to shareholders, which would otherwise be necessary to relieve the Fund of any liability for federal income or excise tax. The deferred capital losses are treated as arising on the first day of the Fund’s next taxable year and retain the same short-term or long-term character as when originally deferred. Of the deferred capital losses at May 31, 2020, $1,720,456 are short-term and $10,861,580 are long-term.
The cost and unrealized appreciation (depreciation) of investments of the Fund at November 30, 2020, as determined on a federal income tax basis, were as follows:
| | | | |
| |
Aggregate cost | | $ | 200,070,946 | |
| |
Gross unrealized appreciation | | $ | 1,365,580 | |
| |
Gross unrealized depreciation | | | (6,591,979 | ) |
| |
Net unrealized depreciation | | $ | (5,226,399 | ) |
4 Investment Adviser Fee and Other Transactions with Affiliates
The investment adviser fee is earned by EVM, a wholly-owned subsidiary of Eaton Vance Corp., as compensation for investment advisory services rendered to the Fund. The fee is computed at an annual rate of 0.75% of the Fund’s average daily total managed assets and is payable monthly. Total managed assets as referred to herein represent total assets of the Fund (including assets attributable to borrowings, any outstanding preferred shares, or other forms of leverage) less accrued liabilities (other than liabilities representing borrowings or such other forms of leverage). For the six months ended November 30, 2020, the Fund’s investment adviser fee amounted to $687,420. The Fund invests its cash in Cash Reserves Fund. EVM does not currently receive a fee for advisory services provided to Cash Reserves Fund. EVM also serves as administrator of the Fund, but receives no compensation.
Eaton Vance
Floating-Rate Income Plus Fund
November 30, 2020
Notes to Financial Statements (Unaudited) — continued
Trustees and officers of the Fund who are members of EVM’s organization receive remuneration for their services to the Fund out of the investment adviser fee. Trustees of the Fund who are not affiliated with EVM may elect to defer receipt of all or a percentage of their annual fees in accordance with the terms of the Trustees Deferred Compensation Plan. For the six months ended November 30, 2020, no significant amounts have been deferred. Certain officers and Trustees of the Fund are officers of EVM.
5 Purchases and Sales of Investments
Purchases and sales of investments, other than short-term obligations and including maturities, paydowns and principal repayments on Senior Loans, aggregated $27,936,480 and $15,722,442, respectively, for the six months ended November 30, 2020.
6 Common Shares of Beneficial Interest
The Fund may issue common shares pursuant to its dividend reinvestment plan. There were no common shares issued by the Fund for the six months ended November 30, 2020 and the year ended May 31, 2020.
In November 2013, the Board of Trustees initially approved a share repurchase program for the Fund. Pursuant to the reauthorization of the share repurchase program by the Board of Trustees in March 2019, the Fund is authorized to repurchase up to 10% of its common shares outstanding as of the last day of the prior calendar year at market prices when shares are trading at a discount to net asset value. The share repurchase program does not obligate the Fund to purchase a specific amount of shares. There were no repurchases of common shares by the Fund for the six months ended November 30, 2020 and the year ended May 31, 2020.
According to filings made on Schedule 13D and 13G pursuant to Sections 13(d) and 13(g) of the Securities Exchange Act of 1934, as amended, one entity and one individual affiliated with such entity together owned 22.5% of the Fund’s common shares.
7 Revolving Credit and Security Agreement
The Fund has entered into a Revolving Credit and Security Agreement, as amended (the Agreement) with conduit lenders and a bank to borrow up to $64 million. Borrowings under the Agreement are secured by the assets of the Fund. Interest is charged at a rate above the conduits’ commercial paper issuance rate and is payable monthly. Under the terms of the Agreement, in effect through March 8, 2021, the Fund also pays a program fee of 0.85% per annum on its outstanding borrowings to administer the facility and a liquidity fee of 0.15% (0.25% if the outstanding loan amount is less than or equal to 60% of the total facility size) per annum on the unused portion of the total commitment under the Agreement. Program and liquidity fees for the six months ended November 30, 2020 totaled $206,217 and are included in interest expense and fees on the Statement of Operations. In connection with the renewal of the Agreement on March 9, 2020, the Fund paid upfront fees of $64,000 and, shortly thereafter on March 20, 2020, the Fund paid waiver fees of $80,000 in connection with a reduction of Fund net asset value during the month of March 2020 due to market volatility; these aggregate upfront and waiver fees are being amortized to interest expense through March 8, 2021. The unamortized balance at November 30, 2020 is approximately $46,000 and is included in prepaid upfront fees and other fees on notes payable on the Statement of Assets and Liabilities. At November 30, 2020, the Fund had borrowings outstanding under the Agreement of $49,000,000 at an annual interest rate of 0.21%. Based on the short-term nature of the borrowings under the Agreement and the variable interest rate, the carrying amount of the borrowings at November 30, 2020 approximated its fair value. If measured at fair value, borrowings under the Agreement would have been considered as Level 2 in the fair value hierarchy (see Note 9) at November 30, 2020. For the six months ended November 30, 2020, the average borrowings under the Agreement and the average annual interest rate (excluding fees) were $44,377,049 and 0.27%, respectively.
8 Investments in Affiliated Funds
At November 30, 2020, the value of the Fund’s investment in affiliated funds was $2,756,462, which represents 2.2% of the Fund’s net assets applicable to common shares. Transactions in affiliated funds by the Fund for the six months ended November 30, 2020 were as follows:
| | | | | | | | | | | | | | | | | | | | | | | | | | | | | | | | |
| Name of affiliated fund | | Value,
beginning of
period | | | Purchases | | | Sales
proceeds | | | Net
realized
gain (loss) | | | Change in
unrealized
appreciation
(depreciation) | | | Value, end
of period | | | Dividend
income | | | Units, end
of period | |
|
Short-Term Investments | |
| | | | | | | | |
Eaton Vance Cash Reserves Fund, LLC | | $ | 1,464,678 | | | $ | 30,809,341 | | | $ | (29,517,429 | ) | | $ | (269 | ) | | $ | 141 | | | $ | 2,756,462 | | | $ | 1,691 | | | | 2,756,462 | |
Eaton Vance
Floating-Rate Income Plus Fund
November 30, 2020
Notes to Financial Statements (Unaudited) — continued
9 Fair Value Measurements
Under generally accepted accounting principles for fair value measurements, a three-tier hierarchy to prioritize the assumptions, referred to as inputs, is used in valuation techniques to measure fair value. The three-tier hierarchy of inputs is summarized in the three broad levels listed below.
| • | | Level 1 – quoted prices in active markets for identical investments |
| • | | Level 2 – other significant observable inputs (including quoted prices for similar investments, interest rates, prepayment speeds, credit risk, etc.) |
| • | | Level 3 – significant unobservable inputs (including a fund’s own assumptions in determining the fair value of investments) |
In cases where the inputs used to measure fair value fall in different levels of the fair value hierarchy, the level disclosed is determined based on the lowest level input that is significant to the fair value measurement in its entirety. The inputs or methodology used for valuing securities are not necessarily an indication of the risk associated with investing in those securities.
At November 30, 2020, the hierarchy of inputs used in valuing the Fund’s investments, which are carried at value, were as follows:
| | | | | | | | | | | | | | | | |
| Asset Description | | Level 1 | | | Level 2 | | | Level 3* | | | Total | |
| | | | |
Asset-Backed Securities | | $ | — | | | $ | 11,280,554 | | | $ | — | | | $ | 11,280,554 | |
| | | | |
Common Stocks | | | 219,595 | | | | 753,793 | | | | 273,587 | | | | 1,246,975 | |
| | | | |
Corporate Bonds & Notes | | | — | | | | 3,808,603 | | | | — | | | | 3,808,603 | |
| | | | |
Preferred Stocks | | | 52,257 | | | | 12,220 | | | | 80,660 | | | | 145,137 | |
| | | | |
Senior Floating-Rate Loans (Less Unfunded Loan Commitments) | | | — | | | | 175,311,774 | | | | 290,955 | | | | 175,602,729 | |
| | | | |
Warrants | | | — | | | | — | | | | 1,491 | | | | 1,491 | |
| | | | |
Miscellaneous | | | — | | | | 2,596 | | | | — | | | | 2,596 | |
| | | | |
Short-Term Investments | | | — | | | | 2,756,462 | | | | — | | | | 2,756,462 | |
| | | | |
Total Investments | | $ | 271,852 | | | $ | 193,926,002 | | | $ | 646,693 | | | $ | 194,844,547 | |
| * | None of the unobservable inputs for Level 3 assets, individually or collectively, had a material impact on the Fund. |
Level 3 investments at the beginning and/or end of the period in relation to net assets were not significant and accordingly, a reconciliation of Level 3 assets for the six months ended November 30, 2020 is not presented.
10 Risks and Uncertainties
Credit Risk
The Fund invests primarily in below investment grade floating-rate loans, which are considered speculative because of the credit risk of their issuers. Changes in economic conditions or other circumstances are more likely to reduce the capacity of issuers of these securities to make principal and interest payments. Such companies are more likely to default on their payments of interest and principal owed than issuers of investment grade bonds. An economic downturn generally leads to a higher non-payment rate, and a loan or other debt obligation may lose significant value before a default occurs. Lower rated investments also may be subject to greater price volatility than higher rated investments. Moreover, the specific collateral used to secure a loan may decline in value or become illiquid, which would adversely affect the loan’s value.
Pandemic Risk
An outbreak of respiratory disease caused by a novel coronavirus was first detected in China in December 2019 and subsequently spread internationally. This coronavirus has resulted in closing borders, enhanced health screenings, changes to healthcare service preparation and delivery, quarantines, cancellations, disruptions to supply chains and customer activity, as well as general concern and uncertainty. Health crises caused by outbreaks, such as the coronavirus outbreak, may exacerbate other pre-existing political, social and economic risks and disrupt normal market conditions and operations. The impact of this outbreak has negatively affected the worldwide economy, the economies of individual countries, individual companies, and the market in general, and may continue to do so in significant and unforeseen ways, as may other epidemics and pandemics that may arise in the future. Any such impact could adversely affect the Fund’s performance, or the performance of the securities in which the Fund invests.
11 Additional Information
On October 8, 2020, Morgan Stanley and Eaton Vance Corp. (“Eaton Vance”) announced that they had entered into a definitive agreement under which Morgan Stanley would acquire Eaton Vance. Under the Investment Company Act of 1940, as amended, consummation of this transaction may be deemed
Eaton Vance
Floating-Rate Income Plus Fund
November 30, 2020
Notes to Financial Statements (Unaudited) — continued
to result in the automatic termination of an Eaton Vance Fund’s investment advisory agreement, and, where applicable, any related sub-advisory agreement. On December 18, 2020, the Fund’s Board approved a new investment advisory agreement. The new investment advisory agreement will be presented to Fund shareholders for approval, and, if approved, would take effect upon consummation of the transaction. Shareholders of record of the Fund at the close of business on January 15, 2021 who have voting power with respect to such shares are entitled to be present and vote at a special meeting of shareholders to be held on February 26, 2021 and at any adjournments or postponements thereof.
Eaton Vance
Floating-Rate Income Plus Fund
November 30, 2020
Officers and Trustees
Officers
Eric A. Stein
President
Deidre E. Walsh
Vice President
Maureen A. Gemma
Secretary and Chief Legal Officer
James F. Kirchner
Treasurer
Richard F. Froio
Chief Compliance Officer
Trustees
William H. Park
Chairperson
David Basile
Peter Borish*
Charles Clarvit
Mark R. Fetting
George J. Gorman
Valerie A. Mosley
Helen Frame Peters
Keith Quinton
Marcus L. Smith
Susan J. Sutherland
| * | Peter Borish resigned as a trustee of the Fund effective October 30, 2020. |
Eaton Vance Funds
IMPORTANT NOTICES
Privacy. The Eaton Vance organization is committed to ensuring your financial privacy. Each entity listed below has adopted privacy policy and procedures (“Privacy Program”) Eaton Vance believes is reasonably designed to protect your personal information and to govern when and with whom Eaton Vance may share your personal information.
| • | | At the time of opening an account, Eaton Vance generally requires you to provide us with certain information such as name, address, social security number, tax status, account numbers, and account balances. This information is necessary for us to both open an account for you and to allow us to satisfy legal requirements such as applicable anti-money laundering reviews and know-your-customer requirements. |
| • | | On an ongoing basis, in the normal course of servicing your account, Eaton Vance may share your information with unaffiliated third parties that perform various services for Eaton Vance and/or your account. These third parties include transfer agents, custodians, broker/dealers and our professional advisers including auditors, accountants, and legal counsel. Eaton Vance may share your personal information with our affiliates. Eaton Vance may also share your information as required or permitted by applicable law. |
| • | | We have adopted a Privacy Program we believe is reasonably designed to protect the confidentiality of your personal information and to prevent unauthorized access to your information. |
| • | | We reserve the right to change our Privacy Program at any time upon proper notification to you. You may want to review our Privacy Program periodically for changes by accessing the link on our homepage: www.eatonvance.com. |
Our pledge of protecting your personal information applies to the following entities within the Eaton Vance organization: the Eaton Vance Family of Funds, Eaton Vance Management, Eaton Vance WaterOak Advisors, Eaton Vance Distributors, Inc., Eaton Vance Trust Company, Eaton Vance Management (International) Limited, Eaton Vance Advisers International Ltd., Eaton Vance Global Advisors Limited, Eaton Vance Management’s Real Estate Investment Group, Boston Management and Research, Calvert Research and Management, and Calvert Funds. This notice supersedes all previously issued privacy disclosures. For more information about Eaton Vance’s Privacy Program or about how your personal information may be used, please call 1-800-262-1122.
Delivery of Shareholder Documents. The Securities and Exchange Commission (SEC) permits funds to deliver only one copy of shareholder documents, including prospectuses, proxy statements and shareholder reports, to fund investors with multiple accounts at the same residential or post office box address. This practice is often called “householding” and it helps eliminate duplicate mailings to shareholders. American Stock Transfer & Trust Company, LLC (“AST”), the closed-end funds transfer agent, or your financial intermediary, may household the mailing of your documents indefinitely unless you instruct AST, or your financial intermediary, otherwise. If you would prefer that your Eaton Vance documents not be householded, please contact AST or your financial intermediary. Your instructions that householding not apply to delivery of your Eaton Vance documents will typically be effective within 30 days of receipt by AST or your financial intermediary.
Portfolio Holdings. Each Eaton Vance Fund and its underlying Portfolio(s) (if applicable) files a schedule of portfolio holdings on Part F to Form N-PORT with the SEC. Certain information filed on Form N-PORT may be viewed on the Eaton Vance website at www.eatonvance.com, by calling Eaton Vance at 1-800-262-1122 or in the EDGAR database on the SEC’s website at www.sec.gov.
Proxy Voting. From time to time, funds are required to vote proxies related to the securities held by the funds. The Eaton Vance Funds or their underlying Portfolios (if applicable) vote proxies according to a set of policies and procedures approved by the Funds’ and Portfolios’ Boards. You may obtain a description of these policies and procedures and information on how the Funds or Portfolios voted proxies relating to portfolio securities during the most recent 12-month period ended June 30, without charge, upon request, by calling 1-800-262-1122 and by accessing the SEC’s website at www.sec.gov.
Share Repurchase Program. The Fund’s Board of Trustees has approved a share repurchase program authorizing the Fund to repurchase up to 10% of its common shares outstanding as of the last day of the prior calendar year in open-market transactions at a discount to net asset value. The repurchase program does not obligate the Fund to purchase a specific amount of shares. The Fund’s repurchase activity, including the number of shares purchased, average price and average discount to net asset value, is disclosed in the Fund’s annual and semi-annual reports to shareholders.
Additional Notice to Shareholders. If applicable, a Fund may also redeem or purchase its outstanding preferred shares in order to maintain compliance with regulatory requirements, borrowing or rating agency requirements or for other purposes as it deems appropriate or necessary.
Closed-End Fund Information. Eaton Vance closed-end funds make fund performance data and certain information about portfolio characteristics available on the Eaton Vance website shortly after the end of each month. Other information about the funds is available on the website. The funds’ net asset value per share is readily accessible on the Eaton Vance website. Portfolio holdings for the most recent month-end are also posted to the website approximately 30 days following the end of the month. This information is available at www.eatonvance.com on the fund information pages under “Individual Investors — Closed-End Funds”.
Investment Adviser and Administrator
Eaton Vance Management
Two International Place
Boston, MA 02110
Custodian
State Street Bank and Trust Company
State Street Financial Center, One Lincoln Street
Boston, MA 02111
Transfer Agent
American Stock Transfer & Trust Company, LLC
6201 15th Avenue
Brooklyn, NY 11219
Fund Offices
Two International Place
Boston, MA 02110

13724 11.30.20
Not required in this filing.
| Item 3. | Audit Committee Financial Expert |
Not required in this filing.
| Item 4. | Principal Accountant Fees and Services |
Not required in this filing.
| Item 5. | Audit Committee of Listed Registrants |
Not required in this filing.
| Item 6. | Schedule of Investments |
Please see schedule of investments contained in the Report to Stockholders included under Item 1 of this Form N-CSR.
| Item 7. | Disclosure of Proxy Voting Policies and Procedures for Closed-End Management Investment Companies |
Not required in this filing.
| Item 8. | Portfolio Managers of Closed-End Management Investment Companies |
Not required in this filing.
| Item 9. | Purchases of Equity Securities by Closed-End Management Investment Company and Affiliated Purchasers |
No such purchases this period.
| Item 10. | Submission of Matters to a Vote of Security Holders |
No material changes.
| Item 11. | Controls and Procedures |
(a) It is the conclusion of the registrant’s principal executive officer and principal financial officer that the effectiveness of the registrant’s current disclosure controls and procedures (such disclosure controls and procedures having been evaluated within 90 days of the date of this filing) provide reasonable assurance that the information required to be disclosed by the registrant has been recorded, processed, summarized and reported within the time period specified in the Commission’s rules and forms and that the information required to be disclosed by the registrant has been accumulated and communicated to the registrant’s principal executive officer and principal financial officer in order to allow timely decisions regarding required disclosure.
(b) There have been no changes in the registrant’s internal controls over financial reporting during the period covered by this report that has materially affected, or is reasonably likely to materially affect, the registrant’s internal control over financial reporting.
| Item 12. | Disclosure of Securities Lending Activities for Closed-End Management Investment Companies |
No activity to report for the registrant’s most recent fiscal year end.
Signatures
Pursuant to the requirements of the Securities Exchange Act of 1934 and the Investment Company Act of 1940, the registrant has duly caused this report to be signed on its behalf by the undersigned, thereunto duly authorized.
Eaton Vance Floating-Rate Income Plus Fund
| | |
| By: | | /s/ Eric A. Stein |
| | Eric A. Stein |
| | President |
| |
| Date: | | January 25, 2021 |
Pursuant to the requirements of the Securities Exchange Act of 1934 and the Investment Company Act of 1940, this report has been signed below by the following persons on behalf of the registrant and in the capacities and on the dates indicated.
| | |
| By: | | /s/ James F. Kirchner |
| | James F. Kirchner |
| | Treasurer |
| |
| Date: | | January 25, 2021 |
| |
| By: | | /s/ Eric A. Stein |
| | Eric A. Stein |
| | President |
| |
| Date: | | January 25, 2021 |