
Investor Day October 2018
Forward Looking Statements and Non-GAAP Measures In keeping with the SEC's "Safe Harbor" guidelines, certain statements made during this presentation could be considered forward- looking and subject to certain risks and uncertainties that could cause results to differ materially from those projected. When we use the words "will likely result," "may," "anticipate," "estimate," "should," "expect," "believe," "intend," or similar expressions, we intend to identify forward-looking statements. Such forward-looking statements include, but are not limited to, our business and investment strategy, our understanding of our competition, current market trends and opportunities, projected operating results, and projected capital expenditures. These forward-looking statements are subject to known and unknown risks and uncertainties, which could cause actual results to differ materially from those anticipated including, without limitation: general volatility of the capital markets and the market price of our common stock; changes in our business or investment strategy; availability, terms and deployment of capital; availability of qualified personnel; changes in our industry and the market in which we operate, interest rates or the general economy, and the degree and nature of our competition. These and other risk factors are more fully discussed in the company's filings with the Securities and Exchange Commission. EBITDA is defined as net income before interest, taxes, depreciation and amortization. EBITDA yield is defined as trailing twelve month EBITDA divided by the purchase price or debt amount. A capitalization rate is determined by dividing the property's net operating income by the purchase price. Net operating income is the property's funds from operations minus a capital expense reserve of either 4% or 5% of gross revenues. Hotel EBITDA flow-through is the change in Hotel EBITDA divided by the change in total revenues. EBITDA, FFO, AFFO, CAD and other terms are non-GAAP measures, reconciliations of which have been provided in prior earnings releases and filings with the SEC or in the appendix to this presentation. The calculation of implied equity value is derived from an estimated blended capitalization rate (“Cap Rate”) for the entire portfolio using the capitalization rate method. The estimated Cap Rate is based on recent Cap Rates of publically traded peers involving a similar blend of asset types found in the portfolio, which is then applied to Net Operating Income (“NOI”) of the company’s assets to calculate a Total Enterprise Value (“TEV”) of the company. From the TEV, we deduct debt and preferred equity and then add back working capital and the company’s investment in Ashford Inc. to derive an equity value. The capitalization rate method is one of several valuation methods for estimating asset value and implied equity value. Among the limitations of using the capitalization rate method for determining an implied equity value are that it does not take into account the potential change or variability in future cash flows, potential significant future capital expenditures, the intended hold period of the asset, or a change in the future risk profile of an asset. This overview is for informational purposes only and is not an offer to sell, or a solicitation of an offer to buy or sell, any securities of Braemar Hotels & Resorts, Inc. or any of its respective affiliates, and may not be relied upon in connection with the purchase or sale of any such security. 2

V i s i o n Vision for Braemar Richard Stockton Chief Executive Officer Hotels & Resorts . 20 years of hospitality experience - Differentiate the Company . 2 years with the Company - Focus on Luxury Segment . 15 years with Morgan Stanley . - Deliver Strong Returns to Cornell School of Shareholders Hotel Administration, BS . University of Pennsylvania, MBA

Achieving the Vision Sell Non-Core Assets Upbrand Non-Core Assets Acquire Luxury Assets Rebrand Company 4
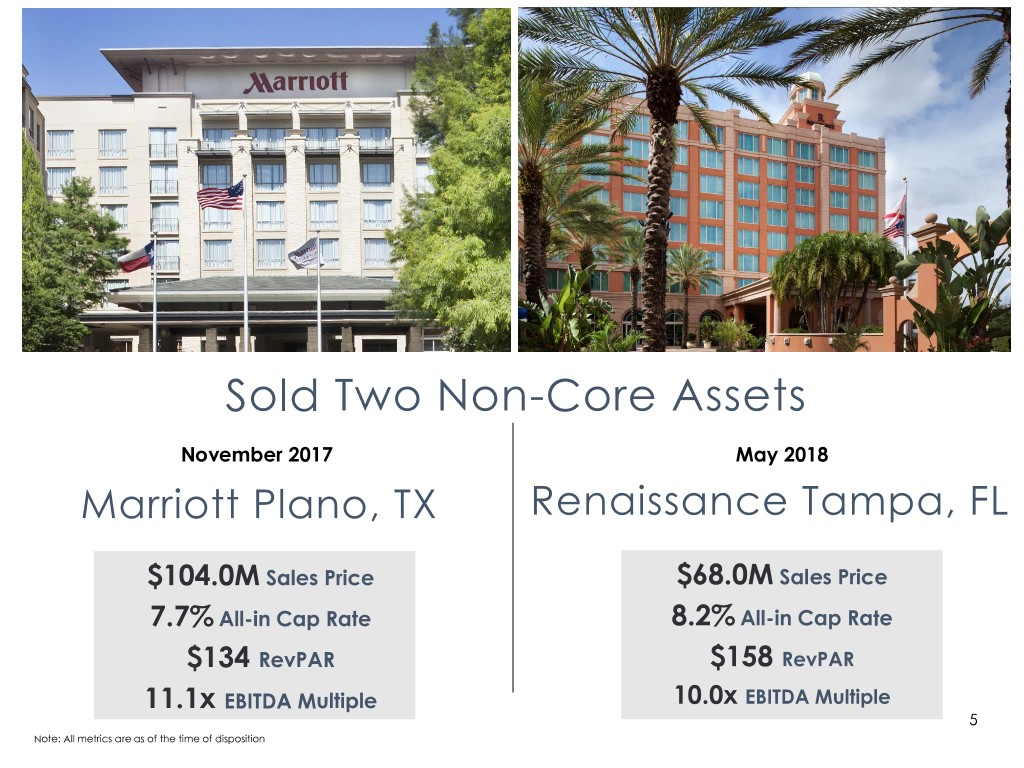
Sold Two Non-Core Assets November 2017 May 2018 Marriott Plano, TX Renaissance Tampa, FL $104.0M Sales Price $68.0M Sales Price 7.7% All-in Cap Rate 8.2% All-in Cap Rate $134 RevPAR $158 RevPAR 11.1x EBITDA Multiple 10.0x EBITDA Multiple 5 Note: All metrics are as of the time of disposition
Achieving the Vision R Sell Non-Core Assets Upbrand Non-Core Assets Acquire Luxury Assets Rebrand Company 6
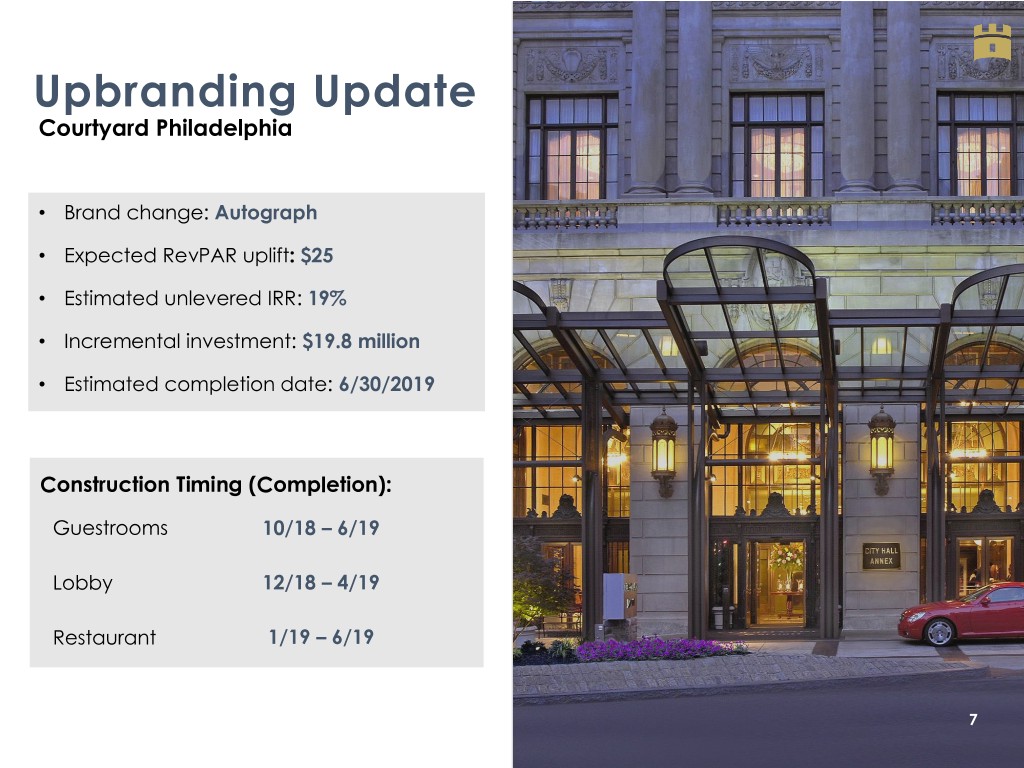
Upbranding Update Courtyard Philadelphia • Brand change: Autograph • Expected RevPAR uplift: $25 • Estimated unlevered IRR: 19% • Incremental investment: $19.8 million • Estimated completion date: 6/30/2019 Construction Timing (Completion): Guestrooms 10/18 – 6/19 Lobby 12/18 – 4/19 Restaurant 1/19 – 6/19 7
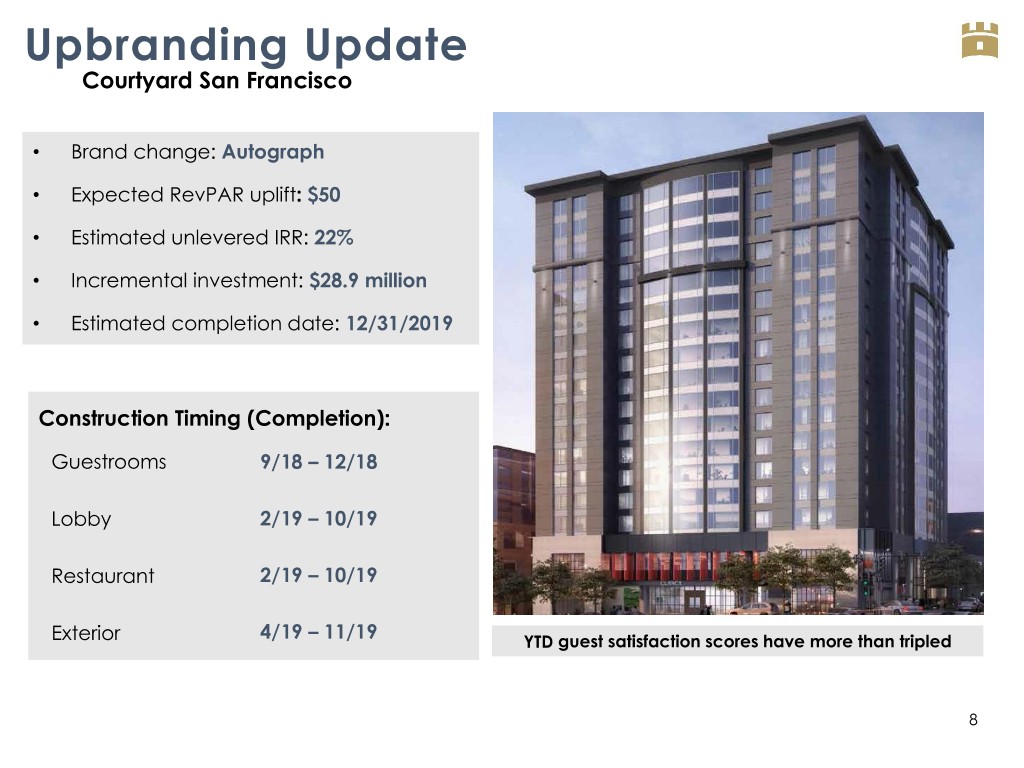
Upbranding Update Courtyard San Francisco • Brand change: Autograph • Expected RevPAR uplift: $50 • Estimated unlevered IRR: 22% • Incremental investment: $28.9 million • Estimated completion date: 12/31/2019 Construction Timing (Completion): Guestrooms 9/18 – 12/18 Lobby 2/19 – 10/19 Restaurant 2/19 – 10/19 Exterior 4/19 – 11/19 YTD guest satisfaction scores have more than tripled 8
Achieving the Vision R Sell Non-Core Assets R Upbrand Non-Core Assets Acquire Luxury Assets Rebrand Company 9
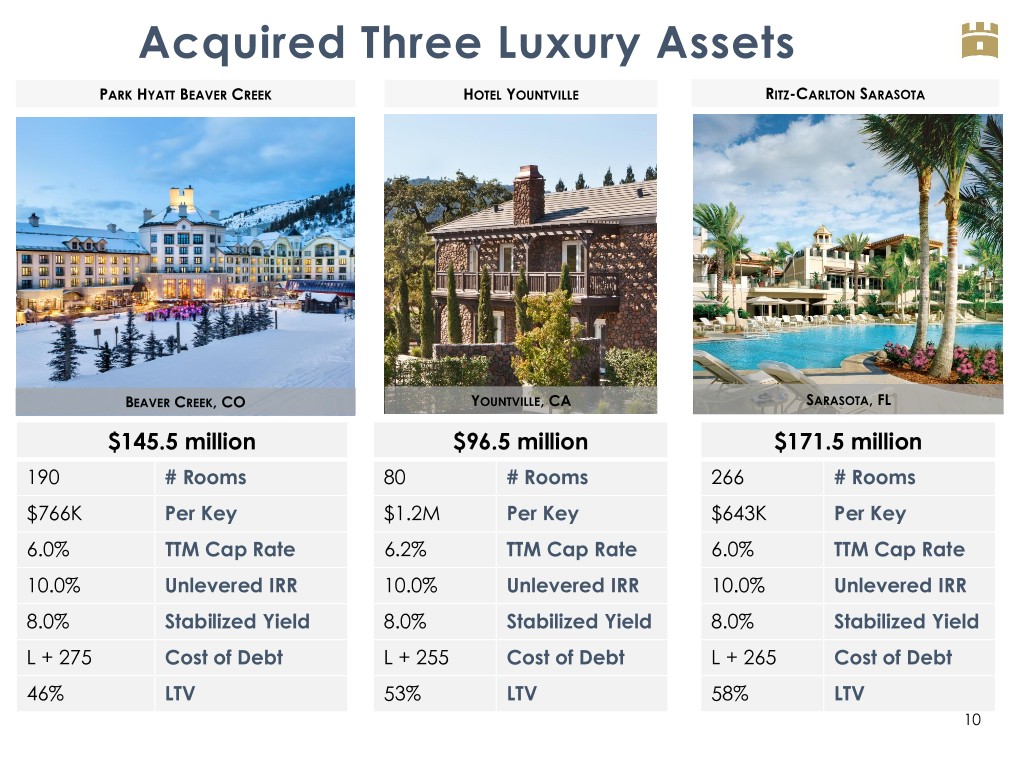
Acquired Three Luxury Assets PARK HYATT BEAVER CREEK HOTEL YOUNTVILLE RITZ-CARLTON SARASOTA BEAVER CREEK, CO YOUNTVILLE, CA SARASOTA, FL $145.5 million $96.5 million $171.5 million 190 # Rooms 80 # Rooms 266 # Rooms $766K Per Key $1.2M Per Key $643K Per Key 6.0% TTM Cap Rate 6.2% TTM Cap Rate 6.0% TTM Cap Rate 10.0% Unlevered IRR 10.0% Unlevered IRR 10.0% Unlevered IRR 8.0% Stabilized Yield 8.0% Stabilized Yield 8.0% Stabilized Yield L + 275 Cost of Debt L + 255 Cost of Debt L + 265 Cost of Debt 46% LTV 53% LTV 58% LTV 10
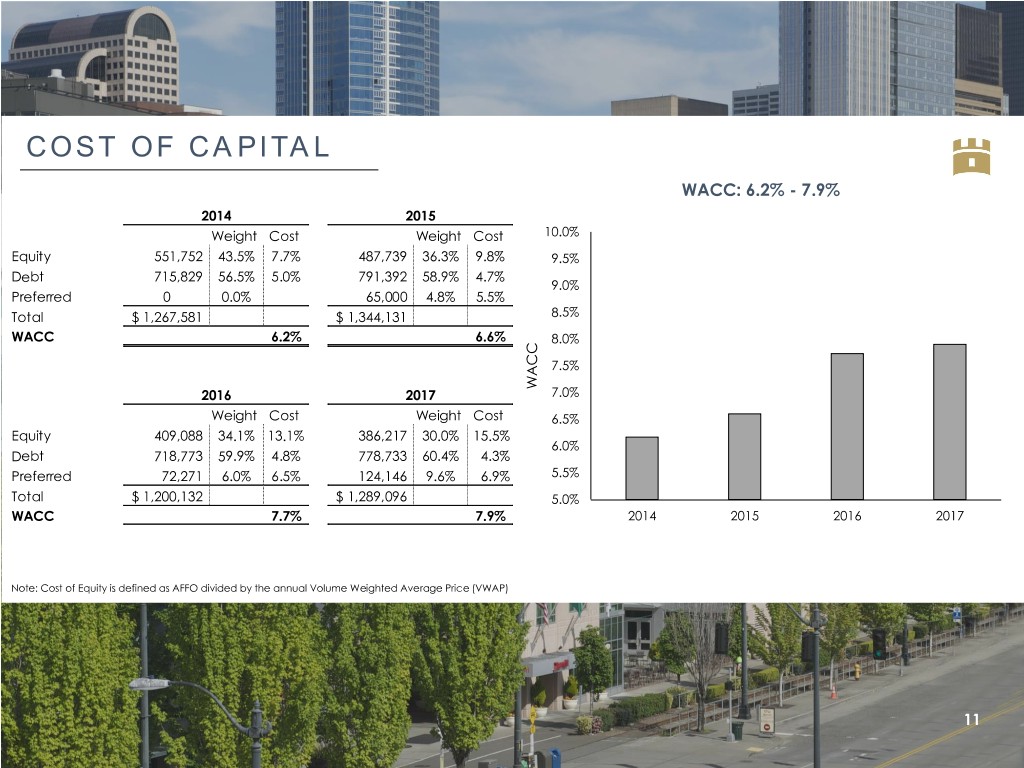
COST OF CAPITAL WACC: 6.2% - 7.9% 2014 2015 Weight Cost Weight Cost 10.0% Equity 551,752 43.5% 7.7% 487,739 36.3% 9.8% 9.5% Debt 715,829 56.5% 5.0% 791,392 58.9% 4.7% 9.0% Preferred 0 0.0% 65,000 4.8% 5.5% Total $ 1,267,581 $ 1,344,131 8.5% WACC 6.2% 6.6% 8.0% 7.5% WACC 2016 2017 7.0% Weight Cost Weight Cost 6.5% Equity 409,088 34.1% 13.1% 386,217 30.0% 15.5% 6.0% Debt 718,773 59.9% 4.8% 778,733 60.4% 4.3% Preferred 72,271 6.0% 6.5% 124,146 9.6% 6.9% 5.5% Total $ 1,200,132 $ 1,289,096 5.0% WACC 7.7% 7.9% 2014 2015 2016 2017 Note: Cost of Equity is defined as AFFO divided by the annual Volume Weighted Average Price (VWAP) 11

Achieving the Vision R Sell Non-Core Assets R Upbrand Non-Core Assets R Acquire Luxury Assets Rebrand Company 12

NYSE Closing Bell April 24, 2018 13
Achieving the Vision R Sell Non-Core Assets R Upbrand Non-Core Assets R Acquire Luxury Assets R Rebrand Company 14

O U R P O R T F O L I O L U X U R Y H O T E L S & R E S O R T S

EBITDA Contribution (1) Q4 2016 TTM EBITDA by Class Q2 2018 TTM EBITDA by Class 21% 20% 27% 46% 46% 54% 34% 52% Luxury Upper Upscale Upscale Luxury Upper Upscale Upscale 16 (1) Pro forma for Autograph conversions
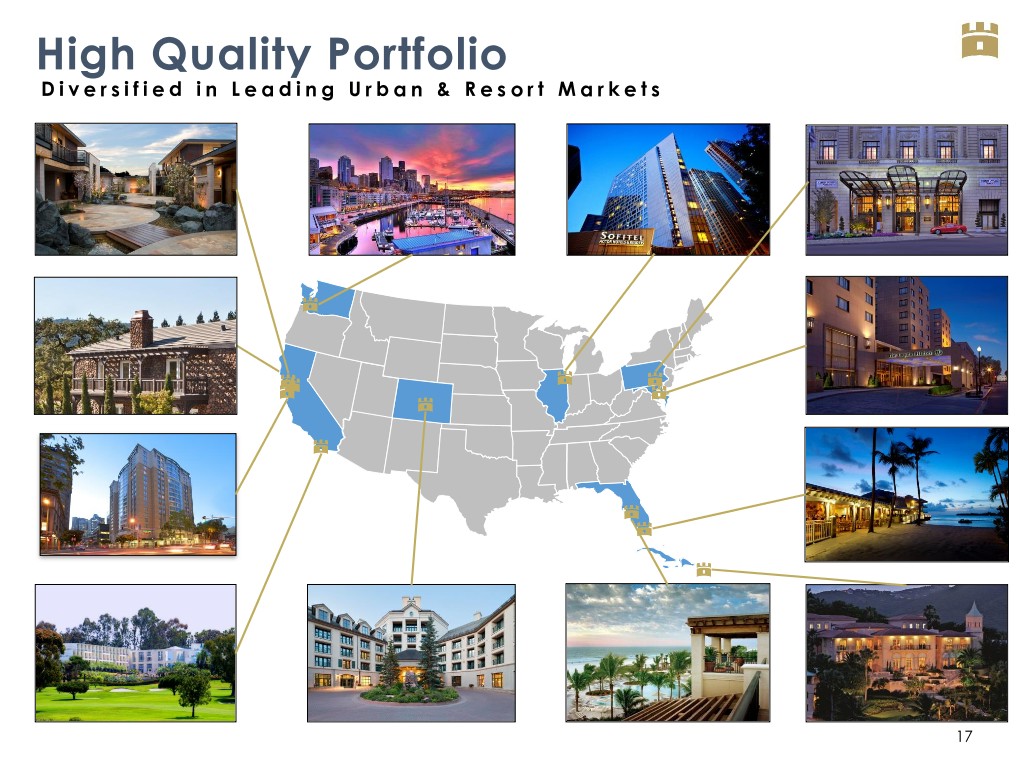
High Quality Portfolio D i v e r s i f i e d i n L e a d i n g U r b a n & R e s o r t M a r k e t s 17

O U R S T R A T E G Y
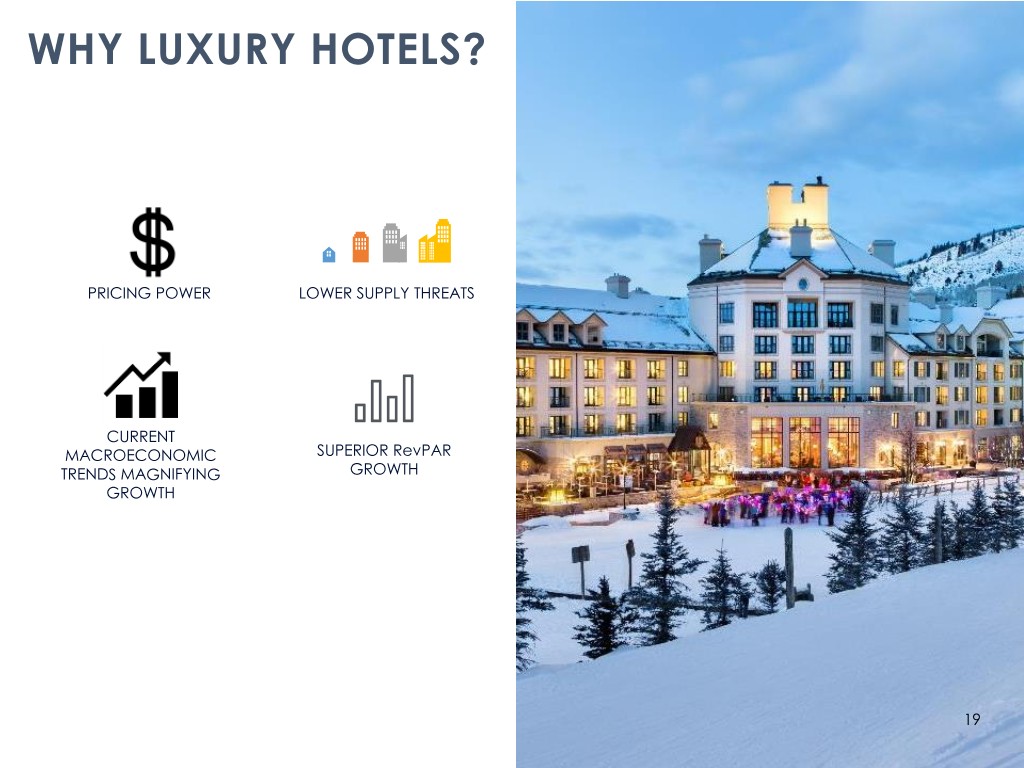
WHY LUXURY HOTELS? PRICING POWER LOWER SUPPLY THREATS CURRENT MACROECONOMIC SUPERIOR RevPAR TRENDS MAGNIFYING GROWTH GROWTH 19
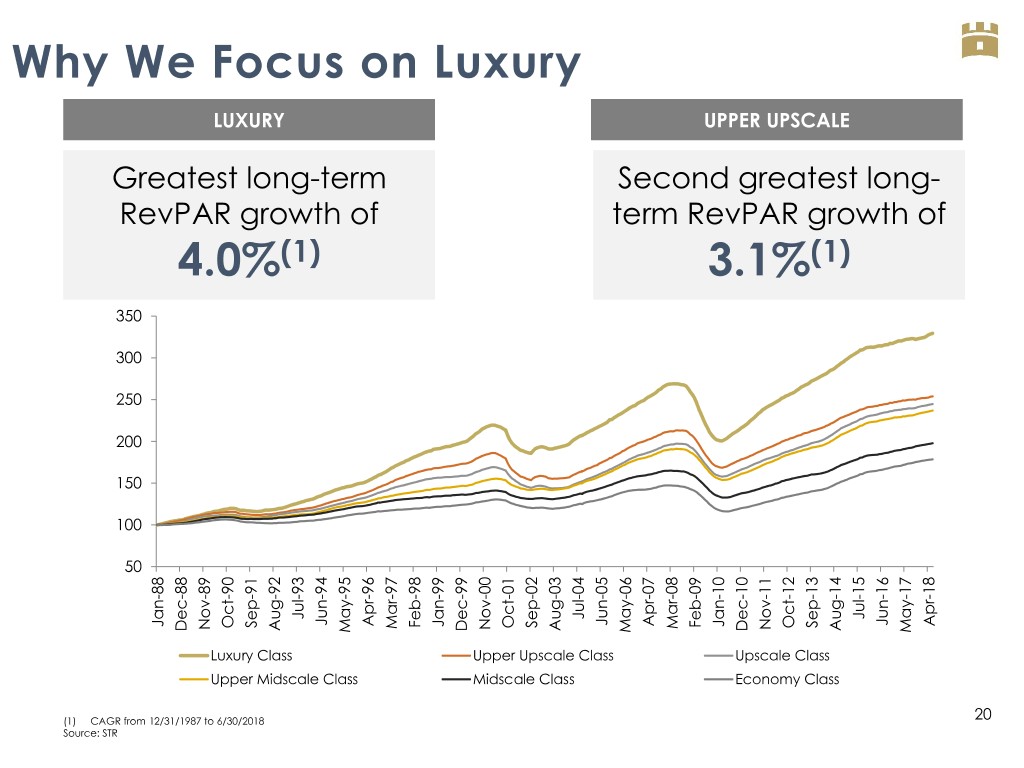
Why We Focus on Luxury LUXURY UPPER UPSCALE Greatest long-term Second greatest long- RevPAR growth of term RevPAR growth of 4.0%(1) 3.1%(1) 350 300 250 200 150 100 50 Jul-93 Jul-04 Jul-15 Jun-94 Jun-05 Jun-16 Apr-96 Apr-07 Apr-18 Jan-88 Jan-99 Jan-10 Feb-98 Feb-09 Sep-91 Sep-02 Sep-13 Oct-90 Oct-01 Oct-12 Mar-97 Mar-08 Nov-89 Nov-00 Nov-11 Aug-92 Aug-03 Aug-14 Dec-88 Dec-99 Dec-10 May-95 May-06 May-17 Luxury Class Upper Upscale Class Upscale Class Upper Midscale Class Midscale Class Economy Class (1) CAGR from 12/31/1987 to 6/30/2018 20 Source: STR
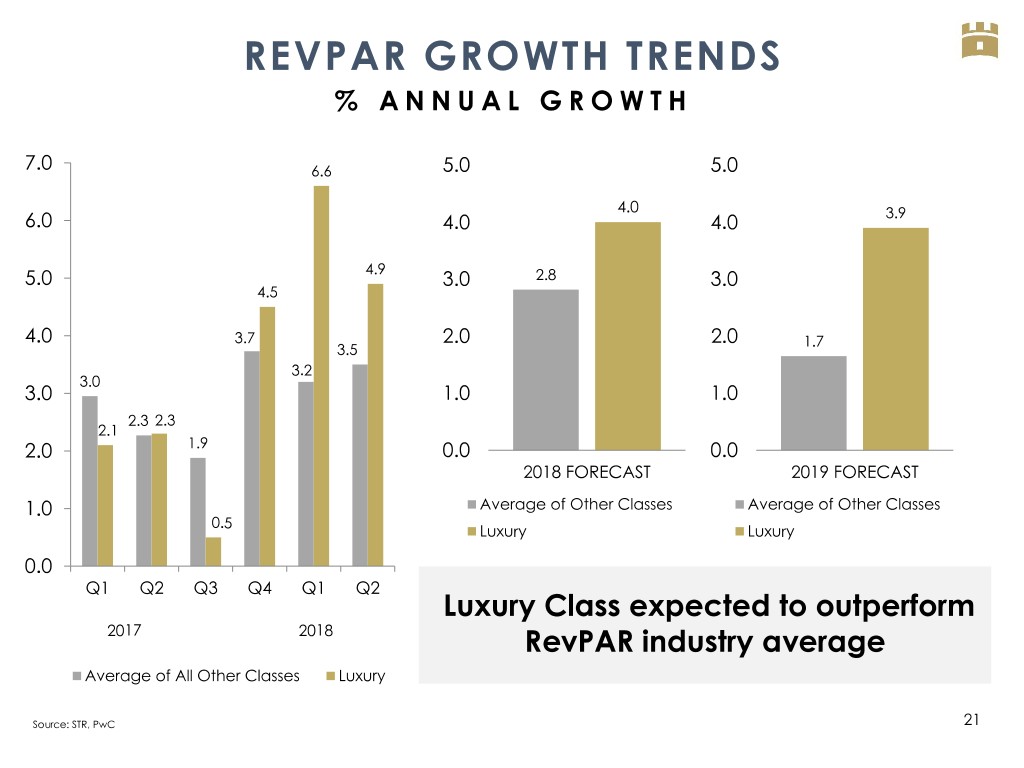
REVPAR GROWTH TRENDS % A N N U A L G R O W T H 7.0 6.6 5.0 5.0 4.0 6.0 4.0 4.0 3.9 4.9 5.0 3.0 2.8 3.0 4.5 4.0 3.7 2.0 2.0 1.7 3.5 3.2 3.0 3.0 1.0 1.0 2.3 2.3 2.1 2.0 1.9 0.0 0.0 2018 FORECAST 2019 FORECAST 1.0 Average of Other Classes Average of Other Classes 0.5 Luxury Luxury 0.0 Q1 Q2 Q3 Q4 Q1 Q2 Luxury Class expected to outperform 2017 2018 RevPAR industry average Average of All Other Classes Luxury Source: STR, PwC 21

Target Market Analysis(1) Market Size Fundamentals Pricing Desirability 60 50 40 30 20 10 0 Fundamentals Market Size Pricing 22 (1) Based on internal analysis as of 6/30/2018

O U R P E R F O R M A N C E H I S T O R I C A L L Y P R O V E N
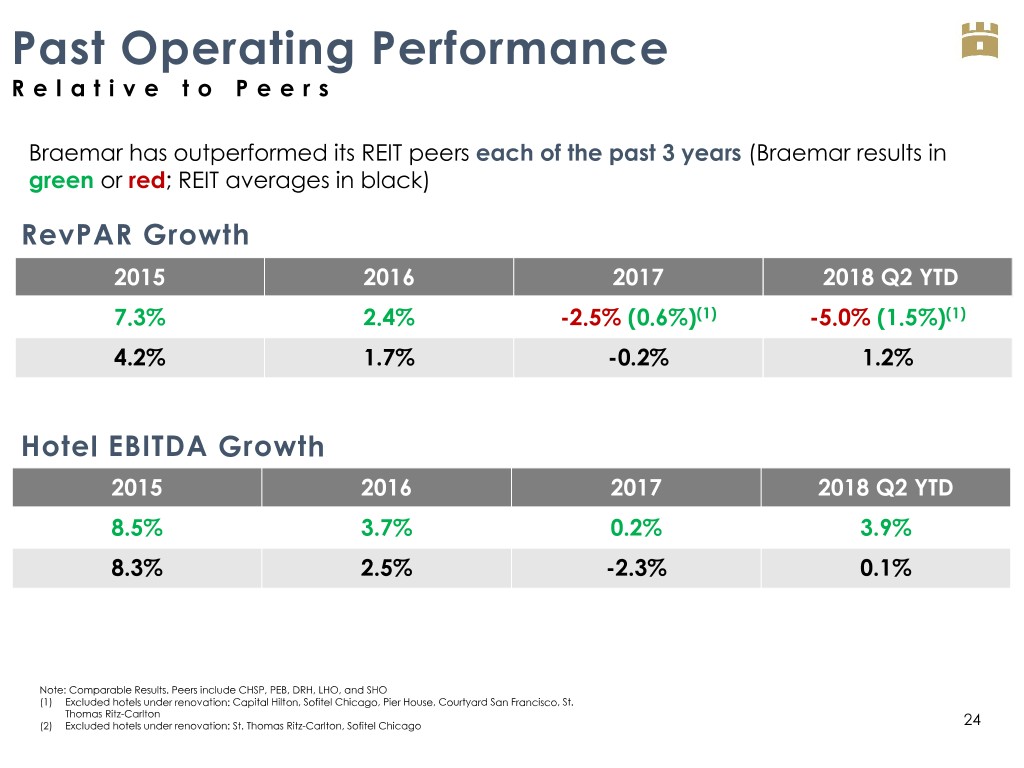
Past Operating Performance R e l a t i v e t o P e e r s Braemar has outperformed its REIT peers each of the past 3 years (Braemar results in green or red; REIT averages in black) RevPAR Growth 2015 2016 2017 2018 Q2 YTD 7.3% 2.4% -2.5% (0.6%)(1) -5.0% (1.5%)(1) 4.2% 1.7% -0.2% 1.2% Hotel EBITDA Growth 2015 2016 2017 2018 Q2 YTD 8.5% 3.7% 0.2% 3.9% 8.3% 2.5% -2.3% 0.1% Note: Comparable Results. Peers include CHSP, PEB, DRH, LHO, and SHO (1) Excluded hotels under renovation: Capital Hilton, Sofitel Chicago, Pier House, Courtyard San Francisco, St. Thomas Ritz-Carlton (2) Excluded hotels under renovation: St. Thomas Ritz-Carlton, Sofitel Chicago 24
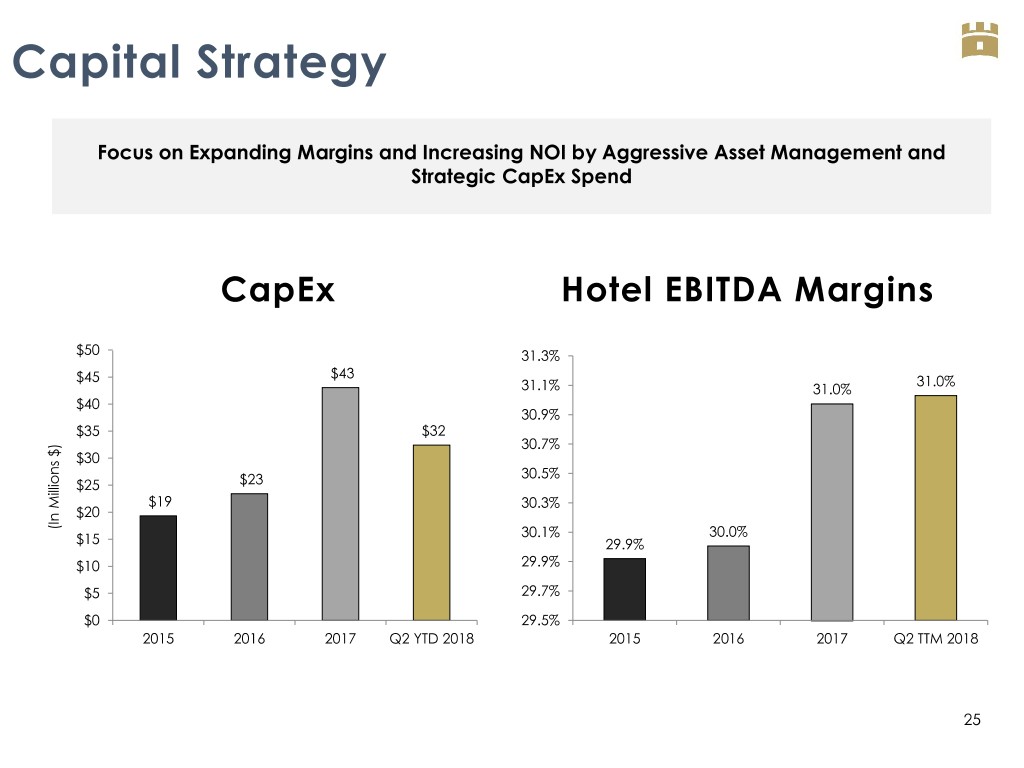
Capital Strategy Focus on Expanding Margins and Increasing NOI by Aggressive Asset Management and Strategic CapEx Spend CapEx Hotel EBITDA Margins $50 31.3% $43 $45 31.0% 31.1% 31.0% $40 30.9% $35 $32 30.7% $30 30.5% $25 $23 $19 30.3% $20 (In Millions $) Millions (In 30.1% 30.0% $15 29.9% $10 29.9% $5 29.7% $0 29.5% 2015 2016 2017 Q2 YTD 2018 2015 2016 2017 Q2 TTM 2018 25

Yield on Cost A g g r e s s i v e A s s e t M a n a g e m e n t Legacy +26% +19bps $120M 16% NOI Growth Annual Incremental Value Value Portfolio Yield on Cost Created(1) Created(1) In Millions $ 2013 2014 2015 2016 2017 2018 Q2 TTM Gross Book Value $ 682.3 $ 698.6 $ 705.9 $ 719.8 $ 744.7 $ 761.8 CapEx $ 20.6 $ 16.3 $ 7.3 $ 13.9 $ 24.9 $ 17.0 NOI $ 50.0 $ 54.1 $ 58.4 $ 60.2 $ 62.9 $ 63.0 Yield on Cost 7.3% 7.8% 8.3% 8.4% 8.5% 8.3% La Jolla Torrey Pines Courtyard Philadelphia Capital Hilton 2013 (1) Assumes a 6.5% cap rate, Portfolio deducts CapEx 26 Courtyard San Francisco Marriott Seattle

Best- in- Class Jeremy Welter Asset Management Chief Operating Officer - Operating Performance . 13 years of hospitality experience - Value-Add Initiatives . 8 years with the - CapEx Investments Company (5 years with the Company’s predecessor) . 5 years with Stephens Investment Bank . Oklahoma State University, BS
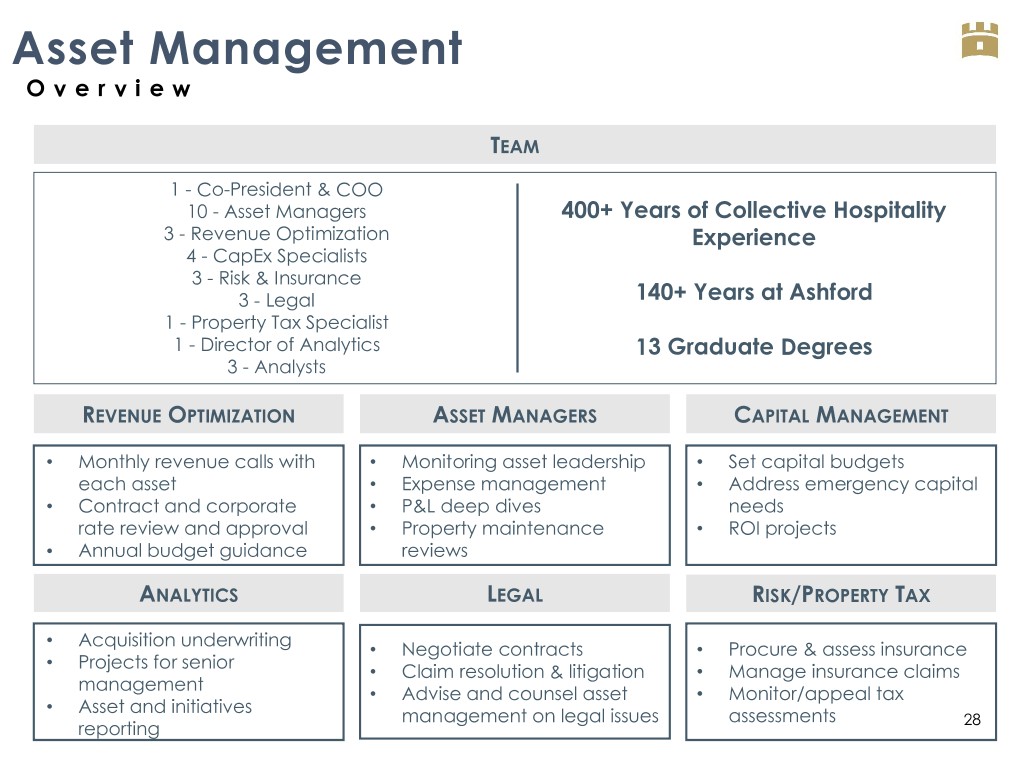
Asset Management O v e r v i e w TEAM 1 - Co-President & COO 10 - Asset Managers 400+ Years of Collective Hospitality 3 - Revenue Optimization Experience 4 - CapEx Specialists 3 - Risk & Insurance 3 - Legal 140+ Years at Ashford 1 - Property Tax Specialist 1 - Director of Analytics 13 Graduate Degrees 3 - Analysts REVENUE OPTIMIZATION ASSET MANAGERS CAPITAL MANAGEMENT • Monthly revenue calls with • Monitoring asset leadership • Set capital budgets each asset • Expense management • Address emergency capital • Contract and corporate • P&L deep dives needs rate review and approval • Property maintenance • ROI projects • Annual budget guidance reviews ANALYTICS LEGAL RISK/PROPERTY TAX • Acquisition underwriting • Negotiate contracts • Procure & assess insurance • Projects for senior • Claim resolution & litigation • Manage insurance claims management • Advise and counsel asset • Monitor/appeal tax • Asset and initiatives management on legal issues assessments reporting 28 4
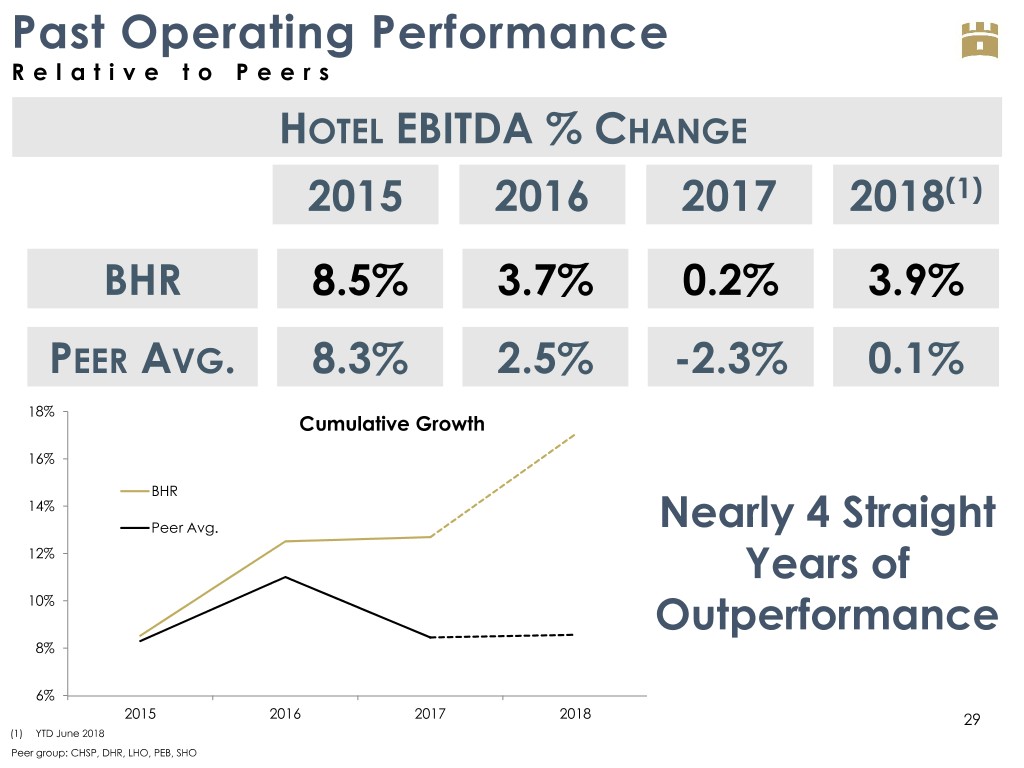
Past Operating Performance R e l a t i v e t o P e e r s HOTEL EBITDA % CHANGE 2015 2016 2017 2018(1) BHR 8.5% 3.7% 0.2% 3.9% PEER AVG. 8.3% 2.5% -2.3% 0.1% 18% Cumulative Growth 16% BHR 14% Peer Avg. Nearly 4 Straight 12% Years of 10% Outperformance 8% 6% 2015 2016 2017 2018 29 (1) YTD June 2018 4 Peer group: CHSP, DHR, LHO, PEB, SHO
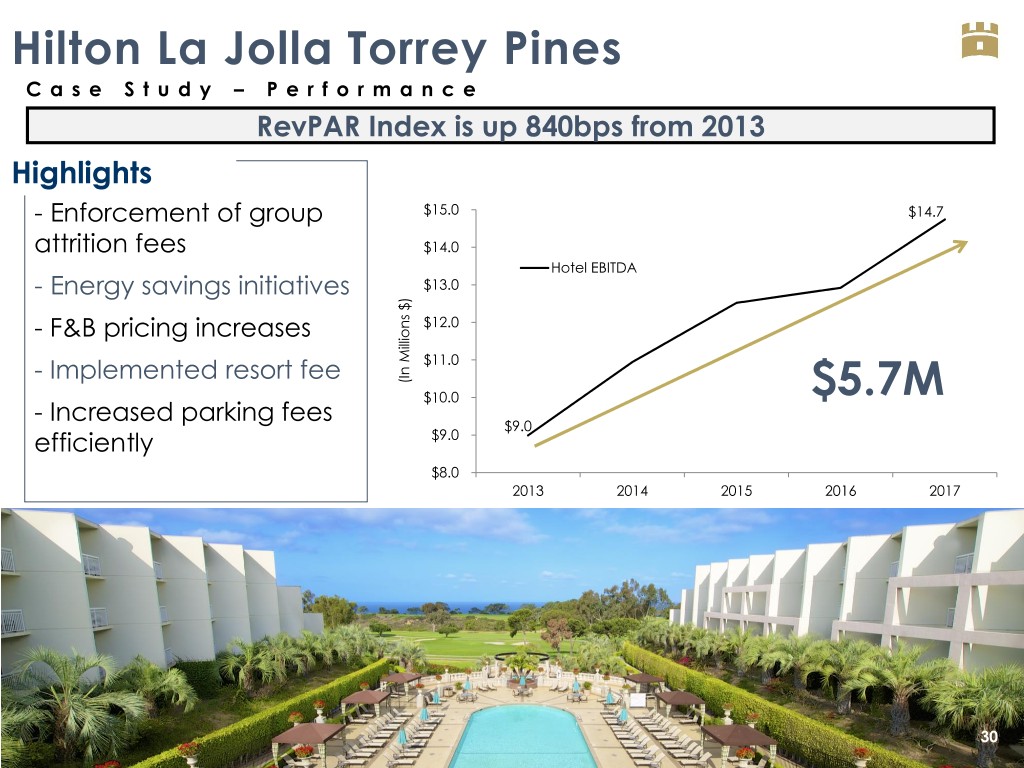
Hilton La Jolla Torrey Pines C a s e S t u d y – P e r f o r m a n c e RevPAR Index is up 840bps from 2013 Highlights - Enforcement of group $15.0 $14.7 attrition fees $14.0 Hotel EBITDA $13.0 - Energy savings initiatives - F&B pricing increases $12.0 $11.0 - Implemented resort fee $) Millions (In $10.0 $5.7M - Increased parking fees $9.0 efficiently $9.0 $8.0 2013 2014 2015 2016 2017 32 30

Courtyard San Francisco Downtown O p p o r t u n i t y – A u t o g r a p h C o n v e r s i o n Autograph Courtyard $28,900,000 Converted Brand Current Brand Incremental CapEx Investment $320 $269 RevPAR RevPAR $371 $312 ADR ADR $18.5m $14.6m EBITDA EBITDA 33.7% 31.8% EBITDA Margin EBITDA Margin 22.4% (1) Unleveraged IRR Estimated Value Added: $60.1M 31 Note: Metrics are Courtyard and Autograph stabilized 2022 underwriting performance comparisons (1) Assumes 6.5% exit cap rate HOTEL YOUNTVILLE – NAPA VALLEY 4

Courtyard San Francisco Downtown O p p o r t u n i t y – A u t o g r a p h C o n v e r s i o n Guestrooms Lobby Lounge/Bar 32 Restaurant Exterior

Courtyard San Francisco Downtown C a s e S t u d y – P e r f o r m a n c e U n d e r R e n o v a t i o n 110 RevPAR Index Renovation Period 105 100 95 90 (1) 2015 2016 2017 2018 Minimized displacement Energy savings initiatives Closed unprofitable F&B outlet Increased parking rate 33 4 (1) YTD July 2018
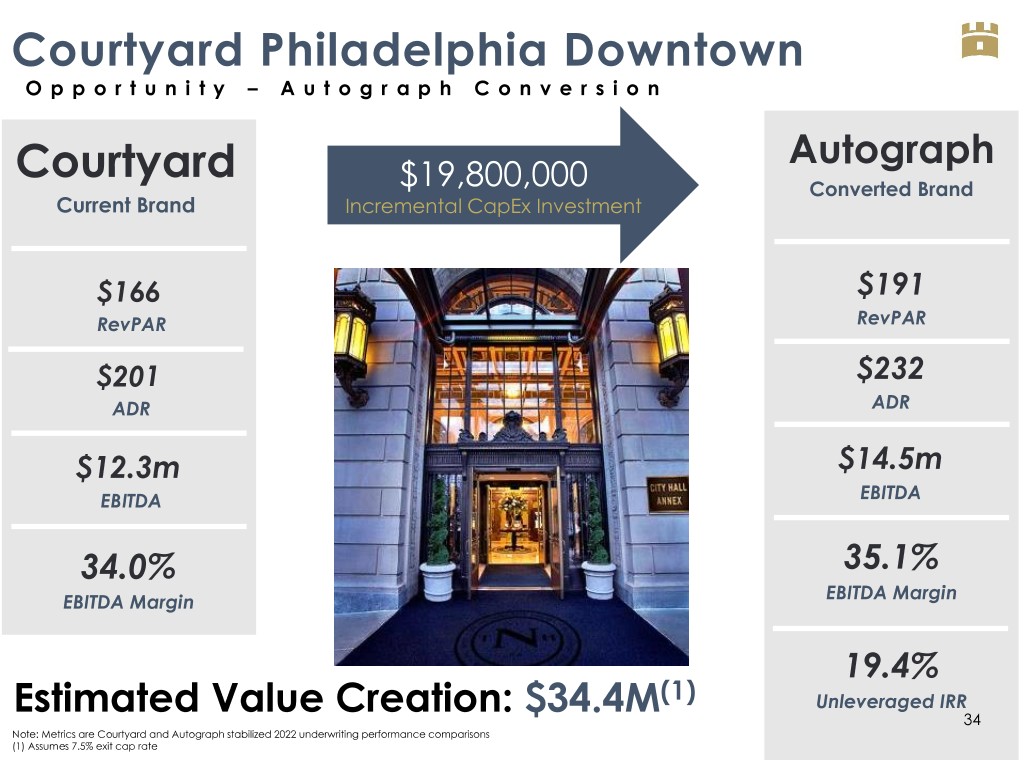
Courtyard Philadelphia Downtown O p p o r t u n i t y – A u t o g r a p h C o n v e r s i o n Courtyard Autograph $19,800,000 Converted Brand Current Brand Incremental CapEx Investment $166 $191 RevPAR RevPAR $201 $232 ADR ADR $12.3m $14.5m EBITDA EBITDA 34.0% 35.1% EBITDA Margin EBITDA Margin 19.4% (1) Estimated Value Creation: $34.4M Unleveraged IRR 34 Note: Metrics are Courtyard and Autograph stabilized 2022 underwriting performance comparisons (1) Assumes 7.5% exit cap rate HOTEL YOUNTVILLE – NAPA VALLEY 4
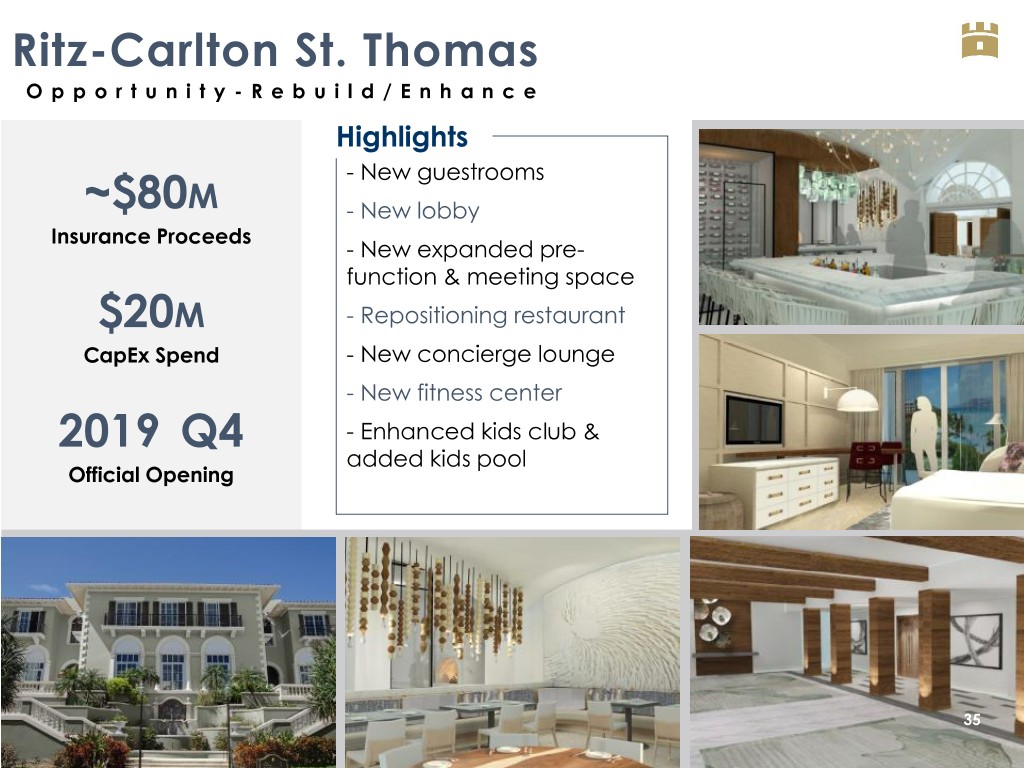
Ritz-Carlton St. Thomas O p p o r t u n i t y - R e b u i l d / E n h a n c e Highlights - New guestrooms ~$80M - New lobby Insurance Proceeds - New expanded pre- function & meeting space $20M - Repositioning restaurant CapEx Spend - New concierge lounge - New fitness center 2019 Q4 - Enhanced kids club & added kids pool Official Opening 35 HOTEL YOUNTVILLE – NAPA VALLEY
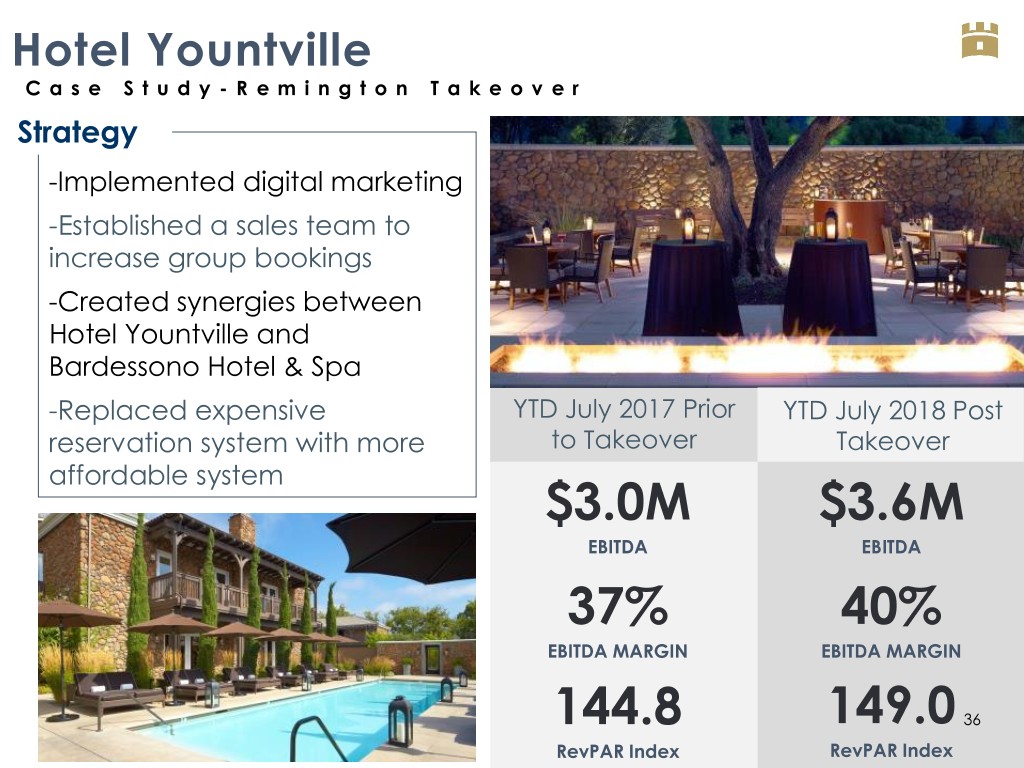
Hotel Yountville C a s e S t u d y - R e m i n g t o n T a k e o v e r Strategy -Implemented digital marketing -Established a sales team to increase group bookings -Created synergies between Hotel Yountville and Bardessono Hotel & Spa -Replaced expensive YTD July 2017 Prior YTD July 2018 Post reservation system with more to Takeover Takeover affordable system $3.0M $3.6M EBITDA EBITDA 37% 40% EBITDA MARGIN EBITDA MARGIN 144.8 149.0 36 RevPAR Index RevPAR Index
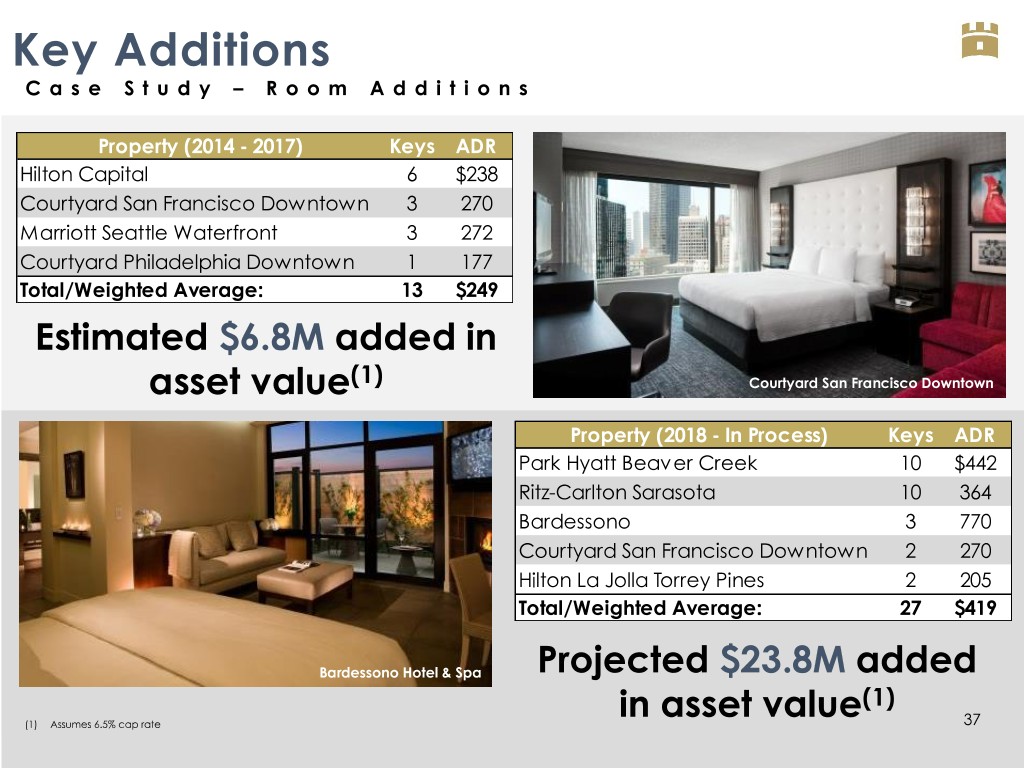
Key Additions C a s e S t u d y – R o o m A d d i t i o n s Property (2014 - 2017) Keys ADR Hilton Capital 6 $238 Courtyard San Francisco Downtown 3 270 Marriott Seattle Waterfront 3 272 Courtyard Philadelphia Downtown 1 177 Total/Weighted Average: 13 $249 Estimated $6.8M added in (1) asset value Courtyard San Francisco Downtown Property (2018 - In Process) Keys ADR Park Hyatt Beaver Creek 10 $442 Ritz-Carlton Sarasota 10 364 Bardessono 3 770 Courtyard San Francisco Downtown 2 270 Hilton La Jolla Torrey Pines 2 205 Total/Weighted Average: 27 $419 Bardessono Hotel & Spa Projected $23.8M added (1) in asset value (1) Assumes 6.5% cap rate 37 4
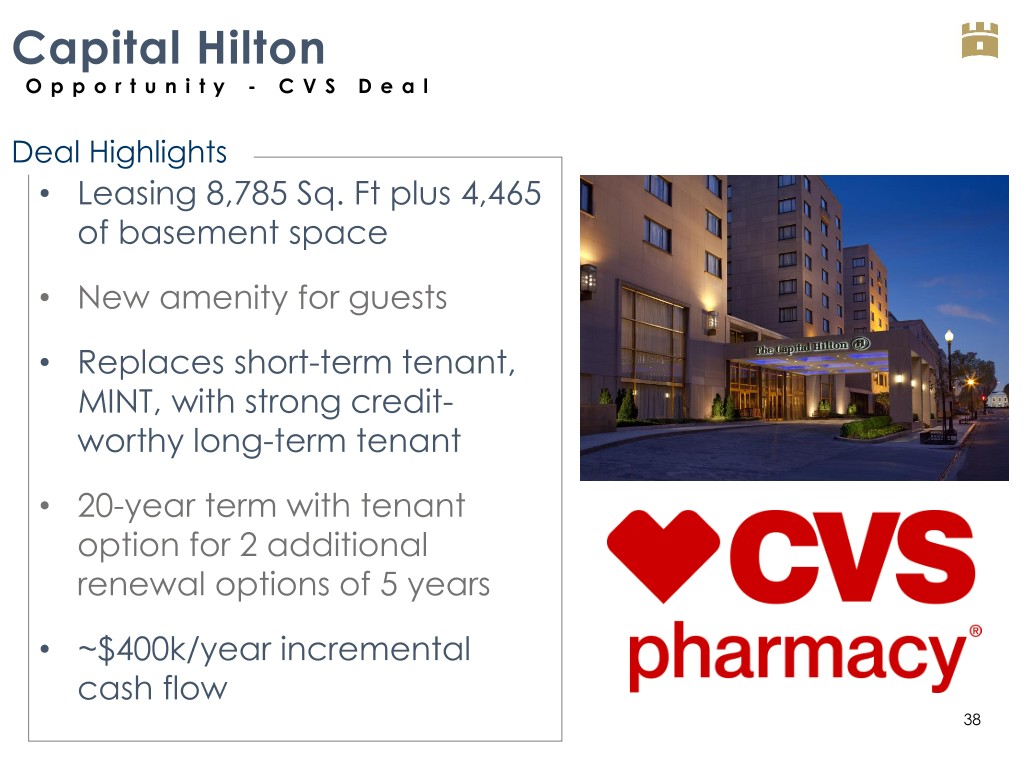
Capital Hilton O p p o r t u n i t y - C V S D e a l Deal Highlights • Leasing 8,785 Sq. Ft plus 4,465 of basement space • New amenity for guests • Replaces short-term tenant, MINT, with strong credit- worthy long-term tenant • 20-year term with tenant option for 2 additional renewal options of 5 years • ~$400k/year incremental cash flow 38

Marriott Seattle C a s e S t u d y – P e r f o r m a n c e Nearly 5 years of RevPAR Index growth Strategy $250 122 - Increased group production RevPAR $240 120 during shoulder months by 37% RevPAR Index $230 118 - Upgraded from lower rated $220 27% crew to higher rated crew 116 $210 114 - Revamped marketing plan to $200 impact low season $190 112 - Increased premium room count $180 110 2014 2015 2016 2017 TTM July 2018 39
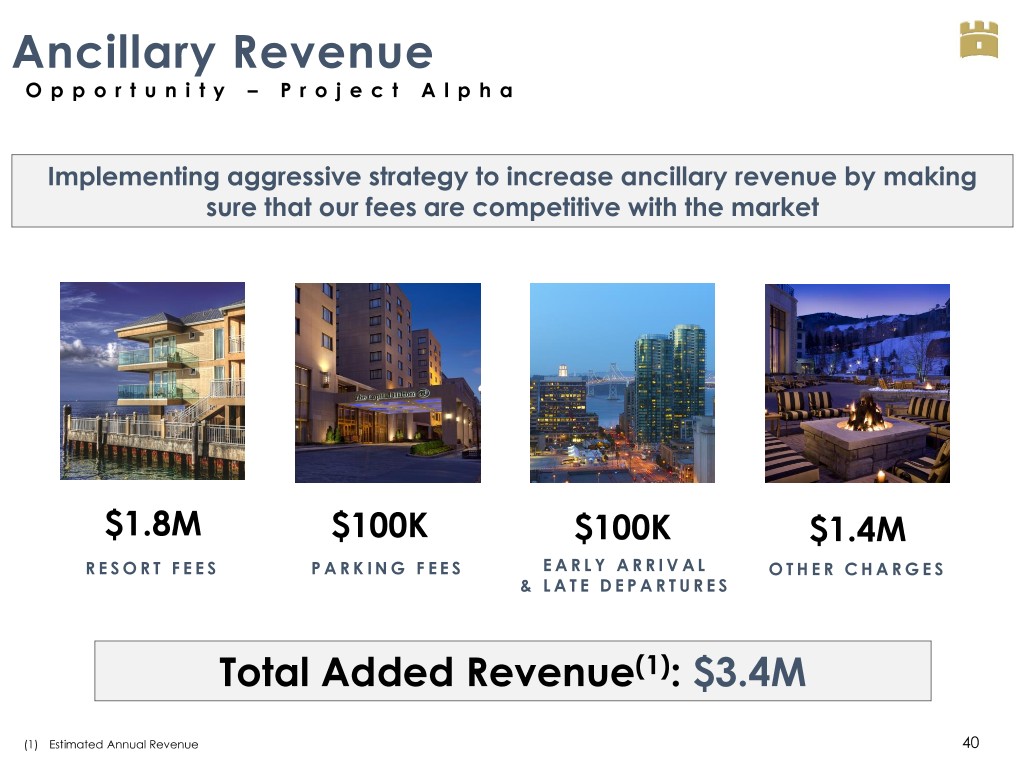
Ancillary Revenue O p p o r t u n i t y – P r o j e c t A l p h a Implementing aggressive strategy to increase ancillary revenue by making sure that our fees are competitive with the market $1.8M $100K $100K $1.4M R E S O R T F E E S PARKING FEES E A R L Y A R R I V A L O T H E R C H A R G E S & L A T E D E P A R T U R E S Total Added Revenue(1): $3.4M (1) Estimated Annual Revenue 40
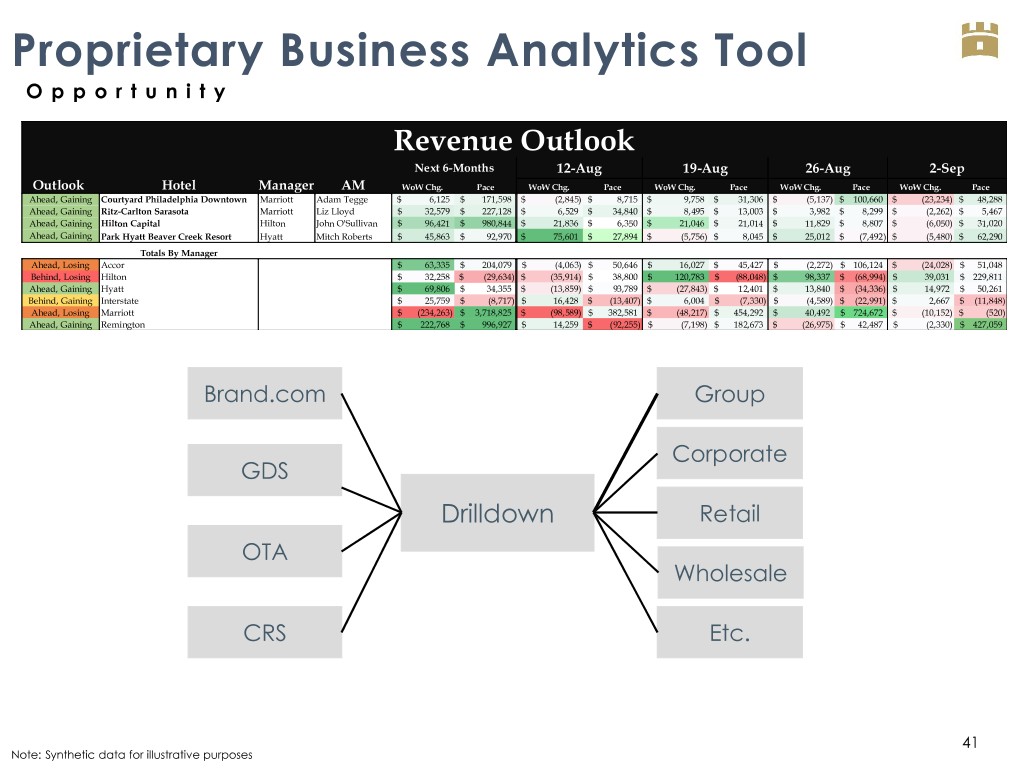
Proprietary Business Analytics Tool O p p o r t u n i t y Revenue Outlook Next 6-Months 12-Aug 19-Aug 26-Aug 2-Sep Outlook Hotel Manager AM WoW Chg. Pace WoW Chg. Pace WoW Chg. Pace WoW Chg. Pace WoW Chg. Pace Ahead, Gaining Courtyard Philadelphia Downtown Marriott Adam Tegge $ 6,125 $ 171,598 $ (2,845) $ 8,715 $ 9,758 $ 31,306 $ (5,137) $ 100,660 $ (23,234) $ 48,288 Ahead, Gaining Ritz-Carlton Sarasota Marriott Liz Lloyd $ 32,579 $ 227,128 $ 6,529 $ 34,840 $ 8,495 $ 13,003 $ 3,982 $ 8,299 $ (2,262) $ 5,467 Ahead, Gaining Hilton Capital Hilton John O'Sullivan $ 96,421 $ 980,844 $ 21,836 $ 6,350 $ 21,046 $ 21,014 $ 11,829 $ 8,807 $ (6,050) $ 31,020 Ahead, Gaining BraemarPark Hyatt Beaver Creek Resort Hyatt Mitch Roberts $ (106,215) 45,863 $ 1,784,072 92,970 $ (43,582) 75,601 $$ 303,788 27,894 $$ 119,495 (5,756) $ 141,213 8,045 $$ 46,468 25,012 $ 215,975 (7,492) $$ 13,190 (5,480) $ 271,315 62,290 Totals By Manager Ahead, Losing Accor $ 63,335 $ 204,079 $ (4,063) $ 50,646 $ 16,027 $ 45,427 $ (2,272) $ 106,124 $ (24,028) $ 51,048 Behind, Losing Hilton $ 32,258 $ (29,634) $ (35,914) $ 38,800 $ 120,783 $ (88,048) $ 98,337 $ (68,994) $ 39,031 $ 229,811 Ahead, Gaining Hyatt $ 69,806 $ 34,355 $ (13,859) $ 93,789 $ (27,843) $ 12,401 $ 13,840 $ (34,336) $ 14,972 $ 50,261 Behind, Gaining Interstate $ 25,759 $ (8,717) $ 16,428 $ (13,407) $ 6,004 $ (7,330) $ (4,589) $ (22,991) $ 2,667 $ (11,848) Ahead, Losing Marriott $ (234,263) $ 3,718,825 $ (98,589) $ 382,581 $ (48,217) $ 454,292 $ 40,492 $ 724,672 $ (10,152) $ (520) Ahead, Gaining Remington $ 222,768 $ 996,927 $ 14,259 $ (92,255) $ (7,198) $ 182,673 $ (26,975) $ 42,487 $ (2,330) $ 427,059 Brand.com Group Corporate GDS Drilldown Retail OTA Wholesale CRS Etc. 41 Note: Synthetic data for illustrative purposes
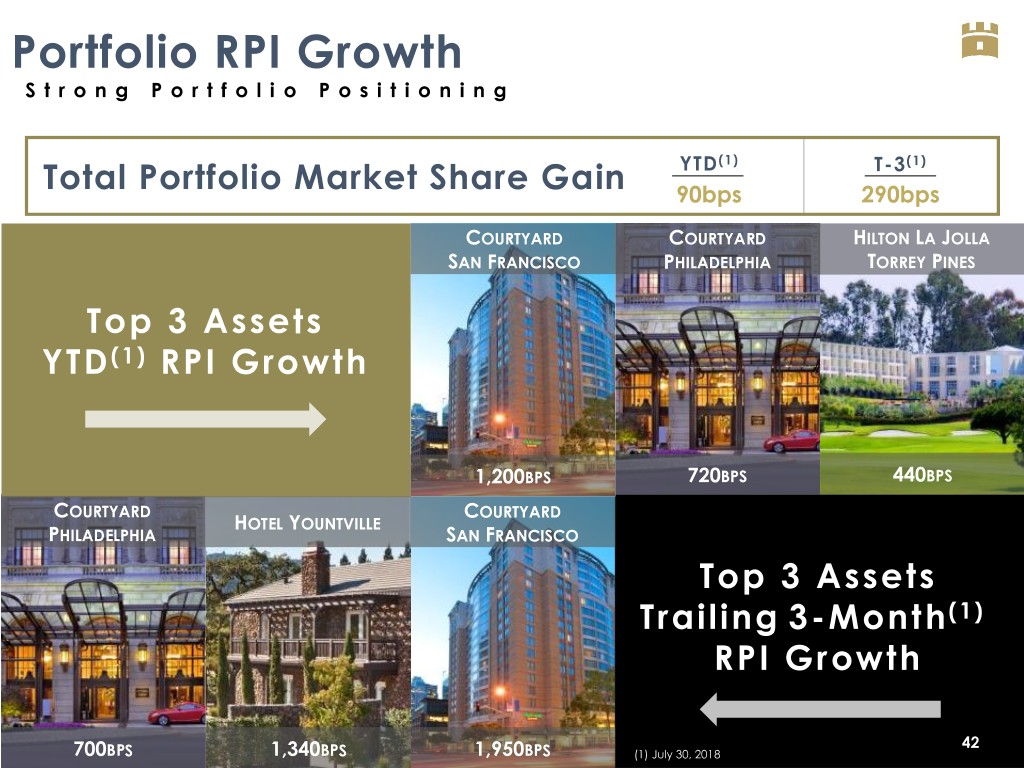
Portfolio RPI Growth S t r o n g P o r t f o l i o P o s i t i o n i n g YTD(1) T-3(1) Total Portfolio Market Share Gain 90bps 290bps COURTYARD COURTYARD HILTON LA JOLLA SAN FRANCISCO PHILADELPHIA TORREY PINES Top 3 Assets YTD(1) RPI Growth 1,200BPS 720BPS 440BPS COURTYARD COURTYARD HOTEL YOUNTVILLE PHILADELPHIA SAN FRANCISCO Top 3 Assets (1) Trailing 3-Month RPI Growth 42 700BPS 1,340BPS 1,950BPS (1) July 30, 2018
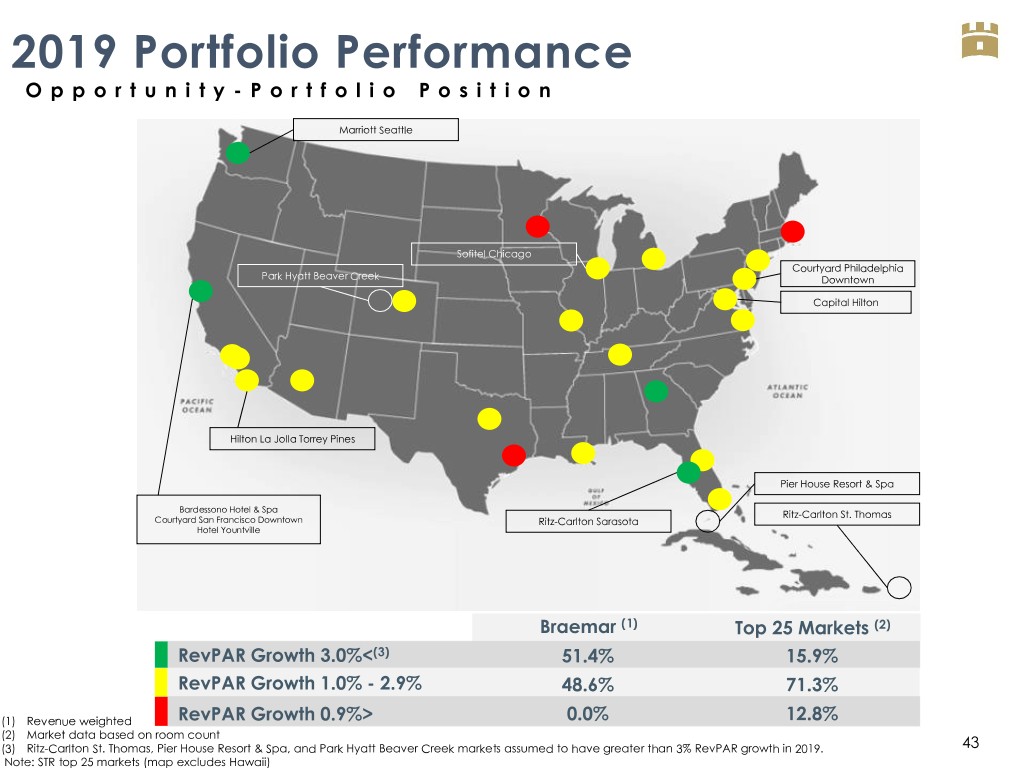
2019 Portfolio Performance O p p o r t u n i t y - P o r t f o l i o P o s i t i o n Marriott Seattle Sofitel Chicago Courtyard Philadelphia Park Hyatt Beaver Creek Downtown Capital Hilton Hilton La Jolla Torrey Pines Pier House Resort & Spa Bardessono Hotel & Spa Ritz-Carlton St. Thomas Courtyard San Francisco Downtown Ritz-Carlton Sarasota Hotel Yountville Braemar (1) Top 25 Markets (2) RevPAR Growth 3.0%<(3) 51.4% 15.9% RevPAR Growth 1.0% - 2.9% 48.6% 71.3% (1) Revenue weighted RevPAR Growth 0.9%> 0.0% 12.8% (2) Market data based on room count (3) Ritz-Carlton St. Thomas, Pier House Resort & Spa, and Park Hyatt Beaver Creek markets assumed to have greater than 3% RevPAR growth in 2019. 43 Note: STR top 25 markets (map excludes Hawaii)

Balance Sheet Deric Eubanks Chief Financial Officer - Target Leverage . 18 years of hospitality experience - Cash Management . 15 years with the - Debt Strategy Company . CFA Charterholder . Southern Methodist University, BBA

Conservative Capital Structure TARGET LEVERAGE OVERVIEW Floating-rate debt provides a natural hedge to hotel cash Non-recourse debt lowers flows and maximizes 45% risk profile of the platform flexibility in all economic environments Gross Assets Proactive strategy to Long-standing lender opportunistically refinance relationships Net Debt loans and extend maturities 45
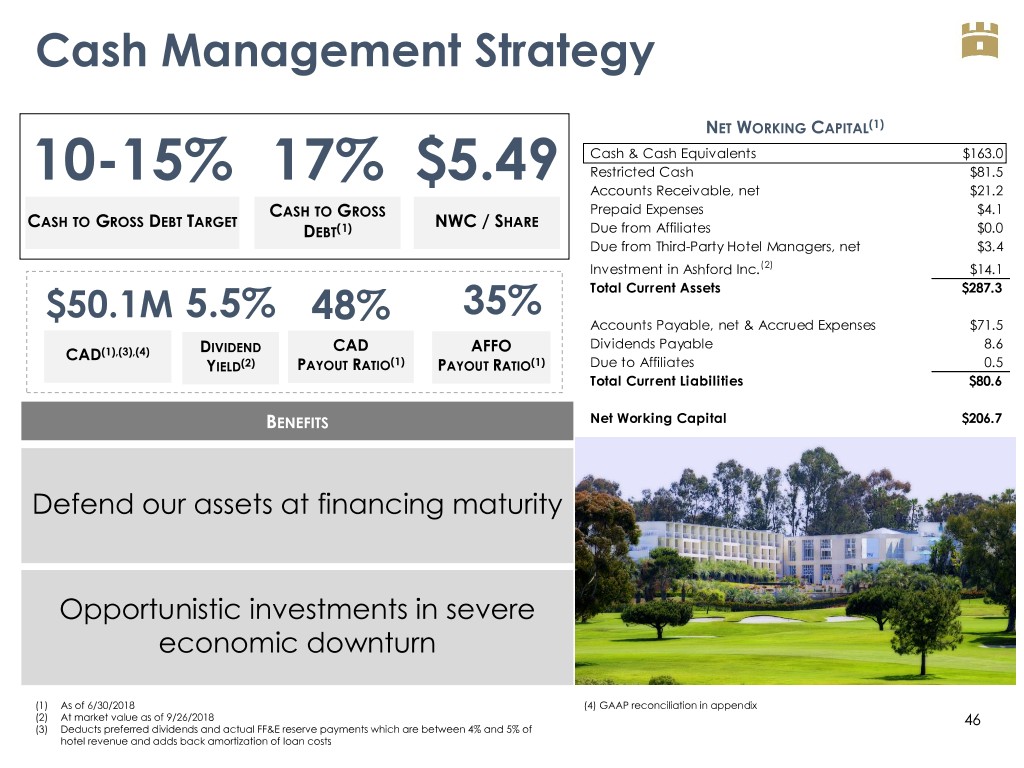
Cash Management Strategy NET WORKING CAPITAL(1) Cash & Cash Equivalents $163.0 10-15% 17% $5.49 Restricted Cash $81.5 Accounts Receivable, net $21.2 CASH TO GROSS Prepaid Expenses $4.1 CASH TO GROSS DEBT TARGET NWC / SHARE DEBT(1) Due from Affiliates $0.0 Due from Third-Party Hotel Managers, net $3.4 Investment in Ashford Inc.(2) $14.1 $50.1M 5.5% 35% Total Current Assets $287.3 48% Accounts Payable, net & Accrued Expenses $71.5 CAD AFFO Dividends Payable 8.6 CAD(1),(3),(4) DIVIDEND YIELD(2) PAYOUT RATIO(1) PAYOUT RATIO(1) Due to Affiliates 0.5 Total Current Liabilities $80.6 BENEFITS Net Working Capital $206.7 Defend our assets at financing maturity Opportunistic investments in severe economic downturn (1) As of 6/30/2018 (4) GAAP reconciliation in appendix (2) At market value as of 9/26/2018 46 (3) Deducts preferred dividends and actual FF&E reserve payments which are between 4% and 5% of hotel revenue and adds back amortization of loan costs
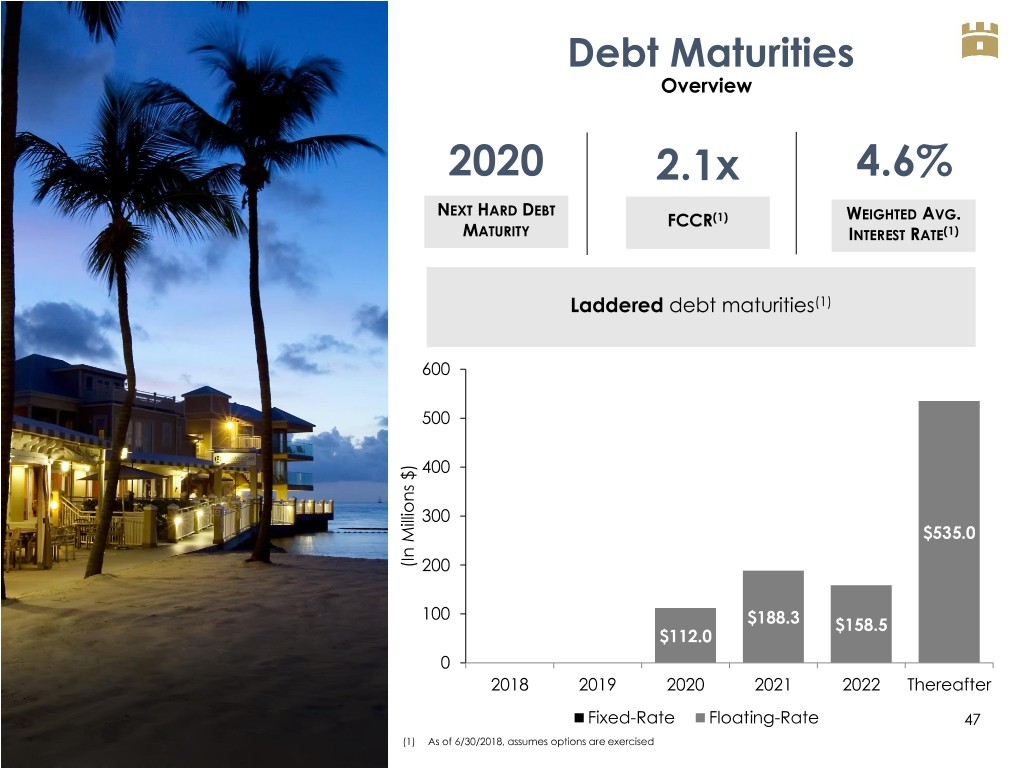
Debt Maturities Overview 2020 2.1x 4.6% NEXT HARD DEBT FCCR(1) WEIGHTED AVG. MATURITY INTEREST RATE(1) Laddered debt maturities(1) 600 500 400 300 $535.0 Millions $) Millions (In (In 200 100 $188.3 $158.5 $112.0 0 2018 2019 2020 2021 2022 Thereafter Fixed-Rate Floating-Rate 47 (1) As of 6/30/2018, assumes options are exercised
V A L U A T I O N I N T R I N S I C V A L U E
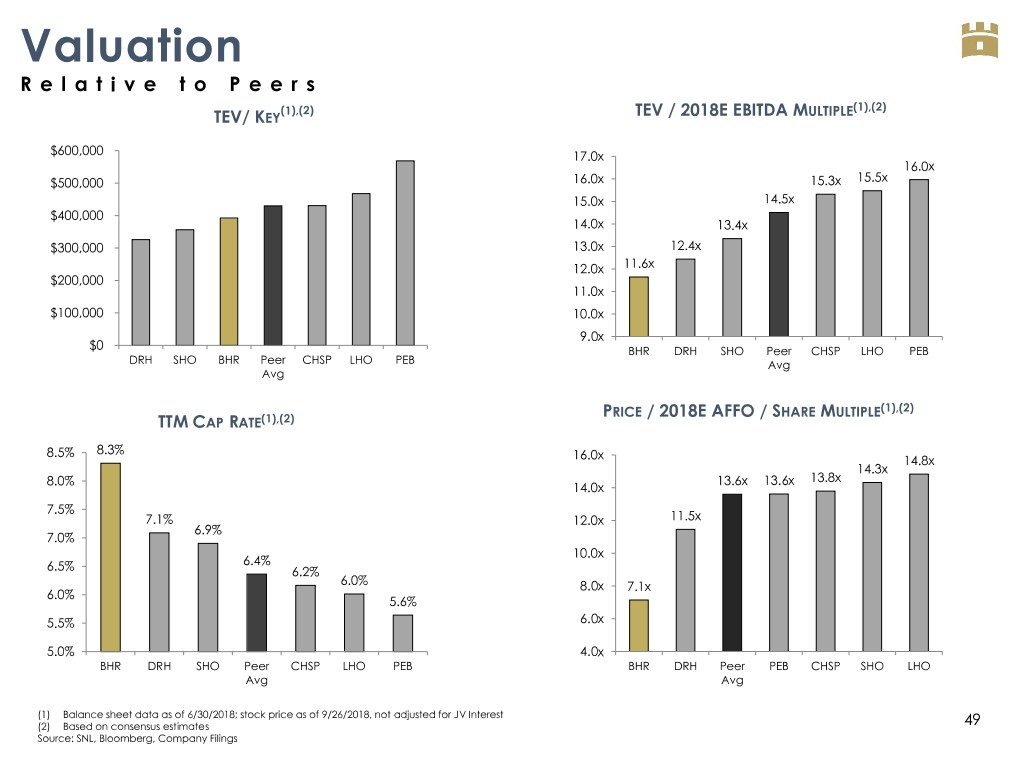
Valuation R e l a t i v e t o P e e r s (1),(2) ULTIPLE(1),(2) TEV/ KEY TEV / 2018E EBITDA M $600,000 17.0x 16.0x $500,000 16.0x 15.3x 15.5x 15.0x 14.5x $400,000 14.0x 13.4x $300,000 13.0x 12.4x 12.0x 11.6x $200,000 11.0x $100,000 10.0x 9.0x $0 BHR DRH SHO Peer CHSP LHO PEB DRH SHO BHR Peer CHSP LHO PEB Avg Avg PRICE / 2018E AFFO / SHARE MULTIPLE(1),(2) TTM CAP RATE(1),(2) 8.5% 8.3% 16.0x 14.8x 14.3x 8.0% 13.6x 13.6x 13.8x 14.0x 7.5% 7.1% 12.0x 11.5x 6.9% 7.0% 10.0x 6.4% 6.5% 6.2% 6.0% 8.0x 7.1x 6.0% 5.6% 5.5% 6.0x 5.0% 4.0x BHR DRH SHO Peer CHSP LHO PEB BHR DRH Peer PEB CHSP SHO LHO Avg Avg (1) Balance sheet data as of 6/30/2018; stock price as of 9/26/2018, not adjusted for JV Interest (2) Based on consensus estimates 49 Source: SNL, Bloomberg, Company Filings

Intrinsic Value(1),(2) V a l u a t i o n D i s c o n n e c t Current Equity Implied Equity Implied Equity Market Cap(3) Market Cap(4) Value Upside $436M $817M $381M BRAEMAR PORTFOLIO $946 87% Increase $817 (In millions $) Low-End High-End $687 TTM NOI(5),(7) $108.6 $108.6 Cap Rate(6) 7.0% 6.0% $436 Implied Value 1,551.4 $1,810.0 NWC(7),(8) $206.7 $206.7 Preferred Equity(7) ($124.1) ($124.1) Debt(7) ($946.7) ($946.7) Current Market Low End - Avg - Implied High End - Implied Equity Mkt $687.3 $945.9 Cap Implied Equity Equity Market Implied Equity Cap Market Cap Cap Market Cap (1) See valuation methodology disclaimer (5) See GAAP reconciliation in appendix (2) Excludes termination fee (6) Based on current implied cap rates of publicly traded peers (3) As of 9/26/2018 (7) As of 6/30/2018; Adjusted for Hilton JV as applicable (4) Based on average of estimated cap rates (8) Investment in Ashford Inc. at market value as of 8/14/2018 50
APPENDIX
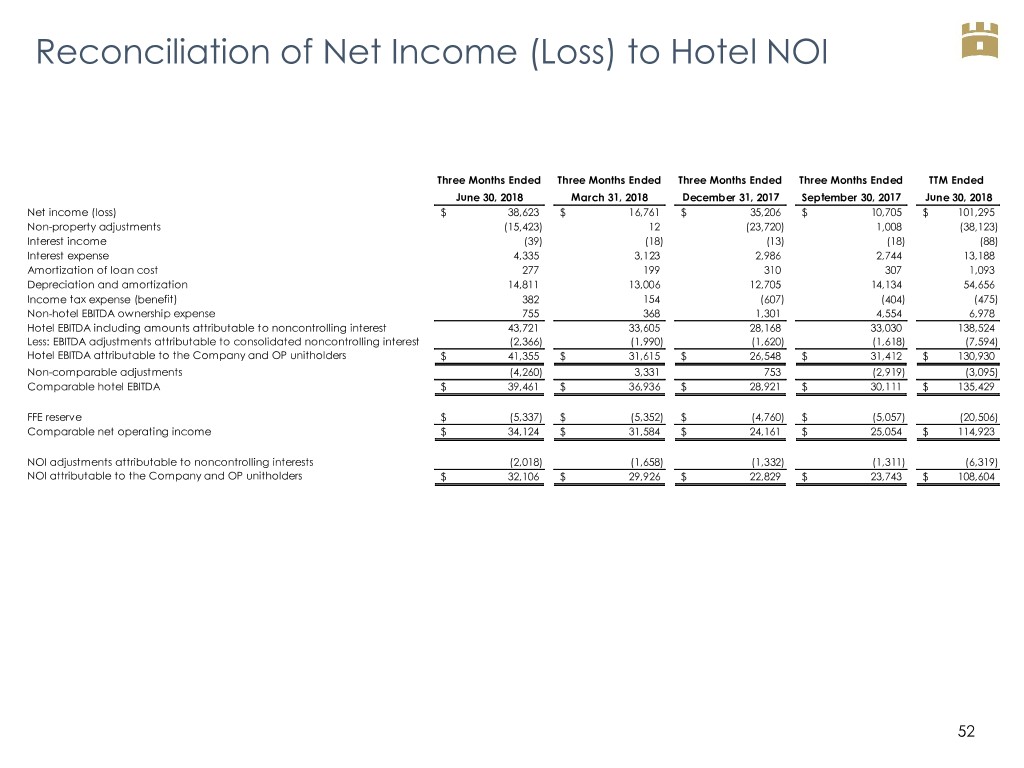
Reconciliation of Net Income (Loss) to Hotel NOI Three Months Ended Three Months Ended Three Months Ended Three Months Ended TTM Ended June 30, 2018 March 31, 2018 December 31, 2017 September 30, 2017 June 30, 2018 Net income (loss) $ 38,623 $ 16,761 $ 35,206 $ 10,705 $ 101,295 Non-property adjustments (15,423) 12 (23,720) 1,008 (38,123) Interest income (39) (18) (13) (18) (88) Interest expense 4,335 3,123 2,986 2,744 13,188 Amortization of loan cost 277 199 310 307 1,093 Depreciation and amortization 14,811 13,006 12,705 14,134 54,656 Income tax expense (benefit) 382 154 (607) (404) (475) Non-hotel EBITDA ownership expense 755 368 1,301 4,554 6,978 Hotel EBITDA including amounts attributable to noncontrolling interest 43,721 33,605 28,168 33,030 138,524 Less: EBITDA adjustments attributable to consolidated noncontrolling interest (2,366) (1,990) (1,620) (1,618) (7,594) Hotel EBITDA attributable to the Company and OP unitholders $ 41,355 $ 31,615 $ 26,548 $ 31,412 $ 130,930 Non-comparable adjustments (4,260) 3,331 753 (2,919) (3,095) Comparable hotel EBITDA $ 39,461 $ 36,936 $ 28,921 $ 30,111 $ 135,429 FFE reserve $ (5,337) $ (5,352) $ (4,760) $ (5,057) (20,506) Comparable net operating income $ 34,124 $ 31,584 $ 24,161 $ 25,054 $ 114,923 NOI adjustments attributable to noncontrolling interests (2,018) (1,658) (1,332) (1,311) (6,319) NOI attributable to the Company and OP unitholders $ 32,106 $ 29,926 $ 22,829 $ 23,743 $ 108,604 52

Reconciliation of Net Income (Loss) to Cash Available for Distribution Three Months Ended Three Months Ended Three Months Ended Three Months Ended TTM Ended June 30, 2018 March 31, 2018 December 31, 2017 September 30, 2017 March 31, 2018 Net income (loss) $ 12,854 $ 4,270 $ 28,444 $ (217) $ 45,351 (Income) loss from consolidated entities attributable to noncontrolling interest (89) 42 (528) (1,143) (1,718) Net (income) loss attributable to redeemable noncontrolling interests in operating partnership (1,235) (292) (2,996) 360 (4,163) Preferred dividends (1,708) (1,707) (1,708) (1,707) (6,830) Net income (loss) attributable to common stockholders 9,822 2,313 23,212 (2,707) 32,640 Depreciation and amortization on real estate 14,052 12,258 11,952 13,406 51,668 Impairment charges on real estate 59 12 60 1,008 1,139 Net income (loss) attributable to redeemable noncontrolling interests in operating partnership 1,235 292 2,996 (360) 4,163 Gain on sale of hotel property (15,711) - (23,797) - (39,508) Equity in (earnings) loss of unconsolidated entities 62 3 - - 65 Company's portion of FFO of OpenKey (63) (2) - - (65) FFO available to common stockholders and OP unitholders 9,456 14,876 14,423 11,347 50,102 Preferred dividends 1,708 1,707 1,708 1,707 6,830 Transaction and management conversion costs 462 503 74 260 1,299 Other (income) expense 63 63 85 22 233 Interest expense accretion on refundable membership club deposits 150 - - - 150 Write-off of loan costs and exit fees 4,176 2 1,531 380 6,089 Unrealized (gain) loss on investments 6,024 (528) (6,314) (1,875) (2,693) Unrealized (gain) loss on derivatives 298 (73) 524 531 1,280 Non-cash stock/unit-based compensation 1,442 2,593 665 (921) 3,779 Legal, advisory and settlement costs 197 (1,141) 203 560 (181) Uninsured hurricane and wildfire related costs (55) 467 248 3,573 4,233 Tax reform 2 - (161) - (159) Adjusted FFO available to the Company and OP unitholders $ 23,923 $ 18,469 $ 12,986 $ 15,584 $ 70,962 FFE reserve (net of noncontrolling interest) (5,349) (4,415) (4,110) (4,775) (18,649) Preferred dividends (1,708) (1,707) (1,708) (1,707) (6,830) Amortization of loan costs 1,075 988 1,149 1,356 4,568 Cash available for distribution to the Company and OP unitholders $ 17,941 $ 13,335 $ 8,317 $ 10,458 $ 50,051 53

Investor Day October 2018


