
Ashford Group of Companies Why Lodging, Why Now – Investor Day 2018
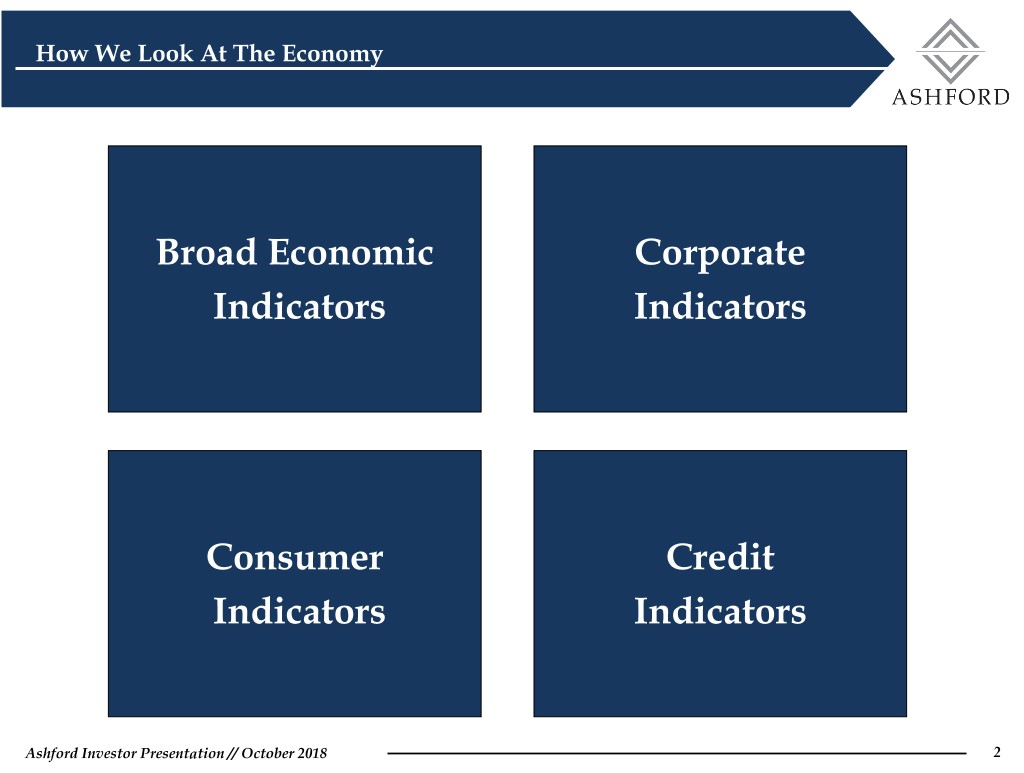
How We Look At The Economy Broad Economic Corporate Indicators Indicators Consumer Credit Indicators Indicators Ashford Investor Presentation // October 2018 2

Broad Economic Indicators Ashford Investor Presentation // October 2018 3

Broad Economic Indicators Positive Real GDP Growth Accelerating Real QoQ GDP Growth % (as of Q2 18) 10 8 6 4.1 4 2 0 -2 -4 -6 -8 -10 Source: Bloomberg, Bureau of Economic Analysis. Ashford Investor Presentation // October 2018 4
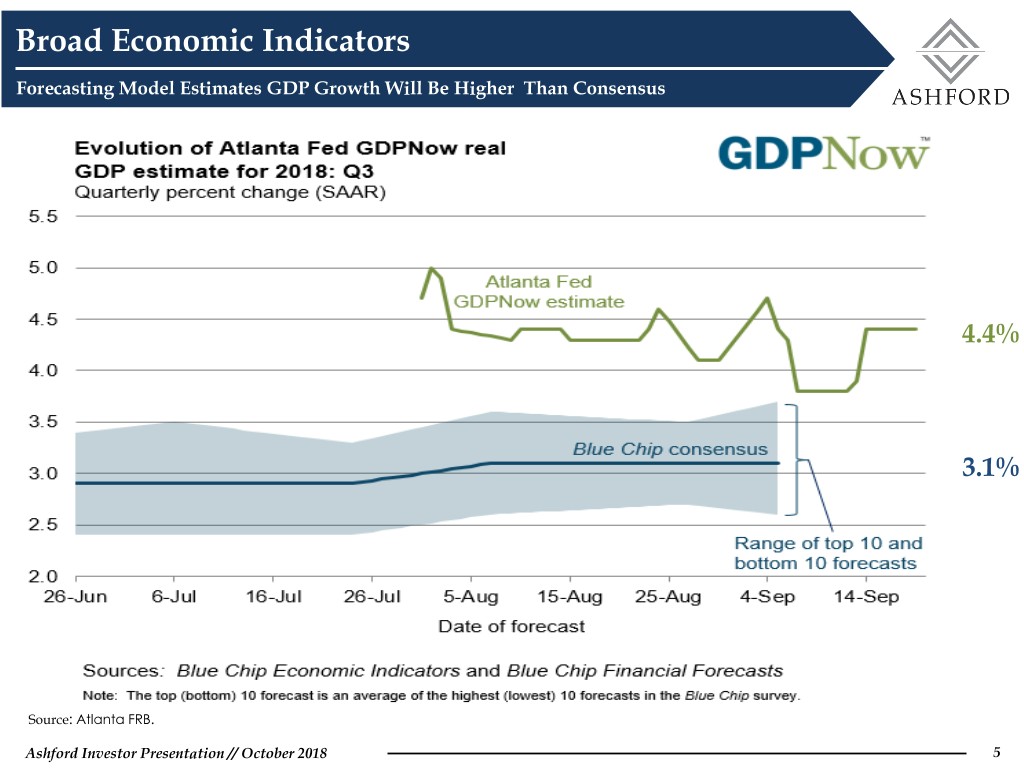
Broad Economic Indicators Forecasting Model Estimates GDP Growth Will Be Higher Than Consensus 4.4% 3.1% Source: Atlanta FRB. Ashford Investor Presentation // October 2018 5

Broad Economic Indicators Low Unemployment Continues To Decline Unemployment Rate % (as of Aug 18) 12 10 8 6 4 3.9 2 0 Source: Bloomberg, Bureau of Labor Statistics. Ashford Investor Presentation // October 2018 6
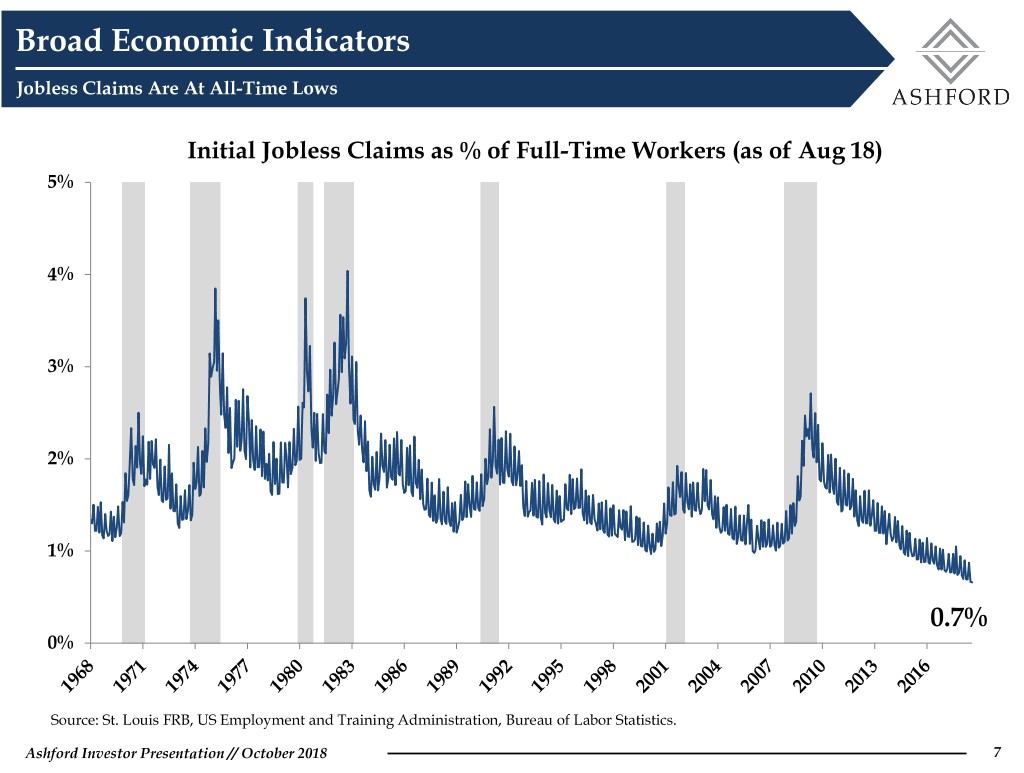
Broad Economic Indicators Jobless Claims Are At All-Time Lows Initial Jobless Claims as % of Full-Time Workers (as of Aug 18) 5% 4% 3% 2% 1% 0.7% 0% Source: St. Louis FRB, US Employment and Training Administration, Bureau of Labor Statistics. Ashford Investor Presentation // October 2018 7

Broad Economic Indicators More Workers Quitting Total Non Farm Quits (as of Jul 18) 2.8% 2.6% 2.4% 2.4% 2.2% 2.0% 1.8% 1.6% 1.4% 1.2% Source: Bloomberg, St. Louis FRB, Bureau of Labor Statistics. Ashford Investor Presentation // October 2018 8
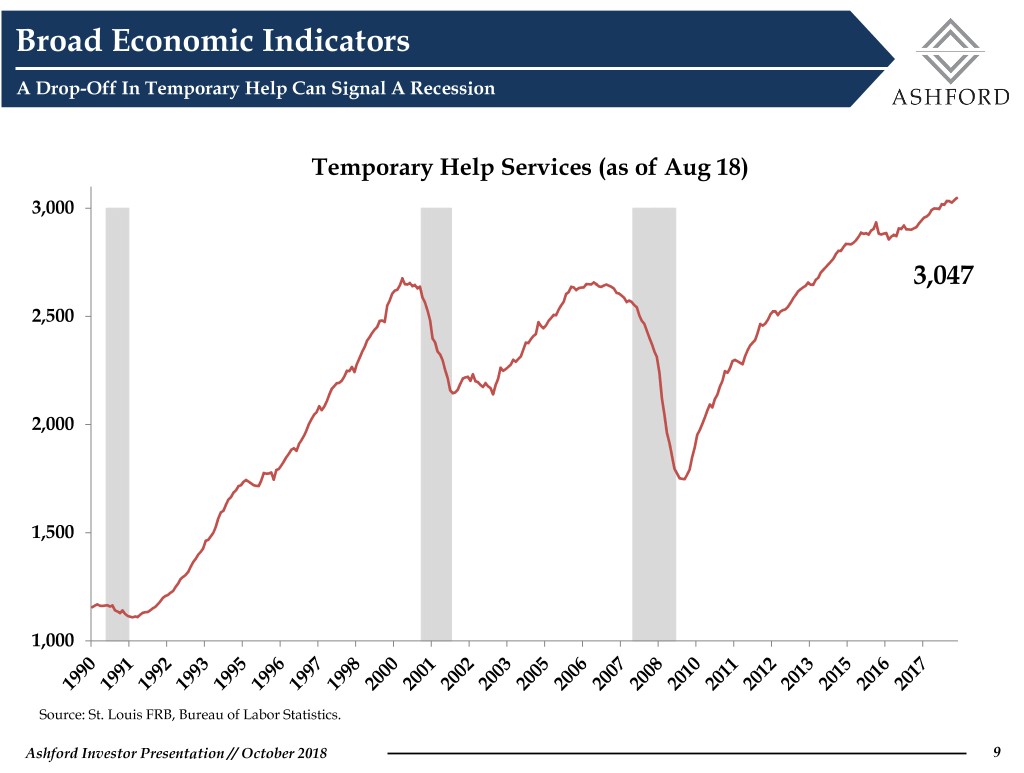
Broad Economic Indicators A Drop-Off In Temporary Help Can Signal A Recession Temporary Help Services (as of Aug 18) 3,000 3,047 2,500 2,000 1,500 1,000 Source: St. Louis FRB, Bureau of Labor Statistics. Ashford Investor Presentation // October 2018 9
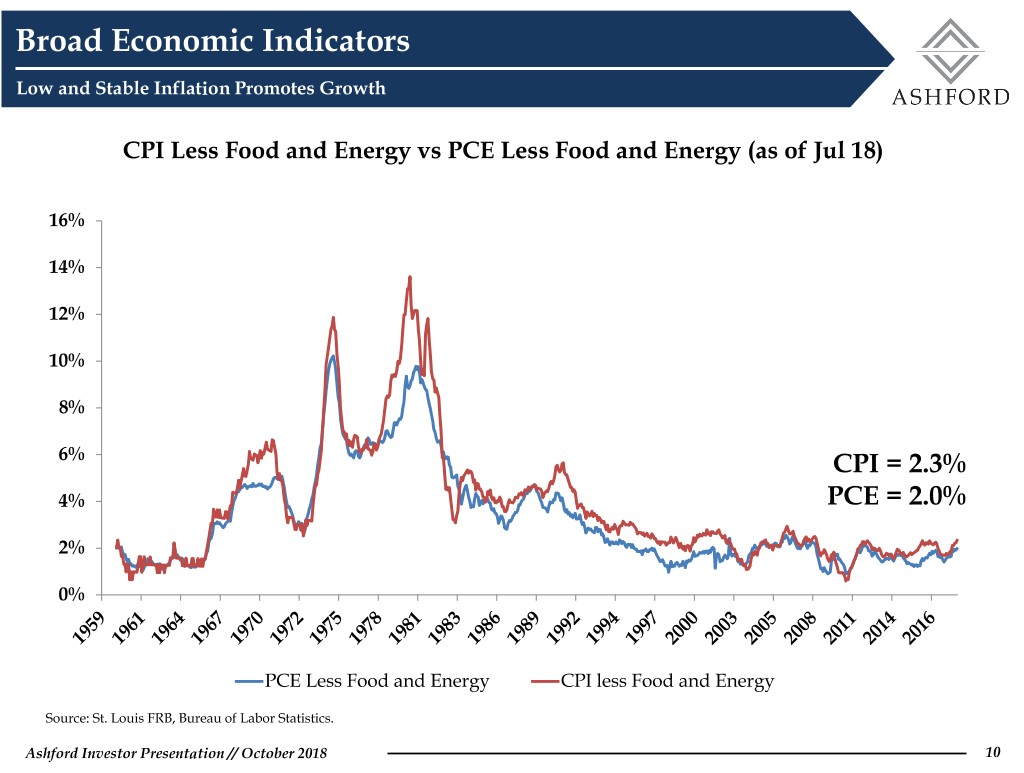
Broad Economic Indicators Low and Stable Inflation Promotes Growth CPI Less Food and Energy vs PCE Less Food and Energy (as of Jul 18) 16% 14% 12% 10% 8% 6% CPI = 2.3% 4% PCE = 2.0% 2% 0% PCE Less Food and Energy CPI less Food and Energy Source: St. Louis FRB, Bureau of Labor Statistics. Ashford Investor Presentation // October 2018 10

Broad Economic Indicators Inflation Forecasted To Remain Low Inflation Forecast (as of Aug 18) Q2 18A Q3 18E Q4 18E Q1 19E Q2 19E Q3 19E Q4 19E CPI (YoY%) 2.7 2.6 2.4 2.2 2.3 2.3 2.3 PCE Price 2.2 2.2 2.1 2.1 2.1 2.1 2.1 Index (YoY%) Core PCE 1.9 2.0 2.1 2.1 2.1 2.2 2.2 (YoY%) Source: Bloomberg Ashford Investor Presentation // October 2018 11

Corporate Indicators Ashford Investor Presentation // October 2018 12

Corporate Indicators Business Strength Remains Strong And Expansion Is Well Established ISM Manufacturing & Services Indexes (Above 50 = expansion) (as of Aug 18) 70 65 61.3 60 58.5 55 50 45 40 35 30 Services Manufacturing Source: Institute for Supply Management. Ashford Investor Presentation // October 2018 13

Corporate Indicators Tax Cuts, Strong Consumer Confidence, And Growing Economy Fueling Corporate Profits After-tax Real U.S. Corporate Profit Growth (as of Q2 18) 60% 50% 40% 30% 13.3% 20% 10% 0% -10% RealCorporate ProfitsGrowth -20% -30% -40% Source: St. Louis FRB, Bureau of Economic Analysis. Ashford Investor Presentation // October 2018 14

Corporate Indicators Small Business Confidence Is Strong Small Business Confidence (as of Aug 18) 60 50 34 40 30 20 10 0 -10 -20 -30 -40 -50 Source: National Federation of Independent Business, Bloomberg Ashford Investor Presentation // October 2018 15

Consumer Indicators Ashford Investor Presentation // October 2018 16
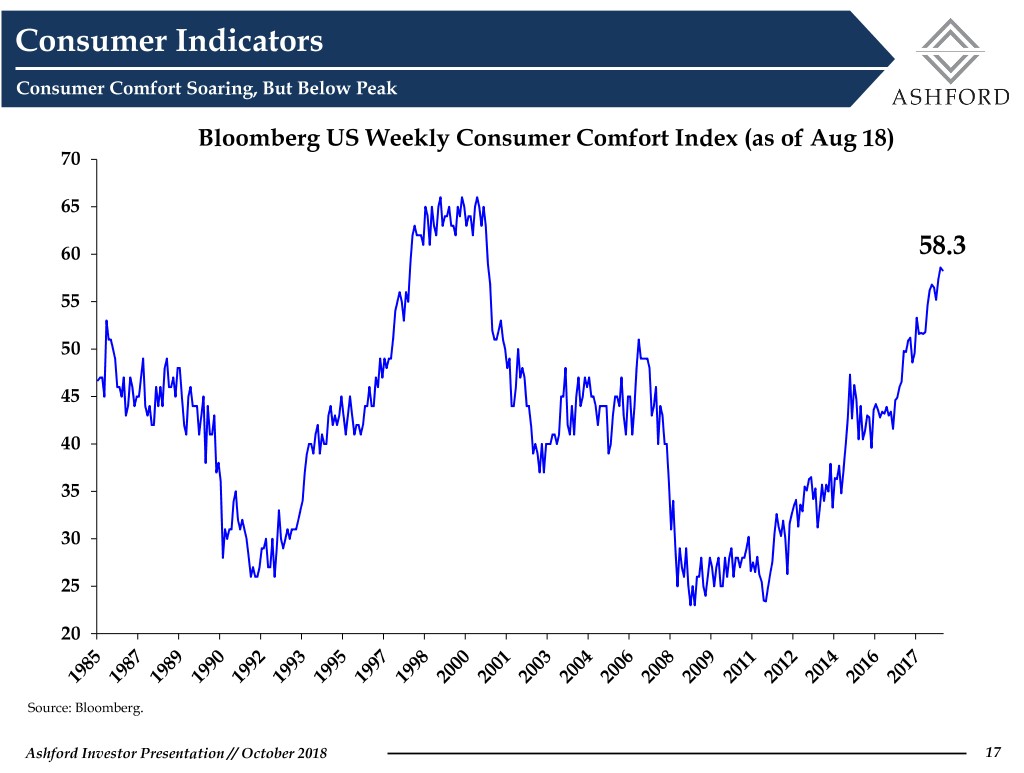
Consumer Indicators Consumer Comfort Soaring, But Below Peak Bloomberg US Weekly Consumer Comfort Index (as of Aug 18) 70 65 60 58.3 55 50 45 40 35 30 25 20 Source: Bloomberg. Ashford Investor Presentation // October 2018 17

Consumer Indicators Consumer Confidence Expectations Are High Consumer Confidence: Expectations (as of Jul 18) 120 102.4 100 80 60 40 Consumer Consumer Confidence Expectations 20 Source: Bloomberg, Conference Board, Bureau of Economic Analysis. Ashford Investor Presentation // October 2018 18

Consumer Indicators Housing Prices Increasing, Benefitting Household Wealth And Consumer Spending Trailing 3-Mo Avg. Real Home Prices (as of Aug 18) $300,000 $282,773 $280,000 $260,000 $240,000 $220,000 $200,000 $180,000 $160,000 $140,000 $120,000 $100,000 Source: Bloomberg, National Assoc. of Realtors, Bureau of Labor Statistics. Ashford Investor Presentation // October 2018 19

Credit Indicators Ashford Investor Presentation // October 2018 20

Credit Indicators Non-Performing Loans Still Low Non Performing Loans to Total Loans and Leases Past Due 90 + days (as of Q2 2018) 6% 5% 4% 3% 2% 1% 1.0% 0% Source: St. Louis FRB, Federal Financial Institutions Examination Council. Ashford Investor Presentation // October 2018 21

Credit Indicators Bank Credit Standards Are Loosening Source: Board of Governors of the Federal Reserve System. Ashford Investor Presentation // October 2018 22

Credit Indicators CRE Loan Standards Have Been Loosening And Are Now Almost Neutral Source: Board of Governors of the Federal Reserve System. Ashford Investor Presentation // October 2018 23
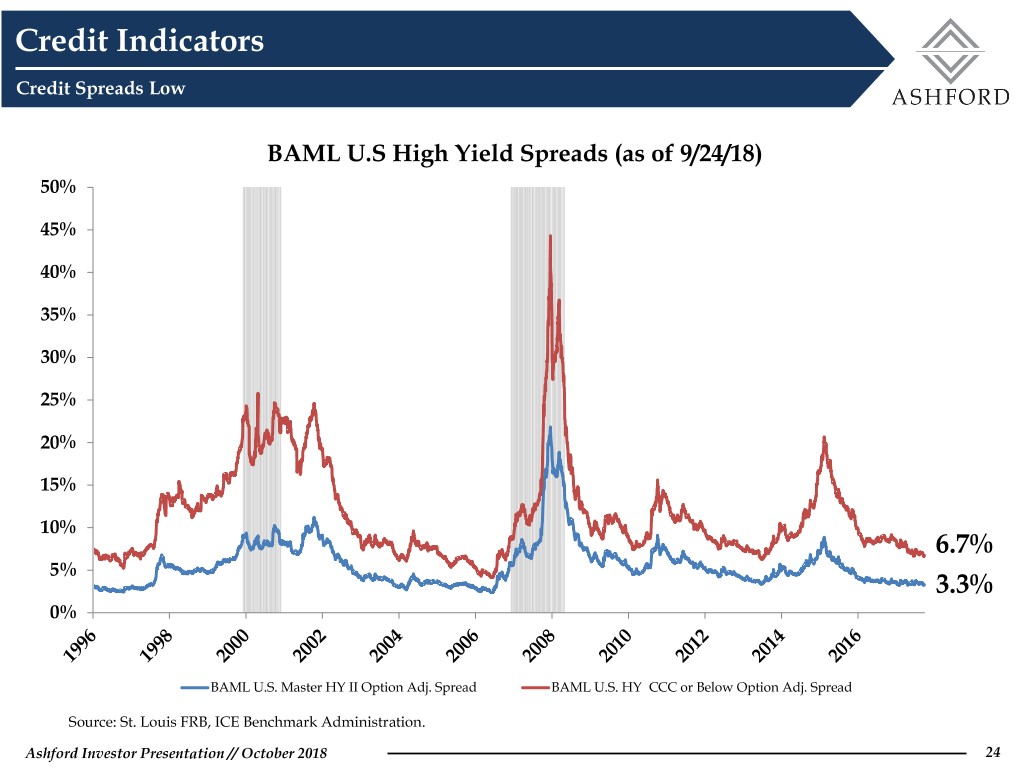
Credit Indicators Credit Spreads Low BAML U.S High Yield Spreads (as of 9/24/18) 50% 45% 40% 35% 30% 25% 20% 15% 10% 6.7% 5% 3.3% 0% BAML U.S. Master HY II Option Adj. Spread BAML U.S. HY CCC or Below Option Adj. Spread Source: St. Louis FRB, ICE Benchmark Administration. Ashford Investor Presentation // October 2018 24
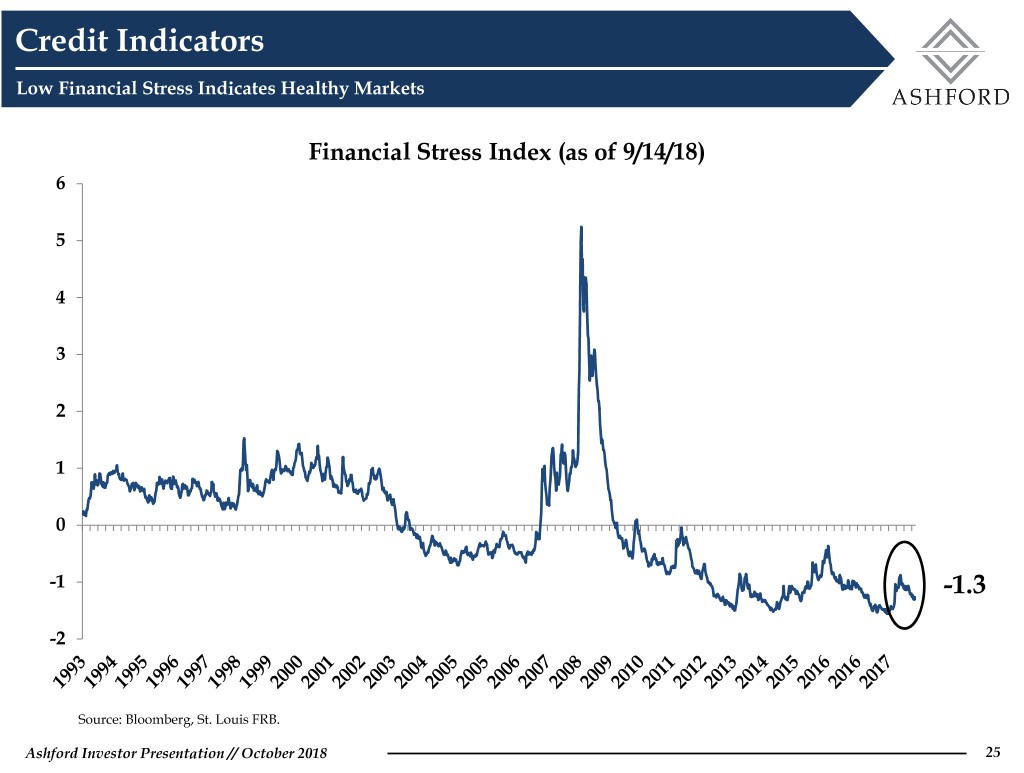
Credit Indicators Low Financial Stress Indicates Healthy Markets Financial Stress Index (as of 9/14/18) 6 5 4 3 2 1 0 -1 -1.3 -2 Source: Bloomberg, St. Louis FRB. Ashford Investor Presentation // October 2018 25

Hotel Industry Outlook Ashford Investor Presentation // October 2018 26
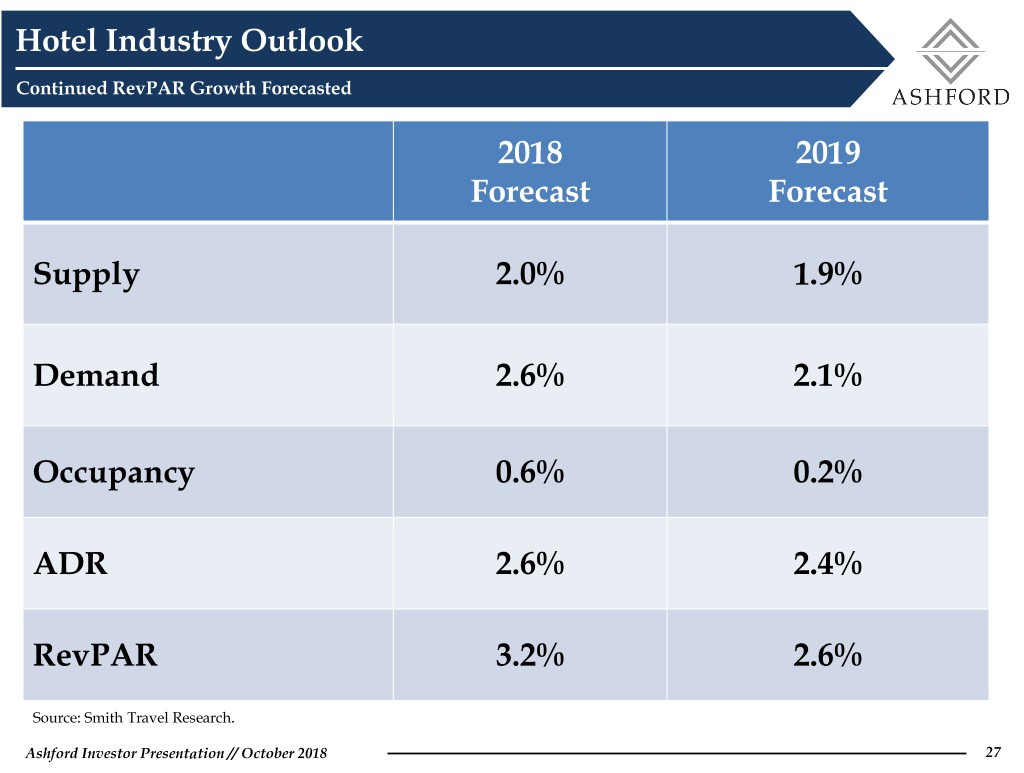
Hotel Industry Outlook Continued RevPAR Growth Forecasted 2018 2019 Forecast Forecast Supply 2.0% 1.9% Demand 2.6% 2.1% Occupancy 0.6% 0.2% ADR 2.6% 2.4% RevPAR 3.2% 2.6% Source: Smith Travel Research. Ashford Investor Presentation // October 2018 27

Ashford Group of Companies Why Lodging, Why Now – Investor Day 2018


