UNITED STATES
SECURITIES AND EXCHANGE COMMISSION
Washington, D.C. 20549
FORM N-CSR
CERTIFIED SHAREHOLDER REPORT OF REGISTERED
MANAGEMENT INVESTMENT COMPANIES
Investment Company Act file number 811-22836
Permal Hedge Strategies Fund II
(Exact name of registrant as specified in charter)
620 Eighth Avenue, 49th Floor, New York, NY 10018
(Address of principal executive offices) (Zip code)
Robert I. Frenkel, Esq.
Legg Mason & Co., LLC
100 First Stamford Place
Stamford, CT 06902
(Name and address of agent for service)
Registrant’s telephone number, including area code: 1-888-777-0102
Date of fiscal year end: March 31
Date of reporting period: September 30, 2015
| ITEM 1. | REPORT TO STOCKHOLDERS. |
The Semi-Annual Report to Stockholders is filed herewith.

| | |
| Semi-Annual Report | | September 30, 2015 |
PERMAL
HEDGE STRATEGIES FUND II

|
| INVESTMENT PRODUCTS: NOT FDIC INSURED • NO BANK GUARANTEE • MAY LOSE VALUE |
|
FOR ACCREDITED INVESTORS ONLY |
Fund objective
The Fund’s investment objective is to seek long-term capital appreciation while attempting to reduce risk and volatility.
In seeking to achieve its objective, the Fund, through its investment in Permal Hedge Strategies Portfolio, provides its shareholders with access, through investments in hedge funds, to a broad range of investment strategies which may include, but are not limited to, global fixed income strategies (e.g., U.S. and non-U.S. fixed income hedge, convertible arbitrage, fixed income arbitrage, asset-backed securities, long-only, high yield, emerging markets debt), global event-driven strategies (e.g., risk arbitrage, distressed debt, special situations, activists) and global macro strategies (e.g., discretionary, systematic, natural resources) and, to a lesser extent, equity long/short strategies.
| | |
| II | | Permal Hedge Strategies Fund II |
Letter from the chairman

Dear Shareholder,
We are pleased to provide the semi-annual report of Permal Hedge Strategies Fund II for the six-month reporting period ended September 30, 2015. Please read on for Fund performance information and a detailed look at prevailing economic and market conditions during the Fund’s reporting period.
I am pleased to introduce myself as the new Chairman, President and Chief Executive Officer of the Fund, succeeding Kenneth D. Fuller. I am honored to have been appointed to my new role. During my 27 year career with Legg Mason, I have seen the investment management industry evolve and expand. Throughout these changes, maintaining an unwavering focus on our shareholders and their needs has remained paramount.
As always, we remain committed to providing you with excellent service and a full spectrum of investment choices. We also remain committed to supplementing the support you receive from your financial advisor. One way we accomplish this is through our website, www.permalhsf.com. Here you can gain immediate access to market and investment information, including:
| • | | Fund prices and performance, |
| • | | Market insights and commentaries from our portfolio managers, and |
| • | | A host of educational resources. |
We look forward to helping you meet your financial goals.
Sincerely,

Jane Trust, CFA
Chairman, President and Chief Executive Officer
October 30, 2015
| | |
| Permal Hedge Strategies Fund II | | III |
Investment commentary
Economic review
The pace of U.S. economic activity was mixed during the six months ended September 30, 2015 (the “reporting period”). Looking back, the U.S. Department of Commerce’s reported that first quarter 2015 U.S. gross domestic product (“GDP”)i growth was 0.6%. This modest reading was attributed to a number of factors, including a deceleration in personal consumption expenditures (“PCE”), along with negative contributions from exports, nonresidential fixed investment, and state and local government spending. Economic activity then accelerated, as second quarter GDP growth was 3.9%. The upturn was driven by increasing exports, accelerating PCE, declining imports, expanding state and local government spending, and rising nonresidential fixed investment. The U.S. Department of Commerce’s initial reading for third quarter 2015 GDP growth — released after the reporting period ended — was 1.5%. Decelerating growth was primarily due to a downturn in private inventory investment and decelerations in exports, nonresidential fixed investment, PCE, state and local government spending, and residential fixed investment.
The labor market was a tailwind for the economy during the reporting period. When the period began, unemployment was 5.4%, as reported by the U.S. Department of Labor. By September 2015, unemployment was 5.1%, equaling its lowest level since April 2008.
Turning to the global economy, in its October 2015 World Economic Outlook Update, released after the close of the reporting period, the International Monetary Fund (“IMF”) said “Prospects across the main countries and regions remain uneven. Relative to last year, the recovery in advanced economies is expected to pick up slightly, while activity in emerging market and developing economies is projected to slow for the fifth year in a row, primarily reflecting weaker prospects for some large emerging market economies and oil-exporting countries.” From a regional perspective, the IMF projects that 2015 growth in the Eurozone will be 1.5%, versus 0.9% in 2014. Japan’s economy is expected to expand 0.6% in 2015, compared to a contraction of -0.1% in 2014. Elsewhere, the IMF said that overall growth in emerging market countries will decelerate in 2015, with growth of 4.0% versus 4.6% in 2014.
| | |
| IV | | Permal Hedge Strategies Fund II |
Market review
Q. How did the Federal Reserve Board (“Fed”)ii respond to the economic environment?
A. The Fed took a number of actions as it sought to meet its dual mandate of fostering maximum employment and price stability. As it has since December 2008, the Fed maintained the federal funds rateiii at a historically low range between zero and 0.25% during the reporting period. At its meeting that concluded on July 29, 2015, the Fed said “The Committee currently anticipates that, even after employment and inflation are near mandate-consistent levels, economic conditions may, for some time, warrant keeping the target federal funds rate below levels the Committee views as normal in the longer run.” At its meeting that ended on September 17, 2015, the Fed decided to maintain the target between zero and 0.25%. Finally, at its meeting that concluded on October 28, 2015, after the close of the reporting period, the Fed said, “In determining whether it will be appropriate to raise the target range at its next meeting, the Committee will assess progress — both realized and expected —toward its objectives of maximum employment and 2 percent inflation.”
Q. What actions did international central banks take during the reporting period?
A. Given the economic challenges in the Eurozone, the European Central Bank (“ECB”)iv took a number of actions to stimulate growth and ward off deflation. The ECB reduced rates in June and September 2014, before the beginning of the reporting period. Then, in January 2015 the ECB announced that, beginning in March 2015, it would start a €60 billion-a-month bond buying program that is expected to run until September 2016. In other developed countries, the Bank of England kept rates on hold at 0.50% during the reporting period, as did Japan at a range of zero to 0.10%, its lowest level since 2006. At the end of October 2014, the Bank of Japan announced that it would increase its asset purchases between 10 trillion yen and 20 trillion yen ($90.7 billion to $181.3 billion) to approximately 80 trillion yen ($725 billion) annually, in an attempt to stimulate growth. Elsewhere, after holding rates steady at 6.0% since July 2012, the People’s Bank of China lowered rates five times from November 23, 2014 to August 25, 2015. On October 23, 2015, after the reporting period ended, China’s central bank again cut rates, pushing them down to 4.35%.
Q. Did Treasury yields trend higher or lower during the six months ended September 30, 2015?
A. Both short- and long-term Treasury yields moved higher during the reporting period. When the period began, the yield on the two-year Treasury note was 0.56%. Its low for the period was 0.49% on April 3, 2015 and it peaked at 0.82% in mid-September 2015. When the reporting period ended the yield on the two-year Treasury note was 0.64%. The yield on the ten-year Treasury note began the period at 1.94%. Its low for the period of 1.85% occurred on April 3, 2015. Its peak of 2.50% was on June 10, 2015 and the ten-year Treasury note concluded the reporting period at 2.06%.
Q. What factors impacted the spread sectors (non-Treasuries) during the reporting period?
A. The spread sectors posted mixed results during the reporting period. Due to
| | |
| Permal Hedge Strategies Fund II | | V |
Investment commentary (cont’d)
weakness toward the end of the reporting period, high-yield corporate bonds and emerging market debt were among the weakest performers over the six months ended September 30, 2015. In contrast, sectors that were generally less sensitive to rising interest rates, such as asset-backed securities, posted positive results. Performance fluctuated with investor sentiment given the uncertainties regarding future Fed monetary policy, along with concerns over global growth and geopolitical issues. The broad U.S. bond market, as measured by the Barclays U.S. Aggregate Bond Indexv, returned -0.47% during the six months ended September 30, 2015.
Q. How did the high-yield bond market perform over the six months ended September 30, 2015?
A. The U.S. high-yield bond market, as measured by the Barclays U.S. Corporate High Yield — 2% Issuer Cap Indexvi, returned -4.82% for the six months ended September 30, 2015. High yield bonds were volatile during the reporting period. While the underlying fundamentals in the high-yield market remained generally solid and default rates were well below their long-term average, the asset class faltered during the last four months of the reporting period as investor risk aversion increased.
Q. How did the emerging markets debt asset class perform over the reporting period?
A. The JPMorgan Emerging Markets Bond Index Global (“EMBI Global”)vii returned -2.33% during the six months ended September 30, 2015. The asset class rose during the first month of the reporting period — and again in July 2015 — but those gains were offset by weakness in May, June, August and September 2015. These setbacks were triggered by a number of factors, including concerns over economic growth in China, falling commodity prices, expectations for future Fed rate hikes and geopolitical issues.
Performance review
For the six-month period ended September 30, 2015, Broker Shares of Permal Hedge Strategies Fund II, excluding sales charges, returned -5.20%. The Fund’s unmanaged benchmarks, the HFRX Global Hedge Fund Indexviii , and the Barclays U.S. Aggregate Bond Index, returned -5.01% and -0.47%, respectively, for the same period.
The Fund operates in a master/feeder structure. The Fund pursues its investment objective by investing substantially all of its assets in an underlying mutual fund, Permal Hedge Strategies Portfolio, which has the same investment objective and substantially the same strategies and policies as the Fund.
| | | | |
Performance Snapshot as of September 30, 2015
(unaudited) | |
| (excluding sales charges) | | 6 months | |
| Permal Hedge Strategies Fund II: | | | | |
Broker Shares | | | -5.20 | % |
| HFRX Global Hedge Fund Index | | | -5.01 | % |
| Barclays U.S. Aggregate Bond Index | | | -0.47 | % |
The performance shown represents past performance. Past performance is no guarantee of future results and current performance may be higher or lower than the performance shown above. Principal value and investment returns will fluctuate and investors’ shares, when redeemed, may be worth more or less than their original cost. Total returns assume the reinvestment of all distributions at net asset value and the deduction of all Fund expenses. Returns have not been adjusted to include the maximum initial sales charge of 3.0% that may apply. If sales charges were reflected, the performance quoted would be
| | |
| VI | | Permal Hedge Strategies Fund II |
lower. Performance figures for periods shorter than one year represent cumulative figures and are not annualized. To obtain performance data current to the most recent month-end, please visit our website at www.permalhsf.com.
Fund performance figures reflect fee waivers and/or expense reimbursements, without which the performance would have been lower.
| | | | |
| Total Annual Operating Expenses (unaudited) |
As of the Fund’s current prospectus dated July 31, 2015, the gross total annual operating expense ratio for the Fund’s Broker Shares was 8.24%.
Actual expenses may be higher. For example, expenses may be higher than those shown if average net assets decrease. Net assets are more likely to decrease and Fund expense ratios are more likely to increase when markets are volatile.
The Fund’s manager has agreed to waive fees and/or reimburse the Fund’s expenses (including organization and offering expenses) to the extent necessary to ensure that the total annual Fund operating expenses do not exceed 2.65% for Broker Shares (excluding fees and expenses, including incentive or performance allocations and fees, attributable to Portfolio Funds, estimated to be 4.21% as of the Fund’s current prospectus dated July 31, 2015, brokerage, interest expense, taxes and extraordinary expenses). This expense limitation arrangement cannot be terminated prior to December 31, 2016 without the Board of Trustees’ consent.
The manager is permitted to recapture amounts previously waived and/or reimbursed to a class within three years after the year in which the manager earned the fee or incurred the expense if the class’ total annual operating expenses have fallen to a level below the expense limitation (“expense cap”) in effect at the time the fees were earned or the expenses incurred. In no case will the manager recapture any amount that would result, on any particular business of the Fund, in the class’ total annual operating expenses exceeding the expense cap or any other lower limit then in effect.
As always, thank you for your confidence in our stewardship of your assets.
Sincerely,
Jane Trust, CFA
Chairman, President and Chief Executive Officer
October 30, 2015
RISKS: An investment in the Fund is illiquid and should be considered speculative. An investment in the Fund entails unique risks because the investment funds or “underlying funds” in which the Fund invests through its investment in Permal Hedge Strategies Portfolio (the “Master Fund”) are private entities with limited regulatory oversight and disclosure obligations. All investments are subject to risk, including the possible loss of principal. The Fund is a non-diversified closed-end management investment company with a limited history of operations. As a non-diversified investment company, the Fund may be subject to greater risk and volatility than if the Fund’s portfolio were invested in securities of a broader range of issuers. In addition to the Fund’s operating expenses, you will indirectly bear the operating expenses of the underlying funds in which the Master Fund invests, which can be substantially higher than fees associated with mutual funds. The Fund,
| | |
| Permal Hedge Strategies Fund II | | VII |
Investment commentary (cont’d)
through its investment in the Master Fund, invests in unregistered hedge funds which are highly speculative investments that employ aggressive investment strategies and carry substantial risk. Investments in hedge funds are generally illiquid, difficult to value and may carry significant transfer restrictions. Some of the underlying funds employ leverage, which increases the volatility of investment return and subjects the Fund to magnified losses if an investment of an underlying fund declines in value. The Fund, the Master Fund and some of the underlying funds may use derivatives, such as options and futures, which can be illiquid, may disproportionately increase losses, and may have a potentially large impact on Fund performance. Some of the underlying funds may employ short selling, a speculative strategy. Unlike the possible loss on a security that is purchased, there is no limit on the amount of loss on an appreciating security that is sold short. The Master Fund and each underlying fund may engage in active and frequent trading, resulting in higher portfolio turnover and transaction costs. There is no assurance that these and other strategies used by the Master Fund or underlying funds will be successful. Equity securities are subject to price fluctuation. International investments are subject to special risks including currency fluctuations, social, economic and political uncertainties, which could increase volatility. These risks are magnified in emerging markets. Small and mid-cap stocks involve greater risks and volatility than large-cap stocks. Fixed income securities involve interest rate, credit, inflation, and reinvestment risks. As interest rates rise, the value of fixed income securities falls. High-yield bonds possess greater price volatility, illiquidity, and possibility of default. Because the Fund, through its investment in the Master Fund, invests in underlying funds, the managers may not be able to shift allocations in time to capture an immediate or sudden spike in the market. Diversification does not guarantee a profit or protect against a loss. Please see the Fund’s prospectus for a more complete discussion of these and other risks, investor requirements, and the Fund’s investment strategies.
All investments are subject to risk including the possible loss of principal. Past performance is no guarantee of future results. All index performance reflects no deduction for fees, expenses or taxes. Please note that an investor cannot invest directly in an index.
The information provided is not intended to be a forecast of future events, a guarantee of future results or investment advice. Views expressed may differ from those of the firm as a whole. Forecasts and predictions are inherently limited and should not be relied upon as an indication of actual or future performance.
| | |
| VIII | | Permal Hedge Strategies Fund II |
| i | Gross domestic product (“GDP”) is the market value of all final goods and services produced within a country in a given period of time. |
| ii | The Federal Reserve Board (“Fed”) is responsible for the formulation of U.S. policies designed to promote economic growth, full employment, stable prices and a sustainable pattern of international trade and payments. |
| iii | The federal funds rate is the rate charged by one depository institution on an overnight sale of immediately available funds (balances at the Federal Reserve) to another depository institution; the rate may vary from depository institution to depository institution and from day to day. |
| iv | The European Central Bank (“ECB”) is responsible for the monetary system of the European Union and the euro currency. |
| v | The Barclays U.S. Aggregate Bond Index is a broad-based bond index comprised of government, corporate, mortgage- and asset-backed issues, rated investment grade or higher, and having at least one year to maturity. |
| vi | The Barclays U.S. Corporate High Yield — 2% Issuer Cap Index is an index of the 2% Issuer Cap component of the Barclays U.S. Corporate High Yield Index, which covers the U.S. dollar-denominated, non-investment grade, fixed-rate, taxable corporate bond market. |
| vii | The JPMorgan Emerging Markets Bond Index Global (“EMBI Global”) tracks total returns for U.S. dollar-denominated debt instruments issued by emerging market sovereign and quasi-sovereign entities: Brady bonds, loans, Eurobonds and local market instruments. |
| viii | The HFRX Global Hedge Fund Index is designed to be representative of the overall composition of the hedge fund universe. It is comprised of all eligible hedge fund strategies; including but not limited to convertible arbitrage, distressed securities, equity hedge, equity market neutral, event-driven, macro, merger arbitrage, and relative value arbitrage. The strategies are asset weighted based on the distribution of assets in the hedge fund industry. |
| | |
| Permal Hedge Strategies Fund II | | IX |
Portfolio at a glance† (unaudited)
Permal Hedge Strategies Portfolio
The Fund invests substantially all of its assets in Permal Hedge Strategies Portfolio, the investment breakdown of which is shown below.
Investment breakdown (%) as a percent of total investments
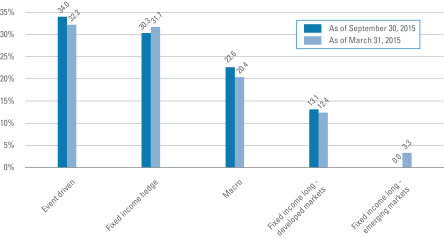
| † | The bar graph above represents the composition of the Portfolio’s investments as of September 30, 2015 and March 31, 2015. The Portfolio is actively managed. As a result, the composition of the Portfolio’s investments is subject to change at any time. |
| | |
| Permal Hedge Strategies Fund II 2015 Semi-Annual Report | | 1 |
Statement of assets and liabilities (unaudited)
September 30, 2015
| | | | |
| |
| Assets | | | | |
Investment in Permal Hedge Strategies Portfolio, at value | | $ | 35,692,640 | |
Cash | | | 131,687 | |
Redemptions receivable from Permal Hedge Strategies Portfolio | | | 1,750,000 | |
Investments in Permal Hedge Strategies Portfolio paid in advance | | | 75,000 | |
Prepaid expenses | | | 1,124 | |
Receivable for reimbursement from adviser | | | 25,919 | |
Total Assets | | | 37,676,370 | |
| |
| Liabilities | | | | |
Capital withdrawals payable | | | 1,643,532 | |
Contributions received in advance | | | 75,000 | |
Professional fees payable | | | 52,671 | |
Service and/or distribution fees payable | | | 25,011 | |
Trustees’ fees payable | | | 893 | |
Accrued expenses | | | 5,889 | |
Total Liabilities | | | 1,802,996 | |
| Total Net Assets | | $ | 35,873,374 | |
| |
| Net Assets | | | | |
Paid-in capital (Note 3) | | $ | 37,481,229 | |
Overdistributed net investment income | | | (931,510) | |
Accumulated net realized gain on investments allocated from Permal Hedge Strategies Portfolio | | | (904,294) | |
Net unrealized appreciation on investments allocated from Permal Hedge Strategies Portfolio | | | 227,949 | |
| Total Net Assets | | $ | 35,873,374 | |
| |
| Shares Outstanding: | | | | |
Broker Shares | | | 3,643,543 | |
| |
| Net Asset Value: | | | | |
Broker Shares | | | $9.85 | |
See Notes to Financial Statements.
| | |
| 2 | | Permal Hedge Strategies Fund II 2015 Semi-Annual Report |
Statement of operations (unaudited)
For the Six Months Ended September 30, 2015
| | | | |
| |
| Investment Income | | | | |
Income from Permal Hedge Strategies Portfolio | | $ | 5,855 | |
Allocated expenses from Permal Hedge Strategies Portfolio | | | (358,699) | |
Allocated waiver from Permal Hedge Strategies Portfolio | | | 6,787 | |
Total Investment Loss | | | (346,057) | |
| |
| Fund Expenses | | | | |
Service and/or distribution fees (Note 2) | | | 152,438 | |
Professional fees | | | 81,170 | |
Printing expenses | | | 30,962 | |
Administration fees | | | 23,431 | |
Registration fees | | | 13,396 | |
Trustees’ fees | | | 5,279 | |
Custodian fees | | | 2,562 | |
Miscellaneous expenses | | | 4,015 | |
Total Operating Expenses | | | 313,253 | |
Less: Fee waivers and /or expense reimbursements (Note 2) | | | (160,554) | |
Net Expenses | | | 152,699 | |
| Net Investment Loss | | | (498,756) | |
| Net Realized Gain on Investments from Permal Hedge Strategies Portfolio | | | 95,662 | |
| Net Change in Unrealized Depreciation from Investments in Permal Hedge Strategies Portfolio | | | (1,645,403) | |
| Net Decrease in Net Assets Resulting from Operations | | $ | (2,048,497) | |
See Notes to Financial Statements.
| | |
| Permal Hedge Strategies Fund II 2015 Semi-Annual Report | | 3 |
Statements of changes in net assets
| | | | | | | | |
For the Six Months Ended September 30, 2015 (unaudited)
and the Year Ended March 31, 2015 | | September 30 | | | March 31 | |
| | |
| Net Increase (Decrease) in Net Assets: | | | | | | | | |
| Operations: | | | | | | | | |
Net investment loss | | $ | (498,756) | | | $ | (780,279) | |
Net realized gain | | | 95,662 | | | | 153,224 | |
Net change in unrealized appreciation (depreciation) | | | (1,645,403) | | | | 682,885 | |
Net Increase (Decrease) in Net Assets Resulting from Operations | | | (2,048,497) | | | | 55,830 | |
| | |
| Distributions to Shareholders From (Notes 1 and 4): | | | | | | | | |
Net investment income | | | — | | | | (150,017) | |
Net realized gains | | | — | | | | (350,000) | |
Net Decrease in Net Assets from Distributions to Shareholders | | | — | | | | (500,017) | |
| | |
| Fund Share Transactions (Note 3): | | | | | | | | |
Net proceeds from issuance of shares | | | 1,892,000 | | | | 19,174,638 | |
Reinvestment of distributions | | | — | | | | 480,182 | |
Value of withdrawals | | | (2,048,412) | | | | (84,752) | |
Net Increase (Decrease) in Net Assets from Fund Share Transactions | | | (156,412) | | | | 19,570,068 | |
Increase (Decrease) in Net Assets | | | (2,204,909) | | | | 19,125,881 | |
| | |
| Net Assets | | | | | | | | |
Beginning of period | | | 38,078,283 | | | | 18,952,402 | |
End of period* | | $ | 35,873,374 | | | $ | 38,078,283 | |
*Includes overdistributed net investment income of: | | | $(931,510) | | | | $(432,754) | |
See Notes to Financial Statements.
| | |
| 4 | | Permal Hedge Strategies Fund II 2015 Semi-Annual Report |
Statement of cash flows (unaudited)
For the Six Months Ended September 30, 2015
| | | | |
| |
| Cash Used in Operating Activities | | | | |
Net decrease in net assets resulting from operations | | $ | (2,048,497) | |
Adjustments to reconcile net decrease in net assets resulting from operations to net cash used in operating activities: | | | | |
Purchases of investment in Permal Hedge Strategies Portfolio | | | (1,812,000) | |
Proceeds from the disposition of investments in Permal Hedge Strategies Portfolio | | | 550,000 | |
Net realized gain on investments from Permal Hedge Strategies Portfolio | | | (95,662) | |
Net change in unrealized depreciation from investments in Permal Hedge Strategies Portfolio | | | 1,645,403 | |
Net investment loss allocated from Permal Hedge Strategies Portfolio | | | 346,057 | |
Decrease in investments in Permal Hedge Strategies Portfolio paid in advance | | | 236,000 | |
Decrease in receivable for reimbursement from adviser | | | 6,149 | |
Increase in prepaid expenses | | | (719) | |
Increase in trustees’ fees payable | | | 470 | |
Decrease in service and/or distribution fees payable | | | (424) | |
Decrease in professional fees payable | | | (9,030) | |
Decrease in accrued expenses | | | (20,668) | |
Net Cash Used in Operating Activities | | | (1,202,921) | |
| |
| Cash Provided by Financing Activities | | | | |
Proceeds from issuance of shares | | | 1,576,000 | |
Value of withdrawals | | | (485,954) | |
Net Cash Provided by Financing Activities | | | 1,090,046 | |
| |
| Cash | | | | |
Net decrease in cash | | | (112,875) | |
Cash at beginning of period | | | 244,562 | |
Cash at end of period | | $ | 131,687 | |
See Notes to Financial Statements.
| | |
| Permal Hedge Strategies Fund II 2015 Semi-Annual Report | | 5 |
Financial highlights (unaudited)
| | | | | | | | | | | | |
| For a share of beneficial interest outstanding throughout each year ended March 31, unless otherwise noted: | |
| Broker Shares | | 20151 | | | 2015 | | | 20142 | |
| | | |
| Net asset value per share, beginning of period: | | | $10.39 | | | | $10.53 | | | | $10.00 | |
| | | |
| Income (loss) from investment operations:3 | | | | | | | | | | | | |
Net investment loss | | | (0.13) | | | | (0.26) | | | | (0.21) | |
Net realized and unrealized gain (loss) | | | (0.41) | | | | 0.27 | | | | 0.85 | |
Total income (loss) from investment operations | | | (0.54) | | | | 0.01 | | | | 0.64 | |
| | | |
| Less distributions from: | | | | | | | | | | | | |
Net investment income | | | — | | | | (0.05) | | | | (0.11) | |
Net realized gains | | | — | | | | (0.10) | | | | — | |
Total distributions | | | — | | | | (0.15) | | | | (0.11) | |
| | | |
| Net asset value per share, end of period: | | | $9.85 | | | | $10.39 | | | | $10.53 | |
Total return4 | | | (5.20) | % | | | 0.11 | % | | | 6.45 | % |
| | | |
| Net assets, end of period (000s) | | | $35,873 | | | | $38,078 | | | | $18,952 | |
| | | |
| Ratios to average net assets: | | | | | | | | | | | | |
Gross expenses6,7 | | | 3.53 | %5 | | | 4.26 | % | | | 7.17 | %5 |
Net expenses6,7,8,9 | | | 2.65 | %5 | | | 2.65 | % | | | 2.65 | %5 |
Net investment loss | | | (2.62) | %5 | | | (2.56) | % | | | (2.60) | %5 |
| | | |
| Portfolio turnover10 | | | 9 | % | | | 5 | % | | | 5 | % |
The above ratios may vary for individual investors based on the timing of Fund share transactions during the period.
| 1 | For the six months ended September 30, 2015 (unaudited). |
| 2 | For the period June 28, 2013 (commencement of operations) to March 31, 2014. |
| 3 | Per share data for income (loss) from investment operations is computed using the net income (loss) for the period divided by the average monthly shares. |
| 4 | Performance figures, exclusive of sales charges, may reflect fee waivers and/or expense reimbursements. In the absence of fee waivers and/or expense reimbursements, the total return would have been lower. Past performance is no guaranteed of future results. The total returns for periods less than one year have not been annualized. |
| 6 | Does not include expenses of the Portfolio Funds in which Permal Hedge Strategies Portfolio invests. |
| 7 | Includes the Fund’s share of Permal Hedge Strategies Portfolio’s allocated expenses. |
| 8 | As a result of an expense limitation agreement, the ratio of expenses (excluding fees and expenses, including incentive or performance allocations and fees, attributable to Portfolio Funds, brokerage, interest expense, taxes and extraordinary expenses) to average net assets of Broker Shares did not exceed 2.65%. This expense limitation arrangement cannot be terminated prior to December 31, 2016 without the Board of Trustees’ consent. |
| 9 | Reflects fee waivers and/or expense reimbursements. |
| 10 | Represents the portfolio turnover rate of Permal Hedge Strategies Portfolio. |
See Notes to Financial Statements.
| | |
| 6 | | Permal Hedge Strategies Fund II 2015 Semi-Annual Report |
Notes to financial statements (unaudited)
1. Organization and significant accounting policies
Permal Hedge Strategies Fund II (the “Fund”) is a Maryland statutory trust registered under the Investment Company Act of 1940, as amended (the “1940 Act”), as a non-diversified, closed-end management investment company. The Fund is a “feeder” fund in a “master feeder” structure and invests substantially all of its assets in Permal Hedge Strategies Portfolio, a Maryland statutory trust (the “Master Fund”). The Master Fund employs a “fund-of hedge funds” investment program that provides a means for the Fund to participate in investments in private investment vehicles, typically referred to as hedge funds (“Portfolio Funds”), by providing a single portfolio of interests in underlying Portfolio Funds, which are managed by a number of third-party investment managers (the “Portfolio Managers”). On June 27, 2013, Permal Hedge Strategies Fund I, an affiliated feeder fund that also invests substantially all of its assets in the Master Fund, declared a special distribution in the aggregate amount of approximately 59% of its interest in the Master Fund, a substantial portion of which was subsequently invested in the Fund. The financial statements of the Master Fund, including its schedule of investments and notes to financial statements, are an integral part of these financial statements and should be read in conjunction with these financial statements. The Fund offers one class of shares (the “Shares” or the “Broker Shares”).
The Fund has the same investment objective and substantially the same strategies as the Master Fund. The Fund’s investment objective is to seek long-term capital appreciation while attempting to reduce risk and volatility. In seeking to achieve its objective, the Fund, through its investment in the Master Fund, will provide its shareholders with access, through investments in the Portfolio Funds to a broad range of investment strategies which may include, but are not limited to, global fixed income strategies (e.g., U.S. and non-U.S. fixed income hedge, convertible arbitrage, fixed income arbitrage, asset-backed securities, long-only, high yield, emerging markets debt), global event-driven strategies (e.g., risk arbitrage, distressed debt, special situations, activists) and global macro strategies (e.g., discretionary, systematic, natural resources) and, to a lesser extent, equity long/short strategies.
The following are significant accounting policies consistently followed by the Fund and are in conformity with U.S. generally accepted accounting principles (“U.S. GAAP”). Estimates and assumptions are required to be made regarding assets, liabilities and changes in net assets resulting from operations when financial statements are prepared. Changes in the economic environment, financial markets and any other parameters used in determining these estimates could cause actual results to differ.
(a) Investment valuation. The Fund records its investment in the Master Fund at value. The value of such investment in the Master Fund reflects the Fund’s proportionate interest (64% at September 30, 2015) in the net assets of the Master Fund. The performance of the Fund is directly affected by the performance of the Master Fund. Valuation of the investments held by the Master Fund is discussed in the notes to the Master Fund’s financial statements, which are attached to this report.
| | |
| Permal Hedge Strategies Fund II 2015 Semi-Annual Report | | 7 |
Notes to financial statements (unaudited) (cont’d)
(b) Net asset value determination. The net asset value of the Fund is determined as of the close of business at the end of each month in accordance with the valuation principles set forth in Note 1(a) of the Master Fund’s Notes to Financial Statements, which are included elsewhere in this report or as may be determined from time to time pursuant to policies established by the Board of Trustees (the “Board”). The net asset value of the Fund will equal the value of the Fund’s total assets including its investment in the Master Fund, less all of its liabilities, including accrued fees and expenses. The net asset value per share of each class will equal the net asset value of the class divided by the number of outstanding shares for each class.
(c) Cash. The cash at September 30, 2015 consists of deposit accounts with The Bank of New York Mellon. Such cash, at times, may exceed U.S. federally insured limits. The Fund has not experienced any losses in such accounts and does not believe it is exposed to any significant credit risk on such bank deposits.
(d) Investment transactions and investment income. Purchases and sales of interest in the Master Fund are recorded on a trade-date basis and related revenues and expenses are recorded on an accrual basis. The Fund adopted the tax allocation rules provided for in Section 704(b) of the Internal Revenue Code. Accordingly, its proportionate share of the Master Fund’s income, expenses, realized and unrealized gains and losses are allocated monthly using the aggregate method. In addition, the Fund records its own investment income and operating expenses on an accrual basis.
(e) Distributions to shareholders. Distributions from net investment income and distributions of net realized gains, if any, are declared at least annually. Distributions to shareholders of the Fund are recorded on the ex-dividend date and are determined in accordance with income tax regulations, which may differ from U.S. GAAP.
(f) Compensating balance arrangements. The Fund has an arrangement with its custodian bank whereby a portion of the custodian’s fees is paid indirectly by credits earned on the Fund’s cash on deposit with the bank.
(g) U.S. federal and other taxes. It is the Fund’s policy to comply with the U.S. federal income and excise tax requirements of the Internal Revenue Code of 1986 (the “Code”), as amended, applicable to regulated investment companies. Accordingly, the Fund intends to distribute its taxable income and net realized gains, if any, to shareholders in accordance with timing requirements imposed by the Code. Therefore, no U.S. federal or state income tax provision is required in the Fund’s financial statements.
Management has analyzed the Fund’s tax positions taken on income tax returns for all open tax years and has concluded that as of September 30, 2015, no provision for income tax is required in the Fund’s financial statements. The Fund’s U.S. federal and state income and U.S. federal excise tax returns for the current tax year are subject to examination by Internal Revenue Service and state departments of revenue.
| | |
| 8 | | Permal Hedge Strategies Fund II 2015 Semi-Annual Report |
(h) Reclassification. U.S. GAAP requires that certain components of net assets be reclassified to reflect permanent differences between financial and tax reporting. These reclassifications have no effect on net assets or net asset values per share.
2. Investment management agreement and other transactions with affiliates
Legg Mason Partners Fund Advisor, LLC (“LMPFA”) serves as investment manager (the “Manager”) and is responsible for the day-to-day operations of the Fund and the Master Fund. Permal Asset Management LLC (“Permal”) is the Fund’s and the Master Fund’s sub-adviser (the “sub-adviser”) and is a member of the Permal Group, owned indirectly by Permal Group Ltd., a holding company of an international financial group of companies. LMPFA delegates to Permal the day to day portfolio management of the Fund and the Master Fund. LMPFA is a wholly-owned subsidiary of Legg Mason Inc. (“Legg Mason”). Permal Group Ltd. is a subsidiary of Legg Mason.
Under the investment management agreement between the Master Fund and LMPFA, the Master Fund pays an investment management fee, calculated and paid monthly, at an annual rate of 1.10% of the Master Fund’s average monthly managed assets. “Managed assets” means net assets plus the principal amount of any borrowings and assets attributable to any preferred shares that may be outstanding.
The management fee and related terms of the Fund’s investment management agreement with LMPFA are substantially the same as the terms of the Master Fund’s investment management agreement with LMPFA. Since the Fund invests all or substantially all of its assets in the Master Fund, the investment management fee of the Fund will be reduced by the investment management fee allocated to the Fund by the Master Fund.
LMPFA has agreed to waive fees and/or reimburse expenses (including organization and offering expenses) to the extent necessary to ensure that the total annual Fund operating expenses attributable to the Broker Shares will not exceed 2.65% (excluding fees and expenses, including incentive or performance allocations and fees, attributable to Portfolio Funds, brokerage, interest expense, taxes and extraordinary expenses). These expense limitation arrangements cannot be terminated prior to December 31, 2016 without the Board’s consent.
The Master Fund will bear its own similar fees and expenses, including the management fee. It also pays fees and expenses incidental to the purchase, holding and sale of interests in, and bears a pro rata share of the fees, including, but not limited to, any commitment fees, and expenses of, any Portfolio Fund and recurring investment-related expenses, including, but not limited to, the management fee, brokerage commissions, dealer mark-ups, and other transactions costs on cash management; interest expense on any borrowings; and any subscription or redemption charges imposed by the Portfolio Funds. These expenses are indirectly borne, on a pro rata basis, by the Fund.
During the six months ended September 30, 2015, fees waived and/or expenses reimbursed by LMPFA for the Fund amounted to $160,554.
| | |
| Permal Hedge Strategies Fund II 2015 Semi-Annual Report | | 9 |
Notes to financial statements (unaudited) (cont’d)
LMPFA is also permitted to recapture amounts waived or reimbursed within three years after the year in which LMPFA earned the fee or incurred the expense if the Fund’s total annual Fund operating expenses have fallen to a level below the limit described above. In no case will LMPFA recapture any amount that would result in the Fund’s total annual Fund operating expenses exceeding the limit described above.
Pursuant to these agreements, at September 30, 2015, the Fund had remaining fee waivers and/or expense reimbursements subject to recapture by LMPFA and respective dates of expiration as follows:
| | | | |
| Expires March 31, 2017 | | $ | 412,433 | |
| Expires March 31, 2018 | | | 404,455 | |
| Expires March 31, 2019 | | | 160,554 | |
| Total fee waivers/expense reimbursements subject to recapture | | $ | 977,442 | |
Legg Mason Investor Services, LLC (“LMIS”), a wholly-owned broker dealer subsidiary of Legg Mason, serves as principal underwriter and distributor of the Fund. The Fund pays LMIS a shareholder services fee of 0.25% of the Fund’s average monthly net assets attributable to Broker Shares and a distribution fee of 0.55% of the Fund’s average monthly net assets attributable to Broker Shares, each on an annualized basis.
There is a maximum initial sales charge of 3.00% of the amount invested in Broker Shares, with breakpoints generally based on size of investment. For the six months ended September 30, 2015, LMIS and affiliates did not receive any sales charges on sales of the Fund’s Broker Shares.
All officers and one Trustee of the Fund are employees of Legg Mason or its affiliates and do not receive compensation from the Fund.
As of September 30, 2015, Legg Mason and its affiliates owned 37% of the Fund.
3. Shares of beneficial interest
Shares in the Fund (“shares”) are sold to eligible investors (“shareholders”) who meet the definition of an accredited investor as defined in Regulation D under the Securities Act of 1933. The minimum initial investment in the Broker Shares from each shareholder is $25,000; the minimum additional investment is $10,000. Dealers may impose different investment minimums.
At September 30, 2015, the Fund had an unlimited number of shares of beneficial interest authorized with a par value of $0.00001 per share. The Fund intends to accept initial and additional purchases of shares as of the first business day of each calendar month. The Fund reserves the right to reject, in whole or in part, any purchase of shares and may suspend the offering of shares at any time and from time to time. The Fund may from time to time repurchase shares from shareholders at the net asset value per share pursuant to written tenders by shareholders, and on those terms and conditions as the Board may determine in its sole discretion. The Fund anticipates that each such repurchase offer will generally be limited to between 5% and 25% of the net assets of the Fund. In determining
| | |
| 10 | | Permal Hedge Strategies Fund II 2015 Semi-Annual Report |
whether the Fund should offer to repurchase shares from shareholders, the Board will consider the recommendation of LMPFA, in consultation with Permal. LMPFA, in consultation with Permal, expects that generally it will recommend the Board repurchase shares from shareholders quarterly, with such repurchases based on fund valuations as of each March 31, June 30, September 30 and December 31 (or, if any such date is not a business day, with such repurchases to occur as of the immediately preceding business day).
Transactions in shares of the Fund were as follows:
| | | | | | | | | | | | | | | | |
| | | Six Months Ended
September 30, 2015 | | | Year Ended
March 31, 2015 | |
| | | Shares | | | Amount | | | Shares | | | Amount | |
| Broker Shares | | | | | | | | | | | | | | | | |
| Shares issued | | | 184,353 | | | $ | 1,892,000 | | | | 1,827,422 | | | $ | 19,174,638 | |
| Shares issued on reinvestment | | | — | | | | — | | | | 47,169 | | | | 480,182 | |
| Value of withdrawals | | | (206,356) | | | | (2,048,412) | | | | (8,164) | | | | (84,752) | |
| Net increase (decrease) | | | (22,003) | | | $ | (156,412) | | | | 1,866,427 | | | $ | 19,570,068 | |
4. Distributions to shareholders
| | | | | | | | |
| | | Six Months Ended
September 30, 2015 | | | Year Ended
March 31, 2015 | |
| Distributions paid from: | | | | | | | | |
| Ordinary income | | | — | | | $ | 150,017 | |
| Net long-term capital gains | | | — | | | | 350,000 | |
| Total distributions paid | | | — | | | $ | 500,017 | |
5. Subsequent events
On September 28, 2015, the Fund commenced an offer to purchase (the “Offer”) up to 25% of the Fund’s outstanding Broker Shares at a price equal to the Broker Shares’ net asset value effective as of December 31, 2015. As of October 27, 2015, the expiration date of the Offer, there were 44,564 Broker Shares tendered.
Management has evaluated the impact of all subsequent events on the Fund through the date financial statements were issued and has determined that there were no additional subsequent events requiring recognition or disclosure in the financial statements.
| | |
| Permal Hedge Strategies Fund II 2015 Semi-Annual Report | | 11 |
Dividend reinvestment plan (unaudited)
Holders of shares of beneficial interest, par value $0.00001 per share (the “Shares”) of Permal Hedge Strategies Fund II (the “Fund”) who participate (the “Participants”) in the Fund’s Dividend Reinvestment Plan (the “Plan”) are advised as follows:
1. Enrollment of Participants. Each holder of Shares (a “Shareholder”) will automatically be a Participant. A Shareholder whose Shares are registered in the name of a nominee (such as an intermediary firm through which the Shareholder acquired Shares (an “Intermediary”)) must contact the nominee regarding the Shareholder’s status under the Plan.
2. The Plan Agent. The Bank of New York Mellon (the “Plan Agent”) will act as Plan Agent for each Participant.
3. Distributions. If the Fund declares income dividends and/or capital gains distributions (collectively, “Distributions”) payable either in Shares or in cash, non-participants in the Plan will receive Shares (in the case of a share distribution) or cash (in the case of a cash distribution), and Participants will receive Shares (in the case of a share distribution) or, in the case of a cash distribution, the equivalent amount in Shares. To the extent that a Participant reinvests Distributions in additional Shares, the Participant will receive an amount of Shares of the Fund equal to the amount of the Distribution on that Participant’s Shares divided by the net asset value per Share (“NAV”) of the Fund determined on the next valuation date following the record date for the payment of the applicable Distribution by the Fund.
4. Opt-Out. A Participant wishing to receive cash must affirmatively elect to receive both income dividends and capital gain distributions, if any, in cash. A Participant holding Shares through an Intermediary may elect to receive cash by notifying the Intermediary (who should be directed to inform the Fund). A Shareholder is free to change this election at any time, subject to the provisions of Section 9 below.
5. Recordkeeping. The Plan Agent will reflect each Participant’s Shares acquired pursuant to the Plan together with the Shares of other shareholders of the Fund acquired pursuant to the Plan in noncertificated form. Each Participant will be sent a confirmation by the Plan Agent of each acquisition made for his, her or its account as soon as practicable, but not later than 60 days after the date thereof. Distributions on fractional Shares will be credited to each Participant’s account to three decimal places. In the event of termination of a Participant’s account under the Plan, the Plan Agent will adjust for any such undivided fractional interest in cash at the NAV of Shares at the time of termination. Any Share Distributions or split shares distributed by the Fund on Shares held by the Plan Agent for Participants will be credited to their accounts.
6. Fees. The Plan Agent’s service fee for handling Distributions will be paid by the Fund.
| | |
| 12 | | Permal Hedge Strategies Fund II |
7. Termination of the Plan. The Plan may be terminated by the Fund at any time upon written notice mailed to the Participants at least 30 days prior to the record date for the payment of any Distribution by the Fund for which the termination is to be effective.
8. Amendment of the Plan. The Plan may be amended or supplemented by the Fund upon notice in writing mailed to Participants at least 30 days prior to the record date for the payment of any Distribution by the Fund for which the amendment is to be effective.
9. Withdrawal from the Plan. Participants may withdraw from the Plan (i.e., opt-out) by notifying the Plan Agent in writing at BNY Investors Services c/o Permal Hedge Strategies Fund II, 400 Bellevue Parkway, Wilmington, DE 19809, Mail Stop 19C-0204 or by calling the Plan Agent at 866-211-4521. Such withdrawal will be effective immediately if notice is received by the Plan Agent not less than ten business days prior to any dividend or distribution record date; otherwise such withdrawal will be effective as soon as practicable after the Plan Agent’s investment of the most recently declared dividend or distribution on the Shares.
10. Standard of Care. The Plan Agent shall at all times act in good faith and agree to use its best efforts within reasonable limits to insure the accuracy of all services performed under the Plan and to comply with applicable law, but the Plan Agent assumes no responsibility and shall not be liable for loss or damage due to errors unless such error is caused by its negligence, bad faith or willful misconduct of the Plan Agent or its employees.
11. Applicable Law. These terms and conditions shall be governed by the laws of the State of New York.
| | |
| Permal Hedge Strategies Fund II | | 13 |
Schedule of investments (unaudited)
September 30, 2015
Permal Hedge Strategies Portfolio
| | | | | | | | | | | | | | |
| | | | | Cost | | | Fair
Value | | | % of
Net Assets | |
| Investments in Portfolio Funds | | | | | | | | | | | | | | |
Event Driven | | | | | | | | | | | | | | |
Empyrean Capital Overseas Fund, Ltd.*(b)(d) | | | | $ | 3,350,000 | | | $ | 3,402,120 | | | | 6.07 | % |
Fortelus Special Situations Fund, Ltd.*(f) | | | | | 73,421 | | | | 110,109 | | | | 0.20 | |
H Offshore Fund, Ltd.*(b)(d) | | | | | 650,000 | | | | 1,315,380 | | | | 2.35 | |
OZ Overseas Fund II, Ltd.*(b) | | | | | 3,200,000 | | | | 3,534,579 | | | | 6.30 | |
Third Point Offshore Fund, Ltd.*(b) | | | | | 2,318,978 | | | | 2,598,776 | | | | 4.63 | |
Trian Partners, Ltd.*(b) | | | | | 900,000 | | | | 1,013,787 | | | | 1.81 | |
Twin Offshore, Ltd.*(a) | | | | | 3,550,000 | | | | 3,186,200 | | | | 5.68 | |
York Investment, Ltd.*(b) | | | | | 3,350,000 | | | | 3,251,797 | | | | 5.80 | |
Total Event Driven | | | | | 17,392,399 | | | | 18,412,748 | | | | 32.84 | |
Fixed Income Hedge | | | | | | | | | | | | | | |
Apollo Strategic Value Offshore Fund, Ltd.*(g) | | | | | 34,983 | | | | 25,333 | | | | 0.04 | |
Canyon Balanced Fund (Cayman), Ltd.*(b)(d) | | | | | 2,150,000 | | | | 2,525,808 | | | | 4.50 | |
Gracie International Credit Opportunities Fund, Ltd.*(b) | | | | | 1,875,000 | | | | 1,918,294 | | | | 3.42 | |
JAE Credit Fund Ltd.*(g)(h) | | | | | 3,580 | | | | 3,718 | | | | 0.01 | |
New Generation Turnaround Fund, Ltd.*(a)(e) | | | | | 1,637,223 | | | | 1,492,077 | | | | 2.66 | |
Reef Road Fund Ltd.*(c) | | | | | 1,250,000 | | | | 1,210,068 | | | | 2.16 | |
River Birch International, Ltd.*(b)(d) | | | | | 3,000,000 | | | | 2,987,595 | | | | 5.33 | |
Standard General Offshore Fund, Ltd.*(b)(d) | | | | | 2,400,000 | | | | 2,448,159 | | | | 4.37 | |
Stone Lion Fund, Ltd.*(b)(d) | | | | | 1,650,000 | | | | 1,486,858 | | | | 2.65 | |
York Credit Opportunities Unit Trust*(b) | | | | | 2,300,000 | | | | 2,358,719 | | | | 4.21 | |
Total Fixed Income Hedge | | | | | 16,300,786 | | | | 16,456,629 | | | | 29.35 | |
Fixed Income Long — Developed Markets | | | | | | | | | | | | | | |
Contrarian Fund I Offshore, Ltd.*(c) | | | | | 500,000 | | | | 658,111 | | | | 1.17 | |
LibreMax Offshore Fund, Ltd.*(b)(d) | | | | | 2,765,000 | | | | 3,110,375 | | | | 5.55 | |
Monarch Debt Recovery Fund, Ltd.*(c) | | | | | 1,100,000 | | | | 1,480,752 | | | | 2.64 | |
Shenkman Energy Opportunity Fund Ltd.*(b) | | | | | 800,000 | | | | 685,201 | | | | 1.22 | |
Thoroughbred Offshore Fund, Ltd.*(c) | | | | | 779,997 | | | | 1,160,374 | | | | 2.07 | |
Total Fixed Income Long — Developed Markets | | | | | 5,944,997 | | | | 7,094,813 | | | | 12.65 | |
Macro | | | | | | | | | | | | | | |
BlueTrend Fund, Ltd.*(a) | | | | | 1,350,000 | | | | 1,457,843 | | | | 2.60 | |
Caxton Global Investments, Ltd.*(b) | | | | | 1,950,000 | | | | 2,237,831 | | | | 3.99 | |
Explorer Global Fund, Ltd.*(b)(d) | | | | | 500,000 | | | | 616,226 | | | | 1.10 | |
Gavea Fund, Ltd.*(a) | | | | | 1,850,000 | | | | 2,000,681 | | | | 3.57 | |
Graticule Asia Macro Fund Ltd*(b) | | | | | 1,000,000 | | | | 958,589 | | | | 1.71 | |
London Select Fund Ltd.*(a) | | | | | 1,550,000 | | | | 1,675,735 | | | | 2.99 | |
See Notes to Financial Statements.
| | |
| 14 | | Permal Hedge Strategies Portfolio 2015 Semi-Annual Report |
Permal Hedge Strategies Portfolio
| | | | | | | | | | | | | | |
| | | | | Cost | | | Fair
Value | | | % of
Net Assets | |
Macro — continued | | | | | | | | | | | | | | |
Moore Macro Managers Fund, Ltd.*(b) | | | | $ | 900,000 | | | $ | 1,040,293 | | | | 1.85 | % |
The Tudor BVI Global Fund, Ltd.*(b) | | | | | 2,000,000 | | | | 2,272,151 | | | | 4.05 | |
Total Macro | | | | | 11,100,000 | | | | 12,259,349 | | | | 21.86 | |
Total Investments in Portfolio Funds | | | | $ | 50,738,182 | # | | | 54,223,539 | | | | 96.70 | |
Other Assets Less Liabilities | | | | | | | | | 1,848,473 | | | | 3.30 | |
Net Assets | | | | | | | | $ | 56,072,012 | | | | 100 | % |
Note: Investments in underlying Portfolio Funds are categorized by investment strategy.
| * | Non-income producing security. |
| (a) | Redemptions permitted monthly. |
| (b) | Redemptions permitted quarterly. |
| (c) | Redemptions permitted annually. |
| (d) | Subject to investor level gates if a significant portion of the investment is redeemed. |
| (e) | $267,019 of this investment is subject to a minimum lock-up period. |
| (f) | Permal Hedge Strategies Portfolio’s interest in the Portfolio Fund is held in a side pocket and is redeemable only when the underlying investment is realized or converted to regular interest in the Portfolio Fund. |
| (g) | Permal Hedge Strategies Portfolio’s interest in the Portfolio Fund is in liquidation. In addition to any redemption proceeds that may have already been received, Permal Hedge Strategies Portfolio will continue to receive proceeds periodically as the Portfolio Fund is able to liquidate the underlying investments. |
| (h) | Portfolio Fund is valued in good faith in accordance with procedures approved by the Board of Trustees (See Note 1). |
| # | Aggregate cost for U.S. federal income tax purposes is substantially the same. |
See Notes to Financial Statements.
| | |
| Permal Hedge Strategies Portfolio 2015 Semi-Annual Report | | 15 |
Statement of assets and liabilities (unaudited)
September 30, 2015
| | | | |
| |
| Assets | | | | |
Investments in Portfolio Funds, at fair value (Cost — $50,738,182) | | $ | 54,223,539 | |
Cash | | | 3,681,083 | |
Redemptions receivable from Portfolio Funds | | | 388,440 | |
Receivable for reimbursement from adviser | | | 2,235 | |
Total Assets | | | 58,295,297 | |
| |
| Liabilities | | | | |
Capital withdrawals payable | | | 1,830,000 | |
Contributions received in advance | | | 175,000 | |
Professional fees payable | | | 127,854 | |
Management fees payable | | | 53,123 | |
Trustees’ fees payable | | | 1,760 | |
Accrued expenses | | | 35,548 | |
Total Liabilities | | | 2,223,285 | |
| Total Net Assets | | $ | 56,072,012 | |
| |
| Net Assets Consist of | | | | |
Investors’ capital | | $ | 52,586,655 | |
Net unrealized appreciation/depreciation | | | 3,485,357 | |
| Total Net Assets | | $ | 56,072,012 | |
See Notes to Financial Statements.
| | |
| 16 | | Permal Hedge Strategies Portfolio 2015 Semi-Annual Report |
Statement of operations (unaudited)
For the Six Months Ended September 30, 2015
| | | | |
| |
| Investment Income | | | | |
Income | | $ | 9,041 | |
Total Investment Income | | | 9,041 | |
| |
| Fund Expenses | | | | |
Investment management fee (Note 2) | | | 323,537 | |
Professional fees | | | 128,645 | |
Administration fees | | | 77,650 | |
Trustees’ fees | | | 8,373 | |
Custodian fees | | | 955 | |
Miscellaneous expenses | | | 14,953 | |
Total Operating Expenses | | | 554,113 | |
Less: Fee waivers and /or expense reimbursements (Note 2) | | | (10,482) | |
Net Expenses | | | 543,631 | |
| Net Investment Loss | | | (534,590) | |
| Net Realized Gain from Investments in Portfolio Funds | | | 148,477 | |
| Net Change in Unrealized Depreciation from Investments in Portfolio Funds | | | (2,545,157) | |
| Net Decrease in Net Assets Resulting from Operations | | $ | (2,931,270) | |
See Notes to Financial Statements.
| | |
| Permal Hedge Strategies Portfolio 2015 Semi-Annual Report | | 17 |
Statements of changes in net assets
| | | | | | | | |
For the Six Months Ended September 30, 2015 (unaudited)
and the Year Ended March 31, 2015 | | September 30 | | | March 31 | |
| | |
| Net Increase (Decrease) in Net Assets: | | | | | | | | |
| | |
| Operations: | | | | | | | | |
Net investment loss | | $ | (534,590) | | | $ | (847,696) | |
Net realized gain from investments in Portfolio Funds | | | 148,477 | | | | 239,492 | |
Net change in unrealized appreciation (depreciation) from investments in
Portfolio Funds | | | (2,545,157) | | | | 1,046,446 | |
Net Increase (Decrease) in Net Assets Resulting from Operations | | | (2,931,270) | | | | 438,242 | |
| | |
| Capital Transactions: | | | | | | | | |
Proceeds from contributions | | | 3,473,500 | | | | 25,617,110 | |
Value of withdrawals | | | (2,880,000) | | | | – | |
Net Increase in Net Assets from Capital Transactions | | | 593,500 | | | | 25,617,110 | |
Increase (Decrease) in Net Assets | | | (2,337,770) | | | | 26,055,352 | |
| | |
| Net Assets | | | | | | | | |
Beginning of period | | | 58,409,782 | | | | 32,354,430 | |
End of period | | $ | 56,072,012 | | | $ | 58,409,782 | |
See Notes to Financial Statements.
| | |
| 18 | | Permal Hedge Strategies Portfolio 2015 Semi-Annual Report |
Statement of cash flows (unaudited)
For the Six Months Ended September 30, 2015
| | | | |
| |
| Cash Provided by Operating Activities | | | | |
Net decrease in net assets resulting from operations | | $ | (2,931,270) | |
Adjustments to reconcile net decrease in net assets resulting from operations to net cash provided by operating activities | | | | |
Purchases of investments in Portfolio Funds | | | (4,950,000) | |
Proceeds from the disposition of investments in Portfolio Funds | | | 4,408,582 | |
Net realized gain on investments in Portfolio Funds | | | (148,477) | |
Net change in unrealized depreciation from investments in Portfolio Funds | | | 2,545,157 | |
Decrease in investments in Portfolio Funds paid in advance | | | 1,500,000 | |
Decrease in receivable for reimbursement from adviser | | | 5,718 | |
Increase in trustees’ fees payable | | | 995 | |
Decrease in management fees payable | | | (461) | |
Decrease in professional fees payable | | | (82,641) | |
Decrease in accrued expenses | | | (12,961) | |
Net Cash Provided by Operating Activities | | | 334,642 | |
| |
| Cash Provided by Financing Activities | | | | |
Proceeds from contributions | | | 3,232,500 | |
Value of withdrawals | | | (1,050,000) | |
Net Cash Provided by Financing Activities | | | 2,182,500 | |
| |
| Cash | | | | |
Net increase in cash | | | 2,517,142 | |
Cash at beginning of period | | | 1,163,941 | |
Cash at end of period | | $ | 3,681,083 | |
See Notes to Financial Statements.
| | |
| Permal Hedge Strategies Portfolio 2015 Semi-Annual Report | | 19 |
Financial highlights (unaudited)
| | | | | | | | | | | | |
| For each year ended March 31, unless otherwise noted: | |
| | | 20151 | | | 2015 | | | 20142 | |
| | | |
| Net assets, end of year (000s) | | | $56,072 | | | | $58,410 | | | | $32,354 | |
Total return3 | | | (4.85) | % | | | 0.85 | % | | | 5.49 | % |
| | | |
| Ratios to average net assets: | | | | | | | | | | | | |
Gross expenses4 | | | 1.89 | %5 | | | 2.14 | % | | | 2.97 | %5 |
Net expenses4,6 | | | 1.85 | %5 | | | 1.85 | % | | | 2.01 | %5 |
Net investment loss | | | (1.82) | %5 | | | (1.76) | % | | | (1.96) | %5 |
| | | |
| Portfolio turnover | | | 9 | % | | | 5 | % | | | 5 | % |
| 1 | For the six months ended September 30, 2015 (unaudited). |
| 2 | For the period June 12, 2013 (commencement of operations) to March 31, 2014. |
| 3 | Permal Hedge Strategies Portfolio is a closed-end fund, the shares of which are offered to the feeder funds. No secondary market for Permal Hedge Strategies Portfolio’s shares exists. Performance figures may reflect fee waivers and/or expense reimbursements. In the absence of fee waivers and/or expense reimbursements, the total return would have been lower. Past performance is no guarantee of future results. The total return for periods less than one year has not been annualized. |
| 4 | Does not include expenses of the Portfolio Funds in which Permal Hedge Strategies Portfolio invests. |
| 6 | Reflects fee waivers and/or expense reimbursements. |
See Notes to Financial Statements.
| | |
| 20 | | Permal Hedge Strategies Portfolio 2015 Semi-Annual Report |
Notes to financial statements (unaudited)
1. Organization and significant accounting policies
Permal Hedge Strategies Portfolio (the “Master Fund”) is a Maryland statutory trust registered under the Investment Company Act of 1940, as amended (the “1940 Act”), as a non-diversified, closed-end management investment company. On June 12, 2013, Permal Hedge Strategies Fund I transferred substantially all of its assets to the Master Fund in return for an interest in the Master Fund. The Master Fund employs a “fund-of-hedge funds” investment program that provides a means for investors to participate in investments in private investment vehicles, typically referred to as hedge funds (“Portfolio Funds”), by providing a single portfolio of interests in underlying Portfolio Funds, which are managed by a number of third-party investment managers (the “Portfolio Managers”).
The Master Fund’s investment objective is to seek long-term capital appreciation while attempting to reduce risk and volatility. In seeking to achieve its objective, the Master Fund will provide its shareholders, through investments primarily in the Portfolio Funds, with access to a broad range of investment strategies with a global fixed income focus, which may include, but are not limited to, global fixed income strategies (e.g., U.S. and non-U.S. fixed income hedge, convertible arbitrage, fixed income arbitrage, asset-backed securities, long-only, high yield, emerging markets debt), global event-driven strategies (e.g., risk arbitrage, distressed debt, special situations, activists) and global macro strategies (e.g., discretionary, systematic, natural resources) and, to a lesser extent, equity long/short strategies.
The following are significant accounting policies consistently followed by the Master Fund and are in conformity with U.S. generally accepted accounting principles (“U.S. GAAP”). Estimates and assumptions are required to be made regarding assets, liabilities and changes in net assets resulting from operations when financial statements are prepared. Changes in the economic environment, financial markets and any other parameters used in determining these estimates could cause actual results to differ.
(a) Investment valuation. The Master Fund primarily invests in Portfolio Funds. The net asset values of Portfolio Funds (“Underlying NAV”) are generally not readily available from pricing vendors, nor are they calculable independently by Permal Asset Management LLC (“Permal”), the Master Fund’s sub-adviser, or the Legg Mason North Atlantic Fund Valuation Committee (the “Valuation Committee”). Therefore, pursuant to the valuation procedures, the Master Fund, under the direction of the Valuation Committee and recommendations from Permal, fair values the Master Fund’s interests in the Portfolio Funds as of each date upon which the Master Fund calculates its net asset value (“NAV Date”). The Master Fund values, using the net asset value as a practical expedient to form the basis of fair value, each underlying Portfolio Fund as of the NAV Date primarily in reliance on the most recent Underlying NAV supplied by the Portfolio Fund’s third party administrator. In the event that a Portfolio Fund’s third party administrator does not report an Underlying NAV to the Master Fund on a timely basis, the Master Fund determines the fair value of its investment in such Portfolio Fund based on a valuation report provided by the Portfolio Fund, as well as any other relevant information available at the NAV Date. Certain securities in which the
| | |
| Permal Hedge Strategies Portfolio 2015 Semi-Annual Report | | 21 |
Notes to financial statements (unaudited) (cont’d)
Portfolio Funds invest may not have a readily ascertainable market price and are fair valued by the Portfolio Managers and/or their administrators. In the event the Underlying NAV is not as of the NAV Date, Permal will use benchmarks or other triggers in determining if a significant market movement has occurred between the effective date of the Underlying NAV and the Master Fund’s NAV Date that should be taken into consideration when determining the reasonableness of the Underlying NAV.
Prior to investing in any Portfolio Fund, Permal conducts a due diligence review of the valuation methodology utilized by a Portfolio Fund’s third party administrator, which utilizes market values when available and otherwise utilizes principles of fair value consistent with U.S. GAAP.
The Board of Trustees (the “Board”) is responsible for the valuation process and has delegated the supervision of the daily valuation process to the Valuation Committee. The Valuation Committee, pursuant to the policies adopted by the Board, is responsible for making fair value determinations, evaluating the effectiveness of the Master Fund’s pricing policies, and reporting to the Board.
Some of the Portfolio Funds may hold a portion of their assets in “side pockets,” which are sub-funds within the Portfolio Funds that have restricted liquidity, potentially extending over a much longer period than the typical liquidity an investment in the Portfolio Funds may provide. Should the Master Fund seek to liquidate its investment in a Portfolio Fund that maintains these side pockets, the Master Fund might not be able to fully liquidate its investment without delay, which could be considerable. In such cases, until the Master Fund is permitted to fully liquidate its interest in the Portfolio Fund, the fair value of its investment could fluctuate based on adjustments to the value of the side pocket. At September 30, 2015, $110,109 or 0.2% of the Master Fund’s net assets was invested in a side pocket maintained by a Portfolio Fund.
As a general matter, the fair value of the Master Fund’s investment in a Portfolio Fund represents the amount that the Master Fund can reasonably expect to receive if the Master Fund’s investment was redeemed in an orderly transaction at the time of valuation. The Portfolio Funds provide for periodic redemptions ranging from monthly to annually. The Portfolio Funds generally require advance notice of an investor’s intent to redeem its interest, and may, depending on the Portfolio Funds’ governing agreements, deny or delay a redemption request. The underlying investments of each Portfolio Fund are accounted for at fair value in accordance with U.S. GAAP. The Portfolio Funds may invest a portion of their assets in restricted securities and other investments that are illiquid.
The Master Fund considers whether an adjustment should be made to an Underlying NAV when the Underlying NAV does not represent fair value consistent with U.S. GAAP or when it is probable that the Master Fund will sell a portion of the Portfolio Fund at an amount different from the Underlying NAV. No adjustments were made to the Underlying NAVs as of September 30, 2015.
| | |
| 22 | | Permal Hedge Strategies Portfolio 2015 Semi-Annual Report |
U.S. GAAP establishes a disclosure hierarchy that categorizes the inputs to valuation techniques used to value assets and liabilities at measurement date. These inputs are summarized in the three broad levels listed below:
| • | | Level 1 — quoted prices in active markets for identical investments |
| • | | Level 2 — other significant observable inputs (including quoted prices for similar investments, interest rates, prepayment speeds, credit risk, etc.) |
| • | | Level 3 — significant unobservable inputs (including the Master Fund’s own assumptions in determining the fair value of investments) |
The inputs or methodologies used to value securities are not necessarily an indication of the risk associated with investing in those securities.
The following is a summary of the inputs used in valuing the Master Fund’s assets and liabilities carried at fair value:
| | | | | | | | | | | | | | | | |
| | | | | | ASSETS | |
| Description | | 9/30/2015 | | | Quoted Prices
(Level 1) | | | Other Significant
Observable Inputs
(Level 2) | | | Significant
Unobservable
Inputs
(Level 3) | |
| Investments in Portfolio Funds† | | | | | | | | | | | | | | | | |
Fixed income hedge | | $ | 3,718 | | | | — | | | | — | | | $ | 3,718 | |
Other investments in Portfolio Funds measured at net asset value(a) | | | 54,219,821 | | | | — | | | | — | | | | — | |
| Total investments in Portfolio Funds | | $ | 54,223,539 | | | | — | | | | — | | | $ | 3,718 | |
| † | See Schedule of Investments for additional detailed categorizations. |
| (a) | In accordance with U.S. GAAP, certain investments in Portfolio Funds that are measured at fair value using the net asset value per share (or its equivalent) practical expedient have not been classified in the fair value hierarchy. The fair value amounts presented in this table are intended to permit reconciliation of the fair value hierarchy to the amounts presented in the Schedule of Investments. |
The following is a summary of the investment strategies, liquidity, redemption notice periods and any restrictions on the liquidity provisions of the investments in Portfolio Funds held by the Master Fund as of September 30, 2015. Portfolio Funds with no current redemption restrictions may be subject to future gates, lock-up provisions or other restrictions, in accordance with their offering documents which would affect their liquidity. The Master Fund had no unfunded capital commitments as of September 30, 2015.
Global fixed income strategies can include U.S. and non-U.S. fixed income hedge, fixed income arbitrage, convertible arbitrage, asset-backed securities, long-only, high yield, and emerging markets debt. U.S. and non-U.S. fixed income hedge generally involve Portfolio Managers taking both long and short positions in credit related instruments, including bonds, loans, asset-backed securities and credit default swaps and in some or all quality segments including investment grade, high yield, and emerging markets debt. Fixed income arbitrage generally involves Portfolio Managers attempting to capture mispricing within and
| | |
| Permal Hedge Strategies Portfolio 2015 Semi-Annual Report | | 23 |
Notes to financial statements (unaudited) (cont’d)
across global fixed income markets and associated derivatives. Value may be added by taking advantage of advantageous tax provisions, yield curve anomalies, volatility differences and arbitraging bond futures versus the underlying bonds (basis trading). Typically, a large amount of leverage is used to enhance returns. Convertible arbitrage generally involves seeking to profit from the mispricing of the embedded option in a convertible bond. Frequently, this strategy is characterized by a long, convertible position and corresponding short position in the underlying stock. Convertible arbitrage may use low or high levels of leverage depending upon the specific securities held by the Portfolio Fund. The Portfolio Funds within this strategy have monthly to annual liquidity, and are generally subject to a 20 to 90 day notice period. A portion of a Portfolio Fund representing approximately 1% in this strategy has redemptions subject to a minimum lock-up period. Portfolio Funds representing approximately 19% in this strategy have a greater than quarterly redemption period. Portfolio Funds representing less than 1% in this strategy are in liquidation. Portfolio Funds representing approximately 53% in this strategy have gated redemptions at the investor account level and limit investors’ ability to redeem their full holdings at any redemption date. The remaining approximately 26% of the Portfolio Funds in this strategy can be redeemed with no restrictions as of the measurement date or within near term.
Global event-driven strategies can include distressed debt, risk arbitrage, special situations and activists. Portfolio Managers employing such strategies maintain positions in companies currently or potentially involved in a wide variety of corporate transactions. Event-driven exposure can include a combination of equity markets, credit markets and idiosyncratic, company-specific developments. The outcome of the investment is predicated on an event or catalyst. Risk arbitrage generally involves Portfolio Managers attempting to seek to exploit the change in the price of a firm’s securities as a result of a takeover or merger. Typically, the Portfolio Manager will take long positions in the securities of the target firm and short positions in the securities of the acquiring firm. Special situations strategies involve investing in securities of issuers that are engaged in, or expected to experience, certain special events such as restructurings, spin-offs, liquidations, privatizations, stock buybacks, bond upgrades from credit agencies, and earnings surprises, all with the intention of profiting from the outcome of such events. Distressed securities involve investing in securities of a company that is near or in bankruptcy and, as a result, the securities are trading at a reduced price. Activist strategies attempt to obtain representation on a company’s board of trustees to impact the firm’s policies or strategic direction. They can employ an investment process primarily focused on opportunities in equity and equity related instruments of companies which are currently or prospectively engaged in a corporate transaction or other catalyst-oriented situation. Activist strategies are distinguished from other event-driven strategies in that, over a given market cycle, activist strategies would expect to have greater than 50% of the portfolio in activist positions. The Portfolio Funds within this strategy have monthly to quarterly liquidity, and are generally subject to 30 to 90 day notice period. A Portfolio Fund representing approximately 1% in this strategy is classified as a side pocket investment. Portfolio Funds
| | |
| 24 | | Permal Hedge Strategies Portfolio 2015 Semi-Annual Report |
representing approximately 26% in this strategy have gated redemptions at the investor account level and limit investors’ ability to redeem their full holdings at any redemption date. The remaining approximately 73% of the Portfolio Funds in this strategy can be redeemed with no restrictions as of the measurement date or within near term.
Global macro strategies seek to profit from changes in global financial markets and take positions to take advantage of changes in interest rates, exchange rates, liquidity and other macroeconomic factors. Investments may be either long or short in cash securities, derivative contracts, or options, and may be in equities, fixed-income markets, currencies, or commodities (e.g., agricultural, metals, energy). This category is composed of three major management strategies: discretionary strategies, systematic strategies and natural resources strategies. Portfolio Managers using discretionary global macro strategies seek to profit by capturing market moves throughout a broad universe of investment opportunities. These opportunities include financial markets, such as global equity, currency, and fixed-income markets, as well as non-financial markets, such as the energy, agricultural, and metals markets. These Portfolio Managers utilize a combination of fundamental market research and information in conjunction with quantitative modeling to identify opportunities that exist within the markets. While the markets they invest in may be diverse, these Portfolio Managers tend to hold more concentrated positions in a limited number of markets at any one time. Positions may be long and short in different markets, and the Portfolio Managers tend to employ leverage. Portfolio Managers using systematic global macro strategies employ proprietary or other models to identify opportunities that exist within a diverse group of financial and non-financial markets and establish positions based on the models. While subjective investment decisions are made, such decisions are the result of a heavier reliance upon models than is the case with discretionary strategies and the vast majority of trading decisions are executed without discretion. Portfolio Managers employing systematic strategies tend to hold positions in several markets at the same time, may be both long and short, and tend to use leverage when establishing positions. Portfolio Managers using natural resources trading strategies use commodity trading strategies generally investing on a global basis in a portfolio of securities, commodities and derivative instruments relating to “Commodity and Basic Industries,” which include but are not limited to energy, chemicals, agriculture, food, precious metals, industrial materials (and their related support industries, including oil service, mining equipment, forest products, building/construction materials, ferrous and non-ferrous metals, petrochemicals, and plastics) and related industries and manufacturing (e.g., homebuilding, automobile manufacturing and auto parts, shipbuilding, and construction and construction engineering). Natural resources trading includes cash commodities and futures, forward, option and swap contracts in agricultural, metals and energy items among other commodities, while equity investments include securities of companies that produce, process, convert, transport and service such commodities. The Portfolio Funds within this strategy have monthly to quarterly liquidity, and are generally subject to 30 to 90 day notice period. A Portfolio Fund representing 5% in this strategy has gated redemptions at the investor account level and limits investors’ ability to redeem their
| | |
| Permal Hedge Strategies Portfolio 2015 Semi-Annual Report | | 25 |
Notes to financial statements (unaudited) (cont’d)
full holdings at any redemption date. The remaining approximately 95% of the Portfolio Funds in this strategy can be redeemed with no restrictions as of the measurement date or within near term.
The Master Fund is not able to obtain complete investment holding details of each of the Portfolio Funds in order to determine whether the Master Fund’s proportionate share of any investments held by a Portfolio Fund exceeds 5% of the net assets of the Master Fund as of September 30, 2015. However, as of each Portfolio Fund’s most recently available audited financial statements, a review of the condensed schedule of investments did not indicate any investments for which the Master Fund’s proportionate share exceeded 5% of net assets of the Master Fund.
(b) Cash. The cash at September 30, 2015 consists of deposit accounts with The Bank of New York Mellon. Such cash, at times, may exceed U.S. federally insured limits. The Master Fund has not experienced any losses in such accounts and does not believe it is exposed to any significant credit risk on such bank deposits.
(c) Security transactions and investment income. The Master Fund’s transactions are accounted for on a trade-date basis. Realized gains and losses on Master Fund transactions are determined by use of the specific identification method. Interest income and expenses are recognized on the accrual basis. Dividend income is recognized on the ex-dividend date. The Master Fund will indirectly bear a portion of the Portfolio Funds’ income and expenses, including management fees and incentive fees charged by the Portfolio Funds. That income and those expenses are recorded in the Master Fund’s financial statements as unrealized appreciation/ depreciation and not as income or expense on the Statement of Operations or in the Financial Highlights.
(d) Compensating balance arrangements. The Master Fund has an arrangement with its custodian bank whereby a portion of the custodian’s fees is paid indirectly by credits earned on the Master Fund’s cash on deposit with the bank.
(e) Method of allocation. Net investment income and net realized gains and/or losses of the Master Fund are allocated pro rata, based on respective ownership interests, among the investors in the Master Fund.
(f) Income taxes. The Master Fund is classified as a partnership for federal income tax purposes. As such, each investor in the Master Fund is treated as owner of its proportionate share of the net assets, income, expenses and realized and unrealized gains and losses of the Master Fund. Therefore, no U.S. federal income tax provision is required. It is intended that the Master Fund’s assets will be managed so an investor in the Master Fund can satisfy the requirements of Subchapter M of the Internal Revenue Code.
For tax purposes, the Master Fund became a partnership following the special distribution on June 27, 2013 made by Permal Hedge Strategies Fund I when Permal Hedge Strategies Fund I and Permal Hedge Strategies Fund II contributed their interests in the Portfolio Funds
| | |
| 26 | | Permal Hedge Strategies Portfolio 2015 Semi-Annual Report |
received as a result of this special distribution to the Master Fund in exchange for interests in the Master Fund.
The tax basis of the investments in the Portfolio Funds that were contributed to the Master Fund was increased for the gain recognized by Permal Hedge Strategies Fund I as a result of the special distribution. This resulted in a higher tax vs. book cost of investments at the Master Fund and less gain or loss to be recognized upon future dispositions of the Portfolio Funds.
Management has analyzed the Master Fund’s tax positions taken on income tax returns for all open tax years and has concluded that as of September 30, 2015, no provision for income tax is required in the Master Fund’s financial statements. The Master Fund’s U.S. federal and state income tax returns for the current tax year are subject to examination by Internal Revenue Service and state departments of revenue.
2. Investment management agreement and other transactions with affiliates
Legg Mason Partners Fund Advisor, LLC (“LMPFA”) is the Master Fund’s investment manager and Permal is the Master Fund’s sub-adviser and is a member of the Permal Group, owned indirectly by Permal Group Ltd., a holding company of an international financial group of companies. LMPFA is a wholly-owned subsidiary of Legg Mason, Inc. (“Legg Mason”). Permal Group Ltd. is a subsidiary of Legg Mason.
Under the investment management agreement between the Master Fund and LMPFA, the Master Fund pays an investment management fee, calculated and paid monthly, at an annual rate of 1.10% of the Master Fund’s average monthly managed assets. “Managed assets” means net assets plus the principal amount of any borrowings and assets attributable to any preferred shares that may be outstanding.
During the six months ended September 30, 2015, LMPFA waived fees and/or reimbursed expenses of $10,482.
LMPFA is also permitted to recapture amounts waived or reimbursed within three years after the year in which LMPFA earned the fee or incurred the expense.
At September 30, 2015, the Master Fund had remaining fee waivers and/or expense reimbursements subject to recapture by LMPFA and respective dates of expiration as follows:
| | | | |
| Expires March 31, 2017 | | $ | 220,048 | |
| Expires March 31, 2018 | | | 141,158 | |
| Expires March 31, 2019 | | | 10,482 | |
| Total fee waivers/expense reimbursements subject to recapture | | $ | 371,688 | |
LMPFA provides administrative and certain oversight services to the Master Fund. LMPFA delegates to the sub-adviser the day-to-day portfolio management of the Master Fund. For its services, LMPFA pays Permal an amount equal to 1.00% of the Master Fund’s average monthly managed assets.
| | |
| Permal Hedge Strategies Portfolio 2015 Semi-Annual Report | | 27 |
Notes to financial statements (unaudited) (cont’d)
Fixed fees of the Portfolio Funds are generally expected to range from 1% to 3% annually of the value of the Master Fund’s investment and incentive allocations or fees of the Portfolio Funds are generally expected to range from 15% to 30% annually of a Portfolio Fund’s net profits or performance. These fixed fees and incentive allocations or fees of the Portfolio Funds are accounted for in the valuations of the Portfolio Funds and are not reflected in the management fees reflected in the Statement of Operations.
All officers and one Trustee of the Master Fund are employees of Legg Mason or its affiliates and do not receive compensation from the Master Fund.
3. Investments
For the six months ended September 30, 2015, the aggregate cost of purchases and proceeds from sales of Portfolio Funds (excluding short-term investments) were as follows:
| | | | |
| Purchases | | $ | 4,950,000 | |
| Sales | | | 4,797,022 | |
At September 30, 2015, the aggregate gross unrealized appreciation and depreciation of investments for U.S. federal income tax purposes were as follows:
| | | | |
| Gross unrealized appreciation | | $ | 5,132,395 | |
| Gross unrealized depreciation | | | (1,647,038) | |
| Net unrealized appreciation | | $ | 3,485,357 | |
4. Derivative instruments and hedging activities
For the six months ended September 30, 2015, the Master Fund did not invest in any derivative instruments.
5. Financial instruments with off-balance sheet risk
In the normal course of business, the Portfolio Funds in which the Master Fund invests trade various financial instruments and enter into various investment activities with off-balance sheet risk. These include, but are not limited to, short selling activities, writing option contracts and entering into equity swaps. The Master Fund’s risk of loss in these Portfolio Funds is limited to the value of its investment in the respective Portfolio Funds.
6. Redemption penalty
The Master Fund may be charged a redemption penalty for redeeming its interests of certain Portfolio Funds prior to the expiration of applicable lock-up periods. For the six months ended September 30, 2015, the Master Fund did not incur a redemption penalty.
7. Contingencies
In the normal course of business, the Master Fund enters into contracts that contain a variety of representations and warranties and which provide general indemnifications. The Master Fund’s maximum exposure under these arrangements is unknown, as any such exposure would result from future claims that may be, but have not yet been, made against the Master Fund based on events which have not yet occurred. However, based on
| | |
| 28 | | Permal Hedge Strategies Portfolio 2015 Semi-Annual Report |
experience, the Master Fund believes the risk of loss from these arrangements to be remote.
8. Subsequent events
Management has evaluated the impact of all subsequent events on the Master Fund through the date financial statements were issued and has determined that there were no subsequent events requiring recognition or disclosure in the financial statements.
| | |
| Permal Hedge Strategies Portfolio 2015 Semi-Annual Report | | 29 |
Permal
Hedge Strategies Fund II
Trustees
Robert D. Agdern
Carol L. Colman
Daniel P. Cronin
Paolo M. Cucchi
Leslie H. Gelb
William R. Hutchinson
Eileen A. Kamerick
Riordan Roett
Jane Trust*
Chairman
Officers
Jane Trust*
President and Chief Executive Officer
Richard F. Sennett
Principal Financial Officer
Ted P. Becker
Chief Compliance Officer
Vanessa A. Williams
Identity Theft Prevention Officer
Robert I. Frenkel
Secretary and Chief Legal Officer
Thomas Mandia
Assistant Secretary
Steven Frank
Treasurer
Jeanne M. Kelly
Senior Vice President
| * | Effective August 1, 2015, Ms. Trust became a Trustee, Chairman, President and Chief Executive Officer. |
Permal Hedge Strategies Fund II
620 Eighth Avenue
49th Floor
New York, NY 10018
Investment manager
Legg Mason Partners Fund
Advisor, LLC
Subadviser
Permal Asset Management LLC
Custodian and transfer agent
The Bank of New York Mellon
One Wall Street
New York, NY 10286
Independent registered public accounting firm
KPMG LLP
345 Park Avenue
New York, NY 10154
Legal counsel
Simpson Thacher & Bartlett LLP
425 Lexington Avenue
New York, NY 10017
Legg Mason Funds Privacy and Security Notice
Your Privacy and the Security of Your Personal Information is Very Important to the Legg Mason Funds
This Privacy and Security Notice (the “Privacy Notice”) addresses the Legg Mason Funds’ privacy and data protection practices with respect to nonpublic personal information the Funds receive. The Legg Mason Funds include any funds sold by the Funds’ distributor, Legg Mason Investor Services, LLC, as well as Legg Mason-sponsored closed-end funds and certain closed-end funds managed or sub-advised by Legg Mason or its affiliates. The provisions of this Privacy Notice apply to your information both while you are a shareholder and after you are no longer invested with the Funds.
The Type of Nonpublic Personal Information the Funds Collect About You
The Funds collect and maintain nonpublic personal information about you in connection with your shareholder account. Such information may include, but is not limited to:
| • | | Personal information included on applications or other forms; |
| • | | Account balances, transactions, and mutual fund holdings and positions; |
| • | | Online account access user IDs, passwords, security challenge question responses; and |
| • | | Information received from consumer reporting agencies regarding credit history and creditworthiness (such as the amount of an individual’s total debt, payment history, etc.). |
How the Funds Use Nonpublic Personal Information About You
The Funds do not sell or share your nonpublic personal information with third parties or with affiliates for their marketing purposes, or with other financial institutions or affiliates for joint marketing purposes, unless you have authorized the Funds to do so. The Funds do not disclose any nonpublic personal information about you except as may be required to perform transactions or services you have authorized or as permitted or required by law. The Funds may disclose information about you to:
| • | | Employees, agents, and affiliates on a “need to know” basis to enable the Funds to conduct ordinary business or comply with obligations to government regulators; |
| • | | Service providers, including the Funds’ affiliates, who assist the Funds as part of the ordinary course of business (such as printing, mailing services, or processing or servicing your account with us) or otherwise perform services on the Funds’ behalf, including companies that may perform marketing services solely for the Funds; |
| • | | The Funds’ representatives such as legal counsel, accountants and auditors; and |
| • | | Fiduciaries or representatives acting on your behalf, such as an IRA custodian or trustee of a grantor trust. |
|
| NOT PART OF THE SEMI-ANNUAL REPORT |
Legg Mason Funds Privacy and Security Notice (cont’d)
Except as otherwise permitted by applicable law, companies acting on the Funds’ behalf are contractually obligated to keep nonpublic personal information the Funds provide to them confidential and to use the information the Funds share only to provide the services the Funds ask them to perform.
The Funds may disclose nonpublic personal information about you when necessary to enforce their rights or protect against fraud, or as permitted or required by applicable law, such as in connection with a law enforcement or regulatory request, subpoena, or similar legal process. In the event of a corporate action or in the event a Fund service provider changes, the Funds may be required to disclose your nonpublic personal information to third parties. While it is the Funds’ practice to obtain protections for disclosed information in these types of transactions, the Funds cannot guarantee their privacy policy will remain unchanged.
Keeping You Informed of the Funds’ Privacy and Security Practices
The Funds will notify you annually of their privacy policy as required by federal law. While the Funds reserve the right to modify this policy at any time they will notify you promptly if this privacy policy changes.
The Funds’ Security Practices
The Funds maintain appropriate physical, electronic and procedural safeguards designed to guard your nonpublic personal information. The Funds’ internal data security policies restrict access to your nonpublic personal information to authorized employees, who may use your nonpublic personal information for Fund business purposes only.
Although the Funds strive to protect your nonpublic personal information, they cannot ensure or warrant the security of any information you provide or transmit to them, and you do so at your own risk. In the event of a breach of the confidentiality or security of your nonpublic personal information, the Funds will attempt to notify you as necessary so you can take appropriate protective steps. If you have consented to the Funds using electronic communications or electronic delivery of statements, they may notify you under such circumstances using the most current email address you have on record with them.
In order for the Funds to provide effective service to you, keeping your account information accurate is very important. If you believe that your account information is incomplete, not accurate or not current, or if you have questions about the Funds’ privacy practices, write the Funds using the contact information on your account statements, email the Funds by clicking on the Contact Us section of the Fund’s website at www.leggmason.com, or contact the Fund at 1-800-822-5544.
|
| NOT PART OF THE SEMI-ANNUAL REPORT |
Permal Hedge Strategies Fund II
Permal Hedge Strategies Fund II
620 Eighth Avenue
49th Floor
New York, NY 10018
The Fund files its complete schedule of portfolio holdings with the Securities and Exchange Commission (“SEC”) for the first and third quarters of each fiscal year on Form N-Q. The Fund’s Forms N-Q are available on the SEC website at www.sec.gov. The Fund’s Forms N-Q may be reviewed and copied at the SEC Public Reference Room in Washington, D.C., and information on the operation of the Public Reference Room may be obtained by calling 1-800-SEC-0330. To obtain information on Form N-Q from the Fund, shareholders can call 1-800-822-5544.
Information on how the Fund voted proxies relating to portfolio securities during the prior 12-month period ended June 30th of each year and a description of the policies and procedures that the Fund uses to determine how to vote proxies related to portfolio transactions are available (1) without charge, upon request, by calling 1-800-822-5544, (2) on the Fund’s website at www.permalhsf.com and (3) on the SEC’s website at www.sec.gov.
This report is transmitted to the shareholders of Permal Hedge Strategies Fund II for their information. This is not a prospectus, circular or representation intended for use in the purchase of shares of the Fund or any securities mentioned in this report.
Investors should consider the Fund’s investment objectives, risks, charges and expenses carefully before investing. The prospectus contains this and other important information about the Fund. Please read the prospectus carefully before investing.
www.leggmason.com/individualinvestors
© 2015 Legg Mason Investor Services, LLC Member FINRA, SIPC
PRML015995 11/15 SR15-2617
Not applicable.
| ITEM 3. | AUDIT COMMITTEE FINANCIAL EXPERT. |
Not applicable.
| ITEM 4. | PRINCIPAL ACCOUNTANT FEES AND SERVICES. |
Not applicable.
| ITEM 5. | AUDIT COMMITTEE OF LISTED REGISTRANTS. |
Not applicable.
| ITEM 6. | SCHEDULE OF INVESTMENTS. |
Included herein under Item 1.
| ITEM 7. | DISCLOSURE OF PROXY VOTING POLICIES AND PROCEDURES FOR CLOSED-END MANAGEMENT INVESTMENT COMPANIES. |
Not applicable.
| ITEM 8. | PORTFOLIO MANAGERS OF CLOSED-END MANAGEMENT INVESTMENT COMPANIES. |
Not applicable.
| ITEM 9. | PURCHASES OF EQUITY SECURITIES BY CLOSED-END MANAGEMENT INVESTMENT COMPANY AND AFFILIATED PURCHASERS. |
Not applicable.
| ITEM 10. | SUBMISSION OF MATTERS TO A VOTE OF SECURITY HOLDERS. |
Not applicable.
| ITEM 11. | CONTROLS AND PROCEDURES. |
| | (a) | The registrant’s principal executive officer and principal financial officer have concluded that the registrant’s disclosure controls and procedures (as defined in Rule 30a- 3(c) under the Investment Company Act of 1940, as amended (the “1940 Act”)) are effective as of a date within 90 days of the filing date of this report that includes the disclosure required by this paragraph, based on their evaluation of the disclosure controls and procedures required by Rule 30a-3(b) under the 1940 Act and 15d-15(b) under the Securities Exchange Act of 1934. |
| | (b) | There were no changes in the registrant’s internal control over financial reporting (as defined in Rule 30a-3(d) under the 1940 Act) that occurred during the second fiscal quarter of the period covered by this report that have materially affected, or are likely to materially affect the registrant’s internal control over financial reporting. |
(a) (1) Not applicable.
Exhibit 99.CODE ETH
(a) (2) Certifications pursuant to section 302 of the Sarbanes-Oxley Act of 2002 attached hereto.
Exhibit 99.CERT
(b) Certifications pursuant to Section 906 of the Sarbanes-Oxley Act of 2002 attached hereto.
Exhibit 99.906CERT
SIGNATURES
Pursuant to the requirements of the Securities Exchange Act of 1934 and the Investment Company Act of 1940, the registrant has duly caused this Report to be signed on its behalf by the undersigned, there unto duly authorized.
Permal Hedge Strategies Fund II
| | |
| By: | | /s/ Jane Trust |
| | Jane Trust |
| | Chief Executive Officer |
| |
| Date: | | November 20, 2015 |
Pursuant to the requirements of the Securities Exchange Act of 1934 and the Investment Company Act of 1940, this report has been signed below by the following persons on behalf of the registrant and in the capacities and on the dates indicated.
| | |
| By: | | /s/ Jane Trust |
| | Jane Trust |
| | Chief Executive Officer |
| |
| Date: | | November 20, 2015 |
| |
| By: | | /s/ Richard F. Sennett |
| | Richard F. Sennett |
| | Principal Financial Officer |
| |
| Date: | | November 20, 2015 |