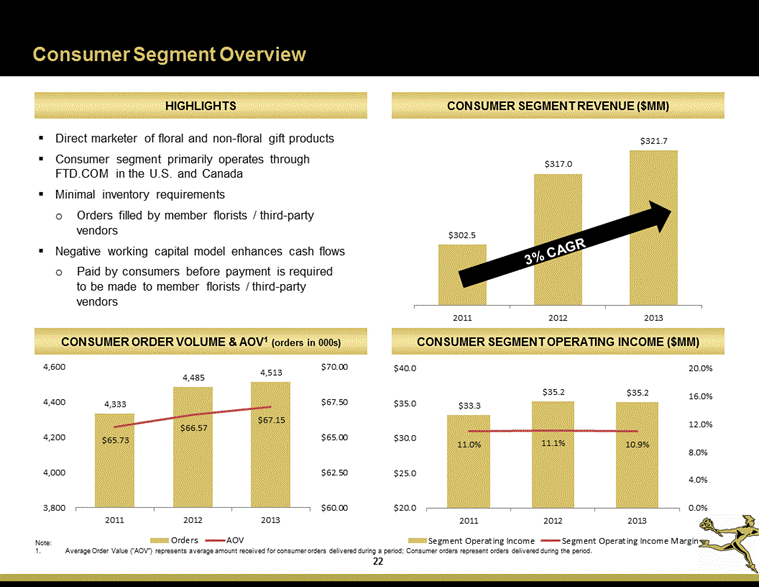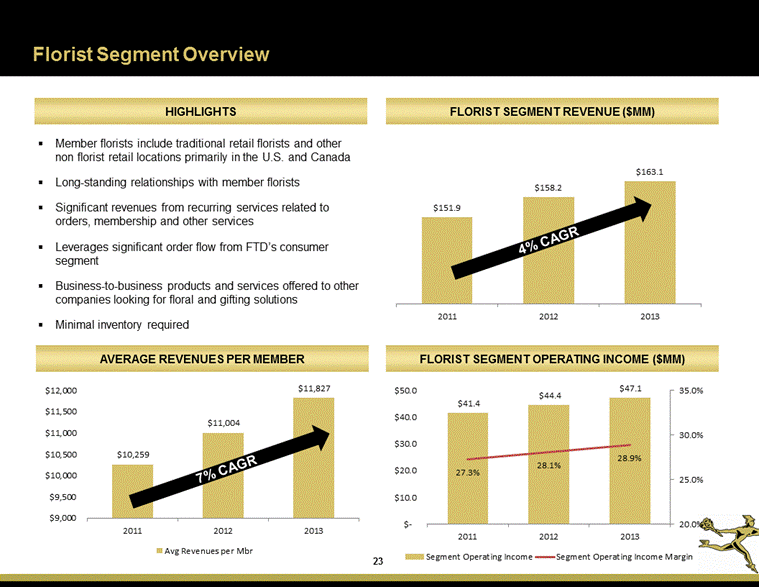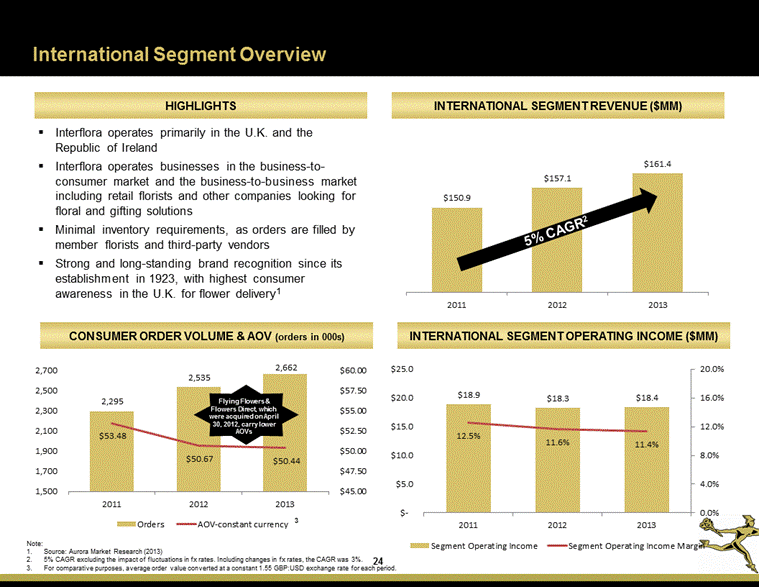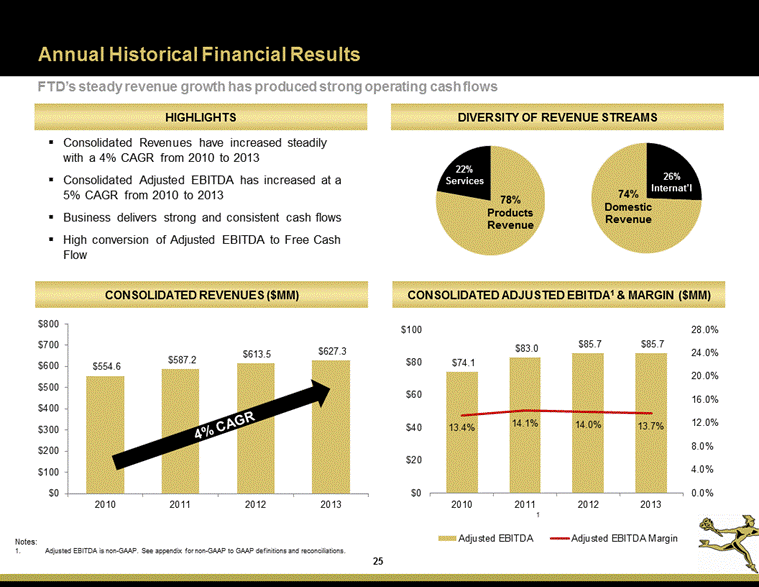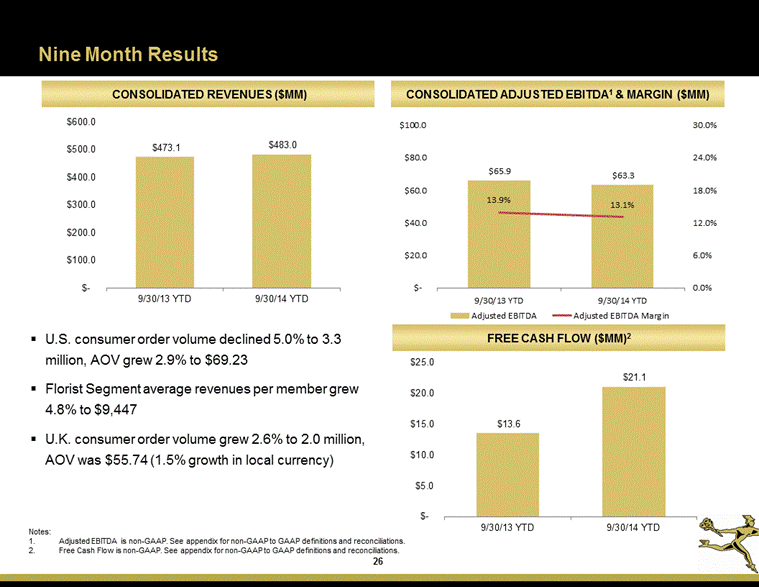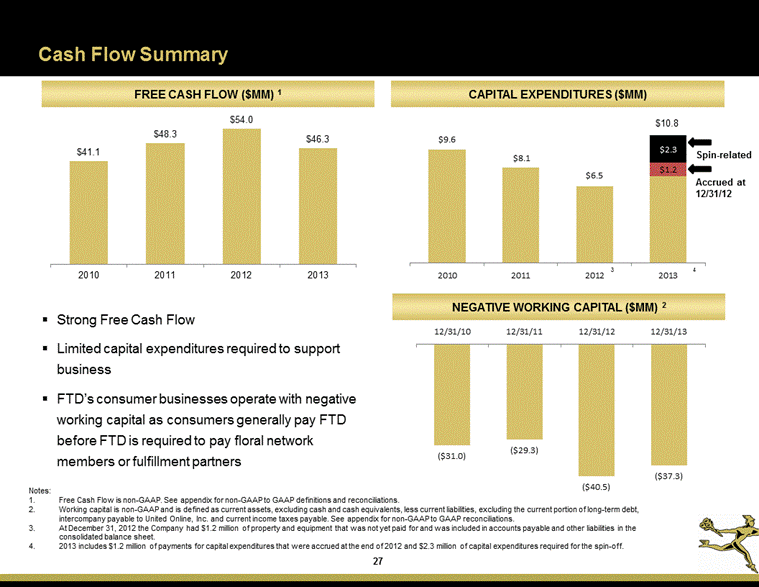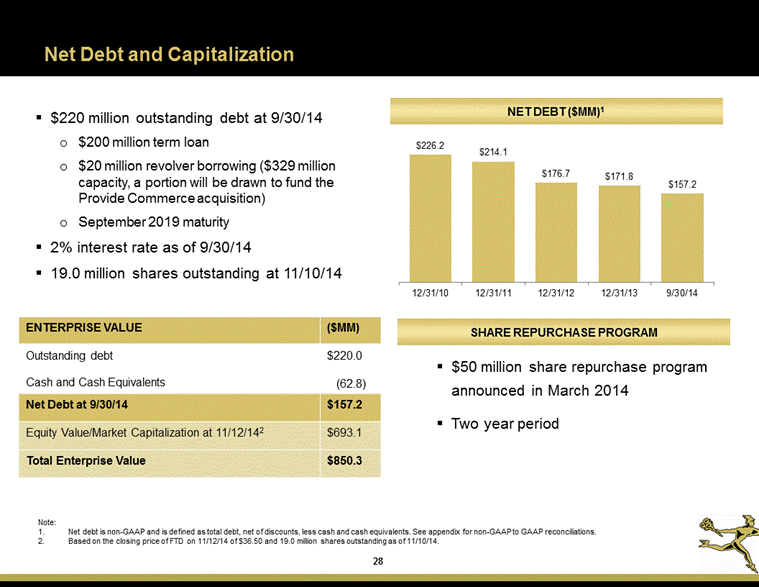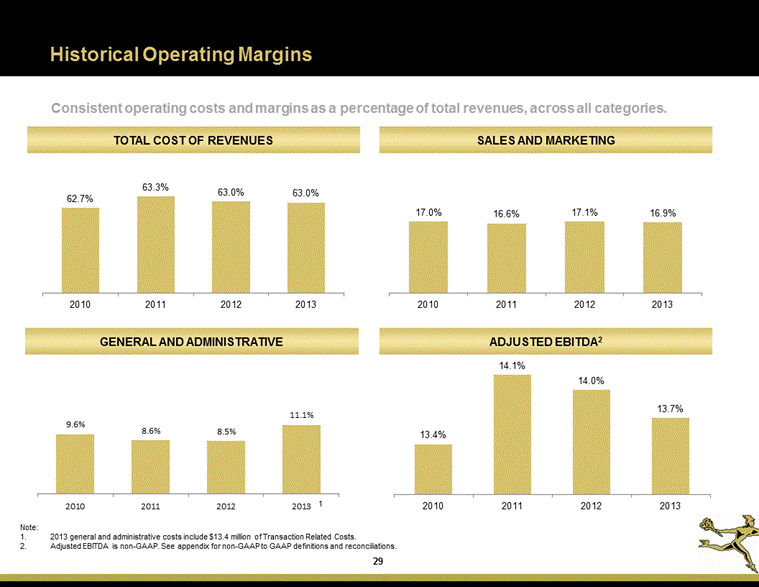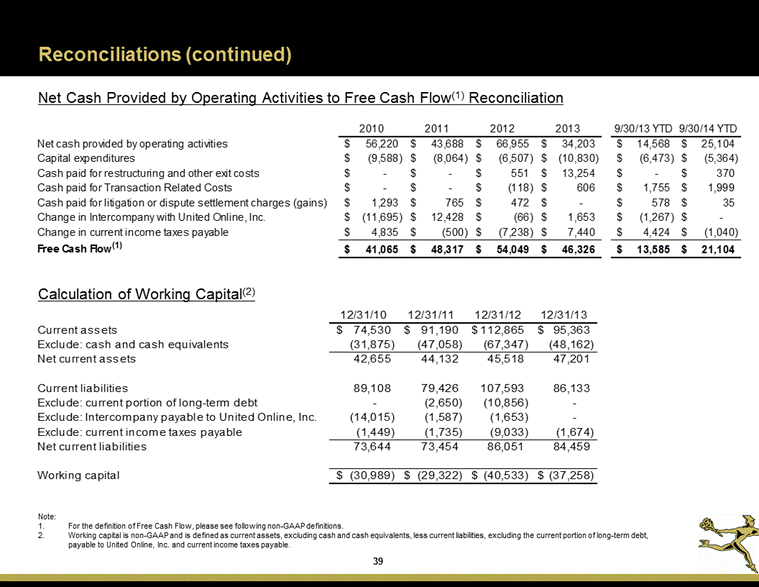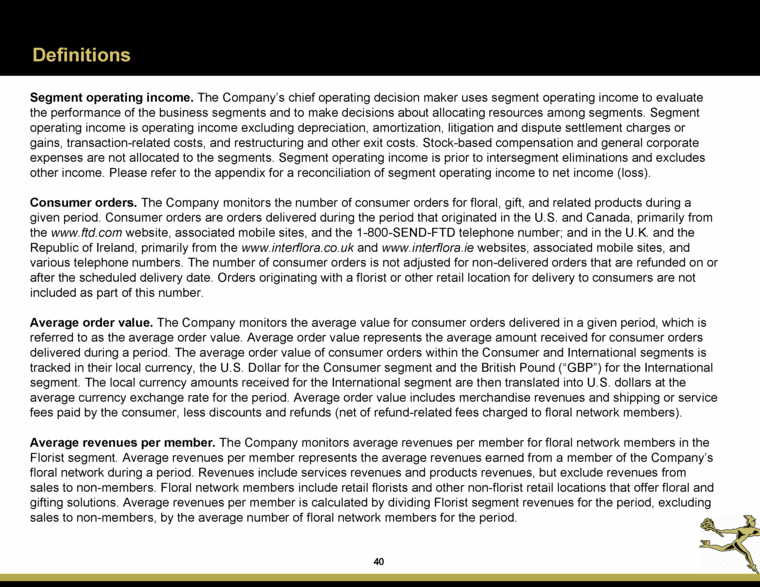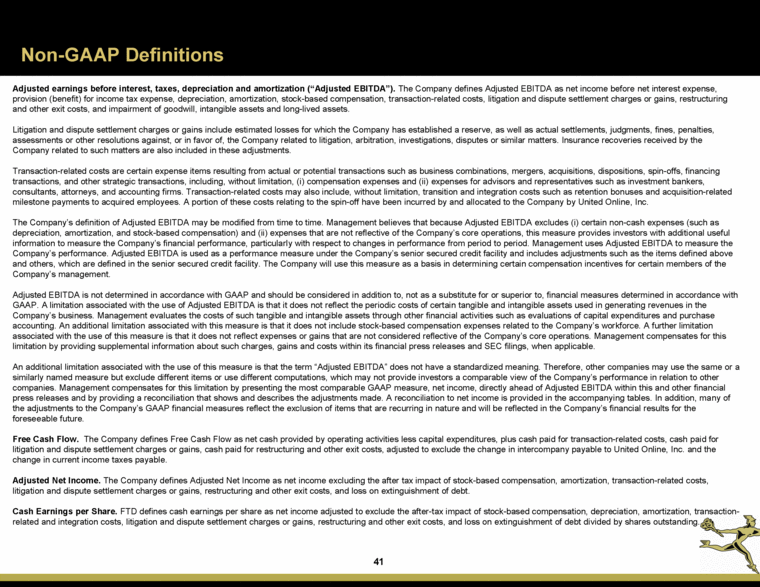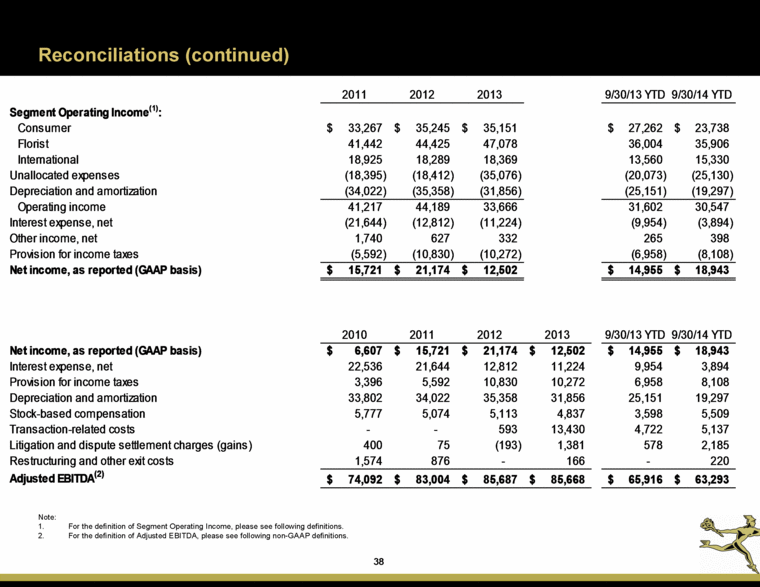
| Reconciliations (continued) Note: For the definition of Segment Operating Income, please see following definitions. For the definition of Adjusted EBITDA, please see following non-GAAP definitions. 2011 2012 2013 9/30/13 YTD 9/30/14 YTD Segment Operating Income (1) : Consumer 33,267 $ 35,245 $ 35,151 $ 27,262 $ 23,738 $ Florist 41,442 44,425 47,078 36,004 35,906 International 18,925 18,289 18,369 13,560 15,330 Unallocated expenses (18,395) (18,412) (35,076) (20,073) (25,130) Depreciation and amortization (34,022) (35,358) (31,856) (25,151) (19,297) Operating income 41,217 44,189 33,666 31,602 30,547 Interest expense, net (21,644) (12,812) (11,224) (9,954) (3,894) Other income, net 1,740 627 332 265 398 Provision for income taxes (5,592) (10,830) (10,272) (6,958) (8,108) Net income, as reported (GAAP basis) 15,721 $ 21,174 $ 12,502 $ 14,955 $ 18,943 $ 2010 2011 2012 2013 9/30/13 YTD 9/30/14 YTD Net income, as reported (GAAP basis) 6,607 $ 15,721 $ 21,174 $ 12,502 $ 14,955 $ 18,943 $ Interest expense, net 22,536 21,644 12,812 11,224 9,954 3,894 Provision for income taxes 3,396 5,592 10,830 10,272 6,958 8,108 Depreciation and amortization 33,802 34,022 35,358 31,856 25,151 19,297 Stock-based compensation 5,777 5,074 5,113 4,837 3,598 5,509 Transaction-related costs - - 593 13,430 4,722 5,137 Litigation and dispute settlement charges (gains) 400 75 (193) 1,381 578 2,185 Restructuring and other exit costs 1,574 876 - 166 - 220 Adjusted EBITDA (2) 74,092 $ 83,004 $ 85,687 $ 85,668 $ 65,916 $ 63,293 $ |

