INVESTOR DECK February 2022 Exhibit 99.3
Forward-Looking Statements Certain statements in this presentation are forward-looking as defined in the Private Securities Litigation Reform Act of 1995. Any statements contained herein (including, but not limited to, statements to the effect that Sprouts Farmers Market, Inc. (the “Company”) or its management "anticipates," "plans," "estimates," "expects," "believes," or the negative of these terms and other similar expressions) that are not statements of historical fact should be considered forward-looking statements, including, without limitation, statements regarding the Company’s guidance, outlook, strategy, financial targets, growth and opportunities. These statements involve certain risks and uncertainties that may cause actual results to differ materially from expectations as of the date of this presentation. These risks and uncertainties include, without limitation, risks associated with the COVID-19 pandemic; the Company’s ability to execute on its long-term strategy; the Company’s ability to successfully compete in its competitive industry; the Company’s ability to successfully open new stores; the Company’s ability to manage its rapid growth; the Company’s ability to maintain or improve its comparable store sales and operating margins; the Company’s ability to identify and react to trends in consumer preferences; product supply disruptions; equipment supply disruptions; general economic conditions; accounting standard changes; and other factors as set forth from time to time in the Company’s Securities and Exchange Commission filings. The Company intends these forward-looking statements to speak only as of the date of this presentation and does not undertake to update or revise them as more information becomes available, except as required by law. Non-GAAP Financial Measures We refer to EBIT, adjusted EBIT, adjusted EBIT Margin, adjusted EBITDA, adjusted net income, adjusted diluted earnings per share and ROIC, each of which is a Non-GAAP Financial Measure. These measures are not prepared in accordance with, and are not intended as alternatives to, generally accepted accounting principles in the United States, or GAAP. The Company's management believes that such measures provide useful information to management, analysts and investors regarding certain additional financial and business trends relating to its results of operations and financial condition. In addition, management uses these measures for reviewing the financial results of the Company, and certain of these measures may be used as components of incentive compensation. The Company defines EBIT, as net income before interest expense and provision for income tax, and adjusted EBIT as EBIT, excluding the impact of special items. Adjusted EBIT Margin reflects adjusted EBIT, divided by net sales for the applicable period. The Company defines adjusted EBITDA as net income before interest expense, provision for income tax, and depreciation, amortization and accretion, excluding the impact of special items. The Company defines adjusted net income and adjusted diluted earnings per share as net income and diluted earnings per share, respectively, excluding the impact of special items. The Company defines ROIC as net operating profit after tax (“NOPAT”), including the effect of capitalized operating leases, divided by average invested capital. Non-GAAP measures are intended to provide additional information only and do not have any standard meanings prescribed by GAAP. Use of these terms may differ from similar measures reported by other companies. Because of their limitations, non-GAAP measures should not be considered as a measure of discretionary cash available to use to reinvest in the growth of the Company’s business, or as a measure of cash that will be available to meet the Company’s obligations. Each non-GAAP measure has its limitations as an analytical tool, and you should not consider them in isolation or as a substitute for analysis of the Company’s results as reported under GAAP. To the extent forward looking non-GAAP financial measures are provided herein, they are not reconciled to comparable forward-looking GAAP measures due to the inherent difficulty in forecasting and quantifying certain amounts that are necessary for such reconciliation.

3
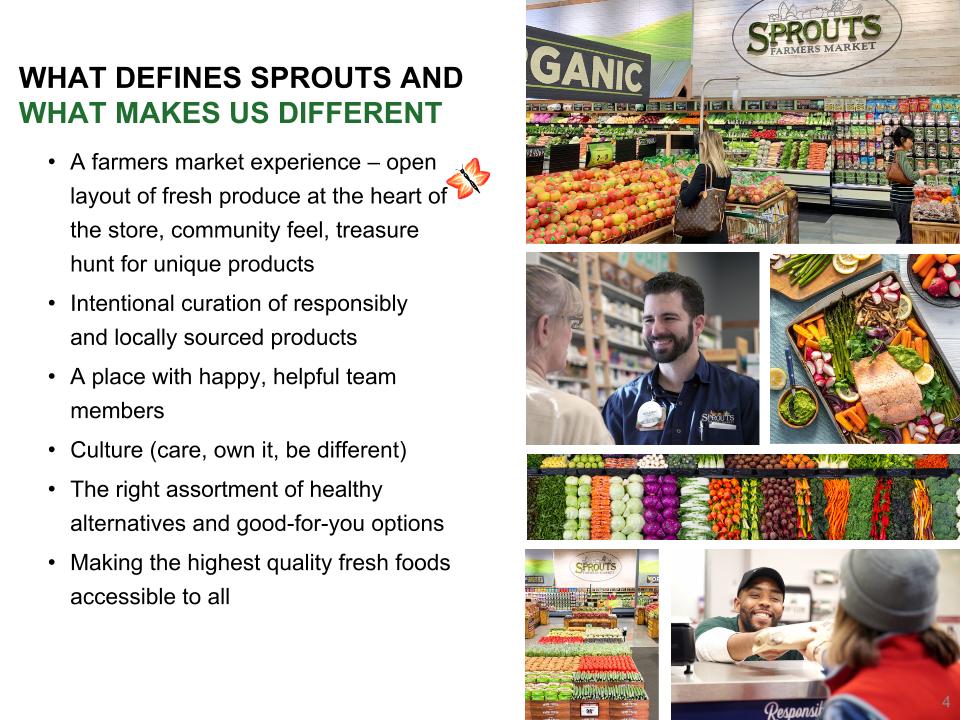
A farmers market experience – open layout of fresh produce at the heart of the store, community feel, treasure hunt for unique products Intentional curation of responsibly and locally sourced products A place with happy, helpful team members Culture (care, own it, be different) The right assortment of healthy alternatives and good-for-you options Making the highest quality fresh foods accessible to all WHAT DEFINES SPROUTS AND WHAT MAKES US DIFFERENT
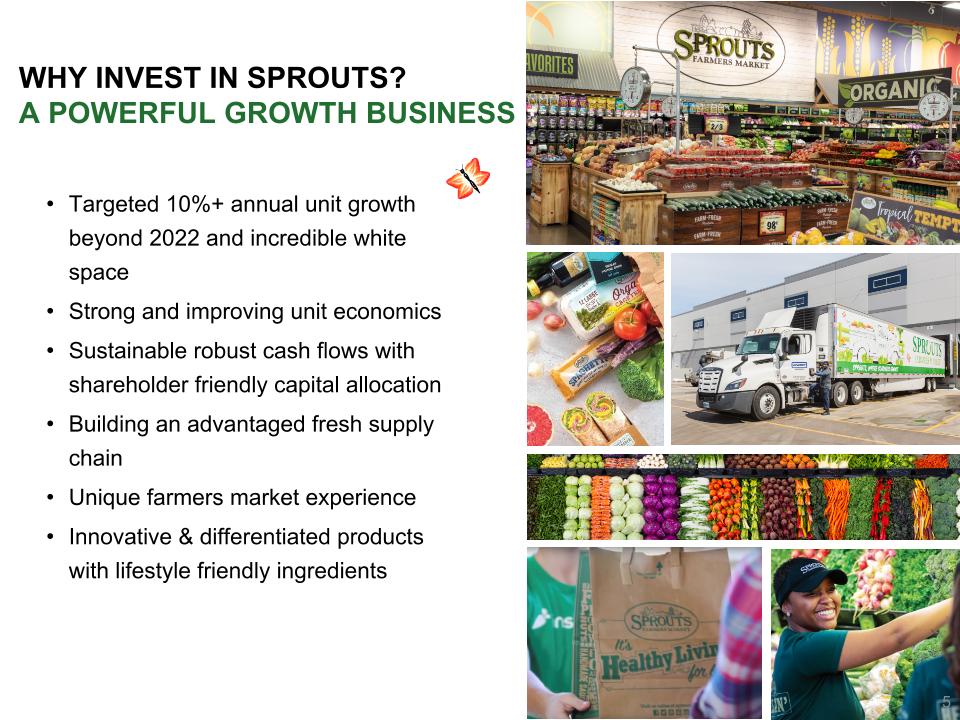
Targeted 10%+ annual unit growth beyond 2022 and incredible white space Strong and improving unit economics Sustainable robust cash flows with shareholder friendly capital allocation Building an advantaged fresh supply chain Unique farmers market experience Innovative & differentiated products with lifestyle friendly ingredients WHY INVEST IN SPROUTS? A POWERFUL GROWTH BUSINESS
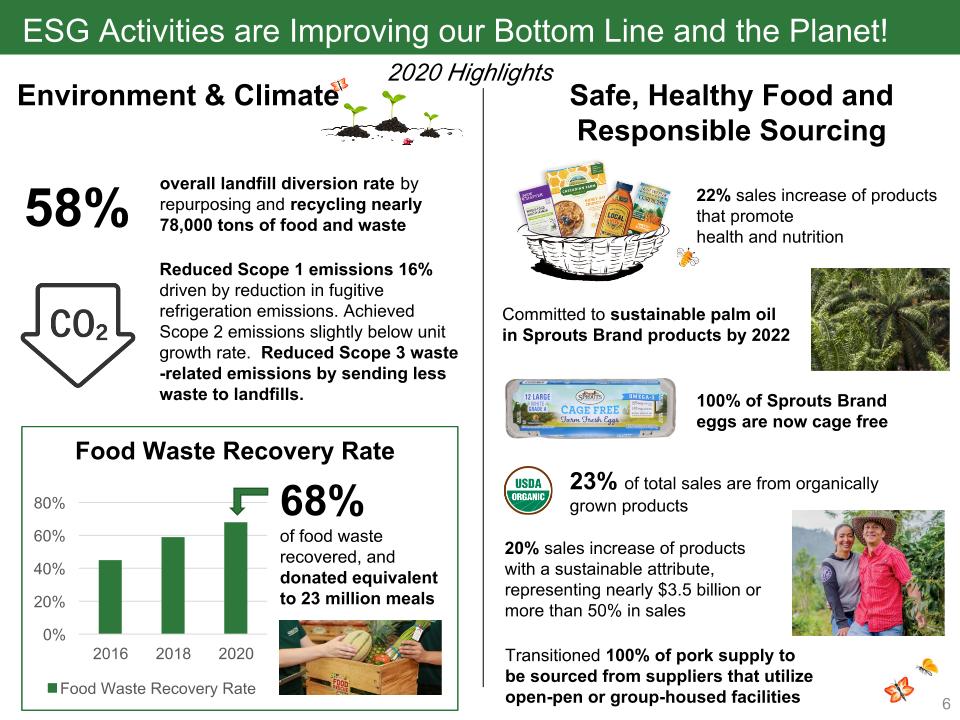
ESG Activities are Improving our Bottom Line and the Planet! Transitioned 100% of pork supply to be sourced from suppliers that utilize open-pen or group-housed facilities Safe, Healthy Food and Responsible Sourcing Environment & Climate overall landfill diversion rate by repurposing and recycling nearly 78,000 tons of food and waste 58% Reduced Scope 1 emissions 16% driven by reduction in fugitive refrigeration emissions. Achieved Scope 2 emissions slightly below unit growth rate. Reduced Scope 3 waste-related emissions by sending less waste to landfills. 68% of food waste recovered, and donated equivalent to 23 million meals Committed to sustainable palm oil in Sprouts Brand products by 2022 22% sales increase of products that promote health and nutrition 20% sales increase of products with a sustainable attribute, representing nearly $3.5 billion or more than 50% in sales 100% of Sprouts Brand eggs are now cage free 23% of total sales are from organically grown products 2020 Highlights
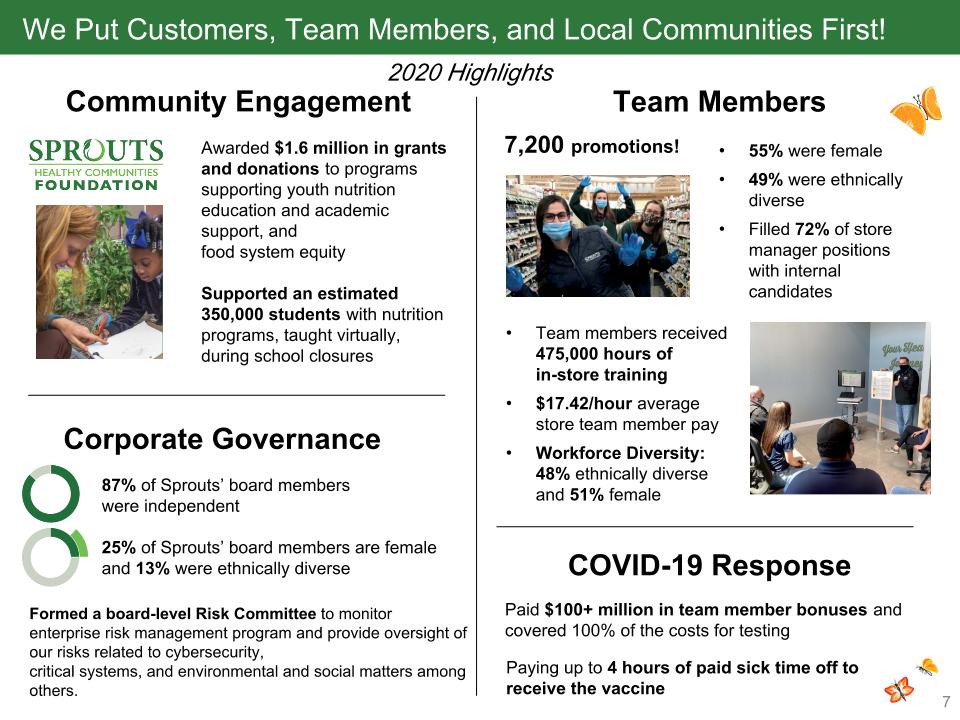
We Put Customers, Team Members, and Local Communities First! Awarded $1.6 million in grants and donations to programs supporting youth nutrition education and academic support, and �food system equity Supported an estimated 350,000 students with nutrition programs, taught virtually, during school closures Community Engagement Team Members 87% of Sprouts’ board members were independent 25% of Sprouts’ board members are female �and 13% were ethnically diverse Corporate Governance Formed a board-level Risk Committee to monitor enterprise risk management program and provide oversight of our risks related to cybersecurity, �critical systems, and environmental and social matters among others. 7,200 promotions! Paid $100+ million in team member bonuses and covered 100% of the costs for testing Paying up to 4 hours of paid sick time off to receive the vaccine COVID-19 Response 55% were female 49% were ethnically diverse Filled 72% of store manager positions with internal candidates Team members received 475,000 hours of �in-store training $17.42/hour average store team member pay Workforce Diversity: 48% ethnically diverse �and 51% female 2020 Highlights
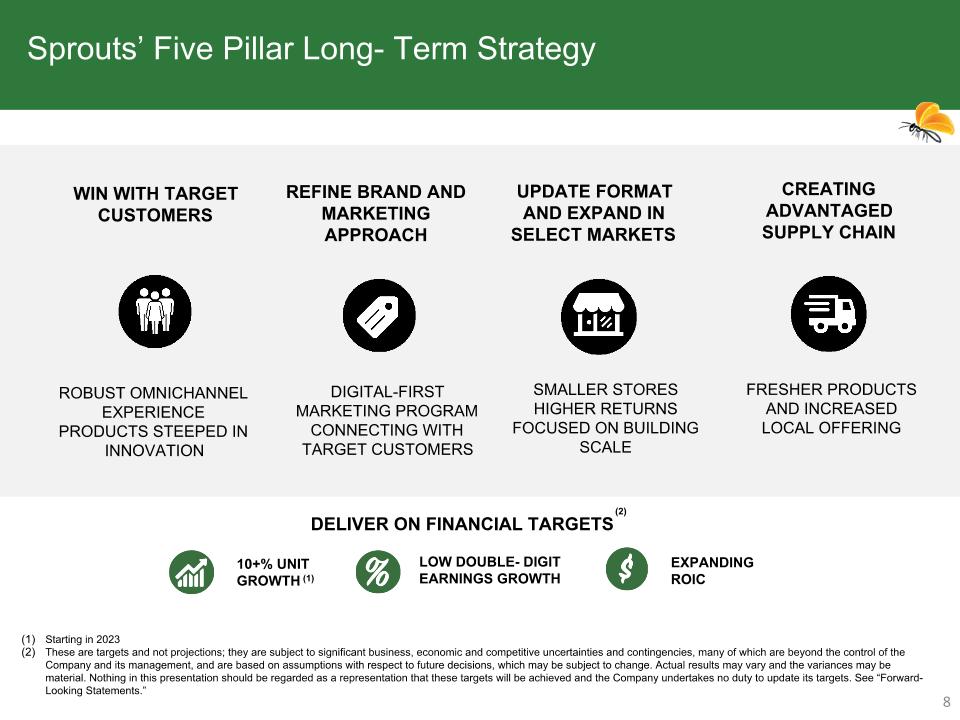
Sprouts’ Five Pillar Long- Term Strategy 10+% UNIT GROWTH (1) LOW DOUBLE- DIGIT EARNINGS GROWTH EXPANDING ROIC REFINE BRAND AND MARKETING APPROACH WIN WITH TARGET CUSTOMERS UPDATE FORMAT AND EXPAND IN SELECT MARKETS CREATING ADVANTAGED SUPPLY CHAIN DIGITAL-FIRST MARKETING PROGRAM CONNECTING WITH TARGET CUSTOMERS ROBUST OMNICHANNEL EXPERIENCE PRODUCTS STEEPED IN INNOVATION SMALLER STORES HIGHER RETURNS FOCUSED ON BUILDING SCALE FRESHER PRODUCTS AND INCREASED LOCAL OFFERING Starting in 2023 These are targets and not projections; they are subject to significant business, economic and competitive uncertainties and contingencies, many of which are beyond the control of the Company and its management, and are based on assumptions with respect to future decisions, which may be subject to change. Actual results may vary and the variances may be material. Nothing in this presentation should be regarded as a representation that these targets will be achieved and the Company undertakes no duty to update its targets. See “Forward-Looking Statements.” DELIVER ON FINANCIAL TARGETS (2)
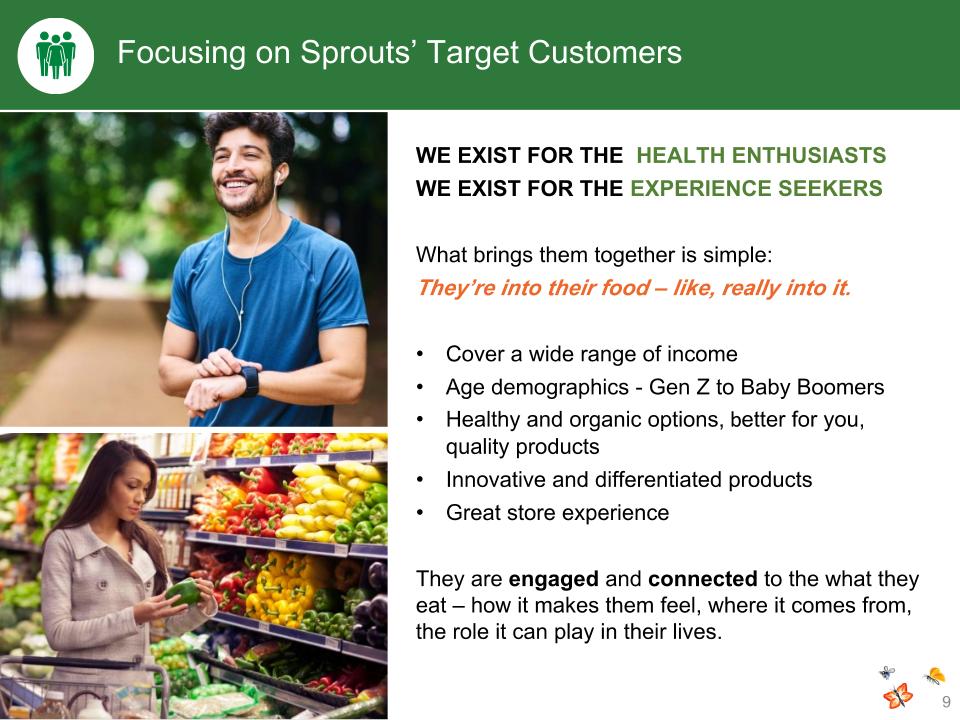
WE EXIST FOR THE HEALTH ENTHUSIASTS WE EXIST FOR THE EXPERIENCE SEEKERS What brings them together is simple: They’re into their food – like, really into it. Cover a wide range of income Age demographics - Gen Z to Baby Boomers Healthy and organic options, better for you, quality products Innovative and differentiated products Great store experience They are engaged and connected to the what they eat – how it makes them feel, where it comes from, the role it can play in their lives. Focusing on Sprouts’ Target Customers
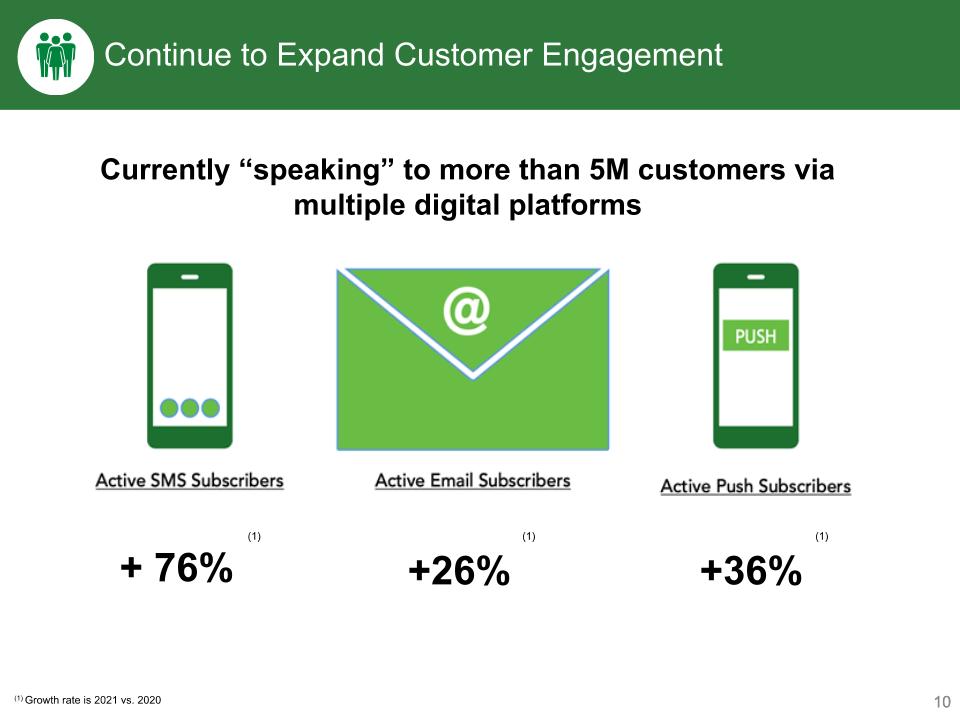
Continue to Expand Customer Engagement 10 Currently “speaking” to more than 5M customers via multiple digital platforms +26% + 76% +36% (1) Growth rate is 2021 vs. 2020 (1) (1) (1)
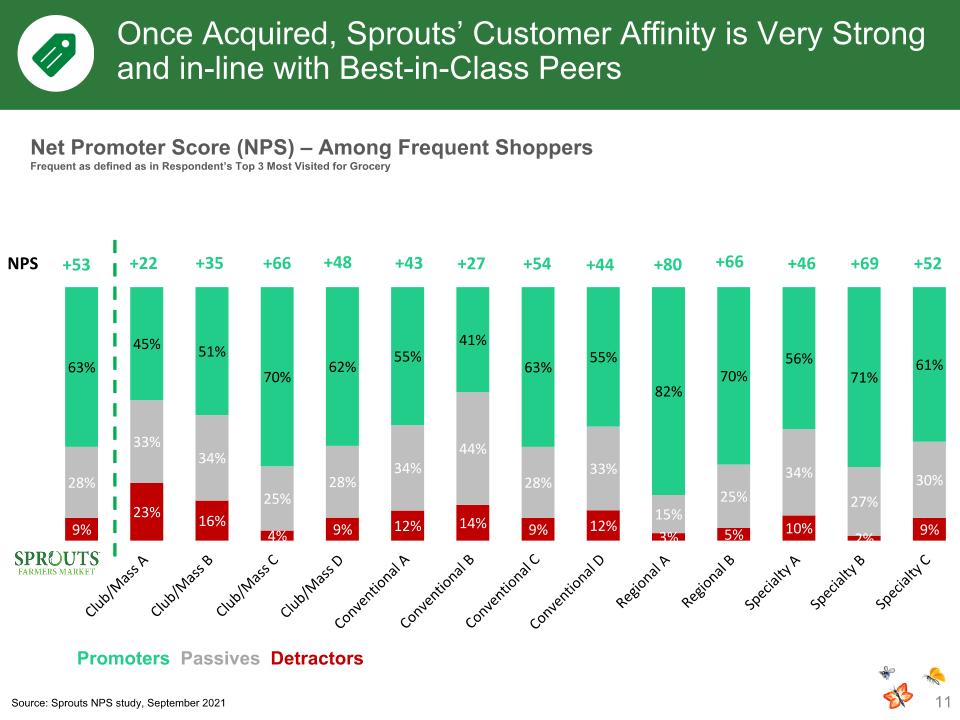
Once Acquired, Sprouts’ Customer Affinity is Very Strong and in-line with Best-in-Class Peers Net Promoter Score (NPS) – Among Frequent Shoppers Frequent as defined as in Respondent’s Top 3 Most Visited for Grocery Promoters Passives Detractors Source: Sprouts NPS study, September 2021 +53 +22 +27 NPS +52 +54 +35 +66 +43 +46 +69 +48 +44 +80 +66
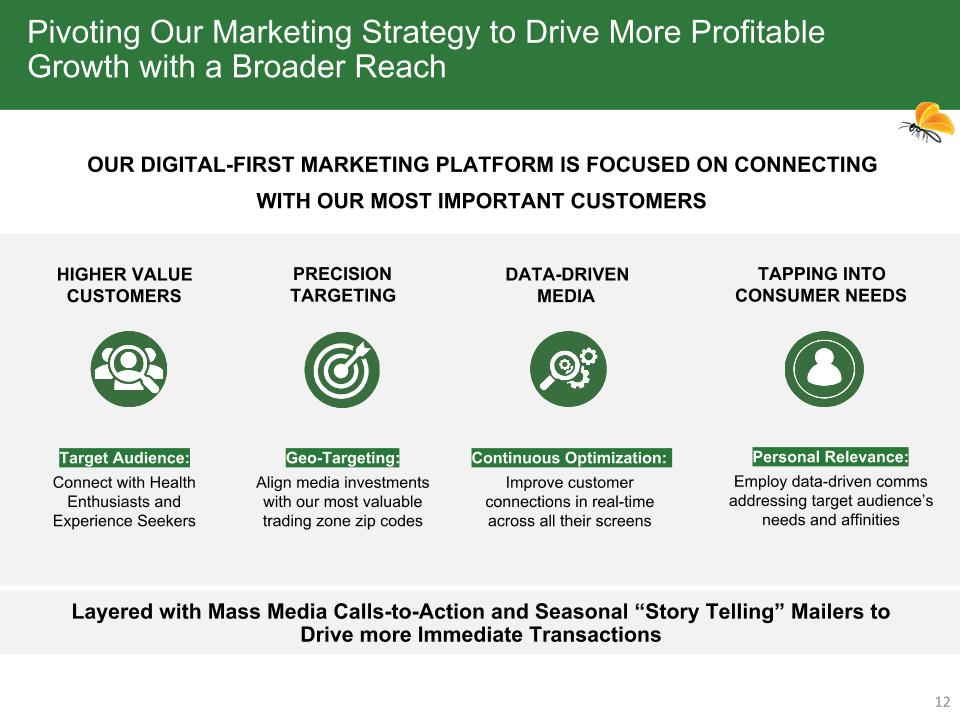
Pivoting Our Marketing Strategy to Drive More Profitable Growth with a Broader Reach OUR DIGITAL-FIRST MARKETING PLATFORM IS FOCUSED ON CONNECTING WITH OUR MOST IMPORTANT CUSTOMERS Target Audience: Connect with Health Enthusiasts and Experience Seekers Geo-Targeting: Align media investments with our most valuable trading zone zip codes Continuous Optimization: Improve customer connections in real-time across all their screens Personal Relevance: Employ data-driven comms addressing target audience’s needs and affinities HIGHER VALUE CUSTOMERS TAPPING INTO CONSUMER NEEDS PRECISION TARGETING DATA-DRIVEN MEDIA Layered with Mass Media Calls-to-Action and Seasonal “Story Telling” Mailers to Drive more Immediate Transactions
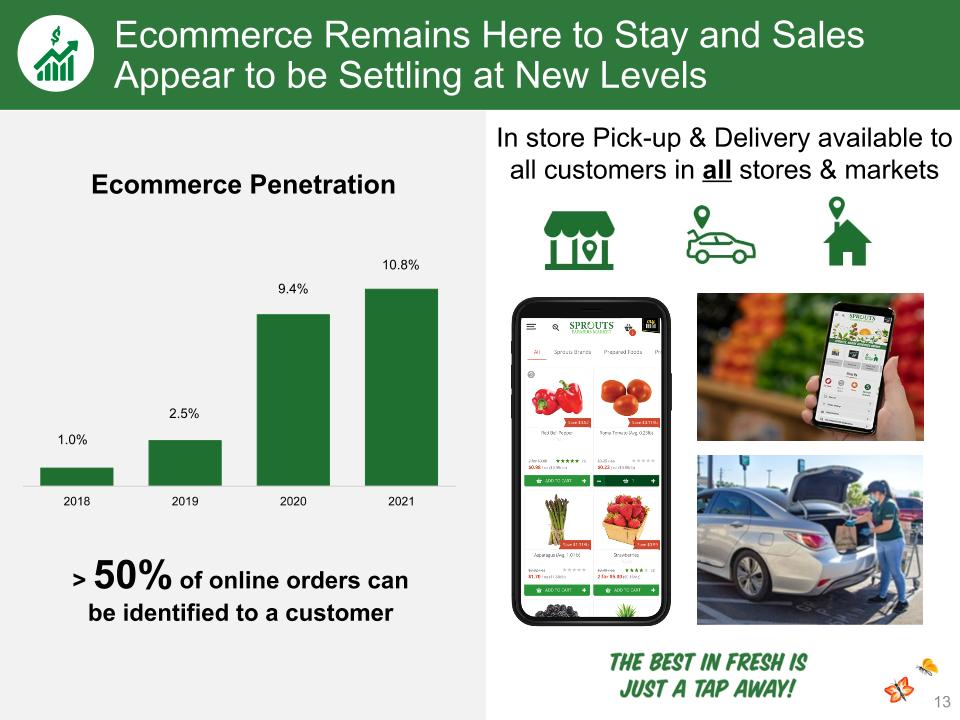
Ecommerce Remains Here to Stay and Sales Appear to be Settling at New Levels In store Pick-up & Delivery available to all customers in all stores & markets Ecommerce Penetration > 50% of online orders can be identified to a customer
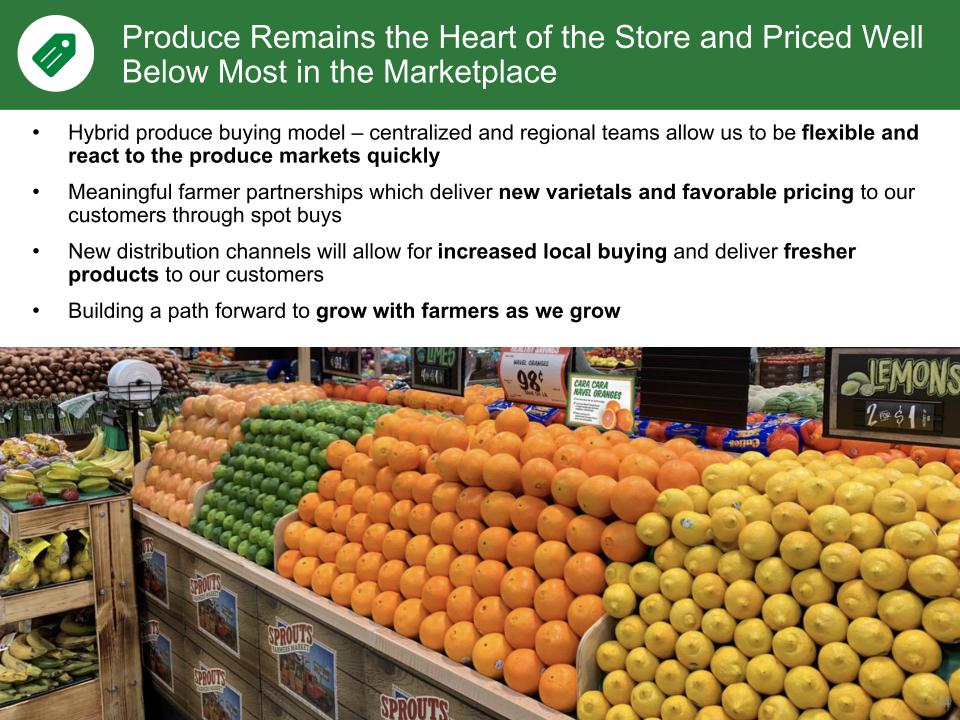
Produce Remains the Heart of the Store and Priced Well Below Most in the Marketplace Hybrid produce buying model – centralized and regional teams allow us to be flexible and react to the produce markets quickly Meaningful farmer partnerships which deliver new varietals and favorable pricing to our customers through spot buys New distribution channels will allow for increased local buying and deliver fresher products to our customers Building a path forward to grow with farmers as we grow
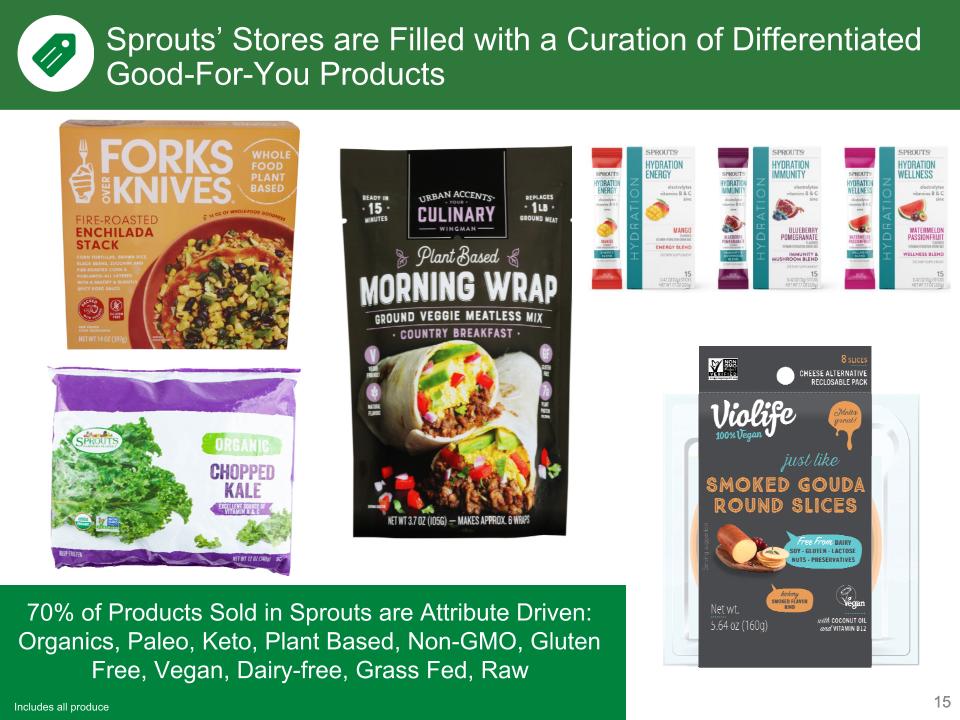
15 Sprouts’ Stores are Filled with a Curation of Differentiated Good-For-You Products 70% of Products Sold in Sprouts are Attribute Driven: Organics, Paleo, Keto, Plant Based, Non-GMO, Gluten Free, Vegan, Dairy-free, Grass Fed, Raw Includes all produce
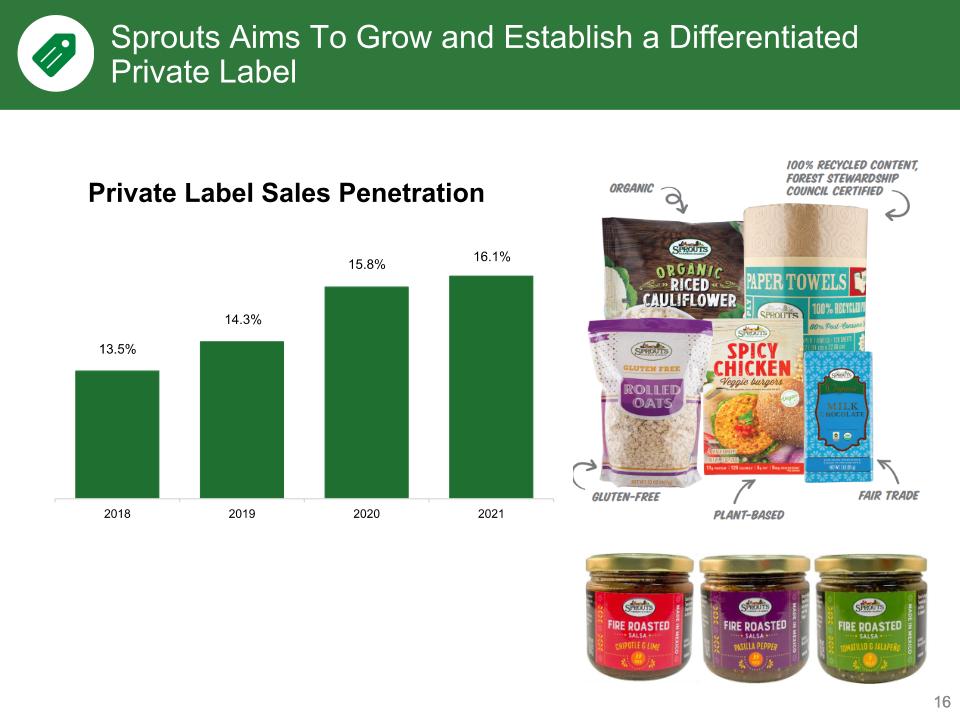
16 Sprouts Aims To Grow and Establish a Differentiated Private Label Private Label Sales Penetration
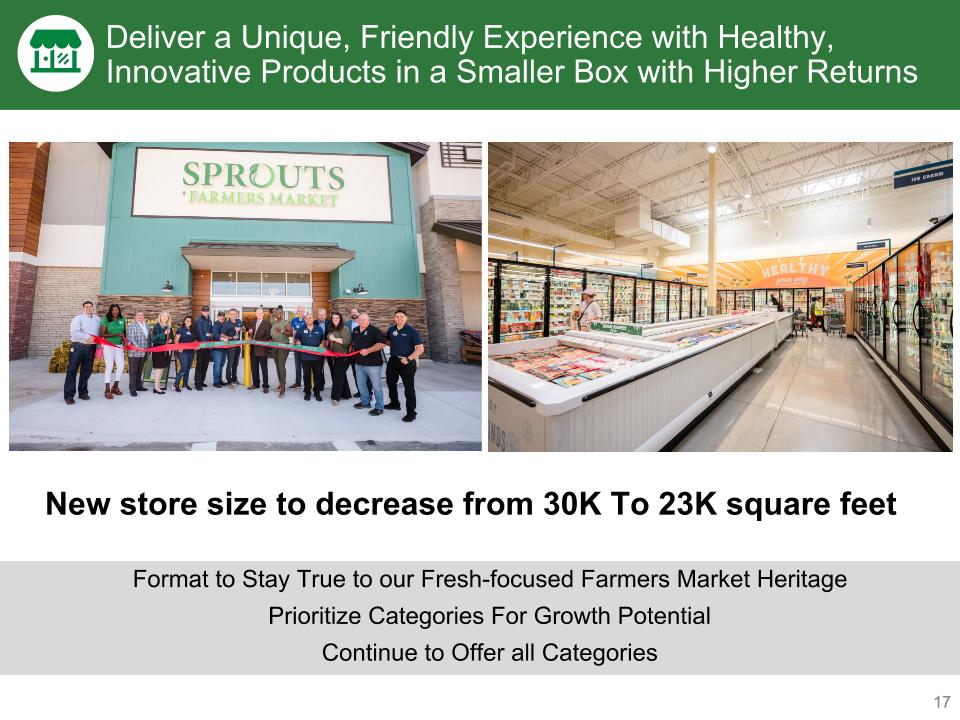
17 Deliver a Unique, Friendly Experience with Healthy, Innovative Products in a Smaller Box with Higher Returns Format to Stay True to our Fresh-focused Farmers Market Heritage Prioritize Categories For Growth Potential Continue to Offer all Categories New store size to decrease from 30K To 23K square feet
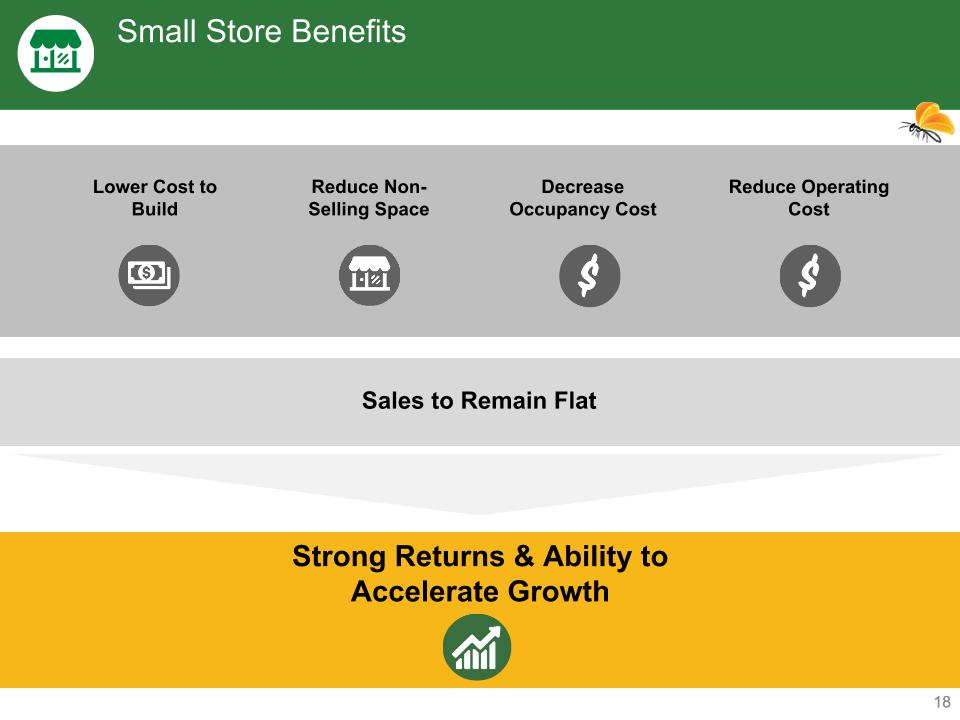
18 Small Store Benefits Reduce Operating Cost Lower Cost to Build Reduce Non-Selling Space Decrease Occupancy Cost Sales to Remain Flat Strong Returns & Ability to Accelerate Growth
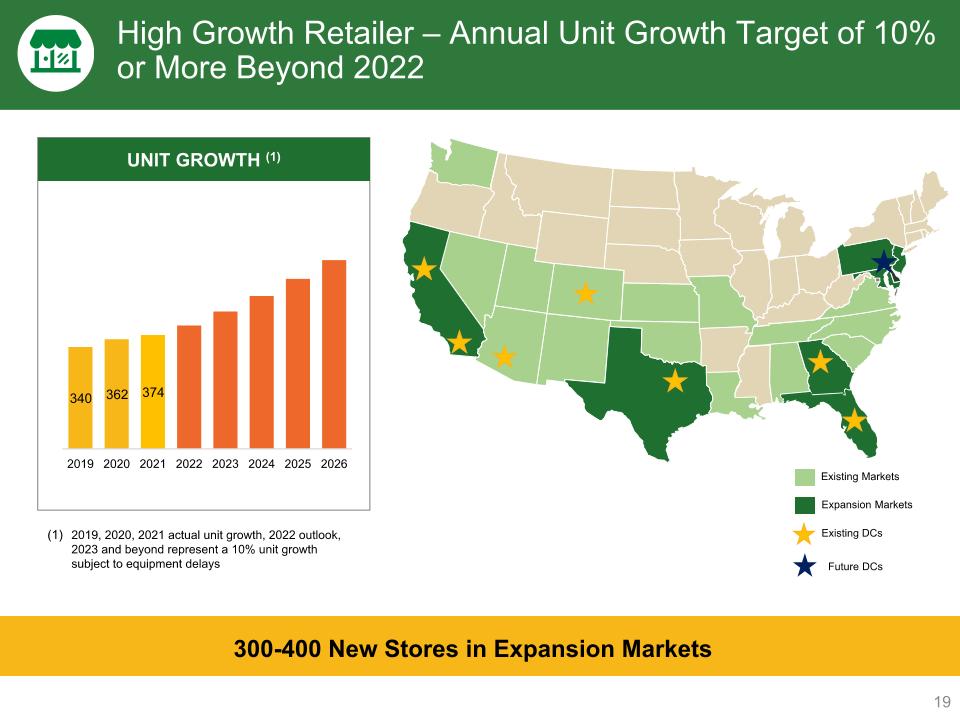
High Growth Retailer – Annual Unit Growth Target of 10% or More Beyond 2022 Unit growth (1) 300-400 New Stores in Expansion Markets 2019, 2020, 2021 actual unit growth, 2022 outlook, 2023 and beyond represent a 10% unit growth subject to equipment delays Expansion Markets Existing DCs Future DCs Existing Markets
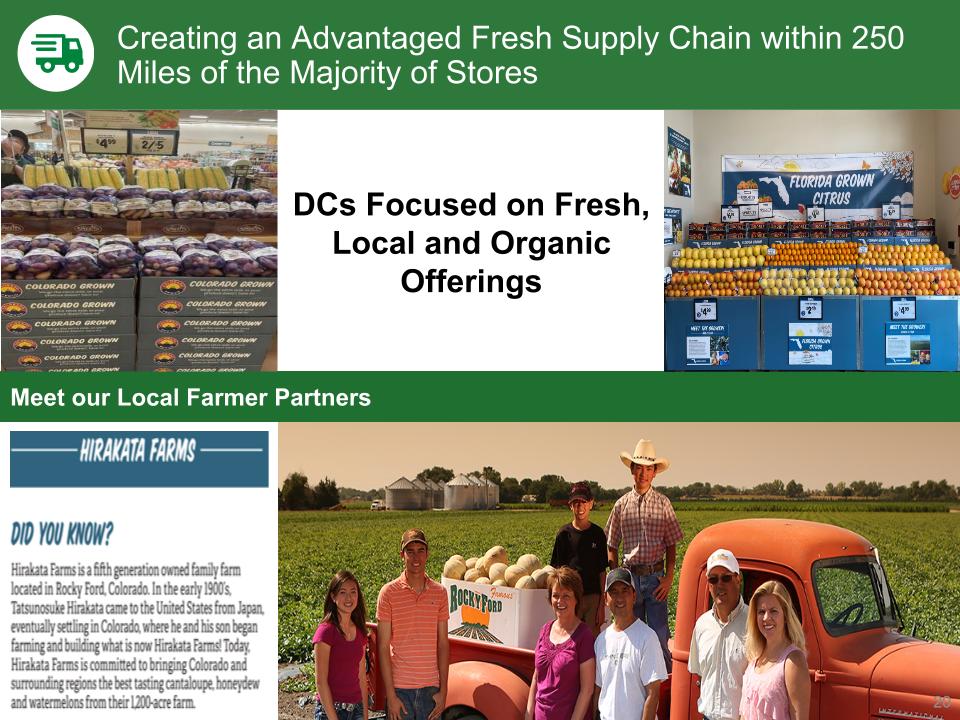
20 Creating an Advantaged Fresh Supply Chain within 250 Miles of the Majority of Stores DCs Focused on Fresh, Local and Organic Offerings Meet our Local Farmer Partners
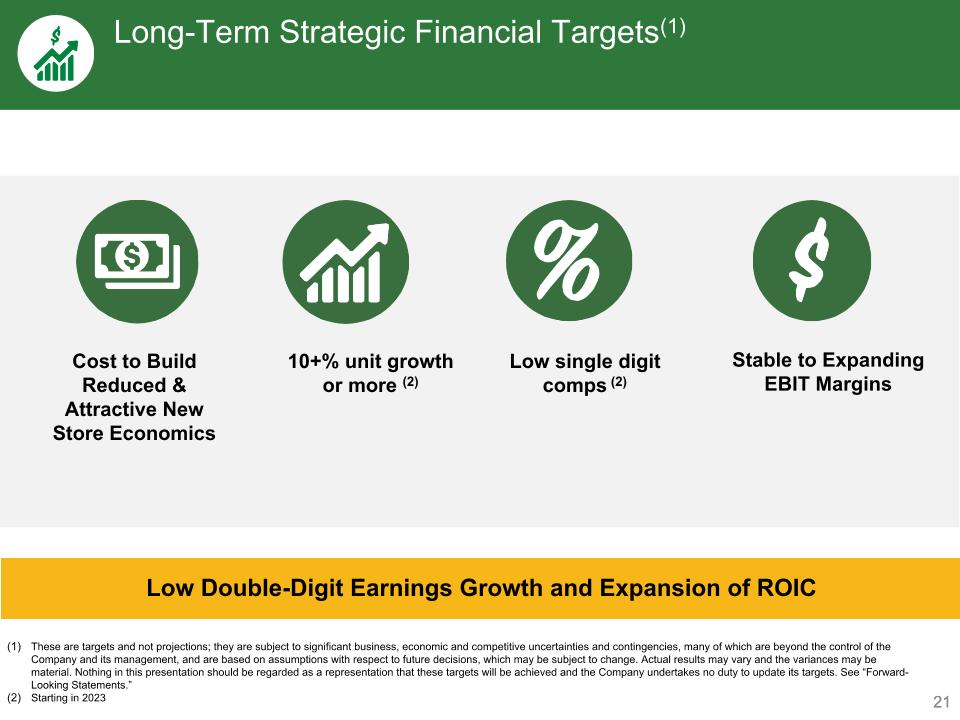
21 Long-Term Strategic Financial Targets(1) Low Double-Digit Earnings Growth and Expansion of ROIC Cost to Build Reduced & Attractive New Store Economics 10+% unit growth or more (2) Low single digit comps (2) Stable to Expanding EBIT Margins These are targets and not projections; they are subject to significant business, economic and competitive uncertainties and contingencies, many of which are beyond the control of the Company and its management, and are based on assumptions with respect to future decisions, which may be subject to change. Actual results may vary and the variances may be material. Nothing in this presentation should be regarded as a representation that these targets will be achieved and the Company undertakes no duty to update its targets. See “Forward-Looking Statements.” Starting in 2023
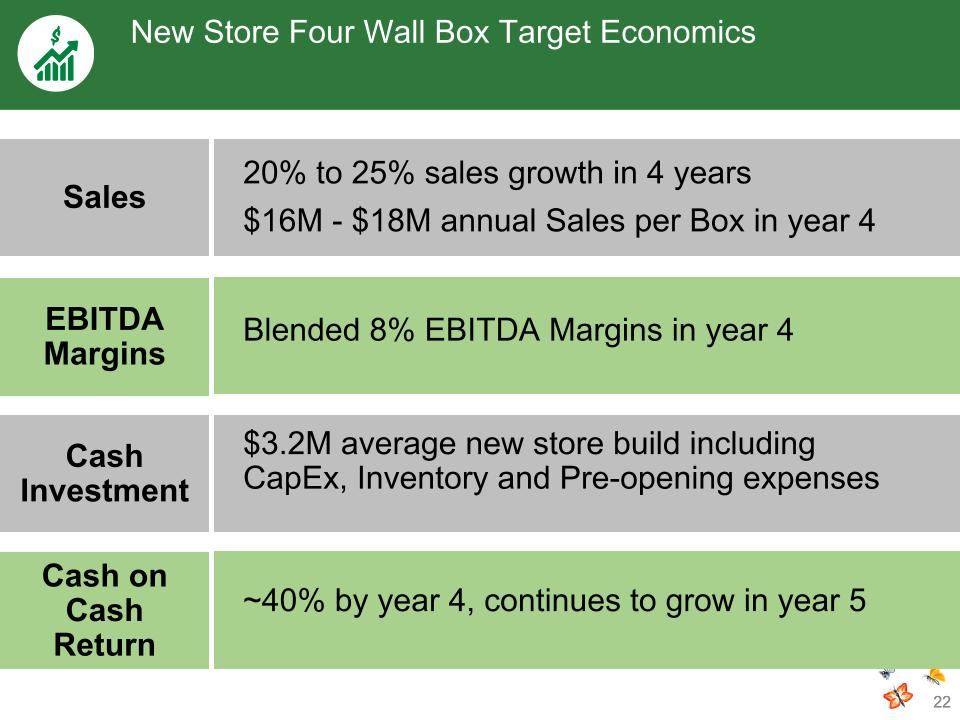
22 New Store Four Wall Box Target Economics Sales EBITDA Margins 20% to 25% sales growth in 4 years $16M - $18M annual Sales per Box in year 4 Blended 8% EBITDA Margins in year 4 Cash on Cash Return ~40% by year 4, continues to grow in year 5 Cash Investment $3.2M average new store build including CapEx, Inventory and Pre-opening expenses
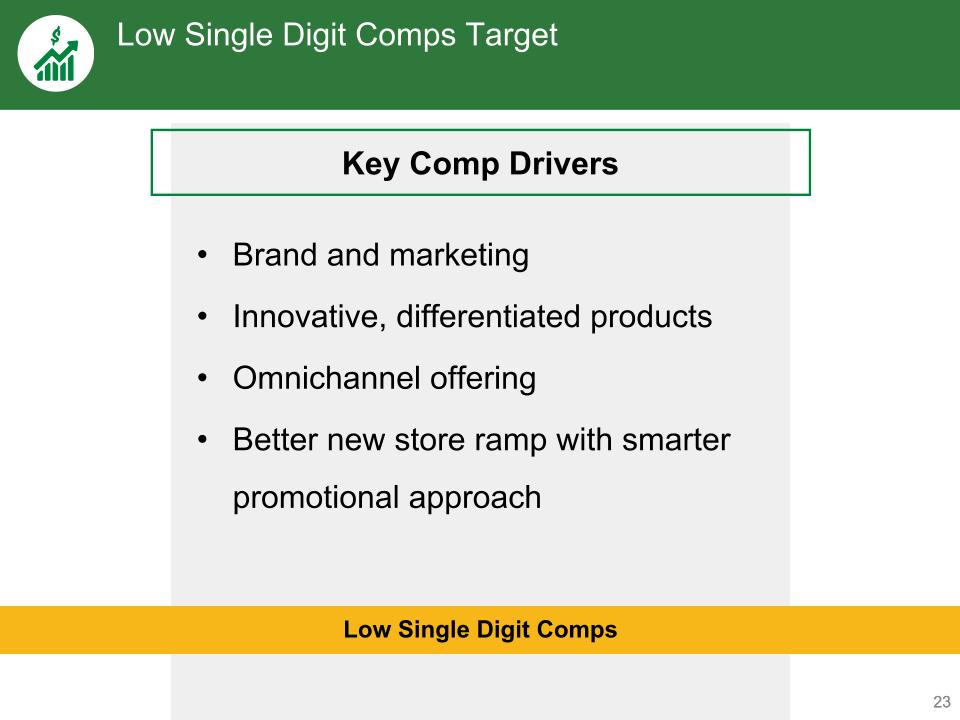
23 Low Single Digit Comps Target Key Comp Drivers Low Single Digit Comps Brand and marketing Innovative, differentiated products Omnichannel offering Better new store ramp with smarter promotional approach
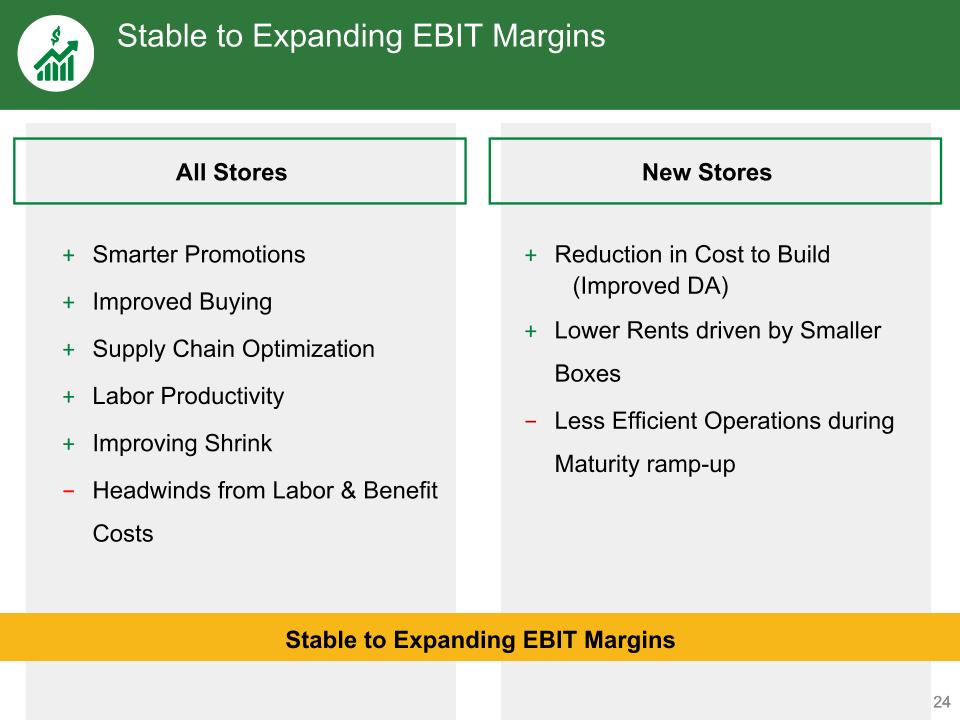
24 Stable to Expanding EBIT Margins Stable to Expanding EBIT Margins All Stores New Stores Smarter Promotions Improved Buying Supply Chain Optimization Labor Productivity Improving Shrink Headwinds from Labor & Benefit Costs Reduction in Cost to Build (Improved DA) Lower Rents driven by Smaller Boxes Less Efficient Operations during Maturity ramp-up

25 NET SALES $6.1B + 8% vs 2019 NET CASH PROVIDED by OPERATIONS $365M + 3% vs 2019 ADJUSTED DILUTED Earnings Per Share $2.10 + 68% vs 2019 ($ in mm) ($ in mm) (1) (3) (3) (3) See the Appendix to this presentation for a reconciliation of adjusted diluted EPS to net income The Company’s results for FY2020 were significantly impacted by the Covid-19 pandemic. Accordingly, this presentation also includes comparisons to result in FY 2019 2020 is presented on a 53-week basis Sprouts is on a Stronger Foundation with Strategic Initiatives Beginning to Take Hold in 2021 (2) (2) (2)
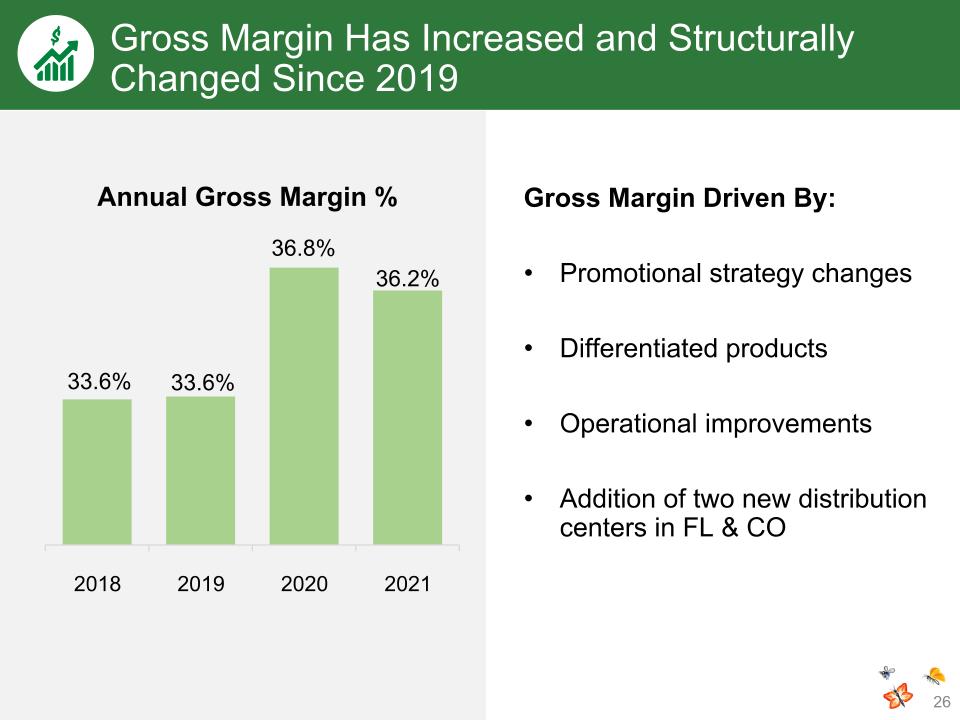
Gross Margin Has Increased and Structurally Changed Since 2019 Gross Margin Driven By: Promotional strategy changes Differentiated products Operational improvements Addition of two new distribution centers in FL & CO Annual Gross Margin %
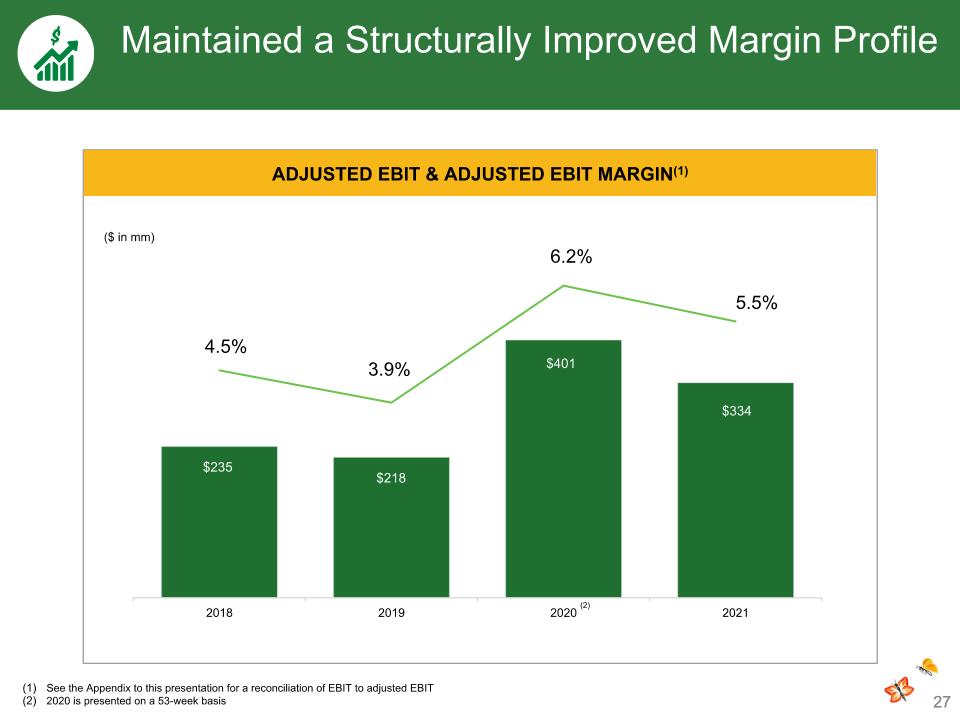
Maintained a Structurally Improved Margin Profile 27 ($ in mm) ADJUSTED EBIT & Adjusted EBIT Margin(1) See the Appendix to this presentation for a reconciliation of EBIT to adjusted EBIT 2020 is presented on a 53-week basis (2)
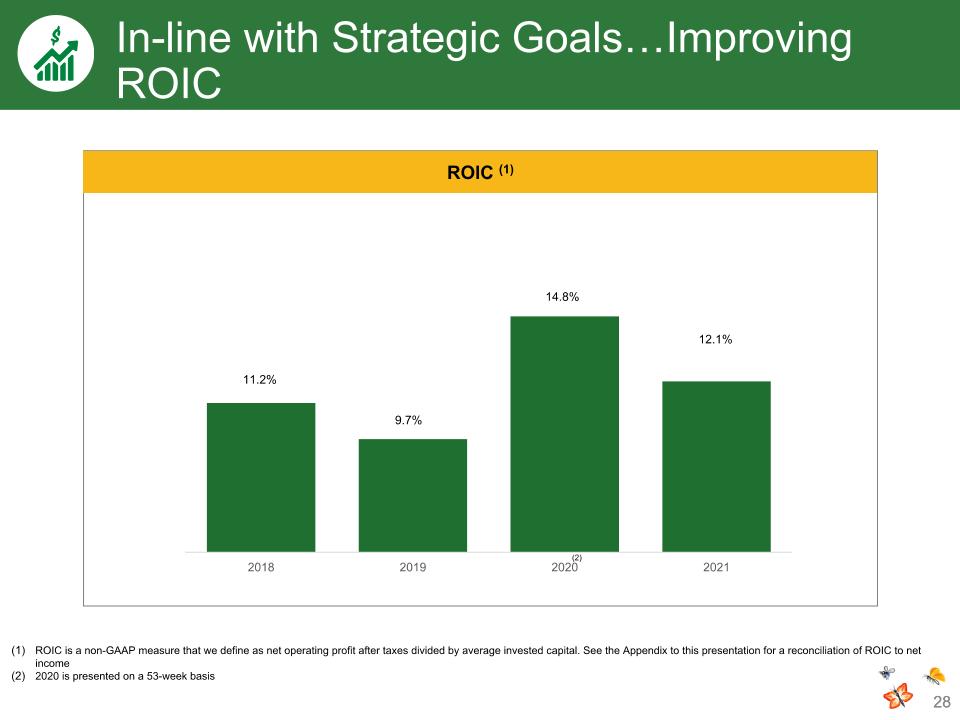
In-line with Strategic Goals…Improving ROIC 28 ROIC (1) ROIC is a non-GAAP measure that we define as net operating profit after taxes divided by average invested capital. See the Appendix to this presentation for a reconciliation of ROIC to net income 2020 is presented on a 53-week basis (2)
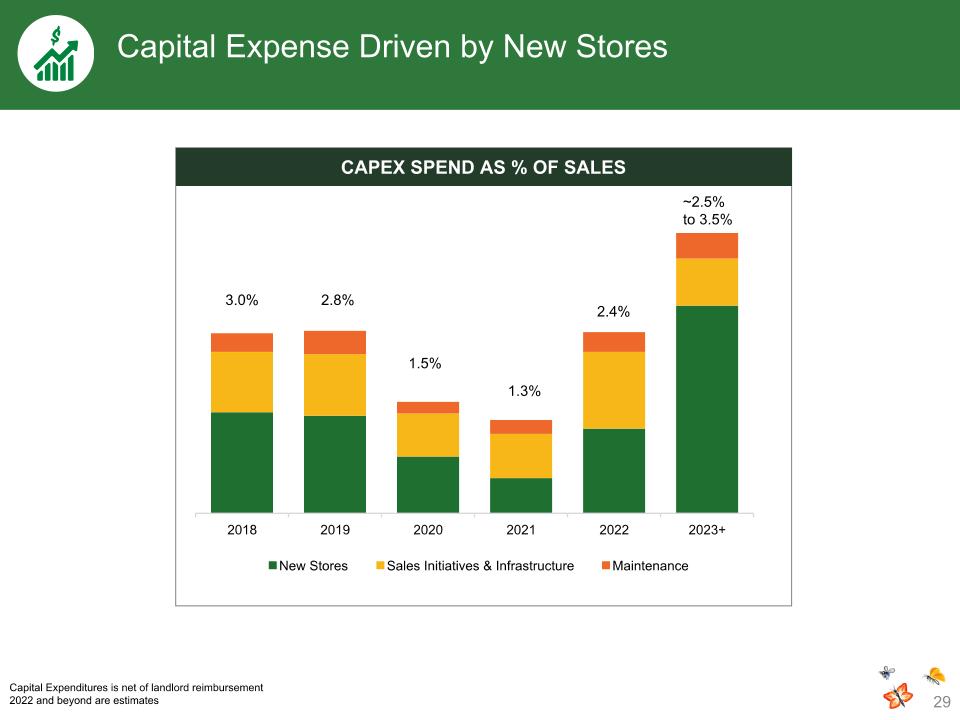
Capital Expense Driven by New Stores Capex Spend as % of Sales 3.0% 1.5% ~2.5% to 3.5% 2.8% Capital Expenditures is net of landlord reimbursement 2022 and beyond are estimates 1.3% 2.4%
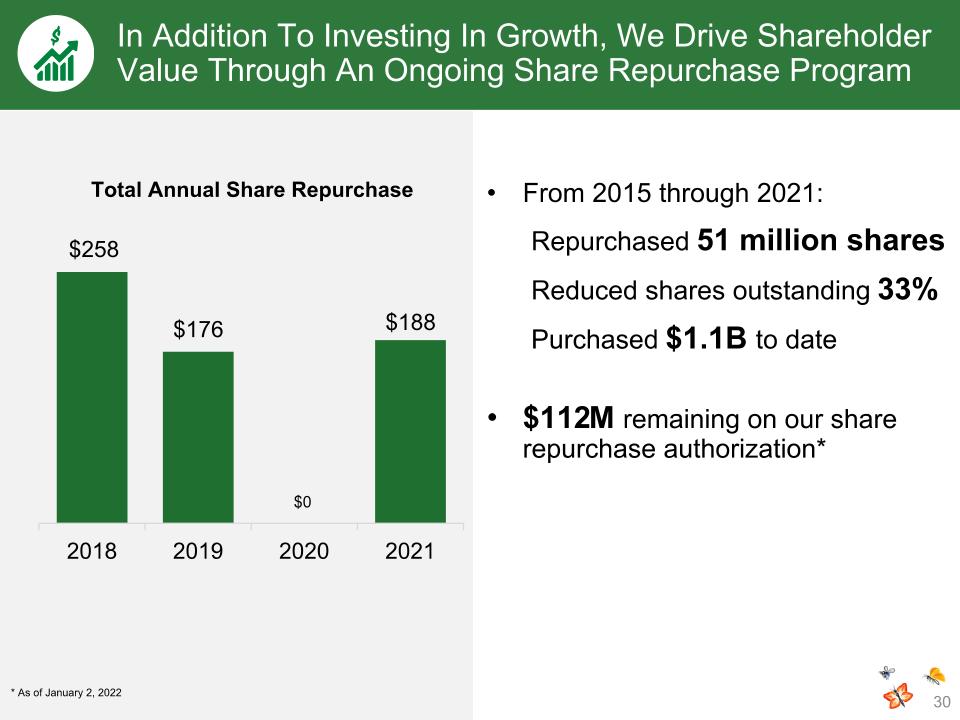
From 2015 through 2021: Repurchased 51 million shares Reduced shares outstanding 33% Purchased $1.1B to date $112M remaining on our share repurchase authorization* $0 Total Annual Share Repurchase * As of January 2, 2022 In Addition To Investing In Growth, We Drive Shareholder Value Through An Ongoing Share Repurchase Program

DELIGHT IN THE GOODNESS OF FRESH, HEALTHY FOODS… Sprouts delivers a unique farmers market experience that brings together passionate, knowledgeable team members and the best assortment of high-quality food that is good for us, and good for the world.

APPENDIX
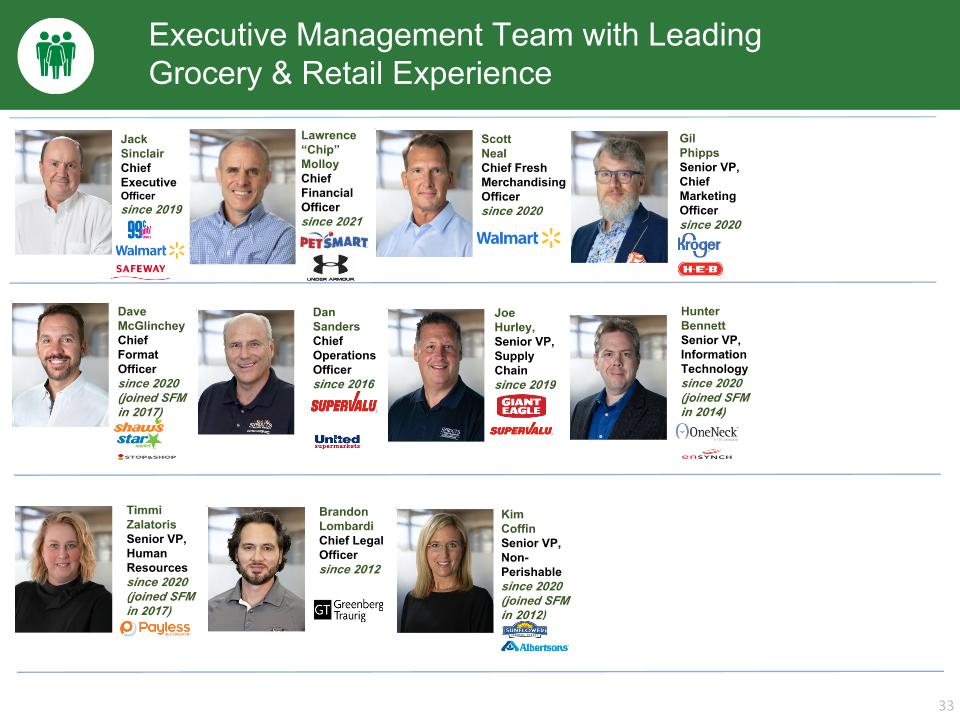
Executive Management Team with Leading Grocery & Retail Experience Jack Sinclair Chief Executive Officer since 2019 Lawrence “Chip” Molloy Chief Financial Officer since 2021 Scott Neal Chief Fresh Merchandising Officer since 2020 Dan Sanders Chief Operations Officer since 2016 Gil Phipps Senior VP, Chief Marketing Officer since 2020 Dave McGlinchey Chief Format Officer since 2020 (joined SFM in 2017) Brandon Lombardi Chief Legal Officer since 2012 Kim Coffin Senior VP, Non- Perishable since 2020 (joined SFM in 2012) Joe Hurley, Senior VP, Supply Chain since 2019 Hunter Bennett Senior VP, Information Technology since 2020 (joined SFM in 2014) Timmi Zalatoris Senior VP, Human Resources since 2020 (joined SFM in 2017)
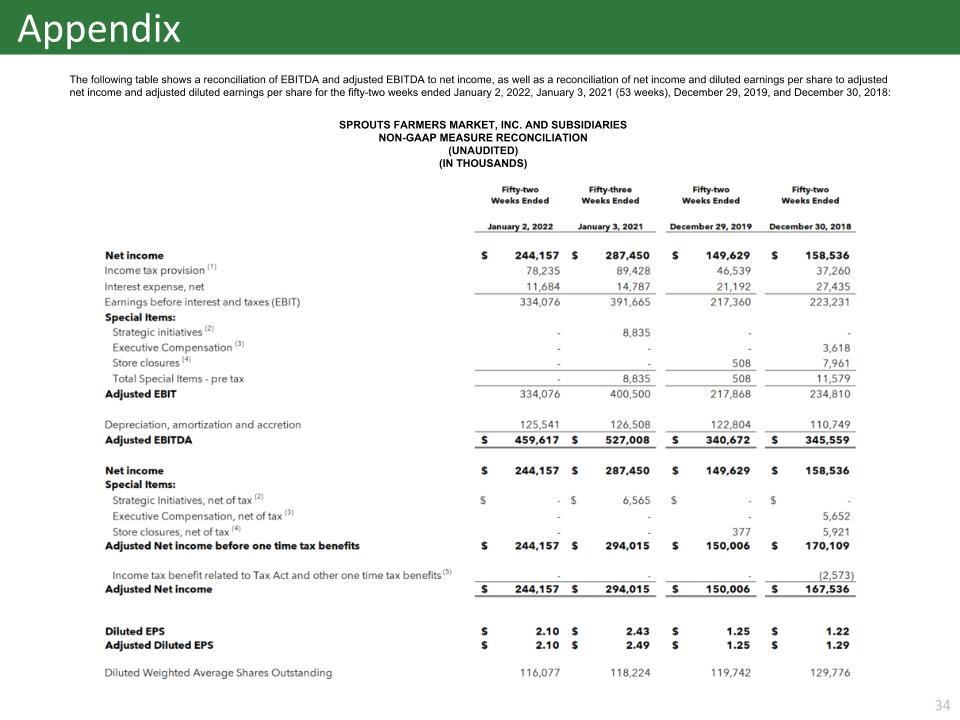
SPROUTS FARMERS MARKET, INC. AND SUBSIDIARIES NON-GAAP MEASURE RECONCILIATION (UNAUDITED) (IN THOUSANDS) The following table shows a reconciliation of EBITDA and adjusted EBITDA to net income, as well as a reconciliation of net income and diluted earnings per share to adjusted net income and adjusted diluted earnings per share for the fifty-two weeks ended January 2, 2022, January 3, 2021 (53 weeks), December 29, 2019, and December 30, 2018: Appendix
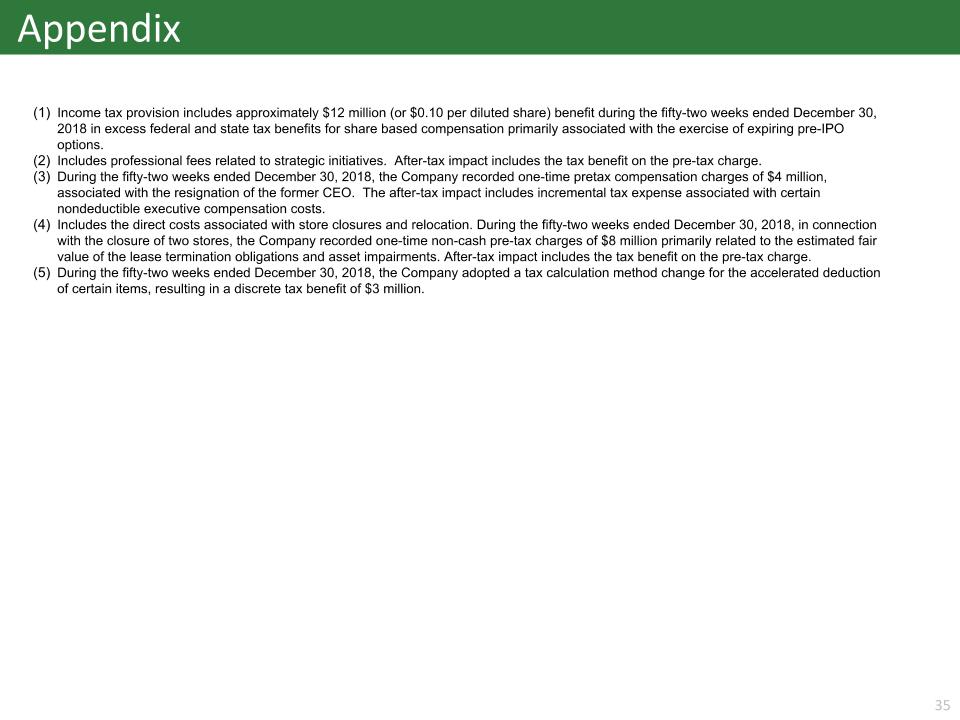
Appendix Income tax provision includes approximately $12 million (or $0.10 per diluted share) benefit during the fifty-two weeks ended December 30, 2018 in excess federal and state tax benefits for share based compensation primarily associated with the exercise of expiring pre-IPO options. Includes professional fees related to strategic initiatives. After-tax impact includes the tax benefit on the pre-tax charge. During the fifty-two weeks ended December 30, 2018, the Company recorded one-time pretax compensation charges of $4 million, associated with the resignation of the former CEO. The after-tax impact includes incremental tax expense associated with certain nondeductible executive compensation costs. Includes the direct costs associated with store closures and relocation. During the fifty-two weeks ended December 30, 2018, in connection with the closure of two stores, the Company recorded one-time non-cash pre-tax charges of $8 million primarily related to the estimated fair value of the lease termination obligations and asset impairments. After-tax impact includes the tax benefit on the pre-tax charge. During the fifty-two weeks ended December 30, 2018, the Company adopted a tax calculation method change for the accelerated deduction of certain items, resulting in a discrete tax benefit of $3 million.
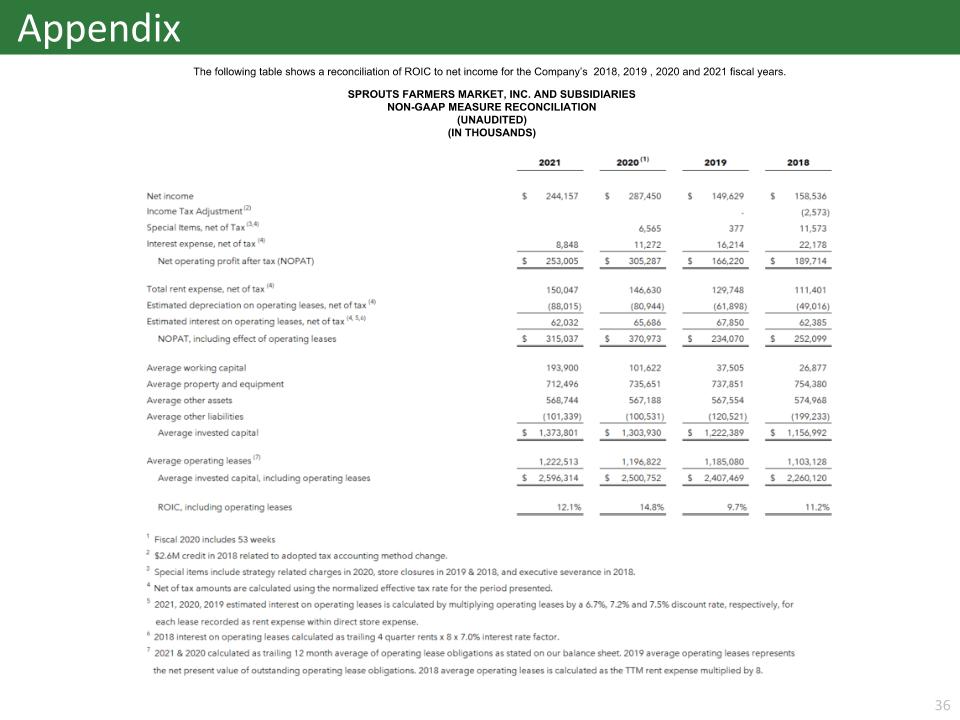
Appendix The following table shows a reconciliation of ROIC to net income for the Company’s 2018, 2019 , 2020 and 2021 fiscal years. SPROUTS FARMERS MARKET, INC. AND SUBSIDIARIES NON-GAAP MEASURE RECONCILIATION (UNAUDITED) (IN THOUSANDS)


