
Horseshoe Baltimore Public Lender Presentation June 2017 Privileged & Confidential
Legal Disclaimer This presentation contains certain forward‐looking statements within the meaning of Section 27A of the Securities Act of 1933, as amended, and Section 21E of the Securities Exchange Act of 1934, as amended. These statements may be made directly in this presentation. Some of the forward‐looking statements can be identified by the use of forward‐looking words. Statements that are not strictly historical in nature, including the words “anticipate,” “estimate,” “expect,” “believe,” “will,” “assume,” and “continue,” and similar words, or the negatives or other variations of those words and comparable terminology, are intended to identify forward‐looking statements. Certain statements regarding the following particularly are forward‐looking in nature: Our business strategy; Future performance, developments, actions, new projects, market forecasts or projections and the outcome of contingencies; and Projected capital expenditures. All forward‐looking statements are based on our management’s current beliefs, assumptions and expectations of our future economic performance, taking into account the information currently available to it. These statements are not statements of historical fact. Forward‐looking statements are subject to a number of factors, risks, contingencies and uncertainties, some of which are not currently known to us, that may cause our actual results, performance or financial condition to be materially different from the expectations of future results, performance or financial position. Such risks and uncertainties include but are not limited to our ability (or inability) to complete the transactions contemplated hereby on the terms described herein or at all as well as the factors described from time to time in our filings with the Securities and Exchange Commission. Although such forward‐looking statements have been prepared in good faith and are based on assumptions believed by our management to be reasonable, there is no assurance or guarantee that the expected results will be achieved. Our actual results may differ materially from the results discussed in forward‐looking statements. We make no representations or warranties as to the accuracy of any such forward-looking statements and we disclaim any obligation to update any forward-looking statements except as required by law. In addition, our discussion will include references to non-GAAP financial measures, including but not limited to EBITDA, Adjusted EBITDA, Adjusted EBITDA margin, Adjusted EBITDAM, and free cash flow. Such non-GAAP measures should be considered only as supplemental to, and not as superior to, financial measures prepared in accordance with GAAP. They are used by management during the strategic review of performance. The results are not necessarily indicative of future performance or the results that would be achieved should the Merger (as detailed below) or the reorganization of Caesars Entertainment Operating Company, Inc., as currently contemplated, be successfully completed. See the Appendix to this presentation for a reconciliation of these non-GAAP measures to their nearest GAAP measures. This presentation and all information provided or discussed in connection therewith are confidential and being provided to you for informational use solely in connection with your consideration of the financing transaction contemplated herein. Acceptance of these materials constitutes your agreement to hold the information contained herein in strict confidence in accordance with the confidentiality provisions agreed to by you in accepting the invitation to this meeting.
Use of Non-GAAP Measures The following non-GAAP measures will be used in the presentation and discussed on the conference call which this presentation accompanies: EBITDA, Adjusted EBITDA, Adjusted EBITDA margin, Adjusted EBITDAM, and free cash flow Definitions of these non-GAAP measures, reconciliations to their nearest GAAP measures, and the reasons management believes these measures provide useful information for investors, can be found in the Appendix to this presentation.
Rule 425 Disclaimer (Important Additional Information) Pursuant to the Amended and Restated Agreement and Plan of Merger dated as of July 9, 2016, between Caesars Entertainment Corporation (“CEC”) and Caesars Acquisition Company (“CAC”) as subsequently amended on February 20, 2017 (as amended, the “Merger Agreement”), among other things, CAC will merge with and into CEC, with CEC as the surviving company (the “Merger”). In connection with the Merger, CEC and CAC filed with the Securities and Exchange Commission (the “SEC”) a registration statement on Form S-4 on March 13, 2017, and Amendment No. 1 to such registration statement on Form S-4 on June 5, 2017 (“Amendment No. 1 to the Form S-4”), which includes a preliminary joint proxy statement/prospectus, as well as other relevant documents concerning the proposed transaction. The registration statement has not yet become effective. After the registration statement is declared effective by the SEC, a definitive joint proxy statement/prospectus will be mailed to stockholders of CEC and CAC. Stockholders are urged to read the registration statement and joint proxy statement/prospectus regarding the Merger and any other relevant documents filed with the SEC, as well as any amendments or supplements to those documents, because they will contain important information. You will be able to obtain a free copy of such joint proxy statement/prospectus, as well as other filings containing information about CEC and CAC, at the SEC’s website (www.sec.gov), from CEC Investor Relations (investor.caesars.com) or from CAC Investor Relations (investor.caesarsacquisitioncompany.com) The information in this communication is for informational purposes only and is neither an offer to purchase, nor a solicitation of an offer to sell, subscribe for or buy any securities or the solicitation of any vote or approval in any jurisdiction pursuant to or in connection with the proposed transactions or otherwise, nor shall there be any sale, issuance or transfer of securities in any jurisdiction in contravention of applicable law. No offer of securities shall be made except by means of a prospectus meeting the requirements of Section 10 of the Securities Act of 1933, as amended, and otherwise in accordance with applicable law. CEC, CAC and their respective directors, executive officers and certain other members of management and employees may be soliciting proxies from CEC and CAC stockholders in favor of the business combination transaction. Information regarding the persons who may, under the rules of the SEC, be considered participants in the solicitation of the CEC and CAC stockholders in connection with the proposed business combination transaction is set forth in Amendment No. 1 to the Form S-4 filed with the SEC on June 5, 2017 and Amendment No. 1 to the Annual Report on Form 10-K for CAC’s fiscal year ended December 31, 2016, filed on March 31, 2017. You can obtain free copies of these documents from CEC and CAC in the manner set forth above.
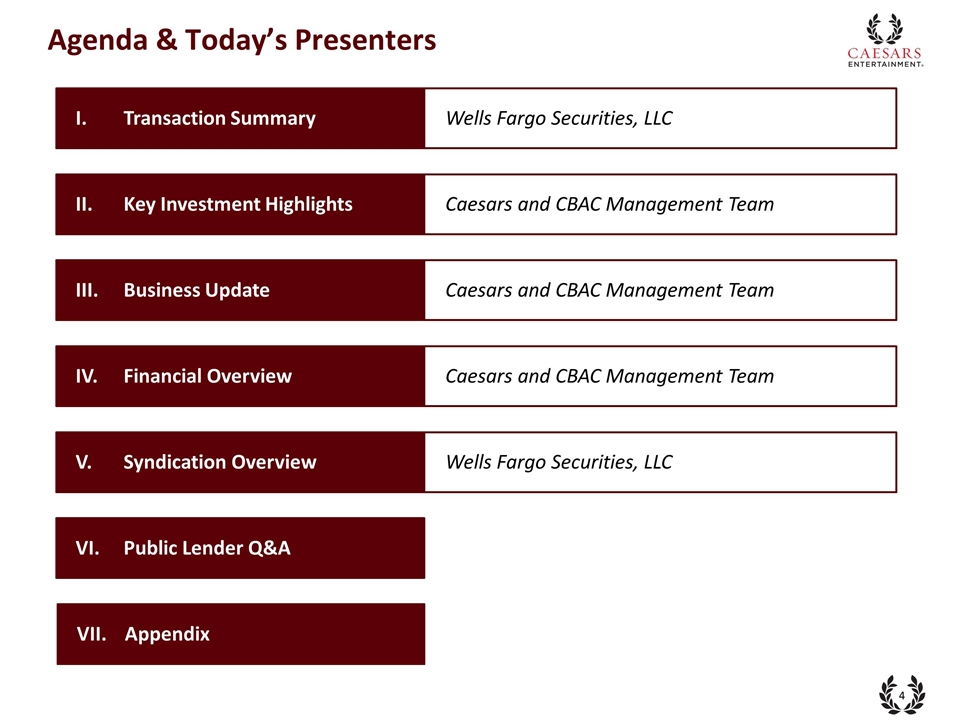
Agenda & Today’s Presenters Wells Fargo Securities, LLC I. Transaction Summary Caesars and CBAC Management Team II. Key Investment Highlights Caesars and CBAC Management Team IV. Financial Overview Wells Fargo Securities, LLC V. Syndication Overview Caesars and CBAC Management Team III. Business Update VI. Public Lender Q&A VII. Appendix
Transaction Summary
Transaction Overview CBAC Borrower, LLC ( “CBAC” or the “Company”) owns the Horseshoe Baltimore (“Horseshoe” or the “Property”) in Baltimore, Maryland with: 2,202 slots and 177 tables (includes 25 poker tables) CBAC generated LTM 3/31/2017 net revenue and Adjusted EBITDA of $321.1 million and $68.4 million, respectively, and a 21.3% Adjusted EBITDA margin Management believes that 2017E net revenue and Adjusted EBITDA will be approximately $294 to $304 million and $48 to $58 million, respectively, primarily driven by the impact of a new competitor opening in the market Caesars Entertainment Corporation (“CEC” or “CZR,” and CEC together with its subsidiaries, “Caesars”), Caesars Acquisition Company (“CAC”) and Rock Gaming Mothership LLC (“Rock”) own their interest through CR Baltimore Holdings LLC (“CRBH”) which forms a joint venture together with Caves Valley Partners (with A&R Companies) (“CVPR”), STRON-MD, and PRT Two (collectively the “Investors”) A subsidiary of Caesars Entertainment Operating Company, Inc. manages operations under the Horseshoe brand Refinance existing capital structure with proceeds from a $315.0 million Secured Credit Facility: $15.0 million senior secured Revolving Credit Facility (“Revolver”) $300.0 million senior secured Term Loan B (“Term Loan B”) Pro forma for the transaction, the Company will materially reduce annual interest expense, enhance asset cash flows and transition capital structure from an in-place construction loan to a true operating loan Pro forma total leverage will be 4.5x based on 3/31/2017 LTM Adjusted EBITDA of $68.4 million and 3.9x based on Adjusted EBITDAM Financing Overview Company Overview
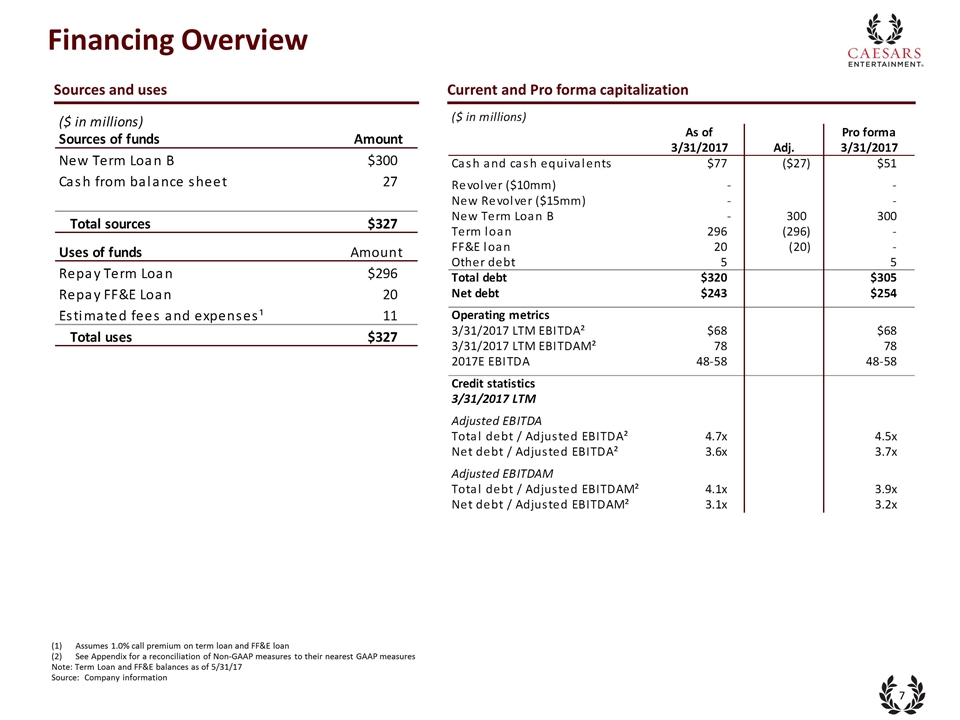
Financing Overview Sources and uses Current and Pro forma capitalization Assumes 1.0% call premium on term loan and FF&E loan See Appendix for a reconciliation of Non-GAAP measures to their nearest GAAP measures Note: Term Loan and FF&E balances as of 5/31/17 Source: Company information
Key Investment Highlights
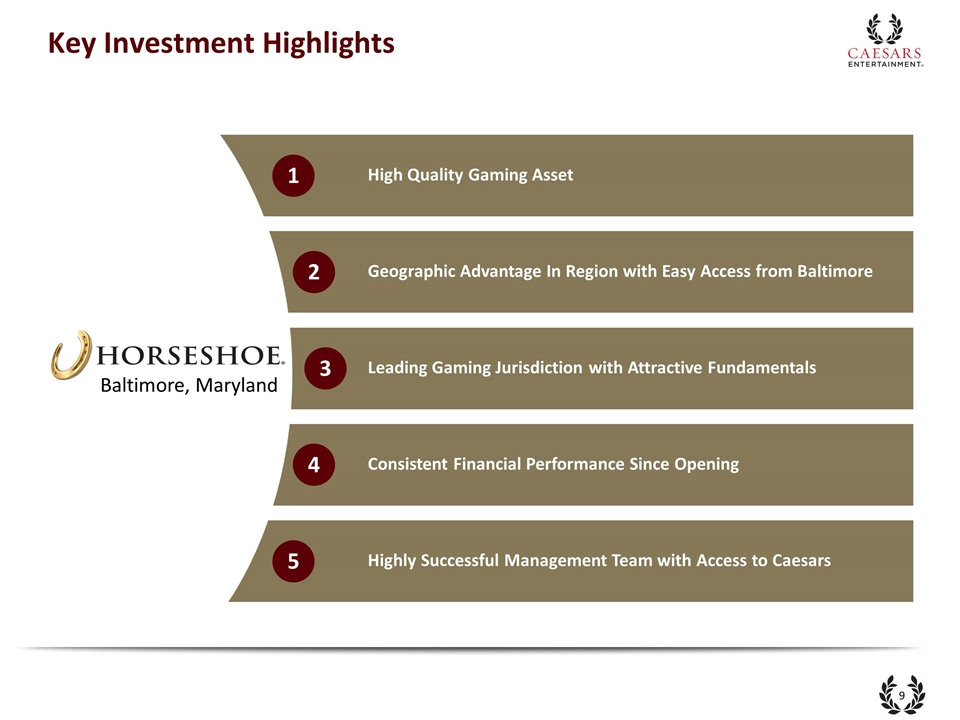
High Quality Gaming Asset Geographic Advantage In Region with Easy Access from Baltimore Leading Gaming Jurisdiction with Attractive Fundamentals Highly Successful Management Team with Access to Caesars Consistent Financial Performance Since Opening 1 2 5 3 Key Investment Highlights 4 Baltimore, Maryland
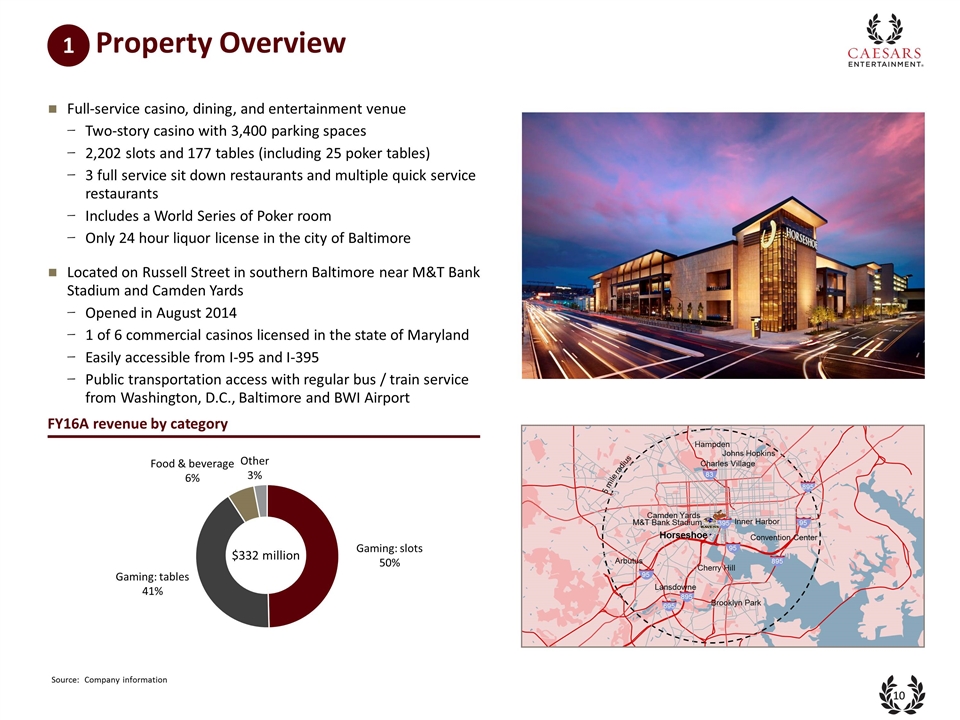
Property Overview FY16A revenue by category Full-service casino, dining, and entertainment venue Two-story casino with 3,400 parking spaces 2,202 slots and 177 tables (including 25 poker tables) 3 full service sit down restaurants and multiple quick service restaurants Includes a World Series of Poker room Only 24 hour liquor license in the city of Baltimore Located on Russell Street in southern Baltimore near M&T Bank Stadium and Camden Yards Opened in August 2014 1 of 6 commercial casinos licensed in the state of Maryland Easily accessible from I-95 and I-395 Public transportation access with regular bus / train service from Washington, D.C., Baltimore and BWI Airport Source: Company information 395 95 Horseshoe M&T Bank Stadium Camden Yards Inner Harbor Johns Hopkins Convention Center Brooklyn Park Lansdowne Arbutus Cherry Hill Charles Village Hampden 895 895 95 895 695 95 83 5 mile radius $332 million 1
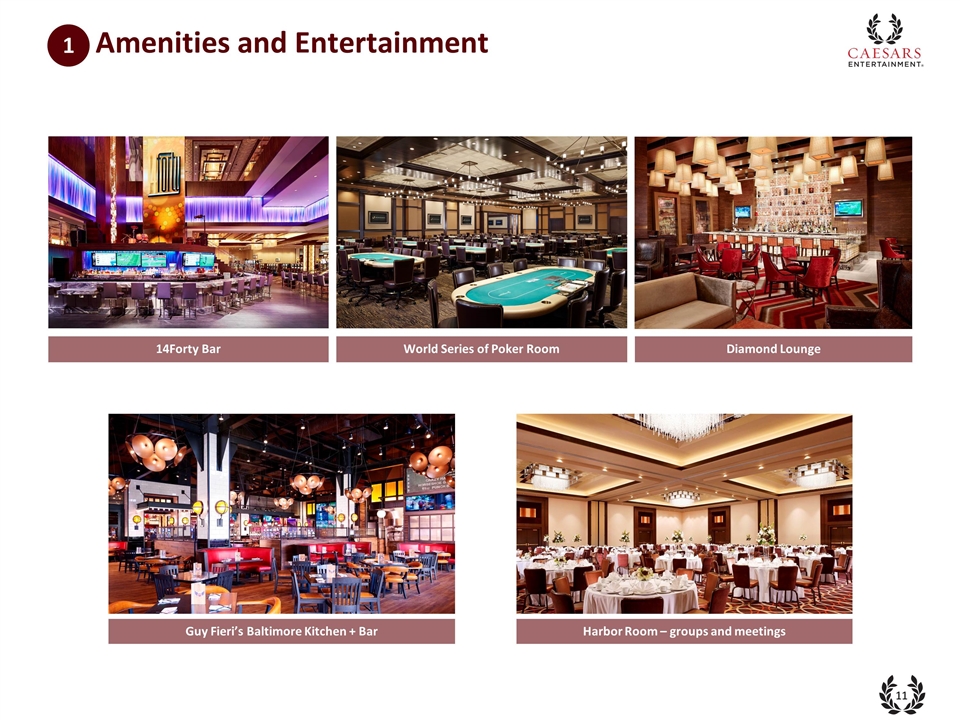
Amenities and Entertainment Diamond Lounge 14Forty Bar Guy Fieri’s Baltimore Kitchen + Bar Harbor Room – groups and meetings World Series of Poker Room 1
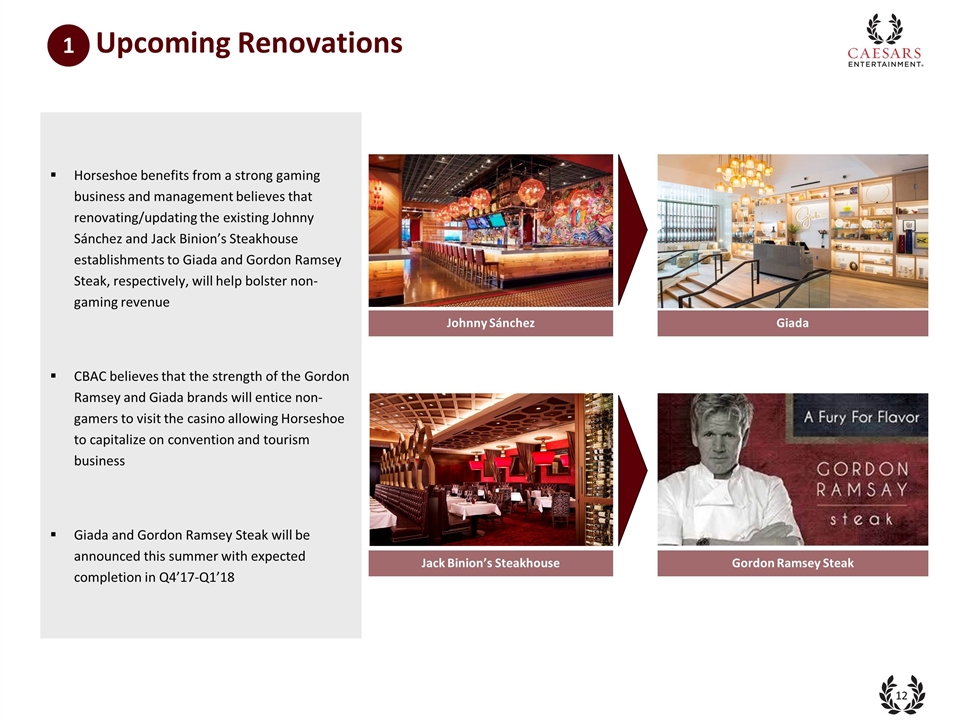
Upcoming Renovations 1 Johnny Sánchez Giada Jack Binion’s Steakhouse Gordon Ramsey Steak Horseshoe benefits from a strong gaming business and management believes that renovating/updating the existing Johnny Sánchez and Jack Binion’s Steakhouse establishments to Giada and Gordon Ramsey Steak, respectively, will help bolster non-gaming revenue CBAC believes that the strength of the Gordon Ramsey and Giada brands will entice non-gamers to visit the casino allowing Horseshoe to capitalize on convention and tourism business Giada and Gordon Ramsey Steak will be announced this summer with expected completion in Q4’17-Q1’18
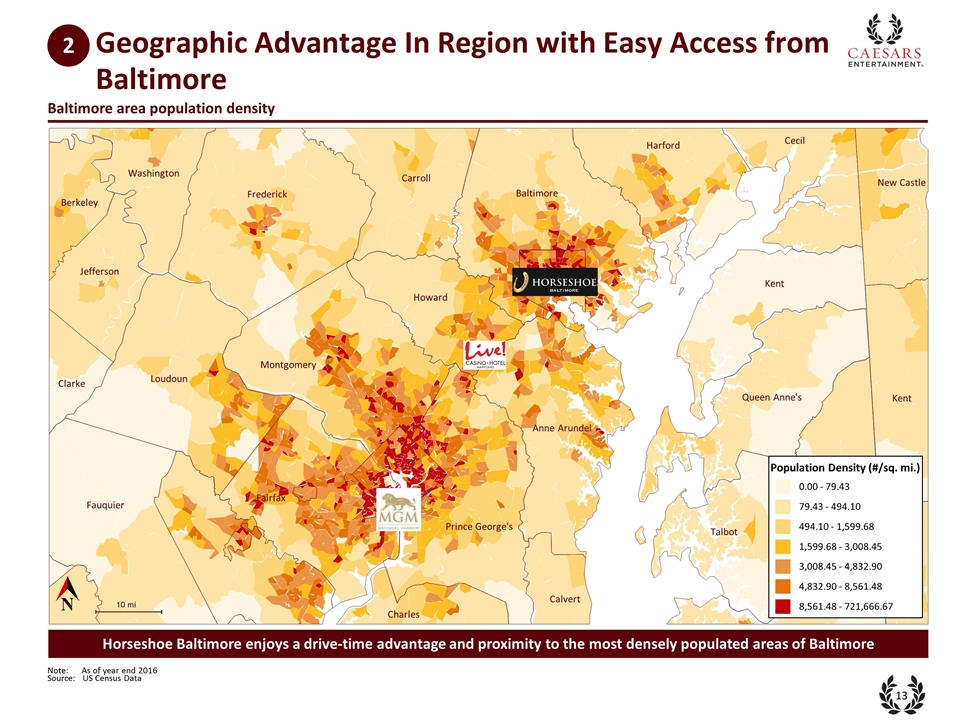
Baltimore area population density Source: US Census Data Note: As of year end 2016 Horseshoe Baltimore enjoys a drive-time advantage and proximity to the most densely populated areas of Baltimore 10 mi Berkeley Carroll Fairfax Talbot Dorchester Charles Caroline Calvert Sussex Jefferson Loudoun Queen Anne's Kent Washington Harford Frederick Cecil Baltimore New Castle Fauquier Prince George's Clarke Montgomery Kent Howard Anne Arundel Population Density (#/sq. mi.) 0.00 - 79.43 79.43 - 494.10 494.10 - 1,599.68 1,599.68 - 3,008.45 3,008.45 - 4,832.90 4,832.90 - 8,561.48 8,561.48 - 721,666.67 Geographic Advantage In Region with Easy Access from Baltimore 2
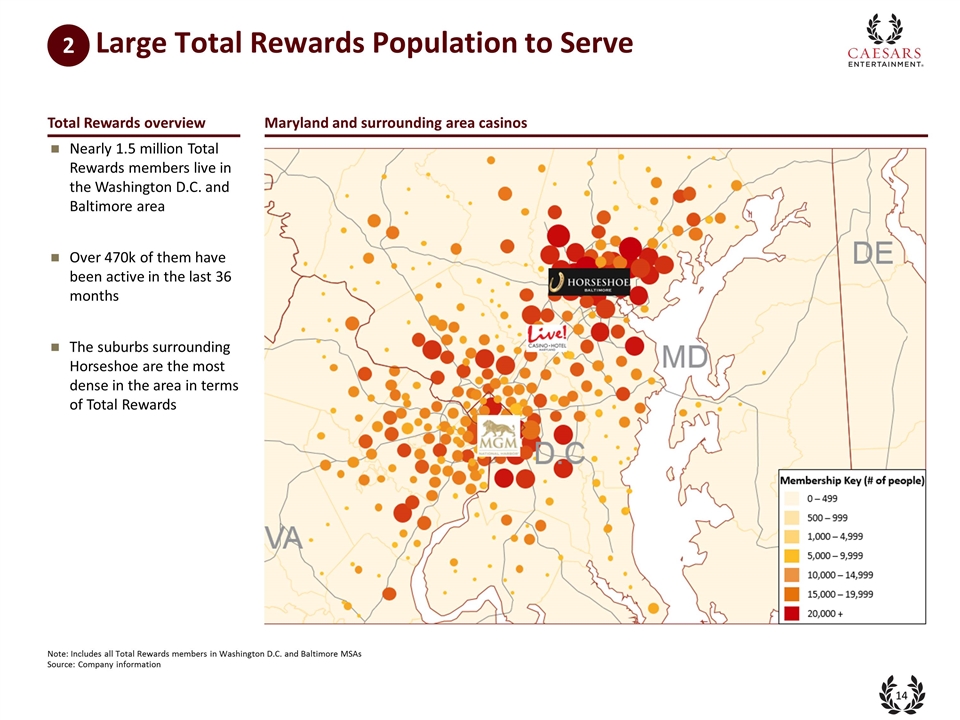
Large Total Rewards Population to Serve Note: Includes all Total Rewards members in Washington D.C. and Baltimore MSAs Source: Company information Nearly 1.5 million Total Rewards members live in the Washington D.C. and Baltimore area Over 470k of them have been active in the last 36 months The suburbs surrounding Horseshoe are the most dense in the area in terms of Total Rewards Total Rewards overview Maryland and surrounding area casinos 2
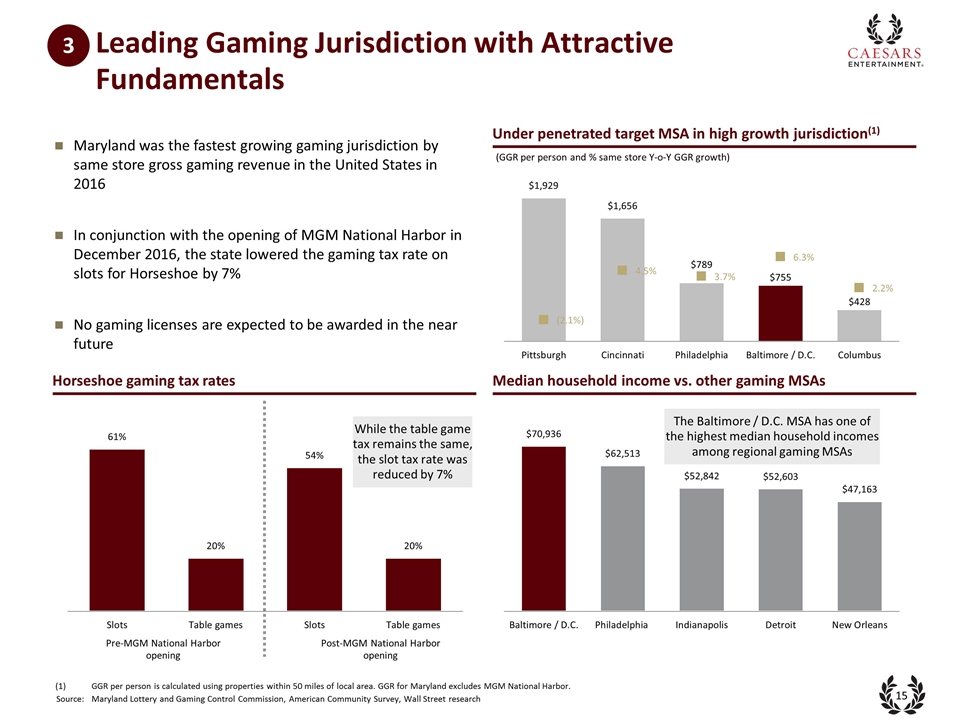
Leading Gaming Jurisdiction with Attractive Fundamentals GGR per person is calculated using properties within 50 miles of local area. GGR for Maryland excludes MGM National Harbor. Source: Maryland Lottery and Gaming Control Commission, American Community Survey, Wall Street research (GGR per person and % same store Y-o-Y GGR growth) Under penetrated target MSA in high growth jurisdiction(1) Median household income vs. other gaming MSAs Maryland was the fastest growing gaming jurisdiction by same store gross gaming revenue in the United States in 2016 In conjunction with the opening of MGM National Harbor in December 2016, the state lowered the gaming tax rate on slots for Horseshoe by 7% No gaming licenses are expected to be awarded in the near future Horseshoe gaming tax rates Pre-MGM National Harbor opening Post-MGM National Harbor opening While the table game tax remains the same, the slot tax rate was reduced by 7% The Baltimore / D.C. MSA has one of the highest median household incomes among regional gaming MSAs 3
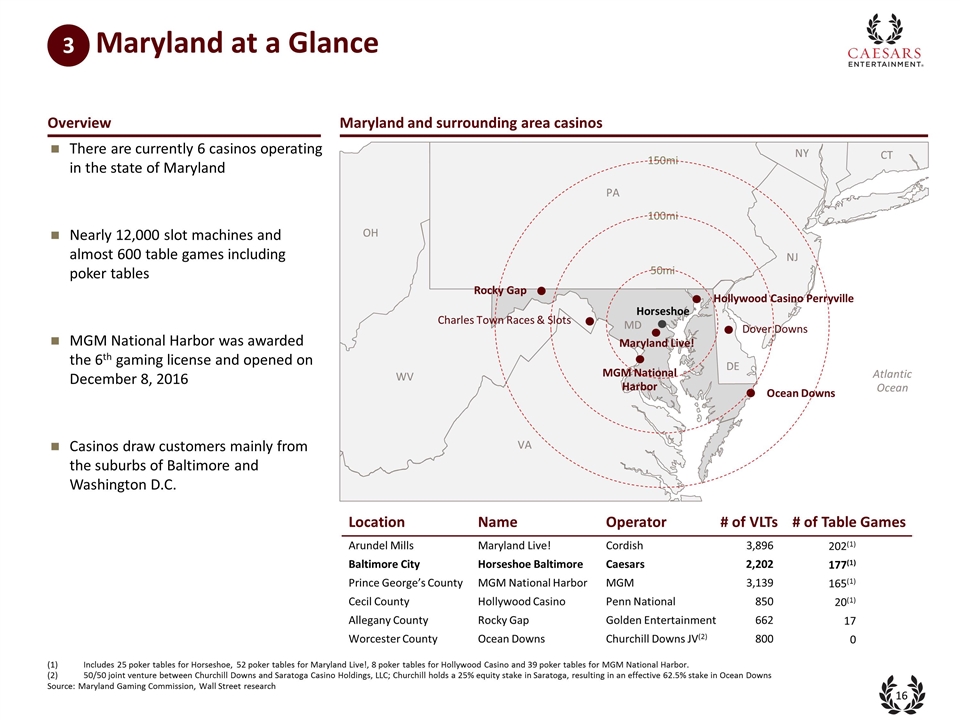
There are currently 6 casinos operating in the state of Maryland Nearly 12,000 slot machines and almost 600 table games including poker tables MGM National Harbor was awarded the 6th gaming license and opened on December 8, 2016 Casinos draw customers mainly from the suburbs of Baltimore and Washington D.C. Source: Maryland Gaming Commission, Wall Street research Location Name Operator # of VLTs # of Table Games Arundel Mills Maryland Live! Cordish 3,896 202(1) Baltimore City Horseshoe Baltimore Caesars 2,202 177(1) Prince George’s County MGM National Harbor MGM 3,139 165(1) Cecil County Hollywood Casino Penn National 850 20(1) Allegany County Rocky Gap Golden Entertainment 662 17 Worcester County Ocean Downs Churchill Downs JV(2) 800 0 Includes 25 poker tables for Horseshoe, 52 poker tables for Maryland Live!, 8 poker tables for Hollywood Casino and 39 poker tables for MGM National Harbor. 50/50 joint venture between Churchill Downs and Saratoga Casino Holdings, LLC; Churchill holds a 25% equity stake in Saratoga, resulting in an effective 62.5% stake in Ocean Downs 100mi 50mi 150mi OH WV VA PA NJ MD DE NY CT Atlantic Ocean Rocky Gap Charles Town Races & Slots Ocean Downs Dover Downs Hollywood Casino Perryville MGM National Harbor Maryland Live! Horseshoe Overview Maryland and surrounding area casinos Maryland at a Glance 3
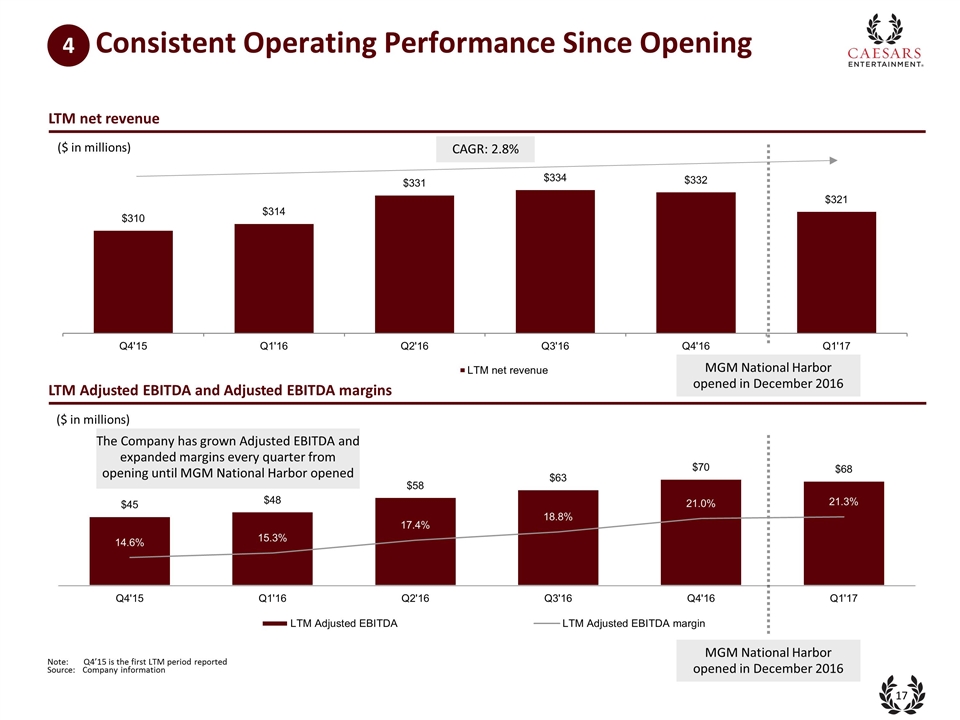
Consistent Operating Performance Since Opening LTM Adjusted EBITDA and Adjusted EBITDA margins Source: Company information Note:Q4’15 is the first LTM period reported ($ in millions) The Company has grown Adjusted EBITDA and expanded margins every quarter from opening until MGM National Harbor opened LTM net revenue ($ in millions) CAGR: 2.8% MGM National Harbor opened in December 2016 MGM National Harbor opened in December 2016 4
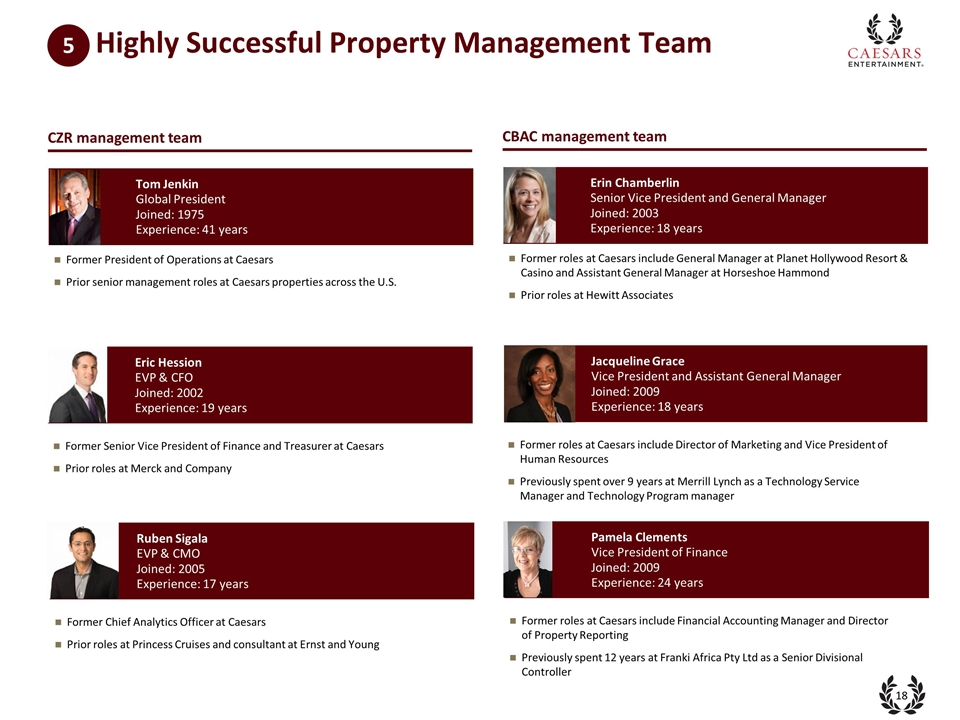
Highly Successful Property Management Team Erin Chamberlin Senior Vice President and General Manager Joined: 2003 Experience: 18 years Former roles at Caesars include General Manager at Planet Hollywood Resort & Casino and Assistant General Manager at Horseshoe Hammond Prior roles at Hewitt Associates CBAC management team Jacqueline Grace Vice President and Assistant General Manager Joined: 2009 Experience: 18 years Former roles at Caesars include Director of Marketing and Vice President of Human Resources Previously spent over 9 years at Merrill Lynch as a Technology Service Manager and Technology Program manager Pamela Clements Vice President of Finance Joined: 2009 Experience: 24 years Former roles at Caesars include Financial Accounting Manager and Director of Property Reporting Previously spent 12 years at Franki Africa Pty Ltd as a Senior Divisional Controller Tom Jenkin Global President Joined: 1975 Experience: 41 years Former President of Operations at Caesars Prior senior management roles at Caesars properties across the U.S. CZR management team Eric Hession EVP & CFO Joined: 2002 Experience: 19 years Former Senior Vice President of Finance and Treasurer at Caesars Prior roles at Merck and Company Ruben Sigala EVP & CMO Joined: 2005 Experience: 17 years Former Chief Analytics Officer at Caesars Prior roles at Princess Cruises and consultant at Ernst and Young 5
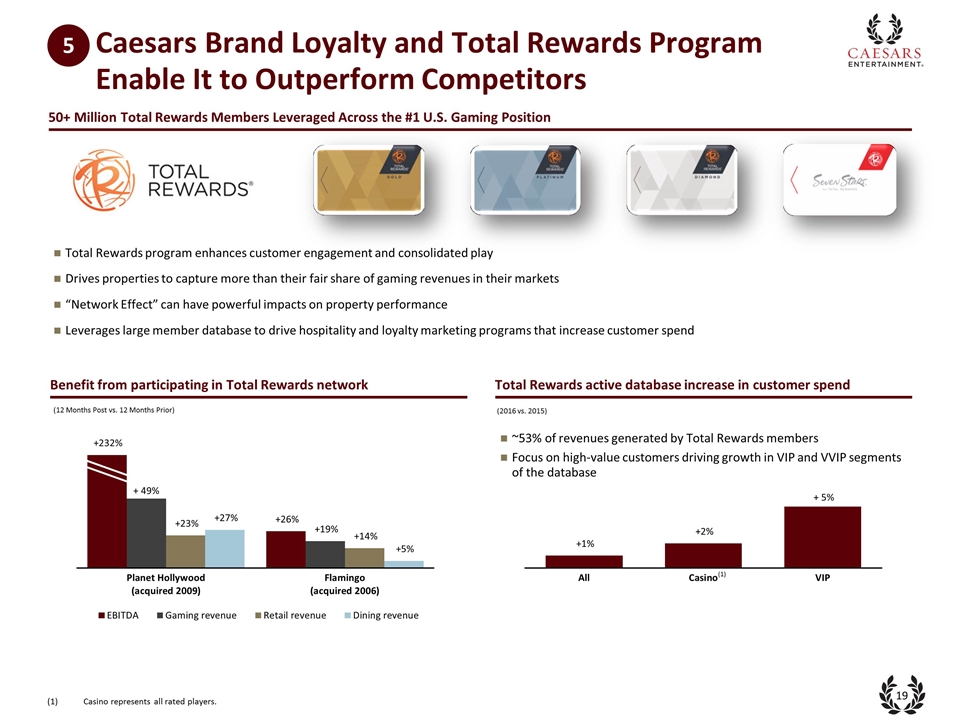
Casino represents all rated players. Benefit from participating in Total Rewards network Total Rewards active database increase in customer spend (12 Months Post vs. 12 Months Prior) (2016 vs. 2015) (1) ~53% of revenues generated by Total Rewards members Focus on high-value customers driving growth in VIP and VVIP segments of the database 50+ Million Total Rewards Members Leveraged Across the #1 U.S. Gaming Position Total Rewards program enhances customer engagement and consolidated play Drives properties to capture more than their fair share of gaming revenues in their markets “Network Effect” can have powerful impacts on property performance Leverages large member database to drive hospitality and loyalty marketing programs that increase customer spend 5 Caesars Brand Loyalty and Total Rewards Program Enable It to Outperform Competitors
Business Update

Performance Since MGM National Harbor Opening Year-over-year gross gaming revenue change Share(1) Year-over-year Adjusted EBITDA change (1) As measured by monthly GGR Source: Maryland Lottery and Gaming Control Commission, Company information Horseshoe is effectively executing post MGM National Harbor opening Q1 2017 year-over-year Adjusted EBITDA is down only 4.6% May year-over-year revenues dropped 18%, in line with the broader Maryland jurisdiction’s same store decline of ~18% Q1’17 Adjusted EBITDA is down year-over-year by only (4.6%) despite the impact of MGM National Harbor ($ in millions)
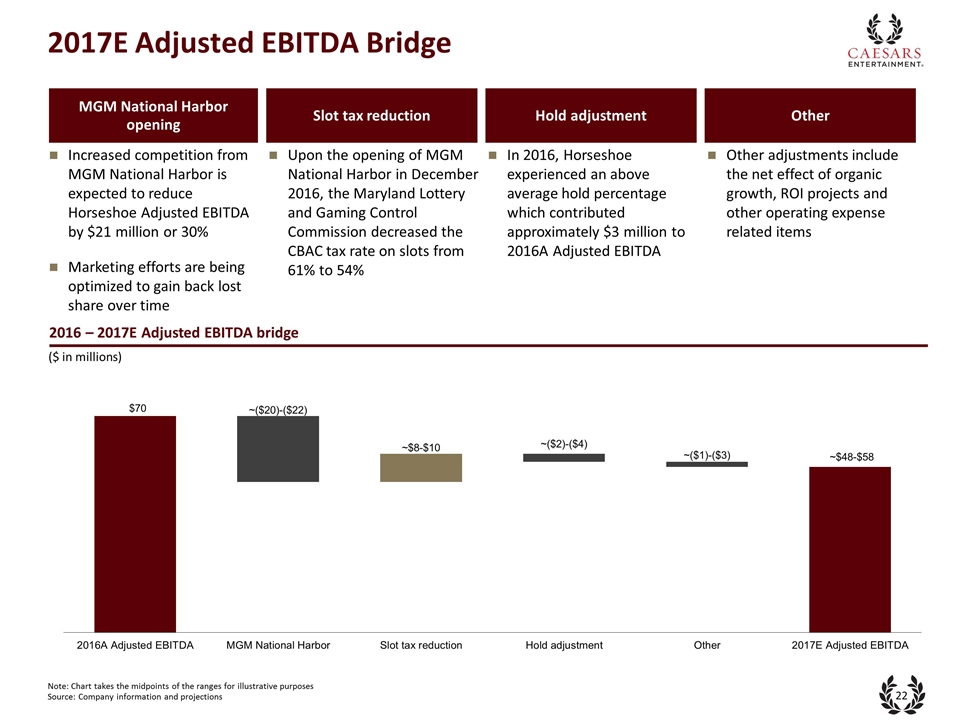
2017E Adjusted EBITDA Bridge ($ in millions) 2016 – 2017E Adjusted EBITDA bridge Increased competition from MGM National Harbor is expected to reduce Horseshoe Adjusted EBITDA by $21 million or 30% Marketing efforts are being optimized to gain back lost share over time Upon the opening of MGM National Harbor in December 2016, the Maryland Lottery and Gaming Control Commission decreased the CBAC tax rate on slots from 61% to 54% In 2016, Horseshoe experienced an above average hold percentage which contributed approximately $3 million to 2016A Adjusted EBITDA Other adjustments include the net effect of organic growth, ROI projects and other operating expense related items MGM National Harbor opening Slot tax reduction Hold adjustment Other Note: Chart takes the midpoints of the ranges for illustrative purposes Source: Company information and projections
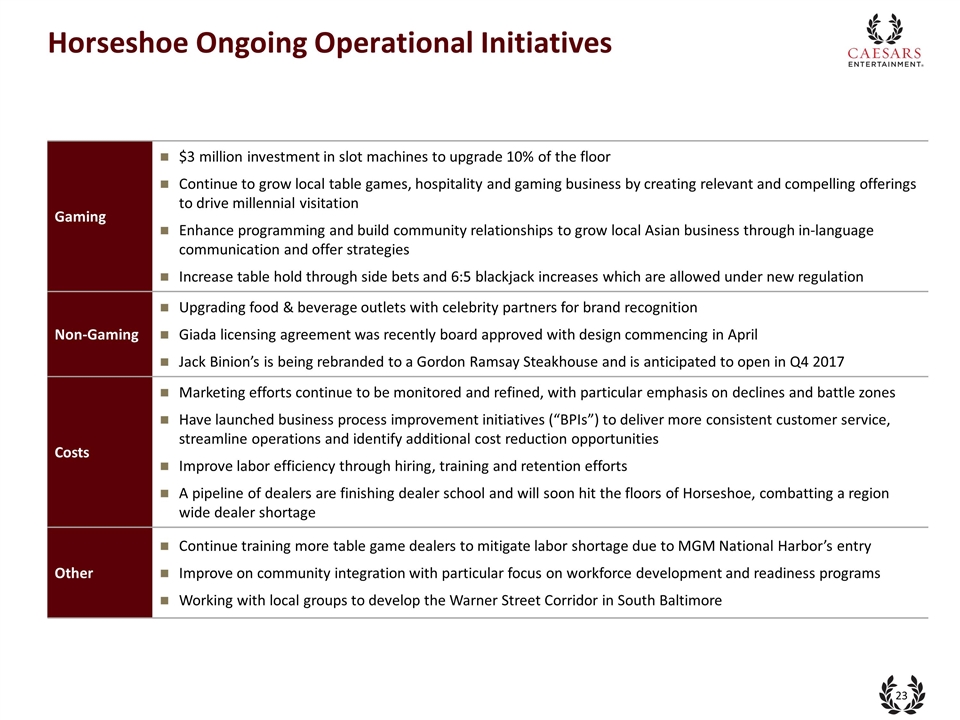
Horseshoe Ongoing Operational Initiatives Gaming $3 million investment in slot machines to upgrade 10% of the floor Continue to grow local table games, hospitality and gaming business by creating relevant and compelling offerings to drive millennial visitation Enhance programming and build community relationships to grow local Asian business through in-language communication and offer strategies Increase table hold through side bets and 6:5 blackjack increases which are allowed under new regulation Non-Gaming Upgrading food & beverage outlets with celebrity partners for brand recognition Giada licensing agreement was recently board approved with design commencing in April Jack Binion’s is being rebranded to a Gordon Ramsay Steakhouse and is anticipated to open in Q4 2017 Costs Marketing efforts continue to be monitored and refined, with particular emphasis on declines and battle zones Have launched business process improvement initiatives (“BPIs”) to deliver more consistent customer service, streamline operations and identify additional cost reduction opportunities Improve labor efficiency through hiring, training and retention efforts A pipeline of dealers are finishing dealer school and will soon hit the floors of Horseshoe, combatting a region wide dealer shortage Other Continue training more table game dealers to mitigate labor shortage due to MGM National Harbor’s entry Improve on community integration with particular focus on workforce development and readiness programs Working with local groups to develop the Warner Street Corridor in South Baltimore
Financial Overview
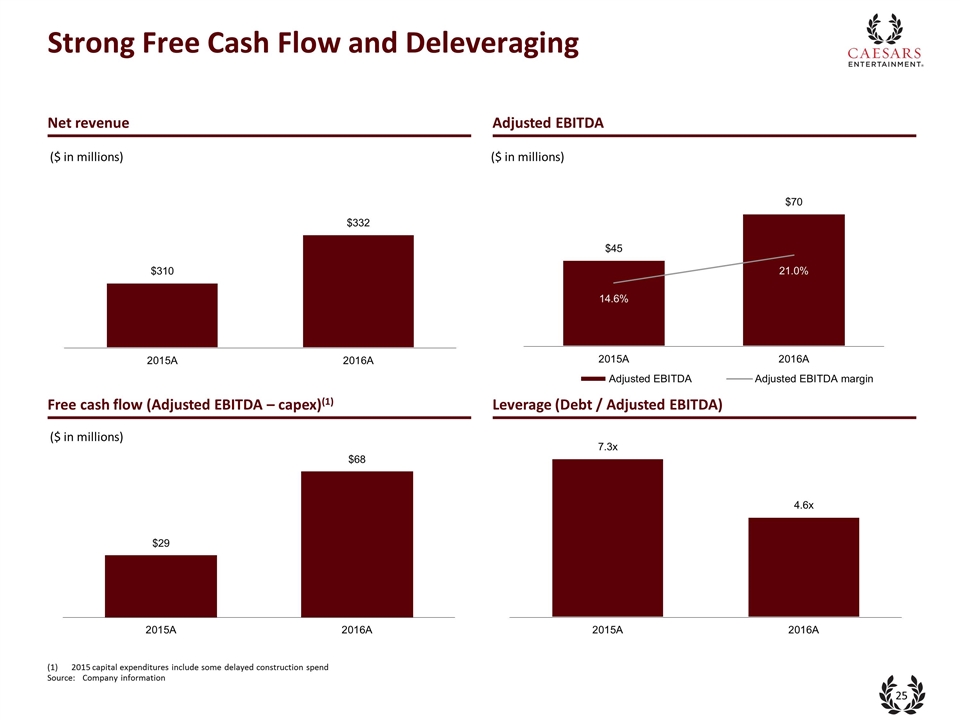
Strong Free Cash Flow and Deleveraging Net revenue Adjusted EBITDA Free cash flow (Adjusted EBITDA – capex)(1) Leverage (Debt / Adjusted EBITDA) ($ in millions) ($ in millions) ($ in millions) 2015 capital expenditures include some delayed construction spend Source: Company information
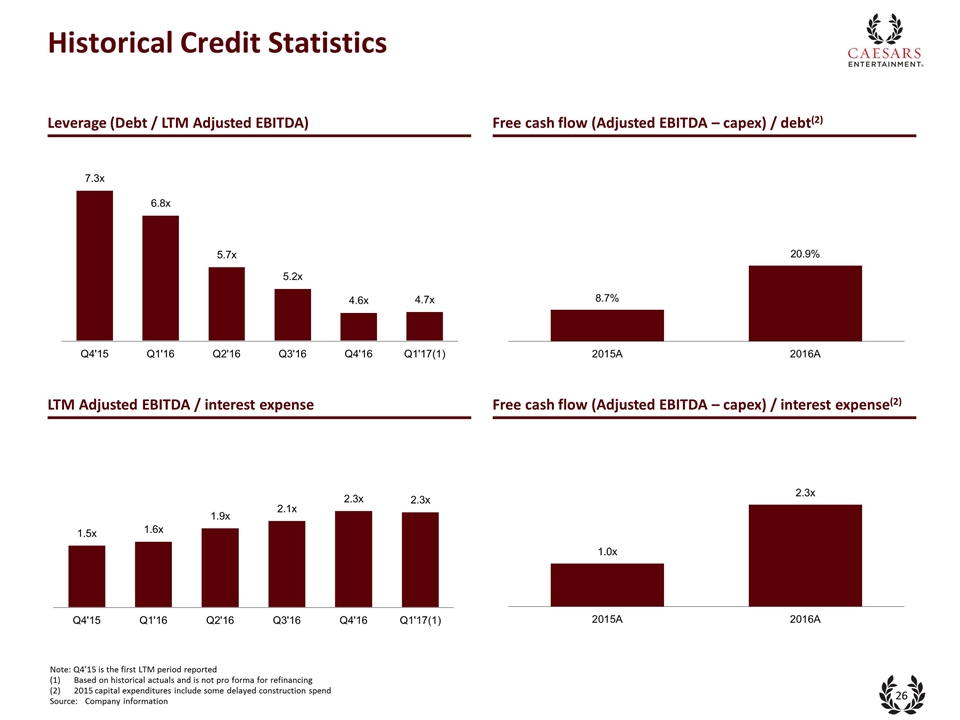
Historical Credit Statistics Leverage (Debt / LTM Adjusted EBITDA) Free cash flow (Adjusted EBITDA – capex) / debt(2) LTM Adjusted EBITDA / interest expense Free cash flow (Adjusted EBITDA – capex) / interest expense(2) Note: Q4’15 is the first LTM period reported Based on historical actuals and is not pro forma for refinancing 2015 capital expenditures include some delayed construction spend Source: Company information
Public Lender Q&A
Appendix
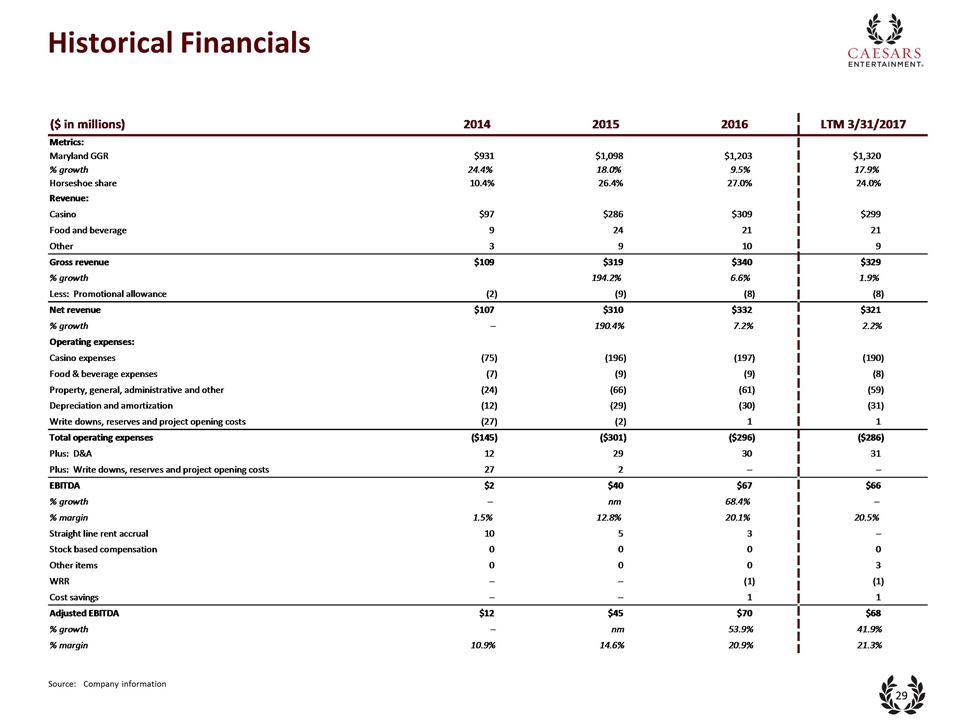
Historical Financials Source: Company information
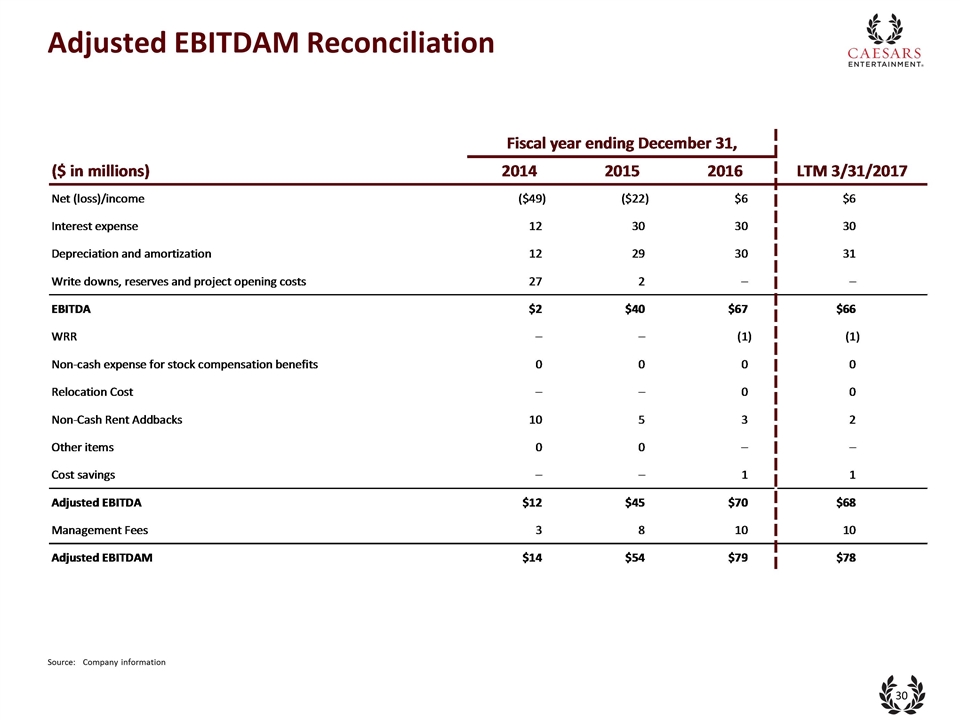
Adjusted EBITDAM Reconciliation Source: Company information
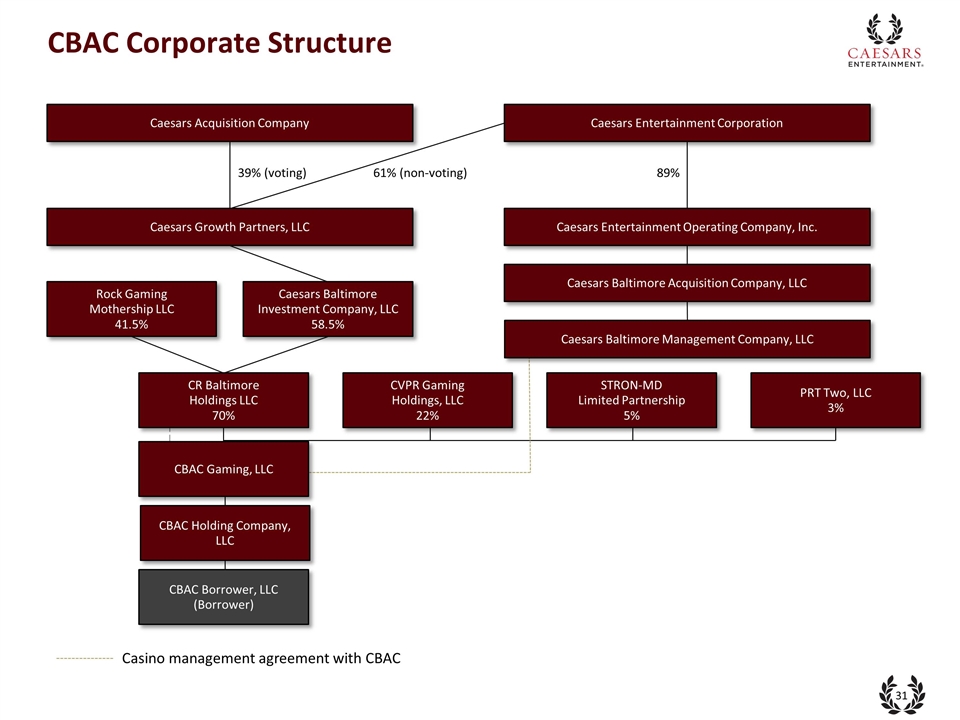
Casino management agreement with CBAC Caesars Baltimore Acquisition Company, LLC Rock Gaming Mothership LLC 41.5% Caesars Baltimore Investment Company, LLC 58.5% Caesars Baltimore Management Company, LLC CR Baltimore Holdings LLC 70% CVPR Gaming Holdings, LLC 22% STRON-MD Limited Partnership 5% PRT Two, LLC 3% CBAC Gaming, LLC CBAC Holding Company, LLC CBAC Borrower, LLC (Borrower) CBAC Corporate Structure Caesars Acquisition Company Caesars Entertainment Corporation Caesars Entertainment Operating Company, Inc. Caesars Growth Partners, LLC 61% (non-voting) 39% (voting) 89%
Privileged & Confidential


