Exhibit 99.2
CBAC Borrower, LLC $315,000,000 Senior Secured Credit Facilities June 2017 PRIVATE AND CONFIDENTIAL
Confidential Materials Note: Your receipt and review of these materials constitutes acceptance of the terms and conditions of the Notice to and Undertaking by Recipients found on the following page of the Administrative Documents in the Notice to and Undertaking by Recipients. You must immediately return these materials if you determine that you cannot abide by the stated terms of the Notice to and Undertaking by Recipients. Special Notice Regarding MaterialNon-Public Information THIS CONFIDENTIAL INFORMATION MEMORANDUM MAY CONTAIN MATERIALNON-PUBLIC INFORMATION CONCERNING THE COMPANY, ITS AFFILIATES OR THEIR RESPECTIVE SECURITIES. BY ACCEPTING THIS CONFIDENTIAL INFORMATION MEMORANDUM, THE RECIPIENT AGREES TO USE ANY SUCH INFORMATION IN ACCORDANCE WITH ITS COMPLIANCE POLICIES, CONTRACTUAL OBLIGATIONS AND APPLICABLE LAW, INCLUDING FEDERAL AND STATE SECURITIES LAWS. Legal Disclaimer This document contains certain forward looking statements within the meaning of Section 27A of the Securities Act of 1933, as amended, and Section 21E of the Securities Exchange Act of 1934, as amended. These statements may be made directly in this document. Some of the forward looking statements can be identified by the use of forward looking words. Statements that are not strictly historical in nature, including the words “anticipate,” “estimate,” “expect,” “believe,” “will,” “assume”, and “continue,” and similar words, or the negatives or other variations of those words and comparable terminology, are intended to identify forward looking statements. Certain statements regarding the following particularly are forward looking in nature: Our business strategy; future performance, developments, actions, new projects, market forecasts or projections and the outcome of contingencies; and projected capital expenditures. Allforward-looking statements are based on our management’s current beliefs, assumptions and expectations of our future economic performance, taking into account the information currently available to it. These statements are not statements of historical fact.Forward-looking statements are subject to a number of factors, risks, contingencies and uncertainties, some of which are not currently known to us, that may cause our actual results, performance or financial condition to be materially different from the expectations of future results, performance or financial position. Such risks and uncertainties include but are not limited to our ability (or inability) to complete the transactions contemplated hereby on the terms described herein or at all as well as the factors described from time to time in our filings with the Securities and Exchange Commission. Although suchforward-looking statements have been prepared in good faith and are based on assumptions believed by our management to be reasonable, there is no assurance or guarantee that the expected results will be achieved. Our actual results may differ materially from the results discussed inforward-looking statements. We make no representations or warranties as to the accuracy of any such forward-looking statements and we disclaim any obligation to update any forward-looking statements except as required by law. In addition, our discussion will include references tonon-GAAP financial measures, including but not limited to EBITDA, Adjusted EBITDA, Adjusted EBITDA margin, Adjusted EBITDAM, and free cash flow. Suchnon-GAAP measures should be considered only as supplemental to, and not as superior to, financial measures prepared in accordance with GAAP. They are used by management during the strategic review of performance. The results are not necessarily indicative of future performance or the results that would be achieved should the Merger (as detailed below) or the reorganization of Caesars Entertainment Operating Company, Inc., as currently contemplated, be successfully completed. See the Appendix to this presentation for a reconciliation of thesenon-GAAP measures to their nearest GAAP measures. This document and all information provided or discussed in connection therewith are confidential and being provided to you for informational use solely in connection with your consideration of the financing transaction contemplated herein. Acceptance of these materials constitutes your agreement to hold the information contained herein in strict confidence in accordance with the confidentiality provisions agreed to by you in accepting the invitation to this meeting.
Rule 425 Disclaimer Pursuant to the Amended and Restated Agreement and Plan of Merger dated as of July 9, 2016, between Caesars Entertainment Corporation (“CEC”) and Caesars Acquisition Company (“CAC”) as subsequently amended on February 20, 2017 (as amended, the “Merger Agreement”), among other things, CAC will merge with and into CEC, with CEC as the surviving company (the “Merger”). In connection with the Merger, CEC and CAC filed with the Securities and Exchange Commission (the “SEC”) a registration statement on FormS-4 on March 13, 2017, and Amendment No. 1 to such registration statement on FormS-4 on June 5, 2017 (“Amendment No. 1 to the FormS-4”), which includes a preliminary joint proxy statement/prospectus, as well as other relevant documents concerning the proposed transaction. The registration statement has not yet become effective. After the registration statement is declared effective by the SEC, a definitive joint proxy statement/prospectus will be mailed to stockholders of CEC and CAC. Stockholders are urged to read the registration statement and joint proxy statement/prospectus regarding the Merger and any other relevant documents filed with the SEC, as well as any amendments or supplements to those documents, because they will contain important information. You will be able to obtain a free copy of such joint proxy statement/prospectus, as well as other filings containing information about CEC and CAC, at the SEC’s website (www.sec.gov), from CEC Investor Relations (investor.caesars.com) or from CAC Investor Relations (investor.caesarsacquisitioncompany.com) The information in this communication is for informational purposes only and is neither an offer to purchase, nor a solicitation of an offer to sell, subscribe for or buy any securities or the solicitation of any vote or approval in any jurisdiction pursuant to or in connection with the proposed transactions or otherwise, nor shall there be any sale, issuance or transfer of securities in any jurisdiction in contravention of applicable law. No offer of securities shall be made except by means of a prospectus meeting the requirements of Section 10 of the Securities Act of 1933, as amended, and otherwise in accordance with applicable law. CEC, CAC and their respective directors, executive officers and certain other members of management and employees may be soliciting proxies from CEC and CAC stockholders in favor of the business combination transaction. Information regarding the persons who may, under the rules of the SEC, be considered participants in the solicitation of the CEC and CAC stockholders in connection with the proposed business combination transaction is set forth in Amendment No. 1 to the FormS-4 filed with the SEC on June 5, 2017 and Amendment No. 1 to the Annual Report on Form10-K for CAC’s fiscal year ended December 31, 2016, filed on March 31, 2017. You can obtain free copies of these documents from CEC and CAC in the manner set forth above.
Section 2 Executive Summary
CBAC Borrower, LLC EXECUTIVE SUMMARY 2—1 CONFIDENTIAL Introduction Introduction The Horseshoe Baltimore (“Horseshoe”, the “Casino” or the “Property”), which is owned by CBAC Borrower, LLC (“CBAC” or the “Company”), is a full-service casino, dining and entertainment venue located in Baltimore, Maryland. Horseshoe features 2,202 slots and 177 table games, including 25 poker tables, as well as a World Series of Poker room, three full-service sit down restaurants, and multiple quick service restaurants. Caesars Entertainment Corporation (“CEC” or “CZR,” and CEC together with its subsidiaries, “Caesars”), Caesars Acquisition Company (“CAC”) and Rock Gaming Mothership LLC (“Rock”) own their interest through CR Baltimore Holdings LLC (“CRBH”) which forms a joint venture together with Caves Valley Partners (with A&R Companies) (“CVPR”),STRON-MD, and PRT Two (collectively the “Investors”). A subsidiary of Caesars Entertainment Operating Company, Inc. manages operations under the Horseshoe brand. CBAC generated LTM 3/31/2017 net revenue and Adjusted EBITDA of $321.1 million and $68.4 million, respectively, representing a 21.3% margin. Additionally, management believes that 2017E net revenue and Adjusted EBITDA will be approximately$294-304 million and$48-58 million, respectively. Transaction Overview The Company has engaged Wells Fargo Securities, LLC, Macquarie Capital (USA) Inc., and Nomura Securities International, Inc. as Joint Lead Arrangers and Joint Bookrunners and Wells Fargo Bank, N.A. as Administrative Agent to arrange and syndicate $315 million in Senior Secured Credit Facilities (the “Facilities”). The Facilities will consist of a $15 million Revolving Credit Facility (the “Revolver”) and a $300 million Term Loan B (the “Term Loan”). Pro forma for the refinancing, the Company will materially reduce annual interest expense, enhance asset cash flows, and transition its capital structure from anin-place construction loan to a true operating loan. The Company’s total leverage will be reduced from 4.7x to 4.5x.
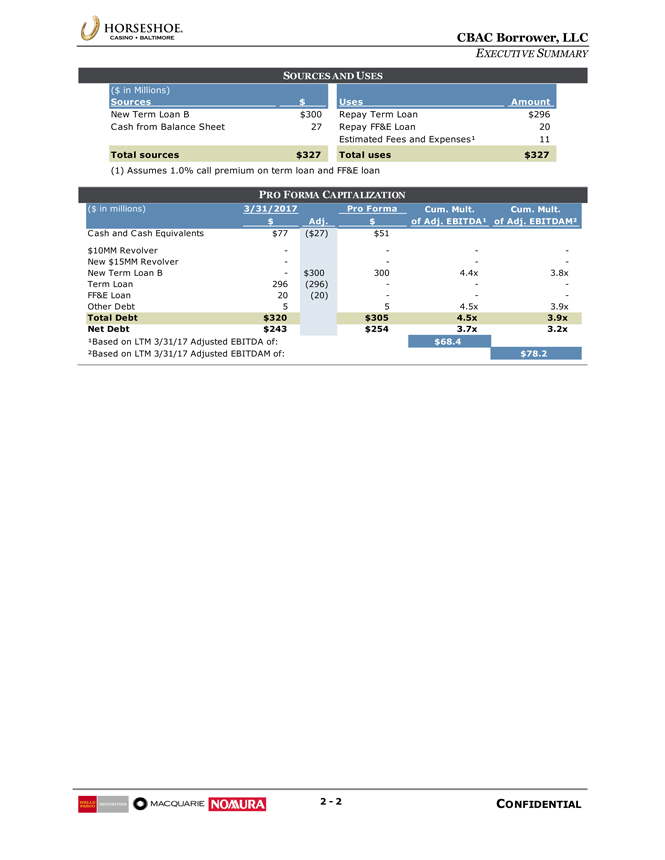
CBAC Borrower, LLC EXECUTIVE SUMMARY 2—2 CONFIDENTIAL ($ in Millions) Sources $ Uses Amount New Term Loan B $300 Repay Term Loan $296 Cash from Balance Sheet 27 Repay FF&E Loan 20 Estimated Fees and Expenses¹ 11 Total sources $327 Total uses $327 (1) Assumes 1.0% call premium on term loan and FF&E loan ($ in millions) 3/31/2017 Pro Forma Cum. Mult. Cum. Mult. $ Adj. $ of Adj. EBITDA¹ of Adj. EBITDAM² Cash and Cash Equivalents $77 ($27) $51 $10MM Revolver — — New $15MM Revolver — — New Term Loan B—$300 300 4.4x 3.8x Term Loan 296 (296) ——FF&E Loan 20 (20) ——Other Debt 5 5 4.5x 3.9x Total Debt $320 $305 4.5x 3.9x Net Debt $243 $254 3.7x 3.2x ¹Based on LTM 3/31/17 Adjusted EBITDA of: $68.4 ²Based on LTM 3/31/17 Adjusted EBITDAM of: $78.2 SOURCES AND USES PRO FORMA CAPITALIZATION
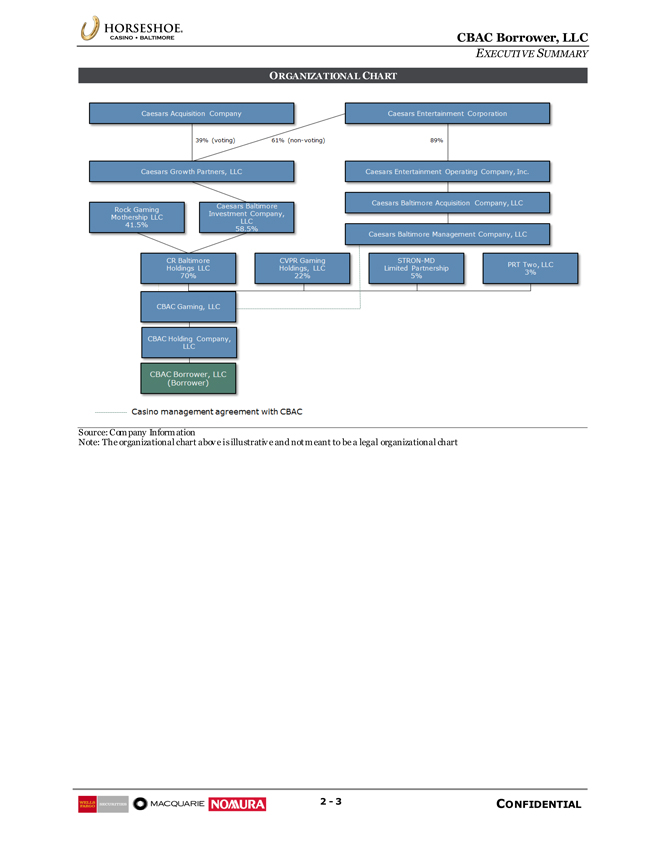
CBAC Borrower, LLC EXECUTIVE SUMMARY 2—3 CONFIDENTIAL ORGANIZATIONAL CHART Source: Company Information Note: The organizational chart above is illustrative and not meant to be a legal organizational chart

Section 4 Business Update
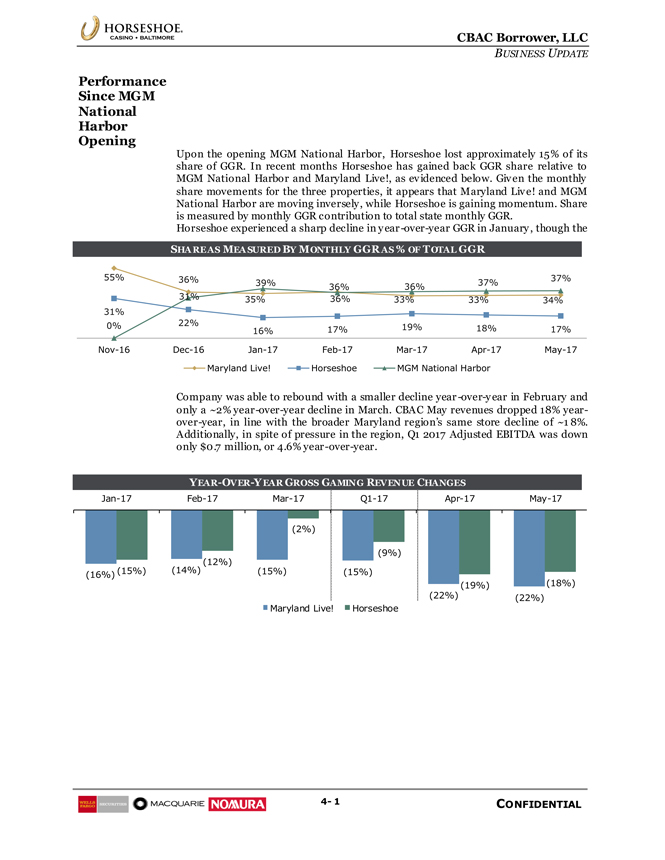
CBAC Borrower, LLC BUSINESS UPDATE4- 1 CONFIDENTIAL Performance 55% 36% 35% 36% 33% 33% 34% 31% 22% 16% 17% 19% 18% 17% 0% 31% 39% 36% 36% 37% 37%Nov-16Dec-16Jan-17Feb-17Mar-17Apr-17May-17 Maryland Live! Horseshoe MGM National Harbor (16%) (14%) (15%) (15%) (22%) (22%) (15%) (12%) (2%) (9%) (19%) (18%)Jan-17Feb-17Mar-17Q1-17Apr-17May-17 Maryland Live! Horseshoe Performance Since MGM National Harbor Opening SHARE AS MEASURED BY MONTHLY GGR AS % OF TOTAL GGR
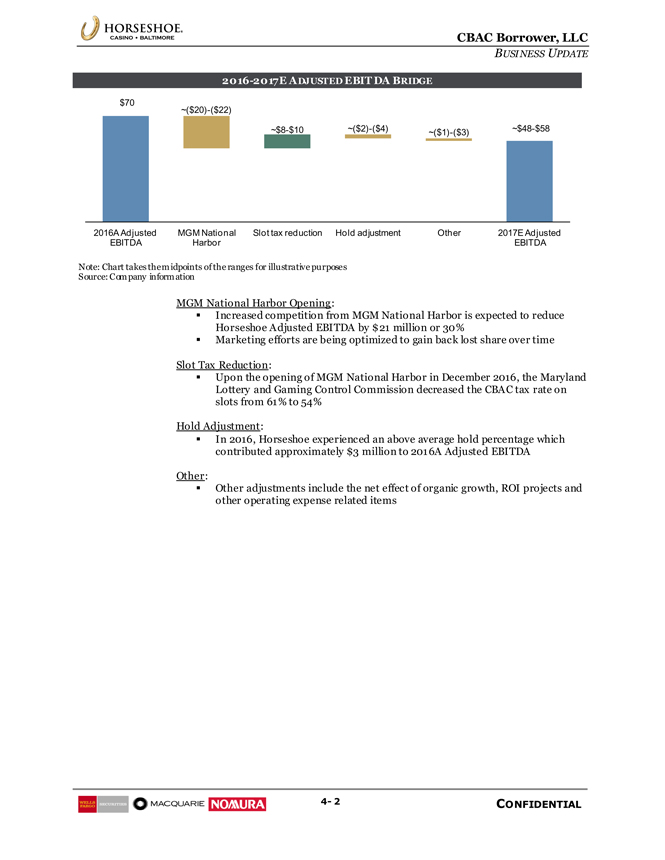
CBAC Borrower, LLC BUSINESS UPDATE4- 2 CONFIDENTIAL Note: Chart takes the midpoints of the ranges for illustrative purposes Source: Company information MGM National Harbor Opening: Increased competition from MGM National Harbor is expected to reduce Horseshoe Adjusted EBITDA by $21 million or 30% Marketing efforts are being optimized to gain back lost share over time Slot Tax Reduction: Upon the opening of MGM National Harbor in December 2016, the Maryland Lottery and Gaming Control Commission decreased the CBAC tax rate on slots from 61% to 54% Hold Adjustment: In 2016, Horseshoe experienced an above average hold percentage which contributed approximately $3 million to 2016A Adjusted EBITDA Other: Other adjustments include the net effect of organic growth, ROI projects and other operating expense related items 2016-2017E ADJUSTED EBITDA BRIDGE $70~$48-$58 ~($20)-($22)~$8-$10 ~($2)-($4) ~($1)-($3) 2016A Adjusted EBITDA MGM National Harbor Slot tax reduction Hold adjustment Other 2017E Adjusted EBITDA
CBAC Borrower, LLC BUSINESS UPDATE 4- 3 CONFIDENTIAL Horseshoe Horseshoe Strategic Initiatives The Company has undertaken multiple strategic initiatives to combat the impact of MGM National Harbor and to improve Horseshoe’s positioning. Gaming $3 million investment in slot machines to upgrade 10% of the floor’s existing machines Continue to grow local table games, hospitality and gaming business by creating relevant and compelling offerings to drive millennial visitation Enhance programming and build community relationships to grow local Asian business throughin-language communication and offer strategies Increase table hold through side bets and 6:5 blackjack increases which are allowed under newregulation Non-Gaming Upgrading food & beverage outlets with celebrity partners for brand recognition Giada licensing agreement was recently approved with design commencing in April Jack Binion’s Steakhouse is being rebranded to Gordon Ramsay Steakhouse, and is expected to open in Q4 2017 CBAC bought out the third party operator of Ruby 8 Noodle Bar and currently runs the restaurantin-house as the Company repositions the restaurant for customers in the Asian demographic Costs Marketing efforts are being optimized to gain back market share, and continue to be monitored and refined with particular emphasis on declines and battle zones CBAC launched business process improvement initiatives “BPIs” to deliver more consistent customer service, streamline operations and identify additional cost reduction opportunities Increase labor efficiency through hiring, training and retention efforts Other Continue training more table game dealers to mitigate labor shortage due to MGM National Harbor’s entry Improve on community integration with particular focus on workforce development and readiness programs CBAC is working with local groups to develop the Warner Street Corridor in South Baltimore to create a hotel and entertainment zone which would drive traffic to the property and further enhance overall customer experience
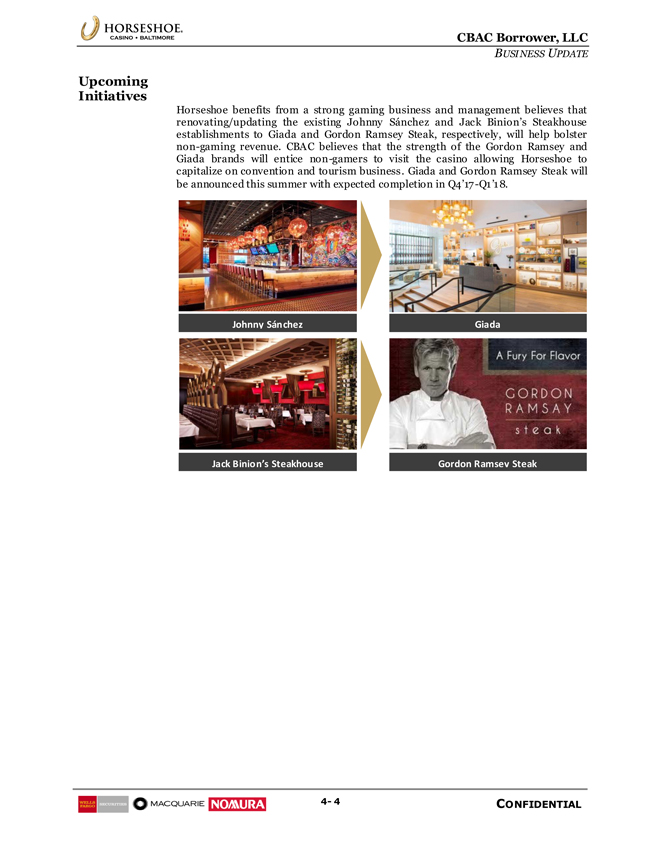
CBAC Borrower, LLC BUSINESS UPDATE4- 4 CONFIDENTIAL Upcoming Upcoming Initiatives Horseshoe benefits from a strong gaming business and management believes that renovating/updating the existing Johnny Sánchez and Jack Binion’s Steakhouse establishments to Giada and Gordon Ramsey Steak, respectively, will help bolsternon-gaming revenue. CBAC believes that the strength of the Gordon Ramsey and Giada brands will enticenon-gamers to visit the casino allowing Horseshoe to capitalize on convention and tourism business. Giada and Gordon Ramsey Steak will be announced this summer with expected completion inQ4’17-Q1’18. Johnny Sánchez Jack Binion’s Steakhouse Gordon Ramsey Steak Giada
Section 5 Key Investment Considerations
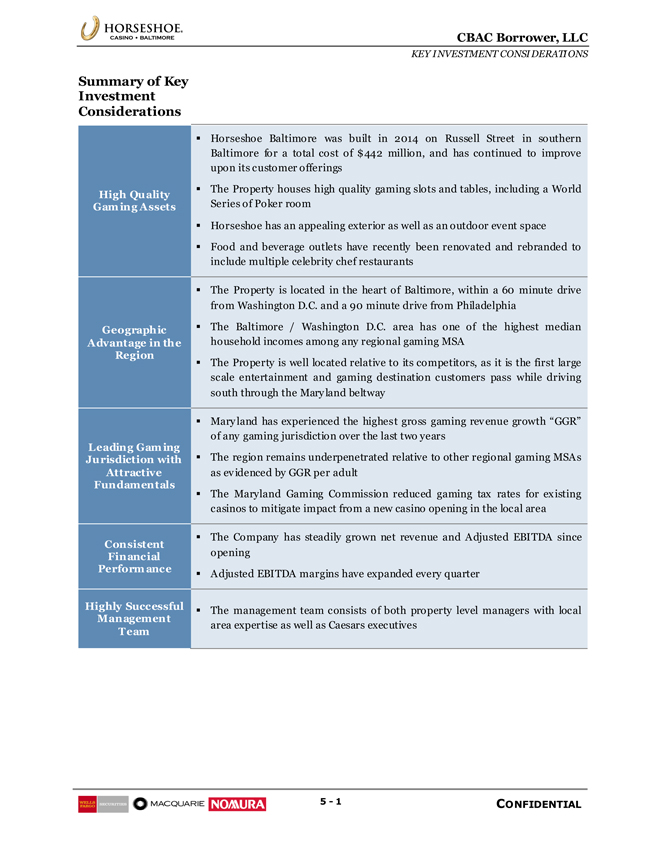
CBAC Borrower, LLC KEY INVESTMENT CONSIDERATIONS 5—1 CONFIDENTIAL Summary of Key Summary of Key Investment Considerations High Quality Gaming Assets Horseshoe Baltimore was built in 2014 on Russell Street in southern Baltimore for a total cost of $442 million, and has continued to improve upon its customer offerings The Property houses high quality gaming slots and tables, including a World Series of Poker room Horseshoe has an appealing exterior as well as an outdoor event space Food and beverage outlets have recently been renovated and rebranded to include multiple celebrity chef restaurants Geographic Advantage in the Region The Property is located in the heart of Baltimore, within a 60 minute drive from Washington D.C. and a 90 minute drive from Philadelphia The Baltimore / Washington D.C. area has one of the highest median household incomes among any regional gaming MSA The Property is well located relative to its competitors, as it is the first large scale entertainment and gaming destination customers pass while driving south through the Maryland beltway Leading Gaming Jurisdiction with Attractive Fundamentals Maryland has experienced the highest gross gaming revenue growth “GGR” of any gaming jurisdiction over the last two years The region remains underpenetrated relative to other regional gaming MSAs as evidenced by GGR per adult The Maryland Gaming Commission reduced gaming tax rates for existing casinos to mitigate impact from a new casino opening in the local area Consistent Financial Performance The Company has steadily grown net revenue and Adjusted EBITDA since opening Adjusted EBITDA margins have expanded every quarter Highly Successful Management Team The management team consists of both property level managers with local area expertise as well as Caesars executives
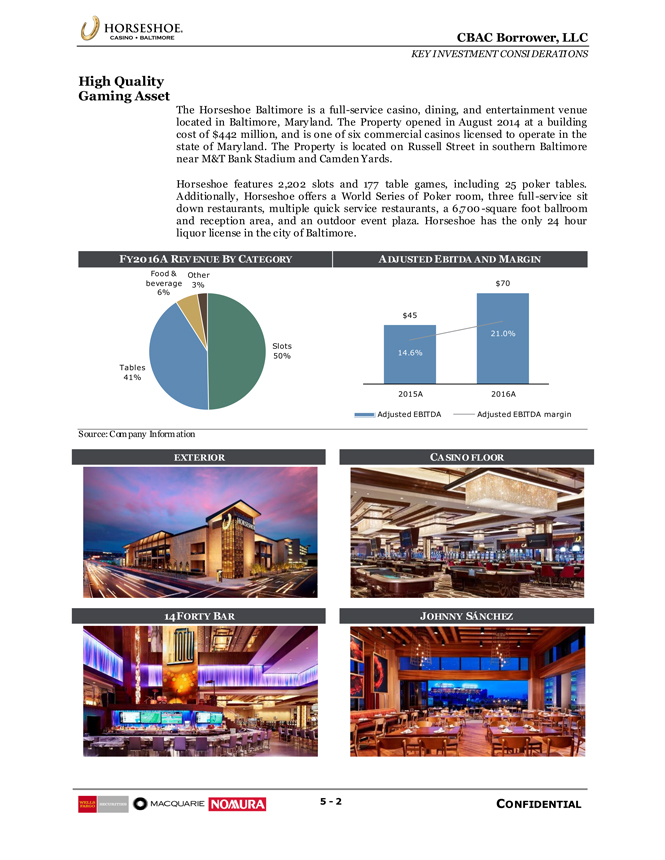
CBAC Borrower, LLC KEY INVESTMENT CONSIDERATIONS 5—2 CONFIDENTIAL High Quality Slots 50% Tables 41% Food & beverage 6% Other 3% $45 $70 14.6% 21.0% 0.0% 5.0% 10.0% 15.0% 20.0% 25.0% 30.0% 35.0% $0 $10 $20 $30 $40 $50 $60 $70 $80 2015A 2016A Adjusted EBITDA Adjusted EBITDA margin High Quality Gaming Asset The Horseshoe Baltimore is a full-service casino, dining, and entertainment venue located in Baltimore, Maryland. The Property opened in August 2014 at a building cost of $442 million, and is one of six commercial casinos licensed to operate in the state of Maryland. The Property is located on Russell Street in southern Baltimore near M&T Bank Stadium and Camden Yards. Horseshoe features 2,202 slots and 177 table games, including 25 poker tables. Additionally, Horseshoe offers a World Series of Poker room, three full-service sit down restaurants, multiple quick service restaurants, a6,700-square foot ballroom and reception area, and an outdoor event plaza. Horseshoe has the only 24 hour liquor license in the city of Baltimore. FY2016A REVENUE BY CATEGORY ADJUSTED EBITDA AND MARGIN
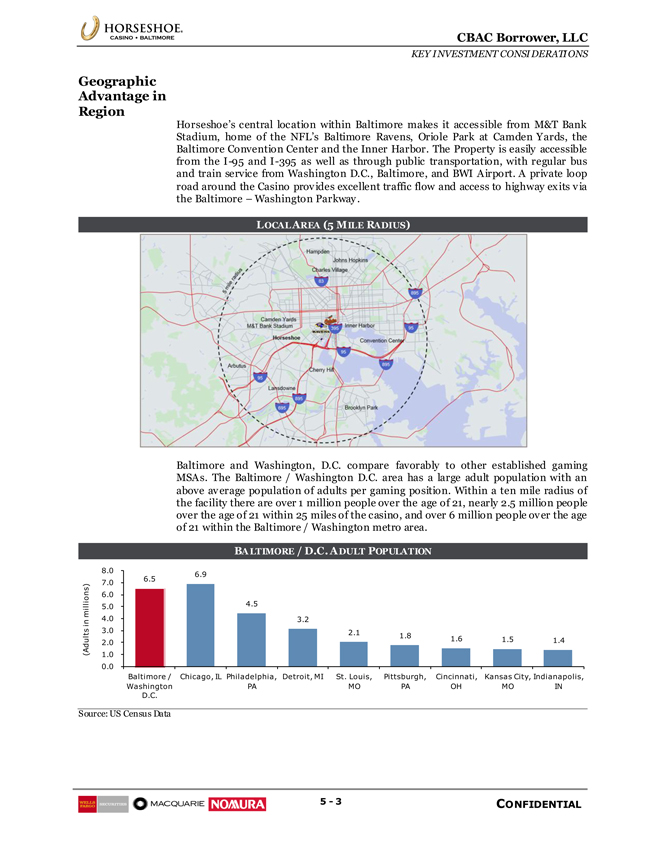
CBAC Borrower, LLC KEY INVESTMENT CONSIDERATIONS 5—3 CONFIDENTIAL Geographic 6.5 6.9 4.5 3.2 2.1 1.8 1.6 1.5 1.4 0.0 1.0 2.0 3.0 4.0 5.0 6.0 7.0 8.0 Baltimore / Washington D.C. Chicago, IL Philadelphia, PA Detroit, MI St. Louis, MO Pittsburgh, PA Cincinnati, OH Kansas City, MO Indianapolis, IN (Adults in millions) Geographic Advantage in Region Horseshoe’s central location within Baltimore makes it accessible from M&T Bank Stadium, home of the NFL’s Baltimore Ravens, Oriole Park at Camden Yards, the Baltimore Convention Center and the Inner Harbor. The Property is easily accessible from theI-95 andI-395 as well as through public transportation, with regular bus and train service from Washington D.C., Baltimore, and BWI Airport. A private loop road around the Casino provides excellent traffic flow and access to highway exits via the Baltimore – Washington Parkway. LO
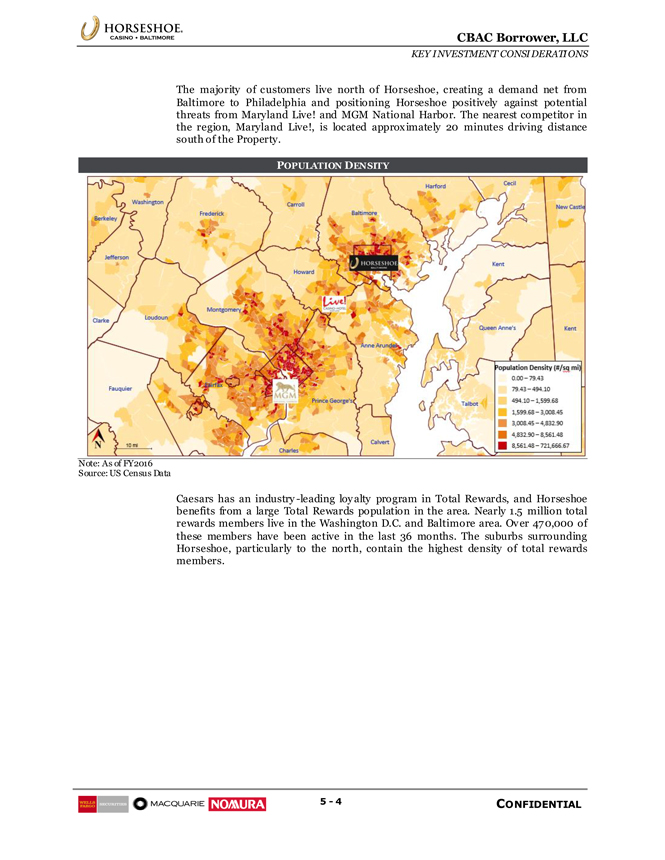
CBAC Borrower, LLC KEY INVESTMENT CONSIDERATIONS 5—4 CONFIDENTIAL The majority of customers live north of Horseshoe, creating a demand net from Baltimore to Philadelphia and positioning Horseshoe positively against potential threats from Maryland Live! and MGM National Harbor. The nearest competitor in the region, Maryland Live!, is located approximately 20 minutes driving distance south of the Property. POPULATION DENSITY
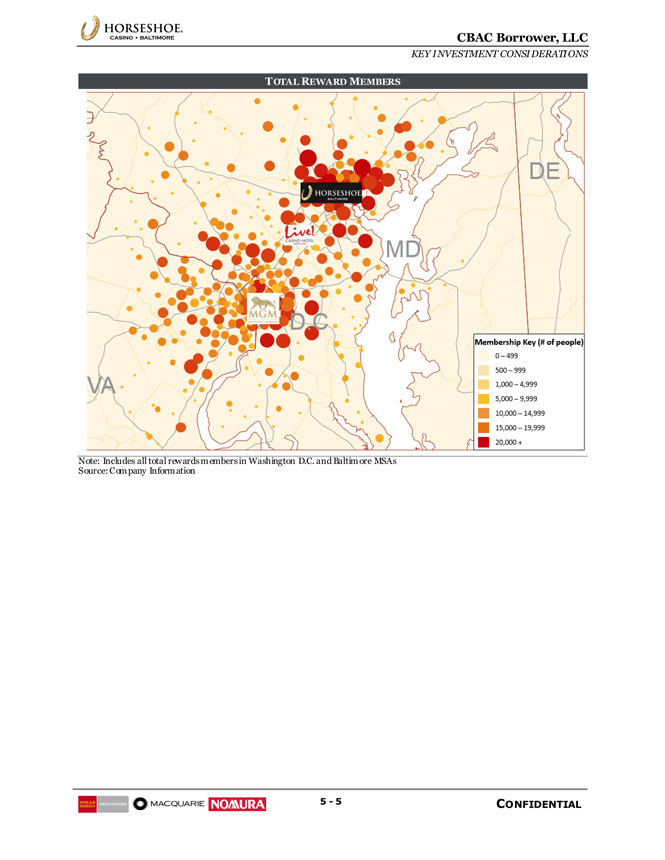
CBAC Borrower, LLC KEY INVESTMENT CONSIDERATIONS 5—5 CONFIDENTIAL TOTAL REWARD MEMBERS
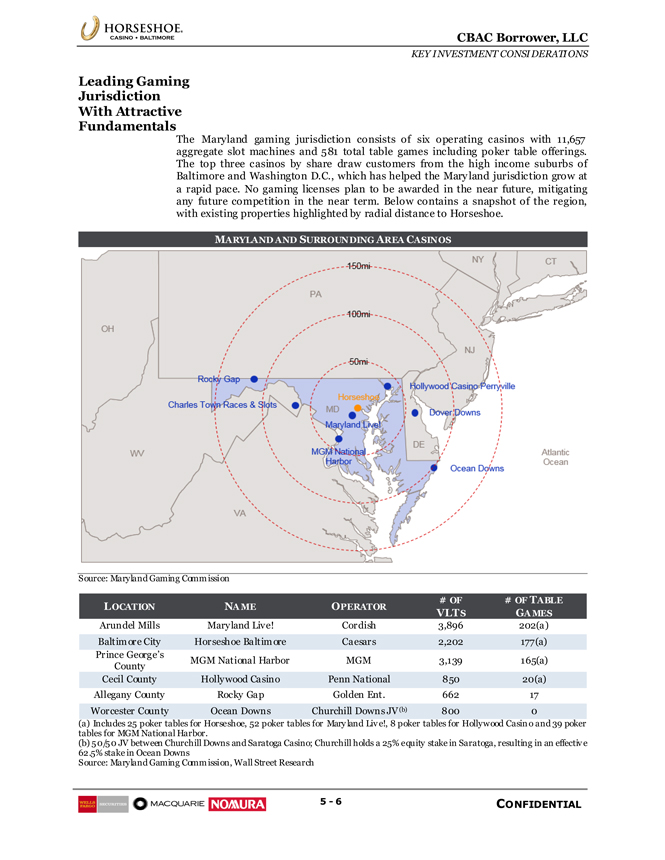
CBAC Borrower, LLC KEY INVESTMENT CONSIDERATIONS 5—6 CONFIDENTIAL Leading Gaming Leading Gaming Jurisdiction With Attractive Fundamentals The Maryland gaming jurisdiction consists of six operating casinos with 11,657 aggregate slot machines and 581 total table games including poker table offerings. The top three casinos by share draw customers from the high income suburbs of Baltimore and Washington D.C., which has helped the Maryland jurisdiction grow at a rapid pace. No gaming licenses plan to be awarded in the near future, mitigating any future competition in the near term. Below contains a snapshot of the region, with existing properties highlighted by radial distance to Horseshoe. MARYLAND AND SURROUNDING AREA CASINOS
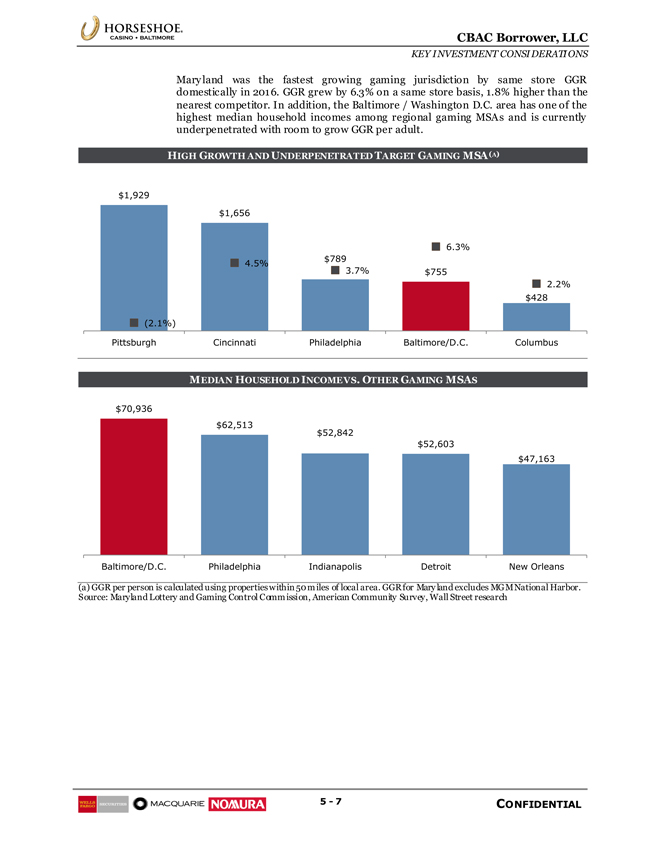
CBAC Borrower, LLC KEY INVESTMENT CONSIDERATIONS 5—7 CONFIDENTIAL Maryland was the fastest growing gaming jurisdiction by same store GGR domestically in 2016. GGR grew by 6.3% on a same store basis, 1.8% higher than the nearest competitor. In addition, the Baltimore / Washington D.C. area has one of the highest median household incomes among regional gaming MSAs and is currently underpenetrated with room to grow GGR per adult. $1,929 $1,656 $789 $755 $428 (2.1%) 4.5% 3.7% 6.3% 2.2% Pittsburgh Cincinnati Philadelphia Baltimore/D.C. Columbus $70,936 $62,513 $52,842 $52,603 $47,163 Baltimore/D.C. Philadelphia Indianapolis Detroit New Orleans Maryland was the fastest growing gaming jurisdiction by same store GGR domestically in 2016. GGR grew by 6.3% on a same store basis, 1.8% higher than the nearest competitor. In addition, the Baltimore / Washington D.C. area has one of the highest median household incomes among regional gaming MSAs and is currently underpenetrated with room to grow GGR per adult. HIGH GROWTH AND UNDERPENETRATED TARGET GAMING MSA(A)
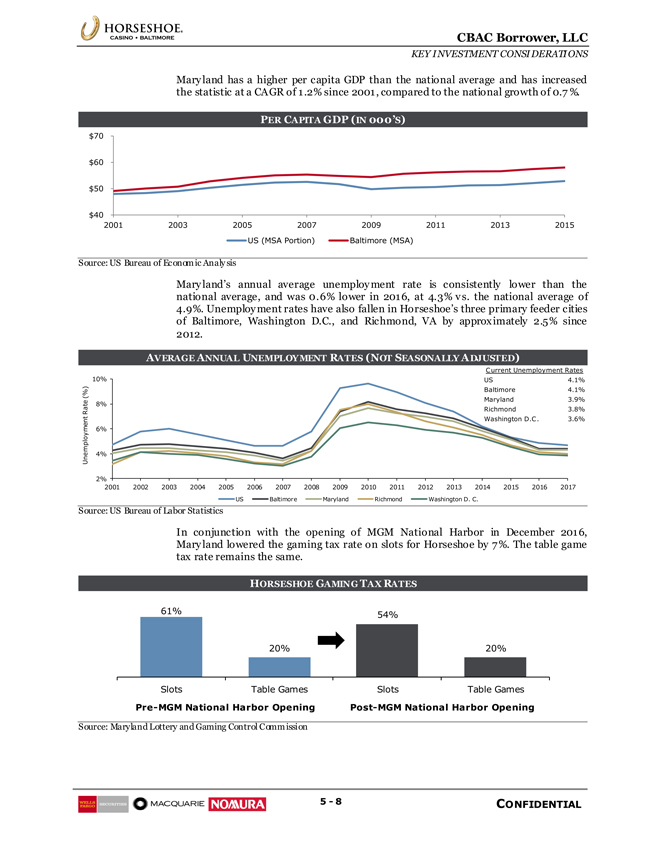
CBAC Borrower, LLC KEY INVESTMENT CONSIDERATIONS 5—8 CONFIDENTIAL Maryland has a higher per capita GDP than the national average and has increased the statistic at a CAGR of 1.2% since 2001, compared to the national growth of 0.7%. $40 $50 $60 $702001 2003 2005 2007 2009 2011 2013 2015 US (MSA Portion) Baltimore (MSA) Current Unemployment Rates US 4.1% Baltimore 4.1% Maryland 3.9% Richmond 3.8% Washington D.C. 3.6% 2% 4% 6% 8% 10%2001 2002 2003 2004 2005 2006 2007 2008 2009 2010 2011 2012 2013 2014 2015 2016 2017 Unemployment Rate (%) US Baltimore Maryland Richmond Washington D. C.Pre-MGM National Harbor OpeningPost-MGM National Harbor Opening 61% 20% 54% 20% Slots Table Games Slots Table Games Maryland has a higher per capita GDP than the national average and has increased the statistic at a CAGR of 1.2% since 2001, compared to the national growth of 0.7%. PER CAPITA GDP (IN 000’S) CAL AREA (5 MILE RADIUS)
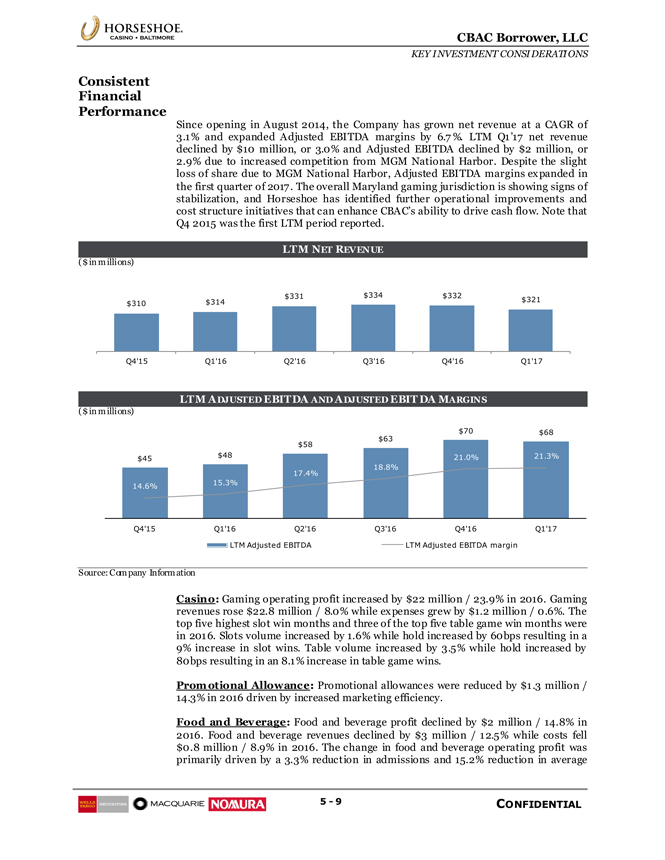
CBAC Borrower, LLC KEY INVESTMENT CONSIDERATIONS 5—9 CONFIDENTIAL Consistent $310 $314 $331 $334 $332 $321 Q4’15 Q1’16 Q2’16 Q3’16 Q4’16 Q1’17 $45 $48 $58 $63 $70 $68 14.6% 15.3% 17.4% 18.8% 21.0% 21.3% Q4’15 Q1’16 Q2’16 Q3’16 Q4’16 Q1’17 LTM Adjusted EBITDA LTM Adjusted EBITDA margin Consistent Financial Performance Since opening in August 2014, the Company has grown net revenue at a CAGR of 3.1% and expanded Adjusted EBITDA margins by 6.7%. LTM Q1’17 net revenue declined by $10 million, or 3.0% and Adjusted EBITDA declined by $2 million, or 2.9% due to increased competition from MGM National Harbor. Despite the slight loss of share due to MGM National Harbor, Adjusted EBITDA margins expanded in the first quarter of 2017. The overall Maryland gaming jurisdiction is showing signs of stabilization, and Horseshoe has identified further operational improvements and cost structure initiatives that can enhance CBAC’s ability to drive cash flow. Note that Q4 2015 was the first LTM period reported. LTM NET REVENUE ($ in millions) LTM ADJUSTED EBITDA AND ADJUSTED EBITDA MARGINS ($ in millions)
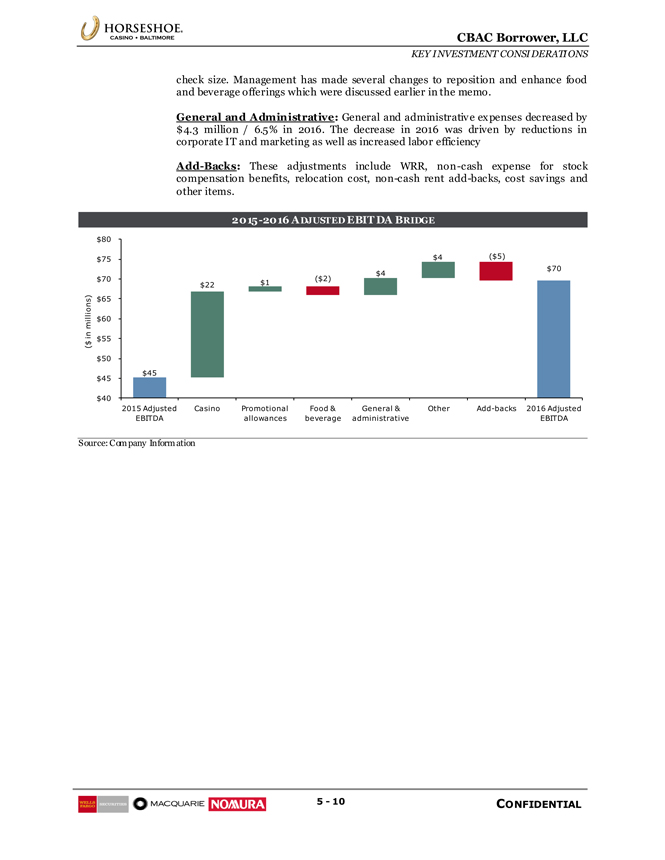
CBAC Borrower, LLC KEY INVESTMENT CONSIDERATIONS 5—10 CONFIDENTIAL check size. Management has made several changes to reposition and enhance food and beverage offerings which were discussed earlier in the memo. $45 $70 $22 $1 ($2) $4 $4 ($5) $40 $45 $50 $55 $60 $65 $70 $75 $80 2015 Adjusted EBITDA Casino Promotional allowances Food & beverage General & administrative OtherAdd-backs 2016 Adjusted EBITDA ($ in millions) check size. Management has made several changes to reposition and enhance food and beverage offerings which were discussed earlier in the memo. General and Administrative: General and administrative expenses decreased by $4.3 million / 6.5% in 2016. The decrease in 2016 was driven by reductions in corporate IT and marketing as well as increased labor efficiency Add-Backs: These adjustments include WRR,non-cash expense for stock compensation benefits, relocation cost,non-cash rentadd-backs, cost savings and other items. 2015-2016 ADJUSTED EBITDA BRIDGE
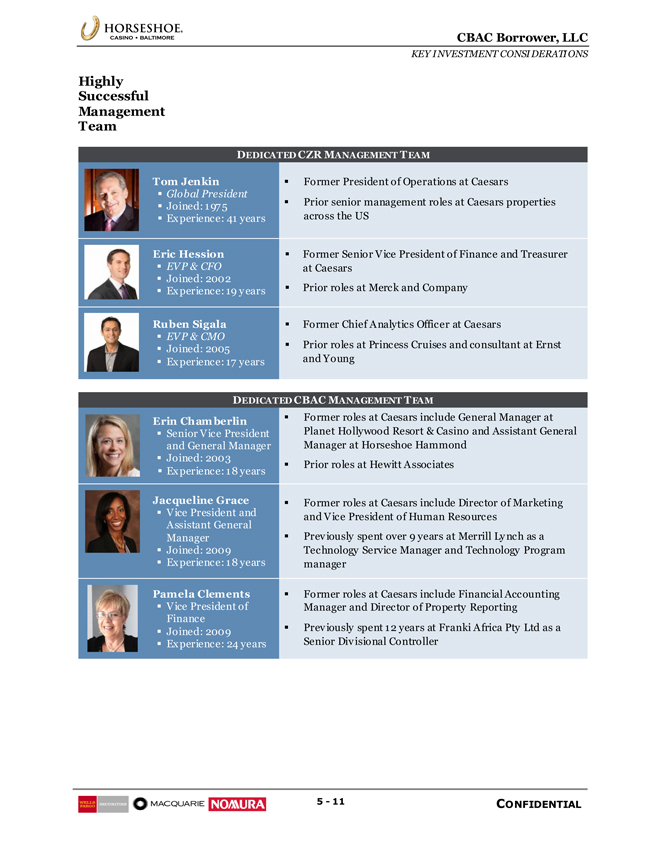
CBAC Borrower, LLC KEY INVESTMENT CONSIDERATIONS 5—11 CONFIDENTIAL Highly Successful Management Team DEDICATED CZR MANAGEMENT TEAM Tom Jenkin Global President Joined: 1975 Experience: 41 years Former President of Operations at Caesars Prior senior management roles at Caesars properties across the US Eric Hession EVP & CFO Joined: 2002 Experience: 19 years Former Senior Vice President of Finance and Treasurer at Caesars Prior roles at Merck and Company Ruben Sigala EVP & CMO Joined: 2005 Experience: 17 years Former Chief Analytics Officer at Caesars Prior roles at Princess Cruises and consultant at Ernst and Young DEDICATED CBAC MANAGEMENT TEAM Erin Chamberlin Senior Vice President and General Manager Joined: 2003 Experience: 18 years Former roles at Caesars include General Manager at Planet Hollywood Resort & Casino and Assistant General Manager at Horseshoe Hammond Prior roles at Hewitt Associates Jacqueline Grace Vice President and Assistant General Manager Joined: 2009 Experience: 18 years Former roles at Caesars include Director of Marketing and Vice President of Human Resources Previously spent over 9 years at Merrill Lynch as a Technology Service Manager and Technology Program manager Pamela Clements Vice President of Finance Joined: 2009 Experience: 24 years Former roles at Caesars include Financial Accounting Manager and Director of Property Reporting Previously spent 12 years at Franki Africa Pty Ltd as a Senior Divisional Controller
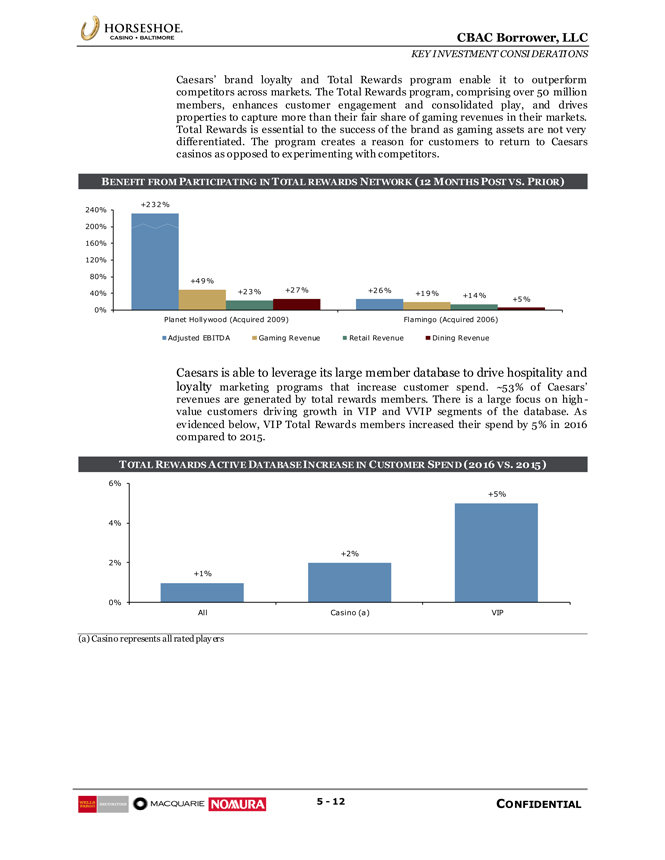
CBAC Borrower, LLC KEY INVESTMENT CONSIDERATIONS 5—12 CONFIDENTIAL Caesars’ brand loyalty and Total Rewards program enable it to outperform competitors across markets. The Total Rewards program, comprising over 50 million members, enhances customer engagement and consolidated play, and drives properties to capture more than their fair share of gaming revenues in their markets. Total Rewards is essential to the success of the brand as gaming assets are not very differentiated. The program creates a reason for customers to return to Caesars casinos as opposed to experimenting with competitors. BENEFIT FROM PARTICIPATING IN TOTAL REWARDS NETWORK (12 MONTHS POST VS. PRIOR) Caesars is able to leverage its large member database to drive hospitality and loyalty marketing programs that increase customer spend. ~53% of Caesars’ revenues are generated by total rewards members. There is a large focus on highvalue customers driving growth in VIP and VVIP segments of the database. As evidenced below, VIP Total Rewards members increased their spend by 5% in 2016 compared to 2015. TOTAL REWARDS ACTIVE DATABASE INCREASE IN CUSTOMER SPEND (2016 VS. 2015) (a) Casino represents all rated players +232% +26% +49% +23% +19% +14% +27% +5% 0% 40% 80% 120% 160% 200% 240% Planet Hollywood (Acquired 2009) Flamingo (Acquired 2006) Adjusted EBITDA Gaming Revenue Retail Revenue Dining Revenue +1% +2% +5% 0% 2% 4% 6% All Casino (a) VIP

Section 6 Caesars Overview

CBAC Borrower, LLC CAESARS OVERVIEW 6—1 CONFIDENTIAL Caesars Overview Caesars Entertainment Corporation (NASDAQ: CZR) is the largest and most diversified gaming and entertainment company in the U.S. Caesars owns, operates or manages 47 gaming properties across 13 states and five countries under a portfolio of widely recognized brands. The portfolio consists of more than 49,000 slots, 4,000 tables and 34,000 rooms. Caesars has the #1 or #2 market share position in nearly every market it participates in driven by its industry-leading Total Rewards loyalty program which has more than 50 million members. CAESARS GEOGRAPHIC OVERVIEW AND POSITION IN MARKET Caesars’ cornerstone initiatives play a significant role in strengthening Caesars corporate foundation and positioning its brands for outsized performance. They include: Invigorating hospitality and loyalty marketing programs Investing in Caesars’ infrastructure to enhance long-term value Instituting a continuous improvement focused operating model Inspiring a sales and service culture
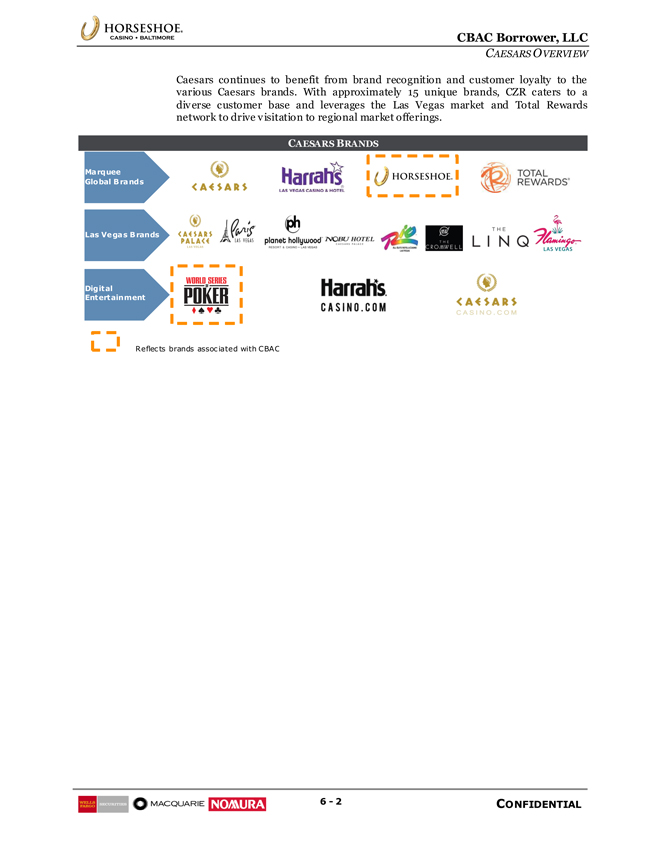
CBAC Borrower, LLC CAESARS OVERVIEW 6—2 CONFIDENTIAL Caesars continues to benefit from brand recognition and customer loyalty to the various Caesars brands. With approximately 15 unique brands, CZR caters to a diverse customer base and leverages the Las Vegas market and Total Rewards network to drive visitation to regional market offerings. CAESARS BRANDS Las Vegas Brands Digital Entertainment Marquee Global Brands Reflects brands associated with CBAC

Section 7 Financial Overview
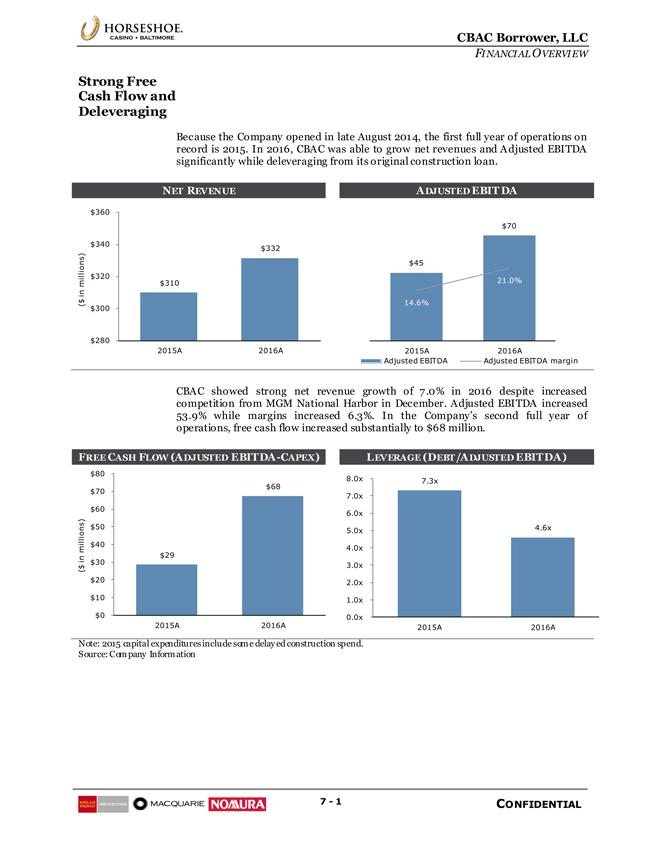
CBAC Borrower, LLC FINANCIAL OVERVIEW 7—1 CONFIDENTIAL Strong Free Cash Flow and Deleveraging Because the Company opened in late August 2014, the first full year of operations on record is 2015. In 2016, CBAC was able to grow net revenues and Adjusted EBITDA significantly while deleveraging from its original construction loan. NET REVENUE ADJUSTED EBITDA CBAC showed strong net revenue growth of 7.0% in 2016 despite increased competition from MGM National Harbor in December. Adjusted EBITDA increased 53.9% while margins increased 6.3%. In the Company’s second full year of operations, free cash flow increased substantially to $68 million. FREE CASH FLOW (ADJUSTED EBITDA-CAPEX) LEVERAGE (DEBT/ADJUSTED EBITDA) Note: 2015 capital expenditures include some delayed construction spend. Source: Company Information $310 $332 $280 $300 $320 $340 $360 2015A 2016A ($ in millions) $45 $70 14.6% 21.0% 0.0% 5.0% 10.0% 15.0% 20.0% 25.0% 30.0% 35.0% $0 $10 $20 $30 $40 $50 $60 $70 $80 2015A 2016A Adjusted EBITDA Adjusted EBITDA margin $29 $68 $0 $10 $20 $30 $40 $50 $60 $70 $80 2015A 2016A ($ in millions) 7.3x 4.6x 0.0x 1.0x 2.0x 3.0x 4.0x 5.0x 6.0x 7.0x 8.0x 2015A 2016A
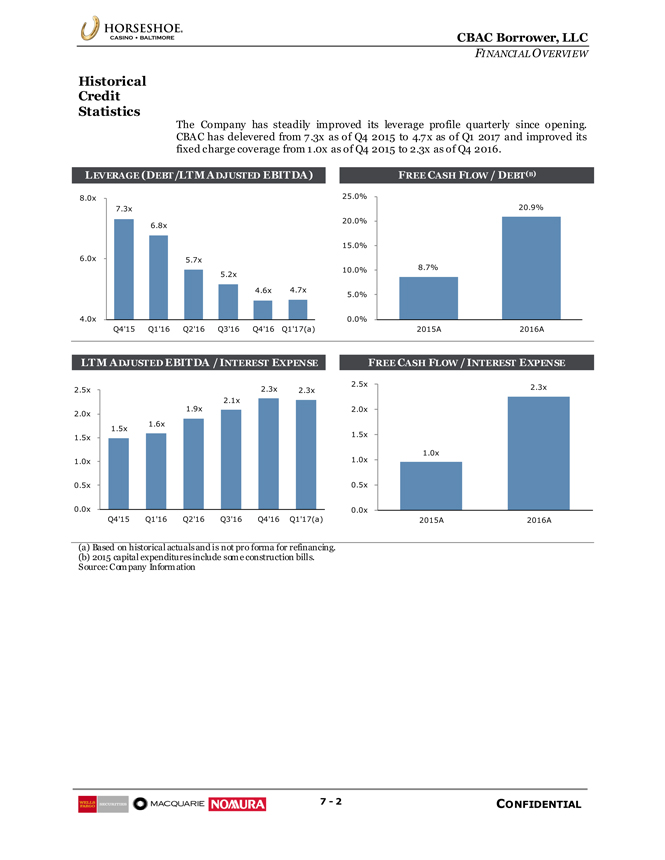
CBAC Borrower, LLC FINANCIAL OVERVIEW 7—2 CONFIDENTIAL Historical Credit Statistics The Company has steadily improved its leverage profile quarterly since opening. CBAC has delevered from 7.3x as of Q4 2015 to 4.7x as of Q1 2017 and improved its fixed charge coverage from 1.0x as of Q4 2015 to 2.3x as of Q4 2016. LEVERAGE (DEBT/LTM ADJUSTED EBITDA) FREE CASH FLOW / DEBT(B) LTM ADJUSTED EBITDA / INTEREST EXPENSE FREE CASH FLOW / INTEREST EXPENSE (a) Based on historical actuals and is not pro forma for refinancing. (b) 2015 capital expenditures include some construction bills. Source: Company Information 7.3x 6.8x 5.7x 5.2x 4.6x 4.7x 4.0x 6.0x 8.0x Q4’15 Q1’16 Q2’16 Q3’16 Q4’16 Q1’17(a) 8.7% 20.9% 0.0% 5.0% 10.0% 15.0% 20.0% 25.0% 2015A 2016A 1.5x 1.6x 1.9x 2.1x 2.3x 2.3x 0.0x 0.5x 1.0x 1.5x 2.0x 2.5x Q4’15 Q1’16 Q2’16 Q3’16 Q4’16 Q1’17(a) 1.0x 2.3x 0.0x 0.5x 1.0x 1.5x 2.0x 2.5x 2015A 2016A
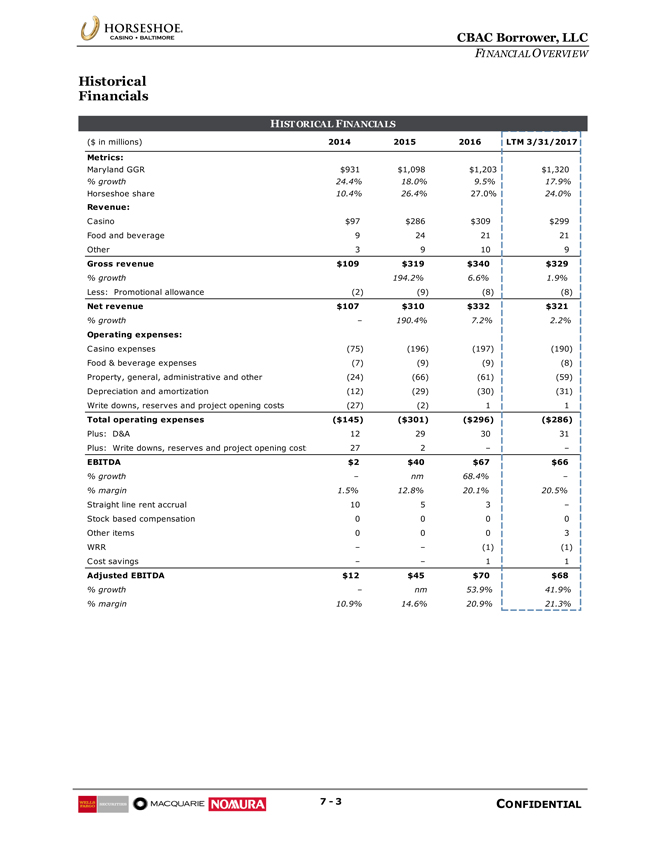
CBAC Borrower, LLC FINANCIAL OVERVIEW 7—3 CONFIDENTIAL Historical Financials HISTORICAL FINANCIALS ($ in millions) 2014 2015 2016 LTM 3/31/2017 Metrics: Maryland GGR $931 $1,098 $1,203 $1,320 % growth 24.4% 18.0% 9.5% 17.9% Horseshoe share 10.4% 26.4% 27.0% 24.0% Revenue: Casino $97 $286 $309 $299 Food and beverage 9 24 21 21 Other 3 9 10 9 Gross revenue $109 $319 $340 $329 % growth 194.2% 6.6% 1.9% Less: Promotional allowance (2) (9) (8) (8) Net revenue $107 $310 $332 $321 % growth – 190.4% 7.2% 2.2% Operating expenses: Casino expenses (75) (196) (197) (190) Food & beverage expenses (7) (9) (9) (8) Property, general, administrative and other (24) (66) (61) (59) Depreciation and amortization (12) (29) (30) (31) Write downs, reserves and project opening costs (27) (2) 1 1 Total operating expenses ($145) ($301) ($296) ($286) Plus: D&A 12 29 30 31 Plus: Write downs, reserves and project opening costs 27 2 – – EBITDA $2 $40 $67 $66 % growth – nm 68.4% – % margin 1.5% 12.8% 20.1% 20.5% Straight line rent accrual 10 5 3 – Stock based compensation 0 0 0 0 Other items 0 0 0 3 WRR – – (1) (1) Cost savings – – 1 1 Adjusted EBITDA $12 $45 $70 $68 % growth – nm 53.9% 41.9% % margin 10.9% 14.6% 20.9% 21.3%
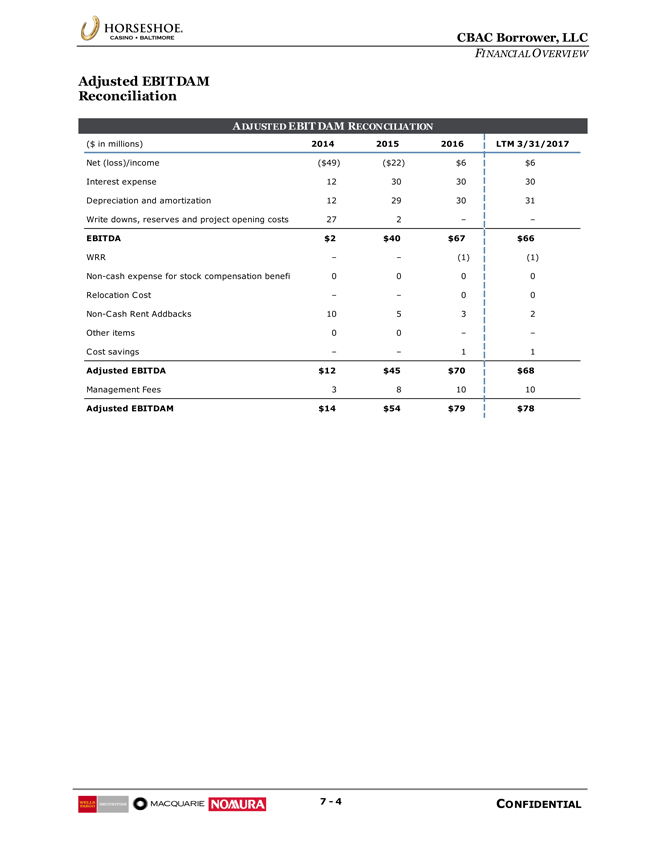
CBAC Borrower, LLC FINANCIAL OVERVIEW 7—4 CONFIDENTIAL Adjusted EBITDAM Reconciliation ADJUSTED EBITDAM RECONCILIATION ($ in millions) 2014 2015 2016 LTM 3/31/2017 Net (loss)/income ($49) ($22) $6 $6 Interest expense 12 30 30 30 Depreciation and amortization 12 29 30 31 Write downs, reserves and project opening costs 27 2 – – EBITDA $2 $40 $67 $66 WRR – – (1) (1)Non-cash expense for stock compensation benefits 0 0 0 0 Relocation Cost – – 0 0Non-Cash Rent Addbacks 10 5 3 2 Other items 0 0 – – Cost savings – – 1 1 Adjusted EBITDA $12 $45 $70 $68 Management Fees 3 8 10 10 Adjusted EBITDAM $14 $54 $79 $78