ITEM 1. REPORT TO STOCKHOLDERS.

CVR DYNAMIC ALLOCATION FUND
Annual Report
November 30, 2018
Beginning on January 2021, as permitted by regulations adopted by the Securities and Exchange Commission, paper copies of the Fund’s shareholder reports will no longer be sent by mail, unless you specifically request paper copies of the reports from the Fund or from your financial intermediary, such as a broker-dealer or bank. Instead, the reports will be made available on a website, and you will be notified by mail each time a report is posted and provided with a website link to access the report.
If you already elected to receive shareholder reports electronically, you will not be affected by this change and you need not take any action. You may elect to receive shareholder reports and other communications from the Fund or your financial intermediary electronically by contacting the Fund at (855) 328-7691, cvrfunds.ta@atlanticfundservices.com, or by contacting your financial intermediary directly.
You may elect to receive all future reports in paper free of charge. You can inform the Fund or your financial intermediary that you wish to continue receiving paper copies of your shareholder reports by contacting the Fund at (855) 328-7691, cvrfunds.ta@atlanticfundservices.com, or by contacting your financial intermediary directly.
The views in this report were those of CVR Dynamic Allocation Fund’s (the “Fund”) adviser as of November 30, 2018, and may not reflect their views on the date this report is first published or any time thereafter. These views are intended to assist shareholders in understanding their investment in the Fund and do not constitute investment advice. None of the information presented should be construed as an offer to sell or recommendation of any security mentioned herein.
All investing involves risk including the possible loss of principal. There can be no assurance the Fund will achieve its investment objective. In addition to the general risks of investing, the Fund is subject to additional risks including commodities risk, derivatives risks, ETF risk, risks of foreign investing and model and data risks. Exposure to the commodities markets may subject the Fund to greater volatility than investments in traditional securities. Derivatives, such as options, futures and swaps, can be volatile, and a small investment in a derivative can have a large impact on the performance of the Fund as derivatives can result in losses in excess of the amount invested. Shares of an ETF may trade at a premium or discount to the net asset value of its portfolio securities. Foreign investments may be subject to additional risks, which include international trade, currency, political, regulatory and diplomatic risks, which may affect their value. Given the complexity of the investments and strategies of the Fund, the Adviser relies heavily on quantitative models and data supplied by third parties. Models and Data may prove to be incorrect or incomplete and expose the Fund to potential risks.
CVR DYNAMIC ALLOCATION FUND
A MESSAGE TO OUR SHAREHOLDERS (Unaudited)
NOVEMBER 30, 2018
CVR Portfolio Funds is pleased to review the performance of the CVR Dynamic Allocation Fund (the “Fund”) from December 1, 2017 through November 30, 2018. During this period, the Fund returned (-5.97%) vs. (-4.43%) for the HFRX Equity Hedge Index (the “HFRX EH”).
The Fund is differentiated by its variable beta, which allows for equity returns in risk-on markets and capital protection in risk-off markets. Highlights include:
| • | Historically Less Risk than the S&P 500 |
| • | Unconstrained Equity Upside Potential in Risk-On Markets |
| • | Systematic Capital Protection in Risk-Off Markets |
The portfolio managers invest the Fund’s assets in three principal investment strategies, each of which is rule-based, leading to an investment process that is unemotional and repeatable. The three strategies are Focused Equity, Defensive Equity and Absolute Return. We believe that each of the three strategies is subject to different, and in some cases contrary risks such that the value of the Fund’s investments in the aggregate will be subject to less risk, over the long term, than the risk associated with any one of the investment strategies taken by itself.
The Fund, which typically has 80-90% of its assets exposed to U.S. equity markets through its Focused and Defensive Equity strategies, seeks to capture most, if not all, of equity market performance in risk-on environments and to protect against significant drawdowns when markets decline. The Focused Equity strategy will always stay invested, but both the Defensive Equity and Absolute Return strategies have the potential to protect capital in declining markets. The Defensive Equity strategy utilizes a quantitative model that raises cash in response to rising equity volatility and the Absolute Return strategy is designed to be uncorrelated to equity markets.
The Year in Review
Equity markets started the year on a high note, supported by a strengthening global economy, strong corporate earnings and U.S. tax cuts passed at the end of last year. The Federal Reserve maintained its path towards interest rate normalization throughout the year, raising rates in March, June and September. As summer turned to fall, fears of a global trade war, a cyclical peak in earnings and slowing global growth began to take hold and spurred a considerable rise in volatility. Global equity markets sold off violently in October, erasing much of the year’s gain. Markets will remain vulnerable to higher volatility until more clarity on these issues emerges to ease current headwinds.
The majority of the Fund’s equity exposure remains in Mid-Cap Value, where our models see the greatest opportunity. We believe that the risk/reward in Value stocks, which trade at historically wide discounts to Growth stocks, offers the potential for alpha.
The top performing holdings for the period were: Hormel Foods Corp (HRL), New York Times (NYT) and Adtalem Global Education (ATGE). The largest detractors from performance during the period were McDermott Intl. Inc (MDR), Copa Holdings (CPA) and LKQ Corp (LKQ). The Focused Equity strategy purchases equities that we believe are undervalued relative to the overall U.S. equity market. These equities may become even more undervalued as they go through management transitions, new product launches, a change in industry dynamics, etc. and can remain undervalued for extended periods of time.
The Defensive Equity strategy seeks broad equity exposure in risk-on markets with a valuation bias that currently favors mid-cap equities. The Absolute Return strategy is uncorrelated to equities and represents less than 10% of current Fund assets. The Fund maintained a risk-on stance throughout the first three quarters of 2018. Rising volatility during the 4Q of 2018 triggered the Defensive Equity strategy to raise cash by exiting exposure in Financials, Materials, Energy, Industrials and Technology. The Defensive Equity strategy maintains exposure to Consumer Discretion, Healthcare, REITS and Utilities. The Fund will continue to adjust to risk by reacting to significant increases or decreases in equity volatility.
CVR DYNAMIC ALLOCATION FUND
A MESSAGE TO OUR SHAREHOLDERS (Unaudited)
NOVEMBER 30, 2018
We remain confident in our investment process and steadfast in our commitment to delivering long term equity returns with less risk than the market. We are grateful for your support and look forward to the year ahead.
Respectfully submitted,

Pete Higgins & Bill Monaghan
CVR DYNAMIC ALLOCATION FUND
PERFORMANCE CHART AND ANALYSIS (Unaudited)
NOVEMBER 30, 2018
The following chart reflects the change in the value of a hypothetical $10,000 investment in Institutional Shares, including reinvested dividends and distributions, in the CVR Dynamic Allocation Fund (the “Fund”) compared with the performance of the benchmark, the HFRX Equity Hedge Index ("HFRX Equity"), since inception. HFRX Equity tracks strategies that maintain positions both long and short in primarily equity and equity derivative securities. The total return of the index includes the reinvestment of dividends and income. The total return of the Fund includes operating expenses that reduce returns, while the total return of the index does not include expenses. The Fund is professionally managed, while the index is unmanaged and is not available for investment.
Comparison of Change in Value of a $10,000 Investment
CVR Dynamic Allocation Fund - Institutional Shares vs. HFRX Equity Hedge Index
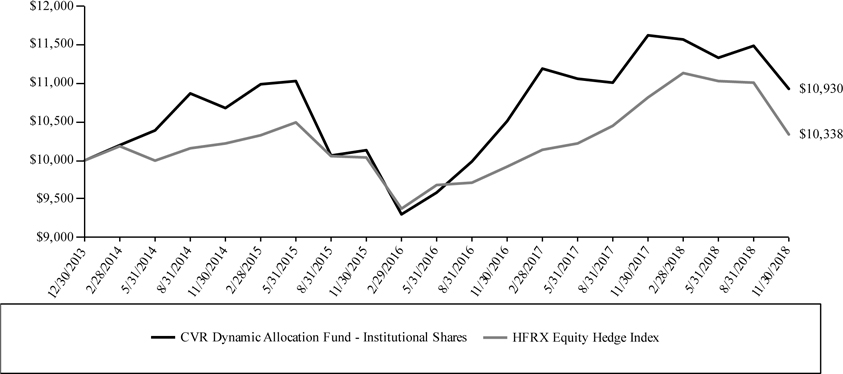
| Average Annual Total Returns | Since Inception | |||||||
| Periods Ended November 30, 2018 | One Year | (12/30/13) | ||||||
| CVR Dynamic Allocation Fund - Institutional Shares | -5.97 | % | 1.83 | % | ||||
| HFRX Equity Hedge Index | -4.43 | % | 0.68 | % | ||||
Performance data quoted represents past performance and is no guarantee of future results. Current performance may be lower or higher than the performance data quoted. Investment return and principal value will fluctuate so that shares, when redeemed, may be worth more or less than original cost. As stated in the Fund’s prospectus, the annual operating expense ratio (gross) is 2.24% for Institutional Shares. However, the Fund’s adviser has contractually agreed to waive its fee and/or reimburse Fund expenses to limit Total Annual Fund Operating Expenses After Fee Waiver and/or Expense Reimbursement (excluding all taxes, interest, portfolio transaction expenses, proxy expenses, and extraordinary expenses) to 1.65% of Institutional Shares, through April 1, 2019 (the “Expense Cap”). The adviser may be reimbursed by the Fund for fees waived and expenses reimbursed by the adviser pursuant to the Expense Cap if such payment is approved by the Board, made within three years of the fee waiver or expense reimbursement, and does not cause the Total Annual Fund Operating Expenses After Fee Waiver and/or Expense Reimbursement to exceed the lesser of (i) the then-current expense cap, or (ii) the expense cap in place at the time the fees/expenses were waived/reimbursed. The performance table and graph do not reflect the deduction of taxes that a shareholder would pay on Fund distributions or the redemption of Fund shares. Returns greater than one year are annualized. For the most recent month-end performance, please call (855) 328-7691.
CVR DYNAMIC ALLOCATION FUND
SCHEDULE OF INVESTMENTS
NOVEMBER 30, 2018
| Shares | Security Description | Value | ||||
| Common Stock - 91.6% | ||||||
| Apparel - 0.4% | ||||||
| 292 | Deckers Outdoor Corp. (a) | $ | 38,906 | |||
| 1,275 | Skechers U.S.A., Inc., Class A (a) | 34,425 | ||||
| 73,331 | ||||||
| Auto & Truck - 12.6% | ||||||
| 7,017 | BorgWarner, Inc. | 277,733 | ||||
| 10,298 | Cooper Tire & Rubber Co. | 352,192 | ||||
| 2,127 | Dana, Inc. | 30,863 | ||||
| 1,604 | Delphi Technologies PLC | 27,412 | ||||
| 22,565 | Gentex Corp. | 508,164 | ||||
| 2,466 | Lear Corp. | 335,993 | ||||
| 11,504 | LKQ Corp. (a) | 320,271 | ||||
| 6,522 | PACCAR, Inc. | 405,799 | ||||
| 481 | Visteon Corp. (a) | 35,507 | ||||
| 2,293,934 | ||||||
| Biotechnology - 0.3% | ||||||
| 524 | United Therapeutics Corp. (a) | 61,884 | ||||
| Building - 1.0% | ||||||
| 1,726 | KB Home | 36,436 | ||||
| 16 | NVR, Inc. (a) | 39,200 | ||||
| 496 | Thor Industries, Inc. | 33,634 | ||||
| 1,122 | Toll Brothers, Inc. | 36,992 | ||||
| 3,071 | TRI Pointe Group, Inc. (a) | 38,326 | ||||
| 184,588 | ||||||
| Commercial Services - 2.7% | ||||||
| 819 | Sotheby's (a) | 32,752 | ||||
| 19,354 | The Interpublic Group of Cos., Inc. | 454,819 | ||||
| 487,571 | ||||||
| Communications - 2.1% | ||||||
| 15,184 | Cars.com, Inc. (a) | 392,810 | ||||
| Computers - 2.8% | ||||||
| 18,040 | Juniper Networks, Inc. | 517,928 | ||||
| Construction Materials - 0.2% | ||||||
| 1,672 | MDU Resources Group, Inc. | 44,258 | ||||
| Consumer Services - 3.1% | ||||||
| 9,904 | Adtalem Global Education, Inc. (a) | 571,857 | ||||
| Cosmetics & Personal Care - 0.4% | ||||||
| 1,722 | Prestige Consumer Healthcare, Inc. (a) | 66,848 | ||||
| Distributors - 0.2% | ||||||
| 239 | Pool Corp. | 38,840 | ||||
| Electronics - 4.2% | ||||||
| 6,145 | Itron, Inc. (a) | 332,813 | ||||
| 17,266 | Jabil, Inc. | 431,132 | ||||
| 763,945 | ||||||
| Food - 3.3% | ||||||
| 13,350 | Hormel Foods Corp. | 601,952 | ||||
| Gaming, Lodging & Restaurants - 0.6% | ||||||
| 130 | Churchill Downs, Inc. | 36,109 | ||||
| 1,566 | Scientific Games Corp. (a) | 30,506 | ||||
| 977 | Wyndham Worldwide Corp. | 40,516 | ||||
| 107,131 | ||||||
| Health Care - 0.4% | ||||||
| 863 | Encompass Health Corp. | 64,906 | ||||
| Household - 2.3% | ||||||
| 728 | Tempur Sealy International, Inc. (a) | 37,113 | ||||
| 923 | Tupperware Brands Corp. | 35,037 | ||||
| 2,774 | Whirlpool Corp. | 349,885 | ||||
| 422,035 | ||||||
| Internet - 1.8% | ||||||
| 4,884 | Akamai Technologies, Inc. (a) | 335,775 | ||||
| Shares | Security Description | Value | ||||
| Leisure - 0.6% | ||||||
| 641 | Brunswick Corp. | $ | 33,999 | |||
| 907 | Cinemark Holdings, Inc. | 34,801 | ||||
| 386 | Polaris Industries, Inc. | 37,442 | ||||
| 106,242 | ||||||
| Machinery - 2.0% | ||||||
| 6,041 | AGCO Corp. | 360,527 | ||||
| Media - 6.8% | ||||||
| 617 | AMC Networks, Inc., Class A (a) | 36,934 | ||||
| 39 | Cable One, Inc. | 35,072 | ||||
| 63 | Graham Holdings Co., Class B | 41,515 | ||||
| 612 | John Wiley & Sons, Inc., Class A | 33,837 | ||||
| 15,557 | Lions Gate Entertainment Corp., Class A | 301,961 | ||||
| 5,415 | Scholastic Corp. | 250,227 | ||||
| 38,984 | TEGNA, Inc. | 518,097 | ||||
| 458 | World Wrestling Entertainment, Inc., Class A | 33,874 | ||||
| 1,251,517 | ||||||
| Medical - 17.7% | ||||||
| 1,529 | Acadia Healthcare Co., Inc. (a) | 51,940 | ||||
| 237 | Bio-Rad Laboratories, Inc., Class A (a) | 65,047 | ||||
| 357 | Bio-Techne Corp. | 57,627 | ||||
| 783 | Cantel Medical Corp. | 67,244 | ||||
| 1,630 | Catalent, Inc. (a) | 64,630 | ||||
| 533 | Charles River Laboratories International, Inc. (a) | 71,875 | ||||
| 216 | Chemed Corp. | 68,424 | ||||
| 4,337 | Exelixis, Inc. (a) | 88,084 | ||||
| 1,204 | Globus Medical, Inc. (a) | 58,141 | ||||
| 751 | Hill-Rom Holdings, Inc. | 72,817 | ||||
| 1,019 | Integra LifeSciences Holdings Corp. (a) | 54,649 | ||||
| 557 | LivaNova PLC (a) | 56,363 | ||||
| 2,426 | Mallinckrodt PLC (a) | 57,715 | ||||
| 554 | Masimo Corp. (a) | 61,173 | ||||
| 888 | Medidata Solutions, Inc. (a) | 68,562 | ||||
| 1,525 | MEDNAX, Inc. (a) | 61,305 | ||||
| 486 | Molina Healthcare, Inc. (a) | 67,899 | ||||
| 1,001 | NuVasive, Inc. (a) | 63,754 | ||||
| 20,745 | Patterson Cos., Inc. | 526,301 | ||||
| 648 | PRA Health Sciences, Inc. (a) | 75,648 | ||||
| 4,328 | Quest Diagnostics, Inc. | 383,331 | ||||
| 585 | STERIS PLC | 69,662 | ||||
| 265 | Teleflex, Inc. | 72,986 | ||||
| 2,460 | Tenet Healthcare Corp. (a) | 64,132 | ||||
| 11,972 | Varex Imaging Corp. (a) | 315,462 | ||||
| 3,620 | Varian Medical Systems, Inc. (a) | 446,672 | ||||
| 209 | WellCare Health Plans, Inc. (a) | 53,270 | ||||
| 613 | West Pharmaceutical Services, Inc. | 67,160 | ||||
| 3,231,873 | ||||||
| Oil & Gas - 1.4% | ||||||
| 20,336 | McDermott International, Inc. (a) | 177,127 | ||||
| 423 | Murphy USA, Inc. (a) | 34,271 | ||||
| 801 | UGI Corp. | 46,017 | ||||
| 257,415 | ||||||
| Paper & Paper Products - 1.2% | ||||||
| 5,189 | Domtar Corp. | 226,137 | ||||
| Pollution Control - 3.1% | ||||||
| 10,131 | Donaldson Co., Inc. | 567,741 | ||||
| Real Estate Development & Operations - 0.3% | ||||||
| 322 | Jones Lang LaSalle, Inc. | 46,110 | ||||
| Recreational Facilities & Services - 0.2% | ||||||
| 630 | Six Flags Entertainment Corp. | 38,657 | ||||
See Notes to Financial Statements.
CVR DYNAMIC ALLOCATION FUND
SCHEDULE OF INVESTMENTS
NOVEMBER 30, 2018
| Shares | Security Description | Value | ||||
| REIT - 6.5% | ||||||
| 1,078 | American Campus Communities, Inc. REIT | $ | 47,249 | |||
| 471 | Camden Property Trust REIT | 44,820 | ||||
| 452 | CoreSite Realty Corp. REIT | 44,052 | ||||
| 5,099 | Cousins Properties, Inc. REIT | 43,086 | ||||
| 805 | CyrusOne, Inc. REIT | 45,144 | ||||
| 1,176 | Douglas Emmett, Inc. REIT | 43,418 | ||||
| 616 | EPR Properties REIT | 43,631 | ||||
| 1,379 | First Industrial Realty Trust, Inc. REIT | 44,211 | ||||
| 1,522 | Healthcare Realty Trust, Inc. REIT | 47,182 | ||||
| 994 | Highwoods Properties, Inc. REIT | 43,110 | ||||
| 1,651 | Hospitality Properties Trust REIT | 44,313 | ||||
| 1,137 | JBG SMITH Properties REIT | 45,560 | ||||
| 619 | Kilroy Realty Corp. REIT | 43,386 | ||||
| 588 | Lamar Advertising Co., Class A REIT | 44,594 | ||||
| 1,286 | LaSalle Hotel Properties REIT | 41,229 | ||||
| 1,018 | Liberty Property Trust REIT | 46,105 | ||||
| 447 | Life Storage, Inc. REIT | 43,645 | ||||
| 2,846 | Medical Properties Trust, Inc. REIT | 49,150 | ||||
| 913 | National Retail Properties, Inc. REIT | 45,705 | ||||
| 1,277 | Omega Healthcare Investors, Inc. REIT | 48,449 | ||||
| 1,409 | Rayonier, Inc. REIT | 44,567 | ||||
| 1,961 | Sabra Health Care REIT, Inc. | 37,828 | ||||
| 2,648 | Senior Housing Properties Trust REIT | 36,436 | ||||
| 772 | Taubman Centers, Inc. REIT | 40,870 | ||||
| 1,815 | The GEO Group, Inc. REIT | 42,181 | ||||
| 2,229 | Uniti Group, Inc. REIT | 44,424 | ||||
| 1,510 | Weingarten Realty Investors REIT | 43,579 | ||||
| 1,187,924 | ||||||
| Retail - 4.0% | ||||||
| 780 | Aaron's, Inc. | 36,504 | ||||
| 1,489 | American Eagle Outfitters, Inc. | 31,165 | ||||
| 797 | AutoNation, Inc. (a) | 29,593 | ||||
| 2,498 | Bed Bath & Beyond, Inc. | 32,174 | ||||
| 803 | Big Lots, Inc. | 34,979 | ||||
| 761 | Brinker International, Inc. | 38,872 | ||||
| 343 | Carter's, Inc. | 31,728 | ||||
| 208 | Cracker Barrel Old Country Store, Inc. | 37,608 | ||||
| 1,027 | Dick's Sporting Goods, Inc. | 36,951 | ||||
| 473 | Dillard's, Inc., Class A | 32,821 | ||||
| 131 | Domino's Pizza, Inc. | 36,329 | ||||
| 462 | Dunkin' Brands Group, Inc. | 34,188 | ||||
| 301 | Five Below, Inc. (a) | 31,542 | ||||
| 432 | Jack in the Box, Inc. | 38,314 | ||||
| 379 | Ollie's Bargain Outlet Holdings, Inc. (a) | 33,617 | ||||
| 663 | Papa John's International, Inc. | 31,817 | ||||
| 1,973 | Sally Beauty Holdings, Inc. (a) | 41,650 | ||||
| 502 | Texas Roadhouse, Inc. | 33,147 | ||||
| 2,133 | The Michaels Cos., Inc. (a) | 36,197 | ||||
| 896 | Urban Outfitters, Inc. (a) | 34,129 | ||||
| 597 | Williams-Sonoma, Inc. | 33,808 | ||||
| 727,133 | ||||||
| Transportation - 6.7% | ||||||
| 4,924 | CH Robinson Worldwide, Inc. | 454,633 | ||||
| 3,334 | Copa Holdings SA, Class A | 283,490 | ||||
| 14,133 | Werner Enterprises, Inc. | 478,543 | ||||
| 1,216,666 | ||||||
| Utilities - 2.7% | ||||||
| 557 | ALLETE, Inc. | 45,329 | ||||
| 1,302 | Aqua America, Inc. | 44,646 | ||||
| 457 | Atmos Energy Corp. | 43,721 | ||||
| 1,549 | CenterPoint Energy, Inc. | 43,387 | ||||
| 1,143 | Hawaiian Electric Industries, Inc. | 43,800 | ||||
| 445 | IDACORP, Inc. | 43,717 | ||||
| Shares | Security Description | Value | ||||
| Utilities - 2.7% (continued) | ||||||
| 780 | National Fuel Gas Co. | $ | 42,003 | |||
| 945 | New Jersey Resources Corp. | 45,861 | ||||
| 1,180 | OGE Energy Corp. | 46,752 | ||||
| 539 | ONE Gas, Inc. | 45,863 | ||||
| 538 | Southwest Gas Holdings, Inc. | 42,378 | ||||
| | 487,457 | |||||
| Total Common Stock (Cost $16,162,508) | 16,734,992 | |||||
| Principal | Security Description | Rate | Maturity | Value | |||||||||||
| U.S. Government & Agency Obligations - 3.3% | |||||||||||||||
| U.S. Treasury Securities - 3.3% | |||||||||||||||
| $ | 600,000 | U.S. Treasury Bill (b) (Cost $596,720) | 2.41% | 02/21/19 | 596,912 | ||||||||||
| Investments, at value - 94.9% (Cost $16,759,228) | $ | 17,331,904 | |||||||||||||
| Other Assets & Liabilities, Net - 5.1% | 938,745 | ||||||||||||||
| Net Assets - 100.0% | $ | 18,270,649 | |||||||||||||
See Notes to Financial Statements.
CVR DYNAMIC ALLOCATION FUND
NOTES TO SCHEDULE OF INVESTMENTS
NOVEMBER 30, 2018
| PLC | Public Limited Company |
| REIT | Real Estate Investment Trust |
| (a) | Non-income producing security. |
| (b) | Rate presented is yield to maturity. |
At November 30, 2018, the Fund held the following exchange traded futures contracts:
| Contracts | Type | Expiration Date | Notional Contract Value | Value | Net Unrealized Appreciation (Depreciation) | |||||||||||
| (9) | ASX SPI 200 Index Future | 12/20/18 | $ | (941,536 | ) | $ | (933,104 | ) | $ | 13,518 | ||||||
| (2) | Australian 10-year Bond Future | 12/17/18 | (186,915 | ) | (189,773 | ) | (2,147 | ) | ||||||||
| (1) | Australian 3-year Bond Future | 12/17/18 | (80,381 | ) | (81,392 | ) | (138 | ) | ||||||||
| (8) | British Pound Currency Future | 12/17/18 | (642,111 | ) | (637,550 | ) | 4,561 | |||||||||
| (18) | Canadian Currency Future | 12/18/18 | (1,369,272 | ) | (1,354,770 | ) | 14,502 | |||||||||
| (10) | Euro FX Currency Future | 12/17/18 | (1,431,319 | ) | (1,415,250 | ) | 16,069 | |||||||||
| (3) | Japanese Yen Currency Future | 12/17/18 | (331,344 | ) | (330,431 | ) | 913 | |||||||||
| (4) | Norwegian Krone Future | 12/17/18 | (944,004 | ) | (930,400 | ) | 13,604 | |||||||||
| (2) | S&P 500 E-mini Future | 12/21/18 | (269,280 | ) | (275,830 | ) | (6,550 | ) | ||||||||
| (3) | Swedish Krona Future | 12/17/18 | (665,668 | ) | (659,220 | ) | 6,448 | |||||||||
| (6) | Swiss Franc Currency Future | 12/17/18 | (751,642 | ) | (751,125 | ) | 517 | |||||||||
| (1) | U.S. 10-year Note Future | 03/20/19 | (119,012 | ) | (119,453 | ) | (441 | ) | ||||||||
| (8) | U.S. 2-year Note Future | 03/29/19 | (1,686,975 | ) | (1,687,875 | ) | (900 | ) | ||||||||
| (3) | U.S. 5-year Note Future | 03/29/19 | (338,439 | ) | (338,883 | ) | (444 | ) | ||||||||
| 6 | Australian-U.S. Dollar Currency Future | 12/17/18 | 433,895 | 438,300 | 4,405 | |||||||||||
| 29 | Brazil Real Future | 12/31/18 | 758,759 | 748,490 | (10,269 | ) | ||||||||||
| 1 | Canadian 10-year Bond Future | 03/20/19 | 100,406 | 100,320 | (86 | ) | ||||||||||
| 11 | EURO-BOBL Future | 03/07/19 | 1,653,659 | 1,646,549 | 1,035 | |||||||||||
| 3 | EURO-BUND Future | 03/07/19 | 554,244 | 551,627 | 716 | |||||||||||
| 11 | EURO-STOXX 50 Future | 12/21/18 | 398,426 | 393,892 | (3,827 | ) | ||||||||||
| 5 | FTSE 100 Index Future | 12/21/18 | 447,140 | 444,013 | (1,920 | ) | ||||||||||
| 15 | Indian Rupee Currency Future | 12/27/18 | 1,050,878 | 1,072,050 | 21,172 | |||||||||||
| 2 | Long Gilt Future | 03/27/19 | 312,139 | 312,548 | 1,192 | |||||||||||
| 1 | Mexican Peso Future | 12/17/18 | 24,550 | 24,450 | (100 | ) | ||||||||||
| 20 | New Zealand Currency Future | 12/17/18 | 1,355,572 | 1,374,200 | 18,628 | |||||||||||
| 5 | Russian Ruble Future | 12/17/18 | 188,771 | 186,063 | (2,708 | ) | ||||||||||
| 1 | Silver Future | 03/27/19 | 71,915 | 71,085 | (830 | ) | ||||||||||
| 24 | South African Rand Currency Future | 12/17/18 | 839,336 | 862,500 | 23,164 | |||||||||||
| $ | (1,568,208 | ) | $ | (1,478,969 | ) | $ | 110,084 | |||||||||
The following is a summary of the inputs used to value the Fund's investments and other financial instruments and liabilities as of November 30, 2018.
The inputs or methodology used for valuing securities are not necessarily an indication of the risks associated with investing in those securities. For more information on valuation inputs, and their aggregation into the levels used in the table below, please refer to the Security Valuation section in Note 2 of the accompanying Notes to Financial Statements.
| Level 1 | Level 2 | Level 3 | Total | |||||||||||||
| Assets | ||||||||||||||||
| Investments at Value | ||||||||||||||||
| Common Stock | ||||||||||||||||
| Apparel | $ | 73,331 | $ | – | $ | – | $ | 73,331 | ||||||||
| Auto & Truck | 2,293,934 | – | – | 2,293,934 | ||||||||||||
| Biotechnology | 61,884 | – | – | 61,884 | ||||||||||||
| Building | 184,588 | – | – | 184,588 | ||||||||||||
| Commercial Services | 487,571 | – | – | 487,571 | ||||||||||||
| Communications | 392,810 | – | – | 392,810 | ||||||||||||
| Computers | 517,928 | – | – | 517,928 | ||||||||||||
| Construction Materials | 44,258 | – | – | 44,258 | ||||||||||||
| Consumer Services | 571,857 | – | – | 571,857 | ||||||||||||
| Cosmetics & Personal Care | 66,848 | – | – | 66,848 | ||||||||||||
| Distributors | 38,840 | – | – | 38,840 | ||||||||||||
| Electronics | 763,945 | – | – | 763,945 | ||||||||||||
| Food | 601,952 | – | – | 601,952 | ||||||||||||
| Gaming, Lodging & Restaurants | 107,131 | – | – | 107,131 | ||||||||||||
| Health Care | 64,906 | – | – | 64,906 | ||||||||||||
| Household | 422,035 | – | – | 422,035 | ||||||||||||
| Internet | 335,775 | – | – | 335,775 | ||||||||||||
See Notes to Financial Statements.
CVR DYNAMIC ALLOCATION FUND
NOTES TO SCHEDULE OF INVESTMENTS
NOVEMBER 30, 2018
| Level 1 | Level 2 | Level 3 | Total | |||||||||||||
| Investments at Value (continued) | ||||||||||||||||
| Leisure | $ | 106,242 | $ | – | $ | – | $ | 106,242 | ||||||||
| Machinery | 360,527 | – | – | 360,527 | ||||||||||||
| Media | 1,251,517 | – | – | 1,251,517 | ||||||||||||
| Medical | 3,231,873 | – | – | 3,231,873 | ||||||||||||
| Oil & Gas | 257,415 | – | – | 257,415 | ||||||||||||
| Paper & Paper Products | 226,137 | – | – | 226,137 | ||||||||||||
| Pollution Control | 567,741 | – | – | 567,741 | ||||||||||||
| Real Estate Development & Operations | 46,110 | – | – | 46,110 | ||||||||||||
| Recreational Facilities & Services | 38,657 | – | – | 38,657 | ||||||||||||
| REIT | 1,187,924 | – | – | 1,187,924 | ||||||||||||
| Retail | 727,133 | – | – | 727,133 | ||||||||||||
| Transportation | 1,216,666 | – | – | 1,216,666 | ||||||||||||
| Utilities | 487,457 | – | – | 487,457 | ||||||||||||
| U.S. Government & Agency Obligations | – | 596,912 | – | 596,912 | ||||||||||||
| Investments at Value | $ | 16,734,992 | $ | 596,912 | $ | – | $ | 17,331,904 | ||||||||
| Other Financial Instruments* | ||||||||||||||||
| Futures | 140,444 | – | – | 140,444 | ||||||||||||
| Total Assets | $ | 16,875,436 | $ | 596,912 | $ | – | $ | 17,472,348 | ||||||||
| Liabilities | ||||||||||||||||
| Other Financial Instruments* | ||||||||||||||||
| Futures | (30,360 | ) | – | – | (30,360 | ) | ||||||||||
| Total Liabilities | $ | (30,360 | ) | $ | – | $ | – | $ | (30,360 | ) | ||||||
| * | Other Financial Instruments are derivatives not reflected in the Schedule of Investments, such as futures, which are valued at the unrealized appreciation (depreciation) at year end. |
The Fund utilizes the end of period methodology when determining transfers. There were no transfers among Level 1, Level 2 and Level 3 for the year ended November 30, 2018.
| PORTFOLIO HOLDINGS (Unaudited) | ||||
| % of Total Investments | ||||
| Apparel | 0.4 | % | ||
| Auto & Truck | 13.2 | % | ||
| Biotechnology | 0.4 | % | ||
| Building | 1.1 | % | ||
| Commercial Services | 2.8 | % | ||
| Communications | 2.3 | % | ||
| Computers | 3.0 | % | ||
| Construction Materials | 0.3 | % | ||
| Consumer Services | 3.3 | % | ||
| Cosmetics & Personal Care | 0.4 | % | ||
| Distributors | 0.2 | % | ||
| Electronics | 4.4 | % | ||
| Food | 3.5 | % | ||
| Gaming, Lodging & Restaurants | 0.6 | % | ||
| Health Care | 0.4 | % | ||
| Household | 2.4 | % | ||
| Internet | 1.9 | % | ||
| Leisure | 0.6 | % | ||
| Machinery | 2.1 | % | ||
| Media | 7.2 | % | ||
| Medical | 18.6 | % | ||
| Oil & Gas | 1.5 | % | ||
| Paper & Paper Products | 1.3 | % | ||
| Pollution Control | 3.3 | % | ||
| Real Estate Development & Operations | 0.3 | % | ||
| Recreational Facilities & Services | 0.2 | % | ||
| REIT | 6.9 | % | ||
| Retail | 4.2 | % | ||
| Transportation | 7.0 | % | ||
| Utilities | 2.8 | % | ||
| U.S. Government & Agency Obligations | 3.4 | % | ||
| 100.0 | % | |||
See Notes to Financial Statements.
CVR DYNAMIC ALLOCATION FUND
STATEMENT OF ASSETS AND LIABILITIES
NOVEMBER 30, 2018
| ASSETS | ||||
| Investments, at value (Cost $16,759,228) | $ | 17,331,904 | ||
| Cash | 875,811 | |||
| Deposits with broker | 109,983 | |||
| Receivables: | ||||
| Dividends and interest | 23,313 | |||
| Prepaid expenses | 10,201 | |||
| Total Assets | 18,351,212 | |||
| LIABILITIES | ||||
| Payables: | ||||
| Fund shares redeemed | 39,319 | |||
| Accrued Liabilities: | ||||
| Investment adviser fees | 4,074 | |||
| Fund services fees | 8,382 | |||
| Other expenses | 28,788 | |||
| Total Liabilities | 80,563 | |||
| NET ASSETS | $ | 18,270,649 | ||
| COMPONENTS OF NET ASSETS | ||||
| Paid-in capital | $ | 17,655,415 | ||
| Distributable earnings | 615,234 | |||
| NET ASSETS | $ | 18,270,649 | ||
| SHARES OF BENEFICIAL INTEREST AT NO PAR VALUE (UNLIMITED SHARES AUTHORIZED) | ||||
| Institutional Shares | 1,721,222 | |||
| NET ASSET VALUE, OFFERING AND REDEMPTION PRICE PER SHARE | ||||
| Institutional Shares (based on net assets of $18,270,649) | $ | 10.61 |
See Notes to Financial Statements.
CVR DYNAMIC ALLOCATION FUND
STATEMENT OF OPERATIONS
YEAR ENDED NOVEMBER 30, 2018
| INVESTMENT INCOME | ||||
| Dividend income (Net of foreign withholding taxes of $608) | $ | 303,596 | ||
| Interest income | 21,534 | |||
| Total Investment Income | 325,130 | |||
| EXPENSES | ||||
| Investment adviser fees | 242,073 | |||
| Fund services fees | 136,580 | |||
| Custodian fees | 8,125 | |||
| Registration fees | 14,094 | |||
| Professional fees | 20,333 | |||
| Trustees' fees and expenses | 2,606 | |||
| Other expenses | 50,882 | |||
| Total Expenses | 474,693 | |||
| Fees waived and expenses reimbursed | (112,544 | ) | ||
| Net Expenses | 362,149 | |||
| NET INVESTMENT LOSS | (37,019 | ) | ||
| NET REALIZED AND UNREALIZED GAIN (LOSS) | ||||
| Net realized gain (loss) on: | ||||
| Investments | 186,903 | |||
| Foreign currency transactions | 2,809 | |||
| Futures | (196,196 | ) | ||
| Net realized loss | (6,484 | ) | ||
| Net change in unrealized appreciation (depreciation) on: | ||||
| Investments | (1,327,069 | ) | ||
| Foreign currency translations | (405 | ) | ||
| Futures | 66,289 | |||
| Net change in unrealized appreciation (depreciation) | (1,261,185 | ) | ||
| NET REALIZED AND UNREALIZED LOSS | (1,267,669 | ) | ||
| DECREASE IN NET ASSETS RESULTING FROM OPERATIONS | $ | (1,304,688 | ) |
See Notes to Financial Statements.
CVR DYNAMIC ALLOCATION FUND
STATEMENTS OF CHANGES IN NET ASSETS
| For the Years Ended November 30, | ||||||||
| 2018 | 2017 | |||||||
| OPERATIONS | ||||||||
| Net investment loss | $ | (37,019 | ) | $ | (63,188 | ) | ||
| Net realized gain (loss) | (6,484 | ) | 2,589,000 | |||||
| Net change in unrealized appreciation (depreciation) | (1,261,185 | ) | (359,201 | ) | ||||
| Increase (Decrease) in Net Assets Resulting from Operations | (1,304,688 | ) | 2,166,611 | |||||
| DISTRIBUTIONS TO SHAREHOLDERS FROM | ||||||||
| Institutional Shares | (526,089 | ) | (11,174 | )* | ||||
| Total Distributions to Shareholders | (526,089 | ) | (11,174 | ) | ||||
| CAPITAL SHARE TRANSACTIONS | ||||||||
| Sale of shares: | ||||||||
| Institutional Shares | 2,340,749 | 2,991,622 | ||||||
| Reinvestment of distributions: | ||||||||
| Institutional Shares | 526,089 | 11,174 | ||||||
| Redemption of shares: | ||||||||
| Institutional Shares | (6,494,673 | ) | (790,020 | ) | ||||
| Increase (Decrease) in Net Assets from Capital Share Transactions | (3,627,835 | ) | 2,212,776 | |||||
| Increase (Decrease) in Net Assets | (5,458,612 | ) | 4,368,213 | |||||
| NET ASSETS | ||||||||
| Beginning of Year | 23,729,261 | 19,361,048 | ||||||
| End of Year | $ | 18,270,649 | $ | 23,729,261 | ** | |||
| SHARE TRANSACTIONS | ||||||||
| Sale of shares: | ||||||||
| Institutional Shares | 208,606 | 272,815 | ||||||
| Reinvestment of distributions: | ||||||||
| Institutional Shares | 46,722 | 1,054 | ||||||
| Redemption of shares: | ||||||||
| Institutional Shares | (590,379 | ) | (72,101 | ) | ||||
| Increase (Decrease) in Shares | (335,051 | ) | 201,768 | |||||
| * | Distribution was the result of net realized gains at November 30, 2017. |
| ** | Includes accumulated net investment loss of $(46,428) at November 30, 2017. The requirement to disclose the corresponding amount as of November 30, 2018 was eliminated. |
See Notes to Financial Statements.
CVR DYNAMIC ALLOCATION FUND
FINANCIAL HIGHLIGHTS
These financial highlights reflect selected data for a share outstanding throughout each period.
| For the Years Ended November 30, | December 30, 2013 (a) Through November | |||||||||||||||||||
| 2018 | 2017 | 2016 | 2015 | 30, 2014 | ||||||||||||||||
| INSTITUTIONAL SHARES | ||||||||||||||||||||
| NET ASSET VALUE, Beginning of Period | $ | 11.54 | $ | 10.44 | $ | 10.07 | $ | 10.68 | $ | 10.00 | ||||||||||
| INVESTMENT OPERATIONS | ||||||||||||||||||||
| Net investment loss (b) | (0.02 | ) | (0.03 | ) | (0.02 | ) | (0.04 | ) | (0.07 | ) | ||||||||||
| Net realized and unrealized gain (loss) | (0.65 | ) | 1.14 | 0.39 | (0.50 | ) | 0.68 | |||||||||||||
| Net income from contribution by affiliate | – | – | – | – | 0.07 | |||||||||||||||
| Total from Investment Operations | (0.67 | ) | 1.11 | 0.37 | (0.54 | ) | 0.68 | |||||||||||||
| DISTRIBUTIONS TO SHAREHOLDERS FROM | ||||||||||||||||||||
| Net realized gain | (0.26 | ) | (0.01 | ) | 0.00 | (c) | (0.07 | ) | – | |||||||||||
| Total Distributions to Shareholders | (0.26 | ) | (0.01 | ) | 0.00 | (0.07 | ) | – | ||||||||||||
| NET ASSET VALUE, End of Period | $ | 10.61 | $ | 11.54 | $ | 10.44 | $ | 10.07 | $ | 10.68 | ||||||||||
| TOTAL RETURN | (5.97 | )% | 10.60 | % | 3.71 | % | (5.11 | )% | 6.80 | %(d)(e) | ||||||||||
| RATIOS/SUPPLEMENTARY DATA | ||||||||||||||||||||
| Net Assets at End of Period (000s omitted) | $ | 18,271 | $ | 23,729 | $ | 19,361 | $ | 22,713 | $ | 19,492 | ||||||||||
| Ratios to Average Net Assets: (f) | ||||||||||||||||||||
| Net investment loss | (0.17 | )% | (0.29 | )% | (0.21 | )% | (0.41 | )% | (0.70 | )%(g) | ||||||||||
| Net expenses (h) | 1.65 | % | 1.65 | % | 1.63 | % | 1.52 | % | 1.47 | %(g) | ||||||||||
| Gross expenses (i) | 2.16 | % | 2.24 | % | 2.33 | % | 2.26 | % | 3.14 | %(g) | ||||||||||
| PORTFOLIO TURNOVER RATE | 129 | % | 93 | % | 108 | % | 129 | % | 157 | %(d) | ||||||||||
| (a) | Commencement of operations. |
| (b) | Calculated based on average shares outstanding during each period. |
| (c) | Less than $0.01 per share. |
| (d) | Not annualized. |
| (e) | Calculation includes affiliate reimbursements and gains incurred on the contribution of capital. Excluding the effect of the net reimbursements from the Fund’s ending net asset value per share, total return for the period ending November 30, 2014 would have been 6.10%. |
| (f) | The ratios of expenses and net investment loss to average net assets do not reflect the Fund’s proportionate share of income and expenses of underlying investment companies in which the Fund invests. |
| (g) | Annualized. |
| (h) | Net expenses include reimbursement of indirect fees by the Adviser, such as acquired fund fees and expenses. |
| (i) | Reflects the expense ratio excluding any waivers and/or reimbursements. |
See Notes to Financial Statements.
CVR DYNAMIC ALLOCATION FUND
NOTES TO FINANCIAL STATEMENTS
NOVEMBER 30, 2018
Note 1. Organization
The CVR Dynamic Allocation Fund (the “Fund”) is a diversified portfolio of Forum Funds II (the “Trust”). The Trust is a Delaware statutory trust that is registered as an open-end, management investment company under the Investment Company Act of 1940, as amended (the “Act”). Under its Trust Instrument, the Trust is authorized to issue an unlimited number of the Fund’s shares of beneficial interest without par value. The Fund commenced operations on December 30, 2013. The Fund currently offers two classes of shares: Institutional Shares and Investor Shares. As of November 30, 2018, Investor Shares had not commenced operations. The Fund seeks long-term capital appreciation while preserving capital in declining markets.
Note 2. Summary of Significant Accounting Policies
The Fund is an investment company and follows accounting and reporting guidance under Financial Accounting Standards Board (“FASB”) Accounting Standards Codification (“ASC”) Topic 946, “Financial Services-Investment Companies”. These financial statements are prepared in accordance with accounting principles generally accepted in the United States of America (“GAAP”), which require management to make estimates and assumptions that affect the reported amounts of assets and liabilities, the disclosure of contingent liabilities at the date of the financial statements, and the reported amounts of increases and decreases in net assets from operations during the fiscal year. Actual amounts could differ from those estimates. The following summarizes the significant accounting policies of the Fund:
Security Valuation – Securities are valued at market prices using the last quoted trade or official closing price from the principal exchange where the security is traded, as provided by independent pricing services on each Fund business day. In the absence of a last trade, securities are valued at the mean of the last bid and ask price provided by the pricing service. Futures contracts are valued at the day’s settlement price on the exchange where the contract is traded. Forward currency contracts are generally valued based on interpolation of forward curve data points obtained from major banking institutions that deal in foreign currencies and currency dealers. Shares of non-exchange traded open-end mutual funds are valued at net asset value (“NAV”). Short-term investments that mature in sixty days or less may be valued at amortized cost.
The Fund values its investments at fair value pursuant to procedures adopted by the Trust’s Board of Trustees (the “Board”) if (1) market quotations are not readily available or (2) the Adviser, as defined in Note 4, believes that the values available are unreliable. The Trust’s Valuation Committee, as defined in the Fund’s registration statement, performs certain functions as they relate to the administration and oversight of the Fund’s valuation procedures. Under these procedures, the Valuation Committee convenes on a regular and ad hoc basis to review such investments and considers a number of factors, including valuation methodologies and significant unobservable inputs, when arriving at fair value.
The Valuation Committee may work with the Adviser to provide valuation inputs. In determining fair valuations, inputs may include market-based analytics that may consider related or comparable assets or liabilities, recent transactions, market multiples, book values and other relevant investment information. Adviser inputs may include an income-based approach in which the anticipated future cash flows of the investment are discounted in determining fair value. Discounts may also be applied based on the nature or duration of any restrictions on the disposition of the investments. The Valuation Committee performs regular reviews of valuation methodologies, key inputs and assumptions, disposition analysis and market activity.
Fair valuation is based on subjective factors and, as a result, the fair value price of an investment may differ from the security’s market price and may not be the price at which the asset may be sold. Fair valuation could result in a different NAV than a NAV determined by using market quotes.
GAAP has a three-tier fair value hierarchy. The basis of the tiers is dependent upon the various “inputs” used to determine the value of the Fund’s investments. These inputs are summarized in the three broad levels listed below:
Level 1 - Quoted prices in active markets for identical assets and liabilities.
Level 2 - Prices determined using significant other observable inputs (including quoted prices for similar securities, interest rates, prepayment speeds, credit risk, etc.). Short-term securities with maturities of sixty days or less are valued at amortized cost, which approximates market value, and are categorized as Level 2 in the hierarchy. Municipal securities, long-term U.S. government obligations and corporate debt securities are valued in accordance with the evaluated price supplied by the pricing service and generally categorized as Level 2 in the hierarchy. Other securities that are categorized as Level 2 in the hierarchy include, but are not limited to, warrants
CVR DYNAMIC ALLOCATION FUND
NOTES TO FINANCIAL STATEMENTS
NOVEMBER 30, 2018
that do not trade on an exchange, securities valued at the mean between the last reported bid and ask quotation and international equity securities valued by an independent third party with adjustments for changes in value between the time of the securities respective local market closes and the close of the U.S. market.
Level 3 - Significant unobservable inputs (including the Fund’s own assumptions in determining the fair value of investments).
The aggregate value by input level, as of November 30, 2018, for the Fund’s investments is included in the Fund’s Schedule of Investments.
Security Transactions, Investment Income and Realized Gain and Loss – Investment transactions are accounted for on the trade date. Dividend income is recorded on the ex-dividend date. Foreign dividend income is recorded on the ex-dividend date or as soon as possible after determining the existence of a dividend declaration after exercising reasonable due diligence. Income and capital gains on some foreign securities may be subject to foreign withholding taxes, which are accrued as applicable. Interest income is recorded on an accrual basis. Premium is amortized and discount is accreted using the effective interest method. Identified cost of investments sold is used to determine the gain and loss for both financial statement and federal income tax purposes.
Foreign Currency Translations – Foreign currency amounts are translated into U.S. dollars as follows: (1) assets and liabilities at the rate of exchange at the end of the respective period; and (2) purchases and sales of securities and income and expenses at the rate of exchange prevailing on the dates of such transactions. The portion of the results of operations arising from changes in the exchange rates and the portion due to fluctuations arising from changes in the market prices of securities are not isolated. Such fluctuations are included with the net realized and unrealized gain or loss on investments.
Foreign Currency Transactions – The Fund may enter into transactions to purchase or sell foreign currency contracts and options on foreign currency. Forward currency contracts are agreements to exchange one currency for another at a future date and at a specified price. A fund may use forward currency contracts to facilitate transactions in foreign securities, to manage a fund’s foreign currency exposure and to protect the U.S. dollar value of its underlying portfolio securities against the effect of possible adverse movements in foreign exchange rates. These contracts are intrinsically valued daily based on forward rates, and a fund’s net equity therein, representing unrealized gain or loss on the contracts as measured by the difference between the forward foreign exchange rates at the dates of entry into the contracts and the forward rates at the reporting date, is recorded as a component of NAV. These instruments involve market risk, credit risk, or both kinds of risks, in excess of the amount recognized in the Statement of Assets and Liabilities. Risks arise from the possible inability of counterparties to meet the terms of their contracts and from movement in currency and securities values and interest rates. Due to the risks associated with these transactions, a fund could incur losses up to the entire contract amount, which may exceed the net unrealized value included in its NAV. As of November 30, 2018, the Fund did not hold any forward currency contracts.
Futures Contracts – The Fund may purchase futures contracts to gain exposure to market changes, which may be more efficient or cost effective than actually buying the securities. A futures contract is an agreement between parties to buy or sell a security at a set price on a future date. Upon entering into such a contract, a fund is required to pledge to the broker an amount of cash, U.S. Government obligations or other high-quality debt securities equal to the minimum “initial margin” requirements of the exchange on which the futures contract is traded. Pursuant to the contract, the Fund agrees to receive from or pay to the broker an amount of cash equal to the daily fluctuation in the value of the contract. Such receipts or payments are known as “variation margin” and are recorded by the Fund as unrealized gains or losses. When the contract is closed, the Fund records a realized gain or loss equal to the difference between the value of the contract at the time it was opened and value at the time it was closed. Risks of entering into futures contracts include the possibility that there may be an illiquid market and that a change in the value of the contract may not correlate with changes in the value of the underlying securities.
Notional amounts of each individual futures contract outstanding as of November 30, 2018, for the Fund, are disclosed in the Notes to Schedule of Investments.
Distributions to Shareholders – The Fund declares any dividends from net investment income and pays them annually. Any net capital gains and net foreign currency gains realized by the Fund are distributed at least annually. Distributions to shareholders are recorded on the ex-dividend date. Distributions are based on amounts calculated in accordance with applicable federal income tax regulations, which may differ from GAAP. These differences are due primarily to differing treatments of income and gain on various investment securities held by the Fund, timing differences and differing characterizations of distributions made by the Fund.
On December 14, 2018, the Fund paid a distribution of $0.12162 in long-term capital gains per share related to the year ended November 30, 2018.
CVR DYNAMIC ALLOCATION FUND
NOTES TO FINANCIAL STATEMENTS
NOVEMBER 30, 2018
Federal Taxes – The Fund intends to continue to qualify each year as a regulated investment company under Subchapter M of Chapter 1, Subtitle A, of the Internal Revenue Code of 1986, as amended (“Code”), and to distribute all of its taxable income to shareholders. In addition, by distributing in each calendar year substantially all of its net investment income and capital gains, if any, the Fund will not be subject to a federal excise tax. Therefore, no federal income or excise tax provision is required. The Fund files a U.S. federal income and excise tax return as required. The Fund’s federal income tax returns are subject to examination by the Internal Revenue Service for a period of three fiscal years after they are filed. As of November 30, 2018, there are no uncertain tax positions that would require financial statement recognition, de-recognition or disclosure.
Income and Expense Allocation – The Trust accounts separately for the assets, liabilities and operations of each of its investment portfolios. Expenses that are directly attributable to more than one investment portfolio are allocated among the respective investment portfolios in an equitable manner.
Commitments and Contingencies – In the normal course of business, the Fund enters into contracts that provide general indemnifications by the Fund to the counterparty to the contract. The Fund’s maximum exposure under these arrangements is dependent on future claims that may be made against the Fund and, therefore, cannot be estimated; however, based on experience, the risk of loss from such claims is considered remote. The Fund has determined that none of these arrangements requires disclosure on the Fund’s balance sheet.
Note 3. Cash – Concentration in Uninsured Account
For cash management purposes, the Fund may concentrate cash with the Fund’s custodian. This typically results in cash balances exceeding the Federal Deposit Insurance Corporation (“FDIC”) insurance limits. As of November 30, 2018, the Fund had $625,811 at MUFG Union Bank, N.A. that exceeded the FDIC insurance limit.
Note 4. Fees and Expenses
Investment Adviser – CVR Portfolio Funds LLC (the “Adviser”) is the investment adviser to the Fund. Pursuant to an investment advisory agreement, the Adviser receives an advisory fee, payable monthly, from the Fund at an annual rate of 1.10% of the Fund’s average daily net assets.
The Adviser has employed a sub-adviser to manage a portion of the Fund’s assets. The sub-advisory fee, calculated as a percentage of the Fund’s average daily net assets managed by the sub-adviser, is paid by the Adviser.
Distribution – Foreside Fund Services, LLC serves as the Fund’s distributor (the “Distributor”). The Fund has adopted a Distribution Plan (the “Plan”) in accordance with Rule 12b-1 of the Act. Under the Plan, the Fund may pay the Distributor and/or any other entity as authorized by the Board a fee of up to 0.25% of the Fund’s average daily net assets of Investor Shares for providing distribution and/or shareholder services to the Fund. The Distributor is not affiliated with the Adviser or Atlantic Fund Administration, LLC (d/b/a Atlantic Fund Services) (“Atlantic”) or their affiliates.
Other Service Providers – Atlantic provides fund accounting, fund administration, compliance and transfer agency services to the Fund. The fees related to these services are included in Fund services fees within the Statement of Operations. Atlantic also provides certain shareholder report production and EDGAR conversion and filing services. Pursuant to an Atlantic services agreement, the Fund pays Atlantic customary fees for its services. Atlantic provides a Principal Executive Officer, a Principal Financial Officer, a Chief Compliance Officer and an Anti-Money Laundering Officer to the Fund, as well as certain additional compliance support functions.
Trustees and Officers – The Trust pays each Independent Trustee an annual fee of $16,000 ($21,000 for the Chairman) for service to the Trust. The Independent Trustees and Chairman may receive additional fees for special Board meetings. The Independent Trustees are also reimbursed for all reasonable out-of-pocket expenses incurred in connection with their duties as Trustees, including travel and related expenses incurred in attending Board meetings. The amount of Independent Trustees’ fees attributable to the Fund is disclosed in the Statement of Operations. Certain officers of the Trust are also officers or employees of the above named service providers, and during their terms of office received no compensation from the Fund.
CVR DYNAMIC ALLOCATION FUND
NOTES TO FINANCIAL STATEMENTS
NOVEMBER 30, 2018
Note 5. Expenses Reimbursed and Fees Waived
The Adviser has contractually agreed to waive its fee and/or reimburse Fund expenses to limit Total Annual Fund Operating Expenses After Fee Waiver and/or Expense Reimbursement (excluding all taxes, interest, portfolio transaction expenses, proxy expenses, and extraordinary expenses) to 1.65% of Institutional Shares, through April 1, 2019. Other Fund service providers have voluntarily agreed to waive and reimburse a portion of their fees. These voluntary fee waivers and reimbursements may be reduced or eliminated at any time. For the year ended November 30, 2018, fees waived and expenses reimbursed were as follows:
Investment Adviser Fees Waived | Acquired Fund Fees and Expenses Reimbursed by Adviser | Other Waivers | Total Fees Waived and Expenses Reimbursed | ||||||||||
| $ | 75,856 | $ | 688 | $ | 36,000 | $ | 112,544 | ||||||
The Adviser may be reimbursed by the Fund for fees waived and expenses reimbursed by the Adviser pursuant to the Expense Cap if such payment is approved by the Board, made within three years of the fee waiver or expense reimbursement, and does not cause the Total Annual Fund Operating Expenses After Fee Waiver and/or Expense Reimbursement to exceed the lesser of (i) the then-current expense cap, or (ii) the expense cap in place at the time the fees/expenses were waived/reimbursed. As of November 30, 2018, $259,756 is subject to recapture by the Adviser. Other Waivers are not eligible for recoupment.
Note 6. Security Transactions
The cost of purchases and proceeds from sales of investment securities (including maturities), other than short-term investments, during the year ended November 30, 2018, were $24,754,427 and $28,584,413, respectively.
Note 7. Summary of Derivative Activity
The volume of open derivative positions may vary on a daily basis as the Fund transacts derivative contracts in order to achieve the exposure desired by the Adviser. The notional value of activity for the year ended November 30, 2018, for any derivative type that was held during the year is as follows:
| Futures Contracts | $ | 32,476,768 |
The Fund’s use of derivatives during the year ended November 30, 2018, was limited to futures contracts.
Realized and unrealized gains and losses on derivatives contracts during the year ended November 30, 2018, by the Fund are recorded in the following locations on the Statement of Operations:
| Location: | Commodity Contracts | Currency Contracts | Equity Contracts | Interest Contracts | Total | �� | ||||||||||||||
| Net realized gain (loss) on: | ||||||||||||||||||||
| Futures | $ | 10,614 | $ | (23,563 | ) | $ | (111,889 | ) | $ | (71,358 | ) | $ | (196,196 | ) | ||||||
| Total net realized gain (loss) | $ | 10,614 | $ | (23,563 | ) | $ | (111,889 | ) | $ | (71,358 | ) | $ | (196,196 | ) | ||||||
| Net change in unrealized appreciation (depreciation) on: | ||||||||||||||||||||
| Futures | $ | (5,023 | ) | $ | 98,463 | $ | (22,262 | ) | $ | (4,889 | ) | $ | 66,289 | |||||||
| Total net change in unrealized appreciation (depreciation) | $ | (5,023 | ) | $ | 98,463 | $ | (22,262 | ) | $ | (4,889 | ) | $ | 66,289 | |||||||
Note 8. Federal Income Tax
As of November 30, 2018, cost of investments is $16,803,160 and the components of net unrealized appreciation consist of:
| Gross Unrealized Appreciation | $ | 1,412,117 | ||
| Gross Unrealized Depreciation | (883,373 | ) | ||
| Net Unrealized Appreciation | $ | 528,744 |
CVR DYNAMIC ALLOCATION FUND
NOTES TO FINANCIAL STATEMENTS
NOVEMBER 30, 2018
Distributions paid during the fiscal years ended as noted were characterized for tax purposes as follows:
| 2018 | 2017 | |||||||
| Long-Term Capital Gain | $ | 526,089 | $ | 11,174 | ||||
As of November 30, 2018, distributable earnings (accumulated loss) on a tax basis were as follows:
| Undistributed Long-Term Gain | $ | 144,182 | ||
| Capital and Other Losses | (68,838 | ) | ||
| Unrealized Appreciation | 539,890 | |||
| Total | $ | 615,234 |
The difference between components of distributable earnings on a tax basis and the amounts reflected in the Statement of Assets and Liabilities are primarily due to wash sales, futures, and equity return of capital.
For tax purposes, the current year deferred late year ordinary loss was $68,838 (realized during the period January 1, 2018 through November 30, 2018). This loss will be recognized for tax purposes on the first business day of the Fund’s next fiscal year, December 1, 2018.
On the Statement of Assets and Liabilities, as a result of permanent book to tax differences, certain amounts have been reclassified for the year ended November 30, 2018. The following reclassification was the result of currency gain/loss, futures, equity return of capital, real estate investment trusts (REITs), and net operating loss and has no impact on the net assets of the Fund.
| Distributable Earnings | $ | 125,888 | ||
| Paid-in-Capital | $ | (125,888 | ) |
Note 9. Recent Accounting Pronouncements
In August 2018, the Financial Accounting Standards Board (“FASB”) issued Accounting Standards Update (ASU) No. 2018-13 “Fair Value Measurement (Topic 820): Disclosure Framework – Changes to the Disclosure Requirements for Fair Value Measurement” (“ASU 2018-13”) which includes amendments intended to improve the effectiveness of disclosures in the notes to financial statements. For example, ASU 2018-13 includes additional disclosures regarding the range and weighted average of significant unobservable inputs used to develop Level 3 fair value measurements, and clarifications to the narrative description of measurement uncertainty disclosures. ASU 2018-13 is effective for interim and annual periods beginning after December 15, 2019. Management is currently evaluating the impact that ASU 2018-13 will have on the Fund's financial statements and related disclosures.
In September 2018, the Securities and Exchange Commission released Final Rule 33-10532 captioned “Disclosure Update and Simplification” which is intended to amend certain disclosure requirements that have become redundant, duplicative, overlapping, outdated, or superseded, in light of other Commission disclosure requirements, GAAP, or changes in the information environment. These changes were effective November 5, 2018. These amendments are reflected in the Fund's financial statements for the year ended November 30, 2018.
Note 10. Subsequent Events
Subsequent events occurring after the date of this report through the date these financial statements were issued have been evaluated for potential impact, and the Fund has had no such events.
REPORT OF INDEPENDENT REGISTERED PUBLIC ACCOUNTING FIRM
To the Board of Trustees of Forum Funds II
and the Shareholders of CVR Dynamic Allocation Fund
Opinion on the Financial Statements
We have audited the accompanying statement of assets and liabilities of CVR Dynamic Allocation Fund, a series of shares of beneficial interest in Forum Funds II (the “Fund”), including the schedule of investments, as of November 30, 2018, and the related statement of operations for the year then ended, the statements of changes in net assets for each of the years in the two-year period then ended and the financial highlights for each of the years in the four-year period then ended and for the period from December 30, 2013 (commencement of operations) to November 30, 2014 and the related notes (collectively referred to as the “financial statements”). In our opinion, the financial statements present fairly, in all material respects, the financial position of the Fund as of November 30, 2018, and the results of its operations for the year then ended, the changes in its net assets for each of the years in the two-year period then ended and its financial highlights for each of the years in the four-year period then ended and for the period from December 30, 2013 to November 30, 2014, in conformity with accounting principles generally accepted in the United States of America.
Basis for Opinion
These financial statements are the responsibility of the Fund's management. Our responsibility is to express an opinion on the Fund’s financial statements based on our audits. We are a public accounting firm registered with the Public Company Accounting Oversight Board (United States) (“PCAOB”) and are required to be independent with respect to the Fund in accordance with the U.S. federal securities law and the applicable rules and regulations of the Securities and Exchange Commission and the PCAOB.
We conducted our audits in accordance with the standards of the PCAOB. Those standards require that we plan and perform the audits to obtain reasonable assurance about whether the financial statements are free of material misstatement, whether due to error or fraud. The Fund is not required to have, nor were we engaged to perform, an audit of its internal control over financial reporting. As part of our audits we are required to obtain an understanding of internal control over financial reporting but not for the purpose of expressing an opinion on the effectiveness of the Fund’s internal control over financial reporting. Accordingly, we express no such opinion.
Our audits included performing procedures to assess the risk of material misstatement of the financial statements, whether due to error or fraud, and performing procedures that respond to those risks. Such procedures include examining, on a test basis, evidence regarding the amounts and disclosures in the financial statements. Our procedures included confirmation of securities owned as of November 30, 2018 by correspondence with the custodian and brokers. Our audits also included evaluating the accounting principles used and significant estimates made by management, as well as evaluating the overall presentation of the financial statements. We believe that our audits provide a reasonable basis for our opinion.

BBD, LLP
We have served as the auditor of one or more of the Funds in the Forum Funds II since 2013.
Philadelphia, Pennsylvania
January 24, 2019
CVR DYNAMIC ALLOCATION FUND
ADDITIONAL INFORMATION (Unaudited)
NOVEMBER 30, 2018
Proxy Voting Information
A description of the policies and procedures that the Fund uses to determine how to vote proxies relating to securities held in the Fund’s portfolio is available, without charge and upon request, by calling (855) 328-7691 and on the U.S. Securities and Exchange Commission’s ("SEC") website at www.sec.gov. The Fund’s proxy voting record for the most recent twelve-month period ended June 30 is available, without charge and upon request, by calling (855) 328-7691 and on the SEC’s website at www.sec.gov.
Availability of Quarterly Portfolio Schedules
The Fund files its complete schedule of portfolio holdings with the SEC for the first and third quarters of each fiscal year on Form N-Q. These filings are available, without charge and upon request on the SEC’s website at www.sec.gov or may be reviewed and copied at the SEC’s Public Reference Room in Washington, DC. Information on the operation of the Public Reference Room may be obtained by calling (800) SEC-0330.
Shareholder Expense Example
As a shareholder of the Fund, you incur ongoing costs, including management fees, distribution and/or service (12b-1) fees (for Investor Shares only), and other Fund expenses. This example is intended to help you understand your ongoing costs (in dollars) of investing in the Fund and to compare these costs with the ongoing costs of investing in other mutual funds.
The example is based on an investment of $1,000 invested at the beginning of the period and held for the entire period from June 1, 2018 through November 30, 2018.
Actual Expenses – The first line of the table below provides information about actual account values and actual expenses. You may use the information in this line, together with the amount you invested, to estimate the expenses that you paid over the period. Simply divide your account value by $1,000 (for example, an $8,600 account value divided by $1,000 = 8.6), then multiply the result by the number in the first line under the heading entitled “Expenses Paid During Period” to estimate the expenses you paid on your account during the period.
Hypothetical Example for Comparison Purposes – The second line of the table below provides information about hypothetical account values and hypothetical expenses based on the Fund’s actual expense ratio and an assumed rate of return of 5% per year before expenses, which is not the Fund’s actual return. The hypothetical account values and expenses may not be used to estimate the actual ending account balance or expenses you paid for the period. You may use this information to compare the ongoing costs of investing in the Fund and other funds. To do so, compare this 5% hypothetical example with the 5% hypothetical examples that appear in the shareholder reports of other funds.
Please note that the expenses shown in the table are meant to highlight your ongoing costs only. Therefore, the second line of the table is useful in comparing ongoing costs only and will not help you determine the relative total costs of owning different funds.
Beginning Account Value | Ending Account Value November 30, 2018 | Expenses Paid During Period* | Annualized Expense Ratio* | |||||||||||||
| Institutional Shares | ||||||||||||||||
| Actual | $ | 1,000.00 | $ | 964.54 | $ | 8.13 | 1.65 | % | ||||||||
| Hypothetical (5% return before expenses) | $ | 1,000.00 | $ | 1,016.80 | $ | 8.34 | 1.65 | % | ||||||||
| * | Expenses are equal to the Fund’s annualized expense ratio multiplied by the average account value over the period, multiplied by the number of days in the most recent fiscal half-year (183) divided by 365 to reflect the half-year period. |
Trustees and Officers of the Trust
The Board is responsible for oversight of the management of the Trust’s business affairs and of the exercise of all the Trust’s powers except those reserved for the shareholders. The following table provides information about each Trustee and certain officers of the Trust. Each Trustee and officer holds office until the person resigns, is removed, or is replaced. Unless otherwise noted, the persons have held their principal occupations for more than five years. The address for all Trustees and officers is Three Canal Plaza, Suite 600, Portland,
CVR DYNAMIC ALLOCATION FUND
ADDITIONAL INFORMATION (Unaudited)
NOVEMBER 30, 2018
Maine 04101. The Fund’s Statement of Additional Information includes additional information about the Trustees and is available, without charge and upon request, by calling (855) 328-7691.
| Name and Year of Birth | Position with the Trust | Length of Time Served | Principal Occupation(s) During Past Five Years | Number of Series in Fund By Trustee | Other Held By Trustee During |
| Independent Trustees | |||||
| David Tucker Born: 1958 | Chairman of the Board; Trustee; Chairman, Nominating Committee and Qualified Legal Compliance Committee | Since 2013 | Director, Blue Sky Experience (a charitable endeavor), since 2008; Senior Vice President & General Counsel, American Century Companies (an investment management firm), 1998- 2008. | 1 | Trustee, Forum Funds; Trustee, Forum ETF Trust; Trustee, U.S. Global Investors Funds. |
| Mark D. Moyer Born: 1959 | Trustee; Chairman Audit Committee | Since 2013 | Chief Financial Officer, Freedom House (a NGO advocating political freedom and democracy), since 2017; independent consultant providing interim CFO services, principally to non-profit organizations, 2011-2017; Chief Financial Officer, Institute of International Education (a NGO administering international educational exchange programs), 2008-2011; Chief Financial Officer and Chief Restructuring Officer, Ziff Davis Media Inc. (an integrated media company), 2005-2008; Adjunct Professor of Accounting, Fairfield University from 2009-2012. | 1 | Trustee, Forum Funds; Trustee, Forum ETF Trust; Trustee, U.S. Global Investors Funds. |
| Jennifer Brown-Strabley Born: 1964 | Trustee | Since 2013 | Principal, Portland Global Advisors (a registered investment adviser), 1996- 2010. | 1 | Trustee, Forum Funds; Trustee, Forum ETF Trust; Trustee, U.S. Global Investors Funds. |
| Interested Trustees(1) | |||||
| Stacey E. Hong Born: 1966 | Trustee | Since 2013 | President, Atlantic since 2008. | 1 | Trustee, Forum Funds, Trustee, U.S. Global Investors Funds. |
| John Y. Keffer Born: 1942 | Trustee | Since 2013 | Chairman, Atlantic since 2008; Chairman, Forum Investment Advisors, LLC since 2011; President, Forum Foundation (a charitable organization) since 2005; President, Forum Trust, LLC (a non-depository trust company chartered in the State of Maine) since 1997. | 1 | Trustee Forum ETF Trust; Trustee U.S. Global Investors Funds; Director, Wintergreen Fund, Inc. |
| (1) | Stacey E. Hong and John Y. Keffer are currently treated as an interested persons of the Trust, as defined in the 1940 Act, due to their affiliations with Atlantic. Atlantic and Forum Investment Advisors, LLC are subsidiaries of Forum Holdings Corp. I, a Delaware corporation that is wholly owned by Mr. Keffer. |
CVR DYNAMIC ALLOCATION FUND
ADDITIONAL INFORMATION (Unaudited)
NOVEMBER 30, 2018
Name and Year of Birth | Position with the Trust | Length of Time Served | Principal Occupation(s) During Past 5 Years |
| Officers | |||
| Jessica Chase Born: 1970 | President; Principal Executive Officer | Since 2015 | Senior Vice President, Atlantic since 2008. |
| Karen Shaw Born: 1972 | Treasurer; Principal Financial Officer | Since 2013 | Senior Vice President, Atlantic since 2008. |
| Zachary Tackett Born: 1988 | Vice President; Secretary and Anti- Money Laundering Compliance Officer | Since 2014 | Counsel, Atlantic since 2014; Intern Associate, Coakley & Hyde, PLLC (a general practice law firm), 2010-2013. |
| Timothy Bowden Born: 1969 | Vice President | Since 2013 | Manager, Atlantic since 2008. |
| Michael J. McKeen Born: 1971 | Vice President | Since 2013 | Senior Vice President, Atlantic since 2008. |
| Geoffrey Ney Born: 1975 | Vice President | Since 2013 | Manager, Atlantic since 2013; Senior Fund Accountant, Atlantic, 2008-2013. |
| Todd Proulx Born: 1978 | Vice President | Since 2013 | Manager, Atlantic since 2013; Senior Fund Accountant, Atlantic, 2008-2013. |
| Carlyn Edgar Born: 1963 | Chief Compliance Officer | Since 2013 | Senior Vice President, Atlantic since 2008. |
CVR DYNAMIC ALLOCATION FUND
FOR MORE INFORMATION:
P.O. Box 588
Portland, ME 04112
(855) 328-7691 (toll free)
INVESTMENT ADVISER
CVR Portfolio Funds LLC
One Bromfield Street, Suite 5100
Boston, MA 02108
TRANSFER AGENT
Atlantic Fund Services
P.O. Box 588
Portland, ME 04112
www.atlanticfundservices.com
DISTRIBUTOR
Foreside Fund Services, LLC
Three Canal Plaza, Suite 100
Portland, Maine 04101
www.foreside.com
This report is submitted for the general information of the shareholders of the Fund. It is not authorized for distribution to prospective investors unless preceded or accompanied by an effective prospectus, which includes information regarding the Fund’s risks, objectives, fees and expenses, experience of its management, and other information.
219-ANR-1118
| (a) | As of the end of the period covered by this report, Forum Funds II (the “Registrant”) has adopted a code of ethics, which applies to its Principal Executive Officer and Principal Financial Officer (the “Code of Ethics”). |
| (c) | There have been no amendments to the Registrant’s Code of Ethics during the period covered by this report. |
| (a) | Included as part of report to shareholders under Item 1. |
| (b) | Not applicable. |
| By: | /s/ Jessica Chase | |
| Jessica Chase, Principal Executive Officer | ||
| Date: | January 24, 2019 |
| By: | /s/ Jessica Chase | |
| Jessica Chase, Principal Executive Officer | ||
| Date: | January 24, 2019 |
| By: | /s/ Karen Shaw | |
| Karen Shaw, Principal Financial Officer | ||
| Date: | January 24, 2019 |