
ACUITAS INTERNATIONAL SMALL CAP FUND
ACUITAS US MICROCAP FUND
ANNUAL REPORT
June 30, 2018
TABLE OF CONTENTS
| Acuitas International Small Cap Fund | |
| A Message to Our Shareholders (Unaudited) | 2 |
| Performance Chart and Analysis (Unaudited) | 5 |
| Schedule of Investments | 6 |
| Statement of Assets and Liabilities | 10 |
| Statement of Operations | 11 |
| Statements of Changes in Net Assets | 12 |
| Financial Highlights | 13 |
| Acuitas US Microcap Fund | |
| A Message to Our Shareholders (Unaudited) | 14 |
| Performance Chart and Analysis (Unaudited) | 17 |
| Schedule of Investments | 18 |
| Statement of Assets and Liabilities | 20 |
| Statement of Operations | 21 |
| Statements of Changes in Net Assets | 22 |
| Financial Highlights | 23 |
| Notes to Financial Statements | 24 |
| Report of Independent Registered Public Accounting Firm | 29 |
| Additional Information (Unaudited) | 30 |
ACUITAS INTERNATIONAL SMALL CAP FUND
A MESSAGE TO OUR SHAREHOLDERS (Unaudited)
JUNE 30, 2018
Dear Shareholders:
As of June 30, 2018, the Acuitas International Small Cap Fund’s (the “Fund”) net asset value was $10.17 per share with total net assets at $48.0 million. Year-to-date, the Fund has returned -3.14% net of all fees, compared to -3.59% for the Russell Global ex-US Small Cap Index (the “Index”). This represents 45 basis points of outperformance vs. the Index so far in 2018. Since the July 18, 2014 inception, the Fund has returned 3.12% net of all fees and expenses, underperforming the Index’s 5.05% return by -193 basis points over the same time period. The Fund’s gross expense ratio, gross of any fee or expense waivers is 2.05% for Institutional Shares. For the most recent month-end performance, please call (844) 805-5628.
Performance data quoted represents past performance, which does not guarantee future results. Investment return and principal value will fluctuate, so that an investor’s shares, when redeemed, may be worth more or less than their original cost; and the current performance may be lower or higher than the performance data quoted.
The Acuitas International Small Cap Fund uses a multi-manager structure to invest in publicly traded international small cap companies. We tend to think of small caps as stocks with market caps of $4 billion or less. The Fund invests in equity securities and does not use derivative instruments.
Over the last year we have witnessed a multitude of impactful events affecting non-U.S. markets. We have seen both threats and early actions toward a trade war, oil prices that have risen dramatically and the impact of Fed tightening in the United States. The geopolitical risk represented from tensions between North Korea and the U.S. was perceived to decline after the leaders met and markets appreciated the news, but there has still been little substantial progress regarding formal agreements. The UK continues toward Brexit with pressure mounting on leadership and lack of a formal plan. Meanwhile the ECB is preparing to raise interest rates next year amid the backdrop of an improving economy.
From a sector standpoint, the biggest contributors to the Fund were consumer discretionary, energy and staples. Stock selection was the driver of returns for all three sectors. While the energy index weight is only 4%, the energy sector was up over 20% while the Fund’s energy holdings were up 27% in aggregate.
The greatest detractors from a sector standpoint were health care and producer durables. Again it was stock selection that was most impactful, particularly in producer durables. Producer durables was the largest weight in the Index and impacted the Fund by approximately -262 basis points of underperformance for the year.
Since the beginning of the year, from a country perspective, our zero weight to India was a benefit for the year as India was down around -20%. Stock selection within Japan was positive and added approximately 47 basis points to the Fund’s return. Our overweight to Norway and stock selection within the country added approximately 87 basis points to the Fund’s return. Over the past year, our Norway exposure added approximately 98 basis points to the Fund’s return.
A few of the leaders for the Fund were:
| ● | Round One Corporation – Round One is a Japanese amusement store chain that was the top contributor to the Fund’s performance. The stock was up 94% over the course of the year and added 93 basis points to performance of the Fund. |
| ● | Global Unichip Corp. – Global Unichip is a global fabless design chip service company with headquarters in Taiwan. The stock was up 172% and added 74 basis points to the Fund’s performance. |
| ● | TGS-NOPEC Geophysical Co. ASA – TGS-NOPEC provides multi-client geoscience data to oil and gas exploration and production companies worldwide. The company is based in Norway and the stock was up 65% adding 71 basis points to the Fund’s performance. |
A few of the laggards for the Fund were:
| ● | Blanco Technology Group PLC – Blanco Technology Group is a global provider of mobile device diagnostics and secure data erasure products based in the UK. The stock was down -50% during the year and detracted -63 basis points from Fund performance. It was the most notable detractor for the year. |
ACUITAS INTERNATIONAL SMALL CAP FUND
A MESSAGE TO OUR SHAREHOLDERS (Unaudited)
JUNE 30, 2018
| ● | Daewoo Engineering & Construction Co., Ltd. – Daewoo is a Korean construction company based in Seoul. The stock was down -19% for the year and detracted -34 basis points from the Fund’s performance. |
| ● | ADVA AG Optical Networking – ADVA is a European telecommunications vendor that provides network equipment for data, storage, voice and video services. The company is based in Munich. The stock was down nearly -28% and detracted -31 basis points from Fund performance. |
As of June 30, 2018, the Fund’s sector allocation, as a percentage of common stock, was:
| Acuitas International Small Cap Fund | Russell Global ex-US Small Cap Index | ||
| Producer Durables | 23.4% | 17.4% | |
| Consumer Discretionary | 20.5% | 15.3% | |
| Technology | 14.6% | 12.0% | |
| Materials & Processing | 10.8% | 13.6% | |
| Financial Services | 9.9% | 20.9% | |
| Consumer Staples | 8.2% | 6.9% | |
| Energy | 7.0% | 4.4% | |
| Health Care | 3.7% | 6.8% | |
| Utilities | 0.4% | 2.7% |
As of June 30, 2018, the Fund’s top ten countries, as a percentage of common stock, were:
Acuitas International Small Cap Fund | Russell Global ex-US Small Cap Index | ||
| Japan | 25.8% | 22.9% | |
| United Kingdom | 10.3% | 9.6% | |
| Germany | 9.3% | 2.6% | |
| Australia | 5.8% | 5.4% | |
| Canada | 4.7% | 6.5% | |
| Sweden | 3.9% | 2.2% | |
| France | 3.4% | 1.7% | |
| Austria | 3.2% | 0.5% | |
| South Korea | 3.2% | 4.9% | |
| Norway | 2.9% | 1.4% |
As of June 30, 2018, the 10 largest positions in the Fund, as a percentage of common stock, were:
| Name | Weight | |
| TGS NOPEC Geophysical Co. ASA | 2.4% | |
| Kewpie Corp. | 2.1% | |
| Bakkafrost P/F | 2.1% | |
| WH Smith PLC | 2.0% | |
| CANCOM SE | 1.8% | |
| Mitsui OSK Lines, Ltd. | 1.8% | |
| Siltronic AG | 1.7% | |
| IDP Education, Ltd. | 1.7% | |
| TomTom NV | 1.5% | |
| Costa Group Holdings, Ltd. | 1.4% |
ACUITAS INTERNATIONAL SMALL CAP FUND
A MESSAGE TO OUR SHAREHOLDERS (Unaudited)
JUNE 30, 2018
Uncertainty remains in international markets as the implementation and effects of tariffs and a potential trade war between the U.S. and multiple countries continues to progress. While U.S. markets have been driven higher by tax cuts and low, but rising interest rates, international markets have not fared as well. While oil prices have risen, we have not seen a broader global commodity boom, tempered to a degree by tariffs and trade talk, and would prefer not to see one as those environments can briefly overwhelm the bottom-up stock selection our managers generally employ. While the situation in the U.S. remains positive, we are not entirely insulated by the deteriorating conditions in some parts of the world. Overall, we continue to believe that there are pockets of opportunity within the international landscape with encouraging prospects and we continue to believe that our managers will capitalize on these opportunities through high-quality stock selection.
We thank you for your continued support.
Best Regards,

Christopher Tessin
IMPORTANT RISKS AND DISCLOSURE:
Equity stocks of small-cap companies carry greater risk, and more volatility than equity stocks of larger, more established companies. Foreign securities are more volatile, harder to price and less liquid than U.S. securities; and are subject to different accounting and regulatory standards, and political and economic risks. These risks are enhanced in emerging markets countries. There can be no guarantee that any strategy (risk management or otherwise) will be successful. All investing involves risk, including potential loss of principal.
The views in this report were those of the Fund managers as of June 30, 2018 and may not reflect their views on the date this report is first published or any time thereafter. These views are intended to assist shareholders in understanding their investment in the International Fund and do not constitute investment advice. This letter may contain discussions about certain investments both held and not held in the portfolio. All current and future holdings are subject to risk and to change.
ACUITAS INTERNATIONAL SMALL CAP FUND
PERFORMANCE CHART AND ANALYSIS (Unaudited)
JUNE 30, 2018
The following chart reflects the change in the value of a hypothetical $100,000 investment in Institutional Shares, including reinvested dividends and distributions, in Acuitas International Small Cap Fund (the “Fund”) compared with the performance of the benchmark, Russell Global ex-US Small Cap Index (“Russell Global ex-US”), since inception. The Russell Global ex-US is an unmanaged index that measures the performance of the small cap segment of the global equity market, excluding companies assigned to the US. The total return of the Russell Global ex-US includes the reinvestment of dividends and income. The total return of the Fund includes operating expenses that reduce returns, while the total return of the Russell Global ex-US does not include expenses. The Fund is professionally managed, while the Russell Global ex-US is unmanaged and is not available for investment.
Comparison of Change in Value of a $100,000 Investment
Acuitas International Small Cap Fund vs. Russell Global ex-US Small Cap Index
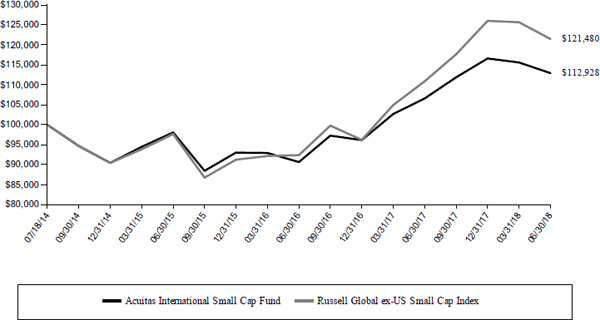
| Average Annual Total Returns Periods Ended June 30, 2018 | One Year | Since Inception 07/18/14 |
| Acuitas International Small Cap Fund | 5.94% | 3.12% |
| Russell Global ex-US Small Cap Index | 9.55% | 5.05% |
Performance data quoted represents past performance and is no guarantee of future results. Current performance may be lower or higher than the performance data quoted. Investment return and principal value will fluctuate so that shares, when redeemed, may be worth more or less than original cost. As stated in the Fund’s prospectus, the annual operating expense ratios (gross) for Institutional and Investor Shares are 2.05% and 2.30%, respectively. However, the Fund’s adviser has contractually agreed to waive its fee and/or reimburse Fund expenses to limit Total Annual Fund Operating Expenses After Fee Waiver and/or Expense Reimbursement (excluding all taxes, interest, portfolio transaction expenses, acquired fund fees and expenses, proxy expenses and extraordinary expenses) to 1.50% and 1.75% for Institutional and Investor Shares, respectively, through November 1, 2018 (the “Expense Cap”). The adviser may be reimbursed by the Fund for fees waived and expenses reimbursed by the adviser pursuant to the Expense Cap if such payment is approved by the Board, made within three years of the fee waiver or expense reimbursement, and does not cause the Total Annual Fund Operating Expenses After Fee Waiver and/or Expense Reimbursement to exceed the lesser of (i) the then-current Expense Cap, or (ii) the Expense Cap in place at the time the fees/expenses were waived/reimbursed. Shares redeemed or exchanged within 60 days of purchase will be charged a 1.00% redemption fee. The performance table and graph do not reflect the deduction of taxes that a shareholder would pay on Fund distributions or the redemption of Fund shares. Returns greater than one year are annualized. For the most recent month-end performance, please call (844) 805-5628.
ACUITAS INTERNATIONAL SMALL CAP FUND
SCHEDULE OF INVESTMENTS
JUNE 30, 2018
| Shares | Security Description | Value | ||||||
| Common Stock - 98.1% | ||||||||
| Australia - 5.9% | ||||||||
| 11,400 | ARB Corp., Ltd. | $ | 192,607 | |||||
| 104,738 | Costa Group Holdings, Ltd. | 639,469 | ||||||
| 74,000 | Greencross, Ltd. | 245,341 | ||||||
| 105,339 | IDP Education, Ltd. | 819,319 | ||||||
| 211,830 | Metals X, Ltd. | 125,412 | ||||||
| 40,423 | SmartGroup Corp., Ltd. | 349,109 | ||||||
| 66,590 | The Star Entertainment Group, Ltd. | 242,950 | ||||||
| 91,660 | Western Areas, Ltd. | 241,485 | ||||||
| 2,855,692 | ||||||||
| Austria - 3.3% | ||||||||
| 16,314 | FACC AG (a) | 305,205 | ||||||
| 7,119 | Oesterreichische Post AG | 325,061 | ||||||
| 16,441 | Palfinger AG | 623,033 | ||||||
| 2,700 | Schoeller-Bleckmann Oilfield Equipment AG | 325,711 | ||||||
| 1,579,010 | ||||||||
| Brazil - 0.2% | ||||||||
| 50,880 | Duratex SA (a) | 114,080 | ||||||
| Canada - 4.8% | ||||||||
| 66,010 | Cardinal Energy, Ltd. | 277,667 | ||||||
| 9,630 | CI Financial Corp. | 173,093 | ||||||
| 14,200 | Intertape Polymer Group, Inc. | 195,181 | ||||||
| 24,100 | Martinrea International, Inc. | 258,479 | ||||||
| 177,970 | Surge Energy, Inc. | 322,191 | ||||||
| 73,870 | TORC Oil & Gas, Ltd. | 412,434 | ||||||
| 167,300 | Trevali Mining Corp. (a) | 114,532 | ||||||
| 68,140 | Western Forest Products, Inc. | 138,908 | ||||||
| 59,110 | Whitecap Resources, Inc. | 400,616 | ||||||
| 2,293,101 | ||||||||
| China - 1.7% | ||||||||
| 70,000 | Beijing Capital International Airport Co., Ltd., Class H | 73,787 | ||||||
| 753,030 | China BlueChemical, Ltd., Class H | 277,386 | ||||||
| 86,000 | China Shineway Pharmaceutical Group, Ltd. | 168,150 | ||||||
| 460,000 | Goodbaby International Holdings, Ltd. | 278,500 | ||||||
| 797,823 | ||||||||
| Cyprus - 0.6% | ||||||||
| 89,500 | Atalaya Mining PLC (a) | 296,475 | ||||||
| Denmark - 1.7% | ||||||||
| 4,690 | Jyske Bank A/S | 257,290 | ||||||
| 1,414 | Rockwool International A/S, Class B | 552,307 | ||||||
| 809,597 | ||||||||
| Faroe Islands - 2.0% | ||||||||
| 17,740 | Bakkafrost P/F | 984,981 | ||||||
| Finland - 2.2% | ||||||||
| 9,000 | Ferratum OYJ | 170,265 | ||||||
| 64,827 | Outotec OYJ (a) | 516,308 | ||||||
| 33,717 | Ramirent OYJ | 358,310 | ||||||
| 1,044,883 | ||||||||
| France - 3.5% | ||||||||
| 5,100 | Akka Technologies | 365,089 | ||||||
| 8,100 | Albioma SA | 182,751 | ||||||
| 3,000 | ESI Group (a) | 157,653 | ||||||
| 15,000 | FIGEAC-AERO (a) | 271,163 | ||||||
| 6,500 | Kaufman & Broad SA | 306,513 | ||||||
| 3,200 | LNA Sante SA | 201,796 | ||||||
| 1,117 | Naturex (a) | 175,838 | ||||||
| 1,660,803 | ||||||||
| Shares | Security Description | Value | ||||||
| Germany - 7.6% | ||||||||
| 8,582 | CANCOM SE | $ | 876,930 | |||||
| 5,077 | CTS Eventim AG & Co. KGaA | 250,082 | ||||||
| 28,043 | Deutz AG | 216,632 | ||||||
| 10,000 | FinTech Group AG (a) | 314,722 | ||||||
| 4,840 | Gerresheimer AG | 392,825 | ||||||
| 12,362 | Hamburger Hafen und Logistik AG | 268,516 | ||||||
| 12,684 | Jenoptik AG | 497,399 | ||||||
| 5,775 | Siltronic AG | 826,483 | ||||||
| 3,643,589 | ||||||||
| Guernsey - 0.6% | ||||||||
| 64,000 | SafeCharge International Group, Ltd. | 299,847 | ||||||
| Hong Kong - 1.5% | ||||||||
| 16,920 | ASM Pacific Technology, Ltd. | 213,937 | ||||||
| 43,000 | Health and Happiness H&H International Holdings, Ltd. (a) | 296,510 | ||||||
| 123,500 | HKBN, Ltd. | 190,155 | ||||||
| 700,602 | ||||||||
| Indonesia - 0.3% | ||||||||
| 311,500 | Semen Indonesia Persero Tbk PT | 154,880 | ||||||
| Ireland - 1.3% | ||||||||
| 99,780 | C&C Group PLC | 377,535 | ||||||
| 141,000 | Hibernia REIT PLC | 246,989 | ||||||
| 624,524 | ||||||||
| Italy - 1.5% | ||||||||
| 2,961 | Biesse SpA | 115,769 | ||||||
| 104,990 | Cairo Communication SpA | 419,930 | ||||||
| 19,840 | Zignago Vetro SpA | 184,890 | ||||||
| 720,589 | ||||||||
| Japan - 26.2% | ||||||||
| 11,300 | ADEKA Corp. | 181,367 | ||||||
| 11,960 | Alps Electric Co., Ltd. | 307,439 | ||||||
| 2,200 | Arakawa Chemical Industries, Ltd. | 35,350 | ||||||
| 5,500 | Arcland Sakamoto Co., Ltd. | 82,663 | ||||||
| 44,000 | Asanuma Corp. | 157,377 | ||||||
| 6,640 | DIC Corp. | 207,509 | ||||||
| 4,300 | Digital Arts, Inc. | 233,031 | ||||||
| 7,300 | Doutor Nichires Holdings Co., Ltd. | 145,057 | ||||||
| 30,700 | eRex Co., Ltd. | 323,041 | ||||||
| 7,400 | FCC Co., Ltd. | 208,870 | ||||||
| 5,500 | FreakOut Holdings inc (a) | 104,819 | ||||||
| 11,555 | Fumakilla, Ltd. | 214,161 | ||||||
| 4,300 | Hakuto Co., Ltd. | 64,083 | ||||||
| 3,700 | Hirata Corp. | 265,682 | ||||||
| 26,500 | Infomart Corp. | 352,328 | ||||||
| 19,500 | Internet Initiative Japan, Inc. | 392,237 | ||||||
| 28,860 | Itoki Corp. | 168,132 | ||||||
| 39,800 | Kewpie Corp. | 1,004,032 | ||||||
| 9,700 | K's Holdings Corp. | 100,842 | ||||||
| 6,100 | Lasertec Corp. | 171,901 | ||||||
| 64,690 | Makino Milling Machine Co., Ltd. | 503,661 | ||||||
| 17,910 | Marui Group Co., Ltd. | 377,563 | ||||||
| 8,600 | Milbon Co., Ltd. | 385,666 | ||||||
| 36,200 | Mitsui OSK Lines, Ltd. | 872,344 | ||||||
| 17,800 | Monex Group, Inc. | 102,895 | ||||||
| 28,820 | Nakano Corp. | 170,762 | ||||||
| 7,100 | Nihon Chouzai Co., Ltd. | 188,666 | ||||||
| 12,600 | Nippo Corp. | 229,888 | ||||||
| 9,900 | Nippon Ceramic Co., Ltd. | 258,152 | ||||||
| 2,800 | Nishio Rent All Co., Ltd. | 89,906 | ||||||
| 48,030 | North Pacific Bank, Ltd. | 160,946 | ||||||
| 56,400 | NTN Corp. | 231,275 | ||||||
| 18,300 | Okamura Corp. | 269,421 | ||||||
See Notes to Financial Statements.
ACUITAS INTERNATIONAL SMALL CAP FUND
SCHEDULE OF INVESTMENTS
JUNE 30, 2018
| Shares | Security Description | Value | ||||||
| Japan - 26.2% (continued) | ||||||||
| 13,900 | Optex Group Co., Ltd. | $ | 389,197 | |||||
| 11,200 | Poletowin Pitcrew Holdings, Inc. | 241,774 | ||||||
| 26,300 | Seikitokyu Kogyo Co., Ltd. | 171,984 | ||||||
| 16,000 | Seino Holdings Co., Ltd. | 283,828 | ||||||
| 15,230 | Shinnihon Corp. | 175,940 | ||||||
| 10,000 | Sun Frontier Fudousan Co., Ltd. | 118,412 | ||||||
| 4,000 | Sun-Wa Technos Corp. | 57,373 | ||||||
| 5,000 | Taiyo Holdings Co., Ltd. | 205,483 | ||||||
| 7,700 | Takaoka Toko Co., Ltd. | 136,453 | ||||||
| 31,600 | The Chiba Bank, Ltd. | 223,482 | ||||||
| 2,800 | The Miyazaki Bank, Ltd. | 85,481 | ||||||
| 3,100 | Uchida Yoko Co., Ltd. | 107,799 | ||||||
| 8,900 | Unipres Corp. | 174,519 | ||||||
| 5,000 | United Arrows, Ltd. | 186,967 | ||||||
| 1,400 | V Technology Co., Ltd. | 258,971 | ||||||
| 14,600 | W-Scope Corp. | 212,179 | ||||||
| 2,000 | Yamaya Corp. | 59,974 | ||||||
| 19,500 | Yonex Co., Ltd. | 120,648 | ||||||
| 6,300 | Yuasa Trading Co., Ltd. | 201,152 | ||||||
| 42,400 | Yumeshin Holdings Co., Ltd. | 444,623 | ||||||
| 14,300 | Zojirushi Corp. | 174,883 | ||||||
| 12,592,188 | ||||||||
| Luxembourg - 0.4% | ||||||||
| 4,906 | Ternium SA, ADR | 170,827 | ||||||
| Malaysia - 0.5% | ||||||||
| 190,900 | Genting Malaysia Bhd | 230,621 | ||||||
| Mexico - 1.7% | ||||||||
| 159,140 | Fibra Uno Administracion SA de CV REIT | 231,976 | ||||||
| 64,000 | Grupo Aeroportuario del Centro Norte SAB de CV | 334,240 | ||||||
| 20,900 | Grupo Comercial Chedraui SA de CV | 48,408 | ||||||
| 132,840 | PLA Administradora Industrial S de RL de CV REIT (a) | 181,265 | ||||||
| 795,889 | ||||||||
| Netherlands - 2.3% | ||||||||
| 12,297 | Intertrust NV (b) | 218,566 | ||||||
| 51,750 | PostNL NV | 194,294 | ||||||
| 78,619 | TomTom NV (a) | 712,272 | ||||||
| 1,125,132 | ||||||||
| New Zealand - 0.6% | ||||||||
| 104,158 | Vista Group International, Ltd. | 270,192 | ||||||
| Norway - 3.3% | ||||||||
| 24,500 | Hoegh LNG Holdings, Ltd. | 135,671 | ||||||
| 10,071 | Norway Royal Salmon ASA | 224,807 | ||||||
| 22,000 | Otello Corp. ASA (a) | 58,347 | ||||||
| 31,297 | TGS NOPEC Geophysical Co. ASA | 1,152,836 | ||||||
| 1,571,661 | ||||||||
| Philippines - 0.5% | ||||||||
| 3,920,500 | Filinvest Land, Inc. | 102,847 | ||||||
| 104,410 | Metropolitan Bank & Trust Co. | 143,602 | ||||||
| 246,449 | ||||||||
| Portugal - 0.4% | ||||||||
| 32,080 | NOS SGPS SA | 175,851 | ||||||
| Singapore - 0.2% | ||||||||
| 9,100 | Venture Corp., Ltd. | 119,152 | ||||||
| South Africa - 0.6% | ||||||||
| 80,000 | Life Healthcare Group Holdings, Ltd. | 145,099 | ||||||
| 23,080 | Truworths International, Ltd. | 129,975 | ||||||
| 275,074 | ||||||||
| Shares | Security Description | Value | ||||||
| South Korea - 3.3% | ||||||||
| 1,076 | Cosmax, Inc. | $ | 156,887 | |||||
| 23,660 | DGB Financial Group, Inc. | 217,600 | ||||||
| 4,971 | F&F Co., Ltd. | 363,960 | ||||||
| 2,624 | Fila Korea, Ltd. | 79,226 | ||||||
| 12,977 | Posco Daewoo Corp. | 249,177 | ||||||
| 9,839 | SFA Engineering Corp. | 289,123 | ||||||
| 1,000 | SK Materials Co., Ltd. | 160,520 | ||||||
| 8,504 | Woongjin Thinkbig Co., Ltd. | 46,621 | ||||||
| 1,563,114 | ||||||||
| Spain - 1.1% | ||||||||
| 31,912 | Ence Energia y Celulosa SA | 283,228 | ||||||
| 155,010 | Unicaja Banco SA (b) | 264,471 | ||||||
| 547,699 | ||||||||
| Sweden - 3.9% | ||||||||
| 6,600 | BioGaia AB | 294,381 | ||||||
| 11,600 | Bulten AB | 135,210 | ||||||
| 30,000 | Humana AB | 203,310 | ||||||
| 20,810 | Husqvarna AB | 197,534 | ||||||
| 22,540 | Nobina AB (b) | 172,635 | ||||||
| 6,257 | Nolato AB | 505,073 | ||||||
| 268,000 | Opus Group AB | 193,892 | ||||||
| 1,483 | Swedish Orphan Biovitrum AB (a) | 32,361 | ||||||
| 5,000 | Troax Group AB | 161,052 | ||||||
| 1,895,448 | ||||||||
| Switzerland - 1.9% | ||||||||
| 3,103 | Bobst Group SA | 318,353 | ||||||
| 1,388 | Kardex AG (a) | 192,579 | ||||||
| 3,720 | Valiant Holding AG | 422,224 | ||||||
| 933,156 | ||||||||
| Taiwan - 2.7% | ||||||||
| 32,020 | Advantech Co., Ltd. | 211,096 | ||||||
| 191,000 | Gigabyte Technology Co., Ltd. | 422,238 | ||||||
| 238,320 | King's Town Bank Co., Ltd. | 255,607 | ||||||
| 86,000 | Kinik Co. | 199,144 | ||||||
| 45,340 | Merry Electronics Co., Ltd. | 197,787 | ||||||
| 1,285,872 | ||||||||
| United Kingdom - 9.8% | ||||||||
| 78,000 | Biffa PLC (b) | 256,322 | ||||||
| 245,893 | boohoo.com plc (a) | 631,186 | ||||||
| 56,300 | Halfords Group PLC | 257,828 | ||||||
| 43,590 | Howden Joinery Group PLC | 308,465 | ||||||
| 107,740 | McCarthy & Stone PLC (b) | 139,488 | ||||||
| 65,140 | Merlin Entertainments PLC (b) | 332,440 | ||||||
| 31,810 | Playtech PLC | 316,119 | ||||||
| 45,000 | Polypipe Group plc | 228,647 | ||||||
| 17,346 | Redde PLC | 40,291 | ||||||
| 49,352 | Safestore Holdings PLC REIT | 357,902 | ||||||
| 3,000 | Stallergenes Greer PLC (a) | 107,554 | ||||||
| 15,880 | Travis Perkins PLC | 298,122 | ||||||
| 37,058 | Tyman PLC | 161,150 | ||||||
| 75,000 | Urban & Civic PLC | 341,486 | ||||||
| 35,067 | WH Smith PLC | 925,131 | ||||||
| 4,702,131 | ||||||||
| Total Common Stock (Cost $45,012,040) | 47,080,932 | |||||||
| Money Market Fund - 0.9% | ||||||||
| 455,259 | BlackRock Liquidity Funds FedFund Portfolio, Institutional Shares, 1.78% (c)(Cost $455,259) | 455,259 | ||||||
| Investments, at value - 99.0% (Cost $45,467,299) | $ | 47,536,191 | ||||||
| Other Assets & Liabilities, Net - 1.0% | 462,823 | |||||||
| Net Assets - 100.0% | $ | 47,999,014 | ||||||
See Notes to Financial Statements.
ACUITAS INTERNATIONAL SMALL CAP FUND
SCHEDULE OF INVESTMENTS
JUNE 30, 2018
| ADR | American Depositary Receipt |
| PLC | Public Limited Company |
| REIT | Real Estate Investment Trust |
| (a) | Non-income producing security. |
| (b) | Security exempt from registration under Rule 144A under the Securities Act of 1933. At the period end, the value of these securities amounted to $1,383,922 or 2.9% of net assets. |
| (c) | Dividend yield changes daily to reflect current market conditions. Rate was the quoted yield as of June 30, 2018. |
The following is a summary of the inputs used to value the Fund's investments as of June 30, 2018.
The inputs or methodology used for valuing securities are not necessarily an indication of the risks associated with investing in those securities. For more information on valuation inputs, and their aggregation into the levels used in the table below, please refer to the Security Valuation section in Note 2 of the accompanying Notes to Financial Statements.
| Level 1 | Level 2 | Level 3 | Total | |||||||||||||
| Investments at Value | ||||||||||||||||
| Common Stock | ||||||||||||||||
| Australia | $ | 2,855,692 | $ | – | $ | – | $ | 2,855,692 | ||||||||
| Austria | 1,579,010 | – | – | 1,579,010 | ||||||||||||
| Brazil | 114,080 | – | – | 114,080 | ||||||||||||
| Canada | 2,293,101 | – | – | 2,293,101 | ||||||||||||
| China | 797,823 | – | – | 797,823 | ||||||||||||
| Cyprus | 296,475 | – | – | 296,475 | ||||||||||||
| Denmark | 809,597 | – | – | 809,597 | ||||||||||||
| Faroe Islands | 984,981 | – | – | 984,981 | ||||||||||||
| Finland | 1,044,883 | – | – | 1,044,883 | ||||||||||||
| France | 1,660,803 | – | – | 1,660,803 | ||||||||||||
| Germany | 3,643,589 | – | – | 3,643,589 | ||||||||||||
| Guernsey | 299,847 | – | – | 299,847 | ||||||||||||
| Hong Kong | 700,602 | – | – | 700,602 | ||||||||||||
| Indonesia | 154,880 | – | – | 154,880 | ||||||||||||
| Ireland | 624,524 | – | – | 624,524 | ||||||||||||
| Italy | 720,589 | – | – | 720,589 | ||||||||||||
| Japan | 12,592,188 | – | – | 12,592,188 | ||||||||||||
| Luxembourg | 170,827 | – | – | 170,827 | ||||||||||||
| Malaysia | 230,621 | – | – | 230,621 | ||||||||||||
| Mexico | 795,889 | – | – | 795,889 | ||||||||||||
| Netherlands | 1,125,132 | – | – | 1,125,132 | ||||||||||||
| New Zealand | 270,192 | – | – | 270,192 | ||||||||||||
| Norway | 1,571,661 | – | – | 1,571,661 | ||||||||||||
| Philippines | 246,449 | – | – | 246,449 | ||||||||||||
| Portugal | 175,851 | – | – | 175,851 | ||||||||||||
| Singapore | 119,152 | – | – | 119,152 | ||||||||||||
| South Africa | 275,074 | – | – | 275,074 | ||||||||||||
| South Korea | 1,563,114 | – | – | 1,563,114 | ||||||||||||
| Spain | 547,699 | – | – | 547,699 | ||||||||||||
| Sweden | 1,895,448 | – | – | 1,895,448 | ||||||||||||
| Switzerland | 933,156 | – | – | 933,156 | ||||||||||||
| Taiwan | 1,285,872 | – | – | 1,285,872 | ||||||||||||
| United Kingdom | 4,702,131 | – | – | 4,702,131 | ||||||||||||
| Money Market Fund | – | 455,259 | – | 455,259 | ||||||||||||
| Investments at Value | $ | 47,080,932 | $ | 455,259 | $ | – | $ | 47,536,191 | ||||||||
The Fund utilizes the end of period methodology when determining transfers. There were no transfers among Level 1, Level 2 and Level 3 for the year ended June 30, 2018.
See Notes to Financial Statements.
ACUITAS INTERNATIONAL SMALL CAP FUND
SCHEDULE OF INVESTMENTS
JUNE 30, 2018
| PORTFOLIO HOLDINGS (Unaudited) | ||||
| % of Total Investments | ||||
| Australia | 6.0 | % | ||
| Austria | 3.3 | % | ||
| Brazil | 0.2 | % | ||
| Canada | 4.8 | % | ||
| China | 1.7 | % | ||
| Cyprus | 0.6 | % | ||
| Denmark | 1.7 | % | ||
| Faroe Islands | 2.1 | % | ||
| Finland | 2.2 | % | ||
| France | 3.5 | % | ||
| Germany | 7.7 | % | ||
| Guernsey | 0.6 | % | ||
| Hong Kong | 1.5 | % | ||
| Indonesia | 0.3 | % | ||
| Ireland | 1.3 | % | ||
| Italy | 1.5 | % | ||
| Japan | 26.5 | % | ||
| Luxembourg | 0.3 | % | ||
| Malaysia | 0.5 | % | ||
| Mexico | 1.7 | % | ||
| Netherlands | 2.4 | % | ||
| New Zealand | 0.6 | % | ||
| Norway | 3.3 | % | ||
| Philippines | 0.5 | % | ||
| Portugal | 0.4 | % | ||
| Singapore | 0.2 | % | ||
| South Africa | 0.6 | % | ||
| South Korea | 3.3 | % | ||
| Spain | 1.1 | % | ||
| Sweden | 4.0 | % | ||
| Switzerland | 2.0 | % | ||
| Taiwan | 2.7 | % | ||
| United Kingdom | 9.9 | % | ||
| Money Market Fund | 1.0 | % | ||
| 100.0 | % | |||
See Notes to Financial Statements.
ACUITAS INTERNATIONAL SMALL CAP FUND
STATEMENT OF ASSETS AND LIABILITIES
JUNE 30, 2018
| ASSETS | ||||
| Investments, at value (Cost $45,467,299) | $ | 47,536,191 | ||
| Foreign currency (Cost $536,108) | 531,057 | |||
| Receivables: | ||||
| Fund shares sold | 85,441 | |||
| Investment securities sold | 4,617,049 | |||
| Dividends | 91,400 | |||
| Prepaid expenses | 17,491 | |||
| Total Assets | 52,878,629 | |||
| LIABILITIES | ||||
| Payables: | ||||
| Investment securities purchased | 4,798,415 | |||
| Accrued Liabilities: | ||||
| Investment adviser fees | 28,679 | |||
| Trustees’ fees and expenses | 159 | |||
| Fund services fees | 11,592 | |||
| Other expenses | 40,770 | |||
| Total Liabilities | 4,879,615 | |||
| NET ASSETS | $ | 47,999,014 | ||
| COMPONENTS OF NET ASSETS | ||||
| Paid-in capital | $ | 46,460,740 | ||
| Distributions in excess of net investment income | (15,461 | ) | ||
| Accumulated net realized loss | (500,003 | ) | ||
| Net unrealized appreciation | 2,053,738 | |||
| NET ASSETS | $ | 47,999,014 | ||
| SHARES OF BENEFICIAL INTEREST AT NO PAR VALUE (UNLIMITED SHARES AUTHORIZED) | ||||
| Institutional Shares | 4,721,206 | |||
| NET ASSET VALUE, OFFERING AND REDEMPTION PRICE PER SHARE* | ||||
| Institutional Shares (based on net assets of $47,999,014) | $ | 10.17 | ||
| * | Shares redeemed or exchanged within 60 days of purchase are charged a 1.00% redemption fee. |
See Notes to Financial Statements.
ACUITAS INTERNATIONAL SMALL CAP FUND
STATEMENT OF OPERATIONS
YEAR ENDED JUNE 30, 2018
| INVESTMENT INCOME | ||||
| Dividend income (Net of foreign withholding taxes of $(149,739)) | $ | 1,125,034 | ||
| Total Investment Income | 1,125,034 | |||
| EXPENSES | ||||
| Investment adviser fees | 594,905 | |||
| Fund services fees | 153,870 | |||
| Shareholder service fees | 49,416 | |||
| Custodian fees | 67,273 | |||
| Registration fees | 19,400 | |||
| Professional fees | 50,029 | |||
| Trustees' fees and expenses | 5,522 | |||
| Other expenses | 45,535 | |||
| Total Expenses | 985,950 | |||
| Fees waived | (240,982 | ) | ||
| Net Expenses | 744,968 | |||
| NET INVESTMENT INCOME | 380,066 | |||
| NET REALIZED AND UNREALIZED GAIN (LOSS) | ||||
| Net realized gain (loss) on: | ||||
| Investments (Net of foreign withholding taxes of $4,722) | 4,768,369 | |||
| Foreign currency transactions | (91,653 | ) | ||
| Net realized gain | 4,676,716 | |||
| Net change in unrealized appreciation (depreciation) on: | ||||
| Investments | (2,306,490 | ) | ||
| Deferred foreign capital gains taxes | 4,394 | |||
| Foreign currency translations | (18,863 | ) | ||
| Net change in unrealized appreciation (depreciation) | (2,320,959 | ) | ||
| NET REALIZED AND UNREALIZED GAIN | 2,355,757 | |||
| INCREASE IN NET ASSETS RESULTING FROM OPERATIONS | $ | 2,735,823 | ||
See Notes to Financial Statements.
ACUITAS INTERNATIONAL SMALL CAP FUND
STATEMENTS OF CHANGES IN NET ASSETS
| For the Years Ended June 30, | ||||||||
| 2018 | 2017 | |||||||
| OPERATIONS | ||||||||
| Net investment income | $ | 380,066 | $ | 402,620 | ||||
| Net realized gain | 4,676,716 | 1,284,928 | ||||||
| Net change in unrealized appreciation (depreciation) | (2,320,959 | ) | 5,528,424 | |||||
| Increase in Net Assets Resulting from Operations | 2,735,823 | 7,215,972 | ||||||
| DISTRIBUTIONS TO SHAREHOLDERS FROM | ||||||||
| Net investment income: | ||||||||
| Institutional Shares | (2,541,258 | ) | (871,425 | ) | ||||
| Total Distributions to Shareholders | (2,541,258 | ) | (871,425 | ) | ||||
| CAPITAL SHARE TRANSACTIONS | ||||||||
| Sale of shares: | ||||||||
| Institutional Shares | 4,867,589 | 4,877,347 | ||||||
| Reinvestment of distributions: | ||||||||
| Institutional Shares | 2,541,258 | 866,120 | ||||||
| Redemption of shares: | ||||||||
| Institutional Shares | (5,944,619 | ) | (8,423,154 | ) | ||||
| Redemption fees: | ||||||||
| Institutional Shares | 43 | 851 | ||||||
| Increase (Decrease) in Net Assets from Capital Share Transactions | 1,464,271 | (2,678,836 | ) | |||||
| Increase in Net Assets | 1,658,836 | 3,665,711 | ||||||
| NET ASSETS | ||||||||
| Beginning of Year | 46,340,178 | 42,674,467 | ||||||
| End of Year (Including line (a)) | $ | 47,999,014 | $ | 46,340,178 | ||||
| SHARE TRANSACTIONS | ||||||||
| Sale of shares: | ||||||||
| Institutional Shares | 459,848 | 512,174 | ||||||
| Reinvestment of distributions: | ||||||||
| Institutional Shares | 242,950 | 95,178 | ||||||
| Redemption of shares: | ||||||||
| Institutional Shares | (566,179 | ) | (882,465 | ) | ||||
| Increase (Decrease) in Shares | 136,619 | (275,113 | ) | |||||
| (a) Undistributed (distributions in excess of ) net investment income | $ | (15,461 | ) | $ | 150,239 | |||
See Notes to Financial Statements.
ACUITAS INTERNATIONAL SMALL CAP FUND
FINANCIAL HIGHLIGHTS
These financial highlights reflect selected data for a share outstanding throughout each period.
| For the Years Ended June 30, | July 18, 2014 (a) Through June 30, 2015 | |||||||||||||||
| 2018 | 2017 | 2016 | ||||||||||||||
| INSTITUTIONAL SHARES | ||||||||||||||||
| NET ASSET VALUE, Beginning of Period | $ | 10.11 | $ | 8.78 | $ | 9.79 | $ | 10.00 | ||||||||
| INVESTMENT OPERATIONS | ||||||||||||||||
| Net investment income (b) | 0.08 | 0.09 | 0.12 | 0.08 | ||||||||||||
| Net realized and unrealized gain (loss) | 0.54 | 1.43 | (0.85 | ) | (0.27 | ) | ||||||||||
| Total from Investment Operations | 0.62 | 1.52 | (0.73 | ) | (0.19 | ) | ||||||||||
| DISTRIBUTIONS TO SHAREHOLDERS FROM | ||||||||||||||||
| Net investment income | (0.56 | ) | (0.19 | ) | (0.28 | ) | (0.02 | ) | ||||||||
| Total Distributions to Shareholders | (0.56 | ) | (0.19 | ) | (0.28 | ) | (0.02 | ) | ||||||||
| REDEMPTION FEES(b) | 0.00 | (c) | 0.00 | (c) | 0.00 | (c) | 0.00 | (c) | ||||||||
| NET ASSET VALUE, End of Period | $ | 10.17 | $ | 10.11 | $ | 8.78 | $ | 9.79 | ||||||||
| TOTAL RETURN | 5.94 | % | 17.57 | % | (7.57 | )% | (1.91 | )%(d) | ||||||||
| RATIOS/SUPPLEMENTARY DATA | ||||||||||||||||
| Net Assets at End of Period (000s omitted) | $ | 47,999 | $ | 46,340 | $ | 42,674 | $ | 46,653 | ||||||||
| Ratios to Average Net Assets: | ||||||||||||||||
| Net investment income | 0.77 | % | 0.91 | % | 1.35 | % | 0.91 | %(e) | ||||||||
| Net expenses | 1.50 | % | 1.50 | % | 1.50 | % | 1.50 | %(e) | ||||||||
| Gross expenses (f) | 1.99 | % | 2.04 | % | 2.15 | % | 2.40 | %(e) | ||||||||
| PORTFOLIO TURNOVER RATE | 144 | % | 105 | % | 104 | % | 112 | %(d) | ||||||||
| (a) | Commencement of operations. |
| (b) | Calculated based on average shares outstanding during each period. |
| (c) | Less than $0.01 per share. |
| (d) | Not annualized. |
| (e) | Annualized. |
| (f) | Reflects the expense ratio excluding any waivers and/or reimbursements. |
See Notes to Financial Statements.
ACUITAS US MICROCAP FUND
A MESSAGE TO OUR SHAREHOLDERS (Unaudited)
JUNE 30, 2018
Dear Shareholders:
As of June 30, 2018, the Acuitas US Microcap Fund’s (the “Fund”) net asset value was $14.17 per share with total net assets at $108.3 million. Calendar year-to-date, the Fund returned 7.11%, compared to 10.71% for the Russell Microcap Index (the “Index”). This represents 360 basis points of underperformance vs. the Index so far in 2018. Since the July 18, 2014 inception, the Fund has returned an annualized 11.54%, outperforming the Index return of 11.25% by 29 basis points over the same time period. The Fund’s gross expense ratio, gross of any fee or expense waivers is 1.87% for Institutional Shares. For the most recent month-end performance, please call (844) 805-5628.
Performance data quoted represents past performance, which does not guarantee future results. Investment return and principal value will fluctuate, so that an investor’s shares, when redeemed, may be worth more or less than their original cost; and the current performance may be lower or higher than the performance data quoted.
The Acuitas US Microcap Fund uses a multi-manager structure to invest in publicly traded domestic microcap companies. We tend to think of microcaps as stocks with market caps of $1 billion or less. The Fund invests in equity securities and does not use derivative instruments.
In June, the Russell Indexes went through their annual reconstitution process. The most obvious effect for Microcap was the decrease in market cap, as the largest names were graduated into the Small Cap Russell 2000 Index. The weighted average market cap at quarter end for the Microcap Index was right around $586 mm, which represents a meaningful decline from before reconstitution.
Domestic economic data continues to remain positive as indications for 2Q GDP were a notable positive jump from an already reasonable 2.0% GDP in the first quarter. Consumer spending in the wake of the tax cuts has been positive and above consensus. In addition, unemployment levels remain incredibly low, dropping to an 18-year low of 3.8% in May and ultimately closing the quarter at 4.0%. An important development in the details of the latest employment report (and cause of the slight increase from 3.8% to 4.0%) is that a number of ‘discouraged workers’, or those who are unemployed and previously stopped their job search, are returning to the job market due to renewed confidence. This causes the labor force participation rate to rise, which has been a goal of new Fed Chairman Jerome Powell. Inflation also continues to steadily climb, as evidenced by increasing oil prices and a six-year high in the Consumer Price Index (+2.9% Y/Y) in June.
From a sector standpoint, the biggest contributors to the Fund over the last 12 months were technology, utilities and consumer staples. Stock selection within technology had the most notable positive impact while the overweight effect was modestly negative. Stock selection within financials was a drag on performance and detracted from the Fund’s relative performance versus the Index. However, the Fund’s underweight to financial services proved to be a modest boost to performance over the last 12 months.
A few of the leaders for the Fund were:
| ● | Addus HomeCare Corp. – Addus is a provider of personal care and assistance with daily living activities for adults. Last year the stock was a detractor from Fund performance, however the stock bounced back over the past year and posted strong earnings each quarter. Overall, Addus gained 54%, adding 147 basis points to the Fund’s returns. |
| ● | Utah Medical Products – Utah is a specialty medical device company with a focus on women and their babies. The company posted strong earnings and had a total return of nearly 52%. Overall the stock added 117 basis points to the Fund’s returns. |
| ● | America’s Car-Mart, Inc. – America’s Car-Mart is an automotive retailer specializing in integrating auto sales and financing in the used car market. The stock was a meaningful weight within the Fund and advanced over 59%, contributing 159 basis points to the Fund’s returns. |
A few of the laggards for the Fund were:
| ● | Atlas Financial Holdings – Atlas provides automobile insurance in the United States with a focus on insurance in the “light” commercial automobile sector. The stock was down -41% on increased claims and revised guidance detracting -94 basis points from performance of the Fund. |
| ● | Horizon Global Corp. – Horizon is a designer, manufacturer and distributor of auto parts. The stock was down -58% during the year detracting -33 basis points from the performance of the Fund. |
ACUITAS US MICROCAP FUND
A MESSAGE TO OUR SHAREHOLDERS (Unaudited)
JUNE 30, 2018
| ● | Enzo Biochem, Inc. - Enzo is a bioscience company that operates in three segments: clinical lab, life sciences and therapeutics. The stock was down -53% during the year detracting -30 basis points from the performance of the Fund. |
As of June 30, 2018, the Fund’s sector allocation, as a percentage of common stock, were:
| Acuitas US Microcap Fund | Russell Microcap® Index | ||
| Health Care | 24.1% | 22.4% | |
| Financial Services | 21.8% | 28.9% | |
| Consumer Discretionary | 16.3% | 12.8% | |
| Producer Durables | 14.8% | 11.5% | |
| Technology | 10.4% | 10.2% | |
| Materials & Processing | 5.8% | 5.3% | |
| Energy | 4.9% | 4.8% | |
| Utilities | 1.0% | 1.8% | |
| Consumer Staples | 0.9% | 2.3% |
As of June 30, 2018, the 10 largest positions in the Fund, as a percentage of common stock, were:
| Name | Weight | |
| Addus HomeCare Corp. | 3.2% | |
| Utah Medical Products, Inc. | 3.0% | |
| Graham Corp. | 2.5% | |
| Winmark Corp. | 2.2% | |
| America's Car-Mart, Inc. | 2.1% | |
| American Software, Inc., Class A | 1.7% | |
| SP Plus Corp. | 1.5% | |
| National Research Corp., Class A | 1.5% | |
| Cass Information Systems, Inc. | 1.5% | |
| UFP Technologies, Inc. | 1.3% |
The strong total returns recently from microcap in the second quarter highlighted the benefit of a microcap allocation within a diversified portfolio. Despite market concerns about tariffs and trade, stocks rose dramatically and microcap was at the head of the pack. Improving forward earnings expectations have led to a more reasonable valuation scenario for the smallest stocks and looking forward, we welcome a measure of volatility as we believe it presents opportunity. The tax cuts have clearly helped drive earnings growth and this has been reflected in the market’s rise. That said, we remain wary that positive total returns will continue with the same regularity of the past few years. While we aren’t calling for recession as every pundit who looks at the nearly inverted yield curve, we do think that the current earnings boom will run out of gas and the market will take a breath. An optimal environment for Acuitas on a relative basis would include a market that rewards quality, shows some volatility and generates flat to down returns. In our view there is higher probability that we will see this within the next few quarters. Regardless of the environment, we look forward to a longer period of time where fundamentals are rewarded and there is greater differentiation between active investment managers as we think this will help drive the relative returns of our Fund.
We thank you for your continued support.
Best Regards,
Christopher Tessin
ACUITAS US MICROCAP FUND
A MESSAGE TO OUR SHAREHOLDERS (Unaudited)
JUNE 30, 2018
IMPORTANT RISKS AND DISCLOSURE:
Equity stocks of microcap companies carry greater risk, and more volatility than equity stocks of larger, more established companies. There can be no guarantee that any strategy (risk management or otherwise) will be successful. All investing involves risk, including potential loss of principal.
The views in this report were those of the Fund managers as of June 30, 2018 and may not reflect their views on the date this report is first published or any time thereafter. These views are intended to assist shareholders in understanding their investment in the International Fund and do not constitute investment advice. This letter may contain discussions about certain investments both held and not held in the portfolio. All current and future holdings are subject to risk and to change.
ACUITAS US MICROCAP FUND
PERFORMANCE CHART AND ANALYSIS (Unaudited)
JUNE 30, 2018
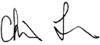
The following chart reflects the change in the value of a hypothetical $100,000 investment in Institutional Shares, including reinvested dividends and distributions, in Acuitas US Microcap Fund (the “Fund”) compared with the performance of the benchmark, Russell Microcap® Index (“Russell Microcap”), since inception. The Russell Microcap is an unmanaged index that measures the performance of the microcap segment of the US equity market, which consists of the smallest 1,000 securities in the Russell 2000® Index and the next 1,000 smallest eligible securities by market capitalization. The total return of the Russell Microcap includes the reinvestment of dividends and income. The total return of the Fund includes operating expenses that reduce returns, while the total return of the Russell Microcap does not include expenses. The Fund is professionally managed, while the Russell Microcap is unmanaged and is not available for investment.
Comparison of Change in Value of a $100,000 Investment
Acuitas US Microcap Fund vs. Russell Microcap Index
| Average Annual Total Returns Periods Ended June 30, 2018 | One Year | Since Inception 07/18/14 |
| Acuitas US Microcap Fund | 16.77% | 11.54% |
| Russell Microcap Index | 20.21% | 11.25% |
Performance data quoted represents past performance and is no guarantee of future results. Current performance may be lower or higher than the performance data quoted. Investment return and principal value will fluctuate so that shares, when redeemed, may be worth more or less than original cost. As stated in the Fund’s prospectus, the annual operating expense ratios (gross) for Institutional and Investor Shares are 1.87% and 2.12%, respectively. However, the Fund’s adviser has contractually agreed to waive its fee and/or reimburse Fund expenses to limit Total Annual Fund Operating Expenses After Fee Waiver and/or Expense Reimbursement (excluding all taxes, interest, portfolio transaction expenses, acquired fund fees and expenses, proxy expenses and extraordinary expenses) to 1.70% and 1.95% for Institutional and Investor Shares, respectively, through November 1, 2018 (the “Expense Cap”). The adviser may be reimbursed by the Fund for fees waived and expenses reimbursed by the adviser pursuant to the Expense Cap if such payment is approved by the Board, made within three years of the fee waiver or expense reimbursement, and does not cause the Total Annual Fund Operating Expenses After Fee Waiver and/or Expense Reimbursement to exceed the lesser of (i) the then-current Expense Cap, or (ii) the Expense Cap in place at the time the fees/expenses were waived/reimbursed. Shares redeemed or exchanged within 60 days of purchase will be charged a 1.00% redemption fee. The performance table and graph do not reflect the deduction of taxes that a shareholder would pay on Fund distributions or the redemption of Fund shares. Returns greater than one year are annualized. For the most recent month-end performance, please call (844) 805-5628.
ACUITAS US MICROCAP FUND
SCHEDULE OF INVESTMENTS
JUNE 30, 2018
| Shares | Security Description | Value | ||||||
| Common Stock - 93.2% | ||||||||
| Consumer Discretionary - 15.9% | ||||||||
| 37,075 | America's Car-Mart, Inc. (a) | $ | 2,294,942 | |||||
| 34,572 | Aspen Group, Inc. (a) | 258,253 | ||||||
| 48,500 | Beazer Homes USA, Inc. (a) | 715,375 | ||||||
| 8,100 | BJ's Restaurants, Inc. | 486,000 | ||||||
| 28,300 | Care.com, Inc. (a) | 590,904 | ||||||
| 26,332 | Carriage Services, Inc. | 646,451 | ||||||
| 56,750 | Chicken Soup For The Soul Entertainment, Inc. (a) | 543,665 | ||||||
| 19,460 | Chuy's Holdings, Inc. (a) | 597,422 | ||||||
| 26,330 | Conn's, Inc. (a) | 868,890 | ||||||
| 21,821 | CRA International, Inc. | 1,110,471 | ||||||
| 24,400 | Crocs, Inc. (a) | 429,684 | ||||||
| 65,625 | Crown Crafts, Inc. | 374,062 | ||||||
| 31,955 | Hemisphere Media Group, Inc. (a) | 418,610 | ||||||
| 34,400 | J. Jill, Inc. (a) | 321,296 | ||||||
| 20,100 | K12, Inc. (a) | 329,037 | ||||||
| 10,400 | Monarch Casino & Resort, Inc. (a) | 458,120 | ||||||
| 43,010 | Motorcar Parts of America, Inc. (a) | 804,717 | ||||||
| 23,100 | Points International, Ltd. (a) | 380,226 | ||||||
| 16,135 | Saga Communications, Inc., Class A | 621,198 | ||||||
| 16,900 | Stoneridge, Inc. (a) | 593,866 | ||||||
| 130,642 | TravelCenters of America, LLC (a) | 457,247 | ||||||
| 23,600 | Vera Bradley, Inc. (a) | 331,344 | ||||||
| 15,878 | William Lyon Homes, Class A (a) | 368,370 | ||||||
| 15,764 | Winmark Corp. | 2,340,166 | ||||||
| 9,100 | Winnebago Industries, Inc. | 369,460 | ||||||
| 19,300 | Zumiez, Inc. (a) | 483,465 | ||||||
| 17,193,241 | ||||||||
| Consumer Staples - 0.9% | ||||||||
| 4,800 | Medifast, Inc. | 768,768 | ||||||
| 7,700 | Seneca Foods Corp., Class A (a) | 207,900 | ||||||
| 976,668 | ||||||||
| Energy - 4.7% | ||||||||
| 135,800 | Abraxas Petroleum Corp. (a) | 392,462 | ||||||
| 9,238 | CONSOL Energy, Inc. (a) | 354,277 | ||||||
| 43,470 | Dawson Geophysical Co. (a) | 343,413 | ||||||
| 57,765 | Natural Gas Services Group, Inc. (a) | 1,363,254 | ||||||
| 67,501 | Newpark Resources, Inc. (a) | 732,386 | ||||||
| 78,000 | Profire Energy, Inc. (a) | 263,640 | ||||||
| 39,100 | SunCoke Energy, Inc. (a) | 523,940 | ||||||
| 33,049 | Unit Corp. (a) | 844,732 | ||||||
| 45,400 | W&T Offshore, Inc. (a) | 324,610 | ||||||
| 5,142,714 | ||||||||
| Financial Services - 17.1% | ||||||||
| 41,100 | Arbor Realty Trust, Inc. REIT | 428,673 | ||||||
| 160,255 | Atlas Financial Holdings, Inc. (a) | 1,402,231 | ||||||
| 13,700 | Berkshire Hills Bancorp, Inc. | 556,220 | ||||||
| 25,326 | Braemar Hotels & Resorts, Inc. REIT | 289,223 | ||||||
| 6,100 | Carolina Financial Corp. | 261,812 | ||||||
| 23,028 | Cass Information Systems, Inc. | 1,584,787 | ||||||
| 19,800 | CatchMark Timber Trust, Inc., Class A REIT | 252,054 | ||||||
| 17,400 | Central Valley Community Bancorp | 368,184 | ||||||
| 29,500 | Crawford & Co., Class B | 255,175 | ||||||
| 3,062 | Diamond Hill Investment Group, Inc. (a) | 595,345 | ||||||
| 17,800 | Enterprise Financial Services Corp. | 960,310 | ||||||
| 49,600 | EZCORP, Inc., Class A (a) | 597,680 | ||||||
| 11,100 | Federal Agricultural Mortgage Corp., Class C | 993,228 | ||||||
| 19,200 | FedNat Holding Co. | 442,944 | ||||||
| 18,500 | Financial Institutions, Inc. | 608,650 | ||||||
| 13,800 | First Defiance Financial Corp. | 925,428 | ||||||
| Shares | Security Description | Value | ||||||
| Financial Services - 17.1% (continued) | ||||||||
| 16,500 | First Internet Bancorp | $ | 562,650 | |||||
| 17,400 | Flushing Financial Corp. | 454,140 | ||||||
| 49,207 | Fortress Transportation & Infrastructure Investors, LLC | 889,171 | ||||||
| 10,200 | FS Bancorp, Inc. | 645,150 | ||||||
| 10,872 | Health Insurance Innovations, Inc., Class A (a) | 351,709 | ||||||
| 29,850 | Horizon Bancorp | 617,597 | ||||||
| 24,700 | Independent Bank Corp. | 629,850 | ||||||
| 34,448 | NMI Holdings, Inc., Class A (a) | 561,502 | ||||||
| 44,500 | OFG Bancorp | 625,225 | ||||||
| 12,500 | Old Line Bancshares, Inc. | 436,375 | ||||||
| 21,200 | Peapack Gladstone Financial Corp. | 733,308 | ||||||
| 9,200 | Preferred Bank/Los Angeles CA | 565,432 | ||||||
| 19,187 | Premier Financial Bancorp, Inc. | 358,221 | ||||||
| 59,540 | Pzena Investment Management, Inc., Class A | 548,363 | ||||||
| 18,500,637 | ||||||||
| Health Care - 23.4% | ||||||||
| 10,315 | Aclaris Therapeutics, Inc. (a) | 205,991 | ||||||
| 60,375 | Addus HomeCare Corp. (a) | 3,456,469 | ||||||
| 26,200 | Adverum Biotechnologies, Inc. (a) | 138,860 | ||||||
| 23,291 | Aldeyra Therapeutics, Inc. (a) | 185,163 | ||||||
| 58,142 | AMAG Pharmaceuticals, Inc. (a) | 1,133,769 | ||||||
| 19,500 | AngioDynamics, Inc. (a) | 433,680 | ||||||
| 152,552 | Antares Pharma, Inc. (a) | 393,584 | ||||||
| 56,448 | Apollo Endosurgery, Inc. (a) | 394,007 | ||||||
| 49,400 | Applied Genetic Technologies Corp. (a) | 182,780 | ||||||
| 31,100 | Ardelyx, Inc. (a) | 115,070 | ||||||
| 31,700 | Arrowhead Pharmaceuticals, Inc. (a) | 431,120 | ||||||
| 41,200 | BioCryst Pharmaceuticals, Inc. (a) | 236,076 | ||||||
| 4,900 | BioSpecifics Technologies Corp. (a) | 219,814 | ||||||
| 28,446 | BioTelemetry, Inc. (a) | 1,280,070 | ||||||
| 27,400 | Calithera Biosciences, Inc. (a) | 137,000 | ||||||
| 8,218 | Cardiovascular Systems, Inc. (a) | 265,770 | ||||||
| 75,638 | Castlight Health, Inc., Class B (a) | 321,461 | ||||||
| 25,400 | ChemoCentryx, Inc. (a) | 334,518 | ||||||
| 10,070 | Clearside Biomedical, Inc. (a) | 107,648 | ||||||
| 12,900 | Concert Pharmaceuticals, Inc. (a) | 217,107 | ||||||
| 118,975 | Cross Country Healthcare, Inc. (a) | 1,338,469 | ||||||
| 45,200 | Enzo Biochem, Inc. (a) | 234,588 | ||||||
| 55,219 | Fortress Biotech, Inc. (a) | 164,553 | ||||||
| 82,400 | Harvard Bioscience, Inc. (a) | 440,840 | ||||||
| 6,800 | IntriCon Corp. (a) | 274,040 | ||||||
| 12,348 | K2M Group Holdings, Inc. (a) | 277,830 | ||||||
| 75,900 | MEI Pharma, Inc. (a) | 299,046 | ||||||
| 28,900 | Melinta Therapeutics, Inc. (a) | 183,515 | ||||||
| 14,896 | Minerva Neurosciences, Inc. (a) | 122,892 | ||||||
| 44,048 | National Research Corp., Class A | 1,647,395 | ||||||
| 88,237 | NeoGenomics, Inc. (a) | 1,156,787 | ||||||
| 53,654 | Neos Therapeutics, Inc. (a) | 335,338 | ||||||
| 29,416 | Nuvectra Corp. (a) | 603,910 | ||||||
| 9,800 | PetIQ, Inc. (a) | 263,228 | ||||||
| 57,076 | Pfenex, Inc. (a) | 308,781 | ||||||
| 36,700 | Progenics Pharmaceuticals, Inc. (a) | 295,068 | ||||||
| 49,400 | RadNet, Inc. (a) | 741,000 | ||||||
| 9,115 | Repligen Corp. (a) | 428,770 | ||||||
| 9,365 | Retrophin, Inc. (a) | 255,290 | ||||||
| 52,447 | SeaSpine Holdings Corp. (a) | 661,881 | ||||||
| 4,320 | Supernus Pharmaceuticals, Inc. (a) | 258,552 | ||||||
| 8,600 | Surmodics, Inc. (a) | 474,720 | ||||||
| 3,800 | The Providence Service Corp. (a) | 298,490 | ||||||
| 29,360 | Utah Medical Products, Inc. | 3,234,004 | ||||||
See Notes to Financial Statements.
ACUITAS US MICROCAP FUND
SCHEDULE OF INVESTMENTS
JUNE 30, 2018
| Shares | Security Description | Value | ||||||
| Health Care - 23.4% (continued) | ||||||||
| 29,000 | Verastem, Inc. (a) | $ | 199,520 | |||||
| 55,790 | ViewRay, Inc. (a) | 386,067 | ||||||
| 11,604 | Viking Therapeutics, Inc. (a) | 110,122 | ||||||
| 10,500 | XOMA Corp. (a) | 219,240 | ||||||
| 25,403,893 | ||||||||
| Materials & Processing - 5.7% | ||||||||
| 26,900 | American Vanguard Corp. | 617,355 | ||||||
| 27,115 | Culp, Inc. | 665,673 | ||||||
| 113,700 | Intrepid Potash, Inc. (a) | 466,170 | ||||||
| 9,323 | KMG Chemicals, Inc. | 687,851 | ||||||
| 8,700 | Koppers Holdings, Inc. (a) | 333,645 | ||||||
| 35,700 | Nexeo Solutions, Inc. (a) | 325,941 | ||||||
| 8,200 | Oil-Dri Corp. of America | 345,548 | ||||||
| 11,100 | Patrick Industries, Inc. (a) | 631,035 | ||||||
| 36,100 | PGT Innovations, Inc. (a) | 752,685 | ||||||
| 25,582 | Quanex Building Products Corp. | 459,197 | ||||||
| 6,624 | U.S.Concrete, Inc. (a) | 347,760 | ||||||
| 24,000 | Verso Corp. (a) | 522,240 | ||||||
| 6,155,100 | ||||||||
| Producer Durables - 14.4% | ||||||||
| 12,900 | ArcBest Corp. | 589,530 | ||||||
| 21,900 | Briggs & Stratton Corp. | 385,659 | ||||||
| 21,500 | CAI International, Inc. (a) | 499,660 | ||||||
| 14,400 | Columbus McKinnon Corp. | 624,384 | ||||||
| 33,800 | Commercial Vehicle Group, Inc. (a) | 248,092 | ||||||
| 15,800 | Covenant Transportation Group, Inc., Class A (a) | 497,700 | ||||||
| 16,400 | Global Brass & Copper Holdings, Inc. | 514,140 | ||||||
| 16,670 | GP Strategies Corp. (a) | 293,392 | ||||||
| 105,134 | Graham Corp. | 2,713,508 | ||||||
| 82,992 | Great Lakes Dredge & Dock Corp. (a) | 435,708 | ||||||
| 24,775 | Kornit Digital, Ltd. (a) | 440,995 | ||||||
| 23,160 | Marlin Business Services Corp. | 691,326 | ||||||
| 18,715 | Marten Transport, Ltd. | 438,867 | ||||||
| 44,610 | SP Plus Corp. (a) | 1,659,492 | ||||||
| 59,740 | Thermon Group Holdings, Inc. (a) | 1,366,254 | ||||||
| 28,600 | Titan Machinery, Inc. (a) | 444,730 | ||||||
| 17,484 | Tutor Perini Corp. (a) | 322,580 | ||||||
| 46,344 | UFP Technologies, Inc. (a) | 1,429,712 | ||||||
| 15,200 | Vectrus, Inc. (a) | 468,464 | ||||||
| 19,026 | Vishay Precision Group, Inc. (a) | 725,842 | ||||||
| 5,600 | VSE Corp. | 267,568 | ||||||
| 52,323 | YRC Worldwide, Inc. (a) | 525,846 | ||||||
| 15,583,449 | ||||||||
| Technology - 10.1% | ||||||||
| 125,705 | American Software, Inc., Class A | 1,831,522 | ||||||
| 25,033 | CalAmp Corp. (a) | 586,523 | ||||||
| 21,534 | Carbonite, Inc. (a) | 751,537 | ||||||
| 111,310 | Clearfield, Inc. (a) | 1,229,976 | ||||||
| 19,400 | Electro Scientific Industries, Inc. (a) | 305,938 | ||||||
| 24,591 | Five9, Inc. (a) | 850,111 | ||||||
| 27,100 | Kimball Electronics, Inc. (a) | 495,930 | ||||||
| 55,478 | Leaf Group, Ltd. (a) | 601,936 | ||||||
| 19,200 | Nova Measuring Instruments, Ltd. (a) | 523,200 | ||||||
| 39,605 | Perficient, Inc. (a) | 1,044,384 | ||||||
| 35,575 | PlayAGS, Inc. (a) | 963,015 | ||||||
| 37,512 | Quantenna Communications, Inc. (a) | 582,936 | ||||||
| 24,300 | Rudolph Technologies, Inc. (a) | 719,280 | ||||||
| 24,900 | Ultra Clean Holdings, Inc. (a) | 413,340 | ||||||
| 10,899,628 | ||||||||
| Shares | Security Description | Value | ||||||
| Utilities - 1.0% | ||||||||
| 115,300 | Atlantic Power Corp. (a) | $ | 253,660 | |||||
| 37,025 | Boingo Wireless, Inc. (a) | 836,395 | ||||||
| 1,090,055 | ||||||||
| Total Common Stock (Cost $80,478,431) | 100,945,385 | |||||||
| Exchange Traded Fund - 4.1% | ||||||||
| 33,960 | iShares Russell 2000 Value ETF (Cost $4,407,465) | 4,480,003 | ||||||
| Money Market Fund - 2.7% | ||||||||
| 2,943,301 | BlackRock Liquidity Funds FedFund Portfolio, Institutional Shares, 1.78% (b) (Cost $2,943,301) | 2,943,301 | ||||||
| Investments, at value - 100.0% (Cost $87,829,197) | $ | 108,368,689 | ||||||
| Other Assets & Liabilities, Net - 0.0% | (29,524 | ) | ||||||
| Net Assets - 100.0% | $ | 108,339,165 | ||||||
| ETF | Exchange Traded Fund |
| LLC | Limited Liability Company |
| REIT | Real Estate Investment Trust |
| (a) | Non-income producing security. |
| (b) | Dividend yield changes daily to reflect current market conditions. Rate was the quoted yield as of June 30, 2018. |
The following is a summary of the inputs used to value the Fund's investments as of June 30, 2018.
The inputs or methodology used for valuing securities are not necessarily an indication of the risks associated with investing in those securities. For more information on valuation inputs, and their aggregation into the levels used in the table below, please refer to the Security Valuation section in Note 2 of the accompanying Notes to Financial Statements.
| Valuation Inputs | Investments in Securities | |||
| Level 1 - Quoted Prices | $ | 105,425,388 | ||
| Level 2 - Other Significant Observable Inputs | 2,943,301 | |||
| Level 3 - Significant Unobservable Inputs | – | |||
| Total | $ | 108,368,689 | ||
The Level 1 value displayed in this table is Common Stock and Exchange Traded Funds. The Level 2 value displayed in this table is a Money Market Fund. Refer to this Schedule of Investments for a further breakout of each security by industry.
The Fund utilizes the end of period methodology when determining transfers. There were no transfers among Level 1, Level 2 and Level 3 for the year ended June 30, 2018.
| PORTFOLIO HOLDINGS (Unaudited) % of Total Investments | ||||
| Consumer Discretionary | 15.9 | % | ||
| Consumer Staples | 0.9 | % | ||
| Energy | 4.7 | % | ||
| Financial Services | 17.1 | % | ||
| Health Care | 23.4 | % | ||
| Materials & Processing | 5.7 | % | ||
| Producer Durables | 14.4 | % | ||
| Technology | 10.1 | % | ||
| Utilities | 1.0 | % | ||
| Exchange Traded Fund | 4.1 | % | ||
| Money Market Fund | 2.7 | % | ||
| 100.0 | % | |||
See Notes to Financial Statements.
ACUITAS US MICROCAP FUND
STATEMENT OF ASSETS AND LIABILITIES
JUNE 30, 2018
| ASSETS | ||||
| Investments, at value (Cost $87,829,197) | $ | 108,368,689 | ||
| Receivables: | ||||
| Fund shares sold | 88,641 | |||
| Investment securities sold | 129,576 | |||
| Dividends | 48,809 | |||
| Prepaid expenses | 18,288 | |||
| Total Assets | 108,654,003 | |||
| LIABILITIES | ||||
| Payables: | ||||
| Investment securities purchased | 136,725 | |||
| Fund shares redeemed | 1,926 | |||
| Accrued Liabilities: | ||||
| Investment adviser fees | 120,818 | |||
| Trustees’ fees and expenses | 351 | |||
| Fund services fees | 14,698 | |||
| Other expenses | 40,320 | |||
| Total Liabilities | 314,838 | |||
| NET ASSETS | $ | 108,339,165 | ||
| COMPONENTS OF NET ASSETS | ||||
| Paid-in capital | $ | 80,224,348 | ||
| Accumulated net investment loss | (47,511 | ) | ||
| Accumulated net realized gain | 7,622,836 | |||
| Net unrealized appreciation | 20,539,492 | |||
| NET ASSETS | $ | 108,339,165 | ||
| SHARES OF BENEFICIAL INTEREST AT NO PAR VALUE (UNLIMITED SHARES AUTHORIZED) | ||||
| Institutional Shares | 7,643,484 | |||
| NET ASSET VALUE, OFFERING AND REDEMPTION PRICE PER SHARE* | ||||
| Institutional Shares (based on net assets of $108,339,165) | $ | 14.17 | ||
| * | Shares redeemed or exchanged within 60 days of purchase are charged a 1.00% redemption fee. |
See Notes to Financial Statements.
ACUITAS US MICROCAP FUND
STATEMENT OF OPERATIONS
YEAR ENDED JUNE 30, 2018
| INVESTMENT INCOME | ||||
| Dividend income (Net of foreign withholding taxes of $(869)) | $ | 779,266 | ||
| Interest income | 31 | |||
| Total Investment Income | 779,297 | |||
| EXPENSES | ||||
| Investment adviser fees | 1,373,461 | |||
| Fund services fees | 187,259 | |||
| Shareholder service fees | 97,465 | |||
| Custodian fees | 20,111 | |||
| Registration fees | 17,682 | |||
| Professional fees | 35,234 | |||
| Trustees' fees and expenses | 5,793 | |||
| Other expenses | 30,159 | |||
| Total Expenses | 1,767,164 | |||
| Fees waived | (99,392 | ) | ||
| Net Expenses | 1,667,772 | |||
| NET INVESTMENT LOSS | (888,475 | ) | ||
| NET REALIZED AND UNREALIZED GAIN (LOSS) | ||||
| Net realized gain on investments | 10,834,970 | |||
| Net change in unrealized appreciation (depreciation) on investments | 5,420,770 | |||
| NET REALIZED AND UNREALIZED GAIN | 16,255,740 | |||
| INCREASE IN NET ASSETS RESULTING FROM OPERATIONS | $ | 15,367,265 | ||
See Notes to Financial Statements.
ACUITAS US MICROCAP FUND
STATEMENTS OF CHANGES IN NET ASSETS
| For the Years Ended June 30, | ||||||||
| 2018 | 2017 | |||||||
| OPERATIONS | ||||||||
| Net investment loss | $ | (888,475 | ) | $ | (616,858 | ) | ||
| Net realized gain | 10,834,970 | 2,584,475 | ||||||
| Net change in unrealized appreciation (depreciation) | 5,420,770 | 13,037,255 | ||||||
| Increase in Net Assets Resulting from Operations | 15,367,265 | 15,004,872 | ||||||
| DISTRIBUTIONS TO SHAREHOLDERS FROM | ||||||||
| Net realized gain: | ||||||||
| Institutional Shares | (3,399,933 | ) | (754,553 | ) | ||||
| Total Distributions to Shareholders | (3,399,933 | ) | (754,553 | ) | ||||
| CAPITAL SHARE TRANSACTIONS | ||||||||
| Sale of shares: | ||||||||
| Institutional Shares | 14,489,617 | 20,667,507 | ||||||
| Reinvestment of distributions: | ||||||||
| Institutional Shares | 3,399,574 | 751,682 | ||||||
| Redemption of shares: | ||||||||
| Institutional Shares | (9,207,906 | ) | (14,136,349 | ) | ||||
| Redemption fees: | ||||||||
| Institutional Shares | 219 | 1,256 | ||||||
| Increase in Net Assets from Capital Share Transactions | 8,681,504 | 7,284,096 | ||||||
| Increase in Net Assets | 20,648,836 | 21,534,415 | ||||||
| NET ASSETS | ||||||||
| Beginning of Year | 87,690,329 | 66,155,914 | ||||||
| End of Year (Including line (a)) | $ | 108,339,165 | $ | 87,690,329 | ||||
| SHARE TRANSACTIONS | ||||||||
| Sale of shares: | ||||||||
| Institutional Shares | 1,094,290 | 1,728,178 | ||||||
| Reinvestment of distributions: | ||||||||
| Institutional Shares | 257,543 | 60,473 | ||||||
| Redemption of shares: | ||||||||
| Institutional Shares | (686,187 | ) | (1,181,991 | ) | ||||
| Increase in Shares | 665,646 | 606,660 | ||||||
| (a) Accumulated net investment loss | $ | (47,511 | ) | $ | (424,621 | ) | ||
See Notes to Financial Statements.
ACUITAS US MICROCAP FUND
FINANCIAL HIGHLIGHTS
These financial highlights reflect selected data for a share outstanding throughout each period.
| For the Years Ended June 30, | July 18, 2014 (a) Through June 30, 2015 | |||||||||||||||
| 2018 | 2017 | 2016 | ||||||||||||||
| INSTITUTIONAL SHARES | ||||||||||||||||
| NET ASSET VALUE, Beginning of Period | $ | 12.57 | $ | 10.38 | $ | 11.27 | $ | 10.00 | ||||||||
| INVESTMENT OPERATIONS | ||||||||||||||||
| Net investment loss (b) | (0.12 | ) | (0.09 | ) | (0.08 | ) | (0.07 | ) | ||||||||
| Net realized and unrealized gain (loss) | 2.19 | 2.39 | (0.41 | ) | 1.34 | |||||||||||
| Total from Investment Operations | 2.07 | 2.30 | (0.49 | ) | 1.27 | |||||||||||
| DISTRIBUTIONS TO SHAREHOLDERS FROM | ||||||||||||||||
| Net realized gain | (0.47 | ) | (0.11 | ) | (0.40 | ) | – | |||||||||
| Total Distributions to Shareholders | (0.47 | ) | (0.11 | ) | (0.40 | ) | – | |||||||||
| REDEMPTION FEES(b) | 0.00 | (c) | 0.00 | (c) | 0.00 | (c) | 0.00 | (c) | ||||||||
| NET ASSET VALUE, End of Period | $ | 14.17 | $ | 12.57 | $ | 10.38 | $ | 11.27 | ||||||||
| TOTAL RETURN | 16.77 | % | 22.21 | % | (4.27 | )% | 12.70 | %(d) | ||||||||
| RATIOS/SUPPLEMENTARY DATA | ||||||||||||||||
| Net Assets at End of Period (000s omitted) | $ | 108,339 | $ | 87,690 | $ | 66,156 | $ | 37,823 | ||||||||
| Ratios to Average Net Assets: | ||||||||||||||||
| Net investment loss | (0.91 | )% | (0.78 | )% | (0.80 | )% | (0.74 | )%(e) | ||||||||
| Net expenses | 1.70 | % | 1.70 | % | 1.70 | % | 1.70 | %(e) | ||||||||
| Gross expenses (f) | 1.80 | % | 1.86 | % | 2.04 | % | 2.37 | %(e) | ||||||||
| PORTFOLIO TURNOVER RATE | 48 | % | 50 | % | 52 | % | 58 | %(d) | ||||||||
| (a) | Commencement of operations. |
| (b) | Calculated based on average shares outstanding during each period. |
| (c) | Less than $0.01 per share. |
| (d) | Not annualized. |
| (e) | Annualized. |
| (f) | Reflects the expense ratio excluding any waivers and/or reimbursements. |
See Notes to Financial Statements.
ACUITAS FUNDS
NOTES TO FINANCIAL STATEMENTS
JUNE 30, 2018
Note 1. Organization
Acuitas International Small Cap Fund and Acuitas US Microcap Fund (individually, a “Fund” and collectively, the “Funds”) are diversified portfolios of Forum Funds II (the “Trust”). The Trust is a Delaware statutory trust that is registered as an open-end, management investment company under the Investment Company Act of 1940, as amended (the “Act”). Under its Trust Instrument, the Trust is authorized to issue an unlimited number of each Fund’s shares of beneficial interest without par value. Each Fund currently offers two classes of shares: Institutional Shares and Investors Shares. As of June 30, 2018, Investor Shares had not commenced operations. Each Fund seeks capital appreciation. Each Fund commenced operations on July 18, 2014.
Note 2. Summary of Significant Accounting Policies
The Funds are investment companies and follow accounting and reporting guidance under Financial Accounting Standards Board (“FASB”) Accounting Standards Codification (“ASC”) Topic 946, “Financial Services-Investment Companies”. These financial statements are prepared in accordance with accounting principles generally accepted in the United States of America (“GAAP”), which require management to make estimates and assumptions that affect the reported amounts of assets and liabilities, the disclosure of contingent liabilities at the date of the financial statements, and the reported amounts of increases and decreases in net assets from operations during the fiscal year. Actual amounts could differ from those estimates. The following summarizes the significant accounting policies of each Fund:
Security Valuation – Securities are valued at market prices using the last quoted trade or official closing price from the principal exchange where the security is traded, as provided by independent pricing services on each Fund business day. In the absence of a last trade, securities are valued at the mean of the last bid and ask price provided by the pricing service. Forward currency contracts are generally valued based on interpolation of forward curve data points obtained from major banking institutions that deal in foreign currencies and currency dealers. Exchange-traded options for which the last quoted sale price is outside the closing bid and ask price, will be valued at the mean of the closing bid and ask price. Shares of non-exchange traded open-end mutual funds are valued at net asset value (“NAV”). Short-term investments that mature in sixty days or less may be valued at amortized cost.
Each Fund values its investments at fair value pursuant to procedures adopted by the Trust’s Board of Trustees (the“Board”) if (1) market quotations are not readily available or (2) the Adviser, as defined in Note 3, believes that the values available are unreliable. The Trust’s Valuation Committee, as defined in each Fund’s registration statement, performs certain functions as they relate to the administration and oversight of each Fund’s valuation procedures. Under these procedures, the Valuation Committee convenes on a regular and ad hoc basis to review such investments and considers a number of factors, including valuation methodologies and significant unobservable inputs, when arriving at fair value.
The Valuation Committee may work with the Adviser to provide valuation inputs. In determining fair valuations, inputs may include market-based analytics that may consider related or comparable assets or liabilities, recent transactions, market multiples, book values and other relevant investment information. Adviser inputs may include an income-based approach in which the anticipated future cash flows of the investment are discounted in determining fair value. Discounts may also be applied based on the nature or duration of any restrictions on the disposition of the investments. The Valuation Committee performs regular reviews of valuation methodologies, key inputs and assumptions, disposition analysis and market activity.
Fair valuation is based on subjective factors and, as a result, the fair value price of an investment may differ from the security’s market price and may not be the price at which the asset may be sold. Fair valuation could result in a different NAV than a NAV determined by using market quotes.
GAAP has a three-tier fair value hierarchy. The basis of the tiers is dependent upon the various “inputs” used to determine the value of each Fund’s investments. These inputs are summarized in the three broad levels listed below:
Level 1 - Quoted prices in active markets for identical assets and liabilities.
Level 2 - Prices determined using significant other observable inputs (including quoted prices for similar securities, interest rates, prepayment speeds, credit risk, etc.). Short-term securities with maturities of sixty days or less are valued at amortized cost, which approximates market value, and are categorized as Level 2 in the hierarchy. Municipal securities, long-term U.S. government obligations and corporate debt securities are valued in accordance with the evaluated price supplied by the pricing service and
ACUITAS FUNDS
NOTES TO FINANCIAL STATEMENTS
JUNE 30, 2018
generally categorized as Level 2 in the hierarchy. Other securities that are categorized as Level 2 in the hierarchy include, but are not limited to, warrants that do not trade on an exchange, securities valued at the mean between the last reported bid and ask quotation and international equity securities valued by an independent third party with adjustments for changes in value between the time of the securities respective local market closes and the close of the U.S. market.
Level 3 - Significant unobservable inputs (including each Fund’s own assumptions in determining the fair value of investments).
The aggregate value by input level, as of June 30, 2018, for each Fund’s investments is included at the end of each Fund’s Schedule of Investments.
Security Transactions, Investment Income and Realized Gain and Loss – Investment transactions are accounted for on the trade date. Dividend income is recorded on the ex-dividend date. Foreign dividend income is recorded on the ex-dividend date or as soon as possible after determining the existence of a dividend declaration after exercising reasonable due diligence. Income and capital gains on some foreign securities may be subject to foreign withholding taxes, which are accrued as applicable. Interest income is recorded on an accrual basis. Premium is amortized and discount is accreted using the effective interest method. Identified cost of investments sold is used to determine the gain and loss for both financial statement and federal income tax purposes.
Foreign Currency Translations – Foreign currency amounts are translated into U.S. dollars as follows: (1) assets and liabilities at the rate of exchange at the end of the respective period; and (2) purchases and sales of securities and income and expenses at the rate of exchange prevailing on the dates of such transactions. The portion of the results of operations arising from changes in the exchange rates and the portion due to fluctuations arising from changes in the market prices of securities are not isolated. Such fluctuations are included with the net realized and unrealized gain or loss on investments.
Foreign Currency Transactions – Each Fund may enter into transactions to purchase or sell foreign currency contracts and options on foreign currency. Forward currency contracts are agreements to exchange one currency for another at a future date and at a specified price. A fund may use forward currency contracts to facilitate transactions in foreign securities, to manage a fund’s foreign currency exposure and to protect the U.S. dollar value of its underlying portfolio securities against the effect of possible adverse movements in foreign exchange rates. These contracts are intrinsically valued daily based on forward rates, and a fund’s net equity therein, representing unrealized gain or loss on the contracts as measured by the difference between the forward foreign exchange rates at the dates of entry into the contracts and the forward rates at the reporting date, is recorded as a component of NAV. These instruments involve market risk, credit risk, or both kinds of risks, in excess of the amount recognized in the Statements of Assets and Liabilities. Risks arise from the possible inability of counterparties to meet the terms of their contracts and from movement in currency and securities values and interest rates. Due to the risks associated with these transactions, a fund could incur losses up to the entire contract amount, which may exceed the net unrealized value included in its NAV.
Distributions to Shareholders – Each Fund declares any dividends from net investment income and pays them annually. Any net capital gains realized by the Funds are distributed at least annually. Distributions to shareholders are recorded on the ex-dividend date. Distributions are based on amounts calculated in accordance with applicable federal income tax regulations, which may differ from GAAP. These differences are due primarily to differing treatments of income and gain on various investment securities held by each Fund, timing differences and differing characterizations of distributions made by each Fund.
Federal Taxes – Each Fund intends to continue to qualify each year as a regulated investment company under Subchapter M of Chapter 1, Subtitle A, of the Internal Revenue Code of 1986, as amended (“Code”), and to distribute all of their taxable income to shareholders. In addition, by distributing in each calendar year substantially all of their net investment income and capital gains, if any, the Funds will not be subject to a federal excise tax. Therefore, no federal income or excise tax provision is required. Each Fund files a U.S. federal income and excise tax return as required. Each Fund’s federal income tax returns are subject to examination by the Internal Revenue Service for a period of three fiscal years after they are filed. As of June 30, 2018, there are no uncertain tax positions that would require financial statement recognition, de-recognition or disclosure.
In addition to the requirements of the Code, the Acuitas International Small Cap Fund may also be subject to capital gains tax in Thailand on gains realized upon sale of Thai securities, payable upon repatriation of sales proceeds. Funds with exposure to Thai securities accrue a deferred liability for unrealized gains based on existing tax rates of the securities. As of June 30, 2018, the Acuitas International Small Cap Fund recorded Thai capital gains tax in the amount of $4,722, which is included in the line item Net realized gain (loss) on investments.
ACUITAS FUNDS
NOTES TO FINANCIAL STATEMENTS
JUNE 30, 2018
Income and Expense Allocation – The Trust accounts separately for the assets, liabilities and operations of each of its investment portfolios. Expenses that are directly attributable to more than one investment portfolio are allocated among the respective investment portfolios in an equitable manner.
Redemption Fees – A shareholder who redeems or exchanges shares within 60 days of purchase will incur a redemption fee of 1.00% of the current NAV of shares redeemed or exchanged, subject to certain limitations. The fee is charged for the benefit of the remaining shareholders and will be paid to each Fund to help offset transaction costs. The fee is accounted for as an addition to paid-in capital. Each Fund reserves the right to modify the terms of or terminate the fee at any time. There are limited exceptions to the imposition of the redemption fee. Redemption fees incurred for the Funds, if any, are reflected on the Statements of Changes in Net Assets.
Commitments and Contingencies – In the normal course of business, each Fund enters into contracts that provide general indemnifications by each Fund to the counterparty to the contract. Each Fund’s maximum exposure under these arrangements is dependent on future claims that may be made against each Fund and, therefore, cannot be estimated; however, based on experience, the risk of loss from such claims is considered remote. Each Fund has determined that none of these arrangements requires disclosure on each Fund’s balance sheet.
Note 3. Fees and Expenses
Investment Adviser – Acuitas Investments, LLC (the “Adviser”) is the investment adviser to the Funds. Pursuant to an investment advisory agreement, the Adviser receives an advisory fee, payable monthly, at an annual rate of 1.20% and 1.40% of the average daily net assets of Acuitas International Small Cap Fund and Acuitas US Microcap Fund, respectively.
Each sub-advisory fee, calculated as a percentage of each Fund’s average daily net assets managed by each subadviser, is paid by the Adviser.
Distribution – Foreside Fund Services, LLC serves as each Fund’s distributor (the “Distributor”). The Funds have adopted a Distribution Plan (the “Plan”) in accordance with Rule 12b-1 of the Act. Under the Plan, each Fund may pay the Distributor and/ or any other entity as authorized by the Board a fee of up to 0.25% of each Fund’s average daily net assets The Distributor is not affiliated with the Adviser or Atlantic Fund Administration, LLC (d/b/a Atlantic Fund Services) (“Atlantic”) or their affiliates.
Other Service Providers – Atlantic provides fund accounting, fund administration, compliance and transfer agency services to each Fund. The fees related to these services are included in Fund services fees within the Statements of Operations. Atlantic also provides certain shareholder report production and EDGAR conversion and filing services. Pursuant to an Atlantic services agreement, each Fund pays Atlantic customary fees for its services. Atlantic provides a Principal Executive Officer, a Principal Financial Officer, a Chief Compliance Officer and an Anti-Money Laundering Officer to each Fund, as well as certain additional compliance support functions.
Trustees and Officers – The Trust pays each Independent Trustee an annual fee of $16,000 ($21,000 for the Chairman) for service to the Trust. The Independent Trustees and Chairman may receive additional fees for special Board meetings. The Independent Trustees are also reimbursed for all reasonable out-of-pocket expenses incurred in connection with their duties as Trustees, including travel and related expenses incurred in attending Board meetings. The amount of Independent Trustees’ fees attributable to each Fund is disclosed in the Statements of Operations. Certain officers of the Trust are also officers or employees of the above named service providers, and during their terms of office received no compensation from each Fund.
Note 4. Expense Reimbursement and Fees Waived
The Adviser has contractually agreed to waive its fee and/or reimburse expenses to limit total annual fund operating expenses (excluding all taxes, interest, portfolio transaction expenses, acquired fund fees and expenses, proxy expenses and extraordinary expenses) of Institutional Shares to 1.50% and Investor Shares to 1.75% through November 1, 2018, for Acuitas International Small Cap Fund. The Adviser has also contractually agreed to waive its fees and/or reimburse expenses to limit total annual operating expenses (excluding all taxes, interest, portfolio transaction expenses, acquired fund fees and expenses, proxy expenses and extraordinary expenses) of Institutional Shares to 1.70% and Investor Shares to 1.95% through November 1, 2018, for Acuitas US Microcap Fund. Other fund service providers have voluntarily agreed to waive a portion of their fees. Voluntary fee waivers
ACUITAS FUNDS
NOTES TO FINANCIAL STATEMENTS
JUNE 30, 2018
may be reduced or eliminated at any time. For the year ended June 30, 2018, the fees waived and/or reimbursed expenses were as follows:
Investment Adviser Fees Waived | Other Waivers | Total Fees Waived and Expenses Reimbursed | ||||||||||
| Acuitas International Small Cap Fund | $ | 228,607 | $ | 12,375 | $ | 240,982 | ||||||
| Acuitas US Microcap Fund | 82,163 | 17,229 | 99,392 | |||||||||
Each Fund may repay the adviser for fees waived and expenses reimbursed pursuant to the expense cap if such payment (1) is made within three years of the fee waiver or expense reimbursement (2) is approved by the Board and (3) does not cause the net annual fund operating expenses of each Fund class to exceed the expense cap in place at the time the fees were waived. As of June 30, 2018, $699,001 and $310,835 are subject to recapture by the adviser for the Acuitas International Small Cap Fund and the Acuitas US Microcap Fund, respectively.
Note 5. Security Transactions
The cost of purchases and proceeds from sales of investment securities (including maturities), other than short-term investments during the year ended June 30, 2018, were as follows:
| Purchases | Sales | |||||||
| Acuitas International Small Cap Fund | $ | 69,083,674 | $ | 69,691,748 | ||||
| Acuitas US Microcap Fund | 49,581,518 | 45,982,969 | ||||||
Note 6. Federal Income Tax
As of June 30, 2018, the cost for federal income tax purposes and the components of net unrealized appreciation (depreciation) were as follows:
| Tax Cost of Investments | Gross Unrealized Appreciation | Gross Unrealized Depreciation | Net Unrealized Appreciation | |||||||||||||
| Acuitas International Small Cap Fund | $ | 46,215,463 | $ | 3,937,066 | $ | (2,616,338 | ) | $ | 1,320,728 | |||||||
| Acuitas US Microcap Fund | 88,176,231 | 25,276,607 | (5,084,149 | ) | 20,192,458 | |||||||||||
Distributions paid during the fiscal years ended as noted were characterized for tax purposes as follows:
| Ordinary Income | Long-Term Capital Gain | Total | |||||||||||
| Acuitas International Small Cap Fund | |||||||||||||
| 2018 | $ | 2,541,258 | $ | – | $ | 2,541,258 | |||||||
| 2017 | 871,425 | – | 871,425 | ||||||||||
| Acuitas US Microcap Fund | |||||||||||||
| 2018 | – | 3,399,933 | 3,399,933 | ||||||||||
| 2017 | – | 754,553 | 754,553 | ||||||||||
As of June 30, 2018, distributable earnings (accumulated loss) on a tax basis were as follows:
| Undistributed Ordinary Income | Undistributed Long-Term Gain | Capital and Other Losses | Unrealized Appreciation | Total | ||||||||||||||||
| Acuitas International Small Cap Fund | $ | 532,926 | $ | – | $ | (301,763 | ) | $ | 1,307,111 | $ | 1,538,274 | |||||||||
| Acuitas US Microcap Fund | 335,697 | 7,586,662 | – | 20,192,458 | 28,114,817 | |||||||||||||||
The difference between components of distributable earnings on a tax basis and the amounts reflected in the Statements of Assets and Liabilities are primarily due to currency contracts, investments in passive foreign investment companies (“PFIC”) and wash sales in the Acuitas International Small Cap Fund and investments in PFICs, equity return of capital, partnerships, real estate investment trusts and wash sales in the Acuitas US Microcap Fund.
ACUITAS FUNDS
NOTES TO FINANCIAL STATEMENTS
JUNE 30, 2018
As of June 30, 2018, the Acuitas International Small Cap Fund and Acuitas US Microcap Fund had $301,763 and $0, respectively, of available short-term capital loss carryforwards and $0 and $0, respectively of available long-term capital loss carryforwards that have no expiration date.
On the Statements of Assets and Liabilities, as a result of permanent book to tax differences, certain amounts have been reclassified for the year ended June 30, 2018. The following reclassifications were the result of currency gains and losses and investments in PFICs in the Acuitas International Small Cap Fund and net investment loss offsetting short-term capital gains, REIT distributions, partnership distributions, K-1 income/(loss) and equity return of capital in the Acuitas US Microcap Fund and have no impact on the net assets of each Fund.
Undistributed Net Investment Income | Accumulated Net Realized Loss | Paid-in-Capital | ||||||||||
| Acuitas International Small Cap Fund | $ | 1,995,492 | $ | (1,995,494 | ) | $ | 2 | |||||
| Acuitas US Microcap Fund | 1,265,585 | (1,265,585 | ) | – | ||||||||
Note 7. Subsequent Events
Subsequent events occurring after the date of this report through the date these financial statements were issued have been evaluated for potential impact, and each Fund has had no such events.
REPORT OF INDEPENDENT REGISTERED PUBLIC ACCOUNTING FIRM
To the Board of Trustees of Forum Funds II
and the Shareholders of Acuitas International Small Cap Fund
and Acuitas US Microcap Fund
Opinion on the Financial Statements
We have audited the accompanying statements of assets and liabilities of Acuitas International Small Cap Fund and Acuitas US Microcap Fund, each a series of shares of beneficial interest in Forum Funds II (the “Funds”), including the schedules of investments, as of June 30, 2018, and the related statements of operations for the year then ended, the statements of changes in net assets for each of the years in the two-year period then ended and the financial highlights for each of the years in the three-year period then ended and for the period from July 18, 2014 (commencement of operations) through June 30, 2015, and the related notes (collectively referred to as the “financial statements”). In our opinion, the financial statements present fairly, in all material respects, the financial position of the Funds as of June 30, 2018, and the results of their operations for the year then ended, the changes in their net assets for each of the years in the two-year period then ended and their financial highlights for each of the years in the three-year period then ended and for the period July 18, 2014 through June 30, 2015, in conformity with accounting principles generally accepted in the United States of America.
Basis for Opinion
These financial statements are the responsibility of the Funds' management. Our responsibility is to express an opinion on the Funds’ financial statements based on our audits. We are a public accounting firm registered with the Public Company Accounting Oversight Board (United States) (“PCAOB”) and are required to be independent with respect to the Funds in accordance with the U.S. federal securities law and the applicable rules and regulations of the Securities and Exchange Commission and the PCAOB.
We conducted our audits in accordance with the standards of the PCAOB. Those standards require that we plan and perform the audits to obtain reasonable assurance about whether the financial statements are free of material misstatement, whether due to error or fraud. The Funds are not required to have, nor were we engaged to perform, an audit of their internal control over financial reporting. As part of our audits we are required to obtain an understanding of internal control over financial reporting but not for the purpose of expressing an opinion on the effectiveness of the Funds’ internal control over financial reporting. Accordingly, we express no such opinion.
Our audits included performing procedures to assess the risk of material misstatement of those financial statements, whether due to error or fraud, and performing procedures that respond to those risks. Such procedures included examining, on a test basis, evidence regarding the amounts and disclosures in the financial statements. Our procedures included confirmation of securities owned as of June 30, 2018 by correspondence with the custodian and brokers, or by other appropriate auditing procedures where replies from brokers were not received. Our audits also included evaluating the accounting principles used and significant estimates made by management, as well as evaluating the overall presentation of the financial statements. We believe that our audits provide a reasonable basis for our opinion.
BBD, LLP
We have served as the auditor of one or more of the Funds in the Forum Funds II since 2013.
Philadelphia, Pennsylvania
August 22, 2018
ACUITAS FUNDS
ADDITIONAL INFORMATION (Unaudited)
JUNE 30, 2018
Investment Advisory Agreement Approval
At the June 15, 2018 Board meeting (the “June meeting”), the Board, including the Independent Trustees, met in person and considered the approval of the continuance of the investment advisory agreement between Acuitas Investments, LLC (the “Adviser”) and the Trust pertaining to the Funds (the “Advisory Agreement”) and the subadvisory agreements between the Adviser and each of Advisory Research, Inc., Algert Global, LLC, ClariVest Asset Management, LLC, DePrince, Race, & Zollo, Inc. and Falcon Point Capital, LLC (each a “Subadviser”) (the “Subadvisory Agreements”).
In preparation for the June meeting, the Board was presented with a range of information to assist in its deliberations. The Board requested and reviewed written responses from the Adviser and each Subadviser to a letter circulated on the Board's behalf concerning the personnel, operations, financial condition, performance, compensation, and services provided to the Funds by the Adviser and each of the respective Subadvisers. During its deliberations, the Board received an oral presentation from the Adviser and discussed the materials with the Adviser, independent legal counsel to the Independent Trustees (“Independent Legal Counsel”), and, as necessary, with the Trust's administrator, Atlantic Fund Services. The Independent Trustees also met in executive session with Independent Legal Counsel while deliberating.
At the June meeting, the Board reviewed, among other matters, the topics discussed below.
Nature, Extent and Quality of Services
Based on written materials received and the presentation from personnel of the Adviser regarding the operations of the Adviser and each Subadviser, the Board considered the quality of services provided by the Adviser under the Advisory Agreement and by each Subadviser under the respective Subadvisory Agreement. In this regard, the Board considered information regarding the experience, qualifications and professional background of the portfolio managers and other personnel at the Adviser and each Subadviser with principal responsibility for the Funds’ investments; the investment philosophy and decision-making process of the Adviser’s and Subadvisers’ investment professionals; the quality of the Adviser’s and Subadvisers’ services with respect to regulatory compliance; and the Adviser’s and each Subadviser’s representations that each firm is in stable financial condition to allow each firm to provide quality advisory services to the Funds.
The Board also considered the Adviser’s analysis of and recommendation to approve the continuance of the Subadvisory Agreements with the Subadvisers. The Board concluded that, overall, it was satisfied with the nature, extent and quality of services provided to the Funds by the Adviser under the Advisory Agreement and by each Subadviser under the respective Subadvisory Agreements.
Performance
In connection with a presentation by the Adviser regarding its approach to managing the Funds, including the investment objective and strategy of each Fund and the Adviser’s discussion of the performance of each of the Subadvisers, the Board reviewed the performance of the Microcap Fund and International Small Cap Fund compared to their respective benchmarks. The Board observed that the Microcap Fund underperformed the Russell Microcap Index, the Microcap Fund’s primary benchmark index, for the one-year period ended March 31, 2018, and outperformed the index for the three-year period ended March 31, 2018, and for the period since the Microcap Fund’s inception on July 18, 2014. The Board observed that the International Small Cap Fund underperformed the Russell Global ex-US Small Cap Index, the International Small Cap Fund’s primary benchmark index, for the one- and three-year periods ended March 31, 2018, and for the period since the International Small Cap Fund’s inception on July 18, 2014. The Board also considered the Funds’ performance relative to independent peer groups of funds identified by Broadridge Financial Solutions, Inc. (“Broadridge”) as having characteristics similar to those of the respective Funds. Based on information presented by Broadridge, the Board observed that the Microcap Fund outperformed the median of its Broadridge peers for the one- and three-year periods ended March 31, 2018. The Board observed that the International Small Cap Fund underperformed the median of its Broadridge peers for the one- and three-year periods ended March 31, 2018.
The Board noted the Adviser’s representation that the International Small Cap Fund’s underperformance relative to the benchmark index and peer group could be attributed, in part, to poor stock selection and the International Small Cap Fund’s value bias in a market environment that favored growth managers over the past several years. The Board also noted the Adviser’s representation that, despite the International Small Cap Fund’s short-term underperformance, the Adviser remained confident in all of its subadvisers and the performance of the Fund going forward.. The Board noted the Adviser’s representation that the Microcap
ACUITAS FUNDS
ADDITIONAL INFORMATION (Unaudited)
JUNE 30, 2018
Fund’s underperformance relative to the benchmark index over the one-year period could be attributed, in part, to the Microcap Fund’s sector allocations, which detracted from performance overall for the one-year period. With respect to the Microcap Fund’s performance relative to the Broadridge peers, the Board also noted the Adviser’s representation that the Microcap Fund’s Broadridge peer group was not an optimal representation of the Microcap Fund’s investment strategy because the funds within the peer group were heavily weighted toward small cap managers. At the request of the Adviser, the Board then reviewed performance of the Microcap Fund compared to that of a group of peer funds identified by the Adviser as being a more optimal comparison to the Microcap Fund (“Comparable Funds”). The Board observed that the Microcap Fund’s performance was more closely aligned with the performance of the respective Comparable Funds than the performance of the respective Broadridge peer group for the one-year period ended March 31, 2018.
The Board also evaluated the Adviser's assessment of each Subadviser’s performance. The Board acknowledged the Adviser’s representation that the different Subadvisers could be expected to achieve different performance results in light of the differences in their strategies, allocated assets, and market environment. In this regard, the Board noted that the Adviser emphasized its responsibility for allocating each Fund’s assets among Subadvisers on an ongoing basis in order to achieve the applicable Fund’s investment objective. In view of the respective roles of the Adviser and Subadvisers, the Board determined that it was appropriate to evaluate the individual performance achieved by each Subadviser as it contributed to the performance of the Fund as a whole. Based on the foregoing, among other applicable considerations, the Board concluded that each Fund and their respective shareholders could benefit from the Adviser’s management under the Advisory Agreement.
Compensation
The Board evaluated the Adviser’s compensation for providing advisory services to the Funds and analyzed comparative information on actual advisory fee rates and actual total expenses of the Funds’ Broadridge peers. The Board noted that, based on the information provided by Broadridge, the actual advisory fee for the International Small Cap Fund was less than the median of its Broadridge peers and the actual total expenses were higher than the median of the Broadridge peers. The Board observed that, based on the information provided by Broadridge, the actual advisory fee and actual total expenses for the Microcap Fund were each higher than the median of its Broadridge peers. The Board noted the Adviser’s representation that the Microcap Fund’s Broadridge peers are heavily weighted toward small cap managers, which offer lower fees than microcap managers, which could account for some of the variance in the fee and expense comparison. With respect to the International Small Cap Fund’s peers, the Board noted the Adviser’s representation that many of the Broadridge peers identified tended to have much greater assets under management than the International Small Cap Fund, which afforded those peers greater opportunity to achieve economies of scale and offer reduced fees and expenses. Finally, the Board noted the Adviser’s representation that several of the funds listed in the respective Broadridge peer groups did not operate pursuant to a multi-manager structure and that, unlike the peers in the Broadridge peer group, the Adviser paid each of the Subadvisers directly from the advisory fee paid to the Adviser such that the fees and expenses of the Broadridge peers were not directly comparable. Based on the foregoing and other applicable considerations, the Board concluded that the Adviser’s advisory fee rate charged to each Fund appeared to be reasonable in light of the nature, extent and quality of services provided by the Adviser.
Cost of Services and Profitability
The Board considered information provided by the Adviser regarding the costs of services and its profitability with respect to the Funds. In this regard, the Board considered the Adviser’s resources devoted to the Funds, as well as the Adviser’s discussion of the aggregate costs and profitability of its mutual fund activity, including the percentage and amount of the Adviser’s fee that the Adviser retained and the percentage and amount of the Adviser’s fee that was paid to the Subadvisers. The Board noted that the Adviser does not maintain separate profit and loss data by account, making it difficult to assess costs incurred specific to providing services to the Funds. The Board did note the Adviser’s representation that the operation of the Funds was more complex from a compliance and oversight perspective and drew more resources than the firm’s other business but that the Adviser is currently capturing a small profit from each Fund. Based on these and other applicable considerations, the Board concluded that the Adviser’s profits attributable to management of the Funds did not appear unreasonably high in light of the nature, extent and quality of the services provided by the Adviser. The Board also noted the Adviser’s representation that the Adviser continues to pay its subadvisers directly from the Adviser’s advisory fees and that the Adviser continued to subsidize the operation of the Funds by waiving its advisory fee and reimbursing expenses to the extent necessary to keep the Funds’ total expense ratios at competitive levels.
ACUITAS FUNDS
ADDITIONAL INFORMATION (Unaudited)
JUNE 30, 2018
The Board did not consider information regarding the costs of services provided or profits realized by the Subadvisers from their relationships with the Funds, noting instead the arms-length nature of the relationship between the Adviser and each Subadviser with respect to the negotiation of the subadvisory fee rate on behalf of the Funds and that the Adviser, and not the Funds, was responsible for paying the subadvisory fee due under each Subadvisory Agreement.
Economies of Scale
The Board considered whether the Funds are benefitting, or would benefit in the future, from any economies of scale. In this respect, the Board noted the Adviser’s representation that the Funds were benefitting from expenses subsidized by the Adviser. The Board noted the Adviser’s representation that, although the Funds could continue to benefit from economies of scale as assets grow, the Adviser was not proposing breakpoints in the advisory fee at this time. Based on the foregoing representations and the size of the Funds, the Board concluded that economies of scale were not a material factor in approving the continuation of the Advisory Agreement.
Other Benefits
The Board noted the Adviser’s representation that, aside from its contractual advisory fees, it does not benefit in a material way from its relationship with the Funds. Based on the foregoing representation, the Board concluded that other benefits received by the Adviser from its relationship with the Funds were not a material factor in approving the continuation of the Advisory Agreement.
Conclusion
The Board did not identify any single factor as being of paramount importance, and different Trustees may have given different weight to different factors. In addition, various materials provided to and discussed with the Board throughout the year, including with respect to performance and compliance, also informed the Board’s decision. In light of the fact that the Funds are multi-manager Funds, however, for which the Adviser identifies Subadvisers whose strategies it seeks to combine to achieve the Funds’ investment objectives, when considering the renewal of the Subadvisory Agreements, the Board gave significant weight to the Adviser’s recommendation that the Subadvisory Agreements be renewed and to the Adviser’s representation that the reappointment of the Subadvisers would positively contribute to the Adviser’s successful execution of each Fund’s overall strategy. The Board reviewed a memorandum from Independent Legal Counsel discussing the legal standards applicable to its consideration of the Advisory Agreement and each Subadvisory Agreement. Based on its review, including consideration of each of the factors referenced above, the Board, in the exercise of its reasonable business judgment, approved the continuation of the Advisory Agreement and each Subadvisory Agreement.
Acuitas Microcap Fund (the “Fund”) – Quantum Capital Management
At the June 15, 2018 Board meeting (the “June meeting”), the Board, including the Independent Trustees, met in person and considered the approval of a new investment subadvisory agreement between Acuitas Investments, LLC (“Adviser”) and Quantum Capital Management (“Subadviser”) pertaining to the Fund (the “Subadvisory Agreement”). The Subadvisory Agreement was being considered in connection with the anticipated termination of a subadvisory agreement between the Adviser and WCM Investment Management (“WCM”) due to WCM no longer offering a microcap strategy appropriate for its respective portion of the Microcap Fund (the “Sleeve”). In preparation for its deliberations, the Board requested and reviewed written responses from the Subadviser to a due diligence questionnaire circulated on the Board's behalf concerning the Subadviser’s personnel, operations, financial condition, performance, compensation, and services to be provided to the Sleeve by the Subadviser. The Board also discussed the materials with Fund/Trustee Counsel and, as necessary, with the Trust's administrator, Atlantic Fund Services. During its deliberations, the Board received an oral presentation from the Adviser and Subadviser and was assisted by the advice of Fund/Trustee Counsel.
Nature, Extent and Quality of Services
The Board received a presentation from senior representatives of the Subadviser and the Adviser and discussed the Subadviser’s personnel, operations and financial condition. In this context, the Board considered the adequacy of the Subadviser’s resources and the quality of services to be provided by the Subadviser under the Subadvisory Agreement. The Board reviewed information regarding the experience, qualifications and professional background of the portfolio managers and other personnel at the Subadviser who would have responsibility for the Sleeve. The Board considered the investment philosophy and decision-making processes of
ACUITAS FUNDS
ADDITIONAL INFORMATION (Unaudited)
JUNE 30, 2018
those professionals and the capability and integrity of the Subadviser’s senior management and staff. The Board also evaluated the anticipated quality of the Subadviser’s services with respect to regulatory compliance and compliance with client investment policies and restrictions. In addition, the Board took into consideration the Adviser’s recommendation with respect to the Subadviser. The Board noted the Subadviser’s representation that it is financially stable and able to provide investment advisory services to the Fund. The Board concluded that, overall, it was satisfied with the nature, extent, and quality of services to be provided to the Fund by the Subadviser under the Subadvisory Agreement.
Costs of Services and Profitability
The Board noted that the Adviser, and not the Fund, was responsible for paying the subadvisory fees due under the Subadvisory Agreement. The Board considered information regarding the costs of services provided or profits to be realized by the Subadviser from its relationship with the Fund, but emphasized the arm’s-length nature of the relationship between the Adviser and the Subadviser with respect to the negotiation of the subadvisory fee rate that would apply. The Board concluded that the Subadviser’s profitability was not a material factor in determining whether or not to approve the Subadvisory Agreement.
Performance
Recognizing that the Subadviser was new and had not yet managed any portion of the Fund, the Board evaluated the Adviser’s assessment of the Subadviser’s historical performance in managing a strategy similar to the one to be employed for the Sleeve, noting the Adviser had expressed satisfaction with the performance of the Subadviser and that the Adviser had recommended the approval of the Subadvisory Agreement. Based on the Adviser’s evaluation of the Subadviser’s performance and other relevant facts and circumstances, the Board concluded that the Subadviser’s management of the Sleeve could benefit the Fund and its shareholders.
Compensation
The Board reviewed the Subadviser’s proposed compensation for providing subadvisory services to the Fund and noted that the subadvisory fee received by the Subadviser would be the same as the subadvisory fee received by WCM. The Board considered information regarding the proposed compensation to be paid to the Subadviser as a result of its relationship with the Fund, and also noted the arm’s-length nature of the relationship between the Adviser and the Subadviser with respect to the negotiation of the subadvisory fee rate that would apply to the Subadviser. As a result, the Board concluded that the proposed compensation for providing subadvisory services to the Fund was not a material factor in considering the approval of the Subadvisory Agreement.
Economies of Scale
The Board considered whether the Fund would benefit from any economies of scale with respect to the Subadvisory Agreement. The Board noted that because the Adviser, and not the Fund, pays the subadvisory fee, shareholders would not benefit from any economies of scale in the form of breakpoints in the subadvisory fee rate. Based on the foregoing information and other materials presented, the Board concluded that economies of scale were not a material factor in approving the Subadvisory Agreement.
Other Benefits
The Board noted the Subadviser’s representation that, aside from its contractual subadvisory fees, it does not benefit in a material way from its relationship with the Fund. As a result, other benefits accrued by the Subadviser were not a material factor in approving the Subadvisory Agreement.
Conclusion
The Board did not identify any single factor as being of paramount importance, and different Trustees may have given different weight to different factors; however, in light of the fact that the Fund is a multi-manager Fund for which the Adviser identifies subadvisers whose strategies it seeks to combine to achieve the Fund’s investment objective, the Board gave significant weight to the Adviser’s recommendation that the Subadviser be appointed as a subadviser to the Fund and to the Adviser’s representation that the appointment of the Subadviser would positively contribute to the Adviser successfully executing the overall strategy of the Fund. Based on its review, including consideration of each of the factors referenced above, the Board (including a majority of the Independent Trustees) determined, in the exercise of its reasonable business judgment, that the subadvisory arrangement, as
ACUITAS FUNDS
ADDITIONAL INFORMATION (Unaudited)
JUNE 30, 2018
outlined in the Subadvisory Agreement, was fair and reasonable in light of the services to be performed, expenses to be incurred by the Fund and such other matters as the Board considered relevant.
Acuitas Microcap Fund (the “Fund”) – AltraVue Capital, LLC
At the June 15, 2018 Board meeting (the “June meeting”), the Board, including the Independent Trustees, met in person and considered the approval of a new investment subadvisory agreement between Acuitas Investments, LLC (“Adviser”) and AltraVue Capital, LLC (“Subadviser”) pertaining to the Fund (the “Subadvisory Agreement”). The Subadvisory Agreement was being considered in connection with the anticipated termination of a subadvisory agreement between the Adviser and WCM Investment Management (“WCM”) due to WCM no longer offering a microcap strategy appropriate for its respective portion of the Microcap Fund (the “Sleeve”). In preparation for its deliberations, the Board requested and reviewed written responses from the Subadviser to a due diligence questionnaire circulated on the Board's behalf concerning the Subadviser’s personnel, operations, financial condition, performance, compensation, and services to be provided to the Sleeve by the Subadviser. The Board also discussed the materials with Fund/Trustee Counsel and, as necessary, with the Trust's administrator, Atlantic Fund Services. During its deliberations, the Board received an oral presentation from the Adviser and Subadviser and was assisted by the advice of Fund/Trustee Counsel.
Nature, Extent and Quality of Services
The Board received a presentation from senior representatives of the Subadviser and the Adviser and discussed the Subadviser’s personnel, operations and financial condition. In this context, the Board considered the adequacy of the Subadviser’s resources and the quality of services to be provided by the Subadviser under the Subadvisory Agreement. The Board reviewed information regarding the experience, qualifications and professional background of the portfolio managers and other personnel at the Subadviser who would have responsibility for the Sleeve. The Board considered the investment philosophy and decision-making processes of those professionals and the capability and integrity of the Subadviser’s senior management and staff. The Board also evaluated the anticipated quality of the Subadviser’s services with respect to regulatory compliance and compliance with client investment policies and restrictions. In addition, the Board took into consideration the Adviser’s recommendation with respect to the Subadviser. The Board noted the Subadviser’s representation that it is financially stable and able to provide investment advisory services to the Fund. The Board concluded that, overall, it was satisfied with the nature, extent, and quality of services to be provided to the Fund by the Subadviser under the Subadvisory Agreement.
Costs of Services and Profitability
The Board noted that the Adviser, and not the Fund, was responsible for paying the subadvisory fees due under the Subadvisory Agreement. The Board considered information regarding the costs of services provided or profits to be realized by the Subadviser from its relationship with the Fund, but emphasized the arm’s-length nature of the relationship between the Adviser and the Subadviser with respect to the negotiation of the subadvisory fee rate that would apply. The Board concluded that the Subadviser’s profitability was not a material factor in determining whether or not to approve the Subadvisory Agreement.
Performance
Recognizing that the Subadviser was new and had not yet managed any portion of the Fund, the Board evaluated the Adviser’s assessment of the Subadviser’s historical performance in managing a strategy similar to the one to be employed for the Sleeve, noting the Adviser had expressed satisfaction with the performance of the Subadviser and that the Adviser had recommended the approval of the Subadvisory Agreement. Based on the Adviser’s evaluation of the Subadviser’s performance and other relevant facts and circumstances, the Board concluded that the Subadviser’s management of the Sleeve could benefit the Fund and its shareholders.
Compensation
The Board reviewed the Subadviser’s proposed compensation for providing subadvisory services to the Fund and noted that the subadvisory fee received by the Subadviser would be the same as the subadvisory fee received by WCM. The Board considered information regarding the proposed compensation to be paid to the Subadviser as a result of its relationship with the Fund, and also noted the arm’s-length nature of the relationship between the Adviser and the Subadviser with respect to the negotiation of the subadvisory fee rate that would apply to the Subadviser. As a result, the Board concluded that the proposed compensation for providing subadvisory services to the Fund was not a material factor in considering the approval of the Subadvisory Agreement.
ACUITAS FUNDS
ADDITIONAL INFORMATION (Unaudited)
JUNE 30, 2018
Economies of Scale
The Board considered whether the Fund would benefit from any economies of scale with respect to the Subadvisory Agreement. The Board noted that because the Adviser, and not the Fund, pays the subadvisory fee, shareholders would not benefit from any economies of scale in the form of breakpoints in the subadvisory fee rate. Based on the foregoing information and other materials presented, the Board concluded that economies of scale were not a material factor in approving the Subadvisory Agreement.
Other Benefits
The Board noted the Subadviser’s representation that, aside from its contractual subadvisory fees, it does not benefit in a material way from its relationship with the Fund. As a result, other benefits accrued by the Subadviser were not a material factor in approving the Subadvisory Agreement.
Conclusion
The Board did not identify any single factor as being of paramount importance, and different Trustees may have given different weight to different factors; however, in light of the fact that the Fund is a multi-manager Fund for which the Adviser identifies subadvisers whose strategies it seeks to combine to achieve the Fund’s investment objective, the Board gave significant weight to the Adviser’s recommendation that the Subadviser be appointed as a subadviser to the Fund and to the Adviser’s representation that the appointment of the Subadviser would positively contribute to the Adviser successfully executing the overall strategy of the Fund. Based on its review, including consideration of each of the factors referenced above, the Board (including a majority of the Independent Trustees) determined, in the exercise of its reasonable business judgment, that the subadvisory arrangement, as outlined in the Subadvisory Agreement, was fair and reasonable in light of the services to be performed, expenses to be incurred by the Fund and such other matters as the Board considered relevant.
Proxy Voting Information
A description of the policies and procedures that each Fund uses to determine how to vote proxies relating to securities held in each Fund’s portfolio is available, without charge and upon request, by calling (844) 805-5628 and on the U.S. Securities and Exchange Commission's (the "SEC") website at www.sec.gov. Each Fund’s proxy voting record for the most recent twelve-month period ended June 30 is available, without charge and upon request, by calling (844) 805-5628 and on the SEC’s website at www.sec.gov.
Availability of Quarterly Portfolio Schedules
Each Fund files its complete schedule of portfolio holdings with the SEC for the first and third quarters of each fiscal year on Form N-Q. These filings are available, without charge and upon request on the SEC’s website at www.sec.gov or may be reviewed and copied at the SEC’s Public Reference Room in Washington, DC. Information on the operation of the Public Reference Room may be obtained by calling (800) SEC-0330.
Shareholder Expense Example
As a shareholder of the Funds, you incur two types of costs: (1) transaction costs, including redemption fees, and (2) ongoing costs, including management fees, distribution and/or service (12b-1) fees (for Investor Shares only) and other Fund expenses. This example is intended to help you understand your ongoing costs (in dollars) of investing in the Funds, and to compare these costs with the ongoing costs of investing in other mutual funds.
The example is based on an investment of $1,000 invested at the beginning of the period and held for the entire period from January 1, 2018 through June 30, 2018.
Actual Expenses – The first line of the table below provides information about actual account values and actual expenses. You may use the information in this line, together with the amount you invested, to estimate the expenses that you paid over the period. Simply divide your account value by $1,000 (for example, an $8,600 account value divided by $1,000 = 8.6), then multiply the result by the number in the first line under the heading entitled “Expenses Paid During Period” to estimate the expenses you paid on your account during the period.
ACUITAS FUNDS
ADDITIONAL INFORMATION (Unaudited)
JUNE 30, 2018
Hypothetical Example for Comparison Purposes – The second line of the table below provides information about hypothetical account values and hypothetical expenses based on each Fund’s actual expense ratio and an assumed rate of return of 5% per year before expenses, which is not each Fund’s actual return. The hypothetical account values and expenses may not be used to estimate the actual ending account balance or expenses you paid for the period. You may use this information to compare the ongoing costs of investing in each Fund and other funds. To do so, compare this 5% hypothetical example with the 5% hypothetical examples that appear in the shareholder reports of other funds.
Please note that the expenses shown in the table are meant to highlight your ongoing costs only. Therefore, the second line of the table is useful in comparing ongoing costs only and will not help you determine the relative total costs of owning different funds.
Beginning Account Value January 1, 2018 | Ending Account Value June 30, 2018 | Expenses Paid During Period* | Annualized Expense Ratio* | |||||||||||||
| Acuitas International Small Cap Fund | ||||||||||||||||
| Actual | $ | 1,000.00 | $ | 968.57 | $ | 7.32 | 1.50 | % | ||||||||
| Hypothetical (5% return before expenses) | $ | 1,000.00 | $ | 1,017.36 | $ | 7.50 | 1.50 | % | ||||||||
| Acuitas US Microcap Fund | ||||||||||||||||
| Actual | $ | 1,000.00 | $ | 1,071.05 | $ | 8.73 | 1.70 | % | ||||||||
| Hypothetical (5% return before expenses) | $ | 1,000.00 | $ | 1,016.36 | $ | 8.50 | 1.70 | % | ||||||||
| * | Expenses are equal to the Fund’s annualized expense ratio multiplied by the average account value over the period, multiplied by the number of days in the most recent fiscal half-year (181) divided by 365 to reflect the half-year period. |
Federal Tax Status of Dividends Declared during the Fiscal Year
For federal income tax purposes, dividends from short-term capital gains are classified as ordinary income. The Acuitas International Small Cap Fund designates 51.54% of its income dividend distributed as qualifying for the qualified dividend rate (QDI) as defined in Section 1(h)(11) of the Code.
Trustees and Officers of the Trust
The Board is responsible for oversight of the management of the Trust’s business affairs and of the exercise of all the Trust’s powers except those reserved for the shareholders. The following table provides information about each Trustee and certain officers of the Trust. Each Trustee and officer holds office until the person resigns, is removed, or is replaced. Unless otherwise noted, the persons have held their principal occupations for more than five years. The address for all Trustees and officers is Three Canal Plaza, Suite 600, Portland, Maine 04101. Each Fund’s Statement of Additional Information includes additional information about the Trustees and is available, without charge and upon request, by calling (844) 805-5628.
Name and Year of Birth | Position with the Trust | Length of Time Served | Principal Occupation(s) During Past Five Years | Number of Series in Fund Complex Overseen By Trustee | Other Directorships Held By Trustee During Past Five Years |
| Independent Trustees | |||||
| David Tucker Born: 1958 | Chairman of the Board; Trustee; Chairman, Nominating Committee and Qualified Legal Compliance Committee | Since 2013 | Director, Blue Sky Experience (a charitable endeavor), since 2008; Senior Vice President & General Counsel, American Century Companies (an investment management firm), 1998-2008. | 2 | Trustee, Forum Funds; Trustee, Forum ETF Trust; Trustee, U.S. Global Investors Funds. |
ACUITAS FUNDS
ADDITIONAL INFORMATION (Unaudited)
JUNE 30, 2018
Name and Year of Birth | Position with the Trust | Length of Time Served | Principal Occupation(s) During Past Five Years | Number of Series in Fund Complex Overseen By Trustee | Other Directorships Held By Trustee During Past Five Years |
| Mark D. Moyer Born: 1959 | Trustee; Chairman Audit Committee | Since 2013 | Chief Financial Officer, Freedom House (a NGO advocating political freedom and democracy), since 2017; independent consultant providing interim CFO services, principally to non-profit organizations, 2011-2017; Chief Financial Officer, Institute of International Education (a NGO administering international educational exchange programs), 2008-2011; Chief Financial Officer and Chief Restructuring Officer, Ziff Davis Media Inc. (an integrated media company), 2005-2008; Adjunct Professor of Accounting, Fairfield University from 2009-2012. | 2 | Trustee, Forum Funds; Trustee, Forum ETF Trust; Trustee, U.S. Global Investors Funds. |
| Jennifer Brown-Strabley Born: 1964 | Trustee | Since 2013 | Principal, Portland Global Advisors 1996-2010. | 2 | Trustee, Forum Funds; Trustee, Forum ETF Trust; Trustee, U.S. Global Investors Funds. |
| Interested Trustees(1) | |||||
| Stacey E. Hong Born: 1966 | Trustee | Since 2013 | President, Atlantic since 2008 | 2 | Trustee, Forum Funds, Trustee, U.S. Global Investors Funds. |
| John Y. Keffer Born: 1942 | Trustee | Since 2013 | Chairman, Atlantic since 2008; Chairman, Forum Investment Advisors, LLC since 2011; President, Forum Foundation (a charitable organization) since 2005; President, Forum Trust, LLC (a non-depository trust company chartered in the State of Maine) since 1997. | 2 | Trustee Forum ETF Trust; Trustee U.S. Global Investors Funds; Director, Wintergreen Fund, Inc. |
| (1) | Stacey E. Hong and John Y. Keffer are currently treated as an interested persons of the Trust, as defined in the 1940 Act, due to their affiliations with Atlantic. Atlantic and Forum Investment Advisors, LLC are subsidiaries of Forum Holdings Corp. I, a Delaware corporation that is wholly owned by Mr. Keffer. |
ACUITAS FUNDS
ADDITIONAL INFORMATION (Unaudited)
JUNE 30, 2018
| Name and Year of Birth | Position with the Trust | Length of Time Served | Principal Occupation(s) During Past 5 Years |
| Officers | |||
| Jessica Chase Born: 1970 | President; Principal Executive Officer | Since 2015 | Senior Vice President, Atlantic since 2008. |
| Karen Shaw Born: 1972 | Treasurer; Principal Financial Officer | Since 2013 | Senior Vice President, Atlantic since 2008. |
| Zachary Tackett Born: 1988 | Vice President; Secretary and Anti- Money Laundering Compliance Officer | Since 2014 | Counsel, Atlantic since 2014; Intern Associate, Coakley & Hyde, PLLC, 2010-2013. |
| Timothy Bowden Born: 1969 | Vice President | Since 2013 | Manager, Atlantic since 2008. |
| Michael J.McKeen Born: 1971 | Vice President | Since 2013 | Senior Vice President, Atlantic since 2008. |
| Geoffrey Ney Born: 1975 | Vice President | Since 2013 | Manager, Atlantic since 2013; Senior Fund Accountant, Atlantic, 2008-2013. |
| Todd Proulx Born: 1978 | Vice President | Since 2013 | Manager, Atlantic since 2013; Senior Fund Accountant, Atlantic, 2008-2013. |
| Carlyn Edgar Born: 1963 | Chief Compliance Officer | Since 2013 | Senior Vice President, Atlantic since 2008. |
FOR MORE INFORMATION
Investment Adviser
Acuitas Investments, LLC
520 Pike Street, Suite 1221
Seattle, WA 98101
www.acuitasinvestments.com
Transfer Agent
Atlantic Fund Services, LLC
P.O. Box 588
Portland, ME 04112
www.atlanticfundservices.com
Distributor
Foreside Fund Services, LLC
Three Canal Plaza, Suite 100
Portland, ME 04101
www.foreside.com
Acuitas International Small Cap Fund
Acuitas US Microcap Fund
P.O. Box 588
Portland, ME 04112
(844) 805-5628
This report is submitted for the general information of the shareholders of the Funds. It is not authorized for distribution to prospective investors unless preceded or accompanied by an effective prospectus, which includes information regarding the Funds’ risks, objectives, fees and expenses, experience of its management, and other information.
220-ANR-0618
| (a) | As of the end of the period covered by this report, Forum Funds II (the "Registrant") has adopted a code of ethics, which applies to its Principal Executive Officer and Principal Financial Officer (the "Code of Ethics"). |
| (c) | There have been no amendments to the Registrant's Code of Ethics during the period covered by this report. |
| (a) | Included as part of report to shareholders under Item 1. |
| (b) | Not applicable. |
| By: | /s/ Jessica Chase | |
| Jessica Chase, Principal Executive Officer | ||
| Date: | August 23, 2018 |
| By: | /s/ Jessica Chase | |
| Jessica Chase, Principal Executive Officer | ||
| Date: | August 23, 2018 |
| By: | /s/ Karen Shaw | |
| Karen Shaw, Principal Financial Officer | ||
| Date: | August 23, 2018 |