UNITED STATES
SECURITIES AND EXCHANGE COMMISSION
WASHINGTON, D.C. 20549
FORM N-CSR
CERTIFIED SHAREHOLDER REPORT OF REGISTERED MANAGEMENT
INVESTMENT COMPANIES
Investment Company Act file number 811-03023
FORUM FUNDS II
Three Canal Plaza, Suite 600
Portland, Maine 04101
Zachary Tackett, Principal Executive Officer
Three Canal Plaza, Suite 600
Portland, Maine 04101
207-347-2000
Date of fiscal year end June 30
Date of reporting period: July 1, 2023 – June 30, 2024
ITEM 1. REPORT TO SHAREHOLDERS.
(a) A copy of the report transmitted to stockholders pursuant to Rule 30e-1 under the Investment Company Act, as amended (“Act”), is attached hereto.
Annual Shareholder Report - June 30, 2024
This annual shareholder report contains important information about the Acuitas US Microcap Fund for the period of July 1, 2023, to June 30, 2024. You can find additional information about the Fund at https://acuitasfunds.com/invest-with-us/ . You can also request this information by contacting us at (844) 805-5628.
What were the Fund's costs for the last year?
(based on a hypothetical $10,000 investment)
| Class Name | Costs of a $10,000 investment | Costs paid as a percentage of a $10,000 investment |
|---|
| Institutional Shares | $155 | 1.50% |
How did the Fund perform in the last year?
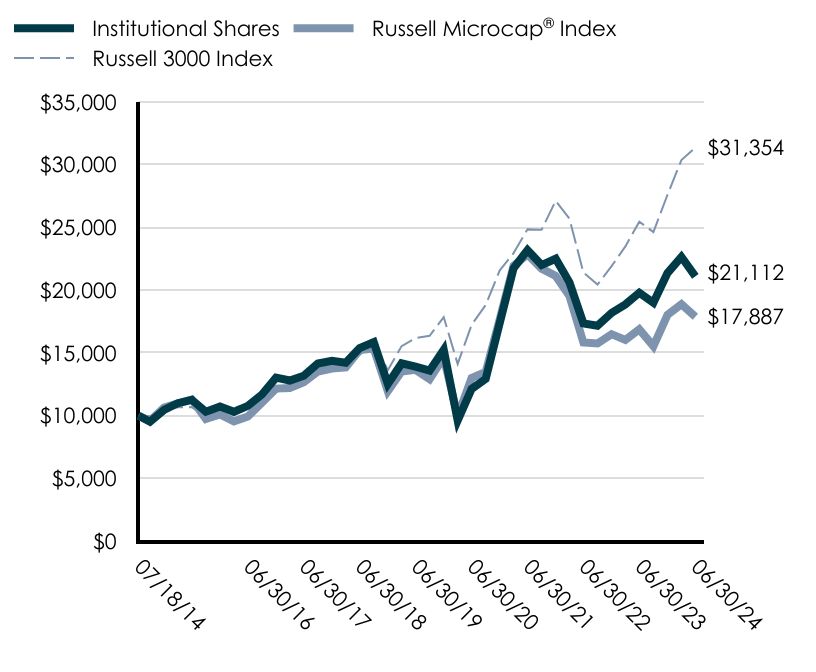
The Fund returned +6.63% over the last year, outperforming the Russell Microcap Index’s return of +5.96% by 67 basis points. Strong stock selection across our subadvisers drove the Fund’s excess returns, with stock picks in financials, technology, consumer discretionary, and basic materials adding the most value relative to the benchmark.
We are proud that the Fund has consistently outperformed the benchmark over various time horizons, including the 1-, 3-, and 5- year periods. Additionally, since the Fund’s inception on 7/18/14, the Fund has returned an annualized 7.80% net of fees, outperforming the benchmark’s 6.02% return by an annualized 178 basis points.
Total Return Based on a $10,000 Investment
| Date | Institutional Shares | Russell Microcap® Index | Russell 3000 Index |
|---|
| 07/18/14 | $10,000 | $10,000 | $10,000 |
| 09/30/14 | $9,520 | $9,581 | $9,963 |
| 12/31/14 | $10,470 | $10,653 | $10,485 |
| 03/31/15 | $11,000 | $10,988 | $10,674 |
| 06/30/15 | $11,270 | $11,295 | $10,688 |
| 09/30/15 | $10,320 | $9,739 | $9,914 |
| 12/31/15 | $10,727 | $10,103 | $10,535 |
| 03/31/16 | $10,311 | $9,555 | $10,637 |
| 06/30/16 | $10,789 | $9,933 | $10,917 |
| 09/30/16 | $11,693 | $11,051 | $11,397 |
| 12/31/16 | $13,039 | $12,161 | $11,877 |
| 03/31/17 | $12,808 | $12,207 | $12,559 |
| 06/30/17 | $13,186 | $12,676 | $12,938 |
| 09/30/17 | $14,161 | $13,519 | $13,529 |
| 12/31/17 | $14,376 | $13,763 | $14,386 |
| 03/31/18 | $14,224 | $13,856 | $14,294 |
| 06/30/18 | $15,397 | $15,237 | $14,849 |
| 09/30/18 | $15,864 | $15,364 | $15,907 |
| 12/31/18 | $12,523 | $11,962 | $13,632 |
| 03/31/19 | $14,170 | $13,529 | $15,547 |
| 06/30/19 | $13,907 | $13,654 | $16,183 |
| 09/30/19 | $13,589 | $12,910 | $16,371 |
| 12/31/19 | $15,264 | $14,645 | $17,861 |
| 03/31/20 | $9,613 | $9,961 | $14,128 |
| 06/30/20 | $12,134 | $13,003 | $17,240 |
| 09/30/20 | $12,937 | $13,483 | $18,827 |
| 12/31/20 | $17,411 | $17,715 | $21,592 |
| 03/31/21 | $21,746 | $21,947 | $22,962 |
| 06/30/21 | $23,201 | $22,856 | $24,854 |
| 09/30/21 | $22,009 | $21,718 | $24,829 |
| 12/31/21 | $22,511 | $21,141 | $27,132 |
| 03/31/22 | $20,614 | $19,535 | $25,700 |
| 06/30/22 | $17,361 | $15,831 | $21,408 |
| 09/30/22 | $17,166 | $15,755 | $20,452 |
| 12/31/22 | $18,199 | $16,499 | $21,921 |
| 03/31/23 | $18,871 | $16,033 | $23,495 |
| 06/30/23 | $19,799 | $16,882 | $25,465 |
| 09/30/23 | $18,999 | $15,542 | $24,637 |
| 12/31/23 | $21,368 | $18,039 | $27,611 |
| 03/31/24 | $22,649 | $18,884 | $30,377 |
| 06/30/24 | $21,112 | $17,887 | $31,354 |
The above chart represents historical performance of a hypothetical $10,000 investment over the past 10 years. Effective June 12, 2024, the Fund changed its primary benchmark index from the Russell Microcap® Index to the Russell 3000® Index due to regulatory requirements. The Fund retained the Russell Microcap® Index as a secondary benchmark because the Russell Microcap® Index more closely aligns with the Fund’s investment strategies and investment restrictions.
The Fund’s past performance is not a good predictor of how the Fund will perform in the future. The graph and table do not reflect the deduction of taxes that a shareholder would pay on Fund distributions or redemption of Fund shares.
Average Annual Total Returns
| | One Year | Five Year | Since Inception 07/18/14 |
|---|
| Institutional Shares | 6.63% | 8.71% | 7.80% |
Russell Microcap® Index | 5.96% | 5.55% | 6.02% |
| Russell 3000 Index | 23.13% | 14.14% | 12.17% |
| Total Net Assets | $82,567,532 |
| # of Portfolio Holdings | 234 |
| Portfolio Turnover Rate | 64% |
| Investment Advisory Fees (Net of fees waived) | $565,156 |
Sector Weightings
(% total investments)*
| Value | Value |
|---|
| Industrials | 23.2% |
| Health Care | 20.2% |
| Technology | 15.7% |
| Financials | 13.2% |
| Consumer Discretionary | 11.4% |
| Energy | 6.5% |
| Utilities | 2.6% |
| Basic Materials | 2.5% |
| Real Estate | 2.4% |
| Consumer Staples | 1.9% |
| Telecommunications | 0.4% |
* excluding cash equivalents
Top Ten Holdings
(% of investments)*
| Columbus McKinnon Corp. | 1.72% |
| Photronics, Inc. | 1.54% |
| Select Water Solutions, Inc., Class A | 1.53% |
| BioLife Solutions, Inc. | 1.52% |
| Magnite, Inc. | 1.46% |
| Interface, Inc. | 1.43% |
| Ducommun, Inc. | 1.26% |
| Customers Bancorp, Inc. | 1.21% |
| Civitas Resources, Inc. | 1.17% |
| Barrett Business Services, Inc. | 1.13% |
* excluding cash equivalents
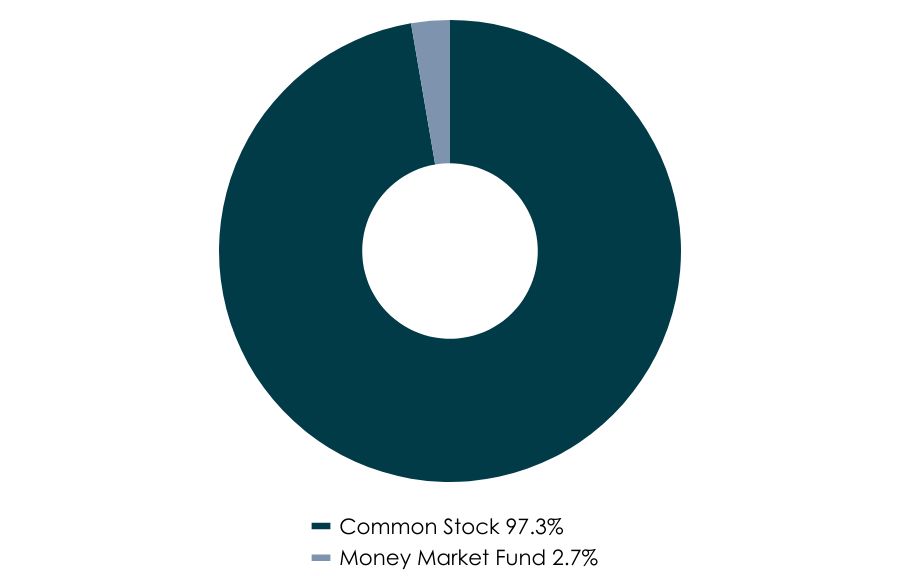
Asset Class Weightings
(% total investments)
| Value | Value |
|---|
| Common Stock | 97.3% |
| Money Market Fund | 2.7% |
Where can I find additional information about the fund?
The Fund is distributed by Foreside Fund Services, LLC, a wholly owned subsidiary of Foreside Financial Group, LLC (dba ACA Group). If you wish to view additional information about the Fund; including but not limited to its prospectus, holdings, financial information, and proxy information, please visit https://acuitasfunds.com/invest-with-us/ .
Annual Shareholder Report - June 30, 2024
(b) Not applicable.
ITEM 2. CODE OF ETHICS.
(a) As of the end of the period covered by this report, Forum Funds (the “Registrant”) has adopted a code of ethics, which applies to its Principal Executive Officer and Principal Financial Officer (the “Code of Ethics”).
(c) There have been no amendments to the Registrant’s Code of Ethics during the period covered by this report.
(d) There have been no waivers to the Registrant’s Code of Ethics during the period covered by this report.
(e) Not applicable.
(f)(1) A copy of the Code of Ethics is being filed under Item 19(a)(1) hereto.
ITEM 3. AUDIT COMMITTEE FINANCIAL EXPERT.
(a)(1) The Board of Trustees has determined that the Registrant has an audit committee financial expert, as defined in Item 3 of Form N-CSR, serving on its audit committee.
(a)(2) The audit committee financial expert, Mr. Mark Moyer, is a non-“interested” Trustee (as defined in Item 3(a)(2) of Form N-CSR.
ITEM 4. PRINCIPAL ACCOUNTANT FEES AND SERVICES.
(a) Audit Fees - The aggregate fees billed for each of the last two fiscal years (the “Reporting Periods”) for professional services rendered by the Registrant’s principal accountant for the audit of the Registrant’s annual financial statements, or services that are normally provided by the principal accountant in connection with the statutory and regulatory filings or engagements for the Reporting Periods, were $13,400 in 2023 and $14,400 in 2024.
(b) Audit-Related Fees – The aggregate fees billed in the Reporting Periods for assurance and related services rendered by the principal accountant that were reasonably related to the performance of the audit of the Registrant’s financial statements and are not reported under paragraph (a) of this Item 4 were $0 in 2023 and $0 in 2024.
(c) Tax Fees - The aggregate fees billed in the Reporting Periods for professional services rendered by the principal accountant to the Registrant for tax compliance, tax advice and tax planning were $3,000 in 2023 and $3,200 in 2024. These services consisted of review or preparation of U.S. federal, state, local and excise tax returns.
(d) All Other Fees - The aggregate fees billed in the Reporting Periods for products and services provided by the principal accountant to the Registrant, other than the services reported in paragraphs (a) through (c) of this Item, were $0 in 2023 and $0 in 2024.
(e)(1) The Audit Committee reviews and approves in advance all audit and “permissible non-audit services” (as that term is defined by the rules and regulations of the U.S. Securities and Exchange Commission) to be rendered to a series of the Registrant (each, a “Series”). In addition, the Audit Committee reviews and approves in advance all “permissible non-audit services” to be provided to an investment adviser (not including any sub-adviser) of a Series, or an affiliate of such investment adviser, that is controlling, controlled by or under common control with the investment adviser and provides on-going services to the Registrant (“Affiliate”), by the Series’ principal accountant if the engagement relates directly to the operations and financial reporting of the Series. The Audit Committee considers whether fees paid by a Series’ investment adviser or an Affiliate to the Series’ principal accountant for audit and permissible non-audit services are consistent with the principal accountant’s independence.
(e)(2) No services included in (b) - (d) above were approved pursuant to paragraph (c)(7)(i)(C) of Rule 2-01 of Regulation S-X.
(f) Not applicable
(g) The aggregate non-audit fees billed by the principal accountant for services rendered to the Registrant for the Reporting Periods were $0 in 2023 and $0 in 2024. There were no fees billed in either of the Reporting Periods for non-audit services rendered by the principal accountant to the Registrant’s investment adviser or any Affiliate.
(h) During the Reporting Period, the Registrant's principal accountant provided no non-audit services to the investment advisers or any entity controlling, controlled by or under common control with the investment advisers to the series of the Registrant to which this report relates.
(i) Not applicable. The Registrant has not retained, for the preparation of the audit report on the financial statements included in the Form N-CSR, a registered public accounting firm that has a branch or office that is located in a foreign jurisdiction and that the Public Company Accounting Oversight Board (the “PCAOB”) has determined that the PCAOB is unable to inspect or investigate completely because of a position taken by an authority in the foreign jurisdiction.
(j) Not applicable. The Registrant is not a “foreign issuer,” as defined in 17 CFR 240.3b-4.
ITEM 5. AUDIT COMMITTEE OF LISTED REGISTRANTS.
Not applicable.
ITEM 6. INVESTMENTS.
(a) Included as part of financial statements filed under Item 7(a).
(b) Not applicable.
ITEM 7. FINANCIAL STATEMENTS AND FINANCIAL HIGHLIGHTS FOR OPEN-END MANAGEMENT INVESTMENT COMPANIES.
(a)
ANNUAL
FINANCIALS
AND
OTHER
INFORMATION
Schedule
of
Investments
4
Statement
of
Assets
and
Liabilities
7
Statement
of
Operations
8
Statements
of
Changes
in
Net
Assets
9
Financial
Highlights
10
Notes
to
Financial
Statements
11
Report
of
Independent
Registered
Public
Accounting
Firm
16
Other
Information
17
ACUITAS
US
MICROCAP
FUND
SCHEDULE
OF
INVESTMENTS
June
30,
2024
See
Notes
to
Financial
Statements.
Shares
Security
Description
Value
Common
Stock
-
96.9%
Basic
Materials
-
2.4%
10,600
AdvanSix,
Inc.
$
242,952
41,914
Gatos
Silver,
Inc.
(a)
437,582
18,567
LifeMD,
Inc.
(a)
127,370
22,490
Northern
Technologies
International
Corp.
372,434
11,641
Proto
Labs,
Inc.
(a)
359,590
98,171
Taseko
Mines,
Ltd.
(a)
240,519
8,300
Universal
Stainless
&
Alloy
Products,
Inc.
(a)
227,254
2,007,701
Consumer
Discretionary
-
11.0%
32,018
Alta
Equipment
Group,
Inc.
257,425
41,800
Arhaus,
Inc.
708,092
6,907
Beazer
Homes
USA,
Inc.
(a)
189,804
5,869
BJ's
Restaurants,
Inc.
(a)
203,654
9,795
Blue
Bird
Corp.
(a)
527,461
14,646
Cardlytics,
Inc.
(a)
120,244
10,785
Climb
Global
Solutions,
Inc.
677,406
52,705
Duluth
Holdings,
Inc.,
Class B
(a)
194,481
74,910
Fluent,
Inc.
(a)
270,425
20,505
Guess?,
Inc.
418,302
36,098
Holley,
Inc.
(a)
129,231
18,887
Hudson
Technologies,
Inc.
(a)
166,017
78,163
Interface,
Inc.
1,147,433
5,956
Jack
in
the
Box,
Inc.
303,399
21,149
Lands'
End,
Inc.
(a)
287,415
83,055
Motorcar
Parts
of
America,
Inc.
(a)
512,449
31,314
Portillo's,
Inc.,
Class A
(a)
304,372
11,211
Shoe
Carnival,
Inc.
413,574
12,135
The
Lovesac
Co.
(a)
274,008
58,283
The
ONE
Group
Hospitality,
Inc.
(a)
247,703
19,730
Travelzoo
(a)
149,751
32,751
Universal
Technical
Institute,
Inc.
(a)
515,173
10,524
Viad
Corp.
(a)
357,816
675
Victoria's
Secret
&
Co.
(a)
11,927
61,512
Vivid
Seats,
Inc.,
Class A
(a)
353,694
18,005
Zumiez,
Inc.
(a)
350,737
9,091,993
Consumer
Staples
-
1.8%
25,100
B&G
Foods,
Inc.
202,808
55,120
Cronos
Group,
Inc.
(a)
128,430
71,523
SunOpta,
Inc.
(a)
386,224
10,322
The
Chefs'
Warehouse,
Inc.
(a)
403,693
12,909
The
Vita
Coco
Co.,
Inc.
(a)
359,516
1,480,671
Energy
-
6.3%
18,311
American
Superconductor
Corp.
(a)
428,294
110,406
Berry
Corp.
713,223
13,600
Civitas
Resources,
Inc.
938,400
14,011
DMC
Global,
Inc.
(a)
202,039
7,783
DNOW,
Inc.
(a)
106,861
16,912
Dril-Quip,
Inc.
(a)
314,563
62,110
Geospace
Technologies
Corp.
(a)
557,748
19,100
Hallador
Energy
Co.
(a)
148,407
103,851
Newpark
Resources,
Inc.
(a)
863,002
23,424
Oil
States
International,
Inc.
(a)
104,002
15,500
Stabilis
Solutions,
Inc.
(a)
59,675
124,815
VAALCO
Energy,
Inc.
782,590
5,218,804
Financials
-
12.8%
13,710
Amalgamated
Financial
Corp.
375,654
85,100
American
Coastal
Insurance
Corp.
(a)
897,805
7,513
Arrow
Financial
Corp.
195,714
Shares
Security
Description
Value
Financials
-
12.8%
(continued)
7,842
Banco
Latinoamericano
de
Comercio
Exterior
SA,
Class E
$
232,672
12,469
Bank
of
Marin
Bancorp
201,873
12,714
Bankwell
Financial
Group,
Inc.
322,554
8,449
Business
First
Bancshares,
Inc.
183,850
3,213
Community
Trust
Bancorp,
Inc.
140,279
10,169
Community
West
Bancshares
188,126
16,873
CrossFirst
Bankshares,
Inc.
(a)
236,559
20,255
Customers
Bancorp,
Inc.
(a)
971,835
5,200
Dave,
Inc.
(a)
157,560
20,137
eHealth,
Inc.
(a)
91,221
13,695
Enova
International,
Inc.
(a)
852,514
20,768
EZCORP,
Inc.,
Class A
(a)
217,441
10,143
First
Internet
Bancorp
274,064
12,675
First
Western
Financial,
Inc.
(a)
215,475
33,314
Heritage
Commerce
Corp.
289,832
12,396
Heritage
Insurance
Holdings,
Inc.
(a)
87,764
2,037
Investors
Title
Co.
366,925
6,600
LendingTree,
Inc.
(a)
274,494
68,325
Medallion
Financial
Corp.
524,736
4,831
Mercantile
Bank
Corp.
195,994
7,740
Mid
Penn
Bancorp,
Inc.
169,893
4,000
Northrim
BanCorp,
Inc.
230,560
18,262
OP
Bancorp
175,133
13,800
PRA
Group,
Inc.
(a)
271,308
3,693
Preferred
Bank/Los
Angeles
CA
278,784
3,040
QCR
Holdings,
Inc.
182,400
18,000
Regional
Management
Corp.
517,320
7,960
Texas
Capital
Bancshares,
Inc.
(a)
486,674
22,975
Veritex
Holdings,
Inc.
484,543
5,185
Westamerica
BanCorp
251,628
10,543,184
Health
Care
-
19.6%
56,689
908
Devices,
Inc.
(a)
291,948
132,026
Accuray,
Inc.
(a)
240,287
2,962
Addus
HomeCare
Corp.
(a)
343,918
41,359
ADMA
Biologics,
Inc.
(a)
462,394
3,710
ANI
Pharmaceuticals,
Inc.
(a)
236,253
17,728
Anika
Therapeutics,
Inc.
(a)
449,050
19,525
ARS
Pharmaceuticals,
Inc.
(a)
166,158
16,215
Astria
Therapeutics,
Inc.
(a)
147,557
56,967
BioLife
Solutions,
Inc.
(a)
1,220,803
22,690
Cantaloupe,
Inc.
(a)
149,754
12,927
CareDx,
Inc.
(a)
200,756
10,701
Castle
Biosciences,
Inc.
(a)
232,961
257,885
ChromaDex
Corp.
(a)
704,026
3,200
Corbus
Pharmaceuticals
Holdings,
Inc.
(a)
144,800
16,789
Edgewise
Therapeutics,
Inc.
(a)
302,370
193,154
Harvard
Bioscience,
Inc.
(a)
550,489
66,140
Health
Catalyst,
Inc.
(a)
422,635
14,192
Healthcare
Services
Group,
Inc.
(a)
150,151
51,248
InfuSystem
Holdings,
Inc.
(a)
350,024
33,526
Inogen,
Inc.
(a)
272,566
15,580
iRadimed
Corp.
684,585
11,509
KalVista
Pharmaceuticals,
Inc.
(a)
135,576
15,993
Kiniksa
Pharmaceuticals,
Ltd.,
Class A
(a)
298,589
68,013
KORU
Medical
Systems,
Inc.
(a)
180,235
9,937
LeMaitre
Vascular,
Inc.
817,616
33,178
MannKind
Corp.
(a)
173,189
46,620
Mersana
Therapeutics,
Inc.
(a)
93,706
3,120
Nature's
Sunshine
Products,
Inc.
(a)
47,018
12,749
Nurix
Therapeutics,
Inc.
(a)
266,072
12,749
Olema
Pharmaceuticals,
Inc.
(a)
137,944
ACUITAS
US
MICROCAP
FUND
SCHEDULE
OF
INVESTMENTS
June
30,
2024
See
Notes
to
Financial
Statements.
Shares
Security
Description
Value
Health
Care
-
19.6%
(continued)
15,811
OrthoPediatrics
Corp.
(a)
$
454,724
28,200
Pediatrix
Medical
Group,
Inc.
(a)
212,910
10,930
Perspective
Therapeutics,
Inc.
(a)
108,972
7,614
PetIQ,
Inc.
(a)
167,965
17,525
Pliant
Therapeutics,
Inc.
(a)
188,394
99,287
Precigen,
Inc.
(a)
156,874
4,115
Prothena
Corp.
PLC
(a)
84,934
30,791
Quanterix
Corp.
(a)
406,749
51,755
Quipt
Home
Medical
Corp.
(a)
166,651
51,779
Savara,
Inc.
(a)
208,669
12,040
Scholar
Rock
Holding
Corp.
(a)
100,293
32,964
SI-BONE,
Inc.
(a)
426,225
23,509
Stoke
Therapeutics,
Inc.
(a)
317,607
10,308
Supernus
Pharmaceuticals,
Inc.
(a)
275,739
14,039
Syndax
Pharmaceuticals,
Inc.
(a)
288,221
61,275
Taysha
Gene
Therapies,
Inc.
(a)
137,256
12,784
Tela
Bio,
Inc.
(a)
60,085
25,771
The
Joint
Corp.
(a)
362,340
21,262
The
Pennant
Group,
Inc.
(a)
493,066
3,982
US
Physical
Therapy,
Inc.
368,016
4,938
Utah
Medical
Products,
Inc.
329,908
20,742
Voyager
Therapeutics,
Inc.
(a)
164,069
6,495
Xenon
Pharmaceuticals,
Inc.
(a)
253,240
21,865
Zymeworks,
Inc.
(a)
186,071
44,101
Zynex,
Inc.
(a)
411,021
16,203,429
Industrials
-
22.5%
14,115
ACM
Research,
Inc.,
Class A
(a)
325,492
27,073
AerSale
Corp.
(a)
187,345
27,536
Barrett
Business
Services,
Inc.
902,355
8,667
Bel
Fuse,
Inc.,
Class B
565,435
87,833
BGSF,
Inc.
750,972
5,914
BlueLinx
Holdings,
Inc.
(a)
550,534
39,935
Columbus
McKinnon
Corp.
1,379,355
26,664
Commercial
Vehicle
Group,
Inc.
(a)
130,654
39,461
Conduent,
Inc.
(a)
128,643
15,155
Core
Molding
Technologies,
Inc.
(a)
241,571
4,064
CRA
International,
Inc.
699,902
40,546
Daktronics,
Inc.
(a)
565,617
212,800
DHI
Group,
Inc.
(a)
444,752
3,460
Distribution
Solutions,
Inc.
(a)
103,800
17,421
Ducommun,
Inc.
(a)
1,011,463
33,489
Great
Lakes
Dredge
&
Dock
Corp.
(a)
294,033
24,108
Information
Services
Group,
Inc.
70,878
13,178
Insteel
Industries,
Inc.
407,991
19,250
Kornit
Digital,
Ltd.
(a)
281,820
31,258
Mayville
Engineering
Co.,
Inc.
(a)
520,758
2,405
Mesa
Laboratories,
Inc.
208,682
2,609
Montrose
Environmental
Group,
Inc.
(a)
116,257
30,567
Myers
Industries,
Inc.
408,987
4,661
MYR
Group,
Inc.
(a)
632,544
6,956
Natural
Gas
Services
Group,
Inc.
(a)
139,955
49,704
Nordic
American
Tankers,
Ltd.
197,822
2,808
Olympic
Steel,
Inc.
125,883
176,084
Orion
Energy
Systems,
Inc.
(a)
195,453
27,447
Orion
Group
Holdings,
Inc.
(a)
261,021
33,435
Park
Aerospace
Corp.
457,391
104,372
Paysign,
Inc.
(a)
449,843
10,980
Primoris
Services
Corp.
547,792
95,366
Radiant
Logistics,
Inc.
(a)
542,633
78,128
Ranpak
Holdings
Corp.
(a)
502,363
24,833
Research
Solutions,
Inc./CA
(a)
63,324
35,390
Resources
Connection,
Inc.
390,706
Shares
Security
Description
Value
Industrials
-
22.5%
(continued)
7,674
REV
Group,
Inc.
$
191,006
16,296
SoundThinking,
Inc.
(a)
198,485
7,548
Sterling
Infrastructure,
Inc.
(a)
893,230
3,186
Teekay
Tankers,
Ltd.,
Class A
219,229
3,820
The
Gorman-Rupp
Co.
140,232
15,055
The
Real
Brokerage,
Inc.
(a)
61,123
17,508
Thermon
Group
Holdings,
Inc.
(a)
538,546
13,457
Ultralife
Corp.
(a)
142,913
20,612
Vishay
Precision
Group,
Inc.
(a)
627,429
33,249
Wabash
National
Corp.
726,158
18,542,377
Real
Estate
-
2.3%
10,953
Alpine
Income
Property
Trust,
Inc.
REIT
170,429
42,384
Apartment
Investment
and
Management
Co.
REIT
(a)
351,363
9,031
BRT
Apartments
Corp.
REIT
157,772
12,675
NET
Lease
Office
Properties
REIT
312,058
33,456
Plymouth
Industrial
REIT,
Inc.
715,289
17,580
Whitestone
REIT
233,990
1,940,901
Technology
-
15.3%
38,917
A10
Networks,
Inc.
539,000
83,800
ADTRAN
Holdings,
Inc.
440,788
51,669
Arteris,
Inc.
(a)
388,034
7,615
AudioEye,
Inc.
(a)
134,100
39,520
AXT,
Inc.
(a)
133,578
15,254
Backblaze,
Inc.,
Class A
(a)
93,965
7,715
Benchmark
Electronics,
Inc.
304,434
50,846
Blend
Labs,
Inc.,
Class A
(a)
119,997
39,350
BM
Technologies,
Inc.
(a)
88,537
42,913
Cerence,
Inc.
(a)
121,444
23,034
CEVA,
Inc.
(a)
444,326
11,419
Consensus
Cloud
Solutions,
Inc.
(a)
196,178
5,551
Diebold
Nixdorf,
Inc.
(a)
213,602
6,512
Donnelley
Financial
Solutions,
Inc.
(a)
388,245
5,900
EverQuote,
Inc.,
Class A
(a)
123,074
22,214
Hurco
Cos.,
Inc.
338,986
8,815
Ichor
Holdings,
Ltd.
(a)
339,818
33,700
Immersion
Corp.
317,117
96,122
indie
Semiconductor,
Inc.,
Class A
(a)
593,073
52,100
Key
Tronic
Corp.
(a)
211,005
87,660
Magnite,
Inc.
(a)
1,165,001
31,911
Methode
Electronics,
Inc.
330,279
2,075
Moneylion,
Inc.
(a)
152,596
6,852
NVE
Corp.
511,776
17,297
OneSpan,
Inc.
(a)
221,748
76,272
Outbrain,
Inc.
(a)
379,835
13,796
PDF
Solutions,
Inc.
(a)
501,898
49,890
Photronics,
Inc.
(a)
1,230,786
14,117
PROS
Holdings,
Inc.
(a)
404,452
76,622
Rackspace
Technology,
Inc.
(a)
228,334
9,659
Radware,
Ltd.
(a)
176,180
12,100
Shutterstock,
Inc.
468,270
27,071
Solaris
Oilfield
Infrastructure,
Inc.,
Class A
232,269
16,795
Tactile
Systems
Technology,
Inc.
(a)
200,532
51,174
TrueCar,
Inc.
(a)
160,175
8,303
Veeco
Instruments,
Inc.
(a)
387,833
17,479
Viant
Technology,
Inc.,
Class A
(a)
172,518
16,594
Weave
Communications,
Inc.
(a)
149,678
12,603,461
ACUITAS
US
MICROCAP
FUND
SCHEDULE
OF
INVESTMENTS
June
30,
2024
See
Notes
to
Financial
Statements.
At
June
30,
2024,
The
Fund
held
the
following
exchange
traded
futures
contracts:
The
following
is
a
summary
of
the
inputs
used
to
value
the
Fund's investments
as
of
June
30,
2024.
The
inputs
or
methodology
used
for
valuing
securities
are
not
necessarily
an
indication
of
the
risks
associated
with
investing
in
those
securities.
For
more
information
on
valuation
inputs,
and
their
aggregation
into
the
levels
used
in
the
table
below,
please
refer
to
the
Security
Valuation
section
in
Note
2
of
the
accompanying
Notes
to
Financial
Statements.
The
Level
1
value
displayed
in
this
table
consists
of
common
stock
and
a
Money
Market
Fund.
Refer
to
this
Schedule
of
Investments
for
a
further
breakout
of
each
security
by
industry.
* Other
Financial
Instruments
are
derivatives
not
reflected
in
the
Schedule
of
Investments,
such
as
futures at
year
end.
Shares
Security
Description
Value
Telecommunications
-
0.4%
41,509
Cambium
Networks
Corp.
(a)
$
115,810
42,595
Powerfleet,
Inc.
NJ
(a)
194,659
310,469
Utilities
-
2.5%
45,497
Aris
Water
Solutions,
Inc.,
Class A
712,938
18,087
Enviri
Corp.
(a)
156,091
114,413
Select
Water
Solutions,
Inc.,
Class A
1,224,219
2,093,248
Total
Common
Stock
(Cost
$74,856,560)
80,036,238
Shares
Security
Description
Value
Money
Market
Fund
-
2.7%
2,242,070
First
American
Government
Obligations
Fund,
Class X,
5.24%
(b)
(Cost
$2,242,070)
2,242,070
Investments,
at
value
-
99.6%
(Cost
$77,098,630)
$
82,278,308
Other
Assets
&
Liabilities,
Net
-
0.4%
289,224
Net
Assets
-
100.0%
$
82,567,532
PLC
Public
Limited
Company
REIT
Real
Estate
Investment
Trust
(a)
Non-income
producing
security.
(b)
Dividend
yield
changes
daily
to
reflect
current
market
conditions.
Rate
was
the
quoted
yield
as
of
June
30,
2024.
Contracts
Description
Expiration
Date
Notional
Contract
Value
Value
Net
Unrealized
Appreciation
13
CME
E-Mini
Russell
2000
Index
Future
09/20/24
$
1,338,870
$1,342,250
$
3,380
Valuation
Inputs
Investments
in
Securities
Other
Financial
Instruments*
Level
1
-
Quoted
Prices
$
82,278,308
$
3,380
Level
2
-
Other
Significant
Observable
Inputs
–
–
Level
3
-
Significant
Unobservable
Inputs
–
–
Total
$
82,278,308
$
3,380
PORTFOLIO
HOLDINGS
(Unaudited)
%
of
Total
Net
Assets
Basic
Materials
2.4%
Consumer
Discretionary
11.0%
Consumer
Staples
1.8%
Energy
6.3%
Financials
12.8%
Health
Care
19.7%
Industrials
22.5%
Real
Estate
2.4%
Technology
15.3%
Telecommunications
0.4%
Utilities
2.6%
Money
Market
Fund
2.7%
Other
Assets
&
Liabilities,
Net
0.1%
100.0%
ACUITAS
US
MICROCAP
FUND
STATEMENT
OF
ASSETS
AND
LIABILITIES
June
30,
2024
See
Notes
to
Financial
Statements.
*
Shares
redeemed
or
exchanged
within
60
days
of
purchase
are
charged
a
1.00%
redemption
fee.
ASSETS
Investments,
at
value
(Cost
$77,098,630)
$
82,278,308
Deposits
with
broker
for
Futures
Contracts
302,800
Receivables:
Fund
shares
sold
116,558
Investment
securities
sold
183,717
Dividends
41,562
Variation
margin
3,185
Prepaid
expenses
24,570
Total
Assets
82,950,700
LIABILITIES
Payables:
Investment
securities
purchased
248,839
Fund
shares
redeemed
630
Accrued
Liabilities:
Investment
adviser
fees
61,469
Fund
services
fees
16,849
Other
expenses
55,381
Total
Liabilities
383,168
NET
ASSETS
$
82,567,532
COMPONENTS
OF
NET
ASSETS
Paid-in
capital
$
76,828,401
Distributable
Earnings
5,739,131
NET
ASSETS
$
82,567,532
SHARES
OF
BENEFICIAL
INTEREST
AT
NO
PAR
VALUE
(UNLIMITED
SHARES
AUTHORIZED)
Institutional
Shares
6,259,295
NET
ASSET
VALUE,
OFFERING
AND
REDEMPTION
PRICE
PER
SHARE*
Institutional
Shares
(based
on
net
assets
of
$82,567,532)
$
13.19
ACUITAS
US
MICROCAP
FUND
STATEMENT
OF
OPERATIONS
FOR
THE
YEAR
ENDED
JUNE
30,
2024
See
Notes
to
Financial
Statements.
INVESTMENT
INCOME
Dividend
income
(Net
of
foreign
withholding
taxes
of
$3,451)
$
930,109
Total
Investment
Income
930,109
EXPENSES
Investment
adviser
fees
851,844
Fund
services
fees
222,371
Custodian
fees
34,354
Registration
fees
22,264
Professional
fees
44,465
Trustees'
fees
and
expenses
12,351
Interest
expense
117
Other
expenses
149,561
Total
Expenses
1,337,327
Fees
waived
(314,999)
Net
Expenses
1,022,328
NET
INVESTMENT
LOSS
(92,219)
NET
REALIZED
AND
UNREALIZED
GAIN
(LOSS)
Net
realized
gain
on:
Investments
3,787,328
Futures
44,794
Net
realized
gain
3,832,122
Net
change
in
unrealized
appreciation
(depreciation)
on:
Investments
16,410
Futures
11,777
Net
change
in
unrealized
appreciation
(depreciation)
28,187
NET
REALIZED
AND
UNREALIZED
GAIN
3,860,309
INCREASE
IN
NET
ASSETS
RESULTING
FROM
OPERATIONS
$
3,768,090
ACUITAS
US
MICROCAP
FUND
STATEMENTS
OF
CHANGES
IN
NET
ASSETS
See
Notes
to
Financial
Statements.
For
the
Years
Ended
June
30,
2024
2023
OPERATIONS
Net
investment
loss
$
(92,219)
$
(117,526)
Net
realized
gain
3,832,122
11,618
Net
change
in
unrealized
appreciation
(depreciation)
28,187
7,375,028
Increase
in
Net
Assets
Resulting
from
Operations
3,768,090
7,269,120
DISTRIBUTIONS
TO
SHAREHOLDERS
Institutional
Shares
–
(2,851,832)
Total
Distributions
Paid
–
(2,851,832)
CAPITAL
SHARE
TRANSACTIONS
Sale
of
shares:
Institutional
Shares
22,076,434
18,042,023
Reinvestment
of
distributions:
Institutional
Shares
–
2,826,613
Redemption
of
shares:
Institutional
Shares
(6,160,312)
(9,485,043)
Redemption
fees:
Institutional
Shares
584
3,861
Increase
in
Net
Assets
from
Capital
Share
Transactions
15,916,706
11,387,454
Increase
in
Net
Assets
19,684,796
15,804,742
NET
ASSETS
Beginning
of
Year
62,882,736
47,077,994
End
of
Year
$
82,567,532
$
62,882,736
SHARE
TRANSACTIONS
Sale
of
shares:
Institutional
Shares
1,680,424
1,537,505
Reinvestment
of
distributions:
Institutional
Shares
–
244,517
Redemption
of
shares:
Institutional
Shares
(502,665)
(784,235)
Increase
in
Shares
1,177,759
997,787
ACUITAS
US
MICROCAP
FUND
FINANCIAL
HIGHLIGHTS
See
Notes
to
Financial
Statements.
These
financial
highlights
reflect
selected
data
for
a
share
outstanding
throughout
each
year.
For
the
Years
Ended
June
30,
2024
2023
2022
2021
2020
INSTITUTIONAL
SHARES
NET
ASSET
VALUE,
Beginning
of
Year
$
12.37
$
11.53
$
16.75
$
8.76
$
10.05
INVESTMENT
OPERATIONS
Net
investment
loss
(a)
(0.02)
(0.03)
(0.06)
(0.05)
(0.05)
Net
realized
and
unrealized
gain
(loss)
0.84
1.60
(3.91)
8.04
(1.23)
Total
from
Investment
Operations
0.82
1.57
(3.97)
7.99
(1.28)
DISTRIBUTIONS
TO
SHAREHOLDERS
FROM
Net
realized
gain
–
(0.73)
(1.25)
–
(0.01)
Total
Distributions
to
Shareholders
–
(0.73)
(1.25)
–
(0.01)
REDEMPTION
FEES(a)
0.00(b)
0.00(b)
0.00(b)
0.00(b)
0.00(b)
NET
ASSET
VALUE,
End
of
Year
$
13.19
$
12.37
$
11.53
$
16.75
$
8.76
TOTAL
RETURN
6.63%
14.04%
(25.17)%
91.21%
(12.75)%
RATIOS/SUPPLEMENTARY
DATA
Net
Assets
at
End
of
Year
(000s
omitted)
$
82,568
$
62,883
$
47,078
$
66,416
$
40,483
Ratios
to
Average
Net
Assets:
Net
investment
loss
(0.14)%
(0.23)%
(0.41)%
(0.36)%
(0.47)%
Net
expenses
1.50%
1.50%
1.50%
1.50%
1.70%
Gross
expenses
(c)
1.96%
2.05%
2.00%
2.08%
2.03%
PORTFOLIO
TURNOVER
RATE
64%
56%
61%
78%
74%
(a)
Calculated
based
on
average
shares
outstanding
during
each
year.
(b)
Less
than
$0.01
per
share.
(c)
Reflects
the
expense
ratio
excluding
any
waivers
and/or
reimbursements.
ACUITAS
US
MICROCAP
FUND
NOTES
TO
FINANCIAL
STATEMENTS
June
30,
2024
Note
1.
Organization
The
Acuitas
US
Microcap
Fund
(the
“Fund”)
is
a
diversified
portfolio
of
Forum
Funds
II
(the
“Trust”).
The
Trust
is
a
Delaware
statutory
trust
that
is
registered
as
an
open-end,
management
investment
company
under
the
Investment
Company
Act
of
1940,
as
amended
(the
“Act”).
Under
its
Trust
Instrument,
the
Trust
is
authorized
to
issue
an
unlimited
number
of
the
Fund’s
shares
of
beneficial
interest
without
par
value.
The
Fund
currently
offers
two
classes
of
shares:
Institutional
Shares
and
Investor
Shares.
As
of
June
30,
2024,
Investor
Shares
had
not
commenced
operations.
The
Fund
seeks
capital
appreciation.
The
Fund
commenced
operations
on
July
18,
2014.
Note
2.
Summary
of
Significant
Accounting
Policies
The
Fund
is
an
investment
company
and
follows
accounting
and
reporting
guidance
under
Financial
Accounting
Standards
Board
Accounting
Standards
Codification
Topic
946,
“Financial
Services
–
Investment
Companies.”
These
financial
statements
are
prepared
in
accordance
with
accounting
principles
generally
accepted
in
the
United
States
of
America
(“GAAP”),
which
require
management
to
make
estimates
and
assumptions
that
affect
the
reported
amounts
of
assets
and
liabilities,
the
disclosure
of
contingent
liabilities
at
the
date
of
the
financial
statements,
and
the
reported
amounts
of
increases
and
decreases
in
net
assets
from
operations
during
the
fiscal
year.
Actual
amounts
could
differ
from
those
estimates.
The
following
summarizes
the
significant
accounting
policies
of
the
Fund:
Security
Valuation
–
Securities
are
valued
at
market
prices
using
the
last
quoted
trade
or
official
closing
price
from
the
principal
exchange
where
the
security
is
traded,
as
provided
by
independent
pricing
services
on
each
Fund
business
day.
In
the
absence
of
a
last
trade,
securities
are
valued
at
the
mean
of
the
last
bid
and
ask
price
provided
by
the
pricing
service.
Futures
contracts
are
valued
at
the
day’s
settlement
price
on
the
exchange
where
the
contract
is
traded.
Forward
currency
contracts
are
generally
valued
based
on
interpolation
of
forward
curve
data
points
obtained
from
major
banking
institutions
that
deal
in
foreign
currencies
and
currency
dealers.
Exchange-traded
options
for
which
the
last
quoted
sale
price
is
outside
the
closing
bid
and
ask
price
will
be
valued
at
the
mean
of
the
closing
bid
and
ask
price.
Shares
of
non-exchange
traded
open-end
mutual
funds
are
valued
at
net
asset
value
per
share
(“NAV”).
Short-term
investments
that
mature
in
sixty
days
or
less
may
be
valued
at
amortized
cost.
Pursuant
to
Rule
2a-5
under
the
Investment
Company
Act,
the
Trust’s
Board
of
Trustees
(the
“Board”)
has
designated
the
Adviser,
as
defined
in
Note
3,
as
the
Fund’s
valuation
designee
to
perform
any
fair
value
determinations
for
securities
and
other
assets
held
by
the
Fund.
The
Adviser
is
subject
to
the
oversight
of
the
Board
and
certain
reporting
and
other
requirements
intended
to
provide
the
Board
the
information
needed
to
oversee
the
Adviser’s
fair
value
determinations.
The
Adviser
is
responsible
for
determining
the
fair
value
of
investments
for
which
market
quotations
are
not
readily
available
in
accordance
with
policies
and
procedures
that
have
been
approved
by
the
Board.
Under
these
procedures,
the
Adviser
convenes
on
a
regular
and
ad
hoc
basis
to
review
such
investments
and
considers
a
number
of
factors,
including
valuation
methodologies
and
significant
unobservable
inputs,
when
arriving
at
fair
value.
The
Board
has
approved
the
Adviser’s
fair
valuation
procedures
as
a
part
of
the
Fund’s
compliance
program
and
will
review
any
changes
made
to
the
procedures.
The
Adviser
provides
fair
valuation
inputs.
In
determining
fair
valuations,
inputs
may
include
market-based
analytics
that
may
consider
related
or
comparable
assets
or
liabilities,
recent
transactions,
market
multiples,
book
values
and
other
relevant
investment
information.
Adviser
inputs
may
include
an
income-based
approach
in
which
the
anticipated
future
cash
flows
of
the
investment
are
discounted
in
determining
fair
value.
Discounts
may
also
be
applied
based
on
the
nature
or
duration
of
any
restrictions
on
the
disposition
of
the
investments.
The
Adviser
performs
regular
reviews
of
valuation
methodologies,
key
inputs
and
assumptions,
disposition
analysis
and
market
activity.
Fair
valuation
is
based
on
subjective
factors
and,
as
a
result,
the
fair
value
price
of
an
investment
may
differ
from
the
security’s
market
price
and
may
not
be
the
price
at
which
the
asset
may
be
sold.
Fair
valuation
could
result
in
a
different
NAV
than
a
NAV
determined
by
using
market
quotes.
GAAP
has
a
three-tier
fair
value
hierarchy.
The
basis
of
the
tiers
is
dependent
upon
the
various
“inputs”
used
to
determine
the
value
of
the
Fund’s
investments.
These
inputs
are
summarized
in
the
three
broad
levels
listed
below:
Level
1
-
Quoted
prices
in
active
markets
for
identical
assets
and
liabilities.
ACUITAS
US
MICROCAP
FUND
NOTES
TO
FINANCIAL
STATEMENTS
June
30,
2024
Level
2
-
Prices
determined
using
significant
other
observable
inputs
(including
quoted
prices
for
similar
securities,
interest
rates,
prepayment
speeds,
credit
risk,
etc.).
Short-term
securities
with
maturities
of
sixty
days
or
less
are
valued
at
amortized
cost,
which
approximates
market
value,
and
are
categorized
as
Level
2
in
the
hierarchy.
Municipal
securities,
long-term
U.S.
government
obligations
and
corporate
debt
securities
are
valued
in
accordance
with
the
evaluated
price
supplied
by
a
pricing
service
and
generally
categorized
as
Level
2
in
the
hierarchy.
Other
securities
that
are
categorized
as
Level
2
in
the
hierarchy
include,
but
are
not
limited
to,
warrants
that
do
not
trade
on
an
exchange,
securities
valued
at
the
mean
between
the
last
reported
bid
and
ask
quotation
and
international
equity
securities
valued
by
an
independent
third
party
with
adjustments
for
changes
in
value
between
the
time
of
the
securities’
respective
local
market
closes
and
the
close
of
the
U.S.
market.
Level
3
-
Significant
unobservable
inputs
(including
the
Fund’s
own
assumptions
in
determining
the
fair
value
of
investments).
The
aggregate
value
by
input
level,
as
of
June
30,
2024,
for
the
Fund’s
investments
is
included
at
the
end
of
the
Fund’s
Schedule
of
Investments.
Security
Transactions,
Investment
Income
and
Realized
Gain
and
Loss
–
Investment
transactions
are
accounted
for
on
the
trade
date.
Dividend
income
is
recorded
on
the
ex-dividend
date.
Interest
income
is
recorded
on
an
accrual
basis.
Premium
is
amortized
to
the
next
call
date
above
par,
and
discount
is
accreted
to
maturity
using
the
effective
interest
method.
Identified
cost
of
investments
sold
is
used
to
determine
the
gain
and
loss
for
both
financial
statement
and
federal
income
tax
purposes.
Futures
Contracts
–
A
futures
contract
is
an
agreement
between
parties
to
buy
or
sell
a
security
at
a
set
price
on
a
future
date.
Upon
entering
into
such
a
contract,
a
fund
is
required
to
pledge
to
the
broker
an
amount
of
cash,
U.S.
Government
obligations
or
other
high-quality
debt
securities
equal
to
the
minimum
“initial
margin”
requirements
of
the
exchange
on
which
the
futures
contract
is
traded.
Pursuant
to
the
contract,
the
Fund
agrees
to
receive
from
or
pay
to
the
broker
an
amount
of
cash
equal
to
the
daily
fluctuation
in
the
value
of
the
contract.
When
the
contract
is
closed,
the
Fund
records
a
realized
gain
or
loss
equal
to
the
difference
between
the
value
of
the
contract
at
the
time
it
was
opened
and
value
at
the
time
it
was
closed.
Risks
of
entering
into
futures
contracts
include
the
possibility
that
there
may
be
an
illiquid
market
and
that
a
change
in
the
value
of
the
contract
may
not
correlate
with
changes
in
the
value
of
the
underlying
securities.
Notional
amounts
of
each
individual
futures
contract
outstanding
as
of
June
30,
2024,
for
the
Fund,
are
disclosed
in
the
Schedule
of
Investments.
Distributions
to
Shareholders
–
The
Fund
declares
any
dividends
from
net
investment
income
and
pays
them
annually.
Any
net
capital
gains
realized
by
the
Fund
are
distributed
at
least
annually.
Distributions
to
shareholders
are
recorded
on
the
ex-dividend
date.
Distributions
are
based
on
amounts
calculated
in
accordance
with
applicable
federal
income
tax
regulations,
which
may
differ
from
GAAP.
These
differences
are
due
primarily
to
differing
treatments
of
income
and
gain
on
various
investment
securities
held
by
the
Fund,
timing
differences
and
differing
characterizations
of
distributions
made
by
the
Fund.
Federal
Taxes
–
The
Fund
intends
to
continue
to
qualify
each
year
as
a
regulated
investment
company
under
Subchapter
M
of
Chapter
1,
Subtitle
A,
of
the
Internal
Revenue
Code
of
1986,
as
amended
(“Code”),
and
to
distribute
all
of
its
taxable
income
to
shareholders.
In
addition,
by
distributing
in
each
calendar
year
substantially
all
of
its
net
investment
income
and
capital
gains,
if
any,
the
Fund
will
not
be
subject
to
a
federal
excise
tax.
Therefore,
no
federal
income
or
excise
tax
provision
is
required.
The
Fund
recognizes
interest
and
penalties,
if
any,
related
to
unrecognized
tax
benefits
as
income
tax
expense
in
the
Statement
of
Operations.
During
the
year,
the
Fund
did
not
incur
any
interest
or
penalties.
The
Fund
files
a
U.S.
federal
income
and
excise
tax
return
as
required.
The
Fund’s
federal
income
tax
returns
are
subject
to
examination
by
the
Internal
Revenue
Service
for
a
period
of
three
fiscal
years
after
they
are
filed.
As
of
June
30,
2024,
there
are
no
uncertain
tax
positions
that
would
require
financial
statement
recognition,
de-recognition
or
disclosure.
Income
and
Expense
Allocation
–
The
Trust
accounts
separately
for
the
assets,
liabilities
and
operations
of
each
of
its
investment
portfolios.
Expenses
that
are
directly
attributable
to
more
than
one
investment
portfolio
are
allocated
among
the
respective
investment
portfolios
in
an
equitable
manner.
Redemption
Fees
–
A
shareholder
who
redeems
or
exchanges
shares
within
60
days
of
purchase
will
incur
a
redemption
fee
of
1.00%
of
the
current
NAV
of
shares
redeemed
or
exchanged,
subject
to
certain
limitations.
The
fee
is
charged
for
the
benefit
of
the
remaining
shareholders
and
will
be
paid
to
the
Fund
to
help
offset
transaction
costs.
The
fee
is
accounted
for
as
an
addition
to
ACUITAS
US
MICROCAP
FUND
NOTES
TO
FINANCIAL
STATEMENTS
June
30,
2024
paid-in
capital.
The
Fund
reserves
the
right
to
modify
the
terms
of
or
terminate
the
fee
at
any
time.
There
are
limited
exceptions
to
the
imposition
of
the
redemption
fee.
Redemption
fees
incurred
for
the
Fund,
if
any,
are
reflected
on
the
Statements
of
Changes
in
Net
Assets.
Commitments
and
Contingencies
–
In
the
normal
course
of
business,
the
Fund
enters
into
contracts
that
provide
general
indemnifications
by
the
Fund
to
the
counterparty
to
the
contract.
The
Fund’s
maximum
exposure
under
these
arrangements
is
dependent
on
future
claims
that
may
be
made
against
the
Fund
and,
therefore,
cannot
be
estimated;
however,
based
on
experience,
the
risk
of
loss
from
such
claims
is
considered
remote.
The
Fund
has
determined
that
none
of
these
arrangements
requires
disclosure
on
the
Fund’s
statement
of
assets
and
liabilities.
Note
3.
Fees
and
Expenses
Investment
Adviser
–
Acuitas
Investments,
LLC
(the
“Adviser”)
is
the
investment
Adviser
to
the
Fund.
Pursuant
to
an
investment
advisory
agreement,
the
Adviser
receives
an
advisory
fee,
payable
monthly,
from
the
Fund
at
an
annual
rate
of
1.25%
of
the
Fund’s
average
daily
net
assets.
The
sub-advisory
fees,
calculated
as
a
percentage
of
the
Fund’s
average
daily
net
assets
managed
by
the
subadvisers,
are
paid
by
the
Adviser.
Distribution
–
Foreside
Fund
Services,
LLC,
a
wholly
owned
subsidiary
of
Foreside
Financial
Group,
LLC
(d/b/a
ACA
Group)
(the
“Distributor”),
acts
as
the
agent
of
the
Trust
in
connection
with
the
continuous
offering
of
shares
of
the
Fund.
The
Fund
has
adopted
a
Distribution
Plan
(the
“Plan”)
for
Investor
Shares
in
accordance
with
Rule
12b-1
of
the
Act.
Under
the
Plan,
the
Fund
pays
the
Distributor
and/or
any
other
entity
as
authorized
by
the
Board
a
fee
of
up
to
0.25%
of
the
average
daily
net
assets
of
Investor
Shares.
The
Distributor
is
not
affiliated
with
the
Adviser
or
Atlantic
Fund
Administration,
LLC,
a
wholly
owned
subsidiary
of
Apex
US
Holdings
LLC
(d/b/a
Apex
Fund
Services)
(“Apex”)
or
their
affiliates.
Currently,
Investor
Shares
are
not
offered
for
sale,
therefore
the
Fund
is
not
currently
paying
12b-1
fees.
Other
Service
Providers
–
Apex
provides
fund
accounting,
fund
administration,
compliance
and
transfer
agency
services
to
the
Fund.
The
fees
related
to
these
services
are
included
in
Fund
services
fees
within
the
Statement
of
Operations.
Apex
also
provides
certain
shareholder
report
production
and
EDGAR
conversion
and
filing
services.
Pursuant
to
an
Apex
Services
Agreement,
the
Fund
pays
Apex
customary
fees
for
its
services.
Apex
provides
a
Principal
Executive
Officer,
a
Principal
Financial
Officer,
a
Chief
Compliance
Officer
and
an
Anti-Money
Laundering
Officer
to
the
Fund,
as
well
as
certain
additional
compliance
support
functions.
Trustees
and
Officers
–
Each
Independent
Trustee
receives
an
annual
fee
of
$25,000
($32,500
for
the
Chairman)
for
service
to
the
Trust.
The
Independent
Trustees
and
Chairman
may
receive
additional
fees
for
special
Board
meetings.
The
Independent
Trustees
are
also
reimbursed
for
all
reasonable
out-of-pocket
expenses
incurred
in
connection
with
their
duties
as
Trustees,
including
travel
and
related
expenses
incurred
in
attending
Board
meetings.
The
amount
of
Independent
Trustees’
fees
attributable
to
the
Fund
is
disclosed
in
the
Statement
of
Operations.
Certain
officers
of
the
Trust
are
also
officers
or
employees
of
the
above
named
service
providers,
and
during
their
terms
of
office
received
no
compensation
from
the
Fund.
Note
4.
Expense
Reimbursement
and
Fees
Waived
The
Adviser
has
contractually
agreed
to
waive
its
fees
and/or
reimburse
expenses
to
limit
total
annual
operating
expenses
(excluding
all
taxes,
interest,
portfolio
transaction
expenses,
acquired
fund
fees
and
expenses,
proxy
expenses
and
extraordinary
expenses)
of
Institutional
Shares
to
1.50%
and
Investor
Shares
to
1.75%
through
November
1,
2024.
Other
fund
service
providers
have
agreed
to
waive
a
portion
of
their
fees
and
such
waivers
may
be
changed
or
eliminated
with
the
approval
of
the
Board
of
Trustees
of
the
Trust.
For
the
year
ended
June
30,
2024,
the
fees
waived
and/or
reimbursed
expenses
were
as
follows:
The
Adviser
may
be
reimbursed
by
the
Fund
for
fees
waived
and
expenses
reimbursed
by
the
Adviser
pursuant
to
the
Expense
Cap
if
such
payment
is
approved
by
the
Board,
made
within
three
years
of
the
fee
waiver
or
expense
reimbursement,
and
does
not
cause
Investment
Adviser
Fees
Waived
Other
Waivers
Total
Fees
Waived
and
Expenses
Reimbursed
$
286,688
$
28,311
$
314,999
ACUITAS
US
MICROCAP
FUND
NOTES
TO
FINANCIAL
STATEMENTS
June
30,
2024
the
Total
Annual
Fund
Operating
Expenses
After
Fee
Waiver
and/or
Expense
Reimbursement
to
exceed
the
lesser
of
(i)
the
then-
current
expense
cap
and
(ii)
the
expense
cap
in
place
at
the
time
the
fees/expenses
were
waived/reimbursed.
As
of
June
30,
2024,
$809,008
is
subject
to
recapture
by
the
Adviser.
Other
waivers
are
not
eligible
for
recoupment.
Note
5.
Security
Transactions
The
cost
of
purchases
and
proceeds
from
sales
of
investment
securities
(including
maturities),
other
than
short-term
investments
during
the
year
ended
June
30,
2024,
totaled
$
59,173,389
and
$
42,294,852
,
respectively.
Note
6.
Summary
of
Derivative
Activity
The
volume
of
open
derivative
positions
may
vary
on
a
daily
basis
as
the
Fund
transacts
derivative
contracts
in
order
to
achieve
the
exposure
desired
by
the
Adviser.
The
notional
value
of
activity
for
the
year
ended
June
30,
2024
,
for
futures
contracts
was
$
16,780,089
.
The
Fund’s
use
of
derivatives
for
the
year
ended
June
30,
2024
,
was
limited
to
futures
contracts.
Following
is
a
summary
of
the
effect
of
derivatives
on
the
Statement
of
Assets
and
Liabilities
as
of
June
30,
2024.
Realized
and
unrealized
gains
and
losses
on
derivatives
contracts
for
the
year
ended
June
30,
2024,
are
recorded
by
the
Fund
in
the
following
locations
on
the
Statement
of
Operations:
Asset
(Liability)
amounts
shown
in
the
table
below
represent
amounts
for
derivative
related
investments
at
June
30,
2024.
These
amounts
may
be
collateralized
by
cash
or
financial
instruments.
Note
7.
Federal
Income
Tax
As
of
June
30,
2024,
the
cost
for
federal
income
tax
purposes
is
$78,773,245
and
the
components
of
net
unrealized
appreciation
consists
of:
Location:
Equity
Contracts
Asset
derivatives:
Unrealized
appreciation
on
futures*
$
3,380
*
Balance
is
included
in
the
deposits
with
broker
for
futures
on
the
Statement
of
Assets
and
Liabilities.
Location:
Equity
Contracts
Net
realized
gain
on:
Futures
$
44,794
Total
net
realized
gain
$
44,794
Net
change
in
unrealized
appreciation
(depreciation)
on:
Futures
$
11,777
Total
net
change
in
unrealized
appreciation
(depreciation)
$
11,777
Gross
Asset
(Liability)
as
Presented
in
the
Statement
of
Assets
and
Liabilities
Financial
Instruments
(Received)
Pledged*
Cash
Collateral
(Received)
Pledged*
Net
Amount
Unrealized
Appreciation
on
Futures**
$
3,380
$
-
$
3,380
$
-
*
The
actual
financial
instruments
and
cash
collateral
(received)
pledged
may
be
in
excess
of
the
amounts
shown
in
the
table.
The
table
only
reflects
collateral
amounts
up
to
the
amount
of
the
financial
instrument
disclosed
on
the
Statement
of
Assets
and
Liabilities.
**
Balance
is
included
in
the
deposits
with
broker
for
futures
on
the
Statement
of
Assets
and
Liabilities.
Gross
Unrealized
Appreciation
$
12,939,511
Gross
Unrealized
Depreciation
(9,434,448)
Net
Unrealized
Appreciation
$
3,505,063
ACUITAS
US
MICROCAP
FUND
NOTES
TO
FINANCIAL
STATEMENTS
June
30,
2024
Distributions
paid
during
the
fiscal
years
ended
as
noted
were
characterized
for
tax
purposes
as
follows:
As
of
June
30,
2024,
distributable
earnings
(accumulated
losses)
on
a
tax
basis
were
as
follows:
The
difference
between
components
of
distributable
earnings
on
a
tax
basis
and
the
amounts
reflected
in
the
Statement
of
Assets
and
Liabilities
are
primarily
due
to
investments
in
real
estate
investment
trusts,
futures,
equity
return
of
capital,
PFICs
and
wash
sales.
Note
8.
Subsequent
Events
Subsequent
events
occurring
after
the
date
of
this
report
through
the
date
these
financial
statements
were
issued
have
been
evaluated
for
potential
impact,
and
the
Fund
has
had
no
such
events.
2024
2023
Long-Term
Capital
Gain
$
–
$
2,851,832
Undistributed
Ordinary
Income
$
264,175
Undistributed
Long-Term
Gain
1,969,893
Net
Unrealized
Appreciation
3,505,063
Total
$
5,739,131
REPORT
OF
INDEPENDENT
REGISTERED
PUBLIC
ACCOUNTING
FIRM
To
the
Shareholders
of
Acuitas
US
Microcap
Fund
and
Board
of
Trustees
of
Forum
Funds
II
Opinion
on
the
Financial
Statements
We
have
audited
the
accompanying
statement
of
assets
and
liabilities,
including
the
schedule
of
investments,
of
Acuitas
US
Microcap
Fund
(the
“Fund”),
a
series
of
Forum
Funds
II,
as
of
June
30,
2024,
the
related
statement
of
operations
for
the
year
then
ended,
the
statements
of
changes
in
net
assets
and
financial
highlights
for
each
of
the
two
years
in
the
period
then
ended,
and
the
related
notes
(collectively
referred
to
as
the
“financial
statements”).
In
our
opinion,
the
financial
statements
present
fairly,
in
all
material
respects,
the
financial
position
of
the
Fund
as
of
June
30,
2024,
the
results
of
its
operations
for
the
year
then
ended,
and
the
changes
in
net
assets
and
financial
highlights
for
each
of
the
two
years
in
the
period
then
ended,
in
conformity
with
accounting
principles
generally
accepted
in
the
United
States
of
America.
The
Fund’s
financial
highlights
for
the
years
ended
June
30,
2022,
and
prior,
were
audited
by
other
auditors
whose
report
dated
August
24,
2022,
expressed
an
unqualified
opinion
on
those
financial
highlights.
Basis
for
Opinion
These
financial
statements
are
the
responsibility
of
the
Fund’s
management.
Our
responsibility
is
to
express
an
opinion
on
the
Fund’s
financial
statements
based
on
our
audits.
We
are
a
public
accounting
firm
registered
with
the
Public
Company
Accounting
Oversight
Board
(United
States)
(“PCAOB”)
and
are
required
to
be
independent
with
respect
to
the
Fund
in
accordance
with
the
U.S.
federal
securities
laws
and
the
applicable
rules
and
regulations
of
the
Securities
and
Exchange
Commission
and
the
PCAOB.
We
conducted
our
audits
in
accordance
with
the
standards
of
the
PCAOB.
Those
standards
require
that
we
plan
and
perform
the
audits
to
obtain
reasonable
assurance
about
whether
the
financial
statements
are
free
of
material
misstatement
whether
due
to
error
or
fraud.
Our
audits
included
performing
procedures
to
assess
the
risks
of
material
misstatement
of
the
financial
statements,
whether
due
to
error
or
fraud,
and
performing
procedures
that
respond
to
those
risks.
Such
procedures
included
examining,
on
a
test
basis,
evidence
regarding
the
amounts
and
disclosures
in
the
financial
statements.
Our
procedures
included
confirmation
of
securities
owned
as
of
June
30,
2024,
by
correspondence
with
the
custodian
and
brokers;
when
replies
were
not
received
from
brokers,
we
performed
other
auditing
procedures.
Our
audits
also
included
evaluating
the
accounting
principles
used
and
significant
estimates
made
by
management,
as
well
as
evaluating
the
overall
presentation
of
the
financial
statements.
We
believe
that
our
audits
provide
a
reasonable
basis
for
our
opinion.
We
have
served
as
the
Fund’s
auditor
since
2023.
COHEN
&
COMPANY,
LTD.
Philadelphia,
Pennsylvania
August
26,
2024
ACUITAS
US
MICROCAP
FUND
OTHER
INFORMATION
June
30,
2024
Changes
in
and
Disagreements
with
Accountants
(Item
8
of
Form
N-CSR)
N/A
Proxy
Disclosure
(Item
9
of
Form
N-CSR)
N/A
Remuneration
Paid
to
Directors,
Officers,
and
Others
(Item
10
of
Form
N-CSR)
Please
see
financial
statements
in
Item
7.
Statement
Regarding
the
Basis
for
the
Board’s
Approval
of
Investment
Advisory
Contract
(Item
11
of
Form
N-CSR)
Acuitas
US
Microcap
Fund
(“Microcap
Fund”)
(the
“Fund”)
At
the
June
13,
2024
Board
meeting
(the
“June
meeting”),
the
Board
of
Trustees
of
Forum
Funds
II
(the
“Board”),
including
the
Trustees
who
are
not
“interested
persons”
of
the
Trust
(“Independent
Trustees”),
considered
the
approval
of
the
continuance
of
the
investment
advisory
agreement
between
Acuitas
Investments,
LLC
(the
“Adviser”)
and
the
Trust
pertaining
to
the
Fund
(the
“Advisory
Agreement”)
and
the
subadvisory
agreements
between
the
Adviser
and
each
of
ClariVest
Asset
Management,
LLC;
Granahan
Investment
Management,
Inc.;
and
Tieton
Capital
Management,
LLC
(each
a
“Subadviser”)
(the
“Subadvisory
Agreements”).
In
preparation
for
the
June
meeting,
the
Board
was
presented
with
a
range
of
information
to
assist
in
its
deliberations.
The
Board
requested
and
reviewed
written
responses
from
the
Adviser
and
each
Subadviser
to
a
letter
circulated
on
the
Board’s
behalf
concerning
the
personnel,
operations,
financial
condition,
performance,
and
services
provided
to
the
Fund
by
the
Adviser
and
each
of
the
Subadvisers.
During
its
deliberations,
the
Board
received
an
oral
presentation
from
the
Adviser
and
discussed
the
materials
with
the
Adviser,
independent
legal
counsel
to
the
Independent
Trustees
(“Independent
Legal
Counsel”),
and,
as
necessary,
with
the
Trust’s
administrator.
The
Independent
Trustees
also
met
in
executive
session
with
Independent
Legal
Counsel
while
deliberating.
At
the
June
meeting,
the
Board
reviewed,
among
other
matters,
the
topics
discussed
below.
Nature,
Extent
and
Quality
of
Services
Based
on
written
materials
received
and
the
presentation
from
senior
representatives
of
the
Adviser
regarding
the
personnel,
operations,
and
financial
condition
of
the
Adviser
and
each
Subadviser,
the
Board
considered
the
quality
of
services
provided
by
the
Adviser
under
the
Advisory
Agreement
and
by
each
Subadviser
under
the
respective
Subadvisory
Agreement.
In
this
regard,
the
Board
considered
information
regarding
the
experience,
qualifications
and
professional
background
of
the
portfolio
managers
and
other
personnel
at
the
Adviser
and
each
Subadviser
with
principal
responsibility
for
the
Fund’s
investments;
the
investment
philosophy
and
decision-making
process
of
the
Adviser’s
and
Subadvisers’
investment
professionals;
the
quality
of
the
Adviser’s
and
Subadvisers’
services
with
respect
to
regulatory
compliance;
and
the
Adviser’s
and
each
Subadviser’s
representations
that
each
firm
is
in
stable
financial
condition
to
allow
each
firm
to
provide
quality
advisory
services
to
the
Fund.
The
Board
also
considered
the
Adviser’s
analysis
of
and
recommendation
to
approve
the
continuance
of
the
Subadvisory
Agreements
with
the
Subadvisers.
The
Board
concluded
that,
overall,
it
was
satisfied
with
the
nature,
extent
and
quality
of
services
provided
to
the
Fund
by
the
Adviser
under
the
Advisory
Agreement
and
by
each
Subadviser
under
the
respective
Subadvisory
Agreements.
Performance
In
connection
with
a
presentation
by
the
Adviser
regarding
its
approach
to
managing
the
Fund,
including
the
investment
objective
and
strategy
of
the
Fund
and
the
Adviser’s
discussion
of
the
performance
of
each
of
the
Subadvisers,
the
Board
reviewed
the
performance
of
the
Fund
compared
to
its
primary
benchmark.
The
Board
observed
that
the
Fund
outperformed
its
primary
benchmark
ACUITAS
US
MICROCAP
FUND
OTHER
INFORMATION
June
30,
2024
index,
the
Russell
Microcap
Index,
for
the
one-,
three-,
and
five-year
periods
ended
March
31,
2024,
and
for
the
period
since
the
Fund’s
inception
on
July
18,
2014.
The
Board
also
considered
the
Fund’s
performance
relative
to
an
independent
peer
group
of
funds
identified
by
Strategic
Insight,
Inc.
(“Strategic
Insight”)
believed
to
have
characteristics
similar
to
those
of
the
Fund.
Based
on
information
presented
by
Strategic
Insight,
the
Board
observed
that
the
Fund
outperformed
the
average
of
the
Strategic
Insight
peers
for
the
one-,
and
five-year
periods
ended
March
31,
2024
and
underperformed
the
average
of
the
Strategic
Insight
peers
for
the
three-year
period
ended
March
31,
2024.
The
Board
noted
the
Adviser’s
representation
that
the
Fund’s
relative
performance
could
be
attributed,
in
part,
to
the
Fund’s
stock
selection
and
bias
toward
high
quality
companies.
The
Board
also
noted
the
Adviser’s
representation
that
the
Strategic
Insight
peer
group
was
not
an
optimal
representation
of
the
Fund’s
investment
strategy
from
a
performance
comparison
standpoint
because
many
of
the
funds
within
the
Strategic
Insight
peer
group
operate
within
the
small
cap
universe,
whereas
the
Fund
places
a
larger
emphasis
on
microcap
investments.
At
the
request
of
the
Adviser,
the
Board
reviewed
the
Fund’s
performance
compared
to
the
performance
of
a
peer
group
of
funds
identified
by
the
Adviser
as
being
a
more
optimal
comparison
to
the
Fund
(the
“Comparable
Funds”).
The
Board
observed
that
the
Fund
outperformed
the
average
of
the
Comparable
Funds
for
the
one-,
three-,
and
five-year
periods
ended
March
31,
2024.
The
Board
also
evaluated
the
Adviser's
assessment
of
each
Subadviser’s
performance.
The
Board
acknowledged
the
Adviser’s
representation
that
the
different
Subadvisers
could
be
expected
to
achieve
different
performance
results
in
light
of
the
differences
in
their
strategies,
allocated
assets,
and
market
environment.
In
this
regard,
the
Board
noted
that
the
Adviser
emphasized
its
responsibility
for
allocating
the
Fund’s
assets
among
Subadvisers
on
an
ongoing
basis
in
order
to
achieve
the
Fund’s
investment
objective.
In
view
of
the
respective
roles
of
the
Adviser
and
Subadvisers,
the
Board
determined
that
it
was
appropriate
to
evaluate
the
individual
performance
achieved
by
each
Subadviser
as
it
contributed
to
the
performance
of
the
Fund
as
a
whole.
Based
on
the
foregoing,
among
other
applicable
considerations,
the
Board
concluded
that
the
Fund
and
its
shareholders
could
benefit
from
the
Adviser’s
continued
management
under
the
Advisory
Agreement
and
from
each
Subadviser’s
continued
management
under
the
respective
Subadvisory
Agreements.
Compensation
The
Board
evaluated
the
Adviser’s
compensation
for
providing
advisory
services
to
the
Fund
and
analyzed
comparative
information
on
actual
advisory
fee
rates
and
actual
total
expense
ratios
of
the
Fund’s
Strategic
Insight
peers.
The
Board
noted
that,
based
on
the
information
provided
by
Strategic
Insight,
the
net
advisory
fee
rate
and
net
total
expense
ratio
for
the
Fund
were
each
higher
than
the
median
of
its
Strategic
Insight
peers.
The
Board
noted
the
Adviser’s
representation
that
the
Fund’s
Strategic
Insight
peers
are
heavily
weighted
toward
small
cap
managers,
which
offer
lower
fees
than
microcap
managers,
which
could
account
for
some
of
the
variance
in
the
fee
and
expense
comparison.
The
Board
also
noted
the
Adviser’s
representation
that
many
of
the
funds
listed
in
the
respective
Strategic
Insight
peer
groups
did
not
operate
pursuant
to
a
multi-manager
structure
and
that,
unlike
the
peers
in
the
Strategic
Insight
peer
group,
the
Adviser
paid
each
of
the
Subadvisers
directly
from
the
advisory
fee
paid
to
the
Adviser
such
that
the
fees
and
expenses
of
the
Strategic
Insight
peers
were
not
directly
comparable.
The
Board
noted
further
the
Adviser’s
representation
that,
although
the
total
expense
ratio
for
the
Fund
was
higher
than
the
average
of
the
expense
ratios
of
the
Comparable
Funds,
the
Fund’s
total
expense
ratio
was
believed
to
be
within
a
reasonable
range.
Finally,
the
Board
observed
that
the
contractual
advisory
fee
and
expense
cap
were
each
lowered
in
2020.
With
regard
to
Subadviser
compensation,
the
Board
noted
the
arms-length
nature
of
the
relationship
between
the
Adviser
and
each
Subadvisers
with
respect
to
the
negotiation
of
the
subadvisory
fee
rate
on
behalf
of
the
Fund
and
that
the
Adviser,
and
not
the
Fund,
was
responsible
for
paying
the
subadvisory
fees
due
under
each
Subadvisory
Agreement.
Based
on
the
foregoing
and
other
relevant
considerations,
the
Board
concluded
that
the
Adviser’s
advisory
fee
rate
charged
to
the
Fund
appeared
to
be
reasonable
in
light
of
the
nature,
extent
and
quality
of
services
provided
by
the
Adviser.
Cost
of
Services
and
Profitability
The
Board
considered
information
provided
by
the
Adviser
regarding
the
costs
of
services
and
its
profitability
with
respect
to
the
Fund.
In
this
regard,
the
Board
considered
the
Adviser’s
resources
devoted
to
the
Fund,
as
well
as
the
Adviser’s
discussion
of
the
aggregate
costs
and
profitability
of
its
mutual
fund
activity,
including
the
percentage
and
amount
of
the
Adviser’s
fee
that
the
ACUITAS
US
MICROCAP
FUND
OTHER
INFORMATION
June
30,
2024
Adviser
retained
and
the
percentage
and
amount
of
the
Adviser’s
fee
that
was
paid
to
the
Subadvisers.
The
Board
noted
that
the
Adviser
does
not
maintain
separate
profit
and
loss
data
by
account,
making
it
difficult
to
assess
costs
incurred
specific
to
providing
services
to
the
Fund.
The
Board
noted
further
the
Adviser’s
representation
that
the
Adviser
continues
to
pay
its
Subadvisers
directly
from
the
Adviser’s
advisory
fees
and
that
the
Adviser
continued
to
subsidize
the
operation
of
the
Fund
by
waiving
its
advisory
fee
and
reimbursing
expenses
to
the
extent
necessary
to
keep
the
Fund’s
total
expense
ratios
at
competitive
levels.
Based
on
these
and
other
applicable
considerations,
the
Board
concluded
that
the
Adviser’s
profits
attributable
to
management
of
the
Fund
were
reasonable
in
light
of
the
nature,
extent
and
quality
of
the
services
provided
by
the
Adviser.
The
Board
did
not
consider
information
regarding
the
costs
of
services
provided
or
profits
realized
by
the
Subadvisers
from
their
relationships
with
the
Fund,
noting
instead
the
arms-length
nature
of
the
relationship
between
the
Adviser
and
each
Subadviser
with
respect
to
the
negotiation
of
the
subadvisory
fee
rate
on
behalf
of
the
Fund
and
that
the
Adviser,
and
not
the
Fund,
was
responsible
for
paying
the
subadvisory
fee
due
under
each
Subadvisory
Agreement.
Economies
of
Scale
The
Board
considered
whether
the
Fund
was
benefiting,
or
may
benefit
in
the
future,
from
any
economies
of
scale.
In
this
regard,
the
Board
considered
the
Fund’s
fee
structure,
asset
size,
net
expense
ratio,
and
the
fees
of
comparable
advisers,
recognizing
that
an
analysis
of
economies
of
scale
is
generally
most
relevant
when
a
fund
has
achieved
a
substantial
size
and
has
growing
assets
and
that,
if
a
fund’s
assets
are
stable
or
decreasing,
the
significance
of
economies
of
scale
may
be
reduced.
The
Board
noted
the
assets
of
the
Fund
were
stable
but
relatively
low.
The
Board
also
noted
the
Adviser’s
representation
that
the
Fund
was
benefiting
from
expenses
subsidized
by
the
Adviser
under
the
contractual
expense
limitation
agreement.
The
Board
noted
further
the
Adviser’s
representation
that,
although
the
Fund
could
benefit
from
economies
of
scale
as
assets
grow,
the
Adviser
believed
that
economies
of
scale
had
not
been
achieved
at
current
asset
levels.
The
Board
also
considered
whether
the
Fund
would
benefit
from
any
economies
of
scale
with
respect
to
the
Subadvisory
Agreements.
In
this
respect,
the
Board
noted
that
there
were
no
breakpoints
in
the
Subadvisory
Agreements
and
that
such
breakpoints
were
likely
to
benefit
the
Adviser,
rather
than
the
Fund,
because
the
Adviser
pays
the
subadvisory
fees
directly
from
the
Adviser’s
advisory
fee.
The
Board
considered
that
the
subadvisory
fee
rates
were
negotiated
at
arm’s
length
between
the
Adviser
and
each
Subadviser
and
that,
for
the
reasons
cited
above,
among
other
relevant
considerations,
breakpoints
in
the
subadvisory
fee
rates
were
unlikely
to
result
in
the
Fund’s
realization
of
economies
of
scale.
Based
on
the
foregoing
information
and
other
applicable
factors,
and
in
light
of
the
size
of
the
Fund,
the
Board
concluded
that
the
asset
level
of
the
Fund
was
not
consistent
with
the
existence
of
economies
of
scale
and
that
economies
of
scale
were
not
a
material
factor
in
approving
the
continuation
of
the
Advisory
Agreement
or
Subadvisory
Agreements.
Other
Benefits
The
Board
noted
the
Adviser’s
representation
that,
aside
from
its
contractual
advisory
fees,
it
does
not
benefit
in
a
material
way
from
its
relationship
with
the
Fund.
Based
on
the
foregoing
representation
and
other
relevant
considerations,
the
Board
concluded
that
other
benefits
received
by
the
Adviser
from
its
relationship
with
the
Fund
were
not
a
material
factor
in
approving
the
continuation
of
the
Advisory
Agreement.
Conclusion
The
Board
did
not
identify
any
single
factor
as
being
of
paramount
importance,
and
different
Trustees
may
have
given
different
weight
to
different
factors.
In
addition,
various
materials
provided
to
and
discussed
with
the
Board
throughout
the
year,
including
with
respect
to
performance
and
compliance,
also
informed
the
Board’s
decision.
In
light
of
the
fact
that
the
Fund
is
a
multi-manager
Fund,
however,
for
which
the
Adviser
identifies
Subadvisers
whose
strategies
it
seeks
to
combine
to
achieve
the
Fund’s
investment
objective,
when
considering
the
renewal
of
the
Subadvisory
Agreements,
the
Board
gave
significant
weight
to
the
Adviser’s
recommendation
that
the
Subadvisory
Agreements
be
renewed
and
to
the
Adviser’s
representation
that
the
reappointment
of
the
Subadvisers
would
positively
contribute
to
the
Adviser’s
successful
execution
of
the
Fund’s
overall
strategy.
The
Board
reviewed
ACUITAS
US
MICROCAP
FUND
OTHER
INFORMATION
June
30,
2024
a
memorandum
from
Independent
Legal
Counsel
discussing
the
legal
standards
applicable
to
its
consideration
of
the
Advisory
Agreement
and
each
Subadvisory
Agreement.
Based
on
its
review,
including
consideration
of
each
of
the
factors
referenced
above,
the
Board,
in
the
exercise
of
its
reasonable
business
judgment,
approved
the
continuation
of
the
Advisory
Agreement
and
each
Subadvisory
Agreement.
FOR
MORE
INFORMATION
Investment
Adviser
Acuitas
Investments,
LLC
520
Pike
Street,
Suite
1221
Seattle,
WA
98101
https://acuitasinvestments.com
Transfer
Agent
Apex
Fund
Services
P.O.
Box
588
Portland,
ME
04112
www.apexgroup.com
Distributor
Foreside
Fund
Services,
LLC
Three
Canal
Plaza,
Suite
100
Portland,
ME
04101
www.foreside.com
Acuitas
US
Microcap
Fund
P.O.
Box
588
Portland,
ME
04112
(844)
805-5628
This
report
is
submitted
for
the
general
information
of
the
shareholders
of
the
Fund.
It
is
not
authorized
for
distribution
to
prospective
investors
unless
preceded
or
accompanied
by
an
effective
prospectus,
which
includes
information
regarding
the
Fund’s
risks,
objectives,
fees
and
expenses,
experience
of
its
management,
and
other
information.
.
(b) Included as part of financial statements filed under Item 7(a).
ITEM 8. CHANGES IN AND DISAGREEMENTS WITH ACCOUNTANTS FOR OPEN-END MANAGEMENT INVESTMENT COMPANIES.
Not applicable.
ITEM 9. PROXY DISCLOSURES FOR OPEN-END MANAGEMENT INVESTMENT COMPANIES.
Not applicable.
ITEM 10. REMUNERATION PAID TO DIRECTORS, OFFICERS, AND OTHERS OF OPEN-END MANAGEMENT INVESTMENT COMPANIES.
Included as part of financial statements filed under Item 7(a).
ITEM 11. STATEMENT REGARDING BASIS FOR APPROVAL OF INVESTMENT ADVISORY CONTRACT.
Included as part of other information filed under Item 7(a).
ITEM 12. DISCLOSURE OF PROXY VOTING POLICIES AND PROCEDURES FOR CLOSED-END MANAGEMENT INVESTMENT COMPANIES.
Not applicable.
ITEM 13. PORTFOLIO MANAGERS OF CLOSED-END MANAGEMENT INVESTMENT COMPANIES.
Not applicable.
ITEM 14. PURCHASES OF EQUITY SECURITIES BY CLOSED-END MANAGEMENT INVESTMENT COMPANY AND AFFILIATED PURCHASERS.
Not applicable.
ITEM 15. SUBMISSION OF MATTERS TO A VOTE OF SECURITY HOLDERS
The Registrant does not accept nominees to the Board of Trustees from shareholders.
ITEM 16. CONTROLS AND PROCEDURES
(a) The Registrant’s Principal Executive Officer and Principal Financial Officer have concluded that the Registrant’s disclosure controls and procedures (as defined in Rule 30a-3(c) under the Act are effective, based on their evaluation of the controls and procedures required by Rule 30a-3(b) under the Act and Rules 13a-15(b) or 15d-15(b) under the Securities Exchange Act of 1934, as of a date within 90 days of the filing date of this report.
(b) There were no changes in the Registrant’s internal control over financial reporting (as defined in Rule 30a-3(d) under the Act) that occurred during the Reporting Period that have materially affected, or are reasonably likely to materially affect, the Registrant’s internal control over financial reporting.
ITEM 17. DISCLOSURE OF SECURITIES LENDING ACTIVITIES FOR CLOSED-END MANAGEMENT INVESTMENT COMPANIES.
Not applicable.
ITEM 18. RECOVERY OF ERRONEOUSLY AWARDED COMPENSATION.
Not applicable.
ITEM 19. EXHIBITS.
(a)(2) Not applicable.
(a)(4) Not applicable.
(a)(5) Not applicable.
SIGNATURES
Pursuant to the requirements of the Securities Exchange Act of 1934 and the Investment Company Act of 1940, the Registrant has duly caused this report to be signed on its behalf by the undersigned, thereunto duly authorized.
Registrant Forum Funds II
| By: | /s/ Zachary Tackett | |
| | Zachary Tackett, Principal Executive Officer | |
| | | |
| Date: | August 28, 2024 | |
Pursuant to the requirements of the Securities Exchange Act of 1934 and the Investment Company Act of 1940, this report has been signed below by the following persons on behalf of the Registrant and in the capacities and on the dates indicated.
| By: | /s/ Zachary Tackett | |
| | Zachary Tackett, Principal Executive Officer | |
| | | |
| Date: | August 28, 2024 | |
| By: | /s/ Karen Shaw | |
| | Karen Shaw, Principal Financial Officer | |
| | | |
| Date: | August 28, 2024 | |