UNITED STATES
SECURITIES AND EXCHANGE COMMISSION
WASHINGTON, D.C. 20549
FORM N-CSR
CERTIFIED SHAREHOLDER REPORT OF REGISTERED MANAGEMENT
INVESTMENT COMPANIES
Investment Company Act file number 811-22842
FORUM FUNDS II
Three Canal Plaza, Suite 600
Portland, Maine 04101
Zachary Tackett, Principal Executive Officer
Three Canal Plaza, Suite 600
Portland, Maine 04101
207-347-2000
Date of fiscal year end: September 30
Date of reporting period: October 1, 2023 – September 30, 2024
ITEM 1. REPORT TO SHAREHOLDERS.
(a) A copy of the report transmitted to stockholders pursuant to Rule 30e-1 under the Investment Company Act, as amended (“Act”), is attached hereto.
Baywood SociallyResponsible Fund
Annual Shareholder Report - September 30, 2024
This annual shareholder report contains important information about the Baywood SociallyResponsible Fund for the period of October 1, 2023, to September 30, 2024. You can find additional information about the Fund at https://www.skba.com/baywood-funds. You can also request this information by contacting us at (855) 409-2297.
What were the Fund's costs for the last year?
(based on a hypothetical $10,000 investment)
| Class Name | Costs of a $10,000 investment | Costs paid as a percentage of a $10,000 investment |
|---|
| Institutional Class | $101 | 0.89% |
How did the Fund perform in the last year?
While one can never be certain how the market will behave in the short run, we believe we have been building a portfolio to help protect our shareholders’ capital by purchasing companies with attractive growth potential at low relative prices while satisfying their socially responsible desires. It is our belief that the majority of risks in the market today are with the narrow set of companies that have been driving the indices to new highs.
For holdings in the period, consider the largest sector in the SociallyResponsible fund: the financial sector. Stocks in this sector often trade at low valuations, yet many of the companies in the SociallyResponsible fund have fundamentals as good if not better than many highly valued stocks in the broad market index. For comparison sake, take AIG, Corebridge, and American Express and compare them to some of the current top IT holdings in the broad market: Apple, Microsoft, and NVIDIA. Both sets of companies currently have similar earnings growth expectations at an average of 18% EPS growth (3-year) for fund holdings in the financial sector, and an average of 20% for the holdings in the broad market IT sector. Yet we are paying an average of 12 times earnings for our holdings versus an average multiple of 32 times earnings for the IT stocks.
For the fiscal year, the fund underperformed the very concentrated set of returns of the technology laden broad market. Value stocks clearly remain “out-of-favor”, yet the it’s difficult to imagine absolute returns of approximately 27% would be considered disappointing. The market’s preference towards highly valued stocks is represented in the fund’s new regulatory benchmark the Morningstar US Market, which owns Apple, Microsoft, NVIDIA, Amazon, Meta and Alphabet as top stocks. Without owning this narrow set of stocks, one is challenged to keep up with an index loaded up on these companies, yet that is not the goal of the SociallyResponsible fund.
The SociallyResponsible fund’s returns nearly matched the Value index’ 27%. That the fund generally kept up in such a strong market is not disappointing, especially when one considers how it has performed in weaker market periods or downdrafts. Stocks in the energy, health care and industrial sectors contributed most to returns, while holdings in the consumer staples and communication sectors detracted most from returns. It is not surprising that stocks within staples and communications lagged as these tend to be out-of-favor during major market advances. In consumer staples, however not owning Walmart detracted most from returns as the nearly 50% increase in the period buoyed benchmark sector returns. While Walmart is a well-run company, we do not believe the risk-reward equation is in our favor as investors are now paying nearly 30 times next year’s earnings. In health care, fund holdings in Royal Philips, which returned more than double the benchmark’s returns and almost five times the benchmark’s health care sector returns, contributed most to returns as the company continues to move past its quality control issues at the product level and medical equipment sales finally recover from the pandemic era sales slump.
For SKBA’s in depth investment perspectives, please visit our website at www.skba.com.
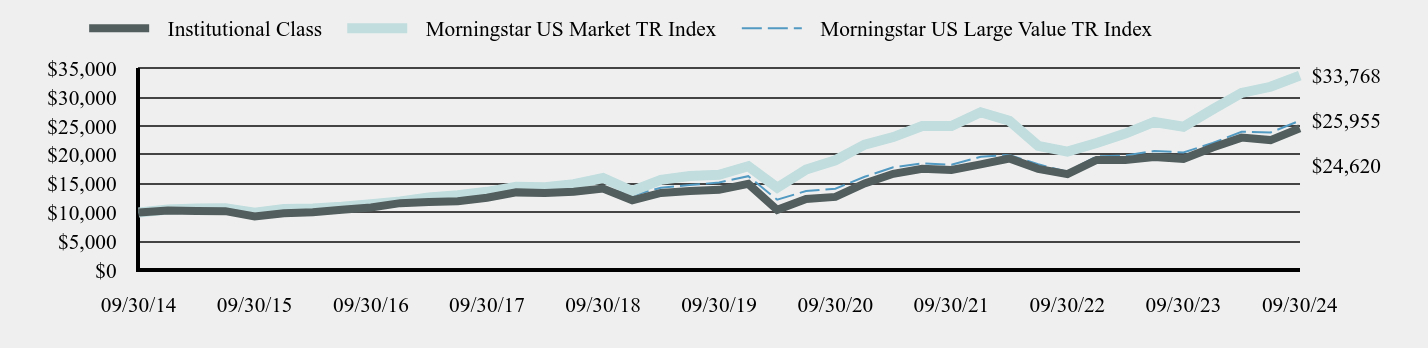
Total Return Based on a $10,000 Investment
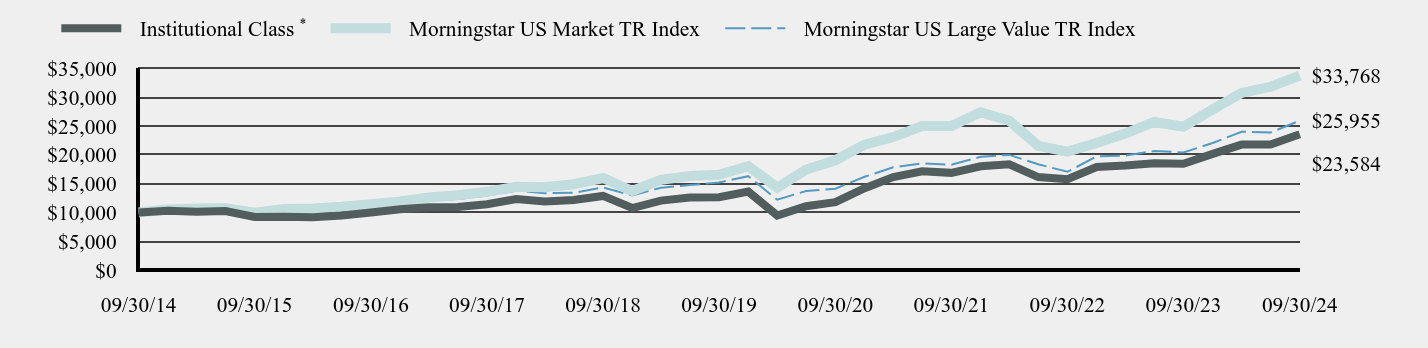
| Date | Institutional ClassFootnote Reference* | Morningstar US Market TR Index | Morningstar US Large Value TR Index |
|---|
| 09/30/14 | $10,000 | $10,000 | $10,000 |
| 12/31/14 | $10,278 | $10,514 | $10,215 |
| 03/31/15 | $10,142 | $10,700 | $10,069 |
| 06/30/15 | $10,258 | $10,709 | $10,163 |
| 09/30/15 | $9,230 | $9,957 | $9,423 |
| 12/31/15 | $9,260 | $10,587 | $10,068 |
| 03/31/16 | $9,165 | $10,701 | $10,415 |
| 06/30/16 | $9,452 | $10,979 | $10,869 |
| 09/30/16 | $10,005 | $11,447 | $11,113 |
| 12/31/16 | $10,567 | $11,904 | $11,973 |
| 03/31/17 | $10,889 | $12,607 | $12,273 |
| 06/30/17 | $10,931 | $12,994 | $12,329 |
| 09/30/17 | $11,424 | $13,582 | $12,932 |
| 12/31/17 | $12,334 | $14,460 | $13,779 |
| 03/31/18 | $11,918 | $14,371 | $13,347 |
| 06/30/18 | $12,180 | $14,905 | $13,410 |
| 09/30/18 | $12,871 | $15,980 | $14,341 |
| 12/31/18 | $10,770 | $13,729 | $12,966 |
| 03/31/19 | $12,063 | $15,664 | $14,304 |
| 06/30/19 | $12,584 | $16,321 | $14,748 |
| 09/30/19 | $12,651 | $16,531 | $15,219 |
| 12/31/19 | $13,631 | $18,016 | $16,298 |
| 03/31/20 | $9,478 | $14,311 | $12,208 |
| 06/30/20 | $11,084 | $17,457 | $13,727 |
| 09/30/20 | $11,796 | $19,069 | $14,132 |
| 12/31/20 | $14,207 | $21,782 | $16,198 |
| 03/31/21 | $16,149 | $23,091 | $17,838 |
| 06/30/21 | $17,161 | $25,023 | $18,519 |
| 09/30/21 | $16,880 | $25,031 | $18,286 |
| 12/31/21 | $18,027 | $27,398 | $19,678 |
| 03/31/22 | $18,361 | $25,939 | $20,000 |
| 06/30/22 | $16,145 | $21,569 | $18,369 |
| 09/30/22 | $15,770 | $20,580 | $17,066 |
| 12/31/22 | $17,897 | $22,075 | $19,730 |
| 03/31/23 | $18,150 | $23,707 | $19,872 |
| 06/30/23 | $18,560 | $25,721 | $20,678 |
| 09/30/23 | $18,466 | $24,902 | $20,426 |
| 12/31/23 | $20,172 | $27,911 | $22,063 |
| 03/31/24 | $21,789 | $30,768 | $24,025 |
| 06/30/24 | $21,808 | $31,837 | $23,883 |
| 09/30/24 | $23,584 | $33,768 | $25,955 |
| Footnote | Description |
Footnote* | Performance for Institutional Shares for periods prior to January 8, 2016, reflects the performance and expenses of City National Rochdale Socially Responsible Equity Fund, a series of City National Rochdale Funds (the “Predecessor Fund”). |
The above chart represents historical performance of a hypothetical $10,000 investment over the past 10 years. Due to regulatory changes, effective September 1, 2024, the Fund changed its primary benchmark index from the Morningstar US Large Value TR Index to the Morningstar US Market TR Index. The Fund retained the Morningstar US Large Value TR Index as a secondary benchmark because the Morningstar US Large Value TR Index more closely aligns with the Fund’s investment strategies and investments restrictions.
Average Annual Total Returns
| | One Year | Five Year | Ten Year |
|---|
Institutional ClassFootnote Reference* | 27.72% | 13.27% | 8.96% |
| Morningstar US Market TR Index | 35.60% | 15.36% | 12.94% |
| Morningstar US Large Value TR Index | 27.07% | 11.27% | 10.01% |
| Footnote | Description |
Footnote* | Performance for Institutional Shares for periods prior to January 8, 2016, reflects the performance and expenses of City National Rochdale Socially Responsible Equity Fund, a series of City National Rochdale Funds (the “Predecessor Fund”). |
The Fund’s past performance is not a good predictor of how the Fund will perform in the future. The graph and table do not reflect the deduction of taxes that a shareholder would pay on Fund distributions or redemption of Fund shares.
| Total Net Assets | $9,048,331 |
| # of Portfolio Holdings | 53 |
| Portfolio Turnover Rate | 23% |
| Investment Advisory Fees (Net of fees waived and expenses reimbursed) | $(96,214) |
Top Ten Holdings
(% of investments)
| Texas Pacific Land Corp. | 4.51% |
| American Express Co. | 4.30% |
| Kontoor Brands, Inc. | 4.17% |
| Koninklijke Philips NV, ADR | 3.97% |
| nVent Electric PLC | 3.50% |
| International Business Machines Corp. | 3.25% |
| NXP Semiconductors NV | 2.99% |
| Kinder Morgan, Inc. | 2.75% |
| CME Group, Inc. | 2.75% |
| Berkshire Hathaway, Inc., Class B | 2.61% |
* excluding cash equivalents
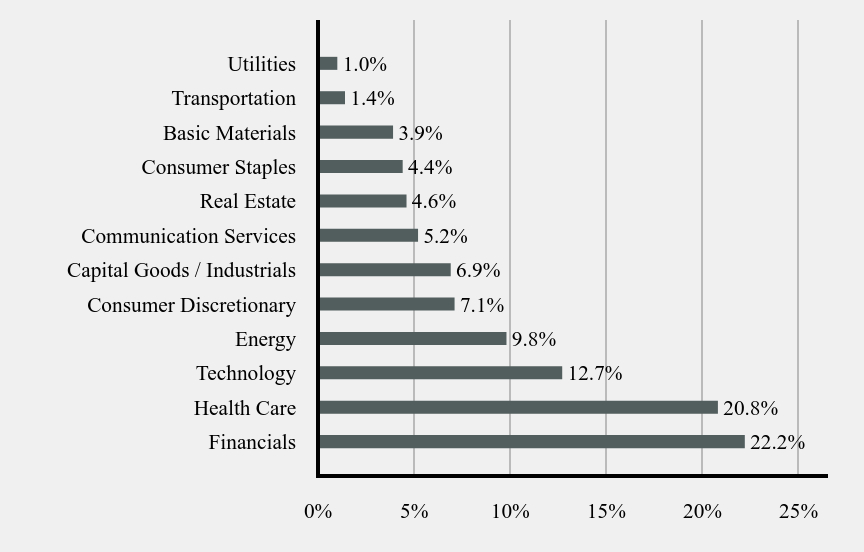
Sector Weightings
(% total investments)
| Value | Value |
|---|
| Financials | 22.2% |
| Health Care | 20.8% |
| Technology | 12.7% |
| Energy | 9.8% |
| Consumer Discretionary | 7.1% |
| Capital Goods / Industrials | 6.9% |
| Communication Services | 5.2% |
| Real Estate | 4.6% |
| Consumer Staples | 4.4% |
| Basic Materials | 3.9% |
| Transportation | 1.4% |
| Utilities | 1.0% |
* excluding cash equivalents
Where can I find additional information about the fund?
Additional information is available by scanning the QR code or at https://www.skba.com/baywood-funds, including its:
prospectus
financial information
holdings
proxy information
Baywood SociallyResponsible Fund
Annual Shareholder Report - September 30, 2024
Annual Shareholder Report - September 30, 2024
This annual shareholder report contains important information about the Baywood ValuePlus Fund for the period of October 1, 2023, to September 30, 2024. You can find additional information about the Fund at https://www.skba.com/baywood-funds. You can also request this information by contacting us at (855) 409-2297.
What were the Fund's costs for the last year?
(based on a hypothetical $10,000 investment)
| Class Name | Costs of a $10,000 investment | Costs paid as a percentage of a $10,000 investment |
|---|
| Institutional Class | $80 | 0.70% |
How did the Fund perform in the last year?
A short prologue regarding the inaugural Tailored Shareholder Report which mandates that funds be compared to broad indexes going forward. For context, the Baywood Funds have historically been compared to domestic value benchmarks, a suitable category given the strategies’ characteristics. Those categories have now been consigned of secondary importance. The quite sudden change in benchmark denotes that the Funds, decidedly value-oriented strategies, will from now on be compared to an index with an unequivocal tech bias. To wit, eight of the ten largest holdings in the Morningstar US Market TR Index can be broadly defined as Tech darlings and weigh in at a hefty 28% of the overall index. The culprits will be familiar: Apple, Microsoft, Nvidia, Amazon, Meta, Alphabet (both classes) and Broadcom. Such a concentration of the largest companies within a narrow subset of industries leaves very little real estate for the remaining 1200 companies vying for room in this index.
Comparison to this benchmark is slightly incongruous at this point in time since Baywood ValuePlus couldn’t be more dissimilar. One thing is clear. Over the foreseeable future, the two will undoubtedly perform very differently. Since your portfolio managers are significant shareholders in the Funds, our bet is on Baywood. Time will tell.
Fund performance for the twelve months ending September 30, 2024, was driven firstly by increasing equity markets. Geopolitical and election year tensions increased noticeably yet markets responded overwhelmingly to the dictum “Don’t Fight the Fed.” By that, we refer to stocks tending to rise during times of easing monetary policy. First, European Union countries began to lower rates, soon followed by the U.S. Federal Reserve lowering its Fed Funds rate by 50 bp’s. Recent stock returns indeed remind us that cheap money tends to rekindle animal spirits.
Declining rates impact the entire capital markets structure, however, as central banks across many parts of the world declared an end to their restrictive monetary policies in the period. Companies with current high levels of debt at generationally low levels – we’ll call these companies corporate sinners – are able to refinance their obligations at less onerous interest rates than what was feared a few months ago. It is not simply the corporate sinners that are benefitting but any entity with financial leverage. With lower costs due to declining interest burdens, companies have the ability to increase spending elsewhere. One can see how the domino effect from central bank policies quickly impacts economic growth. There are of course many additional variables but at its core, monetary profligacy serves as a powerful tonic. We nevertheless believe those effects have mostly played themselves out and that conservatism is called for as reflected in the transactions engaged in the fund over the period.
Baywood ValuePlus participated in this broad rally as a number of our holdings increased over 30%. Royal Philips took the cake with its six-month return nearing 70%. One might presume shares to now be expensive yet despite the significant rally, shares in Philips trade below the market’s multiple and at approximately half the valuation levels of Apple, the largest holding in our new index. Our other medal-winners included Kontoor Brands, Hasbro, 3M and Healthcare Realty. The Fund’s worst performers in the period included Lear, Phillips 66, Conoco, Merck and Molson Coors.
The ValuePlus Fund seeks to achieve its returns over complete cycles by purchasing currently out-of-favor companies that demonstrate solid financials able to pay their shareholders in the form of dividends. The yield on the Fund is over twice that of our new primary benchmark while most of the Fund’s valuation benchmarks are at mere fractions. We believe we are well-positioned for the current market environment, especially considering the strategy has historically offered defensive characteristics.
For SKBA’s in depth investment perspectives, please visit our website at www.skba.com.
Total Return Based on a $10,000 Investment
| Date | Institutional Class | Morningstar US Market TR Index | Morningstar US Large Value TR Index |
|---|
| 09/30/14 | $10,000 | $10,000 | $10,000 |
| 12/31/14 | $10,344 | $10,514 | $10,215 |
| 03/31/15 | $10,267 | $10,700 | $10,069 |
| 06/30/15 | $10,226 | $10,709 | $10,163 |
| 09/30/15 | $9,320 | $9,957 | $9,423 |
| 12/31/15 | $9,875 | $10,587 | $10,068 |
| 03/31/16 | $10,044 | $10,701 | $10,415 |
| 06/30/16 | $10,455 | $10,979 | $10,869 |
| 09/30/16 | $10,868 | $11,447 | $11,113 |
| 12/31/16 | $11,613 | $11,904 | $11,973 |
| 03/31/17 | $11,831 | $12,607 | $12,273 |
| 06/30/17 | $11,953 | $12,994 | $12,329 |
| 09/30/17 | $12,563 | $13,582 | $12,932 |
| 12/31/17 | $13,487 | $14,460 | $13,779 |
| 03/31/18 | $13,374 | $14,371 | $13,347 |
| 06/30/18 | $13,591 | $14,905 | $13,410 |
| 09/30/18 | $14,142 | $15,980 | $14,341 |
| 12/31/18 | $12,109 | $13,729 | $12,966 |
| 03/31/19 | $13,395 | $15,664 | $14,304 |
| 06/30/19 | $13,732 | $16,321 | $14,748 |
| 09/30/19 | $13,923 | $16,531 | $15,219 |
| 12/31/19 | $14,958 | $18,016 | $16,298 |
| 03/31/20 | $10,450 | $14,311 | $12,208 |
| 06/30/20 | $12,348 | $17,457 | $13,727 |
| 09/30/20 | $12,701 | $19,069 | $14,132 |
| 12/31/20 | $15,037 | $21,782 | $16,198 |
| 03/31/21 | $16,710 | $23,091 | $17,838 |
| 06/30/21 | $17,602 | $25,023 | $18,519 |
| 09/30/21 | $17,374 | $25,031 | $18,286 |
| 12/31/21 | $18,346 | $27,398 | $19,678 |
| 03/31/22 | $19,375 | $25,939 | $20,000 |
| 06/30/22 | $17,570 | $21,569 | $18,369 |
| 09/30/22 | $16,651 | $20,580 | $17,066 |
| 12/31/22 | $19,121 | $22,075 | $19,730 |
| 03/31/23 | $19,108 | $23,707 | $19,872 |
| 06/30/23 | $19,616 | $25,721 | $20,678 |
| 09/30/23 | $19,315 | $24,902 | $20,426 |
| 12/31/23 | $21,281 | $27,911 | $22,063 |
| 03/31/24 | $23,000 | $30,768 | $24,025 |
| 06/30/24 | $22,569 | $31,837 | $23,883 |
| 09/30/24 | $24,620 | $33,768 | $25,955 |
The above chart represents historical performance of a hypothetical $10,000 investment over the past 10 years. Due to regulatory changes, effective September 1, 2024, the Fund changed its primary benchmark index from the Morningstar US Large Value TR Index to the Morningstar US Market TR Index. The Fund retained the Morningstar US Large Value TR Index as a secondary benchmark because the Morningstar US Large Value TR Index more closely aligns with the Fund’s investment strategies and investments restrictions.
Average Annual Total Returns
| | One Year | Five Year | Ten Year |
|---|
| Institutional Class | 27.46% | 12.08% | 9.43% |
| Morningstar US Market TR Index | 35.60% | 15.36% | 12.94% |
| Morningstar US Large Value TR Index | 27.07% | 11.27% | 10.01% |
The Fund’s past performance is not a good predictor of how the Fund will perform in the future. The graph and table do not reflect the deduction of taxes that a shareholder would pay on Fund distributions or redemption of Fund shares.
| Total Net Assets | $5,033,821 |
| # of Portfolio Holdings | 57 |
| Portfolio Turnover Rate | 22% |
| Investment Advisory Fees (Net of fees waived and expenses reimbursed) | $(129,562) |
Top Ten Holdings
(% of investments)
| RTX Corp. | 4.50% |
| Kontoor Brands, Inc. | 3.88% |
| AT&T, Inc. | 3.45% |
| International Business Machines Corp. | 3.42% |
| Merck & Co., Inc. | 3.04% |
| Koninklijke Philips NV, ADR | 2.92% |
| Medtronic PLC | 2.88% |
| Corebridge Financial, Inc. | 2.83% |
| Kinder Morgan, Inc. | 2.82% |
| ConocoPhillips | 2.39% |
* excluding cash equivalents
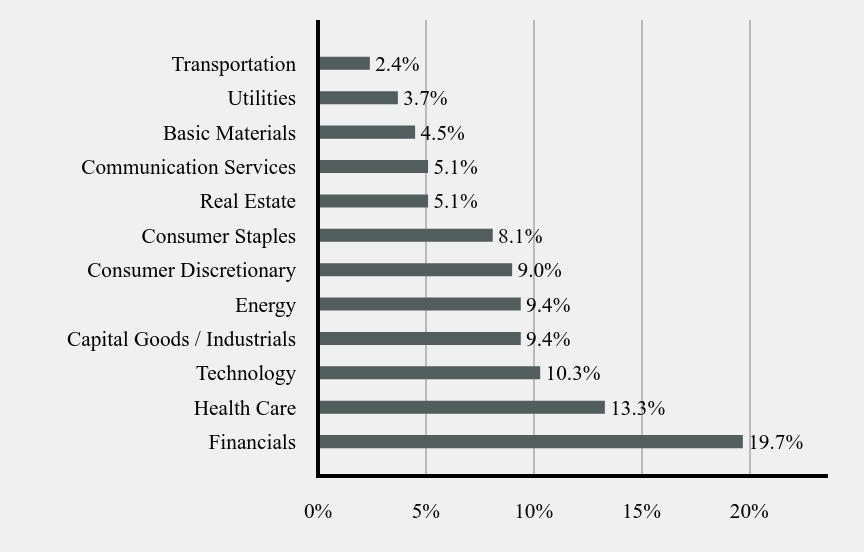
Sector Weightings
(% total investments)
| Value | Value |
|---|
| Financials | 19.7% |
| Health Care | 13.3% |
| Technology | 10.3% |
| Capital Goods / Industrials | 9.4% |
| Energy | 9.4% |
| Consumer Discretionary | 9.0% |
| Consumer Staples | 8.1% |
| Real Estate | 5.1% |
| Communication Services | 5.1% |
| Basic Materials | 4.5% |
| Utilities | 3.7% |
| Transportation | 2.4% |
* excluding cash equivalents
Where can I find additional information about the fund?
Additional information is available by scanning the QR code or at https://www.skba.com/baywood-funds, including its:
prospectus
financial information
holdings
proxy information
Annual Shareholder Report - September 30, 2024
(b) Not applicable.
ITEM 2. CODE OF ETHICS.
(a) As of the end of the period covered by this report, Forum Funds II (the “Registrant”) has adopted a code of ethics, which applies to its Principal Executive Officer and Principal Financial Officer (the “Code of Ethics”).
(c) There have been no amendments to the Registrant’s Code of Ethics during the period covered by this report.
(d) There have been no waivers to the Registrant’s Code of Ethics during the period covered by this report.
(e) Not applicable.
(f)(1) A copy of the Code of Ethics is being filed under Item 19(a)(1) hereto.
ITEM 3. AUDIT COMMITTEE FINANCIAL EXPERT.
(a)(1) The Board of Trustees has determined that the Registrant has an audit committee financial expert, as defined in Item 3 of Form N-CSR, serving on its audit committee.
(a)(2) The audit committee financial expert, Mr. Mark Moyer, is a non-“interested” Trustee (as defined in Item 3(a)(2) of Form N-CSR.
ITEM 4. PRINCIPAL ACCOUNTANT FEES AND SERVICES.
(a) Audit Fees - The aggregate fees billed for each of the last two fiscal years (the “Reporting Periods”) for professional services rendered by the Registrant’s principal accountant for the audit of the Registrant’s annual financial statements, or services that are normally provided by the principal accountant in connection with the statutory and regulatory filings or engagements for the Reporting Periods, were $27,600 in 2023 and $29,600 in 2024.
(b) Audit-Related Fees – The aggregate fees billed in the Reporting Periods for assurance and related services rendered by the principal accountant that were reasonably related to the performance of the audit of the Registrant’s financial statements and are not reported under paragraph (a) of this Item 4 were $0 in 2023 and $0 in 2024.
(c) Tax Fees - The aggregate fees billed in the Reporting Periods for professional services rendered by the principal accountant to the Registrant for tax compliance, tax advice and tax planning were $6,200 in 2023 and $6,400 in 2024. These services consisted of review or preparation of U.S. federal, state, local and excise tax returns.
(d) All Other Fees - The aggregate fees billed in the Reporting Periods for products and services provided by the principal accountant to the Registrant, other than the services reported in paragraphs (a) through (c) of this Item, were $0 in 2023 and $0 in 2024.
(e)(1) The Audit Committee reviews and approves in advance all audit and “permissible non-audit services” (as that term is defined by the rules and regulations of the U.S. Securities and Exchange Commission) to be rendered to a series of the Registrant (each, a “Series”). In addition, the Audit Committee reviews and approves in advance all “permissible non-audit services” to be provided to an investment adviser (not including any sub-adviser) of a Series, or an affiliate of such investment adviser, that is controlling, controlled by or under common control with the investment adviser and provides on-going services to the Registrant (“Affiliate”), by the Series’ principal accountant if the engagement relates directly to the operations and financial reporting of the Series. The Audit Committee considers whether fees paid by a Series’ investment adviser or an Affiliate to the Series’ principal accountant for audit and permissible non-audit services are consistent with the principal accountant’s independence.
(e)(2) No services included in (b) - (d) above were approved pursuant to paragraph (c)(7)(i)(C) of Rule 2-01 of Regulation S-X.
(f) Not applicable
(g) The aggregate non-audit fees billed by the principal accountant for services rendered to the Registrant for the Reporting Periods were $0 in 2023 and $0 in 2024. There were no fees billed in either of the Reporting Periods for non-audit services rendered by the principal accountant to the Registrant’s investment adviser or any Affiliate.
(h) During the Reporting Period, the Registrant's principal accountant provided no non-audit services to the investment advisers or any entity controlling, controlled by or under common control with the investment advisers to the series of the Registrant to which this report relates.
(i) Not applicable. The Registrant has not retained, for the preparation of the audit report on the financial statements included in the Form N-CSR, a registered public accounting firm that has a branch or office that is located in a foreign jurisdiction and that the Public Company Accounting Oversight Board (the “PCAOB”) has determined that the PCAOB is unable to inspect or investigate completely because of a position taken by an authority in the foreign jurisdiction.
(j) Not applicable. The Registrant is not a “foreign issuer,” as defined in 17 CFR 240.3b-4.
ITEM 5. AUDIT COMMITTEE OF LISTED REGISTRANTS.
Not applicable.
ITEM 6. INVESTMENTS.
(a) Included as part of financial statements filed under Item 7(a).
(b) Not applicable.
ITEM 7. FINANCIAL STATEMENTS AND FINANCIAL HIGHLIGHTS FOR OPEN-END MANAGEMENT INVESTMENT COMPANIES.
(a)
Annual
Financials
and
Other
Information
September
30,
2024
Advised
by:
SKBA
Capital
Management,
LLC
www.baywoodfunds.com
BAYWOOD
VALUE
PLUS
FUND
SCHEDULE
OF
INVESTMENTS
September
30,
2024
See
Notes
to
Financial
Statements.
The
following
is
a
summary
of
the
inputs
used
to
value
the
Fund's instruments
as
of
September
30,
2024.
The
inputs
or
methodology
used
for
valuing
securities
are
not
necessarily
an
indication
of
the
risks
associated
with
investing
in
those
securities.
For
more
information
on
valuation
inputs,
and
their
aggregation
into
the
levels
used
in
the
table
below,
please
refer
to
the
Security
Valuation
section
in
Note
2
of
the
accompanying
Notes
to
Financial
Statements.
The
Level
1
value
displayed
in
this
table
is
Common
Stock
and
a
Money
Market
Fund.
Refer
to
this
Schedule
of
Investments
for
a
further
breakout
of
each
security
by
industry.
Shares
Security
Description
Value
Common
Stock
-
96.4%
Basic
Materials
-
4.3%
300
Air
Products
and
Chemicals,
Inc.
$
89,322
400
Packaging
Corp.
of
America
86,160
600
Rio
Tinto
PLC,
ADR
42,702
218,184
Capital
Goods
/
Industrials
-
9.0%
700
3M
Co.
95,690
300
L3Harris
Technologies,
Inc.
71,361
110
Parker-Hannifin
Corp.
69,500
1,800
RTX
Corp.
218,088
454,639
Communication
Services
-
4.9%
7,600
AT&T,
Inc.
167,200
1,900
Comcast
Corp.,
Class A
79,363
246,563
Consumer
Discretionary
-
8.7%
500
Darden
Restaurants,
Inc.
82,065
400
Genuine
Parts
Co.
55,872
800
Hasbro,
Inc.
57,856
2,300
Kontoor
Brands,
Inc.
188,094
200
Lowe's
Cos.,
Inc.
54,170
438,057
Consumer
Staples
-
7.9%
800
Ingredion,
Inc.
109,944
2,600
Kenvue,
Inc.
60,138
1,110
Molson
Coors
Beverage
Co.,
Class B
63,847
300
PepsiCo.,
Inc.
51,015
400
Target
Corp.
62,344
250
The
Hershey
Co.
47,945
395,233
Energy
-
9.0%
500
Chevron
Corp.
73,635
1,100
ConocoPhillips
115,808
1,400
Equinor
ASA,
ADR
35,462
6,200
Kinder
Morgan,
Inc.
136,958
700
Phillips
66
92,015
453,878
Financials
-
19.0%
1,500
Air
Lease
Corp.
67,935
1,100
American
International
Group,
Inc.
80,553
1,100
Brookfield
Asset
Management,
Ltd.
52,019
1,200
Citigroup,
Inc.
75,120
500
CME
Group,
Inc.
110,325
4,700
Corebridge
Financial,
Inc.
137,052
1,200
MetLife,
Inc.
98,976
3,000
Radian
Group,
Inc.
104,070
900
The
Charles
Schwab
Corp.
58,329
1,100
Truist
Financial
Corp.
47,047
1,000
U.S.
Bancorp
45,730
1,400
Wells
Fargo
&
Co.
79,086
956,242
Health
Care
-
12.8%
140
Amgen,
Inc.
45,109
700
Cardinal
Health,
Inc.
77,364
4,336
Koninklijke
Philips
NV,
ADR
(a)
141,874
1,550
Medtronic
PLC
139,547
1,300
Merck
&
Co.,
Inc.
147,628
3,200
Pfizer,
Inc.
92,608
644,130
Real
Estate
-
5.0%
4,200
Healthcare
Realty
Trust,
Inc.
REIT
76,230
1,104
Realty
Income
Corp.
REIT
70,016
2,600
VICI
Properties,
Inc.
REIT
86,606
Shares
Security
Description
Value
Real
Estate
-
5.0%
(continued)
500
Weyerhaeuser
Co.
REIT
$
16,930
249,782
Technology
-
9.9%
1,200
Cisco
Systems,
Inc.
63,864
750
International
Business
Machines
Corp.
165,810
900
NetApp,
Inc.
111,159
400
NXP
Semiconductors
NV
96,004
300
Texas
Instruments,
Inc.
61,971
498,808
Transportation
-
2.3%
250
FedEx
Corp.
68,420
200
Union
Pacific
Corp.
49,296
117,716
Utilities
-
3.6%
700
American
Electric
Power
Co.,
Inc.
71,820
1,200
Pinnacle
West
Capital
Corp.
106,308
178,128
Total
Common
Stock
(Cost
$3,390,286)
4,851,360
Shares
Security
Description
Value
Money
Market
Fund
-
3.3%
168,206
First
American
Government
Obligations
Fund,
Class X,
4.82%
(b)
(Cost
$168,206)
168,206
Investments,
at
value
-
99.7%
(Cost
$3,558,492)
$
5,019,566
Other
Assets
&
Liabilities,
Net
-
0.3%
14,255
Net
Assets
-
100.0%
$
5,033,821
ADR
American
Depositary
Receipt
PLC
Public
Limited
Company
REIT
Real
Estate
Investment
Trust
(a)
Non-income
producing
security.
(b)
Dividend
yield
changes
daily
to
reflect
current
market
conditions.
Rate
was
the
quoted
yield
as
of
September
30,
2024.
Valuation
Inputs
Investments
in
Securities
Level
1
-
Quoted
Prices
$
5,019,566
Level
2
-
Other
Significant
Observable
Inputs
–
Level
3
-
Significant
Unobservable
Inputs
–
Total
$
5,019,566
BAYWOOD
VALUE
PLUS
FUND
SCHEDULE
OF
INVESTMENTS
September
30,
2024
See
Notes
to
Financial
Statements.
PORTFOLIO
HOLDINGS
(Unaudited)
%
of
Total
Investments
Basic
Materials
4.3%
Capital
Goods
/
Industrials
9.1%
Communication
Services
4.9%
Consumer
Discretionary
8.7%
Consumer
Staples
7.9%
Energy
9.0%
Financials
19.1%
Health
Care
12.8%
Real
Estate
5.0%
Technology
9.9%
Transportation
2.3%
Utilities
3.6%
Money
Market
Fund
3.4%
100.0%
BAYWOOD
VALUE
PLUS
FUND
STATEMENT
OF
ASSETS
AND
LIABILITIES
September
30,
2024
See
Notes
to
Financial
Statements.
ASSETS
Investments,
at
value
(Cost
$3,558,492)
$
5,019,566
Receivables:
Fund
shares
sold
2,109
Dividends
6,374
From
investment
advisor
11,586
Prepaid
expenses
9,446
Total
Assets
5,049,081
LIABILITIES
Accrued
Liabilities:
Fund
services
fees
4,752
Other
expenses
10,508
Total
Liabilities
15,260
NET
ASSETS
$
5,033,821
COMPONENTS
OF
NET
ASSETS
Paid-in
capital
$
3,422,273
Distributable
Earnings
1,611,548
NET
ASSETS
$
5,033,821
SHARES
OF
BENEFICIAL
INTEREST
AT
NO
PAR
VALUE
(UNLIMITED
SHARES
AUTHORIZED)
218,400
NET
ASSET
VALUE,
OFFERING
AND
REDEMPTION
PRICE
PER
SHARE
$
23.05
BAYWOOD
VALUE
PLUS
FUND
STATEMENT
OF
OPERATIONS
FOR
THE
YEAR
ENDED
SEPTEMBER
30,
2024
See
Notes
to
Financial
Statements.
INVESTMENT
INCOME
Dividend
income
(Net
of
foreign
withholding
taxes
of
$2,474)
$
158,399
Total
Investment
Income
158,399
EXPENSES
Investment
advisor
fees
22,305
Fund
services
fees
58,616
Transfer
agent
fees
19,380
Custodian
fees
5,185
Registration
fees
20,826
Professional
fees
33,579
Trustees'
fees
and
expenses
7,246
Shareholder
reports
17,470
Other
expenses
19,485
Total
Expenses
204,092
`Fees
waived
and
expenses
reimbursed
(172,867)
Net
Expenses
31,225
NET
INVESTMENT
INCOME
127,174
NET
REALIZED
AND
UNREALIZED
GAIN
(LOSS)
Net
realized
gain
on
investments
129,979
Net
change
in
unrealized
appreciation
(depreciation)
on
investments
821,954
NET
REALIZED
AND
UNREALIZED
GAIN
951,933
INCREASE
IN
NET
ASSETS
RESULTING
FROM
OPERATIONS
$
1,079,107
BAYWOOD
VALUE
PLUS
FUND
STATEMENTS
OF
CHANGES
IN
NET
ASSETS
See
Notes
to
Financial
Statements.
For
the
Years
Ended
September
30,
2024
2023
OPERATIONS
Net
investment
income
$
127,174
$
120,020
Net
realized
gain
129,979
120,610
Net
change
in
unrealized
appreciation
(depreciation)
821,954
275,694
Increase
in
Net
Assets
Resulting
from
Operations
1,079,107
516,324
DISTRIBUTIONS
TO
SHAREHOLDERS
Total
Distributions
Paid
(240,472)
(191,543)
CAPITAL
SHARE
TRANSACTIONS
Sale
of
shares
111,881
334,388
Reinvestment
of
distributions
239,380
191,229
Redemption
of
shares
(75,626)
(164,807)
Increase
in
Net
Assets
from
Capital
Share
Transactions
275,635
360,810
Increase
in
Net
Assets
1,114,270
685,591
NET
ASSETS
Beginning
of
Year
3,919,551
3,233,960
End
of
Year
$
5,033,821
$
3,919,551
SHARE
TRANSACTIONS
Sale
of
shares
5,376
16,809
Reinvestment
of
distributions
11,622
9,826
Redemption
of
shares
(3,694)
(8,369)
Increase
in
Shares
13,304
18,266
BAYWOOD
VALUE
PLUS
FUND
FINANCIAL
HIGHLIGHTS
See
Notes
to
Financial
Statements.
These
financial
highlights
reflect
selected
data
for
a
share
outstanding
throughout
each
year.
For
the
Years
Ended
September
30,
2024
2023
2022
2021
2020
INSTITUTIONAL
SHARES
NET
ASSET
VALUE,
Beginning
of
Year
$
19.11
$
17.31
$
20.03
$
14.96
$
17.03
INVESTMENT
OPERATIONS
Net
investment
income
(a)
0.60
0.60
0.55
0.45
0.39
Net
realized
and
unrealized
gain
(loss)
4.49
2.17
(1.26)
5.04
(1.86)
Total
from
Investment
Operations
5.09
2.77
(0.71)
5.49
(1.47)
DISTRIBUTIONS
TO
SHAREHOLDERS
FROM
Net
investment
income
(0.56)
(0.59)
(0.49)
(0.42)
(0.38)
Net
realized
gain
(0.59)
(0.38)
(1.52)
–
(0.22)
Total
Distributions
to
Shareholders
(1.15)
(0.97)
(2.01)
(0.42)
(0.60)
NET
ASSET
VALUE,
End
of
Year
$
23.05
$
19.11
$
17.31
$
20.03
$
14.96
TOTAL
RETURN
27.46%
16.00%
(4.16)%
36.80%
(8.77)%
RATIOS/SUPPLEMENTARY
DATA
Net
Assets
at
End
of
Year
(000s
omitted)
$
5,034
$
3,920
$
3,234
$
3,389
$
2,588
Ratios
to
Average
Net
Assets:
Net
investment
income
2.84%
3.08%
2.77%
2.39%
2.51%
Net
expenses
0.70%
0.70%
0.70%
0.70%
0.70%
Gross
expenses
(b)
4.57%
4.75%
5.19%
5.66%
6.68%
PORTFOLIO
TURNOVER
RATE
22%
28%
48%
35%
40%
(a)
Calculated
based
on
average
shares
outstanding
during
each
year.
(b)
Reflects
the
expense
ratio
excluding
any
waivers
and/or
reimbursements.
BAYWOOD
SOCIALLY
RESPONSIBLE
FUND
SCHEDULE
OF
INVESTMENTS
September
30,
2024
See
Notes
to
Financial
Statements.
The
following
is
a
summary
of
the
inputs
used
to
value
the
Fund's instruments
as
of
September
30,
2024.
The
inputs
or
methodology
used
for
valuing
securities
are
not
necessarily
an
indication
of
the
risks
associated
with
investing
in
those
securities.
For
more
information
on
valuation
inputs,
and
their
aggregation
into
the
levels
used
in
the
table
below,
please
refer
to
the
Security
Valuation
section
in
Note
2
of
the
accompanying
Notes
to
Financial
Statements.
The
Level
1
value
displayed
in
this
table
is
Common
Stock.and
a
Money
Market
Fund.
Refer
to
this
Schedule
of
Investments
for
a
further
breakout
of
each
security
by
industry.
Shares
Security
Description
Value
Common
Stock
-
97.6%
Basic
Materials
-
3.8%
200
Air
Products
and
Chemicals,
Inc.
$
59,548
5,900
Graphic
Packaging
Holding
Co.
174,581
500
Packaging
Corp.
of
America
107,700
341,829
Capital
Goods
/
Industrials
-
6.7%
800
3M
Co.
109,360
13,000
Clarivate
PLC
(a)
92,300
300
Cummins,
Inc.
97,137
4,400
nVent
Electric
PLC
309,144
607,941
Communication
Services
-
5.1%
600
Alphabet,
Inc.,
Class A
99,510
9,200
AT&T,
Inc.
202,400
3,800
Comcast
Corp.,
Class A
158,726
460,636
Consumer
Discretionary
-
7.0%
1,900
Aptiv
PLC
(a)
136,819
900
Genuine
Parts
Co.
125,712
4,500
Kontoor
Brands,
Inc.
368,010
630,541
Consumer
Staples
-
4.3%
7,900
Kenvue,
Inc.
182,727
1,600
Mondelez
International,
Inc.,
Class A
117,872
500
PepsiCo.,
Inc.
85,025
385,624
Energy
-
9.6%
2,600
Devon
Energy
Corp.
101,712
11,000
Kinder
Morgan,
Inc.
242,990
3,000
Schlumberger
NV
125,850
450
Texas
Pacific
Land
Corp.
398,133
868,685
Financials
-
21.6%
2,600
Air
Lease
Corp.
117,754
1,400
American
Express
Co.
379,680
3,100
American
International
Group,
Inc.
227,013
500
Berkshire
Hathaway,
Inc.,
Class B
(a)
230,130
2,775
Brookfield
Corp.
147,491
400
Cboe
Global
Markets,
Inc.
81,948
1,100
CME
Group,
Inc.
242,715
7,000
Corebridge
Financial,
Inc.
204,120
700
Interactive
Brokers
Group,
Inc.
97,552
4,050
W
R
Berkley
Corp.
229,757
1,958,160
Health
Care
-
20.3%
1,500
AstraZeneca
PLC,
ADR
116,865
4,000
Avantor,
Inc.
(a)
103,480
800
Becton
Dickinson
&
Co.
192,880
1,400
Cardinal
Health,
Inc.
154,728
7,500
Fortrea
Holdings,
Inc.
(a)
150,000
10,708
Koninklijke
Philips
NV,
ADR
(a)
350,366
650
Labcorp
Holdings,
Inc.
145,262
2,300
Medtronic
PLC
207,069
1,800
Merck
&
Co.,
Inc.
204,408
200
Regeneron
Pharmaceuticals,
Inc.
(a)
210,248
1,835,306
Real
Estate
-
4.5%
10,000
Healthcare
Realty
Trust,
Inc.
REIT
181,500
2,071
Realty
Income
Corp.
REIT
131,343
2,800
Weyerhaeuser
Co.
REIT
94,808
407,651
Shares
Security
Description
Value
Technology
-
12.4%
2,300
Cisco
Systems,
Inc.
$
122,406
1,100
Coherent
Corp.
(a)
97,801
3,200
Corning,
Inc.
144,480
3,600
Intel
Corp.
84,456
1,300
International
Business
Machines
Corp.
287,404
1,000
NetApp,
Inc.
123,510
1,100
NXP
Semiconductors
NV
264,011
1,124,068
Transportation
-
1.4%
500
Union
Pacific
Corp.
123,240
Utilities
-
0.9%
900
WEC
Energy
Group,
Inc.
86,562
Total
Common
Stock
(Cost
$5,367,986)
8,830,243
Shares
Security
Description
Value
Money
Market
Fund
-
4.3%
388,822
First
American
Government
Obligations
Fund,
Class X,
4.82%
(b)
(Cost
$388,822)
388,822
Investments,
at
value
-
101.9%
(Cost
$5,756,808)
$
9,219,065
Other
Assets
&
Liabilities,
Net
-
(1.9)%
(170,734)
Net
Assets
-
100.0%
$
9,048,331
ADR
American
Depositary
Receipt
PLC
Public
Limited
Company
REIT
Real
Estate
Investment
Trust
(a)
Non-income
producing
security.
(b)
Dividend
yield
changes
daily
to
reflect
current
market
conditions.
Rate
was
the
quoted
yield
as
of
September
30,
2024.
Valuation
Inputs
Investments
in
Securities
Level
1
-
Quoted
Prices
$
9,219,065
Level
2
-
Other
Significant
Observable
Inputs
–
Level
3
-
Significant
Unobservable
Inputs
–
Total
$
9,219,065
BAYWOOD
SOCIALLY
RESPONSIBLE
FUND
SCHEDULE
OF
INVESTMENTS
September
30,
2024
See
Notes
to
Financial
Statements.
PORTFOLIO
HOLDINGS
(Unaudited)
%
of
Total
Investments
Basic
Materials
3.7%
Capital
Goods
/
Industrials
6.6%
Communication
Services
5.0%
Consumer
Discretionary
6.9%
Consumer
Staples
4.2%
Energy
9.4%
Financials
21.3%
Health
Care
19.9%
Real
Estate
4.4%
Technology
12.2%
Transportation
1.3%
Utilities
0.9%
Money
Market
Fund
4.2%
100.0%
BAYWOOD
SOCIALLY
RESPONSIBLE
FUND
STATEMENT
OF
ASSETS
AND
LIABILITIES
September
30,
2024
See
Notes
to
Financial
Statements.
ASSETS
Investments,
at
value
(Cost
$5,756,808)
$
9,219,065
Receivables:
Fund
shares
sold
1,927
Dividends
10,579
From
investment
advisor
9,168
Prepaid
expenses
9,633
Total
Assets
9,250,372
LIABILITIES
Payables:
Investment
securities
purchased
185,563
Fund
shares
redeemed
12
Accrued
Liabilities:
Fund
services
fees
5,229
Other
expenses
11,237
Total
Liabilities
202,041
NET
ASSETS
$
9,048,331
COMPONENTS
OF
NET
ASSETS
Paid-in
capital
$
5,363,015
Distributable
Earnings
3,685,316
NET
ASSETS
$
9,048,331
SHARES
OF
BENEFICIAL
INTEREST
AT
NO
PAR
VALUE
(UNLIMITED
SHARES
AUTHORIZED)
511,901
NET
ASSET
VALUE,
OFFERING
AND
REDEMPTION
PRICE
PER
SHARE
$
17.68
BAYWOOD
SOCIALLY
RESPONSIBLE
FUND
STATEMENT
OF
OPERATIONS
FOR
THE
YEAR
ENDED
SEPTEMBER
30,
2024
See
Notes
to
Financial
Statements.
INVESTMENT
INCOME
Dividend
income
(Net
of
foreign
withholding
taxes
of
$2,355)
$
218,203
Total
Investment
Income
218,203
EXPENSES
Investment
advisor
fees
56,540
Fund
services
fees
64,384
Transfer
agent
fees
19,380
Custodian
fees
5,336
Registration
fees
18,687
Professional
fees
33,833
Trustees'
fees
and
expenses
7,551
Shareholder
reports
19,164
Other
expenses
20,765
Total
Expenses
245,640
Fees
waived
and
expenses
reimbursed
(173,754)
Net
Expenses
71,886
NET
INVESTMENT
INCOME
146,317
NET
REALIZED
AND
UNREALIZED
GAIN
(LOSS)
Net
realized
gain
on
investments
224,950
Net
change
in
unrealized
appreciation
(depreciation)
on
investments
1,604,921
NET
REALIZED
AND
UNREALIZED
GAIN
1,829,871
INCREASE
IN
NET
ASSETS
RESULTING
FROM
OPERATIONS
$
1,976,188
BAYWOOD
SOCIALLY
RESPONSIBLE
FUND
STATEMENTS
OF
CHANGES
IN
NET
ASSETS
See
Notes
to
Financial
Statements.
For
the
Years
Ended
September
30,
2024
2023
OPERATIONS
Net
investment
income
$
146,317
$
135,177
Net
realized
gain
224,950
157,089
Net
change
in
unrealized
appreciation
(depreciation)
1,604,921
809,424
Increase
in
Net
Assets
Resulting
from
Operations
1,976,188
1,101,690
DISTRIBUTIONS
TO
SHAREHOLDERS
Total
Distributions
Paid
(304,037)
(296,577)
CAPITAL
SHARE
TRANSACTIONS
Sale
of
shares
1,659,816
260,194
Reinvestment
of
distributions
297,165
290,272
Redemption
of
shares
(1,561,909)
(910,587)
Increase
(Decrease)
in
Net
Assets
from
Capital
Share
Transactions
395,072
(360,121)
Increase
in
Net
Assets
2,067,223
444,992
NET
ASSETS
Beginning
of
Year
6,981,108
6,536,116
End
of
Year
$
9,048,331
$
6,981,108
SHARE
TRANSACTIONS
Sale
of
shares
104,055
18,016
Reinvestment
of
distributions
19,247
20,068
Redemption
of
shares
(96,661)
(63,325)
Increase
(Decrease)
in
Shares
26,641
(25,241)
BAYWOOD
SOCIALLY
RESPONSIBLE
FUND
FINANCIAL
HIGHLIGHTS
See
Notes
to
Financial
Statements.
These
financial
highlights
reflect
selected
data
for
a
share
outstanding
throughout
each
year.
For
the
Years
Ended
September
30,
2024
2023
2022
2021
2020
INSTITUTIONAL
SHARES
NET
ASSET
VALUE,
Beginning
of
Year
$
14.39
$
12.80
$
14.32
$
10.18
$
11.21
INVESTMENT
OPERATIONS
Net
investment
income
(a)
0.29
0.27
0.25
0.18
0.15
Net
realized
and
unrealized
gain
(loss)
3.60
1.91
(1.14)
4.19
(0.90)
Total
from
Investment
Operations
3.89
2.18
(0.89)
4.37
(0.75)
DISTRIBUTIONS
TO
SHAREHOLDERS
FROM
Net
investment
income
(0.26)
(0.27)
(0.21)
(0.14)
(0.15)
Net
realized
gain
(0.34)
(0.32)
(0.42)
(0.09)
(0.13)
Total
Distributions
to
Shareholders
(0.60)
(0.59)
(0.63)
(0.23)
(0.28)
NET
ASSET
VALUE,
End
of
Year
$
17.68
$
14.39
$
12.80
$
14.32
$
10.18
TOTAL
RETURN
27.72%
17.10%
(6.58)%
43.10%
(6.67)%
RATIOS/SUPPLEMENTARY
DATA
Net
Assets
at
End
of
Year
(000s
omitted)
$
9,048
$
6,981
$
6,536
$
6,766
$
3,626
Ratios
to
Average
Net
Assets:
Net
investment
income
1.81%
1.88%
1.73%
1.31%
1.45%
Net
expenses
0.89%
0.89%
0.89%
0.89%
0.89%
Gross
expenses
(b)
3.03%
3.12%
3.17%
3.76%
5.10%
PORTFOLIO
TURNOVER
RATE
23%
25%
22%
15%
30%
(a)
Calculated
based
on
average
shares
outstanding
during
each
year.
(b)
Reflects
the
expense
ratio
excluding
any
waivers
and/or
reimbursements.
BAYWOOD
FUNDS
NOTES
TO
FINANCIAL
STATEMENTS
September
30,
2024
Note
1.
Organization
Baywood
Value
Plus
Fund
and
Baywood
Socially
Responsible
Fund
(individually,
a
“Fund”
and
collectively,
the
“Funds”)
are
diversified
portfolios
of
Forum
Funds
II
(the
“Trust”).
The
Trust
is
a
Delaware
statutory
trust
that
is
registered
as
an
open-end,
management
investment
company
under
the
Investment
Company
Act
of
1940,
as
amended
(the
“Act”).
Under
its
Trust
Instrument,
the
Trust
is
authorized
to
issue
an
unlimited
number
of
each
Fund’s
shares
of
beneficial
interest
without
par
value.
The
Baywood
Value
Plus
Fund
commenced
operations
on
December
2,
2013,
through
a
reorganization
of
a
collective
investment
trust
into
the
Baywood
Value
Plus
Fund.
The
collective
investment
trust
was
previously
managed
by
the
Baywood
Value
Plus
Fund’s
Advisor
and
portfolio
management
team.
This
collective
investment
trust
was
organized
and
commenced
operations
on
June
27,
2008.
The
Baywood
Value
Plus
Fund
currently
offers
Institutional
Shares.
The
Baywood
Value
Plus
Fund
seeks
to
achieve
long-term
capital
appreciation
by
investing
in
undervalued
equity
securities.
The
Baywood
Socially
Responsible
Fund
commenced
operations
on
January
3,
2005.
The
Baywood
Socially
Responsible
Fund
currently
offers
Institutional
Shares.
The
Baywood
Socially
Responsible
Fund
seeks
to
provide
long-term
capital
growth.
Note
2.
Summary
of
Significant
Accounting
Policies
The
Funds
are
investment
companies
and
follow
accounting
and
reporting
guidance
under
Financial
Accounting
Standards
Board
Accounting
Standards
Codification
Topic
946,
“Financial
Services
–
Investment
Companies.”
These
financial
statements
are
prepared
in
accordance
with
accounting
principles
generally
accepted
in
the
United
States
of
America
(“GAAP”),
which
require
management
to
make
estimates
and
assumptions
that
affect
the
reported
amounts
of
assets
and
liabilities,
the
disclosure
of
contingent
liabilities
at
the
date
of
the
financial
statements,
and
the
reported
amounts
of
increases
and
decreases
in
net
assets
from
operations
during
the
fiscal
year.
Actual
amounts
could
differ
from
those
estimates.
The
following
summarizes
the
significant
accounting
policies
of
each
Fund:
Security
Valuation
–
Securities
are
recorded
at
fair
value
using
last
quoted
trade
or
official
closing
price
from
the
principal
exchange
where
the
security
is
traded,
as
provided
by
independent
pricing
services
on
each
Fund
business
day.
In
the
absence
of
a
last
trade,
securities
are
valued
at
the
mean
of
the
last
bid
and
ask
price
provided
by
the
pricing
service.
Shares
of
non-exchange
traded
open-end
mutual
funds
are
valued
at
net
asset
value
per
share
(“NAV”).
Short-term
investments
that
mature
in
sixty
days
or
less
may
be
recorded
at
amortized
cost,
which
approximates
fair
value.
Pursuant
to
Rule
2a-5
under
the
Investment
Company
Act,
the
Trust’s
Board
of
Trustees
(the
“Board”)
has
designated
the
Advisor,
as
defined
in
Note
3,
as
each
Fund’s
valuation
designee
to
perform
any
fair
value
determinations
for
securities
and
other
assets
held
by
each
Fund.
The
Advisor
is
subject
to
the
oversight
of
the
Board
and
certain
reporting
and
other
requirements
intended
to
provide
the
Board
the
information
needed
to
oversee
the
Advisor’s
fair
value
determinations.
The
Advisor
is
responsible
for
determining
the
fair
value
of
investments
for
which
market
quotations
are
not
readily
available
in
accordance
with
policies
and
procedures
that
have
been
approved
by
the
Board.
Under
these
procedures,
the
Advisor
convenes
on
a
regular
and
ad
hoc
basis
to
review
such
investments
and
considers
a
number
of
factors,
including
valuation
methodologies
and
significant
unobservable
inputs,
when
arriving
at
fair
value.
The
Board
has
approved
the
Advisor’s
fair
valuation
procedures
as
a
part
of
each
Fund’s
compliance
program
and
will
review
any
changes
made
to
the
procedures.
The
Advisor
provides
fair
valuation
inputs.
In
determining
fair
valuations,
inputs
may
include
market-based
analytics
that
may
consider
related
or
comparable
assets
or
liabilities,
recent
transactions,
market
multiples,
book
values
and
other
relevant
investment
information.
Advisor
inputs
may
include
an
income-based
approach
in
which
the
anticipated
future
cash
flows
of
the
investment
are
discounted
in
determining
fair
value.
Discounts
may
also
be
applied
based
on
the
nature
or
duration
of
any
restrictions
on
the
disposition
of
the
investments.
The
Advisor
performs
regular
reviews
of
valuation
methodologies,
key
inputs
and
assumptions,
disposition
analysis
and
market
activity.
Fair
valuation
is
based
on
subjective
factors
and,
as
a
result,
the
fair
value
of
an
investment
may
differ
from
the
security’s
market
price
and
may
not
be
the
price
at
which
the
asset
may
be
sold.
Fair
valuation
could
result
in
a
different
NAV
than
a
NAV
determined
by
using
market
quotes.
GAAP
has
a
three-tier
fair
value
hierarchy.
The
basis
of
the
tiers
is
dependent
upon
the
level
of
various
“inputs”
used
to
determine
the
value
of
each
Fund’s
investments.
These
inputs
are
summarized
in
the
three
broad
levels
listed
below:
Level
1
-
Quoted
prices
in
active
markets
for
identical
assets
and
liabilities.
BAYWOOD
FUNDS
NOTES
TO
FINANCIAL
STATEMENTS
September
30,
2024
Level
2
-
Prices
determined
using
significant
other
observable
inputs
(including
quoted
prices
for
similar
securities,
interest
rates,
prepayment
speeds,
credit
risk,
etc.).
Short-term
securities
are
valued
at
amortized
cost,
which
approximates
market
value,
are
categorized
as
Level
2
in
the
hierarchy.
Municipal
securities,
long-term
U.S.
government
obligations
and
corporate
debt
securities
are
valued
in
accordance
with
the
evaluated
price
supplied
by
a
pricing
service
and
generally
categorized
as
Level
2
in
the
hierarchy.
Other
securities
that
are
categorized
as
Level
2
in
the
hierarchy
include,
but
are
not
limited
to,
warrants
that
do
not
trade
on
an
exchange,
securities
valued
at
the
mean
between
the
last
reported
bid
and
ask
quotation
and
international
equity
securities
valued
by
an
independent
third
party
with
adjustments
for
changes
in
value
between
the
time
that
the
securities’
respective
local
market
closes
and
the
close
of
the
U.S.
market.
Level
3
-
Significant
unobservable
inputs
(including
each
Fund’s
own
assumptions
in
determining
the
fair
value
of
investments).
The
aggregate
value
by
input
level,
as
of
September
30,
2024,
for
each
Fund’s
investments
is
included
at
the
end
of
each
Fund’s
Schedule
of
Investments.
REITs
–
Each
Fund
has
made
certain
investments
in
real
estate
investment
trusts
(“REITs”)
which
pay
dividends
to
their
shareholders
based
upon
funds
available
from
operations.
It
is
quite
common
for
these
dividends
to
exceed
the
REIT’s
taxable
earnings
and
profits
resulting
in
the
excess
portion
of
such
dividends
being
designated
as
a
return
of
capital.
Each
Fund
may
include
the
gross
dividends
from
such
REITs
in
income
or
may
utilize
estimates
of
any
potential
REIT
dividend
reclassifications
in
each
Fund’s
annual
distributions
to
shareholders
and,
accordingly,
a
portion
of
each
Fund’s
distributions
may
be
designated
as
a
return
of
capital,
require
reclassification,
or
be
under
distributed
on
an
excise
basis
and
subject
to
excise
tax.
Security
Transactions,
Investment
Income
and
Realized
Gain
and
Loss
–
Investment
transactions
are
accounted
for
on
the
trade
date.
Dividend
income
is
recorded
on
the
ex-dividend
date.
Foreign
dividend
income
is
recorded
on
the
ex-dividend
date
or
as
soon
as
possible
after
determining
the
existence
of
a
dividend
declaration
after
exercising
reasonable
due
diligence.
Interest
income
is
recorded
on
an
accrual
basis.
Premium
is
amortized
to
the
next
call
date
above
par,
and
discount
is
accreted
to
maturity
using
the
effective
interest
method
and
included
in
interest
income.
Identified
cost
of
investments
sold
is
used
to
determine
the
gain
and
loss
for
both
financial
statement
and
federal
income
tax
purposes.
Distributions
to
Shareholders
–
Distributions
to
shareholders
of
net
investment
income,
if
any,
are
declared
and
paid
at
least
annually.
Distributions
to
shareholders
of
net
capital
gains,
if
any,
are
declared
and
paid
at
least
at
least
annually.
Distributions
to
shareholders
are
recorded
on
the
ex-dividend
date.
Distributions
are
based
on
amounts
calculated
in
accordance
with
applicable
federal
income
tax
regulations,
which
may
differ
from
GAAP.
These
differences
are
due
primarily
to
differing
treatments
of
income
and
gain
on
various
investment
securities
held
by
each
Fund,
timing
differences
and
differing
characterizations
of
distributions
made
by
each
Fund.
Federal
Taxes
–
Each
Fund
intends
to
continue
to
qualify
each
year
as
a
regulated
investment
company
under
Subchapter
M
of
Chapter
1,
Subtitle
A,
of
the
Internal
Revenue
Code
of
1986,
as
amended
(“Code”),
and
to
distribute
all
of
its
taxable
income
to
shareholders.
In
addition,
by
distributing
in
each
calendar
year
substantially
all
of
its
net
investment
income
and
capital
gains,
if
any,
the
Funds
will
not
be
subject
to
a
federal
excise
tax.
Therefore,
no
federal
income
or
excise
tax
provision
is
required.
Each
Fund
recognizes
interest
and
penalties,
if
any,
related
to
unrecognized
tax
benefits
as
income
tax
expense
in
the
Statements
of
Operations.
During
the
year,
each
Fund
did
not
incur
any
interest
or
penalties.
Each
Fund
files
a
U.S.
federal
income
and
excise
tax
return
as
required.
Each
Fund’s
federal
income
tax
returns
are
subject
to
examination
by
the
Internal
Revenue
Service
for
a
period
of
three
fiscal
years
after
they
are
filed.
As
of
September
30,
2024,
there
are
no
uncertain
tax
positions
that
would
require
financial
statement
recognition,
de-recognition
or
disclosure.
Income
and
Expense
Allocation
–
The
Trust
accounts
separately
for
the
assets,
liabilities
and
operations
of
each
of
its
investment
portfolios.
Expenses
that
are
directly
attributable
to
more
than
one
investment
portfolio
are
allocated
among
the
respective
investment
portfolios
in
an
equitable
manner.
Commitments
and
Contingencies
–
In
the
normal
course
of
business,
each
Fund
enters
into
contracts
that
provide
general
indemnifications
by
each
Fund
to
the
counterparty
to
the
contract.
Each
Fund’s
maximum
exposure
under
these
arrangements
is
dependent
on
future
claims
that
may
be
made
against
each
Fund
and,
therefore,
cannot
be
estimated;
however,
based
on
experience,
the
risk
of
loss
from
such
claims
is
considered
remote.
Each
Fund
has
determined
that
none
of
these
arrangements
requires
disclosure
on
each
Fund’s
statement
of
assets
and
liabilities.
BAYWOOD
FUNDS
NOTES
TO
FINANCIAL
STATEMENTS
September
30,
2024
Note
3.
Fees
and
Expenses
Investment
Advisor
–
SKBA
Capital
Management,
LLC
(the
“Advisor”)
is
the
investment
adviser
to
the
Funds.
Pursuant
to
an
investment
advisory
agreement,
the
Advisor
receives
an
advisory
fee,
payable
monthly,
at
an
annual
rate
of
0.50%
and
0.70%
of
the
average
daily
net
assets
of
Baywood
Value
Plus
Fund
and
Baywood
Socially
Responsible
Fund,
respectively.
Distribution
–
Foreside
Fund
Services,
LLC,
a
wholly
owned
subsidiary
of
Foreside
Financial
Group,
LLC
(d/b/a
ACA
Group)
(the
“Distributor”),
acts
as
the
agent
of
the
Trust
in
connection
with
the
continuous
offering
of
shares
of
the
Funds.
The
Funds
do
not
have
a
distribution
(12b-1)
plan;
accordingly,
the
Distributor
does
not
receive
compensation
from
the
Funds
for
its
distribution
services.
The
Advisor
compensates
the
Distributor
directly
for
its
services.
The
Distributor
is
not
affiliated
with
the
Advisor
or
Atlantic
Fund
Administration,
LLC,
a
wholly
owned
subsidiary
of
Apex
US
Holdings
LLC
(d/b/a
Apex
Fund
Services)
(“Apex”)
or
their
affiliates.
Other
Service
Providers
–
Apex
provides
fund
accounting,
fund
administration,
compliance
and
transfer
agency
services
to
each
Fund.
The
fees
related
to
these
services
are
included
in
Fund
services
fees
within
the
Statements
of
Operations.
Apex
also
provides
certain
shareholder
report
production
and
EDGAR
conversion
and
filing
services.
Pursuant
to
an
Apex
Services
Agreement,
each
Fund
pays
Apex
customary
fees
for
its
services.
Apex
provides
a
Principal
Executive
Officer,
a
Principal
Financial
Officer,
a
Chief
Compliance
Officer
and
an
Anti-Money
Laundering
Officer
to
each
Fund,
as
well
as
certain
additional
compliance
support
functions.
Trustees
and
Officers
–
Each
Independent
Trustee
receives
an
annual
fee
of
$25,000
($32,500
for
the
Chairman)
for
service
to
the
Trust.
The
Independent
Trustees
and
Chairman
may
receive
additional
fees
for
special
Board
meetings.
The
Independent
Trustees
are
also
reimbursed
for
all
reasonable
out-of-pocket
expenses
incurred
in
connection
with
their
duties
as
Trustees,
including
travel
and
related
expenses
incurred
in
attending
Board
meetings.
The
amount
of
Independent
Trustees’
fees
attributable
to
each
Fund
is
disclosed
in
the
Statements
of
Operations.
Certain
officers
of
the
Trust
are
also
officers
or
employees
of
the
above
named
service
providers,
and
during
their
terms
of
office
received
no
compensation
from
each
Fund.
Note
4.
Expense
Reimbursement
and
Fees
Waived
The
Advisor
has
contractually
agreed
to
waive
its
fee
and/or
reimburse
certain
expenses
to
limit
total
operating
expenses
(excluding
all
taxes,
interest,
portfolio
transaction
expenses,
acquired
fund
fees
and
expenses,
proxy
expenses
and
extraordinary
expenses)
to
0.70%
through
January
31,
2025,
for
Baywood
Value
Plus
Fund.
The
Advisor
also
has
contractually
agreed
to
waive
its
fees
and/or
reimburse
certain
expenses
to
limit
total
operating
expenses
(excluding
all
taxes,
interest,
portfolio
transaction
expenses,
acquired
fund
fees
and
expenses,
proxy
expenses
and
extraordinary
expenses)
to
0.89%
through
January
31,
2025,
for
Baywood
Socially
Responsible
Fund.
Other
Fund
service
providers
have
agreed
to
waive
a
portion
of
their
fees
and
such
waivers
may
be
changed
or
eliminated
with
the
approval
of
the
Board
of
Trustees
of
the
Trust.
For
the
year
ended
September
30,
2024,
fees
waived
and
expenses
reimbursed
were
as
follows:
The
Advisor
may
be
reimbursed
by
each
Fund
for
fees
waived
and
expenses
reimbursed
by
the
Advisor
pursuant
to
the
Expense
Cap
if
such
payment
is
made
within
three
years
of
the
fee
waiver
or
expense
reimbursement,
and
does
not
cause
the
Total
Annual
Fund
Operating
Expenses
After
Fee
Waiver
and/or
Expense
Reimbursement
to
exceed
the
lesser
of
(i)
the
then-current
expense
cap,
or
(ii)
the
expense
cap
in
place
at
the
time
the
fees/expenses
were
waived/reimbursed.
As
of
September
30,
2024,
$426,774
and
$430,466
in
the
Baywood
Value
Plus
Fund
and
Baywood
Socially
Responsible
Fund,
respectively,
is
subject
to
recapture
by
the
Advisor.
Other
Waivers
are
not
eligible
for
recoupment.
Note
5.
Security
Transactions
The
cost
of
purchases
and
proceeds
from
sales
of
investment
securities
(including
maturities),
other
than
short-term
investments
during
the
year
ended
September
30,
2024
were
as
follows:
Investment
Adviser
Fees
Waived
Investment
Adviser
Expenses
Reimbursed
Other
Waivers
Total
Fees
Waived
and
Expenses
Reimbursed
Baywood
Value
Plus
Fund
$
22,305
$
129,562
$
21,000
$
172,867
Baywood
Socially
Responsible
Fund
56,540
96,214
21,000
173,754
Purchases
Sales
Baywood
Value
Plus
Fund
$
1,189,702
$
949,599
Baywood
Socially
Responsible
Fund
2,148,665
1,751,954
BAYWOOD
FUNDS
NOTES
TO
FINANCIAL
STATEMENTS
September
30,
2024
Note
6.
Federal
Income
Tax
As
of
September
30,
2024
,
the
cost
for
federal
income
tax
purposes
and
the
components
of
net
unrealized
appreciation
were
as
follows:
Distributions
paid
during
the
fiscal
years
ended
as
noted
were
characterized
for
tax
purposes
as
follows:
As
of
September
30,
2024,
distributable
earnings
(accumulated
loss)
on
a
tax
basis
were
as
follows:
The
difference
between
components
of
distributable
earnings
on
a
tax
basis
and
the
amounts
reflected
in
the
Statements
of
Assets
and
Liabilities
are
primarily
due
to
wash
sales,
REITS
and
equity
return
of
capital.
Note
7.
Subsequent
Events
Subsequent
events
occurring
after
the
date
of
this
report
through
the
date
these
financial
statements
were
issued
have
been
evaluated
for
potential
impact,
and
each
Fund
has
had
no
such
events.
Tax
Cost
of
Investments
Gross
Unrealized
Appreciation
Gross
Unrealized
Depreciation
Net
Unrealized
Appreciation
Baywood
Value
Plus
Fund
$
3,541,292
$
1,487,232
$
(8,958)
$
1,478,274
Baywood
Socially
Responsible
Fund
5,756,245
3,482,350
(19,530)
3,462,820
Ordinary
Income
Long-Term
Capital
Gain
Total
Baywood
Value
Plus
Fund
2024
$
119,009
$
121,463
$
240,472
2023
118,073
73,470
191,543
Baywood
Socially
Responsible
Fund
2024
131,870
172,167
304,037
2023
129,507
167,070
296,577
Undistributed
Ordinary
Income
Undistributed
Long-Term
Gain
Net
Unrealized
Appreciation
Total
Baywood
Value
Plus
Fund
$
1,415
$
131,859
$
1,478,274
$
1,611,548
Baywood
Socially
Responsible
Fund
2,001
220,495
3,462,820
3,685,316
REPORT
OF
INDEPENDENT
REGISTERED
PUBLIC
ACCOUNTING
FIRM
To
the
Shareholders
of
Baywood
Value
Plus
Fund
and
Baywood
Socially
Responsible
Fund
and
the
Board
of
Trustees
of
Forum
Funds
II
Opinion
on
the
Financial
Statements
We
have
audited
the
accompanying
statements
of
assets
and
liabilities,
including
the
schedules
of
investments,
of
Baywood
Value
Plus
Fund
and
Baywood
Socially
Responsible
Fund
(the
“Funds”),
each
a
series
of
Forum
Funds
II,
as
of
September
30,
2024,
the
related
statements
of
operations
for
the
year
then
ended,
the
statements
of
changes
in
net
assets
and
the
financial
highlights
for
each
of
the
two
years
in
the
period
then
ended,
and
the
related
notes
(collectively
referred
to
as
the
“financial
statements”).
In
our
opinion,
the
financial
statements
present
fairly,
in
all
material
respects,
the
financial
position
of
each
of
the
Funds
as
of
September
30,
2024,
the
results
of
their
operations
for
the
year
then
ended,
and
the
changes
in
net
assets
and
the
financial
highlights
for
each
of
the
two
years
in
the
period
then
ended,
in
conformity
with
accounting
principles
generally
accepted
in
the
United
States
of
America.
The
Funds’
financial
highlights
for
the
years
ended
September
30,
2022,
and
prior,
were
audited
by
other
auditors
whose
report
dated
November
28,
2022,
expressed
an
unqualified
opinion
on
those
financial
highlights.
Basis
for
Opinion
These
financial
statements
are
the
responsibility
of
the
Funds’
management.
Our
responsibility
is
to
express
an
opinion
on
the
Funds’
financial
statements
based
on
our
audits.
We
are
a
public
accounting
firm
registered
with
the
Public
Company
Accounting
Oversight
Board
(United
States)
(“PCAOB”)
and
are
required
to
be
independent
with
respect
to
the
Funds
in
accordance
with
the
U.S.
federal
securities
laws
and
the
applicable
rules
and
regulations
of
the
Securities
and
Exchange
Commission
and
the
PCAOB.
We
conducted
our
audits
in
accordance
with
the
standards
of
the
PCAOB.
Those
standards
require
that
we
plan
and
perform
the
audit
to
obtain
reasonable
assurance
about
whether
the
financial
statements
are
free
of
material
misstatement
whether
due
to
error
or
fraud.
Our
audits
included
performing
procedures
to
assess
the
risks
of
material
misstatement
of
the
financial
statements,
whether
due
to
error
or
fraud,
and
performing
procedures
that
respond
to
those
risks.
Such
procedures
included
examining,
on
a
test
basis,
evidence
regarding
the
amounts
and
disclosures
in
the
financial
statements.
Our
procedures
included
confirmation
of
securities
owned
as
of
September
30,
2024,
by
correspondence
with
the
custodian
and
broker.
Our
audits
also
included
evaluating
the
accounting
principles
used
and
significant
estimates
made
by
management,
as
well
as
evaluating
the
overall
presentation
of
the
financial
statements.
We
believe
that
our
audits
provide
a
reasonable
basis
for
our
opinion.
We
have
served
as
the
Funds’
auditor
since
2023.
COHEN
&
COMPANY,
LTD.
Philadelphia,
Pennsylvania
November
22,
2024
Baywood
Funds
IMPORTANT
TAX
INFORMATION
(Unaudited)
September
30,
2024
Federal
Tax
Status
of
Dividends
Declared
during
the
Fiscal
Year
For
federal
income
tax
purposes,
dividends
from
short-term
capital
gains
are
classified
as
ordinary
income.
Baywood
Value
Plus
Fund
and
Baywood
Socially
Responsible
Fund
designate
97.30
%
and
100.00%
of
its
income
dividend
distributed
as
qualifying
for
the
corporate
dividends-received
deduction
(DRD)
and
100.00%
and
100.00
%
for
the
qualified
dividend
rate
(QDI),
respectively.
Pursuant
to
Section
852(b)(3)
of
the
Internal
Revenue
Code,
Baywood
Value
Plus
Fund
and
Baywood
Socially
Responsible
Fund
designated
$121,463
and
$172,167
as
long-term
capital
gain
dividends,
respectively.
Baywood
Funds
OTHER
INFORMATION
(Unaudited)
September
30,
2024
Changes
in
and
Disagreements
with
Accountants
(Item
8
of
Form
N-CSR)
N/A
Proxy
Disclosure
(Item
9
of
Form
N-CSR)
N/A
Remuneration
Paid
to
Directors,
Officers,
and
Others
(Item
10
of
Form
N-CSR)
Please
see
financial
statements
in
Item
7.
Statement
Regarding
the
Basis
for
the
Board’s
Approval
of
Investment
Advisory
Contract
(Item
11
of
Form
N-CSR)
At
the
September
19,
2024
Board
meeting
(“September
meeting”),
the
Board
of
Trustees
of
Forum
Funds
II,
including
the
Trustees
who
are
not
“interested
persons”
of
the
Trust,
met
and
considered
the
approval
of
the
continuance
of
the
investment
advisory
agreement
between
the
Adviser
and
the
Trust
pertaining
to
the
Funds
(the
“Advisory
Agreement”).
In
preparation
for
the
September
meeting,
the
Board
was
presented
with
a
range
of
information
to
assist
in
its
deliberations.
The
Board
requested
and
reviewed
written
responses
from
the
Adviser
to
a
letter
circulated
on
the
Board's
behalf
concerning
the
Adviser’s
personnel,
operations,
financial
condition,
performance,
and
services
provided
to
the
Funds
by
the
Adviser.
During
its
deliberations,
the
Board
received
an
oral
presentation
from
the
Adviser
and
discussed
the
materials
with
the
Adviser,
independent
legal
counsel
to
the
Independent
Trustees
(“Independent
Legal
Counsel”),
and,
as
necessary,
with
the
Trust's
administrator.
The
Independent
Trustees
also
met
in
executive
session
with
Independent
Legal
Counsel
while
deliberating.
At
the
September
meeting,
the
Board
reviewed,
among
other
matters,
the
topics
discussed
below:
Nature,
Extent
and
Quality
of
Services
Based
on
written
materials
received
and
the
presentation
from
the
Adviser
regarding
the
personnel,
operations,
and
financial
condition
of
the
Adviser,
the
Board
considered
the
quality
of
services
provided
by
the
Adviser
under
the
Advisory
Agreement.
In
this
regard,
the
Board
considered
information
regarding
the
experience,
qualifications
and
professional
background
of
the
portfolio
managers
and
other
personnel
at
the
Adviser
with
principal
responsibility
for
the
Funds,
as
well
as
the
investment
philosophy
and
decision-making
process
of
those
professionals
and
the
capability
and
integrity
of
the
Adviser’s
senior
management
and
staff.
The
Board
also
considered
the
adequacy
of
the
Adviser’s
resources
and
noted
the
Adviser’s
representations
that
the
firm
is
in
stable
financial
condition
and
has
the
operational
capability
and
the
necessary
staffing
and
experience
to
continue
providing
high-quality
investment
advisory
services
to
the
Funds.
Based
on
the
presentation
and
the
materials
provided
by
the
Adviser
in
connection
with
the
Board’s
consideration
of
the
renewal
of
the
Advisory
Agreement,
among
other
relevant
factors,
the
Board
concluded
that,
overall,
it
was
satisfied
with
the
nature,
extent
and
quality
of
services
provided
to
the
Funds
under
the
Advisory
Agreement.
Performance
In
connection
with
a
presentation
by
the
Adviser
regarding
its
approach
to
managing
the
Funds,
including
the
investment
objective
and
strategy
of
each
Fund,
the
Board
reviewed
the
performance
of
each
Fund
compared
to
their
respective
primary
benchmarks
and
compared
to
independent
peer
groups
of
funds
identified
by
a
third-party,
independent
service
provider,
Strategic
Insight,
Inc.
(“Strategic
Insight”),
believed
to
have
characteristics
similar
to
those
of
the
Funds.
The
Board
observed
that
the
Socially
Responsible
Fund
outperformed
its
primary
benchmark
index,
the
Morningstar
US
Large
Value
Total
Return
Index,
for
the
one-
and
five-year
periods
ended
June
30,
2024,
and
underperformed
its
primary
benchmark
index
for
the
three-
and
ten-year
periods
ended
June
30,
2024,
as
well
as
the
period
since
the
Socially
Responsible
Fund’s
inception
on
January
3,
2005.
The
Board
observed
that
the
Socially
Responsible
Fund
outperformed
the
average
of
its
Strategic
Insight
peers
for
the
one-,
three-,
and
five-year
periods
ended
June
30,
2024
and
underperformed
the
average
of
its
Strategic
Insight
peers
for
the
ten-year
period
ended
June
30,
2024.
The
Board
noted
the
Adviser’s
representation
that
the
Socially
Responsible
Fund’s
relative
outperformance
during
the
short
term
could
be
attributed,
at
least
in
part,
to
sector
allocation
and
stock
selection.
The
Board
also
noted
the
Adviser’s
representation
that
the
Socially
Responsible
Fund’s
underperformance
over
the
longer
term
could
be
attributed,
at
least
in
part,
to
a
Baywood
Funds
OTHER
INFORMATION
(Unaudited)
September
30,
2024
significant
shareholder
redemption
that
occurred
prior
to
the
Socially
Responsible
Fund’s
reorganization
into
the
Trust
at
the
beginning
of
2016,
which
disproportionately
impacted
the
Socially
Responsible
Fund’s
long-term
performance.
The
Board
further
noted
the
Adviser’s
representation
that
the
Morningstar
US
Large
Value
Total
Return
Index
did
not
have
the
same
socially
responsible
investment
constraints
as
those
of
the
Socially
Responsible
Fund,
which
could
result
in
performance
variance
versus
the
index.
The
Board
observed
that
the
Value
Plus
Fund
underperformed
its
primary
benchmark
index,
the
Morningstar
US
Large
Value
Total
Return
Index,
for
the
one-,
three-
and
ten-year
periods
ended
June
30,
2024
and
outperformed
the
primary
benchmark
index
for
the
five-
year
period
ended
June
30,
2024
and
for
the
period
since
the
Value
Plus
Fund’s
inception
on
June
27,
2008.
The
Board
also
observed
that,
based
on
the
information
provided
by
Strategic
Insight,
the
Value
Plus
Fund
outperformed
the
average
of
its
Strategic
Insight
peers
for
the
one-,
three-,
and
five-year
periods
ended
June
30,
2024
and
underperformed
the
average
of
it
Strategic
Insight
peers
for
the
ten-year
period
ended
June
30,
2024.
The
Board
noted
the
Adviser’s
representations
that
stock
selection,
particularly
in
the
consumer
discretionary,
industrials,
and
health
care
space
contributed
to
the
Value
Plus
Fund’s
performance
during
the
year.
The
Board
also
noted
the
Adviser’s
representation
that
the
Value
Plus
Fund’s
active
management
style
and
value
bias
remained
out
of
favor
in
the
market
relative
to
passive
investment
and
growth-oriented
strategies.
In
consideration
of
the
Funds’
investment
strategies
and
the
foregoing
performance
information,
among
other
considerations,
the
Board
determined
that
the
Funds
could
benefit
from
the
Adviser’s
continued
management
of
each
Fund.
Compensation
The
Board
evaluated
the
Adviser’s
compensation
for
providing
advisory
services
to
the
Funds
and
analyzed
comparative
information
on
actual
advisory
fee
rates
and
actual
total
expense
ratios
of
the
Funds
as
compared
to
those
of
their
respective
Strategic
Insight
peer
groups.
The
Board
observed
that
the
Adviser’s
net
management
fee
rates
for
each
of
the
Funds
were
less
than
the
medians
of
their
respective
Strategic
Insight
peer
groups.
The
Board
also
observed
that
the
net
total
expense
ratio
for
the
Value
Plus
Fund
was
less
than
the
median
of
its
Strategic
Insight
peer
group
and
that,
although
the
net
total
expense
ratio
for
the
Socially
Responsible
Fund
was
higher
than
the
median
of
its
Strategic
Insight
peer
group,
the
Socially
Responsible
Fund’s
net
total
expense
ratio
with
within
a
narrow
range
of
the
median
of
its
peers.
Based
on
the
foregoing,
and
other
relevant
considerations,
the
Board
concluded
that
the
Adviser’s
advisory
fee
rates
charged
to
the
Funds
were
reasonable.
Cost
of
Services
and
Profitability
The
Board
considered
information
provided
by
the
Adviser
regarding
the
costs
of
services
and
its
profitability
with
respect
to
the
Funds.
In
this
regard,
the
Board
considered
the
Adviser’s
resources
devoted
to
the
Funds,
as
well
as
the
information
provided
by
the
Adviser
regarding
the
costs
and
profitability
of
its
Fund
activities.
The
Board
noted
the
Adviser’s
representation
that,
as
a
result
of
the
contractual
expense
limitation
arrangement
in
place
for
each
of
the
Funds,
the
Adviser
was
not
earning
any
profit
from
its
mutual
fund
operations
but
that
the
Adviser
was
willing
to
continue
subsidizing
the
Funds
in
an
effort
to
support
growth
initiatives.
Based
on
these
and
other
applicable
considerations,
including
financial
statements
from
the
Adviser
indicating
its
profitability
and
expenses
from
overall
operations,
the
Board
concluded
that
the
Adviser’s
costs
of
services
and
profits
attributable
to
management
of
the
Funds
appeared
to
be
reasonable
in
light
of
the
nature,
extent
and
quality
of
the
services
provided
by
the
Adviser.
Economies
of
Scale
The
Board
evaluated
whether
the
Funds
were
benefitting,
or
may
benefit
in
the
future,
from
any
economies
of
scale.
In
this
respect,
the
Board
considered
the
Funds’
fee
structures,
asset
sizes,
and
net
expense
ratios.
The
Board
noted
the
Adviser’s
representation
that
economies
of
scale
could
be
experienced
if
the
Funds
were
to
reach
significantly
higher
asset
levels
but
that,
in
light
of
the
Funds’
current
asset
levels
and
the
Adviser’s
ongoing
subsidization
of
the
Funds,
breakpoints
in
the
advisory
fee
were
not
believed
by
the
Adviser
to
be
appropriate
at
this
time.
Based
on
the
foregoing
information
and
other
applicable
considerations,
the
Board
concluded
that
the
asset
levels
of
the
Funds
were
not
consistent
with
the
existence
of
economies
of
scale
and
that
economies
of
scale
were
not
a
material
factor
in
approving
the
continuation
of
the
Advisory
Agreement.
Other
Benefits
The
Board
noted
the
Adviser’s
representation
that,
aside
from
its
contractual
advisory
fees,
it
does
not
benefit
in
a
material
way
from
its
relationship
with
the
Funds.
Based
on
the
foregoing
representation
and
the
materials
presented,
the
Board
concluded
that
other
benefits
Baywood
Funds
OTHER
INFORMATION
(Unaudited)
September
30,
2024
received
by
the
Adviser
from
its
relationship
with
the
Funds
were
not
a
material
factor
to
consider
in
approving
the
continuation
of
the
Advisory
Agreement.
Conclusion
The
Board
did
not
identify
any
single
factor
as
being
of
paramount
importance,
and
different
Trustees
may
have
given
different
weight
to
different
factors.
The
Board
reviewed
a
memorandum
from
Fund
counsel
discussing
the
legal
standards
applicable
to
its
consideration
of
the
Advisory
Agreement.
Based
on
its
review,
including
consideration
of
each
of
the
factors
referenced
above,
the
Board
determined,
in
the
exercise
of
its
reasonable
business
judgment,
that
the
advisory
arrangement,
as
outlined
in
the
Advisory
Agreement,
was
fair
and
reasonable
in
light
of
the
services
performed
or
to
be
performed,
expenses
incurred
or
to
be
incurred
and
such
other
matters
as
the
Board
considered
relevant.
FOR
MORE
INFORMATION:
P.O.
Box
588
Portland,
ME
04112
(855)
409-2297
(toll
free)
INVESTMENT
ADVISOR
SKBA
Capital
Management,
LLC
601
California
Street,
Suite
1500
San
Francisco,
CA
94108
TRANSFER
AGENT
Apex
Fund
Services
P.O.
Box
588
Portland,
ME
04112
www.apexgroup.com
This
report
is
submitted
for
the
general
information
of
the
shareholders
of
the
Funds.
It
is
not
authorized
for
distribution
to
prospective
investors
unless
preceded
or
accompanied
by
an
effective
prospectus,
which
includes
information
regarding
the
Funds’
risks,
objectives,
fees
and
expenses,
experience
of
its
management,
and
other
information.
217-ANR-0924
(b) Included as part of financial statements filed under Item 7(a).
ITEM 8. CHANGES IN AND DISAGREEMENTS WITH ACCOUNTANTS FOR OPEN-END MANAGEMENT INVESTMENT COMPANIES.
Not applicable.
ITEM 9. PROXY DISCLOSURES FOR OPEN-END MANAGEMENT INVESTMENT COMPANIES.
Not applicable.
ITEM 10. REMUNERATION PAID TO DIRECTORS, OFFICERS, AND OTHERS OF OPEN-END MANAGEMENT INVESTMENT COMPANIES.
Included as part of financial statements filed under Item 7(a).
ITEM 11. STATEMENT REGARDING BASIS FOR APPROVAL OF INVESTMENT ADVISORY CONTRACT.
Included as part of other information filed under Item 7(a).
ITEM 12. DISCLOSURE OF PROXY VOTING POLICIES AND PROCEDURES FOR CLOSED-END MANAGEMENT INVESTMENT COMPANIES.
Not applicable.
ITEM 13. PORTFOLIO MANAGERS OF CLOSED-END MANAGEMENT INVESTMENT COMPANIES.
Not applicable.
ITEM 14. PURCHASES OF EQUITY SECURITIES BY CLOSED-END MANAGEMENT INVESTMENT COMPANY AND AFFILIATED PURCHASERS.
Not applicable.
ITEM 15. SUBMISSION OF MATTERS TO A VOTE OF SECURITY HOLDERS
The Registrant does not accept nominees to the Board of Trustees from shareholders.
ITEM 16. CONTROLS AND PROCEDURES
(a) The Registrant’s Principal Executive Officer and Principal Financial Officer have concluded that the Registrant’s disclosure controls and procedures (as defined in Rule 30a-3(c) under the Act are effective, based on their evaluation of the controls and procedures required by Rule 30a-3(b) under the Act and Rules 13a-15(b) or 15d-15(b) under the Securities Exchange Act of 1934, as of a date within 90 days of the filing date of this report.
(b) There were no changes in the Registrant’s internal control over financial reporting (as defined in Rule 30a-3(d) under the Act) that occurred during the Reporting Period that have materially affected, or are reasonably likely to materially affect, the Registrant’s internal control over financial reporting.
ITEM 17. DISCLOSURE OF SECURITIES LENDING ACTIVITIES FOR CLOSED-END MANAGEMENT INVESTMENT COMPANIES.
Not applicable.
ITEM 18. RECOVERY OF ERRONEOUSLY AWARDED COMPENSATION.
Not applicable.
ITEM 19. EXHIBITS.
(a)(2) Not applicable.
(a)(4) Not applicable.
(a)(5) Not applicable.
SIGNATURES
Pursuant to the requirements of the Securities Exchange Act of 1934 and the Investment Company Act of 1940, the Registrant has duly caused this report to be signed on its behalf by the undersigned, thereunto duly authorized.
Registrant Forum Funds II
| By: | /s/ Zachary Tackett | |
| | Zachary Tackett, Principal Executive Officer | |
| | | |
| Date: | November 18, 2024 | |
Pursuant to the requirements of the Securities Exchange Act of 1934 and the Investment Company Act of 1940, this report has been signed below by the following persons on behalf of the Registrant and in the capacities and on the dates indicated.
| By: | /s/ Zachary Tackett | |
| | Zachary Tackett, Principal Executive Officer | |
| | | |
| Date: | November 18, 2024 | |
| By: | /s/ Karen Shaw | |
| | Karen Shaw, Principal Financial Officer | |
| | | |
| Date: | November 18, 2024 | |