Exhibit 99.2

Table of Contents
| | |
| 1 QTS Q4 Earnings 2013 | | Contact: IR@qtsdatacenters.com |
Forward Looking Statements
Some of the statements contained in this document constitute forward-looking statements within the meaning of the federal securities laws. Forward-looking statements relate to expectations, beliefs, projections, future plans and strategies, anticipated events or trends and similar expressions concerning matters that are not historical facts. In particular, statements pertaining to the Company’s capital resources, portfolio performance and results of operations contain forward-looking statements. Likewise, all of the statements regarding anticipated growth in funds from operations and anticipated market conditions are forward-looking statements. In some cases, you can identify forward-looking statements by the use of forward-looking terminology such as “may,” “will,” “should,” “expects,” “intends,” “plans,” “anticipates,” “believes,” “estimates,” “predicts,” or “potential” or the negative of these words and phrases or similar words or phrases which are predictions of or indicate future events or trends and which do not relate solely to historical matters. You can also identify forward-looking statements by discussions of strategy, plans or intentions.
The forward-looking statements contained in this document reflect the Company’s current views about future events and are subject to numerous known and unknown risks, uncertainties, assumptions and changes in circumstances that may cause actual results to differ significantly from those expressed in any forward-looking statement. The Company does not guarantee that the transactions and events described will happen as described (or that they will happen at all). The following factors, among others, could cause actual results and future events to differ materially from those set forth or contemplated in the forward-looking statements: adverse economic or real estate developments in the Company’s markets or the technology industry; national and local economic conditions; difficulties in identifying properties to acquire and completing acquisitions; the Company’s failure to successfully develop, redevelop and operate acquired properties and operations; significant increases in construction and development costs; the increasingly competitive environment in which the Company operates; defaults on or non-renewal of leases by customers; increased interest rates and operating costs, including increased energy costs; financing risks, including the Company’s failure to obtain necessary outside financing; decreased rental rates or increased vacancy rates; dependence on third parties to provide Internet, telecommunications and network connectivity to the Company’s data centers; the Company’s failure to qualify and maintain its qualification as a real estate investment trust; environmental uncertainties and risks related to natural disasters; financial market fluctuations; and changes in real estate and zoning laws and increases in real property tax rates.
While forward-looking statements reflect the Company’s good faith beliefs, they are not guarantees of future performance. The Company disclaims any obligation to publicly update or revise any forward-looking statement to reflect changes in underlying assumptions or factors, of new information, data or methods, future events or other changes. For a further discussion of these and other factors that could cause the Company’s future results to differ materially from any forward-looking statements, see the section entitled “Risk Factors” in the Company’s final prospectus related to its IPO filed with the Securities and Exchange Commission on October 10, 2013.
| | |
| 2 QTS Q4 Earnings 2013 | | Contact: IR@qtsdatacenters.com |
Company Profile
| | |
| 3 QTS Q4 Earnings 2013 | | Contact: IR@qtsdatacenters.com |
Summary of Financial Data
(in thousands, except share, per share and operating portfolio statistics data)
Our financial and operating data for the three months ended December 31, 2013, and as of December 31, 2013, includes results on a consolidated basis for the Predecessor and the Company:
| | | | | | | | | | | | | | | | | | | | |
| | | Three Months Ended | | | Year Ended | |
| | | December 31, | | | September 30, | | | December 31, | | | December 31, | |
Summary of Results | | 2013 | | | 2013 | | | 2012 | | | 2013 | | | 2012 | |
Total revenue | | $ | 47,429 | | | $ | 46,020 | | | $ | 38,173 | | | $ | 177,887 | | | $ | 145,759 | |
Net income (loss) | | | 4,447 | | | | 2,709 | | | | (1,608 | ) | | | 3,850 | | | | (9,767 | ) |
| | | | | |
Other Data | | | | | | | | | | | | | | | | | | | | |
FFO | | $ | 16,213 | | | $ | 13,440 | | | $ | 6,364 | | | $ | 45,964 | | | $ | 20,253 | |
Operating FFO | | | 16,432 | | | | 13,440 | | | | 6,857 | | | | 49,512 | | | | 25,568 | |
Adjusted Operating FFO | | | 16,292 | | | | 12,932 | | | | 6,917 | | | | 47,408 | | | | 25,067 | |
Recognized MRR in the period | | | 41,881 | | | | 39,914 | | | | 33,009 | | | | 155,579 | | | | 128,533 | |
MRR (at period end) | | | 14,138 | | | | 13,799 | | | | 11,857 | | | | 14,138 | | | | 11,857 | |
EBITDA | | | 20,354 | | | | 19,184 | | | | 14,122 | | | | 69,914 | | | | 50,244 | |
Adjusted EBITDA | | | 21,228 | | | | 19,694 | | | | 14,686 | | | | 75,422 | | | | 55,330 | |
NOI | | | 30,421 | | | | 29,281 | | | | 24,742 | | | | 112,645 | | | | 90,904 | |
NOI as a % of revenue | | | 64.1 | % | | | 63.6 | % | | | 64.8 | % | | | 63.3 | % | | | 62.4 | % |
Adjusted EBITDA as a % of revenue | | | 44.8 | % | | | 42.8 | % | | | 38.5 | % | | | 42.4 | % | | | 38.0 | % |
Annualized ROIC | | | 15.7 | % | | | 15.6 | % | | | 15.6 | % | | | 15.5 | % | | | 15.7 | % |
General and administrative expenses as a % of revenue | | | 20.8 | % | | | 21.9 | % | | | 26.5 | % | | | 22.0 | % | | | 24.7 | % |
| | | | | | | | |
Balance Sheet Data | | December 31,
2013 | | | December 31,
2012 | |
Real estate at cost | | $ | 905,735 | | | $ | 734,829 | |
Net investment in real estate | | | 768,010 | | | | 631,928 | |
Total assets | | | 831,356 | | | | 685,443 | |
Credit facilities, mortgages payables, and capital leases | | | 347,877 | | | | 490,282 | |
Debt to last quarter annualized Adjusted EBITDA | | | 4.1x | | | | | |
Debt to Undepreciated real estate assets | | | 38.4 | % | | | | |
Debt to Implied Enterprise Value | | | 27.6 | % | | | | |
| | | | | | | | |
Operating Portfolio Statistics | | December 31,
2013 | | | December 31,
2012 | |
Built out square footage: | | | | | | | | |
Raised floor | | | 689,587 | | | | 651,236 | |
Leasable raised floor (1) | | | 485,546 | | | | 483,871 | |
Leased raised floor | | | 446,353 | | | | 418,204 | |
| | |
Total Raw Shell: | | | | | | | | |
Total | | | 3,779,519 | | | | 3,054,049 | |
Basis-of-design raised floor space (1) | | | 1,804,777 | | | | 1,519,086 | |
| | |
Data center properties | | | 10 | | | | 9 | |
Basis of design raised floor capacity | | | 38.2 | % | | | 42.9 | % |
Data center % occupied | | | 91.9 | % | | | 86.4 | % |
| (1) | See definition in Appendix. |
| | |
| 4 QTS Q4 Earnings 2013 | | Contact: IR@qtsdatacenters.com |
Reconciliations of Return on Invested Capital (ROIC)
(in thousands)
| | | | | | | | | | | | | | | | | | | | |
Return on Invested Capital (ROIC) | | Three Months Ended | | | Year Ended | |
| | | December 31, | | | September 30, | | | December 31, | | | December 31, | |
| | | 2013 | | | 2013 | | | 2012 | | | 2013 | | | 2012 | |
NOI | | $ | 30,421 | | | $ | 29,281 | | | $ | 24,742 | | | $ | 112,645 | | | $ | 90,904 | |
Annualized NOI | | | 121,684 | | | | 117,124 | | | | 98,968 | | | | 112,645 | | | | 90,904 | |
| | | | | |
Average Undepreciated Real Estate Assets and other Net Fixed Assets Placed in Service | | | 776,729 | | | | 748,490 | | | | 633,111 | | | | 726,616 | | | | 578,254 | |
Annualized ROIC | | | 15.7 | % | | | 15.6 | % | | | 15.6 | % | | | 15.5 | % | | | 15.7 | % |
| | |
Calculation of Average Undepreciated Real Estate Assets
and other Net Fixed Assets Placed in Service | | As of | | | As of | |
Undepreciated Real Estate Assets and other
Net Fixed Assets Placed in Service | | December 31,
2013 | | | September 30,
2013 | | | December 31,
2012 | | | December 31,
2013 | | | December 31,
2012 | |
Real Estate Assets, net | | $ | 768,011 | | | $ | 719,683 | | | $ | 631,927 | | | $ | 768,011 | | | $ | 631,927 | |
Less: Construction in progress | | | (146,905 | ) | | | (106,630 | ) | | | (87,609 | ) | | | (146,905 | ) | | | (87,609 | ) |
Plus: Accumulated depreciation | | | 137,725 | | | | 128,703 | | | | 102,901 | | | | 137,725 | | | | 102,901 | |
Plus: Other fixed assets, net | | | 7,292 | | | | 10,211 | | | | 5,153 | | | | 7,292 | | | | 5,153 | |
Plus: Acquired intangibles, net | | | 5,397 | | | | 6,850 | | | | 9,276 | | | | 5,397 | | | | 9,276 | |
Plus: Leasing Commissions, net | | | 11,858 | | | | 11,262 | | | | 8,206 | | | | 11,858 | | | | 8,206 | |
| | | | | | | | | | | | | | | | | | | | |
Total as of period end | | $ | 783,378 | | | $ | 770,079 | | | $ | 669,854 | | | $ | 783,378 | | | $ | 669,854 | |
| | | | | | | | | | | | | | | | | | | | |
Average undepreciated real estate assets and other net fixed assets as of reporting period (1) | | $ | 776,729 | | | $ | 748,490 | | | $ | 633,111 | | | $ | 726,616 | | | $ | 578,254 | |
| | | | | | | | | | | | | | | | | | | | |
| (1) | Calculated by using quarterly balance of each account. |
| | |
| 5 QTS Q4 Earnings 2013 | | Contact: IR@qtsdatacenters.com |
Implied Enterprise Value and Equity Breakdown
| | | | |
Implied Enterprise Value as of December 31, 2013: | | | | |
Total Shares Outstanding: | | | | |
Class A Common Stock | | | 28,731,145 | |
Class B Common Stock | | | 133,000 | |
| | | | |
Total Shares Outstanding | | | 28,864,145 | |
Units of Limited Partnership (1) | | | 7,930,843 | |
Options to purchase Class A Common Stock (2) | | | 56,503 | |
| | | | |
Fully Diluted Total Shares and Units of Limited Partnership outstanding | | | 36,851,491 | |
Share price as of December 31, 2013 | | $ | 24.78 | |
| | | | |
Market equity capitalization (in thousands) | | $ | 913,180 | |
Debt (in thousands) | | | 347,877 | |
| | | | |
Implied Enterprise Value (in thousands) | | $ | 1,261,057 | |
| | | | |
| (1) | Includes 25,214 of operating partnership units representing the “in the money” value of Class O LTIP units on an “as if” converted basis |
| (2) | Includes 56,503 options to purchase Class A Common Stock in QTS Realty Trust Inc. options representing the “in the money” value options on an “as if” converted basis. |
| | | | |
Equity Breakdown as of December 31, 2013 ($ in thousands): | | | | |
Members equity on Oct 14, 2013 | | $ | 125,483 | |
Net proceeds from IPO | | | 279,090 | |
| | | | |
Total equity at IPO | | | 404,573 | |
Net income from Oct 15 – Dec 31, 2013 | | | 4,002 | |
Other comprehensive income from Oct 15 – Dec 31, 2013 | | | 94 | |
Dividend to common shareholders | | | (6,953 | ) |
Distribution to noncontrolling interest holders | | | (2,012 | ) |
| | | | |
Total equity | | $ | 399,704 | |
| | | | |
Common stock | | $ | 289 | |
Additional paid-in capital | | | 318,834 | |
Accumulated other comprehensive loss | | | (357 | ) |
Retained earnings | | | 3,154 | |
Dividend to common shareholders | | | (6,953 | ) |
| | | | |
Total stockholders’ equity | | | 314,967 | |
Noncontrolling interests (1) | | | 84,737 | |
| | | | |
Total equity | | $ | 399,704 | |
| | | | |
| (1) | Concurrently with the completion of the IPO, QTS Realty Trust, Inc. became the sole general partner and majority owner of QualityTech, LP, which then became its operating partnership. The previous owners of QualityTech, LP retained 21.2% of ownership in operating partnership. |
| | |
| 6 QTS Q4 Earnings 2013 | | Contact: IR@qtsdatacenters.com |
Data Center Properties
(in thousands, except NRSF data)
The following table presents an overview of the portfolio of data center properties that the Company owns or leases, referred to herein as our data center properties, based on information as of December 31, 2013:
| | | | | | | | | | | | | | | | | | | | | | | | | | | | | | | | | | | | | | | | | | | | |
| | | | | | | | | Operating Net Rentable Square Feet
(Operating NRSF) (3) | | | | | | | | | Available | | | | | | | |
| | | | | | | | | | | | | | | | | | | | | | | | | | | Utility | | | Basis of | | | % | |
Property | | Year
Acquired (1) | | | Square
Feet (2) | | | Raised
Floor (4) | | | Office &
Other (5) | | | Supporting
Infrastructure (6) | | | Total | | | %
Leased (7) | | | Annualized
Rent (8) | | | Power
(MW) (9) | | | Design
NRSF | | | Raised
Floor | |
Richmond, VA | | | 2010 | | | | 1,318,353 | | | | 84,511 | | | | 27,214 | | | | 113,091 | | | | 224,816 | | | | 80.2 | % | | $ | 14,860,819 | | | | 110 | | | | 556,595 | | | | 15.2 | |
Atlanta, GA (Metro) | | | 2006 | | | | 968,695 | | | | 292,070 | | | | 24,851 | | | | 308,527 | | | | 625,448 | | | | 99.8 | % | | $ | 66,350,200 | | | | 72 | | | | 527,216 | | | | 55.4 | |
Dallas, TX | | | 2013 | | | | 698,000 | | | | — | | | | — | | | | — | | | | — | | | | N/A | % | | $ | — | | | | 140 | | | | 292,000 | | | | — | |
Suwanee, GA | | | 2005 | | | | 367,322 | | | | 155,422 | | | | 5,981 | | | | 99,760 | | | | 261,163 | | | | 87.4 | % | | $ | 41,968,647 | | | | 36 | | | | 214,422 | | | | 72.5 | |
Santa Clara, CA** | | | 2007 | | | | 135,322 | | | | 55,494 | | | | 1,146 | | | | 45,721 | | | | 102,361 | | | | 89.6 | % | | $ | 19,322,590 | | | | 11 | | | | 80,548 | | | | 68.9 | |
Jersey City, NJ* | | | 2006 | | | | 122,448 | | | | 31,503 | | | | 14,220 | | | | 35,387 | | | | 81,110 | | | | 75.6 | % | | $ | 10,518,580 | | | | 7 | | | | 52,744 | | | | 59.8 | |
Sacramento, CA | | | 2012 | | | | 92,644 | | | | 45,595 | | | | 3,592 | | | | 27,100 | | | | 76,287 | | | | 90.7 | % | | $ | 11,815,827 | | | | 8 | | | | 56,260 | | | | 81.0 | |
Overland Park, KS* | | | 2003 | | | | 32,706 | | | | 2,493 | | | | — | | | | 5,338 | | | | 7,831 | | | | 71.2 | % | | $ | 611,025 | | | | 1 | | | | 2,493 | | | | 100 | |
Miami, FL | | | 2008 | | | | 30,029 | | | | 19,887 | | | | — | | | | 6,592 | | | | 26,479 | | | | 55.6 | % | | $ | 3,990,391 | | | | 4 | | | | 19,887 | | | | 100 | |
Wichita, KS | | | 2005 | | | | 14,000 | | | | 2,612 | | | | 2,854 | | | | 8,534 | | | | 14,000 | | | | 100.0 | % | | $ | 222,120 | | | | 1 | | | | 2,612 | | | | 100 | |
| | | | | | | | | | | | | | | | | | | | | | | | | | | | | | | | | | | | | | | | | | | | |
Total | | | | | | | 3,779,519 | | | | 689,587 | | | | 79,858 | | | | 650,050 | | | | 1,419,495 | | | | 91.9 | % | | $ | 169,660,199 | | | | 390 | | | | 1,804,777 | | | | 38.2 | |
| | | | | | | | | | | | | | | | | | | | | | | | | | | | | | | | | | | | | | | | | | | | |
| (1) | Represents the year a property was acquired or, in the case of a property under lease, the year our initial lease commenced for the property. |
| (2) | With respect to our owned properties, gross square feet represents the entire building area. With respect to leased properties, gross square feet represents that portion of the gross square feet subject to our lease. This includes 171,755 square feet of QTS office and support space, which is not included in operating NRSF. |
| (3) | Represents the total square feet of a building that is currently leased or available for lease plus developed supporting infrastructure, based on engineering drawings and estimates, but does not include space held for redevelopment or space used for our own office space. |
| (4) | Represents management’s estimate of the portion of NRSF of the facility with available power and cooling capacity that is currently leased or readily available to be leased to customers as data center space based on engineering drawings. |
| (5) | Represents the operating NRSF of the facility other than data center space (typically office and storage space) that is currently leased or available to be leased. |
| (6) | Represents required data center support space, including mechanical, telecommunications and utility rooms, as well as building common areas. |
| (7) | Calculated as data center raised floor that is subject to a signed lease for which billing has commenced as of December 31, 2013 divided by leasable raised floor based on the current configuration of the properties (485,546 square feet as of December 31, 2013), expressed as a percentage. |
| (8) | Annualized rent is presented for leases commenced as of December 31, 2013. The Company define annualized rent as MRR multiplied by 12. The Company calculates MRR as monthly contractual revenue under executed contracts as of a particular date, which includes revenue from our C1, C2 and C3 rental activities and cloud and managed services, but excludes customer recoveries, deferred set up fees and other one-time and variable revenues. MRR does not include the impact from booked not billed contracts as of a particular date, unless otherwise specifically noted. |
| (9) | Represents installed utility power and transformation capacity that is available for use by the facility as of December 31, 2013. |
| | * | Represents facilities that we lease. |
| | ** | Subject to long term ground lease. |
NOTE: Excludes our facility at Lenexa, Kansas, which is not an operating data center.
| | |
| 7 QTS Q4 Earnings 2013 | | Contact: IR@qtsdatacenters.com |
Change in Operating NRSF
During the quarter, QTS had a net reduction of approximately 51,000 of net rentable square feet (“NRSF”). QTS obtained approximately 66,000 NRSF from a prior C1 tenant in the Atlanta-Metro facility which is currently being redeveloped for another C1 tenant and additional C2 rental space. During the fourth quarter of 2013, QTS placed 15,000 NRSF into service in the Atlanta-Suwanee facility and placed capital of $12 million into service on its platform. For the year ended December 31, 2013, QTS brought a net amount of approximately 112,000 NRSF of Raised Floor Capacity into service at an aggregate cost of $112 million.
The table below sets forth the changes in each category of operating NRSF during the fourth quarter of 2013 and for the year ended December 31, 2013.
| | | | | | | | |
| | | Change in Raised Floor NRSF | |
Property | | Three Months
Ended December 31,
2013 (1) | | | Year Ended
December 31,
2013 | |
Richmond, VA | | | — | | | | 24,581 | |
Atlanta, GA (Atlanta – Metro) | | | (65,946 | ) | | | (30,946 | ) |
Suwanee, GA (Atlanta – Suwanee) | | | 15,000 | | | | 50,000 | |
Jersey City, NJ(1) | | | — | | | | (5,480 | ) |
| | | | | | | | |
Total | | | (50,946 | ) | | | 38,155 | |
| | | | | | | | |
| (1) | Represents facility that QTS leases. |
| | |
| 8 QTS Q4 Earnings 2013 | | Contact: IR@qtsdatacenters.com |
Redevelopment Costs Summary
(in thousands, except NRSF data)
The under construction table below summarizes our outlook for development projects which we expect to complete by December 31, 2014 (in millions). The majority of capital in this plan is discretionary. In addition to the projects completed in the fourth quarter of 2013, this table reflects modifications to our capital plan as of December 31, 2013, relating to our plan to operate our facilities at higher efficiency levels and to better match new capacity with lease-up at each facility.
| | | | | | | | | | | | | | | | |
| | | Under Construction Costs (3) | |
Property | | Actual (1) | | | Estimated Cost
to Completion (2) | | | Total | | | Expected
Completion
date | |
Atlanta Metro | | $ | 30 | | | $ | 32 | | | $ | 62 | | | | Q2 2014 | |
Dallas | | | 25 | | | | 31 | | | | 56 | | | | Q3 2014 | |
Richmond | | | 26 | | | | 3 | | | | 29 | | | | Q2 2014 | |
Sacramento | | | 4 | | | | 4 | | | | 8 | | | | Q2 2014 | |
Atlanta Suwanee | | | — | | | | 2 | | | | 2 | | | | Q2 2014 | |
| | | | | | | | | | | | | | | | |
Totals | | $ | 85 | | | $ | 72 | | | $ | 157 | | | | | |
| | | | | | | | | | | | | | | | |
| (1) | Actual for NRSF under construction through December 31, 2013. In addition to the $85 million of construction costs incurred through December 31, 2013 for redevelopment expected to be completed by December 31, 2014, as of December 31, 2013 we had incurred $62 million of additional costs (including acquisition costs and other capitalized costs) for other redevelopment projects that are expected to be completed after December 31, 2014. |
| (2) | Represents management’s estimate of the additional costs required to complete the current NRSF under development. There may be an increase in costs if customers’ requirements exceed our current basis of design. |
| (3) | In addition to projects currently under construction, our near term redevelopment projects are expected to be delivered in a modular manner, and we currently expect to invest additional capital to complete these near term projects. The ultimate timing and completion of, and the commitment of capital to, our future redevelopment projects is within our discretion and will depend upon a variety of factors, including the availability of financing and our estimation of the future market for data center space in each particular market. |
| | |
| 9 QTS Q4 Earnings 2013 | | Contact: IR@qtsdatacenters.com |
Redevelopment Summary
(in thousands, except NRSF data)
The following redevelopment table presents an overview of our redevelopment pipeline, based on information as of December 31, 2013. This table shows our ability to increase our raised floor of 689,587 square feet by more than 2.5 times to over 1,800,000 square feet:
| | | | | | | | | | | | | | | | |
| | | Raised Floor NRSF
Overview as of December 31, 2013 | |
Property | | Current NRSF
in Service | | | Under
Construction (1) | | | Future
Available (2) | | | Basis of Design
NRSF | |
Richmond | | | 84,511 | | | | 22,084 | | | | 450,000 | | | | 556,595 | |
Atlanta Metro | | | 292,070 | | | | 100,946 | | | | 134,200 | | | | 527,216 | |
Dallas | | | — | | | | 26,000 | | | | 266,000 | | | | 292,000 | |
Suwanee | | | 155,422 | | | | 30,000 | | | | 29,000 | | | | 214,422 | |
Santa Clara | | | 55,494 | | | | — | | | | 25,054 | | | | 80,548 | |
Jersey City | | | 31,503 | | | | — | | | | 21,241 | | | | 52,744 | |
Sacramento | | | 45,595 | | | | 9,000 | | | | 1,665 | | | | 56,260 | |
Overland Park | | | 2,493 | | | | — | | | | — | | | | 2,493 | |
Wichita | | | 2,612 | | | | — | | | | — | | | | 2,612 | |
Miami | | | 19,887 | | | | — | | | | — | | | | 19,887 | |
| | | | | | | | | | | | | | | | |
Totals | | | 689,587 | | | | 188,030 | | | | 927,160 | | | | 1,804,777 | |
| | | | | | | | | | | | | | | | |
| (1) | Reflects NRSF at a facility for which the initiation of substantial activities to prepare the property for its intended use is available on or before December 31, 2014. |
| (2) | Reflects NRSF at a facility for which the initiation of substantial activities to prepare the property for its intended use is available after December 31, 2014. |
| | |
| 10 QTS Q4 Earnings 2013 | | Contact: IR@qtsdatacenters.com |
NOI by Facility and Capital Expenditure Summary
(in thousands, except NRSF data)
The Company calculates net operating income, or NOI, as net income (loss), excluding: interest expense, interest income, depreciation and amortization, write off of unamortized deferred financing costs, gain on extinguishment of debt, transaction costs, gain on legal settlement, gain on sale of real estate, restructuring charge and general and administrative expenses. The Company believes that NOI is another metric that is often utilized to evaluate returns on operating real estate from period to period and also, in part, to assess the value of the operating real estate. The breakdown of NOI by facility is shown below:
| | | | | | | | | | | | | | | | | | | | |
| | | Three Months Ended | | | Year Ended | |
| | | December 31, | | | September 30, | | | December 31, | | | December 31, | |
| | | 2013 | | | 2013 | | | 2012 | | | 2013 | | | 2012 | |
Breakdown of NOI by facility: | | | | | | | | | | | | | | | | | | | | |
Atlanta-Metro data center | | $ | 13,654 | | | $ | 13,740 | | | $ | 11,967 | | | $ | 52,393 | | | $ | 42,787 | |
Atlanta-Suwanee data center | | | 8,210 | | | | 7,517 | | | | 6,853 | | | | 29,155 | | | | 30,471 | |
Santa Clara data center | | | 2,640 | | | | 2,801 | | | | 3,131 | | | | 10,939 | | | | 11,183 | |
Richmond data center | | | 2,780 | | | | 2,859 | | | | 2,180 | | | | 10,318 | | | | 6,094 | |
Sacramento data center (1) | | | 2,061 | | | | 1,752 | | | | 240 | | | | 7,699 | | | | 240 | |
Other data centers | | | 1,076 | | | | 612 | | | | 371 | | | | 2,141 | | | | 129 | |
| | | | | | | | | | | | | | | | | | | | |
NOI | | $ | 30,421 | | | $ | 29,281 | | | $ | 24,742 | | | $ | 112,645 | | | $ | 90,904 | |
| | | | | | | | | | | | | | | | | | | | |
| (1) | Facility was acquired in December 2012. |
Capital expenditures related to real estate assets are summarized as follows:
| | | | | | | | | | | | | | | | |
| | | Real Estate Capital Expenditures (1) | |
| | | Three Months Ended
December 31, | | | Year Ended
December 31, | |
| | | 2013 | | | 2012 | | | 2013 | | | 2012 | |
Redevelopment | | $ | 53,280 | | | $ | 26,534 | | | $ | 132,755 | | | $ | 102,330 | |
Acquisitions | | | — | | | | 53,920 | | | | 21,173 | | | | 56,544 | |
Dispositions | | | — | | | | — | | | | — | | | | (601 | ) |
Maintenance capital expenditures | | | 298 | | | | 1,011 | | | | 2,538 | | | | 1,725 | |
Other capitalized costs | | | 3,771 | | | | 2,874 | | | | 14,441 | | | | 11,093 | |
| | | | | | | | | | | | | | | | |
Total capital expenditures | | $ | 57,349 | | | $ | 84,339 | | | $ | 170,907 | | | $ | 171,091 | |
| | | | | | | | | | | | | | | | |
| (1) | Does not include capitalized leasing commissions included in deferred costs, acquired intangibles or other management related fixed assets included in other assets. |
| | |
| 11 QTS Q4 Earnings 2013 | | Contact: IR@qtsdatacenters.com |
Leasing Statistics – Signed Leases
(in thousands)
The mix of sales has significant impact on quarterly rates, both within major product segments and for overall blended leasing rates. QTS rate performance will vary quarter to quarter based on the mix of deals sold – C1 Custom Data Center, C2 Colocation (Cabinet, Cage and Suite), and C3 Cloud and Managed Services categories all vary on rate per square foot basis. The amounts below include renewals when there was a change in square footage rented, but not renewals where square footage remained consistent before and after renewal (See renewal table on page 14 for such renewals).
During the fourth quarter of 2013, the Company signed 285 new and modified leases aggregating to $14.2 million of annualized rent which includes new leased revenue plus revenue from modified renewals. Removing annualized modified renewal MRR and deducting period downgrades results in $9.3 million in incremental annualized rent. The average rent per square foot was approximately $351 per square foot which compares to a trailing four quarter average rate per square foot of approximately $353. Overall fourth quarter 2013 new/modified lease rates are slightly below the trailing four quarter average due to higher mix of C1 business in the quarter.
The prior four quarter average of $353 per square foot is below overall installed base rates as a function of mega-C1 customer upgrades in first quarter of 2013. As these C1 customers ramp their deployment over 2013 and 2014, we expect marginal pressure on overall blended C1 rates. A mega-C1 customer returned a significant amount of space in the fourth quarter of 2013 with a smaller reduction in MRR, resulting in higher effective rates per square foot, which will help overall blended C1 rates moving forward. The fourth quarter 2013 C1 rates reflect the discounts we have provided to our largest customers and are not indicative of the rest of our C1 business which typically purchases much smaller power increments (500KW-1MW versus multiple MW contracts reflected in the second half of 2013).
Annualized Rent of New and Modified Leases represent total MRR associated with all new and modified leases for the respective periods for the purposes of computing annualized rent rates per square foot during the period. Incremental Annualized Rent, Net of Downgrades reflects net incremental MRR signed during the period for purposes of tracking incremental revenue contribution.
| | | | | | | | | | | | | | | | | | | | | | | | |
| | | Period | | | Number of
Leases | | | Total
Leased sq ft | | | Annualized
Rent per
Leased sq ft | | | Annualized
Rent of New
and Modified
Leases | | | Incremental
Annualized
Rent, Net of
Downgrades | |
New/modified leases signed – Total | | | Q4 2013 | | | | 285 | | | | 40,632 | | | $ | 351 | | | $ | 14,241,606 | | | $ | 9,252,764 | |
| | | P4QA | * | | | 320 | | | | 40,339 | | | | 353 | | | | 14,237,430 | | | | 9,689,243 | |
| | | Q3 2013 | | | | 351 | | | | 23,138 | | | | 566 | | | | 13,086,021 | | | | 8,230,201 | |
| | | Q2 2013 | | | | 355 | | | | 17,151 | | | | 748 | | | | 12,822,584 | | | | 8,324,853 | |
| | | Q1 2013 | | | | 334 | | | | 110,298 | | | | 209 | | | | 23,023,046 | | | | 17,233,394 | |
| | | Q4 2012 | | | | 238 | | | | 10,770 | | | | 744 | | | | 8,018,068 | | | | 4,968,522 | |
| | | | | | |
New/modified leases signed – C1 | | | Q4 2013 | | | | 15 | | | | 34,354 | | | $ | 187 | | | $ | 6,434,898 | | | | | |
| | | P4QA | * | | | 14 | | | | 32,700 | | | | 185 | | | | 6,053,968 | | | | | |
| | | Q3 2013 | | | | 11 | | | | 11,446 | | | | 235 | | | | 2,695,290 | | | | | |
| | | Q2 2013 | | | | 11 | | | | 7,920 | | | | 291 | | | | 2,301,818 | | | | | |
| | | Q1 2013 | | | | 10 | | | | 106,085 | | | | 162 | | | | 17,168,784 | | | | | |
| | | Q4 2012 | | | | 23 | | | | 5,349 | | | | 383 | | | | 2,049,979 | | | | | |
| | | | | | |
New/modified leases signed – C2/C3 | | | Q4 2013 | | | | 270 | | | | 6,278 | | | $ | 1,244 | | | $ | 7,806,708 | | | | | |
| | | P4QA | * | | | 306 | | | | 7,639 | | | | 1,071 | | | | 8,183,462 | | | | | |
| | | Q3 2013 | | | | 340 | | | | 11,692 | | | | 889 | | | | 10,390,731 | | | | | |
| | | Q2 2013 | | | | 344 | | | | 9,231 | | | | 1,140 | | | | 10,520,766 | | | | | |
| | | Q1 2013 | | | | 324 | | | | 4,213 | | | | 1,390 | | | | 5,854,262 | | | | | |
| | | Q4 2012 | | | | 215 | | | | 5,421 | | | | 1,101 | | | | 5,968,088 | | | | | |
| * | Average of prior 4 quarters |
Note: Figures above do not include cost recoveries. In general, C1 customers reimburse QTS for certain operating costs wheras C2/C3 customers are on a gross lease basis. As a result, pricing and resulting per square foot rates for the C2/C3 customers includes the recovery of such operating costs.
The following table outlines the Booked-not-billed (“BNB”) balance as of December 31, 2013 and how that will affect revenue in subsequent years:
| | | | | | | | | | | | | | | | |
Booked-not-billed (“BNB”) | | 2014 | | | 2015 | | | Thereafter | | | Total | |
MRR | | $ | 1,118,498 | | | $ | 702,962 | | | $ | 524,671 | | | $ | 2,346,131 | |
Incremental revenue | | | 9,537,918 | | | | 3,598,581 | | | | 6,296,052 | | | | | |
Annualized revenue | | | 13,421,982 | | | | 8,435,538 | | | | 6,296,052 | | | | 28,153,572 | |
| | |
| 12 QTS Q4 Earnings 2013 | | Contact: IR@qtsdatacenters.com |
Leasing Statistics – Renewed Leases and Rental Churn
(in thousands)
The mix of sales has significant impact on quarterly rates, both within major product segments and for overall blended renewal rates. QTS rate performance will vary quarter to quarter based on the mix of deals sold – C1 Custom Data Center, C2 Colocation, and C3 Cloud and Managed Services categories all vary on rate per square foot basis.
Consistent with our 3C strategy and business model, the renewal rates below reflect total MRR per square foot including all subscribed services. For comparability, we include only those customers that have maintained consistent space footprints in the computations below. All customers with space changes are incorporated into new/modified leasing statistics and rates.
The overall blended rate for renewals signed in the fourth quarter was 1.1% lower than the rates for those customers immediately prior to renewal, which reflects the impact of a C2 customer which changed its product mix, resulting in a lower rate per square foot. This renewal represents 1 of our 50 renewed leases in the fourth quarter and the renewal rates in the fourth quarter of 2013 would have increased 3.3% without the impact of this renewal. The actual change in fourth quarter renewal rates compares to a prior four quarter average increase of 1.6%, which reflects the impact of 3 significant C2/C3 renewals signed in the first 2 quarters of 2013. These leases were extended at lower total effective rates as a function of services changes associated with the customer deployments. Overall renewal rate increases in the preceding four quarters would have been 4.1% without the impact of these first half 2013 lease renewals.
C2/C3 rates were down 1.1% in the fourth quarter and up 1.9% over preceding four quarters. Without the impact of the three leases noted above, C2/C3 renewal rates would have increased 4.3% in the preceding four quarters. In the fourth quarter of 2013, there was a single renewed lease that reflected a change in core power service that negatively impacted rates. Excluding the impact of this renewal in fourth quarter renewal performance would have increased 3.3%.
Rental Churn (which we define as MRR lost to complete termination of customer services in a given period compared to total MRR at the beginning of the period) for the fourth quarter of 2013 was 2.3% and 5.7% for the year ended December 31, 2013. This compares to rental churn for the fourth quarter of 2012 of 1.0%. and rental churn of 8.0% for the year ended December 31, 2012.
| | | | | | | | | | | | | | | | | | | | | | | | |
| | | Period | | | Number of
renewed
leases | | | Total
Leased sq ft | | | Annualized
rent per
leased sq ft | | | Annualized
Rent | | | Rent
Change (1) | |
Renewed Leases – Total | | | Q4 2013 | | | | 50 | | | | 3,795 | | | $ | 922 | | | $ | 3,497,992 | | | | -1.1 | %(2) |
| | | P4QA | * | | | 51 | | | | 5,526 | | | $ | 985 | | | $ | 4,990,334 | | | | 1.6 | % |
| | | Q3 2013 | | | | 47 | | | | 6,812 | | | $ | 783 | | | $ | 5,335,293 | | | | 8.0 | % |
| | | Q2 2013 | | | | 68 | | | | 7,713 | | | $ | 795 | | | $ | 6,128,460 | | | | -1.8 | % |
| | | Q1 2013 | | | | 53 | | | | 5,548 | | | $ | 1,051 | | | $ | 5,833,380 | | | | -4.5 | % |
| | | Q4 2012 | | | | 34 | | | | 2,032 | | | $ | 1,311 | | | $ | 2,664,204 | | | | 5.4 | % |
| | | | | | |
Renewed Leases – C1 | | | Q4 2013 | | | | 0 | | | | — | | | $ | — | | | $ | — | | | | 0.0 | % |
| | | P4QA | * | | | 3 | | | | 3,119 | | | $ | 476 | | | $ | 748,377 | | | | 8.4 | % |
| | | Q3 2013 | | | | 2 | | | | 3,119 | | | $ | 476 | | | $ | 1,484,166 | | | | 8.3 | % |
| | | Q2 2013 | | | | 0 | | | | — | | | $ | — | | | $ | — | | | | 0.0 | % |
| | | Q1 2013 | | | | 0 | | | | — | | | $ | — | | | $ | — | | | | 0.0 | % |
| | | Q4 2012 | | | | 4 | | | | — | | | $ | — | | | $ | 12,588 | | | | 0.0 | % |
| | | | | | |
Renewed Leases – C2/C3 | | | Q4 2013 | | | | 50 | | | | 3,795 | | | $ | 922 | | | $ | 3,497,992 | | | | -1.1 | % |
| | | P4QA | * | | | 49 | | | | 4,747 | | | $ | 1,048 | | | $ | 4,616,146 | | | | 1.9 | % |
| | | Q3 2013 | | | | 45 | | | | 3,693 | | | $ | 1,043 | | | $ | 3,851,127 | | | | 8.0 | % |
| | | Q2 2013 | | | | 68 | | | | 7,713 | | | $ | 795 | | | $ | 6,128,460 | | | | -1.8 | % |
| | | Q1 2013 | | | | 53 | | | | 5,548 | | | $ | 1,051 | | | $ | 5,833,380 | | | | -4.5 | % |
| | | Q4 2012 | | | | 30 | | | | 2,032 | | | $ | 1,305 | | | $ | 2,651,616 | | | | 5.4 | % |
| (1) | Calculated as the percentage change of the rent per square foot immediately before renewal when compared to the rent per square foot immediately after renewal. |
| (2) | This decrease includes the impact of a C2 customer which changed its product mix resulting in a lower rate per square foot. The renewal rates in the fourth quarter of 2013 would have increased 3.3% without the impact of that renewal. |
| | |
| 13 QTS Q4 Earnings 2013 | | Contact: IR@qtsdatacenters.com |
Leasing Statistics – Commenced Leases
(in thousands)
The mix of sales across C1, C2 and C3 has significant impact on quarterly rates, both within major product segments and for overall blended commencement rates. QTS rate performance will vary quarter to quarter based on the mix of deals sold. C1 Custom Data Center, C2 Colocation , and C3 Cloud and Managed Services categories all vary on rate per sq ft basis.
During the fourth quarter of 2013, we commenced customer leases (which includes both new customers and existing customers that extended their lease terms) representing approximately $2.3 million of MRR and representing approximately $27.7 million of annualized rent at $280 per square foot. This compares to customer leases representing an aggregate trailing four quarter average of approximately $1.3 million of MRR (representing approximately $16.1 million of annualized rent) at $436 per square foot. Both the fourth quarter of 2013 and the trailing four quarter average rates reflect the impact of significant C1 lease commencements.
Initial commencements from a large C1 deal booked in the first quarter of 2013 impacted C1 commencement rates in the fourth quarter of 2013. Pricing for this strategic deal reflects the unique power commitment and lease size. The effects of the largest QTS C1 clients can also be seen in the fourth quarter of 2012, where new business and renewed leases for these two strategic customers also draw down average C1 rates.
C2/C3 average commencement rate for the fourth quarter of 2013 was $1,043.2 versus the trailing four quarter average of $1,075.2 and reflect the impact of several large C2 customers on overall rates. Related metrics reflect the presence of these large commencements and their larger footprint pricing economics – new MRR totaled $1.2 million ($14.2 million annualized) versus trailing average of $1.1 million ($11.5 million annualized) and space leased of 13,590, nearly 27% higher than the trailing average of 10,732 square feet.
| | | | | | | | | | | | | | | | | | | | |
| | | Period | | | Number of
leases | | | Total
Leased sq ft | | | Annualized
rent per
leased sq ft | | | Annualized
Rent | |
Leases commenced – Total | | | Q4 2013 | | | | 356 | | | | 99,123 | | | $ | 280 | | | $ | 27,714,462 | |
| | | P4QA | * | | | 324 | | | | 36,957 | | | | 436 | | | | 16,128,542 | |
| | | Q3 2013 | | | | 417 | | | | 72,516 | | | | 324 | | | | 23,524,566 | |
| | | Q2 2013 | | | | 387 | | | | 16,891 | | | | 792 | | | | 13,372,729 | |
| | | Q1 2013 | | | | 283 | | | | 45,373 | | | | 430 | | | | 19,526,631 | |
| | | Q4 2012 | | | | 210 | | | | 13,047 | | | | 620 | | | | 8,090,243 | |
| | | | | |
Leases commenced – C1 | | | Q4 2013 | | | | 25 | | | | 85,533 | | | $ | 158 | | | $ | 13,536,139 | |
| | | P4QA | * | | | 26 | | | | 26,225 | | | | 175 | | | | 4,589,050 | |
| | | Q3 2013 | | | | 31 | | | | 56,878 | | | | 152 | | | | 8,635,316 | |
| | | Q2 2013 | | | | 29 | | | | 6,775 | | | | 198 | | | | 1,343,731 | |
| | | Q1 2013 | | | | 25 | | | | 34,801 | | | | 202 | | | | 7,025,724 | |
| | | Q4 2012 | | | | 20 | | | | 6,444 | | | | 210 | | | | 1,351,431 | |
| | | | | |
Leases commenced – C2/C3 | | | Q4 2013 | | | | 331 | | | | 13,590 | | | $ | 1,043 | | | $ | 14,178,324 | |
| | | P4QA | * | | | 298 | | | | 10,732 | | | | 1,075 | | | | 11,539,492 | |
| | | Q3 2013 | | | | 386 | | | | 15,638 | | | | 952 | | | | 14,889,250 | |
| | | Q2 2013 | | | | 358 | | | | 10,116 | | | | 1,189 | | | | 12,028,998 | |
| | | Q1 2013 | | | | 258 | | | | 10,572 | | | | 1,182 | | | | 12,500,907 | |
| | | Q4 2012 | | | | 190 | | | | 6,603 | | | | 1,021 | | | | 6,738,812 | |
| * | Average of prior 4 quarters |
| | |
| 14 QTS Q4 Earnings 2013 | | Contact: IR@qtsdatacenters.com |
Lease Expirations
C1 leases are typically 5-7 years with the majority of C1 lease expirations occurring in 2016 and beyond. C2/C3 leases are typically 3 years in duration, thus the majority of C2/C3 lease expirations are in 2014 and 2015. The following table sets forth a summary schedule of the lease expirations as of December 31, 2013 at the properties in the Company’s portfolio. Unless otherwise stated in the footnotes, the information set forth in the table assumes that customers exercise no renewal options and all early termination rights are exercised:
| | | | | | | | | | | | | | | | | | | | | | | | | | | | | | | | |
Year of Lease
Expiration (1) | | Number of
Leases
Expiring (2) | | | Total
Raised Floor of
Expiring Leases | | | % of Portfolio
Leased
Raised Floor | | | Annualized
Rent (3) | | | % of Portfolio
Annualized
Rent | | | C1 as % of
Portfolio
Annualized
Rent | | | C2 as % of
Portfolio
Annualized
Rent | | | C3 as % of
Portfolio
Annualized
Rent | |
Month-to-
Month (4) | | | 313 | | | | 16,915 | | | | 4 | % | | | 12,189,321 | | | | 7 | % | | | 1 | % | | | 6 | % | | | 1 | % |
2014 | | | 967 | | | | 49,830 | | | | 11 | % | | | 39,610,112 | | | | 23 | % | | | 3 | % | | | 17 | % | | | 3 | % |
2015 | | | 685 | | | | 44,761 | | | | 10 | % | | | 33,402,815 | | | | 20 | % | | | 2 | % | | | 16 | % | | | 1 | % |
2016 | | | 509 | | | | 54,845 | | | | 12 | % | | | 27,140,158 | | | | 16 | % | | | 4 | % | | | 11 | % | | | 1 | % |
2017 | | | 76 | | | | 52,771 | | | | 12 | % | | | 14,336,154 | | | | 8 | % | | | 7 | % | | | 1 | % | | | 0 | % |
2018 | | | 75 | | | | 183,985 | | | | 41 | % | | | 31,307,727 | | | | 18 | % | | | 17 | % | | | 1 | % | | | 1 | % |
After 2018 | | | 50 | | | | 42,654 | | | | 10 | % | | | 11,673,912 | | | | 7 | % | | | 6 | % | | | 0 | % | | | 1 | % |
| | | | | | | | | | | | | | | | | | | | | | | | | | | | | | | | |
Portfolio Total | | | 2,675 | | | | 445,761 | | | | 100 | % | | $ | 169,660,199 | | | | 100 | % | | | 40 | % | | | 52 | % | | | 8 | % |
| | | | | | | | | | | | | | | | | | | | | | | | | | | | | | | | |
| (1) | Does not include data for leases expiring in a particular year when leases for the same space have already been signed with replacement customers with future commencement dates. In those cases, the data is included in the year in which the future lease expires. |
| (2) | Represents each agreement with a customer signed as of December 31, 2013 for which billing has commenced; a lease agreement could include multiple spaces and a customer could have multiple leases. |
| (3) | Annualized rent is presented for leases commenced as of December 31, 2013. The Company defines annualized rent as MRR multiplied by 12. The Company calculates MRR as monthly contractual revenue under signed leases as of a particular date, which includes revenue from our C1, C2 and C3 rental and cloud and managed services activities, but excludes customer recoveries, deferred set-up fees, variable related revenues, non-cash revenues and other one-time revenues. MRR does not include the impact from booked-not-billed leases as of a particular date, unless otherwise specifically noted. This amount reflects the annualized cash rental payments. It does not reflect the accounting associated with any free rent, rent abatements or future scheduled rent increases and also excludes operating expense and power reimbursements. |
| (4) | Consists of customers whose leases expired prior to December 31, 2013 and have continued on a month-to-month basis. |
| | |
| 15 QTS Q4 Earnings 2013 | | Contact: IR@qtsdatacenters.com |
Largest Customers
As of December 31, 2013, the Company’s portfolio was leased to over 880 customers comprised of companies of all sizes representing an array of industries, each with unique and varied business models and needs. The following table sets forth information regarding the ten largest customers in the portfolio based on annualized rent as of December 31, 2013:
| | | | | | | | | | | | | | | | |
Principal Customer Industry | | Number of
Locations | | | Annualized
Rent (1) | | | % of Portfolio
Annualized
Rent | | | Weighted
Average
Remaining
Lease Term
(Months) (2) | |
Internet | | | 1 | | | $ | 12,652,580 | | | | 7.5 | % | | | 57 | |
Internet | | | 1 | | | | 9,644,400 | | | | 5.7 | % | | | 58 | |
Information Technology | | | 3 | | | | 4,758,047 | | | | 2.8 | % | | | 19 | |
Financial Services | | | 1 | | | | 4,318,740 | | | | 2.5 | % | | | 37 | |
Financial Services | | | 1 | | | | 3,640,053 | | | | 2.1 | % | | | 19 | |
Financial Services | | | 2 | | | | 3,244,109 | | | | 1.9 | % | | | 48 | |
Information Technology | | | 1 | | | | 3,174,000 | | | | 1.9 | % | | | 114 | |
Professional Services | | | 1 | | | | 3,134,220 | | | | 1.8 | % | | | 17 | |
Internet (3) | | | 2 | | | | 3,115,417 | | | | 1.8 | % | | | 1 | |
Information Technology | | | 2 | | | | 2,768,334 | | | | 1.6 | % | | | 10 | |
| | | | | | | | | | | | | | | | |
Total / Weighted Average | | | | | | $ | 50,449,900 | | | | 29.8 | % | | | 44 | |
| | | | | | | | | | | | | | | | |
| (1) | Annualized rent is presented for leases commenced as of December 31, 2013. We define annualized rent as MRR multiplied by 12. We calculate MRR as monthly contractual revenue under signed leases as of a particular date, which includes revenue from our C1, C2 and C3 rental and cloud and managed services activities, but excludes customer recoveries, deferred set-up fees, variable related revenues, non-cash revenues and other one-time revenues. MRR does not include the impact from booked-not-billed leases as of a particular date. This amount reflects the annualized cash rental payments. It does not reflect any free rent, rent abatements or future scheduled rent increases and also excludes operating expense and power reimbursements. |
| (2) | Weighted average based on customer’s percentage of total annualized rent expiring and is as of December 31, 2013. |
| (3) | This customer is deployed across two QTS data centers; the Company and the customer are jointly working on finalizing their renewal requirements for a balanced product mix and returns across the two deployments. |
| | |
| 16 QTS Q4 Earnings 2013 | | Contact: IR@qtsdatacenters.com |
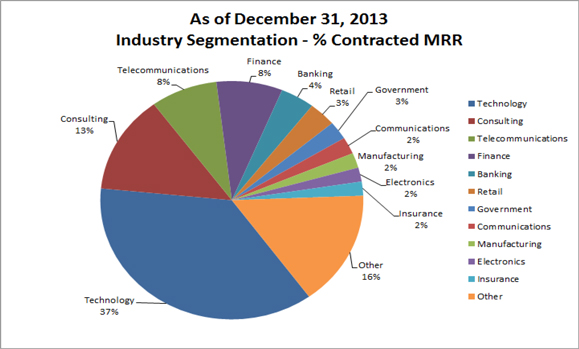
Industry Segmentation
The following table sets forth information relating to the industry segmentation as ofDecember 31, 2013:
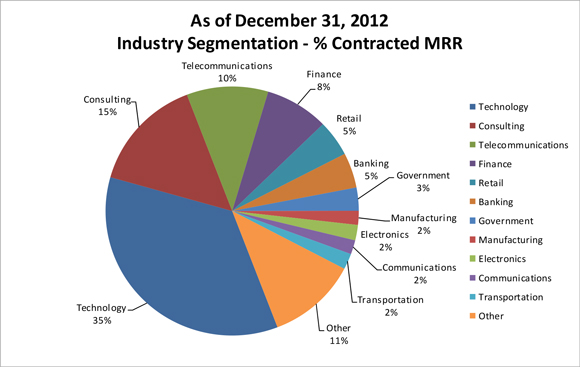
The following table sets forth information relating to the industry segmentation as ofDecember 31, 2012:
| | |
| 17 QTS Q4 Earnings 2013 | | Contact: IR@qtsdatacenters.com |
Product Diversification
The following table sets forth information relating to the distribution of leases at the properties, by type of product offering, as ofDecember 31, 2013:
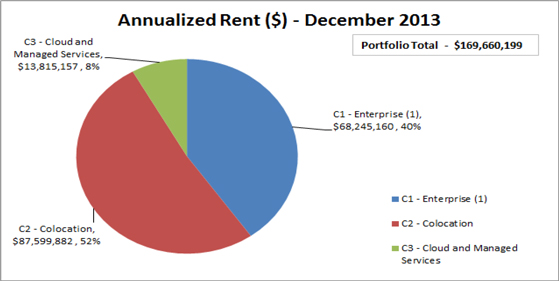
| (1) | As of December 31, 2013, C1 customers renting over 6,600 square represented $34.5 million of annualized C1 MRR, C1 customers renting between 3,300 and 6,600 square feet represented $19.4 million of annualized C1 MRR and C1 customers renting below 3,300 square feet represented or $14.3 million of annualized C1 MRR. As of December 31, 2013, C1 customers’ median used square footage was 3,271 square feet. |
The following table sets forth information relating to the distribution of leases at the properties, by type of product offering, as ofDecember 31, 2012:
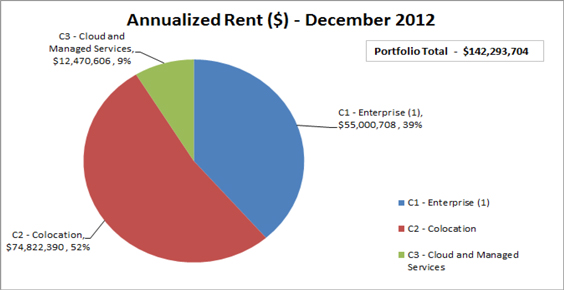
| (1) | As of December 31, 2012, C1 customers renting over 6,600 square represented $24.1 million of annualized C1 MRR, C1 customers renting between 3,300 and 6,600 square feet represented $16.6 million of annualized C1 MRR and C1 customers renting below 3,300 square feet represented or $14.3 million of annualized C1 MRR. As of December 31, 2012, C1 customers’ median used square footage was 3,737 square feet. |
| | |
| 18 QTS Q4 Earnings 2013 | | Contact: IR@qtsdatacenters.com |
Debt Summary and Maturities
(in thousands)
| | | | | | | | |
| | | December 31,
2013 | | | December 31,
2012 | |
Secured Credit Facility | | $ | — | | | $ | 316,500 | |
Unsecured Credit Facility | | | 256,500 | | | | — | |
Richmond Credit Facility | | | 70,000 | | | | 70,000 | |
Atlanta-Metro Equipment Loan | | | 18,839 | | | | 20,931 | |
Miami Loan | | | — | | | | 26,048 | |
Suwanee Land Loan | | | — | | | | 1,600 | |
Lenexa Loan | | | — | | | | 2,712 | |
Santa Clara Bridge Loan | | | — | | | | 50,000 | |
| | | | | | | | |
Total (1) | | $ | 345,339 | | | $ | 487,791 | |
| | | | | | | | |
| (1) | Exclusive of capital lease obligations which totaled $2.5 million and $2.5 million as of December 31, 2013 and December 31, 2012, respectively. |
As of December 31, 2013
| | | | | | | | | | | | | | | | | | | | | | | | | | | | |
Debt instruments | | 2014 | | | 2015 | | | 2016 | | | 2017 | | | 2018 | | | Thereafter | | | Total | |
Unsecured Credit Facility (1) | | $ | — | | | $ | — | | | $ | — | | | $ | 31,500 | | | $ | 225,000 | | | $ | — | | | $ | 256,500 | |
Richmond Credit Facility (2) | | | — | | | | 70,000 | | | | — | | | | — | | | | — | | | | — | | | | 70,000 | |
Atlanta-Metro Equipment Loan | | | 2,239 | | | | 2,397 | | | | 2,567 | | | | 2,748 | | | | 2,943 | | | | 5,945 | | | | 18,839 | |
| | | | | | | | | | | | | | | | | | | | | | | | | | | | |
Total | | $ | 2,239 | | | $ | 72,397 | | | $ | 2,567 | | | $ | 34,248 | | | $ | 227,943 | | | $ | 5,945 | | | $ | 345,339 | |
| | | | | | | | | | | | | | | | | | | | | | | | | | | | |
| (1) | Revolving portion of the Unsecured Credit Facility has a stated maturity of May 1, 2017 with an option to extend for one additional year. |
| (2) | Richmond Credit Facility has a stated maturity of December 18, 2015 with an option to extend for one additional year. |
| | |
| 19 QTS Q4 Earnings 2013 | | Contact: IR@qtsdatacenters.com |
Interest Summary
(in thousands)
| | | | | | | | | | | | | | | | | | | | |
| | | Three Months Ended | | | | | | | |
| | | December 31, | | | September 30, | | | December 31, | | | Years Ended December 31, | |
| | | 2013 | | | 2013 | | | 2012 | | | 2013 | | | 2012 | |
Interest expense and fees | | $ | 3,171 | | | $ | 4,508 | | | $ | 5,976 | | | $ | 19,548 | | | $ | 23,469 | |
Swap interest | | | 156 | | | | 146 | | | | — | | | | 536 | | | | 493 | |
Amortization of deferred financing costs | | | 582 | | | | 588 | | | | 803 | | | | 2,775 | | | | 3,370 | |
Capitalized interest (1) | | | (1,162 | ) | | | (899 | ) | | | (678 | ) | | | (4,135 | ) | | | (2,192 | ) |
| | | | | | | | | | | | | | | | | | | | |
Total interest expense | | $ | 2,747 | | | $ | 4,343 | | | $ | 6,101 | | | $ | 18,724 | | | $ | 25,140 | |
| | | | | | | | | | | | | | | | | | | | |
| (1) | The weighted average interest rate for the three months ended December 31, 2013, September 30, 2013, and December 31, 2012 was 4.59%, 3.58%, and 5.64%, respectively. The weighted average interest rate for the years ended December 31, 2013 and 2012 was 4.48% and 5.84%, respectively. As of December 31, 2013 and 2012 our weighted average coupon interest rate was 2.90% and 4.67%, respectively. |
| | |
| 20 QTS Q4 Earnings 2013 | | Contact: IR@qtsdatacenters.com |
Appendix
Non-GAAP Financial Measures
This document includes certain non-GAAP financial measures that management believes are helpful in understanding the Company’s business, as further described below.
The Company considers the following non-GAAP financial measures to be useful to investors as key supplemental measures of the Company’s performance: (1) FFO; (2) Operating FFO; (3) Adjusted Operating FFO; (4) MRR; (5) EBITDA; and (6) Adjusted EBITDA. These non-GAAP financial measures should be considered along with, but not as alternatives to, net income or loss and cash flows from operating activities as a measure of the Company’s operating performance and liquidity. FFO, Operating FFO, MRR, NOI, EBITDA and Adjusted EBITDA, as calculated by us, may not be comparable to FFO, Operating FFO, MRR, NOI, EBITDA and Adjusted EBITDA as reported by other companies that do not use the same definition or implementation guidelines or interpret the standards differently from us.
Definitions
C1 – Custom Data Center. Power costs are passed on to customers (metered power); generally 3,000 square feet or more of raised floor; lease term of 5 to 10 years; customers are large corporations, government agencies, and global Internet businesses.
C2 – Colocation. Power overages charged separately; specified kW included in lease; up to 3,000 square feet of raised floor; lease term of up to 3 years; customers are large corporations, small and medium businesses and government agencies.
C3 – Cloud and Managed Services. Power bundled with service; Small amounts of space; customers rent managed virtual servers; lease term up to 3 years; customers are large corporations, small and medium businesses and government agencies.
Booked-not-billed (“BNB”). The Company defines booked-not-billed as customer leases that have been signed, but for which lease payments have not yet commenced.
Leasable raised floor. The Company defines leasable raised floor as the amount of raised floor square footage that the Company has leased plus the available capacity of raised floor square footage that is in a leasable format as of a particular date and according to a particular product configuration. The amount of leasable raised floor may change even without completion of new redevelopment projects due to changes in the Company’s configuration of C1, C2 and C3 product space.
Basis-of-design floor space. The Company defines basis-of-design floor space as the total data center raised floor potential of its existing data center facilities.
| | |
| 21 QTS Q4 Earnings 2013 | | Contact: IR@qtsdatacenters.com |
Operating NRSF. Represents the total square feet of a building that is currently leased or available for lease plus developed supporting infrastructure, based on engineering drawings and estimates, but does not include space held for redevelopment or space used for the Company’s own office space.
The Company. Refers to QTS Realty Trust, Inc., a Maryland corporation, together with its consolidated subsidiaries, including QualityTech, LP.
Historical Predecessor. Refers to QualityTech, LP, our operating partnership.
FFO, Operating FFO and Adjusted Operating FFO
The Company considers funds from operations, or FFO, to be a supplemental measure of its performance which should be considered along with, but not as an alternative to, net income (loss) and cash provided by operating activities as a measure of operating performance and liquidity. The Company calculates FFO in accordance with the standards established by the National Association of Real Estate Investment Trusts, or NAREIT. FFO represents net income (loss) (computed in accordance with GAAP), adjusted to exclude gains (or losses) from sales of property, real estate related depreciation and amortization and similar adjustments for unconsolidated partnerships and joint ventures. The Company’s management uses FFO as a supplemental performance measure because, in excluding real estate related depreciation and amortization and gains and losses from property dispositions, it provides a performance measure that, when compared year over year, captures trends in occupancy rates, rental rates and operating costs.
Due to the volatility and nature of certain significant charges and gains recorded in the Company’s operating results that management believes are not reflective of its core operating performance and liquidity, management computes an adjusted measure of FFO, which the Company refers to as Operating FFO. The Company generally calculates Operating FFO as FFO excluding certain non-recurring and often non-cash charges and gains and losses that management believes are not indicative of the results of the Company’s operating real estate portfolio. The Company believes that Operating FFO provides investors with another financial measure that may facilitate comparisons of operating performance and liquidity between periods and, to the extent they calculate Operating FFO on a comparable basis, between REITs.
Adjusted Operating Funds From Operations “Adjusted Operating FFO” is a non-GAAP measure that is used as a supplemental operating measure specifically for comparing year over year ability to fund dividend distribution from operating activities. Adjusted Operating FFO is used by the Company as a basis to address cash flow and its ability to fund its dividend payments. The Company calculates Adjusted Operating FFO by adding or subtracting from Operating FFO items such as: maintenance capital investment, paid leasing commissions, amortization of deferred financing costs, non- real estate depreciation, straight line rent adjustments, and non-cash compensation.
The Company offers these measures because it recognizes that FFO, Operating FFO and Adjusted Operating FFO will be used by investors as a basis to compare its operating performance and liquidity with that of other REITs. However, because FFO, Operating FFO and Adjusted Operating FFO exclude real estate depreciation and amortization and capture neither the changes in the value of the Company’s properties that result from use or market conditions, nor the level of capital expenditures and capitalized leasing commissions necessary to maintain the operating performance
| | |
| 22 QTS Q4 Earnings 2013 | | Contact: IR@qtsdatacenters.com |
of its properties, all of which have real economic effect and could materially impact its financial condition, cash flows and results of operations, the utility of FFO, Operating FFO and Adjusted Operating FFO as measures of its operating performance and liquidity is limited. The Company’s calculation of FFO may not be comparable to measures calculated by other companies who do not use the NAREIT definition of FFO or do not calculate FFO in accordance with NAREIT guidance. In addition, the Company’s calculations of FFO, Operating FFO and Adjusted Operating FFO are not necessarily comparable to FFO, Operating FFO and Adjusted Operating FFO as calculated by other REITs that do not use the same definition or implementation guidelines or interpret the standards differently from us. FFO, Operating FFO and Adjusted Operating FFO are non-GAAP measures and should not be considered a measure of the Company’s results of operations or liquidity or as a substitute for, or an alternative to, net income (loss), cash provided by operating activities or any other performance measure determined in accordance with GAAP, nor is it indicative of funds available to fund its cash needs, including our ability to make distributions to our stockholders.
| | | | | | | | | | | | | | | | | | | | |
| | | Three Months Ended | | | Year Ended | |
| | | December 31, | | | September 30, | | | December 31, | | | December 31, | |
| | | 2013 | | | 2013 | | | 2012 | | | 2013 | | | 2012 | |
FFO | | | | | | | | | | | | | | | | | | | | |
Net income (loss) | | $ | 4,447 | | | $ | 2,709 | | | $ | (1,608 | ) | | $ | 3,850 | | | $ | (9,767 | ) |
Real estate depreciation and amortizaton | | | 11,766 | | | | 10,731 | | | | 7,972 | | | | 42,114 | | | | 30,968 | |
Gain on sale of real estate | | | — | | | | — | | | | — | | | | — | | | | (948 | ) |
| | | | | | | | | | | | | | | | | | | | |
FFO | | | 16,213 | | | | 13,440 | | | | 6,364 | | | | 45,964 | | | | 20,253 | |
| | | | | | | | | | | | | | | | | | | | |
Restructuring charge | | | — | | | | — | | | | — | | | | — | | | | 3,291 | |
Write off of unamortized deferred finance costs | | | 153 | | | | — | | | | — | | | | 3,430 | | | | 1,434 | |
Transaction costs | | | 66 | | | | — | | | | 493 | | | | 118 | | | | 897 | |
Unrealized gain on derivatives | | | — | | | | — | | | | — | | | | — | | | | (307 | ) |
| | | | | | | | | | | | | | | | | | | | |
Operating FFO* | | | 16,432 | | | | 13,440 | | | | 6,857 | | | | 49,512 | | | | 25,568 | |
| | | | | | | | | | | | | | | | | | | | |
Maintenance Capex | | | (298 | ) | | | (492 | ) | | | (1,011 | ) | | | (2,538 | ) | | | (1,725 | ) |
Leasing Commissions paid | | | (2,407 | ) | | | (2,374 | ) | | | (1,579 | ) | | | (9,296 | ) | | | (6,856 | ) |
Amortization of deferred financing costs | | | 582 | | | | 588 | | | | 803 | | | | 2,775 | | | | 3,370 | |
Non real estate depreciation and amortizaton | | | 1,395 | | | | 1,406 | | | | 1,664 | | | | 5,244 | | | | 3,965 | |
Straight line rent revenue | | | (149 | ) | | | (229 | ) | | | 35 | | | | (577 | ) | | | 14 | |
Straight line rent expense | | | 82 | | | | 83 | | | | 77 | | | | 328 | | | | 319 | |
Equity-based compensation expense | | | 655 | | | | 510 | | | | 71 | | | | 1,960 | | | | 412 | |
| | | | | | | | | | | | | | | | | | | | |
Adjusted Operating FFO* | | $ | 16,292 | | | $ | 12,932 | | | $ | 6,917 | | | $ | 47,408 | | | $ | 25,067 | |
| | | | | | | | | | | | | | | | | | | | |
| * | The Company’s calculations of Operating FFO and Adjusted Operating FFO may not be comparable to Operating FFO and Adjusted Operating FFO as calculated by other REITs that do not use the same definition. |
Monthly Recurring Revenue (MRR)
The Company calculates MRR as monthly contractual revenue under signed leases as of a particular date, which includes revenue from its C1, C2 and C3 rental and cloud and managed services
| | |
| 23 QTS Q4 Earnings 2013 | | Contact: IR@qtsdatacenters.com |
activities, but excludes customer recoveries, deferred set-up fees, variable related revenues, non-cash revenues and other one-time revenues. MRR does not include the impact from booked-not-billed leases as of a particular date, unless otherwise specifically noted.
Separately, the Company calculates recognized MRR as the recurring revenue recognized during a given period, which includes revenue from its C1, C2 and C3 rental and cloud and managed services activities, but excludes customer recoveries, deferred set-up fees, variable related revenues, non-cash revenues and other one-time revenues.
Management uses MRR and recognized MRR as supplemental performance measures because they provide useful measures of increases in contractual revenue from the Company’s customer leases. MRR and recognized MRR should not be viewed by investors as alternatives to actual monthly revenue, as determined in accordance with GAAP. Other companies may not calculate MRR or recognized MRR in the same manner. Accordingly, the Company’s MRR and recognized MRR may not be comparable to other companies’ MRR and recognized MRR. MRR and recognized MRR should be considered only as supplements to total revenues as a measure of its performance. MRR and recognized MRR should not be used as measures of the Company’s results of operations or liquidity, nor is it indicative of funds available to meet its cash needs, including its ability to make distributions to its stockholders.
| | | | | | | | | | | | | | | | | | | | |
| | | Three Months Ended | | | Year Ended | |
| | | December 31, | | | September 30, | | | December 31, | | | December 31, | |
| | | 2013 | | | 2013 | | | 2012 | | | 2013 | | | 2012 | |
Recognized MRR in the period | | | | | | | | | | | | | | | | | | | | |
Total period revenues (GAAP basis) | | $ | 47,429 | | | $ | 46,020 | | | $ | 38,173 | | | $ | 177,887 | | | $ | 145,759 | |
Less: Total period recoveries | | | (3,173 | ) | | | (3,603 | ) | | | (2,509 | ) | | | (13,098 | ) | | | (9,294 | ) |
Total period deferred setup fees | | | (1,228 | ) | | | (1,263 | ) | | | (1,290 | ) | | | (4,678 | ) | | | (4,317 | ) |
Total period other | | | (1,147 | ) | | | (1,240 | ) | | | (1,365 | ) | | | (4,532 | ) | | | (3,615 | ) |
| | | | | | | | | | | | | | | | | | | | |
Recognized MRR in the period | | | 41,881 | | | | 39,914 | | | | 33,009 | | | | 155,579 | | | | 128,533 | |
| | | | | |
MRR at period end | | | | | | | | | | | | | | | | | | | | |
Total period revenues (GAAP basis) | | $ | 47,429 | | | $ | 46,020 | | | $ | 38,173 | | | $ | 177,887 | | | $ | 145,759 | |
Less: Total revenues excluding last month | | | (31,212 | ) | | | (30,448 | ) | | | (24,752 | ) | | | (161,670 | ) | | | (132,338 | ) |
| | | | | | | | | | | | | | | | | | | | |
Total revenues for last month of period | | | 16,217 | | | | 15,572 | | | | 13,421 | | | | 16,217 | | | | 13,421 | |
Less: Last month recoveries | | | (1,240 | ) | | | (1,219 | ) | | | (879 | ) | | | (1,240 | ) | | | (879 | ) |
Last month deferred setup fees | | | (370 | ) | | | (427 | ) | | | (441 | ) | | | (370 | ) | | | (441 | ) |
Last month other | | | (469 | ) | | | (127 | ) | | | (244 | ) | | | (469 | ) | | | (244 | ) |
| | | | | | | | | | | | | | | | | | | | |
MRR at period end | | $ | 14,138 | | | $ | 13,799 | | | $ | 11,857 | | | $ | 14,138 | | | $ | 11,857 | |
| | | | | | | | | | | | | | | | | | | | |
Earnings Before Interest, Taxes, Depreciation and Amortization (EBITDA) and Adjusted EBITDA
The Company calculates EBITDA as net income (loss) adjusted to exclude interest expense and interest income, provision for income taxes (including income taxes applicable to sale of assets) and depreciation and amortization. Management believes that EBITDA is useful to investors in evaluating and facilitating comparisons of the Company’s operating performance between periods and between REITs by removing the impact of its capital structure (primarily interest expense) and asset base charges (primarily depreciation and amortization) from its operating results.
| | |
| 24 QTS Q4 Earnings 2013 | | Contact: IR@qtsdatacenters.com |
In addition to EBITDA, the Company calculates an adjusted measure of EBITDA, which it refers to as Adjusted EBITDA, as EBITDA excluding unamortized deferred financing costs, gains on extinguishment of debt, transaction costs, equity-based compensation expense, restructuring charge, gain (loss) on legal settlement and gain on sale of real estate. The Company believes that Adjusted EBITDA provides investors with another financial measure that can facilitate comparisons of operating performance between periods and between REITs.
Management uses EBITDA and Adjusted EBITDA as supplemental performance measures as they provide useful measures of assessing the Company’s operating results. Other companies may not calculate EBITDA or Adjusted EBITDA in the same manner. Accordingly, the Company’s EBITDA and Adjusted EBITDA may not be comparable to others. EBITDA and Adjusted EBITDA should be considered only as supplements to net income (loss) as measures of the Company’s performance and should not be used as substitutes for net income (loss), as measures of its results of operations or liquidity or as an indications of funds available to meet our cash needs, including our ability to make distributions to our stockholders.
| | | | | | | | | | | | | | | | | | | | |
| | | Three Months Ended | | | Year Ended | |
| | | December 31, | | | September 30, | | | December 31, | | | December 31, | |
| | | 2013 | | | 2013 | | | 2012 | | | 2013 | | | 2012 | |
EBITDA and Adjusted EBITDA | | | | | | | | | | | | | | | | | | | | |
Net income (loss) | | $ | 4,447 | | | $ | 2,709 | | | $ | (1,608 | ) | | $ | 3,850 | | | $ | (9,767 | ) |
Interest expense | | | 2,747 | | | | 4,343 | | | | 6,101 | | | | 18,724 | | | | 25,140 | |
Interest income | | | (1 | ) | | | (4 | ) | | | (7 | ) | | | (18 | ) | | | (61 | ) |
Depreciation and amortization | | | 13,161 | | | | 12,136 | | | | 9,636 | | | | 47,358 | | | | 34,932 | |
| | | | | | | | | | | | | | | | | | | | |
EBITDA | | | 20,354 | | | | 19,184 | | | | 14,122 | | | | 69,914 | | | | 50,244 | |
| | | | | | | | | | | | | | | | | | | | |
Write off of unamortized deferred finance costs | | | 153 | | | | — | | | | — | | | | 3,430 | | | | 1,434 | |
Equity-based compensation expense | | | 655 | | | | 510 | | | | 71 | | | | 1,960 | | | | 412 | |
Transaction costs | | | 66 | | | | — | | | | 493 | | | | 118 | | | | 897 | |
Gain on sale of real estate | | | — | | | | — | | | | — | | | | — | | | | (948 | ) |
Restructuring charge | | | — | | | | — | | | | — | | | | — | | | | 3,291 | |
| | | | | | | | | | | | | | | | | | | | |
Adjusted EBITDA | | $ | 21,228 | | | $ | 19,694 | | | $ | 14,686 | | | $ | 75,422 | | | $ | 55,330 | |
| | | | | | | | | | | | | | | | | | | | |
Net Operating Income (NOI)
The Company calculates net operating income, or NOI, as net income (loss), excluding: interest expense, interest income, depreciation and amortization, write off of unamortized deferred financing costs, gain on extinguishment of debt, transaction costs, gain on legal settlement, gain on sale of real
| | |
| 25 QTS Q4 Earnings 2013 | | Contact: IR@qtsdatacenters.com |
estate, restructuring charge and general and administrative expenses. The Company believes that NOI is another metric that is often utilized to evaluate returns on operating real estate from period to period and also, in part, to assess the value of the operating real estate. A reconciliation of net income (loss) to NOI is presented below:
| | | | | | | | | | | | | | | | | | | | |
| | | Three Months Ended | | | Year Ended | |
| | | December 31, | | | September 30, | | | December 31, | | | December 31, | |
| | | 2013 | | | 2013 | | | 2012 | | | 2013 | | | 2012 | |
Net Operating Income (NOI) | | | | | | | | | | | | | | | | | | | | |
Net income (loss) | | $ | 4,447 | | | $ | 2,709 | | | $ | (1,608 | ) | | $ | 3,850 | | | $ | (9,767 | ) |
Interest expense | | | 2,747 | | | | 4,343 | | | | 6,101 | | | | 18,724 | | | | 25,140 | |
Interest income | | | (1 | ) | | | (4 | ) | | | (7 | ) | | | (18 | ) | | | (61 | ) |
Depreciation and amortization | | | 13,161 | | | | 12,136 | | | | 9,636 | | | | 47,358 | | | | 34,932 | |
Write off of unamortized deferred finance costs | | | 153 | | | | — | | | | — | | | | 3,430 | | | | 1,434 | |
Transaction costs | | | 66 | | | | — | | | | 493 | | | | 118 | | | | 897 | |
Gain on sale of real estate | | | — | | | | — | | | | — | | | | — | | | | (948 | ) |
Restructuring charge | | | — | | | | — | | | | — | | | | — | | | | 3,291 | |
General and administrative expenses | | | 9,848 | | | | 10,097 | | | | 10,127 | | | | 39,183 | | | | 35,986 | |
| | | | | | | | | | | | | | | | | | | | |
NOI | | $ | 30,421 | | | $ | 29,281 | | | $ | 24,742 | | | $ | 112,645 | | | $ | 90,904 | |
| | | | | | | | | | | | | | | | | | | | |
Breakdown of NOI by facility: | | | | | | | | | | | | | | | | | | | | |
Atlanta-Metro data center | | $ | 13,654 | | | $ | 13,740 | | | $ | 11,967 | | | $ | 52,393 | | | $ | 42,787 | |
Atlanta-Suwanee data center | | | 8,210 | | | | 7,517 | | | | 6,853 | | | | 29,155 | | | | 30,471 | |
Santa Clara data center | | | 2,640 | | | | 2,801 | | | | 3,131 | | | | 10,939 | | | | 11,183 | |
Richmond data center | | | 2,780 | | | | 2,859 | | | | 2,180 | | | | 10,318 | | | | 6,094 | |
Sacramento data center (1) | | | 2,061 | | | | 1,752 | | | | 240 | | | | 7,699 | | | | 240 | |
Other data centers | | | 1,076 | | | | 612 | | | | 371 | | | | 2,141 | | | | 129 | |
| | | | | | | | | | | | | | | | | | | | |
NOI | | $ | 30,421 | | | $ | 29,281 | | | $ | 24,742 | | | $ | 112,645 | | | $ | 90,904 | |
| | | | | | | | | | | | | | | | | | | | |
| (1) | Facility was acquired in December 2012. |
| | |
| 26 QTS Q4 Earnings 2013 | | Contact: IR@qtsdatacenters.com |