Table of Contents
UNITED STATES
SECURITIES AND EXCHANGE COMMISSION
Washington, D.C. 20549
FORM N-CSR
CERTIFIED SHAREHOLDER REPORT OF REGISTERED
MANAGEMENT INVESTMENT COMPANIES
Investment Company Act file number(s) 811-22845
Barings Funds Trust
(Exact Name of Registrant as Specified in Charter)
300 South Tryon Street
Suite 2500
Charlotte, NC 28202
(Address of Principal Executive Offices)
Registrant’s telephone number, including area code: (704) 805-7200
Corporation Service Company (CSC)
251 Little Falls Drive
Wilmington DE 19808
United States
(Name and Address of Agent for Service)
Date of fiscal year end: June 30
Date of reporting period: December 31, 2020
Table of Contents
| Item 1. | Reports to Stockholders. |
| (a) | The Semi-Annual Report to Shareholders is attached hereto. |
Table of Contents

BARINGS FUNDS TRUST
Semi-Annual Report
December 31, 2020
Table of Contents
BFT Service Providers
ADVISER
Barings LLC
300 South Tryon Street
Suite 2500
Charlotte, NC 28202
SUB-ADVISER
Barings International Investments Limited
20 Old Bailey
London, UK
EC4M 7BF
COUNSEL TO THE TRUST
Ropes & Gray LLP
Prudential Tower
800 Boylston Street
Boston, MA 02110
INDEPENDENT REGISTERED PUBLIC ACCOUNTING FIRM
Deloitte & Touche LLP
30 Rockefeller Plaza
New York, NY
10112-0015
CUSTODIAN
State Street Bank & Trust Company
One Lincoln Street
Boston, MA 02111
TRANSFER AGENT AND REGISTRAR
ALPS Fund Services, Inc.
1290 Broadway
Suite 1100
Denver, CO 80203
FUND ADMINISTRATION / ACCOUNTING
State Street Bank &Trust Company
One Lincoln Street
Boston, MA 02111
FUND DISTRIBUTOR
ALPS Distributors, Inc.
1290 Broadway
Suite 1100
Denver, CO 80203
BLUE SKY ADMINISTRATION
DST Asset Manager Solutions, Inc.
2000 Crown Colony Drive
Quincy, MA 02169
PROXY VOTING POLICIES & PROCEDURES
The Trustees of Barings Funds Trust (the “Trust”) have delegated proxy voting responsibilities relating to the voting of securities held by the Trust to Barings LLC (“Barings”). A description of Barings’ proxy voting policies and procedures is available (1) without charge, upon request, by calling, toll-free 1-877-766-0014; (2) on the Trust’s website at http://www.Barings.com; and (3) on the U.S. Securities and Exchange Commission’s (“SEC”) website at http://www.sec.gov.
QUARTERLY PORTFOLIO HOLDINGS
The funds in the Trust file their complete schedules of portfolio holdings with the SEC for the first and third quarters of each fiscal year as an attachment to Form N-PORT. The funds’ Form N-PORT are available on the SEC’s website at http://www.sec.gov. A complete schedule of portfolio holdings as of each quarter-end is available on the Trust’s website at http://www.Barings.com or upon request by calling, toll-free, 1-877-766-0014.
ALPS Distributors, Inc. is the distributor for the Barings mutual funds. ALPS and Barings are separate and unaffiliated.
Table of Contents

Daniel McGee
President,
Barings Funds Trust
Barings Funds Trust
Barings Global Floating Rate Fund
Barings Global Credit Income Opportunities Fund
Barings Active Short Duration Bond Fund
Barings Diversified Income Fund
Barings Emerging Markets Debt Blended Total Return Fund
Barings Global Emerging Markets Equity Fund
Barings U.S. High Yield Fund
Dear Shareholder,
Thank you for your continued trust and partnership in 2020. We hope that you and your families are staying healthy and safe.
2020 was certainly a year unlike anything we’ve seen. Ending one of the longest expansions on record, the global economy suffered the most severe shock in recent history – followed by a synchronized government response that exceeded most expectations. With news of the vaccine and its subsequent rollout, global growth forecasts have risen and the economic trajectory appears to be improving, although we expect that the timing and scope of the recovery will surely be uneven.
Looking ahead to the next several months, we see both tailwinds and headwinds for the global economy and capital markets. On the positive side, financial markets have continued to rebound. From high yield and investment grade credit to emerging markets debt, fixed income asset classes ended 2020 largely in positive territory, a notable milestone given the steep and widespread decline at the onset of the pandemic. Equity markets continue to trade at elevated valuations, even amid the more recent gyrations in stock and options prices. Thanks in large part to substantial central bank support, many companies now appear to have sufficient liquidity to manage near-term challenges – whether coming from further lockdowns, uncertainty around the vaccine or macro/political factors.
From a bottom-up perspective, we believe there is still attractive value to be found across both developed and emerging markets, particularly in today’s low-rate and low-yielding environment. However, selectivity has become increasingly paramount to identifying resilient issuers that can withstand short-term volatility and potentially offer attractive upside as the economy continues to improve. As active managers, we believe we are well-positioned to provide access to the evolving relative value opportunities and capture the upside as the market recovers.
Throughout the ups and downs of economic cycles, and through periods of volatility and risk, we remain focused on delivering you, our shareholders, strong risk-adjusted returns. Our mutual fund platform offers a wide range of institutional-quality investment vehicles across fixed income and equity, and through a focus on rigorous, fundamental analysis, aims to provide innovative solutions for achieving diversification as well as long-term capital growth.
On behalf of the entire Barings team, we thank you for your trust and partnership and look forward to helping you achieve your investment objectives.
Sincerely,

Daniel McGee
President
The statements and opinions expressed are those of the author as of the date of this report. All information is historical and not indicative of future results and subject to change. This information is not a recommendation to buy or sell any security.
Table of Contents
Barings Global Floating Rate Fund 2020 Semi-Annual Report
Investment Objective
Barings Global Floating Rate Fund (“Global Floating Rate Fund” or the “Fund”) seeks a high level of current income. Preservation of capital is a secondary goal.
Portfolio Management Commentary
How did the Fund perform?
| ∎ | The Fund reported a net total rate of return for the six-month reporting period from July 1, 2020 through December 31, 2020 of 9.44%, outperforming the Credit Suisse Global Loan Benchmark (the “Benchmark”), which returned 7.71%.1,6 |
What factors influenced performance of the Fund?
| ∎ | Trading levels in the global loan market continued to recover from the drawdown in March 2020 as investor sentiment improved. Fund and Benchmark monthly total returns were positive in each month during the period. |
| ∎ | Credit selection within industry sectors (based on the Benchmark’s industry sectors) was the primary driver of Fund outperformance during the period. While outperformance by Fund holdings relative to the Benchmark holdings occurred across a range of industry sectors, top performing industry sectors included the financial and healthcare sectors. |
| ∎ | Positioning across rating categories also had a positive impact on Fund performance relative to the Benchmark. Lower rated credits across the market outperformed during the period. Therefore, the Fund’s underweight exposure relative to the Benchmark of double-B rated loans and overweight exposure to loans rated single-B and lower provided a positive impact to attribution results. |
| ∎ | From a regional perspective, the Fund’s allocations between the North American and European markets did not have a material impact on performance. Fund holdings in both regions outperformed Benchmark holdings in each region. |
| ∎ | Given the positive performance across the global loan market, the Fund’s exposure to cash (for which the average weight during the period was approximately 6%) was a detractor from relative results as the Benchmark is not exposed to cash. |
Describe recent portfolio activity.
| ∎ | During the period, there were not strategic shifts made to the exposure between the North American and European loan markets. The focus of portfolio management activity was on individual credit decisions. |
| ∎ | The Fund’s exposure to double-B rated credits modestly declined during the period and the exposure to credits rated single-B or triple-C modestly increased. This was a function of market value appreciation and individual credit decisions rather than a strategic shift. |
| ∎ | There was not a change in the order of the Fund’s top three industry exposures (based on Moody’s industries) during the period, which were the healthcare/education/childcare, diversified/conglomerate service and leisure/amusement/entertainment sectors. The Fund’s exposure to the diversified/conglomerate service sector modestly decreased during the period whereas exposure to the other two sectors modestly increased. Similar to positioning by rating category, this was a function of market value appreciation and individual credit decisions rather than a strategic shift. |
| 1. | Total return describes the return to an investor of Class Y shares and includes the reinvestment of dividends and capital gains. Past performance is no guarantee of future results and investment returns and the net asset value (NAV) of shares of the Fund will fluctuate so that shares, when redeemed, may be worth more or less than their original cost. Current performance may be higher or lower than performance quoted. Call 1.855.439.5459 or visit barings.com for current month end performance. All returns 1-year or less are cumulative. |
| 6. | Benchmark A: The Credit Suisse Global Loan Benchmark is a market capitalization weighted average of the Credit Suisse Leveraged Loan Index and the Credit Suisse Western European Leveraged Loan Index. The Credit Suisse Leveraged Loan Index is designed to mirror the investable universe of the U.S. dollar-denominated leveraged loan market. The Credit Suisse Western European Leveraged Loan Index is designed to mirror the investable universe of the Western European leveraged loan market, with loans denominated in U.S. and Western European currencies. Indices are unmanaged. It is not possible to invest directly in an index. |
2
Table of Contents
Barings Global Floating Rate Fund 2020 Semi-Annual Report
Describe portfolio positioning at period end.
| ∎ | The Fund finished the reporting period with 87.2% allocated to global senior secured loans, 5.3% to global senior secured high yield bonds, and 6.8% to cash. |
| ∎ | From an industry perspective (based on Moody’s industries), the Fund remained well diversified across a number of sectors, with concentrations in healthcare/education/childcare (14.8%), diversified/conglomerate services (9.9%), and leisure/amusement/entertainment (8.8%) as of December 31, 2020. |
| ∎ | As of December 31, 2020, the Fund had the following credit quality breakdown: 0.8% in triple-B assets, 12.9% in double-B assets, 64.1% in single-B assets, and 12.2% in triple-C and below assets. Approximately 3.3% of the Fund’s assets are non-publicly rated. Cash and accrued income accounted for the remaining 6.8% of the portfolio assets.2 |
| ∎ | The top five countries in the portfolio at the end of the reporting period were the U.S. (66.6%), Germany (8.1%), the UK (8.0%), Spain (2.6%) and France (2.6%). Overall, the Fund had exposure to 15 different countries and we continue to focus on building a well-diversified portfolio of global floating rate securities. |
Describe market and portfolio outlook.
| ∎ | While high yield credit markets have bounced back significantly since the troughs of the pandemic, we believe the market continues to offer upside potential, particularly in today’s low-rate and low-yielding environment. Additionally, as demand has improved for the bank loan asset class recently, we believe this will provide a supportive tailwind for the asset class heading into 2021. |
| ∎ | Given the focus of borrowers on maintaining liquidity, we believe defaults may compress as we move throughout 2021 and credit spreads are fairly compensating investors based on the expectations for defaults. |
| ∎ | However, there remains an element of uncertainty in the markets as a result of the global pandemic and therefore we believe credit selection will remain critical in high yield credit markets focused on issuers that can withstand short-term volatility and potentially offer upside as the economy continues to recover. |
| 2. | Ratings shown are the highest rating given by one of the following national rating agencies: S&P, Moody’s or Fitch. Additional information about ratings can be found, respectively, at www.standardandpoors.com, www.moodys.com and www.fitchratings.com. Credit ratings are subject to change. AAA, AA, single-A, and BBB are investment grade ratings categories used by S&P and Fitch; BB, single-B, CCC/CC/C and single-D are below investment grade ratings categories used by S&P and Fitch. Aaa, Aa, single-A and Baa are investment grade ratings categories used by Moody’s; Ba, B, Caa/Ca and single-C are below investment grade ratings categories used by Moody’s. Ratings categories may include gradations within each category. Bonds backed by U.S. Government or agency securities are given an implied rating equal to the rating of such securities. Holdings designated Not Publicly Rated are not rated by these national rating agencies. |
3
Table of Contents
Barings Global Floating Rate Fund 2020 Semi-Annual Report
PORTFOLIO COMPOSITION (% OF ASSETS*)
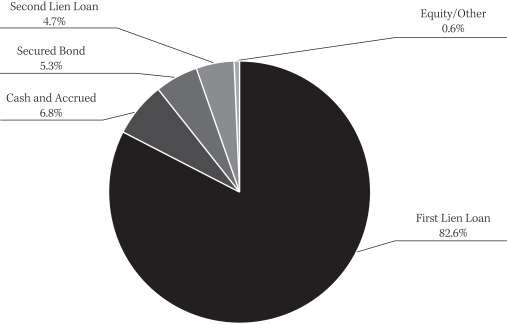
| * | As of December 31, 2020. |
COUNTRY COMPOSITION (% OF ASSETS**)
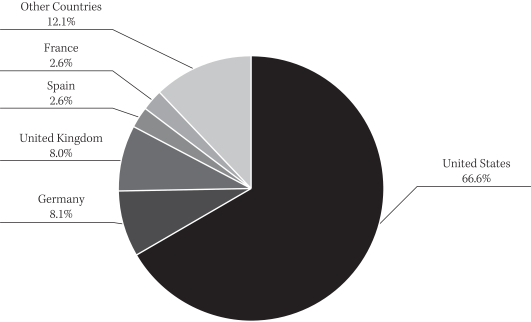
| ** | Percentage of assets are expressed by market value excluding cash and accrued income, and may vary over time. As of December 31, 2020. |
4
Table of Contents
Barings Global Floating Rate Fund 2020 Semi-Annual Report
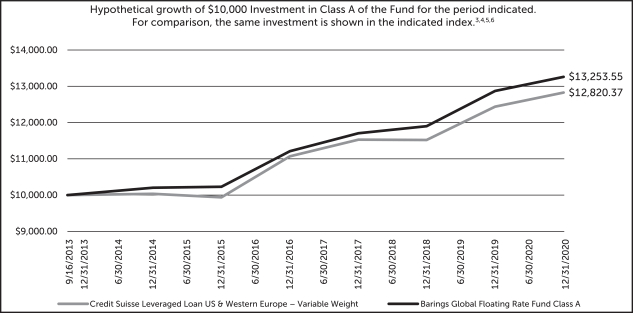
| % AVERAGE ANNUAL TOTAL RETURNS 5,7,8,9 | INCEPTION DATE | ONE YEAR | THREE YEARS | FIVE YEARS | INCEPTION TO DATE | |||||||||||||||
Class A With Load | 09/16/2013 | 0.01 | % | 2.56 | % | 4.58 | % | 3.26 | % | |||||||||||
Class A No Load | 09/16/2013 | 3.10 | % | 3.60 | % | 5.22 | % | 3.69 | % | |||||||||||
Class C With Load | 09/16/2013 | 1.34 | % | 2.84 | % | 4.44 | % | 2.93 | % | |||||||||||
Class C No Load | 09/16/2013 | 2.33 | % | 2.84 | % | 4.44 | % | 2.93 | % | |||||||||||
Class I With Load | 09/16/2013 | 3.36 | % | 3.90 | % | 5.51 | % | 3.99 | % | |||||||||||
Class I No Load | 09/16/2013 | 3.36 | % | 3.90 | % | 5.51 | % | 3.99 | % | |||||||||||
Class Y With Load | 09/16/2013 | 3.36 | % | 3.87 | % | 5.49 | % | 3.96 | % | |||||||||||
Class Y No Load | 09/16/2013 | 3.36 | % | 3.87 | % | 5.49 | % | 3.96 | % | |||||||||||
| 3. | Duration is a measure of the sensitivity of the price — the value of principal — of a fixed-income investment to a change in interest rates. Duration is expressed as a number of years. Bond prices are said to have an inverse relationship with interest rates. Therefore, rising interest rates indicate bond prices are likely to fall, while declining interest rates indicate bond prices are likely to rise. |
| 4. | Inception date: September 16, 2013. |
| 5. | Class A performance with the sales charges includes the maximum 3.00% sales charge. |
| 6. | Benchmark A: The Credit Suisse Global Loan Benchmark is a market capitalization weighted average of the Credit Suisse Leveraged Loan Index and the Credit Suisse Western European Leveraged Loan Index. The Credit Suisse Leveraged Loan Index is designed to mirror the investable universe of the U.S. dollar-denominated leveraged loan market. The Credit Suisse Western European Leveraged Loan Index is designed to mirror the investable universe of the Western European leveraged loan market, with loans denominated in U.S. and Western European currencies. Indices are unmanaged. It is not possible to invest directly in an index. |
| 7. | Line graph and table do not reflect the deduction of taxes that a shareholder would pay. |
| 8. | Class C performance with the sales charges includes the 1.00% contingent deferred sales charge (CDSC) for returns of one year or less. |
| 9. | Total return includes the reinvestment of dividends and capital gains. Past performance is no guarantee of future results and investment returns and the net asset value (NAV) of shares of the Fund will fluctuate so that shares, when redeemed, may be worth more or less than their original cost. Current performance may be higher or lower than performance quoted. Call 1.855.439.5459 or visit barings.com for current month end performance. All returns 1-year or less are cumulative. |
5
Table of Contents
Barings Global Credit Income Opportunities Fund 2020 Semi-Annual Report
Investment Objective
Barings Global Credit Income Opportunities Fund (“Global Credit Income Opportunities Fund” or the “Fund”) seeks an absolute return, primarily through current income and secondarily through capital appreciation.
Portfolio Management Commentary
How did the Fund perform?
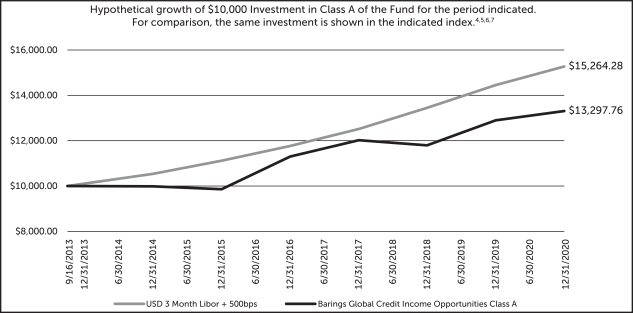
| ∎ | The Fund reported a net total rate of return for the six-month reporting period from July 1, 2020 through December 31, 2020 of 11.00%, outperforming the 3 Month USD LIBOR +500 basis points (bps)1 benchmark, which returned 2.61%.2,6 |
What factors influenced performance of the Fund?
| ∎ | Improvement in investor sentiment throughout the reporting period resulted in material improvement in trading levels across global high yield credit markets and was the primary driver of the Fund’s outperformance relative to the benchmark. |
| ∎ | For the core asset classes, the Fund’s high yield bond holdings outperformed its senior secured loan holdings during the period with more outperformance in the latter portion of the period. However, both asset classes provided a positive contribution to the Fund’s total return. |
| ∎ | During the period, the Fund’s holdings across regions contributed positively to the Fund’s return. |
| ∎ | From a ratings category perspective, as the recovery in trading levels improved across ratings categories it had a positive impact to the Fund’s total return. |
| ∎ | For the opportunistic asset classes, the Fund’s collateralized loan obligation (CLO) holdings generated a strong positive return and contributed positively to the Fund’s total return for the period. |
Describe recent portfolio activity.
| ∎ | During the reporting period, there were limited strategic shifts made to target allocations across asset classes. In the middle of the period, the Fund modestly shifted exposure from North American loans to North American high yield bonds and late in the quarter the Fund modestly increased its exposure to senior secured loans as demand for that asset class improved as the period progressed. The Fund’s focus during the period was on individual credit relative value decisions within asset classes. |
| ∎ | In general, as portfolio exposures build over time, the Fund intends to deploy cash into asset classes which we believe offer the best relative value at that time, and will shift exposure among asset classes as relative value opportunities change. |
| ∎ | There were no strategic shifts made to exposure by rating categories during the period. Modest changes in exposure by ratings category were the result of market value appreciation and individual credit decisions. |
| ∎ | From an industry sector perspective (based on Moody’s industries), the Fund’s exposure to the telecommunications sector increased, moving it into the top three industry exposures and moving the broadcasting and entertainment sector out of the top three. This was a reflection of individual credit decisions rather than a strategic shift. |
| 2. | Total return describes the return to an investor of Class Y shares and includes the reinvestment of dividends and capital gains. Past performance is no guarantee of future results and investment returns and the net asset value (NAV) of shares of the Fund will fluctuate so that shares, when redeemed, may be worth more or less than their original cost. Current performance may be higher or lower than performance quoted. Call 1.855.439.5459 or visit barings.com for current month end performance. All returns 1-year or less are cumulative. |
| 6. | Benchmark: 3-Month USD LIBOR plus 500 bps. The 3-Month USD LIBOR (London Interbank Offered Rate) is an average interest rate, determined by the Intercontinental Exchange, that banks charge one another for the use of short-term money (three months) in England’s Euro dollar market. The return shown includes 3-Month USD LIBOR plus 500 bps, or 5% per annum. LIBOR is unmanaged. It is not possible to invest directly in LIBOR. No assurance can be given that the Fund’s performance will exceed that of LIBOR by any given increment, or at all. |
6
Table of Contents
Barings Global Credit Income Opportunities Fund 2020 Semi-Annual Report
Describe portfolio positioning at period end.
| ∎ | The Fund finished the reporting period with an allocation of 43.7%, 36.4% and 8.4% to global high yield bonds, global senior secured loans and CLOs, respectively. The remainder of the portfolio was invested in equities at 1.0%, special situations at 0.6%, and cash/other at 9.9%. A significant portion of the portfolio (approximately 55.5%) was senior secured in nature (including CLOs backed by secured loans), which can potentially mitigate principal loss in default situations. |
| ∎ | From an industry perspective, the Fund was well diversified across a number of sectors, with concentrations in healthcare, education and childcare (9.2%), telecommunications (6.3%), and diversified/conglomerate services (5.8%) as of December 31, 2020. |
| ∎ | As of December 31, 2020, the Fund had the following credit quality breakdown: 2.7% in triple-B assets, 23.8% in double-B assets, 42.5% in single-B assets and 15.9% in triple-C and below assets. Approximately 5.1% of the Fund’s assets are not publicly rated. Cash and accrued income accounted for the remaining 9.9% of the portfolio assets.3 |
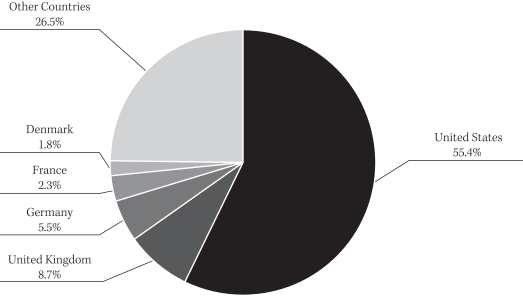
| ∎ | The top five countries in the portfolio at the end of the reporting period were the U.S. (55.4%), the U.K. (8.7%), Germany (5.5%), France (2.3%) and Denmark (1.8%). The Fund’s U.S. allocation included Cayman Islands exposure related to the Fund’s CLO holdings. Overall, the Fund had exposure to 32 different countries, and we continue to focus on building a well-diversified portfolio of global high yield credit. |
Describe market and portfolio outlook.
| ∎ | While high yield credit markets have bounced back significantly since the troughs of the pandemic, we believe the market continues to offer upside potential, particularly in today’s low-rate and low-yielding environment. |
| ∎ | Given the focus of borrowers on maintaining liquidity, we believe defaults may compress as we move throughout 2021 and credit spreads are fairly compensating investors based on the expectations for defaults. |
| ∎ | However, there remains an element of uncertainty in the markets as a result of the global pandemic and therefore we believe credit selection will remain critical in high yield credit markets focused on issuers that can withstand short-term volatility and potentially offer upside as the economy continues to recover. |
| 3. | Ratings shown are the highest rating given by one of the following national rating agencies: S&P, Moody’s or Fitch. Additional information about ratings can be found, respectively, at www.standardandpoors.com, www.moodys.com and www.fitchratings.com. Credit ratings are subject to change. AAA, AA, single-A, and BBB are investment grade ratings categories used by S&P and Fitch; BB, single-B, CCC/CC/C and single-D are below investment grade ratings categories used by S&P and Fitch. Aaa, Aa, single-A and Baa are investment grade ratings categories used by Moody’s; Ba, single-B, Caa/Ca and single-C are below investment grade ratings categories used by Moody’s. Ratings categories may include gradations within each category. Bonds backed by U.S. Government or agency securities are given an implied rating equal to the rating of such securities. Holdings designated “Not Publicly Rated” are not rated by these national rating agencies. |
7
Table of Contents
Barings Global Credit Income Opportunities Fund 2020 Semi-Annual Report
PORTFOLIO COMPOSITION (% OF ASSETS*)
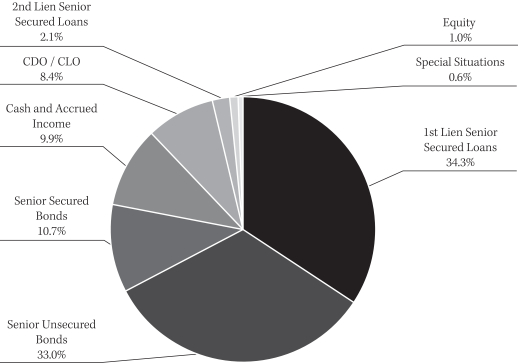
| * | As of December 31, 2020. |
COUNTRY COMPOSITION (% OF ASSETS**)
| ** | Percentage of assets are expressed by market value excluding cash and accrued income, and may vary over time. As of December 31, 2020. |
8
Table of Contents
Barings Global Credit Income Opportunities Fund 2020 Semi-Annual Report
| % AVERAGE ANNUAL TOTAL RETURNS 5,7,8,9 | INCEPTION DATE | ONE YEAR | THREE YEARS | FIVE YEARS | INCEPTION TO DATE | |||||||||||||||
Class A With Load | 09/16/2013 | (0.98 | )% | 2.03 | % | 5.33 | % | 3.91 | % | |||||||||||
Class A No Load | 09/16/2013 | 3.14 | % | 3.43 | % | 6.19 | % | 4.46 | % | |||||||||||
Class C With Load | 09/16/2013 | 1.43 | % | 2.67 | % | 5.40 | % | 3.68 | % | |||||||||||
Class C No Load | 09/16/2013 | 2.41 | % | 2.67 | % | 5.40 | % | 3.68 | % | |||||||||||
Class I With Load | 09/16/2013 | 3.44 | % | 3.70 | % | 6.46 | % | 4.72 | % | |||||||||||
Class I No Load | 09/16/2013 | 3.44 | % | 3.70 | % | 6.46 | % | 4.72 | % | |||||||||||
Class Y With Load | 09/16/2013 | 3.45 | % | 3.70 | % | 6.46 | % | 4.72 | % | |||||||||||
Class Y No Load | 09/16/2013 | 3.45 | % | 3.70 | % | 6.46 | % | 4.72 | % | |||||||||||
| 1. | A unit that is equal to 1/100th of 1% or 0.01%. |
| 4. | Inception date: September 16, 2013. |
| 5. | Class A performance with the sales charges includes the maximum 3.00% sales charge. |
| 6. | Benchmark: 3-Month USD LIBOR plus 500 bps. The 3-Month USD LIBOR (London Interbank Offered Rate) is an average interest rate, determined by the Intercontinental Exchange, that banks charge one another for the use of short-term money (three months) in England’s Euro dollar market. The return shown includes 3-Month USD LIBOR plus 500 bps, or 5% per annum. LIBOR is unmanaged. It is not possible to invest directly in LIBOR. No assurance can be given that the Fund’s performance will exceed that of LIBOR by any given increment, or at all. |
| 7. | Line graph and table do not reflect the deduction of taxes that a shareholder would pay. |
| 8. | Class C performance with the sales charges includes the 1.00% contingent deferred sales charge (CDSC) for returns of one year or less. |
| 9. | Total return includes the reinvestment of dividends and capital gains. Past performance is no guarantee of future results and investment returns and the net asset value (NAV) of shares of the Fund will fluctuate so that shares, when redeemed, may be worth more or less than their original cost. Current performance may be higher or lower than performance quoted. Call 1.855.439.5459 or visit barings.com for current month end performance. All returns 1-year or less are cumulative. |
9
Table of Contents
Barings Active Short Duration Bond Fund 2020 Semi-Annual Report
Investment Objective
Barings Active Short Duration Bond Fund (“Active Short Duration Bond Fund” or the “Fund”) seeks to achieve a high total rate of return, primarily from current income, while minimizing fluctuations in capital values by investing primarily in a diversified portfolio of short-term investment grade fixed income securities.
Portfolio Management Commentary
How did the Fund perform?
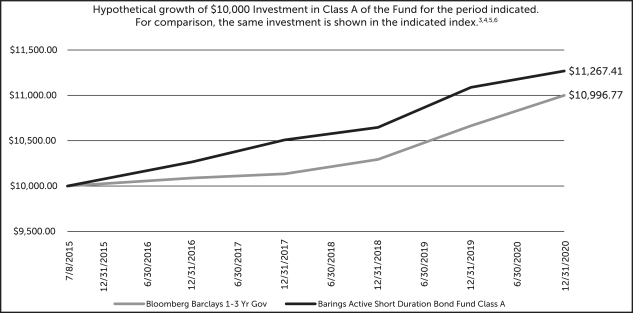
| ∎ | The Fund reported a net total rate of return for the six-month reporting period from July 1, 2020 through December 31, 2020 of 5.05%, outperforming the Bloomberg Barclays U.S. 1-3 Year Government Bond Index (the “Benchmark”), which returned 0.15%.1,5 |
What factors influenced performance of the Fund?
| ∎ | A shorter-duration position contributed positively to performance relative to the Benchmark as front-end rates declined over the period. The Fund uses Treasury bonds and futures to help manage duration. The front end of the Treasury yield curve remained flat between three months and three years as of the end of the period. The U.S. Federal Reserve (Fed) continued its accommodative monetary policy with rates held at a target of 0.00% to 0.25%. The Fund ended the period with a 0.45 year duration in accordance with our rules-based duration management process. |
| ∎ | As of the end of the period, the Fund continued to favor securitized and structured credit over corporate credit, emphasizing the benefit of security packages over unsecured positions. The Fund’s allocation to consumer asset-backed securities (ABS) was a positive contributor to performance over the period. Auto, aviation, container, franchise receivable, student loan, timeshare and personal consumer loan collateral were among the top contributing sectors within the ABS allocation. The market continues to show modest signs of bifurcation between “COVID sensitive” and more “COVID insulated” collateral segments, despite the tide of positive investor risk sentiment lifting most collateral groups. Dealer inventory levels remained low and continued to tick lower in December, while what limited new issue that continued was met with market demand. Secondary trading volumes remained healthy, maintaining adequate liquidity in the ABS market. |
| ∎ | The Fund’s allocation to commercial mortgage-backed securities (CMBS) and residential mortgage-backed securities (RMBS) also contributed to performance over the period. Despite lower than normal issuance over the period, there was still a willingness of issuers to come to market given the strong market demand for yield. |
| ∎ | The 33% allocation to investment grade corporate credit contributed positively to performance as a result of spreads continuing to tighten. If all goes to plan with the vaccine, we believe there is a good chance the economy could meaningfully reopen during the second half of 2021, and the fundamental picture for most corporate issuers could improve accordingly. Corporate leverage, while at all-time highs, has remained lower than initially feared—and a significant portion of the debt that companies have raised is sitting as cash on their balance sheets, meaning net leverage, in particular, has risen less substantially. |
| ∎ | The Fund’s small position in high-quality collateralized loan obligation (CLO) tranches was also a positive contributor as security spreads continued to tighten. The CLO market proved resilient as it was tested by volatility in the first two quarters of the year, which we believe speaks to the resiliency of the CLO structure itself. |
| ∎ | The allocation to BB-rated high yield corporate bonds was a positive contributor to performance, while the Fund’s underweight to Treasuries detracted from relative performance. |
| 1. | Total return describes the return to an investor of Class Y shares and includes the reinvestment of dividends and capital gains. Past performance is no guarantee of future results, and investment returns and the net asset value (NAV) of shares of the Fund will fluctuate so that shares, when redeemed, may be worth more or less than their original cost. Current performance may be higher or lower than performance quoted. Call 1.855.439.5459 or visit barings.com for current month-end performance. All returns one-year or less are cumulative. |
| 5. | Benchmark: The Bloomberg Barclays U.S. 1-3 Year Government Bond Index is comprised of the U.S. Treasury Index and U.S. Agency Index. The U.S. Government Index includes Treasuries (public obligations of the U.S. Treasury) and U.S. agency debentures (publicly issued debt of U.S. government agencies, quasi-federal corporations, and corporate or foreign debt guaranteed by the U.S. government) that have remaining maturities of more than one year, and up to but not including three years. Indexes are unmanaged. It is not possible to invest directly in an index. |
10
Table of Contents
Barings Active Short Duration Bond Fund 2020 Semi-Annual Report
Describe recent portfolio activity.
| ∎ | The Fund ended the period with a duration positioning of 0.45 years, as the front end of the U.S. Treasury curve remained flat. |
| ∎ | The Fund reduced its holdings in ABS, RMBS, and developed market investment grade corporates, while increasing allocations to emerging market corporate and CMBS over the period. The Fund’s high quality CLO, BB-rated high yield corporate, and treasury weightings remained unchanged. |
| ∎ | The Funds allocations to AAA-rated and single-A rated positions decreased, while its allocations to AA and BBB quality positions increased over the reporting period. The Fund’s cash allocation increased over the period. |
Describe portfolio positioning at period end.
| ∎ | The Fund continued to be well diversified across corporate and securitized sectors. The securitized ABS allocation was 27.3% at the end of the period. Automotive loan collateral represented the largest allocation, followed by student loan collateral. Additional commercial and consumer ABS sub-sectors include timeshare, personal consumer loan, aircraft leasing and franchise receivables. The Fund maintained an active position in RMBS and CMBS securities, ending the period at 8.7% and 5.9%, respectively. |
| ∎ | At the end of the period, the Fund’s credit allocation was 42.0%. This allocation was comprised of 32.6% developed market investment grade corporates, 4.2% in BB-rated high yield corporates and 5.2% in U.S. dollar-denominated emerging markets debt (EMD). Banking and diversified industrial holdings represented the Fund’s largest corporate sector allocations, followed by consumer holdings.2 |
| ∎ | High-quality AAA and AA CLO tranches represented a combined 4.8% allocation for the Fund. |
Describe market and portfolio outlook.
| ∎ | Despite the historic events that occurred in 2020, investment grade credit sailed through the fourth quarter to finish the year in strong positive territory, benefitting from lower interest rates as well as a flight to quality amid heightened volatility. |
| ∎ | Investment grade credit delivered both positive and excess returns across multiple markets as investors — thanks to monetary support and the release of COVID vaccines — largely shrugged off concerns around rising COVID cases and the possibility of additional consumer restrictions entering the New Year. |
| ∎ | As we look ahead to the coming months, it is worth reiterating that questions remain around the deployment and acceptance of the vaccines, which we believe will ultimately serve as a catalyst to the momentum and length of this recovery. |
| ∎ | Although we believe there is room for optimism, our view is that we are not necessarily out of the woods yet, as there are many unknowns that face markets in 2021. In this environment, we believe fundamental credit-by-credit selection remains critical, to not only capture upside potential and identify issuers that are equipped to weather near-term challenges, but also to avoid those that may face greater challenges down the road. |
| 2. | Ratings shown are the highest ratings given by one of the following national rating agencies: S&P, Moody’s or Fitch. Additional information about ratings can be found, respectively, at www.standardandpoors.com, www.moodys.com and www.fitchratings.com. Credit ratings are subject to change. AAA, AA, single-A and BBB are investment grade ratings categories used by S&P and Fitch. BB, single-B, CCC/CC/C and single-D are below investment grade ratings categories used by S&P and Fitch. Aaa, Aa, single-A and Baa are investment grade ratings categories used by Moody’s. Ba, single-B, Caa/Ca and single-C are below investment grade ratings categories used by Moody’s. Ratings categories may include gradations within each category. Bonds backed by U.S. government or agency securities are given an implied rating equal to the rating of such securities. Holdings designated Not Publicly Rated are not rated by these national rating agencies. |
11
Table of Contents
Barings Active Short Duration Bond Fund 2020 Semi-Annual Report
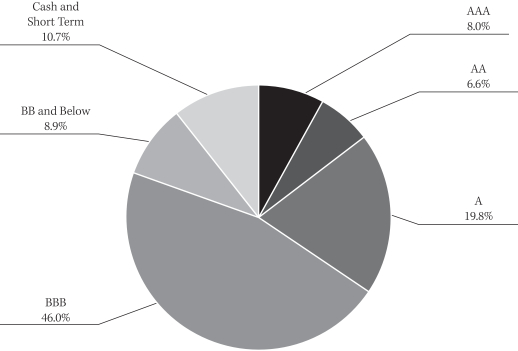
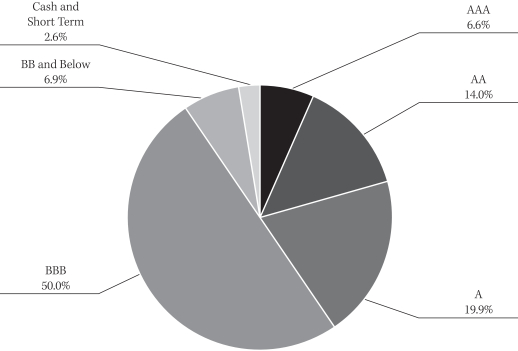
CREDIT QUALITY BREAKDOWN (% OF ASSETS*)
| * | As of December 31, 2020. |
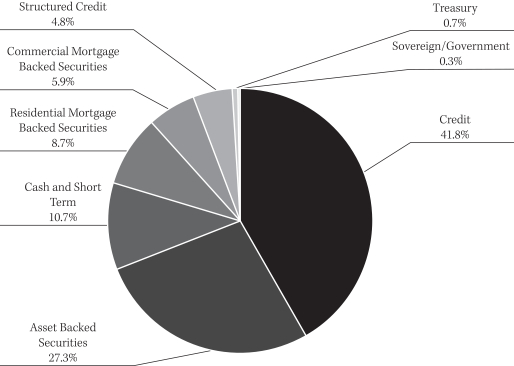
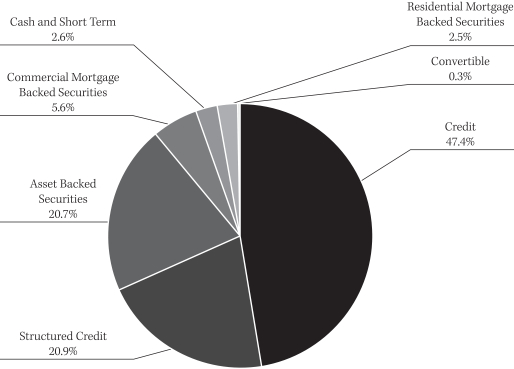
PORTFOLIO COMPOSITION (% OF ASSETS*)
| * | As of December 31, 2020. |
12
Table of Contents
Barings Active Short Duration Bond Fund 2020 Semi-Annual Report
| % AVERAGE ANNUAL TOTAL RETURNS 3,4,6,7,8,9 | INCEPTION DATE | ONE YEAR | THREE YEARS | FIVE YEARS | INCEPTION TO DATE | |||||||||||||||
Class A With Load | 07/08/2015 | 1.63 | % | 2.36 | % | 2.42 | % | 2.01 | % | |||||||||||
Class A No Load | 07/08/2015 | 1.63 | % | 2.36 | % | 2.42 | % | 2.01 | % | |||||||||||
Class C With Load | 07/08/2015 | 0.86 | % | 2.08 | % | 2.20 | % | 1.74 | % | |||||||||||
Class C No Load | 07/08/2015 | 1.36 | % | 2.08 | % | 2.20 | % | 1.74 | % | |||||||||||
Class L With Load | 05/01/2020 | N/A | N/A | N/A | 13.10 | % | ||||||||||||||
Class L No Load | 05/01/2020 | N/A | N/A | N/A | 13.10 | % | ||||||||||||||
Class I With Load | 07/08/2015 | 1.86 | % | 2.61 | % | 2.68 | % | 2.27 | % | |||||||||||
Class I No Load | 07/08/2015 | 1.86 | % | 2.61 | % | 2.68 | % | 2.27 | % | |||||||||||
Class Y With Load | 07/08/2015 | 1.86 | % | 2.61 | % | 2.67 | % | 2.26 | % | |||||||||||
Class Y No Load | 07/08/2015 | 1.86 | % | 2.61 | % | 2.67 | % | 2.26 | % | |||||||||||
| 3. | Inception date: July 8, 2015. |
| 4. | Class A performance with the sales charges includes the maximum 3.00% sales charge. |
| 5. | Benchmark: The Bloomberg Barclays U.S. 1-3 Year Government Bond Index is comprised of the U.S. Treasury Index and U.S. Agency Index. The U.S. Government Index includes Treasuries (public obligations of the U.S. Treasury) and U.S. agency debentures (publicly issued debt of U.S. government agencies, quasi-federal corporations, and corporate or foreign debt guaranteed by the U.S. government) that have remaining maturities of more than one year, and up to but not including three years. Indexes are unmanaged. It is not possible to invest directly in an index. |
| 6. | Line graph and table do not reflect the deduction of taxes that a shareholder would pay. |
| 7. | Class C performance with the sales charges includes the 1.00% contingent deferred sales charge (CDSC) for returns of one year or less. |
| 8. | Class L share class launched effective 05/01/2020. |
| 9. | Total return includes the reinvestment of dividends and capital gains. Past performance is no guarantee of future results, and investment returns and the net asset value (NAV) of shares of the Fund will fluctuate so that shares, when redeemed, may be worth more or less than their original cost. Current performance may be higher or lower than performance quoted. Call 1.855.439.5459 or visit barings.com for current month-end performance. All returns one-year or less are cumulative. |
13
Table of Contents
Barings Diversified Income Fund 2020 Semi-Annual Report
Investment Objective
The Barings Diversified Income Fund (“Diversified Income Fund” or the “Fund”) seeks to provide a total return comprised of current income and capital appreciation by investing primarily in an actively managed diversified portfolio of global investment grade rated fixed and floating rate instruments.
Portfolio Management Commentary
How did the Fund perform?
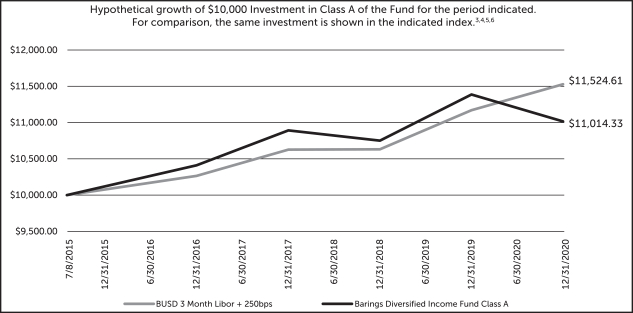
| ∎ | The Fund reported a total net rate of return for the six-month reporting period from July 1, 2020 through December 31, 2020 of 7.90%, outperforming the 3 Month LIBOR +250 basis points (bps) benchmark, which returned 1.37%.1,5 |
What factors influenced performance of the Fund?
| ∎ | High quality collateralized loan obligation (CLO) positioning in AA to BBB-rated tranches contributed positively to performance over the period. The allocation had a high average of AA- quality. The CLO market proved resilient as it was tested by volatility in the first two quarters of the year, which we believe speaks to the resiliency of the CLO structure itself. High quality tranches have seen meaningful spread compression since reaching peak levels in March, and are entering 2021 at tight levels. |
| ∎ | The Fund’s allocations to securitized credit and consumer asset-backed securities (ABS) were both positive contributors to performance. Within the ABS sector, aviation, student loan, and personal consumer loan collateral were among the top performers. Securitized risk assets finished the fourth quarter in positive territory given the continuation of positive technicals that allowed spreads to compress tighter. The market’s risk-on tone brought a majority of market segments tighter amid the backdrop of shrinking dealer balance sheets and lower primary market issuance. We believe the market continues to show signs of bifurcation between “COVID sensitive” and more “COVID insulated” collateral segments, despite the tide of positive investor risk sentiment lifting most collateral groups. |
| ∎ | The Fund’s allocation to commercial mortgage backed securities (CMBS) and residential mortgage backed securities (RMBS) also contributed positively to performance over the period. Dealer inventory levels remained low and continued to tick lower in December, while what limited new issue that continued was met with market demand. Secondary trading volumes remained healthy, maintaining adequate liquidity in the securitized market. |
| ∎ | Investment grade corporate credit across both developed and emerging market geographies contributed positively to performance. Corporate leverage, while at all-time highs, has remained lower than initially feared—and a significant portion of the debt that companies have raised is sitting as cash on their balance sheets, meaning net leverage, in particular, has risen less substantially. Going forward, if companies are prudent, and use the cash on their balance sheets to pay down debt they no longer need, we expect leverage to trend towards more normal levels. |
| ∎ | At the end of the period, the Fund continued to hold an allocation to high yield corporate bonds with a weighted average rating of BB. This allocation was a positive contributor to performance over the period. |
| 1. | Total return describes the return to an investor of Class Y shares and includes the reinvestment of dividends and capital gains. Past performance is no guarantee of future results, and investment returns and the net asset value (NAV) of shares of the Fund will fluctuate so that shares, when redeemed, may be worth more or less than their original cost. Current performance may be higher or lower than performance quoted. Call 1.855.439.5459 or visit barings.com for current month-end performance. All returns one-year or less are cumulative. |
| 5. | Benchmark: 3-Month USD LIBOR plus 250 bps. The 3-Month USD LIBOR (London Interbank Offered Rate) is an average interest rate, determined by the Intercontinental Exchange, that banks charge one another for the use of short-term money (three months) in England’s Euro dollar market. The return shown includes 3-Month USD LIBOR plus 250 bps, or 2.5% per annum. LIBOR is unmanaged. It is not possible to invest directly in LIBOR. No assurance can be given that the Fund’s performance will exceed that of LIBOR by any given increment, or at all. |
14
Table of Contents
Barings Diversified Income Fund 2020 Semi-Annual Report
| ∎ | Duration positioning was a positive contributor to performance, as front-end rates declined over the period. The Fund uses Treasury bonds and futures to help manage duration. At the end of the period, the front end of the Treasury yield curve remained flat between three months and three years. The U.S. Federal Reserve (Fed) continued its accommodative monetary policy with rates held at a target of 0.00% to 0.25%. The Fund ended the period with a 0.49 year duration in accordance with our rules-based duration management process. |
Describe recent portfolio activity.
| ∎ | The Fund reduced its developed market investment grade corporate, CLO, and CMBS allocations, while increasing allocations to hard currency emerging market corporate, high yield corporate, and ABS over the period. |
| ∎ | The Fund’s allocations to AAA and single-A rated positions decreased, while its allocations to AA, BBB, and BB quality positions increased. The Fund’s cash allocation increased 2% over the period. |
Describe portfolio positioning at period end.
| ∎ | Emerging markets debt (EMD) hard currency positioning ended the period at 21.8%. The allocation in the Fund remained well diversified across sectors and regions. The allocation remained diversified across 15 markets with average allocations of 1.5%. The allocation had an average rating of BBB, and continued to provide a yield advantage over many similarly rated developed market corporate bonds. |
| ∎ | The securitized ABS allocation was the second largest allocation at the end of the period at 20.6%. Student loan and aviation collateral were the highest sector allocations, followed by personal consumer loan and medical collateral. The Fund maintained an active position in CMBS and RMBS securities, ending the period at 3.9% and 3.4%, respectively. |
| ∎ | The high quality CLO allocation was 20.5% at the end of the period. The Fund continued to favor the structural subordination of CLOs, and favor AAA through BBB quality tranches.2 |
| ∎ | Investment grade corporates represented a 20.0% allocation at the end of the period. The Fund has favored BBB-rated positions in less cyclical industries such as banking, diversified industrials and insurance. |
| ∎ | The Fund maintained a 4.9% to high yield corporate credit with a high average quality of BB at the end of the period. |
Describe market and portfolio outlook.
| ∎ | Despite the historic events that occurred in 2020, investment grade credit sailed through the fourth quarter to finish the year in strong positive territory, benefitting from lower interest rates as well as a flight to quality amid heightened volatility. |
| ∎ | Investment grade credit delivered both positive and excess returns across multiple markets as investors—thanks to monetary support and the release of COVID vaccines—largely shrugged off concerns around rising COVID cases and the possibility of additional consumer restrictions entering the New Year. |
| ∎ | As we look ahead to the coming months, it is worth reiterating that questions remain around the deployment and acceptance of the vaccines, which we believe will ultimately serve as a catalyst to the momentum and length of this recovery. |
| ∎ | Although we believe there is room for optimism, our view is that we are not necessarily out of the woods yet, as there are many unknowns that face markets in 2021. In this environment, we believe fundamental credit-by-credit selection remains critical, to not only capture upside potential and identify issuers that are equipped to weather near-term challenges, but also to avoid those that may face greater challenges down the road. |
| 2. | Ratings shown are the highest ratings given by one of the following national rating agencies: S&P, Moody’s or Fitch. Additional information about ratings can be found, respectively, at www.standardandpoors.com, www.moodys.com and www.fitchratings.com. Credit ratings are subject to change. AAA, AA, single-A and BBB are investment grade ratings categories used by S&P and Fitch. BB, single-B, CCC/CC/C and single-D are below investment grade ratings categories used by S&P and Fitch. Aaa, Aa, single-A and Baa are investment grade ratings categories used by Moody’s. Ba, single-B, Caa/Ca and single-C are below investment grade ratings categories used by Moody’s. Ratings categories may include gradations within each category. Bonds backed by U.S. government or agency securities are given an implied rating equal to the rating of such securities. Holdings designated Not Publicly Rated are not rated by these national rating agencies. |
15
Table of Contents
Barings Diversified Income Fund 2020 Semi-Annual Report
CREDIT QUALITY BREAKDOWN (% OF ASSETS*)
| * | As of December 31, 2020. |
PORTFOLIO COMPOSITION (% OF ASSETS*)
| * | As of December 31, 2020. |
16
Table of Contents
Barings Diversified Income Fund 2020 Semi-Annual Report
| % AVERAGE ANNUAL TOTAL RETURNS 3,4,6,7,8 | INCEPTION DATE | ONE YEAR | THREE YEARS | FIVE YEARS | INCEPTION TO DATE | |||||||||||||||
Class A With Load | 07/08/2015 | (7.14 | )% | (0.99 | )% | 1.12 | % | 0.86 | % | |||||||||||
Class A No Load | 07/08/2015 | (3.27 | )% | 0.37 | % | 1.95 | % | 1.61 | % | |||||||||||
Class C With Load | 07/08/2015 | (4.94 | )% | (0.38 | )% | 1.19 | % | 0.85 | % | |||||||||||
Class C No Load | 07/08/2015 | (4.00 | )% | (0.38 | )% | 1.19 | % | 0.85 | % | |||||||||||
Class I With Load | 07/08/2015 | (3.03 | )% | 0.62 | % | 2.20 | % | 1.86 | % | |||||||||||
Class I No Load | 07/08/2015 | (3.03 | )% | 0.62 | % | 2.20 | % | 1.86 | % | |||||||||||
Class Y With Load | 07/08/2015 | (3.05 | )% | 0.61 | % | 2.20 | % | 1.86 | % | |||||||||||
Class Y No Load | 07/08/2015 | (3.05 | )% | 0.61 | % | 2.20 | % | 1.86 | % | |||||||||||
| 3. | Inception date: July 8, 2015. Diversified Income strategy change effective March 1, 2019. |
| 4. | Class A performance with the sales charges includes the maximum 4.00% sales charge. |
| 5. | Benchmark: 3-Month USD LIBOR plus 250 bps. The 3-Month USD LIBOR (London Interbank Offered Rate) is an average interest rate, determined by the Intercontinental Exchange, that banks charge one another for the use of short-term money (three months) in England’s Euro dollar market. The return shown includes 3-Month USD LIBOR plus 250 bps, or 2.5% per annum. LIBOR is unmanaged. It is not possible to invest directly in LIBOR. No assurance can be given that the Fund’s performance will exceed that of LIBOR by any given increment, or at all. |
| 6. | Line graph and table do not reflect the deduction of taxes that a shareholder would pay. |
| 7. | Class C performance with the sales charges includes the 1.00% contingent deferred sales charge (CDSC) for returns of one year or less. |
| 8. | Total return includes the reinvestment of dividends and capital gains. Past performance is no guarantee of future results, and investment returns and the net asset value (NAV) of shares of the Fund will fluctuate so that shares, when redeemed, may be worth more or less than their original cost. Current performance may be higher or lower than performance quoted. Call 1.855.439.5459 or visit barings.com for current month-end performance. All returns one-year or less are cumulative. |
17
Table of Contents
Barings Emerging Markets Debt Blended Total Return Fund 2020 Semi-Annual Report
Investment Objective
Barings Emerging Markets Debt Blended Total Return Fund (“EMD Blended Total Return Fund” or the “Fund”) seeks to achieve maximum total return, consistent with preservation of capital and prudent investment management, through high current income generation and, where appropriate, capital appreciation.
Portfolio Management Commentary
How did the Fund perform?
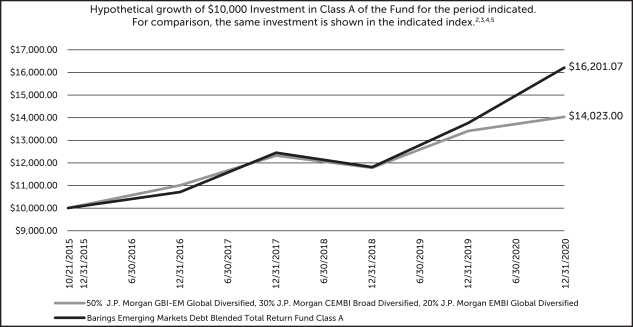
| ∎ | The Fund reported a net total rate of return for the six-month reporting period from July 1, 2020 through December 31, 2020 of 12.46%. The net total rate of return for the Fund’s performance benchmark – a blend of 50% JPMorgan Government Bond Index – Emerging Markets Global Diversified (GBI-EMGD), 30% JPMorgan EMBI Global Diversified and 20% JPMorgan CEMBI Broad Diversified – was 9.01%. The Fund is not managed relative to the benchmark; however, the comparison is provided to show how the Fund’s returns compare with those of a broad measure of market performance.1,4 |
| ∎ | All three of the Fund’s sub-strategies – emerging market (EM) corporates, EM sovereign and EM local – generated positive performance over the period. This occurred as spreads tightened (123 basis points (bps) for EM Sovereign and 146 bps for EM corporates), local rates rallied and EM currencies appreciated on the back of rising commodity prices. |
What factors influenced performance of the Fund?
| ∎ | The Fund’s positioning, and active allocations across countries and credits, were additive to performance. Spreads tightened as markets continued to rebound, lockdowns were lifted, and global stimulus flooded markets following the outbreak of COVID-19. EM currencies rallied, as we saw an increase in commodity prices as demand picked up following the global lockdowns. EM debt flows were strong during the period, with $48 billion of positive flows ($30 billion from hard currency and $18 billion from local currency). |
| ∎ | For the 6-month reporting period ending December 31, 2020, the Fund’s positioning in Brazil, Mexico, South Africa, Ukraine and Poland contributed positively to Fund performance. However, the Fund’s positions in Israel, Switzerland, Hungary, Singapore and Morocco detracted from performance. |
Describe recent portfolio activity.
| ∎ | The Fund continued to increase its exposure to EM currencies, to capture potential currency appreciation as a result of stronger balance-of-payments outlook and with higher commodity prices. The Fund also increased duration in EM local rates on the expectation that rates will stay low. |
| ∎ | The Fund also decreased exposure to EM sovereign hard currency assets, as spreads have tightened considerably, close to their pre-COVID levels. |
| ∎ | At the end of the period, positioning in select corporate names remained similar to earlier in 2020, backed by healthy balance sheets and bonds, offering strong yields compared to some sovereign credits. |
Describe portfolio positioning at period end.
| ∎ | The Fund finished the reporting period with a 39% exposure to corporate debt, 35% to sovereign hard currencies (inclusive of credit default swaps), 29% to sovereign local currencies, and a 9% cash position. |
| ∎ | The top five countries in the portfolio at the end of the reporting period were Mexico (13.3%), Brazil (12.2%), South Africa (7.4%), Ukraine (6.6%) and Indonesia (5.2%). The top five corporate issuers were Petrobras (1.9%), Sovcom Bank (1.9%), PEMEX (1.9%), Tullow Oil (1.8%) and India Infoline Finance (1.3%). Overall, the Fund had exposure to 44 countries, 44 corporates and 23 different currencies. |
| 1. | Total return describes the return to an investor of Class Y shares and includes the reinvestment of dividends and capital gains. Past performance is no guarantee of future results, and investment returns and the net asset value (NAV) of shares of the Fund will fluctuate so that shares, when redeemed, may be worth more or less than their original cost. Current performance may be higher or lower than performance quoted. Call 1.855.439.5459 or visit barings.com for current month-end performance. All returns one-year or less are cumulative. |
| 4. | Benchmark is a blend of 50% JPMorgan Government Bond Index – Emerging Markets Global Diversified (GBI-EMGD), 30% JPMorgan EMBI Global Diversified and 20% JPMorgan CEMBI Broad Diversified. |
18
Table of Contents
Barings Emerging Markets Debt Blended Total Return Fund 2020 Semi-Annual Report
Describe market and portfolio outlook.
| ∎ | While EM currencies are still lagging overall, we believe a number of tailwinds have emerged that could create a potentially compelling opportunity in the asset class going forward. For one, many emerging markets, because they have faced weaker consumption as well as outflows on the heels of the pandemic, have been running smaller account deficits in aggregate – with some countries now running current account surpluses. In countries like Brazil, Mexico, South Africa and Indonesia, for instance, deficits have either significantly narrowed or turned into surpluses. |
| ∎ | Exports from many EM countries have performed much better than expected as demand for commodities proved to be fairly resilient and underwent significant recoveries in the second half of 2020 – helped by sustained demand from China. |
| ∎ | We believe EM sovereign debt continues to face challenges, though the effects of the pandemic have varied widely from country to country. Generally speaking, downgrades and defaults have remained below initial expectations – and, in our view, the rollout of the vaccine, coupled with higher commodity prices, should help keep defaults measured in the coming year. There are bright spots across the EM universe, and we expect to continue seeing opportunities as the vaccine is deployed and economies around the globe begin to open back up. Nonetheless, there is no shortage of risks, from political tensions to the longer-term potential for rising rates in developed markets. |
19
Table of Contents
Barings Emerging Markets Debt Blended Total Return Fund 2020 Semi-Annual Report
PORTFOLIO COMPOSITION (% OF ASSETS*)
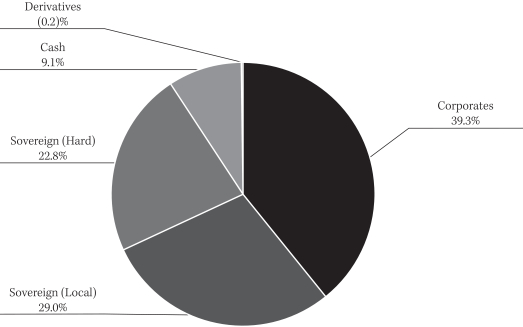
| * | As of December 31, 2020. |
REGIONAL COMPOSITION (% OF ASSETS**)
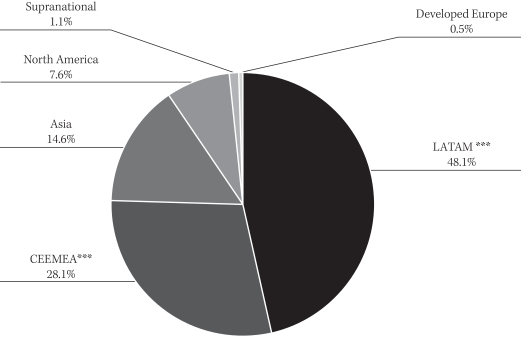
| ** | The percentages shown above are expressed by market value, excluding cash and accrued income, and may vary over time. As of December 31, 2020. |
| *** | CEEMEA: Central Europe, Eastern Europe, Middle East and Africa. LATAM: Latin America (includes countries in Central and South America). |
20
Table of Contents
Barings Emerging Markets Debt Blended Total Return Fund 2020 Semi-Annual Report
| % AVERAGE ANNUAL TOTAL RETURNS 2,3,5,6 ,7 | INCEPTION DATE | ONE YEAR | THREE YEARS | FIVE YEARS | INCEPTION TO DATE | |||||||||||||||
Class A With Load | 10/21/2015 | 12.99 | % | 7.69 | % | 9.24 | % | 8.14 | % | |||||||||||
Class A No Load | 10/21/2015 | 17.70 | % | 9.17 | % | 10.13 | % | 8.99 | % | |||||||||||
Class C With Load | 10/21/2015 | 15.78 | % | 8.37 | % | 9.33 | % | 8.20 | % | |||||||||||
Class C No Load | 10/21/2015 | 16.78 | % | 8.37 | % | 9.33 | % | 8.20 | % | |||||||||||
Class I With Load | 10/21/2015 | 18.02 | % | 9.44 | % | 10.41 | % | 9.27 | % | |||||||||||
Class I No Load | 10/21/2015 | 18.02 | % | 9.44 | % | 10.41 | % | 9.27 | % | |||||||||||
Class Y With Load | 10/21/2015 | 17.96 | % | 9.43 | % | 10.40 | % | 9.26 | % | |||||||||||
Class Y No Load | 10/21/2015 | 17.96 | % | 9.43 | % | 10.40 | % | 9.26 | % | |||||||||||
| 2. | Inception date: October 21, 2015. |
| 3. | Class A performance with the sales charges includes the maximum 4.00% sales charge. |
| 4. | Benchmark is a blend of 50% JPMorgan Government Bond Index – Emerging Markets Global Diversified (GBI-EMGD), 30% JPMorgan EMBI Global Diversified and 20% JPMorgan CEMBI Broad Diversified. |
| 5. | Line graph and table do not reflect the deduction of taxes that a shareholder would pay. |
| 6. | Class C performance with the sales charges includes the 1.00% contingent deferred sales charge (CDSC) for returns of one year or less. |
| 7. | Total return includes the reinvestment of dividends and capital gains. Past performance is no guarantee of future results, and investment returns and the net asset value (NAV) of shares of the Fund will fluctuate so that shares, when redeemed, may be worth more or less than their original cost. Current performance may be higher or lower than performance quoted. Call 1.855.439.5459 or visit barings.com for current month-end performance. All returns one-year or less are cumulative. |
21
Table of Contents
Barings Global Emerging Markets Equity Fund 2020 Semi-Annual Report
Investment Objective
Barings Global Emerging Markets Equity Fund (the “Fund”) seeks to achieve long-term capital growth.
Portfolio Management Commentary
How did the Fund perform?
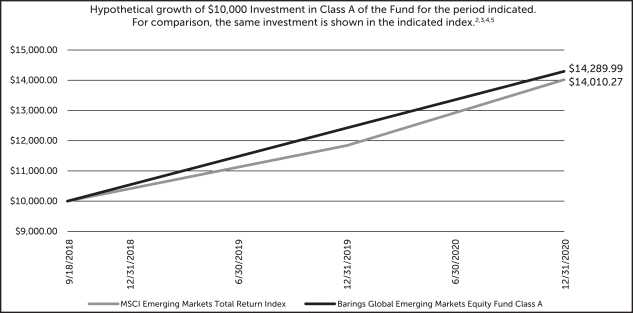
| ∎ | The Fund reported a net rate of return for the six-month reporting period from July 1, 2020, through December 31, 2020 of 29.36%, underperforming the MSCI Emerging Markets Index (the “Benchmark”), which returned 24.07%.1,4 |
What factors influenced performance of the Fund?
| ∎ | Contributors to relative Fund performance included the following: |
| ∎ | Korean chemicals manufacturer LG Chem was the Fund’s top contributor to relative returns. The company continues to benefit from the increased demand for electric vehicle batteries and slowly improving margins in its petrochemical business. |
| ∎ | TSMC was another strong performer, benefitting from improving product demand and news that Intel may potentially outsource to TSMC next year as it struggles with migration to the next technology node. |
| ∎ | Leading Chinese social media company Tencent also outperformed, supported by an acceleration in online advertising revenue and a strong gaming release pipeline. |
| ∎ | Detractors to relative Fund performance included the following: |
| ∎ | China Overseas Land and Investment detracted over the period due to concerns that policy measures introduced to cool the residential market may lead to a decline in new sales. |
| ∎ | CNOOC Limited, a Chinese energy company, detracted due to the decline in the oil price over the year. The announcement by the United States Department of Defense that its parent company was added to a list of companies with alleged ties to the Chinese military negatively impacted the share price towards the end of the year. |
| ∎ | Not owning Meituan-Dianping detracted after the stock performed well in response to the company’s online shopping platform gaining traction in China. However, we continue to find better opportunities elsewhere in the investment universe. |
Describe recent portfolio activity.
| ∎ | Whilst turnover for the year remained low (11.24%), the volatile market backdrop provided a number of opportunities to start building exposure in companies with sustainable business franchises and strong balance sheets at more attractive valuation entry points. |
| ∎ | Q3 2020: The Fund sold Russian retailer X5 and used the proceeds to initiate a new holding in its competitor, Magnit. The Fund also sold out of its positions in Lukoil and Banco do Brasil, in favor of opportunities elsewhere. In China, the Fund initiated positions in internet company NetEase, fast food chain Yum China and private education provider New Oriental. |
| ∎ | Q4 2020: In China, the Fund took profits in video surveillance company Hikvision after a period of strong performance. The Fund also purchased shares in wind power company Longyuan Power and initiated a position in NARI Technology, a company that produces hardware and software for the power industry. Elsewhere, the Fund initiated a position in Brazilian hypermarket Atacadão, a company we view as having compelling future growth prospects. |
| 1. | Total return describes the return to an investor of Class Y shares and includes the reinvestment of dividends and capital gains. Past performance is no guarantee of future results, and investment returns and the net asset value (NAV) of shares of the Fund will fluctuate so that shares, when redeemed, may be worth more or less than their original cost. Current performance may be higher or lower than performance quoted. Call 1.855.439.5459 or visit barings.com for current month-end performance. All returns one-year or less are cumulative. The performance comparator is MSCI Emerging Markets Total Return Index with net dividends. |
| 4. | Benchmark: MSCI Emerging Markets Total Return Index with net dividends designed to measure the equity market performance of the emerging markets. Indices are unmanaged. It is not possible to invest directly in an index. |
22
Table of Contents
Barings Global Emerging Markets Equity Fund 2020 Semi-Annual Report
Describe portfolio positioning at period end.
| ∎ | The Fund’s positioning at the end of the period reflected our bottom-up investment process, where we aim to identify companies with sustainable business franchises and future growth potential that is not fully reflected in the current share price. As a result, our active country and sector positioning relative to the benchmark was not driven by a deliberate top-down strategy, but was a by-product of our bottom-up stock selection process. |
| ∎ | Relative to the benchmark, the largest active country position was in India and the largest active sector exposure was to financials, where in each case we continue to identify many companies that we believe have strong medium-term growth prospects and are attractively valued. |
| ∎ | As of the end of the reporting period, the top five country weightings in the Fund, on an absolute basis, were China & Hong Kong (39.2%), Taiwan (14.0%), Korea (13.4%), India (11.2%) and Brazil (4.9%). In line with our investment process, we continue to seek out bottom-up investment opportunities where we believe the future earnings potential is not fully reflected in the current share price. |
Describe market and portfolio outlook.
| ∎ | As we enter 2021, we believe markets are likely to remain volatile as investors closely monitor the third wave of infections in Europe and elsewhere. However, the ongoing trend of improving economic and earnings momentum is encouraging, while the rolling out of vaccination programs gives us grounds for optimism. |
| ∎ | Accommodative monetary and fiscal policy across emerging markets (“EM”) and elsewhere in the world has already driven an improvement in leading economic indicators everywhere, which we believe should in turn translate into stronger corporate profit performance over the course of this year. |
| ∎ | We believe continued weakness in the U.S. dollar would provide an additional boost while, in our view, the relative valuation of EM equities versus developed equities continues to remain very attractive, suggesting investor expectations for the asset class remain overly depressed. We believe this combination of steadily improving earnings, receding risk and attractive valuations should create a positive backdrop for equity markets as we navigate through 2021. |
23
Table of Contents
Barings Global Emerging Markets Equity Fund 2020 Semi-Annual Report
| % AVERAGE ANNUAL TOTAL RETURNS 2,3,5,6,7 | INCEPTION DATE | ONE YEAR | INCEPTION TO DATE | |||||||||
Class A With Load | 9/17/2018 | 15.01 | % | 15.00 | % | |||||||
Class A No Load | 9/17/2018 | 15.01 | % | 15.00 | % | |||||||
Class C With Load | 9/17/2018 | 14.14 | % | 14.14 | % | |||||||
Class C No Load | 9/17/2018 | 14.14 | % | 14.14 | % | |||||||
Class I With Load | 9/17/2018 | 15.30 | % | 15.29 | % | |||||||
Class I No Load | 9/17/2018 | 15.30 | % | 15.29 | % | |||||||
Class Y With Load | 9/17/2018 | 15.30 | % | 15.29 | % | |||||||
Class Y No Load | 9/17/2018 | 15.30 | % | 15.29 | % | |||||||
| 2. | Inception date: September 17, 2018. A fund’s performance for very short time periods may not be indicative of future performance |
| 3. | Class A performance with the sales charges includes the maximum 4.00% sales charge. |
| 4. | Benchmark: MSCI Emerging Markets Total Return Index with net dividends designed to measure the equity market performance of the emerging markets. Indices are unmanaged. It is not possible to invest directly in an index. |
| 5. | Line graph and table do not reflect the deduction of taxes that a shareholder would pay. |
| 6. | Class C performance with the sales charges includes the 1.00% contingent deferred sales charge (CDSC) for returns of one year or less. |
| 7. | Total return includes the reinvestment of dividends and capital gains. Past performance is no guarantee of future results, and investment returns and the net asset value (NAV) of shares of the Fund will fluctuate so that shares, when redeemed, may be worth more or less than their original cost. Current performance may be higher or lower than performance quoted. Call 1.855.439.5459 or visit barings.com for current month-end performance. All returns one-year or less are cumulative. The performance comparator is MSCI Emerging Markets Total Return Index with net dividends. |
24
Table of Contents
Barings U.S. High Yield Fund 2020 Semi-Annual Report
Investment Objective
Barings U.S. High Yield Fund (“U.S. High Yield Fund” or the “Fund”) seeks to achieve a high level of total return, with an emphasis on current income, by investing primarily in high yield debt and related securities.
Portfolio Management Commentary
How did the Fund perform?
| ∎ | The Fund reported a net total rate of return for the six-month reporting period from July 1, 2020 through December 31, 2020 of 12.18%, outperforming the Bloomberg Barclays U.S. Corporate High Yield Index (the “Benchmark”), which returned 11.34%.1,5 |
What factors influenced performance of the Fund?
| ∎ | During the six-month period, the U.S. high yield bond market continued its strong recovery following the sell-off in March. For much of the third quarter, the market looked to gain back ground lost during the early days of the Covid-19 pandemic, albeit with bouts of continued volatility. However, going into the fourth quarter, progress on Covid-19 vaccines and further fiscal stimulus measures sent the market into a risk rally, propelling U.S. high yield bonds to generate a strong positive return for the period and for the full calendar year 2020. |
| ∎ | The risk-on mentality led triple-Cs to outperform during the period followed by single-Bs and double-Bs. Within the Fund, single-Bs were the largest contributor to outperformance versus the Benchmark during the six-month period as a result of credit selection, followed by triple-Cs due to an overweight allocation, which benefitted relative performance. Double-Bs lagged the Benchmark due to credit selection. |
| ∎ | From an industry perspective, sectors most heavily impacted by the Covid-19 pandemic earlier in the year also saw a strong rebound, including names in the aerospace and defense sector and the leisure, amusement and entertainment sector. Fund positioning across many of these names benefitted performance relative to the Benchmark, including hotel, airline, gaming, and travel holdings. The Fund’s credit selection within the telecommunications sector was the largest positive contributor to performance versus the Benchmark. The oil and gas sector continued to rally alongside the price of crude oil, outperforming much of the broader market. As such, a modest underweight allocation to the sector, alongside individual credit underperformance of Fund holdings, led the Fund to lag the Benchmark in the sector. |
Describe recent portfolio activity.
| ∎ | The Fund’s allocation to BB and above rated credits decreased during the course of the six-month period, primarily through a shift towards B holdings but also select CCC-rated credits. |
| ∎ | Across industries, the oil and gas sector remained the largest sector by market value among the Fund’s holdings followed by the telecommunications sector, with each seeing modest increases during the period. The Fund’s allocation to the broadcasting and entertainment sector was reduced along with holdings in the buildings and real estate sector. |
| ∎ | Senior secured high yield bonds represented a larger allocation of Fund holdings at period-end, while the Fund’s holdings of senior unsecured bond were reduced. This was in-part due to the substantial new issuance of senior secured bonds during the period, which tend to carry a lower risk of principal loss than other debt instruments issued by the same corporation given their position at the top of a company’s capital structure, ranking ahead of subordinated debt and equity. |
| 1. | Total return describes the return to an investor of Class Y shares and includes the reinvestment of dividends and capital gains. Past performance is no guarantee of future results, and investment returns and the net asset value (NAV) of shares of the Fund will fluctuate so that shares, when redeemed, may be worth more or less than their original cost. Current performance may be higher or lower than performance quoted. Call 1.855.439.5459 or visit barings.com for current month-end performance. All returns one-year or less are cumulative. |
| 5. | Benchmark: Bloomberg Barclays U.S. Corporate High Yield Benchmark. The benchmark covers the universe of fixed-rate, non-investment grade debt focusing on corporate USD denominated and non-convertible debt. It is not possible to invest directly in a Benchmark. |
25
Table of Contents
Barings U.S. High Yield Fund 2020 Semi-Annual Report
Describe portfolio positioning at period end.
| ∎ | On a traded basis, the Fund finished December 31, 2020 with a 73.4% weighting to senior unsecured bonds and a 17.6% weighting to senior secured high yield bonds. The remaining balance of the portfolio was invested in senior secured loans (6.5%), and cash, accrued income and other holdings (2.5%). |
| ∎ | From a sector perspective, the Fund remained well-diversified across a number of Moody’s-based industries, with higher concentrations, as mentioned above, in oil and gas (13.8%), telecommunications (12.0%), and finance (7.5%) as of December 31, 2020. |
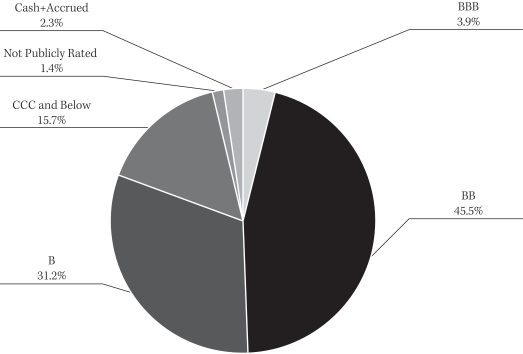
| ∎ | In terms of portfolio credit quality, the Fund had the following weighting breakdown: 3.9% in triple-B, 45.5% in double-B, 31.2% in single-B, 15.7% in triple-C and below, and 2.3% in cash and accrued income. The Fund’s weighting in not-publicly rated holdings finished the period at 1.4%.2 |
Describe market and portfolio outlook.
| ∎ | While high yield credit markets have bounced back significantly since the troughs of the pandemic, we believe the market continues to offer upside potential, particularly in today’s low-rate and low-yielding environment. Additionally, as demand has improved for the bank loan asset class recently, we believe this will provide a supportive tailwind for the asset class heading into 2021. |
| ∎ | Given the focus of borrowers on maintaining liquidity, we believe defaults may compress as we move throughout 2021 and credit spreads are fairly compensating investors based on the expectations for defaults. |
| ∎ | However, there remains an element of uncertainty in the markets as a result of the global pandemic and therefore we believe credit selection will remain critical in high yield credit markets focused on issuers that can withstand short-term volatility and potentially offer upside as the economy continues to recover. |
| 2. | Ratings shown are the highest ratings given by one of the following national rating agencies: S&P, Moody’s or Fitch. Additional information about ratings can be found, respectively, at www.standardandpoors.com, www.moodys.com and www.fitchratings.com. Credit ratings are subject to change. AAA, AA, single-A and BBB are investment grade ratings categories used by S&P and Fitch. BB, single-B, CCC/CC/C and single-D are below investment grade ratings categories used by S&P and Fitch. Aaa, Aa, single-A and Baa are investment grade ratings categories used by Moody’s. Ba, single-B, Caa/Ca and single-C are below investment grade ratings categories used by Moody’s. Ratings categories may include gradations within each category. Bonds backed by U.S. government or agency securities are given an implied rating equal to the rating of such securities. Holdings designated Not Publicly Rated are not rated by these national rating agencies. |
26
Table of Contents
Barings U.S. High Yield Fund 2020 Semi-Annual Report
CREDIT QUALITY COMPOSITION (% OF ASSETS*)
| * | As of December 31, 2020. |
COUNTRY COMPOSITION (% OF ASSETS**)
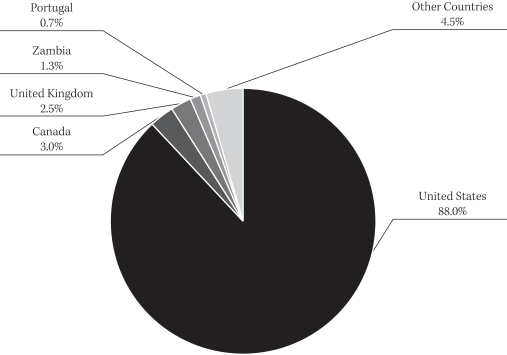
| ** | The percentages of assets are expressed by market value excluding cash and accrued income, and may vary over time. As of December 31, 2020. |
27
Table of Contents
Barings U.S. High Yield Fund 2020 Semi-Annual Report
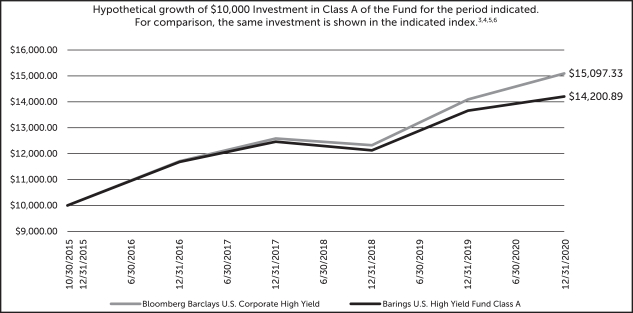
| % AVERAGE ANNUAL TOTAL RETURNS 4,6,7,8 | INCEPTION DATE | ONE YEAR | THREE YEARS | FIVE YEARS | INCEPTION TO DATE | |||||||||||||||
Class A With Load | 10/30/2015 | (0.20 | )% | 3.04 | % | 6.39 | % | 5.58 | % | |||||||||||
Class A No Load | 10/30/2015 | 3.96 | % | 4.45 | % | 7.27 | % | 6.42 | % | |||||||||||
Class C With Load | 10/30/2015 | 2.25 | % | 3.67 | % | 6.47 | % | 5.63 | % | |||||||||||
Class C No Load | 10/30/2015 | 3.23 | % | 3.67 | % | 6.47 | % | 5.63 | % | |||||||||||
Class I With Load | 10/30/2015 | 4.27 | % | 4.71 | % | 7.53 | % | 6.68 | % | |||||||||||
Class I No Load | 10/30/2015 | 4.27 | % | 4.71 | % | 7.53 | % | 6.68 | % | |||||||||||
Class Y With Load | 10/30/2015 | 4.27 | % | 4.71 | % | 7.53 | % | 6.68 | % | |||||||||||
Class Y No Load | 10/30/2015 | 4.27 | % | 4.71 | % | 7.53 | % | 6.68 | % | |||||||||||
| 3. | Inception date: October 30, 2015. |
| 4. | Class A performance with the sales charges includes the maximum 4.00% sales charge. |
| 5. | Benchmark: Bloomberg Barclays U.S. Corporate High Yield Benchmark. The benchmark covers the universe of fixed-rate, non-investment grade debt focusing on corporate USD denominated and non-convertible debt. It is not possible to invest directly in a Benchmark. |
| 6. | Line graph and table do not reflect the deduction of taxes that a shareholder would pay. |
| 7. | Class C performance with the sales charges includes the 1.00% contingent deferred sales charge (CDSC) for returns of one year or less. |
| 8. | Total return includes the reinvestment of dividends and capital gains. Past performance is no guarantee of future results, and investment returns and the net asset value (NAV) of shares of the Fund will fluctuate so that shares, when redeemed, may be worth more or less than their original cost. Current performance may be higher or lower than performance quoted. Call 1.855.439.5459 or visit barings.com for current month-end performance. All returns one-year or less are cumulative. |
28
Table of Contents
Barings Funds Trust 2020 Semi-Annual Report
This page intentionally left blank.
29
Table of Contents
Barings Funds Trust 2020 Semi-Annual Report
SHAREHOLDER EXPENSES (UNAUDITED)
As a shareholder of Barings Global Floating Rate Fund, Barings Global Credit Income Opportunities Fund, Barings Active Short Duration Bond Fund, Barings Diversified Income Fund, Barings Emerging Markets Debt Blended Total Return Fund, Barings Global Emerging Markets Equity Fund or Barings U.S. High Yield Fund you incur ongoing expenses, such as management fees, shareholder service fees, distribution fees and other fund expenses. The following table is intended to help you understand your ongoing expenses (in dollars and cents) of investing in the Funds and to compare these expenses with the ongoing expenses of investing in other funds.
The table is based on an investment of $1,000 invested at the beginning of the period and held for the entire period from July 1, 2020 to December 31, 2020.
Actual Expenses
The first line in the table below provides information about the actual account values and actual expenses. You may use the information in this line, together with the amount you invested, to estimate the expenses that you paid over the period. Simply divide your account value by $1,000 (for example, an $8,600 account value divided by $1,000 = 8.6), then multiply the result by the number in the first line for the Fund under the heading entitled “Operating Expense Incurred” to estimate the expenses you paid on your account during this period.
Hypothetical Example for Comparison Purposes
The second line in the table below provides information about the hypothetical account values and hypothetical expenses based on the Fund’s actual expense ratio and an assumed rate of return of 5% per year before expenses, which is not the Fund’s actual return. The hypothetical account value and expenses may not be used to estimate the actual ending account balance or expenses you paid for the period. You may use this information to compare the ongoing costs of investing in your Fund and other funds. To do so, compare this 5% hypothetical example with the 5% hypothetical examples that appear in the shareholder reports of the other funds.
Barings Global Floating Rate Fund
| EXPENSE RATIO | BEGINNING AMOUNT | ENDING VALUE | AVERAGE VALUE | OPERATING EXPENSE INCURRED* | ||||||||||||||||
Class A |
| |||||||||||||||||||
Actual | 1.00 | % | $ | 1,000.00 | $ | 1,093.00 | $ | 1,046.50 | $ | 5.28 | ||||||||||
Hypothetical | 1.00 | % | 1,000.00 | 1,020.20 | 1,010.10 | 5.09 | ||||||||||||||
Class C |
| |||||||||||||||||||
Actual | 1.75 | % | 1,000.00 | 1,088.90 | 1,044.45 | 9.21 | ||||||||||||||
Hypothetical | 1.75 | % | 1,000.00 | 1,016.40 | 1,008.20 | 8.89 | ||||||||||||||
Class I |
| |||||||||||||||||||
Actual | 0.75 | % | 1,000.00 | 1,094.40 | 1,047.20 | 3.96 | ||||||||||||||
Hypothetical | 0.75 | % | 1,000.00 | 1,021.40 | 1,010.70 | 3.82 | ||||||||||||||
Class Y |
| |||||||||||||||||||
Actual | 0.75 | % | 1,000.00 | 1,094.40 | 1,047.20 | 3.96 | ||||||||||||||
Hypothetical | 0.75 | % | 1,000.00 | 1,021.40 | 1,010.70 | 3.82 | ||||||||||||||
| * | For each Class of the Fund, net expenses are equal to the annualized expense ratio net of any expenses waived or reimbursed by the adviser for such class multiplied by the average account value over the period, multiplied by 184/365. |
30
Table of Contents
Barings Funds Trust 2020 Semi-Annual Report
SHAREHOLDER EXPENSES (UNAUDITED) (CONTINUED)
Barings Global Credit Income Opportunities Fund
| EXPENSE RATIO | BEGINNING AMOUNT | ENDING VALUE | AVERAGE VALUE | OPERATING EXPENSE INCURRED* | ||||||||||||||||
Class A |
| |||||||||||||||||||
Actual | 1.20 | % | $ | 1,000.00 | $ | 1,108.10 | $ | 1,054.05 | $ | 6.38 | ||||||||||
Hypothetical | 1.20 | % | 1,000.00 | 1,019.20 | 1,009.60 | 6.11 | ||||||||||||||
Class C |
| |||||||||||||||||||
Actual | 1.95 | % | 1,000.00 | 1,104.30 | 1,052.15 | 10.34 | ||||||||||||||
Hypothetical | 1.95 | % | 1,000.00 | 1,015.40 | 1,007.70 | 9.91 | ||||||||||||||
Class I |
| |||||||||||||||||||
Actual | 0.95 | % | 1,000.00 | 1,109.90 | 1,054.95 | 5.05 | ||||||||||||||
Hypothetical | 0.95 | % | 1,000.00 | 1,020.40 | 1,010.20 | 4.84 | ||||||||||||||
Class Y |
| |||||||||||||||||||
Actual | 0.95 | % | 1,000.00 | 1,110.00 | 1,055.00 | 5.05 | ||||||||||||||
Hypothetical | 0.95 | % | 1,000.00 | 1,020.40 | 1,010.20 | 4.84 | ||||||||||||||
| * | For each Class of the Fund, net expenses are equal to the annualized expense ratio net of any expenses waived or reimbursed by the adviser for such class multiplied by the average account value over the period, multiplied by 184/365. |
Barings Active Short Duration Bond Fund
| EXPENSE RATIO | BEGINNING AMOUNT | ENDING VALUE | AVERAGE VALUE | OPERATING EXPENSE INCURRED* | ||||||||||||||||
Class A |
| |||||||||||||||||||
Actual | 0.65 | % | $ | 1,000.00 | $ | 1,049.20 | $ | 1,024.60 | $ | 3.36 | ||||||||||
Hypothetical | 0.65 | % | 1,000.00 | 1,021.90 | 1,010.95 | 3.31 | ||||||||||||||
Class C |
| |||||||||||||||||||
Actual | 0.90 | % | 1,000.00 | 1,047.90 | 1,023.95 | 4.65 | ||||||||||||||
Hypothetical | 0.90 | % | 1,000.00 | 1,020.70 | 1,010.35 | 4.58 | ||||||||||||||
Class I |
| |||||||||||||||||||
Actual | 0.40 | % | 1,000.00 | 1,050.50 | 1,025.25 | 2.07 | ||||||||||||||
Hypothetical | 0.40 | % | 1,000.00 | 1,023.20 | 1,011.60 | 2.04 | ||||||||||||||
Class Y |
| |||||||||||||||||||
Actual | 0.40 | % | 1,000.00 | 1,050.50 | 1,025.25 | 2.07 | ||||||||||||||
Hypothetical | 0.40 | % | 1,000.00 | 1,023.20 | 1,011.60 | 2.04 | ||||||||||||||
Class L |
| |||||||||||||||||||
Actual | 0.65 | % | 1,000.00 | 1,049.20 | 1,024.60 | 3.36 | ||||||||||||||
Hypothetical | 0.65 | % | 1,000.00 | 1,021.90 | 1,010.95 | 3.31 | ||||||||||||||
| * | For each Class of the Fund, net expenses are equal to the annualized expense ratio net of any expenses waived or reimbursed by the adviser for such class multiplied by the average account value over the period, multiplied by 184/365. |
31
Table of Contents
Barings Funds Trust 2020 Semi-Annual Report
SHAREHOLDER EXPENSES (UNAUDITED) (CONTINUED)
Barings Diversified Income Fund
| EXPENSE RATIO | BEGINNING AMOUNT | ENDING VALUE | AVERAGE VALUE | OPERATING EXPENSE INCURRED* | ||||||||||||||||
Class A |
| |||||||||||||||||||
Actual | 0.80 | % | $ | 1,000.00 | $ | 1,077.80 | $ | 1,038.90 | $ | 4.19 | ||||||||||
Hypothetical | 0.80 | % | 1,000.00 | 1,021.20 | 1,010.60 | 4.08 | ||||||||||||||
Class C |
| |||||||||||||||||||
Actual | 1.55 | % | 1,000.00 | 1,073.70 | 1,036.85 | 8.10 | ||||||||||||||
Hypothetical | 1.55 | % | 1,000.00 | 1,017.40 | 1,008.70 | 7.88 | ||||||||||||||
Class I |
| |||||||||||||||||||
Actual | 0.55 | % | 1,000.00 | 1,079.10 | 1,039.55 | 2.88 | ||||||||||||||
Hypothetical | 0.55 | % | 1,000.00 | 1,022.40 | 1,011.20 | 2.80 | ||||||||||||||
Class Y |
| |||||||||||||||||||
Actual | 0.55 | % | 1,000.00 | 1,079.00 | 1,039.50 | 2.88 | ||||||||||||||
Hypothetical | 0.55 | % | 1,000.00 | 1,022.40 | 1,011.20 | 2.80 | ||||||||||||||
| * | For each Class of the Fund, net expenses are equal to the annualized expense ratio net of any expenses waived or reimbursed by the adviser for such class multiplied by the average account value over the period, multiplied by 184/365. |
Barings Emerging Markets Debt Blended Total Return Fund
| EXPENSE RATIO | BEGINNING AMOUNT | ENDING VALUE | AVERAGE VALUE | OPERATING EXPENSE INCURRED* | ||||||||||||||||
Class A |
| |||||||||||||||||||
Actual | 1.20 | % | $ | 1,000.00 | $ | 1,123.10 | $ | 1,061.55 | $ | 6.42 | ||||||||||
Hypothetical | 1.20 | % | 1,000.00 | 1,019.20 | 1,009.60 | 6.11 | ||||||||||||||
Class C |
| |||||||||||||||||||
Actual | 1.95 | % | 1,000.00 | 1,119.00 | 1,059.50 | 10.42 | ||||||||||||||
Hypothetical | 1.95 | % | 1,000.00 | 1,015.40 | 1,007.70 | 9.91 | ||||||||||||||
Class I |
| |||||||||||||||||||
Actual | 0.95 | % | 1,000.00 | 1,124.50 | 1,062.25 | 5.09 | ||||||||||||||
Hypothetical | 0.95 | % | 1,000.00 | 1,020.40 | 1,010.20 | 4.84 | ||||||||||||||
Class Y |
| |||||||||||||||||||
Actual | 0.95 | % | 1,000.00 | 1,124.60 | 1,062.30 | 5.09 | ||||||||||||||
Hypothetical | 0.95 | % | 1,000.00 | 1,020.40 | 1,010.20 | 4.84 | ||||||||||||||
| * | For each Class of the Fund, net expenses are equal to the annualized expense ratio net of any expenses waived or reimbursed by the adviser for such class multiplied by the average account value over the period, multiplied by 184/365. |
32
Table of Contents
Barings Funds Trust 2020 Semi-Annual Report
SHAREHOLDER EXPENSES (UNAUDITED) (CONTINUED)
Barings Global Emerging Markets Equity Fund
| EXPENSE RATIO(**)(***) | BEGINNING AMOUNT | ENDING VALUE | AVERAGE VALUE | OPERATING EXPENSE INCURRED* | ||||||||||||||||
Class A |
| |||||||||||||||||||
Actual | 1.40 | % | $ | 1,000.00 | $ | 1,291.90 | $ | 1,145.95 | $ | 8.09 | ||||||||||
Hypothetical | 1.40 | % | 1,000.00 | 1,018.10 | 1,009.05 | 7.12 | ||||||||||||||
Class C |
| |||||||||||||||||||
Actual | 2.15 | % | 1,000.00 | 1,287.00 | 1,143.50 | 12.39 | ||||||||||||||
Hypothetical | 2.15 | % | 1,000.00 | 1,014.40 | 1,007.20 | 10.92 | ||||||||||||||
Class I |
| |||||||||||||||||||
Actual | 1.15 | % | 1,000.00 | 1,293.60 | 1,146.80 | 6.65 | ||||||||||||||
Hypothetical | 1.15 | % | 1,000.00 | 1,019.40 | 1,009.70 | 5.85 | ||||||||||||||
Class Y |
| |||||||||||||||||||
Actual | 1.15 | % | 1,000.00 | 1,293.60 | 1,146.80 | 6.65 | ||||||||||||||
Hypothetical | 1.15 | % | 1,000.00 | 1,019.40 | 1,009.70 | 5.85 | ||||||||||||||
| * | For each Class of the Fund, net expenses are equal to the annualized expense ratio net of any expenses waived or reimbursed by the adviser for such class multiplied by the average account value over the period, multiplied by 184/365. |
| ** | Expense ratios (as disclosed in the table) do not include the expenses of any underlying funds in which the Fund invests. The annualized expense ratios, as stated in the fee table of the Prospectus, may differ from the expense ratios disclosed in this report. |
| *** | As of November 5, 2020, the Adviser agreed to waive and/or reimburse certain fees and/or expenses so that, on an annualized basis, such expenses incurred will not exceed 1.15%, 1.90%, 0.90% and 0.90% as a percentage of average daily net assets for Class A, Class C, Class I and Class Y, respectively. Prior to this date, the Adviser had agreed to waive and/or reimburse certain fees and/or expenses so that, on an annualized basis, such expenses would have not exceeded 1.45%, 2.20%, 1.20% and 1.20% as a percentage of net assets for Class A, Class C, Class I and Class Y, respectively. |
Barings U.S. High Yield Fund
| EXPENSE RATIO | BEGINNING AMOUNT | ENDING VALUE | AVERAGE VALUE | OPERATING EXPENSE INCURRED* | ||||||||||||||||
Class A |
| |||||||||||||||||||
Actual | 1.00 | % | $ | 1,000.00 | $ | 1,120.20 | $ | 1,060.10 | $ | 5.34 | ||||||||||
Hypothetical | 1.00 | % | 1,000.00 | 1,020.20 | 1,010.10 | 5.09 | ||||||||||||||
Class C |
| |||||||||||||||||||
Actual | 1.75 | % | 1,000.00 | 1,116.20 | 1,058.10 | 9.33 | ||||||||||||||
Hypothetical | 1.75 | % | 1,000.00 | 1,016.40 | 1,008.20 | 8.89 | ||||||||||||||
Class I |
| |||||||||||||||||||
Actual | 0.75 | % | 1,000.00 | 1,121.80 | 1,060.90 | 4.01 | ||||||||||||||
Hypothetical | 0.75 | % | 1,000.00 | 1,021.40 | 1,010.70 | 3.82 | ||||||||||||||
Class Y |
| |||||||||||||||||||
Actual | 0.75 | % | 1,000.00 | 1,121.80 | 1,060.90 | 4.01 | ||||||||||||||
Hypothetical | 0.75 | % | 1,000.00 | 1,021.40 | 1,010.70 | 3.82 | ||||||||||||||
| * | For each Class of the Fund, net expenses are equal to the annualized expense ratio net of any expenses waived or reimbursed by the adviser for such class multiplied by the average account value over the period, multiplied by 184/365. |
33
Table of Contents
Barings Funds Trust 2020 Semi-Annual Report
FINANCIAL REPORT
| Statements of Assets and Liabilities | 35 | |
| Statements of Operations | 39 | |
| Statements of Changes in Net Assets | 43 | |
| Financial Highlights | 47 | |
| Schedules of Investments | 76-153 | |
| Notes to Financial Statements | 154-191 | |
34
Table of Contents
Barings Funds Trust 2020 Semi-Annual Report
STATEMENTS OF ASSETS AND LIABILITIES
December 31, 2020 (Unaudited)
| BARINGS GLOBAL FLOATING RATE FUND | BARINGS GLOBAL CREDIT INCOME OPPORTUNITIES FUND | BARINGS ACTIVE BOND FUND | BARINGS DIVERSIFIED | |||||||||||||
| Assets | ||||||||||||||||
| Investments, at fair value (cost $202,978,376, $159,801,908, $856,482,341 and $43,825,895, respectively) | $ | 198,264,735 | $ | 155,330,661 | $ | 866,998,965 | $ | 44,706,035 | ||||||||
| Cash | 9,306,261 | 13,267,481 | 8,006,775 | 2,200,539 | ||||||||||||
| Foreign currency, at value (cost $163,250, $958,933, $0 and $0, respectively) | 163,697 | 973,852 | – | – | ||||||||||||
| Receivable for investments sold | 8,263,417 | 2,545,615 | – | – | ||||||||||||
| Receivable for Fund shares sold | 41,955 | 19,006 | 11,488,772 | 27,073 | ||||||||||||
| Interest receivable | 1,374,332 | 1,981,070 | 4,203,757 | 289,046 | ||||||||||||
| Receivable from adviser (see Note 3) | – | – | – | 1,781 | ||||||||||||
| Cash collateral held at broker on forward foreign currency exchange contracts | – | 420,000 | – | – | ||||||||||||
| Cash collateral held at broker on open futures contracts | – | – | – | 229,593 | ||||||||||||
| Foreign tax reclaims receivable | 609 | 1,778 | 2,510 | – | ||||||||||||
| Unrealized appreciation on forward foreign currency exchange contracts | 52,763 | 50,743 | – | 2,086 | ||||||||||||
| Prepaid expenses | 74,147 | 63,309 | 144,854 | 27,453 | ||||||||||||
|
|
|
|
|
|
|
| |||||||||
Total assets | 217,541,916 | 174,653,515 | 890,845,633 | 47,483,606 | ||||||||||||
|
|
|
|
|
|
|
| |||||||||
| Liabilities | ||||||||||||||||
| Payable for investments purchased | – | 87,692 | – | – | ||||||||||||
| Payable for TBA and when-issued securities purchased | 4,465,454 | 1,727,461 | – | 1,000,000 | ||||||||||||
| Payable for Fund shares repurchased | 699,279 | 311,919 | 5,672,516 | 6,617 | ||||||||||||
| Payable for variation margin on open futures contracts | – | – | 114,806 | 15,867 | ||||||||||||
| Investment advisory fee payable (see Note 3) | 75,897 | 82,948 | 111,299 | – | ||||||||||||
| Cash collateral Due to Broker | – | – | 1,010,000 | – | ||||||||||||
| Distribution fees payable | 14,116 | 8,011 | 30,464 | 230 | ||||||||||||
| Shareholder service fees payable | 21,839 | 12,547 | 51,272 | 1,088 | ||||||||||||
| Dividends payable | 77,874 | 205,173 | 248,606 | 52,106 | ||||||||||||
| Unrealized depreciation on forward foreign currency exchange contracts | 482,402 | 457,436 | – | 10,431 | ||||||||||||
| Unrealized depreciation on unfunded loan commitments | 618 | 317 | – | – | ||||||||||||
| Accrued expenses and other liabilities | 182,741 | 166,532 | 396,488 | 53,392 | ||||||||||||
|
|
|
|
|
|
|
| |||||||||
Total liabilities | 6,020,220 | 3,060,036 | 7,635,451 | 1,139,731 | ||||||||||||
|
|
|
|
|
|
|
| |||||||||
Total net assets | $ | 211,521,696 | $ | 171,593,479 | $ | 883,210,182 | $ | 46,343,875 | ||||||||
|
|
|
|
|
|
|
| |||||||||
See accompanying Notes to the Financial Statements.
35
Table of Contents
Barings Funds Trust 2020 Semi-Annual Report
STATEMENTS OF ASSETS AND LIABILITIES (CONTINUED)
December 31, 2020 (Unaudited)
| BARINGS GLOBAL FLOATING RATE FUND | BARINGS GLOBAL CREDIT INCOME OPPORTUNITIES FUND | BARINGS ACTIVE BOND FUND | BARINGS DIVERSIFIED INCOME FUND | |||||||||||||
| Composition of net assets | ||||||||||||||||
| Shares of beneficial interest outstanding (par value $0.00001 per share), unlimited number of shares authorized | $ | 230 | $ | 195 | $ | 897 | $ | 50 | ||||||||
| Additional paid-in capital | 229,871,177 | 194,838,911 | 898,596,149 | 48,355,266 | ||||||||||||
| Total distributable earnings (accumulated loss) | (18,349,711 | ) | (23,245,627 | ) | (15,386,864 | ) | (2,011,441 | ) | ||||||||
|
|
|
|
|
|
|
| |||||||||
Total net assets | $ | 211,521,696 | $ | 171,593,479 | $ | 883,210,182 | $ | 46,343,875 | ||||||||
|
|
|
|
|
|
|
| |||||||||
| Class A | ||||||||||||||||
| Net assets applicable to outstanding shares | $ | 38,613,688 | $ | 7,701,572 | $ | 39,449,905 | $ | 336,414 | ||||||||
|
|
|
|
|
|
|
| |||||||||
| Shares of beneficial interest outstanding | 4,212,567 | 876,908 | 4,004,520 | 36,172 | ||||||||||||
|
|
|
|
|
|
|
| |||||||||
| Net asset value per share outstanding | $ | 9.17 | $ | 8.78 | $ | 9.85 | $ | 9.30 | ||||||||
|
|
|
|
|
|
|
| |||||||||
| Maximum offering price per share outstanding (Net asset value plus sales charge of 3.00%, 4.00%, 0.00% and 4.00%, respectively) | $ | 9.45 | $ | 9.15 | $ | 9.85 | $ | 9.69 | ||||||||
|
|
|
|
|
|
|
| |||||||||
| Class C | ||||||||||||||||
| Net assets applicable to outstanding shares | $ | 6,831,771 | $ | 7,550,142 | $ | 2,358,850 | $ | 186,560 | ||||||||
|
|
|
|
|
|
|
| |||||||||
| Shares of beneficial interest outstanding | 748,098 | 860,404 | 239,775 | 20,061 | ||||||||||||
|
|
|
|
|
|
|
| |||||||||
| Net asset value per share outstanding | $ | 9.13 | $ | 8.78 | $ | 9.84 | $ | 9.30 | ||||||||
|
|
|
|
|
|
|
| |||||||||
| Class I | ||||||||||||||||
| Net assets applicable to outstanding shares | $ | 43,205,714 | $ | 23,557,632 | $ | 97,536 | $ | 11,489,714 | ||||||||
|
|
|
|
|
|
|
| |||||||||
| Shares of beneficial interest outstanding | 4,700,726 | 2,681,904 | 9,901 | 1,235,482 | ||||||||||||
|
|
|
|
|
|
|
| |||||||||
| Net asset value per share outstanding | $ | 9.19 | $ | 8.78 | $ | 9.85 | $ | 9.30 | ||||||||
|
|
|
|
|
|
|
| |||||||||
| Class Y | ||||||||||||||||
| Net assets applicable to outstanding shares | $ | 122,870,523 | $ | 132,784,133 | $ | 745,872,066 | $ | 34,315,241 | ||||||||
|
|
|
|
|
|
|
| |||||||||
| Shares of beneficial interest outstanding | 13,383,050 | 15,116,437 | 75,776,872 | 3,690,166 | ||||||||||||
|
|
|
|
|
|
|
| |||||||||
| Net asset value per share outstanding | $ | 9.18 | $ | 8.78 | $ | 9.84 | $ | 9.30 | ||||||||
|
|
|
|
|
|
|
| |||||||||
| Class L | ||||||||||||||||
| Net assets applicable to outstanding shares | $ | 95,431,825 | ||||||||||||||
|
| |||||||||||||||
| Shares of beneficial interest outstanding | 9,688,833 | |||||||||||||||
|
| |||||||||||||||
| Net asset value per share outstanding | $ | 9.85 | ||||||||||||||
|
| |||||||||||||||
See accompanying Notes to the Financial Statements.
36
Table of Contents
Barings Funds Trust 2020 Semi-Annual Report
STATEMENTS OF ASSETS AND LIABILITIES
December 31, 2020 (Unaudited)
| BARINGS EMERGING MARKETS DEBT BLENDED TOTAL RETURN FUND | BARINGS GLOBAL EMERGING MARKETS EQUITY FUND | BARINGS U.S. HIGH YIELD FUND | ||||||||||
| Assets | ||||||||||||
| Investments, at fair value (cost $66,034,132, $9,598,076 and $48,082,878, respectively) | $ | 70,605,905 | $ | 12,942,691 | $ | 49,489,251 | ||||||
| Cash | 6,068,858 | 289,596 | 1,677,311 | |||||||||
| Foreign currency, at value (cost $174, $10,588 and $0, respectively) | 174 | 10,601 | – | |||||||||
| Receivable for investments sold | 2,758,545 | 52,398 | 1,095 | |||||||||
| Receivable for Fund shares sold | 443,450 | – | 5,156 | |||||||||
| Interest receivable | 1,225,801 | 4,847 | 791,076 | |||||||||
| Cash collateral held at broker on open swap contracts | 2,559,753 | – | – | |||||||||
| Receivable from adviser (see Note 3) | – | 5,394 | – | |||||||||
| Cash collateral held at broker on open futures contracts | 142,000 | – | – | |||||||||
| Foreign tax reclaims receivable | 10,446 | 1,365 | – | |||||||||
| Unrealized appreciation on forward foreign currency exchange contracts | 1,497,910 | – | – | |||||||||
| Prepaid expenses | 130,769 | 49,045 | 29,365 | |||||||||
|
|
|
|
|
| |||||||
Total assets | 85,443,611 | 13,355,937 | 51,993,254 | |||||||||
|
|
|
|
|
| |||||||
| Liabilities | ||||||||||||
| Payable for investments purchased | 2,758,545 | – | – | |||||||||
| Payable for TBA and when-issued securities purchased | – | – | 654,969 | |||||||||
| Payable for Fund shares repurchased | 19,429 | – | 2,719 | |||||||||
| Swap contracts, at fair value (up-front net premiums received of $222,336, $0, $0, respectively) | 976,756 | – | – | |||||||||
| Payable for variation margin on open swap contracts | 37,154 | – | – | |||||||||
| Payable for variation margin on open futures contracts | 9,750 | – | – | |||||||||
| Investment advisory fee payable (see Note 3) | 30,968 | – | 11,613 | |||||||||
| Directors’ fees payable | – | 3,110 | – | |||||||||
| Cash collateral Due to Broker | 740,000 | – | – | |||||||||
| Distribution fees payable | 2,286 | 139 | 419 | |||||||||
| Dividends payable | 116,408 | – | 100,128 | |||||||||
| Unrealized depreciation on forward foreign currency exchange contracts | 1,524,709 | – | – | |||||||||
| Accrued expenses and other liabilities | 65,939 | 49,738 | 37,726 | |||||||||
|
|
|
|
|
| |||||||
Total liabilities | 6,281,944 | 52,987 | 807,574 | |||||||||
|
|
|
|
|
| |||||||
Total net assets | $ | 79,161,667 | $ | 13,302,950 | $ | 51,185,680 | ||||||
|
|
|
|
|
| |||||||
See accompanying Notes to the Financial Statements.
37
Table of Contents
Barings Funds Trust 2020 Semi-Annual Report
STATEMENTS OF ASSETS AND LIABILITIES (CONTINUED)
December 31, 2020 (Unaudited)
| BARINGS EMERGING MARKETS DEBT BLENDED TOTAL RETURN FUND | BARINGS GLOBAL EMERGING MARKETS EQUITY FUND | BARINGS U.S. HIGH YIELD FUND | ||||||||||
| Composition of net assets | ||||||||||||
| Shares of beneficial interest outstanding (par value $0.00001 per share), unlimited number of shares authorized | $ | 71 | $ | 10 | $ | 53 | ||||||
| Additional paid-in capital | 73,520,641 | 9,984,604 | 52,988,162 | |||||||||
| Total distributable earnings (accumulated loss) | 5,640,955 | 3,318,336 | (1,802,535 | ) | ||||||||
|
|
|
|
|
| |||||||
Total net assets | $ | 79,161,667 | $ | 13,302,950 | $ | 51,185,680 | ||||||
|
|
|
|
|
| |||||||
| Class A | ||||||||||||
| Net assets applicable to outstanding shares | $ | 10,493,407 | $ | 132,843 | $ | 1,189,109 | ||||||
|
|
|
|
|
| |||||||
| Shares of beneficial interest outstanding | 940,737 | 10,000 | 122,249 | |||||||||
|
|
|
|
|
| |||||||
| Net asset value per share outstanding | $ | 11.15 | $ | 13.28 | $ | 9.73 | ||||||
|
|
|
|
|
| |||||||
| Maximum offering price per share outstanding (Net asset value plus sales charge of 4.00%) | $ | 11.61 | $ | 13.83 | $ | 10.14 | ||||||
|
|
|
|
|
| |||||||
| Class C | ||||||||||||
| Net assets applicable to outstanding shares | $ | 258,444 | $ | 132,191 | $ | 97,256 | ||||||
|
|
|
|
|
| |||||||
| Shares of beneficial interest outstanding | 23,174 | 10,000 | 10,000 | |||||||||
|
|
|
|
|
| |||||||
| Net asset value per share outstanding | $ | 11.15 | $ | 13.22 | $ | 9.73 | ||||||
|
|
|
|
|
| |||||||
| Class I | ||||||||||||
| Net assets applicable to outstanding shares | $ | 10,443,256 | $ | 6,518,958 | $ | 12,058,898 | ||||||
|
|
|
|
|
| |||||||
| Shares of beneficial interest outstanding | 935,905 | 490,000 | 1,240,000 | |||||||||
|
|
|
|
|
| |||||||
| Net asset value per share outstanding | $ | 11.16 | $ | 13.30 | $ | 9.72 | ||||||
|
|
|
|
|
| |||||||
| Class Y | ||||||||||||
| Net assets applicable to outstanding shares | $ | 57,966,560 | $ | 6,518,958 | $ | 37,840,417 | ||||||
|
|
|
|
|
| |||||||
| Shares of beneficial interest outstanding | 5,196,994 | 490,000 | 3,891,138 | |||||||||
|
|
|
|
|
| |||||||
| Net asset value per share outstanding | $ | 11.15 | $ | 13.30 | $ | 9.72 | ||||||
|
|
|
|
|
| |||||||
See accompanying Notes to the Financial Statements.
38
Table of Contents
Barings Funds Trust 2020 Semi-Annual Report
For the Six Months Ended December 31, 2020 (Unaudited)
| BARINGS GLOBAL FLOATING RATE FUND | BARINGS GLOBAL CREDIT INCOME OPPORTUNITIES FUND | BARINGS ACTIVE SHORT DURATION BOND FUND | BARINGS DIVERSIFIED INCOME FUND | |||||||||||||
| Investment Income |
| |||||||||||||||
Interest income (net of withholding tax of $0, $0, $7,198 and $0, respectively) | $ | 5,578,955 | $ | 5,347,794 | $ | 11,973,900 | $ | 689,544 | ||||||||
Dividends | 642 | 123 | 276,426 | – | ||||||||||||
Other income | 151,640 | 378,595 | – | – | ||||||||||||
|
|
|
|
|
|
|
| |||||||||
Total investment income | 5,731,237 | 5,726,512 | 12,250,326 | 689,544 | ||||||||||||
|
|
|
|
|
|
|
| |||||||||
| Operating Expenses |
| |||||||||||||||
Advisory fees | 705,632 | 621,134 | 1,439,275 | 87,203 | ||||||||||||
12b-1 distribution and servicing plan | ||||||||||||||||
Class A | 48,073 | 39,067 | 53,519 | 575 | ||||||||||||
Class C | 34,020 | 37,523 | 6,254 | 914 | ||||||||||||
Class L | – | – | 125,352 | – | ||||||||||||
Shareholder service fee | ||||||||||||||||
Class A | 6,311 | 2,083 | 23,510 | 13 | ||||||||||||
Class C | 1,801 | 2,158 | 747 | – | ||||||||||||
Class Y | 44,617 | 24,003 | 248,626 | 7,610 | ||||||||||||
Class L | – | – | 747 | – | ||||||||||||
Administrator fees | 72,264 | 62,512 | 206,893 | 25,455 | ||||||||||||
Custody fees | 66,959 | 63,581 | 225,851 | 14,749 | ||||||||||||
Professional fees | 50,195 | 49,025 | 47,571 | 36,298 | ||||||||||||
Transfer agent fees | 17,493 | 14,214 | 54,308 | 10,418 | ||||||||||||
Directors’ fees | 14,650 | 12,735 | 36,046 | 8,041 | ||||||||||||
Registration fees | 40,971 | 35,643 | 85,155 | 27,493 | ||||||||||||
Printing and mailing expenses | 8,738 | 6,635 | 16,773 | 1,288 | ||||||||||||
Other operating expenses | 37,278 | 30,297 | 130,611 | 5,808 | ||||||||||||
|
|
|
|
|
|
|
| |||||||||
Total operating expenses | 1,149,002 | 1,000,610 | 2,701,238 | 225,865 | ||||||||||||
Waiver/Reimbursement of expenses | ||||||||||||||||
Class A | (41,675 | ) | (23,178 | ) | (56,642 | ) | (3,537 | ) | ||||||||
Class C | (10,428 | ) | (9,362 | ) | (6,029 | ) | (2,943 | ) | ||||||||
Class I | (37,920 | ) | (15,828 | ) | (3,646 | ) | (24,917 | ) | ||||||||
Class Y | (162,695 | ) | (88,881 | ) | (733,963 | ) | (73,065 | ) | ||||||||
Class L | – | – | (70,947 | ) | – | |||||||||||
|
|
|
|
|
|
|
| |||||||||
Net operating expenses | 896,284 | 863,361 | 1,830,011 | 121,403 | ||||||||||||
|
|
|
|
|
|
|
| |||||||||
Net investment income | 4,834,953 | 4,863,151 | 10,420,315 | 568,141 | ||||||||||||
|
|
|
|
|
|
|
| |||||||||
See accompanying Notes to the Financial Statements.
39
Table of Contents
Barings Funds Trust 2020 Semi-Annual Report
STATEMENTS OF OPERATIONS (CONTINUED)
For the Six Months Ended December 31, 2020 (Unaudited)
| BARINGS GLOBAL FLOATING RATE FUND | BARINGS GLOBAL CREDIT INCOME OPPORTUNITIES FUND | BARINGS ACTIVE SHORT DURATION BOND FUND | BARINGS DIVERSIFIED INCOME FUND | |||||||||||||
| Realized and Unrealized Gains (Losses) |
| |||||||||||||||
Net realized gain (loss) on investments | $ | (2,466,799 | ) | $ | (3,090,983 | ) | $ | 4,528,598 | $ | 523,142 | ||||||
Net realized gain (loss) on forward foreign currency exchange contracts | (2,979,313 | ) | (2,629,760 | ) | – | (33,840 | ) | |||||||||
Net realized gain on foreign currency and translation | 231,912 | 42,960 | – | 5,556 | ||||||||||||
Net realized gain (loss) on futures contracts | – | – | 13,032 | 52,374 | ||||||||||||
Net realized gain (loss) on swap contracts | – | – | (340,586 | ) | (27,294 | ) | ||||||||||
Net realized gain on written options | – | 403,346 | – | – | ||||||||||||
Net realized gain (loss) on purchased options | – | (692,562 | ) | – | – | |||||||||||
|
|
|
|
|
|
|
| |||||||||
Net realized gain (loss) | (5,214,200 | ) | (5,966,999 | ) | 4,201,044 | 519,938 | ||||||||||
|
|
|
|
|
|
|
| |||||||||
Net change in unrealized appreciation on investments | 20,713,479 | 19,074,581 | 24,989,366 | 2,136,749 | ||||||||||||
Net change in unrealized appreciation (depreciation) on unfunded loan commitments | (618 | ) | (317 | ) | – | – | ||||||||||
Net change in unrealized appreciation (depreciation) on forward foreign currency exchange contracts | (989,769 | ) | (853,832 | ) | – | (4,172 | ) | |||||||||
Net change in unrealized appreciation (depreciation) on foreign currency and translation | (9,313 | ) | 29,534 | – | (860 | ) | ||||||||||
Net change in unrealized appreciation (depreciation) on futures contracts | – | – | 115,105 | 61,968 | ||||||||||||
Net change in unrealized appreciation (depreciation) on swap contracts | – | – | 121,089 | – | ||||||||||||
Net change in unrealized appreciation on written option contracts | – | 18,451 | – | – | ||||||||||||
Net change in unrealized appreciation (depreciation) on purchased option contracts | – | (37,712 | ) | (46,684 | ) | – | ||||||||||
|
|
|
|
|
|
|
| |||||||||
Net change in unrealized appreciation (depreciation) | 19,713,779 | 18,230,705 | 25,178,876 | 2,193,685 | ||||||||||||
|
|
|
|
|
|
|
| |||||||||
Net realized and unrealized gains | 14,499,579 | 12,263,706 | 29,379,920 | 2,713,623 | ||||||||||||
|
|
|
|
|
|
|
| |||||||||
Net increase in net assets resulting from operations | $ | 19,334,532 | $ | 17,126,857 | $ | 39,800,235 | $ | 3,281,764 | ||||||||
|
|
|
|
|
|
|
| |||||||||
See accompanying Notes to the Financial Statements.
40
Table of Contents
Barings Funds Trust 2020 Semi-Annual Report
STATEMENTS OF OPERATIONS
For the Six Months Ended December 31, 2020 (Unaudited)
| BARINGS EMERGING MARKETS DEBT BLENDED TOTAL RETURN FUND | BARINGS GLOBAL EQUITY FUND | BARINGS U.S. HIGH YIELD FUND | ||||||||||
| Investment Income |
| |||||||||||
Interest income (net of withholding tax of $3,094, $0 and $0, respectively) | $ | 2,027,682 | $ | — | $ | 1,524,104 | ||||||
Dividend income (net of withholding tax of $0, $14,750, and $0, respectively) | — | 118,449 | — | |||||||||
Other income | 4,250 | — | 5,250 | |||||||||
|
|
|
|
|
| |||||||
Total investment income | 2,031,932 | 118,449 | 1,529,354 | |||||||||
|
|
|
|
|
| |||||||
| Operating Expenses |
| |||||||||||
Advisory fees | 233,224 | 54,308 | 135,405 | |||||||||
12b-1 distribution and servicing plan | ||||||||||||
Class A | 10,598 | 151 | 2,488 | |||||||||
Class C | 1,303 | 601 | 470 | |||||||||
Shareholder service fee | ||||||||||||
Class A | 1,224 | — | 559 | |||||||||
Class C | 24 | — | — | |||||||||
Class Y | 4,215 | — | 2,663 | |||||||||
Administrator fees | 27,882 | 15,123 | 26,018 | |||||||||
Custody fees | 37,409 | 5,176 | 16,065 | |||||||||
Professional fees | 32,947 | 23,975 | 24,494 | |||||||||
Transfer agent fees | 14,661 | 8,361 | 5,890 | |||||||||
Directors’ fees | 9,003 | 15,198 | 8,762 | |||||||||
Registration fees | 30,327 | 27,968 | 28,769 | |||||||||
Printing and mailing expenses | 1,148 | 3,025 | 1,382 | |||||||||
Other operating expenses | 7,966 | 2,703 | 7,418 | |||||||||
|
|
|
|
|
| |||||||
Total operating expenses | 411,931 | 156,589 | 260,383 | |||||||||
Waiver/Reimbursement of expenses | ||||||||||||
Class A | (16,390 | ) | (2,902 | ) | (4,604 | ) | ||||||
Class C | (3,976 | ) | (2,898 | ) | (1,551 | ) | ||||||
Class I | (19,770 | ) | (41,844 | ) | (16,497 | ) | ||||||
Class Y | (64,476 | ) | (41,842 | ) | (50,130 | ) | ||||||
|
|
|
|
|
| |||||||
Net operating expenses | 307,319 | 67,103 | 187,601 | |||||||||
|
|
|
|
|
| |||||||
Net investment income | 1,724,613 | 51,346 | 1,341,753 | |||||||||
|
|
|
|
|
| |||||||
See accompanying Notes to the Financial Statements.
41
Table of Contents
Barings Funds Trust 2020 Semi-Annual Report
STATEMENTS OF OPERATIONS (CONTINUED)
For the Six Months Ended December 31, 2020 (Unaudited)
| BARINGS EMERGING MARKETS DEBT BLENDED TOTAL RETURN FUND | BARINGS GLOBAL EQUITY FUND | BARINGS U.S. HIGH YIELD FUND | ||||||||||
Realized and Unrealized Gains (Losses) |
| |||||||||||
Net realized gain (loss) on investments | $ | 1,214,371 | $ | 377,552 | $ | (815,848 | ) | |||||
Net realized gain on forward foreign currency exchange contracts | 1,185,382 | — | — | |||||||||
Net realized gain (loss) on foreign currency and translation | (1,538 | ) | (1,304 | ) | — | |||||||
Net realized gain (loss) on futures contracts | 33,456 | — | — | |||||||||
Net realized gain on swap contracts | 2,191,177 | — | — | |||||||||
|
|
|
|
|
| |||||||
Net realized gain (loss) | 4,622,848 | 376,248 | (815,848 | ) | ||||||||
|
|
|
|
|
| |||||||
Net change in unrealized appreciation on investments (1) | 5,726,852 | 2,603,672 | 5,093,978 | |||||||||
Net change in unrealized appreciation (depreciation) on forward foreign currency exchange contracts | (881,405 | ) | — | — | ||||||||
Net change in unrealized appreciation on foreign currency and translation | 61,035 | 203 | — | |||||||||
Net change in unrealized appreciation (depreciation) on futures contracts | 47,219 | — | — | |||||||||
Net change in unrealized appreciation (depreciation) on swap contracts | (3,520,542 | ) | — | — | ||||||||
|
|
|
|
|
| |||||||
Net change in unrealized appreciation (depreciation) | 1,433,159 | 2,603,875 | 5,093,978 | |||||||||
|
|
|
|
|
| |||||||
Net realized and unrealized gains | 6,056,007 | 2,980,123 | 4,278,130 | |||||||||
|
|
|
|
|
| |||||||
Net increase in net assets resulting from operations | $ | 7,780,620 | $ | 3,031,469 | $ | 5,619,883 | ||||||
|
|
|
|
|
| |||||||
| (1) | Net of change in unrealized appreciation/(depreciation) of foreign capital gains taxes of $(1,486). |
See accompanying Notes to the Financial Statements.
42
Table of Contents
Barings Funds Trust 2020 Semi-Annual Report
STATEMENTS OF CHANGES IN NET ASSETS
(Unaudited)
| BARINGS GLOBAL FLOATING RATE FUND | BARINGS GLOBAL CREDIT INCOME OPPORTUNITIES FUND | |||||||||||||||
| FOR THE SIX MONTHS ENDED DECEMBER 31, 2020 | FOR THE YEAR ENDED JUNE 30, 2020 | FOR THE SIX MONTHS ENDED DECEMBER 31, 2020 | FOR THE YEAR ENDED JUNE 30, 2020 | |||||||||||||
| Operations |
| |||||||||||||||
Net investment income | 4,834,953 | 11,934,842 | 4,863,151 | 10,927,198 | ||||||||||||
Net realized loss | (5,214,200 | ) | (8,284,095 | ) | (5,966,999 | ) | (9,309,427 | ) | ||||||||
Net change in unrealized appreciation (depreciation) | 19,713,779 | (13,188,700 | ) | 18,230,705 | (12,349,471 | ) | ||||||||||
|
|
|
|
|
|
|
| |||||||||
Net increase (decrease) in net assets from operations | 19,334,532 | (9,537,953 | ) | 17,126,857 | (10,731,700 | ) | ||||||||||
|
|
|
|
|
|
|
| |||||||||
| Dividends and distributions |
| |||||||||||||||
Class A | (788,813 | ) | (1,752,333 | ) | (829,217 | ) | (2,270,709 | ) | ||||||||
|
|
|
|
|
|
|
| |||||||||
Class C | (114,021 | ) | (263,597 | ) | (174,393 | ) | (321,702 | ) | ||||||||
|
|
|
|
|
|
|
| |||||||||
Class I | (906,517 | ) | (1,584,124 | ) | (639,563 | ) | (1,091,239 | ) | ||||||||
|
|
|
|
|
|
|
| |||||||||
Class Y | (2,833,397 | ) | (7,063,704 | ) | (2,958,638 | ) | (5,901,580 | ) | ||||||||
|
|
|
|
|
|
|
| |||||||||
Total Dividends and distributions | (4,642,748 | ) | (10,663,758 | ) | (4,601,811 | ) | (9,585,230 | ) | ||||||||
|
|
|
|
|
|
|
| |||||||||
Class A | — | (360,351 | ) | — | (356,912 | ) | ||||||||||
|
|
|
|
|
|
|
| |||||||||
Class C | — | (52,291 | ) | — | (51,371 | ) | ||||||||||
|
|
|
|
|
|
|
| |||||||||
Class I | — | (369,841 | ) | — | (174,380 | ) | ||||||||||
|
|
|
|
|
|
|
| |||||||||
Class Y | — | (1,382,565 | ) | — | (870,042 | ) | ||||||||||
|
|
|
|
|
|
|
| |||||||||
Total Return of capital | — | (2,165,048 | ) | — | (1,452,705 | ) | ||||||||||
|
|
|
|
|
|
|
| |||||||||
| Capital Share Transactions |
| |||||||||||||||
Net proceeds from sale of shares | 16,803,479 | 106,125,221 | 50,765,498 | 64,702,295 | ||||||||||||
Net Asset Value of shares issued to shareholders in payment of distributions declared | 4,014,725 | 10,443,892 | 3,361,201 | 8,443,894 | ||||||||||||
Cost of shares redeemed | (38,698,298 | ) | (153,128,901 | ) | (59,198,058 | ) | (99,727,481 | ) | ||||||||
|
|
|
|
|
|
|
| |||||||||
Net decrease in net assets resulting from capital stock transactions | (17,880,094 | ) | (36,559,788 | ) | (5,071,359 | ) | (26,581,292 | ) | ||||||||
|
|
|
|
|
|
|
| |||||||||
Total increase (decrease) in net assets | (3,188,310 | ) | (58,926,547 | ) | 7,453,687 | (48,350,927 | ) | |||||||||
|
|
|
|
|
|
|
| |||||||||
| Net Assets |
| |||||||||||||||
Beginning of period | 214,710,006 | 273,636,553 | 164,139,792 | 212,490,719 | ||||||||||||
|
|
|
|
|
|
|
| |||||||||
End of period | 211,521,696 | 214,710,006 | 171,593,479 | 164,139,792 | ||||||||||||
|
|
|
|
|
|
|
| |||||||||
See accompanying Notes to the Financial Statements.
43
Table of Contents
Barings Funds Trust 2020 Semi-Annual Report
STATEMENTS OF CHANGES IN NET ASSETS
(Unaudited)
| BARINGS ACTIVE SHORT DURATION BOND FUND | BARINGS DIVERSIFIED INCOME FUND | |||||||||||||||
| FOR THE SIX MONTHS ENDED DECEMBER 31, 2020 | FOR THE YEAR JUNE 30, 2020 | FOR THE SIX MONTHS ENDED DECEMBER 31, 2020 | FOR THE YEAR JUNE 30, 2020 | |||||||||||||
| Operations |
| |||||||||||||||
Net investment income | $ | 10,420,315 | $ | 24,970,866 | $ | 568,141 | $ | 1,479,690 | ||||||||
Net realized gain (loss) | 4,201,044 | (24,682,091 | ) | 519,938 | (2,679,571 | ) | ||||||||||
Net change in unrealized appreciation (depreciation) | 25,178,876 | (20,585,735 | ) | 2,193,685 | (1,572,448 | ) | ||||||||||
|
|
|
|
|
|
|
| |||||||||
Net increase (decrease) in net assets from operations | 39,800,235 | (20,296,960 | ) | 3,281,764 | (2,772,329 | ) | ||||||||||
|
|
|
|
|
|
|
| |||||||||
| Dividends and distributions | ||||||||||||||||
Class A | (498,176 | ) | (4,268,051 | ) | (5,481 | ) | (9,395 | ) | ||||||||
|
|
|
|
|
|
|
| |||||||||
Class C | (25,992 | ) | (61,754 | ) | (1,454 | ) | (4,704 | ) | ||||||||
|
|
|
|
|
|
|
| |||||||||
Class I | (1,249 | ) | (6,754 | ) | (145,806 | ) | (406,140 | ) | ||||||||
|
|
|
|
|
|
|
| |||||||||
Class Y | (8,704,283 | ) | (20,482,090 | ) | (409,913 | ) | (1,051,301 | ) | ||||||||
|
|
|
|
|
|
|
| |||||||||
Class L(1) | (1,170,139 | ) | (108,096 | ) | — | — | ||||||||||
|
|
|
|
|
|
|
| |||||||||
Total Dividends and distributions | (10,399,839 | ) | (24,926,745 | ) | (562,654 | ) | (1,471,540 | ) | ||||||||
|
|
|
|
|
|
|
| |||||||||
| Capital Share Transactions | ||||||||||||||||
Net proceeds from sale of shares | 245,184,887 | 686,580,548 | 3,812,154 | 21,879,952 | ||||||||||||
Net Asset Value of shares issued to shareholders in payment of distributions declared | 8,754,603 | 20,314,845 | 254,761 | 636,919 | ||||||||||||
Cost of shares redeemed | (203,626,709 | ) | (573,907,960 | ) | (1,231,882 | ) | (19,982,097 | ) | ||||||||
|
|
|
|
|
|
|
| |||||||||
Net increase in net assets resulting from capital stock transactions | 50,312,781 | 132,987,433 | 2,835,033 | 2,534,774 | ||||||||||||
|
|
|
|
|
|
|
| |||||||||
Total increase (decrease) in net assets | 79,713,177 | 87,763,728 | 5,554,143 | (1,709,095 | ) | |||||||||||
|
|
|
|
|
|
|
| |||||||||
| Net Assets | ||||||||||||||||
Beginning of period | 803,497,005 | 715,733,277 | 40,789,732 | 42,498,827 | ||||||||||||
|
|
|
|
|
|
|
| |||||||||
End of period | $ | 883,210,182 | $ | 803,497,005 | $ | 46,343,875 | $ | 40,789,732 | ||||||||
|
|
|
|
|
|
|
| |||||||||
| (1) | Commenced operations on May 1, 2020. |
See accompanying Notes to the Financial Statements.
44
Table of Contents
Barings Funds Trust 2020 Semi-Annual Report
STATEMENTS OF CHANGES IN NET ASSETS
(Unaudited)
| BARINGS EMERGING MARKETS DEBT BLENDED TOTAL RETURN FUND | BARINGS GLOBAL EMERGING MARKETS EQUITY FUND | |||||||||||||||
| FOR THE SIX MONTHS ENDED DECEMBER 31, 2020 | FOR THE YEAR ENDED JUNE 30, 2020 | FOR THE SIX MONTHS ENDED DECEMBER 31, 2020 | FOR THE YEAR ENDED JUNE 30, 2020 | |||||||||||||
| Operations |
| |||||||||||||||
Net investment income | $ | 1,724,613 | $ | 3,720,549 | $ | 51,346 | $ | 179,524 | ||||||||
Net realized gain (loss) | 4,622,848 | (237,910 | ) | 376,248 | (343,901 | ) | ||||||||||
Net change in unrealized appreciation (depreciation) | 1,433,159 | 2,688,775 | 2,603,875 | (235,789 | ) | |||||||||||
|
|
|
|
|
|
|
| |||||||||
Net increase (decrease) in net assets from operations | 7,780,620 | 6,171,414 | 3,031,469 | (400,166 | ) | |||||||||||
|
|
|
|
|
|
|
| |||||||||
| Dividends and distributions | ||||||||||||||||
Class A | (449,567 | ) | (150,461 | ) | (933 | ) | (3,013 | ) | ||||||||
|
|
|
|
|
|
|
| |||||||||
Class C | (11,888 | ) | (14,353 | ) | (547 | ) | (2,081 | ) | ||||||||
|
|
|
|
|
|
|
| |||||||||
Class I | (569,490 | ) | (1,361,075 | ) | (51,989 | ) | (163,753 | ) | ||||||||
|
|
|
|
|
|
|
| |||||||||
Class Y | (2,376,873 | ) | (2,004,219 | ) | (51,989 | ) | (163,753 | ) | ||||||||
|
|
|
|
|
|
|
| |||||||||
Total Dividends and distributions | (3,407,818 | ) | (3,530,108 | ) | (105,458 | ) | (332,600 | ) | ||||||||
|
|
|
|
|
|
|
| |||||||||
| Return of capital | ||||||||||||||||
Class A | — | — | — | (137 | ) | |||||||||||
|
|
|
|
|
|
|
| |||||||||
Class C | — | — | — | (95 | ) | |||||||||||
|
|
|
|
|
|
|
| |||||||||
Class I | — | — | — | (7,453 | ) | |||||||||||
|
|
|
|
|
|
|
| |||||||||
Class Y | — | — | — | (7,453 | ) | |||||||||||
|
|
|
|
|
|
|
| |||||||||
Total Return of capital | — | — | — | (15,138 | ) | |||||||||||
|
|
|
|
|
|
|
| |||||||||
| Capital Share Transactions | ||||||||||||||||
Net proceeds from sale of shares | 31,377,023 | 28,149,569 | — | — | ||||||||||||
Net Asset Value of shares issued to shareholders in payment of distributions declared | 2,076,996 | 647,379 | — | — | ||||||||||||
Cost of shares redeemed | (13,324,953 | ) | (27,212,488 | ) | — | — | ||||||||||
|
|
|
|
|
|
|
| |||||||||
Net increase in net assets resulting from capital stock transactions | 20,129,066 | 1,584,460 | — | — | ||||||||||||
|
|
|
|
|
|
|
| |||||||||
Total increase (decrease) in net assets | 24,501,868 | 4,225,766 | 2,926,011 | (747,904 | ) | |||||||||||
|
|
|
|
|
|
|
| |||||||||
| Net Assets | ||||||||||||||||
Beginning of period | 54,659,799 | 50,434,033 | 10,376,939 | 11,124,843 | ||||||||||||
|
|
|
|
|
|
|
| |||||||||
End of period | $ | 79,161,667 | $ | 54,659,799 | $ | 13,302,950 | $ | 10,376,939 | ||||||||
|
|
|
|
|
|
|
| |||||||||
See accompanying Notes to the Financial Statements.
45
Table of Contents
Barings Funds Trust 2020 Semi-Annual Report
STATEMENTS OF CHANGES IN NET ASSETS
(Unaudited)
| BARINGS U.S. HIGH YIELD FUND | ||||||||
| FOR THE SIX MONTHS ENDED DECEMBER 31, 2020 | FOR THE YEAR ENDED JUNE 30, 2020 | |||||||
| Operations |
| |||||||
Net investment income | $ | 1,341,753 | $ | 2,826,976 | ||||
Net realized loss | (815,848 | ) | (1,800,225 | ) | ||||
Net change in unrealized appreciation (depreciation) | 5,093,978 | (3,074,461 | ) | |||||
|
|
|
| |||||
Net increase (decrease) in net assets from operations | 5,619,883 | (2,047,710 | ) | |||||
|
|
|
| |||||
| Dividends and distributions | ||||||||
Class A | (51,975 | ) | (142,062 | ) | ||||
|
|
|
| |||||
Class C | (2,090 | ) | (4,612 | ) | ||||
|
|
|
| |||||
Class I | (317,396 | ) | (688,893 | ) | ||||
|
|
|
| |||||
Class Y | (966,995 | ) | (2,043,599 | ) | ||||
|
|
|
| |||||
Total Dividends and distributions | (1,338,456 | ) | (2,879,166 | ) | ||||
|
|
|
| |||||
| Capital Share Transactions | ||||||||
Net proceeds from sale of shares | 3,576,531 | 8,447,531 | ||||||
Net Asset Value of shares issued to shareholders in payment of distributions declared | 693,151 | 1,475,410 | ||||||
Cost of shares redeemed | (3,402,079 | ) | (9,728,479 | ) | ||||
|
|
|
| |||||
Net increase in net assets resulting from capital stock transactions | �� | 867,603 | 194,462 | |||||
|
|
|
| |||||
Total increase (decrease) in net assets | 5,149,030 | (4,732,414 | ) | |||||
|
|
|
| |||||
| Net Assets | ||||||||
Beginning of period | 46,036,650 | 50,769,064 | ||||||
|
|
|
| |||||
End of period | $ | 51,185,680 | $ | 46,036,650 | ||||
|
|
|
| |||||
See accompanying Notes to the Financial Statements.
46
Table of Contents
Barings Global Floating Rate Fund 2020 Semi-Annual Report
| CLASS A | ||||||||||||||||||||||||
FOR THE SIX MONTHS | FOR THE YEAR ENDED JUNE 30, 2020 | FOR THE YEAR ENDED JUNE 30, 2019 | FOR THE YEAR ENDED JUNE 30, 2018 | FOR THE YEAR ENDED JUNE 30, 2017 | FOR THE YEAR ENDED JUNE 30, 2016 | |||||||||||||||||||
| Per Common Share Data | ||||||||||||||||||||||||
Net asset value, beginning of period | $ | 8.56 | $ | 9.26 | $ | 9.48 | $ | 9.54 | $ | 9.13 | $ | 9.60 | ||||||||||||
Income from investment operations: | ||||||||||||||||||||||||
Net investment income (2) | 0.19 | 0.41 | 0.44 | 0.43 | 0.43 | 0.44 | ||||||||||||||||||
Net realized and unrealized gain (loss) | 0.60 | (0.66 | ) | (0.18 | ) | (0.06 | ) | 0.42 | (0.45 | ) | ||||||||||||||
|
|
|
|
|
|
|
|
|
|
|
| |||||||||||||
Total increase (decrease) from investment operations | 0.79 | (0.25 | ) | 0.26 | 0.37 | 0.85 | (0.01 | ) | ||||||||||||||||
|
|
|
|
|
|
|
|
|
|
|
| |||||||||||||
Less dividends and distributions: | ||||||||||||||||||||||||
From net investment income | (0.18 | ) | (0.34 | ) | (0.44 | ) | (0.38 | ) | (0.31 | ) | (0.46 | ) | ||||||||||||
From net realized gain | – | (0.03 | ) | (0.04 | ) | – | – | – | ||||||||||||||||
From return of capital | – | (0.08 | ) | – | (0.05 | ) | (0.13 | ) | – | |||||||||||||||
|
|
|
|
|
|
|
|
|
|
|
| |||||||||||||
Total dividends and distributions | (0.18 | ) | (0.45 | ) | (0.48 | ) | (0.43 | ) | (0.44 | ) | (0.46 | ) | ||||||||||||
|
|
|
|
|
|
|
|
|
|
|
| |||||||||||||
Net asset value, at end of period | $ | 9.17 | $ | 8.56 | $ | 9.26 | $ | 9.48 | $ | 9.54 | $ | 9.13 | ||||||||||||
|
|
|
|
|
|
|
|
|
|
|
| |||||||||||||
Total investment return (3) | 9.30 | %(4) | (2.79 | )% | 2.77 | % | 4.00 | % | 9.47 | % | (0.04 | )% | ||||||||||||
|
|
|
|
|
|
|
|
|
|
|
| |||||||||||||
| Supplemental Data and Ratios | ||||||||||||||||||||||||
Net assets, end of period (000’s) | $ | 38,614 | $ | 37,431 | $ | 45,213 | $ | 53,371 | $ | 45,363 | $ | 13,980 | ||||||||||||
Ratio of total expenses (before reductions and reimbursements) to average net assets | 1.22 | % (5) | 1.22 | % | 1.25 | % | 1.26 | % | 1.37 | % | 1.72 | % | ||||||||||||
Ratio of net expenses to average net assets (6) | 1.00 | % (5) | 1.00 | % | 1.00 | % | 0.96 | %(7) | 0.99 | %(8) | 1.05 | % (9) | ||||||||||||
Ratio of net investment income to average net assets | 4.28 | % (5) | 4.63 | % | 4.72 | % | 4.55 | % | 4.52 | % | 4.74 | % | ||||||||||||
Portfolio turnover rate | 17.35 | % (4) | 37.23 | % | 46.51 | % | 57.74 | % | 47.06 | % | 62.99 | % | ||||||||||||
| (1) | Unaudited. |
| (2) | Calculated using average shares outstanding. |
| (3) | Total investment return calculation does not consider the effects of sales loads and assumes the reinvestment of dividends at actual prices pursuant to the Fund’s dividend reinvestment plan. |
| (4) | Not annualized. |
| (5) | Annualized for periods less than one full year. |
| (6) | The Adviser has agreed to waive and/or reimburse certain fees and/or expense so that, on an annualized basis, such expenses incurred will not exceed 1.00% as a percentage of average daily net assets. |
| (7) | Net expenses reflect a voluntary expense reimbursement to prevent a negative yield. |
| (8) | Net expenses reflect a one-time voluntary reimbursement to the Fund during the period in connection with a change to the fee waiver and/or expense reimbursement agreement. |
| (9) | Net expenses reflect a previous fee waiver and/or expense reimbursement agreement. |
See accompanying Notes to the Financial Statements.
47
Table of Contents
Barings Global Floating Rate Fund 2020 Semi-Annual Report
FINANCIAL HIGHLIGHTS (CONTINUED)
| CLASS C | ||||||||||||||||||||||||
FOR THE SIX MONTHS | FOR THE YEAR ENDED JUNE 30, 2020 | FOR THE YEAR ENDED JUNE 30, 2019 | FOR THE YEAR ENDED JUNE 30, 2018 | FOR THE YEAR ENDED JUNE 30, 2017 | FOR THE YEAR ENDED JUNE 30, 2016 | |||||||||||||||||||
| Per Common Share Data | ||||||||||||||||||||||||
Net asset value, beginning of period | $ | 8.53 | $ | 9.22 | $ | 9.45 | $ | 9.51 | $ | 9.10 | $ | 9.57 | ||||||||||||
Income from investment operations: | ||||||||||||||||||||||||
Net investment income (2) | 0.16 | 0.35 | 0.37 | 0.36 | 0.37 | 0.37 | ||||||||||||||||||
Net realized and unrealized gain (loss) | 0.59 | (0.66 | ) | (0.19 | ) | (0.06 | ) | 0.41 | (0.45 | ) | ||||||||||||||
|
|
|
|
|
|
|
|
|
|
|
| |||||||||||||
Total increase (decrease) from investment operations | 0.75 | (0.31 | ) | 0.18 | 0.30 | 0.78 | (0.08 | ) | ||||||||||||||||
|
|
|
|
|
|
|
|
|
|
|
| |||||||||||||
Less dividends and distributions: | ||||||||||||||||||||||||
From net investment income | (0.15 | ) | (0.29 | ) | (0.37 | ) | (0.32 | ) | (0.26 | ) | (0.39 | ) | ||||||||||||
From net realized gain | – | (0.03 | ) | (0.04 | ) | – | – | – | ||||||||||||||||
From return of capital | – | (0.06 | ) | – | (0.04 | ) | (0.11 | ) | – | |||||||||||||||
|
|
|
|
|
|
|
|
|
|
|
| |||||||||||||
Total dividends and distributions | (0.15 | ) | (0.38 | ) | (0.41 | ) | (0.36 | ) | (0.37 | ) | (0.39 | ) | ||||||||||||
|
|
|
|
|
|
|
|
|
|
|
| |||||||||||||
Net asset value, at end of period | $ | 9.13 | $ | 8.53 | $ | 9.22 | $ | 9.45 | $ | 9.51 | $ | 9.10 | ||||||||||||
|
|
|
|
|
|
|
|
|
|
|
| |||||||||||||
Total investment return (3) | 8.89 | %(4) | (3.52 | )% | 2.02 | % | 3.24 | % | 8.68 | % | (0.81 | )% | ||||||||||||
|
|
|
|
|
|
|
|
|
|
|
| |||||||||||||
| Supplemental Data and Ratios | ||||||||||||||||||||||||
Net assets, end of period (000’s) | $ | 6,832 | $ | 6,494 | $ | 8,005 | $ | 8,311 | $ | 8,018 | $ | 6,803 | ||||||||||||
Ratio of total expenses (before reductions and reimbursements) to average net assets | 2.06 | % (5) | 2.04 | % | 2.05 | % | 2.09 | % | 2.24 | % | 2.50 | % | ||||||||||||
Ratio of net expenses to average net assets (6) | 1.75 | % (5) | 1.75 | % | 1.74 | %(7) | 1.70 | % (7) | 1.71 | % (8) | 1.80 | % (9) | ||||||||||||
Ratio of net investment income to average net assets | 3.53 | % (5) | 3.88 | % | 4.00 | % | 3.80 | % | 3.91 | % | 4.04 | % | ||||||||||||
Portfolio turnover rate | 17.35 | % (4) | 37.23 | % | 46.51 | % | 57.74 | % | 47.06 | % | 62.99 | % | ||||||||||||
| (1) | Unaudited. |
| (2) | Calculated using average shares outstanding. |
| (3) | Total investment return calculation does not consider the effects of sales loads and assumes the reinvestment of dividends at actual prices pursuant to the Fund’s dividend reinvestment plan. |
| (4) | Not annualized. |
| (5) | Annualized for periods less than one full year. |
| (6) | The Adviser has agreed to waive and/or reimburse certain fees and/or expense so that, on an annualized basis, such expenses incurred will not exceed 1.75% as a percentage of average daily net assets. |
| (7) | Net expenses reflect a voluntary expense reimbursement to prevent a negative yield. |
| (8) | Net expenses reflect a one-time voluntary reimbursement to the Fund during the period in connection with a change to the fee waiver and/or expense reimbursement agreement. |
| (9) | Net expenses reflect a previous fee waiver and/or expense reimbursement agreement. |
See accompanying Notes to the Financial Statements.
48
Table of Contents
Barings Global Floating Rate Fund 2020 Semi-Annual Report
FINANCIAL HIGHLIGHTS (CONTINUED)
| CLASS I | ||||||||||||||||||||||||
| FOR THE SIX MONTHS ENDED DECEMBER 31, 2020(1) | FOR THE YEAR ENDED JUNE 30, 2020 | FOR THE YEAR ENDED JUNE 30, 2019 | FOR THE YEAR ENDED JUNE 30, 2018 | FOR THE YEAR ENDED JUNE 30, 2017 | FOR THE YEAR ENDED JUNE 30, 2016 | |||||||||||||||||||
| Per Common Share Data | ||||||||||||||||||||||||
Net asset value, beginning of period | $ | 8.58 | $ | 9.28 | $ | 9.50 | $ | 9.56 | $ | 9.15 | $ | 9.62 | ||||||||||||
Income from investment operations: | ||||||||||||||||||||||||
Net investment income (2) | 0.20 | 0.43 | 0.47 | 0.46 | 0.47 | 0.47 | ||||||||||||||||||
Net realized and unrealized gain (loss) | 0.61 | (0.66 | ) | (0.18 | ) | (0.06 | ) | 0.40 | (0.45 | ) | ||||||||||||||
|
|
|
|
|
|
|
|
|
|
|
| |||||||||||||
Total increase (decrease) from investment operations | 0.81 | (0.23 | ) | 0.29 | 0.40 | 0.87 | 0.02 | |||||||||||||||||
|
|
|
|
|
|
|
|
|
|
|
| |||||||||||||
Less dividends and distributions: | ||||||||||||||||||||||||
From net investment income | (0.20 | ) | (0.36 | ) | (0.47 | ) | (0.41 | ) | (0.32 | ) | (0.49 | ) | ||||||||||||
From net realized gain | – | (0.03 | ) | (0.04 | ) | – | – | – | ||||||||||||||||
From return of capital | – | (0.08 | ) | – | (0.05 | ) | (0.14 | ) | – | |||||||||||||||
|
|
|
|
|
|
|
|
|
|
|
| |||||||||||||
Total dividends and distributions | (0.20 | ) | (0.47 | ) | (0.51 | ) | (0.46 | ) | (0.46 | ) | (0.49 | ) | ||||||||||||
|
|
|
|
|
|
|
|
|
|
|
| |||||||||||||
Net asset value, at end of period | $ | 9.19 | $ | 8.58 | $ | 9.28 | $ | 9.50 | $ | 9.56 | $ | 9.15 | ||||||||||||
|
|
|
|
|
|
|
|
|
|
|
| |||||||||||||
Total investment return (3) | 9.44 | %(4) | (2.47 | )% | 3.04 | % | 4.28 | % | 9.74 | % | 0.25 | % | ||||||||||||
|
|
|
|
|
|
|
|
|
|
|
| |||||||||||||
| Supplemental Data and Ratios | ||||||||||||||||||||||||
Net assets, end of period (000’s) | $ | 43,206 | $ | 39,483 | $ | 32,531 | $ | 18,370 | $ | 19,733 | $ | 19,903 | ||||||||||||
Ratio of total expenses (before reductions and reimbursements) to average net assets | 0.93 | % (5) | 0.92 | % | 0.94 | % | 1.03 | % | 1.16 | % | 1.29 | % | ||||||||||||
Ratio of net expenses to average net assets (6) | 0.75 | % (5) | 0.75 | % | 0.75 | % | 0.71 | % (7) | 0.75 | % | 0.75 | % | ||||||||||||
Ratio of net investment income to average net assets | 4.53 | % (5) | 4.87 | % | 5.01 | % | 4.78 | % | 4.90 | % | 5.07 | % | ||||||||||||
Portfolio turnover rate | 17.35 | % (4) | 37.23 | % | 46.51 | % | 57.74 | % | 47.06 | % | 62.99 | % | ||||||||||||
| (1) | Unaudited. |
| (2) | Calculated using average shares outstanding. |
| (3) | Total investment return calculation assumes the reinvestment of dividends at actual prices pursuant to the Fund’s dividend reinvestment plan. |
| (4) | Not annualized. |
| (5) | Annualized for periods less than one full year. |
| (6) | The Adviser has agreed to waive and/or reimburse certain fees and/or expense so that, on an annualized basis, such expenses incurred will not exceed 0.75% as a percentage of average daily net assets. |
| (7) | Net expenses reflect a voluntary expense reimbursement to prevent a negative yield. |
See accompanying Notes to the Financial Statements.
49
Table of Contents
Barings Global Floating Rate Fund 2020 Semi-Annual Report
FINANCIAL HIGHLIGHTS (CONTINUED)
| CLASS Y | ||||||||||||||||||||||||
| FOR THE SIX MONTHS ENDED DECEMBER 31, 2020(1) | FOR THE YEAR ENDED JUNE 30, 2020 | FOR THE YEAR ENDED JUNE 30, 2019 | FOR THE YEAR ENDED JUNE 30, 2018 | FOR THE YEAR ENDED JUNE 30, 2017 | FOR THE YEAR ENDED JUNE 30, 2016 | |||||||||||||||||||
| Per Common Share Data | ||||||||||||||||||||||||
Net asset value, beginning of period | $ | 8.58 | $ | 9.27 | $ | 9.50 | $ | 9.56 | $ | 9.15 | $ | 9.62 | ||||||||||||
Income from investment operations: | ||||||||||||||||||||||||
Net investment income (2) | 0.20 | 0.44 | 0.47 | 0.46 | 0.47 | 0.47 | ||||||||||||||||||
Net realized and unrealized gain (loss) | 0.60 | (0.66 | ) | (0.19 | ) | (0.06 | ) | 0.40 | (0.45 | ) | ||||||||||||||
|
|
|
|
|
|
|
|
|
|
|
| |||||||||||||
Total increase (decrease) from investment operations | 0.80 | (0.22 | ) | 0.28 | 0.40 | 0.87 | 0.02 | |||||||||||||||||
|
|
|
|
|
|
|
|
|
|
|
| |||||||||||||
Less dividends and distributions: | ||||||||||||||||||||||||
From net investment income | (0.20) | (0.36 | ) | (0.47 | ) | (0.41 | ) | (0.32 | ) | (0.49 | ) | |||||||||||||
From net realized gain | – | (0.03 | ) | (0.04 | ) | – | – | – | ||||||||||||||||
From return of capital | – | (0.08 | ) | – | (0.05 | ) | (0.14 | ) | – | |||||||||||||||
|
|
|
|
|
|
|
|
|
|
|
| |||||||||||||
Total dividends and distributions | (0.20) | (0.47 | ) | (0.51 | ) | (0.46 | ) | (0.46 | ) | (0.49 | ) | |||||||||||||
|
|
|
|
|
|
|
|
|
|
|
| |||||||||||||
Net asset value, at end of period | $9.18 | $ | 8.58 | $ | 9.27 | $ | 9.50 | $ | 9.56 | $ | 9.15 | |||||||||||||
|
|
|
|
|
|
|
|
|
|
|
| |||||||||||||
Total investment return (3) | 9.44 | %(4) | (2.54 | )% | 3.03 | % | 4.27 | % | 9.73 | % | 0.22 | % | ||||||||||||
|
|
|
|
|
|
|
|
|
|
|
| |||||||||||||
| Supplemental Data and Ratios | ||||||||||||||||||||||||
Net assets, end of period (000’s) | $ | 122,871 | $ | 131,302 | $ | 187,887 | $ | 172,736 | $ | 122,736 | $ | 125,957 | ||||||||||||
Ratio of total expenses (before reductions and reimbursements) to average net assets | 1.00 | %(5) | 0.99 | % | 0.96 | % | 1.01 | % | 1.14 | % | 1.27 | % | ||||||||||||
Ratio of net expenses to average net assets (6) | 0.75 | %(5) | 0.75 | % | 0.75 | % | 0.71 | % (7) | 0.75 | % | 0.75 | % | ||||||||||||
Ratio of net investment income to average net assets | 4.53 | %(5) | 4.89 | % | 4.99 | % | 4.79 | % | 4.90 | % | 5.08 | % | ||||||||||||
Portfolio turnover rate | 17.35 | %(4) | 37.23 | % | 46.51 | % | 57.74 | % | 47.06 | % | 62.99 | % | ||||||||||||
| (1) | Unaudited. |
| (2) | Calculated using average shares outstanding. |
| (3) | Total investment return calculation assumes the reinvestment of dividends at actual prices pursuant to the Fund’s dividend reinvestment plan. |
| (4) | Not annualized. |
| (5) | Annualized for periods less than one full year. |
| (6) | The Adviser has agreed to waive and/or reimburse certain fees and/or expense so that, on an annualized basis, such expenses incurred will not exceed 0.75% as a percentage of average daily net assets. |
| (7) | Net expenses reflect a voluntary expense reimbursement to prevent a negative yield. |
See accompanying Notes to the Financial Statements.
50
Table of Contents
Barings Global Credit Income Opportunities Fund 2020 Semi-Annual Report
FINANCIAL HIGHLIGHTS
| CLASS A | ||||||||||||||||||||||||
| FOR THE SIX MONTHS ENDED DECEMBER 31, 2020(1) | FOR THE YEAR ENDED JUNE 30, 2020 | FOR THE YEAR ENDED JUNE 30, 2019 | FOR THE YEAR ENDED JUNE 30, 2018 | FOR THE YEAR ENDED JUNE 30, 2017 | FOR THE YEAR ENDED JUNE 30, 2016 | |||||||||||||||||||
| Per Common Share Data | ||||||||||||||||||||||||
Net asset value, beginning of period | $ | 8.14 | $ | 8.93 | $ | 9.32 | $ | 9.51 | $ | 8.80 | $ | 9.51 | ||||||||||||
Income from investment operations: | ||||||||||||||||||||||||
Net investment income (2) | 0.25 | 0.46 | 0.50 | 0.49 | 0.55 | 0.56 | ||||||||||||||||||
Net realized and unrealized gain (loss) | 0.62 | (0.79 | ) | (0.30 | ) | (0.19 | ) | 0.71 | (0.66 | ) | ||||||||||||||
|
|
|
|
|
|
|
|
|
|
|
| |||||||||||||
Total increase (decrease) from investment operations | 0.87 | (0.33 | ) | 0.20 | 0.30 | 1.26 | (0.10 | ) | ||||||||||||||||
|
|
|
|
|
|
|
|
|
|
|
| |||||||||||||
Less dividends and distributions: | ||||||||||||||||||||||||
From net investment income | (0.23) | (0.40 | ) | (0.48 | ) | (0.47 | ) | (0.50 | ) | (0.61 | ) | |||||||||||||
From net realized gain | – | – | (0.10 | ) | – | – | – | |||||||||||||||||
From return of capital | – | (0.06 | ) | (0.01 | ) | (0.02 | ) | (0.05 | ) | – | ||||||||||||||
|
|
|
|
|
|
|
|
|
|
|
| |||||||||||||
Total dividends and distributions | (0.23) | (0.46 | ) | (0.59 | ) | (0.49 | ) | (0.55 | ) | (0.61 | ) | |||||||||||||
|
|
|
|
|
|
|
|
|
|
|
| |||||||||||||
Net asset value, at end of period | $8.78 | $ | 8.14 | $ | 8.93 | $ | 9.32 | $ | 9.51 | $ | 8.80 | |||||||||||||
|
|
|
|
|
|
|
|
|
|
|
| |||||||||||||
Total investment return (3) | 10.81 | %(4) | (3.69 | )% | 2.39 | % | 3.24 | % | 14.61 | % | (0.84 | )% | ||||||||||||
|
|
|
|
|
|
|
|
|
|
|
| |||||||||||||
| Supplemental Data and Ratios | ||||||||||||||||||||||||
Net assets, end of period (000’s) | $7,702 | $ | 44,860 | $ | 51,205 | $ | 60,507 | $ | 26,904 | $ | 12,340 | |||||||||||||
Ratio of total expenses (before reductions and reimbursements) to average net assets | 1.35 | %(5) | 1.32 | % | 1.36 | % | 1.38 | % | 1.56 | % | 1.90 | % | ||||||||||||
Ratio of net expenses to average net assets (6) | 1.20 | %(5) | 1.20 | % | 1.20 | % | 1.20 | % | 1.20 | % | 1.20 | % | ||||||||||||
Ratio of net investment income to average net assets | 5.86 | %(5) | 5.35 | % | 5.46 | % | 5.17 | % | 5.83 | % | 6.28 | % | ||||||||||||
Portfolio turnover rate | 28.09 | %(4) | 64.23 | % | 58.78 | % | 52.29 | % | 48.69 | % | 58.08 | % | ||||||||||||
| (1) | Unaudited. |
| (2) | Calculated using average shares outstanding. |
| (3) | Total investment return calculation does not consider the effects of sales loads and assumes the reinvestment of dividends at actual prices pursuant to the Fund’s dividend reinvestment plan. |
| (4) | Not annualized. |
| (5) | Annualized for periods less than one full year. |
| (6) | The Adviser has agreed to waive and/or reimburse certain fees and/or expense so that, on an annualized basis, such expenses incurred will not exceed 1.20% as a percentage of average daily net assets. |
See accompanying Notes to the Financial Statements.
51
Table of Contents
Barings Global Credit Income Opportunities Fund 2020 Semi-Annual Report
FINANCIAL HIGHLIGHTS (CONTINUED)
| CLASS C | ||||||||||||||||||||||||
| FOR THE SIX MONTHS ENDED DECEMBER 31, 2020(1) | FOR THE YEAR ENDED JUNE 30, 2020 | FOR THE YEAR ENDED JUNE 30, 2019 | FOR THE YEAR ENDED JUNE 30, 2018 | FOR THE YEAR ENDED JUNE 30, 2017 | FOR THE YEAR ENDED JUNE 30, 2016 | |||||||||||||||||||
| Per Common Share Data | ||||||||||||||||||||||||
Net asset value, beginning of period | $ | 8.13 | $ | 8.92 | $ | 9.31 | $ | 9.50 | $ | 8.79 | $ | 9.50 | ||||||||||||
Income from investment operations: | ||||||||||||||||||||||||
Net investment income (2) | 0.21 | 0.39 | 0.43 | 0.42 | 0.48 | 0.49 | ||||||||||||||||||
Net realized and unrealized gain (loss) | 0.64 | (0.78 | ) | (0.29 | ) | (0.19 | ) | 0.71 | (0.65 | ) | ||||||||||||||
|
|
|
|
|
|
|
|
|
|
|
| |||||||||||||
Total increase (decrease) from investment operations | 0.85 | (0.39 | ) | 0.14 | 0.23 | 1.19 | (0.16 | ) | ||||||||||||||||
|
|
|
|
|
|
|
|
|
|
|
| |||||||||||||
Less dividends and distributions: | ||||||||||||||||||||||||
From net investment income | (0.20) | (0.35 | ) | (0.42 | ) | (0.40 | ) | (0.43 | ) | (0.55 | ) | |||||||||||||
From net realized gain | – | – | (0.10 | ) | – | – | – | |||||||||||||||||
From return of capital | – | (0.05 | ) | (0.01 | ) | (0.02 | ) | (0.05 | ) | – | ||||||||||||||
|
|
|
|
|
|
|
|
|
|
|
| |||||||||||||
Total dividends and distributions | (0.20) | (0.40 | ) | (0.53 | ) | (0.42 | ) | (0.48 | ) | (0.55 | ) | |||||||||||||
|
|
|
|
|
|
|
|
|
|
|
| |||||||||||||
Net asset value, at end of period | $8.78 | $ | 8.13 | $ | 8.92 | $ | 9.31 | $ | 9.50 | $ | 8.79 | |||||||||||||
|
|
|
|
|
|
|
|
|
|
|
| |||||||||||||
Total investment return (3) | 10.43 | %(4) | (4.41 | )% | 1.63 | % | 2.47 | % | 13.75 | % | (1.59 | )% | ||||||||||||
|
|
|
|
|
|
|
|
|
|
|
| |||||||||||||
| Supplemental Data and Ratios | ||||||||||||||||||||||||
Net assets, end of period (000’s) | $7,550 | $ | 7,421 | $ | 8,462 | $ | 8,842 | $ | 6,628 | $ | 3,578 | |||||||||||||
Ratio of total expenses (before reductions and reimbursements) to average net assets | 2.20 | %(5) | 2.18 | % | 2.21 | % | 2.21 | % | 2.39 | % | 2.91 | % | ||||||||||||
Ratio of net expenses to average net assets (6) | 1.95 | %(5) | 1.95 | % | 1.95 | % | 1.95 | % | 1.95 | % | 1.95 | % | ||||||||||||
Ratio of net investment income to average net assets | 4.96 | %(5) | 4.60 | % | 4.73 | % | 4.44 | % | 5.12 | % | 5.50 | % | ||||||||||||
Portfolio turnover rate | 28.09 | %(4) | 64.23 | % | 58.78 | % | 52.29 | % | 48.69 | % | 58.08 | % | ||||||||||||
| (1) | Unaudited. |
| (2) | Calculated using average shares outstanding. |
| (3) | Total investment return calculation assumes the reinvestment of dividends at actual prices pursuant to the Fund’s dividend reinvestment plan. |
| (4) | Not annualized. |
| (5) | Annualized for periods less than one full year. |
| (6) | The Adviser has agreed to waive and/or reimburse certain fees and/or expense so that, on an annualized basis, such expenses incurred will not exceed 1.95% as a percentage of average daily net assets. |
See accompanying Notes to the Financial Statements.
52
Table of Contents
Barings Global Credit Income Opportunities Fund 2020 Semi-Annual Report
FINANCIAL HIGHLIGHTS (CONTINUED)
| CLASS I | ||||||||||||||||||||||||
| FOR THE SIX MONTHS ENDED DECEMBER 31, 2020(1) | FOR THE YEAR ENDED JUNE 30, 2020 | FOR THE YEAR ENDED JUNE 30, 2019 | FOR THE YEAR ENDED JUNE 30, 2018 | FOR THE YEAR ENDED JUNE 30, 2017 | FOR THE YEAR ENDED JUNE 30, 2016 | |||||||||||||||||||
| Per Common Share Data | ||||||||||||||||||||||||
Net asset value, beginning of period | $ | 8.14 | $ | 8.93 | $ | 9.32 | $ | 9.50 | $ | 8.80 | $ | 9.51 | ||||||||||||
Income from investment operations: | ||||||||||||||||||||||||
Net investment income (2) | 0.25 | 0.48 | 0.52 | 0.51 | 0.58 | 0.58 | ||||||||||||||||||
Net realized and unrealized gain (loss) | 0.63 | (0.79 | ) | (0.29 | ) | (0.18 | ) | 0.70 | (0.65 | ) | ||||||||||||||
|
|
|
|
|
|
|
|
|
|
|
| |||||||||||||
Total increase (decrease) from investment operations | 0.88 | (0.31 | ) | 0.23 | 0.33 | 1.28 | (0.07 | ) | ||||||||||||||||
|
|
|
|
|
|
|
|
|
|
|
| |||||||||||||
Less dividends and distributions: | ||||||||||||||||||||||||
From net investment income | (0.24) | (0.41 | ) | (0.51 | ) | (0.49 | ) | (0.52 | ) | (0.64 | ) | |||||||||||||
From net realized gain | – | – | (0.10 | ) | – | – | – | |||||||||||||||||
From return of capital | – | (0.07 | ) | (0.01 | ) | (0.02 | ) | (0.06 | ) | – | ||||||||||||||
|
|
|
|
|
|
|
|
|
|
|
| |||||||||||||
Total dividends and distributions | (0.24) | (0.48 | ) | (0.62 | ) | (0.51 | ) | (0.58 | ) | (0.64 | ) | |||||||||||||
|
|
|
|
|
|
|
|
|
|
|
| |||||||||||||
Net asset value, at end of period | $8.78 | $ | 8.14 | $ | 8.93 | $ | 9.32 | $ | 9.50 | $ | 8.80 | |||||||||||||
|
|
|
|
|
|
|
|
|
|
|
| |||||||||||||
Total investment return (3) | 10.99 | %(4) | (3.45 | )% | 2.65 | % | 3.49 | % | 14.90 | % | (0.61 | )% | ||||||||||||
|
|
|
|
|
|
|
|
|
|
|
| |||||||||||||
| Supplemental Data and Ratios | ||||||||||||||||||||||||
Net assets, end of period (000’s) | $23,558 | $ | 21,606 | $ | 23,203 | $ | 21,788 | $ | 22,228 | $ | 24,689 | |||||||||||||
Ratio of total expenses (before reductions and reimbursements) to average net assets | 1.09 | %(5) | 1.07 | % | 1.09 | % | 1.13 | % | 1.27 | % | 1.54 | % | ||||||||||||
Ratio of net expenses to average net assets (6) | 0.95 | %(5) | 0.95 | % | 0.95 | % | 0.95 | % | 0.95 | % | 0.95 | % | ||||||||||||
Ratio of net investment income to average net assets | 5.96 | %(5) | 5.60 | % | 5.69 | % | 5.45 | % | 6.22 | % | 6.54 | % | ||||||||||||
Portfolio turnover rate | 28.09 | %(4) | 64.23 | % | 58.78 | % | 52.29 | % | 48.69 | % | 58.08 | % | ||||||||||||
| (1) | Unaudited. |
| (2) | Calculated using average shares outstanding. |
| (3) | Total investment return calculation assumes the reinvestment of dividends at actual prices pursuant to the Fund’s dividend reinvestment plan. |
| (4) | Not annualized. |
| (5) | Annualized for periods less than one full year. |
| (6) | The Adviser has agreed to waive and/or reimburse certain fees and/or expense so that, on an annualized basis, such expenses incurred will not exceed 0.95% as a percentage of average daily net assets. |
See accompanying Notes to the Financial Statements.
53
Table of Contents
Barings Global Credit Income Opportunities Fund 2020 Semi-Annual Report
FINANCIAL HIGHLIGHTS (CONTINUED)
| CLASS Y | ||||||||||||||||||||||||
| FOR THE SIX MONTHS ENDED DECEMBER 31, 2020(1) | FOR THE YEAR ENDED JUNE 30, 2020 | FOR THE YEAR ENDED JUNE 30, 2019 | FOR THE YEAR ENDED JUNE 30, 2018 | FOR THE YEAR ENDED JUNE 30, 2017 | FOR THE YEAR ENDED JUNE 30, 2016 | |||||||||||||||||||
| Per Common Share Data | ||||||||||||||||||||||||
Net asset value, beginning of period | $ | 8.14 | $ | 8.93 | $ | 9.31 | $ | 9.50 | $ | 8.80 | $ | 9.51 | ||||||||||||
Income from investment operations: | ||||||||||||||||||||||||
Net investment income (2) | 0.25 | 0.48 | 0.52 | 0.51 | 0.57 | 0.59 | ||||||||||||||||||
Net realized and unrealized gain (loss) | 0.63 | (0.79 | ) | (0.28 | ) | (0.19 | ) | 0.71 | (0.66 | ) | ||||||||||||||
|
|
|
|
|
|
|
|
|
|
|
| |||||||||||||
Total increase (decrease) from investment operations | 0.88 | (0.31 | ) | 0.24 | 0.32 | 1.28 | (0.07 | ) | ||||||||||||||||
|
|
|
|
|
|
|
|
|
|
|
| |||||||||||||
Less dividends and distributions: | ||||||||||||||||||||||||
From net investment income | (0.24) | (0.41 | ) | (0.51 | ) | (0.49 | ) | (0.52 | ) | (0.64 | ) | |||||||||||||
From net realized gain | – | – | (0.10 | ) | – | – | – | |||||||||||||||||
From return of capital | – | (0.07 | ) | (0.01 | ) | (0.02 | ) | (0.06 | ) | – | ||||||||||||||
|
|
|
|
|
|
|
|
|
|
|
| |||||||||||||
Total dividends and distributions | (0.24) | (0.48 | ) | (0.62 | ) | (0.51 | ) | (0.58 | ) | (0.64 | ) | |||||||||||||
|
|
|
|
|
|
|
|
|
|
|
| |||||||||||||
Net asset value, at end of period | $8.78 | $ | 8.14 | $ | 8.93 | $ | 9.31 | $ | 9.50 | $ | 8.80 | |||||||||||||
|
|
|
|
|
|
|
|
|
|
|
| |||||||||||||
Total investment return (3) | 11.00 | %(4) | (3.44 | )% | 2.64 | % | 3.48 | % | 14.90 | % | (0.61 | )% | ||||||||||||
|
|
|
|
|
|
|
|
|
|
|
| |||||||||||||
| Supplemental Data and Ratios | ||||||||||||||||||||||||
Net assets, end of period (000’s) | $132,784 | $ | 90,254 | $ | 129,621 | $ | 140,362 | $ | 96,014 | $ | 58,312 | |||||||||||||
Ratio of total expenses (before reductions and reimbursements) to average net assets | 1.12 | %(5) | 1.10 | % | 1.12 | % | 1.14 | % | 1.28 | % | 1.55 | % | ||||||||||||
Ratio of net expenses to average net assets (6) | 0.95 | %(5) | 0.95 | % | 0.95 | % | 0.95 | % | 0.95 | % | 0.95 | % | ||||||||||||
Ratio of net investment income to average net assets | 5.92 | %(5) | 5.60 | % | 5.71 | % | 5.43 | % | 6.14 | % | 6.56 | % | ||||||||||||
Portfolio turnover rate | 28.09 | %(4) | 64.23 | % | 58.78 | % | 52.29 | % | 48.69 | % | 58.08 | % | ||||||||||||
| (1) | Unaudited. |
| (2) | Calculated using average shares outstanding. |
| (3) | Total investment return calculation assumes the reinvestment of dividends at actual prices pursuant to the Fund’s dividend reinvestment plan. |
| (4) | Not annualized. |
| (5) | Annualized for periods less than one full year. |
| (6) | The Adviser has agreed to waive and/or reimburse certain fees and/or expense so that, on an annualized basis, such expenses incurred will not exceed 0.95% as a percentage of average daily net assets. |
See accompanying Notes to the Financial Statements.
54
Table of Contents
Barings Active Short Duration Bond Fund 2020 Semi-Annual Report
FINANCIAL HIGHLIGHTS
| CLASS A | ||||||||||||||||||||||||
FOR THE SIX MONTHS | FOR THE YEAR ENDED JUNE 30, 2020 | FOR THE YEAR ENDED JUNE 30, 2019 | FOR THE YEAR ENDED JUNE 30, 2018 | FOR THE YEAR ENDED JUNE 30, 2017 | PERIOD FROM JULY 8, 2015 THROUGH JUNE 30, 2016 (2) | |||||||||||||||||||
| Per Common Share Data | ||||||||||||||||||||||||
Net asset value, beginning of period | $ | 9.50 | $ | 9.94 | $ | 9.88 | $ | 10.01 | $ | 9.98 | $ | 10.00 | ||||||||||||
Income from investment operations: | ||||||||||||||||||||||||
Net investment income (3) | 0.11 | 0.27 | 0.27 | 0.21 | 0.17 | 0.15 | ||||||||||||||||||
Net realized and unrealized gain (loss) | 0.35 | (0.44 | ) | 0.08 | (0.10 | ) | 0.03 | (0.03 | )(4) | |||||||||||||||
|
|
|
|
|
|
|
|
|
|
|
| |||||||||||||
Total increase (decrease) from investment operations | 0.46 | (0.17 | ) | 0.35 | 0.11 | 0.20 | 0.12 | |||||||||||||||||
|
|
|
|
|
|
|
|
|
|
|
| |||||||||||||
Less dividends and distributions: | ||||||||||||||||||||||||
From net investment income | (0.11 | ) | (0.27 | ) | (0.27 | ) | (0.21 | ) | (0.17 | ) | (0.14 | ) | ||||||||||||
From net realized gain | – | – | (0.02 | ) | (0.03 | ) | (0.00 | )(5) | – | |||||||||||||||
|
|
|
|
|
|
|
|
|
|
|
| |||||||||||||
Total dividends and distributions | (0.11 | ) | (0.27 | ) | (0.29 | ) | (0.24 | ) | (0.17 | ) | (0.14 | ) | ||||||||||||
|
|
|
|
|
|
|
|
|
|
|
| |||||||||||||
Net asset value, at end of period | $ | 9.85 | $ | 9.50 | $ | 9.94 | $ | 9.88 | $ | 10.01 | $ | 9.98 | ||||||||||||
|
|
|
|
|
|
|
|
|
|
|
| |||||||||||||
Total investment return (6) | 4.92 | %(7) | (1.68 | )% | 3.52 | % | 1.10 | % | 2.12 | % | 1.17 | %(7) | ||||||||||||
|
|
|
|
|
|
|
|
|
|
|
| |||||||||||||
| Supplemental Data and Ratios | ||||||||||||||||||||||||
Net assets, end of period (000’s) | $ | 39,450 | $ | 43,022 | $ | 135,981 | $ | 177,020 | $ | 119,189 | $ | 39,992 | ||||||||||||
Ratio of total expenses (before reductions and reimbursements) to average net assets | 0.91 | %(8) | 0.85 | % | 0.90 | % | 0.94 | % | 1.06 | % | 1.18 | %(8) | ||||||||||||
Ratio of net expenses to average net assets (9) | 0.65 | %(8) | 0.65 | % | 0.65 | % | 0.65 | % | 0.65 | % | 0.65 | %(8) | ||||||||||||
Ratio of net investment income to average net assets | 2.33 | %(8) | 2.81 | % | 2.75 | % | 2.15 | % | 1.72 | % | 1.51 | %(8) | ||||||||||||
Portfolio turnover rate | 29.88 | %(7) | 58.11 | % | 43.15 | % | 53.33 | % | 88.52 | % | 218.67 | %(7) | ||||||||||||
| (1) | Unaudited. |
| (2) | Fund commenced operations on July 8, 2015. |
| (3) | Calculated using average shares outstanding. |
| (4) | The per share amount varies from the net realized and unrealized gain/loss for the period because of the timing of sales of fund shares and the per share amount of realized and unrealized gains and losses at such time. |
| (5) | Amount rounds to less than $.01 per share. |
| (6) | Total investment return calculation assumes the reinvestment of dividends at actual prices pursuant to the Fund’s dividend reinvestment plan. |
| (7) | Not annualized. |
| (8) | Annualized for periods less than one full year. |
| (9) | The Adviser has agreed to waive and/or reimburse certain fees and/or expense so that, on an annualized basis, such expenses incurred will not exceed 0.65% as a percentage of average daily net assets. |
See accompanying Notes to the Financial Statements.
55
Table of Contents
Barings Active Short Duration Bond Fund 2020 Semi-Annual Report
FINANCIAL HIGHLIGHTS (CONTINUED)
| CLASS C | ||||||||||||||||||||||||
FOR THE SIX MONTHS | FOR THE YEAR ENDED JUNE 30, 2020 | FOR THE YEAR ENDED JUNE 30, 2019 | FOR THE YEAR ENDED JUNE 30, 2018 | FOR THE YEAR ENDED JUNE 30, 2017 | PERIOD FROM JULY 8, 2015 THROUGH JUNE 30, 2016 (2) | |||||||||||||||||||
| Per Common Share Data | ||||||||||||||||||||||||
Net asset value, beginning of period | $ | 9.49 | $ | 9.93 | $ | 9.87 | $ | 10.01 | $ | 9.97 | $ | 10.00 | ||||||||||||
Income from investment operations: | ||||||||||||||||||||||||
Net investment income (3) | 0.10 | 0.25 | 0.25 | 0.19 | 0.19 | 0.07 | ||||||||||||||||||
Net realized and unrealized gain (loss) | 0.35 | (0.44 | ) | 0.08 | (0.11 | ) | 0.05 | (0.03 | )(4) | |||||||||||||||
|
|
|
|
|
|
|
|
|
|
|
| |||||||||||||
Total increase (decrease) from investment operations | 0.45 | (0.19 | ) | 0.33 | 0.08 | 0.24 | 0.04 | |||||||||||||||||
|
|
|
|
|
|
|
|
|
|
|
| |||||||||||||
Less dividends and distributions: | ||||||||||||||||||||||||
From net investment income | (0.10 | ) | (0.25 | ) | (0.25 | ) | (0.19 | ) | (0.20 | ) | (0.07 | ) | ||||||||||||
From net realized gain | – | – | (0.02 | ) | (0.03 | ) | (0.00 | )(5) | – | |||||||||||||||
|
|
|
|
|
|
|
|
|
|
|
| |||||||||||||
Total dividends and distributions | (0.10 | ) | (0.25 | ) | (0.27 | ) | (0.22 | ) | (0.20 | ) | (0.07 | ) | ||||||||||||
|
|
|
|
|
|
|
|
|
|
|
| |||||||||||||
Net asset value, at end of period | $ | 9.84 | $ | 9.49 | $ | 9.93 | $ | 9.87 | $ | 10.01 | $ | 9.97 | ||||||||||||
|
|
|
|
|
|
|
|
|
|
|
| |||||||||||||
Total investment return (6) | 4.79 | %(7) | (1.96 | )% | 3.23 | % | 0.84 | % | 2.41 | % | 0.39 | %(7) | ||||||||||||
|
|
|
|
|
|
|
|
|
|
|
| |||||||||||||
| Supplemental Data and Ratios | ||||||||||||||||||||||||
Net assets, end of period (000’s) | $ | 2,359 | $ | 2,498 | $ | 1,178 | $ | 1,139 | $ | 236 | $ | 257 | ||||||||||||
Ratio of total expenses (before reductions and reimbursements) to average net assets | 1.38 | %(8) | 1.41 | % | 1.70 | % | 1.95 | % | 3.09 | %(9) | 5.44 | %(8)(10) | ||||||||||||
Ratio of net expenses to average net assets (11) | 0.90 | %(8) | 0.90 | % | 0.90 | % | 0.90 | % | 0.40 | %(9) | 1.40 | %(8)(10) | ||||||||||||
Ratio of net investment income to average net assets | 2.08 | %(8) | 2.56 | % | 2.51 | % | 1.92 | % | 1.94 | %(9) | 0.71 | %(8)(10) | ||||||||||||
Portfolio turnover rate | 29.88 | %(7) | 58.11 | % | 43.15 | % | 53.33 | % | 88.52 | % | 218.67 | %(7) | ||||||||||||
| (1) | Unaudited. |
| (2) | Fund commenced operations on July 8, 2015. |
| (3) | Calculated using average shares outstanding. |
| (4) | The per share amount varies from the net realized and unrealized gain/loss for the period because of the timing of sales of fund shares and the per share amount of realized and unrealized gains and losses at such time. |
| (5) | Amount rounds to less than $.01 per share. |
| (6) | Total investment return calculation assumes the reinvestment of dividends at actual prices pursuant to the Fund’s dividend reinvestment plan. |
| (7) | Not annualized. |
| (8) | Annualized for periods less than one full year. |
| (9) | Expenses shown reflect a reimbursement to the Fund during the period for an overaccrual of 12b-1 fees made during and prior to the period. |
| (10) | Expenses shown reflect an overaccrual of 12b-1 fees for the period of $1,478 or 0.50% of average net assets over the period. Subsequent to the period, the Fund was reimbursed for the overaccrued amount. |
| (11) | The Adviser has agreed to waive and/or reimburse certain fees and/or expense so that, on an annualized basis, such expenses incurred will not exceed 0.90% as a percentage of average daily net assets. |
See accompanying Notes to the Financial Statements.
56
Table of Contents
Barings Active Short Duration Bond Fund 2020 Semi-Annual Report
FINANCIAL HIGHLIGHTS (CONTINUED)
| CLASS I | ||||||||||||||||||||||||
FOR THE SIX MONTHS | FOR THE YEAR ENDED JUNE 30, 2020 | FOR THE YEAR ENDED JUNE 30, 2019 | FOR THE YEAR ENDED JUNE 30, 2018 | FOR THE YEAR ENDED JUNE 30, 2017 | PERIOD FROM JULY 8, 2015 THROUGH JUNE 30, 2016 (2) | |||||||||||||||||||
| Per Common Share Data | ||||||||||||||||||||||||
Net asset value, beginning of | $ | 9.50 | $ | 9.94 | $ | 9.88 | $ | 10.01 | $ | 9.97 | $ | 10.00 | ||||||||||||
Income from investment operations: | ||||||||||||||||||||||||
Net investment income (3) | 0.13 | 0.30 | 0.30 | 0.24 | 0.18 | 0.16 | ||||||||||||||||||
Net realized and unrealized gain (loss) | 0.35 | (0.44 | ) | 0.08 | (0.10 | ) | 0.06 | (0.03 | )(4) | |||||||||||||||
|
|
|
|
|
|
|
|
|
|
|
| |||||||||||||
Total increase (decrease) from investment operations | 0.48 | (0.14 | ) | 0.38 | 0.14 | 0.24 | 0.13 | |||||||||||||||||
|
|
|
|
|
|
|
|
|
|
|
| |||||||||||||
Less dividends and distributions: | ||||||||||||||||||||||||
From net investment income | (0.13 | ) | (0.30 | ) | (0.30 | ) | (0.24 | ) | (0.20 | ) | (0.16 | ) | ||||||||||||
From net realized gain | – | – | (0.02 | ) | (0.03 | ) | (0.00 | )(5) | – | |||||||||||||||
|
|
|
|
|
|
|
|
|
|
|
| |||||||||||||
Total dividends and distributions | (0.13 | ) | (0.30 | ) | (0.32 | ) | (0.27 | ) | (0.20 | ) | (0.16 | ) | ||||||||||||
|
|
|
|
|
|
|
|
|
|
|
| |||||||||||||
Net asset value, at end of period | $ | 9.85 | $ | 9.50 | $ | 9.94 | $ | 9.88 | $ | 10.01 | $ | 9.97 | ||||||||||||
|
|
|
|
|
|
|
|
|
|
|
| |||||||||||||
Total investment return (6) | 5.05 | %(7) | (1.45 | )% | 3.78 | % | 1.39 | % | 2.44 | % | 1.35 | %(7) | ||||||||||||
|
|
|
|
|
|
|
|
|
|
|
| |||||||||||||
| Supplemental Data and Ratios | ||||||||||||||||||||||||
Net assets, end of period (000’s) | $ | 98 | $ | 94 | $ | 301 | $ | 300 | $ | 100 | $ | 5,971 | ||||||||||||
Ratio of total expenses (before reductions and reimbursements) to average net assets | 7.92 | %(8) | 3.86 | % | 2.84 | % | 3.07 | % | 1.67 | % | 0.96 | %(8) | ||||||||||||
Ratio of net expenses to average net assets (9) | 0.40 | %(8) | 0.40 | % | 0.40 | % | 0.40 | % | 0.40 | % | 0.44 | %(8) | ||||||||||||
Ratio of net investment income to average net assets | 2.59 | %(8) | 3.03 | % | 3.01 | % | 2.39 | % | 1.84 | % | 1.67 | %(8) | ||||||||||||
Portfolio turnover rate | 29.88 | %(7) | 58.11 | % | 43.15 | % | 53.33 | % | 88.52 | % | 218.67 | %(7) | ||||||||||||
| (1) | Unaudited. |
| (2) | Fund commenced operations on July 8, 2015. |
| (3) | Calculated using average shares outstanding. |
| (4) | The per share amount varies from the net realized and unrealized gain/loss for the period because of the timing of sales of fund shares and the per share amount of realized and unrealized gains and losses at such time. |
| (5) | Amount rounds to less than $.01 per share. |
| (6) | Total investment return calculation assumes the reinvestment of dividends at actual prices pursuant to the Fund’s dividend reinvestment plan. |
| (7) | Not annualized. |
| (8) | Annualized for periods less than one full year. |
| (9) | The Adviser has agreed to waive and/or reimburse certain fees and/or expense so that, on an annualized basis, such expenses incurred will not exceed 0.40% as a percentage of average daily net assets. |
See accompanying Notes to the Financial Statements.
57
Table of Contents
Barings Active Short Duration Bond Fund 2020 Semi-Annual Report
FINANCIAL HIGHLIGHTS (CONTINUED)
| CLASS Y | ||||||||||||||||||||||||
FOR THE SIX MONTHS | FOR THE YEAR ENDED JUNE 30, 2020 | FOR THE YEAR ENDED JUNE 30, 2019 | FOR THE YEAR ENDED JUNE 30, 2018 | FOR THE YEAR ENDED JUNE 30, 2017 | PERIOD FROM JULY 8, 2015 THROUGH JUNE 30, 2016 (2) | |||||||||||||||||||
| Per Common Share Data | ||||||||||||||||||||||||
Net asset value, beginning of period | $ | 9.49 | $ | 9.93 | $ | 9.87 | $ | 10.01 | $ | 9.97 | $ | 10.00 | ||||||||||||
Income from investment operations: | ||||||||||||||||||||||||
Net investment income (3) | 0.13 | 0.30 | 0.30 | 0.24 | 0.20 | 0.17 | (4) | |||||||||||||||||
Net realized and unrealized gain (loss) | 0.35 | (0.44 | ) | 0.07 | (0.11 | ) | 0.04 | (0.04 | ) | |||||||||||||||
|
|
|
|
|
|
|
|
|
|
|
| |||||||||||||
Total increase (decrease) from investment operations | 0.48 | (0.14 | ) | 0.37 | 0.13 | 0.24 | 0.13 | |||||||||||||||||
|
|
|
|
|
|
|
|
|
|
|
| |||||||||||||
Less dividends and distributions: | ||||||||||||||||||||||||
From net investment income | (0.13 | ) | (0.30 | ) | (0.29 | ) | (0.24 | ) | (0.20 | ) | (0.16 | ) | ||||||||||||
From net realized gain | – | – | (0.02 | ) | (0.03 | ) | (0.00 | )(5) | – | |||||||||||||||
|
|
|
|
|
|
|
|
|
|
|
| |||||||||||||
Total dividends and distributions | (0.13 | ) | (0.30 | ) | (0.31 | ) | (0.27 | ) | (0.20 | ) | (0.16 | ) | ||||||||||||
|
|
|
|
|
|
|
|
|
|
|
| |||||||||||||
Net asset value, at end of period | $ | 9.84 | $ | 9.49 | $ | 9.93 | $ | 9.87 | $ | 10.01 | $ | 9.97 | ||||||||||||
|
|
|
|
|
|
|
|
|
|
|
| |||||||||||||
Total investment return (6) | 5.05 | %(7) | (1.45 | )% | 3.78 | % | 1.35 | % | 2.38 | % | 1.36 | %(7) | ||||||||||||
|
|
|
|
|
|
|
|
|
|
|
| |||||||||||||
| Supplemental Data and Ratios | ||||||||||||||||||||||||
Net assets, end of period (000’s) | $ | 745,872 | $ | 656,611 | $ | 578,272 | $ | 252,325 | $ | 204,464 | $ | 109,645 | ||||||||||||
Ratio of total expenses (before reductions and reimbursements) to average net assets | 0.62 | %(8) | 0.63 | % | 0.61 | % | 0.70 | % | 0.82 | % | 0.87 | %(8) | ||||||||||||
Ratio of net expenses to average net assets (9) | 0.40 | %(8) | 0.40 | % | 0.40 | % | 0.40 | % | 0.40 | % | 0.41 | %(8) | ||||||||||||
Ratio of net investment income to average net assets | 2.58 | %(8) | 3.06 | % | 3.06 | % | 2.39 | % | 1.97 | % | 1.73 | %(8) | ||||||||||||
Portfolio turnover rate | 29.88 | %(7) | 58.11 | % | 43.15 | % | 53.33 | % | 88.52 | % | 218.67 | %(7) | ||||||||||||
| (1) | Unaudited. |
| (2) | Fund commenced operations on July 8, 2015. |
| (3) | Calculated using average shares outstanding. |
| (4) | The per share amount varies from the net realized and unrealized gain/loss for the period because of the timing of sales of fund shares and the per share amount of realized and unrealized gains and losses at such time. |
| (5) | Amount rounds to less than $.01 per share. |
| (6) | Total investment return calculation assumes the reinvestment of dividends at actual prices pursuant to the Fund’s dividend reinvestment plan. |
| (7) | Not annualized. |
| (8) | Annualized for periods less than one full year. |
| (9) | The Adviser has agreed to waive and/or reimburse certain fees and/or expense so that, on an annualized basis, such expenses incurred will not exceed 0.40% as a percentage of average daily net assets. |
See accompanying Notes to the Financial Statements.
58
Table of Contents
Barings Active Short Duration Bond Fund 2020 Semi-Annual Report
FINANCIAL HIGHLIGHTS (CONTINUED)
| CLASS L | ||||||||
FOR THE SIX MONTHS ENDED | PERIOD FROM MAY 1, 2020 THROUGH JUNE 30, 2020 (2) | |||||||
| Per Common Share Data | ||||||||
Net asset value, beginning of period | $ | 9.50 | $ | 9.21 | ||||
Income from investment operations: | ||||||||
Net investment income (3) | 0.11 | 0.05 | ||||||
Net realized and unrealized gain | 0.35 | 0.28 | ||||||
|
|
|
| |||||
Total increase from investment operations | 0.46 | 0.33 | ||||||
|
|
|
| |||||
Less dividends and distributions: | ||||||||
From net investment income | (0.11 | ) | (0.04 | ) | ||||
|
|
|
| |||||
Total dividends and distributions | (0.11 | ) | (0.04 | ) | ||||
|
|
|
| |||||
Net asset value, at end of period | $ | 9.85 | $ | 9.50 | ||||
|
|
|
| |||||
Total investment return (4) | 4.92 | %(5) | 3.52 | %(5) | ||||
|
|
|
| |||||
| Supplemental Data and Ratios | ||||||||
Net assets, end of period (000’s) | $ | 95,432 | $ | 101,272 | ||||
Ratio of total expenses (before reductions and reimbursements) to average net assets | 0.79 | %(6) | 0.92 | %(6) | ||||
Ratio of net expenses to average net assets (7) | 0.65 | %(6) | 0.65 | %(6) | ||||
Ratio of net investment income to average net assets | 2.34 | %(6) | 3.17 | %(6) | ||||
Portfolio turnover rate | 29.88 | %(5) | 58.11 | %(5) | ||||
| (1) | Unaudited. |
| (2) | Commenced operations on May 1, 2020. |
| (3) | Calculated using average shares outstanding. |
| (4) | Total investment return calculation assumes the reinvestment of dividends at actual prices pursuant to the Fund’s dividend reinvestment plan. |
| (5) | Not annualized. |
| (6) | Annualized for periods less than one full year. |
| (7) | The Adviser has agreed to waive and/or reimburse certain fees and/or expense so that, on an annualized basis, such expenses incurred will not exceed 0.65% as a percentage of average daily net assets. |
See accompanying Notes to the Financial Statements.
59
Table of Contents
Barings Diversified Income Fund 2020 Semi-Annual Report
FINANCIAL HIGHLIGHTS
| CLASS A | ||||||||||||||||||||||||
FOR THE SIX MONTHS | FOR THE YEAR ENDED JUNE 30, 2020 | FOR THE YEAR ENDED JUNE 30, 2019 | FOR THE YEAR ENDED JUNE 30, 2018 | FOR THE YEAR ENDED JUNE 30, 2017 | PERIOD FROM JULY 8, 2015 THROUGH JUNE 30, 2016(2) | |||||||||||||||||||
| Per Common Share Data | ||||||||||||||||||||||||
Net asset value, beginning of period | $ | 8.73 | $ | 9.82 | $ | 9.77 | $ | 10.08 | $ | 10.18 | $ | 10.00 | ||||||||||||
Income from investment operations: | ||||||||||||||||||||||||
Net investment income (3) | 0.11 | 0.29 | 0.30 | 0.27 | 0.25 | 0.25 | ||||||||||||||||||
Net realized and unrealized gain (loss) | 0.57 | (1.07 | ) | 0.06 | (0.28 | ) | (0.09 | ) | 0.20 | |||||||||||||||
|
|
|
|
|
|
|
|
|
|
|
| |||||||||||||
Total increase (decrease) from investment operations | 0.68 | (0.78 | ) | 0.36 | (0.01 | ) | 0.16 | 0.45 | ||||||||||||||||
|
|
|
|
|
|
|
|
|
|
|
| |||||||||||||
Less dividends and distributions: | ||||||||||||||||||||||||
From net investment income | (0.11 | ) | (0.31 | ) | (0.31 | ) | (0.29 | ) | (0.26 | ) | (0.25 | ) | ||||||||||||
From net realized gain | – | – | – | – | – | (0.02 | ) | |||||||||||||||||
From return of capital | – | – | – | (0.01 | ) | – | – | |||||||||||||||||
|
|
|
|
|
|
|
|
|
|
|
| |||||||||||||
Total dividends and distributions | (0.11 | ) | (0.31 | ) | (0.31 | ) | (0.30 | ) | (0.26 | ) | (0.27 | ) | ||||||||||||
|
|
|
|
|
|
|
|
|
|
|
| |||||||||||||
Net asset value, at end of period | $ | 9.30 | $ | 8.73 | $ | 9.82 | $ | 9.77 | $ | 10.08 | $ | 10.18 | ||||||||||||
|
|
|
|
|
|
|
|
|
|
|
| |||||||||||||
Total investment return (4) | 7.78 | %(5) | (8.11 | )% | 3.77 | % | (0.12 | )% | 1.65 | % | 4.63 | %(5) | ||||||||||||
|
|
|
|
|
|
|
|
|
|
|
| |||||||||||||
| Supplemental Data and Ratios | ||||||||||||||||||||||||
Net assets, end of period (000’s) | $ | 336 | $ | 592 | $ | 247 | $ | 207 | $ | 218 | $ | 211 | ||||||||||||
Ratio of total expenses (before reductions and reimbursements) to average net assets | 2.34 | %(6) | 3.23 | % | 3.57 | % | 3.72 | % | 3.52 | % | 5.60 | %(6) | ||||||||||||
Ratio of net expenses to average net assets (7) | 0.80 | %(6) | 0.80 | % | 0.79 | %(8)(9) | 0.80 | %(8) | 0.80 | %(8) | 0.80 | %(6)(8) | ||||||||||||
Ratio of net investment income to average net assets | 2.41 | %(6) | 3.14 | % | 3.11 | % | 2.70 | % | 2.49 | % | 2.52 | %(6) | ||||||||||||
Portfolio turnover rate | 52.73 | %(5) | 104.04 | % | 192.64 | % | 172.39 | % | 242.55 | % | 434.37 | %(5) | ||||||||||||
| (1) | Unaudited. |
| (2) | Fund commenced operations on July 8, 2015. |
| (3) | Calculated using average shares outstanding. |
| (4) | Total investment return calculation does not consider the effects of sales loads and assumes the reinvestment of dividends at actual prices pursuant to the Fund’s dividend reinvestment plan. |
| (5) | Not annualized. |
| (6) | Annualized for periods less than one full year. |
| (7) | The Adviser has agreed to waive and/or reimburse certain fees and/or expense so that, on an annualized basis, such expenses incurred will not exceed 0.80% as a percentage of average daily net assets. |
| (8) | Ratio of net expenses to average net assets does not include expenses of the underlying fund in which the Fund invests. |
| (9) | Net expenses reflect a voluntary expense reimbursement to prevent a negative yield. |
See accompanying Notes to the Financial Statements.
60
Table of Contents
Barings Diversified Income Fund 2020 Semi-Annual Report
FINANCIAL HIGHLIGHTS (CONTINUED)
| CLASS C | ||||||||||||||||||||||||
| FOR THE SIX MONTHS ENDED DECEMBER 31, 2020(1) | FOR THE 2020 | FOR THE YEAR ENDED JUNE 30, 2019 | FOR THE YEAR ENDED JUNE 30, 2018 | FOR THE YEAR ENDED JUNE 30, 2017 | PERIOD FROM JULY 8, 2015 THROUGH JUNE 30, 2016(2) | |||||||||||||||||||
| Per Common Share Data | ||||||||||||||||||||||||
Net asset value, beginning of period | $ | 8.73 | $ | 9.82 | $ | 9.77 | $ | 10.08 | $ | 10.18 | $ | 10.00 | ||||||||||||
Income from investment operations: | ||||||||||||||||||||||||
Net investment income (3) | 0.07 | 0.24 | 0.24 | 0.19 | 0.17 | 0.17 | ||||||||||||||||||
Net realized and unrealized gain (loss) | 0.57 | (1.10 | ) | 0.05 | (0.27 | ) | (0.08 | ) | 0.21 | |||||||||||||||
|
|
|
|
|
|
|
|
|
|
|
| |||||||||||||
Total increase (decrease) from investment operations | 0.64 | (0.86 | ) | 0.29 | (0.08 | ) | 0.09 | 0.38 | ||||||||||||||||
|
|
|
|
|
|
|
|
|
|
|
| |||||||||||||
Less dividends and distributions: | ||||||||||||||||||||||||
From net investment income | (0.07 | ) | (0.23 | ) | (0.24 | ) | (0.22 | ) | (0.19 | ) | (0.18 | ) | ||||||||||||
From net realized gain | – | – | – | – | – | (0.02 | ) | |||||||||||||||||
From return of capital | – | – | – | (0.01 | ) | – | – | |||||||||||||||||
|
|
|
|
|
|
|
|
|
|
|
| |||||||||||||
Total dividends and distributions | (0.07 | ) | (0.23 | ) | (0.24 | ) | (0.23 | ) | (0.19 | ) | (0.20 | ) | ||||||||||||
|
|
|
|
|
|
|
|
|
|
|
| |||||||||||||
Net asset value, at end of period | $ | 9.30 | $ | 8.73 | $ | 9.82 | $ | 9.77 | $ | 10.08 | $ | 10.18 | ||||||||||||
|
|
|
|
|
|
|
|
|
|
|
| |||||||||||||
Total investment return (4) | 7.37 | %(5) | (8.80 | )% | 2.99 | % | (0.87 | )% | 0.89 | % | 3.87 | %(5) | ||||||||||||
|
|
|
|
|
|
|
|
|
|
|
| |||||||||||||
| Supplemental Data and Ratios | ||||||||||||||||||||||||
Net assets, end of period (000’s) | $ | 187 | $ | 175 | $ | 197 | $ | 196 | $ | 202 | $ | 204 | ||||||||||||
Ratio of total expenses (before reductions and reimbursements) to average net assets | 4.77 | %(6) | 4.97 | % | 4.75 | % | 4.60 | % | 4.41 | %(8) | 6.38 | %(6) | ||||||||||||
Ratio of net expenses to average net assets (7) | 1.55 | %(6) | 1.55 | % | 1.54 | %(8)(9) | 1.55 | %(8) | 1.55 | %(8) | 1.55 | %(6)(8) | ||||||||||||
Ratio of net investment income to average net assets | 1.62 | %(6) | 2.50 | % | 2.45 | % | 1.95 | % | 1.74 | % | 1.77 | %(6) | ||||||||||||
Portfolio turnover rate | 52.73 | %(5) | 104.04 | % | 192.64 | % | 172.39 | % | 242.55 | % | 434.37 | %(5) | ||||||||||||
| (1) | Unaudited. |
| (2) | Fund commenced operations on July 8, 2015. |
| (3) | Calculated using average shares outstanding. |
| (4) | Total investment return calculation does not consider the effects of sales loads and assumes the reinvestment of dividends at actual prices pursuant to the Fund’s dividend reinvestment plan. |
| (5) | Not annualized. |
| (6) | Annualized for periods less than one full year. |
| (7) | The Adviser has agreed to waive and/or reimburse certain fees and/or expense so that, on an annualized basis, such expenses incurred will not exceed 1.55% as a percentage of average daily net assets. |
| (8) | Ratio of net expenses to average net assets does not include expenses of the underlying fund in which the Fund invests. |
| (9) | Net expenses reflect a voluntary expense reimbursement to prevent a negative yield. |
See accompanying Notes to the Financial Statements.
61
Table of Contents
Barings Diversified Income Fund 2020 Semi-Annual Report
FINANCIAL HIGHLIGHTS (CONTINUED)
| CLASS I | ||||||||||||||||||||||||
| FOR THE SIX MONTHS ENDED DECEMBER 31, 2020(1) | FOR THE YEAR ENDED JUNE 30, 2020 | FOR THE YEAR ENDED JUNE 30, 2019 | FOR THE YEAR ENDED JUNE 30, 2018 | FOR THE YEAR ENDED JUNE 30, 2017 | PERIOD FROM JULY 8, 2015 THROUGH JUNE 30, 2016(2) | |||||||||||||||||||
| Per Common Share Data | ||||||||||||||||||||||||
Net asset value, beginning of period | $ | 8.73 | $ | 9.82 | $ | 9.77 | $ | 10.08 | $ | 10.18 | $ | 10.00 | ||||||||||||
Income from investment operations: | ||||||||||||||||||||||||
Net investment income (3) | 0.12 | 0.33 | 0.33 | 0.29 | 0.28 | 0.27 | ||||||||||||||||||
Net realized and unrealized gain (loss) | 0.57 | (1.09 | ) | 0.05 | (0.27 | ) | (0.09 | ) | 0.20 | |||||||||||||||
|
|
|
|
|
|
|
|
|
|
|
| |||||||||||||
Total increase (decrease) from investment operations | 0.69 | (0.76 | ) | 0.38 | 0.02 | 0.19 | 0.47 | |||||||||||||||||
|
|
|
|
|
|
|
|
|
|
|
| |||||||||||||
Less dividends and distributions: | ||||||||||||||||||||||||
From net investment income | (0.12 | ) | (0.33 | ) | (0.33 | ) | (0.32 | ) | (0.29 | ) | (0.27 | ) | ||||||||||||
From net realized gain | – | – | – | – | – | (0.02 | ) | |||||||||||||||||
From return of capital | – | – | – | (0.01 | ) | – | – | |||||||||||||||||
|
|
|
|
|
|
|
|
|
|
|
| |||||||||||||
Total dividends and distributions | (0.12 | ) | (0.33 | ) | (0.33 | ) | (0.33 | ) | (0.29 | ) | (0.29 | ) | ||||||||||||
|
|
|
|
|
|
|
|
|
|
|
| |||||||||||||
Net asset value, at end of period | $ | 9.30 | $ | 8.73 | $ | 9.82 | $ | 9.77 | $ | 10.08 | $ | 10.18 | ||||||||||||
|
|
|
|
|
|
|
|
|
|
|
| |||||||||||||
Total investment return (4) | 7.91 | %(5) | (7.88 | )% | 4.01 | % | 0.13 | % | 1.90 | % | 4.89 | %(5) | ||||||||||||
|
|
|
|
|
|
|
|
|
|
|
| |||||||||||||
| Supplemental Data and Ratios | ||||||||||||||||||||||||
Net assets, end of period (000’s) | $ | 11,490 | $ | 10,790 | $ | 12,130 | $ | 12,070 | $ | 12,457 | $ | 12,582 | ||||||||||||
Ratio of total expenses (before reductions and reimbursements) to average net assets | 0.99 | %(6) | 1.19 | % | 1.29 | % | 1.30 | % | 1.36 | % | 1.37 | %(6) | ||||||||||||
Ratio of net expenses to average net assets (7) | 0.55 | %(6) | 0.55 | % | 0.55 | %(8)(9) | 0.55 | %(8) | 0.55 | %(8) | 0.55 | %(6)(8) | ||||||||||||
Ratio of net investment income to average net assets | 2.62 | %(6) | 3.51 | % | 3.44 | % | 2.94 | % | 2.74 | % | 2.77 | %(6) | ||||||||||||
Portfolio turnover rate | 52.73 | %(5) | 104.04 | % | 192.64 | % | 172.39 | % | 242.55 | % | 434.37 | %(5) | ||||||||||||
| (1) | Unaudited. |
| (2) | Fund commenced operations on July 8, 2015. |
| (3) | Calculated using average shares outstanding. |
| (4) | Total investment return calculation assumes the reinvestment of dividends at actual prices pursuant to the Fund’s dividend reinvestment plan. |
| (5) | Not annualized. |
| (6) | Annualized for periods less than one full year. |
| (7) | The Adviser has agreed to waive and/or reimburse certain fees and/or expense so that, on an annualized basis, such expenses incurred will not exceed 0.55% as a percentage of average daily net assets. |
| (8) | Ratio of net expenses to average net assets does not include expenses of the underlying fund in which the Fund invests. |
| (9) | Net expenses reflect a voluntary expense reimbursement to prevent a negative yield. |
See accompanying Notes to the Financial Statements.
62
Table of Contents
Barings Diversified Income Fund 2020 Semi-Annual Report
FINANCIAL HIGHLIGHTS (CONTINUED)
| CLASS Y | ||||||||||||||||||||||||
| FOR THE SIX MONTHS ENDED DECEMBER 31, 2020(1) | FOR THE YEAR ENDED JUNE 30, 2020 | FOR THE YEAR ENDED JUNE 30, 2019 | FOR THE YEAR ENDED JUNE 30, 2018 | FOR THE YEAR ENDED JUNE 30, 2017 | PERIOD FROM JULY 8, 2015 THROUGH JUNE 30, 2016(2) | |||||||||||||||||||
| Per Common Share Data | ||||||||||||||||||||||||
Net asset value, beginning of period | $ | 8.73 | $ | 9.82 | $ | 9.77 | $ | 10.08 | $ | 10.18 | $ | 10.00 | ||||||||||||
Income from investment operations: | ||||||||||||||||||||||||
Net investment income (3) | 0.12 | 0.33 | 0.33 | 0.29 | 0.27 | 0.27 | ||||||||||||||||||
Net realized and unrealized gain (loss) | 0.57 | (1.09 | ) | 0.05 | (0.27 | ) | (0.08 | ) | 0.20 | |||||||||||||||
|
|
|
|
|
|
|
|
|
|
|
| |||||||||||||
Total increase (decrease) from investment operations | 0.69 | (0.76 | ) | 0.38 | 0.02 | 0.19 | 0.47 | |||||||||||||||||
|
|
|
|
|
|
|
|
|
|
|
| |||||||||||||
Less dividends and distributions: | ||||||||||||||||||||||||
From net investment income | (0.12 | ) | (0.33 | ) | (0.33 | ) | (0.32 | ) | (0.29 | ) | (0.27 | ) | ||||||||||||
From net realized gain | – | – | – | – | – | (0.02 | ) | |||||||||||||||||
From return of capital | – | – | – | (0.01 | ) | – | – | |||||||||||||||||
|
|
|
|
|
|
|
|
|
|
|
| |||||||||||||
Total dividends and distributions | (0.12 | ) | (0.33 | ) | (0.33 | ) | (0.33 | ) | (0.29 | ) | (0.29 | ) | ||||||||||||
|
|
|
|
|
|
|
|
|
|
|
| |||||||||||||
Net asset value, at end of period | $ | 9.30 | $ | 8.73 | $ | 9.82 | $ | 9.77 | $ | 10.08 | $ | 10.18 | ||||||||||||
|
|
|
|
|
|
|
|
|
|
|
| |||||||||||||
Total investment return (4) | 7.90 | %(5) | (7.88 | )% | 4.01 | % | 0.13 | % | 1.90 | % | 4.89 | %(5) | ||||||||||||
|
|
|
|
|
|
|
|
|
|
|
| |||||||||||||
| Supplemental Data and Ratios | ||||||||||||||||||||||||
Net assets, end of period (000’s) | $ | 34,315 | $ | 29,233 | $ | 29,925 | $ | 16,414 | $ | 17,478 | $ | 13,011 | ||||||||||||
Ratio of total expenses (before reductions and reimbursements) to average net assets | 1.01 | %(6) | 1.20 | % | 1.30 | % | 1.33 | % | 1.36 | % | 1.36 | %(6) | ||||||||||||
Ratio of net expenses to average net assets (7) | 0.55 | %(6) | 0.55 | % | 0.55 | %(8)(9) | 0.55 | %(8) | 0.55 | %(8) | 0.55 | %(6)(8) | ||||||||||||
Ratio of net investment income to average net assets | 2.61 | %(6) | 3.48 | % | 3.42 | % | 2.95 | % | 2.72 | % | 2.77 | %(6) | ||||||||||||
Portfolio turnover rate | 52.73 | %(5) | 104.04 | % | 192.64 | % | 172.39 | % | 242.55 | % | 434.37 | %(5) | ||||||||||||
| (1) | Unaudited. |
| (2) | Fund commenced operations on July 8, 2015. |
| (3) | Calculated using average shares outstanding. |
| (4) | Total investment return calculation assumes the reinvestment of dividends at actual prices pursuant to the Fund’s dividend reinvestment plan. |
| (5) | Not annualized. |
| (6) | Annualized for periods less than one full year. |
| (7) | The Adviser has agreed to waive and/or reimburse certain fees and/or expense so that, on an annualized basis, such expenses incurred will not exceed 0.55% as a percentage of average daily net assets. |
| (8) | Ratio of net expenses to average net assets does not include expenses of the underlying fund in which the Fund invests. |
| (9) | Net expenses reflect a voluntary expense reimbursement to prevent a negative yield. |
See accompanying Notes to the Financial Statements.
63
Table of Contents
Barings Emerging Markets Debt Blended Total Return Fund 2020 Semi-Annual Report
FINANCIAL HIGHLIGHTS
| CLASS A | ||||||||||||||||||||||||
FOR THE SIX 2020 (1) | FOR THE YEAR 2020 | FOR THE YEAR 2019 | FOR THE YEAR ENDED | FOR THE YEAR 2017 | PERIOD FROM OCTOBER 21, 2015 THROUGH JUNE 30, 2016 (2) | |||||||||||||||||||
| Per Common Share Data | ||||||||||||||||||||||||
Net asset value, beginning of period | $ | 10.42 | $ | 10.06 | $ | 9.51 | $ | 10.55 | $ | 9.90 | $ | 10.00 | ||||||||||||
Income from investment operations: | ||||||||||||||||||||||||
Net investment income (3) | 0.29 | 0.60 | 0.55 | 0.45 | 0.42 | 0.43 | ||||||||||||||||||
Net realized and unrealized gain (loss) | 0.96 | 0.38 | 0.60 | (0.64 | ) | 0.73 | (0.19 | ) | ||||||||||||||||
|
|
|
|
|
|
|
|
|
|
|
| |||||||||||||
Total increase (decrease) from investment operations | 1.25 | 0.98 | 1.15 | (0.19 | ) | 1.15 | 0.24 | |||||||||||||||||
|
|
|
|
|
|
|
|
|
|
|
| |||||||||||||
Less dividends and distributions: | ||||||||||||||||||||||||
From net investment income | (0.32 | ) | (0.62 | ) | (0.55 | ) | (0.55 | ) | (0.50 | ) | (0.34 | ) | ||||||||||||
From net realized gain | (0.20 | ) | – | – | (0.30 | ) | – | (0.00 | )(4) | |||||||||||||||
From return of capital | – | – | (0.05 | ) | – | – | – | |||||||||||||||||
|
|
|
|
|
|
|
|
|
|
|
| |||||||||||||
Total dividends and distributions | (0.52 | ) | (0.62 | ) | (0.60 | ) | (0.85 | ) | (0.50 | ) | (0.34 | ) | ||||||||||||
|
|
|
|
|
|
|
|
|
|
|
| |||||||||||||
Net asset value, at end of period | $ | 11.15 | $ | 10.42 | $ | 10.06 | $ | 9.51 | $ | 10.55 | $ | 9.90 | ||||||||||||
|
|
|
|
|
|
|
|
|
|
|
| |||||||||||||
Total investment return (5) | 12.31 | %(6) | 10.11 | % | 12.59 | % | (2.21 | )% | 11.94 | % | 2.62 | %(6) | ||||||||||||
|
|
|
|
|
|
|
|
|
|
|
| |||||||||||||
| Supplemental Data and Ratios | ||||||||||||||||||||||||
Net assets, end of period (000’s) | $ | 10,493 | $ | 6,443 | $ | 405 | $ | 566 | $ | 211 | $ | 198 | ||||||||||||
Ratio of total expenses (before reductions and reimbursements) to average net assets | 1.59 | %(7) | 2.08 | % | 3.19 | % | 3.63 | % | 5.77 | % | 6.82 | %(7) | ||||||||||||
Ratio of net expenses to average net assets (8) | 1.20 | %(7) | 1.20 | % | 1.02 | %(9) | 1.11 | %(9) | 1.15 | %(9) | 1.16 | %(7) | ||||||||||||
Ratio of net investment income to average net assets | 5.33 | %(7) | 6.21 | % | 5.74 | % | 4.33 | % | 4.17 | % | 6.52 | %(7) | ||||||||||||
Portfolio turnover rate | 35.57 | %(6) | 126.54 | % | 89.98 | % | 51.95 | % | 55.66 | % | 83.26 | %(6) | ||||||||||||
| (1) | Unaudited. |
| (2) | Fund commenced operations on October 21, 2015. |
| (3) | Calculated using average shares outstanding. |
| (4) | Amount rounds to less than $.01 per share. |
| (5) | Total investment return calculation does not consider the effects of sales loads and assumes the reinvestment of dividends at actual prices pursuant to the Fund’s dividend reinvestment plan. |
| (6) | Not annualized. |
| (7) | Annualized for periods less than one full year. |
| (8) | The Adviser has agreed to waive and/or reimburse certain fees and/or expense so that, on an annualized basis, such expenses incurred will not exceed 1.20% as a percentage of average daily net assets. |
| (9) | Net expenses reflect a voluntary expense reimbursement to prevent a negative yield. |
See accompanying Notes to the Financial Statements.
64
Table of Contents
Barings Emerging Markets Debt Blended Total Return Fund 2020 Semi-Annual Report
FINANCIAL HIGHLIGHTS (CONTINUED)
| CLASS C | ||||||||||||||||||||||||
| FOR THE SIX MONTHS ENDED DECEMBER 31, 2020 (1) | FOR THE YEAR ENDED JUNE 30, 2020 | FOR THE YEAR ENDED JUNE 30, 2019 | FOR THE YEAR ENDED JUNE 30, 2018 | FOR THE YEAR ENDED JUNE 30, 2017 | PERIOD FROM OCTOBER 21, 2015 THROUGH JUNE 30, 2016 (2) | |||||||||||||||||||
| Per Common Share Data | ||||||||||||||||||||||||
Net asset value, beginning of period | $ | 10.42 | $ | 10.06 | $ | 9.51 | $ | 10.55 | $ | 9.90 | $ | 10.00 | ||||||||||||
Income from investment operations: | ||||||||||||||||||||||||
Net investment income (3) | 0.25 | 0.60 | 0.49 | 0.48 | 0.35 | 0.38 | ||||||||||||||||||
Net realized and unrealized gain (loss) | 0.96 | 0.31 | 0.59 | (0.74 | ) | 0.73 | (0.19 | ) | ||||||||||||||||
|
|
|
|
|
|
|
|
|
|
|
| |||||||||||||
Total increase (decrease) from investment operations | 1.21 | 0.91 | 1.08 | (0.26 | ) | 1.08 | 0.19 | |||||||||||||||||
|
|
|
|
|
|
|
|
|
|
|
| |||||||||||||
Less dividends and distributions: | ||||||||||||||||||||||||
From net investment income | (0.28 | ) | (0.55 | ) | (0.48 | ) | (0.48 | ) | (0.43 | ) | (0.29 | ) | ||||||||||||
From net realized gain | (0.20 | ) | – | – | (0.30 | ) | – | (0.00 | )(4) | |||||||||||||||
From return of capital | – | – | (0.05 | ) | – | – | – | |||||||||||||||||
|
|
|
|
|
|
|
|
|
|
|
| |||||||||||||
Total dividends and distributions | (0.48 | ) | (0.55 | ) | (0.53 | ) | (0.78 | ) | (0.43 | ) | (0.29 | ) | ||||||||||||
|
|
|
|
|
|
|
|
|
|
|
| |||||||||||||
Net asset value, at end of period | $ | 11.15 | $ | 10.42 | $ | 10.06 | $ | 9.51 | $ | 10.55 | $ | 9.90 | ||||||||||||
|
|
|
|
|
|
|
|
|
|
|
| |||||||||||||
Total investment return (5) | 11.90 | %(6) | 9.28 | % | 11.78 | % | (2.90 | )% | 11.11 | % | 2.10 | %(6) | ||||||||||||
|
|
|
|
|
|
|
|
|
|
|
| |||||||||||||
| Supplemental Data and Ratios | ||||||||||||||||||||||||
Net assets, end of period (000’s) | $ | 258 | $ | 225 | $ | 261 | $ | 277 | $ | 222 | $ | 198 | ||||||||||||
Ratio of total expenses (before reductions and reimbursements) to average net assets | 5.00 | %(7) | 5.29 | % | 5.02 | % | 5.85 | % | 6.47 | % | 7.57 | %(7) | ||||||||||||
Ratio of net expenses to average net assets (8) | 1.95 | %(7) | 1.95 | % | 1.71 | %(9) | 1.85 | %(9) | 1.89 | %(9) | 1.90 | %(7) | ||||||||||||
Ratio of net investment income to average net assets | 4.57 | %(7) | 6.09 | % | 5.14 | % | 4.63 | % | 3.44 | % | 5.79 | %(7) | ||||||||||||
Portfolio turnover rate | 35.57 | %(6) | 126.54 | % | 89.98 | % | 51.95 | % | 55.66 | % | 83.26 | %(6) | ||||||||||||
| (1) | Unaudited. |
| (2) | Fund commenced operations on October 21, 2015. |
| (3) | Calculated using average shares outstanding. |
| (4) | Amount rounds to less than $.01 per share. |
| (5) | Total investment return calculation does not consider the effects of sales loads and assumes the reinvestment of dividends at actual prices pursuant to the Fund’s dividend reinvestment plan. |
| (6) | Not annualized. |
| (7) | Annualized for periods less than one full year. |
| (8) | The Adviser has agreed to waive and/or reimburse certain fees and/or expense so that, on an annualized basis, such expenses incurred will not exceed 1.95% as a percentage of average daily net assets. |
| (9) | Net expenses reflect a voluntary expense reimbursement to prevent a negative yield. |
See accompanying Notes to the Financial Statements.
65
Table of Contents
Barings Emerging Markets Debt Blended Total Return Fund 2020 Semi-Annual Report
FINANCIAL HIGHLIGHTS (CONTINUED)
| CLASS I | ||||||||||||||||||||||||
| FOR THE SIX MONTHS ENDED DECEMBER 31, 2020 (1) | FOR THE YEAR ENDED JUNE 30, 2020 | FOR THE YEAR ENDED JUNE 30, 2019 | FOR THE YEAR ENDED JUNE 30, 2018 | FOR THE YEAR ENDED JUNE 30, 2017 | PERIOD FROM OCTOBER 21, 2015 THROUGH JUNE 30, 2016 (2) | |||||||||||||||||||
| Per Common Share Data | ||||||||||||||||||||||||
Net asset value, beginning of period | $ | 10.43 | $ | 10.06 | $ | 9.51 | $ | 10.55 | $ | 9.90 | $ | 10.00 | ||||||||||||
Income from investment operations: | ||||||||||||||||||||||||
Net investment income (3) | 0.31 | 0.69 | 0.59 | 0.54 | 0.45 | 0.45 | ||||||||||||||||||
Net realized and unrealized gain (loss) | 0.95 | 0.32 | 0.58 | (0.70 | ) | 0.73 | (0.19 | ) | ||||||||||||||||
|
|
|
|
|
|
|
|
|
|
|
| |||||||||||||
Total increase (decrease) from investment operations | 1.26 | 1.01 | 1.17 | (0.16 | ) | 1.18 | 0.26 | |||||||||||||||||
|
|
|
|
|
|
|
|
|
|
|
| |||||||||||||
Less dividends and distributions: | ||||||||||||||||||||||||
From net investment income | (0.33 | ) | (0.64 | ) | (0.57 | ) | (0.58 | ) | (0.53 | ) | (0.36 | ) | ||||||||||||
From net realized gain | (0.20 | ) | – | – | (0.30 | ) | – | (0.00 | )(4) | |||||||||||||||
From return of capital | – | – | (0.05 | ) | – | – | – | |||||||||||||||||
|
|
|
|
|
|
|
|
|
|
|
| |||||||||||||
Total dividends and distributions | (0.53 | ) | (0.64 | ) | (0.62 | ) | (0.88 | ) | (0.53 | ) | (0.36 | ) | ||||||||||||
|
|
|
|
|
|
|
|
|
|
|
| |||||||||||||
Net asset value, at end of period | $ | 11.16 | $ | 10.43 | $ | 10.06 | $ | 9.51 | $ | 10.55 | $ | 9.90 | ||||||||||||
|
|
|
|
|
|
|
|
|
|
|
| |||||||||||||
Total investment return (5) | 12.45 | %(6) | 10.39 | % | 12.86 | % | (1.94 | )% | 12.22 | % | 2.79 | %(6) | ||||||||||||
|
|
|
|
|
|
|
|
|
|
|
| |||||||||||||
| Supplemental Data and Ratios | ||||||||||||||||||||||||
Net assets, end of period (000’s) | $ | 10,443 | $ | 14,563 | $ | 23,964 | $ | 22,650 | $ | 5,063 | $ | 4,753 | ||||||||||||
Ratio of total expenses (before reductions and reimbursements) to average net assets | 1.29 | %(7) | 1.40 | % | 1.44 | % | 1.94 | % | 2.76 | % | 2.58 | %(7) | ||||||||||||
Ratio of net expenses to average net assets (8) | 0.95 | %(7) | 0.95 | % | 0.73 | %(9) | 0.80 | %(9) | 0.90 | %(9) | 0.92 | %(7) | ||||||||||||
Ratio of net investment income to average net assets | 5.66 | %(7) | 6.99 | % | 6.18 | % | 5.31 | % | 4.42 | % | 6.77 | %(7) | ||||||||||||
Portfolio turnover rate | 35.57 | %(6) | 126.54 | % | 89.98 | % | 51.95 | % | 55.66 | % | 83.26 | %(6) | ||||||||||||
| (1) | Unaudited. |
| (2) | Fund commenced operations on October 21, 2015. |
| (3) | Calculated using average shares outstanding. |
| (4) | Amount rounds to less than $.01 per share. |
| (5) | Total investment return calculation assumes the reinvestment of dividends at actual prices pursuant to the Fund’s dividend reinvestment plan. |
| (6) | Not annualized. |
| (7) | Annualized for periods less than one full year. |
| (8) | The Adviser has agreed to waive and/or reimburse certain fees and/or expense so that, on an annualized basis, such expenses incurred will not exceed 0.95% as a percentage of average daily net assets. |
| (9) | Net expenses reflect a voluntary expense reimbursement to prevent a negative yield. |
See accompanying Notes to the Financial Statements.
66
Table of Contents
Barings Emerging Markets Debt Blended Total Return Fund 2020 Semi-Annual Report
FINANCIAL HIGHLIGHTS (CONTINUED)
| CLASS Y | ||||||||||||||||||||||||
| FOR THE SIX MONTHS ENDED DECEMBER 31, 2020 (1) | FOR THE YEAR ENDED JUNE 30, 2020 | FOR THE YEAR ENDED JUNE 30, 2019 | FOR THE YEAR ENDED JUNE 30, 2018 | FOR THE YEAR ENDED JUNE 30, 2017 | PERIOD FROM OCTOBER 21, 2015 THROUGH JUNE 30, 2016 (2) | |||||||||||||||||||
| Per Common Share Data | ||||||||||||||||||||||||
Net asset value, beginning of period | $ | 10.42 | $ | 10.06 | $ | 9.51 | $ | 10.55 | $ | 9.90 | $ | 10.00 | ||||||||||||
Income from investment operations: | ||||||||||||||||||||||||
Net investment income (3) | 0.30 | 0.67 | 0.59 | 0.55 | 0.45 | 0.45 | ||||||||||||||||||
Net realized and unrealized gain (loss) | 0.96 | 0.33 | 0.58 | (0.71 | ) | 0.73 | (0.19 | ) | ||||||||||||||||
|
|
|
|
|
|
|
|
|
|
|
| |||||||||||||
Total increase (decrease) from investment operations | 1.26 | 1.00 | 1.17 | (0.16 | ) | 1.18 | 0.26 | |||||||||||||||||
|
|
|
|
|
|
|
|
|
|
|
| |||||||||||||
Less dividends and distributions: | ||||||||||||||||||||||||
From net investment income | (0.33 | ) | (0.64 | ) | (0.57 | ) | (0.58 | ) | (0.53 | ) | (0.36 | ) | ||||||||||||
From net realized gain | (0.20 | ) | – | – | (0.30 | ) | – | (0.00 | )(4) | |||||||||||||||
From return of capital | – | – | (0.05 | ) | – | – | – | |||||||||||||||||
|
|
|
|
|
|
|
|
|
|
|
| |||||||||||||
Total dividends and distributions | (0.53 | ) | (0.64 | ) | (0.62 | ) | (0.88 | ) | (0.53 | ) | (0.36 | ) | ||||||||||||
|
|
|
|
|
|
|
|
|
|
|
| |||||||||||||
Net asset value, at end of period | $ | 11.15 | $ | 10.42 | $ | 10.06 | $ | 9.51 | $ | 10.55 | $ | 9.90 | ||||||||||||
|
|
|
|
|
|
|
|
|
|
|
| |||||||||||||
Total investment return (5) | 12.46 | %(6) | 10.33 | % | 12.86 | % | (1.94 | )% | 12.22 | % | 2.79 | %(6) | ||||||||||||
|
|
|
|
|
|
|
|
|
|
|
| |||||||||||||
| Supplemental Data and Ratios | ||||||||||||||||||||||||
Net assets, end of period (000’s) | $ | 57,967 | $ | 33,429 | $ | 25,805 | $ | 23,122 | $ | 5,340 | $ | 4,754 | ||||||||||||
Ratio of total expenses (before reductions and reimbursements) to average net assets | 1.26 | %(7) | 1.42 | % | 1.44 | % | 1.95 | % |
| 2.77 | % | 2.58 | %(7) | |||||||||||
Ratio of net expenses to average net assets (8) | 0.95 | %(7) | 0.95 | % | 0.72 | %(9) | 0.80 | %(9) | 0.90 | %(9) | 0.92 | %(7) | ||||||||||||
Ratio of net investment income to average net assets | 5.56 | %(7) | 6.84 | % | 6.19 | % | 5.38 | % | 4.43 | % | 6.77 | %(7) | ||||||||||||
Portfolio turnover rate | 35.57 | %(6) | 126.54 | % | 89.98 | % | 51.95 | % | 55.66 | % | 83.26 | %(6) | ||||||||||||
| (1) | Unaudited. |
| (2) | Fund commenced operations on October 21, 2015. |
| (3) | Calculated using average shares outstanding. |
| (4) | Amount rounds to less than $.01 per share. |
| (5) | Total investment return calculation assumes the reinvestment of dividends at actual prices pursuant to the Fund’s dividend reinvestment plan. |
| (6) | Not annualized. |
| (7) | Annualized for periods less than one full year. |
| (8) | The Adviser has agreed to waive and/or reimburse certain fees and/or expense so that, on an annualized basis, such expenses incurred will not exceed 0.95% as a percentage of average daily net assets. |
| (9) | Net expenses reflect a voluntary expense reimbursement to prevent a negative yield. |
See accompanying Notes to the Financial Statements.
67
Table of Contents
Barings Global Emerging Markets Equity Fund 2020 Semi-Annual Report
FINANCIAL HIGHLIGHTS
| CLASS A | ||||||||||||
| FOR THE SIX MONTHS ENDED DECEMBER 31, 2020 (1) | FOR THE YEAR ENDED JUNE 30, 2020 | PERIOD FROM SEPTEMBER 17, 2018 THROUGH JUNE 30, 2019 (2) | ||||||||||
| Per Common Share Data | ||||||||||||
Net asset value, beginning of period | $ | 10.36 | $ | 11.10 | $ | 10.00 | ||||||
Income from investment operations: | ||||||||||||
Net investment income (3) | 0.04 | 0.15 | 0.06 | |||||||||
Net realized and unrealized gain (loss) | 2.97 | (0.57 | ) | 1.04 | ||||||||
|
|
|
|
|
| |||||||
Total increase (decrease) from investment operations | 3.01 | (0.42 | ) | 1.10 | ||||||||
|
|
|
|
|
| |||||||
Less dividends and distributions: | ||||||||||||
From net investment income | (0.09 | ) | (0.20 | ) | – | |||||||
From net realized gain | – | (0.11 | ) | – | ||||||||
From return of capital | – | (0.01 | ) | – | ||||||||
|
|
|
|
|
| |||||||
Total dividends and distributions | (0.09 | ) | (0.32 | ) | – | |||||||
|
|
|
|
|
| |||||||
Net asset value, at end of period | $ | 13.28 | $ | 10.36 | $ | 11.10 | ||||||
|
|
|
|
|
| |||||||
Total investment return (4) | 29.19 | %(5) | (4.02 | )% | 11.04 | %(5) | ||||||
|
|
|
|
|
| |||||||
| Supplemental Data and Ratios | ||||||||||||
Net assets, end of period (000’s) | $ | 133 | $ | 104 | $ | 111 | ||||||
Ratio of total expenses (before reductions and reimbursements) to average net assets | 6.16 | %(6) | 9.06 | % | 7.43 | %(6) | ||||||
Ratio of net expenses to average net assets (7)(8) | 1.40 | %(6) | 1.45 | % | 1.45 | %(6) | ||||||
Ratio of net investment income to average net assets | 0.61 | %(6) | 1.46 | % | 0.73 | %(6) | ||||||
Portfolio turnover rate | 11.24 | %(5) | 18.80 | % | 7.48 | %(5) | ||||||
| (1) | Unaudited. |
| (2) | Fund commenced operations on September 17, 2018. |
| (3) | Calculated using average shares outstanding. |
| (4) | Total investment return calculation assumes the reinvestment of dividends at actual prices pursuant to the Fund’s dividend reinvestment plan. |
| (5) | Not annualized. |
| (6) | Annualized for periods less than one full year. |
| (7) | As of November 5, 2020, the Adviser has agreed to waive and/or reimburse certain fees and/or expense so that, on an annualized basis, such expenses incurred will not exceed 1.15% as a percentage of average daily net assets. Prior to this date, the Adviser had agreed to waive and/or reimburse certain fees and/or expenses so that, on an annualized basis, such expenses would have not exceeded 1.45% as a percentage of net assets. |
| (8) | Ratio of net expenses to average net assets does not include expenses of the underlying fund in which the Fund invests. |
See accompanying Notes to the Financial Statements.
68
Table of Contents
Barings Global Emerging Markets Equity Fund 2020 Semi-Annual Report
FINANCIAL HIGHLIGHTS (CONTINUED)
| CLASS C | ||||||||||||
| FOR THE SIX MONTHS ENDED DECEMBER 31, 2020 (1) | FOR THE YEAR ENDED JUNE 30, 2020 | PERIOD FROM SEPTEMBER 17, 2018 THROUGH JUNE 30, 2019 (2) | ||||||||||
| Per Common Share Data | ||||||||||||
Net asset value, beginning of period | $ | 10.32 | $ | 11.04 | $ | 10.00 | ||||||
Income from investment operations: | ||||||||||||
Net investment income (3) | (0.01 | ) | 0.07 | 0.00 | (4) | |||||||
Net realized and unrealized gain (loss) | 2.96 | (0.57 | ) | 1.04 | ||||||||
|
|
|
|
|
| |||||||
Total increase (decrease) from investment operations | 2.95 | (0.50 | ) | 1.04 | ||||||||
|
|
|
|
|
| |||||||
Less dividends and distributions: | ||||||||||||
From net investment income | (0.05 | ) | (0.10 | ) | – | |||||||
From net realized gain | – | (0.11 | ) | – | ||||||||
From return of capital | – | (0.01 | ) | – | ||||||||
|
|
|
|
|
| |||||||
Total dividends and distributions | (0.05 | ) | (0.22 | ) | – | |||||||
|
|
|
|
|
| |||||||
Net asset value, at end of period | $ | 13.22 | $ | 10.32 | $ | 11.04 | ||||||
|
|
|
|
|
| |||||||
Total investment return (5) | 28.70 | %(6) | (4.74 | )% | 10.39 | %(6) | ||||||
|
|
|
|
|
| |||||||
| Supplemental Data and Ratios | ||||||||||||
Net assets, end of period (000’s) | $ | 132 | $ | 103 | $ | 110 | ||||||
Ratio of total expenses (before reductions and reimbursements) to average net assets | 6.92 | %(7) | 9.82 | % | 8.19 | %(7) | ||||||
Ratio of net expenses to average net assets (8)(9) | 2.15 | %(7) | 2.20 | % | 2.20 | %(7) | ||||||
Ratio of net investment income (loss) to average net assets | (0.14 | )%(7) | 0.71 | % | (0.03 | )%(7) | ||||||
Portfolio turnover rate | 11.24 | %(6) | 18.80 | % | 7.48 | %(6) | ||||||
| (1) | Unaudited. |
| (2) | Fund commenced operations on September 17, 2018. |
| (3) | Calculated using average shares outstanding. |
| (4) | Amount rounds to less than $.01 per share. |
| (5) | Total investment return calculation assumes the reinvestment of dividends at actual prices pursuant to the Fund’s dividend reinvestment plan. |
| (6) | Not annualized. |
| (7) | Annualized for periods less than one full year. |
| (8) | As of November 5, 2020, the Adviser has agreed to waive and/or reimburse certain fees and/or expense so that, on an annualized basis, such expenses incurred will not exceed 1.90% as a percentage of average daily net assets. Prior to this date, the Adviser had agreed to waive and/or reimburse certain fees and/or expenses so that, on an annualized basis, such expenses would have not exceeded 2.20% as a percentage of net assets. |
| (9) | Ratio of net expenses to average net assets does not include expenses of the underlying fund in which the Fund invests. |
See accompanying Notes to the Financial Statements.
69
Table of Contents
Barings Global Emerging Markets Equity Fund 2020 Semi-Annual Report
FINANCIAL HIGHLIGHTS (CONTINUED)
| CLASS I | ||||||||||||
| FOR THE SIX MONTHS ENDED DECEMBER 31, 2020(1) | FOR THE YEAR ENDED JUNE 30, 2020(2) | PERIOD FROM SEPTEMBER 17, 2018 THROUGH JUNE 30, 2019(2) | ||||||||||
| Per Common Share Data | ||||||||||||
Net asset value, beginning of period | $ | 10.38 | $ | 11.13 | $ | 10.00 | ||||||
Income from investment operations: | ||||||||||||
Net investment income (3) | 0.05 | 0.18 | 0.08 | |||||||||
Net realized and unrealized gain (loss) | 2.98 | (0.58 | ) | 1.05 | ||||||||
|
|
|
|
|
| |||||||
Total increase (decrease) from investment operations | 3.03 | (0.40 | ) | 1.13 | ||||||||
|
|
|
|
|
| |||||||
Less dividends and distributions: | ||||||||||||
From net investment income | (0.11 | ) | (0.22 | ) | – | |||||||
From net realized gain | – | (0.11 | ) | – | ||||||||
From return of capital | – | (0.02 | ) | – | ||||||||
|
|
|
|
|
| |||||||
Total dividends and distributions | (0.11 | ) | (0.35 | ) | – | |||||||
|
|
|
|
|
| |||||||
Net asset value, at end of period | $ | 13.30 | $ | 10.38 | $ | 11.13 | ||||||
|
|
|
|
|
| |||||||
Total investment return (4) | 29.36 | %(5) | (3.78 | )% | 11.26 | %(5) | ||||||
|
|
|
|
|
| |||||||
| Supplemental Data and Ratios | ||||||||||||
Net assets, end of period (000’s) | $ | 6,519 | $ | 5,085 | $ | 5,452 | ||||||
Ratio of total expenses (before reductions and reimbursements) to average net assets | 2.51 | %(6) | 2.96 | % | 2.94 | %(6) | ||||||
Ratio of net expenses to average net assets (7)(8) | 1.15 | %(6) | 1.20 | % | 1.20 | %(6) | ||||||
Ratio of net investment income to average net assets | 0.86 | %(6) | 1.71 | % | 0.98 | %(6) | ||||||
Portfolio turnover rate | 11.24 | %(5) | 18.80 | % | 7.48 | %(5) | ||||||
| (1) | Unaudited. |
| (2) | Fund commenced operations on September 17, 2018. |
| (3) | Calculated using average shares outstanding. |
| (4) | Total investment return calculation assumes the reinvestment of dividends at actual prices pursuant to the Fund’s dividend reinvestment plan. |
| (5) | Not annualized. |
| (6) | Annualized for periods less than one full year. |
| (7) | As of November 5, 2020, the Adviser has agreed to waive and/or reimburse certain fees and/or expense so that, on an annualized basis, such expenses incurred will not exceed 0.90% as a percentage of average daily net assets. Prior to this date, the Adviser had agreed to waive and/or reimburse certain fees and/or expenses so that, on an annualized basis, such expenses would have not exceeded 1.20% as a percentage of net assets. |
| (8) | Ratio of net expenses to average net assets does not include expenses of the underlying fund in which the Fund invests. |
See accompanying Notes to the Financial Statements.
70
Table of Contents
Barings Global Emerging Markets Equity Fund 2020 Semi-Annual Report
FINANCIAL HIGHLIGHTS (CONTINUED)
| CLASS Y | ||||||||||||
| FOR THE SIX MONTHS ENDED DECEMBER 31, 2020 (1) | FOR THE YEAR ENDED JUNE 30, 2020 | PERIOD FROM SEPTEMBER 17, 2018 THROUGH JUNE 30, 2019 (2) | ||||||||||
| Per Common Share Data | ||||||||||||
Net asset value, beginning of period | $ | 10.38 | $ | 11.13 | $ | 10.00 | ||||||
Income from investment operations: | ||||||||||||
Net investment income (3) | 0.05 | 0.18 | 0.08 | |||||||||
Net realized and unrealized gain (loss) | 2.98 | (0.58 | ) | 1.05 | ||||||||
|
|
|
|
|
| |||||||
Total increase (decrease) from investment operations | 3.03 | (0.40 | ) | 1.13 | ||||||||
|
|
|
|
|
| |||||||
Less dividends and distributions: | ||||||||||||
From net investment income | (0.11 | ) | (0.22 | ) | – | |||||||
From net realized gain | – | (0.11 | ) | – | ||||||||
From return of capital | – | (0.02 | ) | – | ||||||||
|
|
|
|
|
| |||||||
Total dividends and distributions | (0.11 | ) | (0.35 | ) | – | |||||||
|
|
|
|
|
| |||||||
Net asset value, at end of period | $ | 13.30 | $ | 10.38 | $ | 11.13 | ||||||
|
|
|
|
|
| |||||||
Total investment return (4) | 29.36 | %(5) | (3.78 | )% | 11.26 | %(5) | ||||||
|
|
|
|
|
| |||||||
| Supplemental Data and Ratios | ||||||||||||
Net assets, end of period (000’s) | $ | 6,519 | $ | 5,085 | $ | 5,452 | ||||||
Ratio of total expenses (before reductions and reimbursements) to average net assets | 2.51 | %(6) | 2.96 | % | 2.94 | %(6) | ||||||
Ratio of net expenses to average net assets (7)(8) | 1.15 | %(6) | 1.20 | % | 1.20 | %(6) | ||||||
Ratio of net investment income to average net assets | 0.86 | %(6) | 1.71 | % | 0.98 | %(6) | ||||||
Portfolio turnover rate | 11.24 | %(5) | 18.80 | % | 7.48 | %(5) | ||||||
| (1) | Unaudited. |
| (2) | Fund commenced operations on September 17, 2018. |
| (3) | Calculated using average shares outstanding. |
| (4) | Total investment return calculation assumes the reinvestment of dividends at actual prices pursuant to the Fund’s dividend reinvestment plan. |
| (5) | Not annualized. |
| (6) | Annualized for periods less than one full year. |
| (7) | Ratio of net expenses to average net assets does not include expenses of the underlying fund in which the Fund invests. |
| (8) | As of November 5, 2020, the Adviser has agreed to waive and/or reimburse certain fees and/or expense so that, on an annualized basis, such expenses incurred will not exceed 0.90% as a percentage of average daily net assets. Prior to this date, the Adviser had agreed to waive and/or reimburse certain fees and/or expenses so that, on an annualized basis, such expenses would have not exceeded 1.20% as a percentage of net assets. |
See accompanying Notes to the Financial Statements.
71
Table of Contents
Barings U.S. High Yield Fund 2020 Semi-Annual Report
FINANCIAL HIGHLIGHTS (CONTINUED)
| CLASS A | ||||||||||||||||||||||||
| FOR THE SIX MONTHS ENDED DECEMBER 31, 2020(1) | FOR THE YEAR ENDED JUNE 30, 2020 | FOR THE YEAR ENDED JUNE 30, 2019 | FOR THE YEAR ENDED JUNE 30, 2018 | FOR THE YEAR ENDED JUNE 30, 2017 | PERIOD FROM OCTOBER 30, 2015 THROUGH JUNE 30, 2016(2) | |||||||||||||||||||
| Per Common Share Data | ||||||||||||||||||||||||
Net asset value, beginning of period | $ | 8.91 | $ | 9.79 | $ | 9.82 | $ | 10.59 | $ | 10.14 | $ | 10.00 | ||||||||||||
Income from investment operations: | ||||||||||||||||||||||||
Net investment income (3) | 0.27 | 0.53 | 0.58 | 0.61 | 0.65 | 0.39 | ||||||||||||||||||
Net realized and unrealized gain (loss) | 0.79 | (0.88 | ) | (0.02 | ) | (0.47 | ) | 0.65 | 0.13 | |||||||||||||||
|
|
|
|
|
|
|
|
|
|
|
| |||||||||||||
Total increase (decrease) from investment operations | 1.06 | (0.35 | ) | 0.56 | 0.14 | 1.30 | 0.52 | |||||||||||||||||
|
|
|
|
|
|
|
|
|
|
|
| |||||||||||||
Less dividends and distributions: | ||||||||||||||||||||||||
From net investment income | (0.24 | ) | (0.53 | ) | (0.59 | ) | (0.61 | ) | (0.66 | ) | (0.38 | ) | ||||||||||||
From net realized gain | – | – | – | (0.30 | ) | (0.19 | ) | – | ||||||||||||||||
|
|
|
|
|
|
|
|
|
|
|
| |||||||||||||
Total dividends and distributions | (0.24 | ) | (0.53 | ) | (0.59 | ) | (0.91 | ) | (0.85 | ) | (0.38 | ) | ||||||||||||
|
|
|
|
|
|
|
|
|
|
|
| |||||||||||||
Net asset value, at end of period | $ | 9.73 | $ | 8.91 | $ | 9.79 | $ | 9.82 | $ | 10.59 | $ | 10.14 | ||||||||||||
|
|
|
|
|
|
|
|
|
|
|
| |||||||||||||
Total investment return (4) | 12.02 | %(5) | (3.67 | )% | 5.84 | % | 1.32 | % | 13.13 | % | 5.36 | %(5) | ||||||||||||
|
|
|
|
|
|
|
|
|
|
|
| |||||||||||||
| Supplemental Data and Ratios | ||||||||||||||||||||||||
Net assets, end of period (000’s) | $ | 1,189 | $ | 1,910 | $ | 3,840 | $ | 2,918 | $ | 2,633 | $ | 206 | ||||||||||||
Ratio of total expenses (before reductions and reimbursements) to average net assets | 1.46 | %(6) | 1.64 | % | 1.64 | % | 1.71 | % | 1.82 | % | 5.47 | %(6) | ||||||||||||
Ratio of net expenses to average net assets (7) | 1.00 | %(6) | 1.00 | % | 1.00 | % | 1.00 | % | 1.00 | % | 0.99 | %(6) | ||||||||||||
Ratio of net investment income to average net assets | 5.84 | %(6) | 5.52 | % | 5.99 | % | 5.92 | % | 6.21 | % | 5.93 | %(6) | ||||||||||||
Portfolio turnover rate | 41.70 | %(5) | 80.66 | % | 55.98 | % | 43.75 | % | 71.57 | % | 77.52 | %(5) | ||||||||||||
| (1) | Unaudited. |
| (2) | Fund commenced operations on October 30, 2015. |
| (3) | Calculated using average shares outstanding. |
| (4) | Total investment return calculation assumes the reinvestment of dividends at actual prices pursuant to the Fund’s dividend reinvestment plan. |
| (5) | Not annualized. |
| (6) | Annualized for periods less than one full year. |
| (7) | The Adviser has agreed to waive and/or reimburse certain fees and/or expense so that, on an annualized basis, such expenses incurred will not exceed 1.00% as a percentage of average daily net assets. |
See accompanying Notes to the Financial Statements.
72
Table of Contents
Barings U.S. High Yield Fund 2020 Semi-Annual Report
FINANCIAL HIGHLIGHTS (CONTINUED)
| CLASS C | ||||||||||||||||||||||||
| FOR THE SIX MONTHS ENDED DECEMBER 31, 2020(1) | FOR THE YEAR ENDED JUNE 30, 2020 | FOR THE YEAR ENDED JUNE 30, 2019 | FOR THE YEAR ENDED JUNE 30, 2018 | FOR THE YEAR ENDED JUNE 30, 2017 | PERIOD FROM OCTOBER 30, 2015 THROUGH JUNE 30, 2016(2) | |||||||||||||||||||
| Per Common Share Data | ||||||||||||||||||||||||
Net asset value, beginning of period | $ | 8.91 | $ | 9.79 | $ | 9.82 | $ | 10.59 | $ | 10.14 | $ | 10.00 | ||||||||||||
Income from investment operations: | ||||||||||||||||||||||||
Net investment income (3) | 0.24 | 0.45 | 0.51 | 0.53 | 0.58 | 0.33 | ||||||||||||||||||
Net realized and unrealized gain (loss) | 0.79 | (0.87 | ) | (0.03 | ) | (0.47 | ) | 0.64 | 0.14 | |||||||||||||||
|
|
|
|
|
|
|
|
|
|
|
| |||||||||||||
Total increase (decrease) from investment operations | 1.03 | (0.42 | ) | 0.48 | 0.06 | 1.22 | 0.47 | |||||||||||||||||
|
|
|
|
|
|
|
|
|
|
|
| |||||||||||||
Less dividends and distributions: | ||||||||||||||||||||||||
From net investment income | (0.21 | ) | (0.46 | ) | (0.51 | ) | (0.53 | ) | (0.58 | ) | (0.33 | ) | ||||||||||||
From net realized gain | – | – | – | (0.30 | ) | (0.19 | ) | – | ||||||||||||||||
|
|
|
|
|
|
|
|
|
|
|
| |||||||||||||
Total dividends and distributions | (0.21 | ) | (0.46 | ) | (0.51 | ) | (0.83 | ) | (0.77 | ) | (0.33 | ) | ||||||||||||
|
|
|
|
|
|
|
|
|
|
|
| |||||||||||||
Net asset value, at end of period | $ | 9.73 | $ | 8.91 | $ | 9.79 | $ | 9.82 | $ | 10.59 | $ | 10.14 | ||||||||||||
|
|
|
|
|
|
|
|
|
|
|
| |||||||||||||
Total investment return (4) | 11.62 | %(5) | (4.39 | )% | 5.03 | % | 0.61 | % | 12.24 | % | 4.85 | %(5) | ||||||||||||
|
|
|
|
|
|
|
|
|
|
|
| |||||||||||||
| Supplemental Data and Ratios | ||||||||||||||||||||||||
Net assets, end of period (000’s) | $ | 97 | $ | 89 | $ | 98 | $ | 98 | $ | 118 | $ | 101 | ||||||||||||
Ratio of total expenses (before reductions and reimbursements) to average net assets | 5.05 | %(6) | 7.31 | % | 7.14 | % | 6.43 | % | 6.18 | % | 7.30 | %(6) | ||||||||||||
Ratio of net expenses to average net assets (7) | 1.75 | %(6) | 1.75 | % | 1.75 | % | 1.75 | % | 1.75 | % | 1.73 | %(6) | ||||||||||||
Ratio of net investment income to average net assets | 5.17 | %(6) | 4.78 | % | 5.27 | % | 5.17 | % | 5.50 | % | 5.08 | %(6) | ||||||||||||
Portfolio turnover rate | 41.70 | %(5) | 80.66 | % | 55.98 | % | 43.75 | % | 71.57 | % | 77.52 | %(5) | ||||||||||||
| (1) | Unaudited. |
| (2) | Fund commenced operations on October 30, 2015. |
| (3) | Calculated using average shares outstanding. |
| (4) | Total investment return calculation assumes the reinvestment of dividends at actual prices pursuant to the Fund’s dividend reinvestment plan. |
| (5) | Not annualized. |
| (6) | Annualized for periods less than one full year. |
| (7) | The Adviser has agreed to waive and/or reimburse certain fees and/or expense so that, on an annualized basis, such expenses incurred will not exceed 1.75% as a percentage of average daily net assets. |
See accompanying Notes to the Financial Statements.
73
Table of Contents
Barings U.S. High Yield Fund 2020 Semi-Annual Report
FINANCIAL HIGHLIGHTS (CONTINUED)
| CLASS I | ||||||||||||||||||||||||
| FOR THE SIX MONTHS ENDED DECEMBER 31, 2020(1) | FOR THE YEAR ENDED JUNE 30, 2020 | FOR THE YEAR ENDED JUNE 30, 2019 | FOR THE YEAR ENDED JUNE 30, 2018 | FOR THE YEAR ENDED JUNE 30, 2017 | PERIOD FROM OCTOBER 30, 2015 THROUGH JUNE 30, 2016(2) | |||||||||||||||||||
| Per Common Share Data | ||||||||||||||||||||||||
Net asset value, beginning of period | $ | 8.91 | $ | 9.79 | $ | 9.82 | $ | 10.59 | $ | 10.14 | $ | 10.00 | ||||||||||||
Income from investment operations: | ||||||||||||||||||||||||
Net investment income (3) | 0.25 | 0.55 | 0.61 | 0.63 | 0.68 | 0.40 | ||||||||||||||||||
Net realized and unrealized gain (loss) | 0.82 | (0.87 | ) | (0.03 | ) | (0.47 | ) | 0.64 | 0.13 | |||||||||||||||
|
|
|
|
|
|
|
|
|
|
|
| |||||||||||||
Total increase (decrease) from investment operations | 1.07 | (0.32 | ) | 0.58 | 0.16 | 1.32 | 0.53 | |||||||||||||||||
|
|
|
|
|
|
|
|
|
|
|
| |||||||||||||
Less dividends and distributions: | ||||||||||||||||||||||||
From net investment income | (0.26 | ) | (0.56 | ) | (0.61 | ) | (0.63 | ) | (0.68 | ) | (0.39 | ) | ||||||||||||
From net realized gain | – | – | – | (0.30 | ) | (0.19 | ) | – | ||||||||||||||||
|
|
|
|
|
|
|
|
|
|
|
| |||||||||||||
Total dividends and distributions | (0.26 | ) | (0.56 | ) | (0.61 | ) | (0.93 | ) | (0.87 | ) | (0.39 | ) | ||||||||||||
|
|
|
|
|
|
|
|
|
|
|
| |||||||||||||
Net asset value, at end of period | $ | 9.72 | $ | 8.91 | $ | 9.79 | $ | 9.82 | $ | 10.59 | $ | 10.14 | ||||||||||||
|
|
|
|
|
|
|
|
|
|
|
| |||||||||||||
Total investment return (4) | 12.18 | %(5) | (3.43 | )% | 6.07 | % | 1.61 | % | 13.36 | % | 5.53 | %(5) | ||||||||||||
|
|
|
|
|
|
|
|
|
|
|
| |||||||||||||
| Supplemental Data and Ratios | ||||||||||||||||||||||||
Net assets, end of period (000’s) | $ | 12,059 | $ | 11,046 | $ | 12,135 | $ | 14,816 | $ | 15,720 | $ | 14,863 | ||||||||||||
Ratio of total expenses (before reductions and reimbursements) to average net assets | 1.03 | %(6) | 1.11 | % | 1.11 | % | 1.28 | % | 1.36 | % | 1.38 | %(6) | ||||||||||||
Ratio of net expenses to average net assets (7) | 0.75 | %(6) | 0.75 | % | 0.75 | % | 0.75 | % | 0.75 | % | 0.74 | %(6) | ||||||||||||
Ratio of net investment income to average net assets | 5.43 | %(6) | 5.78 | % | 6.28 | % | 6.16 | % | 6.50 | % | 6.11 | %(6) | ||||||||||||
Portfolio turnover rate | 41.70 | %(5) | 80.66 | % | 55.98 | % | 43.75 | % | 71.57 | % | 77.52 | %(5) | ||||||||||||
| (1) | Unaudited. |
| (2) | Fund commenced operations on October 30, 2015. |
| (3) | Calculated using average shares outstanding. |
| (4) | Total investment return calculation assumes the reinvestment of dividends at actual prices pursuant to the Fund’s dividend reinvestment plan. |
| (5) | Not annualized. |
| (6) | Annualized for periods less than one full year. |
| (7) | The Adviser has agreed to waive and/or reimburse certain fees and/or expense so that, on an annualized basis, such expenses incurred will not exceed 0.75% as a percentage of average daily net assets. |
See accompanying Notes to the Financial Statements.
74
Table of Contents
Barings U.S. High Yield Fund 2020 Semi-Annual Report
FINANCIAL HIGHLIGHTS (CONTINUED)
| CLASS Y | ||||||||||||||||||||||||
| FOR THE SIX MONTHS ENDED DECEMBER 31, 2020(1) | FOR THE YEAR ENDED JUNE 30, 2020 | FOR THE YEAR ENDED JUNE 30, 2019 | FOR THE YEAR ENDED JUNE 30, 2018 | FOR THE YEAR ENDED JUNE 30, 2017 | PERIOD FROM OCTOBER 30, 2015 THROUGH JUNE 30, 2016(2) | |||||||||||||||||||
| Per Common Share Data | ||||||||||||||||||||||||
Net asset value, beginning of period | $ | 8.91 | $ | 9.79 | $ | 9.82 | $ | 10.58 | $ | 10.14 | $ | 10.00 | ||||||||||||
Income from investment operations: | ||||||||||||||||||||||||
Net investment income (3) | 0.26 | 0.54 | 0.61 | 0.62 | 0.68 | 0.39 | ||||||||||||||||||
Net realized and unrealized gain (loss) | 0.81 | (0.86 | ) | (0.03 | ) | (0.45 | ) | 0.63 | 0.14 | |||||||||||||||
|
|
|
|
|
|
|
|
|
|
|
| |||||||||||||
Total increase (decrease) from investment operations | 1.07 | (0.32 | ) | 0.58 | 0.17 | 1.31 | 0.53 | |||||||||||||||||
|
|
|
|
|
|
|
|
|
|
|
| |||||||||||||
Less dividends and distributions: | ||||||||||||||||||||||||
From net investment income | (0.26 | ) | (0.56 | ) | (0.61 | ) | (0.63 | ) | (0.68 | ) | (0.39 | ) | ||||||||||||
From net realized gain | – | – | – | (0.30 | ) | (0.19 | ) | – | ||||||||||||||||
|
|
|
|
|
|
|
|
|
|
|
| |||||||||||||
Total dividends and distributions | (0.26 | ) | (0.56 | ) | (0.61 | ) | (0.93 | ) | (0.87 | ) | (0.39 | ) | ||||||||||||
|
|
|
|
|
|
|
|
|
|
|
| |||||||||||||
Net asset value, at end of period | $ | 9.72 | $ | 8.91 | $ | 9.79 | $ | 9.82 | $ | 10.58 | $ | 10.14 | ||||||||||||
|
|
|
|
|
|
|
|
|
|
|
| |||||||||||||
Total investment return (4) | 12.18 | %(5) | (3.43 | )% | 6.09 | % | 1.61 | % | 13.35 | % | 5.52 | %(5) | ||||||||||||
|
|
|
|
|
|
|
|
|
|
|
| |||||||||||||
| Supplemental Data and Ratios | ||||||||||||||||||||||||
Net assets, end of period (000’s) | $ | 37,840 | $ | 32,992 | $ | 34,695 | $ | 39,176 | $ | 14,631 | $ | 12,675 | ||||||||||||
Ratio of total expenses (before reductions and reimbursements) to average net assets | 1.03 | %(6) | 1.10 | % | 1.09 | % | 1.25 | % | 1.36 | % | 1.42 | %(6) | ||||||||||||
Ratio of net expenses to average net assets (7) | 0.75 | %(6) | 0.75 | % | 0.75 | % | 0.75 | % | 0.75 | % | 0.74 | %(6) | ||||||||||||
Ratio of net investment income to average net assets | 5.44 | %(6) | 5.78 | % | 6.27 | % | 6.09 | % | 6.50 | % | 6.06 | %(6) | ||||||||||||
Portfolio turnover rate | 41.70 | %(5) | 80.66 | % | 55.98 | % | 43.75 | % | 71.57 | % | 77.52 | %(5) | ||||||||||||
| (1) | Unaudited. |
| (2) | Fund commenced operations on October 30, 2015. |
| (3) | Calculated using average shares outstanding. |
| (4) | Total investment return calculation assumes the reinvestment of dividends at actual prices pursuant to the Fund’s dividend reinvestment plan. |
| (5) | Not annualized. |
| (6) | Annualized for periods less than one full year. |
| (7) | The Adviser has agreed to waive and/or reimburse certain fees and/or expense so that, on an annualized basis, such expenses incurred will not exceed 0.75% as a percentage of average daily net assets. |
See accompanying Notes to the Financial Statements.
75
Table of Contents
Barings Global Floating Rate Fund 2020 Semi-Annual Report
December 31, 2020 (Unaudited)
| SHARES | COST | FAIR VALUE | ||||||||||||||||||
Equities — 0.7%*: | ||||||||||||||||||||
Common Stocks — 0.7%*: | ||||||||||||||||||||
Beverage, Food and Tobacco — 0.3%*: | ||||||||||||||||||||
CTI Foods Holding Co. LLC(a) | 4,657 | $495,155 | $571,274 | |||||||||||||||||
|
|
|
|
|
| |||||||||||||||
Broadcasting and Entertainment — 0.1%*: | ||||||||||||||||||||
Technicolor SA(b) | 88,751 | 34,103 | 197,221 | |||||||||||||||||
|
|
|
|
|
| |||||||||||||||
Finance — 0.0%*: | ||||||||||||||||||||
Travelex Topco Ltd.(a),(b) | 880 | — | — | |||||||||||||||||
|
|
|
|
|
| |||||||||||||||
Healthcare, Education and Childcare — 0.1%*: | ||||||||||||||||||||
Don Jersey Topco Ltd.(a),(b) | 292,469 | 195,070 | 309,962 | |||||||||||||||||
|
|
|
|
|
| |||||||||||||||
Mining, Steel, Iron and Non-Precious Metals — 0.0%*: |
| |||||||||||||||||||
Boomerang Tube LLC(a) | 1,769 | 171,860 | — | |||||||||||||||||
|
|
|
|
|
| |||||||||||||||
Oil and Gas — 0.2%*: | ||||||||||||||||||||
Fieldwood Energy LLC | 6,469 | 226,415 | — | |||||||||||||||||
Fieldwood Energy LLC | 26,365 | 568,599 | — | |||||||||||||||||
Kelly Topco Ltd.(b) | 7,801 | 327,642 | 315,941 | |||||||||||||||||
Sabine Oil & Gas LLC | 394 | 22,597 | 5,122 | |||||||||||||||||
Templar Energy LLC(a) | 8,763 | 50,647 | — | |||||||||||||||||
Templar Energy LLC(a) | 7,121 | 56,021 | — | |||||||||||||||||
|
|
|
|
|
| |||||||||||||||
Total Oil and Gas | 56,913 | 1,251,921 | 321,063 | |||||||||||||||||
|
|
|
|
|
| |||||||||||||||
Total Common Stocks | 445,439 | 2,148,109 | 1,399,520 | |||||||||||||||||
|
|
|
|
|
| |||||||||||||||
Warrant — 0.0%*: | ||||||||||||||||||||
Finance — 0.0%*: | ||||||||||||||||||||
Travelex Topco Ltd.(b) | 285 | — | 32,153 | |||||||||||||||||
|
|
|
|
|
| |||||||||||||||
Total Equities | 445,724 | 2,148,109 | 1,431,673 | |||||||||||||||||
|
|
|
|
|
| |||||||||||||||
| EFFECTIVE INTEREST RATE | DUE DATE | PRINCIPAL‡‡ | COST | FAIR VALUE | ||||||||||||||||
Fixed Income — 93.0%*: | ||||||||||||||||||||
Bank Loans — 87.7%*(c): | ||||||||||||||||||||
Aerospace and Defense — 0.9%*: |
| |||||||||||||||||||
TransDigm Group, Inc., 1M LIBOR + 2.250% | 2.40 | % | 5/30/2025 | 490,013 | 488,451 | 479,600 | ||||||||||||||
TransDigm Group, Inc., 1M LIBOR + 2.250% | 2.40 | 12/9/2025 | 1,492,462 | 1,385,680 | 1,460,598 | |||||||||||||||
|
|
|
|
|
| |||||||||||||||
Total Aerospace and Defense | 1,982,475 | 1,874,131 | 1,940,198 | |||||||||||||||||
|
|
|
|
|
| |||||||||||||||
Automobile — 1.5%*: |
| |||||||||||||||||||
BCA Marketplace plc, LIBOR – GBP + 4.750%(b) | 4.84 | 11/13/2026 | 500,000 | 622,265 | 672,516 | |||||||||||||||
DexKo Global, Inc., 3M LIBOR + 3.500% | 4.50 | 7/24/2024 | 301,885 | 303,282 | 301,885 | |||||||||||||||
Panther BF Aggregator 2 LP, 1M LIBOR + 3.500% | 3.65 | 4/30/2026 | 1,113,294 | 1,106,448 | 1,107,494 | |||||||||||||||
US Farathane LLC, 3M LIBOR + 3.500% | 4.50 | 12/23/2021 | 1,084,111 | 1,085,738 | 1,000,093 | |||||||||||||||
|
|
|
|
|
| |||||||||||||||
Total Automobile | 2,999,290 | 3,117,733 | 3,081,988 | |||||||||||||||||
|
|
|
|
|
| |||||||||||||||
See accompanying Notes to the Financial Statements.
76
Table of Contents
Barings Global Floating Rate Fund 2020 Semi-Annual Report
SCHEDULE OF INVESTMENTS (CONTINUED)
December 31, 2020 (Unaudited)
| EFFECTIVE INTEREST RATE | DUE DATE | PRINCIPAL ‡‡ | COST | FAIR VALUE | ||||||||||||||||
Bank Loans (Continued) |
| |||||||||||||||||||
Beverage, Food and Tobacco — 2.8%*: |
| |||||||||||||||||||
Amphora Finance Ltd., LIBOR – GBP + 4.750%(b) | 4.77 | % | 5/23/2025 | 500,000 | $661,980 | $632,469 | ||||||||||||||
CTI Foods Holding Co, LLC, 3M LIBOR + 7.000%(a) | 8.00 | 5/3/2024 | 313,232 | 309,150 | 313,232 | |||||||||||||||
CTI Foods Holding Co, LLC, 3M LIBOR + 9.000%(a) | 10.00 | 5/3/2024 | 203,775 | 203,775 | 191,548 | |||||||||||||||
Deoleo S.A., EURIBOR + 4.000%(b) | 5.00 | 6/24/2025 | 117,907 | 132,946 | 137,740 | |||||||||||||||
IRB Holding Corp., 6M LIBOR + 2.750% | 3.75 | 2/5/2025 | 1,545,879 | 1,549,487 | 1,530,946 | |||||||||||||||
Sunshine Investments B.V., 3M LIBOR + 3.250%(b) | 3.47 | 3/28/2025 | 155,877 | 155,403 | 154,513 | |||||||||||||||
Welbilt, Inc., 1M LIBOR + 2.500% | 2.65 | 10/23/2025 | 1,000,000 | 886,169 | 945,000 | |||||||||||||||
Winebow Group, Inc. (The), 1M LIBOR + 3.750% | 4.75 | 7/1/2021 | 2,272,915 | 2,241,748 | 2,078,013 | |||||||||||||||
|
|
|
|
|
| |||||||||||||||
Total Beverage, Food and Tobacco | 6,109,585 | 6,140,658 | 5,983,461 | |||||||||||||||||
|
|
|
|
|
| |||||||||||||||
Broadcasting and Entertainment — 4.7%*: |
| |||||||||||||||||||
Altice USA, Inc., 1M LIBOR + 2.250% | 2.41 | 7/17/2025 | 1,156,481 | 1,145,511 | 1,137,479 | |||||||||||||||
AVSC Holding Corp., 3M LIBOR + 1.000% | 6.50 | 10/15/2026 | 509,133 | 464,749 | 453,128 | |||||||||||||||
Banijay Entertainment S.A.S, 1M LIBOR + 3.750%(b) | 3.90 | 3/1/2025 | 1,309,028 | 1,313,015 | 1,289,393 | |||||||||||||||
Clear Channel Worldwide Holdings, Inc., 3M LIBOR + 3.500% | 3.71 | 8/21/2026 | 1,978,525 | 1,932,673 | 1,900,789 | |||||||||||||||
Cox Media Group, 1M LIBOR + 4.250% | 4.40 | 12/17/2026 | 708,692 | 705,664 | 708,472 | |||||||||||||||
iHeartCommunications, Inc., 1M LIBOR + 3.000% | 3.15 | 5/1/2026 | 994,975 | 961,837 | 977,563 | |||||||||||||||
Imagina Media Audiovisual, S.L., EURIBOR + 4.750%(b) | 4.75 | 6/26/2025 | 500,000 | 572,924 | 516,147 | |||||||||||||||
Imagina Media Audiovisual, S.L., EURIBOR + 7.500%(b) | 7.50 | 12/26/2024 | 500,000 | 553,475 | 461,173 | |||||||||||||||
Learfield Communications, Inc., 1M LIBOR + 3.250% | 4.25 | 12/1/2023 | 1,979,382 | 1,852,660 | 1,780,731 | |||||||||||||||
Technicolor SA, EURIBOR + 6.000%(b) | 6.00 | 6/30/2024 | 401,511 | 395,147 | 503,482 | |||||||||||||||
Technicolor SA, EURIBOR + 3.000%(b) | 3.00 | 12/31/2024 | 232,610 | 222,800 | 239,886 | |||||||||||||||
|
|
|
|
|
| |||||||||||||||
Total Broadcasting and Entertainment | 10,270,337 | 10,120,455 | 9,968,243 | |||||||||||||||||
|
|
|
|
|
| |||||||||||||||
Buildings and Real Estate — 3.2%*: |
| |||||||||||||||||||
Core & Main L.P., 3M LIBOR + 2.750% | 3.75 | 8/1/2024 | 1,948,639 | 1,953,186 | 1,937,278 | |||||||||||||||
CP Atlas Buyer, Inc., 3M LIBOR + 4.500% | 5.25 | 11/23/2027 | 753,814 | 746,380 | 754,757 | |||||||||||||||
GYP Holdings III Corp., 1M LIBOR + 2.750% | 2.90 | 6/1/2025 | 1,198,053 | 1,195,971 | 1,191,559 | |||||||||||||||
Quikrete Holdings, Inc., 1M LIBOR + 2.500% | 2.65 | 2/1/2027 | 1,488,750 | 1,489,038 | 1,482,244 | |||||||||||||||
SRS Distribution, Inc., 1M LIBOR + 3.000% | 3.15 | 5/23/2025 | 1,398,193 | 1,389,383 | 1,374,229 | |||||||||||||||
|
|
|
|
|
| |||||||||||||||
Total Buildings and Real Estate | 6,787,449 | 6,773,958 | 6,740,067 | |||||||||||||||||
|
|
|
|
|
| |||||||||||||||
Cargo Transport — 0.9%*: |
| |||||||||||||||||||
Kenan Advantage Group, Inc., 1M LIBOR + 3.000% | 4.00 | 7/31/2022 | 1,899,837 | 1,901,255 | 1,878,312 | |||||||||||||||
|
|
|
|
|
| |||||||||||||||
Total Cargo Transport | 1,899,837 | 1,901,255 | 1,878,312 | |||||||||||||||||
|
|
|
|
|
| |||||||||||||||
See accompanying Notes to the Financial Statements.
77
Table of Contents
Barings Global Floating Rate Fund 2020 Semi-Annual Report
SCHEDULE OF INVESTMENTS (CONTINUED)
December 31, 2020 (Unaudited)
| EFFECTIVE INTEREST RATE | DUE DATE | PRINCIPAL ‡‡ | COST | FAIR VALUE | ||||||||||||||||
Bank Loans (Continued) |
| |||||||||||||||||||
Chemicals, Plastics and Rubber — 5.3%*: |
| |||||||||||||||||||
Allnex (Luxembourg) & Cy S.C.A., 3M LIBOR + 3.250% | 4.00 | % | 9/13/2023 | 356,033 | $355,343 | $351,917 | ||||||||||||||
Allnex USA, Inc., 3M LIBOR + 3.250% | 4.00 | 9/13/2023 | 268,231 | 267,712 | 265,130 | |||||||||||||||
Consolidated Energy Finance S.A., 1M LIBOR + 2.500% | 2.65 | 5/7/2025 | 1,462,293 | 1,433,497 | 1,394,662 | |||||||||||||||
Diamond (BC) B.V., EURIBOR + 3.250% | 3.25 | 9/6/2024 | 972,437 | 1,137,002 | 1,171,643 | |||||||||||||||
Flint Group GmbH, EURIBOR + 4.250%(b) | 2.87 | 9/21/2023 | 393,244 | 465,975 | 451,184 | |||||||||||||||
Flint Group GmbH, EURIBOR + 0.750%(b) | 2.88 | 9/21/2023 | 677,179 | 777,337 | 776,951 | |||||||||||||||
Flint Group GmbH, EURIBOR + 0.750%(b) | 3.00-5.25 | 9/21/2023 | 520,089 | 506,488 | 485,415 | |||||||||||||||
Flint Group US LLC, 3M LIBOR + 4.250%(b) | 3.00-5.25 | 9/21/2023 | 3,021,398 | 2,942,708 | 2,819,962 | |||||||||||||||
Gemini HDPE LLC, 3M LIBOR + 3.000% | 3.50 | 12/31/2027 | 315,985 | 312,825 | 313,615 | |||||||||||||||
Graftech International Ltd., 1M LIBOR + 3.500% | 4.50 | 2/12/2025 | 474,272 | 466,351 | 473,286 | |||||||||||||||
Novacap S.A., EURIBOR + 3.500%(b) | 3.50 | 6/22/2023 | 1,000,000 | 1,138,246 | 1,201,493 | |||||||||||||||
Polar US Borrower, LLC, 1M LIBOR + 4.750% | 4.90-5.00 | 10/15/2025 | 823,717 | 823,717 | 808,272 | |||||||||||||||
Solenis Holdings LLC, 3M LIBOR + 4.000% | 4.23 | 6/26/2025 | 621,579 | 617,566 | 620,180 | |||||||||||||||
|
|
|
|
|
| |||||||||||||||
Total Chemicals, Plastics and Rubber | 10,906,457 | 11,244,767 | 11,133,710 | |||||||||||||||||
|
|
|
|
|
| |||||||||||||||
Containers, Packaging and Glass — 4.2%*: |
| |||||||||||||||||||
Albea Beauty Holdings S.A., 3M LIBOR + 3.000%(b) | 4.00 | 4/22/2024 | 201,714 | 201,576 | 189,864 | |||||||||||||||
Berry Global Group, Inc., 1M LIBOR + 2.000% | 2.15 | 7/1/2026 | 234,433 | 234,765 | 233,057 | |||||||||||||||
Flex Acquisition Co., Inc., 1M LIBOR + 3.000% | 4.00 | 12/29/2023 | 1,344,504 | 1,351,771 | 1,335,684 | |||||||||||||||
Flex Acquisition Co., Inc., 3M LIBOR + 3.000% | 3.23 | 6/29/2025 | 851,221 | 828,921 | 839,942 | |||||||||||||||
Graham Packaging Co. Inc., 1M LIBOR + 3.750% | 4.50 | 8/4/2027 | 517,821 | 514,160 | 519,053 | |||||||||||||||
Mauser Packaging Solutions, 3M LIBOR + 3.250% | 3.48 | 4/3/2024 | 2,915,854 | 2,906,111 | 2,810,154 | |||||||||||||||
Reynolds Consumer Products LLC, 1M LIBOR + 1.750% | 1.90 | 2/4/2027 | 259,477 | 259,193 | 257,530 | |||||||||||||||
Roy Bidco ApS, EURIBOR + 3.500%(b) | 3.50 | 8/23/2024 | 1,000,000 | 1,154,999 | 1,209,434 | |||||||||||||||
Trident TPI Holdings, Inc., 3M LIBOR + 3.000% | 4.00 | 10/17/2024 | 1,484,677 | 1,468,321 | 1,462,734 | |||||||||||||||
|
|
|
|
|
| |||||||||||||||
Total Containers, Packaging and Glass | 8,809,701 | 8,919,817 | 8,857,452 | |||||||||||||||||
|
|
|
|
|
| |||||||||||||||
Diversified/Conglomerate Manufacturing — 2.7%*: |
| |||||||||||||||||||
Alliance Laundry Systems LLC, 3M LIBOR + 3.500% | 4.25 | 10/8/2027 | 56,365 | 55,952 | 56,295 | |||||||||||||||
Alstom Auxiliary Components (Arvos), 3M LIBOR + 4.500%(b) | 5.50 | 8/29/2021 | 241,586 | 241,358 | 195,684 | |||||||||||||||
Amer Sports Oyj, EURIBOR + 4.500%(b) | 4.50 | 3/30/2026 | 500,000 | 563,981 | 581,127 | |||||||||||||||
Energizer Holdings, Inc., 3M LIBOR + 2.250% | 2.75 | 12/16/2027 | 138,399 | 137,707 | 138,140 | |||||||||||||||
Energizer Holdings, Inc., 3M LIBOR + 2.250% | 2.75 | 12/22/2027 | 117,107 | 116,522 | 116,888 | |||||||||||||||
LSF10 XL Bidco S.C.A., EURIBOR + 4.000%(b) | 4.00 | 10/12/2026 | 1,500,000 | 1,635,559 | 1,815,012 | |||||||||||||||
LTI Holdings, Inc., 1M LIBOR + 3.500% | 3.65 | 9/6/2025 | 1,098,674 | 1,085,267 | 1,064,934 | |||||||||||||||
Project Alpha Intermediate Holding, Inc., 3M LIBOR + 3.500% | 4.50 | 4/26/2024 | 1,351,579 | 1,352,977 | 1,337,495 | |||||||||||||||
See accompanying Notes to the Financial Statements.
78
Table of Contents
Barings Global Floating Rate Fund 2020 Semi-Annual Report
SCHEDULE OF INVESTMENTS (CONTINUED)
December 31, 2020 (Unaudited)
| EFFECTIVE INTEREST RATE | DUE DATE | PRINCIPAL ‡‡ | COST | FAIR VALUE | ||||||||||||||||
Bank Loans (Continued) |
| |||||||||||||||||||
Diversified/Conglomerate Manufacturing (continued): |
| |||||||||||||||||||
SGB-SMIT Management GmbH, EURIBOR + 4.500%(b) | 4.50 | % | 7/18/2024 | 503,117 | $511,608 | $456,753 | ||||||||||||||
|
|
|
|
|
| |||||||||||||||
Total Diversified/Conglomerate Manufacturing | 5,506,827 | 5,700,931 | 5,762,328 | |||||||||||||||||
|
|
|
|
|
| |||||||||||||||
Diversified/Conglomerate Service — 9.3%*: |
| |||||||||||||||||||
Allied Universal Holdco LLC, 1M LIBOR + 4.250% | 4.40 | 7/10/2026 | 524,128 | 520,540 | 521,397 | |||||||||||||||
Cornerstone OnDemand, Inc., 1M LIBOR + 4.250% | 4.39 | 4/22/2027 | 473,867 | 460,881 | 475,473 | |||||||||||||||
Cvent, Inc., 1M LIBOR + 3.750% | 3.90 | 11/29/2024 | 1,359,217 | 1,041,811 | 1,304,849 | |||||||||||||||
EAB Global, Inc., 6M LIBOR + 3.750% | 4.75 | 11/15/2024 | 736,279 | 734,237 | 729,380 | |||||||||||||||
Financial & Risk US Holdings, Inc., 1M LIBOR + 3.250% | 3.40 | 10/1/2025 | 975,050 | 948,652 | 973,022 | |||||||||||||||
Finastra USA, Inc., 6M LIBOR + 7.250% | 8.25 | 6/13/2025 | 6,482 | 6,555 | 6,485 | |||||||||||||||
Finastra USA, Inc., 6M LIBOR + 3.500% | 4.50 | 6/13/2024 | 3,432,239 | 3,321,191 | 3,358,240 | |||||||||||||||
Greeneden U.S. Holdings II, LLC, 1M LIBOR + 4.000% | 4.75 | 12/1/2027 | 1,484,502 | 1,481,569 | 1,485,897 | |||||||||||||||
I-Logic Technologies Bidco Ltd., 3M LIBOR + 2.750% | 3.75 | 12/21/2024 | 1,008,009 | 1,011,418 | 991,629 | |||||||||||||||
Informatica LLC, 1M LIBOR + 3.250% | 3.40 | 2/25/2027 | 992,500 | 988,127 | 983,200 | |||||||||||||||
Informatica LLC, 1M LIBOR + 7.125% | 7.13 | 2/25/2025 | 350,242 | 348,782 | 355,758 | |||||||||||||||
Internet Brands, Inc, 1M LIBOR + 3.500% | 3.65 | 9/13/2024 | 2,009,897 | 2,003,977 | 1,980,512 | |||||||||||||||
Mitchell International, Inc., 1M LIBOR + 3.250% | 3.40 | 11/29/2024 | 1,487,264 | 1,451,601 | 1,458,456 | |||||||||||||||
Project Leopard Holdings, Inc., 3M LIBOR + 4.500% | 5.50 | 7/7/2023 | 1,461,404 | 1,465,257 | 1,455,018 | |||||||||||||||
Surf Holdings, LLC, 3M LIBOR + 3.500%(b) | 3.73 | 3/5/2027 | 183,469 | 183,064 | 181,635 | |||||||||||||||
TMF Group Holding B.V., EURIBOR + 3.250%(b) | 3.25 | 5/5/2025 | 500,000 | 584,771 | 595,939 | |||||||||||||||
Ultimate Software Group, Inc. (The), 3M LIBOR + 4.000% | 4.75 | 5/4/2026 | 997,500 | 983,796 | 1,001,919 | |||||||||||||||
Verisure Holding AB, EURIBOR + 2.750%(b) | 2.75 | 10/20/2022 | 1,000,000 | 1,159,968 | 1,217,533 | |||||||||||||||
Virtusa Corp., EURIBOR + 2.750% | 5.00 | 12/1/2027 | 229,434 | 225,992 | 227,713 | |||||||||||||||
Weld North Education, LLC, 3M LIBOR + 4.000% | 4.75 | 12/15/2027 | 354,160 | 352,389 | 352,832 | |||||||||||||||
|
|
|
|
|
| |||||||||||||||
Total Diversified/Conglomerate Service | 19,565,643 | 19,274,578 | 19,656,887 | |||||||||||||||||
|
|
|
|
|
| |||||||||||||||
Electronics — 4.1%*: |
| |||||||||||||||||||
Ahead DB Borrower, LLC, 3M LIBOR + 5.000% | 6.00 | 10/13/2027 | 710,285 | 682,655 | 697,187 | |||||||||||||||
EXC Holdings III Corp., 3M LIBOR + 3.500% | 4.50 | 12/2/2024 | 482,255 | 485,482 | 477,230 | |||||||||||||||
Imprivata,, Inc., 1M LIBOR + 3.750% | 4.25 | 12/1/2027 | 354,553 | 351,042 | 354,553 | |||||||||||||||
Ivanti Software, Inc., 1M LIBOR + 4.750% | 5.75 | 12/1/2027 | 1,000,000 | 985,141 | 996,560 | |||||||||||||||
Omnitracs, Inc., 1M LIBOR + 2.750% | 2.90 | 3/21/2025 | 1,465,129 | 1,463,136 | 1,431,856 | |||||||||||||||
See accompanying Notes to the Financial Statements.
79
Table of Contents
Barings Global Floating Rate Fund 2020 Semi-Annual Report
SCHEDULE OF INVESTMENTS (CONTINUED)
December 31, 2020 (Unaudited)
| EFFECTIVE INTEREST RATE | DUE DATE | PRINCIPAL ‡‡ | COST | FAIR VALUE | ||||||||||||||||
Bank Loans (Continued) |
| |||||||||||||||||||
Electronics (Continued) |
| |||||||||||||||||||
Renaissance Holding Corp., 1M LIBOR + 3.250% | 3.40 | % | 5/30/2025 | 730,028 | $730,028 | $716,223 | ||||||||||||||
RP Crown Parent LLC, 1M LIBOR + 3.000% | 4.00 | 2/2/2026 | 964,489 | 960,017 | 962,078 | |||||||||||||||
Sophia, LP, 3M LIBOR + 3.750% | 4.50 | 10/7/2027 | 344,860 | 342,354 | 345,105 | |||||||||||||||
SS&C Technologies Inc., 1M LIBOR + 1.750% | 1.90 | 4/16/2025 | 470,086 | 469,297 | 464,271 | |||||||||||||||
Tibco Software Inc., 1M LIBOR + 7.250% | 7.40 | 3/3/2028 | 385,440 | 383,708 | 388,651 | |||||||||||||||
Tibco Software Inc., 1M LIBOR + 3.750% | 3.90 | 6/30/2026 | 995,000 | 965,120 | 974,165 | |||||||||||||||
Veritas US Inc., EURIBOR + 5.500% | 6.50 | 9/1/2025 | 748,125 | 865,882 | 914,111 | |||||||||||||||
|
|
|
|
|
| |||||||||||||||
Total Electronics | 8,650,250 | 8,683,862 | 8,721,990 | |||||||||||||||||
|
|
|
|
|
| |||||||||||||||
Finance — 1.0%*: |
| |||||||||||||||||||
Deerfield Dakota Holding LLC, 1M LIBOR + 8.000% | 9.00 | 4/7/2028 | 1,000,000 | 986,343 | 1,015,000 | |||||||||||||||
Tempo Acquisition LLC, 1M LIBOR + 2.750% | 2.90 | 5/1/2024 | 1,078,827 | 1,081,249 | 1,069,387 | |||||||||||||||
|
|
|
|
|
| |||||||||||||||
Total Finance | 2,078,827 | 2,067,592 | 2,084,387 | |||||||||||||||||
|
|
|
|
|
| |||||||||||||||
Healthcare, Education and Childcare — 14.6%*: | ||||||||||||||||||||
AccentCare, Inc., 3M LIBOR + 5.000% | 5.50 | 6/22/2026 | 218,085 | 216,996 | 218,085 | |||||||||||||||
Advanz Pharma Corp., 1M LIBOR + 5.500%(b) | 6.50 | 9/6/2024 | 2,244,250 | 2,221,076 | 2,189,266 | |||||||||||||||
Advanz Pharma Corp., EURIBOR + 5.250%(b) | 6.25 | 9/6/2024 | 477,500 | 552,885 | 577,143 | |||||||||||||||
Aenova Holding GmbH, EURIBOR + 5.000%(b) | 5.00 | 3/6/2025 | 500,000 | 537,201 | 613,226 | |||||||||||||||
Amneal Pharmaceuticals LLC, 1M LIBOR + 3.500% | 3.69 | 5/4/2025 | 1,477,267 | 1,394,783 | 1,436,953 | |||||||||||||||
Arbor Pharmaceuticals, Inc., 6M LIBOR + 5.000% | 6.00 | 7/5/2023 | 1,354,102 | 1,352,282 | 1,299,938 | |||||||||||||||
Aspen Dental Management, Inc., 1M LIBOR + 4.000% | 4.75 | 12/23/2027 | 196,609 | 189,158 | 196,560 | |||||||||||||||
Auris Luxembourg III Sarl, EURIBOR + 4.000%(b) | 4.00 | 2/27/2026 | 1,000,000 | 1,103,861 | 1,185,978 | |||||||||||||||
Auris Luxembourg III Sarl, 1M LIBOR + 3.750%(b) | 3.90 | 2/27/2026 | 982,502 | 978,856 | 945,658 | |||||||||||||||
Aveanna Healthcare, LLC, 1M LIBOR + 5.500% | 6.50 | 3/18/2024 | 1,270,680 | 1,261,334 | 1,240,501 | |||||||||||||||
Change Healthcare Holdings LLC, 3M LIBOR + 2.500% | 3.50 | 3/1/2024 | 1,252,411 | 1,249,937 | 1,245,522 | |||||||||||||||
CTC AcquiCo GmbH, 1M LIBOR + 2.750%(b) | 2.90 | 3/7/2025 | 1,250,000 | 1,232,468 | 1,200,312 | |||||||||||||||
Endo Luxembourg Finance Co. I S.a r.l., 3M LIBOR + 4.250% | 5.00 | 4/29/2024 | 2,136,501 | 2,125,423 | 2,099,112 | |||||||||||||||
Envision Healthcare Corp., 1M LIBOR + 3.750% | 3.90 | 10/10/2025 | 592,399 | 347,204 | 492,360 | |||||||||||||||
Fugue Finance B.V., EURIBOR + 3.250%(b) | 3.25 | 9/1/2024 | 500,000 | 542,704 | 601,895 | |||||||||||||||
Horizon Therapeutics USA, Inc., 1M LIBOR + 2.000% | 2.19 | 5/22/2026 | 494,267 | 495,994 | 491,429 | |||||||||||||||
Indivior Finance Sarl, 3M LIBOR + 4.500% | 5.50 | 12/18/2022 | 777,472 | 772,946 | 758,036 | |||||||||||||||
LifePoint Health, 1M LIBOR + 3.750% | 3.90 | 11/16/2025 | 742,455 | 746,757 | 739,582 | |||||||||||||||
Lifescan Global Corp., 3M LIBOR + 6.000% | 6.23 | 10/1/2024 | 351,000 | 344,396 | 333,450 | |||||||||||||||
Nidda Healthcare Holding AG, LIBOR – GBP + 4.500%(b) | 4.55 | 8/21/2026 | 500,000 | 652,756 | 669,433 | |||||||||||||||
Nidda Healthcare Holding AG, EURIBOR + 3.500%(b) | 3.50 | 8/21/2026 | 1,000,000 | 1,084,419 | 1,209,177 | |||||||||||||||
See accompanying Notes to the Financial Statements.
80
Table of Contents
Barings Global Floating Rate Fund 2020 Semi-Annual Report
SCHEDULE OF INVESTMENTS (CONTINUED)
December 31, 2020 (Unaudited)
| EFFECTIVE INTEREST RATE | DUE DATE | PRINCIPAL‡‡ | COST | FAIR VALUE | ||||||||||||||||
Bank Loans (Continued) | ||||||||||||||||||||
Healthcare, Education and Childcare (Continued) |
| |||||||||||||||||||
Ortho-Clinical Diagnostics SA, 1M LIBOR + 3.250% | 3.40 | % | 6/30/2025 | 2,362,374 | $2,348,820 | $2,325,758 | ||||||||||||||
Parexel International Corp., 1M LIBOR + 2.750% | 2.90 | 9/27/2024 | 1,766,045 | 1,744,980 | 1,733,761 | |||||||||||||||
Rodenstock GmbH, EURIBOR + 5.250%(b) | 5.25 | 6/15/2026 | 500,000 | 557,847 | 603,190 | |||||||||||||||
Surgery Center Holdings, Inc., 1M LIBOR + 3.250% | 4.25 | 9/3/2024 | 1,484,655 | 1,485,093 | 1,457,233 | |||||||||||||||
Team Health Holdings, Inc., 1M LIBOR + 2.750% | 3.75 | 2/6/2024 | 1,937,110 | 1,908,245 | 1,720,231 | |||||||||||||||
Tunstall Group Holdings Ltd., EURIBOR + 5.000%(b) | 5.00 | 6/30/2025 | 321,190 | 377,864 | 380,610 | |||||||||||||||
Unilabs Holding AB, EURIBOR + 3.000%(b) | 3.00 | 4/19/2024 | 500,000 | 576,785 | 603,092 | |||||||||||||||
US Radiology Specialists, Inc., 3M LIBOR + 5.500% | 6.25 | 12/10/2027 | 802,536 | 786,548 | 795,762 | |||||||||||||||
Verscend Holding Corp., 1M LIBOR + 4.500% | 4.65 | 8/27/2025 | 1,492,366 | 1,468,626 | 1,489,382 | |||||||||||||||
|
|
|
|
|
| |||||||||||||||
Total Healthcare, Education and Childcare | 30,483,776 | 30,658,244 | 30,852,635 | |||||||||||||||||
|
|
|
|
|
| |||||||||||||||
Home and Office Furnishings, Housewares, and Durable Consumer Products — 1.1%*: |
| |||||||||||||||||||
Serta Simmons Bedding LLC, 1M LIBOR + 7.500% | 8.50 | 8/10/2023 | 1,517,617 | 1,517,617 | 1,363,138 | |||||||||||||||
SIWF Holdings Inc., 1M LIBOR + 4.250% | 4.40 | 6/15/2025 | 977,443 | 983,710 | 968,080 | |||||||||||||||
|
|
|
|
|
| |||||||||||||||
Total Home and Office Furnishings, Housewares, and Durable Consumer Products | 2,495,060 | 2,501,327 | 2,331,218 | |||||||||||||||||
|
|
|
|
|
| |||||||||||||||
Hotels, Motels, Inns and Gaming — 4.3%*: | ||||||||||||||||||||
Caesars Entertainment Corp., 1M LIBOR + 4.500% | 4.65 | 7/21/2025 | 730,910 | 710,942 | 731,137 | |||||||||||||||
Caesars Resort Collection LLC, 1M LIBOR + 2.750% | 2.90 | 12/23/2024 | 1,963,245 | 1,958,275 | 1,923,745 | |||||||||||||||
Compass IV Ltd., 6M EURIBOR + 4.250%(b) | 4.25 | 4/30/2025 | 500,000 | 599,829 | 592,720 | |||||||||||||||
Compass IV Ltd., EURIBOR + 8.000%(b) | 9.00 | 4/30/2026 | 500,000 | 591,089 | 532,181 | |||||||||||||||
Golden Nugget, Inc., 2M LIBOR + 2.500% | 3.25 | 10/4/2023 | 313,093 | 261,224 | 301,596 | |||||||||||||||
HNVR Holdco Ltd., 6M EURIBOR + 4.250%(b) | 4.25 | 9/12/2023 | 1,000,000 | 969,313 | 1,091,850 | |||||||||||||||
Penn National Gaming, Inc., 1M LIBOR + 2.250% | 3.00 | 10/15/2025 | 1,779,064 | 1,775,703 | 1,754,388 | |||||||||||||||
Richmond UK Bidco Ltd., LIBOR – GBP + 4.250%(b) | 4.34 | 3/3/2024 | 482,094 | 609,540 | 619,708 | |||||||||||||||
Rouge Beachhouse B.V., EURIBOR + 5.000%(b) | 5.00 | 9/4/2025 | 500,000 | 586,575 | 607,392 | |||||||||||||||
Station Casinos LLC, 1M LIBOR + 2.250% | 2.50 | 2/8/2027 | 996,704 | 968,666 | 980,129 | |||||||||||||||
|
|
|
|
|
| |||||||||||||||
Total Hotels, Motels, Inns and Gaming | 8,765,110 | 9,031,156 | 9,134,846 | |||||||||||||||||
|
|
|
|
|
| |||||||||||||||
See accompanying Notes to the Financial Statements.
81
Table of Contents
Barings Global Floating Rate Fund 2020 Semi-Annual Report
SCHEDULE OF INVESTMENTS (CONTINUED)
December 31, 2020 (Unaudited)
| EFFECTIVE INTEREST RATE | DUE DATE | PRINCIPAL‡‡ | COST | FAIR VALUE | ||||||||||||||||
Bank Loans (Continued) | ||||||||||||||||||||
Insurance — 3.9%*: | ||||||||||||||||||||
Acrisure LLC, 1M LIBOR + 3.500% | 3.65 | % | 2/15/2027 | 1,489,994 | $1,465,766 | $1,458,644 | ||||||||||||||
Alliant Holdings Intermediate LLC, 1M LIBOR + 3.250% | 3.40 | 5/9/2025 | 2,247,150 | 2,253,521 | 2,209,690 | |||||||||||||||
AssuredPartners Capital, Inc., 1M LIBOR + 3.500% | 3.65 | 2/12/2027 | 1,748,272 | 1,755,909 | 1,720,404 | |||||||||||||||
Confie Seguros Holding II Co., 3M LIBOR + 8.500% | 8.73 | 10/31/2025 | 1,633,626 | 1,611,007 | 1,459,547 | |||||||||||||||
Hub International Ltd., 3M LIBOR + 2.750% | 2.96 | 4/25/2025 | 993,626 | 976,863 | 974,687 | |||||||||||||||
Ryan Specialty Group, LLC, 1M LIBOR + 3.250% | 4.00 | 9/1/2027 | 436,266 | 430,018 | 434,631 | |||||||||||||||
|
|
|
|
|
| |||||||||||||||
Total Insurance | 8,548,934 | 8,493,084 | 8,257,603 | |||||||||||||||||
|
|
|
|
|
| |||||||||||||||
Leisure, Amusement, Entertainment — 8.4%*: | ||||||||||||||||||||
AMC Entertainment Holdings, Inc., PRIME + 2.000%, 2M LIBOR + 3.000% | 5.25 | 4/22/2026 | 1,263,022 | 1,006,474 | 808,019 | |||||||||||||||
Columbus Capital BV, EURIBOR + 3.750%(b) | 3.75 | 3/5/2027 | 500,000 | 559,574 | 530,080 | |||||||||||||||
Crown Finance US, Inc., 6M LIBOR + 2.500% | 2.77-3.50 | 2/28/2025 | 2,070,466 | 2,053,478 | 1,397,233 | |||||||||||||||
Delta 2 (LUX) Sarl, 1M LIBOR + 2.500%(b) | 3.50 | 2/1/2024 | 1,394,967 | 1,397,477 | 1,378,032 | |||||||||||||||
Dorna Sports, S.L., EURIBOR + 3.250%(b) | 3.25 | 5/3/2024 | 978,282 | 1,093,909 | 1,177,765 | |||||||||||||||
Golden Entertainment, Inc., 1M LIBOR + 3.000% | 3.75 | 10/21/2024 | 432,061 | 395,491 | 421,328 | |||||||||||||||
International Park Holdings B.V., EURIBOR + 3.500%(b) | 3.50 | 6/13/2024 | 500,000 | 580,575 | 570,248 | |||||||||||||||
Metro-Goldwyn-Mayer, Inc., 1M LIBOR + 4.500% | 5.50 | 7/3/2026 | 3,000,000 | 2,982,040 | 2,985,000 | |||||||||||||||
Motion Finco Sarl, EURIBOR + 3.000%(b) | 3.00- | 11/12/2026 | 500,000 | 528,985 | 579,166 | |||||||||||||||
Parques Reunidos SAU, EURIBOR + 3.750%(b) | 3.75 | 9/16/2026 | 500,000 | 546,016 | 562,417 | |||||||||||||||
Playtika Holding Corp., 3M LIBOR + 6.000% | 7.00 | 12/10/2024 | 554,167 | 545,428 | 556,876 | |||||||||||||||
PUG LLC, 1M LIBOR + 3.500% | 3.65 | 2/12/2027 | 971,798 | 967,541 | 924,831 | |||||||||||||||
SeaWorld Parks & Entertainment, Inc., 1M LIBOR + 3.000% | 3.75 | 3/31/2024 | 2,507,650 | 2,502,022 | 2,432,421 | |||||||||||||||
Vacalians Group, EURIBOR + 4.000%(b) | 4.00 | 11/28/2025 | 500,000 | 565,244 | 521,950 | |||||||||||||||
Vue International Bidco plc, EURIBOR + 4.750%(b) | 4.75 | 7/3/2026 | 423,797 | 474,031 | 438,591 | |||||||||||||||
William Morris Endeavor Entertainment, LLC, 1M LIBOR + 2.750% | 2.90 | 5/18/2025 | 2,278,816 | 2,256,635 | 2,092,705 | |||||||||||||||
WMG Acquisition Corp., 1M LIBOR + 2.125% | 2.27 | 11/1/2023 | 309,206 | 308,989 | 308,384 | |||||||||||||||
|
|
|
|
|
| |||||||||||||||
Total Leisure, Amusement, Entertainment | 18,684,232 | 18,763,909 | 17,685,046 | |||||||||||||||||
|
|
|
|
|
| |||||||||||||||
Machinery Non-Agriculture, Non-Construction, Non-Electronic — 1.7%*: |
| |||||||||||||||||||
Alison Bidco Sarl, EURIBOR + 4.500%(b) | 5.50 | 8/29/2021 | 844,343 | 980,447 | 823,904 | |||||||||||||||
Apex Tool Group, LLC, 1M LIBOR + 5.250% | 6.50 | 8/1/2024 | 830,039 | 818,275 | 818,867 | |||||||||||||||
Husky Injection Molding Systems Ltd., 6M LIBOR + 3.000%(b) | 3.27 | 3/28/2025 | 1,945,872 | 1,944,514 | 1,893,470 | |||||||||||||||
|
|
|
|
|
| |||||||||||||||
Total Machinery Non-Agriculture, Non-Construction, Non-Electronic | 3,620,254 | 3,743,236 | 3,536,241 | |||||||||||||||||
|
|
|
|
|
| |||||||||||||||
See accompanying Notes to the Financial Statements.
82
Table of Contents
Barings Global Floating Rate Fund 2020 Semi-Annual Report
SCHEDULE OF INVESTMENTS (CONTINUED)
December 31, 2020 (Unaudited)
EFFECTIVE INTEREST RATE | DUE DATE | PRINCIPAL‡‡ | COST | FAIR VALUE | ||||||||||||||||
Bank Loans (Continued) | ||||||||||||||||||||
Mining, Steel, Iron and Non-Precious Metals — 0.3%*: |
| |||||||||||||||||||
Boomerang Tube, LLC, 1M LIBOR + 5.000%(a) | 5.16 | % | 6/30/2022 | 64,262 | $64,262 | $2,571 | ||||||||||||||
US Silica Co., 1M LIBOR + 4.000% | 5.00 | 5/1/2025 | 860,299 | 867,049 | 751,686 | |||||||||||||||
|
|
|
|
|
| |||||||||||||||
Total Mining, Steel, Iron and Non-Precious Metals | 924,561 | 931,311 | 754,257 | |||||||||||||||||
|
|
|
|
|
| |||||||||||||||
Oil and Gas — 0.6%*: | ||||||||||||||||||||
Fieldwood Energy LLC, 1M LIBOR + 7.250%(d) | 7.25 | 4/11/2023 | 864,968 | 614,081 | 199 | |||||||||||||||
Gulf Finance LLC, 1M LIBOR + 5.250% | 6.25 | 8/25/2023 | 1,615,265 | 1,540,841 | 1,214,340 | |||||||||||||||
|
|
|
|
|
| |||||||||||||||
Total Oil and Gas | 2,480,233 | 2,154,922 | 1,214,539 | |||||||||||||||||
|
|
|
|
|
| |||||||||||||||
Personal and Non-Durable Consumer Products Mfg. Only — 0.4%*: |
| |||||||||||||||||||
Coty Inc., 1M LIBOR + 2.250% | 2.40 | 4/7/2025 | 921,323 | 898,761 | 866,043 | |||||||||||||||
|
|
|
|
|
| |||||||||||||||
Personal Transportation — 1.8%*: | ||||||||||||||||||||
American Airlines, Inc., 1M LIBOR + 2.000% | 2.15 | 4/28/2023 | 1,969,283 | 1,961,636 | 1,769,538 | |||||||||||||||
Bahia De Las Isletas, S.L., EURIBOR + 2.500%, EURIBOR + 7.500%(b) | 7.50 | 4/30/2021 | 44,847 | 51,175 | 53,691 | |||||||||||||||
Kestrel Bidco, Inc., 6M LIBOR + 3.000%(b) | 4.00 | 12/11/2026 | 2,106,234 | 2,109,107 | 2,015,414 | |||||||||||||||
|
|
|
|
|
| |||||||||||||||
Total Personal Transportation | 4,120,364 | 4,121,918 | 3,838,643 | |||||||||||||||||
|
|
|
|
|
| |||||||||||||||
Printing and Publishing — 1.1%*: | ||||||||||||||||||||
Houghton Mifflin Harcourt Publishing Co., 1M LIBOR + 6.250% | 7.25 | 11/22/2024 | 288,235 | 279,203 | 276,106 | |||||||||||||||
Springer Nature Deutschland GmbH, EURIBOR + 3.250%(b) | 3.75 | 8/14/2024 | 1,658,998 | 1,851,030 | 2,024,182 | |||||||||||||||
|
|
|
|
|
| |||||||||||||||
Total Printing and Publishing | 1,947,233 | 2,130,233 | 2,300,288 | |||||||||||||||||
|
|
|
|
|
| |||||||||||||||
Retail Stores — 2.1%*: | ||||||||||||||||||||
Bass Pro Group, LLC, 1M LIBOR + 5.000% | 5.75 | 9/25/2024 | 1,472,113 | 1,447,189 | 1,474,748 | |||||||||||||||
Eyemart Express LLC, 1M LIBOR + 3.000% | 3.15 | 8/4/2024 | 979,798 | 982,455 | 972,450 | |||||||||||||||
Harbor Freight Tools USA, Inc., 1M LIBOR + 3.250% | 4.00 | 10/19/2027 | 979,210 | 968,912 | 977,575 | |||||||||||||||
Kirk Beauty One GmbH, 3M EURIBOR + 3.500%(b) | 3.50 | 8/12/2022 | 450,000 | 483,659 | 488,974 | |||||||||||||||
Thom Europe S.A.S, EURIBOR + 4.250%(b) | 4.25 | 8/7/2024 | 500,000 | 577,977 | 587,003 | |||||||||||||||
|
|
|
|
|
| |||||||||||||||
Total Retail Stores | 4,381,121 | 4,460,192 | 4,500,750 | |||||||||||||||||
|
|
|
|
|
| |||||||||||||||
Telecommunications — 6.1%*: | ||||||||||||||||||||
Banff Merger Sub, Inc., 1M LIBOR + 4.250% | 4.40 | 10/2/2025 | 980,000 | 973,343 | 974,816 | |||||||||||||||
CCI Buyer, Inc., 3M LIBOR + 4.000% | 4.75 | 12/17/2027 | 304,519 | 301,473 | 304,010 | |||||||||||||||
CenturyLink, Inc., 1M LIBOR + 2.250% | 2.40 | 3/15/2027 | 1,539,359 | 1,476,298 | 1,521,657 | |||||||||||||||
CommScope, Inc., 1M LIBOR + 3.250% | 3.40 | 4/6/2026 | 1,982,371 | 1,977,366 | 1,965,025 | |||||||||||||||
Consolidated Communications, Inc., 1M LIBOR + 4.750% | 5.75 | 10/2/2027 | 383,821 | 378,245 | 385,042 | |||||||||||||||
See accompanying Notes to the Financial Statements.
83
Table of Contents
Barings Global Floating Rate Fund 2020 Semi-Annual Report
SCHEDULE OF INVESTMENTS (CONTINUED)
December 31, 2020 (Unaudited)
| EFFECTIVE INTEREST RATE | DUE DATE | PRINCIPAL‡‡ | COST | FAIR VALUE | ||||||||||||||||
Bank Loans (Continued) | ||||||||||||||||||||
Telecommunications (Continued) | ||||||||||||||||||||
Digicel International Finance Ltd., 6M LIBOR + 3.250%(b) | 3.51 | % | 5/28/2024 | 151,428 | $152,105 | $138,114 | ||||||||||||||
Eagle Broadband Investments LLC, 3M LIBOR + 3.000% | 3.75 | 11/12/2027 | 454,538 | 450,059 | 453,688 | |||||||||||||||
ION Trading Technologies Sarl, 3M EURIBOR + 3.250% | 4.25 | 11/21/2024 | 1,360,556 | 1,544,277 | 1,659,531 | |||||||||||||||
Lorca Finco plc, 6M EURIBOR + 4.250%(b) | 4.25 | 9/17/2027 | 500,000 | 580,402 | 611,717 | |||||||||||||||
Syniverse Technologies, Inc., 3M LIBOR + 5.000% | 6.00 | 3/9/2023 | 1,113,039 | 1,117,685 | 1,002,815 | |||||||||||||||
Syniverse Technologies, Inc., 3M LIBOR + 9.000% | 10.00 | 3/11/2024 | 2,175,482 | 1,852,182 | 1,411,126 | |||||||||||||||
Virgin Media SFA Finance Ltd., LIBOR – GBP + 3.250%(b) | 3.28 | 11/15/2027 | 1,250,000 | 1,725,845 | 1,667,171 | |||||||||||||||
Zayo Group Holdings, Inc., 1M LIBOR + 3.000% | 3.15 | 3/9/2027 | 860,786 | 858,884 | 854,330 | |||||||||||||||
|
|
|
|
|
| |||||||||||||||
Total Telecommunications | 13,055,899 | 13,388,164 | 12,949,042 | |||||||||||||||||
|
|
|
|
|
| |||||||||||||||
Utilities — 0.7%*: | ||||||||||||||||||||
Astoria Energy LLC, 3M LIBOR + 3.500% | 4.50 | 12/10/2027 | 715,747 | 712,168 | 709,841 | |||||||||||||||
Calpine Corp., 1M LIBOR + 2.000% | 2.15 | 8/12/2026 | 220,066 | 219,182 | 216,864 | |||||||||||||||
Edgewater Generation, L.L.C., 1M LIBOR + 3.750% | 3.90 | 12/13/2025 | 608,181 | 590,955 | 594,838 | |||||||||||||||
|
|
|
|
|
| |||||||||||||||
Total Utilities | 1,543,994 | 1,522,305 | 1,521,543 | |||||||||||||||||
|
|
|
|
|
| |||||||||||||||
Total Bank Loans | 187,538,772 | 188,618,499 | 185,551,717 | |||||||||||||||||
|
|
|
|
|
| |||||||||||||||
Corporate Bonds — 5.3%*: | ||||||||||||||||||||
Automobile — 0.5%*: | ||||||||||||||||||||
AA Bond Co. Ltd.(b) | 5.50 | 7/31/2022 | 700,000 | 913,443 | 926,982 | |||||||||||||||
RAC Bond Co. plc(b) | 5.00 | 11/6/2022 | 100,000 | 125,817 | 136,415 | |||||||||||||||
|
|
|
|
|
| |||||||||||||||
Total Automobile | 800,000 | 1,039,260 | 1,063,397 | |||||||||||||||||
|
|
|
|
|
| |||||||||||||||
Beverage, Food and Tobacco — 0.2%*: | ||||||||||||||||||||
Boparan Finance plc(b) | 7.63 | 11/30/2025 | 300,000 | 398,130 | 414,148 | |||||||||||||||
|
|
|
|
|
| |||||||||||||||
Broadcasting and Entertainment — 0.5%*: | ||||||||||||||||||||
Tele Columbus AG(b) | 3.88 | 5/2/2025 | 800,000 | 871,152 | 979,077 | |||||||||||||||
|
|
|
|
|
| |||||||||||||||
Containers, Packaging and Glass — 0.1%*: | ||||||||||||||||||||
Bormioli Pharma Bidco SpA(b) | 3.50 | 11/15/2024 | 100,000 | 104,350 | 118,867 | |||||||||||||||
Reynolds Group Issuer, Inc./Reynolds Group Issuer LLC/Reynolds Group Issuer Lu(e) | 5.13 | 7/15/2023 | 7,000 | 7,000 | 7,086 | |||||||||||||||
|
|
|
|
|
| |||||||||||||||
Total Containers, Packaging and Glass | 107,000 | 111,350 | 125,953 | |||||||||||||||||
|
|
|
|
|
| |||||||||||||||
See accompanying Notes to the Financial Statements.
84
Table of Contents
Barings Global Floating Rate Fund 2020 Semi-Annual Report
SCHEDULE OF INVESTMENTS (CONTINUED)
December 31, 2020 (Unaudited)
| EFFECTIVE INTEREST RATE | DUE DATE | PRINCIPAL ‡‡ | COST | FAIR VALUE | ||||||||||||||||
Corporate Bonds (Continued) |
| |||||||||||||||||||
Diversified/Conglomerate Manufacturing — 0.2%*: |
| |||||||||||||||||||
Fabric BC SpA, 3M EURIBOR + 4.125%(b) | 4.13 | (f)% | 8/31/2026 | 100,000 | $109,975 | $121,554 | ||||||||||||||
Galapagos S.A.(a),(b),(d) | 4.21 | 6/15/2021 | 20,000 | 27,263 | — | |||||||||||||||
Mangrove Luxco III Sarl(b) | 7.78 | 10/9/2025 | 265,415 | 252,077 | 277,553 | |||||||||||||||
|
|
|
|
|
| |||||||||||||||
Total Diversified/Conglomerate | 385,415 | 389,315 | 399,107 | |||||||||||||||||
|
|
|
|
|
| |||||||||||||||
Diversified/Conglomerate Service — 0.6%*: |
| |||||||||||||||||||
Algeco Global Finance PLC, 3M EURIBOR + 6.250%(b) | 6.25 | (f) | 2/15/2023 | 150,000 | 183,697 | 182,560 | ||||||||||||||
Carlson Travel, Inc., 3M EURIBOR + 4.750% | 4.75 | (f) | 6/15/2025 | 1,200,000 | 1,371,335 | 1,070,166 | ||||||||||||||
|
|
|
|
|
| |||||||||||||||
Total Diversified/Conglomerate Service | 1,350,000 | 1,555,032 | 1,252,726 | |||||||||||||||||
|
|
|
|
|
| |||||||||||||||
Electronics — 0.4%*: |
| |||||||||||||||||||
Veritas US, Inc./Veritas Bermuda Ltd.(e) | 7.50 | 2/1/2023 | 817,000 | 820,179 | 818,961 | |||||||||||||||
|
|
|
|
|
| |||||||||||||||
Finance — 0.4%*: |
| |||||||||||||||||||
Cabot Financial Luxembourg SA | 7.50 | 10/1/2023 | 132,313 | 179,236 | 183,959 | |||||||||||||||
Garfunkelux Holdco 3 SA(b) | 6.75 | 11/1/2025 | 250,000 | 296,575 | 313,048 | |||||||||||||||
Travelex Financing plc(a),(b),(d) | 8.00 | 5/15/2022 | 250,000 | 274,580 | — | |||||||||||||||
Travelex Issuerco Ltd.(b) | 12.50 | 8/5/2025 | 110,000 | 119,243 | 270,765 | |||||||||||||||
|
|
|
|
|
| |||||||||||||||
Total Finance | 742,313 | 869,634 | 767,772 | |||||||||||||||||
|
|
|
|
|
| |||||||||||||||
Healthcare, Education and Childcare — 0.1%*: |
| |||||||||||||||||||
Tenet Healthcare Corp. | 4.63 | 7/15/2024 | 255,000 | 254,396 | 261,380 | |||||||||||||||
|
|
|
|
|
| |||||||||||||||
Home and Office Furnishings, Housewares, and Durable Consumer Products — 0.2%*: |
| |||||||||||||||||||
LSF9 Balta Issuer Sarl(b) | 7.75 | 9/15/2022 | 445,500 | 532,399 | 514,875 | |||||||||||||||
|
|
|
|
|
| |||||||||||||||
Hotels, Motels, Inns and Gaming — 0.3%*: |
| |||||||||||||||||||
TVL Finance plc, 3M GBP LIBOR + 5.375%(b) | 5.42 | (f) | 7/15/2025 | 600,000 | 759,436 | 725,813 | ||||||||||||||
|
|
|
|
|
| |||||||||||||||
Leisure, Amusement, Entertainment — 0.5%*: |
| |||||||||||||||||||
CPUK Finance Ltd.(b) | 4.88 | 8/28/2025 | 600,000 | 791,049 | 816,300 | |||||||||||||||
CPUK Finance Ltd.(b) | 6.50 | 8/28/2026 | 100,000 | 126,076 | 142,045 | |||||||||||||||
|
|
|
|
|
| |||||||||||||||
Total Leisure, Amusement, | 700,000 | 917,125 | 958,345 | |||||||||||||||||
|
|
|
|
|
| |||||||||||||||
Oil and Gas — 0.4%*: |
| |||||||||||||||||||
CGG Holding US, Inc.(b),(e) | 9.00 | 5/1/2023 | 500,000 | 515,039 | 507,500 | |||||||||||||||
KCA Deutag UK Finance plc(a),(b) | 9.88 | 12/1/2025 | 390,061 | 390,061 | 404,688 | |||||||||||||||
|
|
|
|
|
| |||||||||||||||
Total Oil and Gas | 890,061 | 905,100 | 912,188 | |||||||||||||||||
|
|
|
|
|
| |||||||||||||||
Personal Transportation — 0.1%*: |
| |||||||||||||||||||
Naviera Armas S.A., 3M EURIBOR + 6.500%(b) | 6.50 | (f) | 7/31/2023 | 250,000 | 290,588 | 142,111 | ||||||||||||||
Naviera Armas SA, 3M EURIBOR + 4.250%(b) | 4.25 | (f) | 11/15/2024 | 250,000 | 296,118 | 136,489 | ||||||||||||||
|
|
|
|
|
| |||||||||||||||
Total Personal Transportation | 500,000 | 586,706 | 278,600 | |||||||||||||||||
|
|
|
|
|
| |||||||||||||||
See accompanying Notes to the Financial Statements.
85
Table of Contents
Barings Global Floating Rate Fund 2020 Semi-Annual Report
SCHEDULE OF INVESTMENTS (CONTINUED)
December 31, 2020 (Unaudited)
| EFFECTIVE INTEREST RATE | DUE DATE | PRINCIPAL ‡‡ | COST | FAIR VALUE | ||||||||||||||||
Corporate Bonds (Continued) | ||||||||||||||||||||
Retail Stores — 0.6%*: |
| |||||||||||||||||||
House of Fraser Funding plc(b),(d) | 5.95 | % | 9/15/2020 | 300,000 | $434,213 | $12,307 | ||||||||||||||
Takko Luxembourg 2 SCA(b) | 5.38 | 11/15/2023 | 1,200,000 | 1,331,899 | 1,313,284 | |||||||||||||||
|
|
|
|
|
| |||||||||||||||
Total Retail Stores | 1,500,000 | 1,766,112 | 1,325,591 | |||||||||||||||||
|
|
|
|
|
| |||||||||||||||
Utilities — 0.2%*: |
| |||||||||||||||||||
Viridian Group Finance Co. PLC/Viridian Power & Energy(b) | 4.75 | 9/15/2024 | 350,000 | 436,442 | 483,412 | |||||||||||||||
|
|
|
|
|
| |||||||||||||||
Total Corporate Bonds | 10,542,289 | 12,211,768 | 11,281,345 | |||||||||||||||||
|
|
|
|
|
| |||||||||||||||
Total Fixed Income | 198,081,061 | 200,830,267 | 196,833,062 | |||||||||||||||||
|
|
|
|
|
| |||||||||||||||
Total Investments | 198,526,785 | 202,978,376 | 198,264,735 | |||||||||||||||||
|
|
|
|
|
| |||||||||||||||
Other assets and liabilities – 6.3%* |
| 13,256,961 | ||||||||||||||||||
|
| |||||||||||||||||||
Net Assets – 100.0% | $211,521,696 | |||||||||||||||||||
|
| |||||||||||||||||||
| ‡‡ | Unless otherwise indicated, all principal amounts are denominated in United States Dollars. |
| * | Calculated as a percentage of net assets applicable to common shareholders. |
| (a) | For fair value measurement disclosure purposes, security is categorized as Level 3 (See Note 2). |
| (b) | Foreign security. |
Distributions of investments by country of risk (excluding temporary cash investments) as a percentage of total investments in securities, is as follows: |
| United States | 71.3% | |
| Germany | 8.7% | |
| United Kingdom | 8.6% | |
| Spain | 2.7% | |
| France | 2.7% | |
| Canada | 2.0% | |
| Denmark | 1.1% | |
| Other (Individually less than 1%) | 2.9% | |
| ||
| Total | 100.0% | |
|
| (c) | Bank loans are exempt from registration under the Securities Act of 1933, as amended, but contain certain restrictions on resale and cannot be sold publicly. These loans pay interest at rates which adjust periodically. The interest rates shown for bank loans are the current interest rates at December 31, 2020. Bank loans are also subject to mandatory and/or optional prepayment which cannot be predicted. As a result, the remaining maturity may be substantially less than the stated maturity shown. |
| (d) | Defaulted security. |
| (e) | Security acquired in a transaction exempt from registration under Rule 144A of the Securities Act of 1933. These securities may only be resold in transactions exempt from registration, normally to qualified institutional buyers. |
| (f) | Variable rate security. The interest rate shown is the rate in effect at December 31, 2020. |
See accompanying Notes to the Financial Statements.
86
Table of Contents
Barings Global Floating Rate Fund 2020 Semi-Annual Report
SCHEDULE OF INVESTMENTS (CONTINUED)
December 31, 2020 (Unaudited)
A summary of outstanding derivatives at December 31, 2020 is as follows:
Forward Foreign Currency Exchange Contracts to Buy
| EXPIRATION DATE | COUNTERPARTY | LOCAL CURRENCY | VALUE IN USD | IN EXCHANGE FOR USD | NET UNREALIZED APPRECIATION | |||||||||||||||||
| 1/14/21 | Canadian Imperial Bank of Commerce | EUR | 1,526,759 | $ | 1,865,631 | $ | 1,854,803 | $ | 10,828 | |||||||||||||
| 1/14/21 | Morgan Stanley & Co. | GBP | 1,399,328 | 1,913,762 | 1,871,827 | 41,935 | ||||||||||||||||
|
| |||||||||||||||||||||
Net unrealized appreciation on forward foreign currency exchange contracts to buy | $ | 52,763 | ||||||||||||||||||||
|
| |||||||||||||||||||||
Forward Foreign Currency Exchange Contracts to Sell
| EXPIRATION DATE | COUNTERPARTY | LOCAL CURRENCY | VALUE IN USD | IN EXCHANGE FOR USD | NET UNREALIZED DEPRECIATION | |||||||||||||||||
| 1/14/21 | Morgan Stanley & Co. | EUR | 31,619,266 | $ | 38,637,322 | $ | 38,409,089 | $ | (228,233 | ) | ||||||||||||
| 1/14/21 | Canadian Imperial Bank of Commerce | EUR | 469,645 | 573,885 | 569,486 | (4,399 | ) | |||||||||||||||
| 1/14/21 | Canadian Imperial Bank of Commerce | GBP | 8,358,390 | 11,431,178 | 11,181,408 | (249,770 | ) | |||||||||||||||
|
| |||||||||||||||||||||
Net unrealized depreciation on forward foreign currency exchange contracts to sell | $ | (482,402 | ) | |||||||||||||||||||
|
| |||||||||||||||||||||
Currency Legend
EUR | – | Euro | ||||||||||||||
GBP | – | British Pound Sterling | ||||||||||||||
See accompanying Notes to the Financial Statements.
87
Table of Contents
Barings Global Credit Income Opportunities Fund 2020 Semi-Annual Report
SCHEDULE OF INVESTMENTS
December 31, 2020 (Unaudited)
| SHARES | COST | FAIR VALUE | ||||||||||||||||||
Equities — 1.0%*: | ||||||||||||||||||||
Common Stocks — 0.9%*: | ||||||||||||||||||||
Broadcasting and Entertainment — 0.0%*: | ||||||||||||||||||||
Technicolor SA(a) | 14,662 | $175 | $32,582 | |||||||||||||||||
|
|
|
|
|
| |||||||||||||||
Diversified/Conglomerate Service — 0.0%*: | ||||||||||||||||||||
Innovation Group(a),(b) | 403,550 | — | — | |||||||||||||||||
|
|
|
|
|
| |||||||||||||||
Finance — 0.0%*: |
| |||||||||||||||||||
Travelex Topco Ltd.(a),(b) | 3,672 | — | — | |||||||||||||||||
|
|
|
|
|
| |||||||||||||||
Healthcare, Education and Childcare — 0.1%*: | ||||||||||||||||||||
Don Jersey Topco Ltd.(a),(b) | 257,069 | 171,459 | 272,445 | |||||||||||||||||
MModal, Inc., Escrow rights(b) | 4,725 | 10,631 | 3,213 | |||||||||||||||||
|
|
|
|
|
| |||||||||||||||
Total Healthcare, Education and Childcare | 261,794 | 182,090 | 275,658 | |||||||||||||||||
|
|
|
|
|
| |||||||||||||||
Mining, Steel, Iron and Non-Precious Metals — 0.0%*: | ||||||||||||||||||||
Boomerang Tube LLC(b) | 1,769 | 171,860 | — | |||||||||||||||||
|
|
|
|
|
| |||||||||||||||
Oil and Gas — 0.4%*: | ||||||||||||||||||||
Fieldwood Energy LLC | 3,698 | 129,430 | — | |||||||||||||||||
Fieldwood Energy LLC | 15,071 | 325,034 | — | |||||||||||||||||
Jupiter Resources, Inc.(a),(b) | 120,272 | 581,286 | 384,870 | |||||||||||||||||
Kelly Topco Ltd.(a) | 6,999 | 293,958 | 283,460 | |||||||||||||||||
|
|
|
|
|
| |||||||||||||||
Total Oil and Gas | 146,040 | 1,329,708 | 668,330 | |||||||||||||||||
|
|
|
|
|
| |||||||||||||||
Retail Stores — 0.4%*: | ||||||||||||||||||||
Maxeda DIY B.V.(a),(b) | 10,446 | — | 184,147 | |||||||||||||||||
Maxeda DIY B.V.(a),(b) | 18,859,871 | 373,738 | 460,803 | |||||||||||||||||
|
|
|
|
|
| |||||||||||||||
Total Retail Stores | 18,870,317 | 373,738 | 644,950 | |||||||||||||||||
|
|
|
|
|
| |||||||||||||||
Total Common Stocks | 19,701,804 | 2,057,571 | 1,621,520 | |||||||||||||||||
|
|
|
|
|
| |||||||||||||||
Warrant — 0.1%*: | ||||||||||||||||||||
Finance — 0.1%*: | ||||||||||||||||||||
Travelex Topco Ltd.(a) | 837 | — | 94,429 | |||||||||||||||||
|
|
|
|
|
| |||||||||||||||
Total Equities | 19,702,641 | 2,057,571 | 1,715,949 | |||||||||||||||||
|
|
|
|
|
| |||||||||||||||
| EFFECTIVE INTEREST RATE | DUE DATE | PRINCIPAL ‡‡ | COST | FAIR VALUE | ||||||||||||||||
Fixed Income — 89.5%*: | ||||||||||||||||||||
Asset-Backed Securities — 8.4%*: | ||||||||||||||||||||
CDO/CLO — 8.4%*: | ||||||||||||||||||||
Alinea CLO 2018-1 Ltd., 3M USD | 6.22 | (d) % | 7/20/2031 | 1,250,000 | 1,250,000 | 1,172,660 | ||||||||||||||
Anchorage Capital CLO 9 Ltd., 3M USD | 4.24 | (d) | 7/15/2032 | 1,250,000 | 1,226,678 | 1,255,087 | ||||||||||||||
See accompanying Notes to the Financial Statements.
88
Table of Contents
Barings Global Credit Income Opportunities Fund 2020 Semi-Annual Report
SCHEDULE OF INVESTMENTS (CONTINUED)
December 31, 2020 (Unaudited)
| EFFECTIVE INTEREST RATE | DUE DATE | PRINCIPAL ‡‡ | COST | FAIR VALUE | ||||||||||||||
Asset-Backed Securities (Continued) |
| |||||||||||||||||
CDO/CLO (continued) | ||||||||||||||||||
Anchorage Capital CLO Ltd. 2015-6A | 6.59(d)% | 7/15/2030 | 500,000 | $511,737 | $477,591 | |||||||||||||
Ares XLVIII CLO, 3M USD LIBOR + 5.200%(c) | 5.42(d) | 7/20/2030 | 800,000 | 800,000 | 741,570 | |||||||||||||
Blackrock European CLO(a) | 5.17 | 10/15/2031 | 725,000 | 804,216 | 846,670 | |||||||||||||
BlueMountain CLO Ltd. 2014-1A(b),(c) | Zero Coupon | 4/30/2026 | 250,000 | 244,225 | — | |||||||||||||
Cairn CLO XI DAC, 3M EURIBOR + | 4.15(d) | 7/15/2035 | 1,000,000 | 1,107,100 | 1,226,493 | |||||||||||||
CBAM Ltd. 2017-3A E, 3M USD LIBOR | 6.72(d) | 10/17/2029 | 750,000 | 750,000 | 715,240 | |||||||||||||
CIFC Funding Ltd. 2017-5A D, 3M USD LIBOR + 6.100%(c) | 6.32(d) | 11/16/2030 | 500,000 | 500,000 | 486,089 | |||||||||||||
Galaxy XXIV CLO Ltd. 2017-24A E, 3M USD LIBOR + 5.500%(c) | 5.74(d) | 1/15/2031 | 700,000 | 700,000 | 656,622 | |||||||||||||
Madison Park Funding XIII Ltd. 2014-13A(c) | Zero Coupon | 4/19/2030 | 500,000 | 432,661 | 249,108 | |||||||||||||
Madison Park Funding XXVII Ltd., 3M USD LIBOR + 5.000%(c) | 5.22(d) | 4/20/2030 | 500,000 | 500,000 | 459,529 | |||||||||||||
Madison Park Funding XXVIII Ltd., 3M USD LIBOR + 7.600%(c) | 7.84(d) | 7/15/2030 | 500,000 | 496,022 | 428,520 | |||||||||||||
Magnetite VII Ltd.(c) | Zero Coupon | 1/15/2028 | 1,898,734 | 1,494,460 | 946,042 | |||||||||||||
Oak Hill Credit Partners X Ltd. 2014-10A(c) | Zero Coupon | 12/12/2030 | 1,000,000 | 767,681 | 427,439 | |||||||||||||
Steele Creek CLO Ltd. 2018-2A E, 3M USD LIBOR + 6.200%(c) | 6.29(d) | 8/18/2031 | 850,000 | 850,000 | 723,079 | |||||||||||||
THL Credit Wind River CLO Ltd. 2017-4A E, 3M USD LIBOR + 5.800%(c) | 6.02(d) | 11/20/2030 | 500,000 | 500,000 | 463,256 | |||||||||||||
THL Credit Wind River CLO Ltd. 2018-2A E, 3M USD LIBOR + 5.750%(c) | 5.99(d) | 7/15/2030 | 1,450,000 | 1,450,000 | 1,335,611 | |||||||||||||
Wellfleet CLO 2018-1 Ltd., 3M USD LIBOR + 5.500%(c) | 5.72(d) | 7/17/2031 | 1,000,000 | 1,000,000 | 900,473 | |||||||||||||
Wellfleet CLO Ltd. 2017-3A D, 3M USD LIBOR + 5.550%(c) | 5.77(d) | 1/17/2031 | 1,000,000 | 1,000,000 | 903,000 | |||||||||||||
|
|
|
|
|
| |||||||||||||
Total CDO/CLO | 16,923,734 | 16,384,780 | 14,414,079 | |||||||||||||||
|
|
|
|
|
| |||||||||||||
Total Asset-Backed Securities | 16,923,734 | 16,384,780 | 14,414,079 | |||||||||||||||
|
|
|
|
|
| |||||||||||||
Bank Loans — 37.2%*(e): | ||||||||||||||||||
Aerospace and Defense — 0.6%*: | ||||||||||||||||||
TransDigm Group, Inc., 1M LIBOR + 2.250% | 2.40 | 5/31/2025 | 980,025 | 976,902 | 959,200 | |||||||||||||
|
|
|
|
|
| |||||||||||||
Automobile — 1.0%*: | ||||||||||||||||||
BCA Marketplace plc, LIBOR – GBP + 4.750%(a) | 4.84 | 11/13/2026 | 500,000 | 622,265 | 672,516 | |||||||||||||
Panther BF Aggregator 2 LP, 1M LIBOR + 3.500% | 3.65 | 4/30/2026 | 1,104,112 | 1,097,154 | 1,098,360 | |||||||||||||
|
|
|
|
|
| |||||||||||||
Total Automobile | 1,604,112 | 1,719,419 | 1,770,876 | |||||||||||||||
|
|
|
|
|
| |||||||||||||
See accompanying Notes to the Financial Statements.
89
Table of Contents
Barings Global Credit Income Opportunities Fund 2020 Semi-Annual Report
SCHEDULE OF INVESTMENTS (CONTINUED)
December 31, 2020 (Unaudited)
| EFFECTIVE INTEREST RATE | DUE DATE | PRINCIPAL ‡‡ | COST | FAIR VALUE | ||||||||||||||||
Bank Loans (Continued) | ||||||||||||||||||||
Beverage, Food and Tobacco — 1.4%*: | ||||||||||||||||||||
Deoleo S.A., EURIBOR + 4.000%(a) | 5.00 | % | 6/24/2025 | 117,907 | $132,946 | $137,740 | ||||||||||||||
IRB Holding Corp., 6M LIBOR + 2.750% | 3.75 | 2/2/2025 | 1,196,740 | 1,199,180 | 1,185,179 | |||||||||||||||
Winebow Group, Inc. (The), 1M LIBOR + 3.750% | 4.75 | 7/1/2021 | 1,166,646 | 1,145,873 | 1,066,606 | |||||||||||||||
|
|
|
|
|
| |||||||||||||||
Total Beverage, Food and Tobacco | 2,481,293 | 2,477,999 | 2,389,525 | |||||||||||||||||
|
|
|
|
|
| |||||||||||||||
Broadcasting and Entertainment — 1.9%*: | ||||||||||||||||||||
Altice USA, Inc., 1M LIBOR + 2.500% | 2.66 | 4/15/2027 | 994,988 | 963,524 | 984,620 | |||||||||||||||
Clear Channel Worldwide Holdings, Inc., 3M LIBOR + 3.500% | 3.71 | 8/21/2026 | 1,546,217 | 1,464,244 | 1,485,466 | |||||||||||||||
Cox Media Group, 1M LIBOR + 4.250% | 4.40 | 12/17/2026 | 259,934 | 258,824 | 259,853 | |||||||||||||||
Technicolor SA, EURIBOR + 6.000%(a) | 12.00 | 6/30/2024 | 401,512 | 395,147 | 503,482 | |||||||||||||||
|
|
|
|
|
| |||||||||||||||
Total Broadcasting and Entertainment | 3,202,651 | 3,081,739 | 3,233,421 | |||||||||||||||||
|
|
|
|
|
| |||||||||||||||
Buildings and Real Estate — 0.2%*: |
| |||||||||||||||||||
SRS Distribution, Inc., 1M LIBOR + 3.000% | 3.15 | 5/23/2025 | 350,840 | 344,297 | 344,826 | |||||||||||||||
Chemicals, Plastics and Rubber — 1.6%*: | ||||||||||||||||||||
Flint Group GmbH, EURIBOR + 4.250%(a) | 5.00 | 9/21/2023 | 182,572 | 216,338 | 209,472 | |||||||||||||||
Flint Group GmbH, EURIBOR + 0.750%(a) | 5.75 | 9/21/2023 | 1,418,101 | 1,678,811 | 1,627,039 | |||||||||||||||
Gemini HDPE LLC, 3M LIBOR + 3.000% | 3.50 | 12/28/2027 | 113,189 | 112,058 | 112,341 | |||||||||||||||
Novacap S.A., EURIBOR + 3.500%(a) | 3.50 | 6/22/2023 | 500,000 | 580,478 | 600,747 | |||||||||||||||
Solenis Holdings LLC, 3M LIBOR + 4.000% | 4.23 | 6/26/2025 | 240,940 | 239,385 | 240,398 | |||||||||||||||
Solenis Holdings LLC, 3M LIBOR + 8.500% | 8.73 | 6/26/2026 | 47,145 | 46,175 | 46,830 | |||||||||||||||
|
|
|
|
|
| |||||||||||||||
Total Chemicals, Plastics and Rubber | 2,501,947 | 2,873,245 | 2,836,827 | |||||||||||||||||
|
|
|
|
|
| |||||||||||||||
Containers, Packaging and Glass — 1.8%*: | ||||||||||||||||||||
Albea Beauty Holdings S.A., 3M LIBOR + 3.000%(a) | 4.00 | 4/22/2024 | 67,078 | 67,032 | 63,137 | |||||||||||||||
Berry Global Group, Inc., 1M LIBOR + 2.000% | 2.15 | 7/1/2026 | 586,193 | 587,021 | 582,751 | |||||||||||||||
CCP Lux Holding S.a. r.l., EURIBOR + 4.250%(a) | 4.25 | 1/10/2025 | 374,946 | 395,394 | 425,417 | |||||||||||||||
Graham Packaging Co. Inc., 1M LIBOR + 3.750% | 4.50 | 8/4/2027 | 182,249 | 180,961 | 182,683 | |||||||||||||||
Mauser Packaging Solutions, 3M LIBOR + 3.250% | 3.48 | 4/3/2024 | 1,302,328 | 1,302,086 | 1,255,118 | |||||||||||||||
Reynolds Consumer Products LLC, 1M LIBOR + 1.750% | 1.90 | 2/4/2027 | 101,023 | 100,913 | 100,266 | |||||||||||||||
Trident TPI Holdings, Inc., 3M LIBOR + 3.000% | 4.00 | 10/17/2024 | 493,639 | 484,791 | 486,343 | |||||||||||||||
|
|
|
|
|
| |||||||||||||||
Total Containers, Packaging and Glass | 3,107,456 | 3,118,198 | 3,095,715 | |||||||||||||||||
|
|
|
|
|
| |||||||||||||||
Diversified/Conglomerate Manufacturing — 1.1%*: |
| |||||||||||||||||||
Alliance Laundry Systems LLC, 3M LIBOR + 3.500% | 4.25 | 10/8/2027 | 42,521 | 42,210 | 42,468 | |||||||||||||||
Alstom Auxiliary Components (Arvos), 3M LIBOR + 4.500%(a) | 5.50 | 8/29/2021 | 628,740 | 621,646 | 509,279 | |||||||||||||||
Amer Sports Oyj, EURIBOR + 4.500%(a) | 4.50 | 3/30/2026 | 600,000 | 667,823 | 697,352 | |||||||||||||||
LTI Holdings, Inc., 1M LIBOR + 3.500% | 3.65 | 9/6/2025 | 742,787 | 732,453 | 719,976 | |||||||||||||||
|
|
|
|
|
| |||||||||||||||
Total Diversified/Conglomerate Manufacturing | 2,014,048 | 2,064,132 | 1,969,075 | |||||||||||||||||
|
|
|
|
|
| |||||||||||||||
See accompanying Notes to the Financial Statements.
90
Table of Contents
Barings Global Credit Income Opportunities Fund 2020 Semi-Annual Report
SCHEDULE OF INVESTMENTS (CONTINUED)
December 31, 2020 (Unaudited)
| EFFECTIVE INTEREST RATE | DUE DATE | PRINCIPAL ‡‡ | COST | FAIR VALUE | ||||||||||||||||
Bank Loans (Continued) | ||||||||||||||||||||
Diversified/Conglomerate Service — 3.8%*: | ||||||||||||||||||||
Cvent, Inc., 1M LIBOR + 3.750% | 3.90 | % | 11/29/2024 | 994,879 | $869,613 | $955,084 | ||||||||||||||
EAB Global, Inc., 3M LIBOR + 3.750%, 6M LIBOR + 3.750% | 4.75 | 11/15/2024 | 106,885 | 106,589 | 105,884 | |||||||||||||||
Finastra USA, Inc., 6M LIBOR + 3.500% | 4.50 | 6/13/2024 | 813,142 | 814,655 | 795,611 | |||||||||||||||
Greeneden U.S. Holdings II, LLC, 1M LIBOR + 4.000% | 4.75 | 12/1/2027 | 127,952 | 126,683 | 128,072 | |||||||||||||||
Hyland Software, Inc., 1M LIBOR + 3.500% | 4.25 | 7/1/2024 | 979,950 | 972,715 | 981,038 | |||||||||||||||
Informatica LLC, 1M LIBOR + 3.250% | 3.40 | 2/25/2027 | 368,482 | 366,858 | 365,029 | |||||||||||||||
Informatica LLC, 1M LIBOR + 7.125% | 7.13 | 2/25/2025 | 133,523 | 132,966 | 135,626 | |||||||||||||||
Innovation Group plc (The), EURIBOR + 5.000%(a) | 5.07 | 4/9/2024 | 58,196 | 75,910 | 31,833 | |||||||||||||||
Innovation Group plc (The), EURIBOR + 6.000%(a) | 6.00 | 4/10/2024 | 254,731 | 286,611 | 62,238 | |||||||||||||||
Innovation Group plc (The), EURIBOR + 8.000%(a) | 8.00 | 4/9/2024 | 150,773 | 104,597 | 206 | |||||||||||||||
Internet Brands, Inc, 1M LIBOR + 3.500% | 3.65 | 9/13/2024 | 980,945 | 970,428 | 966,604 | |||||||||||||||
Mitchell International, Inc., 1M LIBOR + 3.250% | 3.40 | 11/29/2024 | 984,810 | 929,278 | 965,734 | |||||||||||||||
TMF Group Holding B.V., EURIBOR + 6.875%(a) | 6.88 | 5/4/2026 | 500,000 | 542,170 | 588,426 | |||||||||||||||
Ultimate Software Group, Inc. (The), 3M LIBOR + 4.000% | 4.75 | 5/4/2026 | 371,219 | 366,119 | 372,863 | |||||||||||||||
|
|
|
|
|
| |||||||||||||||
Total Diversified/Conglomerate Service | 6,825,487 | 6,665,192 | 6,454,248 | |||||||||||||||||
|
|
|
|
|
| |||||||||||||||
Ecological — 0.0%*: | ||||||||||||||||||||
GFL Environmental Inc., 3M LIBOR + 3.000%(a) | 3.50 | 5/31/2025 | 66,895 | 66,932 | 66,923 | |||||||||||||||
|
|
|
|
|
| |||||||||||||||
Electronics — 2.4%*: | ||||||||||||||||||||
Ahead DB Borrower, LLC, 3M LIBOR + 5.000% | 6.00 | 10/13/2027 | 238,495 | 228,097 | 234,097 | |||||||||||||||
Ivanti Software, Inc., 1M LIBOR + 4.750% | 5.75 | 12/1/2027 | 530,916 | 523,028 | 529,090 | |||||||||||||||
Omnitracs, Inc., 1M LIBOR + 2.750% | 2.90 | 3/21/2025 | 955,733 | 957,192 | 934,028 | |||||||||||||||
Renaissance Holding Corp., 1M LIBOR + 3.250% | 3.40 | 5/30/2025 | 473,766 | 474,759 | 464,808 | |||||||||||||||
RP Crown Parent LLC, 1M LIBOR + 3.000% | 4.00 | 2/2/2026 | 712,917 | 709,611 | 711,135 | |||||||||||||||
Sophia, LP, 3M LIBOR + 3.750% | 4.50 | 10/7/2027 | 116,192 | 115,347 | 116,274 | |||||||||||||||
Tibco Software Inc., 1M LIBOR + 3.750% | 3.90 | 6/30/2026 | 995,000 | 963,798 | 974,165 | |||||||||||||||
Tibco Software Inc., 1M LIBOR + 7.250% | 7.40 | 3/3/2028 | 146,643 | 145,983 | 147,864 | |||||||||||||||
|
|
|
|
|
| |||||||||||||||
Total Electronics | 4,169,662 | 4,117,815 | 4,111,461 | |||||||||||||||||
|
|
|
|
|
| |||||||||||||||
Finance — 0.5%*: | ||||||||||||||||||||
Deerfield Dakota Holding LLC, 1M LIBOR + 8.000% | 9.00 | 4/7/2028 | 410,077 | 404,478 | 416,229 | |||||||||||||||
Tempo Acquisition LLC, 1M LIBOR + 2.750% | 2.90 | 5/1/2024 | 484,055 | 485,238 | 479,819 | |||||||||||||||
|
|
|
|
|
| |||||||||||||||
Total Finance | 894,132 | 889,716 | 896,048 | |||||||||||||||||
|
|
|
|
|
| |||||||||||||||
Healthcare, Education and Childcare — 5.9%*: | ||||||||||||||||||||
Advanz Pharma Corp., 1M LIBOR + 5.500%(a) | 6.50 | 9/6/2024 | 1,766,750 | 1,753,018 | 1,723,465 | |||||||||||||||
Aenova Holding GmbH, EURIBOR + 5.000%(a) | 5.00 | 3/6/2025 | 500,000 | 537,361 | 613,225 | |||||||||||||||
Auris Luxembourg III Sarl, EURIBOR + 4.000%(a) | 4.00 | 2/27/2026 | 1,000,000 | 1,101,892 | 1,185,978 | |||||||||||||||
See accompanying Notes to the Financial Statements.
91
Table of Contents
Barings Global Credit Income Opportunities Fund 2020 Semi-Annual Report
SCHEDULE OF INVESTMENTS (CONTINUED)
December 31, 2020 (Unaudited)
| EFFECTIVE INTEREST RATE | DUE DATE | PRINCIPAL ‡‡ | COST | FAIR VALUE | ||||||||||||||||
Bank Loans (Continued) | ||||||||||||||||||||
Healthcare, Education and Childcare (Continued) |
| |||||||||||||||||||
Change Healthcare Holdings LLC, 3M LIBOR + 2.500% | 3.50 | % | 3/1/2024 | 620,348 | $617,833 | $616,935 | ||||||||||||||
Fugue Finance B.V., EURIBOR + 3.250%(a) | 3.25 | 9/1/2024 | 750,000 | 850,489 | 902,842 | |||||||||||||||
LifePoint Health, 1M LIBOR + 3.750% | 3.90 | 11/16/2025 | 413,275 | 415,649 | 411,676 | |||||||||||||||
Lifescan Global Corp., 3M LIBOR + 6.000% | 6.23 | 10/1/2024 | 162,882 | 159,818 | 154,738 | |||||||||||||||
Ortho-Clinical Diagnostics SA, 1M LIBOR + 3.250% | 3.40 | 6/30/2025 | 664,472 | 664,683 | 654,172 | |||||||||||||||
Parexel International Corp., 1M LIBOR + 2.750% | 2.90 | 9/27/2024 | 827,677 | 819,777 | 812,547 | |||||||||||||||
Radiology Partners, Inc., 1M LIBOR + 4.250% | 4.40-5.29 | 7/9/2025 | 1,000,000 | 925,754 | 981,880 | |||||||||||||||
Rodenstock GmbH, EURIBOR + 5.250%(a) | 5.25 | 6/15/2026 | 500,000 | 557,847 | 603,190 | |||||||||||||||
Synlab Bondco plc, EURIBOR + 3.750%(a) | 3.75 | 7/31/2027 | 500,000 | 596,593 | 609,616 | |||||||||||||||
Tunstall Group Holdings Ltd., EURIBOR + 5.000%(a) | 5.00 | 6/30/2025 | 282,314 | 332,128 | 334,542 | |||||||||||||||
U.S. Anesthesia Partners, Inc., 6M LIBOR + 3.000% | 4.00 | 6/23/2024 | 491,058 | 492,022 | 479,165 | |||||||||||||||
|
|
|
|
|
| |||||||||||||||
Total Healthcare, Education and Childcare | 9,478,776 | 9,824,864 | 10,083,971 | |||||||||||||||||
|
|
|
|
|
| |||||||||||||||
Home and Office Furnishings, Housewares, and Durable Consumer Products — 0.8%*: |
| |||||||||||||||||||
Hilding Anders International AB, 6M EURIBOR + 5.000%(a) | 5.75 | 11/30/2024 | 504,105 | 460,127 | 437,634 | |||||||||||||||
Serta Simmons Bedding LLC, 1M LIBOR + 7.500% | 8.50 | 8/10/2023 | 1,071,060 | 1,071,059 | 962,037 | |||||||||||||||
|
|
|
|
|
| |||||||||||||||
Total Home and Office Furnishings, Housewares, and Durable Consumer Products | 1,575,165 | 1,531,186 | 1,399,671 | |||||||||||||||||
|
|
|
|
|
| |||||||||||||||
Hotels, Motels, Inns and Gaming — 2.7%*: | ||||||||||||||||||||
Caesars Entertainment Corp., 1M LIBOR + 4.500% | 4.65 | 7/21/2025 | 250,080 | 243,248 | 250,158 | |||||||||||||||
Caesars Resort Collection LLC, 1M LIBOR + 2.750% | 2.90 | 12/23/2024 | 1,469,697 | 1,461,916 | 1,440,126 | |||||||||||||||
Casper BidCo SAS, 6M EURIBOR + 3.875%(a) | 3.88 | 7/30/2026 | 500,000 | 543,083 | 565,343 | |||||||||||||||
Compass IV Ltd., 6M EURIBOR + 4.250%(a) | 4.25 | 4/30/2025 | 500,000 | 599,829 | 592,720 | |||||||||||||||
HNVR Holdco Ltd., 6M EURIBOR + 4.250%(a) | 4.25 | 9/12/2023 | 1,000,000 | 967,585 | 1,091,850 | |||||||||||||||
Richmond UK Bidco Ltd., LIBOR – GBP + 4.250%(a) | 4.34 | 3/3/2024 | 550,000 | 672,175 | 706,998 | |||||||||||||||
|
|
|
|
|
| |||||||||||||||
Total Hotels, Motels, Inns and Gaming | 4,269,777 | 4,487,836 | 4,647,195 | |||||||||||||||||
|
|
|
|
|
| |||||||||||||||
Insurance — 2.1%*: | ||||||||||||||||||||
Acrisure LLC, 1M LIBOR + 3.500% | 3.65 | 2/15/2027 | 497,494 | 475,551 | 487,027 | |||||||||||||||
AssuredPartners Capital, Inc., 1M LIBOR + 3.500% | 3.65 | 2/12/2027 | 966,247 | 970,468 | 950,845 | |||||||||||||||
Asurion LLC, 1M LIBOR + 3.000% | 3.15 | 11/3/2023 | 662,268 | 640,607 | 655,367 | |||||||||||||||
See accompanying Notes to the Financial Statements.
92
Table of Contents
Barings Global Credit Income Opportunities Fund 2020 Semi-Annual Report
SCHEDULE OF INVESTMENTS (CONTINUED)
December 31, 2020 (Unaudited)
| EFFECTIVE INTEREST RATE | DUE DATE | PRINCIPAL ‡‡ | COST | FAIR VALUE | ||||||||||||||||
Bank Loans (Continued) | ||||||||||||||||||||
Insurance (Continued) | ||||||||||||||||||||
Confie Seguros Holding II Co., 3M LIBOR + 8.500% | 8.73 | % | 10/31/2025 | 464,527 | $457,051 | $415,027 | ||||||||||||||
Ryan Specialty Group, LLC, 1M LIBOR + 3.250% | 4.00 | 9/1/2027 | 151,595 | 149,423 | 151,026 | |||||||||||||||
Sedgwick Claims Management Services, Inc., 1M LIBOR + 3.250% | 3.40 | 12/31/2025 | 980,000 | 964,065 | 963,262 | |||||||||||||||
|
|
|
|
|
| |||||||||||||||
Total Insurance | 3,722,131 | 3,657,165 | 3,622,554 | |||||||||||||||||
|
|
|
|
|
| |||||||||||||||
Leisure, Amusement, Entertainment — 3.2%*: | ||||||||||||||||||||
AMC Entertainment Holdings, Inc., PRIME + 2.000%, 2M LIBOR + 3.000% | 3.23 | 4/22/2026 | 986,309 | 789,682 | 630,991 | |||||||||||||||
Crown Finance US, Inc., 6M LIBOR + 2.500% | 2.77-3.50 | 2/28/2025 | 1,222,837 | 1,202,989 | 825,219 | |||||||||||||||
Dorna Sports, S.L., 6M LIBOR + 3.500%(a) | 3.76 | 5/3/2024 | 400,000 | 400,000 | 388,000 | |||||||||||||||
Golden Entertainment, Inc., 1M LIBOR + 3.000% | 3.75 | 10/20/2024 | 432,061 | 395,491 | 421,328 | |||||||||||||||
Metro-Goldwyn-Mayer, Inc., 1M LIBOR + 4.500% | 5.50 | 7/3/2026 | 893,847 | 887,652 | 889,378 | |||||||||||||||
Motion Finco Sarl, 1M LIBOR + 3.25%(a) | 3.47 | 11/12/2026 | 498,749 | 475,060 | 480,047 | |||||||||||||||
Playtika Holding Corp., 3M LIBOR + 6.000% | 7.00 | 12/10/2024 | 554,167 | 545,427 | 556,877 | |||||||||||||||
PUG LLC, 1M LIBOR + 3.500% | 3.65 | 2/12/2027 | 369,135 | 367,519 | 351,295 | |||||||||||||||
Vacalians Group, EURIBOR + 4.000%(a) | 4.00 | 12/4/2025 | 500,000 | 481,309 | 521,950 | |||||||||||||||
Vue International Bidco plc, EURIBOR + 4.750%(a) | �� | 4.75 | 6/30/2026 | 423,797 | 474,020 | 438,591 | ||||||||||||||
|
|
|
|
|
| |||||||||||||||
Total Leisure, Amusement, Entertainment | 6,280,902 | 6,019,149 | 5,503,676 | |||||||||||||||||
|
|
|
|
|
| |||||||||||||||
Machinery Non-Agriculture, Non-Construction, Non-Electronic — 0.6%*: |
| |||||||||||||||||||
Apex Tool Group, LLC, 1M LIBOR + 5.250% | 6.50 | 8/1/2024 | 62,345 | 61,461 | 61,506 | |||||||||||||||
Husky Injection Molding Systems Ltd., 6M LIBOR + 3.000%(a) | 3.27 | 3/28/2025 | 959,457 | 960,193 | 933,618 | |||||||||||||||
|
|
|
|
|
| |||||||||||||||
Total Machinery Non-Agriculture, Non-Construction, Non-Electronic | 1,021,802 | 1,021,654 | 995,124 | |||||||||||||||||
|
|
|
|
|
| |||||||||||||||
Mining, Steel, Iron and Non-Precious Metals — 0.0%*: |
| |||||||||||||||||||
Boomerang Tube, LLC, 1M LIBOR + 5.000%(b) | 5.16 | 6/30/2022 | 128,814 | 128,814 | 5,153 | |||||||||||||||
|
|
|
|
|
| |||||||||||||||
Oil and Gas — 0.6%*: | ||||||||||||||||||||
Fieldwood Energy LLC, 1M LIBOR + 7.250%(f) | 7.25 | 4/11/2023 | 885,631 | 598,211 | 204 | |||||||||||||||
Gulf Finance LLC, 1M LIBOR + 5.250% | 6.25 | 8/25/2023 | 1,265,326 | 1,224,935 | 951,259 | |||||||||||||||
|
|
|
|
|
| |||||||||||||||
Total Oil and Gas | 2,150,957 | 1,823,146 | 951,463 | |||||||||||||||||
|
|
|
|
|
| |||||||||||||||
Personal and Non-Durable Consumer Products Mfg. Only — 0.4%*: |
| |||||||||||||||||||
Coty Inc., 1M LIBOR + 2.250% | 2.40 | 4/7/2025 | 734,578 | 713,273 | 690,504 | |||||||||||||||
|
|
|
|
|
| |||||||||||||||
Personal Transportation — 0.0%*: | ||||||||||||||||||||
Bahia De Las Isletas, S.L., EURIBOR + 2.500%, EURIBOR + 7.500%(a) | 2.50-7.50 | 4/30/2021 | 22,423 | 25,604 | 26,846 | |||||||||||||||
|
|
|
|
|
| |||||||||||||||
See accompanying Notes to the Financial Statements.
93
Table of Contents
Barings Global Credit Income Opportunities Fund 2020 Semi-Annual Report
SCHEDULE OF INVESTMENTS (CONTINUED)
December 31, 2020 (Unaudited)
| EFFECTIVE INTEREST RATE | DUE DATE | PRINCIPAL ‡‡ | COST | FAIR VALUE | ||||||||||||||||
Bank Loans (Continued) | ||||||||||||||||||||
Printing and Publishing — 0.1%*: | ||||||||||||||||||||
Houghton Mifflin Harcourt Publishing Co., 1M LIBOR + 6.250% | 7.25 | % | 11/19/2024 | 106,320 | $102,989 | $101,846 | ||||||||||||||
|
|
|
|
|
| |||||||||||||||
Retail Stores — 1.0%*: | ||||||||||||||||||||
Bass Pro Group, LLC, 1M LIBOR + 5.000% | 5.75 | 9/25/2024 | 482,317 | 480,284 | 483,181 | |||||||||||||||
Harbor Freight Tools USA, Inc., 1M LIBOR + 3.250% | 4.00 | 10/19/2027 | 767,459 | 759,606 | 766,178 | |||||||||||||||
Kirk Beauty One GmbH, 3M EURIBOR + 3.500%(a) | 3.50 | 8/12/2022 | 500,001 | 546,283 | 543,304 | |||||||||||||||
|
|
|
|
|
| |||||||||||||||
Total Retail Stores | 1,749,777 | 1,786,173 | 1,792,663 | |||||||||||||||||
|
|
|
|
|
| |||||||||||||||
Telecommunications — 3.5%*: |
| |||||||||||||||||||
Banff Merger Sub, Inc., 1M LIBOR + 4.250% | 4.40 | 10/2/2025 | 1,042,431 | 1,011,569 | 1,036,916 | |||||||||||||||
CommScope, Inc., 1M LIBOR + 3.250% | 3.40 | 4/6/2026 | 987,500 | 987,500 | 978,859 | |||||||||||||||
Eagle Broadband Investments LLC, 3M LIBOR + 3.000% | 3.75 | 11/12/2027 | 159,556 | 157,961 | 159,258 | |||||||||||||||
ION Trading Technologies Sarl, 3M EURIBOR + 3.250% | 4.25 | 11/21/2024 | 1,073,619 | 1,235,193 | 1,309,540 | |||||||||||||||
ION Trading Technologies Sarl, 3M LIBOR + 4.000% | 5.00 | 11/21/2024 | 279,142 | 274,771 | 278,146 | |||||||||||||||
Lorca Finco plc, 6M EURIBOR + 4.250%(a) | 4.25 | 9/17/2027 | 500,000 | 580,402 | 611,717 | |||||||||||||||
Syniverse Technologies, Inc., 3M LIBOR + 5.000% | 6.00 | 3/9/2023 | 194,576 | 193,723 | 175,307 | |||||||||||||||
Syniverse Technologies, Inc., 3M LIBOR + 9.000% | 10.00 | 3/11/2024 | 153,729 | 152,501 | 99,716 | |||||||||||||||
Virgin Media SFA Finance Ltd., 1M GBP LIBOR + 3.250%(a) | 3.28 | 1/15/2027 | 1,000,000 | 1,211,938 | 1,333,601 | |||||||||||||||
|
|
|
|
|
| |||||||||||||||
Total Telecommunications | 5,390,553 | 5,805,558 | 5,983,060 | |||||||||||||||||
|
|
|
|
|
| |||||||||||||||
Total Bank Loans | 64,830,523 | 65,322,997 | 63,931,871 | |||||||||||||||||
|
|
|
|
|
| |||||||||||||||
Corporate Bonds — 43.9%*: |
| |||||||||||||||||||
Aerospace and Defense — 1.7%*: |
| |||||||||||||||||||
Heathrow Finance plc(a) | 4.38 | 3/1/2027 | 100,000 | 117,775 | 136,490 | |||||||||||||||
Heathrow Finance plc(a) | 5.25 | 3/1/2024 | 100,000 | 127,946 | 142,118 | |||||||||||||||
Rolls-Royce plc(a) | 3.38 | 6/18/2026 | 500,000 | 605,092 | 680,570 | |||||||||||||||
Rolls-Royce plc(a) | 4.63 | 2/16/2026 | 100,000 | 117,545 | 131,938 | |||||||||||||||
Triumph Group, Inc. | 5.25 | 6/1/2022 | 875,000 | 873,970 | 833,437 | |||||||||||||||
Triumph Group, Inc.(c) | 6.25 | 9/15/2024 | 308,000 | 308,000 | 304,920 | |||||||||||||||
Triumph Group, Inc. | 7.75 | 8/15/2025 | 750,000 | 784,928 | 685,313 | |||||||||||||||
|
|
|
|
|
| |||||||||||||||
Total Aerospace and Defense | 2,733,000 | 2,935,256 | 2,914,786 | |||||||||||||||||
|
|
|
|
|
| |||||||||||||||
Automobile — 3.2%*: |
| |||||||||||||||||||
AA Bond Co. Ltd.(a) | 5.50 | 7/31/2022 | 1,300,000 | 1,655,390 | 1,721,539 | |||||||||||||||
Clarios Global LP/Clarios US Finance Co.(c) | 8.50 | 5/15/2027 | 1,000,000 | 1,031,602 | 1,086,409 | |||||||||||||||
See accompanying Notes to the Financial Statements.
94
Table of Contents
Barings Global Credit Income Opportunities Fund 2020 Semi-Annual Report
SCHEDULE OF INVESTMENTS (CONTINUED)
December 31, 2020 (Unaudited)
| EFFECTIVE INTEREST RATE | DUE DATE | PRINCIPAL ‡‡ | COST | FAIR VALUE | ||||||||||||||||
Corporate Bonds (Continued) |
| |||||||||||||||||||
Automobile (Continued) |
| |||||||||||||||||||
Ford Motor Co. | 7.45 | % | 7/16/2031 | 500,000 | $584,494 | $641,250 | ||||||||||||||
Ford Motor Co. | 8.50 | 4/21/2023 | 569,000 | 567,496 | 640,415 | |||||||||||||||
Ford Motor Co. | 9.63 | 4/22/2030 | 127,000 | 154,887 | 179,229 | |||||||||||||||
Gates Global LLC/Gates Global Co.(c) | 6.25 | 1/15/2026 | 550,000 | 528,072 | 577,500 | |||||||||||||||
RAC Bond Co. plc(a) | 5.00 | 11/6/2022 | 257,000 | 349,792 | 350,586 | |||||||||||||||
Schaeffler AG(a) | 3.38 | 10/12/2028 | 200,000 | 235,690 | 268,763 | |||||||||||||||
|
|
|
|
|
| |||||||||||||||
Total Automobile | 4,503,000 | 5,107,423 | 5,465,691 | |||||||||||||||||
|
|
|
|
|
| |||||||||||||||
Banking — 1.8%*: |
| |||||||||||||||||||
Alpha Bank AE, 5 year EUR Swap + 4.504%(a) | 4.25 | (d) | 2/13/2030 | 275,000 | 301,895 | 314,039 | ||||||||||||||
Emirates NBD Bank PJSC, 6 year USD Swap + 5.702%(a) | 6.13 | (d) | 1/9/2169 | 454,000 | 454,000 | 490,320 | ||||||||||||||
India Infoline Finance Ltd.(a) | 5.88 | 4/20/2023 | 805,000 | 803,778 | 772,800 | |||||||||||||||
Nova Ljubljanska Banka dd, 5 year EUR Swap + 3.833%(a) | 3.65 | (d) | 11/19/2029 | 700,000 | 770,700 | 769,640 | ||||||||||||||
Piraeus Bank SA, 5 year EUR Swap + 5.774%(a) | 5.50 | (d) | 2/19/2030 | 688,000 | 748,200 | 621,336 | ||||||||||||||
Piraeus Group Finance plc, 5 year EUR Swap + 9.952%(a) | 9.75 | (d) | 6/26/2029 | 100,000 | 94,010 | 107,323 | ||||||||||||||
|
|
|
|
|
| |||||||||||||||
Total Banking | 3,022,000 | 3,172,583 | 3,075,458 | |||||||||||||||||
|
|
|
|
|
| |||||||||||||||
Beverage, Food and Tobacco — 2.2%*: |
| |||||||||||||||||||
Boparan Finance plc(a) | 7.63 | 11/30/2025 | 200,000 | 265,420 | 276,098 | |||||||||||||||
Eurotorg LLC Via Bonitron DAC(a) | 9.00 | 10/22/2025 | 482,000 | 482,000 | 515,788 | |||||||||||||||
Foodco Bondco SA(a) | 6.25 | 5/15/2026 | 100,000 | 111,292 | 108,727 | |||||||||||||||
JBS USA Food Co.(c) | 5.50 | 1/15/2030 | 586,000 | 585,478 | 673,173 | |||||||||||||||
JBS USA LUX SA/JBS USA Finance, Inc.(c) | 5.75 | 6/15/2025 | 344,000 | 348,597 | 355,180 | |||||||||||||||
JBS USA LUX SA/JBS USA Finance, Inc.(c) | 6.75 | 2/15/2028 | 500,000 | 500,000 | 561,750 | |||||||||||||||
Sunshine Mid BV(a) | 6.50 | 5/15/2026 | 600,000 | 726,330 | 760,111 | |||||||||||||||
Ulker Biskuvi Sanayi AS(a) | 6.95 | 10/30/2025 | 494,000 | 494,000 | 533,876 | |||||||||||||||
|
|
|
|
|
| |||||||||||||||
Total Beverage, Food and Tobacco | 3,306,000 | 3,513,117 | 3,784,703 | |||||||||||||||||
|
|
|
|
|
| |||||||||||||||
Broadcasting and Entertainment — 2.8%*: |
| |||||||||||||||||||
Altice USA, Inc.(c) | 5.75 | 1/15/2030 | 455,000 | 471,911 | 498,794 | |||||||||||||||
Banijay Group SAS(a) | 6.50 | 3/1/2026 | 750,000 | 828,337 | 918,070 | |||||||||||||||
Clear Channel Worldwide Holdings, Inc. | 9.25 | 2/15/2024 | 192,000 | 194,125 | 194,400 | |||||||||||||||
Cox Media Group(c) | 8.88 | 12/15/2027 | 376,000 | 376,000 | 414,540 | |||||||||||||||
DISH Network Corp. | 3.38 | 8/15/2026 | 750,000 | 689,434 | 714,924 | |||||||||||||||
Netflix, Inc. | 3.63 | 6/15/2030 | 500,000 | 569,318 | 693,457 | |||||||||||||||
Outfront Media, Inc.(c) | 6.25 | 6/15/2025 | 298,000 | 298,000 | 314,390 | |||||||||||||||
Tele Columbus AG(a) | 3.88 | 5/2/2025 | 900,000 | 974,846 | 1,101,462 | |||||||||||||||
|
|
|
|
|
| |||||||||||||||
Total Broadcasting and Entertainment | 4,221,000 | 4,401,971 | 4,850,037 | |||||||||||||||||
|
|
|
|
|
| |||||||||||||||
Buildings and Real Estate — 1.7%*: |
| |||||||||||||||||||
China Aoyuan Group Ltd.(a) | 5.98 | 8/18/2025 | 652,000 | 651,547 | 682,219 | |||||||||||||||
Kaisa Group Holdings Ltd.(a) | 9.95 | 7/23/2025 | 1,000,000 | 1,000,173 | 977,500 | |||||||||||||||
See accompanying Notes to the Financial Statements.
95
Table of Contents
Barings Global Credit Income Opportunities Fund 2020 Semi-Annual Report
SCHEDULE OF INVESTMENTS (CONTINUED)
December 31, 2020 (Unaudited)
| EFFECTIVE INTEREST RATE | DUE DATE | PRINCIPAL ‡‡ | COST | FAIR VALUE | ||||||||||||||||
Corporate Bonds (Continued) |
| |||||||||||||||||||
Buildings and Real Estate (Continued) |
| |||||||||||||||||||
Sunac China Holdings Ltd.(a) | 6.50 | % | 1/10/2025 | 790,000 | $790,000 | $811,725 | ||||||||||||||
Taylor Morrison Communities, Inc.(c) | 5.13 | 8/1/2030 | 265,000 | 265,000 | 296,800 | |||||||||||||||
Ukraine Railways Via Shortline plc(a) | 9.88 | 9/15/2021 | 100,000 | 101,071 | 102,250 | |||||||||||||||
|
|
|
|
|
| |||||||||||||||
Total Buildings and Real Estate | 2,807,000 | 2,807,791 | 2,870,494 | |||||||||||||||||
|
|
|
|
|
| |||||||||||||||
Cargo Transport — 0.8%*: |
| |||||||||||||||||||
Kenan Advantage Group, Inc. (The)(c) | 7.88 | 7/31/2023 | 1,367,000 | 1,367,000 | 1,367,000 | |||||||||||||||
|
|
|
|
|
| |||||||||||||||
Chemicals, Plastics and Rubber — 0.9%*: |
| |||||||||||||||||||
Braskem Idesa SAPI(a) | 7.45 | 11/15/2029 | 750,000 | 747,639 | 703,125 | |||||||||||||||
Consolidated Energy Finance SA(c) | 6.88 | 6/15/2025 | 874,000 | 890,779 | 886,017 | |||||||||||||||
|
|
|
|
|
| |||||||||||||||
Total Chemicals, Plastics and Rubber | 1,624,000 | 1,638,418 | 1,589,142 | |||||||||||||||||
|
|
|
|
|
| |||||||||||||||
Containers, Packaging and Glass — 1.1%*: |
| |||||||||||||||||||
Plastipak Holdings, Inc.(c) | 6.25 | 10/15/2025 | 711,000 | 711,000 | 732,330 | |||||||||||||||
Trident TPI Holdings, Inc.(c) | 9.25 | 8/1/2024 | 1,125,000 | 1,144,333 | 1,198,125 | |||||||||||||||
|
|
|
|
|
| |||||||||||||||
Total Containers, Packaging and Glass | 1,836,000 | 1,855,333 | 1,930,455 | |||||||||||||||||
|
|
|
|
|
| |||||||||||||||
Diversified/Conglomerate Manufacturing — 0.4%*: |
| |||||||||||||||||||
Amsted Industries, Inc.(c) | 4.63 | 5/15/2030 | 422,000 | 422,000 | 442,045 | |||||||||||||||
Mangrove Luxco III Sarl(a) | 7.78 | 10/9/2025 | 300,000 | 315,751 | 313,720 | |||||||||||||||
|
|
|
|
|
| |||||||||||||||
Total Diversified/Conglomerate Manufacturing | 722,000 | 737,751 | 755,765 | |||||||||||||||||
|
|
|
|
|
| |||||||||||||||
Diversified/Conglomerate Service — 2.1%*: |
| |||||||||||||||||||
Centurion Bidco SpA(a) | 5.88 | 9/30/2026 | 300,000 | 347,155 | 377,032 | |||||||||||||||
EIG Investors Corp. | 10.88 | 2/1/2024 | 352,000 | 362,376 | 364,144 | |||||||||||||||
Iron Mountain, Inc.(c) | 5.25 | 7/15/2030 | 554,000 | 552,560 | 598,320 | |||||||||||||||
Summer BC Holdco A Sarl(a) | 9.25 | 10/31/2027 | 315,368 | 389,409 | 406,383 | |||||||||||||||
Verisure Midholding AB(a) | 5.75 | 12/1/2023 | 1,500,000 | 1,756,823 | 1,851,716 | |||||||||||||||
|
|
|
|
|
| |||||||||||||||
Total Diversified/Conglomerate Service | 3,021,368 | 3,408,323 | 3,597,595 | |||||||||||||||||
|
|
|
|
|
| |||||||||||||||
Electronics — 1.0%*: |
| |||||||||||||||||||
Veritas US, Inc./Veritas Bermuda Ltd.(c) | 7.50 | 9/1/2025 | 225,000 | 229,071 | 230,906 | |||||||||||||||
Veritas US, Inc./Veritas Bermuda Ltd.(c) | 10.50 | 2/1/2024 | 1,419,000 | 1,433,048 | 1,440,285 | |||||||||||||||
|
|
|
|
|
| |||||||||||||||
Total Electronics | 1,644,000 | 1,662,119 | 1,671,191 | |||||||||||||||||
|
|
|
|
|
| |||||||||||||||
Farming and Agriculture — 0.3%*: |
| |||||||||||||||||||
Kernel Holding SA(a) | 6.75 | 10/27/2027 | 458,000 | 458,000 | 486,625 | |||||||||||||||
|
|
|
|
|
| |||||||||||||||
Finance — 4.3%*: |
| |||||||||||||||||||
Alliance Data Systems Corp.(c) | 4.75 | 12/15/2024 | 1,500,000 | 1,501,445 | 1,515,000 | |||||||||||||||
Cabot Financial Luxembourg SA | 7.50 | 10/1/2023 | 286,677 | 411,388 | 398,577 | |||||||||||||||
Ford Motor Credit Co. LLC | 4.13 | 8/17/2027 | 247,000 | 247,000 | 258,733 | |||||||||||||||
Global Aircraft Leasing Co. Ltd.(c) | 6.50 | 9/15/2024 | 2,072,500 | 2,072,500 | 1,849,706 | |||||||||||||||
See accompanying Notes to the Financial Statements.
96
Table of Contents
Barings Global Credit Income Opportunities Fund 2020 Semi-Annual Report
SCHEDULE OF INVESTMENTS (CONTINUED)
December 31, 2020 (Unaudited)
| EFFECTIVE INTEREST RATE | DUE DATE | PRINCIPAL ‡‡ | COST | FAIR VALUE | ||||||||||||||||
Corporate Bonds (Continued) |
| |||||||||||||||||||
Finance (Continued) |
| |||||||||||||||||||
Icahn Enterprises LP/Icahn Enterprises Finance Corp. | 4.75 | % | 9/15/2024 | 540,000 | $548,603 | $560,925 | ||||||||||||||
Icahn Enterprises LP/Icahn Enterprises Finance Corp. | 6.75 | 2/1/2024 | 1,162,000 | 1,162,000 | 1,181,731 | |||||||||||||||
OneMain Finance Corp. | 5.38 | 11/15/2029 | 438,000 | 438,000 | 492,750 | |||||||||||||||
Travelex Financing plc(a),(b),(f) | 8.00 | 5/15/2022 | 1,050,000 | 1,178,949 | — | |||||||||||||||
Travelex Issuerco Ltd.(a) | 12.50 | 8/5/2025 | 459,000 | 504,026 | 1,129,829 | |||||||||||||||
|
|
|
|
|
| |||||||||||||||
Total Finance | 7,755,177 | 8,063,911 | 7,387,251 | |||||||||||||||||
|
|
|
|
|
| |||||||||||||||
Healthcare, Education and Childcare — 3.2%*: |
| |||||||||||||||||||
Advanz Pharma Corp.(a) | 8.00 | 9/6/2024 | 500,000 | 480,808 | 505,000 | |||||||||||||||
Bausch Health Cos., Inc.(c) | 8.50 | 1/31/2027 | 415,000 | 421,063 | 461,550 | |||||||||||||||
Bausch Health Cos., Inc.(c) | 9.00 | 12/15/2025 | 165,000 | 163,392 | 182,152 | |||||||||||||||
Bausch Health Cos., Inc.(c) | 5.00 | 1/30/2028 | 204,000 | 204,000 | 210,230 | |||||||||||||||
Bausch Health Cos., Inc.(c) | 5.00 | 2/15/2029 | 281,000 | 281,000 | 288,924 | |||||||||||||||
Bausch Health Cos., Inc.(c) | 5.25 | 1/30/2030 | 200,000 | 200,000 | 210,000 | |||||||||||||||
Bausch Health Cos., Inc.(c) | 5.25 | 2/15/2031 | 208,000 | 208,000 | 217,302 | |||||||||||||||
Centene Corp. | 4.25 | 12/15/2027 | 285,000 | 282,880 | 302,100 | |||||||||||||||
Centene Corp. | 4.63 | 12/15/2029 | 605,000 | 616,555 | 671,677 | |||||||||||||||
Cream Tech(a) | 5.25 | 12/15/2025 | 450,000 | 514,306 | 559,638 | |||||||||||||||
Endo Pharmaceuticals, Inc.(c) | 7.50 | 4/1/2027 | 708,000 | 708,000 | 768,180 | |||||||||||||||
Nidda BondCo GmbH(a) | 7.25 | 9/30/2025 | 500,000 | 580,935 | 632,204 | |||||||||||||||
Tenet Healthcare Corp.(c) | 6.13 | 10/1/2028 | 400,000 | 400,000 | 416,792 | |||||||||||||||
|
|
|
|
|
| |||||||||||||||
Total Healthcare, Education and Childcare | 4,921,000 | 5,060,939 | 5,425,749 | |||||||||||||||||
|
|
|
|
|
| |||||||||||||||
Home and Office Furnishings, Housewares, and Durable Consumer Products — 0.9%*: |
| |||||||||||||||||||
LSF9 Balta Issuer Sarl(a) | 7.75 | 9/15/2022 | 453,600 | 525,351 | 524,237 | |||||||||||||||
Resideo Funding, Inc.(c) | 6.13 | 11/1/2026 | 1,000,000 | 999,609 | 1,052,500 | |||||||||||||||
|
|
|
|
|
| |||||||||||||||
Total Home and Office Furnishings, Housewares, and Durable Consumer Products | 1,453,600 | 1,524,960 | 1,576,737 | |||||||||||||||||
|
|
|
|
|
| |||||||||||||||
Hotels, Motels, Inns and Gaming — 1.4%*: |
| |||||||||||||||||||
Caesars Resort Collection LLC/CRC Finco, Inc.(c) | 5.25 | 10/15/2025 | 301,000 | 272,587 | 304,188 | |||||||||||||||
Caesars Resort Collection LLC/CRC Finco, Inc.(c) | 5.75 | 7/1/2025 | 214,000 | 214,000 | 226,750 | |||||||||||||||
Scientific Games International, Inc.(c) | 8.63 | 7/1/2025 | 400,000 | 399,356 | 438,000 | |||||||||||||||
TVL Finance plc, 3M GBP LIBOR + 5.375%(a) | 5.42 | (d) | 7/15/2025 | 500,000 | 632,787 | 604,844 | ||||||||||||||
Wynn Las Vegas LLC/Wynn Las Vegas Capital Corp.(c) | 5.50 | 3/1/2025 | 464,000 | 442,540 | 484,300 | |||||||||||||||
Wynn Macau Ltd.(a),(c) | 5.13 | 12/15/2029 | 270,000 | 270,000 | 275,737 | |||||||||||||||
|
|
|
|
|
| |||||||||||||||
Total Hotels, Motels, Inns and Gaming | 2,149,000 | 2,231,270 | 2,333,819 | |||||||||||||||||
|
|
|
|
|
| |||||||||||||||
See accompanying Notes to the Financial Statements.
97
Table of Contents
Barings Global Credit Income Opportunities Fund 2020 Semi-Annual Report
SCHEDULE OF INVESTMENTS (CONTINUED)
December 31, 2020 (Unaudited)
| EFFECTIVE INTEREST RATE | DUE DATE | PRINCIPAL ‡‡ | COST | FAIR VALUE | ||||||||||||||||
Corporate Bonds (Continued) |
| |||||||||||||||||||
Leisure, Amusement, Entertainment — 1.1%*: |
| |||||||||||||||||||
AMC Entertainment Holdings, Inc.(c) | 10.50 | % | 4/24/2026 | 142,000 | $142,000 | $95,850 | ||||||||||||||
AMC Entertainment Holdings, Inc.(c) | 12.00 | 6/15/2026 | 1,229,393 | 1,620,973 | 270,466 | |||||||||||||||
Caesars Entertainment, Inc.(c) | 6.25 | 7/1/2025 | 382,000 | 382,000 | 406,830 | |||||||||||||||
Caesars Entertainment, Inc.(c) | 8.13 | 7/1/2027 | 279,000 | 279,000 | 308,859 | |||||||||||||||
Carnival Corp. | 7.63 | 3/1/2026 | 150,000 | 177,893 | 193,858 | |||||||||||||||
CPUK Finance Ltd.(a) | 4.88 | 8/28/2025 | 100,000 | 119,817 | 136,050 | |||||||||||||||
CPUK Finance Ltd.(a) | 6.50 | 8/28/2026 | 100,000 | 129,880 | 142,045 | |||||||||||||||
Live Nation Entertainment, Inc.(c) | 6.50 | 5/15/2027 | 133,000 | 133,000 | 148,763 | |||||||||||||||
Merlin Entertainments(a) | 7.00 | 5/15/2025 | 100,000 | 125,558 | 128,579 | |||||||||||||||
|
|
|
|
|
| |||||||||||||||
Total Leisure, Amusement, Entertainment | 2,615,393 | 3,110,121 | 1,831,300 | |||||||||||||||||
|
|
|
|
|
| |||||||||||||||
Machinery Non-Agriculture, Non-Construction, Non-Electronic — 0.6%*: |
| |||||||||||||||||||
Apex Tool Group LLC/BC Mountain Finance, Inc.(c) | 9.00 | 2/15/2023 | 578,000 | 576,286 | 566,440 | |||||||||||||||
Briggs & Stratton Corp.(f) | 6.88 | 12/15/2020 | 514,000 | 510,268 | 38,550 | |||||||||||||||
Diebold Nixdorf Dutch Holding BV | 9.00 | 7/15/2025 | 350,000 | 410,411 | 463,922 | |||||||||||||||
|
|
|
|
|
| |||||||||||||||
Total Machinery Non-Agriculture, Non-Construction, Non-Electronic | 1,442,000 | 1,496,965 | 1,068,912 | |||||||||||||||||
|
|
|
|
|
| |||||||||||||||
Mining, Steel, Iron and Non-Precious Metals — 3.9%*: |
| |||||||||||||||||||
CSN Islands XI Corp.(a) | 6.75 | 1/28/2028 | 800,000 | 800,000 | 866,000 | |||||||||||||||
First Quantum Minerals Ltd.(a),(c) | 6.50 | 3/1/2024 | 1,006,000 | 969,691 | 1,033,665 | |||||||||||||||
First Quantum Minerals Ltd.(a) | 6.88 | 10/15/2027 | 719,000 | 719,000 | 780,115 | |||||||||||||||
Freeport-McMoRan, Inc. | 4.63 | 8/1/2030 | 881,000 | 881,000 | 966,897 | |||||||||||||||
Metinvest BV(a) | 7.65 | 10/1/2027 | 286,000 | 281,631 | 311,025 | |||||||||||||||
Metinvest BV(a) | 8.50 | 4/23/2026 | 200,000 | 211,723 | 223,500 | |||||||||||||||
Northwest Acquisitions ULC(a),(c),(f) | 7.13 | 11/1/2022 | 1,227,000 | 1,242,919 | 8,282 | |||||||||||||||
SunCoke Energy Partners LP(c) | 7.50 | 6/15/2025 | 608,000 | 602,334 | 603,562 | |||||||||||||||
Vedanta Resources Ltd.(a) | 6.38 | 7/30/2022 | 1,075,000 | 630,064 | 951,039 | |||||||||||||||
Warrior Met Coal, Inc.(c) | 8.00 | 11/1/2024 | 840,000 | 848,920 | 858,900 | |||||||||||||||
|
|
|
|
|
| |||||||||||||||
Total Mining, Steel, Iron and Non-Precious Metals | 7,642,000 | 7,187,282 | 6,602,985 | |||||||||||||||||
|
|
|
|
|
| |||||||||||||||
Oil and Gas — 3.2%*: |
| |||||||||||||||||||
Borets International Ltd.(a) | 6.00 | 9/17/2026 | 531,000 | 531,000 | 554,258 | |||||||||||||||
Cenovus Energy, Inc.(a) | 6.75 | 11/15/2039 | 61,000 | 60,850 | 80,648 | |||||||||||||||
CVR Energy, Inc.(c) | 5.25 | 2/15/2025 | 552,000 | 552,000 | 532,680 | |||||||||||||||
CVR Energy, Inc.(c) | 5.75 | 2/15/2028 | 573,000 | 573,000 | 542,917 | |||||||||||||||
EnLink Midstream Partners LP | 5.60 | 4/1/2044 | 206,000 | 159,186 | 165,315 | |||||||||||||||
Hilcorp Energy I LP/Hilcorp Finance Co.(c) | 6.25 | 11/1/2028 | 1,000,000 | 1,000,000 | 1,021,250 | |||||||||||||||
KCA Deutag UK Finance plc(a),(b) | 9.88 | 12/1/2025 | 349,975 | 349,977 | 363,099 | |||||||||||||||
Occidental Petroleum Corp. | 5.88 | 9/1/2025 | 153,000 | 153,000 | 162,945 | |||||||||||||||
Occidental Petroleum Corp. | 6.13 | 1/1/2031 | 221,000 | 221,000 | 236,514 | |||||||||||||||
Occidental Petroleum Corp. | 6.38 | 9/1/2028 | 157,000 | 157,000 | 165,635 | |||||||||||||||
PBF Holding Co. LLC/PBF Finance Corp. | 7.25 | 6/15/2025 | 778,000 | 797,953 | 504,327 | |||||||||||||||
See accompanying Notes to the Financial Statements.
98
Table of Contents
Barings Global Credit Income Opportunities Fund 2020 Semi-Annual Report
SCHEDULE OF INVESTMENTS (CONTINUED)
December 31, 2020 (Unaudited)
| EFFECTIVE INTEREST RATE | DUE DATE | PRINCIPAL ‡‡ | COST | FAIR VALUE | ||||||||||||||||
Corporate Bonds (Continued) |
| |||||||||||||||||||
Oil and Gas (Continued) |
| |||||||||||||||||||
PBF Holding Co. LLC/PBF Finance Corp.(c) | 9.25 | % | 5/15/2025 | 161,000 | $161,399 | $158,730 | ||||||||||||||
PT Medco Bell Pte Ltd.(a) | 6.38 | 1/30/2027 | 435,000 | 429,632 | 443,918 | |||||||||||||||
Targa Resources Partners LP/Targa Resources Partners Finance Corp.(c) | 4.88 | 2/1/2031 | 251,000 | 251,000 | 273,487 | |||||||||||||||
Tullow Oil plc(a) | 6.25 | 4/15/2022 | 200,000 | 83,568 | 159,000 | |||||||||||||||
Tullow Oil plc(a) | 7.00 | 3/1/2025 | 300,000 | 100,174 | 199,500 | |||||||||||||||
|
|
|
|
|
| |||||||||||||||
Total Oil and Gas | 5,928,975 | 5,580,739 | 5,564,223 | |||||||||||||||||
|
|
|
|
|
| |||||||||||||||
Personal Transportation — 0.2%*: |
| |||||||||||||||||||
Mileage Plus Holdings LLC/Mileage Plus Intellectual Property Assets Ltd.(c) | 6.50 | 6/20/2027 | 237,000 | 234,208 | 254,775 | |||||||||||||||
Naviera Armas S.A., 3M EURIBOR + 6.500%(a) | 6.50 | (d) | 7/31/2023 | 250,000 | 288,580 | 142,111 | ||||||||||||||
|
|
|
|
|
| |||||||||||||||
Total Personal Transportation | 487,000 | 522,788 | 396,886 | |||||||||||||||||
|
|
|
|
|
| |||||||||||||||
Personal, Food and Miscellaneous — 0.3%*: |
| |||||||||||||||||||
Walnut Bidco plc(a) | 6.75 | 8/1/2024 | 397,000 | 441,643 | 502,891 | |||||||||||||||
|
|
|
|
|
| |||||||||||||||
Printing and Publishing — 0.2%*: |
| |||||||||||||||||||
IPD 3 BV(a) | 5.50 | 12/1/2025 | 200,000 | 237,560 | 251,661 | |||||||||||||||
|
|
|
|
|
| |||||||||||||||
Retail Stores — 1.1%*: |
| |||||||||||||||||||
Arabian Centres Sukuk Ltd.(a) | 5.38 | 11/26/2024 | 500,000 | 500,000 | 505,400 | |||||||||||||||
Future Retail Ltd.(a) | 5.60 | 1/22/2025 | 950,000 | 849,259 | 804,234 | |||||||||||||||
House of Fraser Funding plc(a),(f) | 5.95 | 9/15/2020 | 150,000 | 217,107 | 6,154 | |||||||||||||||
Takko Luxembourg 2 SCA, 3M EURIBOR + 5.375%(a) | 5.38 | (d) | 11/15/2023 | 200,000 | 247,259 | 217,415 | ||||||||||||||
Takko Luxembourg 2 SCA(a) | 5.38 | 11/15/2023 | 350,000 | 381,189 | 383,041 | |||||||||||||||
|
|
|
|
|
| |||||||||||||||
Total Retail Stores | 2,150,000 | 2,194,814 | 1,916,244 | |||||||||||||||||
|
|
|
|
|
| |||||||||||||||
Telecommunications — 2.8%*: |
| |||||||||||||||||||
DKT Finance ApS(a) | 7.00 | 6/17/2023 | 1,500,000 | 1,692,243 | 1,884,455 | |||||||||||||||
HTA Group Ltd.(a) | 7.00 | 12/18/2025 | 623,000 | 619,791 | 670,114 | |||||||||||||||
IHS Netherlands Holdco BV(a),(c) | 8.00 | 9/18/2027 | 750,000 | 739,256 | 808,125 | |||||||||||||||
Sprint Capital Corp. | 6.88 | 11/15/2028 | 800,000 | 786,290 | 1,054,784 | |||||||||||||||
ViaSat, Inc.(c) | 6.50 | 7/15/2028 | 327,000 | 327,000 | 353,883 | |||||||||||||||
|
|
|
|
|
| |||||||||||||||
Total Telecommunications | 4,000,000 | 4,164,580 | 4,771,361 | |||||||||||||||||
|
|
|
|
|
| |||||||||||||||
Utilities — 0.7%*: |
| |||||||||||||||||||
Techem Verwaltungsgesellschaft 674 mbH(a) | 6.00 | 7/30/2026 | 1,000,000 | 1,153,903 | 1,279,801 | |||||||||||||||
|
|
|
|
|
| |||||||||||||||
Total Corporate Bonds | 73,405,513 | 76,036,560 | 75,268,762 | |||||||||||||||||
|
|
|
|
|
| |||||||||||||||
Total Fixed Income | 155,159,770 | 157,744,337 | 153,614,712 | |||||||||||||||||
|
|
|
|
|
| |||||||||||||||
Total Investments |
| 174,862,411 | 159,801,908 | 155,330,661 | ||||||||||||||||
|
|
|
|
|
| |||||||||||||||
Other assets and liabilities – 9.5%* |
| 16,262,818 | ||||||||||||||||||
|
| |||||||||||||||||||
Net Assets – 100.0% |
| $171,593,479 | ||||||||||||||||||
|
| |||||||||||||||||||
See accompanying Notes to the Financial Statements.
99
Table of Contents
Barings Global Credit Income Opportunities Fund 2020 Semi-Annual Report
SCHEDULE OF INVESTMENTS (CONTINUED)
December 31, 2020 (Unaudited)
| ‡‡ | Unless otherwise indicated, all principal amounts are denominated in United States Dollars. |
| * | Calculated as a percentage of net assets applicable to common shareholders. |
| (a) | Foreign security. |
Distributions of investments by country of risk (excluding temporary cash investments) as a percentage of total investments in securities, is as follows: |
| United States | 61.3% | |||
| United Kingdom | 9.5% | |||
| Germany | 6.1% | |||
| France | 2.5% | |||
| Denmark | 2.0% | |||
| India | 1.6% | |||
| Spain | 1.6% | |||
| China | 1.6% | |||
| Sweden | 1.5% | |||
| Ireland | 1.3% | |||
| Netherlands | 1.3% | |||
| Zambia | 1.2% | |||
| Other (Individually less than 1%) | 8.5% | |||
|
| |||
| Total | 100.0% | |||
|
|
| (b) | For fair value measurement disclosure purposes, security is categorized as Level 3 (See Note 2). |
| (c) | Security acquired in a transaction exempt from registration under Rule 144A of the Securities Act of 1933. These securities may only be resold in transactions exempt from registration, normally to qualified institutional buyers. |
| (d) | Variable rate security. The interest rate shown is the rate in effect at December 31, 2020. |
| (e) | Bank loans are exempt from registration under the Securities Act of 1933, as amended, but contain certain restrictions on resale and cannot be sold publicly. These loans pay interest at rates which adjust periodically. The interest rates shown for bank loans are the current interest rates at December 31, 2020. Bank loans are also subject to mandatory and/or optional prepayment which cannot be predicted. As a result, the remaining maturity may be substantially less than the stated maturity shown. |
| (f) | Defaulted security. |
See accompanying Notes to the Financial Statements.
100
Table of Contents
Barings Global Credit Income Opportunities Fund 2020 Semi-Annual Report
SCHEDULE OF INVESTMENTS (CONTINUED)
December 31, 2020 (Unaudited)
A summary of outstanding derivatives at December 31, 2020 is as follows:
Forward Foreign Currency Exchange Contracts to Buy
| EXPIRATION DATE | COUNTERPARTY | LOCAL CURRENCY | VALUE IN USD | IN EXCHANGE FOR USD | NET UNREALIZED APPRECIATION | |||||||||||||||||
| 1/14/21 | Canadian Imperial Bank of Commerce | EUR | 836,965 | $ | 1,022,734 | $ | 1,016,647 | $ | 6,087 | |||||||||||||
| 1/14/21 | Bank of America N.A. | GBP | 1,500,000 | 2,051,444 | 2,006,789 | 44,656 | ||||||||||||||||
|
| |||||||||||||||||||||
Net unrealized appreciation on forward foreign currency exchange contracts to buy | $ | 50,743 | ||||||||||||||||||||
|
| |||||||||||||||||||||
Forward Foreign Currency Exchange Contracts to Sell
| EXPIRATION DATE | COUNTERPARTY | LOCAL CURRENCY | VALUE IN USD | IN EXCHANGE FOR USD | NET UNREALIZED DEPRECIATION | |||||||||||||||||
| 1/14/21 | Barclays Bank plc | EUR | 28,579,393 | $ | 34,922,734 | $ | 34,714,266 | $ | (208,468 | ) | ||||||||||||
| 1/14/21 | Citibank N.A. | EUR | 239,375 | 292,505 | 290,306 | (2,199 | ) | |||||||||||||||
| 1/14/21 | Canadian Imperial Bank of Commerce | GBP | 8,319,202 | 11,377,583 | 11,130,814 | (246,769 | ) | |||||||||||||||
|
| |||||||||||||||||||||
Net unrealized depreciation on forward foreign currency exchange contracts to sell | $ | (457,436 | ) | |||||||||||||||||||
|
| |||||||||||||||||||||
| EUR | Euro | |
| GBP | British Pound Sterling |
See accompanying Notes to the Financial Statements.
101
Table of Contents
Barings Active Short Duration Bond Fund 2020 Semi-Annual Report
SCHEDULE OF INVESTMENTS
December 31, 2020 (Unaudited)
| EFFECTIVE INTEREST RATE | DUE DATE | PRINCIPAL ‡‡ | COST | FAIR VALUE | ||||||||||||||||
Fixed Income — 88.3%*: | ||||||||||||||||||||
Asset-Backed Securities — 32.4%*: | ||||||||||||||||||||
CDO/CLO — 6.1%*: | ||||||||||||||||||||
Affirm Asset Securitization Trust 2020-A(a) | 2.10 | % | 2/18/2025 | 5,141,000 | $5,140,425 | $5,167,834 | ||||||||||||||
Affirm Asset Securitization Trust 2020-Z1(a) | 3.46 | 10/15/2024 | 1,475,481 | 1,475,354 | 1,498,719 | |||||||||||||||
Bain Capital Credit CLO 2020-2 Ltd., 3M USD LIBOR + 1.850%(a) | 2.07 | (b) | 7/21/2031 | 2,250,000 | 2,250,000 | 2,256,827 | ||||||||||||||
Bain Capital Credit CLO Ltd. 2016-2, 3M USD LIBOR + 1.800%(a) | 2.04 | (b) | 1/15/2029 | 1,500,000 | 1,500,000 | 1,500,000 | ||||||||||||||
Benefit Street Partners CLO X Ltd., 3M USD LIBOR + 1.750%(a) | 1.99 | (b) | 1/15/2029 | 2,200,000 | 2,200,000 | 2,199,991 | ||||||||||||||
BlueMountain CLO 2013-1 Ltd., 3M USD LIBOR + 1.230%(a) | 1.45 | (b) | 1/20/2029 | 2,446,918 | 2,446,918 | 2,446,911 | ||||||||||||||
CBAM 2018-6 Ltd., 3M USD LIBOR + 1.270%(a) | 1.51 | (b) | 1/15/2031 | 2,500,000 | 2,500,000 | 2,500,108 | ||||||||||||||
Cedar Funding IX CLO Ltd., 3M USD LIBOR + 0.980%(a) | 1.20 | (b) | 4/20/2031 | 600,000 | 592,679 | 597,950 | ||||||||||||||
CIFC Funding 2015-IV Ltd., 3M USD3M USD LIBOR + 1.850%(a) | 2.07 | (b) | 10/20/2027 | 1,900,000 | 1,898,126 | 1,900,181 | ||||||||||||||
Elmwood CLO II Ltd., 3M USD LIBOR + 1.450%(a) | 1.67 | (b) | 4/20/2031 | 1,650,000 | 1,650,000 | 1,651,452 | ||||||||||||||
FCI Funding 2019-1 LLC(a) | 3.63 | 2/18/2031 | 300,455 | 300,410 | 305,119 | |||||||||||||||
GoldentTree Loan Management US CLO 1 Ltd., 3M USD LIBOR + 1.450%(a) | 1.67 | (b) | 4/20/2029 | 1,250,000 | 1,250,000 | 1,245,120 | ||||||||||||||
HPS Loan Management 15-2019 Ltd., 3M USD LIBOR + 1.320%(a) | 1.54 | (b) | 7/22/2032 | 1,000,000 | 996,592 | 1,000,558 | ||||||||||||||
KKR CLO 28, Ltd., 3M USD LIBOR + 1.140%(a) | 1.36 | (b) | 3/15/2031 | 700,000 | 692,048 | 698,217 | ||||||||||||||
KREF Ltd. 2018-FL1 AS, 1M USD LIBOR + 1.350%(a) | 1.50 | (b) | 6/15/2036 | 2,380,000 | 2,380,000 | 2,374,152 | ||||||||||||||
Lunar AirCraft 2020-1 Ltd.(a) | 3.38 | 2/15/2045 | 811,725 | 811,716 | 766,628 | |||||||||||||||
Magnetite XVIII Ltd., 3M USD LIBOR + 1.080%(a) | 1.30 | (b) | 11/15/2028 | 355,000 | 354,268 | 354,505 | ||||||||||||||
Milos CLO Ltd., 3M USD LIBOR + 1.070%(a) | 1.29 | (b) | 10/20/2030 | 2,100,000 | 2,100,000 | 2,088,811 | ||||||||||||||
Navient Private Education Refi Loan Trust 2020-B(a) | 2.77 | 1/15/2069 | 4,400,000 | 4,459,250 | 4,465,784 | |||||||||||||||
Neuberger Berman CLO XX Ltd. 2015-20A BR, 3M USD LIBOR + 1.250%(a) | 1.49 | (b) | 1/15/2028 | 2,600,000 | 2,590,485 | 2,579,400 | ||||||||||||||
Neuberger Berman Loan Advisers CLO 24 Ltd., 3M USD LIBOR + 1.500%(a) | 1.72 | (b) | 4/19/2030 | 500,000 | 500,000 | 499,302 | ||||||||||||||
OCP CLO 2020-19 Ltd., 3M USD LIBOR + 1.750%(a) | 2.07 | (b) | 7/20/2031 | 2,250,000 | 2,250,000 | 2,257,727 | ||||||||||||||
OCP CLO Ltd. 2015-8A A2AR, 3M USD LIBOR + 1.450%(a) | 1.67 | (b) | 4/17/2027 | 900,000 | 900,000 | 899,838 | ||||||||||||||
Palmer Square CLO 2015-1 Ltd., 3M USD LIBOR + 1.650%(a) | 1.86 | (b) | 5/21/2029 | 700,000 | 700,000 | 700,027 | ||||||||||||||
Recette CLO Ltd., 3M USD LIBOR + 1.700%(a) | 1.92 | (b) | 10/20/2027 | 1,034,000 | 1,032,706 | 1,032,916 | ||||||||||||||
See accompanying Notes to the Financial Statements.
102
Table of Contents
Barings Active Short Duration Bond Fund 2020 Semi-Annual Report
SCHEDULE OF INVESTMENTS (CONTINUED)
December 31, 2020 (Unaudited)
| EFFECTIVE INTEREST RATE | DUE DATE | PRINCIPAL ‡‡ | COST | FAIR VALUE | ||||||||||||||||
Asset-Backed Securities (Continued) | ||||||||||||||||||||
CDO/CLO (Continued) | ||||||||||||||||||||
Rockford Tower CLO 2017-1 Ltd., 3M USD LIBOR + 1.450%(a) | 1.69 | (b)% | 4/15/2029 | 850,000 | $850,000 | $841,888 | ||||||||||||||
Rockford Tower CLO 2017-2 Ltd., 3M USD LIBOR + 1.500%(a) | 1.74 | (b) | 10/15/2029 | 1,250,000 | 1,250,000 | 1,247,339 | ||||||||||||||
Rockford Tower CLO Ltd. 2017-3, 3M USD LIBOR + 1.190%(a) | 1.41 | (b) | 10/20/2030 | 1,750,000 | 1,740,533 | 1,750,014 | ||||||||||||||
RR 3 Ltd. Series 2018-3 A A1R2, 3M USD LIBOR + 1.090%(a) | 1.33 | (b) | 1/15/2030 | 1,625,000 | 1,619,844 | 1,620,598 | ||||||||||||||
RR 6 Ltd., 3M USD LIBOR + 1.250%(a) | 1.49 | (b) | 4/15/2030 | 625,000 | 622,087 | 625,011 | ||||||||||||||
Salem Fields CLO Ltd. 2016-2, 3M USD LIBOR + 1.150%(a) | 1.36 | (b) | 10/25/2028 | 2,000,000 | 1,999,101 | 2,000,008 | ||||||||||||||
TICP CLO XI Ltd.(a) | 1.40 | (b) | 10/20/2031 | 1,600,000 | 1,591,243 | 1,600,005 | ||||||||||||||
Treman Park CLO Ltd. 2015-1A ARR, 3M USD LIBOR + 1.070%(a) | 1.29 | (b) | 10/20/2028 | 1,170,000 | 1,170,000 | 1,170,023 | ||||||||||||||
|
|
|
|
|
| |||||||||||||||
Total CDO/CLO | 53,814,579 | 53,813,785 | 53,842,963 | |||||||||||||||||
|
|
|
|
|
| |||||||||||||||
Other Asset-Backed Securities — 26.3%*: |
| |||||||||||||||||||
321 Henderson Receivables II LLC 2006-3A A1, 1M USD LIBOR + 0.200%(a) | 0.36 | (b) | 9/15/2041 | 76,379 | 74,501 | 74,220 | ||||||||||||||
AASET 2017-1 Trust(a) | 3.97 | 5/16/2042 | 724,887 | 725,453 | 672,263 | |||||||||||||||
AASET 2020-1 Trust(a) | 4.34 | 1/16/2040 | 783,605 | 783,589 | 671,943 | |||||||||||||||
AASET US Ltd. 2018-2 A(a) | 4.45 | 11/18/2038 | 864,388 | 872,474 | 816,604 | |||||||||||||||
Access Group, Inc. 2015-1 B, 1M USD LIBOR + 1.500%(a) | 1.65 | (b) | 7/25/2058 | 100,000 | 86,939 | 91,421 | ||||||||||||||
AccessLex Institute 2002-A A2, AUCTION | 1.96 | (b) | 9/25/2037 | 400,000 | 392,696 | 399,053 | ||||||||||||||
Adams Outdoor Advertising LP(a) | 4.81 | 11/15/2048 | 1,110,778 | 1,124,874 | 1,171,263 | |||||||||||||||
Affirm Asset Securitization Trust 2020-Z2(a) | 1.90 | 1/15/2025 | 7,418,243 | 7,417,765 | 7,413,382 | |||||||||||||||
AmeriCredit Automobile Receivables Trust 2020-3 | 1.49 | 9/18/2026 | 339,000 | 338,885 | 339,461 | |||||||||||||||
Argent Securities, Inc. Asset-Backed Pass-Through Certificates 2004-W10 M1, 1M USD LIBOR + 0.900% | 1.05 | (b) | 10/25/2034 | 176,438 | 162,969 | 169,831 | ||||||||||||||
Avis Budget Rental Car Funding AESOP LLC(a) | 3.02 | 8/20/2026 | 5,598,000 | 5,595,880 | 5,452,027 | |||||||||||||||
Avis Budget Rental Car Funding AESOP LLC(a) | 4.15 | 9/20/2023 | 1,200,000 | 1,221,428 | 1,197,205 | |||||||||||||||
Avis Budget Rental Car Funding AESOP LLC(a) | 4.53 | 3/20/2023 | 2,607,000 | 2,656,630 | 2,650,955 | |||||||||||||||
Avis Budget Rental Car Funding AESOP LLC(a) | 4.73 | 9/20/2024 | 2,080,000 | 2,163,641 | 2,145,094 | |||||||||||||||
BRE Grand Islander Timeshare Issuer LLC 2017-1A A(a) | 2.94 | 5/25/2029 | 113,909 | 113,888 | 114,387 | |||||||||||||||
BRE Grand Islander Timeshare Issuer LLC 2017-1A B(a) | 3.24 | 5/25/2029 | 93,808 | 93,798 | 93,867 | |||||||||||||||
See accompanying Notes to the Financial Statements.
103
Table of Contents
Barings Active Short Duration Bond Fund 2020 Semi-Annual Report
SCHEDULE OF INVESTMENTS (CONTINUED)
December 31, 2020 (Unaudited)
| EFFECTIVE INTEREST RATE | DUE DATE | PRINCIPAL ‡‡ | COST | FAIR VALUE | ||||||||||||||||
Asset-Backed Securities (Continued) | ||||||||||||||||||||
Other Asset-Backed Securities (Continued) |
| |||||||||||||||||||
BRE Grand Islander Timeshare Issuer LLC 2019-A(a) | 3.78 | % | 9/26/2033 | 922,904 | $922,874 | $933,030 | ||||||||||||||
Business Jet Securities 2020-1 LLC(a) | 2.98 | 11/15/2035 | 1,033,892 | 1,033,877 | 1,047,833 | |||||||||||||||
Capital Automotive LLC 2017-1A A1(a) | 3.87 | 4/15/2047 | 285,017 | 284,940 | 285,421 | |||||||||||||||
Carmax Auto Owner Trust 2019-2 | 3.41 | 10/15/2025 | 615,000 | 614,971 | 639,923 | |||||||||||||||
Carmax Auto Owner Trust 2019-4 | 2.80 | 4/15/2026 | 5,159,000 | 5,217,309 | 5,331,790 | |||||||||||||||
CarMax Auto Owner Trust 2020-4 | 1.75 | 4/15/2027 | 1,946,000 | 1,945,812 | 1,945,522 | |||||||||||||||
CARS-DB4 LP(a) | 4.17 | 2/15/2050 | 2,189,000 | 2,188,076 | 2,279,469 | |||||||||||||||
Carvana Auto Receivables Trust 2019-4(a) | 3.07 | 7/15/2025 | 3,547,000 | 3,546,960 | 3,673,122 | |||||||||||||||
Castlelake Aircraft Securitization Trust 2018-1(a) | 4.13 | 6/15/2043 | 1,812,518 | 1,813,437 | 1,722,805 | |||||||||||||||
Castlelake Aircraft Securitization Trust 2019-1A(a) | 3.97 | 4/15/2039 | 1,097,818 | 1,103,109 | 1,044,018 | |||||||||||||||
Castlelake Aircraft Securitization Trust 2019-1A(a) | 5.10 | 4/15/2039 | 824,562 | 832,401 | 677,203 | |||||||||||||||
Centex Home Equity Loan Trust 2006-A AV4, 1M USD LIBOR + 0.250% | 0.40 | (b) | 6/25/2036 | 9,022 | 8,850 | 8,964 | ||||||||||||||
CF Hippolyta LLC(a) | 2.28 | 7/15/2060 | 399,885 | 399,740 | 406,071 | |||||||||||||||
Chase Education Loan Trust, 3M USD LIBOR + 0.220% | 0.47 | (b) | 6/28/2040 | 574,916 | 546,207 | 520,372 | ||||||||||||||
CLI Funding VI LLC(a) | 3.71 | 5/18/2044 | 946,315 | 946,315 | 965,009 | |||||||||||||||
College Avenue Student Loans LLC, 1M USD LIBOR + 1.650%(a) | 1.80 | (b) | 11/26/2046 | 764,129 | 765,001 | 767,440 | ||||||||||||||
College Avenue Student Loans LLC(a) | 3.81 | 12/28/2048 | 1,351,000 | 1,350,876 | 1,388,565 | |||||||||||||||
College Avenue Student Loans LLC 2018-A, 1M USD LIBOR + 1.200%(a) | 1.35 | (b) | 12/26/2047 | 753,026 | 753,026 | 756,797 | ||||||||||||||
College Loan Corp. Trust I 2005-2 B, 3M USD LIBOR + 0.490% | 0.73 | (b) | 1/15/2037 | 128,155 | 115,126 | 115,476 | ||||||||||||||
Commonbond Student Loan Trust 2017-A-GS(a) | 3.47 | 5/25/2041 | 764,472 | 754,404 | 794,766 | |||||||||||||||
Commonbond Student Loan Trust 2017-A-GS(a) | 5.28 | 5/25/2041 | 102,377 | 102,365 | 111,779 | |||||||||||||||
Commonbond Student Loan Trust 2018-A-GS(a) | 3.82 | 2/25/2044 | 66,942 | 66,928 | 68,296 | |||||||||||||||
Commonbond Student Loan Trust 2018-BGS(a) | 4.12 | 9/25/2045 | 75,437 | 75,428 | 76,799 | |||||||||||||||
Commonbond Student Loan Trust 2018-C-GS(a) | 4.35 | 2/25/2046 | 45,801 | 45,797 | 46,850 | |||||||||||||||
Commonbond Student Loan Trust 2019-A-GS(a) | 3.04 | 1/25/2047 | 1,514,291 | 1,513,918 | 1,533,857 | |||||||||||||||
Credit Suisse ABS Repackaging Trust 2013-A B(a) | 2.50 | 1/25/2030 | 26,606 | 25,660 | 26,721 | |||||||||||||||
DB Master Finance LLC(a) | 3.79 | 5/20/2049 | 935,163 | 935,163 | 953,400 | |||||||||||||||
DB Master Finance LLC(a) | 4.02 | 5/20/2049 | 1,105,012 | 1,105,013 | 1,157,223 | |||||||||||||||
DB Master Finance LLC(a) | 4.03 | 11/20/2047 | 972,500 | 941,295 | 1,032,717 | |||||||||||||||
Diamond Resorts Owner Trust 2018-1(a) | 3.70 | 1/21/2031 | 258,610 | 258,610 | 270,081 | |||||||||||||||
See accompanying Notes to the Financial Statements.
104
Table of Contents
Barings Active Short Duration Bond Fund 2020 Semi-Annual Report
SCHEDULE OF INVESTMENTS (CONTINUED)
December 31, 2020 (Unaudited)
| EFFECTIVE INTEREST RATE | DUE DATE | PRINCIPAL ‡‡ | COST | FAIR VALUE | ||||||||||||||||
Asset-Backed Securities (Continued) | ||||||||||||||||||||
Other Asset-Backed Securities (Continued) |
| |||||||||||||||||||
Domino’s Pizza Master Issuer LLC(a) | 4.12 | % | 7/25/2048 | 645,150 | $645,150 | $675,979 | ||||||||||||||
DRB Prime Student Loan Trust 2016-R A2(a) | 3.07 | 10/25/2044 | 364,558 | 363,935 | 369,435 | |||||||||||||||
Drive Auto Receivables Trust 2019-4 | 2.70 | 2/16/2027 | 1,983,000 | 1,982,959 | 2,042,412 | |||||||||||||||
Earnest Student Loan Program 2017-A LLC(a) | 3.59 | 1/25/2041 | 447,336 | 447,018 | 453,716 | |||||||||||||||
EdLinc Student Loan Funding Trust 2017-A A, PRIME–1.150%(a) | 3.60 | (b) | 12/1/2047 | 863,941 | 858,268 | 854,324 | ||||||||||||||
EDvestinU Private Education Loan Issue No 1 LLC(a) | 3.58 | 11/25/2038 | 1,379,319 | 1,379,093 | 1,452,682 | |||||||||||||||
Elara HGV Timeshare Issuer 2016-A LLC(a) | 3.22 | 4/25/2028 | 456,333 | 452,723 | 450,360 | |||||||||||||||
Elara HGV Timeshare Issuer LLC 2014-A B(a) | 3.02 | (c) | 2/25/2027 | 6,107 | 6,074 | 6,100 | ||||||||||||||
Elara HGV Timeshare Issuer LLC 2016-A A(a) | 2.73 | 4/25/2028 | 661,803 | 652,167 | 659,043 | |||||||||||||||
Elara HGV Timeshare Issuer LLC 2017-A(a) | 2.96 | 3/25/2030 | 1,079,786 | 1,072,665 | 1,061,815 | |||||||||||||||
Elara HGV Timeshare Issuer LLC 2017-A A(a) | 2.69 | 3/25/2030 | 193,995 | 193,982 | 193,383 | |||||||||||||||
Elara HGV Timeshare Issuer LLC 2019-A(a) | 3.45 | 1/25/2034 | 2,153,869 | 2,153,381 | 2,115,685 | |||||||||||||||
ELFI Graduate Loan Program LLC 2018-A(a) | 4.00 | 8/25/2042 | 305,730 | 300,124 | 317,983 | |||||||||||||||
Exeter Automobile Receivables Eart 2019 1A(a) | 4.13 | 12/16/2024 | 7,435,000 | 7,679,661 | 7,750,918 | |||||||||||||||
Exeter Automobile Receivables Trust 2019-3(a) | 3.11 | 8/15/2025 | 1,545,000 | 1,544,735 | 1,596,556 | |||||||||||||||
Flagship Credit Auto Trust 2017-4(a) | 3.58 | 1/15/2024 | 3,500,000 | 3,560,913 | 3,600,876 | |||||||||||||||
Flagship Credit Auto Trust 2019-1(a) | 3.60 | 2/18/2025 | 2,175,000 | 2,176,251 | 2,254,550 | |||||||||||||||
Global SC Finance II SRL 2014-1A A1(a),(d) | 3.19 | 7/17/2029 | 111,083 | 111,066 | 110,528 | |||||||||||||||
Goal Capital Funding Trust 2010-1 A, 3M USD LIBOR + 0.700%(a) | 0.91 | (b) | 8/25/2048 | 104,041 | 100,248 | 103,293 | ||||||||||||||
Goal Structured Solution Trust 2015-1 B, 1M USD LIBOR + 1.500%(a) | 1.65 | (b) | 9/25/2043 | 100,000 | 77,907 | 92,468 | ||||||||||||||
Goodgreen 2019-2(a) | 2.76 | 10/15/2054 | 2,051,941 | 2,051,941 | 2,120,866 | |||||||||||||||
Goodgreen Trust 2016-1 A(a) | 3.23 | 10/15/2052 | 633,341 | 626,088 | 652,463 | |||||||||||||||
Goodgreen Trust 2018-1A A(a) | 3.93 | 10/15/2053 | 2,803,849 | 2,834,952 | 2,988,975 | |||||||||||||||
Goodgreen Trust 2019-1(a) | 3.86 | 10/15/2054 | 2,335,213 | 2,335,622 | 2,468,200 | |||||||||||||||
HERO Funding Trust 2015-1A A(a) | 3.84 | 9/21/2040 | 371,175 | 377,336 | 392,332 | |||||||||||||||
HERO Funding Trust 2016-4A A1(a) | 3.57 | 9/20/2047 | 173,893 | 173,828 | 182,310 | |||||||||||||||
HERO Funding Trust 2017-2A A1(a) | 3.28 | 9/20/2048 | 66,196 | 66,188 | 68,402 | |||||||||||||||
HERO Funding Trust 2017-2A A2(a) | 4.07 | 9/20/2048 | 52,011 | 53,228 | 54,236 | |||||||||||||||
HERO Funding Trust 2017-3A A1(a) | 3.19 | 9/20/2048 | 437,658 | 437,519 | 450,797 | |||||||||||||||
HERO Funding Trust 2018-1(a) | 4.67 | 9/20/2048 | 699,016 | 712,840 | 748,401 | |||||||||||||||
Hertz Fleet Lease Funding LP(a) | 3.44 | 1/10/2033 | 2,625,000 | 2,624,617 | 2,675,189 | |||||||||||||||
Hertz Vehicle Financing II LP(a) | 3.29 | 7/25/2022 | 1,000,000 | 993,705 | 996,671 | |||||||||||||||
Hertz Vehicle Financing II LP(a) | 3.56 | 10/25/2021 | 2,300,000 | 2,294,377 | 2,295,558 | |||||||||||||||
Hertz Vehicle Financing II LP(a) | 3.60 | 2/25/2024 | 3,200,000 | 3,256,968 | 3,199,874 | |||||||||||||||
Hertz Vehicle Financing II LP(a) | 4.39 | 2/25/2024 | 3,000,000 | 2,692,446 | 2,965,020 | |||||||||||||||
Hertz Vehicle Financing LLC 2018-3(a) | 4.37 | 7/25/2024 | 620,000 | 620,959 | 622,124 | |||||||||||||||
Higher Education Funding I 2004-1 B1, 28 day ARS(a) | 3.41 | (b) | 1/1/2044 | 950,000 | 840,824 | 806,522 | ||||||||||||||
Hilton Grand Vacations Trust 2017-AA B(a) | 2.96 | (c) | 12/26/2028 | 417,241 | 418,296 | 420,631 | ||||||||||||||
Hilton Grand Vacations Trust 2018-A(a) | 3.54 | 2/25/2032 | 232,119 | 232,114 | 245,837 | |||||||||||||||
Hilton Grand Vacations Trust 2019-A(a) | 2.84 | 7/25/2033 | 1,884,000 | 1,884,000 | 1,889,096 | |||||||||||||||
See accompanying Notes to the Financial Statements.
105
Table of Contents
Barings Active Short Duration Bond Fund 2020 Semi-Annual Report
SCHEDULE OF INVESTMENTS (CONTINUED)
December 31, 2020 (Unaudited)
| EFFECTIVE INTEREST RATE | DUE DATE | PRINCIPAL ‡‡ | COST | FAIR VALUE | ||||||||||||||||
Asset-Backed Securities (Continued) | ||||||||||||||||||||
Other Asset-Backed Securities (Continued) |
| |||||||||||||||||||
Horizon Aircraft Finance I Ltd. 2018-1 A(a) | 4.46 | % | 12/15/2038 | 443,817 | $443,808 | $428,693 | ||||||||||||||
Horizon Aircraft Finance III Ltd.(a) | 3.43 | 11/15/2039 | 965,772 | 918,886 | 933,190 | |||||||||||||||
KDAC Aviation Finance Ltd.(a) | 4.21 | 12/15/2042 | 1,005,567 | 1,002,878 | 906,981 | |||||||||||||||
Kestrel Aircraft Funding Ltd.(a),(d) | 4.25 | 12/15/2038 | 3,337,308 | 3,398,573 | 3,090,879 | |||||||||||||||
Laurel Road Prime Student Loan Trust 2017-B CFX(a) | 3.61 | 8/25/2042 | 235,506 | 235,473 | 240,754 | |||||||||||||||
Laurel Road Prime Student Loan Trust 2017-C B(a) | 2.95 | 11/25/2042 | 271,253 | 271,156 | 278,412 | |||||||||||||||
Laurel Road Prime Student Loan Trust 2019-A(a) | 3.00 | 10/25/2048 | 687,875 | 687,817 | 702,074 | |||||||||||||||
Lendmark Funding Trust 2018-1(a) | 3.81 | 12/21/2026 | 630,000 | 629,975 | 637,755 | |||||||||||||||
MACH 1 Cayman 2019-1 Ltd.(a) | 3.47 | 10/15/2039 | 1,370,111 | 1,370,068 | 1,323,589 | |||||||||||||||
Marlette Funding Trust 2019-2(a) | 3.53 | 7/16/2029 | 976,000 | 975,836 | 997,897 | |||||||||||||||
Mosaic Solar Loan Trust 2018-2-GS(a) | 4.20 | 2/22/2044 | 404,885 | 404,823 | 435,975 | |||||||||||||||
Mosaic Solar Loans LLC 2017-1A A(a) | 4.45 | 6/20/2042 | 59,329 | 59,314 | 63,804 | |||||||||||||||
Navient Private Education Loan Trust 2018-B, 1M USD LIBOR + 0.720%(a) | 0.88 | (b) | 12/15/2059 | 266,989 | 266,989 | 265,985 | ||||||||||||||
Navient Student Loan Trust 2015-1 B, 1M USD LIBOR + 1.500% | 1.65 | (b) | 7/25/2052 | 1,100,000 | 1,096,007 | 1,042,033 | ||||||||||||||
Navient Student Loan Trust 2018-1A A3, 1M USD LIBOR + 0.720%(a) | 0.87 | (b) | 3/25/2067 | 1,600,000 | 1,600,000 | 1,585,266 | ||||||||||||||
Navient Student Loan Trust 2018-2, 1M USD LIBOR + 0.750%(a) | 0.90 | (b) | 3/25/2067 | 1,360,000 | 1,360,000 | 1,361,730 | ||||||||||||||
Navistar Financial Dealer Note Master Owner Trust II, 1M USD LIBOR + 0.950%(a) | 1.10 | (b) | 5/25/2024 | 1,108,000 | 1,108,000 | 1,104,547 | ||||||||||||||
Navistar Financial Dealer Note Master Owner Trust II, 1M USD LIBOR + 1.450%(a) | 1.60 | (b) | 5/25/2024 | 1,018,000 | 1,018,000 | 1,017,584 | ||||||||||||||
Nelnet Private Education Loan Trust 2016-A A1A, 1M USD LIBOR + 1.750%(a) | 1.90 | (b) | 12/26/2040 | 83,438 | 83,438 | 83,863 | ||||||||||||||
Nelnet Private Education Loan Trust 2016-A A1B(a) | 3.60 | 12/26/2040 | 100,139 | 100,071 | 102,048 | |||||||||||||||
Nelnet Student Loan Trust 2006-2 B, 3M USD LIBOR + 0.200% | 0.41 | (b) | 1/25/2038 | 950,922 | 898,399 | 812,877 | ||||||||||||||
Nelnet Student Loan Trust 2006-3, 3M USD LIBOR + 0.250% | 0.50 | (b) | 6/25/2041 | 1,513,112 | 1,421,410 | 1,289,765 | ||||||||||||||
Nelnet Student Loan Trust 2007-2, 28 day ARS(a) | 2.97 | (b) | 6/25/2035 | 2,000,000 | 1,976,684 | 1,918,554 | ||||||||||||||
Nelnet Student Loan Trust 2012-4, 1M USD LIBOR + 1.000%(a) | 1.15 | (b) | 7/26/2049 | 900,000 | 870,468 | 821,087 | ||||||||||||||
New Residential Advance Receivables Trust Advance Receivables Backed 2020-T1(a) | 5.47 | 8/15/2053 | 1,651,000 | 1,651,000 | 1,656,865 | |||||||||||||||
NorthStar Student Loan Trust III 2016-1 A, 1M USD LIBOR + 1.250%(a) | 1.40 | (b) | 5/27/2036 | 77,107 | 74,323 | 77,381 | ||||||||||||||
NovaStar Mortgage Funding Trust 2004-4 M5, 1M LIBOR + 1.725% | 1.87 | (b) | 3/25/2035 | 136,134 | 136,134 | 135,853 | ||||||||||||||
See accompanying Notes to the Financial Statements.
106
Table of Contents
Barings Active Short Duration Bond Fund 2020 Semi-Annual Report
SCHEDULE OF INVESTMENTS (CONTINUED)
December 31, 2020 (Unaudited)
| EFFECTIVE INTEREST RATE | DUE DATE | PRINCIPAL ‡‡ | COST | FAIR VALUE | ||||||||||||||||
Asset-Backed Securities (Continued) | ||||||||||||||||||||
Other Asset-Backed Securities (Continued) | ||||||||||||||||||||
NP SPE II LLC(a) | 2.57 | % | 9/20/2049 | 667,574 | $667,574 | $667,749 | ||||||||||||||
NP SPE II LLC 2017-1A A1(a) | 3.37 | 10/21/2047 | 315,354 | 315,354 | 326,134 | |||||||||||||||
NRZ Advance Receivables Trust 2015-ON1(a) | 2.46 | 10/15/2052 | 1,688,000 | 1,688,000 | 1,688,014 | |||||||||||||||
Oak Street Investment Grade Net Lease Fund Series 2020-1(a) | 2.26 | 11/20/2050 | 1,654,000 | 1,653,819 | 1,665,595 | |||||||||||||||
OneMain Financial Issuance Trust 2019-2(a) | 3.66 | 10/14/2036 | 2,400,000 | 2,399,509 | 2,477,492 | |||||||||||||||
Orange Lake Timeshare Trust 2016-A B(a) | 2.91 | 3/8/2029 | 237,526 | 234,863 | 237,711 | |||||||||||||||
Orange Lake Timeshare Trust 2018-A(a) | 3.74 | 11/8/2030 | 466,881 | 474,232 | 469,138 | |||||||||||||||
Orange Lake Timeshare Trust 2019-A(a) | 4.93 | 4/9/2038 | 1,760,657 | 1,760,312 | 1,775,969 | |||||||||||||||
Oxford Finance Funding 2020-1 LLC(a) | 3.10 | 2/15/2028 | 1,296,000 | 1,296,000 | 1,325,215 | |||||||||||||||
Oxford Finance Funding 2020-1 LLC(a) | 4.04 | 2/15/2028 | 1,750,000 | 1,783,154 | 1,789,477 | |||||||||||||||
Pennsylvania Higher Education Assistance Agency | 1.41 | 10/25/2042 | 800,000 | 789,449 | 796,008 | |||||||||||||||
Pioneer Aircraft Finance Ltd.(a),(d) | 3.97 | 6/15/2044 | 957,937 | 957,937 | 910,014 | |||||||||||||||
Planet Fitness Master Issuer LLC(a) | 4.26 | 9/5/2048 | 2,541,500 | 2,558,820 | 2,552,682 | |||||||||||||||
Popular ABS Mortgage Pass-Through Trust 2006-B A3, 1M USD LIBOR + 0.560% | 0.71 | (b) | 5/25/2036 | 1,497 | 1,448 | 1,495 | ||||||||||||||
RAMP Series 2005-EFC1 Trust, 1M USD | 1.12 | (b) | 5/25/2035 | 2,300,000 | 2,297,143 | 2,293,612 | ||||||||||||||
Santander Drive Auto Receivables Trust 2020-4 | 1.48 | 1/15/2027 | 401,000 | 400,925 | 401,496 | |||||||||||||||
Santander Revolving Auto Loan Trust 2019-A(a) | 2.80 | 1/26/2032 | 687,000 | 686,719 | 727,165 | |||||||||||||||
Santander Revolving Auto Loan Trust 2019-A(a) | 3.00 | 1/26/2032 | 439,000 | 438,867 | 463,051 | |||||||||||||||
Santander Revolving Auto Loan Trust 2019-A(a) | 3.45 | 1/26/2032 | 867,000 | 866,960 | 918,171 | |||||||||||||||
SBA Tower Trust(a) | 2.84 | 1/15/2050 | 5,300,000 | 5,300,000 | 5,542,186 | |||||||||||||||
SBA Tower Trust(a) | 3.87 | 10/15/2049 | 1,300,000 | 1,304,906 | 1,390,081 | |||||||||||||||
Sierra Receivables Funding Co LLC 2017-1A A(a) | 2.91 | 3/20/2034 | 254,293 | 254,969 | 258,049 | |||||||||||||||
Sierra Timeshare 2016-2 Receivables Funding LLC(a) | 2.78 | 7/20/2033 | 161,991 | 160,703 | 162,266 | |||||||||||||||
Sierra Timeshare 2018-3 Receivables Funding LLC(a) | 5.20 | 9/20/2035 | 343,358 | 346,656 | 343,257 | |||||||||||||||
Sierra Timeshare 2019-1 Receivables Funding LLC(a) | 3.77 | 1/20/2036 | 820,702 | 824,489 | 823,807 | |||||||||||||||
Sierra Timeshare 2019-1 Receivables Funding LLC(a) | 4.75 | 1/20/2036 | 1,090,061 | 1,091,449 | 1,097,458 | |||||||||||||||
Sierra Timeshare 2019-3 Receivables Funding LLC(a) | 3.00 | 8/20/2036 | 3,148,752 | 3,148,466 | 3,180,135 | |||||||||||||||
Sierra Timeshare 2019-3 Receivables Funding LLC(a) | 4.18 | 8/20/2036 | 1,534,873 | 1,535,053 | 1,509,524 | |||||||||||||||
Sierra Timeshare 2020-2 Receivables Funding LLC(a) | 3.51 | 7/20/2037 | 440,595 | 440,541 | 450,140 | |||||||||||||||
Sierra Timeshare Receivables Funding LLC 2019-2(a) | 4.54 | 5/20/2036 | 1,409,985 | 1,414,159 | 1,412,553 | |||||||||||||||
SLC Student Loan Trust 2005-1 B, 3M USD LIBOR + 0.200% | 0.42 | (b) | 2/15/2045 | 555,609 | 504,254 | 491,541 | ||||||||||||||
See accompanying Notes to the Financial Statements.
107
Table of Contents
Barings Active Short Duration Bond Fund 2020 Semi-Annual Report
SCHEDULE OF INVESTMENTS (CONTINUED)
December 31, 2020 (Unaudited)
| EFFECTIVE INTEREST RATE | DUE DATE | PRINCIPAL ‡‡ | COST | FAIR VALUE | ||||||||||||||||
Asset-Backed Securities (Continued) | ||||||||||||||||||||
Other Asset-Backed Securities (Continued) | ||||||||||||||||||||
SLC Student Loan Trust 2006-1, 3M USD LIBOR + 0.210% | 0.43 | (b)% | 3/15/2055 | 1,960,224 | $1,829,300 | $1,739,297 | ||||||||||||||
SLC Student Loan Trust 2006-2 B, 3M USD LIBOR + 0.230% | 0.45 | (b) | 12/15/2039 | 1,463,519 | 1,368,649 | 1,307,048 | ||||||||||||||
SLM Student Loan Trust 2003-11, 3M USD LIBOR + 0.650% | 0.87 | (b) | 12/15/2038 | 823,522 | 785,815 | 770,384 | ||||||||||||||
SLM Student Loan Trust 2003-14 A6, 3M USD LIBOR + 0.300% | 0.51 | (b) | 7/25/2025 | 21,006 | 20,566 | 20,936 | ||||||||||||||
SLM Student Loan Trust 2003-4 B, 3M USD LIBOR + 0.650% | 0.87 | (b) | 6/15/2038 | 318,502 | 305,747 | 297,535 | ||||||||||||||
SLM Student Loan Trust 2004-1, 3M USD LIBOR + 0.500% | 0.71 | (b) | 7/25/2039 | 459,368 | 438,378 | 424,488 | ||||||||||||||
SLM Student Loan Trust 2004-8, 3M USD LIBOR + 0.460% | 0.67 | (b) | 1/25/2040 | 963,070 | 915,940 | 892,773 | ||||||||||||||
SLM Student Loan Trust 2005-4 B, 3M USD LIBOR + 0.180% | 0.39 | (b) | 7/25/2055 | 615,920 | 551,830 | 559,081 | ||||||||||||||
SLM Student Loan Trust 2005-5, 3M USD LIBOR + 0.250% | 0.46 | (b) | 10/25/2040 | 617,859 | 582,017 | 554,902 | ||||||||||||||
SLM Student Loan Trust 2005-6 B, 3M USD LIBOR + 0.290% | 0.50 | (b) | 1/25/2044 | 1,791,198 | 1,678,150 | 1,597,580 | ||||||||||||||
SLM Student Loan Trust 2005-9, 3M USD LIBOR + 0.300% | 0.51 | (b) | 1/25/2041 | 712,518 | 682,921 | 650,479 | ||||||||||||||
SLM Student Loan Trust 2006-2(e) | Zero Coupon | 1/25/2041 | 3,956 | 1,621,960 | 2,175,800 | |||||||||||||||
SLM Student Loan Trust 2006-5 B, 3M USD LIBOR + 0.210% | 0.42 | (b) | 10/25/2040 | 482,228 | 432,390 | 431,089 | ||||||||||||||
SLM Student Loan Trust 2006-7 B, 3M USD LIBOR + 0.200% | 0.41 | (b) | 1/27/2042 | 476,861 | 445,070 | 429,550 | ||||||||||||||
SLM Student Loan Trust 2006-9 A5, 3M USD LIBOR + 0.100% | 0.31 | (b) | 1/26/2026 | 3,108 | 3,060 | 3,107 | ||||||||||||||
SMB Private Education Loan Trust 2014-A(a) | 4.00 | 9/15/2042 | 1,250,000 | 1,270,829 | 1,311,390 | |||||||||||||||
SMB Private Education Loan Trust 2014-A A2B, 1M USD LIBOR + 1.150%(a) | 1.31 | (b) | 5/15/2026 | 111,908 | 112,459 | 112,101 | ||||||||||||||
SMB Private Education Loan Trust 2015-A A2B, 1M USD LIBOR + 1.000%(a) | 1.16 | (b) | 6/15/2027 | 24,822 | 24,556 | 24,859 | ||||||||||||||
SMB Private Education Loan Trust 2015-A A3, 1M USD LIBOR + 1.500%(a) | 1.66 | (b) | 2/17/2032 | 900,000 | 917,233 | 907,540 | ||||||||||||||
SMB Private Education Loan Trust 2015-C(a) | 4.50 | 9/17/2046 | 1,710,000 | 1,753,197 | 1,868,483 | |||||||||||||||
SMB Private Education Loan Trust 2015-C A3, 1M USD LIBOR + 1.950%(a) | 2.11 | (b) | 8/16/2032 | 700,000 | 726,329 | 716,973 | ||||||||||||||
SMB Private Education Loan Trust 2016-B A2B, 1M USD LIBOR + 1.450%(a) | 1.61 | (b) | 2/17/2032 | 63,602 | 63,602 | 63,885 | ||||||||||||||
SMB Private Education Loan Trust 2016-C A2B, 1M USD LIBOR + 1.100%(a) | 1.26 | (b) | 9/15/2034 | 152,490 | 152,490 | 153,911 | ||||||||||||||
SoFi Alternative Trust 2019-C(a),(e) | 4.97 | 1/25/2045 | 2,666,123 | 2,754,579 | 2,875,960 | |||||||||||||||
See accompanying Notes to the Financial Statements.
108
Table of Contents
Barings Active Short Duration Bond Fund 2020 Semi-Annual Report
SCHEDULE OF INVESTMENTS (CONTINUED)
December 31, 2020 (Unaudited)
| EFFECTIVE INTEREST RATE | DUE DATE | PRINCIPAL ‡‡ | COST | FAIR VALUE | ||||||||||||||||
Asset-Backed Securities (Continued) | ||||||||||||||||||||
Other Asset-Backed Securities (Continued) | ||||||||||||||||||||
SoFi Consumer Loan Program 2020-1 Trust(a) | 2.94 | % | 1/25/2029 | 4,000,000 | $3,999,364 | $4,004,868 | ||||||||||||||
SoFi Consumer Loan Program Trust 2019-3(a) | 3.89 | 5/25/2028 | 2,766,000 | 2,767,800 | 2,866,463 | |||||||||||||||
SoFi Professional Loan Program 2017-C LLC(a) | 4.21 | 7/25/2040 | 2,410,000 | 2,519,584 | 2,532,672 | |||||||||||||||
SoFi Professional Loan Program 2018-A LLC(a),(e) | Zero Coupon | 2/25/2042 | 1,372,500 | 1,026,351 | 507,652 | |||||||||||||||
SoFi Professional Loan Program 2018-B Trust(a),(e) | Zero Coupon | 8/26/2047 | 1,265,700 | 724,417 | 469,471 | |||||||||||||||
SoFi Professional Loan Program 2018-D Trust(a),(e) | Zero Coupon | 2/25/2048 | 1,887,200 | 706,109 | 417,260 | |||||||||||||||
SoFi Professional Loan Program 2019-A LLC(a),(e) | Zero Coupon | 6/15/2048 | 3,522,900 | 1,114,845 | 758,833 | |||||||||||||||
SoFi Professional Loan Program 2019-A LLC(a) | 4.11 | 6/15/2048 | 870,000 | 876,441 | 922,705 | |||||||||||||||
SoFi Professional Loan Program LLC 2015-C A2(a) | 2.51 | 8/25/2033 | 11,918 | 11,869 | 11,968 | |||||||||||||||
SoFi Professional Loan Program LLC 2016-B A1, 1M USD LIBOR + 1.200%(a) | 1.35 | (b) | 6/25/2033 | 131,048 | 132,353 | 131,724 | ||||||||||||||
SoFi Professional Loan Program LLC 2016-D A1, 1M USD LIBOR + 0.950%(a) | 1.10 | (b) | 1/25/2039 | 25,213 | 25,213 | 25,233 | ||||||||||||||
SoFi Professional Loan Program LLC 2017-D R1(a) | Zero Coupon | 9/25/2040 | 1,233,700 | 759,656 | 357,107 | |||||||||||||||
SpringCastle America Funding LLC(a) | 1.97 | 9/25/2037 | 3,435,423 | 3,435,255 | 3,456,426 | |||||||||||||||
Stack Infrastructure Issuer LLC(a) | 1.89 | 8/25/2045 | 674,000 | 674,000 | 681,111 | |||||||||||||||
Store Master Funding I-VII A3(a) | 4.40 | 10/20/2048 | 1,877,833 | 1,896,823 | 1,923,194 | |||||||||||||||
TAL Advantage VII LLC(a) | 3.82 | 9/20/2045 | 2,531,750 | 2,531,191 | 2,523,243 | |||||||||||||||
Terwin Mortgage Trust 2006-5, 1M USD LIBOR + 0.210%(a) | 0.36 | (b) | 7/25/2037 | 2,821,353 | 2,779,125 | 2,779,836 | ||||||||||||||
TLF National Tax Lien Trust 2017-1(a) | 3.09 | 12/15/2029 | 901,896 | 897,496 | 908,000 | |||||||||||||||
Trafigura Securitisation Finance plc 2018-1, 1M USD LIBOR + 0.730%(a),(d) | 0.89 | (b) | 3/15/2022 | 1,820,000 | 1,817,207 | 1,820,018 | ||||||||||||||
Trafigura Securitisation Finance plc 2018-1(a),(d) | 4.29 | 3/15/2022 | 1,800,000 | 1,799,956 | 1,801,548 | |||||||||||||||
Trinity Rail Leasing 2019 LLC(a) | 3.82 | 4/17/2049 | 2,119,347 | 2,118,319 | 2,216,495 | |||||||||||||||
TRIP Rail Master Funding LLC 2011-1A A2(a) | 6.02 | 7/15/2041 | 1,248,118 | 1,326,740 | 1,271,099 | |||||||||||||||
TRIP Rail Master Funding LLC 2017-1A A1(a) | 2.71 | 8/15/2047 | 49,985 | 49,985 | 50,048 | |||||||||||||||
Upstart Securitization Trust 2020-3(a) | 1.70 | 11/20/2030 | 4,436,068 | 4,436,068 | 4,430,774 | |||||||||||||||
Vantage Data Centers LLC(a) | 1.65 | 9/15/2045 | 2,475,000 | 2,475,000 | 2,491,962 | |||||||||||||||
VSE 2018-A Voi Mortgage LLC(a) | 4.02 | 2/20/2036 | 225,541 | 225,515 | 221,709 | |||||||||||||||
Wachovia Student Loan Trust 2005-1 B, 3M USD LIBOR + 0.300% | 0.51 | (b) | 10/25/2040 | 514,769 | 476,200 | 469,858 | ||||||||||||||
Welk Resorts LLC 2017-AA B(a) | 3.41 | 6/15/2033 | 558,702 | 561,353 | 557,102 | |||||||||||||||
Westgate Resorts LLC 2017-1A A(a) | 3.05 | 12/20/2030 | 122,138 | 122,138 | 123,458 | |||||||||||||||
See accompanying Notes to the Financial Statements.
109
Table of Contents
Barings Active Short Duration Bond Fund 2020 Semi-Annual Report
SCHEDULE OF INVESTMENTS (CONTINUED)
December 31, 2020 (Unaudited)
| EFFECTIVE INTEREST RATE | DUE DATE | PRINCIPAL ‡‡ | COST | FAIR VALUE | ||||||||||||||||
Asset-Backed Securities (Continued) | ||||||||||||||||||||
Other Asset-Backed Securities (Continued) | ||||||||||||||||||||
Westgate Resorts LLC 2018-1(a) | 3.38 | % | 12/20/2031 | 308,761 | $308,306 | $313,693 | ||||||||||||||
Westlake Automobile Receivables Trust 2019-3(a) | 3.59 | 3/17/2025 | 2,182,000 | 2,181,703 | 2,226,066 | |||||||||||||||
Willis Engine Structured Trust IV(a) | 4.75 | 9/15/2043 | 1,044,505 | 1,058,574 | 901,438 | |||||||||||||||
|
|
|
|
|
| |||||||||||||||
Total Other Asset-Backed Securities | 236,055,090 | 232,253,349 | 231,984,716 | |||||||||||||||||
|
|
|
|
|
| |||||||||||||||
Total Asset-Backed Securities | 289,869,669 | 286,067,134 | 285,827,679 | |||||||||||||||||
|
|
|
|
|
| |||||||||||||||
Corporate Bonds — 41.4%*: | ||||||||||||||||||||
Agriculture — 1.2%*: |
| |||||||||||||||||||
BAT Capital Corp.(d) | 3.22 | 8/15/2024 | 3,115,000 | 3,139,414 | 3,372,368 | |||||||||||||||
Bunge Ltd. Finance Corp. | 3.00 | 9/25/2022 | 1,840,000 | 1,828,502 | 1,910,253 | |||||||||||||||
Imperial Brands Finance plc(a),(d) | 3.13 | 7/26/2024 | 2,677,000 | 2,747,311 | 2,866,928 | |||||||||||||||
Imperial Brands Finance plc(a),(d) | 3.50 | 2/11/2023 | 1,347,000 | 1,350,016 | 1,410,150 | |||||||||||||||
Reynolds American, Inc. | 4.45 | 6/12/2025 | 775,000 | 873,664 | 882,721 | |||||||||||||||
|
|
|
|
|
| |||||||||||||||
Total Agriculture | 9,754,000 | 9,938,907 | 10,442,420 | |||||||||||||||||
|
|
|
|
|
| |||||||||||||||
Airlines — 0.1%*: |
| |||||||||||||||||||
Delta Air Lines, Inc. / SkyMiles IP Ltd.(a) | 4.50 | 10/20/2025 | 755,000 | 755,000 | 806,989 | |||||||||||||||
|
|
|
|
|
| |||||||||||||||
Auto Manufacturers — 1.9%*: |
| |||||||||||||||||||
Ford Motor Credit Co. LLC, 3M USD LIBOR + 0.810% | 1.05 | (b) | 4/5/2021 | 1,135,000 | 1,135,000 | 1,130,137 | ||||||||||||||
Ford Motor Credit Co. LLC, 3M USD LIBOR + 1.235% | 1.46 | (b) | 2/15/2023 | 985,000 | 985,000 | 950,557 | ||||||||||||||
Ford Motor Credit Co. LLC | 3.09 | 1/9/2023 | 1,860,000 | 1,863,984 | 1,892,448 | |||||||||||||||
Ford Motor Credit Co. LLC | 3.35 | 11/1/2022 | 2,485,000 | 2,492,261 | 2,528,487 | |||||||||||||||
Ford Motor Credit Co. LLC | 5.09 | 1/7/2021 | 350,000 | 350,004 | 350,000 | |||||||||||||||
General Motors Co. | 6.13 | 10/1/2025 | 815,000 | 969,321 | 988,570 | |||||||||||||||
General Motors Financial Co., Inc. | 3.25 | 1/5/2023 | 3,942,000 | 3,916,023 | 4,133,614 | |||||||||||||||
Harley-Davidson Financial Services, Inc.(a) | 3.35 | 6/8/2025 | 886,000 | 934,735 | 959,707 | |||||||||||||||
Hyundai Capital America(a) | 2.38 | 2/10/2023 | 1,920,000 | 1,927,153 | 1,978,795 | |||||||||||||||
Hyundai Capital America(a) | 2.85 | 11/1/2022 | 1,320,000 | 1,319,897 | 1,367,914 | |||||||||||||||
Nissan Motor Acceptance Corp.(a),(d) | 1.90 | 9/14/2021 | 670,000 | 669,193 | 674,635 | |||||||||||||||
|
|
|
|
|
| |||||||||||||||
Total Auto Manufacturers | 16,368,000 | 16,562,571 | 16,954,864 | |||||||||||||||||
|
|
|
|
|
| |||||||||||||||
Beverages — 0.9%*: |
| |||||||||||||||||||
Bacardi Ltd.(a),(d) | 4.45 | 5/15/2025 | 3,304,000 | 3,654,483 | 3,687,307 | |||||||||||||||
Molson Coors Beverage Co. | 2.10 | 7/15/2021 | 325,000 | 324,668 | 327,728 | |||||||||||||||
Molson Coors Beverage Co. | 3.00 | 7/15/2026 | 2,595,000 | 2,756,047 | 2,828,996 | |||||||||||||||
Molson Coors Beverage Co. | 3.50 | 5/1/2022 | 1,089,000 | 1,085,184 | 1,132,391 | |||||||||||||||
|
|
|
|
|
| |||||||||||||||
Total Beverages | 7,313,000 | 7,820,382 | 7,976,422 | |||||||||||||||||
|
|
|
|
|
| |||||||||||||||
Chemicals — 1.5%*: |
| |||||||||||||||||||
Alpek SAB de CV(a),(d) | 4.50 | 11/20/2022 | 1,679,000 | 1,745,100 | 1,773,968 | |||||||||||||||
See accompanying Notes to the Financial Statements.
110
Table of Contents
Barings Active Short Duration Bond Fund 2020 Semi-Annual Report
SCHEDULE OF INVESTMENTS (CONTINUED)
December 31, 2020 (Unaudited)
| EFFECTIVE INTEREST RATE | DUE DATE | PRINCIPAL ‡‡ | COST | FAIR VALUE | ||||||||||||||||
Corporate Bonds (Continued) | ||||||||||||||||||||
Chemicals (Continued) |
| |||||||||||||||||||
DuPont de Nemours, Inc. | 4.49 | % | 11/15/2025 | 2,960,000 | $3,233,826 | $3,455,356 | ||||||||||||||
LYB International Finance III LLC | 1.25 | 10/1/2025 | 750,000 | 747,731 | 763,137 | |||||||||||||||
Nutrition & Biosciences, Inc.(a) | 1.23 | 10/1/2025 | 1,495,000 | 1,495,000 | 1,510,868 | |||||||||||||||
RPM International, Inc. | 3.45 | 11/15/2022 | 1,155,000 | 1,158,849 | 1,199,760 | |||||||||||||||
Syngenta Finance NV(a),(d) | 3.93 | 4/23/2021 | 500,000 | 500,265 | 503,356 | |||||||||||||||
Syngenta Finance NV(a),(d) | 4.44 | 4/24/2023 | 3,800,000 | 3,924,351 | 3,987,843 | |||||||||||||||
Syngenta Finance NV(a),(d) | 4.89 | 4/24/2025 | 200,000 | 216,904 | 214,651 | |||||||||||||||
|
|
|
|
|
| |||||||||||||||
Total Chemicals | 12,539,000 | 13,022,026 | 13,408,939 | |||||||||||||||||
|
|
|
|
|
| |||||||||||||||
Commercial Banks — 9.1%*: |
| |||||||||||||||||||
ABN AMRO Bank NV(a),(d) | 4.75 | 7/28/2025 | 1,840,000 | 2,018,912 | 2,117,566 | |||||||||||||||
Banco Santander SA(d) | 2.75 | 5/28/2025 | 1,600,000 | 1,600,000 | 1,708,040 | |||||||||||||||
Banco Santander SA(d) | 3.50 | 4/11/2022 | 2,400,000 | 2,404,316 | 2,492,289 | |||||||||||||||
Bank of America Corp., 3M USD | 2.82 | (b) | 7/21/2023 | 9,545,000 | 9,593,839 | 9,911,824 | ||||||||||||||
Bank of Nova Scotia (The)(d) | 4.50 | 12/16/2025 | 3,518,000 | 3,928,059 | 4,101,784 | |||||||||||||||
Barclays Bank plc, 3M USD LIBOR + 1.380%(d) | 1.60 | (b) | 5/16/2024 | 1,235,000 | 1,229,993 | 1,251,648 | ||||||||||||||
Barclays Bank plc(a),(d) | 10.18 | 6/12/2021 | 3,435,000 | 3,546,476 | 3,572,567 | |||||||||||||||
BPCE SA(a),(d) | 5.70 | 10/22/2023 | 3,525,000 | 3,882,243 | 3,989,730 | |||||||||||||||
Burgan Bank SAK, 5 year CMT + 2.229%(d) | 2.75 | (b) | 12/15/2031 | 2,000,000 | 2,000,000 | 1,986,800 | ||||||||||||||
Citigroup, Inc. | 4.40 | 6/10/2025 | 4,840,000 | 5,318,732 | 5,533,602 | |||||||||||||||
Credit Suisse AG(a),(d) | 6.50 | 8/8/2023 | 4,510,000 | 4,906,925 | 5,072,776 | |||||||||||||||
Danske Bank A/S(a),(d) | 5.00 | 1/12/2022 | 1,990,000 | 2,036,155 | 2,077,477 | |||||||||||||||
Deutsche Bank AG, SOFRRATE + 2.159%(d) | 2.22 | (b) | 9/18/2024 | 2,815,000 | 2,815,000 | 2,895,899 | ||||||||||||||
Discover Bank | 4.20 | 8/8/2023 | 2,185,000 | 2,227,939 | 2,388,893 | |||||||||||||||
Goldman Sachs Group, Inc. (The) | 4.25 | 10/21/2025 | 9,390,000 | 10,556,325 | 10,768,465 | |||||||||||||||
HSBC Holdings plc(d) | 4.25 | 3/14/2024 | 3,615,000 | 3,784,474 | 3,988,586 | |||||||||||||||
HSBC Holdings plc(d) | 4.25 | 8/18/2025 | 200,000 | 221,043 | 227,235 | |||||||||||||||
Mitsubishi UFJ Financial Group, Inc.(d) | 2.67 | 7/25/2022 | 2,580,000 | 2,556,345 | 2,669,302 | |||||||||||||||
Morgan Stanley, SOFRRATE + 1.990% | 2.19 | (b) | 4/28/2026 | 1,795,000 | 1,795,000 | 1,895,954 | ||||||||||||||
Morgan Stanley | 4.10 | 5/22/2023 | 1,785,000 | 1,879,969 | 1,937,143 | |||||||||||||||
Societe Generale SA, 1 year CMT +1.100%(a),(d) | 1.49 | (b) | 12/14/2026 | 2,211,000 | 2,211,000 | 2,230,532 | ||||||||||||||
Sumitomo Mitsui Financial Group, Inc.(d) | 1.47 | 7/8/2025 | 1,440,000 | 1,440,000 | 1,474,761 | |||||||||||||||
Sumitomo Mitsui Financial Group, Inc. | 2.45 | 9/27/2024 | 2,025,000 | 2,025,000 | 2,156,642 | |||||||||||||||
Sumitomo Mitsui Financial Group, Inc.(d) | 3.75 | 7/19/2023 | 460,000 | 479,469 | 497,900 | |||||||||||||||
Synchrony Bank | 3.00 | 6/15/2022 | 1,680,000 | 1,651,815 | 1,734,819 | |||||||||||||||
UBS Group AG(a),(d) | 4.13 | 9/24/2025 | 1,500,000 | 1,632,562 | 1,717,587 | |||||||||||||||
|
|
|
|
|
| |||||||||||||||
Total Commercial Banks | 74,119,000 | 77,741,591 | 80,399,821 | |||||||||||||||||
|
|
|
|
|
| |||||||||||||||
Commercial Services — 0.7%*: |
| |||||||||||||||||||
Adani Ports & Special Economic Zone Ltd.(a),(d) | 3.38 | 7/24/2024 | 5,878,000 | 5,986,404 | 6,114,957 | |||||||||||||||
|
|
|
|
|
| |||||||||||||||
See accompanying Notes to the Financial Statements.
111
Table of Contents
Barings Active Short Duration Bond Fund 2020 Semi-Annual Report
SCHEDULE OF INVESTMENTS (CONTINUED)
December 31, 2020 (Unaudited)
| EFFECTIVE INTEREST RATE | DUE DATE | PRINCIPAL ‡‡ | COST | FAIR VALUE | ||||||||||||||||
Corporate Bonds (Continued) | ||||||||||||||||||||
Diversified Financial Services — 5.0%*: |
| |||||||||||||||||||
AerCap Ireland Capital DAC / AerCap Global Aviation Trust(d) | 2.88 | % | 8/14/2024 | 4,960,000 | $4,964,544 | $5,158,330 | ||||||||||||||
AerCap Ireland Capital DAC / AerCap Global Aviation Trust | 4.50 | 9/15/2023 | 1,095,000 | 1,089,074 | 1,187,224 | |||||||||||||||
Africa Finance Corp.(d) | 3.13 | 6/16/2025 | 3,898,000 | 4,020,970 | 4,019,812 | |||||||||||||||
Aircastle Ltd. | 5.00 | 4/1/2023 | 4,871,000 | 5,024,105 | 5,192,021 | |||||||||||||||
Antares Holdings LP(a) | 6.00 | 8/15/2023 | 2,160,000 | 2,209,719 | 2,202,818 | |||||||||||||||
Athene Global Funding(a) | 2.75 | 6/25/2024 | 2,705,000 | 2,710,916 | 2,860,069 | |||||||||||||||
Avolon Holdings Funding Ltd.(a),(d) | 2.88 | 2/15/2025 | 1,470,000 | 1,468,563 | 1,498,910 | |||||||||||||||
BGC Partners, Inc. | 4.38 | 12/15/2025 | 1,475,000 | 1,472,311 | 1,560,208 | |||||||||||||||
Brookfield Finance LLC(d) | 4.00 | 4/1/2024 | 2,275,000 | 2,332,652 | 2,497,238 | |||||||||||||||
Genpact Luxembourg Sarl | 3.70 | 4/1/2022 | 2,175,000 | 2,181,819 | 2,217,638 | |||||||||||||||
Lazard Group LLC | 3.75 | 2/13/2025 | 3,430,000 | 3,631,512 | 3,809,046 | |||||||||||||||
LeasePlan Corp. NV(a),(d) | 2.88 | 10/24/2024 | 1,502,000 | 1,511,622 | 1,587,100 | |||||||||||||||
Park Aerospace Holdings Ltd.(a),(d) | 5.25 | 8/15/2022 | 6,270,000 | 6,390,866 | 6,580,427 | |||||||||||||||
SPARC EM SPC Panama Metro Line 2 SP(a),(d) | Zero Coupon | 12/5/2022 | 970,553 | 948,689 | 945,086 | |||||||||||||||
Synchrony Financial | 2.85 | 7/25/2022 | 2,510,000 | 2,511,935 | 2,591,949 | |||||||||||||||
|
|
|
|
|
| |||||||||||||||
Total Diversified Financial Services | 41,766,553 | 42,469,297 | 43,907,876 | |||||||||||||||||
|
|
|
|
|
| |||||||||||||||
Electric — 1.5%*: |
| |||||||||||||||||||
Alliant Energy Finance LLC(a) | 1.40 | 3/15/2026 | 1,085,000 | 1,083,003 | 1,089,680 | |||||||||||||||
American Electric Power Co., Inc. | 1.00 | 11/1/2025 | 1,970,000 | 1,965,554 | 1,993,446 | |||||||||||||||
Enel Finance International NV(a),(d) | 2.88 | 5/25/2022 | 1,050,000 | 1,049,073 | 1,083,360 | |||||||||||||||
Entergy Corp. | 4.00 | 7/15/2022 | 750,000 | 760,147 | 786,418 | |||||||||||||||
Entergy Texas, Inc. | 2.55 | 6/1/2021 | 460,000 | 459,986 | 463,181 | |||||||||||||||
National Central Cooling Co. PJSC(d) | 2.50 | 10/21/2027 | 2,519,000 | 2,491,125 | 2,547,339 | |||||||||||||||
Pacific Gas and Electric Co. | 1.75 | 6/16/2022 | 4,070,000 | 4,071,098 | 4,081,486 | |||||||||||||||
Puget Energy, Inc. | 6.00 | 9/1/2021 | 1,275,000 | 1,298,654 | 1,319,493 | |||||||||||||||
|
|
|
|
|
| |||||||||||||||
Total Electric | 13,179,000 | 13,178,640 | 13,364,403 | |||||||||||||||||
|
|
|
|
|
| |||||||||||||||
Gas — 0.3%*: |
| |||||||||||||||||||
NiSource, Inc. | 0.95 | 8/15/2025 | 2,790,000 | 2,783,582 | 2,806,852 | |||||||||||||||
|
|
|
|
|
| |||||||||||||||
Housewares — 0.4%*: |
| |||||||||||||||||||
Newell Brands, Inc. | 4.35 | 4/1/2023 | 3,749,000 | 3,816,645 | 3,932,289 | |||||||||||||||
|
|
|
|
|
| |||||||||||||||
Insurance — 2.3%*: |
| |||||||||||||||||||
AmTrust Financial Services, Inc. | 6.13 | 8/15/2023 | 3,245,000 | 3,306,492 | 3,204,539 | |||||||||||||||
Athene Global Funding(a) | 2.50 | 1/14/2025 | 1,610,000 | 1,612,512 | 1,686,533 | |||||||||||||||
CNO Financial Group, Inc. | 5.25 | 5/30/2025 | 2,720,000 | 3,103,599 | 3,157,313 | |||||||||||||||
Enstar Group Ltd. | 4.50 | 3/10/2022 | 2,750,000 | 2,769,669 | 2,854,575 | |||||||||||||||
Jackson National Life Global Funding(a) | 2.50 | 6/27/2022 | 2,475,000 | 2,469,019 | 2,553,198 | |||||||||||||||
Lincoln National Corp. | 4.00 | 9/1/2023 | 472,000 | 477,422 | 514,846 | |||||||||||||||
Trinity Acquisition PLC | 3.50 | 9/15/2021 | 2,662,000 | 2,665,075 | 2,709,690 | |||||||||||||||
See accompanying Notes to the Financial Statements.
112
Table of Contents
Barings Active Short Duration Bond Fund 2020 Semi-Annual Report
SCHEDULE OF INVESTMENTS (CONTINUED)
December 31, 2020 (Unaudited)
| EFFECTIVE INTEREST RATE | DUE DATE | PRINCIPAL ‡‡ | COST | FAIR VALUE | ||||||||||||||||
Corporate Bonds (Continued) | ||||||||||||||||||||
Insurance (Continued) |
| |||||||||||||||||||
Unum Group | 3.88 | % | 11/5/2025 | 2,625,000 | $2,688,883 | $2,908,617 | ||||||||||||||
Willis Towers Watson PLC | 5.75 | 3/15/2021 | 370,000 | 371,743 | 373,726 | |||||||||||||||
|
|
|
|
|
| |||||||||||||||
Total Insurance | 18,929,000 | 19,464,414 | 19,963,037 | |||||||||||||||||
|
|
|
|
|
| |||||||||||||||
Investment Company Security — 1.6%*: |
| |||||||||||||||||||
Ares Capital Corp. | 4.20 | 6/10/2024 | 5,110,000 | 5,202,754 | 5,515,921 | |||||||||||||||
BlackRock TCP Capital Corp. | 3.90 | 8/23/2024 | 3,630,000 | 3,597,949 | 3,792,775 | |||||||||||||||
BlackRock TCP Capital Corp. | 4.13 | 8/11/2022 | 1,140,000 | 1,138,295 | 1,188,621 | |||||||||||||||
Sixth Street Specialty Lending, Inc. | 3.88 | 11/1/2024 | 3,360,000 | 3,357,314 | 3,463,677 | |||||||||||||||
|
|
|
|
|
| |||||||||||||||
Total Investment Company Security | 13,240,000 | 13,296,312 | 13,960,994 | |||||||||||||||||
|
|
|
|
|
| |||||||||||||||
Iron/Steel — 1.7%*: |
| |||||||||||||||||||
Reliance Steel & Aluminum Co. | 1.30 | 8/15/2025 | 1,510,000 | 1,505,745 | 1,533,661 | |||||||||||||||
Severstal OAO Via Steel Capital SA(a),(d) | 3.15 | 9/16/2024 | 5,878,000 | 6,058,816 | 6,146,184 | |||||||||||||||
Steel Dynamics, Inc. | 2.40 | 6/15/2025 | 710,000 | 707,587 | 754,637 | |||||||||||||||
Steel Dynamics, Inc. | 2.80 | 12/15/2024 | 1,070,000 | 1,069,358 | 1,150,346 | |||||||||||||||
Vale Overseas Ltd.(d) | 6.25 | 8/10/2026 | 4,199,000 | 5,040,550 | 5,204,136 | |||||||||||||||
|
|
|
|
|
| |||||||||||||||
Total Iron/Steel | 13,367,000 | 14,382,056 | 14,788,964 | |||||||||||||||||
|
|
|
|
|
| |||||||||||||||
IT Services — 0.7%*: |
| |||||||||||||||||||
Dell International LLC/EMC Corp.(a) | 4.00 | 7/15/2024 | 2,472,000 | 2,533,276 | 2,725,693 | |||||||||||||||
Dell International LLC/EMC Corp.(a) | 5.85 | 7/15/2025 | 1,155,000 | 1,284,626 | 1,386,943 | |||||||||||||||
Leidos, Inc.(a) | 2.95 | 5/15/2023 | 1,635,000 | 1,629,773 | 1,720,195 | |||||||||||||||
|
|
|
|
|
| |||||||||||||||
Total IT Services | 5,262,000 | 5,447,675 | 5,832,831 | |||||||||||||||||
|
|
|
|
|
| |||||||||||||||
Lodging — 0.6%*: |
| |||||||||||||||||||
Las Vegas Sands Corp. | 3.20 | 8/8/2024 | 4,595,000 | 4,605,964 | 4,866,905 | |||||||||||||||
Marriott International, Inc. | 5.75 | 5/1/2025 | 679,000 | 678,976 | 794,227 | |||||||||||||||
|
|
|
|
|
| |||||||||||||||
Total Lodging | 5,274,000 | 5,284,940 | 5,661,132 | |||||||||||||||||
|
|
|
|
|
| |||||||||||||||
Machinery-Diversified — 0.3%*: |
| |||||||||||||||||||
CNH Industrial Capital LLC | 1.95 | 7/2/2023 | 515,000 | 512,279 | 530,165 | |||||||||||||||
CNH Industrial Capital LLC | 3.88 | 10/15/2021 | 1,110,000 | 1,113,703 | 1,136,063 | |||||||||||||||
CNH Industrial NV(d) | 4.50 | 8/15/2023 | 900,000 | 908,023 | 981,348 | |||||||||||||||
|
|
|
|
|
| |||||||||||||||
Total Machinery-Diversified | 2,525,000 | 2,534,005 | 2,647,576 | |||||||||||||||||
|
|
|
|
|
| |||||||||||||||
Media — 0.8%*: |
| |||||||||||||||||||
Sirius XM Radio, Inc.(a) | 3.88 | 8/1/2022 | 1,898,000 | 1,894,613 | 1,926,470 | |||||||||||||||
ViacomCBS, Inc. | 4.75 | 5/15/2025 | 4,075,000 | 4,655,381 | 4,731,005 | |||||||||||||||
|
|
|
|
|
| |||||||||||||||
Total Media | 5,973,000 | 6,549,994 | 6,657,475 | |||||||||||||||||
|
|
|
|
|
| |||||||||||||||
Mining — 0.5%*: |
| |||||||||||||||||||
Glencore Finance Canada Ltd.(a),(d) | 4.25 | 10/25/2022 | 484,000 | 493,802 | 515,543 | |||||||||||||||
Glencore Funding LLC(a),(d) | 3.00 | 10/27/2022 | 730,000 | 729,177 | 757,257 | |||||||||||||||
Glencore Funding LLC(a),(d) | 4.13 | 5/30/2023 | 1,880,000 | 1,909,434 | 2,033,126 | |||||||||||||||
See accompanying Notes to the Financial Statements.
113
Table of Contents
Barings Active Short Duration Bond Fund 2020 Semi-Annual Report
SCHEDULE OF INVESTMENTS (CONTINUED)
December 31, 2020 (Unaudited)
| EFFECTIVE INTEREST RATE | DUE DATE | PRINCIPAL ‡‡ | COST | FAIR VALUE | ||||||||||||||||
Corporate Bonds (Continued) | ||||||||||||||||||||
Mining (Continued) |
| |||||||||||||||||||
Kinross Gold Corp. | 5.13 | % | 9/1/2021 | 1,365,000 | $1,377,672 | $1,389,637 | ||||||||||||||
|
|
|
|
|
| |||||||||||||||
Total Mining | 4,459,000 | 4,510,085 | 4,695,563 | |||||||||||||||||
|
|
|
|
|
| |||||||||||||||
Oil and Gas — 2.0%*: |
| |||||||||||||||||||
Cenovus Energy, Inc.(d) | 3.00 | 8/15/2022 | 2,120,000 | 2,155,470 | 2,166,256 | |||||||||||||||
Continental Resources, Inc. | 5.00 | 9/15/2022 | 988,000 | 991,482 | 989,482 | |||||||||||||||
EQT Corp. | 3.00 | 10/1/2022 | 3,185,000 | 3,142,188 | 3,208,888 | |||||||||||||||
EQT Corp. | 7.88 | 2/1/2025 | 1,660,000 | 1,694,404 | 1,890,325 | |||||||||||||||
Occidental Petroleum Corp. | 5.50 | 12/1/2025 | 4,860,000 | 4,860,000 | 5,067,085 | |||||||||||||||
Ovintiv Exploration, Inc. | 5.63 | 7/1/2024 | 2,375,000 | 2,575,899 | 2,543,944 | |||||||||||||||
Petroleos Mexicanos(d) | 4.63 | 9/21/2023 | 2,045,000 | 2,048,619 | 2,120,409 | |||||||||||||||
|
|
|
|
|
| |||||||||||||||
Total Oil and Gas | 17,233,000 | 17,468,062 | 17,986,389 | |||||||||||||||||
|
|
|
|
|
| |||||||||||||||
Pharmaceuticals — 1.4%*: |
| |||||||||||||||||||
AbbVie, Inc. | 3.80 | 3/15/2025 | 1,925,000 | 2,061,795 | 2,146,718 | |||||||||||||||
Cardinal Health, Inc., 3M USD LIBOR + 0.770% | 0.99 | (b) | 6/15/2022 | 3,085,000 | 3,084,783 | 3,106,935 | ||||||||||||||
McKesson Corp. | 0.90 | 12/3/2025 | 2,925,000 | 2,923,877 | 2,939,621 | |||||||||||||||
Mylan, Inc.(a) | 3.13 | 1/15/2023 | 1,920,000 | 1,891,375 | 2,015,333 | |||||||||||||||
Teva Pharmaceutical Finance Netherlands III B.V.(d) | 2.20 | 7/21/2021 | 1,008,000 | 995,073 | 1,005,480 | |||||||||||||||
Viatris, Inc.(a) | 1.65 | 6/22/2025 | 960,000 | 958,103 | 992,921 | |||||||||||||||
|
|
|
|
|
| |||||||||||||||
Total Pharmaceuticals | 11,823,000 | 11,915,006 | 12,207,008 | |||||||||||||||||
|
|
|
|
|
| |||||||||||||||
Pipelines — 1.4%*: | ||||||||||||||||||||
Energy Transfer Partners LP | 4.20 | 9/15/2023 | 3,765,000 | 3,826,290 | 4,058,020 | |||||||||||||||
EnLink Midstream Partners LP | 4.40 | 4/1/2024 | 2,020,000 | 2,013,884 | 1,993,275 | |||||||||||||||
EQM Midstream Partners LP | 4.75 | 7/15/2023 | 2,250,000 | 2,284,873 | 2,365,830 | |||||||||||||||
Plains All American Pipeline LP / PAA Finance Corp. | 3.60 | 11/1/2024 | 489,000 | 505,714 | 521,150 | |||||||||||||||
Plains All American Pipeline LP / PAA Finance Corp. | 4.65 | 10/15/2025 | 3,405,000 | 3,692,856 | 3,806,721 | |||||||||||||||
|
|
|
|
|
| |||||||||||||||
Total Pipelines | 11,929,000 | 12,323,617 | 12,744,996 | |||||||||||||||||
|
|
|
|
|
| |||||||||||||||
Real Estate — 0.7%*: | ||||||||||||||||||||
Country Garden Holdings Co. Ltd.(d) | 8.00 | 1/27/2024 | 5,503,000 | 5,951,525 | 5,939,801 | |||||||||||||||
|
|
|
|
|
| |||||||||||||||
Real Estate Investment Trusts — 2.3%*: | ||||||||||||||||||||
CubeSmart LP | 4.38 | 12/15/2023 | 1,339,000 | 1,401,947 | 1,465,395 | |||||||||||||||
Essex Portfolio LP | 3.50 | 4/1/2025 | 515,000 | 537,389 | 570,637 | |||||||||||||||
Essex Portfolio LP | 3.88 | 5/1/2024 | 654,000 | 684,590 | 719,315 | |||||||||||||||
Federal Realty Investment Trust | 1.25 | 2/15/2026 | 1,430,000 | 1,420,920 | 1,456,248 | |||||||||||||||
Host Hotels & Resorts LP | 3.75 | 10/15/2023 | 4,080,000 | 4,218,036 | 4,308,038 | |||||||||||||||
Service Properties Trust | 4.35 | 10/1/2024 | 2,175,000 | 2,245,557 | 2,147,813 | |||||||||||||||
Tanger Properties LP | 3.75 | 12/1/2024 | 725,000 | 739,148 | 760,245 | |||||||||||||||
Tanger Properties LP | 3.88 | 12/1/2023 | 1,890,000 | 1,917,288 | 1,963,061 | |||||||||||||||
Trust Fibra Uno(a),(d) | 5.25 | 1/30/2026 | 2,772,000 | 3,005,000 | 3,108,971 | |||||||||||||||
See accompanying Notes to the Financial Statements.
114
Table of Contents
Barings Active Short Duration Bond Fund 2020 Semi-Annual Report
SCHEDULE OF INVESTMENTS (CONTINUED)
December 31, 2020 (Unaudited)
| EFFECTIVE INTEREST RATE | DUE DATE | PRINCIPAL ‡‡ | COST | FAIR VALUE | ||||||||||||||||
Corporate Bonds (Continued) | ||||||||||||||||||||
Real Estate Investment Trusts (Continued) | ||||||||||||||||||||
VEREIT Operating Partnership LP | 4.60 | % | 2/6/2024 | 2,140,000 | $2,210,797 | $2,353,530 | ||||||||||||||
VEREIT Operating Partnership LP | 4.63 | 11/1/2025 | 1,650,000 | 1,818,297 | 1,899,162 | |||||||||||||||
|
|
|
|
|
| |||||||||||||||
Total REITS | 19,370,000 | 20,198,969 | 20,752,415 | |||||||||||||||||
|
|
|
|
|
| |||||||||||||||
Retail — 0.9%*: | ||||||||||||||||||||
O’Reilly Automotive, Inc. | 3.80 | 9/1/2022 | 284,000 | 284,298 | 297,273 | |||||||||||||||
O’Reilly Automotive, Inc. | 3.85 | 6/15/2023 | 3,389,000 | 3,431,207 | 3,630,707 | |||||||||||||||
QVC, Inc. | 4.38 | 3/15/2023 | 4,060,000 | 4,059,291 | 4,257,925 | |||||||||||||||
|
|
|
|
|
| |||||||||||||||
Total Retail | 7,733,000 | 7,774,796 | 8,185,905 | |||||||||||||||||
|
|
|
|
|
| |||||||||||||||
Semiconductors — 0.2%*: | ||||||||||||||||||||
Microchip Technology, Inc.(a) | 0.97 | 2/15/2024 | 1,485,000 | 1,485,000 | 1,488,635 | |||||||||||||||
|
|
|
|
|
| |||||||||||||||
Storage/Warehousing — 0.4%*: | ||||||||||||||||||||
GLP China Holdings Ltd.(d) | 4.97 | 2/26/2024 | 2,977,000 | 3,137,750 | 3,182,599 | |||||||||||||||
|
|
|
|
|
| |||||||||||||||
Telecommunications — 0.8%*: | ||||||||||||||||||||
Juniper Networks, Inc. | 1.20 | 12/10/2025 | 700,000 | 699,834 | 708,329 | |||||||||||||||
Qwest Corp. | 6.75 | 12/1/2021 | 2,480,000 | 2,559,511 | 2,594,452 | |||||||||||||||
Sprint Communications, Inc. | 9.25 | 4/15/2022 | 1,005,000 | 1,072,427 | 1,098,847 | |||||||||||||||
Telefonaktiebolaget LM Ericsson(d) | 4.13 | 5/15/2022 | 2,650,000 | 2,656,187 | 2,756,000 | |||||||||||||||
|
|
|
|
|
| |||||||||||||||
Total Telecommunications | 6,835,000 | 6,987,959 | 7,157,628 | |||||||||||||||||
|
|
|
|
|
| |||||||||||||||
Venture Capital — 0.2%*: | ||||||||||||||||||||
Hercules Capital, Inc. | 4.63 | 10/23/2022 | 1,625,000 | 1,621,520 | 1,651,941 | |||||||||||||||
|
|
|
|
|
| |||||||||||||||
Total Corporate Bonds | 343,752,553 | 354,408,730 | 365,620,721 | |||||||||||||||||
|
|
|
|
|
| |||||||||||||||
Mortgage-Backed Securities — 13.9%*: | ||||||||||||||||||||
Angel Oak Mortgage Trust 2019-3(a) | 3.24 | (f) | 5/25/2059 | 1,876,853 | 1,876,830 | 1,900,465 | ||||||||||||||
Angel Oak Mortgage Trust 2019-6(a) | 3.39 | (f) | 11/25/2059 | 3,250,000 | 3,250,000 | 3,304,427 | ||||||||||||||
Angel Oak Mortgage Trust LLC 2020-5(a) | 1.58 | (f) | 5/25/2065 | 1,594,974 | 1,594,974 | 1,602,969 | ||||||||||||||
Angel Oak Mortgage Trust LLC 2020-5(a) | 2.04 | (f) | 5/25/2065 | 1,454,497 | 1,454,472 | 1,461,690 | ||||||||||||||
BAMLL Commercial Mortgage Securities Trust 2018-DSNY, 1M USD LIBOR + 1.350%(a) | 1.51 | (b) | 9/15/2034 | 270,000 | 270,000 | 261,198 | ||||||||||||||
BAMLL Commercial Mortgage Securities Trust 2019-BPR(a) | 3.89 | (f) | 11/5/2032 | 3,420,000 | 3,440,107 | 3,138,208 | ||||||||||||||
BHMS, 1M USD LIBOR + 1.500%(a) | 1.66 | (b) | 7/15/2035 | 1,800,000 | 1,800,000 | 1,727,806 | ||||||||||||||
BHMS 2018-ATLS, 1M USD LIBOR + 1.250%(a) | 1.41 | (b) | 7/15/2035 | 2,750,000 | 2,750,000 | 2,674,164 | ||||||||||||||
BX Commercial Mortgage Trust 2018-IND, 1M USD LIBOR + 1.300%(a) | 1.46 | (b) | 11/15/2035 | 1,050,000 | 1,042,975 | 1,047,368 | ||||||||||||||
BX Commercial Mortgage Trust 2019-XL, 1M USD LIBOR + 1.800%(a) | 1.96 | (b) | 10/15/2036 | 1,142,005 | 1,142,005 | 1,135,257 | ||||||||||||||
BX Commercial Mortgage Trust 2019-XL, 1M USD LIBOR + 2.000%(a) | 2.16 | (b) | 10/15/2036 | 3,677,580 | 3,686,309 | 3,628,282 | ||||||||||||||
See accompanying Notes to the Financial Statements.
115
Table of Contents
Barings Active Short Duration Bond Fund 2020 Semi-Annual Report
SCHEDULE OF INVESTMENTS (CONTINUED)
December 31, 2020 (Unaudited)
| EFFECTIVE INTEREST RATE | DUE DATE | PRINCIPAL ‡‡ | COST | FAIR VALUE | ||||||||||||||||
Mortgage-Backed Securities (Continued) | ||||||||||||||||||||
BX Commercial Mortgage Trust 2020-BXLP, 1M USD LIBOR + 1.250%(a) | 1.41 | (b)% | 12/15/2036 | 1,328,784 | $1,315,123 | $1,313,858 | ||||||||||||||
BX Commercial Mortgage Trust 2020-BXLP, 1M USD LIBOR + 1.600%(a) | 1.76 | (b) | 12/15/2036 | 5,412,047 | 5,411,483 | 5,303,512 | ||||||||||||||
CAMB Commercial Mortgage Trust 2019-LIFE, 1M USD LIBOR + 2.150%(a) | 2.31 | (b) | 12/15/2037 | 1,499,283 | 1,499,283 | 1,489,620 | ||||||||||||||
Citigroup Mortgage Loan Trust 2019-IMC1(a) | 3.03 | (f) | 7/25/2049 | 1,208,790 | 1,208,216 | 1,233,518 | ||||||||||||||
Citigroup Mortgage Loan Trust 2019-IMC1(a) | 3.17 | (f) | 7/25/2049 | 3,101,000 | 3,100,429 | 3,198,017 | ||||||||||||||
COMM 2015-CCRE22 Mortgage Trust | 3.93 | (f) | 3/10/2048 | 1,650,000 | 1,640,561 | 1,776,954 | ||||||||||||||
COMM 2015-DC1 Mortgage Trust | 4.04 | (f) | 2/10/2048 | 1,087,775 | 1,110,311 | 1,141,035 | ||||||||||||||
COMM 2020-SBX Mortgage Trust(a) | 2.32 | (f) | 1/10/2038 | 6,200,000 | 6,354,511 | 6,355,510 | ||||||||||||||
COMM Mortgage Trust 2014-UBS2 B | 4.70 | (f) | 3/10/2047 | 600,000 | 641,313 | 655,374 | ||||||||||||||
Connecticut Avenue Securities Trust 2019-R03, 1M USD LIBOR + 2.150%(a) | 2.30 | (b) | 9/25/2031 | 1,216,120 | 1,223,222 | 1,212,001 | ||||||||||||||
Credit Suisse Mortgage Capital Certificates 2019-ICE4, 1M USD LIBOR + 1.600%(a) | 1.76 | (b) | 5/15/2036 | 960,000 | 960,000 | 950,368 | ||||||||||||||
Credit Suisse Mortgage Capital Certificates 2019-ICE4, 1M USD LIBOR + 2.150%(a) | 2.31 | (b) | 5/15/2036 | 4,000,000 | 3,976,302 | 3,976,533 | ||||||||||||||
Deephave Residential Mortgage Trust 2019-2(a) | 3.92 | (f) | 4/25/2059 | 672,000 | 672,000 | 677,520 | ||||||||||||||
Deephaven Residential Mortgage Trust 2018-1(a) | 3.03 | (f) | 12/25/2057 | 219,877 | 219,874 | 221,531 | ||||||||||||||
Deephaven Residential Mortgage Trust 2018-2(a) | 3.68 | (f) | 4/25/2058 | 623,038 | 623,032 | 622,528 | ||||||||||||||
Deephaven Residential Mortgage Trust 2018-3(a) | 3.96 | (f) | 8/25/2058 | 521,910 | 521,244 | 517,227 | ||||||||||||||
Deephaven Residential Mortgage Trust 2018-4(a) | 4.29 | (f) | 10/25/2058 | 808,451 | 808,451 | 800,177 | ||||||||||||||
Deephaven Residential Mortgage Trust 2019-4(a) | 3.48 | (f) | 10/25/2059 | 4,400,000 | 4,399,950 | 4,465,943 | ||||||||||||||
Federal Home Loan Mortgage Corp., SOFR30A + 0.900%(a) | 0.98 | (b) | 12/25/2050 | 3,931,000 | 3,931,000 | 3,930,989 | ||||||||||||||
Federal Home Loan Mortgage Corp., 1M USD LIBOR + 1.500%(a) | 1.65 | (b) | 6/25/2050 | 763,633 | 763,633 | 764,660 | ||||||||||||||
Federal Home Loan Mortgage Corp., SOFR30A + 2.800%(a) | 2.88 | (b) | 10/25/2050 | 2,306,000 | 2,306,000 | 2,330,544 | ||||||||||||||
Federal Home Loan Mortgage Corp., 1M USD LIBOR + 3.000%(a) | 3.15 | (b) | 6/25/2050 | 7,200,000 | 7,200,000 | 7,239,157 | ||||||||||||||
FWD Securitization Trust 2020-INV1(a) | 2.85 | (f) | 1/25/2050 | 1,804,000 | 1,803,913 | 1,765,175 | ||||||||||||||
GS Mortgage Securities Trust 2016-GS2 | 4.71 | (f) | 5/10/2049 | 1,000,000 | 1,049,524 | 1,070,634 | ||||||||||||||
JP Morgan Chase Commercial Mortgage Securities Trust 2013-LC11 | 3.96 | (f) | 4/15/2046 | 1,015,000 | 1,002,970 | 900,953 | ||||||||||||||
JP Morgan Chase Commercial Mortgage Securities Trust 2018-LAQ, 1M USD LIBOR + 1.000%(a) | 1.16 | (b) | 6/15/2032 | 4,847,574 | 4,845,565 | 4,787,209 | ||||||||||||||
JP Morgan Mortgage Trust 2017-6 A5(a) | 3.50 | (f) | 12/25/2048 | 166,391 | 168,474 | 166,878 | ||||||||||||||
See accompanying Notes to the Financial Statements.
116
Table of Contents
Barings Active Short Duration Bond Fund 2020 Semi-Annual Report
SCHEDULE OF INVESTMENTS (CONTINUED)
December 31, 2020 (Unaudited)
| EFFECTIVE INTEREST RATE | DUE DATE | PRINCIPAL ‡‡ | COST | FAIR VALUE | ||||||||||||||||
Mortgage-Backed Securities (Continued) | ||||||||||||||||||||
JP Morgan Mortgage Trust 2018-1(a) | 3.50 | (f)% | 6/25/2048 | 134,064 | $135,110 | $135,304 | ||||||||||||||
KNDL 2019-KNSQ Mortgage Trust, 1M USD LIBOR + 1.800%(a) | 1.96 | (b) | 5/15/2036 | 865,000 | 865,000 | 860,759 | ||||||||||||||
Morgan Stanley Bank of America Merrill Lynch Trust 2013-C7 | 3.77 | (f) | 2/15/2046 | 1,340,000 | 1,370,632 | 1,347,542 | ||||||||||||||
Morgan Stanley Capital I Trust 2012-STAR(a) | 3.93 | (f) | 8/5/2034 | 1,300,000 | 1,300,463 | 1,276,315 | ||||||||||||||
New Residential Mortgage Loan Trust 2019-A1(a) | 3.60 | (f) | 4/25/2049 | 429,354 | 429,354 | 432,215 | ||||||||||||||
New Residential Mortgage Loan Trust 2019-A3(a) | 3.75 | (f) | 4/25/2049 | 1,769,660 | 1,769,660 | 1,802,800 | ||||||||||||||
New Residential Mortgage Loan Trust 2019-NQM1(a) | 3.93 | (f) | 1/25/2049 | 1,495,169 | 1,495,241 | 1,504,295 | ||||||||||||||
New Residential Mortgage Loan Trust 2020-NQM1(a) | 3.21 | (f) | 1/26/2060 | 2,252,000 | 2,252,000 | 2,280,590 | ||||||||||||||
OBX 2020-INV1 Trust(a) | 3.50 | (f) | 12/25/2049 | 2,294,808 | 2,336,001 | 2,345,682 | ||||||||||||||
One New York Plaza Trust 2020-1NYP, 1M USD LIBOR + 2.200%(a) | 2.36 | (b) | 1/15/2026 | 2,787,000 | 2,787,000 | 2,787,835 | ||||||||||||||
One New York Plaza Trust 2020-1NYP, 1M USD LIBOR + 2.750%(a) | 2.91 | (b) | 1/15/2026 | 1,874,000 | 1,874,000 | 1,874,556 | ||||||||||||||
PNMAC GMSR Issuer Trust 2018-GT1, 1M USD LIBOR + 2.850%(a) | 3.00 | (b) | 2/25/2023 | 470,000 | 470,000 | 462,054 | ||||||||||||||
PSMC Trust(a) | 3.50 | (f) | 2/25/2048 | 190,693 | 190,468 | 191,504 | ||||||||||||||
PSMC Trust 2018-2(a) | 3.50 | (f) | 6/25/2048 | 103,152 | 101,545 | 103,167 | ||||||||||||||
Sequoia Mortgage Trust 2018-5(a) | 3.50 | (f) | 5/25/2048 | 92,097 | 91,129 | 92,156 | ||||||||||||||
Shellpoint Co-Originator Trust 2016-1 2A3(a) | 3.00 | (f) | 10/25/2031 | 367,808 | 370,893 | 374,166 | ||||||||||||||
Starwood Mortgage Residential Trust 2019-INV1(a) | 2.92 | (f) | 9/27/2049 | 2,073,266 | 2,073,266 | 2,128,123 | ||||||||||||||
Starwood Mortgage Residential Trust 2020-1(a) | 2.88 | (f) | 2/25/2050 | 4,700,000 | 4,699,873 | 4,700,751 | ||||||||||||||
Starwood Mortgage Residential Trust 2020-INV(a) | 2.50 | (f) | 11/25/2055 | 2,500,000 | 2,499,913 | 2,505,256 | ||||||||||||||
TIAA Bank Mortgage Loan Trust 2018-2(a) | 3.50 | (f) | 7/25/2048 | 51,173 | 50,701 | 51,267 | ||||||||||||||
Verus Securitization Trust 2018-INV2(a) | 4.71 | (f) | 10/25/2058 | 2,501,899 | 2,546,746 | 2,553,594 | ||||||||||||||
Verus Securitization Trust 2019-4(a) | 3.21 | (f) | 11/25/2059 | 1,750,000 | 1,750,000 | 1,763,573 | ||||||||||||||
Verus Securitization Trust 2019-INV2(a) | 3.22 | (f) | 7/25/2059 | 2,074,692 | 2,074,667 | 2,135,268 | ||||||||||||||
Verus Securitization Trust 2019-INV3(a) | 3.28 | (f) | 11/25/2059 | 1,462,000 | 1,461,966 | 1,496,473 | ||||||||||||||
Verus Securitization Trust 2020-1(a) | 3.02 | (f) | 1/25/2060 | 4,646,000 | 4,646,000 | 4,661,839 | ||||||||||||||
Verus Securitization Trust 2020-4(a) | 3.29 | (f) | 5/25/2065 | 2,348,000 | 2,337,023 | 2,407,253 | ||||||||||||||
|
|
|
|
|
| |||||||||||||||
Total Mortgage-Backed Securities | 122,700,417 | 123,042,707 | 123,023,596 | |||||||||||||||||
|
|
|
|
|
| |||||||||||||||
U.S. Treasury & Government Agencies — 0.6%*: |
| |||||||||||||||||||
U.S. Treasury Bonds(g) | 8.00 | 11/15/2021 | 5,000,000 | 5,264,184 | 5,339,844 | |||||||||||||||
|
|
|
|
|
| |||||||||||||||
Total Fixed Income | 761,322,639 | 768,782,755 | 779,811,840 | |||||||||||||||||
|
|
|
|
|
| |||||||||||||||
See accompanying Notes to the Financial Statements.
117
Table of Contents
Barings Active Short Duration Bond Fund 2020 Semi-Annual Report
SCHEDULE OF INVESTMENTS (CONTINUED)
December 31, 2020 (Unaudited)
| COUNTERPARTY | STRIKE PRICE | EXPIRATION DATE | CONTRACTS | NOTIONAL | COST | UNREALIZED VALUE | FAIR VALUE | |||||||||||||||||||||||
Purchased Options — 0.1%*: |
| |||||||||||||||||||||||||||||
Call Option Purchased — 0.0%*: |
| |||||||||||||||||||||||||||||
OTC – BCM Swaption | JPMorgan Chase Bank N.A. | $2.44 | 12/13/2032 | 1,958,250 | 1,958,250 | $98,255 | $97,634 | $195,889 | ||||||||||||||||||||||
|
|
|
|
|
|
|
|
|
| |||||||||||||||||||||
Put Options Purchased — 0.1%*: |
| |||||||||||||||||||||||||||||
OTC – BCM Swaption | JPMorgan Chase Bank N.A. | 2.94 | 12/13/2032 | 22,790,000 | 22,790,000 | 1,143,488 | (455,171 | ) | 688,317 | |||||||||||||||||||||
OTC – BCM Swaption | JPMorgan Chase Bank N.A. | 3.11 | 1/31/2033 | 7,500,000 | 7,500,000 | 358,500 | (154,924 | ) | 203,576 | |||||||||||||||||||||
|
|
|
|
|
|
|
|
|
| |||||||||||||||||||||
Total Put Options | 30,290,000 | 30,290,000 | 1,501,988 | (610,095 | ) | 891,893 | ||||||||||||||||||||||||
|
|
|
|
|
|
|
|
|
| |||||||||||||||||||||
| EFFECTIVE INTEREST RATE | DUE DATE | PRINCIPAL ‡‡ | COST | FAIR VALUE | ||||||||||||||||
Short-Term Investments — 9.8%*: | ||||||||||||||||||||
Commercial Paper — 9.8%*: |
| |||||||||||||||||||
Automobiles — 1.3%*: |
| |||||||||||||||||||
American Honda Finance | 0.29 | % | 3/3/2021 | 5,000,000 | $4,997,543 | $4,997,543 | ||||||||||||||
Vw Credit Inc.(d) | 0.25 | 1/14/2021 | 7,000,000 | 6,999,368 | 6,999,368 | |||||||||||||||
|
|
|
|
|
| |||||||||||||||
Total Automobiles | 12,000,000 | 11,996,911 | 11,996,911 | |||||||||||||||||
|
|
|
|
|
| |||||||||||||||
Chemicals — 0.6%*: | ||||||||||||||||||||
PPG Industries | 0.43 | 8/2/2021 | 5,000,000 | 4,987,575 | 4,987,575 | |||||||||||||||
|
|
|
|
|
| |||||||||||||||
Commercial Banks — 0.6%*: | ||||||||||||||||||||
Standard Chartered Bank(d) | 0.26 | 6/30/2021 | 5,000,000 | 4,993,500 | 4,993,500 | |||||||||||||||
|
|
|
|
|
| |||||||||||||||
Diversified Financial Services — 1.2%*: | ||||||||||||||||||||
Intercontinental Exchange | 0.43 | 6/29/2021 | 5,000,000 | 4,989,558 | 4,989,558 | |||||||||||||||
Parker-Hannifin Corp. | 0.27 | 2/4/2021 | 5,355,000 | 5,353,635 | 5,353,635 | |||||||||||||||
|
|
|
|
|
| |||||||||||||||
Total Diversified Financial Services | 10,355,000 | 10,343,193 | 10,343,193 | |||||||||||||||||
|
|
|
|
|
| |||||||||||||||
Electric — 0.7%*: | ||||||||||||||||||||
Entergy Corp. | 0.31 | 3/9/2021 | 6,000,000 | 5,996,538 | 5,996,538 | |||||||||||||||
|
|
|
|
|
| |||||||||||||||
Energy Equipement and services — 0.7%*: | ||||||||||||||||||||
Suncor Energy, Inc.(d) | 0.32 | 3/25/2021 | 6,000,000 | 5,995,573 | 5,995,573 | |||||||||||||||
|
|
|
|
|
| |||||||||||||||
Healthcare-Products — 0.7%*: | ||||||||||||||||||||
Agilent Tech, Inc. | 0.26 | 1/11/2021 | 6,000,000 | 5,999,567 | 5,999,567 | |||||||||||||||
|
|
|
|
|
| |||||||||||||||
IT Services — 0.9%*: | ||||||||||||||||||||
Fidelity Natl Information Services | 0.36 | 1/25/2021 | 7,800,000 | 7,798,180 | 7,798,180 | |||||||||||||||
|
|
|
|
|
| |||||||||||||||
Oil and Gas — 1.2%*: | ||||||||||||||||||||
FMC Tech, Inc. | 0.27 | 2/5/2021 | 5,000,000 | 4,998,688 | 4,998,688 | |||||||||||||||
Spire, Inc. | 0.27 | 2/2/2021 | 6,000,000 | 5,998,560 | 5,998,560 | |||||||||||||||
|
|
|
|
|
| |||||||||||||||
Total Oil and Gas | 11,000,000 | 10,997,248 | 10,997,248 | |||||||||||||||||
|
|
|
|
|
| |||||||||||||||
See accompanying Notes to the Financial Statements.
118
Table of Contents
Barings Active Short Duration Bond Fund 2020 Semi-Annual Report
SCHEDULE OF INVESTMENTS (CONTINUED)
December 31, 2020 (Unaudited)
| EFFECTIVE INTEREST RATE | DUE DATE | PRINCIPAL ‡‡ | COST | FAIR VALUE | ||||||||||||||||
Commercial Paper (Continued) | ||||||||||||||||||||
Retail — 0.8%*: |
| |||||||||||||||||||
Walgreens Boots | 0.33 | % | 1/29/2021 | $7,000,000 | $6,998,204 | $6,998,204 | ||||||||||||||
|
|
|
|
|
| |||||||||||||||
Telecommunications — 1.1%*: |
| |||||||||||||||||||
Telus Corp.(d) | 0.30 | 6/16/2021 | 5,000,000 | 4,993,083 | 4,993,083 | |||||||||||||||
Vodafone Group Plc(d) | 0.33 | 1/6/2021 | 5,000,000 | 4,999,771 | 4,999,771 | |||||||||||||||
|
|
|
|
|
| |||||||||||||||
Total Telecommunications | 10,000,000 | 9,992,854 | 9,992,854 | |||||||||||||||||
|
|
|
|
|
| |||||||||||||||
Total Commercial Paper | 86,155,000 | 86,099,343 | 86,099,343 | |||||||||||||||||
|
|
|
|
|
| |||||||||||||||
Total Short-Term Investments | 86,155,000 | 86,099,343 | 86,099,343 | |||||||||||||||||
|
|
|
|
|
| |||||||||||||||
Total Investments | 879,725,889 | 856,482,341 | 866,998,965 | |||||||||||||||||
|
|
|
|
|
| |||||||||||||||
Other assets and liabilities – 1.8%* |
| 16,211,217 | ||||||||||||||||||
|
| |||||||||||||||||||
Net Assets – 100.0% | $883,210,182 | |||||||||||||||||||
|
| |||||||||||||||||||
| OTC | Over the Counter |
| ‡‡ | Unless otherwise indicated, all principal amounts are denominated in United States Dollars. |
| * | Calculated as a percentage of net assets applicable to common shareholders. |
| (a) | Security acquired in a transaction exempt from registration under Rule 144A of the Securities Act of 1933. These securities may only be resold in transactions exempt from registration, normally to qualified institutional buyers. |
| (b) | Variable rate security. The interest rate shown is the rate in effect at December 31, 2020. |
| (c) | Variable Rate is Fixed to Float: Rate remains fixed until designated future date. |
| (d) | Foreign security. |
Distributions of investments by country of risk (excluding temporary cash investments) as a percentage of total investments in securities, is as follows: |
| United States | 80.8% | |||||
| United Kingdom | 3.1% | |||||
| Ireland | 2.4% | |||||
| Canada | 2.3% | |||||
| Switzerland | 1.7% | |||||
| Germany | 1.1% | |||||
| China | 1.1% | |||||
| Other (Individually less than 1%) | 7.5% | |||||
|
| |||||
| Total | 100.0% | |||||
|
|
| (e) | For fair value measurement disclosure purposes, security is categorized as Level 3 (See Note 2). |
| (f) | Effective interest rate for this security is the coupon rate at issue based on the underlying loans. |
| (g) | All or a portion of this security is held for open swaps collateral. |
See accompanying Notes to the Financial Statements.
119
Table of Contents
Barings Active Short Duration Bond Fund 2020 Semi-Annual Report
SCHEDULE OF INVESTMENTS (CONTINUED)
December 31, 2020 (Unaudited)
A summary of outstanding derivatives at December 31, 2020 is as follows:
Futures
| TYPE | EXPIRATION DATE | CONTRACTS | NOTIONAL AMOUNT | POSITION | FAIR VALUE | UNREALIZED APPRECIATION (DEPRECIATION) | ||||||||||||||||||
Short Futures | ||||||||||||||||||||||||
90 Day Euro Futures | 03/15/21 | 5 | (1,219,357 | ) | Short | $ | (1,247,875 | ) | $ | (28,518 | ) | |||||||||||||
90 Day Euro Futures | 09/13/21 | 9 | (2,195,179 | ) | Short | (2,246,175 | ) | (50,996 | ) | |||||||||||||||
90 Day Euro Futures | 03/14/22 | 8 | (1,950,670 | ) | Short | (1,996,400 | ) | (45,730 | ) | |||||||||||||||
90 Day Euro Futures | 09/19/22 | 7 | (1,706,136 | ) | Short | (1,746,412 | ) | (40,276 | ) | |||||||||||||||
90 Day Euro Futures | 03/13/23 | 6 | (1,461,503 | ) | Short | (1,496,175 | ) | (34,672 | ) | |||||||||||||||
90 Day Euro Futures | 12/18/23 | 8 | (1,946,870 | ) | Short | (1,990,300 | ) | (43,430 | ) | |||||||||||||||
90 Day Euro Futures | 12/16/24 | 22 | (5,347,293 | ) | Short | (5,458,750 | ) | (111,457 | ) | |||||||||||||||
U.S. 10-Year Ultra Bond | 03/22/21 | 81 | (12,742,088 | ) | Short | (12,665,109 | ) | 76,979 | ||||||||||||||||
U.S. 2-Year Treasury Note | 03/31/21 | 610 | (134,646,447 | ) | Short | (134,795,703 | ) | (149,256 | ) | |||||||||||||||
U.S. 5-Year Treasury Note | 03/31/21 | 1,723 | (216,897,576 | ) | Short | (217,380,680 | ) | (483,104 | ) | |||||||||||||||
|
| |||||||||||||||||||||||
Total Short Futures |
| $ | (910,460 | ) | ||||||||||||||||||||
|
| |||||||||||||||||||||||
See accompanying Notes to the Financial Statements.
120
Table of Contents
Barings Diversified Income Fund 2020 Semi-Annual Report
SCHEDULE OF INVESTMENTS
December 31, 2020 (Unaudited)
| EFFECTIVE INTEREST RATE | DUE DATE | PRINCIPAL‡‡ | COST | FAIR VALUE | ||||||||||||||||
Fixed Income — 96.5%*: |
| |||||||||||||||||||
Asset-Backed Securities — 40.9%*: |
| |||||||||||||||||||
CDO/CLO — 21.4%*: |
| |||||||||||||||||||
Ares LV CLO Ltd. 2020-55A B, 3M USD LIBOR + 2.500%(a) | 2.74 | (b)% | 4/15/2031 | 750,000 | $750,000 | $752,588 | ||||||||||||||
Avery Point VII CLO Ltd., 3M USD LIBOR + 3.600%(a) | 3.84 | (b) | 1/15/2028 | 500,000 | 500,000 | 497,508 | ||||||||||||||
Canyon CLO 2020-2 Ltd., 3M USD LIBOR + 1.450%(a) | 1.66 | (b) | 10/15/2031 | 1,000,000 | 1,000,000 | 1,002,768 | ||||||||||||||
CBAM Ltd. 2019-10, 3M USD LIBOR + 2.050%(a) | 2.27 | (b) | 4/20/2032 | 500,000 | 500,000 | 500,636 | ||||||||||||||
Crestline Denali CLO XIV Ltd., 3M USD LIBOR + 1.800%(a) | 2.01 | (b) | 10/23/2031 | 250,000 | 250,000 | 246,704 | ||||||||||||||
Denali Capital CLO XI Ltd., 3M USD LIBOR + 1.650%(a) | 1.87 | (b) | 10/20/2028 | 550,000 | 549,566 | 544,133 | ||||||||||||||
Eaton Vance CLO Ltd. 2013-1, 3M USD LIBOR + 2.800%(a) | 3.04 | (b) | 1/15/2028 | 500,000 | 500,000 | 500,054 | ||||||||||||||
Eaton Vance CLO Ltd. 2019-1, 3M USD LIBOR + 1.950%(a) | 2.19 | (b) | 4/15/2031 | 500,000 | 500,000 | 500,700 | ||||||||||||||
Elmwood CLO II Ltd., 3M USD LIBOR + 2.900%(a) | 3.12 | (b) | 4/20/2031 | 750,000 | 750,000 | 751,816 | ||||||||||||||
Horizon Aircraft Finance II Ltd.(a) | 4.70 | 7/15/2039 | 286,539 | 286,529 | 245,718 | |||||||||||||||
KREF 2018-FL1 Ltd., 1M USD LIBOR + 1.100%(a) | 1.25 | (b) | 6/15/2036 | 400,000 | 385,743 | 399,322 | ||||||||||||||
KREF Ltd. 2018-FL1, 1M USD LIBOR + 2.550%(a) | 2.70 | (b) | 6/15/2036 | 420,000 | 423,251 | 409,756 | ||||||||||||||
Magnetite XXVI Ltd. 2020-26A B, 3M USD LIBOR + 2.400%(a) | 2.64 | (b) | 7/15/2030 | 750,000 | 750,000 | 753,799 | ||||||||||||||
OCP CLO 2020-19 Ltd., 3M USD LIBOR + 2.500%(a) | 2.82 | (b) | 7/20/2031 | 500,000 | 500,000 | 502,069 | ||||||||||||||
OHA Credit Partners XI Ltd., 1M USD LIBOR + 2.150%(a) | 2.37 | (b) | 1/20/2032 | 300,000 | 298,505 | 298,418 | ||||||||||||||
TCI-Flatiron CLO 2016-1 Ltd., 3M USD LIBOR + 2.200%(a) | 1.00 | (b) | 1/17/2032 | 1,000,000 | 1,000,000 | 1,000,000 | ||||||||||||||
TICP CLO VI Ltd. 2016-2, 3M USD LIBOR + 3.300%(a) | 3.54 | (b) | 1/15/2029 | 500,000 | 500,000 | 499,754 | ||||||||||||||
Verde CLO, 3M USD LIBOR + 1.900%(a) | 2.14 | (b) | 4/15/2032 | 500,000 | 500,000 | 500,172 | ||||||||||||||
|
|
|
|
|
| |||||||||||||||
Total CDO/CLO | 9,956,539 | 9,943,594 | 9,905,915 | |||||||||||||||||
|
|
|
|
|
| |||||||||||||||
Other Asset-Backed Securities — 19.5%*: |
| |||||||||||||||||||
AASET 2019-1 Trust(a) | 3.84 | 5/15/2039 | 285,098 | 285,098 | 269,245 | |||||||||||||||
AASET 2020-1 Trust(a) | 4.34 | 1/16/2040 | 489,753 | 489,743 | 419,964 | |||||||||||||||
Access Group, Inc. 2015-1 B, 1M USD LIBOR + 1.500%(a) | 1.65 | (b) | 7/25/2058 | 100,000 | 86,939 | 91,421 | ||||||||||||||
Adams Outdoor Advertising LP(a) | 4.81 | 11/15/2048 | 191,513 | 198,572 | 201,942 | |||||||||||||||
CARS-DB4 LP(a) | 3.81 | 2/15/2050 | 249,896 | 258,888 | 255,843 | |||||||||||||||
CARS-DB4 LP(a) | 4.17 | 2/15/2050 | 100,000 | 99,958 | 104,133 | |||||||||||||||
CLI Funding VI LLC(a) | 4.64 | 5/18/2044 | 168,386 | 168,359 | 170,465 | |||||||||||||||
See accompanying Notes to the Financial Statements.
121
Table of Contents
Barings Diversified Income Fund 2020 Semi-Annual Report
SCHEDULE OF INVESTMENTS (CONTINUED)
December 31, 2020 (Unaudited)
| EFFECTIVE INTEREST RATE | DUE DATE | PRINCIPAL ‡‡ | COST | FAIR VALUE | ||||||||||||||||
Fixed Income (Continued) |
| |||||||||||||||||||
Other Asset-Backed Securities (Continued) |
| |||||||||||||||||||
College Avenue Student Loans LLC, 1M USD LIBOR + 1.650%(a) | 1.80 | (b)% | 11/26/2046 | 133,723 | $128,635 | $134,302 | ||||||||||||||
College Loan Corp. Trust I 2005-2 B, 3M USD LIBOR + 0.490% | 0.73 | (b) | 1/15/2037 | 67,281 | 60,441 | 60,625 | ||||||||||||||
College Loan Corp. Trust I 2017-1 B2, 28 day ARS | 1.90 | (b) | 1/25/2047 | 45,000 | 38,967 | 44,108 | ||||||||||||||
Credit Suisse ABS Repackaging Trust 2013-A B(a) | 2.50 | 1/25/2030 | 23,280 | 22,383 | 23,380 | |||||||||||||||
EdLinc Student Loan Funding Trust 2017-A A, PRIME—1.150%(a) | 3.60 | (b) | 12/1/2047 | 44,305 | 44,014 | 43,811 | ||||||||||||||
EDvestinU Private Education Loan Issue No 1 LLC(a) | 4.49 | 11/25/2043 | 277,000 | 276,812 | 291,815 | |||||||||||||||
Goodgreen Trust 2018-1A A(a) | 3.93 | 10/15/2053 | 242,758 | 251,031 | 258,786 | |||||||||||||||
Goodgreen Trust 2019-2(a) | 3.86 | 10/15/2054 | 262,669 | 262,628 | 274,153 | |||||||||||||||
Horizon Aircraft Finance I Ltd.(a) | 5.27 | 12/15/2038 | 450,400 | 459,124 | 386,370 | |||||||||||||||
Kestrel Aircraft Funding Ltd.(a),(c) | 4.25 | 12/15/2038 | 297,974 | 303,473 | 275,971 | |||||||||||||||
KeyCorp Student Loan Trust 2005-A, 3M USD LIBOR + 0.730% | 0.98 | (b) | 9/27/2038 | 502,663 | 493,436 | 501,173 | ||||||||||||||
Labrador Aviation Finance Ltd. 2016-1A(a) | 4.30 | 1/15/2042 | 190,725 | 191,229 | 180,263 | |||||||||||||||
Navient Student Loan Trust 2018-1B, 1M USD LIBOR + 1.200%(a) | 1.35 | (b) | 3/25/2067 | 100,000 | 96,032 | 94,541 | ||||||||||||||
Nelnet Private Education Loan Trust 2016-A A1B(a) | 3.60 | 12/26/2040 | 16,690 | 16,591 | 17,008 | |||||||||||||||
Nelnet Student Loan Trust 2006-2 B, 3M USD LIBOR + 0.200% | 0.41 | (b) | 1/25/2038 | 175,268 | 165,137 | 149,824 | ||||||||||||||
Nelnet Student Loan Trust 2006-3, 3M USD LIBOR + 0.250% | 0.50 | (b) |
| 6/25/2041 |
| 113,483 | 106,606 | 96,732 | ||||||||||||
OneMain Financial Issuance Trust 2020-2(a) | 2.21 | 9/14/2035 | 400,000 | 399,791 | 405,480 | |||||||||||||||
OneMain Financial Issuance Trust 2020-2(a) | 2.76 | 9/14/2035 | 400,000 | 399,834 | 396,728 | |||||||||||||||
Oxford Finance Funding 2020-1 LLC(a) | 3.10 | 2/15/2028 | 475,000 | 475,000 | 485,708 | |||||||||||||||
Oxford Finance Funding 2020-1 LLC(a) | 4.04 | 2/15/2028 | 450,000 | 450,000 | 460,151 | |||||||||||||||
SLC Student Loan Trust 2005-1 B, 3M USD LIBOR + 0.200% | 0.42 | (b) | 2/15/2045 | 68,997 | 60,197 | 61,041 | ||||||||||||||
SLM Student Loan Trust 2003-14, 3M USD LIBOR + 0.550% | 0.76 | (b) | 10/25/2065 | 159,865 | 152,153 | 149,770 | ||||||||||||||
SLM Student Loan Trust 2004-1, 3M USD LIBOR + 0.500% | 0.71 | (b) | 7/25/2039 | 149,720 | 139,245 | 138,352 | ||||||||||||||
SLM Student Loan Trust 2005-6 B, 3M USD LIBOR + 0.290% | 0.50 | (b) | 1/25/2044 | 92,818 | 86,617 | 82,785 | ||||||||||||||
SLM Student Loan Trust 2006-5 B, 3M USD LIBOR + 0.210% | 0.42 | (b) | 10/25/2040 | 87,360 | 77,694 | 78,096 | ||||||||||||||
SMB Private Education Loan Trust 2017-A B(a) | 3.50 | 6/17/2041 | 225,000 | 233,199 | 234,386 | |||||||||||||||
Sofi Consumer Loan Program 2018-1 Trust(a) | 3.97 | 2/25/2027 | 550,000 | 558,574 | 562,527 | |||||||||||||||
SoFi Professional Loan Program LLC 2017-A C(a) | 4.43 | 3/26/2040 | 100,000 | 99,523 | 105,407 | |||||||||||||||
South Carolina Student Loan Corp. 2014-1 B, 1M USD LIBOR + 1.500% | 1.65 | (b) | 8/1/2035 | 100,000 | 98,868 | 101,200 | ||||||||||||||
Store Master Funding I-VII(a) | 3.96 | 10/20/2048 | 239,253 | 250,084 | 249,942 | |||||||||||||||
Store Master Funding I-VII(a) | 4.74 | 10/20/2048 | 227,317 | 233,930 | 239,882 | |||||||||||||||
Textainer Marine Containers VII Ltd.(a) | 5.28 | 4/20/2044 | 173,333 | 173,265 | 175,503 | |||||||||||||||
See accompanying Notes to the Financial Statements.
122
Table of Contents
Barings Diversified Income Fund 2020 Semi-Annual Report
SCHEDULE OF INVESTMENTS (CONTINUED)
December 31, 2020 (Unaudited)
| EFFECTIVE INTEREST RATE | DUE DATE | PRINCIPAL ‡‡ | COST | FAIR VALUE | ||||||||||||||||
Fixed Income (Continued) |
| |||||||||||||||||||
Other Asset-Backed Securities (Continued) |
| |||||||||||||||||||
Wachovia Student Loan Trust 2005-1 B, 3M USD LIBOR + 0.300% | 0.51 | (b)% | 10/25/2040 | 51,477 | $47,620 | $46,986 | ||||||||||||||
Westlake Automobile Receivables Trust 2020-3(a) | 1.65 | 2/17/2026 | 440,000 | 439,925 | 444,864 | |||||||||||||||
Willis Engine Structured Trust IV(a) | 4.75 | 9/15/2043 | 339,676 | 347,190 | 293,151 | |||||||||||||||
|
|
|
|
|
| |||||||||||||||
Total Other Asset-Backed Securities | 9,257,681 | 9,226,805 | 9,057,834 | |||||||||||||||||
|
|
|
|
|
| |||||||||||||||
Total Asset-Backed Securities | 19,214,220 | 19,170,399 | 18,963,749 | |||||||||||||||||
|
|
|
|
|
| |||||||||||||||
Corporate Bonds — 47.5%*: |
| |||||||||||||||||||
Auto Manufacturers — 1.1%*: |
| |||||||||||||||||||
Allison Transmission, Inc.(a) | 3.75 | 1/30/2031 | 150,000 | 150,000 | 153,469 | |||||||||||||||
Ford Motor Co. | 9.63 | 4/22/2030 | 100,000 | 115,121 | 141,125 | |||||||||||||||
Ford Motor Credit Co. LLC | 4.00 | 11/13/2030 | 200,000 | 200,000 | 210,000 | |||||||||||||||
|
|
|
|
|
| |||||||||||||||
Total Auto Manufacturers | 450,000 | 465,121 | 504,594 | |||||||||||||||||
|
|
|
|
|
| |||||||||||||||
Chemicals — 0.9%*: |
| |||||||||||||||||||
Axalta Coating Systems LLC(a) | 3.38 | 2/15/2029 | 150,000 | 150,000 | 150,000 | |||||||||||||||
UPL Corp. Ltd.(c) | 4.63 | 6/16/2030 | 260,000 | 258,918 | 280,475 | |||||||||||||||
|
|
|
|
|
| |||||||||||||||
Total Chemicals | 410,000 | 408,918 | 430,475 | |||||||||||||||||
|
|
|
|
|
| |||||||||||||||
Coal — 0.3%*: |
| |||||||||||||||||||
SunCoke Energy Partners LP(a) | 7.50 | 6/15/2025 | 116,000 | 107,062 | 115,153 | |||||||||||||||
|
|
|
|
|
| |||||||||||||||
Commercial Banks — 9.6%*: |
| |||||||||||||||||||
Arab National Bank, 5 year CMT + 2.974%(c) | 3.33 | (b) | 10/28/2030 | 500,000 | 500,000 | 513,730 | ||||||||||||||
Banco de Credito del Peru, 5 year CMT + 3.000%(a),(c) | 3.13 | (b) | 7/1/2030 | 414,000 | 411,044 | 425,385 | ||||||||||||||
Bank of America Corp. | 4.20 | 8/26/2024 | 280,000 | 300,387 | 313,455 | |||||||||||||||
Barclays plc, 3M USD LIBOR + 2.452%(c) | 2.85 | (b) | 5/7/2026 | 390,000 | 390,000 | 418,837 | ||||||||||||||
BPCE SA(a),(c) | 5.70 | 10/22/2023 | 385,000 | 424,018 | 435,758 | |||||||||||||||
Burgan Bank SAK, 5 year CMT + 2.229%(c) | 2.75 | (b) | 12/15/2031 | 500,000 | 500,000 | 496,700 | ||||||||||||||
Credit Suisse AG(a),(c) | 6.50 | 8/8/2023 | 310,000 | 339,936 | 348,683 | |||||||||||||||
HSBC Holdings plc(c) | 4.38 | 11/23/2026 | 420,000 | 474,110 | 484,607 | |||||||||||||||
Morgan Stanley | 4.10 | 5/22/2023 | 105,000 | 109,981 | 113,949 | |||||||||||||||
Nbk Tier 2 Ltd., 5 year CMT + 2.108%(c) | 2.50 | (b) | 11/24/2030 | 645,000 | 645,000 | 654,675 | ||||||||||||||
Shinhan Financial Group Co. Ltd., 5 year CMT + 1.500%(a),(c) | 3.34 | (b) | 2/5/2030 | 242,000 | 242,000 | 257,125 | ||||||||||||||
|
|
|
|
|
| |||||||||||||||
Total Commercial Banks | 4,191,000 | 4,336,476 | 4,462,904 | |||||||||||||||||
|
|
|
|
|
| |||||||||||||||
Distribution/Wholesale — 0.3%*: |
| |||||||||||||||||||
H&E Equipment Services, Inc.(a) | 3.88 | 12/15/2028 | 150,000 | 150,000 | 151,605 | |||||||||||||||
|
|
|
|
|
| |||||||||||||||
Diversified Financial Services — 4.1%*: |
| |||||||||||||||||||
Lazard Group LLC | 3.75 | 2/13/2025 | 410,000 | 434,032 | 455,309 | |||||||||||||||
LeasePlan Corp. NV(a),(c) | 2.88 | 10/24/2024 | 605,000 | 611,657 | 639,278 | |||||||||||||||
See accompanying Notes to the Financial Statements.
123
Table of Contents
Barings Diversified Income Fund 2020 Semi-Annual Report
SCHEDULE OF INVESTMENTS (CONTINUED)
December 31, 2020 (Unaudited)
| EFFECTIVE INTEREST RATE | DUE DATE | PRINCIPAL ‡‡ | COST | FAIR VALUE | ||||||||||||||||
Corporate Bonds (Continued) |
| |||||||||||||||||||
Diversified Financial Services (Continued) |
| |||||||||||||||||||
Park Aerospace Holdings Ltd.(a),(c) | 5.25 | % | 8/15/2022 | 650,000 | $667,144 | $682,181 | ||||||||||||||
SPARC EM SPC Panama Metro Line 2 SP(c) | 1.85 | 12/5/2022 | 126,024 | 121,617 | 122,717 | |||||||||||||||
|
|
|
|
|
| |||||||||||||||
Total Diversified Financial Services | 1,791,024 | 1,834,450 | 1,899,485 | |||||||||||||||||
|
|
|
|
|
| |||||||||||||||
Electric — 6.7%*: |
| |||||||||||||||||||
Adani Electricity Mumbai Ltd.(a),(c) | 3.95 | 2/12/2030 | 550,000 | 526,972 | 581,969 | |||||||||||||||
AES Panama Generation Holdings SRL(a),(c) | 4.38 | 5/31/2030 | 465,000 | 465,000 | 502,055 | |||||||||||||||
FEL Energy VI Sarl(a),(c) | 5.75 | 12/1/2040 | 500,000 | 500,000 | 532,150 | |||||||||||||||
Fenix Power Peru SA(a),(c) | 4.32 | 9/20/2027 | 448,529 | 466,975 | 468,012 | |||||||||||||||
Infraestructura Energetica Nova SAB de CV(a),(c) | 3.75 | 1/14/2028 | 488,000 | 497,081 | 520,330 | |||||||||||||||
Saudi Electricity Global Sukuk Co. 5(c) | 2.41 | 9/17/2030 | 500,000 | 500,000 | 510,342 | |||||||||||||||
|
|
|
|
|
| |||||||||||||||
Total Electric | 2,951,529 | 2,956,028 | 3,114,858 | |||||||||||||||||
|
|
|
|
|
| |||||||||||||||
Entertainment — 0.6%*: |
| |||||||||||||||||||
WMG Acquisition Corp.(a) | 3.00 | 2/15/2031 | 150,000 | 146,302 | 147,000 | |||||||||||||||
Wynn Resorts Finance LLC / Wynn Resorts Capital Corp.(a) | 5.13 | 10/1/2029 | 112,000 | 107,737 | 117,320 | |||||||||||||||
|
|
|
|
|
| |||||||||||||||
Total Entertainment | 262,000 | 254,039 | 264,320 | |||||||||||||||||
|
|
|
|
|
| |||||||||||||||
Food — 1.4%*: |
| |||||||||||||||||||
Blossom Joy Ltd.(c) | 3.10 | 4/21/2169 | 250,000 | 251,850 | 250,000 | |||||||||||||||
JBS USA Food Co.(a) | 5.50 | 1/15/2030 | 202,000 | 206,792 | 232,049 | |||||||||||||||
Smithfield Foods, Inc.(a) | 3.00 | 10/15/2030 | 154,000 | 154,998 | 162,944 | |||||||||||||||
|
|
|
|
|
| |||||||||||||||
Total Food | 606,000 | 613,640 | 644,993 | |||||||||||||||||
|
|
|
|
|
| |||||||||||||||
Forestry and Paper Products — 0.8%*: |
| |||||||||||||||||||
Suzano Austria GmbH(c) | 3.75 | 1/15/2031 | 360,000 | 354,094 | 381,600 | |||||||||||||||
|
|
|
|
|
| |||||||||||||||
Insurance — 7.3%*: |
| |||||||||||||||||||
Athene Global Funding(a) | 2.50 | 1/14/2025 | 710,000 | 692,815 | 743,751 | |||||||||||||||
AXIS Specialty Finance LLC | 3.90 | 7/15/2029 | 233,000 | 254,247 | 256,929 | |||||||||||||||
Brighthouse Financial, Inc. | 3.70 | 6/22/2027 | 400,000 | 417,788 | 435,009 | |||||||||||||||
CNO Financial Group, Inc. | 5.25 | 5/30/2025 | 150,000 | 171,154 | 174,117 | |||||||||||||||
Enstar Group Ltd. | 4.95 | 6/1/2029 | 600,000 | 643,123 | 678,700 | |||||||||||||||
Hanwha Life Insurance Co. Ltd., 5 year CMT + 2.000%(a),(c) | 4.70 | (b) | 4/23/2048 | 500,000 | 501,600 | 517,188 | ||||||||||||||
Prudential Financial, Inc., 3M USD LIBOR + 3.920% | 5.63 | (b) | 6/15/2043 | 320,000 | 340,645 | 343,176 | ||||||||||||||
Tongyang Life Insurance Co. Ltd., 5 year CMT + 4.981%(c) | 5.25 | (b) | 12/31/2099 | 250,000 | 255,555 | 254,844 | ||||||||||||||
|
|
|
|
|
| |||||||||||||||
Total Insurance | 3,163,000 | 3,276,927 | 3,403,714 | |||||||||||||||||
|
|
|
|
|
| |||||||||||||||
Investment Company Security — 1.5%*: |
| |||||||||||||||||||
Ares Capital Corp. | 3.25 | 7/15/2025 | 230,000 | 232,225 | 243,753 | |||||||||||||||
Ares Capital Corp. | 3.88 | 1/15/2026 | 200,000 | 202,580 | 216,717 | |||||||||||||||
See accompanying Notes to the Financial Statements.
124
Table of Contents
Barings Diversified Income Fund 2020 Semi-Annual Report
SCHEDULE OF INVESTMENTS (CONTINUED)
December 31, 2020 (Unaudited)
| EFFECTIVE INTEREST RATE | DUE DATE | PRINCIPAL ‡‡ | COST | FAIR VALUE | ||||||||||||||||
Corporate Bonds (Continued) |
| |||||||||||||||||||
Investment Company Security (Continued) |
| |||||||||||||||||||
BlackRock TCP Capital Corp. | 4.13 | % | 8/11/2022 | 225,000 | $229,590 | $234,596 | ||||||||||||||
|
|
|
|
|
| |||||||||||||||
Total Investment Company Security | 655,000 | 664,395 | 695,066 | |||||||||||||||||
|
|
|
|
|
| |||||||||||||||
Iron/Steel — 0.8%*: |
| |||||||||||||||||||
Vale Overseas Ltd.(c) | 3.75 | 7/8/2030 | 314,000 | 311,516 | 348,834 | |||||||||||||||
|
|
|
|
|
| |||||||||||||||
IT Services — 1.0%*: |
| |||||||||||||||||||
Lenovo Group Ltd.(a),(c) | 3.42 | 11/2/2030 | 430,000 | 430,000 | 453,098 | |||||||||||||||
|
|
|
|
|
| |||||||||||||||
Media — 1.7%*: |
| |||||||||||||||||||
DISH Network Corp. | 3.38 | 8/15/2026 | 140,000 | 128,034 | 133,452 | |||||||||||||||
Sirius XM Radio, Inc.(a) | 5.50 | 7/1/2029 | 90,000 | 93,712 | 99,028 | |||||||||||||||
ViacomCBS, Inc. | 4.95 | 1/15/2031 | 270,000 | 323,168 | 338,885 | |||||||||||||||
Virgin Media Secured Finance plc(a),(c) | 4.50 | 8/15/2030 | 200,000 | 203,959 | 209,000 | |||||||||||||||
|
|
|
|
|
| |||||||||||||||
Total Media | 700,000 | 748,873 | 780,365 | |||||||||||||||||
|
|
|
|
|
| |||||||||||||||
Mining — 1.7%*: |
| |||||||||||||||||||
AngloGold Ashanti Holdings plc(c) | 3.75 | 10/1/2030 | 345,000 | 343,913 | 369,150 | |||||||||||||||
Glencore Funding LLC(a),(c) | 4.00 | 4/16/2025 | 385,000 | 405,621 | 430,807 | |||||||||||||||
|
|
|
|
|
| |||||||||||||||
Total Mining | 730,000 | 749,534 | 799,957 | |||||||||||||||||
|
|
|
|
|
| |||||||||||||||
Oil and Gas — 1.1%*: |
| |||||||||||||||||||
Gazprom PJSC via Gaz Finance plc(a),(c) | 3.25 | 2/25/2030 | 500,000 | 481,662 | 517,031 | |||||||||||||||
|
|
|
|
|
| |||||||||||||||
Pharmaceuticals — 0.6%*: | ||||||||||||||||||||
Bausch Health Cos., Inc.(a) | 5.00 | 2/15/2029 | 125,000 | 125,000 | 128,525 | |||||||||||||||
Bausch Health Cos., Inc.(a) | 5.25 | 2/15/2031 | 125,000 | 125,000 | 130,590 | |||||||||||||||
|
|
|
|
|
| |||||||||||||||
Total Pharmaceuticals | 250,000 | 250,000 | 259,115 | |||||||||||||||||
|
|
|
|
|
| |||||||||||||||
Pipelines — 0.6%*: | ||||||||||||||||||||
Fermaca Enterprises S de RL de CV(a),(c) | 6.38 | 3/30/2038 | 254,202 | 259,192 | 293,984 | |||||||||||||||
|
|
|
|
|
| |||||||||||||||
Real Estate — 1.2%*: | ||||||||||||||||||||
Country Garden Holdings Co. Ltd.(c) | 5.63 | 1/14/2030 | 500,000 | 525,284 | 551,875 | |||||||||||||||
|
|
|
|
|
| |||||||||||||||
Real Estate Investment Trusts — 3.5%*: | ||||||||||||||||||||
PLA Administradora Industrial S de RL de CV(a),(c) | 4.96 | 7/18/2029 | 290,000 | 290,000 | 327,703 | |||||||||||||||
SBA Tower Trust(a) | 2.33 | 7/15/2052 | 308,000 | 308,000 | 313,486 | |||||||||||||||
STORE Capital Corp. | 4.63 | 3/15/2029 | 555,000 | 513,914 | 643,840 | |||||||||||||||
Tanger Properties LP | 3.88 | 12/1/2023 | 316,000 | 321,710 | 328,215 | |||||||||||||||
|
|
|
|
|
| |||||||||||||||
Total REITS | 1,469,000 | 1,433,624 | 1,613,244 | |||||||||||||||||
|
|
|
|
|
| |||||||||||||||
Telecommunications — 0.5%*: | ||||||||||||||||||||
Sprint Capital Corp. | 8.75 | 3/15/2032 | 140,000 | 198,635 | 221,673 | |||||||||||||||
|
|
|
|
|
| |||||||||||||||
See accompanying Notes to the Financial Statements.
125
Table of Contents
Barings Diversified Income Fund 2020 Semi-Annual Report
SCHEDULE OF INVESTMENTS (CONTINUED)
December 31, 2020 (Unaudited)
| EFFECTIVE INTEREST RATE | DUE DATE | PRINCIPAL ‡‡ | COST | FAIR VALUE | ||||||||||||||||
Corporate Bonds (Continued) | ||||||||||||||||||||
Transportation — 0.2%*: | ||||||||||||||||||||
XPO Logistics, Inc.(a) | 6.25 | % | 5/1/2025 | 95,000 | $95,000 | $102,233 | ||||||||||||||
|
|
|
|
|
| |||||||||||||||
Total Corporate Bonds | 20,487,755 | 20,904,470 | 22,010,176 | |||||||||||||||||
|
|
|
|
|
| |||||||||||||||
Mortgage-Backed Securities — 8.1%*: | ||||||||||||||||||||
BANK 2018-BNK14 | 4.58 | (d) | 9/15/2060 | 400,000 | 462,333 | 468,845 | ||||||||||||||
BX Commercial Mortgage Trust 2019-XL, 1M USD LIBOR + 2.000%(a) | 2.16 | (b) | 10/15/2036 | 379,719 | 357,770 | 374,629 | ||||||||||||||
COMM 2014-LC17 Mortgage Trust | 4.55 | (d) | 10/10/2047 | 400,000 | 410,020 | 415,377 | ||||||||||||||
COMM 2014-UBS5 Mortgage Trust | 4.61 | (d) | 9/10/2047 | 395,000 | 409,526 | 392,875 | ||||||||||||||
Connecticut Avenue Securities Trust 2019-R03, 1M USD LIBOR + 2.150%(a) | 2.30 | (b) | 9/25/2031 | 523,688 | 523,205 | 521,914 | ||||||||||||||
Federal Home Loan Mortgage Corp., 1M USD LIBOR + 3.000%(a) | 3.15 | (b) | 6/25/2050 | 620,000 | 615,825 | 623,372 | ||||||||||||||
GS Mortgage Securities Corp. II(a) | 3.00 | (d) | 7/10/2051 | 500,000 | 449,843 | 418,830 | ||||||||||||||
GS Mortgage Securities Corp. II | 4.16 | (d) | 7/10/2051 | 92,252 | 104,109 | 108,192 | ||||||||||||||
GS Mortgage Securities Trust 2016-GS2 | 4.71 | (d) | 5/10/2049 | 200,000 | 206,889 | 214,127 | ||||||||||||||
J.P. Morgan Chase Commercial Mortgage Securities Trust 2019-OSB(a) | 3.78 | (d) | 6/5/2039 | 213,000 | 211,506 | 193,949 | ||||||||||||||
|
|
|
|
|
| |||||||||||||||
Total Mortgage-Backed Securities | 3,723,659 | 3,751,026 | 3,732,110 | |||||||||||||||||
|
|
|
|
|
| |||||||||||||||
Total Fixed Income | 43,425,634 | 43,825,895 | 44,706,035 | |||||||||||||||||
|
|
|
|
|
| |||||||||||||||
Total Investments | 43,425,634 | 43,825,895 | 44,706,035 | |||||||||||||||||
|
|
|
|
|
| |||||||||||||||
Other assets and liabilities – 3.5%* |
| 1,637,840 | ||||||||||||||||||
|
| |||||||||||||||||||
Net Assets – 100.0% | $46,343,875 | |||||||||||||||||||
|
| |||||||||||||||||||
| ‡‡ | Unless otherwise indicated, all principal amounts are denominated in United States Dollars. |
| * | Calculated as a percentage of net assets applicable to common shareholders. |
| (a) | Security acquired in a transaction exempt from registration under Rule 144A of the Securities Act of 1933. These securities may only be resold in transactions exempt from registration, normally to qualified institutional buyers. |
| (b) | Variable rate security. The interest rate shown is the rate in effect at December 31, 2020. |
| (c) | Foreign security. |
See accompanying Notes to the Financial Statements.
126
Table of Contents
Barings Diversified Income Fund 2020 Semi-Annual Report
SCHEDULE OF INVESTMENTS (CONTINUED)
December 31, 2020 (Unaudited)
Distributions of investments by country of risk (excluding temporary cash investments) as a percentage of total investments in securities, is as follows: |
| United States | 68.6% | |||||
| Mexico | 3.7% | |||||
| Kuwait | 2.6% | |||||
| United Kingdom | 2.5% | |||||
| Republic of Korea | 2.3% | |||||
| Saudi Arabia | 2.3% | |||||
| China | 2.3% | |||||
| Ireland | 2.1% | |||||
| Peru | 2.0% | |||||
| India | 1.9% | |||||
| Switzerland | 1.7% | |||||
| Brazil | 1.6% | |||||
| Netherlands | 1.4% | |||||
| Panama | 1.4% | |||||
| Russia | 1.2% | |||||
| France | 1.0% | |||||
| Other (Individually less than 1%) | 1.4% | |||||
|
| |||||
| Total | 100.0% | |||||
|
|
| (d) | Effective interest rate for this security is the coupon rate at issue based on the underlying loans. |
A summary of outstanding derivatives at December 31, 2020 is as follows:
Forward Foreign Currency Exchange Contracts to Buy
| EXPIRATION DATE | COUNTERPARTY | LOCAL CURRENCY | VALUE IN USD | IN EXCHANGE FOR USD | NET UNREALIZED APPRECIATION | |||||||||||||||||
| 1/7/21 | Canadian Imperial Bank of Commerce | EUR | 415,178 | $ | 507,232 | $ | 505,146 | $ | 2,086 | |||||||||||||
|
| |||||||||||||||||||||
Net unrealized appreciation on forward foreign currency exchange contracts to buy | $ | 2,086 | ||||||||||||||||||||
|
| |||||||||||||||||||||
Forward Foreign Currency Exchange Contracts to Sell
| EXPIRATION DATE | COUNTERPARTY | LOCAL CURRENCY | VALUE IN USD | IN EXCHANGE FOR USD | NET UNREALIZED DEPRECIATION | |||||||||||||||||
| 1/7/21 | Canadian Imperial Bank of Commerce | EUR | 405,870 | $ | 495,859 | $ | 485,540 | $ | (10,319 | ) | ||||||||||||
| 1/7/21 | Barclays Bank plc | EUR | 9,308 | 11,371 | 11,259 | (112 | ) | |||||||||||||||
|
| |||||||||||||||||||||
Net unrealized depreciation on forward foreign currency exchange contracts to sell | $ | (10,431 | ) | |||||||||||||||||||
|
| |||||||||||||||||||||
Currency Legend
| EUR | – | Euro |
See accompanying Notes to the Financial Statements.
127
Table of Contents
Barings Diversified Income Fund 2020 Semi-Annual Report
SCHEDULE OF INVESTMENTS (CONTINUED)
December 31, 2020 (Unaudited)
Futures
| TYPE | EXPIRATION DATE | CONTRACTS | NOTIONAL AMOUNT | POSITION | FAIR VALUE | UNREALIZED APPRECIATION | ||||||||||||||||||
Long Future | ||||||||||||||||||||||||
| U.S. 2-Year Treasury Note | 03/31/21 | 1 | 220,745 | Long | $ | 220,977 | $ | 232 | ||||||||||||||||
|
| |||||||||||||||||||||||
| TYPE | EXPIRATION DATE | CONTRACTS | NOTIONAL AMOUNT | POSITION | FAIR VALUE | UNREALIZED APPRECIATION (DEPRECIATION) | ||||||||||||||||||
Short Futures | ||||||||||||||||||||||||
| U.S. 10-Year Ultra Bond | 03/22/21 | 44 | (6,920,441 | ) | Short | $ (6,879,813 | ) | $ | 40,628 | |||||||||||||||
| U.S. 5-Year Treasury Note | 03/31/21 | 128 | (16,111,843 | ) | Short | (16,149,000 | ) | (37,157 | ) | |||||||||||||||
| U.S. Long Bond | 03/22/21 | 1 | (174,029 | ) | Short | (173,188 | ) | 841 | ||||||||||||||||
|
| |||||||||||||||||||||||
Total Short Futures |
| $ | 4,312 | |||||||||||||||||||||
|
| |||||||||||||||||||||||
See accompanying Notes to the Financial Statements.
128
Table of Contents
Barings Emerging Markets Debt Blended Total Return Fund 2020 Semi-Annual Report
SCHEDULE OF INVESTMENTS
December 31, 2020 (Unaudited)
| EFFECTIVE INTEREST RATE | DUE DATE | PRINCIPAL ‡‡ | COST | FAIR VALUE | ||||||||||||||||
Fixed Income — 89.2%*: | ||||||||||||||||||||
Corporate Bonds — 39.7%*: | ||||||||||||||||||||
Aerospace/Defense — 0.4%*: | ||||||||||||||||||||
Embraer Netherlands Finance BV(a),(b) | 6.95 | % | 1/17/2028 | 250,000 | $249,346 | $282,500 | ||||||||||||||
|
|
|
|
|
| |||||||||||||||
Agriculture — 0.9%*: | ||||||||||||||||||||
Kernel Holding SA(a),(b) | 6.75 | 10/27/2027 | 687,000 | 687,000 | 726,503 | |||||||||||||||
|
|
|
|
|
| |||||||||||||||
Chemicals — 1.6%*: | ||||||||||||||||||||
Braskem Idesa SAPI(a),(b) | 7.45 | 11/15/2029 | 795,000 | 792,498 | 745,312 | |||||||||||||||
Grupo Idesa SA de CV(a),(b) | 10.13 | 5/22/2026 | 1,049,926 | 1,016,658 | 545,962 | |||||||||||||||
|
|
|
|
|
| |||||||||||||||
Total Chemicals | 1,844,926 | 1,809,156 | 1,291,274 | |||||||||||||||||
|
|
|
|
|
| |||||||||||||||
Commercial Banks — 6.4%*: | ||||||||||||||||||||
Ipoteka-Bank ATIB(b) | 5.50 | 11/19/2025 | 544,000 | 544,000 | 549,440 | |||||||||||||||
Kasikornbank PCL, 5 year CMT + 4.940%(b) | 5.28 | (c),(d) | 500,000 | 500,000 | 518,750 | |||||||||||||||
National Bank of Greece SA, 5 year EUR Swap + 8.464%(b) | 8.25 | (c) | 7/18/2029 | 750,000 | 844,200 | 989,498 | ||||||||||||||
Nova Ljubljanska Banka dd, 5 year EUR Swap + 3.833%(b) | 3.65 | (c) | 11/19/2029 | 400,000 | 440,400 | 439,794 | ||||||||||||||
Sovcombank Via SovCom Capital DAC, 5 year CMT + 6.380%(a),(b) | 7.75 | (c),(d) | 200,000 | 200,000 | 203,500 | |||||||||||||||
Sovcombank Via SovCom Capital DAC, 5 year CMT + 6.427%(a),(b) | 8.00 | (c) | 4/7/2030 | 1,165,000 | 1,169,166 | 1,237,696 | ||||||||||||||
TBC Bank JSC, 5 year USD ICE Swap + 8.995%(a),(b) | 10.78 | (c),(d) | 645,000 | 645,000 | 645,806 | |||||||||||||||
TMB Bank PCL, 5 year CMT + 3.256%(b) | 4.90 | (c),(d) | 500,000 | 475,938 | 487,188 | |||||||||||||||
|
|
|
|
|
| |||||||||||||||
Total Commercial Banks | 4,704,000 | 4,818,704 | 5,071,672 | |||||||||||||||||
|
|
|
|
|
| |||||||||||||||
Diversified Financial Services — 1.9%*: | ||||||||||||||||||||
Gtlk Europe Capital DAC(b) | 4.80 | 2/26/2028 | 500,000 | 492,607 | 522,500 | |||||||||||||||
India Infoline Finance Ltd.(b) | 5.88 | 4/20/2023 | 1,055,000 | 998,548 | 1,012,800 | |||||||||||||||
|
|
|
|
|
| |||||||||||||||
Total Diversified Financial Services | 1,555,000 | 1,491,155 | 1,535,300 | |||||||||||||||||
|
|
|
|
|
| |||||||||||||||
Electric — 1.8%*: | ||||||||||||||||||||
FEL Energy VI Sarl(a),(b) | 5.75 | 12/1/2040 | 700,000 | 700,000 | 745,010 | |||||||||||||||
Infraestructura Energetica Nova SAB de CV(a),(b) | 4.75 | 1/15/2051 | 312,000 | 303,006 | 340,470 | |||||||||||||||
Infraestructura Energetica Nova SAB de CV(a),(b) | 4.88 | 1/14/2048 | 328,000 | 271,960 | 365,310 | |||||||||||||||
|
|
|
|
|
| |||||||||||||||
Total Electric | 1,340,000 | 1,274,966 | 1,450,790 | |||||||||||||||||
|
|
|
|
|
| |||||||||||||||
Engineering&Construction — 0.8%*: | ||||||||||||||||||||
Rutas 2 and 7 Finance Ltd.(a),(b) | | Zero Coupon | | 9/30/2036 | 850,000 | 567,543 | 633,250 | |||||||||||||
|
|
|
|
|
| |||||||||||||||
See accompanying Notes to the Financial Statements.
129
Table of Contents
Barings Emerging Markets Debt Blended Total Return Fund 2020 Semi-Annual Report
SCHEDULE OF INVESTMENTS (CONTINUED)
December 31, 2020 (Unaudited)
| EFFECTIVE INTEREST RATE | DUE DATE | PRINCIPAL ‡‡ | COST | FAIR VALUE | ||||||||||||||||
Corporate Bonds (Continued) | ||||||||||||||||||||
Food — 1.0%*: |
| |||||||||||||||||||
MHP Lux SA(a),(b) | 6.25 | % | 9/19/2029 | 270,000 | $274,403 | $275,484 | ||||||||||||||
Ulker Biskuvi Sanayi AS(a),(b) | 6.95 | 10/30/2025 | 494,000 | 494,000 | 533,876 | |||||||||||||||
|
|
|
|
|
| |||||||||||||||
Total Food | 764,000 | 768,403 | 809,360 | |||||||||||||||||
|
|
|
|
|
| |||||||||||||||
Forestry and Paper Products — 0.5%*: | ||||||||||||||||||||
Suzano Austria GmbH(b) | 3.75 | 1/15/2031 | 361,000 | 355,078 | 382,660 | |||||||||||||||
|
|
|
|
|
| |||||||||||||||
Household Products — 0.5%*: | ||||||||||||||||||||
Walnut Bidco plc(a),(b) | 6.75 | 8/1/2024 | 317,000 | 352,647 | 401,553 | |||||||||||||||
|
|
|
|
|
| |||||||||||||||
Internet — 1.6%*: | ||||||||||||||||||||
B2W Digital Lux Sarl(a),(b) | 4.38 | 12/20/2030 | 706,000 | 705,972 | 730,710 | |||||||||||||||
Meituan(a),(b) | 3.05 | 10/28/2030 | 529,000 | 528,286 | 549,949 | |||||||||||||||
|
|
|
|
|
| |||||||||||||||
Total Internet | 1,235,000 | 1,234,258 | 1,280,659 | |||||||||||||||||
|
|
|
|
|
| |||||||||||||||
Metal Fabricate/Hardware — 0.6%*: | ||||||||||||||||||||
HTA Group Ltd.(a),(b) | 7.00 | 12/18/2025 | 416,000 | 413,857 | 447,460 | |||||||||||||||
|
|
|
|
|
| |||||||||||||||
Mining — 5.6%*: | ||||||||||||||||||||
Bayan Resources Tbk PT(a),(b) | 6.13 | 1/24/2023 | 900,000 | 850,521 | 921,937 | |||||||||||||||
CSN Islands XI Corp.(a),(b) | 6.75 | 1/28/2028 | 721,000 | 721,000 | 780,482 | |||||||||||||||
First Quantum Minerals Ltd.(a),(b) | 6.88 | 10/15/2027 | 610,000 | 610,000 | 661,850 | |||||||||||||||
First Quantum Minerals Ltd.(a),(b) | 7.50 | 4/1/2025 | 250,000 | 246,766 | 260,313 | |||||||||||||||
Metinvest BV(a),(b) | 5.63 | 6/17/2025 | 750,000 | 816,347 | 955,178 | |||||||||||||||
Vedanta Resources Finance II plc(a),(b) | 9.25 | 4/23/2026 | 550,000 | 548,160 | 407,000 | |||||||||||||||
Vedanta Resources Finance II plc(a),(b) | 13.88 | 1/21/2024 | 400,000 | 399,834 | 422,600 | |||||||||||||||
|
|
|
|
|
| |||||||||||||||
Total Mining | 4,181,000 | 4,192,628 | 4,409,360 | |||||||||||||||||
|
|
|
|
|
| |||||||||||||||
Multi-National — 1.1%*: | ||||||||||||||||||||
Asian Development Bank, TBIB6MIR(b),(e) | 2.55 | (c) | 7/14/2021 | 680,000 | 228,372 | 204,538 | ||||||||||||||
European Bank for Reconstruction & Development, GGRRC9MX—0.500%(b),(e) | 7.62 | (c) | 10/29/2022 | 1,200,000 | 404,027 | 363,927 | ||||||||||||||
International Bank for Reconstruction & Development(b),(e) | 7.25 | 11/22/2021 | 960,000 | 325,423 | 285,925 | |||||||||||||||
|
|
|
|
|
| |||||||||||||||
Total Multi-National | 2,840,000 | 957,822 | 854,390 | |||||||||||||||||
|
|
|
|
|
| |||||||||||||||
Oil and Gas — 6.7%*: | ||||||||||||||||||||
Gazprom PJSC via Gaz Finance plc, 5 year EUR Swap + 4.346%(a),(b) | 3.90 | (c),(d) | 750,000 | 881,138 | 948,924 | |||||||||||||||
Petrobras Global Finance BV(b) | 6.75 | 6/3/2050 | 300,000 | 294,364 | 371,531 | |||||||||||||||
Petrobras Global Finance BV(b) | 6.90 | 3/19/2049 | 900,000 | 968,466 | 1,140,750 | |||||||||||||||
Petroleos Mexicanos(b) | 5.95 | 1/28/2031 | 200,000 | 172,082 | 199,500 | |||||||||||||||
Petroleos Mexicanos(b) | 6.95 | 1/28/2060 | 1,304,000 | 1,203,342 | 1,226,608 | |||||||||||||||
Tullow Oil PLC(a),(b) | 6.25 | 4/15/2022 | 210,000 | 87,746 | 166,950 | |||||||||||||||
Tullow Oil plc(a),(b) | 7.00 | 3/1/2025 | 1,840,000 | 1,302,314 | 1,223,600 | |||||||||||||||
|
|
|
|
|
| |||||||||||||||
Total Oil and Gas | 5,504,000 | 4,909,452 | 5,277,863 | |||||||||||||||||
|
|
|
|
|
| |||||||||||||||
See accompanying Notes to the Financial Statements.
130
Table of Contents
Barings Emerging Markets Debt Blended Total Return Fund 2020 Semi-Annual Report
SCHEDULE OF INVESTMENTS (CONTINUED)
December 31, 2020 (Unaudited)
| EFFECTIVE INTEREST RATE | DUE DATE | PRINCIPAL ‡‡ | COST | FAIR VALUE | ||||||||||||||||
Corporate Bonds (Continued) | ||||||||||||||||||||
Oil and Gas Services — 0.7%*: | ||||||||||||||||||||
Borets Finance DAC(a),(b) | 6.00 | % | 9/17/2026 | 531,000 | $531,000 | $554,258 | ||||||||||||||
|
|
|
|
|
| |||||||||||||||
Real Estate — 1.0%*: | ||||||||||||||||||||
Kaisa Group Holdings Ltd.(b) | 11.25 | 4/9/2022 | 750,000 | 758,002 | 782,770 | |||||||||||||||
|
|
|
|
|
| |||||||||||||||
Retail — 2.7%*: | ||||||||||||||||||||
Arabian Centres Sukuk Ltd.(a),(b) | 5.38 | 11/26/2024 | 700,000 | 651,974 | 707,560 | |||||||||||||||
Eurotorg LLC Via Bonitron DAC(a),(b) | 9.00 | 10/22/2025 | 723,000 | 723,000 | 771,802 | |||||||||||||||
Future Retail Ltd.(b) | 5.60 | 1/22/2025 | 794,000 | 704,023 | 672,171 | |||||||||||||||
|
|
|
|
|
| |||||||||||||||
Total Retail | 2,217,000 | 2,078,997 | 2,151,533 | |||||||||||||||||
|
|
|
|
|
| |||||||||||||||
Sovereign — 0.6%*: | ||||||||||||||||||||
Ukreximbank Via Biz Finance plc, 5 year USD ICE Swap + 8.178%(b) | 9.95 | (c) | 11/14/2029 | 500,000 | 500,000 | 504,250 | ||||||||||||||
|
|
|
|
|
| |||||||||||||||
Telecommunications — 1.8%*: | ||||||||||||||||||||
IHS Netherlands Holdco BV(a),(b) | 8.00 | 9/18/2027 | 500,000 | 492,837 | 538,750 | |||||||||||||||
Network i2i Ltd., 5 year CMT + 4.277%(a),(b) | 5.65 | (c),(d) | 400,000 | 374,686 | 426,625 | |||||||||||||||
VF Ukraine PAT via VFU Funding plc(a),(b) | 6.20 | 2/11/2025 | 405,000 | 405,000 | 424,111 | |||||||||||||||
|
|
|
|
|
| |||||||||||||||
Total Telecommunications | 1,305,000 | 1,272,523 | 1,389,486 | |||||||||||||||||
|
|
|
|
|
| |||||||||||||||
Transportation — 1.5%*: |
| |||||||||||||||||||
ENA Master Trust(a),(b) | 4.00 | 5/19/2048 | 200,000 | 200,000 | 215,500 | |||||||||||||||
MV24 Capital BV(a),(b) | 6.75 | 6/1/2034 | 575,363 | 575,363 | 630,747 | |||||||||||||||
Prumo Participacoes e Investimentos SA(a),(b) | 7.50 | 12/31/2031 | 269,479 | 276,617 | 301,396 | |||||||||||||||
|
|
|
|
|
| |||||||||||||||
Total Transportation | 1,044,842 | 1,051,980 | 1,147,643 | |||||||||||||||||
|
|
|
|
|
| |||||||||||||||
Total Corporate Bonds | 33,196,768 | 30,274,517 | 31,384,534 | |||||||||||||||||
|
|
|
|
|
| |||||||||||||||
Foreign Government — 49.5%*: | ||||||||||||||||||||
Albania — 1.2%*: |
| |||||||||||||||||||
Albania Government International Bond(a),(b) | 3.50 | 6/16/2027 | 740,000 | 832,975 | 965,042 | |||||||||||||||
|
|
|
|
|
| |||||||||||||||
Belarus — 3.5%*: |
| |||||||||||||||||||
Republic of Belarus International Bond(a),(b) | 7.63 | 6/29/2027 | 1,000,000 | 1,027,516 | 1,098,750 | |||||||||||||||
Republic of Belarus Ministry of Finance(a),(b) | 6.38 | 2/24/2031 | 1,630,000 | 1,630,000 | 1,654,450 | |||||||||||||||
|
|
|
|
|
| |||||||||||||||
Total Belarus | 2,630,000 | 2,657,516 | 2,753,200 | |||||||||||||||||
|
|
|
|
|
| |||||||||||||||
Belize — 0.3%*: |
| |||||||||||||||||||
Brazilian Government International Bond(b) | 4.75 | 1/14/2050 | 200,000 | 207,981 | 213,375 | |||||||||||||||
|
|
|
|
|
| |||||||||||||||
Bolivia — 0.4%*: |
| |||||||||||||||||||
Bolivian Government International Bond(a),(b) | 4.50 | 3/20/2028 | 323,000 | 290,207 | 303,115 | |||||||||||||||
|
|
|
|
|
| |||||||||||||||
Brazil — 1.7%*: |
| |||||||||||||||||||
Brazil Notas do Tesouro Nacional Serie B(b) | 6.00 | 8/15/2050 | 780,000 | 659,378 | 716,815 | |||||||||||||||
Brazilian Government International Bond(b) | 5.63 | 2/21/2047 | 500,000 | 574,823 | 596,094 | |||||||||||||||
|
|
|
|
|
| |||||||||||||||
Total Brazil | 1,280,000 | 1,234,201 | 1,312,909 | |||||||||||||||||
|
|
|
|
|
| |||||||||||||||
See accompanying Notes to the Financial Statements.
131
Table of Contents
Barings Emerging Markets Debt Blended Total Return Fund 2020 Semi-Annual Report
SCHEDULE OF INVESTMENTS (CONTINUED)
December 31, 2020 (Unaudited)
| EFFECTIVE INTEREST RATE | DUE DATE | PRINCIPAL ‡‡ | COST | FAIR VALUE | ||||||||||||||||
Foreign Government (Continued) | ||||||||||||||||||||
Colombia — 2.1%*: |
| |||||||||||||||||||
Colombian TES(b) | 7.00 | % | 6/30/2032 | 1,120,400,000 | $267,529 | $360,821 | ||||||||||||||
Colombian TES(b) | 7.50 | 8/26/2026 | 2,350,000,000 | 744,548 | 792,918 | |||||||||||||||
Colombian TES(b) | 10.00 | 7/24/2024 | 1,385,600,000 | 518,441 | 492,601 | |||||||||||||||
|
|
|
|
|
| |||||||||||||||
Total Colombia | 4,856,000,000 | 1,530,518 | 1,646,340 | |||||||||||||||||
|
|
|
|
|
| |||||||||||||||
Czech Republic — 1.5%*: |
| |||||||||||||||||||
Czech Republic Government Bond(b) | 1.50 | 4/24/2040 | 27,000,000 | 1,193,450 | 1,221,930 | |||||||||||||||
|
|
|
|
|
| |||||||||||||||
Egypt — 0.6%*: |
| |||||||||||||||||||
Egypt Government International Bond(a),(b) | 6.38 | 4/11/2031 | 350,000 | 392,822 | 458,978 | |||||||||||||||
|
|
|
|
|
| |||||||||||||||
El Salvador — 2.0%*: |
| |||||||||||||||||||
El Salvador Government International Bond(a),(b) | 7.65 | 6/15/2035 | 700,000 | 511,116 | 658,875 | |||||||||||||||
El Salvador Government International Bonds(a),(b) | 8.25 | 4/10/2032 | 230,000 | 244,630 | 225,185 | |||||||||||||||
El Salvador Government International Bonds(a),(b) | 8.63 | 2/28/2029 | 670,000 | 763,111 | 667,906 | |||||||||||||||
|
|
|
|
|
| |||||||||||||||
Total El Salvador | 1,600,000 | 1,518,857 | 1,551,966 | |||||||||||||||||
|
|
|
|
|
| |||||||||||||||
Hungary — 0.7%*: |
| |||||||||||||||||||
Hungary Government International Bond(b) | 1.50 | 11/17/2050 | 460,000 | 523,429 | 568,673 | |||||||||||||||
|
|
|
|
|
| |||||||||||||||
Israel — 2.2%*: |
| |||||||||||||||||||
Israel Government Bond(b) | 5.50 | 1/31/2042 | 3,250,000 | 1,660,389 | 1,730,987 | |||||||||||||||
|
|
|
|
|
| |||||||||||||||
Ivory Coast — 1.4%*: |
| |||||||||||||||||||
Ivory Coast Government International Bond(a),(b) | 5.88 | 10/17/2031 | 550,000 | 599,973 | 742,248 | |||||||||||||||
Ivory Coast Government International Bond(a),(b) | 6.63 | 3/22/2048 | 300,000 | 385,208 | 405,320 | |||||||||||||||
|
|
|
|
|
| |||||||||||||||
Total Ivory Coast | 850,000 | 985,181 | 1,147,568 | |||||||||||||||||
|
|
|
|
|
| |||||||||||||||
Jordan — 1.4%*: |
| |||||||||||||||||||
Jordan Government International Bond(a),(b) | 5.85 | 7/7/2030 | 1,030,000 | 1,030,000 | 1,135,575 | |||||||||||||||
|
|
|
|
|
| |||||||||||||||
Kenya — 0.9%*: |
| |||||||||||||||||||
Kenya Government International Bond(a),(b) | 8.25 | 2/28/2048 | 600,000 | 655,264 | 689,437 | |||||||||||||||
|
|
|
|
|
| |||||||||||||||
Macedonia — 0.9%*: |
| |||||||||||||||||||
North Macedonia Government International Bond(a),(b) | 3.68 | 6/3/2026 | 550,000 | 596,991 | 751,697 | |||||||||||||||
|
|
|
|
|
| |||||||||||||||
Malaysia — 2.1%*: |
| |||||||||||||||||||
Malaysia Government Bond(b) | 3.96 | 9/15/2025 | 3,502,000 | 869,683 | 940,795 | |||||||||||||||
Malaysia Government Bond(b) | 4.94 | 9/30/2043 | 2,500,000 | 719,361 | 725,412 | |||||||||||||||
|
|
|
|
|
| |||||||||||||||
Total Malaysia | 6,002,000 | 1,589,044 | 1,666,207 | |||||||||||||||||
|
|
|
|
|
| |||||||||||||||
See accompanying Notes to the Financial Statements.
132
Table of Contents
Barings Emerging Markets Debt Blended Total Return Fund 2020 Semi-Annual Report
SCHEDULE OF INVESTMENTS (CONTINUED)
December 31, 2020 (Unaudited)
| EFFECTIVE INTEREST RATE | DUE DATE | PRINCIPAL ‡‡ | COST | FAIR VALUE | ||||||||||||||||
Foreign Government (Continued) | ||||||||||||||||||||
Mexico — 5.2%*: |
| |||||||||||||||||||
Mexican Bonos(b) | 5.75 | % | 3/5/2026 | 14,500,000 | $737,789 | $760,673 | ||||||||||||||
Mexican Bonos(b) | 7.75 | 11/13/2042 | 23,900,000 | 1,004,829 | 1,377,536 | |||||||||||||||
Mexican Bonos(b) | 8.00 | 9/5/2024 | 3,200,000 | 140,968 | 179,531 | |||||||||||||||
Mexican Bonos(b) | 8.00 | 11/7/2047 | 30,000,000 | 1,391,998 | 1,770,510 | |||||||||||||||
|
|
|
|
|
| |||||||||||||||
Total Mexico | 71,600,000 | 3,275,584 | 4,088,250 | |||||||||||||||||
|
|
|
|
|
| |||||||||||||||
Morocco — 0.8%*: |
| |||||||||||||||||||
Morocco Government International Bond(a),(b) | 2.00 | 9/30/2030 | 530,000 | 611,832 | 655,274 | |||||||||||||||
|
|
|
|
|
| |||||||||||||||
Peru — 1.5%*: |
| |||||||||||||||||||
Peru Government Bond(b) | 6.85 | 2/12/2042 | 3,633,000 | 1,274,400 | 1,226,080 | |||||||||||||||
|
|
|
|
|
| |||||||||||||||
Romania — 2.4%*: |
| |||||||||||||||||||
Romania Government Bond(b) | 3.65 | 9/24/2031 | 2,500,000 | 588,707 | 647,347 | |||||||||||||||
Romanian Government International Bond(a),(b) | 4.63 | 4/3/2049 | 750,000 | 1,112,314 | 1,235,821 | |||||||||||||||
|
|
|
|
|
| |||||||||||||||
Total Romania | 3,250,000 | 1,701,021 | 1,883,168 | |||||||||||||||||
|
|
|
|
|
| |||||||||||||||
Serbia — 1.2%*: |
| |||||||||||||||||||
Serbia International Bond(a),(b) | 3.13 | 5/15/2027 | 680,000 | 725,108 | 932,486 | |||||||||||||||
|
|
|
|
|
| |||||||||||||||
South Africa — 7.2%*: |
| |||||||||||||||||||
Republic of South Africa Government Bond(b) | 8.75 | 1/31/2044 | 63,000,000 | 3,498,441 | 3,507,546 | |||||||||||||||
Republic of South Africa Government Bond(b) | 10.50 | 12/21/2026 | 27,000,000 | 1,699,500 | 2,177,841 | |||||||||||||||
|
|
|
|
|
| |||||||||||||||
Total South Africa | 90,000,000 | 5,197,941 | 5,685,387 | |||||||||||||||||
|
|
|
|
|
| |||||||||||||||
Tajikistan — 0.2%*: |
| |||||||||||||||||||
Republic of Tajikistan International Bond(a),(b) | 7.13 | 9/14/2027 | 200,000 | 158,340 | 170,687 | |||||||||||||||
|
|
|
|
|
| |||||||||||||||
Thailand — 2.3%*: | ||||||||||||||||||||
Thailand Government Bond(b) | 1.60 | 12/17/2029 | 28,105,000 | 918,088 | 962,711 | |||||||||||||||
Thailand Government Bond(b) | 2.88 | 12/17/2028 | 22,913,000 | 807,653 | 870,613 | |||||||||||||||
|
|
|
|
|
| |||||||||||||||
Total Thailand | 51,018,000 | 1,725,741 | 1,833,324 | |||||||||||||||||
|
|
|
|
|
| |||||||||||||||
Tunisia — 0.7%*: | ||||||||||||||||||||
Banque Centrale de Tunisie International Bond(a),(b) | 6.38 | 7/15/2026 | 510,000 | 567,970 | 568,915 | |||||||||||||||
|
|
|
|
|
| |||||||||||||||
Ukraine — 3.3%*: | ||||||||||||||||||||
Ukraine Government International Bonds(a),(b) | 4.38 | 1/27/2030 | 1,250,000 | 1,387,457 | 1,456,913 | |||||||||||||||
Ukraine Government International Bonds(a),(b) | 9.75 | 11/1/2028 | 960,000 | 933,193 | 1,180,800 | |||||||||||||||
|
|
|
|
|
| |||||||||||||||
Total Ukraine | 2,210,000 | 2,320,650 | 2,637,713 | |||||||||||||||||
|
|
|
|
|
| |||||||||||||||
Uruguay — 1.5%*: | ||||||||||||||||||||
Uruguay Government International Bond(b) | 3.88 | 7/2/2040 | 20,894,571 | 488,055 | 575,247 | |||||||||||||||
Uruguay Government International Bond(b) | 4.38 | 12/15/2028 | 21,598,058 | 564,148 | 584,716 | |||||||||||||||
|
|
|
|
|
| |||||||||||||||
Total Uruguay | 42,492,629 | 1,052,203 | 1,159,963 | |||||||||||||||||
|
|
|
|
|
| |||||||||||||||
See accompanying Notes to the Financial Statements.
133
Table of Contents
Barings Emerging Markets Debt Blended Total Return Fund 2020 Semi-Annual Report
SCHEDULE OF INVESTMENTS (CONTINUED)
December 31, 2020 (Unaudited)
| EFFECTIVE INTEREST RATE | DUE DATE | PRINCIPAL ‡‡ | COST | FAIR VALUE | ||||||||||||||||
Foreign Government (Continued) | ||||||||||||||||||||
Uzbekistan — 0.3%*: | ||||||||||||||||||||
Republic of Uzbekistan Bond(a),(b) | 3.70 | % | 11/25/2030 | 250,000 | $250,000 | $263,125 | ||||||||||||||
Total Foreign Government | 5,169,238,629 | 35,759,615 | 39,221,371 | |||||||||||||||||
|
|
|
|
|
| |||||||||||||||
Total Fixed Income | 5,202,435,397 | 66,034,132 | 70,605,905 | |||||||||||||||||
|
|
|
|
|
| |||||||||||||||
Total Investments | 5,202,435,397 | 66,034,132 | 70,605,905 | |||||||||||||||||
|
|
|
|
|
| |||||||||||||||
Other assets and liabilities – 10.8%* |
| 8,555,762 | ||||||||||||||||||
|
| |||||||||||||||||||
Net Assets – 100.0% | $79,161,667 | |||||||||||||||||||
|
| |||||||||||||||||||
| ‡‡ | Unless otherwise indicated, all principal amounts are denominated in United States Dollars. |
| * | Calculated as a percentage of net assets applicable to common shareholders. |
| (a) | Security acquired in a transaction exempt from registration under Rule 144A of the Securities Act of 1933. These securities may only be resold in transactions exempt from registration, normally to qualified institutional buyers. |
| (b) | Foreign security. |
Distributions of investments by country of risk (excluding temporary cash investments) as a percentage of total investments in securities, is as follows: |
| Mexico | 11.7% | |||
| Brazil | 8.4% | |||
| South Africa | 8.1% | |||
| Ukraine | 7.2% | |||
| Russia | 5.5% | |||
| Belarus | 5.0% | |||
| India | 4.2% | |||
| Thailand | 4.0% | |||
| Romania | 2.7% | |||
| Israel | 2.5% | |||
| Malaysia | 2.4% | |||
| Colombia | 2.3% | |||
| El Salvador | 2.2% | |||
| Ghana | 2.0% | |||
| China | 1.9% | |||
| Peru | 1.7% | |||
| Czech Republic | 1.7% | |||
| Uruguay | 1.6% | |||
| Ivory Coast | 1.6% | |||
| Jordan | 1.6% | |||
| Greece | 1.4% | |||
| Albania | 1.4% | |||
| Serbia | 1.3% | |||
| Zambia | 1.3% | |||
| Indonesia | 1.3% | |||
| Supranational | 1.2% | |||
| Uzbekistan | 1.1% |
See accompanying Notes to the Financial Statements.
134
Table of Contents
Barings Emerging Markets Debt Blended Total Return Fund 2020 Semi-Annual Report
SCHEDULE OF INVESTMENTS (CONTINUED)
December 31, 2020 (Unaudited)
| Macedonia | 1.1% | |||||
| Saudi Arabia | 1.0% | |||||
| Kenya | 1.0% | |||||
| Other (Individually less than 1%) | 9.6% | |||||
|
| |||||
| Total | 100.0% | |||||
|
|
| (c) | Variable rate security. The interest rate shown is the rate in effect at December 31, 2020. |
| (d) | Security is perpetual in nature and has no stated maturity. |
| (e) | For fair value measurement disclosure purposes, security is categorized as Level 3 (See Note 2). |
A summary of outstanding derivatives at December 31, 2020 is as follows:
Forward Foreign Currency Exchange Contracts to Buy
| EXPIRATION DATE | COUNTERPARTY | LOCAL CURRENCY | VALUE IN USD | IN EXCHANGE FOR USD | NET UNREALIZED APPRECIATION (DEPRECIATION) | |||||||||||||||||
| 1/27/21 | Bank of America N.A. | AUD | 2,602,246 | $ | 2,006,720 | $ | 1,868,637 | $ | 138,083 | |||||||||||||
| 2/23/21 | Morgan Stanley & Co. | AUD | 2,336,846 | 1,802,417 | 1,709,282 | 93,135 | ||||||||||||||||
| 2/23/21 | Goldman Sachs & Co. | AUD | 666,770 | 514,282 | 492,000 | 22,282 | ||||||||||||||||
| 1/12/21 | JPMorgan Chase Bank N.A. | BRL | 235,118 | 45,273 | 41,390 | 3,883 | ||||||||||||||||
| 2/9/21 | Citibank N.A. | BRL | 36,857,998 | 7,092,422 | 6,545,238 | 547,184 | ||||||||||||||||
| 1/12/21 | Citibank N.A. | COP | 4,045,777,459 | 1,184,534 | 1,145,788 | 38,746 | ||||||||||||||||
| 2/9/21 | Citibank N.A. | COP | 990,166,114 | 289,873 | 280,175 | 9,698 | ||||||||||||||||
| 2/16/21 | Bank of America N.A. | EUR | 1,951,611 | 2,386,537 | 2,316,963 | 69,574 | ||||||||||||||||
| 2/16/21 | Morgan Stanley & Co. | EUR | 29,716 | 36,338 | 36,000 | 338 | ||||||||||||||||
| 2/23/21 | Goldman Sachs & Co. | INR | 9,586,764 | 130,605 | 129,000 | 1,605 | ||||||||||||||||
| 2/23/21 | Citibank N.A. | INR | 258,764,005 | 3,525,268 | 3,478,153 | 47,115 | ||||||||||||||||
| 1/12/21 | Goldman Sachs & Co. | MXN | 52,687,690 | 2,645,403 | 2,318,901 | 326,502 | ||||||||||||||||
| 2/8/21 | JPMorgan Chase Bank N.A. | PKR | 53,735,115 | 334,174 | 334,590 | (416 | ) | |||||||||||||||
| 2/18/21 | JPMorgan Chase Bank N.A. | PKR | 53,735,115 | 333,427 | 334,174 | (747 | ) | |||||||||||||||
| 1/19/21 | HSBC Bank USA | PLN | 5,936,395 | 1,589,276 | 1,551,000 | 38,276 | ||||||||||||||||
| 1/19/21 | Bank of America N.A. | PLN | 11,922,060 | 3,191,743 | 3,131,862 | 59,881 | ||||||||||||||||
| 2/16/21 | Bank of America N.A. | PLN | 6,792,070 | 1,818,554 | 1,798,191 | 20,363 | ||||||||||||||||
| 2/16/21 | Goldman Sachs & Co. | PLN | 851,478 | 227,980 | 230,000 | (2,020 | ) | |||||||||||||||
| 1/19/21 | Morgan Stanley & Co. | RUB | 236,204,500 | 3,191,167 | 3,110,000 | 81,167 | ||||||||||||||||
| 2/16/21 | Bank of America N.A. | RUB | 172,783,686 | 2,325,465 | 2,334,000 | (8,535 | ) | |||||||||||||||
|
| |||||||||||||||||||||
Net unrealized appreciation on forward foreign currency exchange contracts to buy | $ | 1,486,114 | ||||||||||||||||||||
|
| |||||||||||||||||||||
See accompanying Notes to the Financial Statements.
135
Table of Contents
Barings Emerging Markets Debt Blended Total Return Fund 2020 Semi-Annual Report
SCHEDULE OF INVESTMENTS (CONTINUED)
December 31, 2020 (Unaudited)
Forward Foreign Currency Exchange Contracts to Sell
| EXPIRATION DATE | COUNTERPARTY | LOCAL CURRENCY | VALUE IN USD | IN EXCHANGE FOR USD | NET UNREALIZED APPRECIATION (DEPRECIATION) | |||||||||||||||||
| 1/19/21 | JPMorgan Chase Bank N.A. | CHF | 924,393 | $ | 1,044,623 | $ | 1,011,493 | $ | (33,130 | ) | ||||||||||||
| 2/16/21 | Bank of America N.A. | CHF | 1,658,636 | 1,875,909 | 1,818,706 | (57,203 | ) | |||||||||||||||
| 1/12/21 | Citibank N.A. | COP | 4,045,777,459 | 1,184,534 | 1,035,825 | (148,709 | ) | |||||||||||||||
| 2/9/21 | Citibank N.A. | COP | 6,434,561,800 | 1,883,731 | 1,753,000 | (130,731 | ) | |||||||||||||||
| 2/16/21 | Morgan Stanley & Co. | CZK | 9,510,010 | 442,844 | 424,804 | (18,040 | ) | |||||||||||||||
| 1/19/21 | Goldman Sachs & Co. | ILS | 675,478 | 210,257 | 200,000 | (10,257 | ) | |||||||||||||||
| 1/19/21 | Bank of America N.A. | ILS | 11,737,114 | 3,653,423 | 3,568,000 | (85,423 | ) | |||||||||||||||
| 2/16/21 | HSBC Bank USA | ILS | 15,810,954 | 4,923,917 | 4,691,330 | (232,587 | ) | |||||||||||||||
| 1/26/21 | Bank of America N.A. | JPY | 21,784,514 | 211,033 | 207,000 | (4,033 | ) | |||||||||||||||
| 2/24/21 | Morgan Stanley & Co. | JPY | 318,925,964 | 3,090,491 | 3,078,847 | (11,644 | ) | |||||||||||||||
| 2/24/21 | Goldman Sachs & Co. | JPY | 18,467,861 | 178,959 | 177,000 | (1,959 | ) | |||||||||||||||
| 1/12/21 | Bank of America N.A. | MXN | 52,687,690 | 2,645,403 | 2,445,930 | (199,473 | ) | |||||||||||||||
| 1/19/21 | Goldman Sachs & Co. | RUB | 141,456,996 | 1,911,110 | 1,792,603 | (118,507 | ) | |||||||||||||||
| 1/26/21 | JPMorgan Chase Bank N.A. | SGD | 571,502 | 432,440 | 421,613 | (10,827 | ) | |||||||||||||||
| 2/23/21 | Citibank N.A. | SGD | 3,227,631 | 2,442,313 | 2,406,875 | (35,438 | ) | |||||||||||||||
| 1/19/21 | Bank of America N.A. | ZAR | 51,246,211 | 3,479,830 | 3,064,800 | (415,030 | ) | |||||||||||||||
| 1/19/21 | Goldman Sachs & Co. | ZAR | 32,776,127 | 2,225,636 | 2,225,714 | 78 | ||||||||||||||||
|
| |||||||||||||||||||||
Net unrealized depreciation on forward foreign currency exchange contracts to sell | $ | (1,512,913 | ) | |||||||||||||||||||
|
| |||||||||||||||||||||
Currency Legend
| AUD | – | Australian Dollar | ||
| BRL | – | Brazilian Real | ||
| CHF | – | Swiss Franc | ||
| COP | – | Colombian Peso | ||
| CZK | – | Czech Koruna | ||
| EUR | – | Euro | ||
| ILS | – | Israeli Shekel | ||
| INR | – | Indian Rupee | ||
| JPY | – | Japanes1e Yen | ||
| MXN | – | Mexican Peso | ||
| PKR | – | Pakistan Rupee | ||
| PLN | – | Polish Zloty | ||
| RUB | – | Russian Ruble | ||
| SGD | – | Singapore Dollar | ||
| ZAR | – | South African Rand |
See accompanying Notes to the Financial Statements.
136
Table of Contents
Barings Emerging Markets Debt Blended Total Return Fund 2020 Semi-Annual Report
SCHEDULE OF INVESTMENTS (CONTINUED)
December 31, 2020 (Unaudited)
FUTURES
| TYPE | EXPIRATION DATE | CONTRACTS | NOTIONAL AMOUNT | POSITION | FAIR VALUE | UNREALIZED APPRECIATION | ||||||||||||||||||
Short Future | ||||||||||||||||||||||||
| U.S. Ultra Bond | 03/22/21 | 13 | (2,823,532 | ) | Short | $ | (2,776,313 | ) | $ | 47,219 | ||||||||||||||
|
| |||||||||||||||||||||||
Centrally Cleared Interest Rate Swaps
| FLOATING RATE REFERENCE | PAY/RECEIVE FLOATING RATE | FIXED RATE | MATURITY DATE | PAY/RECEIVE PAYMENT FREQUENCY | NOTIONAL AMOUNT | CLEARED EXCHANGE | UNREALIZED DEPRECIATION | |||||||||||||||||||||||||
PLN-LIBOR Rate | Receive | 0.19 | % | 10/30/2022 | 1Y/6M | 25,100,000 | LCH | $ | 1,491 | |||||||||||||||||||||||
CZK-PRIBOR Rate | Pay | 1.94 | % | 01/24/2025 | 1Y/6M | 117,500,000 | CME | 298,645 | ||||||||||||||||||||||||
PLN-LIBOR Rate | Pay | 0.90 | % | 10/30/2030 | 6M/1Y | 5,200,000 | LCH | (20,533 | ) | |||||||||||||||||||||||
THB-THBFIX Rate | Pay | 0.73 | % | 07/13/2025 | 6M/6M | 27,300,000 | LCH | 6,235 | ||||||||||||||||||||||||
THB-THBFIX Rate | Pay | 0.72 | % | 07/13/2025 | 6M/6M | 27,300,000 | LCH | 5,784 | ||||||||||||||||||||||||
THB-THBFIX Rate | Pay | 1.50 | % | 09/08/2030 | 6M/6M | 33,191,000 | LCH | (1,765 | ) | |||||||||||||||||||||||
THB-THBFIX Rate | Pay | 1.51 | % | 09/10/2030 | 6M/6M | 49,455,000 | LCH | (2,293 | ) | |||||||||||||||||||||||
BRL-CDI Rate | Pay | 7.49 | % | 01/02/2029 | At Maturity | 9,935,952 | CME | 182,541 | ||||||||||||||||||||||||
BRL-CDI Rate | Pay | 7.48 | % | 01/02/2029 | At Maturity | 989,335 | CME | 17,967 | ||||||||||||||||||||||||
BRL-CDI Rate | Pay | 5.00 | % | 01/02/2023 | At Maturity | 10,352,374 | CME | 42,702 | ||||||||||||||||||||||||
BRL-CDI Rate | Pay | 5.00 | % | 01/02/2023 | At Maturity | 15,843,633 | CME | 65,353 | ||||||||||||||||||||||||
BRL-CDI Rate | Pay | 4.98 | % | 01/02/2023 | At Maturity | 7,925,069 | CME | 32,042 | ||||||||||||||||||||||||
BRL-CDI Rate | Pay | 6.38 | % | 01/02/2023 | At Maturity | 15,433,848 | CME | 263,537 | ||||||||||||||||||||||||
|
| |||||||||||||||||||||||||||||||
Total Centrally Cleared Interest Rate Swaps |
| $ | 891,706 | |||||||||||||||||||||||||||||
|
| |||||||||||||||||||||||||||||||
OTC Cross Currency Swaps
| NOTIONAL AMOUNT | FUND PAYS | PAY/ RECEIVE PAYMENT FREQUENCY | MATURITY DATE | COUNTERPARTY | NOTIONAL AMOUNT | FUND RECEIVES | UPFRONT PREMIUMS PAID/ (RECEIVED) | FAIR VALUE | UNREALIZED APPRECIATION (DEPRECIATION) | |||||||||||||||||||||||||||||||||
303,000 EUR | 6.38 | % | 1Y/6M | 07/15/2026 | Citibank N.A. | 359,358 | 7.58 | % | $ | (136 | ) | $ | (16,291 | ) | $ | (16,155 | ) | |||||||||||||||||||||||||
250,000 EUR | 4.63 | % | 1Y/6M | 04/03/2049 | Citibank N.A. | 296,250 | 6.65 | % | 100 | (72,158 | ) | (72,258 | ) | |||||||||||||||||||||||||||||
207,000 EUR | 6.38 | % | 1Y/6M | 07/15/2026 | Citibank N.A. | 245,088 | 7.58 | % | 818 | (11,775 | ) | (12,593 | ) | |||||||||||||||||||||||||||||
500,000 EUR | 4.63 | % | 1Y/6M | 04/03/2049 | Citibank N.A. | 586,750 | 6.86 | % | (675 | ) | (127,364 | ) | (126,689 | ) | ||||||||||||||||||||||||||||
750,000 EUR | 3.90 | % | 1Y/6M | 01/26/2026 | Citibank N.A. | 880,875 | 5.06 | % | (713 | ) | (43,493 | ) | (42,781 | ) | ||||||||||||||||||||||||||||
362,000 EUR | 2.00 | % | 1Y/6M | 09/30/2030 | Citibank N.A. | 429,332 | 3.47 | % | (109 | ) | (18,686 | ) | (18,577 | ) | ||||||||||||||||||||||||||||
168,000 EUR | 2.00 | % | 1Y/6M | 09/30/2030 | Citibank N.A. | 198,408 | 3.43 | % | 50 | (10,428 | ) | (10,478 | ) | |||||||||||||||||||||||||||||
740,000 EUR | 3.50 | % | 1Y/6M | 06/16/2027 | Citibank N.A. | 839,530 | 4.74 | % | 629 | (104,099 | ) | (104,727 | ) | |||||||||||||||||||||||||||||
550,000 EUR | 3.68 | % | 1Y/6M | 06/03/2026 | Citibank N.A. | 604,450 | 4.79 | % | (467 | ) | (99,498 | ) | (99,031 | ) | ||||||||||||||||||||||||||||
680,000 EUR | 3.13 | % | 1Y/6M | 05/15/2027 | Citibank N.A. | 735,081 | 4.32 | % | (339 | ) | (138,389 | ) | (138,050 | ) | ||||||||||||||||||||||||||||
350,000 EUR | 6.38 | % | 1Y/6M | 04/11/2031 | Citibank N.A. | 392,700 | 9.37 | % | (122 | ) | (28,401 | ) | (28,279 | ) | ||||||||||||||||||||||||||||
1,250,000 EUR | 4.38 | % | 1Y/6M | 01/27/2030 | Citibank N.A. | 1,385,625 | 6.70 | % | (938 | ) | (147,014 | ) | (146,076 | ) | ||||||||||||||||||||||||||||
400,000 EUR | 3.65 | % | 1Y/6M | 11/19/2029 | Citibank N.A. | 440,600 | 6.02 | % | 200 | (36,161 | ) | (36,360 | ) | |||||||||||||||||||||||||||||
550,000 EUR | 5.88 | % | 1Y/6M | 10/17/2031 | Citibank N.A. | 605,000 | 8.46 | % | (495 | ) | (68,409 | ) | (67,914 | ) | ||||||||||||||||||||||||||||
750,000 EUR | 5.63 | % | 1Y/6M | 06/17/2025 | Citibank N.A. | 819,150 | 8.12 | % | (1,088 | ) | (74,987 | ) | (73,899 | ) | ||||||||||||||||||||||||||||
317,000 EUR | 6.75 | % | 1Y/6M | 08/01/2024 | Citibank N.A. | 353,011 | 9.71 | % | (365 | ) | (16,347 | ) | (15,983 | ) | ||||||||||||||||||||||||||||
750,000 EUR | 8.25 | % | 1Y/6M | 07/18/2029 | Citibank N.A. | 843,675 | 11.44 | % | (525 | ) | (23,562 | ) | (23,037 | ) | ||||||||||||||||||||||||||||
See accompanying Notes to the Financial Statements.
137
Table of Contents
Barings Emerging Markets Debt Blended Total Return Fund 2020 Semi-Annual Report
SCHEDULE OF INVESTMENTS (CONTINUED)
December 31, 2020 (Unaudited)
| NOTIONAL AMOUNT | FUND PAYS | PAY/ RECEIVE PAYMENT FREQUENCY | MATURITY DATE | COUNTERPARTY | NOTIONAL AMOUNT | FUND RECEIVES | UPFRONT PREMIUMS PAID/ (RECEIVED) | FAIR VALUE | UNREALIZED APPRECIATION (DEPRECIATION) | |||||||||||||||||||||||||||||||||
460,000 EUR | 1.50 | % | 1Y/6M | 11/17/2050 | JPMorgan Chase Bank N.A. | 542,800 | 3.18 | % | $ | (345 | ) | $ | (77,352 | ) | $ | (77,006 | ) | |||||||||||||||||||||||||
300,000 EUR | 6.63 | % | 1Y/6M | 03/22/2048 | JPMorgan Chase Bank N.A. | 357,600 | 9.32 | % | (105 | ) | (61,107 | ) | (61,001 | ) | ||||||||||||||||||||||||||||
|
|
|
|
|
| |||||||||||||||||||||||||||||||||||||
Total OTC Cross Currency Swaps |
| $ | (4,627 | ) | $ | (1,175,521 | ) | $ | (1,170,894 | ) | ||||||||||||||||||||||||||||||||
|
|
|
|
|
| |||||||||||||||||||||||||||||||||||||
OTC — Interest Rate Swaps
| COUNTERPARTY | NOTIONAL AMOUNT | FUND RECEIVES/ PAYS FLOATING RATE | FLOATING RATE INDEX | ANNUAL FIXED RATE | FREQUENCY OF FUND RECEIPT/ PAYMENT | MATURITY DATE | UPFRONT PREMIUMS PAID/ (RECEIVED) | VALUE | UNREALIZED APPRECIATION/ (DEPRECIATION) | |||||||||||||||||||||||||||||||||
Bank of America N.A. | CLP 1,079,754,672 | Receive | CLP-CLICP | 1.36% | 6M/6M | 09/01/2025 | $ | — | $ | (16,463 | ) | $ | (16,463 | ) | ||||||||||||||||||||||||||||
Bank of America N.A. | CLP 1,079,789,685 | Receive | CLP-CLICP | 1.36% | 6M/6M | 09/02/2025 | — | (16,783 | ) | (16,783 | ) | |||||||||||||||||||||||||||||||
Bank of America N.A. | CLP 1,079,824,321 | Receive | CLP-CLICP | 1.37% | 6M/6M | 09/03/2025 | — | (15,945 | ) | (15,945 | ) | |||||||||||||||||||||||||||||||
Bank of America N.A. | BRL 18,084,492 | Pay | BRL-CDI | 5.88% | 6M/6M | 01/02/2023 | — | 243,610 | 243,610 | |||||||||||||||||||||||||||||||||
|
|
|
|
|
| |||||||||||||||||||||||||||||||||||||
Total OTC Interest Rate Swaps |
| $ | — | $ | 194,419 | $ | 194,419 | |||||||||||||||||||||||||||||||||||
|
|
|
|
|
| |||||||||||||||||||||||||||||||||||||
OTC Credit Default Swaps — Sell Protection(1)
| REFERENCE OBLIGATION | FIXED-DEAL RECEIVED RATE | PAYMENT FREQUENCY | MATURITY DATE | COUNTERPARTY | ORIGINAL NOTIONAL AMOUNT | CURRENT NOTIONAL AMOUNT(2) | UPFRONT PREMIUMS PAID/ (RECEIVED) | FAIR VALUE(3) | UNREALIZED APPRECIATION | |||||||||||||||||||||||||||||||||
Brazil Government International Bond | 1.00 | % | 3M | 12/20/2025 | Morgan Stanley & Co. | 1,530,000 | 1,530,000 | $ | (75,056 | ) | $ | (30,640 | ) | $ | 44,416 | |||||||||||||||||||||||||||
Brazil Government International Bond | 1.00 | % | 3M | 12/20/2025 | Morgan Stanley & Co. | 1,110,000 | 1,110,000 | (85,059 | ) | (43,086 | ) | 41,973 | ||||||||||||||||||||||||||||||
Colombia Government International Bond | 1.00 | % | 3M | 12/20/2025 | Bank of America N.A. | 1,530,000 | 1,530,000 | (18,725 | ) | 9,266 | 27,991 | |||||||||||||||||||||||||||||||
Indonesia Government International Bond | 1.00 | % | 3M | 12/20/2025 | Morgan Stanley & Co. | 3,080,000 | 3,080,000 | (14,529 | ) | 49,251 | 63,780 | |||||||||||||||||||||||||||||||
Mexico Government International Bond | 1.00 | % | 3M | 12/20/2025 | Morgan Stanley & Co. | 2,045,000 | 2,045,000 | (24,010 | ) | 19,555 | 43,565 | |||||||||||||||||||||||||||||||
|
|
|
|
|
| |||||||||||||||||||||||||||||||||||||
Total OTC Credit Default Swaps |
| $ | (217,379 | ) | 4,346 | $ | 221,725 | |||||||||||||||||||||||||||||||||||
|
|
|
|
|
| |||||||||||||||||||||||||||||||||||||
| (1) | If the Fund is a seller of protection and a credit event occurs, as defined under the terms of that particular swap agreement, the Fund will either (i) pay to the buyer of protection an amount equal to the notional amount of the swap and take delivery of the referenced obligation or underlying securities comprising the referenced index or (ii) pay a net settlement amount in the form of cash or securities equal to the notional amount of the swap less the recovery value of the referenced obligation or underlying securities comprising the referenced index. |
See accompanying Notes to the Financial Statements.
138
Table of Contents
Barings Emerging Markets Debt Blended Total Return Fund 2020 Semi-Annual Report
SCHEDULE OF INVESTMENTS (CONTINUED)
December 31, 2020 (Unaudited)
| (2) | The maximum potential amount the Portfolio could be required to make as a seller of credit protection or receive as a buyer of credit event as defined under the terms of that particular swap agreement. |
| (3) | The quoted market prices and resulting values for credit default swap agreements on asset-backed securities and credit indices serve as an indicator of the current status of the payment/performance risk and represent the expected amount paid or received for the credit derivative if the amount of the swap agreement was closed/sold as of the period end. Increasing market values, in absolute terms when compared to the notional amount of the swap, represent a deterioration of the referenced entity’s credit soundness and a greater likelihood or risk of default or other credit event occurring as defined under the terms of the agreements. |
Abbreviation Legend
| OTC | Over the Counter |
See accompanying Notes to the Financial Statements.
139
Table of Contents
Barings Global Emerging Markets Equity Fund 2020 Semi-Annual Report
SCHEDULE OF INVESTMENTS
December 31, 2020 (Unaudited)
| SHARES | COST | FAIR VALUE | ||||||||||
Equities — 95.5%*: | ||||||||||||
Common Stocks — 95.5%*: | ||||||||||||
Communication Services — 11.7%*: | ||||||||||||
Mail.Ru Group Ltd.(a),(b) | 5,891 | $145,728 | $154,933 | |||||||||
NetEase, Inc.(b) | 1,528 | 149,644 | 146,337 | |||||||||
PT Telekomunikasi Indonesia Persero Tbk(b) | 497,400 | 135,601 | 117,181 | |||||||||
Tencent Holdings Ltd.(b) | 15,600 | 644,632 | 1,134,919 | |||||||||
|
|
|
|
|
| |||||||
Total Communication Services | 520,419 | 1,075,605 | 1,553,370 | |||||||||
|
|
|
|
|
| |||||||
Consumer Discretionary — 14.6%*: | ||||||||||||
Alibaba Group Holding Ltd.(a),(b) | 4,353 | 716,705 | 1,013,074 | |||||||||
New Oriental Education & Technology Group, Inc.(a),(b) | 786 | 120,474 | 146,046 | |||||||||
Prosus NV(b) | 1,999 | 151,130 | 215,782 | |||||||||
Samsonite International SA(a),(b),(c) | 96,900 | 206,895 | 171,740 | |||||||||
Topsports International Holdings Ltd.(b),(c) | 189,000 | 224,491 | 282,801 | |||||||||
Yum China Holdings, Inc.(b) | 2,035 | 118,345 | 116,178 | |||||||||
|
|
|
|
|
| |||||||
Total Consumer Discretionary | 295,073 | 1,538,040 | 1,945,621 | |||||||||
|
|
|
|
|
| |||||||
Consumer Staples — 3.4%*: | ||||||||||||
Atacadao SA(b) | 36,000 | 130,639 | 134,388 | |||||||||
CP ALL Public Company Limited(a),(b) | 71,600 | 150,312 | 139,209 | |||||||||
Magnit PJSC(b) | 2,328 | 140,628 | 178,442 | |||||||||
|
|
|
|
|
| |||||||
Total Consumer Staples | 109,928 | 421,579 | 452,039 | |||||||||
|
|
|
|
|
| |||||||
Energy — 4.1%*: | ||||||||||||
CNOOC Ltd.(b) | 154,000 | 271,158 | 142,628 | |||||||||
Reliance Industries Ltd.(b),(c) | 7,307 | 241,603 | 399,693 | |||||||||
|
|
|
|
|
| |||||||
Total Energy | 161,307 | 512,761 | 542,321 | |||||||||
|
|
|
|
|
| |||||||
Financials — 25.7%*: | ||||||||||||
AIA Group Ltd.(b) | 21,000 | 174,126 | 257,338 | |||||||||
B3 SA – Brasil Bolsa Balcao(b) | 21,207 | 130,128 | 253,053 | |||||||||
China Construction Bank Corp.(b) | 454,000 | 376,153 | 344,931 | |||||||||
China Pacific Insurance Group Co. Ltd.(b) | 41,800 | 146,124 | 163,642 | |||||||||
Grupo Financiero Banorte SAB de CV(a),(b) | 41,427 | 240,863 | 228,271 | |||||||||
Hana Financial Group, Inc.(b) | 6,409 | 218,118 | 203,545 | |||||||||
HDFC Bank Ltd.(a),(b) | 8,296 | 387,809 | 599,469 | |||||||||
Itau Unibanco Holding SA(b) | 30,735 | 193,827 | 187,176 | |||||||||
Mega Financial Holding Co. Ltd.(b) | 213,000 | 182,642 | 225,902 | |||||||||
Ping An Insurance Group Co. of China Ltd.(b) | 32,000 | 304,143 | 392,134 | |||||||||
PT Bank Negara Indonesia Persero Tbk(b) | 443,700 | 218,213 | 195,007 | |||||||||
Sanlam Ltd.(b) | 53,876 | 247,227 | 215,394 | |||||||||
Sberbank of Russia PJSC(b) | 10,509 | 119,730 | 152,381 | |||||||||
|
|
|
|
|
| |||||||
Total Financials | 1,377,959 | 2,939,103 | 3,418,243 | |||||||||
|
|
|
|
|
| |||||||
Industrials — 1.2%*: | ||||||||||||
China State Construction International Holdings Ltd.(b) | 12,000 | 11,351 | 6,842 | |||||||||
NARI Technology Co. Ltd.(b) | 18,400 | 67,636 | 74,756 | |||||||||
See accompanying Notes to the Financial Statements.
140
Table of Contents
Barings Global Emerging Markets Equity Fund 2020 Semi-Annual Report
SCHEDULE OF INVESTMENTS (CONTINUED)
December 31, 2020 (Unaudited)
| SHARES | COST | FAIR VALUE | ||||||||||
Common Stocks (Continued) | ||||||||||||
Industrials (Continued) | ||||||||||||
Rumo SA(a),(b) | 22,985 | $79,872 | $85,139 | |||||||||
|
|
|
|
|
| |||||||
Total Industrials | 53,385 | 158,859 | 166,737 | |||||||||
|
|
|
|
|
| |||||||
Information Technology — 24.6%*: | ||||||||||||
Chicony Electronics Co. Ltd.(b) | 49,000 | 100,603 | 150,324 | |||||||||
Infosys Ltd.(b) | 15,336 | 135,841 | 259,945 | |||||||||
MediaTek, Inc.(b) | 6,000 | 93,974 | 159,513 | |||||||||
Powertech Technology, Inc.(b) | 44,000 | 139,191 | 148,609 | |||||||||
Samsung Electronics Co. Ltd.(b) | 16,780 | 671,633 | 1,251,201 | |||||||||
Sunny Optical Technology Group Co. Ltd.(b) | 5,400 | 62,423 | 118,205 | |||||||||
Taiwan Semiconductor Manufacturing Co. Ltd.(b) | 63,000 | 524,568 | 1,188,341 | |||||||||
|
|
|
|
|
| |||||||
Total Information Technology | 199,516 | 1,728,233 | 3,276,138 | |||||||||
|
|
|
|
|
| |||||||
Materials — 5.5%*: | ||||||||||||
Anglo American plc(b) | 8,807 | 177,392 | 290,670 | |||||||||
China Resources Cement Holdings Ltd.(b) | 94,000 | 114,786 | 105,004 | |||||||||
LG Chem Ltd.(a),(b) | 438 | 138,262 | 332,240 | |||||||||
|
|
|
|
|
| |||||||
Total Materials | 103,245 | 430,440 | 727,914 | |||||||||
|
|
|
|
|
| |||||||
Real Estate — 2.8%*: | ||||||||||||
China Overseas Land & Investment Ltd.(b) | 74,000 | 225,256 | 160,935 | |||||||||
China Resources Land Ltd.(b) | 50,000 | 168,686 | 206,386 | |||||||||
|
|
|
|
|
| |||||||
Total Real Estate | 124,000 | 393,942 | 367,321 | |||||||||
|
|
|
|
|
| |||||||
Utilities — 1.9%*: | ||||||||||||
China Longyuan Power Group Corp. Ltd.(b) | 80,000 | 69,417 | 80,181 | |||||||||
ENN Energy Holdings Ltd.(b) | 12,000 | 132,494 | 176,151 | |||||||||
|
|
|
|
|
| |||||||
Total Utilities | 92,000 | 201,911 | 256,332 | |||||||||
|
|
|
|
|
| |||||||
Total Common Stocks | 3,036,832 | 9,400,473 | 12,706,036 | |||||||||
|
|
|
|
|
| |||||||
Total Equities | 3,036,832 | 9,400,473 | 12,706,036 | |||||||||
|
|
|
|
|
| |||||||
Mutual Fund — 1.8%*: | ||||||||||||
iShares MSCI India ETF(b) | 5,884 | 197,603 | 236,655 | |||||||||
|
|
|
|
|
| |||||||
Total Investments | 3,042,716 | 9,598,076 | 12,942,691 | |||||||||
|
|
|
|
|
| |||||||
Other assets and liabilities – 2.7%* | 360,259 | |||||||||||
|
| |||||||||||
Net Assets – 100.0% |
| $13,302,950 | ||||||||||
|
| |||||||||||
| * | Calculated as a percentage of net assets applicable to common shareholders. |
| (a) | Non-income producing security. |
| (b) | Foreign security. |
See accompanying Notes to the Financial Statements.
141
Table of Contents
Barings Global Emerging Markets Equity Fund 2020 Semi-Annual Report
SCHEDULE OF INVESTMENTS (CONTINUED)
December 31, 2020 (Unaudited)
Distributions of investments by country of risk (excluding temporary cash investments) as a percentage of total investments in securities, is as follows:
| China | 34.4% | |||
| Taiwan | 14.5% | |||
| Republic of Korea | 13.8% | |||
| India | 11.5% | |||
| Hong Kong | 6.1% | |||
| Brazil | 5.1% | |||
| South Africa | 3.9% | |||
| Russia | 3.7% | |||
| Indonesia | 2.4% | |||
| Mexico | 1.8% | |||
| Netherlands | 1.7% | |||
| Thailand | 1.1% | |||
|
| |||
| Total | 100.0% | |||
|
|
| (c) | Security acquired in a transaction exempt from registration under Rule 144A of the Securities Act of 1933. These securities may only be resold in transactions exempt from registration, normally to qualified institutional buyers. |
See accompanying Notes to the Financial Statements.
142
Table of Contents
Barings U.S. High Yield Fund 2020 Semi-Annual Report
SCHEDULE OF INVESTMENTS
December 31, 2020 (Unaudited)
| SHARES | COST | FAIR VALUE | ||||||||||||||||||
Equities — 0.2%*: | ||||||||||||||||||||
Common Stocks — 0.2%*: | ||||||||||||||||||||
Oil and Gas — 0.2%*: | ||||||||||||||||||||
Fieldwood Energy LLC | 4,100 | $88,421 | $– | |||||||||||||||||
Fieldwood Energy LLC | 1,006 | 35,210 | – | |||||||||||||||||
Jupiter Resources, Inc.(a),(b) | 39,729 | 192,017 | 127,133 | |||||||||||||||||
|
|
|
|
|
| |||||||||||||||
Total Oil and Gas | 44,835 | 315,648 | 127,133 | |||||||||||||||||
|
|
|
|
|
| |||||||||||||||
Total Common Stocks | 44,835 | 315,648 | 127,133 | |||||||||||||||||
|
|
|
|
|
| |||||||||||||||
Total Equities | 44,835 | 315,648 | 127,133 | |||||||||||||||||
|
|
|
|
|
| |||||||||||||||
| EFFECTIVE INTEREST RATE | DUE DATE | PRINCIPAL ‡‡ | COST | FAIR VALUE | ||||||||||||||||
Fixed Income — 96.5%*: | ||||||||||||||||||||
| Bank Loans — 6.5%*(c): | ||||||||||||||||||||
| Broadcasting and Entertainment — 0.5%*: | ||||||||||||||||||||
Altice USA, Inc., 1M LIBOR + 2.500% | 2.66 | % | 4/15/2027 | 44,519 | 44,519 | 44,055 | ||||||||||||||
Clear Channel Worldwide Holdings, Inc., 3M LIBOR + 3.500% | 3.71 | 8/21/2026 | 233,409 | 222,774 | 224,239 | |||||||||||||||
|
|
|
|
|
| |||||||||||||||
Total Broadcasting and Entertainment | 277,928 | 267,293 | 268,294 | |||||||||||||||||
|
|
|
|
|
| |||||||||||||||
| Chemicals, Plastics and Rubber — 0.3%*: | ||||||||||||||||||||
Consolidated Energy Finance S.A., 1M LIBOR + 2.500% | 2.65 | 5/7/2025 | 156,752 | 152,184 | 149,503 | |||||||||||||||
|
|
|
|
|
| |||||||||||||||
Containers, Packaging and Glass — 0.8%*: | ||||||||||||||||||||
Mauser Packaging Solutions, 3M LIBOR + 3.250% | 3.48 | 4/3/2024 | 437,507 | 428,692 | 421,647 | |||||||||||||||
|
|
|
|
|
| |||||||||||||||
Diversified/Conglomerate Service — 2.6%*: | ||||||||||||||||||||
Finastra USA, Inc., 6M LIBOR + 3.500% | 4.50 | 6/13/2024 | 796,643 | 777,534 | 779,468 | |||||||||||||||
Finastra USA, Inc., 6M LIBOR + 7.250% | 8.25 | 6/13/2025 | 500,000 | 485,572 | 500,180 | |||||||||||||||
SonicWall U.S. Holdings, Inc., 3M LIBOR + 7.500% | 7.72 | 5/18/2026 | 51,897 | 51,544 | 45,780 | |||||||||||||||
|
|
|
|
|
| |||||||||||||||
Total Diversified/Conglomerate Service | 1,348,540 | 1,314,650 | 1,325,428 | |||||||||||||||||
|
|
|
|
|
| |||||||||||||||
Electronics — 0.1%*: | ||||||||||||||||||||
Renaissance Holding Corp., 1M LIBOR + 7.000% | 7.15 | 5/29/2026 | 68,963 | 68,028 | 68,015 | |||||||||||||||
|
|
|
|
|
| |||||||||||||||
Grocery — 0.2%*: | ||||||||||||||||||||
Ozark Holdings LLC, 1M LIBOR + 4.000% | 4.75 | 12/16/2027 | 85,095 | 84,671 | 85,095 | |||||||||||||||
|
|
|
|
|
| |||||||||||||||
Healthcare, Education and Childcare — 0.6%*: | ||||||||||||||||||||
Radiology Partners, Inc., 1M LIBOR + 4.250% | 4.81 | 7/9/2025 | 234,000 | 231,169 | 229,760 | |||||||||||||||
US Radiology Specialists, Inc., 3M LIBOR + 5.500% | 6.25 | 12/10/2027 | 57,226 | 56,085 | 56,742 | |||||||||||||||
|
|
|
|
|
| |||||||||||||||
Total Healthcare, Education and Childcare | 291,226 | 287,254 | 286,502 | |||||||||||||||||
|
|
|
|
|
| |||||||||||||||
See accompanying Notes to the Financial Statements.
143
Table of Contents
Barings U.S. High Yield Fund 2020 Semi-Annual Report
SCHEDULE OF INVESTMENTS (CONTINUED)
December 31, 2020 (Unaudited)
| EFFECTIVE INTEREST RATE | DUE DATE | PRINCIPAL ‡‡ | COST | FAIR VALUE | ||||||||||||||||
Bank Loans (Continued) | ||||||||||||||||||||
Leisure, Amusement, Entertainment — 0.3%*: | ||||||||||||||||||||
Delta 2 (LUX) Sarl, 1M LIBOR + 2.500%(a) | 3.50 | % | 2/1/2024 | 129,011 | $126,780 | $127,445 | ||||||||||||||
|
|
|
|
|
| |||||||||||||||
Oil and Gas — 0.0%*: | ||||||||||||||||||||
Fieldwood Energy LLC, 1M LIBOR + 7.250%(e) | 7.25 | 4/11/2023 | 91,996 | 61,365 | 21 | |||||||||||||||
|
|
|
|
|
| |||||||||||||||
Personal and Non-Durable Consumer Products Mfg. Only — 0.5%*: |
| |||||||||||||||||||
Kronos Acquisition Holdings Inc., 1M LIBOR + 4.500% | 5.25 | 12/17/2026 | 263,000 | 260,375 | 262,671 | |||||||||||||||
|
|
|
|
|
| |||||||||||||||
Telecommunications — 0.6%*: | ||||||||||||||||||||
Banff Merger Sub, Inc., 1M LIBOR + 4.250% | 4.40 | 10/2/2025 | 286,151 | 276,750 | 284,637 | |||||||||||||||
CommScope, Inc., 1M LIBOR + 3.250% | 3.40 | 4/6/2026 | 30,175 | 29,948 | 29,911 | |||||||||||||||
|
|
|
|
|
| |||||||||||||||
Total Telecommunications | 316,326 | 306,698 | 314,548 | |||||||||||||||||
|
|
|
|
|
| |||||||||||||||
Total Bank Loans | 3,466,344 | 3,357,990 | 3,309,169 | |||||||||||||||||
|
|
|
|
|
| |||||||||||||||
Convertible Bond — 0.3%*: | ||||||||||||||||||||
Software — 0.3%*: | ||||||||||||||||||||
Avaya Holdings Corp. | 2.25 | 6/15/2023 | 136,000 | 135,413 | 141,666 | |||||||||||||||
|
|
|
|
|
| |||||||||||||||
Corporate Bonds — 89.7%*: | ||||||||||||||||||||
Aerospace and Defense — 2.0%*: | ||||||||||||||||||||
TransDigm, Inc.(d) | 8.00 | 12/15/2025 | 221,000 | 221,000 | 244,272 | |||||||||||||||
Triumph Group, Inc.(d) | 6.25 | 9/15/2024 | 216,000 | 216,000 | 213,840 | |||||||||||||||
Triumph Group, Inc. | 7.75 | 8/15/2025 | 595,000 | 598,090 | 543,681 | |||||||||||||||
|
|
|
|
|
| |||||||||||||||
Total Aerospace and Defense | 1,032,000 | 1,035,090 | 1,001,793 | |||||||||||||||||
|
|
|
|
|
| |||||||||||||||
Automobile — 3.7%*: | ||||||||||||||||||||
Adient Global Holdings Ltd.(d) | 4.88 | 8/15/2026 | 67,000 | 62,947 | 68,843 | |||||||||||||||
Adient US LLC(d) | 9.00 | 4/15/2025 | 85,000 | 85,000 | 94,775 | |||||||||||||||
American Axle & Manufacturing, Inc. | 6.50 | 4/1/2027 | 88,000 | 86,079 | 92,620 | |||||||||||||||
Clarios Global LP(d) | 6.75 | 5/15/2025 | 83,000 | 83,000 | 89,432 | |||||||||||||||
Clarios Global LP/Clarios US Finance Co.(d) | 8.50 | 5/15/2027 | 142,000 | 146,410 | 154,270 | |||||||||||||||
Ford Motor Co. | 7.45 | 7/16/2031 | 190,000 | 221,527 | 243,675 | |||||||||||||||
Ford Motor Co. | 8.50 | 4/21/2023 | 257,000 | 257,000 | 289,256 | |||||||||||||||
Ford Motor Co. | 9.63 | 4/22/2030 | 235,000 | 242,850 | 331,644 | |||||||||||||||
Gates Global LLC/Gates Global Co.(d) | 6.25 | 1/15/2026 | 250,000 | 250,000 | 262,500 | |||||||||||||||
JB Poindexter & Co., Inc.(d) | 7.13 | 4/15/2026 | 250,000 | 263,597 | 264,375 | |||||||||||||||
|
|
|
|
|
| |||||||||||||||
Total Automobile | 1,647,000 | 1,698,410 | 1,891,390 | |||||||||||||||||
|
|
|
|
|
| |||||||||||||||
Beverage, Food and Tobacco — 3.3%*: | ||||||||||||||||||||
JBS Investments II GmbH(d) | 7.00 | 1/15/2026 | 200,000 | 202,165 | 215,940 | |||||||||||||||
JBS USA Food Co.(d) | 5.50 | 1/15/2030 | 125,000 | 125,000 | 143,595 | |||||||||||||||
JBS USA LUX SA/JBS USA Finance, Inc.(d) | 6.75 | 2/15/2028 | 250,000 | 250,000 | 280,875 | |||||||||||||||
JBS USA LUX SA/JBS USA Food Co./JBS USA Finance, Inc.(d) | 6.50 | 4/15/2029 | 500,000 | 500,000 | 582,050 | |||||||||||||||
See accompanying Notes to the Financial Statements.
144
Table of Contents
Barings U.S. High Yield Fund 2020 Semi-Annual Report
SCHEDULE OF INVESTMENTS (CONTINUED)
December 31, 2020 (Unaudited)
| EFFECTIVE INTEREST RATE | DUE DATE | PRINCIPAL ‡‡ | COST | FAIR VALUE | ||||||||||||||||
Corporate Bonds (Continued) | ||||||||||||||||||||
Beverage, Food and Tobacco (Continued) | ||||||||||||||||||||
Kraft Heinz Foods Co.(d) | 3.75 | % | 4/1/2030 | 51,000 | $53,281 | $54,507 | ||||||||||||||
Kraft Heinz Foods Co.(d) | 4.25 | 3/1/2031 | 100,000 | 100,000 | 111,506 | |||||||||||||||
Kraft Heinz Foods Co. | 5.20 | 7/15/2045 | 72,000 | 77,593 | 85,612 | |||||||||||||||
Kraft Heinz Foods Co. | 6.50 | 2/9/2040 | 38,000 | 45,627 | 51,365 | |||||||||||||||
Kraft Heinz Foods Co. | 6.88 | 1/26/2039 | 84,000 | 104,543 | 116,395 | |||||||||||||||
Welbilt, Inc. | 9.50 | 2/15/2024 | 54,000 | 55,357 | 55,811 | |||||||||||||||
|
|
|
|
|
| |||||||||||||||
Total Beverage, Food and Tobacco | 1,474,000 | 1,513,566 | 1,697,656 | |||||||||||||||||
|
|
|
|
|
| |||||||||||||||
Broadcasting and Entertainment — 6.3%*: | ||||||||||||||||||||
Altice USA, Inc.(d) | 5.75 | 1/15/2030 | 147,000 | 152,464 | 161,149 | |||||||||||||||
Banijay Entertainment Sasu(a),(d) | 5.38 | 3/1/2025 | 170,000 | 170,000 | 176,204 | |||||||||||||||
Block Communications, Inc.(d) | 4.88 | 3/1/2028 | 239,000 | 239,000 | 246,170 | |||||||||||||||
CCO Holdings LLC/CCO Holdings Capital Corp.(d) | 4.75 | 3/1/2030 | 280,000 | 280,000 | 302,120 | |||||||||||||||
Clear Channel Worldwide Holdings, Inc.(d) | 5.13 | 8/15/2027 | 201,000 | 201,000 | 203,010 | |||||||||||||||
Clear Channel Worldwide Holdings, Inc. | 9.25 | 2/15/2024 | 207,000 | 207,520 | 209,588 | |||||||||||||||
Cox Media Group(d) | 8.88 | 12/15/2027 | 261,000 | 261,000 | 287,752 | |||||||||||||||
CSC Holdings LLC(d) | 3.38 | 2/15/2031 | 250,000 | 250,000 | 245,312 | |||||||||||||||
DISH DBS Corp. | 5.00 | 3/15/2023 | 79,000 | 78,129 | 81,568 | |||||||||||||||
DISH Network Corp. | 3.38 | 8/15/2026 | 267,000 | 254,906 | 254,513 | |||||||||||||||
iHeartCommunications, Inc. | 8.38 | 5/1/2027 | 194,000 | 192,780 | 207,087 | |||||||||||||||
Netflix, Inc.(d) | 5.38 | 11/15/2029 | 339,000 | 340,149 | 399,596 | |||||||||||||||
Nexstar Broadcasting, Inc.(d) | 4.75 | 11/1/2028 | 50,000 | 51,664 | 52,313 | |||||||||||||||
Sirius XM Radio, Inc.(d) | 5.00 | 8/1/2027 | 350,000 | 350,000 | 371,878 | |||||||||||||||
Townsquare Media, Inc.(d) | 6.50 | 4/1/2023 | 50,000 | 46,800 | 50,880 | |||||||||||||||
|
|
|
|
|
| |||||||||||||||
Total Broadcasting and Entertainment | 3,084,000 | 3,075,412 | 3,249,140 | |||||||||||||||||
|
|
|
|
|
| |||||||||||||||
Buildings and Real Estate — 4.4%*: | ||||||||||||||||||||
Brookfield Residential Properties, Inc./Brookfield Residential US Corp.(a),(d) | 4.88 | 2/15/2030 | 183,000 | 183,000 | 189,176 | |||||||||||||||
CP Atlas Buyer, Inc.(d) | 7.00 | 12/1/2028 | 175,000 | 175,000 | 182,000 | |||||||||||||||
Empire Communities Corp.(d) | 7.00 | 12/15/2025 | 115,000 | 115,000 | 121,194 | |||||||||||||||
James Hardie International Finance DAC(d) | 4.75 | 1/15/2025 | 244,000 | 240,475 | 248,199 | |||||||||||||||
Mattamy Group Corp.(a),(d) | 4.63 | 3/1/2030 | 330,000 | 329,149 | 349,800 | |||||||||||||||
Mattamy Group Corp.(a),(d) | 5.25 | 12/15/2027 | 25,000 | 25,000 | 26,438 | |||||||||||||||
New Enterprise Stone & Lime Co., Inc.(d) | 9.75 | 7/15/2028 | 250,000 | 250,000 | 273,750 | |||||||||||||||
Service Properties Trust | 3.95 | 1/15/2028 | 29,000 | 25,084 | 28,021 | |||||||||||||||
Service Properties Trust | 4.38 | 2/15/2030 | 47,000 | 40,876 | 45,825 | |||||||||||||||
Service Properties Trust | 4.95 | 2/15/2027 | 23,000 | 21,236 | 23,115 | |||||||||||||||
Service Properties Trust | 5.50 | 12/15/2027 | 127,000 | 127,000 | 138,857 | |||||||||||||||
Service Properties Trust | 7.50 | 9/15/2025 | 200,000 | 208,050 | 230,464 | |||||||||||||||
Standard Industries, Inc.(d) | 4.75 | 1/15/2028 | 52,000 | 53,517 | 54,730 | |||||||||||||||
STL Holding Co. LLC(d) | 7.50 | 2/15/2026 | 175,000 | 175,000 | 181,562 | |||||||||||||||
TRI Pointe Group, Inc. | 5.70 | 6/15/2028 | 121,000 | 121,000 | 136,609 | |||||||||||||||
|
|
|
|
|
| |||||||||||||||
Total Buildings and Real Estate | 2,096,000 | 2,089,387 | 2,229,740 | |||||||||||||||||
|
|
|
|
|
| |||||||||||||||
See accompanying Notes to the Financial Statements.
145
Table of Contents
Barings U.S. High Yield Fund 2020 Semi-Annual Report
SCHEDULE OF INVESTMENTS (CONTINUED)
December 31, 2020 (Unaudited)
| EFFECTIVE INTEREST RATE | DUE DATE | PRINCIPAL ‡‡ | COST | FAIR VALUE | ||||||||||||||||
Corporate Bonds (Continued) | ||||||||||||||||||||
Cargo Transport — 1.5%*: | ||||||||||||||||||||
Core & Main Holdings LP, 8.625% CASH / 9.375% PIK(d) | 8.63 | % | 9/15/2024 | 43,000 | $42,711 | $43,967 | ||||||||||||||
Kenan Advantage Group, Inc. (The)(d) | 7.88 | 7/31/2023 | 700,000 | 700,000 | 700,000 | |||||||||||||||
|
|
|
|
|
| |||||||||||||||
Total Cargo Transport | 743,000 | 742,711 | 743,967 | |||||||||||||||||
|
|
|
|
|
| |||||||||||||||
Chemicals, Plastics and Rubber — 2.8%*: | ||||||||||||||||||||
CF Industries, Inc. | 4.95 | 6/1/2043 | 23,000 | 23,084 | 28,233 | |||||||||||||||
CF Industries, Inc. | 5.38 | 3/15/2044 | 48,000 | 47,183 | 60,756 | |||||||||||||||
Consolidated Energy Finance SA(d) | 6.88 | 6/15/2025 | 405,000 | 403,842 | 410,569 | |||||||||||||||
GrafTech Finance, Inc.(d) | 4.63 | 12/15/2028 | 164,000 | 164,846 | 165,845 | |||||||||||||||
Ingevity Corp.(d) | 3.88 | 11/1/2028 | 162,000 | 162,000 | 163,215 | |||||||||||||||
Kraton Polymers LLC / Kraton Polymers Capital Corp.(d) | 4.25 | 12/15/2025 | 91,000 | 91,000 | 92,829 | |||||||||||||||
LBC Tank Terminals Holding Netherlands BV(d) | 6.88 | 5/15/2023 | 250,000 | 246,292 | 250,000 | |||||||||||||||
Nouryon Holding BV(a),(d) | 8.00 | 10/1/2026 | 56,000 | 54,913 | 59,500 | |||||||||||||||
Univar Solutions USA, Inc.(d) | 5.13 | 12/1/2027 | 177,000 | 177,000 | 186,956 | |||||||||||||||
|
|
|
|
|
| |||||||||||||||
Total Chemicals, Plastics and Rubber | 1,376,000 | 1,370,160 | 1,417,903 | |||||||||||||||||
|
|
|
|
|
| |||||||||||||||
Containers, Packaging and Glass — 1.0%*: | ||||||||||||||||||||
Mauser Packaging Solutions Holding Co.(d) | 7.25 | 4/15/2025 | 302,000 | 291,954 | 305,020 | |||||||||||||||
Trident TPI Holdings, Inc.(d) | 9.25 | 8/1/2024 | 171,000 | 166,987 | 182,115 | |||||||||||||||
|
|
|
|
|
| |||||||||||||||
Total Containers, Packaging and Glass | 473,000 | 458,941 | 487,135 | |||||||||||||||||
|
|
|
|
|
| |||||||||||||||
Diversified/Conglomerate Manufacturing — 0.6%*: |
| |||||||||||||||||||
Avaya, Inc.(d) | 6.13 | 9/15/2028 | 62,000 | 62,000 | 66,232 | |||||||||||||||
Forterra Finance LLC / FRTA Finance Corp.(d) | 6.50 | 7/15/2025 | 120,000 | 120,000 | 129,000 | |||||||||||||||
Griffon Corp. | 5.75 | 3/1/2028 | 127,000 | 127,000 | 134,303 | |||||||||||||||
|
|
|
|
|
| |||||||||||||||
Total Diversified/Conglomerate Manufacturing | 309,000 | 309,000 | 329,535 | |||||||||||||||||
|
|
|
|
|
| |||||||||||||||
Diversified/Conglomerate Service — 2.3%*: | ||||||||||||||||||||
Carlson Travel, Inc.(d) | 11.50 | 12/15/2026 | 352,216 | 339,158 | 191,077 | |||||||||||||||
Iron Mountain, Inc.(d) | 5.25 | 7/15/2030 | 235,000 | 235,000 | 253,800 | |||||||||||||||
KAR Auction Services, Inc.(d) | 5.13 | 6/1/2025 | 186,000 | 164,761 | 191,400 | |||||||||||||||
Prime Security Services Borrower LLC/Prime Finance, Inc.(d) | 6.25 | 1/15/2028 | 339,000 | 337,399 | 363,947 | |||||||||||||||
Sabre GLBL, Inc.(d) | 9.25 | 4/15/2025 | 50,000 | 50,000 | 59,500 | |||||||||||||||
Uber Technologies, Inc.(d) | 6.25 | 1/15/2028 | 127,000 | 127,000 | 138,112 | |||||||||||||||
|
|
|
|
|
| |||||||||||||||
Total Diversified/Conglomerate Service | 1,289,216 | 1,253,318 | 1,197,836 | |||||||||||||||||
|
|
|
|
|
| |||||||||||||||
Electronics — 4.3%*: | ||||||||||||||||||||
Austin BidCo, Inc.(d) | 7.13 | 12/15/2028 | 75,000 | 75,000 | 78,281 | |||||||||||||||
BY Crown Parent LLC(d) | 7.38 | 10/15/2024 | 96,000 | 96,000 | 97,680 | |||||||||||||||
Dell International LLC/EMC Corp.(d) | 7.13 | 6/15/2024 | 230,000 | 235,978 | 238,539 | |||||||||||||||
See accompanying Notes to the Financial Statements.
146
Table of Contents
Barings U.S. High Yield Fund 2020 Semi-Annual Report
SCHEDULE OF INVESTMENTS (CONTINUED)
December 31, 2020 (Unaudited)
| EFFECTIVE INTEREST RATE | DUE DATE | PRINCIPAL ‡‡ | COST | FAIR VALUE | ||||||||||||||||
Corporate Bonds (Continued) | ||||||||||||||||||||
Electronics (Continued) | ||||||||||||||||||||
Presidio Holdings, Inc.(d) | 8.25 | % | 2/1/2028 | 66,000 | $66,000 | $72,765 | ||||||||||||||
Solera LLC/Solera Finance, Inc.(d) | 10.50 | 3/1/2024 | 195,000 | 197,311 | 202,069 | |||||||||||||||
Veritas US, Inc./Veritas Bermuda Ltd.(d) | 7.50 | 9/1/2025 | 125,000 | 127,795 | 128,281 | |||||||||||||||
Veritas US, Inc./Veritas Bermuda Ltd.(d) | 10.50 | 2/1/2024 | 958,000 | 898,413 | 972,370 | |||||||||||||||
WESCO Distribution, Inc.(d) | 7.13 | 6/15/2025 | 191,000 | 191,000 | 210,068 | |||||||||||||||
WESCO Distribution, Inc.(d) | 7.25 | 6/15/2028 | 197,000 | 195,588 | 224,046 | |||||||||||||||
|
|
|
|
|
| |||||||||||||||
Total Electronics | 2,133,000 | 2,083,085 | 2,224,099 | |||||||||||||||||
|
|
|
|
|
| |||||||||||||||
Finance — 7.6%*: | ||||||||||||||||||||
Alliance Data Systems Corp.(d) | 4.75 | 12/15/2024 | 300,000 | 300,000 | 303,000 | |||||||||||||||
Alliance Data Systems Corp.(d) | 7.00 | 1/15/2026 | 78,000 | 77,976 | 82,508 | |||||||||||||||
Ford Motor Credit Co. LLC | 4.13 | 8/17/2027 | 225,000 | 225,000 | 235,687 | |||||||||||||||
Ford Motor Credit Co. LLC | 4.13 | 8/4/2025 | 200,000 | 161,084 | 209,750 | |||||||||||||||
Ford Motor Credit Co. LLC | 5.13 | 6/16/2025 | 233,000 | 233,000 | 253,341 | |||||||||||||||
Ford Motor Credit Co. LLC | 5.60 | 1/7/2022 | 200,000 | 184,343 | 206,736 | |||||||||||||||
Ford Motor Credit Co. LLC | 5.88 | 8/2/2021 | 200,000 | 189,923 | 204,700 | |||||||||||||||
Global Aircraft Leasing Co. Ltd.(d) | 6.50 | 9/15/2024 | 540,125 | 534,885 | 482,062 | |||||||||||||||
Icahn Enterprises LP / Icahn Enterprises Finance Corp. | 6.25 | 5/15/2026 | 500,000 | 500,000 | 529,450 | |||||||||||||||
Icahn Enterprises LP/Icahn Enterprises Finance Corp. | 4.75 | 9/15/2024 | 161,000 | 161,806 | 167,239 | |||||||||||||||
LPL Holdings, Inc.(d) | 5.75 | 9/15/2025 | 518,000 | 513,466 | 535,829 | |||||||||||||||
OneMain Finance Corp. | 4.00 | 9/15/2030 | 160,000 | 160,000 | 166,018 | |||||||||||||||
OneMain Finance Corp. | 5.38 | 11/15/2029 | 302,000 | 303,931 | 339,750 | |||||||||||||||
Park Intermediate Holdings LLC / PK Domestic Property LLC / PK Finance Co-Issuer(d) | 5.88 | 10/1/2028 | 81,000 | 81,000 | 86,265 | |||||||||||||||
Shift4 Payments LLC / Shift4 Payments Finance Sub, Inc.(d) | 4.63 | 11/1/2026 | 86,000 | 86,000 | 89,440 | |||||||||||||||
|
|
|
|
|
| |||||||||||||||
Total Finance | 3,784,125 | 3,712,414 | 3,891,775 | |||||||||||||||||
|
|
|
|
|
| |||||||||||||||
Healthcare, Education and Childcare — 5.6%*: | ||||||||||||||||||||
Bausch Health Cos., Inc.(d) | 8.50 | 1/31/2027 | 175,000 | 179,823 | 194,630 | |||||||||||||||
Bausch Health Cos., Inc.(d) | 5.00 | 1/30/2028 | 130,000 | 130,000 | 133,970 | |||||||||||||||
Bausch Health Cos., Inc.(d) | 5.00 | 2/15/2029 | 253,000 | 253,000 | 260,135 | |||||||||||||||
Bausch Health Cos., Inc.(d) | 5.25 | 1/30/2030 | 188,000 | 188,000 | 197,400 | |||||||||||||||
Bausch Health Cos., Inc.(d) | 5.25 | 2/15/2031 | 187,000 | 187,000 | 195,363 | |||||||||||||||
Centene Corp. | 4.63 | 12/15/2029 | 209,000 | 209,000 | 232,034 | |||||||||||||||
Centene Corp.(d) | 5.38 | 6/1/2026 | 19,000 | 19,800 | 20,039 | |||||||||||||||
CHS/Community Health Systems, Inc.(d) | 5.63 | 3/15/2027 | 71,000 | 71,000 | 76,343 | |||||||||||||||
CHS/Community Health Systems, Inc.(d) | 6.00 | 1/15/2029 | 33,000 | 33,000 | 35,648 | |||||||||||||||
Endo Dac / Endo Finance LLC / Endo Finco, Inc.(d) | 6.00 | 6/30/2028 | 57,000 | 46,942 | 48,450 | |||||||||||||||
Endo Pharmaceuticals, Inc.(d) | 7.50 | 4/1/2027 | 300,000 | 300,000 | 325,500 | |||||||||||||||
Molina Healthcare, Inc.(d) | 3.88 | 11/15/2030 | 133,000 | 133,000 | 142,642 | |||||||||||||||
Molina Healthcare, Inc.(d) | 4.38 | 6/15/2028 | 165,000 | 165,000 | 173,662 | |||||||||||||||
See accompanying Notes to the Financial Statements.
147
Table of Contents
Barings U.S. High Yield Fund 2020 Semi-Annual Report
SCHEDULE OF INVESTMENTS (CONTINUED)
December 31, 2020 (Unaudited)
| EFFECTIVE INTEREST RATE | DUE DATE | PRINCIPAL ‡‡ | COST | FAIR VALUE | ||||||||||||||||
Corporate Bonds (Continued) | ||||||||||||||||||||
Healthcare, Education and Childcare (Continued) |
| |||||||||||||||||||
Radiology Partners, Inc.(d) | 9.25 | % | 2/1/2028 | 176,000 | $176,000 | $197,560 | ||||||||||||||
RP Escrow Issuer LLC(d) | 5.25 | 12/15/2025 | 181,000 | 181,000 | 189,156 | |||||||||||||||
Tenet Healthcare Corp.(d) | 4.88 | 1/1/2026 | 125,000 | 125,000 | 130,764 | |||||||||||||||
Tenet Healthcare Corp.(d) | 5.13 | 11/1/2027 | 125,000 | 125,000 | 132,344 | |||||||||||||||
Tenet Healthcare Corp.(d) | 6.13 | 10/1/2028 | 150,000 | 150,000 | 156,297 | |||||||||||||||
|
|
|
|
|
| |||||||||||||||
Total Healthcare, Education and Childcare | 2,677,000 | 2,672,565 | 2,841,937 | |||||||||||||||||
|
|
|
|
|
| |||||||||||||||
Home and Office Furnishings, Housewares, and Durable Consumer Products — 0.9%*: |
| |||||||||||||||||||
LBM Acquisition LLC(d) | 6.25 | 1/15/2029 | 133,000 | 133,000 | 137,322 | |||||||||||||||
Resideo Funding, Inc.(d) | 6.13 | 11/1/2026 | 192,000 | 189,119 | 202,080 | |||||||||||||||
Staples, Inc.(d) | 7.50 | 4/15/2026 | 128,000 | 132,861 | 133,667 | |||||||||||||||
|
|
|
|
|
| |||||||||||||||
Total Home and Office Furnishings, Housewares, and Durable Consumer Products | 453,000 | 454,980 | 473,069 | |||||||||||||||||
|
|
|
|
|
| |||||||||||||||
Hotels, Motels, Inns and Gaming — 3.9%*: | ||||||||||||||||||||
Boyne USA, Inc.(d) | 7.25 | 5/1/2025 | 125,000 | 125,000 | 131,094 | |||||||||||||||
Caesars Resort Collection LLC/CRC Finco, Inc.(d) | 5.25 | 10/15/2025 | 104,000 | 93,858 | 105,101 | |||||||||||||||
Caesars Resort Collection LLC/CRC Finco, Inc.(d) | 5.75 | 7/1/2025 | 125,000 | 125,000 | 132,447 | |||||||||||||||
CCM Merger, Inc.(d) | 6.38 | 5/1/2026 | 159,000 | 159,000 | 166,950 | |||||||||||||||
ESH Hospitality, Inc.(d) | 4.63 | 10/1/2027 | 265,000 | 265,000 | 271,625 | |||||||||||||||
Scientific Games International, Inc.(d) | 5.00 | 10/15/2025 | 81,000 | 73,749 | 83,583 | |||||||||||||||
Scientific Games International, Inc.(d) | 7.25 | 11/15/2029 | 74,000 | 62,811 | 81,215 | |||||||||||||||
Scientific Games International, Inc.(d) | 8.63 | 7/1/2025 | 113,000 | 113,000 | 123,735 | |||||||||||||||
Wyndham Destinations, Inc.(d) | 6.63 | 7/31/2026 | 170,000 | 170,000 | 194,650 | |||||||||||||||
Wyndham Hotels & Resorts, Inc.(d) | 4.38 | 8/15/2028 | 125,000 | 125,000 | 129,881 | |||||||||||||||
Wynn Las Vegas LLC/Wynn Las Vegas Capital Corp.(d) | 5.25 | 5/15/2027 | 98,000 | 98,000 | 101,014 | |||||||||||||||
Wynn Las Vegas LLC/Wynn Las Vegas Capital Corp.(d) | 5.50 | 3/1/2025 | 250,000 | 247,841 | 260,938 | |||||||||||||||
Wynn Macau Ltd.(a),(d) | 5.13 | 12/15/2029 | 188,000 | 188,000 | 191,995 | |||||||||||||||
|
|
|
|
|
| |||||||||||||||
Total Hotels, Motels, Inns and Gaming | 1,877,000 | 1,846,259 | 1,974,228 | |||||||||||||||||
|
|
|
|
|
| |||||||||||||||
Insurance — 1.6%*: | ||||||||||||||||||||
Acrisure LLC/Acrisure Finance, Inc.(d) | 7.00 | 11/15/2025 | 275,000 | 264,390 | 286,289 | |||||||||||||||
Acrisure LLC/Acrisure Finance, Inc.(d) | 8.13 | 2/15/2024 | 84,000 | 84,000 | 88,932 | |||||||||||||||
AssuredPartners, Inc.(d) | 5.63 | 1/15/2029 | 174,000 | 174,000 | 181,613 | |||||||||||||||
Highlands Holdings Bond Issuer Ltd. / Highlands Holdings Bond Co-Issuer, Inc., 7.625% Cash, 8.375% PIK(a),(d) | 7.63 | 10/15/2025 | 250,000 | 250,000 | 261,877 | |||||||||||||||
|
|
|
|
|
| |||||||||||||||
Total Insurance | 783,000 | 772,390 | 818,711 | |||||||||||||||||
|
|
|
|
|
| |||||||||||||||
See accompanying Notes to the Financial Statements.
148
Table of Contents
Barings U.S. High Yield Fund 2020 Semi-Annual Report
SCHEDULE OF INVESTMENTS (CONTINUED)
December 31, 2020 (Unaudited)
| EFFECTIVE INTEREST RATE | DUE DATE | PRINCIPAL ‡‡ | COST | FAIR VALUE | ||||||||||||||||
Corporate Bonds (Continued) | ||||||||||||||||||||
Leisure, Amusement, Entertainment — 2.8%*: |
| |||||||||||||||||||
Caesars Entertainment, Inc.(d) | 6.25 | % | 7/1/2025 | 125,000 | $125,000 | $133,125 | ||||||||||||||
Caesars Entertainment, Inc.(d) | 8.13 | 7/1/2027 | 300,000 | 297,985 | 332,107 | |||||||||||||||
Carnival Corp.(d) | 7.63 | 3/1/2026 | 85,000 | 85,000 | 92,606 | |||||||||||||||
Cinemark USA, Inc. | 5.13 | 12/15/2022 | 110,000 | 98,967 | 107,800 | |||||||||||||||
Live Nation Entertainment, Inc.(d) | 4.75 | 10/15/2027 | 251,000 | 250,053 | 257,255 | |||||||||||||||
NCL Corp. Ltd.(d) | 5.88 | 3/15/2026 | 182,000 | 182,000 | 190,645 | |||||||||||||||
RHP Hotel Properties LP / RHP Finance Corp. | 4.75 | 10/15/2027 | 296,000 | 296,000 | 306,360 | |||||||||||||||
|
|
|
|
|
| |||||||||||||||
Total Leisure, Amusement, Entertainment | 1,349,000 | 1,335,005 | 1,419,898 | |||||||||||||||||
|
|
|
|
|
| |||||||||||||||
Machinery Non-Agriculture, Non-Construction, Non-Electronic — 1.1%*: |
| |||||||||||||||||||
Apex Tool Group LLC/BC Mountain Finance, Inc.(d) | 9.00 | 2/15/2023 | 278,000 | 272,768 | 272,440 | |||||||||||||||
Diebold Nixdorf, Inc.(d) | 9.38 | 7/15/2025 | 276,000 | 289,917 | 309,120 | |||||||||||||||
|
|
|
|
|
| |||||||||||||||
Total Machinery Non-Agriculture, Non-Construction, Non-Electronic | 554,000 | 562,685 | 581,560 | |||||||||||||||||
|
|
|
|
|
| |||||||||||||||
Mining, Steel, Iron and Non-Precious Metals — 5.8%*: |
| |||||||||||||||||||
Big River Steel LLC / BRS Finance Corp.(d) | 6.63 | 1/31/2029 | 197,000 | 197,000 | 212,760 | |||||||||||||||
Cleveland-Cliffs, Inc.(d) | 6.75 | 3/15/2026 | 72,000 | 71,502 | 77,760 | |||||||||||||||
Compass Minerals International, Inc.(d) | 4.88 | 7/15/2024 | 124,000 | 118,308 | 128,650 | |||||||||||||||
First Quantum Minerals Ltd.(a),(d) | 6.88 | 3/1/2026 | 229,000 | 229,000 | 238,732 | |||||||||||||||
First Quantum Minerals Ltd.(a),(d) | 6.88 | 10/15/2027 | 250,000 | 250,000 | 271,250 | |||||||||||||||
First Quantum Minerals Ltd.(a),(d) | 7.50 | 4/1/2025 | 158,000 | 152,087 | 164,517 | |||||||||||||||
Freeport-McMoRan, Inc. | 4.13 | 3/1/2028 | 28,000 | 27,072 | 29,365 | |||||||||||||||
Freeport-McMoRan, Inc. | 4.38 | 8/1/2028 | 125,000 | 125,000 | 132,813 | |||||||||||||||
Freeport-McMoRan, Inc. | 4.63 | 8/1/2030 | 125,000 | 125,000 | 137,187 | |||||||||||||||
Hecla Mining Co. | 7.25 | 2/15/2028 | 115,000 | 124,749 | 125,638 | |||||||||||||||
Hudbay Minerals, Inc.(a),(d) | 6.13 | 4/1/2029 | 111,000 | 111,000 | 119,603 | |||||||||||||||
Kinross Gold Corp. | 6.88 | 9/1/2041 | 99,000 | 98,542 | 136,152 | |||||||||||||||
Northwest Acquisitions ULC(a),(d),(e) | 7.13 | 11/1/2022 | 493,000 | 498,177 | 3,328 | |||||||||||||||
Peabody Energy Corp.(d) | 6.00 | 3/31/2022 | 511,000 | 511,491 | 373,030 | |||||||||||||||
SunCoke Energy Partners LP(d) | 7.50 | 6/15/2025 | 265,000 | 265,007 | 263,065 | |||||||||||||||
Warrior Met Coal, Inc.(d) | 8.00 | 11/1/2024 | 540,000 | 546,431 | 552,150 | |||||||||||||||
|
|
|
|
|
| |||||||||||||||
Total Mining, Steel, Iron and Non-Precious Metals | 3,442,000 | 3,450,366 | 2,966,000 | |||||||||||||||||
|
|
|
|
|
| |||||||||||||||
Oil and Gas — 13.8%*: |
| |||||||||||||||||||
Antero Resources Corp.(d) | 8.38 | 7/15/2026 | 78,000 | 78,000 | 79,614 | |||||||||||||||
Apache Corp. | 4.75 | 4/15/2043 | 26,000 | 21,054 | 26,959 | |||||||||||||||
Apache Corp. | 5.10 | 9/1/2040 | 51,000 | 41,445 | 54,379 | |||||||||||||||
Apache Corp. | 5.35 | 7/1/2049 | 78,000 | 62,614 | 80,030 | |||||||||||||||
Blue Racer Midstream LLC / Blue Racer Finance Corp.(d) | 7.63 | 12/15/2025 | 119,000 | 119,000 | 126,735 | |||||||||||||||
Buckeye Partners LP | 5.85 | 11/15/2043 | 26,000 | 21,816 | 25,582 | |||||||||||||||
See accompanying Notes to the Financial Statements.
149
Table of Contents
Barings U.S. High Yield Fund 2020 Semi-Annual Report
SCHEDULE OF INVESTMENTS (CONTINUED)
December 31, 2020 (Unaudited)
| EFFECTIVE INTEREST RATE | DUE DATE | PRINCIPAL ‡‡ | COST | FAIR VALUE | ||||||||||||||||
Corporate Bonds (Continued) | ||||||||||||||||||||
Oil and Gas (Continued) |
| |||||||||||||||||||
Cenovus Energy, Inc.(a) | 5.40 | % | 6/15/2047 | 54,000 | $47,673 | $63,391 | ||||||||||||||
Cenovus Energy, Inc.(a) | 6.75 | 11/15/2039 | 61,000 | 57,838 | 80,648 | |||||||||||||||
Cheniere Energy Partners LP | 5.63 | 10/1/2026 | 250,000 | 250,000 | 260,000 | |||||||||||||||
Continental Resources, Inc. | 3.80 | 6/1/2024 | 59,000 | 52,211 | 60,924 | |||||||||||||||
Continental Resources, Inc. | 4.38 | 1/15/2028 | 66,000 | 54,845 | 67,663 | |||||||||||||||
Continental Resources, Inc.(d) | 5.75 | 1/15/2031 | 143,000 | 143,000 | 158,727 | |||||||||||||||
CVR Energy, Inc.(d) | 5.25 | 2/15/2025 | 300,000 | 300,000 | 289,500 | |||||||||||||||
CVR Energy, Inc.(d) | 5.75 | 2/15/2028 | 300,000 | 300,000 | 284,250 | |||||||||||||||
DCP Midstream Operating LP(d) | 6.45 | 11/3/2036 | 4,000 | 3,312 | 4,320 | |||||||||||||||
EnLink Midstream Partners LP | 4.15 | 6/1/2025 | 67,000 | 63,044 | 65,325 | |||||||||||||||
EnLink Midstream Partners LP | 4.85 | 7/15/2026 | 23,000 | 20,081 | 22,456 | |||||||||||||||
EnLink Midstream Partners LP | 5.45 | 6/1/2047 | 49,000 | 37,006 | 39,458 | |||||||||||||||
EnLink Midstream Partners LP | 5.60 | 4/1/2044 | 191,000 | 129,327 | 153,278 | |||||||||||||||
EQM Midstream Partners LP(d) | 6.00 | 7/1/2025 | 145,000 | 145,000 | 158,775 | |||||||||||||||
EQM Midstream Partners LP(d) | 6.50 | 7/1/2027 | 119,000 | 119,000 | 133,998 | |||||||||||||||
Genesis Energy LP / Genesis Energy Finance Corp. | 5.63 | 6/15/2024 | 56,000 | 52,093 | 54,600 | |||||||||||||||
Genesis Energy LP / Genesis Energy Finance Corp. | 8.00 | 1/15/2027 | 252,000 | 252,000 | 249,530 | |||||||||||||||
Genesis Energy LP/Genesis Energy Finance Corp. | 6.50 | 10/1/2025 | 390,000 | 372,741 | 379,275 | |||||||||||||||
Harvest Midstream I LP(d) | 7.50 | 9/1/2028 | 178,000 | 178,000 | 189,348 | |||||||||||||||
Hilcorp Energy I LP / Hilcorp Finance Co.(d) | 5.75 | 10/1/2025 | 17,000 | 10,681 | 17,191 | |||||||||||||||
Hilcorp Energy I LP/Hilcorp Finance Co.(d) | 5.00 | 12/1/2024 | 32,000 | 23,570 | 31,853 | |||||||||||||||
Hilcorp Energy I LP/Hilcorp Finance Co.(d) | 6.25 | 11/1/2028 | 142,000 | 116,955 | 145,018 | |||||||||||||||
MEG Energy Corp.(a),(d) | 7.13 | 2/1/2027 | 270,000 | 270,000 | 278,775 | |||||||||||||||
Nabors Industries Ltd.(d) | 7.25 | 1/15/2026 | 100,000 | 100,432 | 70,117 | |||||||||||||||
Nabors Industries Ltd.(d) | 7.50 | 1/15/2028 | 72,000 | 72,000 | 49,298 | |||||||||||||||
Neptune Energy Bondco PLC(a),(d) | 6.63 | 5/15/2025 | 242,000 | 242,166 | 239,403 | |||||||||||||||
Newfield Exploration Co. | 5.38 | 1/1/2026 | 45,000 | 47,216 | 48,292 | |||||||||||||||
Occidental Petroleum Corp. | 2.70 | 2/15/2023 | 14,000 | 9,448 | 13,987 | |||||||||||||||
Occidental Petroleum Corp. | 2.90 | 8/15/2024 | 38,000 | 23,269 | 36,575 | |||||||||||||||
Occidental Petroleum Corp. | 3.50 | 6/15/2025 | 75,000 | 55,591 | 72,447 | |||||||||||||||
Occidental Petroleum Corp. | 4.20 | 3/15/2048 | 12,000 | 8,546 | 9,780 | |||||||||||||||
Occidental Petroleum Corp. | 4.40 | 4/15/2046 | 78,000 | 55,762 | 67,974 | |||||||||||||||
Occidental Petroleum Corp. | 4.40 | 8/15/2049 | 31,000 | 22,222 | 26,127 | |||||||||||||||
Occidental Petroleum Corp. | 4.50 | 7/15/2044 | 32,000 | 23,203 | 27,120 | |||||||||||||||
Occidental Petroleum Corp. | 5.88 | 9/1/2025 | 193,000 | 193,129 | 205,545 | |||||||||||||||
Occidental Petroleum Corp. | 6.13 | 1/1/2031 | 199,000 | 199,000 | 212,970 | |||||||||||||||
Occidental Petroleum Corp. | 6.20 | 3/15/2040 | 217,000 | 198,108 | 214,830 | |||||||||||||||
Occidental Petroleum Corp. | 6.38 | 9/1/2028 | 155,000 | 154,481 | 163,525 | |||||||||||||||
Occidental Petroleum Corp. | 6.45 | 9/15/2036 | 86,000 | 79,110 | 90,042 | |||||||||||||||
Occidental Petroleum Corp. | 6.60 | 3/15/2046 | 139,000 | 113,647 | 141,040 | |||||||||||||||
Occidental Petroleum Corp. | 6.95 | 7/1/2024 | 36,000 | 22,409 | 38,880 | |||||||||||||||
Ovintiv Exploration, Inc. | 5.63 | 7/1/2024 | 23,000 | 22,504 | 24,636 | |||||||||||||||
Ovintiv, Inc.(a) | 6.50 | 8/15/2034 | 42,000 | 37,837 | 48,638 | |||||||||||||||
Ovintiv, Inc.(a) | 6.50 | 2/1/2038 | 19,000 | 18,248 | 21,216 | |||||||||||||||
Ovintiv, Inc.(a) | 6.63 | 8/15/2037 | 9,000 | 7,936 | 10,042 | |||||||||||||||
See accompanying Notes to the Financial Statements.
150
Table of Contents
Barings U.S. High Yield Fund 2020 Semi-Annual Report
SCHEDULE OF INVESTMENTS (CONTINUED)
December 31, 2020 (Unaudited)
| EFFECTIVE INTEREST RATE | DUE DATE | PRINCIPAL ‡‡ | COST | FAIR VALUE | ||||||||||||||||
Corporate Bonds (Continued) | ||||||||||||||||||||
Oil and Gas (Continued) |
| |||||||||||||||||||
Ovintiv, Inc.(a) | 7.20 | % | 11/1/2031 | 12,000 | $12,441 | $14,202 | ||||||||||||||
Ovintiv, Inc.(a) | 7.38 | 11/1/2031 | 37,000 | 37,583 | 43,932 | |||||||||||||||
Ovintiv, Inc. | 8.13 | 9/15/2030 | 70,000 | 82,000 | 85,480 | |||||||||||||||
Parkland Fuel Corp.(a),(d) | 5.88 | 7/15/2027 | 125,000 | 125,000 | 135,154 | |||||||||||||||
PBF Holding Co. LLC / PBF Finance Corp. | 6.00 | 2/15/2028 | 600,000 | 600,000 | 342,750 | |||||||||||||||
PBF Holding Co. LLC/PBF Finance Corp. | 7.25 | 6/15/2025 | 350,000 | 357,684 | 226,882 | |||||||||||||||
Providence Service Corp. (The)(d) | 5.88 | 11/15/2025 | 142,000 | 143,304 | 150,165 | |||||||||||||||
Targa Resources Partners LP / Targa Resources Partners Finance Corp. | 5.50 | 3/1/2030 | 6,000 | 5,436 | 6,514 | |||||||||||||||
Targa Resources Partners LP / Targa Resources Partners Finance Corp. | 6.88 | 1/15/2029 | 24,000 | 23,771 | 27,030 | |||||||||||||||
Targa Resources Partners LP/Targa Resources Partners Finance Corp. | 4.25 | 11/15/2023 | 53,000 | 46,720 | 53,265 | |||||||||||||||
Targa Resources Partners LP/Targa Resources Partners Finance Corp.(d) | 4.88 | 2/1/2031 | 227,000 | 227,000 | 247,337 | |||||||||||||||
Western Midstream Operating LP | 5.05 | 2/1/2030 | 56,000 | 50,026 | 62,709 | |||||||||||||||
Western Midstream Operating LP | 5.30 | 3/1/2048 | 157,000 | 121,066 | 155,581 | |||||||||||||||
Western Midstream Operating LP | 5.45 | 4/1/2044 | 79,000 | 64,626 | 79,890 | |||||||||||||||
|
|
|
|
|
| |||||||||||||||
Total Oil and Gas | 7,341,000 | 6,945,227 | 7,044,977 | |||||||||||||||||
|
|
|
|
|
| |||||||||||||||
Personal and Non-Durable Consumer Products Mfg. Only — 0.5%*: |
| |||||||||||||||||||
Clearwater Paper Corp.(d) | 4.75 | 8/15/2028 | 177,000 | 177,000 | 183,195 | |||||||||||||||
Kronos Acquisition Holdings, Inc. / KIK Custom Products, Inc.(d) | 7.00 | 12/31/2027 | 91,000 | 91,000 | 95,279 | |||||||||||||||
|
|
|
|
|
| |||||||||||||||
Total Personal and Non-Durable Consumer Products Mfg. Only | 268,000 | 268,000 | 278,474 | |||||||||||||||||
|
|
|
|
|
| |||||||||||||||
Personal Transportation — 0.7%*: |
| |||||||||||||||||||
American Airlines, Inc.(d) | 11.75 | 7/15/2025 | 161,000 | 167,026 | 185,673 | |||||||||||||||
Mileage Plus Holdings LLC/Mileage Plus Intellectual Property Assets Ltd.(d) | 6.50 | 6/20/2027 | 150,000 | 148,233 | 161,250 | |||||||||||||||
|
|
|
|
|
| |||||||||||||||
Total Personal Transportation | 311,000 | 315,259 | 346,923 | |||||||||||||||||
|
|
|
|
|
| |||||||||||||||
Personal, Food and Miscellaneous — 0.7%*: |
| |||||||||||||||||||
Mattel, Inc.(d) | 5.88 | 12/15/2027 | 159,000 | 157,874 | 176,689 | |||||||||||||||
Mattel, Inc.(d) | 6.75 | 12/31/2025 | 132,000 | 134,270 | 139,322 | |||||||||||||||
Simmons Foods, Inc.(d) | 7.75 | 1/15/2024 | 64,000 | 64,000 | 66,640 | |||||||||||||||
|
|
|
|
|
| |||||||||||||||
Total Personal, Food and Miscellaneous | 355,000 | 356,144 | 382,651 | |||||||||||||||||
|
|
|
|
|
| |||||||||||||||
Printing and Publishing — 0.9%*: |
| |||||||||||||||||||
Cimpress plc(d) | 7.00 | 6/15/2026 | 427,000 | 446,711 | 448,884 | |||||||||||||||
|
|
|
|
|
| |||||||||||||||
Retail Stores — 0.5%*: |
| |||||||||||||||||||
Penske Automotive Group, Inc. | 3.50 | 9/1/2025 | 250,000 | 250,000 | 254,063 | |||||||||||||||
|
|
|
|
|
| |||||||||||||||
See accompanying Notes to the Financial Statements.
151
Table of Contents
Barings U.S. High Yield Fund 2020 Semi-Annual Report
SCHEDULE OF INVESTMENTS (CONTINUED)
December 31, 2020 (Unaudited)
| EFFECTIVE INTEREST RATE | DUE DATE | PRINCIPAL ‡‡ | COST | FAIR VALUE | ||||||||||||||||
Corporate Bonds (Continued) | ||||||||||||||||||||
Telecommunications — 9.8%*: |
| |||||||||||||||||||
Altice Financing SA(a),(d) | 5.00 | % | 1/15/2028 | 222,000 | $222,000 | $227,469 | ||||||||||||||
Altice Financing SA(a),(d) | 7.50 | 5/15/2026 | 106,000 | 101,617 | 111,862 | |||||||||||||||
Banff Merger Sub, Inc.(d) | 9.75 | 9/1/2026 | 185,000 | 183,563 | 199,828 | |||||||||||||||
Boxer Parent Co., Inc.(d) | 9.13 | 3/1/2026 | 158,000 | 158,000 | 169,850 | |||||||||||||||
CCO Holdings LLC/CCO Holdings Capital Corp.(d) | 4.50 | 5/1/2032 | 215,000 | 222,947 | 229,560 | |||||||||||||||
CommScope Technologies Finance LLC(d) | 6.00 | 6/15/2025 | 34,000 | 30,579 | 34,765 | |||||||||||||||
CommScope Technologies LLC(d) | 5.00 | 3/15/2027 | 305,000 | 294,208 | 300,425 | |||||||||||||||
Consolidated Communications, Inc.(d) | 6.50 | 10/1/2028 | 250,000 | 250,000 | 267,500 | |||||||||||||||
Frontier Communications Corp.(d) | 5.00 | 5/1/2028 | 400,000 | 400,000 | 417,000 | |||||||||||||||
Frontier Communications Corp.(d) | 6.75 | 5/1/2029 | 119,000 | 119,000 | 127,330 | |||||||||||||||
Hughes Satellite Systems Corp. | 6.63 | 8/1/2026 | 426,000 | 430,213 | 482,006 | |||||||||||||||
LCPR Senior Secured Financing DAC(a),(d) | 6.75 | 10/15/2027 | 200,000 | 200,000 | 215,250 | |||||||||||||||
Midcontinent Communications/Midcontinent Finance Corp.(d) | 5.38 | 8/15/2027 | 149,000 | 149,000 | 155,705 | |||||||||||||||
Northwest Fiber LLC / Northwest Fiber Finance Sub, Inc.(d) | 10.75 | 6/1/2028 | 74,000 | 82,515 | 84,360 | |||||||||||||||
Sprint Capital Corp. | 6.88 | 11/15/2028 | 648,000 | 653,185 | 854,375 | |||||||||||||||
Sprint Capital Corp. | 8.75 | 3/15/2032 | 52,000 | 73,049 | 82,335 | |||||||||||||||
Telecom Italia Capital SA(a) | 6.00 | 9/30/2034 | 62,000 | 72,052 | 75,522 | |||||||||||||||
Uniti Group LP / Uniti Fiber Holdings, Inc. / CSL Capital LLC(d) | 7.13 | 12/15/2024 | 23,000 | 22,886 | 23,230 | |||||||||||||||
Uniti Group LP / Uniti Fiber Holdings, Inc. / CSL Capital LLC(d) | 7.88 | 2/15/2025 | 13,000 | 13,895 | 13,965 | |||||||||||||||
Uniti Group LP / Uniti Group Finance, Inc. / CSL Capital LLC | 8.25 | 10/15/2023 | 85,000 | 85,484 | 85,637 | |||||||||||||||
ViaSat, Inc.(d) | 6.50 | 7/15/2028 | 200,000 | 200,000 | 216,442 | |||||||||||||||
Virgin Media Finance plc(a),(d) | 5.00 | 7/15/2030 | 117,000 | 117,000 | 121,387 | |||||||||||||||
Virgin Media Secured Finance plc(a),(d) | 4.50 | 8/15/2030 | 250,000 | 254,949 | 261,250 | |||||||||||||||
Windstream Escrow LLC / Windstream Escrow Finance Corp.(d) | 7.75 | 8/15/2028 | 123,000 | 123,000 | 123,861 | |||||||||||||||
Ziggo BV(a),(d) | 5.50 | 1/15/2027 | 140,000 | 135,109 | 146,125 | |||||||||||||||
|
|
|
|
|
| |||||||||||||||
Total Telecommunications | 4,556,000 | 4,594,251 | 5,027,039 | |||||||||||||||||
|
|
|
|
|
| |||||||||||||||
See accompanying Notes to the Financial Statements.
152
Table of Contents
Barings U.S. High Yield Fund 2020 Semi-Annual Report
SCHEDULE OF INVESTMENTS (CONTINUED)
December 31, 2020 (Unaudited)
| EFFECTIVE INTEREST RATE | DUE DATE | PRINCIPAL ‡‡ | COST | FAIR VALUE | ||||||||||||||||
Corporate Bonds (Continued) | ||||||||||||||||||||
Utilities — 1.3%*: |
| |||||||||||||||||||
FirstEnergy Corp. | 2.25 | % | 9/1/2030 | 75,000 | $71,836 | $72,548 | ||||||||||||||
FirstEnergy Corp. | 4.85 | 7/15/2047 | 175,000 | 215,550 | 217,786 | |||||||||||||||
FirstEnergy Corp. | 7.38 | 11/15/2031 | 23,000 | 31,105 | 32,797 | |||||||||||||||
PG&E Corp. | 5.00 | 7/1/2028 | 95,000 | 95,000 | 101,175 | |||||||||||||||
PG&E Corp. | 5.25 | 7/1/2030 | 82,000 | 82,000 | 90,200 | |||||||||||||||
Pike Corp.(d) | 5.50 | 9/1/2028 | 167,000 | 167,000 | 176,394 | |||||||||||||||
|
|
|
|
|
| |||||||||||||||
Total Utilities | 617,000 | 662,491 | 690,900 | |||||||||||||||||
|
|
|
|
|
| |||||||||||||||
Total Corporate Bonds | 44,700,341 | 44,273,827 | 45,911,283 | |||||||||||||||||
|
|
|
|
|
| |||||||||||||||
Total Fixed Income | 48,302,685 | 47,767,230 | 49,362,118 | |||||||||||||||||
|
|
|
|
|
| |||||||||||||||
Total Investments | 48,347,520 | 48,082,878 | 49,489,251 | |||||||||||||||||
|
|
|
|
|
| |||||||||||||||
Other assets and liabilities – 3.3%* |
| 1,696,429 | ||||||||||||||||||
|
| |||||||||||||||||||
Net Assets – 100.0% |
| $51,185,680 | ||||||||||||||||||
|
| |||||||||||||||||||
| PIK | Payment-in-kind |
| ‡‡ | Unless otherwise indicated, all principal amounts are denominated in United States Dollars. |
| * | Calculated as a percentage of net assets applicable to common shareholders. |
| (a) | Foreign security. |
Distributions of investments by country of risk (excluding temporary cash investments) as a percentage of total investments in securities, is as follows: |
| United States | 91.1% | |||||
| Canada | 3.0% | |||||
| United Kingdom | 1.5% | |||||
| Zambia | 1.4% | |||||
| Other (Individually less than 1%) | 3.0% | |||||
|
| |||||
| Total | 100.0% | |||||
|
|
| (b) | For fair value measurement disclosure purposes, security is categorized as Level 3 (See Note 2). |
| (c) | Bank loans are exempt from registration under the Securities Act of 1933, as amended, but contain certain restrictions on resale and cannot be sold publicly. These loans pay interest at rates which adjust periodically. The interest rates shown for bank loans are the current interest rates at December 31, 2020. Bank loans are also subject to mandatory and/or optional prepayment which cannot be predicted. As a result, the remaining maturity may be substantially less than the stated maturity shown. |
| (d) | Security acquired in a transaction exempt from registration under Rule 144A of the Securities Act of 1933. These securities may only be resold in transactions exempt from registration, normally to qualified institutional buyers. |
| (e) | Defaulted security. |
See accompanying Notes to the Financial Statements.
153
Table of Contents
Barings Funds Trust 2020 Semi-Annual Report
December 31, 2020 (Unaudited)
| 1. | Organization |
Barings Funds Trust (the “Trust”) was organized as a business trust under the laws of the Commonwealth of Massachusetts on May 3, 2013 and commenced operations on September 16, 2013. The Trust is registered under the Investment Company Act of 1940, as amended (the “1940 Act”), as an open-end management investment company. As of December 31, 2020, the Trust consists of seven funds (separately, a “Fund” and collectively, the “Funds”): Barings Global Floating Rate Fund (“Global Floating Rate Fund”), Barings Global Credit Income Opportunities Fund (“Global Credit Income Opportunities Fund”), Barings Active Short Duration Bond Fund (“Active Short Duration Bond Fund”), Barings Diversified Income Fund (“Diversified Income Fund”), Barings Emerging Markets Debt Blended Total Return Fund (“Emerging Markets Debt Blended Total Return Fund”), Barings Global Emerging Markets Equity Fund (“Global Emerging Markets Equity Fund”) and Barings U.S. High Yield Fund (“U.S. High Yield Fund”). Each Fund, other than Emerging Markets Debt Blended Total Return Fund and Global Emerging Markets Equity Fund, is a “diversified” investment company. Global Credit Income Opportunities Fund and Global Floating Rate Fund commenced operations on September 16, 2013. Active Short Duration Bond Fund and Diversified Income Fund commenced operations on July 8, 2015. Emerging Markets Debt Blended Total Return Fund commenced operations on October 21, 2015. U.S. High Yield Fund commenced operations on October 30, 2015. Global Emerging Markets Equity Fund commenced operations on September 17, 2018.
Barings LLC (the “Adviser”), a wholly-owned indirect subsidiary of Massachusetts Mutual Life Insurance Company, is a registered investment adviser under the Investment Advisers Act of 1940, as amended (the “Advisers Act”), and serves as investment adviser to the Funds.
Barings International Investment Limited (“BIIL”), a private limited company incorporated under the laws of England, serves as a sub-adviser with respect to European investments for the Global Floating Rate Fund, Global Credit Income Opportunities Fund, Emerging Markets Debt Blended Total Return Fund and Global Emerging Markets Equity Fund. The Adviser also has entered into a personnel-sharing arrangement with BIIL with respect to the Diversified Income Fund, pursuant to which, certain employees of BIIL may serve as “associated persons” of the Adviser and, in this capacity, subject to the oversight
and supervision of the Adviser may provide research and related services, and discretionary investment management and trading services to the Fund on behalf of the Adviser.
The primary investment objective of the Global Floating Rate Fund is to seek a high level of current income. The Global Floating Rate Fund seeks preservation of capital as a secondary investment objective. The investment objective of the Global Credit Income Opportunities Fund is to seek an absolute return, primarily through current income and secondarily through capital appreciation. The investment objective of the Active Short Duration Bond Fund is to seek to achieve a high total rate of return primarily from current income while minimizing fluctuations in capital values by investing primarily in a diversified portfolio of short-term investment grade fixed income securities. The investment objective of the Diversified Income Fund seeks an absolute return, primarily through current income and capital appreciation. The investment objective of the Emerging Markets Debt Blended Total Return Fund is to seek to achieve maximum total return, consistent with preservation of capital and prudent investment management, through high current income generation and, where appropriate, capital appreciation. The investment objective of the Global Emerging Markets Equity Fund is to seek to achieve long-term capital growth. The investment objective of the U.S. High Yield Fund is to seek to achieve a high level of total return, with an emphasis on current income, by investing primarily in high yield debt and related securities.
There can be no assurance that the Funds will achieve their investment objectives. Under normal market conditions, the Global Floating Rate Fund invests at least 80% of its net assets (including the amount of any borrowings for investment purposes) in income producing floating rate debt securities, consisting of floating rate loans, bonds and notes, issued primarily by North American and Western European companies that are primarily, at the time of purchase, rated below-investment grade (below Baa3 by Moody’s Investors Service, Inc. (“Moody’s”) or below BBB- by either Standard & Poor’s Rating Services, a division of the McGraw-Hill Company, Inc. (“S&P”) or Fitch, Inc. (“Fitch”)) or, if unrated, determined by the Adviser or BIIL to be of comparable quality. Under normal market conditions, the Global Credit Income Opportunities Fund invests at least 80% of its net assets (including the amount of any borrowings for investment purposes) in debt instruments,
154
Table of Contents
Barings Funds Trust 2020 Semi-Annual Report
NOTES TO FINANCIAL STATEMENTS (CONTINUED)
December 31, 2020 (Unaudited)
consisting of loans, bonds and notes. Investments may be based in U.S. and non-U.S. markets, as well as over-the-counter and exchange traded derivatives. Investments may be issued or guaranteed by governments and their agencies, corporations, financial institutions and supranational organizations that the Adviser believes have the potential to provide a high total return over time. A significant portion of the Global Floating Rate Fund and Global Credit Income Opportunities Fund’s investments in debt instruments will be denominated in a currency other than the U.S. dollar. Although the investments in non-U.S. dollar denominated assets may be on a currency hedged or unhedged basis, the Global Floating Rate Fund and Global Credit Income Opportunities Fund expect that, under current market conditions, they will seek to hedge substantially all of their exposure to foreign currencies. Under normal market conditions, the Active Short Duration Bond Fund invests at least 80% of its net assets (including the amount of any borrowings for investment purposes) in investment grade fixed income securities (rated Baa3 or higher by Moody’s or BBB- or higher by S&P or Fitch or if unrated, determined to be of comparable quality by the Adviser). These typically include U.S. dollar-denominated corporate obligations, securities issued or guaranteed by the U.S. government or its agencies or instrumentalities, U.S. and foreign issuer dollar-denominated bonds including, but not limited to, corporate obligations, government and agency issues, private placement bonds, securities subject to resale pursuant to Rule 144A, mortgage-backed, and other asset-backed securities. Under normal market conditions, the Diversified Income Fund invests at least 80% of its net assets (including the amount of any borrowings for investment purposes) in fixed income securities. These typically include: U.S. dollar denominated corporate obligations and bank loans, securities issued or guaranteed by the U.S. government or its agencies or instrumentalities, U.S. and foreign issuer dollar denominated bonds including, but not limited to, corporate obligations, government and agency issues, private placement bonds, securities subject to resale pursuant to Rule 144A, convertible bonds, mortgage-backed, and other asset-backed securities. Under normal market conditions, the Emerging Markets Debt Blended Total Return Fund will invest at least 80% of its net assets (including the amount of any borrowings for investment purposes) in (i) securities denominated in currencies of the emerging market countries, (ii) fixed income securities or debt instruments
issued by emerging market entities or sovereign nations, and/or (iii) debt instruments denominated in or based on the currencies, interest rates, or issues of emerging market countries. Emerging market countries are defined to include any country that did not become a member of the Organization for Economic Cooperation and Development (O.E.C.D.) prior to 1975 and Turkey. Certain emerging market countries are referred to as “frontier” market countries. The Emerging Markets Debt Blended Total Return Fund will likely focus its investments in Asia, Africa, the Middle East, Latin America and the developing countries of Europe. Under normal market conditions, the Global Emerging Markets Equity Fund will invest at least 80% of its net assets (including the amount of any borrowings for investment purposes) in equity and equity-related securities of issues that are economically tied to one or more emerging market countries. In general, countries may be considered emerging markets if they are included in any one of the Morgan Stanley Capital Index (“MSCI”) emerging markets indices. Under normal circumstances, the U.S. High Yield Fund invests at least 80% of its net assets (including the amount of any borrowings for investment purposes) in lower rated fixed income securities (rated below Baa3 by Moody’s or BBB- by either S&P or Fitch (using the lower rating) or, if unrated, determined by the Adviser to be of comparable quality), and at least 80% of its net assets (including the amount of any borrowings for investment purposes) in securities of U.S. issuers. The U.S. High Yield Fund may also invest in convertible securities, preferred stocks, warrants, bank loans, and other fixed income securities, including Rule 144A securities, of both U.S. and foreign issuers. Currently, the Adviser does not expect that the U.S. High Yield Fund will invest more than 20% of its total assets in bank loans. The U.S. High Yield Fund may invest up to 15% of its total assets in securities that are not denominated in U.S. dollars including, but not limited to, corporate bonds, government and agency issues, Rule 144A securities, convertible securities, bank loans, mortgage-backed, and asset-backed securities.
Each Fund has four classes of shares: Class A, C, I, and Y (except Active Short Duration Bond Fund, which has 5 classes of shares: Class A, C, I, Y and L), each with different expenses and dividends. Class L of Active Short Duration Bond Fund began operations on May 1, 2020. With the exception of Active Short Duration Bond Fund, which has no sales charge on any class, a front-end sales charge is normally added to the net asset value (“NAV”) for Class A shares. There is no front-end sales charge in
155
Table of Contents
Barings Funds Trust 2020 Semi-Annual Report
NOTES TO FINANCIAL STATEMENTS (CONTINUED)
December 31, 2020 (Unaudited)
the case of Class C, I, and Y shares. There may be a contingent deferred sales charge (“CDSC”) in certain cases as follows: 1) Effective January 15, 2018, Class A Shares purchased without an initial sales charge in accounts aggregating $500,000 or more are subject to a 1.00% contingent deferred sales charge (CDSC) if the shares are tendered and accepted for repurchase within 18 months of purchase (or within 12 months for shares purchased prior to January 15, 2018). The 18-month period (or 12-month period for shares purchased prior to January 15, 2018) begins on the day on which the purchase was made; and 2) Class C shares redeemed within the first year of purchase. All classes of shares have equal voting rights, with the exception of matters that relate solely to one class.
| 2. | Significant Accounting Policies |
The Trust is an investment company and follows accounting and reporting guidance in Financial Accounting Standards Board (“FASB”) Accounting Standards Codification Topic 946 (“ASC 946”).
The following is a summary of significant accounting policies followed consistently by the Funds in the preparation of their financial statements in conformity with accounting principles generally accepted in the United States of America (“U.S. GAAP”).
| A. | Valuation of Investments |
The Funds’ investments in fixed income securities are generally valued using the prices provided directly by independent third party services or provided directly from one or more broker dealers or market makers, each in accordance with the valuation policies and procedures approved by the Funds’ Board of Trustees (the “Board”).
The pricing services may use valuation models or matrix pricing, which consider yield or prices with respect to comparable bond quotations from bond dealers or by reference to other securities that are considered comparable in such characteristics as credit rating, interest rates and maturity date to determine the current value. The Funds’ investments in bank loans are normally valued at the bid quotation obtained from dealers in loans by an independent pricing service in accordance with the Funds’ valuation policies and procedures approved by the Board. Short-term securities with remaining maturities of 60 days or less may be valued at amortized cost, which approximates fair value. Derivative financial instruments, such as futures contracts or options contracts that are traded on a national securities
exchange, are stated at the last reported sale or settlement price on the day of valuation. Futures traded on inactive markets are valued using broker quotations. OTC derivative financial instruments, such as foreign currency contracts, options contracts, or swaps agreements, derive their value from underlying asset prices, indices, reference rates, and other inputs or a combination of these factors. These contracts are normally valued on the basis of an independent pricing service providers or broker dealer quotations. Depending on the derivative type and the terms of the derivative, the value of the derivative financial instruments is assigned by independent pricing service providers using a series of techniques, which may include pricing models. The pricing models use inputs that are observed from actively quoted markets such as issuer details, indices, spreads, interest rates, curves, volatilities, dividends and exchange rates.
The assets and liabilities shown in the Statements of Assets and Liabilities related to investments purchased for “to-be-announced” (“TBA”) or when-issued securities approximate fair value and are determined using Level 2 inputs, as of December 31, 2020. The assets and liabilities shown in the Statements of Assets and Liabilities related to cash collateral held at broker on open futures contracts, cash collateral held at broker on open forward foreign currency exchange contracts and cash collateral held at broker on open swap contracts are determined using Level 1 inputs as of December 31, 2020.
A Valuation Committee, made up of officers of the Trust and employees of the Adviser, is responsible for determining, in accordance with the Funds’ valuation policies and procedures approved by the Board; (1) whether market quotations are readily available for investments held by the Fund; and (2) the fair value of investments held by the Fund for which market quotations are not readily available or are deemed not reliable by the Adviser. In certain cases, authorized pricing service vendors may not provide prices for a security held by the Funds, or the price provided by such pricing service vendor is deemed unreliable by the Adviser. In such cases, the Funds may use market maker quotations provided by an established market maker for that security (i.e., broker quotes) to value the security if the Adviser has experience obtaining quotations from the market maker and the Adviser determines that quotations obtained from the market maker in the past have generally been reliable (or, if the Adviser has no such experience with respect to a market maker, it determines
156
Table of Contents
Barings Funds Trust 2020 Semi-Annual Report
NOTES TO FINANCIAL STATEMENTS (CONTINUED)
December 31, 2020 (Unaudited)
based on other information available to it that quotations to be obtained by it from the market maker are reasonably likely to be reliable). In any such case, the Adviser will review any market quotations so obtained in light of other information in its possession for their general reliability.
Bond investments are valued on the basis of last available bid prices or current market quotations provided by dealers or pricing services. Bank loan positions are valued at the bid price from one or more brokers or dealers as obtained from a pricing service. In determining the value of a particular investment, pricing services may use certain information with respect to transactions in such investments, quotations from dealers, pricing matrixes, market transactions in comparable investments, various relationships observed in the market between investments and calculated yield measures. Asset-backed and mortgage-backed securities are valued by independent pricing services using models that consider estimated cash flows of each tranche of the security, establish a benchmark yield and develop an estimated tranche-specific spread to the benchmark yield based on the unique attributes of the tranche.
Bank loans in which the Funds may invest have similar risks to lower-rated fixed income securities. Changes in the financial condition of the borrower or economic conditions or other circumstances may reduce the capacity of the borrower to make principal and interest payments on such instruments and may lead to defaults. Senior secured bank loans are supported by collateral; however, the value of the collateral may be insufficient to cover the amount owed to the Funds. By relying on a third party to administer a loan, the Funds are subject to the risk that the third party will fail to perform its obligations. The loans in which the Funds will invest are largely floating rate instruments; therefore, the interest rate risk generally is lower than for fixed-rate debt obligations. However, from the perspective of the borrower, an increase in interest rates may adversely affect the borrower’s financial condition. Due to the unique and customized nature of loan agreements evidencing loans and the private syndication thereof, loans are not as easily purchased or sold as publicly traded securities. Although the range of investors in loans has broadened in recent years, there can be no assurance that future levels of supply and demand in loan trading will provide the degree of liquidity which currently exists in the market. In addition, the terms of the loans may restrict their transferability without borrower consent.
These factors may have an adverse effect on the market price and the Funds’ ability to dispose of particular portfolio investments. A less liquid secondary market also may make it more difficult for the Funds to obtain precise valuations of the high yield loans in its portfolio.
The Funds may invest in collateralized debt obligations (“CDOs”), which include collateralized bond obligations (“CBOs”) and collateralized loan obligations (“CLOs”). CBOs and CLOs are types of asset-backed securities. A CDO is an entity that is backed by a diversified pool of debt securities (CBOs) or syndicated bank loans (CLOs). The cash flows of the CDO can be split into multiple segments, called “tranches,” which will vary in risk profile and yield. The riskiest segment is the subordinated or “equity” tranche. This tranche bears the greatest risk of defaults from the underlying assets in the CDO and serves to protect the other, more senior, tranches from default in all but the most severe circumstances. Since it is shielded from defaults by the more junior tranches, a “senior” tranche will typically have higher credit ratings and lower yields than their underlying securities, and often receive investment grade ratings from one or more of the nationally recognized rating agencies. Despite the protection from the more junior tranches, senior tranches can experience substantial losses due to actual defaults, increased sensitivity to future defaults and the disappearance of one or more protecting tranches as a result of changes in the credit profile of the underlying pool of assets.
Fair value is defined as the price that the Funds would receive upon selling an investment in a timely transaction to an independent buyer in the principal or most advantageous market of the investment. A three-tier hierarchy is utilized to maximize the use of observable market data and minimize the use of unobservable inputs and to establish classification of fair value measurements for disclosure purposes. Inputs refer broadly to the assumptions that market participants would use in pricing the asset or liability, including assumptions about risk. For example, market participants would consider the risk inherent in a particular valuation technique used to measure fair value, such as a pricing model, and/or the risk inherent in the inputs to the valuation technique. Inputs may be observable or unobservable. Observable inputs are inputs that reflect the assumptions market participants would use in pricing the asset or liability and are developed based on market data obtained from sources independent of the reporting entity. Unobservable inputs are inputs that reflect the reporting
157
Table of Contents
Barings Funds Trust 2020 Semi-Annual Report
NOTES TO FINANCIAL STATEMENTS (CONTINUED)
December 31, 2020 (Unaudited)
entity’s own assumptions about the assumptions market participants would use in pricing the asset or liability and are developed based on the best information available in the circumstances. The three-tier hierarchy of inputs is summarized in the three broad levels listed below.
Level 1 – quoted prices in active markets for identical securities
Level 2 – other significant observable inputs (including quoted prices for similar securities, interest rates, prepayment speeds, credit risk, etc.)
Level 3 – significant unobservable inputs (including the Funds’ own assumptions in determining the fair value of investments)
The availability of observable inputs can vary from security to security and is affected by a wide variety of factors, including, for example, the type of security, whether the security is new and not yet established in the
marketplace, the liquidity of markets, and other characteristics particular to the security. To the extent that valuation is based on models or inputs that are less observable or unobservable in the market, the determination of fair value requires more judgment. Accordingly, the degree of judgment exercised in determining fair value is greatest for instruments categorized in level 3.
The inputs used to measure fair value may fall into different levels of the fair value hierarchy. In such cases, for disclosure purposes, the level in the fair value hierarchy within which the fair value measurement falls in its entirety is determined based on the lowest level input that is significant to the fair value measurement in its entirety.
The following is a summary of the inputs used as of December 31, 2020 in valuing the Funds’ investments:
Global Floating Rate Fund
| DESCRIPTION | LEVEL 1 | LEVEL 2 | LEVEL 3 | TOTAL INVESTMENTS | ||||||||||||
Assets: |
| |||||||||||||||
| Equities: |
| |||||||||||||||
Common Stocks | $ | 197,221 | $ | 321,063 | $ | 881,236 | *** | $ | 1,399,520 | |||||||
Warrant | – | 32,153 | – | 32,153 | ||||||||||||
|
|
|
|
|
|
|
| |||||||||
| Total Equities | 197,221 | 353,216 | 881,236 | 1,431,673 | ||||||||||||
|
|
|
|
|
|
|
| |||||||||
Fixed Income: |
| |||||||||||||||
Bank Loans | – | 185,044,366 | 507,351 | *** | 185,551,717 | |||||||||||
Corporate Bonds | – | 10,876,657 | 404,688 | *** | 11,281,345 | |||||||||||
|
|
|
|
|
|
|
| |||||||||
| Total Fixed Income | – | 195,921,023 | 912,039 | 196,833,062 | ||||||||||||
|
|
|
|
|
|
|
| |||||||||
Derivative Securities: |
| |||||||||||||||
Forward Foreign Currency Exchange Contracts | – | 52,763 | – | 52,763 | ||||||||||||
|
|
|
|
|
|
|
| |||||||||
| Total | $ | 197,221 | $ | 196,327,002 | $ | 1,793,275 | $ | 198,317,498 | ||||||||
|
|
|
|
|
|
|
| |||||||||
Liabilities: |
| |||||||||||||||
| Derivative Securities: |
| |||||||||||||||
Forward Foreign Currency Exchange Contracts | – | (482,402 | ) | – | (482,402 | ) | ||||||||||
|
|
|
|
|
|
|
| |||||||||
| Total Investments | $ | 197,221 | $ | 195,844,600 | $ | 1,793,275 | $ | 197,835,096 | ||||||||
|
|
|
|
|
|
|
| |||||||||
| *** | None of the unobservable inputs for Level 3 assets, individually or collectively, had a material impact on the Fund Level 3 investments at the end of the period in relation to net assets were not significant and accordingly, a reconciliation of Level 3 assets for the six months ended December 31, 2020 is not presented. |
158
Table of Contents
Barings Funds Trust 2020 Semi-Annual Report
NOTES TO FINANCIAL STATEMENTS (CONTINUED)
December 31, 2020 (Unaudited)
The following table is a summary of quantitative information about significant unobservable valuation inputs for Level 3 fair value measurement for investments held as of December 31, 2020:
| TYPE OF ASSETS | FAIR VALUE AS OF DECEMBER 31, 2020 | VALUATION TECHNIQUE(S) | UNOBSERVABLE INPUT | |||||
Equities | ||||||||
CTI Foods Holding Co, LLC | $ | 571,274 | Discounted Cash Flow | Average Enterprise Valuation Multiple: 4 year projection, 7.1x; EBITDA: $53.7 million; 15% discount rate | ||||
Don Jersey Topco Ltd. | $ | 309,962 | Broker Quote | 0.775 Broker Quote depth of 1 | ||||
Travelex Topco Ltd. | $ | – | Zero Value | Valued at zero | ||||
Boomerang Tube LLC | $ | – | Discounted Cash Flow | Average Enterprise Valuation Multiple: 5 year projection, 5.0x; EBITDA: $32.2 million; 20% discount rate | ||||
Templar Energy LLC | $ | – | Broker Quote | Valued at zero until final accrual is received | ||||
Templar Energy LLC | $ | – | Broker Quote | Valued at zero until final accrual is received | ||||
Bank Loans | ||||||||
CTI Foods Holding Co, LLC, 3M LIBOR | $ | 313,232 | Discounted Cash Flow | Average Enterprise Valuation Multiple: 3 year projection, 7.1x; EBITDA: $52.5 million;: 15% discount rate | ||||
CTI Foods Holding Co, LLC, 3M LIBOR | $ | 191,548 | Discounted Cash Flow | Average Enterprise Valuation Multiple: 3 year projection, 7.1x; EBITDA: $52.5 million;: 15% discount rate | ||||
Boomerang Tube LLC | $ | 2,571 | Discounted Cash Flow | Average Enterprise Valuation Multiple: 5 year projection, 5.0x; EBITDA: $32.2 million; 20% discount rate | ||||
Corporate Bonds | ||||||||
Travelex Financing plc | $ | – | Zero Value | Valued at zero | ||||
KCA Deutag UK Finance plc | $ | 404,688 | Broker Quote | 9.875 Broker Quote depth of 3 | ||||
Although the Fund believes the valuation methods described above are appropriate, the use of different methodologies or assumptions to determine fair value could result in different estimates of fair value at the reporting date.
Global Credit Income Opportunities Fund
| DESCRIPTION | LEVEL 1 | LEVEL 2 | LEVEL 3 | TOTAL INVESTMENTS | ||||||||||||
Assets: |
| |||||||||||||||
| Equities: |
| |||||||||||||||
Common Stocks | $ | 32,582 | $ | 283,460 | $ | 1,305,478 | *** | $ | 1,621,520 | |||||||
Warrant | – | 94,429 | – | 94,429 | ||||||||||||
|
|
|
|
|
|
|
| |||||||||
| Total Equities | 32,582 | 377,889 | 1,305,478 | 1,715,949 | ||||||||||||
|
|
|
|
|
|
|
| |||||||||
Fixed Income: |
| |||||||||||||||
Asset-Backed Securities | – | 14,414,079 | 0 | *** | 14,414,079 | |||||||||||
Bank Loans | – | 63,926,718 | 5,153 | *** | 63,931,871 | |||||||||||
Corporate Bonds | – | 74,905,663 | 363,099 | *** | 75,268,762 | |||||||||||
|
|
|
|
|
|
|
| |||||||||
| Total Fixed Income | – | 153,246,460 | 368,252 | 153,614,712 | ||||||||||||
|
|
|
|
|
|
|
| |||||||||
159
Table of Contents
Barings Funds Trust 2020 Semi-Annual Report
NOTES TO FINANCIAL STATEMENTS (CONTINUED)
December 31, 2020 (Unaudited)
| DESCRIPTION | LEVEL 1 | LEVEL 2 | LEVEL 3 | TOTAL INVESTMENTS | ||||||||||||
Derivative Securities: |
| |||||||||||||||
Forward Foreign Currency Exchange Contracts | $ | – | $ | 50,743 | $ | – | $ | 50,743 | ||||||||
|
|
|
|
|
|
|
| |||||||||
| Total | $ | 32,582 | $ | 153,675,092 | $ | 1,673,730 | $ | 155,381,404 | ||||||||
|
|
|
|
|
|
|
| |||||||||
Liabilities: |
| |||||||||||||||
| Derivative Securities: |
| |||||||||||||||
Forward Foreign Currency Exchange Contracts | – | (457,436 | ) | – | (457,436 | ) | ||||||||||
|
|
|
|
|
|
|
| |||||||||
| Total Investments | $ | 32,582 | $ | 153,217,656 | $ | 1,673,730 | $ | 154,923,968 | ||||||||
|
|
|
|
|
|
|
| |||||||||
| *** | None of the unobservable inputs for Level 3 assets, individually or collectively, had a material impact on the Fund Level 3 investments at the end of the period in relation to net assets were not significant and accordingly, a reconciliation of Level 3 assets for the six months ended December 31, 2020 is not presented. |
The following table is a summary of quantitative information about significant unobservable valuation inputs for Level 3 fair value measurement for investments held as of December 31, 2020:
| TYPE OF ASSETS | FAIR VALUE AS OF DECEMBER 31, 2020 | VALUATION TECHNIQUE(S) | UNOBSERVABLE INPUT | |||||
Equities | ||||||||
Innovation Group | $ | – | Zero Value | Valued at zero | ||||
Don Jersey Topco Ltd. | $ | 272,445 | Broker Quote | 0.775 Broker Quote depth 1 | ||||
Travelex Topco Ltd. | $ | – | Zero Value | Valued at zero | ||||
MModal, Inc. | $ | 3,213 | Analyst Priced | Analyst verified stale price and adjusted for cash receipts | ||||
Boomerang Tube LLC | $ | – | Discounted Cash Flow | Average Enterprise Valuation Multiple: 5 year projection, 5.0x; EBITDA: $32.2 million; 20% discount rate | ||||
Jupiter Resources, Inc. | $ | 384,870 | Model Price | $3.20; price taken by converting to post acquisition value | ||||
Maxeda DIY B.V. | $ | 184,147 | Market Comparables | LTM EBITDA €115m; Net leverage €409m; Average Comparable Valuation: 6.0X | ||||
Maxeda DIY B.V. | $ | 460,803 | Market Comparables | LTM EBITDA €115m; Net leverage €409m; Average Comparable Valuation: 6.0X | ||||
Asset Backed Securities | ||||||||
BlueMountain CLO Ltd. | $ | – | Zero Value | Valued at zero | ||||
Bank Loans | ||||||||
Boomerang Tube LLC | $ | 5,153 | Discounted Cash Flow | Average Enterprise Valuation Multiple: 5 year projection, 5.0x; EBITDA: $32.2 million; 20% discount rate | ||||
Corporate Bonds | ||||||||
Travelex Financing PLC | $ | – | Zero Value | Valued at zero | ||||
KCA Deutag UK Finance plc | $ | 363,099 | Broker Quote | 9.875 Broker Quote depth of 3 | ||||
160
Table of Contents
Barings Funds Trust 2020 Semi-Annual Report
NOTES TO FINANCIAL STATEMENTS (CONTINUED)
December 31, 2020 (Unaudited)
Although the Fund believes the valuation methods described above are appropriate, the use of different methodologies or assumptions to determine fair value could result in different estimates of fair value at the reporting date.
Active Short Duration Bond Fund
| DESCRIPTION | LEVEL 1 | LEVEL 2 | LEVEL 3 | TOTAL INVESTMENTS | ||||||||||||
Assets: | ||||||||||||||||
| Fixed Income: | ||||||||||||||||
Asset-Backed Securities | $ | – | $ | 278,622,703 | $ | 7,204,976 | *** | $ | 285,827,679 | |||||||
Corporate Bonds | – | 365,620,721 | – | 365,620,721 | ||||||||||||
Mortgage-Backed Securities | – | 123,023,596 | – | 123,023,596 | ||||||||||||
U.S. Treasury & Government Agencies | – | 5,339,844 | – | 5,339,844 | ||||||||||||
|
|
|
|
|
|
|
| |||||||||
| Total Fixed Income | – | 772,606,864 | 7,204,976 | 779,811,840 | ||||||||||||
|
|
|
|
|
|
|
| |||||||||
Purchased Options: | ||||||||||||||||
Call Option Purchased | – | 195,889 | – | 195,889 | ||||||||||||
Put Options Purchased | – | 891,893 | – | 891,893 | ||||||||||||
|
|
|
|
|
|
|
| |||||||||
| Total Purchased Options | – | 1,087,782 | – | 1,087,782 | ||||||||||||
|
|
|
|
|
|
|
| |||||||||
Short-Term Investments: | ||||||||||||||||
Commercial Paper | – | 86,099,343 | – | 86,099,343 | ||||||||||||
|
|
|
|
|
|
|
| |||||||||
| Total Short-Term Investments | – | 86,099,343 | – | 86,099,343 | ||||||||||||
|
|
|
|
|
|
|
| |||||||||
Derivative Securities: | ||||||||||||||||
Futures* | 76,979 | – | – | 76,979 | ||||||||||||
|
|
|
|
|
|
|
| |||||||||
| Total | $ | 76,979 | $ | 859,793,989 | $ | 7,204,976 | $ | 867,075,944 | ||||||||
|
|
|
|
|
|
|
| |||||||||
Liabilities: |
| |||||||||||||||
| Derivative Securities: | ||||||||||||||||
Futures* | (987,439 | ) | – | – | (987,439 | ) | ||||||||||
|
|
|
|
|
|
|
| |||||||||
| Total Investments | $ | (910,460 | ) | $ | 859,793,989 | $ | 7,204,976 | $ | 866,088,505 | |||||||
|
|
|
|
|
|
|
| |||||||||
| * | Futures are valued at unrealized appreciation/depreciation. Only current day’s variation margin, if any, is reported on the Statement of Assets and Liabilities. |
| *** | None of the unobservable inputs for Level 3 assets, individually or collectively, had a material impact on the Fund Level 3 investments at the end of the period in relation to net assets were not significant and accordingly, a reconciliation of Level 3 assets for the six months ended December 31, 2020 is not presented. |
The following table is a summary of quantitative information about significant unobservable valuation inputs for Level 3 fair value measurement for investments held as of December 31, 2020:
| TYPE OF ASSETS | FAIR VALUE AS OF DECEMBER 31, 2020 | VALUATION TECHNIQUE(S) | UNOBSERVABLE INPUT | |||||
Asset-Backed Securities | ||||||||
SLM Student Loan Trust 2006-2 | $ | 2,175,800 | Broker Quote | $550.00: Broker quote depth of 1 | ||||
SoFi Alternative Trust 2019-C | $ | 2,875,960 | Broker Quote | $108.00: Broker quote depth of 1 | ||||
SoFi Professional Loan Program 2018-A | $ | 507,652 | Broker Quote | $ 37.00: Broker quote depth of 1 | ||||
161
Table of Contents
Barings Funds Trust 2020 Semi-Annual Report
NOTES TO FINANCIAL STATEMENTS (CONTINUED)
December 31, 2020 (Unaudited)
| TYPE OF ASSETS | FAIR VALUE AS OF DECEMBER 31, 2020 | VALUATION TECHNIQUE(S) | UNOBSERVABLE INPUT | |||||
SoFi Professional Loan Program 2018-B Trust | $ | 469,471 | Broker Quote | $ 37.00 Broker quote depth of 1 | ||||
SoFi Professional Loan Program 2018-D Trust | $ | 417,260 | Broker Quote | $ 22.00: Broker quote depth of 1 | ||||
SoFi Professional Loan Program 2019-A LLC | $ | 758,833 | Broker Quote | $ 22.00: Broker quote depth of 1 | ||||
Although the Fund believes the valuation methods described above are appropriate, the use of different methodologies or assumptions to determine fair value could result in different estimates of fair value at the reporting date.
Diversified Income Fund
| DESCRIPTION | LEVEL 1 | LEVEL 2 | LEVEL 3 | TOTAL INVESTMENTS | ||||||||||||
Assets: | ||||||||||||||||
| Fixed Income: | ||||||||||||||||
Asset-Backed Securities | $ | – | $ | 18,963,749 | $ | – | $ | 18,963,749 | ||||||||
Corporate Bonds | – | 22,010,176 | – | 22,010,176 | ||||||||||||
Mortgage-Backed Securities | – | 3,732,110 | – | 3,732,110 | ||||||||||||
|
|
|
|
|
|
|
| |||||||||
| Total Fixed Income | – | 44,706,035 | – | 44,706,035 | ||||||||||||
|
|
|
|
|
|
|
| |||||||||
Derivative Securities: | ||||||||||||||||
Forward Foreign Currency Exchange Contracts | – | 2,086 | – | 2,086 | ||||||||||||
Futures* | 41,701 | – | – | 41,701 | ||||||||||||
|
|
|
|
|
|
|
| |||||||||
| Total Derivative Securities | 41,701 | 2,086 | – | 43,787 | ||||||||||||
|
|
|
|
|
|
|
| |||||||||
| Total | $ | 41,701 | $ | 44,708,121 | $ | – | $ | 44,749,822 | ||||||||
|
|
|
|
|
|
|
| |||||||||
Liabilities: | ||||||||||||||||
| Derivative Securities: | ||||||||||||||||
Forward Foreign Currency Exchange Contracts | – | (10,431 | ) | – | (10,431 | ) | ||||||||||
Futures* | (37,157 | ) | – | – | (37,157 | ) | ||||||||||
|
|
|
|
|
|
|
| |||||||||
| Total Derivative Securities | (37,157 | ) | (10,431 | ) | – | (47,588 | ) | |||||||||
|
|
|
|
|
|
|
| |||||||||
| Total Investments | $ | 4,544 | $ | 44,697,690 | $ | – | $ | 44,702,234 | ||||||||
|
|
|
|
|
|
|
| |||||||||
| * | Futures are valued at unrealized appreciation/depreciation. Only current day’s variation margin, if any, is reported on the Statement of Assets and Liabilities. |
Emerging Markets Debt Blended Total Return Fund
| DESCRIPTION | LEVEL 1 | LEVEL 2 | LEVEL 3 | TOTAL INVESTMENTS | ||||||||||||
Assets: | ||||||||||||||||
| Fixed Income: | ||||||||||||||||
Corporate Bonds | $ | – | $ | 30,530,144 | $ | 854,390 | $ | 31,384,534 | ||||||||
Foreign Government | – | 39,221,371 | – | 39,221,371 | ||||||||||||
|
|
|
|
|
|
|
| |||||||||
Total Fixed Income | – | 69,751,515 | 854,390 | 70,605,905 | ||||||||||||
|
|
|
|
|
|
|
| |||||||||
162
Table of Contents
Barings Funds Trust 2020 Semi-Annual Report
NOTES TO FINANCIAL STATEMENTS (CONTINUED)
December 31, 2020 (Unaudited)
| DESCRIPTION | LEVEL 1 | LEVEL 2 | LEVEL 3 | TOTAL INVESTMENTS | ||||||||||||
Derivative Securities: | ||||||||||||||||
Centrally Cleared Interest Rate Swaps* | $ | – | $ | 916,297 | $ | – | $ | 916,297 | ||||||||
Forward Foreign Currency Exchange Contracts | – | 1,497,910 | – | 1,497,910 | ||||||||||||
Futures* | 47,219 | – | – | 47,219 | ||||||||||||
OTC–Credit Default Swaps | – | 78,072 | – | 78,072 | ||||||||||||
OTC–Interest Rate Swaps | – | 243,610 | – | 243,610 | ||||||||||||
|
|
|
|
|
|
|
| |||||||||
| Total Derivative Securities | 47,219 | 2,735,889 | – | 2,783,108 | ||||||||||||
|
|
|
|
|
|
|
| |||||||||
| Total | $ | 47,219 | $ | 72,487,404 | $ | 854,390 | $ | 73,389,013 | ||||||||
|
|
|
|
|
|
|
| |||||||||
Liabilities: | ||||||||||||||||
| Derivative Securities: | ||||||||||||||||
Centrally Cleared Interest Rate Swaps* | – | (24,591 | ) | – | (24,591 | ) | ||||||||||
Forward Foreign Currency Exchange Contracts | – | (1,524,709 | ) | – | (1,524,709 | ) | ||||||||||
OTC — Credit Default Swaps | – | (73,726 | ) | – | (73,726 | ) | ||||||||||
OTC — Cross Currency Swaps | – | (1,175,521 | ) | – | (1,175,521 | ) | ||||||||||
OTC — Interest Rate Swaps | – | (49,191 | ) | – | (49,191 | ) | ||||||||||
|
|
|
|
|
|
|
| |||||||||
| Total Derivative Securities | – | (2,847,738 | ) | – | (2,847,738 | ) | ||||||||||
|
|
|
|
|
|
|
| |||||||||
| Total Investments | $ | 47,219 | $ | 69,639,666 | �� | $ | 854,390 | $ | 70,541,275 | |||||||
|
|
|
|
|
|
|
| |||||||||
| * | Centrally Cleared Swaps and Futures are valued at unrealized appreciation/depreciation. Only current day’s variation margin, if any, is reported on the Statement of Assets and Liabilities. |
The following table is a summary of quantitative information about significant unobservable valuation inputs for Level 3 fair value measurement for investments held as of December 31, 2020:
| TYPE OF ASSETS | FAIR VALUE AS OF DECEMBER 31, 2020 | VALUATION TECHNIQUE(S) | UNOBSERVABLE INPUT | |||||
Foreign Government | ||||||||
Asian Development Bank 7/14/21 | $ | 204,538 | Broker Quote | $30.00: Broker quote depth of 1 | ||||
European Bank for Reconstruction and Development 10/29/22 | $ | 363,927 | Broker Quote | $30.00: Broker quote depth of 1 | ||||
International Bank for Reconstruction and Development 11/22/21 | $ | 285,925 | Broker Quote | $30.00: Broker quote depth of 1 | ||||
Although the Fund believes the valuation methods described above are appropriate, the use of different methodologies or assumptions to determine fair value could result in different estimates of fair value at the reporting date.
163
Table of Contents
Barings Funds Trust 2020 Semi-Annual Report
NOTES TO FINANCIAL STATEMENTS (CONTINUED)
December 31, 2020 (Unaudited)
The following is a reconciliation of investments with unobservable inputs (Level 3) that were used in determining fair value:
INVESTMENTS IN SECURITIES | BALANCE AS OF JULY 1, 2020 | REALIZED (LOSS) | CHANGE IN UNREALIZED APPRECIATION (DEPRECIATION) | NET TRANSFERS IN (OUT) OF LEVEL 3 | ACCRUED PREMIUMS/ | PURCHASES | SALES | BALANCE AS OF | CHANGE IN UNREALIZED APPRECIATION (DEPRECIATION) FROM INVESTMENTS HELD AT DECEMBER 31, 2020 | |||||||||||||||||||||||||||
Foreign Government | $ | 1,016,514 | $ | (3,075 | ) | $ | (47,938 | ) | $ | – | $ | – | $ | – | $ | (111,111 | ) | $ | 854,390 | $ | (47,938 | ) | ||||||||||||||
|
|
|
|
|
|
|
|
|
|
|
|
|
|
|
|
|
| |||||||||||||||||||
| Total | $ | 1,016,514 | $ | (3,075 | ) | $ | (47,938 | ) | $ | – | $ | – | $ | – | $ | (111,111 | ) | $ | 854,390 | $ | (47,938 | ) | ||||||||||||||
|
|
|
|
|
|
|
|
|
|
|
|
|
|
|
|
|
| |||||||||||||||||||
Global Emerging Markets Equity Fund
| DESCRIPTION | LEVEL 1 | LEVEL 2 | LEVEL 3 | TOTAL INVESTMENTS | ||||||||||||
Assets: | ||||||||||||||||
| Equities: | ||||||||||||||||
Common Stocks | $ | 12,706,036 | $ | – | $ | – | $ | 12,706,036 | ||||||||
|
|
|
|
|
|
|
| |||||||||
| Total Equities | 12,706,036 | – | – | 12,706,036 | ||||||||||||
|
|
|
|
|
|
|
| |||||||||
Mutual Fund: | ||||||||||||||||
Mutual Fund | 236,655 | – | – | 236,655 | ||||||||||||
|
|
|
|
|
|
|
| |||||||||
| Total | $ | 12,942,691 | $ | – | $ | – | $ | 12,942,691 | ||||||||
|
|
|
|
|
|
|
| |||||||||
| Total Investments | $ | 12,942,691 | $ | – | $ | – | $ | 12,942,691 | ||||||||
|
|
|
|
|
|
|
| |||||||||
U.S. High Yield Fund
| DESCRIPTION | LEVEL 1 | LEVEL 2 | LEVEL 3 | TOTAL INVESTMENTS | ||||||||||||
Assets: | ||||||||||||||||
| Equities: | ||||||||||||||||
Common Stocks | $ | – | $ | 0 | $ | 127,133 | *** | $ | 127,133 | |||||||
|
|
|
|
|
|
|
| |||||||||
| Total Equities | – | 0 | 127,133 | 127,133 | ||||||||||||
|
|
|
|
|
|
|
| |||||||||
Fixed Income: | ||||||||||||||||
Bank Loans | – | 3,309,169 | – | 3,309,169 | ||||||||||||
Convertible Bond | – | 141,666 | – | 141,666 | ||||||||||||
Corporate Bonds | – | 45,911,283 | – | 45,911,283 | ||||||||||||
|
|
|
|
|
|
|
| |||||||||
| Total Fixed Income | – | 49,362,118 | – | 49,362,118 | ||||||||||||
|
|
|
|
|
|
|
| |||||||||
| Total | $ | – | $ | 49,362,118 | $ | 127,133 | $ | 49,489,251 | ||||||||
|
|
|
|
|
|
|
| |||||||||
| Total Investments | $ | – | $ | 49,362,118 | $ | 127,133 | $ | 49,489,251 | ||||||||
|
|
|
|
|
|
|
| |||||||||
| *** | None of the unobservable inputs for Level 3 assets, individually or collectively, had a material impact on the Fund Level 3 investments at the end of the period in relation to net assets were not significant and accordingly, a reconciliation of Level 3 assets for the six months ended December 31, 2020 is not presented. |
164
Table of Contents
Barings Funds Trust 2020 Semi-Annual Report
NOTES TO FINANCIAL STATEMENTS (CONTINUED)
December 31, 2020 (Unaudited)
The following table is a summary of quantitative information about significant unobservable valuation inputs for Level 3 fair value measurement for investments held as of December 31, 2020:
| TYPE OF ASSETS | FAIR VALUE AS OF DECEMBER 31, 2020 | VALUATION TECHNIQUE(S) | UNOBSERVABLE INPUT | |||||
Equities | ||||||||
Jupiter Resources, Inc. | $ | 127,133 | Model Price | $3.20; price taken by converting to post acquisition value | ||||
Although the Fund believes the valuation methods described above are appropriate, the use of different methodologies or assumptions to determine fair value could result in different estimates of fair value at the reporting date.
| B. | When-Issued, Delayed-Delivery, Forward Commitment, and To-Be-Announced Transactions |
The Funds may enter into when-issued, delayed-delivery, forward commitment, or TBA transactions (collectively, the “Forward Transactions”) in order to lock in the purchase price of the underlying security, or in order to adjust the interest rate exposure of the Fund’s existing portfolio. In Forward Transactions, a Fund commits to purchase or sell particular securities, with payment and delivery to take place at a future date. In the case of TBA purchase commitments, the unit price and the estimated principal amount are established when the Fund enters into a commitment, with the actual principal amount being within a specified range of the estimate. Although a Fund does not typically pay for the securities in these types of transactions until they are delivered, it immediately assumes the risks of ownership, including the risk of price fluctuation. As a result, each of these types of transactions may create investment leverage in a Fund’s portfolio and increase the volatility of the Fund. If a Fund’s counterparty fails to deliver a security purchased in a Forward Transaction, there may be a loss, and the Fund may have missed an opportunity to make an alternative investment.
These securities are valued on the basis of valuations furnished by a pricing service, selected pursuant to procedures approved by the Trustees, which determines valuations taking into account appropriate factors such as institutional-size trading in similar groups of securities, yield, quality, coupon rate, maturity, type of issue, trading characteristics, and other market data. Securities for which no market quotation is available are valued at fair value in accordance with procedures approved by the Trustees. The Funds record on a daily basis the unrealized appreciation (depreciation) based upon changes in the values of these securities. When a Forward Transaction is closed, the Funds record a realized gain or loss equal to
the difference between the value of the transaction at the time it was opened and the value of the transaction at the time it was closed.
| C. | Cash and Short-Term Investments |
Cash and cash equivalents consist principally of short-term investments that are readily convertible into cash and have original maturities of three months or less. At December 31, 2020, all cash and cash equivalents are held by the custodian.
| D. | Investment Transactions, Related Investment Income and Expenses |
Investment transactions are accounted for on a trade date basis. Interest income is recorded on the accrual basis, including the amortization of premiums and accretion of discounts on bonds held using the yield-to-maturity method. Interest income from securitized investments in which the Fund(s) has/have a beneficial interest, such as the “equity” security class of a CLO vehicle (typically in the form of income or subordinated notes), are recorded upon receipt. The accrual of interest income related to these types of securities is periodically reviewed and adjustments are made as necessary. These cash inflows are regularly reviewed to ensure these payments are not materially different from what would be required by GAAP reporting. Adjustments would be made if needed to address any changes.
In March 2017, FASB issued Accounting Standards Update No. 2017-08 “Premium Amortization of Purchased Callable Debt Securities”, which amends the amortization period for certain purchased callable debt securities. Under the standards update, the premium amortization of purchased callable debt securities that have explicit, non-contingent call features and are callable at fixed prices will be amortized to the earliest
165
Table of Contents
Barings Funds Trust 2020 Semi-Annual Report
NOTES TO FINANCIAL STATEMENTS (CONTINUED)
December 31, 2020 (Unaudited)
call date. The guidance will be applied on a modified retrospective basis and is effective for fiscal years, and their interim periods, beginning after December 15, 2018. Management has evaluated the impact of ASU 2017-08 and has adopted the requirements, and the impact, if any, is reflected within the Funds’ financial statements. In October 2020, ASU 2017-08 was amended by Accounting Standards Update 2020-08, Codification Improvements to Subtopic 310-20, Receivables—Nonrefundable Fees and Other Costs (“ASU 2020-08”). ASU 2020-08 requires entities to reevaluate whether callable debt securities fall within the scope of ASU 2017-08 at each reporting period. ASU 2020-08 also amends the relevant guidance to require premiums to be amortized to the “next call date” rather than the “earliest call date,” and further clarifies the definition of “next call date.” ASU 2020-08 is effective for fiscal years, and interim periods within those fiscal years, beginning after December 15, 2020. Early adoption of ASU 2020-08 is not permitted. Management is currently evaluating the impact of applying ASU 2020-08.
Realized gains and losses on investment transactions and unrealized appreciation and depreciation of investments are reported for financial statement and Federal income tax purposes on the identified cost method.
Expenses are recorded on the accrual basis as incurred.
| E. | Redemption Fees |
The Funds do not have redemption fees.
| F. | Use of Estimates |
The preparation of financial statements in conformity with U.S. GAAP requires management to make estimates and assumptions that affect the reported amounts of assets and liabilities at the date of the financial statements and the reported amounts of revenues and expenses during the reporting period. Actual results could differ from these estimates.
| G. | Federal Income Taxation |
The Funds have elected to be taxed as a Regulated Investment Company (“RIC”) under sub-chapter M of the U.S. Internal Revenue Code of 1986, as amended, and intend to maintain this qualification and to distribute substantially all of their net taxable income to their shareholders. As of December 31, 2020, the Funds had no uncertain tax positions that would require financial statement recognition, de-recognition, or disclosure. The
Funds file a U.S. federal income tax return annually after their fiscal year-end, which is subject to examination by the Internal Revenue Service for a period of three years from the date of the filings.
| H. | Dividends and Distributions |
Each Fund, except Global Emerging Markets Equity Fund, declares a dividend daily based on the Adviser’s projections of the Funds’ estimated net investment income and distributes such dividend monthly. To the extent that these distributions exceed net investment income, they may be classified as return of capital. The Funds also pay a distribution at least annually from their net realized capital gains, if any. Dividends and distributions are recorded on the ex-dividend date. All common shares have equal dividend and other distribution rights. A notice disclosing the source(s) of a distribution will be provided if payment is made from any source other than net investment income. Any such notice would be provided only for informational purposes in order to comply with the requirements of Section 19(a) of the 1940 Act and not for tax reporting purposes. The tax composition of the Funds’ distributions for each calendar year is reported on Internal Revenue Service Form 1099-DIV.
Dividends from net investment income and distributions from realized gains from investment transactions have been determined in accordance with Federal income tax regulations and may differ from net investment income and realized gains recorded by the Funds for financial reporting purposes. These differences, which could be temporary or permanent in nature may result in reclassification of distributions; however, net investment income, net realized gains and losses, and net assets are not affected.
| I. | Bank Loans |
The Funds may invest in bank loans, which usually take the form of loan participations and assignments. Loan participations and assignments are agreements to make money available to U.S. or foreign corporations, partnerships or other business entities (the “Borrower”) in a specified amount, at a specified rate and within a specified time. A loan is typically originated, negotiated and structured by a U.S. or foreign bank, insurance company or other financial institution (the “Agent”) for a group of loan investors (“Loan Investors”). The Agent typically administers and enforces the loan on behalf of the other Loan Investors in the syndicate and may hold
166
Table of Contents
Barings Funds Trust 2020 Semi-Annual Report
NOTES TO FINANCIAL STATEMENTS (CONTINUED)
December 31, 2020 (Unaudited)
any collateral on behalf of the Loan Investors. Such loan participations and assignments are typically senior, secured and collateralized in nature. The Funds record an investment when the Borrower withdraws money and records interest as earned. These loans pay interest at rates which are periodically reset by reference to a base lending rate plus a spread. These base lending rates are generally the prime rate offered by a designated U.S. bank or London InterBank Offered Rate (“LIBOR”). Certain Funds may receive other income from investment in loan assignments and/or unfunded commitments, including amendment fees, consent fees and commitment fees. These fees are recorded as income when received by the Funds.
The loans in which the Funds invest may be subject to some restrictions on resale. For example, the Funds may be contractually obligated to receive approval from the Agent and/or Borrower prior to the sale of these investments. The Funds generally have no right to enforce compliance with the terms of the loan agreement with the Borrower. As a result, the Funds assume the credit risk of the Borrower, the selling participant and any other persons interpositioned between the Funds and the Borrower (“Intermediate Participants”). In the event that the Borrower, selling participant or Intermediate Participants become insolvent or enter into bankruptcy, the Funds may incur certain costs and delays in realizing payment or may suffer a loss of principal and/or interest.
Unfunded commitments represent the remaining obligation of the Funds to the Borrower. At any point in time, up to the maturity date of the issue, the Borrower may demand the unfunded portion. Until demanded by the Borrower, unfunded commitments are not recognized as an asset on the Statements of Assets and Liabilities. Unrealized appreciation/depreciation on unfunded commitments presented on the Statements of Assets and Liabilities represents mark to market of the unfunded portion of the Funds’ bank loans. As of December 31, 2020, the following Funds had unfunded loan commitments:
| FUND | SECURITY | AMOUNT | ||||
Global Floating Rate Fund | Bahia De Las Isletas, S.L., 4/30/21 | $ | 94,422 | |||
Global Credit Income Opportunities Fund | Bahia De Las Isletas, S.L., 4/30/21 | $ | 47,211 | |||
| J. | Derivative Instruments |
The following is a description of the derivative instruments that the Funds utilize as part of their investment strategy, including the primary underlying risk exposures related to the instrument.
The Funds are subject to foreign currency exchange rate risk in the normal course of pursuing their investment objectives. The Funds may use forward foreign currency exchange contracts to hedge against changes in the value of foreign currencies. The Funds may enter into forward foreign currency exchange contracts obligating the Funds to deliver or receive a currency at a specified future date. Forward contracts are valued daily and unrealized appreciation or depreciation is recorded daily as the difference between the contract exchange rate and the closing forward rate applied to the face amount of the contract. A realized gain or loss is recorded at the time the forward contract expires. Credit risk may arise as a result of the failure of the counterparty to comply with the terms of the contract. The Funds consider the creditworthiness of each counterparty to a contract in evaluating potential credit risk quarterly. The Funds are also subject to credit risk with respect to the counterparties to derivative contracts that are not cleared through a central counterparty but instead are traded over-the-counter between two counterparties. If a counterparty to an over-the-counter derivative becomes bankrupt or otherwise fails to perform its obligations under a derivative contract due to financial difficulties, the Funds may experience significant delays in obtaining any recovery under the derivative contract in a bankruptcy or other reorganization proceeding. The Funds may obtain only a limited recovery or may obtain no recovery in such circumstances. The counterparty risk for cleared derivatives is generally lower than for uncleared over-the-counter derivative transactions since generally a clearing organization becomes substituted for each counterparty to a cleared derivative contract and, in effect, guarantees the parties’ performance under the contract as each party to a trade looks only to the clearing house for performance of financial obligations. However, there can be no assurance that the clearing house, or its members, will satisfy its obligations to the Funds. In addition, in the event of a bankruptcy of a clearing house, the Funds could experience a loss of the funds deposited with such clearing house as margin and of any profits on its open positions. The counterparty risk to the Funds is limited to the net unrealized gain, if any, on the contract.
167
Table of Contents
Barings Funds Trust 2020 Semi-Annual Report
NOTES TO FINANCIAL STATEMENTS (CONTINUED)
December 31, 2020 (Unaudited)
The use of forward foreign currency exchange contracts does not eliminate fluctuations in the underlying prices of the Funds’ investment securities; however, it does establish a rate of exchange that can be achieved in the future. The use of forward foreign currency exchange contracts involves the risk that anticipated currency movements will not be accurately predicted. A forward foreign currency exchange contract would limit the risk of loss due to a decline in the value of a particular currency; however, it would also limit any potential gain that might result should the value of the currency increase instead of decrease. These contracts may involve market risk in excess of the amount of receivable or payable reflected on the Statement of Assets and Liabilities.
The Funds may purchase and sell futures contracts to enhance returns, to attempt to hedge some of its investment risk, or as a substitute position in lieu of holding the underlying asset on which the instrument is based. At the time of entering into a futures transaction, an investor is required to deposit and maintain a specified amount of cash or eligible securities called “initial margin.” Subsequent payments made or received by a Fund called “variation margin” are made on a daily basis as the market price of the futures contract fluctuates. Each Fund will record an unrealized gain (loss) based on the amount of variation margin. When a contract is closed, a realized gain (loss) is recorded equal to the difference between the opening and closing value of the contract.
The Funds may purchase call or put options. When a Fund purchases an option, the premium paid by the Fund is recorded as an asset and is subsequently adjusted to the current fair value of the option purchased. Purchasing call options tends to increase the Fund’s exposure to the underlying instrument. Purchasing put options tends to decrease the Fund’s exposure to the underlying instrument. Premiums paid for purchasing options that expire are treated as realized losses. Premiums paid for purchasing options that are exercised or closed are added to the amounts paid or offset against the proceeds on the underlying security to determine the realized gain or loss. The risks associated with purchasing put and call options are potential loss of the premium paid and, in the instances of over-the-counter derivatives, the failure of the counterparty to honor its obligation under the contract.
The Funds may enter into swap options (“swaptions”). A swaption is an option to enter into a pre-defined swap
agreement by some specified date in the future. The writer of the swaption becomes the counterparty to the swap if the buyer exercises. The interest rate swaption agreement will specify whether the buyer of the swaption will be a fixed rate receiver or a fixed rate buyer. Depending on the terms of the particular option agreement, a Fund generally will incur a greater degree of risk when the Fund writes a swaption than the Fund will incur when it purchases a swaption. When a Fund purchases a swaption, the Fund’s risk of loss is limited to the amount of the premium it has paid should it decide to let the swaption expire unexercised.
When a Fund writes a covered call or a put option, an amount equal to the premium received by the Fund is included in the Fund’s Statement of Assets and Liabilities as an asset and as an equivalent liability. The amount of the liability is subsequently marked-to-market to reflect the current market value of the option written. The Fund receives a premium on the sale of a call option but gives up the opportunity to profit from any increase in stock value above the exercise price of the option, and when a Fund writes a put option, it is exposed to a decline in the price of the underlying security.
Whether an option which a Fund has written expires on its stipulated expiration date or a Fund enters into a closing purchase transaction, the Fund realizes a gain (or loss, if the cost of a closing purchase transaction exceeds the premium received when the option was sold) without regard to any unrealized gain or loss on the underlying security, and the liability related to such option is extinguished. If a call option which a Fund has written is exercised, the Fund realizes a capital gain or loss from the sale of the underlying security, and the cost basis of the lots sold are decreased by the premium originally received. When a put option which a Fund has written is exercised, the amount of the premium originally received will reduce the cost of the security which the Fund purchases upon exercise of the option.
The Funds’ use of written options involves, to varying degrees, elements of market risk in excess of the amount recognized in the Statements of Assets and Liabilities. The face or contract amounts of these instruments reflect the extent of the Funds’ exposure to market risk. The risks may be caused by an imperfect correlation between movements in the price of the instrument and the price of the underlying securities, currencies and interest rates.
The Funds may enter into credit default swap contracts. As a seller of a credit default swap contract (“seller of protection”), a Fund is required to pay the notional
168
Table of Contents
Barings Funds Trust 2020 Semi-Annual Report
NOTES TO FINANCIAL STATEMENTS (CONTINUED)
December 31, 2020 (Unaudited)
amount or other agreed-upon value of a referenced debt obligation to the counterparty (or central clearing party in the case of centrally cleared swaps) in the event of a default by or other credit event involving the referenced issuer, obligation or index. In return, a Fund receives from the counterparty (or central clearing party in the case of centrally cleared swaps) a periodic stream of payments over the term of the contract.
As a purchaser of a credit default swap contract (“buyer of protection”), a Fund would receive the notional amount or other agreed upon value of a referenced debt obligation from the counterparty (or central clearing party in the case of centrally cleared swaps) in the event of default by or other credit event involving the referenced issuer, obligation or index. In return, a Fund would make periodic payments to the counterparty (or central clearing party in the case of centrally cleared swaps) over the term of the contracts, provided no event of default has occurred.
These credit default swaps may have as a reference obligation corporate or sovereign issuers or credit indices. These credit indices are comprised of a basket of securities representing a particular sector of the market.
Credit default swaps are fair valued based upon quotations from counterparties, brokers or market-makers and the change in value, if any, is recorded as an unrealized appreciation or depreciation. For a credit default swap sold by a Fund, payment of the agreed-upon amount made by a Fund in the event of default of the referenced debt obligation is recorded as the cost of the referenced debt obligation purchased/received. For a credit default swap purchased by a Fund, the agreed-upon amount received by a Fund in the event of default of the referenced debt obligation is recorded as proceeds from sale/delivery of the referenced debt obligation and the resulting gain or loss realized on the referenced debt obligation is recorded as such by a Fund.
Any upfront payments made or received upon entering a credit default swap contract would be amortized or accreted over the life of the swap and recorded as realized gains or losses. Collateral, in the form of cash or securities, may be required to be held in segregated accounts with the custodian bank or broker in accordance with the swap agreement. The value and credit rating of each credit default swap where a Fund is the seller of protection, are both measures of the current payment/performance risk of the swap. As the value of the swap changes as a positive or negative percentage of
the total notional amount, the payment/performance risk may decrease or increase, respectively. The maximum potential amount of future payments (undiscounted) that a Fund as a seller of protection could be required to make under a credit default swap agreement would be an amount equal to the notional amount of the agreement. These potential amounts would be partially offset by any recovery values of the respective referenced obligations, upfront payments received upon entering into the agreement, or net amounts received from the settlement of buy protection credit default swap agreements entered into by a Fund for the same referenced entity or entities. For centrally cleared swaps, the daily change in valuation is recorded as a receivable or payable for variation margin and settled in cash with the central clearing party daily.
Entering into swap agreements involves counterparty and market risk. Such risks involve the possibility that there will be no liquid market for these agreements, that the counterparty to the agreements may default on its obligation to perform or disagree as to the meaning of the contractual terms in the agreements, that there may be unfavorable changes in interest rates, and, in the case of credit default swaps, that the Adviser does not correctly predict the creditworthiness of the issuers of the reference obligation on which the credit default swap is based. In the case of centrally cleared swaps, counterparty risk is minimal due to protections provided by the central clearing party.
Interest rate swaps involve the exchange by a Fund with another party of their respective commitments to receive or pay interest (e.g., an exchange of fixed rate payments for floating rate payments) with respect to a notional amount of principal. When a Fund enters into an interest rate swap, it typically agrees to make payments to its counterparty based on a specified long- or short-term interest rate, and will receive payments from its counterparty based on another interest rate. Other forms of interest rate swap agreements include interest rate caps, under which, in return for a specified payment stream, one party agrees to make payments to the other to the extent that interest rates exceed a specified rate, or “cap”; interest rate floors, under which, in return for a specified payment stream, one party agrees to make payments to the other to the extent that interest rates fall below a specified rate, or “floor”; and interest rate collars, under which a party sells a cap and purchases a floor or vice versa in an attempt to protect itself against interest rate movements exceeding given minimum or maximum
169
Table of Contents
Barings Funds Trust 2020 Semi-Annual Report
NOTES TO FINANCIAL STATEMENTS (CONTINUED)
December 31, 2020 (Unaudited)
levels. A Fund may enter into an interest rate swap in order, for example, to hedge against the effect of interest rate changes on the value of specific securities in its portfolio, or to adjust the interest rate sensitivity (duration) or the credit exposure of its portfolio overall, or otherwise as a substitute for a direct investment in debt securities.
During the period ended December 31, 2020, the Funds’ direct investment in derivatives consisted of forward foreign currency exchange contracts, futures contracts, credit default swaps, interest rate swaps and purchased options.
The following is a summary of the fair value of derivative instruments held directly by the Funds as of December 31, 2020:
| Global | Floating Rate Fund |
| ASSET DERIVATIVES | STATEMENTS OF ASSETS AND LIABILITIES LOCATION | FOREIGN EXCHANGE CONTRACTS RISK | ||||
Forward Foreign Currency Exchange Contracts | Unrealized appreciation on forward foreign currency exchange contracts | $ | 52,763 | |||
|
| |||||
Total | $ | 52,763 | ||||
|
| |||||
| LIABILITY DERIVATIVES | STATEMENTS OF ASSETS AND LIABILITIES LOCATION | FOREIGN EXCHANGE CONTRACTS RISK | ||||
Forward Foreign Currency Exchange Contracts | Unrealized depreciation on forward foreign currency exchange contracts | $ | (482,402 | ) | ||
|
| |||||
Total | $ | (482,402 | ) | |||
|
| |||||
Global Credit Income Opportunities Fund
| ASSET DERIVATIVES | STATEMENTS OF ASSETS AND LIABILITIES LOCATION | FOREIGN EXCHANGE CONTRACTS RISK | ||||
Forward Foreign Currency Exchange Contracts | Unrealized appreciation on forward foreign currency exchange contracts | $ | 50,743 | |||
|
| |||||
Total | $ | 50,743 | ||||
|
| |||||
| LIABILITY DERIVATIVES | STATEMENTS OF ASSETS AND LIABILITIES LOCATION | FOREIGN EXCHANGE CONTRACTS RISK | ||||
Forward Foreign Currency Exchange Contracts | Unrealized depreciation on forward foreign currency exchange contracts | $ | (457,436 | ) | ||
|
| |||||
Total | $ | (457,436 | ) | |||
|
| |||||
Active Short Duration Bond Fund
ASSET | STATEMENTS OF ASSETS AND LIABILITIES LOCATION | INTEREST RATE RISK | ||||
Futures Contracts | Includes cumulative unrealized appreciation/ depreciation of futures contracts as reported in the Schedule of Investments. Only current day’s variation margin is reported within the Statements of Assets and Liabilities. | $ | 76,979 | |||
Purchased Options | Investments, at fair value | 1,087,782 | ||||
|
| |||||
Total | $ | 1,164,761 | ||||
|
| |||||
| LIABILITY DERIVATIVES | STATEMENTS OF ASSETS AND LIABILITIES LOCATION | INTEREST RATE RISK | ||||
Futures Contracts | Includes cumulative unrealized appreciation/ depreciation of futures contracts as reported in the Schedule of Investments. Only current day’s variation margin is reported within the Statements of Assets and Liabilities. | $ | (987,439 | ) | ||
|
| |||||
Total | $ | (987,439 | ) | |||
|
| |||||
170
Table of Contents
Barings Funds Trust 2020 Semi-Annual Report
NOTES TO FINANCIAL STATEMENTS (CONTINUED)
December 31, 2020 (Unaudited)
Diversified Income Fund
| ASSET DERIVATIVES | STATEMENTS OF ASSETS AND LIABILITIES LOCATION | FOREIGN EXCHANGE CONTRACTS RISK | INTEREST RATE RISK | TOTAL | ||||||||||
Forward Foreign Currency Exchange Contracts | Unrealized appreciation on forward foreign currency exchange contracts | $ | 2,086 | $ | – | $ | 2,086 | |||||||
Futures Contracts | Includes cumulative unrealized appreciation/depreciation of futures contracts as reported in the Schedule of Investments. Only current day’s variation margin is reported within the Statements of Assets and Liabilities. | – | 41,701 | 41,701 | ||||||||||
|
|
|
|
|
| |||||||||
| Total | $ | 2,086 | $ | 41,701 | $ | 43,787 | ||||||||
|
|
|
|
|
| |||||||||
| LIABILITY DERIVATIVES | STATEMENTS OF ASSETS AND LIABILITIES LOCATION | FOREIGN EXCHANGE CONTRACTS RISK | INTEREST RATE RISK | TOTAL | ||||||||||
Forward Foreign Currency Exchange Contracts | Unrealized depreciation on forward foreign currency exchange contracts | $ | (10,431 | ) | $ | – | $ | (10,431 | ) | |||||
Futures Contracts | Includes cumulative unrealized appreciation/depreciation of futures contracts as reported in the Schedule of Investments. Only current day’s variation margin is reported within the Statements of Assets and Liabilities. | – | (37,157 | ) | (37,157 | ) | ||||||||
|
|
|
|
|
| |||||||||
| Total | $ | (10,431 | ) | $ | (37,157 | ) | $ | (47,588 | ) | |||||
|
|
|
|
|
| |||||||||
171
Table of Contents
Barings Funds Trust 2020 Semi-Annual Report
NOTES TO FINANCIAL STATEMENTS (CONTINUED)
December 31, 2020 (Unaudited)
Emerging Markets Debt Blended Total Return Fund
| ASSET DERIVATIVES | STATEMENTS OF ASSETS AND LIABILITIES LOCATION | FOREIGN EXCHANGE CONTRACTS RISK | INTEREST RATE RISK | CREDIT RISK | TOTAL | |||||||||||||
Forward Foreign Currency Exchange Contracts | Unrealized appreciation on forward foreign currency exchange contracts | $ | 1,497,910 | $ | – | $ | – | $ | 1,497,910 | |||||||||
Futures Contracts | Includes cumulative unrealized appreciation/depreciation of futures contracts as reported in the Schedule of Investments. Only current day’s variation margin is reported within the Statements of Assets and Liabilities. | – | 47,219 | – | 47,219 | |||||||||||||
OTC – Swaps Contracts | Swap contracts, at fair value | – | 243,610 | 78,072 | 321,682 | |||||||||||||
Centrally Cleared Swaps Contracts | Includes cumulative unrealized appreciation/ depreciation of swaps contracts as reported in the Schedule of Investments. Only current day’s variation margin is reported within the Statements of Assets and Liabilities. | – | 916,297 | – | 916,297 | |||||||||||||
|
|
|
|
|
|
|
| |||||||||||
| Total | $ | 1,497,910 | $ | 1,207,126 | $ | 78,072 | $ | 2,783,108 | ||||||||||
|
|
|
|
|
|
|
| |||||||||||
| LIABILITY DERIVATIVES | STATEMENTS OF ASSETS AND LIABILITIES LOCATION | FOREIGN EXCHANGE CONTRACTS RISK | INTEREST RATE RISK | CREDIT RISK | TOTAL | |||||||||||||
Forward Foreign Currency Exchange Contracts | Unrealized depreciation on forward foreign currency exchange contracts | $ | (1,524,709 | ) | $ | – | $ | — | $ | (1,524,709 | ) | |||||||
OTC – Swaps Contracts | Swap contracts, at fair value | (1,175,521 | ) | (49,191 | ) | (73,726 | ) | (1,298,438 | ) | |||||||||
Centrally Cleared Interest Rate Swaps | Includes cumulative unrealized appreciation/ depreciation of swaps contracts as reported in the Schedule of Investments. Only current day’s variation margin is reported within the Statements of Assets and Liabilities. | – | (24,591 | ) | – | (24,591 | ) | |||||||||||
|
|
|
|
|
|
|
| |||||||||||
| Total | $ | (2,700,230 | ) | $ | (73,782 | ) | $ | (73,726 | ) | $ | (2,847,738 | ) | ||||||
|
|
|
|
|
|
|
| |||||||||||
172
Table of Contents
Barings Funds Trust 2020 Semi-Annual Report
NOTES TO FINANCIAL STATEMENTS (CONTINUED)
December 31, 2020 (Unaudited)
Amount of Realized Gain/(Loss) on Derivatives:
Global Floating Rate Fund
| FOREIGN EXCHANGE CONTRACTS RISK | ||||
| Forward Foreign Currency Exchange Contracts | $ | (2,979,313 | ) | |
|
| |||
Total | $ | (2,979,313 | ) | |
|
| |||
Global Credit Income Opportunities Fund
| FOREIGN EXCHANGE CONTRACTS RISK | EQUITY RISK | TOTAL | ||||||||||
Forward Foreign Currency Exchange Contracts | $ | (2,629,760 | ) | $ | – | $ | (2,629,760 | ) | ||||
Purchased Options | – | (692,562 | ) | (692,562 | ) | |||||||
Written Options | – | 403,346 | 403,346 | |||||||||
|
|
|
|
|
| |||||||
Total | $ | (2,629,760 | ) | $ | (289,216 | ) | $ | (2,918,976 | ) | |||
|
|
|
|
|
| |||||||
Active Short Duration Bond Fund
| INTEREST RATE RISK | CREDIT RISK | TOTAL | ||||||||||
Futures Contracts | $ | 13,032 | $ | – | $ | 13,032 | ||||||
Swaps Contracts | – | (340,586 | ) | (340,586 | ) | |||||||
|
|
|
|
|
| |||||||
Total | $ | 13,032 | $ | (340,586 | ) | $ | (327,554 | ) | ||||
|
|
|
|
|
| |||||||
Diversified Income Fund
| FOREIGN EXCHANGE CONTRACTS RISK | INTEREST RATE RISK | CREDIT RISK | TOTAL | |||||||||||||
Forward Foreign Currency Exchange Contracts | $ | (33,840 | ) | $ | – | $ | – | $ | (33,840 | ) | ||||||
Futures Contracts | – | 52,374 | – | 52,374 | ||||||||||||
Swaps Contracts | – | – | (27,294 | ) | (27,294 | ) | ||||||||||
|
|
|
|
|
|
|
| |||||||||
Total | $ | (33,840 | ) | $ | 52,374 | $ | (27,294 | ) | $ | (8,760 | ) | |||||
|
|
|
|
|
|
|
| |||||||||
Emerging Markets Debt Blended Total Return Fund
| FOREIGN EXCHANGE CONTRACTS RISK | INTEREST RATE RISK | CREDIT RISK | TOTAL | |||||||||||||
Forward Foreign Currency Exchange Contracts | $ | 1,185,382 | $ | – | $ | – | $ | 1,185,382 | ||||||||
Futures Contracts | – | 33,456 | – | 33,456 | ||||||||||||
Swaps Contracts | (15,336 | ) | 1,421,518 | 784,995 | 2,191,177 | |||||||||||
|
|
|
|
|
|
|
| |||||||||
Total | $ | 1,170,046 | $ | 1,454,974 | $ | 784,995 | $ | 3,410,015 | ||||||||
|
|
|
|
|
|
|
| |||||||||
173
Table of Contents
Barings Funds Trust 2020 Semi-Annual Report
NOTES TO FINANCIAL STATEMENTS (CONTINUED)
December 31, 2020 (Unaudited)
Change in Unrealized Appreciation/(Depreciation) on Derivatives:
Global Floating Rate Fund
| FOREIGN EXCHANGE CONTRACTS RISK | ||||
Forward Foreign Currency Exchange Contracts | $ | (989,769 | ) | |
|
| |||
Total | $ | (989,769 | ) | |
|
| |||
Global Credit Income Opportunities Fund
| FOREIGN EXCHANGE CONTRACTS RISK | EQUITY RISK | TOTAL | ||||||||||
Forward Foreign Currency Exchange Contracts | $ | (853,832 | ) | $ | – | $ | (853,832 | ) | ||||
Purchased Options | – | (37,712 | ) | (37,712 | ) | |||||||
Written Options | – | 18,451 | 18,451 | |||||||||
|
|
|
|
|
| |||||||
Total | $ | (853,832 | ) | $ | (19,261 | ) | $ | (873,093 | ) | |||
|
|
|
|
|
| |||||||
Active Short Duration Bond Fund
| INTEREST RATE RISK | CREDIT RISK | TOTAL | ||||||||||
Futures Contracts | $ | 115,105 | $ | – | $ | 115,105 | ||||||
Purchased Options | (46,684 | ) | – | (46,684 | ) | |||||||
Swaps Contracts | – | (121,089 | ) | (121,089 | ) | |||||||
|
|
|
|
|
| |||||||
Total | $ | 68,421 | $ | (121,089 | ) | $ | 52,668 | |||||
|
|
|
|
|
| |||||||
Diversified Income Fund
| FOREIGN EXCHANGE CONTRACTS RISK | INTEREST RATE RISK | TOTAL | ||||||||||
Forward Foreign Currency Exchange Contracts | $ | (4,172 | ) | $ | – | $ | (4,172 | ) | ||||
Futures Contracts | – | 61,968 | 61,968 | |||||||||
|
|
|
|
|
| |||||||
Total | $ | (4,172 | ) | $ | 61,968 | $ | 57,796 | |||||
|
|
|
|
|
| |||||||
Emerging Markets Debt Blended Total Return Fund
| FOREIGN EXCHANGE CONTRACTS RISK | INTEREST RATE RISK | CREDIT RISK | TOTAL | |||||||||||||
Forward Foreign Currency Exchange Contracts | $ | (881,405 | ) | $ | – | $ | – | $ | (881,405 | ) | ||||||
Futures Contracts | – | 47,219 | – | 47,219 | ||||||||||||
Swaps Contracts | (1,624,803 | ) | (1,637,471 | ) | (258,268 | ) | (3,520,542 | ) | ||||||||
|
|
|
|
|
|
|
| |||||||||
Total | $ | (2,506,208 | ) | $ | (1,590,252 | ) | $ | (258,268 | ) | $ | (4,354,728 | ) | ||||
|
|
|
|
|
|
|
| |||||||||
174
Table of Contents
Barings Funds Trust 2020 Semi-Annual Report
NOTES TO FINANCIAL STATEMENTS (CONTINUED)
December 31, 2020 (Unaudited)
Global Floating Rate Fund
| NUMBER OF CONTRACTS, NOTIONAL AMOUNTS OF SHARES/UNITS | FOREIGN EXCHANGE CONTRACTS RISK | |||
Forward Foreign Currency Exchange Contracts(a) | $ | 50,639,240 | ||
(a) Volume of derivative activity is based on an average of month-end notional amounts outstanding during the period. |
| |||
Global Credit Income Opportunities Fund
| FOREIGN EXCHANGE CONTRACTS RISK | EQUITY RISK | TOTAL | ||||||||||
Forward Foreign Currency Exchange Contracts(a) | $ | 45,328,847 | $ | – | $ | 45,328,847 | ||||||
Purchased Options(a) | $ | – | $ | 5,600 | $ | 5,600 | ||||||
Written Options(a) | $ | – | $ | 5,600 | $ | 5,600 | ||||||
| (a) | Volume of derivative activity is based on an average of month-end notional amounts outstanding during the period. |
Active Short Duration Bond Fund
| NUMBER OF CONTRACTS, NOTIONAL AMOUNTS OF SHARES/UNITS | INTEREST RATE RISK | CREDIT RISK | TOTAL | |||||||||
Futures Contracts(a) | 2,463 | – | 2,463 | |||||||||
Forward Foreign Currency Exchange Contracts(b) | $ | – | $ | – | $ | – | ||||||
Purchased Options(b) | $ | 32,248,250 | $ | – | $ | – | ||||||
Centrally Cleared Swap Contracts(b) | $ | – | $ | 15,725,000 | $ | 15,725,000 | ||||||
| (a) | Volume of derivative activity is based on an average of month-end contracts outstanding during the period. |
| (b) | Volume of derivative activity is based on an average of month-end notional amounts outstanding during the period. |
Diversified Income Fund
| NUMBER OF CONTRACTS, NOTIONAL AMOUNTS OF SHARES/UNITS | FOREIGN EXCHANGE CONTRACTS RISK | INTEREST RATE RISK | TOTAL | |||||||||
Futures Contracts(a) | – | 160 | 160 | |||||||||
Forward Foreign Currency Exchange Contracts(b) | $ | 1,340,123 | $ | – | $ | 1,340,123 | ||||||
| (a) | Volume of derivative activity is based on an average of month-end contracts outstanding during the period. |
| (b) | Volume of derivative activity is based on an average of month-end notional amounts outstanding during the period. |
175
Table of Contents
Barings Funds Trust 2020 Semi-Annual Report
NOTES TO FINANCIAL STATEMENTS (CONTINUED)
December 31, 2020 (Unaudited)
Emerging Markets Debt Blended Total Return Fund
| NUMBER OF CONTRACTS, NOTIONAL AMOUNTS OF SHARES/UNITS | FOREIGN EXCHANGE CONTRACTS RISK | INTEREST RATE RISK | CREDIT RISK | TOTAL | ||||||||||||
Futures Contracts(a) | – | 12 | – | 12 | ||||||||||||
Forward Foreign Currency Exchange Contracts(b) | $ | 54,107,738 | $ | – | $ | – | $ | 54,107,738 | ||||||||
OTC – Swaps Contracts(b) | $ | 9,443,634 | $ | 13,597,101 | $ | 9,468,333 | $ | 32,509,068 | ||||||||
Centrally Cleared Swap Contracts(b) | $ | – | $ | 19,384,109 | $ | – | $ | 19,384,109 | ||||||||
| (a) | Volume of derivative activity is based on an average of month-end contracts outstanding during the period. |
| (b) | Volume of derivative activity is based on an average of month-end notional amounts outstanding during the period. |
| K. | Disclosures about Offsetting Assets and Liabilities |
The Financial Accounting Standards Board (“FASB”) issued Accounting Standards Update No. 2011-11 “Disclosures about Offsetting Assets and Liabilities” (“ASU 2011-11”). These disclosure requirements are intended to help better assess the effect or potential effect of offsetting arrangements on a Fund’s financial position. In addition, FASB issued Accounting Standards Update No. 2013-01 “Clarifying the Scope of Offsetting Assets and Liabilities” (“ASU 2013-01”), specifying which transactions are subject to disclosures about offsetting. In order to better define its contractual rights and to secure rights that will help the Fund mitigate its counterparty risk, the Fund may enter into an International Swaps and Derivatives Association, Inc. Master Agreement (“ISDA Master Agreement”) or similar agreement with its counterparties. An ISDA Master Agreement is a bilateral agreement between the Fund and a counterparty that governs certain OTC derivatives and typically contains, among other things, collateral posting terms and netting provisions in the event of a default and/or termination event. Under an ISDA Master Agreement, the Fund may, under certain circumstances, offset with the counterparty certain derivative financial instruments’ payables and/or receivables with collateral held and/or posted and create one single net payment. The provisions of the ISDA Master Agreement typically permit a single net payment in the event of default including the bankruptcy or insolvency of the counterparty. Bankruptcy or insolvency laws of a particular jurisdiction may restrict or prohibit the right of offset in bankruptcy, insolvency or other events. In addition, certain ISDA Master Agreements allow counterparties to terminate derivative contracts prior to maturity in the event the Fund’s net assets decline by a stated percentage or the Fund fails to meet the terms of its ISDA Master Agreements. The result would cause the Fund to accelerate payment of any net liability owed to the counterparty.
For derivatives traded under an ISDA Master Agreement, the collateral requirements are typically calculated by netting the mark to market amount for each transaction under such agreement and comparing that amount to the value of any collateral currently pledged by the Funds and the counterparty.
Cash collateral that has been pledged to cover obligations of the Funds and cash collateral received from the counterparty, if any, is reported separately on the Statement of Assets and Liabilities as cash collateral held at broker or cash collateral due to broker, respectively. Non-cash collateral pledged by or received by the Funds, if any, is noted in the Schedule of Investments. Generally, the amount of collateral due from or to a party has to exceed a minimum transfer amount threshold before a transfer is required, which is determined each day at the close of business of the Funds, typically based on changes in market values for each transaction under an ISDA Master Agreement and netted into one amount for such agreement and any additional required collateral is delivered to/pledged by the Funds on the next business day. Typically, the Funds and counterparties are not permitted to sell, re-pledge or use the collateral they receive. To the extent amounts due to the Funds from their counterparties are not fully collateralized, contractually or otherwise, the Funds bear the risk of loss from counterparty non-performance. The Funds attempt to mitigate counterparty risk by entering into agreements only with counterparties that they believe have the financial resources to honor their obligations and by monitoring the financial stability of those counterparties.
The following tables illustrate gross and net information about recognized assets eligible for offset in the Statement of Assets and Liabilities, and disclose such amounts subject to an enforceable master netting agreement or similar agreement, by counterparty. A master netting agreement is an agreement between two counterparties who have
176
Table of Contents
Barings Funds Trust 2020 Semi-Annual Report
NOTES TO FINANCIAL STATEMENTS (CONTINUED)
December 31, 2020 (Unaudited)
multiple contracts with each other that provides for the net settlement of all contracts, as well as cash collateral, through a single payment in the event of default on or termination of any one contract:
Global Floating Rate Fund
| DESCRIPTION | GROSS AMOUNTS OF RECOGNIZED ASSETS | GROSS AMOUNTS OFFSET IN THE STATEMENTS OF ASSETS AND LIABILITIES | NET AMOUNTS OF ASSETS PRESENTED IN THE STATEMENTS OF ASSETS AND LIABILITIES | |||||||||
Forward Foreign Currency Exchange Contracts | $ | 52,763 | $ | – | $ | 52,763 | ||||||
|
|
|
|
|
| |||||||
Total | $ | 52,763 | $ | – | $ | 52,763 | ||||||
|
|
|
|
|
| |||||||
| GROSS AMOUNTS NOT OFFSET IN THE STATEMENTS OF ASSETS AND LIABILITIES | ||||||||||||||||
| COUNTERPARTY | NET AMOUNTS OF ASSETS PRESENTED IN THE STATEMENTS OF ASSETS AND LIABILITIES | FINANCIAL INSTRUMENT | CASH COLLATERAL RECEIVED (a) | NET AMOUNT (b) | ||||||||||||
Canadian Imperial Bank of Commerce | $ | 10,828 | $ | (10,828 | ) | $ | – | $ | – | |||||||
Morgan Stanley & Co. | 41,935 | (41,935 | ) | – | – | |||||||||||
|
|
|
|
|
|
|
| |||||||||
Total | $ | 52,763 | $ | (52,763 | ) | $ | — | $ | — | |||||||
|
|
|
|
|
|
|
| |||||||||
| (a) | Collateral disclosed is limited to an amount not to exceed 100% of the net amount of assets presented in the Statements of Assets and Liabilities, for each respective counterparty. |
| (b) | Net Amount represents the amount that is subject to loss in the event of a counterparty failure as of December 31, 2020. |
| DESCRIPTION | GROSS AMOUNTS OF RECOGNIZED LIABILITIES | GROSS AMOUNTS OFFSET IN THE STATEMENTS OF ASSETS AND LIABILITIES | NET AMOUNTS OF LIABILITIES PRESENTED IN THE STATEMENTS OF ASSETS AND LIABILITIES | |||||||||
Forward Foreign Currency Exchange Contracts | $ | 482,402 | $ | — | $ | 482,402 | ||||||
|
|
|
|
|
| |||||||
Total | $ | 482,402 | $ | — | $ | 482,402 | ||||||
|
|
|
|
|
| |||||||
177
Table of Contents
Barings Funds Trust 2020 Semi-Annual Report
NOTES TO FINANCIAL STATEMENTS (CONTINUED)
December 31, 2020 (Unaudited)
| GROSS AMOUNTS NOT OFFSET IN THE STATEMENTS OF ASSETS AND LIABILITIES | ||||||||||||||||
| COUNTERPARTY | NET AMOUNTS OF IN THE STATEMENTS OF | FINANCIAL INSTRUMENT | CASH COLLATERAL PLEDGED (a) | NET AMOUNT (b) | ||||||||||||
Canadian Imperial Bank of Commerce | $ | 254,169 | $ | (10,828 | ) | $ | — | $ | 243,341 | |||||||
Morgan Stanley & Co. | 228,233 | (41,935 | ) | — | 186,298 | |||||||||||
|
|
|
|
|
|
|
| |||||||||
Total | $ | 482,402 | $ | (52,763 | ) | $ | — | $ | 429,639 | |||||||
|
|
|
|
|
|
|
| |||||||||
| (a) | Collateral disclosed is limited to an amount not to exceed 100% of the net amount of assets presented in the Statements of Assets and Liabilities, for each respective counterparty. |
| (b) | Net Amount represents the amount that is subject to loss in the event of a counterparty failure as of December 31, 2020. |
Global Credit Income Opportunities Fund
| DESCRIPTION | GROSS AMOUNTS OF RECOGNIZED ASSETS | GROSS AMOUNTS OFFSET IN THE STATEMENTS OF ASSETS AND LIABILITIES | NET AMOUNTS OF ASSETS PRESENTED IN THE STATEMENTS OF ASSETS AND LIABILITIES | |||||||||
Forward Foreign Currency Exchange Contracts | $ | 50,743 | $ | — | $ | 50,743 | ||||||
|
|
|
|
|
| |||||||
Total | $ | 50,743 | $ | — | $ | 50,743 | ||||||
|
|
|
|
|
| |||||||
| GROSS AMOUNTS NOT OFFSET IN THE STATEMENTS OF ASSETS AND LIABILITIES | ||||||||||||||||
| COUNTERPARTY | NET AMOUNTS OF ASSETS PRESENTED IN THE STATEMENTS OF ASSETS AND LIABILITIES | FINANCIAL INSTRUMENT | CASH COLLATERAL RECEIVED (a) | NET AMOUNT (b) | ||||||||||||
Bank of America N.A. | $ | 44,656 | $ | — | $ | — | $ | 44,656 | ||||||||
Canadian Imperial Bank of Commerce | 6,087 | (6,087 | ) | — | — | |||||||||||
|
|
|
|
|
|
|
| |||||||||
Total | $ | 50,743 | $ | (6,087 | ) | $ | — | $ | 44,656 | |||||||
|
|
|
|
|
|
|
| |||||||||
| (a) | Collateral disclosed is limited to an amount not to exceed 100% of the net amount of assets presented in the Statements of Assets and Liabilities, for each respective counterparty. |
| (b) | Net Amount represents the amount that is subject to loss in the event of a counterparty failure as of December 31, 2020. |
178
Table of Contents
Barings Funds Trust 2020 Semi-Annual Report
NOTES TO FINANCIAL STATEMENTS (CONTINUED)
December 31, 2020 (Unaudited)
| DESCRIPTION | GROSS AMOUNTS OF RECOGNIZED LIABILITIES | GROSS AMOUNTS OFFSET IN THE STATEMENTS OF ASSETS AND LIABILITIES | NET AMOUNTS OF LIABILITIES PRESENTED IN THE STATEMENTS OF ASSETS AND LIABILITIES | |||||||||
Forward Foreign Currency Exchange Contracts | $ | 457,436 | $ | — | $ | 457,436 | ||||||
|
|
|
|
|
| |||||||
Total | $ | 457,436 | $ | — | $ | 457,436 | ||||||
|
|
|
|
|
| |||||||
| GROSS AMOUNTS NOT OFFSET IN THE STATEMENTS OF ASSETS AND LIABILITIES | ||||||||||||||||
| COUNTERPARTY | NET AMOUNTS OF LIABILITIES PRESENTED IN THE STATEMENTS OF ASSETS AND LIABILITIES | FINANCIAL INSTRUMENT | CASH COLLATERAL PLEDGED (a) | NET AMOUNT (b) | ||||||||||||
Barclays Bank plc | $ | 208,468 | $ | — | $ | (208,468 | ) | $ | — | |||||||
Canadian Imperial Bank of Commerce | 246,769 | (6,087 | ) | — | 240,682 | |||||||||||
Citibank N.A. | 2,199 | — | — | 2,199 | ||||||||||||
|
|
|
|
|
|
|
| |||||||||
Total | $ | 457,436 | $ | (6,087 | ) | $ | (208,468 | ) | $ | 242,881 | ||||||
|
|
|
|
|
|
|
| |||||||||
| (a) | Collateral disclosed is limited to an amount not to exceed 100% of the net amount of assets presented in the Statements of Assets and Liabilities, for each respective counterparty. |
| (b) | Net Amount represents the amount that is subject to loss in the event of a counterparty failure as of December 31, 2020. |
Active Short Duration Bond Fund
| DESCRIPTION | GROSS AMOUNTS OF RECOGNIZED ASSETS | GROSS AMOUNTS OFFSET IN THE STATEMENTS OF ASSETS AND LIABILITIES | NET AMOUNTS OF ASSETS PRESENTED IN THE STATEMENTS OF ASSETS AND LIABILITIES | |||||||||
Purchased Options | $ | 1,087,782 | $ | — | $ | 1,087,782 | ||||||
|
|
|
|
|
| |||||||
Total | $ | 1,087,782 | $ | — | $ | 1,087,782 | ||||||
|
|
|
|
|
| |||||||
| GROSS AMOUNTS NOT OFFSET IN THE STATEMENTS OF ASSETS AND LIABILITIES | ||||||||||||||||
| COUNTERPARTY | NET AMOUNTS OF ASSETS PRESENTED IN THE STATEMENTS OF ASSETS AND LIABILITIES | FINANCIAL INSTRUMENT | CASH COLLATERAL RECEIVED (a) | NET AMOUNT (b) | ||||||||||||
JPMorgan Chase Bank N.A. | $ | 1,087,782 | $ | — | $ | (1,010,000 | ) | $ | 77,782 | |||||||
|
|
|
|
|
|
|
| |||||||||
Total | $ | 1,087,782 | $ | — | $ | (1,010,000 | ) | $ | 77,782 | |||||||
|
|
|
|
|
|
|
| |||||||||
| (a) | Collateral disclosed is limited to an amount not to exceed 100% of the net amount of assets presented in the Statements of Assets and Liabilities, for each respective counterparty. |
179
Table of Contents
Barings Funds Trust 2020 Semi-Annual Report
NOTES TO FINANCIAL STATEMENTS (CONTINUED)
December 31, 2020 (Unaudited)
| (b) | Net Amount represents the amount that is subject to loss in the event of a counterparty failure as of December 31, 2020. |
Diversified Income Fund
| DESCRIPTION | GROSS AMOUNTS OF RECOGNIZED ASSETS | GROSS AMOUNTS OFFSET IN THE STATEMENTS OF ASSETS AND LIABILITIES | NET AMOUNTS OF ASSETS PRESENTED | |||||||||
Forward Foreign Currency Exchange Contracts | $ | 2,086 | $ | — | $ | 2,086 | ||||||
|
|
|
|
|
| |||||||
Total | $ | 2,086 | $ | — | $ | 2,086 | ||||||
|
|
|
|
|
| |||||||
| GROSS AMOUNTS NOT OFFSET IN THE STATEMENTS OF ASSETS AND LIABILITIES | ||||||||||||||||
| COUNTERPARTY | NET AMOUNTS OF ASSETS PRESENTED IN THE STATEMENTS OF ASSETS AND LIABILITIES | FINANCIAL INSTRUMENT | CASH COLLATERAL RECEIVED (a) | NET AMOUNT (b) | ||||||||||||
Canadian Imperial Bank of Commerce | $ | 2,086 | $ | (2,086 | ) | $ | — | $ | — | |||||||
|
|
|
|
|
|
|
| |||||||||
Total | $ | 2,086 | $ | (2,086 | ) | $ | — | $ | — | |||||||
|
|
|
|
|
|
|
| |||||||||
| (a) | Collateral disclosed is limited to an amount not to exceed 100% of the net amount of assets presented in the Statements of Assets and Liabilities, for each respective counterparty. |
| (b) | Net Amount represents the amount that is subject to loss in the event of a counterparty failure as of December 31, 2020. |
| DESCRIPTION | GROSS AMOUNTS OF RECOGNIZED LIABILITIES | GROSS AMOUNTS OFFSET IN THE STATEMENTS OF ASSETS AND LIABILITIES | NET AMOUNTS OF LIABILITIES PRESENTED IN THE STATEMENTS OF ASSETS AND LIABILITIES | |||||||||
Forward Foreign Currency Exchange Contracts | $ | 10,431 | $ | — | $ | 10,431 | ||||||
|
|
|
|
|
| |||||||
Total | $ | 10,431 | $ | — | $ | 10,431 | ||||||
|
|
|
|
|
| |||||||
| GROSS AMOUNTS NOT OFFSET IN THE STATEMENTS OF ASSETS AND LIABILITIES | ||||||||||||||||
| COUNTERPARTY | NET AMOUNTS OF LIABILITIES PRESENTED IN THE STATEMENTS OF ASSETS AND LIABILITIES | FINANCIAL INSTRUMENT | CASH COLLATERAL PLEDGED (a) | NET AMOUNT (b) | ||||||||||||
Barclays Bank plc | $ | 112 | $ | — | $ | (112 | ) | $ | — | |||||||
Canadian Imperial Bank of Commerce | 10,319 | (2,086 | ) | (8,162 | ) | 71 | ||||||||||
|
|
|
|
|
|
|
| |||||||||
Total | $ | 10,431 | $ | (2,086 | ) | $ | (8,274 | ) | $ | 71 | ||||||
|
|
|
|
|
|
|
| |||||||||
180
Table of Contents
Barings Funds Trust 2020 Semi-Annual Report
NOTES TO FINANCIAL STATEMENTS (CONTINUED)
December 31, 2020 (Unaudited)
| (a) | Collateral disclosed is limited to an amount not to exceed 100% of the net amount of assets presented in the Statements of Assets and Liabilities, for each respective counterparty. |
| (b) | Net Amount represents the amount that is subject to loss in the event of a counterparty failure as of December 31, 2020. |
Emerging Markets Debt Blended Total Return Fund
DESCRIPTION | GROSS AMOUNTS OF RECOGNIZED ASSETS | GROSS AMOUNTS OFFSET IN THE STATEMENTS OF ASSETS AND LIABILITIES | NET AMOUNTS OF ASSETS PRESENTED IN THE STATEMENTS OF ASSETS AND LIABILITIES | |||||||||
Forward Foreign Currency Exchange Contracts | $ | 1,497,910 | $ | — | $ | 1,497,910 | ||||||
Swap Contracts | 321,682 | — | 321,682 | |||||||||
|
|
|
|
|
| |||||||
Total | $ | 1,819,592 | $ | — | $ | 1,819,592 | ||||||
|
|
|
|
|
| |||||||
| GROSS AMOUNTS NOT OFFSET IN THE STATEMENTS OF ASSETS AND LIABILITIES | ||||||||||||||||
| COUNTERPARTY | NET AMOUNTS OF ASSETS PRESENTED IN THE STATEMENTS OF ASSETS AND LIABILITIES | FINANCIAL INSTRUMENT | CASH COLLATERAL RECEIVED (a) | NET AMOUNT (b) | ||||||||||||
Bank of America N.A. | $ | 540,777 | $ | (540,777 | ) | $ | — | $ | — | |||||||
Citibank N.A. | 642,744 | (642,744 | ) | — | — | |||||||||||
Goldman Sachs & Co. | 350,468 | (132,743 | ) | (217,725 | ) | — | ||||||||||
HSBC Bank USA | 38,276 | (38,276 | ) | — | — | |||||||||||
JPMorgan Chase Bank N.A. | 3,883 | (3,883 | ) | — | — | |||||||||||
Morgan Stanley & Co. | 243,444 | (103,410 | ) | (130,000 | ) | 10,034 | ||||||||||
|
|
|
|
|
|
|
| |||||||||
Total | $ | 1,819,592 | $ | (1,461,833 | ) | $ | (347,725 | ) | $ | 10,034 | ||||||
|
|
|
|
|
|
|
| |||||||||
| (a) | Collateral disclosed is limited to an amount not to exceed 100% of the net amount of assets presented in the Statements of Assets and Liabilities, for each respective counterparty. |
| (b) | Net Amount represents the amount that is subject to loss in the event of a counterparty failure as of December 31, 2020. |
| DESCRIPTION | GROSS AMOUNTS OF RECOGNIZED LIABILITIES | GROSS AMOUNTS OFFSET IN THE STATEMENTS OF ASSETS AND LIABILITIES | NET AMOUNTS OF LIABILITIES PRESENTED IN THE STATEMENTS OF ASSETS AND LIABILITIES | |||||||||
Forward Foreign Currency Exchange Contracts | $ | 1,524,709 | $ | — | $ | 1,524,709 | ||||||
Swap Contracts | 1,298,438 | — | 1,298,438 | |||||||||
|
|
|
|
|
| |||||||
Total | $ | 2,823,147 | $ | — | $ | 2,823,147 | ||||||
|
|
|
|
|
| |||||||
181
Table of Contents
Barings Funds Trust 2020 Semi-Annual Report
NOTES TO FINANCIAL STATEMENTS (CONTINUED)
December 31, 2020 (Unaudited)
| GROSS AMOUNTS NOT OFFSET IN THE STATEMENTS OF ASSETS AND LIABILITIES | ||||||||||||||||
| COUNTERPARTY | NET AMOUNTS OF LIABILITIES PRESENTED IN THE STATEMENTS OF ASSETS AND LIABILITIES | FINANCIAL INSTRUMENT | CASH COLLATERAL PLEDGED (a) | NET AMOUNT (b) | ||||||||||||
Bank of America N.A. | $ | 818,888 | $ | (540,777 | ) | $ | (278,111 | ) | $ | — | ||||||
Citibank N.A. | 1,351,940 | (642,744 | ) | (709,196 | ) | — | ||||||||||
Goldman Sachs & Co. | 132,743 | (132,743 | ) | — | — | |||||||||||
HSBC Bank USA | 232,587 | (38,276 | ) | (120,000 | ) | 74,311 | ||||||||||
JPMorgan Chase Bank N.A. | 183,579 | (3,883 | ) | (179,696 | ) | — | ||||||||||
Morgan Stanley & Co. | 103,410 | (103,410 | ) | — | — | |||||||||||
|
|
|
|
|
|
|
| |||||||||
Total | $ | 2,823,147 | $ | (1,461,833 | ) | $ | (1,287,003 | ) | $ | 74,311 | ||||||
|
|
|
|
|
|
|
| |||||||||
| (a) | Collateral disclosed is limited to an amount not to exceed 100% of the net amount of assets presented in the Statements of Assets and Liabilities, for each respective counterparty. |
| (b) | Net Amount represents the amount that is subject to loss in the event of a counterparty failure as of December 31, 2020. |
L. Foreign Securities
Investing in securities of foreign companies and foreign governments involves special risks and considerations not typically associated with investing in U.S. companies and the U.S. government. These risks include valuation of currencies and adverse political and economic developments. Moreover, securities of many foreign companies, foreign governments, and their markets may be less liquid and their prices more volatile than those of securities of comparable U.S. companies and the U.S. government.
M. Foreign Currency Translation
The books and records of the Funds are maintained in U.S. dollars. Foreign currency transactions are translated into U.S. dollars on the following basis: (i) market value of investment securities, assets and liabilities at the daily rates of exchange, and (ii) purchases and sales of investment securities, dividend and interest income and certain expenses at the rates of exchange prevailing on the respective dates of such transactions. For financial reporting purposes, the Funds do not isolate changes in the exchange rate of investment securities from the fluctuations arising from changes in the market prices of securities. However, for Federal income tax purposes, the Funds do isolate and treat as ordinary income the effect of changes in foreign exchange rates on realized gain or loss from the sale of investment securities and payables and receivables arising from trade-date and settlement-date differences.
N. Counterparty Risk
The Funds seek to manage counterparty credit risk by entering into agreements only with counterparties the Adviser believes have the financial resources to honor their obligations. The Adviser monitors the financial stability of the Funds’ counterparties.
3. Advisory Fee
The Funds have entered into an Investment Management Agreement (the “Agreement”) with the Adviser. Pursuant to the Agreement, the Funds have agreed to pay the Adviser a fee payable at the end of each calendar month as set forth below:
Global Floating Rate Fund | 0.65% of average daily net assets | |
Global Credit Income Opportunities Fund | 0.75% of average daily net assets | |
Active Short Duration Bond Fund | 0.35% of average daily net assets | |
Diversified Income Fund | 0.40% of average daily net assets | |
Emerging Markets Debt Blended Total Return Fund | 0.75% of average daily net assets | |
Global Emerging Markets Equity Fund | 0.90% of average daily net assets | |
U.S. High Yield Fund | 0.55% of average daily net assets |
182
Table of Contents
Barings Funds Trust 2020 Semi-Annual Report
NOTES TO FINANCIAL STATEMENTS (CONTINUED)
December 31, 2020 (Unaudited)
The Adviser has contractually agreed to waive and/or reimburse a portion of its fees and/or reimburse expenses (excluding distribution and service (12b-1) fees, interest expenses, taxes, acquired fund fees and expenses, fees incurred in acquiring and disposing of securities and extraordinary expenses) such that total net annual operating expenses (including 12b-1 fees) for each class do not exceed the following rates (as a percentage of average daily net assets allocated to each such class):
| CLASS A | CLASS C | CLASS I | CLASS L | CLASS Y | ||||||||
Global Floating Rate Fund | 1.00% | 1.75% | 0.75% | — | 0.75% | |||||||
Global Credit Income Opportunities Fund | 1.20% | 1.95% | 0.95% | — | 0.95% | |||||||
Active Short Duration Bond Fund | 0.65% | 0.90% | 0.40% | 0.65 | % | 0.40% | ||||||
Diversified Income Fund | 0.80% | 1.55% | 0.55% | — | 0.55% | |||||||
Emerging Markets Debt Blended Total Return Fund | 1.20% | 1.95% | 0.95% | — | 0.95% | |||||||
Global Emerging Markets Equity Fund(1) | 1.15% | 1.90% | 0.90% | — | 0.90% | |||||||
U.S. High Yield Fund | 1.00% | 1.75% | 0.75% | — | 0.75% | |||||||
| (1) | As of November 5, 2020, the Advisor contractually updated the waiver/reimbursement amounts for the Global Emerging Markets Equity Fund to be as shown in the table above. Prior to November 5, 2020, the waiver/reimbursement amounts for the Global Emerging Markets Equity Fund were as follows: Class A: 1.45%, Class C: 2.20%, Class I: 1.20% and Class Y: 1.20%. |
Pursuant to the expense waiver/reimbursement agreement, the Adviser is entitled to be reimbursed for any fees the Adviser waives and Fund expenses that the Adviser reimburses for a period of three years following such fee waivers and expense reimbursements, to the extent that such reimbursement of the Adviser by a Fund will not cause the Fund to exceed any applicable expense limitation that is in place for the Fund.
The contractual management fee waiver and expense reimbursement agreements between the Funds and the Adviser will remain in effect until November 1, 2021 and may be terminated only upon the approval of the Funds’ Board of Trustees.
Subject to the supervision of the Adviser and the Board, BIIL manages the investment and reinvestment of a portion of the assets of the Global Floating Rate Fund, Global Credit Income Opportunities Fund, Emerging Markets Debt Blended Total Return Fund and Global Emerging Markets Equity Fund, as allocated from time to time to BIIL. As compensation for its services, the Adviser (not the Funds) pays to BIIL sub-advisory fees equal to the below percentages of the advisory fee paid to the Adviser by the applicable Fund, net of any fee waivers and/or expense reimbursements:
Global Floating Rate Fund | 0.35 | % | ||
Global Credit Income Opportunities Fund | 0.35 | % | ||
Emerging Markets Debt Blended Total Return Fund | 0.50 | % | ||
Global Emerging Markets Equity Fund | 0.70 | % |
The Adviser or its affiliates voluntarily agreed to waive certain fees for the Global Floating Rate Fund, the Active Short Duration Bond Fund, the Diversified Income Fund and the Emerging Markets Debt Blended Total Return Fund. Such arrangements may be discontinued by the Adviser at any time.
| 4. | 12b-1 Distribution and Service Plan |
ALPS Distributors, Inc. (the “Distributor”) is the Distributor of the Funds’ shares as of December 31, 2020.
The Funds have adopted a Distribution and Shareholder Services Plan (the “Plan”), pursuant to Rule 12b-1 under the 1940 Act. Under the Plan, each Fund’s Class A, Class C shares and Class L shares may compensate certain financial institutions, including the Distributor, for certain distribution and shareholder servicing activities. The Funds’ Class A shares may expend an aggregate amount, on an annual basis, not to exceed 0.25% of the value of the average daily net assets of a Fund attributable to Class A shares. The Funds’ Class C shares may expend an aggregate amount, on an annual basis, not to exceed 1.00% (0.50% for Active Short Duration Bond Fund) of the value of the average daily net assets of a Fund attributable to Class C shares. Active Short Duration Bond Fund’s Class L shares may expend an aggregate amount, on an annual basis, not to exceed 0.25% of the value of the average daily net assets of Active Short Duration Bond Fund attributable to Class L
183
Table of Contents
Barings Funds Trust 2020 Semi-Annual Report
NOTES TO FINANCIAL STATEMENTS (CONTINUED)
December 31, 2020 (Unaudited)
shares. The Plan provides that the distribution and service fees are payable to the Distributor regardless of the amounts actually expended by the Distributor for distribution of the Funds’ shares and service activities.
Under its terms, the Funds’ Plan shall remain in effect from year to year, provided such continuance is approved annually by a vote of a majority of the Board’s members and a majority of the Board’s members who are not “interested persons” of the Funds and who have no direct or indirect financial interest in the operation of the Plan or in any agreement related to the Plan.
| 5. | Sales Charges and Commissions |
For the six months ended December 31, 2020, the Distributor received the following commissions on sales of shares of the Funds, after concessions were paid to authorized dealers:
| DISTRIBUTOR COMMISSIONS | DEALERS’ CONCESSIONS | |||||||
Global Floating Rate Fund | $ | – | $ | 10,340 | ||||
Global Credit Income Opportunities Fund | 1,294 | 10,299 | ||||||
Active Short Duration Bond Fund | – | 21,727 | ||||||
Emerging Markets Debt Blended Total Return Fund | 1,020 | 7,435 | ||||||
| 6. | Administrator, Custody, and Transfer Agent Fees |
The Funds have engaged State Street Bank and Trust (“SSB”) to serve as the Funds’ administrator, custodian, and fund accountant. For these services, the Funds have agreed to pay SSB fees payable at the end of each calendar month pursuant to an agreement between SSB
and the Funds. For the six months ended December 31, 2020, the aggregate effective fee for the services performed by SSB was at the following annual rate of each Fund’s average daily managed assets:
Aggregate Administrator, Custodian and Fund Accountant Fee to SSB: |
| |||
Global Floating Rate Fund | 0.13 | % | ||
Global Credit Income Opportunities Fund | 0.15 | % | ||
Active Short Duration Bond Fund | 0.11 | % | ||
Diversified Income Fund | 0.18 | % | ||
Emerging Markets Debt Blended Total Return Fund | 0.21 | % | ||
Global Emerging Markets Equity Fund | 0.34 | % | ||
U.S. High Yield Fund | 0.17 | % | ||
The Funds have engaged ALPS Fund Services, Inc. (“ALPS”) to serve as the Funds’ transfer agent. For these services, the Funds have agreed to pay ALPS fees payable at the end of each calendar month pursuant to an agreement between ALPS and the Funds. For the six months ended December 31, 2020, the effective fee for the services performed by ALPS was at the following annual rate of each Fund’s average daily managed assets:
Transfer Agency Fee to ALPS: | ||||
Global Floating Rate Fund | 0.02 | % | ||
Global Credit Income Opportunities Fund | 0.02 | % | ||
Active Short Duration Bond Fund | 0.01 | % | ||
Diversified Income Fund | 0.05 | % | ||
Emerging Markets Debt Blended Total Return Fund | 0.05 | % | ||
Global Emerging Markets Equity Fund | 0.14 | % | ||
U.S. High Yield Fund | 0.02 | % |
| 7. | Income Taxes |
It is the Funds’ intention to qualify as a RIC under subchapter M of the Internal Revenue Code and distribute all of its taxable income. Accordingly, no provision for Federal income taxes is required in the financial statements.
The tax character of dividends paid to shareholders during the tax year ended June 30, 2020 was as follows:
| ORDINARY INCOME | NET LONG-TERM CAPITAL GAINS | RETURN OF CAPITAL | TOTAL DISTRIBUTIONS PAID | |||||||||||||||||
Global Floating Rate Fund | $ | 10,225,052 | $ | 438,706 | $ | 2,165,048 | $ | 12,828,806 | ||||||||||||
Global Credit Income Opportunities Fund | 9,585,231 | – | 1,452,704 | 11,037,935 | ||||||||||||||||
Active Short Duration Bond Fund | 24,926,745 | – | – | 24,926,745 | ||||||||||||||||
Diversified Income Fund | 1,471,540 | – | – | 1,471,540 | ||||||||||||||||
Emerging Markets Debt Blended Total Return Fund | 3,530,108 | – | – | 3,530,108 | ||||||||||||||||
Global Emerging Markets Equity Fund | 311,500 | 21,100 | 15,138 | 347,738 | ||||||||||||||||
U.S. High Yield Fund | 2,879,166 | – | – | 2,879,166 | ||||||||||||||||
184
Table of Contents
Barings Funds Trust 2020 Semi-Annual Report
NOTES TO FINANCIAL STATEMENTS (CONTINUED)
December 31, 2020 (Unaudited)
In accordance with the Regulated Investment Company Modernization Act of 2010, the Funds will carryforward capital losses incurred in taxable years beginning after December 22, 2010 (“post-enactment losses”) indefinitely. Post-enactment losses will also retain their character as either short-term or long-term and be utilized before any pre-enactment losses.
As of December 31, 2020, the aggregate unrealized security gains and losses based on cost for U.S. federal income tax purposes were as follows:
| COST OF INVESTMENTS | GROSS UNREALIZED APPRECIATION | GROSS UNREALIZED DEPRECIATION | NET UNREALIZED APPRECIATION (DEPRECIATION) | |||||||||||||
Global Floating Rate Fund | $ | 202,978,376 | $ | 3,714,987 | $ | (8,428,628 | ) | $ | (4,713,641 | ) | ||||||
Global Credit Income Opportunities Fund | 159,801,908 | 7,052,244 | (11,523,490 | ) | (4,471,246 | ) | ||||||||||
Active Short Duration Bond Fund | 854,882,098 | 16,704,631 | (5,675,545 | ) | 11,029,086 | |||||||||||
Diversified Income Fund | 43,825,895 | 1,310,182 | (430,041 | ) | 880,141 | |||||||||||
Emerging Markets Debt Blended Total Return Fund | 66,034,132 | 5,634,231 | (1,062,457 | ) | 4,571,774 | |||||||||||
Global Emerging Markets Equity Fund | 9,598,076 | 3,741,986 | (397,371 | ) | 3,344,615 | |||||||||||
U.S. High Yield Fund | 48,082,878 | 3,044,330 | (1,637,957 | ) | 1,406,373 | |||||||||||
The difference between book-basis and tax-basis unrealized gains (losses) is attributable to wash sales and partnership book-tax differences.
| 8. | Investment Transactions |
Purchases and sales of securities (excluding short-term debt securities) for the six months ended December 31, 2020 were as follows:
| PURCHASES | SALES | GOVERNMENT PURCHASES | GOVERNMENT SALES | |||||||||||||
Global Floating Rate Fund | $ | 35,345,129 | $ | 56,666,100 | $ | – | $ | – | ||||||||
Global Credit Income Opportunities Fund | 43,466,368 | 56,386,628 | – | – | ||||||||||||
Active Short Duration Bond Fund | 223,104,801 | 216,292,295 | 6,237,000 | 10,062,799 | ||||||||||||
Diversified Income Fund | 22,793,671 | 21,959,197 | 924,481 | 4,949 | ||||||||||||
Emerging Markets Debt Blended Total Return Fund | 32,291,506 | 20,527,471 | – | – | ||||||||||||
Global Emerging Markets Equity Fund | 1,300,266 | 1,489,493 | – | – | ||||||||||||
U.S. High Yield Fund | 20,504,378 | 19,877,940 | – | – | ||||||||||||
| 9. | Common Stock |
Transactions in common stock for the six months ended December 31, 2020 were as follows:
Global Floating Rate Fund
FOR THE SIX MONTHS ENDED | FOR THE YEAR ENDED JUNE 30, 2020 | |||||||||||||||
| CLASS A | SHARES | AMOUNT | SHARES | AMOUNT | ||||||||||||
Shares sold | 126,476 | $ | 1,143,645 | 937,310 | $ | 8,607,970 | ||||||||||
Shares sold through reinvestments of distributions | 88,455 | 787,649 | 235,705 | 2,102,247 | ||||||||||||
Shares redeemed | (374,441 | ) | (3,353,402 | ) | (1,685,551 | ) | (14,925,227 | ) | ||||||||
|
|
|
|
|
|
|
| |||||||||
Net decrease | (159,510 | ) | $ | (1,422,108 | ) | (512,536 | ) | $ | (4,215,010 | ) | ||||||
|
|
|
|
|
|
|
| |||||||||
185
Table of Contents
Barings Funds Trust 2020 Semi-Annual Report
NOTES TO FINANCIAL STATEMENTS (CONTINUED)
December 31, 2020 (Unaudited)
FOR THE SIX MONTHS ENDED | FOR THE YEAR ENDED JUNE 30, 2020 | |||||||||||||||
| CLASS C | SHARES | AMOUNT | SHARES | AMOUNT | ||||||||||||
Shares sold | 28,881 | $ | 252,883 | 116,238 | $ | 1,052,227 | ||||||||||
Shares sold through reinvestments of distributions | 12,818 | 113,695 | 35,471 | 315,149 | ||||||||||||
Shares redeemed | (54,944 | ) | (489,596 | ) | (258,409 | ) | (2,260,008 | ) | ||||||||
|
|
|
|
|
|
|
| |||||||||
Net decrease | (13,245 | ) | $ | (123,018 | ) | (106,700 | ) | $ | (892,632 | ) | ||||||
|
|
|
|
|
|
|
| |||||||||
CLASS I | ||||||||||||||||
Shares sold | – | $ | – | 2,860,215 | $ | 26,600,000 | ||||||||||
Shares sold through reinvestments of distributions | 101,491 | 906,517 | 218,857 | 1,946,913 | ||||||||||||
Shares redeemed | – | – | (1,987,129 | ) | (18,392,138 | ) | ||||||||||
|
|
|
|
|
|
|
| |||||||||
Net increase | 101,491 | $ | 906,517 | 1,091,943 | $ | 10,154,775 | ||||||||||
|
|
|
|
|
|
|
| |||||||||
CLASS Y | ||||||||||||||||
Shares sold | 1,716,634 | $ | 15,406,951 | 7,795,746 | $ | 69,865,024 | ||||||||||
Shares sold through reinvestments of distributions | 247,411 | 2,206,864 | 679,977 | 6,079,583 | ||||||||||||
Shares redeemed | (3,893,075 | ) | (34,855,300 | ) | (13,429,756 | ) | (117,551,528 | ) | ||||||||
|
|
|
|
|
|
|
| |||||||||
Net decrease | (1,929,030 | ) | $ | (17,241,485 | ) | (4,954,033 | ) | $ | (41,606,921 | ) | ||||||
|
|
|
|
|
|
|
| |||||||||
Global Credit Income Opportunities Fund
FOR THE SIX MONTHS ENDED | FOR THE YEAR ENDED JUNE 30, 2020 | |||||||||||||||
| CLASS A | SHARES | AMOUNT | SHARES | AMOUNT | ||||||||||||
Shares sold | 96,184 | $ | 818,972 | 296,398 | $ | 2,525,056 | ||||||||||
Shares sold through reinvestments of distributions | 94,994 | 793,709 | 299,001 | 2,528,159 | ||||||||||||
Shares redeemed | (4,822,668 | ) | (40,435,180 | ) | (821,303 | ) | (6,756,723 | ) | ||||||||
|
|
|
|
|
|
|
| |||||||||
Net decrease | (4,631,490 | ) | $ | (38,822,499 | ) | (225,904 | ) | $ | (1,703,508 | ) | ||||||
|
|
|
|
|
|
|
| |||||||||
CLASS C | ||||||||||||||||
Shares sold | 52,146 | $ | 432,600 | 124,636 | $ | 1,042,537 | ||||||||||
Shares sold through reinvestments of distributions | 20,368 | 171,944 | 43,353 | 365,771 | ||||||||||||
Shares redeemed | (124,432 | ) | (1,043,574 | ) | (204,465 | ) | (1,662,882 | ) | ||||||||
|
|
|
|
|
|
|
| |||||||||
Net decrease | (51,918 | ) | $ | (439,030 | ) | (36,476 | ) | $ | (254,574 | ) | ||||||
|
|
|
|
|
|
|
| |||||||||
CLASS I | ||||||||||||||||
Shares sold | – | $ | – | – | $ | – | ||||||||||
Shares sold through reinvestments of distributions | 28,331 | 239,465 | 54,613 | 461,023 | ||||||||||||
Shares redeemed | – | – | – | – | ||||||||||||
|
|
|
|
|
|
|
| |||||||||
Net increase | 28,331 | $ | 239,465 | 54,613 | $ | 461,023 | ||||||||||
|
|
|
|
|
|
|
| |||||||||
CLASS Y | ||||||||||||||||
Shares sold | 5,888,979 | $ | 49,513,926 | 7,193,613 | $ | 61,134,702 | ||||||||||
Shares sold through reinvestments of distributions | 254,075 | 2,156,083 | 596,969 | 5,088,941 | ||||||||||||
Shares redeemed | (2,112,381 | ) | (17,719,304 | ) | (11,225,790 | ) | (91,307,876 | ) | ||||||||
|
|
|
|
|
|
|
| |||||||||
Net increase (decrease) | 4,030,673 | $ | 33,950,705 | (3,435,208 | ) | $ | (25,084,233 | ) | ||||||||
|
|
|
|
|
|
|
| |||||||||
186
Table of Contents
Barings Funds Trust 2020 Semi-Annual Report
NOTES TO FINANCIAL STATEMENTS (CONTINUED)
December 31, 2020 (Unaudited)
Active Short Duration Bond Fund
FOR THE SIX MONTHS ENDED | FOR THE YEAR ENDED JUNE 30, 2020 | |||||||||||||||
| CLASS A | SHARES | AMOUNT | SHARES | AMOUNT | ||||||||||||
Shares sold | 907,391 | $ | 8,849,991 | 11,719,632 | $ | 115,672,777 | ||||||||||
Shares sold through reinvestments of distributions | 48,079 | 468,089 | 420,591 | 4,092,410 | ||||||||||||
Shares redeemed | (1,479,587 | ) | (14,433,333 | ) | (21,296,207 | ) | (203,582,143 | ) | ||||||||
|
|
|
|
|
|
|
| |||||||||
Net decrease | (524,117 | ) | $ | (5,115,253 | ) | (9,155,984 | ) | $ | (83,816,956 | ) | ||||||
|
|
|
|
|
|
|
| |||||||||
CLASS C | ||||||||||||||||
Shares sold | 44,061 | $ | 428,313 | 259,113 | $ | 2,557,857 | ||||||||||
Shares sold through reinvestments of distributions | 2,670 | 25,961 | 6,376 | 61,661 | ||||||||||||
Shares redeemed | (70,284 | ) | (684,085 | ) | (120,852 | ) | (1,130,979 | ) | ||||||||
|
|
|
|
|
|
|
| |||||||||
Net increase (decrease) | (23,553 | ) | $ | (229,811 | ) | 144,637 | $ | 1,488,539 | ||||||||
|
|
|
|
|
|
|
| |||||||||
CLASS I | ||||||||||||||||
Shares sold | – | $ | – | – | $ | – | ||||||||||
Shares sold through reinvestments of distributions | – | – | – | – | ||||||||||||
Shares redeemed | – | – | (20,418 | ) | (203,186 | ) | ||||||||||
|
|
|
|
|
|
|
| |||||||||
Net increase (decrease) | – | $ | – | (20,418 | ) | $ | (203,186 | ) | ||||||||
|
|
|
|
|
|
|
| |||||||||
CLASS Y | ||||||||||||||||
Shares sold | 23,364,116 | $ | 227,615,400 | 47,841,468 | $ | 466,968,769 | ||||||||||
Shares sold through reinvestments of distributions | 728,858 | 7,090,406 | 1,655,334 | 16,052,682 | ||||||||||||
Shares redeemed | (17,490,106 | ) | (169,563,434 | ) | (38,557,362 | ) | (367,924,280 | ) | ||||||||
|
|
|
|
|
|
|
| |||||||||
Net increase | 6,602,868 | $ | 65,142,372 | 10,939,440 | $ | 115,097,171 | ||||||||||
|
|
|
|
|
|
|
| |||||||||
CLASS L(1) | ||||||||||||||||
Shares sold | 853,766 | $ | 8,291,183 | 10,764,003 | $ | 101,381,145 | ||||||||||
Shares sold through reinvestments of distributions | 120,242 | 1,170,147 | 11,378 | 108,092 | ||||||||||||
Shares redeemed | (1,947,832 | ) | (18,945,857 | ) | (112,724 | ) | (1,067,372 | ) | ||||||||
|
|
|
|
|
|
|
| |||||||||
Net increase (decrease) | (973,824 | ) | $ | (9,484,527 | ) | 10,662,657 | $ | 100,421,865 | ||||||||
|
|
|
|
|
|
|
| |||||||||
| (1) | Class commenced operations on May 1, 2020. |
Diversified Income Fund
FOR THE SIX MONTHS ENDED | FOR THE YEAR ENDED | |||||||||||||||
| CLASS A | SHARES | AMOUNT | SHARES | AMOUNT | ||||||||||||
Shares sold | 585 | $ | 5,365 | 43,627 | $ | 365,314 | ||||||||||
Shares sold through reinvestments of distributions | 188 | 1,705 | 223 | 2,062 | ||||||||||||
Shares redeemed | (32,350 | ) | (292,656 | ) | (1,218 | ) | (11,647 | ) | ||||||||
|
|
|
|
|
|
|
| |||||||||
Net increase (decrease) | (31,577 | ) | $ | (285,586 | ) | 42,632 | $ | 355,729 | ||||||||
|
|
|
|
|
|
|
| |||||||||
187
Table of Contents
Barings Funds Trust 2020 Semi-Annual Report
NOTES TO FINANCIAL STATEMENTS (CONTINUED)
December 31, 2020 (Unaudited)
FOR THE SIX MONTHS ENDED | FOR THE YEAR ENDED | |||||||||||||||
| CLASS C | SHARES | AMOUNT | SHARES | AMOUNT | ||||||||||||
Shares sold | – | $ | – | – | $ | – | ||||||||||
Shares sold through reinvestments of distributions | – | – | – | – | ||||||||||||
Shares redeemed | – | – | – | – | ||||||||||||
|
|
|
|
|
|
|
| |||||||||
Net increase | – | $ | – | – | $ | – | ||||||||||
|
|
|
|
|
|
|
| |||||||||
CLASS I | ||||||||||||||||
Shares sold | – | $ | – | – | $ | – | ||||||||||
Shares sold through reinvestments of distributions | – | – | – | – | ||||||||||||
Shares redeemed | – | – | – | – | ||||||||||||
|
|
|
|
|
|
|
| |||||||||
Net increase | – | $ | – | – | $ | – | ||||||||||
|
|
|
|
|
|
|
| |||||||||
CLASS Y | ||||||||||||||||
Shares sold | 419,505 | $ | 3,806,789 | 2,471,722 | $ | 21,514,638 | ||||||||||
Shares sold through reinvestments of distributions | 27,885 | 253,056 | 67,280 | 634,857 | ||||||||||||
Shares redeemed | (104,467 | ) | (939,226 | ) | (2,239,574 | ) | (19,970,450 | ) | ||||||||
|
|
|
|
|
|
|
| |||||||||
Net increase | 342,923 | $ | 3,120,619 | 299,428 | $ | 2,179,045 | ||||||||||
|
|
|
|
|
|
|
| |||||||||
Emerging Markets Debt Blended Total Return Fund
FOR THE SIX MONTHS ENDED | FOR THE YEAR ENDED JUNE 30, 2020 | |||||||||||||||
| CLASS A | SHARES | AMOUNT | SHARES | AMOUNT | ||||||||||||
Shares sold | 325,997 | $ | 3,538,950 | 607,596 | $ | 5,629,686 | ||||||||||
Shares sold through reinvestments of distributions | 40,199 | 438,639 | 13,820 | 134,714 | ||||||||||||
Shares redeemed | (43,563 | ) | (475,850 | ) | (43,542 | ) | (434,004 | ) | ||||||||
|
|
|
|
|
|
|
| |||||||||
Net increase | 322,633 | $ | 3,501,739 | 577,874 | $ | 5,330,396 | ||||||||||
|
|
|
|
|
|
|
| |||||||||
CLASS C | ||||||||||||||||
Shares sold | 11,313 | $ | 122,943 | 14,324 | $ | 146,900 | ||||||||||
Shares sold through reinvestments of distributions | 965 | 10,499 | 761 | 7,490 | ||||||||||||
Shares redeemed | (10,706 | ) | (115,696 | ) | (19,419 | ) | (203,101 | ) | ||||||||
|
|
|
|
|
|
|
| |||||||||
Net increase (decrease) | 1,572 | $ | 17,746 | (4,334 | ) | $ | (48,711 | ) | ||||||||
|
|
|
|
|
|
|
| |||||||||
CLASS I | ||||||||||||||||
Shares sold | – | $ | – | – | $ | – | ||||||||||
Shares sold through reinvestments of distributions | – | – | – | – | ||||||||||||
Shares redeemed | (460,840 | ) | (5,000,000 | ) | (984,551 | ) | (9,800,000 | ) | ||||||||
|
|
|
|
|
|
|
| |||||||||
Net decrease | (460,840 | ) | $ | (5,000,000 | ) | (984,551 | ) | $ | (9,800,000 | ) | ||||||
|
|
|
|
|
|
|
| |||||||||
CLASS Y | ||||||||||||||||
Shares sold | 2,553,026 | $ | 27,715,130 | 2,290,494 | $ | 22,372,983 | ||||||||||
Shares sold through reinvestments of distributions | 148,860 | 1,627,858 | 51,572 | 505,175 | ||||||||||||
Shares redeemed | (712,581 | ) | (7,733,407 | ) | (1,698,477 | ) | (16,775,383 | ) | ||||||||
|
|
|
|
|
|
|
| |||||||||
Net increase | 1,989,305 | $ | 21,609,581 | 643,589 | $ | 6,102,775 | ||||||||||
|
|
|
|
|
|
|
| |||||||||
188
Table of Contents
Barings Funds Trust 2020 Semi-Annual Report
NOTES TO FINANCIAL STATEMENTS (CONTINUED)
December 31, 2020 (Unaudited)
Global Emerging Markets Equity Fund
FOR THE SIX MONTHS ENDED | FOR THE YEAR ENDED | |||||||||||||||
| CLASS A | SHARES | AMOUNT | SHARES | AMOUNT | ||||||||||||
Shares sold | – | $ | – | – | $ | – | ||||||||||
Shares sold through reinvestments of distributions | – | – | – | – | ||||||||||||
Shares redeemed | – | – | – | – | ||||||||||||
|
|
|
|
|
|
|
| |||||||||
Net increase | – | $ | – | – | $ | – | ||||||||||
|
|
|
|
|
|
|
| |||||||||
CLASS C | ||||||||||||||||
Shares sold | – | $ | – | – | $ | – | ||||||||||
Shares sold through reinvestments of distributions | – | – | – | – | ||||||||||||
Shares redeemed | – | – | – | – | ||||||||||||
|
|
|
|
|
|
|
| |||||||||
Net increase | – | $ | – | – | $ | – | ||||||||||
|
|
|
|
|
|
|
| |||||||||
CLASS I | ||||||||||||||||
Shares sold | – | $ | – | – | $ | – | ||||||||||
Shares sold through reinvestments of distributions | – | – | – | – | ||||||||||||
Shares redeemed | – | – | – | – | ||||||||||||
Net increase | – | $ | – | – | $ | – | ||||||||||
|
|
|
|
|
|
|
| |||||||||
CLASS Y | ||||||||||||||||
Shares sold through reinvestments of distributions | – | – | – | – | ||||||||||||
Shares redeemed | – | – | – | – | ||||||||||||
|
|
|
|
|
|
|
| |||||||||
Net increase | – | $ | – | – | $ | – | ||||||||||
|
|
|
|
|
|
|
| |||||||||
U.S. High Yield Fund
FOR THE SIX MONTHS ENDED | FOR THE YEAR ENDED JUNE 30, 2020 | |||||||||||||||
| CLASS A | SHARES | AMOUNT | SHARES | AMOUNT | ||||||||||||
Shares sold | 27,571 | $ | 256,180 | 161,745 | $ | 1,594,758 | ||||||||||
Shares sold through reinvestments of distributions | 4,817 | 44,956 | 13,792 | 130,405 | ||||||||||||
Shares redeemed | (124,442 | ) | (1,193,847 | ) | (353,471 | ) | (3,416,025 | ) | ||||||||
|
|
|
|
|
|
|
| |||||||||
Net decrease | (92,054 | ) | $ | (892,711 | ) | (177,934 | ) | $ | (1,690,862 | ) | ||||||
|
|
|
|
|
|
|
| |||||||||
CLASS C | ||||||||||||||||
Shares sold | – | $ | – | – | $ | – | ||||||||||
Shares sold through reinvestments of distributions | – | – | – | – | ||||||||||||
Shares redeemed | – | – | – | – | ||||||||||||
|
|
|
|
|
|
|
| |||||||||
Net increase | – | $ | – | – | $ | – | ||||||||||
|
|
|
|
|
|
|
| |||||||||
CLASS I | ||||||||||||||||
Shares sold | – | $ | – | – | $ | – | ||||||||||
Shares sold through reinvestments of distributions | – | – | – | – | ||||||||||||
Shares redeemed | – | – | – | – | ||||||||||||
|
|
|
|
|
|
|
| |||||||||
Net increase | – | $ | – | – | $ | – | ||||||||||
|
|
|
|
|
|
|
| |||||||||
189
Table of Contents
Barings Funds Trust 2020 Semi-Annual Report
NOTES TO FINANCIAL STATEMENTS (CONTINUED)
December 31, 2020 (Unaudited)
FOR THE SIX MONTHS ENDED | FOR THE YEAR ENDED JUNE 30, 2020 | |||||||||||||||
| CLASS Y | SHARES | AMOUNT | SHARES | AMOUNT | ||||||||||||
Shares sold | 353,967 | $ | 3,320,351 | 714,332 | $ | 6,852,773 | ||||||||||
Shares sold through reinvestments of distributions | 69,304 | 648,195 | 143,418 | 1,345,005 | ||||||||||||
Shares redeemed | (235,771 | ) | (2,208,232 | ) | (699,271 | ) | (6,312,454 | ) | ||||||||
|
|
|
|
|
|
|
| |||||||||
Net increase | 187,500 | $ | 1,760,314 | 158,479 | $ | 1,885,324 | ||||||||||
|
|
|
|
|
|
|
| |||||||||
| 10. | Line of Credit |
The Trust (the “Borrower”) has entered into a Credit Agreement (the “Credit Agreement”) with State Street Bank and Trust Company (the “Bank”). The Credit Agreement provides for a revolving credit facility of $150,000,000 (the “Facility Amount”) to be utilized for temporary or emergency purposes to fund shareholder redemptions or for other short-term liquidity purposes. Per the Credit Agreement, outstanding principal on the loan shall bear interest at a variable rate per annum equal to the higher of (a) the Federal Funds Rate as in effect on the day of the borrowing plus 1.25% and (b) the one month LIBOR rate as in effect on the day of the borrowing plus 1.25%. In addition, the Borrower shall pay to the Bank a commitment fee at the rate of 0.25% per annum on the daily unused portion of the Facility Amount.
For the six months ended December 31, 2020, the Funds did not utilize the Facility Amount.
| 11. | Indemnifications |
Under the Funds’ organizational documents, its officers and Trustees may be indemnified against certain liabilities and expenses arising out of the performance of their duties to the Funds. Additionally, in the normal course of business, the Funds have entered into contracts with service providers which may contain indemnification clauses. The Funds maximum exposure under these arrangements is unknown. No claim has been made for indemnification pursuant to any such agreement of the Funds.
| 12. | Risks |
Impacts of Covid-19
The pandemic related to the global spread of novel coronavirus disease (Covid-19), which was first detected in December 2019, has resulted in significant disruptions
to global business activity and the global economy, as well as the economies of individual countries, the financial performance of individual companies and sectors, and the securities and commodities markets in general. This pandemic, the full effects of which are still unknown, has resulted in substantial market volatility and may continue to adversely impact the prices and liquidity of the fund’s investments and the fund’s performance.
LIBOR
On July 27, 2017, the United Kingdom’s Financial Conduct Authority (“FCA”), which regulates LIBOR, announced a desire to phase out the use of LIBOR by the end of 2021. LIBOR has historically been a common benchmark interest rate index used to make adjustments to variable-rate loans. It is used throughout global banking and financial industries to determine interest rates for a variety of financial instruments and borrowing arrangements. The transition process might lead to increased volatility and illiquidity in markets that currently rely on LIBOR to determine interest rates. It could also lead to a reduction in the value of some LIBOR-based investments held by a fund and reduce the effectiveness of new hedges placed against existing LIBOR-based investments. While some LIBOR-based instruments contemplate a scenario where LIBOR is no longer available by providing for an alternative rate-setting methodology, not all have such provisions and there may be significant uncertainty regarding the effectiveness of any such alternative methodologies. Since the usefulness of LIBOR as a benchmark could deteriorate during the transition period, these effects could occur prior to the end of 2021.
| 13. | Subsequent Events |
Management has considered the circumstances under which the Funds should recognize or make disclosures regarding events or transactions occurring subsequent to
190
Table of Contents
Barings Funds Trust 2020 Semi-Annual Report
NOTES TO FINANCIAL STATEMENTS (CONTINUED)
December 31, 2020 (Unaudited)
December 31, 2020 through the date the financial statements were issued. Adjustments or additional disclosures, if any, have been included in these financial statements.
On November 12, 2020, the President of the United States of America signed an Executive Order prohibiting U.S. persons from purchasing or investing in publicly-traded securities of companies identified by the U.S. government as “Communist Chinese military companies.” Beginning January 11, 2021, the Order prohibits U.S. entities from participating in certain types of transactions involving securities of Chinese companies known to be associated with the Chinese military. The list of such companies can change from time to time, and the Funds intend to comply with the Executive Order to the extent applicable. As a result of forced selling or inability to participate in an investment the Manager otherwise believes is attractive, the Funds may incur losses.
On November 9, 2020, Thomas M. Finke submitted his resignation from the Board of Directors (the “Board”) of Barings Fund Trust (the “Trust”), effective as of the close of business on November 30, 2020. Mr. Finke, former Chief Executive Officer of Barings LLC (“Barings”), the Trust’s external investment adviser, decided to retire from Barings. Mr. Finke’s resignation was not the result of a disagreement with the Trust on any matter relating to its operations, policies or practices. The Board, upon recommendation from its Nominating and Corporate Governance Committee, appointed David Mihalick to fill the vacant seat created by Mr. Finke’s resignation, effective as of the close of business on November 30, 2020, to serve as a Class I member of the Board for the remainder of the full term of such Class I directorship.
191
Table of Contents
Barings Funds Trust 2020 Semi-Annual Report
STATEMENT REGARDING LIQUIDITY RISK MANAGEMENT PROGRAM
Barings, the Board appointed administrator of the Funds’ liquidity risk management program (LRMP), presented the first annual report on the program to the Trusts on August 7, 2020. The report covered the structure of the program, including the program documents and related policies and procedures adopted to comply with Rule 22e-4 under the Investment Company Act of 1940, and reviewed the operation of the program from December 2018 through June 30, 2020. The report included a description of the annual liquidity assessment of the funds that Barings performed. The report noted that there were no compliance exceptions identified under Rule 22e-4 during the period. The report included a review of the governance of the program and the methodology for classifying the Funds’ investments. The report also included a discussion of liquidity monitoring during the period, including during the market liquidity challenges caused by the Covid-19 pandemic, and the impact those challenges had on the liquidity of the Funds’ investments. Barings concluded that the program has been operating effectively and adequately to ensure compliance with Rule 22e-4. There can be no assurance that the program will achieve its objectives in the future.
192
Table of Contents
Barings Funds Trust 2020 Semi-Annual Report
APPROVAL OF INVESTMENT MANAGEMENT AGREEMENT AND SUB-ADVISORY AGREEMENT
The Investment Company Act of 1940 (the “1940 Act”) requires that a majority of both the full Board of Trustees and the Trustees who are not interested persons of the Trust, as defined under the 1940 Act (“Independent Trustees”), voting separately, annually approve the continuation of the Investment Management Agreement between Barings Funds Trust (the “Trust”), on behalf of each of its eight series funds (the “Funds”), and Barings LLC (“Barings”) (the “Management Agreement”) and the Sub-Advisory Agreement (the “BIIL Sub-Advisory Agreement” and, together with the Management Agreement, the “Agreements”) between Barings and Baring International Investment Limited (“BIIL”) on behalf of Barings Emerging Markets Debt Blended Total Return Fund, Barings Global Credit Income Opportunities Fund, Barings Global Emerging Markets Equity Fund and Barings Global Floating Rate Fund. The Trustees considered matters bearing on the Funds and the Agreements at their meetings throughout the year, including a review of the Funds’ performance at each regular meeting. At in-person meeting held on August 6, 2020 (the “Meeting”), the Trustees met for the purpose of considering whether to approve the Agreements for the Funds. The Trustees’ review process and considerations in approving the Agreements are summarized below. Prior to the Meetings, the Trustees requested and received from Morgan, Lewis & Bockius LLP, independent legal counsel to the Independent Trustees, a memorandum describing the Trustees’ legal responsibilities in connection with their review and approval of the Agreements. The Independent Trustees met prior to the August Board meeting with independent legal counsel to discuss their duties, the memorandum and the Agreements. The Trustees also requested and received from Barings extensive written and oral information regarding various matters including, but not limited to: the principal terms of the Agreements; Barings and its personnel; the Funds’ investment performance, including comparative performance information; the nature and quality of the services provided by Barings to the Funds; the financial strength of Barings; the fee arrangements between Barings and each Fund and each Fund’s fee and expense information, including comparative fee and expense information; the profitability of the Agreements to Barings; and the potential “fallout” benefits to Barings resulting from the Agreements. The Trustees’ conclusion as to the continuation of the Agreements was based on a comprehensive consideration of all information provided to the Board and not the result of any single issue. Some of the more significant factors that influenced the Trustees’ deliberations are described below, although individual Trustees may have evaluated the information presented differently from one another, giving different weights to different factors. It is also important to recognize that the Board’s review of the Agreements is the result of ongoing review and discussion, rather than a single discussion. The Trustees’ conclusions may be based, in part, on their consideration of these arrangements throughout the year and in prior years. The Trustees considered the terms of the Agreements, including the scope of the advisory and non-advisory services provided under the Agreements or otherwise. In evaluating the nature, scope and quality of the services provided by Barings to Barings Global Floating Rate Fund, Barings Global Credit Income Opportunities Fund, Barings Active Short Duration Bond Fund, Barings Diversified Income Fund, formerly known as Barings Total Return Bond Fund, Barings Emerging Markets Debt Blended Total Return Fund, Barings Global Emerging Markets Equity Funds, and Barings U.S. High Yield Fund; and by Barings and BIIL to Barings Global Floating Rate Fund, Barings Global Credit Income Opportunities Fund and Barings Global Emerging Markets Equity Funds, the Trustees considered the specific responsibilities of each of Barings and BIIL in the day-to-day management of the Funds, the qualifications, experience and responsibilities of the portfolio managers and other key personnel who are involved in the day-to-day management of the Funds, the ability of each of Barings and BIIL to attract and retain high-quality personnel, and the organizational depth and stability of each of Barings and BIIL. The Trustees also considered the trading capabilities of each of Barings and BIIL. The Trustees reviewed the Funds’ investment performance, as well as the performance of peer groups of funds, over various time periods, using information provided by Broadridge Financial Solutions, Inc. (“Broadridge”) and Barings. The Trustees noted that the net total return performance of Class I shares of each of the Funds was as follows: Barings Global Floating Rate Fund ranked in the 1st quintile of its Broadridge performance universe for each of the one-year, three-year and five-year periods ended February 29, 2020 (the 1st quintile being the best performers and the 5th quintile being the worst performers); Barings Global Credit Income Opportunities Fund ranked in the 5th quintile of its Broadridge performance universe for the one-year period, in the 4th quintile for the three-year period, and in the 1st quintile for the five-year period ended February 29, 2020; Barings Active Short Duration Bond Fund ranked in the 5th quintile of its Broadridge performance universe for the one-year period and in the 2nd quintile for the three-year period ended February 29, 2020; Barings Diversified Income Fund ranked in the 3rd quintile of its Broadridge performance universe for each of the one-year and three-year periods ended February 29, 2020; Barings U.S. High Yield Fund ranked in the 3rd quintile of its Broadridge performance universe for each of the one-year and three-year periods ended February 29, 2020; Barings Emerging Markets Debt Blended Total Return Fund ranked in the 1st quintile of its Broadridge performance universe for each of the one-year and three-year periods ended February 29, 2020; and Barings Global Emerging Markets Equity Fund ranked in the 3rd quintile of its Broadridge performance universe for the one-year period ended February 29, 2020.
193
Table of Contents
Barings Funds Trust 2020 Semi-Annual Report
APPROVAL OF INVESTMENT MANAGEMENT AGREEMENT AND SUB-ADVISORY AGREEMENT (CONTINUED)
In the course of their deliberations, the Trustees also took into account information provided by Barings during investment review meetings conducted with portfolio management personnel during the course of the year. After reviewing these and related factors, the Trustees concluded, within the context of their overall conclusions regarding the Agreements, that they were satisfied with the performance achieved by Barings and BIIL. The Trustees considered the investment management fee paid by each Fund to Barings pursuant to the Management Agreement. The Trustees noted that Barings (and not the Funds) pays BIIL its sub-advisory fee under the BIIL Sub-Advisory Agreement for the applicable Funds. In assessing the reasonableness of the fee paid by the Funds under the Management Agreement, the Trustees considered, among other information, each Fund’s advisory fee and the total expense ratio for the Fund’s shares as a percentage of net asset value and the advisory fee and total expense ratios of peer groups of funds based on information provided by Broadridge. The Trustees considered that, according to the Broadridge data (which takes into account any fee reductions or expense limitations that were in effect during the last fiscal year), the effective advisory fee rate and total expense ratio for each Fund’s Class I shares were as follows: Barings Global Floating Rate Fund’s effective advisory fee rate was higher than the Broadridge expense group median and total expense ratio was higher than the Broadridge expense group average; Barings Global Credit Income Opportunities Fund’s effective advisory fee rate was higher than the Broadridge expense group median and total expense ratio was higher than the Broadridge expense group average; Barings Active Short Duration Bond Fund’s effective advisory fee rate was lower than the Broadridge expense group median and total expense ratio was lower than the Broadridge expense group average; Barings Diversified Income Fund’s effective advisory fee rate was lower than the Broadridge expense group median and total expense ratio was lower than the Broadridge expense group average; Barings U.S. High Yield Fund’s effective advisory fee rate was lower than the Broadridge expense group median and total expense ratio was higher than the Broadridge expense group average; Barings Emerging Markets Debt Blended Total Return Fund’s effective advisory fee rate was equal to the Broadridge expense group median and total expense ratio was lower than the Broadridge expense group average; and Barings Global Emerging Markets Equity Fund’s effective advisory fee rate was lower than the Broadridge expense group median and total expense ratio equal to the Broadridge expense group average.
The Trustees also considered the advisory fees charged by Barings to institutional separate accounts advised by Barings (“separate accounts”) and unaffiliated investment companies for which Barings serves as subadviser (“subadvised funds”), if any, that have comparable investment strategies to the Funds. In comparing these fees, the Trustees considered information provided by Barings as to the generally broader scope of services provided by Barings to the Funds, as well as the more extensive regulatory burdens imposed on Barings in managing the Funds, in comparison to separate accounts and subadvised funds. The Trustees also considered the higher demands placed on Barings’ investment personnel and trading infrastructure as a result of the daily cash in-flows and out-flows of the Funds in comparison to separate accounts. The Trustees then considered that, as each Fund’s assets increase, each Fund and its shareholders would be expected to realize economies of scale as certain expenses, such as fixed operating costs, become a smaller percentage of overall assets. They considered the extent to which any such savings would benefit shareholders and Barings’ statement that it would consider proposing breakpoints in the management fee payable by a Fund once a Fund approached the break-even point. The Trustees noted that Barings has instituted caps on expenses that insulate shareholders from the effects on expenses of the Funds’ relatively small size The Trustees reviewed information prepared by Barings regarding Barings’ costs of managing the Funds, and the profitability of the Management Agreement to Barings. In considering the profitability of Barings, the Board noted that BIIL is an affiliate of Barings and is paid by Barings, and, therefore, did not consider BIIL’s profitability separately. The Trustees then considered potential “fall-out” benefits to Barings and its affiliates as a result of Barings’ relationship with the Trust. The Board concluded that, in light of the expected costs of providing investment management and other services to the Trust and Barings’ commitment to cap the expenses of each Fund, the other ancillary benefits that Barings and its affiliates expect to receive supported the approval of the Agreements. The Trustees concluded that, at this time, and in light of the nature, extent and quality of the respective services provided by Barings, the fee rates and expenses of each Fund supported the approval of the Management Agreement and the BIIL Sub-Advisory Agreement for the applicable Funds. Based on their evaluation of factors that they deemed to be material, including those factors described above, the Board of Trustees, including the Independent Trustees, concluded that the Management Agreement and the BIIL Sub-Advisory Agreement should be continued for an additional one-year period through August 2021.
194
Table of Contents
Barings Funds Trust
Table of Contents
| (b) | Not applicable |
| Item 2. | Code of Ethics. |
Not applicable to this semi-annual report.
| Item 3. | Audit Committee Financial Expert. |
Not applicable to this semi-annual report.
| Item 4. | Principal Accountant Fees and Services. |
Not applicable to this semi-annual report.
| Item 5. | Audit Committee of Listed Registrants. |
Not applicable to this semi-annual report.
| Item 6. | Investments. |
| (a) | The Registrant’s Consolidated Schedule of Investments as of the close of the reporting period is included in the Report to Shareholders filed under Item 1 of this form. |
| (b) | Not applicable. |
| Item 7. | Disclosure of Proxy Voting Policies and Procedures for Closed-End Management Investment Companies. |
Not applicable.
| Item 8. | Portfolio Managers of Closed-End Investment Management Companies. |
Not applicable.
| Item 9. | Purchases of Equity Securities by Closed-End Management Investment Company and Affiliated Purchasers. |
Not applicable.
| Item 10. | Submission of Matters to a Vote of Security Holders. |
There have been no material changes to procedures by which the shareholders may recommend nominees to the Registrant’s Board of Trustees.
| Item 11. | Controls and Procedures. |
| (a) | The Registrant’s principal executive officer and principal financial officer, or persons performing similar functions, have concluded that the Registrant’s disclosure controls and procedures as defined in Rule 30a-3(c) under the Investment Company Act of 1940, as amended (the “1940 Act”), are effective as of a date within 90 days of the filing date of this report based on the evaluation of these controls and procedures required by Rule 30a-3(b) under the 1940 Act and Rules 13a-15(b) or 15d-15(b) under the Securities Exchange Act of 1934, as amended. |
| (b) | There were no changes in the Registrant’s internal control over financial reporting (as defined in Rule 30a-3(d) under the 1940 Act) that occurred during the period covered by this report that have materially affected or are reasonably likely to materially affect, the Registrant’s internal control over financial reporting. |
| Item 12. | Disclosure of Securities Lending Activities for Closed-End Management Investment Companies. |
| (a) | Not applicable. |
Table of Contents
| (b) | Not applicable. |
| Item 13. | Exhibits. |
| (a)(1) | Not applicable. | |
| (a)(2) | Certifications pursuant to Rule 30a-2(a) under the 1940 Act are attached hereto. | |
| Exhibit 99.1 Cert | ||
| Exhibit 99.2 Cert | ||
| (a)(3) | Not applicable. | |
| (a)(4) | Not applicable. | |
| (b) | Certification pursuant to Rule 30a-2(b) under the 1940 Act is attached hereto. | |
| Exhibit 99.906 Cert | ||
Table of Contents
SIGNATURES
Pursuant to the requirements of the Securities Exchange Act of 1934 and the Investment Company Act of 1940, the Registrant has duly caused this report to be signed on its behalf by the undersigned, thereunto duly authorized.
| (Registrant) | Barings Funds Trust | |
| By (Signature and Title) | /s/ Daniel McGee | |
| Daniel McGee, President (Principal Executive Officer) | ||
| Date | March 8, 2021 | |
Pursuant to the requirements of the Securities Exchange Act of 1934 and the Investment Company Act of 1940, this report has been signed below by the following persons on behalf of the Registrant and in the capacities and on the dates indicated.
| By (Signature and Title) | /s/ Daniel McGee | |
| Daniel McGee, President (Principal Executive Officer) | ||
| Date | March 8, 2021 | |
| By (Signature and Title) | /s/ Carlene Pollock | |
| Carlene Pollock, Chief Financial Officer (Principal Financial Officer) | ||
| Date | March 8, 2021 | |