UNITED STATES
SECURITIES AND EXCHANGE COMMISSION
Washington, D.C. 20549
FORMN-CSR
CERTIFIED SHAREHOLDER REPORT OF REGISTERED
MANAGEMENT INVESTMENT COMPANIES
Investment Company Act file number(s)811-22845
Barings Funds Trust
(Exact Name of Registrant as Specified in Charter)
300 South Tryon Street
Suite 2500
Charlotte, NC 28202
(Address of Principal Executive Offices)
Registrant’s telephone number, including area code: (704)805-7200
Janice M. Bishop
Secretary and Chief Legal Officer
c/o Barings LLC
Independence Wharf
470 Atlantic Avenue
Boston MA 02210
(Name and Address of Agent for Service)
Date of fiscal year end: June 30
Date of reporting period: December 31, 2018
Item 1. Reports to Stockholders.
The Semi-Annual Report to Shareholders is attached hereto.

BARINGS FUNDS TRUST
Beginning on January 1, 2021, as permitted by regulations adopted by the U.S. Securities and Exchange Commission, paper copies of the Fund’s annual and semi-annual shareholder reports will no longer be sent by mail, unless you specifically request paper copies of the reports. Instead, the reports will be made available on the Funds’ website http://www.barings.com/, and you will be notified by mail each time a report is posted and provided with a website link to access the report.
If you already elected to receive shareholder reports electronically, you will not be affected by this change and you need not take any action. You may elect to receive shareholder reports and other communications from the Funds electronically anytime by contacting your financial intermediary (such as a broker-dealer or bank) or, if you are a direct investor, by calling 1-877-766-0014.
Beginning on January 1, 2019, you may elect to receive all future reports in paper free of charge. If you invest through a financial intermediary, you can contact your financial intermediary to request that you continue to receive paper copies of your shareholder reports. If you invest directly with the Fund, you can call1-877-766-0014 to inform the Fund that you wish to continue receiving paper copies of your shareholder reports. Your election to receive reports in paper will apply to all funds held in your account if you invest through your financial intermediary or all funds held with the fund complex if you invest directly with the Fund.
Semi-Annual Report
December 31, 2018
BFT Service Providers
ADVISER
Barings LLC
300 South Tryon Street
Suite 2500
Charlotte, NC 28202
SUB-ADVISER
Baring International Investments Limited
20 Old Bailey
London, UK
EC4M 7BF
COUNSEL TO THE TRUST
Ropes & Gray LLP
Prudential Tower
800 Boylston Street
Boston, MA 02110
INDEPENDENT REGISTERED PUBLIC ACCOUNTING FIRM
Deloitte & Touche LLP
30 Rockefeller Plaza
New York, NY
10112-0015
CUSTODIAN
State Street Bank & Trust Company
One Lincoln Street
Boston, MA 02111
TRANSFER AGENT AND REGISTRAR
ALPS Fund Services, Inc.
1290 Broadway
Suite 1100
Denver, CO 80203
FUND ADMINISTRATION / ACCOUNTING
State Street Bank & Trust Company
One Lincoln Street
Boston, MA 02111
FUND DISTRIBUTOR
ALPS Distributors, Inc.
1290 Broadway
Suite 1100
Denver, CO 80203
BLUE SKY ADMINISTRATION
DST Asset Manager Solutions, Inc.
2000 Crown Colony Drive
Quincy, MA 02169
PROXY VOTING POLICIES & PROCEDURES
The Trustees of Barings Funds Trust (the “Trust”) have delegated proxy voting responsibilities relating to the voting of securities held by the Trust to Barings LLC (“Barings”). A description of Barings’ proxy voting policies and procedures is available (1) without charge, upon request, by calling, toll-free 1-877-766-0014; (2) on the Trust’s website at http://www.Barings.com; and (3) on the U.S. Securities and Exchange Commission’s (“SEC”) website at http://www.sec.gov.
FORM N-Q
The Trust will file its complete schedule of portfolio holdings with the SEC for the first and third quarters of each fiscal year on Form N-Q. This information is available (i) on the SEC’s website at http://www.sec.gov; and (ii) at the SEC’s Public Reference Room in Washington, DC (which information on their operation may be obtained by calling 1-800-SEC-0330). A complete schedule of portfolio holdings as of each quarter-end is available on the Trust’s website at http://www.Barings.com or upon request by calling, toll-free, 1-877-766-0014.

Daniel McGee
President,
Barings Funds Trust
Barings Funds Trust
Barings Global Floating Rate Fund
Barings Global Credit Income Opportunities Fund
Barings Active Short Duration Bond Fund
Barings Total Return Bond Fund
Barings Emerging Markets Debt Blended Total Return Fund
Barings Global Emerging Markets Equity Fund
Barings Global High Yield Fund
Barings U.S. High Yield Fund
Dear Shareholder,
Thank you for your continued trust and partnership in 2018. The past year was characterized by continued political tensions and uncertainty, contributing to an uptick in market volatility late in the fourth quarter as equities experienced a near bear-market drop. Global growth was mixed – the U.S. accelerated following large tax cuts and loosening government regulation, while Europe faltered under political turmoil and Brexit negotiations.
As we consider what lies ahead in 2019 and beyond, we see a number of potential headwinds on the horizon. While the global economy may not be headed toward a recession this year, there is certainly concern around the International Monetary Fund’s lower global growth projections. Political risk will likely remain very topical in the year ahead, particularly as uncertainty around U.S.-China trade talks continues to escalate and the path to resolving the border and immigration conflict remains murky. In Europe, Brexit negotiations are still front and center, and some investors are questioning the potential ramifications of a U.K. exit on the broader Eurozone economy.
On the positive side, despite the late-year market swings and abundance of headline events, the global economy and capital markets are holding up fairly well. In the U.S., labor markets remain strong. While European growth is expected to slow, the deceleration is unlikely to be dramatic – at the same time, unemployment in the region continues to fall. In China, although growth is slowing, the government appears to be managing the economy well.
At Barings, we look for opportunities in markets during periods of volatility and change. Throughout the ups and downs of economic and market cycles, we remain focused on delivering you, our shareholders, with strong, risk-adjusted returns.
Our mutual fund platform offers a diverse selection of institutional-quality investment vehicles that aim to meet investors’ evolving needs by providing a wide range of solutions across fixed income and equity. This was the main driver behind our decision, in 2018, to launch the Barings Global Emerging Markets Equity Fund. While our investment process remains focused on rigorous, bottom-up analysis across all asset classes, we believe this update to our platform will give investors a solution for achieving diversification as well as long-term capital growth.
On behalf of the entire Barings team, we thank you for your partnership and look forward to helping you achieve your investment objectives.
Sincerely,

Daniel McGee
President
The statements and opinions expressed are those of the author as of the date of this report. All information is historical and not indicative of future results and subject to change. This information is not a recommendation to buy or sell any security.
Cautionary Notice: Certain statements contained in this report may be “forward looking” statements. Investors are cautioned not to place undue reliance on forward-looking statements, which speak only as of the date in which they are made and reflect management’s current estimates, projections, expectations or beliefs, and which are subject to risks and uncertainties that may cause actual results to differ materially. These statements are subject to change at any time based upon economic, market or other conditions and may not be relied upon as investment advice or an indication of the Trust’s trading intent. References to specific securities are not recommendations of such securities, and may not be representative of the Trusts’ current or future investments. We undertake no obligation to publicly update these forward looking statements, whether as a result of new information, future events, or otherwise.
ALPS Distributors, Inc. is the distributor for the Barings mutual funds. ALPS and Barings are separate and unaffiliated. A prospectus can be obtained by calling 1.855.439.5459. Read the prospectus carefully before investing. Investors should carefully consider the investment objective, risks, charges and expenses of any mutual fund before investing. This and other important information is contained in the prospectus.
Barings Global Floating Rate Fund 2018 Semi-Annual Report
Investment Objective
Barings Global Floating Rate Fund (“Global Floating Rate Fund” or the “Fund”) seeks a high level of current income. Preservation of capital is a secondary goal.
Portfolio Management Commentary
How did the Fund perform?
| | ∎ | | The Fund reported a net total rate of return for the reporting period from June 30, 2018 through December 31, 2018 of -1.79%, and underperformed the Credit Suisse Global Loan Benchmark, which returned -0.72%.1 |
What factors influenced performance of the Fund?
| | ∎ | | Over the past six months, the global loan markets had positive returns for the first four months, before turning negative in November and December. |
| | ∎ | | Defaults remain low, and we believe most of the decline in the last two months of the year was due to technical factors and not based on fundamentals. |
| | ∎ | | From a geographic perspective, the Fund’s slight overweight to European loans helped performance because the European loans in the Fund outperformed the U.S. loans. |
| | ∎ | | From a ratings category perspective, the Fund’s overweight to single B’s and underweight to double B’s helped performance from an allocation perspective, but credit selection within single B’s detracted from performance. |
| | ∎ | | Across industries, credit selection was the primary detractor to performance relative to the benchmark, particularly within the energy and retail sectors. |
Describe recent portfolio activity.
| | ∎ | | During the period, the Fund increased its exposure to European loans and reduced exposure to U.S. loans. For most of the period, we found more attractive opportunities in Europe than the U.S. |
| | ∎ | | Over the past six months, the Fund’s top three industry exposures have not changed. The Fund’s three largest sectors were health care, education and child care, diversified/conglomerate services, and chemicals, plastics and rubber. The two sectors that decreased the most during the period were mining, steel and iron and oil and gas. The two sectors that increased the most were electronics and chemicals, plastics and rubber. |
| | ∎ | | By ratings category, the Fund increased exposure to the B category and reduced exposure to the BB category. |
Describe portfolio positioning at period end.
| | ∎ | | The Fund finished the six-month reporting period, ending December 31, 2018, with 82.7% weighted to global senior secured loans, 11.6% to global senior secured high yield bonds and 5.2% to cash. |
| | ∎ | | From an industry perspective, the Fund remains well-diversified across a number of sectors based on Moody’s Industry Classification, with higher concentrations in health care, education and child care (12.1%), diversified/conglomerate services (9.7%), and chemicals, plastics and rubber (7.3%), as of December 31, 2018. |
| 1. | Total return describes the return to an investor of Class Y shares and includes the reinvestment of dividends and capital gains.Past performance is no guarantee of future results, and investment returns and the net asset value (NAV) of shares of the Fund will fluctuate so that shares, when redeemed, may be worth more or less than their original cost. Current performance may be higher or lower than performance quoted. Call 1.855.439.5459 or visit barings.com for current month-end performance. All returns one-year or less are cumulative. The Credit Suisse Global Loan Benchmark is a market capitalization weighted average of the Credit Suisse Leveraged Loan Index and the Credit Suisse Western European Leveraged Loan Index. The Credit Suisse Leveraged Loan Index is designed to mirror the investable universe of the U.S. dollar-denominated leveraged loan market. The Credit Suisse Western European Leveraged Loan Index is designed to mirror the investable universe of the Western European leveraged loan market, with loans denominated in U.S. and Western European currencies. Indexes are unmanaged. It is not possible to invest directly in an index. |
2
Barings Global Floating Rate Fund 2018 Semi-Annual Report
| | ∎ | | As of December 31, 2018, the Fund had the following credit quality breakdown: 0.9% in BBB assets, 21.8% in BB assets, 62.8% in single-B credits and 5.3% to CCC and below assets. Approximately 4.0% of the Fund’s assets are not publicly rated. Cash and accrued assets accounted for the remaining 5.2% of the portfolio assets.2 |
| | ∎ | | The top five countries in the portfolio at the end of the annual reporting period are the United States (57.5%), the United Kingdom (11.7%), Germany (9.2%), France (3.9%) and the Netherlands (3.8%). Overall, the Fund has exposure to 18 different countries, and we continue to focus on building a well-diversified portfolio of global floating rate securities. |
Describe market and portfolio outlook.
| | ∎ | | We believe that the volatility and sentiment in the global loan markets was driven by several factors including trade wars, Brexit and monetary policy. However, on a fundamental basis, we believe issuers continue to generate modest top and bottom-line growth with leverage remaining at healthy and sustainable levels. Default rates are below historical averages and we expect this to continue into 2019. While crude oil prices and geopolitical events may continue to cause further market price volatility, we believe this represents an opportunity for investors in global loans. |
| 2. | Ratings shown are the highest ratings given by one of the following national rating agencies: S&P, Moody’s or Fitch. Additional information about ratings can be found, respectively, at www.standardandpoors.com, www.moodys.com and www.fitchratings.com. Credit ratings are subject to change. AAA, AA, A and BBB are investment grade ratings categories used by S&P and Fitch. BB, B, CCC/CC/C and D are below investment grade ratings categories used by S&P and Fitch. Aaa, Aa, A and Baa are investment grade ratings categories used by Moody’s. Ba, B, Caa/Ca and C are below investment grade ratings categories used by Moody’s. Ratings categories may include gradations within each category. Bonds backed by U.S. government or agency securities are given an implied rating equal to the rating of such securities. Holdings designated Not Publicly Rated are not rated by these national rating agencies. |
3
Barings Global Floating Rate Fund 2018 Semi-Annual Report
PORTFOLIO COMPOSITION(% OF ASSETS*)
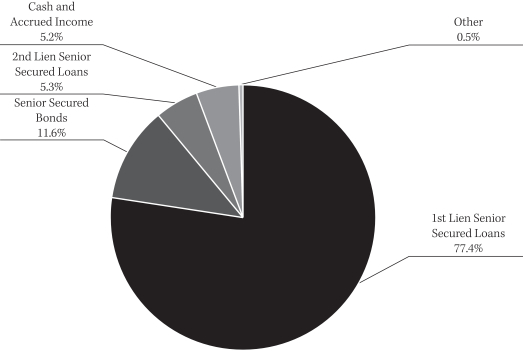
| * | The percentages shown above represent a percentage of the assets as of December 31, 2018. |
COUNTRY COMPOSITION(% OF ASSETS**)
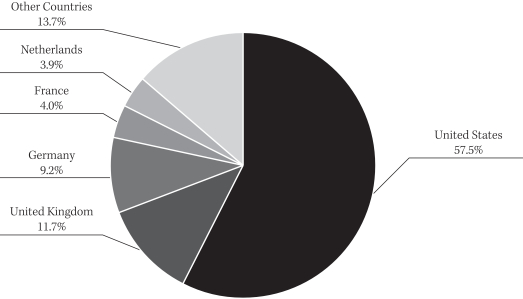
| ** | The percentages shown above are expressed by market value excluding cash and accrued income, may vary over time and represent a percentage of the assets as of December 31, 2018. |
4
Barings Global Floating Rate Fund 2018 Semi-Annual Report
| | | | | | | | | | | | | | | | | | | | |
| % AVERAGE ANNUAL TOTAL RETURNS 4,6,7 | | INCEPTION DATE | | ONE YEAR | | THREE YEARS | | INCEPTION TO DATE |
Class A With Load | | | | 09/16/2013 | | | | | -3.10 | % | | | | 3.96 | % | | | | 2.42 | % |
Class A No Load | | | | 09/16/2013 | | | | | -0.11 | % | | | | 5.03 | % | | | | 3.01 | % |
Class C With Load | | | | 09/16/2013 | | | | | -1.79 | % | | | | 4.26 | % | | | | 2.26 | % |
Class C No Load | | | | 09/16/2013 | | | | | -0.84 | % | | | | 4.26 | % | | | | 2.26 | % |
Class I With Load | | | | 09/16/2013 | | | | | 0.16 | % | | | | 5.30 | % | | | | 3.31 | % |
Class I No Load | | | | 09/16/2013 | | | | | 0.16 | % | | | | 5.30 | % | | | | 3.31 | % |
Class Y With Load | | | | 09/16/2013 | | | | | 0.14 | % | | | | 5.29 | % | | | | 3.29 | % |
Class Y No Load | | | | 09/16/2013 | | | | | 0.14 | % | | | | 5.29 | % | | | | 3.29 | % |
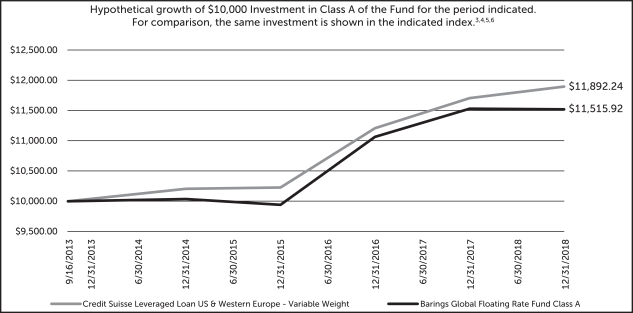
Performance shown is historical and does not guarantee future results. Current performance may be lower or higher. Because share price, principal value and return will vary, you may have a gain or loss when you sell Fund shares. For current month-end performance information, call 1.855.439.5459. Performance includes the reinvestment of dividends and capital gains. Performance less than one year is cumulative; all other performance is annualized.
| 3. | Inception date: 9/16/2013 |
| 4. | Class A performance with the sales charges includes the maximum 3.00% sales charge. |
| 5. | Benchmark A: Credit Suisse Global Loan. The benchmark is a market capitalization weighted average of the Credit Suisse Leveraged Loan Index and the Credit Suisse Western European Leveraged Loan Index. Indexes are unmanaged. It is not possible to invest directly in an index. |
| 6. | Line graph and table do not reflect the deduction of taxes that a shareholder would pay. |
| 7. | Class C performance with the sales charges includes the 1.00% contingent deferred sales charge (CDSC) for returns of one year or less. |
5
Barings Global Credit Income Opportunities Fund 2018 Semi-Annual Report
Investment Objective
Barings Global Credit Income Opportunities Fund (“Global Credit Income Opportunities Fund” or the “Fund”) seeks an absolute return, primarily through current income and secondarily through capital appreciation.
Portfolio Management Commentary
How did the Fund perform?
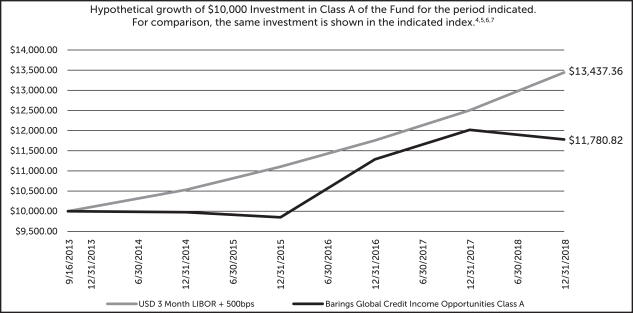
| | ∎ | | The Fund reported a net total rate of return for the reporting period from June 30, 2018 through December 31, 2018 of -3.08%, and underperformed the 3-Month USD LIBOR (London Interbank Offered Rate) + 500 basis points (bps)1 benchmark (the “Benchmark”), which returned +3.80%.2 |
What factors influenced performance of the Fund?
| | ∎ | | Over the last six months, the global high yield bond and loan markets both had negative returns, underperforming the Benchmark. |
| | ∎ | | Although all of the asset classes had negative returns, loans had the best returns, followed by high yield bonds and collateralized loan obligations (“CLOs”). Bonds had the largest allocation and were the largest detractor from performance. |
| | ∎ | | From a geographic perspective, the Fund’s European assets outperformed the North American assets. The North American assets were the largest detractor from performance. |
| | ∎ | | From a ratings category perspective, the Fund’s B-rated assets were the largest detractor from performance, followed by BB-rated and CCC-rated assets. |
| | ∎ | | Energy and retail were the two largest sector detractors from performance. Telecommunications and housing were the only positive contributing sectors. |
Describe recent portfolio activity.
| | ∎ | | During the period, the Fund increased its exposure to Europe and reduced exposure to North America. For most of the period, we found more attractive opportunities in Europe than North America. |
| | ∎ | | The Fund’s loan and senior secured bond exposure increased, while the Fund’s unsecured bond exposure decreased. |
| | ∎ | | By ratings category, the Fund increased exposure to the B-rated and CCC-rated categories, and reduced exposure to the BB-rated and not publically rated categories. |
| | ∎ | | Over the past six months, the Fund’s top three industry exposures did not change. The Fund’s three largest sectors were health care, education and child care, oil and gas, and diversified/conglomerate services. The two sectors that decreased the most during the period were diversified/conglomerate services and diversified/conglomerate manufacturing. The two sectors that increased the most were health care, education and child care, and chemicals, plastics and rubber. |
| 1. | A unit that is equal to 1/100th of 1% or 0.01%. |
| 2. | Total return describes the return to an investor of Class Y shares and includes the reinvestment of dividends and capital gains.Past performance is no guarantee of future results, and investment returns and the net asset value (NAV) of shares of the Fund will fluctuate so that shares, when redeemed, may be worth more or less than their original cost. Current performance may be higher or lower than performance quoted. Call 1.855.439.5459 or visit barings.com for current month-end performance.All returns one-year or less are cumulative. The 3-Month USD LIBOR is an average interest rate, determined by the Intercontinental Exchange, that banks charge one another for the use of short-term money (three months) in England’s Eurodollar market. The return shown includes 3-Month USD LIBOR + 500 bps, or 5% per annum. LIBOR is unmanaged. It is not possible to invest directly in LIBOR. No assurance can be given that the Fund’s performance will exceed that of LIBOR by any given increment, or at all. |
6
Barings Global Credit Income Opportunities Fund 2018 Semi-Annual Report
Describe portfolio positioning at period end.
| | ∎ | | The Fund finished the semi-annual reporting period, ended December 31, 2018, with an allocation of 44.0%, 33.6%, and 14.1% to global high yield bonds, global senior secured loans and CLOs, respectively. The remainder of the portfolio was invested in a few opportunistic special situation credits (0.5%), equity (0.8%) and cash (6.5%). A significant portion of the portfolio (over 65%) is senior secured in nature (including CLOs backed by secured loans), which can potentially mitigate principal loss in the event that default rates increase. |
| | ∎ | | From an industry perspective, the Fund remains well diversified across a number of sectors based on Moody’s Industry Classification, with higher concentrations in health care, education and child care (10.6%), oil and gas (7.5%), and diversified/conglomerate services (6.0%) as of December 31, 2018. |
| | ∎ | | As of December 31, 2018, the Fund had the following credit quality breakdown: 1.6% in BBB-rated assets, 29.1% in BB-rated assets, 47.0% in B-rated credits, and 11.2% in CCC and below. Approximately 4.7% of the Fund’s assets are not publicly rated.3 |
| | ∎ | | The top five countries in the portfolio at the end of the annual reporting period are the United States (50.2%), the United Kingdom (13.9%), Germany (7.2%), the Netherlands (5.1%) and France (3.0%). The Cayman Islands exposure related to the Fund’s CLO holdings is included in the United States. Overall, the Fund has exposure to 18 different countries, and we continue to focus on building a well-diversified portfolio of global high yield securities. |
Describe market and portfolio outlook.
| | ∎ | | We believe that the volatility and sentiment in the global high yield bond and loan markets was driven by several factors, including trade wars, Brexit and monetary policy. However, on a fundamental basis, we believe issuers continue to generate modest top and bottom-line growth, with leverage remaining at healthy and sustainable levels. Default rates are below historical averages, and we expect this to continue into 2019. While crude oil prices and geopolitical events may continue to cause further market price volatility, we believe this represents an opportunity for investors in high yield bonds and loans. |
| 3. | Ratings shown are the highest ratings given by one of the following national rating agencies: S&P, Moody’s or Fitch. Additional information about ratings can be found, respectively, at www.standardandpoors.com, www.moodys.com and www.fitchratings.com. Credit ratings are subject to change. AAA, AA, A and BBB are investment grade ratings categories used by S&P and Fitch. BB, B, CCC/CC/C and D are below investment grade ratings categories used by S&P and Fitch. Aaa, Aa, A and Baa are investment grade ratings categories used by Moody’s. Ba, B, Caa/Ca and C are below investment grade ratings categories used by Moody’s. Ratings categories may include gradations within each category. Bonds backed by U.S. government or agency securities are given an implied rating equal to the rating of such securities. Holdings designated Not Publicly Rated are not rated by these national rating agencies. |
7
Barings Global Credit Income Opportunities Fund 2018 Semi-Annual Report
PORTFOLIO COMPOSITION(% OF ASSETS*)
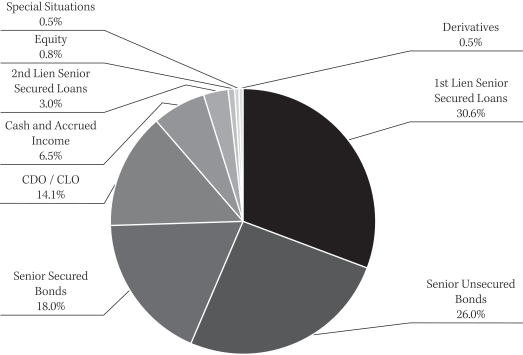
| * | The percentages shown above represent a percentage of the assets as of December 31, 2018. |
COUNTRY COMPOSITION(% OF ASSETS**)
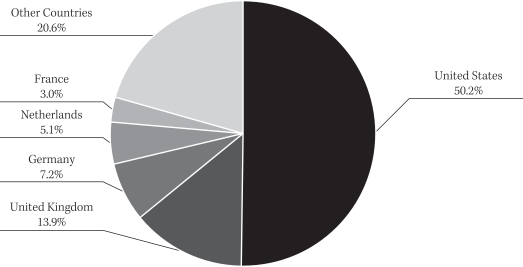
| ** | The percentages shown above are expressed by market value excluding cash and accrued income, may vary over time and represent a percentage of the assets as of December 31, 2018. |
8
Barings Global Credit Income Opportunities Fund 2018 Semi-Annual Report
| | | | | | | | | | | | | | | | | | | | |
| % AVERAGE ANNUAL TOTAL RETURNS 4,5,8 | | INCEPTION DATE | | ONE YEAR | | THREE YEARS | | INCEPTION TO DATE |
Class A With Load | | | | 09/16/2013 | | | | | -5.90 | % | | | | 4.72 | % | | | | 3.04 | % |
Class A No Load | | | | 09/16/2013 | | | | | -1.98 | % | | | | 6.15 | % | | | | 3.79 | % |
Class C With Load | | | | 09/16/2013 | | | | | -3.64 | % | | | | 5.36 | % | | | | 3.01 | % |
Class C No Load | | | | 09/16/2013 | | | | | -2.72 | % | | | | 5.36 | % | | | | 3.01 | % |
Class I With Load | | | | 09/16/2013 | | | | | -1.73 | % | | | | 6.42 | % | | | | 4.04 | % |
Class I No Load | | | | 09/16/2013 | | | | | -1.73 | % | | | | 6.42 | % | | | | 4.04 | % |
Class Y With Load | | | | 09/16/2013 | | | | | -1.75 | % | | | | 6.41 | % | | | | 4.04 | % |
Class Y No Load | | | | 09/16/2013 | | | | | -1.75 | % | | | | 6.41 | % | | | | 4.04 | % |
Performance shown is historical and does not guarantee future results. Current performance may be lower or higher. Because share price, principal value and return will vary, you may have a gain or loss when you sell Fund shares. For current month-end performance information, call 1.855.439.5459. Performance includes the reinvestment of dividends and capital gains. Performance less than one year is cumulative; all other performance is annualized
| 4. | Inception date: 9/16/2013 |
| 5. | Class A performance with the sales charges includes the maximum 3.00% sales charge. |
| 6. | Benchmark A: Credit Suisse Global Loan. The benchmark is a market capitalization weighted average of the Credit Suisse Leveraged Loan Index and the Credit Suisse Western European Leveraged Loan Index. Indexes are unmanaged. It is not possible to invest directly in an index. |
| 7. | Line graph and table do not reflect the deduction of taxes that a shareholder would pay. |
| 8. | Class C performance with the sales charges includes the 1.00% contingent deferred sales charge (CDSC) for returns of one year or less. |
9
Barings Active Short Duration Bond Fund 2018 Semi-Annual Report
Investment Objective
Barings Active Short Duration Bond Fund (“Active Short Duration Bond Fund” or the “Fund”) seeks to achieve a high total rate of return, primarily from current income while minimizing fluctuations in capital values by investing primarily in a diversified portfolio of short-term investment grade fixed income securities.
Portfolio Management Commentary
How did the Fund perform?
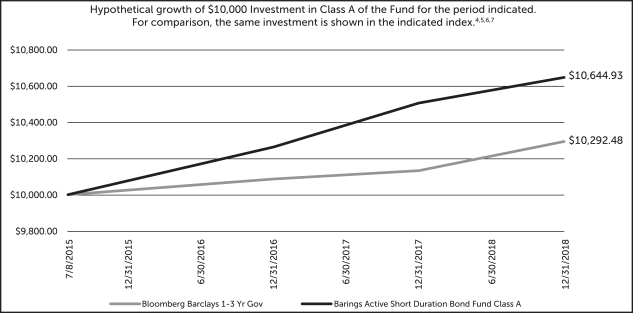
| | ∎ | | The Fund reported a net total rate of return for the period from July 1, 2018 through December 31, 2018 of 1.02%, underperforming the Bloomberg Barclays U.S. 1-3 Year Government Bond Index (the “Benchmark”), which returned 1.51%.1 |
What factors influenced performance of the Fund?
| | ∎ | | Duration positioning negatively contributed to performance relative to the index. The Fund uses Treasury bonds and futures to help manage duration. During the period, the slope that points along the curve we monitor modestly flattened. In accordance with our duration management process, the Fund shortened duration from 1.83 to 0.79 years to end the fiscal year. |
| | ∎ | | The Fund’s allocation to corporate credit detracted from performance. Corporate spreads widened over the quarter across sectors, and experienced a volatile fourth quarter leading up to the end of the year. Allocations to telecommunications and insurance contributed the most over the period, with automotive manufacturers and chemicals detracting the most. |
| | ∎ | | Automotive receivables were the primary contributor within the securitized sector. Allocations to government-guaranteed Federal Family Education Loan Program (FFELP) student loans, container and clean energy ABS collateral were the largest contributing subsectors. |
| | ∎ | | Downside derivative mitigation, such as using a payer/receiver swaption pair to hedge against possible rising volatility, added to Fund performance during the period, while positions in CMBX3 to gain exposure to the commercial mortgage backed securities (CMBS) sector detracted during the period. |
Describe recent portfolio activity.
| | ∎ | | The Fund ended the period with a duration position of 0.79 years, as the basis between three-month and one-year remains flat. |
| 1. | Total return describes the return to an investor of Class Y shares and includes the reinvestment of dividends and capital gains.Past performance is no guarantee of future results, and investment returns and the net asset value (NAV) of shares of the Fund will fluctuate so that shares, when redeemed, may be worth more or less than their original cost. Current performance may be higher or lower than performance quoted. Call 1.855.439.5459 or visit barings.com for current month-end performance.All returns one-year or less are cumulative. The Bloomberg Barclays U.S. 1-3 Year Government Bond Index is comprised of the U.S. Treasury Index and U.S. Agency Index. The U.S. Government Index includes Treasuries (public obligations of the U.S. Treasury) and U.S. agency debentures (publicly issued debt of U.S. government agencies, quasi-federal corporations, and corporate or foreign debt guaranteed by the U.S. government) that have remaining maturities of more than one year, and up to but not including three years. Indexes are unmanaged. It is not possible to invest directly in an index. |
| 2. | Ratings shown are the highest ratings given by one of the following national rating agencies: S&P, Moody’s or Fitch. Additional information about ratings can be found, respectively, atwww.standardandpoors.com,www.moodys.com andwww.fitchratings.com. Credit ratings are subject to change. AAA, AA, A and BBB are investment grade ratings categories used by S&P and Fitch. BB, B, CCC/CC/C and D are below investment grade ratings categories used by S&P and Fitch. Aaa, Aa, A and Baa are investment grade ratings categories used by Moody’s. Ba, B, Caa/Ca and C are below investment grade ratings categories used by Moody’s. Ratings categories may include gradations within each category. Bonds backed by U.S. government or agency securities are given an implied rating equal to the rating of such securities. Holdings designated Not Publicly Rated are not rated by these national rating agencies. |
| 3. | Barings Active Short Duration Bond Fund currently holds long investment grade CDX index credit default swap (CMBX) positions, which cover approximately 30 companies within each position. |
10
Barings Active Short Duration Bond Fund 2018 Semi-Annual Report
| | ∎ | | The Fund marginally reduced lower quality corporate bond exposure and added to several consumer asset backed securities (ABS) sectors given the low duration profile, higher yield and higher quality characteristics of the sector. |
Describe portfolio positioning at period end.
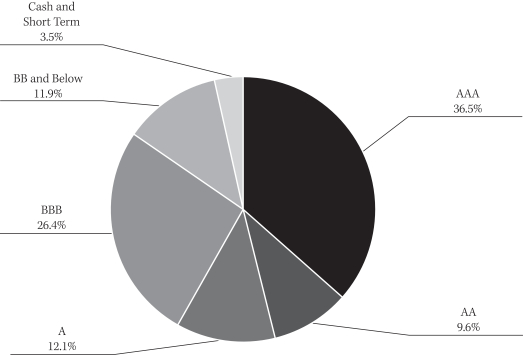
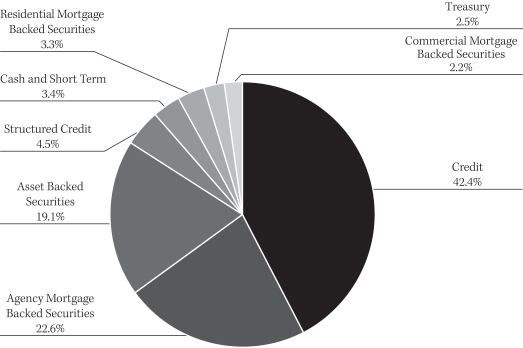
| | ∎ | | The Fund continues to be well diversified across corporates, securitized and governments. The corporate allocation is at approximately 41.1%, with 37.7% in investment grade corporates, 2.4% in BB-rated and crossover high yield, and 1.0% in U.S. dollar-denominated emerging markets. U.S. money centers and regional banks represent the Fund’s largest corporate allocation, followed by food/beverage/tobacco and chemicals. |
| | ∎ | | The securitized ABS allocation was 34.8% at the end of the period. Student loans represent the largest allocation, followed by automotive loan collateral. Further ABS sub-sectors include consumer loans, timeshares and railroad. The Fund maintains an active position in CMBS given strong technicals and still-supportive fundamentals. Allocations are in shorter maturity deals with a bias toward new issues, as well as secondary issues that meet our selection criteria. |
Describe market and portfolio outlook.
| | ∎ | | We believe that the U.S. economy, fueled by tax cuts and stimulus spending, is a key factor in leading investors to look beyond negative contributing factors – like the trade sparing amongst the U.S., China and other nations, which could be a hindrance to global growth if escalated. For context, economic output is growing at its fastest rate since 2014; the unemployment rate is at its lowest level in almost two decades; and initial jobs claims have fallen to the lowest level since 1969. |
| | ∎ | | In our view, corporate fundamentals continue to modestly improve from stretched levels, as both revenue and EBITDA growth are continuing to outpace debt growth, per third quarter data. This is positive for both securitized credit sectors, such as ABS and corporate bonds. |
| | ∎ | | The Fund remains overweight sectors such as corporates and securitized, relative to liquid products such as governments and agencies, and will continue to focus on bottom-up security selection. |
11
Barings Active Short Duration Bond Fund 2018 Semi-Annual Report
CREDIT QUALITY BREAKDOWN(% OF ASSETS*)
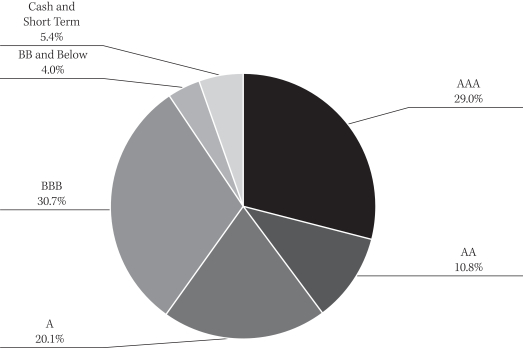
| * | The percentages shown above represent a percentage of the assets as of December 31, 2018. |
PORTFOLIO COMPOSITION(% OF ASSETS*)
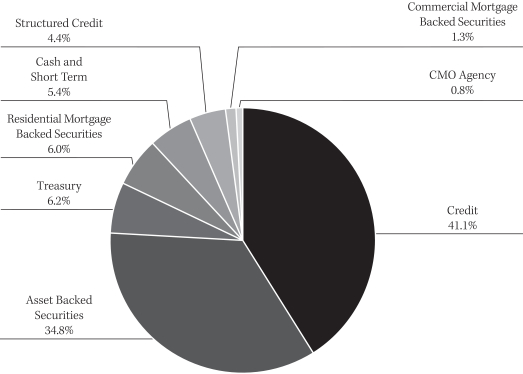
| * | The percentages shown above represent a percentage of the assets as of December 31, 2018. |
12
Barings Active Short Duration Bond Fund 2018 Semi-Annual Report
| | | | | | | | | | | | | | | | | | | | |
| % AVERAGE ANNUAL TOTAL RETURNS 4,5,7,8 | | INCEPTION DATE | | ONE YEAR | | THREE YEARS | | INCEPTION TO DATE |
Class A With Load | | | | 07/08/2015 | | | | | 1.33 | % | | | | 2.11 | % | | | | 1.52 | % |
Class A No Load | | | | 07/08/2015 | | | | | 1.33 | % | | | | 2.11 | % | | | | 1.52 | % |
Class C With Load | | | | 07/08/2015 | | | | | 0.56 | % | | | | 1.94 | % | | | | 1.26 | % |
Class C No Load | | | | 07/08/2015 | | | | | 1.06 | % | | | | 1.94 | % | | | | 1.26 | % |
Class I With Load | | | | 07/08/2015 | | | | | 1.58 | % | | | | 2.38 | % | | | | 1.78 | % |
Class I No Load | | | | 07/08/2015 | | | | | 1.58 | % | | | | 2.38 | % | | | | 1.78 | % |
Class Y With Load | | | | 07/08/2015 | | | | | 1.58 | % | | | | 2.36 | % | | | | 1.76 | % |
Class Y No Load | | | | 07/08/2015 | | | | | 1.58 | % | | | | 2.36 | % | | | | 1.76 | % |
Performance shown is historical and does not guarantee future results. Current performance may be lower or higher. Because share price, principal value and return will vary, you may have a gain or loss when you sell Fund shares. For current month-end performance information, call 1.855.439.5459. Performance includes the reinvestment of dividends and capital gains. Performance less than one year is cumulative; all other performance is annualized.
| 4. | Inception date: 7/8/2015 |
| 5. | Class A performance with the sales charges includes the maximum 3.00% sales charge. |
| 6. | Benchmark: The Bloomberg Barclays U.S. 1-3 Year Government Bond Index includes securities in the U.S. Government Bond Index that have between one and three years until maturity. Indices are unmanaged. It is not possible to invest directly in an index. |
| 7. | Line graph and table do not reflect the deduction of taxes that a shareholder would pay. |
| 8. | Class C performance with the sales charges includes the 1.00% contingent deferred sales charge (CDSC) for returns of one year or less. |
13
Barings Total Return Bond Fund 2018 Semi-Annual Report
Investment Objective
Barings Total Return Bond Fund (“Total Return Bond Fund” or the “Fund”) seeks a superior total rate of return by investing in fixed income instruments.
Portfolio Management Commentary
How did the Fund perform?
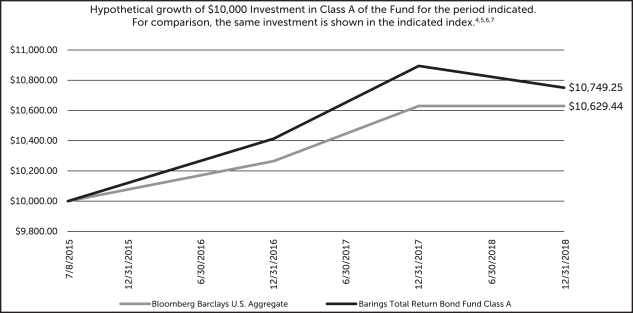
| | ∎ | | The Fund reported a net total rate of return for the reporting period from June 30, 2018 through December 31, 2018 of 0.42%, underperforming the Bloomberg Barclays U.S. Aggregate Index (the “Benchmark”), which returned 1.66%.1 |
What factors influenced performance of the Fund?
| | ∎ | | Investment grade corporate credit was a negative contributor to performance. Corporate spreads widened over the quarter across sectors, and experienced a volatile fourth quarter leading up to year end. Allocations to electronics and machinery contributed the most over the period, with automotive finance and banking detracting the most. |
| | ∎ | | Security selection in high yield credit, an out-of-index allocation, detracted from Fund performance over the period. |
| | ∎ | | An underweight to U.S. Treasuries relative to the Benchmark detracted from Fund performance. |
| | ∎ | | The Fund has a 4.5% allocation to short weighted average life, collateralized loan obligation (CLO) structured product.1 This out-of-index allocation detracted relative to the Benchmark. |
| | ∎ | | Asset backed securities (ABS) contributed to Fund performance, largely due to holdings in private and government-guaranteed Federal Family Education Loan Program (FFELP) student loans, as this sector performed well for the reporting period. Selective positioning to commercial ABS sectors also contributed positively to performance. |
| | ∎ | | Downside derivative mitigation, such as using a payer/receiver swaption pair to hedge against possible rising volatility, added to Fund performance during the period, while positions in CMBX to gain exposure to the commercial mortgage backed securities (CMBS) sector detracted during the period. 3 |
Describe recent portfolio activity.
| | ∎ | | The Fund maintained an active allocation to ABS, with recent purchases in both student loans and financial deals in the primary market. |
| | ∎ | | The Fund marginally increased its exposure to higher coupon 30-year collateral Federal National Mortgage Association (FNMA) agency mortgage-backed securities (MBS) due to attractive carry profile and relative value versus discount coupons. The Fund remains underweight to agency MBS relative to the Benchmark. |
| 1. | Total return describes the return to an investor of Class Y shares and includes the reinvestment of dividends and capital gains.Past performance is no guarantee of future results, and investment returns and the net asset value (NAV) of shares of the Fund will fluctuate so that shares, when redeemed, may be worth more or less than their original cost. Current performance may be higher or lower than performance quoted. Call 1.855.439.5459 or visit barings.com for current month-end performance.All returns one-year or less are cumulative. The Bloomberg Barclays U.S. Aggregate Index represents securities that are SEC-registered, taxable and dollar denominated. The index covers the U.S. investment grade fixed rate bond market, with index components for government and corporate securities, mortgage pass-through securities and asset-backed securities. These major sectors are subdivided into more specific indexes that are calculated and reported on a regular basis. Indexes are unmanaged. It is not possible to invest directly in an index. |
| 2. | Ratings shown are the highest ratings given by one of the following national rating agencies: S&P, Moody’s or Fitch. Additional information about ratings can be found, respectively, at www.standardandpoors.com, www.moodys.com and www.fitchratings.com. Credit ratings are subject to change. AAA, AA, A and BBB are investment grade ratings categories used by S&P and Fitch. BB, B, CCC/CC/C and D are below investment grade ratings categories used by S&P and Fitch. Aaa, Aa, A and Baa are investment grade ratings categories used by Moody’s. Ba, B, Caa/Ca and C are below investment grade ratings categories used by Moody’s. Ratings categories may include gradations within each category. Bonds backed by U.S. government or agency securities are given an implied rating equal to the rating of such securities. Holdings designated Not Publicly Rated are not rated by these national rating agencies. |
| 3. | Barings Total Return Bond Fund currently holds long investment grade CDX index credit default swap (CMBX) positions, which cover approximately 30 companies within each position. |
14
Barings Total Return Bond Fund 2018 Semi-Annual Report
Describe portfolio positioning at period end.
| | ∎ | | As of December 31, 2018, the Fund was duration neutral relative to the Benchmark. |
| | ∎ | | The Fund’s largest overweight relative to the Benchmark is the ABS allocation, which represents 19.1% of the Fund. The allocation to ABS comprises FFELP student loans, private student loans, a modest allocation to traditional automotive loan collateral, and commercial collateral such as whole business franchise receivables, shipping containers and loan servicers, in addition to other sub-sectors. |
| | ∎ | | As of December 31, 2018, corporate credit represented approximately 42.4% of the Fund (versus 29.2% for the Benchmark). Of that amount, investment grade corporates made up approximately 28.2%, high yield corporates made up 10.9% and U.S. dollar-denominated emerging markets made up almost 3.3%. The insurance sector is the Fund’s largest overweight position by 2.3%, as we believe yields are attractive. The technology sector represents the Fund’s largest underweight position by 1.60%. |
| | ∎ | | The Fund’s allocation to agency MBS is underweight by 5.6% relative to the Benchmark. |
| | ∎ | | The Fund maintains a 4.5% allocation to structured credit, represented by short weighted average life, AAA-rated collateralized loan obligations. |
| | ∎ | | The fund is maintaining a neutral position to CMBS. |
Describe market and portfolio outlook.
| | ∎ | | The Bloomberg Barclays U.S. Aggregate Index was positive for the month of December, with a total return of 1.84%. U.S. Treasury constituents provided the highest return for the period as rates rallied. Corporates were positive, with utilities being the highest performing sector. CMBS was positive, with non-agency outperforming agency deals. Within ABS, credit card and automotive sub-sectors were positive contributors. Agency MBS was also positive. |
| | ∎ | | December economic data continued to indicate that the U.S. economy is growing at an above-trend pace, but volatility was back with a vengeance. Factors weighing on market sentiment included a possible global growth slowdown, a trade war with China, an uncertain Fed and idiosyncratic credit risk. Despite the volatility, the Fed raised its target rate by 25 basis points (bps) as anticipated, with the upper bound at 2.50%. |
| | ∎ | | Although December returns were positive for many investment grade sectors, due to rallying Treasury prices, excess returns to equivalent Treasuries were mostly negative. Corporates were 16 bps wider for the month, with spreads ending at 153 bps according to Bloomberg Barclays. The last time spreads were this wide was during the commodity sell-off in early 2016. |
| | ∎ | | We believe that the market may have been pricing in some of 2019’s uncertainties during the recent quarter. The Fed is now off of “autopilot”, so to speak, giving investors one additional variable to navigate in 2019. Looking forward, we expect potential market turbulence as investors seek to interpret Fed policy, brace for potential Treasury yield curve inversion, consider a growing BBB market and evaluate slowing foreign demand. |
| | ∎ | | We believe the market may see a slowdown in corporate M&A activity due to the rising cost of funding; however, we do not anticipate a large-scale compression in corporate profit margins. Looking ahead to the new year, we will be closely watching the volume of primary market issuance, as we believe the level at which new deals come to market – along with price and how those deals are received by the market – should be strong indications of 2019 sentiment. |
15
Barings Total Return Bond Fund 2018 Semi-Annual Report
CREDIT QUALITY BREAKDOWN(% OF ASSETS*)
| * | The percentages shown above represent a percentage of the assets as of December 31, 2018. |
PORTFOLIO COMPOSITION(% OF ASSETS*)
| * | The percentages shown above represent a percentage of the assets as of December 31, 2018. |
16
Barings Total Return Bond Fund 2018 Semi-Annual Report
| | | | | | | | | | | | | | | | | | | | |
| % AVERAGE ANNUAL TOTAL RETURNS 5,7,8 | | INCEPTION DATE | | ONE YEAR | | THREE YEARS | | INCEPTION TO DATE |
Class A With Load | | | | 07/08/2015 | | | | | -5.27 | % | | | | 1.05 | % | | | | 0.65 | % |
Class A No Load | | | | 07/08/2015 | | | | | -1.32 | % | | | | 2.44 | % | | | | 1.83 | % |
Class C With Load | | | | 07/08/2015 | | | | | -3.01 | % | | | | 1.67 | % | | | | 1.07 | % |
Class C No Load | | | | 07/08/2015 | | | | | -2.06 | % | | | | 1.67 | % | | | | 1.07 | % |
Class I With Load | | | | 07/08/2015 | | | | | -1.08 | % | | | | 2.69 | % | | | | 2.09 | % |
Class I No Load | | | | 07/08/2015 | | | | | -1.08 | % | | | | 2.69 | % | | | | 2.09 | % |
Class Y With Load | | | | 07/08/2015 | | | | | -1.08 | % | | | | 2.69 | % | | | | 2.09 | % |
Class Y No Load | | | | 07/08/2015 | | | | | -1.08 | % | | | | 2.69 | % | | | | 2.09 | % |
Performance shown is historical and does not guarantee future results. Current performance may be lower or higher. Because share price, principal value and return will vary, you may have a gain or loss when you sell Fund shares. For current month-end performance information, call 1.855.439.5459. Performance includes the reinvestment of dividends and capital gains. Performance less than one year is cumulative; all other performance is annualized.
| 4. | Inception date: 7/8/2015 |
| 5. | Class A performance with the sales charges includes the maximum 4.00% sales charge. |
| 6. | Benchmark: Bloomberg Barclays U.S. Aggregate. The benchmark includes domestic, taxable, dollar-denominated securities. The index covers U.S. investment grade fixed rate bond market, with index components for government and corporate securities, mortgage pass-through securities and asset-backed securities. It is not possible to invest directly in an index. |
| 7. | Line graph and table do not reflect the deduction of taxes that a shareholder would pay. |
| 8. | Class C performance with the sales charges includes the 1.00% contingent deferred sales charge (CDSC) for returns of one year or less. |
17
Barings Emerging Markets Debt Blended Total Return Fund 2018 Semi-Annual Report
Investment Objective
Barings Emerging Markets Debt Blended Total Return Fund (“EMD Blended Total Return Fund” or the “Fund”) seeks to achieve maximum total return, consistent with preservation of capital and prudent investment management, through high current income generation and, where appropriate, capital appreciation.
Portfolio Management Commentary
How did the Fund perform?
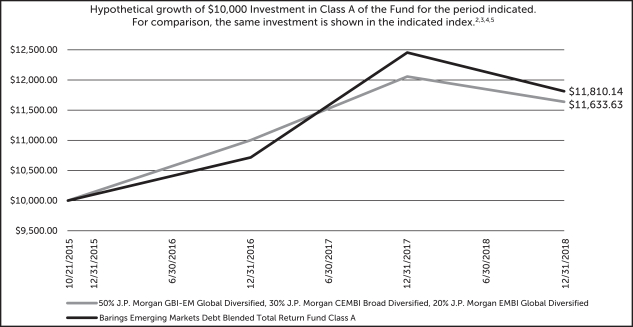
| | ∎ | | The Fund reported a net total rate of return for the period from June 30, 2018 through December 31, 2018 of 1.62%.1The net total rate of return for the Fund’s performance benchmark (a blend of 50% JPMorgan Government Bond Index – Emerging Markets Global Diversified (GBI-EMGD), 30% JPMorgan EMBI Global Diversified and 20% JPMorgan CEMBI Broad Diversified) was 1.09%. The Fund is not managed relative to the benchmark, however, the comparison is provided to show how the Fund’s returns compare with those of a broad measure of market performance. |
| | ∎ | | Each of the Fund’s three sub-strategies – emerging markets (EM) corporates, EM sovereign and EM local – turned in positive performance over the period despite a litany of headwinds, including higher U.S. Treasury rates, ongoing trade war between the U.S. and China, geopolitical stress points, local elections and the end of quantitative easing (QE) by the European Central Bank (ECB). |
What factors influenced performance of the Fund?
| | ∎ | | The Fund’s positioning and active allocations across countries and credits were additive to performance. Presidential elections in Mexico and Brazil provided for market volatility and opportunity. The Fund was able to capture strong performance from Brazil, following the election of Jair Bolsonaro, the country’s first far-right President in more than 17 years. The Mexican election, which resulted in the win by left-wing Andrés Manuel López Obrador, initially benefited the Fund as Mexican assets allied, then detracted from performance following a referendum that resulted in the cancellation of a $13.0 billion airport which was one-third complete. In general, the Fund had to meander through a number of headwinds, including a more assertive U.S. Federal Reserve, an ongoing trade war between the U.S. and China, management of financial crises in Turkey and Argentina, and rapid decline in Brent crude prices (-32%) and the CRB Commodity Index (-15%) over the reporting period. EM debt flows remained supportive through 2018, with $19.3 of positive flows during the year, almost equally split between local and hard currency. |
| | ∎ | | For the six-month reporting period ending December 31, 2018, the Fund’s positioning in Brazil, Poland, Turkey, China and Argentina contributed to Fund performance. However, the Fund’s positions in Russia, Mexico, Colombia, South Africa and Ukraine detracted from performance. |
Describe recent portfolio activity.
| | ∎ | | As a result of spread widening during the second quarter of 2018, the Fund increased its exposure to short duration EM corporates to capture the higher yields on companies we believe to have strong potential. The Fund decreased its exposure to local rates, but maintained positioning on overall moderate growth, low inflation and high rates in select EM local markets, with our expectation that local rates will fall over the next 12 months in countries that are well managed and have falling inflation. |
Describe portfolio positioning at period end.
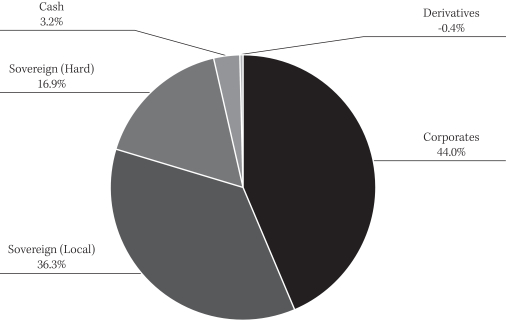
| | ∎ | | The Fund finished the reporting period, ended December 31, 2018, with a 44% exposure to emerging markets corporate bonds, 36% to local debt and currencies, 36% to sovereign hard currency (inclusive of Credit Default Swaps), and a 3.2% cash position. |
| 1. | Total return describes the return to an investor of Class Y shares and includes the reinvestment of dividends and capital gains.Past performance is no guarantee of future results, and investment returns and the net asset value (NAV) of shares of the Fund will fluctuate so that shares, when redeemed, may be worth more or less than their original cost. Current performance may be higher or lower than performance quoted. Call 1.855.439.5459 or visit barings.com for current month-end performance. All returns one-year or less are cumulative. |
18
Barings Emerging Markets Debt Blended Total Return Fund 2018 Semi-Annual Report
| | ∎ | | The top five countries in the portfolio at the end of the reporting period were Brazil (18.1%), Mexico (12.2%), Russia (8.2%), Turkey (6.0%) and Ukraine (5.9%). The top five corporate issuers were Panama Metro (2.6%), MHP (2.5%), Petra Diamonds (2.1%), VTR Finance (2.0%) and ALTICE (1.7%). Overall, the Fund had exposure to 29 countries, 34 corporates and 25 different currencies. |
Describe market and portfolio outlook.
| | ∎ | | Overall, we find EM debt valuations to be relatively attractive on a fundamental basis, as yields are approaching 7% for EM dollar denominated sovereign bonds; however, without a strong catalyst, the potential trigger for a broad-based EM market rally remains unclear. We expect the Fed to continue hiking rates, albeit gradually as U.S. growth continues to outpace many other developed economies. The ECB has ended its asset purchasing programme (APP); however, it will continue its reinvestment operations into 2019. The U.S. trade protectionist policies continue to target China and other countries with large trade surpluses, which are dampening global trade. |
| | ∎ | | EM corporate earnings continue to be largely positive, while sovereign and corporate default rates remain below historical averages. Corporate leverage is expected to decline for a third consecutive year. Balance of payments and current accounts across EM countries are generally sound, with many economies having seen substantial adjustments to their external accounts given weaker currencies in 2018. |
| | ∎ | | While higher U.S. rates may prove challenging for some EM sovereigns and corporates, in our view, stronger developed market growth overall should benefit the asset class as a whole going forward. |
| | ∎ | | We continue to take a constructive view of EM debt as a whole, and expect EM local debt to strengthen from here due to slower growth, contained inflationary pressures and continued fiscal/external adjustments across many countries. With sovereign hard currency spreads having widened materially this year, we see select opportunities where we believe spreads continue to overcompensate for defaults, mostly in investment grade countries and select issuers within vulnerable countries. |
19
Barings Emerging Markets Debt Blended Total Return Fund 2018 Semi-Annual Report
PORTFOLIO COMPOSITION(% OF ASSETS*)
| * | The percentages shown above represent a percentage of the assets as of December 31, 2018. |
REGIONAL COMPOSITION(% OF ASSETS**)
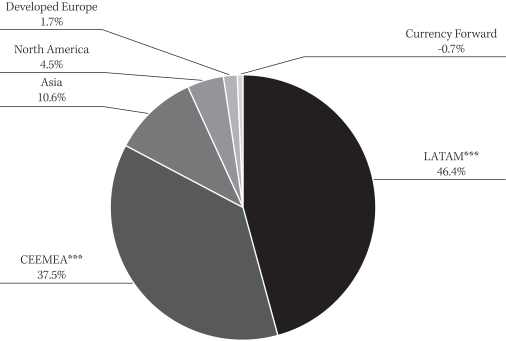
| ** | The percentages shown above are expressed by market value, excluding cash and accrued income, may vary over time and, represent a percentage of the assets as of December 31, 2018. |
| *** | CEEMEA: Central Europe, Eastern Europe, Middle East and Africa. |
| | LATAM: Latin America (includes countries in Central and South America). |
20
Barings Emerging Markets Debt Blended Total Return Fund 2018 Semi-Annual Report
| | | | | | | | | | | | | | | | | | | | |
| % AVERAGE ANNUAL TOTAL RETURNS 3,5,6 | | INCEPTION DATE | | ONE YEAR | | THREE YEARS | | INCEPTION TO DATE |
Class A With Load | | | | 10/21/2015 | | | | | -8.96 | % | | | | 4.27 | % | | | | 2.87 | % |
Class A No Load | | | | 10/21/2015 | | | | | -5.16 | % | | | | 5.70 | % | | | | 4.19 | % |
Class C With Load | | | | 10/21/2015 | | | | | -6.74 | % | | | | 4.94 | % | | | | 3.44 | % |
Class C No Load | | | | 10/21/2015 | | | | | -5.84 | % | | | | 4.94 | % | | | | 3.44 | % |
Class I With Load | | | | 10/21/2015 | | | | | -4.93 | % | | | | 5.97 | % | | | | 4.45 | % |
Class I No Load | | | | 10/21/2015 | | | | | -4.93 | % | | | | 5.97 | % | | | | 4.45 | % |
Class Y With Load | | | | 10/21/2015 | | | | | -4.92 | % | | | | 5.98 | % | | | | 4.46 | % |
Class Y No Load | | | | 10/21/2015 | | | | | -4.92 | % | | | | 5.98 | % | | | | 4.46 | % |
Performance shown is historical and does not guarantee future results. Current performance may be lower or higher. Because share price, principal value and return will vary, you may have a gain or loss when you sell Fund shares. For current month-end performance information, call 1.855.439.5459. Performance includes the reinvestment of dividends and capital gains. Performance less than one year is cumulative; all other performance is annualized.
| 2. | Inception date: 10/21/2015 |
| 3. | Class A performance with the sales charges includes the maximum 4.00% sales charge. |
| 4. | Benchmark is a blend of 50% JPMorgan Government Bond Index – Emerging Markets Global Diversified (GBI-EMGD), 30% JPMorgan EMBI Global Diversified and 20% JPMorgan CEMBI Broad Diversified. |
| 5. | Line graph and table do not reflect the deduction of taxes that a shareholder would pay. |
| 6. | Class C performance with the sales charges includes the 1.00% contingent deferred sales charge (CDSC) for returns of one year or less. |
21
Barings Global Emerging Markets Equity Fund 2018 Semi-Annual Report
Investment Objective
Barings Global Emerging Markets Equity Fund (the “Fund”) seeks to achieve long-term capital growth.
Portfolio Management Commentary
How did the Fund perform?
| | ∎ | | The Fund reported a net rate of return for the period from its inception, September 18, 2018, through December 31, 2018 of-3.58%, outperforming the MSCI Emerging Markets Benchmark (the “Benchmark”), which returned-4.49%.1 |
What factors influenced performance of the Fund?
| | ∎ | | During the period, the Fund outperformed its Benchmark, primarily due to stock selection. |
| | ∎ | | Contributors to relative Fund performance included: |
| | ∎ | | Natura Cosmeticos, a Brazilian cosmetics company, benefited from margin recovery within its international operations and rising sales productivity in Brazil. |
| | ∎ | | HDFC Bank, an Indian bank, outperformed on the back of earnings that demonstrated improving margins and strong growth momentum. |
| | ∎ | | Bank Negara Indonesia was one of the top performers, as investors continued to take note of the company’s loan growth and improving credit quality. |
| | ∎ | | Detractors to relative Fund performance included: |
| | ∎ | | Grupo Financiero Banorte, a Mexican commercial bank, detracted following the incoming government’s announcement of changes to banking legislation that could potentially reduce fee income. |
| | ∎ | | Brilliance China Automotive, a Chinese automobile manufacturer that operates a joint venture with BMW, was negatively impacted by the announcement that BMW will increase its stake in the joint venture to 75%, leading to concern among investors that minority interests will be negatively impacted. |
| | ∎ | | China State Construction, a Chinese engineering and construction company, detracted on local market weakness and broader macroeconomic concerns, as investors remained cautious of the slowing domestic economy and U.S./China trade dispute. |
Describe recent portfolio activity.
| | ∎ | | During the period, the Fund initiated a position in Chinese luggage manufacturer Samsonite, and exited its positon in Chinese automobile manufacturer Brilliance China Automotive (please see above). |
Describe portfolio positioning at period end.
| | ∎ | | Our current Fund positioning reflects ourbottom-up investment process – where we aim to identify companies with sustainable business franchises, and with future growth potential that is not fully reflected in the current share price. As a result, our active country and sector positioning relative to the Benchmark is not driven by a deliberatetop-down strategy, but is aby-product of ourbottom-up stock selection process. |
| | ∎ | | Relative to the Benchmark, the largest active country position is in China and the largest active sector exposure is to financials, where in each case we continue to identify many companies that we believe have strong medium-term growth prospects and are attractively valued. |
| | ∎ | | Despite the large active position in both cases, we believe that the performance of these companies will be influenced by company specific factors (i.e. that these companies will be in control of their own destiny), rather than by correlations to their respective country or sector. Asbottom-up investors, we always seek these types of companies. |
| 1 | Source: Barings, Morningstar. As of December 31, 2018. In US$. Fund performance is based on I class unit return, Net of Fees. The performance comparator is MSCI Emerging Markets Total Return Index with net dividends. © 2019 Morningstar, Inc. All Rights Reserved. The information contained herein: (1) is proprietary to Morningstar; (2) may not be copied or distributed; and (3) is not warranted to be accurate, complete or timely. Neither Morningstar nor its content providers are responsible for any damages or losses arising from any use of this information. |
22
Barings Global Emerging Markets Equity Fund 2018 Semi-Annual Report
| | ∎ | | As of the end of the reporting period, the top five county weightings in the Fund, on an absolute basis, were China (37.3%), India (11.4%), Korea (10.8%), Taiwan (9.4%) and Brazil (7.9%). The Fund has exposure to 11 different countries, and in line with our investment process, we continue to seek outbottom-up investment opportunities where we believe the future earnings potential is not fully reflected in the current share price. |
Describe market and portfolio outlook.
| | ∎ | | Despite the volatility of 2018, driven by several short-term headwinds, we believe that emerging markets are better positioned looking towards 2019. Emerging market equities are forecast for an acceleration in corporate earnings growth over the course of 2019 and into 2020. The flattening US yield curve and the more recent dovish comments from the Federal Reserve suggest interest rate expectations have peaked which could signal we are at or close to a turning point for the USD. We note the progress on trade talks between the U.S. and China at the G20 meeting and the ongoing subsequent talks, raising expectations for a future resolution. We believe this communication could lay the foundation for further progress to find a satisfactory solution for both sides in 2019. The current account deficits of Argentina and Turkey are quickly rebalancing following significant monetary tightening. Here the currencies of both countries are starting to appreciate in recognition that the risk of contagion across the broader EM equity asset class has fallen sharply. The relative valuation of EM equities versus developed equities appears very attractive which suggests investor expectations for EM equities remains overly depressed while in the case of developed equities remain somewhat higher. |
23
Barings Global High Yield Fund 2018 Semi-Annual Report
Investment Objective
Barings Global High Yield Fund (“Global High Yield Fund” or the “Fund”) seeks to provide high current income generation and, where appropriate, capital appreciation.
Portfolio Management Commentary
How did the Fund perform?
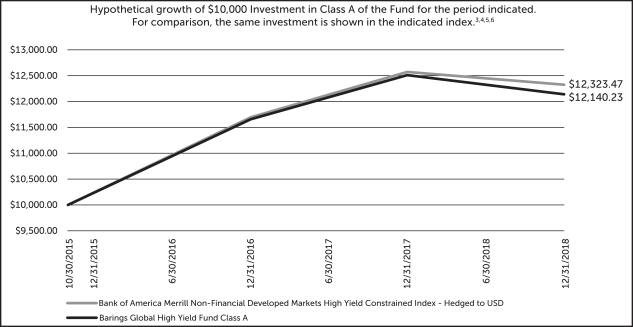
| | ∎ | | The Fund reported a net total rate of return for the reporting period from June 30, 2018 through December 31, 2018 of -2.65%, and underperformed the Bank of America Merrill Lynch Non-Financial Developed Markets High Yield Constrained Index (the “Benchmark”), which returned -2.07%. In addition, the Fund returned -2.67% on a net basis for the full year of 2018, and underperformed the Benchmark, which returned -1.98%.1 |
What factors influenced performance of the Fund?
| | ∎ | | For much of the year, the global high yield bond market generated a positive return on the back of stable economic growth, low inflation and solid corporate fundamentals. During the fourth quarter, however, a bout of volatility across asset classes drove markets lower, with the global high yield market ending the six-month period negative. |
| | ∎ | | In general, the demand for lower quality paper was muted, which led the CCC-rated portion of the market to underperform relative to B-rated and BB-rated holdings. As a result, the Fund’s underweight allocation to BB-rated holdings and overweight allocation to the lower rated categories relative to the Benchmark were performance detractors. Security selection within the B-rated and CCC-rated categories did contribute to performance positively versus the Benchmark. |
| | ∎ | | From an industry perspective, the Fund had an overweight exposure to the oil and gas sector relative to the Benchmark, which outperformed during the first half of the period, until volatility increased in this segment of the market during the fourth quarter. Security selection, coupled with the overweight position within the sector relative to the Benchmark, was a drag on the Fund’s performance during the period. |
| | ∎ | | The Fund’s credit selection in Europe was the largest contributor to performance relative to the Benchmark during the period, while credit selection within the U.S. was a notable detractor. Allocation across geographies was not a significant factor in relative performance. |
Describe recent portfolio activity.
| | ∎ | | The Fund continues to favor the B-rated and CCC-rated subsets of the global high yield bond market given the shorter duration and favorable yield dynamics. With default expectations remaining low and corporate fundamentals generally healthy, we have found better relative value opportunities in B-rated and CCC-rated assets. There was a modest increase in BB-rated holdings alongside a slight increase in CCC-rated holdings; however, no significant shifts took place during the period. |
| | ∎ | | Across industries, the Fund’s allocation to the oil and gas industry was modestly reduced as certain relative value opportunities played out. Additionally, credits within the sector tend to be shorter in duration. The Fund saw positions mature or called during the six-month period; however, the Fund may seek to increase its positions as crude oil prices recover from recent lows. The Fund increased its exposure to certain names in the telecommunications sector, which displayed strong relative value within the space. The Fund’s allocations to the health care, education, and child care, and the mining, steel, iron and non-precious metals sectors were also increased. |
| 1. | Total return describes the return to an investor of Class Y shares and includes the reinvestment of dividends and capital gains.Past performance is no guarantee of future results, and investment returns and the net asset value (NAV) of shares of the Fund will fluctuate so that shares, when redeemed, may be worth more or less than their original cost. Current performance may be higher or lower than performance quoted. Call 1.855.439.5459 or visit barings.com for current month-end performance. All returns one-year or less are cumulative. The Bank of America Merrill Lynch Non-Financial Developed Markets High Yield Constrained Index contains all securities in the Bank of America Merrill Lynch Global High Yield Index that are non-financials and from developed markets countries, but caps issuer exposure at 2%. A developed market is defined as an FX-G10 member, a Western European nation, or a territory of the U.S. or a Western European nation. Indexes are unmanaged. It is not possible to invest directly in an index. |
24
Barings Global High Yield Fund 2018 Semi-Annual Report
| | ∎ | | Going into the second half of 2018, the European high yield market began to see modest spread widening, driven by political uncertainty in Italy, as well as changes to European Central Bank monetary policy. As such, the Fund sought to capitalize on what we believe to be an oversold market, and increased the weighting to the region while it reduced its U.S. exposure. The Fund remained overweight to the European market and underweight to the U.S. market, relative to the Benchmark at period end. |
Describe portfolio positioning at period end.
| | ∎ | | On a traded basis, the Fund finished 2018 with a 30.2% weighting to senior secured high yield bonds, and a 61.9% weighting to senior unsecured high yield bonds. The balance of the portfolio was invested in senior secured loans (5.5%), and cash and accrued income (2.4%). |
| | ∎ | | From an industry perspective, the Fund remains diversified across a number of Moody’s-based industries, with higher concentrations in oil and gas (15.6%), health care, education and child care (8.3%), and telecommunications (8.1%) as of December 31, 2018. |
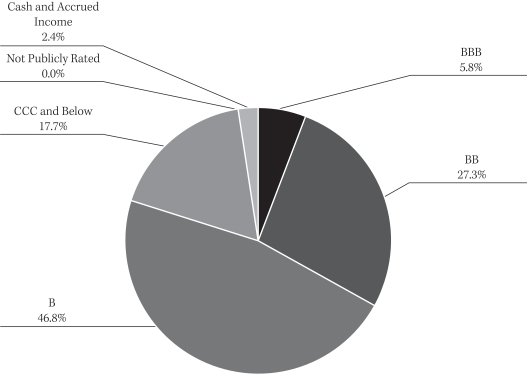
| | ∎ | | In terms of portfolio credit quality at the end of 2018, the Fund had the following weighting breakdown: 5.8% in BBB, 27.3% in BB, 46.8% in B, 17.7% in CCC and below, and 2.4% in cash and accrued income. A small portion of the portfolio (less than 0.1%) is designated as not publicly rated, and is not rated by S&P, Moody’s or Fitch.2 |
| | ∎ | | The top five countries in the portfolio as of December 31, 2018 are currently represented by the U.S. (65.0%), the U.K. (12.0%), Germany (4.5%), Ghana (3.0%) and the Netherlands (1.9%). Overall, the Fund has exposure to 15 countries, and supports our focus on building a well-diversified portfolio of global high yield bonds. |
Describe market and portfolio outlook.
| | ∎ | | We believe that the volatility and sentiment in the global high yield market was driven by several factors, including trade wars, Brexit and monetary policy. However, on a fundamental basis, we believe issuers continue to generate modest top and bottom-line growth, with leverage remaining at healthy and sustainable levels. |
| | ∎ | | Default rates are below historical averages, and we expect this to continue into 2019. |
| | ∎ | | While crude oil prices and geopolitical events may continue to cause further market price volatility, we believe this represents an attractive opportunity for investors in high yield. |
| 2. | Ratings shown are the highest ratings given by one of the following national rating agencies: S&P, Moody’s or Fitch. Additional information about ratings can be found, respectively, at www.standardandpoors.com, www.moodys.com and www.fitchratings.com. Credit ratings are subject to change. AAA, AA, A and BBB are investment grade ratings categories used by S&P and Fitch. BB, B, CCC/CC/C and D are below investment grade ratings categories used by S&P and Fitch. Aaa, Aa, A and Baa are investment grade ratings categories used by Moody’s. Ba, B, Caa/Ca and C are below investment grade ratings categories used by Moody’s. Ratings categories may include gradations within each category. Bonds backed by U.S. government or agency securities are given an implied rating equal to the rating of such securities. Holdings designated Not Publicly Rated are not rated by these national rating agencies. |
25
Barings Global High Yield Fund 2018 Semi-Annual Report
CREDIT QUALITY COMPOSITION(% OF ASSETS*)
| * | The percentages shown above represent a percentage of the assets as of December 31, 2018. |
COUNTRY COMPOSITION(% OF ASSETS**)
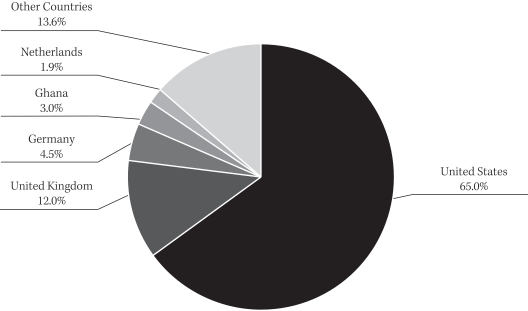
| ** | The percentages shown above are expressed by market value excluding cash and accrued income, may vary over time and represent a percentage of the assets as of December 31, 2018. |
26
Barings Global High Yield Fund 2018 Semi-Annual Report
| | | | | | | | | | | | | | | | | | | | |
| % AVERAGE ANNUAL TOTAL RETURNS 4,6,7 | | INCEPTION DATE | | ONE YEAR | | THREE YEARS | | INCEPTION TO DATE |
Class A With Load | | | | 10/30/2015 | | | | | -6.82 | % | | | | 5.24 | % | | | | 4.13 | % |
Class A No Load | | | | 10/30/2015 | | | | | -2.94 | % | | | | 6.68 | % | | | | 5.48 | % |
Class C With Load | | | | 10/30/2015 | | | | | -4.51 | % | | | | 5.90 | % | | | | 4.72 | % |
Class C No Load | | | | 10/30/2015 | | | | | -3.62 | % | | | | 5.90 | % | | | | 4.72 | % |
Class I With Load | | | | 10/30/2015 | | | | | -2.67 | % | | | | 6.95 | % | | | | 5.76 | % |
Class I No Load | | | | 10/30/2015 | | | | | -2.67 | % | | | | 6.95 | % | | | | 5.76 | % |
Class Y With Load | | | | 10/30/2015 | | | | | -2.67 | % | | | | 6.95 | % | | | | 5.75 | % |
Class Y No Load | | | | 10/30/2015 | | | | | -2.67 | % | | | | 6.95 | % | | | | 5.75 | % |
Performance shown is historical and does not guarantee future results. Current performance may be lower or higher. Because share price, principal value and return will vary, you may have a gain or loss when you sell Fund shares. For current month-end performance information, call 1.855.439.5459. Performance includes the reinvestment of dividends and capital gains. Performance less than one year is cumulative; all other performance is annualized.
| 3. | Inception date: 10/30/2015 |
| 4. | Class A performance with the sales charges includes the maximum 4.00% sales charge. |
| 5. | Benchmark: BofA Merrill Lynch Non-Fin. Developed Markets High Yield Constrained Index. The benchmark contains all securities in The BofA Merrill Lynch Global High Yield Index that are non-financials and from developed markets countries, but caps issuer exposure at 2%. Developed markets is defined as an FX-G10 member, a Western European nation, or a territory of the U.S. or a Western European nation. Indexes are unmanaged. It is not possible to invest directly in an index. |
| 6. | Line graph and table do not reflect the deduction of taxes that a shareholder would pay. |
| 7. | Class C performance with the sales charges includes the 1.00% contingent deferred sales charge (CDSC) for returns of one year or less. |
27
Barings U.S. High Yield Fund 2018 Semi-Annual Report
Investment Objective
Barings U.S. High Yield Fund (“U.S. High Yield Fund” or the “Fund”) seeks to achieve a high level of total return, with an emphasis on current income, by investing primarily in high yield debt and related securities.
Portfolio Management Commentary
How did the Fund perform?
| | ∎ | | The Fund reported a net total rate of return for the reporting period from June 30, 2018 through December 31, 2018 of -2.41%, and slightly underperformed the Bloomberg Barclays U.S. Corporate High Yield Index (the “Benchmark”), which returned -2.24%. In addition, the Fund returned -2.51% on a net basis for the full year of 2018, and slightly underperformed the Benchmark, which returned -2.08%.1 |
What factors influenced performance of the Fund?
| | ∎ | | For much of the year, the U.S. high yield market generated a positive return on the back of stable economic growth, low inflation and solid corporate fundamentals. During the fourth quarter, however, a bout of volatility across asset classes drove markets lower with the U.S. high yield market, ending the six-month period negative. |
| | ∎ | | In general, the demand for lower quality paper was muted, which led the CCC-rated portion of the market to underperform relative to B-rated and BB-rated assets. As a result, the Fund’s underweight allocation to BB-rated assets, and overweight allocation to the lower rated categories relative to the Benchmark, were performance detractors. Security selection within the B-rated and CCC-rated categories did contribute to performance positively versus the Benchmark. |
| | ∎ | | From an industry category perspective, the Fund’s holdings within the communications and consumer cyclical sectors outperformed relative to the Benchmark. Credit selection in the capital goods and technology sectors were a drag on the Fund’s performance during the period. |
Describe recent portfolio activity.
| | ∎ | | The Fund continues to favor the B-rated and CCC-rated subsets of the U.S. high yield bond market given the shorter duration profile and favorable yield dynamics. Therefore, the Fund continued to be underweight in BB-rated holdings. With default expectations remaining low and corporate fundamentals generally healthy, we have found better relative value opportunities in B-rated and CCC-rated credits. As such, there was a slight increase in CCC-rated holdings, and a more substantial increase to B-rated assets. |
| | ∎ | | Across industries, the Fund’s allocation to the oil and gas industry was modestly reduced, as certain relative value opportunities played out. Additionally, credits within the sector tend to be shorter in duration, and therefore the Fund saw positions mature or called during the six-month period. The Fund may seek to increase its position in this market segment as crude oil prices recover from recent lows. The Fund increased its exposure to certain names in the telecommunications sector, which displayed strong relative value within the space. The Fund’s allocations to the health care, education and child care, and mining, steel, iron and non-precious metals sectors were also increased. |
Describe portfolio positioning at period end.
| | ∎ | | On a traded basis, the Fund finished December 31, 2018 with a 19.6% weighting to senior secured high yield bonds, and a 72.9% weighting in senior unsecured bonds. The remaining balance of the portfolio was invested in senior secured loans (5.1%) and cash, accrued and other holdings (2.4%). |
| 1. | Total return describes the return to an investor of Class Y shares and includes the reinvestment of dividends and capital gains.Past performance is no guarantee of future results, and investment returns and the net asset value (NAV) of shares of the Fund will fluctuate so that shares, when redeemed, may be worth more or less than their original cost. Current performance may be higher or lower than performance quoted. Call 1.855.439.5459 or visit barings.com for current month-end performance. All returns one-year or less are cumulative. The Bloomberg Barclays U.S. Corporate High Yield Index covers the universe of fixed-rate, non-investment grade debt focusing on corporate USD denominated and non-convertible debt. Indexes are unmanaged. It is not possible to invest directly in an index. |
28
Barings U.S. High Yield Fund 2018 Semi-Annual Report
| | ∎ | | From a sector perspective, the Fund remains well diversified across a number of Moody’s-based industries, with higher concentrations in oil and gas (14.2%), telecommunications (11.0%), and mining, steel, iron and non-precious metals (10.1%) as of December 31, 2018. |
| | ∎ | | In terms of portfolio credit quality as of December 31, 2018, the Fund had the following weighting breakdown: 6.3% in BBB, 34.0% in BB, 40.0% in B, 16.3% in CCC and below, and cash and accrued income at 2.0%. The Fund’s weighting in Not Publicly Rated holdings finished the period at 1.4%.2 |
Describe market and portfolio outlook.
| | ∎ | | We believe that the volatility and sentiment in the high yield market was driven by several factors, including trade wars, Brexit and monetary policy. However, on a fundamental basis, we believe issuers continue to generate modest top and bottom-line growth, with leverage remaining at healthy and sustainable levels. |
| | ∎ | | Default rates are below historical averages, and we expect this to continue into 2019. |
| | ∎ | | While crude oil prices and geopolitical events may continue to cause further market price volatility, we believe this represents an attractive opportunity for investors in high yield. |
| 2. | Ratings shown are the highest ratings given by one of the following national rating agencies: S&P, Moody’s or Fitch. Additional information about ratings can be found, respectively, at www.standardandpoors.com, www.moodys.com and www.fitchratings.com. Credit ratings are subject to change. AAA, AA, A and BBB are investment grade ratings categories used by S&P and Fitch. BB, B, CCC/CC/C and D are below investment grade ratings categories used by S&P and Fitch. Aaa, Aa, A and Baa are investment grade ratings categories used by Moody’s. Ba, B, Caa/Ca and C are below investment grade ratings categories used by Moody’s. Ratings categories may include gradations within each category. Bonds backed by U.S. government or agency securities are given an implied rating equal to the rating of such securities. Holdings designated Not Publicly Rated are not rated by these national rating agencies. |
29
Barings U.S. High Yield Fund 2018 Semi-Annual Report
CREDIT QUALITY COMPOSITION(% OF ASSETS*)
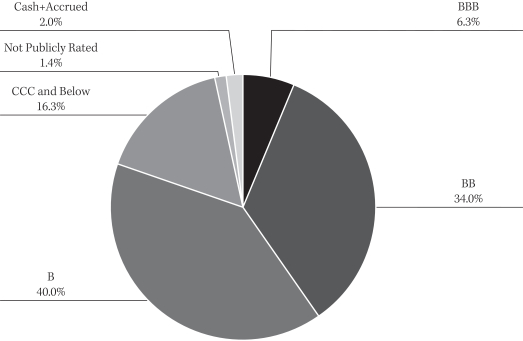
| * | The percentages shown above represent a percentage of the assets as of December 31, 2018. |
COUNTRY COMPOSITION(% OF ASSETS**)
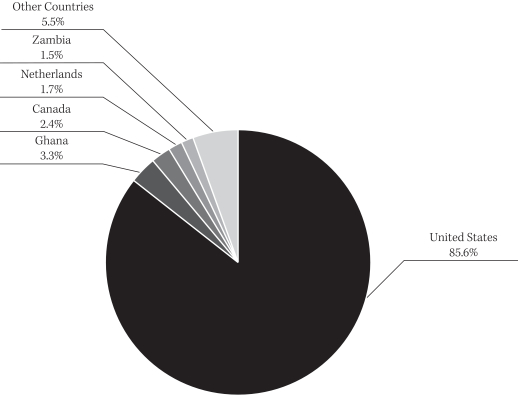
| ** | The percentages of assets are expressed by market value excluding cash and accrued income, and may vary over time. The percentages shown above represent a percentage of the assets as of December 31, 2018. |
30
Barings U.S. High Yield Fund 2018 Semi-Annual Report
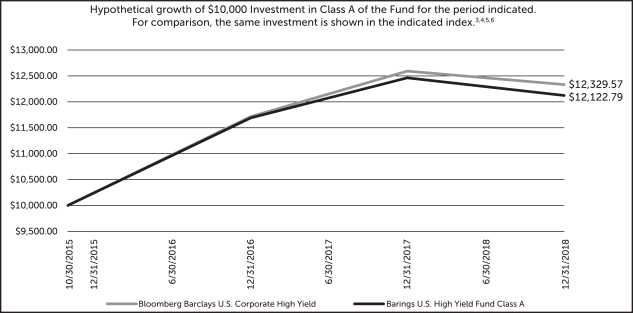
| | | | | | | | | | | | | | | | | | | | |
| % AVERAGE ANNUAL TOTAL RETURNS 4,6,7 | | INCEPTION DATE | | ONE YEAR | | THREE YEARS | | INCEPTION TO DATE |
Class A With Load | | | | 10/30/2015 | | | | | -6.61 | % | | | | 5.18 | % | | | | 3.94 | % |
Class A No Load | | | | 10/30/2015 | | | | | -2.72 | % | | | | 6.63 | % | | | | 5.29 | % |
Class C With Load | | | | 10/30/2015 | | | | | -4.39 | % | | | | 5.82 | % | | | | 4.49 | % |
Class C No Load | | | | 10/30/2015 | | | | | -3.47 | % | | | | 5.82 | % | | | | 4.49 | % |
Class I With Load | | | | 10/30/2015 | | | | | -2.51 | % | | | | 6.88 | % | | | | 5.53 | % |
Class I No Load | | | | 10/30/2015 | | | | | -2.51 | % | | | | 6.88 | % | | | | 5.53 | % |
Class Y With Load | | | | 10/30/2015 | | | | | -2.51 | % | | | | 6.87 | % | | | | 5.53 | % |
Class Y No Load | | | | 10/30/2015 | | | | | -2.51 | % | | | | 6.87 | % | | | | 5.53 | % |
Performance shown is historical and does not guarantee future results. Current performance may be lower or higher. Because share price, principal value and return will vary, you may have a gain or loss when you sell Fund shares. For current month-end performance information, call 1.855.439.5459. Performance includes the reinvestment of dividends and capital gains. Performance less than one year is cumulative; all other performance is annualized.
| 3. | Inception date: 10/30/2015 |
| 4. | Class A performance with the sales charges includes the maximum 4.00% sales charge. |
| 5. | Benchmark: Bloomberg Barclays U.S. Corporate High Yield Index. The benchmark covers the universe of fixed-rate, non-investment grade debt focusing on corporate USD denominated and non-convertible debt. It is not possible to invest directly in an index. |
| 6. | Line graph and table do not reflect the deduction of taxes that a shareholder would pay. |
| 7. | Class C performance with the sales charges includes the 1.00% contingent deferred sales charge (CDSC) for returns of one year or less. |
31
Barings Funds Trust 2018 Semi-Annual Report
This page left intentionally blank.
32
Barings Funds Trust 2018 Semi-Annual Report
SHAREHOLDER EXPENSES(UNAUDITED)
As a shareholder of Barings Global Floating Rate Fund, Barings Global Credit Income Opportunities Fund, Barings Active Short Duration Bond Fund, Barings Total Return Bond Fund, Barings Emerging Markets Debt Blended Total Return Fund, Barings Global Emerging Markets Equity Fund, Barings Global High Yield Fund or Barings U.S. High Yield Fund you incur ongoing expenses, such as management fees, shareholder service fees, distribution fees and other fund expenses. The following table is intended to help you understand your ongoing expenses (in dollars and cents) of investing in the Funds and to compare these expenses with the ongoing expenses of investing in other funds.
The table is based on an investment of $1,000 invested at the beginning of the period and held for the entire period from July 1, 2018 to December 31, 2018.
Actual Expenses
The first line in the table below provides information about the actual account values and actual expenses. You may use the information in this line, together with the amount you invested, to estimate the expenses that you paid over the period. Simply divide your account value by $1,000 (for example, an $8,600 account value divided by $1,000 = 8.6), then multiply the result by the number in the first line for the Fund under the heading entitled “Operating Expense Incurred” to estimate the expenses you paid on your account during this period.
Hypothetical Example for Comparison Purposes
The second line in the table below provides information about the hypothetical account values and hypothetical expenses based on the Fund’s actual expense ratio and an assumed rate of return of 5% per year before expenses, which is not the Fund’s actual return. The hypothetical account value and expenses may not be used to estimate the actual ending account balance or expenses you paid for the period. You may use this information to compare the ongoing costs of investing in your Fund and other funds. To do so, compare this 5% hypothetical example with the 5% hypothetical examples that appear in the shareholder reports of the other funds.
Barings Global Floating Rate Fund
| | | | | | | | | | | | | | | | | | | | | | | | | |
| | | EXPENSE
RATIO | | BEGINNING
AMOUNT | | ENDING
VALUE | | AVERAGE
VALUE | | OPERATING
EXPENSE
INCURRED* |
Class A | | | | | | | | | | | | | | | | | | | | | | | | | |
Actual | | | | 1.00 | % | | | $ | 1,000.00 | | | | $ | 980.90 | | | | $ | 990.45 | | | | $ | 4.99 | |
Hypothetical | | | | 1.00 | % | | | | 1,000.00 | | | | | 1,020.20 | | | | | 1,010.10 | | | | | 5.09 | |
| | | | | |
Class C | | | | | | | | | | | | | | | | | | | | | | | | | |
Actual | | | | 1.73 | % | | | | 1,000.00 | | | | | 977.20 | | | | | 988.60 | | | | | 8.62 | |
Hypothetical | | | | 1.73 | % | | | | 1,000.00 | | | | | 1,016.50 | | | | | 1,008.25 | | | | | 8.79 | |
| | | | | |
Class I | | | | | | | | | | | | | | | | | | | | | | | | | |
Actual | | | | 0.75 | % | | | | 1,000.00 | | | | | 982.20 | | | | | 991.10 | | | | | 3.75 | |
Hypothetical | | | | 0.75 | % | | | | 1,000.00 | | | | | 1,021.40 | | | | | 1,010.70 | | | | | 3.82 | |
| | | | | |
Class Y | | | | | | | | | | | | | | | | | | | | | | | | | |
Actual | | | | 0.75 | % | | | | 1,000.00 | | | | | 982.10 | | | | | 991.05 | | | | | 3.75 | |
Hypothetical | | | | 0.75 | % | | | | 1,000.00 | | | | | 1,021.40 | | | | | 1,010.70 | | | | | 3.82 | |
| * | For each Class of the Fund, net expenses are equal to the annualized expense ratio net of any expenses waived or reimbursed by the adviser for such class multiplied by the average account value over the period, multiplied by 184/365. |
33
Barings Funds Trust 2018 Semi-Annual Report
SHAREHOLDER EXPENSES(UNAUDITED) (CONTINUED)
Barings Global Credit Income Opportunities Fund
| | | | | | | | | | | | | | | | | | | | | | | | | |
| | | EXPENSE
RATIO | | BEGINNING
AMOUNT | | ENDING
VALUE | | AVERAGE
VALUE | | OPERATING
EXPENSE
INCURRED* |
Class A | | | | | | | | | | | | | | | | | | | | | | | | | |
Actual | | | | 1.20 | % | | | $ | 1,000.00 | | | | $ | 968.00 | | | | $ | 984.00 | | | | $ | 5.95 | |
Hypothetical | | | | 1.20 | % | | | | 1,000.00 | | | | | 1,019.20 | | | | | 1,009.60 | | | | | 6.11 | |
| | | | | |
Class C | | | | | | | | | | | | | | | | | | | | | | | | | |
Actual | | | | 1.95 | % | | | | 1,000.00 | | | | | 964.30 | | | | | 982.15 | | | | | 9.65 | |
Hypothetical | | | | 1.95 | % | | | | 1,000.00 | | | | | 1,015.40 | | | | | 1,007.70 | | | | | 9.91 | |
| | | | | |
Class I | | | | | | | | | | | | | | | | | | | | | | | | | |
Actual | | | | 0.95 | % | | | | 1,000.00 | | | | | 969.30 | | | | | 984.65 | | | | | 4.72 | |
Hypothetical | | | | 0.95 | % | | | | 1,000.00 | | | | | 1,020.40 | | | | | 1,010.20 | | | | | 4.84 | |
| | | | | |
Class Y | | | | | | | | | | | | | | | | | | | | | | | | | |
Actual | | | | 0.95 | % | | | | 1,000.00 | | | | | 969.20 | | | | | 984.60 | | | | | 4.72 | |
Hypothetical | | | | 0.95 | % | | | | 1,000.00 | | | | | 1,020.40 | | | | | 1,010.20 | | | | | 4.84 | |
| * | For each Class of the Fund, net expenses are equal to the annualized expense ratio net of any expenses waived or reimbursed by the adviser for such class multiplied by the average account value over the period, multiplied by 184/365. |
Barings Active Short Duration Bond Fund
| | | | | | | | | | | | | | | | | | | | | | | | | |
| | | EXPENSE
RATIO | | BEGINNING
AMOUNT | | ENDING
VALUE | | AVERAGE
VALUE | | OPERATING
EXPENSE
INCURRED* |
Class A | | | | | | | | | | | | | | | | | | | | | | | | | |
Actual | | | | 0.65 | % | | | $ | 1,000.00 | | | | $ | 1,008.90 | | | | $ | 1,004.45 | | | | $ | 3.29 | |
Hypothetical | | | | 0.65 | % | | | | 1,000.00 | | | | | 1,021.90 | | | | | 1,010.95 | | | | | 3.31 | |
| | | | | |
Class C | | | | | | | | | | | | | | | | | | | | | | | | | |
Actual | | | | 0.90 | % | | | | 1,000.00 | | | | | 1,007.60 | | | | | 1,003.80 | | | | | 4.55 | |
Hypothetical | | | | 0.90 | % | | | | 1,000.00 | | | | | 1,020.70 | | | | | 1,010.35 | | | | | 4.58 | |
| | | | | |
Class I | | | | | | | | | | | | | | | | | | | | | | | | | |
Actual | | | | 0.40 | % | | | | 1,000.00 | | | | | 1,010.20 | | | | | 1,005.10 | | | | | 2.03 | |
Hypothetical | | | | 0.40 | % | | | | 1,000.00 | | | | | 1,023.20 | | | | | 1,011.60 | | | | | 2.04 | |
| | | | | |
Class Y | | | | | | | | | | | | | | | | | | | | | | | | | |
Actual | | | | 0.40 | % | | | | 1,000.00 | | | | | 1,010.20 | | | | | 1,005.10 | | | | | 2.03 | |
Hypothetical | | | | 0.40 | % | | | | 1,000.00 | | | | | 1,023.20 | | | | | 1,011.60 | | | | | 2.04 | |
| * | For each Class of the Fund, net expenses are equal to the annualized expense ratio net of any expenses waived or reimbursed by the adviser for such class multiplied by the average account value over the period, multiplied by 184/365. |
34
Barings Funds Trust 2018 Semi-Annual Report
SHAREHOLDER EXPENSES(UNAUDITED) (CONTINUED)
Barings Total Return Bond Fund
| | | | | | | | | | | | | | | | | | | | | | | | | |
| | | EXPENSE
RATIO** | | BEGINNING
AMOUNT | | ENDING
VALUE | | AVERAGE
VALUE | | OPERATING
EXPENSE
INCURRED* |
Class A | | | | | | | | | | | | | | | | | | | | | | | | | |
Actual | | | | 0.80 | % | | | $ | 1,000.00 | | | | $ | 1,002.90 | | | | $ | 1,001.45 | | | | $ | 4.04 | |
Hypothetical | | | | 0.80 | % | | | | 1,000.00 | | | | | 1,021.20 | | | | | 1,010.60 | | | | | 4.08 | |
| | | | | |
Class C | | | | | | | | | | | | | | | | | | | | | | | | | |
Actual | | | | 1.55 | % | | | | 1,000.00 | | | | | 999.10 | | | | | 999.55 | | | | | 7.81 | |
Hypothetical | | | | 1.55 | % | | | | 1,000.00 | | | | | 1,017.40 | | | | | 1,008.70 | | | | | 7.88 | |
| | | | | |
Class I | | | | | | | | | | | | | | | | | | | | | | | | | |
Actual | | | | 0.55 | % | | | | 1,000.00 | | | | | 1,004.20 | | | | | 1,002.10 | | | | | 2.78 | |
Hypothetical | | | | 0.55 | % | | | | 1,000.00 | | �� | | | 1,022.40 | | | | | 1,011.20 | | | | | 2.80 | |
| | | | | |
Class Y | | | | | | | | | | | | | | | | | | | | | | | | | |
Actual | | | | 0.55 | % | | | | 1,000.00 | | | | | 1,004.20 | | | | | 1,002.10 | | | | | 2.78 | |
Hypothetical | | | | 0.55 | % | | | | 1,000.00 | | | | | 1,022.40 | | | | | 1,011.20 | | | | | 2.80 | |
| * | For each Class of the Fund, net expenses are equal to the annualized expense ratio net of any expenses waived or reimbursed by the adviser for such class multiplied by the average account value over the period, multiplied by 184/365. |
| ** | Expense ratios (as disclosed in the table) do not include the expenses of any underlying funds in which the Fund invests. The annualized expense ratios, as stated in the fee table of the Prospectus, may differ from the expense ratios disclosed in this report. |
Barings Emerging Markets Debt Blended Total Return Fund
| | | | | | | | | | | | | | | | | | | | | | | | | |
| | | EXPENSE
RATIO | | BEGINNING
AMOUNT | | ENDING
VALUE | | AVERAGE
VALUE | | OPERATING
EXPENSE
INCURRED* |
Class A | | | | | | | | | | | | | | | | | | | | | | | | | |
Actual | | | | 1.14 | % | | | $ | 1,000.00 | | | | $ | 1,014.90 | | | | $ | 1,007.45 | | | | $ | 5.79 | |
Hypothetical | | | | 1.14 | % | | | | 1,000.00 | | | | | 1,019.50 | | | | | 1,009.75 | | | | | 5.80 | |
| | | | | |
Class C | | | | | | | | | | | | | | | | | | | | | | | | | |
Actual | | | | 1.82 | % | | | | 1,000.00 | | | | | 1,011.30 | | | | | 1,005.65 | | | | | 9.23 | |
Hypothetical | | | | 1.82 | % | | | | 1,000.00 | | | | | 1,016.00 | | | | | 1,008.00 | | | | | 9.25 | |
| | | | | |
Class I | | | | | | | | | | | | | | | | | | | | | | | | | |
Actual | | | | 0.85 | % | | | | 1,000.00 | | | | | 1,016.20 | | | | | 1,008.10 | | | | | 4.32 | |
Hypothetical | | | | 0.85 | % | | | | 1,000.00 | | | | | 1,020.90 | | | | | 1,010.45 | | | | | 4.33 | |
| | | | | |
Class Y | | | | | | | | | | | | | | | | | | | | | | | | | |
Actual | | | | 0.85 | % | | | | 1,000.00 | | | | | 1,016.20 | | | | | 1,008.10 | | | | | 4.32 | |
Hypothetical | | | | 0.85 | % | | | | 1,000.00 | | | | | 1,020.90 | | | | | 1,010.45 | | | | | 4.33 | |
| * | For each Class of the Fund, net expenses are equal to the annualized expense ratio net of any expenses waived or reimbursed by the adviser for such class multiplied by the average account value over the period, multiplied by 184/365. |
35
Barings Funds Trust 2018 Semi-Annual Report
SHAREHOLDER EXPENSES(UNAUDITED) (CONTINUED)
Barings Global Emerging Markets Equity Fund
| | | | | | | | | | | | | | | | | | | | | | | | | |
| | | EXPENSE
RATIO | | BEGINNING
AMOUNT | | ENDING
VALUE | | AVERAGE
VALUE | | OPERATING
EXPENSE
INCURRED* |
Class A | | | | | | | | | | | | | | | | | | | | | | | | | |
Actual | | | | 1.45 | % | | | $ | 1,000.00 | | | | $ | 963.50 | | | | $ | 981.75 | | | | $ | 4.10 | |
Hypothetical | | | | 1.45 | % | | | | 1,000.00 | | | | | 1,010.20 | | | | | 1,005.10 | | | | | 4.19 | |
| | | | | |
Class C | | | | | | | | | | | | | | | | | | | | | | | | | |
Actual | | | | 2.20 | % | | | | 1,000.00 | | | | | 961.50 | | | | | 980.75 | | | | | 6.21 | |
Hypothetical | | | | 2.20 | % | | | | 1,000.00 | | | | | 1,008.10 | | | | | 1,004.05 | | | | | 6.35 | |
| | | | | |
Class I | | | | | | | | | | | | | | | | | | | | | | | | | |
Actual | | | | 1.20 | % | | | | 1,000.00 | | | | | 964.20 | | | | | 982.10 | | | | | 3.39 | |
Hypothetical | | | | 1.20 | % | | | | 1,000.00 | | | | | 1,010.90 | | | | | 1,005.45 | | | | | 3.47 | |
| | | | | |
Class Y | | | | | | | | | | | | | | | | | | | | | | | | | |
Actual | | | | 1.20 | % | | | | 1,000.00 | | | | | 964.20 | | | | | 982.10 | | | | | 3.39 | |
Hypothetical | | | | 1.20 | % | | | | 1,000.00 | | | | | 1,010.90 | | | | | 1,005.45 | | | | | 3.47 | |
| * | For each Class of the Fund, net expenses are equal to the annualized expense ratio net of any expenses waived or reimbursed by the adviser for such class multiplied by the average account value over the period, multiplied by 105/365. |
Barings Global High Yield Fund
| | | | | | | | | | | | | | | | | | | | | | | | | |
| | | EXPENSE
RATIO | | BEGINNING
AMOUNT | | ENDING
VALUE | | AVERAGE
VALUE | | OPERATING
EXPENSE
INCURRED* |
Class A | | | | | | | | | | | | | | | | | | | | | | | | | |
Actual | | | | 1.05 | % | | | $ | 1,000.00 | | | | $ | 972.00 | | | | $ | 986.00 | | | | $ | 5.22 | |
Hypothetical | | | | 1.05 | % | | | | 1,000.00 | | | | | 1,019.90 | | | | | 1,009.95 | | | | | 5.35 | |
| | | | | |
Class C | | | | | | | | | | | | | | | | | | | | | | | | | |
Actual | | | | 1.80 | % | | | | 1,000.00 | | | | | 968.70 | | | | | 984.35 | | | | | 8.93 | |
Hypothetical | | | | 1.80 | % | | | | 1,000.00 | | | | | 1,016.10 | | | | | 1,008.05 | | | | | 9.15 | |
| | | | | |
Class I | | | | | | | | | | | | | | | | | | | | | | | | | |
Actual | | | | 0.80 | % | | | | 1,000.00 | | | | | 973.50 | | | | | 986.75 | | | | | 3.98 | |
Hypothetical | | | | 0.80 | % | | | | 1,000.00 | | | | | 1,021.20 | | | | | 1,010.60 | | | | | 4.08 | |
| | | | | |
Class Y | | | | | | | | | | | | | | | | | | | | | | | | | |
Actual | | | | 0.80 | % | | | | 1,000.00 | | | | | 973.50 | | | | | 986.75 | | | | | 3.98 | |
Hypothetical | | | | 0.80 | % | | | | 1,000.00 | | | | | 1,021.20 | | | | | 1,010.60 | | | | | 4.08 | |
| * | For each Class of the Fund, net expenses are equal to the annualized expense ratio net of any expenses waived or reimbursed by the adviser for such class multiplied by the average account value over the period, multiplied by 184/365. |
36
Barings Funds Trust 2018 Semi-Annual Report
SHAREHOLDER EXPENSES(UNAUDITED) (CONTINUED)
Barings U.S. High Yield Fund
| | | | | | | | | | | | | | | | | | | | | | | | | |
| | | EXPENSE
RATIO | | BEGINNING
AMOUNT | | ENDING
VALUE | | AVERAGE
VALUE | | OPERATING
EXPENSE
INCURRED* |
Class A | | | | | | | | | | | | | | | | | | | | | | | | | |
Actual | | | | 1.00 | % | | | $ | 1,000.00 | | | | $ | 975.00 | | | | $ | 987.50 | | | | $ | 4.98 | |
Hypothetical | | | | 1.00 | % | | | | 1,000.00 | | | | | 1,020.20 | | | | | 1,010.10 | | | | | 5.09 | |
| | | | | |
Class C | | | | | | | | | | | | | | | | | | | | | | | | | |
Actual | | | | 1.75 | % | | | | 1,000.00 | | | | | 971.00 | | | | | 985.50 | | | | | 8.69 | |
Hypothetical | | | | 1.75 | % | | | | 1,000.00 | | | | | 1,016.40 | | | | | 1,008.20 | | | | | 8.89 | |
| | | | | |
Class I | | | | | | | | | | | | | | | | | | | | | | | | | |
Actual | | | | 0.75 | % | | | | 1,000.00 | | | | | 975.90 | | | | | 987.95 | | | | | 3.74 | |
Hypothetical | | | | 0.75 | % | | | | 1,000.00 | | | | | 1,021.40 | | | | | 1,010.70 | | | | | 3.82 | |
| | | | | |
Class Y | | | | | | | | | | | | | | | | | | | | | | | | | |
Actual | | | | 0.75 | % | | | | 1,000.00 | | | | | 975.90 | | | | | 987.95 | | | | | 3.74 | |
Hypothetical | | | | 0.75 | % | | | | 1,000.00 | | | | | 1,021.40 | | | | | 1,010.70 | | | | | 3.82 | |
| * | For each Class of the Fund, net expenses are equal to the annualized expense ratio net of any expenses waived or reimbursed by the adviser for such class multiplied by the average account value over the period, multiplied by 184/365. |
37
Barings Funds Trust 2018 Semi-Annual Report
BARINGS FUNDS TRUST
FINANCIAL REPORT
38
Barings Funds Trust 2018 Semi-Annual Report
STATEMENTS OF ASSETS AND LIABILITIES
December 31, 2018 (Unaudited)
| | | | | | | | | | | | | | | | |
| | | BARINGS GLOBAL
FLOATING RATE FUND | | | BARINGS GLOBAL
CREDIT INCOME
OPPORTUNITIES FUND | | | BARINGS ACTIVE
SHORT DURATION
BOND FUND | | | BARINGS TOTAL
RETURN
BOND FUND | |
| | | | |
| Assets | | | | | | | | | | | | | | | | |
| Investments, at fair value (cost $291,533,544, $185,578,108, $481,539,156 and $28,647,467, respectively) | | $ | 273,291,956 | | | $ | 169,404,914 | | | $ | 476,949,479 | | | $ | 28,161,779 | |
| Investments in affiliates, at fair value (cost $2,681,797) | | | – | | | | – | | | | – | | | | 2,557,954 | |
| Cash | | | 13,573,347 | | | | 4,566,154 | | | | 660,021 | | | | 311,662 | |
| Foreign currency, at value (cost $2,101,812, $61,734, $0 and $2, respectively) | | | 2,121,622 | | | | 62,060 | | | | – | | | | 2 | |
| Receivable for investments sold | | | 16,812,778 | | | | 11,042,814 | | | | – | | | | 1,762,791 | |
| Receivable for Fund shares sold | | | 540,187 | | | | 1,703,617 | | | | 8,945,823 | | | | 538,189 | |
| Interest receivable | | | 1,718,879 | | | | 2,575,245 | | | | 2,816,542 | | | | 193,346 | |
| Receivable from adviser (see Note 3) | | | – | | | | – | | | | – | | | | 9,429 | |
| Cash collateral held at broker on open swap contracts | | | – | | | | 290,000 | | | | – | | | | 7 | |
| Receivable for variation margin on open futures contracts | | | – | | | | – | | | | – | | | | 10,783 | |
| Foreign tax reclaims receivable | | | – | | | | 903 | | | | 3,398 | | | | – | |
| Unrealized appreciation on forward foreign currency exchange contracts | | | 28,173 | | | | 51,721 | | | | – | | | | 18,077 | |
| Unrealized appreciation on unfunded loan commitments | | | – | | | | 534 | | | | – | | | | – | |
| Prepaid expenses | | | 38,398 | | | | 54,086 | | | | – | | | | 11,833 | |
| | | | | | | | | | | | | | | | |
Total assets | | | 308,125,340 | | | | 189,752,048 | | | | 489,375,263 | | | | 33,575,852 | |
| | | | | | | | | | | | | | | | |
| | | | |
| Liabilities | | | | | | | | | | | | | | | | |
| Payable for investments purchased | | | 18,589,820 | | | | 8,473,471 | | | | – | | | | 4,753,286 | |
| Payable for Fund shares repurchased | | | 1,965,458 | | | | 2,009,001 | | | | 2,628,791 | | | | 19,015 | |
| Swap contracts, at fair value (up-front net premiums received of $0, $0, $20,656 and $4,976, respectively) | | | – | | | | – | | | | 83,855 | | | | 20,964 | |
| Payable for variation margin on open futures contracts | | | – | | | | – | | | | 135,184 | | | | – | |
| Investment advisory fee payable (see Note 3) | | | 122,865 | | | | 88,549 | | | | 51,665 | | | | – | |
| Directors’ fees payable | | | – | | | | – | | | | 4,278 | | | | 191 | |
| Cash collateral Due to Broker | | | – | | | | 150,000 | | | | 3,980,000 | | | | 380,000 | |
| Distribution fees payable | | | 18,157 | | | | 19,043 | | | | 31,613 | | | | 211 | |
| Shareholder service fees payable | | | 19,460 | | | | 23,712 | | | | 36,651 | | | | 1,771 | |
| Dividends payable | | | 287,121 | | | | 255,823 | | | | 187,029 | | | | 82,815 | |
| Unrealized depreciation on forward foreign currency exchange contracts | | | 271,019 | | | | 187,612 | | | | – | | | | 27,210 | |
| Unrealized depreciation on unfunded loan commitments | | | 6,896 | | | | – | | | | – | | | | – | |
| Accrued expenses and other liabilities | | | 176,323 | | | | 165,526 | | | | 334,014 | | | | 53,231 | |
| | | | | | | | | | | | | | | | |
Total liabilities | | | 21,457,119 | | | | 11,372,737 | | | | 7,473,080 | | | | 5,338,694 | |
| | | | | | | | | | | | | | | | |
Total net assets | | $ | 286,668,221 | | | $ | 178,379,311 | | | $ | 481,902,183 | | | $ | 28,237,158 | |
| | | | | | | | | | | | | | | | |
See accompanying Notes to the Financial Statements.
39
Barings Funds Trust 2018 Semi-Annual Report
STATEMENTS OF ASSETS AND LIABILITIES(CONTINUED)
December 31, 2018 (Unaudited)
| | | | | | | | | | | | | | | | |
| | | BARINGS GLOBAL
FLOATING RATE FUND | | | BARINGS GLOBAL
CREDIT INCOME
OPPORTUNITIES FUND | | | BARINGS ACTIVE
SHORT DURATION
BOND FUND | | | BARINGS TOTAL
RETURN
BOND FUND | |
| | | | |
| Composition of net assets | | | | | | | | | | | | | | | | |
| Shares of beneficial interest outstanding (par value $0.00001 per share), unlimited number of shares authorized | | $ | 316 | | | $ | 206 | | | $ | 491 | | | $ | 29 | |
| Additional paid-in capital | | | 305,936,312 | | | | 199,366,312 | | | | 488,411,013 | | | | 29,320,587 | |
| Total distributable earnings | | | (19,268,407 | ) | | | (20,987,207 | ) | | | (6,509,321 | ) | | | (1,083,458 | ) |
| | | | | | | | | | | | | | | | |
Total net assets (1) | | $ | 286,668,221 | | | $ | 178,379,311 | | | $ | 481,902,183 | | | $ | 28,237,158 | |
| | | | | | | | | | | | | | | | |
| | | | |
| Class A | | | | | | | | | | | | | | | | |
| Net assets applicable to outstanding shares | | $ | 49,248,389 | | | $ | 46,395,611 | | | $ | 147,828,676 | | | $ | 702,672 | |
| | | | | | | | | | | | | | | | |
| Shares of beneficial interest outstanding | | | 5,437,395 | | | | 5,348,749 | | | | 15,050,848 | | | | 72,897 | |
| | | | | | | | | | | | | | | | |
| Net asset value per share outstanding | | $ | 9.06 | | | $ | 8.67 | | | $ | 9.82 | | | $ | 9.64 | |
| | | | | | | | | | | | | | | | |
| Maximum offering price per share outstanding (Net asset value plus sales charge of 3.00%, 4.00%, 0.00% and 4.00%, respectively) | | $ | 9.34 | | | $ | 9.03 | | | $ | 9.82 | | | $ | 10.04 | |
| | | | | | | | | | | | | | | | |
| | | | |
| Class C | | | | | | | | | | | | | | | | |
| Net assets applicable to outstanding shares | | $ | 8,616,673 | | | $ | 8,174,581 | | | $ | 1,287,209 | | | $ | 193,328 | |
| | | | | | | | | | | | | | | | |
| Shares of beneficial interest outstanding | | | 954,854 | | | | 943,569 | | | | 131,157 | | | | 20,061 | |
| | | | | | | | | | | | | | | | |
| Net asset value per share outstanding | | $ | 9.02 | | | $ | 8.66 | | | $ | 9.81 | | | $ | 9.64 | |
| | | | | | | | | | | | | | | | |
| | | | |
| Class I | | | | | | | | | | | | | | | | |
| Net assets applicable to outstanding shares | | $ | 33,938,741 | | | $ | 14,476,740 | | | $ | 297,825 | | | $ | 11,906,545 | |
| | | | | | | | | | | | | | | | |
| Shares of beneficial interest outstanding | | | 3,739,270 | | | | 1,669,284 | | | | 30,319 | | | | 1,235,482 | |
| | | | | | | | | | | | | | | | |
| Net asset value per share outstanding | | $ | 9.08 | | | $ | 8.67 | | | $ | 9.82 | | | $ | 9.64 | |
| | | | | | | | | | | | | | | | |
| | | | |
| Class Y | | | | | | | | | | | | | | | | |
| Net assets applicable to outstanding shares | | $ | 194,864,418 | | | $ | 109,332,379 | | | $ | 332,488,473 | | | $ | 15,434,613 | |
| | | | | | | | | | | | | | | | |
| Shares of beneficial interest outstanding | | | 21,480,483 | | | | 12,608,762 | | | | 33,874,699 | | | | 1,601,522 | |
| | | | | | | | | | | | | | | | |
| Net asset value per share outstanding | | $ | 9.07 | | | $ | 8.67 | | | $ | 9.82 | | | $ | 9.64 | |
| | | | | | | | | | | | | | | | |
| (1) | | The SEC eliminated the requirement to disclose total distributable earnings by each of its components as previously disclosed as the previous presentation did not provide insight into the tax implications of distributions. |
See accompanying Notes to the Financial Statements.
40
Barings Funds Trust 2018 Semi-Annual Report
STATEMENTS OF ASSETS AND LIABILITIES
December 31, 2018 (Unaudited)
| | | | | | | | | | | | | | | | |
| | | BARINGS EMERGING
MARKETS DEBT
BLENDED TOTAL
RETURN FUND | | | BARINGS GLOBAL
EMERGING MARKETS
EQUITY FUND | | | BARINGS GLOBAL
HIGH YIELD
FUND | | | BARINGS U.S.
HIGH YIELD
FUND | |
| | |
| Assets | | | | | | | | | |
| Investments, at fair value (cost $47,846,878, $9,499,900, $24,803,674 and $53,017,778, respectively) | | $ | 44,469,027 | | | $ | 9,226,371 | | | $ | 22,493,758 | | | $ | 49,548,895 | |
| Cash | | | 818,550 | | | | 437,612 | | | | 280,188 | | | | 687,652 | |
| Foreign currency, at value (cost $161,413, $0, $5,782 and $0, respectively) | | | 162,486 | | | | – | | | | 5,847 | | | | – | |
| Receivable for investments sold | | | 230,957 | | | | – | | | | 240,935 | | | | 71,233 | |
| Receivable for Fund shares sold | | | 21,083 | | | | – | | | | 35,239 | | | | 218,494 | |
| Interest receivable | | | 788,203 | | | | 2,909 | | | | 426,525 | | | | 875,349 | |
| Interest receivable on swap contracts | | | 10,996 | | | | – | | | | – | | | | – | |
| Receivable from adviser (see Note 3) | | | – | | | | 9,471 | | | | 5,465 | | | | – | |
| Cash collateral held at broker on open swap contracts | | | 1,660,000 | | | | – | | | | – | | | | – | |
| Cash collateral held at broker on open future contracts | | | 32,120 | | | | – | | | | – | | | | – | |
| Swap contracts, at fair value | | | 186,619 | | | | – | | | | – | | | | – | |
| Foreign tax reclaims receivable | | | – | | | | – | | | | 1,966 | | | | 297 | |
| Unrealized appreciation on forward foreign currency exchange contracts | | | 1,123,271 | | | | – | | | | 5,014 | | | | – | |
| Prepaid expenses | | | 12,168 | | | | – | | | | 11,567 | | | | 12,598 | |
| | | | | | | | | | | | | | | | |
Total assets | | | 49,515,480 | | | | 9,676,363 | | | | 23,506,504 | | | | 51,414,518 | |
| | | | | | | | | | | | | | | | |
| | | | |
| Liabilities | | | | | | | | | | | | | | | | |
| Payable for investments purchased | | | 228,822 | | | | – | | | | 409,644 | | | | 636,221 | |
| Payable for Fund shares repurchased | | | 97,707 | | | | – | | | | 544 | | | | 6,224 | |
| Payable for variation margin on open swap contracts | | | 289,765 | | | | – | | | | – | | | | – | |
| Payable for variation margin on open futures contracts | | | 4,751 | | | | – | | | | – | | | | – | |
| Investment advisory fee payable (see Note 3) | | | 2,485 | | | | – | | | | – | | | | 7,639 | |
| Directors’ fees payable | | | 649 | | | | 8,196 | | | | – | | | | – | |
| Cash collateral Due to Broker | | | 880,000 | | | | – | | | | – | | | | – | |
| Distribution fees payable | | | 318 | | | | 103 | | | | 191 | | | | 389 | |
| Shareholder service fees payable | | | 2,427 | | | | – | | | | 2,585 | | | | 5,446 | |
| Dividends payable | | | 242,891 | | | | – | | | | 128,369 | | | | 126,084 | |
| Unrealized depreciation on forward foreign currency exchange contracts | | | 1,469,838 | | | | – | | | | 22,602 | | | | – | |
| Accrued expenses and other liabilities | | | 66,640 | | | | 25,836 | | | | 48,032 | | | | 45,633 | |
| | | | | | | | | | | | | | | | |
Total liabilities | | | 3,286,293 | | | | 34,135 | | | | 611,967 | | | | 827,636 | |
| | | | | | | | | | | | | | | | |
Total net assets | | $ | 46,229,187 | | | $ | 9,642,228 | | | $ | 22,894,537 | | | $ | 50,586,882 | |
| | | | | | | | | | | | | | | | |
See accompanying Notes to the Financial Statements.
41
Barings Funds Trust 2018 Semi-Annual Report
STATEMENTS OF ASSETS AND LIABILITIES(CONTINUED)
December 31, 2018 (Unaudited)
| | | | | | | | | | | | | | | | |
| | | BARINGS EMERGING
MARKETS DEBT
BLENDED TOTAL
RETURN FUND | | | BARINGS GLOBAL
EMERGING MARKETS
EQUITY FUND | | | BARINGS GLOBAL
HIGH YIELD
FUND | | | BARINGS U.S.
HIGH YIELD
FUND | |
| | | | |
| Composition of net assets | | | | | | | | | | | | | | | | |
| Shares of beneficial interest outstanding (par value $0.00001 per share), unlimited number of shares authorized | | $ | 49 | | | $ | 10 | | | $ | 25 | | | $ | 54 | |
| Additional paid-in capital | | | 51,307,695 | | | | 9,999,990 | | | | 25,493,523 | | | | 54,439,768 | |
| Total distributable earnings | | | (5,078,557 | ) | | | (357,772 | ) | | | (2,599,011 | ) | | | (3,852,940 | ) |
| | | | | | | | | | | | | | | | |
Total net assets (1) | | $ | 46,229,187 | | | $ | 9,642,228 | | | $ | 22,894,537 | | | $ | 50,586,882 | |
| | | | | | | | | | | | | | | | |
| | | | |
| Class A | | | | | | | | | | | | | | | | |
| Net assets applicable to outstanding shares | | $ | 373,591 | | | $ | 96,356 | | | $ | 169,068 | | | $ | 1,334,013 | |
| | | | | | | | | | | | | | | | |
| Shares of beneficial interest outstanding | | | 39,854 | | | | 10,000 | | | | 18,798 | | | | 143,632 | |
| | | | | | | | | | | | | | | | |
| Net asset value per share outstanding | | $ | 9.37 | | | $ | 9.64 | | | $ | 8.99 | | | $ | 9.29 | |
| | | | | | | | | | | | | | | | |
| Maximum offering price per share outstanding (Net asset value plus sales charge of 4.00%) | | $ | 9.76 | | | $ | 10.04 | | | $ | 9.36 | | | $ | 9.68 | |
| | | | | | | | | | | | | | | | |
| | | | |
| Class C | | | | | | | | | | | | | | | | |
| Net assets applicable to outstanding shares | | $ | 241,574 | | | $ | 96,149 | | | $ | 176,766 | | | $ | 92,836 | |
| | | | | | | | | | | | | | | | |
| Shares of beneficial interest outstanding | | | 25,767 | | | | 10,000 | | | | 19,640 | | | | 10,000 | |
| | | | | | | | | | | | | | | | |
| Net asset value per share outstanding | | $ | 9.38 | | | $ | 9.61 | | | $ | 9.00 | | | $ | 9.28 | |
| | | | | | | | | | | | | | | | |
| | | | |
| Class I | | | | | | | | | | | | | | | | |
| Net assets applicable to outstanding shares | | $ | 22,324,600 | | | $ | 4,724,861 | | | $ | 11,154,702 | | | $ | 14,081,904 | |
| | | | | | | | | | | | | | | | |
| Shares of beneficial interest outstanding | | | 2,381,296 | | | | 490,000 | | | | 1,240,000 | | | | 1,516,834 | |
| | | | | | | | | | | | | | | | |
| Net asset value per share outstanding | | $ | 9.37 | | | $ | 9.64 | | | $ | 9.00 | | | $ | 9.28 | |
| | | | | | | | | | | | | | | | |
| | | | |
| Class Y | | | | | | | | | | | | | | | | |
| Net assets applicable to outstanding shares | | $ | 23,289,422 | | | $ | 4,724,862 | | | $ | 11,394,001 | | | $ | 35,078,129 | |
| | | | | | | | | | | | | | | | |
| Shares of beneficial interest outstanding | | | 2,484,058 | | | | 490,000 | | | | 1,266,607 | | | | 3,778,921 | |
| | | | | | | | | | | | | | | | |
| Net asset value per share outstanding | | $ | 9.38 | | | $ | 9.64 | | | $ | 9.00 | | | $ | 9.28 | |
| | | | | | | | | | | | | | | | |
| (1) | | The SEC eliminated the requirement to disclose total distributable earnings by each of its components as previously disclosed as the previous presentation did not provide insight into the tax implications of distributions. |
See accompanying Notes to the Financial Statements.
42
Barings Funds Trust 2018 Semi-Annual Report
STATEMENTS OF OPERATIONS
For the Six Months Ended December 31, 2018 (Unaudited)
| | | | | | | | | | | | | | | | |
| | | BARINGS GLOBAL
FLOATING RATE FUND | | | BARINGS GLOBAL
CREDIT INCOME
OPPORTUNITIES FUND | | | BARINGS ACTIVE
SHORT DURATION
BOND FUND | | | BARINGS
TOTAL RETURN
BOND FUND | |
| |
| Investment Income | | | | | |
Interest income (net of withholding tax of $0, $2,640, $102 and $0, respectively) | | $ | 8,112,536 | | | $ | 7,680,374 | | | $ | 7,225,352 | | | $ | 482,398 | |
Dividends | | | – | | | | – | | | | – | | | | 69,936 | |
Dividends from affiliated securities | | | – | | | | – | | | | – | | | | 25,591 | |
Other income | | | 31,259 | | | | 1,058 | | | | 176 | | | | – | |
| | | | | | | | | | | | | | | | |
Total investment income | | | 8,143,795 | | | | 7,681,432 | | | | 7,225,528 | | | | 577,925 | |
| | | | | | | | | | | | | | | | |
| | | | |
| Operating Expenses | | | | | | | | | | | | | | | | |
Advisory fees | | | 977,882 | | | | 886,216 | | | | 766,880 | | | | 56,915 | |
12b-1 distribution and servicing plan | | | | | |
Class A | | | 67,024 | | | | 76,479 | | | | 203,332 | | | | 263 | |
Class C | | | 44,044 | | | | 45,630 | | | | 2,865 | | | | 981 | |
Shareholder service fee | | | | | |
Class A | | | 15,789 | | | | 11,971 | | | | 36,462 | | | | 5 | |
Class C | | | 2,313 | | | | 2,379 | | | | 1,370 | | | | – | |
Class Y | | | 28,653 | | | | 31,289 | | | | 72,450 | | | | 1,845 | |
Administrator fees | | | 115,956 | | | | 109,843 | | | | 218,062 | | | | 24,666 | |
Custody fees | | | 82,599 | | | | 81,923 | | | | 162,920 | | | | 23,478 | |
Professional fees | | | 51,294 | | | | 49,460 | | | | 47,360 | | | | 21,910 | |
Transfer agent fees | | | 13,859 | | | | 19,374 | | | | 25,500 | | | | 11,077 | |
Directors’ fees | | | 35,463 | | | | 32,555 | | | | 60,453 | | | | 16,170 | |
Registration fees | | | 40,999 | | | | 56,636 | | | | 41,532 | | | | 23,787 | |
Printing and mailing expenses | | | 14,875 | | | | 10,867 | | | | 19,901 | | | | 2,134 | |
Other operating expenses | | | 15,138 | | | | 14,143 | | | | 27,659 | | | | 3,920 | |
| | | | | | | | | | | | | | | | |
Total operating expenses | | | 1,505,888 | | | | 1,428,765 | | | | 1,686,746 | | | | 187,151 | |
Reimbursement of expenses | | | | | |
Class A | | | (56,000 | ) | | | (46,832 | ) | | | (219,022 | ) | | | (3,235 | ) |
Class C | | | (12,105 | ) | | | (10,309 | ) | | | (6,160 | ) | | | (3,170 | ) |
Class I | | | (23,358 | ) | | | (13,214 | ) | | | (3,823 | ) | | | (42,759 | ) |
Class Y | | | (175,700 | ) | | | (113,760 | ) | | | (376,286 | ) | | | (58,485 | ) |
| | | | | | | | | | | | | | | | |
Net operating expenses | | | 1,238,725 | | | | 1,244,650 | | | | 1,081,455 | | | | 79,502 | |
| | | | | | | | | | | | | | | | |
Net investment income | | | 6,905,070 | | | | 6,436,782 | | | | 6,144,073 | | | | 498,423 | |
| | | | | | | | | | | | | | | | |
See accompanying Notes to the Financial Statements.
43
Barings Funds Trust 2018 Semi-Annual Report
STATEMENTS OF OPERATIONS(CONTINUED)
For the Six Months Ended December 31, 2018 (Unaudited)
| | | | | | | | | | | | | | | | |
| | | BARINGS GLOBAL
FLOATING RATE FUND | | | BARINGS GLOBAL
CREDIT INCOME
OPPORTUNITIES FUND | | | BARINGS ACTIVE
SHORT DURATION
BOND FUND | | | BARINGS
TOTAL RETURN
BOND FUND | |
| | | | |
| Realized and Unrealized Gains (Losses) on Investments | | | | | | | | | | | | | | | | |
Net realized loss on investments | | $ | (792,687 | ) | | $ | (4,361,537 | ) | | $ | (450,284 | ) | | $ | (146,297 | ) |
Net realized gain (loss) on forward foreign currency exchange contracts | | | 2,571,993 | | | | 2,595,266 | | | | – | | | | (7,627 | ) |
Net realized gain (loss) on foreign currency and translation | | | 1,240,723 | | | | 849,698 | | | | – | | | | (1,076 | ) |
Net realized gain (loss) on futures contracts | | | – | | | | – | | | | (389,877 | ) | | | (11,676 | ) |
Net realized gain on swap contracts | | | – | | | | – | | | | 103,535 | | | | 11,632 | |
Net realized gain (loss) on purchased options | | | – | | | | (174,390 | ) | | | – | | | | – | |
| | | | | | | | | | | | | | | | |
Net realized gain (loss) | | | 3,020,029 | | | | (1,090,963 | ) | | | (736,626 | ) | | | (155,044 | ) |
| | | | | | | | | | | | | | | | |
Net change in unrealized depreciation on investments | | | (15,339,017 | ) | | | (11,796,696 | ) | | | (265,254 | ) | | | (135,316 | ) |
Net change in unrealized appreciation on unfunded loan commitments | | | 3,094 | | | | 15,316 | | | | – | | | | – | |
Net change in unrealized appreciation (depreciation) on forward foreign currency exchange contracts | | | (872,221 | ) | | | (951,649 | ) | | | – | | | | 13,843 | |
Net change in unrealized appreciation on foreign currency and translation | | | 87,983 | | | | 35,604 | | | | – | | | | – | |
Change in net unrealized appreciation (depreciation) on affiliates | | | – | | | | – | | | | – | | | | (145,750 | ) |
Net change in unrealized appreciation (depreciation) on futures contracts | | | – | | | | – | | | | (1,081,998 | ) | | | 33,450 | |
Net change in unrealized appreciation (depreciation) on swap contracts | | | – | | | | – | | | | (30,142 | ) | | | (7,533 | ) |
Net change in unrealized appreciation (depreciation) on purchased option contracts | | | – | | | | 521,733 | | | | 129,773 | | | | 13,314 | |
| | | | | | | | | | | | | | | | |
Net change in unrealized appreciation (depreciation) | | | (16,120,161 | ) | | | (12,175,692 | ) | | | (1,247,621 | ) | | | (227,992 | ) |
| | | | | | | | | | | | | | | | |
Net realized and unrealized losses on investments | | | (13,100,132 | ) | | | (13,266,655 | ) | | | (1,984,247 | ) | | | (383,036 | ) |
| | | | | | | | | | | | | | | | |
Net increase (decrease) in net assets resulting from operations | | $ | (6,195,062 | ) | | $ | (6,829,873 | ) | | $ | 4,159,826 | | | $ | 115,387 | |
| | | | | | | | | | | | | | | | |
See accompanying Notes to the Financial Statements.
44
Barings Funds Trust 2018 Semi-Annual Report
STATEMENTS OF OPERATIONS
For the Six Months Ended December 31, 2018 (Unaudited)
| | | | | | | | | | | | | | | | |
| | | BARINGS EMERGING
MARKETS DEBT
BLENDED TOTAL
RETURN FUND | | | BARINGS GLOBAL
EMERGING MARKETS
EQUITY FUND | | | BARINGS GLOBAL
HIGH YIELD
FUND | | | BARINGS U.S.
HIGH YIELD
FUND | |
| | | | |
| Investment Income | | | | | | | | | | | | | | | | |
Interest income (net of withholding tax of $7,856, $0, $3,547 and $0, respectively) | | $ | 1,536,398 | | | $ | 829 | | | $ | 902,576 | | | $ | 1,954,743 | |
Dividends (net of withholding tax of $0, $1,829, $0 and $0, respectively) | | | – | | | | 16,894 | | | | – | | | | – | |
| | | | | | | | | | | | | | | | |
Total investment income | | | 1,536,398 | | | | 17,723 | | | | 902,576 | | | | 1,954,743 | |
| | | | | | | | | | | | | | | | |
| | | | |
| Operating Expenses | | | | | | | | | | | | | | | | |
Advisory fees | | | 176,679 | | | | 25,324 | | | | 74,574 | | | | 155,429 | |
12b-1 distribution and servicing plan | | | | | | | | | | | | | | | | |
Class A | | | 723 | | | | 70 | | | | 149 | | | | 2,779 | |
Class C | | | 1,418 | | | | 281 | | | | 988 | | | | 492 | |
Shareholder service fee | | | | | | | | | | | | | | | | |
Class A | | | 1,330 | | | | – | | | | 1,207 | | | | 6,049 | |
Class C | | | 21 | | | | – | | | | 62 | | | | 3 | |
Class Y | | | 1,290 | | | | – | | | | 1,381 | | | | 264 | |
Administrator fees | | | 32,381 | | | | 10,738 | | | | 23,003 | | | | 32,314 | |
Custody fees | | | 38,243 | | | | 12,850 | | | | 16,049 | | | | 22,653 | |
Professional fees | | | 26,719 | | | | 20,560 | | | | 23,180 | | | | 20,459 | |
Transfer agent fees | | | 14,151 | | | | 6,608 | | | | 11,262 | | | | 10,157 | |
Directors’ fees | | | 18,295 | | | | 8,196 | | | | 15,543 | | | | 16,284 | |
Registration fees | | | 26,195 | | | | 2,019 | | | | 23,641 | | | | 25,316 | |
Printing and mailing expenses | | | 1,153 | | | | 2,203 | | | | 2,102 | | | | 2,444 | |
Other operating expenses | | | 4,617 | | | | 2,388 | | | | 3,685 | | | | 4,739 | |
| | | | | | | | | | | | | | | | |
Total operating expenses | | | 343,215 | | | | 91,237 | | | | 196,826 | | | | 299,382 | |
Reimbursement of expenses | | | | | |
Class A | | | (6,303 | ) | | | (2,156 | ) | | | (4,423 | ) | | | (11,052 | ) |
Class C | | | (4,326 | ) | | | (2,156 | ) | | | (3,532 | ) | | | (2,647 | ) |
Class I | | | (63,733 | ) | | | (26,221 | ) | | | (43,000 | ) | | | (20,436 | ) |
Class Y | | | (67,260 | ) | | | (26,587 | ) | | | (45,302 | ) | | | (50,028 | ) |
| | | | | | | | | | | | | | | | |
Net operating expenses | | | 201,593 | | | | 34,117 | | | | 100,569 | | | | 215,219 | |
| | | | | | | | | | | | | | | | |
Net investment income (loss) | | | 1,334,805 | | | | (16,394 | ) | | | 802,007 | | | | 1,739,524 | |
| | | | | | | | | | | | | | | | |
See accompanying Notes to the Financial Statements.
45
Barings Funds Trust 2018 Semi-Annual Report
STATEMENTS OF OPERATIONS(CONTINUED)
For the Six Months Ended December 31, 2018 (Unaudited)
| | | | | | | | | | | | | | | | |
| | | BARINGS EMERGING
MARKETS DEBT
BLENDED TOTAL
RETURN FUND | | | BARINGS GLOBAL
EMERGING MARKETS
EQUITY FUND | | | BARINGS GLOBAL
HIGH YIELD
FUND | | | BARINGS U.S.
HIGH YIELD
FUND | |
| | | | |
| Realized and Unrealized Gains (Losses) on Investments | | | | | | | | | | | | | | | | |
Net realized loss on investments | | $ | (2,020,372 | ) | | $ | (62,047 | ) | | $ | (257,441 | ) | | $ | (307,321 | ) |
Net realized gain on forward foreign currency exchange contracts | | | 313,999 | | | | – | | | | 341,079 | | | | – | |
Net realized gain (loss) on foreign currency and translation | | | (102,312 | ) | | | (5,815 | ) | | | (12,052 | ) | | | – | |
Net realized gain (loss) on futures contracts | | | 22,470 | | | | – | | | | – | | | | – | |
Net realized gain on swap contracts | | | 302,874 | | | | – | | | | – | | | | – | |
| | | | | | | | | | | | | | | | |
Net realized gain (loss) | | | (1,483,341 | ) | | | (67,862 | ) | | | 71,586 | | | | (307,321 | ) |
| | | | | | | | | | | | | | | | |
Net change in unrealized appreciation (depreciation) on investments | | | 540,564 | | | | (273,529 | ) | | | (1,474,158 | ) | | | (2,715,016 | ) |
Net change in unrealized appreciation (depreciation) on forward foreign currency exchange contracts | | | 210,822 | | | | – | | | | (63,486 | ) | | | – | |
Net change in unrealized appreciation on foreign currency and translation | | | 16,898 | | | | 13 | | | | 2,924 | | | | – | |
Net change in unrealized appreciation (depreciation) on futures contracts | | | (22,445 | ) | | | – | | | | – | | | | – | |
Net change in unrealized appreciation (depreciation) on swap contracts | | | 158,739 | | | | – | | | | – | | | | – | |
| | | | | | | | | | | | | | | | |
Net change in unrealized appreciation (depreciation) | | | 904,578 | | | | (273,516 | ) | | | (1,534,720 | ) | | | (2,715,016 | ) |
| | | | | | | | | | | | | | | | |
Net realized and unrealized losses on investments | | | (578,763 | ) | | | (341,378 | ) | | | (1,463,134 | ) | | | (3,022,337 | ) |
| | | | | | | | | | | | | | | | |
Net increase (decrease) in net assets resulting from operations | | $ | 756,042 | | | $ | (357,772 | ) | | $ | (661,127 | ) | | $ | (1,282,813 | ) |
| | | | | | | | | | | | | | | | |
See accompanying Notes to the Financial Statements.
46
Barings Funds Trust 2018 Semi-Annual Report
STATEMENTS OF CHANGES IN NET ASSETS
(Unaudited)
| | | | | | | | | | | | | | | | |
| | | BARINGS GLOBAL
FLOATING RATE FUND | | | BARINGS GLOBAL
CREDIT INCOME
OPPORTUNITIES FUND | |
| | | FOR THE SIX
MONTHS ENDED
DECEMBER 31, 2018 | | | FOR THE YEAR
ENDED
JUNE 30, 2018 | | | FOR THE SIX
MONTHS ENDED
DECEMBER 31, 2018 | | | FOR THE YEAR
ENDED
JUNE 30, 2018 | |
|
| Operations | |
Net investment income | | $ | 6,905,070 | | | $ | 9,760,403 | | | $ | 6,436,782 | | | $ | 9,588,045 | |
Net realized gain (loss) on investments | | | 3,020,029 | | | | (1,856,944 | ) | | | (1,090,963 | ) | | | 677,960 | |
Net change in unrealized appreciation (depreciation) on investments | | | (16,120,161 | ) | | | 362,889 | | | | (12,175,692 | ) | | | (4,509,081 | ) |
| | | | | | | | | | | | | | | | |
Net increase (decrease) in net assets from operations | | | (6,195,062 | ) | | | 8,266,348 | | | | (6,829,873 | ) | | | 5,756,924 | |
| | | | | | | | | | | | | | | | |
| | | | |
| Distributable earnings | | | | | | | | | | | | | | | | |
Class A | | | (1,402,401 | ) | | | (2,063,485 | ) | | | (2,316,261 | ) | | | (1,756,888 | ) |
| | | | | | | | | | | | | | | | |
Class C | | | (201,374 | ) | | | (270,057 | ) | | | (308,336 | ) | | | (327,000 | ) |
| | | | | | | | | | | | | | | | |
Class I | | | (875,713 | ) | | | (854,559 | ) | | | (750,944 | ) | | | (1,145,985 | ) |
| | | | | | | | | | | | | | | | |
Class Y | | | (5,777,919 | ) | | | (5,403,280 | ) | | | (5,423,124 | ) | | | (5,859,509 | ) |
| | | | | | | | | | | | | | | | |
Total Distributable Earnings (1)(2) | | | (8,257,407 | ) | | | (8,591,381 | ) | | | (8,798,665 | ) | | | (9,089,382 | ) |
| | | | | | | | | | | | | | | | |
| | | | |
| Return of capital | | | | | | | | | | | | | | | | |
Class A | | | – | | | | (279,765 | ) | | | – | | | | (100,036 | ) |
| | | | | | | | | | | | | | | | |
Class C | | | – | | | | (35,709 | ) | | | – | | | | (17,976 | ) |
| | | | | | | | | | | | | | | | |
Class I | | | – | | | | (107,589 | ) | | | – | | | | (57,195 | ) |
| | | | | | | | | | | | | | | | |
Class Y | | | – | | | | (748,240 | ) | | | – | | | | (321,100 | ) |
| | | | | | | | | | | | | | | | |
Total Return of capital | | | – | | | | (1,171,303 | ) | | | – | | | | (496,307 | ) |
| | | | | | | | | | | | | | | | |
| | | | |
| Capital Share Transactions | | | | | | | | | | | | | | | | |
Net proceeds from sale of shares | | | 130,972,765 | | | | 112,207,247 | | | | 45,792,609 | | | | 121,425,079 | |
Net Asset Value of shares issued to shareholders in payment of distributions declared | | | 6,529,769 | | | | 8,983,366 | | | | 6,526,862 | | | | 6,045,876 | |
Cost of shares redeemed | | | (89,169,048 | ) | | | (62,757,889 | ) | | | (89,810,699 | ) | | | (43,918,289 | ) |
| | | | | | | | | | | | | | | | |
Net increase (decrease) in net assets resulting from capital stock transactions | | | 48,333,486 | | | | 58,432,724 | | | | (37,491,228 | ) | | | 83,552,666 | |
| | | | | | | | | | | | | | | | |
Total increase (decrease) in net assets | | | 33,881,017 | | | | 56,936,388 | | | | (53,119,766 | ) | | | 79,723,901 | |
| | | | | | | | | | | | | | | | |
| | | | |
| Net Assets | | | | | | | | | | | | | | | | |
Beginning of period | | | 252,787,204 | | | | 195,850,816 | | | | 231,499,077 | | | | 151,775,176 | |
| | | | | | | | | | | | | | | | |
End of period | | $ | 286,668,221 | | | $ | 252,787,204 | | | $ | 178,379,311 | | | $ | 231,499,077 | |
| | | | | | | | | | | | | | | | |
| (1) | | The SEC eliminated the requirement to disclose distributions to shareholders from net investment income and from net realized gains in November 2018. Included in Barings Global Floating Rate Fund’s total distributions for net investment income and net realized gains, respectively, as of the year ended June 30, 2018 was $(2,063,485) and $0 for Class A, $(270,057) and $0 for Class C, $(854,559) and $0 for Class I and $(5,403,280) and $0 for Class Y. The undistributed net investment income (loss) was $(113,373) as of the year ended June 30, 2018. |
| (2) | | The SEC eliminated the requirement to disclose distributions to shareholders from net investment income and from net realized gains in November 2018. Included in Barings Global Credit Income Opportunities Fund’s total distributions for net investment income and net realized gains, respectively, as of the year ended June 30, 2018 was $(1,756,888) and $0 for Class A, $(327,000) and $0 for Class C, $(1,145,985) and $0 for Class I and $(5,859,509) and $0 for Class Y. The undistributed net investment income (loss) was $(305,680) as of the year ended June 30, 2018. |
See accompanying Notes to the Financial Statements.
47
Barings Funds Trust 2018 Semi-Annual Report
STATEMENTS OF CHANGES IN NET ASSETS
(Unaudited)
| | | | | | | | | | | | | | | | |
| | | BARINGS ACTIVE
SHORT DURATION
BOND FUND | | | BARINGS TOTAL
RETURN BOND
FUND | |
| | | FOR THE SIX
MONTHS ENDED
DECEMBER 31, 2018 | | | FOR THE YEAR
ENDED
JUNE 30, 2018 | | | FOR THE SIX
MONTHS ENDED
DECEMBER 31, 2018 | | | FOR THE YEAR
ENDED
JUNE 30, 2018 | |
|
| Operations | |
Net investment income | | $ | 6,144,073 | | | $ | 9,285,132 | | | $ | 498,423 | | | $ | 903,641 | |
Net realized gain (loss) on investments | | | (736,626 | ) | | | 1,300,980 | | | | (155,044 | ) | | | (118,675 | ) |
Net change in unrealized depreciation on investments | | | (1,247,621 | ) | | | (5,924,031 | ) | | | (227,992 | ) | | | (750,496 | ) |
| | | | | | | | | | | | | | | | |
Net increase in net assets resulting from operations | | | 4,159,826 | | | | 4,662,081 | | | | 115,387 | | | | 34,470 | |
| | | | | | | | | | | | | | | | |
| | | | |
| Distributable earnings | | | | | | | | | | | | | | | | |
Class A | | | (2,359,407 | ) | | | (3,875,523 | ) | | | (3,465 | ) | | | (6,279 | ) |
| | | | | | | | | | | | | | | | |
Class C | | | (15,322 | ) | | | (19,495 | ) | | | (2,479 | ) | | | (4,440 | ) |
| | | | | | | | | | | | | | | | |
Class I | | | (4,790 | ) | | | (7,420 | ) | | | (213,043 | ) | | | (392,338 | ) |
| | | | | | | | | | | | | | | | |
Class Y | | | (4,419,039 | ) | | | (6,664,499 | ) | | | (281,292 | ) | | | (573,463 | ) |
| | | | | | | | | | | | | | | | |
Total Distributable Earnings (1)(2) | | | (6,798,558 | ) | | | (10,566,937 | ) | | | (500,279 | ) | | | (976,520 | ) |
| | | | | | | | | | | | | | | | |
| | | | |
| Return of capital | | | | | | | | | | | | | | | | |
Class A | | | – | | | | – | | | | – | | | | (217 | ) |
| | | | | | | | | | | | | | | | |
Class C | | | – | | | | – | | | | – | | | | (153 | ) |
| | | | | | | | | | | | | | | | |
Class I | | | – | | | | – | | | | – | | | | (13,609 | ) |
| | | | | | | | | | | | | | | | |
Class Y | | | – | | | | – | | | | – | | | | (19,524 | ) |
| | | | | | | | | | | | | | | | |
Total Return of capital | | | – | | | | – | | | | – | | | | (33,503 | ) |
| | | | | | | | | | | | | | | | |
| | | | |
| Capital Share Transactions | | | | | | | | | | | | | | | | |
Net proceeds from sale of shares | | | 174,542,588 | | | | 354,038,993 | | | | 929,531 | | | | 2,983,984 | |
Net Asset Value of shares issued to shareholders in payment of distributions declared | | | 5,887,143 | | | | 9,474,859 | | | | 68,265 | | | | 183,911 | |
Cost of shares redeemed | | | (126,673,016 | ) | | | (250,813,003 | ) | | | (1,261,983 | ) | | | (3,661,938 | ) |
| | | | | | | | | | | | | | | | |
Net increase (decrease) in net assets resulting from capital stock transactions | | | 53,756,715 | | | | 112,700,849 | | | | (264,187 | ) | | | (494,043 | ) |
| | | | | | | | | | | | | | | | |
Total increase (decrease) in net assets | | | 51,117,983 | | | | 106,795,993 | | | | (649,079 | ) | | | (1,469,596 | ) |
| | | | | | | | | | | | | | | | |
| | | | |
| Net Assets | | | | | | | | | | | | | | | | |
Beginning of period | | | 430,784,200 | | | | 323,988,207 | | | | 28,886,237 | | | | 30,355,833 | |
| | | | | | | | | | | | | | | | |
End of period | | $ | 481,902,183 | | | $ | 430,784,200 | | | $ | 28,237,158 | | | $ | 28,886,237 | |
| | | | | | | | | | | | | | | | |
| (1) | | The SEC eliminated the requirement to disclose distributions to shareholders from net investment income and from net realized gains in November 2018. Included in Barings Active Short Duration Fund’s total distributions for net investment income and net realized gains, respectively, as of the year ended June 30, 2018 was $(3,385,234) and $(490,289) for Class A, $(17,041) and $(2,454) for Class C, $(6,510) and $(910) for Class I and $(5,887,689) and $(776,810) for Class Y. The undistributed net investment income (loss) was $(10,364) as of the year ended June 30, 2018. |
| (2) | | The SEC eliminated the requirement to disclose distributions to shareholders from net investment income and from net realized gains in November 2018. Included in Barings Total Return Fund’s total distributions for net investment income and net realized gains, respectively, as of the year ended June 30, 2018 was $(6,279) and $0 for Class A, $(4,440) and $0 for Class C, $(392,338) and $0 for Class I and $(573,463) and $0 for Class Y. The undistributed net investment income (loss) was $(60,031) as of the year ended June 30, 2018. |
See accompanying Notes to the Financial Statements.
48
Barings Funds Trust 2018 Semi-Annual Report
STATEMENTS OF CHANGES IN NET ASSETS
(Unaudited)
| | | | | | | | | | | | |
| | | BARINGS EMERGING
MARKETS DEBT
BLENDED TOTAL
RETURN FUND | | | BARINGS GLOBAL
EMERGING MARKETS
EQUITY FUND | |
| | | FOR THE SIX
MONTHS ENDED
DECEMBER 31, 2018 | | | FOR THE YEAR
ENDED
JUNE 30, 2018 | | | PERIOD FROM
SEPTEMBER 17, 2018
TO
DECEMBER 31, 2018 (1) | |
|
| Operations | |
Net investment income | | $ | 1,334,805 | | | $ | 1,225,718 | | | $ | (16,394 | ) |
Net realized gain (loss) on investments | | | (1,483,341 | ) | | | 232,231 | | | | (67,862 | ) |
Net change in unrealized appreciation (depreciation) on investments | | | 904,578 | | | | (4,915,528 | ) | | | (273,516 | ) |
| | | | | | | | | | | | |
Net increase (decrease) in net assets from operations | | | 756,042 | | | | (3,457,579 | ) | | | (357,772 | ) |
| | | | | | | | | | | | |
| | | |
| Distributable earnings | | | | | | | | | | | | |
Class A | | | (16,850 | ) | | | (46,971 | ) | | | – | |
| | | | | | | | | | | | |
Class C | | | (7,230 | ) | | | (17,558 | ) | | | – | |
| | | | | | | | | | | | |
Class I | | | (692,956 | ) | | | (700,991 | ) | | | – | |
| | | | | | | | | | | | |
Class Y | | | (718,174 | ) | | | (722,445 | ) | | | – | |
| | | | | | | | | | | | |
Total Distributable Earnings (2) | | | (1,435,210 | ) | | | (1,487,965 | ) | | | – | |
| | | | | | | | | | | | |
| | | |
| Capital Share Transactions | | | | | | | | | | | | |
Net proceeds from sale of shares | | | 797,457 | | | | 41,179,347 | | | | 10,000,000 | |
Net Asset Value of shares issued to shareholders in payment of distributions declared | | | 27,521 | | | | 43,749 | | | | – | |
Cost of shares redeemed | | | (531,435 | ) | | | (498,234 | ) | | | – | |
| | | | | | | | | | | | |
Net increase in net assets resulting from capital stock transactions | | | 293,543 | | | | 40,724,862 | | | | 10,000,000 | |
| | | | | | | | | | | | |
Total increase (decrease) in net assets | | | (385,625 | ) | | | 35,779,318 | | | | 9,642,228 | |
| | | | | | | | | | | | |
| | | |
| Net Assets | | | | | | | | | | | | |
Beginning of period | | | 46,614,812 | | | | 10,835,494 | | | | – | |
| | | | | | | | | | | | |
End of period | | $ | 46,229,187 | | | $ | 46,614,812 | | | $ | 9,642,228 | |
| | | | | | | | | | | | |
| (1) | | Fund commenced operations on September 17, 2018. |
| (2) | | The SEC eliminated the requirement to disclose distributions to shareholders from net investment income and from net realized gains in November 2018. Included in Barings Emerging Markets Debt Blended Total Return Fund’s total distributions for net investment income and net realized gains, respectively, as of the year ended June 30, 2018 was $(29,114) and $(17,857) for Class A, $(10,947) and $(6,611) for Class C, $(556,464) and $(144,527) for Class I and $(570,211) and $(152,234) for Class Y. The undistributed net investment income was $123,614 as of the year ended June 30, 2018. |
See accompanying Notes to the Financial Statements.
49
Barings Funds Trust 2018 Semi-Annual Report
STATEMENTS OF CHANGES IN NET ASSETS
(Unaudited)
| | | | | | | | | | | | | | | | |
| | | BARINGS GLOBAL
HIGH YIELD FUND | | | BARINGS U.S.
HIGH YIELD FUND | |
| | | FOR THE SIX
MONTHS ENDED
DECEMBER 31, 2018 | | | FOR THE YEAR
ENDED
JUNE 30, 2018 | | | FOR THE SIX
MONTHS ENDED
DECEMBER 31, 2018 | | | FOR THE YEAR
ENDED
JUNE 30, 2018 | |
|
| Operations | |
Net investment income | | $ | 802,007 | | | $ | 1,649,437 | | | $ | 1,739,524 | | | $ | 2,245,957 | |
Net realized gain (loss) on investments | | | 71,586 | | | | 402,802 | | | | (307,321 | ) | | | 150,989 | |
Net change in unrealized depreciation on investments | | | (1,534,720 | ) | | | (1,472,755 | ) | | | (2,715,016 | ) | | | (1,765,072 | ) |
| | | | | | | | | | | | | | | | |
Net increase (decrease) in net assets from operations | | | (661,127 | ) | | | 579,484 | | | | (1,282,813 | ) | | | 631,874 | |
| | | | | | | | | | | | | | | | |
| | | | |
| Distributable earnings | | | | | | | | | | | | | | | | |
Class A | | | (7,632 | ) | | | (9,066 | ) | | | (65,512 | ) | | | (210,019 | ) |
| | | | | | | | | | | | | | | | |
Class C | | | (9,989 | ) | | | (17,640 | ) | | | (2,541 | ) | | | (9,206 | ) |
| | | | | | | | | | | | | | | | |
Class I | | | (653,597 | ) | | | (1,081,306 | ) | | | (458,588 | ) | | | (1,394,522 | ) |
| | | | | | | | | | | | | | | | |
Class Y | | | (667,731 | ) | | | (1,191,673 | ) | | | (1,211,914 | ) | | | (1,602,934 | ) |
| | | | | | | | | | | | | | | | |
Total Distributable Earnings (1)(2) | | | (1,338,949 | ) | | | (2,299,685 | ) | | | (1,738,555 | ) | | | (3,216,681 | ) |
| | | | | | | | | | | | | | | | |
| | | | |
| Capital Share Transactions | | | | | | | | | | | | | | | | |
Net proceeds from sale of shares | | | 272,479 | | | | 3,560,120 | | | | 4,004,337 | | | | 29,139,508 | |
Net Asset Value of shares issued to shareholders in payment of distributions declared | | | 16,018 | | | | 116,325 | | | | 976,943 | | | | 882,238 | |
Cost of shares redeemed | | | (219,657 | ) | | | (4,970,047 | ) | | | (8,380,307 | ) | | | (3,532,281 | ) |
| | | | | | | | | | | | | | | | |
Net increase (decrease) in net assets resulting from capital stock transactions | | | 68,840 | | | | (1,293,602 | ) | | | (3,399,027 | ) | | | 26,489,465 | |
| | | | | | | | | | | | | | | | |
Total increase (decrease) in net assets | | | (1,931,236 | ) | | | (3,013,803 | ) | | | (6,420,395 | ) | | | 23,904,658 | |
| | | | | | | | | | | | | | | | |
| | | | |
| Net Assets | | | | | | | | | | | | | | | | |
Beginning of period | | | 24,825,773 | | | | 27,839,576 | | | | 57,007,277 | | | | 33,102,619 | |
| | | | | | | | | | | | | | | | |
End of period | | $ | 22,894,537 | | | $ | 24,825,773 | | | $ | 50,586,882 | | | $ | 57,007,277 | |
| | | | | | | | | | | | | | | | |
| (1) | | The SEC eliminated the requirement to disclose distributions to shareholders from net investment income and from net realized gains in November 2018. Included in Barings Global High Yield Fund’s total distributions for net investment income and net realized gains, respectively, as of the year ended June 30, 2018 was $(6,439) and $(2,627) for Class A, $(11,793) and $(5,847) for Class C, $(775,770) and $(305,536) for Class I and $(855,423) and $(336,250) for Class Y. The undistributed net investment income (loss) was $440 as of the year ended June 30, 2018. |
| (2) | | The SEC eliminated the requirement to disclose distributions to shareholders from net investment income and from net realized gains in November 2018. Included in Barings U.S. High Yield Fund’s total distributions for net investment income and net realized gains, respectively, as of the year ended June 30, 2018 was $(139,147) and $(70,872) for Class A, $(5,823) and $(3,383) for Class C, $(944,699) and $(449,823) for Class I and $(1,156,409) and $(446,525) for Class Y. The undistributed net investment income (loss) was $(536) as of the year ended June 30, 2018. |
See accompanying Notes to the Financial Statements.
50
Barings Global Floating Rate Fund 2018 Semi-Annual Report
FINANCIAL HIGHLIGHTS
| | | | | | | | | | | | | | | | | | | | | | | | |
| | | CLASS A | |
| | | FOR THE
SIX MONTHS ENDED
DECEMBER 31,
2018 (1) | | | FOR THE
YEAR ENDED
JUNE 30,
2018 | | | FOR THE
YEAR ENDED
JUNE 30,
2017 | | | FOR THE
YEAR ENDED
JUNE 30,
2016 | | | FOR THE
YEAR ENDED
JUNE 30,
2015 | | | PERIOD FROM
SEPTEMBER 16,
2013
THROUGH
JUNE 30,
2014 (2) | |
| | | | | | |
| Per Common Share Data | | | | | | | | | | | | | | | | | | | | | | | | |
Net asset value, beginning of period | | $ | 9.48 | | | $ | 9.54 | | | $ | 9.13 | | | $ | 9.60 | | | $ | 10.20 | | | $ | 10.00 | |
Income from investment operations: | | | | | | | | | | | | | | | | | | | | | | | | |
Net investment income (3) | | | 0.21 | | | | 0.43 | | | | 0.43 | | | | 0.44 | | | | 0.44 | | | | 0.30 | |
Net realized and unrealized gain (loss) on investments | | | (0.38 | ) | | | (0.06 | ) | | | 0.42 | | | | (0.45 | ) | | | (0.35 | ) | | | 0.08 | |
| | | | | | | | | | | | | | | | | | | | | | | | |
Total increase (decrease) from investment operations | | | (0.17 | ) | | | 0.37 | | | | 0.85 | | | | (0.01 | ) | | | 0.09 | | | | 0.38 | |
| | | | | | | | | | | | | | | | | | | | | | | | |
Less dividends and distributions: | | | | | | | | | | | | | | | | | | | | | | | | |
From net investment income | | | (0.21 | ) | | | (0.38 | ) | | | (0.31 | ) | | | (0.46 | ) | | | (0.68 | ) | | | (0.18 | ) |
From net realized gain | | | (0.04 | ) | | | – | | | | – | | | | – | | | | (0.01 | ) | | | – | |
From return of capital | | | – | | | | (0.05 | ) | | | (0.13 | ) | | | – | | | | – | | | | – | |
| | | | | | | | | | | | | | | | | | | | | | | | |
Total dividends and distributions | | | (0.25 | ) | | | (0.43 | ) | | | (0.44 | ) | | | (0.46 | ) | | | (0.69 | ) | | | (0.18 | ) |
| | | | | | | | | | | | | | | | | | | | | | | | |
Redemption fees | | | – | | | | – | | | | – | | | | – | | | | 0.00 | (4) | | | – | |
| | | | | | | | | | | | | | | | | | | | | | | | |
Net asset value, at end of period | | $ | 9.06 | | | $ | 9.48 | | | $ | 9.54 | | | $ | 9.13 | | | $ | 9.60 | | | $ | 10.20 | |
| | | | | | | | | | | | | | | | | | | | | | | | |
Total investment return (5) | | | (1.91 | )%(6) | | | 4.00 | % | | | 9.47 | % | | | (0.04 | )% | | | 0.95 | % | | | 3.81 | %(6) |
| | | | | | | | | | | | | | | | | | | | | | | | |
| | | | | | |
| Supplemental Data and Ratios | | | | | | | | | | | | | | | | | | | | | | | | |
Net assets, end of period (000’s) | | $ | 49,248 | | | $ | 53,371 | | | $ | 45,363 | | | $ | 13,980 | | | $ | 5,153 | | | $ | 12,464 | |
Ratio of total expenses (before reductions and reimbursements) to average net assets | | | 1.21 | %(7) | | | 1.26 | % | | | 1.37 | % | | | 1.72 | % | | | 1.74 | % | | | 2.27 | %(7) |
Ratio of net expenses to average net assets (8) | | | 1.00 | %(7) | | | 0.96 | %(9) | | | 0.99 | %(10) | | | 1.05 | %(11) | | | 1.05 | %(11) | | | 1.05 | %(7) |
Ratio of net investment income to average net assets | | | 4.40 | %(7) | | | 4.55 | % | | | 4.52 | % | | | 4.74 | % | | | 4.44 | % | | | 3.76 | %(7)(11) |
Portfolio turnover rate | | | 25.13 | %(6) | | | 57.74 | % | | | 47.06 | % | | | 62.99 | % | | | 63.17 | % | | | 49.51 | %(6) |
| (2) | | Fund commenced operations on September 16, 2013. |
| (3) | | Calculated using average shares outstanding. |
| (4) | | Amount rounds to less than $.01 per share. |
| (5) | | Total investment return calculation does not consider the effects of sales loads and assumes the reinvestment of dividends at actual prices pursuant to the Fund’s dividend reinvestment plan. |
| (7) | | Annualized for periods less than one full year. |
| (8) | | The Adviser has agreed to waive and/or reimburse certain fees and/or expense so that, on an annualized basis, such expenses incurred will not exceed 1.00% as a percentage of average daily net assets. |
| (9) | | Net expenses reflect a voluntary expense reimbursement to prevent a negative yield. |
| (10) | | Net expenses reflect a one-time voluntary reimbursement to the Fund during the period in connection with a change to the fee waiver and/or expense reimbursement agreement. |
| (11) | | Net expenses reflect a previous fee waiver and/or expense reimbursement agreement. |
See accompanying Notes to the Financial Statements.
51
Barings Global Floating Rate Fund 2018 Semi-Annual Report
FINANCIAL HIGHLIGHTS(CONTINUED)
| | | | | | | | | | | | | | | | | | | | | | | | |
| | | CLASS C | |
| | | FOR THE
SIX MONTHS
ENDED
DECEMBER 31,
2018 (1) | | | FOR THE
YEAR
ENDED
JUNE 30,
2018 | | | FOR THE
YEAR
ENDED
JUNE 30,
2017 | | | FOR THE
YEAR
ENDED
JUNE 30,
2016 | | | FOR THE
YEAR
ENDED
JUNE 30,
2015 | | | PERIOD FROM
SEPTEMBER 16,
2013
THROUGH
JUNE 30,
2014 (2) | |
| | | | | | |
| Per Common Share Data | | | | | | | | | | | | | | | | | | | | | | | | |
Net asset value, beginning of period | | $ | 9.45 | | | $ | 9.51 | | | $ | 9.10 | | | $ | 9.57 | | | $ | 10.16 | | | $ | 10.00 | |
Income from investment operations: | | | | | | | | | | | | | | | | | | | | | | | | |
Net investment income (3) | | | 0.18 | | | | 0.36 | | | | 0.37 | | | | 0.37 | | | | 0.35 | | | | 0.24 | |
Net realized and unrealized gain (loss) on investments | | | (0.40 | ) | | | (0.06 | ) | | | 0.41 | | | | (0.45 | ) | | | (0.33 | ) | | | 0.07 | |
| | | | | | | | | | | | | | | | | | | | | | | | |
Total increase (decrease) from investment operations | | | (0.22 | ) | | | 0.30 | | | | 0.78 | | | | (0.08 | ) | | | 0.02 | | | | 0.31 | |
| | | | | | | | | | | | | | | | | | | | | | | | |
Less dividends and distributions: | | | | | | | | | | | | | | | | | | | | | | | | |
From net investment income | | | (0.17 | ) | | | (0.32 | ) | | | (0.26 | ) | | | (0.39 | ) | | | (0.60 | ) | | | (0.15 | ) |
From net realized gain | | | (0.04 | ) | | | – | | | | – | | | | – | | | | (0.01 | ) | | | – | |
From return of capital | | | – | | | | (0.04 | ) | | | (0.11 | ) | | | – | | | | – | | | | – | |
| | | | | | | | | | | | | | | | | | | | | | | | |
Total dividends and distributions | | | (0.21 | ) | | | (0.36 | ) | | | (0.37 | ) | | | (0.39 | ) | | | (0.61 | ) | | | (0.15 | ) |
| | | | | | | | | | | | | | | | | | | | | | | | |
Redemption fees | | | – | | | | – | | | | – | | | | – | | | | 0.00 | (4) | | | – | |
| | | | | | | | | | | | | | | | | | | | | | | | |
Net asset value, at end of period | | $ | 9.02 | | | $ | 9.45 | | | $ | 9.51 | | | $ | 9.10 | | | $ | 9.57 | | | $ | 10.16 | |
| | | | | | | | | | | | | | | | | | | | | | | | |
Total investment return (5) | | | (2.28 | )%(6) | | | 3.24 | % | | | 8.68 | % | | | (0.81 | )% | | | 0.30 | % | | | 3.15 | %(6) |
| | | | | | | | | | | | | | | | | | | | | | | | |
| | | | | | |
| Supplemental Data and Ratios | | | | | | | | | | | | | | | | | | | | | | | | |
Net assets, end of period (000’s) | | $ | 8,617 | | | $ | 8,311 | | | $ | 8,018 | | | $ | 6,803 | | | $ | 5,461 | | | $ | 2,396 | |
Ratio of total expenses (before reductions and reimbursements) to average net assets | | | 2.01 | %(7) | | | 2.09 | % | | | 2.24 | % | | | 2.50 | % | | | 3.12 | % | | | 4.97 | %(7) |
Ratio of net expenses to average net assets (8) | | | 1.73 | %(7)(9) | | | 1.70 | %(9) | | | 1.71 | %(10) | | | 1.80 | %(11) | | | 1.80 | %(11) | | | 1.80 | %(7)(11) |
Ratio of net investment income to average net assets | | | 3.68 | %(7) | | | 3.80 | % | | | 3.91 | % | | | 4.04 | % | | | 3.60 | % | | | 3.07 | %(7) |
Portfolio turnover rate | | | 25.13 | %(6) | | | 57.74 | % | | | 47.06 | % | | | 62.99 | % | | | 63.17 | % | | | 49.51 | %(6) |
| (2) | | Fund commenced operations on September 16, 2013. |
| (3) | | Calculated using average shares outstanding. |
| (4) | | Amount rounds to less than $.01 per share. |
| (5) | | Total investment return calculation assumes the reinvestment of dividends at actual prices pursuant to the Fund’s dividend reinvestment plan. |
| (7) | | Annualized for periods less than one full year. |
| (8) | | The Adviser has agreed to waive and/or reimburse certain fees and/or expense so that, on an annualized basis, such expenses incurred will not exceed 1.75% as a percentage of average daily net assets. |
| (9) | | Net expenses reflect a voluntary expense reimbursement to prevent a negative yield. |
| (10) | | Net expenses reflect a one-time voluntary reimbursement to the Fund during the period in connection with a change to the fee waiver and/or expense reimbursement agreement. |
| (11) | | Net expenses reflect a previous fee waiver and/or expense reimbursement agreement. |
See accompanying Notes to the Financial Statements.
52
Barings Global Floating Rate Fund 2018 Semi-Annual Report
FINANCIAL HIGHLIGHTS(CONTINUED)
| | | | | | | | | | | | | | | | | | | | | | | | |
| | | CLASS I | |
| | | FOR THE
SIX MONTHS
ENDED
DECEMBER 31,
2018 (1) | | | FOR THE
YEAR
ENDED
JUNE 30,
2018 | | | FOR THE
YEAR
ENDED
JUNE 30,
2017 | | | FOR THE
YEAR
ENDED
JUNE 30,
2016 | | | FOR THE
YEAR
ENDED
JUNE 30,
2015 | | | PERIOD FROM
SEPTEMBER 16,
2013
THROUGH
JUNE 30,
2014 (2) | |
| | | | | | |
| Per Common Share Data | | | | | | | | | | | | | | | | | | | | | | | | |
Net asset value, beginning of period | | $ | 9.50 | | | $ | 9.56 | | | $ | 9.15 | | | $ | 9.62 | | | $ | 10.21 | | | $ | 10.00 | |
Income from investment operations: | | | | | | | | | | | | | | | | | | | | | | | | |
Net investment income (3) | | | 0.17 | | | | 0.46 | | | | 0.47 | | | | 0.47 | | | | 0.46 | | | | 0.30 | |
Net realized and unrealized gain (loss) on investments | | | (0.33 | ) | | | (0.06 | ) | | | 0.40 | | | | (0.45 | ) | | | (0.34 | ) | | | 0.10 | |
| | | | | | | | | | | | | | | | | | | | | | | | |
Total increase (decrease) from investment operations | | | (0.16 | ) | | | 0.40 | | | | 0.87 | | | | 0.02 | | | | 0.12 | | | | 0.40 | |
| | | | | | | | | | | | | | | | | | | | | | | | |
Less dividends and distributions: | | | | | | | | | | | | | | | | | | | | | | | | |
From net investment income | | | (0.22 | ) | | | (0.41 | ) | | | (0.32 | ) | | | (0.49 | ) | | | (0.70 | ) | | | (0.19 | ) |
From net realized gain | | | (0.04 | ) | | | – | | | | – | | | | – | | | | (0.01 | ) | | | – | |
From return of capital | | | – | | | | (0.05 | ) | | | (0.14 | ) | | | – | | | | – | | | | – | |
| | | | | | | | | | | | | | | | | | | | | | | | |
Total dividends and distributions | | | (0.26 | ) | | | (0.46 | ) | | | (0.46 | ) | | | (0.49 | ) | | | (0.71 | ) | | | (0.19 | ) |
| | | | | | | | | | | | | | | | | | | | | | | | |
Redemption fees | | | – | | | | – | | | | – | | | | – | | | | 0.00 | (4) | | | – | |
| | | | | | | | | | | | | | | | | | | | | | | | |
Net asset value, at end of period | | $ | 9.08 | | | $ | 9.50 | | | $ | 9.56 | | | $ | 9.15 | | | $ | 9.62 | | | $ | 10.21 | |
| | | | | | | | | | | | | | | | | | | | | | | | |
Total investment return (5) | | | (1.78 | )%(6) | | | 4.28 | % | | | 9.74 | % | | | 0.25 | % | | | 1.34 | % | | | 4.04 | %(6) |
| | | | | | | | | | | | | | | | | | | | | | | | |
| | | | | | |
| Supplemental Data and Ratios | | | | | | | | | | | | | | | | | | | | | | | | |
Net assets, end of period (000’s) | | $ | 33,939 | | | $ | 18,370 | | | $ | 19,733 | | | $ | 19,903 | | | $ | 25,885 | | | $ | 32,772 | |
Ratio of total expenses (before reductions and reimbursements) to average net assets | | | 0.90 | %(7) | | | 1.03 | % | | | 1.16 | % | | | 1.29 | % | | | 1.31 | % | | | 1.52 | %(7) |
Ratio of net expenses to average net assets (8) | | | 0.75 | %(7) | | | 0.71 | %(9) | | | 0.75 | % | | | 0.75 | % | | | 0.75 | % | | | 0.75 | %(7) |
Ratio of net investment income to average net assets | | | 4.67 | %(7) | | | 4.78 | % | | | 4.90 | % | | | 5.07 | % | | | 4.69 | % | | | 3.72 | %(7) |
Portfolio turnover rate | | | 25.13 | %(6) | | | 57.74 | % | | | 47.06 | % | | | 62.99 | % | | | 63.17 | % | | | 49.51 | %(6) |
| (2) | | Fund commenced operations on September 16, 2013. |
| (3) | | Calculated using average shares outstanding. |
| (4) | | Amount rounds to less than $.01 per share. |
| (5) | | Total investment return calculation assumes the reinvestment of dividends at actual prices pursuant to the Fund’s dividend reinvestment plan. |
| (7) | | Annualized for periods less than one full year. |
| (8) | | The Adviser has agreed to waive and/or reimburse certain fees and/or expense so that, on an annualized basis, such expenses incurred will not exceed .75% as a percentage of average daily net assets. |
| (9) | | Net expenses reflect a voluntary expense reimbursement to prevent a negative yield. |
See accompanying Notes to the Financial Statements.
53
Barings Global Floating Rate Fund 2018 Semi-Annual Report
FINANCIAL HIGHLIGHTS(CONTINUED)
| | | | | | | | | | | | | | | | | | | | | | | | |
| | | CLASS Y | |
| | | FOR THE
SIX MONTHS
ENDED
DECEMBER 31,
2018 (1) | | | FOR THE
YEAR
ENDED
JUNE 30,
2018 | | | FOR THE
YEAR
ENDED
JUNE 30,
2017 | | | FOR THE
YEAR
ENDED
JUNE 30,
2016 | | | FOR THE
YEAR
ENDED
JUNE 30,
2015 | | | PERIOD FROM
SEPTEMBER 16,
2013
THROUGH
JUNE 30,
2014 (2) | |
| | | | | | |
| Per Common Share Data | | | | | | | | | | | | | | | | | | | | | | | | |
Net asset value, beginning of period | | $ | 9.50 | | | $ | 9.56 | | | $ | 9.15 | | | $ | 9.62 | | | $ | 10.21 | | | $ | 10.00 | |
Income from investment operations: | | | | | | | | | | | | | | | | | | | | | | | | |
Net investment income (3) | | | 0.24 | | | | 0.46 | | | | 0.47 | | | | 0.47 | | | | 0.45 | | | | 0.30 | |
Net realized and unrealized gain (loss) on investments | | | (0.41 | ) | | | (0.06 | ) | | | 0.40 | | | | (0.45 | ) | | | (0.33 | ) | | | 0.10 | |
| | | | | | | | | | | | | | | | | | | | | | | | |
Total increase (decrease) from investment operations | | | (0.17 | ) | | | 0.40 | | | | 0.87 | | | | 0.02 | | | | 0.12 | | | | 0.40 | |
| | | | | | | | | | | | | | | | | | | | | | | | |
Less dividends and distributions: | | | | | | | | | | | | | | | | | | | | | | | | |
From net investment income | | | (0.22 | ) | | | (0.41 | ) | | | (0.32 | ) | | | (0.49 | ) | | | (0.70 | ) | | | (0.19 | ) |
From net realized gain | | | (0.04 | ) | | | – | | | | – | | | | – | | | | (0.01 | ) | | | – | |
From return of capital | | | – | | | | (0.05 | ) | | | (0.14 | ) | | | – | | | | – | | | | – | |
| | | | | | | | | | | | | | | | | | | | | | | | |
Total dividends and distributions | | | (0.26 | ) | | | (0.46 | ) | | | (0.46 | ) | | | (0.49 | ) | | | (0.71 | ) | | | (0.19 | ) |
| | | | | | | | | | | | | | | | | | | | | | | | |
Redemption fees | | | – | | | | – | | | | – | | | | – | | | | 0.00 | (4) | | | – | |
| | | | | | | | | | | | | | | | | | | | | | | | |
Net asset value, at end of period | | $ | 9.07 | | | $ | 9.50 | | | $ | 9.56 | | | $ | 9.15 | | | $ | 9.62 | | | $ | 10.21 | |
| | | | | | | | | | | | | | | | | | | | | | | | |
Total investment return (5) | | | (1.79 | )%(6) | | | 4.27 | % | | | 9.73 | % | | | 0.22 | % | | | 1.28 | % | | | 4.04 | %(6) |
| | | | | | | | | | | | | | | | | | | | | | | | |
| | | | | | |
| Supplemental Data and Ratios | | | | | | | | | | | | | | | | | | | | | | | | |
Net assets, end of period (000’s) | | $ | 194,864 | | | $ | 172,736 | | | $ | 122,736 | | | $ | 125,957 | | | $ | 129,659 | | | $ | 66,999 | |
Ratio of total expenses (before reductions and reimbursements) to average net assets | | | 0.92 | %(7) | | | 1.01 | % | | | 1.14 | % | | | 1.27 | % | | | 1.25 | % | | | 1.53 | %(7) |
Ratio of net expenses to average net assets (8) | | | 0.75 | %(7) | | | 0.71 | %(9) | | | 0.75 | % | | | 0.75 | % | | | 0.75 | % | | | 0.75 | %(7) |
Ratio of net investment income to average net assets | | | 4.67 | %(7) | | | 4.79 | % | | | 4.90 | % | | | 5.08 | % | | | 4.58 | % | | | 3.80 | %(7) |
Portfolio turnover rate | | | 25.13 | %(6) | | | 57.74 | % | | | 47.06 | % | | | 62.99 | % | | | 63.17 | % | | | 49.51 | %(6) |
| (2) | | Fund commenced operations on September 16, 2013. |
| (3) | | Calculated using average shares outstanding. |
| (4) | | Amount rounds to less than $.01 per share. |
| (5) | | Total investment return calculation assumes the reinvestment of dividends at actual prices pursuant to the Fund’s dividend reinvestment plan. |
| (7) | | Annualized for periods less than one full year. |
| (8) | | The Adviser has agreed to waive and/or reimburse certain fees and/or expense so that, on an annualized basis, such expenses incurred will not exceed .75% as a percentage of average daily net assets. |
| (9) | | Net expenses reflect a voluntary expense reimbursement to prevent a negative yield. |
See accompanying Notes to the Financial Statements.
54
Barings Global Credit Income Opportunities Fund 2018 Semi-Annual Report
FINANCIAL HIGHLIGHTS
| | | | | | | | | | | | | | | | | | | | | | | | |
| | | CLASS A | |
| | | FOR THE
SIX MONTHS
ENDED
DECEMBER 31,
2018 (1) | | | FOR THE
YEAR
ENDED
JUNE 30,
2018 | | | FOR THE
YEAR
ENDED
JUNE 30,
2017 | | | FOR THE
YEAR
ENDED
JUNE 30,
2016 | | | FOR THE
YEAR
ENDED
JUNE 30,
2015 | | | PERIOD FROM
SEPTEMBER 16,
2013
THROUGH
JUNE 30,
2014 (2) | |
| | | | | | |
| Per Common Share Data | | | | | | | | | | | | | | | | | | | | | | | | |
Net asset value, beginning of period | | $ | 9.32 | | | $ | 9.51 | | | $ | 8.80 | | | $ | 9.51 | | | $ | 10.45 | | | $ | 10.00 | |
Income from investment operations: | | | | | | | | | | | | | | | | | | | | | | | | |
Net investment income (3) | | | 0.24 | | | | 0.49 | | | | 0.55 | | | | 0.56 | | | | 0.54 | | | | 0.40 | |
Net realized and unrealized gain (loss) on investments | | | (0.55 | ) | | | (0.19 | ) | | | 0.71 | | | | (0.66 | ) | | | (0.57 | ) | | | 0.33 | |
| | | | | | | | | | | | | | | | | | | | | | | | |
Total increase (decrease) from investment operations | | | (0.31 | ) | | | 0.30 | | | | 1.26 | | | | (0.10 | ) | | | (0.03 | ) | | | 0.73 | |
| | | | | | | | | | | | | | | | | | | | | | | | |
Less dividends and distributions: | | | | | | | | | | | | | | | | | | | | | | | | |
From net investment income | | | (0.24 | ) | | | (0.47 | ) | | | (0.50 | ) | | | (0.61 | ) | | | (0.78 | ) | | | (0.28 | ) |
From net realized gain | | | (0.10 | ) | | | – | | | | – | | | | – | | | | (0.13 | ) | | | – | |
From return of capital | | | – | | | | (0.02 | ) | | | (0.05 | ) | | | – | | | | – | | | | – | |
| | | | | | | | | | | | | | | | | | | | | | | | |
Total dividends and distributions | | | (0.34 | ) | | | (0.49 | ) | | | (0.55 | ) | | | (0.61 | ) | | | (0.91 | ) | | | (0.28 | ) |
| | | | | | | | | | | | | | | | | | | | | | | | |
Redemption fees | | | – | | | | – | | | | – | | | | – | | | | 0.00 | (4) | | | – | |
| | | | | | | | | | | | | | | | | | | | | | | | |
Net asset value, at end of period | | $ | 8.67 | | | $ | 9.32 | | | $ | 9.51 | | | $ | 8.80 | | | $ | 9.51 | | | $ | 10.45 | |
| | | | | | | | | | | | | | | | | | | | | | | | |
Total investment return (5) | | | (3.20 | )%(6) | | | 3.24 | % | | | 14.61 | % | | | (0.84 | )% | | | (0.11 | )% | | | 7.30 | %(6) |
| | | | | | | | | | | | | | | | | | | | | | | | |
| | | | | | |
| Supplemental Data and Ratios | | | | | | | | | | | | | | | | | | | | | | | | |
Net assets, end of period (000’s) | | $ | 46,396 | | | $ | 60,507 | | | $ | 26,904 | | | $ | 12,340 | | | $ | 12,718 | | | $ | 2,591 | |
Ratio of total expenses (before reductions and reimbursements) to average net assets | | | 1.35 | %(7) | | | 1.38 | % | | | 1.56 | % | | | 1.90 | % | | | 1.98 | % | | | 3.95 | %(7) |
Ratio of net expenses to average net assets (8) | | | 1.20 | %(7) | | | 1.20 | % | | | 1.20 | % | | | 1.20 | % | | | 1.20 | % | | | 1.20 | %(7) |
Ratio of net investment income to average net assets | | | 5.31 | %(7) | | | 5.17 | % | | | 5.83 | % | | | 6.28 | % | | | 5.46 | % | | | 4.88 | %(7) |
Portfolio turnover rate | | | 26.75 | %(6) | | | 52.29 | % | | | 48.69 | % | | | 58.08 | % | | | 84.65 | % | | | 99.72 | %(6) |
| (2) | | Fund commenced operations on September 16, 2013. |
| (3) | | Calculated using average shares outstanding. |
| (4) | | Amount rounds to less than $.01 per share. |
| (5) | | Total investment return calculation does not consider the effects of sales loads and assumes the reinvestment of dividends at actual prices pursuant to the Fund’s dividend reinvestment plan. |
| (7) | | Annualized for periods less than one full year. |
| (8) | | The Adviser has agreed to waive and/or reimburse certain fees and/or expense so that, on an annualized basis, such expenses incurred will not exceed 1.20% as a percentage of average daily net assets. |
See accompanying Notes to the Financial Statements.
55
Barings Global Credit Income Opportunities Fund 2018 Semi-Annual Report
FINANCIAL HIGHLIGHTS(CONTINUED)
| | | | | | | | | | | | | | | | | | | | | | | | |
| | | CLASS C | |
| | | FOR THE
SIX MONTHS
ENDED
DECEMBER 31,
2018 (1) | | | FOR THE
YEAR
ENDED
JUNE 30,
2018 | | | FOR THE
YEAR
ENDED
JUNE 30,
2017 | | | FOR THE
YEAR
ENDED
JUNE 30,
2016 | | | FOR THE
YEAR
ENDED
JUNE 30,
2015 | | | PERIOD FROM
SEPTEMBER 16,
2013
THROUGH
JUNE 30,
2014 (2) | |
| | | | | | |
| Per Common Share Data | | | | | | | | | | | | | | | | | | | | | | | | |
Net asset value, beginning of period | | $ | 9.31 | | | $ | 9.50 | | | $ | 8.79 | | | $ | 9.50 | | | $ | 10.45 | | | $ | 10.00 | |
Income from investment operations: | | | | | | | | | | | | | | | | | | | | | | | | |
Net investment income (3) | | | 0.21 | | | | 0.42 | | | | 0.48 | | | | 0.49 | | | | 0.47 | | | | 0.35 | |
Net realized and unrealized gain (loss) on investments | | | (0.55 | ) | | | (0.19 | ) | | | 0.71 | | | | (0.65 | ) | | | (0.58 | ) | | | 0.32 | |
| | | | | | | | | | | | | | | | | | | | | | | | |
Total increase (decrease) from investment operations | | | (0.34 | ) | | | 0.23 | | | | 1.19 | | | | (0.16 | ) | | | (0.11 | ) | | | 0.67 | |
| | | | | | | | | | | | | | | | | | | | | | | | |
Less dividends and distributions: | | | | | | | | | | | | | | | | | | | | | | | | |
From net investment income | | | (0.21 | ) | | | (0.40 | ) | | | (0.43 | ) | | | (0.55 | ) | | | (0.71 | ) | | | (0.22 | ) |
From net realized gain | | | (0.10 | ) | | | – | | | | – | | | | – | | | | (0.13 | ) | | | – | |
From return of capital | | | – | | | | (0.02 | ) | | | (0.05 | ) | | | – | | | | – | | | | – | |
| | | | | | | | | | | | | | | | | | | | | | | | |
Total dividends and distributions | | | (0.31 | ) | | | (0.42 | ) | | | (0.48 | ) | | | (0.55 | ) | | | (0.84 | ) | | | (0.22 | ) |
| | | | | | | | | | | | | | | | | | | | | | | | |
Redemption fees | | | – | | | | – | | | | – | | | | – | | | | 0.00 | (4) | | | – | |
| | | | | | | | | | | | | | | | | | | | | | | | |
Net asset value, at end of period | | $ | 8.66 | | | $ | 9.31 | | | $ | 9.50 | | | $ | 8.79 | | | $ | 9.50 | | | $ | 10.45 | |
| | | | | | | | | | | | | | | | | | | | | | | | |
Total investment return (5) | | | (3.57 | )%(6) | | | 2.47 | % | | | 13.75 | % | | | (1.59 | )% | | | (0.93 | )% | | | 6.75 | %(6) |
| | | | | | | | | | | | | | | | | | | | | | | | |
| | | | | | |
| Supplemental Data and Ratios | | | | | | | | | | | | | | | | | | | | | | | | |
Net assets, end of period (000’s) | | $ | 8,175 | | | $ | 8,842 | | | $ | 6,628 | | | $ | 3,578 | | | $ | 3,579 | | | $ | 944 | |
Ratio of total expenses (before reductions and reimbursements) to average net assets | | | 2.18 | %(7) | | | 2.21 | % | | | 2.39 | % | | | 2.91 | % | | | 4.09 | % | | | 10.50 | %(7) |
Ratio of net expenses to average net assets (8) | | | 1.95 | %(7) | | | 1.95 | % | | | 1.95 | % | | | 1.95 | % | | | 1.95 | % | | | 1.95 | %(7) |
Ratio of net investment income to average net assets | | | 4.56 | %(7) | | | 4.44 | % | | | 5.12 | % | | | 5.50 | % | | | 4.79 | % | | | 4.39 | %(7) |
Portfolio turnover rate | | | 26.75 | %(6) | | | 52.29 | % | | | 48.69 | % | | | 58.08 | % | | | 84.65 | % | | | 99.72 | %(6) |
| (2) | | Fund commenced operations on September 16, 2013. |
| (3) | | Calculated using average shares outstanding. |
| (4) | | Amount rounds to less than $.01 per share. |
| (5) | | Total investment return calculation does not consider the effects of sales loads and assumes the reinvestment of dividends at actual prices pursuant to the Fund’s dividend reinvestment plan. |
| (7) | | Annualized for periods less than one full year. |
| (8) | | The Adviser has agreed to waive and/or reimburse certain fees and/or expense so that, on an annualized basis, such expenses incurred will not exceed 1.95% as a percentage of average daily net assets. |
See accompanying Notes to the Financial Statements.
56
Barings Global Credit Income Opportunities Fund 2018 Semi-Annual Report
FINANCIAL HIGHLIGHTS(CONTINUED)
| | | | | | | | | | | | | | | | | | | | | | | | |
| | | CLASS I | |
| | | FOR THE
SIX MONTHS
ENDED
DECEMBER 31,
2018 (1) | | | FOR THE
YEAR
ENDED
JUNE 30,
2018 | | | FOR THE
YEAR
ENDED
JUNE 30,
2017 | | | FOR THE
YEAR
ENDED
JUNE 30,
2016 | | | FOR THE
YEAR
ENDED
JUNE 30,
2015 | | | PERIOD FROM
SEPTEMBER 16,
2013
THROUGH
JUNE 30,
2014 (2) | |
| | | | | | |
| Per Common Share Data | | | | | | | | | | | | | | | | | | | | | | | | |
Net asset value, beginning of period | | $ | 9.32 | | | $ | 9.50 | | | $ | 8.80 | | | $ | 9.51 | | | $ | 10.46 | | | $ | 10.00 | |
Income from investment operations: | | | | | | | | | | | | | | | | | | | | | | | | |
Net investment income (3) | | | 0.23 | | | | 0.51 | | | | 0.58 | | | | 0.58 | | | | 0.56 | | | | 0.41 | |
Net realized and unrealized gain (loss) on investments | | | (0.52 | ) | | | (0.18 | ) | | | 0.70 | | | | (0.65 | ) | | | (0.58 | ) | | | 0.35 | |
| | | | | | | | | | | | | | | | | | | | | | | | |
Total increase (decrease) from investment operations | | | (0.29 | ) | | | 0.33 | | | | 1.28 | | | | (0.07 | ) | | | (0.02 | ) | | | 0.76 | |
| | | | | | | | | | | | | | | | | | | | | | | | |
Less dividends and distributions: | | | | | | | | | | | | | | | | | | | | | | | | |
From net investment income | | | (0.26 | ) | | | (0.49 | ) | | | (0.52 | ) | | | (0.64 | ) | | | (0.80 | ) | | | (0.30 | ) |
From net realized gain | | | (0.10 | ) | | | – | | | | – | | | | – | | | | (0.13 | ) | | | – | |
From return of capital | | | – | | | | (0.02 | ) | | | (0.06 | ) | | | – | | | | – | | | | – | |
| | | | | | | | | | | | | | | | | | | | | | | | |
Total dividends and distributions | | | (0.36 | ) | | | (0.51 | ) | | | (0.58 | ) | | | (0.64 | ) | | | (0.93 | ) | | | (0.30 | ) |
| | | | | | | | | | | | | | | | | | | | | | | | |
Redemption fees | | | – | | | | – | | | | – | | | | – | | | | 0.00 | (4) | | | – | |
| | | | | | | | | | | | | | | | | | | | | | | | |
Net asset value, at end of period | | $ | 8.67 | | | $ | 9.32 | | | $ | 9.50 | | | $ | 8.80 | | | $ | 9.51 | | | $ | 10.46 | |
| | | | | | | | | | | | | | | | | | | | | | | | |
Total investment return (5) | | | (3.07 | )%(6) | | | 3.49 | % | | | 14.90 | % | | | (0.61 | )% | | | 0.05 | % | | | 7.59 | %(6) |
| | | | | | | | | | | | | | | | | | | | | | | | |
| | | | | | |
| Supplemental Data and Ratios | | | | | | | | | | | | | | | | | | | | | | | | |
Net assets, end of period (000’s) | | $ | 14,477 | | | $ | 21,788 | | | $ | 22,228 | | | $ | 24,689 | | | $ | 26,428 | | | $ | 26,406 | |
Ratio of total expenses (before reductions and reimbursements) to average net assets | | | 1.08 | %(7) | | | 1.13 | % | | | 1.27 | % | | | 1.54 | % | | | 1.58 | % | | | 1.83 | %(7) |
Ratio of net expenses to average net assets (8) | | | 0.95 | %(7) | | | 0.95 | % | | | 0.95 | % | | | 0.95 | % | | | 0.95 | % | | | 0.95 | %(7) |
Ratio of net investment income to average net assets | | | 5.54 | %(7) | | | 5.45 | % | | | 6.22 | % | | | 6.54 | % | | | 5.69 | % | | | 5.02 | %(7) |
Portfolio turnover rate | | | 26.75 | %(6) | | | 52.29 | % | | | 48.69 | % | | | 58.08 | % | | | 84.65 | % | | | 99.72 | %(6) |
| (2) | | Fund commenced operations on September 16, 2013. |
| (3) | | Calculated using average shares outstanding. |
| (4) | | Amount rounds to less than $.01 per share. |
| (5) | | Total investment return calculation assumes the reinvestment of dividends at actual prices pursuant to the Fund’s dividend reinvestment plan. |
| (7) | | Annualized for periods less than one full year. |
| (8) | | The Adviser has agreed to waive and/or reimburse certain fees and/or expense so that, on an annualized basis, such expenses incurred will not exceed .95% as a percentage of average daily net assets. |
See accompanying Notes to the Financial Statements.
57
Barings Global Credit Income Opportunities Fund 2018 Semi-Annual Report
FINANCIAL HIGHLIGHTS(CONTINUED)
| | | | | | | | | | | | | | | | | | | | | | | | |
| | | CLASS Y | |
| | | FOR THE
SIX MONTHS
ENDED
DECEMBER 31,
2018 (1) | | | FOR THE
YEAR
ENDED
JUNE 30,
2018 | | | FOR THE
YEAR
ENDED
JUNE 30,
2017 | | | FOR THE
YEAR
ENDED
JUNE 30,
2016 | | | FOR THE
YEAR
ENDED
JUNE 30,
2015 | | | PERIOD FROM
SEPTEMBER 16,
2013
THROUGH
JUNE 30,
2014 (2) | |
| | | | | | |
| Per Common Share Data | | | | | | | | | | | | | | | | | | | | | | | | |
Net asset value, beginning of period | | $ | 9.31 | | | $ | 9.50 | | | $ | 8.80 | | | $ | 9.51 | | | $ | 10.46 | | | $ | 10.00 | |
Income from investment operations: | | | | | | | | | | | | | | | | | | | | | | | | |
Net investment income (3) | | | 0.26 | | | | 0.51 | | | | 0.57 | | | | 0.59 | | | | 0.56 | | | | 0.41 | |
Net realized and unrealized gain (loss) on investments | | | (0.54 | ) | | | (0.19 | ) | | | 0.71 | | | | (0.66 | ) | | | (0.58 | ) | | | 0.35 | |
| | | | | | | | | | | | | | | | | | | | | | | | |
Total increase (decrease) from investment operations | | | (0.28 | ) | | | 0.32 | | | | 1.28 | | | | (0.07 | ) | | | (0.02 | ) | | | 0.76 | |
| | | | | | | | | | | | | | | | | | | | | | | | |
Less dividends and distributions: | | | | | | | | | | | | | | | | | | | | | | | | |
From net investment income | | | (0.26 | ) | | | (0.49 | ) | | | (0.52 | ) | | | (0.64 | ) | | | (0.80 | ) | | | (0.30 | ) |
From net realized gain | | | (0.10 | ) | | | – | | | | – | | | | – | | | | (0.13 | ) | | | – | |
From return of capital | | | – | | | | (0.02 | ) | | | (0.06 | ) | | | – | | | | – | | | | – | |
| | | | | | | | | | | | | | | | | | | | | | | | |
Total dividends and distributions | | | (0.36 | ) | | | (0.51 | ) | | | (0.58 | ) | | | (0.64 | ) | | | (0.93 | ) | | | (0.30 | ) |
| | | | | | | | | | | | | | | | | | | | | | | | |
Redemption fees | | | – | | | | – | | | | – | | | | – | | | | 0.00 | (4) | | | – | |
| | | | | | | | | | | | | | | | | | | | | | | | |
Net asset value, at end of period | | $ | 8.67 | | | $ | 9.31 | | | $ | 9.50 | | | $ | 8.80 | | | $ | 9.51 | | | $ | 10.46 | |
| | | | | | | | | | | | | | | | | | | | | | | | |
Total investment return (5) | | | (3.08 | )%(6) | | | 3.48 | % | | | 14.90 | % | | | (0.61 | )% | | | 0.05 | % | | | 7.59 | %(6) |
| | | | | | | | | | | | | | | | | | | | | | | | |
| | | | | | |
| Supplemental Data and Ratios | | | | | | | | | | | | | | | | | | | | | | | | |
Net assets, end of period (000’s) | | $ | 109,332 | | | $ | 140,362 | | | $ | 96,014 | | | $ | 58,312 | | | $ | 39,006 | | | $ | 33,885 | |
Ratio of total expenses (before reductions and reimbursements) to average net assets | | | 1.11 | %(7) | | | 1.14 | % | | | 1.28 | % | | | 1.55 | % | | | 1.58 | % | | | 1.84 | %(7) |
Ratio of net expenses to average net assets (8) | | | 0.95 | %(7) | | | 0.95 | % | | | 0.95 | % | | | 0.95 | % | | | 0.95 | % | | | 0.95 | %(7) |
Ratio of net investment income to average net assets | | | 5.55 | %(7) | | | 5.43 | % | | | 6.14 | % | | | 6.56 | % | | | 5.67 | % | | | 5.04 | %(7) |
Portfolio turnover rate | | | 26.75 | %(6) | | | 52.29 | % | | | 48.69 | % | | | 58.08 | % | | | 84.65 | % | | | 99.72 | %(6) |
| (2) | | Fund commenced operations on September 16, 2013. |
| (3) | | Calculated using average shares outstanding. |
| (4) | | Amount rounds to less than $.01 per share. |
| (5) | | Total investment return calculation assumes the reinvestment of dividends at actual prices pursuant to the Fund’s dividend reinvestment plan. |
| (7) | | Annualized for periods less than one full year. |
| (8) | | The Adviser has agreed to waive and/or reimburse certain fees and/or expense so that, on an annualized basis, such expenses incurred will not exceed .95% as a percentage of average daily net assets. |
See accompanying Notes to the Financial Statements.
58
Barings Active Short Duration Bond Fund 2018 Semi-Annual Report
FINANCIAL HIGHLIGHTS
| | | | | | | | | | | | | | | | |
| | | CLASS A | |
| | | FOR THE
SIX MONTHS ENDED
DECEMBER 31, 2018 (1) | | | FOR THE
YEAR ENDED
JUNE 30, 2018 | | | FOR THE
YEAR ENDED
JUNE 30, 2017 | | | PERIOD FROM
JULY 8, 2015
THROUGH
JUNE 30, 2016 (2) | |
| | | | |
| Per Common Share Data | | | | | | | | | | | | | | | | |
Net asset value, beginning of period | | $ | 9.88 | | | $ | 10.01 | | | $ | 9.98 | | | $ | 10.00 | |
Income from investment operations: | | | | | | | | | | | | | | | | |
Net investment income (3) | | | 0.13 | | | | 0.21 | | | | 0.17 | | | | 0.15 | |
Net realized and unrealized gain (loss) on investments | | | (0.04 | ) | | | (0.10 | ) | | | 0.03 | | | | (0.03 | )(4) |
| | | | | | | | | | | | | | | | |
Total increase from investment operations | | | 0.09 | | | | 0.11 | | | | 0.20 | | | | 0.12 | |
| | | | | | | | | | | | | | | | |
Less dividends and distributions: | | | | | | | | | | | | | | | | |
From net investment income | | | (0.13 | ) | | | (0.21 | ) | | | (0.17 | ) | | | (0.14 | ) |
From net realized gain | | | (0.02 | ) | | | (0.03 | ) | | | (0.00 | )(5) | | | – | |
| | | | | | | | | | | | | | | | |
Total dividends and distributions | | | (0.15 | ) | | | (0.24 | ) | | | (0.17 | ) | | | (0.14 | ) |
| | | | | | | | | | | | | | | | |
Net asset value, at end of period | | $ | 9.82 | | | $ | 9.88 | | | $ | 10.01 | | | $ | 9.98 | |
| | | | | | | | | | | | | | | | |
Total investment return (6) | | | 0.89 | %(7) | | | 1.10 | % | | | 2.12 | % | | | 1.17 | %(7) |
| | | | | | | | | | | | | | | | |
| | | | |
| Supplemental Data and Ratios | | | | | | | | | | | | | | | | |
Net assets, end of period (000’s) | | $ | 147,829 | | | $ | 177,020 | | | $ | 119,189 | | | $ | 39,992 | |
Ratio of total expenses (before reductions and reimbursements) to average net assets | | | 0.92 | %(8) | | | 0.94 | % | | | 1.06 | % | | | 1.18 | %(8) |
Ratio of net expenses to average net assets (9) | | | 0.65 | %(8) | | | 0.65 | % | | | 0.65 | % | | | 0.65 | %(8) |
Ratio of net investment income to average net assets | | | 2.65 | %(8) | | | 2.15 | % | | | 1.72 | % | | | 1.51 | %(8) |
Portfolio turnover rate | | | 18.42 | %(7) | | | 53.33 | % | | | 88.52 | % | | | 218.67 | %(7) |
| (2) | | Fund commenced operations on July 8, 2015. |
| (3) | | Calculated using average shares outstanding. |
| (4) | | The per share amount varies from the net realized and unrealized gain/loss for the period because of the timing of sales of fund shares and the per share amount of realized and unrealized gains and losses at such time. |
| (5) | | Amount rounds to less than $.01 per share. |
| (6) | | Total investment return calculation assumes the reinvestment of dividends at actual prices pursuant to the Fund’s dividend reinvestment plan. |
| (8) | | Annualized for periods less than one full year. |
| (9) | | The Adviser has agreed to waive and/or reimburse certain fees and/or expense so that, on an annualized basis, such expenses incurred will not exceed .65% as a percentage of average daily net assets. |
See accompanying Notes to the Financial Statements.
59
Barings Active Short Duration Bond Fund 2018 Semi-Annual Report
FINANCIAL HIGHLIGHTS(CONTINUED)
| | | | | | | | | | | | | | | | |
| | | CLASS C | |
| | | FOR THE
SIX MONTHS ENDED
DECEMBER 31, 2018 (1) | | | FOR THE
YEAR ENDED
JUNE 30, 2018 | | | FOR THE
YEAR ENDED
JUNE 30, 2017 | | | PERIOD FROM
JULY 8, 2015
THROUGH
JUNE 30, 2016 (2) | |
| | | | |
| Per Common Share Data | | | | | | | | | | | | | | | | |
Net asset value, beginning of period | | $ | 9.87 | | | $ | 10.01 | | | $ | 9.97 | | | $ | 10.00 | |
Income from investment operations: | | | | | | | | | | | | | | | | |
Net investment income (3) | | | 0.12 | | | | 0.19 | | | | 0.19 | | | | 0.07 | |
Net realized and unrealized gain (loss) on investments | | | (0.04 | ) | | | (0.11 | ) | | | 0.05 | | | | (0.03 | )(4) |
| | | | | | | | | | | | | | | | |
Total increase from investment operations | | | 0.08 | | | | 0.08 | | | | 0.24 | | | | 0.04 | |
| | | | | | | | | | | | | | | | |
Less dividends and distributions: | | | | | | | | | | | | | | | | |
From net investment income | | | (0.12 | ) | | | (0.19 | ) | | | (0.20 | ) | | | (0.07 | ) |
From net realized gain | | | (0.02 | ) | | | (0.03 | ) | | | (0.00 | )(5) | | | – | |
| | | | | | | | | | | | | | | | |
Total dividends and distributions | | | (0.14 | ) | | | (0.22 | ) | | | (0.20 | ) | | | (0.07 | ) |
| | | | | | | | | | | | | | | | |
Net asset value, at end of period | | $ | 9.81 | | | $ | 9.87 | | | $ | 10.01 | | | $ | 9.97 | |
| | | | | | | | | | | | | | | | |
Total investment return (6) | | | 0.76 | %(7) | | | 0.84 | % | | | 2.41 | % | | | 0.39 | %(7) |
| | | | | | | | | | | | | | | | |
| | | | |
| Supplemental Data and Ratios | | | | | | | | | | | | | | | | |
Net assets, end of period (000’s) | | $ | 1,287 | | | $ | 1,139 | | | $ | 236 | | | $ | 257 | |
Ratio of total expenses (before reductions and reimbursements) to average net assets | | | 1.97 | %(8) | | | 1.95 | % | | | 3.09 | %(9) | | | 5.44 | %(8)(10) |
Ratio of net expenses to average net assets (11) | | | 0.90 | %(8) | | | 0.90 | % | | | 0.40 | %(9) | | | 1.40 | %(8)(10) |
Ratio of net investment income to average net assets | | | 2.40 | %(8) | | | 1.92 | % | | | 1.94 | %(9) | | | 0.71 | %(8)(10) |
Portfolio turnover rate | | | 18.42 | %(7) | | | 53.33 | % | | | 88.52 | % | | | 218.67 | %(7) |
| (2) | | Fund commenced operations on July 8, 2015. |
| (3) | | Calculated using average shares outstanding. |
| (4) | | The per share amount varies from the net realized and unrealized gain/loss for the period because of the timing of sales of fund shares and the per share amount of realized and unrealized gains and losses at such time. |
| (5) | | Amount rounds to less than $.01 per share. |
| (6) | | Total investment return calculation assumes the reinvestment of dividends at actual prices pursuant to the Fund’s dividend reinvestment plan. |
| (8) | | Annualized for periods less than one full year. |
| (9) | | Expenses shown reflect a reimbursement to the Fund during the period for an overaccrual of 12b-1 fees made during and prior to the period. |
| (10) | | Expenses shown reflect an overaccrual of 12b-1 fees for the period of $1,478 or 0.50% of average net assets over the period. Subsequent to the period, the Fund was reimbursed for the overaccrued amount. |
| (11) | | The Adviser has agreed to waive and/or reimburse certain fees and/or expense so that, on an annualized basis, such expenses incurred will not exceed 0.90% as a percentage of average daily net assets. |
See accompanying Notes to the Financial Statements.
60
Barings Active Short Duration Bond Fund 2018 Semi-Annual Report
FINANCIAL HIGHLIGHTS(CONTINUED)
| | | | | | | | | | | | | | | | |
| | | CLASS I | |
| | | FOR THE
SIX MONTHS ENDED
DECEMBER 31, 2018 (1) | | | FOR THE
YEAR ENDED
JUNE 30, 2018 | | | FOR THE
YEAR ENDED
JUNE 30, 2017 | | | PERIOD FROM
JULY 8, 2015
THROUGH
JUNE 30, 2016 (2) | |
| | | | |
| Per Common Share Data | | | | | | | | | | | | | | | | |
Net asset value, beginning of period | | $ | 9.88 | | | $ | 10.01 | | | $ | 9.97 | | | $ | 10.00 | |
Income from investment operations: | | | | | | | | | | | | | | | | |
Net investment income (3) | | | 0.14 | | | | 0.24 | | | | 0.18 | | | | 0.16 | |
Net realized and unrealized gain (loss) on investments | | | (0.04 | ) | | | (0.10 | ) | | | 0.06 | | | | (0.03 | )(4) |
| | | | | | | | | | | | | | | | |
Total increase from investment operations | | | 0.10 | | | | 0.14 | | | | 0.24 | | | | 0.13 | |
| | | | | | | | | | | | | | | | |
Less dividends and distributions: | | | | | | | | | | | | | | | | |
From net investment income | | | (0.14 | ) | | | (0.24 | ) | | | (0.20 | ) | | | (0.16 | ) |
From net realized gain | | | (0.02 | ) | | | (0.03 | ) | | | (0.00 | )(5) | | | – | |
| | | | | | | | | | | | | | | | |
Total dividends and distributions | | | (0.16 | ) | | | (0.27 | ) | | | (0.20 | ) | | | (0.16 | ) |
| | | | | | | | | | | | | | | | |
Net asset value, at end of period | | $ | 9.82 | | | $ | 9.88 | | | $ | 10.01 | | | $ | 9.97 | |
| | | | | | | | | | | | | | | | |
Total investment return (6) | | | 1.02 | %(7) | | | 1.39 | % | | | 2.44 | % | | | 1.35 | %(7) |
| | | | | | | | | | | | | | | | |
| | | | |
| Supplemental Data and Ratios | | | | | | | | | | | | | | | | |
Net assets, end of period (000’s) | | $ | 298 | | | $ | 300 | | | $ | 100 | | | $ | 5,971 | |
Ratio of total expenses (before reductions and reimbursements) to average net assets | | | 2.93 | %(8) | | | 3.07 | % | | | 1.67 | % | | | 0.96 | %(8) |
Ratio of net expenses to average net assets (9) | | | 0.40 | %(8) | | | 0.40 | % | | | 0.40 | % | | | 0.44 | %(8) |
Ratio of net investment income to average net assets | | | 2.89 | %(8) | | | 2.39 | % | | | 1.84 | % | | | 1.67 | %(8) |
Portfolio turnover rate | | | 18.42 | %(7) | | | 53.33 | % | | | 88.52 | % | | | 218.67 | %(7) |
| (2) | | Fund commenced operations on July 8, 2015. |
| (3) | | Calculated using average shares outstanding. |
| (4) | | The per share amount varies from the net realized and unrealized gain/loss for the period because of the timing of sales of fund shares and the per share amount of realized and unrealized gains and losses at such time. |
| (5) | | Amount rounds to less than $.01 per share. |
| (6) | | Total investment return calculation assumes the reinvestment of dividends at actual prices pursuant to the Fund’s dividend reinvestment plan. |
| (8) | | Annualized for periods less than one full year. |
| (9) | | The Adviser has agreed to waive and/or reimburse certain fees and/or expense so that, on an annualized basis, such expenses incurred will not exceed .40% as a percentage of average daily net assets. |
See accompanying Notes to the Financial Statements.
61
Barings Active Short Duration Bond Fund 2018 Semi-Annual Report
FINANCIAL HIGHLIGHTS(CONTINUED)
| | | | | | | | | | | | | | | | |
| | | CLASS Y | |
| | | FOR THE
SIX MONTHS ENDED
DECEMBER 31, 2018 (1) | | | FOR THE
YEAR ENDED
JUNE 30, 2018 | | | FOR THE
YEAR ENDED
JUNE 30, 2017 | | | PERIOD FROM
JULY 8, 2015
THROUGH
JUNE 30, 2016 (2) | |
| | | | |
| Per Common Share Data | | | | | | | | | | | | | | | | |
Net asset value, beginning of period | | $ | 9.87 | | | $ | 10.01 | | | $ | 9.97 | | | $ | 10.00 | |
Income from investment operations: | | | | | | | | | | | | | | | | |
Net investment income (3) | | | 0.14 | | | | 0.24 | | | | 0.20 | | | | 0.17 | |
Net realized and unrealized gain (loss) on investments | | | (0.03 | ) | | | (0.11 | ) | | | 0.04 | | | | (0.04 | )(4) |
| | | | | | | | | | | | | | | | |
Total increase from investment operations | | | 0.11 | | | | 0.13 | | | | 0.24 | | | | 0.13 | |
| | | | | | | | | | | | | | | | |
Less dividends and distributions: | | | | | | | | | | | | | | | | |
From net investment income | | | (0.14 | ) | | | (0.24 | ) | | | (0.20 | ) | | | (0.16 | ) |
From net realized gain | | | (0.02 | ) | | | (0.03 | ) | | | (0.00 | )(5) | | | – | |
| | | | | | | | | | | | | | | | |
Total dividends and distributions | | | (0.16 | ) | | | (0.27 | ) | | | (0.20 | ) | | | (0.16 | ) |
| | | | | | | | | | | | | | | | |
Net asset value, at end of period | | $ | 9.82 | | | $ | 9.87 | | | $ | 10.01 | | | $ | 9.97 | |
| | | | | | | | | | | | | | | | |
Total investment return (6) | | | 1.02 | %(7) | | | 1.35 | % | | | 2.38 | % | | | 1.36 | %(7) |
| | | | | | | | | | | | | | | | |
| | | | |
| Supplemental Data and Ratios | | | | | | | | | | | | | | | | |
Net assets, end of period (000’s) | | $ | 332,488 | | | $ | 252,325 | | | $ | 204,464 | | | $ | 109,645 | |
Ratio of total expenses (before reductions and reimbursements) to average net assets | | | 0.67 | %(8) | | | 0.70 | % | | | 0.82 | % | | | 0.87 | %(8) |
Ratio of net expenses to average net assets (9) | | | 0.40 | %(8) | | | 0.40 | % | | | 0.40 | % | | | 0.41 | %(8) |
Ratio of net investment income to average net assets | | | 2.90 | %(8) | | | 2.39 | % | | | 1.97 | % | | | 1.73 | %(8) |
Portfolio turnover rate | | | 18.42 | %(7) | | | 53.33 | % | | | 88.52 | % | | | 218.67 | %(7) |
| (2) | | Fund commenced operations on July 8, 2015. |
| (3) | | Calculated using average shares outstanding. |
| (4) | | The per share amount varies from the net realized and unrealized gain/loss for the period because of the timing of sales of fund shares and the per share amount of realized and unrealized gains and losses at such time. |
| (5) | | Amount rounds to less than $.01 per share. |
| (6) | | Total investment return calculation assumes the reinvestment of dividends at actual prices pursuant to the Fund’s dividend reinvestment plan. |
| (8) | | Annualized for periods less than one full year. |
| (9) | | The Adviser has agreed to waive and/or reimburse certain fees and/or expense so that, on an annualized basis, such expenses incurred will not exceed .40% as a percentage of average daily net assets. |
See accompanying Notes to the Financial Statements.
62
Barings Total Return Bond Fund 2018 Semi-Annual Report
FINANCIAL HIGHLIGHTS
| | | | | | | | | | | | | | | | |
| | | CLASS A | |
| | | FOR THE
SIX MONTHS ENDED
DECEMBER 31, 2018 (1) | | | FOR THE
YEAR ENDED
JUNE 30, 2018 | | | FOR THE
YEAR ENDED
JUNE 30, 2017 | | | PERIOD FROM
JULY 8, 2015
THROUGH
JUNE 30, 2016 (2) | |
| | | | |
| Per Common Share Data | | | | | | | | | | | | | | | | |
Net asset value, beginning of period | | $ | 9.77 | | | $ | 10.08 | | | $ | 10.18 | | | $ | 10.00 | |
Income from investment operations: | | | | | | | | | | | | | | | | |
Net investment income (3) | | | 0.17 | | | | 0.27 | | | | 0.25 | | | | 0.25 | |
Net realized and unrealized gain (loss) on investments | | | (0.14 | ) | | | (0.28 | ) | | | (0.09 | ) | | | 0.20 | |
| | | | | | | | | | | | | | | | |
Total increase (decrease) from investment operations | | | 0.03 | | | | (0.01 | ) | | | 0.16 | | | | 0.45 | |
| | | | | | | | | | | | | | | | |
Less dividends and distributions: | | | | | | | | | | | | | | | | |
From net investment income | | | (0.16 | ) | | | (0.29 | ) | | | (0.26 | ) | | | (0.25 | ) |
From net realized gain | | | – | | | | – | | | | – | | | | (0.02 | ) |
From return of capital | | | – | | | | (0.01 | ) | | | – | | | | – | |
| | | | | | | | | | | | | | | | |
Total dividends and distributions | | | (0.16 | ) | | | (0.30 | ) | | | (0.26 | ) | | | (0.27 | ) |
| | | | | | | | | | | | | | | | |
Net asset value, at end of period | | $ | 9.64 | | | $ | 9.77 | | | $ | 10.08 | | | $ | 10.18 | |
| | | | | | | | | | | | | | | | |
Total investment return (4) | | | 0.29 | %(5) | | | (0.12 | )% | | | 1.65 | % | | | 4.63 | %(5) |
| | | | | | | | | | | | | | | | |
| | | | |
| Supplemental Data and Ratios | | | | | | | | | | | | | | | | |
Net assets, end of period (000’s) | | $ | 703 | | | $ | 207 | | | $ | 218 | | | $ | 211 | |
Ratio of total expenses (before reductions and reimbursements) to average net assets | | | 3.87 | %(6) | | | 3.72 | % | | | 3.52 | % | | | 5.60 | %(6) |
Ratio of net expenses to average net assets (7)(8) | | | 0.80 | %(6) | | | 0.80 | % | | | 0.80 | % | | | 0.80 | %(6) |
Ratio of net investment income to average net assets | | | 3.27 | %(6) | | | 2.70 | % | | | 2.49 | % | | | 2.52 | %(6) |
Portfolio turnover rate | | | 21.85 | %(5) | | | 172.39 | % | | | 242.55 | % | | | 434.37 | %(5) |
| (2) | | Fund commenced operations on July 8, 2015. |
| (3) | | Calculated using average shares outstanding. |
| (4) | | Total investment return calculation does not consider the effects of sales loads and assumes the reinvestment of dividends at actual prices pursuant to the Fund’s dividend reinvestment plan. |
| (6) | | Annualized for periods less than one full year. |
| (7) | | The Adviser has agreed to waive and/or reimburse certain fees and/or expense so that, on an annualized basis, such expenses incurred will not exceed .80% as a percentage of average daily net assets. |
| (8) | | Ratio of net expenses to average net assets does not include expenses of the underlying fund in which the Fund invests. |
See accompanying Notes to the Financial Statements.
63
Barings Total Return Bond Fund 2018 Semi-Annual Report
FINANCIAL HIGHLIGHTS(CONTINUED)
| | | | | | | | | | | | | | | | |
| | | CLASS C | |
| | | FOR THE
SIX MONTHS ENDED
DECEMBER 31, 2018 (1) | | | FOR THE
YEAR ENDED
JUNE 30, 2018 | | | FOR THE
YEAR ENDED
JUNE 30, 2017 | | | PERIOD FROM
JULY 8, 2015
THROUGH
JUNE 30, 2016 (2) | |
| | | | |
| Per Common Share Data | | | | | | | | | | | | | | | | |
Net asset value, beginning of period | | $ | 9.77 | | | $ | 10.08 | | | $ | 10.18 | | | $ | 10.00 | |
Income from investment operations: | | | | | | | | | | | | | | | | |
Net investment income (3) | | | 0.12 | | | | 0.19 | | | | 0.17 | | | | 0.17 | |
Net realized and unrealized gain (loss) on investments | | | (0.13 | ) | | | (0.27 | ) | | | (0.08 | ) | | | 0.21 | |
| | | | | | | | | | | | | | | | |
Total increase (decrease) from investment operations | | | (0.01 | ) | | | (0.08 | ) | | | 0.09 | | | | 0.38 | |
| | | | | | | | | | | | | | | | |
Less dividends and distributions: | | | | | | | | | | | | | | | | |
From net investment income | | | (0.12 | ) | | | (0.22 | ) | | | (0.19 | ) | | | (0.18 | ) |
From net realized gain | | | – | | | | – | | | | – | | | | (0.02 | ) |
From return of capital | | | – | | | | (0.01 | ) | | | – | | | | – | |
| | | | | | | | | | | | | | | | |
Total dividends and distributions | | | (0.12 | ) | | | (0.23 | ) | | | (0.19 | ) | | | (0.20 | ) |
| | | | | | | | | | | | | | | | |
Net asset value, at end of period | | $ | 9.64 | | | $ | 9.77 | | | $ | 10.08 | | | $ | 10.18 | |
| | | | | | | | | | | | | | | | |
Total investment return (4) | | | (0.09 | )%(5) | | | (0.87 | )% | | | 0.89 | % | | | 3.87 | %(5) |
| | | | | | | | | | | | | | | | |
| | | | |
| Supplemental Data and Ratios | | | | | | | | | | | | | | | | |
Net assets, end of period (000’s) | | $ | 193 | | | $ | 196 | | | $ | 202 | | | $ | 204 | |
Ratio of total expenses (before reductions and reimbursements) to average net assets | | | 4.78 | %(6) | | | 4.60 | % | | | 4.41 | % | | | 6.38 | %(6) |
Ratio of net expenses to average net assets (7)(8) | | | 1.55 | %(6) | | | 1.55 | % | | | 1.55 | % | | | 1.55 | %(6) |
Ratio of net investment income to average net assets | | | 2.51 | %(6) | | | 1.95 | % | | | 1.74 | % | | | 1.77 | %(6) |
Portfolio turnover rate | | | 21.85 | %(5) | | | 172.39 | % | | | 242.55 | % | | | 434.37 | %(5) |
| (2) | | Fund commenced operations on July 8, 2015. |
| (3) | | Calculated using average shares outstanding. |
| (4) | | Total investment return calculation does not consider the effects of sales loads and assumes the reinvestment of dividends at actual prices pursuant to the Fund’s dividend reinvestment plan. |
| (6) | | Annualized for periods less than one full year. |
| (7) | | The Adviser has agreed to waive and/or reimburse certain fees and/or expense so that, on an annualized basis, such expenses incurred will not exceed 1.55% as a percentage of average daily net assets. |
| (8) | | Ratio of net expenses to average net assets does not include expenses of the underlying fund in which the Fund invests. |
See accompanying Notes to the Financial Statements.
64
Barings Total Return Bond Fund 2018 Semi-Annual Report
FINANCIAL HIGHLIGHTS(CONTINUED)
| | | | | | | | | | | | | | | | |
| | | CLASS I | |
| | | FOR THE SIX MONTHS ENDED
DECEMBER 31, 2018 (1) | | | FOR THE
YEAR ENDED
JUNE 30, 2018 | | | FOR THE
YEAR ENDED
JUNE 30, 2017 | | | PERIOD FROM
JULY 8, 2015
THROUGH
JUNE 30, 2016 (2) | |
| | | | |
| Per Common Share Data | | | | | | | | | | | | | | | | |
Net asset value, beginning of period | | $ | 9.77 | | | $ | 10.08 | | | $ | 10.18 | | | $ | 10.00 | |
Income from investment operations: | | | | | | | | | | | | | | | | |
Net investment income (3) | | | 0.17 | | | | 0.29 | | | | 0.28 | | | | 0.27 | |
Net realized and unrealized gain (loss) on investments | | | (0.13 | ) | | | (0.27 | ) | | | (0.09 | ) | | | 0.20 | |
| | | | | | | | | | | | | | | | |
Total increase from investment operations | | | 0.04 | | | | 0.02 | | | | 0.19 | | | | 0.47 | |
| | | | | | | | | | | | | | | | |
Less dividends and distributions: | | | | | | | | | | | | | | | | |
From net investment income | | | (0.17 | ) | | | (0.32 | ) | | | (0.29 | ) | | | (0.27 | ) |
From net realized gain | | | – | | | | – | | | | – | | | | (0.02 | ) |
From return of capital | | | – | | | | (0.01 | ) | | | – | | | | – | |
| | | | | | | | | | | | | | | | |
Total dividends and distributions | | | (0.17 | ) | | | (0.33 | ) | | | (0.29 | ) | | | (0.29 | ) |
| | | | | | | | | | | | | | | | |
Net asset value, at end of period | | $ | 9.64 | | | $ | 9.77 | | | $ | 10.08 | | | $ | 10.18 | |
| | | | | | | | | | | | | | | | |
Total investment return (4) | | | 0.42 | %(5) | | | 0.13 | % | | | 1.90 | % | | | 4.89 | %(5) |
| | | | | | | | | | | | | | | | |
| | | | |
| Supplemental Data and Ratios | | | | | | | | | | | | | | | | |
Net assets, end of period (000’s) | | $ | 11,907 | | | $ | 12,070 | | | $ | 12,457 | | | $ | 12,582 | |
Ratio of total expenses (before reductions and reimbursements) to average net assets | | | 1.26 | %(6) | | | 1.30 | % | | | 1.36 | % | | | 1.37 | %(6) |
Ratio of net expenses to average net assets (7)(8) | | | 0.55 | %(6) | | | 0.55 | % | | | 0.55 | % | | | 0.55 | %(6) |
Ratio of net investment income to average net assets | | | 3.51 | %(6) | | | 2.94 | % | | | 2.74 | % | | | 2.77 | %(6) |
Portfolio turnover rate | | | 21.85 | %(5) | | | 172.39 | % | | | 242.55 | % | | | 434.37 | %(5) |
| (2) | | Fund commenced operations on July 8, 2015. |
| (3) | | Calculated using average shares outstanding. |
| (4) | | Total investment return calculation assumes the reinvestment of dividends at actual prices pursuant to the Fund’s dividend reinvestment plan. |
| (6) | | Annualized for periods less than one full year. |
| (7) | | The Adviser has agreed to waive and/or reimburse certain fees and/or expense so that, on an annualized basis, such expenses incurred will not exceed .55% as a percentage of average daily net assets. |
| (8) | | Ratio of net expenses to average net assets does not include expenses of the underlying fund in which the Fund invests. |
See accompanying Notes to the Financial Statements.
65
Barings Total Return Bond Fund 2018 Semi-Annual Report
FINANCIAL HIGHLIGHTS(CONTINUED)
| | | | | | | | | | | | | | | | |
| | | CLASS Y | |
| | | FOR THE SIX MONTHS ENDED
DECEMBER 31, 2018 (1) | | | FOR THE
YEAR ENDED
JUNE 30, 2018 | | | FOR THE
YEAR ENDED
JUNE 30, 2017 | | | PERIOD FROM
JULY 8, 2015
THROUGH
JUNE 30, 2016 (2) | |
| | | | |
| Per Common Share Data | | | | | | | | | | | | | | | | |
Net asset value, beginning of period | | $ | 9.77 | | | $ | 10.08 | | | $ | 10.18 | | | $ | 10.00 | |
Income from investment operations: | | | | | | | | | | | | | | | | |
Net investment income (3) | | | 0.16 | | | | 0.29 | | | | 0.27 | | | | 0.27 | |
Net realized and unrealized gain (loss) on investments | | | (0.12 | ) | | | (0.27 | ) | | | (0.08 | ) | | | 0.20 | |
| | | | | | | | | | | | | | | | |
Total increase from investment operations | | | 0.04 | | | | 0.02 | | | | 0.19 | | | | 0.47 | |
| | | | | | | | | | | | | | | | |
Less dividends and distributions: | | | | | | | | | | | | | | | | |
From net investment income | | | (0.17 | ) | | | (0.32 | ) | | | (0.29 | ) | | | (0.27 | ) |
From net realized gain | | | – | | | | – | | | | – | | | | (0.02 | ) |
From return of capital | | | – | | | | (0.01 | ) | | | – | | | | – | |
| | | | | | | | | | | | | | | | |
Total dividends and distributions | | | (0.17 | ) | | | (0.33 | ) | | | (0.29 | ) | | | (0.29 | ) |
| | | | | | | | | | | | | | | | |
Net asset value, at end of period | | $ | 9.64 | | | $ | 9.77 | | | $ | 10.08 | | | $ | 10.18 | |
| | | | | | | | | | | | | | | | |
Total investment return (4) | | | 0.42 | %(5) | | | 0.13 | % | | | 1.90 | % | | | 4.89 | %(5) |
| | | | | | | | | | | | | | | | |
| | | | |
| Supplemental Data and Ratios | | | | | | | | | | | | | | | | |
Net assets, end of period (000’s) | | $ | 15,435 | | | $ | 16,414 | | | $ | 17,478 | | | $ | 13,011 | |
Ratio of total expenses (before reductions and reimbursements) to average net assets | | | 1.28 | %(6) | | | 1.33 | % | | | 1.36 | % | | | 1.36 | %(6) |
Ratio of net expenses to average net assets (7)(8) | | | 0.55 | %(6) | | | 0.55 | % | | | 0.55 | % | | | 0.55 | %(6) |
Ratio of net investment income to average net assets | | | 3.51 | %(6) | | | 2.95 | % | | | 2.72 | % | | | 2.77 | %(6) |
Portfolio turnover rate | | | 21.85 | %(5) | | | 172.39 | % | | | 242.55 | % | | | 434.37 | %(5) |
| (2) | | Fund commenced operations on July 8, 2015. |
| (3) | | Calculated using average shares outstanding. |
| (4) | | Total investment return calculation assumes the reinvestment of dividends at actual prices pursuant to the Fund’s dividend reinvestment plan. |
| (6) | | Annualized for periods less than one full year. |
| (7) | | The Adviser has agreed to waive and/or reimburse certain fees and/or expense so that, on an annualized basis, such expenses incurred will not exceed .55% as a percentage of average daily net assets. |
| (8) | | Ratio of net expenses to average net assets does not include expenses of the underlying fund in which the Fund invests. |
See accompanying Notes to the Financial Statements.
66
Barings Emerging Markets Debt Blended Total Return Fund 2018 Semi-Annual Report
FINANCIAL HIGHLIGHTS
| | | | | | | | | | | | | | | | |
| | | CLASS A | |
| | | FOR THE SIX MONTHS ENDED
DECEMBER 31, 2018 (1) | | | FOR THE
YEAR ENDED
JUNE 30, 2018 | | | FOR THE
YEAR ENDED
JUNE 30, 2017 | | | PERIOD FROM
OCTOBER 21, 2015
THROUGH
JUNE 30, 2016 (2) | |
| | | | |
| Per Common Share Data | | | | | | | | | | | | | | | | |
Net asset value, beginning of period | | $ | 9.51 | | | $ | 10.55 | | | $ | 9.90 | | | $ | 10.00 | |
Income from investment operations: | | | | | | | | | | | | | | | | |
Net investment income (3) | | | 0.20 | | | | 0.45 | | | | 0.42 | | | | 0.43 | |
Net realized and unrealized gain (loss) on investments | | | (0.06 | ) | | | (0.64 | ) | | | 0.73 | | | | (0.19 | ) |
| | | | | | | | | | | | | | | | |
Total increase (decrease) from investment operations | | | 0.14 | | | | (0.19 | ) | | | 1.15 | | | | 0.24 | |
| | | | | | | | | | | | | | | | |
Less dividends and distributions: | | | | | | | | | | | | | | | | |
From net investment income | | | (0.28 | ) | | | (0.55 | ) | | | (0.50 | ) | | | (0.34 | ) |
From net realized gain | | | – | | | | (0.30 | ) | | | – | | | | (0.00 | )(4) |
| | | | | | | | | | | | | | | | |
Total dividends and distributions | | | (0.28 | ) | | | (0.85 | ) | | | (0.50 | ) | | | (0.34 | ) |
| | | | | | | | | | | | | | | | |
Net asset value, at end of period | | $ | 9.37 | | | $ | 9.51 | | | $ | 10.55 | | | $ | 9.90 | |
| | | | | | | | | | | | | | | | |
Total investment return (5) | | | 1.49 | %(6) | | | (2.21 | )% | | | 11.94 | % | | | 2.62 | %(6) |
| | | | | | | | | | | | | | | | |
| | | | |
| Supplemental Data and Ratios | | | | | | | | | | | | | | | | |
Net assets, end of period (000’s) | | $ | 374 | | | $ | 566 | | | $ | 211 | | | $ | 198 | |
Ratio of total expenses (before reductions and reimbursements) to average net assets | | | 3.32 | %(7) | | | 3.63 | % | | | 5.77 | % | | | 6.82 | %(7) |
Ratio of net expenses to average net assets (9) | | | 1.14 | %(7)(8) | | | 1.11 | %(8) | | | 1.15 | %(8) | | | 1.16 | %(7) |
Ratio of net investment income to average net assets | | | 5.38 | %(7) | | | 4.33 | % | | | 4.17 | % | | | 6.52 | %(7) |
Portfolio turnover rate | | | 42.39 | %(6) | | | 51.95 | % | | | 55.66 | % | | | 83.26 | %(6) |
| (2) | | Fund commenced operations on October 21, 2015. |
| (3) | | Calculated using average shares outstanding. |
| (4) | | Amount rounds to less than $.01 per share. |
| (5) | | Total investment return calculation does not consider the effects of sales loads and assumes the reinvestment of dividends at actual prices pursuant to the Fund’s dividend reinvestment plan. |
| (7) | | Annualized for periods less than one full year. |
| (8) | | Net expenses reflect a voluntary expense reimbursement to prevent a negative yield. |
| (9) | | The Adviser has agreed to waive and/or reimburse certain fees and/or expense so that, on an annualized basis, such expenses incurred will not exceed 1.20% as a percentage of average daily net assets. |
See accompanying Notes to the Financial Statements.
67
Barings Emerging Markets Debt Blended Total Return Fund 2018 Semi-Annual Report
FINANCIAL HIGHLIGHTS(CONTINUED)
| | | | | | | | | | | | | | | | |
| | | CLASS C | |
| | | FOR THE SIX MONTHS ENDED
DECEMBER 31, 2018 (1) | | | FOR THE
YEAR ENDED
JUNE 30, 2018 | | | FOR THE
YEAR ENDED
JUNE 30, 2017 | | | PERIOD FROM
OCTOBER 21, 2015
THROUGH
JUNE 30, 2016 (2) | |
| | | | |
| Per Common Share Data | | | | | | | | | | | | | | | | |
Net asset value, beginning of period | | $ | 9.51 | | | $ | 10.55 | | | $ | 9.90 | | | $ | 10.00 | |
Income from investment operations: | | | | | | | | | | | | | | | | |
Net investment income (3) | | | 0.22 | | | | 0.48 | | | | 0.35 | | | | 0.38 | |
Net realized and unrealized gain (loss) on investments | | | (0.10 | ) | | | (0.74 | ) | | | 0.73 | | | | (0.19 | ) |
| | | | | | | | | | | | | | | | |
Total increase (decrease) from investment operations | | | 0.12 | | | | (0.26 | ) | | | 1.08 | | | | 0.19 | |
| | | | | | | | | | | | | | | | |
Less dividends and distributions: | | | | | | | | | | | | | | | | |
From net investment income | | | (0.25 | ) | | | (0.48 | ) | | | (0.43 | ) | | | (0.29 | ) |
From net realized gain | | | – | | | | (0.30 | ) | | | – | | | | (0.00 | )(4) |
| | | | | | | | | | | | | | | | |
Total dividends and distributions | | | (0.25 | ) | | | (0.78 | ) | | | (0.43 | ) | | | (0.29 | ) |
| | | | | | | | | | | | | | | | |
Net asset value, at end of period | | $ | 9.38 | | | $ | 9.51 | | | $ | 10.55 | | | $ | 9.90 | |
| | | | | | | | | | | | | | | | |
Total investment return (5) | | | 1.13 | %(6) | | | (2.90 | )% | | | 11.11 | % | | | 2.10 | %(6) |
| | | | | | | | | | | | | | | | |
| | | | |
| Supplemental Data and Ratios | | | | | | | | | | | | | | | | |
Net assets, end of period (000’s) | | $ | 242 | | | $ | 277 | | | $ | 222 | | | $ | 198 | |
Ratio of total expenses (before reductions and reimbursements) to average net assets | | | 4.87 | %(7) | | | 5.85 | % | | | 6.47 | % | | | 7.57 | %(7) |
Ratio of net expenses to average net assets (9) | | | 1.82 | %(7)(8) | | | 1.85 | %(8) | | | 1.89 | %(8) | | | 1.90 | %(7) |
Ratio of net investment income to average net assets | | | 4.68 | %(7) | | | 4.63 | % | | | 3.44 | % | | | 5.79 | %(7) |
Portfolio turnover rate | | | 42.39 | %(6) | | | 51.95 | % | | | 55.66 | % | | | 83.26 | %(6) |
| (2) | | Fund commenced operations on October 21, 2015. |
| (3) | | Calculated using average shares outstanding. |
| (4) | | Amount rounds to less than $.01 per share. |
| (5) | | Total investment return calculation does not consider the effects of sales loads and assumes the reinvestment of dividends at actual prices pursuant to the Fund’s dividend reinvestment plan. |
| (7) | | Annualized for periods less than one full year. |
| (8) | | Net expenses reflect a voluntary expense reimbursement to prevent a negative yield. |
| (9) | | The Adviser has agreed to waive and/or reimburse certain fees and/or expense so that, on an annualized basis, such expenses incurred will not exceed 1.95% as a percentage of average daily net assets. |
See accompanying Notes to the Financial Statements.
68
Barings Emerging Markets Debt Blended Total Return Fund 2018 Semi-Annual Report
FINANCIAL HIGHLIGHTS(CONTINUED)
| | | | | | | | | | | | | | | | |
| | | CLASS I | |
| | | FOR THE SIX MONTHS ENDED
DECEMBER 31, 2018 (1) | | | FOR THE
YEAR ENDED
JUNE 30, 2018 | | | FOR THE
YEAR ENDED
JUNE 30, 2017 | | | PERIOD FROM
OCTOBER 21, 2015
THROUGH
JUNE 30, 2016 (2) | |
| | | | |
| Per Common Share Data | | | | | | | | | | | | | | | | |
Net asset value, beginning of period | | $ | 9.51 | | | $ | 10.55 | | | $ | 9.90 | | | $ | 10.00 | |
Income from investment operations: | | | | | | | | | | | | | | | | |
Net investment income (3) | | | 0.27 | | | | 0.54 | | | | 0.45 | | | | 0.45 | |
Net realized and unrealized gain (loss) on investments | | | (0.12 | ) | | | (0.70 | ) | | | 0.73 | | | | (0.19 | ) |
| | | | | | | | | | | | | | | | |
Total increase (decrease) from investment operations | | | 0.15 | | | | (0.16 | ) | | | 1.18 | | | | 0.26 | |
| | | | | | | | | | | | | | | | |
Less dividends and distributions: | | | | | | | | | | | | | | | | |
From net investment income | | | (0.29 | ) | | | (0.58 | ) | | | (0.53 | ) | | | (0.36 | ) |
From net realized gain | | | – | | | | (0.30 | ) | | | – | | | | (0.00 | )(4) |
| | | | | | | | | | | | | | | | |
Total dividends and distributions | | | (0.29 | ) | | | (0.88 | ) | | | (0.53 | ) | | | (0.36 | ) |
| | | | | | | | | | | | | | | | |
Net asset value, at end of period | | $ | 9.37 | | | $ | 9.51 | | | $ | 10.55 | | | $ | 9.90 | |
| | | | | | | | | | | | | | | | |
Total investment return (5) | | | 1.62 | %(6) | | | (1.94 | )% | | | 12.22 | % | | | 2.79 | %(6) |
| | | | | | | | | | | | | | | | |
| | | | |
| Supplemental Data and Ratios | | | | | | | | | | | | | | | | |
Net assets, end of period (000’s) | | $ | 22,325 | | | $ | 22,650 | | | $ | 5,063 | | | $ | 4,753 | |
Ratio of total expenses (before reductions and reimbursements) to average net assets | | | 1.41 | %(7) | | | 1.94 | % | | | 2.76 | % | | | 2.58 | %(7) |
Ratio of net expenses to average net assets (9) | | | 0.85 | %(7)(8) | | | 0.80 | %(8) | | | 0.90 | %(8) | | | 0.92 | %(7) |
Ratio of net investment income to average net assets | | | 5.67 | %(7) | | | 5.31 | % | | | 4.42 | % | | | 6.77 | %(7) |
Portfolio turnover rate | | | 42.39 | %(6) | | | 51.95 | % | | | 55.66 | % | | | 83.26 | %(6) |
| (2) | | Fund commenced operations on October 21, 2015. |
| (3) | | Calculated using average shares outstanding. |
| (4) | | Amount rounds to less than $.01 per share. |
| (5) | | Total investment return calculation assumes the reinvestment of dividends at actual prices pursuant to the Fund’s dividend reinvestment plan. |
| (7) | | Annualized for periods less than one full year. |
| (8) | | Net expenses reflect a voluntary expense reimbursement to prevent a negative yield. |
| (9) | | The Adviser has agreed to waive and/or reimburse certain fees and/or expense so that, on an annualized basis, such expenses incurred will not exceed .95% as a percentage of average daily net assets. |
See accompanying Notes to the Financial Statements.
69
Barings Emerging Markets Debt Blended Total Return Fund 2018 Semi-Annual Report
FINANCIAL HIGHLIGHTS(CONTINUED)
| | | | | | | | | | | | | | | | |
| | | CLASS Y | |
| | | FOR THE SIX MONTHS ENDED
DECEMBER 31, 2018 (1) | | | FOR THE
YEAR ENDED
JUNE 30, 2018 | | | FOR THE YEAR ENDED
JUNE 30, 2017 | | | PERIOD FROM
OCTOBER 21, 2015
THROUGH
JUNE 30, 2016 (2) | |
| | | | |
| Per Common Share Data | | | | | | | | | | | | | | | | |
Net asset value, beginning of period | | $ | 9.51 | | | $ | 10.55 | | | $ | 9.90 | | | $ | 10.00 | |
Income from investment operations: | | | | | | | | | | | | | | | | |
Net investment income (3) | | | 0.26 | | | | 0.55 | | | | 0.45 | | | | 0.45 | |
Net realized and unrealized gain (loss) on investments | | | (0.10 | ) | | | (0.71 | ) | | | 0.73 | | | | (0.19 | ) |
| | | | | | | | | | | | | | | | |
Total increase (decrease) from investment operations | | | 0.16 | | | | (0.16 | ) | | | 1.18 | | | | 0.26 | |
| | | | | | | | | | | | | | | | |
Less dividends and distributions: | | | | | | | | | | | | | | | | |
From net investment income | | | (0.29 | ) | | | (0.58 | ) | | | (0.53 | ) | | | (0.36 | ) |
From net realized gain | | | – | | | | (0.30 | ) | | | – | | | | (0.00 | )(4) |
| | | | | | | | | | | | | | | | |
Total dividends and distributions | | | (0.29 | ) | | | (0.88 | ) | | | (0.53 | ) | | | (0.36 | ) |
| | | | | | | | | | | | | | | | |
Net asset value, at end of period | | $ | 9.38 | | | $ | 9.51 | | | $ | 10.55 | | | $ | 9.90 | |
| | | | | | | | | | | | | | | | |
Total investment return (5) | | | 1.62 | %(6) | | | (1.94 | )% | | | 12.22 | % | | | 2.79 | %(6) |
| | | | | | | | | | | | | | | | |
| | | | |
| Supplemental Data and Ratios | | | | | | | | | | | | | | | | |
Net assets, end of period (000’s) | | $ | 23,289 | | | $ | 23,122 | | | $ | 5,340 | | | $ | 4,754 | |
Ratio of total expenses (before reductions and reimbursements) to average net assets | | | 1.42 | %(7) | | | 1.95 | % | | | 2.77 | % | | | 2.58 | %(7) |
Ratio of net expenses to average net assets (9) | | | 0.85 | %(7)(8) | | | 0.80 | %(8) | | | 0.90 | %(8) | | | 0.92 | %(7) |
Ratio of net investment income to average net assets | | | 5.68 | %(7) | | | 5.38 | % | | | 4.43 | % | | | 6.77 | %(7) |
Portfolio turnover rate | | | 42.39 | %(6) | | | 51.95 | % | | | 55.66 | % | | | 83.26 | %(6) |
| (2) | | Fund commenced operations on October 21, 2015. |
| (3) | | Calculated using average shares outstanding. |
| (4) | | Amount rounds to less than $.01 per share. |
| (5) | | Total investment return calculation assumes the reinvestment of dividends at actual prices pursuant to the Fund’s dividend reinvestment plan. |
| (7) | | Annualized for periods less than one full year. |
| (8) | | Net expenses reflect a voluntary expense reimbursement to prevent a negative yield. |
| (9) | | The Adviser has agreed to waive and/or reimburse certain fees and/or expense so that, on an annualized basis, such expenses incurred will not exceed .95% as a percentage of average daily net assets. |
See accompanying Notes to the Financial Statements.
70
Barings Global Emerging Markets Equity Fund 2018 Semi-Annual Report
FINANCIAL HIGHLIGHTS
| | | | |
| | | CLASS A | |
| | | PERIOD FROM
SEPTEMBER 17, 2018
THROUGH
DECEMBER 31, 2018 (1)(2) | |
| |
| Per Common Share Data | | | | |
Net asset value, beginning of period | | $ | 10.00 | |
Income from investment operations: | | | | |
Net investment income (3) | | | (0.02 | ) |
Net realized and unrealized loss on investments | | | (0.34 | ) |
| | | | |
Total decrease from investment operations | | | (0.36 | ) |
| | | | |
Net asset value, at end of period | | $ | 9.64 | |
| | | | |
Total investment return (4) | | | (3.65 | )%(5) |
| | | | |
| |
| Supplemental Data and Ratios | | | | |
Net assets, end of period (000’s) | | $ | 96 | |
Ratio of total expenses (before reductions and reimbursements) to average net assets | | | 9.11 | %(6) |
Ratio of net expenses to average net assets (7) | | | 1.45 | %(6) |
Ratio of net investment loss to average net assets | | | (0.82 | )%(6) |
Portfolio turnover rate | | | 1.25 | %(5) |
| (2) | | Fund commenced operations on September 17, 2018. |
| (3) | | Calculated using average shares outstanding. |
| (4) | | Total investment return calculation does not consider the effects of sales loads and assumes the reinvestment of dividends at actual prices pursuant to the Fund’s dividend reinvestment plan. |
| (6) | | Annualized for periods less than one full year. |
| (7) | | The Adviser has agreed to waive and/or reimburse certain fees and/or expense so that, on an annualized basis, such expenses incurred will not exceed 1.45% as a percentage of average daily net assets. |
See accompanying Notes to the Financial Statements.
71
Barings Global Emerging Markets Equity Fund 2018 Semi-Annual Report
FINANCIAL HIGHLIGHTS(CONTINUED)
| | | | |
| | | CLASS C | |
| | | PERIOD FROM
SEPTEMBER 17, 2018
THROUGH
DECEMBER 31, 2018 (1)(2) | |
| |
| Per Common Share Data | | | | |
Net asset value, beginning of period | | $ | 10.00 | |
Income from investment operations: | | | | |
Net investment income (3) | | | (0.04 | ) |
Net realized and unrealized loss on investments | | | (0.35 | ) |
| | | | |
Total decrease from investment operations | | | (0.39 | ) |
| | | | |
Net asset value, at end of period | | $ | 9.61 | |
| | | | |
Total investment return (4) | | | (3.85 | )%(5) |
| | | | |
| |
| Supplemental Data and Ratios | | | | |
Net assets, end of period (000’s) | | $ | 96 | |
Ratio of total expenses (before reductions and reimbursements) to average net assets | | | 9.87 | %(6) |
Ratio of net expenses to average net assets (7) | | | 2.20 | %(6) |
Ratio of net investment loss to average net assets | | | (1.56 | )%(6) |
Portfolio turnover rate | | | 1.25 | %(5) |
| (2) | | Fund commenced operations on September 17, 2018. |
| (3) | | Calculated using average shares outstanding. |
| (4) | | Total investment return calculation does not consider the effects of sales loads and assumes the reinvestment of dividends at actual prices pursuant to the Fund’s dividend reinvestment plan. |
| (6) | | Annualized for periods less than one full year. |
| (7) | | The Adviser has agreed to waive and/or reimburse certain fees and/or expense so that, on an annualized basis, such expenses incurred will not exceed 2.20% as a percentage of average daily net assets. |
See accompanying Notes to the Financial Statements.
72
Barings Global Emerging Markets Equity Fund 2018 Semi-Annual Report
FINANCIAL HIGHLIGHTS(CONTINUED)
| | | | |
| | | CLASS I | |
| | | PERIOD FROM
SEPTEMBER 17, 2018
THROUGH
DECEMBER 31, 2018 (1)(2) | |
| |
| Per Common Share Data | | | | |
Net asset value, beginning of period(2) | | $ | 10.00 | |
Income from investment operations: | | | | |
Net investment income (3) | | | (0.02 | ) |
Net realized and unrealized loss on investments | | | (0.34 | ) |
| | | | |
Total decrease from investment operations | | | (0.36 | ) |
| | | | |
Net asset value, at end of period | | $ | 9.64 | |
| | | | |
Total investment return (4) | | | (3.58 | )%(5) |
| | | | |
| |
| Supplemental Data and Ratios | | | | |
Net assets, end of period (000’s) | | $ | 4,725 | |
Ratio of total expenses (before reductions and reimbursements) to average net assets | | | 3.10 | %(6) |
Ratio of net expenses to average net assets (7) | | | 1.20 | %(6) |
Ratio of net investment loss to average net assets | | | (0.57 | )%(6) |
Portfolio turnover rate | | | 1.25 | %(5) |
| (2) | | Fund commenced operations on September 17, 2018. |
| (3) | | Calculated using average shares outstanding. |
| (4) | | Total investment return calculation assumes the reinvestment of dividends at actual prices pursuant to the Fund’s dividend reinvestment plan. |
| (6) | | Annualized for periods less than one full year. |
| (7) | | The Adviser has agreed to waive and/or reimburse certain fees and/or expense so that, on an annualized basis, such expenses incurred will not exceed 1.20% as a percentage of average daily net assets. |
See accompanying Notes to the Financial Statements.
73
Barings Global Emerging Markets Equity Fund 2018 Semi-Annual Report
FINANCIAL HIGHLIGHTS(CONTINUED)
| | | | |
| | | CLASS Y | |
| | | PERIOD FROM
SEPTEMBER 17, 2018
THROUGH
DECEMBER 31, 2018 (1)(2) | |
| |
| Per Common Share Data | | | | |
Net asset value, beginning of period | | $ | 10.00 | |
Income from investment operations: | | | | |
Net investment income (3) | | | (0.02 | ) |
Net realized and unrealized loss on investments | | | (0.34 | ) |
| | | | |
Total decrease from investment operations | | | (0.36 | ) |
| | | | |
Net asset value, at end of period | | $ | 9.64 | |
| | | | |
Total investment return (4) | | | (3.58 | )%(5) |
| | | | |
| |
| Supplemental Data and Ratios | | | | |
Net assets, end of period (000’s) | | $ | 4,725 | |
Ratio of total expenses (before reductions and reimbursements) to average net assets | | | 3.13 | %(6) |
Ratio of net expenses to average net assets (7) | | | 1.20 | %(6) |
Ratio of net investment loss to average net assets | | | (0.57 | )%(6) |
Portfolio turnover rate | | | 1.25 | %(5) |
| (2) | | Fund commenced operations on September 17, 2018. |
| (3) | | Calculated using average shares outstanding. |
| (4) | | Total investment return calculation assumes the reinvestment of dividends at actual prices pursuant to the Fund’s dividend reinvestment plan. |
| (6) | | Annualized for periods less than one full year. |
| (7) | | The Adviser has agreed to waive and/or reimburse certain fees and/or expense so that, on an annualized basis, such expenses incurred will not exceed 1.20% as a percentage of average daily net assets. |
See accompanying Notes to the Financial Statements.
74
Barings Global High Yield Fund 2018 Semi-Annual Report
FINANCIAL HIGHLIGHTS
| | | | | | | | | | | | | | | | |
| | | CLASS A | |
| | | FOR THE SIX MONTHS ENDED
DECEMBER 31, 2018 (1) | | | FOR THE YEAR
ENDED
JUNE 30, 2018 | | | FOR THE YEAR
ENDED
JUNE 30, 2017 | | | PERIOD FROM
OCTOBER 30, 2015
THROUGH
JUNE 30, 2016 (2) | |
| | | | |
| Per Common Share Data | | | | | | | | | | | | | | | | |
Net asset value, beginning of period | | $ | 9.78 | | | $ | 10.44 | | | $ | 10.05 | | | $ | 10.00 | |
Income from investment operations: | | | | | | | | | | | | | | | | |
Net investment income (3) | | | 0.30 | | | | 0.60 | | | | 0.64 | | | | 0.38 | |
Net realized and unrealized gain (loss) on investments | | | (0.58 | ) | | | (0.41 | ) | | | 0.77 | | | | 0.05 | |
| | | | | | | | | | | | | | | | |
Total increase (decrease) from investment operations | | | (0.28 | ) | | | 0.19 | | | | 1.41 | | | | 0.43 | |
| | | | | | | | | | | | | | | | |
Less dividends and distributions: | | | | | | | | | | | | | | | | |
From net investment income | | | (0.30 | ) | | | (0.60 | ) | | | (0.64 | ) | | | (0.38 | ) |
From net realized gain | | | (0.21 | ) | | | (0.25 | ) | | | (0.38 | ) | | | – | |
| | | | | | | | | | | | | | | | |
Total dividends and distributions | | | (0.51 | ) | | | (0.85 | ) | | | (1.02 | ) | | | (0.38 | ) |
| | | | | | | | | | | | | | | | |
Net asset value, at end of period | | $ | 8.99 | | | $ | 9.78 | | | $ | 10.44 | | | $ | 10.05 | |
| | | | | | | | | | | | | | | | |
Total investment return (4) | | | (2.80 | )%(5) | | | 1.79 | % | | | 14.61 | % | | | 4.45 | %(5) |
| | | | | | | | | | | | | | | | |
| | | | |
| Supplemental Data and Ratios | | | | | | | | | | | | | | | | |
Net assets, end of period (000’s) | | $ | 169 | | | $ | 106 | | | $ | 111 | | | $ | 101 | |
Ratio of total expenses (before reductions and reimbursements) to average net assets | | | 8.47 | %(6) | | | 6.55 | % | | | 6.27 | % | | | 7.14 | %(6) |
Ratio of net expenses to average net assets (7) | | | 1.05 | %(6) | | | 1.05 | % | | | 1.05 | % | | | 1.04 | %(6) |
Ratio of net investment income to average net assets | | | 6.20 | %(6) | | | 5.89 | % | | | 6.20 | % | | | 5.83 | %(6) |
Portfolio turnover rate | | | 24.01 | %(5) | | | 65.26 | % | | | 87.34 | % | | | 83.24 | %(5) |
| (2) | | Fund commenced operations on October 30, 2015. |
| (3) | | Calculated using average shares outstanding. |
| (4) | | Total investment return calculation does not consider the effects of sales loads and assumes the reinvestment of dividends at actual prices pursuant to the Fund’s dividend reinvestment plan. |
| (6) | | Annualized for periods less than one full year. |
| (7) | | The Adviser has agreed to waive and/or reimburse certain fees and/or expense so that, on an annualized basis, such expenses incurred will not exceed 1.05% as a percentage of average daily net assets. |
See accompanying Notes to the Financial Statements.
75
Barings Global High Yield Fund 2018 Semi-Annual Report
FINANCIAL HIGHLIGHTS(CONTINUED)
| | | | | | | | | | | | | | | | |
| | | CLASS C | |
| | | FOR THE SIX MONTHS ENDED
DECEMBER 31, 2018 (1) | | | FOR THE YEAR
ENDED
JUNE 30, 2018 | | | FOR THE YEAR
ENDED
JUNE 30, 2017 | | | PERIOD FROM
OCTOBER 30, 2015
THROUGH
JUNE 30, 2016 (2) | |
| | | | |
| Per Common Share Data | | | | | | | | | | | | | | | | |
Net asset value, beginning of period | | $ | 9.78 | | | $ | 10.44 | | | $ | 10.05 | | | $ | 10.00 | |
Income from investment operations: | | | | | | | | | | | | | | | | |
Net investment income (3) | | | 0.27 | | | | 0.52 | | | | 0.56 | | | | 0.33 | |
Net realized and unrealized gain (loss) on investments | | | (0.57 | ) | | | (0.41 | ) | | | 0.77 | | | | 0.05 | |
| | | | | | | | | | | | | | | | |
Total increase (decrease) from investment operations | | | (0.30 | ) | | | 0.11 | | | | 1.33 | | | | 0.38 | |
| | | | | | | | | | | | | | | | |
Less dividends and distributions: | | | | | | | | | | | | | | | | |
From net investment income | | | (0.27 | ) | | | (0.52 | ) | | | (0.56 | ) | | | (0.33 | ) |
From net realized gain | | | (0.21 | ) | | | (0.25 | ) | | | (0.38 | ) | | | – | |
| | | | | | | | | | | | | | | | |
Total dividends and distributions | | | (0.48 | ) | | | (0.77 | ) | | | (0.94 | ) | | | (0.33 | ) |
| | | | | | | | | | | | | | | | |
Net asset value, at end of period | | $ | 9.00 | | | $ | 9.78 | | | $ | 10.44 | | | $ | 10.05 | |
| | | | | | | | | | | | | | | | |
Total investment return (4) | | | (3.13 | )%(5) | | | 1.04 | % | | | 13.75 | % | | | 3.94 | %(5) |
| | | | | | | | | | | | | | | | |
| | | | |
| Supplemental Data and Ratios | | | | | | | | | | | | | | | | |
Net assets, end of period (000’s) | | $ | 177 | | | $ | 197 | | | $ | 247 | | | $ | 101 | |
Ratio of total expenses (before reductions and reimbursements) to average net assets | | | 5.37 | %(6) | | | 4.80 | % | | | 4.94 | % | | | 7.89 | %(6) |
Ratio of net expenses to average net assets (7) | | | 1.80 | %(6) | | | 1.80 | % | | | 1.80 | % | | | 1.78 | %(6) |
Ratio of net investment income to average net assets | | | 5.45 | %(6) | | | 5.14 | % | | | 5.40 | % | | | 5.09 | %(6) |
Portfolio turnover rate | | | 24.01 | %(5) | | | 65.26 | % | | | 87.34 | % | | | 83.24 | %(5) |
| (2) | | Fund commenced operations on October 30, 2015. |
| (3) | | Calculated using average shares outstanding. |
| (4) | | Total investment return calculation does not consider the effects of sales loads and assumes the reinvestment of dividends at actual prices pursuant to the Fund’s dividend reinvestment plan. |
| (6) | | Annualized for periods less than one full year. |
| (7) | | The Adviser has agreed to waive and/or reimburse certain fees and/or expense so that, on an annualized basis, such expenses incurred will not exceed 1.80% as a percentage of average daily net assets. |
See accompanying Notes to the Financial Statements.
76
Barings Global High Yield Fund 2018 Semi-Annual Report
FINANCIAL HIGHLIGHTS(CONTINUED)
| | | | | | | | | | | | | | | | |
| | | CLASS I | |
| | | FOR THE SIX MONTHS ENDED
DECEMBER 31, 2018 (1) | | | FOR THE YEAR
ENDED
JUNE 30, 2018 | | | FOR THE YEAR
ENDED
JUNE 30, 2017 | | | PERIOD FROM
OCTOBER 30, 2015
THROUGH
JUNE 30, 2016 (2) | |
| | | | |
| Per Common Share Data | | | | | | | | | | | | | | | | |
Net asset value, beginning of period | | $ | 9.78 | | | $ | 10.44 | | | $ | 10.05 | | | $ | 10.00 | |
Income from investment operations: | | | | | | | | | | | | | | | | |
Net investment income (3) | | | 0.32 | | | | 0.63 | | | | 0.67 | | | | 0.39 | |
Net realized and unrealized gain (loss) on investments | | | (0.57 | ) | | | (0.41 | ) | | | 0.77 | | | | 0.05 | |
| | | | | | | | | | | | | | | | |
Total increase (decrease) from investment operations | | | (0.25 | ) | | | 0.22 | | | | 1.44 | | | | 0.44 | |
| | | | | | | | | | | | | | | | |
Less dividends and distributions: | | | | | | | | | | | | | | | | |
From net investment income | | | (0.32 | ) | | | (0.63 | ) | | | (0.67 | ) | | | (0.39 | ) |
From net realized gain | | | (0.21 | ) | | | (0.25 | ) | | | (0.38 | ) | | | – | |
| | | | | | | | | | | | | | | | |
Total dividends and distributions | | | (0.53 | ) | | | (0.88 | ) | | | (1.05 | ) | | | (0.39 | ) |
| | | | | | | | | | | | | | | | |
Net asset value, at end of period | | $ | 9.00 | | | $ | 9.78 | | | $ | 10.44 | | | $ | 10.05 | |
| | | | | | | | | | | | | | | | |
Total investment return (4) | | | (2.65 | )%(5) | | | 2.05 | % | | | 14.90 | % | | | 4.62 | %(5) |
| | | | | | | | | | | | | | | | |
| | | | |
| Supplemental Data and Ratios | | | | | | | | | | | | | | | | |
Net assets, end of period (000’s) | | $ | 11,155 | | | $ | 12,130 | | | $ | 12,947 | | | $ | 12,466 | |
Ratio of total expenses (before reductions and reimbursements) to average net assets | | | 1.51 | %(6) | | | 1.53 | % | | | 1.53 | % | | | 1.51 | %(6) |
Ratio of net expenses to average net assets (7) | | | 0.80 | %(6) | | | 0.80 | % | | | 0.80 | % | | | 0.79 | %(6) |
Ratio of net investment income to average net assets | | | 6.46 | %(6) | | | 6.14 | % | | | 6.46 | % | | | 6.08 | %(6) |
Portfolio turnover rate | | | 24.01 | %(5) | | | 65.26 | % | | | 87.34 | % | | | 83.24 | %(5) |
| (2) | | Fund commenced operations on October 30, 2015. |
| (3) | | Calculated using average shares outstanding. |
| (4) | | Total investment return calculation assumes the reinvestment of dividends at actual prices pursuant to the Fund’s dividend reinvestment plan. |
| (6) | | Annualized for periods less than one full year. |
| (7) | | The Adviser has agreed to waive and/or reimburse certain fees and/or expense so that, on an annualized basis, such expenses incurred will not exceed .80% as a percentage of average daily net assets. |
See accompanying Notes to the Financial Statements.
77
Barings Global High Yield Fund 2018 Semi-Annual Report
FINANCIAL HIGHLIGHTS(CONTINUED)
| | | | | | | | | | | | | | | | |
| | | CLASS Y | |
| | | FOR THE SIX MONTHS ENDED
DECEMBER 31, 2018 (1) | | | FOR THE YEAR ENDED
JUNE 30, 2018 | | | FOR THE YEAR ENDED
JUNE 30, 2017 | | | PERIOD FROM
OCTOBER 30, 2015
THROUGH
JUNE 30, 2016 (2) | |
| | | | |
| Per Common Share Data | | | | | | | | | | | | | | | | |
Net asset value, beginning of period | | $ | 9.78 | | | $ | 10.44 | | | $ | 10.05 | | | $ | 10.00 | |
Income from investment operations: | | | | | | | | | | | | | | | | |
Net investment income (3) | | | 0.32 | | | | 0.63 | | | | 0.67 | | | | 0.39 | |
Net realized and unrealized gain (loss) on investments | | | (0.57 | ) | | | (0.41 | ) | | | 0.77 | | | | 0.05 | |
| | | | | | | | | | | | | | | | |
Total increase (decrease) from investment operations | | | (0.25 | ) | | | 0.22 | | | | 1.44 | | | | 0.44 | |
| | | | | | | | | | | | | | | | |
Less dividends and distributions: | | | | | | | | | | | | | | | | |
From net investment income | | | (0.32 | ) | | | (0.63 | ) | | | (0.67 | ) | | | (0.39 | ) |
From net realized gain | | | (0.21 | ) | | | (0.25 | ) | | | (0.38 | ) | | | – | |
| | | | | | | | | | | | | | | | |
Total dividends and distributions | | | (0.53 | ) | | | (0.88 | ) | | | (1.05 | ) | | | (0.39 | ) |
| | | | | | | | | | | | | | | | |
Net asset value, at end of period | | $ | 9.00 | | | $ | 9.78 | | | $ | 10.44 | | | $ | 10.05 | |
| | | | | | �� | | | | | | | | | | |
Total investment return (4) | | | (2.65 | )%(5) | | | 2.05 | % | | | 14.90 | % | | | 4.62 | %(5) |
| | | | | | | | | | | | | | | | |
| | | | |
| Supplemental Data and Ratios | | | | | | | | | | | | | | | | |
Net assets, end of period (000’s) | | $ | 11,394 | | | $ | 12,393 | | | $ | 14,535 | | | $ | 12,604 | |
Ratio of total expenses (before reductions and reimbursements) to average net assets | | | 1.53 | %(6) | | | 1.53 | % | | | 1.53 | % | | | 1.51 | %(6) |
Ratio of net expenses to average net assets (7) | | | 0.80 | %(6) | | | 0.80 | % | | | 0.80 | % | | | 0.79 | %(6) |
Ratio of net investment income to average net assets | | | 6.46 | %(6) | | | 6.14 | % | | | 6.45 | % | | | 6.08 | %(6) |
Portfolio turnover rate | | | 24.01 | %(5) | | | 65.26 | % | | | 87.34 | % | | | 83.24 | %(5) |
| (2) | | Fund commenced operations on October 30, 2015. |
| (3) | | Calculated using average shares outstanding. |
| (4) | | Total investment return calculation assumes the reinvestment of dividends at actual prices pursuant to the Fund’s dividend reinvestment plan. |
| (6) | | Annualized for periods less than one full year. |
| (7) | | The Adviser has agreed to waive and/or reimburse certain fees and/or expense so that, on an annualized basis, such expenses incurred will not exceed .80% as a percentage of average daily net assets. |
See accompanying Notes to the Financial Statements.
78
Barings U.S. High Yield Fund 2018 Semi-Annual Report
FINANCIAL HIGHLIGHTS
| | | | | | | | | | | | | | | | |
| | | CLASS A | |
| | | FOR THE SIX MONTHS ENDED
DECEMBER 31, 2018 (1) | | | FOR THE YEAR
ENDED
JUNE 30, 2018 | | | FOR THE YEAR ENDED
JUNE 30, 2017 | | | PERIOD FROM
OCTOBER 30, 2015
THROUGH
JUNE 30, 2016 (2) | |
| | | | |
| Per Common Share Data | | | | | | | | | | | | | | | | |
Net asset value, beginning of period | | $ | 9.82 | | | $ | 10.59 | | | $ | 10.14 | | | $ | 10.00 | |
Income from investment operations: | | | | | | | | | | | | | | | | |
Net investment income (3) | | | 0.29 | | | | 0.61 | | | | 0.65 | | | | 0.39 | |
Net realized and unrealized gain (loss) on investments | | | (0.53 | ) | | | (0.47 | ) | | | 0.65 | | | | 0.13 | |
| | | | | | | | | | | | | | | | |
Total increase (decrease) from investment operations | | | (0.24 | ) | | | 0.14 | | | | 1.30 | | | | 0.52 | |
| | | | | | | | | | | | | | | | |
Less dividends and distributions: | | | | | | | | | | | | | | | | |
From net investment income | | | (0.29 | ) | | | (0.61 | ) | | | (0.66 | ) | | | (0.38 | ) |
From net realized gain | | | – | | | | (0.30 | ) | | | (0.19 | ) | | | – | |
| | | | | | | | | | | | | | | | |
Total dividends and distributions | | | (0.29 | ) | | | (0.91 | ) | | | (0.85 | ) | | | (0.38 | ) |
| | | | | | | | | | | | | | | | |
Net asset value, at end of period | | $ | 9.29 | | | $ | 9.82 | | | $ | 10.59 | | | $ | 10.14 | |
| | | | | | | | | | | | | | | | |
Total investment return (4) | | | (2.50 | )%(5) | | | 1.32 | % | | | 13.13 | % | | | 5.36 | %(5) |
| | | | | | | | | | | | | | | | |
| | | | |
| Supplemental Data and Ratios | | | | | | | | | | | | | | | | |
Net assets, end of period (000’s) | | $ | 1,334 | | | $ | 2,918 | | | $ | 2,633 | | | $ | 206 | |
Ratio of total expenses (before reductions and reimbursements) to average net assets | | | 1.99 | %(6) | | | 1.71 | % | | | 1.82 | % | | | 5.47 | %(6) |
Ratio of net expenses to average net assets (7) | | | 1.00 | %(6) | | | 1.00 | % | | | 1.00 | % | | | 0.99 | %(6) |
Ratio of net investment income to average net assets | | | 5.90 | %(6) | | | 5.92 | % | | | 6.21 | % | | | 5.93 | %(6) |
Portfolio turnover rate | | | 20.38 | %(5) | | | 43.75 | % | | | 71.57 | % | | | 77.52 | %(5) |
| (2) | | Fund commenced operations on October 30, 2015. |
| (3) | | Calculated using average shares outstanding. |
| (4) | | Total investment return calculation does not consider the effects of sales loads and assumes the reinvestment of dividends at actual prices pursuant to the Fund’s dividend reinvestment plan. |
| (6) | | Annualized for periods less than one full year. |
| (7) | | The Adviser has agreed to waive and/or reimburse certain fees and/or expense so that, on an annualized basis, such expenses incurred will not exceed 1.00% as a percentage of average daily net assets. |
See accompanying Notes to the Financial Statements.
79
Barings U.S. High Yield Fund 2018 Semi-Annual Report
FINANCIAL HIGHLIGHTS(CONTINUED)
| | | | | | | | | | | | | | | | |
| | | CLASS C | |
| | | FOR THE SIX MONTHS ENDED
DECEMBER 31, 2018 (1) | | | FOR THE YEAR ENDED
JUNE 30, 2018 | | | FOR THE YEAR ENDED
JUNE 30, 2017 | | | PERIOD FROM
OCTOBER 30, 2015
THROUGH
JUNE 30, 2016 (2) | |
| | | | |
| Per Common Share Data | | | | | | | | | | | | | | | | |
Net asset value, beginning of period | | $ | 9.82 | | | $ | 10.59 | | | $ | 10.14 | | | $ | 10.00 | |
Income from investment operations: | | | | | | | | | | | | | | | | |
Net investment income (3) | | | 0.25 | | | | 0.53 | | | | 0.58 | | | | 0.33 | |
Net realized and unrealized gain (loss) on investments | | | (0.54 | ) | | | (0.47 | ) | | | 0.64 | | | | 0.14 | |
| | | | | | | | | | | | | | | | |
Total increase (decrease) from investment operations | | | (0.29 | ) | | | 0.06 | | | | 1.22 | | | | 0.47 | |
| | | | | | | | | | | | | | | | |
Less dividends and distributions: | | | | | | | | | | | | | | | | |
From net investment income | | | (0.25 | ) | | | (0.53 | ) | | | (0.58 | ) | | | (0.33 | ) |
From net realized gain | | | – | | | | (0.30 | ) | | | (0.19 | ) | | | – | |
| | | | | | | | | | | | | | | | |
Total dividends and distributions | | | (0.25 | ) | | | (0.83 | ) | | | (0.77 | ) | | | (0.33 | ) |
| | | | | | | | | | | | | | | | |
Net asset value, at end of period | | $ | 9.28 | | | $ | 9.82 | | | $ | 10.59 | | | $ | 10.14 | |
| | | | | | | | | | | | | | | | |
Total investment return (4) | | | (2.90 | )%(5) | | | 0.61 | % | | | 12.24 | % | | | 4.85 | %(5) |
| | | | | | | | | | | | | | | | |
| | | | |
| Supplemental Data and Ratios | | | | | | | | | | | | | | | | |
Net assets, end of period (000’s) | | $ | 93 | | | $ | 98 | | | $ | 118 | | | $ | 101 | |
Ratio of total expenses (before reductions and reimbursements) to average net assets | | | 7.13 | %(6) | | | 6.43 | % | | | 6.18 | % | | | 7.30 | %(6) |
Ratio of net expenses to average net assets (7) | | | 1.75 | %(6) | | | 1.75 | % | | | 1.75 | % | | | 1.73 | %(6) |
Ratio of net investment income to average net assets | | | 5.17 | %(6) | | | 5.17 | % | | | 5.50 | % | | | 5.08 | %(6) |
Portfolio turnover rate | | | 20.38 | %(5) | | | 43.75 | % | | | 71.57 | % | | | 77.52 | %(5) |
| (2) | | Fund commenced operations on October 30, 2015. |
| (3) | | Calculated using average shares outstanding. |
| (4) | | Total investment return calculation does not consider the effects of sales loads and assumes the reinvestment of dividends at actual prices pursuant to the Fund’s dividend reinvestment plan. |
| (6) | | Annualized for periods less than one full year. |
| (7) | | The Adviser has agreed to waive and/or reimburse certain fees and/or expense so that, on an annualized basis, such expenses incurred will not exceed 1.75% as a percentage of average daily net assets. |
See accompanying Notes to the Financial Statements.
80
Barings U.S. High Yield Fund 2018 Semi-Annual Report
FINANCIAL HIGHLIGHTS(CONTINUED)
| | | | | | | | | | | | | | | | |
| | | CLASS I | |
| | | FOR THE SIX MONTHS ENDED
DECEMBER 31, 2018 (1) | | | FOR THE YEAR ENDED
JUNE 30, 2018 | | | FOR THE YEAR ENDED
JUNE 30, 2017 | | | PERIOD FROM
OCTOBER 30, 2015
THROUGH
JUNE 30, 2016 (2) | |
| | | | |
| Per Common Share Data | | | | | | | | | | | | | | | | |
Net asset value, beginning of period | | $ | 9.82 | | | $ | 10.59 | | | $ | 10.14 | | | $ | 10.00 | |
Income from investment operations: | | | | | | | | | | | | | | | | |
Net investment income (3) | | | 0.30 | | | | 0.63 | | | | 0.68 | | | | 0.40 | |
Net realized and unrealized gain (loss) on investments | | | (0.54 | ) | | | (0.47 | ) | | | 0.64 | | | | 0.13 | |
| | | | | | | | | | | | | | | | |
Total increase (decrease) from investment operations | | | (0.24 | ) | | | 0.16 | | | | 1.32 | | | | 0.53 | |
| | | | | | | | | | | | | | | | |
Less dividends and distributions: | | | | | | | | | | | | | | | | |
From net investment income | | | (0.30 | ) | | | (0.63 | ) | | | (0.68 | ) | | | (0.39 | ) |
From net realized gain | | | – | | | | (0.30 | ) | | | (0.19 | ) | | | – | |
| | | | | | | | | | | | | | | | |
Total dividends and distributions | | | (0.30 | ) | | | (0.93 | ) | | | (0.87 | ) | | | (0.39 | ) |
| | | | | | | | | | | | | | | | |
Net asset value, at end of period | | $ | 9.28 | | | $ | 9.82 | | | $ | 10.59 | | | $ | 10.14 | |
| | | | | | | | | | | | | | | | |
Total investment return (4) | | | (2.41 | )%(5) | | | 1.61 | % | | | 13.36 | % | | | 5.53 | %(5) |
| | | | | | | | | | | | | | | | |
| | | | |
| Supplemental Data and Ratios | | | | | | | | | | | | | | | | |
Net assets, end of period (000’s) | | $ | 14,082 | | | $ | 14,816 | | | $ | 15,720 | | | $ | 14,863 | |
Ratio of total expenses (before reductions and reimbursements) to average net assets | | | 1.02 | %(6) | | | 1.28 | % | | | 1.36 | % | | | 1.38 | %(6) |
Ratio of net expenses to average net assets (7) | | | 0.75 | %(6) | | | 0.75 | % | | | 0.75 | % | | | 0.74 | %(6) |
Ratio of net investment income to average net assets | | | 6.17 | %(6) | | | 6.16 | % | | | 6.50 | % | | | 6.11 | %(6) |
Portfolio turnover rate | | | 20.38 | %(5) | | | 43.75 | % | | | 71.57 | % | | | 77.52 | %(5) |
| (2) | | Fund commenced operations on October 30, 2015. |
| (3) | | Calculated using average shares outstanding. |
| (4) | | Total investment return calculation assumes the reinvestment of dividends at actual prices pursuant to the Fund’s dividend reinvestment plan. |
| (6) | | Annualized for periods less than one full year. |
| (7) | | The Adviser has agreed to waive and/or reimburse certain fees and/or expense so that, on an annualized basis, such expenses incurred will not exceed .75% as a percentage of average daily net assets. |
See accompanying Notes to the Financial Statements.
81
Barings U.S. High Yield Fund 2018 Semi-Annual Report
FINANCIAL HIGHLIGHTS(CONTINUED)
| | | | | | | | | | | | | | | | |
| | | CLASS Y | |
| | | FOR THE SIX MONTHS ENDED DECEMBER 31, 2018 (1) | | | FOR THE YEAR
ENDED
JUNE 30, 2018 | | | FOR THE YEAR ENDED
JUNE 30, 2017 | | | PERIOD FROM
OCTOBER 30, 2015
THROUGH
JUNE 30, 2016 (2) | |
| | | | |
| Per Common Share Data | | | | | | | | | | | | | | | | |
Net asset value, beginning of period | | $ | 9.82 | | | $ | 10.58 | | | $ | 10.14 | | | $ | 10.00 | |
Income from investment operations: | | | | | | | | | | | | | | | | |
Net investment income (3) | | | 0.30 | | | | 0.62 | | | | 0.68 | | | | 0.39 | |
Net realized and unrealized gain (loss) on investments | | | (0.54 | ) | | | (0.45 | ) | | | 0.63 | | | | 0.14 | |
| | | | | | | | | | | | | | | | |
Total increase (decrease) from investment operations | | | (0.24 | ) | | | 0.17 | | | | 1.31 | | | | 0.53 | |
| | | | | | | | | | | | | | | | |
Less dividends and distributions: | | | | | | | | | | | | | | | | |
From net investment income | | | (0.30 | ) | | | (0.63 | ) | | | (0.68 | ) | | | (0.39 | ) |
From net realized gain | | | – | | | | (0.30 | ) | | | (0.19 | ) | | | – | |
| | | | | | | | | | | | | | | | |
Total dividends and distributions | | | (0.30 | ) | | | (0.93 | ) | | | (0.87 | ) | | | (0.39 | ) |
| | | | | | | | | | | | | | | | |
Net asset value, at end of period | | $ | 9.28 | | | $ | 9.82 | | | $ | 10.58 | | | $ | 10.14 | |
| | | | | | | | | | | | | | | | |
Total investment return (4) | | | (2.41 | )%(5) | | | 1.61 | % | | | 13.35 | % | | | 5.52 | %(5) |
| | | | | | | | | | | | | | | | |
| | | | |
| Supplemental Data and Ratios | | | | | | | | | | | | | | | | |
Net assets, end of period (000’s) | | $ | 35,078 | | | $ | 39,176 | | | $ | 14,631 | | | $ | 12,675 | |
Ratio of total expenses (before reductions and reimbursements) to average net assets | | | 1.00 | %(6) | | | 1.25 | % | | | 1.36 | % | | | 1.42 | %(6) |
Ratio of net expenses to average net assets (7) | | | 0.75 | %(6) | | | 0.75 | % | | | 0.75 | % | | | 0.74 | %(6) |
Ratio of net investment income to average net assets | | | 6.17 | %(6) | | | 6.09 | % | | | 6.50 | % | | | 6.06 | %(6) |
Portfolio turnover rate | | | 20.38 | %(5) | | | 43.75 | % | | | 71.57 | % | | | 77.52 | %(5) |
| (2) | | Fund commenced operations on October 30, 2015. |
| (3) | | Calculated using average shares outstanding. |
| (4) | | Total investment return calculation assumes the reinvestment of dividends at actual prices pursuant to the Fund’s dividend reinvestment plan. |
| (6) | | Annualized for periods less than one full year. |
| (7) | | The Adviser has agreed to waive and/or reimburse certain fees and/or expense so that, on an annualized basis, such expenses incurred will not exceed .75% as a percentage of average daily net assets. |
See accompanying Notes to the Financial Statements.
82
Barings Global Floating Rate Fund 2018 Semi-Annual Report
SCHEDULE OF INVESTMENTS
December 31, 2018 (Unaudited)
| | | | | | | | | | | | | | | | | | | | | | | | | |
| | | | | | | SHARES | | COST | | FAIR
VALUE |
Equities — 0.5%*: | | | | | | | | | | | | | | | | | | | | | | | | | |
| | | | | |
Common Stocks — 0.5%*: | | | | | | | | | | | | | | | | | | | | | | | | | |
| | | | | |
Healthcare, Education and Childcare — 0.0%*: | | | | | | | | | | | | | | | | | | | | | | | | | |
Tunstall Group Holdings Ltd.+¤ | | | | | | | | | | | | | | 469 | | | | | $– | | | | | $– | |
Tunstall Group Holdings Ltd.+¤ | | | | | | | | | | | | | | 310 | | | | | – | | | | | – | |
| | | | | | | | | | | | | | | | | | | | | | | | | |
Total Healthcare, Education and Childcare | | | | | | | | | | | | | | 779 | | | | | – | | | | | – | |
| | | | | | | | | | | | | | | | | | | | | | | | | |
| | | | |
Mining, Steel, Iron and Non-Precious Metals — 0.1%*: | | | | | | | | | | | | | | | | | | | | | |
Boomerang Tube LLC¤ | | | | | | | | | | | | | | 1,769,565 | | | | | 171,860 | | | | | 172,055 | |
| | | | | | | | | | | | | | | | | | | | | | | | | |
| | | | | |
Oil and Gas — 0.4%*: | | | | | | | | | | | | | | | | | | | | | | | | | |
Fieldwood Energy LLC | | | | | | | | | | | | | | 6,469 | | | | | 226,415 | | | | | 232,884 | |
Fieldwood Energy LLC | | | | | | | | | | | | | | 26,365 | | | | | 568,599 | | | | | 949,140 | |
Sabine Oil & Gas LLC¤ | | | | | | | | | | | | | | 387 | | | | | 22,597 | | | | | 17,028 | |
Southcross Energy Holdings LP | | | | | | | | | | | | | | 22 | | | | | – | | | | | – | |
Southcross Energy Partners LP | | | | | | | | | | | | | | 22 | | | | | 5,500 | | | | | 10,450 | |
Templar Energy LLC¤ | | | | | | | | | | | | | | 8,762 | | | | | 50,647 | | | | | 5,257 | |
Templar Energy LLC¤†† | | | | | | | | | | | | | | 6,069 | | | | | 60,686 | | | | | 15,172 | |
| | | | | | | | | | | | | | | | | | | | | | | | | |
Total Oil and Gas | | | | | | | | | | | | | | 48,096 | | | | | 934,444 | | | | | 1,229,931 | |
| | | | | | | | | | | | | | | | | | | | | | | | | |
| | | | | | | | | | | | | | | | | | | | | | | | | |
Total Common Stocks | | | | | | | | | | | | | | 1,818,440 | | | | | 1,106,304 | | | | | 1,401,986 | |
| | | | | | | | | | | | | | | | | | | | | | | | | |
| | | | | |
Preferred Stock — 0.0%*: | | | | | | | | | | | | | | | | | | | | | | | | | |
| | | | | |
Farming and Agriculture — 0.0%*: | | | | | | | | | | | | | | | | | | | | | | | | | |
Pinnacle Agriculture Holdings A 2¤†† | | | | | | | | | | | | | | 259,648 | | | | | 173,408 | | | | | 25,965 | |
| | | | | | | | | | | | | | | | | | | | | | | | | |
Warrants — 0.0%*: | | | | | | | | | | | | | | | | | | | | | | | | | |
| | | | |
Diversified/Conglomerate Manufacturing — 0.0%*: | | | | | | | | | | | | | | | | | | | | | |
Appvion Holdings Corp. (exp. June 13, 2023)¤†† | | | | | | | | | | | | | | 449 | | | | | �� | | | | | 4,781 | |
Appvion Holdings Corp. (exp. June 13, 2023)¤ | | | | | | | | | | | | | | 449 | | | | | – | | | | | – | |
| | | | | | | | | | | | | | | | | | | | | | | | | |
Total Diversified/Conglomerate Manufacturing | | | | | | | | | | | | | | 898 | | | | | – | | | | | 4,781 | |
| | | | | | | | | | | | | | | | | | | | | | | | | |
| | | | | |
Oil and Gas — 0.0%*: | | | | | | | | | | | | | | | | | | | | | | | | | |
Sabine Oil & Gas LLC Warrants¤†† | | | | | | | | | | | | | | 1,230 | | | | | 5,523 | | | | | 1,845 | |
Sabine Oil & Gas LLC Warrants¤†† | | | | | | | | | | | | | | 219 | | | | | 595 | | | | | 1,150 | |
| | | | | | | | | | | | | | | | | | | | | | | | | |
Total Oil and Gas | | | | | | | | | | | | | | 1,449 | | | | | 6,118 | | | | | 2,995 | |
| | | | | | | | | | | | | | | | | | | | | | | | | |
Total Warrants | | | | | | | | | | | | | | 2,347 | | | | | 6,118 | | | | | 7,776 | |
| | | | | | | | | | | | | | | | | | | | | | | | | |
Total Equities | | | | | | | | | | | | | | 2,080,435 | | | | | 1,285,830 | | | | | 1,435,727 | |
| | | | | | | | | | | | | | | | | | | | | | | | | |
| | | | | |
| | | EFFECTIVE
INTEREST RATE | | DUE DATE | | PRINCIPAL ‡‡ | | COST | | FAIR
VALUE |
Fixed Income — 94.8%*: | | | | | | | | | | | | | | | | | | | | | | | | | |
| | | | | |
Bank Loans — 83.4%*§: | | | | | | | | | | | | | | | | | | | | | | | | | |
| | | | | |
Aerospace and Defense — 0.1%*: | | | | | | | | | | | | | | | | | | | | | | | | | |
Doncasters Finance US LLC, 3M LIBOR + 3.500% | | | | 6.30 | % | | | | 4/9/2020 | | | | | 443,239 | | | | | 434,715 | | | | | 389,164 | |
| | | | | | | | | | | | | | | | | | | | | | | | | |
See accompanying Notes to the Financial Statements.
83
Barings Global Floating Rate Fund 2018 Semi-Annual Report
SCHEDULE OF INVESTMENTS (CONTINUED)
December 31, 2018 (Unaudited)
| | | | | | | | | | | | | | | | | | | | | | | | | |
| | | EFFECTIVE
INTEREST RATE | | DUE DATE | | PRINCIPAL ‡‡ | | COST | | FAIR
VALUE |
Bank Loans(Continued) | | | | | | | | | | | | | | | | | | | | | | | | | |
| | | | | |
Automobile — 1.7%*: | | | | | | | | | | | | | | | | | | | | | | | | | |
Belron Finance US LLC, 3M LIBOR + 2.500% | | | | 5.11 | % | | | | 11/13/2025 | | | | | 291,064 | | | | | $290,345 | | | | | $280,149 | |
DexKo Global, Inc., 2M LIBOR + 3.500% | | | | 6.02 | | | | | 7/24/2024 | | | | | 307,524 | | | | | 309,747 | | | | | 296,505 | |
NN, Inc., 1M LIBOR + 3.750% | | | | 6.27 | | | | | 10/19/2022 | | | | | 1,336,607 | | | | | 1,339,600 | | | | | 1,296,509 | |
Roy Bidco ApS, EURIBOR + 3.250%+ | | | | 3.25 | | | | | 8/23/2024 | | | | | 1,000,000 | | | | | 1,153,515 | | | | | 1,125,940 | |
US Farathane LLC, 3M LIBOR + 3.500% | | | | 6.30 | | | | | 12/23/2021 | | | | | 1,898,197 | | | | | 1,906,896 | | | | | 1,812,778 | |
| | | | | | | | | | | | | | | | | | | | | | | | | |
Total Automobile | | | | | | | | | | | | | | 4,833,392 | | | | | 5,000,103 | | | | | 4,811,881 | |
| | | | | | | | | | | | | | | | | | | | | | | | | |
| | | | | |
Beverage, Food and Tobacco — 3.2%*: | | | | | | | | | | | | | | | | | | | | | | | | | |
Amphora Finance Ltd., 3M LIBOR + 4.750%+ | | | | 5.48 | | | | | 5/29/2025 | | | | | 500,000 | | | | | 661,044 | | | | | 631,723 | |
CTI Foods Holding Co. LLC, 1M LIBOR + 3.500%†† | | | | 6.10 | | | | | 6/29/2020 | | | | | 1,371,857 | | | | | 1,368,084 | | | | | 1,019,742 | |
Deoleo, S.A., EURIBOR + 3.500%+†† | | | | 4.50 | | | | | 6/11/2021 | | | | | 500,000 | | | | | 597,299 | | | | | 265,814 | |
IRB Holding Corp., 1M LIBOR + 3.250% | | | | 5.68 | | | | | 2/5/2025 | | | | | 2,595,619 | | | | | 2,607,290 | | | | | 2,469,732 | |
JBS USA LLC, 3M LIBOR + 2.500% | | | | 5.26 | | | | | 10/30/2022 | | | | | 1,923,773 | | | | | 1,919,272 | | | | | 1,846,822 | |
Labeyrie Fine Foods SAS, EURIBOR + 4.250%+ | | | | 4.25 | | | | | 5/23/2023 | | | | | 500,000 | | | | | 553,759 | | | | | 569,581 | |
Refresco Group B.V., EURIBOR + 3.250%+ | | | | 5.87 | | | | | 3/28/2025 | | | | | 159,042 | | | | | 158,330 | | | | | 151,885 | |
Refresco Group B.V., EURIBOR + 3.250%+ | | | | 3.25 | | | | | 3/28/2025 | | | | | 500,000 | | | | | 580,940 | | | | | 559,361 | |
Sigma Bidco B.V., EURIBOR + 3.500%+ | | | | 3.50 | | | | | 7/2/2025 | | | | | 1,000,000 | | | | | 1,147,299 | | | | | 1,110,667 | |
Sigma Bidco B.V., LIBOR + 4.000%+ | | | | 4.90 | | | | | 3/31/2025 | | | | | 500,000 | | | | | 644,497 | | | | | 616,588 | |
| | | | | | | | | | | | | | | | | | | | | | | | | |
Total Beverage, Food and Tobacco | | | | | | | | | | | | | | 9,550,291 | | | | | 10,237,814 | | | | | 9,241,915 | |
| | | | | | | | | | | | | | | | | | | | | | | | | |
| | | | | |
Broadcasting and Entertainment — 3.9%*: | | | | | | | | | | | | | | | | | | | | | | | | | |
All3Media International, 6M LIBOR + 4.250%+ | | | | 5.25 | | | | | 6/30/2021 | | | | | 1,500,000 | | | | | 2,305,647 | | | | | 1,907,120 | |
AP NMT Acquisition B.V., 3M LIBOR + 5.750%+ | | | | 8.55 | | | | | 8/13/2021 | | | | | 2,073,015 | | | | | 2,037,577 | | | | | 1,982,838 | |
AP NMT Acquisition B.V., 3M LIBOR + 9.000%+ | | | | 11.40 | | | | | 8/13/2022 | | | | | 2,182,720 | | | | | 2,167,629 | | | | | 2,016,681 | |
AP NMT Acquisition B.V., EURIBOR + 6.000%+ | | | | 7.00 | | | | | 8/13/2021 | | | | | 521,343 | | | | | 636,373 | | | | | 589,008 | |
DLG Acquisitions Ltd., EURIBOR + 7.250%+ | | | | 8.25 | | | | | 6/30/2022 | | | | | 500,000 | | | | | 673,790 | | | | | 572,995 | |
Imagina Media Audiovisual, S.L., EURIBOR + 4.500%+ | | | | 4.50 | | | | | 6/26/2025 | | | | | 312,606 | | | | | 355,118 | | | | | 358,394 | |
Imagina Media Audiovisual, S.L., EURIBOR + 7.500%+ | | | | 7.50 | | | | | 12/28/2025 | | | | | 500,000 | | | | | 539,301 | | | | | 567,146 | |
Imagina Media Audiovisual, S.L., EURIBOR + 4.500%+ | | | | 4.50 | | | | | 6/20/2025 | | | | | 187,394 | | | | | 212,879 | | | | | 214,842 | |
Intelsat Jackson Holdings S.A., 3M LIBOR + 3.750% | | | | 6.26 | | | | | 11/27/2023 | | | | | 750,000 | | | | | 747,989 | | | | | 724,552 | |
Technicolor S.A., EURIBOR + 3.000%+ | | | | 3.00 | | | | | 12/6/2023 | | | | | 500,000 | | | | | 538,684 | | | | | 532,774 | |
Univision Communications, Inc., 1M LIBOR + 2.750% | | | | 5.27 | | | | | 3/15/2024 | | | | | 1,981,009 | | | | | 1,963,877 | | | | | 1,788,693 | |
| | | | | | | | | | | | | | | | | | | | | | | | | |
Total Broadcasting and Entertainment | | | | | | | | | | | | | | 11,008,087 | | | | | 12,178,864 | | | | | 11,255,043 | |
| | | | | | | | | | | | | | | | | | | | | | | | | |
See accompanying Notes to the Financial Statements.
84
Barings Global Floating Rate Fund 2018 Semi-Annual Report
SCHEDULE OF INVESTMENTS (CONTINUED)
December 31, 2018 (Unaudited)
| | | | | | | | | | | | | | | | | | | | | | | | | |
| | | EFFECTIVE
INTEREST RATE | | DUE DATE | | PRINCIPAL ‡‡ | | COST | | FAIR
VALUE |
Bank Loans(Continued) | | | | | | | | | | | | | | | | | | | | | | | | | |
| | | | | |
Buildings and Real Estate — 2.5%*: | | | | | | | | | | | | | | | | | | | | | | | | | |
Core & Main L.P., 6M LIBOR + 3.000% | | | | 5.72 | % | | | | 8/1/2024 | | | | | 1,485,000 | | | | | $1,495,209 | | | | | $1,431,793 | |
GYP Holdings III Corp., 1M LIBOR + 2.750% | | | | 5.27 | | | | | 6/1/2025 | | | | | 1,994,988 | | | | | 1,990,171 | | | | | 1,875,288 | |
LSF10 Impala Investments S.a r.l., EURIBOR + 4.750%+ | | | | 4.75 | | | | | 7/31/2025 | | | | | 500,000 | | | | | 573,833 | | | | | 571,981 | |
Quikrete Holdings, Inc., 1M LIBOR + 2.750% | | | | 5.27 | | | | | 11/15/2023 | | | | | 1,000,000 | | | | | 1,001,009 | | | | | 950,630 | |
SRS Distribution, Inc., 3M LIBOR + 3.250% | | | | 5.77 | | | | | 5/23/2025 | | | | | 2,447,261 | | | | | 2,432,019 | | | | | 2,277,495 | |
| | | | | | | | | | | | | | | | | | | | | | | | | |
Total Buildings and Real Estate | | | | | | | | | | | | | | 7,427,249 | | | | | 7,492,241 | | | | | 7,107,187 | |
| | | | | | | | | | | | | | | | | | | | | | | | | |
| | | | | |
Cargo Transport — 0.8%*: | | | | | | | | | | | | | | | | | | | | | | | | | |
CEVA Group plc, 3M LIBOR + 3.750%+ | | | | 6.55 | | | | | 7/24/2025 | | | | | 389,109 | | | | | 387,270 | | | | | 376,140 | |
Kenan Advantage Group, Inc., 1M LIBOR + 3.000% | | | | 5.52 | | | | | 7/31/2022 | | | | | 1,939,906 | | | | | 1,943,268 | | | | | 1,868,381 | |
| | | | | | | | | | | | | | | | | | | | | | | | | |
Total Cargo Transport | | | | | | | | | | | | | | 2,329,015 | | | | | 2,330,538 | | | | | 2,244,521 | |
| | | | | | | | | | | | | | | | | | | | | | | | | |
| | | | | |
Chemicals, Plastics and Rubber — 6.9%*: | | | | | | | | | | | | | | | | | | | | | | | | | |
Albaugh LLC, 1M LIBOR + 3.500% | | | | 6.02 | | | | | 12/23/2024 | | | | | 694,714 | | | | | 698,693 | | | | | 681,688 | |
Allnex (Luxembourg) & Cy S.C.A., EURIBOR + 3.250%+ | | | | 3.25 | | | | | 9/13/2023 | | | | | 684,235 | | | | | 774,849 | | | | | 769,631 | |
Allnex (Luxembourg) & Cy S.C.A., 3M LIBOR + 3.250%+ | | | | 5.96 | | | | | 9/13/2023 | | | | | 363,503 | | | | | 362,276 | | | | | 355,325 | |
Allnex USA, Inc., 3M LIBOR + 3.250%+ | | | | 5.96 | | | | | 9/13/2023 | | | | | 273,859 | | | | | 272,935 | | | | | 267,698 | |
Archroma Finance Sarl, EURIBOR + 3.750%+ | | | | 3.75 | | | | | 8/11/2024 | | | | | 1,000,000 | | | | | 1,152,670 | | | | | 1,131,428 | |
Associated Asphalt Partners LLC, 1M LIBOR + 5.250% | | | | 7.77 | | | | | 4/5/2024 | | | | | 290,649 | | | | | 289,555 | | | | | 279,991 | |
Azelis Finance S.A., EURIBOR + 4.000%+ | | | | 4.00 | | | | | 7/31/2025 | | | | | 500,000 | | | | | 611,679 | | | | | 567,862 | |
Colouroz Investment 1 GmbH, EURIBOR + 3.0000%+ | | | | 3.75 | | | | | 9/7/2021 | | | | | 327,956 | | | | | 387,493 | | | | | 356,029 | |
Diamond B.V., EURIBOR + 3.2500% | | | | 3.25 | | | | | 9/6/2024 | | | | | 992,487 | | | | | 1,157,845 | | | | | 1,092,725 | |
Flint Group GmbH, LIBOR + 3.000%+ | | | | 3.75 | | | | | 9/7/2021 | | | | | 761,596 | | | | | 868,811 | | | | | 826,786 | |
Flint Group GmbH, 3M LIBOR + 3.000%+ | | | | 5.49 | | | | | 9/7/2021 | | | | | 529,567 | | | | | 506,253 | | | | | 471,314 | |
Flint Group US LLC, 3M LIBOR + 3.000%+ | | | | 5.49 | | | | | 9/7/2021 | | | | | 3,076,456 | | | | | 2,941,652 | | | | | 2,738,046 | |
GrafTech Finance, Inc., 1M LIBOR + 3.500% | | | | 6.02 | | | | | 2/12/2025 | | | | | 1,883,081 | | | | | 1,879,515 | | | | | 1,779,512 | |
Ineos US Finance LLC, EURIBOR + 2.000%+ | | | | 2.50 | | | | | 3/31/2024 | | | | | 1,492,469 | | | | | 1,722,309 | | | | | 1,665,638 | |
MacDermid, Inc., EURIBOR + 2.500% | | | | 3.25 | | | | | 6/7/2020 | | | | | 412,929 | | | | | 485,411 | | | | | 471,339 | |
Novacap S.A., EURIBOR + 3.500%+ | | | | 3.50 | | | | | 6/22/2023 | | | | | 1,000,000 | | | | | 1,133,908 | | | | | 1,109,945 | |
Pinnacle Operating Corp., 1M LIBOR + 7.250% | | | | 9.77 | | | | | 11/15/2021 | | | | | 722,449 | | | | | 688,812 | | | | | 581,571 | |
Platform Specialty Products Corp., 1M LIBOR + 2.250% | | | | 5.05 | | | | | 11/15/2025 | | | | | 666,392 | | | | | 665,559 | | | | | 645,568 | |
Schenectady International Group, Inc., LIBOR + 4.750% | | | | 7.19 | | | | | 10/15/2025 | | | | | 840,528 | | | | | 840,528 | | | | | 806,906 | |
Solenis International LP, 3M LIBOR + 4.000% | | | | 6.71 | | | | | 12/26/2023 | | | | | 638,147 | | | | | 632,305 | | | | | 615,812 | |
Solenis International LP, 3M LIBOR + 8.500% | | | | 11.21 | | | | | 6/26/2024 | | | | | 376,263 | | | | | 365,934 | | | | | 353,687 | |
Starfruit Finco B.V, EURIBOR + 3.750%+ | | | | 3.75 | | | | | 9/20/2025 | | | | | 500,000 | | | | | 588,925 | | | | | 562,993 | |
See accompanying Notes to the Financial Statements.
85
Barings Global Floating Rate Fund 2018 Semi-Annual Report
SCHEDULE OF INVESTMENTS (CONTINUED)
December 31, 2018 (Unaudited)
| | | | | | | | | | | | | | | | | | | | | | | | | |
| | | EFFECTIVE
INTEREST RATE | | DUE DATE | | PRINCIPAL ‡‡ | | COST | | FAIR
VALUE |
Bank Loans(Continued) | | | | | | | | | | | | | | | | | | | | | | | | | |
| | | | | |
Chemicals, Plastics and Rubber(Continued) | | | | | | | | | | | | | | | | | | | | | | | | | |
Tronox Blocked Borrower LLC, 3M LIBOR + 3.000% | | | | 5.52 | % | | | | 9/22/2024 | | | | | 478,009 | | | | | $476,039 | | | | | $462,985 | |
Tronox Finance LLC, 3M LIBOR + 3.000% | | | | 5.52 | | | | | 9/22/2024 | | | | | 1,103,098 | | | | | 1,098,552 | | | | | 1,068,428 | |
| | | | | | | | | | | | | | | | | | | | | | | | | |
Total Chemicals, Plastics and Rubber | | | | | | | | | | | | | | 19,608,387 | | | | | 20,602,508 | | | | | 19,662,907 | |
| | | | | | | | | | | | | | | | | | | | | | | | | |
| | | | | |
Containers, Packaging and Glass — 3.2%*: | | | | | | | | | | | | | | | | | | | | | | | | | |
Albea Beauty Holdings S.A., EURIBOR + 3.000%+ | | | | 5.89 | | | | | 4/22/2024 | | | | | 617,624 | | | | | 616,942 | | | | | 579,794 | |
BWAY Holding Co., 1M LIBOR + 3.250% | | | | 5.66 | | | | | 4/3/2024 | | | | | 2,472,450 | | | | | 2,466,829 | | | | | 2,319,974 | |
Flex Acquisition Co., Inc., 3M LIBOR + 3.000% | | | | 5.52 | | | | | 12/29/2023 | | | | | 1,575,940 | | | | | 1,590,154 | | | | | 1,482,692 | |
Horizon Holdings III S.A.S., EURIBOR + 2.750%+ | | | | 2.75 | | | | | 10/29/2022 | | | | | 1,390,909 | | | | | 1,661,490 | | | | | 1,550,207 | |
ProAmpac PG Borrower LLC, 1M LIBOR + 3.500% | | | | 6.05 | | | | | 11/18/2023 | | | | | 735,000 | | | | | 737,596 | | | | | 700,088 | |
ProAmpac PG Borrower LLC, 3M LIBOR + 8.500% | | | | 11.14 | | | | | 11/18/2024 | | | | | 750,000 | | | | | 741,716 | | | | | 748,125 | |
Reynolds Group Holdings, Inc., LIBOR + 2.750% | | | | 5.27 | | | | | 2/5/2023 | | | | | 1,989,848 | | | | | 1,999,144 | | | | | 1,890,355 | |
| | | | | | | | | | | | | | | | | | | | | | | | | |
Total Containers, Packaging and Glass | | | | | | | | | | | | | | 9,531,771 | | | | | 9,813,871 | | | | | 9,271,235 | |
| | | | | | | | | | | | | | | | | | | | | | | | | |
| | | | |
Diversified/Conglomerate Manufacturing — 3.5%*: | | | | | | | | | | | | | | | | | | | | | |
Brookfield WEC Holdings, Inc., 1M LIBOR + 3.750% | | | | 6.27 | | | | | 8/1/2025 | | | | | 2,075,309 | | | | | 2,088,952 | | | | | 2,006,014 | |
LTI Holdings, Inc., 1M LIBOR + 3.500% | | | | 6.02 | | | | | 9/6/2025 | | | | | 1,440,316 | | | | | 1,442,464 | | | | | 1,352,702 | |
PCF GmbH, EURIBOR + 5.000%+†† | | | | 5.00 | | | | | 8/1/2024 | | | | | 500,000 | | | | | 525,613 | | | | | 564,998 | |
Project Alpha Intermediate Holding, Inc., 3M LIBOR + 3.500% | | | | 5.94 | | | | | 4/26/2024 | | | | | 1,581,125 | | | | | 1,582,492 | | | | | 1,517,880 | |
Triple Point Technology, Inc., 3M LIBOR + 4.250% | | | | 6.77 | | | | | 7/10/2020 | | | | | 935,607 | | | | | 915,543 | | | | | 767,198 | |
Wilsonart LLC, 3M LIBOR + 3.250% | | | | 6.06 | | | | | 12/19/2023 | | | | | 603,337 | | | | | 603,843 | | | | | 575,813 | |
Winebow Group, Inc. (The), 1M LIBOR + 3.750% | | | | 6.27 | | | | | 7/1/2021 | | | | | 1,747,045 | | | | | 1,642,504 | | | | | 1,503,908 | |
Xella International GmbH, EURIBOR + 4.000%+ | | | | 4.00 | | | | | 4/11/2024 | | | | | 1,500,000 | | | | | 1,830,365 | | | | | 1,680,385 | |
| | | | | | | | | | | | | | | | | | | | | | | | | |
Total Diversified/Conglomerate Manufacturing | | | | | | | | | | | | | | 10,382,739 | | | | | 10,631,776 | | | | | 9,968,898 | |
| | | | | | | | | | | | | | | | | | | | | | | | | |
| | | | | |
Diversified/Conglomerate Service — 8.7%*: | | | | | | | | | | | | | | | | | | | | | | | | | |
Almonde, Inc., 3M LIBOR + 7.250%+ | | | | 10.05 | | | | | 6/13/2025 | | | | | 752,587 | | | | | 764,786 | | | | | 690,770 | |
Almonde, Inc., 3M LIBOR + 3.500%+ | | | | 6.30 | | | | | 6/13/2024 | | | | | 1,992,126 | | | | | 1,966,345 | | | | | 1,851,263 | |
EAB Global, Inc., LIBOR + 3.750% | | | | 6.41 | | | | | 11/15/2024 | | | | | 751,421 | | | | | 748,260 | | | | | 711,971 | |
GTCR Valor Cos., Inc., 3M LIBOR + 2.750% | | | | 5.55 | | | | | 6/16/2023 | | | | | 444,707 | | | | | 443,855 | | | | | 426,474 | |
Hyland Software, Inc., 1M LIBOR + 3.500% | | | | 6.02 | | | | | 7/1/2022 | | | | | 985,000 | | | | | 989,577 | | | | | 952,495 | |
See accompanying Notes to the Financial Statements.
86
Barings Global Floating Rate Fund 2018 Semi-Annual Report
SCHEDULE OF INVESTMENTS (CONTINUED)
December 31, 2018 (Unaudited)
| | | | | | | | | | | | | | | | | | | | | | | | | |
| | | EFFECTIVE
INTEREST RATE | | DUE DATE | | PRINCIPAL ‡‡ | | COST | | FAIR
VALUE |
Bank Loans(Continued) | | | | | | | | | | | | | | | | | | | | | | | | | |
| | | | | |
Diversified/Conglomerate Service(Continued) | | | | | | | | | | | | | | | | | | | | | | | | | |
I-Logic Technologies Bidco Ltd., 1M LIBOR + 3.250%+ | | | | 5.86 | % | | | | 12/21/2024 | | | | | 1,036,809 | | | | | $1,041,350 | | | | | $1,010,889 | |
Infor (US), Inc., EURIBOR + 2.250% | | | | 3.25 | | | | | 2/1/2022 | | | | | 489,842 | | | | | 580,616 | | | | | 551,718 | |
Infor (US), Inc., 3M LIBOR + 2.750% | | | | 5.27 | | | | | 2/1/2022 | | | | | 1,465,780 | | | | | 1,466,537 | | | | | 1,402,341 | |
Informatica LLC, 1M LIBOR + 3.250% | | | | 5.77 | | | | | 8/5/2022 | | | | | 1,388,855 | | | | | 1,391,830 | | | | | 1,345,453 | |
Kronos, Inc., 3M LIBOR + 3.500% | | | | 5.54 | | | | | 11/1/2023 | | | | | 1,583,068 | | | | | 1,586,314 | | | | | 1,501,270 | |
LegalZoom.com, Inc., 1M LIBOR + 4.500% | | | | 7.00 | | | | | 11/20/2024 | | | | | 585,508 | | | | | 579,712 | | | | | 573,798 | |
MH Sub I LLC, 3M LIBOR + 3.750% | | | | 6.25 | | | | | 9/13/2024 | | | | | 3,051,432 | | | | | 3,059,037 | | | | | 2,887,417 | |
Project Leopard Holdings, Inc., 1M LIBOR + 4.000% | | | | 6.52 | | | | | 7/7/2023 | | | | | 1,491,536 | | | | | 1,498,547 | | | | | 1,452,384 | |
Red Ventures, LLC, 1M LIBOR + 3.000% | | | | 5.52 | | | | | 11/8/2024 | | | | | 2,652,524 | | | | | 2,670,814 | | | | | 2,519,898 | |
TierPoint LLC, 1M LIBOR + 3.750% | | | | 6.27 | | | | | 5/6/2024 | | | | | 36,752 | | | | | 36,611 | | | | | 34,235 | |
TMF Group Holding B.V., EURIBOR + 3.250%+ | | | | 3.25 | | | | | 5/5/2025 | | | | | 500,000 | | | | | 584,559 | | | | | 554,256 | |
Verisure Holding AB, EURIBOR + 3.500%+ | | | | 3.50 | | | | | 10/21/2022 | | | | | 500,000 | | | | | 566,875 | | | | | 565,267 | |
Verisure Holding AB, EURIBOR + 3.000%+ | | | | 3.00 | | | | | 10/20/2022 | | | | | 2,700,000 | | | | | 3,093,060 | | | | | 3,009,504 | |
Vertafore, Inc., 1M LIBOR + 3.250% | | | | 6.05 | | | | | 7/2/2025 | | | | | 2,000,000 | | | | | 1,998,994 | | | | | 1,895,620 | |
Vertafore, Inc., 1M LIBOR + 7.250% | | | | 10.05 | | | | | 7/2/2026 | | | | | 1,000,000 | | | | | 990,571 | | | | | 953,750 | |
| | | | | | | | | | | | | | | | | | | | | | | | | |
Total Diversified/Conglomerate Service | | | | | | | | | | | | | | 25,407,947 | | | | | 26,058,250 | | | | | 24,890,773 | |
| | | | | | | | | | | | | | | | | | | | | | | | | |
| | | | | |
Ecological — 0.6%*: | | | | | | | | | | | | | | | | | | | | | | | | | |
Emerald 3 Ltd., 3M LIBOR + 7.000% | | | | 9.80 | | | | | 5/31/2022 | | | | | 390,426 | | | | | 388,736 | | | | | 379,365 | |
Emerald US, Inc., 3M LIBOR + 4.000% | | | | 6.80 | | | | | 5/9/2021 | | | | | 529,428 | | | | | 506,572 | | | | | 519,279 | |
PHS Group Ltd., 1M LIBOR + 5.250%+ | | | | 7.77 | | | | | 12/20/2021 | | | | | 764,450 | | | | | 977,886 | | | | | 973,881 | |
| | | | | | | | | | | | | | | | | | | | | | | | | |
Total Ecological | | | | | | | | | | | | | | 1,684,304 | | | | | 1,873,194 | | | | | 1,872,525 | |
| | | | | | | | | | | | | | | | | | | | | | | | | |
| | | | | |
Electronics — 5.4%*: | | | | | | | | | | | | | | | | | | | | | | | | | |
EXC Holdings III Corp., 3M LIBOR + 3.500% | | | | 6.30 | | | | | 12/2/2024 | | | | | 492,198 | | | | | 497,177 | | | | | 473,741 | |
First Data Corp., 1M LIBOR + 2.000% | | | | 4.50 | | | | | 4/26/2024 | | | | | 1,500,000 | | | | | 1,500,000 | | | | | 1,429,500 | |
ION Trading Technologies Sarl, 3M LIBOR + 4.000% | | | | 6.52 | | | | | 11/21/2024 | | | | | 1,705,205 | | | | | 1,685,994 | | | | | 1,607,156 | |
ION Trading Technologies Sarl, EURIBOR + 3.250% | | | | 4.25 | | | | | 11/21/2024 | | | | | 1,381,750 | | | | | 1,563,240 | | | | | 1,524,563 | |
Omnitracs, Inc., 3M LIBOR + 2.750% | | | | 5.57 | | | | | 3/21/2025 | | | | | 3,013,683 | | | | | 3,004,872 | | | | | 2,834,369 | |
Renaissance Holding Corp., 1M LIBOR + 3.250% | | | | 5.77 | | | | | 5/30/2025 | | | | | 745,003 | | | | | 745,003 | | | | | 689,597 | |
RP Crown Parent LLC, 1M LIBOR + 2.750% | | | | 5.27 | | | | | 10/12/2023 | | | | | 1,742,451 | | | | | 1,739,065 | | | | | 1,675,018 | |
Sophia LP, LIBOR + 3.250% | | | | 6.05 | | | | | 9/30/2022 | | | | | 1,491,001 | | | | | 1,498,288 | | | | | 1,432,956 | |
SS&C Technologies Inc., 1M LIBOR + 2.250% | | | | 4.77 | | | | | 4/16/2025 | | | | | 479,877 | | | | | 478,695 | | | | | 451,986 | |
Veritas Bermuda Ltd., 3M LIBOR + 4.500% | | | | 7.09 | | | | | 1/27/2023 | | | | | 1,277,250 | | | | | 1,273,733 | | | | | 1,084,756 | |
Veritas Bermuda Ltd., EURIBOR + 4.500% | | | | 5.50 | | | | | 1/27/2023 | | | | | 786,000 | | | | | 876,312 | | | | | 789,493 | |
Wall Street Systems Delaware, Inc., 1M LIBOR + 3.000% | | | | 5.52 | | | | | 11/21/2024 | | | | | 1,138,983 | | | | | 1,138,983 | | | | | 1,057,352 | |
Wall Street Systems Delaware, Inc., EURIBOR + 3.000% | | | | 4.00 | | | | | 11/21/2024 | | | | | 492,053 | | | | | 578,308 | | | | | 550,381 | |
| | | | | | | | | | | | | | | | | | | | | | | | | |
Total Electronics | | | | | | | | | | | | | | 16,245,454 | | | | | 16,579,670 | | | | | 15,600,868 | |
| | | | | | | | | | | | | | | | | | | | | | | | | |
See accompanying Notes to the Financial Statements.
87
Barings Global Floating Rate Fund 2018 Semi-Annual Report
SCHEDULE OF INVESTMENTS (CONTINUED)
December 31, 2018 (Unaudited)
| | | | | | | | | | | | | | | | | | | | | | | | | |
| | | EFFECTIVE
INTEREST RATE | | DUE DATE | | PRINCIPAL ‡‡ | | COST | | FAIR
VALUE |
Bank Loans(Continued) | | | | | | | | | | | | | | | | | | | | | | | | | |
| | | | | |
Farming and Agriculture — 0.8%*: | | | | | | | | | | | | | | | | | | | | | | | | | |
Dole Food Co. Inc., 1M LIBOR + 2.750% | | | | 5.25 | % | | | | 4/6/2024 | | | | | 2,417,537 | | | | | $2,426,508 | | | | | $2,341,989 | |
| | | | | | | | | | | | | | | | | | | | | | | | | |
| | | | | |
Finance — 2.3%*: | | | | | | | | | | | | | | | | | | | | | | | | | |
Edelman Financial Center LLC, 3M LIBOR + 6.750% | | | | 9.19 | | | | | 7/20/2026 | | | | | 337,346 | | | | | 335,751 | | | | | 320,478 | |
Evergood 4 ApS, EURIBOR + 3.750%+ | | | | 3.75 | | | | | 2/6/2025 | | | | | 500,000 | | | | | 579,476 | | | | | 566,550 | |
NAB Holdings LLC, 3M LIBOR + 3.000% | | | | 5.80 | | | | | 7/1/2024 | | | | | 990,013 | | | | | 991,589 | | | | | 939,275 | |
Nets Holding A/S, EURIBOR + 3.000%+ | | | | 3.00 | | | | | 2/6/2025 | | | | | 440,972 | | | | | 522,706 | | | | | 497,903 | |
NFP Corp., 1M LIBOR + 3.000% | | | | 5.52 | | | | | 1/8/2024 | | | | | 2,515,613 | | | | | 2,532,773 | | | | | 2,374,110 | |
Tempo Acquisition LLC, 1M LIBOR + 3.000% | | | | 5.52 | | | | | 5/1/2024 | | | | | 2,108,858 | | | | | 2,113,988 | | | | | 2,013,959 | |
| | | | | | | | | | | | | | | | | | | | | | | | | |
Total Finance | | | | | | | | | | | | | | 6,892,802 | | | | | 7,076,283 | | | | | 6,712,275 | |
| | | | | | | | | | | | | | | | | | | | | | | | | |
| | | | |
Healthcare, Education and Childcare — 11.5%*: | | | | | | | | | | | | | | | | | | | | | |
Aenova Holding GmbH, EURIBOR + 4.000%+ | | | | 5.00 | | | | | 9/29/2020 | | | | | 2,000,000 | | | | | 2,286,597 | | | | | 2,242,393 | |
Amedes Holding AG, EURIBOR + 4.750%+ | | | | 4.75 | | | | | 8/19/2022 | | | | | 498,777 | | | | | 576,322 | | | | | 567,548 | |
Arbor Pharmaceuticals, Inc., 3M LIBOR + 5.000% | | | | 7.80 | | | | | 7/5/2023 | | | | | 1,515,786 | | | | | 1,506,225 | | | | | 1,349,049 | |
Auris Luxembourg III Sarl, LIBOR + 3.750% | | | | 6.55 | | | | | 7/20/2025 | | | | | 1,000,000 | | | | | 995,299 | | | | | 970,630 | |
Avantor, Inc., 1M LIBOR + 4.000% | | | | 6.57 | | | | | 11/21/2024 | | | | | 1,892,467 | | | | | 1,917,234 | | | | | 1,829,391 | |
Aveanna Healthcare, LLC, 1M LIBOR + 5.500% | | | | 8.02 | | | | | 3/18/2024 | | | | | 1,000,708 | | | | | 984,264 | | | | | 960,680 | |
Bausch Health Companies, 1M LIBOR + 3.000% | | | | 5.38 | | | | | 6/1/2025 | | | | | 957,485 | | | | | 963,386 | | | | | 912,541 | |
Cerba Healthcare S.A.S., EURIBOR + 3.000%+ | | | | 3.00 | | | | | 4/20/2024 | | | | | 1,000,000 | | | | | 1,172,711 | | | | | 1,113,016 | |
CEVA Sante Animale, EURIBOR + 3.000%+ | | | | 3.00 | | | | | 6/30/2021 | | | | | 1,500,000 | | | | | 1,738,577 | | | | | 1,692,845 | |
Concordia International Corp., LIBOR + 5.500%+ | | | | 7.89 | | | | | 9/6/2024 | | | | | 2,338,250 | | | | | 2,301,231 | | | | | 2,224,588 | |
Concordia International Corp., EURIBOR + 5.250%+ | | | | 6.25 | | | | | 9/8/2024 | | | | | 497,500 | | | | | 576,523 | | | | | 562,600 | |
Domus Vi SA, EURIBOR + 3.250%+ | | | | 3.25 | | | | | 10/31/2024 | | | | | 500,000 | | | | | 592,175 | | | | | 567,026 | |
Endo Luxembourg Finance Co. I S.a r.l., 1M LIBOR + 4.250% | | | | 6.81 | | | | | 4/29/2024 | | | | | 2,530,889 | | | | | 2,534,881 | | | | | 2,391,690 | |
GHD GesundHeits GmbH Deutschland, EURIBOR + 3.000%+ | | | | 4.00 | | | | | 8/28/2021 | | | | | 750,000 | | | | | 866,831 | | | | | 846,852 | |
Horizon Pharma, Inc., 1M LIBOR + 3.000% | | | | 5.56 | | | | | 3/29/2024 | | | | | 964,707 | | | | | 966,644 | | | | | 918,083 | |
Indivior Finance Sarl, 3M LIBOR + 4.500% | | | | 7.03 | | | | | 12/18/2022 | | | | | 304,931 | | | | | 303,521 | | | | | 296,798 | |
Lifescan Global Corp., 3M LIBOR + 6.000% | | | | 8.80 | | | | | 9/27/2024 | | | | | 400,000 | | | | | 388,456 | | | | | 377,000 | |
Mallinckrodt International Finance S.A., 3M LIBOR + 2.750% | | | | 5.55 | | | | | 9/24/2024 | | | | | 2,046,909 | | | | | 2,040,875 | | | | | 1,872,922 | |
Nidda Healthcare Holding AG, EURIBOR + 3.500%+ | | | | 3.50 | | | | | 8/21/2024 | | | | | 1,000,000 | | | | | 1,152,460 | | | | | 1,111,377 | |
Nidda Healthcare Holding AG, GBP + 4.500%+ | | | | 5.37 | | | | | 8/21/2024 | | | | | 500,000 | | | | | 678,300 | | | | | 620,972 | |
Ortho-Clinical Diagnostics SA, 3M LIBOR + 3.250% | | | | 5.76 | | | | | 6/30/2025 | | | | | 1,457,372 | | | | | 1,458,042 | | | | | 1,348,521 | |
See accompanying Notes to the Financial Statements.
88
Barings Global Floating Rate Fund 2018 Semi-Annual Report
SCHEDULE OF INVESTMENTS (CONTINUED)
December 31, 2018 (Unaudited)
| | | | | | | | | | | | | | | | | | | | | | | | | |
| | | EFFECTIVE
INTEREST RATE | | DUE DATE | | PRINCIPAL ‡‡ | | COST | | FAIR
VALUE |
Bank Loans(Continued) | | | | | | | | | | | | | | | | | | | | | | | | | |
| | | | |
Healthcare, Education and Childcare(Continued) | | | | | | | | | | | | | | | | | | | | | |
Press Ganey Holdings, Inc., 1M LIBOR + 2.750% | | | | 5.27 | % | | | | 10/23/2023 | | | | | 1,225,000 | | | | | $1,230,892 | | | | | $1,174,469 | |
Press Ganey Holdings, Inc., 1M LIBOR + 6.500% | | | | 9.02 | | | | | 10/21/2024 | | | | | 369,105 | | | | | 372,821 | | | | | 365,414 | |
Riemser Pharma GmbH, EURIBOR + 5.500%+ | | | | 5.25 | | | | | 6/29/2023 | | | | | 500,000 | | | | | 545,577 | | | | | 570,371 | |
Rodenstock GmbH, EURIBOR + 5.250%+ | | | | 5.25 | | | | | 6/30/2021 | | | | | 1,500,000 | | | | | 1,747,046 | | | | | 1,667,066 | |
Rossini Sarl, EURIBOR + 6.25%+ | | | | 6.25 | | | | | 10/30/2025 | | | | | 750,000 | | | | | 875,574 | | | | | 859,312 | |
Team Health Holdings, Inc., 1M LIBOR + 2.750% | | | | 5.27 | | | | | 2/6/2024 | | | | | 1,977,362 | | | | | 1,928,994 | | | | | 1,762,323 | |
Tunstall Group Holdings Ltd., 3M LIBOR + 5.000%+ | | | | 4.40 | | | | | 10/16/2020 | | | | | 523,577 | | | | | 828,526 | | | | | 655,673 | |
Unilabs Holding AB, EURIBOR + 2.750%+ | | | | 2.75 | | | | | 4/19/2024 | | | | | 500,000 | | | | | 571,194 | | | | | 554,566 | |
Verscend Holding Corp., 1M LIBOR + 4.500% | | | | 7.02 | | | | | 8/27/2025 | | | | | 633,453 | | | | | 628,918 | | | | | 611,282 | |
| | | | | | | | | | | | | | | | | | | | | | | | | |
Total Healthcare, Education and Childcare | | | | | | | | | | | | | | 32,634,278 | | | | | 34,730,096 | | | | | 32,996,998 | |
| | | | | | | | | | | | | | | | | | | | | | | | | |
| | |
Home and Office Furnishings, Housewares, and Durable Consumer Products — 1.4%*: | | | | | | | | | | | |
Keter Group B.V., EURIBOR + 4.250%+ | | | | 5.25 | | | | | 10/31/2023 | | | | | 500,000 | | | | | 547,872 | | | | | 454,003 | |
Serta Simmons Bedding LLC, 3M LIBOR + 3.500% | | | | 5.89 | | | | | 11/8/2023 | | | | | 1,700,009 | | | | | 1,694,035 | | | | | 1,416,668 | |
Serta Simmons Bedding LLC, 1M LIBOR + 8.000% | | | | 10.43 | | | | | 11/8/2024 | | | | | 724,666 | | | | | 664,905 | | | | | 512,100 | |
SIWF Holdings Inc., 1M LIBOR + 4.250% | | | | 6.72 | | | | | 6/15/2025 | | | | | 997,494 | | | | | 1,006,765 | | | | | 966,951 | |
Visual Comfort Generation Brands Holdings, Inc., 1M LIBOR + 8.000% | | | | 10.52 | | | | | 2/28/2025 | | | | | 646,667 | | | | | 644,037 | | | | | 627,267 | |
| | | | | | | | | | | | | | | | | | | | | | | | | |
Total Home and Office Furnishings, Housewares, and Durable Consumer Products | | | | | | | | | | | | | | 4,568,836 | | | | | 4,557,614 | | | | | 3,976,989 | |
| | | | | | | | | | | | | | | | | | | | | | | | | |
| | | | | |
Hotels, Motels, Inns and Gaming — 3.1%*: | | | | | | | | | | | | | | | | | | | | | | | | | |
Caesars Resort Collection LLC, 1M LIBOR + 2.750% | | | | 5.27 | | | | | 12/22/2024 | | | | | 1,982,481 | | | | | 1,982,691 | | | | | 1,900,347 | |
Compass IV Ltd., 3M LIBOR + 4.500%+ | | | | 4.50 | | | | | 4/30/2025 | | | | | 500,000 | | | | | 598,167 | | | | | 567,324 | |
Compass IV Ltd., EURIBOR + 8.000%+ | | | | 9.00 | | | | | 4/30/2026 | | | | | 500,000 | | | | | 586,740 | | | | | 558,553 | |
Financiere Sun S.A.S., EURIBOR + 3.000%+ | | | | 3.00 | | | | | 3/14/2023 | | | | | 338,983 | | | | | 404,495 | | | | | 380,381 | |
HNVR Holdco Ltd., EURIBOR + 3.250%+ | | | | 3.25 | | | | | 9/12/2023 | | | | | 992,449 | | | | | 1,125,926 | | | | | 1,119,564 | |
Penn National Gaming, Inc., 1M LIBOR + 2.250% | | | | 4.71 | | | | | 10/15/2025 | | | | | 622,489 | | | | | 620,976 | | | | | 599,537 | |
Richmond UK Bidco Ltd., LIBOR + 4.250%+ | | | | 4.98 | | | | | 3/3/2024 | | | | | 500,000 | | | | | 632,374 | | | | | 578,350 | |
Rouge Beachhouse B.V., EURIBOR + 4.250%+ | | | | 4.25 | | | | | 7/25/2025 | | | | | 500,000 | | | | | 586,575 | | | | | 573,591 | |
Stars Group Holdings B.V. (The), 3M LIBOR + 3.500%+ | | | | 6.30 | | | | | 7/10/2025 | | | | | 1,492,500 | | | | | 1,485,524 | | | | | 1,439,024 | |
Tackle Sarl, EURIBOR + 5.000%+ | | | | 3.50 | | | | | 8/8/2022 | | | | | 1,000,000 | | | | | 1,117,193 | | | | | 1,135,014 | |
| | | | | | | | | | | | | | | | | | | | | | | | | |
Total Hotels, Motels, Inns and Gaming | | | | | | | | | | | | | | 8,428,902 | | | | | 9,140,661 | | | | | 8,851,685 | |
| | | | | | | | | | | | | | | | | | | | | | | | | |
See accompanying Notes to the Financial Statements.
89
Barings Global Floating Rate Fund 2018 Semi-Annual Report
SCHEDULE OF INVESTMENTS (CONTINUED)
December 31, 2018 (Unaudited)
| | | | | | | | | | | | | | | | | | | | | | | | | |
| | | EFFECTIVE
INTEREST RATE | | DUE DATE | | PRINCIPAL ‡‡ | | COST | | FAIR
VALUE |
Bank Loans(Continued) | | | | | | | | | | | | | | | | | | | | | | | | | |
| | | | | |
Insurance — 3.8%*: | | | | | | | | | | | | | | | | | | | | | | | | | |
Alliant Holdings I, Inc., 1M LIBOR + 3.000% | | | | 5.21 | % | | | | 5/9/2025 | | | | | 2,797,043 | | | | | $2,808,841 | | | | | $2,637,779 | |
AssuredPartners, Inc., 1M LIBOR + 3.250% | | | | 5.77 | | | | | 10/22/2024 | | | | | 1,786,169 | | | | | 1,797,028 | | | | | 1,682,357 | |
Asurion LLC, 1M LIBOR + 2.750% | | | | 5.52 | | | | | 11/3/2023 | | | | | 1,548,034 | | | | | 1,554,628 | | | | | 1,480,307 | |
Confie Seguros Holding II Co., 3M LIBOR + 8.500% | | | | 11.24 | | | | | 10/31/2025 | | | | | 1,633,626 | | | | | 1,601,633 | | | | | 1,581,890 | |
Hub International Ltd., 2M LIBOR + 3.000% | | | | 5.24 | | | | | 4/25/2025 | | | | | 1,990,000 | | | | | 1,985,498 | | | | | 1,874,958 | |
York Risk Services Holding Corp., 1M LIBOR + 3.750% | | | | 6.27 | | | | | 10/1/2021 | | | | | 1,641,645 | | | | | 1,621,754 | | | | | 1,528,486 | |
| | | | | | | | | | | | | | | | | | | | | | | | | |
Total Insurance | | | | | | | | | | | | | | 11,396,517 | | | | | 11,369,382 | | | | | 10,785,777 | |
| | | | | | | | | | | | | | | | | | | | | | | | | |
| | | | | |
Leisure, Amusement, Entertainment — 4.8%*: | | | | | | | | | | | | | | | | | | | | | | | | | |
Columbus Capital B.V., EURIBOR + 4.750%+ | | | | 4.75 | | | | | 6/30/2024 | | | | | 500,000 | | | | | 569,560 | | | | | 571,087 | |
Crown Finance US, Inc., 1M LIBOR + 2.500% | | | | 5.02 | | | | | 2/28/2025 | | | | | 992,500 | | | | | 993,619 | | | | | 936,255 | |
Delta 2 (LUX) Sarl, 1M LIBOR + 2.500%+ | | | | 5.02 | | | | | 2/1/2024 | | | | | 1,394,967 | | | | | 1,399,107 | | | | | 1,315,914 | |
Dorna Sports, S.L., EURIBOR + 3.000%+ | | | | 2.75 | | | | | 4/12/2024 | | | | | 978,282 | | | | | 1,092,872 | | | | | 1,103,358 | |
International Park Holdings B.V., EURIBOR + 3.500%+ | | | | 3.50 | | | | | 6/13/2024 | | | | | 500,000 | | | | | 580,575 | | | | | 563,027 | |
Metro-Goldwyn-Mayer, Inc., 1M LIBOR + 4.500% | | | | 7.03 | | | | | 7/3/2026 | | | | | 2,000,000 | | | | | 1,981,097 | | | | | 1,860,000 | |
SeaWorld Parks & Entertainment, Inc., 3M LIBOR + 3.000% | | | | 5.52 | | | | | 3/31/2024 | | | | | 2,559,758 | | | | | 2,550,330 | | | | | 2,438,170 | |
Vacalians Group, EURIBOR + 4.000%+ | | | | 4.00 | | | | | 10/26/2025 | | | | | 500,000 | | | | | 564,429 | | | | | 572,159 | |
Vougeot Bidco PLC, EURIBOR + 5.500%+ | | | | 5.50 | | | | | 7/18/2023 | | | | | 1,000,000 | | | | | 1,164,245 | | | | | 1,144,317 | |
William Morris Endeavor Entertainment, LLC, 2M LIBOR + 2.750% | | | | 5.28 | | | | | 5/18/2025 | | | | | 1,837,047 | | | | | 1,832,290 | | | | | 1,683,195 | |
WMG Acquisition Corp., LIBOR + 2.250% | | | | 4.65 | | | | | 11/1/2023 | | | | | 1,500,000 | | | | | 1,498,202 | | | | | 1,441,125 | |
| | | | | | | | | | | | | | | | | | | | | | | | | |
Total Leisure, Amusement, Entertainment | | | | | | | | | | | | | | 13,762,554 | | | | | 14,226,326 | | | | | 13,628,607 | |
| | | | | | | | | | | | | | | | | | | | | | | | | |
| |
Machinery Non-Agriculture, Non-Construction, Non-Electronic — 1.7%*: | | | | | | |
Alison Bidco Sarl, 1M LIBOR + 4.500%+ | | | | 7.03 | | | | | 8/29/2021 | | | | | 284,624 | | | | | 283,538 | | | | | 270,392 | |
Alison Bidco Sarl, EURIBOR + 4.500%+ | | | | 5.50 | | | | | 8/29/2021 | | | | | 994,798 | | | | | 1,151,088 | | | | | 1,122,214 | |
Apex Tool Group LLC, 1M LIBOR + 3.750% | | | | 6.27 | | | | | 2/1/2022 | | | | | 1,690,251 | | | | | 1,687,694 | | | | | 1,626,021 | |
Titan Acquisition Ltd., 1M LIBOR + 3.000%+ | | | | 5.52 | | | | | 3/28/2025 | | | | | 1,985,895 | | | | | 1,983,806 | | | | | 1,811,296 | |
| | | | | | | | | | | | | | | | | | | | | | | | | |
Total Machinery Non-Agriculture, Non-Construction, Non-Electronic | | | | | | | | | | | | | | 4,955,568 | | | | | 5,106,126 | | | | | 4,829,923 | |
| | | | | | | | | | | | | | | | | | | | | | | | | |
| | | | |
Mining, Steel, Iron and Non-Precious Metals — 0.7%*: | | | | | | | | | | | | | | | | | | | | | |
Big River Steel LLC, 3M LIBOR + 5.000% | | | | 7.80 | | | | | 8/23/2023 | | | | | 622,394 | | | | | 630,166 | | | | | 614,614 | |
Boomerang Tube, LLC, 3M LIBOR + 3.000%¤†† | | | | 7.52 | | | | | 10/31/2021 | | | | | 62,044 | | | | | 62,044 | | | | | 62,044 | |
Covia Holdings Corp., 3M LIBOR + 3.750% | | | | 6.55 | | | | | 6/1/2025 | | | | | 598,805 | | | | | 598,806 | | | | | 431,140 | |
US Silica Co., 1M LIBOR + 4.000% | | | | 6.56 | | | | | 5/1/2025 | | | | | 878,100 | | | | | 888,174 | | | | | 765,044 | |
| | | | | | | | | | | | | | | | | | | | | | | | | |
Total Mining, Steel, Iron and Non-Precious Metals | | | | | | | | | | | | | | 2,161,343 | | | | | 2,179,190 | | | | | 1,872,842 | |
| | | | | | | | | | | | | | | | | | | | | | | | | |
See accompanying Notes to the Financial Statements.
90
Barings Global Floating Rate Fund 2018 Semi-Annual Report
SCHEDULE OF INVESTMENTS (CONTINUED)
December 31, 2018 (Unaudited)
| | | | | | | | | | | | | | | | | | | | | | | | | |
| | | EFFECTIVE
INTEREST RATE | | DUE DATE | | PRINCIPAL ‡‡ | | COST | | FAIR
VALUE |
Bank Loans(Continued) | | | | | | | | | | | | | | | | | | | | | | | | | |
| | | | | |
Oil and Gas — 2.1%*: | | | | | | | | | | | | | | | | | | | | | | | | | |
Caelus Energy Alaska O3 LLC, 3M LIBOR + 7.500% | | | | 10.30 | % | | | | 4/15/2020 | | | | | 1,399,200 | | | | | $1,353,750 | | | | | $1,240,628 | |
Fieldwood Energy LLC, 1M LIBOR + 7.250% | | | | 9.77 | | | | | 4/11/2023 | | | | | 864,968 | | | | | 393,120 | | | | | 751,657 | |
Gulf Finance LLC, 3M LIBOR + 5.250% | | | | 7.89 | | | | | 8/25/2023 | | | | | 1,648,157 | | | | | 1,516,756 | | | | | 1,250,539 | |
KCA Deutag Alpha Ltd., 3M LIBOR + 6.750%+ | | | | 9.55 | | | | | 2/28/2023 | | | | | 497,500 | | | | | 495,289 | | | | | 398,995 | |
Seadrill Partners Finco LLC, 3M LIBOR + 6.000% | | | | 8.82 | | | | | 2/21/2021 | | | | | 2,074,034 | | | | | 1,618,401 | | | | | 1,619,054 | |
UTEX Industries, Inc., 1M LIBOR + 7.250% | | | | 9.77 | | | | | 5/22/2022 | | | | | 1,000,000 | | | | | 714,113 | | | | | 855,000 | |
| | | | | | | | | | | | | | | | | | | | | | | | | |
Total Oil and Gas | | | | | | | | | | | | | | 7,483,859 | | | | | 6,091,429 | | | | | 6,115,873 | |
| | | | | | | | | | | | | | | | | | | | | | | | | |
| | | |
Personal and Non-Durable Consumer Products Mfg. Only — 0.3%*: | | | | | | | | | | | | | | | | |
Coty Inc., 1M LIBOR + 2.250% | | | | 4.63 | | | | | 4/7/2025 | | | | | 997,494 | | | | | 957,357 | | | | | 918,941 | |
| | | | | | | | | | | | | | | | | | | | | | | | | |
| | | | | |
Personal, Food and Miscellaneous — 0.2%*: | | | | | | | | | | | | | | | | | | | | | | | | | |
Capri Finance LLC, 3M LIBOR + 3.250%+ | | | | 5.78 | | | | | 11/1/2024 | | | | | 497,495 | | | | | 496,341 | | | | | 470,132 | |
| | | | | | | | | | | | | | | | | | | | | | | | | |
| | | | | |
Printing and Publishing — 1.6%*: | | | | | | | | | | | | | | | | | | | | | | | | | |
Getty Images, Inc., 3M LIBOR + 3.500% | | | | 6.02 | | | | | 10/18/2019 | | | | | 1,592,086 | | | | | 1,559,889 | | | | | 1,544,323 | |
Springer Nature Deutschland GmbH, EURIBOR + 3.250%+†† | | | | 3.75 | | | | | 8/24/2022 | | | | | 1,739,274 | | | | | 1,980,946 | | | | | 1,965,373 | |
Springer Science+Business Media Deutschland GmbH, 2M LIBOR + 3.500%+†† | | | | 6.02 | | | | | 8/15/2022 | | | | | 1,251,741 | | | | | 1,254,754 | | | | | 1,222,012 | |
| | | | | | | | | | | | | | | | | | | | | | | | | |
Total Printing and Publishing | | | | | | | | | | | | | | 4,583,101 | | | | | 4,795,589 | | | | | 4,731,708 | |
| | | | | | | | | | | | | | | | | | | | | | | | | |
| | | | | |
Retail Stores — 4.2%*: | | | | | | | | | | | | | | | | | | | | | | | | | |
24 Hour Fitness Worldwide, Inc., 1M LIBOR + 3.500% | | | | 6.02 | | | | | 5/24/2025 | | | | | 2,513,228 | | | | | 2,524,353 | | | | | 2,452,483 | |
Ascena Retail Group, Inc., 1M LIBOR + 4.500% | | | | 7.06 | | | | | 8/21/2022 | | | | | 613,388 | | | | | 541,002 | | | | | 568,918 | |
EG Finco Ltd., 3M LIBOR + 4.000%+ | | | | 6.81 | | | | | 2/7/2025 | | | | | 1,097,339 | | | | | 1,092,403 | | | | | 1,054,817 | |
EG Group Ltd., EURIBOR + 4.000%+ | | | | 4.00 | | | | | 2/6/2025 | | | | | 1,492,929 | | | | | 1,750,900 | | | | | 1,659,207 | |
EG Group Ltd., 3M LIBOR + 4.000%+ | | | | 6.81 | | | | | 2/7/2025 | | | | | 223,369 | | | | | 222,874 | | | | | 214,713 | |
Eyemart Express LLC, 1M LIBOR + 3.000% | | | | 5.46 | | | | | 8/4/2024 | | | | | 997,475 | | | | | 1,001,686 | | | | | 965,057 | |
Harbor Freight Tools USA, Inc., 1M LIBOR + 2.500% | | | | 5.02 | | | | | 8/18/2023 | | | | | 499,578 | | | | | 493,650 | | | | | 470,073 | |
Kirk Beauty One GmbH, EURIBOR + 3.500%+ | | | | 3.50 | | | | | 8/12/2022 | | | | | 2,250,000 | | | | | 2,530,944 | | | | | 1,903,368 | |
Staples, Inc., 3M LIBOR + 4.000% | | | | 6.54 | | | | | 9/12/2024 | | | | | 2,229,987 | | | | | 2,215,252 | | | | | 2,133,362 | |
Thom Europe S.A.S, EURIBOR + 4.500%+ | | | | 4.50 | | | | | 8/7/2024 | | | | | 500,000 | | | | | 576,090 | | | | | 547,382 | |
| | | | | | | | | | | | | | | | | | | | | | | | | |
Total Retail Stores | | | | | | | | | | | | | | 12,417,293 | | | | | 12,949,154 | | | | | 11,969,380 | |
| | | | | | | | | | | | | | | | | | | | | | | | | |
| | | | | |
Telecommunications — 4.0%*: | | | | | | | | | | | | | | | | | | | | | | | | | |
BMC Software Finance, Inc., LIBOR + 4.250% | | | | 7.05 | | | | | 10/2/2025 | | | | | 1,000,000 | | | | | 990,344 | | | | | 962,190 | |
CDS Holdco III B.V., EURIBOR + 2.750%+ | | | | 3.75 | | | | | 12/31/2024 | | | | | 500,000 | | | | | 577,168 | | | | | 569,581 | |
Digicel International Finance Ltd., 3M LIBOR + 3.250%+ | | | | 5.96 | | | | | 5/28/2024 | | | | | 422,740 | | | | | 425,793 | | | | | 382,580 | |
See accompanying Notes to the Financial Statements.
91
Barings Global Floating Rate Fund 2018 Semi-Annual Report
SCHEDULE OF INVESTMENTS (CONTINUED)
December 31, 2018 (Unaudited)
| | | | | | | | | | | | | | | | | | | | | | | | | |
| | | EFFECTIVE
INTEREST RATE | | DUE DATE | | PRINCIPAL ‡‡ | | COST | | FAIR
VALUE |
Bank Loans(Continued) | | | | | | | | | | | | | | | | | | | | | | | | | |
| | | | | |
Telecommunications(Continued) | | | | | | | | | | | | | | | | | | | | | | | | | |
Eircom Finco Sarl, EURIBOR + 3.250%+ | | | | 3.25 | % | | | | 4/19/2024 | | | | | 1,000,000 | | | | | $1,155,416 | | | | | $1,130,889 | |
GTT Communications, Inc., 1M LIBOR + 2.750% | | | | 5.27 | | | | | 5/31/2025 | | | | | 2,000,854 | | | | | 1,991,632 | | | | | 1,879,143 | |
Sprint Communications, Inc., 1M LIBOR + 2.500% | | | | 5.06 | | | | | 2/2/2024 | | | | | 2,969,849 | | | | | 2,979,196 | | | | | 2,818,891 | |
Syniverse Holdings, Inc., 1M LIBOR + 5.000% | | | | 7.46 | | | | | 3/9/2023 | | | | | 1,569,339 | | | | | 1,574,413 | | | | | 1,399,332 | |
Syniverse Holdings, Inc., 1M LIBOR + 9.000% | | | | 11.46 | | | | | 3/11/2024 | | | | | 425,482 | | | | | 419,949 | | | | | 355,277 | |
Virgin Media Investment Holdings Ltd., LIBOR — GBP + 3.250%+ | | | | 3.98 | | | | | 11/15/2027 | | | | | 1,250,000 | | | | | 1,725,633 | | | | | 1,541,469 | |
Ziggo Secured Finance Partnership, 1M LIBOR + 2.500%+ | | | | 4.96 | | | | | 4/15/2025 | | | | | 500,000 | | | | | 501,050 | | | | | 470,000 | |
| | | | | | | | | | | | | | | | | | | | | | | | | |
Total Telecommunications | | | | | | | | | | | | | | 11,638,264 | | | | | 12,340,594 | | | | | 11,509,352 | |
| | | | | | | | | | | | | | | | | | | | | | | | | |
| | | | | |
Utilities — 0.4%*: | | | | | | | | | | | | | | | | | | | | | | | | | |
Helix Gen Funding LLC, 3M LIBOR + 3.750% | | | | 6.27 | | | | | 6/2/2024 | | | | | 172,292 | | | | | 172,806 | | | | | 160,824 | |
Vistra Operations Co. LLC, 1M LIBOR + 2.250% | | | | 4.77 | | | | | 12/14/2023 | | | | | 1,067,902 | | | | | 1,075,748 | | | | | 1,024,300 | |
| | | | | | | | | | | | | | | | | | | | | | | | | |
Total Utilities | | | | | | | | | | | | | | 1,240,194 | | | | | 1,248,554 | | | | | 1,185,124 | |
| | | | | | | | | | | | | | | | | | | | | | | | | |
| | | | | | | | | | | | | | | | | | | | | | | | | |
Total Bank Loans | | | | | | | | | | | | | | 244,527,912 | | | | | 252,924,748 | | | | | 239,214,512 | |
| | | | | | | | | | | | | | | | | | | | | | | | | |
| | | | | |
Corporate Bonds — 11.4%*: | | | | | | | | | | | | | | | | | | | | | | | | | |
| | | | | |
Automobile — 0.3%*: | | | | | | | | | | | | | | | | | | | | | | | | | |
AA Bond Co. Ltd.+ | | | | 5.50 | | | | | 7/31/2022 | | | | | 700,000 | | | | | 937,908 | | | | | 712,695 | |
RAC Bond Co. PLC+ | | | | 5.00 | | | | | 11/6/2022 | | | | | 200,000 | | | | | 251,509 | | | | | 227,558 | |
| | | | | | | | | | | | | | | | | | | | | | | | | |
Total Automobile | | | | | | | | | | | | | | 900,000 | | | | | 1,189,417 | | | | | 940,253 | |
| | | | | | | | | | | | | | | | | | | | | | | | | |
| | | | | |
Beverage, Food and Tobacco — 0.1%*: | | | | | | | | | | | | | | | | | | | | | | | | | |
Burger King, Inc.^+ | | | | 5.00 | | | | | 10/15/2025 | | | | | 327,000 | | | | | 327,000 | | | | | 300,840 | |
| | | | | | | | | | | | | | | | | | | | | | | | | |
| | | | | |
Broadcasting and Entertainment — 0.3%*: | | | | | | | | | | | | | | | | | | | | | | | | | |
Entertainment One Ltd.+ | | | | 6.88 | | | | | 12/15/2022 | | | | | 100,000 | | | | | 150,190 | | | | | 131,092 | |
Tele Columbus AG+ | | | | 3.88 | | | | | 5/2/2025 | | | | | 600,000 | | | | | 634,815 | | | | | 621,111 | |
VTR Finance BV^+ | | | | 6.88 | | | | | 1/15/2024 | | | | | 200,000 | | | | | 202,451 | | | | | 200,000 | |
| | | | | | | | | | | | | | | | | | | | | | | | | |
Total Broadcasting and Entertainment | | | | | | | | | | | | | | 900,000 | | | | | 987,456 | | | | | 952,203 | |
| | | | | | | | | | | | | | | | | | | | | | | | | |
| | | | | |
Chemicals, Plastics and Rubber — 0.5%*: | | | | | | | | | | | | | | | | | | | | | | | | | |
Kronos International, Inc. | | | | 3.75 | | | | | 9/15/2025 | | | | | 750,000 | | | | | 847,554 | | | | | 769,085 | |
Monitchem HoldCo 3 SA, 3 mo. EURIBOR + 4.750%+ | | | | 4.44 | # | | | | 6/15/2021 | | | | | 250,000 | | | | | 288,695 | | | | | 276,842 | |
Monitchem HoldCo 3 SA+ | | | | 5.25 | | | | | 6/15/2021 | | | | | 200,000 | | | | | 228,466 | | | | | 222,848 | |
Pinnacle Operating Corp.^ | | | | 9.00 | | | | | 5/15/2023 | | | | | 378,294 | | | | | 452,982 | | | | | 245,891 | |
| | | | | | | | | | | | | | | | | | | | | | | | | |
Total Chemicals, Plastics and Rubber | | | | | | | | | | | | | | 1,578,294 | | | | | 1,817,697 | | | | | 1,514,666 | |
| | | | | | | | | | | | | | | | | | | | | | | | | |
See accompanying Notes to the Financial Statements.
92
Barings Global Floating Rate Fund 2018 Semi-Annual Report
SCHEDULE OF INVESTMENTS (CONTINUED)
December 31, 2018 (Unaudited)
| | | | | | | | | | | | | | | | | | | | | | | | | |
| | | EFFECTIVE
INTEREST RATE | | DUE DATE | | PRINCIPAL ‡‡ | | COST | | FAIR
VALUE |
Corporate Bonds(Continued) | | | | | | | | | | | | | | | | | | | | | | | | | |
| | | | | |
Containers, Packaging and Glass — 0.8%*: | | | | | | | | | | | | | | | | | | | | | | | | | |
Ardagh Packaging Finance PLC/Ardagh Holdings USA, Inc.^+ | | | | 4.63 | % | | | | 5/15/2023 | | | | | 1,500,000 | | | | | $1,487,014 | | | | | $1,432,500 | |
BWAY Holding Co. | | | | 4.75 | | | | | 4/15/2024 | | | | | 350,000 | | | | | 404,810 | | | | | 392,563 | |
BWAY Holding Co.^ | | | | 5.50 | | | | | 4/15/2024 | | | | | 300,000 | | | | | 300,000 | | | | | 282,000 | |
Guala Closures SpA+ | | | | 3.50 | | | | | 4/15/2024 | | | | | 100,000 | | | | | 117,465 | | | | | 113,147 | |
Reynolds Group Issuer, Inc./Reynolds Group Issuer LLC/Reynolds Group Issuer Lu^ | | | | 5.13 | | | | | 7/15/2023 | | | | | 178,000 | | | | | 178,000 | | | | | 169,545 | |
| | | | | | | | | | | | | | | | | | | | | | | | | |
Total Containers, Packaging and Glass | | | | | | | | | | | | | | 2,428,000 | | | | | 2,487,289 | | | | | 2,389,755 | |
| | | | | | | | | | | | | | | | | | | | | | | | | |
| | | | |
Diversified/Conglomerate Manufacturing — 0.1%*: | | | | | | | | | | | | | | | | | | | | | |
Appvion ESC^¤ | | | | 9.00 | | | | | 6/1/2020 | | | | | 460,000 | | | | | 462,565 | | | | | – | |
Fabric BC SpA, 3M EURIBOR + 4.125%+ | | | | 4.13 | # | | | | 11/30/2024 | | | | | 250,000 | | | | | 284,131 | | | | | 279,277 | |
Galapagos S.A., 3 mo. EURIBOR + 4.750%+ | | | | 4.44 | # | | | | 6/15/2021 | | | | | 200,000 | | | | | 272,630 | | | | | 157,169 | |
| | | | | | | | | | | | | | | | | | | | | | | | | |
Total Diversified/Conglomerate Manufacturing | | | | | | | | | | | | | | 910,000 | | | | | 1,019,326 | | | | | 436,446 | |
| | | | | | | | | | | | | | | | | | | | | | | | | |
| | | | | |
Diversified/Conglomerate Service — 0.9%*: | | | | | | | | | | | | | | | | | | | | | | | | | |
Algeco Global Finance PLC, 3 mo. EURIBOR + 6.250%+ | | | | 6.25 | # | | | | 2/15/2023 | | | | | 150,000 | | | | | 182,396 | | | | | 169,130 | |
Algeco Global Finance PLC+ | | | | 6.50 | | | | | 2/15/2023 | | | | | 450,000 | | | | | 549,354 | | | | | 503,497 | |
Carlson Travel, Inc., 3 mo. EURIBOR + 4.750% | | | | 4.75 | # | | | | 6/15/2023 | | | | | 1,200,000 | | | | | 1,369,434 | | | | | 1,361,151 | |
Prime Security Services Borrower LLC/Prime Finance, Inc.^ | | | | 9.25 | | | | | 5/15/2023 | | | | | 220,000 | | | | | 220,000 | | | | | 226,875 | |
TeamSystem SpA, 3 mo. EURIBOR + 4.000%+ | | | | 4.00 | # | | | | 4/15/2023 | | | | | 400,000 | | | | | 492,740 | | | | | 454,381 | |
| | | | | | | | | | | | | | | | | | | | | | | | | |
Total Diversified/Conglomerate Service | | | | | | | | | | | | | | 2,420,000 | | | | | 2,813,924 | | | | | 2,715,034 | |
| | | | | | | | | | | | | | | | | | | | | | | | | |
| | | | | |
Electronics — 0.3%*: | | | | | | | | | | | | | | | | | | | | | | | | | |
First Data Corp.^ | | | | 5.00 | | | | | 1/15/2024 | | | | | 179,000 | | | | | 178,225 | | | | | 172,288 | |
Veritas US, Inc./Veritas Bermuda Ltd.^ | | | | 7.50 | | | | | 2/1/2023 | | | | | 817,000 | | | | | 860,663 | | | | | 665,855 | |
| | | | | | | | | | | | | | | | | | | | | | | | | |
Total Electronics | | | | | | | | | | | | | | 996,000 | | | | | 1,038,888 | | | | | 838,143 | |
| | | | | | | | | | | | | | | | | | | | | | | | | |
| | | | | |
Finance — 2.7%*: | | | | | | | | | | | | | | | | | | | | | | | | | |
Arrow Global Finance PLC, 3 mo. EURIBOR + 3.750%+ | | | | 3.75 | # | | | | 3/1/2026 | | | | | 400,000 | | | | | 496,520 | | | | | 430,674 | |
Arrow Global Finance PLC+ | | | | 5.13 | | | | | 9/15/2024 | | | | | 1,000,000 | | | | | 1,227,925 | | | | | 1,134,904 | |
Cabot Financial Luxembourg SA+ | | | | 7.50 | | | | | 10/1/2023 | | | | | 300,000 | | | | | 426,974 | | | | | 347,430 | |
Galaxy Bidco Ltd., 3M GBP LIBOR + 4.500%+ | | | | 5.39 | # | | | | 11/15/2020 | | | | | 300,000 | | | | | 398,619 | | | | | 378,556 | |
Galaxy Bidco Ltd.+ | | | | 6.38 | | | | | 11/15/2020 | | | | | 500,000 | | | | | 638,363 | | | | | 626,211 | |
Garfunkelux Holdco 3 S.A., 3 mo. EURIBOR + 4.500%+ | | | | 4.50 | # | | | | 9/1/2023 | | | | | 1,100,000 | | | | | 1,325,396 | | | | | 1,039,818 | |
Garfunkelux Holdco 3 S.A.+ | | | | 8.50 | | | | | 11/1/2022 | | | | | 1,050,000 | | | | | 1,394,778 | | | | | 1,123,314 | |
Jerrold Finco PLC+ | | | | 6.13 | | | | | 1/15/2024 | | | | | 100,000 | | | | | 124,555 | | | | | 122,370 | |
Jerrold Finco PLC+ | | | | 6.25 | | | | | 9/15/2021 | | | | | 500,000 | | | | | 693,867 | | | | | 625,765 | |
Nexi Capital SpA, 3 mo. EURIBOR + 3.625%+ | | | | 3.63 | # | | | | 5/1/2023 | | | | | 1,600,000 | | | | | 1,883,291 | | | | | 1,810,284 | |
| | | | | | | | | | | | | | | | | | | | | | | | | |
Total Finance | | | | | | | | | | | | | | 6,850,000 | | | | | 8,610,288 | | | | | 7,639,326 | |
| | | | | | | | | | | | | | | | | | | | | | | | | |
See accompanying Notes to the Financial Statements.
93
Barings Global Floating Rate Fund 2018 Semi-Annual Report
SCHEDULE OF INVESTMENTS (CONTINUED)
December 31, 2018 (Unaudited)
| | | | | | | | | | | | | | | | | | | | | | | | | |
| | | EFFECTIVE
INTEREST RATE | | DUE DATE | | PRINCIPAL ‡‡ | | COST | | FAIR
VALUE |
Corporate Bonds(Continued) | | | | | | | | | | | | | | | | | | | | | | | | | |
| | | |
Healthcare, Education and Childcare — 0.6%*: | | | | | | | | | | | | | | | | |
Bausch Health Companies, Inc.^ | | | | 5.50 | % | | | | 11/1/2025 | | | | | 165,000 | | | | | $165,000 | | | | | $153,863 | |
IDH Finance PLC+ | | | | 6.25 | | | | | 8/15/2022 | | | | | 100,000 | | | | | 131,025 | | | | | 104,581 | |
Synlab Bondco PLC+ | | | | 6.25 | | | | | 7/1/2022 | | | | | 1,000,000 | | | | | 1,238,355 | | | | | 1,162,695 | |
Tenet Healthcare Corp. | | | | 4.63 | | | | | 7/15/2024 | | | | | 255,000 | | | | | 254,097 | | | | | 237,150 | |
| | | | | | | | | | | | | | | | | | | | | | | | | |
Total Healthcare, Education and Childcare | | | | | | | | | | | | | | 1,520,000 | | | | | 1,788,477 | | | | | 1,658,289 | |
| | | | | | | | | | | | | | | | | | | | | | | | | |
| | |
Home and Office Furnishings, Housewares, and Durable Consumer Products — 0.2%*: | | | | | | | | | | | |
LSF9 Balta Issuer Sarl+ | | | | 7.75 | | | | | 9/15/2022 | | | | | 445,500 | | | | | 552,558 | | | | | 471,794 | |
| | | | | | | | | | | | | | | | | | | | | | | | | |
| | | | | |
Hotels, Motels, Inns and Gaming — 0.2%*: | | | | | | | | | | | | | | | | | | | | | | | | | |
TVL Finance PLC, 3M GBP LIBOR + 4.875%+ | | | | 5.76 | # | | | | 5/15/2023 | | | | | 100,000 | | | | | 130,998 | | | | | 125,599 | |
TVL Finance PLC+ | | | | 8.50 | | | | | 5/15/2023 | | | | | 280,000 | | | | | 388,865 | | | | | 365,689 | |
| | | | | | | | | | | | | | | | | | | | | | | | | |
Total Hotels, Motels, Inns and Gaming | | | | | | | | | | | | | | 380,000 | | | | | 519,863 | | | | | 491,288 | |
| | | | | | | | | | | | | | | | | | | | | | | | | |
| | | | |
Leisure, Amusement, Entertainment — 0.4%*: | | | | | | | | | | | | | | | | | | | | | |
CPUK Finance Ltd.+ | | | | 4.88 | | | | | 8/28/2025 | | | | | 600,000 | | | | | 791,746 | | | | | 714,842 | |
Perform Group Financing PLC+ | | | | 8.50 | | | | | 11/15/2020 | | | | | 250,000 | | | | | 347,826 | | | | | 318,777 | |
Vue International Bidco PLC, 3 mo. EURIBOR + 5.250%+ | | | | 4.93 | # | | | | 7/15/2020 | | | | | 100,000 | | | | | 134,292 | | | | | 113,057 | |
WMG Acquisition Corp.^ | | | | 5.00 | | | | | 8/1/2023 | | | | | 63,000 | | | | | 63,000 | | | | | 61,268 | |
| | | | | | | | | | | | | | | | | | | | | | | | | |
Total Leisure, Amusement, Entertainment | | | | | | | | | | | | | | 1,013,000 | | | | | 1,336,864 | | | | | 1,207,944 | |
| | | | | | | | | | | | | | | | | | | | | | | | | |
| | | |
Machinery Non-Agriculture, Non-Construction, Non-Electronic — 0.3%*: | | | | | | | | | | | | | | | | |
Novafives SAS+ | | | | 5.00 | | | | | 6/15/2025 | | | | | 1,000,000 | | | | | 1,087,022 | | | | | 917,745 | |
| | | | | | | | | | | | | | | | | | | | | | | | | |
| | | | | |
Oil and Gas — 1.0%*: | | | | | | | | | | | | | | | | | | | | | | | | | |
Citgo Holding, Inc.^ | | | | 10.75 | | | | | 2/15/2020 | | | | | 1,500,000 | | | | | 1,493,208 | | | | | 1,530,000 | |
EP Energy LLC/Everest Acquisition Finance, Inc.^ | | | | 8.00 | | | | | 2/15/2025 | | | | | 713,000 | | | | | 625,572 | | | | | 294,112 | |
KCA Deutag UK Finance PLC^+ | | | | 9.88 | | | | | 4/1/2022 | | | | | 1,000,000 | | | | | 1,017,094 | | | | | 820,000 | |
Kosmos Energy Ltd.^+ | | | | 7.88 | | | | | 8/1/2021 | | | | | 150,000 | | | | | 146,751 | | | | | 149,250 | |
| | | | | | | | | | | | | | | | | | | | | | | | | |
Total Oil and Gas | | | | | | | | | | | | | | 3,363,000 | | | | | 3,282,625 | | | | | 2,793,362 | |
| | | | | | | | | | | | | | | | | | | | | | | | | |
| | | |
Personal and Non-Durable Consumer Products Mfg. Only — 0.2%*: | | | | | | | | | | | | | | | | |
WEPA Hygieneprodukte GmbH+ | | | | 3.75 | | | | | 5/15/2024 | | | | | 500,000 | | | | | 574,424 | | | | | 542,662 | |
| | | | | | | | | | | | | | | | | | | | | | | | | |
| | | | | |
Personal Transportation — 0.9%*: | | | | | | | | | | | | | | | | | | | | | | | | | |
Hertz Corp. (The)^ | | | | 7.63 | | | | | 6/1/2022 | | | | | 2,051,000 | | | | | 2,033,821 | | | | | 1,933,067 | |
Naviera Armas S.A., 3M EURIBOR + 6.500%+ | | | | 6.50 | # | | | | 7/31/2023 | | | | | 250,000 | | | | | 297,216 | | | | | 277,171 | |
Naviera Armas SA, 3 mo. EURIBOR + 4.250%+ | | | | 4.25 | # | | | | 11/15/2024 | | | | | 250,000 | | | | | 296,754 | | | | | 267,533 | |
| | | | | | | | | | | | | | | | | | | | | | | | | |
Total Personal Transportation | | | | | | | | | | | | | | 2,551,000 | | | | | 2,627,791 | | | | | 2,477,771 | |
| | | | | | | | | | | | | | | | | | | | | | | | | |
| | | | | |
Retail Stores — 0.6%*: | | | | | | | | | | | | | | | | | | | | | | | | | |
CBR Fashion Finance BV+ | | | | 5.13 | | | | | 10/1/2022 | | | | | 100,000 | | | | | 94,459 | | | | | 93,595 | |
House of Fraser Funding PLC, 3M GBP LIBOR + 5.750%+†† | | | | 6.55 | # | | | | 9/15/2020 | | | | | 300,000 | | | | | 438,054 | | | | | 21,987 | |
See accompanying Notes to the Financial Statements.
94
Barings Global Floating Rate Fund 2018 Semi-Annual Report
SCHEDULE OF INVESTMENTS (CONTINUED)
December 31, 2018 (Unaudited)
| | | | | | | | | | | | | | | | | | | | | | | | | |
| | | EFFECTIVE
INTEREST RATE | | DUE DATE | | PRINCIPAL ‡‡ | | COST | | FAIR
VALUE |
Corporate Bonds(Continued) | | | | | | | | | | | | | | | | | | | | | | | | | |
| | | | | |
Retail Stores(Continued) | | | | | | | | | | | | | | | | | | | | | | | | | |
Jewel UK Bondco PLC+ | | | | 8.50 | % | | | | 4/15/2023 | | | | | 100,000 | | | | | $142,450 | | | | | $118,091 | |
Marcolin SpA, 3 mo. EURIBOR + 4.125%+ | | | | 4.13 | # | | | | 2/15/2023 | | | | | 300,000 | | | | | 338,882 | | | | | 340,604 | |
Maxeda DIY Holding B.V.+ | | | | 6.13 | | | | | 7/15/2022 | | | | | 100,000 | | | | | 114,070 | | | | | 105,139 | |
Takko Luxembourg 2 SCA, 3M USD LIBOR + 5.375%+ | | | | 5.38 | | | | | 11/15/2023 | | | | | 1,200,000 | | | | | 1,298,245 | | | | | 976,124 | |
Travelex Financing PLC+ | | | | 8.00 | | | | | 5/15/2022 | | | | | 100,000 | | | | | 108,750 | | | | | 97,384 | |
| | | | | | | | | | | | | | | | | | | | | | | | | |
Total Retail Stores | | | | | | | | | | | | | | 2,200,000 | | | | | 2,534,910 | | | | | 1,752,924 | |
| | | | | | | | | | | | | | | | | | | | | | | | | |
| | | | | |
Telecommunications — 0.6%*: | | | | | | | | | | | | | | | | | | | | | | | | | |
Altice Financing SA^+ | | | | 6.63 | | | | | 2/15/2023 | | | | | 500,000 | | | | | 498,802 | | | | | 480,000 | |
Wind Tre SpA, 3M EURIBOR + 2.750%+ | | | | 2.75 | # | | | | 1/20/2024 | | | | | 700,000 | | | | | 764,344 | | | | | 715,807 | |
Ziggo B.V.+ | | | | 4.25 | | | | | 1/15/2027 | | | | | 350,000 | | | | | 390,408 | | | | | 393,895 | |
| | | | | | | | | | | | | | | | | | | | | | | | | |
Total Telecommunications | | | | | | | | | | | | | | 1,550,000 | | | | | 1,653,554 | | | | | 1,589,702 | |
| | | | | | | | | | | | | | | | | | | | | | | | | |
| | | | | |
Utilities — 0.4%*: | | | | | | | | | | | | | | | | | | | | | | | | | |
Viridian Group Finance Co. PLC+ | | | | 4.75 | | | | | 9/15/2024 | | | | | 865,000 | | | | | 1,073,593 | | | | | 1,011,570 | |
| | | | | | | | | | | | | | | | | | | | | | | | | |
Total Corporate Bonds | | | | | | | | | | | | | | 32,696,794 | | | | | 37,322,966 | | | | | 32,641,717 | |
| | | | | | | | | | | | | | | | | | | | | | | | | |
Total Fixed Income | | | | | | | | | | | | | | 277,224,706 | | | | | 290,247,714 | | | | | 271,856,229 | |
| | | | | | | | | | | | | | | | | | | | | | | | | |
Total Investments | | | | | | | | | | | | | | 279,305,141 | | | | | 291,533,544 | | | | | 273,291,956 | |
| | | | | | | | | | | | | | | | | | | | | | | | | |
| |
Other assets and liabilities — 4.7%* | | | | | 13,376,265 | |
| | | | | | | | | | | | | | | | | | | | | | | | | |
| |
Net Assets — 100.0% | | | | | $286,668,221 | |
| | | | | | | | | | | | | | | | | | | | | | | | | |
| ‡‡ | Unless otherwise indicated, all principal amounts are denominated in United States Dollars. |
| * | Calculated as a percentage of net assets applicable to common shareholders. |
Distributions of investments by country of risk (excluding temporary cash investments) as a percentage of total investments in securities, is as follows:
| | | | | | |
| | United States | | | 60.3% | |
| | United Kingdom | | | 12.2% | |
| | Germany | | | 9.7% | |
| | France | | | 4.2% | |
| | Netherlands | | | 4.1% | |
| | Spain | | | 1.7% | |
| | Italy | | | 1.7% | |
| | Ireland | | | 1.3% | |
| | Sweden | | | 1.3% | |
| | Other (Individually less than 1%) | | | 3.5% | |
| | | | | | |
| | Total | | | 100.0% | |
| | | | | | |
See accompanying Notes to the Financial Statements.
95
Barings Global Floating Rate Fund 2018 Semi-Annual Report
SCHEDULE OF INVESTMENTS (CONTINUED)
December 31, 2018 (Unaudited)
| ^ | Security acquired in a transaction exempt from registration under Rule 144A of the Securities Act of 1933. These securities may only be resold in transactions exempt from registration, normally to qualified institutional buyers. |
| § | Bank loans are exempt from registration under the Securities Act of 1933, as amended, but contain certain restrictions on resale and cannot be sold publicly. These loans pay interest at rates which adjust periodically. The interest rates shown for bank loans are the current interest rates at December 31, 2018. Bank loans are also subject to mandatory and/or optional prepayment which cannot be predicted. As a result, the remaining maturity may be substantially less than the stated maturity shown. |
| ¤ | For fair value measurement disclosure purposes, security is categorized as Level 3 (See Note 2). |
| # | Variable rate security. The interest rate shown is the rate in effect at December 31, 2018. |
A summary of outstanding derivatives at December 31, 2018 is as follows:
Forward Foreign Currency Exchange Contracts to Sell
| | | | | | | | | | | | | | | | | | | | | | |
EXPIRATION
DATE | | COUNTERPARTY | | LOCAL
CURRENCY | | | VALUE IN USD | | | IN
EXCHANGE
FOR USD | | | NET UNREALIZED
APPRECIATION
(DEPRECIATION) | |
| 1/14/19 | | Morgan Stanley & Co. | | | EUR | | | | 65,681,553 | | | $ | 75,323,145 | | | $ | 75,052,126 | | | $ | (271,019 | ) |
| 1/14/19 | | Morgan Stanley & Co. | | | GBP | | | | 13,499,750 | | | | 17,216,127 | | | | 17,244,300 | | | | 28,173 | |
| | | | | | | | | | | | | | | | | | | | | | |
Net unrealized depreciation on forward foreign currency exchange contracts to sell | | | $ | (242,846 | ) |
| | | | | | | | | | | | | | | | | | | | | | |
Currency Legend
| | | | |
| EUR | | – | | Euro |
| GBP | | – | | British Pound Sterling |
See accompanying Notes to the Financial Statements.
96
Barings Global Credit Income Opportunities Fund 2018 Semi-Annual Report
SCHEDULE OF INVESTMENTS
December 31, 2018 (Unaudited)
| | | | | | | | | | | | | | | | | | | | | | | | | |
| | | | | | | SHARES | | COST | | FAIR
VALUE |
Equities — 1.2%*: | | | | | | | | | | | | | | | | | | | | | | | | | |
| | | | | |
Common Stocks — 1.2%*: | | | | | | | | | | | | | | | | | | | | | | | | | |
| | | | | |
Healthcare, Education and Childcare — 0.2%*: | | | | | | | | | | | | | | | | | | | | | | | | | |
MModal, Inc. | | | | | | | | | | | | | | 4,725 | | | | | $131,922 | | | | | $363,825 | |
Tunstall Group Holdings Ltd.+¤ | | | | | | | | | | | | | | 396 | | | | | – | | | | | – | |
Tunstall Group Holdings Ltd.+¤ | | | | | | | | | | | | | | 261 | | | | | – | | | | | – | |
| | | | | | | | | | | | | | | | | | | | | | | | | |
Total Healthcare, Education and Childcare | | | | | | | | | | | | | | 5,382 | | | | | 131,922 | | | | | 363,825 | |
| | | | | | | | | | | | | | | | | | | | | | | | | |
| | | |
Mining, Steel, Iron and Non-Precious Metals — 0.1%*: | | | | | | | | | | | | | | | | |
Boomerang Tube LLC¤ | | | | | | | | | | | | | | 1,769,566 | | | | | 171,860 | | | | | 172,055 | |
| | | | | | | | | | | | | | | | | | | | | | | | | |
| | | | | |
Oil and Gas — 0.6%*: | | | | | | | | | | | | | | | | | | | | | | | | | |
Fieldwood Energy LLC | | | | | | | | | | | | | | 3,698 | | | | | 129,430 | | | | | 133,128 | |
Fieldwood Energy LLC | | | | | | | | | | | | | | 15,071 | | | | | 325,034 | | | | | 542,556 | |
Jupiter Resources, Inc.+ | | | | | | | | | | | | | | 120,272 | | | | | 581,286 | | | | | 408,925 | |
Southcross Energy Holdings LP | | | | | | | | | | | | | | 11 | | | | | – | | | | | – | |
Southcross Energy Partners LP | | | | | | | | | | | | | | 11 | | | | | 2,750 | | | | | 5,225 | |
| | | | | | | | | | | | | | | | | | | | | | | | | |
Total Oil and Gas | | | | | | | | | | | | | | 139,063 | | | | | 1,038,500 | | | | | 1,089,834 | |
| | | | | | | | | | | | | | | | | | | | | | | | | |
| | | | | |
Retail Stores — 0.3%*: | | | | | | | | | | | | | | | | | | | | | | | | | |
Maxeda DIY B.V.+¤ | | | | | | | | | | | | | | 18,859,871 | | | | | 373,737 | | | | | 432,174 | |
Maxeda DIY B.V.+¤ | | | | | | | | | | | | | | 10,446 | | | | | – | | | | | 108,051 | |
| | | | | | | | | | | | | | | | | | | | | | | | | |
Total Retail Stores | | | | | | | | | | | | | | 18,870,317 | | | | | 373,737 | | | | | 540,225 | |
| | | | | | | | | | | | | | | | | | | | | | | | | |
| | | | | | | | | | | | | | | | | | | | | | | | | |
Total Common Stocks | | | | | | | | | | | | | | 20,784,328 | | | | | 1,716,019 | | | | | 2,165,939 | |
| | | | | | | | | | | | | | | | | | | | | | | | | |
Preferred Stock — 0.0%*: | | | | | | | | | | | | | | | | | | | | | | | | | |
| | | | | |
Farming and Agriculture — 0.0%*: | | | | | | | | | | | | | | | | | | | | | | | | | |
Pinnacle Agriculture Holdings A 2¤†† | | | | | | | | | | | | | | 311,577 | | | | | 202,152 | | | | | 31,158 | |
| | | | | | | | | | | | | | | | | | | | | | | | | |
Warrants — 0.0%*: | | | | | | | | | | | | | | | | | | | | | | | | | |
| | | | | |
Diversified/Conglomerate Manufacturing — 0.0%*: | | | | | | | | | | | | | | | | | | | | | | | | | |
Appvion Holdings Corp. (exp. June 13, 2023)¤†† | | | | | | | | | | | | | | 488 | | | | | – | | | | | 5,196 | |
Appvion Holdings Corp. (exp. June 13, 2023)¤ | | | | | | | | | | | | | | 488 | | | | | – | | | | | – | |
| | | | | | | | | | | | | | | | | | | | | | | | | |
Total Diversified/Conglomerate Manufacturing | | | | | | | | | | | | | | 976 | | | | | – | | | | | 5,196 | |
| | | | | | | | | | | | | | | | | | | | | | | | | |
Total Warrants | | | | | | | | | | | | | | 976 | | | | | – | | | | | 5,196 | |
| | | | | | | | | | | | | | | | | | | | | | | | | |
Total Equities | | | | | | | | | | | | | | 21,096,881 | | | | | 1,918,171 | | | | | 2,202,293 | |
| | | | | | | | | | | | | | | | | | | | | | | | | |
| | | | | |
| | | EFFECTIVE
INTEREST RATE | | DUE DATE | | PRINCIPAL ‡‡ | | COST | | FAIR
VALUE |
Fixed Income — 93.3%*: | | | | | | | | | | | | | | | | | | | | | | | | | |
| | | | | |
Asset-Backed Securities — 14.3%*: | | | | | | | | | | | | | | | | | | | | | | | | | |
| | | | | |
CDO/CLO — 14.3%*: | | | | | | | | | | | | | | | | | | | | | | | | | |
AIMCO CLO Series 2015-AA ER, 3M USD LIBOR + 5.200%^ | | | | 7.64 | #% | | | | 1/15/2028 | | | | | 500,000 | | | | | 500,000 | | | | | 455,615 | |
Alinea CLO 2018-1 Ltd., 3M LIBOR + 6.000%^ | | | | 8.46 | # | | | | 7/20/2031 | | | | | 1,250,000 | | | | | 1,250,000 | | | | | 1,128,951 | |
See accompanying Notes to the Financial Statements.
97
Barings Global Credit Income Opportunities Fund 2018 Semi-Annual Report
SCHEDULE OF INVESTMENTS (CONTINUED)
December 31, 2018 (Unaudited)
| | | | | | | | | | | | | | | | | | | | | | | | | |
| | | EFFECTIVE
INTEREST RATE | | DUE DATE | | PRINCIPAL ‡‡ | | COST | | FAIR
VALUE |
Asset-Backed Securities(Continued) | | | | | | | | | | | | | | | | | | | | | | | | | |
| | | | | |
CDO/CLO(Continued) | | | | | | | | | | | | | | | | | | | | | | | | | |
ALME Loan Funding III Designated Activity Co. 3A ERV, 3M EURIBOR + 5.400%+^ | | | | 5.40 | #% | | | | 4/15/2030 | | | | | 500,000 | | | | | $522,804 | | | | | $547,427 | |
ALME Loan Funding IV BV 4A ER, 3M EURIBOR
+ 4.670%+^ | | | | 4.67 | # | | | | 1/15/2032 | | | | | 1,000,000 | | | | | 1,143,606 | | | | | 1,045,326 | |
Anchorage Capital CLO Ltd. 2015-6A ER, 3M USD LIBOR + 6.350%^ | | | | 8.79 | # | | | | 7/15/2030 | | | | | 500,000 | | | | | 513,214 | | | | | 466,400 | |
Apidos CLO XXIV, 3M USD LIBOR + 5.800%^¤ | | | | 8.27 | # | | | | 10/20/2030 | | | | | 1,000,000 | | | | | 1,000,000 | | | | | 906,090 | |
Ares XLVIII CLO, 3M LIBOR + 5.200%^ | | | | 7.54 | # | | | | 7/20/2030 | | | | | 800,000 | | | | | 800,000 | | | | | 696,133 | |
Atlas Senior Loan Fund X Ltd., 3M USD LIBOR + 5.700%^ | | | | 8.14 | # | | | | 1/15/2031 | | | | | 500,000 | | | | | 500,000 | | | | | 432,856 | |
Atlas Senior Loan Fund XI Ltd., 3M LIBOR + 5.7500%^ | | | | 8.09 | # | | | | 7/26/2031 | | | | | 1,900,000 | | | | | 1,900,000 | | | | | 1,697,025 | |
Avoca CLO XIV Designated Activity Co. 14X FR, 3M EURIBOR + 6.350%+ | | | | 6.35 | # | | | | 1/12/2031 | | | | | 500,000 | | | | | 559,570 | | | | | 510,680 | |
Blackrock European CLO VII DAC 7X E, 3M USD LIBOR + 5.170%+ | | | | 5.17 | # | | | | 10/15/2031 | | | | | 725,000 | | | | | 801,418 | | | | | 740,730 | |
BlueMountain CLO Ltd. 2014-1A^¤ | | | | Zero Coupon | | | | | 4/30/2026 | | | | | 250,000 | | | | | 242,311 | | | | | – | |
Cairn CLO B.V. 2013-3A E, 6M EURIBOR + 4.900%+^ | | | | 4.90 | # | | | | 10/20/2028 | | | | | 1,000,000 | | | | | 1,039,739 | | | | | 1,077,562 | |
Carbone CLO Ltd. 2017-1A D, 3M USD LIBOR + 5.900%^ | | | | 8.37 | # | | | | 1/20/2031 | | | | | 500,000 | | | | | 500,000 | | | | | 452,725 | |
CBAM Ltd. 2017-3A E, 3M USD LIBOR + 6.500%^ | | | | 8.95 | # | | | | 10/17/2029 | | | | | 750,000 | | | | | 750,000 | | | | | 704,088 | |
CIFC Funding 2018-III Ltd., 3M LIBOR + 5.500%^ | | | | 7.95 | # | | | | 7/18/2031 | | | | | 1,500,000 | | | | | 1,500,000 | | | | | 1,316,176 | |
CIFC Funding Ltd. 2017-1A E, 3M USD LIBOR + 6.350%^ | | | | 8.82 | # | | | | 4/23/2029 | | | | | 750,000 | | | | | 746,890 | | | | | 711,855 | |
CIFC Funding Ltd. 2017-5A D, 3M USD LIBOR + 6.100%^ | | | | 8.55 | # | | | | 11/16/2030 | | | | | 500,000 | | | | | 500,000 | | | | | 457,892 | |
Cordatus 3X CLO plc+ | | | | 4.86 | | | | | 8/15/2032 | | | | | 1,000,000 | | | | | 1,156,684 | | | | | 1,044,677 | |
Galaxy XXIV CLO Ltd. 2017-24A E, 3M USD LIBOR + 5.500%^ | | | | 7.94 | # | | | | 1/15/2031 | | | | | 700,000 | | | | | 700,000 | | | | | 616,684 | |
KKR Financial CLO Ltd. 2018 E, 3M USD LIBOR
+ 6.450%^ | | | | 8.89 | # | | | | 7/18/2030 | | | | | 800,000 | | | | | 784,846 | | | | | 728,726 | |
LCM XV LP 2015-A ER, 3M USD LIBOR + 6.500%^ | | | | 8.97 | # | | | | 7/20/2030 | | | | | 500,000 | | | | | 500,000 | | | | | 477,705 | |
Madison Park Funding XIII Ltd. 2014-13A^ | | | | Zero Coupon | | | | | 4/19/2030 | | | | | 500,000 | | | | | 419,415 | | | | | 350,216 | |
Madison Park Funding XXVII Ltd., 3M USD LIBOR + 5.200%”^ | | | | 7.47 | # | | | | 4/20/2030 | | | | | 500,000 | | | | | 500,000 | | | | | 429,884 | |
Madison Park Funding XXVIII Ltd., 3M LIBOR + 7.600%^ | | | | 10.22 | # | | | | 7/15/2030 | | | | | 500,000 | | | | | 495,491 | | | | | 441,767 | |
Magnetite VII Ltd.^ | | | | Zero Coupon | | | | | 1/15/2028 | | | | | 2,000,000 | | | | | 1,470,712 | | | | | 1,325,766 | |
Neuberger Berman Loan Advisers CLO 28 Ltd., 3M USD LIBOR + 5.600%^ | | | | 8.07 | # | | | | 4/20/2030 | | | | | 500,000 | | | | | 500,000 | | | | | 442,494 | |
Oak Hill Credit Partners X Ltd. 2014-10A^ | | | | Zero Coupon | | | | | 7/20/2026 | | | | | 1,000,000 | | | | | 707,674 | | | | | 448,566 | |
See accompanying Notes to the Financial Statements.
98
Barings Global Credit Income Opportunities Fund 2018 Semi-Annual Report
SCHEDULE OF INVESTMENTS (CONTINUED)
December 31, 2018 (Unaudited)
| | | | | | | | | | | | | | | | | | | | | | | | | |
| | | EFFECTIVE
INTEREST RATE | | DUE DATE | | PRINCIPAL ‡‡ | | COST | | FAIR
VALUE |
Asset-Backed Securities(Continued) | | | | | | | | | | | | | | | | | | | | | | | | | |
| | | | | |
CDO/CLO(Continued) | | | | | | | | | | | | | | | | | | | | | | | | | |
Steele Creek CLO Ltd. 2017-1A E, 3M USD LIBOR + 6.200%^ | | | | 8.64 | #% | | | | 1/15/2031 | | | | | 500,000 | | | | | $500,000 | | | | | $446,900 | |
Steele Creek CLO Ltd. 2018-2A E, 3M USD LIBOR + 2.600%^ | | | | 8.84 | # | | | | 8/18/2031 | | | | | 850,000 | | | | | 850,000 | | | | | 750,828 | |
TCI-Symphony CLO Ltd. 2017-1A E, 3M USD LIBOR + 6.450%^ | | | | 8.89 | # | | | | 7/15/2030 | | | | | 1,000,000 | | | | | 990,600 | | | | | 938,473 | |
THL Credit Wind River CLO Ltd. 2017-4A E, 3M USD LIBOR + 5.800%^ | | | | 8.44 | # | | | | 11/20/2030 | | | | | 500,000 | | | | | 500,000 | | | | | 450,356 | |
THL Credit Wind River CLO Ltd. 2018-2A E, 3M USD LIBOR + 5.750%^ | | | | 8.19 | # | | | | 7/15/2030 | | | | | 1,450,000 | | | | | 1,450,000 | | | | | 1,293,151 | |
Wellfleet CLO 2018-1 Ltd., 3M USD LIBOR + 5.600%^ | | | | 8.06 | # | | | | 7/17/2031 | | | | | 1,150,000 | | | | | 1,150,000 | | | | | 996,980 | |
Wellfleet CLO Ltd. 2017-3A D, 3M USD LIBOR + 5.550%^ | | | | 8.00 | # | | | | 1/17/2031 | | | | | 1,000,000 | | | | | 1,000,000 | | | | | 873,381 | |
| | | | | | | | | | | | | | | | | | | | | | | | | |
Total CDO/CLO | | | | | | | | | | | | | | 28,875,000 | | | | | 28,444,974 | | | | | 25,404,085 | |
| | | | | | | | | | | | | | | | | | | | | | | | | |
| | | | | | | | | | | | | | | | | | | | | | | | | |
Total Asset-Backed Securities | | | | | | | | | | | | | | 28,875,000 | | | | | 28,444,974 | | | | | 25,404,085 | |
| | | | | | | | | | | | | | | | | | | | | | | | | |
| | | | | |
Bank Loans — 35.1%*§: | | | | | | | | | | | | | | | | | | | | | | | | | |
| | | | | |
Beverage, Food and Tobacco — 1.6%*: | | | | | | | | | | | | | | | | | | | | | | | | | |
Deoleo S.A., EURIBOR + 3.500%+†† | | | | 4.50 | | | | | 6/11/2021 | | | | | 500,000 | | | | | 559,439 | | | | | 238,459 | |
IRB Holding Corp., 1M LIBOR + 3.250% | | | | 5.68 | | | | | 2/5/2025 | | | | | 1,829,005 | | | | | 1,846,388 | | | | | 1,740,297 | |
JBS USA LLC, 3M LIBOR + 2.500% | | | | 5.26 | | | | | 10/30/2022 | | | | | 402,787 | | | | | 401,563 | | | | | 386,676 | |
Refresco Group B.V., EURIBOR + 3.250%+ | | | | 3.25 | | | | | 3/28/2025 | | | | | 500,000 | | | | | 585,095 | | | | | 559,361 | |
| | | | | | | | | | | | | | | | | | | | | | | | | |
Total Beverage, Food and Tobacco | | | | | | | | | | | | | | 3,231,792 | | | | | 3,392,485 | | | | | 2,924,793 | |
| | | | | | | | | | | | | | | | | | | | | | | | | |
| | | | | |
Broadcasting and Entertainment — 2.4%*: | | | | | | | | | | | | | | | | | | | | | | | | | |
All3Media International, 6M LIBOR + 4.250%+ | | | | 5.25 | | | | | 6/30/2021 | | | | | 500,000 | | | | | 835,749 | | | | | 635,707 | |
AP NMT Acquisition B.V., EURIBOR + 6.000%+ | | | | 7.00 | | | | | 8/13/2021 | | | | | 389,064 | | | | | 479,641 | | | | | 439,560 | |
AP NMT Acquisition B.V., 3M LIBOR + 9.000%+ | | | | 11.40 | | | | | 8/13/2022 | | | | | 300,000 | | | | | 289,080 | | | | | 277,179 | |
AP NMT Acquisition B.V., 3M LIBOR + 5.750%+ | | | | 8.15 | | | | | 8/13/2021 | | | | | 1,181,285 | | | | | 1,157,803 | | | | | 1,129,899 | |
Univision Communications, Inc., 1M LIBOR + 2.750% | | | | 5.27 | | | | | 3/15/2024 | | | | | 1,983,691 | | | | | 1,963,652 | | | | | 1,791,114 | |
| | | | | | | | | | | | | | | | | | | | | | | | | |
Total Broadcasting and Entertainment | | | | | | | | | | | | | | 4,354,040 | | | | | 4,725,925 | | | | | 4,273,459 | |
| | | | | | | | | | | | | | | | | | | | | | | | | |
| | | | | |
Buildings and Real Estate — 0.5%*: | | | | | | | | | | | | | | | | | | | | | | | | | |
LSF10 Impala Investments S.a r.l., EURIBOR + 4.750%+ | | | | 4.75 | | | | | 8/2/2025 | | | | | 500,000 | | | | | 573,833 | | | | | 571,981 | |
SRS Distribution, Inc., 3M LIBOR + 3.250% | | | | 5.77 | | | | | 5/23/2025 | | | | | 364,395 | | | | | 363,559 | | | | | 339,117 | |
| | | | | | | | | | | | | | | | | | | | | | | | | |
Total Buildings and Real Estate | | | | | | | | | | | | | | 864,395 | | | | | 937,392 | | | | | 911,098 | |
| | | | | | | | | | | | | | | | | | | | | | | | | |
| | | | | |
Cargo Transport — 0.1%*: | | | | | | | | | | | | | | | | | | | | | | | | | |
CEVA Group plc, 3M LIBOR + 3.750%+ | | | | 6.55 | | | | | 7/24/2025 | | | | | 150,945 | | | | | 150,231 | | | | | 145,914 | |
| | | | | | | | | | | | | | | | | | | | | | | | | |
See accompanying Notes to the Financial Statements.
99
Barings Global Credit Income Opportunities Fund 2018 Semi-Annual Report
SCHEDULE OF INVESTMENTS (CONTINUED)
December 31, 2018 (Unaudited)
| | | | | | | | | | | | | | | | | | | | | | | | | |
| | | EFFECTIVE
INTEREST RATE | | DUE DATE | | PRINCIPAL ‡‡ | | COST | | FAIR
VALUE |
Bank Loans(Continued) | | | | | | | | | | | | | | | | | | | | | | | | | |
| | | | | |
Chemicals, Plastics and Rubber — 2.2%*: | | | | | | | | | | | | | | | | | | | | | | | | | |
Colouroz Investment 1 GmbH, EURIBOR + 3.0000%+ | | | | 3.75 | % | | | | 9/7/2021 | | | | | 1,344,957 | | | | | $1,578,552 | | | | | $1,460,083 | |
Diamond B.V., EURIBOR + 3.2500% | | | | 3.25 | | | | | 9/6/2024 | | | | | 495,000 | | | | | 584,966 | | | | | 544,993 | |
Flint Group GmbH, LIBOR + 3.000%+ | | | | 3.75 | | | | | 9/7/2021 | | | | | 284,770 | | | | | 337,012 | | | | | 309,145 | |
Novacap S.A., EURIBOR + 3.500%+ | | | | 3.50 | | | | | 6/22/2023 | | | | | 500,000 | | | | | 576,034 | | | | | 554,973 | |
Platform Specialty Products Corp., 1M LIBOR + 2.250% | | | | 5.05 | | | | | 11/15/2025 | | | | | 201,168 | | | | | 200,916 | | | | | 194,882 | |
Solenis International LP, 3M LIBOR + 4.000% | | | | 6.71 | | | | | 12/26/2023 | | | | | 247,362 | | | | | 245,098 | | | | | 238,705 | |
Solenis International LP, 3M LIBOR + 8.500% | | | | 11.21 | | | | | 6/26/2024 | | | | | 158,282 | | | | | 153,937 | | | | | 148,785 | |
Starfruit Finco B.V, 1M LIBOR + 3.250%+ | | | | 5.60 | | | | | 10/1/2025 | | | | | 514,731 | | | | | 512,235 | | | | | 491,568 | |
| | | | | | | | | | | | | | | | | | | | | | | | | |
Total Chemicals, Plastics and Rubber | | | | | | | | | | | | | | 3,746,270 | | | | | 4,188,750 | | | | | 3,943,134 | |
| | | | | | | | | | | | | | | | | | | | | | | | | |
| | | | | |
Containers, Packaging and Glass — 1.1%*: | | | | | | | | | | | | | | | | | | | | | | | | | |
Albea Beauty Holdings S.A., EURIBOR + 3.000%+ | | | | 5.89 | | | | | 4/22/2024 | | | | | 205,385 | | | | | 205,158 | | | | | 192,805 | |
BWAY Holding Co., 1M LIBOR + 3.250% | | | | 5.66 | | | | | 4/3/2024 | | | | | 1,329,319 | | | | | 1,328,826 | | | | | 1,247,340 | |
ProAmpac PG Borrower LLC, 3M LIBOR + 8.500% | | | | 11.14 | | | | | 11/18/2024 | | | | | 500,000 | | | | | 494,477 | | | | | 498,750 | |
| | | | | | | | | | | | | | | | | | | | | | | | | |
Total Containers, Packaging and Glass | | | | | | | | | | | | | | 2,034,704 | | | | | 2,028,461 | | | | | 1,938,895 | |
| | | | | | | | | | | | | | | | | | | | | | | | | |
| | | | |
Diversified/Conglomerate Manufacturing — 0.8%*: | | | | | | | | | | | | | | | | | | | | | |
LTI Holdings, Inc., 1M LIBOR + 3.500% | | | | 6.02 | | | | | 9/6/2025 | | | | | 409,879 | | | | | 407,920 | | | | | 384,946 | |
Triple Point Technology, Inc., 3M LIBOR + 4.250% | | | | 6.77 | | | | | 7/10/2020 | | | | | 571,728 | | | | | 558,852 | | | | | 468,817 | |
Xella International GmbH, EURIBOR + 4.000%+ | | | | 4.00 | | | | | 4/11/2024 | | | | | 500,000 | | | | | 588,325 | | | | | 560,129 | |
| | | | | | | | | | | | | | | | | | | | | | | | | |
Total Diversified/Conglomerate Manufacturing | | | | | | | | | | | | | | 1,481,607 | | | | | 1,555,097 | | | | | 1,413,892 | |
| | | | | | | | | | | | | | | | | | | | | | | | | |
| | | | | |
Diversified/Conglomerate Service — 2.8%*: | | | | | | | | | | | | | | | | | | | | | | | | | |
Almonde, Inc., 3M LIBOR + 3.500%+ | | | | 6.30 | | | | | 6/13/2024 | | | | | 1,338,968 | | | | | 1,342,298 | | | | | 1,244,290 | |
EAB (Avatar Purchaser), 1M LIBOR + 3.750% | | | | 6.41 | | | | | 11/15/2024 | | | | | 243,918 | | | | | 242,892 | | | | | 231,113 | |
MH Sub I LLC, 3M LIBOR + 3.750% | | | | 6.25 | | | | | 9/13/2024 | | | | | 694,724 | | | | | 696,273 | | | | | 657,382 | |
Verisure Holding AB, EURIBOR + 3.000%+ | | | | 3.00 | | | | | 10/20/2022 | | | | | 1,000,000 | | | | | 1,164,583 | | | | | 1,114,631 | |
Vertafore, Inc., 1M LIBOR + 3.250% | | | | 6.05 | | | | | 7/2/2025 | | | | | 1,000,000 | | | | | 995,327 | | | | | 947,810 | |
Vertafore, Inc., 1M LIBOR + 7.250% | | | | 10.05 | | | | | 7/2/2026 | | | | | 879,452 | | | | | 871,160 | | | | | 838,777 | |
| | | | | | | | | | | | | | | | | | | | | | | | | |
Total Diversified/Conglomerate Service | | | | | | | | | | | | | | 5,157,062 | | | | | 5,312,533 | | | | | 5,034,003 | |
| | | | | | | | | | | | | | | | | | | | | | | | | |
| | | | | |
Ecological — 0.5%*: | | | | | | | | | | | | | | | | | | | | | | | | | |
Emerald 3 Ltd., 3M LIBOR + 7.000% | | | | 9.80 | | | | | 5/31/2022 | | | | | 196,488 | | | | | 195,631 | | | | | 190,922 | |
GFL Environmental Inc., 1M LIBOR + 3.000%+ | | | | 5.22 | | | | | 5/31/2025 | | | | | 132,799 | | | | | 132,527 | | | | | 123,570 | |
PHS Group Ltd., 1M LIBOR + 5.250%+ | | | | 7.77 | | | | | 12/20/2021 | | | | | 500,000 | | | | | 650,900 | | | | | 636,981 | |
| | | | | | | | | | | | | | | | | | | | | | | | | |
Total Ecological | | | | | | | | | | | | | | 829,287 | | | | | 979,058 | | | | | 951,473 | |
| | | | | | | | | | | | | | | | | | | | | | | | | |
See accompanying Notes to the Financial Statements.
100
Barings Global Credit Income Opportunities Fund 2018 Semi-Annual Report
SCHEDULE OF INVESTMENTS (CONTINUED)
December 31, 2018 (Unaudited)
| | | | | | | | | | | | | | | | | | | | | | | | | |
| | | EFFECTIVE
INTEREST RATE | | DUE DATE | | PRINCIPAL ‡‡ | | COST | | FAIR
VALUE |
Bank Loans(Continued) | | | | | | | | | | | | | | | | | | | | | | | | | |
| | | | | |
Electronics — 2.9%*: | | | | | | | | | | | | | | | | | | | | | | | | | |
ION Trading Technologies Sarl, 3M LIBOR + 4.000% | | | | 6.52 | % | | | | 11/21/2024 | | | | | 282,941 | | | | | $276,229 | | | | | $266,672 | |
ION Trading Technologies Sarl, EURIBOR + 3.250% | | | | 4.25 | | | | | 11/21/2024 | | | | | 1,090,342 | | | | | 1,252,535 | | | | | 1,203,036 | |
Omnitracs, Inc., 3M LIBOR + 2.750% | | | | 5.57 | | | | | 3/21/2025 | | | | | 1,492,500 | | | | | 1,495,860 | | | | | 1,403,696 | |
Renaissance Holding Corp., 1M LIBOR + 3.250% | | | | 5.77 | | | | | 5/30/2025 | | | | | 995,000 | | | | | 995,000 | | | | | 921,002 | |
RP Crown Parent LLC, 1M LIBOR + 2.750% | | | | 5.27 | | | | | 10/12/2023 | | | | | 728,432 | | | | | 725,940 | | | | | 700,242 | |
SS&C Technologies Inc., 1M LIBOR + 2.250% | | | | 4.77 | | | | | 4/16/2025 | | | | | 146,067 | | | | | 145,707 | | | | | 137,578 | |
Veritas Bermuda Ltd., 3M LIBOR + 4.500% | | | | 7.09 | | | | | 1/27/2023 | | | | | 557,230 | | | | | 555,695 | | | | | 473,249 | |
| | | | | | | | | | | | | | | | | | | | | | | | | |
Total Electronics | | | | | | | | | | | | | | 5,292,512 | | | | | 5,446,966 | | | | | 5,105,475 | |
| | | | | | | | | | | | | | | | | | | | | | | | | |
| | | | | |
Finance — 0.8%*: | | | | | | | | | | | | | | | | | | | | | | | | | |
Tempo Acquisition LLC, 1M LIBOR + 3.000% | | | | 5.52 | | | | | 5/1/2024 | | | | | 1,506,940 | | | | | 1,510,849 | | | | | 1,439,128 | |
| | | | | | | | | | | | | | | | | | | | | | | | | |
| | | | | |
Healthcare, Education and Childcare — 6.3%*: | | | | | | | | | | | | | | | | | | | | | | | | | |
Aenova Holding GmbH, EURIBOR + 4.000%+ | | | | 5.00 | | | | | 9/29/2020 | | | | | 999,999 | | | | | 1,151,295 | | | | | 1,121,196 | |
Auris Luxembourg III Sarl, LIBOR + 3.750% | | | | 6.55 | | | | | 7/20/2025 | | | | | 392,021 | | | | | 390,178 | | | | | 380,507 | |
Aveanna Healthcare, LLC, 1M LIBOR + 5.500% | | | | 8.02 | | | | | 3/18/2024 | | | | | 113,307 | | | | | 106,946 | | | | | 108,774 | |
Bausch Health Companies, 1M LIBOR + 3.000% | | | | 5.38 | | | | | 6/1/2025 | | | | | 481,250 | | | | | 479,041 | | | | | 458,660 | |
Cerba Healthcare S.A.S., EURIBOR + 3.000%+ | | | | 3.00 | | | | | 4/20/2024 | | | | | 1,000,000 | | | | | 1,177,255 | | | | | 1,113,016 | |
Concordia International Corp., LIBOR + 5.500%+ | | | | 7.89 | | | | | 9/6/2024 | | | | | 1,840,750 | | | | | 1,818,830 | | | | | 1,751,271 | |
Endo Luxembourg Finance Co. I S.a r.l., 1M LIBOR + 4.250% | | | | 6.81 | | | | | 4/29/2024 | | | | | 666,371 | | | | | 669,341 | | | | | 629,721 | |
GHD GesundHeits GmbH Deutschland, EURIBOR + 3.000%+ | | | | 4.00 | | | | | 8/28/2021 | | | | | 500,000 | | | | | 577,887 | | | | | 564,568 | |
Horizon Pharma, Inc., 1M LIBOR + 3.000% | | | | 5.56 | | | | | 3/29/2024 | | | | | 967,220 | | | | | 969,161 | | | | | 920,474 | |
Lifescan Global Corp., 3M LIBOR + 6.000% | | | | 8.40 | | | | | 9/27/2024 | | | | | 189,398 | | | | | 183,932 | | | | | 178,508 | |
MModal, Inc., 1M LIBOR + 4.750% | | | | 7.53 | | | | | 1/31/2020 | | | | | 556,739 | | | | | 550,419 | | | | | 554,306 | |
Ortho-Clinical Diagnostics SA, 3M LIBOR + 3.250% | | | | 5.76 | | | | | 6/30/2025 | | | | | 1,213,342 | | | | | 1,213,900 | | | | | 1,122,717 | |
Parexel International Corp., 1M LIBOR + 2.7500% | | | | 5.27 | | | | | 9/27/2024 | | | | | 987,500 | | | | | 992,868 | | | | | 889,984 | |
Rodenstock GmbH, EURIBOR + 5.250%+ | | | | 5.25 | | | | | 6/30/2021 | | | | | 500,000 | | | | | 582,349 | | | | | 555,689 | |
Rossini Sarl, EURIBOR + 6.25%+ | | | | 6.25 | | | | | 10/30/2025 | | | | | 250,000 | | | | | 291,859 | | | | | 286,437 | |
Tunstall Group Holdings Ltd., 1M LIBOR + 4.500%+ | | | | 7.50 | | | | | 10/16/2020 | | | | | 507,612 | | | | | 595,974 | | | | | 546,701 | |
| | | | | | | | | | | | | | | | | | | | | | | | | |
Total Healthcare, Education and Childcare | | | | | | | | | | | | | | 11,165,509 | | | | | 11,751,235 | | | | | 11,182,529 | |
| | | | | | | | | | | | | | | | | | | | | | | | | |
See accompanying Notes to the Financial Statements.
101
Barings Global Credit Income Opportunities Fund 2018 Semi-Annual Report
SCHEDULE OF INVESTMENTS (CONTINUED)
December 31, 2018 (Unaudited)
| | | | | | | | | | | | | | | | | | | | | | | | | |
| | | EFFECTIVE
INTEREST RATE | | DUE DATE | | PRINCIPAL ‡‡ | | COST | | FAIR
VALUE |
Bank Loans(Continued) | | | | | | | | | | | | | | | | | | | | | | | | | |
| | |
Home and Office Furnishings, Housewares, and Durable Consumer Products — 1.0%*: | | | | | | | | | | | |
Keter Group B.V., EURIBOR + 4.250%+ | | | | 5.25 | % | | | | 10/31/2023 | | | | | 500,000 | | | | | $547,872 | | | | | $454,003 | |
Serta Simmons Bedding LLC, 1M LIBOR + 8.000% | | | | 10.43 | | | | | 11/8/2024 | | | | | 474,666 | | | | | 469,421 | | | | | 335,433 | |
Serta Simmons Bedding LLC, 3M LIBOR + 3.500% | | | | 5.89 | | | | | 11/8/2023 | | | | | 1,219,461 | | | | | 1,218,692 | | | | | 1,016,213 | |
| | | | | | | | | | | | | | | | | | | | | | | | | |
Total Home and Office Furnishings, Housewares, and Durable Consumer Products | | | | | | | | | | | | | | 2,194,127 | | | | | 2,235,985 | | | | | 1,805,649 | |
| | | | | | | | | | | | | | | | | | | | | | | | | |
| | | | | |
Hotels, Motels, Inns and Gaming — 0.8%*: | | | | | | | | | | | | | | | | | | | | | | | | | |
Compass IV Ltd., 3M LIBOR + 4.500%+ | | | | 4.50 | | | | | 4/30/2025 | | | | | 500,000 | | | | | 598,167 | | | | | 567,324 | |
Penn National Gaming, Inc., 1M LIBOR + 2.250% | | | | 4.71 | | | | | 8/14/2025 | | | | | 213,185 | | | | | 212,667 | | | | | 205,325 | |
Stars Group Holdings B.V. (The), 3M LIBOR +
3.500%+ | | | | 6.30 | | | | | 7/10/2025 | | | | | 705,217 | | | | | 701,921 | | | | | 679,949 | |
| | | | | | | | | | | | | | | | | | | | | | | | | |
Total Hotels, Motels, Inns and Gaming | | | | | | | | | | | | | | 1,418,402 | | | | | 1,512,755 | | | | | 1,452,598 | |
| | | | | | | | | | | | | | | | | | | | | | | | | |
| | | | | |
Insurance — 1.8%*: | | | | | | | | | | | | | | | | | | | | | | | | | |
AssuredPartners, Inc., 1M LIBOR + 3.250% | | | | 5.77 | | | | | 10/22/2024 | | | | | 987,193 | | | | | 991,194 | | | | | 929,818 | |
Confie Seguros Holding II Co., 3M LIBOR + 8.500% | | | | 11.24 | | | | | 10/31/2025 | | | | | 464,528 | | | | | 455,237 | | | | | 449,816 | |
Hub International Ltd., 2M LIBOR + 3.000% | | | | 5.24 | | | | | 4/25/2025 | | | | | 1,305,121 | | | | | 1,302,168 | | | | | 1,229,672 | |
Innovation Group plc (The), EURIBOR + 4.750%+ | | | | 5.25 | | | | | 3/31/2019 | | | | | 519,388 | | | | | 460,579 | | | | | 238,035 | |
Innovation Group plc (The), LIBOR + 8.000%+¤†† | | | | 8.80 | | | | | 12/2/2022 | | | | | 33,211 | | | | | 41,993 | | | | | 41,484 | |
York Risk Services Holding Corp., 1M LIBOR + 3.750% | | | | 6.27 | | | | | 10/1/2021 | | | | | 435,860 | | | | | 429,619 | | | | | 405,816 | |
| | | | | | | | | | | | | | | | | | | | | | | | | |
Total Insurance | | | | | | | | | | | | | | 3,745,301 | | | | | 3,680,790 | | | | | 3,294,641 | |
| | | | | | | | | | | | | | | | | | | | | | | | | |
| | | | | |
Leisure, Amusement, Entertainment — 1.0%*: | | | | | | | | | | | | | | | | | | | | | | | | | |
Delta 2 (LUX) Sarl, 1M LIBOR + 2.500%+ | | | | 5.02 | | | | | 2/1/2024 | | | | | 509,619 | | | | | 511,131 | | | | | 480,739 | |
Dorna Sports, S.L., 1M LIBOR + 3.250%+ | | | | 5.88 | | | | | 4/12/2024 | | | | | 400,000 | | | | | 400,000 | | | | | 390,500 | |
Metro-Goldwyn-Mayer, Inc., 1M LIBOR + 4.500% | | | | 7.03 | | | | | 7/3/2026 | | | | | 893,847 | | | | | 885,399 | | | | | 831,277 | |
| | | | | | | | | | | | | | | | | | | | | | | | | |
Total Leisure, Amusement, Entertainment | | | | | | | | | | | | | | 1,803,466 | | | | | 1,796,530 | | | | | 1,702,516 | |
| | | | | | | | | | | | | | | | | | | | | | | | | |
| | | |
Machinery Non-Agriculture, Non-Construction, Non-Electronic — 1.3%*: | | | | | | | | | | | | | | | | |
Alison Bidco Sarl, 1M LIBOR + 4.500%+ | | | | 7.03 | | | | | 8/29/2021 | | | | | 740,749 | | | | | 711,626 | | | | | 703,712 | |
Apex Tool Group LLC, 1M LIBOR + 3.750% | | | | 6.27 | | | | | 2/1/2022 | | | | | 183,460 | | | | | 182,738 | | | | | 176,488 | |
Titan Acquisition Ltd., 1M LIBOR + 3.000%+ | | | | 5.52 | | | | | 3/28/2025 | | | | | 1,488,750 | | | | | 1,490,432 | | | | | 1,357,859 | |
| | | | | | | | | | | | | | | | | | | | | | | | | |
Total Machinery Non-Agriculture, Non-Construction, Non-Electronic | | | | | | | | | | | | | | 2,412,959 | | | | | 2,384,796 | | | | | 2,238,059 | |
| | | | | | | | | | | | | | | | | | | | | | | | | |
See accompanying Notes to the Financial Statements.
102
Barings Global Credit Income Opportunities Fund 2018 Semi-Annual Report
SCHEDULE OF INVESTMENTS (CONTINUED)
December 31, 2018 (Unaudited)
| | | | | | | | | | | | | | | | | | | | | | | | | |
| | | EFFECTIVE
INTEREST RATE | | DUE DATE | | PRINCIPAL ‡‡ | | COST | | FAIR
VALUE |
Bank Loans(Continued) | | | | | | | | | | | | | | | | | | | | | | | | | |
| | | | |
Mining, Steel, Iron and Non-Precious Metals — 0.3%*: | | | | | | | | | | | | | | | | | | | | | |
Boomerang Tube, LLC, 3M LIBOR + 3.000%¤†† | | | | 7.52 | % | | | | 10/31/2021 | | | | | 124,368 | | | | | $124,368 | | | | | $124,368 | |
Covia Holdings Corp., 3M LIBOR + 3.750% | | | | 6.55 | | | | | 6/1/2025 | | | | | 567,617 | | | | | 567,617 | | | | | 408,684 | |
| | | | | | | | | | | | | | | | | | | | | | | | | |
Total Mining, Steel, Iron and Non-Precious Metals | | | | | | | | | | | | | | 691,985 | | | | | 691,985 | | | | | 533,052 | |
| | | | | | | | | | | | | | | | | | | | | | | | | |
| | | | | |
Oil and Gas — 2.1%*: | | | | | | | | | | | | | | | | | | | | | | | | | |
Caelus Energy Alaska O3 LLC, 3M LIBOR + 7.500% | | | | 10.30 | | | | | 4/15/2020 | | | | | 637,193 | | | | | 613,711 | | | | | 564,980 | |
Fieldwood Energy LLC, 1M LIBOR + 7.250% | | | | 7.77 | | | | | 4/11/2023 | | | | | 885,631 | | | | | 345,074 | | | | | 769,613 | |
Fieldwood Energy LLC, 1M LIBOR + 5.250% | | | | 9.77 | | | | | 4/11/2022 | | | | | 649,368 | | | | | 586,813 | | | | | 605,133 | |
Gulf Finance LLC, 3M LIBOR + 5.250% | | | | 7.89 | | | | | 8/25/2023 | | | | | 1,291,092 | | | | | 1,219,620 | | | | | 979,617 | |
KCA Deutag Alpha Ltd., 3M LIBOR + 6.750%+ | | | | 9.55 | | | | | 2/28/2023 | | | | | 497,500 | | | | | 495,303 | | | | | 398,995 | |
Seadrill Partners Finco LLC, 3M LIBOR + 6.000% | | | | 8.80 | | | | | 2/21/2021 | | | | | 236,422 | | | | | 194,613 | | | | | 184,558 | |
UTEX Industries, Inc., 1M LIBOR + 7.250% | | | | 9.77 | | | | | 5/22/2022 | | | | | 355,556 | | | | | 330,988 | | | | | 304,000 | |
| | | | | | | | | | | | | | | | | | | | | | | | | |
Total Oil and Gas | | | | | | | | | | | | | | 4,552,762 | | | | | 3,786,122 | | | | | 3,806,896 | |
| | | | | | | | | | | | | | | | | | | | | | | | | |
| | | |
Personal and Non-Durable Consumer Products Mfg. Only — 0.6%*: | | | | | | | | | | | | | | | | |
Coty Inc., 1M LIBOR + 2.250% | | | | 4.63 | | | | | 4/7/2025 | | | | | 1,196,993 | | | | | 1,149,327 | | | | | 1,102,729 | |
| | | | | | | | | | | | | | | | | | | | | | | | | |
| | | | | |
Printing and Publishing — 0.2%*: | | | | | | | | | | | | | | | | | | | | | | | | | |
Springer Science+Business Media Deutschland GmbH, 2M LIBOR + 3.500%+†† | | | | 6.02 | | | | | 8/15/2022 | | | | | 298,376 | | | | | 299,095 | | | | | 291,290 | |
| | | | | | | | | | | | | | | | | | | | | | | | | |
| | | | | |
Retail Stores — 1.4%*: | | | | | | | | | | | | | | | | | | | | | | | | | |
EG Finco Ltd., 3M LIBOR + 4.000%+ | | | | 6.81 | | | | | 2/7/2025 | | | | | 364,909 | | | | | 363,268 | | | | | 350,769 | |
EG Group Ltd., EURIBOR + 4.000%+ | | | | 4.00 | | | | | 2/6/2025 | | | | | 664,866 | | | | | 801,940 | | | | | 738,558 | |
Kirk Beauty One GmbH, EURIBOR + 3.500%+ | | | | 3.50 | | | | | 8/12/2022 | | | | | 1,000,000 | | | | | 1,007,681 | | | | | 841,885 | |
Thom Europe S.A.S, EURIBOR + 4.500%+ | | | | 4.50 | | | | | 8/7/2024 | | | | | 500,000 | | | | | 576,090 | | | | | 547,382 | |
| | | | | | | | | | | | | | | | | | | | | | | | | |
Total Retail Stores | | | | | | | | | | | | | | 2,529,775 | | | | | 2,748,979 | | | | | 2,478,594 | |
| | | | | | | | | | | | | | | | | | | | | | | | | |
| | | | | |
Telecommunications — 1.0%*: | | | | | | | | | | | | | | | | | | | | | | | | | |
BMC Software Finance, Inc., LIBOR + 4.250% | | | | 7.05 | | | | | 10/2/2025 | | | | | 664,412 | | | | | 657,996 | | | | | 646,805 | |
Syniverse Holdings, Inc., 1M LIBOR + 5.000% | | | | 7.46 | | | | | 3/9/2023 | | | | | 198,577 | | | | | 196,909 | | | | | 177,065 | |
Syniverse Holdings, Inc., 1M LIBOR + 9.000% | | | | 11.46 | | | | | 3/11/2024 | | | | | 153,729 | | | | | 151,730 | | | | | 128,364 | |
Virgin Media Investment Holdings Ltd., LIBOR — GBP + 3.250%+ | | | | 3.98 | | | | | 11/15/2027 | | | | | 750,000 | | | | | 1,062,500 | | | | | 924,881 | |
| | | | | | | | | | | | | | | | | | | | | | | | | |
Total Telecommunications | | | | | | | | | | | | | | 1,766,718 | | | | | 2,069,135 | | | | | 1,877,115 | |
| | | | | | | | | | | | | | | | | | | | | | | | | |
| | | | | |
Utilities — 1.6%*: | | | | | | | | | | | | | | | | | | | | | | | | | |
Calpine Corp., LIBOR + 2.500% | | | | 5.31 | | | | | 1/15/2024 | | | | | 987,212 | | | | | 987,212 | | | | | 936,154 | |
EFS Cogen Holdings I LLC, 3M LIBOR + 3.250% | | | | 5.99 | | | | | 6/28/2023 | | | | | 1,065,153 | | | | | 1,060,918 | | | | | 1,039,855 | |
Vistra Energy Corp., 1M LIBOR + 2.000% | | | | 4.47 | | | | | 12/31/2025 | | | | | 873,059 | | | | | 869,731 | | | | | 838,259 | |
| | | | | | | | | | | | | | | | | | | | | | | | | |
Total Utilities | | | | | | | | | | | | | | 2,925,424 | | | | | 2,917,861 | | | | | 2,814,268 | |
| | | | | | | | | | | | | | | | | | | | | | | | | |
| | | | | | | | | | | | | | | | | | | | | | | | | |
Total Bank Loans | | | | | | | | | | | | | | 65,351,351 | | | | | 67,252,342 | | | | | 62,661,200 | |
| | | | | | | | | | | | | | | | | | | | | | | | | |
See accompanying Notes to the Financial Statements.
103
Barings Global Credit Income Opportunities Fund 2018 Semi-Annual Report
SCHEDULE OF INVESTMENTS (CONTINUED)
December 31, 2018 (Unaudited)
| | | | | | | | | | | | | | | | | | | | | | | | | |
| | | EFFECTIVE
INTEREST RATE | | DUE DATE | | PRINCIPAL ‡‡ | | COST | | FAIR
VALUE |
Corporate Bonds — 43.9%**: | | | | | | | | | | | | | | | | | | | | | | | | | |
| | | | | |
Aerospace and Defense — 1.0%*: | | | | | | | | | | | | | | | | | | | | | | | | | |
Swissport Financing Sarl+ | | | | 9.75 | % | | | | 12/15/2022 | | | | | 300,000 | | | | | $387,184 | | | | | $360,049 | |
Triumph Group, Inc. | | | | 5.25 | | | | | 6/1/2022 | | | | | 875,000 | | | | | 872,637 | | | | | 761,250 | |
Triumph Group, Inc. | | | | 7.75 | | | | | 8/15/2025 | | | | | 750,000 | | | | | 799,577 | | | | | 661,875 | |
| | | | | | | | | | | | | | | | | | | | | | | | | |
Total Aerospace and Defense | | | | | | | | | | | | | | 1,925,000 | | | | | 2,059,398 | | | | | 1,783,174 | |
| | | | | | | | | | | | | | | | | | | | | | | | | |
| | | | | |
Automobile — 1.9%*: | | | | | | | | | | | | | | | | | | | | | | | | | |
AA Bond Co. Ltd.+ | | | | 5.50 | | | | | 7/31/2022 | | | | | 1,300,000 | | | | | 1,652,789 | | | | | 1,323,577 | |
Garrett LX I Sarl/Garrett Borrowing LLC+ | | | | 5.13 | | | | | 10/15/2026 | | | | | 900,000 | | | | | 1,000,213 | | | | | 909,805 | |
Gates Global LLC/Gates Global Co.^ | | | | 6.00 | | | | | 7/15/2022 | | | | | 477,000 | | | | | 405,931 | | | | | 467,460 | |
RAC Bond Co. PLC+ | | | | 5.00 | | | | | 11/6/2022 | | | | | 600,000 | | | | | 796,400 | | | | | 682,673 | |
| | | | | | | | | | | | | | | | | | | | | | | | | |
Total Automobile | | | | | | | | | | | | | | 3,277,000 | | | | | 3,855,333 | | | | | 3,383,515 | |
| | | | | | | | | | | | | | | | | | | | | | | | | |
| | | | | |
Beverage, Food and Tobacco — 1.9%*: | | | | | | | | | | | | | | | | | | | | | | | | | |
Boparan Finance PLC+ | | | | 4.38 | | | | | 7/15/2021 | | | | | 150,000 | | | | | 124,614 | | | | | 123,466 | |
Boparan Finance PLC+ | | | | 5.50 | | | | | 7/15/2021 | | | | | 1,300,000 | | | | | 1,709,184 | | | | | 1,189,712 | |
JBS USA LUX SA/JBS USA Finance, Inc.^ | | | | 5.88 | | | | | 7/15/2024 | | | | | 651,000 | | | | | 664,241 | | | | | 641,235 | |
JBS USA LUX SA/JBS USA Finance, Inc.^ | | | | 6.75 | | | | | 2/15/2028 | | | | | 500,000 | | | | | 500,000 | | | | | 487,500 | |
Sunshine Mid BV+ | | | | 6.50 | | | | | 5/15/2026 | | | | | 850,000 | | | | | 1,012,593 | | | | | 895,976 | |
| | | | | | | | | | | | | | | | | | | | | | | | | |
Total Beverage, Food and Tobacco | | | | | | | | | | | | | | 3,451,000 | | | | | 4,010,632 | | | | | 3,337,889 | |
| | | | | | | | | | | | | | | | | | | | | | | | | |
| | | | | |
Broadcasting and Entertainment — 1.4%*: | | | | | | | | | | | | | | | | | | | | | | | | | |
Clear Channel Worldwide Holdings, Inc. | | | | 7.63 | | | | | 3/15/2020 | | | | | 996,000 | | | | | 997,953 | | | | | 971,100 | |
Intelsat Jackson Holdings SA^ | | | | 8.50 | | | | | 10/15/2024 | | | | | 500,000 | | | | | 500,000 | | | | | 485,000 | |
Intelsat Jackson Holdings SA^ | | | | 9.75 | | | | | 7/15/2025 | | | | | 436,000 | | | | | 459,412 | | | | | 437,221 | |
Tele Columbus AG+ | | | | 3.88 | | | | | 5/2/2025 | | | | | 450,000 | | | | | 497,535 | | | | | 465,833 | |
VTR Finance BV+^ | | | | 6.88 | | | | | 1/15/2024 | | | | | 224,000 | | | | | 219,708 | | | | | 224,000 | |
| | | | | | | | | | | | | | | | | | | | | | | | | |
Total Broadcasting and Entertainment | | | | | | | | | | | | | | 2,606,000 | | | | | 2,674,608 | | | | | 2,583,154 | |
| | | | | | | | | | | | | | | | | | | | | | | | | |
| | | | | |
Cargo Transport — 1.5%*: | | | | | | | | | | | | | | | | | | | | | | | | | |
CMA CGM SA+ | | | | 7.75 | | | | | 1/15/2021 | | | | | 225,000 | | | | | 272,714 | | | | | 253,831 | |
Deck Chassis Acquisition, Inc.^ | | | | 10.00 | | | | | 6/15/2023 | | | | | 1,080,000 | | | | | 1,112,629 | | | | | 1,036,800 | |
Kenan Advantage Group, Inc.^ | | | | 7.88 | | | | | 7/31/2023 | | | | | 1,367,000 | | | | | 1,367,000 | | | | | 1,308,903 | |
| | | | | | | | | | | | | | | | | | | | | | | | | |
Total Cargo Transport | | | | | | | | | | | | | | 2,672,000 | | | | | 2,752,343 | | | | | 2,599,534 | |
| | | | | | | | | | | | | | | | | | | | | | | | | |
| | | | | |
Chemicals, Plastics and Rubber — 1.9%*: | | | | | | | | | | | | | | | | | | | | | | | | | |
Consolidated Energy Finance SA^ | | | | 6.88 | | | | | 6/15/2025 | | | | | 874,000 | | | | | 895,354 | | | | | 832,485 | |
Diamond | | | | 5.63 | | | | | 8/15/2025 | | | | | 200,000 | | | | | 213,952 | | | | | 194,777 | |
Monitchem HoldCo 2 SA+ | | | | 6.88 | | | | | 6/15/2022 | | | | | 650,000 | | | | | 724,208 | | | | | 595,388 | |
Monitchem HoldCo 3 SA+ | | | | 5.25 | | | | | 6/15/2021 | | | | | 500,000 | | | | | 557,058 | | | | | 557,121 | |
Pinnacle Operating Corp.^ | | | | 9.00 | | | | | 5/15/2023 | | | | | 453,953 | | | | | 535,346 | | | | | 295,070 | |
Platform Specialty Products Corp.^ | | | | 5.88 | | | | | 12/1/2025 | | | | | 180,000 | | | | | 180,000 | | | | | 168,300 | |
Starfruit Finco BV/Starfruit US Holdco LLC+ | | | | 6.50 | | | | | 10/1/2026 | | | | | 625,000 | | | | | 719,142 | | | | | 660,775 | |
| | | | | | | | | | | | | | | | | | | | | | | | | |
Total Chemicals, Plastics and Rubber | | | | | | | | | | | | | | 3,482,953 | | | | | 3,825,060 | | | | | 3,303,916 | |
| | | | | | | | | | | | | | | | | | | | | | | | | |
See accompanying Notes to the Financial Statements.
104
Barings Global Credit Income Opportunities Fund 2018 Semi-Annual Report
SCHEDULE OF INVESTMENTS (CONTINUED)
December 31, 2018 (Unaudited)
| | | | | | | | | | | | | | | | | | | | | | | | | |
| | | EFFECTIVE
INTEREST RATE | | DUE DATE | | PRINCIPAL ‡‡ | | COST | | FAIR
VALUE |
Corporate Bonds(Continued) | | | | | | | | | | | | | | | | | | | | | | | | | |
| | | | | |
Containers, Packaging and Glass — 1.0%*: | | | | | | | | | | | | | | | | | | | | | | | | | |
Ardagh Packaging Finance PLC/Ardagh Holdings USA, Inc.+^ | | | | 4.63 | % | | | | 5/15/2023 | | | | | 803,000 | | | | | $791,988 | | | | | $766,865 | |
Ardagh Packaging Finance PLC/Ardagh Holdings USA, Inc.^+ | | | | 7.25 | | | | | 5/15/2024 | | | | | 300,000 | | | | | 309,447 | | | | | 299,250 | |
BWAY Holding Co. | | | | 4.75 | | | | | 4/15/2024 | | | | | 700,000 | | | | | 809,620 | | | | | 785,126 | |
| | | | | | | | | | | | | | | | | | | | | | | | | |
Total Containers, Packaging and Glass | | | | | | | | | | | | | | 1,803,000 | | | | | 1,911,055 | | | | | 1,851,241 | |
| | | | | | | | | | | | | | | | | | | | | | | | | |
| | | | |
Diversified/Conglomerate Manufacturing — 0.3%*: | | | | | | | | | | | | | | | | | | | | | |
Appvion ESC¤ | | | | 9.00 | | | | | 6/1/2020 | | | | | 500,000 | | | | | 504,256 | | | | | — | |
Fabric BC SpA, 3M EURIBOR + 4.125%+ | | | | 4.13 | # | | | | 11/30/2024 | | | | | 150,000 | | | | | 170,132 | | | | | 167,566 | |
StoneMor Partners LP/Cornerstone Family Services of West Virginia Subsidiary | | | | 7.88 | | | | | 6/1/2021 | | | | | 459,000 | | | | | 466,562 | | | | | 418,837 | |
| | | | | | | | | | | | | | | | | | | | | | | | | |
Total Diversified/Conglomerate Manufacturing | | | | | | | | | | | | | | 1,109,000 | | | | | 1,140,950 | | | | | 586,403 | |
| | | | | | | | | | | | | | | | | | | | | | | | | |
| | | | | |
Diversified/Conglomerate Service — 3.2%*: | | | | | | | | | | | | | | | | | | | | | | | | | |
Algeco Global Finance PLC+ | | | | 6.50 | | | | | 2/15/2023 | | | | | 950,000 | | | | | 1,146,761 | | | | | 1,062,938 | |
Carlson Travel, Inc.^ | | | | 6.75 | | | | | 12/15/2023 | | | | | 1,337,000 | | | | | 1,355,881 | | | | | 1,288,534 | |
Iron Mountain UK PLC | | | | 3.88 | | | | | 11/15/2025 | | | | | 450,000 | | | | | 597,668 | | | | | 504,719 | |
La Financiere Atalian SASU+ | | | | 6.63 | | | | | 5/15/2025 | | | | | 600,000 | | | | | 835,110 | | | | | 626,446 | |
Verisure Midholding AB+ | | | | 5.75 | | | | | 12/1/2023 | | | | | 2,050,000 | | | | | 2,399,144 | | | | | 2,260,237 | |
| | | | | | | | | | | | | | | | | | | | | | | | | |
Total Diversified/Conglomerate Service | | | | | | | | | | | | | | 5,387,000 | | | | | 6,334,564 | | | | | 5,742,874 | |
| | | | | | | | | | | | | | | | | | | | | | | | | |
| | | | | |
Electronics — 2.0%*: | | | | | | | | | | | | | | | | | | | | | | | | | |
TIBCO Software, Inc.^ | | | | 11.38 | | | | | 12/1/2021 | | | | | 1,881,000 | | | | | 2,020,987 | | | | | 1,970,347 | |
Veritas US, Inc./Veritas Bermuda Ltd.^ | | | | 7.50 | | | | | 2/1/2023 | | | | | 817,000 | | | | | 860,663 | | | | | 665,855 | |
Veritas US, Inc./Veritas Bermuda Ltd.^ | | | | 10.50 | | | | | 2/1/2024 | | | | | 1,419,000 | | | | | 1,458,954 | | | | | 929,445 | |
| | | | | | | | | | | | | | | | | | | | | | | | | |
Total Electronics | | | | | | | | | | | | | | 4,117,000 | | | | | 4,340,604 | | | | | 3,565,647 | |
| | | | | | | | | | | | | | | | | | | | | | | | | |
| | | | | |
Finance — 4.8%*: | | | | | | | | | | | | | | | | | | | | | | | | | |
Arrow Global Finance PLC+ | | | | 5.13 | | | | | 9/15/2024 | | | | | 300,000 | | | | | 408,671 | | | | | 340,471 | |
Cabot Financial Luxembourg SA+ | | | | 7.50 | | | | | 10/1/2023 | | | | | 650,000 | | | | | 903,927 | | | | | 752,766 | |
Galaxy Bidco Ltd., 3M GBP LIBOR + 4.500%+ | | | | 5.39 | # | | | | 11/15/2020 | | | | | 250,000 | | | | | 327,044 | | | | | 315,464 | |
Galaxy Bidco Ltd.+ | | | | 6.38 | | | | | 11/15/2020 | | | | | 650,000 | | | | | 887,364 | | | | | 814,074 | |
Galaxy Finco Ltd.+ | | | | 7.88 | | | | | 11/15/2021 | | | | | 1,000,000 | | | | | 1,393,758 | | | | | 1,244,522 | |
Garfunkelux Holdco 2 SA+ | | | | 11.00 | | | | | 11/1/2023 | | | | | 800,000 | | | | | 1,125,270 | | | | | 764,597 | |
Garfunkelux Holdco 3 S.A., 3 mo. EURIBOR +
4.500%+ | | | | 4.50 | # | | | | 9/1/2023 | | | | | 200,000 | | | | | 211,579 | | | | | 189,058 | |
Garfunkelux Holdco 3 S.A.+ | | | | 8.50 | | | | | 11/1/2022 | | | | | 850,000 | | | | | 1,163,663 | | | | | 909,349 | |
Icahn Enterprises LP/Icahn Enterprises Finance Corp. | | | | 6.75 | | | | | 2/1/2024 | | | | | 1,162,000 | | | | | 1,162,000 | | | | | 1,150,380 | |
Jerrold Finco PLC+ | | | | 6.13 | | | | | 1/15/2024 | | | | | 650,000 | | | | | 822,390 | | | | | 795,408 | |
Nexi Capital SpA+ | | | | 4.13 | | | | | 11/1/2023 | | | | | 425,000 | | | | | 483,676 | | | | | 480,886 | |
VFH Parent LLC/Orchestra Co-Issuer, Inc.^ | | | | 6.75 | | | | | 6/15/2022 | | | | | 921,000 | | | | | 958,959 | | | | | 895,184 | |
| | | | | | | | | | | | | | | | | | | | | | | | | |
Total Finance | | | | | | | | | | | | | | 7,858,000 | | | | | 9,848,301 | | | | | 8,652,159 | |
| | | | | | | | | | | | | | | | | | | | | | | | | |
See accompanying Notes to the Financial Statements.
105
Barings Global Credit Income Opportunities Fund 2018 Semi-Annual Report
SCHEDULE OF INVESTMENTS (CONTINUED)
December 31, 2018 (Unaudited)
| | | | | | | | | | | | | | | | | | | | | | | | | |
| | | EFFECTIVE
INTEREST RATE | | DUE DATE | | PRINCIPAL ‡‡ | | COST | | FAIR
VALUE |
Corporate Bonds(Continued) | | | | | | | | | | | | | | | | | | | | | | | | | |
| | | | | |
Healthcare, Education and Childcare — 4.1%*: | | | | | | | | | | | | | | | | | | | | | | | | | |
Avantor, Inc.^ | | | | 9.00 | % | | | | 10/1/2025 | | | | | 929,000 | | | | | $948,596 | | | | | $929,000 | |
Bausch Health Companies, Inc.^ | | | | 5.50 | | | | | 11/1/2025 | | | | | 184,000 | | | | | 184,000 | | | | | 171,580 | |
Bausch Health Cos., Inc. | | | | 4.50 | | | | | 5/15/2023 | | | | | 100,000 | | | | | 95,099 | | | | | 108,058 | |
Bausch Health Cos., Inc.^ | | | | 6.13 | | | | | 4/15/2025 | | | | | 1,232,000 | | | | | 1,059,238 | | | | | 1,074,920 | |
Bausch Health Cos., Inc.^ | | | | 9.00 | | | | | 12/15/2025 | | | | | 165,000 | | | | | 162,921 | | | | | 164,175 | |
CTC BondCo GmbH+ | | | | 5.25 | | | | | 12/15/2025 | | | | | 400,000 | | | | | 480,918 | | | | | 436,274 | |
Endo Dac/Endo Finance LLC/Endo Finco, Inc.^ | | | | 6.00 | | | | | 7/15/2023 | | | | | 220,000 | | | | | 190,451 | | | | | 167,750 | |
Endo Finance LLC/Endo Finco, Inc.^ | | | | 7.25 | | | | | 1/15/2022 | | | | | 550,000 | | | | | 526,889 | | | | | 475,750 | |
Envision Healthcare Corp.^ | | | | 8.75 | | | | | 10/15/2026 | | | | | 742,000 | | | | | 742,000 | | | | | 641,830 | |
IDH Finance PLC+ | | | | 6.25 | | | | | 8/15/2022 | | | | | 400,000 | | | | | 504,630 | | | | | 418,323 | |
Ortho-Clinical Diagnostics, Inc./Ortho-Clinical Diagnostics SA^ | | | | 6.63 | | | | | 5/15/2022 | | | | | 735,000 | | | | | 701,586 | | | | | 661,500 | |
Synlab Unsecured Bondco PLC+ | | | | 8.25 | | | | | 7/1/2023 | | | | | 750,000 | | | | | 933,402 | | | | | 881,912 | |
Teva Pharmaceutical Finance Netherlands III BV+ | | | | 6.00 | | | | | 4/15/2024 | | | | | 678,000 | | | | | 673,422 | | | | | 653,059 | |
Unilabs Subholding AB+ | | | | 5.75 | | | | | 5/15/2025 | | | | | 400,000 | | | | | 479,196 | | | | | 412,725 | |
Valeant Pharmaceuticals International^ | | | | 8.50 | | | | | 1/31/2027 | | | | | 195,000 | | | | | 195,000 | | | | | 189,150 | |
| | | | | | | | | | | | | | | | | | | | | | | | | |
Total Healthcare, Education and Childcare | | | | | | | | | | | | | | 7,680,000 | | | | | 7,877,348 | | | | | 7,386,006 | |
| | | | | | | | | | | | | | | | | | | | | | | | | |
| | |
Home and Office Furnishings, Housewares, and Durable Consumer Products — 0.5%*: | | | | | | | | | | | |
LSF9 Balta Issuer Sarl+ | | | | 7.75 | | | | | 9/15/2022 | | | | | 769,500 | | | | | 934,725 | | | | | 814,917 | |
| | | | | | | | | | | | | | | | | | | | | | | | | |
| | | | | |
Hotels, Motels, Inns and Gaming — 1.0%*: | | | | | | | | | | | | | | | | | | | | | | | | | |
Marriott Ownership Resorts, Inc.^ | | | | 5.63 | | | | | 4/15/2023 | | | | | 459,000 | | | | | 464,378 | | | | | 455,842 | |
Thomas Cook Group PLC+ | | | | 6.25 | | | | | 6/15/2022 | | | | | 800,000 | | | | | 940,403 | | | | | 701,199 | |
TVL Finance PLC+ | | | | 8.50 | | | | | 5/15/2023 | | | | | 480,000 | | | | | 674,693 | | | | | 626,895 | |
| | | | | | | | | | | | | | | | | | | | | | | | | |
Total Hotels, Motels, Inns and Gaming | | | | | | | | | | | | | | 1,739,000 | | | | | 2,079,474 | | | | | 1,783,936 | |
| | | | | | | | | | | | | | | | | | | | | | | | | |
| | | | | |
Insurance — 0.3%*: | | | | | | | | | | | | | | | | | | | | | | | | | |
Acrisure LLC/Acrisure Finance, Inc.^ | | | | 7.00 | | | | | 11/15/2025 | | | | | 500,000 | | | | | 479,065 | | | | | 426,250 | |
USIS Merger Sub, Inc.^ | | | | 6.88 | | | | | 5/1/2025 | | | | | 146,000 | | | | | 146,000 | | | | | 134,043 | |
| | | | | | | | | | | | | | | | | | | | | | | | | |
Total Insurance | | | | | | | | | | | | | | 646,000 | | | | | 625,065 | | | | | 560,293 | |
| | | | | | | | | | | | | | | | | | | | | | | | | |
| | | | | |
Leisure, Amusement, Entertainment — 2.4%*: | | | | | | | | | | | | | | | | | | | | | | | | | |
Allegiant Travel Co.†† | | | | 5.50 | | | | | 7/15/2019 | | | | | 800,000 | | | | | 806,080 | | | | | 800,000 | |
AMC Entertainment Holdings, Inc. | | | | 6.38 | | | | | 11/15/2024 | | | | | 1,300,000 | | | | | 1,690,325 | | | | | 1,536,352 | |
CPUK Finance Ltd.+ | | | | 4.88 | | | | | 2/28/2025 | | | | | 500,000 | | | | | 651,336 | | | | | 595,702 | |
Perform Group Financing PLC+ | | | | 8.50 | | | | | 11/15/2020 | | | | | 850,000 | | | | | 1,166,783 | | | | | 1,083,843 | |
Vue International Bidco PLC+ | | | | 7.88 | | | | | 7/15/2020 | | | | | 200,000 | | | | | 249,043 | | | | | 250,777 | |
| | | | | | | | | | | | | | | | | | | | | | | | | |
Total Leisure, Amusement, Entertainment | | | | | | | | | | | | | | 3,650,000 | | | | | 4,563,567 | | | | | 4,266,674 | |
| | | | | | | | | | | | | | | | | | | | | | | | | |
| | | |
Machinery Non-Agriculture, Non-Construction, Non-Electronic — 0.6%*: | | | | | | | | | | | | | | | | |
Apex Tool Group LLC/BC Mountain Finance, Inc.^ | | | | 9.00 | | | | | 2/15/2023 | | | | | 578,000 | | | | | 574,966 | | | | | 488,410 | |
Novafives SAS+ | | | | 5.00 | | | | | 6/15/2025 | | | | | 550,000 | | | | | 586,408 | | | | | 504,760 | |
| | | | | | | | | | | | | | | | | | | | | | | | | |
Total Machinery Non-Agriculture, Non-Construction, Non-Electronic | | | | | | | | | | | | | | 1,128,000 | | | | | 1,161,374 | | | | | 993,170 | |
| | | | | | | | | | | | | | | | | | | | | | | | | |
See accompanying Notes to the Financial Statements.
106
Barings Global Credit Income Opportunities Fund 2018 Semi-Annual Report
SCHEDULE OF INVESTMENTS (CONTINUED)
December 31, 2018 (Unaudited)
| | | | | | | | | | | | | | | | | | | | | | | | | |
| | | EFFECTIVE
INTEREST RATE | | DUE DATE | | PRINCIPAL ‡‡ | | COST | | FAIR
VALUE |
Corporate Bonds(Continued) | | | | | | | | | | | | | | | | | | | | | | | | | |
| | | | |
Mining, Steel, Iron and Non-Precious Metals — 2.6%*: | | | | | | | | | | | | | | | | | | | | | |
First Quantum Minerals Ltd.+^ | | | | 6.50 | % | | | | 3/1/2024 | | | | | 1,000,000 | | | | | $1,000,000 | | | | | $830,000 | |
First Quantum Minerals Ltd.+^ | | | | 7.00 | | | | | 2/15/2021 | | | | | 1,000,000 | | | | | 1,006,676 | | | | | 960,000 | |
First Quantum Minerals Ltd.+^ | | | | 7.50 | | | | | 4/1/2025 | | | | | 465,000 | | | | | 458,526 | | | | | 383,625 | |
Northwest Acquisitions ULC/Dominion Finco, Inc.+^ | | | | 7.13 | | | | | 11/1/2022 | | | | | 1,500,000 | | | | | 1,532,450 | | | | | 1,481,700 | |
SunCoke Energy Partners LP/SunCoke Energy Partners Finance Corp.^ | | | | 7.50 | | | | | 6/15/2025 | | | | | 608,000 | | | | | 600,350 | | | | | 576,080 | |
Warrior Met Coal, Inc.^ | | | | 8.00 | | | | | 11/1/2024 | | | | | 340,000 | | | | | 348,793 | | | | | 337,450 | |
| | | | | | | | | | | | | | | | | | | | | | | | | |
Total Mining, Steel, Iron and Non-Precious Metals | | | | | | | | | | | | | | 4,913,000 | | | | | 4,946,795 | | | | | 4,568,855 | |
| | | | | | | | | | | | | | | | | | | | | | | | | |
| | | | | |
Oil and Gas — 4.7%*: | | | | | | | | | | | | | | | | | | | | | | | | | |
Calumet Specialty Products Partners LP/Calumet Finance Corp. | | | | 6.50 | | | | | 4/15/2021 | | | | | 500,000 | | | | | 477,370 | | | | | 417,500 | |
Citgo Holding, Inc.^ | | | | 10.75 | | | | | 2/15/2020 | | | | | 2,363,000 | | | | | 2,443,794 | | | | | 2,410,260 | |
Ferrellgas Partners LP/Ferrellgas Partners Finance Corp. | | | | 8.63 | | | | | 6/15/2020 | | | | | 264,000 | | | | | 259,035 | | | | | 188,760 | |
Hilcorp Energy I LP/Hilcorp Finance Co.^ | | | | 6.25 | | | | | 11/1/2028 | | | | | 1,000,000 | | | | | 1,000,000 | | | | | 880,000 | |
Jonah Energy LLC/Jonah Energy Finance Corp.^ | | | | 7.25 | | | | | 10/15/2025 | | | | | 1,121,000 | | | | | 1,105,923 | | | | | 717,440 | |
KCA Deutag UK Finance PLC+^ | | | | 9.63 | | | | | 4/1/2023 | | | | | 250,000 | | | | | 250,000 | | | | | 201,250 | |
KCA Deutag UK Finance PLC+^ | | | | 9.88 | | | | | 4/1/2022 | | | | | 600,000 | | | | | 620,247 | | | | | 492,000 | |
Kosmos Energy Ltd. | | | | 7.88 | | | | | 8/1/2021 | | | | | 2,177,000 | | | | | 2,170,821 | | | | | 2,173,970 | |
PBF Holding Co. LLC/PBF Finance Corp. | | | | 7.25 | | | | | 6/15/2025 | | | | | 1,022,000 | | | | | 1,056,944 | | | | | 960,680 | |
| | | | | | | | | | | | | | | | | | | | | | | | | |
Total Oil and Gas | | | | | | | | | | | | | | 9,297,000 | | | | | 9,384,134 | | | | | 8,441,860 | |
| | | | | | | | | | | | | | | | | | | | | | | | | |
| | | |
Personal and Non-Durable Consumer Products Mfg. Only — 0.3%*: | | | | | | | | | | | | | | | | |
WEPA Hygieneprodukte GmbH+ | | | | 3.75 | | | | | 5/15/2024 | | | | | 500,000 | | | | | 561,491 | | | | | 542,662 | |
| | | | | | | | | | | | | | | | | | | | | | | | | |
| | | | | |
Personal Transportation — 0.2%*: | | | | | | | | | | | | | | | | | | | | | | | | | |
Naviera Armas S.A., 3M EURIBOR + 6.500%+ | | | | 6.50 | # | | | | 7/31/2023 | | | | | 250,000 | | | | | 290,912 | | | | | 277,171 | |
| | | | | | | | | | | | | | | | | | | | | | | | | |
| | | | | |
Personal, Food and Miscellaneous — 0.4%*: | | | | | | | | | | | | | | | | | | | | | | | | | |
Ocado Group PLC+ | | | | 4.00 | | | | | 6/15/2024 | | | | | 600,000 | | | | | 773,240 | | | | | 738,406 | |
| | | | | | | | | | | | | | | | | | | | | | | | | |
| | | | | |
Retail Stores — 1.3%*: | | | | | | | | | | | | | | | | | | | | | | | | | |
CBR Fashion Finance BV+ | | | | 5.13 | | | | | 10/1/2022 | | | | | 650,000 | | | | | 707,804 | | | | | 608,367 | |
House of Fraser Funding PLC, 3M GBP LIBOR + 5.750%+†† | | | | 6.55 | # | | | | 9/15/2020 | | | | | 150,000 | | | | | 219,027 | | | | | 10,993 | |
Jewel UK Bondco PLC+ | | | | 8.50 | | | | | 4/15/2023 | | | | | 300,000 | | | | | 427,350 | | | | | 354,275 | |
Maxeda DIY Holding B.V.+ | | | | 6.13 | | | | | 7/15/2022 | | | | | 400,000 | | | | | 474,665 | | | | | 420,555 | |
Takko Luxembourg 2 SCA, 3M USD LIBOR +
5.375%+ | | | | 5.38 | # | | | | 11/15/2023 | | | | | 550,000 | | | | | 612,211 | | | | | 445,495 | |
Travelex Financing PLC+ | | | | 8.00 | | | | | 5/15/2022 | | | | | 500,000 | | | | | 568,526 | | | | | 486,921 | |
| | | | | | | | | | | | | | | | | | | | | | | | | |
Total Retail Stores | | | | | | | | | | | | | | 2,550,000 | | | | | 3,009,583 | | | | | 2,326,606 | |
| | | | | | | | | | | | | | | | | | | | | | | | | |
See accompanying Notes to the Financial Statements.
107
Barings Global Credit Income Opportunities Fund 2018 Semi-Annual Report
SCHEDULE OF INVESTMENTS (CONTINUED)
December 31, 2018 (Unaudited)
| | | | | | | | | | | | | | | | | | | | | | | | | |
| | | EFFECTIVE
INTEREST RATE | | DUE DATE | | PRINCIPAL ‡‡ | | COST | | FAIR
VALUE |
Corporate Bonds(Continued) | | | | | | | | | | | | | | | | | | | | | | | | | |
| | | | | |
Telecommunications — 2.9%*: | | | | | | | | | | | | | | | | | | | | | | | | | |
Altice Finco S.A.+ | | | | 9.00 | % | | | | 6/15/2023 | | | | | 500,000 | | | | | $596,292 | | | | | $590,096 | |
CSC Holdings LLC^ | | | | 7.50 | | | | | 4/1/2028 | | | | | 386,000 | | | | | 386,000 | | | | | 385,035 | |
TDC A/S+ | | | | 5.63 | | | | | 2/23/2023 | | | | | 1,000,000 | | | | | 1,423,841 | | | | | 1,402,213 | |
Telecom Italia SpA/Milano+ | | | | 3.63 | | | | | 5/25/2026 | | | | | 1,700,000 | | | | | 2,052,230 | | | | | 1,942,901 | |
Virgin Media Receivables Financing Notes II DAC+ | | | | 5.75 | | | | | 4/15/2023 | | | | | 250,000 | | | | | 343,710 | | | | | 315,702 | |
Wind Tre SpA, 3M EURIBOR + 2.750%+ | | | | 2.75 | # | | | | 1/20/2024 | | | | | 100,000 | | | | | 110,036 | | | | | 102,258 | |
Wind Tre SpA+ | | | | 3.13 | | | | | 1/20/2025 | | | | | 400,000 | | | | | 446,632 | | | | | 407,503 | |
| | | | | | | | | | | | | | | | | | | | | | | | | |
Total Telecommunications | | | | | | | | | | | | | | 4,336,000 | | | | | 5,358,741 | | | | | 5,145,708 | |
| | | | | | | | | | | | | | | | | | | | | | | | | |
| | | | | |
Textiles and Leather — 0.2%*: | | | | | | | | | | | | | | | | | | | | | | | | | |
Eagle Intermediate Global Holding BV/Ruyi US Finance LLC+ | | | | 5.38 | | | | | 5/1/2023 | | | | | 350,000 | | | | | 410,662 | | | | | 367,849 | |
| | | | | | | | | | | | | | | | | | | | | | | | | |
| | | | | |
Utilities — 1.5%*: | | | | | | | | | | | | | | | | | | | | | | | | | |
Blitz F18-674 GmbH+ | | | | 6.00 | | | | | 7/30/2026 | | | | | 1,200,000 | | | | | 1,386,661 | | | | | 1,295,807 | |
Nordex SE+ | | | | 6.50 | | | | | 2/1/2023 | | | | | 650,000 | | | | | 747,680 | | | | | 672,051 | |
Viridian Group Finance Co. PLC+ | | | | 4.75 | | | | | 9/15/2024 | | | | | 600,000 | | | | | 798,947 | | | | | 701,667 | |
| | | | | | | | | | | | | | | | | | | | | | | | | |
Total Utilities | | | | | | | | | | | | | | 2,450,000 | | | | | 2,933,288 | | | | | 2,669,525 | |
| | | | | | | | | | | | | | | | | | | | | | | | | |
Total Corporate Bonds | | | | | | | | | | | | | | 78,546,453 | | | | | 87,663,247 | | | | | 78,273,144 | |
| | | | | | | | | | | | | | | | | | | | | | | | | |
Total Fixed Income | | | | | | | | | | | | | | 172,772,804 | | | | | 183,360,563 | | | | | 166,338,429 | |
| | | | | | | | | | | | | | | | | | | | | | | | | |
| | | | | | | | | | | | | | | | | | | | | | | | | | | | | | |
| | | | | | | | |
| COUNTERPARTY | | | | STRIKE
PRICE | | | EXPIRATION
DATE | | | CONTRACTS | | | NOTIONAL | | | COST | | | UNREALIZED
VALUE | | | FAIR VALUE | |
| | | | | |
Purchased Option — 0.5%*: | | | | | | | | | | | | | | | | | | | | | |
| | | | | | |
Put Option Purchased — 0.5%*: | | | | | | | | | | | | | | | | | | | | | | | | | |
Euro Stoxx 50 Index+ | | Morgan Stanley & Co | | | $3,000.00 | | | | 6/21/2019 | | | | 359 | | | | 10,721,643 | | | | 299,374 | | | | 564,818 | | | | 864,192 | |
| | | | | | | | | | | | | | | | | | | | | | | | | | | | | | |
Total Investments | | | | | | | | | | | | | | | 204,591,328 | | | | 185,578,108 | | | | | | | | 169,404,914 | |
| | | | | | | | | | | | | | | | | | | | | | | | | | | | | | |
| |
Other assets and liabilities — 5.0%* | | | | 8,974,397 | |
| | | | | | | | | | | | | | | | | | | | | | | | | | | | | | |
| | | | | | | |
Net Assets — 100.0% | | | | | | | | | | | | | | | | | | | | | | | | | | | $178,379,311 | |
| | | | | | | | | | | | | | | | | | | | | | | | | | | | | | |
| ‡‡ | Unless otherwise indicated, all principal amounts are denominated in United States Dollars. |
| * | Calculated as a percentage of net assets applicable to common shareholders. |
See accompanying Notes to the Financial Statements.
108
Barings Global Credit Income Opportunities Fund 2018 Semi-Annual Report
SCHEDULE OF INVESTMENTS (CONTINUED)
December 31, 2018 (Unaudited)
| | Distributions of investments by country of risk (excluding temporary cash investments) as a percentage of total investments in securities, is as follows: |
| | | | | | |
| | United States | | | 54.5% | |
| | United Kingdom | | | 14.8% | |
| | Germany | | | 7.4% | |
| | Netherlands | | | 5.6% | |
| | France | | | 3.2% | |
| | Ireland | | | 2.4% | |
| | Italy | | | 2.0% | |
| | Sweden | | | 2.0% | |
| | Canada | | | 2.0% | |
| | Ghana | | | 1.3% | |
| | Switzerland | | | 1.0% | |
| | Other (Individually less than 1%) | | | 3.8% | |
| | | | | | |
| | Total | | | 100.0% | |
| | | | | | |
| ^ | Security acquired in a transaction exempt from registration under Rule 144A of the Securities Act of 1933. These securities may only be resold in transactions exempt from registration, normally to qualified institutional buyers. |
| § | Bank loans are exempt from registration under the Securities Act of 1933, as amended, but contain certain restrictions on resale and cannot be sold publicly. These loans pay interest at rates which adjust periodically. The interest rates shown for bank loans are the current interest rates at December 31, 2018. Bank loans are also subject to mandatory and/or optional prepayment which cannot be predicted. As a result, the remaining maturity may be substantially less than the stated maturity shown. |
| ¤ | For fair value measurement disclosure purposes, security is categorized as Level 3 (See Note 2). |
| # | Variable rate security. The interest rate shown is the rate in effect at December 31, 2018. |
A summary of outstanding derivatives at December 31, 2018 is as follows:
Forward Foreign Currency Exchange Contracts to Buy
| | | | | | | | | | | | | | | | | | | | | | |
EXPIRATION
DATE | | COUNTERPARTY | | LOCAL
CURRENCY | | | VALUE IN USD | | | IN
EXCHANGE
FOR USD | | | NET UNREALIZED
APPRECIATION
(DEPRECIATION) | |
| 1/14/19 | | Bank of America N.A. | | | EUR | | | | 1,034,245 | | | $ | 1,186,064 | | | $ | 1,187,531 | | | $ | (1,467 | ) |
| 1/14/19 | | Barclays Bank plc | | | EUR | | | | 2,327,223 | | | | 2,668,843 | | | | 2,655,415 | | | | 13,428 | |
| 1/14/19 | | Barclays Bank plc | | | GBP | | | | 428,323 | | | | 546,237 | | | | 543,606 | | | | 2,631 | |
| | | | | | | | | | | | | | | | | | | | | | |
Net unrealized appreciation on forward foreign currency exchange contracts to buy | | | $ | 14,592 | |
| | | | | | | | | | | | | | | | | | | | | | |
Forward Foreign Currency Exchange Contracts to Sell
| | | | | | | | | | | | | | | | | | | | | | |
EXPIRATION
DATE | | COUNTERPARTY | | LOCAL
CURRENCY | | | VALUE IN USD | | | IN
EXCHANGE
FOR USD | | | NET UNREALIZED
APPRECIATION
(DEPRECIATION) | |
| 1/14/19 | | Barclays Bank plc | | | EUR | | | | 43,413,750 | | | $ | 49,786,584 | | | $ | 49,600,439 | | | $ | (186,145 | ) |
| 1/14/19 | | Bank of America N.A. | | | GBP | | | | 16,951,091 | | | | 21,617,596 | | | | 21,653,258 | | | | 35,662 | |
| | | | | | | | | | | | | | | | | | | | | | |
Net unrealized depreciation on forward foreign currency exchange contracts to sell | | | $ | (150,483 | ) |
| | | | | | | | | | | | | | | | | | | | | | |
Currency Legend
| | | | |
| EUR | | – | | Euro |
| GBP | | – | | British Pound Sterling |
See accompanying Notes to the Financial Statements.
109
Barings Active Short Duration Bond Fund 2018 Semi-Annual Report
SCHEDULE OF INVESTMENTS
December 31, 2018 (Unaudited)
| | | | | | | | | | | | | | | | | | | | | | | | | |
| | | EFFECTIVE
INTEREST RATE | | DUE DATE | | PRINCIPAL ‡‡ | | COST | | FAIR
VALUE |
Fixed Income — 92.1%*: | | | | | | | | | | | | | | | | | | | | | | | | | |
| | | | | |
Asset-Backed Securities — 39.7%*: | | | | | | | | | | | | | | | | | | | | | | | | | |
| | | | | |
CDO/CLO — 3.7%*: | | | | | | | | | | | | | | | | | | | | | | | | | |
AIMCO CLO 2014-AA AR, 3M USD LIBOR + 1.100%^ | | | | 3.57 | #% | | | | 7/20/2026 | | | | | 1,106,615 | | | | | $1,106,616 | | | | | $1,101,963 | |
ALM VII Ltd. 2012-7A A1R, 3M USD LIBOR + 1.480%^ | | | | 3.92 | # | | | | 10/15/2028 | | | | | 390,000 | | | | | 390,000 | | | | | 390,195 | |
Avery Point III CLO Ltd. 2013-3A AR, 3M USD LIBOR + 1.120%^ | | | | 3.56 | # | | | | 1/18/2025 | | | | | 347,395 | | | | | 347,395 | | | | | 346,567 | |
Bain Capital Credit CLO 2017-1, 3M USD LIBOR + 1.250%^ | | | | 3.72 | # | | | | 7/20/2030 | | | | | 900,000 | | | | | 896,638 | | | | | 893,889 | |
Denali Capital CLO Ltd. 2013 1A A1LR, 3M USD LIBOR + 1.050%^ | | | | 3.56 | # | | | | 10/26/2027 | | | | | 2,420,000 | | | | | 2,420,000 | | | | | 2,406,736 | |
Galaxy XX CLO Ltd., 3M USD LIBOR + 1.000%^ | | | | 3.47 | # | | | | 4/20/2031 | | | | | 1,200,000 | | | | | 1,200,000 | | | | | 1,184,917 | |
Hertz Vehicle Financing LLC 2018-3^ | | | | 4.37 | | | | | 7/25/2024 | | | | | 620,000 | | | | | 621,434 | | | | | 628,408 | |
LCM XXIII Ltd. 23A A1, 3M USD LIBOR + 1.400%^ | | | | 3.87 | # | | | | 10/20/2029 | | | | | 610,000 | | | | | 610,000 | | | | | 608,725 | |
Madison Park Funding XXII Ltd. 2016-22A A, 3M USD LIBOR + 1.480%^ | | | | 3.97 | # | | | | 10/25/2029 | | | | | 350,000 | | | | | 350,000 | | | | | 350,178 | |
Magnetite XI Ltd. 2014-11A A1R, 3M USD LIBOR + 1.120%^ | | | | 3.56 | # | | | | 1/18/2027 | | | | | 890,000 | | | | | 890,000 | | | | | 886,396 | |
Neuberger Berman CLO XX Ltd. 2015-20A BR, 3M USD LIBOR + 1.250%^ | | | | 3.69 | # | | | | 1/15/2028 | | | | | 2,000,000 | | | | | 2,000,000 | | | | | 1,936,810 | |
OCP CLO Ltd. 2015-8A A2AR, 3M USD LIBOR + 1.450%^ | | | | 3.90 | # | | | | 4/17/2027 | | | | | 900,000 | | | | | 900,000 | | | | | 881,227 | |
OHA Loan Funding Ltd. 2015-1A AR, 3M USD LIBOR + 1.410%^ | | | | 4.03 | # | | | | 8/15/2029 | | | | | 840,000 | | | | | 840,000 | | | | | 839,977 | |
Race Point VIII CLO Ltd. 2013-8A AR, 3M USD LIBOR + 1.340%^ | | | | 3.98 | # | | | | 2/20/2030 | | | | | 1,320,000 | | | | | 1,320,000 | | | | | 1,313,830 | |
ROHA Loan Funding Ltd. 2012-1 B, 3M USD LIBOR + 1.850%^ | | | | 4.33 | # | | | | 1/23/2027 | | | | | 1,000,000 | | | | | 1,000,000 | | | | | 998,060 | |
RR 3 Ltd. Series 2018-3 A A1R2, 3M USD LIBOR + 1.090%^ | | | | 3.53 | # | | | | 1/15/2030 | | | | | 570,000 | | | | | 570,000 | | | | | 559,831 | |
Seneca Park CLO Ltd. 2014-1A AR, 3M USD LIBOR + 1.120%^ | | | | 3.57 | # | | | | 7/17/2026 | | | | | 316,366 | | | | | 316,366 | | | | | 315,416 | |
TCI-Symphony CLO Ltd. 2016-1A A, 3M USD LIBOR + 1.480%^ | | | | 3.92 | # | | | | 10/13/2029 | | | | | 320,000 | | | | | 320,000 | | | | | 319,996 | |
Treman Park CLO Ltd. 2015-1A ARR, 3M USD LIBOR + 1.070%^ | | | | 3.53 | # | | | | 10/20/2028 | | | | | 1,170,000 | | | | | 1,170,000 | | | | | 1,157,893 | |
VMC Finance 2018-FL1 LLC, 1M USD LIBOR + 0.820%^ | | | | 3.28 | # | | | | 3/15/2035 | | | | | 854,332 | | | | | 854,332 | | | | | 847,088 | |
| | | | | | | | | | | | | | | | | | | | | | | | | |
Total CDO/CLO | | | | | | | | | | | | | | 18,124,708 | | | | | 18,122,781 | | | | | 17,968,102 | |
| | | | | | | | | | | | | | | | | | | | | | | | | |
See accompanying Notes to the Financial Statements.
110
Barings Active Short Duration Bond Fund 2018 Semi-Annual Report
SCHEDULE OF INVESTMENTS (CONTINUED)
December 31, 2018 (Unaudited)
| | | | | | | | | | | | | | | | | | | | | | | | | |
| | | EFFECTIVE
INTEREST RATE | | DUE DATE | | PRINCIPAL ‡‡ | | COST | | FAIR
VALUE |
Asset-Backed Securities(Continued) | | | | | | | | | | | | | | | | | | | | | | | | | |
| | | | | |
Other Asset-Backed Securities — 36.0%*: | | | | | | | | | | | | | | | | | | | | | | | | | |
321 Henderson Receivables II LLC 2006-3A A1, 1M USD LIBOR + 0.200%^ | | | | 2.66 | #% | | | | 9/15/2041 | | | | | 124,512 | | | | | $121,020 | | | | | $119,001 | |
AASET US Ltd. 2018-2 A^ | | | | 4.45 | | | | | 11/16/2038 | | | | | 665,377 | | | | | 665,356 | | | | | 672,144 | |
Access Group, Inc. 2015-1 A, 1M USD LIBOR + 0.700%^ | | | | 3.21 | # | | | | 7/25/2056 | | | | | 114,142 | | | | | 111,690 | | | | | 114,108 | |
Access Group, Inc. 2015-1 B, 1M USD LIBOR + 1.500%^ | | | | 4.01 | # | | | | 7/25/2058 | | | | | 100,000 | | | | | 86,620 | | | | | 93,862 | |
AccessLex Institute 2002-A A2, 28 Day ARS | | | | 1.96 | # | | | | 9/25/2037 | | | | | 450,000 | | | | | 416,535 | | | | | 446,151 | |
AccessLex Institute 2004-A A3, 28 day ARS | | | | 1.70 | # | | | | 7/1/2039 | | | | | 1,400,000 | | | | | 1,375,052 | | | | | 1,379,524 | |
AccessLex Institute 2005-1 A3, 3M USD LIBOR + 0.150% | | | | 2.97 | # | | | | 6/22/2022 | | | | | 1,212 | | | | | 1,201 | | | | | 1,212 | |
Accredited Mortgage Loan Trust 2004-04 A2D, 1M USD LIBOR + 0.700% | | | | 3.21 | # | | | | 1/25/2035 | | | | | 487,329 | | | | | 478,220 | | | | | 483,450 | |
Adams Outdoor Advertising LP^ | | | | 4.81 | | | | | 11/15/2048 | | | | | 759,093 | | | | | 759,071 | | | | | 780,704 | |
American Credit Acceptance Receivables Trust 2017-4 C^ | | | | 2.94 | | | | | 1/10/2024 | | | | | 1,790,000 | | | | | 1,789,946 | | | | | 1,781,911 | |
Arbys Funding LLC 2015-1A A2^ | | | | 4.97 | | | | | 10/30/2045 | | | | | 77,600 | | | | | 77,600 | | | | | 80,326 | |
Argent Securities, Inc. Asset-Backed Pass-Through Certificates 2004-W10 M1, 1M USD LIBOR + 0.900% | | | | 3.22 | # | | | | 10/25/2034 | | | | | 246,348 | | | | | 225,068 | | | | | 238,872 | |
ARI Fleet Lease Trust 2016-A A3^ | | | | 2.11 | | | | | 7/15/2024 | | | | | 186,980 | | | | | 186,955 | | | | | 186,306 | |
Ascentium Equipment Receivables Trust2018-2 B^ | | | | 3.76 | | | | | 5/10/2024 | | | | | 1,418,000 | | | | | 1,417,975 | | | | | 1,443,939 | |
Ascentium Equipment Receivables Trust2018-2 B^ | | | | 5.18 | | | | | 7/10/2026 | | | | | 1,273,000 | | | | | 1,272,548 | | | | | 1,297,997 | |
Asset Backed Securities Corp. Home Equity Loan Trust 2005-HE1 M1, 1M USD LIBOR + 0.750% | | | | 3.26 | # | | | | 3/25/2035 | | | | | 243,992 | | | | | 242,615 | | | | | 240,037 | |
Avant Loans Funding Trust 2018-A^ | | | | 3.09 | | | | | 6/15/2021 | | | | | 357,264 | | | | | 357,257 | | | | | 356,688 | |
BlueVirgo Trust 2015-1A^ | | | | 3.00 | | | | | 12/15/2022 | | | | | 51,983 | | | | | 51,846 | | | | | 51,983 | |
BRE Grand Islander Timeshare Issuer LLC 2017-1A A^ | | | | 2.94 | | | | | 5/25/2029 | | | | | 211,699 | | | | | 211,652 | | | | | 208,963 | |
BRE Grand Islander Timeshare Issuer LLC 2017-1A B^ | | | | 3.24 | | | | | 5/25/2029 | | | | | 174,341 | | | | | 174,319 | | | | | 170,365 | |
CAL Funding III Ltd.^ | | | | 4.34 | | | | | 9/25/2043 | | | | | 565,500 | | | | | 565,437 | | | | | 579,170 | |
Canadian Pacer Auto Receivables Trust2018-2^+ | | | | 3.63 | | | | | 1/19/2024 | | | | | 470,000 | | | | | 469,978 | | | | | 476,763 | |
Capital Automotive LLC 2017-1A A1^ | | | | 3.87 | | | | | 4/15/2047 | | | | | 304,833 | | | | | 304,748 | | | | | 306,166 | |
Castlelake Aircraft Securitization Trust 2018-1^ | | | | 4.13 | | | | | 6/15/2043 | | | | | 578,580 | | | | | 578,149 | | | | | 587,703 | |
Cazenovia Creek Funding I LLC 2015-1A A^ | | | | 2.00 | | | | | 12/10/2023 | | | | | 15,833 | | | | | 15,719 | | | | | 15,744 | |
Centex Home Equity Loan Trust 2006-A AV4, 1M USD LIBOR + 0.250% | | | | 2.76 | # | | | | 6/25/2036 | | | | | 100,390 | | | | | 98,154 | | | | | 99,618 | |
Chase Education Loan Trust, 3M USD LIBOR + 0.220% | | | | 3.03 | # | | | | 6/28/2040 | | | | | 745,264 | | | | | 704,284 | | | | | 705,740 | |
CLI Funding V LLC 2013-1A^ | | | | 2.83 | | | | | 3/18/2028 | | | | | 38,733 | | | | | 38,576 | | | | | 38,073 | |
See accompanying Notes to the Financial Statements.
111
Barings Active Short Duration Bond Fund 2018 Semi-Annual Report
SCHEDULE OF INVESTMENTS (CONTINUED)
December 31, 2018 (Unaudited)
| | | | | | | | | | | | | | | | | | | | | | | | | |
| | | EFFECTIVE
INTEREST RATE | | DUE DATE | | PRINCIPAL ‡‡ | | COST | | FAIR
VALUE |
Asset-Backed Securities(Continued) | | | | | | | | | | | | | | | | | | | | | | | | | |
| | | | | |
Other Asset-Backed Securities(Continued) | | | | | | | | | | | | | | | | | | | | | | | | | |
CLI Funding V LLC 2013-2A^ | | | | 3.22 | % | | | | 6/18/2028 | | | | | 896,034 | | | | | $886,947 | | | | | $887,685 | |
CLI Funding V LLC 2014-1A A^ | | | | 3.29 | | | | | 6/18/2029 | | | | | 710,157 | | | | | 706,786 | | | | | 699,370 | |
CLI Funding VI LLC 2017-1A A^ | | | | 3.62 | | | | | 5/18/2042 | | | | | 1,656,136 | | | | | 1,659,484 | | | | | 1,649,981 | |
College Ave Student Loans LLC 2018-A, 1M USD LIBOR + 1.200%^ | | | | 3.71 | # | | | | 12/26/2047 | | | | | 1,070,370 | | | | | 1,070,370 | | | | | 1,061,943 | |
College Loan Corp. Trust I 2005-2 B, 3M USD LIBOR + 0.490% | | | | 2.93 | # | | | | 1/15/2037 | | | | | 167,226 | | | | | 148,306 | | | | | 157,638 | |
Commonbond Student Loan Trust2016-B A1^ | | | | 2.73 | | | | | 10/25/2040 | | | | | 1,316,578 | | | | | 1,321,776 | | | | | 1,297,341 | |
Commonbond Student Loan Trust2017-A-GS^ | | | | 5.28 | | | | | 5/25/2041 | | | | | 229,684 | | | | | 229,656 | | | | | 236,455 | |
Commonbond Student Loan Trust2018-A-GS^ | | | | 3.82 | | | | | 2/25/2044 | | | | | 440,000 | | | | | 439,902 | | | | | 438,756 | |
Commonbond Student Loan Trust2018-BGS^ | | | | 4.12 | | | | | 9/25/2045 | | | | | 430,000 | | | | | 429,943 | | | | | 431,243 | |
Commonbond Student Loan Trust2018-C-GS^ | | | | 4.35 | | | | | 2/25/2046 | | | | | 439,000 | | | | | 438,958 | | | | | 438,958 | |
CPS Auto Receivables Trust 2016-C B^ | | | | 2.48 | | | | | 9/15/2020 | | | | | 70,925 | | | | | 70,922 | | | | | 70,864 | |
CPS Auto Receivables Trust 2018-A^ | | | | 2.16 | | | | | 5/17/2021 | | | | | 171,933 | | | | | 171,931 | | | | | 171,408 | |
CPS Auto Trust^ | | | | 3.43 | | | | | 7/15/2022 | | | | | 440,000 | | | | | 439,957 | | | | | 440,080 | |
CPS Auto Trust 2017-A B^ | | | | 2.68 | | | | | 5/17/2021 | | | | | 1,200,000 | | | | | 1,200,000 | | | | | 1,196,116 | |
Credit Suisse ABS Repackaging Trust 2013-A B^ | | | | 2.50 | | | | | 1/25/2030 | | | | | 41,205 | | | | | 39,467 | | | | | 38,580 | |
DB Master Finance LLC 2015-1A A2II^ | | | | 3.98 | | | | | 2/20/2045 | | | | | 1,155,000 | | | | | 1,163,306 | | | | | 1,176,172 | |
Diamond Resorts Owner Trust 2015-2 A^ | | | | 2.99 | | | | | 5/22/2028 | | | | | 398,891 | | | | | 392,313 | | | | | 397,611 | |
Diamond Resorts Owner Trust 2015-2 B^ | | | | 3.54 | | | | | 5/22/2028 | | | | | 19,911 | | | | | 19,911 | | | | | 19,837 | |
Diamond Resorts Owner Trust 2016-1 A^ | | | | 3.08 | | | | | 11/20/2028 | | | | | 381,901 | | | | | 381,901 | | | | | 377,150 | |
Diamond Resorts Owner Trust 2018-1^ | | | | 3.70 | | | | | 1/21/2031 | | | | | 608,426 | | | | | 608,419 | | | | | 613,401 | |
Domino’s Pizza Master Issuer LLC^ | | | | 4.12 | | | | | 7/25/2048 | | | | | 656,700 | | | | | 656,700 | | | | | 648,525 | |
DRB Prime Student Loan Trust 2015-A A2^ | | | | 3.06 | | | | | 7/25/2031 | | | | | 45,830 | | | | | 45,315 | | | | | 45,672 | |
DRB Prime Student Loan Trust 2015-B A3^ | | | | 2.54 | | | | | 4/27/2026 | | | | | 11,465 | | | | | 11,464 | | | | | 11,335 | |
DRB Prime Student Loan Trust 2015-D A1, 1M USD LIBOR + 1.700%^ | | | | 4.21 | # | | | | 1/25/2040 | | | | | 116,999 | | | | | 115,539 | | | | | 118,590 | |
DRB Prime Student Loan Trust 2015-D A2^ | | | | 3.20 | | | | | 1/25/2040 | | | | | 562,092 | | | | | 561,535 | | | | | 566,214 | |
DRB Prime Student Loan Trust 2016-A A1, 1M USD LIBOR + 2.000%^ | | | | 4.51 | # | | | | 4/25/2040 | | | | | 509,544 | | | | | 521,187 | | | | | 520,329 | |
DRB Prime Student Loan Trust 2016-R A1, 1M USD LIBOR + 1.900%^¤ | | | | 4.41 | # | | | | 10/25/2044 | | | | | 691,958 | | | | | 691,958 | | | | | 696,801 | |
Drive Auto Receivables Trust | | | | 3.66 | | | | | 11/15/2024 | | | | | 450,000 | | | | | 449,924 | | | | | 451,962 | |
Drive Auto Receivables Trust 2015-AA C^ | | | | 3.06 | | | | | 5/17/2021 | | | | | 9,057 | | | | | 9,115 | | | | | 9,056 | |
Drive Auto Receivables Trust 2017-1 C | | | | 2.84 | | | | | 4/15/2022 | | | | | 350,000 | | | | | 349,965 | | | | | 349,554 | |
Drive Auto Receivables Trust 2017-2 C | | | | 2.75 | | | | | 9/15/2023 | | | | | 200,000 | | | | | 199,993 | | | | | 199,658 | |
Drive Auto Receivables Trust 2018-2 | | | | 3.22 | | | | | 4/15/2022 | | | | | 380,000 | | | | | 379,957 | | | | | 379,608 | |
Drive Auto Receivables Trust 2018-5 A2B, 1M USD LIBOR + 0.320% | | | | 2.78 | # | | | | 7/15/2021 | | | | | 1,100,000 | | | | | 1,098,941 | | | | | 1,098,406 | |
Drug Royalty 2012-1 A1, 3M USD LIBOR + 5.250%^ | | | | 7.32 | # | | | | 7/15/2024 | | | | | 10,718 | | | | | 10,906 | | | | | 10,742 | |
DT Auto Owner Trust 2018-1^ | | | | 2.59 | | | | | 5/17/2021 | | | | | 829,616 | | | | | 829,605 | | | | | 828,097 | |
DT Auto Owner Trust 2018-1^ | | | | 3.04 | | | | | 1/18/2022 | | | | | 570,000 | | | | | 569,961 | | | | | 568,559 | |
Earnest Student Loan Program LLC 2016-C A2^ | | | | 2.68 | | | | | 7/25/2035 | | | | | 249,088 | | | | | 247,759 | | | | | 246,542 | |
See accompanying Notes to the Financial Statements.
112
Barings Active Short Duration Bond Fund 2018 Semi-Annual Report
SCHEDULE OF INVESTMENTS (CONTINUED)
December 31, 2018 (Unaudited)
| | | | | | | | | | | | | | | | | | | | | | | | | |
| | | EFFECTIVE
INTEREST RATE | | DUE DATE | | PRINCIPAL ‡‡ | | COST | | FAIR
VALUE |
Asset-Backed Securities(Continued) | | | | | | | | | | | | | | | | | | | | | | | | | |
| | | | | |
Other Asset-Backed Securities(Continued) | | | | | | | | | | | | | | | | | | | | | | | | | |
Earnest Student Loan Program LLC2016-D A2^ | | | | 2.72 | % | | | | 1/25/2041 | | | | | 270,148 | | | | | $270,069 | | | | | $267,157 | |
ECMC Group Student Loan Trust2016-1A A, 1M USD LIBOR + 1.350%^ | | | | 3.86 | # | | | | 7/26/2066 | | | | | 421,027 | | | | | 421,027 | | | | | 429,015 | |
ECMC Group Student Loan Trust2017-1A A, 1M USD LIBOR + 1.200%^ | | | | 3.71 | # | | | | 12/27/2066 | | | | | 1,209,559 | | | | | 1,209,559 | | | | | 1,223,272 | |
ECMC Group Student Loan Trust2018-1, 1M USD LIBOR + 0.750%^ | | | | 3.26 | # | | | | 2/27/2068 | | | | | 1,520,654 | | | | | 1,520,654 | | | | | 1,518,583 | |
ECMC Group Student Loan Trust2018-2, 1M USD LIBOR + 0.800%^ | | | | 3.31 | # | | | | 9/25/2068 | | | | | 1,062,686 | | | | | 1,061,323 | | | | | 1,061,790 | |
EdLinc Student Loan Funding Trust2017-A A, Prime – 1.150%^ | | | | 3.35 | # | | | | 12/1/2047 | | | | | 1,595,124 | | | | | 1,584,250 | | | | | 1,613,725 | |
Education Loan Asset-Backed Trust I2013-1 A1, 1M USD LIBOR + 0.800%^ | | | | 3.31 | # | | | | 6/25/2026 | | | | | 307,352 | | | | | 304,193 | | | | | 307,456 | |
Elara HGV Timeshare Issuer LLC 2014-A B^ | | | | 3.02 | #** | | | | 2/25/2027 | | | | | 18,802 | | | | | 18,671 | | | | | 18,588 | |
Elara HGV Timeshare Issuer LLC 2016-A A^ | | | | 2.73 | | | | | 4/25/2028 | | | | | 1,271,063 | | | | | 1,248,159 | | | | | 1,258,376 | |
Elara HGV Timeshare Issuer LLC 2017-A A^ | | | | 2.69 | | | | | 3/25/2030 | | | | | 377,026 | | | | | 376,995 | | | | | 372,709 | |
ELFI Graduate Loan Program LLC 2018-A, 1M USD LIBOR + 0.750%^ | | | | 3.26 | # | | | | 8/25/2042 | | | | | 937,365 | | | | | 937,365 | | | | | 931,462 | |
ELFI Graduate Loan Program LLC 2018-A^ | | | | 4.00 | | | | | 8/25/2042 | | | | | 460,000 | | | | | 451,102 | | | | | 452,134 | |
Entergy New Orleans Storm Recovery Funding I LLC 2015-1 A | | | | 2.67 | | | | | 6/1/2027 | | | | | 119,719 | | | | | 119,697 | | | | | 117,791 | |
Enterprise Fleet Financing LLC 2016-1 A2^ | | | | 1.83 | | | | | 9/20/2021 | | | | | 6,196 | | | | | 6,196 | | | | | 6,195 | |
Enterprise Fleet Financing LLC 2017-1 A3^ | | | | 2.60 | | | | | 7/20/2022 | | | | | 240,000 | | | | | 239,960 | | | | | 238,431 | |
Exeter Automobile Receivables Trust2015-2A C^ | | | | 3.90 | | | | | 3/15/2021 | | | | | 658,963 | | | | | 664,135 | | | | | 660,477 | |
Exeter Automobile Receivables Trust2016-3A B^ | | | | 2.84 | | | | | 8/16/2021 | | | | | 237,457 | | | | | 237,433 | | | | | 237,145 | |
Exeter Automobile Receivables Trust2017-1A B^ | | | | 3.00 | | | | | 12/15/2021 | | | | | 430,000 | | | | | 429,940 | | | | | 429,297 | |
Exeter Automobile Receivables Trust 2018-1^ | | | | 2.75 | | | | | 4/15/2022 | | | | | 480,000 | | | | | 480,000 | | | | | 477,644 | |
Exeter Automobile Receivables Trust 2018-3^ | | | | 2.90 | | | | | 1/18/2022 | | | | | 929,784 | | | | | 929,731 | | | | | 928,582 | |
First Franklin Mortgage Loan Trust 2004-FFH4 M5, 1M USD LIBOR + 1.575% | | | | 4.08 | # | | | | 1/25/2035 | | | | | 207,374 | | | | | 208,220 | | | | | 207,548 | |
First Investors Auto Owner Trust 2016-2A B^ | | | | 2.21 | | | | | 7/15/2022 | | | | | 520,000 | | | | | 519,982 | | | | | 514,195 | |
First Investors Auto Owner Trust 2017-3A B^ | | | | 2.72 | | | | | 4/17/2023 | | | | | 560,000 | | | | | 559,967 | | | | | 554,998 | |
First Investors Auto Owner Trust 2018-1^ | | | | 3.22 | | | | | 1/17/2023 | | | | | 540,000 | | | | | 539,957 | | | | | 541,428 | |
Flagship Credit Auto Trust 2015-3 A^ | | | | 2.38 | | | | | 10/15/2020 | | | | | 24,256 | | | | | 24,300 | | | | | 24,237 | |
Flagship Credit Auto Trust 2016-1 A^ | | | | 2.77 | | | | | 12/15/2020 | | | | | 34,101 | | | | | 34,066 | | | | | 34,080 | |
Flagship Credit Auto Trust 2016-3 B^ | | | | 2.43 | | | | | 6/15/2021 | | | | | 310,000 | | | | | 309,985 | | | | | 308,821 | |
Flagship Credit Auto Trust 2016-4 B^ | | | | 2.41 | | | | | 10/15/2021 | | | | | 1,940,000 | | | | | 1,940,919 | | | | | 1,927,940 | |
Flagship Credit Auto Trust 2016-4 C^ | | | | 2.71 | | | | | 11/15/2022 | | | | | 410,000 | | | | | 409,985 | | | | | 407,019 | |
Flagship Credit Auto Trust 2017-1 B^ | | | | 2.83 | | | | | 3/15/2023 | | | | | 895,000 | | | | | 894,980 | | | | | 892,385 | |
Flagship Credit Auto Trust 2017-4 C^ | | | | 2.92 | | | | | 11/15/2023 | | | | | 1,140,000 | | | | | 1,139,130 | | | | | 1,123,932 | |
Flagship Credit Auto Trust 2018-1^ | | | | 3.13 | | | | | 1/17/2023 | | | | | 2,250,000 | | | | | 2,249,600 | | | | | 2,242,532 | |
See accompanying Notes to the Financial Statements.
113
Barings Active Short Duration Bond Fund 2018 Semi-Annual Report
SCHEDULE OF INVESTMENTS (CONTINUED)
December 31, 2018 (Unaudited)
| | | | | | | | | | | | | | | | | | | | | | | | | |
| | | EFFECTIVE
INTEREST RATE | | DUE DATE | | PRINCIPAL ‡‡ | | COST | | FAIR
VALUE |
Asset-Backed Securities(Continued) | | | | | | | | | | | | | | | | | | | | | | | | | |
| | | | | |
Other Asset-Backed Securities(Continued) | | | | | | | | | | | | | | | | | | | | | | | | | |
Flagship Credit Auto Trust 2018-2^ | | | | 2.97 | % | | | | 10/17/2022 | | | | | 694,762 | | | | | $694,762 | | | | | $693,432 | |
FRS I LLC 2013-1A A1^ | | | | 1.80 | | | | | 4/15/2043 | | | | | 5,591 | | | | | 5,537 | | | | | 5,573 | |
Global SC Finance II SRL 2014-1A A1+^ | | | | 3.19 | | | | | 7/17/2029 | | | | | 173,083 | | | | | 173,051 | | | | | 170,982 | |
GLS Auto Receivables Trust 2018-3 A^ | | | | 3.35 | | | | | 8/15/2022 | | | | | 598,818 | | | | | 598,805 | | | | | 598,943 | |
Goal Capital Funding Trust 2010-1 A, 3M USD LIBOR + 0.700%^ | | | | 3.39 | # | | | | 8/25/2048 | | | | | 157,734 | | | | | 151,565 | | | | | 157,790 | |
Goal Structured Solution Trust 2015-1 B, 1M USD LIBOR + 1.500%^ | | | | 4.01 | # | | | | 9/25/2043 | | | | | 100,000 | | | | | 76,715 | | | | | 98,703 | |
Goodgreen 2018-1^ | | | | 3.93 | # | | | | 10/15/2053 | | | | | 1,021,994 | | | | | 1,021,889 | | | | | 1,039,714 | |
Goodgreen Trust 2016-1 A^ | | | | 3.23 | | | | | 10/15/2052 | | | | | 459,053 | | | | | 458,832 | | | | | 451,618 | |
Hero Funding 2017-3A A1^ | | | | 3.19 | | | | | 9/20/2048 | | | | | 730,254 | | | | | 730,012 | | | | | 722,619 | |
HERO FUNDING 2018-1^ | | | | 4.67 | | | | | 9/20/2048 | | | | | 1,158,336 | | | | | 1,182,037 | | | | | 1,205,931 | |
HERO Funding Trust 2015-1A A^ | | | | 3.84 | | | | | 9/21/2040 | | | | | 670,831 | | | | | 682,703 | | | | | 680,804 | |
HERO Funding Trust 2016-4A A1^ | | | | 3.57 | | | | | 9/20/2047 | | | | | 292,660 | | | | | 292,547 | | | | | 296,092 | |
HERO Funding Trust 2017-2A A1^ | | | | 3.28 | | | | | 9/20/2048 | | | | | 109,741 | | | | | 109,727 | | | | | 109,787 | |
HERO Funding Trust 2017-2A A2^ | | | | 4.07 | | | | | 9/20/2048 | | | | | 86,225 | | | | | 88,319 | | | | | 88,521 | |
Hertz Vehicle Financing II LP^ | | | | 3.29 | | | | | 2/25/2024 | | | | | 2,830,000 | | | | | 2,771,950 | | | | | 2,783,502 | |
Hertz Vehicle Financing II LP^ | | | | 3.56 | | | | | 10/25/2021 | | | | | 2,300,000 | | | | | 2,281,297 | | | | | 2,293,845 | |
Hertz Vehicle Financing II LP^ | | | | 3.60 | | | | | 2/25/2024 | | | | | 1,320,000 | | | | | 1,319,590 | | | | | 1,302,627 | |
Higher Education Funding I 2004-1 B1, 28 day ARS^ | | | | 3.51 | # | | | | 1/1/2044 | | | | | 950,000 | | | | | 831,970 | | | | | 901,595 | |
Hilton Grand Vacations Trust 2013-A A^ | | | | 2.28 | | | | | 1/25/2026 | | | | | 31,367 | | | | | 30,999 | | | | | 31,226 | |
Hilton Grand Vacations Trust 2017-AA B^ | | | | 2.96 | #** | | | | 12/26/2028 | | | | | 247,198 | | | | | 247,188 | | | | | 241,698 | |
Hilton Grand Vacations Trust 2018-A^ | | | | 3.54 | | | | | 2/25/2032 | | | | | 381,078 | | | | | 381,069 | | | | | 382,204 | |
Horizon Aircraft Finance I Ltd. 2018-1 A^ | | | | 4.46 | | | | | 12/15/2038 | | | | | 500,000 | | | | | 499,989 | | | | | 509,663 | |
KREF Ltd. 2018-FL1 AS, 1M USD LIBOR + 1.350%^ | | | | 3.65 | # | | | | 6/15/2036 | | | | | 2,380,000 | | | | | 2,380,000 | | | | | 2,343,278 | |
Laurel Road Prime Student Loan Trust2017-B CFX^ | | | | 3.61 | | | | | 8/25/2042 | | | | | 411,775 | | | | | 411,714 | | | | | 401,709 | |
Laurel Road Prime Student Loan Trust2017-C B^ | | | | 2.95 | | | | | 11/25/2042 | | | | | 478,643 | | | | | 478,462 | | | | | 462,473 | |
Lendmark Funding Trust 2017-1A^ | | | | 2.83 | | | | | 12/22/2025 | | | | | 570,000 | | | | | 569,072 | | | | | 562,589 | |
Lendmark Funding Trust 2017-2A A^ | | | | 2.80 | | | | | 5/20/2026 | | | | | 679,964 | | | | | 679,940 | | | | | 668,269 | |
Lendmark Funding Trust 2018-1^ | | | | 3.81 | | | | | 12/21/2026 | | | | | 630,000 | | | | | 629,968 | | | | | 628,937 | |
Mariner Finance Issuance Trust 2017-AA A^ | | | | 3.62 | | | | | 2/20/2029 | | | | | 480,000 | | | | | 479,917 | | | | | 480,001 | |
Mariner Finance Issuance Trust 2017-BA B^ | | | | 2.92 | | | | | 12/20/2029 | | | | | 2,100,000 | | | | | 2,099,802 | | | | | 2,078,010 | |
Mariner Finance Issuance Trust 2018-A^ | | | | 4.20 | | | | | 11/20/2030 | | | | | 1,848,000 | | | | | 1,847,866 | | | | | 1,868,584 | |
Marlette Funding Trust 2017-1A A^ | | | | 2.83 | | | | | 3/15/2024 | | | | | 203,789 | | | | | 204,227 | | | | | 203,707 | |
Marlette Funding Trust 2017-2A A^ | | | | 2.39 | | | | | 7/15/2024 | | | | | 69,475 | | | | | 69,475 | | | | | 69,381 | |
Marlette Funding Trust 2017-3A A^ | | | | 2.36 | | | | | 12/15/2024 | | | | | 155,875 | | | | | 155,868 | | | | | 155,408 | |
Marlette Funding Trust 2018-1^ | | | | 2.61 | | | | | 3/15/2028 | | | | | 1,102,378 | | | | | 1,102,329 | | | | | 1,099,509 | |
Marlette Funding Trust 2018-2^ | | | | 3.06 | | | | | 7/17/2028 | | | | | 358,806 | | | | | 358,806 | | | | | 358,534 | |
Marlette Funding Trust 2018-3^ | | | | 3.20 | | | | | 9/15/2028 | | | | | 930,939 | | | | | 930,864 | | | | | 929,628 | |
Mosaic Solar Loan Trust 2018-2-GS^†† | | | | 4.20 | | | | | 2/22/2044 | | | | | 614,235 | | | | | 614,137 | | | | | 613,375 | |
Mosaic Solar Loans LLC 2017-1A A^†† | | | | 4.45 | | | | | 6/20/2042 | | | | | 91,404 | | | | | 91,379 | | | | | 92,082 | |
Mosaic Solar Loans LLC 2017-2A D^†† | | | | Zero Coupon | | | | | 6/22/2043 | | | | | 624,252 | | | | | 559,552 | | | | | 583,146 | |
See accompanying Notes to the Financial Statements.
114
Barings Active Short Duration Bond Fund 2018 Semi-Annual Report
SCHEDULE OF INVESTMENTS (CONTINUED)
December 31, 2018 (Unaudited)
| | | | | | | | | | | | | | | | | | | | | | | | | |
| | | EFFECTIVE
INTEREST RATE | | DUE DATE | | PRINCIPAL ‡‡ | | COST | | FAIR
VALUE |
Asset-Backed Securities(Continued) | | | | | | | | | | | | | | | | | | | | | | | | | |
| | | | | |
Other Asset-Backed Securities(Continued) | | | | | | | | | | | | | | | | | | | | | | | | | |
MVW Owner Trust 2013-1A A^ | | | | 2.15 | % | | | | 4/22/2030 | | | | | 224,591 | | | | | $223,038 | | | | | $221,871 | |
MVW Owner Trust 2015-1A A^ | | | | 2.52 | | | | | 12/20/2032 | | | | | 28,165 | | | | | 28,163 | | | | | 27,749 | |
MVW Owner Trust 2016-1A A^ | | | | 2.25 | | | | | 12/20/2033 | | | | | 1,273,311 | | | | | 1,262,957 | | | | | 1,245,316 | |
MVW Owner Trust 2017-1A A^ | | | | 2.42 | | | | | 12/20/2034 | | | | | 85,625 | | | | | 85,613 | | | | | 84,000 | |
Navient Private Education Loan Trust 2018-B, 1M USD LIBOR + 0.720%^ | | | | 3.18 | # | | | | 12/15/2059 | | | | | 320,000 | | | | | 320,000 | | | | | 320,895 | |
Navient Student Loan Trust 2015-1 B, 1M USD LIBOR + 1.500% | | | | 4.01 | # | | | | 7/25/2052 | | | | | 1,100,000 | | | | | 1,094,593 | | | | | 1,124,373 | |
Navient Student Loan Trust 2015-2 A3, 1M USD LIBOR + 0.570% | | | | 3.08 | # | | | | 11/26/2040 | | | | | 500,000 | | | | | 492,857 | | | | | 497,229 | |
Navient Student Loan Trust 2016-5A A, 1M USD LIBOR + 1.250%^ | | | | 3.76 | # | | | | 6/25/2065 | | | | | 927,396 | | | | | 931,297 | | | | | 934,339 | |
Navient Student Loan Trust 2016-6 A3, 1M USD LIBOR + 1.300%^ | | | | 3.81 | # | | | | 3/25/2066 | | | | | 550,000 | | | | | 550,000 | | | | | 561,854 | |
Navient Student Loan Trust 2017-1A A3, 1M USD LIBOR + 1.150%^ | | | | 3.66 | # | | | | 7/26/2066 | | | | | 1,000,000 | | | | | 1,000,000 | | | | | 1,011,125 | |
Navient Student Loan Trust 2017-5A A, 1M USD LIBOR + 0.800%^ | | | | 3.31 | # | | | | 7/26/2066 | | | | | 532,425 | | | | | 531,830 | | | | | 533,302 | |
Navient Student Loan Trust 2018-1A A3, 1M USD LIBOR + 0.720%^ | | | | 3.23 | # | | | | 3/25/2067 | | | | | 1,600,000 | | | | | 1,600,000 | | | | | 1,591,036 | |
Navient Student Loan Trust 2018-2, 1M USD LIBOR + 0.750%^ | | | | 3.26 | # | | | | 3/25/2067 | | | | | 1,360,000 | | | | | 1,360,000 | | | | | 1,360,962 | |
Navient Student Loan Trust 2018-3, 1M USD LIBOR + 0.800%^ | | | | 3.31 | # | | | | 3/25/2067 | | | | | 1,600,000 | | | | | 1,600,000 | | | | | 1,580,203 | |
Navistar Financial Dealer Note Master Owner Trust II, 1M USD LIBOR + 1.050%^ | | | | 3.56 | # | | | | 9/25/2023 | | | | | 300,000 | | | | | 300,000 | | | | | 300,486 | |
Navistar Financial Dealer Note Master Owner Trust II, 1M USD LIBOR + 1.550%^ | | | | 4.06 | # | | | | 9/25/2023 | | | | | 520,000 | | | | | 520,000 | | | | | 520,343 | |
Nelnet Private Education Loan Trust2016-A A1A, 1M USD LIBOR + 1.750%^ | | | | 4.26 | # | | | | 12/26/2040 | | | | | 225,257 | | | | | 225,257 | | | | | 225,257 | |
Nelnet Private Education Loan Trust2016-A A1B^ | | | | 3.60 | | | | | 12/26/2040 | | | | | 162,201 | | | | | 161,179 | | | | | 157,947 | |
Nelnet Student Loan Trust 2005-1, 3M USD LIBOR + 0.110% | | | | 2.60 | # | | | | 10/25/2033 | | | | | 398,537 | | | | | 396,167 | | | | | 393,142 | |
Nelnet Student Loan Trust 2005-2, 3M USD LIBOR + 0.100% | | | | 2.92 | # | | | | 3/23/2037 | | | | | 415,687 | | | | | 412,873 | | | | | 411,751 | |
Nelnet Student Loan Trust 2006-2 B, 3M USD LIBOR + 0.200% | | | | 2.69 | # | | | | 1/25/2038 | | | | | 1,036,615 | | | | | 975,032 | | | | | 968,206 | |
Nelnet Student Loan Trust 2007-2, 28 day ARS^ | | | | 2.46 | # | | | | 6/25/2035 | | | | | 2,000,000 | | | | | 1,972,980 | | | | | 1,987,029 | |
Nelnet Student Loan Trust 2018-1A, 1M USD LIBOR + 0.760%^ | | | | 3.27 | # | | | | 5/25/2066 | | | | | 1,390,000 | | | | | 1,390,000 | | | | | 1,376,107 | |
Nelnet Student Loan Trust 2018-3, 1M USD LIBOR + 0.750%^ | | | | 3.26 | # | | | | 9/27/2066 | | | | | 1,300,000 | | | | | 1,300,000 | | | | | 1,301,643 | |
New Residential Advance Receivables Trust Advance Receivables Backed Notes2016-T2 AT2^ | | | | 2.58 | | | | | 10/15/2049 | | | | | 975,000 | | | | | 975,000 | | | | | 968,919 | |
See accompanying Notes to the Financial Statements.
115
Barings Active Short Duration Bond Fund 2018 Semi-Annual Report
SCHEDULE OF INVESTMENTS (CONTINUED)
December 31, 2018 (Unaudited)
| | | | | | | | | | | | | | | | | | | | | | | | | |
| | | EFFECTIVE
INTEREST RATE | | DUE DATE | | PRINCIPAL ‡‡ | | COST | | FAIR
VALUE |
Asset-Backed Securities(Continued) | | | | | | | | | | | | | | | | | | | | | | | | | |
| | | | | |
Other Asset-Backed Securities(Continued) | | | | | | | | | | | | | | | | | | | | | | | | | |
New Residential Advance Receivables Trust Advance Receivables Backed Notes2017-T1 AT1^ | | | | 3.21 | % | | | | 2/15/2051 | | | | | 1,080,000 | | | | | $1,067,717 | | | | | $1,077,811 | |
NextGear Floorplan Master Owner Trust2016-1A A1, 1M USD LIBOR + 1.700%^ | | | | 4.16 | # | | | | 4/15/2021 | | | | | 490,000 | | | | | 490,000 | | | | | 491,790 | |
NextGear Floorplan Master Owner Trust2016-2A A2^ | | | | 2.19 | | | | | 9/15/2021 | | | | | 762,000 | | | | | 760,423 | | | | | 756,532 | |
Northstar Education Finance, Inc. 2005-1 A5, 3M USD LIBOR + 0.750% | | | | 3.26 | # | | | | 10/30/2045 | | | | | 188,658 | | | | | 180,904 | | | | | 187,243 | |
NorthStar Student Loan Trust III 2016-1 A, 1M USD LIBOR + 1.250%^ | | | | 3.76 | # | | | | 5/27/2036 | | | | | 175,064 | | | | | 167,790 | | | | | 174,927 | |
NovaStar Mortgage Funding Trust 2004-4 M5, 1M USD LIBOR + 1.725% | | | | 4.23 | # | | | | 3/25/2035 | | | | | 387,993 | | | | | 387,898 | | | | | 387,445 | |
NP Ferrum LLC 2015 1A A1 | | | | 2.71 | | | | | 2/19/2045 | | | | | 294,222 | | | | | 291,736 | | | | | 290,112 | |
NP Ferrum LLC 2015 1A A1 | | | | 3.97 | | | | | 3/19/2046 | | | | | 106,165 | | | | | 106,165 | | | | | 106,165 | |
NP Ferrum LLC 2015 1A A1 | | | | 5.05 | | | | | 3/19/2046 | | | | | 800,000 | | | | | 812,968 | | | | | 806,488 | |
NP SPE II LLC 2017-1A A1^ | | | | 3.37 | | | | | 10/21/2047 | | | | | 404,377 | | | | | 404,377 | | | | | 399,385 | |
NRZ Advance Receivables Trust2016-T4 AT4^ | | | | 3.11 | | | | | 12/15/2050 | | | | | 900,000 | | | | | 900,000 | | | | | 898,478 | |
OneMain Direct Auto Receivables Trust 2017-2A A^ | | | | 2.31 | | | | | 12/14/2021 | | | | | 1,130,000 | | | | | 1,129,900 | | | | | 1,123,178 | |
Orange Lake Timeshare Trust 2016-A A^ | | | | 2.61 | | | | | 3/8/2029 | | | | | 1,271,177 | | | | | 1,245,982 | | | | | 1,254,179 | |
Orange Lake Timeshare Trust 2016-A B^ | | | | 2.91 | | | | | 3/8/2029 | | | | | 515,210 | | | | | 508,232 | | | | | 511,685 | |
Oscar US Funding Trust II 2015 1A A4^ | | | | 2.44 | | | | | 6/15/2022 | | | | | 191,579 | | | | | 188,215 | | | | | 191,003 | |
OSCAR US Funding Trust IX LLC^+ | | | | 3.63 | | | | | 9/10/2025 | | | | | 480,000 | | | | | 479,896 | | | | | 484,822 | |
Oscar US Funding Trust VI LLC2017-1A A3+^ | | | | 2.82 | | | | | 6/10/2021 | | | | | 370,000 | | | | | 369,960 | | | | | 368,797 | |
Oscar US Funding Trust VI LLC2017-1A A4+^ | | | | 3.30 | | | | | 5/10/2024 | | | | | 500,000 | | | | | 501,646 | | | | | 500,333 | |
OSCAR US Funding Trust VIII LLC+^ | | | | 2.91 | | | | | 4/12/2021 | | | | | 483,067 | | | | | 483,031 | | | | | 482,356 | |
Oxford Finance Funding LLC 2016-1A A^ | | | | 3.97 | | | | | 6/17/2024 | | | | | 128,916 | | | | | 128,916 | | | | | 129,316 | |
PHEAA Student Loan Trust 2016-2A A, 1M USD LIBOR + 0.950%^ | | | | 3.46 | # | | | | 11/25/2065 | | | | | 556,460 | | | | | 556,460 | | | | | 559,234 | |
Popular ABS Mortgage Pass-Through Trust 2006-B A3, 1M USD LIBOR + 0.280% | | | | 2.79 | # | | | | 5/25/2036 | | | | | 49,784 | | | | | 47,931 | | | | | 49,348 | |
Prestige Auto Receivables Trust 2018-1^ | | | | 2.53 | | | | | 10/15/2019 | | | | | 208,498 | | | | | 208,498 | | | | | 208,411 | |
Santander Drive Auto Receivables Trust 2014-4 D | | | | 3.10 | | | | | 11/16/2020 | | | | | 354,707 | | | | | 356,621 | | | | | 354,596 | |
Santander Drive Auto Receivables Trust 2016-1 D | | | | 4.02 | | | | | 4/15/2022 | | | | | 430,000 | | | | | 436,427 | | | | | 433,949 | |
SBA Tower Trust^ | | | | 2.88 | | | | | 7/15/2046 | | | | | 880,000 | | | | | 875,695 | | | | | 863,860 | |
SBA Tower Trust^ | | | | 3.17 | | | | | 4/9/2047 | | | | | 630,000 | | | | | 630,844 | | | | | 622,566 | |
SBA Tower Trust 2014-1A C^ | | | | 2.90 | | | | | 10/15/2044 | | | | | 590,000 | | | | | 591,484 | | | | | 586,522 | |
Securitized Equipment Receivables | | | | 3.76 | | | | | 10/11/2024 | | | | | 550,000 | | | | | 549,989 | | | | | 551,839 | |
Securitized Equipment Receivables | | | | 4.20 | | | | | 10/11/2024 | | | | | 610,000 | | | | | 609,963 | | | | | 612,213 | |
See accompanying Notes to the Financial Statements.
116
Barings Active Short Duration Bond Fund 2018 Semi-Annual Report
SCHEDULE OF INVESTMENTS (CONTINUED)
December 31, 2018 (Unaudited)
| | | | | | | | | | | | | | | | | | | | | | | | | |
| | | EFFECTIVE
INTEREST RATE | | DUE DATE | | PRINCIPAL ‡‡ | | COST | | FAIR
VALUE |
Asset-Backed Securities(Continued) | | | | | | | | | | | | | | | | | | | | | | | | | |
| | | | | |
Other Asset-Backed Securities(Continued) | | | | | | | | | | | | | | | | | | | | | | | | | |
Sierra Receivables Funding Co LLC2017-1A A^ | | | | 2.91 | % | | | | 3/20/2034 | | | | | 545,345 | | | | | $547,274 | | | | | $540,222 | |
Sierra Timeshare 2014-3 Receivables Funding LLC^ | | | | 2.80 | | | | | 10/20/2031 | | | | | 510,685 | | | | | 508,559 | | | | | 508,749 | |
Sierra Timeshare 2015-1 Receivables Funding LLC^ | | | | 3.05 | | | | | 3/22/2032 | | | | | 569,008 | | | | | 566,973 | | | | | 566,895 | |
Sierra Timeshare 2015-2 Receivables Funding LLC^ | | | | 2.43 | | | | | 6/20/2032 | | | | | 458,560 | | | | | 454,736 | | | | | 452,850 | |
Sierra Timeshare 2016-2 Receivables Funding LLC^ | | | | 2.78 | | | | | 7/20/2033 | | | | | 383,494 | | | | | 380,051 | | | | | 374,064 | |
Sierra Timeshare 2018-2 Receivables Funding LLC^ | | | | 3.94 | | | | | 6/20/2035 | | | | | 500,871 | | | | | 500,734 | | | | | 504,820 | |
Sierra Timeshare Receivables Funding LLC2014-2A A^ | | | | 2.05 | # | | | | 6/20/2031 | | | | | 34,791 | | | | | 34,448 | | | | | 34,749 | |
Sierra Timeshare Receivables Funding LLC2014-3A A^ | | | | 2.30 | | | | | 10/20/2031 | | | | | 140,438 | | | | | 139,687 | | | | | 139,617 | |
Sierra Timeshare Receivables Funding LLC 2015 3A B^ | | | | 3.08 | | | | | 9/20/2032 | | | | | 19,675 | | | | | 19,674 | | | | | 19,573 | |
Sierra Timeshare Receivables Funding LLC2015-1A A^ | | | | 2.40 | | | | | 3/22/2032 | | | | | 103,844 | | | | | 102,701 | | | | | 102,567 | |
Sierra Timeshare Receivables Funding LLC2015-2A B^ | | | | 3.02 | | | | | 6/20/2032 | | | | | 884,365 | | | | | 880,478 | | | | | 870,613 | |
Sierra Timeshare Receivables Funding LLC2015-3A A^ | | | | 2.58 | | | | | 9/20/2032 | | | | | 19,675 | | | | | 19,671 | | | | | 19,477 | |
SLC Student Loan Trust 2005-1 B, 3M USD LIBOR + 0.200% | | | | 2.82 | # | | | | 2/15/2045 | | | | | 411,110 | | | | | 360,515 | | | | | 381,455 | |
SLC Student Loan Trust 2006-2 B, 3M USD LIBOR + 0.230% | | | | 2.72 | # | | | | 1/25/2041 | | | | | 775,896 | | | | | 729,396 | | | | | 739,839 | |
SLC Student Loan Trust 2006-2 B, 3M USD LIBOR + 0.230% | | | | 3.02 | # | | | | 12/15/2039 | | | | | 1,832,415 | | | | | 1,702,755 | | | | | 1,726,438 | |
SLM Student Loan Trust 2003-14, 3M USD LIBOR + 0.600%^ | | | | 3.09 | # | | | | 10/25/2065 | | | | | 4,450,000 | | | | | 4,434,891 | | | | | 4,437,619 | |
SLM Student Loan Trust 2003-14 A6, 3M USD LIBOR + 0.300% | | | | 2.79 | # | | | | 7/25/2025 | | | | | 39,180 | | | | | 38,007 | | | | | 39,085 | |
SLM Student Loan Trust 2003-4 B, 3M USD LIBOR + 0.650% | | | | 3.44 | # | | | | 6/15/2038 | | | | | 401,214 | | | | | 383,237 | | | | | 388,962 | |
SLM Student Loan Trust 2004-3A A6A, 3M USD LIBOR + 0.550%^ | | | | 3.04 | # | | | | 10/25/2064 | | | | | 1,550,000 | | | | | 1,522,430 | | | | | 1,528,657 | |
SLM Student Loan Trust 2005-4 B, 3M USD LIBOR + 0.180% | | | | 2.67 | # | | | | 7/25/2055 | | | | | 360,769 | | | | | 302,112 | | | | | 339,091 | |
SLM Student Loan Trust 2005-6 B, 3M USD LIBOR + 0.290% | | | | 2.78 | # | | | | 1/25/2044 | | | | | 1,530,888 | | | | | 1,424,849 | | | | | 1,420,546 | |
SLM Student Loan Trust 2005-7, 3M USD LIBOR + 0.750% | | | | 3.24 | # | | | | 1/25/2040 | | | | | 1,400,000 | | | | | 1,395,329 | | | | | 1,388,844 | |
SLM Student Loan Trust 2005-9, 3M USD LIBOR + 0.300% | | | | 2.79 | # | | | | 1/25/2041 | | | | | 881,092 | | | | | 841,167 | | | | | 843,490 | |
See accompanying Notes to the Financial Statements.
117
Barings Active Short Duration Bond Fund 2018 Semi-Annual Report
SCHEDULE OF INVESTMENTS (CONTINUED)
December 31, 2018 (Unaudited)
| | | | | | | | | | | | | | | | | | | | | | | | | |
| | | EFFECTIVE
INTEREST RATE | | DUE DATE | | PRINCIPAL ‡‡ | | COST | | FAIR
VALUE |
Asset-Backed Securities(Continued) | | | | | | | | | | | | | | | | | | | | | | | | | |
| | | | | |
Other Asset-Backed Securities(Continued) | | | | | | | | | | | | | | | | | | | | | | | | | |
SLM Student Loan Trust 2005-9, 3M EURIBOR + 0.600% | | | | 3.09 | #% | | | | 1/25/2041 | | | | | 1,280,000 | | | | | $1,264,411 | | | | | $1,269,251 | |
SLM Student Loan Trust 2006-10 A6, 3M USD LIBOR + 0.150% | | | | 2.64 | # | | | | 3/25/2044 | | | | | 2,800,000 | | | | | 2,699,009 | | | | | 2,722,944 | |
SLM Student Loan Trust 2006-10 B, 3M USD LIBOR + 0.220% | | | | 2.71 | # | | | | 3/25/2044 | | | | | 1,310,098 | | | | | 1,236,903 | | | | | 1,228,020 | |
SLM Student Loan Trust 2006-2, 3M USD LIBOR + 0.170% | | | | 2.66 | # | | | | 1/25/2041 | | | | | 1,213,581 | | | | | 1,183,424 | | | | | 1,174,367 | |
SLM Student Loan Trust 2006-5 B, 3M USD LIBOR + 0.210% | | | | 2.70 | # | | | | 10/25/2040 | | | | | 603,634 | | | | | 536,298 | | | | | 573,026 | |
SLM Student Loan Trust 2006-7 B, 3M USD LIBOR + 0.200% | | | | 2.69 | # | | | | 1/27/2042 | | | | | 614,319 | | | | | 570,132 | | | | | 585,431 | |
SLM Student Loan Trust 2006-9 A5, 3M USD LIBOR + 0.100% | | | | 2.59 | # | | | | 1/26/2026 | | | | | 64,675 | | | | | 63,280 | | | | | 64,597 | |
SLM Student Loan Trust 2007-1 A6, 3M USD LIBOR + 0.140% | | | | 2.63 | # | | | | 1/27/2042 | | | | | 200,000 | | | | | 192,199 | | | | | 192,458 | |
SMB Private Education Loan Trust 2014-A A2B, 1M USD LIBOR + 1.150%^ | | | | 3.61 | # | | | | 5/15/2026 | | | | | 474,366 | | | | | 477,340 | | | | | 477,135 | |
SMB Private Education Loan Trust 2015-A A2B, 1M USD LIBOR + 1.000%^ | | | | 3.46 | # | | | | 6/15/2027 | | | | | 71,085 | | | | | 69,997 | | | | | 71,363 | |
SMB Private Education Loan Trust 2015-A A3, 1M USD LIBOR + 1.500%^ | | | | 3.96 | # | | | | 2/17/2032 | | | | | 900,000 | | | | | 919,302 | | | | | 918,277 | |
SMB Private Education Loan Trust 2015-C A3, 1M USD LIBOR + 1.950%^ | | | | 4.41 | # | | | | 8/16/2032 | | | | | 700,000 | | | | | 729,276 | | | | | 720,811 | |
SMB Private Education Loan Trust 2016-B A2B, 1M USD LIBOR + 1.450%^ | | | | 3.91 | # | | | | 2/17/2032 | | | | | 104,714 | | | | | 104,714 | | | | | 106,284 | |
SMB Private Education Loan Trust 2016-C A2B, 1M USD LIBOR + 1.100%^ | | | | 3.56 | # | | | | 9/15/2034 | | | | | 269,642 | | | | | 269,642 | | | | | 271,592 | |
SMB Private Education Loan Trust 2017-B A2B, 1M USD LIBOR + 0.750%^ | | | | 3.21 | # | | | | 10/15/2035 | | | | | 670,000 | | | | | 670,000 | | | | | 665,609 | |
SMB Private Education Loan Trust 2018-B, 1M USD LIBOR + 0.720%^ | | | | 3.18 | # | | | | 1/15/2037 | | | | | 1,050,000 | | | | | 1,050,000 | | | | | 1,042,840 | |
Sofi Consumer Loan Program 2018-3 Trust^ | | | | 3.20 | | | | | 8/25/2027 | | | | | 458,464 | | | | | 458,464 | | | | | 457,574 | |
SoFi Consumer Loan Program LLC2016-1A A^ | | | | 3.26 | | | | | 8/25/2025 | | | | | 427,117 | | | | | 428,443 | | | | | 427,127 | |
SoFi Consumer Loan Program LLC2016-2A A^ | | | | 3.09 | | | | | 10/27/2025 | | | | | 138,847 | | | | | 138,830 | | | | | 138,651 | |
SoFi Consumer Loan Program LLC2016-3 A^ | | | | 3.05 | | | | | 12/26/2025 | | | | | 132,233 | | | | | 132,231 | | | | | 132,149 | |
SoFi Consumer Loan Program LLC2016-5 A^ | | | | 3.06 | | | | | 9/25/2028 | | | | | 780,798 | | | | | 778,548 | | | | | 776,687 | |
SoFi Consumer Loan Program LLC2017-2 A^ | | | | 3.28 | | | | | 2/25/2026 | | | | | 349,279 | | | | | 348,803 | | | | | 348,385 | |
SoFi Consumer Loan Program LLC2017-3 A^ | | | | 2.77 | | | | | 5/25/2026 | | | | | 546,392 | | | | | 546,392 | | | | | 541,913 | |
See accompanying Notes to the Financial Statements.
118
Barings Active Short Duration Bond Fund 2018 Semi-Annual Report
SCHEDULE OF INVESTMENTS (CONTINUED)
December 31, 2018 (Unaudited)
| | | | | | | | | | | | | | | | | | | | | | | | | |
| | | EFFECTIVE
INTEREST RATE | | DUE DATE | | PRINCIPAL ‡‡ | | COST | | FAIR
VALUE |
Asset-Backed Securities(Continued) | | | | | | | | | | | | | | | | | | | | | | | | | |
| | | | | |
Other Asset-Backed Securities(Continued) | | | | | | | | | | | | | | | | | | | | | | | | | |
SoFi Consumer Loan Program Trust2015-1 A^ | | | | 3.28 | % | | | | 9/15/2023 | | | | | 174,793 | | | | | $174,867 | | | | | $174,799 | |
Sofi Professional Loan Program 2018-A LLC^¤ | | | | Zero Coupon | | | | | 2/25/2042 | | | | | 1,372,500 | | | | | 998,522 | | | | | 985,729 | |
Sofi Professional Loan Program 2018-B Trust^¤ | | | | Zero Coupon | | | | | 8/26/2047 | | | | | 1,265,700 | | | | | 694,769 | | | | | 694,371 | |
Sofi Professional Loan Program 2018-D Trust^¤ | | | | Zero Coupon | | | | | 2/25/2048 | | | | | 1,887,200 | | | | | 656,759 | | | | | 650,140 | |
SoFi Professional Loan Program LLC2015-A RC^¤ | | | | 7.63 | | | | | 3/25/2033 | | | | | 300 | | | | | 844,125 | | | | | 311,250 | |
SoFi Professional Loan Program LLC2015-C A2^ | | | | 2.51 | | | | | 8/25/2033 | | | | | 30,243 | | | | | 30,103 | | | | | 29,809 | |
SoFi Professional Loan Program LLC 2016 A A1, 1M USD LIBOR + 1.750%^ | | | | 4.26 | # | | | | 8/25/2036 | | | | | 103,892 | | | | | 103,020 | | | | | 105,195 | |
SoFi Professional Loan Program LLC2016-B A1, 1M USD LIBOR + 1.200%^ | | | | 3.71 | # | | | | 6/25/2033 | | | | | 363,575 | | | | | 367,552 | | | | | 368,150 | |
SoFi Professional Loan Program LLC2016-D A1, 1M USD LIBOR + 0.950%^ | | | | 3.46 | # | | | | 1/25/2039 | | | | | 73,814 | | | | | 73,814 | | | | | 73,874 | |
SoFi Professional Loan Program LLC2017-D R1^ | | | | Zero Coupon | | | | | 9/25/2040 | | | | | 1,233,700 | | | | | 723,220 | | | | | 796,045 | |
SpringCastle America Funding LLC2016-AA A^ | | | | 3.05 | | | | | 4/25/2029 | | | | | 346,159 | | | | | 346,148 | | | | | 342,811 | |
Springleaf Funding Trust 2016-AA A^ | | | | 2.90 | | | | | 11/15/2029 | | | | | 1,523,688 | | | | | 1,523,484 | | | | | 1,514,831 | |
Store Master Funding I-VII A3^ | | | | 4.40 | | | | | 10/20/2048 | | | | | 649,458 | | | | | 649,181 | | | | | 662,650 | |
Taco Bell Funding LLC 2018-1A A2I^ | | | | 4.32 | | | | | 11/25/2048 | | | | | 2,130,000 | | | | | 2,130,000 | | | | | 2,151,058 | |
TAL Advantage LLC 2017-1A A^ | | | | 4.50 | | | | | 4/20/2042 | | | | | 600,700 | | | | | 607,701 | | | | | 612,694 | |
TAL Advantage V LLC^ | | | | 3.33 | | | | | 5/20/2039 | | | | | 1,434,139 | | | | | 1,424,807 | | | | | 1,422,777 | |
Tesla Auto Lease Trust 2018-A^ | | | | 2.32 | | | | | 12/20/2019 | | | | | 272,276 | | | | | 272,273 | | | | | 271,182 | |
Tesla Auto Lease Trust 2018-A^ | | | | 2.75 | | | | | 2/20/2020 | | | | | 275,000 | | | | | 274,987 | | | | | 274,131 | |
Tesla Auto Lease Trust 2018-B A^ | | | | 3.71 | | | | | 8/20/2021 | | | | | 513,000 | | | | | 512,963 | | | | | 514,790 | |
Textainer Marine Containers VII Ltd.+^ | | | | 4.11 | | | | | 7/20/2043 | | | | | 727,500 | | | | | 718,980 | | | | | 731,649 | |
TLF National Tax Lien Trust 2017-1^ | | | | 3.09 | | | | | 12/15/2029 | | | | | 779,603 | | | | | 779,578 | | | | | 777,511 | |
TPG Real Estate Finance 2018-FL-1 Issuer Ltd., 1M USD LIBOR + 0.750%^ | | | | 3.21 | # | | | | 2/15/2035 | | | | | 1,224,646 | | | | | 1,222,709 | | | | | 1,208,653 | |
Trafigura Securitisation Finance PLC 2017-1, 1M USD LIBOR + 1.700%+^ | | | | 4.16 | # | | | | 12/15/2020 | | | | | 900,000 | | | | | 902,075 | | | | | 899,293 | |
Trafigura Securitisation Finance plc 2018-1, 1M USD LIBOR + 0.730%^+ | | | | 3.19 | # | | | | 3/15/2022 | | | | | 1,170,000 | | | | | 1,170,000 | | | | | 1,170,304 | |
Trafigura Securitisation Finance plc 2018-1^+ | | | | 4.29 | | | | | 3/15/2022 | | | | | 1,800,000 | | | | | 1,799,889 | | | | | 1,816,349 | |
Trinity Rail Leasing LP^ | | | | 3.82 | | | | | 6/17/2048 | | | | | 949,809 | | | | | 949,462 | | | | | 964,646 | |
TRIP Rail Master Funding LLC 2011-1A A2^ | | | | 6.02 | | | | | 7/15/2041 | | | | | 1,248,118 | | | | | 1,330,654 | | | | | 1,316,051 | |
TRIP Rail Master Funding LLC 2017-1A A1^ | | | | 2.71 | | | | | 8/15/2047 | | | | | 187,705 | | | | | 187,703 | | | | | 186,132 | |
VSE 2018-A Voi Mortgage LLC^ | | | | 4.02 | | | | | 2/20/2036 | | | | | 445,945 | | | | | 445,887 | | | | | 449,336 | |
VSE VOI Mortgage LLC 2016-A A^ | | | | 2.54 | | | | | 7/20/2033 | | | | | 392,394 | | | | | 392,358 | | | | | 385,975 | |
Wachovia Student Loan Trust2005-1 B, 3M USD LIBOR + 0.300% | | | | 2.79 | # | | | | 10/25/2040 | | | | | 673,061 | | | | | 618,468 | | | | | 622,849 | |
Welk Resorts LLC 2017-AA B^ | | | | 3.41 | | | | | 6/15/2033 | | | | | 296,912 | | | | | 296,866 | | | | | 292,016 | |
Westgate Resorts LLC 2015-2A A^ | | | | 3.20 | | | | | 7/20/2028 | | | | | 101,221 | | | | | 101,114 | | | | | 101,018 | |
Westgate Resorts LLC 2017-1A A^ | | | | 3.05 | | | | | 12/20/2030 | | | | | 331,206 | | | | | 331,206 | | | | | 328,736 | |
Westgate Resorts LLC 2018-1^ | | | | 3.38 | | | | | 12/20/2031 | | | | | 667,814 | | | | | 666,687 | | | | | 666,630 | |
See accompanying Notes to the Financial Statements.
119
Barings Active Short Duration Bond Fund 2018 Semi-Annual Report
SCHEDULE OF INVESTMENTS (CONTINUED)
December 31, 2018 (Unaudited)
| | | | | | | | | | | | | | | | | | | | | | | | | |
| | | EFFECTIVE
INTEREST RATE | | DUE DATE | | PRINCIPAL ‡‡ | | COST | | FAIR
VALUE |
Asset-Backed Securities(Continued) | | | | | | | | | | | | | | | | | | | | | | | | | |
| | | | | |
Other Asset-Backed Securities(Continued) | | | | | | | | | | | | | | | | | | | | | | | | | |
Willis Engine Structured Trust IV^ | | | | 4.75 | % | | | | 9/15/2043 | | | | | 474,588 | | | | | $474,564 | | | | | $486,915 | |
Wingstop Funding 2018-1 LLC^ | | | | 4.97 | | | | | 12/5/2048 | | | | | 250,000 | | | | | 250,000 | | | | | 252,440 | |
| | | | | | | | | | | | | | | | | | | | | | | | | |
Total Other Asset-Backed Securities | | | | | | | | | | | | | | 176,646,270 | | | | | 173,385,462 | | | | | 173,258,361 | |
| | | | | | | | | | | | | | | | | | | | | | | | | |
| | | | | | | | | | | | | | | | | | | | | | | | | |
Total Asset-Backed Securities | | | | | | | | | | | | | | 194,770,978 | | | | | 191,508,243 | | | | | 191,226,463 | |
| | | | | | | | | | | | | | | | | | | | | | | | | |
| | | | | |
Corporate Bonds — 40.2%*: | | | | | | | | | | | | | | | | | | | | | | | | | |
| | | | | |
Advertising — 0.2%*: | | | | | | | | | | | | | | | | | | | | | | | | | |
Interpublic Group of Cos., Inc. (The) | | | | 3.75 | | | | | 10/1/2021 | | | | | 400,000 | | | | | 399,749 | | | | | 402,495 | |
S&P Global, Inc. | | | | 3.30 | | | | | 8/14/2020 | | | | | 700,000 | | | | | 712,648 | | | | | 701,379 | |
| | | | | | | | | | | | | | | | | | | | | | | | | |
Total Advertising | | | | | | | | | | | | | | 1,100,000 | | | | | 1,112,397 | | | | | 1,103,874 | |
| | | | | | | | | | | | | | | | | | | | | | | | | |
| | | | | |
Aerospace/Defense — 0.4%*: | | | | | | | | | | | | | | | | | | | | | | | | | |
Harris Corp. | | | | 2.70 | | | | | 4/27/2020 | | | | | 2,140,000 | | | | | 2,136,680 | | | | | 2,121,775 | |
| | | | | | | | | | | | | | | | | | | | | | | | | |
| | | | | |
Agriculture — 1.3%*: | | | | | | | | | | | | | | | | | | | | | | | | | |
Bunge Ltd. Finance Corp. | | | | 3.00 | | | | | 9/25/2022 | | | | | 1,040,000 | | | | | 1,035,650 | | | | | 993,972 | |
Bunge Ltd. Finance Corp. | | | | 3.50 | | | | | 11/24/2020 | | | | | 1,520,000 | | | | | 1,536,476 | | | | | 1,516,324 | |
Imperial Brands Finance PLC+^ | | | | 2.95 | | | | | 7/21/2020 | | | | | 2,247,000 | | | | | 2,255,294 | | | | | 2,213,441 | |
Reynolds American, Inc. | | | | 4.00 | | | | | 6/12/2022 | | | | | 1,370,000 | | | | | 1,373,038 | | | | | 1,355,233 | |
| | | | | | | | | | | | | | | | | | | | | | | | | |
Total Agriculture | | | | | | | | | | | | | | 6,177,000 | | | | | 6,200,458 | | | | | 6,078,970 | |
| | | | | | | | | | | | | | | | | | | | | | | | | |
| | | | | |
Airlines — 0.3%*: | | | | | | | | | | | | | | | | | | | | | | | | | |
Delta Air Lines, Inc. | | | | 3.63 | | | | | 3/15/2022 | | | | | 1,700,000 | | | | | 1,708,726 | | | | | 1,663,603 | |
| | | | | | | | | | | | | | | | | | | | | | | | | |
| | | | | |
Auto Manufacturers — 1.4%*: | | | | | | | | | | | | | | | | | | | | | | | | | |
Ford Motor Credit Co. LLC, 3M USD LIBOR + 0.810% | | | | 3.22 | # | | | | 4/5/2021 | | | | | 1,135,000 | | | | | 1,135,000 | | | | | 1,105,886 | |
Ford Motor Credit Co. LLC, 3M USD LIBOR + 1.235% | | | | 3.85 | # | | | | 2/15/2023 | | | | | 985,000 | | | | | 985,000 | | | | | 911,263 | |
General Motors Financial Co., Inc. | | | | 3.25 | | | | | 1/5/2023 | | | | | 2,590,000 | | | | | 2,548,799 | | | | | 2,439,060 | |
Hyundai Capital America^ | | | | 2.00 | | | | | 7/1/2019 | | | | | 70,000 | | | | | 69,992 | | | | | 69,550 | |
Hyundai Capital America^ | | | | 2.55 | | | | | 2/6/2019 | | | | | 1,138,000 | | | | | 1,138,407 | | | | | 1,137,344 | |
Hyundai Capital America^ | | | | 3.00 | | | | | 10/30/2020 | | | | | 480,000 | | | | | 483,369 | | | | | 473,681 | |
Nissan Motor Acceptance Corp.^ | | | | 1.90 | | | | | 9/14/2021 | | | | | 670,000 | | | | | 666,957 | | | | | 638,044 | |
| | | | | | | | | | | | | | | | | | | | | | | | | |
Total Auto Manufacturers | | | | | | | | | | | | | | 7,068,000 | | | | | 7,027,524 | | | | | 6,774,828 | |
| | | | | | | | | | | | | | | | | | | | | | | | | |
| | | | | |
Auto Parts&Equipment — 0.4%*: | | | | | | | | | | | | | | | | | | | | | | | | | |
Lear Corp. | | | | 5.25 | | | | | 1/15/2025 | | | | | 300,000 | | | | | 319,552 | | | | | 308,175 | |
Lear Corp. | | | | 5.38 | | | | | 3/15/2024 | | | | | 1,660,000 | | | | | 1,753,983 | | | | | 1,707,621 | |
| | | | | | | | | | | | | | | | | | | | | | | | | |
Total Auto Parts&Equipment | | | | | | | | | | | | | | 1,960,000 | | | | | 2,073,535 | | | | | 2,015,796 | |
| | | | | | | | | | | | | | | | | | | | | | | | | |
| | | | | |
Beverages — 1.1%*: | | | | | | | | | | | | | | | | | | | | | | | | | |
Anheuser-Busch InBev Worldwide, Inc. | | | | 3.50 | | | | | 1/12/2024 | | | | | 2,360,000 | | | | | 2,311,598 | | | | | 2,308,423 | |
Maple Escrow Subsidiary, Inc.^ | | | | 4.06 | | | | | 5/25/2023 | | | | | 1,505,000 | | | | | 1,504,024 | | | | | 1,499,790 | |
Molson Coors Brewing Co. | | | | 2.10 | | | | | 7/15/2021 | | | | | 325,000 | | | | | 323,473 | | | | | 313,350 | |
Molson Coors Brewing Co. | | | | 3.50 | | | | | 5/1/2022 | | | | | 1,089,000 | | | | | 1,079,791 | | | | | 1,082,482 | |
| | | | | | | | | | | | | | | | | | | | | | | | | |
Total Beverages | | | | | | | | | | | | | | 5,279,000 | | | | | 5,218,886 | | | | | 5,204,045 | |
| | | | | | | | | | | | | | | | | | | | | | | | | |
See accompanying Notes to the Financial Statements.
120
Barings Active Short Duration Bond Fund 2018 Semi-Annual Report
SCHEDULE OF INVESTMENTS (CONTINUED)
December 31, 2018 (Unaudited)
| | | | | | | | | | | | | | | | | | | | | | | | | |
| | | EFFECTIVE
INTEREST RATE | | DUE DATE | | PRINCIPAL ‡‡ | | COST | | FAIR
VALUE |
Corporate Bonds(Continued) | | | | | | | | | | | | | | | | | | | | | | | | | |
| | | | | |
Biotechnology — 0.4%*: | | | | | | | | | | | | | | | | | | | | | | | | | |
Celgene Corp. | | | | 3.25 | % | | | | 2/20/2023 | | | | | 804,000 | | | | | $786,345 | | | | | $785,068 | |
Celgene Corp. | | | | 3.55 | | | | | 8/15/2022 | | | | | 475,000 | | | | | 485,638 | | | | | 469,783 | |
Celgene Corp. | | | | 4.00 | | | | | 8/15/2023 | | | | | 619,000 | | | | | 631,324 | | | | | 621,817 | |
| | | | | | | | | | | | | | | | | | | | | | | | | |
Total Biotechnology | | | | | | | | | | | | | | 1,898,000 | | | | | 1,903,307 | | | | | 1,876,668 | |
| | | | | | | | | | | | | | | | | | | | | | | | | |
| | | | | |
Chemicals — 2.1%*: | | | | | | | | | | | | | | | | | | | | | | | | | |
CF Industries, Inc. | | | | 7.13 | | | | | 5/1/2020 | | | | | 151,000 | | | | | 159,285 | | | | | 155,530 | |
Huntsman International LLC | | | | 5.13 | | | | | 11/15/2022 | | | | | 2,930,000 | | | | | 3,000,713 | | | | | 2,951,975 | |
Incitec Pivot Finance LLC^ | | | | 6.00 | | | | | 12/10/2019 | | | | | 1,443,000 | | | | | 1,485,748 | | | | | 1,474,863 | |
LyondellBasell Industries NV+ | | | | 5.00 | | | | | 4/15/2019 | | | | | 945,000 | | | | | 951,728 | | | | | 946,028 | |
LyondellBasell Industries NV+ | | | | 6.00 | | | | | 11/15/2021 | | | | | 985,000 | | | | | 1,073,466 | | | | | 1,041,163 | |
RPM International, Inc. | | | | 3.45 | | | | | 11/15/2022 | | | | | 380,000 | | | | | 390,022 | | | | | 376,409 | |
RPM International, Inc. | | | | 6.13 | | | | | 10/15/2019 | | | | | 1,205,000 | | | | | 1,238,360 | | | | | 1,226,938 | |
Sherwin-Williams Co. (The) | | | | 2.75 | | | | | 6/1/2022 | | | | | 1,245,000 | | | | | 1,245,719 | | | | | 1,205,172 | |
Syngenta Finance NV+^ | | | | 3.70 | | | | | 4/24/2020 | | | | | 790,000 | | | | | 790,000 | | | | | 784,276 | |
| | | | | | | | | | | | | | | | | | | | | | | | | |
Total Chemicals | | | | | | | | | | | | | | 10,074,000 | | | | | 10,335,041 | | | | | 10,162,354 | |
| | | | | | | | | | | | | | | | | | | | | | | | | |
| | | | | |
Commercial Banks — 7.2%*: | | | | | | | | | | | | | | | | | | | | | | | | | |
Banco Santander SA+ | | | | 3.50 | | | | | 4/11/2022 | | | | | 2,400,000 | | | | | 2,410,785 | | | | | 2,355,217 | |
Bancolombia SA+ | | | | 5.95 | | | | | 6/3/2021 | | | | | 315,000 | | | | | 331,835 | | | | | 326,813 | |
Bank of America Corp. | | | | 2.82 | #** | | | | 7/21/2023 | | | | | 5,220,000 | | | | | 5,161,532 | | | | | 5,049,161 | |
Barclays PLC, 3M USD LIBOR + 1.380%+ | | | | 4.01 | # | | | | 5/16/2024 | | | | | 885,000 | | | | | 885,000 | | | | | 842,714 | |
Citigroup, Inc. | | | | 3.14 | #** | | | | 1/24/2023 | | | | | 2,640,000 | | | | | 2,617,831 | | | | | 2,593,142 | |
Compass Bank | | | | 5.50 | | | | | 4/1/2020 | | | | | 2,403,000 | | | | | 2,464,218 | | | | | 2,456,443 | |
Discover Bank | | | | 3.35 | | | | | 2/6/2023 | | | | | 1,667,000 | | | | | 1,667,122 | | | | | 1,622,590 | |
Discover Bank | | | | 4.20 | | | | | 8/8/2023 | | | | | 635,000 | | | | | 651,616 | | | | | 635,146 | |
First Horizon National Corp. | | | | 3.50 | | | | | 12/15/2020 | | | | | 2,170,000 | | | | | 2,179,796 | | | | | 2,169,868 | |
Goldman Sachs Group, Inc. (The) | | | | 3.20 | | | | | 2/23/2023 | | | | | 4,965,000 | | | | | 4,891,054 | | | | | 4,815,872 | |
JPMorgan Chase & Co. | | | | 4.50 | | | | | 1/24/2022 | | | | | 2,245,000 | | | | | 2,350,354 | | | | | 2,313,216 | |
Macquarie Bank Ltd.+^ | | | | 2.85 | | | | | 1/15/2021 | | | | | 130,000 | | | | | 132,048 | | | | | 128,566 | |
Mitsubishi UFJ Financial Group, Inc.+ | | | | 2.67 | | | | | 7/25/2022 | | | | | 2,345,000 | | | | | 2,296,430 | | | | | 2,278,948 | |
Morgan Stanley MTN | | | | 3.75 | | | | | 2/25/2023 | | | | | 2,765,000 | | | | | 2,825,812 | | | | | 2,760,126 | |
Sumitomo Mitsui Financial Group, Inc.+ | | | | 2.06 | | | | | 7/14/2021 | | | | | 682,000 | | | | | 678,224 | | | | | 660,491 | |
Sumitomo Mitsui Financial Group, Inc.+ | | | | 2.85 | | | | | 1/11/2022 | | | | | 580,000 | | | | | 583,513 | | | | | 569,342 | |
Sumitomo Mitsui Financial Group, Inc.+ | | | | 3.75 | | | | | 7/19/2023 | | | | | 300,000 | | | | | 299,878 | | | | | 301,923 | |
SVB Financial Group | | | | 5.38 | | | | | 9/15/2020 | | | | | 200,000 | | | | | 208,462 | | | | | 206,308 | |
Synchrony Bank | | | | 3.00 | | | | | 6/15/2022 | | | | | 2,280,000 | | | | | 2,208,732 | | | | | 2,130,497 | |
Turkiye Garanti Bankasi AS+^ | | | | 4.75 | | | | | 10/17/2019 | | | | | 325,000 | | | | | 327,895 | | | | | 320,580 | |
| | | | | | | | | | | | | | | | | | | | | | | | | |
Total Commercial Banks | | | | | | | | | | | | | | 35,152,000 | | | | | 35,172,137 | | | | | 34,536,963 | |
| | | | | | | | | | | | | | | | | | | | | | | | | |
| | | | | |
Construction Materials — 1.1%*: | | | | | | | | | | | | | | | | | | | | | | | | | |
Holcim US Finance Sarl & Cie SCS+^ | | | | 6.00 | | | | | 12/30/2019 | | | | | 1,990,000 | | | | | 2,057,058 | | | | | 2,038,017 | |
Martin Marietta Materials, Inc., 3M USD LIBOR + 0.500% | | | | 3.29 | # | | | | 12/20/2019 | | | | | 445,000 | | | | | 445,000 | | | | | 443,722 | |
See accompanying Notes to the Financial Statements.
121
Barings Active Short Duration Bond Fund 2018 Semi-Annual Report
SCHEDULE OF INVESTMENTS (CONTINUED)
December 31, 2018 (Unaudited)
| | | | | | | | | | | | | | | | | | | | | | | | | |
| | | EFFECTIVE
INTEREST RATE | | DUE DATE | | PRINCIPAL ‡‡ | | COST | | FAIR
VALUE |
Corporate Bonds(Continued) | | | | | | | | | | | | | | | | | | | | | | | | | |
| | | | | |
Construction Materials(Continued) | | | | | | | | | | | | | | | | | | | | | | | | | |
Martin Marietta Materials, Inc., 3M USD LIBOR + 0.650% | | | | 3.33 | #% | | | | 5/22/2020 | | | | | 530,000 | | | | | $530,000 | | | | | $527,141 | |
Masco Corp. | | | | 3.50 | | | | | 4/1/2021 | | | | | 590,000 | | | | | 594,014 | | | | | 587,246 | |
Masco Corp. | | | | 7.13 | | | | | 3/15/2020 | | | | | 124,000 | | | | | 130,816 | | | | | 129,533 | |
Standard Industries, Inc.^ | | | | 5.50 | | | | | 2/15/2023 | | | | | 1,385,000 | | | | | 1,419,301 | | | | | 1,357,300 | |
| | | | | | | | | | | | | | | | | | | | | | | | | |
Total Construction Materials | | | | | | | | | | | | | | 5,064,000 | | | | | 5,176,189 | | | | | 5,082,959 | |
| | | | | | | | | | | | | | | | | | | | | | | | | |
| | | | | |
Diversified Financial Services — 2.4%*: | | | | | | | | | | | | | | | | | | | | | | | | | |
AerCap Ireland Capital Ltd./AerCap Global Aviation Trust+ | | | | 3.95 | | | | | 2/1/2022 | | | | | 2,030,000 | | | | | 2,053,466 | | | | | 1,994,347 | |
AerCap Ireland Capital Ltd./AerCap Global Aviation Trust+ | | | | 4.50 | | | | | 5/15/2021 | | | | | 300,000 | | | | | 311,564 | | | | | 300,866 | |
Aircastle Ltd. | | | | 5.00 | | | | | 4/1/2023 | | | | | 2,721,000 | | | | | 2,868,338 | | | | | 2,731,692 | |
Antares Holdings LP^ | | | | 6.00 | | | | | 8/15/2023 | | | | | 1,260,000 | | | | | 1,259,941 | | | | | 1,245,565 | |
Athene Global Funding^ | | | | 4.00 | | | | | 1/25/2022 | | | | | 2,551,000 | | | | | 2,582,621 | | | | | 2,577,121 | |
Genpact Luxembourg Sarl+ | | | | 3.70 | | | | | 4/1/2022 | | | | | 1,575,000 | | | | | 1,577,887 | | | | | 1,563,023 | |
Lazard Group LLC | | | | 4.25 | | | | | 11/14/2020 | | | | | 1,134,000 | | | | | 1,158,715 | | | | | 1,149,086 | |
| | | | | | | | | | | | | | | | | | | | | | | | | |
Total Diversified Financial Services | | | | | | | | | | | | | | 11,571,000 | | | | | 11,812,532 | | | | | 11,561,700 | |
| | | | | | | | | | | | | | | | | | | | | | | | | |
| | | | | |
Electric — 1.4%*: | | | | | | | | | | | | | | | | | | | | | | | | | |
Ameren Corp. | | | | 2.70 | | | | | 11/15/2020 | | | | | 760,000 | | | | | 765,164 | | | | | 749,840 | |
EDP Finance BV+^ | | | | 4.13 | | | | | 1/15/2020 | | | | | 981,000 | | | | | 995,844 | | | | | 982,020 | |
Enel Finance International NV+^ | | | | 2.88 | | | | | 5/25/2022 | | | | | 1,050,000 | | | | | 1,047,810 | | | | | 989,317 | |
Entergy Corp. | | | | 4.00 | | | | | 7/15/2022 | | | | | 750,000 | | | | | 773,601 | | | | | 756,585 | |
Entergy Texas, Inc. | | | | 2.55 | | | | | 6/1/2021 | | | | | 460,000 | | | | | 459,936 | | | | | 452,585 | |
Entergy Texas, Inc. | | | | 7.13 | | | | | 2/1/2019 | | | | | 934,000 | | | | | 937,891 | | | | | 936,580 | |
Israel Electric Corp. Ltd.+^ | | | | 7.25 | | | | | 1/15/2019 | | | | | 607,000 | | | | | 608,002 | | | | | 607,255 | |
Puget Energy, Inc. | | | | 6.00 | | | | | 9/1/2021 | | | | | 675,000 | | | | | 731,407 | | | | | 714,035 | |
Puget Energy, Inc. | | | | 6.50 | | | | | 12/15/2020 | | | | | 321,000 | | | | | 344,481 | | | | | 339,125 | |
| | | | | | | | | | | | | | | | | | | | | | | | | |
Total Electric | | | | | | | | | | | | | | 6,538,000 | | | | | 6,664,136 | | | | | 6,527,342 | |
| | | | | | | | | | | | | | | | | | | | | | | | | |
| | | | | |
Electronics — 0.2%*: | | | | | | | | | | | | | | | | | | | | | | | | | |
FLIR Systems, Inc. | | | | 3.13 | | | | | 6/15/2021 | | | | | 480,000 | | | | | 485,748 | | | | | 473,246 | |
Tech Data Corp. | | | | 3.70 | | | | | 2/15/2022 | | | | | 260,000 | | | | | 259,747 | | | | | 255,090 | |
| | | | | | | | | | | | | | | | | | | | | | | | | |
Total Electronics | | | | | | | | | | | | | | 740,000 | | | | | 745,495 | | | | | 728,336 | |
| | | | | | | | | | | | | | | | | | | | | | | | | |
| | | | | |
Food — 0.3%*: | | | | | | | | | | | | | | | | | | | | | | | | | |
McCormick & Co., Inc. | | | | 2.70 | | | | | 8/15/2022 | | | | | 1,430,000 | | | | | 1,386,692 | | | | | 1,386,612 | |
| | | | | | | | | | | | | | | | | | | | | | | | | |
| | | | | |
Healthcare-Products — 0.9%*: | | | | | | | | | | | | | | | | | | | | | | | | | |
Becton Dickinson and Co., 3M USD LIBOR + 0.875% | | | | 3.68 | # | | | | 12/29/2020 | | | | | 2,135,000 | | | | | 2,136,292 | | | | | 2,113,542 | |
CVS Health Corp. | | | | 2.13 | | | | | 6/1/2021 | | | | | 1,815,000 | | | | | 1,803,435 | | | | | 1,751,229 | |
CVS Health Corp. | | | | 3.70 | | | | | 3/9/2023 | | | | | 620,000 | | | | | 615,280 | | | | | 613,363 | |
| | | | | | | | | | | | | | | | | | | | | | | | | |
Total Healthcare-Products | | | | | | | | | | | | | | 4,570,000 | | | | | 4,555,007 | | | | | 4,478,134 | |
| | | | | | | | | | | | | | | | | | | | | | | | | |
See accompanying Notes to the Financial Statements.
122
Barings Active Short Duration Bond Fund 2018 Semi-Annual Report
SCHEDULE OF INVESTMENTS (CONTINUED)
December 31, 2018 (Unaudited)
| | | | | | | | | | | | | | | | | | | | | | | | | |
| | | EFFECTIVE
INTEREST RATE | | DUE DATE | | PRINCIPAL ‡‡ | | COST | | FAIR
VALUE |
Corporate Bonds(Continued) | | | | | | | | | | | | | | | | | | | | | | | | | |
| | | | | |
Healthcare-Services — 0.4%*: | | | | | | | | | | | | | | | | | | | | | | | | | |
Cigna Corp. | | | | 4.00 | % | | | | 2/15/2022 | | | | | 942,000 | | | | | $978,571 | | | | | $951,642 | |
Cigna Corp. | | | | 4.50 | | | | | 3/15/2021 | | | | | 1,170,000 | | | | | 1,217,497 | | | | | 1,195,487 | |
| | | | | | | | | | | | | | | | | | | | | | | | | |
Total Healthcare-Services | | | | | | | | | | | | | | 2,112,000 | | | | | 2,196,068 | | | | | 2,147,129 | |
| | | | | | | | | | | | | | | | | | | | | | | | | |
| | | | | |
Home Builders — 0.4%*: | | | | | | | | | | | | | | | | | | | | | | | | | |
Lennar Corp. | | | | 4.50 | | | | | 6/15/2019 | | | | | 150,000 | | | | | 150,553 | | | | | 149,625 | |
Lennar Corp. | | | | 4.50 | | | | | 11/15/2019 | | | | | 1,090,000 | | | | | 1,101,711 | | | | | 1,081,825 | |
Lennar Corp. | | | | 4.75 | | | | | 4/1/2021 | | �� | | | 900,000 | | | | | 925,013 | | | | | 892,125 | |
| | | | | | | | | | | | | | | | | | | | | | | | | |
Total Home Builders | | | | | | | | | | | | | | 2,140,000 | | | | | 2,177,277 | | | | | 2,123,575 | |
| | | | | | | | | | | | | | | | | | | | | | | | | |
| | | | | |
Household Products/Wares — 0.2%*: | | | | | | | | | | | | | | | | | | | | | | | | | |
Church & Dwight Co., Inc. | | | | 2.88 | | | | | 10/1/2022 | | | | | 1,120,000 | | | | | 1,093,378 | | | | | 1,101,498 | |
| | | | | | | | | | | | | | | | | | | | | | | | | |
| | | | | |
Insurance — 2.3%*: | | | | | | | | | | | | | | | | | | | | | | | | | |
American International Group, Inc. | | | | 3.30 | | | | | 3/1/2021 | | | | | 1,125,000 | | | | | 1,131,469 | | | | | 1,121,185 | |
AmTrust Financial Services, Inc. | | | | 6.13 | | | | | 8/15/2023 | | | | | 780,000 | | | | | 776,113 | | | | | 692,702 | |
CNA Financial Corp. | | | | 5.75 | | | | | 8/15/2021 | | | | | 941,000 | | | | | 1,000,042 | | | | | 993,076 | |
Enstar Group Ltd.+ | | | | 4.50 | | | | | 3/10/2022 | | | | | 1,350,000 | | | | | 1,359,658 | | | | | 1,359,014 | |
Jackson National Life Global Funding^ | | | | 2.50 | | | | | 6/27/2022 | | | | | 1,925,000 | | | | | 1,921,700 | | | | | 1,861,079 | |
Lincoln National Corp. | | | | 4.00 | | | | | 9/1/2023 | | | | | 472,000 | | | | | 481,185 | | | | | 481,168 | |
Lincoln National Corp. | | | | 4.20 | | | | | 3/15/2022 | | | | | 725,000 | | | | | 759,527 | | | | | 737,057 | |
Lincoln National Corp. | | | | 6.25 | | | | | 2/15/2020 | | | | | 400,000 | | | | | 414,518 | | | | | 412,860 | |
Reinsurance Group of America, Inc. | | | | 5.00 | | | | | 6/1/2021 | | | | | 1,429,000 | | | | | 1,499,191 | | | | | 1,483,609 | |
Trinity Acquisition PLC+ | | | | 3.50 | | | | | 9/15/2021 | | | | | 1,516,000 | | | | | 1,524,508 | | | | | 1,501,270 | |
Willis Towers Watson PLC+ | | | | 5.75 | | | | | 3/15/2021 | | | | | 370,000 | | | | | 388,493 | | | | | 386,948 | |
| | | | | | | | | | | | | | | | | | | | | | | | | |
Total Insurance | | | | | | | | | | | | | | 11,033,000 | | | | | 11,256,404 | | | | | 11,029,968 | |
| | | | | | | | | | | | | | | | | | | | | | | | | |
| | | | | |
Investment Company Security — 0.6%*: | | | | | | | | | | | | | | | | | | | | | | | | | |
Ares Capital Corp. | | | | 3.63 | | | | | 1/19/2022 | | | | | 420,000 | | | | | 422,782 | | | | | 407,751 | |
Ares Capital Corp. | | | | 3.88 | | | | | 1/15/2020 | | | | | 607,000 | | | | | 612,801 | | | | | 608,274 | |
FS KKR Capital Corp. | | | | 4.00 | | | | | 7/15/2019 | | | | | 853,000 | | | | | 854,814 | | | | | 852,035 | |
TCP Capital Corp. | | | | 4.13 | | | | | 8/11/2022 | | | | | 1,140,000 | | | | | 1,136,330 | | | | | 1,098,516 | |
| | | | | | | | | | | | | | | | | | | | | | | | | |
Total Investment Company Security | | | | | | | | | | | | | | 3,020,000 | | | | | 3,026,727 | | | | | 2,966,576 | |
| | | | | | | | | | | | | | | | | | | | | | | | | |
| | | | | |
IT Services — 0.8%*: | | | | | | | | | | | | | | | | | | | | | | | | | |
Dell International LLC/EMC Corp.^ | | | | 4.42 | | | | | 6/15/2021 | | | | | 1,470,000 | | | | | 1,502,542 | | | | | 1,467,575 | |
DXC Technology Co. | | | | 2.88 | | | | | 3/27/2020 | | | | | 270,000 | | | | | 269,646 | | | | | 267,667 | |
Leidos Holdings, Inc. | | | | 4.45 | | | | | 12/1/2020 | | | | | 1,975,000 | | | | | 2,010,296 | | | | | 1,960,187 | |
| | | | | | | | | | | | | | | | | | | | | | | | | |
Total IT Services | | | | | | | | | | | | | | 3,715,000 | | | | | 3,782,484 | | | | | 3,695,429 | |
| | | | | | | | | | | | | | | | | | | | | | | | | |
| | | | | |
Leisure Time — 0.3%*: | | | | | | | | | | | | | | | | | | | | | | | | | |
Brunswick Corp.^ | | | | 4.63 | | | | | 5/15/2021 | | | | | 1,476,000 | | | | | 1,494,328 | | | | | 1,449,559 | |
| | | | | | | | | | | | | | | | | | | | | | | | | |
| | | | | |
Lodging — 0.3%*: | | | | | | | | | | | | | | | | | | | | | | | | | |
Marriott International, Inc. | | | | 2.30 | | | | | 1/15/2022 | | | | | 300,000 | | | | | 299,307 | | | | | 288,418 | |
Marriott International, Inc. | | | | 2.88 | | | | | 3/1/2021 | | | | | 1,345,000 | | | | | 1,357,367 | | | | | 1,326,333 | |
| | | | | | | | | | | | | | | | | | | | | | | | | |
Total Lodging | | | | | | | | | | | | | | 1,645,000 | | | | | 1,656,674 | | | | | 1,614,751 | |
| | | | | | | | | | | | | | | �� | | | | | | | | | | |
See accompanying Notes to the Financial Statements.
123
Barings Active Short Duration Bond Fund 2018 Semi-Annual Report
SCHEDULE OF INVESTMENTS (CONTINUED)
December 31, 2018 (Unaudited)
| | | | | | | | | | | | | | | | | | | | | | | | | |
| | | EFFECTIVE
INTEREST RATE | | DUE DATE | | PRINCIPAL ‡‡ | | COST | | FAIR
VALUE |
Corporate Bonds(Continued) | | | | | | | | | | | | | | | | | | | | | | | | | |
| | | | | |
Machinery-Diversified — 0.9%*: | | | | | | | | | | | | | | | | | | | | | | | | | |
CNH Industrial Capital LLC | | | | 3.38 | % | | | | 7/15/2019 | | | | | 945,000 | | | | | $947,780 | | | | | $937,912 | |
CNH Industrial Capital LLC | | | | 3.88 | | | | | 10/15/2021 | | | | | 1,110,000 | | | | | 1,122,776 | | | | | 1,102,563 | |
CNH Industrial NV+ | | | | 4.50 | | | | | 8/15/2023 | | | | | 450,000 | | | | | 459,344 | | | | | 452,205 | |
Wabtec Corp. | | | | 4.15 | | | | | 3/15/2024 | | | | | 1,725,000 | | | | | 1,721,802 | | | | | 1,666,948 | |
| | | | | | | | | | | | | | | | | | | | | | | | | |
Total Machinery-Diversified | | | | | | | | | | | | | | 4,230,000 | | | | | 4,251,702 | | | | | 4,159,628 | |
| | | | | | | | | | | | | | | | | | | | | | | | | |
| | | | | |
Media — 0.9%*: | | | | | | | | | | | | | | | | | | | | | | | | | |
Charter Communications Operating LLC/Charter Communications Operating Capital | | | | 3.58 | | | | | 7/23/2020 | | | | | 1,130,000 | | | | | 1,140,438 | | | | | 1,128,782 | |
Discovery Communications LLC | | | | 2.95 | | | | | 3/20/2023 | | | | | 1,195,000 | | | | | 1,164,684 | | | | | 1,143,306 | |
Sirius XM Radio, Inc.^ | | | | 3.88 | | | | | 8/1/2022 | | | | | 2,388,000 | | | | | 2,406,701 | | | | | 2,268,600 | |
| | | | | | | | | | | | | | | | | | | | | | | | | |
Total Media | | | | | | | | | | | | | | 4,713,000 | | | | | 4,711,823 | | | | | 4,540,688 | |
| | | | | | | | | | | | | | | | | | | | | | | | | |
| | | | | |
Mining — 1.2%*: | | | | | | | | | | | | | | | | | | | | | | | | | |
Glencore Finance Canada Ltd.+^ | | | | 4.25 | | | | | 10/25/2022 | | | | | 484,000 | | | | | 504,012 | | | | | 482,468 | |
Glencore Funding LLC^ | | | | 3.00 | | | | | 10/27/2022 | | | | | 730,000 | | | | | 728,323 | | | | | 693,062 | |
Glencore Funding LLC^ | | | | 4.13 | | | | | 5/30/2023 | | | | | 980,000 | | | | | 975,918 | | | | | 962,348 | |
Kinross Gold Corp. | | | | 5.13 | | | | | 9/1/2021 | | | | | 990,000 | | | | | 1,034,723 | | | | | 987,525 | |
Kinross Gold Corp.+ | | | | 5.95 | | | | | 3/15/2024 | | | | | 1,270,000 | | | | | 1,307,191 | | | | | 1,263,650 | |
Newcrest Finance Pty Ltd.+^ | | | | 4.20 | | | | | 10/1/2022 | | | | | 1,145,000 | | | | | 1,194,453 | | | | | 1,151,109 | |
| | | | | | | | | | | | | | | | | | | | | | | | | |
Total Mining | | | | | | | | | | | | | | 5,599,000 | | | | | 5,744,620 | | | | | 5,540,162 | |
| | | | | | | | | | | | | | | | | | | | | | | | | |
| | | | | |
Office/Business Equip — 0.5%*: | | | | | | | | | | | | | | | | | | | | | | | | | |
Pitney Bowes, Inc. | | | | 3.88 | | | | | 10/1/2021 | | | | | 2,765,000 | | | | | 2,747,333 | | | | | 2,588,731 | |
| | | | | | | | | | | | | | | | | | | | | | | | | |
| | | | | |
Oil and Gas — 0.5%*: | | | | | | | | | | | | | | | | | | | | | | | | | |
Antero Resources Corp. | | | | 5.38 | | | | | 11/1/2021 | | | | | 480,000 | | | | | 488,474 | | | | | 463,200 | |
Continental Resources, Inc. | | | | 5.00 | | | | | 9/15/2022 | | | | | 1,008,000 | | | | | 1,022,584 | | | | | 1,000,848 | |
EQT Corp. | | | | 3.00 | | | | | 10/1/2022 | | | | | 1,045,000 | | | | | 1,042,392 | | | | | 990,897 | |
| | | | | | | | | | | | | | | | | | | | | | | | | |
Total Oil and Gas | | | | | | | | | | | | | | 2,533,000 | | | | | 2,553,450 | | | | | 2,454,945 | |
| | | | | | | | | | | | | | | | | | | | | | | | | |
| | | | | |
Packaging and Containers — 0.4%*: | | | | | | | | | | | | | | | | | | | | | | | | | |
Graphic Packaging International, Inc. | | | | 4.75 | | | | | 4/15/2021 | | | | | 2,096,000 | | | | | 2,164,520 | | | | | 2,090,760 | |
| | | | | | | | | | | | | | | | | | | | | | | | | |
| | | | | |
Pharmaceuticals — 2.1%*: | | | | | | | | | | | | | | | | | | | | | | | | | |
AbbVie, Inc. | | | | 2.30 | | | | | 5/14/2021 | | | | | 150,000 | | | | | 149,287 | | | | | 146,486 | |
Bayer US Finance II LLC, 3M USD LIBOR + 1.010%^ | | | | 3.80 | # | | | | 12/15/2023 | | | | | 2,135,000 | | | | | 2,125,706 | | | | | 2,043,549 | |
Cardinal Health, Inc., 3M USD LIBOR + 0.770% | | | | 3.56 | # | | | | 6/15/2022 | | | | | 2,145,000 | | | | | 2,154,145 | | | | | 2,121,488 | |
Express Scripts Holding Co. | | | | 3.30 | | | | | 2/25/2021 | | | | | 1,590,000 | | | | | 1,606,161 | | | | | 1,584,163 | |
Express Scripts Holding Co. | | | | 4.75 | | | | | 11/15/2021 | | | | | 950,000 | | | | | 1,001,759 | | | | | 977,196 | |
Shire Acquisitions Investments Ireland DAC+ | | | | 2.40 | | | | | 9/23/2021 | | | | | 630,000 | | | | | 626,200 | | | | | 609,200 | |
Shire Acquisitions Investments Ireland DAC+ | | | | 2.88 | | | | | 9/23/2023 | | | | | 470,000 | | | | | 450,396 | | | | | 444,299 | |
Teva Pharmaceutical Finance Netherlands III B.V.+ | | | | 2.20 | | | | | 7/21/2021 | | | | | 2,390,000 | | | | | 2,345,697 | | | | | 2,196,917 | |
| | | | | | | | | | | | | | | | | | | | | | | | | |
Total Pharmaceuticals | | | | | | | | | | | | | | 10,460,000 | | | | | 10,459,351 | | | | | 10,123,298 | |
| | | | | | | | | | | | | | | | | | | | | | | | | |
See accompanying Notes to the Financial Statements.
124
Barings Active Short Duration Bond Fund 2018 Semi-Annual Report
SCHEDULE OF INVESTMENTS (CONTINUED)
December 31, 2018 (Unaudited)
| | | | | | | | | | | | | | | | | | | | | | | | | |
| | | EFFECTIVE
INTEREST RATE | | DUE DATE | | PRINCIPAL ‡‡ | | COST | | FAIR
VALUE |
Corporate Bonds(Continued) | | | | | | | | | | | | | | | | | | | | | | | | | |
| | | | | |
Pipelines — 0.5%*: | | | | | | | | | | | | | | | | | | | | | | | | | |
Energy Transfer Partners LP | | | | 4.20 | % | | | | 9/15/2023 | | | | | 2,325,000 | | | | | $2,322,241 | | | | | $2,291,381 | |
| | | | | | | | | | | | | | | | | | | | | | | | | |
| | | | | |
Real Estate Investment Trusts — 1.1%*: | | | | | | | | | | | | | | | | | | | | | | | | | |
American Tower Corp. | | | | 2.25 | | | | | 1/15/2022 | | | | | 330,000 | | | | | 329,724 | | | | | 315,813 | |
American Tower Corp. | | | | 3.00 | | | | | 6/15/2023 | | | | | 1,400,000 | | | | | 1,396,413 | | | | | 1,346,973 | |
American Tower Corp. | | | | 3.30 | | | | | 2/15/2021 | | | | | 530,000 | | | | | 534,317 | | | | | 526,960 | |
Crown Castle International Corp. | | | | 3.40 | | | | | 2/15/2021 | | | | | 1,272,000 | | | | | 1,289,448 | | | | | 1,271,556 | |
Digital Realty Trust LP | | | | 3.40 | | | | | 10/1/2020 | | | | | 385,000 | | | | | 386,857 | | | | | 383,771 | |
Healthcare Trust of America Holdings LP | | | | 2.95 | | | | | 7/1/2022 | | | | | 370,000 | | | | | 369,838 | | | | | 359,630 | |
Simon Property Group LP | | | | 2.35 | | | | | 1/30/2022 | | | | | 955,000 | | | | | 951,377 | | | | | 927,474 | |
Weyerhaeuser Co. | | | | 7.38 | | | | | 10/1/2019 | | | | | 315,000 | | | | | 325,049 | | | | | 323,671 | |
| | | | | | | | | | | | | | | | | | | | | | | | | |
Total REITS | | | | | | | | | | | | | | 5,557,000 | | | | | 5,583,023 | | | | | 5,455,848 | |
| | | | | | | | | | | | | | | | | | | | | | | | | |
| | | | | |
Retail — 1.4%*: | | | | | | | | | | | | | | | | | | | | | | | | | |
Advance Auto Parts, Inc. | | | | 4.50 | | | | | 12/1/2023 | | | | | 617,000 | | | | | 628,359 | | | | | 631,504 | |
Dollar Tree, Inc. | | | | 3.70 | | | | | 5/15/2023 | | | | | 2,570,000 | | | | | 2,522,080 | | | | | 2,527,170 | |
O’Reilly Automotive, Inc. | | | | 3.80 | | | | | 9/1/2022 | | | | | 284,000 | | | | | 284,667 | | | | | 287,057 | |
O’Reilly Automotive, Inc. | | | | 3.85 | | | | | 6/15/2023 | | | | | 1,139,000 | | | | | 1,140,322 | | | | | 1,144,610 | |
QVC, Inc. | | | | 4.38 | | | | | 3/15/2023 | | | | | 2,410,000 | | | | | 2,364,257 | | | | | 2,312,475 | |
| | | | | | | | | | | | | | | | | | | | | | | | | |
Total Retail | | | | | | | | | | | | | | 7,020,000 | | | | | 6,939,685 | | | | | 6,902,816 | |
| | | | | | | | | | | | | | | | | | | | | | | | | |
| | | | | |
Semiconductors — 0.8%*: | | | | | | | | | | | | | | | | | | | | | | | | | |
Broadcom Corp./Broadcom Cayman Finance Ltd. | | | | 3.00 | | | | | 1/15/2022 | | | | | 1,785,000 | | | | | 1,781,400 | | | | | 1,716,640 | |
Microchip Technology, Inc.^ | | | | 3.92 | | | | | 6/1/2021 | | | | | 835,000 | | | | | 835,000 | | | | | 828,310 | |
NXP BV/NXP Funding LLC^ | | | | 4.13 | | | | | 6/1/2021 | | | | | 1,270,000 | | | | | 1,291,510 | | | | | 1,254,125 | |
| | | | | | | | | | | | | | | | | | | | | | | | | |
Total Semiconductors | | | | | | | | | | | | | | 3,890,000 | | | | | 3,907,910 | | | | | 3,799,075 | |
| | | | | | | | | | | | | | | | | | | | | | | | | |
| | | | | |
Telecommunications — 1.5%*: | | | | | | | | | | | | | | | | | | | | | | | | | |
Hughes Satellite Systems Corp. | | | | 6.50 | | | | | 6/15/2019 | | | | | 1,932,000 | | | | | 1,965,118 | | | | | 1,948,905 | |
Sprint Communications, Inc. | | | | 9.25 | | | | | 4/15/2022 | | | | | 1,005,000 | | | | | 1,171,065 | | | | | 1,148,212 | |
Telefonaktiebolaget LM Ericsson+ | | | | 4.13 | | | | | 5/15/2022 | | | | | 3,320,000 | | | | | 3,338,304 | | | | | 3,265,602 | |
Verizon Communications, Inc. | | | | 2.95 | | | | | 3/15/2022 | | | | | 760,000 | | | | | 768,715 | | | | | 751,993 | |
| | | | | | | | | | | | | | | | | | | | | | | | | |
Total Telecommunications | | | | | | | | | | | | | | 7,017,000 | | | | | 7,243,202 | | | | | 7,114,712 | |
| | | | | | | | | | | | | | | | | | | | | | | | | |
| | | | | |
Transportation — 0.9%*: | | | | | | | | | | | | | | | | | | | | | | | | | |
Penske Truck Leasing Co. LP/PTL Finance Corp.^ | | | | 2.70 | | | | | 3/14/2023 | | | | | 410,000 | | | | | 403,260 | | | | | 391,168 | |
Penske Truck Leasing Co. LP/PTL Finance Corp.^ | | | | 3.30 | | | | | 4/1/2021 | | | | | 240,000 | | | | | 243,794 | | | | | 238,371 | |
Penske Truck Leasing Co. LP/PTL Finance Corp.^ | | | | 3.38 | | | | | 2/1/2022 | | | | | 80,000 | | | | | 80,913 | | | | | 79,107 | |
Penske Truck Leasing Co. LP/PTL Finance Corp.^ | | | | 4.88 | | | | | 7/11/2022 | | | | | 1,590,000 | | | | | 1,654,737 | | | | | 1,646,217 | |
Ryder System, Inc. | | | | 2.50 | | | | | 9/1/2022 | | | | | 26,000 | | | | | 25,012 | | | | | 24,980 | |
See accompanying Notes to the Financial Statements.
125
Barings Active Short Duration Bond Fund 2018 Semi-Annual Report
SCHEDULE OF INVESTMENTS (CONTINUED)
December 31, 2018 (Unaudited)
| | | | | | | | | | | | | | | | | | | | | | | | | |
| | | EFFECTIVE
INTEREST RATE | | DUE DATE | | PRINCIPAL ‡‡ | | COST | | FAIR
VALUE |
Corporate Bonds(Continued) | | | | | | | | | | | | | | | | | | | | | | | | | |
| | | | | |
Transportation(Continued) | | | | | | | | | | | | | | | | | | | | | | | | | |
Ryder System, Inc. | | | | 3.40 | % | | | | 3/1/2023 | | | | | 330,000 | | | | | $326,234 | | | | | $325,655 | |
Ryder System, Inc. | | | | 3.75 | | | | | 6/9/2023 | | | | | 885,000 | | | | | 885,872 | | | | | 879,561 | |
Ryder System, Inc. MTN | | | | 2.25 | | | | | 9/1/2021 | | | | | 635,000 | | | | | 632,127 | | | | | 614,312 | |
| | | | | | | | | | | | | | | | | | | | | | | | | |
Total Transportation | | | | | | | | | | | | | | 4,196,000 | | | | | 4,251,949 | | | | | 4,199,371 | |
| | | | | | | | | | | | | | | | | | | | | | | | | |
| | | | | |
Trucking and Leasing — 0.7%*: | | | | | | | | | | | | | | | | | | | | | | | | | |
DAE Funding LLC+^ | | | | 4.00 | | | | | 8/1/2020 | | | | | 276,000 | | | | | 276,000 | | | | | 269,100 | |
GATX Corp. | | | | 2.50 | | | | | 7/30/2019 | | | | | 250,000 | | | | | 250,614 | | | | | 248,468 | |
GATX Corp. | | | | 2.60 | | | | | 3/30/2020 | | | | | 685,000 | | | | | 682,315 | | | | | 678,342 | |
Park Aerospace Holdings Ltd.+^ | | | | 5.25 | | | | | 8/15/2022 | | | | | 2,230,000 | | | | | 2,286,968 | | | | | 2,157,525 | |
| | | | | | | | | | | | | | | | | | | | | | | | | |
Total Trucking and Leasing | | | | | | | | | | | | | | 3,441,000 | | | | | 3,495,897 | | | | | 3,353,435 | |
| | | | | | | | | | | | | | | | | | | | | | | | | |
| | | | | |
Venture Capital — 0.4%*: | | | | | | | | | | | | | | | | | | | | | | | | | |
Hercules Capital, Inc. | | | | 4.63 | | | | | 10/23/2022 | | | | | 1,725,000 | | | | | 1,717,566 | | | | | 1,683,341 | |
| | | | | | | | | | | | | | | | | | | | | | | | | |
Total Corporate Bonds | | | | | | | | | | | | | | 196,289,000 | | | | | 198,006,354 | | | | | 193,730,635 | |
| | | | | | | | | | | | | | | | | | | | | | | | | |
| | | | | |
Mortgage-Backed Securities — 6.2%*: | | | | | | | | | | | | | | | | | | | | | | | | | |
BAMLL Commercial Mortgage Securities Trust 2018-DSNY, 1M USD LIBOR + 1.350%^ | | | | 3.81 | # | | | | 9/15/2034 | | | | | 270,000 | | | | | 270,000 | | | | | 268,743 | |
BHMS, 1M USD LIBOR + 1.500%^ | | | | 3.96 | # | | | | 7/15/2035 | | | | | 1,800,000 | | | | | 1,800,000 | | | | | 1,780,206 | |
BX Commercial Mortgage Trust 2018-IND, 1M USD LIBOR + 1.700%^ | | | | 4.16 | # | | | | 11/15/2035 | | | | | 828,763 | | | | | 828,763 | | | | | 819,442 | |
COMM Mortgage Trust 2014-UBS2 B | | | | 4.70 | | | | | 3/10/2047 | | | | | 600,000 | | | | | 642,961 | | | | | 615,696 | |
Deephaven Residential Mortgage Trust 2018-1^ | | | | 2.98 | #@ | | | | 12/25/2057 | | | | | 933,883 | | | | | 922,798 | | | | | 924,943 | |
Deephaven Residential Mortgage Trust 2018-1^ | | | | 3.03 | #@ | | | | 12/25/2057 | | | | | 798,716 | | | | | 798,704 | | | | | 787,858 | |
Deephaven Residential Mortgage Trust 2018-2^ | | | | 3.68 | #@ | | | | 4/25/2058 | | | | | 1,413,590 | | | | | 1,413,575 | | | | | 1,416,921 | |
Deephaven Residential Mortgage Trust 2018-3^ | | | | 3.96 | #@ | | | | 8/25/2058 | | | | | 1,480,009 | | | | | 1,478,365 | | | | | 1,482,095 | |
Deephaven Residential Mortgage Trust 2018-4^ | | | | 4.29 | #@ | | | | 10/25/2058 | | | | | 2,007,273 | | | | | 2,007,273 | | | | | 2,021,162 | |
JP Morgan Chase Commercial Mortgage Securities Corp., 1M USD LIBOR + 1.000%^ | | | | 3.46 | # | | | | 6/15/2032 | | | | | 1,550,000 | | | | | 1,550,000 | | | | | 1,544,117 | |
JP Morgan Mortgage Trust 2017-6 A5^ | | | | 3.50 | #@ | | | | 12/25/2048 | | | | | 997,330 | | | | | 1,010,330 | | | | | 984,750 | |
JP Morgan Mortgage Trust 2018-1^ | | | | 3.50 | #@ | | | | 6/25/2048 | | | | | 733,575 | | | | | 739,544 | | | | | 723,864 | |
JP Morgan Mortgage Trust 2018-3^ | | | | 3.50 | #@ | | | | 9/25/2048 | | | | | 1,136,028 | | | | | 1,132,528 | | | | | 1,117,493 | |
JP Morgan Mortgage Trust 2018-4^ | | | | 3.50 | #@ | | | | 10/25/2048 | | | | | 2,512,108 | | | | | 2,493,573 | | | | | 2,477,176 | |
JPMorgan Chase Commercial Mortgage Securities Trust 2007-CIBC18 AM | | | | 5.47 | #@ | | | | 6/12/2047 | | | | | 2,645 | | | | | 2,707 | | | | | 2,644 | |
MSCG Trust 2018-SELF, 1M USD LIBOR + 1.180%^ | | | | 3.64 | # | | | | 10/15/2037 | | | | | 165,000 | | | | | 165,000 | | | | | 162,059 | |
See accompanying Notes to the Financial Statements.
126
Barings Active Short Duration Bond Fund 2018 Semi-Annual Report
SCHEDULE OF INVESTMENTS (CONTINUED)
December 31, 2018 (Unaudited)
| | | | | | | | | | | | | | | | | | | | | | | | | |
| | | EFFECTIVE
INTEREST RATE | | DUE DATE | | PRINCIPAL ‡‡ | | COST | | FAIR
VALUE |
Mortgage-Backed Securities(Continued) | | | | | | | | | | | | | | | | | | | | | | | | | |
New Residential Mortgage Loan Trust 2016-4A A1^ | | | | 3.75 | #@% | | | | 11/25/2056 | | | | | 387,054 | | | | | $398,485 | | | | | $388,263 | |
PNMAC GMSR Issuer Trust 2018-GT1, 1M USD LIBOR + 2.850%^ | | | | 5.36 | # | | | | 2/25/2023 | | | | | 470,000 | | | | | 470,000 | | | | | 471,010 | |
PSMC Trust^ | | | | 3.50 | #@ | | | | 2/25/2048 | | | | | 1,171,024 | | | | | 1,169,583 | | | | | 1,156,067 | |
PSMC Trust 2018-2^ | | | | 3.50 | #@ | | | | 6/25/2048 | | | | | 1,051,840 | | | | | 1,034,780 | | | | | 1,038,612 | |
RETL 2018-RVP, 1M USD LIBOR + 1.100%^ | | | | 3.56 | # | | | | 3/15/2033 | | | | | 915,729 | | | | | 915,729 | | | | | 913,884 | |
Sequoia Mortgage Trust 2015-1^ | | | | 2.50 | #@ | | | | 1/25/2045 | | | | | 787,118 | | | | | 775,041 | | | | | 760,159 | |
Sequoia Mortgage Trust 2018-3^ | | | | 3.50 | #@ | | | | 3/25/2048 | | | | | 1,337,892 | | | | | 1,335,835 | | | | | 1,320,171 | |
Sequoia Mortgage Trust 2018-5^ | | | | 3.50 | #@ | | | | 5/25/2048 | | | | | 990,290 | | | | | 979,444 | | | | | 981,998 | |
Sequoia Mortgage Trust 2018-7^ | | | | 4.00 | #@ | | | | 9/25/2048 | | | | | 730,833 | | | | | 734,464 | | | | | 735,091 | |
Sequoia Mortgage Trust 2018-CH1^ | | | | 4.00 | #@ | | | | 2/25/2048 | | | | | 882,449 | | | | | 897,784 | | | | | 887,023 | |
Sequoia Mortgage Trust 2018-CH2^ | | | | 4.00 | #@ | | | | 6/25/2048 | | | | | 1,555,512 | | | | | 1,571,420 | | | | | 1,567,215 | |
Sequoia Mortgage Trust 2018-CH3^ | | | | 4.00 | #@ | | | | 8/25/2048 | | | | | 1,153,317 | | | | | 1,163,206 | | | | | 1,166,587 | |
Shellpoint Co-Originator Trust 2016-1 2A3^ | | | | 3.00 | #@ | | | | 10/25/2031 | | | | | 767,792 | | | | | 775,214 | | | | | 754,746 | |
TIAA Bank Mortgage Loan Trust 2018-2^ | | | | 3.50 | #@ | | | | 7/25/2048 | | | | | 545,458 | | | | | 540,225 | | | | | 538,026 | |
Velocity Commercial Capital Loan Trust 2016-2 AFX | | | | 3.00 | #@ | | | | 10/25/2046 | | | | | 239,257 | | | | | 239,257 | | | | | 237,840 | |
| | | | | | | | | | | | | | | | | | | | | | | | | |
Total Mortgage-Backed Securities | | | | | | | | | | | | | | 30,214,485 | | | | | 30,256,588 | | | | | 30,045,861 | |
| | | | | | | | | | | | | | | | | | | | | | | | | |
| | | | |
U.S. Treasury & Government Agencies — 6.0%*: | | | | | | | | | | | | | | | | | | | | | |
Federal Home Loan Mortgage Corp., 1M USD LIBOR + 0.480% | | | | 2.94 | # | | | | 10/15/2040 | | | | | 337,903 | | | | | 337,595 | | | | | 339,337 | |
Federal Home Loan Mortgage Corp. | | | | 3.00 | | | | | 5/15/2039 | | | | | 503,234 | | | | | 507,586 | | | | | 499,728 | |
Federal Home Loan Mortgage Corp. | | | | 3.00 | | | | | 8/15/2040 | | | | | 762,278 | | | | | 773,338 | | | | | 760,020 | |
Federal Home Loan Mortgage Corp. | | | | 3.00 | | | | | 3/15/2041 | | | | | 657,783 | | | | | 666,439 | | | | | 655,573 | |
Federal National Mortgage Association | | | | 3.00 | | | | | 4/25/2040 | | | | | 1,030,281 | | | | | 1,041,960 | | | | | 1,024,017 | |
Federal National Mortgage Association | | | | 3.00 | | | | | 1/25/2041 | | | | | 517,292 | | | | | 523,745 | | | | | 516,843 | |
U.S. Treasury Bonds | | | | 8.00 | | | | | 11/15/2021 | | | | | 3,880,000 | | | | | 4,433,667 | | | | | 4,466,699 | |
U.S. Treasury Bonds | | | | 8.75 | | | | | 5/15/2020 | | | | | 19,000,000 | | | | | 20,536,810 | | | | | 20,568,242 | |
| | | | | | | | | | | | | | | | | | | | | | | | | |
Total U.S. Treasury & Government Agencies | | | | | | | | | | | | | | 26,688,771 | | | | | 28,821,140 | | | | | 28,830,459 | |
| | | | | | | | | | | | | | | | | | | | | | | | | |
| | | | | | | | | | | | | | | | | | | | | | | | | |
Total Fixed Income | | | | | | | | | | | | | | 447,963,234 | | | | | 448,592,325 | | | | | 443,833,418 | |
| | | | | | | | | | | | | | | | | | | | | | | | | |
| | | | | | | | | | | | | | | | | | | | | | | | | | | | | | |
| COUNTERPARTY | | | | STRIKE
PRICE | | | EXPIRATION
DATE | | | CONTRACTS | | | NOTIONAL | | | COST | | | UNREALIZED
VALUE | | | FAIR
VALUE | |
Purchased Options — 0.8%*: | | | | | | | | | | | | | | | | | | | | | | | | | | | | |
| | | | | | |
Call Options Purchased — 0.2%*: | | | | | | | | | | | | | | | | | | | | | | | | | |
OTC — BCM Swaption | | JPMorgan Chase Bank N.A. | | | $2.44 | | | | 12/13/2032 | | | | 11,190,000 | | | | 11,190,000 | | | | $561,458 | | | | $(83,021 | ) | | | $478,437 | |
OTC — BCM Swaption | | JPMorgan Chase Bank N.A. | | | 2.61 | | | | 1/31/2033 | | | | 14,590,000 | | | | 14,590,000 | | | | 698,861 | | | | (5,479 | ) | | | 693,382 | |
| | | | | | | | | | | | | | | | | | | | | | | | | | | | | | |
Total Call Options Purchased | | | | | | | | 25,780,000 | | | | 25,780,000 | | | | 1,260,319 | | | | (88,500 | ) | | | 1,171,819 | |
| | | | | | | | | | | | | | | | | | | | | | | | | | | | | | |
See accompanying Notes to the Financial Statements.
127
Barings Active Short Duration Bond Fund 2018 Semi-Annual Report
SCHEDULE OF INVESTMENTS (CONTINUED)
December 31, 2018 (Unaudited)
| | | | | | | | | | | | | | | | | | | | | | | | | | | | | | |
| COUNTERPARTY | | | | STRIKE
PRICE | | | EXPIRATION
DATE | | | CONTRACTS | | | NOTIONAL | | | COST | | | UNREALIZED
VALUE | | | FAIR
VALUE | |
Purchased Options(Continued) | | | | | | | | | | | | | | | | | | | | | | | | | |
| | | | | | |
Put Options Purchased — 0.6%*: | | | | | | | | | | | | | | | | | | | | | | | | | |
OTC — BCM Swaption | | JPMorgan Chase Bank N.A. | | | $2.94 | | | | 12/13/2032 | | | | 22,790,000 | | | | 22,790,000 | | | | $1,143,488 | | | | $147,780 | | | | $1,291,268 | |
OTC — BCM Swaption | | JPMorgan Chase Bank N.A. | | | 3.11 | | | | 1/31/2033 | | | | 29,090,000 | | | | 29,090,000 | | | | 1,390,502 | | | | 109,950 | | | | 1,500,452 | |
| | | | | | | | | | | | | | | | | | | | | | | | | | | | | | |
Total Put Options Purchased | | | | | | | | 51,880,000 | | | | 51,880,000 | | | | 2,533,990 | | | | 257,730 | | | | 2,791,720 | |
| | | | | | | | | | | | | | | | | | | | | | | | | | | | | | |
| | | | | | | | | | | | | | | | | | | | | | | | | |
| | | EFFECTIVE
INTEREST RATE | | DUE DATE | | PRINCIPAL ‡‡ | | COST | | FAIR VALUE |
Short-Term Investments — 6.1%*: | | | | | | | | | | | | | | | | | | | | | | | | | |
| | | | | |
Commercial Paper — 6.1%*: | | | | | | | | | | | | | | | | | | | | | | | | | |
| | | | | |
Auto Manufacturers — 1.4%*: | | | | | | | | | | | | | | | | | | | | | | | | | |
Hyundai Capital America | | | | 2.85 | | | | | 2/14/2019 | | | | | 4,000,000 | | | | | 3,986,311 | | | | | 3,986,311 | |
VW Credit Inc. | | | | 3.10 | | | | | 2/12/2019 | | | | | 2,900,000 | | | | | 2,889,715 | | | | | 2,889,715 | |
| | | | | | | | | | | | | | | | | | | | | | | | | |
Total Auto Manufacturers | | | | | 6,900,000 | | | | | 6,876,026 | | | | | 6,876,026 | |
| | | | | | | | | | | | | | | | | | | | | | | | | |
| | | | | |
Chemicals — 0.9%*: | | | | | | | | | | | | | | | | | | | | | | | | | |
Albemarle Corp. | | | | 2.54 | | | | | 1/8/2019 | | | | | 4,000,000 | | | | | 3,998,056 | | | | | 3,998,056 | |
| | | | | | | | | | | | | | | | | | | | | | | | | |
| | | | | |
Entertainment — 0.8%*: | | | | | | | | | | | | | | | | | | | | | | | | | |
CBS Corp. | | | | 2.95 | | | | | 1/29/2019 | | | | | 4,000,000 | | | | | 3,990,978 | | | | | 3,990,978 | |
| | | | | | | | | | | | | | | | | | | | | | | | | |
| | | | | |
Food — 0.6%*: | | | | | | | | | | | | | | | | | | | | | | | | | |
Mondelez International, Inc. | | | | 2.85 | | | | | 2/19/2019 | | | | | 2,850,000 | | | | | 2,839,138 | | | | | 2,839,138 | |
| | | | | | | | | | | | | | | | | | | | | | | | | |
| | | | | |
Hotel & Restaurant — 0.2%*: | | | | | | | | | | | | | | | | | | | | | | | | | |
McDonald’s Corp. | | | | 2.84 | | | | | 1/8/2019 | | | | | 1,045,000 | | | | | 1,044,431 | | | | | 1,044,431 | |
| | | | | | | | | | | | | | | | | | | | | | | | | |
| | | | | |
Machinery-Constr&Mining — 0.5%*: | | | | | | | | | | | | | | | | | | | | | | | | | |
Caterpiler fFnance Service Co. | | | | 2.48 | | | | | 1/2/2019 | | | | | 2,100,000 | | | | | 2,099,857 | | | | | 2,099,857 | |
| | | | | | | | | | | | | | | | | | | | | | | | | |
| | | | | |
Oil and Gas Services — 0.4%*: | | | | | | | | | | | | | | | | | | | | | | | | | |
Schlumberger Holdings Corp. | | | | 2.91 | | | | | 1/8/2019 | | | | | 2,000,000 | | | | | 1,998,888 | | | | | 1,998,888 | |
| | | | | | | | | | | | | | | | | | | | | | | | | |
| | | | | |
Utilities — 1.3%*: | | | | | | | | | | | | | | | | | | | | | | | | | |
DTE Capital Corp. | | | | 2.86 | | | | | 1/9/2019 | | | | | 3,000,000 | | | | | 2,998,093 | | | | | 2,998,093 | |
Nextera Energy Capital Holdings, Inc. | | | | 3.06 | | | | | 2/25/2019 | | | | | 1,768,000 | | | | | 1,759,897 | | | | | 1,759,897 | |
Public Service Enterprise Group, Inc. | | | | 3.05 | | | | | 1/23/2019 | | | | | 1,550,000 | | | | | 1,547,158 | | | | | 1,547,158 | |
| | | | | | | | | | | | | | | | | | | | | | | | | |
Total Utilities | | | | | | | | | | | | | | 6,318,000 | | | | | 6,305,148 | | | | | 6,305,148 | |
| | | | | | | | | | | | | | | | | | | | | | | | | |
Total Commercial Paper | | | | | | | | | | | | | | 29,213,000 | | | | | 29,152,522 | | | | | 29,152,522 | |
| | | | | | | | | | | | | | | | | | | | | | | | | |
Total Short-Term Investments | | | | | | | | | | | | | | 29,213,000 | | | | | 29,152,522 | | | | | 29,152,522 | |
| | | | | | | | | | | | | | | | | | | | | | | | | |
Total Investments | | | | | | | | | | | | | | 554,836,234 | | | | | 481,539,156 | | | | | 476,949,479 | |
| | | | | | | | | | | | | | | | | | | | | | | | | |
| | | | | |
Other assets and liabilities — 1.0%* | | | | | | | | | | | | | | | | | | | | | | | | 4,952,704 | |
| | | | | | | | | | | | | | | | | | | | | | | | | |
| | | | | |
Net Assets — 100.0% | | | | | | | | | | | | | | | | | | | | | | | | $481,902,183 | |
| | | | | | | | | | | | | | | | | | | | | | | | | |
See accompanying Notes to the Financial Statements.
128
Barings Active Short Duration Bond Fund 2018 Semi-Annual Report
SCHEDULE OF INVESTMENTS (CONTINUED)
December 31, 2018 (Unaudited)
| ‡‡ | Unless otherwise indicated, all principal amounts are denominated in United States Dollars. |
| * | Calculated as a percentage of net assets applicable to common shareholders. |
| | Distributions of investments by country of risk (excluding temporary cash investments) as a percentage of total investments in securities, is as follows: |
| | | | | | |
| | United States | | | 90.3% | |
| | Ireland | | | 2.0% | |
| | Netherlands | | | 1.5% | |
| | United Kingdom | | | 1.2% | |
| | Japan | | | 1.2% | |
| | Other (Individually less than 1%) | | | 3.8% | |
| | | | | | |
| | Total | | | 100.0% | |
| | | | | | |
| ^ | Security acquired in a transaction exempt from registration under Rule 144A of the Securities Act of 1933. These securities may only be resold in transactions exempt from registration, normally to qualified institutional buyers. |
| ¤ | For fair value measurement disclosure purposes, security is categorized as Level 3 (See Note 2). |
| # | Variable rate security. The interest rate shown is the rate in effect at December 31, 2018. |
| @ | Effective interest rate for this security is the coupon rate at issue based on the underlying loans. |
| ** | Variable Rate is Fixed to Float: Rate remains fixed until designated future date. |
A summary of outstanding derivatives at December 31, 2018 is as follows:
Futures
| | | | | | | | | | | | | | | | | | | | | | | | | | | | | | |
| TYPE | | EXPIRATION
DATE | | CONTRACTS | | NOTIONAL
AMOUNT | | POSITION | | FAIR VALUE | | UNREALIZED
APPRECIATION |
Long Future | | | | | | | | | | | | | | | | | | | | | | | | | | | | | | |
U.S. 10-Year Treasury Note | | | | 03/20/19 | | | | | 201 | | | | | 23,919,477 | | | | | Long | | | | | $24,525,141 | | | | | $605,664 | |
| | | | | | |
| TYPE | | EXPIRATION
DATE | | CONTRACTS | | NOTIONAL
AMOUNT | | POSITION | | FAIR VALUE | | UNREALIZED
DEPRECIATION |
Short Futures | | | | | | | | | | | | | | | | | | | | | | | | | | | | | | |
U.S. 10-Year Ultra Bond | | | | 03/20/19 | | | | | 99 | | | | | (12,461,331 | ) | | | | Short | | | | | $ (12,877,734 | ) | | | $ | (416,403 | ) |
U.S. 2-Year Treasury Note | | | | 03/29/19 | | | | | 26 | | | | | (5,484,853 | ) | | | | Short | | | | | (5,520,125 | ) | | | | (35,272 | ) |
U.S. 5-Year Treasury Note | | | | 03/29/19 | | | | | 887 | | | | | (100,103,749 | ) | | | | Short | | | | | (101,727,813 | ) | | | | (1,624,064 | ) |
| | | | | | | | | | | | | | | | | | | | | | | | | | | | | | |
Total Short Futures | | | | $ | (2,075,739 | ) |
| | | | | | | | | | | | | | | | | | | | | | | | | | | | | | |
See accompanying Notes to the Financial Statements.
129
Barings Active Short Duration Bond Fund 2018 Semi-Annual Report
SCHEDULE OF INVESTMENTS (CONTINUED)
December 31, 2018 (Unaudited)
OTC Credit Default Swaps – Sell Protection(1) (2)
| | | | | | | | | | | | | | | | | | | | | | | | | | | | | | | | | | | | | | | | | | |
REFERENCE
OBLIGATION | | FIXED-DEAL
RECEIVED
RATE | | PAYMENT
FREQUENCY | | MATURITY
DATE | | COUNTERPARTY | | ORIGINAL
NOTIONAL
AMOUNT | | CURRENT
NOTIONAL
AMOUNT (3) | | UPFRONT
PREMIUMS
PAID/
(RECEIVED) | | FAIR
VALUE (4) | | UNREALIZED
DEPRECIATION |
| CMBX.NA.BBB-.6† | | | | 3.00 | % | | | | 1M | | | | | 11/17/2045 | | | JPMorgan Chase Bank N.A. | | | | 230,000 | | | | | 230,000 | | | | $ | 505 | | | | $ | (37,090 | ) | | | $ | (37,595 | ) |
| CMBX.NA.BBB-.6†+ | | | | 3.00 | % | | | | 1M | | | | | 5/11/2063 | | | Goldman Sachs & Co. | | | | 290,000 | | | | | 290,000 | | | | | (21,161 | ) | | | | (46,766 | ) | | | | (25,605 | ) |
| | | | | | | | | | | | | | | | | | | | | | | | | | | | | | | | | | | | | | | | | | |
Total OTC Credit Default Swaps | | | | | | | | | | | | | | | | | | | | | $ | (20,656 | ) | | | $ | (83,856 | ) | | | $ | (63,200 | ) |
| | | | | | | | | | | | | | | | | | | | | | | | | | | | | | | | | | | | | | | | | | |
| (1) | If the Fund is a seller of protection and a credit event occurs, as defined under the terms of that particular swap agreement, the Fund will either (i) pay to the buyer of protection an amount equal to the notional amount of the swap and take delivery of the referenced obligation or underlying securities comprising the referenced index or (ii) pay a net settlement amount in the form of cash or securities equal to the notional amount of the swap less the recovery value of the referenced obligation or underlying securities comprising the referenced index. |
| (2) | Represents an investment grade index of single name credit default swaps (CDS). All of the companies underlying the single name CDS within the index are rated investment grade or higher. Rating represents a weighted average of the credit ratings of all the companies underlying the single name CDS within the index. |
| (3) | The maximum potential amount the Portfolio could be required to make as a seller of credit protection or receive as a buyer of credit event as defined under the terms of that particular swap agreement. |
| (4) | The quoted market prices and resulting values for credit default swap agreements on asset-backed securities and credit indices serve as an indicator of the current status of the payment/performance risk and represent the expected amount paid or received for the credit derivative if the amount of the swap agreement was closed/sold as of the period end. Increasing market values, in absolute terms when compared to the notional amount of the swap, represent a deterioration of the referenced entity’s credit soundness and a greater likelihood or risk of default or other credit event occurring as defined under the terms of the agreements. |
| † | Payment is based on a percentage of the index. Reference entities are a number of individual issuers comprising the index. |
Abbreviation Legend
See accompanying Notes to the Financial Statements.
130
Barings Total Return Bond Fund 2018 Semi-Annual Report
SCHEDULE OF INVESTMENTS
December 31, 2018 (Unaudited)
| | | | | | | | | | | | | | | | | | | | | | | | | |
| | | EFFECTIVE
INTEREST RATE | | DUE DATE | | PRINCIPAL ‡‡ | | COST | | FAIR
VALUE |
Fixed Income — 84.1%*: | | | | | | | | | | | | | | | | | | | | | | | | | |
| | | | | |
Asset-Backed Securities — 26.1%*: | | | | | | | | | | | | | | | | | | | | | | | | | |
| | | | | |
CDO/CLO — 4.4%*: | | | | | | | | | | | | | | | | | | | | | | | | | |
ALM VII Ltd. 2012-7A A1R, 3M USD LIBOR + 1.480%^ | | | | 3.92 | #% | | | | 10/15/2028 | | | | | 250,000 | | | | | $250,000 | | | | | $250,125 | |
Crestline Denali CLO XIV Ltd.^ | | | | 4.44 | # | | | | 10/23/2031 | | | | | 250,000 | | | | | 250,000 | | | | | 243,183 | |
LCM XXIII Ltd. 23A A1, 3M USD LIBOR + 1.400%^ | | | | 3.87 | # | | | | 10/20/2029 | | | | | 250,000 | | | | | 250,000 | | | | | 249,477 | |
Marble Point CLO XI Ltd. 2017-2A A, 3M USD LIBOR + 1.180%^ | | | | 3.62 | # | | | | 12/18/2030 | | | | | 250,000 | | | | | 250,000 | | | | | 246,877 | |
RR 3 Ltd. Series 2018-3 A A1R2, 3M USD LIBOR + 1.090%^ | | | | 3.53 | # | | | | 1/15/2030 | | | | | 250,000 | | | | | 250,000 | | | | | 245,540 | |
| | | | | | | | | | | | | | | | | | | | | | | | | |
Total CDO/CLO | | | | | | | | | | | | | | 1,250,000 | | | | | 1,250,000 | | | | | 1,235,202 | |
| | | | | | | | | | | | | | | | | | | | | | | | | |
| | | | | |
Other Asset-Backed Securities — 21.7%*: | | | | | | | | | | | | | | | | | | | | | | | | | |
Access Group, Inc. 2015-1 A, 1M USD LIBOR + 0.700%^ | | | | 3.21 | # | | | | 7/25/2056 | | | | | 49,627 | | | | | 48,561 | | | | | 49,612 | |
Access Group, Inc. 2015-1 B, 1M USD LIBOR + 1.500%^ | | | | 4.01 | # | | | | 7/25/2058 | | | | | 100,000 | | | | | 86,620 | | | | | 93,862 | |
AccessLex Institute 2004-1 B, 3M USD LIBOR + 0.570% | | | | 3.39 | # | | | | 9/22/2037 | | | | | 55,509 | | | | | 53,347 | | | | | 53,394 | |
AccessLex Institute 2004-A A3, 28 day ARS | | | | 1.70 | # | | | | 7/1/2039 | | | | | 150,000 | | | | | 147,285 | | | | | 147,806 | |
AccessLex Institute 2006-1 B, 3M USD LIBOR + 0.450% | | | | 3.14 | # | | | | 8/25/2037 | | | | | 79,402 | | | | | 69,978 | | | | | 76,165 | |
Arbys Funding LLC 2015-1A A2^ | | | | 4.97 | | | | | 10/30/2045 | | | | | 38,800 | | | | | 38,800 | | | | | 40,163 | |
Argent Securities, Inc. Asset-Backed Pass-Through Certificates 2004-W10 M1, 1M USD LIBOR + 0.900% | | | | 3.22 | # | | | | 10/25/2034 | | | | | 44,343 | | | | | 40,512 | | | | | 42,997 | |
Ascentium Equipment Receivables Trust2018-2 B^ | | | | 5.18 | | | | | 7/10/2026 | | | | | 81,000 | | | | | 80,971 | | | | | 82,591 | |
Asset Backed Securities Corp. Home Equity Loan Trust 2005-HE1 M1, 1M USD LIBOR + 0.750% | | | | 3.26 | # | | | | 3/25/2035 | | | | | 42,433 | | | | | 42,194 | | | | | 41,746 | |
CLI Funding V LLC 2013-2A^ | | | | 3.22 | | | | | 6/18/2028 | | | | | 44,690 | | | | | 44,237 | | | | | 44,274 | |
CLI Funding VI LLC 2016-1A A^ | | | | 4.21 | | | | | 2/18/2041 | | | | | 56,405 | | | | | 56,400 | | | | | 55,362 | |
College Avenue Student Loans LLC 2017, 1M USD LIBOR + 1.650%^ | | | | 4.16 | # | | | | 11/26/2046 | | | | | 88,129 | | | | | 89,488 | | | | | 89,281 | |
College Loan Corp. Trust I 2005-2 B, 3M USD LIBOR + 0.490% | | | | 2.93 | # | | | | 1/15/2037 | | | | | 87,793 | | | | | 77,861 | | | | | 82,760 | |
College Loan Corp. Trust I 2017-1 B2, 28 day ARS | | | | 1.84 | # | | | | 1/25/2047 | | | | | 45,000 | | | | | 38,612 | | | | | 39,803 | |
Credit Suisse ABS Repackaging Trust 2013-A B^ | | | | 2.50 | | | | | 1/25/2030 | | | | | 36,054 | | | | | 34,406 | | | | | 33,758 | |
CWABS Asset-Backed Certificates Trust 2005-4 MV5, 1M USD LIBOR + 0.670% | | | | 3.51 | # | | | | 10/25/2035 | | | | | 60,000 | | | | | 54,257 | | | | | 59,454 | |
DB Master Finance LLC 2015-1A A2II^ | | | | 3.98 | | | | | 2/20/2045 | | | | | 48,125 | | | | | 49,080 | | | | | 49,007 | |
Diamond Resorts Owner Trust 2016-1 B^ | | | | 3.37 | | | | | 11/20/2028 | | | | | 39,507 | | | | | 39,501 | | | | | 38,673 | |
See accompanying Notes to the Financial Statements.
131
Barings Total Return Bond Fund 2018 Semi-Annual Report
SCHEDULE OF INVESTMENTS (CONTINUED)
December 31, 2018 (Unaudited)
| | | | | | | | | | | | | | | | | | | | | | | | | |
| | | EFFECTIVE
INTEREST RATE | | DUE DATE | | PRINCIPAL ‡‡ | | COST | | FAIR
VALUE |
Asset-Backed Securities(Continued) | | | | | | | | | | | | | | | | | | | | | | | | | |
| | | | | |
Other Asset-Backed Securities(Continued) | | | | | | | | | | | | | | | | | | | | | | | | | |
Domino’s Pizza Master Issuer LLC 2015-1A A2II^ | | | | 4.47 | % | | | | 10/25/2045 | | | | | 58,500 | | | | $ | 58,500 | | | | $ | 59,080 | |
DRB Prime Student Loan Trust 2016-R A1, 1M USD LIBOR + 1.900%^¤ | | | | 4.41 | # | | | | 10/25/2044 | | | | | 47,721 | | | | | 47,721 | | | | | 48,055 | |
DRB Prime Student Loan Trust 2016-R A2^¤ | | | | 3.07 | | | | | 10/25/2044 | | | | | 47,721 | | | | | 47,712 | | | | | 46,939 | |
Drug Royalty 2012-1 A1, 3M USD LIBOR +
5.250%^ | | | | 7.32 | # | | | | 7/15/2024 | | | | | 4,872 | | | | | 4,973 | | | | | 4,883 | |
Earnest Student Loan Program LLC 2016-C A1, 1M USD LIBOR + 1.850%^ | | | | 4.36 | # | | | | 10/27/2036 | | | | | 25,345 | | | | | 25,345 | | | | | 25,549 | |
ECMC Group Student Loan Trust 2016-1A A, 1M USD LIBOR + 1.350%^ | | | | 3.86 | # | | | | 7/26/2066 | | | | | 65,786 | | | | | 65,785 | | | | | 67,034 | |
EdLinc Student Loan Funding Trust 2017-A A, Prime — 1.150%^ | | | | 3.35 | # | | | | 12/1/2047 | | | | | 81,801 | | | | | 81,244 | | | | | 82,755 | |
Entergy New Orleans Storm Recovery Funding I LLC 2015-1 A | | | | 2.67 | | | | | 6/1/2027 | | | | | 66,510 | | | | | 66,498 | | | | | 65,440 | |
First Franklin Mortgage Loan Trust 2004-FFH4 M6, 1M USD LIBOR + 1.725% | | | | 4.23 | # | | | | 1/25/2035 | | | | | 50,000 | | | | | 49,823 | | | | | 50,941 | |
Flagship Credit Auto Trust 2017-4 C^ | | | | 2.92 | | | | | 11/15/2023 | | | | | 100,000 | | | | | 99,844 | | | | | 98,591 | |
Goodgreen Trust 2017-1A A^ | | | | 3.74 | | | | | 10/15/2052 | | | | | 78,467 | | | | | 78,431 | | | | | 79,292 | |
Helios Issuer LLC 2017-1A A^ | | | | 4.94 | | | | | 9/20/2049 | | | | | 92,745 | | | | | 92,702 | | | | | 94,456 | |
HERO Funding Trust 2015-1A A^ | | | | 3.84 | | | | | 9/21/2040 | | | | | 75,468 | | | | | 76,804 | | | | | 76,590 | |
Hertz Vehicle Financing II LP^ | | | | 3.60 | | | | | 2/25/2024 | | | | | 150,000 | | | | | 145,956 | | | | | 148,026 | |
Hilton Grand Vacations Trust 2013-A A^ | | | | 2.28 | | | | | 1/25/2026 | | | | | 46,717 | | | | | 46,628 | | | | | 46,506 | |
J.G. Wentworth XXXV LLC 2015-2A A^ | | | | 3.87 | | | | | 3/15/2058 | | | | | 44,537 | | | | | 44,504 | | | | | 45,780 | |
Mariner Finance Issuance Trust 2017-AA A^ | | | | 3.62 | | | | | 2/20/2029 | | | | | 100,000 | | | | | 99,983 | | | | | 100,000 | |
Marlette Funding Trust 2017-2A B^ | | | | 3.19 | | | | | 7/15/2024 | | | | | 100,000 | | | | | 99,993 | | | | | 99,845 | |
Montana Higher Education Student Assistance Corp. 2012-1 A3, 1M USD LIBOR + 1.050% | | | | 3.52 | # | | | | 7/20/2043 | | | | | 150,000 | | | | | 145,283 | | | | | 152,765 | |
Navient Student Loan Trust 2017-1A A3, 1M USD LIBOR + 1.150%^ | | | | 3.66 | # | | | | 7/26/2066 | | | | | 120,000 | | | | | 120,000 | | | | | 121,335 | |
Navient Student Loan Trust 2018-1A A3, 1M USD LIBOR + 0.720%^ | | | | 3.23 | # | | | | 3/25/2067 | | | | | 100,000 | | | | | 100,000 | | | | | 99,440 | |
Navient Student Loan Trust 2018-1B, 1M USD LIBOR + 1.200%^ | | | | 3.71 | # | | | | 3/25/2067 | | | | | 100,000 | | | | | 100,620 | | | | | 100,000 | |
Nelnet Private Education Loan Trust 2016-A A1B^ | | | | 3.60 | | | | | 12/26/2040 | | | | | 45,056 | | | | | 44,772 | | | | | 43,874 | |
Nelnet Student Loan Trust 2006-2 B, 3M USD LIBOR + 0.200% | | | | 2.69 | # | | | | 1/25/2038 | | | | | 75,850 | | | | | 71,344 | | | | | 70,844 | |
New Residential Advance Receivables Trust Advance Receivables Backed Notes 2016-T2 AT2^ | | | | 2.58 | | | | | 10/15/2049 | | | | | 125,000 | | | | | 125,000 | | | | | 124,220 | |
Northstar Education Finance, Inc. 2005-1 A5, 3M USD LIBOR + 0.750% | | | | 3.26 | # | | | | 10/30/2045 | | | | | 23,830 | | | | | 22,851 | | | | | 23,652 | |
NovaStar Mortgage Funding Trust 2004-4 M5, 1M USD LIBOR + 1.725% | | | | 4.23 | # | | | | 3/25/2035 | | | | | 64,666 | | | | | 64,650 | | | | | 64,574 | |
NP Ferrum LLC 2015 1A A1 | | | | 2.71 | | | | | 2/19/2045 | | | | | 45,265 | | | | | 43,798 | | | | | 44,633 | |
NRZ Advance Receivables Trust 2016-T4 AT4^ | | | | 3.11 | | | | | 12/15/2050 | | | | | 100,000 | | | | | 100,000 | | | | | 99,831 | |
NRZ Advance Receivables Trust Advance Receivables Backed 2016-T3 AT3^ | | | | 2.83 | | | | | 10/16/2051 | | | | | 230,000 | | | | | 230,000 | | | | | 226,896 | |
See accompanying Notes to the Financial Statements.
132
Barings Total Return Bond Fund 2018 Semi-Annual Report
SCHEDULE OF INVESTMENTS (CONTINUED)
December 31, 2018 (Unaudited)
| | | | | | | | | | | | | | | | | | | | | | | | | |
| | | EFFECTIVE
INTEREST RATE | | DUE DATE | | PRINCIPAL ‡‡ | | COST | | FAIR
VALUE |
Asset-Backed Securities(Continued) | | | | | | | | | | | | | | | | | | | | | | | | | |
| | | | | |
Other Asset-Backed Securities(Continued) | | | | | | | | | | | | | | | | | | | | | | | | | |
OSCAR US Funding Trust V 2016-2A A4^ | | | | 2.99 | % | | | | 12/15/2023 | | | | | 130,000 | | | | $ | 129,331 | | | | $ | 129,403 | |
Oscar US Funding Trust VI LLC 2017-1A A4+^ | | | | 3.30 | | | | | 5/10/2024 | | | | | 30,000 | | | | | 29,995 | | | | | 30,020 | |
Planet Fitness Master Issuer LLC^ | | | | 4.67 | | | | | 9/5/2048 | | | | | 99,750 | | | | | 99,750 | | | | | 101,352 | |
Popular ABS Mortgage Pass-Through Trust 2006-B A3, 1M USD LIBOR + 0.280% | | | | 2.79 | # | | | | 5/25/2036 | | | | | 24,181 | | | | | 23,281 | | | | | 23,969 | |
Sierra Timeshare Receivables Funding LLC 2015-2A B^ | | | | 3.02 | | | | | 6/20/2032 | | | | | 16,377 | | | | | 16,374 | | | | | 16,122 | |
SLC Student Loan Trust 2005-1 B, 3M USD LIBOR + 0.200% | | | | 2.82 | # | | | | 2/15/2045 | | | | | 86,790 | | | | | 74,919 | | | | | 80,529 | |
SLM Student Loan Trust 2002-7 A11, 28 day ARS | | | | 3.03 | # | | | | 3/15/2028 | | | | | 50,000 | | | | | 49,494 | | | | | 49,968 | |
SLM Student Loan Trust 2002-7 B, 28 day ARS | | | | 3.28 | # | | | | 12/15/2039 | | | | | 80,000 | | | | | 80,059 | | | | | 80,289 | |
SLM Student Loan Trust 2003-2 A9, 28 day ARS | | | | 4.27 | # | | | | 9/15/2028 | | | | | 100,000 | | | | | 99,787 | | | | | 102,830 | |
SLM Student Loan Trust 2003-4 B, 3M USD LIBOR + 0.650% | | | | 3.44 | # | | | | 6/15/2038 | | | | | 60,899 | | | | | 56,073 | | | | | 59,039 | |
SLM Student Loan Trust 2005-4 B, 3M USD LIBOR + 0.180% | | | | 2.67 | # | | | | 7/25/2055 | | | | | 102,261 | | | | | 88,028 | | | | | 96,116 | |
SLM Student Loan Trust 2005-6 B, 3M USD LIBOR + 0.290% | | | | 2.78 | # | | | | 1/25/2044 | | | | | 116,616 | | | | | 108,265 | | | | | 108,210 | |
SLM Student Loan Trust 2006-10 A6, 3M USD LIBOR + 0.150% | | | | 2.64 | # | | | | 3/25/2044 | | | | | 200,000 | | | | | 192,645 | | | | | 194,496 | |
SLM Student Loan Trust 2006-10 B, 3M USD LIBOR + 0.220% | | | | 2.71 | # | | | | 3/25/2044 | | | | | 56,961 | | | | | 53,834 | | | | | 53,392 | |
SLM Student Loan Trust 2006-4 B, 3M USD LIBOR + 0.200% | | | | 2.69 | # | | | | 1/25/2070 | | | | | 55,410 | | | | | 51,906 | | | | | 52,674 | |
SLM Student Loan Trust 2006-5 B, 3M USD LIBOR + 0.210% | | | | 2.70 | # | | | | 10/25/2040 | | | | | 109,354 | | | | | 96,300 | | | | | 103,809 | |
SLM Student Loan Trust 2006-7 B, 3M USD LIBOR + 0.200% | | | | 2.69 | # | | | | 1/27/2042 | | | | | 55,847 | | | | | 52,701 | | | | | 53,221 | |
SLM Student Loan Trust 2007-1 A6, 3M USD LIBOR + 0.140% | | | | 2.63 | # | | | | 1/27/2042 | | | | | 100,000 | | | | | 96,100 | | | | | 96,229 | |
SMB Private Education Loan Trust 2017-A B^ | | | | 3.50 | | | | | 6/17/2041 | | | | | 130,000 | | | | | 126,153 | | | | | 126,074 | |
SoFi Professional Loan Program LLC 2017-A C^ | | | | 4.43 | | | | | 3/26/2040 | | | | | 100,000 | | | | | 99,493 | | | | | 98,753 | |
SoFi Professional Loan Program LLC 2017-D BFX^ | | | | 3.61 | | | | | 9/25/2040 | | | | | 100,000 | | | | | 99,950 | | | | | 97,179 | |
South Carolina Student Loan Corp. 2014-1 B, 1M USD LIBOR + 1.500% | | | | 3.85 | # | | | | 8/1/2035 | | | | | 100,000 | | | | | 98,560 | | | | | 101,402 | |
SPS Servicer Advance Receivables Trust Advance Receivables Backed Notes 2016-T2 AT2^ | | | | 2.75 | | | | | 11/15/2049 | | | | | 100,000 | | | | | 99,986 | | | | | 99,814 | |
Taco Bell Funding LLC^ | | | | 4.94 | | | | | 11/25/2048 | | | | | 40,000 | | | | | 40,000 | | | | | 40,352 | |
Taco Bell Funding LLC 2016-1A A23^ | | | | 4.97 | | | | | 5/25/2046 | | | | | 68,950 | | | | | 69,555 | | | | | 70,305 | |
Textainer Marine Containers V Ltd. 2017-1A A^ | | | | 3.72 | | | | | 5/20/2042 | | | | | 85,050 | | | | | 85,046 | | | | | 84,920 | |
TRIP Rail Master Funding LLC 2011-1A A2^ | | | | 6.02 | | | | | 7/15/2041 | | | | | 99,849 | | | | | 107,660 | | | | | 105,284 | |
Triton Container Finance IV LLC 2017-2A A^ | | | | 3.62 | | | | | 8/20/2042 | | | | | 123,050 | | | | | 123,036 | | | | | 122,632 | |
Triton Container Finance VI LLC 2017-1A A^ | | | | 3.52 | | | | | 6/20/2042 | | | | | 85,291 | | | | | 85,276 | | | | | 84,036 | |
See accompanying Notes to the Financial Statements.
133
Barings Total Return Bond Fund 2018 Semi-Annual Report
SCHEDULE OF INVESTMENTS (CONTINUED)
December 31, 2018 (Unaudited)
| | | | | | | | | | | | | | | | | | | | | | | | | |
| | | EFFECTIVE
INTEREST RATE | | DUE DATE | | PRINCIPAL ‡‡ | | COST | | FAIR
VALUE |
Asset-Backed Securities(Continued) | | | | | | | | | | | | | | | | | | | | | | | | | |
| | | | | |
Other Asset-Backed Securities(Continued) | | | | | | | | | | | | | | | | | | | | | | | | | |
Wachovia Student Loan Trust 2005-1 B, 3M USD LIBOR + 0.300% | | | | 2.79 | # % | | | | 10/25/2040 | | | | | 67,306 | | | | $ | 61,847 | | | | $ | 62,285 | |
Welk Resorts LLC 2017-AA B^ | | | | 3.41 | | | | | 6/15/2033 | | | | | 79,659 | | | | | 79,695 | | | | | 78,346 | |
| | | | | | | | | | | | | | | | | | | | | | | | | |
Total Other Asset-Backed Securities | | | | | | | | | | | | | | 6,216,275 | | | | | 6,067,973 | | | | | 6,135,584 | |
| | | | | | | | | | | | | | | | | | | | | | | | | |
| | | | | | | | | | | | | | | | | | | | | | | | | |
Total Asset-Backed Securities | | | | | | | | | | | | | | 7,466,275 | | | | | 7,317,973 | | | | | 7,370,786 | |
| | | | | | | | | | | | | | | | | | | | | | | | | |
Corporate Bonds — 31.4%*: | | | | | | | | | | | | | | | | | | | | | | | | | |
| | | | | |
Advertising — 0.0%*: | | | | | | | | | | | | | | | | | | | | | | | | | |
WPP Finance 2010+ | | | | 5.63 | | | | | 11/15/2043 | | | | | 3,000 | | | | | 3,263 | | | | | 2,941 | |
| | | | | | | | | | | | | | | | | | | | | | | | | |
| | | | | |
Aerospace/Defense — 0.1%*: | | | | | | | | | | | | | | | | | | | | | | | | | |
United Technologies Corp. | | | | 5.70 | | | | | 4/15/2040 | | | | | 25,000 | | | | | 31,109 | | | | | 27,433 | |
| | | | | | | | | | | | | | | | | | | | | | | | | |
| | | | | |
Agriculture — 0.5%*: | | | | | | | | | | | | | | | | | | | | | | | | | |
Bunge Ltd. Finance Corp. | | | | 3.25 | | | | | 8/15/2026 | | | | | 45,000 | | | | | 43,471 | | | | | 39,427 | |
Bunge Ltd. Finance Corp. | | | | 4.35 | | | | | 3/15/2024 | | | | | 50,000 | | | | | 49,942 | | | | | 49,056 | |
Reynolds American, Inc. | | | | 4.45 | | | | | 6/12/2025 | | | | | 30,000 | | | | | 30,469 | | | | | 28,927 | |
Reynolds American, Inc. | | | | 5.85 | | | | | 8/15/2045 | | | | | 25,000 | | | | | 30,202 | | | | | 23,226 | |
| | | | | | | | | | | | | | | | | | | | | | | | | |
Total Agriculture | | | | | | | | | | | | | | 150,000 | | | | | 154,084 | | | | | 140,636 | |
| | | | | | | | | | | | | | | | | | | | | | | | | |
| | | | | |
Airlines — 0.1%*: | | | | | | | | | | | | | | | | | | | | | | | | | |
United Airlines 2018-1 Class B Pass Through Trust | | | | 4.60 | | | | | 3/1/2026 | | | | | 15,000 | | | | | 15,000 | | | | | 14,828 | |
WestJet Airlines Ltd.+^ | | | | 3.50 | | | | | 6/16/2021 | | | | | 14,000 | | | | | 13,990 | | | | | 13,878 | |
| | | | | | | | | | | | | | | | | | | | | | | | | |
Total Airlines | | | | | | | | | | | | | | 29,000 | | | | | 28,990 | | | | | 28,706 | |
| | | | | | | | | | | | | | | | | | | | | | | | | |
| | | | | |
Auto Manufacturers — 1.6%*: | | | | | | | | | | | | | | | | | | | | | | | | | |
Ford Motor Co. | | | | 7.45 | | | | | 7/16/2031 | | | | | 40,000 | | | | | 46,619 | | | | | 41,241 | |
Ford Motor Credit Co. LLC | | | | 4.38 | | | | | 8/6/2023 | | | | | 200,000 | | | | | 194,512 | | | | | 189,448 | |
General Motors Co. | | | | 4.20 | | | | | 10/1/2027 | | | | | 30,000 | | | | | 29,961 | | | | | 27,040 | |
General Motors Co. | | | | 5.15 | | | | | 4/1/2038 | | | | | 20,000 | | | | | 19,988 | | | | | 17,087 | |
General Motors Co. | | | | 5.20 | | | | | 4/1/2045 | | | | | 35,000 | | | | | 34,597 | | | | | 29,007 | |
General Motors Financial Co., Inc. | | | | 3.50 | | | | | 11/7/2024 | | | | | 50,000 | | | | | 49,937 | | | | | 45,718 | |
General Motors Financial Co., Inc. | | | | 3.55 | | | | | 4/9/2021 | | | | | 30,000 | | | | | 29,546 | | | | | 29,587 | |
General Motors Financial Co., Inc. | | | | 4.15 | | | | | 6/19/2023 | | | | | 35,000 | | | | | 34,953 | | | | | 34,102 | |
General Motors Financial Co., Inc. | | | | 4.30 | | | | | 7/13/2025 | | | | | 50,000 | | | | | 49,747 | | | | | 47,381 | |
| | | | | | | | | | | | | | | | | | | | | | | | | |
Total Auto Manufacturers | | | | | | | | | | | | | | 490,000 | | | | | 489,860 | | | | | 460,611 | |
| | | | | | | | | | | | | | | | | | | | | | | | | |
| | | | | |
Beverages — 0.4%*: | | | | | | | | | | | | | | | | | | | | | | | | | |
Anheuser-Busch InBev Worldwide, Inc. | | | | 4.60 | | | | | 4/15/2048 | | | | | 45,000 | | | | | 44,748 | | | | | 40,332 | |
Anheuser-Busch InBev Worldwide, Inc. | | | | 8.20 | | | | | 1/15/2039 | | | | | 35,000 | | | | | 51,213 | | | | | 45,002 | |
Molson Coors Brewing Co. | | | | 4.20 | | | | | 7/15/2046 | | | | | 36,000 | | | | | 33,107 | | | | | 29,909 | |
Molson Coors Brewing Co. | | | | 5.00 | | | | | 5/1/2042 | | | | | 5,000 | | | | | 5,031 | | | | | 4,706 | |
| | | | | | | | | | | | | | | | | | | | | | | | | |
Total Beverages | | | | | | | | | | | | | | 121,000 | | | | | 134,099 | | | | | 119,949 | |
| | | | | | | | | | | | | | | | | | | | | | | | | |
See accompanying Notes to the Financial Statements.
134
Barings Total Return Bond Fund 2018 Semi-Annual Report
SCHEDULE OF INVESTMENTS (CONTINUED)
December 31, 2018 (Unaudited)
| | | | | | | | | | | | | | | | | | | | | | | | | |
| | | EFFECTIVE
INTEREST RATE | | DUE DATE | | PRINCIPAL ‡‡ | | COST | | FAIR
VALUE |
Corporate Bonds (Continued) | | | | | | | | | | | | | | | | | | | | | | | | | |
| | | | | |
Biotechnology — 0.3%*: | | | | | | | | | | | | | | | | | | | | | | | | | |
Amgen, Inc. | | | | 5.15 | % | | | | 11/15/2041 | | | | | 10,000 | | | | | $10,400 | | | | | $10,301 | |
Celgene Corp. | | | | 3.45 | | | | | 11/15/2027 | | | | | 65,000 | | | | | 63,745 | | | | | 59,150 | |
Celgene Corp. | | | | 4.63 | | | | | 5/15/2044 | | | | | 25,000 | | | | | 26,839 | | | | | 21,961 | |
| | | | | | | | | | | | | | | | | | | | | | | | | |
Total Biotechnology | | | | | | | | | | | | | | 100,000 | | | | | 100,984 | | | | | 91,412 | |
| | | | | | | | | | | | | | | | | | | | | | | | | |
| | | | | |
Chemicals — 0.7%*: | | | | | | | | | | | | | | | | | | | | | | | | | |
DowDuPont, Inc. | | | | 5.32 | | | | | 11/15/2038 | | | | | 45,000 | | | | | 45,000 | | | | | 46,336 | |
Incitec Pivot Finance LLC^ | | | | 6.00 | | | | | 12/10/2019 | | | | | 30,000 | | | | | 30,964 | | | | | 30,662 | |
LYB International Finance B.V.+ | | | | 5.25 | | | | | 7/15/2043 | | | | | 35,000 | | | | | 35,958 | | | | | 33,367 | |
Mosaic Co. (The) | | | | 4.05 | | | | | 11/15/2027 | | | | | 25,000 | | | | | 24,240 | | | | | 23,711 | |
RPM International, Inc. | | | | 3.75 | | | | | 3/15/2027 | | | | | 8,000 | | | | | 7,991 | | | | | 7,596 | |
Sherwin-Williams Co. (The) | | | | 4.50 | | | | | 6/1/2047 | | | | | 15,000 | | | | | 14,900 | | | | | 13,526 | |
Yara International ASA+^ | | | | 4.75 | | | | | 6/1/2028 | | | | | 50,000 | | | | | 49,880 | | | | | 49,836 | |
| | | | | | | | | | | | | | | | | | | | | | | | | |
Total Chemicals | | | | | | | | | | | | | | 208,000 | | | | | 208,933 | | | | | 205,034 | |
| | | | | | | | | | | | | | | | | | | | | | | | | |
| | | | | |
Commercial Banks — 4.5%*: | | | | | | | | | | | | | | | | | | | | | | | | | |
Associated Banc-Corp | | | | 4.25 | | | | | 1/15/2025 | | | | | 70,000 | | | | | 70,015 | | | | | 70,387 | |
Bank of America Corp. | | | | 4.18 | | | | | 11/25/2027 | | | | | 65,000 | | | | | 65,000 | | | | | 62,476 | |
Bank of America Corp. | | | | 4.20 | | | | | 8/26/2024 | | | | | 30,000 | | | | | 29,898 | | | | | 29,754 | |
Bank of America Corp., 3M USD LIBOR + 1.814% | | | | 4.24 | # | | | | 4/24/2038 | | | | | 30,000 | | | | | 30,000 | | | | | 28,539 | |
Bank of America Corp. | | | | 4.75 | | | | | 4/21/2045 | | | | | 45,000 | | | | | 46,723 | | | | | 44,387 | |
Bank of Montreal+ | | | | 3.80 | | | | | 12/15/2032 | | | | | 40,000 | | | | | 40,000 | | | | | 37,040 | |
Bank of Nova Scotia (The)+ | | | | 4.50 | | | | | 12/16/2025 | | | | | 30,000 | | | | | 30,307 | | | | | 29,872 | |
Bank of Nova Scotia (The)+ | | | | 4.65 | | | | | 12/31/2099 | | | | | 80,000 | | | | | 80,300 | | | | | 69,350 | |
Barclays Bank plc+^ | | | | 10.18 | | | | | 6/12/2021 | | | | | 80,000 | | | | | 90,361 | | | | | 89,932 | |
Citigroup, Inc. | | | | 3.88 | | | | | 3/26/2025 | | | | | 60,000 | | | | | 58,820 | | | | | 58,031 | |
Citigroup, Inc. | | | | 4.60 | | | | | 3/9/2026 | | | | | 45,000 | | | | | 44,932 | | | | | 44,412 | |
Fulton Financial Corp. | | | | 3.60 | | | | | 3/16/2022 | | | | | 35,000 | | | | | 34,911 | | | | | 34,764 | |
Goldman Sachs Group, Inc. (The) | | | | 3.81 | | | | | 4/23/2029 | | | | | 40,000 | | | | | 40,000 | | | | | 37,345 | |
Goldman Sachs Group, Inc. (The) | | | | 5.15 | | | | | 5/22/2045 | | | | | 70,000 | | | | | 67,842 | | | | | 65,460 | |
Goldman Sachs Group, Inc. (The) | | | | 5.95 | | | | | 1/15/2027 | | | | | 32,000 | | | | | 35,142 | | | | | 33,696 | |
HSBC Holdings plc+ | | | | 4.25 | | | | | 3/14/2024 | | | | | 200,000 | | | | | 201,639 | | | | | 198,482 | |
Huntington Bancshares, Inc. | | | | 5.70 | | | | | 12/31/2099 | | | | | 80,000 | | | | | 80,000 | | | | | 71,000 | |
JPMorgan Chase & Co. | | | | 4.95 | | | | | 6/1/2045 | | | | | 40,000 | | | | | 39,332 | | | | | 40,565 | |
Morgan Stanley | | | | 4.35 | | | | | 9/8/2026 | | | | | 85,000 | | | | | 84,677 | | | | | 82,603 | |
Morgan Stanley | | | | 5.00 | | | | | 11/24/2025 | | | | | 25,000 | | | | | 25,639 | | | | | 25,492 | |
Valley National Bancorp | | | | 5.13 | | | | | 9/27/2023 | | | | | 75,000 | | | | | 79,169 | | | | | 77,938 | |
Wells Fargo & Co. | | | | 5.38 | | | | | 11/2/2043 | | | | | 29,000 | | | | | 34,211 | | | | | 30,264 | |
Wells Fargo & Co. | | | | 5.61 | | | | | 1/15/2044 | | | | | 15,000 | | | | | 18,242 | | | | | 16,268 | |
| | | | | | | | | | | | | | | | | | | | | | | | | |
Total Commercial Banks | | | | | | | | | | | | | | 1,301,000 | | | | | 1,327,160 | | | | | 1,278,057 | |
| | | | | | | | | | | | | | | | | | | | | | | | | |
| | | | | |
Construction Materials — 0.2%*: | | | | | | | | | | | | | | | | | | | | | | | | | |
Standard Industries, Inc.^ | | | | 5.00 | | | | | 2/15/2027 | | | | | 70,000 | | | | | 70,000 | | | | | 61,250 | |
| | | | | | | | | | | | | | | | | | | | | | | | | |
See accompanying Notes to the Financial Statements.
135
Barings Total Return Bond Fund 2018 Semi-Annual Report
SCHEDULE OF INVESTMENTS (CONTINUED)
December 31, 2018 (Unaudited)
| | | | | | | | | | | | | | | | | | | | | | | | | |
| | | EFFECTIVE
INTEREST RATE | | DUE DATE | | PRINCIPAL ‡‡ | | COST | | FAIR
VALUE |
Corporate Bonds (Continued) | | | | | | | | | | | | | | | | | | | | | | | | | |
| | | | | |
Distribution/Wholesale — 0.2%*: | | | | | | | | | | | | | | | | | | | | | | | | | |
Ingram Micro, Inc. | | | | 5.45 | % | | | | 12/15/2024 | | | | | 45,000 | | | | | $45,937 | | | | | $43,767 | |
| | | | | | | | | | | | | | | | | | | | | | | | | |
| | | | | |
Diversified Financial Services — 3.8%*: | | | | | | | | | | | | | | | | | | | | | | | | | |
AerCap Ireland Capital DAC/AerCap Global Aviation Trust+ | | | | 3.50 | | | | | 1/15/2025 | | | | | 160,000 | | | | | 159,229 | | | | | 145,980 | |
Aircastle Ltd. | | | | 4.13 | | | | | 5/1/2024 | | | | | 30,000 | | | | | 28,960 | | | | | 28,309 | |
Aircastle Ltd. | | | | 4.40 | | | | | 9/25/2023 | | | | | 25,000 | | | | | 24,960 | | | | | 24,588 | |
Aircastle Ltd. | | | | 5.00 | | | | | 4/1/2023 | | | | | 50,000 | | | | | 50,414 | | | | | 50,196 | |
Antares Holdings LP^ | | | | 6.00 | | | | | 8/15/2023 | | | | | 250,000 | | | | | 251,767 | | | | | 247,136 | |
Brookfield Finance, Inc.+ | | | | 4.25 | | | | | 6/2/2026 | | | | | 60,000 | | | | | 59,548 | | | | | 58,779 | |
Discover Financial Services, Inc. | | | | 4.10 | | | | | 2/9/2027 | | | | | 65,000 | | | | | 65,394 | | | | | 60,682 | |
Discover Financial Services, Inc. | | | | 5.50 | | | | | 12/31/2099 | | | | | 160,000 | | | | | 160,000 | | | | | 132,933 | |
Genpact Luxembourg Sarl+ | | | | 3.70 | | | | | 4/1/2022 | | | | | 65,000 | | | | | 65,104 | | | | | 64,506 | |
High Street Funding Trust I^ | | | | 4.11 | | | | | 2/15/2028 | | | | | 150,000 | | | | | 150,000 | | | | | 147,306 | |
Lazard Group LLC | | | | 3.63 | | | | | 3/1/2027 | | | | | 30,000 | | | | | 29,894 | | | | | 28,214 | |
Lazard Group LLC | | | | 4.50 | | | | | 9/19/2028 | | | | | 20,000 | | | | | 19,820 | | | | | 20,004 | |
Legg Mason, Inc. | | | | 5.63 | | | | | 1/15/2044 | | | | | 35,000 | | | | | 36,267 | | | | | 34,540 | |
Neuberger Berman Group LLC/Neuberger Berman Finance Corp.^ | | | | 4.50 | | | | | 3/15/2027 | | | | | 25,000 | | | | | 24,831 | | | | | 24,978 | |
| | | | | | | | | | | | | | | | | | | | | | | | | |
Total Diversified Financial Services | | | | | | | | | | | | | | 1,125,000 | | | | | 1,126,188 | | | | | 1,068,151 | |
| | | | | | | | | | | | | | | | | | | | | | | | | |
| | | | | |
Electric — 1.1%*: | | | | | | | | | | | | | | | | | | | | | | | | | |
Appalachian Power Co. | | | | 6.70 | | | | | 8/15/2037 | | | | | 30,000 | | | | | 37,052 | | | | | 36,673 | |
Cleveland Electric Illuminating Co. (The)^ | | | | 3.50 | | | | | 4/1/2028 | | | | | 25,000 | | | | | 24,933 | | | | | 23,816 | |
CMS Energy Corp. | | | | 4.88 | | | | | 3/1/2044 | | | | | 5,000 | | | | | 5,136 | | | | | 5,219 | |
Duke Energy Corp. | | | | 3.75 | | | | | 9/1/2046 | | | | | 40,000 | | | | | 39,526 | | | | | 34,582 | |
Indianapolis Power & Light Co.^ | | | | 4.05 | | | | | 5/1/2046 | | | | | 45,000 | | | | | 44,714 | | | | | 41,100 | |
IPALCO Enterprises, Inc. | | | | 3.45 | | | | | 7/15/2020 | | | | | 50,000 | | | | | 50,130 | | | | | 49,936 | |
IPALCO Enterprises, Inc. | | | | 3.70 | | | | | 9/1/2024 | | | | | 25,000 | | | | | 24,979 | | | | | 24,338 | |
Oncor Electric Delivery Co. LLC | | | | 5.25 | | | | | 9/30/2040 | | | | | 40,000 | | | | | 48,490 | | | | | 45,654 | |
Southwestern Public Service Co. | | | | 6.00 | | | | | 10/1/2036 | | | | | 30,000 | | | | | 35,227 | | | | | 35,430 | |
| | | | | | | | | | | | | | | | | | | | | | | | | |
Total Electric | | | | | | | | | | | | | | 290,000 | | | | | 310,187 | | | | | 296,748 | |
| | | | | | | | | | | | | | | | | | | | | | | | | |
| | | | | |
Electronics — 0.1%*: | | | | | | | | | | | | | | | | | | | | | | | | | |
Arrow Electronics, Inc. | | | | 3.88 | | | | | 1/12/2028 | | | | | 25,000 | | | | | 24,907 | | | | | 22,773 | |
| | | | | | | | | | | | | | | | | | | | | | | | | |
| | | | | |
Forestry and Paper Products — 0.1%*: | | | | | | | | | | | | | | | | | | | | | | | | | |
Fibria Overseas Finance Ltd.+ | | | | 4.00 | | | | | 1/14/2025 | | | | | 30,000 | | | | | 27,765 | | | | | 28,299 | |
| | | | | | | | | | | | | | | | | | | | | | | | | |
| | | | | |
Gas — 0.2%*: | | | | | | | | | | | | | | | | | | | | | | | | | |
NiSource Finance Corp. | | | | 4.80 | | | | | 2/15/2044 | | | | | 60,000 | | | | | 65,563 | | | | | 58,090 | |
| | | | | | | | | | | | | | | | | | | | | | | | | |
| | | | | |
Healthcare-Products — 0.1%*: | | | | | | | | | | | | | | | | | | | | | | | | | |
Becton Dickinson and Co. | | | | 4.69 | | | | | 12/15/2044 | | | | | 25,000 | | | | | 25,920 | | | | | 23,399 | |
| | | | | | | | | | | | | | | | | | | | | | | | | |
See accompanying Notes to the Financial Statements.
136
Barings Total Return Bond Fund 2018 Semi-Annual Report
SCHEDULE OF INVESTMENTS (CONTINUED)
December 31, 2018 (Unaudited)
| | | | | | | | | | | | | | | | | | | | | | | | | |
| | | EFFECTIVE
INTEREST RATE | | DUE DATE | | PRINCIPAL ‡‡ | | COST | | FAIR
VALUE |
Corporate Bonds (Continued) | | | | | | | | | | | | | | | | | | | | | | | | | |
| | | | | |
Healthcare-Services — 0.5%*: | | | | | | | | | | | | | | | | | | | | | | | | | |
Humana, Inc. | | | | 3.95 | % | | | | 3/15/2027 | | | | | 13,000 | | | | | $12,986 | | | | | $12,701 | |
Humana, Inc. | | | | 4.80 | | | | | 3/15/2047 | | | | | 20,000 | | | | | 19,982 | | | | | 20,016 | |
IHC Health Services, Inc. | | | | 4.13 | | | | | 5/15/2048 | | | | | 100,000 | | | | | 100,661 | | | | | 98,815 | |
| | | | | | | | | | | | | | | | | | | | | | | | | |
Total Healthcare-Services | | | | | | | | | | | | | | 133,000 | | | | | 133,629 | | | | | 131,532 | |
| | | | | | | | | | | | | | | | | | | | | | | | | |
| | | | | |
Housewares — 0.1%*: | | | | | | | | | | | | | | | | | | | | | | | | | |
Toro Co. (The) | | | | 7.80 | | | | | 6/15/2027 | | | | | 25,000 | | | | | 30,724 | | | | | 29,886 | |
| | | | | | | | | | | | | | | | | | | | | | | | | |
| | | | | |
Insurance — 3.1%*: | | | | | | | | | | | | | | | | | | | | | | | | | |
Allstate Corp. (The), 3M USD LIBOR + 2.938% | | | | 5.75 | # | | | | 8/15/2053 | | | | | 110,000 | | | | | 116,396 | | | | | 107,250 | |
American International Group, Inc. | | | | 3.90 | | | | | 4/1/2026 | | | | | 20,000 | | | | | 19,992 | | | | | 19,241 | |
American International Group, Inc. | | | | 4.20 | | | | | 4/1/2028 | | | | | 30,000 | | | | | 29,895 | | | | | 28,901 | |
American International Group, Inc. | | | | 4.50 | | | | | 7/16/2044 | | | | | 25,000 | | | | | 25,658 | | | | | 22,311 | |
American International Group, Inc. | | | | 4.75 | | | | | 4/1/2048 | | | | | 15,000 | | | | | 14,913 | | | | | 13,727 | |
American International Group, Inc. | | | | 5.75 | | | | | 4/1/2048 | | | | | 70,000 | | | | | 69,378 | | | | | 60,900 | |
AmTrust Financial Services, Inc. | | | | 6.13 | | | | | 8/15/2023 | | | | | 75,000 | | | | | 74,626 | | | | | 66,606 | |
Arch Capital Group US, Inc. | | | | 5.14 | | | | | 11/1/2043 | | | | | 25,000 | | | | | 25,297 | | | | | 26,185 | |
Athene Holding Ltd.+ | | | | 4.13 | | | | | 1/12/2028 | | | | | 125,000 | | | | | 121,704 | | | | | 113,545 | |
AXIS Specialty Finance PLC+ | | | | 4.00 | | | | | 12/6/2027 | | | | | 60,000 | | | | | 59,061 | | | | | 57,420 | |
CNA Financial Corp. | | | | 3.45 | | | | | 8/15/2027 | | | | | 25,000 | | | | | 24,950 | | | | | 23,260 | |
Enstar Group Ltd.+ | | | | 4.50 | | | | | 3/10/2022 | | | | | 20,000 | | | | | 20,000 | | | | | 20,134 | |
Progressive Corp. (The) | | | | 5.38 | ** | | | | 12/31/2099 | | | | | 75,000 | | | | | 75,000 | | | | | 70,279 | |
Prudential Financial, Inc. | | | | 5.70 | ** | | | | 9/15/2048 | | | | | 85,000 | | | | | 83,963 | | | | | 79,050 | |
Trinity Acquisition PLC+ | | | | 4.40 | | | | | 3/15/2026 | | | | | 55,000 | | | | | 56,344 | | | | | 54,654 | |
XLIT Ltd. | | | | 4.45 | | | | | 3/31/2025 | | | | | 85,000 | | | | | 87,631 | | | | | 84,471 | |
XLIT Ltd. | | | | 5.50 | | | | | 3/31/2045 | | | | | 30,000 | | | | | 28,811 | | | | | 31,021 | |
| | | | | | | | | | | | | | | | | | | | | | | | | |
Total Insurance | | | | | | | | | | | | | | 930,000 | | | | | 933,619 | | | | | 878,955 | |
| | | | | | | | | | | | | | | | | | | | | | | | | |
| | |
Internet — 0.3%*: | | | | | | | | | | | |
Amazon.com, Inc. | | | | 4.05 | | | | | 8/22/2047 | | | | | 45,000 | | | | | 44,675 | | | | | 43,969 | |
Expedia, Inc. | | | | 5.00 | | | | | 2/15/2026 | | | | | 40,000 | | | | | 39,861 | | | | | 40,406 | |
| | | | | | | | | | | | | | | | | | | | | | | | | |
Total Internet | | | | | | | | | | | | | | 85,000 | | | | | 84,536 | | | | | 84,375 | |
| | | | | | | | | | | | | | | | | | | | | | | | | |
| | | | | |
Investment Company Security — 0.8%*: | | | | | | | | | | | | | | | | | | | | | | | | | |
Ares Capital Corp. | | | | 3.50 | | | | | 2/10/2023 | | | | | 75,000 | | | | | 74,955 | | | | | 71,286 | |
FS KKR Capital Corp. | | | | 4.00 | | | | | 7/15/2019 | | | | | 75,000 | | | | | 75,228 | | | | | 74,915 | |
TCP Capital Corp. | | | | 4.13 | | | | | 8/11/2022 | | | | | 75,000 | | | | | 74,782 | | | | | 72,271 | |
| | | | | | | | | | | | | | | | | | | | | | | | | |
Total Investment Company Security | | | | | | | | | | | | | | 225,000 | | | | | 224,965 | | | | | 218,472 | |
| | | | | | | | | | | | | | | | | | | | | | | | | |
| | | | | |
Iron/Steel — 0.5%*: | | | | | | | | | | | | | | | | | | | | | | | | | |
Vale Overseas Ltd.+ | | | | 5.88 | | | | | 6/10/2021 | | | | | 125,000 | | | | | 132,932 | | | | | 131,094 | |
Vale Overseas Ltd.+ | | | | 6.88 | | | | | 11/21/2036 | | | | | 15,000 | | | | | 14,988 | | | | | 17,152 | |
| | | | | | | | | | | | | | | | | | | | | | | | | |
Total Iron/Steel | | | | | | | | | | | | | | 140,000 | | | | | 147,920 | | | | | 148,246 | |
| | | | | | | | | | | | | | | | | | | | | | | | | |
See accompanying Notes to the Financial Statements.
137
Barings Total Return Bond Fund 2018 Semi-Annual Report
SCHEDULE OF INVESTMENTS (CONTINUED)
December 31, 2018 (Unaudited)
| | | | | | | | | | | | | | | | | | | | | | | | | |
| | | EFFECTIVE
INTEREST RATE | | DUE DATE | | PRINCIPAL ‡‡ | | COST | | FAIR
VALUE |
Corporate Bonds (Continued) | | | | | | | | | | | | | | | | | | | | | | | | | |
| | | | | |
IT Services — 0.4%*: | | | | | | | | | | | | | | | | | | | | | | | | | |
Dell International LLC/EMC Corp.^ | | | | 8.35 | % | | | | 7/15/2046 | | | | | 45,000 | | | | | $57,684 | | | | | $48,726 | |
Leidos Holdings, Inc. | | | | 4.45 | | | | | 12/1/2020 | | | | | 75,000 | | | | | 75,855 | | | | | 74,437 | |
| | | | | | | | | | | | | | | | | | | | | | | | | |
Total IT Services | | | | | | | | | | | | | | 120,000 | | | | | 133,539 | | | | | 123,163 | |
| | | | | | | | | | | | | | | | | | | | | | | | | |
| | | | | |
Media — 0.4%*: | | | | | | | | | | | | | | | | | | | | | | | | | |
Comcast Corp. | | | | 3.40 | | | | | 7/15/2046 | | | | | 20,000 | | | | | 19,834 | | | | | 16,572 | |
Discovery Communications LLC | | | | 4.88 | | | | | 4/1/2043 | | | | | 25,000 | | | | | 22,851 | | | | | 22,120 | |
Discovery Communications LLC | | | | 5.00 | | | | | 9/20/2037 | | | | | 25,000 | | | | | 24,976 | | | | | 23,189 | |
Time Warner Cable LLC | | | | 4.50 | | | | | 9/15/2042 | | | | | 60,000 | | | | | 49,714 | | | | | 48,234 | |
| | | | | | | | | | | | | | | | | | | | | | | | | |
Total Media | | | | | | | | | | | | | | 130,000 | | | | | 117,375 | | | | | 110,115 | |
| | | | | | | | | | | | | | | | | | | | | | | | | |
| | | | | |
Mining — 0.9%*: | | | | | | | | | | | | | | | | | | | | | | | | | |
Glencore Finance Canada Ltd.+^ | | | | 5.55 | | | | | 10/25/2042 | | | | | 22,000 | | | | | 22,080 | | | | | 19,803 | |
Glencore Funding LLC^ | | | | 3.88 | | | | | 10/27/2027 | | | | | 25,000 | | | | | 24,808 | | | | | 22,350 | |
Glencore Funding LLC^ | | | | 4.00 | | | | | 4/16/2025 | | | | | 50,000 | | | | | 49,946 | | | | | 47,071 | |
Glencore Funding LLC^ | | | | 4.63 | | | | | 4/29/2024 | | | | | 25,000 | | | | | 25,892 | | | | | 24,781 | |
Kinross Gold Corp.+ | | | | 4.50 | | | | | 7/15/2027 | | | | | 30,000 | | | | | 27,727 | | | | | 25,912 | |
Kinross Gold Corp.+ | | | | 5.13 | | | | | 9/1/2021 | | | | | 85,000 | | | | | 87,647 | | | | | 84,787 | |
Kinross Gold Corp.+ | | | | 5.95 | | | | | 3/15/2024 | | | | | 25,000 | | | | | 25,662 | | | | | 24,875 | |
| | | | | | | | | | | | | | | | | | | | | | | | | |
Total Mining | | | | | | | | | | | | | | 262,000 | | | | | 263,762 | | | | | 249,579 | |
| | | | | | | | | | | | | | | | | | | | | | | | | |
| | | | | |
Miscellaneous Manufacturing — 0.3%*: | | | | | | | | | | | | | | | | | | | | | | | | | |
General Electric Co. | | | | 2.70 | | | | | 10/9/2022 | | | | | 30,000 | | | | | 26,636 | | | | | 27,838 | |
General Electric Co. | | | | 4.13 | | | | | 10/9/2042 | | | | | 25,000 | | | | | 22,861 | | | | | 19,533 | |
General Electric Co. MTN | | | | 6.88 | | | | | 1/10/2039 | | | | | 35,000 | | | | | 46,094 | | | | | 36,593 | |
| | | | | | | | | | | | | | | | | | | | | | | | | |
Total Miscellaneous Manufacturing | | | | | | | | | | | | | | 90,000 | | | | | 95,591 | | | | | 83,964 | |
| | | | | | | | | | | | | | | | | | | | | | | | | |
| | | | | |
Office/Business Equip — 0.4%*: | | | | | | | | | | | | | | | | | | | | | | | | | |
Pitney Bowes, Inc. | | | | 3.88 | | | | | 9/15/2020 | | | | | 20,000 | | | | | 19,972 | | | | | 19,550 | |
Pitney Bowes, Inc. | | | | 3.88 | | | | | 10/1/2021 | | | | | 115,000 | | | | | 114,819 | | | | | 107,669 | |
| | | | | | | | | | | | | | | | | | | | | | | | | |
Total Office/Business Equip | | | | | | | | | | | | | | 135,000 | | | | | 134,791 | | | | | 127,219 | |
| | | | | | | | | | | | | | | | | | | | | | | | | |
| | | | | |
Oil and Gas — 2.4%*: | | | | | | | | | | | | | | | | | | | | | | | | | |
Anadarko Petroleum Corp. | | | | 5.55 | | | | | 3/15/2026 | | | | | 20,000 | | | | | 19,952 | | | | | 20,947 | |
Anadarko Petroleum Corp. | | | | 6.60 | | | | | 3/15/2046 | | | | | 24,000 | | | | | 29,370 | | | | | 26,500 | |
Cenovus Energy, Inc.+ | | | | 3.00 | | | | | 8/15/2022 | | | | | 60,000 | | | | | 58,108 | | | | | 56,959 | |
Cenovus Energy, Inc.+ | | | | 4.25 | | | | | 4/15/2027 | | | | | 75,000 | | | | | 73,521 | | | | | 68,312 | |
Cenovus Energy, Inc.+ | | | | 6.75 | | | | | 11/15/2039 | | | | | 25,000 | | | | | 28,611 | | | | | 24,398 | |
Continental Resources, Inc. | | | | 5.00 | | | | | 9/15/2022 | | | | | 30,000 | | | | | 30,111 | | | | | 29,787 | |
Encana Corp.+ | | | | 6.50 | | | | | 2/1/2038 | | | | | 40,000 | | | | | 46,221 | | | | | 43,368 | |
EQT Corp. | | | | 3.90 | | | | | 10/1/2027 | | | | | 105,000 | | | | | 104,622 | | | | | 90,518 | |
Helmerich & Payne, Inc.^ | | | | 4.65 | | | | | 3/15/2025 | | | | | 25,000 | | | | | 25,388 | | | | | 25,491 | |
Marathon Petroleum Corp.^ | | | | 4.50 | | | | | 4/1/2048 | | | | | 15,000 | | | | | 14,790 | | | | | 12,591 | |
Marathon Petroleum Corp. | | | | 6.50 | | | | | 3/1/2041 | | | | | 30,000 | | | | | 33,175 | | | | | 32,362 | |
Nabors Industries, Inc. | | | | 5.50 | | | | | 1/15/2023 | | | | | 35,000 | | | | | 35,772 | | | | | 27,780 | |
See accompanying Notes to the Financial Statements.
138
Barings Total Return Bond Fund 2018 Semi-Annual Report
SCHEDULE OF INVESTMENTS (CONTINUED)
December 31, 2018 (Unaudited)
| | | | | | | | | | | | | | | | | | | | | | | | | |
| | | EFFECTIVE
INTEREST RATE | | DUE DATE | | PRINCIPAL ‡‡ | | COST | | FAIR
VALUE |
Corporate Bonds (Continued) | | | | | | | | | | | | | | | | | | | | | | | | | |
| | | | | |
Oil and Gas (Continued) | | | | | | | | | | | | | | | | | | | | | | | | | |
Patterson-UTI Energy, Inc. | | | | 3.95 | % | | | | 2/1/2028 | | | | | 22,000 | | | | $ | 21,249 | | | | $ | 20,174 | |
PBF Holding Co. LLC/PBF Finance Corp. | | | | 7.00 | | | | | 11/15/2023 | | | | | 25,000 | | | | | 25,454 | | | | | 23,875 | |
Petroleos Mexicanos+ | | | | 3.50 | | | | | 1/30/2023 | | | | | 50,000 | | | | | 48,191 | | | | | 45,250 | |
Petroleos Mexicanos+ | | | | 4.63 | | | | | 9/21/2023 | | | | | 10,000 | | | | | 10,206 | | | | | 9,385 | |
Petroleos Mexicanos+ | | | | 5.35 | | | | | 2/12/2028 | | | | | 30,000 | | | | | 30,000 | | | | | 26,175 | |
Petroleos Mexicanos+ | | | | 5.50 | | | | | 1/21/2021 | | | | | 85,000 | | | | | 87,052 | | | | | 84,657 | |
Petroleos Mexicanos+ | | | | 6.50 | | | | | 3/13/2027 | | | | | 15,000 | | | | | 14,885 | | | | | 14,100 | |
Rowan Cos., Inc. | | | | 4.88 | | | | | 6/1/2022 | | | | | 8,000 | | | | | 7,991 | | | | | 6,600 | |
| | | | | | | | | | | | | | | | | | | | | | | | | |
Total Oil and Gas | | | | | | | | | | | | | | 729,000 | | | | | 744,669 | | | | | 689,229 | |
| | | | | | | | | | | | | | | | | | | | | | | | | |
| | | | | |
Oil and Gas Services — 0.3%*: | | | | | | | | | | | | | | | | | | | | | | | | | |
Baker Hughes a GE Co. LLC / Baker HughesCo-Obligor, Inc. | | | | 3.34 | | | | | 12/15/2027 | | | | | 8,000 | | | | | 7,318 | | | | | 7,361 | |
National Oilwell Varco, Inc. | | | | 3.95 | | | | | 12/1/2042 | | | | | 37,000 | | | | | 30,643 | | | | | 29,529 | |
SESI LLC | | | | 7.13 | | | | | 12/15/2021 | | | | | 32,000 | | | | | 32,974 | | | | | 27,200 | |
Weatherford International Ltd. | | | | 5.95 | | | | | 4/15/2042 | | | | | 30,000 | | | | | 25,297 | | | | | 15,262 | |
| | | | | | | | | | | | | | | | | | | | | | | | | |
Total Oil and Gas Services | | | | | | | | | | | | | | 107,000 | | | | | 96,232 | | | | | 79,352 | |
| | | | | | | | | | | | | | | | | | | | | | | | | |
| | | | | |
Pharmaceuticals — 1.5%*: | | | | | | | | | | | | | | | | | | | | | | | | | |
AbbVie, Inc. | | | | 4.70 | | | | | 5/14/2045 | | | | | 30,000 | | | | | 29,346 | | | | | 27,282 | |
Bayer US Finance II LLC^ | | | | 4.40 | | | | | 7/15/2044 | | | | | 45,000 | | | | | 40,994 | | | | | 38,515 | |
CVS Health Corp. | | | | 4.30 | | | | | 3/25/2028 | | | | | 27,000 | | | | | 26,645 | | | | | 26,396 | |
CVS Health Corp. | | | | 5.05 | | | | | 3/25/2048 | | | | | 40,000 | | | | | 39,775 | | | | | 38,904 | |
CVS Pass-Through Trust^ | | | | 5.93 | | | | | 1/10/2034 | | | | | 28,376 | | | | | 32,103 | | | | | 30,561 | |
Express Scripts Holding Co. | | | | 4.50 | | | | | 2/25/2026 | | | | | 21,000 | | | | | 21,550 | | | | | 21,284 | |
Express Scripts Holding Co. | | | | 4.80 | | | | | 7/15/2046 | | | | | 30,000 | | | | | 30,182 | | | | | 28,760 | |
McKesson Corp. | | | | 6.00 | | | | | 3/1/2041 | | | | | 50,000 | | | | | 55,584 | | | | | 55,359 | |
Mylan NV | | | | 5.25 | | | | | 6/15/2046 | | | | | 40,000 | | | | | 39,994 | | | | | 33,706 | |
Teva Pharmaceutical Finance Netherlands III B.V.+ | | | | 1.70 | | | | | 7/19/2019 | | | | | 13,000 | | | | | 12,909 | | | | | 12,768 | |
Teva Pharmaceutical Finance Netherlands III B.V.+ | | | | 2.20 | | | | | 7/21/2021 | | | | | 99,000 | | | | | 94,947 | | | | | 91,002 | |
Teva Pharmaceutical Finance Netherlands III B.V.+ | | | | 4.10 | | | | | 10/1/2046 | | | | | 10,000 | | | | | 9,920 | | | | | 6,610 | |
| | | | | | | | | | | | | | | | | | | | | | | | | |
Total Pharmaceuticals | | | | | | | | | | | | | | 433,376 | | | | | 433,949 | | | | | 411,147 | |
| | | | | | | | | | | | | | | | | | | | | | | | | |
| | | | | |
Pipelines — 2.6%*: | | | | | | | | | | | | | | | | | | | | | | | | | |
Andeavor Logistics LP | | | | 6.88 | #** | | | | 12/31/2099 | | | | | 115,000 | | | | | 113,968 | | | | | 102,350 | |
Energy Transfer Operating LP | | | | 4.20 | | | | | 4/15/2027 | | | | | 25,000 | | | | | 24,955 | | | | | 23,298 | |
Energy Transfer Operating LP | | | | 4.75 | | | | | 1/15/2026 | | | | | 30,000 | | | | | 29,860 | | | | | 29,150 | |
Energy Transfer Operating LP | | | | 6.13 | | | | | 12/15/2045 | | | | | 25,000 | | | | | 27,394 | | | | | 24,450 | |
Energy Transfer Operating LP | | | | 6.25 | | | | | 12/31/2099 | | | | | 60,000 | | | | | 60,000 | | | | | 50,213 | |
Energy Transfer Operating LP | | | | 7.50 | | | | | 10/15/2020 | | | | | 37,000 | | | | | 39,009 | | | | | 38,480 | |
EnLink Midstream Partners LP | | | | 2.70 | | | | | 4/1/2019 | | | | | 30,000 | | | | | 30,005 | | | | | 29,813 | |
EnLink Midstream Partners LP | | | | 4.15 | | | | | 6/1/2025 | | | | | 25,000 | | | | | 25,088 | | | | | 22,538 | |
EnLink Midstream Partners LP | | | | 4.85 | | | | | 7/15/2026 | | | | | 19,000 | | | | | 19,363 | | | | | 17,134 | |
EnLink Midstream Partners LP | | | | 6.00 | | | | | 12/31/2099 | | | | | 50,000 | | | | | 42,936 | | | | | 36,345 | |
Enterprise Products Operating LLC | | | | 5.38 | | | | | 2/15/2078 | | | | | 30,000 | | | | | 30,000 | | | | | 24,805 | |
See accompanying Notes to the Financial Statements.
139
Barings Total Return Bond Fund 2018 Semi-Annual Report
SCHEDULE OF INVESTMENTS (CONTINUED)
December 31, 2018 (Unaudited)
| | | | | | | | | | | | | | | | | | | | | | | | | |
| | | EFFECTIVE
INTEREST RATE | | DUE DATE | | PRINCIPAL ‡‡ | | COST | | FAIR
VALUE |
Corporate Bonds (Continued) | | | | | | | | | | | | | | | | | | | | | | | | | |
| | | | | |
Pipelines(Continued) | | | | | | | | | | | | | | | | | | | | | | | | | |
Kinder Morgan Energy Partners LP MTN | | | | 6.95 | % | | | | 1/15/2038 | | | | | 30,000 | | | | $ | 31,917 | | | | $ | 33,460 | |
MPLX LP | | | | 4.50 | | | | | 4/15/2038 | | | | | 30,000 | | | | | 29,653 | | | | | 26,200 | |
MPLX LP | | | | 4.80 | | | | | 2/15/2029 | | | | | 15,000 | | | | | 14,916 | | | | | 14,963 | |
MPLX LP | | | | 5.20 | | | | | 3/1/2047 | | | | | 5,000 | | | | | 4,966 | | | | | 4,602 | |
Phillips 66 Partners LP | | | | 4.68 | | | | | 2/15/2045 | | | | | 2,000 | | | | | 2,001 | | | | | 1,801 | |
Phillips 66 Partners LP | | | | 4.90 | | | | | 10/1/2046 | | | | | 15,000 | | | | | 14,899 | | | | | 13,751 | |
Plains All American Pipeline LP/PAA Finance Corp. | | | | 4.50 | | | | | 12/15/2026 | | | | | 80,000 | | | | | 80,013 | | | | | 77,056 | |
Plains All American Pipeline LP/PAA Finance Corp. | | | | 4.70 | | | | | 6/15/2044 | | | | | 40,000 | | | | | 36,255 | | | | | 34,323 | |
Sabine Pass Liquefaction LLC | | | | 4.20 | | | | | 3/15/2028 | | | | | 75,000 | | | | | 74,937 | | | | | 71,739 | |
Sunoco Logistics Partners Operations LP | | | | 4.00 | | | | | 10/1/2027 | | | | | 20,000 | | | | | 19,860 | | | | | 18,319 | |
Sunoco Logistics Partners Operations LP | | | | 5.30 | | | | | 4/1/2044 | | | | | 25,000 | | | | | 24,673 | | | | | 22,075 | |
Western Gas Partners LP | | | | 4.50 | | | | | 3/1/2028 | | | | | 15,000 | | | | | 14,921 | | | | | 14,021 | |
| | | | | | | | | | | | | | | | | | | | | | | | | |
Total Pipelines | | | | | | | | | | | | | | 798,000 | | | | | 791,589 | | | | | 730,886 | |
| | | | | | | | | | | | | | | | | | | | | | | | | |
| | | | | |
Real Estate Investment Trusts — 0.6%*: | | | | | | | | | | | | | | | | | | | | | | | | | |
Crown Castle International Corp. | | | | 4.75 | | | | | 5/15/2047 | | | | | 10,000 | | | | | 9,923 | | | | | 9,270 | |
CubeSmart LP | | | | 3.13 | | | | | 9/1/2026 | | | | | 45,000 | | | | | 44,823 | | | | | 41,267 | |
Healthcare Trust of America Holdings LP | | | | 3.75 | | | | | 7/1/2027 | | | | | 35,000 | | | | | 34,846 | | | | | 33,325 | |
Kimco Realty Corp. | | | | 3.30 | | | | | 2/1/2025 | | | | | 25,000 | | | | | 24,967 | | | | | 23,828 | |
National Retail Properties, Inc. | | | | 4.30 | | | | | 10/15/2028 | | | | | 20,000 | | | | | 19,861 | | | | | 20,099 | |
VEREIT Operating Partnership LP | | | | 4.63 | | | | | 11/1/2025 | | | | | 35,000 | | | | | 34,771 | | | | | 35,065 | |
Weingarten Realty Investors | | | | 3.25 | | | | | 8/15/2026 | | | | | 10,000 | | | | | 9,933 | | | | | 9,255 | |
| | | | | | | | | | | | | | | | | | | | | | | | | |
Total REITS | | | | | | | | | | | | | | 180,000 | | | | | 179,124 | | | | | 172,109 | |
| | | | | | | | | | | | | | | | | | | | | | | | | |
| | | | | |
Retail — 0.9%*: | | | | | | | | | | | | | | | | | | | | | | | | | |
Dollar Tree, Inc. | | | | 4.20 | | | | | 5/15/2028 | | | | | 45,000 | | | | | 44,888 | | | | | 42,624 | |
El Puerto de Liverpool SAB de CV+^ | | | | 3.95 | | | | | 10/2/2024 | | | | | 200,000 | | | | | 199,334 | | | | | 187,502 | |
QVC, Inc. | | | | 4.38 | | | | | 3/15/2023 | | | | | 30,000 | | | | | 29,549 | | | | | 28,786 | |
| | | | | | | | | | | | | | | | | | | | | | | | | |
Total Retail | | | | | | | | | | | | | | 275,000 | | | | | 273,771 | | | | | 258,912 | |
| | | | | | | | | | | | | | | | | | | | | | | | | |
| | | | | |
Semiconductors — 0.2%*: | | | | | | | | | | | | | | | | | | | | | | | | | |
Microchip Technology, Inc.^ | | | | 3.92 | | | | | 6/1/2021 | | | | | 70,000 | | | | | 69,786 | | | | | 69,439 | |
| | | | | | | | | | | | | | | | | | | | | | | | | |
| | | | | |
Telecommunications — 0.6%*: | | | | | | | | | | | | | | | | | | | | | | | | | |
AT&T, Inc. | | | | 3.40 | | | | | 5/15/2025 | | | | | 25,000 | | | | | 23,838 | | | | | 23,541 | |
AT&T, Inc. | | | | 4.75 | | | | | 5/15/2046 | | | | | 60,000 | | | | | 55,489 | | | | | 53,274 | |
AT&T, Inc. | | | | 5.25 | | | | | 3/1/2037 | | | | | 15,000 | | | | | 14,933 | | | | | 14,734 | |
Verizon Communications, Inc. | | | | 6.55 | | | | | 9/15/2043 | | | | | 56,000 | | | | | 69,437 | | | | | 66,056 | |
| | | | | | | | | | | | | | | | | | | | | | | | | |
Total Telecommunications | | | | | | | | | | | | | | 156,000 | | | | | 163,697 | | | | | 157,605 | |
| | | | | | | | | | | | | | | | | | | | | | | | | |
| | | | | |
Transportation — 0.1%*: | | | | | | | | | | | | | | | | | | | | | | | | | |
CSX Corp. | | | | 4.75 | | | | | 11/15/2048 | | | | | 20,000 | | | | | 19,814 | | | | | 20,217 | |
| | | | | | | | | | | | | | | | | | | | | | | | | |
See accompanying Notes to the Financial Statements.
140
Barings Total Return Bond Fund 2018 Semi-Annual Report
SCHEDULE OF INVESTMENTS (CONTINUED)
December 31, 2018 (Unaudited)
| | | | | | | | | | | | | | | | | | | | | | | | | |
| | | EFFECTIVE
INTEREST RATE | | DUE DATE | | PRINCIPAL ‡‡ | | COST | | FAIR
VALUE |
Corporate Bonds (Continued) | | | | | | | | | | | | | | | | | | | | | | | | | |
| | | | | |
Venture Capital — 0.5%*: | | | | | | | | | | | | | | | | | | | | | | | | | |
Hercules Capital, Inc. | | | | 4.63 | % | | | | 10/23/2022 | | | | | 150,000 | | | | | $149,354 | | | | | $146,377 | |
| | | | | | | | | | | | | | | | | | | | | | | | | |
Total Corporate Bonds | | | | | | | | | | | | | | 9,290,376 | | | | | 9,397,385 | | | | | 8,878,035 | |
| | | | | | | | | | | | | | | | | | | | | | | | | |
| | |
Foreign Government — 0.8%*: | | | | | | | | | | | |
| | | | | |
Colombia — 0.4%*: | | | | | | | | | | | | | | | | | | | | | | | | | |
Colombia Government International Bond+ | | | | 6.13 | | | | | 1/18/2041 | | | | | 100,000 | | | | | 115,106 | | | | | 108,125 | |
| | | | | | | | | | | | | | | | | | | | | | | | | |
| | | | | |
Mexico — 0.4%*: | | | | | | | | | | | | | | | | | | | | | | | | | |
Mexico Government International Bond+ | | | | 4.75 | | | | | 3/8/2044 | | | | | 68,000 | | | | | 69,446 | | | | | 61,710 | |
Mexico Government International Bond+ | | | | 5.55 | | | | | 1/21/2045 | | | | | 60,000 | | | | | 64,502 | | | | | 60,825 | |
| | | | | | | | | | | | | | | | | | | | | | | | | |
Total Mexico | | | | | 128,000 | | | | | 133,948 | | | | | 122,535 | |
| | | | | | | | | | | | | | | | | | | | | | | | | |
| | | | | | | | | | | | | | | | | | | | | | | | | |
Total Foreign Government | | | | | | | | | | | | | | 228,000 | | | | | 249,054 | | | | | 230,660 | |
| | | | | | | | | | | | | | | | | | | | | | | | | |
| | | | | |
Mortgage-Backed Securities — 2.6%*: | | | | | | | | | | | | | | | | | | | | | | | | | |
Aventura Mall Trust^ | | | | 4.11 | #@ | | | | 7/5/2040 | | | | | 70,000 | | | | | 68,645 | | | | | 67,404 | |
BANK 2018-BNK14 | | | | 4.60 | #@ | | | | 9/15/2060 | | | | | 30,000 | | | | | 30,310 | | | | | 29,453 | |
BBCMS 2018-CHRS Mortgage Trust^ | | | | 4.27 | | | | | 8/5/2038 | | | | | 100,000 | | | | | 97,701 | | | | | 97,012 | |
BBCMS Mortgage Trust^ | | | | 4.27 | #@ | | | | 8/5/2038 | | | | | 100,000 | | | | | 100,459 | | | | | 99,271 | |
BHMS, 1M USD LIBOR + 1.500%^ | | | | 3.96 | # | | | | 7/15/2035 | | | | | 100,000 | | | | | 100,000 | | | | | 98,900 | |
BX Commercial Mortgage Trust 2018-IND, 1M USD LIBOR + 1.700%^ | | | | 4.16 | # | | | | 11/15/2035 | | | | | 119,821 | | | | | 119,821 | | | | | 118,474 | |
GS Mortgage Securities Corp. II^ | | | | 3.00 | | | | | 7/10/2051 | | | | | 15,000 | | | | | 12,364 | | | | | 11,898 | |
GS Mortgage Securities Trust | | | | 4.40 | #@ | | | | 7/10/2048 | | | | | 100,000 | | | | | 102,735 | | | | | 100,930 | |
JPMorgan Mortgage Trust^ | | | | 3.50 | #@ | | | | 1/25/2047 | | | | | 85,714 | | | | | 85,326 | | | | | 83,689 | |
MSCG Trust 2018-SELF, 1M USD LIBOR + 1.180%^ | | | | 3.64 | # | | | | 10/15/2037 | | | | | 20,000 | | | | | 20,000 | | | | | 19,644 | |
| | | | | | | | | | | | | | | | | | | | | | | | | |
Total Mortgage-Backed Securities | | | | | 740,535 | | | | | 737,361 | | | | | 726,675 | |
| | | | | | | | | | | | | | | | | | | | | | | | | |
| | |
U.S. Treasury & Government Agencies — 23.2%*: | | | | | | | | | | | |
Federal Home Loan Mortgage Corp. | | | | 3.50 | | | | | 7/1/2046 | | | | | 43,004 | | | | | 45,392 | | | | | 43,169 | |
Federal Home Loan Mortgage Corp. | | | | 3.50 | | | | | 11/1/2046 | | | | | 62,326 | | | | | 65,727 | | | | | 62,471 | |
Federal Home Loan Mortgage Corp. | | | | 4.00 | | | | | 12/1/2047 | | | | | 789,173 | | | | | 828,683 | | | | | 804,875 | |
Federal Home Loan Mortgage Corp. | | | | 4.00 | | | | | 2/1/2048 | | | | | 47,497 | | | | | 48,341 | | | | | 48,439 | |
Federal Home Loan Mortgage Corp. | | | | 4.00 | | | | | 7/1/2048 | | | | | 49,431 | | | | | 50,427 | | | | | 50,405 | |
Federal National Mortgage Association | | | | 3.00 | | | | | 11/1/2046 | | | | | 430,236 | | | | | 413,909 | | | | | 419,602 | |
Federal National Mortgage Association | | | | 3.00 | | | | | 7/1/2047 | | | | | 93,408 | | | | | 89,345 | | | | | 91,071 | |
Federal National Mortgage Association | | | | 3.50 | | | | | 12/1/2028 | | | | | 38,448 | | | | | 40,527 | | | | | 39,052 | |
Federal National Mortgage Association | | | | 3.50 | | | | | 2/1/2041 | | | | | 43,487 | | | | | 43,937 | | | | | 44,017 | |
Federal National Mortgage Association | | | | 3.50 | | | | | 2/1/2043 | | | | | 174,341 | | | | | 174,019 | | | | | 175,373 | |
Federal National Mortgage Association | | | | 3.50 | | | | | 1/1/2044 | | | | | 45,457 | | | | | 45,506 | | | | | 45,727 | |
Federal National Mortgage Association | | | | 3.50 | | | | | 1/1/2048 | | | | | 447,329 | | | | | 459,671 | | | | | 447,363 | |
Federal National Mortgage Association | | | | 4.00 | | | | | 4/1/2048 | | | | | 96,588 | | | | | 99,106 | | | | | 98,481 | |
Federal National Mortgage Association | | | | 4.00 | | | | | 7/1/2048 | | | | | 146,531 | | | | | 149,357 | | | | | 149,401 | |
Federal National Mortgage Association | | | | 4.50 | | | | | 6/1/2048 | | | | | 350,490 | | | | | 361,086 | | | | | 363,167 | |
See accompanying Notes to the Financial Statements.
141
Barings Total Return Bond Fund 2018 Semi-Annual Report
SCHEDULE OF INVESTMENTS (CONTINUED)
December 31, 2018 (Unaudited)
| | | | | | | | | | | | | | | | | | | | | | | | | |
| | | EFFECTIVE
INTEREST RATE | | DUE DATE | | PRINCIPAL ‡‡ | | COST | | FAIR
VALUE |
U.S. Treasury & Government Agencies (Continued) | | | | | | | | | | | | | | | | | | | | | | | | | |
Federal National Mortgage Association | | | | 4.50 | % | | | | 7/1/2048 | | | | | 24,132 | | | | $ | 25,174 | | | | $ | 24,999 | |
Federal National Mortgage Association | | | | 4.50 | | | | | 1/1/2049 | | | | | 695,000 | | | | | 717,298 | | | | | 719,664 | |
Federal National Mortgage Association | | | | 5.00 | | | | | 6/1/2040 | | | | | 9,134 | | | | | 10,115 | | | | | 9,715 | |
Federal National Mortgage Association | | | | 5.00 | | | | | 7/1/2040 | | | | | 68,104 | | | | | 75,112 | | | | | 72,293 | |
Federal National Mortgage Association | | | | 5.00 | | | | | 2/1/2044 | | | | | 26,424 | | | | | 29,244 | | | | | 28,051 | |
Federal National Mortgage Association TBA | | | | 4.00 | | | | | 1/1/2049 | | | | | 1,115,000 | | | | | 1,129,918 | | | | | 1,136,603 | |
Government National Mortgage Association TBA | | | | 3.00 | | | | | 1/1/2049 | | | | | 1,075,000 | | | | | 1,045,438 | | | | | 1,058,602 | |
Government National Mortgage Association TBA | | | | 3.50 | | | | | 1/1/2049 | | | | | 200,000 | | | | | 199,602 | | | | | 201,234 | |
Government National Mortgage Association TBA | | | | 4.00 | | | | | 1/1/2049 | | | | | 135,000 | | | | | 137,489 | | | | | 138,227 | |
U.S. Treasury Bond | | | | 2.50 | | | | | 5/15/2046 | | | | | 235,000 | | | | | 207,140 | | | | | 211,931 | |
U.S. Treasury Bond | | | | 3.50 | | | | | 2/15/2039 | | | | | 65,000 | | | | | 70,648 | | | | | 71,096 | |
| | | | | | | | | | | | | | | | | | | | | | | | | |
Total U.S. Treasury & Government Agencies | | | | | | | | | | | | | | 6,505,540 | | | | | 6,562,211 | | | | | 6,555,028 | |
| | | | | | | | | | | | | | | | | | | | | | | | | |
| | | | | | | | | | | | | | | | | | | | | | | | | |
Total Fixed Income | | | | | | | | | | | | | | 24,230,726 | | | | | 24,263,984 | | | | | 23,761,184 | |
| | | | | | | | | | | | | | | | | | | | | | | | | |
| | | | | |
| | | | | | | SHARES | | COST | | FAIR
VALUE |
Mutual Fund — 9.1%*: | | | | | | | | | | | | | | | | | | | | | | | | | |
Barings U.S. High Yield Fund | | | | | | | | | | | | | | 275,345 | | | | | 2,681,797 | | | | | 2,557,954 | |
| | | | | | | | | | | | | | | | | | | | | | | | | |
| | | | | | | | | | | | | | | | | | | | | | | | | | | | | | |
| | | COUNTERPARTY | | STRIKE
PRICE | | | EXPIRATION
DATE | | | CONTRACTS | | | NOTIONAL | | | COST | | | UNREALIZED
VALUE | | | FAIR
VALUE | |
Purchased Options — 1.4%*: | |
|
Call Options Purchased — 0.4%*: | |
OTC — BCM Swaption | | JPMorgan Chase
Bank N.A. | | | $2.44 | | | | 12/13/2032 | | | | 1,270,000 | | | | 1,270,000 | | | | $63,722 | | | | $(9,422) | | | | 54,300 | |
OTC — BCM Swaption | | JPMorgan Chase
Bank N.A. | | | 2.61 | | | | 1/31/2033 | | | | 1,370,000 | | | | 1,370,000 | | | | 65,623 | | | | (515 | ) | | | 65,108 | |
| | | | | | | | | | | | | | | | | | | | | | | | | | | | | | |
Total Call Options Purchased | | | | | | | | | | | 2,640,000 | | | | 2,640,000 | | | | 129,345 | | | | (9,937 | ) | | | 119,408 | |
| | | | | | | | | | | | | | | | | | | | | | | | | | | | | | |
|
Put Options Purchased — 1.0%*: | |
OTC — BCM Swaption | | JPMorgan Chase
Bank N.A. | | | 2.94 | | | | 12/13/2032 | | | | 2,580,000 | | | | 2,580,000 | | | | 129,451 | | | | 16,730 | | | | 146,181 | |
OTC — BCM Swaption | | JPMorgan Chase
Bank N.A. | | | 3.11 | | | | 1/31/2033 | | | | 2,730,000 | | | | 2,730,000 | | | | 130,495 | | | | 10,318 | | | | 140,813 | |
| | | | | | | | | | | | | | | | | | | | | | | | | | | | | | |
Total Put Options Purchased | | | | | | | | | | | 5,310,000 | | | | 5,310,000 | | | | 259,946 | | | | 27,048 | | | | 286,994 | |
| | | | | | | | | | | | | | | | | | | | | | | | | | | | | | |
See accompanying Notes to the Financial Statements.
142
Barings Total Return Bond Fund 2018 Semi-Annual Report
SCHEDULE OF INVESTMENTS (CONTINUED)
December 31, 2018 (Unaudited)
| | | | | | | | | | | | | | | | | | | | | | | | | |
| | | EFFECTIVE
INTEREST RATE | | DUE DATE | | PRINCIPAL ‡‡ | | COST | | FAIR
VALUE |
Short-Term Investments — 14.2%*: | |
|
Commercial Paper — 14.2%*: | |
| | | | | |
Auto Manufacturers — 1.8%*: | | | | | | | | | | | | | | | | | | | | | | | | | |
Hyundai Capital America | | | | 2.85 | % | | | | 1/3/2019 | | | | | 250,000 | | | | | $249,961 | | | | | $249,961 | |
VW CR, Inc. | | | | 2.91 | | | | | 2/22/2019 | | | | | 250,000 | | | | | 248,971 | | | | | 248,971 | |
| | | | | | | | | | | | | | | | | | | | | | | | | |
Total Auto Manufacturers | | | | | | | | | | | | | | 500,000 | | | | | 498,932 | | | | | 498,932 | |
| | | | | | | | | | | | | | | | | | | | | | | | | |
|
Chemicals — 0.9%*: | |
Albemarle Corp. | | | | 2.54 | | | | | 1/8/2019 | | | | | 250,000 | | | | | 249,879 | | | | | 249,879 | |
| | | | | | | | | | | | | | | | | | | | | | | | | |
|
Diversified Financial Services — 1.8%*: | |
First Abu Dhabi Bank PJSC+ | | | | 2.44 | | | | | 1/4/2019 | | | | | 250,000 | | | | | 249,950 | | | | | 249,950 | |
National Rural Utilities Cooperative Finance Corp. | | | | 2.55 | | | | | 1/14/2019 | | | | | 250,000 | | | | | 249,773 | | | | | 249,773 | |
| | | | | | | | | | | | | | | | | | | | | | | | | |
Total Diversified Financial Services | | | | | | | | | | | | | | 500,000 | | | | | 499,723 | | | | | 499,723 | |
| | | | | | | | | | | | | | | | | | | | | | | | | |
|
Electric — 0.9%*: | |
Fortive Corp. | | | | 2.87 | | | | | 1/15/2019 | | | | | 250,000 | | | | | 249,726 | | | | | 249,726 | |
| | | | | | | | | | | | | | | | | | | | | | | | | |
|
Entertainment — 0.9%*: | |
CBS Corp. | | | | 2.95 | | | | | 1/29/2019 | | | | | 250,000 | | | | | 249,436 | | | | | 249,436 | |
| | | | | | | | | | | | | | | | | | | | | | | | | |
|
Food — 1.7%*: | |
Keurig Dr. Pepper | | | | 2.92 | | | | | 1/14/2019 | | | | | 250,000 | | | | | 249,741 | | | | | 249,741 | |
Mondelez International, Inc. | | | | 2.85 | | | | | 2/19/2019 | | | | | 250,000 | | | | | 249,047 | | | | | 249,047 | |
| | | | | | | | | | | | | | | | | | | | | | | | | |
Total Food | | | | | | | | | | | | | | 500,000 | | | | | 498,788 | | | | | 498,788 | |
| | | | | | | | | | | | | | | | | | | | | | | | | |
|
Hotel & Restaurant — 0.9%*: | |
McDonald’s Corp. | | | | 2.84 | | | | | 1/8/2019 | | | | | 250,000 | | | | | 249,864 | | | | | 249,864 | |
| | | | | | | | | | | | | | | | | | | | | | | | | |
|
Oil and Gas Services — 0.9%*: | |
Schlumberger Holdings Corp. | | | | 2.91 | | | | | 1/8/2019 | | | | | 250,000 | | | | | 249,861 | | | | | 249,861 | |
| | | | | | | | | | | | | | | | | | | | | | | | | |
|
Pipelines — 0.9%*: | |
Spectra Energy Partners LP | | | | 2.90 | | | | | 1/2/2019 | | | | | 250,000 | | | | | 249,980 | | | | | 249,980 | |
| | | | | | | | | | | | | | | | | | | | | | | | | |
|
Utilities — 3.5%*: | |
DTE Capital Corp. | | | | 2.86 | | | | | 1/9/2019 | | | | | 250,000 | | | | | 249,841 | | | | | 249,841 | |
Nextera Energy Capital Holdings, Inc. | | | | 3.06 | | | | | 2/26/2019 | | | | | 250,000 | | | | | 248,833 | | | | | 248,833 | |
Public Service Enterprise Group, Inc. | | | | 3.05 | | | | | 1/23/2019 | | | | | 250,000 | | | | | 249,542 | | | | | 249,542 | |
Public Service Enterprise Group, Inc. | | | | 3.10 | | | | | 1/11/2019 | | | | | 250,000 | | | | | 249,788 | | | | | 249,788 | |
| | | | | | | | | | | | | | | | | | | | | | | | | |
Total Utilities | | | | | | | | | | | | | | 1,000,000 | | | | | 998,004 | | | | | 998,004 | |
| | | | | | | | | | | | | | | | | | | | | | | | | |
Total Commercial Paper | | | | | | | | | | | | | | 4,000,000 | | | | | 3,994,193 | | | | | 3,994,193 | |
| | | | | | | | | | | | | | | | | | | | | | | | | |
Total Short-Term Investments | | | | | | | | | | | | | | 4,000,000 | | | | | 3,994,193 | | | | | 3,994,193 | |
| | | | | | | | | | | | | | | | | | | | | | | | | |
Total Investments | | | | | | | | | | | | | | 36,456,071 | | | | | 31,329,265 | | | | | 30,719,733 | |
| | | | | | | | | | | | | | | | | | | | | | | | | |
| |
Other assets and liabilities — (8.8%)* | | | | | (2,482,575 | ) |
| | | | | | | | | | | | | | | | | | | | | | | | | |
| |
Net Assets — 100.0% | | | | | $28,237,158 | |
| | | | | | | | | | | | | | | | | | | | | | | | | |
See accompanying Notes to the Financial Statements.
143
Barings Total Return Bond Fund 2018 Semi-Annual Report
SCHEDULE OF INVESTMENTS (CONTINUED)
December 31, 2018 (Unaudited)
| TBA | To Be Announced: Securities purchased on a forward commitment basis with an approximate principal amount and maturity date. The actual principal amount and maturity date will be determined upon settlement. |
| @ | Effective interest rate for this security is the coupon rate at issue based on the underlying loans. |
| ‡‡ | Unless otherwise indicated, all principal amounts are denominated in United States Dollars. |
| * | Calculated as a percentage of net assets applicable to common shareholders. |
Distributions of investments by country of risk (excluding temporary cash investments) as a percentage of total investments in securities, is as follows:
| | | | | | |
| | United States | | | 91.5% | |
| | Canada | | | 1.8% | |
| | Mexico | | | 1.6% | |
| | United Kingdom | | | 1.3% | |
| | Other (Individually less than 1%) | | | 3.8% | |
| | | | | | |
| | Total | | | 100.0% | |
| | | | | | |
| ^ | Security acquired in a transaction exempt from registration under Rule 144A of the Securities Act of 1933. These securities may only be resold in transactions exempt from registration, normally to qualified institutional buyers. |
| ¤ | For fair value measurement disclosure purposes, security is categorized as Level 3 (See Note 2). |
| # | Variable rate security. The interest rate shown is the rate in effect at December 31, 2018. |
| ** | Variable Rate is Fixed to Float: Rate remains fixed until designated future date. |
Affiliate Table
| | | | | | | | | | | | | | | | | | | | | | | | | | | | | | | | | | | | | | | | | | | | | | | | | | |
| | | NUMBER
OF
SHARES
HELD AT
6/30/18 | | VALUE AT
6/30/18 | | COST
OF
PURCHASES | | PROCEEDS
FROM
SHARES
SOLD | | REALIZED
GAIN
(LOSS) | | CHANGE IN
UNREALIZED
APPRECIATION/
DEPRECIATION | | NUMBER OF
SHARES
HELD
AT 12/31/18 | | VALUE AT
12/31/18 | | DIVIDEND
INCOME | | CAPITAL
GAIN
DISTRIBUTIONS |
| Barings U.S. High Yield Fund | | | | 268,341 | | | | | 2,635,105 | | | | | 68,559 | | | | | – | | | | | – | | | | | (145,750) | | | | | 275,345 | | | | | 2,557,954 | | | | | 95,512 | | | | | – | |
A summary of outstanding derivatives at December 31, 2018 is as follows:
Cross Currency Forward Foreign Currency Exchange Contracts
| | | | | | | | | | | | | | | | |
EXPIRATION
DATE | | DELIVER/RECEIVE | | COUNTERPARTY | | CONTRACT
AMOUNT
PURCHASED | | | CONTRACT
AMOUNT
SOLD | | | NET UNREALIZED
APPRECIATION
(DEPRECIATION) | |
| 1/15/19 | | CZK/EUR | | Bank of America N.A. | | | 31,274 | | | | 808,158 | | | $ | (125 | ) |
| 1/15/19 | | EUR/CZK | | Bank of America N.A. | | | 413,664 | | | | 16,000 | | | | 73 | |
| 1/15/19 | | EUR/CZK | | Citibank N.A. | | | 394,493 | | | | 15,235 | | | | 97 | |
| 1/15/19 | | EUR/HUF | | Barclays Bank plc | | | 6,188,382 | | | | 19,051 | | | | 253 | |
| 1/15/19 | | EUR/PLN | | Barclays Bank plc | | | 194,942 | | | | 44,944 | | | | 553 | |
| 1/15/19 | | EUR/PLN | | Citibank N.A. | | | 13,079 | | | | 3,000 | | | | 55 | |
| 1/15/19 | | HUF/EUR | | BNP Paribas S.A. | | | 19,019 | | | | 6,188,382 | | | | (291 | ) |
| | | | | | | | | | | | | | | | |
Net unrealized appreciation on cross currency forward foreign currency exchange contracts | | | $ | 615 | |
| | | | | | | | | | | | | | | | |
See accompanying Notes to the Financial Statements.
144
Barings Total Return Bond Fund 2018 Semi-Annual Report
SCHEDULE OF INVESTMENTS (CONTINUED)
December 31, 2018 (Unaudited)
Forward Foreign Currency Exchange Contracts to Buy
| | | | | | | | | | | | | | | | | | | | | | |
EXPIRATION
DATE | | COUNTERPARTY | | LOCAL
CURRENCY | | | VALUE IN USD | | | IN
EXCHANGE
FOR USD | | | NET UNREALIZED
APPRECIATION
(DEPRECIATION) | |
| 2/12/19 | | Bank of America N.A. | | | ARS | | | | 433,440 | | | $ | 10,903 | | | $ | 18,000 | | | | $(7,097) | |
| 2/12/19 | | JPMorgan Chase Bank N.A. | | | ARS | | | | 445,360 | | | | 11,203 | | | | 19,000 | | | | (7,797 | ) |
| 10/29/19 | | JPMorgan Chase Bank N.A. | | | ARS | | | | 285,907 | | | | 5,619 | | | | 5,425 | | | | 194 | |
| 10/29/19 | | BNP Paribas S.A. | | | ARS | | | | 1,275,516 | | | | 25,067 | | | | 24,000 | | | | 1,067 | |
| 10/29/19 | | Bank of America N.A. | | | ARS | | | | 285,907 | | | | 5,619 | | | | 5,557 | | | | 62 | |
| 1/22/19 | | JPMorgan Chase Bank N.A. | | | AUD | | | | 32,232 | | | | 22,712 | | | | 23,000 | | | | (288 | ) |
| 1/22/19 | | Barclays Bank plc | | | AUD | | | | 19,389 | | | | 13,662 | | | | 13,834 | | | | (172 | ) |
| 1/8/19 | | JPMorgan Chase Bank N.A. | | | BRL | | | | 300,856 | | | | 77,589 | | | | 77,680 | | | | (92 | ) |
| 1/8/19 | | BNP Paribas S.A. | | | BRL | | | | 77,220 | | | | 19,914 | | | | 20,000 | | | | (85 | ) |
| 1/8/19 | | BNP Paribas S.A. | | | COP | | | | 58,075,740 | | | | 17,878 | | | | 18,000 | | | | (122 | ) |
| 1/8/19 | | Citibank N.A. | | | CRC | | | | 10,513,050 | | | | 17,340 | | | | 17,563 | | | | (223 | ) |
| 1/15/19 | | Citibank N.A. | | | EUR | | | | 13,855 | | | | 15,891 | | | | 15,798 | | | | 92 | |
| 1/15/19 | | Bank of America N.A. | | | EUR | | | | 48,359 | | | | 55,463 | | | | 55,000 | | | | 463 | |
| 1/15/19 | | JPMorgan Chase Bank N.A. | | | GHS | | | | 66,600 | | | | 13,526 | | | | 13,241 | | | | 285 | |
| 1/22/19 | | Bank of America N.A. | | | INR | | | | 1,047,130 | | | | 15,035 | | | | 14,000 | | | | 1,035 | |
| 1/22/19 | | Goldman Sachs & Co. | | | INR | | | | 70,115 | | | | 1,007 | | | | 1,000 | | | | 7 | |
| 1/8/19 | | Barclays Bank plc | | | MXN | | | | 1,365,199 | | | | 69,427 | | | | 71,862 | | | | (2,435 | ) |
| 1/8/19 | | Citibank N.A. | | | MXN | | | | 38,041 | | | | 1,935 | | | | 2,000 | | | | (65 | ) |
| 1/8/19 | | BNP Paribas S.A. | | | MXN | | | | 306,896 | | | | 15,607 | | | | 15,000 | | | | 607 | |
| 1/22/19 | | Barclays Bank plc | | | MYR | | | | 150,516 | | | | 36,440 | | | | 36,000 | | | | 440 | |
| 1/8/19 | | JPMorgan Chase Bank N.A. | | | PEN | | | | 46,214 | | | | 13,717 | | | | 13,655 | | | | 62 | |
| 2/1/19 | | Bank of America N.A. | | | PEN | | | | 93,380 | | | | 27,692 | | | | 28,695 | | | | (1,004 | ) |
| 1/15/19 | | JPMorgan Chase Bank N.A. | | | RUB | | | | 1,199,329 | | | | 17,199 | | | | 17,943 | | | | (744 | ) |
| 1/15/19 | | Bank of America N.A. | | | SEK | | | | 125,260 | | | | 14,147 | | | | 14,034 | | | | 114 | |
| 1/22/19 | | BNP Paribas S.A. | | | THB | | | | 2,352,960 | | | | 72,279 | | | | 71,604 | | | | 675 | |
| | | | | | | | | | | | | | | | | | | | | | |
Net unrealized depreciation on forward foreign currency exchange contracts to buy | | | $ | (15,021 | ) |
| | | | | | | | | | | | | | | | | | | | | | |
Forward Foreign Currency Exchange Contracts to Sell
| | | | | | | | | | | | | | | | | | | | | | |
EXPIRATION
DATE | | COUNTERPARTY | | LOCAL
CURRENCY | | | VALUE IN USD | | | IN
EXCHANGE
FOR USD | | | NET UNREALIZED
APPRECIATION
(DEPRECIATION) | |
| 2/12/19 | | JPMorgan Chase Bank N.A. | | | ARS | | | | 439,400 | | | $ | 11,053 | | | $ | 17,654 | | | $ | 6,601 | |
| 2/12/19 | | Bank of America N.A. | | | ARS | | | | 439,400 | | | | 11,053 | | | | 12,816 | | | | 1,763 | |
| 1/8/19 | | JPMorgan Chase Bank N.A. | | | BRL | | | | 97,396 | | | | 25,118 | | | | 26,000 | | | | 882 | |
| 1/8/19 | | BNP Paribas S.A. | | | CLP | | | | 9,491,286 | | | | 13,676 | | | | 14,425 | | | | 749 | |
| 1/22/19 | | Bank of America N.A. | | | CNH | | | | 256,863 | | | | 37,397 | | | | 37,000 | | | | (397 | ) |
| 1/8/19 | | Goldman Sachs & Co. | | | COP | | | | 58,075,740 | | | | 17,878 | | | | 17,909 | | | | 30 | |
| 1/8/19 | | Citibank N.A. | | | CRC | | | | 10,513,050 | | | | 17,340 | | | | 17,442 | | | | 102 | |
| 2/21/19 | | Citibank N.A. | | | CRC | | | | 7,999,336 | | | | 13,215 | | | | 13,171 | | | | (44 | ) |
| 3/14/19 | | Citibank N.A. | | | CRC | | | | 10,513,050 | | | | 17,348 | | | | 17,383 | | | | 35 | |
| 1/15/19 | | Goldman Sachs & Co. | | | EUR | | | | 11,727 | | | | 13,449 | | | | 13,677 | | | | 227 | |
See accompanying Notes to the Financial Statements.
145
Barings Total Return Bond Fund 2018 Semi-Annual Report
SCHEDULE OF INVESTMENTS (CONTINUED)
December 31, 2018 (Unaudited)
| | | | | | | | | | | | | | | | | | | | | | |
EXPIRATION
DATE | | COUNTERPARTY | | LOCAL
CURRENCY | | | VALUE IN USD | | | IN
EXCHANGE
FOR USD | | | NET UNREALIZED
APPRECIATION
(DEPRECIATION) | |
| 1/15/19 | | Bank of America N.A. | | | EUR | | | | 2,128 | | | $ | 2,441 | | | $ | 2,475 | | | $ | 34 | |
| 1/15/19 | | Bank of America N.A. | | | GBP | | | | 11,735 | | | | 14,966 | | | | 15,000 | | | | 34 | |
| 1/22/19 | | JPMorgan Chase Bank N.A. | | | IDR | | | | 213,585,000 | | | | 14,793 | | | | 13,833 | | | | (959 | ) |
| 1/22/19 | | Citibank N.A. | | | INR | | | | 2,675,900 | | | | 38,423 | | | | 35,954 | | | | (2,468 | ) |
| 1/15/19 | | JPMorgan Chase Bank N.A. | | | KES | | | | 1,565,398 | | | | 15,337 | | | | 15,000 | | | | (337 | ) |
| 1/22/19 | | JPMorgan Chase Bank N.A. | | | KRW | | | | 16,795,500 | | | | 15,089 | | | | 15,000 | | | | (89 | ) |
| 1/8/19 | | JPMorgan Chase Bank N.A. | | | MXN | | | | 1,403,240 | | | | 71,362 | | | | 69,371 | | | | (1,991 | ) |
| 1/8/19 | | Bank of America N.A. | | | MXN | | | | 19,874 | | | | 1,011 | | | | 1,000 | | | | (11 | ) |
| 1/8/19 | | JPMorgan Chase Bank N.A. | | | PEN | | | | 46,214 | | | | 13,716 | | | | 13,909 | | | | 193 | |
| 2/1/19 | | Barclays Bank plc | | | PEN | | | | 93,380 | | | | 27,692 | | | | 28,587 | | | | 896 | |
| 1/22/19 | | BNP Paribas S.A. | | | PHP | | | | 788,850 | | | | 15,018 | | | | 15,000 | | | | (18 | ) |
| 1/15/19 | | JPMorgan Chase Bank N.A. | | | RUB | | | | 201,585 | | | | 2,891 | | | | 3,000 | | | | 109 | |
| 1/22/19 | | Bank of America N.A. | | | SGD | | | | 20,768 | | | | 15,244 | | | | 15,000 | | | | (244 | ) |
| 1/22/19 | | Barclays Bank plc | | | THB | | | | 2,352,960 | | | | 72,279 | | | | 72,566 | | | | 288 | |
| 1/15/19 | | Bank of America N.A. | | | ZAR | | | | 260,949 | | | | 18,112 | | | | 18,000 | | | | (112 | ) |
| | | | | | | | | | | | | | | | | | | | | | |
Net unrealized appreciation on forward foreign currency exchange contracts to sell | | | $ | 5,273 | |
| | | | | | | | | | | | | | | | | | | | | | |
Currency Legend
| | | | |
| ARS | | – | | Argentine Peso |
| AUD | | – | | Australian Dollar |
| BRL | | – | | Brazilian Real |
| CLP | | – | | Chilean Peso |
| CNH | | – | | Chinese Yuan Renminbi |
| COP | | – | | Colombian Peso |
| CRC | | – | | Costa Rican Colon |
| CZK | | – | | Czech Koruna |
| EUR | | – | | Euro |
| GBP | | – | | British Pound Sterling |
| GHS | | – | | Ghana Cedi |
| HUF | | – | | Hungarian Forint |
| IDR | | – | | Indonesian Rupiah |
| INR | | – | | Indian Rupee |
| KES | | – | | Kenyan Shilling |
| KRW | | – | | South Korean Won |
| MXN | | – | | Mexican Peso |
| MYR | | – | | Malaysian Ringgit |
| PEN | | – | | Peruvian Nuevo Sol |
| PHP | | – | | Philippines Peso |
| PLN | | – | | Polish Zloty |
| RUB | | – | | Russian Ruble |
| SEK | | – | | Swedish Krona |
| SGD | | – | | Singapore Dollar |
| THB | | – | | Thai Baht |
| ZAR | | – | | South African Rand |
See accompanying Notes to the Financial Statements.
146
Barings Total Return Bond Fund 2018 Semi-Annual Report
SCHEDULE OF INVESTMENTS (CONTINUED)
December 31, 2018 (Unaudited)
Futures
| | | | | | | | | | | | | | | | | | | | | | |
| TYPE | | EXPIRATION
DATE | | CONTRACTS | | | NOTIONAL
AMOUNT | | | POSITION | | | FAIR VALUE | | | UNREALIZED
APPRECIATION | |
Long Futures | |
U.S. 10-Year Treasury Note | | 03/20/19 | | | 8 | | | | 958,570 | | | | Long | | | $ | 976,125 | | | $ | 17,555 | |
U.S. 2-Year Treasury Note | | 03/29/19 | | | 19 | | | | 4,008,834 | | | | Long | | | | 4,033,937 | | | | 25,103 | |
U.S. 5-Year Treasury Note | | 03/29/19 | | | 2 | | | | 225,787 | | | | Long | | | | 229,375 | | | | 3,588 | |
U.S. Ultra Bond | | 03/20/19 | | | 10 | | | | 1,524,487 | | | | Long | | | | 1,606,563 | | | | 82,076 | |
| | | | | | | | | | | | | | | | | | | | | | |
Total Long Futures | | | $ | 128,322 | |
| | | | | | | | | | | | | | | | | | | | | | |
| | | | | | |
| TYPE | | EXPIRATION
DATE | | CONTRACTS | | | NOTIONAL
AMOUNT | | | POSITION | | | FAIR VALUE | | | UNREALIZED
DEPRECIATION | |
Short Future | |
U.S. Long Bond | | 03/20/19 | | | 3 | | | | (418,138 | ) | | | Short | | | $ | (438,000 | ) | | $ | (19,862 | ) |
| | | | | | | | | | | | | | | | | | | | | | |
OTC Credit Default Swaps – Sell Protection (1)(2)
| | | | | | | | | | | | | | | | | | | | | | | | | | | | | | | | |
REFERENCE
OBLIGATION | | FIXED-DEAL
RECEIVED
RATE | | | PAYMENT
FREQUENCY | | MATURITY
DATE | | | COUNTERPARTY | | ORIGINAL
NOTIONAL
AMOUNT | | | CURRENT
NOTIONAL
AMOUNT(3) | | | UPFRONT
PREMIUMS
PAID/
(RECEIVED) | | | FAIR
VALUE(4) | | | UNREALIZED
DEPRECIATION | |
| CMBX.NA.BBB-.6† | | | 3.00 | % | | 1M | | | 11/17/2045 | | | JPMorgan Chase
Bank N.A. | | | 60,000 | | | | 60,000 | | | $ | 132 | | | $ | (9,676 | ) | | $ | (9,808 | ) |
| CMBX.NA.BBB-.6† | | | 3.00 | % | | 1M | | | 5/11/2063 | | | Goldman
Sachs & Co. | | | 70,000 | | | | 70,000 | | | | (5,108 | ) | | | (11,288 | ) | | | (6,180 | ) |
| | | | | | | | | | | | | | | | | | | | | | | | | | | | | | | | |
Total OTC Credit Default Swaps | | | $ | (4,976 | ) | | $ | (20,964 | ) | | $ | (15,988 | ) |
| | | | | | | | | | | | | | | | | | | | | | | | | | | | | | | | |
| (1) | If the Fund is a seller of protection and a credit event occurs, as defined under the terms of that particular swap agreement, the Fund will either (i) pay to the buyer of protection an amount equal to the notional amount of the swap and take delivery of the referenced obligation or underlying securities comprising the referenced index or (ii) pay a net settlement amount in the form of cash or securities equal to the notional amount of the swap less the recovery value of the referenced obligation or underlying securities comprising the referenced index. |
| (2) | Represents an investment grade index of single name credit default swaps (CDS). All of the companies underlying the single name CDS within the index are rated investment grade or higher. Rating represents a weighted average of the credit ratings of all the companies underlying the single name CDS within the index. |
| (3) | The maximum potential amount the Portfolio could be required to make as a seller of credit protection or receive as a buyer of credit event as defined under the terms of that particular swap agreement. |
| (4) | The quoted market prices and resulting values for credit default swap agreements on asset-backed securities and credit indices serve as an indicator of the current status of the payment/performance risk and represent the expected amount paid or received for the credit derivative if the amount of the swap agreement was closed/sold as of the period end. Increasing market values, in absolute terms when compared to the notional amount of the swap, represent a deterioration of the referenced entity’s credit soundness and a greater likelihood or risk of default or other credit event occurring as defined under the terms of the agreements. |
| † | Payment is based on a percentage of the index. Reference entities are a number of individual issuers comprising the index. |
Abbreviation Legend
See accompanying Notes to the Financial Statements.
147
Barings Emerging Markets Debt Blended Total Return Fund 2018 Semi-Annual Report
SCHEDULE OF INVESTMENTS
December 31, 2018 (Unaudited)
| | | | | | | | | | | | | | | | | | | | | | | | | |
| | | EFFECTIVE
INTEREST RATE | | DUE DATE | | PRINCIPAL ‡‡ | | COST | | FAIR
VALUE |
Fixed Income — 96.2%*: | | | | | | | | | | | | | | | | | | | | | | | | | |
| | | | | |
Corporate Bonds — 43.7%*: | | | | | | | | | | | | | | | | | | | | | | | | | |
| | | | | |
Agriculture — 3.6%*: | | | | | | | | | | | | | | | | | | | | | | | | | |
JBS Investments II GmbH^ | | | | 7.00 | % | | | | 1/15/2026 | | | | | 500,000 | | | | | $496,662 | | | | | $490,000 | |
MHP SE^+ | | | | 7.75 | | | | | 5/10/2024 | | | | | 1,250,000 | | | | | 1,248,111 | | | | | 1,159,375 | |
| | | | | | | | | | | | | | | | | | | | | | | | | |
Total Agriculture | | | | | | | | | | | | | | 1,750,000 | | | | | 1,744,773 | | | | | 1,649,375 | |
| | | | | | | | | | | | | | | | | | | | | | | | | |
| | | | | |
Chemicals — 3.9%*: | | | | | | | | | | | | | | | | | | | | | | | | | |
Consolidated Energy Finance SA+^ | | | | 6.88 | | | | | 6/15/2025 | | | | | 170,000 | | | | | 175,797 | | | | | 161,925 | |
Grupo Idesa SA de CV+^ | | | | 7.88 | | | | | 12/18/2020 | | | | | 1,000,000 | | | | | 920,241 | | | | | 698,750 | |
Petkim Petrokimya Holding AS+^ | | | | 5.88 | | | | | 1/26/2023 | | | | | 500,000 | | | | | 466,344 | | | | | 453,750 | |
SASOL Financing USA LLC+ | | | | 5.88 | | | | | 3/27/2024 | | | | | 465,000 | | | | | 464,340 | | | | | 461,512 | |
| | | | | | | | | | | | | | | | | | | | | | | | | |
Total Chemicals | | | | | | | | | | | | | | 2,135,000 | | | | | 2,026,722 | | | | | 1,775,937 | |
| | | | | | | | | | | | | | | | | | | | | | | | | |
| | | | | |
Commercial Banks — 6.2%*: | | | | | | | | | | | | | | | | | | | | | | | | | |
Alfa Bank AO Via Alfa Bond Issuance plc,
5 year USD Swap + 6.660%+ | | | | 8.00 | # | | | | 12/29/2066 | | | | | 400,000 | | | | | 415,303 | | | | | 359,000 | |
Banco Mercantil del Norte SA,
10 year CMT + 5.353%+ | | | | 7.63 | # | | | | 12/31/2065 | | | | | 500,000 | | | | | 546,039 | | | | | 481,875 | |
Itau Unibanco Holding SA+ | | | | 6.13 | | | | | 12/31/2065 | | | | | 500,000 | | | | | 501,499 | | | | | 468,000 | |
Turkiye Garanti Bankasi AS^+ | | | | 4.75 | | | | | 10/17/2019 | | | | | 500,000 | | | | | 488,095 | | | | | 493,200 | |
Turkiye Is Bankasi AS+^ | | | | 5.00 | | | | | 4/30/2020 | | | | | 600,000 | | | | | 585,324 | | | | | 582,000 | |
Turkiye Sinai Kalkinma Bankasi AS+ | | | | 5.38 | | | | | 10/30/2019 | | | | | 500,000 | | | | | 486,774 | | | | | 490,625 | |
| | | | | | | | | | | | | | | | | | | | | | | | | |
Total Commercial Banks | | | | | | | | | | | | | | 3,000,000 | | | | | 3,023,034 | | | | | 2,874,700 | |
| | | | | | | | | | | | | | | | | | | | | | | | | |
| | | | | |
Diversified Financial Services — 1.9%*: | | | | | | | | | | | | | | | | | | | | | | | | | |
Power Finance Corp. Ltd.^+ | | | | 6.15 | | | | | 12/6/2028 | | | | | 450,000 | | | | | 449,405 | | | | | 439,153 | |
REC Ltd.+ | | | | 3.88 | | | | | 7/7/2027 | | | | | 500,000 | | | | | 458,329 | | | | | 455,625 | |
| | | | | | | | | | | | | | | | | | | | | | | | | |
Total Diversified Financial Services | | | | | | | | | | | | | | 950,000 | | | | | 907,734 | | | | | 894,778 | |
| | | | | | | | | | | | | | | | | | | | | | | | | |
| | | | | |
Food — 2.2%*: | | | | | | | | | | | | | | | | | | | | | | | | | |
JBS Investments GmbH+^ | | | | 7.25 | | | | | 4/3/2024 | | | | | 500,000 | | | | | 497,658 | | | | | 504,005 | |
Marfrig Holdings Europe BV+^ | | | | 8.00 | | | | | 6/8/2023 | | | | | 500,000 | | | | | 509,997 | | | | | 500,000 | |
| | | | | | | | | | | | | | | | | | | | | | | | | |
Total Food | | | | | | | | | | | | | | 1,000,000 | | | | | 1,007,655 | | | | | 1,004,005 | |
| | | | | | | | | | | | | | | | | | | | | | | | | |
| | | | | |
Holding Companies-Diversified — 1.6%*: | | | | | | | | | | | | | | | | | | | | | | | | | |
KOC Holding AS+^ | | | | 3.50 | | | | | 4/24/2020 | | | | | 750,000 | | | | | 727,818 | | | | | 724,687 | |
| | | | | | | | | | | | | | | | | | | | | | | | | |
| | | | | |
Iron/Steel — 2.9%*: | | | | | | | | | | | | | | | | | | | | | | | | | |
CSN Resources SA+^ | | | | 6.50 | | | | | 7/21/2020 | | | | | 750,000 | | | | | 724,169 | | | | | 723,375 | |
Metinvest BV+^ | | | | 7.75 | | | | | 4/23/2023 | | | | | 700,000 | | | | | 668,547 | | | | | 632,625 | |
| | | | | | | | | | | | | | | | | | | | | | | | | |
Total Iron/Steel | | | | | | | | | | | | | | 1,450,000 | | | | | 1,392,716 | | | | | 1,356,000 | |
| | | | | | | | | | | | | | | | | | | | | | | | | |
| | | | | |
Media — 3.6%*: | | | | | | | | | | | | | | | | | | | | | | | | | |
Altice Financing SA+^ | | | | 6.63 | | | | | 2/15/2023 | | | | | 800,000 | | | | | 794,305 | | | | | 768,000 | |
VTR Finance BV+^ | | | | 6.88 | | | | | 1/15/2024 | | | | | 899,000 | | | | | 935,042 | | | | | 899,000 | |
| | | | | | | | | | | | | | | | | | | | | | | | | |
Total Media | | | | | | | | | | | | | | 1,699,000 | | | | | 1,729,347 | | | | | 1,667,000 | |
| | | | | | | | | | | | | | | | | | | | | | | | | |
See accompanying Notes to the Financial Statements.
148
Barings Emerging Markets Debt Blended Total Return Fund 2018 Semi-Annual Report
SCHEDULE OF INVESTMENTS (CONTINUED)
December 31, 2018 (Unaudited)
| | | | | | | | | | | | | | | | | | | | | | | | | |
| | | EFFECTIVE
INTEREST RATE | | DUE DATE | | PRINCIPAL ‡‡ | | COST | | FAIR
VALUE |
Corporate Bonds(Continued) | | | | | | | | | | | | | | | | | | | | | | | | | |
| | | | | |
Mining — 2.1%*: | | | | | | | | | | | | | | | | | | | | | | | | | |
Petra Diamonds US Treasury plc+^ | | | | 7.25 | % | | | | 5/1/2022 | | | | | 1,050,000 | | | | | $1,047,774 | | | | | $971,250 | |
| | | | | | | | | | | | | | | | | | | | | | | | | |
| | | | | |
Oil and Gas — 1.4%*: | | | | | | | | | | | | | | | | | | | | | | | | | |
Petroleos Mexicanos+ | | | | 6.75 | | | | | 9/21/2047 | | | | | 750,000 | | | | | 704,442 | | | | | 620,168 | |
| | | | | | | | | | | | | | | | | | | | | | | | | |
| | | | | |
Real Estate — 5.1%*: | | | | | | | | | | | | | | | | | | | | | | | | | |
CIFI Holdings Group Co. Ltd.+ | | | | 6.88 | | | | | 4/23/2021 | | | | | 630,000 | | | | | 630,000 | | | | | 615,885 | |
New Metro Global Ltd.+ | | | | 6.50 | | | | | 4/23/2021 | | | | | 1,250,000 | | | | | 1,232,511 | | | | | 1,209,126 | |
Powerlong Real Estate Holdings Ltd.+ | | | | 5.95 | | | | | 7/19/2020 | | | | | 300,000 | | | | | 297,320 | | | | | 287,250 | |
Yuzhou Properties Co. Ltd.+ | | | | 6.38 | | | | | 3/6/2021 | | | | | 250,000 | | | | | 249,812 | | | | | 242,500 | |
| | | | | | | | | | | | | | | | | | | | | | | | | |
Total Real Estate | | | | | | | | | | | | | | 2,430,000 | | | | | 2,409,643 | | | | | 2,354,761 | |
| | | | | | | | | | | | | | | | | | | | | | | | | |
| | | | | |
Retail — 1.6%*: | | | | | | | | | | | | | | | | | | | | | | | | | |
Eurotorg LLC Via Bonitron DAC+^ | | | | 8.75 | | | | | 10/30/2022 | | | | | 750,000 | | | | | 758,646 | | | | | 750,660 | |
| | | | | | | | | | | | | | | | | | | | | | | | | |
| | | | | |
Telecommunications — 5.1%*: | | | | | | | | | | | | | | | | | | | | | | | | | |
GTH Finance BV^+ | | | | 7.25 | | | | | 4/26/2023 | | | | | 500,000 | | | | | 513,290 | | | | | 511,875 | |
HTA Group Ltd.+^ | | | | 9.13 | | | | | 3/8/2022 | | | | | 525,000 | | | | | 534,196 | | | | | 532,875 | |
IHS Netherlands Holdco BV^+ | | | | 9.50 | | | | | 10/27/2021 | | | | | 550,000 | | | | | 557,920 | | | | | 553,060 | |
Millicom International Cellular SA^+ | | | | 6.63 | | | | | 10/15/2026 | | | | | 750,000 | | | | | 756,504 | | | | | 763,125 | |
| | | | | | | | | | | | | | | | | | | | | | | | | |
Total Telecommunications | | | | | | | | | | | | | | 2,325,000 | | | | | 2,361,910 | | | | | 2,360,935 | |
| | | | | | | | | | | | | | | | | | | | | | | | | |
| | | | | |
Transportation — 1.0%*: | | | | | | | | | | | | | | | | | | | | | | | | | |
Rumo Luxembourg Sarl+^ | | | | 5.88 | | | | | 1/18/2025 | | | | | 500,000 | | | | | 463,140 | | | | | 478,750 | |
| | | | | | | | | | | | | | | | | | | | | | | | | |
| | | | | |
Water — 1.5%*: | | | | | | | | | | | | | | | | | | | | | | | | | |
Aegea Finance Sarl+^ | | | | 5.75 | | | | | 10/10/2024 | | | | | 750,000 | | | | | 712,916 | | | | | 711,563 | |
| | | | | | | | | | | | | | | | | | | | | | | | | |
Total Corporate Bonds | | | | | | | | | | | | | | 21,289,000 | | | | | 21,018,270 | | | | | 20,194,569 | |
| | | | | | | | | | | | | | | | | | | | | | | | | |
| | | | | |
Foreign Government — 52.5%*: | | | | | | | | | | | | | | | | | | | | | | | | | |
| | | | | |
Albania — 1.0%*: | | | | | | | | | | | | | | | | | | | | | | | | | |
Albania Government International Bond^+ | | | | 3.50 | | | | | 10/9/2025 | | | | | 400,000 | | | | | 460,692 | | | | | 455,113 | |
| | | | | | | | | | | | | | | | | | | | | | | | | |
| | | | | |
Argentina — 2.0%*: | | | | | | | | | | | | | | | | | | | | | | | | | |
Provincia de Buenos Aires+ | | | | 4.00 | | | | | 5/1/2020 | | | | | 349,999 | | | | | 386,200 | | | | | 388,981 | |
Provincia de Cordoba+^ | | | | 7.13 | | | | | 6/10/2021 | | | | | 580,000 | | | | | 593,843 | | | | | 514,750 | |
| | | | | | | | | | | | | | | | | | | | | | | | | |
Total Argentina | | | | | | | | | | | | | | 929,999 | | | | | 980,043 | | | | | 903,731 | |
| | | | | | | | | | | | | | | | | | | | | | | | | |
| | | | | |
Armenia — 2.1%*: | | | | | | | | | | | | | | | | | | | | | | | | | |
Republic of Armenia International Bond+^ | | | | 7.15 | | | | | 3/26/2025 | | | | | 920,000 | | | | | 995,509 | | | | | 963,700 | |
| | | | | | | | | | | | | | | | | | | | | | | | | |
| | | | | |
Brazil — 10.2%*: | | | | | | | | | | | | | | | | | | | | | | | | | |
Brazil Notas do Tesouro Nacional Serie B+ | | | | 6.00 | | | | | 8/15/2050 | | | | | 4,980,000 | | | | | 5,025,614 | | | | | 4,695,560 | |
| | | | | | | | | | | | | | | | | | | | | | | | | |
| | | | | |
Colombia — 3.6%*: | | | | | | | | | | | | | | | | | | | | | | | | | |
Colombian TES+ | | | | 7.50 | | | | | 8/26/2026 | | | | | 750,000,000 | | | | | 243,137 | | | | | 243,087 | |
Colombian TES+ | | | | 7.75 | | | | | 9/18/2030 | | | | | 1,344,000,000 | | | | | 494,279 | | | | | 438,430 | |
Colombian TES+ | | | | 10.00 | | | | | 7/24/2024 | | | | | 2,688,600,000 | | | | | 1,048,196 | | | | | 973,664 | |
| | | | | | | | | | | | | | | | | | | | | | | | | |
Total Colombia | | | | | | | | | | | | | | 4,782,600,000 | | | | | 1,785,612 | | | | | 1,655,181 | |
| | | | | | | | | | | | | | | | | | | | | | | | | |
See accompanying Notes to the Financial Statements.
149
Barings Emerging Markets Debt Blended Total Return Fund 2018 Semi-Annual Report
SCHEDULE OF INVESTMENTS (CONTINUED)
December 31, 2018 (Unaudited)
| | | | | | | | | | | | | | | | | | | | | | | | | |
| | | EFFECTIVE
INTEREST RATE | | DUE DATE | | PRINCIPAL ‡‡ | | COST | | FAIR
VALUE |
Foreign Government(Continued) | | | | | | | | | | | | | | | | | | | | | | | | | |
| | | | | |
Dominican Republic — 1.4%*: | | | | | | | | | | | | | | | | | | | | | | | | | |
Dominican Republic International Bond+^ | | | | 8.63 | % | | | | 4/20/2027 | | | | | 570,000 | | | | | $670,881 | | | | | $651,938 | |
| | | | | | | | | | | | | | | | | | | | | | | | | |
| | | | | |
Egypt — 1.7%*: | | | | | | | | | | | | | | | | | | | | | | | | | |
Egypt Treasury Bills+ | | | | Zero Coupon | | | | | 7/2/2019 | | | | | 10,550,000 | | | | | 538,736 | | | | | 536,513 | |
Egypt Treasury Bills+ | | | | Zero Coupon | | | | | 7/16/2019 | | | | | 5,275,000 | | | | | 266,983 | | | | | 266,398 | |
| | | | | | | | | | | | | | | | | | | | | | | | | |
Total Egypt | | | | | | | | | | | | | | 15,825,000 | | | | | 805,719 | | | | | 802,911 | |
| | | | | | | | | | | | | | | | | | | | | | | | | |
| | | | | |
El Salvador — 3.6%*: | | | | | | | | | | | | | | | | | | | | | | | | | |
El Salvador Government International Bond+^ | | | | 7.38 | | | | | 12/1/2019 | | | | | 200,000 | | | | | 201,721 | | | | | 200,311 | |
El Salvador Government International Bond+^ | | | | 8.25 | | | | | 4/10/2032 | | | | | 600,000 | | | | | 643,966 | | | | | 603,000 | |
El Salvador Government International Bond+^ | | | | 8.63 | | | | | 2/28/2029 | | | | | 850,000 | | | | | 988,926 | | | | | 884,000 | |
| | | | | | | | | | | | | | | | | | | | | | | | | |
Total El Salvador | | | | | | | | | | | | | | 1,650,000 | | | | | 1,834,613 | | | | | 1,687,311 | |
| | | | | | | | | | | | | | | | | | | | | | | | | |
| | | | | |
Ghana — 3.5%*: | | | | | | | | | | | | | | | | | | | | | | | | | |
Ghana Government Bond+^ | | | | 10.75 | | | | | 10/14/2030 | | | | | 700,000 | | | | | 869,295 | | | | | 791,000 | |
Ghana Government Bond+ | | | | 16.50 | | | | | 2/6/2023 | | | | | 3,500,000 | | | | | 809,438 | | | | | 637,054 | |
Ghana Government Bond+ | | | | 18.25 | | | | | 7/25/2022 | | | | | 408,000 | | | | | 92,756 | | | | | 79,414 | |
Ghana Government Bond+ | | | | 21.50 | | | | | 3/9/2020 | | | | | 480,000 | | | | | 112,289 | | | | | 99,402 | |
| | | | | | | | | | | | | | | | | | | | | | | | | |
Total Ghana | | | | | | | | | | | | | | 5,088,000 | | | | | 1,883,778 | | | | | 1,606,870 | |
| | | | | | | | | | | | | | | | | | | | | | | | | |
| | | | | |
Indonesia — 2.5%*: | | | | | | | | | | | | | | | | | | | | | | | | | |
Indonesia Treasury Bond+ | | | | 7.00 | | | | | 5/15/2027 | | | | | 3,578,000,000 | | | | | 238,711 | | | | | 231,401 | |
Indonesia Treasury Bond+ | | | | 8.38 | | | | | 3/15/2034 | | | | | 13,640,000,000 | | | | | 1,040,402 | | | | | 949,725 | |
| | | | | | | | | | | | | | | | | | | | | | | | | |
Total Indonesia | | | | | | | | | | | | | | 17,218,000,000 | | | | | 1,279,113 | | | | | 1,181,126 | |
| | | | | | | | | | | | | | | | | | | | | | | | | |
| | | | | |
Macedonia — 1.2%*: | | | | | | | | | | | | | | | | | | | | | | | | | |
Macedonia Government International Bond+^ | | | | 2.75 | | | | | 1/18/2025 | | | | | 510,000 | | | | | 586,011 | | | | | 569,140 | |
| | | | | | | | | | | | | | | | | | | | | | | | | |
| | | | | |
Malaysia — 1.0%*: | | | | | | | | | | | | | | | | | | | | | | | | | |
Malaysia Government Bond+ | | | | 3.96 | | | | | 9/15/2025 | | | | | 1,978,000 | | | | | 476,547 | | | | | 476,371 | |
| | | | | | | | | | | | | | | | | | | | | | | | | |
| | | | | |
Mexico — 8.4%*: | | | | | | | | | | | | | | | | | | | | | | | | | |
Mexican Bonos+ | | | | 7.75 | | | | | 11/13/2042 | | | | | 60,400,000 | | | | | 2,914,045 | | | | | 2,709,273 | |
Mexican Bonos+ | | | | 8.00 | | | | | 11/7/2047 | | | | | 15,000,000 | | | | | 657,401 | | | | | 690,778 | |
Mexico Government International Bond+ | | | | 5.75 | | | | | 10/12/2110 | | | | | 500,000 | | | | | 504,498 | | | | | 469,375 | |
| | | | | | | | | | | | | | | | | | | | | | | | | |
Total Mexico | | | | | | | | | | | | | | 75,900,000 | | | | | 4,075,944 | | | | | 3,869,426 | |
| | | | | | | | | | | | | | | | | | | | | | | | | |
| | | | | |
Peru — 1.4%*: | | | | | | | | | | | | | | | | | | | | | | | | | |
Peru Government Bond+ | | | | 6.85 | | | | | 2/12/2042 | | | | | 1,173,000 | | | | | 400,113 | | | | | 369,684 | |
Peru Government Bond+ | | | | 8.20 | | | | | 8/12/2026 | | | | | 800,000 | | | | | 285,331 | | | | | 278,585 | |
| | | | | | | | | | | | | | | | | | | | | | | | | |
Total Peru | | | | | | | | | | | | | | 1,973,000 | | | | | 685,444 | | | | | 648,269 | |
| | | | | | | | | | | | | | | | | | | | | | | | | |
See accompanying Notes to the Financial Statements.
150
Barings Emerging Markets Debt Blended Total Return Fund 2018 Semi-Annual Report
SCHEDULE OF INVESTMENTS (CONTINUED)
December 31, 2018 (Unaudited)
| | | | | | | | | | | | | | | | | | | | | | | | | |
| | | EFFECTIVE
INTEREST RATE | | DUE DATE | | PRINCIPAL ‡‡ | | COST | | FAIR
VALUE |
Foreign Government(Continued) | | | | | | | | | | | | | | | | | | | | | | | | | |
| | | | | |
Russia — 6.2%*: | | | | | | | | | | | | | | | | | | | | | | | | | |
Russian Federal Bond — OFZ+ | | | | 7.70 | % | | | | 3/23/2033 | | | | | 12,440,000 | | | | | $226,263 | | | | | $166,042 | |
Russian Federal Bond — OFZ+ | | | | 8.50 | | | | | 9/17/2031 | | | | | 190,560,000 | | | | | 3,705,507 | | | | | 2,717,425 | |
| | | | | | | | | | | | | | | | | | | | | | | | | |
Total Russia | | | | | | | | | | | | | | 203,000,000 | | | | | 3,931,770 | | | | | 2,883,467 | |
| | | | | | | | | | | | | | | | | | | | | | | | | |
| | | | | |
Senegal — 0.7%*: | | | | | | | | | | | | | | | | | | | | | | | | | |
Senegal Government International Bond+^ | | | | 4.75 | | | | | 3/13/2028 | | | | | 300,000 | | | | | 372,120 | | | | | 314,938 | |
| | | | | | | | | | | | | | | | | | | | | | | | | |
| | | | | |
Ukraine — 2.0%*: | | | | | | | | | | | | | | | | | | | | | | | | | |
Ukraine Government International Bond+^ | | | | 7.75 | | | | | 9/1/2020 | | | | | 625,000 | | | | | 639,854 | | | | | 603,906 | |
Ukraine Government International Bond+^ | | | | 7.75 | | | | | 9/1/2021 | | | | | 325,000 | | | | | 339,344 | | | | | 305,500 | |
| | | | | | | | | | | | | | | | | | | | | | | | | |
Total Ukraine | | | | | | | | | | | | | | 950,000 | | | | | 979,198 | | | | | 909,406 | |
| | | | | | | | | | | | | | | | | | | | | | | | | |
Total Foreign Government | | | | | | | | | | | | | | 22,315,573,999 | | | | | 26,828,608 | | | | | 24,274,458 | |
| | | | | | | | | | | | | | | | | | | | | | | | | |
Total Fixed Income | | | | | | | | | | | | | | 22,336,862,999 | | | | | 47,846,878 | | | | | 44,469,027 | |
| | | | | | | | | | | | | | | | | | | | | | | | | |
Total Investments | | | | | | | | | | | | | | 22,336,862,999 | | | | | 47,846,878 | | | | | 44,469,027 | |
| | | | | | | | | | | | | | | | | | | | | | | | | |
| |
Other assets and liabilities — 3.8%* | | | | | 1,760,160 | |
| | | | | | | | | | | | | | | | | | | | | | | | | |
| |
Net Assets — 100.0% | | | | | $46,229,187 | |
| | | | | | | | | | | | | | | | | | | | | | | | | |
| ‡‡ | Unless otherwise indicated, all principal amounts are denominated in United States Dollars. |
| * | Calculated as a percentage of net assets applicable to common shareholders. |
Distributions of investments by country of risk (excluding temporary cash investments) as a percentage of total investments in securities, is as follows:
| | | | | | |
| | Brazil | | | 17.0% | |
| | Mexico | | | 12.7% | |
| | Russia | | | 6.5% | |
| | Turkey | | | 6.2% | |
| | Colombia | | | 5.4% | |
| | China | | | 5.3% | |
| | El Salvador | | | 3.8% | |
| | Ghana | | | 3.6% | |
| | Ukraine | | | 3.5% | |
| | United Kingdom | | | 3.4% | |
| | Indonesia | | | 2.7% | |
| | Cocos (Keeling) Islands | | | 2.6% | |
| | Ireland | | | 2.5% | |
| | Niger | | | 2.4% | |
| | Armenia | | | 2.2% | |
| | Argentina | | | 2.0% | |
| | Chile | | | 2.0% | |
| | India | | | 2.0% | |
| | Egypt | | | 1.8% | |
| | Portugal | | | 1.7% | |
See accompanying Notes to the Financial Statements.
151
Barings Emerging Markets Debt Blended Total Return Fund 2018 Semi-Annual Report
SCHEDULE OF INVESTMENTS (CONTINUED)
December 31, 2018 (Unaudited)
| | | | | | |
| | Dominican Republic | | | 1.5% | |
| | Peru | | | 1.5% | |
| | United States | | | 1.4% | |
| | Macedonia | | | 1.3% | |
| | Netherlands | | | 1.1% | |
| | American Samoa | | | 1.1% | |
| | Malaysia | | | 1.1% | |
| | Albania | | | 1.0% | |
| | Other (Individually less than 1%) | | | 0.7% | |
| | | | | | |
| | Total | | | 100.0% | |
| | | | | | |
| ^ | Security acquired in a transaction exempt from registration under Rule 144A of the Securities Act of 1933. These securities may only be resold in transactions exempt from registration, normally to qualified institutional buyers. |
| # | Variable rate security. The interest rate shown is the rate in effect at December 31, 2018. |
| ** | Variable Rate is Fixed to Float: Rate remains fixed until designated future date. |
A summary of outstanding derivatives at December 31, 2018 is as follows:
Cross Currency Forward Foreign Currency Exchange Contracts
| | | | | | | | | | | | | | | | |
EXPIRATION
DATE | | DELIVER/RECEIVE | | COUNTERPARTY | | CONTRACT
AMOUNT
PURCHASED | | | CONTRACT
AMOUNT
SOLD | | | NET UNREALIZED
APPRECIATION
(DEPRECIATION) | |
| 1/15/19 | | CZK/EUR | | Bank of America N.A. | | | 2,007,565 | | | | 51,878,504 | | | $ | (8,049 | ) |
| 1/15/19 | | EUR/CZK | | Bank of America N.A. | | | 25,931,572 | | | | 1,003,000 | | | | 4,580 | |
| 1/15/19 | | EUR/CZK | | Citibank N.A. | | | 25,946,932 | | | | 1,002,023 | | | | 6,385 | |
| 1/15/19 | | EUR/HUF | | Barclays Bank plc | | | 390,193,751 | | | | 1,201,244 | | | | 15,958 | |
| 1/15/19 | | EUR/PLN | | Citibank N.A. | | | 684,444 | | | | 157,000 | | | | 2,861 | |
| 1/15/19 | | EUR/PLN | | Barclays Bank plc | | | 12,767,043 | | | | 2,943,478 | | | | 36,245 | |
| 1/15/19 | | HUF/EUR | | BNP Paribas S.A. | | | 1,199,177 | | | | 390,193,751 | | | | (18,329 | ) |
| 1/15/19 | | PLN/EUR | | Barclays Bank plc | | | 101,000 | | | | 434,721 | | | | (347 | ) |
| | | | | | | | | | | | | | | | |
Net unrealized appreciation on cross currency forward foreign currency exchange contracts | | | $ | 39,304 | |
| | | | | | | | | | | | | | | | |
Forward Foreign Currency Exchange Contracts to Buy
| | | | | | | | | | | | | | | | | | | | | | |
EXPIRATION
DATE | | COUNTERPARTY | | LOCAL CURRENCY | | | VALUE IN USD | | | IN
EXCHANGE
FOR USD | | | NET UNREALIZED
APPRECIATION
(DEPRECIATION) | |
| 2/12/19 | | State Street Bank & Trust Co. | | | ARS | | | | 48,501,050 | | | $ | 1,220,021 | | | $ | 2,015,000 | | | $ | (794,979 | ) |
| 2/12/19 | | Bank of America N.A. | | | ARS | | | | 6,742,400 | | | | 169,602 | | | | 280,000 | | | | (110,398 | ) |
| 10/29/19 | | Bank of America N.A. | | | ARS | | | | 18,656,207 | | | | 366,641 | | | | 362,609 | | | | 4,032 | |
| 10/29/19 | | JPMorgan Chase Bank N.A. | | | ARS | | | | 18,656,207 | | | | 366,641 | | | | 354,008 | | | | 12,633 | |
| 10/29/19 | | BNP Paribas S.A. | | | ARS | | | | 82,111,364 | | | | 1,613,692 | | | | 1,545,000 | | | | 68,692 | |
| 1/22/19 | | JPMorgan Chase Bank N.A. | | | AUD | | | | 2,645,835 | | | | 1,864,329 | | | | 1,888,000 | | | | (23,671 | ) |
| 1/8/19 | | JPMorgan Chase Bank N.A. | | | BRL | | | | 3,591,056 | | | | 926,110 | | | | 927,203 | | | | (1,093 | ) |
| 1/22/19 | | Citibank N.A. | | | CNY | | | | 354,832 | | | | 51,688 | | | | 51,000 | | | | 688 | |
| 1/8/19 | | Barclays Bank plc | | | COP | | | | 501,167,000 | | | | 154,282 | | | | 165,608 | | | | (11,326 | ) |
See accompanying Notes to the Financial Statements.
152
Barings Emerging Markets Debt Blended Total Return Fund 2018 Semi-Annual Report
SCHEDULE OF INVESTMENTS (CONTINUED)
December 31, 2018 (Unaudited)
| | | | | | | | | | | | | | | | | | | | | | |
EXPIRATION
DATE | | COUNTERPARTY | | LOCAL CURRENCY | | | VALUE IN USD | | | IN
EXCHANGE
FOR USD | | | NET UNREALIZED
APPRECIATION
(DEPRECIATION) | |
| 1/8/19 | | Citibank N.A. | | | CRC | | | | 678,383,707 | | | $ | 1,118,937 | | | $ | 1,133,303 | | | $ | (14,366 | ) |
| 1/15/19 | | Bank of America N.A. | | | EUR | | | | 3,864,353 | | | | 4,431,984 | | | | 4,394,991 | | | | 36,993 | |
| 1/15/19 | | JPMorgan Chase Bank N.A. | | | EUR | | | | 564,565 | | | | 647,493 | | | | 646,834 | | | | 659 | |
| 1/15/19 | | Citibank N.A. | | | EUR | | | | 503,550 | | | | 577,516 | | | | 573,619 | | | | 3,897 | |
| 1/22/19 | | Bank of America N.A. | | | INR | | | | 63,351,365 | | | | 909,648 | | | | 847,000 | | | | 62,648 | |
| 1/22/19 | | Goldman Sachs & Co. | | | INR | | | | 6,240,235 | | | | 89,602 | | | | 89,000 | | | | 602 | |
| 1/8/19 | | Barclays Bank plc | | | MXN | | | | 1,488,272 | | | | 75,686 | | | | 78,340 | | | | (2,654 | ) |
| 1/8/19 | | BNP Paribas S.A. | | | MXN | | | | 4,317,009 | | | | 219,542 | | | | 211,000 | | | | 8,542 | |
| 1/8/19 | | Citibank N.A. | | | MXN | | | | 2,073,256 | | | | 105,435 | | | | 109,000 | | | | (3,565 | ) |
| 1/22/19 | | Barclays Bank plc | | | MYR | | | | 12,299,186 | | | | 2,977,648 | | | | 2,950,820 | | | | 26,828 | |
| 1/22/19 | | Goldman Sachs & Co. | | | MYR | | | | 10,099 | | | | 2,445 | | | | 2,430 | | | | 15 | |
| 1/8/19 | | JPMorgan Chase Bank N.A. | | | PEN | | | | 3,066,357 | | | | 910,110 | | | | 906,000 | | | | 4,110 | |
| 2/1/19 | | Bank of America N.A. | | | PEN | | | | 888,720 | | | | 263,548 | | | | 273,099 | | | | (9,551 | ) |
| 2/1/19 | | State Street Bank & Trust Co. | | | PEN | | | | 3,222,868 | | | | 955,734 | | | | 979,000 | | | | (23,266 | ) |
| 1/15/19 | | Bank of America N.A. | | | SEK | | | | 8,864,950 | | | | 1,001,239 | | | | 993,184 | | | | 8,055 | |
| 1/22/19 | | BNP Paribas S.A. | | | THB | | | | 152,223,440 | | | | 4,676,023 | | | | 4,632,386 | | | | 43,637 | |
| | | | | | | | | | | | | | | | | | | | | | |
Net unrealized depreciation on forward foreign currency exchange contracts to buy | | | $ | (712,838 | ) |
| | | | | | | | | | | | | | | | | | | | | | |
Forward Foreign Currency Exchange Contracts to Sell
| | | | | | | | | | | | | | | | | | | | | | |
EXPIRATION
DATE | | COUNTERPARTY | | LOCAL
CURRENCY | | | VALUE IN USD | | | IN
EXCHANGE
FOR USD | | | NET UNREALIZED
APPRECIATION
(DEPRECIATION) | |
| 2/12/19 | | Bank of America N.A. | | | ARS | | | | 27,621,725 | | | $ | 694,811 | | | $ | 805,650 | | | $ | 110,839 | |
| 2/12/19 | | JPMorgan Chase Bank N.A. | | | ARS | | | | 27,621,725 | | | | 694,811 | | | | 1,109,752 | | | | 414,941 | |
| 1/8/19 | | JPMorgan Chase Bank N.A. | | | BRL | | | | 1,861,080 | | | | 479,960 | | | | 495,000 | | | | 15,040 | |
| 1/8/19 | | BNP Paribas S.A. | | | CLP | | | | 596,358,886 | | | | 859,325 | | | | 906,362 | | | | 47,037 | |
| 1/22/19 | | Bank of America N.A. | | | CNH | | | | 16,383,710 | | | | 2,385,339 | | | | 2,360,000 | | | | (25,339 | ) |
| 1/8/19 | | Barclays Bank plc | | | COP | | | | 785,862,000 | | | | 241,925 | | | | 243,000 | | | | 1,075 | |
| 1/8/19 | | Citibank N.A. | | | CRC | | | | 678,383,707 | | | | 1,118,937 | | | | 1,125,525 | | | | 6,588 | |
| 2/21/19 | | Citibank N.A. | | | CRC | | | | 514,483,437 | | | | 849,929 | | | | 847,128 | | | | (2,801 | ) |
| 3/14/19 | | Citibank N.A. | | | CRC | | | | 678,383,707 | | | | 1,119,445 | | | | 1,121,703 | | | | 2,258 | |
| 1/15/19 | | Goldman Sachs & Co. | | | EUR | | | | 576,194 | | | | 660,830 | | | | 672,000 | | | | 11,170 | |
| 1/15/19 | | Bank of America N.A. | | | EUR | | | | 347,189 | | | | 398,188 | | | | 403,710 | | | | 5,522 | |
| 1/22/19 | | JPMorgan Chase Bank N.A. | | | IDR | | | | 31,824,743,572 | | | | 2,204,143 | | | | 2,061,188 | | | | (142,955 | ) |
| 1/2/19 | | Bank of America N.A. | | | ILS | | | | 5,509 | | | | 1,473 | | | | 1,464 | | | | (9 | ) |
| 1/22/19 | | Citibank N.A. | | | INR | | | | 168,015,660 | | | | 2,412,500 | | | | 2,257,516 | | | | (154,984 | ) |
| 1/15/19 | | JPMorgan Chase Bank N.A. | | | KES | | | | 98,620,053 | | | | 966,218 | | | | 945,000 | | | | (21,218 | ) |
| 1/22/19 | | JPMorgan Chase Bank N.A. | | | KRW | | | | 1,026,764,900 | | | | 922,415 | | | | 917,000 | | | | (5,415 | ) |
| 1/8/19 | | Citibank N.A. | | | MXN | | | | 16,003,485 | | | | 813,859 | | | | 780,159 | | | | (33,700 | ) |
| 1/8/19 | | Bank of America N.A. | | | MXN | | | | 21,994,914 | | | | 1,118,553 | | | | 1,098,069 | | | | (20,484 | ) |
| 1/22/19 | | Goldman Sachs & Co. | | | MYR | | | | 4,637,685 | | | | 1,122,789 | | | | 1,105,000 | | | | (17,789 | ) |
| 1/8/19 | | JPMorgan Chase Bank N.A. | | | PEN | | | | 5,304,772 | | | | 1,574,483 | | | | 1,596,620 | | | | 22,137 | |
| 2/1/19 | | Barclays Bank plc | | | PEN | | | | 4,111,588 | | | | 1,219,282 | | | | 1,258,714 | | | | 39,432 | |
See accompanying Notes to the Financial Statements.
153
Barings Emerging Markets Debt Blended Total Return Fund 2018 Semi-Annual Report
SCHEDULE OF INVESTMENTS (CONTINUED)
December 31, 2018 (Unaudited)
| | | | | | | | | | | | | | | | | | | | | | |
EXPIRATION
DATE | | COUNTERPARTY | | LOCAL
CURRENCY | | | VALUE IN USD | | | IN
EXCHANGE
FOR USD | | | NET UNREALIZED
APPRECIATION
(DEPRECIATION) | |
| 1/22/19 | | BNP Paribas S.A. | | | PHP | | | | 48,225,030 | | | $ | 918,089 | | | $ | 917,000 | | | $ | (1,089 | ) |
| 1/15/19 | | JPMorgan Chase Bank N.A. | | | RUB | | | | 140,119,891 | | | | 2,009,398 | | | | 2,089,961 | | | | 80,563 | |
| 1/15/19 | | Citibank N.A. | | | SEK | | | | 570,890 | | | | 64,478 | | | | 63,000 | | | | (1,478 | ) |
| 1/22/19 | | Bank of America N.A. | | | SGD | | | | 1,308,376 | | | | 960,351 | | | | 945,000 | | | | (15,351 | ) |
| 1/22/19 | | Barclays Bank plc | | | THB | | | | 152,223,440 | | | | 4,676,023 | | | | 4,694,632 | | | | 18,609 | |
| 1/15/19 | | Bank of America N.A. | | | ZAR | | | | 13,090,950 | | | | 908,632 | | | | 903,000 | | | | (5,632 | ) |
| | | | | | | | | | | | | | | | | | | | | | |
Net unrealized appreciation on forward foreign currency exchange contracts to sell | | | $ | 326,967 | |
| | | | | | | | | | | | | | | | | | | | | | |
Currency Legend
| | | | |
| ARS | | – | | Argentine Peso |
| AUD | | – | | Australian Dollar |
| BRL | | – | | Brazilian Real |
| CLP | | – | | Chilean Peso |
| CNH | | – | | Chinese Yuan Renminbi |
| CNY | | – | | Chinese Yuan |
| COP | | – | | Colombian Peso |
| CRC | | – | | Costa Rican Colon |
| CZK | | – | | Czech Koruna |
| EUR | | – | | Euro |
| HUF | | – | | Hungarian Forint |
| IDR | | – | | Indonesian Rupiah |
| ILS | | – | | Israeli Shekel |
| INR | | – | | Indian Rupee |
| KES | | – | | Kenyan Shilling |
| KRW | | – | | South Korean Won |
| MXN | | – | | Mexican Peso |
| MYR | | – | | Malaysian Ringgit |
| PEN | | – | | Peruvian Nuevo Sol |
| PHP | | – | | Philippines Peso |
| PLN | | – | | Polish Zloty |
| RUB | | – | | Russian Ruble |
| SEK | | – | | Swedish Krona |
| SGD | | – | | Singapore Dollar |
| THB | | – | | Thai Baht |
| ZAR | | – | | South African Rand |
Futures
| | | | | | | | | | | | | | | | | | | | | | |
| TYPE | | EXPIRATION
DATE | | | CONTRACTS | | | NOTIONAL
AMOUNT | | | POSITION | | FAIR VALUE | | | UNREALIZED
DEPRECIATION | |
Short Future | |
U.S. Ultra Bond | | | 03/20/19 | | | | 8 | | | | (1,220,231 | ) | | Short | | $ | (1,285,250 | ) | | $ | (65,019 | ) |
| | | | | | | | | | | | | | | | | | | | | | |
See accompanying Notes to the Financial Statements.
154
Barings Emerging Markets Debt Blended Total Return Fund 2018 Semi-Annual Report
SCHEDULE OF INVESTMENTS (CONTINUED)
December 31, 2018 (Unaudited)
Centrally Cleared Interest Rate Swaps
| | | | | | | | | | | | | | | | | | | | | | | | |
FLOATING RATE
REFERENCE | | PAY/RECEIVE
FLOATING
RATE | | FIXED
RATE | | | MATURITY
DATE | | | PAY/RECEIVE
PAYMENT
FREQUENCY | | NOTIONAL
AMOUNT | | | CLEARED
EXCHANGE | | | UNREALIZED
APPRECIATION
DEPRECIATION | |
| KRW-KSDA Rate | | Receive | | | 1.86 | % | | | 12/14/23 | | | 3M/3M | | | 5,600,000,000 | | | | CME | | | $ | (19,799 | ) |
| HUF-BUBOR Rate | | Receive | | | 1.32 | % | | | 12/17/21 | | | 6M/6M | | | 2,241,000,000 | | | | CME | | | | (35,342 | ) |
| | | | | | | | | | | | | | | | | | | | | | | | |
Total Centrally Cleared Interest Rate Swaps | | | $ | (55,141 | ) |
| | | | | | | | | | | | | | | | | | | | | | | | |
OTC Cross Currency Swaps
| | | | | | | | | | | | | | | | | | | | | | | | | | | | | | | | | | |
NOTIONAL
AMOUNT | | FUND
PAYS | | | PAY/
RECEIVE
PAYMENT
FREQUENCY | | MATURITY
DATE | | | COUNTERPARTY
| | | NOTIONAL
AMOUNT | | | FUND
RECEIVES | | | UPFRONT
PREMIUMS
PAID/
(RECEIVED) | | | FAIR
VALUE | | | UNREALIZED
APPRECIATION
(DEPRECIATION) | |
300,000 EUR | | | 4.75 | % | | 1Y/6M | | | 03/13/2028 | | |
| Bank of
America
N.A. |
| | | 372,150 USD | | | | 7.43 | % | | $ | 30 | | | $ | 35,283 | | | $ | 35,253 | |
113,000 EUR | | | 4.00 | % | | 1Y/6M | | | 05/01/2020 | | |
| Citibank
N.A. |
| | | 128,402 USD | | | | 7.30 | % | | | (6 | ) | | | (922 | ) | | | (917 | ) |
400,000 EUR | | | 3.50 | % | | 1Y/6M | | | 10/09/2025 | | |
| Citibank
N.A. |
| | | 462,000 USD | | | | 6.56 | % | | | (60 | ) | | | 18,360 | | | | 18,420 | |
510,000 EUR | | | 2.75 | % | | 1Y/6M | | | 01/18/2025 | | |
| Citibank
N.A. |
| | | 591,600 USD | | | | 5.75 | % | | | 2,065 | | | | 24,696 | | | | 22,631 | |
237,000 EUR | | | 4.00 | % | | 1Y/6M | | | 05/01/2020 | | |
| Citibank
N.A. |
| | | 270,654 USD | | | | 7.33 | % | | | 1,126 | | | | (416 | ) | | | (1,542 | ) |
350,000 EUR | | | 2.70 | % | | 1Y/6M | | | 06/15/2028 | | |
| Citibank
N.A. |
| | | 411,740 USD | | | | 5.34 | % | | | (245 | ) | | | 14,663 | | | | 14,909 | |
| | | | | | | | | | | | | | | | | | | | | | | | | | | | | | | | | | |
Total OTC Cross Currency Swaps | | | | | | | | | | | | | | | $ | 2,910 | | | $ | 91,664 | | | $ | 88,754 | |
| | | | | | | | | | | | | | | | | | | | | | | | | | | | | | | | | | |
OTC – Interest Rate Swaps
| | | | | | | | | | | | | | | | |
| DESCRIPTION | | NOTIONAL AMOUNT | | | UNREALIZED
APPRECIATION | | | VALUE | |
Agreement with Bank of America N.A. dated 7/12/2018 paying a fixed rate of 9.18% receiving the notional amount multiplied by the BRL-CDI rate of Expiring 1/4/2021 | | | BRL | | | | 12,640,167 | | | $ | 162,274 | | | $ | 162,274 | |
Agreement with Bank of America N.A. dated 06/27/18 receiving a fixed rate of 9.35% paying the notional amount multiplied by the BRL-CDI rate. Expiring 1/4/21 | | | BRL | | | | 3,994,027 | | | | 57,304 | | | | 57,304 | |
| | | | | | | | | | | | | | | | |
Total OTC Interest Rate Swaps | | | | | | | | | | $ | 219,578 | | | $ | 219,578 | |
| | | | | | | | | | | | | | | | |
See accompanying Notes to the Financial Statements.
155
Barings Emerging Markets Debt Blended Total Return Fund 2018 Semi-Annual Report
SCHEDULE OF INVESTMENTS (CONTINUED)
December 31, 2018 (Unaudited)
OTC Credit Default Swaps – Sell Protection (1)
| | | | | | | | | | | | | | | | | | | | | | | | | | | | | | | | |
REFERENCE
OBLIGATION | | FIXED-
DEAL
RECEIVED
RATE | | PAYMENT
FREQUENCY | | | MATURITY
DATE | | | COUNTERPARTY | | ORIGINAL
NOTIONAL
AMOUNT | | | CURRENT
NOTIONAL
AMOUNT (2) | | | UPFRONT
PREMIUMS
PAID/
(RECEIVED) | | | FAIR
VALUE (3) | | | UNREALIZED
APPRECIATION
(DEPRECIATION) | |
Brazil Government International Bond | | 1.00% | | | 3M | | | | 12/20/2023 | | | BNP Paribas S.A. | | $ | 500,000 | | | $ | 500,000 | | | $ | (41,120 | ) | | $ | (23,521 | ) | | $ | 17,599 | |
Colombia Government International Bond | | 1.00% | | | 3M | | | | 12/20/2023 | | | BNP Paribas S.A. | | | 500,000 | | | | 500,000 | | | | (11,847 | ) | | | (12,918 | ) | | | (1,071 | ) |
Colombia Government International Bond | | 1.00% | | | 3M | | | | 12/20/2023 | | | BNP Paribas S.A. | | | 500,000 | | | | 500,000 | | | | (2,407 | ) | | | (12,918 | ) | | | (10,511 | ) |
Indonesia Government International Bond | | 1.00% | | | 3M | | | | 12/20/2023 | | | BNP Paribas S.A. | | | 1,000,000 | | | | 1,000,000 | | | | (18,230 | ) | | | (16,739 | ) | | | 1,491 | |
Indonesia Government International Bond | | 1.00% | | | 3M | | | | 12/20/2023 | | | BNP Paribas S.A. | | | 2,000,000 | | | | 2,000,000 | | | | (42,604 | ) | | | (33,479 | ) | | | 9,125 | |
Malaysia Government International Bond | | 1.00% | | | 3M | | | | 12/20/2023 | | | BNP Paribas S.A. | | | 1,500,000 | | | | 1,500,000 | | | | (4,826 | ) | | | (6,397 | ) | | | (1,571 | ) |
Mexico Government International Bond | | 1.00% | | | 3M | | | | 12/20/2023 | | | Goldman Sachs
& Co. | | | 1,000,000 | | | | 1,000,000 | | | | (5,726 | ) | | | (24,515 | ) | | | (18,789 | ) |
Panama Government International Bond | | 1.00% | | | 3M | | | | 12/20/2023 | | | JPMorgan
Chase Bank
N.A. | | | 1,000,000 | | | | 1,000,000 | | | | 14,049 | | | | 6,362 | | | | (7,687 | ) |
Peruvian Government International Bond | | 1.00% | | | 3M | | | | 12/20/2023 | | | Bank of
America N.A. | | | 1,000,000 | | | | 1,000,000 | | | | 6,184 | | | | 2,430 | | | | (3,754 | ) |
Turkey Government International Bond | | 1.00% | | | 3M | | | | 6/20/2019 | | | JPMorgan
Chase Bank
N.A. | | | 500,000 | | | | 500,000 | | | | (9,042 | ) | | | (2,928 | ) | | | 6,114 | |
| | | | | | | | | | | | | | | | | | | | | | | | | | | | | | | | |
Total OTC Credit Default Swaps | | | | | | | | | | $ | (115,569 | ) | | $ | (124,623 | ) | | $ | (9,054 | ) |
| | | | | | | | | | | | | | | | | | | | | | | | | | | | | | | | |
| (1) | If the Fund is a seller of protection and a credit event occurs, as defined under the terms of that particular swap agreement, the Fund will either (i) pay to the buyer of protection an amount equal to the notional amount of the swap and take delivery of the referenced obligation or underlying securities comprising the referenced index or (ii) pay a net settlement amount in the form of cash or securities equal to the notional amount of the swap less the recovery value of the referenced obligation or underlying securities comprising the referenced index. |
| (2) | The maximum potential amount the Portfolio could be required to make as a seller of credit protection or receive as a buyer of credit event as defined under the terms of that particular swap agreement. |
| (3) | The quoted market prices and resulting values for credit default swap agreements on asset-backed securities and credit indices serve as an indicator of the current status of the payment/performance risk and represent the expected amount paid or received for the credit derivative if the amount of the swap agreement was closed/sold as of the period end. Increasing market values, in absolute terms when compared to the notional amount of the swap, represent a deterioration of the referenced entity’s credit soundness and a greater likelihood or risk of default or other credit event occurring as defined under the terms of the agreements. |
Abbreviation Legend
See accompanying Notes to the Financial Statements.
156
Barings Global Emerging Markets Equity Fund 2018 Semi-Annual Report
SCHEDULE OF INVESTMENTS
December 31, 2018 (Unaudited)
| | | | | | | | | | | | | | | |
| | | SHARES | | COST | | FAIR
VALUE |
Equities — 91.1%*: | |
| | | |
Common Stocks — 91.1%*: | | | | | | | | | | | | | | | |
| | | |
Communication Services — 8.0%*: | | | | | | | | | | | | | | | |
Mail.Ru Group Ltd.+(a) | | | | 4,180 | | | | | $110,980 | | | | | $98,063 | |
Naspers Ltd.+ | | | | 934 | | | | | 202,883 | | | | | 187,759 | |
Tencent Holdings Ltd.+ | | | | 12,100 | | | | | 486,586 | | | | | 485,205 | |
| | | | | | | | | | | | | | | |
Total Communication Services | | | | 17,214 | | | | | 800,449 | | | | | 771,027 | |
| | | | | | | | | | | | | | | |
| | | |
Consumer Discretionary — 7.1%*: | | | | | | | | | | | | | | | |
Alibaba Group Holding Ltd.+(a) | | | | 4,266 | | | | | 669,663 | | | | | 584,741 | |
Samsonite International SA^ | | | | 33,600 | | | | | 97,499 | | | | | 95,473 | |
| | | | | | | | | | | | | | | |
Total Consumer Discretionary | | | | 37,866 | | | | | 767,162 | | | | | 680,214 | |
| | | | | | | | | | | | | | | |
| | | |
Consumer Staples — 3.9%*: | | | | | | | | | | | | | | | |
CP ALL Public Company Limited+ | | | | 71,600 | | | | | 150,311 | | | | | 151,182 | |
Natura Cosmeticos SA+ | | | | 10,400 | | | | | 70,742 | | | | | 120,751 | |
X5 Retail Group NV+ | | | | 4,259 | | | | | 103,537 | | | | | 105,538 | |
| | | | | | | | | | | | | | | |
Total Consumer Staples | | | | 86,259 | | | | | 324,590 | | | | | 377,471 | |
| | | | | | | | | | | | | | | |
| | | |
Energy — 4.2%*: | | | | | | | | | | | | | | | |
CNOOC Ltd.+ | | | | 86,000 | | | | | 159,195 | | | | | 132,891 | |
Reliance Industries Ltd.+^ | | | | 8,504 | | | | | 288,054 | | | | | 270,852 | |
| | | | | | | | | | | | | | | |
Total Energy | | | | 94,504 | | | | | 447,249 | | | | | 403,743 | |
| | | | | | | | | | | | | | | |
| | | |
Financials — 34.5%*: | | | | | | | | | | | | | | | |
AIA Group Ltd.+ | | | | 24,200 | | | | | 200,659 | | | | | 200,881 | |
B3 SA — Brasil Bolsa Balcao+ | | | | 23,123 | | | | | 124,844 | | | | | 159,950 | |
Banco do Brasil SA+ | | | | 9,800 | | | | | 67,209 | | | | | 117,552 | |
Bancolombia SA+ | | | | 4,723 | | | | | 192,923 | | | | | 179,946 | |
China Construction Bank Corp.+ | | | | 534,000 | | | | | 442,435 | | | | | 440,539 | |
China Pacific Insurance Group Co. Ltd.+ | | | | 49,400 | | | | | 172,692 | | | | | 159,925 | |
Grupo Financiero Banorte SAB de CV+ | | | | 30,302 | | | | | 215,928 | | | | | 147,919 | |
Hana Financial Group, Inc.+ | | | | 6,217 | | | | | 237,492 | | | | | 201,977 | |
HDFC Bank Ltd.+ | | | | 3,800 | | | | | 358,595 | | | | | 393,642 | |
Itau Unibanco Holding SA+ | | | | 23,715 | | | | | 165,801 | | | | | 216,755 | |
Mega Financial Holding Co. Ltd.+ | | | | 213,000 | | | | | 182,642 | | | | | 179,827 | |
Ping An Insurance Group Co. of China Ltd.+ | | | | 42,000 | | | | | 399,188 | | | | | 370,896 | |
PT Bank Negara Indonesia Persero Tbk+ | | | | 354,100 | | | | | 174,120 | | | | | 216,696 | |
Sanlam Ltd.+ | | | | 32,257 | | | | | 164,909 | | | | | 178,913 | |
Sberbank of Russia PJSC+†† | | | | 14,847 | | | | | 169,153 | | | | | 162,723 | |
| | | | | | | | | | | | | | | |
Total Financials | | | | 1,365,484 | | | | | 3,268,590 | | | | | 3,328,141 | |
| | | | | | | | | | | | | | | |
| | | |
Industrials — 3.4%*: | | | | | | | | | | | | | | | |
China State Construction International Holdings Ltd.+ | | | | 210,000 | | | | | 198,648 | | | | | 166,810 | |
Rumo SA+(a) | | | | 36,200 | | | | | 125,794 | | | | | 158,782 | |
| | | | | | | | | | | | | | | |
Total Industrials | | | | 246,200 | | | | | 324,442 | | | | | 325,592 | |
| | | | | | | | | | | | | | | |
See accompanying Notes to the Financial Statements.
157
Barings Global Emerging Markets Equity Fund 2018 Semi-Annual Report
SCHEDULE OF INVESTMENTS (CONTINUED)
December 31, 2018 (Unaudited)
| | | | | | | | | | | | | | | |
| | | SHARES | | COST | | FAIR
VALUE |
Common Stocks(Continued) | | | | | | | | | | | | | | | |
| | | |
Information Technology — 16.0%*: | | | | | | | | | | | | | | | |
Chicony Electronics Co. Ltd.+ | | | | 49,000 | | | | | $100,603 | | | | | $99,795 | |
Hangzhou Hikvision Digital Technology Co. Ltd.+ | | | | 33,300 | | | | | 135,627 | | | | | 124,941 | |
Samsung Electronics Co. Ltd.+ | | | | 17,290 | | | | | 692,046 | | | | | 599,680 | |
Sunny Optical Technology Group Co. Ltd.+ | | | | 9,400 | | | | | 108,663 | | | | | 83,550 | |
Taiwan Semiconductor Manufacturing Co. Ltd.+ | | | | 86,000 | | | | | 716,077 | | | | | 630,934 | |
| | | | | | | | | | | | | | | |
Total Information Technology | | | | 194,990 | | | | | 1,753,016 | | | | | 1,538,900 | |
| | | | | | | | | | | | | | | |
| | | |
Materials — 7.3%*: | | | | | | | | | | | | | | | |
Angang Steel Co. Ltd.+ | | | | 180,000 | | | | | 156,043 | | | | | 124,130 | |
Anglo American plc+ | | | | 11,462 | | | | | 235,186 | | | | | 256,741 | |
Cemex SAB de CV+(a) | | | | 16,900 | | | | | 120,690 | | | | | 81,458 | |
LG Chem Ltd.+(a) | | | | 793 | | | | | 250,323 | | | | | 246,613 | |
| | | | | | | | | | | | | | | |
Total Materials | | | | 209,155 | | | | | 762,242 | | | | | 708,942 | |
| | | | | | | | | | | | | | | |
| | | |
Real Estate — 4.8%*: | | | | | | | | | | | | | | | |
China Overseas Land & Investment Ltd.+ | | | | 72,000 | | | | | 214,001 | | | | | 247,340 | |
China Resources Land Ltd.+ | | | | 56,000 | | | | | 188,928 | | | | | 215,261 | |
| | | | | | | | | | | | | | | |
Total Real Estate | | | | 128,000 | | | | | 402,929 | | | | | 462,601 | |
| | | | | | | | | | | | | | | |
| | | |
Utilities — 1.9%*: | | | | | | | | | | | | | | | |
Huaneng Renewables Corp. Ltd.*+ | | | | 694,000 | | | | | 202,375 | | | | | 186,118 | |
| | | | | | | | | | | | | | | |
Total Common Stocks | | | | 3,073,672 | | | | | 9,053,044 | | | | | 8,782,749 | |
| | | | | | | | | | | | | | | |
| | | | | | | | | | | | | | | |
Total Equities | | | | 3,073,672 | | | | | 9,053,044 | | | | | 8,782,749 | |
| | | | | | | | | | | | | | | |
| | | |
Mutual Fund — 4.6%*: | | | | | | | | | | | | | | | |
iShares MSCI India ETF | | | | 13,306 | | | | | 446,856 | | | | | 443,622 | |
| | | | | | | | | | | | | | | |
Total Investments | | | | 3,086,978 | | | | | 9,499,900 | | | | | 9,226,371 | |
| | | | | | | | | | | | | | | |
| |
Other assets and liabilities — 4.3%* | | | | | 415,857 | |
| | | | | | | | | | | | | | | |
| |
Net Assets — 100.0% | | | | | $9,642,228 | |
| | | | | | | | | | | | | | | |
| * | Calculated as a percentage of net assets applicable to common shareholders. |
Distributions of investments by country of risk (excluding temporary cash investments) as a percentage of total investments in securities, is as follows:
| | | | | | |
| | China | | | 36.0% | |
| | Republic of Korea | | | 11.4% | |
| | Taiwan | | | 9.9% | |
| | Brazil | | | 8.4% | |
| | India | | | 7.2% | |
| | South Africa | | | 6.8% | |
| | United States | | | 4.8% | |
| | Russia | | | 4.0% | |
See accompanying Notes to the Financial Statements.
158
Barings Global Emerging Markets Equity Fund 2018 Semi-Annual Report
SCHEDULE OF INVESTMENTS (CONTINUED)
December 31, 2018 (Unaudited)
| | | | | | |
| | Hong Kong | | | 3.2% | |
| | Mexico | | | 2.5% | |
| | Indonesia | | | 2.3% | |
| | Colombia | | | 1.9% | |
| | Thailand | | | 1.6% | |
| | | | | | |
| | Total | | | 100.0% | |
| | | | | | |
| ^ | Security acquired in a transaction exempt from registration under Rule 144A of the Securities Act of 1933. These securities may only be resold in transactions exempt from registration, normally to qualified institutional buyers. |
| (a) | Non-income producing security. |
See accompanying Notes to the Financial Statements.
159
Barings Global High Yield Fund 2018 Semi-Annual Report
SCHEDULE OF INVESTMENTS
December 31, 2018 (Unaudited)
| | | | | | | | | | | | | | | | | | | | | | | | | |
| | | | | | | SHARES | | COST | | FAIR VALUE |
Equities — 0.5%*: | |
| | | | | |
Common Stock — 0.5%*: | | | | | | | | | | | | | | | | | | | | | | | | | |
| | | | | |
Oil and Gas — 0.5%*: | | | | | | | | | | | | | | | | | | | | | | | | | |
Jupiter Resources, Inc.+ | | | | | | | | | | | | | | 33,592 | | | | | $162,354 | | | | | $114,213 | |
| | | | | | | | | | | | | | | | | | | | | | | | | |
Warrants — 0.0%*: | | | | | | | | | | | | | | | | | | | | | | | | | |
| | | | |
Diversified/Conglomerate Manufacturing — 0.0%*: | | | | | | | | | | | | | | | | | | | | | |
Appvion Holdings Corp. (exp. June 13, 2023)¤†† | | | | | | | | | | | | | | 319 | | | | | – | | | | | 3,397 | |
Appvion Holdings Corp. (exp. June 13, 2023)¤ | | | | | | | | | | | | | | 319 | | | | | – | | | | | – | |
| | | | | | | | | | | | | | | | | | | | | | | | | |
Total Diversified/Conglomerate Manufacturing | | | | | | | | | | | | | | 638 | | | | | – | | | | | 3,397 | |
| | | | | | | | | | | | | | | | | | | | | | | | | |
Total Warrants | | | | | | | | | | | | | | 638 | | | | | – | | | | | 3,397 | |
| | | | | | | | | | | | | | | | | | | | | | | | | |
Total Equities | | | | | | | | | | | | | | 34,230 | | | | | 162,354 | | | | | 117,610 | |
| | | | | | | | | | | | | | | | | | | | | | | | | |
| | | | | |
| | | EFFECTIVE
INTEREST RATE | | DUE DATE | | PRINCIPAL ‡‡ | | COST | | FAIR
VALUE |
Fixed Income — 97.7%*: | | | | | | | | | | | | | | | | | | | | | | | | | |
| | | | | |
Bank Loans — 5.6%*§: | | | | | | | | | | | | | | | | | | | | | | | | | |
| | | | | |
Aerospace and Defense — 0.2%*: | | | | | | | | | | | | | | | | | | | | | | | | | |
Ducommun, Inc., 1M LIBOR + 4.000% | | | | 6.80 | % | | | | 11/16/2025 | | | | | 33,440 | | | | | 33,273 | | | | | 32,604 | |
| | | | | | | | | | | | | | | | | | | | | | | | | |
| | | | | |
Diversified/Conglomerate Service — 0.9%*: | | | | | | | | | | | | | | | | | | | | | | | | | |
Vertafore, Inc., 1M LIBOR + 3.250% | | | | 6.05 | | | | | 7/2/2025 | | | | | 180,000 | | | | | 175,708 | | | | | 170,606 | |
Evertec Group, LLC, 1M LIBOR + 3.500% | | | | 6.02 | | | | | 11/27/2024 | | | | | 43,312 | | | | | 43,096 | | | | | 42,409 | |
| | | | | | | | | | | | | | | | | | | | | | | | | |
Total Diversified/Conglomerate Service | | | | | | | | | | | | | | 223,312 | | | | | 218,804 | | | | | 213,015 | |
| | | | | | | | | | | | | | | | | | | | | | | | | |
| | | | |
Leisure, Amusement, Entertainment — 0.3%*: | | | | | | | | | | | | | | | | | | | | | |
SeaWorld Parks & Entertainment, Inc., 3M LIBOR + 3.000% | | | | 5.52 | | | | | 3/31/2024 | | | | | 78,577 | | | | | 78,482 | | | | | 74,845 | |
| | | | | | | | | | | | | | | | | | | | | | | | | |
| | | | | |
Oil and Gas — 1.2%*: | | | | | | | | | | | | | | | | | | | | | | | | | |
Fieldwood Energy LLC, 1M LIBOR + 5.250% | | | | 7.77 | | | | | 4/11/2022 | | | | | 300,000 | | | | | 303,979 | | | | | 279,564 | |
| | | | | | | | | | | | | | | | | | | | | | | | | |
| | | | | |
Printing and Publishing — 0.8%*: | | | | | | | | | | | | | | | | | | | | | | | | | |
Getty Images, Inc., 3M LIBOR + 3.500% | | | | 6.02 | | | | | 10/18/2019 | | | | | 198,402 | | | | | 194,459 | | | | | 192,450 | |
| | | | | | | | | | | | | | | | | | | | | | | | | |
| | | | | |
Retail Stores — 0.8%*: | | | | | | | | | | | | | | | | | | | | | | | | | |
Michaels Stores, Inc., 1M LIBOR + 2.500% | | | | 5.01 | | | | | 1/30/2023 | | | | | 180,000 | | | | | 174,636 | | | | | 171,675 | |
| | | | | | | | | | | | | | | | | | | | | | | | | |
| | | | | |
Telecommunications — 1.4%*: | | | | | | | | | | | | | | | | | | | | | | | | | |
CenturyLink, Inc., 3M LIBOR + 2.750% | | | | 5.27 | | | | | 1/31/2025 | | | | | 248,744 | | | | | 247,020 | | | | | 231,581 | |
Sprint Communications, Inc., 1M LIBOR + 2.500% | | | | 5.06 | | | | | 2/2/2024 | | | | | 86,779 | | | | | 83,952 | | | | | 82,368 | |
| | | | | | | | | | | | | | | | | | | | | | | | | |
Total Telecommunications | | | | | | | | | | | | | | 335,523 | | | | | 330,972 | | | | | 313,949 | |
| | | | | | | | | | | | | | | | | | | | | | | | | |
| | | | | | | | | | | | | | | | | | | | | | | | | |
Total Bank Loans | | | | | | | | | | | | | | 1,349,254 | | | | | 1,334,605 | | | | | 1,278,102 | |
| | | | | | | | | | | | | | | | | | | | | | | | | |
See accompanying Notes to the Financial Statements.
160
Barings Global High Yield Fund 2018 Semi-Annual Report
SCHEDULE OF INVESTMENTS (CONTINUED)
December 31, 2018 (Unaudited)
| | | | | | | | | | | | | | | | | | | | | | | | | |
| | | EFFECTIVE
INTEREST RATE | | DUE DATE | | PRINCIPAL ‡‡ | | COST | | FAIR
VALUE |
Corporate Bonds — 92.1%*: | | | | | | | | | | | | | | | | | | | | | | | | | |
| | | | | |
Aerospace and Defense — 2.5%*: | | | | | | | | | | | | | | | | | | | | | | | | | |
Swissport Financing Sarl+ | | | | 9.75 | % | | | | 12/15/2022 | | | | | 100,000 | | | | | $129,901 | | | | | $120,016 | |
Triumph Group, Inc. | | | | 4.88 | | | | | 4/1/2021 | | | | | 38,000 | | | | | 37,117 | | | | | 34,105 | |
Triumph Group, Inc. | | | | 7.75 | | | | | 8/15/2025 | | | | | 250,000 | | | | | 250,000 | | | | | 220,625 | |
VistaJet Malta Finance PLC/VistaJet Co. Finance LLC^ | | | | 7.75 | | | | | 6/1/2020 | | | | | 200,000 | | | | | 199,817 | | | | | 191,500 | |
| | | | | | | | | | | | | | | | | | | | | | | | | |
Total Aerospace and Defense | | | | | | | | | | | | | | 588,000 | | | | | 616,835 | | | | | 566,246 | |
| | | | | | | | | | | | | | | | | | | | | | | | | |
| | | | | |
Automobile — 1.8%*: | | | | | | | | | | | | | | | | | | | | | | | | | |
AA Bond Co. Ltd.+ | | | | 5.50 | | | | | 7/31/2022 | | | | | 200,000 | | | | | 276,874 | | | | | 203,627 | |
Garrett LX I Sarl/Garrett Borrowing LLC+ | | | | 5.13 | | | | | 10/15/2026 | | | | | 100,000 | | | | | 117,490 | | | | | 101,089 | |
RAC Bond Co. PLC+ | | | | 5.00 | | | | | 11/6/2022 | | | | | 100,000 | | | | | 128,880 | | | | | 113,779 | |
| | | | | | | | | | | | | | | | | | | | | | | | | |
Total Automobile | | | | | | | | | | | | | | 400,000 | | | | | 523,244 | | | | | 418,495 | |
| | | | | | | | | | | | | | | | | | | | | | | | | |
| | | | | |
Beverage, Food and Tobacco — 3.3%*: | | | | | | | | | | | | | | | | | | | | | | | | | |
Boparan Finance PLC+ | | | | 5.50 | | | | | 7/15/2021 | | | | | 150,000 | | | | | 190,983 | | | | | 137,274 | |
JBS USA LUX SA/JBS USA Finance, Inc.^ | | | | 5.88 | | | | | 7/15/2024 | | | | | 137,000 | | | | | 140,136 | | | | | 134,945 | |
JBS USA LUX SA/JBS USA Finance, Inc.^ | | | | 6.75 | | | | | 2/15/2028 | | | | | 250,000 | | | | | 250,000 | | | | | 243,750 | |
KeHE Distributors LLC/KeHE Finance Corp.^ | | | | 7.63 | | | | | 8/15/2021 | | | | | 150,000 | | | | | 150,952 | | | | | 142,500 | |
Sunshine Mid BV+ | | | | 6.50 | | | | | 5/15/2026 | | | | | 100,000 | | | | | 121,055 | | | | | 105,409 | |
| | | | | | | | | | | | | | | | | | | | | | | | | |
Total Beverage, Food and Tobacco | | | | | | | | | | | | | | 787,000 | | | | | 853,126 | | | | | 763,878 | |
| | | | | | | | | | | | | | | | | | | | | | | | | |
| | | | | |
Broadcasting and Entertainment — 6.7%*: | | | | | | | | | | | | | | | | | | | | | | | | | |
Arqiva Broadcast Finance PLC+ | | | | 6.75 | | | | | 9/30/2023 | | | | | 100,000 | | | | | 130,610 | | | | | 127,460 | |
CCO Holdings LLC/CCO Holdings Capital Corp.^ | | | | 5.00 | | | | | 2/1/2028 | | | | | 275,000 | | | | | 275,090 | | | | | 253,000 | |
CCO Holdings LLC/CCO Holdings Capital Corp.^ | | | | 5.75 | | | | | 2/15/2026 | | | | | 275,000 | | | | | 274,356 | | | | | 269,500 | |
Clear Channel Worldwide Holdings, Inc. | | | | 7.63 | | | | | 3/15/2020 | | | | | 241,000 | | | | | 240,452 | | | | | 235,475 | |
DISH DBS Corp. | | | | 7.75 | | | | | 7/1/2026 | | | | | 125,000 | | | | | 125,000 | | | | | 103,437 | |
Intelsat Jackson Holdings SA^ | | | | 8.50 | | | | | 10/15/2024 | | | | | 250,000 | | | | | 250,000 | | | | | 242,500 | |
Intelsat Jackson Holdings SA^ | | | | 9.75 | | | | | 7/15/2025 | | | | | 25,000 | | | | | 26,343 | | | | | 25,070 | |
Tele Columbus AG+ | | | | 3.88 | | | | | 5/2/2025 | | | | | 150,000 | | | | | 156,780 | | | | | 155,278 | |
Unitymedia Hessen GmbH & Co. KG/Unitymedia NRW GmbH+ | | | | 6.25 | | | | | 1/15/2029 | | | | | 90,000 | | | | | 104,944 | | | | | 112,761 | |
| | | | | | | | | | | | | | | | | | | | | | | | | |
Total Broadcasting and Entertainment | | | | | | | | | | | | | | 1,531,000 | | | | | 1,583,575 | | | | | 1,524,481 | |
| | | | | | | | | | | | | | | | | | | | | | | | | |
| | | | | |
Buildings and Real Estate — 2.1%*: | | | | | | | | | | | | | | | | | | | | | | | | | |
Residomo SRO+ | | | | 3.38 | | | | | 10/15/2024 | | | | | 150,000 | | | | | 176,117 | | | | | 166,782 | |
Standard Industries, Inc.^ | | | | 4.75 | | | | | 1/15/2028 | | | | | 250,000 | | | | | 250,000 | | | | | 210,000 | |
William Lyon Homes, Inc. | | | | 6.00 | | | | | 9/1/2023 | | | | | 123,000 | | | | | 123,000 | | | | | 110,700 | |
| | | | | | | | | | | | | | | | | | | | | | | | | |
Total Buildings and Real Estate | | | | | | | | | | | | | | 523,000 | | | | | 549,117 | | | | | 487,482 | |
| | | | | | | | | | | | | | | | | | | | | | | | | |
| | | | | |
Cargo Transport — 4.4%*: | | | | | | | | | | | | | | | | | | | | | | | | | |
American Airlines Group, Inc.^ | | | | 5.50 | | | | | 10/1/2019 | | | | | 265,000 | | | | | 266,395 | | | | | 265,662 | |
Deck Chassis Acquisition, Inc.^ | | | | 10.00 | | | | | 6/15/2023 | | | | | 381,000 | | | | | 386,737 | | | | | 365,760 | |
Kenan Advantage Group, Inc.^ | | | | 7.88 | | | | | 7/31/2023 | | | | | 400,000 | | | | | 409,469 | | | | | 383,000 | |
| | | | | | | | | | | | | | | | | | | | | | | | | |
Total Cargo Transport | | | | | | | | | | | | | | 1,046,000 | | | | | 1,062,601 | | | | | 1,014,422 | |
| | | | | | | | | | | | | | | | | | | | | | | | | |
See accompanying Notes to the Financial Statements.
161
Barings Global High Yield Fund 2018 Semi-Annual Report
SCHEDULE OF INVESTMENTS (CONTINUED)
December 31, 2018 (Unaudited)
| | | | | | | | | | | | | | | | | | | | | | | | | |
| | | EFFECTIVE
INTEREST RATE | | DUE DATE | | PRINCIPAL ‡‡ | | COST | | FAIR
VALUE |
Corporate Bonds(Continued) | | | | | | | | | | | | | | | | | | | | | | | | | |
| | | | | |
Chemicals, Plastics and Rubber — 4.0%*: | | | | | | | | | | | | | | | | | | | | | | | | | |
Consolidated Energy Finance SA^ | | | | 6.88 | % | | | | 6/15/2025 | | | | | 300,000 | | | | | $298,731 | | | | | $285,750 | |
Huntsman International LLC | | | | 4.25 | | | | | 4/1/2025 | | | | | 100,000 | | | | | 128,478 | | | | | 124,073 | |
INEOS Group Holdings SA+ | | | | 5.38 | | | | | 8/1/2024 | | | | | 100,000 | | | | | 109,981 | | | | | 111,997 | |
LBC Tank Terminals Holding Netherlands BV^ | | | | 6.88 | | | | | 5/15/2023 | | | | | 215,000 | | | | | 209,523 | | | | | 191,350 | |
Monitchem HoldCo 2 SA+ | | | | 6.88 | | | | | 6/15/2022 | | | | | 100,000 | | | | | 99,895 | | | | | 91,598 | |
Starfruit Finco BV/Starfruit US Holdco LLC+ | | | | 6.50 | | | | | 10/1/2026 | | | | | 100,000 | | | | | 117,785 | | | | | 105,724 | |
| | | | | | | | | | | | | | | | | | | | | | | | | |
Total Chemicals, Plastics and Rubber | | | | | | | | | | | | | | 915,000 | | | | | 964,393 | | | | | 910,492 | |
| | | | | | | | | | | | | | | | | | | | | | | | | |
| | | | | |
Containers, Packaging and Glass — 1.4%*: | | | | | | | | | | | | | | | | | | | | | | | | | |
Ardagh Packaging Finance PLC/Ardagh Holdings USA, Inc.^+ | | | | 7.25 | | | | | 5/15/2024 | | | | | 200,000 | | | | | 206,298 | | | | | 199,500 | |
BWAY Holding Co. | | | | 4.75 | | | | | 4/15/2024 | | | | | 100,000 | | | | | 115,660 | | | | | 112,161 | |
| | | | | | | | | | | | | | | | | | | | | | | | | |
Total Containers, Packaging and Glass | | | | | | | | | | | | | | 300,000 | | | | | 321,958 | | | | | 311,661 | |
| | | | | | | | | | | | | | | | | | | | | | | | | |
| | | | |
Diversified/Conglomerate Manufacturing — 0.5%*: | | | | | | | | | | | | | | | | | | | | | |
Appvion ESC¤^ | | | | 9.00 | | | | | 6/1/2020 | | | | | 327,000 | | | | | 252,212 | | | | | — | |
Energizer Gamma Acquisition BV | | | | 4.63 | | | | | 7/15/2026 | | | | | 100,000 | | | | | 116,130 | | | | | 107,128 | |
| | | | | | | | | | | | | | | | | | | | | | | | | |
Total Diversified/Conglomerate Manufacturing | | | | | | | | | | | | | | 427,000 | | | | | 368,342 | | | | | 107,128 | |
| | | | | | | | | | | | | | | | | | | | | | | | | |
| | | | | |
Diversified/Conglomerate Service — 6.4%*: | | | | | | | | | | | | | | | | | | | | | | | | | |
Algeco Global Finance PLC+ | | | | 6.50 | | | | | 2/15/2023 | | | | | 100,000 | | | | | 121,509 | | | | | 111,888 | |
Carlson Travel, Inc.^ | | | | 9.50 | | | | | 12/15/2024 | | | | | 280,000 | | | | | 280,000 | | | | | 254,100 | |
Genesys Telecommunications Laboratories Inc/Greeneden Lux 3 Sarl/Greeneden US Ho^ | | | | 10.00 | | | | | 11/30/2024 | | | | | 200,000 | | | | | 218,204 | | | | | 209,500 | |
Iron Mountain UK PLC | | | | 3.88 | | | | | 11/15/2025 | | | | | 100,000 | | | | | 132,815 | | | | | 112,160 | |
Prime Security Services Borrower LLC/Prime Finance, Inc.^ | | | | 9.25 | | | | | 5/15/2023 | | | | | 353,000 | | | | | 362,980 | | | | | 364,031 | |
Verisure Midholding AB+ | | | | 5.75 | | | | | 12/1/2023 | | | | | 150,000 | | | | | 176,872 | | | | | 165,383 | |
Zachry Holdings, Inc.^ | | | | 7.50 | | | | | 2/1/2020 | | | | | 250,000 | | | | | 250,889 | | | | | 245,000 | |
| | | | | | | | | | | | | | | | | | | | | | | | | |
Total Diversified/Conglomerate Service | | | | | | | | | | | | | | 1,433,000 | | | | | 1,543,269 | | | | | 1,462,062 | |
| | | | | | | | | | | | | | | | | | | | | | | | | |
| | | | | |
Electronics — 2.7%*: | | | | | | | | | | | | | | | | | | | | | | | | | |
TIBCO Software, Inc.^ | | | | 11.38 | | | | | 12/1/2021 | | | | | 439,000 | | | | | 468,296 | | | | | 459,852 | |
Veritas US, Inc./Veritas Bermuda Ltd.^ | | | | 10.50 | | | | | 2/1/2024 | | | | | 250,000 | | | | | 257,322 | | | | | 163,750 | |
| | | | | | | | | | | | | | | | | | | | | | | | | |
Total Electronics | | | | | | | | | | | | | | 689,000 | | | | | 725,618 | | | | | 623,602 | |
| | | | | | | | | | | | | | | | | | | | | | | | | |
| | | | | |
Finance — 6.6%*: | | | | | | | | | | | | | | | | | | | | | | | | | |
Cabot Financial Luxembourg SA+ | | | | 7.50 | | | | | 10/1/2023 | | | | | 100,000 | | | | | 134,287 | | | | | 115,810 | |
Galaxy Finco Ltd.+ | | | | 7.88 | | | | | 11/15/2021 | | | | | 250,000 | | | | | 380,743 | | | | | 311,130 | |
Garfunkelux Holdco 3 S.A.+ | | | | 8.50 | | | | | 11/1/2022 | | | | | 300,000 | | | | | 446,289 | | | | | 320,947 | |
Jerrold Finco PLC+ | | | | 6.13 | | | | | 1/15/2024 | | | | | 100,000 | | | | | 124,555 | | | | | 122,370 | |
LPL Holdings, Inc.^ | | | | 5.75 | | | | | 9/15/2025 | | | | | 250,000 | | | | | 250,000 | | | | | 234,375 | |
Nexi Capital SpA+ | | | | 4.13 | | | | | 11/1/2023 | | | | | 100,000 | | | | | 119,575 | | | | | 113,150 | |
See accompanying Notes to the Financial Statements.
162
Barings Global High Yield Fund 2018 Semi-Annual Report
SCHEDULE OF INVESTMENTS (CONTINUED)
December 31, 2018 (Unaudited)
| | | | | | | | | | | | | | | | | | | | | | | | | |
| | | EFFECTIVE
INTEREST RATE | | DUE DATE | | PRINCIPAL ‡‡ | | COST | | FAIR
VALUE |
Corporate Bonds(Continued) | | | | | | | | | | | | | | | | | | | | | | | | | |
| | | | | |
Finance(Continued) | | | | | | | | | | | | | | | | | | | | | | | | | |
Park Aerospace Holdings Ltd.+^ | | | | 5.25 | % | | | | 8/15/2022 | | | | | 47,000 | | | | | $46,928 | | | | | $45,473 | |
VFH Parent LLC/Orchestra Co-Issuer, Inc.^ | | | | 6.75 | | | | | 6/15/2022 | | | | | 244,000 | | | | | 249,666 | | | | | 237,161 | |
| | | | | | | | | | | | | | | | | | | | | | | | | |
Total Finance | | | | | | | | | | | | | | 1,391,000 | | | | | 1,752,043 | | | | | 1,500,416 | |
| | | | | | | | | | | | | | | | | | | | | | | | | |
| | | | | |
Healthcare, Education and Childcare — 8.3%*: | | | | | | | | | | | | | | | | | | | | | | | | | |
Auris Luxembourg II SA | | | | 8.00 | | | | | 1/15/2023 | | | | | 100,000 | | | | | 116,395 | | | | | 116,649 | |
Avantor, Inc.^ | | | | 9.00 | | | | | 10/1/2025 | | | | | 220,000 | | | | | 220,000 | | | | | 220,000 | |
Bausch Health Cos., Inc.^ | | | | 5.88 | | | | | 5/15/2023 | | | | | 42,000 | | | | | 36,156 | | | | | 38,850 | |
Bausch Health Cos., Inc.^ | | | | 6.13 | | | | | 4/15/2025 | | | | | 224,000 | | | | | 199,647 | | | | | 195,440 | |
Bausch Health Cos., Inc.^ | | | | 7.00 | | | | | 3/15/2024 | | | | | 125,000 | | | | | 125,000 | | | | | 126,250 | |
Bausch Health Cos., Inc.^ | | | | 5.50 | | | | | 3/1/2023 | | | | | 101,000 | | | | | 80,370 | | | | | 92,415 | |
CTC BondCo GmbH+ | | | | 5.25 | | | | | 12/15/2025 | | | | | 100,000 | | | | | 117,464 | | | | | 109,069 | |
Endo Dac/Endo Finance LLC/Endo Finco Inc^ | | | | 6.00 | | | | | 2/1/2025 | | | | | 240,000 | | | | | 194,504 | | | | | 172,200 | |
Endo Finance LLC/Endo Finco, Inc.^ | | | | 7.25 | | | | | 1/15/2022 | | | | | 39,000 | | | | | 37,516 | | | | | 33,735 | |
Envision Healthcare Corp.^ | | | | 8.75 | | | | | 10/15/2026 | | | | | 250,000 | | | | | 250,000 | | | | | 216,250 | |
IDH Finance PLC+ | | | | 6.25 | | | | | 8/15/2022 | | | | | 100,000 | | | | | 131,025 | | | | | 104,581 | |
Mallinckrodt International Finance SA/Mallinckrodt CB LLC^ | | | | 5.63 | | | | | 10/15/2023 | | | | | 38,000 | | | | | 33,734 | | | | | 28,880 | |
Mallinckrodt International Finance SA/Mallinckrodt CB LLC^ | | | | 5.75 | | | | | 8/1/2022 | | | | | 34,000 | | | | | 31,477 | | | | | 29,240 | |
Nidda Healthcare Holding GmbH+ | | | | 3.50 | | | | | 9/30/2024 | | | | | 100,000 | | | | | 111,846 | | | | | 107,517 | |
Ortho-Clinical Diagnostics, Inc./Ortho-Clinical Diagnostics SA^ | | | | 6.63 | | | | | 5/15/2022 | | | | | 220,000 | | | | | 211,459 | | | | | 198,000 | |
Synlab Unsecured Bondco PLC+ | | | | 8.25 | | | | | 7/1/2023 | | | | | 100,000 | | | | | 130,957 | | | | | 117,588 | |
| | | | | | | | | | | | | | | | | | | | | | | | | |
Total Healthcare, Education and Childcare | | | | | | | | | | | | | | 2,033,000 | | | | | 2,027,550 | | | | | 1,906,664 | |
| | | | | | | | | | | | | | | | | | | | | | | | | |
| |
Home and Office Furnishings, Housewares, and Durable Consumer Products — 0.9%*: | | | | | | |
LSF9 Balta Issuer Sarl+ | | | | 7.75 | | | | | 9/15/2022 | | | | | 202,500 | | | | | 238,062 | | | | | 214,452 | |
| | | | | | | | | | | | | | | | | | | | | | | | | |
| | | | | |
Hotels, Motels, Inns and Gaming — 1.4%*: | | | | | | | | | | | | | | | | | | | | | | | | | |
TVL Finance PLC+ | | | | 8.50 | | | | | 5/15/2023 | | | | | 160,000 | | | | | 224,427 | | | | | 208,965 | |
Wynn Las Vegas LLC/Wynn Las Vegas Capital Corp.^ | | | | 5.25 | | | | | 5/15/2027 | | | | | 125,000 | | | | | 125,000 | | | | | 110,000 | |
| | | | | | | | | | | | | | | | | | | | | | | | | |
Total Hotels, Motels, Inns and Gaming | | | | | | | | | | | | | | 285,000 | | | | | 349,427 | | | | | 318,965 | |
| | | | | | | | | | | | | | | | | | | | | | | | | |
| | | | | |
Insurance — 0.9%*: | | | | | | | | | | | | | | | | | | | | | | | | | |
Acrisure LLC/Acrisure Finance, Inc.^ | | | | 7.00 | | | | | 11/15/2025 | | | | | 250,000 | | | | | 250,000 | | | | | 213,125 | |
| | | | | | | | | | | | | | | | | | | | | | | | | |
| | | | | |
Leisure, Amusement, Entertainment — 4.6%*: | | | | | | | | | | | | | | | | | | | | | | | | | |
Allegiant Travel Co.†† | | | | 5.50 | | | | | 7/15/2019 | | | | | 200,000 | | | | | 201,520 | | | | | 200,000 | |
AMC Entertainment Holdings, Inc. | | | | 6.38 | | | | | 11/15/2024 | | | | | 100,000 | | | | | 132,394 | | | | | 118,181 | |
Brunswick Corp. | | | | 7.13 | | | | | 8/1/2027 | | | | | 317,000 | | | | | 333,063 | | | | | 350,233 | |
CPUK Finance Ltd.+ | | | | 4.88 | | | | | 8/28/2025 | | | | | 100,000 | | | | | 120,937 | | | | | 119,140 | |
Perform Group Financing PLC+ | | | | 8.50 | | | | | 11/15/2020 | | | | | 100,000 | | | | | 150,651 | | | | | 127,511 | |
Vue International Bidco PLC+ | | | | 7.88 | | | | | 7/15/2020 | | | | | 100,000 | | | | | 130,705 | | | | | 125,389 | |
| | | | | | | | | | | | | | | | | | | | | | | | | |
Total Leisure, Amusement, Entertainment | | | | | | | | | | | | | | 917,000 | | | | | 1,069,270 | | | | | 1,040,454 | |
| | | | | | | | | | | | | | | | | | | | | | | | | |
See accompanying Notes to the Financial Statements.
163
Barings Global High Yield Fund 2018 Semi-Annual Report
SCHEDULE OF INVESTMENTS (CONTINUED)
December 31, 2018 (Unaudited)
| | | | | | | | | | | | | | | | | | | | | | | | | |
| | | EFFECTIVE
INTEREST RATE | | DUE DATE | | PRINCIPAL ‡‡ | | COST | | FAIR
VALUE |
Corporate Bonds(Continued) | | | | | | | | | | | | | | | | | | | | | | | | | |
| | | |
Machinery Non-Agriculture, Non-Construction, Non-Electronic — 0.9%*: | | | | | | | | | | | | | | | | |
Apex Tool Group LLC/BC Mountain Finance, Inc.^ | | | | 9.00 | % | | | | 2/15/2023 | | | | | 250,000 | | | | | $250,000 | | | | | $211,250 | |
| | | | | | | | | | | | | | | | | | | | | | | | | |
| | | | |
Mining, Steel, Iron and Non-Precious Metals — 7.1%*: | | | | | | | | | | | | | | | | | | | | | |
Alliance Resource Operating Partners LP/Alliance Resource Finance Corp.^ | | | | 7.50 | | | | | 5/1/2025 | | | | | 215,000 | | | | | 215,000 | | | | | 215,537 | |
Constellium NV | | | | 4.25 | | | | | 2/15/2026 | | | | | 100,000 | | | | | 117,449 | | | | | 103,175 | |
First Quantum Minerals Ltd.+^ | | | | 6.88 | | | | | 3/1/2026 | | | | | 229,000 | | | | | 229,000 | | | | | 183,772 | |
Hecla Mining Co. | | | | 6.88 | | | | | 5/1/2021 | | | | | 250,000 | | | | | 231,164 | | | | | 245,000 | |
Kinross Gold Corp.+ | | | | 5.95 | | | | | 3/15/2024 | | | | | 127,000 | | | | | 131,185 | | | | | 126,365 | |
Kinross Gold Corp. | | | | 6.88 | | | | | 9/1/2041 | | | | | 82,000 | | | | | 81,605 | | | | | 78,310 | |
Northwest Acquisitions ULC/Dominion Finco, Inc.+^ | | | | 7.13 | | | | | 11/1/2022 | | | | | 107,000 | | | | | 106,674 | | | | | 105,695 | |
Peabody Energy Corp.^ | | | | 6.00 | | | | | 3/31/2022 | | | | | 145,000 | | | | | 145,695 | | | | | 140,650 | |
SunCoke Energy Partners LP/SunCoke Energy Partners Finance Corp.^ | | | | 7.50 | | | | | 6/15/2025 | | | | | 250,000 | | | | | 246,854 | | | | | 236,875 | |
Warrior Met Coal, Inc.^ | | | | 8.00 | | | | | 11/1/2024 | | | | | 198,000 | | | | | 198,000 | | | | | 196,515 | |
| | | | | | | | | | | | | | | | | | | | | | | | | |
Total Mining, Steel, Iron and Non-Precious Metals | | | | | | | | | | | | | | 1,703,000 | | | | | 1,702,626 | | | | | 1,631,894 | |
| | | | | | | | | | | | | | | | | | | | | | | | | |
| | | | | |
Oil and Gas — 13.8%*: | | | | | | | | | | | | | | | | | | | | | | | | | |
Calumet Specialty Products Partners LP/Calumet Finance Corp. | | | | 7.63 | | | | | 1/15/2022 | | | | | 125,000 | | | | | 124,719 | | | | | 100,937 | |
CGG Holding US, Inc.+ | | | | 7.88 | | | | | 5/1/2023 | | | | | 150,000 | | | | | 184,679 | | | | | 172,722 | |
Chesapeake Energy Corp. | | | | 8.00 | | | | | 1/15/2025 | | | | | 177,000 | | | | | 174,893 | | | | | 156,202 | |
Chesapeake Energy Corp. | | | | 8.00 | | | | | 6/15/2027 | | | | | 17,000 | | | | | 17,000 | | | | | 14,280 | |
Citgo Holding, Inc.^ | | | | 10.75 | | | | | 2/15/2020 | | | | | 341,000 | | | | | 342,572 | | | | | 347,820 | |
EP Energy LLC/Everest Acquisition Finance, Inc.^ | | | | 8.00 | | | | | 2/15/2025 | | | | | 229,000 | | | | | 229,000 | | | | | 94,463 | |
Ferrellgas Partners LP/Ferrellgas Partners Finance Corp. | | | | 8.63 | | | | | 6/15/2020 | | | | | 500,000 | | | | | 495,952 | | | | | 357,500 | |
Genesis Energy LP/Genesis Energy Finance Corp. | | | | 6.50 | | | | | 10/1/2025 | | | | | 300,000 | | | | | 300,000 | | | | | 264,000 | |
Jonah Energy LLC/Jonah Energy Finance Corp.^ | | | | 7.25 | | | | | 10/15/2025 | | | | | 250,000 | | | | | 250,000 | | | | | 160,000 | |
Jupiter Resource, Inc.+ | | | | 8.50 | | | | | 10/1/2022 | | | | | – | | | | | (26 | ) | | | | – | |
KCA Deutag UK Finance PLC+^ | | | | 9.63 | | | | | 4/1/2023 | | | | | 200,000 | | | | | 205,715 | | | | | 161,000 | |
Kosmos Energy Ltd.+^ | | | | 7.88 | | | | | 8/1/2021 | | | | | 450,000 | | | | | 436,647 | | | | | 450,000 | |
Neptune Energy Bondco PLC^ | | | | 6.63 | | | | | 5/15/2025 | | | | | 200,000 | | | | | 200,232 | | | | | 185,500 | |
QEP Resources, Inc. | | | | 5.63 | | | | | 3/1/2026 | | | | | 125,000 | | | | | 120,338 | | | | | 103,750 | |
SM Energy Co. | | | | 6.63 | | | | | 1/15/2027 | | | | | 119,000 | | | | | 119,000 | | | | | 105,315 | |
Transocean Pontus Ltd.^ | | | | 6.13 | | | | | 8/1/2025 | | | | | – | | | | | – | | | | | – | |
Transocean, Inc. | | | | 6.80 | | | | | 3/15/2038 | | | | | 42,000 | | | | | 33,799 | | | | | 27,930 | |
Transocean, Inc. | | | | 9.35 | | | | | 12/15/2041 | | | | | 32,000 | | | | | 29,798 | | | | | 26,640 | |
Tullow Oil PLC+^ | | | | 6.25 | | | | | 4/15/2022 | | | | | 250,000 | | | | | 215,567 | | | | | 240,625 | |
Welltec A/S+^ | | | | 9.50 | | | | | 12/1/2022 | | | | | 200,000 | | | | | 198,402 | | | | | 197,500 | |
| | | | | | | | | | | | | | | | | | | | | | | | | |
Total Oil and Gas | | | | | | | | | | | | | | 3,707,000 | | | | | 3,678,287 | | | | | 3,166,184 | |
| | | | | | | | | | | | | | | | | | | | | | | | | |
See accompanying Notes to the Financial Statements.
164
Barings Global High Yield Fund 2018 Semi-Annual Report
SCHEDULE OF INVESTMENTS (CONTINUED)
December 31, 2018 (Unaudited)
| | | | | | | | | | | | | | | | | | | | | | | | | |
| | | EFFECTIVE
INTEREST RATE | | DUE DATE | | PRINCIPAL ‡‡ | | COST | | FAIR
VALUE |
Corporate Bonds(Continued) | | | | | | | | | | | | | | | | | | | | | | | | | |
| | |
Personal and Non-Durable Consumer Products Mfg. Only — 0.5%*: | | | | | | | | | | | |
Samsonite Finco Sarl | | | | 3.50 | % | | | | 5/15/2026 | | | | | 100,000 | | | | | $109,538 | | | | | $103,347 | |
| | | | | | | | | | | | | | | | | | | | | | | | | |
| | | | | |
Personal Transportation — 0.5%*: | | | | | | | | | | | | | | | | | | | | | | | | | |
Getlink SE+ | | | | 3.63 | | | | | 10/1/2023 | | | | | 100,000 | | | | | 117,465 | | | | | 111,694 | |
| | | | | | | | | | | | | | | | | | | | | | | | | |
| | | | | |
Personal, Food and Miscellaneous — 1.0%*: | | | | | | | | | | | | | | | | | | | | | | | | | |
Ocado Group PLC+ | | | | 4.00 | | | | | 6/15/2024 | | | | | 100,000 | | | | | 128,084 | | | | | 123,068 | |
Simmons Foods, Inc.^ | | | | 7.75 | | | | | 1/15/2024 | | | | | 104,000 | | | | | 104,947 | | | | | 104,520 | |
| | | | | | | | | | | | | | | | | | | | | | | | | |
Total Personal, Food and Miscellaneous | | | | | | | | | | | | | | 204,000 | | | | | 233,031 | | | | | 227,588 | |
| | | | | | | | | | | | | | | | | | | | | | | | | |
| | |
Printing and Publishing — 0.3%*: | | | | | | | | | | | |
Nielsen Finance LLC/Nielsen Finance Co.^ | | | | 5.00 | | | | | 4/15/2022 | | | | | 73,000 | | | | | 71,589 | | | | | 69,715 | |
| | | | | | | | | | | | | | | | | | | | | | | | | |
| | | | | |
Retail Stores — 1.2%*: | | | | | | | | | | | | | | | | | | | | | | | | | |
Maxeda DIY Holding B.V.+ | | | | 6.13 | | | | | 7/15/2022 | | | | | 100,000 | | | | | 114,070 | | | | | 105,139 | |
Takko Luxembourg 2 SCA, 3M USD LIBOR + 5.375%+ | | | | 5.38 | | | | | 11/15/2023 | | | | | 100,000 | | | | | 98,568 | | | | | 81,344 | |
Travelex Financing PLC+ | | | | 8.00 | | | | | 5/15/2022 | | | | | 100,000 | | | | | 108,750 | | | | | 97,384 | |
| | | | | | | | | | | | | | | | | | | | | | | | | |
Total Retail Stores | | | | | | | | | | | | | | 300,000 | | | | | 321,388 | | | | | 283,867 | |
| | | | | | | | | | | | | | | | | | | | | | | | | |
| | |
Telecommunications — 6.7%*: | | | | | | | | | | | |
CSC Holdings LLC^ | | | | 7.50 | | | | | 4/1/2028 | | | | | 250,000 | | | | | 250,000 | | | | | 249,375 | |
Frontier Communications Corp. | | | | 7.13 | | | | | 3/15/2019 | | | | | 250,000 | | | | | 250,860 | | | | | 243,125 | |
Intelsat Connect Finance SA^ | | | | 9.50 | | | | | 2/15/2023 | | | | | 92,000 | | | | | 90,500 | | | | | 79,120 | |
Sprint Corp. | | | | 7.63 | | | | | 3/1/2026 | | | | | 325,000 | | | | | 336,395 | | | | | 320,938 | |
Sprint Corp. | | | | 7.88 | | | | | 9/15/2023 | | | | | 165,000 | | | | | 167,556 | | | | | 169,331 | |
Telecom Italia SpA/Milano+ | | | | 5.88 | | | | | 5/19/2023 | | | | | 100,000 | | | | | 147,583 | | | | | 132,661 | |
UPCB Finance VII Ltd.+ | | | | 3.63 | | | | | 6/15/2029 | | | | | 100,000 | | | | | 114,320 | | | | | 108,703 | |
Virgin Media Receivables Financing Notes I DAC+ | | | | 5.50 | | | | | 9/15/2024 | | | | | 100,000 | | | | | 134,730 | | | | | 122,151 | |
Ziggo B.V.+ | | | | 4.25 | | | | | 1/15/2027 | | | | | 100,000 | | | | | 115,035 | | | | | 112,541 | |
| | | | | | | | | | | | | | | | | | | | | | | | | |
Total Telecommunications | | | | | | | | | | | | | | 1,482,000 | | | | | 1,606,979 | | | | | 1,537,945 | |
| | | | | | | | | | | | | | | | | | | | | | | | | |
| | |
Utilities — 1.6%*: | | | | | | | | | | | |
Blitz F18-674 GmbH+ | | | | 6.00 | | | | | 7/30/2026 | | | | | 150,000 | | | | | 174,548 | | | | | 161,976 | |
Nordex SE+ | | | | 6.50 | | | | | 2/1/2023 | | | | | 100,000 | | | | | 124,195 | | | | | 103,393 | |
Viridian Group Finance Co PLC+ | | | | 4.00 | | | | | 9/15/2025 | | | | | 100,000 | | | | | 118,639 | | | | | 105,168 | |
| | | | | | | | | | | | | | | | | | | | | | | | | |
Total Utilities | | | | | | | | | | | | | | 350,000 | | | | | 417,382 | | | | | 370,537 | |
| | | | | | | | | | | | | | | | | | | | | | | | | |
Total Corporate Bonds | | | | | 21,986,500 | | | | | 23,306,715 | | | | | 21,098,046 | |
| | | | | | | | | | | | | | | | | | | | | | | | | |
Total Fixed Income | | | | | | | | | | | | | | 23,335,754 | | | | | 24,641,320 | | | | | 22,376,148 | |
| | | | | | | | | | | | | | | | | | | | | | | | | |
Total Investments | | | | | | | | | | | | | | 23,369,984 | | | | | 24,803,674 | | | | | 22,493,758 | |
| | | | | | | | | | | | | | | | | | | | | | | | | |
| |
Other assets and liabilities — 1.8%* | | | | | 400,779 | |
| | | | | | | | | | | | | | | | | | | | | | | | | |
| |
Net Assets — 100.0% | | | | | $22,894,537 | |
| | | | | | | | | | | | | | | | | | | | | | | | | |
See accompanying Notes to the Financial Statements.
165
Barings Global High Yield Fund 2018 Semi-Annual Report
SCHEDULE OF INVESTMENTS (CONTINUED)
December 31, 2018 (Unaudited)
| ‡‡ | Unless otherwise indicated, all principal amounts are denominated in United States Dollars. |
| * | Calculated as a percentage of net assets applicable to common shareholders. |
Distributions of investments by country of risk (excluding temporary cash investments) as a percentage of total investments in securities, is as follows:
| | | | | | |
| | United States | | | 66.6% | |
| | United Kingdom | | | 12.2% | |
| | Germany | | | 4.6% | |
| | Ghana | | | 3.1% | |
| | Netherlands | | | 1.9% | |
| | France | | | 1.8% | |
| | Ireland | | | 1.6% | |
| | Canada | | | 1.5% | |
| | Switzerland | | | 1.5% | |
| | Italy | | | 1.1% | |
| | Belgium | | | 0.9% | |
| | Other (Individually less than 1%) | | | 3.2% | |
| | | | | | |
| | Total | | | 100.0% | |
| | | | | | |
| ^ | Security acquired in a transaction exempt from registration under Rule 144A of the Securities Act of 1933. These securities may only be resold in transactions exempt from registration, normally to qualified institutional buyers. |
| § | Bank loans are exempt from registration under the Securities Act of 1933, as amended, but contain certain restrictions on resale and cannot be sold publicly. These loans pay interest at rates which adjust periodically. The interest rates shown for bank loans are the current interest rates at December 31, 2018. Bank loans are also subject to mandatory and/or optional prepayment which cannot be predicted. As a result, the remaining maturity may be substantially less than the stated maturity shown. |
| ¤ | For fair value measurement disclosure purposes, security is categorized as Level 3 (See Note 2). |
A summary of outstanding derivatives at December 31, 2018 is as follows:
Forward Foreign Currency Exchange Contracts to Buy
| | | | | | | | | | | | | | | | | | | | | | |
EXPIRATION
DATE | | COUNTERPARTY | | LOCAL
CURRENCY | | | VALUE IN USD | | | IN
EXCHANGE
FOR USD | | | NET UNREALIZED
APPRECIATION
(DEPRECIATION) | |
| 1/8/19 | | Bank of America N.A. | | | EUR | | | | 8,312 | | | $ | 9,527 | | | $ | 9,466 | | | $ | 61 | |
| 1/8/19 | | BNP Paribas S.A. | | | GBP | | | | 41,269 | | | | 52,615 | | | | 52,701 | | | | (86 | ) |
| 1/8/19 | | Goldman Sachs & Co. | | | GBP | | | | 2,000 | | | | 2,550 | | | | 2,532 | | | | 18 | |
| | | | | | | | | | | | | | | | | | | | | | |
Net unrealized depreciation on forward foreign currency exchange contracts to buy | | | $ | (7 | ) |
| | | | | | | | | | | | | | | | | | | | | | |
See accompanying Notes to the Financial Statements.
166
Barings Global High Yield Fund 2018 Semi-Annual Report
SCHEDULE OF INVESTMENTS (CONTINUED)
December 31, 2018 (Unaudited)
Forward Foreign Currency Exchange Contracts to Sell
| | | | | | | | | | | | | | | | | | | | | | |
EXPIRATION
DATE | | COUNTERPARTY | | LOCAL
CURRENCY | | | VALUE IN USD | | | IN
EXCHANGE
FOR USD | | | NET UNREALIZED
APPRECIATION
(DEPRECIATION) | |
| 1/8/19 | | Barclays Bank plc | | | EUR | | | | 3,379,699 | | | $ | 3,873,882 | | | $ | 3,852,020 | | | $ | (21,862 | ) |
| 1/8/19 | | Bank of America N.A. | | | EUR | | | | 78,658 | | | | 90,160 | | | | 89,506 | | | | (654 | ) |
| 1/8/19 | | Bank of America N.A. | | | GBP | | | | 2,180,322 | | | | 2,779,723 | | | | 2,784,206 | | | | 4,483 | |
| 1/8/19 | | JPMorgan Chase Bank N.A. | | | GBP | | | | 96,338 | | | | 122,823 | | | | 123,275 | | | | 452 | |
| | | | | | | | | | | | | | | | | | | | | | |
Net unrealized depreciation on forward foreign currency exchange contracts to sell | | | $ | (17,581 | ) |
| | | | | | | | | | | | | | | | | | | | | | |
Currency Legend
| | | | |
| EUR | | – | | Euro |
| GBP | | – | | British Pound Sterling |
See accompanying Notes to the Financial Statements.
167
Barings U.S. High Yield Fund 2018 Semi-Annual Report
SCHEDULE OF INVESTMENTS
December 31, 2018 (Unaudited)
| | | | | | | | | | | | | | | | | | | | | | | | | |
| | | | | | | SHARES | | COST | | FAIR
VALUE |
Equities — 0.6%*: | | | | | | | | | | | | | | | | | | | | | | | | | |
| | | | | |
Common Stocks — 0.6%*: | | | | | | | | | | | | | | | | | | | | | | | | | |
| | | | | |
Oil and Gas — 0.6%*: | | | | | | | | | | | | | | | | | | | | | | | | | |
Jupiter Resources, Inc.+ | | | | | | | | | | | | | | 39,729 | | | | | $192,017 | | | | | $135,079 | |
Fieldwood Energy LLC | | | | | | | | | | | | | | 1,006 | | | | | 35,210 | | | | | 36,216 | |
Fieldwood Energy LLC | | | | | | | | | | | | | | 4,100 | | | | | 88,421 | | | | | 147,600 | |
| | | | | | | | | | | | | | | | | | | | | | | | | |
Total Oil and Gas | | | | | | | | | | | | | | 44,835 | | | | | 315,648 | | | | | 318,895 | |
| | | | | | | | | | | | | | | | | | | | | | | | | |
| | | | | | | | | | | | | | | | | | | | | | | | | |
Total Common Stocks | | | | | | | | | | | | | | 44,835 | | | | | 315,648 | | | | | 318,895 | |
| | | | | | | | | | | | | | | | | | | | | | | | | |
| | | | | |
Warrants — 0.0%*: | | | | | | | | | | | | | | | | | | | | | | | | | |
| | | | | |
Diversified/Conglomerate Manufacturing — 0.0%*: | | | | | | | | | | | | | | | | | | | | | | | | | |
Appvion Holdings Corp. (exp. June 13, 2023)¤†† | | | | | | | | | | | | | | 357 | | | | | — | | | | | 3,802 | |
Appvion Holdings Corp. (exp. June 13, 2023)¤ | | | | | | | | | | | | | | 357 | | | | | — | | | | | — | |
| | | | | | | | | | | | | | | | | | | | | | | | | |
Total Diversified/Conglomerate Manufacturing | | | | | | | | | | | | | | 714 | | | | | — | | | | | 3,802 | |
| | | | | | | | | | | | | | | | | | | | | | | | | |
Total Warrants | | | | | | | | | | | | | | 714 | | | | | — | | | | | 3,802 | |
| | | | | | | | | | | | | | | | | | | | | | | | | |
Total Equities | | | | | | | | | | | | | | 45,549 | | | | | 315,648 | | | | | 322,697 | |
| | | | | | | | | | | | | | | | | | | | | | | | | |
| | | | | |
| | | EFFECTIVE
INTEREST RATE | | DUE DATE | | PRINCIPAL ‡‡ | | COST | | FAIR
VALUE |
Fixed Income — 97.3%*: | | | | | | | | | | | | | | | | | | | | | | | | | |
| | | | | |
Bank Loans — 5.1%*§: | | | | | | | | | | | | | | | | | | | | | | | | | |
| | | | | |
Aerospace and Defense — 0.1%*: | | | | | | | | | | | | | | | | | | | | | | | | | |
Ducommun, Inc., 1M LIBOR + 4.000% | | | | 6.80 | % | | | | 11/16/2025 | | | | | 34,722 | | | | | 34,549 | | | | | 33,854 | |
| | | | | | | | | | | | | | | | | | | | | | | | | |
| | | | | |
Broadcasting and Entertainment — 0.6%*: | | | | | | | | | | | | | | | | | | | | | | | | | |
AP NMT Acquisition B.V., 3M LIBOR + 5.750%+ | | | | 8.55 | | | | | 8/13/2021 | | | | | 297,668 | | | | | 297,689 | | | | | 284,720 | |
| | | | | | | | | | | | | | | | | | | | | | | | | |
| | | | | |
Buildings and Real Estate — 0.1%*: | | | | | | | | | | | | | | | | | | | | | | | | | |
GYP Holdings III Corp., 1M LIBOR + 2.750% | | | | 5.27 | | | | | 6/1/2025 | | | | | 30,479 | | | | | 30,479 | | | | | 28,650 | |
| | | | | | | | | | | | | | | | | | | | | | | | | |
| | | | | |
Diversified/Conglomerate Service — 0.9%*: | | | | | | | | | | | | | | | | | | | | | | | | | |
Evertec Group, LLC, 1M LIBOR + 3.500% | | | | 6.02 | | | | | 11/27/2024 | | | | | 46,150 | | | | | 45,921 | | | | | 45,188 | |
SonicWALL, Inc., 3M LIBOR + 7.500% | | | | 10.14 | | | | | 5/18/2026 | | | | | 51,897 | | | | | 51,413 | | | | | 50,859 | |
Vertafore, Inc., 1M LIBOR + 3.250% | | | | 6.05 | | | | | 7/2/2025 | | | | | 400,000 | | | | | 390,473 | | | | | 379,124 | |
| | | | | | | | | | | | | | | | | | | | | | | | | |
Total Diversified/Conglomerate Service | | | | | | | | | | | | | | 498,047 | | | | | 487,807 | | | | | 475,171 | |
| | | | | | | | | | | | | | | | | | | | | | | | | |
| | | | | |
Electronics — 0.1%*: | | | | | | | | | | | | | | | | | | | | | | | | | |
Renaissance Holding Corp., 1M LIBOR + 7.000% | | | | 9.52 | | | | | 5/29/2026 | | | | | 68,963 | | | | | 67,681 | | | | | 63,216 | |
| | | | | | | | | | | | | | | | | | | | | | | | | |
| | | | | |
Leisure, Amusement, Entertainment — 0.2%*: | | | | | | | | | | | | | | | | | | | | | | | | | |
SeaWorld Parks & Entertainment, Inc., 3M LIBOR + 3.000% | | | | 5.52 | | | | | 3/31/2024 | | | | | 91,160 | | | | | 91,049 | | | | | 86,830 | |
| | | | | | | | | | | | | | | | | | | | | | | | | |
See accompanying Notes to the Financial Statements.
168
Barings U.S. High Yield Fund 2018 Semi-Annual Report
SCHEDULE OF INVESTMENTS (CONTINUED)
December 31, 2018 (Unaudited)
| | | | | | | | | | | | | | | | | | | | | | | | | |
| | | EFFECTIVE
INTEREST RATE | | DUE DATE | | PRINCIPAL ‡‡ | | COST | | FAIR
VALUE |
Bank Loans(Continued) | | | | | | | | | | | | | | | | | | | | | | | | | |
| | | | | |
Oil and Gas — 0.5%*: | | | | | | | | | | | | | | | | | | | | | | | | | |
Fieldwood Energy LLC, 1M LIBOR + 5.250% | | | | 7.77 | % | | | | 4/11/2022 | | | | | 172,215 | | | | | $155,664 | | | | | $160,484 | |
Fieldwood Energy LLC, 1M LIBOR + 7.250% | | | | 9.77 | | | | | 4/11/2023 | | | | | 91,996 | | | | | 34,389 | | | | | 79,944 | |
| | | | | | | | | | | | | | | | | | | | | | | | | |
Total Oil and Gas | | | | | | | | | | | | | | 264,211 | | | | | 190,053 | | | | | 240,428 | |
| | | | | | | | | | | | | | | | | | | | | | | | | |
| | | | | |
Printing and Publishing — 0.8%*: | | | | | | | | | | | | | | | | | | | | | | | | | |
Getty Images, Inc., 3M LIBOR + 3.500% | | | | 6.02 | | | | | 10/18/2019 | | | | | 397,344 | | | | | 389,677 | | | | | 385,424 | |
| | | | | | | | | | | | | | | | | | | | | | | | | |
| | | | | |
Retail Stores — 0.7%*: | | | | | | | | | | | | | | | | | | | | | | | | | |
Michaels Stores, Inc., 1M LIBOR + 2.500% | | | | 5.01 | | | | | 1/30/2023 | | | | | 400,000 | | | | | 388,079 | | | | | 381,500 | |
| | | | | | | | | | | | | | | | | | | | | | | | | |
| | | | | |
Telecommunications — 1.1%*: | | | | | | | | | | | | | | | | | | | | | | | | | |
CenturyLink, Inc., 3M LIBOR + 2.750% | | | | 5.27 | | | | | 1/31/2025 | | | | | 497,487 | | | | | 494,038 | | | | | 463,161 | |
Sprint Communications, Inc., 1M LIBOR + 2.500% | | | | 5.06 | | | | | 2/2/2024 | | | | | 124,683 | | | | | 120,620 | | | | | 118,345 | |
| | | | | | | | | | | | | | | | | | | | | | | | | |
Total Telecommunications | | | | | | | | | | | | | | 622,170 | | | | | 614,658 | | | | | 581,506 | |
| | | | | | | | | | | | | | | | | | | | | | | | | |
| | | | | | | | | | | | | | | | | | | | | | | | | |
Total Bank Loans | | | | | | | | | | | | | | 2,704,764 | | | | | 2,591,721 | | | | | 2,561,299 | |
| | | | | | | | | | | | | | | | | | | | | | | | | |
| | | | | |
Corporate Bonds — 92.2%*: | | | | | | | | | | | | | | | | | | | | | | | | | |
| | | | | |
Aerospace and Defense — 4.1%*: | | | | | | | | | | | | | | | | | | | | | | | | | |
General Electric Co. | | | | 4.65 | | | | | 10/17/2021 | | | | | 244,000 | | | | | 240,158 | | | | | 244,732 | |
TransDigm UK Holdings PLC^ | | | | 6.88 | | | | | 5/15/2026 | | | | | 500,000 | | | | | 496,405 | | | | | 476,250 | |
TransDigm, Inc. | | | | 6.38 | | | | | 6/15/2026 | | | | | 307,000 | | | | | 304,706 | | | | | 285,510 | |
Triumph Group, Inc. | | | | 4.88 | | | | | 4/1/2021 | | | | | 43,000 | | | | | 42,001 | | | | | 38,593 | |
Triumph Group, Inc. | | | | 7.75 | | | | | 8/15/2025 | | | | | 595,000 | | | | | 599,776 | | | | | 525,087 | |
VistaJet Malta Finance PLC/VistaJet Co. Finance LLC^ | | | | 7.75 | | | | | 6/1/2020 | | | | | 550,000 | | | | | 544,163 | | | | | 526,625 | |
| | | | | | | | | | | | | | | | | | | | | | | | | |
Total Aerospace and Defense | | | | | | | | | | | | | | 2,239,000 | | | | | 2,227,209 | | | | | 2,096,797 | |
| | | | | | | | | | | | | | | | | | | | | | | | | |
| | | | | |
Beverage, Food and Tobacco — 1.7%*: | | | | | | | | | | | | | | | | | | | | | | | | | |
Carrols Restaurant Group, Inc. | | | | 8.00 | | | | | 5/1/2022 | | | | | 260,000 | | | | | 269,019 | | | | | 260,650 | |
JBS USA LUX SA/JBS USA Finance, Inc.^ | | | | 5.88 | | | | | 7/15/2024 | | | | | 165,000 | | | | | 168,780 | | | | | 162,525 | |
JBS USA LUX SA/JBS USA Finance, Inc.^ | | | | 6.75 | | | | | 2/15/2028 | | | | | 250,000 | | | | | 250,000 | | | | | 243,750 | |
KeHE Distributors LLC/KeHE Finance Corp.^ | | | | 7.63 | | | | | 8/15/2021 | | | | | 203,000 | | | | | 201,380 | | | | | 192,850 | |
| | | | | | | | | | | | | | | | | | | | | | | | | |
Total Beverage, Food and Tobacco | | | | | | | | | | | | | | 878,000 | | | | | 889,179 | | | | | 859,775 | |
| | | | | | | | | | | | | | | | | | | | | | | | | |
| | | | | |
Broadcasting and Entertainment — 6.5%*: | | | | | | | | | | | | | | | | | | | | | | | | | |
Block Communications, Inc.^ | | | | 6.88 | | | | | 2/15/2025 | | | | | 434,000 | | | | | 434,000 | | | | | 435,085 | |
CCO Holdings LLC/CCO Holdings Capital Corp.^ | | | | 5.75 | | | | | 2/15/2026 | | | | | 1,200,000 | | | | | 1,197,415 | | | | | 1,176,000 | |
Clear Channel Worldwide Holdings, Inc. | | | | 7.63 | | | | | 3/15/2020 | | | | | 271,000 | | | | | 269,493 | | | | | 264,788 | |
DISH DBS Corp. | | | | 7.75 | | | | | 7/1/2026 | | | | | 280,000 | | | | | 261,550 | | | | | 231,700 | |
Intelsat Jackson Holdings SA^ | | | | 8.50 | | | | | 10/15/2024 | | | | | 603,000 | | | | | 603,831 | | | | | 584,910 | |
Intelsat Jackson Holdings SA^ | | | | 9.75 | | | | | 7/15/2025 | | | | | 56,000 | | | | | 59,007 | | | | | 56,157 | |
Netflix, Inc.^ | | | | 5.88 | | | | | 11/15/2028 | | | | | 250,000 | | | | | 248,522 | | | | | 242,925 | |
Sirius XM Radio, Inc.^ | | | | 5.00 | | | | | 8/1/2027 | | | | | 350,000 | | | | | 350,000 | | | | | 319,812 | |
| | | | | | | | | | | | | | | | | | | | | | | | | |
Total Broadcasting and Entertainment | | | | | | | | | | | | | | 3,444,000 | | | | | 3,423,818 | | | | | 3,311,377 | |
| | | | | | | | | | | | | | | | | | | | | | | | | |
See accompanying Notes to the Financial Statements.
169
Barings U.S. High Yield Fund 2018 Semi-Annual Report
SCHEDULE OF INVESTMENTS (CONTINUED)
December 31, 2018 (Unaudited)
| | | | | | | | | | | | | | | | | | | | | | | | | |
| | | EFFECTIVE
INTEREST RATE | | DUE DATE | | PRINCIPAL ‡‡ | | COST | | FAIR
VALUE |
Corporate Bonds(Continued) | | | | | | | | | | | | | | | | | | | | | | | | | |
| | | | | |
Buildings and Real Estate — 4.0%*: | | | | | | | | | | | | | | | | | | | | | | | | | |
Brookfield Residential Properties, Inc.^ | | | | 6.50 | % | | | | 12/15/2020 | | | | | 250,000 | | | | | $249,736 | | | | | $249,687 | |
Brookfield Residential Properties, Inc./Brookfield Residential US Corp.^ | | | | 6.13 | | | | | 7/1/2022 | | | | | 225,000 | | | | | 218,160 | | | | | 212,625 | |
Century Communities, Inc. | | | | 5.88 | | | | | 7/15/2025 | | | | | 250,000 | | | | | 249,736 | | | | | 220,000 | |
M/I Homes, Inc. | | | | 5.63 | | | | | 8/1/2025 | | | | | 550,000 | | | | | 532,126 | | | | | 503,250 | |
M/I Homes, Inc. | | | | 6.75 | | | | | 1/15/2021 | | | | | 250,000 | | | | | 250,000 | | | | | 248,750 | |
MPT Operating Partnership LP/MPT Finance Corp. | | | | 5.00 | | | | | 10/15/2027 | | | | | 250,000 | | | | | 250,000 | | | | | 228,594 | |
Standard Industries, Inc.^ | | | | 4.75 | | | | | 1/15/2028 | | | | | 300,000 | | | | | 300,000 | | | | | 252,000 | |
William Lyon Homes, Inc. | | | | 6.00 | | | | | 9/1/2023 | | | | | 123,000 | | | | | 123,000 | | | | | 110,700 | |
| | | | | | | | | | | | | | | | | | | | | | | | | |
Total Buildings and Real Estate | | | | | | | | | | | | | | 2,198,000 | | | | | 2,172,758 | | | | | 2,025,606 | |
| | | | | | | | | | | | | | | | | | | | | | | | | |
| | | | | |
Cargo Transport — 3.9%*: | | | | | | | | | | | | | | | | | | | | | | | | | |
American Airlines Group, Inc.^ | | | | 4.63 | | | | | 3/1/2020 | | | | | 250,000 | | | | | 249,638 | | | | | 248,750 | |
American Airlines Group, Inc.^ | | | | 5.50 | | | | | 10/1/2019 | | | | | 532,000 | | | | | 537,058 | | | | | 533,330 | |
Deck Chassis Acquisition, Inc.^ | | | | 10.00 | | | | | 6/15/2023 | | | | | 520,000 | | | | | 531,114 | | | | | 499,200 | |
Kenan Advantage Group, Inc.^ | | | | 7.88 | | | | | 7/31/2023 | | | | | 700,000 | | | | | 716,154 | | | | | 670,250 | |
| | | | | | | | | | | | | | | | | | | | | | | | | |
Total Cargo Transport | | | | | | | | | | | | | | 2,002,000 | | | | | 2,033,964 | | | | | 1,951,530 | |
| | | | | | | | | | | | | | | | | | | | | | | | | |
| | | | | |
Chemicals, Plastics and Rubber — 2.9%*: | | | | | | | | | | | | | | | | | | | | | | | | | |
Chemours Co. (The) | | | | 7.00 | | | | | 5/15/2025 | | | | | 254,000 | | | | | 257,209 | | | | | 255,905 | |
Consolidated Energy Finance SA^ | | | | 6.88 | | | | | 6/15/2025 | | | | | 300,000 | | | | | 298,731 | | | | | 285,750 | |
LBC Tank Terminals Holding Netherlands BV^ | | | | 6.88 | | | | | 5/15/2023 | | | | | 250,000 | | | | | 243,631 | | | | | 222,500 | |
Platform Specialty Products Corp.^ | | | | 5.88 | | | | | 12/1/2025 | | | | | 250,000 | | | | | 248,250 | | | | | 233,750 | |
Starfruit Finco BV/Starfruit US Holdco LLC+^ | | | | 8.00 | | | | | 10/1/2026 | | | | | 490,000 | | | | | 490,000 | | | | | 453,250 | |
| | | | | | | | | | | | | | | | | | | | | | | | | |
Total Chemicals, Plastics and Rubber | | | | | | | | | | | | | | 1,544,000 | | | | | 1,537,821 | | | | | 1,451,155 | |
| | | | | | | | | | | | | | | | | | | | | | | | | |
| | | | | |
Containers, Packaging and Glass — 0.2%*: | | | | | | | | | | | | | | | | | | | | | | | | | |
Crown Americas LLC/Crown Americas Capital Corp.^ | | | | 4.75 | | | | | 2/1/2026 | | | | | 135,000 | | | | | 135,000 | | | | | 127,237 | |
| | | | | | | | | | | | | | | | | | | | | | | | | |
| | | | |
Diversified/Conglomerate Manufacturing — 0.8%*: | | | | | | | | | | | | | | | | | | | | | |
Appvion ESC¤ | | | | 9.00 | | | | | 6/1/2020 | | | | | 366,000 | | | | | 282,333 | | | | | – | |
Griffon Corp. | | | | 5.25 | | | | | 3/1/2022 | | | | | 303,000 | | | | | 302,183 | | | | | 274,215 | |
StoneMor Partners LP/Cornerstone Family Services of West Virginia Subsidiary | | | | 7.88 | | | | | 6/1/2021 | | | | | 124,000 | | | | | 126,271 | | | | | 113,150 | |
| | | | | | | | | | | | | | | | | | | | | | | | | |
Total Diversified/Conglomerate Manufacturing | | | | | | | | | | 793,000 | | | | | 710,787 | | | | | 387,365 | |
| | | | | | | | | | | | | | | | | | | | | | | | | |
| | | | | |
Diversified/Conglomerate Service — 4.5%*: | | | | | | | | | | | | | | | | | | | | | | | | | |
Carlson Travel, Inc.^ | | | | 6.75 | | | | | 12/15/2023 | | | | | 250,000 | | | | | 254,506 | | | | | 240,937 | |
Carlson Travel, Inc.^ | | | | 9.50 | | | | | 12/15/2024 | | | | | 350,000 | | | | | 332,749 | | | | | 317,625 | |
Prime Security Services Borrower LLC/Prime Finance, Inc.^ | | | | 9.25 | | | | | 5/15/2023 | | | | | 1,237,000 | | | | | 1,301,748 | | | | | 1,275,656 | |
Refinitiv US Holdings, Inc.^ | | | | 8.25 | | | | | 11/15/2026 | | | | | 218,000 | | | | | 218,000 | | | | | 199,197 | |
United Rentals North America, Inc. | | | | 4.63 | | | | | 10/15/2025 | | | | | 125,000 | | | | | 125,000 | | | | | 111,563 | |
See accompanying Notes to the Financial Statements.
170
Barings U.S. High Yield Fund 2018 Semi-Annual Report
SCHEDULE OF INVESTMENTS (CONTINUED)
December 31, 2018 (Unaudited)
| | | | | | | | | | | | | | | | | | | | | | | | | |
| | | EFFECTIVE
INTEREST RATE | | DUE DATE | | PRINCIPAL ‡‡ | | COST | | FAIR
VALUE |
Corporate Bonds(Continued) | | | | | | | | | | | | | | | | | | | | | | | | | |
| | | | | |
Diversified/Conglomerate Service(Continued) | | | | | | | | | | | | | | | | | | | | | | | | | |
United Rentals North America, Inc. | | | | 4.88 | % | | | | 1/15/2028 | | | | | 125,000 | | | | | $125,281 | | | | | $109,688 | |
Waste Pro USA, Inc.^ | | | | 5.50 | | | | | 2/15/2026 | | | | | 17,000 | | | | | 17,000 | | | | | 15,640 | |
| | | | | | | | | | | | | | | | | | | | | | | | | |
Total Diversified/Conglomerate Service | | | | | | | | | | | | | | 2,322,000 | | | | | 2,374,284 | | | | | 2,270,306 | |
| | | | | | | | | | | | | | | | | | | | | | | | | |
| | | | | |
Electronics — 5.0%*: | | | | | | | | | | | | | | | | | | | | | | | | | |
Dell, Inc. | | | | 6.50 | | | | | 4/15/2038 | | | | | 126,000 | | | | | 129,058 | | | | | 112,140 | |
RP Crown Parent LLC^ | | | | 7.38 | | | | | 10/15/2024 | | | | | 96,000 | | | | | 96,000 | | | | | 96,720 | |
Symantec Corp. | | | | 4.20 | | | | | 9/15/2020 | | | | | 551,000 | | | | | 550,488 | | | | | 544,899 | |
TIBCO Software, Inc.^ | | | | 11.38 | | | | | 12/1/2021 | | | | | 1,383,000 | | | | | 1,482,880 | | | | | 1,448,692 | |
Veritas US, Inc./Veritas Bermuda Ltd.^ | | | | 10.50 | | | | | 2/1/2024 | | | | | 524,000 | | | | | 484,633 | | | | | 343,220 | |
| | | | | | | | | | | | | | | | | | | | | | | | | |
Total Electronics | | | | | | | | | | | | | | 2,680,000 | | | | | 2,743,059 | | | | | 2,545,671 | |
| | | | | | | | | | | | | | | | | | | | | | | | | |
| | | | | |
Finance — 5.0%*: | | | | | | | | | | | | | | | | | | | | | | | | | |
Alliance Data Systems Corp.^ | | | | 5.88 | | | | | 11/1/2021 | | | | | 550,000 | | | | | 559,712 | | | | | 549,230 | |
Icahn Enterprises LP/Icahn Enterprises Finance Corp. | | | | 6.25 | | | | | 2/1/2022 | | | | | 135,000 | | | | | 138,089 | | | | | 133,313 | |
Icahn Enterprises LP/Icahn Enterprises Finance Corp. | | | | 6.38 | | | | | 12/15/2025 | | | | | 415,000 | | | | | 416,395 | | | | | 399,437 | |
LPL Holdings, Inc.^ | | | | 5.75 | | | | | 9/15/2025 | | | | | 575,000 | | | | | 568,909 | | | | | 539,062 | |
Park Aerospace Holdings Ltd.+^ | | | | 5.25 | | | | | 8/15/2022 | | | | | 59,000 | | | | | 58,905 | | | | | 57,083 | |
Tempo Acquisition LLC/Tempo Acquisition Finance Corp.^ | | | | 6.75 | | | | | 6/1/2025 | | | | | 210,000 | | | | | 210,000 | | | | | 194,250 | |
VFH Parent LLC/Orchestra Co-Issuer, Inc.^ | | | | 6.75 | | | | | 6/15/2022 | | | | | 671,000 | | | | | 684,521 | | | | | 652,192 | |
| | | | | | | | | | | | | | | | | | | | | | | | | |
Total Finance | | | | | | | | | | | | | | 2,615,000 | | | | | 2,636,531 | | | | | 2,524,567 | |
| | | | | | | | | | | | | | | | | | | | | | | | | |
| | | | | |
Grocery — 0.9%*: | | | | | | | | | | | | | | | | | | | | | | | | | |
C&S Group Enterprises LLC^ | | | | 5.38 | | | | | 7/15/2022 | | | | | 174,000 | | | | | 172,355 | | | | | 166,605 | |
Post Holdings, Inc.^ | | | | 5.50 | | | | | 3/1/2025 | | | | | 300,000 | | | | | 293,401 | | | | | 287,943 | |
| | | | | | | | | | | | | | | | | | | | | | | | | |
Total Grocery | | | | | | | | | | | | | | 474,000 | | | | | 465,756 | | | | | 454,548 | |
| | | | | | | | | | | | | | | | | | | | | | | | | |
| | | | | |
Healthcare, Education and Childcare — 10.0%*: | | | | | | | | | | | | | | | | | | | | | | | | | |
Avantor, Inc.^ | | | | 9.00 | | | | | 10/1/2025 | | | | | 600,000 | | | | | 602,718 | | | | | 600,000 | |
Bausch Health Cos., Inc.^ | | | | 5.88 | | | | | 5/15/2023 | | | | | 50,000 | | | | | 43,043 | | | | | 46,250 | |
Bausch Health Cos., Inc.^ | | | | 6.13 | | | | | 4/15/2025 | | | | | 391,000 | | | | | 349,050 | | | | | 341,147 | |
Bausch Health Cos., Inc.^ | | | | 6.50 | | | | | 3/15/2022 | | | | | 118,000 | | | | | 118,000 | | | | | 118,590 | |
Bausch Health Cos., Inc.^ | | | | 7.00 | | | | | 3/15/2024 | | | | | 125,000 | | | | | 125,000 | | | | | 126,250 | |
Bausch Health Cos., Inc.^ | | | | 5.50 | | | | | 3/1/2023 | | | | | 118,000 | | | | | 93,897 | | | | | 107,970 | |
Bausch Health Cos.,Inc.^ | | | | 9.25 | | | | | 4/1/2026 | | | | | 525,000 | | | | | 533,380 | | | | | 525,000 | |
Catalent Pharma Solutions, Inc.^ | | | | 4.88 | | | | | 1/15/2026 | | | | | 227,000 | | | | | 227,000 | | | | | 215,083 | |
Endo Dac/Endo Finance LLC/Endo Finco Inc^ | | | | 6.00 | | | | | 2/1/2025 | | | | | 400,000 | | | | | 344,721 | | | | | 287,000 | |
Endo Finance LLC/Endo Finco, Inc.^ | | | | 5.38 | | | | | 1/15/2023 | | | | | 60,000 | | | | | 51,689 | | | | | 45,600 | |
Envision Healthcare Corp.^ | | | | 8.75 | | | | | 10/15/2026 | | | | | 450,000 | | | | | 450,000 | | | | | 389,250 | |
HCA, Inc. | | | | 5.38 | | | | | 2/1/2025 | | | | | 375,000 | | | | | 379,664 | | | | | 365,625 | |
Mallinckrodt International Finance SA/Mallinckrodt CB LLC^ | | | | 5.50 | | | | | 4/15/2025 | | | | | 170,000 | | | | | 146,398 | | | | | 117,300 | |
See accompanying Notes to the Financial Statements.
171
Barings U.S. High Yield Fund 2018 Semi-Annual Report
SCHEDULE OF INVESTMENTS (CONTINUED)
December 31, 2018 (Unaudited)
| | | | | | | | | | | | | | | | | | | | | | | | | |
| | | EFFECTIVE
INTEREST RATE | | DUE DATE | | PRINCIPAL ‡‡ | | COST | | FAIR
VALUE |
Corporate Bonds(Continued) | | | | | | | | | | | | | | | | | | | | | | | | | |
| | | | | |
Healthcare, Education and Childcare(Continued) | | | | | | | | | | | | | | | | | | | | | | | | | |
Mallinckrodt International Finance SA/Mallinckrodt CB LLC^ | | | | 5.63 | % | | | | 10/15/2023 | | | | | 87,000 | | | | | $77,260 | | | | | $66,120 | |
Mallinckrodt International Finance SA/Mallinckrodt CB LLC^ | | | | 5.75 | | | | | 8/1/2022 | | | | | 152,000 | | | | | 139,745 | | | | | 130,720 | |
Ortho-Clinical Diagnostics, Inc./Ortho-Clinical Diagnostics SA^ | | | | 6.63 | | | | | 5/15/2022 | | | | | 1,144,000 | | | | | 1,124,958 | | | | | 1,029,600 | |
RegionalCare Hospital Partners Holdings, Inc.^ | | | | 8.25 | | | | | 5/1/2023 | | | | | 232,000 | | | | | 244,570 | | | | | 234,320 | |
Teva Pharmaceutical Finance Netherlands III BV+ | | | | 6.00 | | | | | 4/15/2024 | | | | | 300,000 | | | | | 296,597 | | | | | 288,964 | |
| | | | | | | | | | | | | | | | | | | | | | | | | |
Total Healthcare, Education and Childcare | | | | | | | | | | | | | | 5,524,000 | | | | | 5,347,690 | | | | | 5,034,789 | |
| | | | | | | | | | | | | | | | | | | | | | | | | |
| | |
Home and Office Furnishings, Housewares, and Durable Consumer Products — 0.1%*: | | | | | | | | | | | |
Mattel, Inc.^ | | | | 6.75 | | | | | 12/31/2025 | | | | | 78,000 | | | | | 78,000 | | | | | 69,591 | |
| | | | | | | | | | | | | | | | | | | | | | | | | |
| | | | | |
Hotels, Motels, Inns and Gaming — 0.9%*: | | | | | | | | | | | | | | | | | | | | | | | | | |
Boyne USA, Inc.^ | | | | 7.25 | | | | | 5/1/2025 | | | | | 125,000 | | | | | 125,000 | | | | | 129,062 | |
Eldorado Resorts, Inc.^ | | | | 6.00 | | | | | 9/15/2026 | | | | | 225,000 | | | | | 225,000 | | | | | 212,625 | |
Wynn Las Vegas LLC/Wynn Las Vegas Capital Corp.^ | | | | 5.25 | | | | | 5/15/2027 | | | | | 125,000 | | | | | 125,000 | | | | | 110,000 | |
| | | | | | | | | | | | | | | | | | | | | | | | | |
Total Hotels, Motels, Inns and Gaming | | | | | | | | | | | | | | 475,000 | | | | | 475,000 | | | | | 451,687 | |
| | | | | | | | | | | | | | | | | | | | | | | | | |
| | | | | |
Insurance — 2.3%*: | | | | | | | | | | | | | | | | | | | | | | | | | |
Acrisure LLC/Acrisure Finance, Inc.^ | | | | 7.00 | | | | | 11/15/2025 | | | | | 500,000 | | | | | 486,085 | | | | | 426,250 | |
AssuredPartners, Inc.^ | | | | 7.00 | | | | | 8/15/2025 | | | | | 339,000 | | | | | 336,101 | | | | | 305,846 | |
USIS Merger Sub, Inc.^ | | | | 6.88 | | | | | 5/1/2025 | | | | | 318,000 | | | | | 314,307 | | | | | 291,956 | |
York Risk Services Holding Corp.^ | | | | 8.50 | | | | | 10/1/2022 | | | | | 220,000 | | | | | 205,178 | | | | | 152,900 | |
| | | | | | | | | | | | | | | | | | | | | | | | | |
Total Insurance | | | | | | | | | | | | | | 1,377,000 | | | | | 1,341,671 | | | | | 1,176,952 | |
| | | | | | | | | | | | | | | | | | | | | | | | | |
| | | | | |
Leisure, Amusement, Entertainment — 3.2%*: | | | | | | | | | | | | | | | | | | | | | | | | | |
Allegiant Travel Co.†† | | | | 5.50 | | | | | 7/15/2019 | | | | | 1,000,000 | | | | | 1,008,034 | | | | | 1,000,000 | |
Brunswick Corp. | | | | 7.13 | | | | | 8/1/2027 | | | | | 567,000 | | | | | 598,209 | | | | | 626,442 | |
| | | | | | | | | | | | | | | | | | | | | | | | | |
Total Leisure, Amusement, Entertainment | | | | | | | | | | | | | | 1,567,000 | | | | | 1,606,243 | | | | | 1,626,442 | |
| | | | | | | | | | | | | | | | | | | | | | | | | |
| | | |
Machinery Non-Agriculture, Non-Construction, Non-Electronic — 0.7%*: | | | | | | | | | | | | | | | | |
Apex Tool Group LLC/BC Mountain Finance, Inc.^ | | | | 9.00 | | | | | 2/15/2023 | | | | | 430,000 | | | | | 420,779 | | | | | 363,350 | |
| | | | | | | | | | | | | | | | | | | | | | | | | |
| | | | |
Mining, Steel, Iron and Non-Precious Metals — 10.1%*: | | | | | | | | | | | | | | | | | | | | | |
Allegheny Technologies, Inc. | | | | 5.95 | | | | | 1/15/2021 | | | | | 234,000 | | | | | 234,535 | | | | | 229,320 | |
Alliance Resource Operating Partners LP/Alliance Resource Finance Corp.^ | | | | 7.50 | | | | | 5/1/2025 | | | | | 328,000 | | | | | 332,158 | | | | | 328,820 | |
Compass Minerals International, Inc.^ | | | | 4.88 | | | | | 7/15/2024 | | | | | 124,000 | | | | | 115,604 | | | | | 112,220 | |
First Quantum Minerals Ltd.+^ | | | | 6.88 | | | | | 3/1/2026 | | | | | 229,000 | | | | | 229,000 | | | | | 183,773 | |
First Quantum Minerals Ltd.+^ | | | | 7.00 | | | | | 2/15/2021 | | | | | 600,000 | | | | | 604,826 | | | | | 576,000 | |
Hecla Mining Co. | | | | 6.88 | | | | | 5/1/2021 | | | | | 250,000 | | | | | 231,164 | | | | | 245,000 | |
See accompanying Notes to the Financial Statements.
172
Barings U.S. High Yield Fund 2018 Semi-Annual Report
SCHEDULE OF INVESTMENTS (CONTINUED)
December 31, 2018 (Unaudited)
| | | | | | | | | | | | | | | | | | | | | | | | | |
| | | EFFECTIVE
INTEREST RATE | | DUE DATE | | PRINCIPAL ‡‡ | | COST | | FAIR
VALUE |
Corporate Bonds(Continued) | | | | | | | | | | | | | | | | | | | | | | | | | |
| | | | |
Mining, Steel, Iron and Non-Precious Metals(Continued) | | | | | | | | | | | | | | | | | | | | | |
Kinross Gold Corp.+ | | | | 5.95 | % | | | | 3/15/2024 | | | | | 152,000 | | | | | $157,032 | | | | | $151,240 | |
Kinross Gold Corp. | | | | 6.88 | | | | | 9/1/2041 | | | | | 99,000 | | | | | 98,523 | | | | | 94,545 | |
Kissner Holdings LP/Kissner Milling Co. Ltd./BSC Holding, Inc./Kissner USA^ | | | | 8.38 | | | | | 12/1/2022 | | | | | 400,000 | | | | | 409,325 | | | | | 398,000 | |
New Gold, Inc.^ | | | | 6.25 | | | | | 11/15/2022 | | | | | 400,000 | | | | | 407,907 | | | | | 336,000 | |
Northwest Acquisitions ULC/Dominion Finco, Inc.+^ | | | | 7.13 | | | | | 11/1/2022 | | | | | 893,000 | | | | | 905,780 | | | | | 882,105 | |
Peabody Energy Corp.^ | | | | 6.00 | | | | | 3/31/2022 | | | | | 524,000 | | | | | 527,220 | | | | | 508,280 | |
SunCoke Energy Partners LP/SunCoke Energy Partners Finance Corp.^ | | | | 7.50 | | | | | 6/15/2025 | | | | | 550,000 | | | | | 557,282 | | | | | 521,125 | |
Warrior Met Coal, Inc.^ | | | | 8.00 | | | | | 11/1/2024 | | | | | 540,000 | | | | | 548,293 | | | | | 535,950 | |
| | | | | | | | | | | | | | | | | | | | | | | | | |
Total Mining, Steel, Iron and Non-Precious Metals | | | | | | | | | | 5,323,000 | | | | | 5,358,649 | | | | | 5,102,378 | |
| | | | | | | | | | | | | | | | | | | | | | | | | |
| | | | | |
Oil and Gas — 13.0%*: | | | | | | | | | | | | | | | | | | | | | | | | | |
Calumet Specialty Products Partners LP/Calumet Finance Corp. | | | | 7.63 | | | | | 1/15/2022 | | | | | 155,000 | | | | | 155,043 | | | | | 125,163 | |
Calumet Specialty Products Partners LP/Calumet Finance Corp. | | | | 7.75 | | | | | 4/15/2023 | | | | | 84,000 | | | | | 83,806 | | | | | 63,840 | |
Cheniere Energy Partners LP^ | | | | 5.63 | | | | | 10/1/2026 | | | | | 250,000 | | | | | 250,000 | | | | | 233,750 | |
Chesapeake Energy Corp. | | | | 8.00 | | | | | 1/15/2025 | | | | | 247,000 | | | | | 244,995 | | | | | 217,977 | |
Citgo Holding, Inc.^ | | | | 10.75 | | | | | 2/15/2020 | | | | | 762,000 | | | | | 782,905 | | | | | 777,240 | |
CVR Refining LLC/Coffeyville Finance, Inc. | | | | 6.50 | | | | | 11/1/2022 | | | | | 331,000 | | | | | 339,634 | | | | | 326,035 | |
Energy Transfer LP | | | | 4.25 | | | | | 3/15/2023 | | | | | 250,000 | | | | | 250,000 | | | | | 240,625 | |
EP Energy LLC/Everest Acquisition Finance, Inc.^ | | | | 8.00 | | | | | 2/15/2025 | | | | | 248,000 | | | | | 248,000 | | | | | 102,300 | |
Ferrellgas LP/Ferrellgas Finance Corp. | | | | 6.75 | | | | | 1/15/2022 | | | | | 100,000 | | | | | 100,724 | | | | | 81,500 | |
Ferrellgas Partners LP/Ferrellgas Partners Finance Corp. | | | | 8.63 | | | | | 6/15/2020 | | | | | 600,000 | | | | | 596,644 | | | | | 429,000 | |
Genesis Energy LP/Genesis Energy Finance Corp. | | | | 6.00 | | | | | 5/15/2023 | | | | | 18,000 | | | | | 17,755 | | | | | 16,650 | |
Jonah Energy LLC/Jonah Energy Finance Corp.^ | | | | 7.25 | | | | | 10/15/2025 | | | | | 540,000 | | | | | 513,005 | | | | | 345,600 | |
KCA Deutag UK Finance PLC+^ | | | | 9.63 | | | | | 4/1/2023 | | | | | 270,000 | | | | | 277,557 | | | | | 217,350 | |
Kosmos Energy Ltd. | | | | 7.88 | | | | | 8/1/2021 | | | | | 1,027,000 | | | | | 1,023,838 | | | | | 1,023,115 | |
PBF Holding Co. LLC/PBF Finance Corp. | | | | 7.25 | | | | | 6/15/2025 | | | | | 350,000 | | | | | 360,695 | | | | | 329,000 | |
QEP Resources, Inc. | | | | 5.63 | | | | | 3/1/2026 | | | | | 550,000 | | | | | 529,487 | | | | | 456,500 | |
SM Energy Co. | | | | 6.63 | | | | | 1/15/2027 | | | | | 118,000 | | | | | 118,000 | | | | | 104,430 | |
Transocean Guardian Ltd.^ | | | | 5.88 | | | | | 1/15/2024 | | | | | 171,000 | | | | | 169,414 | | | | | 163,733 | |
Transocean, Inc. | | | | 6.80 | | | | | 3/15/2038 | | | | | 120,000 | | | | | 100,592 | | | | | 79,800 | |
Transocean, Inc. | | | | 9.35 | | | | | 12/15/2041 | | | | | 38,000 | | | | | 35,385 | | | | | 31,635 | |
Tullow Oil PLC+^ | | | | 6.25 | | | | | 4/15/2022 | | | | | 695,000 | | | | | 689,130 | | | | | 668,937 | |
Welltec A/S+^ | | | | 9.50 | | | | | 12/1/2022 | | | | | 550,000 | | | | | 553,961 | | | | | 543,125 | |
| | | | | | | | | | | | | | | | | | | | | | | | | |
Total Oil and Gas | | | | | | | | | | | | | | 7,474,000 | | | | | 7,440,570 | | | | | 6,577,305 | |
| | | | | | | | | | | | | | | | | | | | | | | | | |
See accompanying Notes to the Financial Statements.
173
Barings U.S. High Yield Fund 2018 Semi-Annual Report
SCHEDULE OF INVESTMENTS (CONTINUED)
December 31, 2018 (Unaudited)
| | | | | | | | | | | | | | | | | | | | | | | | | |
| | | EFFECTIVE
INTEREST RATE | | DUE DATE | | PRINCIPAL ‡‡ | | COST | | FAIR VALUE |
Corporate Bonds(Continued) | | | | | | | | | | | | | | | | | | | | | | | | | |
| | | | | |
Personal, Food and Miscellaneous — 0.5%*: | | | | | | | | | | | | | | | | | | | | | | | | | |
Simmons Foods, Inc.^ | | | | 5.75 | % | | | | 11/1/2024 | | | | | 193,000 | | | | | $165,651 | | | | | $137,030 | |
Simmons Foods, Inc.^ | | | | 7.75 | | | | | 1/15/2024 | | | | | 122,000 | | | | | 122,000 | | | | | 122,610 | |
| | | | | | | | | | | | | | | | | | | | | | | | | |
Total Personal, Food and Miscellaneous | | | | | | | | | | | | | | 315,000 | | | | | 287,651 | | | | | 259,640 | |
| | | | | | | | | | | | | | | | | | | | | | | | | |
| | | | | |
Printing and Publishing — 0.5%*: | | | | | | | | | | | | | | | | | | | | | | | | | |
Nielsen Finance LLC/Nielsen Finance Co.^ | | | | 5.00 | | | | | 4/15/2022 | | | | | 274,000 | | | | | 269,020 | | | | | 261,670 | |
| | | | | | | | | | | | | | | | | | | | | | | | | |
| | | | | |
Retail Stores — 1.5%*: | | | | | | | | | | | | | | | | | | | | | | | | | |
Golden Nugget, Inc.^ | | | | 8.75 | | | | | 10/1/2025 | | | | | 200,000 | | | | | 204,273 | | | | | 192,000 | |
KGA Escrow LLC^ | | | | 7.50 | | | | | 8/15/2023 | | | | | 298,000 | | | | | 298,000 | | | | | 293,530 | |
Penske Automotive Group, Inc. | | | | 5.50 | | | | | 5/15/2026 | | | | | 250,000 | | | | | 250,000 | | | | | 232,500 | |
Sonic Automotive, Inc. | | | | 5.00 | | | | | 5/15/2023 | | | | | 32,000 | | | | | 29,401 | | | | | 29,040 | |
| | | | | | | | | | | | | | | | | | | | | | | | | |
Total Retail Stores | | | | | | | | | | | | | | 780,000 | | | | | 781,674 | | | | | 747,070 | |
| | | | | | | | | | | | | | | | | | | | | | | | | |
| | | | | |
Telecommunications — 9.9%*: | | | | | | | | | | | | | | | | | | | | | | | | | |
Altice Financing SA+^ | | | | 6.63 | | | | | 2/15/2023 | | | | | 250,000 | | | | | 251,088 | | | | | 240,000 | |
Altice Luxembourg SA+^ | | | | 7.63 | | | | | 2/15/2025 | | | | | 225,000 | | | | | 237,665 | | | | | 168,187 | |
Cablevision Systems Corp. | | | | 5.88 | | | | | 9/15/2022 | | | | | 400,000 | | | | | 395,231 | | | | | 393,000 | |
CCO Holdings LLC/CCO Holdings Capital Corp.^ | | | | 5.88 | | | | | 5/1/2027 | | | | | 250,000 | | | | | 247,570 | | | | | 242,500 | |
CenturyLink, Inc. | | | | 6.75 | | | | | 12/1/2023 | | | | | 280,000 | | | | | 280,633 | | | | | 269,850 | |
CommScope Technologies LLC^ | | | | 5.00 | | | | | 3/15/2027 | | | | | 600,000 | | | | | 573,352 | | | | | 486,000 | |
CSC Holdings LLC^ | | | | 7.50 | | | | | 4/1/2028 | | | | | 250,000 | | | | | 250,000 | | | | | 249,375 | |
Frontier Communications Corp. | | | | 7.13 | | | | | 3/15/2019 | | | | | 550,000 | | | | | 551,892 | | | | | 534,875 | |
Hughes Satellite Systems Corp. | | | | 6.63 | | | | | 8/1/2026 | | | | | 550,000 | | | | | 549,183 | | | | | 503,937 | |
Intelsat Connect Finance SA^ | | | | 9.50 | | | | | 2/15/2023 | | | | | 100,000 | | | | | 98,369 | | | | | 86,000 | |
Sprint Capital Corp. | | | | 6.88 | | | | | 11/15/2028 | | | | | 700,000 | | | | | 706,747 | | | | | 661,500 | |
Sprint Corp. | | | | 7.63 | | | | | 3/1/2026 | | | | | 125,000 | | | | | 125,000 | | | | | 123,438 | |
Sprint Corp. | | | | 7.88 | | | | | 9/15/2023 | | | | | 239,000 | | | | | 240,801 | | | | | 245,274 | |
T-Mobile USA, Inc. | | | | 4.50 | | | | | 2/1/2026 | | | | | 96,000 | | | | | 96,000 | | | | | 88,080 | |
T-Mobile USA, Inc. | | | | 4.75 | | | | | 2/1/2028 | | | | | 155,000 | | | | | 155,000 | | | | | 140,275 | |
T-Mobile USA, Inc. | | | | 5.38 | | | | | 4/15/2027 | | | | | 200,000 | | | | | 200,000 | | | | | 193,000 | |
Telecom Italia SpA+^ | | | | 5.30 | | | | | 5/30/2024 | | | | | 250,000 | | | | | 260,917 | | | | | 237,500 | |
Ziggo BV+^ | | | | 5.50 | | | | | 1/15/2027 | | | | | 140,000 | | | | | 133,848 | | | | | 125,300 | |
| | | | | | | | | | | | | | | | | | | | | | | | | |
Total Telecommunications | | | | | | | | | | | | | | 5,360,000 | | | | | 5,353,296 | | | | | 4,988,091 | |
| | | | | | | | | | | | | | | | | | | | | | | | | |
Total Corporate Bonds | | | | | | | | | | | | | | 50,301,000 | | | | | 50,110,409 | | | | | 46,664,899 | |
| | | | | | | | | | | | | | | | | | | | | | | | | |
Total Fixed Income | | | | | | | | | | | | | | 53,005,764 | | | | | 52,702,130 | | | | | 49,226,198 | |
| | | | | | | | | | | | | | | | | | | | | | | | | |
Total Investments | | | | | | | | | | | | | | 53,051,313 | | | | | 53,017,778 | | | | | 49,548,895 | |
| | | | | | | | | | | | | | | | | | | | | | | | | |
| |
Other assets and liabilities — 2.1%* | | | | | 1,037,987 | |
| | | | | | | | | | | | | | | | | | | | | | | | | |
| |
Net Assets — 100.0% | | | | | $50,586,882 | |
| | | | | | | | | | | | | | | | | | | | | | | | | |
See accompanying Notes to the Financial Statements.
174
Barings U.S. High Yield Fund 2018 Semi-Annual Report
SCHEDULE OF INVESTMENTS (CONTINUED)
December 31, 2018 (Unaudited)
| ‡‡ | Unless otherwise indicated, all principal amounts are denominated in United States Dollars. |
| * | Calculated as a percentage of net assets applicable to common shareholders. |
Distributions of investments by country of risk (excluding temporary cash investments) as a percentage of total investments in securities, is as follows:
| | | | | | |
| | United States | | | 87.4% | |
| | Ghana | | | 3.4% | |
| | Canada | | | 2.4% | |
| | Netherlands | | | 2.3% | |
| | Zambia | | | 1.5% | |
| | Denmark | | | 1.1% | |
| | Other (Individually less than 1%) | | | 1.9% | |
| | | | | | |
| | Total | | | 100.0% | |
| | | | | | |
| ^ | Security acquired in a transaction exempt from registration under Rule 144A of the Securities Act of 1933. These securities may only be resold in transactions exempt from registration, normally to qualified institutional buyers. |
| § | Bank loans are exempt from registration under the Securities Act of 1933, as amended, but contain certain restrictions on resale and cannot be sold publicly. These loans pay interest at rates which adjust periodically. The interest rates shown for bank loans are the current interest rates at December 31, 2018. Bank loans are also subject to mandatory and/or optional prepayment which cannot be predicted. As a result, the remaining maturity may be substantially less than the stated maturity shown. |
| ¤ | For fair value measurement disclosure purposes, security is categorized as Level 3 (See Note 2). |
See accompanying Notes to the Financial Statements.
175
Barings Funds Trust 2018 Semi-Annual Report
NOTES TO FINANCIAL STATEMENTS
December 31, 2018 (Unaudited)
Barings Funds Trust (the “Trust”) was organized as a business trust under the laws of the Commonwealth of Massachusetts on May 3, 2013 and commenced operations on September 16, 2013. The Trust is registered under the Investment Company Act of 1940, as amended (the “1940 Act”), as anopen-end management investment company. As of December 31, 2018, the Trust consists of eight funds (separately, a “Fund” and collectively, the “Funds”): Barings Global Floating Rate Fund (“Global Floating Rate Fund”), Barings Global Credit Income Opportunities Fund (“Global Credit Income Opportunities Fund”), Barings Active Short Duration Bond Fund (“Active Short Duration Bond Fund”), Barings Total Return Bond Fund (“Total Return Bond Fund”), Barings Emerging Markets Debt Blended Total Return Fund (“Emerging Markets Debt Blended Total Return Fund”), Barings Global Emerging Markets Equity Fund (“Global Emerging Markets Equity Fund”), Barings Global High Yield Fund (“Global High Yield Fund”) and Barings U.S. High Yield Fund (“U.S. High Yield Fund”). On November 30, 2018 the Emerging Markets Local Currency Debt Fund was liquidated. Each Fund, other than Emerging Markets Debt Blended Total Return Fund and Global Emerging Markets Equity Fund, is a “diversified” investment company. Global Credit Income Opportunities Fund and Global Floating Rate Fund commenced operations on September 16, 2013. Active Short Duration Bond Fund and Total Return Bond Fund commenced operations on July 8, 2015. Emerging Markets Debt Blended Total Return Fund commenced operations on October 21, 2015. Global High Yield Fund and U.S. High Yield Fund commenced operations on October 30, 2015. Global Emerging Markets Equity Fund commenced operations on September 17, 2018.
Barings LLC (the “Adviser”), a wholly-owned indirect subsidiary of Massachusetts Mutual Life Insurance Company, is a registered investment adviser under the Investment Advisers Act of 1940, as amended (the “Advisers Act”), and serves as investment adviser to the Funds.
Baring International Investment Limited (“BIIL”), a private limited company incorporated under the laws of England, serves as asub-adviser with respect to European investments for the Global Floating Rate Fund, Global Credit Income Opportunities Fund, Emerging Markets Debt Blended Total Return Fund, Global Emerging Markets Equity Fund, and Global High Yield Fund.
The primary investment objective of the Global Floating Rate Fund is to seek a high level of current income. The Global Floating Rate Fund seeks preservation of capital as a secondary investment objective. The investment objective of the Global Credit Income Opportunities Fund is to seek an absolute return, primarily through current income and secondarily through capital appreciation. The investment objective of the Active Short Duration Bond Fund is to seek to achieve a high total rate of return primarily from current income while minimizing fluctuations in capital values by investing primarily in a diversified portfolio of short-term investment grade fixed income securities. The investment objective of the Total Return Bond Fund is to seek a superior total rate of return by investing in fixed income instruments. The investment objective of the Emerging Markets Debt Blended Total Return Fund is to seek to achieve maximum total return, consistent with preservation of capital and prudent investment management, through high current income generation and, where appropriate, capital appreciation. The investment objective of the Global Emerging Markets Equity Fund is to seek to achieve long-term capital growth.The investment objective of the Global High Yield Fund is to seek to provide high current income generation and, where appropriate, capital appreciation. The investment objective of the U.S. High Yield Fund is to seek to achieve a high level of total return, with an emphasis on current income, by investing primarily in high yield debt and related securities.
There can be no assurance that the Funds will achieve their investment objectives. Under normal market conditions, the Global Floating Rate Fund invests at least 80% of its net assets (including the amount of any borrowings for investment purposes) in income producing floating rate debt securities, consisting of floating rate loans, bonds and notes, issued primarily by North American and Western European companies that are primarily, at the time of purchase, rated below-investment grade (below Baa3 by Moody’s Investors Service, Inc. (“Moody’s”) or belowBBB- by either Standard & Poor’s Rating Services, a division of the McGraw-Hill Company, Inc. (“S&P”) or Fitch, Inc. (“Fitch”)) or, if unrated, determined by the Adviser or BIIL to be of comparable quality. Under normal market conditions, the Global Credit Income Opportunities Fund invests at least 80% of its net assets (including the amount of any borrowings for investment purposes) in debt instruments, consisting of loans, bonds and notes. Investments may be based in U.S. andnon-U.S. markets, as well asover-the-counter and
176
Barings Funds Trust 2018 Semi-Annual Report
NOTES TO FINANCIAL STATEMENTS(CONTINUED)
December 31, 2018 (Unaudited)
exchange traded derivatives. Investments may be issued or guaranteed by governments and their agencies, corporations, financial institutions and supranational organizations that the Adviser believes have the potential to provide a high total return over time. A significant portion of the Global Floating Rate Fund and Global Credit Income Opportunities Fund’s investments in debt instruments will be denominated in a currency other than the U.S. dollar. Although the investments innon-U.S. dollar denominated assets may be on a currency hedged or unhedged basis, the Global Floating Rate Fund and Global Credit Income Opportunities Fund expect that, under current market conditions, they will seek to hedge substantially all of their exposure to foreign currencies. Under normal market conditions, the Active Short Duration Bond Fund invests at least 80% of its net assets (including the amount of any borrowings for investment purposes) in investment grade fixed income securities (rated Baa3 or higher by Moody’s orBBB- or higher by S&P or Fitch or if unrated, determined to be of comparable quality by the Adviser). These typically include U.S. dollar-denominated corporate obligations, securities issued or guaranteed by the U.S. government or its agencies or instrumentalities, U.S. and foreign issuer dollar-denominated bonds including, but not limited to, corporate obligations, government and agency issues, private placement bonds, securities subject to resale pursuant to Rule 144A, mortgage-backed, and other asset-backed securities. Under normal market conditions, the Total Return Bond Fund invests at least 80% of its net assets (including the amount of any borrowings for investment purposes) in fixed income securities. These typically include: U.S. dollar denominated corporate obligations and bank loans, securities issued or guaranteed by the U.S. government or its agencies or instrumentalities, U.S. and foreign issuer dollar denominated bonds including, but not limited to, corporate obligations, government and agency issues, private placement bonds, securities subject to resale pursuant to Rule 144A, convertible bonds, mortgage-backed, and other asset-backed securities. Under normal market conditions, the Emerging Markets Debt Blended Total Return Fund will invest at least 80% of its net assets (including the amount of any borrowings for investment purposes) in (i) securities denominated in currencies of the emerging market countries, (ii) fixed income securities or debt instruments issued by emerging market entities or sovereign nations, and/or (iii) debt instruments denominated in or based on the currencies, interest rates, or issues of emerging market countries. Emerging market
countries are defined to include any country that did not become a member of the Organization for Economic Cooperation and Development (O.E.C.D.) prior to 1975 and Turkey. Certain emerging market countries are referred to as “frontier” market countries. The Emerging Markets Debt Blended Total Return Fund will likely focus its investments in Asia, Africa, the Middle East, Latin America and the developing countries of Europe. Under normal conditions, the Global High Yield Fund will invest at least 80% of its net assets (including the amount of any borrowing for investment purposes) in below investment grade (“high yield”) fixed and floating rate corporate debt securities including bonds, notes and other fixed and floating rate income securities issued primarily by North American and Western European companies. For this purpose, debt instruments issued by issuers based in the Channel Islands, Cayman Islands and Bermuda will be considered North American and Western European companies. Such debt securities may be secured or unsecured, and, either senior or subordinated. Secured debt means that collateral has been pledged as security against default, while investors in senior debt instruments are legally entitled to be repaid ahead of investors in subordinated (i.e.non-senior) instruments issued by the same corporation. Derivative instruments that provide exposure to such high yield debt securities or have similar economic characteristics may be used to satisfy the Fund’s 80% policy. The Adviser expects that such instruments will primarily, at the time of purchase, be rated below investment grade (commonly referred to as “junk bonds”) by at least one credit rating agency (below Baa3 by Moody’s or belowBBB- by either S&P or Fitch) or, if unrated, determined by the Adviser or BIIL, to be of comparable quality. Under normal market conditions, the Global Emerging Markets Equity Fund will invest at least 80% of its net assets (including the amount of any borrowings for investment purposes) in equity and equity-related securities of issues that are economically tied to one or more emerging market countries. In general, countries may be considered emerging markets if they are included in any one of the Morgan Stanley Capital Index (“MSCI”) emerging markets indices. The Global High Yield Fund may invest in high yield securities of any rating, including securities that are in default at the time of purchase. Under normal circumstances, the U.S. High Yield Fund invests at least 80% of its net assets (including the amount of any borrowings for investment purposes) in lower rated fixed income securities (rated below Baa3 by Moody’s orBBB- by either S&P or Fitch (using the lower rating) or, if unrated, determined by the Adviser to be of
177
Barings Funds Trust 2018 Semi-Annual Report
NOTES TO FINANCIAL STATEMENTS(CONTINUED)
December 31, 2018 (Unaudited)
comparable quality), and at least 80% of its net assets (including the amount of any borrowings for investment purposes) in securities of U.S. issuers. The U.S. High Yield Fund may also invest in convertible securities, preferred stocks, warrants, bank loans, and other fixed income securities, including Rule 144A securities, of both U.S. and foreign issuers. Currently, the Adviser does not expect that the U.S. High Yield Fund will invest more than 20% of its total assets in bank loans. The U.S. High Yield Fund may invest up to 15% of its total assets in securities that are not denominated in U.S. dollars including, but not limited to, corporate bonds, government and agency issues, Rule 144A securities, convertible securities, bank loans, mortgage-backed, and asset-backed securities.
Each Fund has four classes of shares: Class A, C, I, and Y, each with different expenses and dividends. With the exception of Active Short Duration Bond Fund, which has no sales charge on any class, afront-end sales charge is normally added to the net asset value (“NAV”) for Class A shares. There is nofront-end sales charge in the case of Class C, I, and Y shares. There may be a contingent deferred sales charge (“CDSC”) in certain cases as follows: 1) Effective January 15, 2018, Class A Shares purchased without an initial sales charge in accounts aggregating $500,000 or more are subject to a 1.00% contingent deferred sales charge (CDSC) if the shares are tendered and accepted for repurchase within 18 months of purchase (or within 12 months for shares purchased prior to January 15, 2018). The18-month period (or12-month period for shares purchased prior to January 15, 2018) begins on the day on which the purchase was made; and 2) Class C shares redeemed within the first year of purchase. All classes of shares have equal voting rights, with the exception of matters that relate solely to one class.
| 2. | Significant Accounting Policies |
The Trust is an investment company and follows accounting and reporting guidance in Financial Accounting Standards Board (“FASB”) Accounting Standards Codification Topic 946 (“ASC 946”).
The following is a summary of significant accounting policies followed consistently by the Funds in the preparation of their financial statements in conformity with accounting principles generally accepted in the United States of America (“U.S. GAAP”).
A. Valuation of Investments
The Funds’ investments in fixed income securities are generally valued using the prices provided directly by independent third party services or provided directly from
one or more broker dealers or market makers, each in accordance with the valuation policies and procedures approved by the Funds’ Board of Trustees (the “Board”).
The pricing services may use valuation models or matrix pricing, which consider yield or prices with respect to comparable bond quotations from bond dealers or by reference to other securities that are considered comparable in such characteristics as credit rating, interest rates and maturity date to determine the current value. The Funds’ investments in bank loans are normally valued at the bid quotation obtained from dealers in loans by an independent pricing service in accordance with the Funds’ valuation policies and procedures approved by the Board. Short-term securities with remaining maturities of 60 days or less may be valued at amortized cost, which approximates fair value. Derivative financial instruments, such as futures contracts or options contracts that are traded on a national securities exchange, are stated at the last reported sale or settlement price on the day of valuation. Futures traded on inactive markets are valued using broker quotations. OTC derivative financial instruments, such as foreign currency contracts, options contracts, or swaps agreements, derive their value from underlying asset prices, indices, reference rates, and other inputs or a combination of these factors. These contracts are normally valued on the basis of an independent pricing service providers or broker dealer quotations. Depending on the derivative type and the terms of the derivative, the value of the derivative financial instruments is assigned by independent pricing service providers using a series of techniques, which may include pricing models. The pricing models use inputs that are observed from actively quoted markets such as issuer details, indices, spreads, interest rates, curves, volatilities, dividends and exchange rates.
The assets and liabilities shown in the Statements of Assets and Liabilities related to investments purchased for“to-be-announced” (“TBA”) or when-issued securities approximate fair value and are determined using Level 2 inputs, as of December 31, 2018. The assets and liabilities shown in the Statements of Assets and Liabilities related to cash collateral held at broker for futures contracts are determined using Level 1 inputs as of December 31, 2018.
A Valuation Committee, made up of officers of the Trust and employees of the Adviser, is responsible for determining, in accordance with the Funds’ valuation policies and procedures approved by the Board; (1) whether market quotations are readily available for
178
Barings Funds Trust 2018 Semi-Annual Report
NOTES TO FINANCIAL STATEMENTS(CONTINUED)
December 31, 2018 (Unaudited)
investments held by the Fund; and (2) the fair value of investments held by the Fund for which market quotations are not readily available or are deemed not reliable by the Adviser. In certain cases, authorized pricing service vendors may not provide prices for a security held by the Funds, or the price provided by such pricing service vendor is deemed unreliable by the Adviser. In such cases, the Funds may use market maker quotations provided by an established market maker for that security (i.e., broker quotes) to value the security if the Adviser has experience obtaining quotations from the market maker and the Adviser determines that quotations obtained from the market maker in the past have generally been reliable (or, if the Adviser has no such experience with respect to a market maker, it determines based on other information available to it that quotations to be obtained by it from the market maker are reasonably likely to be reliable). In any such case, the Adviser will review any market quotations so obtained in light of other information in its possession for their general reliability.
Bond investments are valued on the basis of last available bid prices or current market quotations provided by dealers or pricing services. Bank loan positions are valued at the bid price from one or more brokers or dealers as obtained from a pricing service. In determining the value of a particular investment, pricing services may use certain information with respect to transactions in such investments, quotations from dealers, pricing matrixes, market transactions in comparable investments, various relationships observed in the market between investments and calculated yield measures. Asset-backed and mortgage-backed securities are valued by independent pricing services using models that consider estimated cash flows of each tranche of the security, establish a benchmark yield and develop an estimated tranche-specific spread to the benchmark yield based on the unique attributes of the tranche.
Bank loans in which the Funds may invest have similar risks to lower-rated fixed income securities. Changes in the financial condition of the borrower or economic conditions or other circumstances may reduce the capacity of the borrower to make principal and interest payments on such instruments and may lead to defaults. Senior secured bank loans are supported by collateral; however, the value of the collateral may be insufficient to cover the amount owed to the Funds. By relying on a third party to administer a loan, the Funds are subject to the risk that the third party will fail to perform its
obligations. The loans in which the Funds will invest are largely floating rate instruments; therefore, the interest rate risk generally is lower than for fixed-rate debt obligations. However, from the perspective of the borrower, an increase in interest rates may adversely affect the borrower’s financial condition. Due to the unique and customized nature of loan agreements evidencing loans and the private syndication thereof, loans are not as easily purchased or sold as publicly traded securities. Although the range of investors in loans has broadened in recent years, there can be no assurance that future levels of supply and demand in loan trading will provide the degree of liquidity which currently exists in the market. In addition, the terms of the loans may restrict their transferability without borrower consent. These factors may have an adverse effect on the market price and the Funds’ ability to dispose of particular portfolio investments. A less liquid secondary market also may make it more difficult for the Funds to obtain precise valuations of the high yield loans in its portfolio.
The Funds may invest in collateralized debt obligations (“CDOs”), which include collateralized bond obligations (“CBOs”) and collateralized loan obligations (“CLOs”). CBOs and CLOs are types of asset-backed securities. A CDO is an entity that is backed by a diversified pool of debt securities (CBOs) or syndicated bank loans (CLOs). The cash flows of the CDO can be split into multiple segments, called “tranches,” which will vary in risk profile and yield. The riskiest segment is the subordinated or “equity” tranche. This tranche bears the greatest risk of defaults from the underlying assets in the CDO and serves to protect the other, more senior, tranches from default in all but the most severe circumstances. Since it is shielded from defaults by the more junior tranches, a “senior” tranche will typically have higher credit ratings and lower yields than their underlying securities, and often receive investment grade ratings from one or more of the nationally recognized rating agencies. Despite the protection from the more junior tranches, senior tranches can experience substantial losses due to actual defaults, increased sensitivity to future defaults and the disappearance of one or more protecting tranches as a result of changes in the credit profile of the underlying pool of assets.
Fair value is defined as the price that the Funds would receive upon selling an investment in a timely transaction to an independent buyer in the principal or most advantageous market of the investment. A three-tier hierarchy is utilized to maximize the use of observable
179
Barings Funds Trust 2018 Semi-Annual Report
NOTES TO FINANCIAL STATEMENTS(CONTINUED)
December 31, 2018 (Unaudited)
market data and minimize the use of unobservable inputs and to establish classification of fair value measurements for disclosure purposes. Inputs refer broadly to the assumptions that market participants would use in pricing the asset or liability, including assumptions about risk. For example, market participants would consider the risk inherent in a particular valuation technique used to measure fair value, such as a pricing model, and/or the risk inherent in the inputs to the valuation technique. Inputs may be observable or unobservable. Observable inputs are inputs that reflect the assumptions market participants would use in pricing the asset or liability and are developed based on market data obtained from sources independent of the reporting entity. Unobservable inputs are inputs that reflect the reporting entity’s own assumptions about the assumptions market participants would use in pricing the asset or liability and are developed based on the best information available in the circumstances. The three-tier hierarchy of inputs is summarized in the three broad levels listed below.
Level 1 – quoted prices in active markets for identical securities
Level 2 – other significant observable inputs (including quoted prices for similar securities, interest rates, prepayment speeds, credit risk, etc.)
Level 3 – significant unobservable inputs (including the Funds’ own assumptions in determining the fair value of investments)
The availability of observable inputs can vary from security to security and is affected by a wide variety of factors, including, for example, the type of security, whether the security is new and not yet established in the marketplace, the liquidity of markets, and other characteristics particular to the security. To the extent that valuation is based on models or inputs that are less observable or unobservable in the market, the determination of fair value requires more judgment. Accordingly, the degree of judgment exercised in determining fair value is greatest for instruments categorized in level 3.
The inputs used to measure fair value may fall into different levels of the fair value hierarchy. In such cases, for disclosure purposes, the level in the fair value hierarchy within which the fair value measurement falls in its entirety is determined based on the lowest level input that is significant to the fair value measurement in its entirety.
The following is a summary of the inputs used as of December 31, 2018 in valuing the Funds’ investments:
Global Floating Rate Fund
| | | | | | | | | | | | | | | | |
| DESCRIPTION | | LEVEL 1 | | | LEVEL 2 | | | LEVEL 3 | | | TOTAL INVESTMENTS | |
| |
Assets:* | | | | | |
| Equities: | | | | | |
Common Stocks | | $ | – | | | $ | 1,192,474 | | | $ | 209,512 | | | $ | 1,401,986 | |
Preferred Stock | | | – | | | | – | | | | 25,965 | | | | 25,965 | |
Warrants | | | – | | | | – | | | | 7,776 | | | | 7,776 | |
| | | | | | | | | | | | | | | | |
| Total Equities | | | – | | | | 1,192,474 | | | | 243,253 | | | | 1,435,727 | |
| | | | | | | | | | | | | | | | |
| |
Fixed Income: | | | | | |
Bank Loans | | | – | | | | 239,152,468 | | | | 62,044 | | | | 239,214,512 | |
Corporate Bonds | | | – | | | | 32,641,717 | | | | 0 | | | | 32,641,717 | |
| | | | | | | | | | | | | | | | |
| Total Fixed Income | | | – | | | | 271,794,185 | | | | 62,044 | | | | 271,856,229 | |
| | | | | | | | | | | | | | | | |
| |
Derivative Securities: | | | | | |
Forward Foreign Currency Exchange Contracts | | | – | | | | 28,173 | | | | – | | | | 28,173 | |
| | | | | | | | | | | | | | | | |
| Total | | $ | – | | | $ | 273,014,832 | | | $ | 305,297 | | | $ | 273,320,129 | |
| | | | | | | | | | | | | | | | |
| |
Liabilities:* | | | | | |
| Derivative Securities: | | | | | |
Forward Foreign Currency Exchange Contracts | | | – | | | | (271,019 | ) | | | – | | | | (271,019 | ) |
| | | | | | | | | | | | | | | | |
| Total Investments | | $ | – | | | $ | 272,743,813 | | | $ | 305,297 | | | $ | 273,049,110 | |
| | | | | | | | | | | | | | | | |
| | * | There were no transfers between levels during the period ended December 31, 2018. |
180
Barings Funds Trust 2018 Semi-Annual Report
NOTES TO FINANCIAL STATEMENTS(CONTINUED)
December 31, 2018 (Unaudited)
The following table is a summary of quantitative information about significant unobservable valuation inputs for Level 3 fair value measurement for investments held as of December 31, 2018:
| | | | | | | | |
| TYPE OF ASSETS | | FAIR VALUE AS OF
DECEMBER 31, 2018 | | | VALUATION
TECHNIQUE(S) | | UNOBSERVABLE INPUT |
| | | |
Equities | | | | | | | | |
| | | |
Tunstall Group Holdings Ltd | | $ | – | | | Zero Value | | Valued at zero without primary asset attached |
| | | |
Tunstall Group Holdings Ltd | | $ | – | | | Zero Value | | Valued at zero without primary asset attached |
| | | |
Boomerang Tube LLC | | $ | 172,055 | | | Discounted Cash Flow | | Average Enterprise Valuation Multiple: 5 year projection, 5.5x; EBITDA: $42.5 million; 15% discount rate |
| | | |
Sabine Oil & Gas LLC | | $ | 17,028 | | | Broker Quote | | $44.00: Price source depth of 1 |
| | | |
Sabine Oil & Gas LLC Warrants | | $ | 1,845 | | | Broker Quote | | $1.50: Price source depth of 1 |
| | | |
Sabine Oil & Gas LLC Warrants | | $ | 1,150 | | | Broker Quote | | $5.25: Price source depth of 1 |
| | | |
Templar Energy LLC | | $ | 5,257 | | | Broker Quote | | $0.60: Price source depth of 1 |
| | | |
Templar Energy LLC | | $ | 15,172 | | | Broker Quote | | $2.50 Price source depth of 1 |
| | | |
Appvion Holdings Corp Warrants | | $ | 4,781 | | | Restructure | | Priced at corporate action restructure price |
| | | |
Appvion Holdings Corp Warrants | | $ | – | | | Zero Value | | Valued at zero without primary asset attached |
| | | |
Pinnacle Agriculture Holdings A 2 | | $ | 25,965 | | | Broker Quote | | $10.00: Price source depth of 1 |
| | | |
Bank Loans | | | | | | | | |
| | | |
Boomerang Tube LLC | | $ | 62,044 | | | Discounted Cash Flow | | Average Enterprise Valuation Multiple: 5 year projection, 5.5x; EBITDA: $42.5 million; 15% discount rate |
| | | |
Corporate Bonds | | | | | | | | |
| | | |
Appvion ESC | | $ | – | | | Zero Value | | Valued at zero without primary asset attached |
Although the Fund believes the valuation methods described above are appropriate, the use of different methodologies or assumptions to determine fair value could result in different estimates of fair value at the reporting date.
181
Barings Funds Trust 2018 Semi-Annual Report
NOTES TO FINANCIAL STATEMENTS(CONTINUED)
December 31, 2018 (Unaudited)
The following is a reconciliation of investments with unobservable inputs (Level 3) that were used in determining fair value:
| | | | | | | | | | | | | | | | | | | | | | | | | | | | | | | | | | | | |
INVESTMENTS IN SECURITIES | | BALANCE
AS OF
JULY 1,
2018 | | | REALIZED
GAIN (LOSS) | | | CHANGE IN
UNREALIZED
APPRECIATION
(DEPRECIATION) | | | NET
TRANSFERS
IN (OUT)
OF LEVEL 3 | | | ACCRUED PREMIUMS/
DISCOUNTS | | | PURCHASES | | | SALES | | | BALANCE AS OF
DECEMBER 31,
2018 | | | CHANGE IN
UNREALIZED
APPRECIATION
(DEPRECIATION)
FROM
INVESTMENTS
HELD AT
DECEMBER 31,
2018 | |
| | | | | | | | | |
Equities | | | | | | | | | | | | | | | | | | | | | | | | | | | | | | | | | | | | |
Common Stock | | $ | 65,806 | | | $ | – | | | $ | (28,154 | ) | | $ | – | | | $ | – | | | $ | 171,860 | | | $ | – | | | $ | 209,512 | | | $ | (28,154 | ) |
Preferred Stock | | $ | 238,876 | | | $ | – | | | $ | (212,911 | ) | | $ | – | | | $ | – | | | $ | – | | | $ | – | | | $ | 25,965 | | | $ | (212,911 | ) |
Warrants | | $ | 8,475 | | | $ | – | | | $ | (699 | ) | | $ | – | | | $ | – | | | $ | – | | | $ | – | | | $ | 7,776 | | | $ | (699 | ) |
| | | | | | | | | | | | | | | | | | | | | | | | | | | | | | | | | | | | |
| | | | | | | | | |
Fixed Income | | | | | | | | | | | | | | | | | | | | | | | | | | | | | | | | | | | | |
Bank Loans | | $ | 206,150 | | | $ | (118,431 | ) | | $ | 98,862 | | | $ | – | | | $ | 233 | | | $ | 86,480 | | | $ | (211,250 | ) | | $ | 62,044 | | | $ | 98,862 | |
Corporate Bonds | | $ | – | | | $ | – | | | $ | – | | | $ | – | | | $ | – | | | $ | – | | | $ | – | | | $ | – | | | $ | – | |
| | | | | | | | | | | | | | | | | | | | | | | | | | | | | | | | | | | | |
Total | | $ | 519,307 | | | $ | (118,431 | ) | | $ | (142,902 | ) | | $ | – | | | $ | 233 | | | $ | 258,340 | | | $ | (211,250 | ) | | $ | 305,297 | | | $ | (142,902 | ) |
| | | | | | | | | | | | | | | | | | | | | | | | | | | | | | | | | | | | |
Global Credit Income Opportunities Fund
| | | | | | | | | | | | | | | | |
| DESCRIPTION | | LEVEL 1 | | | LEVEL 2 | | | LEVEL 3 | | | TOTAL INVESTMENTS | |
| |
Assets:* | | | | | |
| Equities: | | | | | |
Common Stocks | | $ | – | | | $ | 1,453,659 | | | $ | 712,280 | | | $ | 2,165,939 | |
Preferred Stock | | | – | | | | – | | | | 31,158 | | | | 31,158 | |
Warrants | | | – | | | | – | | | | 5,196 | | | | 5,196 | |
| | | | | | | | | | | | | | | | |
| Total Equities | | | – | | | | 1,453,659 | | | | 748,634 | | | | 2,202,293 | |
| | | | | | | | | | | | | | | | |
Fixed Income: | | | | | |
Asset-Backed Securities | | | – | | | | 25,404,085 | | | | 0 | | | | 25,404,085 | |
Bank Loans | | | – | | | | 62,495,348 | | | | 165,852 | | | | 62,661,200 | |
Corporate Bonds | | | – | | | | 78,273,144 | | | | 0 | | | | 78,273,144 | |
| | | | | | | | | | | | | | | | |
| Total Fixed Income | | | – | | | | 166,172,577 | | | | 165,852 | | | | 166,338,429 | |
| | | | | | | | | | | | | | | | |
| Purchased Option: | | | | | |
Put Option Purchased | | | – | | | | 864,192 | | | | – | | | | 864,192 | |
| Derivative Securities: | | | | | |
Forward Foreign Currency Exchange Contracts | | | – | | | | 51,721 | | | | – | | | | 51,721 | |
| | | | | | | | | | | | | | | | |
| Total | | $ | – | | | $ | 168,542,149 | | | $ | 914,486 | | | $ | 169,456,635 | |
| | | | | | | | | | | | | | | | |
| |
Liabilities:* | | | | | |
| Derivative Securities: | | | | | |
Forward Foreign Currency Exchange Contracts | | | – | | | | (187,612 | ) | | | – | | | | (187,612 | ) |
| | | | | | | | | | | | | | | | |
| Total Investments | | $ | – | | | $ | 168,354,537 | | | $ | 914,486 | | | $ | 169,269,023 | |
| | | | | | | | | | | | | | | | |
182
Barings Funds Trust 2018 Semi-Annual Report
NOTES TO FINANCIAL STATEMENTS(CONTINUED)
December 31, 2018 (Unaudited)
The following table is a summary of quantitative information about significant unobservable valuation inputs for Level 3 fair value measurement for investments held as of December 31, 2018:
| | | | | | | | |
| TYPE OF ASSETS | | FAIR VALUE AS OF
DECEMBER 31, 2018 | | | VALUATION
TECHNIQUE(S) | | UNOBSERVABLE INPUT |
| | | |
Equities | | | | | | | | |
| | | |
Tunstall Group Holdings LTD | | $ | – | | | Zero Value | | Valued at zero without primary asset attached |
| | | |
Tunstall Group Holdings LTD | | $ | – | | | Zero Value | | Valued at zero without primary asset attached |
| | | |
Boomerang Tube LLC | | $ | 172,055 | | | Discounted Cash Flow | | Average Enterprise Valuation Multiple: 5 year projection, 5.5x; EBITDA: $42.5 million; 15% discount rate |
| | | |
Maxeda DIY B.V. | | $ | 432,174 | | | Market Comparables | | LTM EBITDA€93m; Net leverage€453m; Average Comparable Valuation: 7.35X |
| | | |
Maxeda DIY B.V. | | $ | 108,051 | | | Market Comparables | | LTM EBITDA€93m; Net leverage€453m; Average Comparable Valuation: 7.35X |
| | | |
Pinnacle Agriculture Holdings A 2 | | $ | 31,158 | | | Broker Quote | | $10.00: Price source depth of 1 |
| | | |
Appvion Holdings Corp Warrants | | $ | 5,196 | | | Restructure | | Priced at corporate action restructure price |
| | | |
Appvion Holdings Corp Warrants | | $ | – | | | Zero Value | | Valued at zero without primary asset attached |
| | | |
Asset-Backed Securities | | | | | | | | |
| | | |
Blue Mountain CLO LTD | | $ | – | | | Zero Value | | Valued at zero pending final coupon |
| | | |
Bank Loans | | | | | | | | |
| | | |
Innvation Grpup PLC | | $ | 41,484 | | | Broker Quote | | $124.91: Price source depth of 1 |
| | | |
Boomerang Tube LLC | | $ | 124,368 | | | Discounted Cash Flow | | Average Enterprise Valuation Multiple: 5 year projection, 5.5x; EBITDA: $42.5 million; 15% discount rate |
| | | |
Corporate Bonds | | | | | | | | |
| | | |
Appvion ESC | | $ | – | | | Zero Value | | Valued at zero without primary asset attached |
Although the Fund believes the valuation methods described above are appropriate, the use of different methodologies or assumptions to determine fair value could result in different estimates of fair value at the reporting date.
183
Barings Funds Trust 2018 Semi-Annual Report
NOTES TO FINANCIAL STATEMENTS(CONTINUED)
December 31, 2018 (Unaudited)
The following is a reconciliation of investments with unobservable inputs (Level 3) that were used in determining fair value:
| | | | | | | | | | | | | | | | | | | | | | | | | | | | | | | | | | | | |
INVESTMENTS IN SECURITIES | | BALANCE
AS OF JULY 1,
2018 | | | REALIZED
GAIN (LOSS) | | | CHANGE IN
UNREALIZED
APPRECIATION
(DEPRECIATION) | | | NET
TRANSFERS
IN (OUT)
OF LEVEL 3 | | | ACCRUED PREMIUMS/
DISCOUNTS | | | PURCHASES | | | SALES | | | BALANCE AS OF
DECEMBER 31,
2018 | | | CHANGE IN
UNREALIZED
APPRECIATION
(DEPRECIATION)
FROM
INVESTMENTS
HELD AT
DECEMBER 31,
2018 | |
| | | | | | | | | |
Equities | | | | | | | | | | | | | | | | | | | | | | | | | | | | | | | | | | | | |
Common Stock | | $ | 550,622 | | | $ | – | | | $ | (10,202 | ) | | $ | – | | | $ | – | | | $ | 171,860 | | | $ | – | | | $ | 712,280 | | | $ | (10,202 | ) |
Preferred Stock | | $ | 286,651 | | | $ | – | | | $ | (255,493 | ) | | $ | – | | | $ | – | | | $ | – | | | $ | – | | | $ | 31,158 | | | $ | (255,493 | ) |
Warrants | | $ | – | | | $ | – | | | $ | 5,196 | | | $ | – | | | $ | – | | | $ | – | | | $ | – | | | $ | 5,196 | | | $ | 5,196 | |
| | | | | | | | | | | | | | | | | | | | | | | | | | | | | | | | | | | | |
| | | | | | | | | |
Fixed Income | | | | | | | | | | | | | | | | | | | | | | | | | | | | | | | | | | | | |
Asset-Backed Securities | | $ | 10,228,154 | | | $ | (258,232 | ) | | $ | (119,363 | ) | | $ | (6,978,771 | ) | | $ | 1,273 | | | $ | – | | | $ | (2,873,061 | ) | | $ | – | | | $ | (119,363 | ) |
Bank Loans | | $ | 277,089 | | | $ | (118,458 | ) | | $ | 98,387 | | | $ | – | | | $ | 528 | | | $ | 199,109 | | | $ | (290,803 | ) | | $ | 165,852 | | | $ | 98,387 | |
Corporate Bonds | | $ | – | | | $ | – | | | $ | (504,257 | ) | | $ | – | | | $ | (1,014 | ) | | $ | 505,271 | | | $ | – | | | $ | – | | | $ | (504,257 | ) |
| | | | | | | | | | | | | | | | | | | | | | | | | | | | | | | | | | | | |
Total | | $ | 11,342,516 | | | $ | (376,690 | ) | | $ | (785,732 | ) | | $ | (6,978,771 | ) | | $ | 787 | | | $ | 876,240 | | | $ | (3,163,864 | ) | | $ | 914,486 | | | $ | (785,732 | ) |
| | | | | | | | | | | | | | | | | | | | | | | | | | | | | | | | | | | | |
Active Short Duration Bond Fund
| | | | | | | | | | | | | | | | |
| DESCRIPTION | | LEVEL 1 | | | LEVEL 2 | | | LEVEL 3 | | | TOTAL INVESTMENTS | |
| | | | |
Assets:* | | | | | | | | | | | | | | | | |
| Fixed Income: | | | | | | | | | | | | | | | | |
Asset-Backed Securities | | $ | – | | | $ | 187,888,172 | | | $ | 3,338,291 | | | $ | 191,226,463 | |
Corporate Bonds | | | – | | | | 193,730,635 | | | | – | | | | 193,730,635 | |
Mortgage-Backed Securities | | | – | | | | 30,045,861 | | | | – | | | | 30,045,861 | |
U.S. Treasury & Government Agencies | | | – | | | | 28,830,459 | | | | – | | | | 28,830,459 | |
| | | | | | | | | | | | | | | | |
| Total Fixed Income | | | – | | | | 440,495,127 | | | | 3,338,291 | | | | 443,833,418 | |
| | | | | | | | | | | | | | | | |
| | | | |
Purchased Options: | | | | | | | | | | | | | | | | |
Call Options Purchased | | | – | | | | 1,171,819 | | | | – | | | | 1,171,819 | |
Put Options Purchased | | | – | | | | 2,791,720 | | | | – | | | | 2,791,720 | |
| | | | | | | | | | | | | | | | |
| Total Purchased Options | | | – | | | | 3,963,539 | | | | – | | | | 3,963,539 | |
| | | | | | | | | | | | | | | | |
| | | | |
Short-Term Investments: | | | | | | | | | | | | | | | | |
Commercial Paper | | | – | | | | 29,152,522 | | | | – | | | | 29,152,522 | |
| | | | | | | | | | | | | | | | |
| Total Short-Term Investments | | | – | | | | 29,152,522 | | | | – | | | | 29,152,522 | |
| | | | | | | | | | | | | | | | |
| | | | |
Derivative Securities: | | | | | | | | | | | | | | | | |
Futures** | | | – | | | | 605,664 | | | | – | | | | 605,664 | |
| | | | | | | | | | | | | | | | |
| Total | | $ | – | | | $ | 474,216,852 | | | $ | 3,338,291 | | | $ | 477,555,143 | |
| | | | | | | | | | | | | | | | |
184
Barings Funds Trust 2018 Semi-Annual Report
NOTES TO FINANCIAL STATEMENTS(CONTINUED)
December 31, 2018 (Unaudited)
| | | | | | | | | | | | | | | | |
| DESCRIPTION | | LEVEL 1 | | | LEVEL 2 | | | LEVEL 3 | | | TOTAL INVESTMENTS | |
| | | | |
Liabilities:* | | | | | | | | | | | | | | | | |
| Derivative Securities: | | | | | | | | | | | | | | | | |
Futures** | | $ | – | | | $ | (2,075,739 | ) | | $ | – | | | $ | (2,075,739 | ) |
OTC — Credit Default Swaps | | | – | | | | (83,856 | ) | | | – | | | | (83,856 | ) |
| | | | | | | | | | | | | | | | |
| Total Derivative Securities | | | – | | | | (2,159,595 | ) | | | – | | | | (2,159,595 | ) |
| | | | | | | | | | | | | | | | |
| | | | |
Total Investments | | $ | – | | | $ | 472,057,257 | | | $ | 3,338,291 | | | $ | 475,395,548 | |
| | | | | | | | | | | | | | | | |
| | * | There were no transfers between levels 1 and 2 during the period ended December 31, 2018. |
| | ** | Centrally Cleared Swaps and Futures are valued at unrealized appreciation/depreciation. Only current day’s variation margin, if any, is reported on the Statement of Assets and Liabilities. |
The following table is a summary of quantitative information about significant unobservable valuation inputs for Level 3 fair value measurement for investments held as of December 31, 2018:
| | | | | | | | |
| TYPE OF ASSETS | | FAIR VALUE AS OF
DECEMBER 31, 2018 | | | VALUATION
TECHNIQUE(S) | | UNOBSERVABLE INPUT |
| | | |
Asset-Backed Securities | | | | | | | | |
| | | |
DRB Prime Student Loan Trust2016-R A1 | | $ | 696,801 | | | Broker Quote | | $100.70: Price source depth of 1 |
| | | |
SoFi Professional Loan Program2018-A | | $ | 985,729 | | | Broker Quote | | $71.82: Price source depth of 1 |
| | | |
SoFi Professional Loan Program2018-B Trust | | $ | 694,371 | | | Discounted Cash Flow | | Prepay CPR 15%; Default CDR 0.3 ramp 24 0.5; Severity 80%;6-month recovery lag |
| | | |
SoFi Professional Loan Program2018-D Trust | | $ | 650,140 | | | Broker Quote | | $34.45: Price source depth of 11 |
| | | |
SoFi Consumer Loan Program LLC2015-A RC | | $ | 311,250 | | | Broker Quote | | $103,750: Price source depth of 1 |
Although the Fund believes the valuation methods described above are appropriate, the use of different methodologies or assumptions to determine fair value could result in different estimates of fair value at the reporting date.
The following is a reconciliation of investments with unobservable inputs (Level 3) that were used in determining fair value:
| | | | | | | | | | | | | | | | | | | | | | | | | | | | | | | | | | | | |
INVESTMENTS IN SECURITIES | | BALANCE
AS OF JULY 1,
2018 | | | REALIZED
GAIN (LOSS) | | | CHANGE IN
UNREALIZED
APPRECIATION
(DEPRECIATION) | | | NET
TRANSFERS
IN (OUT)
OF LEVEL 3 | | | ACCRUED PREMIUMS/
DISCOUNTS | | | PURCHASES | | | SALES | | | BALANCE AS OF
DECEMBER 31,
2018 | | | CHANGE IN
UNREALIZED
APPRECIATION
(DEPRECIATION)
FROM
INVESTMENTS
HELD AT
DECEMBER 31,
2018 | |
| | | | | | | | | |
Asset — Backed Securities | | $ | 4,347,527 | | | $ | – | | | $ | (187,422 | ) | | $ | (1,286,920 | ) | | $ | 20,724 | | | $ | 650,140 | | | $ | (205,758 | ) | | $ | 3,338,291 | | | $ | (187,422 | ) |
| | | | | | | | | | | | | | | | | | | | | | | | | | | | | | | | | | | | |
| | | | | | | | | |
Mortgage — Backed Securities | | $ | 564,478 | | | $ | – | | | $ | – | | | $ | (564,478 | ) | | $ | – | | | $ | – | | | $ | – | | | $ | – | | | $ | – | |
| | | | | | | | | | | | | | | | | | | | | | | | | | | | | | | | | | | | |
Total | | $ | 4,912,005 | | | $ | – | | | $ | (187,422 | ) | | $ | (1,851,398 | ) | | $ | 20,724 | | | $ | 650,140 | | | $ | (205,758 | ) | | $ | 3,338,291 | | | $ | (187,422 | ) |
| | | | | | | | | | | | | | | | | | | | | | | | | | | | | | | | | | | | |
185
Barings Funds Trust 2018 Semi-Annual Report
NOTES TO FINANCIAL STATEMENTS(CONTINUED)
December 31, 2018 (Unaudited)
Total Return Bond Fund
| | | | | | | | | | | | | | | | |
| DESCRIPTION | | LEVEL 1 | | | LEVEL 2 | | | LEVEL 3 | | | TOTAL INVESTMENTS | |
| | | | |
Assets:* | | | | | | | | | | | | | | | | |
| Fixed Income: | | | | | | | | | | | | | | | | |
Asset-Backed Securities | | $ | – | | | $ | 7,275,792 | | | $ | 94,994 | | | $ | 7,370,786 | |
Corporate Bonds | | | – | | | | 8,878,035 | | | | – | | | | 8,878,035 | |
Foreign Government | | | – | | | | 230,660 | | | | – | | | | 230,660 | |
Mortgage-Backed Securities | | | – | | | | 726,675 | | | | – | | | | 726,675 | |
U.S. Treasury & Government Agencies | | | – | | | | 6,555,028 | | | | – | | | | 6,555,028 | |
| | | | | | | | | | | | | | | | |
| Total Fixed Income | | | – | | | | 23,666,190 | | | | 94,994 | | | | 23,761,184 | |
| | | | | | | | | | | | | | | | |
| | | | |
Mutual Fund: | | | | | | | | | | | | | | | | |
Mutual Fund | | | 2,557,954 | | | | – | | | | – | | | | 2,557,954 | |
| Purchased Options: | | | | | | | | | | | | | | | | |
Call Options Purchased | | | – | | | | 119,408 | | | | – | | | | 119,408 | |
Put Options Purchased | | | – | | | | 286,994 | | | | – | | | | 286,994 | |
| | | | | | | | | | | | | | | | |
| Total Purchased Options | | | – | | | | 406,402 | | | | – | | | | 406,402 | |
| | | | | | | | | | | | | | | | |
| | | | |
Short-Term Investments: | | | | | | | | | | | | | | | | |
Commercial Paper | | | – | | | | 3,994,193 | | | | – | | | | 3,994,193 | |
| | | | | | | | | | | | | | | | |
| Total Short-Term Investments | | | – | | | | 3,994,193 | | | | – | | | | 3,994,193 | |
| | | | | | | | | | | | | | | | |
| | | | |
Derivative Securities: | | | | | | | | | | | | | | | | |
Forward Foreign Currency Exchange Contracts | | | – | | | | 18,077 | | | | – | | | | 18,077 | |
Futures** | | | – | | | | 128,322 | | | | – | | | | 128,322 | |
| | | | | | | | | | | | | | | | |
| Total Derivative Securities | | | – | | | | 146,399 | | | | – | | | | 146,399 | |
| | | | | | | | | | | | | | | | |
| Total | | $ | 2,557,954 | | | $ | 28,213,184 | | | $ | 94,994 | | | $ | 30,866,132 | |
| | | | | | | | | | | | | | | | |
| | | | |
Liabilities:* | | | | | | | | | | | | | | | | |
| Derivative Securities: | | | | | | | | | | | | | | | | |
Forward Foreign Currency Exchange Contracts | | | – | | | | (27,210 | ) | | | – | | | | (27,210 | ) |
Futures** | | | – | | | | (19,862 | ) | | | – | | | | (19,862 | ) |
OTC — Credit Default Swaps | | | – | | | | (20,964 | ) | | | – | | | | (20,964 | ) |
| | | | | | | | | | | | | | | | |
| Total Derivative Securities | | | – | | | | (68,036 | ) | | | – | | | | (68,036 | ) |
| | | | | | | | | | | | | | | | |
| | | | |
Total Investments | | $ | 2,557,954 | | | $ | 28,145,148 | | | $ | 94,994 | | | $ | 30,798,096 | |
| | | | | | | | | | | | | | | | |
| | * | There were no transfers between levels 1 and 2 during the period ended December 31, 2018. |
| | ** | Centrally Cleared Swaps and Futures are valued at unrealized appreciation/depreciation. Only current day’s variation margin, if any, is reported on the Statement of Assets and Liabilities. |
186
Barings Funds Trust 2018 Semi-Annual Report
NOTES TO FINANCIAL STATEMENTS(CONTINUED)
December 31, 2018 (Unaudited)
The following table is a summary of quantitative information about significant unobservable valuation inputs for Level 3 fair value measurement for investments held as of December 31, 2018:
| | | | | | | | |
| TYPE OF ASSETS | | FAIR VALUE AS OF
DECEMBER 31, 2018 | | | VALUATION
TECHNIQUE(S) | | UNOBSERVABLE INPUT |
| | | |
Asset-Backed Securities | | | | | | | | |
| | | |
DRB Prime Student Loan Trust2016-R A1 | | $ | 48,055 | | | Broker Quote | | $100.70: Price source depth of 1 |
| | | |
DRB Prime Student Loan Trust2016-R A2 | | $ | 46,939 | | | Broker Quote | | $98.36: Price source depth of 1 |
Although the Fund believes the valuation methods described above are appropriate, the use of different methodologies or assumptions to determine fair value could result in different estimates of fair value at the reporting date.
The following is a reconciliation of investments with unobservable inputs (Level 3) that were used in determining fair value:
| | | | | | | | | | | | | | | | | | | | | | | | | | | | | | | | | | | | |
INVESTMENTS IN SECURITIES | | BALANCE
AS OF JULY 1,
2018 | | | REALIZED
GAIN (LOSS) | | | CHANGE IN
UNREALIZED
APPRECIATION
(DEPRECIATION) | | | NET
TRANSFERS
IN (OUT)
OF LEVEL 3 | | | ACCRUED PREMIUMS/
DISCOUNTS | | | PURCHASES | | | SALES | | | BALANCE AS OF
DECEMBER 31,
2018 | | | CHANGE IN
UNREALIZED
APPRECIATION
(DEPRECIATION)
FROM
INVESTMENTS
HELD AT
DECEMBER 31,
2018 | |
| | | | | | | | | |
Asset Backed Securities | | $ | 163,761 | | | $ | 2 | | | $ | (1,689 | ) | | $ | (38,700 | ) | | $ | – | | | $ | – | | | $ | (28,380 | ) | | $ | 94,994 | | | $ | (1,689 | ) |
| | | | | | | | | | | | | | | | | | | | | | | | | | | | | | | | | | | | |
Total | | $ | 163,761 | | | $ | 2 | | | $ | (1,689 | ) | | $ | (38,700 | ) | | $ | – | | | $ | – | | | $ | (28,380 | ) | | $ | 94,994 | | | $ | (1,689 | ) |
| | | | | | | | | | | | | | | | | | | | | | | | | | | | | | | | | | | | |
Emerging Markets Debt Blended Total Return Fund
| | | | | | | | | | | | | | | | |
| DESCRIPTION | | LEVEL 1 | | | LEVEL 2 | | | LEVEL 3 | | | TOTAL INVESTMENTS | |
| | | | |
Assets:* | | | | | | | | | | | | | | | | |
| Fixed Income: | | | | | | | | | | | | | | | | |
Corporate Bonds | | $ | – | | | $ | 20,194,569 | | | $ | – | | | $ | 20,194,569 | |
Foreign Government | | | – | | | | 24,274,458 | | | | – | | | | 24,274,458 | |
| | | | | | | | | | | | | | | | |
| Total Fixed Income | | | – | | | | 44,469,027 | | | | – | | | | 44,469,027 | |
| | | | | | | | | | | | | | | | |
| | | | |
Derivative Securities: | | | | | | | | | | | | | | | | |
Forward Foreign Currency Exchange Contracts | | | – | | | | 1,123,271 | | | | – | | | | 1,123,271 | |
OTC — Credit Default Swaps | | | – | | | | 8,792 | | | | – | | | | 8,792 | |
OTC — Cross Currency Swaps | | | – | | | | 93,002 | | | | – | | | | 93,002 | |
OTC — Interest Rate Swaps | | | – | | | | 219,578 | | | | – | | | | 219,578 | |
| | | | | | | | | | | | | | | | |
| Total Derivative Securities | | | – | | | | 1,444,643 | | | | – | | | | 1,444,643 | |
| | | | | | | | | | | | | | | | |
| Total | | $ | – | | | $ | 45,913,670 | | | $ | – | | | $ | 45,913,670 | |
| | | | | | | | | | | | | | | | |
187
Barings Funds Trust 2018 Semi-Annual Report
NOTES TO FINANCIAL STATEMENTS(CONTINUED)
December 31, 2018 (Unaudited)
| | | | | | | | | | | | | | | | |
| DESCRIPTION | | LEVEL 1 | | | LEVEL 2 | | | LEVEL 3 | | | TOTAL INVESTMENTS | |
| | | | |
Liabilities:* | | | | | | | | | | | | | | | | |
| Derivative Securities: | | | | | |
Centrally Cleared Interest Rate Swaps | | $ | – | | | $ | (55,141 | ) | | $ | – | | | $ | (55,141 | ) |
Forward Foreign Currency Exchange Contracts | | | – | | | | (1,469,838 | ) | | | – | | | | (1,469,838 | ) |
Futures** | | | – | | | | (65,019 | ) | | | – | | | | (65,019 | ) |
OTC — Credit Default Swaps | | | – | | | | (133,415 | ) | | | – | | | | (133,415 | ) |
OTC — Cross Currency Swaps | | | – | | | | (1,338 | ) | | | – | | | | (1,338 | ) |
| | | | | | | | | | | | | | | | |
| Total Derivative Securities | | | – | | | | (1,724,751 | ) | | | – | | | | (1,724,751 | ) |
| | | | | | | | | | | | | | | | |
| | | | |
Total Investments | | $ | – | | | $ | 44,188,919 | | | $ | – | | | $ | 44,188,919 | |
| | | | | | | | | | | | | | | | |
| | * | There were no transfers between levels during the period ended December 31, 2018. |
| | ** | Centrally Cleared Swaps and Futures are valued at unrealized appreciation/depreciation. Only current day’s variation margin, if any, is reported on the Statement of Assets and Liabilities. |
Global Emerging Markets Equity Fund
| | | | | | | | | | | | | | | | |
| DESCRIPTION | | LEVEL 1 | | | LEVEL 2 | | | LEVEL 3 | | | TOTAL INVESTMENTS | |
| | | | |
Assets:* | | | | | | | | | | | | | | | | |
| Equities: | | | | | | | | | | | | | | | | |
Common Stocks | | $ | 6,537,849 | | | $ | 2,244,900 | | | $ | – | | | $ | 8,782,749 | |
| | | | | | | | | | | | | | | | |
| Total Equities | | | 6,537,849 | | | | 2,244,900 | | | | – | | | | 8,782,749 | |
| | | | | | | | | | | | | | | | |
| | | | |
Mutual Fund: | | | | | | | | | | | | | | | | |
Mutual Fund | | | – | | | | 443,622 | | | | – | | | | 443,622 | |
| | | | | | | | | | | | | | | | |
| Total | | $ | 6,537,849 | | | $ | 2,688,522 | | | $ | – | | | $ | 9,226,371 | |
| | | | | | | | | | | | | | | | |
| | | | |
Total Investments | | $ | 6,537,849 | | | $ | 2,688,522 | | | $ | – | | | $ | 9,226,371 | |
| | | | | | | | | | | | | | | | |
| | * | There were no transfers between levels during the period ended December 31, 2018. |
Global High Yield Fund
| | | | | | | | | | | | | | | | |
| DESCRIPTION | | LEVEL 1 | | | LEVEL 2 | | | LEVEL 3 | | | TOTAL INVESTMENTS | |
| | | | |
Assets:* | | | | | | | | | | | | | | | | |
| Equities: | | | | | | | | | | | | | | | | |
Common Stock | | $ | – | | | $ | 114,213 | | | $ | – | | | $ | 114,213 | |
Warrants | | | – | | | | – | | | | 3,397 | | | | 3,397 | |
| | | | | | | | | | | | | | | | |
| Total Equities | | | – | | | | 114,213 | | | | 3,397 | | | | 117,610 | |
| | | | | | | | | | | | | | | | |
| | | | |
Fixed Income: | | | | | | | | | | | | | | | | |
Bank Loans | | | – | | | | 1,278,102 | | | | – | | | | 1,278,102 | |
Corporate Bonds | | | – | | | | 21,098,046 | | | | 0 | | | | 21,098,046 | |
| | | | | | | | | | | | | | | | |
| Total Fixed Income | | | – | | | | 22,376,148 | | | | 0 | | | | 22,376,148 | |
| | | | | | | | | | | | | | | | |
| | | | |
Derivative Securities: | | | | | | | | | | | | | | | | |
Forward Foreign Currency Exchange Contracts | | | – | | | | 5,014 | | | | – | | | | 5,014 | |
| | | | | | | | | | | | | | | | |
| Total | | $ | – | | | $ | 22,495,375 | | | $ | 3,397 | | | $ | 22,498,772 | |
| | | | | | | | | | | | | | | | |
188
Barings Funds Trust 2018 Semi-Annual Report
NOTES TO FINANCIAL STATEMENTS(CONTINUED)
December 31, 2018 (Unaudited)
| | | | | | | | | | | | | | | | |
| DESCRIPTION | | LEVEL 1 | | | LEVEL 2 | | | LEVEL 3 | | | TOTAL INVESTMENTS | |
| | | | |
Liabilities:* | | | | | | | | | | | | | | | | |
| Derivative Securities: | | | | | | | | | | | | | | | | |
Forward Foreign Currency Exchange Contracts | | $ | – | | | $ | (22,602 | ) | | $ | – | | | $ | (22,602 | ) |
| | | | | | | | | | | | | | | | |
| Total Investments | | $ | – | | | $ | 22,472,773 | | | $ | 3,397 | | | $ | 22,476,170 | |
| | | | | | | | | | | | | | | | |
| | * | There were no transfers between levels during the period ended December 31, 2018. |
The following table is a summary of quantitative information about significant unobservable valuation inputs for Level 3 fair value measurement for investments held as of December 31, 2018:
| | | | | | | | |
| TYPE OF ASSETS | | FAIR VALUE AS OF
DECEMBER 31, 2018 | | | VALUATION TECHNIQUE(S) | | UNOBSERVABLE INPUT |
| | | |
Equities | | | | | | | | |
| | | |
Appvion Holdings Corp Warrants | | $ | 3,397 | | | Restructure | | Priced at corporate action restructure price |
| | | |
Appvion Holdings Corp Warrants | | $ | – | | | Zero Value | | Valued at zero without primary asset attached |
| | | |
Corporate Bonds | | | | | | | | |
| | | |
Appvion ESC | | $ | – | | | Zero Value | | Valued at zero without primary asset attached |
Although the Fund believes the valuation methods described above are appropriate, the use of different methodologies or assumptions to determine fair value could result in different estimates of fair value at the reporting date.
The following is a reconciliation of investments with unobservable inputs (Level 3) that were used in determining fair value:
| | | | | | | | | | | | | | | | | | | | | | | | | | | | | | | | | | | | |
INVESTMENTS IN SECURITIES | | BALANCE
AS OF JULY 1,
2018 | | | REALIZED
GAIN (LOSS) | | | CHANGE IN UNREALIZED
APPRECIATION
(DEPRECIATION) | | | NET
TRANSFERS
IN (OUT)
OF LEVEL 3 | | | ACCRUED PREMIUMS/
DISCOUNTS | | | PURCHASES | | | SALES | | | BALANCE AS OF
DECEMBER 31,
2018 | | | CHANGE IN UNREALIZED
APPRECIATION
(DEPRECIATION)
FROM
INVESTMENTS
HELD AT
DECEMBER 31,
2018 | |
| | | | | | | | | |
Equities | | | | | | | | | | | | | | | | | | | | | | | | | | | | | | | | | | | | |
Appvion Holdings Corp Warrants | | $ | – | | | $ | – | | | $ | 3,397 | | | $ | – | | | $ | – | | | $ | – | | | $ | – | | | $ | 3,397 | | | $ | 3,397 | |
Appvion Holdings Corp Warrants | | $ | – | | | $ | – | | | $ | – | | | $ | – | | | $ | – | | | $ | – | | | $ | – | | | $ | – | | | $ | – | |
| | | | | | | | | | | | | | | | | | | | | | | | | | | | | | | | | | | | |
| | | | | | | | | |
Fixed Income | | | | | | | | | | | | | | | | | | | | | | | | | | | | | | | | | | | | |
Corporate Bonds | | $ | – | | | $ | – | | | $ | (252,212 | ) | | $ | – | | | $ | 15,287 | | | $ | 236,925 | | | $ | – | | | $ | – | | | $ | (252,212 | ) |
| | | | | | | | | | | | | | | | | | | | | | | | | | | | | | | | | | | | |
Total | | $ | – | | | $ | – | | | $ | (248,815 | ) | | $ | – | | | $ | 15,287 | | | $ | 236,925 | | | $ | – | | | $ | 3,397 | | | $ | (248,815 | ) |
| | | | | | | | | | | | | | | | | | | | | | | | | | | | | | | | | | | | |
189
Barings Funds Trust 2018 Semi-Annual Report
NOTES TO FINANCIAL STATEMENTS(CONTINUED)
December 31, 2018 (Unaudited)
U.S. High Yield Fund
| | | | | | | | | | | | | | | | |
| DESCRIPTION | | LEVEL 1 | | | LEVEL 2 | | | LEVEL 3 | | | TOTAL INVESTMENTS | |
| | | | |
Assets:* | | | | | | | | | | | | | | | | |
| Equities: | | | | | | | | | | | | | | | | |
Common Stocks | | $ | – | | | $ | 318,895 | | | $ | – | | | $ | 318,895 | |
Warrants | | | – | | | | – | | | | 3,802 | | | | 3,802 | |
| | | | | | | | | | | | | | | | |
| Total Equities | | | – | | | | 318,895 | | | | 3,802 | | | | 322,697 | |
| | | | | | | | | | | | | | | | |
| | | | |
Fixed Income: | | | | | | | | | | | | | | | | |
Bank Loans | | | – | | | | 2,561,299 | | | | – | | | | 2,561,299 | |
Corporate Bonds | | | – | | | | 46,664,899 | | | | 0 | | | | 46,664,899 | |
| | | | | | | | | | | | | | | | |
| Total Fixed Income | | | – | | | | 49,226,198 | | | | 0 | | | | 49,226,198 | |
| | | | | | | | | | | | | | | | |
| Total | | $ | – | | | $ | 49,545,093 | | | $ | 3,802 | | | $ | 49,548,895 | |
| | | | | | | | | | | | | | | | |
| | | | |
Total Investments | | $ | – | | | $ | 49,545,093 | | | $ | 3,802 | | | $ | 49,548,895 | |
| | | | | | | | | | | | | | | | |
| | * | There were no transfers between levels during the period ended December 31, 2018. |
The following table is a summary of quantitative information about significant unobservable valuation inputs for Level 3 fair value measurement for investments held as of December 31, 2018:
| | | | | | | | |
| TYPE OF ASSETS | | FAIR VALUE AS OF
DECEMBER 31, 2018 | | | VALUATION TECHNIQUE(S) | | UNOBSERVABLE INPUT |
| | | |
Equities | | | | | | | | |
| | | |
Appvion Holdings Corp Warrants | | $ | – | | | Zero Value | | Valued at zero without primary asset attached |
| | | |
Appvion Holdings Corp Warrants | | $ | 3,802 | | | Restructure | | Priced at corporate action restructure price |
| | | |
Corporate Bonds | | | | | | | | |
| | | |
Appvion ESC | | $ | – | | | Zero Value | | Valued at zero without primary asset attached |
Although the Fund believes the valuation methods described above are appropriate, the use of different methodologies or assumptions to determine fair value could result in different estimates of fair value at the reporting date.
190
Barings Funds Trust 2018 Semi-Annual Report
NOTES TO FINANCIAL STATEMENTS(CONTINUED)
December 31, 2018 (Unaudited)
The following is a reconciliation of investments with unobservable inputs (Level 3) that were used in determining fair value:
| | | | | | | | | | | | | | | | | | | | | | | | | | | | | | | | | | | | |
INVESTMENTS IN SECURITIES | | BALANCE
AS OF JULY 1,
2018 | | | REALIZED
GAIN (LOSS) | | | CHANGE IN UNREALIZED
APPRECIATION
(DEPRECIATION) | | | NET
TRANSFERS
IN (OUT)
OF LEVEL 3 | | | ACCRUED PREMIUMS/
DISCOUNTS | | | PURCHASES | | | SALES | | | BALANCE AS OF
DECEMBER 31,
2018 | | | CHANGE IN UNREALIZED
APPRECIATION
(DEPRECIATION)
FROM
INVESTMENTS
HELD AT
DECEMBER 31,
2018 | |
| | | | | | | | | |
Equities | | | | | | | | | | | | | | | | | | | | | | | | | | | | | | | | | | | | |
Appvion Holdings Corp Warrants | | $ | – | | | $ | – | | | $ | 3,802 | | | $ | – | | | $ | – | | | $ | – | | | $ | – | | | $ | 3,802 | | | $ | 3,802 | |
Appvion Holdings Corp Warrants | | $ | – | | | $ | – | | | $ | – | | | $ | – | | | $ | – | | | $ | – | | | $ | – | | | $ | – | | | $ | – | |
| | | | | | | | | |
Fixed Income | | | | | | | | | | | | | | | | | | | | | | | | | | | | | | | | | | | | |
Corporate Bonds | | $ | – | | | $ | – | | | $ | (282,332 | ) | | $ | – | | | $ | 17,103 | | | $ | 265,229 | | | $ | – | | | $ | – | | | $ | (282,332 | ) |
| | | | | | | | | | | | | | | | | | | | | | | | | | | | | | | | | | | | |
Total | | $ | – | | | $ | – | | | $ | (278,530 | ) | | $ | – | | | $ | 17,103 | | | $ | 265,229 | | | $ | – | | | $ | 3,802 | | | $ | (278,530 | ) |
| | | | | | | | | | | | | | | | | | | | | | | | | | | | | | | | | | | | |
| | B. | When-Issued, Delayed-Delivery, Forward Commitment, andTo-Be-Announced Transactions |
The Funds may enter into when-issued, delayed-delivery, forward commitment, or TBA transactions (collectively, the “Forward Transactions”) in order to lock in the purchase price of the underlying security, or in order to adjust the interest rate exposure of the Fund’s existing portfolio. In Forward Transactions, a Fund commits to purchase or sell particular securities, with payment and delivery to take place at a future date. In the case of TBA purchase commitments, the unit price and the estimated principal amount are established when the Fund enters into a commitment, with the actual principal amount being within a specified range of the estimate. Although a Fund does not typically pay for the securities in these types of transactions until they are delivered, it immediately assumes the risks of ownership, including the risk of price fluctuation. As a result, each of these types of transactions may create investment leverage in a Fund’s portfolio and increase the volatility of the Fund. If a Fund’s counterparty fails to deliver a security purchased in a Forward Transaction, there may be a loss, and the Fund may have missed an opportunity to make an alternative investment.
These securities are valued on the basis of valuations furnished by a pricing service, selected pursuant to procedures approved by the Trustees, which determines valuations taking into account appropriate factors such asinstitutional-size trading in similar groups of securities,
yield, quality, coupon rate, maturity, type of issue, trading characteristics, and other market data. Securities for which no market quotation is available are valued at fair value in accordance with procedures approved by the Trustees. The Funds record on a daily basis the unrealized appreciation (depreciation) based upon changes in the values of these securities. When a Forward Transaction is closed, the Funds record a realized gain or loss equal to the difference between the value of the transaction at the time it was opened and the value of the transaction at the time it was closed.
| | C. | Cash and Short-Term Investments |
Cash and cash equivalents consist principally of short-term investments that are readily convertible into cash and have original maturities of three months or less. At December 31, 2018, all cash and cash equivalents are held by the custodian.
| | D. | Investment Transactions, Related Investment Income and Expenses |
Investment transactions are accounted for on a trade date basis. Interest income is recorded on the accrual basis, including the amortization of premiums and accretion of discounts on bonds held using theyield-to-maturity method. Interest income from securitized investments in which the Fund(s) has/have a beneficial interest, such as the “equity” security class of a CLO vehicle (typically in the form of income or subordinated notes), are recorded upon receipt. The
191
Barings Funds Trust 2018 Semi-Annual Report
NOTES TO FINANCIAL STATEMENTS(CONTINUED)
December 31, 2018 (Unaudited)
accrual of interest income related to these types of securities is periodically reviewed and adjustments are made as necessary. These cash inflows are regularly reviewed to ensure these payments are not materially different from what would be required by GAAP reporting. Adjustments would be made if needed to address any changes.
Realized gains and losses on investment transactions and unrealized appreciation and depreciation of investments are reported for financial statement and Federal income tax purposes on the identified cost method.
Expenses are recorded on the accrual basis as incurred.
E. Redemption Fees
The Funds do not have redemption fees.
F. Use of Estimates
The preparation of financial statements in conformity with U.S. GAAP requires management to make estimates and assumptions that affect the reported amounts of assets and liabilities at the date of the financial statements and the reported amounts of revenues and expenses during the reporting period. Actual results could differ from these estimates.
G. Federal Income Taxation
The Funds have elected to be taxed as a Regulated Investment Company (“RIC”) undersub-chapter M of the U.S. Internal Revenue Code of 1986, as amended, and intend to maintain this qualification and to distribute substantially all of their net taxable income to their shareholders. As of December 31, 2018, the Funds had no uncertain tax positions that would require financial statement recognition,de-recognition, or disclosure. The Funds file a U.S. federal income tax return annually after their fiscalyear-end, which is subject to examination by the Internal Revenue Service for a period of three years from the date of the filings.
H. Dividends and Distributions
Each Fund declares a dividend daily based on the Adviser’s projections of the Funds’ estimated net investment income and distributes such dividend monthly. To the extent that these distributions exceed net investment income, they may be classified as return of capital. The Funds also pay a distribution at least annually from their net realized capital gains, if any. Dividends and distributions are recorded on theex-dividend date. All common shares have equal dividend and other distribution rights. A notice disclosing
the source(s) of a distribution will be provided if payment is made from any source other than net investment income. Any such notice would be provided only for informational purposes in order to comply with the requirements of Section 19(a) of the 1940 Act and not for tax reporting purposes. The tax composition of the Funds’ distributions for each calendar year is reported on Internal Revenue Service Form1099-DIV.
Dividends from net investment income and distributions from realized gains from investment transactions have been determined in accordance with Federal income tax regulations and may differ from net investment income and realized gains recorded by the Funds for financial reporting purposes. These differences, which could be temporary or permanent in nature may result in reclassification of distributions; however, net investment income, net realized gains and losses, and net assets are not affected.
I. Bank Loans
The Funds may invest in bank loans, which usually take the form of loan participations and assignments. Loan participations and assignments are agreements to make money available to U.S. or foreign corporations, partnerships or other business entities (the “Borrower”) in a specified amount, at a specified rate and within a specified time. A loan is typically originated, negotiated and structured by a U.S. or foreign bank, insurance company or other financial institution (the “Agent”) for a group of loan investors (“Loan Investors”). The Agent typically administers and enforces the loan on behalf of the other Loan Investors in the syndicate and may hold any collateral on behalf of the Loan Investors. Such loan participations and assignments are typically senior, secured and collateralized in nature. The Funds record an investment when the Borrower withdraws money and records interest as earned. These loans pay interest at rates which are periodically reset by reference to a base lending rate plus a spread. These base lending rates are generally the prime rate offered by a designated U.S. bank or London InterBank Offered Rate (“LIBOR”).
The loans in which the Funds invest may be subject to some restrictions on resale. For example, the Funds may be contractually obligated to receive approval from the Agent and/or Borrower prior to the sale of these investments. The Funds generally have no right to enforce compliance with the terms of the loan agreement with the Borrower. As a result, the Funds assume the credit risk of the Borrower, the selling
192
Barings Funds Trust 2018 Semi-Annual Report
NOTES TO FINANCIAL STATEMENTS(CONTINUED)
December 31, 2018 (Unaudited)
participant and any other persons interpositioned between the Funds and the Borrower (“Intermediate Participants”). In the event that the Borrower, selling participant or Intermediate Participants become insolvent or enter into bankruptcy, the Funds may incur certain costs and delays in realizing payment or may suffer a loss of principal and/or interest.
Unfunded commitments represent the remaining obligation of the Funds to the Borrower. At any point in time, up to the maturity date of the issue, the Borrower may demand the unfunded portion. Until demanded by the Borrower, unfunded commitments are not recognized as an asset on the Statements of Assets and Liabilities. Unrealized appreciation/depreciation on unfunded commitments presented on the Statements of Assets and Liabilities represents mark to market of the unfunded portion of the Funds’ bank loans. As of December 31, 2018, the following Funds had unfunded loan commitments:
| | | | | | |
| FUND | | SECURITY | | PAR AMOUNT | |
Global Floating Rate Fund | | Aveanna Healthcare, 3/18/2024 | | $ | 292,605 | |
Global Credit Income Opportunities Fund | | Aveanna Healthcare, 3/18/2024 | | $ | 33,130 | |
J. Derivative Instruments
The following is a description of the derivative instruments that the Funds utilize as part of their investment strategy, including the primary underlying risk exposures related to the instrument.
The Funds are subject to foreign currency exchange rate risk in the normal course of pursuing their investment objectives. The Funds may use forward foreign currency exchange contracts to hedge against changes in the value of foreign currencies. The Funds may enter into forward foreign currency exchange contracts obligating the Funds to deliver or receive a currency at a specified future date. Forward contracts are valued daily and unrealized appreciation or depreciation is recorded daily as the difference between the contract exchange rate and the closing forward rate applied to the face amount of the contract. A realized gain or loss is recorded at the time the forward contract expires. Credit risk may arise as a result of the failure of the counterparty to comply with the terms of the contract. The Funds consider the creditworthiness of each counterparty to a contract in
evaluating potential credit risk quarterly. The Funds are also subject to credit risk with respect to the counterparties to derivative contracts that are not cleared through a central counterparty but instead are tradedover-the-counter between two counterparties. If a counterparty to anover-the-counter derivative becomes bankrupt or otherwise fails to perform its obligations under a derivative contract due to financial difficulties, the Funds may experience significant delays in obtaining any recovery under the derivative contract in a bankruptcy or other reorganization proceeding. The Funds may obtain only a limited recovery or may obtain no recovery in such circumstances. The counterparty risk for cleared derivatives is generally lower than for unclearedover-the-counter derivative transactions since generally a clearing organization becomes substituted for each counterparty to a cleared derivative contract and, in effect, guarantees the parties’ performance under the contract as each party to a trade looks only to the clearing house for performance of financial obligations. However, there can be no assurance that the clearing house, or its members, will satisfy its obligations to the Funds. In addition, in the event of a bankruptcy of a clearing house, the Funds could experience a loss of the funds deposited with such clearing house as margin and of any profits on its open positions. The counterparty risk to the Funds is limited to the net unrealized gain, if any, on the contract.
The use of forward foreign currency exchange contracts does not eliminate fluctuations in the underlying prices of the Funds’ investment securities; however, it does establish a rate of exchange that can be achieved in the future. The use of forward foreign currency exchange contracts involves the risk that anticipated currency movements will not be accurately predicted. A forward foreign currency exchange contract would limit the risk of loss due to a decline in the value of a particular currency; however, it would also limit any potential gain that might result should the value of the currency increase instead of decrease. These contracts may involve market risk in excess of the amount of receivable or payable reflected on the Statement of Assets and Liabilities.
The Funds may purchase and sell futures contracts to enhance returns, to attempt to hedge some of its investment risk, or as a substitute position in lieu of holding the underlying asset on which the instrument is based. At the time of entering into a futures transaction, an investor is required to deposit and maintain a specified
193
Barings Funds Trust 2018 Semi-Annual Report
NOTES TO FINANCIAL STATEMENTS(CONTINUED)
December 31, 2018 (Unaudited)
amount of cash or eligible securities called “initial margin.” Subsequent payments made or received by a Fund called “variation margin” are made on a daily basis as the market price of the futures contract fluctuates. Each Fund will record an unrealized gain (loss) based on the amount of variation margin. When a contract is closed, a realized gain (loss) is recorded equal to the difference between the opening and closing value of the contract.
The Funds may purchase call or put options. When a Fund purchases an option, the premium paid by the Fund is recorded as an asset and is subsequently adjusted to the current fair value of the option purchased. Purchasing call options tends to increase the Fund’s exposure to the underlying instrument. Purchasing put options tends to decrease the Fund’s exposure to the underlying instrument. Premiums paid for purchasing options that expire are treated as realized losses. Premiums paid for purchasing options that are exercised or closed are added to the amounts paid or offset against the proceeds on the underlying security to determine the realized gain or loss. The risks associated with purchasing put and call options are potential loss of the premium paid and, in the instances ofover-the-counter derivatives, the failure of the counterparty to honor its obligation under the contract.
The Funds may enter into swap options (“swaptions”). A swaption is an option to enter into apre-defined swap agreement by some specified date in the future. The writer of the swaption becomes the counterparty to the swap if the buyer exercises. The interest rate swaption agreement will specify whether the buyer of the swaption will be a fixed rate receiver or a fixed rate buyer. Depending on the terms of the particular option agreement, a Fund generally will incur a greater degree of risk when the Fund writes a swaption than the Fund will incur when it purchases a swaption. When a Fund purchases a swaption, the Fund’s risk of loss is limited to the amount of the premium it has paid should it decide to let the swaption expire unexercised.
When a Fund writes a covered call or a put option, an amount equal to the premium received by the Fund is included in the Fund’s Statement of Assets and Liabilities as an asset and as an equivalent liability. The amount of the liability is subsequentlymarked-to-market to reflect the current market value of the option written. The Fund receives a premium on the sale of a call option but gives up the opportunity to profit from any increase in stock value above the exercise price of the option, and when a Fund writes a put option, it is exposed to a decline in the price of the underlying security.
Whether an option which a Fund has written expires on its stipulated expiration date or a Fund enters into a closing purchase transaction, the Fund realizes a gain (or loss, if the cost of a closing purchase transaction exceeds the premium received when the option was sold) without regard to any unrealized gain or loss on the underlying security, and the liability related to such option is extinguished. If a call option which a Fund has written is exercised, the Fund realizes a capital gain or loss from the sale of the underlying security, and the cost basis of the lots sold are decreased by the premium originally received. When a put option which a Fund has written is exercised, the amount of the premium originally received will reduce the cost of the security which the Fund purchases upon exercise of the option. Realized gains (losses) on purchased options are included in net realized gain (loss) from investments.
The Funds’ use of written options involves, to varying degrees, elements of market risk in excess of the amount recognized in the Statements of Assets and Liabilities. The face or contract amounts of these instruments reflect the extent of the Funds’ exposure to market risk. The risks may be caused by an imperfect correlation between movements in the price of the instrument and the price of the underlying securities, currencies and interest rates.
The Funds may enter into credit default swap contracts. As a seller of a credit default swap contract (“seller of protection”), a Fund is required to pay the notional amount or other agreed-upon value of a referenced debt obligation to the counterparty (or central clearing party in the case of centrally cleared swaps) in the event of a default by or other credit event involving the referenced issuer, obligation or index. In return, a Fund receives from the counterparty (or central clearing party in the case of centrally cleared swaps) a periodic stream of payments over the term of the contract.
As a purchaser of a credit default swap contract (“buyer of protection”), a Fund would receive the notional amount or other agreed upon value of a referenced debt obligation from the counterparty (or central clearing party in the case of centrally cleared swaps) in the event of default by or other credit event involving the referenced issuer, obligation or index. In return, a Fund would make periodic payments to the counterparty (or central clearing party in the case of centrally cleared swaps) over the term of the contracts, provided no event of default has occurred.
194
Barings Funds Trust 2018 Semi-Annual Report
NOTES TO FINANCIAL STATEMENTS(CONTINUED)
December 31, 2018 (Unaudited)
These credit default swaps may have as a reference obligation corporate or sovereign issuers or credit indices. These credit indices are comprised of a basket of securities representing a particular sector of the market. During the period, Active Short Duration Bond Fund and Total Return Bond Fund entered into credit default swaps based on a CMBX index, which is comprised of commercial mortgage-backed securities and a CDX index, which is comprised of North American and Emerging Market companies.
Credit default swaps are fair valued based upon quotations from counterparties, brokers or market-makers and the change in value, if any, is recorded as an unrealized appreciation or depreciation. For a credit default swap sold by a Fund, payment of the agreed-upon amount made by a Fund in the event of default of the referenced debt obligation is recorded as the cost of the referenced debt obligation purchased/received. For a credit default swap purchased by a Fund, the agreed-upon amount received by a Fund in the event of default of the referenced debt obligation is recorded as proceeds from sale/delivery of the referenced debt obligation and the resulting gain or loss realized on the referenced debt obligation is recorded as such by a Fund.
Any upfront payments made or received upon entering a credit default swap contract would be amortized or accreted over the life of the swap and recorded as realized gains or losses. Collateral, in the form of cash or securities, may be required to be held in segregated accounts with the custodian bank or broker in accordance with the swap agreement. The value and credit rating of each credit default swap where a Fund is the seller of protection, are both measures of the current payment/performance risk of the swap. As the value of the swap changes as a positive or negative percentage of the total notional amount, the payment/performance risk may decrease or increase, respectively. The maximum potential amount of future payments (undiscounted) that a Fund as a seller of protection could be required to make under a credit default swap agreement would be an amount equal to the notional amount of the agreement. These potential amounts would be partially offset by any recovery values of the respective referenced obligations, upfront payments received upon entering into the agreement, or net amounts received from the settlement of buy protection credit default swap agreements entered into by a Fund for the same referenced entity or entities. For centrally cleared swaps, the daily change in valuation is recorded as a receivable or payable for variation margin and settled in cash with the central clearing party daily.
Entering into swap agreements involves counterparty and market risk. Such risks involve the possibility that there will be no liquid market for these agreements, that the counterparty to the agreements may default on its obligation to perform or disagree as to the meaning of the contractual terms in the agreements, that there may be unfavorable changes in interest rates, and, in the case of credit default swaps, that the Adviser does not correctly predict the creditworthiness of the issuers of the reference obligation on which the credit default swap is based. In the case of centrally cleared swaps, counterparty risk is minimal due to protections provided by the central clearing party.
Interest rate swaps involve the exchange by a Fund with another party of their respective commitments to receive or pay interest (e.g., an exchange of fixed rate payments for floating rate payments) with respect to a notional amount of principal. When a Fund enters into an interest rate swap, it typically agrees to make payments to its counterparty based on a specified long- or short-term interest rate, and will receive payments from its counterparty based on another interest rate. Other forms of interest rate swap agreements include interest rate caps, under which, in return for a specified payment stream, one party agrees to make payments to the other to the extent that interest rates exceed a specified rate, or “cap”; interest rate floors, under which, in return for a specified payment stream, one party agrees to make payments to the other to the extent that interest rates fall below a specified rate, or “floor”; and interest rate collars, under which a party sells a cap and purchases a floor or vice versa in an attempt to protect itself against interest rate movements exceeding given minimum or maximum levels. A Fund may enter into an interest rate swap in order, for example, to hedge against the effect of interest rate changes on the value of specific securities in its portfolio, or to adjust the interest rate sensitivity (duration) or the credit exposure of its portfolio overall, or otherwise as a substitute for a direct investment in debt securities.
During the period ended December 31, 2018, the Funds’ direct investment in derivatives consisted of forward foreign currency exchange contracts, futures contracts, credit default swaps, interest rate swaps and purchased options.
195
Barings Funds Trust 2018 Semi-Annual Report
NOTES TO FINANCIAL STATEMENTS(CONTINUED)
December 31, 2018 (Unaudited)
The following is a summary of the fair value of derivative instruments held directly by the Funds as of December 31, 2018:
Global Floating Rate Fund
| | | | | | | | |
ASSET
DERIVATIVES | | STATEMENTS OF ASSETS
AND LIABILITIES
LOCATION | | | FOREIGN
EXCHANGE
CONTRACTS RISK | |
Forward Foreign Currency Exchange Contracts | |
| Unrealized
appreciation
on forward
foreign
currency
exchange
contracts |
| | $ | 28,173 | |
| | | | | | | | |
Total | | | | | | $ | 28,173 | |
| | | | | | | | |
| | | | | | | | |
LIABILITY
DERIVATIVES | | STATEMENTS OF ASSETS
AND LIABILITIES
LOCATION | | | FOREIGN
EXCHANGE
CONTRACTS
RISK | |
Forward Foreign Currency Exchange Contracts | |
| Unrealized
depreciation
on forward
foreign
currency
exchange
contracts |
| | $ | (271,019 | ) |
| | | | | | | | |
Total | | | | | | $ | (271,019 | ) |
| | | | | | | | |
Global Credit Income Opportunities Fund
| | | | | | | | | | | | | | | | |
ASSET
DERIVATIVES | | STATEMENTS OF ASSETS
AND LIABILITIES
LOCATION | | | FOREIGN
EXCHANGE
CONTRACTS RISK | | | EQUITY RISK | | | TOTAL | |
Forward Foreign Currency Exchange Contracts | |
| Unrealized appreciation
on forward foreign
currency exchange
contracts |
| | $ | 51,721 | | | $ | – | | | $ | 51,721 | |
Purchased Options | |
| Investments, at fair
value |
| | | – | | | | 864,192 | | | | 864,192 | |
| | | | | | | | | | | | | | | | |
Total | | | | | | $ | 51,721 | | | $ | 864,192 | | | $ | 915,913 | |
| | | | | | | | | | | | | | | | |
| | | | | | | | | | | | | | | | |
ASSET
DERIVATIVES | | STATEMENTS OF ASSETS
AND LIABILITIES
LOCATION | | | FOREIGN
EXCHANGE
CONTRACTS RISK | | | EQUITY RISK | | | TOTAL | |
Forward Foreign Currency Exchange Contracts | |
| Unrealized depreciation
on forward foreign
currency exchange
contracts |
| | $ | (187,612 | ) | | $ | – | | | $ | (187,612 | ) |
| | | | | | | | | | | | | | | | |
Total | | | | | | $ | (187,612 | ) | | $ | – | | | $ | (187,612 | ) |
| | | | | | | | | | | | | | | | |
196
Barings Funds Trust 2018 Semi-Annual Report
NOTES TO FINANCIAL STATEMENTS(CONTINUED)
December 31, 2018 (Unaudited)
Active Short Duration Bond Fund
| | | | | | | | | | | | | | |
ASSET
DERIVATIVES | | STATEMENTS OF ASSETS
AND LIABILITIES
LOCATION | | INTEREST RATE
RISK | | | CREDIT RISK | | | TOTAL | |
Futures Contracts | | Includes cumulative unrealized appreciation/ depreciation of futures contracts as reported in the Schedule of Investments. Only current day’s variation margin is reported within the Statements of Assets and Liabilities. | | $ | 605,664 | | | $ | – | | | $ | 605,664 | |
Purchased Options | | Investments, at fair value | | | 3,963,539 | | | | – | | | | 3,963,539 | |
| | | | | | | | | | | | | | |
Total | | | | $ | 4,569,203 | | | $ | – | | | $ | 4,569,203 | |
| | | | | | | | | | | | | | |
| | | | | | | | | | | | | | |
LIABILITY
DERIVATIVES | | STATEMENTS OF ASSETS
AND LIABILITIES
LOCATION | | INTEREST RATE
RISK | | | CREDIT RISK | | | TOTAL | |
Futures Contracts | | Includes cumulative unrealized appreciation/ depreciation of futures contracts as reported in the Schedule of Investments. Only current day’s variation margin is reported within the Statements of Assets and Liabilities. | | $ | (2,075,739 | ) | | $ | – | | | $ | (2,075,739 | ) |
OTC – Swaps Contracts | | Swap contracts, at fair value | | | – | | | | (83,856 | ) | | | (83,856 | ) |
| | | | | | | | | | | | | | |
Total | | | | $ | (2,075,739 | ) | | $ | (83,856 | ) | | $ | (2,159,595 | ) |
| | | | | | | | | | | | | | |
Total Return Bond Fund
| | | | | | | | | | | | | | | | | | |
ASSET
DERIVATIVES | | STATEMENTS OF ASSETS
AND LIABILITIES
LOCATION | | FOREIGN
EXCHANGE
CONTRACTS RISK | | | INTEREST RATE
RISK | | | CREDIT RISK | | | TOTAL | |
Forward Foreign Currency Exchange Contracts | | Unrealized appreciation on forward foreign currency exchange contracts | | $ | 18,077 | | | $ | – | | | $ | – | | | $ | 18,077 | |
Futures Contracts | | Includes cumulative unrealized appreciation/ depreciation of futures contracts as reported in the Schedule of Investments. Only current day’s variation margin is reported within the Statements of Assets and Liabilities. | | | – | | | | 128,322 | | | | – | | | | 128,322 | |
Purchased Options | | Investments, at fair value | | | – | | | | 406,402 | | | | – | | | | 406,402 | |
| | | | | | | | | | | | | | | | | | |
Total | | | | $ | 18,077 | | | $ | 534,724 | | | $ | – | | | $ | 552,801 | |
| | | | | | | | | | | | | | | | | | |
197
Barings Funds Trust 2018 Semi-Annual Report
NOTES TO FINANCIAL STATEMENTS(CONTINUED)
December 31, 2018 (Unaudited)
| | | | | | | | | | | | | | | | | | | | |
LIABILITY
DERIVATIVES | | STATEMENTS OF ASSETS
AND LIABILITIES
LOCATION | | | FOREIGN
EXCHANGE
CONTRACTS RISK | | | INTEREST RATE
RISK | | | CREDIT RISK | | | TOTAL | |
Forward Foreign Currency Exchange Contracts | |
| Unrealized depreciation
on forward foreign
currency exchange
contracts |
| | $ | (27,210 | ) | | $ | – | | | $ | – | | | $ | (27,210 | ) |
Futures Contracts | |
| Includes cumulative
unrealized appreciation/
depreciation of futures
contracts as reported in
the Schedule of
Investments. Only
current day’s variation
margin is reported
within the Statements
of Assets and Liabilities. |
| | | – | | | | (19,862 | ) | | | – | | | | (19,862 | ) |
OTC – Swaps Contracts | |
| Swap contracts, at fair
value |
| | | – | | | | – | | | | (20,964 | ) | | | (20,964 | ) |
| | | | | | | | | | | | | | | | | | | | |
Total | | | | | | $ | (27,210 | ) | | $ | (19,862 | ) | | $ | (20,964 | ) | | $ | (68,036 | ) |
| | | | | | | | | | | | | | | | | | | | |
Emerging Markets Debt Blended Total Return Fund
| | | | | | | | | | | | | | | | | | | | |
ASSET
DERIVATIVES | | STATEMENTS OF ASSETS
AND LIABILITIES
LOCATION | | | FOREIGN
EXCHANGE
CONTRACTS RISK | | | INTEREST RATE
RISK | | | CREDIT RISK | | | TOTAL | |
Forward Foreign Currency Exchange Contracts | |
| Unrealized appreciation
on forward foreign
currency exchange
contracts |
| | $ | 1,123,271 | | | $ | – | | | $ | – | | | $ | 1,123,271 | |
OTC – Swaps Contracts | |
| Swap contracts, at fair
value |
| | | 93,002 | | | | 219,579 | | | | 8,792 | | | | 321,373 | |
| | | | | | | | | | | | | | | | | | | | |
Total | | | | | | $ | 1,216,273 | | | $ | 219,579 | | | $ | 8,792 | | | $ | 1,444,644 | |
| | | | | | | | | | | | | | | | | | | | |
198
Barings Funds Trust 2018 Semi-Annual Report
NOTES TO FINANCIAL STATEMENTS(CONTINUED)
December 31, 2018 (Unaudited)
| | | | | | | | | | | | | | | | | | |
LIABILITY
DERIVATIVES | | STATEMENTS OF ASSETS
AND LIABILITIES
LOCATION | | FOREIGN
EXCHANGE
CONTRACTS RISK | | | INTEREST RATE
RISK | | | CREDIT RISK | | | TOTAL | |
Forward Foreign Currency Exchange Contracts | | Unrealized depreciation on forward foreign currency exchange contracts | | $ | (1,469,838 | ) | | $ | – | | | $ | – | | | $ | (1,469,838 | ) |
Futures Contracts | | Includes cumulative unrealized appreciation/ depreciation of futures contracts as reported in the Schedule of Investments. Only current day’s variation margin is reported within the Statements of Assets and Liabilities. | | | – | | | | (65,019 | ) | | | – | | | | (65,019 | ) |
OTC – Swaps Contracts | | Swap contracts, at fair value | | | (1,338 | ) | | | – | | | | (133,415 | ) | | | (134,753 | ) |
Centrally Cleared Interest Rate Swaps | | Unrealized depreciation on forward foreign currency exchange contracts | | | – | | | | (55,142 | ) | | | – | | | | (55,142 | ) |
| | | | | | | | | | | | | | | | | | |
Total | | | | $ | (1,471,176 | ) | | $ | (120,161 | ) | | $ | (133,415 | ) | | $ | (1,724,752 | ) |
| | | | | | | | | | | | | | | | | | |
Global High Yield Fund
| | | | | | | | |
ASSET
DERIVATIVES | | STATEMENTS OF ASSETS
AND LIABILITIES
LOCATION | | | FOREIGN
EXCHANGE
CONTRACTS RISK | |
Forward Foreign Currency Exchange Contracts | |
| Unrealized appreciation
on forward foreign
currency exchange
contracts |
| | $ | 5,014 | |
| | | | | | | | |
Total | | | | | | $ | 5,014 | |
| | | | | | | | |
| | | | | | | | |
LIABILITY
DERIVATIVES | | STATEMENTS OF ASSETS
AND LIABILITIES
LOCATION | | | FOREIGN
EXCHANGE
CONTRACTS RISK | |
Forward Foreign Currency Exchange Contracts | |
| Unrealized depreciation
on forward foreign
currency exchange
contracts |
| | $ | (22,602 | ) |
| | | | | | | | |
Total | | | | | | $ | (22,602 | ) |
| | | | | | | | |
Amount of Realized Gain/(Loss) on Derivatives:
Global Floating Rate Fund
| | | | |
| | | FOREIGN
EXCHANGE
CONTRACTS RISK | |
Forward Foreign Currency Exchange Contracts | | $ | 2,571,993 | |
| | | | |
Total | | $ | 2,571,993 | |
| | | | |
199
Barings Funds Trust 2018 Semi-Annual Report
NOTES TO FINANCIAL STATEMENTS(CONTINUED)
December 31, 2018 (Unaudited)
Global Credit Income Opportunities Fund
| | | | | | | | | | | | |
| | | FOREIGN
EXCHANGE
CONTRACTS RISK | | | EQUITY RISK | | | TOTAL | |
Forward Foreign Currency Exchange Contracts | | $ | 2,595,266 | | | $ | – | | | $ | 2,595,266 | |
Purchased Options | | | – | | | | (174,390 | ) | | | (174,390 | ) |
| | | | | | | | | | | | |
Total | | $ | 2,595,266 | | | $ | (174,390 | ) | | $ | 2,420,876 | |
| | | | | | | | | | | | |
Active Short Duration Bond Fund
| | | | | | | | | | | | |
| *COLUMN HEADERS* | | INTEREST RATE
RISK | | | CREDIT RISK | | | TOTAL | |
Futures Contracts | | $ | (389,877 | ) | | $ | – | | | $ | (389,877 | ) |
Swaps Contracts | | | – | | | | 8,161 | | | | 8,161 | |
| | | | | | | | | | | | |
Total | | $ | (389,877 | ) | | $ | 8,161 | | | $ | (381,716 | ) |
| | | | | | | | | | | | |
Total Return Bond Fund
| | | | | | | | | | | | | | | | |
| *COLUMN HEADERS* | | FOREIGN
EXCHANGE
CONTRACTS RISK | | | INTEREST RATE
RISK | | | CREDIT RISK | | | TOTAL | |
Forward Foreign Currency Exchange Contracts | | $ | (7,627 | ) | | $ | – | | | $ | – | | | $ | (7,627 | ) |
Futures Contracts | | | – | | | | (11,676 | ) | | | – | | | | (11,676 | ) |
Swaps Contracts | | | – | | | | – | | | | 2,038 | | | | 2,038 | |
| | | | | | | | | | | | | | | | |
Total | | $ | (7,627 | ) | | $ | (11,676 | ) | | $ | 2,038 | | | $ | (17,265 | ) |
| | | | | | | | | | | | | | | | |
Emerging Markets Debt Blended Total Return Fund
| | | | | | | | | | | | | | | | |
| *COLUMN HEADERS* | | FOREIGN
EXCHANGE
CONTRACTS RISK | | | INTEREST RATE
RISK | | | CREDIT RISK | | | TOTAL | |
Forward Foreign Currency Exchange Contracts | | $ | 313,999 | | | $ | – | | | $ | – | | | $ | 313,999 | |
Futures Contracts | | | – | | | | 22,470 | | | | – | | | | 22,470 | |
Swaps Contracts | | | 52,970 | | | | 217,132 | | | | 32,772 | | | | 302,874 | |
| | | | | | | | | | | | | | | | |
Total | | $ | 366,969 | | | $ | 239,602 | | | $ | 32,772 | | | $ | 639,343 | |
| | | | | | | | | | | | | | | | |
200
Barings Funds Trust 2018 Semi-Annual Report
NOTES TO FINANCIAL STATEMENTS(CONTINUED)
December 31, 2018 (Unaudited)
Global High Yield Fund
| | | | |
| | | FOREIGN
EXCHANGE
CONTRACTS RISK | |
Forward Foreign Currency Exchange Contracts | | $ | 341,079 | |
| | | | |
Total | | $ | 341,079 | |
| | | | |
Change in Unrealized Appreciation/(Depreciation) on Derivatives:
Global Floating Rate Fund
| | | | |
| | | FOREIGN
EXCHANGE
CONTRACTS RISK | |
Forward Foreign Currency Exchange Contracts | | $ | (872,221 | ) |
| | | | |
Total | | $ | (872,221 | ) |
| | | | |
Global Credit Income Opportunities Fund
| | | | | | | | | | | | |
| | | FOREIGN
EXCHANGE
CONTRACTS RISK | | | EQUITY
RISK | | | TOTAL | |
Forward Foreign Currency Exchange Contracts | | $ | (951,649 | ) | | $ | – | | | $ | (951,649 | ) |
Purchased Options | | | – | | | | 521,733 | | | | 521,733 | |
| | | | | | | | | | | | |
Total | | $ | (951,649 | ) | | $ | 521,733 | | | $ | (429,916 | ) |
| | | | | | | | | | | | |
Active Short Duration Bond Fund
| | | | | | | | | | | | |
| *COLUMN HEADERS* | | INTEREST RATE
RISK | | | CREDIT RISK | | | TOTAL | |
Futures Contracts | | $ | (1,081,998 | ) | | $ | – | | | $ | (1,081,998 | ) |
Purchased Options | | $ | 129,773 | | | $ | – | | | $ | 129,773 | |
Swaps Contracts | | | – | | | | (30,142 | ) | | | (30,142 | ) |
| | | | | | | | | | | | |
Total | | $ | (952,225 | ) | | $ | (30,142 | ) | | $ | (982,367 | ) |
| | | | | | | | | | | | |
Total Return Bond Fund
| | | | | | | | | | | | | | | | |
| *COLUMN HEADERS* | | FOREIGN
EXCHANGE
CONTRACTS RISK | | | INTEREST RATE
RISK | | | CREDIT RISK | | | TOTAL | |
Forward Foreign Currency Exchange Contracts | | $ | (13,843 | ) | | $ | – | | | $ | – | | | $ | (13,843 | ) |
Futures Contracts | | $ | – | | | $ | 33,450 | | | $ | – | | | $ | 33,450 | |
Purchased Options | | | – | | | | 13,314 | | | | – | | | | 13,314 | |
Swaps Contracts | | $ | – | | | $ | – | | | $ | (7,533 | ) | | $ | (7,533 | ) |
| | | | | | | | | | | | | | | | |
Total | | $ | (13,843 | ) | | $ | 46,764 | | | $ | (7,533 | ) | | $ | 25,388 | |
| | | | | | | | | | | | | | | | |
201
Barings Funds Trust 2018 Semi-Annual Report
NOTES TO FINANCIAL STATEMENTS(CONTINUED)
December 31, 2018 (Unaudited)
Emerging Markets Debt Blended Total Return Fund
| | | | | | | | | | | | | | | | |
| *COLUMN HEADERS* | | FOREIGN
EXCHANGE
CONTRACTS RISK | | | INTEREST RATE
RISK | | | CREDIT
RISK | | | TOTAL | |
Forward Foreign Currency Exchange Contracts | | $ | 210,822 | | | $ | – | | | $ | – | | | $ | 210,822 | |
Futures Contracts | | | – | | | | (22,445 | ) | | | – | | | | (22,445 | ) |
Swaps Contracts | | | 71,027 | | | | 38,272 | | | | 49,440 | | | | 158,739 | |
| | | | | | | | | | | | | | | | |
Total | | $ | 281,849 | | | $ | 15,827 | | | $ | 49,440 | | | $ | 347,116 | |
| | | | | | | | | | | | | | | | |
Global High Yield Fund
| | | | |
| | | FOREIGN
EXCHANGE
CONTRACTS RISK | |
Forward Foreign Currency Exchange Contracts | | $ | (63,486 | ) |
| | | | |
Total | | $ | (63,486 | ) |
| | | | |
Global Floating Rate Fund
| | | | |
NUMBER OF CONTRACTS, NOTIONAL
AMOUNTS OF SHARES/UNITS | | FOREIGN
EXCHANGE
CONTRACTS RISK | |
Forward Foreign Currency Exchange Contracts(1) | | $ | 77,332,210 | |
| | (1) | Volume of derivative activity is based on an average ofmonth-end notional amounts outstanding during the period. |
Global Credit Income Opportunities Fund
| | | | | | | | | | | | |
| | | FOREIGN
EXCHANGE
CONTRACTS RISK | | | EQUITY
RISK | | | TOTAL | |
Forward Foreign Currency Exchange Contracts(1) | | | 67,006,850 | | | | – | | | | 67,006,850 | |
Purchased Options(1) | | | – | | | | 5,643 | | | | 5,643 | |
| | (1) | Volume of derivative activity is based on an average ofmonth-end notional amounts outstanding during the period. |
Active Short Duration Bond Fund
| | | | | | | | | | | | |
NUMBER OF CONTRACTS, NOTIONAL AMOUNTS OF SHARES/UNITS | | INTEREST RATE
RISK | | | CREDIT RISK | | | TOTAL | |
Futures Contracts(1) | | | 1,638 | | | | – | | | | 1,638 | |
Purchased Options(2) | | | 77,660,000 | | | | – | | | | 77,660,000 | |
OTC - Swaps Contracts | | | – | | | | 520,000 | | | | 520,000 | |
| | (1) | Volume of derivative activity is based on an average ofmonth-end contracts outstanding during the period. |
| | (2) | Volume of derivative activity is based on an average ofmonth-end notional amounts outstanding during the period. |
202
Barings Funds Trust 2018 Semi-Annual Report
NOTES TO FINANCIAL STATEMENTS(CONTINUED)
December 31, 2018 (Unaudited)
Total Return Bond Fund
| | | | | | | | | | | | | | | | |
NUMBER OF CONTRACTS, NOTIONAL AMOUNTS OF SHARES/UNITS | | FOREIGN
EXCHANGE
CONTRACTS RISK | | | INTEREST RATE
RISK | | | CREDIT RISK | | | TOTAL | |
Forward Foreign Currency Exchange Contracts(1) | | $ | 1,140,054 | | | | – | | | | – | | | | 1,140,054 | |
Futures Contracts(2) | | $ | – | | | | 45 | | | | – | | | | 45 | |
Purchased Options(1) | | | – | | | | 7,950,000 | | | | – | | | | 7,950,000 | |
OTC - Swaps Contracts | | $ | – | | | | – | | | | 130,000 | | | | 130,000 | |
| | (1) | Volume of derivative activity is based on an average ofmonth-end notional amounts outstanding during the period. |
| | (2) | Volume of derivative activity is based on an average ofmonth-end contracts outstanding during the period. |
Emerging Markets Debt Blended Total Return Fund
| | | | | | | | | | | | | | | | |
NUMBER OF CONTRACTS, NOTIONAL AMOUNTS OF SHARES/UNITS | | FOREIGN
EXCHANGE
CONTRACTS RISK | | | INTEREST RATE
RISK | | | CREDIT
RISK | | | TOTAL | |
Forward Foreign Currency Exchange Contracts(1) | | $ | 67,252,272 | | | | – | | | | – | | | | 67,252,272 | |
Futures Contracts(2) | | $ | – | | | | 8 | | | | – | | | | 8 | |
OTC - Swaps Contracts | | $ | 1,925,551 | | | | 12,687,606 | | | | 8,666,667 | | | | 23,279,824 | |
| | (1) | Volume of derivative activity is based on an average ofmonth-end notional amounts outstanding during the period. |
| | (2) | Volume of derivative activity is based on an average ofmonth-end contracts outstanding during the period. |
Global High Yield Fund
| | | | |
NUMBER OF CONTRACTS, NOTIONAL AMOUNTS OF SHARES/UNITS | | FOREIGN EXCHANGE CONTRACTS RISK | |
Forward Foreign Currency Exchange Contracts(1) | | $ | 7,712,694 | |
| | (1) | Volume of derivative activity is based on an average ofmonth-end notional amounts outstanding during the period. |
| | K. | Disclosures about Offsetting Assets and Liabilities |
The Financial Accounting Standards Board (“FASB”) issued Accounting Standards UpdateNo. 2011-11 “Disclosures about Offsetting Assets and Liabilities” (“ASU2011-11”). These disclosure requirements are intended to help better assess the effect or potential effect of offsetting arrangements on a Fund’s financial position. In addition, FASB issued Accounting Standards UpdateNo. 2013-01 “Clarifying the Scope of Offsetting Assets and Liabilities” (“ASU2013-01”), specifying which transactions are subject to disclosures about offsetting. In order to better define its contractual rights and to secure rights that will help the Fund mitigate its counterparty risk, the Fund may enter into an International Swaps and Derivatives Association, Inc. Master Agreement (“ISDA Master Agreement”) or similar agreement with its counterparties. An ISDA Master Agreement is a bilateral agreement between the Fund and a counterparty that governs certain OTC derivatives and typically contains, among other things, collateral posting terms and netting provisions in the event of a default and/or termination event. Under an ISDA Master Agreement, the Fund may, under certain circumstances, offset with the counterparty certain derivative financial instruments’ payables and/or receivables with collateral held and/or posted and create one single net payment. The provisions of the ISDA Master Agreement typically permit a single net payment in the event of default including the bankruptcy or insolvency of the counterparty. Bankruptcy or insolvency laws of a particular jurisdiction may restrict or prohibit the right of offset in bankruptcy, insolvency or other events. In addition, certain ISDA Master Agreements allow counterparties to terminate derivative contracts prior to maturity in the event the Fund’s net assets decline by a stated percentage or the Fund fails to meet the terms of its ISDA Master Agreements. The result would cause the Fund to accelerate payment of any net liability owed to the counterparty.
203
Barings Funds Trust 2018 Semi-Annual Report
NOTES TO FINANCIAL STATEMENTS(CONTINUED)
December 31, 2018 (Unaudited)
For derivatives traded under an ISDA Master Agreement, the collateral requirements are typically calculated by netting the mark to market amount for each transaction under such agreement and comparing that amount to the value of any collateral currently pledged by the Funds and the counterparty.
Cash collateral that has been pledged to cover obligations of the Funds and cash collateral received from the counterparty, if any, is reported separately on the Statement of Assets and Liabilities as cash collateral held at broker or cash collateral due to broker, respectively.Non-cash collateral pledged by or received by the Funds, if any, is noted in the Schedule of Investments. Generally, the amount of collateral due from or to a party has to exceed a minimum transfer amount threshold before a transfer is required, which is determined each day at the close of business of the Funds, typically based on changes in market values for each transaction under an ISDA Master Agreement and netted into one amount for such agreement and any additional required collateral is delivered to/pledged by the Funds on the next business day. Typically, the Funds and counterparties are not permitted to sell,re-pledge or use the collateral they receive. To the extent amounts due to the Funds from their counterparties are not fully collateralized, contractually or otherwise, the Funds bear the risk of loss from counterpartynon-performance. The Funds attempt to mitigate counterparty risk by entering into agreements only with counterparties that they believe have the financial resources to honor their obligations and by monitoring the financial stability of those counterparties.
The following tables illustrate gross and net information about recognized assets eligible for offset in the Statement of Assets and Liabilities, and disclose such amounts subject to an enforceable master netting agreement or similar agreement, by counterparty. A master netting agreement is an agreement between two counterparties who have multiple contracts with each other that provides for the net settlement of all contracts, as well as cash collateral, through a single payment in the event of default on or termination of any one contract:
Global Floating Rate Fund
| | | | | | | | | | | | |
| DESCRIPTION | | GROSS AMOUNTS OF
RECOGNIZED ASSETS | | | GROSS AMOUNTS OFFSET
IN THE STATEMENTS OF
ASSETS AND LIABILITIES | | | NET AMOUNTS OF
ASSETS PRESENTED
IN THE STATEMENTS OF
ASSETS AND LIABILITIES | |
Forward Foreign Currency Exchange Contracts | | $ | 28,173 | | | $ | – | | | $ | 28,173 | |
| | | | | | | | | | | | |
Total | | $ | 28,173 | | | $ | – | | | $ | 28,173 | |
| | | | | | | | | | | | |
| | | | | | | | | | | | | | | | |
| | | | | | GROSS AMOUNTS NOT OFFSET IN THE
STATEMENTS OF ASSETS AND LIABILITIES | | | | | | | |
| COUNTERPARTY | | NET AMOUNTS OF ASSETS
PRESENTED IN THE STATEMENTS
OF ASSETS AND LIABILITIES | | | FINANCIAL
INSTRUMENT | | | CASH
COLLATERAL
RECEIVED (a) | | | NET
AMOUNT (b) | |
Morgan Stanley & Co. | | $ | 28,173 | | | $ | (28,173 | ) | | $ | – | | | $ | – | |
| | | | | | | | | | | | | | | | |
Total | | $ | 28,173 | | | $ | (28,173 | ) | | $ | – | | | $ | – | |
| | | | | | | | | | | | | | | | |
| | (a) | Collateral disclosed is limited to an amount not to exceed 100% of the net amount of assets presented in the Statements of Assets and Liabilities, for each respective counterparty. |
| | (b) | Net Amount represents the amount that is subject to loss in the event of a counterparty failure as of December 31, 2018. |
204
Barings Funds Trust 2018 Semi-Annual Report
NOTES TO FINANCIAL STATEMENTS(CONTINUED)
December 31, 2018 (Unaudited)
| | | | | | | | | | | | |
| DESCRIPTION | | GROSS AMOUNTS OF
RECOGNIZED LIABILITIES | | | GROSS AMOUNTS OFFSET
IN THE STATEMENTS OF
ASSETS AND LIABILITIES | | | NET AMOUNTS OF
LIABILITIES PRESENTED
IN THE STATEMENTS OF
ASSETS AND LIABILITIES | |
Forward Foreign Currency Exchange Contracts | | $ | 271,019 | | | $ | – | | | $ | 271,019 | |
| | | | | | | | | | | | |
Total | | $ | 271,019 | | | $ | – | | | $ | 271,019 | |
| | | | | | | | | | | | |
| | | | | | | | | | | | | | | | |
| | | | | | GROSS AMOUNTS NOT OFFSET IN THE
STATEMENTS OF ASSETS AND LIABILITIES | | | | | | | |
| COUNTERPARTY | | NET AMOUNTS OF LIABILITIES
PRESENTED IN THE STATEMENTS
OF ASSETS AND LIABILITIES | | | FINANCIAL
INSTRUMENT | | | CASH
COLLATERAL
PLEDGED (a) | | | NET
AMOUNT (b) | |
Morgan Stanley & Co. | | $ | 271,019 | | | $ | (28,173 | ) | | $ | – | | | $ | 242,846 | |
| | | | | | | | | | | | | | | | |
Total | | $ | 271,019 | | | $ | (28,173 | ) | | $ | – | | | $ | 242,846 | |
| | | | | | | | | | | | | | | | |
| | (a) | Collateral disclosed is limited to an amount not to exceed 100% of the net amount of assets presented in the Statements of Assets and Liabilities, for each respective counterparty. |
| | (b) | Net Amount represents the amount that is subject to loss in the event of a counterparty failure as of December 31, 2018. |
Global Credit Income Opportunities Fund
| | | | | | | | | | | | |
| DESCRIPTION | | GROSS AMOUNTS OF
RECOGNIZED ASSETS | | | GROSS AMOUNTS OFFSET
IN THE STATEMENTS OF
ASSETS AND LIABILITIES | | | NET AMOUNTS OF
ASSETS PRESENTED
IN THE STATEMENTS OF
ASSETS AND LIABILITIES | |
Forward Foreign Currency Exchange Contracts | | $ | 51,721 | | | $ | – | | | $ | 51,721 | |
Purchased Options | | | 864,192 | | | | – | | | | 864,192 | |
| | | | | | | | | | | | |
Total | | $ | 915,913 | | | $ | – | | | $ | 915,913 | |
| | | | | | | | | | | | |
| | | | | | | | | | | | | | | | |
| | | | | | GROSS AMOUNTS NOT OFFSET IN THE
STATEMENTS OF ASSETS AND LIABILITIES | | | | | | | |
| COUNTERPARTY | | NET AMOUNTS OF ASSETS
PRESENTED IN THE STATEMENTS
OF ASSETS AND LIABILITIES | | | FINANCIAL
INSTRUMENT | | | CASH
COLLATERAL
RECEIVED (a) | | | NET
AMOUNT (b) | |
Bank of America N.A. | | $ | 35,662 | | | $ | (1,467 | ) | | $ | – | | | $ | 34,195 | |
Barclays Bank plc | | | 16,059 | | | | (16,059 | ) | | | – | | | | – | |
Morgan Stanley & Co | | | 864,192 | | | | – | | | | – | | | | 864,192 | |
| | | | | | | | | | | | | | | | |
Total | | $ | 915,913 | | | $ | (17,526 | ) | | $ | – | | | $ | 898,387 | |
| | | | | | | | | | | | | | | | |
| | (a) | Collateral disclosed is limited to an amount not to exceed 100% of the net amount of assets presented in the Statements of Assets and Liabilities, for each respective counterparty. |
| | (b) | Net Amount represents the amount that is subject to loss in the event of a counterparty failure as of December 31, 2018. |
205
Barings Funds Trust 2018 Semi-Annual Report
NOTES TO FINANCIAL STATEMENTS(CONTINUED)
December 31, 2018 (Unaudited)
| | | | | | | | | | | | |
| DESCRIPTION | | GROSS AMOUNTS OF
RECOGNIZED LIABILITIES | | | GROSS AMOUNTS OFFSET
IN THE STATEMENTS OF
ASSETS AND LIABILITIES | | | NET AMOUNTS OF
LIABILITIES PRESENTED
IN THE STATEMENTS OF
ASSETS AND LIABILITIES | |
Forward Foreign Currency Exchange Contracts | | $ | 187,612 | | | $ | – | | | $ | 187,612 | |
| | | | | | | | | | | | |
Total | | $ | 187,612 | | | $ | – | | | $ | 187,612 | |
| | | | | | | | | | | | |
| | | | | | | | | | | | | | | | |
| | | | | | GROSS AMOUNTS NOT OFFSET IN THE
STATEMENTS OF ASSETS AND LIABILITIES | | | | | | | |
| COUNTERPARTY | | NET AMOUNTS OF LIABILITIES
PRESENTED IN THE STATEMENTS
OF ASSETS AND LIABILITIES | | | FINANCIAL
INSTRUMENT | | | CASH
COLLATERAL
PLEDGED (a) | | | NET
AMOUNT (b) | |
Bank of America N.A. | | $ | 1,467 | | | $ | (1,467 | ) | | $ | – | | | $ | – | |
Barclays Bank plc | | | 186,145 | | | | (16,059 | ) | | | (140,000 | ) | | | 30,086 | |
| | | | | | | | | | | | | | | | |
Total | | $ | 187,612 | | | $ | (17,526 | ) | | $ | (140,000 | ) | | $ | 30,086 | |
| | | | | | | | | | | | | | | | |
| | (a) | Collateral disclosed is limited to an amount not to exceed 100% of the net amount of assets presented in the Statements of Assets and Liabilities, for each respective counterparty. |
| | (b) | Net Amount represents the amount that is subject to loss in the event of a counterparty failure as of December 31, 2018. |
Active Short Duration Bond Fund
| | | | | | | | | | | | |
| DESCRIPTION | | GROSS AMOUNTS OF
RECOGNIZED ASSETS | | | GROSS AMOUNTS OFFSET IN THE STATEMENTS OF
ASSETS AND LIABILITIES | | | NET AMOUNTS OF
ASSETS PRESENTED
IN THE STATEMENTS OF
ASSETS AND LIABILITIES | |
Purchased Options | | $ | 3,963,539 | | | $ | – | | | $ | 3,963,539 | |
| | | | | | | | | | | | |
Total | | $ | 3,963,539 | | | $ | – | | | $ | 3,963,539 | |
| | | | | | | | | | | | |
| | | | | | | | | | | | | | | | |
| | | | | | GROSS AMOUNTS NOT OFFSET IN THE
STATEMENTS OF ASSETS AND LIABILITIES | | | | | | | |
| COUNTERPARTY | | NET AMOUNTS OF ASSETS
PRESENTED IN THE STATEMENTS
OF ASSETS AND LIABILITIES | | | FINANCIAL
INSTRUMENT | | | CASH
COLLATERAL
RECEIVED (a) | | | NET
AMOUNT (b) | |
JPMorgan Chase Bank N.A. | | $ | 3,963,539 | | | $ | (37,595 | ) | | $ | (3,925,944 | ) | | $ | – | |
| | | | | | | | | | | | | | | | |
Total | | $ | 3,963,539 | | | $ | (37,595 | ) | | $ | (3,925,944 | ) | | $ | – | |
| | | | | | | | | | | | | | | | |
| | (a) | Collateral disclosed is limited to an amount not to exceed 100% of the net amount of assets presented in the Statements of Assets and Liabilities, for each respective counterparty. |
| | (b) | Net Amount represents the amount that is subject to loss in the event of a counterparty failure as of December 31, 2018. |
206
Barings Funds Trust 2018 Semi-Annual Report
NOTES TO FINANCIAL STATEMENTS(CONTINUED)
December 31, 2018 (Unaudited)
| | | | | | | | | | | | |
| DESCRIPTION | | GROSS AMOUNTS OF RECOGNIZED LIABILITIES | | | GROSS AMOUNTS OFFSET IN THE STATEMENTS OF
ASSETS AND LIABILITIES | | | NET AMOUNTS OF
LIABILITIES PRESENTED
IN THE STATEMENTS OF
ASSETS AND LIABILITIES | |
Swap Contracts | | $ | 63,200 | | | $ | – | | | $ | 63,200 | |
| | | | | | | | | | | | |
Total | | $ | 63,200 | | | $ | – | | | $ | 63,200 | |
| | | | | | | | | | | | |
| | | | | | | | | | | | | | | | |
| | | | | | GROSS AMOUNTS NOT OFFSET IN THE
STATEMENTS OF ASSETS AND LIABILITIES | | | | | | | |
| COUNTERPARTY | | NET AMOUNTS OF LIABILITIES
PRESENTED IN THE STATEMENTS
OF ASSETS AND LIABILITIES | | | FINANCIAL
INSTRUMENT | | | CASH
COLLATERAL
PLEDGED (a) | | | NET
AMOUNT (b) | |
Goldman Sachs & Co. | | $ | 25,605 | | | $ | – | | | $ | – | | | $ | 25,605 | |
JPMorgan Chase Bank N.A. | | | 37,595 | | | | (37,595 | ) | | | – | | | | – | |
| | | | | | | | | | | | | | | | |
Total | | $ | 63,200 | | | $ | (37,595 | ) | | $ | – | | | $ | 25,605 | |
| | | | | | | | | | | | | | | | |
| | (a) | Collateral disclosed is limited to an amount not to exceed 100% of the net amount of assets presented in the Statements of Assets and Liabilities, for each respective counterparty. |
| | (b) | Net Amount represents the amount that is subject to loss in the event of a counterparty failure as of December 31, 2018. |
Total Return Bond Fund
| | | | | | | | | | | | |
| DESCRIPTION | | GROSS AMOUNTS OF
RECOGNIZED ASSETS | | | GROSS AMOUNTS OFFSET
IN THE STATEMENTS OF
ASSETS AND LIABILITIES | | | NET AMOUNTS OF
ASSETS PRESENTED
IN THE STATEMENTS OF
ASSETS AND LIABILITIES | |
Forward Foreign Currency Exchange Contracts | | $ | 18,077 | | | $ | – | | | $ | 18,077 | |
Purchased Options | | | 406,402 | | | | – | | | | 406,402 | |
| | | | | | | | | | | | |
Total | | $ | 424,479 | | | $ | – | | | $ | 424,479 | |
| | | | | | | | | | | | |
| | | | | | | | | | | | | | | | |
| | | | | | GROSS AMOUNTS NOT OFFSET IN THE
STATEMENTS OF ASSETS AND LIABILITIES | | | | | | | |
| COUNTERPARTY | | NET AMOUNTS OF ASSETS
PRESENTED IN THE STATEMENTS
OF ASSETS AND LIABILITIES | | | FINANCIAL
INSTRUMENT | | | CASH
COLLATERAL
RECEIVED (a) | | | NET
AMOUNT (b) | |
Bank of America N.A. | | $ | 3,578 | | | $ | (3,578 | ) | | $ | – | | | $ | – | |
Barclays Bank plc | | | 2,430 | | | | (2,430 | ) | | | – | | | | – | |
BNP Paribas S.A. | | | 3,098 | | | | (516 | ) | | | – | | | | 2,582 | |
Citibank N.A. | | | 381 | | | | (381 | ) | | | – | | | | – | |
Goldman Sachs & Co. | | | 264 | | | | (264 | ) | | | – | | | | – | |
JPMorgan Chase Bank N.A. | | | 414,728 | | | | (22,105 | ) | | | (380,000 | ) | | | 12,623 | |
| | | | | | | | | | | | | | | | |
Total | | $ | 424,479 | | | $ | (29,274 | ) | | $ | (380,000 | ) | | $ | 15,205 | |
| | | | | | | | | | | | | | | | |
| | (a) | Collateral disclosed is limited to an amount not to exceed 100% of the net amount of assets presented in the Statements of Assets and Liabilities, for each respective counterparty. |
| | (b) | Net Amount represents the amount that is subject to loss in the event of a counterparty failure as of December 31, 2018. |
207
Barings Funds Trust 2018 Semi-Annual Report
NOTES TO FINANCIAL STATEMENTS(CONTINUED)
December 31, 2018 (Unaudited)
| | | | | | | | | | | | |
| DESCRIPTION | | GROSS AMOUNTS OF
RECOGNIZED LIABILITIES | | | GROSS AMOUNTS OFFSET
IN THE STATEMENTS OF
ASSETS AND LIABILITIES | | | NET AMOUNTS OF
LIABILITIES PRESENTED
IN THE STATEMENTS OF
ASSETS AND LIABILITIES | |
Forward Foreign Currency Exchange Contracts | | $ | 27,210 | | | $ | – | | | $ | 27,210 | |
Swap Contracts | | | 15,988 | | | | – | | | | 15,988 | |
| | | | | | | | | | | | |
Total | | $ | 43,198 | | | $ | – | | | $ | 43,198 | |
| | | | | | | | | | | | |
| | | | | | | | | | | | | | | | |
| | | | | | GROSS AMOUNTS NOT OFFSET IN THE
STATEMENTS OF ASSETS AND LIABILITIES | | | | | | | |
| COUNTERPARTY | | NET AMOUNTS OF LIABILITIES
PRESENTED IN THE STATEMENTS
OF ASSETS AND LIABILITIES | | | FINANCIAL
INSTRUMENT | | | CASH
COLLATERAL
PLEDGED (a) | | | NET
AMOUNT (b) | |
Bank of America N.A. | | $ | 8,990 | | | $ | (3,578 | ) | | $ | – | | | $ | 5,412 | |
Barclays Bank plc | | | 2,607 | | | | (2,430 | ) | | | – | | | | 177 | |
BNP Paribas S.A. | | | 516 | | | | (516 | ) | | | – | | | | – | |
Citibank N.A. | | | 2,800 | | | | (381 | ) | | | – | | | | 2,419 | |
Goldman Sachs & Co. | | | 6,180 | | | | (264 | ) | | | – | | | | 5,916 | |
JPMorgan Chase Bank N.A. | | | 22,105 | | | | (22,105 | ) | | | – | | | | – | |
| | | | | | | | | | | | | | | | |
Total | | $ | 43,198 | | | $ | (29,274 | ) | | $ | – | | | $ | 13,924 | |
| | | | | | | | | | | | | | | | |
| | (a) | Collateral disclosed is limited to an amount not to exceed 100% of the net amount of assets presented in the Statements of Assets and Liabilities, for each respective counterparty. |
| | (b) | Net Amount represents the amount that is subject to loss in the event of a counterparty failure as of December 31, 2018. |
Emerging Markets Debt Blended Total Return Fund
| | | | | | | | | | | | |
| DESCRIPTION | | GROSS AMOUNTS OF
RECOGNIZED ASSETS | | | GROSS AMOUNTS OFFSET
IN THE STATEMENTS OF
ASSETS AND LIABILITIES | | | NET AMOUNTS OF
ASSETS PRESENTED
IN THE STATEMENTS OF
ASSETS AND LIABILITIES | |
Forward Foreign Currency Exchange Contracts | | $ | 1,123,271 | | | $ | – | | | $ | 1,123,271 | |
Swap Contracts | | | 345,120 | | | | – | | | | 345,120 | |
| | | | | | | | | | | | |
Total | | $ | 1,468,391 | | | $ | – | | | $ | 1,468,391 | |
| | | | | | | | | | | | |
208
Barings Funds Trust 2018 Semi-Annual Report
NOTES TO FINANCIAL STATEMENTS(CONTINUED)
December 31, 2018 (Unaudited)
| | | | | | | | | | | | | | | | |
| | | | | | GROSS AMOUNTS NOT OFFSET IN THE
STATEMENTS OF ASSETS AND LIABILITIES | | | | | | | |
| COUNTERPARTY | | NET AMOUNTS OF ASSETS
PRESENTED IN THE STATEMENTS
OF ASSETS AND LIABILITIES | | | FINANCIAL
INSTRUMENT | | | CASH
COLLATERAL
RECEIVED (a) | | | NET
AMOUNT (b) | |
Bank of America N.A. | | $ | 487,500 | | | $ | (198,567 | ) | | $ | (260,000 | ) | | $ | 28,933 | |
Barclays Bank plc | | | 138,147 | | | | (14,327 | ) | | | (100,000 | ) | | | 23,820 | |
BNP Paribas S.A. | | | 196,123 | | | | (32,571 | ) | | | – | | | | 163,552 | |
Citibank N.A. | | | 78,637 | | | | (78,637 | ) | | | – | | | | – | |
Goldman Sachs & Co. | | | 11,787 | | | | (11,787 | ) | | | – | | | | – | |
JPMorgan Chase Bank N.A. | | | 556,197 | | | | (202,039 | ) | | | (354,158 | ) | | | – | |
| | | | | | | | | | | | | | | | |
Total | | $ | 1,468,391 | | | $ | (537,928 | ) | | $ | (714,158 | ) | | $ | 216,305 | |
| | | | | | | | | | | | | | | | |
| | (a) | Collateral disclosed is limited to an amount not to exceed 100% of the net amount of assets presented in the Statements of Assets and Liabilities, for each respective counterparty. |
| | (b) | Net Amount represents the amount that is subject to loss in the event of a counterparty failure as of December 31, 2018. |
| | | | | | | | | | | | |
| DESCRIPTION | | GROSS AMOUNTS OF
RECOGNIZED LIABILITIES | | | GROSS AMOUNTS OFFSET
IN THE STATEMENTS OF
ASSETS AND LIABILITIES | | | NET AMOUNTS OF
LIABILITIES PRESENTED
IN THE STATEMENTS OF
ASSETS AND LIABILITIES | |
Forward Foreign Currency Exchange Contracts | | $ | 1,469,838 | | | $ | – | | | $ | 1,469,838 | |
Swap Contracts | | | 45,842 | | | | – | | | | 45,842 | |
| | | | | | | | | | | | |
Total | | $ | 1,515,680 | | | $ | – | | | $ | 1,515,680 | |
| | | | | | | | | | | | |
| | | | | | | | | | | | | | | | |
| | | | | | GROSS AMOUNTS NOT OFFSET IN THE
STATEMENTS OF ASSETS AND LIABILITIES | | | | | | | |
| COUNTERPARTY | | NET AMOUNTS OF LIABILITIES
PRESENTED IN THE STATEMENTS
OF ASSETS AND LIABILITIES | | | FINANCIAL
INSTRUMENT | | | CASH
COLLATERAL
PLEDGED (a) | | | NET
AMOUNT (b) | |
Bank of America N.A. | | $ | 198,567 | | | $ | (198,567 | ) | | $ | – | | | $ | – | |
Barclays Bank plc | | | 14,327 | | | | (14,327 | ) | | | – | | | | – | |
BNP Paribas S.A. | | | 32,571 | | | | (32,571 | ) | | | – | | | | – | |
Citibank N.A. | | | 213,353 | | | | (78,637 | ) | | | – | | | | 134,716 | |
Goldman Sachs & Co. | | | 36,578 | | | | (11,787 | ) | | | – | | | | 24,791 | |
JPMorgan Chase Bank N.A. | | | 202,039 | | | | (202,039 | ) | | | – | | | | – | |
State Street Bank & Trust Co. | | | 818,245 | | | | – | | | | (818,245 | ) | | | – | |
| | | | | | | | | | | | | | | | |
Total | | $ | 1,515,680 | | | $ | (537,928 | ) | | $ | (818,245 | ) | | $ | 159,507 | |
| | | | | | | | | | | | | | | | |
| | (a) | Collateral disclosed is limited to an amount not to exceed 100% of the net amount of assets presented in the Statements of Assets and Liabilities, for each respective counterparty. |
| | (b) | Net Amount represents the amount that is subject to loss in the event of a counterparty failure as of December 31, 2018. |
209
Barings Funds Trust 2018 Semi-Annual Report
NOTES TO FINANCIAL STATEMENTS(CONTINUED)
December 31, 2018 (Unaudited)
Global High Yield Fund
| | | | | | | | | | | | |
| DESCRIPTION | | GROSS AMOUNTS OF
RECOGNIZED ASSETS | | | GROSS AMOUNTS OFFSET
IN THE STATEMENTS OF
ASSETS AND LIABILITIES | | | NET AMOUNTS OF
ASSETS PRESENTED
IN THE STATEMENTS OF
ASSETS AND LIABILITIES | |
Forward Foreign Currency Exchange Contracts | | $ | 5,014 | | | $ | – | | | $ | 5,014 | |
| | | | | | | | | | | | |
Total | | $ | 5,014 | | | $ | – | | | $ | 5,014 | |
| | | | | | | | | | | | |
| | | | | | | | | | | | | | | | |
| | | | | | GROSS AMOUNTS NOT OFFSET IN THE
STATEMENTS OF ASSETS AND LIABILITIES | | | | | | | |
| COUNTERPARTY | | NET AMOUNTS OF ASSETS
PRESENTED IN THE STATEMENTS
OF ASSETS AND LIABILITIES | | | FINANCIAL
INSTRUMENT | | | CASH
COLLATERAL
RECEIVED (a) | | | NET
AMOUNT (b) | |
Bank of America N.A. | | $ | 4,544 | | | $ | (654 | ) | | $ | – | | | $ | 3,890 | |
Goldman Sachs & Co. | | | 18 | | | | – | | | | – | | | | 18 | |
JPMorgan Chase Bank N.A. | | | 452 | | | | – | | | | – | | | | 452 | |
| | | | | | | | | | | | | | | | |
Total | | $ | 5,014 | | | $ | (654 | ) | | $ | – | | | $ | 4,360 | |
| | | | | | | | | | | | | | | | |
| | (a) | Collateral disclosed is limited to an amount not to exceed 100% of the net amount of assets presented in the Statements of Assets and Liabilities, for each respective counterparty. |
| | (b) | Net Amount represents the amount that is subject to loss in the event of a counterparty failure as of December 31, 2018. |
| | | | | | | | | | | | |
| DESCRIPTION | | GROSS AMOUNTS OF
RECOGNIZED LIABILITIES | | | GROSS AMOUNTS OFFSET
IN THE STATEMENTS OF
ASSETS AND LIABILITIES | | | NET AMOUNTS OF
LIABILITIES PRESENTED
IN THE STATEMENTS OF
ASSETS AND LIABILITIES | |
Forward Foreign Currency Exchange Contracts | | $ | 22,602 | | | $ | – | | | $ | 22,602 | |
| | | | | | | | | | | | |
Total | | $ | 22,602 | | | $ | – | | | $ | 22,602 | |
| | | | | | | | | | | | |
| | | | | | | | | | | | | | | | |
| | | | | | GROSS AMOUNTS NOT OFFSET IN THE
STATEMENTS OF ASSETS AND LIABILITIES | | | | | | | |
| COUNTERPARTY | | NET AMOUNTS OF LIABILITIES
PRESENTED IN THE STATEMENTS
OF ASSETS AND LIABILITIES | | | FINANCIAL
INSTRUMENT | | | CASH
COLLATERAL
PLEDGED (a) | | | NET
AMOUNT (b) | |
Bank of America N.A. | | $ | 654 | | | $ | (654 | ) | | $ | – | | | $ | – | |
Barclays Bank plc | | | 21,862 | | | | – | | | | – | | | | 21,862 | |
BNP Paribas S.A. | | | 86 | | | | – | | | | – | | | | 86 | |
| | | | | | | | | | | | | | | | |
Total | | $ | 22,602 | | | $ | (654 | ) | | $ | – | | | $ | 21,948 | |
| | | | | | | | | | | | | | | | |
| | (a) | Collateral disclosed is limited to an amount not to exceed 100% of the net amount of assets presented in the Statements of Assets and Liabilities, for each respective counterparty. |
| | (b) | Net Amount represents the amount that is subject to loss in the event of a counterparty failure as of December 31, 2018. |
210
Barings Funds Trust 2018 Semi-Annual Report
NOTES TO FINANCIAL STATEMENTS(CONTINUED)
December 31, 2018 (Unaudited)
L. Foreign Securities
Investing in securities of foreign companies and foreign governments involves special risks and considerations not typically associated with investing in U.S. companies and the U.S. government. These risks include valuation of currencies and adverse political and economic developments. Moreover, securities of many foreign companies, foreign governments, and their markets may be less liquid and their prices more volatile than those of securities of comparable U.S. companies and the U.S. government.
M. Foreign Currency Translation
The books and records of the Funds are maintained in U.S. dollars. Foreign currency transactions are translated into U.S. dollars on the following basis: (i) market value of investment securities, assets and liabilities at the daily rates of exchange, and (ii) purchases and sales of investment securities, dividend and interest income and certain expenses at the rates of exchange prevailing on the respective dates of such transactions. For financial reporting purposes, the Funds do not isolate changes in the exchange rate of investment securities from the fluctuations arising from changes in the market prices of securities. However, for Federal income tax purposes, the Funds do isolate and treat as ordinary income the effect of changes in foreign exchange rates on realized gain or loss from the sale of investment securities and payables and receivables arising from trade-date and settlement-date differences.
N. Counterparty Risk
The Funds seek to manage counterparty credit risk by entering into agreements only with counterparties the Adviser believes have the financial resources to honor their obligations. The Adviser monitors the financial stability of the Funds’ counterparties.
The Funds have entered into an Investment Management Agreement (the “Agreement”) with the Adviser. Pursuant to the Agreement, the Funds have agreed to pay the Adviser a fee payable at the end of each calendar month as set forth below:
| | |
Global Floating Rate Fund | | 0.65% of average daily net assets |
Global Credit Income Opportunities Fund | | 0.75% of average daily net assets |
| | |
Active Short Duration Bond Fund | | 0.35% of average daily net assets |
Total Return Bond Fund | | 0.40% of average daily net assets |
Emerging Markets Debt Blended Total Return Fund | | 0.75% of average daily net assets |
Global Emerging Markets Equity Fund | | 0.90% of average daily net assets |
Global High Yield Fund | | 0.60% of average daily net assets |
U.S. High Yield Fund | | 0.55% of average daily net assets |
The Adviser has contractually agreed to waive and/or reimburse a portion of its fees and/or reimburse expenses (excluding distribution and service(12b-1) fees, interest expenses, taxes, acquired fund fees and expenses, fees incurred in acquiring and disposing of securities and extraordinary expenses) such that total net annual operating expenses (including12b-1 fees) for each class do not exceed the following rates (as a percentage of average daily net assets allocated to each such class):
| | | | | | | | | | | | | | | | |
| | | CLASS A | | | CLASS C | | | CLASS I | | | CLASS Y | |
Global Floating Rate Fund | | | 1.00 | % | | | 1.75 | % | | | 0.75 | % | | | 0.75 | % |
Global Credit Income Opportunities Fund | | | 1.20 | % | | | 1.95 | % | | | 0.95 | % | | | 0.95 | % |
Active Short Duration Bond Fund | | | 0.65 | % | | | 0.90 | % | | | 0.40 | % | | | 0.40 | % |
Total Return Bond Fund | | | 0.80 | % | | | 1.55 | % | | | 0.55 | % | | | 0.55 | % |
Emerging Markets Debt Blended Total Return Fund | | | 1.20 | % | | | 1.95 | % | | | 0.95 | % | | | 0.95 | % |
Global Emerging Markets Equity Fund | | | 1.45 | % | | | 2.20 | % | | | 1.20 | % | | | 1.20 | % |
Global High Yield Fund | | | 1.05 | % | | | 1.80 | % | | | 0.80 | % | | | 0.80 | % |
U.S. High Yield Fund | | | 1.00 | % | | | 1.75 | % | | | 0.75 | % | | | 0.75 | % |
Pursuant to the expense waiver/reimbursement agreement, the Adviser is entitled to be reimbursed for any fees the Adviser waives and Fund expenses that the Adviser reimburses for a period of three years following such fee
211
Barings Funds Trust 2018 Semi-Annual Report
NOTES TO FINANCIAL STATEMENTS(CONTINUED)
December 31, 2018 (Unaudited)
waivers and expense reimbursements, to the extent that such reimbursement of the Adviser by a Fund will not cause the Fund to exceed any applicable expense limitation that is in place for the Fund.
The contractual management fee waiver and expense reimbursement agreements between the Funds and the Adviser will remain in effect until November 1, 2019 and may be terminated only upon the approval of the Funds’ Board of Trustees.
Subject to the supervision of the Adviser and the Board, BIIL manages the investment and reinvestment of a portion of the assets of the Global Floating Rate Fund, Global Credit Income Opportunities Fund, Emerging Markets Debt Blended Total Return Fund, Global Emerging Markets Equity Fund and Global High Yield Fund, as allocated from time to time to BIIL. As compensation for its services, the Adviser (not the Funds) pays to BIILsub-advisory fees equal to the below percentages of the advisory fee paid to the Adviser by the applicable Fund, net of any fee waivers and/or expense reimbursements:
| | | | |
Global Floating Rate Fund | | | 0.35 | % |
Global Credit Income Opportunities Fund | | | 0.35 | % |
Emerging Markets Debt Blended Total Return Fund | | | 0.50 | % |
Global Emerging Markets Equity Fund | | | 0.70 | % |
Global High Yield Fund | | | 0.35 | % |
The Adviser or its affiliates voluntarily agreed to waive certain fees for the Global Floating Rate Fund, the Active Short Duration Bond Fund and the Emerging Markets Debt Blended Total Return Fund. Such arrangements may be discontinued by the Adviser at any time. For the year ended December 31, 2018, the amount of the waivers were $669, $1,176 and $24,340, respectively.
| 4. | 12b-1 Distribution and Service Plan and other Shareholder Servicing Payments |
ALPS Distributors, Inc. (the “Distributor”) is the Distributor of the Funds’ shares as of December 31, 2018.
The Funds have adopted a Distribution and Shareholder Services Plan (the “Plan”), pursuant to Rule12b-1 under the 1940 Act. Under the Plan, each Fund’s Class A and Class C shares may compensate certain financial institutions, including the Distributor, for certain distribution and shareholder servicing activities. The Funds’ Class A shares may expend an aggregate amount, on an annual basis, not to exceed 0.25% of the value of the average daily net assets of a Fund attributable to Class A shares and 1.00% (0.50% for Active Short Duration
Bond Fund) of the value of the average daily net assets of a Fund attributable to Class C shares. The Plan provides that the distribution and service fees are payable to the Distributor regardless of the amounts actually expended by the Distributor for distribution of the Funds’ shares and service activities.
Under its terms, the Funds’ Plan shall remain in effect from year to year, provided such continuance is approved annually by a vote of a majority of the Board’s members and a majority of the Board’s members who are not “interested persons” of the Funds and who have no direct or indirect financial interest in the operation of the Plan or in any agreement related to the Plan.
Effective July 1, 2018, the Board approved the payment by each Fund of investor services (“sub-TA”) payments with respect to shares of such Fund held in omnibus accounts by financial intermediaries.
| 5. | Sales Charges and Commissions |
For the year ended December 31, 2018, the amount of sales charges retained by the Distributor on sales of Class A and Class C shares of the Funds were as follows:
| | | | |
| | | CLASS C | |
Global Floating Rate Fund | | $ | 401 | |
Global Credit Income Opportunities Fund | | | 25 | |
For the year ended December 31, 2018, the Distributor received the following commissions on sales of shares of the Funds, after concessions were paid to authorized dealers:
| | | | | | | | |
| | | DISTRIBUTOR
COMMISSIONS | | | DEALERS’
CONCESSIONS | |
Global Floating Rate Fund | | $ | 1,119 | | | $ | 38,666 | |
Global Credit Income Opportunities Fund | | | 680 | | | | 106,139 | |
Active Short Duration Bond Fund | | | – | | | | 338 | |
Total Return Bond Fund | | | 116 | | | | 805 | |
Emerging Markets Debt Blended Total Return Fund | | | – | | | | 260 | |
Global High Yield Fund | | | – | | | | 150 | |
| 6. | Administrator, Custody, and Transfer Agent Fees |
The Funds have engaged State Street Bank and Trust (“SSB”) to serve as the Funds’ administrator, custodian,
212
Barings Funds Trust 2018 Semi-Annual Report
NOTES TO FINANCIAL STATEMENTS(CONTINUED)
December 31, 2018 (Unaudited)
and fund accountant. For these services, the Funds have agreed to pay SSB fees payable at the end of each calendar month pursuant to an agreement between SSB and the Funds. For the year ended December 31, 2018, the aggregate effective fee for the services performed by SSB was at the following annual rate of each Fund’s average daily managed assets:
| | | | |
Aggregate Administrator, Custodian and Fund Accountant Fee to SSB: | |
Global Floating Rate Fund | | | 0.13 | % |
Global Credit Income Opportunities Fund | | | 0.16 | % |
Active Short Duration Bond Fund | | | 0.17 | % |
Total Return Bond Fund | | | 0.34 | % |
Emerging Markets Debt Blended Total Return Fund | | | 0.30 | % |
Global Emerging Markets Equity Fund | | | 0.48 | % |
Global High Yield Fund | | | 0.31 | % |
U.S. High Yield Fund | | | 0.19 | % |
The Funds have engaged ALPS Fund Services, Inc. (“ALPS”) to serve as the Funds’ transfer agent. For these services, the Funds have agreed to pay ALPS fees payable at the end of each calendar month pursuant to an
agreement between ALPS and the Funds. For the year ended December 31, 2018, the effective fee for the services performed by ALPS was at the following annual rate of each Fund’s average daily managed assets:
| | | | |
Transfer Agency Fee to ALPS: | |
Global Floating Rate Fund | | | 0.01 | % |
Global Credit Income Opportunities Fund | | | 0.02 | % |
Active Short Duration Bond Fund | | | 0.01 | % |
Total Return Bond Fund | | | 0.08 | % |
Emerging Markets Debt Blended Total Return Fund | | | 0.06 | % |
Global Emerging Markets Equity Fund | | | 0.13 | % |
Global High Yield Fund | | | 0.09 | % |
U.S. High Yield Fund | | | 0.04 | % |
It is the Funds’ intention to qualify as a RIC under subchapter M of the Internal Revenue Code and distribute all of its taxable income. Accordingly, no provision for Federal income taxes is required in the financial statements.
The tax character of dividends paid to shareholders during the tax year ended June 30, 2018 was as follows:
| | | | | | | | | | | | | | | | |
| | | ORDINARY
INCOME | | | NET
LONG-TERM
CAPITAL
GAINS | | | RETURN
OF
CAPITAL | | | TOTAL
DISTRIBUTIONS
PAID | |
Global Floating Rate Fund | | $ | 8,591,381 | | | $ | – | | | $ | 1,171,303 | | | $ | 9,762,684 | |
Global Credit Income Opportunities Fund | | | 9,089,382 | | | | – | | | | 496,307 | | | | 9,585,689 | |
Active Short Duration Bond Fund | | | 9,664,909 | | | | 902,028 | | | | – | | | | 10,566,937 | |
Total Return Bond Fund | | | 976,520 | | | | – | | | | 33,503 | | | | 1,010,023 | |
Emerging Markets Debt Blended Total Return Fund | | | 1,342,816 | | | | 145,149 | | | | – | | | | 1,487,965 | |
Global High Yield Fund | | | 2,242,682 | | | | 57,003 | | | | – | | | | 2,299,685 | |
U.S. High Yield Fund | | | 2,968,418 | | | | 248,263 | | | | – | | | | 3,216,681 | |
In accordance with the Regulated Investment Company Modernization Act of 2010, the Funds will carryforward capital losses incurred in taxable years beginning after December 22, 2010 (“post-enactment losses”) indefinitely. Post-enactment losses will also retain their character as either short-term or long-term and be utilized before anypre-enactment losses.
213
Barings Funds Trust 2018 Semi-Annual Report
NOTES TO FINANCIAL STATEMENTS(CONTINUED)
December 31, 2018 (Unaudited)
As of December 31, 2018, the aggregate unrealized security gains and losses based on cost for U.S. federal income tax purposes were as follows:
| | | | | | | | | | | | | | | | |
| | | COST OF
INVESTMENTS | | | GROSS
UNREALIZED
APPRECIATION | | | GROSS
UNREALIZED
DEPRECIATION | | | NET
UNREALIZED
DEPRECIATION | |
Global Floating Rate Fund | | $ | 291,554,310 | | | $ | 1,146,624 | | | $ | (19,408,978 | ) | | $ | (18,262,354 | ) |
Global Credit Income Opportunities Fund | | | 185,304,153 | | | | 1,245,760 | | | | (18,009,191 | ) | | | (16,763,431 | ) |
Active Short Duration Bond Fund | | | 477,766,961 | | | | 1,185,975 | | | | (5,966,997 | ) | | | (4,781,022 | ) |
Total Return Bond Fund | | | 30,951,329 | | | | 147,978 | | | | (785,976 | ) | | | (637,998 | ) |
Emerging Markets Debt Blended Total Return Fund | | | 47,849,079 | | | | 73,693 | | | | (3,453,745 | ) | | | (3,380,052 | ) |
Global Emerging Markets Equity Fund | | | 9,499,900 | | | | 395,348 | | | | (668,877 | ) | | | (273,529 | ) |
Global High Yield Fund | | | 24,803,674 | | | | 107,528 | | | | (2,417,444 | ) | | | (2,309,916 | ) |
U.S. High Yield Fund | | | 53,017,778 | | | | 205,338 | | | | (3,674,221 | ) | | | (3,468,883 | ) |
The difference between book-basis andtax-basis unrealized gains (losses) is attributable to wash sales.
| 8. | Investment Transactions |
Purchases and sales of securities (excluding short-term debt securities) for the year ended December 31, 2018 were as follows:
| | | | | | | | | | | | | | | | |
| | | PURCHASES | | | SALES | | | GOVERNMENT
PURCHASES | | | GOVERNMENT
SALES | |
Global Floating Rate Fund | | $ | 116,910,270 | | | $ | 69,903,973 | | | $ | – | | | $ | – | |
Global Credit Income Opportunities Fund | | | 57,396,659 | | | | 87,639,314 | | | | – | | | | – | |
Active Short Duration Bond Fund | | | 92,785,462 | | | | 73,288,843 | | | | 22,986,680 | | | | 4,808,563 | |
Total Return Bond Fund | | | 5,633,043 | | | | 8,651,332 | | | | – | | | | – | |
Emerging Markets Debt Blended Total Return Fund | | | 20,462,622 | | | | 18,232,716 | | | | – | | | | – | |
Global Emerging Markets Equity Fund | | | 9,678,783 | | | | 117,232 | | | | – | | | | – | |
Global High Yield Fund | | | 3,119,953 | | | | 3,091,967 | | | | 2,464,028 | | | | 5,558,790 | |
U.S. High Yield Fund | | | 10,787,242 | | | | 12,012,330 | | | | – | | | | – | |
Transactions in common stock for the six months ended December 31, 2018 were as follows:
Global Floating Rate Fund
| | | | | | | | | | | | | | | | |
| | | FOR THE SIX MONTHS ENDED
DECEMBER 31, 2018 | | | FOR THE YEAR ENDED JUNE 30, 2018 | |
| CLASS A | | SHARES | | | AMOUNT | | | SHARES | | | AMOUNT | |
Shares sold | | | 380,062 | | | $ | 3,580,331 | | | | 1,667,532 | | | $ | 15,918,813 | |
Shares sold through reinvestments of distributions | | | 148,487 | | | | 1,389,754 | | | | 243,001 | | | | 2,317,457 | |
Shares redeemed | | | (718,264 | ) | | | (6,712,248 | ) | | | (1,036,759 | ) | | | (9,887,519 | ) |
| | | | | | | | | | | | | | | | |
Net increase (decrease) | | | (189,715 | ) | | $ | (1,742,163 | ) | | | 873,774 | | | $ | 8,348,751 | |
| | | | | | | | | | | | | | | | |
CLASS C | | | | | | | | | | | | | | | | |
Shares sold | | | 193,947 | | | $ | 1,834,992 | | | | 185,281 | | | $ | 1,760,750 | |
Shares sold through reinvestments of distributions | | | 21,595 | | | | 200,958 | | | | 29,111 | | | | 276,669 | |
Shares redeemed | | | (140,091 | ) | | | (1,312,266 | ) | | | (178,196 | ) | | | (1,693,674 | ) |
| | | | | | | | | | | | | | | | |
Net increase | | | 75,451 | | | $ | 723,684 | | | | 36,196 | | | $ | 343,745 | |
| | | | | | | | | | | | | | | | |
214
Barings Funds Trust 2018 Semi-Annual Report
NOTES TO FINANCIAL STATEMENTS(CONTINUED)
December 31, 2018 (Unaudited)
| | | | | | | | | | | | | | | | |
| | | FOR THE SIX MONTHS ENDED
DECEMBER 31, 2018 | | | FOR THE YEAR ENDED JUNE 30, 2018 | |
| CLASS I | | SHARES | | | AMOUNT | | | SHARES | | | AMOUNT | |
Shares sold | | | 3,057,892 | | | $ | 29,141,715 | | | | 575,961 | | | $ | 5,511,861 | |
Shares sold through reinvestments of distributions | | | 89,985 | | | | 841,860 | | | | 100,453 | | | | 960,046 | |
Shares redeemed | | | (1,341,586 | ) | | | (12,751,297 | ) | | | (807,441 | ) | | | (7,709,995 | ) |
| | | | | | | | | | | | | | | | |
Net increase (decrease) | | | 1,806,291 | | | $ | 17,232,278 | | | | (131,027 | ) | | $ | (1,238,088 | ) |
| | | | | | | | | | | | | | | | |
CLASS Y | | | | | | | | | | | | | | | | |
Shares sold | | | 10,154,323 | | | $ | 96,415,727 | | | | 9,320,803 | | | $ | 89,015,823 | |
Shares sold through reinvestments of distributions | | | 437,232 | | | | 4,097,197 | | | | 568,316 | | | | 5,429,194 | |
Shares redeemed | | | (7,294,163 | ) | | | (68,393,237 | ) | | | (4,547,811 | ) | | | (43,466,701 | ) |
| | | | | | | | | | | | | | | | |
Net increase | | | 3,297,392 | | | $ | 32,119,687 | | | | 5,341,308 | | | $ | 50,978,316 | |
| | | | | | | | | | | | | | | | |
Global Credit Income Opportunities Fund
| | | | | | | | | | | | | | | | |
| | | FOR THE SIX MONTHS ENDED
DECEMBER 31, 2018 | | | FOR THE YEAR ENDED JUNE 30, 2018 | |
| CLASS A | | SHARES | | | AMOUNT | | | SHARES | | | AMOUNT | |
Shares sold | | | 1,014,462 | | | $ | 9,385,123 | | | | 4,878,668 | | | $ | 45,886,717 | |
Shares sold through reinvestments of distributions | | | 248,888 | | | | 2,251,726 | | | | 185,198 | | | | 1,746,315 | |
Shares redeemed | | | (2,407,981 | ) | | | (21,497,858 | ) | | | (1,400,679 | ) | | | (13,240,661 | ) |
| | | | | | | | | | | | | | | | |
Net increase (decrease) | | | (1,144,631 | ) | | $ | (9,861,009 | ) | | | 3,663,187 | | | $ | 34,392,371 | |
| | | | | | | | | | | | | | | | |
CLASS C | | | | | | | | | | | | | | | | |
Shares sold | | | 139,608 | | | $ | 1,288,060 | | | | 371,526 | | | $ | 3,505,551 | |
Shares sold through reinvestments of distributions | | | 30,435 | | | | 274,643 | | | | 30,456 | | | | 286,954 | |
Shares redeemed | | | (176,499 | ) | | | (1,590,498 | ) | | | (150,027 | ) | | | (1,414,034 | ) |
| | | | | | | | | | | | | | | | |
Net increase (decrease) | | | (6,456 | ) | | $ | (27,795 | ) | | | 251,955 | | | $ | 2,378,471 | |
| | | | | | | | | | | | | | | | |
CLASS I | | | | | | | | | | | | | | | | |
Shares sold | | | – | | | $ | – | | | | – | | | $ | – | |
Shares sold through reinvestments of distributions | | | 71 | | | | 641 | | | | 93 | | | | 876 | |
Shares redeemed | | | (669,643 | ) | | | (6,000,000 | ) | | | – | | | | – | |
| | | | | | | | | | | | | | | | |
Net increase (decrease) | | | (669,572 | ) | | $ | (5,999,359 | ) | | | 93 | | | $ | 876 | |
| | | | | | | | | | | | | | | | |
CLASS Y | | | | | | | | | | | | | | | | |
Shares sold | | | 3,808,931 | | | $ | 35,119,426 | | | | 7,646,098 | | | $ | 72,032,811 | |
Shares sold through reinvestments of distributions | | | 441,236 | | | | 3,999,852 | | | | 425,660 | | | | 4,011,731 | |
Shares redeemed | | | (6,710,044 | ) | | | (60,722,343 | ) | | | (3,105,523 | ) | | | (29,263,594 | ) |
| | | | | | | | | | | | | | | | |
Net increase (decrease) | | | (2,459,877 | ) | | $ | (21,603,065 | ) | | | 4,966,235 | | | $ | 46,780,948 | |
| | | | | | | | | | | | | | | | |
215
Barings Funds Trust 2018 Semi-Annual Report
NOTES TO FINANCIAL STATEMENTS(CONTINUED)
December 31, 2018 (Unaudited)
Active Short Duration Bond Fund
| | | | | | | | | | | | | | | | |
| | | FOR THE SIX MONTHS ENDED
DECEMBER 31, 2018 | | | FOR THE YEAR ENDED JUNE 30, 2018 | |
| CLASS A | | SHARES | | | AMOUNT | | | SHARES | | | AMOUNT | |
Shares sold | | | 3,405,963 | | | $ | 33,607,315 | | | | 14,618,622 | | | $ | 145,642,052 | |
Shares sold through reinvestments of distributions | | | 236,586 | | | | 2,333,461 | | | | 386,954 | | | | 3,845,964 | |
Shares redeemed | | | (6,508,466 | ) | | | (64,234,467 | ) | | | (8,990,871 | ) | | | (89,385,833 | ) |
| | | | | | | | | | | | | | | | |
Net increase (decrease) | | | (2,865,917 | ) | | $ | (28,293,691 | ) | | | 6,014,705 | | | $ | 60,102,183 | |
| | | | | | | | | | | | | | | | |
CLASS C | | | | | | | | | | | | | | | | |
Shares sold | | | 38,540 | | | $ | 378,443 | | | | 103,284 | | | $ | 1,031,298 | |
Shares sold through reinvestments of distributions | | | 1,555 | | | | 15,330 | | | | 1,963 | | | | 19,485 | |
Shares redeemed | | | (24,321 | ) | | | (239,189 | ) | | | (13,404 | ) | | | (133,445 | ) |
| | | | | | | | | | | | | | | | |
Net increase | | | 15,774 | | | $ | 154,584 | | | | 91,843 | | | $ | 917,338 | |
| | | | | | | | | | | | | | | | |
CLASS I | | | | | | | | | | | | | | | | |
Shares sold | | | – | | | $ | – | | | | 20,309 | | | $ | 203,500 | |
Shares sold through reinvestments of distributions | | | – | | | | – | | | | – | | | | – | |
Shares redeemed | | | – | | | | – | | | | – | | | | – | |
| | | | | | | | | | | | | | | | |
Net increase | | | – | | | $ | – | | | | 20,309 | | | $ | 203,500 | |
| | | | | | | | | | | | | | | | |
| | | | | | | | | | | | | | | | |
CLASS Y | | | | | | | | | | | | | | | | |
Shares sold | | | 14,268,282 | | | $ | 140,556,830 | | | | 20,820,040 | | | $ | 207,162,143 | |
Shares sold through reinvestments of distributions | | | 359,093 | | | | 3,538,352 | | | | 564,556 | | | | 5,609,410 | |
Shares redeemed | | | (6,310,254 | ) | | | (62,199,360 | ) | | | (16,257,695 | ) | | | (161,293,725 | ) |
| | | | | | | | | | | | | | | | |
Net increase | | | 8,317,121 | | | $ | 81,895,822 | | | | 5,126,901 | | | $ | 51,477,828 | |
| | | | | | | | | | | | | | | | |
Total Return Bond Fund
| | | | | | | | | | | | | | | | |
| | | FOR THE SIX MONTHS ENDED DECEMBER 31, 2018 | | | FOR THE YEAR ENDED JUNE 30, 2018 | |
| CLASS A | | SHARES | | | AMOUNT | | | SHARES | | | AMOUNT | |
Shares sold | | | 52,006 | | | $ | 501,227 | | | | – | | | $ | – | |
Shares sold through reinvestments of distributions | | | 25 | | | | 243 | | | | 40 | | | | 398 | |
Shares redeemed | | | (297 | ) | | | (2,902 | ) | | | (495 | ) | | | (4,965 | ) |
| | | | | | | | | | | | | | | | |
Net increase (decrease) | | | 51,734 | | | $ | 498,568 | | | | (455 | ) | | $ | (4,567 | ) |
| | | | | | | | | | | | | | | | |
CLASS C | | | | | | | | | | | | | | | | |
Shares sold | | | – | | | $ | – | | | | – | | | $ | – | |
Shares sold through reinvestments of distributions | | | – | | | | – | | | | – | | | | – | |
Shares redeemed | | | – | | | | – | | | | – | | | | – | |
| | | | | | | | | | | | | | | | |
Net increase | | | – | | | $ | – | | | | – | | | $ | – | |
| | | | | | | | | | | | | | | | |
216
Barings Funds Trust 2018 Semi-Annual Report
NOTES TO FINANCIAL STATEMENTS(CONTINUED)
December 31, 2018 (Unaudited)
| | | | | | | | | | | | | | | | |
| | | FOR THE SIX MONTHS ENDED
DECEMBER 31, 2018 | | | FOR THE YEAR ENDED
JUNE 30, 2018 | |
| CLASS I | | SHARES | | | AMOUNT | | | SHARES | | | AMOUNT | |
Shares sold | | | – | | | $ | – | | | | – | | | $ | – | |
Shares sold through reinvestments of distributions | | | – | | | | – | | | | – | | | | – | |
Shares redeemed | | | – | | | | – | | | | – | | | | – | |
| | | | | | | | | | | | | | | | |
Net increase | | | – | | | $ | – | | | | – | | | $ | – | |
| | | | | | | | | | | | | | | | |
CLASS Y | | | | | | | | | | | | | | | | |
Shares sold | | | 44,212 | | | $ | 428,304 | | | | 297,499 | | | $ | 2,983,984 | |
Shares sold through reinvestments of distributions | | | 7,019 | | | | 68,022 | | | | 18,366 | | | | 183,513 | |
Shares redeemed | | | (129,830 | ) | | | (1,259,081 | ) | | | (369,123 | ) | | | (3,656,973 | ) |
| | | | | | | | | | | | | | | | |
Net decrease | | | (78,599 | ) | | $ | (762,755 | ) | | | (53,258 | ) | | $ | (489,476 | ) |
| | | | | | | | | | | | | | | | |
Emerging Markets Debt Blended Total Return Fund
| | | | | | | | | | | | | | | | |
| | | FOR THE SIX
MONTHS ENDED
DECEMBER 31, 2018 | | | FOR THE YEAR ENDED JUNE 30, 2018 | |
| CLASS A | | SHARES | | | AMOUNT | | | SHARES | | | AMOUNT | |
Shares sold | | | 3,463 | | | $ | 32,250 | | | | 41,516 | | | $ | 444,647 | |
Shares sold through reinvestments of distributions | | | 834 | | | | 7,856 | | | | 2,054 | | | | 21,425 | |
Shares redeemed | | | (23,984 | ) | | | (224,063 | ) | | | (4,035 | ) | | | (40,621 | ) |
| | | | | | | | | | | | | | | | |
Net increase (decrease) | | | (19,687 | ) | | $ | (183,957 | ) | | | 39,535 | | | $ | 425,451 | |
| | | | | | | | | | | | | | | | |
CLASS C | | | | | | | | | | | | | | | | |
Shares sold | | | 4,308 | | | $ | 41,000 | | | | 10,058 | | | $ | 105,120 | |
Shares sold through reinvestments of distributions | | | 248 | | | | 2,337 | | | | 193 | | | | 1,964 | |
Shares redeemed | | | (7,937 | ) | | | (74,070 | ) | | | (2,108 | ) | | | (20,978 | ) |
| | | | | | | | | | | | | | | | |
Net increase (decrease) | | | (3,381 | ) | | $ | (30,733 | ) | | | 8,143 | | | $ | 86,106 | |
| | | | | | | | | | | | | | | | |
CLASS I | | | | | | | | | | | | | | | | |
Shares sold | | | – | | | $ | – | | | | 1,901,140 | | | $ | 20,000,000 | |
Shares sold through reinvestments of distributions | | | – | | | | – | | | | – | | | | – | |
Shares redeemed | | | – | | | | – | | | | – | | | | – | |
| | | | | | | | | | | | | | | | |
Net increase | | | – | | | $ | – | | | | 1,901,140 | | | $ | 20,000,000 | |
| | | | | | | | | | | | | | | | |
CLASS Y | | | | | | | | | | | | | | | | |
Shares sold | | | 76,276 | | | $ | 724,207 | | | | 1,964,043 | | | $ | 20,629,580 | |
Shares sold through reinvestments of distributions | | | 1,840 | | | | 17,328 | | | | 1,949 | | | | 20,360 | |
Shares redeemed | | | (24,839 | ) | | | (233,302 | ) | | | (41,536 | ) | | | (436,635 | ) |
| | | | | | | | | | | | | | | | |
Net increase | | | 53,277 | | | $ | 508,233 | | | | 1,924,456 | | | $ | 20,213,305 | |
| | | | | | | | | | | | | | | | |
217
Barings Funds Trust 2018 Semi-Annual Report
NOTES TO FINANCIAL STATEMENTS(CONTINUED)
December 31, 2018 (Unaudited)
Global Emerging Markets Equity Fund
| | | | | | | | |
| | | FOR THE PERIOD ENDED
DECEMBER 31,
2018(1) | |
| CLASS A | | SHARES | | | AMOUNT | |
Shares sold | | | 10,000 | | | $ | 100,000 | |
Shares sold through reinvestments of distributions | | | – | | | | – | |
Shares redeemed | | | – | | | | – | |
| | | | | | | | |
Net increase | | | 10,000 | | | $ | 100,000 | |
| | | | | | | | |
CLASS C | | | | | | | | |
Shares sold | | | 10,000 | | | $ | 100,000 | |
Shares sold through reinvestments of distributions | | | – | | | | – | |
Shares redeemed | | | – | | | | – | |
| | | | | | | | |
Net increase | | | 10,000 | | | $ | 100,000 | |
| | | | | | | | |
CLASS I | | | | | | | | |
Shares sold | | | 490,000 | | | $ | 4,900,000 | |
Shares sold through reinvestments of distributions | | | – | | | | – | |
Shares redeemed | | | – | | | | – | |
| | | | | | | | |
Net increase | | | 490,000 | | | $ | 4,900,000 | |
| | | | | | | | |
CLASS Y | | | | | | | | |
Shares sold | | | 490,000 | | | $ | 4,900,000 | |
Shares sold through reinvestments of distributions | | | – | | | | – | |
Shares redeemed | | | – | | | | – | |
| | | | | | | | |
Net increase | | | 490,000 | | | $ | 4,900,000 | |
| | | | | | | | |
| | (1) | Fund commenced operations on September 17, 2018. |
Global High Yield Fund
| | | | | | | | | | | | | | | | |
| | | FOR THE SIX MONTHS ENDED
DECEMBER 31, 2018 | | | FOR THE YEAR ENDED JUNE 30, 2018 | |
| CLASS A | | SHARES | | | AMOUNT | | | SHARES | | | AMOUNT | |
Shares sold | | | 7,899 | | | $ | 75,082 | | | | 127 | | | $ | 1,278 | |
Shares sold through reinvestments of distributions | | | 271 | | | | 2,498 | | | | 59 | | | | 602 | |
Shares redeemed | | | (208 | ) | | | (1,960 | ) | | | – | | | | – | |
| | | | | | | | | | | | | | | | |
Net increase | | | 7,962 | | | $ | 75,620 | | | | 186 | | | $ | 1,880 | |
| | | | | | | | | | | | | | | | |
CLASS C | | | | | | | | | | | | | | | | |
Shares sold | | | 5,503 | | | $ | 50,233 | | | | – | | | $ | – | |
Shares sold through reinvestments of distributions | | | 553 | | | | 5,208 | | | | 976 | | | | 9,925 | |
Shares redeemed | | | (6,602 | ) | | | (59,687 | ) | | | (4,423 | ) | | | (44,337 | ) |
| | | | | | | | | | | | | | | | |
Net decrease | | | (546 | ) | | $ | (4,246 | ) | | | (3,447 | ) | | $ | (34,412 | )�� |
| | | | | | | | | | | | | | | | |
218
Barings Funds Trust 2018 Semi-Annual Report
NOTES TO FINANCIAL STATEMENTS(CONTINUED)
December 31, 2018 (Unaudited)
| | | | | | | | | | | | | | | | |
| | | FOR THE SIX MONTHS ENDED
DECEMBER 31, 2018 | | | FOR THE YEAR ENDED JUNE 30, 2018 | |
| CLASS I | | SHARES | | | AMOUNT | | | SHARES | | | AMOUNT | |
Shares sold | | | – | | | $ | – | | | | – | | | $ | – | |
Shares sold through reinvestments of distributions | | | – | | | | – | | | | – | | | | – | |
Shares redeemed | | | – | | | | – | | | | – | | | | – | |
| | | | | | | | | | | | | | | | |
Net increase | | | – | | | $ | – | | | | – | | | $ | – | |
| | | | | | | | | | | | | | | | |
CLASS Y | | | | | | | | | | | | | | | | |
Shares sold | | | 14,901 | | | $ | 147,164 | | | | 350,327 | | | $ | 3,558,842 | |
Shares sold through reinvestments of distributions | | | 878 | | | | 8,312 | | | | 10,313 | | | | 105,798 | |
Shares redeemed | | | (16,079 | ) | | | (158,010 | ) | | | (485,834 | ) | | | (4,925,710 | ) |
| | | | | | | | | | | | | | | | |
Net decrease | | | (300 | ) | | $ | (2,534 | ) | | | (125,194 | ) | | $ | (1,261,070 | ) |
| | | | | | | | | | | | | | | | |
U.S. High Yield Fund
| | | | | | | | | | | | | | | | |
| | | FOR THE SIX MONTHS ENDED
DECEMBER 31, 2018 | | | FOR THE YEAR ENDED JUNE 30, 2018 | |
| CLASS A | | SHARES | | | AMOUNT | | | SHARES | | | AMOUNT | |
Shares sold | | | 25,411 | | | $ | 250,300 | | | | 311,531 | | | $ | 3,152,721 | |
Shares sold through reinvestments of distributions | | | 6,032 | | | | 58,930 | | | | 19,367 | | | | 197,966 | |
Shares redeemed | | | (184,795 | ) | | | (1,813,787 | ) | | | (282,527 | ) | | | (2,883,028 | ) |
| | | | | | | | | | | | | | | | |
Net increase (decrease) | | | (153,352 | ) | | $ | (1,504,557 | ) | | | 48,371 | | | $ | 467,659 | |
| | | | | | | | | | | | | | | | |
CLASS C | | | | | | | | | | | | | | | | |
Shares sold | | | – | | | $ | – | | | | – | | | $ | – | |
Shares sold through reinvestments of distributions | | | – | | | | – | | | | 88 | | | | 900 | |
Shares redeemed | | | – | | | | – | | | | (1,277 | ) | | | (12,651 | ) |
| | | | | | | | | | | | | | | | |
Net increase (decrease) | | | – | | | $ | – | | | | (1,189 | ) | | $ | (11,751 | ) |
| | | | | | | | | | | | | | | | |
CLASS I | | | | | | | | | | | | | | | | |
Shares sold | | | – | | | $ | – | | | | – | | | $ | – | |
Shares sold through reinvestments of distributions | | | 8,493 | | | | 82,437 | | | | 23,290 | | | | 237,490 | |
Shares redeemed | | | – | | | | – | | | | – | | | | – | |
| | | | | | | | | | | | | | | | |
Net increase | | | 8,493 | | | $ | 82,437 | | | | 23,290 | | | $ | 237,490 | |
| | | | | | | | | | | | | | | | |
CLASS Y | | | | | | | | | | | | | | | | |
Shares sold | | | 385,559 | | | $ | 3,754,037 | | | | 2,624,846 | | | $ | 25,986,787 | |
Shares sold through reinvestments of distributions | | | 86,050 | | | | 835,576 | | | | 44,607 | | | | 445,882 | |
Shares redeemed | | | (681,489 | ) | | | (6,566,520 | ) | | | (62,945 | ) | | | (636,602 | ) |
| | | | | | | | | | | | | | | | |
Net increase (decrease) | | | (209,880 | ) | | $ | (1,976,907 | ) | | | 2,606,508 | | | $ | 25,796,067 | |
| | | | | | | | | | | | | | | | |
219
Barings Funds Trust 2018 Semi-Annual Report
NOTES TO FINANCIAL STATEMENTS(CONTINUED)
December 31, 2018 (Unaudited)
The Trust (the “Borrower”) has entered into a Credit Agreement (the “Credit Agreement”) with State Street Bank and Trust Company (the “Bank”). The Credit Agreement provides for a revolving credit facility of $40,000,000 (the “Facility Amount”) to be utilized for temporary or emergency purposes to fund shareholder redemptions or for other short-term liquidity purposes. Per the Credit Agreement, outstanding principal on the loan shall bear interest at a variable rate per annum equal to the higher of (a) the Federal Funds Rate as in effect on the day of the borrowing plus 1.25% and (b) the one month LIBOR rate as in effect on the day of the borrowing plus 1.25%. In addition, the Borrower shall pay to the Bank a commitment fee at the rate of 0.25% per
annum on the daily unused portion of the Facility Amount. As of June 30, 2018, there were no loans outstanding pursuant to the Credit Agreement. Effective July 18, 2018, the Facility Amount increased from $40,000,000 to $61,000,000.
Management has considered the circumstances under which the Funds should recognize or make disclosures regarding events or transactions occurring subsequent to December 31, 2018 through the date the financial statements were issued. Adjustments or additional disclosures, if any, have been included in these financialstatements.
220
Barings Funds Trust 2018 Semi-Annual Report
APPROVAL OF INVESTMENT MANAGEMENT AGREEMENT ANDSUB-ADVISORY AGREEMENT
The Investment Company Act of 1940 (the “1940 Act”) requires that a majority of both the full Board of Trustees and the Trustees who are not interested persons of the Trust, as defined under the 1940 Act (“Independent Trustees”), voting separately, annually approve the continuation of the Investment Management Agreement between Barings Funds Trust (the “Trust”), on behalf of each of its eight series funds (the “Funds”), and Barings LLC (“Barings”) (the “Management Agreement”) andthe Sub-Advisory Agreement between Barings and Barings Global Advisers Limited (“BGA”) (the “BGASub-Advisory Agreement”). Similarly, the 1940 Act requires that a majority of both the full Board of Trustees and the Independent Trustees approve initially, on behalf of Barings Global Emerging Markets Equity Fund, the Management Agreement and theSub-Advisory Agreement (the “BIILSub-Advisory Agreement” and, together with the Management Agreement and the BGASub-Advisory Agreement, the “Agreements”) between Barings and Barings International Investments Limited (“BIIL”). In addition, in connection with Barings’ consolidation of certain of its wholly-owned corporate entities, including the effective consolidation of BGA into BIIL, immediately after which the same personnel would be providing the same services to the Funds, Barings proposed that the Board of Trustees and the Independent Trustees approve the BIILSub-Advisory Agreement on behalf of the other Funds, as is also required by the 1940 Act. With respect to the BIILSub-Advisory Agreement, the Trustees also considered Barings’ representation that the same people will continue to perform the same services they currently perform for the Funds, through BIIL, rather than BGA, and that the BIILSub-Advisory Agreement will not result in any change to the management of the Funds or the scope or quality of services provided to the Funds. The Trustees considered matters bearing on the Funds and the Agreements at their meetings throughout the year, including a review of the Funds’ performance at each regular meeting.At in-person meetings held on May 9, 2018 and August 2, 2018 (the “Meetings”), the Trustees met for the purpose of considering whether to approve the Agreements for the Funds. The Trustees’ review process and considerations in approving the Agreements are summarized below.
Prior to the Meetings, the Trustees requested and received from Morgan, Lewis & Bockius LLP, independent legal counsel to the Independent Trustees, a memorandum describing the Trustees’ legal responsibilities in connection with their review and approval of the Agreements. The Independent Trustees met prior to the August Board meeting with independent legal counsel to discuss their duties, the memorandum and the Agreements. The Trustees also requested and received from Barings extensive written and oral information regarding various matters including: the principal terms of the Agreements; Barings and its personnel; the Funds’ investment performance, including comparative performance information; the nature and quality of the services provided by Barings to the Funds; the financial strength of Barings; the fee arrangements between Barings and each Fund and each Fund’s fee and expense information, including comparative fee and expense information; the profitability of the Agreements to Barings; and the potential “fallout” benefits to Barings resulting from the Agreements.
The Trustees’ conclusion as to the continuation of the Agreements was based on a comprehensive consideration of all information provided to the Board and not the result of any single issue. Some of the more significant factors that influenced the Trustees’ deliberations are described below, although individual Trustees may have evaluated the information presented differently from one another, giving different weights to different factors. It is also important to recognize that the Board’s review of the Agreements is the result of ongoing review and discussion, rather than a single discussion. The Trustees’ conclusions may be based, in part, on their consideration of these arrangements throughout the year and in prior years.
The Trustees considered the terms of the Agreements, including the scope of the advisoryand non-advisory services provided under the Agreements or otherwise. In evaluating the nature, scope and quality of the services provided by Barings to Barings Active Short Duration Bond Fund, Barings Total Return Bond Fund and Barings U.S. High Yield Fund; by Barings and BGA to Barings Emerging Markets Debt Blended Total Return Fund, Barings Global Credit Income Opportunities Fund, Barings Global Floating Rate Fund and Barings Global High Yield Fund; and by Barings and BIIL to Barings Global Emerging Markets Equity Fund, the Trustees considered the specific responsibilities of each of Barings, BGA and BIIL inthe day-to-day management of the Fund, the qualifications, experience and responsibilities of the portfolio managers and other key personnel who are involved inthe day-to-day management of the Fund, the ability of each of Barings, BGA and BIIL to attract and retain high-quality personnel, and the organizational depth and stability of each of Barings, BGA and BIIL. The Trustees also considered the trading capabilities of each of Barings, BGA and BIIL.
221
Barings Funds Trust 2018 Semi-Annual Report
APPROVAL OF INVESTMENT MANAGEMENT AGREEMENT AND SUB-ADVISORY AGREEMENT(CONTINUED)
The Trustees reviewed the Funds’ investment performance, as well as the performance of peer groups of funds, over various time periods, using information provided by Broadridge Financial Solutions, Inc. (“Broadridge”) and Barings. The Trustees noted that the net total return performance of Class I shares of each of the Funds was as follows: Barings Global Floating Rate Fund ranked in the 2nd quintile of its Broadridge performance universe forthe one-year period, and the 1st quintile for each of thetwo-year, three-year and four-year periods, ended March 31, 2018 (the 1st quintile being the best performers and the 5th quintile being the worst performers); Barings Global Credit Income Opportunities Fund ranked in the 2nd quintile of its Broadridge performance universe forthe one-year period, and in the 1st quintile for each of thetwo-year, three-year and four-year periods ended March 31, 2018; Barings Active Short Duration Bond Fund ranked in the 1st quintile of its Broadridge performance universe for each ofthe one-year andtwo-year periods ended March 31, 2018; Barings Total Return Bond Fund ranked in the 1st quintile of its Broadridge performance universe for each ofthe one-year andtwo-year periods ended March 31, 2018; Barings Emerging Markets Debt Blended Total Return Fund ranked in the 1st quintile of its Broadridge performance universe for each ofthe one-year andtwo-year periods ended March 31, 2018; Barings Global High Yield Fund ranked in the 2nd quintile of its Broadridge performance universe forthe one-year period, and in the 1st quintile for thetwo-year period, ended March 31, 2018; and Barings U.S. High Yield Fund ranked in the 4th quintile of its Broadridge performance universe forthe one-year period, and in the 2nd quintile for thetwo-year period, ended March 31, 2018. Because Barings Global Emerging Markets Equity Fund was newly organized and had not yet commenced investment operations at the time of the Meetings, the Fund had no investment performance for the Trustees to review. In the course of their deliberations, the Trustees also took into account information provided by Barings during investment review meetings conducted with portfolio management personnel during the course of the year. After reviewing these and related factors, the Trustees concluded, within the context of their overall conclusions regarding the Agreements, that they were satisfied with the performance achieved by Barings and BGA.
The Trustees considered the investment management fee paid by each Fund to Barings pursuant to the Management Agreement. The Trustees noted that Barings (and not the Funds) pays BGA or BIILits sub-advisory fee under the applicablesub-advisory agreement. In assessing the reasonableness of the fee paid by the Funds under the Management Agreement, the Trustees considered, among other information, each Fund’s advisory fee and the total expense ratio for the Fund’s shares as a percentage of net asset value and the advisory fee and total expense ratios of peer groups of funds based on information provided by Broadridge. The Trustees considered that, according to the Broadridge data (which takes into account any fee reductions or expense limitations that were in effect during the last fiscal year), the effective advisory fee rate and total expense ratio for each Fund’s Class I shares were as follows: Barings Global Floating Rate Fund’s effective advisory fee rate was lower than the Broadridge expense group median and total expense ratio was higher than the Broadridge expense group average; Barings Global Credit Income Opportunities Fund’s effective advisory fee rate was lower than the Broadridge expense group median and total expense ratio was lower than the Broadridge expense group average; Barings Active Short Duration Bond Fund’s effective advisory fee rate was lower than the Broadridge expense group median and total expense ratio was lower than the Broadridge expense group average; Barings Total Return Bond Fund’s effective advisory fee rate was lower than the Broadridge expense group median and total expense ratio was lower than the Broadridge expense group average; Barings Emerging Markets Debt Blended Total Return Fund’s effective advisory fee rate was higher than the Broadridge expense group median and total expense ratio was lower than the Broadridge expense group average; Barings Global High Yield Fund’s effective advisory fee rate was lower than the Broadridge expense group median and total expense ratio was lower than the Broadridge expense group average; and Barings U.S. High Yield Fund’s effective advisory fee rate was lower than the Broadridge expense group median and total expense ratio was lower than the Broadridge expense group average. In assessing the reasonableness of Barings Global Emerging Markets Equity Fund’s advisory fee, the Trustees considered, among other information, the Fund’s proposed advisory fee and the estimated total expense ratio of the Fund’s Class I shares as a percentage of average daily net assets and the advisory fee and total expense ratios of peer groups of funds based on information provided by Broadridge. The Trustees also considered that Barings will observe an expense limitation for the Fund, which may not be changed without the Trustees’ approval. The Trustees considered that, according to the data provided by Broadridge (which takes into account any proposed fee reductions or expense limitations for the Fund), Barings Global Emerging Markets Equity Fund’s effective advisory fee rate would be lower than the Broadridge expense group median and total expense ratio would be higher than the Broadridge expense group average.
222
Barings Funds Trust 2018 Semi-Annual Report
APPROVAL OF INVESTMENT MANAGEMENT AGREEMENT AND SUB-ADVISORY AGREEMENT(CONTINUED)
The Trustees then considered that, as each Fund’s assets increase, each Fund and its shareholders would be expected to realize economies of scale as certain expenses, such as fixed operating costs, become a smaller percentage of overall assets. They considered the extent to which any such savings would benefit shareholders and Barings’ statement that it would consider proposing breakpoints in the management fee payable by a Fund once a Fund approached the break-even point. The Trustees noted that Barings has instituted caps on expenses that insulate shareholders from the effects on expenses of the Funds’ relatively small size.
The Trustees reviewed information prepared by Barings regarding Barings’ costs of managing the Funds, and the profitability of the Management Agreement to Barings. In considering the profitability of Barings, the Board noted that each of BGA and BIIL is an affiliate of Barings and is paid by Barings, and, therefore, did not consider BGA’s or BIIL’s profitability separately. The Trustees then consideredpotential “fall-out” benefits to Barings and its affiliates as a result of Barings’ relationship with the Trust. The Board concluded that, in light of the expected costs of providing investment management and other services to the Trust and Barings’ commitment to cap the expenses of each Fund, the other ancillary benefits that Barings and its affiliates expect to receive supported the approval of the Agreements. The Trustees concluded that, at this time, and in light of the nature, extent and quality of the respective services provided by Barings, the fee rates and expenses of each Fund supported the approval of the Management Agreement and theapplicable sub-advisory agreement.
Based on their evaluation of factors that they deemed to be material, including those factors described above, the Board of Trustees, including the Independent Trustees, concluded that the Management Agreement and theSub-Advisory Agreement with BGA should be continued for an additionalone-year period through August 2019 and that theSub-Advisory Agreement with BIIL should be approved for aone-year period through August 2019.
223
Barings Funds Trust
Item 2. Code of Ethics.
Not applicable to this semi-annual report.
Item 3. Audit Committee Financial Expert.
Not applicable to this semi-annual report.
Item 4. Principal Accountant Fees and Services.
Not applicable to this semi-annual report.
Item 5. Audit Committee of Listed Registrants.
Not applicable to this semi-annual report.
Item 6. Investments.
| (a) | The Registrant’s Consolidated Schedule of Investments as of the close of the reporting period is included in the Semi-Annual Report to Shareholders filed under Item 1 of this form. |
Item 7. Disclosure of Proxy Voting Policies and Procedures forClosed-End Management Investment Companies.
Not applicable.
Item 8. Portfolio Managers ofClosed-End Investment Management Companies.
Not applicable.
Item 9. Purchases of Equity Securities byClosed-End Management Investment Company and Affiliated Purchasers.
Not applicable.
Item 10. Submission of Matters to a Vote of Security Holders.
There have been no material changes to procedures by which the shareholders may recommend nominees to the Registrant’s Board of Trustees.
Item 11. Controls and Procedures.
| (a) | The Registrant’s principal executive officer and principal financial officer, or persons performing similar functions, have concluded that the Registrant’s disclosure controls and procedures as defined in Rule30a-3(c) under the Investment Company Act of 1940, as amended (the “1940 Act”), are effective as of a date within 90 days of the filing date of this report based on the evaluation of these controls and procedures required by Rule30a-3(b) under the 1940 Act and Rules13a-15(b) or15d-15(b) under the Securities Exchange Act of 1934, as amended. |
| (b) | There were no changes in the Registrant’s internal control over financial reporting (as defined in Rule30a-3(d) under the 1940 Act) that occurred during the second fiscal quarter of the period covered by this report that have materially affected or are reasonably likely to materially affect, the Registrant’s internal control over financial reporting. |
Item 12. Disclosure of Securities Lending Activities forClosed-End Management Investment Companies.
Item 13. Exhibits.
| | |
| (a)(1) | | Not applicable. |
| |
| (a)(2) | | Certifications pursuant to Rule30a-2(a) under the 1940 Act are attached hereto. |
| |
| | Exhibit 99.1 Cert |
| | Exhibit 99.2 Cert |
| |
| (a)(3) | | Not applicable. |
| |
| (a)(4) | | Not applicable. |
| |
| (b) | | Certification pursuant to Rule30a-2(b) under the 1940 Act is attached hereto. |
| |
| | Exhibit 99.906 Cert |
SIGNATURES
Pursuant to the requirements of the Securities Exchange Act of 1934 and the Investment Company Act of 1940, the Registrant has duly caused this report to be signed on its behalf by the undersigned, thereunto duly authorized.
| | |
| (Registrant) Barings Funds Trust �� |
|
| By (Signature and Title) /s/ Dan McGee |
| Dan McGee, President (Principal Executive Officer) |
|
| Date March 8, 2019 |
Pursuant to the requirements of the Securities Exchange Act of 1934 and the Investment Company Act of 1940, this report has been signed below by the following persons on behalf of the Registrant and in the capacities and on the dates indicated.
| | |
| By (Signature and Title) /s/ Dan McGee |
| Dan McGee, President (Principal Executive Officer) |
|
| Date March 8, 2019 |
|
| By (Signature and Title) /s/ Carlene Pollock |
| Carlene Pollock, Chief Financial Officer (Principal Financial Officer) |
|
| Date March 8, 2019 |