UNITED STATES
SECURITIES AND EXCHANGE COMMISSION
Washington, D.C. 20549
FORM N-CSR
CERTIFIED SHAREHOLDER REPORT OF REGISTERED
MANAGEMENT INVESTMENT COMPANIES
Investment Company Act file number(s) 811-22845
Babson Capital Funds Trust
(Exact Name of Registrant as Specified in Charter)
550 South Tryon Street
Suite 3300
Charlotte, NC 28202
(Address of Principal Executive Offices)
Registrant’s telephone number, including area code: (704) 805-7200
Janice M. Bishop
Secretary and Chief Legal Officer
c/o Babson Capital Management LLC
Independence Wharf
470 Atlantic Avenue
Boston MA 02210
(Name and Address of Agent for Service)
Date of fiscal year end: June 30
Date of reporting period: December 31, 2015
Item 1. Reports to Stockholders.

BABSON CAPITAL FUNDS TRUST
Semi-Annual Report
December 31, 2015
This page intentionally left blank.

Anthony Sciacca
President
Babson Capital Funds Trust
Babson Capital Funds Trust
Babson Global Floating Rate Fund
Babson Global Credit Income Opportunities Fund
Babson Active Short Duration Bond Fund
Babson Total Return Bond Fund
Babson Emerging Market Debt Blended Total Return Fund
Babson Emerging Market Local Currency Debt Fund
Babson Global High Yield Fund
Babson U.S. High Yield Fund
Dear Shareholder,
Markets were volatile throughout 2015, and the final six months of the year did little to soothe investors’ angst about the future direction of the global economy. Falling commodity prices, currency market swings, uneven economic growth and opposing central bank monetary policies cast a negative pall on the minds of investors in the third and fourth quarters. Policy divergence among central banks was notably evident in December, as the U.S. Federal Reserve (Fed) began tightening monetary policy by raising interest rates for the first time in nearly a decade while central banks in Europe, China and Japan continued a loose monetary policy stance. The Fed’s move in December offered a glimmer of hope that the U.S. economy had recovered sufficiently to begin to raise interest rates after a decade of moribund growth and elevated unemployment levels. But that glimmer may already be dissipating, as recent Fed policy guidance indicates additional interest rate increases in 2016 may be muted.
The dichotomy among central banks in their efforts to manage economies is just one of several headwinds facing investors in 2016. Decelerating global growth remains a concern, with China, the world’s second-largest economy, showing signs of strain. Inflation expectations are declining globally, making it difficult for central banks to identify catalysts to move interest rates significantly higher than current levels. Case in point—the European Central Bank (ECB) elected to extend its current quantitative easing program by at least six months to March 2017. Add to the mix the U.S. presidential election and rising geopolitical tensions across Europe, the Middle East and parts of Asia, and 2016 is off to an inauspicious beginning. Investors are understandably tentative.
At Babson, we believe that with uncertainty comes opportunity. Our mutual fund platform has been constructed to reflect the best of our core competencies as an organization. With the addition of six new funds during the fourth quarter, our platform offers a diverse selection of investment vehicles that provide investors with access to the global fixed income markets, leveraging the same investment experience that we provide to the many institutional clients that we are privileged to serve. Our investment teams conduct rigorous fundamental analysis on every company in which we invest, while also bringing local market insights from our investment teams around the globe. While we expect continued headwinds in the near term, we believe the market volatility will likely provide opportunities to invest in high-conviction names. The markets in which we invest are inherently volatile, but by adhering to a disciplined, repeatable, bottom-up investment process and investing through the economic cycle, we believe we can identify attractive investment opportunities and create portfolios that are able to weather market turbulence over the long term. Our process has served our clients well for decades, through many market cycles and in adverse market conditions.
On behalf of the entire Babson team, we thank you for your partnership and trust, and we look forward to helping you achieve your investment objectives.
Sincerely,

Anthony Sciacca
Cautionary Notice: Certain statements contained in this report may be “forward looking” statements. Investors are cautioned not to place undue reliance on forward-looking statements, which speak only as of the date in which they are made and reflect management’s current estimates, projections, expectations or beliefs, and which are subject to risks and uncertainties that may cause actual results to differ materially. These statements are subject to change at any time based upon economic, market or other conditions and may not be relied upon as investment advice or an indication of Babson Capital Funds Trust’s (the “Trust”) trading intent. References to specific securities are not recommendations of such securities, and may not be representative of the Trust’s current or future investments. We undertake no obligation to publicly update these forward looking statements, whether as a result of new information, future events, or otherwise.
ALPS Distributors, Inc. is the distributor for the Babson mutual funds. ALPS and Babson are separate and unaffiliated. A prospectus can be obtained by calling 1.855.439.5459. Read the prospectus carefully before investing. Investors should carefully consider the investment objective, risks, charges and expenses of any mutual fund before investing. This and other important information is contained in the prospectus and summary prospectus.
1
Babson Global Floating Rate Fund 2015 Semi-Annual Report
Investment Objective
The investment objective of the Babson Global Floating Rate Fund (“Global Floating Rate Fund” or the “Fund”) is to seek a high level of current income. Preservation of capital is a secondary goal.
Portfolio Management Commentary
How did the Fund perform?
| | n | | The Fund reported a net total rate of return for the semi-annual reporting period from July 1, 2015 through December 31, 2015 of -3.50% and underperformed the Credit Suisse Global Loan Benchmark, which returned -2.66%.1 |
What factors influenced performance of the Fund?
| | n | | For the semi-annual reporting period, the Fund was overweight to European assets. The Fund’s European assets provided positive contribution to returns, while U.S. assets detracted from the Fund’s performance. |
| | n | | The Fund’s investments in the Energy sector and Metals/Mining sector were the leading detractors to contribution to return. Continued volatility and pressure on the price of oil caused commodity-related issuers to face significant selling pressure over the period. Seven of the Fund’s bottom ten contributors to its performance were commodity-related issuers. |
Describe recent portfolio activity.
| | n | | The number of portfolio holdings decreased to 185 from 197 during the reporting period. As a result, the portfolio’s positioning in Floating Rate Debt increased to 86.07% from 83.65%, and Fixed Rate Debt holdings decreased to 6.55% from 9.47%. |
| | n | | The Fund’s positioning across geographies remains relatively unchanged as the Fund remained overweight to European assets relative to the European weight in the global senior secured loan market. Even with the overweight positioning, the Fund modestly increased its exposure to U.S. assets over the past six months as the U.S. market experienced greater pricing pressure than the European market. |
| | n | | Over the past six months, the Fund’s Top 5 Industry concentrations remain unchanged with Healthcare, Education and Childcare maintaining the highest concentration, followed by Diversified/Conglomerate Service, Finance, Chemicals, Plastics and Rubber, and Retails Stores, respectively. |
Describe portfolio positioning at period end.
| | n | | The Fund finished the semi-annual reporting period, December 31, 2015, with holdings primarily in senior secured debt, namely 77.3% in First Lien Senior Secured Loans, 5.5% in Second Lien Senior Secured Loans, and 9.5% in Senior Secured Bonds. Senior Unsecured bonds composed just 0.3% of the portfolio. |
| | n | | From an industry perspective, the Fund remains well-diversified across a number of sectors based on Moody’s Industry Classification, with higher concentrations in Healthcare, Education and Childcare (10.5%), Diversified/Conglomerate Service (7.7%), and non-bank related Finance companies (7.4%) as of December 31, 2015. |
| 1. | Total return describes the return to an investor based on the Class Y net expense ratio and includes the reinvestment of dividends and capital gains. Performance results reflect past performance and are no guarantee of future results. Current performance may be lower or higher than the performance data quoted. The net asset value (NAV) will fluctuate with market conditions. All returns 1-year or less are cumulative. The Credit Suisse Global Loan Benchmark is a market capitalization weighted average of the Credit Suisse Leveraged Loan Index and the Credit Suisse Western European Leveraged Loan Index. The Credit Suisse Leveraged Loan Index is designed to mirror the investable universe of the U.S. dollar-denominated leveraged loan market. The Credit Suisse Western European Leveraged Loan Index is designed to mirror the investable universe of the Western European leveraged loan market, with loans denominated in U.S. and Western European currencies. Indices are unmanaged. It is not possible to invest directly in an index. |
2
Babson Global Floating Rate Fund 2015 Semi-Annual Report
| | n | | As of December 31, 2015, the Fund had the following credit quality breakdown: 16.6% in Ba assets, 59.6% in single-B credits and a small exposure to Caa and below at 4.4%. Approximately 10.6% of the Fund’s assets are not publicly rated, primarily consisting of European issuers that we believe have a credit quality similar to that of other assets in the portfolio. Cash and accrued income was 7.4% and Baa assets accounted for the remaining 2.2% of the portfolio assets.2 |
| | n | | The Top 5 countries in the portfolio at the end of the semi-annual reporting period are the U.S. (64.5%), the United Kingdom (14.6%), Germany (9.3%), France (3.2%) and Canada (2.7%). Overall, the Fund has exposure to 16 different countries, and we continue to focus on building a well-diversified portfolio of global floating rate securities. |
Describe market and portfolio outlook.
| | n | | As we look into 2016, the Energy and Commodity sectors will continue to remain volatile as a result of the supply and demand imbalance. This volatility should be primarily concentrated in the U.S., as the European loan market has very little exposure to the Energy sector. |
| | n | | Despite a volatile reporting period, we believe issuer fundamentals outside of Energy and Commodity related sectors remain largely intact. With the exception of those troubled sectors, we expect loan market default rates to remain below long-term averages; within Energy and Commodities, however, we anticipate an increase in defaults in 2016. |
| | n | | Further divergence of Fed and ECB monetary policy will likely impact the global loan market to varying degrees in 2016. |
| 2. | Ratings shown are the highest rating given by one of the following national rating agencies: S&P or Moody’s. Additional information about ratings can be found at www.moodys.com and www.standardandpoors.com. Credit ratings are subject to change. AAA, AA, A, and BBB are investment grade ratings; BB, B, CCC/CC/C and D are below investment grade ratings. Bonds backed by U.S. Government or agency securities are given an implied rating equal to the rating of such securities. Holdings designated Not Publicly Rated are not rated by these national rating agencies. |
3
Babson Global Floating Rate Fund 2015 Semi-Annual Report
PORTFOLIO COMPOSITION (% OF ASSETS*)
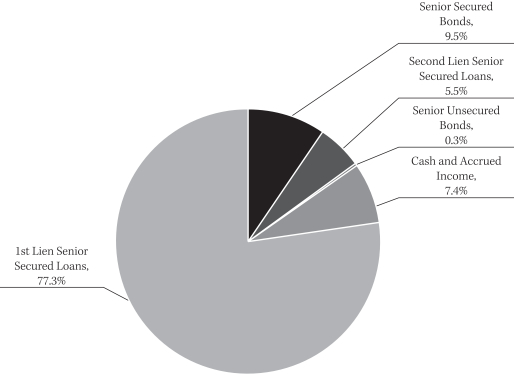
| * | The percentages shown above represent a percentage of the assets as of December 31, 2015. |
COUNTRY COMPOSITION (% OF ASSETS**)
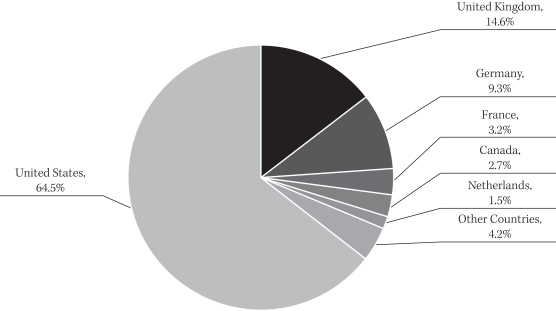
| ** | Percentage of assets are expressed by market value excluding cash and accrued income, and may vary over time. The percentages shown above represent a percentage of the assets as of December 31, 2015. |
4
Babson Global Credit Income Opportunities Fund 2015 Semi-Annual Report
Investment Objective
The investment objective of the Babson Global Credit Income Opportunities Fund (“Global Credit Income Opportunities Fund” or the “Fund”) is to seek an absolute return, primarily through current income and secondarily through capital appreciation.
Portfolio Management Commentary
How did the Fund perform?
| | n | | The Fund reported a net total rate of return for the semi-annual reporting period from July 1, 2015 through December 31, 2015, of -4.95% and underperformed the 3 Month USD LIBOR + 500 basis points1 Benchmark, which retuned 2.72%2 |
What factors influenced performance of the Fund?
| | n | | During the semi-annual reporting period, European assets were the main contributors to performance, while the U.S. assets, special situations and CLO’s were the main detractors. |
| | n | | The Energy sector was the largest detractor to contribution to return over the six month period. Continued volatility and pressure on the price of oil caused commodity-related issuers to face significant selling pressure over the period. The Fund was negatively impacted by its exposure to these credits. Six of the Fund’s bottom ten contributors to its underperformance were commodity-related issuers. |
| | n | | During the period, CLO’s also faced significant selling pressure and three of the Fund’s bottom ten contributors were CLO’s. |
| | n | | The Fund’s special situation credits had a negative impact on performance during the semi-annual reporting period; however, we believe these assets provide attractive current income to the portfolio and should contribute to the Fund’s performance in the future. |
Describe recent portfolio activity.
| | n | | The number of holdings in the portfolio decreased slightly during the second half of the year even though the Fund’s assets grew slightly. Despite the small decrease in the number of holdings, the Fund’s positioning across geographies remained fairly consistent and the Fund continues to maintain significant positions in high conviction credits while maintaining an average credit rating of single-B. |
| | n | | The Fund increased its exposure to global high yield bonds while reducing senior secured loans in order to focus on what we believe to be a more attractive part of the below-investment grade market from a risk-adjusted basis. |
| | n | | The Fund remains well diversified across industries with the largest concentration in CLO’s at 17.7% (a 1.0% increase from June 30, 2015), the next two largest industries are Healthcare, Education and Childcare at 6.5% and Chemicals, Plastics and Rubber at 5.7%. Over the past six months, the Fund’s top 3 industry exposures have shifted as the Fund reduced exposure to Oil & Gas (down 3.1%) and Telecom (down 4.5%) and increased exposure to Chemicals, Plastics and Rubber (up 2.0%). |
Describe portfolio positioning at period end.
| | n | | The Fund finished the semi-annual reporting period, December 31, 2015, with an allocation of 51.0%, 22.0%, and 17.7% to global high yield bonds, global senior secured loans and CLOs, respectively. The remainder of the portfolio was invested in a few opportunistic special situation credits at 1.0%, derivatives at 0.2%, equity 0.5% and cash at 7.4%. A significant portion of the portfolio (40.4%) is senior secured in nature, which can potentially mitigate principal loss in the event that default rates increase. |
| 1. | A unit that is equal to 1/100th of 1% or 0.01%. |
| 2. | Total return describes the return to an investor based on the Class Y net expense ratio and includes the reinvestment of dividends and capital gains. Performance results reflect past performance and are no guarantee of future results. Current performance may be lower or higher than the performance data quoted. The net asset value (NAV) will fluctuate with market conditions. All returns 1-year or less are cumulative. The 3 Month USD LIBOR (London Interbank Offered Rate) is an average interest rate, determined by the British Bankers Association, that banks charge one another for the use of short-term money (3 months) in England’s Eurodollar market. The return shown includes 3 Month USD LIBOR plus 500 bps, or 5% per annum. LIBOR is unmanaged. It is not possible to invest directly in LIBOR. No assurance can be given that the Fund’s performance will exceed that of LIBOR by any given increment, or at all. |
5
Babson Global Credit Income Opportunities Fund 2015 Semi-Annual Report
| | n | | From an industry perspective, the Fund remains well-diversified across a number of sectors based on Moody’s Industry Classification, with higher concentrations in CLOs (17.7%), Healthcare, Education and Childcare (6.5%) and Chemicals, Plastics and Rubber (5.7%) as of December 31, 2015. |
| | n | | As of December 31, 2015, the Fund had the following credit quality breakdown: 28.0% in Ba assets, 49.2% in single-B credits and a modest exposure to Caa and below at 11.7%. Approximately 3.6% of the Fund’s assets are not publicly rated. Over the course of the last six months, the single-B and Caa and below increased slightly as the Fund’s exposure to unrated, Ba and Baa rated assets decreased slightly.3 |
| | n | | The Top 5 countries in the portfolio at the end of the semi-annual reporting period are the U.S. (66.6%), the United Kingdom (11.5%), Germany (5.9%), the Netherlands (4.2%) and France (2.1%). The U.S. exposure includes the Cayman Islands, which is related to the Fund’s CLO holdings that is predominantly invested in U.S. senior secured loans. Overall, the Fund has exposure to 17 different countries, and we continue to focus on building a well-diversified portfolio of global high yield securities. |
Describe market and portfolio outlook.
| | n | | As we look into 2016, the Energy and Commodity sectors will continue to remain volatile as a result of the supply and demand imbalance. This volatility should be primarily concentrated in the U.S., as the European high yield markets have minimal exposure to the Energy sector. |
| | n | | Despite a volatile reporting period, we believe issuer fundamentals outside of Energy and Commodity related sectors remain largely intact. With the exception of those troubled sectors, we expect high yield market default rates to remain below long-term averages, with Europe expecting to experience the fewest defaults; within Energy and Commodities, mostly in the U.S., however, we anticipate an increase in defaults in 2016. |
| | n | | Further divergence of Fed and ECB monetary policy will likely impact the global high yield markets to varying degrees in 2016. |
| 3. | Ratings shown are the highest rating given by one of the following national rating agencies: S&P or Moody’s. Additional information about ratings can be found at www.moodys.com and www.standardandpoors.com. Credit ratings are subject to change. AAA, AA, A, and BBB are investment grade ratings; BB, B, CCC/CC/C and D are below investment grade ratings. Bonds backed by U.S. Government or agency securities are given an implied rating equal to the rating of such securities. Holdings designated Not Publicly Rated are not rated by these national rating agencies. |
6
Babson Global Credit Income Opportunities Fund 2015 Semi-Annual Report
PORTFOLIO COMPOSITION (% OF ASSETS*)
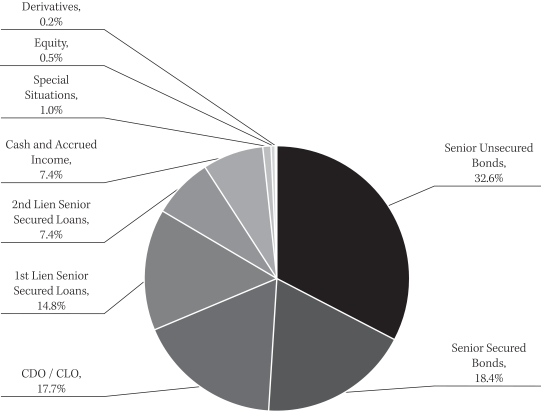
| * | The percentages shown above represent a percentage of the assets as of December 31, 2015. |
7
Babson Global Credit Income Opportunities Fund 2015 Semi-Annual Report
COUNTRY COMPOSITION (% OF ASSETS**)
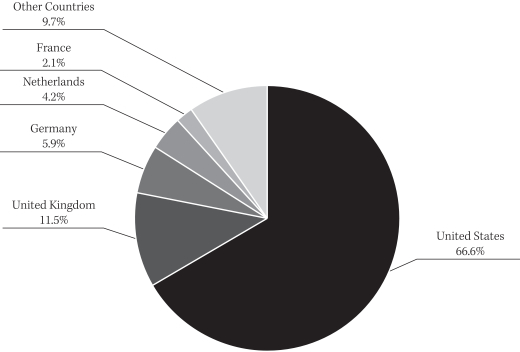
| ** | Percentage of assets are expressed by market value excluding cash and accrued income, and may vary over time. The percentages shown above represent a percentage of the assets as of December 31, 2015. |
8
Babson Active Short Duration Fund 2015 Semi-Annual Report
Investment Objective
Babson Active Short Duration Bond Fund (“Active Short Duration Bond Fund” or the “Fund”) seeks to achieve a high total rate of return primarily from current income while minimizing fluctuations in capital values by investing primarily in a diversified portfolio of short-term investment grade fixed income securities.
Portfolio Management Commentary
How did the Fund perform?
| | n | | The Fund was launched on July 8, 2015 and reported a net total rate of return for the reporting period through December 31, 2015 of -0.93%, underperforming the Barclays U.S. 1-3 Year Government Bond Index, which returned -0.24%.1 |
What factors influenced performance of the Fund?
| | n | | The Fund’s allocation to investment grade corporate, BB-rated high yield bonds and convertible securities were detractors to performance driven largely by the sell-off in Metals & Mining and Oil & Gas producers. |
| | n | | The Securitized sector positively impacted performance over the period. Specific allocations that contributed were U.S. agency MBS, CMBS, non-agency residential mortgage backed securities (RMBS) and consumer ABS. Student loan ABS, however, was a modest negative due to rating agency action within the sector. |
| | n | | Duration positioning positively contributed to performance. The front-end of the yield curve, particularly the two to three year area, flattened as the market priced in a lower probability of an extended series of Fed interest rate hikes. The Fund was at its maximum duration of approximately 2.9 years for much of the period, given the steepness of the yield curve. |
Describe recent portfolio activity.
| | n | | The Fund experienced positive flows during the period and purchases were across Corporate, Securitized and Government sectors. |
| | n | | The Fund reduced holdings in lower quality energy corporates and convertible securities that were believed to be downgrade candidates. Purchases were in Automotive, Banking, Consumer, Insurance and Real Estate Investment Trust (REIT) sectors. The Fund selectively added exposure to student loan ABS due to pricing dislocations. These securities are backed by the federal government and pricing has become attractive as a result of rating agency action. However, this did negatively impact recent performance. |
Describe portfolio positioning at period end.
| | n | | The Fund duration ended the period at 2.9 years, which is about the maximum for the strategy. The steepness of the yield curve between three months and three years led us to retain a maximum duration for the period. |
| | n | | From a sector perspective, the Fund has been well-diversified across Corporates, Securitized and Governments. The Corporate allocation represents approximately 37.5%, with 31% in investment grade corporates and 6% in BB-rated and crossover high yield. Banking represents the largest industry at almost 10% followed by Diversified Industrials (9%). The Fund had a 2.7% allocation to Energy and 0.2% in Convertible Securities. |
| | n | | Securitized ABS represents a 14.5% allocation, it was largely comprised of traditional automotive loan collateral and compelling esoteric collateral such as timeshares, cell towers, medical receivables, and personal consumer loans. CMBS made up 3.8% of the Fund. |
| 1. | Total return describes the return to an investor based on the Class Y net expense ratio and includes the reinvestment of dividends and capital gains. Performance results reflect past performance and are no guarantee of future results. Current performance may be lower or higher than the performance data quoted. The net asset value (NAV) will fluctuate with market conditions. All returns 1-year or less are cumulative. The Barclays U.S. 1-3 Year Government Bond Index is comprised of the U.S. Treasury and U.S. Agency Indices. The U.S. Government Index includes Treasuries (public obligations of the U.S. Treasury) and U.S. agency debentures (publicly issued debt of U.S. Government agencies, quasi-federal corporations, and corporate or foreign debt guaranteed by the U.S. Government) that have remaining maturities of more than one year and up to but not including 3 years. Indices are unmanaged. It is not possible to invest directly in an index. |
9
Babson Active Short Duration Fund 2015 Semi-Annual Report
| | n | | The agency MBS allocation (5.7%) was in lower coupon 15 year FNMAs. The Fund also had a small allocation to agency collateralize mortgage obligations (CMO) with compelling structural features. |
Describe market and portfolio outlook.
| | n | | Volatility will likely persist in 2016, driven by global monetary policies, shifting global growth patterns and fluctuating commodity prices. |
| | n | | U.S. Government yields rose modestly in 2015. However, the case for significantly higher rates is challenging to make, with inflation low and real growth hobbling along at 2%-2.5%. The shape of the short-end of the yield curve bears watching, as there has been a significant flattening from three months to three years. Should this continue, the duration of the Fund may start to shorten. |
| | n | | Commodities will continue to necessitate close monitoring. The Fund is taking opportunities to reduce Energy and Metals & Mining exposure, as well as any other names that may possess idiosyncratic risks. |
| | n | | The recent bout of spread widening should provide the Fund select opportunities. Short weighted average life CLOs offer attractive yields and have experienced less volatility than other asset classes. FFELP student loans may represent one of the better opportunities in ABS. |
10
Babson Active Short Duration Fund 2015 Semi-Annual Report
PORTFOLIO COMPOSITION (% OF ASSETS*)
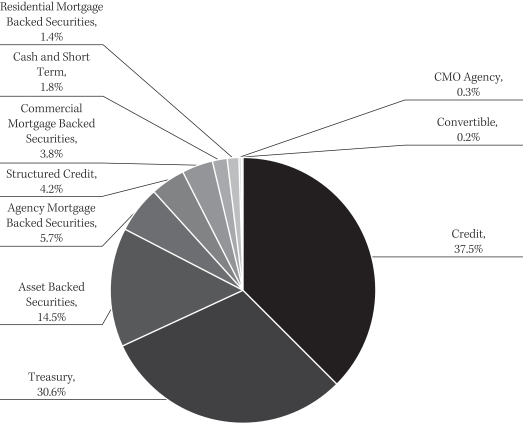
| * | The percentages shown above represent a percentage of the assets as of December 31, 2015. |
11
Babson Total Return Bond Fund 2015 Semi-Annual Report
Investment Objective
Babson Total Return Bond Fund (“Total Return Bond Fund” or the “Fund”) seeks a superior total rate of return by investing in fixed income instruments.
Portfolio Management Commentary
How did the Fund perform?
| | n | | The Fund was launched on July 8, 2015 and reported a net total rate of return for the reporting period through December 31, 2015 of -0.78%, underperforming the Barclays U.S. Aggregate Bond Index, which returned 0.16%.1 |
What factors influenced performance of the Fund?
| | n | | An overweight to investment grade corporate credit and an allocation to convertible and high yield corporate securities were the primary detractors to performance. Within those allocations, exposures to commodity related industries were the main negative drivers. The Fund was positioned in shorter maturity names, however credit curves flattened with shorter maturity credits underperforming the most. Asset backed securities (ABS) were the primary detractor in the Securitized sector largely due to holdings in government guaranteed FFELP student loans which underperformed during the period. |
| | n | | USD/CNH and IGCDX put spread options performed well during the period due to multiple devaluations of the Chinese yuan. |
Describe recent portfolio activity.
| | n | | Corporate purchases were in Banking, Technology and Consumer sectors with only modest purchases in Energy. |
| | n | | The Fund selectively added exposure to ABS in such esoteric sectors as business franchise whole loans and personal consumer loans. |
| | n | | The agency mortgage backed securities ( MBS) allocation began transitioning into more liquid specified pools. |
| | n | | Purchased synthetic investment grade credit put options due to heightened volatility within the credit markets. |
| | n | | Recent purchases also include AAA-rated, short weighted average life CLO’s. |
Describe portfolio positioning at period end.
| | n | | The Fund was duration and curve neutral relative to the benchmark. |
| | n | | The largest overweight relative to the benchmark was corporate credit representing approximately a 41.7% allocation versus 30.0% for the index. High yield corporate made up 8.5% of that exposure. Banking and diversified industrials were the largest industries within corporate credit. The energy allocation represented about 3.1% of the Fund and was 0.5% overweight relative to the benchmark. The allocation to convertible securities was 0.4%. |
| | n | | The Fund was underweight in agency MBS (25.0%) relative to the benchmark (28.6%). More recently, the Fund rotated into specified mortgage pools becoming more balanced along the coupon stack, this change also enhanced the overall liquidity profile of the Fund. |
| | n | | Securitized ABS represents a 11.8% allocation, it was largely comprised of traditional automotive loan collateral and compelling esoteric collateral such as timeshares, cell towers, medical receivables, and personal consumer loans. |
| | n | | Commercial mortgage backed securities (CMBS) made up 6.0% of the Fund representing a 4.2% overweight. BBB-rated tranches backed by 2012 vintage collateral represent the best value. However, they are difficult to source given their strong underwriting profile. The Fund gained exposure to these vintages using CMBX, a synthetic index. |
| 1. | Total return describes the return to an investor based on the Class Y net expense ratio and includes the reinvestment of dividends and capital gains. Performance results reflect past performance and are no guarantee of future results. Current performance may be lower or higher than the performance data quoted. The net asset value (NAV) will fluctuate with market conditions. All returns 1-year or less are cumulative. The Barclays U.S. Aggregate Index represents securities that are SEC-registered, taxable, and dollar denominated. The index covers the U.S. investment grade fixed rate bond market, with index components for government and corporate securities, mortgage pass-through securities, and asset-backed securities. These major sectors are subdivided into more specific indices that are calculated and reported on a regular basis. Indices are unmanaged. It is not possible to invest directly in an index. |
12
Babson Total Return Bond Fund 2015 Semi-Annual Report
Describe market and portfolio outlook.
| | n | | Volatility will likely persist in 2016, driven by global monetary policies, shifting global growth patterns and fluctuating commodity prices. |
| | n | | U.S. Government yields rose modestly in 2015. However, the case for significantly higher rates is challenging to make, with inflation low and real growth hobbling along at 2%-2.5%. |
| | n | | Commodities will continue to necessitate close monitoring. The Fund is taking opportunities to reduce Energy and Metals & Mining exposure, as well as any other names that may possess idiosyncratic risks. |
| | n | | The recent bout of spread widening should provide the Fund select opportunities. Short weighted average life CLOs offer attractive yields and have experienced less volatility than other asset classes. FFELP student loans may represent one of the better opportunities in ABS. |
13
Babson Total Return Bond Fund 2015 Semi-Annual Report
PORTFOLIO COMPOSITION (% OF ASSETS*)

| * | The percentages shown above represent a percentage of the assests as of December 31, 2015 |
14
Babson Emerging Markets Debt Blended Total Return Fund 2015 Semi-Annual Report
Investment Objective
The investment objective of the Babson Emerging Markets Debt Blended Total Return (“EMD Blended Total Return “ or the “Fund”) is to seek a long-term total return through a combination of current income and capital appreciation though exposure to a diversified portfolio of emerging markets corporate, sovereign hard currency and local currency-denominated debt securities.
Portfolio Management Commentary
How did the Fund perform?
| | n | | The Fund reported a net total rate of return of -3.321 since the Fund’s inception date of October 21, 2015. |
What factors influenced performance of the Fund?
| | n | | For the period ended December 31, 2015, the Fund’s currency positions against the Russian Ruble, British Pound, Canadian Dollar, and Singaporean Dollar, as well as an Ecuadorian sovereign bond were the primary contributors to performance. Corporate holdings in Yasar, ICICI Bank and Sino-Ocean Land Holdings also aided returns. Key detractors from performance were the Fund’s local bond positions in South Africa, Mexico and Colombia, while the Fund’s holding in Digicel Group also detracted from returns. |
| | n | | Emerging Markets local currency bonds experienced large sell-offs during December on the heels of the U.S. Fed’s rate hike, the ECB’s disappointing actions and a further sell-off of commodities. Within the portfolio, South Africa detracted more than 1% following President Zuma’s unexpected termination of finance minister Neve, while naming someone who was perceived to be a weak replacement. Following heavy criticism at home, President Zuma then named Pravin Gordhan as finance minister. Although Minister Gordhan previously held the position from 2009-2014, investors were less than impressed; impacting both rates and pushing the currency to its weakest point ever. |
Describe recent portfolio activity.
| | n | | The portfolio launched on October 21, 2015 with US$10 million, therefore, the activity in Fund primarily represents the initial investment of seed capital and some monthly adjustments as a result of our currency framework. |
Describe portfolio positioning at period end.
| | n | | The Fund finished the year with a 37% exposure to Emerging Markets Corporate bonds, 39% exposure to Emerging Markets Local Debt and Currencies, 23% exposure to Sovereign Hard Currency bonds and a 1% cash position. |
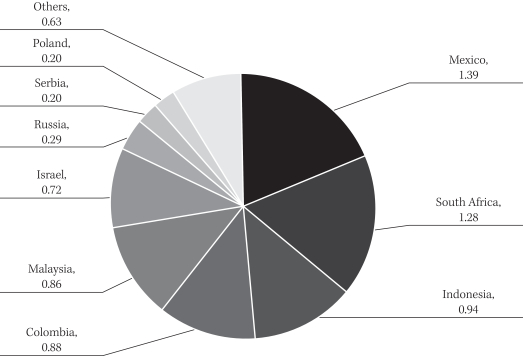
| | n | | The Top 5 countries in the portfolio at the end of the period are Mexico (10.6%), Indonesia (6.9%), South Africa (5.4%), Israel (4.7%) and Turkey (4.6%). The top 3 corporate bonds are AES Corp (3.7%), Israel Electric Corp (2.4%) and Cemex (2.2%). Overall, the Fund has exposure to 17 countries, 21 corporates, and 24 different currencies. |
Describe market and portfolio outlook.
| | n | | We remain optimistic that some Emerging Markets headwinds are poised to reverse and become tailwinds or at least stabilize |
| 1. | Total return describes the return to an investor based on the Class Y net expense ratio and includes the reinvestment of dividends and capital gains. Performance results reflect past performance and are no guarantee of future results. Current performance may be lower or higher than the performance data quoted. The net asset value (NAV) will fluctuate with market conditions. All returns 1-year or less are cumulative. The Credit Suisse Global Loan Benchmark is a market capitalization weighted average of the Credit Suisse Leveraged Loan Index and the Credit Suisse Western European Leveraged Loan Index. The Credit Suisse Leveraged Loan Index is designed to mirror the investable universe of the U.S. dollar-denominated leveraged loan market. The Credit Suisse Western European Leveraged Loan Index is designed to mirror the investable universe of the Western European leveraged loan market, with loans denominated in U.S. and Western European currencies. Indices are unmanaged. It is not possible to invest directly in an index. |
15
Babson Emerging Markets Debt Blended Total Return Fund 2015 Semi-Annual Report
| | n | | Credit selection will be key to seeking the best risk-adjusted return opportunities across the Emerging Market corporate debt spectrum. |
| | n | | Lower net supply, driven by reduced issuance and heightened buyback activity, will likely serve as a strong supportive technical factor for Emerging Market corporate debt. For Emerging Market Sovereigns, we continue to favor Central European countries, as well as Caribbean and Central American countries, which should continue to be beneficiaries of the pickup in growth out of core Europe and the U.S. |
| | n | | Currency valuations have adjusted significantly over the past 24 months and we are now seeing some Emerging Market currencies at their most attractive levels in more than 10 years, thereby providing for selective Emerging Market growth prospects. |
| | n | | The portfolio continues to be positioned in selective rates where inflation is falling along with narrowing current account deficits. A picture of global disinflation should remain favorable for emerging markets local debt and the Fund. |
16
Babson Emerging Markets Debt Blended Total Return Fund 2015 Semi-Annual Report
PORTFOLIO COMPOSITION (% OF ASSETS*)
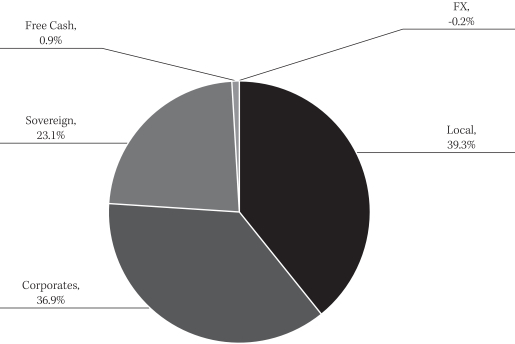
| * | The percentages shown above represent a percentage of the assets as of December 31, 2015. |
COUNTRY COMPOSITION (% OF ASSETS**)
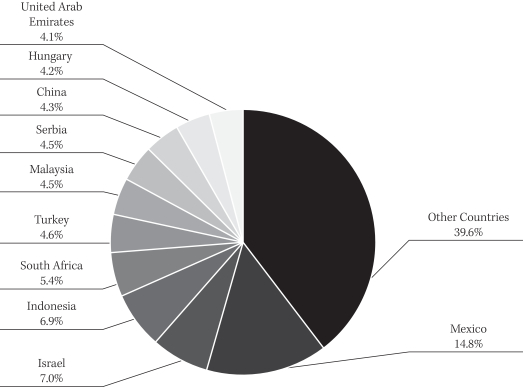
| ** | Percentage of assets are expressed by market value excluding cash and accrued income, and may vary over time. The percentages shown above represent a percentage of the assets as of December 31, 2015. |
17
Babson Emerging Markets Local Currency Debt Fund 2015 Semi-Annual Report
Investment Objective
The investment objective of the Babson Emerging Markets Local Currency Debt Fund (“EM Local Currency Debt Fund” or the “Fund”) is to seek a high level of current income. Preservation of capital is a secondary goal.
Portfolio Management Commentary
How did the Fund perform?
| | n | | The Fund reported a net total rate of return of -1.59%1 since the Fund’s inception date of December 8, 2015. |
What factors influenced performance of the Fund?
| | n | | For the period ended December 31, 2015, the Fund’s positions in Colombia, Indonesia, Malaysia and South Africa were the primary detractors from performance relative to the benchmark. The Fund’s underweight in Brazilian rates and overall underweight exposure to emerging markets currencies positively impacted Fund performance. |
| | n | | Colombia, Indonesia, Malaysia and South Africa all experienced large sell-offs during December and our overweight positions were more negatively affected than the benchmark. South Africa, in particular, underperformed due to President Zuma’s unexpected termination of finance minister Neve, while naming someone who was perceived to be a weak replacement. Following heavy criticism at home, President Zuma then named Pravin Gordhan as finance minister. Although Minister Gordhan previously held the position from 2009-2014, investors were less than impressed; impacting both rates and pushing the currency to its weakest point ever. |
Describe recent portfolio activity.
| | n | | The portfolio launched on December 8, 2015 with US$5 million, therefore, the trades reflected initial seed capital being invested. |
Describe portfolio positioning at period end.
| | n | | The Fund finished the year with a 92.1% exposure to Emerging Market bonds and a 7.5% cash position. |
| | n | | The Top 5 countries in the portfolio at the end of the period are Malaysia (12.8%), Indonesia (11.4%), Colombia (11.4%), Brazil (9.8%) and South Africa (7.2%). Overall, the Fund has exposure to 16 different countries and 28 different currencies. |
Describe market and portfolio outlook.
| | n | | We remain optimistic that some Emerging Markets headwinds are poised to reverse and become tailwinds or at least stabilize. |
| | n | | Currency valuations have adjusted significantly over the past 24 months and we are now seeing some emerging markets currencies at their most attractive levels in more than 10 years, thereby providing for selective emerging markets growth prospects. |
| | n | | The portfolio continues to add to constructive positioning on selected European and Latin American currencies, less so on Asian currencies, while maintaining a watchful eye on commodity prices. |
| | n | | The portfolio continues to be positioned in selective rates where inflation is falling along with narrowing current account deficits. A picture of global disinflation should remain favorable for emerging markets local debt and the Fund. |
| 1. | Total return describes the return to an investor based on the Class Y net expense ratio and includes the reinvestment of dividends and capital gains. Performance results reflect past performance and are no guarantee of future results. Current performance may be lower or higher than the performance data quoted. The net asset value (NAV) will fluctuate with market conditions. All returns 1-year or less are cumulative. The Credit Suisse Global Loan Benchmark is a market capitalization weighted average of the Credit Suisse Leveraged Loan Index and the Credit Suisse Western European Leveraged Loan Index. The Credit Suisse Leveraged Loan Index is designed to mirror the investable universe of the U.S. dollar-denominated leveraged loan market. The Credit Suisse Western European Leveraged Loan Index is designed to mirror the investable universe of the Western European leveraged loan market, with loans denominated in U.S. and Western European currencies. Indices are unmanaged. It is not possible to invest directly in an index. |
18
Babson Emerging Markets Local Currency Debt Fund 2015 Semi-Annual Report
COUNTRY COMPOSITION (% OF ASSETS*)
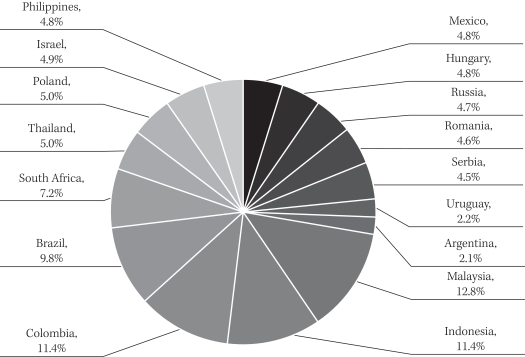
| * | Percentage of assets are expressed by market value excluding cash and accrued income, and may vary over time. The percentages shown above represent a percentage of the assets as of December 31, 2015. |
CONTRIBUTION TO DURATION (IN YEARS)
| ** | The values shown above represent the contribution to duration, in years, of the assets as of December 31, 2015. |
19
Babson Global High Yield Fund 2015 Semi-Annual Report
Investment Objective
The investment objective of the Babson Global High Yield Fund (“Global High Yield Fund” or the “Fund”) is to provide high current income generation and, where appropriate, capital appreciation.
Portfolio Management Commentary
How did the Fund perform?
| | n | | The Fund reported a total rate of return of -2.40% since the Fund’s inception date of October 30, 2015. |
What factors influenced performance of the Fund?
| | n | | The initial ramping of the portfolio positively influenced the performance of the Fund during this period as a higher cash balance helped protect the portfolio from the volatility the U.S. and European high yield bond markets experienced at the end of the year. |
| | n | | In addition, strong security selection, particularly high quality credits with improving outlooks, and the Fund’s underweight to commodities relative to the market positively influenced performance. |
Describe recent portfolio activity.
| | n | | During the period, the Fund continued to ramp the initial capital funding by constructing a well-diversified portfolio across issuers, ratings, countries and industries. As of December 31, 2015, the portfolio had a geographical weighting of 69.5% in U.S. and 30.5% in primarily European issuers and other non-U.S. domiciled issuers. |
| | n | | Due to the initial ramping of the portfolio, approximately one-third of the assets were purchased in the U.S. and European new issue market and the remaining two-thirds were purchased on the secondary markets to take advantage of opportunities that we believe offer attractive yields and the potential for capital appreciation. |
Describe portfolio positioning at period end.
| | n | | On a traded basis, the Fund ended the year with a 24.6% weighting to senior secured high yield bonds and a 75.4% weighting to senior unsecured bonds. |
| | n | | From an industry perspective, the Fund remains well-diversified across a number of Moody’s-based industries, with higher concentrations in Healthcare, Education and Childcare (11.6%), Finance (8.2%), and Telecommunications (7.7%) as of year-end. |
| | n | | In terms of portfolio credit quality as of December 31, 2015, the Fund had the following weighting breakdown: 3.3% in Baa, 33.2% in Ba, 50.8% in single-B, 5.7% in Caa and below and 6.4% in cash and accrued income. A small portion of the assets are not publicly rated (0.6%), but we believe have a similar ratings profile as other assets in the portfolio. |
Describe market and portfolio outlook.
| | n | | Although the Fed’s December announcement of the first interest rate increase since 2006 marks the conclusion of one of the biggest question marks for the market, uncertainty remains around the potential consequences increased interest rate volatility may have on currencies, treasury yields, and risk assets going forward. While the extensive volatility we have seen in the commodity space will likely persist, we expect general corporate fundamentals to remain intact. This should continue to support high yield valuations in the near-term as we believe the market is now pricing in a higher level of defaults than we anticipated. Despite recent pressure, any further pull back in prices will likely provide opportunities to add to positions in “high conviction” names offering attractive relative value. |
20
Babson Global High Yield Fund 2015 Semi-Annual Report
CREDIT QUALITY COMPOSITION (% OF ASSETS*)
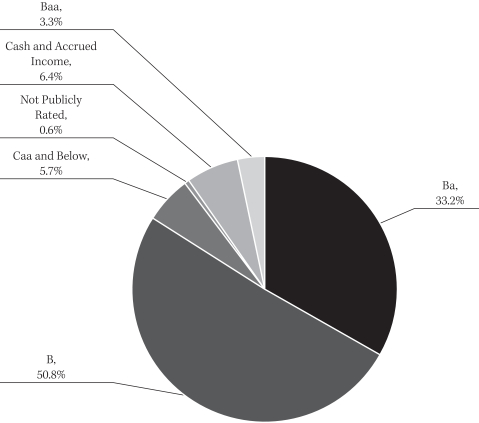
| * | The percentages shown above represent a percentage of the assets as of December 31, 2015. |
21
Babson Global High Yield Fund 2015 Semi-Annual Report
COUNTRY COMPOSITION (% OF ASSETS*)
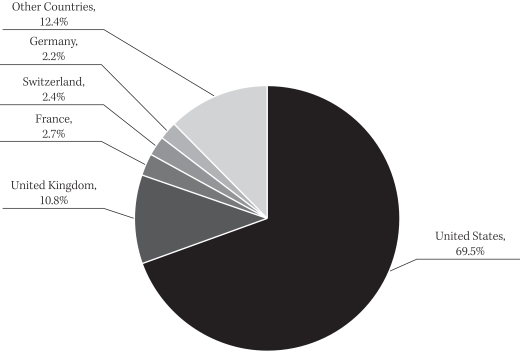
| * | Percentage of assets are expressed by market value excluding cash and accrued income, and may vary over time. The percentages shown above represent a percentage of the assets as of December 31, 2015. |
22
Babson U.S. High Yield Fund 2015 Semi-Annual Report
Investment Objective
The investment objective of the Babson U.S. High Yield Fund (“U.S. High Yield Fund” or the “Fund”) is to seek a high level of total return, with an emphasis on current income.
Portfolio Management Commentary
How did the Fund perform?
| | n | | The Fund reported a total rate of return of -2.84% since the Fund’s inception date of October 30, 2015. |
What factors influenced performance of the Fund?
| | n | | The initial ramping of the portfolio positively influenced the performance of the Fund during this period as a higher cash balance helped protect the portfolio from the volatility the U.S. high yield bond market experienced at the end of the year. |
| | n | | In addition, strong security selection, particularly high quality credits with improving outlooks, and the Fund’s underweight to commodities relative to the market positively influenced performance. |
Describe recent portfolio activity.
| | n | | During the period, the Fund continued to ramp the initial capital funding by constructing a well-diversified portfolio across issuers, ratings and industries. |
| | n | | Due to the initial ramping of the portfolio, approximately one-third of the assets were purchased in the U.S. new issue market and the remaining two-thirds were purchased on the secondary market to take advantage of opportunities that we believe offer attractive yields and the potential for capital appreciation. |
Describe portfolio positioning at period end.
| | n | | On a traded basis, the Fund ended the year with a 99.6% weighting to high yield bonds. The remaining balance of the portfolio was invested in senior secured loans (0.4%). |
| | n | | From an industry perspective, the Fund remains well-diversified across a number of Moody’s-based industries, with higher concentrations in Healthcare, Education and Childcare (12.8%), Oil and Gas (7.8%), and Aerospace and Defense (7.1%) as of year-end. |
| | n | | In terms of portfolio credit quality as of December 31, 2015, the Fund had the following weighting breakdown: 3.0% in Baa, 34.5% in Ba, 40.9% in single-B, 5.6% in Caa and below and cash and accrued income at 16.0%. |
Describe market and portfolio outlook.
| | n | | Although the Fed’s December announcement of the first interest rate increase since 2006 marks the conclusion of one of the biggest question marks for the market, uncertainty remains around the potential consequences increased interest rate volatility may have on currencies, treasury yields, and risk assets going forward. While the extensive volatility we have seen in the commodity space will likely persist, we expect general corporate fundamentals to remain intact. This should continue to support high yield valuations in the near-term as we believe the market is now pricing in a higher level of defaults than we anticipated. Despite recent pressure, any further pull back in prices will likely provide opportunities to add to positions in high conviction names offering attractive relative value. |
23
Babson U.S. High Yield Fund 2015 Semi-Annual Report
CREDIT QUALITY COMPOSITION (% OF ASSETS*)
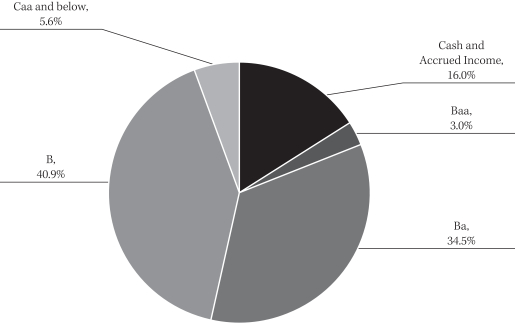
| * | The percentages shown above represent a percentage of the assets as of December 31, 2015. |
COUNTRY COMPOSITION (% OF ASSETS*)
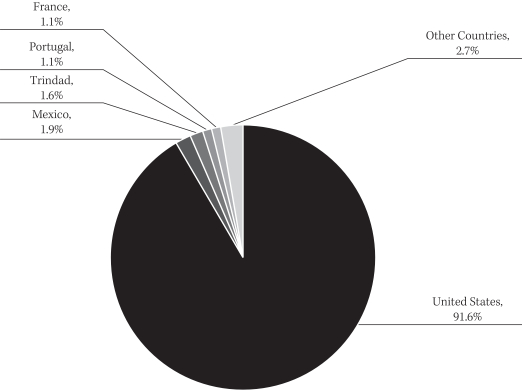
| * | Percentage of assets are expressed by market value excluding cash and accrued income, and may vary over time. The percentages shown above represent a percentage of the assets as of December 31, 2015. |
24
Babson Capital Funds Trust 2015 Semi-Annual Report
SHAREHOLDER EXPENSES (UNAUDITED)
As a shareholder of Babson Global Floating Rate Fund, Babson Global Credit Income Opportunities Fund, Babson Active Short Duration Bond Fund, Babson Total Return Bond Fund, Babson Emerging Markets Debt Blended Total Return Fund, Babson Emerging Markets Local Currency Debt Fund, Babson Global High Yield Fund or Babson U.S. High Yield Fund (each a “Fund” and collectively, the “Funds”) you incur ongoing expenses, such as management fees, shareholder service fees, distribution fees and other fund expenses. The following table is intended to help you understand your ongoing expenses (in dollars and cents) of investing in the Funds and to compare these expenses with the ongoing expenses of investing in other funds.
The table is based on an investment of $1,000 invested at the beginning of the period and held for the entire period from July 1, 2015 to December 31, 2015.
Actual Expenses
The first line in the table below provides information about the actual account values and actual expenses. You may use the information in this line, together with the amount you invested, to estimate the expenses that you paid over the period. Simply divide your account value by $1,000 (for example, an $8,600 account value divided by $1,000 = 8.6), then multiply the result by the number in the first line for the Fund under the heading entitled “Operating Expenses Incurred” to estimate the expenses you paid on your account during this period.
Hypothetical Example for Comparison Purposes
The second line in the table below provides information about the hypothetical account values and hypothetical expenses based on the Fund’s actual expense ratio and an assumed rate of return of 5% per year before expenses, which is not the Fund’s actual return. The hypothetical account value and expenses may not be used to estimate the actual ending account balance or expenses you paid for the period. You may use this information to compare the ongoing costs of investing in your Fund and other funds. To do so, compare this 5% hypothetical example with the 5% hypothetical examples that appear in the shareholder reports of the other funds.
Babson Global Floating Rate Fund
| | | | | | | | | | | | | | | | | | | | |
| | | EXPENSE
RATIO | | | BEGINNING
AMOUNT | | | ENDING
VALUE | | | AVERAGE
VALUE | | | OPERATING
EXPENSE
INCURRED* | |
Class A | | | | | | | | | | | | | | | | | | | | |
Actual | | | 1.05 | % | | $ | 1,000.00 | | | $ | 963.60 | | | $ | 981.80 | | | $ | 5.18 | |
Hypothetical | | | 1.05 | % | | | 1,000.00 | | | | 1,019.90 | | | | 1,009.95 | | | | 5.33 | |
| | | | | |
Class C | | | | | | | | | | | | | | | | | | | | |
Actual | | | 1.80 | % | | | 1,000.00 | | | | 959.80 | | | | 979.90 | | | | 8.87 | |
Hypothetical | | | 1.80 | % | | | 1,000.00 | | | | 1,016.10 | | | | 1,008.05 | | | | 9.12 | |
| | | | | |
Class I | | | | | | | | | | | | | | | | | | | | |
Actual | | | 0.75 | % | | | 1,000.00 | | | | 965.00 | | | | 982.50 | | | | 3.70 | |
Hypothetical | | | 0.75 | % | | | 1,000.00 | | | | 1,021.40 | | | | 1,010.70 | | | | 3.81 | |
| | | | | |
Class Y | | | | | | | | | | | | | | | | | | | | |
Actual | | | 0.75 | % | | | 1,000.00 | | | | 964.70 | | | | 982.35 | | | | 3.70 | |
Hypothetical | | | 0.75 | % | | | 1,000.00 | | | | 1,021.40 | | | | 1,010.70 | | | | 3.81 | |
| * | For each Class of the Fund, net expenses are equal to the annualized expense ratio net of any expenses waived or reimbursed by the advisor for such class multiplied by the average account value over the period, multiplied by 184/366. |
25
Babson Capital Funds Trust 2015 Semi-Annual Report
SHAREHOLDER EXPENSES (UNAUDITED) (CONTINUED)
Babson Global Credit Income Opportunities Fund
| | | | | | | | | | | | | | | | | | | | |
| | | EXPENSE
RATIO | | | BEGINNING
AMOUNT | | | ENDING
VALUE | | | AVERAGE
VALUE | | | OPERATING
EXPENSE
INCURRED* | |
Class A | | | | | | | | | | | | | | | | | | | | |
Actual | | | 1.20 | % | | $ | 1,000.00 | | | $ | 949.50 | | | $ | 974.75 | | | $ | 5.88 | |
Hypothetical | | | 1.20 | % | | | 1,000.00 | | | | 1,019.10 | | | | 1,009.55 | | | | 6.09 | |
| | | | | |
Class C | | | | | | | | | | | | | | | | | | | | |
Actual | | | 1.95 | % | | | 1,000.00 | | | | 945.90 | | | | 972.95 | | | | 9.54 | |
Hypothetical | | | 1.95 | % | | | 1,000.00 | | | | 1,015.30 | | | | 1,007.65 | | | | 9.88 | |
| | | | | |
Class I | | | | | | | | | | | | | | | | | | | | |
Actual | | | 0.95 | % | | | 1,000.00 | | | | 950.60 | | | | 975.30 | | | | 4.66 | |
Hypothetical | | | 0.95 | % | | | 1,000.00 | | | | 1,020.40 | | | | 1,010.20 | | | | 4.82 | |
| | | | | |
Class Y | | | | | | | | | | | | | | | | | | | | |
Actual | | | 0.95 | % | | | 1,000.00 | | | | 950.50 | | | | 975.25 | | | | 4.66 | |
Hypothetical | | | 0.95 | % | | | 1,000.00 | | | | 1,020.40 | | | | 1,010.20 | | | | 4.82 | |
| * | For each Class of the Fund, net expenses are equal to the annualized expense ratio net of any expenses waived or reimbursed by the advisor for such class multiplied by the average account value over the period, multiplied by 184/366. |
Babson Active Short Duration Bond Fund
| | | | | | | | | | | | | | | | | | | | |
| | | EXPENSE
RATIO | | | BEGINNING
AMOUNT | | | ENDING
VALUE | | | AVERAGE
VALUE | | | OPERATING
EXPENSE
INCURRED* | |
Class A | | | | | | | | | | | | | | | | | | | | |
Actual | | | 0.66 | % | | $ | 1,000.00 | | | $ | 990.00 | | | $ | 995.00 | | | $ | 3.16 | |
Hypothetical | | | 0.66 | % | | | 1,000.00 | | | | 1,020.90 | | | | 1,010.45 | | | | 3.21 | |
| | | | | |
Class C | | | | | | | | | | | | | | | | | | | | |
Actual | | | 1.44 | % | | | 1,000.00 | | | | 986.10 | | | | 993.05 | | | | 6.88 | |
Hypothetical | | | 1.44 | % | | | 1,000.00 | | | | 1,017.10 | | | | 1,008.55 | | | | 6.98 | |
| | | | | |
Class I | | | | | | | | | | | | | | | | | | | | |
Actual | | | 0.47 | % | | | 1,000.00 | | | | 990.80 | | | | 995.40 | | | | 2.25 | |
Hypothetical | | | 0.47 | % | | | 1,000.00 | | | | 1,021.80 | | | | 1,010.90 | | | | 2.28 | |
| | | | | |
Class Y | | | | | | | | | | | | | | | | | | | | |
Actual | | | 0.45 | % | | | 1,000.00 | | | | 990.70 | | | | 995.35 | | | | 2.15 | |
Hypothetical | | | 0.45 | % | | | 1,000.00 | | | | 1,021.90 | | | | 1,010.95 | | | | 2.19 | |
| * | For each Class of the Fund, net expenses are equal to the annualized expense ratio net of any expenses waived or reimbursed by the advisor for such class multiplied by the average account value over the period, multiplied by 176/366. |
Expense Changes Impacting the Table
Changes to the Fund’s fee arrangements occurred during the period. Had these fee changes been in effect throughout the entire period, the annualized expense ratios would have been 0.65%, 1.40%, 0.40%, and 0.40% for Classes A, C, I, and Y, respectively; the actual expenses paid during the period would have been approximately $3.11, $6.69, $1.91, and $1.91 and the hypothetical expenses paid during the period would have been approximately $3.16, $6.79, $1.94, and $1.94 for Classes A, C, I, and Y, respectively.
26
Babson Capital Funds Trust 2015 Semi-Annual Report
SHAREHOLDER EXPENSES (UNAUDITED) (CONTINUED)
Babson Total Return Bond Fund
| | | | | | | | | | | | | | | | | | | | |
| | | EXPENSE
RATIO | | | BEGINNING
AMOUNT | | | ENDING
VALUE | | | AVERAGE
VALUE | | | OPERATING
EXPENSE
INCURRED* | |
Class A | | | | | | | | | | | | | | | | | | | | |
Actual | | | 0.80 | % | | $ | 1,000.00 | | | $ | 991.00 | | | $ | 995.50 | | | $ | 3.83 | |
Hypothetical | | | 0.80 | % | | | 1,000.00 | | | | 1,020.20 | | | | 1,010.10 | | | | 3.89 | |
| | | | | |
Class C | | | | | | | | | | | | | | | | | | | | |
Actual | | | 1.55 | % | | | 1,000.00 | | | | 987.50 | | | | 993.75 | | | | 7.41 | |
Hypothetical | | | 1.55 | % | | | 1,000.00 | | | | 1,016.60 | | | | 1,008.30 | | | | 7.52 | |
| | | | | |
Class I | | | | | | | | | | | | | | | | | | | | |
Actual | | | 0.55 | % | | | 1,000.00 | | | | 992.20 | | | | 996.10 | | | | 2.63 | |
Hypothetical | | | 0.55 | % | | | 1,000.00 | | | | 1,021.40 | | | | 1,010.70 | | | | 2.67 | |
| | | | | |
Class Y | | | | | | | | | | | | | | | | | | | | |
Actual | | | 0.55 | % | | | 1,000.00 | | | | 992.20 | | | | 996.10 | | | | 2.63 | |
Hypothetical | | | 0.55 | % | | | 1,000.00 | | | | 1,021.40 | | | | 1,010.70 | | | | 2.67 | |
| * | For each Class of the Fund, net expenses are equal to the annualized expense ratio net of any expenses waived or reimbursed by the advisor for such class multiplied by the average account value over the period, multiplied by 176/366. |
Babson Emerging Markets Debt Blended Total Return Fund
| | | | | | | | | | | | | | | | | | | | |
| | | EXPENSE
RATIO | | | BEGINNING
AMOUNT | | | ENDING
VALUE | | | AVERAGE
VALUE | | | OPERATING
EXPENSE
INCURRED* | |
Class A | | | | | | | | | | | | | | | | | | | | |
Actual | | | 1.20 | % | | $ | 1,000.00 | | | $ | 965.30 | | | $ | 982.65 | | | $ | 2.29 | |
Hypothetical | | | 1.20 | % | | | 1,000.00 | | | | 1,007.40 | | | | 1,003.70 | | | | 2.34 | |
| | | | | |
Class C | | | | | | | | | | | | | | | | | | | | |
Actual | | | 1.95 | % | | | 1,000.00 | | | | 964.00 | | | | 982.00 | | | | 3.71 | |
Hypothetical | | | 1.95 | % | | | 1,000.00 | | | | 1,005.90 | | | | 1,002.95 | | | | 3.79 | |
| | | | | |
Class I | | | | | | | | | | | | | | | | | | | | |
Actual | | | 0.95 | % | | | 1,000.00 | | | | 965.80 | | | | 982.90 | | | | 1.81 | |
Hypothetical | | | 0.95 | % | | | 1,000.00 | | | | 1,007.90 | | | | 1,003.95 | | | | 1.85 | |
| | | | | |
Class Y | | | | | | | | | | | | | | | | | | | | |
Actual | | | 0.95 | % | | | 1,000.00 | | | | 965.80 | | | | 982.90 | | | | 1.81 | |
Hypothetical | | | 0.95 | % | | | 1,000.00 | | | | 1,007.90 | | | | 1,003.95 | | | | 1.85 | |
| * | For each Class of the Fund, net expenses are equal to the annualized expense ratio net of any expenses waived or reimbursed by the advisor for such class multiplied by the average account value over the period, multiplied by 71/366. |
27
Babson Capital Funds Trust 2015 Semi-Annual Report
SHAREHOLDER EXPENSES (UNAUDITED) (CONTINUED)
Babson Emerging Markets Local Currency Debt Fund
| | | | | | | | | | | | | | | | | | | | |
| | | EXPENSE
RATIO | | | BEGINNING
AMOUNT | | | ENDING
VALUE | | | AVERAGE
VALUE | | | OPERATING
EXPENSE
INCURRED* | |
Class A | | | | | | | | | | | | | | | | | | | | |
Actual | | | 1.20 | % | | $ | 1,000.00 | | | $ | 971.90 | | | $ | 985.95 | | | $ | 0.74 | |
Hypothetical | | | 1.20 | % | | | 1,000.00 | | | | 1,002.40 | | | | 1,001.20 | | | | 0.76 | |
| | | | | |
Class C | | | | | | | | | | | | | | | | | | | | |
Actual | | | 1.95 | % | | | 1,000.00 | | | | 971.60 | | | | 985.80 | | | | 1.21 | |
Hypothetical | | | 1.95 | % | | | 1,000.00 | | | | 1,001.90 | | | | 1,000.95 | | | | 1.23 | |
| | | | | |
Class I | | | | | | | | | | | | | | | | | | | | |
Actual | | | 0.95 | % | | | 1,000.00 | | | | 972.00 | | | | 986.00 | | | | 0.59 | |
Hypothetical | | | 0.95 | % | | | 1,000.00 | | | | 1,002.50 | | | | 1,001.25 | | | | 0.60 | |
| | | | | |
Class Y | | | | | | | | | | | | | | | | | | | | |
Actual | | | 0.95 | % | | | 1,000.00 | | | | 972.00 | | | | 986.00 | | | | 0.59 | |
Hypothetical | | | 0.95 | % | | | 1,000.00 | | | | 1,002.50 | | | | 1,001.25 | | | | 0.60 | |
| * | For each Class of the Fund, net expenses are equal to the annualized expense ratio net of any expenses waived or reimbursed by the advisor for such class multiplied by the average account value over the period, multiplied by 23/366. |
Babson Global High Yield Fund
| | | | | | | | | | | | | | | | | | | | |
| | | EXPENSE
RATIO | | | BEGINNING
AMOUNT | | | ENDING
VALUE | | | AVERAGE
VALUE | | | OPERATING
EXPENSE
INCURRED* | |
Class A | | | | | | | | | | | | | | | | | | | | |
Actual | | | 1.05 | % | | $ | 1,000.00 | | | $ | 975.60 | | | $ | 987.80 | | | $ | 1.70 | |
Hypothetical | | | 1.05 | % | | | 1,000.00 | | | | 1,006.50 | | | | 1,003.25 | | | | 1.73 | |
| | | | | |
Class C | | | | | | | | | | | | | | | | | | | | |
Actual | | | 1.80 | % | | | 1,000.00 | | | | 974.50 | | | | 987.25 | | | | 2.91 | |
Hypothetical | | | 1.80 | % | | | 1,000.00 | | | | 1,005.20 | | | | 1,002.60 | | | | 2.96 | |
| | | | | |
Class I | | | | | | | | | | | | | | | | | | | | |
Actual | | | 0.80 | % | | | 1,000.00 | | | | 976.00 | | | | 988.00 | | | | 1.30 | |
Hypothetical | | | 0.80 | % | | | 1,000.00 | | | | 1,006.90 | | | | 1,003.45 | | | | 1.32 | |
| | | | | |
Class Y | | | | | | | | | | | | | | | | | | | | |
Actual | | | 0.80 | % | | | 1,000.00 | | | | 976.00 | | | | 988.00 | | | | 1.30 | |
Hypothetical | | | 0.80 | % | | | 1,000.00 | | | | 1,006.90 | | | | 1,003.45 | | | | 1.32 | |
| * | For each Class of the Fund, net expenses are equal to the annualized expense ratio net of any expenses waived or reimbursed by the advisor for such class multiplied by the average account value over the period, multiplied by 60/366. |
28
Babson Capital Funds Trust 2015 Semi-Annual Report
SHAREHOLDER EXPENSES (UNAUDITED) (CONTINUED)
Babson U.S. High Yield Fund
| | | | | | | | | | | | | | | | | | | | |
| | | EXPENSE
RATIO | | | BEGINNING
AMOUNT | | | ENDING
VALUE | | | AVERAGE
VALUE | | | OPERATING
EXPENSE
INCURRED* | |
Class A | | | | | | | | | | | | | | | | | | | | |
Actual | | | 1.00 | % | | $ | 1,000.00 | | | $ | 971.20 | | | $ | 985.60 | | | $ | 1.62 | |
Hypothetical | | | 1.00 | % | | | 1,000.00 | | | | 1,006.60 | | | | 1,003.30 | | | | 1.64 | |
| | | | | |
Class C | | | | | | | | | | | | | | | | | | | | |
Actual | | | 1.75 | % | | | 1,000.00 | | | | 970.10 | | | | 985.05 | | | | 2.83 | |
Hypothetical | | | 1.75 | % | | | 1,000.00 | | | | 1,005.30 | | | | 1,002.65 | | | | 2.88 | |
| | | | | |
Class I | | | | | | | | | | | | | | | | | | | | |
Actual | | | 0.75 | % | | | 1,000.00 | | | | 971.60 | | | | 985.80 | | | | 1.21 | |
Hypothetical | | | 0.75 | % | | | 1,000.00 | | | | 1,007.00 | | | | 1,003.50 | | | | 1.23 | |
| | | | | |
Class Y | | | | | | | | | | | | | | | | | | | | |
Actual | | | 0.75 | % | | | 1,000.00 | | | | 971.60 | | | | 985.80 | | | | 1.21 | |
Hypothetical | | | 0.75 | % | | | 1,000.00 | | | | 1,007.00 | | | | 1,003.50 | | | | 1.23 | |
| * | For each Class of the Fund, net expenses are equal to the annualized expense ratio net of any expenses waived or reimbursed by the advisor for such class multiplied by the average account value over the period, multiplied by 60/366. |
29
Babson Capital Funds Trust 2015 Semi-Annual Report
BABSON CAPITAL FUNDS TRUST
FINANCIAL REPORT
30
Babson Capital Funds Trust 2015 Semi-Annual Report
STATEMENTS OF ASSETS AND LIABILITIES
December 31, 2015 (Unaudited)
| | | | | | | | | | | | | | | | |
| | | BABSON GLOBAL
FLOATING RATE
FUND | | | BABSON GLOBAL
CREDIT INCOME
OPPORTUNITIES
FUND | | | BABSON ACTIVE
SHORT DURATION
BOND FUND | | | BABSON TOTAL
RETURN BOND
FUND | |
| | | | |
| Assets | | | | | | | | | | | | | | | | |
| Investments, at fair value (cost $172,954,252, $93,332,587, $99,872,848 and $30,208,344, respectively) | | $ | 158,958,569 | | | $ | 82,456,570 | | | $ | 99,041,894 | | | $ | 29,941,778 | |
| Foreign currency, at value (cost $635,089, $55,476, $0 and $0, respectively) | | | 629,529 | | | | 54,798 | | | | – | | | | – | |
| Receivable for investments sold | | | 4,331,635 | | | | 719,129 | | | | 2,356,969 | | | | – | |
| Receivable for Fund shares sold | | | 84,756 | | | | 1,590,937 | | | | 136,766 | | | | – | |
| Interest receivable | | | 1,036,593 | | | | 1,291,268 | | | | 471,333 | | | | 136,076 | |
| Receivable from adviser (see Note 3) | | | – | | | | – | | | | 10,584 | | | | 28,884 | |
| Receivable for variation margin on open futures contracts | | | – | | | | – | | | | 3,407 | | | | 3,697 | |
| Foreign tax reclaims receivable | | | – | | | | – | | | | 2,139 | | | | – | |
| Unrealized appreciation on forward foreign currency exchange contracts | | | 394,403 | | | | 197,214 | | | | – | | | | 4,766 | |
| Prepaid expenses | | | 37,666 | | | | 37,256 | | | | 12,638 | | | | 10,617 | |
| | | | | | | | | | | | | | | | |
Total assets | | | 165,473,151 | | | | 86,347,172 | | | | 102,035,730 | | | | 30,125,818 | |
| | | | | | | | | | | | | | | | |
| | | | |
| Liabilities | | | | | | | | | | | | | | | | |
| Payable for investments purchased | | | 9,948,630 | | | | 2,124,412 | | | | 10,729,984 | | | | 5,207,799 | |
| Payable for Fund shares repurchased | | | 265,933 | | | | 1,033,040 | | | | 212,407 | | | | – | |
| Swap contracts, at fair value (up-front net premiums received of $0, $0, $562 and $147, respectively) | | | – | | | | – | | | | 7,229 | | | | 1,885 | |
| Investment advisory fee payable (see Note 3) | | | 16,802 | | | | 4,870 | | | | – | | | | – | |
| Distribution fees payable | | | 6,773 | | | | 5,439 | | | | 2,452 | | | | 209 | |
| Dividends payable | | | 328,329 | | | | 600,819 | | | | 66,092 | | | | 185,135 | |
| Written options, at fair value (premiums of $972,000) | | | – | | | | 207,921 | | | | – | | | | – | |
| Unrealized depreciation on forward foreign currency exchange contracts | | | 11,957 | | | | 8,461 | | | | – | | | | 12,870 | |
| Accrued expenses and other liabilities | | | 263,531 | | | | 216,824 | | | | 179,476 | | | | 183,361 | |
| | | | | | | | | | | | | | | | |
Total liabilities | | | 10,841,955 | | | | 4,201,786 | | | | 11,197,640 | | | | 5,591,259 | |
| | | | | | | | | | | | | | | | |
Total net assets | | $ | 154,631,196 | | | $ | 82,145,386 | | | $ | 90,838,090 | | | $ | 24,534,559 | |
| | | | | | | | | | | | | | | | |
See accompanying Notes to Financial Statements.
31
Babson Capital Funds Trust 2015 Semi-Annual Report
STATEMENTS OF ASSETS AND LIABILITIES (CONTINUED)
December 31, 2015 (Unaudited)
| | | | | | | | | | | | | | | | |
| | | BABSON GLOBAL
FLOATING RATE
FUND | | | BABSON GLOBAL
CREDIT INCOME
OPPORTUNITIES
FUND | | | BABSON ACTIVE
SHORT DURATION
BOND FUND | | | BABSON TOTAL
RETURN BOND
FUND | |
| | | | |
| Composition of net assets | | | | | | | | | | | | | | | | |
| Shares of beneficial interest outstanding (par value $0.00001 per share), unlimited number of shares authorized | | $ | 171 | | | $ | 94 | | | $ | 92 | | | $ | 25 | |
| Additional paid-in capital | | | 170,715,425 | | | | 94,602,432 | | | | 91,904,125 | | | | 25,131,900 | |
| Undistributed (distributions in excess of) net investment income | | | 85,033 | | | | 337,961 | | | | (3,130 | ) | | | (1,352 | ) |
| Accumulated net realized loss | | | (2,591,436 | ) | | | (2,891,685 | ) | | | (161,348 | ) | | | (311,100 | ) |
| Net unrealized depreciation | | | (13,577,997 | ) | | | (9,903,416 | ) | | | (901,649 | ) | | | (284,914 | ) |
| | | | | | | | | | | | | | | | |
Total net assets | | $ | 154,631,196 | | | $ | 82,145,386 | | | $ | 90,838,090 | | | $ | 24,534,559 | |
| | | | | | | | | | | | | | | | |
| | | | |
| Class A | | | | | | | | | | | | | | | | |
| Net assets applicable to outstanding shares | | $ | 5,578,247 | | | $ | 11,924,553 | | | $ | 10,518,584 | | | $ | 196,032 | |
| | | | | | | | | | | | | | | | |
| Shares of beneficial interest outstanding | | | 618,563 | | | | 1,368,677 | | | | 1,069,223 | | | | 20,082 | |
| | | | | | | | | | | | | | | | |
| Net asset value per share outstanding | | $ | 9.02 | | | $ | 8.71 | | | $ | 9.84 | | | $ | 9.76 | |
| | | | | | | | | | | | | | | | |
| Maximum offering price per share outstanding (Net asset value plus sales charge of 3.00%, 4.00%, 0.00% and 4.00%, respectively) | | $ | 9.30 | | | $ | 9.07 | | | $ | – | | | $ | 10.17 | |
| | | | | | | | | | | | | | | | |
| | | | |
| Class C | | | | | | | | | | | | | | | | |
| Net assets applicable to outstanding shares | | $ | 6,597,783 | | | $ | 3,302,315 | | | $ | 340,667 | | | $ | 195,825 | |
| | | | | | | | | | | | | | | | |
| Shares of beneficial interest outstanding | | | 734,085 | | | | 379,418 | | | | 34,649 | | | | 20,061 | |
| | | | | | | | | | | | | | | | |
| Net asset value per share outstanding | | $ | 8.99 | | | $ | 8.70 | | | $ | 9.83 | | | $ | 9.76 | |
| | | | | | | | | | | | | | | | |
| | | | |
| Class I | | | | | | | | | | | | | | | | |
| Net assets applicable to outstanding shares | | $ | 22,130,131 | | | $ | 24,445,056 | | | $ | 21,968,595 | | | $ | 12,060,376 | |
| | | | | | | | | | | | | | | | |
| Shares of beneficial interest outstanding | | | 2,449,029 | | | | 2,806,051 | | | | 2,234,436 | | | | 1,235,482 | |
| | | | | | | | | | | | | | | | |
| Net asset value per share outstanding | | $ | 9.04 | | | $ | 8.71 | | | $ | 9.83 | | | $ | 9.76 | |
| | | | | | | | | | | | | | | | |
| | | | |
| Class Y | | | | | | | | | | | | | | | | |
| Net assets applicable to outstanding shares | | $ | 120,325,035 | | | $ | 42,473,462 | | | $ | 58,010,244 | | | $ | 12,082,326 | |
| | | | | | | | | | | | | | | | |
| Shares of beneficial interest outstanding | | | 13,320,246 | | | | 4,875,730 | | | | 5,900,387 | | | | 1,237,731 | |
| | | | | | | | | | | | | | | | |
| Net asset value per share outstanding | | $ | 9.03 | | | $ | 8.71 | | | $ | 9.83 | | | $ | 9.76 | |
| | | | | | | | | | | | | | | | |
See accompanying Notes to Financial Statements.
��
32
Babson Capital Funds Trust 2015 Semi-Annual Report
STATEMENTS OF ASSETS AND LIABILITIES (CONTINUED)
December 31, 2015 (Unaudited)
| | | | | | | | | | | | | | | | |
| | | BABSON
EMERGING
MARKETS DEBT
BLENDED TOTAL
RETURN FUND | | | BABSON
EMERGING
MARKETS LOCAL
CURRENCY DEBT
FUND | | | BABSON GLOBAL
HIGH YIELD
FUND | | | BABSON U.S.
HIGH YIELD
FUND | |
| | | | |
| Assets | | | | | | | | | | | | | | | | |
| Investments, at fair value (cost $9,935,402, $4,928,972, $24,902,440 and $26,953,697, respectively) | | $ | 9,521,067 | | | $ | 4,828,638 | | | $ | 23,969,550 | | | $ | 26,020,071 | |
| Foreign currency, at value (cost $0, $0, $17,809 and $0, respectively) | | | – | | | | – | | | | 17,362 | | | | – | |
| Interest receivable | | | 151,312 | | | | 75,510 | | | | 405,837 | | | | 359,358 | |
| Receivable from adviser (see Note 3) | | | 36,071 | | | | 35,259 | | | | 26,852 | | | | 27,615 | |
| Receivable for variation margin on open futures contracts | | | 7,524 | | | | – | | | | – | | | | – | |
| Swap contracts, at fair value | | | 10,877 | | | | 7,952 | | | | – | | | | – | |
| Foreign tax reclaims receivable | | | – | | | | 383 | | | | – | | | | – | |
| Unrealized appreciation on forward foreign currency exchange contracts | | | 130,248 | | | | 24,387 | | | | 61,325 | | | | – | |
| Prepaid expenses | | | 1,059 | | | | 50 | | | | 1,059 | | | | 1,059 | |
| | | | | | | | | | | | | | | | |
Total assets | | | 9,858,158 | | | | 4,972,179 | | | | 24,481,985 | | | | 26,408,103 | |
| | | | | | | | | | | | | | | | |
| | | | |
| Liabilities | | | | | | | | | | | | | | | | |
| Swap contracts, at fair value (up-front net premiums received of $9,276, $0, $0 and $0, respectively) | | | 7,281 | | | | 29,065 | | | | – | | | | – | |
| Directors’ fees payable | | | 6,144 | | | | 2,524 | | | | 4,958 | | | | 4,958 | |
| Distribution fees payable | | | 204 | | | | 77 | | | | 103 | | | | 103 | |
| Dividends payable | | | 45,780 | | | | 12,275 | | | | 118,898 | | | | 121,847 | |
| Unrealized depreciation on forward foreign currency exchange contracts | | | 146,056 | | | | 47,969 | | | | 68,199 | | | | – | |
| Accrued expenses and other liabilities | | | 89,724 | | | | 32,383 | | | | 74,515 | | | | 74,513 | |
| | | | | | | | | | | | | | | | |
Total liabilities | | | 295,189 | | | | 124,293 | | | | 266,673 | | | | 201,421 | |
| | | | | | | | | | | | | | | | |
Total net assets | | $ | 9,562,969 | | | $ | 4,847,886 | | | $ | 24,215,312 | | | $ | 26,206,682 | |
| | | | | | | | | | | | | | | | |
| | | | |
| Composition of net assets | | | | | | | | | | | | | | | | |
| Shares of beneficial interest outstanding (par value $0.00001 per share), unlimited number of shares authorized | | $ | 10 | | | $ | 5 | | | $ | 25 | | | $ | 27 | |
| Additional paid-in capital | | | 10,003,090 | | | | 4,999,995 | | | | 25,007,488 | | | | 27,102,498 | |
| Undistributed (distributions in excess of) net investment income | | | (1,110 | ) | | | – | | | | – | | | | – | |
| Accumulated net realized gain (loss) | | | (20,407 | ) | | | (6,794 | ) | | | 149,372 | | | | 37,783 | |
| Net unrealized depreciation | | | (418,614 | ) | | | (145,320 | ) | | | (941,573 | ) | | | (933,626 | ) |
| | | | | | | | | | | | | | | | |
Total net assets | | $ | 9,562,969 | | | $ | 4,847,886 | | | $ | 24,215,312 | | | $ | 26,206,682 | |
| | | | | | | | | | | | | | | | |
See accompanying Notes to Financial Statements.
33
Babson Capital Funds Trust 2015 Semi-Annual Report
STATEMENTS OF ASSETS AND LIABILITIES (CONTINUED)
December 31, 2015 (Unaudited)
| | | | | | | | | | | | | | | | |
| | | BABSON
EMERGING
MARKETS DEBT
BLENDED TOTAL
RETURN FUND | | | BABSON
EMERGING
MARKETS LOCAL
CURRENCY DEBT
FUND | | | BABSON GLOBAL
HIGH YIELD
FUND | | | BABSON U.S.
HIGH YIELD
FUND | |
| | | | |
| Class A | | | | | | | | | | | | | | | | |
| Net assets applicable to outstanding shares | | $ | 191,258 | | | $ | 96,958 | | | $ | 96,831 | | | $ | 96,397 | |
| | | | | | | | | | | | | | | | |
| Shares of beneficial interest outstanding | | | 20,006 | | | | 10,000 | | | | 10,000 | | | | 10,000 | |
| | | | | | | | | | | | | | | | |
| Net asset value per share outstanding | | $ | 9.56 | | | $ | 9.70 | | | $ | 9.68 | | | $ | 9.64 | |
| | | | | | | | | | | | | | | | |
| Maximum offering price per share outstanding (Net asset value plus sales charge of 4.00%) | | $ | 9.96 | | | $ | 10.10 | | | $ | 10.08 | | | $ | 10.04 | |
| | | | | | | | | | | | | | | | |
| | | | |
| Class C | | | | | | | | | | | | | | | | |
| Net assets applicable to outstanding shares | | $ | 191,254 | | | $ | 96,958 | | | $ | 96,831 | | | $ | 96,397 | |
| | | | | | | | | | | | | | | | |
| Shares of beneficial interest outstanding | | | 20,006 | | | | 10,000 | | | | 10,000 | | | | 10,000 | |
| | | | | | | | | | | | | | | | |
| Net asset value per share outstanding | | $ | 9.56 | | | $ | 9.70 | | | $ | 9.68 | | | $ | 9.64 | |
| | | | | | | | | | | | | | | | |
| | | | |
| Class I | | | | | | | | | | | | | | | | |
| Net assets applicable to outstanding shares | | $ | 4,590,229 | | | $ | 2,326,985 | | | $ | 12,007,048 | | | $ | 14,060,706 | |
| | | | | | | | | | | | | | | | |
| Shares of beneficial interest outstanding | | | 480,156 | | | | 240,000 | | | | 1,240,000 | | | | 1,458,557 | |
| | | | | | | | | | | | | | | | |
| Net asset value per share outstanding | | $ | 9.56 | | | $ | 9.70 | | | $ | 9.68 | | | $ | 9.64 | |
| | | | | | | | | | | | | | | | |
| | | | |
| Class Y | | | | | | | | | | | | | | | | |
| Net assets applicable to outstanding shares | | $ | 4,590,228 | | | $ | 2,326,985 | | | $ | 12,014,602 | | | $ | 11,953,182 | |
| | | | | | | | | | | | | | | | |
| Shares of beneficial interest outstanding | | | 480,156 | | | | 240,000 | | | | 1,240,780 | | | | 1,240,000 | |
| | | | | | | | | | | | | | | | |
| Net asset value per share outstanding | | $ | 9.56 | | | $ | 9.70 | | | $ | 9.68 | | | $ | 9.64 | |
| | | | | | | | | | | | | | | | |
See accompanying Notes to Financial Statements.
34
Babson Capital Funds Trust 2015 Semi-Annual Report
STATEMENTS OF OPERATIONS
For the Six Months Ended December 31, 2015 (Unaudited)
| | | | | | | | | | | | | | | | |
| | | BABSON GLOBAL
FLOATING RATE
FUND | | | BABSON GLOBAL
CREDIT INCOME
OPPORTUNITIES
FUND | | | BABSON ACTIVE
SHORT DURATION
BOND FUND (1) | | | BABSON TOTAL
RETURN BOND
FUND (1) | |
| | | | |
| Investment Income | | | | | | | | | | | | | | | | |
Interest income | | $ | 4,511,456 | | | $ | 3,023,582 | | | $ | 584,971 | | | $ | 272,670 | |
Dividends | | | – | | | | – | | | | 3,309 | | | | 145,912 | |
Other income | | | 5,515 | | | | – | | | | – | | | | – | |
| | | | | | | | | | | | | | | | |
Total investment income | | | 4,516,971 | | | | 3,023,582 | | | | 588,280 | | | | 418,582 | |
| | | | | | | | | | | | | | | | |
| | | | |
| Operating Expenses | | | | | | | | | | | | | | | | |
Advisory fees | | | 527,713 | | | | 320,968 | | | | 101,599 | | | | 47,892 | |
12b-1 distribution and servicing plan | | | | | | | | | | | | | | | | |
Class A | | | 7,135 | | | | 15,851 | | | | 4,455 | | | | 239 | |
Class C | | | 30,529 | | | | 17,486 | | | | 1,333 | | | | 957 | |
Administrator fees | | | 89,601 | | | | 53,814 | | | | 46,089 | | | | 46,089 | |
Custody fees | | | 77,173 | | | | 50,585 | | | | 38,715 | | | | 38,715 | |
Professional fees | | | 70,653 | | | | 70,653 | | | | 58,512 | | | | 58,511 | |
Transfer agent fees | | | 70,168 | | | | 70,379 | | | | 45,229 | | | | 45,229 | |
Directors’ fees | | | 51,954 | | | | 42,932 | | | | 14,749 | | | | 14,749 | |
Registration fees | | | 32,593 | | | | 30,892 | | | | 4,140 | | | | 2,796 | |
Printing and mailing expenses | | | 22,256 | | | | 20,913 | | | | 7,374 | | | | 7,374 | |
Interest expense | | | – | | | | – | | | | 17 | | | | 6 | |
Other operating expenses | | | 27,077 | | | | 16,467 | | | | 14,749 | | | | 14,749 | |
| | | | | | | | | | | | | | | | |
Total operating expenses | | | 1,006,852 | | | | 710,940 | | | | 336,961 | | | | 277,306 | |
Reimbursement of expenses | | | | | |
Class A | | | (24,028 | ) | | | (48,582 | ) | | | (18,868 | ) | | | (12,626 | ) |
Class C | | | (25,422 | ) | | | (24,181 | ) | | | (12,077 | ) | | | (12,625 | ) |
Class I | | | (56,600 | ) | | | (75,726 | ) | | | (72,856 | ) | | | (92,478 | ) |
Class Y | | | (251,285 | ) | | | (122,555 | ) | | | (95,436 | ) | | | (92,524 | ) |
| | | | | | | | | | | | | | | | |
Net operating expenses | | | 649,517 | | | | 439,896 | | | | 137,724 | | | | 67,053 | |
| | | | | | | | | | | | | | | | |
Net investment income | | | 3,867,454 | | | | 2,583,686 | | | | 450,556 | | | | 351,529 | |
| | | | | | | | | | | | | | | | |
See accompanying Notes to Financial Statements.
35
Babson Capital Funds Trust 2015 Semi-Annual Report
STATEMENTS OF OPERATIONS (CONTINUED)
For the Six Months Ended December 31, 2015 (Unaudited)
| | | | | | | | | | | | | | | | |
| | | BABSON GLOBAL
FLOATING RATE
FUND | | | BABSON GLOBAL
CREDIT INCOME
OPPORTUNITIES
FUND | | | BABSON ACTIVE
SHORT DURATION
BOND FUND (1) | | | BABSON TOTAL
RETURN BOND
FUND (1) | |
| | | | |
| Realized and Unrealized Gains (Losses) on Investments | | | | | | | | | | | | | | | | |
Net realized loss on investments | | $ | (2,330,721 | ) | | $ | (1,468,733 | ) | | $ | (84,163 | ) | | $ | (241,991 | ) |
Net realized gain on forward foreign currency exchange contracts | | | 670,025 | | | | 439,379 | | | | – | | | | – | |
Net realized gain on foreign currency and translation | | | 305,264 | | | | 261,643 | | | | – | | | | – | |
Net realized gain on futures contracts | | | – | | | | – | | | | (80,683 | ) | | | (19,608 | ) |
Net realized gain on swap contracts | | | – | | | | – | | | | 3,498 | | | | 913 | |
Net realized gain (loss) on written options | | | – | | | | (34,180 | ) | | | – | | | | – | |
| | | | | | | | | | | | | | | | |
Net realized loss | | | (1,355,432 | ) | | | (801,891 | ) | | | (161,348 | ) | | | (260,686 | ) |
| | | | | | | | | | | | | | | | |
Net change in unrealized depreciation on investments | | | (9,162,252 | ) | | | (7,103,347 | ) | | | (830,954 | ) | | | (266,566 | ) |
Net change in unrealized appreciation on unfunded loan commitments | | | 4,592 | | | | 4,592 | | | | – | | | | – | |
Net change in unrealized appreciation (depreciation) on forward foreign currency exchange contracts | | | 752,516 | | | | 332,385 | | | | – | | | | (8,104 | ) |
Net change in unrealized appreciation (depreciation) on foreign currency and translation | | | (68,670 | ) | | | (50,178 | ) | | | – | | | | – | |
Net change in unrealized appreciation on futures contracts | | | – | | | | – | | | | (62,904 | ) | | | (8,212 | ) |
Net change in unrealized appreciation on swap contracts | | | – | | | | – | | | | (7,791 | ) | | | (2,032 | ) |
Net change in unrealized appreciation on written option contracts | | | – | | | | 701,556 | | | | – | | | | – | |
| | | | | | | | | | | | | | | | |
Net change in unrealized depreciation | | | (8,473,814 | ) | | | (6,114,992 | ) | | | (901,649 | ) | | | (284,914 | ) |
| | | | | | | | | | | | | | | | |
Net realized and unrealized losses on investments | | | (9,829,246 | ) | | | (6,916,883 | ) | | | (1,062,997 | ) | | | (545,600 | ) |
| | | | | | | | | | | | | | | | |
Net decrease in net assets resulting from operations | | $ | (5,961,792 | ) | | $ | (4,333,197 | ) | | $ | (612,441 | ) | | $ | (194,071 | ) |
| | | | | | | | | | | | | | | | |
| (1) | | Fund commenced operations on July 8, 2015. |
See accompanying Notes to Financial Statements.
36
Babson Capital Funds Trust 2015 Semi-Annual Report
STATEMENTS OF OPERATIONS (CONTINUED)
For the Six Months Ended December 31, 2015 (Unaudited)
| | | | | | | | | | | | | | | | |
| | | BABSON
EMERGING
MARKETS DEBT
BLENDED TOTAL
RETURN FUND (1) | | | BABSON
EMERGING
MARKETS LOCAL
CURRENCY DEBT
FUND (3) | | | BABSON GLOBAL
HIGH YIELD
FUND (2) | | | BABSON U.S.
HIGH YIELD
FUND (2) | |
| | | | |
| Investment Income | | | | | | | | | | | | | | | | |
Interest income (net of withholding tax of $2,704, $4,388, $0 and $0, respectively) | | $ | 110,152 | | | $ | 12,275 | | | $ | 224,294 | | | $ | 223,202 | |
| | | | | | | | | | | | | | | | |
Total investment income | | | 110,152 | | | | 12,275 | | | | 224,294 | | | | 223,202 | |
| | | | | | | | | | | | | | | | |
| | | | |
| Operating Expenses | | | | | | | | | | | | | | | | |
Advisory fees | | | 14,214 | | | | 2,302 | | | | 24,192 | | | | 22,359 | |
12b-1 distribution and servicing plan | | | | | | | | | | | | | | | | |
Class A | | | 95 | | | | 15 | | | | 41 | | | | 40 | |
Class C | | | 379 | | | | 61 | | | | 161 | | | | 161 | |
Administrator fees | | | 19,201 | | | | 6,136 | | | | 15,496 | | | | 15,496 | |
Custody fees | | | 16,128 | | | | 5,154 | | | | 13,016 | | | | 13,016 | |
Professional fees | | | 29,492 | | | | 11,369 | | | | 25,950 | | | | 25,950 | |
Transfer agent fees | | | 18,843 | | | | 6,021 | | | | 15,206 | | | | 15,206 | |
Directors’ fees | | | 6,144 | | | | 2,524 | | | | 4,958 | | | | 4,958 | |
Registration fees | | | 275 | | | | 57 | | | | 624 | | | | 624 | |
Printing and mailing expenses | | | 4,096 | | | | 1,683 | | | | 3,719 | | | | 3,719 | |
Other operating expenses | | | 6,144 | | | | 1,964 | | | | 4,958 | | | | 4,958 | |
| | | | | | | | | | | | | | | | |
Total operating expenses | | | 115,011 | | | | 37,286 | | | | 108,321 | | | | 106,487 | |
Reimbursement of expenses | | | | | | | | | | | | | | | | |
Class A | | | (6,308 | ) | | | (2,144 | ) | | | (4,053 | ) | | | (4,050 | ) |
Class C | | | (6,324 | ) | | | (2,190 | ) | | | (4,059 | ) | | | (4,056 | ) |
Class I | | | (42,918 | ) | | | (16,476 | ) | | | (34,689 | ) | | | (34,931 | ) |
Class Y | | | (42,918 | ) | | | (16,476 | ) | | | (34,693 | ) | | | (34,288 | ) |
| | | | | | | | | | | | | | | | |
Net operating expenses | | | 16,543 | | | | – | | | | 30,827 | | | | 29,162 | |
| | | | | | | | | | | | | | | | |
Net investment income | | | 93,609 | | | | 12,275 | | | | 193,467 | | | | 194,040 | |
| | | | | | | | | | | | | | | | |
See accompanying Notes to Financial Statements.
37
Babson Capital Funds Trust 2015 Semi-Annual Report
STATEMENTS OF OPERATIONS (CONTINUED)
For the Six Months Ended December 31, 2015 (Unaudited)
| | | | | | | | | | | | | | | | |
| | | BABSON
EMERGING
MARKETS DEBT
BLENDED TOTAL
RETURN FUND (1) | | | BABSON
EMERGING
MARKETS LOCAL
CURRENCY DEBT
FUND (3) | | | BABSON GLOBAL
HIGH YIELD
FUND (2) | | | BABSON U.S.
HIGH YIELD
FUND (2) | |
| | | | |
| Realized and Unrealized Gains (Losses) on Investments | | | | | | | | | | | | | | | | |
Net realized gain (loss) on investments | | $ | (2,552 | ) | | $ | – | | | $ | 41,392 | | | $ | 37,783 | |
Net realized gain (loss) on forward foreign currency exchange contracts | | | (5,772 | ) | | | (11,053 | ) | | | 81,280 | | | | – | |
Net realized gain (loss) on foreign currency and translation | | | (13,644 | ) | | | 4,259 | | | | 26,700 | | | | – | |
Net realized gain on futures contracts | | | 3,818 | | | | – | | | | – | | | | – | |
Net realized gain on swap contracts | | | 843 | | | | – | | | | – | | | | – | |
| | | | | | | | | | | | | | | | |
Net realized gain (loss) | | | (17,307 | ) | | | (6,794 | ) | | | 149,372 | | | | 37,783 | |
| | | | | | | | | | | | | | | | |
Net change in unrealized depreciation on investments | | | (414,335 | ) | | | (100,334 | ) | | | (932,890 | ) | | | (933,626 | ) |
Net change in unrealized appreciation (depreciation) on forward foreign currency exchange contracts | | | (15,808 | ) | | | (23,582 | ) | | | (6,874 | ) | | | – | |
Net change in unrealized appreciation (depreciation) on foreign currency and translation | | | (2,363 | ) | | | (291 | ) | | | (1,809 | ) | | | – | |
Net change in unrealized appreciation on futures contracts | | | 1,022 | | | | – | | | | – | | | | – | |
Net change in unrealized appreciation on swap contracts | | | 12,870 | | | | (21,113 | ) | | | – | | | | – | |
| | | | | | | | | | | | | | | | |
Net change in unrealized depreciation | | | (418,614 | ) | | | (145,320 | ) | | | (941,573 | ) | | | (933,626 | ) |
| | | | | | | | | | | | | | | | |
Net realized and unrealized losses on investments | | | (435,921 | ) | | | (152,114 | ) | | | (792,201 | ) | | | (895,843 | ) |
| | | | | | | | | | | | | | | | |
Net decrease in net assets resulting from operations | | $ | (342,312 | ) | | $ | (139,839 | ) | | $ | (598,734 | ) | | $ | (701,803 | ) |
| | | | | | | | | | | | | | | | |
| (1) | | Fund commenced operations on October 21, 2015. |
| (2) | | Fund commenced operations on October 30, 2015. |
| (3) | | Fund commenced operations on December 8, 2015. |
See accompanying Notes to Financial Statements.
38
Babson Capital Funds Trust 2015 Semi-Annual Report
STATEMENTS OF CHANGES IN NET ASSETS
(Unaudited)
| | | | | | | | | | | | | | | | |
| | | BABSON GLOBAL
FLOATING RATE FUND | | | BABSON GLOBAL
CREDIT INCOME
OPPORTUNITIES FUND | |
| | | FOR THE
SIX MONTHS ENDED
DECEMBER 31, 2015 | | | FOR THE
YEAR ENDED
JUNE 30, 2015 | | | FOR THE
SIX MONTHS ENDED
DECEMBER 31, 2015 | | | FOR THE
YEAR ENDED
JUNE 30, 2015 | |
| | | | |
| Operations | | | | | | | | | | | | | | | | |
Net investment income | | $ | 3,867,454 | | | $ | 5,541,218 | | | $ | 2,583,686 | | | $ | 4,332,948 | |
Net realized gain (loss) on investments | | | (1,355,432 | ) | | | 1,558,409 | | | | (801,891 | ) | | | 451,988 | |
Net change in unrealized depreciation on investments | | | (8,473,814 | ) | | | (5,820,218 | ) | | | (6,114,992 | ) | | | (4,970,881 | ) |
| | | | | | | | | | | | | | | | |
Net increase (decrease) in net assets from operations | | | (5,961,792 | ) | | | 1,279,409 | | | | (4,333,197 | ) | | | (185,945 | ) |
| | | | | | | | | | | | | | | | |
| | | | |
| Dividends to Common Shareholders | | | | | | | | | | | | | | | | |
Net investment income | | | | | | | | | | | | | | | | |
Class A | | | (138,924 | ) | | | (805,770 | ) | | | (443,669 | ) | | | (1,114,861 | ) |
| | | | | | | | | | | | | | | | |
Class C | | | (127,786 | ) | | | (199,251 | ) | | | (108,721 | ) | | | (136,768 | ) |
| | | | | | | | | | | | | | | | |
Class I | | | (607,056 | ) | | | (2,251,195 | ) | | | (941,918 | ) | | | (2,110,134 | ) |
| | | | | | | | | | | | | | | | |
Class Y | | | (3,294,114 | ) | | | (4,937,396 | ) | | | (1,584,258 | ) | | | (2,778,042 | ) |
| | | | | | | | | | | | | | | | |
Net realized gain | | | | | | | | | | | | | | | | |
Class A | | | – | | | | (11,345 | ) | | | – | | | | (186,020 | ) |
| | | | | | | | | | | | | | | | |
Class C | | | – | | | | (2,779 | ) | | | – | | | | (25,871 | ) |
| | | | | | | | | | | | | | | | |
Class I | | | – | | | | (27,574 | ) | | | – | | | | (340,131 | ) |
| | | | | | | | | | | | | | | | |
Class Y | | | – | | | | (49,009 | ) | | | – | | | | (416,997 | ) |
| | | | | | | | | | | | | | | | |
Total dividends to common shareholders | | | (4,167,880 | ) | | | (8,284,319 | ) | | | (3,078,566 | ) | | | (7,108,824 | ) |
| | | | | | | | | | | | | | | | |
| | | | |
| Capital Share Transactions | | | | | | | | | | | | | | | | |
Net proceeds from sale of shares | | | 37,680,828 | | | | 103,090,790 | | | | 15,826,739 | | | | 42,681,717 | |
Net Asset Value of shares issued to shareholders in payment of distributions declared | | | 3,122,607 | | | | 8,079,411 | | | | 1,604,629 | | | | 6,926,691 | |
Cost of shares redeemed | | | (42,201,704 | ) | | | (52,643,055 | ) | | | (9,606,848 | ) | | | (24,420,068 | ) |
Redemption fees | | | – | | | | 5,459 | | | | – | | | | 13,600 | |
| | | | | | | | | | | | | | | | |
Net increase (decrease) in net assets resulting from capital stock transactions | | | (1,398,269 | ) | | | 58,532,605 | | | | 7,824,520 | | | | 25,201,940 | |
| | | | | | | | | | | | | | | | |
Total increase (decrease) in net assets | | | (11,527,941 | ) | | | 51,527,695 | | | | 412,757 | | | | 17,907,171 | |
| | | | | | | | | | | | | | | | |
| | | | |
| Net Assets | | | | | | | | | | | | | | | | |
Beginning of period | | | 166,159,137 | | | | 114,631,442 | | | | 81,732,629 | | | | 63,825,458 | |
| | | | | | | | | | | | | | | | |
End of period (includes undistributed net investment income of $85,033, $385,459, $337,961 and $832,841, respectively) | | $ | 154,631,196 | | | $ | 166,159,137 | | | $ | 82,145,386 | | | $ | 81,732,629 | |
| | | | | | | | | | | | | | | | |
See accompanying Notes to Financial Statements.
39
Babson Capital Funds Trust 2015 Semi-Annual Report
STATEMENTS OF CHANGES IN NET ASSETS (CONTINUED)
(Unaudited)
| | | | | | | | |
| | | BABSON ACTIVE
SHORT DURATION
BOND FUND | | | BABSON TOTAL
RETURN BOND FUND | |
| | | PERIOD FROM
JULY 9, 2015
THROUGH
DECEMBER 31, 2015 (1) | | | PERIOD FROM
JULY 9, 2015
THROUGH
DECEMBER 31, 2015 (1) | |
| | |
| Operations | | | | | | | | |
Net investment income | | $ | 450,556 | | | $ | 351,529 | |
Net realized loss on investments | | | (161,348 | ) | | | (260,686 | ) |
Net change in unrealized depreciation on investments | | | (901,649 | ) | | | (284,914 | ) |
| | | | | | | | |
Net decrease in net assets from operations | | | (612,441 | ) | | | (194,071 | ) |
| | | | | | | | |
| | |
| Dividends to Common Shareholders | | | | | | | | |
Net investment income | | | | | | | | |
Class A | | | (23,708 | ) | | | (2,591 | ) |
| | | | | | | | |
Class C | | | (841 | ) | | | (1,871 | ) |
| | | | | | | | |
Class I | | | (169,787 | ) | | | (174,113 | ) |
| | | | | | | | |
Class Y | | | (259,350 | ) | | | (174,306 | ) |
| | | | | | | | |
Net realized gain | | | | | | | | |
Class A | | | – | | | | (403 | ) |
| | | | | | | | |
Class C | | | – | | | | (402 | ) |
| | | | | | | | |
Class I | | | – | | | | (24,782 | ) |
| | | | | | | | |
Class Y | | | – | | | | (24,827 | ) |
| | | | | | | | |
Total dividends to common shareholders | | | (453,686 | ) | | | (403,295 | ) |
| | | | | | | | |
| | |
| Capital Share Transactions | | | | | | | | |
Net proceeds from sale of shares | | | 93,882,507 | | | | 25,022,092 | |
Net Asset Value of shares issued to shareholders in payment of distributions declared | | | 191,035 | | | | 109,833 | |
Cost of shares redeemed | | | (2,169,325 | ) | | | – | |
| | | | | | | | |
Net increase in net assets resulting from capital stock transactions | | | 91,904,217 | | | | 25,131,925 | |
| | | | | | | | |
Total increase in net assets | | | 90,838,090 | | | | 24,534,559 | |
| | | | | | | | |
| | |
| Net Assets | | | | | | | | |
Beginning of period | | | – | | | | – | |
| | | | | | | | |
End of period (includes undistributed net investment income of $(3,130) and $(1,352), respectively) | | $ | 90,838,090 | | | $ | 24,534,559 | |
| | | | | | | | |
| (1) | | Fund commenced operations on July 8, 2015. |
See accompanying Notes to Financial Statements.
40
Babson Capital Funds Trust 2015 Semi-Annual Report
STATEMENTS OF CHANGES IN NET ASSETS (CONTINUED)
(Unaudited)
| | | | | | | | |
| | | BABSON EMERGING
MARKETS DEBT
BLENDED TOTAL
RETURN FUND | | | BABSON EMERGING
MARKETS LOCAL
CURRENCY DEBT
FUND | |
| | | PERIOD FROM
OCTOBER 22, 2015
THROUGH
DECEMBER 31, 2015 (1) | | | PERIOD FROM
DECEMBER 9, 2015
THROUGH
DECEMBER 31, 2015 (2) | |
| | |
| Operations | | | | | | | | |
Net investment income | | $ | 93,609 | | | $ | 12,275 | |
Net realized loss on investments | | | (17,307 | ) | | | (6,794 | ) |
Net change in unrealized depreciation on investments | | | (418,614 | ) | | | (145,320 | ) |
| | | | | | | | |
Net decrease in net assets from operations | | | (342,312 | ) | | | (139,839 | ) |
| | | | | | | | |
| | |
| Dividends to Common Shareholders | | | | | | | | |
Net investment income | | | | | | | | |
Class A | | | (1,814 | ) | | | (235 | ) |
| | | | | | | | |
Class C | | | (1,550 | ) | | | (199 | ) |
| | | | | | | | |
Class I | | | (45,677 | ) | | | (5,920 | ) |
| | | | | | | | |
Class Y | | | (45,678 | ) | | | (5,921 | ) |
| | | | | | | | |
Net realized gain | | | | | | | | |
Class A | | | (62 | ) | | | – | |
| | | | | | | | |
Class C | | | (62 | ) | | | – | |
| | | | | | | | |
Class I | | | (1,488 | ) | | | – | |
| | | | | | | | |
Class Y | | | (1,488 | ) | | | – | |
| | | | | | | | |
Total dividends to common shareholders | | | (97,819 | ) | | | (12,275 | ) |
| | | | | | | | |
| | |
| Capital Share Transactions | | | | | | | | |
Net proceeds from sale of shares | | | 10,000,000 | | | | 5,000,000 | |
Net Asset Value of shares issued to shareholders in payment of distributions declared | | | 3,100 | | | | – | |
Net increase in net assets resulting from capital stock transactions | | | 10,003,100 | | | | 5,000,000 | |
| | | | | | | | |
Total increase in net assets | | | 9,562,969 | | | | 4,847,886 | |
| | | | | | | | |
| | |
| Net Assets | | | | | | | | |
Beginning of period | | | – | | | | – | |
| | | | | | | | |
End of period (includes undistributed net investment income of $(1,110) and $0, respectively) | | $ | 9,562,969 | | | $ | 4,847,886 | |
| | | | | | | | |
| (1) | | Fund commenced operations on October 21, 2015. |
| (2) | | Fund commenced operations on December 8, 2015. |
See accompanying Notes to Financial Statements.
41
Babson Capital Funds Trust 2015 Semi-Annual Report
STATEMENTS OF CHANGES IN NET ASSETS (CONTINUED)
(Unaudited)
| | | | | | | | |
| | | BABSON GLOBAL
HIGH YIELD FUND | | | BABSON U.S. HIGH
YIELD FUND | |
| | | PERIOD FROM
NOVEMBER 2, 2015
THROUGH
DECEMBER 31, 2015 (1) | | | PERIOD FROM
NOVEMBER 2, 2015
THROUGH
DECEMBER 31, 2015 (1) | |
| | |
| Operations | | | | | | | | |
Net investment income | | $ | 193,467 | | | $ | 194,040 | |
Net realized gain on investments | | | 149,372 | | | | 37,783 | |
Net change in unrealized depreciation on investments | | | (941,573 | ) | | | (933,626 | ) |
| | | | | | | | |
Net decrease in net assets from operations | | | (598,734 | ) | | | (701,803 | ) |
| | | | | | | | |
| | |
| Dividends to Common Shareholders | | | | | | | | |
Net investment income | | | | | | | | |
Class A | | | (736 | ) | | | (729 | ) |
| | | | | | | | |
Class C | | | (622 | ) | | | (615 | ) |
| | | | | | | | |
Class I | | | (96,048 | ) | | | (97,611 | ) |
| | | | | | | | |
Class Y | | | (96,061 | ) | | | (95,085 | ) |
| | | | | | | | |
Net realized gain | | | | | | | | |
Total dividends to common shareholders | | | (193,467 | ) | | | (194,040 | ) |
| | | | | | | | |
| | |
| Capital Share Transactions | | | | | | | | |
Net proceeds from sale of shares | | | 25,007,500 | | | | 27,100,000 | |
Net Asset Value of shares issued to shareholders in payment of distributions declared | | | 13 | | | | 2,525 | |
| | | | | | | | |
Net increase in net assets resulting from capital stock transactions | | | 25,007,513 | | | | 27,102,525 | |
| | | | | | | | |
Total increase in net assets | | | 24,215,312 | | | | 26,206,682 | |
| | | | | | | | |
| | |
| Net Assets | | | | | | | | |
Beginning of period | | | — | | | | — | |
| | | | | | | | |
End of period (includes undistributed net investment income of $0 and $0, respectively) | | $ | 24,215,312 | | | $ | 26,206,682 | |
| | | | | | | | |
| (1) | | Fund commenced operations on October 30, 2015. |
See accompanying Notes to Financial Statements.
42
Babson Global Floating Rate Fund 2015 Semi-Annual Report
FINANCIAL HIGHLIGHTS
| | | | | | | | | | | | |
| | | CLASS A | |
| | | FOR THE
SIX MONTHS ENDED
DECEMBER 31, 2015 (1) | | | FOR THE
YEAR ENDED
JUNE 30, 2015 | | | PERIOD FROM
SEPTEMBER 16, 2013
THROUGH
JUNE 30, 2014 (2) | |
| | | |
| Per Common Share Data | | | | | | | | | | | | |
Net asset value, beginning of period | | $ | 9.60 | | | $ | 10.20 | | | $ | 10.00 | |
Income from investment operations: | | | | | | | | | | | | |
Net investment income (3) | | | 0.14 | | | | 0.44 | | | | 0.30 | |
Net realized and unrealized gain (loss) on investments | | | (0.49 | ) | | | (0.35 | ) | | | 0.08 | |
| | | | | | | | | | | | |
Total increase (decrease) from investment operations | | | (0.35 | ) | | | 0.09 | | | | 0.38 | |
| | | | | | | | | | | | |
Less dividends and distributions: | | | | | | | | | | | | |
From net investment income | | | (0.23 | ) | | | (0.68 | ) | | | (0.18 | ) |
From net realized gain | | | – | | | | (0.01 | ) | | | – | |
| | | | | | | | | | | | |
Total dividends and distributions | | | (0.23 | ) | | | (0.69 | ) | | | (0.18 | ) |
| | | | | | | | | | | | |
Redemption fees | | | – | | | | 0.00 | (4) | | | – | |
| | | | | | | | | | | | |
Net asset value, at end of period | | $ | 9.02 | | | $ | 9.60 | | | $ | 10.20 | |
| | | | | | | | | | | | |
Total investment return (5) | | | (3.64 | )%(6) | | | 0.95 | % | | | 3.81 | %(6) |
| | | | | | | | | | | | |
| | | |
| Supplemental Data and Ratios | | | | | | | | | | | | |
Net assets, end of period (000’s) | | $ | 5,578 | | | $ | 5,153 | | | $ | 12,464 | |
Ratio of total expenses (before reductions and reimbursements) to average net assets (7) | | | 1.89 | %(8) | | | 1.74 | % | | | 2.27 | %(8) |
Ratio of net expenses to average net assets | | | 1.05 | %(8) | | | 1.05 | % | | | 1.05 | %(8) |
Ratio of net investment income to average net assets | | | 4.49 | %(8) | | | 4.44 | % | | | 3.76 | %(8) |
Portfolio turnover rate | | | 35.54 | %(6) | | | 63.17 | % | | | 49.51 | %(6) |
| (2) | | Fund commenced operations on September 16, 2013. |
| (3) | | Calculated using average shares outstanding. |
| (4) | | Amount rounds to less than $.01 per share. |
| (5) | | Total investment return calculation does not consider the effects of sales loads and assumes the reinvestment of dividends at actual prices pursuant to the Fund’s dividend reinvestment plan. |
| (7) | | The Adviser has agreed to waive and/or reimburse certain fees and/or expense so that, on an annualized basis, such expenses incurred will not exceed 1.05% as a percentage of average daily net assets. |
| (8) | | Annualized for periods less than one full year. |
See accompanying Notes to Financial Statements.
43
Babson Global Floating Rate Fund 2015 Semi-Annual Report
FINANCIAL HIGHLIGHTS (CONTINUED)
| | | | | | | | | | | | |
| | | CLASS C | |
| | | FOR THE
SIX MONTHS ENDED
DECEMBER 31, 2015 (1) | | | FOR THE
YEAR ENDED
JUNE 30, 2015 | | | PERIOD FROM
SEPTEMBER 16, 2013
THROUGH
JUNE 30, 2014 (2) | |
| | | |
| Per Common Share Data | | | | | | | | | | | | |
Net asset value, beginning of period | | $ | 9.57 | | | $ | 10.16 | | | $ | 10.00 | |
Income from investment operations: | | | | | | | | | | | | |
Net investment income (3) | | | 0.17 | | | | 0.35 | | | | 0.24 | |
Net realized and unrealized gain (loss) on investments | | | (0.56 | ) | | | (0.33 | ) | | | 0.07 | |
| | | | | | | | | | | | |
Total increase (decrease) from investment operations | | | (0.39 | ) | | | 0.02 | | | | 0.31 | |
| | | | | | | | | | | | |
Less dividends and distributions: | | | | | | | | | | | | |
From net investment income | | | (0.19 | ) | | | (0.60 | ) | | | (0.15 | ) |
From net realized gain | | | – | | | | (0.01 | ) | | | – | |
| | | | | | | | | | | | |
Total dividends and distributions | | | (0.19 | ) | | | (0.61 | ) | | | (0.15 | ) |
| | | | | | | | | | | | |
Redemption fees | | | – | | | | 0.00 | (4) | | | – | |
| | | | | | | | | | | | |
Net asset value, at end of period | | $ | 8.99 | | | $ | 9.57 | | | $ | 10.16 | |
| | | | | | | | | | | | |
Total investment return (5) | | | (4.02 | )%(6) | | | 0.30 | % | | | 3.15 | %(6) |
| | | | | | | | | | | | |
| | | |
| Supplemental Data and Ratios | | | | | | | | | | | | |
Net assets, end of period (000’s) | | $ | 6,598 | | | $ | 5,461 | | | $ | 2,396 | |
Ratio of total expenses (before reductions and reimbursements) to average net assets (7) | | | 2.63 | %(8) | | | 3.12 | % | | | 4.97 | %(8) |
Ratio of net expenses to average net assets | | | 1.80 | %(8) | | | 1.80 | % | | | 1.80 | %(8) |
Ratio of net investment income to average net assets | | | 3.76 | %(8) | | | 3.60 | % | | | 3.07 | %(8) |
Portfolio turnover rate | | | 35.54 | %(6) | | | 63.17 | % | | | 49.51 | %(6) |
| (2) | | Fund commenced operations on September 16, 2013. |
| (3) | | Calculated using average shares outstanding. |
| (4) | | Amount rounds to less than $.01 per share. |
| (5) | | Total investment return calculation does not consider the effects of sales loads and assumes the reinvestment of dividends at actual prices pursuant to the Fund’s dividend reinvestment plan. |
| (7) | | The Adviser has agreed to waive and/or reimburse certain fees and/or expense so that, on an annualized basis, such expenses incurred will not exceed 1.80% as a percentage of average daily net assets. |
| (8) | | Annualized for periods less than one full year. |
See accompanying Notes to Financial Statements.
44
Babson Global Floating Rate Fund 2015 Semi-Annual Report
FINANCIAL HIGHLIGHTS (CONTINUED)
| | | | | | | | | | | | |
| | | CLASS I | |
| | | FOR THE
SIX MONTHS ENDED
DECEMBER 31, 2015 (1) | | | FOR THE
YEAR ENDED
JUNE 30, 2015 | | | FOR THE
YEAR ENDED
JUNE 30, 2014 (2) | |
| | | |
| Per Common Share Data | | | | | | | | | | | | |
Net asset value, beginning of period | | $ | 9.62 | | | $ | 10.21 | | | $ | 10.00 | |
Income from investment operations: | | | | | | | | | | | | |
Net investment income (3) | | | 0.24 | | | | 0.46 | | | | 0.30 | |
Net realized and unrealized gain (loss) on investments | | | (0.58 | ) | | | (0.34 | ) | | | 0.10 | |
| | | | | | | | | | | | |
Total increase (decrease) from investment operations | | | (0.34 | ) | | | 0.12 | | | | 0.40 | |
| | | | | | | | | | | | |
Less dividends and distributions: | | | | | | | | | | | | |
From net investment income | | | (0.24 | ) | | | (0.70 | ) | | | (0.19 | ) |
From net realized gain | | | – | | | | (0.01 | ) | | | – | |
| | | | | | | | | | | | |
Total dividends and distributions | | | (0.24 | ) | | | (0.71 | ) | | | (0.19 | ) |
| | | | | | | | | | | | |
Redemption fees | | | – | | | | 0.00 | (4) | | | – | |
| | | | | | | | | | | | |
Net asset value, at end of period | | $ | 9.04 | | | $ | 9.62 | | | $ | 10.21 | |
| | | | | | | | | | | | |
Total investment return (5) | | | (3.50 | )%(6) | | | 1.34 | % | | | 4.04 | %(6) |
| | | | | | | | | | | | |
| | | |
| Supplemental Data and Ratios | | | | | | | | | | | | |
Net assets, end of period (000���s) | | $ | 22,130 | | | $ | 25,885 | | | $ | 32,772 | |
Ratio of total expenses (before reductions and reimbursements) to average net assets (7) | | | 1.23 | %(8) | | | 1.31 | % | | | 1.52 | %(8) |
Ratio of net expenses to average net assets | | | 0.75 | %(8) | | | 0.75 | % | | | 0.75 | %(8) |
Ratio of net investment income to average net assets | | | 4.81 | %(8) | | | 4.69 | % | | | 3.72 | %(8) |
Portfolio turnover rate | | | 35.54 | %(6) | | | 63.17 | % | | | 49.51 | %(6) |
| (2) | | Fund commenced operations on September 16, 2013. |
| (3) | | Calculated using average shares outstanding. |
| (4) | | Amount rounds to less than $.01 per share. |
| (5) | | Total investment return calculation assumes the reinvestment of dividends at actual prices pursuant to the Fund’s dividend reinvestment plan. |
| (7) | | The Adviser has agreed to waive and/or reimburse certain fees and/or expense so that, on an annualized basis, such expenses incurred will not exceed .75% as a percentage of average daily net assets. |
| (8) | | Annualized for periods less than one full year. |
See accompanying Notes to Financial Statements.
45
Babson Global Floating Rate Fund 2015 Semi-Annual Report
FINANCIAL HIGHLIGHTS (CONTINUED)
| | | | | | | | | | | | |
| | | CLASS Y | |
| | | FOR THE
SIX MONTHS ENDED
DECEMBER 31, 2015 (1) | | | FOR THE
YEAR ENDED
JUNE 30, 2015 | | | FOR THE
YEAR ENDED
JUNE 30, 2014 (2) | |
| | | |
| Per Common Share Data | | | | | | | | | | | | |
Net asset value, beginning of period | | $ | 9.62 | | | $ | 10.21 | | | $ | 10.00 | |
Income from investment operations: | | | | | | | | | | | | |
Net investment income (3) | | | 0.23 | | | | 0.45 | | | | 0.30 | |
Net realized and unrealized gain (loss) on investments | | | (0.58 | ) | | | (0.33 | ) | | | 0.10 | |
| | | | | | | | | | | | |
Total increase (decrease) from investment operations | | | (0.35 | ) | | | 0.12 | | | | 0.40 | |
| | | | | | | | | | | | |
Less dividends and distributions: | | | | | | | | | | | | |
From net investment income | | | (0.24 | ) | | | (0.70 | ) | | | (0.19 | ) |
From net realized gain | | | – | | | | (0.01 | ) | | | – | |
| | | | | | | | | | | | |
Total dividends and distributions | | | (0.24 | ) | | | (0.71 | ) | | | (0.19 | ) |
| | | | | | | | | | | | |
Redemption fees | | | – | | | | 0.00 | (4) | | | – | |
| | | | | | | | | | | | |
Net asset value, at end of period | | $ | 9.03 | | | $ | 9.62 | | | $ | 10.21 | |
| | | | | | | | | | | | |
Total investment return (5) | | | (3.53 | )%(6) | | | 1.28 | % | | | 4.04 | %(6) |
| | | | | | | | | | | | |
| | | |
| Supplemental Data and Ratios | | | | | | | | | | | | |
Net assets, end of period (000’s) | | $ | 120,325 | | | $ | 129,659 | | | $ | 66,999 | |
Ratio of total expenses (before reductions and reimbursements) to average net assets (7) | | | 1.15 | %(8) | | | 1.25 | % | | | 1.53 | %(8) |
Ratio of net expenses to average net assets | | | 0.75 | %(8) | | | 0.75 | % | | | 0.75 | %(8) |
Ratio of net investment income to average net assets | | | 4.82 | %(8) | | | 4.58 | % | | | 3.80 | %(8) |
Portfolio turnover rate | | | 35.54 | %(6) | | | 63.17 | % | | | 49.51 | %(6) |
| (2) | | Fund commenced operations on September 16, 2013. |
| (3) | | Calculated using average shares outstanding. |
| (4) | | Amount rounds to less than $.01 per share. |
| (5) | | Total investment return calculation assumes the reinvestment of dividends at actual prices pursuant to the Fund’s dividend reinvestment plan. |
| (7) | | The Adviser has agreed to waive and/or reimburse certain fees and/or expense so that, on an annualized basis, such expenses incurred will not exceed .75% as a percentage of average daily net assets. |
| (8) | | Annualized for periods less than one full year. |
See accompanying Notes to Financial Statements.
46
Babson Global Credit Income Opportunities Fund 2015 Semi-Annual Report
FINANCIAL HIGHLIGHTS
| | | | | | | | | | | | |
| | | CLASS A | |
| | | FOR THE
SIX MONTHS ENDED
DECEMBER 31, 2015 (1) | | | FOR THE
YEAR ENDED
JUNE 30, 2015 | | | PERIOD FROM
SEPTEMBER 16, 2013
THROUGH
JUNE 30, 2014 (2) | |
| | | |
| Per Common Share Data | | | | | | | | | | | | |
Net asset value, beginning of period | | $ | 9.51 | | | $ | 10.45 | | | $ | 10.00 | |
Income from investment operations: | | | | | | | | | | | | |
Net investment income (3) | | | 0.27 | | | | 0.54 | | | | 0.40 | |
Net realized and unrealized gain (loss) on investments | | | (0.75 | ) | | | (0.57 | ) | | | 0.33 | |
| | | | | | | | | | | | |
Total increase (decrease) from investment operations | | | (0.48 | ) | | | (0.03 | ) | | | 0.73 | |
| | | | | | | | | | | | |
Less dividends and distributions: | | | | | | | | | | | | |
From net investment income | | | (0.32 | ) | | | (0.78 | ) | | | (0.28 | ) |
From net realized gain | | | – | | | | (0.13 | ) | | | – | |
| | | | | | | | | | | | |
Total dividends and distributions | | | (0.32 | ) | | | (0.91 | ) | | | (0.28 | ) |
| | | | | | | | | | | | |
Redemption fees | | | – | | | | 0.00 | (4) | | | – | |
| | | | | | | | | | | | |
Net asset value, at end of period | | $ | 8.71 | | | $ | 9.51 | | | $ | 10.45 | |
| | | | | | | | | | | | |
Total investment return (5) | | | (5.05 | )%(6) | | | (0.11 | )% | | | 7.30 | %(6) |
| | | | | | | | | | | | |
| | | |
| Supplemental Data and Ratios | | | | | | | | | | | | |
Net assets, end of period (000’s) | | $ | 11,925 | | | $ | 12,718 | | | $ | 2,591 | |
Ratio of total expenses (before reductions and reimbursements) to average net assets (7) | | | 1.97 | %(8) | | | 1.98 | % | | | 3.95 | %(8) |
Ratio of net expenses to average net assets | | | 1.20 | %(8) | | | 1.20 | % | | | 1.20 | %(8) |
Ratio of net investment income to average net assets | | | 5.86 | %(8) | | | 5.46 | % | | | 4.88 | %(8) |
Portfolio turnover rate | | | 36.91 | %(6) | | | 84.65 | % | | | 99.72 | %(6) |
| (2) | | Fund commenced operations on September 16, 2013. |
| (3) | | Calculated using average shares outstanding. |
| (4) | | Amount rounds to less than $.01 per share. |
| (5) | | Total investment return calculation does not consider the effects of sales loads and assumes the reinvestment of dividends at actual prices pursuant to the Fund’s dividend reinvestment plan. |
| (7) | | The Adviser has agreed to waive and/or reimburse certain fees and/or expense so that, on an annualized basis, such expenses incurred will not exceed 1.20% as a percentage of average daily net assets. |
| (8) | | Annualized for periods less than one full year. |
See accompanying Notes to Financial Statements.
47
Babson Global Credit Income Opportunities Fund 2015 Semi-Annual Report
FINANCIAL HIGHLIGHTS (CONTINUED)
| | | | | | | | | | | | |
| | | CLASS C | |
| | | FOR THE
SIX MONTHS ENDED
DECEMBER 31, 2015 (1) | | | FOR THE
YEAR ENDED
JUNE 30, 2015 | | | PERIOD FROM
SEPTEMBER 16, 2013
THROUGH
JUNE 30, 2014 (2) | |
| | | |
| Per Common Share Data | | | | | | | | | | | | |
Net asset value, beginning of period | | $ | 9.50 | | | $ | 10.45 | | | $ | 10.00 | |
Income from investment operations: | | | | | | | | | | | | |
Net investment income (3) | | | 0.23 | | | | 0.47 | | | | 0.35 | |
Net realized and unrealized gain (loss) on investments | | | (0.74 | ) | | | (0.58 | ) | | | 0.32 | |
| | | | | | | | | | | | |
Total increase (decrease) from investment operations | | | (0.51 | ) | | | (0.11 | ) | | | 0.67 | |
| | | | | | | | | | | | |
Less dividends and distributions: | | | | | | | | | | | | |
From net investment income | | | (0.29 | ) | | | (0.71 | ) | | | (0.22 | ) |
From net realized gain | | | – | | | | (0.13 | ) | | | – | |
| | | | | | | | | | | | |
Total dividends and distributions | | | (0.29 | ) | | | (0.84 | ) | | | (0.22 | ) |
| | | | | | | | | | | | |
Redemption fees | | | – | | | | 0.00 | (4) | | | – | |
| | | | | | | | | | | | |
Net asset value, at end of period | | $ | 8.70 | | | $ | 9.50 | | | $ | 10.45 | |
| | | | | | | | | | | | |
Total investment return (5) | | | (5.41 | )%(6) | | | (0.93 | )% | | | 6.75 | %(6) |
| | | | | | | | | | | | |
| | | |
| Supplemental Data and Ratios | | | | | | | | | | | | |
Net assets, end of period (000’s) | | $ | 3,302 | | | $ | 3,579 | | | $ | 944 | |
Ratio of total expenses (before reductions and reimbursements) to average net assets (7) | | | 3.33 | %(8) | | | 4.09 | % | | | 10.50 | %(8) |
Ratio of net expenses to average net assets | | | 1.95 | %(8) | | | 1.95 | % | | | 1.95 | %(8) |
Ratio of net investment income to average net assets | | | 5.07 | %(8) | | | 4.79 | % | | | 4.39 | %(8) |
Portfolio turnover rate | | | 36.91 | %(6) | | | 84.65 | % | | | 99.72 | %(6) |
| (2) | | Fund commenced operations on September 16, 2013. |
| (3) | | Calculated using average shares outstanding. |
| (4) | | Amount rounds to less than $.01 per share. |
| (5) | | Total investment return calculation does not consider the effects of sales loads and assumes the reinvestment of dividends at actual prices pursuant to the Fund’s dividend reinvestment plan. |
| (7) | | The Adviser has agreed to waive and/or reimburse certain fees and/or expense so that, on an annualized basis, such expenses incurred will not exceed 1.95% as a percentage of average daily net assets. |
| (8) | | Annualized for periods less than one full year. |
See accompanying Notes to Financial Statements.
48
Babson Global Credit Income Opportunities Fund 2015 Semi-Annual Report
FINANCIAL HIGHLIGHTS (CONTINUED)
| | | | | | | | | | | | |
| | | CLASS I | |
| | | FOR THE
SIX MONTHS ENDED
DECEMBER 31, 2015 (1) | | | FOR THE
YEAR ENDED
JUNE 30, 2015 | | | FOR THE
YEAR ENDED
JUNE 30, 2014 (2) | |
| | | |
| Per Common Share Data | | | | | | | | | | | | |
Net asset value, beginning of period | | $ | 9.51 | | | $ | 10.46 | | | $ | 10.00 | |
Income from investment operations: | | | | | | | | | | | | |
Net investment income (3) | | | 0.28 | | | | 0.56 | | | | 0.41 | |
Net realized and unrealized gain (loss) on investments | | | (0.74 | ) | | | (0.58 | ) | | | 0.35 | |
| | | | | | | | | | | | |
Total increase (decrease) from investment operations | | | (0.46 | ) | | | (0.02 | ) | | | 0.76 | |
| | | | | | | | | | | | |
Less dividends and distributions: | | | | | | | | | | | | |
From net investment income | | | (0.34 | ) | | | (0.80 | ) | | | (0.30 | ) |
From net realized gain | | | – | | | | (0.13 | ) | | | – | |
| | | | | | | | | | | | |
Total dividends and distributions | | | (0.34 | ) | | | (0.93 | ) | | | (0.30 | ) |
| | | | | | | | | | | | |
Redemption fees | | | – | | | | 0.00 | (4) | | | – | |
| | | | | | | | | | | | |
Net asset value, at end of period | | $ | 8.71 | | | $ | 9.51 | | | $ | 10.46 | |
| | | | | | | | | | | | |
Total investment return (5) | | | (4.94 | )%(6) | | | 0.05 | % | | | 7.59 | %(6) |
| | | | | | | | | | | | |
| | | |
| Supplemental Data and Ratios | | | | | | | | | | | | |
Net assets, end of period (000’s) | | $ | 24,445 | | | $ | 26,428 | | | $ | 26,406 | |
Ratio of total expenses (before reductions and reimbursements) to average net assets (7) | | | 1.53 | %(8) | | | 1.58 | % | | | 1.83 | %(8) |
Ratio of net expenses to average net assets | | | 0.95 | %(8) | | | 0.95 | % | | | 0.95 | %(8) |
Ratio of net investment income to average net assets | | | 6.11 | %(8) | | | 5.69 | % | | | 5.02 | %(8) |
Portfolio turnover rate | | | 36.91 | %(6) | | | 84.65 | % | | | 99.72 | %(6) |
| (2) | | Fund commenced operations on September 16, 2013. |
| (3) | | Calculated using average shares outstanding. |
| (4) | | Amount rounds to less than $.01 per share. |
| (5) | | Total investment return calculation assumes the reinvestment of dividends at actual prices pursuant to the Fund’s dividend reinvestment plan. |
| (7) | | The Adviser has agreed to waive and/or reimburse certain fees and/or expense so that, on an annualized basis, such expenses incurred will not exceed .95% as a percentage of average daily net assets. |
| (8) | | Annualized for periods less than one full year. |
See accompanying Notes to Financial Statements.
49
Babson Global Credit Income Opportunities Fund 2015 Semi-Annual Report
FINANCIAL HIGHLIGHTS (CONTINUED)
| | | | | | | | | | | | |
| | | CLASS Y | |
| | | FOR THE
SIX MONTHS ENDED
DECEMBER 31, 2015 (1) | | | FOR THE
YEAR ENDED
JUNE 30, 2015 | | | FOR THE
YEAR ENDED
JUNE 30, 2014 (2) | |
| | | |
| Per Common Share Data | | | | | | | | | | | | |
Net asset value, beginning of period | | $ | 9.51 | | | $ | 10.46 | | | $ | 10.00 | |
Income from investment operations: | | | | | | | | | | | | |
Net investment income (3) | | | 0.28 | | | | 0.56 | | | | 0.41 | |
Net realized and unrealized gain (loss) on investments | | | (0.74 | ) | | | (0.58 | ) | | | 0.35 | |
| | | | | | | | | | | | |
Total increase (decrease) from investment operations | | | (0.46 | ) | | | (0.02 | ) | | | 0.76 | |
| | | | | | | | | | | | |
Less dividends and distributions: | | | | | | | | | | | | |
From net investment income | | | (0.34 | ) | | | (0.80 | ) | | | (0.30 | ) |
From net realized gain | | | – | | | | (0.13 | ) | | | – | |
| | | | | | | | | | | | |
Total dividends and distributions | | | (0.34 | ) | | | (0.93 | ) | | | (0.30 | ) |
| | | | | | | | | | | | |
Redemption fees | | | – | | | | 0.00 | (4) | | | – | |
| | | | | | | | | | | | |
Net asset value, at end of period | | $ | 8.71 | | | $ | 9.51 | | | $ | 10.46 | |
| | | | | | | | | | | | |
Total investment return (5) | | | (4.95 | )%(6) | | | 0.05 | % | | | 7.59 | %(6) |
| | | | | | | | | | | | |
| | | |
| Supplemental Data and Ratios | | | | | | | | | | | | |
Net assets, end of period (000’s) | | $ | 42,473 | | | $ | 39,006 | | | $ | 33,885 | |
Ratio of total expenses (before reductions and reimbursements) to average net assets (7) | | | 1.51 | %(8) | | | 1.58 | % | | | 1.84 | %(8) |
Ratio of net expenses to average net assets | | | 0.95 | %(8) | | | 0.95 | % | | | 0.95 | %(8) |
Ratio of net investment income to average net assets | | | 6.12 | %(8) | | | 5.67 | % | | | 5.04 | %(8) |
Portfolio turnover rate | | | 36.91 | %(6) | | | 84.65 | % | | | 99.72 | %(6) |
| (2) | | Fund commenced operations on September 16, 2013. |
| (3) | | Calculated using average shares outstanding. |
| (4) | | Amount rounds to less than $.01 per share. |
| (5) | | Total investment return calculation assumes the reinvestment of dividends at actual prices pursuant to the Fund’s dividend reinvestment plan. |
| (7) | | The Adviser has agreed to waive and/or reimburse certain fees and/or expense so that, on an annualized basis, such expenses incurred will not exceed .95% as a percentage of average daily net assets. |
| (8) | | Annualized for periods less than one full year. |
See accompanying Notes to Financial Statements.
50
Babson Active Short Duration Bond Fund 2015 Semi-Annual Report
FINANCIAL HIGHLIGHTS
| | | | |
| | | CLASS A | |
| | | PERIOD FROM
JULY 8, 2015
THROUGH
DECEMBER 31, 2015 (1)(2) | |
| |
| Per Common Share Data | | | | |
Net asset value, beginning of period | | $ | 10.00 | |
Income from investment operations: | | | | |
Net investment income (3) | | | 0.06 | |
Net realized and unrealized loss on investments | | | (0.16 | ) |
| | | | |
Total decrease from investment operations | | | (0.10 | ) |
| | | | |
Less dividends and distributions: | | | | |
From net investment income | | | (0.06 | ) |
| | | | |
Net asset value, at end of period | | $ | 9.84 | |
| | | | |
Total investment return (4) | | | (1.00 | )%(5) |
| | | | |
| |
| Supplemental Data and Ratios | | | | |
Net assets, end of period (000’s) | | $ | 10,519 | |
Ratio of total expenses (before reductions and reimbursements) to average net assets (6) | | | 1.72 | %(7) |
Ratio of net expenses to average net assets | | | 0.66 | %(7) |
Ratio of net investment income to average net assets | | | 1.32 | %(7) |
Portfolio turnover rate | | | 122.49 | %(5) |
| (2) | | Fund commenced operations on July 8, 2015. |
| (3) | | Calculated using average shares outstanding. |
| (4) | | Total investment return calculation does not consider the effects of sales loads and assumes the reinvestment of dividends at actual prices pursuant to the Fund’s dividend reinvestment plan. |
| (6) | | The Adviser has agreed to waive and/or reimburse certain fees and/or expense so that, on an annualized basis, such expenses incurred will not exceed .65% as a percentage of average daily net assets. |
| (7) | | Annualized for periods less than one full year. |
See accompanying Notes to Financial Statements.
51
Babson Active Short Duration Bond Fund 2015 Semi-Annual Report
FINANCIAL HIGHLIGHTS (CONTINUED)
| | | | |
| | | CLASS C | |
| | | PERIOD FROM
JULY 8, 2015
THROUGH
DECEMBER 31, 2015 (1)(2) | |
| |
| Per Common Share Data | | | | |
Net asset value, beginning of period | | $ | 10.00 | |
Income from investment operations: | | | | |
Net investment income | | | 0.03 | |
Net realized and unrealized loss on investments | | | (0.17 | ) |
| | | | |
Total decrease from investment operations | | | (0.14 | ) |
| | | | |
Less dividends and distributions: | | | | |
From net investment income | | | (0.03 | ) |
| | | | |
Net asset value, at end of period | | $ | 9.83 | |
| | | | |
Total investment return (3) | | | (1.39 | )%(4) |
| | | | |
| |
| Supplemental Data and Ratios | | | | |
Net assets, end of period (000’s) | | $ | 341 | |
Ratio of total expenses (before reductions and reimbursements) to average net
assets (5) | | | 10.50 | %(6) |
Ratio of net expenses to average net assets | | | 1.44 | %(6) |
Ratio of net investment income to average net assets | | | 0.62 | %(6) |
Portfolio turnover rate | | | 122.49 | %(4) |
| (2) | | Fund commenced operations on July 8, 2015. |
| (3) | | Total investment return calculation does not consider the effects of sales loads and assumes the reinvestment of dividends at actual prices pursuant to the Fund’s dividend reinvestment plan. |
| (5) | | The Adviser has agreed to waive and/or reimburse certain fees and/or expense so that, on an annualized basis, such expenses incurred will not exceed .90% as a percentage of average daily net assets. |
| (6) | | Annualized for periods less than one full year. |
See accompanying Notes to Financial Statements.
52
Babson Active Short Duration Bond Fund 2015 Semi-Annual Report
FINANCIAL HIGHLIGHTS (CONTINUED)
| | | | |
| | | CLASS I | |
| | | FOR THE
SIX MONTHS ENDED
DECEMBER 31, 2015 (1)(2) | |
| |
| Per Common Share Data | | | | |
Net asset value, beginning of period | | $ | 10.00 | |
Income from investment operations: | | | | |
Net investment income | | | 0.08 | |
Net realized and unrealized loss on investments | | | (0.17 | ) |
| | | | |
Total decrease from investment operations | | | (0.09 | ) |
| | | | |
Less dividends and distributions: | | | | |
From net investment income | | | (0.08 | ) |
| | | | |
Net asset value, at end of period | | $ | 9.83 | |
| | | | |
Total investment return (3) | | | (0.92 | )%(4) |
| | | | |
| |
| Supplemental Data and Ratios | | | | |
Net assets, end of period (000’s) | | $ | 21,969 | |
Ratio of total expenses (before reductions and reimbursements) to average net
assets (6) | | | 1.15 | %(5) |
Ratio of net expenses to average net assets | | | 0.47 | %(5) |
Ratio of net investment income to average net assets | | | 1.58 | %(5) |
Portfolio turnover rate | | | 122.49 | %(4) |
| (2) | | Fund commenced operations on July 8, 2015. |
| (3) | | Total investment return calculation assumes the reinvestment of dividends at actual prices pursuant to the Fund’s dividend reinvestment plan. |
| (5) | | Annualized for periods less than one full year. |
| (6) | | The Adviser has agreed to waive and/or reimburse certain fees and/or expense so that, on an annualized basis, such expenses incurred will not exceed .40% as a percentage of average daily net assets. |
See accompanying Notes to Financial Statements.
53
Babson Active Short Duration Bond Fund 2015 Semi-Annual Report
FINANCIAL HIGHLIGHTS (CONTINUED)
| | | | |
| | | CLASS Y | |
| | | FOR THE
SIX MONTHS ENDED
DECEMBER 31, 2015 (1)(2) | |
| |
| Per Common Share Data | | | | |
Net asset value, beginning of period | | $ | 10.00 | |
Income from investment operations: | | | | |
Net investment income | | | 0.08 | |
Net realized and unrealized loss on investments | | | (0.17 | ) |
| | | | |
Total decrease from investment operations | | | (0.09 | ) |
| | | | |
Less dividends and distributions: | | | | |
From net investment income | | | (0.08 | ) |
| | | | |
Net asset value, at end of period | | $ | 9.83 | |
| | | | |
Total investment return (3) | | | (0.93 | )%(4) |
| | | | |
| |
| Supplemental Data and Ratios | | | | |
Net assets, end of period (000’s) | | $ | 58,010 | |
Ratio of total expenses (before reductions and reimbursements) to average net
assets (5) | | | 1.03 | %(6) |
Ratio of net expenses to average net assets | | | 0.45 | %(6) |
Ratio of net investment income to average net assets | | | 1.57 | %(6) |
Portfolio turnover rate | | | 122.49 | %(4) |
| (2) | | Fund commenced operations on July 8, 2015. |
| (3) | | Total investment return calculation assumes the reinvestment of dividends at actual prices pursuant to the Fund’s dividend reinvestment plan. |
| (5) | | The Adviser has agreed to waive and/or reimburse certain fees and/or expense so that, on an annualized basis, such expenses incurred will not exceed .40% as a percentage of average daily net assets. |
| (6) | | Annualized for periods less than one full year. |
See accompanying Notes to Financial Statements.
54
Babson Total Return Bond Fund 2015 Semi-Annual Report
FINANCIAL HIGHLIGHTS
| | | | |
| | | CLASS A | |
| | | PERIOD FROM
JULY 8, 2015
THROUGH
DECEMBER 31, 2015 (1)(2) | |
| |
| Per Common Share Data | | | | |
Net asset value, beginning of period | | $ | 10.00 | |
Income from investment operations: | | | | |
Net investment income (3) | | | 0.13 | |
Net realized and unrealized loss on investments | | | (0.20 | ) |
| | | | |
Total decrease from investment operations | | | (0.07 | ) |
| | | | |
Less dividends and distributions: | | | | |
From net investment income | | | (0.15 | ) |
From net realized gain | | | (0.02 | ) |
| | | | |
Total dividends and distributions | | | (0.17 | ) |
| | | | |
Net asset value, at end of period | | $ | 9.76 | |
| | | | |
Total investment return (4) | | | (0.90 | )%(5) |
| | | | |
| |
| Supplemental Data and Ratios | | | | |
Net assets, end of period (000’s) | | $ | 196 | |
Ratio of total expenses (before reductions and reimbursements) to average net
assets (6) | | | 13.99 | %(7) |
Ratio of net expenses to average net assets | | | 0.80 | %(7) |
Ratio of net investment income to average net assets | | | 2.69 | %(7) |
Portfolio turnover rate | | | 250.13 | %(5) |
| (2) | | Fund commenced operations on July 8, 2015. |
| (3) | | Calculated using average shares outstanding. |
| (4) | | Total investment return calculation does not consider the effects of sales loads and assumes the reinvestment of dividends at actual prices pursuant to the Fund’s dividend reinvestment plan. |
| (6) | | The Adviser has agreed to waive and/or reimburse certain fees and/or expense so that, on an annualized basis, such expenses incurred will not exceed .80% as a percentage of average daily net assets. |
| (7) | | Annualized for periods less than one full year. |
See accompanying Notes to Financial Statements.
55
Babson Total Return Bond Fund 2015 Semi-Annual Report
FINANCIAL HIGHLIGHTS (CONTINUED)
| | | | |
| | | CLASS C | |
| | | PERIOD FROM
JULY 8, 2015
THROUGH
DECEMBER 31, 2015 (1)(2) | |
| |
| Per Common Share Data | | | | |
Net asset value, beginning of period | | $ | 10.00 | |
Income from investment operations: | | | | |
Net investment income (3) | | | 0.09 | |
Net realized and unrealized loss on investments | | | (0.20 | ) |
| | | | |
Total decrease from investment operations | | | (0.11 | ) |
| | | | |
Less dividends and distributions: | | | | |
From net investment income | | | (0.11 | ) |
From net realized gain | | | (0.02 | ) |
| | | | |
Total dividends and distributions | | | (0.13 | ) |
| | | | |
Net asset value, at end of period | | $ | 9.76 | |
| | | | |
Total investment return (4) | | | (1.25 | )%(5) |
| | | | |
| |
| Supplemental Data and Ratios | | | | |
Net assets, end of period (000’s) | | $ | 196 | |
Ratio of total expenses (before reductions and reimbursements) to average net
assets (6) | | | 14.75 | %(7) |
Ratio of net expenses to average net assets | | | 1.55 | %(7) |
Ratio of net investment income to average net assets | | | 1.95 | %(7) |
Portfolio turnover rate | | | 250.13 | %(5) |
| (2) | | Fund commenced operations on July 8, 2015. |
| (3) | | Calculated using average shares outstanding. |
| (4) | | Total investment return calculation does not consider the effects of sales loads and assumes the reinvestment of dividends at actual prices pursuant to the Fund’s dividend reinvestment plan. |
| (6) | | The Adviser has agreed to waive and/or reimburse certain fees and/or expense so that, on an annualized basis, such expenses incurred will not exceed 1.55% as a percentage of average daily net assets. |
| (7) | | Annualized for periods less than one full year. |
See accompanying Notes to Financial Statements.
56
Babson Total Return Bond Fund 2015 Semi-Annual Report
FINANCIAL HIGHLIGHTS (CONTINUED)
| | | | |
| | | CLASS I | |
| | | FOR THE
SIX MONTHS ENDED
DECEMBER 31, 2015 (1)(2) | |
| |
| Per Common Share Data | | | | |
Net asset value, beginning of period | | $ | 10.00 | |
Income from investment operations: | | | | |
Net investment income (3) | | | 0.14 | |
Net realized and unrealized loss on investments | | | (0.20 | ) |
| | | | |
Total decrease from investment operations | | | (0.06 | ) |
| | | | |
Less dividends and distributions: | | | | |
From net investment income | | | (0.16 | ) |
From net realized gain | | | (0.02 | ) |
| | | | |
Total dividends and distributions | | | (0.18 | ) |
| | | | |
Net asset value, at end of period | | $ | 9.76 | |
| | | | |
Total investment return (4) | | | (0.78 | )%(5) |
| | | | |
| |
| Supplemental Data and Ratios | | | | |
Net assets, end of period (000’s) | | $ | 12,060 | |
Ratio of total expenses (before reductions and reimbursements) to average net
assets (6) | | | 2.12 | %(7) |
Ratio of net expenses to average net assets | | | 0.55 | %(7) |
Ratio of net investment income to average net assets | | | 2.95 | %(7) |
Portfolio turnover rate | | | 250.13 | %(5) |
| (2) | | Fund commenced operations on July 8, 2015. |
| (3) | | Calculated using average shares outstanding. |
| (4) | | Total investment return calculation assumes the reinvestment of dividends at actual prices pursuant to the Fund’s dividend reinvestment plan. |
| (6) | | The Adviser has agreed to waive and/or reimburse certain fees and/or expense so that, on an annualized basis, such expenses incurred will not exceed .55% as a percentage of average daily net assets. |
| (7) | | Annualized for periods less than one full year. |
See accompanying Notes to Financial Statements.
57
Babson Total Return Bond Fund 2015 Semi-Annual Report
FINANCIAL HIGHLIGHTS (CONTINUED)
| | | | |
| | | CLASS Y | |
| | | FOR THE
SIX MONTHS ENDED
DECEMBER 31, 2015 (1)(2) | |
| |
| Per Common Share Data | | | | |
Net asset value, beginning of period | | $ | 10.00 | |
Income from investment operations: | | | | |
Net investment income (3) | | | 0.14 | |
Net realized and unrealized loss on investments | | | (0.20 | ) |
| | | | |
Total decrease from investment operations | | | (0.06 | ) |
| | | | |
Less dividends and distributions: | | | | |
From net investment income | | | (0.16 | ) |
From net realized gain | | | (0.02 | ) |
| | | | |
Total dividends and distributions | | | (0.18 | ) |
| | | | |
Net asset value, at end of period | | $ | 9.76 | |
| | | | |
Total investment return (4) | | | (0.78 | )%(5) |
| | | | |
| |
| Supplemental Data and Ratios | | | | |
Net assets, end of period (000’s) | | $ | 12,082 | |
Ratio of total expenses (before reductions and reimbursements) to average net
assets (6) | | | 2.12 | %(7) |
Ratio of net expenses to average net assets | | | 0.55 | %(7) |
Ratio of net investment income to average net assets | | | 2.95 | %(7) |
Portfolio turnover rate | | | 250.13 | %(5) |
| (2) | | Fund commenced operations on July 8, 2015. |
| (3) | | Calculated using average shares outstanding. |
| (4) | | Total investment return calculation assumes the reinvestment of dividends at actual prices pursuant to the Fund’s dividend reinvestment plan. |
| (6) | | The Adviser has agreed to waive and/or reimburse certain fees and/or expense so that, on an annualized basis, such expenses incurred will not exceed .55% as a percentage of average daily net assets. |
| (7) | | Annualized for periods less than one full year. |
See accompanying Notes to Financial Statements.
58
Babson Emerging Markets Debt Blended Total Return Fund 2015 Semi-Annual Report
FINANCIAL HIGHLIGHTS
| | | | |
| | | CLASS A | |
| | | PERIOD FROM
OCTOBER 21, 2015
THROUGH
DECEMBER 31, 2015 (1)(2) | |
| |
| Per Common Share Data | | | | |
Net asset value, beginning of period | | $ | 10.00 | |
Income from investment operations: | | | | |
Net investment income (3) | | | 0.09 | |
Net realized and unrealized loss on investments | | | (0.44 | ) |
| | | | |
Total decrease from investment operations | | | (0.35 | ) |
| | | | |
Less dividends and distributions: | | | | |
From net investment income | | | (0.09 | ) |
| | | | |
Net asset value, at end of period | | $ | 9.56 | |
| | | | |
Total investment return (4) | | | (3.47 | )%(5) |
| | | | |
| |
| Supplemental Data and Ratios | | | | |
Net assets, end of period (000’s) | | $ | 191 | |
Ratio of total expenses (before reductions and reimbursements) to average net
assets (6) | | | 17.73 | %(7) |
Ratio of net expenses to average net assets | | | 1.09 | %(7) |
Ratio of net investment income to average net assets | | | 4.73 | %(7) |
Portfolio turnover rate | | | 9.39 | %(5) |
| (2) | | Fund commenced operations on October 21, 2015. |
| (3) | | Calculated using average shares outstanding. |
| (4) | | Total investment return calculation does not consider the effects of sales loads and assumes the reinvestment of dividends at actual prices pursuant to the Fund’s dividend reinvestment plan. |
| (6) | | The Adviser has agreed to waive and/or reimburse certain fees and/or expense so that, on an annualized basis, such expenses incurred will not exceed 1.20% as a percentage of average daily net assets. |
| (7) | | Annualized for periods less than one full year. |
See accompanying Notes to Financial Statements.
59
Babson Emerging Markets Debt Blended Total Return Fund 2015 Semi-Annual Report
FINANCIAL HIGHLIGHTS (CONTINUED)
| | | | |
| | | CLASS C | |
| | | PERIOD FROM
OCTOBER 21, 2015
THROUGH
DECEMBER 31, 2015 (1)(2) | |
| |
| Per Common Share Data | | | | |
Net asset value, beginning of period | | $ | 10.00 | |
Income from investment operations: | | | | |
Net investment income (3) | | | 0.08 | |
Net realized and unrealized loss on investments | | | (0.44 | ) |
| | | | |
Total decrease from investment operations | | | (0.36 | ) |
| | | | |
Less dividends and distributions: | | | | |
From net investment income | | | (0.08 | ) |
| | | | |
Net asset value, at end of period | | $ | 9.56 | |
| | | | |
Total investment return (4) | | | (3.60 | )%(5) |
| | | | |
| |
| Supplemental Data and Ratios | | | | |
Net assets, end of period (000’s) | | $ | 191 | |
Ratio of total expenses (before reductions and reimbursements) to average net
assets (6) | | | 18.48 | %(7) |
Ratio of net expenses to average net assets | | | 1.80 | %(7) |
Ratio of net investment income to average net assets | | | 4.02 | %(7) |
Portfolio turnover rate | | | 9.39 | %(5) |
| (2) | | Fund commenced operations on October 21, 2015. |
| (3) | | Calculated using average shares outstanding. |
| (4) | | Total investment return calculation does not consider the effects of sales loads and assumes the reinvestment of dividends at actual prices pursuant to the Fund’s dividend reinvestment plan. |
| (6) | | The Adviser has agreed to waive and/or reimburse certain fees and/or expense so that, on an annualized basis, such expenses incurred will not exceed 1.95% as a percentage of average daily net assets. |
| (7) | | Annualized for periods less than one full year. |
See accompanying Notes to Financial Statements.
60
Babson Emerging Markets Debt Blended Total Return Fund 2015 Semi-Annual Report
FINANCIAL HIGHLIGHTS (CONTINUED)
| | | | |
| | | CLASS I | |
| | | FOR THE
SIX MONTHS ENDED
DECEMBER 31, 2015 (1)(2) | |
| |
| Per Common Share Data | | | | |
Net asset value, beginning of period | | $ | 10.00 | |
Income from investment operations: | | | | |
Net investment income (3) | | | 0.10 | |
Net realized and unrealized loss on investments | | | (0.44 | ) |
| | | | |
Total decrease from investment operations | | | (0.34 | ) |
| | | | |
Less dividends and distributions: | | | | |
From net investment income | | | (0.10 | ) |
| | | | |
Net asset value, at end of period | | $ | 9.56 | |
| | | | |
Total investment return (4) | | | (3.42 | )%(5) |
| | | | |
| |
| Supplemental Data and Ratios | | | | |
Net assets, end of period (000’s) | | $ | 4,590 | |
Ratio of total expenses (before reductions and reimbursements) to average net
assets (7) | | | 5.57 | %(6) |
Ratio of net expenses to average net assets | | | 0.85 | %(6) |
Ratio of net investment income to average net assets | | | 4.96 | %(6) |
Portfolio turnover rate | | | 9.39 | %(5) |
| (2) | | Fund commenced operations on October 21, 2015. |
| (3) | | Calculated using average shares outstanding. |
| (4) | | Total investment return calculation assumes the reinvestment of dividends at actual prices pursuant to the Fund’s dividend reinvestment plan. |
| (6) | | Annualized for periods less than one full year. |
| (7) | | The Adviser has agreed to waive and/or reimburse certain fees and/or expense so that, on an annualized basis, such expenses incurred will not exceed .95% as a percentage of average daily net assets. |
See accompanying Notes to Financial Statements.
61
Babson Emerging Markets Debt Blended Total Return Fund 2015 Semi-Annual Report
FINANCIAL HIGHLIGHTS (CONTINUED)
| | | | |
| | | CLASS Y | |
| | | FOR THE
SIX MONTHS ENDED
DECEMBER 31, 2015 (1)(2) | |
| |
| Per Common Share Data | | | | |
Net asset value, beginning of period | | $ | 10.00 | |
Income from investment operations: | | | | |
Net investment income (3) | | | 0.10 | |
Net realized and unrealized loss on investments | | | (0.44 | ) |
| | | | |
Total decrease from investment operations | | | (0.34 | ) |
| | | | |
Less dividends and distributions: | | | | |
From net investment income | | | (0.10 | ) |
| | | | |
Net asset value, at end of period | | $ | 9.56 | |
| | | | |
Total investment return (4) | | | (3.42 | )%(5) |
| | | | |
| |
| Supplemental Data and Ratios | | | | |
Net assets, end of period (000’s) | | $ | 4,590 | |
Ratio of total expenses (before reductions and reimbursements) to average net
assets (7) | | | 5.57 | %(6) |
Ratio of net expenses to average net assets | | | 0.85 | %(6) |
Ratio of net investment income to average net assets | | | 4.96 | %(6) |
Portfolio turnover rate | | | 9.39 | %(5) |
| (2) | | Fund commenced operations on October 21, 2015. |
| (3) | | Calculated using average shares outstanding. |
| (4) | | Total investment return calculation assumes the reinvestment of dividends at actual prices pursuant to the Fund’s dividend reinvestment plan. |
| (6) | | Annualized for periods less than one full year. |
| (7) | | The Adviser has agreed to waive and/or reimburse certain fees and/or expense so that, on an annualized basis, such expenses incurred will not exceed .95% as a percentage of average daily net assets. |
See accompanying Notes to Financial Statements.
62
Babson Emerging Markets Local Currency Debt Fund 2015 Semi-Annual Report
FINANCIAL HIGHLIGHTS
| | | | |
| | | CLASS A | |
| | | PERIOD FROM
DECEMBER 8, 2015
THROUGH
DECEMBER 31, 2015 (1)(2) | |
| |
| Per Common Share Data | | | | |
Net asset value, beginning of period | | $ | 10.00 | |
Income from investment operations: | | | | |
Net investment income (3) | | | 0.02 | |
Net realized and unrealized loss on investments | | | (0.30 | ) |
| | | | |
Total decrease from investment operations | | | (0.28 | ) |
| | | | |
Less dividends and distributions: | | | | |
From net investment income | | | (0.02 | ) |
| | | | |
Net asset value, at end of period | | $ | 9.70 | |
| | | | |
Total investment return (4) | | | (2.81 | )%(5) |
| | | | |
| |
| Supplemental Data and Ratios | | | | |
Net assets, end of period (000’s) | | $ | 97 | |
Ratio of total expenses (before reductions and reimbursements) to average net assets (6) | | | 34.93 | %(7) |
Ratio of net expenses to average net assets | | | – | %(7) |
Ratio of net investment income to average net assets | | | 3.83 | %(7) |
Portfolio turnover rate | | | – | %(5) |
| (2) | | Fund commenced operations on December 8, 2015. |
| (3) | | Calculated using average shares outstanding. |
| (4) | | Total investment return calculation does not consider the effects of sales loads and assumes the reinvestment of dividends at actual prices pursuant to the Fund’s dividend reinvestment plan. |
| (6) | | The Adviser has agreed to waive and/or reimburse certain fees and/or expense so that, on an annualized basis, such expenses incurred will not exceed 1.20% as a percentage of average daily net assets. |
| (7) | | Annualized for periods less than one full year. |
See accompanying Notes to Financial Statements.
63
Babson Emerging Markets Local Currency Debt Fund 2015 Semi-Annual Report
FINANCIAL HIGHLIGHTS (CONTINUED)
| | | | |
| | | CLASS C | |
| | | PERIOD FROM
DECEMBER 8, 2015
THROUGH
DECEMBER 31, 2015 (1)(2) | |
| |
| Per Common Share Data | | | | |
Net asset value, beginning of period | | $ | 10.00 | |
Income from investment operations: | | | | |
Net investment income (3) | | | 0.02 | |
Net realized and unrealized loss on investments | | | (0.30 | ) |
| | | | |
Total decrease from investment operations | | | (0.28 | ) |
| | | | |
Less dividends and distributions: | | | | |
From net investment income | | | (0.02 | ) |
| | | | |
Net asset value, at end of period | | $ | 9.70 | |
| | | | |
Total investment return (4) | | | (2.84 | )%(5) |
| | | | |
| |
| Supplemental Data and Ratios | | | | |
Net assets, end of period (000’s) | | $ | 97 | |
Ratio of total expenses (before reductions and reimbursements) to average net
assets (6) | | | 35.68 | %(7) |
Ratio of net expenses to average net assets | | | – | %(7) |
Ratio of net investment income to average net assets | | | 3.24 | %(7) |
Portfolio turnover rate | | | – | %(5) |
| (2) | | Fund commenced operations on December 8, 2015. |
| (3) | | Calculated using average shares outstanding. |
| (4) | | Total investment return calculation does not consider the effects of sales loads and assumes the reinvestment of dividends at actual prices pursuant to the Fund’s dividend reinvestment plan. |
| (6) | | The Adviser has agreed to waive and/or reimburse certain fees and/or expense so that, on an annualized basis, such expenses incurred will not exceed 1.95% as a percentage of average daily net assets. |
| (7) | | Annualized for periods less than one full year. |
See accompanying Notes to Financial Statements.
64
Babson Emerging Markets Local Currency Debt Fund 2015 Semi-Annual Report
FINANCIAL HIGHLIGHTS (CONTINUED)
| | | | |
| | | CLASS I | |
| | | FOR THE
SIX MONTHS ENDED
DECEMBER 31, 2015 (1)(2) | |
| |
| Per Common Share Data | | | | |
Net asset value, beginning of period | | $ | 10.00 | |
Income from investment operations: | | | | |
Net investment income (3) | | | 0.02 | |
Net realized and unrealized loss on investments | | | (0.30 | ) |
| | | | |
Total decrease from investment operations | | | (0.28 | ) |
| | | | |
Less dividends and distributions: | | | | |
From net investment income | | | (0.02 | ) |
| | | | |
Net asset value, at end of period | | $ | 9.70 | |
| | | | |
Total investment return (4) | | | (2.80 | )%(5) |
| | | | |
| |
| Supplemental Data and Ratios | | | | |
Net assets, end of period (000’s) | | $ | 2,327 | |
Ratio of total expenses (before reductions and reimbursements) to average net
assets (6) | | | 11.18 | %(7) |
Ratio of net expenses to average net assets | | | – | %(7) |
Ratio of net investment income to average net assets | | | 4.02 | %(7) |
Portfolio turnover rate | | | – | %(5) |
| (2) | | Fund commenced operations on December 8, 2015. |
| (3) | | Calculated using average shares outstanding. |
| (4) | | Total investment return calculation assumes the reinvestment of dividends at actual prices pursuant to the Fund’s dividend reinvestment plan. |
| (6) | | The Adviser has agreed to waive and/or reimburse certain fees and/or expense so that, on an annualized basis, such expenses incurred will not exceed 0.95% as a percentage of average daily net assets. |
| (7) | | Annualized for periods less than one full year. |
See accompanying Notes to Financial Statements.
65
Babson Emerging Markets Local Currency Debt Fund 2015 Semi-Annual Report
FINANCIAL HIGHLIGHTS (CONTINUED)
| | | | |
| | | CLASS Y | |
| | | FOR THE
SIX MONTHS ENDED
DECEMBER 31, 2015 (1)(2) | |
| |
| Per Common Share Data | | | | |
Net asset value, beginning of period | | $ | 10.00 | |
Income from investment operations: | | | | |
Net investment income (3) | | | 0.02 | |
Net realized and unrealized loss on investments | | | (0.30 | ) |
| | | | |
Total decrease from investment operations | | | (0.28 | ) |
| | | | |
Less dividends and distributions: | | | | |
From net investment income | | | (0.02 | ) |
| | | | |
Net asset value, at end of period | | $ | 9.70 | |
| | | | |
Total investment return (4) | | | (2.80 | )%(5) |
| | | | |
| |
| Supplemental Data and Ratios | | | | |
Net assets, end of period (000’s) | | $ | 2,327 | |
Ratio of total expenses (before reductions and reimbursements) to average net
assets (6) | | | 11.18 | %(7) |
Ratio of net expenses to average net assets | | | – | %(7) |
Ratio of net investment income to average net assets | | | 4.02 | %(7) |
Portfolio turnover rate | | | – | %(5) |
| (2) | | Fund commenced operations on December 8, 2015. |
| (3) | | Calculated using average shares outstanding. |
| (4) | | Total investment return calculation assumes the reinvestment of dividends at actual prices pursuant to the Fund’s dividend reinvestment plan. |
| (6) | | The Adviser has agreed to waive and/or reimburse certain fees and/or expense so that, on an annualized basis, such expenses incurred will not exceed 0.95% as a percentage of average daily net assets. |
| (7) | | Annualized for periods less than one full year. |
See accompanying Notes to Financial Statements.
66
Babson Global High Yield Fund 2015 Semi-Annual Report
FINANCIAL HIGHLIGHTS
| | | | |
| | | CLASS A | |
| | | PERIOD FROM
OCTOBER 30, 2015
THROUGH
DECEMBER 31, 2015 (1)(2) | |
| |
| Per Common Share Data | | | | |
Net asset value, beginning of period | | $ | 10.00 | |
Income from investment operations: | | | | |
Net investment income (3) | | | 0.07 | |
Net realized and unrealized loss on investments | | | (0.32 | ) |
| | | | |
Total decrease from investment operations | | | (0.25 | ) |
| | | | |
Less dividends and distributions: | | | | |
From net investment income | | | (0.07 | ) |
| | | | |
Net asset value, at end of period | | $ | 9.68 | |
| | | | |
Total investment return (4) | | | (2.44 | )%(5) |
| | | | |
| |
| Supplemental Data and Ratios | | | | |
Net assets, end of period (000’s) | | $ | 97 | |
Ratio of total expenses (before reductions and reimbursements) to average net
assets (6) | | | 26.13 | %(7) |
Ratio of net expenses to average net assets | | | 1.00 | %(7) |
Ratio of net investment income to average net assets | | | 4.56 | %(7) |
Portfolio turnover rate | | | 13.30 | %(5) |
| (2) | | Fund commenced operations on October 30, 2015. |
| (3) | | Calculated using average shares outstanding. |
| (4) | | Total investment return calculation does not consider the effects of sales loads and assumes the reinvestment of dividends at actual prices pursuant to the Fund’s dividend reinvestment plan. |
| (6) | | The Adviser has agreed to waive and/or reimburse certain fees and/or expense so that, on an annualized basis, such expenses incurred will not exceed 1.05% as a percentage of average daily net assets. |
| (7) | | Annualized for periods less than one full year. |
See accompanying Notes to Financial Statements.
67
Babson Global High Yield Fund 2015 Semi-Annual Report
FINANCIAL HIGHLIGHTS (CONTINUED)
| | | | |
| | | CLASS C | |
| | | PERIOD FROM
OCTOBER 30, 2015
THROUGH
DECEMBER 31, 2015 (1)(2) | |
| |
| Per Common Share Data | | | | |
Net asset value, beginning of period | | $ | 10.00 | |
Income from investment operations: | | | | |
Net investment income (3) | | | 0.06 | |
Net realized and unrealized loss on investments | | | (0.32 | ) |
| | | | |
Total decrease from investment operations | | | (0.26 | ) |
| | | | |
Less dividends and distributions: | | | | |
From net investment income | | | (0.06 | ) |
| | | | |
Net asset value, at end of period | | $ | 9.68 | |
| | | | |
Total investment return (4) | | | (2.55 | )%(5) |
| | | | |
| |
| Supplemental Data and Ratios | | | | |
Net assets, end of period (000’s) | | $ | 97 | |
Ratio of total expenses (before reductions and reimbursements) to average net
assets (6) | | | 26.87 | %(7) |
Ratio of net expenses to average net assets | | | 1.70 | %(7) |
Ratio of net investment income to average net assets | | | 3.86 | %(7) |
Portfolio turnover rate | | | 13.30 | %(5) |
| (2) | | Fund commenced operations on October 30, 2015. |
| (3) | | Calculated using average shares outstanding. |
| (4) | | Total investment return calculation does not consider the effects of sales loads and assumes the reinvestment of dividends at actual prices pursuant to the Fund’s dividend reinvestment plan. |
| (6) | | The Adviser has agreed to waive and/or reimburse certain fees and/or expense so that, on an annualized basis, such expenses incurred will not exceed 1.80% as a percentage of average daily net assets. |
| (7) | | Annualized for periods less than one full year. |
See accompanying Notes to Financial Statements.
68
Babson Global High Yield Fund 2015 Semi-Annual Report
FINANCIAL HIGHLIGHTS (CONTINUED)
| | | | |
| | | CLASS I | |
| | | FOR THE
SIX MONTHS ENDED
DECEMBER 31, 2015 (1)(2) | |
| |
| Per Common Share Data | | | | |
Net asset value, beginning of period | | $ | 10.00 | |
Income from investment operations: | | | | |
Net investment income (3) | | | 0.08 | |
Net realized and unrealized loss on investments | | | (0.32 | ) |
| | | | |
Total decrease from investment operations | | | (0.24 | ) |
| | | | |
Less dividends and distributions: | | | | |
From net investment income | | | (0.08 | ) |
| | | | |
Net asset value, at end of period | | $ | 9.68 | |
| | | | |
Total investment return (4) | | | (2.40 | )%(5) |
| | | | |
| |
| Supplemental Data and Ratios | | | | |
Net assets, end of period (000’s) | | $ | 12,007 | |
Ratio of total expenses (before reductions and reimbursements) to average net
assets (7) | | | 2.49 | %(6) |
Ratio of net expenses to average net assets | | | 0.76 | %(6) |
Ratio of net investment income to average net assets | | | 4.80 | %(6) |
Portfolio turnover rate | | | 13.30 | %(5) |
| (2) | | Fund commenced operations on October 30, 2015. |
| (3) | | Calculated using average shares outstanding. |
| (4) | | Total investment return calculation assumes the reinvestment of dividends at actual prices pursuant to the Fund’s dividend reinvestment plan. |
| (6) | | Annualized for periods less than one full year. |
| (7) | | The Adviser has agreed to waive and/or reimburse certain fees and/or expense so that, on an annualized basis, such expenses incurred will not exceed .80% as a percentage of average daily net assets. |
See accompanying Notes to Financial Statements.
69
Babson Global High Yield Fund 2015 Semi-Annual Report
FINANCIAL HIGHLIGHTS (CONTINUED)
| | | | |
| | | CLASS Y | |
| | | FOR THE
SIX MONTHS ENDED
DECEMBER 31, 2015 (1)(2) | |
| |
| Per Common Share Data | | | | |
Net asset value, beginning of period | | $ | 10.00 | |
Income from investment operations: | | | | |
Net investment income (3) | | | 0.08 | |
Net realized and unrealized loss on investments | | | (0.32 | ) |
| | | | |
Total decrease from investment operations | | | (0.24 | ) |
| | | | |
Less dividends and distributions: | | | | |
From net investment income | | | (0.08 | ) |
| | | | |
Net asset value, at end of period | | $ | 9.68 | |
| | | | |
Total investment return (4) | | | (2.40 | )%(5) |
| | | | |
| |
| Supplemental Data and Ratios | | | | |
Net assets, end of period (000’s) | | $ | 12,015 | |
Ratio of total expenses (before reductions and reimbursements) to average net
assets (6) | | | 2.49 | %(7) |
Ratio of net expenses to average net assets | | | 0.76 | %(7) |
Ratio of net investment income to average net assets | | | 4.80 | %(7) |
Portfolio turnover rate | | | 13.30 | %(5) |
| (2) | | Fund commenced operations on October 30, 2015. |
| (3) | | Calculated using average shares outstanding. |
| (4) | | Total investment return calculation assumes the reinvestment of dividends at actual prices pursuant to the Fund’s dividend reinvestment plan. |
| (6) | | The Adviser has agreed to waive and/or reimburse certain fees and/or expense so that, on an annualized basis, such expenses incurred will not exceed .80% as a percentage of average daily net assets. |
| (7) | | Annualized for periods less than one full year. |
See accompanying Notes to Financial Statements.
70
Babson U.S. High Yield Fund 2015 Semi-Annual Report
FINANCIAL HIGHLIGHTS
| | | | |
| | | CLASS A | |
| | | PERIOD FROM
OCTOBER 30, 2015
THROUGH
DECEMBER 31, 2015 (1)(2) | |
| |
| Per Common Share Data | | | | |
Net asset value, beginning of period | | $ | 10.00 | |
Income from investment operations: | | | | |
Net investment income (3) | | | 0.07 | |
Net realized and unrealized loss on investments | | | (0.36 | ) |
| | | | |
Total decrease from investment operations | | | (0.29 | ) |
| | | | |
Less dividends and distributions: | | | | |
From net investment income | | | (0.07 | ) |
| | | | |
Net asset value, at end of period | | $ | 9.64 | |
| | | | |
Total investment return (4) | | | (2.88 | )%(5) |
| | | | |
| |
| Supplemental Data and Ratios | | | | |
Net assets, end of period (000’s) | | $ | 96 | |
Ratio of total expenses (before reductions and reimbursements) to average net
assets (6) | | | 26.14 | %(7) |
Ratio of net expenses to average net assets | | | 0.95 | %(7) |
Ratio of net investment income to average net assets | | | 4.53 | %(7) |
Portfolio turnover rate | | | 12.07 | %(5) |
| (2) | | Fund commenced operations on October 30, 2015. |
| (3) | | Calculated using average shares outstanding. |
| (4) | | Total investment return calculation does not consider the effects of sales loads and assumes the reinvestment of dividends at actual prices pursuant to the Fund’s dividend reinvestment plan. |
| (6) | | The Adviser has agreed to waive and/or reimburse certain fees and/or expense so that, on an annualized basis, such expenses incurred will not exceed 1.00% as a percentage of average daily net assets. |
| (7) | | Annualized for periods less than one full year. |
See accompanying Notes to Financial Statements.
71
Babson U.S. High Yield Fund 2015 Semi-Annual Report
FINANCIAL HIGHLIGHTS (CONTINUED)
| | | | |
| | | CLASS C | |
| | | PERIOD FROM
OCTOBER 30, 2015
THROUGH
DECEMBER 31, 2015 (1)(2) | |
| |
| Per Common Share Data | | | | |
Net asset value, beginning of period | | $ | 10.00 | |
Income from investment operations: | | | | |
Net investment income (3) | | | 0.06 | |
Net realized and unrealized loss on investments | | | (0.36 | ) |
| | | | |
Total decrease from investment operations | | | (0.30 | ) |
| | | | |
Less dividends and distributions: | | | | |
From net investment income | | | (0.06 | ) |
| | | | |
Net asset value, at end of period | | $ | 9.64 | |
| | | | |
Total investment return (4) | | | (2.99 | )%(5) |
| | | | |
| |
| Supplemental Data and Ratios | | | | |
Net assets, end of period (000’s) | | $ | 96 | |
Ratio of total expenses (before reductions and reimbursements) to average net
assets (7) | | | 26.89 | %(6) |
Ratio of net expenses to average net assets | | | 1.66 | %(6) |
Ratio of net investment income to average net assets | | | 3.81 | %(6) |
Portfolio turnover rate | | | 12.07 | %(5) |
| (2) | | Fund commenced operations on October 30, 2015. |
| (3) | | Calculated using average shares outstanding. |
| (4) | | Total investment return calculation does not consider the effects of sales loads and assumes the reinvestment of dividends at actual prices pursuant to the Fund’s dividend reinvestment plan. |
| (6) | | Annualized for periods less than one full year. |
| (7) | | The Adviser has agreed to waive and/or reimburse certain fees and/or expense so that, on an annualized basis, such expenses incurred will not exceed 1.75% as a percentage of average daily net assets. |
See accompanying Notes to Financial Statements.
72
Babson U.S. High Yield Fund 2015 Semi-Annual Report
FINANCIAL HIGHLIGHTS (CONTINUED)
| | | | |
| | | CLASS I | |
| | | FOR THE
SIX MONTHS ENDED
DECEMBER 31, 2015 (1)(2) | |
| |
| Per Common Share Data | | | | |
Net asset value, beginning of period | | $ | 10.00 | |
Income from investment operations: | | | | |
Net investment income (3) | | | 0.08 | |
Net realized and unrealized loss on investments | | | (0.36 | ) |
| | | | |
Total decrease from investment operations | | | (0.28 | ) |
| | | | |
Less dividends and distributions: | | | | |
From net investment income | | | (0.08 | ) |
| | | | |
Net asset value, at end of period | | $ | 9.64 | |
| | | | |
Total investment return (4) | | | (2.84 | )%(5) |
| | | | |
| |
| Supplemental Data and Ratios | | | | |
Net assets, end of period (000’s) | | $ | 14,061 | |
Ratio of total expenses (before reductions and reimbursements) to average net
assets (7) | | | 2.43 | %(6) |
Ratio of net expenses to average net assets | | | 0.71 | %(6) |
Ratio of net investment income to average net assets | | | 4.79 | %(6) |
Portfolio turnover rate | | | 12.07 | %(5) |
| (2) | | Fund commenced operations on October 30, 2015. |
| (3) | | Calculated using average shares outstanding. |
| (4) | | Total investment return calculation assumes the reinvestment of dividends at actual prices pursuant to the Fund’s dividend reinvestment plan. |
| (6) | | Annualized for periods less than one full year. |
| (7) | | The Adviser has agreed to waive and/or reimburse certain fees and/or expense so that, on an annualized basis, such expenses incurred will not exceed .75% as a percentage of average daily net assets. |
See accompanying Notes to Financial Statements.
73
Babson U.S. High Yield Fund 2015 Semi-Annual Report
FINANCIAL HIGHLIGHTS (CONTINUED)
| | | | |
| | | CLASS Y | |
| | | FOR THE
SIX MONTHS ENDED
DECEMBER 31, 2015 (1)(2) | |
| |
| Per Common Share Data | | | | |
Net asset value, beginning of period | | $ | 10.00 | |
Income from investment operations: | | | | |
Net investment income (3) | | | 0.08 | |
Net realized and unrealized loss on investments | | | (0.36 | ) |
| | | | |
Total decrease from investment operations | | | (0.28 | ) |
| | | | |
Less dividends and distributions: | | | | |
From net investment income | | | (0.08 | ) |
| | | | |
Net asset value, at end of period | | $ | 9.64 | |
| | | | |
Total investment return (4) | | | (2.84 | )%(5) |
| | | | |
| |
| Supplemental Data and Ratios | | | | |
Net assets, end of period (000’s) | | $ | 11,953 | |
Ratio of total expenses (before reductions and reimbursements) to average net
assets (7) | | | 2.43 | %(6) |
Ratio of net expenses to average net assets | | | 0.71 | %(6) |
Ratio of net investment income to average net assets | | | 4.77 | %(6) |
Portfolio turnover rate | | | 12.07 | %(5) |
| (2) | | Fund commenced operations on October 30, 2015. |
| (3) | | Calculated using average shares outstanding. |
| (4) | | Total investment return calculation assumes the reinvestment of dividends at actual prices pursuant to the Fund’s dividend reinvestment plan. |
| (6) | | Annualized for periods less than one full year. |
| (7) | | The Adviser has agreed to waive and/or reimburse certain fees and/or expense so that, on an annualized basis, such expenses incurred will not exceed .75% as a percentage of average daily net assets. |
See accompanying Notes to Financial Statements.
74
Babson Global Floating Rate Fund 2015 Semi-Annual Report
SCHEDULE OF INVESTMENTS (UNAUDITED)
December 31, 2015
| | | | | | | | | | | | | | | | | | | | |
| | | EFFECTIVE
INTEREST RATE | | | DUE DATE | | | PRINCIPAL ‡‡ | | | COST | | | FAIR VALUE | |
Fixed Income — 93.1%*: | | | | | | | | | | | | | | | | | | | | |
| | | | | |
Bank Loans — 83.3%*§: | | | | | | | | | | | | | | | | | | | | |
| | | | | |
Aerospace and Defense — 0.5%*: | | | | | | | | | | | | | | | | | | | | |
Swissport Investments SA+ | | | 6.25 | % | | | 11/30/2021 | | | | 700,000 | | | | $731,901 | | | | $759,302 | |
| | | | | | | | | | | | | | | | | | | | |
| | | | | |
Automobile — 2.3%*: | | | | | | | | | | | | | | | | | | | | |
Gates Global, Inc. | | | 4.25 | | | | 7/5/2021 | | | | 1,486,206 | | | | 1,481,275 | | | | 1,390,658 | |
RAC Finance (Holdings) Ltd.+ | | | 5.36 | | | | 12/17/2021 | | | | 990,000 | | | | 1,478,964 | | | | 1,457,371 | |
RAC Finance (Holdings) Ltd.+ | | | 8.25 | | | | 12/17/2022 | | | | 500,000 | | | | 791,805 | | | | 737,410 | |
| | | | | | | | | | | | | | | | | | | | |
Total Automobile | | | | | | | | | | | 2,976,206 | | | | 3,752,044 | | | | 3,585,439 | |
| | | | | | | | | | | | | | | | | | | | |
| | |
Beverage, Food and Tobacco — 1.7%*: | | | | | | | | | |
1011778 B.C. Unlimited Liability Co.+ | | | 3.75 | | | | 12/12/2021 | | | | 797,981 | | | | 790,001 | | | | 790,001 | |
Acosta Holdco, Inc. | | | 4.25 | | | | 9/26/2021 | | | | 404,825 | | | | 404,825 | | | | 384,150 | |
Del Monte Foods, Inc. | | | 4.25 | | | | 2/18/2021 | | | | 245,625 | | | | 244,722 | | | | 235,800 | |
Deoleo SA+ | | | 4.50 | | | | 6/11/2021 | | | | 500,000 | | | | 677,157 | | | | 474,399 | |
JBS USA, LLC | | | 3.75 | | | | 9/18/2020 | | | | 488,750 | | | | 489,595 | | | | 478,975 | |
Telepizza SA+ | | | 7.00 | | | | 10/20/2020 | | | | 250,000 | | | | 315,638 | | | | 270,783 | |
| | | | | | | | | | | | | | | | | | | | |
Total Beverage, Food and Tobacco | | | | | | | | | | | 2,687,181 | | | | 2,921,938 | | | | 2,634,108 | |
| | | | | | | | | | | | | | | | | | | | |
| | |
Broadcasting and Entertainment — 4.9%*: | | | | | | | | | |
All3Media International+ | | | 5.25 | | | | 6/30/2021 | | | | 1,500,000 | | | | 2,301,776 | | | | 2,009,519 | |
Charter Communications Operating LLC | | | 3.00 | | | | 1/4/2021 | | | | 1,487,392 | | | | 1,478,021 | | | | 1,455,785 | |
Cumulus Media Holdings, Inc. | | | 4.25 | | | | 12/23/2020 | | | | 152,239 | | | | 150,280 | | | | 114,686 | |
DLG Acquisitions Ltd.+ | | | 8.25 | | | | 6/30/2022 | | | | 500,000 | | | | 671,653 | | | | 502,622 | |
Learfield Communications, Inc. | | | 4.50 | | | | 10/9/2020 | | | | 411,259 | | | | 410,881 | | | | 407,146 | |
Tech Finance & Co. S.C.A+ | | | 5.00 | | | | 7/10/2020 | | | | 500,000 | | | | 558,172 | | | | 543,147 | |
Tele Columbus AG+ | | | 5.11 | | | | 1/4/2021 | | | | 500,000 | | | | 546,572 | | | | 532,659 | |
Univision Communications, Inc. | | | 4.00 | | | | 3/1/2020 | | | | 1,985,545 | | | | 1,984,948 | | | | 1,939,877 | |
| | | | | | | | | | | | | | | | | | | | |
Total Broadcasting and Entertainment | | | | | | | | | | | 7,036,435 | | | | 8,102,303 | | | | 7,505,441 | |
| | | | | | | | | | | | | | | | | | | | |
| | |
Buildings and Real Estate — 2.5%*: | | | | | | | | | |
Alison Bidco Sarl+ | | | 5.50 | | | | 8/29/2021 | | | | 293,542 | | | | 291,156 | | | | 286,937 | |
Builders FirstSource, Inc. | | | 6.00 | | | | 7/31/2022 | | | | 1,590,834 | | | | 1,585,719 | | | | 1,570,949 | |
DTZ US Borrower LLC | | | 4.25 | | | | 11/4/2021 | | | | 2,055,004 | | | | 2,044,082 | | | | 2,001,697 | |
| | | | | | | | | | | | | | | | | | | | |
Total Buildings and Real Estate | | | | | | | | | | | 3,939,380 | | | | 3,920,957 | | | | 3,859,583 | |
| | | | | | | | | | | | | | | | | | | | |
| | |
Cargo Transport — 1.5%*: | | | | | | | | | |
Direct ChassisLink, Inc.¤ | | | 8.25 | | | | 11/12/2019 | | | | 490,476 | | | | 485,684 | | | | 473,310 | |
Direct ChassisLink, Inc. (Add-On Facility)¤ | | | 8.25 | | | | 10/31/2019 | | | | 500,633 | | | | 500,633 | | | | 483,111 | |
XPO Logistics, Inc. | | | 5.50 | | | | 11/1/2021 | | | | 1,446,320 | | | | 1,426,488 | | | | 1,438,481 | |
| | | | | | | | | | | | | | | | | | | | |
Total Cargo Transport | | | | | | | | | | | 2,437,429 | | | | 2,412,805 | | | | 2,394,902 | |
| | | | | | | | | | | | | | | | | | | | |
| | |
Chemicals, Plastics and Rubber — 5.9%*: | | | | | | | | | |
Chromaflo Technologies Corp. | | | 4.50 | | | | 12/2/2019 | | | | 1,209,074 | | | | 1,207,169 | | | | 1,154,666 | |
Flint Group GmbH+ | | | 4.25 | | | | 9/7/2021 | | | | 500,000 | | | | 536,505 | | | | 538,283 | |
Flint Group GmbH+ | | | 4.50 | | | | 9/7/2021 | | | | 90,565 | | | | 89,820 | | | | 88,618 | |
See accompanying Notes to Financial Statements.
75
Babson Global Floating Rate Fund 2015 Semi-Annual Report
SCHEDULE OF INVESTMENTS (UNAUDITED) (CONTINUED)
December 31, 2015
| | | | | | | | | | | | | | | | | | | | |
| | | EFFECTIVE
INTEREST RATE | | | DUE DATE | | | PRINCIPAL ‡‡ | | | COST | | | FAIR VALUE | |
Bank Loans (Continued) | | | | | | | | | | | | | | | | | | | | |
| | |
Chemicals, Plastics and Rubber (Continued) | | | | | | | | | |
Flint Group U.S. LLC+ | | | 4.50 | % | | | 9/7/2021 | | | | 547,846 | | | | $543,340 | | | | $536,067 | |
MacDermid European Holdings B.V. | | | 5.50 | | | | 6/7/2020 | | | | 498,750 | | | | 525,751 | | | | 530,163 | |
MacDermid, Inc. | | | 5.50 | | | | 6/7/2020 | | | | 1,477,458 | | | | 1,448,304 | | | | 1,430,548 | |
Methanol Holdings (Trinidad) Ltd. | | | 4.25 | | | | 6/30/2022 | | | | 1,129,784 | | | | 1,119,266 | | | | 1,039,401 | |
OXEA Finance & Cy S.C.A.+ | | | 4.50 | | | | 1/15/2020 | | | | 497,462 | | | | 525,678 | | | | 526,198 | |
OXEA Finance LLC+ | | | 4.25 | | | | 1/15/2020 | | | | 354,120 | | | | 348,022 | | | | 339,070 | |
Styrolution Group GmbH+ | | | 6.50 | | | | 11/7/2019 | | | | 594,000 | | | | 732,350 | | | | 645,801 | |
Univar, Inc. | | | 4.25 | | | | 7/1/2022 | | | | 983,113 | | | | 981,926 | | | | 949,658 | |
Vantage Specialty Chemicals, Inc. | | | 5.00 | | | | 2/10/2019 | | | | 1,438,870 | | | | 1,427,967 | | | | 1,410,093 | |
| | | | | | | | | | | | | | | | | | | | |
Total Chemicals, Plastics and Rubber | | | | | | | | | | | 9,321,042 | | | | 9,486,098 | | | | 9,188,566 | |
| | | | | | | | | | | | | | | | | | | | |
| | | | | |
Containers, Packaging and Glass — 4.9%*: | | | | | | | | | | | | | | | | | | | | |
Consolidated Container Co. LLC | | | 5.00 | | | | 7/3/2019 | | | | 1,488,461 | | | | 1,486,727 | | | | 1,345,569 | |
Consolidated Container Co. LLC | | | 7.75 | | | | 1/3/2020 | | | | 188,280 | | | | 185,543 | | | | 160,038 | |
Hilex Poly Co. LLC | | | 6.00 | | | | 12/5/2021 | | | | 402,814 | | | | 399,356 | | | | 401,001 | |
Mauser U.S. Corporate LLC+ | | | 4.50 | | | | 7/31/2021 | | | | 1,564,389 | | | | 1,564,484 | | | | 1,525,279 | |
Multi Packaging Solutions, Inc. | | | 4.25 | | | | 9/30/2020 | | | | 917,857 | | | | 917,852 | | | | 881,143 | |
Prolampac Intermediate, Inc. | | | 5.75 | | | | 8/18/2022 | | | | 956,586 | | | | 947,497 | | | | 935,063 | |
Prolampac Intermediate, Inc. | | | 9.25 | | | | 8/18/2023 | | | | 1,000,000 | | | | 980,872 | | | | 895,000 | |
Tekni-Plex, Inc. | | | 4.50 | | | | 6/1/2022 | | | | 371,882 | | | | 370,173 | | | | 365,374 | |
Verallia+ | | | 5.00 | | | | 10/29/2022 | | | | 1,000,000 | | | | 1,092,382 | | | | 1,085,283 | |
| | | | | | | | | | | | | | | | | | | | |
Total Containers, Packaging and Glass | | | | | | | | | | | 7,890,269 | | | | 7,944,886 | | | | 7,593,750 | |
| | | | | | | | | | | | | | | | | | | | |
| | |
Diversified Natural Resources, Precious Metals and Minerals — 0.3%*: | | | | | | | | | |
Cemex SAB de CV | | | 4.11 | | | | 7/23/2020 | | | | 538,919 | | | | 548,582 | | | | 539,369 | |
| | | | | | | | | | | | | | | | | | | | |
| | |
Diversified/Conglomerate Manufacturing — 2.2%*: | | | | | | | | | |
Pelican Products, Inc. | | | 5.25 | | | | 4/10/2020 | | | | 989,924 | | | | 987,851 | | | | 970,126 | |
Quality Home Brands Holdings LLC | | | 7.75 | | | | 5/25/2018 | | | | 258,399 | | | | 256,979 | | | | 258,185 | |
STS Operating, Inc. | | | 4.75 | | | | 2/12/2021 | | | | 311,347 | | | | 311,619 | | | | 295,001 | |
Tennessee Acquisition Holding B.V.+ | | | 5.25 | | | | 11/30/2022 | | | | 500,000 | | | | 534,009 | | | | 535,903 | |
Terex Corp. | | | 4.50 | | | | 12/31/2022 | | | | 500,000 | | | | 535,178 | | | | 532,958 | |
Triple Point Technology, Inc. | | | 5.25 | | | | 7/10/2020 | | | | 339,095 | | | | 316,511 | | | | 244,148 | |
Triple Point Technology, Inc.†† | | | 9.25 | | | | 7/10/2021 | | | | 145,676 | | | | 137,307 | | | | 87,406 | |
West Corp. | | | 2.86 | | | | 7/1/2019 | | | | 495,181 | | | | 481,673 | | | | 475,374 | |
| | | | | | | | | | | | | | | | | | | | |
Total Diversified/Conglomerate Manufacturing | | | | | | | | | | | 3,539,622 | | | | 3,561,127 | | | | 3,399,101 | |
| | | | | | | | | | | | | | | | | | | | |
| | |
Diversified/Conglomerate Service — 6.5%*: | | | | | | | | | |
Aquilex Holdings LLC | | | 5.00 | | | | 12/31/2020 | | | | 196,139 | | | | 195,786 | | | | 186,332 | |
Atrium Innovations, Inc.+ | | | 4.25 | | | | 2/13/2021 | | | | 823,547 | | | | 822,391 | | | | 757,663 | |
Brock Holdings III, Inc. | | | 6.00 | | | | 3/16/2017 | | | | 949,798 | | | | 939,877 | | | | 883,312 | |
EIG Investors Corp. | | | 5.00 | | | | 11/9/2019 | | | | 822,974 | | | | 823,656 | | | | 800,342 | |
Garda World Security Corp.+ | | | 4.00 | | | | 11/6/2020 | | | | 1,163,279 | | | | 1,156,817 | | | | 1,107,058 | |
Men’s Wearhouse, Inc. (The) | | | 4.50 | | | | 6/18/2021 | | | | 880,484 | | | | 790,193 | | | | 772,625 | |
See accompanying Notes to Financial Statements.
76
Babson Global Floating Rate Fund 2015 Semi-Annual Report
SCHEDULE OF INVESTMENTS (UNAUDITED) (CONTINUED)
December 31, 2015
| | | | | | | | | | | | | | | | | | | | |
| | | EFFECTIVE
INTEREST RATE | | | DUE DATE | | | PRINCIPAL ‡‡ | | | COST | | | FAIR VALUE | |
Bank Loans (Continued) | | | | | | | | | | | | | | | | | | | | |
| | |
Diversified/Conglomerate Service (Continued) | | | | | | | | | |
MH Sub I LLC | | | 4.75 | % | | | 7/8/2021 | | | | 583,849 | | | | $581,193 | | | | $563,899 | |
MH Sub I LLC | | | 8.50 | | | | 7/8/2022 | | | | 400,000 | | | | 396,731 | | | | 377,332 | |
MPH Acquisition Holdings LLC | | | 3.75 | | | | 3/31/2021 | | | | 700,699 | | | | 699,357 | | | | 680,848 | |
Northgate Information Solutions Ltd.+ | | | 4.61 | | | | 3/18/2018 | | | | 293,704 | | | | 393,438 | | | | 312,799 | |
Northgate Information Solutions Ltd.+ | | | 5.11 | | | | 3/18/2018 | | | | 290,745 | | | | 390,163 | | | | 309,647 | |
Power Team Services LLC | | | 8.25 | | | | 11/6/2020 | | | | 500,000 | | | | 496,496 | | | | 473,750 | |
RP Crown Parent LLC | | | 6.00 | | | | 12/21/2018 | | | | 545,420 | | | | 546,814 | | | | 483,084 | |
RP Crown Parent LLC | | | 11.25 | | | | 12/20/2019 | | | | 678,571 | | | | 689,038 | | | | 551,903 | |
SkillSoft Corp. | | | 5.75 | | | | 4/28/2021 | | | | 398,989 | | | | 396,368 | | | | 307,221 | |
Vogue International, Inc. | | | 5.75 | | | | 2/14/2020 | | | | 1,433,080 | | | | 1,443,651 | | | | 1,426,818 | |
| | | | | | | | | | | | | | | | | | | | |
Total Diversified/Conglomerate Service | | | | | | | | | | | 10,661,278 | | | | 10,761,969 | | | | 9,994,633 | |
| | | | | | | | | | | | | | | | | | | | |
| | |
Ecological — 2.6%*: | | | | | | | | | |
Biffa Waste Services Ltd.+ | | | 5.61 | | | | 1/30/2018 | | | | 2,000,000 | | | | 3,178,564 | | | | 2,870,267 | |
Emerald 3 Ltd.+ | | | 8.00 | | | | 5/31/2022 | | | | 390,426 | | | | 387,249 | | | | 367,001 | |
PHS Group PLC+ | | | 6.00 | | | | 4/17/2020 | | | | 500,000 | | | | 771,486 | | | | 732,493 | |
| | | | | | | | | | | | | | | | | | | | |
Total Ecological | | | | | | | | | | | 2,890,426 | | | | 4,337,299 | | | | 3,969,761 | |
| | | | | | | | | | | | | | | | | | | | |
| | |
Electronics — 3.2%*: | | | | | | | | | |
CDW LLC | | | 3.25 | | | | 4/29/2020 | | | | 1,190,819 | | | | 1,185,648 | | | | 1,159,262 | |
Informatica Corp. | | | 4.50 | | | | 8/5/2022 | | | | 1,596,000 | | | | 1,594,105 | | | | 1,532,735 | |
Microsemi Corp. | | | 5.11 | | | | 12/2/2022 | | | | 915,669 | | | | 888,199 | | | | 897,814 | |
Renaissance Learning, Inc. | | | 4.50 | | | | 4/9/2021 | | | | 1,486,137 | | | | 1,467,505 | | | | 1,419,260 | |
| | | | | | | | | | | | | | | | | | | | |
Total Electronics | | | | | | | | | | | 5,188,625 | | | | 5,135,457 | | | | 5,009,071 | |
| | | | | | | | | | | | | | | | | | | | |
| | |
Finance — 5.6%*: | | | | | | | | | |
Alliant Holdings I, Inc. | | | 4.50 | | | | 8/12/2022 | | | | 1,246,867 | | | | 1,236,204 | | | | 1,214,137 | |
Confie Seguros Holdings II Co. | | | 5.75 | | | | 11/9/2018 | | | | 531,339 | | | | 529,798 | | | | 522,705 | |
Cunningham Lindsey US, Inc. | | | 5.00 | | | | 12/10/2019 | | | | 486,139 | | | | 484,591 | | | | 313,560 | |
Cunningham Lindsey US, Inc. | | | 9.25 | | | | 6/10/2020 | | | | 748,546 | | | | 749,917 | | | | 389,244 | |
Eze Castle Software, Inc. | | | 4.00 | | | | 4/6/2020 | | | | 971,818 | | | | 967,372 | | | | 950,758 | |
First Data Corp. | | | 4.36 | | | | 7/8/2022 | | | | 1,022,479 | | | | 1,014,906 | | | | 1,006,886 | |
GENEX Holdings, Inc. | | | 5.25 | | | | 5/30/2021 | | | | 1,496,203 | | | | 1,490,805 | | | | 1,467,520 | |
Moneygram International, Inc. | | | 4.25 | | | | 3/27/2020 | | | | 829,494 | | | | 776,119 | | | | 755,528 | |
P2 Newco Acquisition, Inc. | | | 5.50 | | | | 10/22/2020 | | | | 379,059 | | | | 376,438 | | | | 374,321 | |
SAM Finance Lux Sarl+ | | | 5.00 | | | | 12/17/2020 | | | | 343,568 | | | | 554,946 | | | | 504,482 | |
Sedgwick Claims Management Services, Inc. | | | 3.75 | | | | 3/1/2021 | | | | 491,250 | | | | 490,342 | | | | 470,372 | |
Sedgwick Claims Management Services, Inc. | | | 6.75 | | | | 2/28/2022 | | | | 561,418 | | | | 560,859 | | | | 505,277 | |
Wall Street Systems Delaware, Inc. | | | 4.50 | | | | 4/30/2021 | | | | 241,948 | | | | 241,024 | | | | 237,563 | |
| | | | | | | | | | | | | | | | | | | | |
Total Finance | | | | | | | | | | | 9,350,128 | | | | 9,473,321 | | | | 8,712,353 | |
| | | | | | | | | | | | | | | | | | | | |
| | |
Healthcare, Education and Childcare — 9.1%*: | | | | | | | | | |
ADMI Corp. | | | 5.50 | | | | 4/30/2022 | | | | 1,492,500 | | | | 1,502,701 | | | | 1,486,903 | |
Amedes Holding AG+ | | | 5.36 | | | | 8/19/2022 | | | | 500,000 | | | | 532,949 | | | | 540,174 | |
See accompanying Notes to Financial Statements.
77
Babson Global Floating Rate Fund 2015 Semi-Annual Report
SCHEDULE OF INVESTMENTS (UNAUDITED) (CONTINUED)
December 31, 2015
| | | | | | | | | | | | | | | | | | | | |
| | | EFFECTIVE
INTEREST RATE | | | DUE DATE | | | PRINCIPAL ‡‡ | | | COST | | | FAIR VALUE | |
Bank Loans (Continued) | | | | | | | | | | | | | | | | | | | | |
| | |
Healthcare, Education and Childcare (Continued) | | | | | | | | | |
CareCore National LLC | | | 5.50 | % | | | 3/5/2021 | | | | 676,178 | | | | $675,808 | | | | $581,513 | |
Drumm Investors LLC | | | 6.75 | | | | 5/4/2018 | | | | 863,565 | | | | 858,661 | | | | 849,895 | |
Financiere Verdi+ | | | 6.11 | | | | 9/30/2022 | | | | 500,000 | | | | 529,281 | | | | 537,490 | |
Jaguar Holding Co. II | | | 4.25 | | | | 8/18/2022 | | | | 902,634 | | | | 898,347 | | | | 875,555 | |
Kindred Healthcare, Inc. | | | 4.25 | | | | 4/9/2021 | | | | 1,694,716 | | | | 1,640,661 | | | | 1,631,165 | |
MedImpact Healthcare Systems, Inc. | | | 5.75 | | | | 10/27/2022 | | | | 444,741 | | | | 440,381 | | | | 438,070 | |
Ortho-Clinical Diagnostics, Inc. | | | 4.75 | | | | 6/30/2021 | | | | 2,036,007 | | | | 2,024,257 | | | | 1,717,881 | |
Rodenstock GmbH+ | | | 5.11 | | | | 5/30/2019 | | | | 1,500,000 | | | | 1,765,267 | | | | 1,602,625 | |
Synarc-Biocore Holdings LLC | | | 5.50 | | | | 3/10/2021 | | | | 491,250 | | | | 487,589 | | | | 456,863 | |
Synarc-Biocore Holdings LLC | | | 9.25 | | | | 3/10/2022 | | | | 500,000 | | | | 496,114 | | | | 456,250 | |
Team Health Inc. | | | 4.50 | | | | 11/23/2022 | | | | 467,760 | | | | 463,114 | | | | 465,716 | |
Tecomet, Inc. | | | 5.75 | | | | 12/5/2021 | | | | 722,135 | | | | 701,038 | | | | 646,310 | |
Tunstall Group Holdings Ltd.+ | | | 5.61 | | | | 10/16/2020 | | | | 500,000 | | | | 793,936 | | | | 691,341 | |
Valeant Pharmaceuticals International | | | 4.00 | | | | 4/1/2022 | | | | 1,089,449 | | | | 1,076,818 | | | | 1,045,598 | |
| | | | | | | | | | | | | | | | | | | | |
Total Healthcare, Education and Childcare | | | | | | | | | | | 14,380,935 | | | | 14,886,922 | | | | 14,023,349 | |
| | | | | | | | | | | | | | | | | | | | |
| | |
Home and Office Furnishings, Housewares, and Durable Consumer Products — 1.4%*: | | | | | | | | | |
HMK Intermediate Holdings LLC | | | 5.00 | | | | 3/30/2019 | | | | 1,576,795 | | | | 1,573,664 | | | | 1,564,969 | |
Leslie’s Poolmart, Inc. | | | 4.25 | | | | 10/16/2019 | | | | 537,166 | | | | 537,166 | | | | 522,528 | |
| | | | | | | | | | | | | | | | | | | | |
Total Home and Office Furnishings, Housewares, and Durable Consumer Products | | | | | | | | | | | 2,113,961 | | | | 2,110,830 | | | | 2,087,497 | |
| | | | | | | | | | | | | | | | | | | | |
| | |
Hotels, Motels, Inns and Gaming — 1.4%*: | | | | | | | | | |
Compass Holdco 2 Ltd.+ | | | 5.86 | | | | 10/31/2022 | | | | 500,000 | | | | 754,716 | | | | 729,729 | |
Cyan Blue Holdco 3 Ltd.+ | | | 6.50 | | | | 2/25/2022 | | | | 500,000 | | | | 733,819 | | | | 736,982 | |
Full Moon Holdco 6 Ltd.+ | | | 6.00 | | | | 6/19/2017 | | | | 500,000 | | | | 762,710 | | | | 733,105 | |
| | | | | | | | | | | | | | | | | | | | |
Total Hotels, Motels, Inns and Gaming | | | | | | | | | | | 1,500,000 | | | | 2,251,245 | | | | 2,199,816 | |
| | | | | | | | | | | | | | | | | | | | |
| | |
Insurance — 2.7%*: | | | | | | | | | |
Asurion LLC | | | 4.25 | | | | 7/8/2020 | | | | 588,678 | | | | 545,623 | | | | 535,945 | |
Asurion LLC | | | 5.00 | | | | 5/24/2019 | | | | 900,401 | | | | 876,901 | | | | 841,596 | |
Hub International Ltd. | | | 4.00 | | | | 10/2/2020 | | | | 1,721,281 | | | | 1,715,285 | | | | 1,620,156 | |
York Risk Services Holding Corp. | | | 4.75 | | | | 10/1/2021 | | | | 1,186,670 | | | | 1,157,758 | | | | 1,118,436 | |
| | | | | | | | | | | | | | | | | | | | |
Total Insurance | | | | | | | | | | | 4,397,030 | | | | 4,295,567 | | | | 4,116,133 | |
| | | | | | | | | | | | | | | | | | | | |
| | |
Leisure, Amusement, Entertainment — 3.6%*: | | | | | | | | | |
AP NMT Acquisition B.V.+ | | | 6.75 | | | | 8/13/2021 | | | | 523,382 | | | | 508,133 | | | | 462,759 | |
AP NMT Acquisition B.V.+ | | | 7.00 | | | | 8/13/2021 | | | | 537,677 | | | | 648,833 | | | | 572,050 | |
AP NMT Acquisition B.V.+ | | | 10.00 | | | | 8/13/2022 | | | | 100,000 | | | | 83,875 | | | | 80,500 | |
Delta 2 (Lux) Sarl+ | | | 4.75 | | | | 7/30/2021 | | | | 1,587,247 | | | | 1,582,771 | | | | 1,530,948 | |
Delta 2 (Lux) Sarl+ | | | 7.75 | | | | 7/31/2022 | | | | 437,500 | | | | 436,786 | | | | 402,281 | |
SeaWorld Parks & Entertainment, Inc. | | | 4.00 | | | | 5/14/2020 | | | | 987,514 | | | | 988,197 | | | | 956,239 | |
WMG Acquisition Corp. | | | 3.75 | | | | 7/1/2020 | | | | 1,586,820 | | | | 1,569,595 | | | | 1,498,878 | |
| | | | | | | | | | | | | | | | | | | | |
Total Leisure, Amusement, Entertainment | | | | | | | | | | | 5,760,140 | | | | 5,818,190 | | | | 5,503,655 | |
| | | | | | | | | | | | | | | | | | | | |
See accompanying Notes to Financial Statements.
78
Babson Global Floating Rate Fund 2015 Semi-Annual Report
SCHEDULE OF INVESTMENTS (UNAUDITED) (CONTINUED)
December 31, 2015
| | | | | | | | | | | | | | | | | | | | |
| | | EFFECTIVE
INTEREST RATE | | | DUE DATE | | | PRINCIPAL ‡‡ | | | COST | | | FAIR VALUE | |
Bank Loans (Continued) | | | | | | | | | | | | | | | | | | | | |
| | |
Machinery Non-Agriculture, Non-Construction, Non-Electronic — 5.3%*: | | | | | | | | | |
Apex Tool Group LLC | | | 4.50 | % | | | 1/31/2020 | | | | 1,994,872 | | | | $1,963,809 | | | | $1,907,596 | |
Doncasters Finance US LLC | | | 4.50 | | | | 4/9/2020 | | | | 957,015 | | | | 955,292 | | | | 924,716 | |
Gardner Denver, Inc. | | | 4.25 | | | | 7/30/2020 | | | | 770,184 | | | | 750,804 | | | | 691,047 | |
Husky Injection Molding Systems Ltd.+ | | | 4.25 | | | | 6/30/2021 | | | | 942,019 | | | | 941,260 | | | | 903,161 | |
Husky Injection Molding Systems Ltd.+ | | | 7.25 | | | | 6/30/2022 | | | | 369,936 | | | | 355,241 | | | | 355,139 | |
Intelligrated, Inc. | | | 4.50 | | | | 7/30/2018 | | | | 1,104,270 | | | | 1,096,283 | | | | 1,076,663 | |
Schenck Measuring and Process Technologies+ | | | 4.11 | | | | 4/28/2017 | | | | 2,000,000 | | | | 1,944,800 | | | | 1,975,000 | |
Silver II US Holdings LLC | | | 4.00 | | | | 12/13/2019 | | | | 435,311 | | | | 431,504 | | | | 367,185 | |
| | | | | | | | | | | | | | | | | | | | |
Total Machinery Non-Agriculture, Non-Construction, Non-Electronic | | | | | | | | | | | 8,573,607 | | | | 8,438,993 | | | | 8,200,507 | |
| | | | | | | | | | | | | | | | | | | | |
| | |
Mining, Steel, Iron and Non-Precious Metals — 1.6%*: | | | | | | | | | |
Arch Coal, Inc. | | | 6.25 | | | | 5/16/2018 | | | | 1,479,606 | | | | 1,249,310 | | | | 651,441 | |
Boomerang Tube LLC††~ | | | 11.00 | | | | 10/11/2017 | | | | 249,123 | | | | 245,041 | | | | 107,746 | |
H.C. Starck GmbH+ | | | 3.36 | | | | 5/30/2016 | | | | 500,000 | | | | 679,250 | | | | 498,275 | |
H.C. Starck GmbH+ | | | 3.36 | | | | 5/30/2016 | | | | 500,000 | | | | 496,039 | | | | 458,335 | |
Murray Energy Corp. | | | 7.50 | | | | 4/16/2020 | | | | 746,183 | | | | 726,867 | | | | 473,028 | |
Peabody Energy Corp. | | | 4.25 | | | | 9/24/2020 | | | | 620,378 | | | | 563,140 | | | | 291,577 | |
| | | | | | | | | | | | | | | | | | | | |
Total Mining, Steel, Iron and Non-Precious Metals | | | | | | | | | | | 4,095,290 | | | | 3,959,647 | | | | 2,480,402 | |
| | | | | | | | | | | | | | | | | | | | |
| | |
Oil and Gas — 2.3%*: | | | | | | | | | |
Caelus Energy Alaska O3 LLC | | | 8.75 | | | | 4/15/2020 | | | | 1,692,308 | | | | 1,536,666 | | | | 888,462 | |
CITGO Holding, Inc. | | | 9.50 | | | | 5/12/2018 | | | | 724,383 | | | | 721,705 | | | | 717,740 | |
Drillships Financing Holding, Inc. | | | 6.00 | | | | 3/31/2021 | | | | 989,835 | | | | 854,929 | | | | 392,222 | |
Drillships Ocean Ventures, Inc. | | | 5.50 | | | | 7/25/2021 | | | | 252,049 | | | | 250,035 | | | | 117,833 | |
Fieldwood Energy LLC | | | 8.38 | | | | 9/30/2020 | | | | 1,613,838 | | | | 1,088,975 | | | | 242,076 | |
Floatel International Ltd. | | | 6.00 | | | | 6/27/2020 | | | | 404,410 | | | | 401,343 | | | | 177,132 | |
Paragon Offshore Finance Co. | | | 3.75 | | | | 7/18/2021 | | | | 545,863 | | | | 447,449 | | | | 138,103 | |
Sabine Oil & Gas LLC~ | | | 8.75 | | | | 12/31/2018 | | | | 700,000 | | | | 707,549 | | | | 11,900 | |
Seadrill Partners Finco LLC | | | 4.00 | | | | 2/21/2021 | | | | 629,425 | | | | 623,617 | | | | 260,160 | |
Southcross Holdings Borrower LP | | | 6.00 | | | | 8/4/2021 | | | | 145,222 | | | | 144,638 | | | | 79,388 | |
Templar Energy LLC | | | 8.50 | | | | 11/25/2020 | | | | 361,162 | | | | 278,996 | | | | 37,922 | |
TPF II Power LLC | | | 5.50 | | | | 10/2/2021 | | | | 515,123 | | | | 511,933 | | | | 502,889 | |
| | | | | | | | | | | | | | | | | | | | |
Total Oil and Gas | | | | | | | | | | | 8,573,618 | | | | 7,567,835 | | | | 3,565,827 | |
| | | | | | | | | | | | | | | | | | | | |
| | |
Personal Transportation — 0.8%*: | | | | | | | | | |
Travelport Finance (Luxembourg) Sarl | | | 5.75 | | | | 9/2/2021 | | | | 1,312,616 | | | | 1,315,286 | | | | 1,281,848 | |
| | | | | | | | | | | | | | | | | | | | |
| | |
Personal, Food and Miscellaneous — 0.1%*: | | | | | | | | | |
Redtop Acquisitions Ltd.+ | | | 8.25 | | | | 6/3/2021 | | | | 155,983 | | | | 154,569 | | | | 153,253 | |
| | | | | | | | | | | | | | | | | | | | |
| | |
Printing and Publishing — 2.2%*: | | | | | | | | | |
Cengage Learning Acquisitions, Inc. | | | 7.00 | | | | 3/31/2020 | | | | 1,043,467 | | | | 1,042,203 | | | | 1,014,772 | |
Eden Bidco Ltd.+ | | | 6.00 | | | | 4/28/2022 | | | | 547,250 | | | | 573,747 | | | | 591,007 | |
See accompanying Notes to Financial Statements.
79
Babson Global Floating Rate Fund 2015 Semi-Annual Report
SCHEDULE OF INVESTMENTS (UNAUDITED) (CONTINUED)
December 31, 2015
| | | | | | | | | | | | | | | | | | | | |
| | | EFFECTIVE
INTEREST RATE | | | DUE DATE | | | PRINCIPAL ‡‡ | | | COST | | | FAIR VALUE | |
Bank Loans (Continued) | | | | | | | | | | | | | | | | | | | | |
| | |
Printing and Publishing (Continued) | | | | | | | | | |
Springer Science+Business Media Deutschland GmbH+ | | | 4.75 | % | | | 8/14/2020 | | | | 1,902,202 | | | | $1,891,745 | | | | $1,818,505 | |
| | | | | | | | | | | | | | | | | | | | |
Total Printing and Publishing | | | | | | | | | | | 3,492,919 | | | | 3,507,695 | | | | 3,424,284 | |
| | | | | | | | | | | | | | | | | | | | |
| | |
Retail Stores — 4.1%*: | | | | | | | | | |
Advantage Sales & Marketing, Inc. | | | 4.25 | | | | 7/23/2021 | | | | 988,976 | | | | 985,933 | | | | 949,140 | |
BJ’s Wholesale Club, Inc. | | | 4.50 | | | | 9/26/2019 | | | | 1,626,117 | | | | 1,629,154 | | | | 1,554,291 | |
FPC Holdings, Inc. | | | 5.25 | | | | 11/19/2019 | | | | 1,474,111 | | | | 1,460,957 | | | | 1,186,659 | |
Kirk Beauty One GmbH+ | | | 6.00 | | | | 8/13/2022 | | | | 799,999 | | | | 889,312 | | | | 868,557 | |
Maxeda DIY B.V.+ | | | 7.00 | | | | 6/28/2019 | | | | 583,334 | | | | 645,382 | | | | 526,396 | |
Neiman Marcus Group, Inc. (The) | | | 4.25 | | | | 10/25/2020 | | | | 116,978 | | | | 110,207 | | | | 103,233 | |
Pilot Travel Centers LLC | | | 4.00 | | | | 10/1/2021 | | | | 405,191 | | | | 405,191 | | | | 405,191 | |
Talbots, Inc. (The) | | | 5.50 | | | | 3/19/2020 | | | | 737,487 | | | | 727,646 | | | | 693,238 | |
| | | | | | | | | | | | | | | | | | | | |
Total Retail Stores | | | | | | | | | | | 6,732,193 | | | | 6,853,782 | | | | 6,286,705 | |
| | | | | | | | | | | | | | | | | | | | |
| | |
Telecommunications — 3.6%*: | | | | | | | | | |
Altice Financing SA+ | | | 5.50 | | | | 7/2/2019 | | | | 260,312 | | | | 262,084 | | | | 258,199 | |
Eircom Finco Sarl+ | | | 5.11 | | | | 9/30/2019 | | | | 988,319 | | | | 1,326,548 | | | | 1,053,111 | |
Eircom Finco Sarl+ | | | 5.11 | | | | 5/31/2022 | | | | 500,000 | | | | 544,419 | | | | 531,220 | |
Equinix, Inc. | | | 4.50 | | | | 11/20/2022 | | | | 500,000 | | | | 748,812 | | | | 735,700 | |
ION Trading Finance Ltd. | | | 4.25 | | | | 6/10/2021 | | | | 1,835,857 | | | | 1,822,786 | | | | 1,771,602 | |
Numericable Group S.A.+ | | | 4.56 | | | | 7/29/2022 | | | | 500,000 | | | | 553,436 | | | | 532,958 | |
Numericable US LLC+ | | | 4.50 | | | | 5/21/2020 | | | | 662,506 | | | | 657,647 | | | | 636,668 | |
| | | | | | | | | | | | | | | | | | | | |
Total Telecommunications | | | | | | | | | | | 5,246,994 | | | | 5,915,732 | | | | 5,519,458 | |
| | | | | | | | | | | | | | | | | | | | |
| | |
Utilities — 0.5%*: | | | | | | | | | |
Calpine Construction Finance Co. LP | | | 3.00 | | | | 5/3/2020 | | | | 489,950 | | | | 489,076 | | | | 459,940 | |
Calpine Corp. | | | 4.00 | | | | 1/13/2023 | | | | 361,360 | | | | 357,759 | | | | 345,099 | |
| | | | | | | | | | | | | | | | | | | | |
Total Utilities | | | | | | | | | | | 851,310 | | | | 846,835 | | | | 805,039 | |
| | | | | | | | | | | | | | | | | | | | |
Total Bank Loans | | | | | | | | | | | 136,343,536 | | | | 141,013,815 | | | | 128,793,152 | |
| | | | | | | | | | | | | | | | | | | | |
Corporate Bonds — 9.8%*: | | | | | | | | | |
| | |
Aerospace and Defense — 0.1%*: | | | | | | | | | |
Swissport Investments SA+ | | | 6.75 | | | | 12/15/2021 | | | | 100,000 | | | | 109,490 | | | | 112,614 | |
| | | | | | | | | | | | | | | | | | | | |
| | |
Banking — 0.1%*: | | | | | | | | | |
Lock AS+ | | | 5.50 | # | | | 8/15/2020 | | | | 100,000 | | | | 110,729 | | | | 109,219 | |
Lock AS+ | | | 7.00 | | | | 8/15/2021 | | | | 100,000 | | | | 134,225 | | | | 113,250 | |
| | | | | | | | | | | | | | | | | | | | |
Total Banking | | | | | | | | | | | 200,000 | | | | 244,954 | | | | 222,469 | |
| | | | | | | | | | | | | | | | | | | | |
| | |
Beverage, Food and Tobacco — 0.1%*: | | | | | | | | | |
Pizzaexpress Financing 2 PLC+ | | | 6.63 | | | | 8/1/2021 | | | | 100,000 | | | | 169,730 | | | | 150,844 | |
| | | | | | | | | | | | | | | | | | | | |
| | |
Broadcasting and Entertainment — 0.1%*: | | | | | | | | | |
Entertainment One Ltd.+ | | | 6.88 | | | | 12/15/2022 | | | | 100,000 | | | | 150,251 | | | | 146,757 | |
| | | | | | | | | | | | | | | | | | | | |
See accompanying Notes to Financial Statements.
80
Babson Global Floating Rate Fund 2015 Semi-Annual Report
SCHEDULE OF INVESTMENTS (UNAUDITED) (CONTINUED)
December 31, 2015
| | | | | | | | | | | | | | | | | | | | |
| | | EFFECTIVE
INTEREST RATE | | | DUE DATE | | | PRINCIPAL ‡‡ | | | COST | | | FAIR VALUE | |
Corporate Bonds (Continued) | | | | | | | | | | | | | | | | | | | | |
| | |
Buildings and Real Estate — 0.1%*: | | | | | | | | | |
Paroc Group Oy+ | | | 6.25 | % | | | 5/15/2020 | | | | 100,000 | | | | $137,565 | | | | $103,799 | |
Paroc Group Oy MTN+ | | | 5.17 | # | | | 5/15/2020 | | | | 100,000 | | | | 137,565 | | | | 102,698 | |
| | | | | | | | | | | | | | | | | | | | |
Total Buildings and Real Estate | | | | | | | | | | | 200,000 | | | | 275,130 | | | | 206,497 | |
| | | | | | | | | | | | | | | | | | | | |
| | |
Cargo Transport — 0.4%*: | | | | | | | | | |
Florida East Coast Holdings Corp.^ | | | 6.75 | | | | 5/1/2019 | | | | 550,000 | | | | 543,305 | | | | 503,250 | |
WFS Global Holding SAS+ | | | 9.50 | | | | 7/15/2022 | | | | 100,000 | | | | 113,435 | | | | 113,798 | |
| | | | | | | | | | | | | | | | | | | | |
Total Cargo Transport | | | | | | | | | | | 650,000 | | | | 656,740 | | | | 617,048 | |
| | | | | | | | | | | | | | | | | | | | |
| | |
Chemicals, Plastics and Rubber — 0.4%*: | | | | | | | | | |
Ineos Finance PLC+ | | | 4.00 | | | | 5/1/2023 | | | | 150,000 | | | | 162,383 | | | | 155,677 | |
Pinnacle Operating Corp.^ | | | 9.00 | | | | 11/15/2020 | | | | 500,000 | | | | 531,133 | | | | 470,000 | |
| | | | | | | | | | | | | | | | | | | | |
Total Chemicals, Plastics and Rubber | | | | | | | | | | | 650,000 | | | | 693,516 | | | | 625,677 | |
| | | | | | | | | | | | | | | | | | | | |
| | |
Containers, Packaging and Glass — 0.4%*: | | | | | | | | | |
Horizon Holdings III SASU+ | | | 5.13 | | | | 8/1/2022 | | | | 100,000 | | | | 109,775 | | | | 111,957 | |
Innovia Group Finance PLC+ | | | 4.87 | # | | | 3/31/2020 | | | | 500,000 | | | | 684,891 | | | | 540,658 | |
| | | | | | | | | | | | | | | | | | | | |
Total Containers, Packaging and Glass | | | | | | | | | | | 600,000 | | | | 794,666 | | | | 652,615 | |
| | | | | | | | | | | | | | | | | | | | |
| | |
Diversified/Conglomerate Manufacturing — 0.3%*: | | | | | | | | | |
Appvion, Inc.^ | | | 9.00 | | | | 6/1/2020 | | | | 460,000 | | | | 467,120 | | | | 182,850 | |
Galapagos SA+ | | | 4.62 | # | | | 6/15/2021 | | | | 200,000 | | | | 272,630 | | | | 207,569 | |
| | | | | | | | | | | | | | | | | | | | |
Total Diversified/Conglomerate Manufacturing | | | | | | | | | | | 660,000 | | | | 739,750 | | | | 390,419 | |
| | | | | | | | | | | | | | | | | | | | |
| | |
Diversified/Conglomerate Service — 1.2%*: | | | | | | | | | |
Carlson Travel Holdings, Inc. PIK^ | | | 7.50 | | | | 8/15/2019 | | | | 470,000 | | | | 474,639 | | | | 462,950 | |
Sabre GLBL, Inc.^ | | | 5.25 | | | | 11/15/2023 | | | | 154,000 | | | | 152,915 | | | | 152,268 | |
Sabre GLBL, Inc.^ | | | 5.38 | | | | 4/15/2023 | | | | 1,061,000 | | | | 1,080,919 | | | | 1,055,695 | |
Verisure Holding AB+ | | | 6.00 | | | | 11/1/2022 | | | | 100,000 | | | | 110,105 | | | | 113,022 | |
| | | | | | | | | | | | | | | | | | | | |
Total Diversified/Conglomerate Service | | | | | | | | | | | 1,785,000 | | | | 1,818,578 | | | | 1,783,935 | |
| | | | | | | | | | | | | | | | | | | | |
| | |
Finance — 1.8%*: | | | | | | | | | |
Arrow Global Finance PLC+ | | | 5.14 | # | | | 11/1/2021 | | | | 150,000 | | | | 167,752 | | | | 164,952 | |
First Data Corp.^ | | | 5.00 | | | | 1/15/2024 | | | | 179,000 | | | | 179,000 | | | | 178,105 | |
Galaxy Bidco Ltd.+ | | | 5.57 | # | | | 11/15/2019 | | | | 100,000 | | | | 161,111 | | | | 147,346 | |
Garfunkelux Holdco 3 SA+ | | | 8.50 | | | | 11/1/2022 | | | | 250,000 | | | | 386,724 | | | | 370,393 | |
Marlin Intermediate Holdings PLC MTN+ | | | 10.50 | | | | 8/1/2020 | | | | 500,000 | | | | 831,901 | | | | 817,076 | |
Travelex Financing PLC+ | | | 6.58 | # | | | 8/1/2018 | | | | 700,000 | | | | 1,121,871 | | | | 1,026,780 | |
Travelex Financing PLC+ | | | 8.00 | | | | 8/1/2018 | | | | 100,000 | | | | 158,662 | | | | 153,096 | |
| | | | | | | | | | | | | | | | | | | | |
Total Finance | | | | | | | | | | | 1,979,000 | | | | 3,007,021 | | | | 2,857,748 | |
| | | | | | | | | | | | | | | | | | | | |
| | |
Grocery — 0.1%*: | | | | | | | | | |
Premier Foods Finance PLC+ | | | 5.58 | # | | | 3/16/2020 | | | | 100,000 | | | | 167,370 | | | | 137,401 | |
| | | | | | | | | | | | | | | | | | | | |
See accompanying Notes to Financial Statements.
81
Babson Global Floating Rate Fund 2015 Semi-Annual Report
SCHEDULE OF INVESTMENTS (UNAUDITED) (CONTINUED)
December 31, 2015
| | | | | | | | | | | | | | | | | | | | |
| | | EFFECTIVE
INTEREST RATE | | | DUE DATE | | | PRINCIPAL ‡‡ | | | COST | | | FAIR VALUE | |
Corporate Bonds (Continued) | | | | | | | | | | | | | | | | | | | | |
| | |
Healthcare, Education and Childcare — 1.4%*: | | | | | | | | | |
Care UK Health & Social Care PLC+ | | | 5.58 | #% | | | 7/15/2019 | | | | 343,000 | | | | $519,392 | | | | $458,878 | |
Prospect Medical Holdings, Inc.^ | | | 8.38 | | | | 5/1/2019 | | | | 435,000 | | | | 459,464 | | | | 452,400 | |
Tenet Healthcare Corp.^ | | | 4.01 | # | | | 6/15/2020 | | | | 819,000 | | | | 815,314 | | | | 798,525 | |
Unilabs Subholding AB+ | | | 7.25 | # | | | 7/15/2018 | | | | 400,000 | | | | 549,951 | | | | 430,570 | |
| | | | | | | | | | | | | | | | | | | | |
Total Healthcare, Education and Childcare | | | | | | | | | | | 1,997,000 | | | | 2,344,121 | | | | 2,140,373 | |
| | | | | | | | | | | | | | | | | | | | |
| | |
Hotels, Motels, Inns and Gaming — 0.1%*: | | | | | | | | | |
Gala Group Finance PLC+ | | | 8.88 | | | | 9/1/2018 | | | | 109,632 | | | | 172,207 | | | | 168,781 | |
| | | | | | | | | | | | | | | | | | | | |
| | |
Insurance — 0.0%*: | | | | | | | | | |
TIG Finco PLC+ | | | 8.50 | # | | | 3/2/2020 | | | | 46,609 | | | | 68,336 | | | | 70,463 | |
| | | | | | | | | | | | | | | | | | | | |
| | |
Leisure, Amusement, Entertainment — 0.4%*: | | | | | | | | | |
Odeon & UCI Finco PLC MTN+ | | | 9.00 | | | | 8/1/2018 | | | | 100,000 | | | | 158,256 | | | | 153,096 | |
Vougeot Bidco PLC+ | | | 5.20 | # | | | 7/15/2020 | | | | 100,000 | | | | 135,056 | | | | 108,466 | |
WMG Acquisition Corp. | | | 6.25 | | | | 1/15/2021 | | | | 387,000 | | | | 467,171 | | | | 430,035 | |
| | | | | | | | | | | | | | | | | | | | |
Total Leisure, Amusement, Entertainment | | | | | | | | | | | 587,000 | | | | 760,483 | | | | 691,597 | |
| | | | | | | | | | | | | | | | | | | | |
| | |
Oil and Gas — 0.5%*: | | | | | | | | | |
Sabine Pass Liquefaction LLC^ | | | 5.63 | | | | 3/1/2025 | | | | 495,000 | | | | 495,000 | | | | 418,894 | |
Shelf Drilling Holdings Ltd.+^ | | | 8.63 | | | | 11/1/2018 | | | | 438,000 | | | | 370,423 | | | | 317,550 | |
| | | | | | | | | | | | | | | | | | | | |
Total Oil and Gas | | | | | | | | | | | 933,000 | | | | 865,423 | | | | 736,444 | |
| | | | | | | | | | | | | | | | | | | | |
| | |
Personal Transportation — 0.1%*: | | | | | | | | | |
AA Bond Co. Ltd.+ | | | 5.50 | | | | 7/31/2043 | | | | 150,000 | | | | 223,140 | | | | 209,797 | |
| | | | | | | | | | | | | | | | | | | | |
| | |
Personal, Food and Miscellaneous — 0.5%*: | | | | | | | | | |
Brakes Capital+ | | | 7.13 | | | | 12/15/2018 | | | | 300,000 | | | | 513,314 | | | | 453,316 | |
Brakes Capital MTN+ | | | 4.87 | # | | | 12/15/2018 | | | | 100,000 | | | | 136,645 | | | | 108,675 | |
Financiere Quick SAS+ | | | 4.70 | # | | | 4/15/2019 | | | | 200,000 | | | | 275,642 | | | | 180,427 | |
| | | | | | | | | | | | | | | | | | | | |
Total Personal, Food and Miscellaneous | | | | | | | | | | | 600,000 | | | | 925,601 | | | | 742,418 | |
| | | | | | | | | | | | | | | | | | | | |
| | |
Retail Stores — 1.0%*: | | | | | | | | | |
Boing Group Financing PLC MTN+ | | | 6.63 | | | | 7/15/2019 | | | | 350,000 | | | | 396,843 | | | | 355,639 | |
Brighthouse Group PLC MTN+ | | | 7.88 | | | | 5/15/2018 | | | | 150,000 | | | | 242,855 | | | | 211,992 | |
HD Supply, Inc.^ | | | 5.25 | | | | 12/15/2021 | | | | 400,000 | | | | 409,666 | | | | 408,000 | |
House of Fraser Funding PLC+ | | | 6.34 | # | | | 9/15/2020 | | | | 300,000 | | | | 463,966 | | | | 445,577 | |
HSS Financing PLC+ | | | 6.75 | | | | 8/1/2019 | | | | 68,000 | | | | 112,557 | | | | 99,243 | |
Takko Luxembourg 2 S.C.A. MTN+ | | | 9.88 | | | | 4/15/2019 | | | | 100,000 | | | | 132,739 | | | | 57,819 | |
| | | | | | | | | | | | | | | | | | | | |
Total Retail Stores | | | | | | | | | | | 1,368,000 | | | | 1,758,626 | | | | 1,578,270 | |
| | | | | | | | | | | | | | | | | | | | |
| | |
Telecommunications — 0.7%*: | | | | | | | | | |
Numericable-SFR+ | | | 5.38 | | | | 5/15/2022 | | | | 100,000 | | | | 138,295 | | | | 110,848 | |
Numericable-SFR SAS+ | | | 5.63 | | | | 5/15/2024 | | | | 100,000 | | | | 138,165 | | | | 109,898 | |
Numericable-SFR SAS+^ | | | 6.00 | | | | 5/15/2022 | | | | 646,000 | | | | 645,280 | | | | 626,620 | |
See accompanying Notes to Financial Statements.
82
Babson Global Floating Rate Fund 2015 Semi-Annual Report
SCHEDULE OF INVESTMENTS (UNAUDITED) (CONTINUED)
December 31, 2015
| | | | | | | | | | | | | | | | | | | | |
| | | EFFECTIVE
INTEREST RATE | | | DUE DATE | | | PRINCIPAL ‡‡ | | | COST | | | FAIR VALUE | |
Corporate Bonds (Continued) | | | | | | | | | | | | | | | | | | | | |
| | | | | |
Telecommunications (Continued) | | | | | | | | | | | | | | | | | | | | |
Wind Acquisition Finance SA+ | | | 4.13 | #% | | | 7/15/2020 | | | | 150,000 | | | | $159,292 | | | | $161,545 | |
| | | | | | | | | | | | | | | | | | | | |
Total Telecommunications | | | | | | | | | | | 996,000 | | | | 1,081,032 | | | | 1,008,911 | |
| | | | | | | | | | | | | | | | | | | | |
Total Corporate Bonds | | | | | | | | | | | 13,911,241 | | | | 17,026,165 | | | | 15,251,078 | |
| | | | | | | | | | | | | | | | | | | | |
Total Fixed Income | | | | | | | | | | | 150,254,777 | | | | 158,039,980 | | | | 144,044,230 | |
| | | | | | | | | | | | | | | | | | | | |
Short-Term Investments — 9.7%*: | | | | | | | | | |
| | |
Bank Deposit — 9.6%*: | | | | | | | | | |
State Street Bank & Trust Co. Euro Time Deposit | | | 0.01 | | | | 1/4/2016 | | | | 14,835,559 | | | | 14,835,559 | | | | 14,835,559 | |
| | | | | | | | | | | | | | | | | | | | |
| | |
Bank Loans — 0.1%*§: | | | | | | | | | |
| | |
Mining, Steel, Iron and Non-Precious Metals — 0.1%*: | | | | | | | | | |
Boomerang Tube LLC¤ | | | 11.61 | | | | 1/8/2016 | | | | 78,780 | | | | 78,713 | | | | 78,780 | |
| | | | | | | | | | | | | | | | | | | | |
Total Short-Term Investments | | | | | | | | | | | 14,914,339 | | | | 14,914,272 | | | | 14,914,339 | |
| | | | | | | | | | | | | | | | | | | | |
| | | | | |
Total Investments | | | | | | | | | | | 165,169,116 | | | | 172,954,252 | | | | 158,958,569 | |
| | | | | | | | | | | | | | | | | | | | |
| | |
Other assets and liabilities — (2.8%)* | | | | | | | | (4,327,373 | ) |
| | |
Net Assets — 100.0% | | | | | | | | $154,631,196 | |
| | | | | | | | | | | | | | | | | | | | |
| ‡‡ | Unless otherwise indicated, all principal amounts are denominated in United States Dollars. |
| * | Calculated as a percentage of net assets applicable to common shareholders. |
Distributions of investments by country of risk (excluding temporary cash investments) as a percentage of total investments in securities, is as follows:
| | | | | | |
| | United States | | | 64.5% | |
| | United Kingdom | | | 14.6% | |
| | Germany | | | 9.3% | |
| | France | | | 3.2% | |
| | Canada | | | 2.7% | |
| | Netherlands | | | 1.5% | |
| | Ireland | | | 1.1% | |
| | Other (Individually less than 1%) | | | 3.1% | |
| | | | | | |
| | Total | | | 100.0% | |
| | | | | | |
| ^ | Security acquired in a transaction exempt from registration under Rule 144A of the Securities Act of 1933. These securities may only be resold in transactions exempt from registration, normally to qualified institutional buyers. |
See accompanying Notes to Financial Statements.
83
Babson Global Floating Rate Fund 2015 Semi-Annual Report
SCHEDULE OF INVESTMENTS (UNAUDITED) (CONTINUED)
December 31, 2015
| § | Bank loans are exempt from registration under the Securities Act of 1933, as amended, but contain certain restrictions on resale and cannot be sold publicly. These loans pay interest at rates which adjust periodically. The interest rates shown for bank loans are the current interest rates at December 31, 2015. Bank loans are also subject to mandatory and/or optional prepayment which cannot be predicted. As a result, the remaining maturity may be substantially less than the stated maturity shown. |
| ¤ | For fair value measurement disclosure purposes, security is categorized as Level 3 (See Note 2). |
| # | Variable rate security. The interest rate shown is the rate in effect at December 31, 2015. |
| A | summary of outstanding derivatives at December 31, 2015 is as follows: |
Forward Foreign Currency Exchange Contracts to Buy
| | | | | | | | | | | | | | | | | | | | | | |
EXPIRATION
DATE | | COUNTERPARTY | | LOCAL
CURRENCY | | | VALUE IN USD | | | IN
EXCHANGE
FOR USD | | | NET UNREALIZED
APPRECIATION
(DEPRECIATION) | |
| 1/14/16 | | Morgan Stanley & Co. | | | EUR | | | | 435,556 | | | | 434,801 | | | | 400,000 | | | $ | (755 | ) |
| 1/14/16 | | Morgan Stanley & Co. | | | EUR | | | | 931,356 | | | | 934,822 | | | | 860,000 | | | | 3,466 | |
| | | | | | | | | | | | | | | | | | | | | | |
Net unrealized appreciation on forward foreign exchange contracts to buy | | | | | | | $ | 2,711 | |
| | | | | | | | | | | | | | | | | | | | | | |
Forward Foreign Currency Exchange Contracts to Sell
| | | | | | | | | | | | | | | | | | | | | | |
EXPIRATION
DATE | | COUNTERPARTY | | LOCAL
CURRENCY | | | VALUE IN USD | | | IN
EXCHANGE
FOR USD | | | NET UNREALIZED
APPRECIATION
(DEPRECIATION) | |
| 1/14/16 | | Morgan Stanley & Co. | | | EUR | | | | 17,281,833 | | | | 18,785,392 | | | | 18,774,190 | | | $ | (11,202 | ) |
| 1/14/16 | | Morgan Stanley & Co. | | | EUR | | | | 40,000 | | | | 43,480 | | | | 43,841 | | | | 362 | |
| 1/14/16 | | Morgan Stanley & Co. | | | GBP | | | | 11,819,807 | | | | 17,425,213 | | | | 17,815,788 | | | | 390,575 | |
| | | | | | | | | | | | | | | | | | | | | | |
Net unrealized appreciation on forward foreign exchange contracts to sell | | | | | | | $ | 379,735 | |
| | | | | | | | | | | | | | | | | | | | | | |
Currency Legend
| | | | |
| EUR | | – | | Euro |
| GBP | | – | | British Pound Sterling |
See accompanying Notes to Financial Statements.
84
Babson Global Credit Income Opportunities Fund 2015 Semi-Annual Report
SCHEDULE OF INVESTMENTS (UNAUDITED)
December 31, 2015
| | | | | | | | | | | | | | | | | | | | |
| | | | | | | | | SHARES | | | COST | | | FAIR
VALUE | |
Common Stocks — 0.5%*: | | | | | | | | | | | | | | | | | | | | |
| | | | | |
Maxeda DIY B.V.+¤ | | | | | | | | | | | 18,859,871 | | | | $373,738 | | | | $409,919 | |
Maxeda DIY B.V.+¤ | | | | | | | | | | | 10,446 | | | | – | | | | – | |
| | | | | | | | | | | | | | | | | | | | |
Total Common Stocks | | | | | | | | | | | 18,870,317 | | | | 373,738 | | | | 409,919 | |
| | | | | | | | | | | | | | | | | | | | |
| | | | | |
| | | EFFECTIVE
INTEREST RATE | | | DUE DATE | | | PRINCIPAL ‡‡ | | | COST | | | FAIR
VALUE | |
Fixed Income — 91.7%*: | | | | | | | | | | | | | | | | | | | | |
| | | | | |
Asset-Backed Securities — 17.7%*: | | | | | | | | | | | | | | | | | | | | |
| | | | | |
CDO/CLO — 17.7%*: | | | | | | | | | | | | | | | | | | | | |
Apidos CLO XII 2013-12A F^ | | | 5.19 | #% | | | 4/15/2025 | | | | 500,000 | | | | 450,051 | | | | 341,048 | |
Apidos CLO XV 2013-15A E^ | | | 5.79 | # | | | 10/20/2025 | | | | 500,000 | | | | 463,822 | | | | 346,303 | |
Apidos CLO XVI 2013-16A D^ | | | 4.79 | # | | | 1/19/2025 | | | | 500,000 | | | | 440,407 | | | | 379,303 | |
Atlas Senior Loan Fund VI Ltd. 2014-6A E^ | | | 5.49 | # | | | 10/15/2026 | | | | 800,000 | | | | 733,286 | | | | 643,639 | |
Avery Point IV CLO Ltd. 2014-1A E^ | | | 4.90 | # | | | 4/25/2026 | | | | 500,000 | | | | 462,506 | | | | 364,314 | |
BlueMountain CLO Ltd. 2014-1A^ | | | Zero Coupon | | | | 4/30/2026 | | | | 250,000 | | | | 239,303 | | | | 155,262 | |
Cairn CLO B.V. 2013-3A E+^ | | | 4.61 | # | | | 10/20/2028 | | | | 1,000,000 | | | | 1,023,096 | | | | 983,381 | |
Carlyle Global Market Strategies CLO Ltd. 2013-3A D^ | | | 4.89 | # | | | 7/15/2025 | | | | 500,000 | | | | 459,254 | | | | 395,765 | |
Carlyle Global Market Strategies CLO Ltd. 2013-4A E^ | | | 4.79 | # | | | 10/15/2025 | | | | 500,000 | | | | 464,335 | | | | 408,854 | |
Carlyle Global Market Strategies CLO Ltd. 2013-4A F^ | | | 5.49 | # | | | 10/15/2025 | | | | 500,000 | | | | 456,814 | | | | 359,517 | |
Carlyle Global Market Strategies CLO Ltd. 2014-1A E^ | | | 4.74 | # | | | 4/17/2025 | | | | 1,000,000 | | | | 889,157 | | | | 787,776 | |
Carlyle Global Market Strategies CLO Ltd. 2014-5A D^ | | | 5.92 | # | | | 10/16/2025 | | | | 500,000 | | | | 454,020 | | | | 404,341 | |
Dryden 41 Senior Loan Fund 2015-41A E^ | | | 5.64 | # | | | 1/15/2028 | | | | 500,000 | | | | 465,321 | | | | 438,347 | |
Dryden XXXI Senior Loan Fund 2014-31A E^ | | | 4.54 | # | | | 4/18/2026 | | | | 1,000,000 | | | | 894,975 | | | | 715,269 | |
Dryden XXXI Senior Loan Fund 2014-31A F^ | | | 5.64 | # | | | 4/18/2026 | | | | 500,000 | | | | 462,563 | | | | 328,441 | |
Eaton Vance CLO Ltd. 2013-1A D^ | | | 5.31 | # | | | 11/13/2024 | | | | 500,000 | | | | 466,593 | | | | 389,343 | |
GoldenTree Loan Opportunities VII Ltd. 2013-7A F^ | | | 5.55 | # | | | 4/25/2025 | | | | 500,000 | | | | 468,083 | | | | 358,488 | |
LCM XIII LP 13A E^ | | | 5.14 | # | | | 1/19/2023 | | | | 750,000 | | | | 705,326 | | | | 629,031 | |
LCM XV LP 15A E1^ | | | 4.78 | # | | | 8/25/2024 | | | | 500,000 | | | | 468,532 | | | | 388,602 | |
LCM XVII LP 17A E^ | | | 5.04 | # | | | 10/15/2026 | | | | 1,000,000 | | | | 899,789 | | | | 799,431 | |
Madison Park Funding XIII Ltd. 2014-13A^ | | | Zero Coupon | | | | 1/19/2025 | | | | 500,000 | | | | 389,334 | | | | 321,010 | |
Newhaven CLO 1A E+^ | | | 5.20 | # | | | 11/15/2028 | | | | 500,000 | | | | 619,893 | | | | 511,180 | |
Oak Hill Credit Partners X Ltd. 2014-10A^ | | | Zero Coupon | | | | 7/20/2026 | | | | 500,000 | | | | 451,316 | | | | 247,352 | |
OHA Credit Partners IX Ltd. 2013-9A E^ | | | 5.29 | # | | | 10/20/2025 | | | | 500,000 | | | | 469,365 | | | | 407,586 | |
Pinnacle Park CLO Ltd. 2014-1A E^ | | | 5.24 | # | | | 4/15/2026 | | | | 500,000 | | | | 470,803 | | | | 408,080 | |
Seneca Park CLO Ltd. 2014-1A E^ | | | 4.99 | # | | | 7/17/2026 | | | | 1,020,000 | | | | 930,570 | | | | 756,000 | |
Silver Spring CLO Ltd. 2014-1A E^ | | | 5.19 | # | | | 10/15/2026 | | | | 1,000,000 | | | | 907,810 | | | | 640,821 | |
Tryon Park CLO Ltd. 2013-1A D^ | | | 4.69 | # | | | 7/15/2025 | | | | 500,000 | | | | 465,057 | | | | 393,416 | |
Voya CLO Ltd. 2013-2A E^ | | | 5.80 | # | | | 4/25/2025 | | | | 500,000 | | | | 467,655 | | | | 336,549 | |
See accompanying Notes to Financial Statements.
85
Babson Global Credit Income Opportunities Fund 2015 Semi-Annual Report
SCHEDULE OF INVESTMENTS (UNAUDITED) (CONTINUED)
December 31, 2015
| | | | | | | | | | | | | | | | | | | | |
| | | EFFECTIVE
INTEREST RATE | | | DUE DATE | | | PRINCIPAL ‡‡ | | | COST | | | FAIR
VALUE | |
Asset-Backed Securities (Continued) | | | | | | | | | | | | | | | | | | | | |
| | | | | |
CDO/CLO (Continued) | | | | | | | | | | | | | | | | | | | | |
Voya CLO Ltd. 2013-3A D^ | | | 4.79 | #% | | | 1/18/2026 | | | | 750,000 | | | | $678,272 | | | | $586,012 | |
Voya CLO Ltd. 2014-3A D^ | | | 5.30 | # | | | 7/25/2026 | | | | 500,000 | | | | 458,520 | | | | 352,551 | |
| | | | | | | | | | | | | | | | | | | | |
Total CDO/CLO | | | | | | | | | | | 19,070,000 | | | | 17,675,828 | | | | 14,577,012 | |
| | | | | | | | | | | | | | | | | | | | |
| | | | | | | | | | | | | | | | | | | | |
Total Asset-Backed Securities | | | | | | | | | | | 19,070,000 | | | | 17,675,828 | | | | 14,577,012 | |
| | | | | | | | | | | | | | | | | | | | |
| | | | | |
Bank Loans — 22.7%*§: | | | | | | | | | | | | | | | | | | | | |
| | | |
Aerospace and Defense — 0.7%*: | | | | | | | | | | | | | |
Swissport Investments SA+ | | | 6.25 | | | | 11/30/2021 | | | | 500,000 | | | | 531,027 | | | | 542,359 | |
| | | | | | | | | | | | | | | | | | | | |
| | | | | |
Automobile — 0.9%*: | | | | | | | | | | | | | | | | | | | | |
RAC Finance (Holdings) Ltd.+ | | | 8.25 | | | | 12/17/2022 | | | | 500,000 | | | | 791,805 | | | | 737,409 | |
| | | | | | | | | | | | | | | | | | | | |
| | | | | |
Beverage, Food and Tobacco — 0.9%*: | | | | | | | | | | | | | | | | | | | | |
Deoleo SA+ | | | 4.50 | | | | 6/11/2021 | | | | 500,000 | | | | 552,905 | | | | 474,399 | |
Telepizza SA+ | | | 7.00 | | | | 10/20/2020 | | | | 250,000 | | | | 315,638 | | | | 270,783 | |
| | | | | | | | | | | | | | | | | | | | |
Total Beverage, Food and Tobacco | | | | | | | | | | | 750,000 | | | | 868,543 | | | | 745,182 | |
| | | | | | | | | | | | | | | | | | | | |
| | |
Broadcasting and Entertainment — 0.8%*: | | | | | | | | | |
All3Media International+ | | | 5.25 | | | | 6/30/2021 | | | | 500,000 | | | | 834,327 | | | | 669,840 | |
| | | | | | | | | | | | | | | | | | | | |
| | |
Buildings and Real Estate — 1.0%*: | | | | | | | | | |
Alison Bidco Sarl+ | | | 5.50 | | | | 8/29/2021 | | | | 146,770 | | | | 145,579 | | | | 143,468 | |
Builders FirstSource, Inc. | | | 6.00 | | | | 7/31/2022 | | | | 718,887 | | | | 717,050 | | | | 709,901 | |
| | | | | | | | | | | | | | | | | | | | |
Total Buildings and Real Estate | | | | | | | | | | | 865,657 | | | | 862,629 | | | | 853,369 | |
| | | | | | | | | | | | | | | | | | | | |
| | |
Cargo Transport — 0.9%*: | | | | | | | | | |
Direct ChassisLink, Inc.¤ | | | 8.25 | | | | 11/12/2019 | | | | 490,476 | | | | 485,686 | | | | 473,309 | |
Direct ChassisLink, Inc. (Add-On Facility)¤ | | | 8.25 | | | | 10/31/2019 | | | | 250,317 | | | | 250,316 | | | | 241,556 | |
| | | | | | | | | | | | | | | | | | | | |
Total Cargo Transport | | | | | | | | | | | 740,793 | | | | 736,002 | | | | 714,865 | |
| | | | | | | | | | | | | | | | | | | | |
| | |
Chemicals, Plastics and Rubber — 1.6%*: | | | | | | | | | |
MacDermid, Inc. | | | 5.50 | | | | 6/7/2020 | | | | 467,216 | | | | 457,997 | | | | 452,382 | |
Methanol Holdings (Trinidad) Ltd. | | | 4.25 | | | | 6/30/2022 | | | | 350,728 | | | | 347,463 | | | | 322,670 | |
Styrolution Group GmbH+ | | | 6.50 | | | | 11/7/2019 | | | | 495,000 | | | | 610,291 | | | | 538,167 | |
| | | | | | | | | | | | | | | | | | | | |
Total Chemicals, Plastics and Rubber | | | | | | | | | | | 1,312,944 | | | | 1,415,751 | | | | 1,313,219 | |
| | | | | | | | | | | | | | | | | | | | |
| | |
Containers, Packaging and Glass — 0.6%*: | | | | | | | | | |
Consolidated Container Co. LLC | | | 7.75 | | | | 1/3/2020 | | | | 94,140 | | | | 92,772 | | | | 80,019 | |
Prolampac Intermediate, Inc. | | | 9.25 | | | | 8/18/2023 | | | | 500,000 | | | | 490,436 | | | | 447,500 | |
| | | | | | | | | | | | | | | | | | | | |
Total Containers, Packaging and Glass | | | | | | | | | | | 594,140 | | | | 583,208 | | | | 527,519 | |
| | | | | | | | | | | | | | | | | | | | |
| | |
Diversified/Conglomerate Manufacturing — 0.9%*: | | | | | | | | | |
Quality Home Brands Holdings LLC | | | 7.75 | | | | 5/25/2018 | | | | 129,200 | | | | 128,490 | | | | 129,093 | |
Triple Point Technology, Inc. | | | 5.25 | | | | 7/10/2020 | | | | 339,095 | | | | 316,511 | | | | 244,148 | |
See accompanying Notes to Financial Statements.
86
Babson Global Credit Income Opportunities Fund 2015 Semi-Annual Report
SCHEDULE OF INVESTMENTS (UNAUDITED) (CONTINUED)
December 31, 2015
| | | | | | | | | | | | | | | | | | | | |
| | | EFFECTIVE
INTEREST RATE | | | DUE DATE | | | PRINCIPAL ‡‡ | | | COST | | | FAIR
VALUE | |
Bank Loans (Continued) | | | | | | | | | | | | | | | | | | | | |
| | |
Diversified/Conglomerate Manufacturing (Continued) | | | | | | | | | |
Triple Point Technology, Inc.†† | | | 9.25 | % | | | 7/10/2021 | | | | 50,845 | | | | $47,632 | | | | $30,507 | |
West Corp. | | | 2.86 | | | | 7/1/2019 | | | | 366,003 | | | | 356,019 | | | | 351,363 | |
| | | | | | | | | | | | | | | | | | | | |
Total Diversified/Conglomerate Manufacturing | | | | | | | | 885,143 | | | | 848,652 | | | | 755,111 | |
| | | | | | | | | | | | | | | | | | | | |
| | |
Diversified/Conglomerate Service — 2.7%*: | | | | | | | | | |
Aquilex Holdings LLC | | | 5.00 | | | | 12/31/2020 | | | | 98,070 | | | | 97,893 | | | | 93,166 | |
Atrium Innovations, Inc.+ | | | 4.25 | | | | 2/13/2021 | | | | 461,701 | | | | 460,426 | | | | 424,765 | |
MH Sub I LLC | | | 4.75 | | | | 7/8/2021 | | | | 181,630 | | | | 180,804 | | | | 175,424 | |
MH Sub I LLC | | | 8.50 | | | | 7/8/2022 | | | | 650,000 | | | | 646,420 | | | | 613,165 | |
Power Team Services LLC | | | 8.25 | | | | 11/6/2020 | | | | 300,000 | | | | 298,927 | | | | 284,250 | |
RP Crown Parent LLC | | | 6.00 | | | | 12/21/2018 | | | | 545,420 | | | | 546,814 | | | | 483,084 | |
RP Crown Parent LLC | | | 11.25 | | | | 12/20/2019 | | | | 178,571 | | | | 182,506 | | | | 145,237 | |
| | | | | | | | | | | | | | | | | | | | |
Total Diversified/Conglomerate Service | | | | | | | | | | | 2,415,392 | | | | 2,413,790 | | | | 2,219,091 | |
| | | | | | | | | | | | | | | | | | | | |
| | |
Ecological — 0.2%*: | | | | | | | | | |
Emerald 3 Ltd.+ | | | 8.00 | | | | 5/31/2022 | | | | 196,488 | | | | 194,877 | | | | 184,699 | |
| | | | | | | | | | | | | | | | | | | | |
| | |
Electronics — 0.6%*: | | | | | | | | | |
Microsemi Corp. | | | 5.11 | | | | 12/2/2022 | | | | 500,000 | | | | 490,625 | | | | 490,250 | |
| | | | | | | | | | | | | | | | | | | | |
| | |
Finance — 1.0%*: | | | | | | | | | |
Moneygram International, Inc. | | | 4.25 | | | | 3/27/2020 | | | | 635,899 | | | | 603,682 | | | | 579,195 | |
Sedgwick Claims Management Services, Inc. | | | 3.75 | | | | 3/1/2021 | | | | 293,425 | | | | 292,883 | | | | 280,955 | |
| | | | | | | | | | | | | | | | | | | | |
Total Finance | | | | | | | | | | | 929,324 | | | | 896,565 | | | | 860,150 | |
| | | | | | | | | | | | | | | | | | | | |
| | |
Healthcare, Education and Childcare — 1.2%*: | | | | | | | | | |
Synarc-Biocore Holdings LLC | | | 5.50 | | | | 3/10/2021 | | | | 393,865 | | | | 390,932 | | | | 366,295 | |
Synarc-Biocore Holdings LLC | | | 9.25 | | | | 3/10/2022 | | | | 500,000 | | | | 496,114 | | | | 456,250 | |
Tecomet, Inc. | | | 5.75 | | | | 12/5/2021 | | | | 207,758 | | | | 202,416 | | | | 185,943 | |
| | | | | | | | | | | | | | | | | | | | |
Total Healthcare, Education and Childcare | | | | | | | | | | | 1,101,623 | | | | 1,089,462 | | | | 1,008,488 | |
| | | | | | | | | | | | | | | | | | | | |
| | |
Hotels, Motels, Inns and Gaming — 0.9%*: | | | | | | | | | |
Compass Holdco 2 Ltd.+ | | | 5.86 | | | | 10/31/2022 | | | | 500,000 | | | | 754,716 | | | | 729,729 | |
| | | | | | | | | | | | | | | | | | | | |
| | |
Leisure, Amusement, Entertainment — 1.0%*: | | | | | | | | | |
AP NMT Acquisition B.V.+ | | | 7.00 | | | | 8/13/2021 | | | | 401,254 | | | | 488,602 | | | | 426,905 | |
AP NMT Acquisition B.V.+ | | | 10.00 | | | | 8/13/2022 | | | | 300,000 | | | | 280,013 | | | | 241,500 | |
Delta 2 (Lux) Sarl+ | | | 7.75 | | | | 7/31/2022 | | | | 125,000 | | | | 124,597 | | | | 114,937 | |
| | | | | | | | | | | | | | | | | | | | |
Total Leisure, Amusement, Entertainment | | | | | | | | | | | 826,254 | | | | 893,212 | | | | 783,342 | |
| | | | | | | | | | | | | | | | | | | | |
| | |
Machinery Non-Agriculture, Non-Construction, Non-Electronic — 0.5%*: | | | | | | | | | |
Gardner Denver, Inc. | | | 4.25 | | | | 7/30/2020 | | | | 469,575 | | | | 453,809 | | | | 421,326 | |
| | | | | | | | | | | | | | | | | | | | |
| | |
Mining, Steel, Iron and Non-Precious Metals — 0.7%*: | | | | | | | | | |
Arch Coal, Inc. | | | 6.25 | | | | 5/16/2018 | | | | 738,546 | | | | 731,296 | | | | 325,167 | |
Boomerang Tube LLC††~ | | | 11.00 | | | | 10/11/2017 | | | | 249,123 | | | | 245,042 | | | | 107,746 | |
See accompanying Notes to Financial Statements.
87
Babson Global Credit Income Opportunities Fund 2015 Semi-Annual Report
SCHEDULE OF INVESTMENTS (UNAUDITED) (CONTINUED)
December 31, 2015
| | | | | | | | | | | | | | | | | | | | |
| | | EFFECTIVE
INTEREST RATE | | | DUE DATE | | | PRINCIPAL ‡‡ | | | COST | | | FAIR
VALUE | |
Bank Loans (Continued) | | | | | | | | | | | | | | | | | | | | |
| | |
Mining, Steel, Iron and Non-Precious Metals (Continued) | | | | | | | | | |
Murray Energy Corp. | | | 7.50 | % | | | 4/16/2020 | | | | 198,827 | | | | $193,680 | | | | $126,042 | |
| | | | | | | | | | | | | | | | | | | | |
Total Mining, Steel, Iron and Non-Precious Metals | | | | | | | | 1,186,496 | | | | 1,170,018 | | | | 558,955 | |
| | | | | | | | | | | | | | | | | | | | |
| | |
Oil and Gas — 1.5%*: | | | | | | | | | |
American Energy — Marcellus LLC | | | 8.50 | | | | 8/4/2021 | | | | 60,368 | | | | 59,643 | | | | 1,107 | |
Caelus Energy Alaska O3 LLC | | | 8.75 | | | | 4/15/2020 | | | | 846,154 | | | | 764,907 | | | | 444,231 | |
Drillships Ocean Ventures, Inc. | | | 5.50 | �� | | | 7/25/2021 | | | | 126,025 | | | | 125,018 | | | | 58,916 | |
Fieldwood Energy LLC | | | 8.38 | | | | 9/30/2020 | | | | 1,885,340 | | | | 1,140,716 | | | | 282,801 | |
Floatel International Ltd. | | | 6.00 | | | | 6/27/2020 | | | | 202,205 | | | | 200,671 | | | | 88,566 | |
Jonah Energy LLC | | | 7.50 | | | | 5/12/2021 | | | | 173,566 | | | | 171,567 | | | | 107,611 | |
Paragon Offshore Finance Co. | | | 3.75 | | | | 7/18/2021 | | | | 479,874 | | | | 381,722 | | | | 121,408 | |
Seadrill Partners Finco LLC | | | 4.00 | | | | 2/21/2021 | | | | 128,363 | | | | 104,228 | | | | 53,056 | |
Southcross Holdings Borrower LP | | | 6.00 | | | | 8/4/2021 | | | | 72,611 | | | | 72,319 | | | | 39,694 | |
| | | | | | | | | | | | | | | | | | | | |
Total Oil and Gas | | | | | | | | | | | 3,974,506 | | | | 3,020,791 | | | | 1,197,390 | |
| | | | | | | | | | | | | | | | | | | | |
| | |
Printing and Publishing — 3.2%*: | | | | | | | | | |
Cengage Learning Acquisitions, Inc. | | | 7.00 | | | | 3/31/2020 | | | | 651,578 | | | | 651,772 | | | | 633,660 | |
Eden Bidco Ltd.+ | | | 6.00 | | | | 4/28/2022 | | | | 497,500 | | | | 521,588 | | | | 537,279 | |
Springer Science+Business Media Deutschland GmbH+ | | | 9.00 | | | | 8/14/2021 | | | | 1,300,000 | | | | 1,499,186 | | | | 1,441,030 | |
| | | | | | | | | | | | | | | | | | | | |
Total Printing and Publishing | | | | | | | | | | | 2,449,078 | | | | 2,672,546 | | | | 2,611,969 | |
| | | | | | | | | | | | | | | | | | | | |
| | |
Retail Stores — 0.9%*: | | | | | | | | | |
Bass Pro Group LLC | | | 4.00 | | | | 6/5/2020 | | | | 178,458 | | | | 178,060 | | | | 171,468 | |
Maxeda DIY B.V.+ | | | 7.00 | | | | 6/28/2019 | | | | 583,334 | | | | 602,600 | | | | 526,396 | |
| | | | | | | | | | | | | | | | | | | | |
Total Retail Stores | | | | | | | | | | | 761,792 | | | | 780,660 | | | | 697,864 | |
| | | | | | | | | | | | | | | | | | | | |
Total Bank Loans | | | | | | | | | | | 21,959,205 | | | | 22,303,015 | | | | 18,622,126 | |
| | | | | | | | | | | | | | | | | | | | |
| | | | | |
Corporate Bonds — 51.3%*: | | | | | | | | | | | | | | | | | | | | |
| | | |
Aerospace and Defense — 1.4%*: | | | | | | | | | | | | | |
AerCap Ireland Capital Ltd./AerCap Global Aviation Trust | | | 4.63 | | | | 10/30/2020 | | | | 332,000 | | | | 332,000 | | | | 339,885 | |
CPI International, Inc. | | | 8.75 | | | | 2/15/2018 | | | | 814,000 | | | | 827,092 | | | | 801,790 | |
| | | | | | | | | | | | | | | | | | | | |
Total Aerospace and Defense | | | | | | | | | | | 1,146,000 | | | | 1,159,092 | | | | 1,141,675 | |
| | | | | | | | | | | | | | | | | | | | |
| | |
Automobile — 3.7%*: | | | | | | | | | |
Allied Specialty Vehicles, Inc.^ | | | 8.50 | | | | 11/1/2019 | | | | 1,000,000 | | | | 1,025,165 | | | | 1,015,000 | |
Gates Global LLC/Gates Global Co.^ | | | 6.00 | | | | 7/15/2022 | | | | 1,000,000 | | | | 762,677 | | | | 720,000 | |
International Automotive Components Group SA^ | | | 9.13 | | | | 6/1/2018 | | | | 940,000 | | | | 960,115 | | | | 803,700 | |
JB Poindexter & Co., Inc.^ | | | 9.00 | | | | 4/1/2022 | | | | 500,000 | | | | 522,856 | | | | 522,500 | |
| | | | | | | | | | | | | | | | | | | | |
Total Automobile | | | | | | | | | | | 3,440,000 | | | | 3,270,813 | | | | 3,061,200 | |
| | | | | | | | | | | | | | | | | | | | |
See accompanying Notes to Financial Statements.
88
Babson Global Credit Income Opportunities Fund 2015 Semi-Annual Report
SCHEDULE OF INVESTMENTS (UNAUDITED) (CONTINUED)
December 31, 2015
| | | | | | | | | | | | | | | | | | | | |
| | | EFFECTIVE
INTEREST RATE | | | DUE DATE | | | PRINCIPAL ‡‡ | | | COST | | | FAIR
VALUE | |
Corporate Bonds (Continued) | | | | | | | | | | | | | | | | | | | | |
| | |
Banking — 0.3%*: | | | | | | | | | |
Lock AS+ | | | 7.00 | % | | | 8/15/2021 | | | | 250,000 | | | | $335,562 | | | | $283,126 | |
| | | | | | | | | | | | | | | | | | | | |
| | |
Beverage, Food and Tobacco — 0.8%*: | | | | | | | | | |
Boparan Finance PLC+ | | | 5.50 | | | | 7/15/2021 | | | | 300,000 | | | | 421,508 | | | | 391,400 | |
Pizzaexpress Financing 2 PLC+ | | | 6.63 | | | | 8/1/2021 | | | | 150,000 | | | | 254,595 | | | | 226,266 | |
| | | | | | | | | | | | | | | | | | | | |
Total Beverage, Food and Tobacco | | | | | | | | | | | 450,000 | | | | 676,103 | | | | 617,666 | |
| | | | | | | | | | | | | | | | | | | | |
| | | | | |
Broadcasting and Entertainment — 3.0%*: | | | | | | | | | | | | | | | | | | | | |
Entertainment One Ltd.+ | | | 6.88 | | | | 12/15/2022 | | | | 200,000 | | | | 302,461 | | | | 293,513 | |
Gray Television, Inc. | | | 7.50 | | | | 10/1/2020 | | | | 600,000 | | | | 615,878 | | | | 616,500 | |
Harron Communications LP/Harron Finance Corp.^ | | | 9.13 | | | | 4/1/2020 | | | | 500,000 | | | | 537,361 | | | | 528,750 | |
RCN Telecom Services LLC/RCN Capital Corp.^ | | | 8.50 | | | | 8/15/2020 | | | | 775,000 | | | | 777,682 | | | | 782,750 | |
Unitymedia GmbH+ | | | 3.75 | | | | 1/15/2027 | | | | 300,000 | | | | 335,460 | | | | 279,730 | |
| | | | | | | | | | | | | | | | | | | | |
Total Broadcasting and Entertainment | | | | | | | | | | | 2,375,000 | | | | 2,568,842 | | | | 2,501,243 | |
| | | | | | | | | | | | | | | | | | | | |
| | | | | |
Buildings and Real Estate — 2.3%*: | | | | | | | | | | | | | | | | | | | | |
Cemex Finance LLC+^ | | | 9.38 | | | | 10/12/2022 | | | | 800,000 | | | | 872,403 | | | | 842,000 | |
Keystone Financing PLC+ | | | 9.50 | | | | 10/15/2019 | | | | 350,000 | | | | 564,053 | | | | 536,609 | |
Paroc Group Oy+ | | | 6.25 | | | | 5/15/2020 | | | | 100,000 | | | | 137,565 | | | | 103,799 | |
Paroc Group Oy MTN+ | | | 5.17 | # | | | 5/15/2020 | | | | 100,000 | | | | 137,565 | | | | 102,698 | |
William Lyon Homes, Inc.^ | | | 7.00 | | | | 8/15/2022 | | | | 295,000 | | | | 300,699 | | | | 295,737 | |
| | | | | | | | | | | | | | | | | | | | |
Total Buildings and Real Estate | | | | | | | | | | | 1,645,000 | | | | 2,012,285 | | | | 1,880,843 | |
| | | | | | | | | | | | | | | | | | | | |
| | |
Cargo Transport — 2.5%*: | | | | | | | | | |
DH Services Luxembourg Sarl^ | | | 7.75 | | | | 12/15/2020 | | | | 200,000 | | | | 204,828 | | | | 201,000 | |
Moto Finance PLC+ | | | 6.38 | | | | 9/1/2020 | | | | 200,000 | | | | 300,787 | | | | 302,801 | |
OPE KAG Finance Sub, Inc.^ | | | 7.88 | | | | 7/31/2023 | | | | 1,367,000 | | | | 1,367,000 | | | | 1,358,456 | |
WFS Global Holding SAS+ | | | 9.50 | | | | 7/15/2022 | | | | 150,000 | | | | 170,153 | | | | 170,697 | |
| | | | | | | | | | | | | | | | | | | | |
Total Cargo Transport | | | | | | | | | | | 1,917,000 | | | | 2,042,768 | | | | 2,032,954 | |
| | | | | | | | | | | | | | | | | | | | |
| | |
Chemicals, Plastics and Rubber — 4.1%*: | | | | | | | | | |
Consolidated Energy Finance SA+^ | | | 6.75 | | | | 10/15/2019 | | | | 1,000,000 | | | | 993,589 | | | | 955,950 | |
Huntsman International LLC | | | 4.25 | | | | 4/1/2025 | | | | 300,000 | | | | 276,719 | | | | 264,080 | |
Ineos Finance PLC+ | | | 4.00 | | | | 5/1/2023 | | | | 200,000 | | | | 216,510 | | | | 207,569 | |
OMNOVA Solutions, Inc. | | | 7.88 | | | | 11/1/2018 | | | | 723,000 | | | | 734,977 | | | | 708,540 | |
Pinnacle Operating Corp.^ | | | 9.00 | | | | 11/15/2020 | | | | 600,000 | | | | 614,493 | | | | 564,000 | |
PSPC Escrow Corp. | | | 6.00 | | | | 2/1/2023 | | | | 250,000 | | | | 241,296 | | | | 232,293 | |
TPC Group, Inc.^ | | | 8.75 | | | | 12/15/2020 | | | | 291,000 | | | | 243,740 | | | | 189,150 | |
Trinseo Materials Operating SCA/Trinseo Materials Finance, Inc. | | | 6.38 | | | | 5/1/2022 | | | | 200,000 | | | | 219,361 | | | | 215,720 | |
| | | | | | | | | | | | | | | | | | | | |
Total Chemicals, Plastics and Rubber | | | | | | | | | | | 3,564,000 | | | | 3,540,685 | | | | 3,337,302 | |
| | | | | | | | | | | | | | | | | | | | |
| | |
Containers, Packaging and Glass — 2.7%*: | | | | | | | | | |
Coveris Holdings SA^ | | | 7.88 | | | | 11/1/2019 | | | | 900,000 | | | | 902,801 | | | | 785,250 | |
See accompanying Notes to Financial Statements.
89
Babson Global Credit Income Opportunities Fund 2015 Semi-Annual Report
SCHEDULE OF INVESTMENTS (UNAUDITED) (CONTINUED)
December 31, 2015
| | | | | | | | | | | | | | | | | | | | |
| | | EFFECTIVE
INTEREST RATE | | | DUE DATE | | | PRINCIPAL ‡‡ | | | COST | | | FAIR
VALUE | |
Corporate Bonds (Continued) | | | | | | | | | | | | | | | | | | | | |
| | |
Containers, Packaging and Glass (Continued) | | | | | | | | | |
Horizon Holdings III SASU+ | | | 5.13 | % | | | 8/1/2022 | | | | 100,000 | | | | $109,775 | | | | $111,957 | |
Innovia Group Finance PLC+ | | | 4.87 | # | | | 3/31/2020 | | | | 100,000 | | | | 136,140 | | | | 108,131 | |
Mustang Merger Corp.^ | | | 8.50 | | | | 8/15/2021 | | | | 750,000 | | | | 746,365 | | | | 778,125 | |
SIG Combibloc Holdings SCA+ | | | 7.75 | | | | 2/15/2023 | | | | 400,000 | | | | 459,340 | | | | 453,175 | |
| | | | | | | | | | | | | | | | | | | | |
Total Containers, Packaging and Glass | | | | | | | | | | | 2,250,000 | | | | 2,354,421 | | | | 2,236,638 | |
| | | | | | | | | | | | | | | | | | | | |
| | |
Diversified Natural Resources, Precious Metals and Minerals — 0.1%*: | | | | | | | | | |
Cemex SAB de CV+ | | | 4.38 | | | | 3/5/2023 | | | | 100,000 | | | | 111,980 | | | | 98,079 | |
| | | | | | | | | | | | | | | | | | | | |
| | |
Diversified/Conglomerate Manufacturing — 2.7%*: | | | | | | | | | |
Appvion, Inc.^ | | | 9.00 | | | | 6/1/2020 | | | | 500,000 | | | | 511,847 | | | | 198,750 | |
CTP Transportation Products LLC/CTP Finance, Inc.^ | | | 8.25 | | | | 12/15/2019 | | | | 648,000 | | | | 663,773 | | | | 675,540 | |
EnPro Industries, Inc. | | | 5.88 | | | | 9/15/2022 | | | | 250,000 | | | | 252,450 | | | | 247,500 | |
Galapagos SA+ | | | 5.38 | | | | 6/15/2021 | | | | 175,000 | | | | 219,461 | | | | 183,335 | |
StoneMor Partners LP/Cornerstone Family Services of West Virginia Subsidiary | | | 7.88 | | | | 6/1/2021 | | | | 500,000 | | | | 516,722 | | | | 515,000 | |
West Corp.^ | | | 5.38 | | | | 7/15/2022 | | | | 500,000 | | | | 475,904 | | | | 431,250 | |
| | | | | | | | | | | | | | | | | | | | |
Total Diversified/Conglomerate Manufacturing | | | | | | | | 2,573,000 | | | | 2,640,157 | | | | 2,251,375 | |
| | | | | | | | | | | | | | | | | | | | |
| | |
Diversified/Conglomerate Service — 2.2%*: | | | | | | | | | |
Carlson Travel Holdings, Inc. PIK^ | | | 7.50 | | | | 8/15/2019 | | | | 665,000 | | | | 673,257 | | | | 655,025 | |
Verisure Holding AB+ | | | 6.00 | | | | 11/1/2022 | | | | 450,000 | | | | 500,729 | | | | 508,599 | |
Zachry Holdings, Inc.^ | | | 7.50 | | | | 2/1/2020 | | | | 671,000 | | | | 672,959 | | | | 657,580 | |
| | | | | | | | | | | | | | | | | | | | |
Total Diversified/Conglomerate Service | | | | | | | | | | | 1,786,000 | | | | 1,846,945 | | | | 1,821,204 | |
| | | | | | | | | | | | | | | | | | | | |
| | |
Electronics — 1.2%*: | | | | | | | | | |
Audatex North America, Inc.^ | | | 6.13 | | | | 11/1/2023 | | | | 1,000,000 | | | | 995,218 | | | | 1,006,250 | |
| | | | | | | | | | | | | | | | | | | | |
| | |
Finance — 3.7%*: | | | | | | | | | |
Cabot Financial Luxembourg SA+ | | | 10.38 | | | | 10/1/2019 | | | | 100,000 | | | | 172,342 | | | | 157,622 | |
First Data Corp.^ | | | 7.00 | | | | 12/1/2023 | | | | 800,000 | | | | 800,000 | | | | 800,000 | |
Galaxy Finco Ltd.+ | | | 7.88 | | | | 11/15/2021 | | | | 100,000 | | | | 165,314 | | | | 147,420 | |
Garfunkelux Holdco 3 SA+ | | | 7.50 | | | | 8/1/2022 | | | | 100,000 | | | | 111,014 | | | | 111,761 | |
Garfunkelux Holdco 3 SA+ | | | 8.50 | | | | 11/1/2022 | | | | 650,000 | | | | 1,007,117 | | | | 963,021 | |
National Financial Partners Corp.^ | | | 9.00 | | | | 7/15/2021 | | | | 279,000 | | | | 277,715 | | | | 255,285 | |
TMF Group Holding B.V.+ | | | 9.88 | | | | 12/1/2019 | | | | 500,000 | | | | 713,622 | | | | 581,520 | |
| | | | | | | | | | | | | | | | | | | | |
Total Finance | | | | | | | | | | | 2,529,000 | | | | 3,247,124 | | | | 3,016,629 | |
| | | | | | | | | | | | | | | | | | | | |
| | |
Grocery — 0.3%*: | | | | | | | | | |
Premier Foods Finance PLC+ | | | 6.50 | | | | 3/15/2021 | | | | 200,000 | | | | 339,057 | | | | 280,098 | |
| | | | | | | | | | | | | | | | | | | | |
| | |
Healthcare, Education and Childcare — 5.3%*: | | | | | | | | | |
Alere, Inc.^ | | | 6.38 | | | | 7/1/2023 | | | | 490,000 | | | | 490,000 | | | | 458,150 | |
Care UK Health & Social Care PLC+ | | | 5.58 | # | | | 7/15/2019 | | | | 100,000 | | | | 153,114 | | | | 133,784 | |
Cerberus Nightingale 1 Sarl+ | | | 8.25 | | | | 2/1/2020 | | | | 550,000 | | | | 629,680 | | | | 613,325 | |
See accompanying Notes to Financial Statements.
90
Babson Global Credit Income Opportunities Fund 2015 Semi-Annual Report
SCHEDULE OF INVESTMENTS (UNAUDITED) (CONTINUED)
December 31, 2015
| | | | | | | | | | | | | | | | | | | | |
| | | EFFECTIVE
INTEREST RATE | | | DUE DATE | | | PRINCIPAL ‡‡ | | | COST | | | FAIR
VALUE | |
Corporate Bonds (Continued) | | | | | | | | | | | | | | | | | | | | |
| | |
Healthcare, Education and Childcare (Continued) | | | | | | | | | |
Cognita Financing PLC+ | | | 7.75 | % | | | 8/15/2021 | | | | 350,000 | | | | $545,630 | | | | $532,522 | |
ConvaTec Healthcare E SA^ | | | 10.50 | | | | 12/15/2018 | | | | 200,000 | | | | 202,959 | | | | 201,832 | |
Ephios Bondco PLC+ | | | 6.25 | | | | 7/1/2022 | | | | 100,000 | | | | 114,749 | | | | 112,729 | |
HomeVi SAS+ | | | 6.88 | | | | 8/15/2021 | | | | 250,000 | | | | 334,500 | | | | 286,195 | |
Priory Group No. 3 PLC MTN+ | | | 8.88 | | | | 2/15/2019 | | | | 500,000 | | | | 806,090 | | | | 759,139 | |
Sterigenics-Nordion Holdings LLC^ | | | 6.50 | | | | 5/15/2023 | | | | 800,000 | | | | 796,097 | | | | 760,000 | |
Tenet Healthcare Corp. | | | 6.75 | | | | 6/15/2023 | | | | 294,000 | | | | 292,607 | | | | 272,685 | |
Unilabs Subholding AB+ | | | 8.50 | | | | 7/15/2018 | | | | 200,000 | | | | 283,163 | | | | 225,224 | |
| | | | | | | | | | | | | | | | | | | | |
Total Healthcare, Education and Childcare | | | | | | | | | | | 3,834,000 | | | | 4,648,589 | | | | 4,355,585 | |
| | | | | | | | | | | | | | | | | | | | |
| | |
Hotels, Motels, Inns and Gaming — 0.1%*: | | | | | | | | | |
Gala Electric Casinos PLC+ | | | 11.50 | | | | 6/1/2019 | | | | 63,636 | | | | 111,576 | | | | 99,441 | |
| | | | | | | | | | | | | | | | | | | | |
| | |
Insurance — 0.0%*: | | | | | | | | | |
TIG Finco PLC+ | | | 8.50 | # | | | 3/2/2020 | | | | 15,734 | | | | 25,178 | | | | 23,787 | |
| | | | | | | | | | | | | | | | | | | | |
| | |
Leisure, Amusement, Entertainment — 3.0%*: | | | | | | | | | |
Allegiant Travel Co. | | | 5.50 | | | | 7/15/2019 | | | | 700,000 | | | | 716,238 | | | | 708,750 | |
CPUK Finance Ltd.+ | | | 7.00 | | | | 2/28/2042 | | | | 150,000 | | | | 234,082 | | | | 226,105 | |
Interval Acquisition Corp.^ | | | 5.63 | | | | 4/15/2023 | | | | 459,000 | | | | 459,000 | | | | 455,558 | |
Odeon & UCI Finco PLC MTN+ | | | 9.00 | | | | 8/1/2018 | | | | 200,000 | | | | 320,247 | | | | 306,191 | |
Perform Group Financing PLC+ | | | 8.50 | | | | 11/15/2020 | | | | 150,000 | | | | 223,790 | | | | 205,673 | |
WMG Acquisition Corp.^ | | | 6.75 | | | | 4/15/2022 | | | | 600,000 | | | | 567,871 | | | | 519,000 | |
| | | | | | | | | | | | | | | | | | | | |
Total Leisure, Amusement, Entertainment | | | | | | | | | | | 2,259,000 | | | | 2,521,228 | | | | 2,421,277 | |
| | | | | | | | | | | | | | | | | | | | |
| | |
Machinery Non-Agriculture, Non-Construction, Non-Electronic — 1.0%*: | | | | | | | | | |
KraussMaffei Group GmbH MTN+ | | | 8.75 | | | | 12/15/2020 | | | | 80,000 | | | | 114,792 | | | | 93,243 | |
Xerium Technologies, Inc. | | | 8.88 | | | | 6/15/2018 | | | | 720,000 | | | | 734,560 | | | | 705,690 | |
| | | | | | | | | | | | | | | | | | | | |
Total Machinery Non-Agriculture, Non-Construction, Non-Electronic | | | | | | | | | | | 800,000 | | | | 849,352 | | | | 798,933 | |
| | | | | | | | | | | | | | | | | | | | |
| | |
Mining, Steel, Iron and Non-Precious Metals — 0.6%*: | | | | | | | | | |
Constellium NV | | | 7.00 | | | | 1/15/2023 | | | | 600,000 | | | | 641,795 | | | | 526,204 | |
| | | | | | | | | | | | | | | | | | | | |
| | |
Oil and Gas — 3.3%*: | | | | | | | | | |
Calumet Specialty Products Partners LP/Calumet Finance Corp. | | | 6.50 | | | | 4/15/2021 | | | | 500,000 | | | | 500,000 | | | | 435,000 | |
Citgo Holding, Inc.^ | | | 10.75 | | | | 2/15/2020 | | | | 350,000 | | | | 339,422 | | | | 339,500 | |
EP Energy LLC/Everest Acquisition Finance, Inc. | | | 9.38 | | | | 5/1/2020 | | | | 350,000 | | | | 272,445 | | | | 223,125 | |
Genesis Energy LP/Genesis Energy Finance Corp. | | | 6.75 | | | | 8/1/2022 | | | | 500,000 | | | | 479,282 | | | | 425,000 | |
Kosmos Energy Ltd.^ | | | 7.88 | | | | 8/1/2021 | | | | 571,000 | | | | 529,340 | | | | 459,655 | |
Seventy Seven Energy, Inc. | | | 6.50 | | | | 7/15/2022 | | | | 313,000 | | | | 313,000 | | | | 48,515 | |
Shelf Drilling Holdings Ltd.+^ | | | 8.63 | | | | 11/1/2018 | | | | 439,000 | | | | 371,268 | | | | 318,275 | |
Sunoco LP/Sunoco Finance Corp.^ | | | 5.50 | | | | 8/1/2020 | | | | 302,000 | | | | 302,000 | | | | 286,145 | |
See accompanying Notes to Financial Statements.
91
Babson Global Credit Income Opportunities Fund 2015 Semi-Annual Report
SCHEDULE OF INVESTMENTS (UNAUDITED) (CONTINUED)
December 31, 2015
| | | | | | | | | | | | | | | | | | | | |
| | | EFFECTIVE
INTEREST RATE | | | DUE DATE | | | PRINCIPAL ‡‡ | | | COST | | | FAIR
VALUE | |
Corporate Bonds (Continued) | | | | | | | | | | | | | | | | | | | | |
| | |
Oil and Gas (Continued) | | | | | | | | | |
Welltec A/S+^ | | | 8.00 | % | | | 2/1/2019 | | | | 174,000 | | | | $148,631 | | | | $163,125 | |
| | | | | | | | | | | | | | | | | | | | |
Total Oil and Gas | | | | | | | | | | | 3,499,000 | | | | 3,255,388 | | | | 2,698,340 | |
| | | | | | | | | | | | | | | | | | | | |
| | |
Personal Transportation — 0.3%*: | | | | | | | | | |
AA Bond Co. Ltd.+ | | | 5.50 | | | | 7/31/2043 | | | | 150,000 | | | | 223,140 | | | | 209,797 | |
| | | | | | | | | | | | | | | | | | | | |
| | |
Personal, Food and Miscellaneous — 0.5%*: | | | | | | | | | |
TeamSystem Holding SpA+ | | | 7.38 | | | | 5/15/2020 | | | | 350,000 | | | | 475,964 | | | | 393,751 | |
| | | | | | | | | | | | | | | | | | | | |
| | |
Printing and Publishing — 1.2%*: | | | | | | | | | |
Cimpress NV^ | | | 7.00 | | | | 4/1/2022 | | | | 470,000 | | | | 456,278 | | | | 451,200 | |
MHGE Parent LLC/MHGE Parent Finance, Inc.^ | | | 8.50 | | | | 8/1/2019 | | | | 500,000 | | | | 509,057 | | | | 495,000 | |
| | | | | | | | | | | | | | | | | | | | |
Total Printing and Publishing | | | | | | | | | | | 970,000 | | | | 965,335 | | | | 946,200 | |
| | | | | | | | | | | | | | | | | | | | |
| | |
Retail Stores — 2.9%*: | | | | | | | | | |
Boing Group Financing PLC MTN+ | | | 6.63 | | | | 7/15/2019 | | | | 200,000 | | | | 272,200 | | | | 203,222 | |
Brighthouse Group PLC MTN+ | | | 7.88 | | | | 5/15/2018 | | | | 150,000 | | | | 242,854 | | | | 211,992 | |
Dollar Tree, Inc.^ | | | 5.25 | | | | 3/1/2020 | | | | 50,000 | | | | 51,268 | | | | 51,625 | |
Dollar Tree, Inc.^ | | | 5.75 | | | | 3/1/2023 | | | | 815,000 | | | | 841,270 | | | | 843,525 | |
Douglas GmbH+ | | | 6.25 | | | | 7/15/2022 | | | | 550,000 | | | | 614,378 | | | | 627,000 | |
House of Fraser Funding PLC+ | | | 6.34 | # | | | 9/15/2020 | | | | 150,000 | | | | 231,983 | | | | 222,789 | |
HSS Financing PLC+ | | | 6.75 | | | | 8/1/2019 | | | | 68,000 | | | | 112,557 | | | | 99,243 | |
Takko Luxembourg 2 S.C.A. MTN+ | | | 9.88 | | | | 4/15/2019 | | | | 200,000 | | | | 259,404 | | | | 115,639 | |
| | | | | | | | | | | | | | | | | | | | |
Total Retail Stores | | | | | | | | | | | 2,183,000 | | | | 2,625,914 | | | | 2,375,035 | |
| | | | | | | | | | | | | | | | | | | | |
| | |
Telecommunications — 2.1%*: | | | | | | | | | |
CCO Holdings LLC/CCO Holdings Capital Corp.^ | | | 5.88 | | | | 5/1/2027 | | | | 391,000 | | | | 391,000 | | | | 389,045 | |
eircom Finance Ltd.MTN+ | | | 9.25 | | | | 5/15/2020 | | | | 100,000 | | | | 146,771 | | | | 116,771 | |
Level 3 Financing, Inc.^ | | | 5.38 | | | | 1/15/2024 | | | | 182,000 | | | | 182,000 | | | | 182,910 | |
Numericable-SFR SAS+ | | | 5.63 | | | | 5/15/2024 | | | | 100,000 | | | | 138,165 | | | | 109,898 | |
Numericable-SFR SAS+^ | | | 6.00 | | | | 5/15/2022 | | | | 315,000 | | | | 315,000 | | | | 305,550 | |
T-Mobile USA, Inc. | | | 6.50 | | | | 1/15/2026 | | | | 294,000 | | | | 294,000 | | | | 296,790 | |
Wind Acquisition Finance SA+ | | | 3.95 | # | | | 7/15/2020 | | | | 100,000 | | | | 135,965 | | | | 107,860 | |
Wind Acquisition Finance SA+ | | | 4.00 | | | | 7/15/2020 | | | | 200,000 | | | | 243,319 | | | | 216,263 | |
| | | | | | | | | | | | | | | | | | | | |
Total Telecommunications | | | | | | | | | | | 1,682,000 | | | | 1,846,220 | | | | 1,725,087 | |
| | | | | | | | | | | | | | | | | | | | |
Total Corporate Bonds | | | | | | | | | | | 41,631,370 | | | | 45,330,731 | | | | 42,139,719 | |
| | | | | | | | | | | | | | | | | | | | |
Total Fixed Income | | | | | | | | | | | 82,660,575 | | | | 85,309,574 | | | | 75,338,857 | |
| | | | | | | | | | | | | | | | | | | | |
See accompanying Notes to Financial Statements.
92
Babson Global Credit Income Opportunities Fund 2015 Semi-Annual Report
SCHEDULE OF INVESTMENTS (UNAUDITED) (CONTINUED)
December 31, 2015
| | | | | | | | | | | | | | | | | | | | |
| | | STRIKE
PRICE | | | EXPIRATION
DATE | | | NOTIONAL | | | COST | | | FAIR
VALUE | |
Purchased Option — 0.5%*: | | | | | | | | | | | | | | | | | | | | |
| | | | | |
Put Option Purchased — 0.5%*: | | | | | | | | | | | | | | | | | | | | |
OTC – BCM Swaption with Citibank | | | $98.00 | | | | 3/16/2016 | | | | 40,000,000 | | | | $1,348,000 | | | | $406,452 | |
| | | | | | | | | | | | | | | | | | | | |
| | | | | |
| | | EFFECTIVE
INTEREST RATE | | | DUE DATE | | | PRINCIPAL ‡‡ | | | COST | | | FAIR
VALUE | |
Short-Term Investments — 7.7%*: | | | | | | | | | | | | | | | | | | | | |
| | | | | |
Bank Deposit — 7.6%*: | | | | | | | | | | | | | | | | | | | | |
State Street Bank & Trust Co. Euro Time Deposit | | | 0.01 | % | | | 1/4/2016 | | | | 6,222,562 | | | | 6,222,562 | | | | 6,222,562 | |
| | | | | | | | | | | | | | | | | | | | |
| | |
Bank Loan — 0.1%*§: | | | | | | | | | |
| | | | |
Mining, Steel, Iron and Non-Precious Metals — 0.1%*: | | | | | | | | | | | | | | | | | |
Boomerang Tube LLC¤ | | | 11.61 | | | | 1/8/2016 | | | | 78,780 | | | | 78,713 | | | | 78,780 | |
| | | | | | | | | | | | | | | | | | | | |
Total Short-Term Investments | | | | | | | | | | | 6,301,342 | | | | 6,301,275 | | | | 6,301,342 | |
| | | | | | | | | | | | | | | | | | | | |
Total Investments | | | | | | | | | | | 147,832,234 | | | | 93,332,587 | | | | 82,456,570 | |
| | | | | | | | | | | | | | | | | | | | |
| | | | | |
Other assets and liabilities — (0.4%)* | | | | | | | | | | | | | | | | | | | (311,184 | ) |
| | | | | |
Net Assets — 100.0% | | | | | | | | | | | | | | | | | | | $82,145,386 | |
| | | | | | | | | | | | | | | | | | | | |
| | |
| MTN | | Medium Term Note |
| OTC | | Over the Counter |
| PIK | | Payment-in-kind |
| ‡‡ | Unless otherwise indicated, all principal amounts are denominated in United States Dollars. |
| * | Calculated as a percentage of net assets applicable to common shareholders. |
| | Distributions of investments by country of risk (excluding temporary cash investments) as a percentage of total investments in securities, is as follows: |
| | | | | | |
| | United States | | | 66.6% | |
| | United Kingdom | | | 11.5% | |
| | Germany | | | 5.9% | |
| | Netherlands | | | 4.2% | |
| | France | | | 2.1% | |
| | Switzerland | | | 1.6% | |
| | Trinidad And Tobago | | | 1.3% | |
| | Mexico | | | 1.2% | |
| | Spain | | | 1.0% | |
| | Sweden | | | 1.0% | |
| | Other (Individually less than 1%) | | | 3.6% | |
| | | | | | |
| | Total | | | 100.0% | |
| | | | | | |
| ^ | Security acquired in a transaction exempt from registration under Rule 144A of the Securities Act of 1933. These securities may only be resold in transactions exempt from registration, normally to qualified institutional buyers. |
See accompanying Notes to Financial Statements.
93
Babson Global Credit Income Opportunities Fund 2015 Semi-Annual Report
SCHEDULE OF INVESTMENTS (UNAUDITED) (CONTINUED)
December 31, 2015
| § | Bank loans are exempt from registration under the Securities Act of 1933, as amended, but contain certain restrictions on resale and cannot be sold publicly. These loans pay interest at rates which adjust periodically. The interest rates shown for bank loans are the current interest rates at December 31, 2015. Bank loans are also subject to mandatory and/or optional prepayment which cannot be predicted. As a result, the remaining maturity may be substantially less than the stated maturity shown. |
| ¤ | For fair value measurement disclosure purposes, security is categorized as Level 3 (See Note 2). |
| # | Variable rate security. The interest rate shown is the rate in effect at December 31, 2015. |
A summary of outstanding derivatives at December 31, 2015 is as follows:
Forward Foreign Currency Exchange Contracts to Buy
| | | | | | | | | | | | | | | | | | | | | | |
EXPIRATION
DATE | | COUNTERPARTY | | LOCAL
CURRENCY | | | VALUE IN USD | | | IN
EXCHANGE
FOR USD | | | NET UNREALIZED
APPRECIATION | |
| 1/14/16 | | Morgan Stanley | | | EUR | | | | 380,000 | | | | 413,061 | | | | 412,044 | | | $ | 1,017 | |
Forward Foreign Currency Exchange Contracts to Sell
| | | | | | | | | | | | | | | | | | | | | | |
EXPIRATION
DATE | | COUNTERPARTY | | LOCAL
CURRENCY | | | VALUE IN USD | | | IN
EXCHANGE
FOR USD | | | NET UNREALIZED
APPRECIATION
(DEPRECIATION) | |
| 1/14/16 | | Morgan Stanley | | | EUR | | | | 13,053,445 | | | | 14,189,124 | | | | 14,180,663 | | | $ | (8,461 | ) |
| 1/14/16 | | Morgan Stanley | | | GBP | | | | 5,929,460 | | | | 8,741,438 | | | | 8,937,635 | | | | 196,197 | |
| | | | | | | | | | | | | | | | | | | | | | |
Net unrealized appreciation on forward foreign exchange contracts to sell | | | | | | | $ | 187,736 | |
| | | | | | | | | | | | | | | | | | | | | | |
Currency Legend
| | | | |
| EUR | | – | | Euro |
| GBP | | – | | British Pound Sterling |
Written Options
| | | | | | | | | | | | | | | | | | | | |
TYPE OF
CONTRACT | | EXPIRATION
DATE | | STRIKE
PRICE | | | COUNTERPARTY | | NUMBER OF
CONTRACTS/
NOTIONAL
AMOUNTS | | | PREMIUMS
RECEIVED | | | VALUE AT
DECEMBER 31,
2015 | |
Put – OTC – BMC Swaption | | 3/16/16 | | $ | 95.00 | | | Citibank | | | 40,000,000 | | | $ | 972,000 | | | $ | (207,921 | ) |
See accompanying Notes to Financial Statements.
94
Babson Active Short Duration Bond Fund 2015 Semi-Annual Report
SCHEDULE OF INVESTMENTS (UNAUDITED)
December 31, 2015
| | | | | | | | | | | | | | | | | | | | |
| | | DIVIDEND
RATE | | | | | | SHARES | | | COST | | | FAIR
VALUE | |
Convertible Preferred Stock — 0.0%*: | | | | | | | | | | | | | | | | | | | | |
Southwestern Energy Co. | | | 6.25 | % | | | | | | | 900 | | | | $38,772 | | | | $16,695 | |
| | | | | |
| | | EFFECTIVE
INTEREST RATE | | | DUE DATE | | | PRINCIPAL ‡‡ | | | COST | | | FAIR VALUE | |
Fixed Income — 96.4%*: | | | | | | | | | | | | | | | | | | | | |
| | | | | |
Asset-Backed Securities — 19.4%*: | | | | | | | | | | | | | | | | | | | | |
| | | | | |
CDO/CLO — 3.7%*: | | | | | | | | | | | | | | | | | | | | |
ALM XIV Ltd. 2014-14A A1^ | | | 1.72 | # | | | 7/28/2026 | | | | 500,000 | | | | 498,781 | | | | 494,677 | |
Atlas Senior Loan Fund V Ltd. 2014-1A A^ | | | 1.84 | # | | | 7/16/2026 | | | | 500,000 | | | | 499,613 | | | | 496,266 | |
BlueMountain CLO Ltd. 2015-2A A1^ | | | 1.71 | | | | 7/18/2027 | | | | 250,000 | | | | 246,281 | | | | 246,584 | |
Carlyle Global Market Strategies CLO Ltd. 2014-1A A^ | | | 1.81 | # | | | 4/17/2025 | | | | 500,000 | | | | 500,000 | | | | 497,610 | |
Carlyle Global Market Strategies CLO Ltd. 2014-4A A1^ | | | 1.79 | # | | | 10/15/2026 | | | | 250,000 | | | | 250,000 | | | | 248,306 | |
Galaxy XX CLO Ltd. 2015-20A A^ | | | 1.73 | # | | | 7/20/2027 | | | | 250,000 | | | | 246,779 | | | | 248,787 | |
Madison Park Funding XII Ltd. 2014-12A A^ | | | 1.79 | # | | | 7/20/2026 | | | | 250,000 | | | | 248,267 | | | | 248,022 | |
Madison Park Funding XIV Ltd. 2014-14A A2^ | | | 1.74 | # | | | 7/20/2026 | | | | 250,000 | | | | 249,847 | | | | 247,420 | |
Seneca Park CLO Ltd. 2014-1A A^ | | | 1.77 | # | | | 7/17/2026 | | | | 360,000 | | | | 358,440 | | | | 357,916 | |
Symphony CLO XV Ltd. 2014-15A A^ | | | 1.77 | # | | | 10/17/2026 | | | | 250,000 | | | | 247,996 | | | | 247,872 | |
| | | | | | | | | | | | | | | | | | | | |
Total CDO/CLO | | | | | | | | | | | 3,360,000 | | | | 3,346,004 | | | | 3,333,460 | |
| | | | | | | | | | | | | | | | | | | | |
| | | | | |
Other Asset-Backed Securities — 15.7%*: | | | | | | | | | | | | | | | | | | | | |
321 Henderson Receivables II LLC 2006-3A A1^ | | | 0.53 | # | | | 9/15/2041 | | | | 261,709 | | | | 251,705 | | | | 250,429 | |
Access Group, Inc. 2015-1 A^ | | | 1.12 | # | | | 7/25/2056 | | | | 211,428 | | | | 206,708 | | | | 205,264 | |
Access Group, Inc. 2015-1 B^ | | | 1.92 | # | | | 7/25/2058 | | | | 100,000 | | | | 86,137 | | | | 84,849 | |
American Credit Acceptance Receivables Trust 2015-3 A^ | | | 1.95 | | | | 9/12/2019 | | | | 143,594 | | | | 143,585 | | | | 143,161 | |
Arbys Funding LLC 2015-1A A2^ | | | 4.97 | | | | 10/30/2045 | | | | 80,000 | | | | 80,000 | | | | 79,992 | |
Avis Budget Rental Car Funding AESOP LLC 2010-5A A^ | | | 3.15 | | | | 3/20/2017 | | | | 167,500 | | | | 168,747 | | | | 167,922 | |
BlueVirgo Trust 2015-1A^ | | | 3.00 | | | | 12/15/2022 | | | | 429,245 | | | | 427,349 | | | | 426,485 | |
California Republic Auto Receivables Trust 2015-4 A4^ | | | 2.58 | | | | 6/15/2021 | | | | 180,000 | | | | 179,983 | | | | 179,983 | |
Capital Automotive REIT 2010-1A A^ | | | 5.73 | | | | 12/15/2038 | | | | 92,461 | | | | 96,265 | | | | 96,536 | |
CarFinance Capital Auto Trust 2014-2^ | | | 1.44 | | | | 11/16/2020 | | | | 272,392 | | | | 269,794 | | | | 269,403 | |
Citi Held For Asset Issuance 2015-PM1 A^ | | | 1.85 | | | | 12/15/2021 | | | | 67,264 | | | | 67,263 | | | | 67,131 | |
Citi Held For Asset Issuance 2015-PM2 A^ | | | 2.35 | | | | 3/15/2022 | | | | 87,105 | | | | 87,099 | | | | 86,841 | |
Citi Held For Asset Issuance 2015-PM3 A | | | 2.60 | | | | 5/16/2022 | | | | 100,000 | | | | 99,984 | | | | 99,906 | |
CKE Restaurant Holdings, Inc. 2013-1A A2^ | | | 4.47 | | | | 3/20/2043 | | | | 220,512 | | | | 225,874 | | | | 219,252 | |
CLI Funding V LLC 2013-1A^ | | | 2.83 | | | | 3/18/2028 | | | | 72,500 | | | | 72,126 | | | | 69,890 | |
CLI Funding V LLC 2014-1A A^ | | | 3.29 | | | | 6/18/2029 | | | | 210,620 | | | | 204,219 | | | | 203,658 | |
College Loan Corp. Trust I 2005-2 B | | | 0.81 | # | | | 1/15/2037 | | | | 253,451 | | | | 221,258 | | | | 219,623 | |
CPS Auto Receivables Trust 2011-C A^ | | | 4.21 | | | | 3/15/2019 | | | | 88,566 | | | | 89,639 | | | | 88,926 | |
CPS Auto Receivables Trust 2012-A A^ | | | 2.78 | | | | 6/17/2019 | | | | 138,656 | | | | 139,569 | | | | 139,088 | |
CPS Auto Receivables Trust 2013-A A^ | | | 1.31 | | | | 6/15/2020 | | | | 223,631 | | | | 222,726 | | | | 221,371 | |
CPS Auto Receivables Trust 2014-D A^ | | | 1.49 | | | | 4/15/2019 | | | | 276,183 | | | | 274,737 | | | | 274,426 | |
See accompanying Notes to Financial Statements.
95
Babson Active Short Duration Bond Fund 2015 Semi-Annual Report
SCHEDULE OF INVESTMENTS (UNAUDITED) (CONTINUED)
December 31, 2015
| | | | | | | | | | | | | | | | | | | | |
| | | EFFECTIVE
INTEREST RATE | | | DUE DATE | | | PRINCIPAL ‡‡ | | | COST | | | FAIR
VALUE | |
Asset-Backed Securities (Continued) | | | | | | | | | | | | | | | | | | | | |
| | | | | |
Other Asset-Backed Securities (Continued) | | | | | | | | | | | | | | | | | | | | |
CPS Auto Receivables Trust 2015-C A^ | | | 1.77 | % | | | 6/17/2019 | | | | 89,462 | | | | $89,455 | | | | $89,258 | |
CPS Auto Receivables Trust 2015-C B^ | | | 2.55 | | | | 2/18/2020 | | | | 100,000 | | | | 99,983 | | | | 99,488 | |
DB Master Finance LLC 2015-1A A2I^ | | | 3.26 | | | | 2/20/2045 | | | | 203,462 | | | | 203,525 | | | | 201,324 | |
Diamond Resorts Owner Trust 2015-1 A^ | | | 2.73 | | | | 7/20/2027 | | | | 74,574 | | | | 74,567 | | | | 74,433 | |
Diamond Resorts Owner Trust 2015-2 B^ | | | 3.54 | | | | 5/22/2028 | | | | 115,055 | | | | 115,049 | | | | 115,049 | |
Domino’s Pizza Master Issuer LLC 2015 1A-A2I^ | | | 3.48 | | | | 10/25/2045 | | | | 240,000 | | | | 237,754 | | | | 235,200 | |
DRB Prime Student Loan Trust 2015-B A3^ | | | 2.54 | | | | 4/27/2026 | | | | 92,500 | | | | 92,490 | | | | 91,899 | |
DRB Prime Student Loan Trust 2015-D A1^ | | | 1.90 | # | | | 1/25/2040 | | | | 300,000 | | | | 293,458 | | | | 293,445 | |
Drive Auto Receivables Trust 2015-CA A3^ | | | 1.38 | | | | 10/15/2018 | | | | 225,000 | | | | 224,993 | | | | 224,491 | |
Drug Royalty LP 1 2012-1 A1^ | | | 5.57 | # | | | 7/15/2024 | | | | 132,000 | | | | 135,328 | | | | 134,937 | |
DT Auto Owner Trust 2015-3A A^ | | | 1.66 | | | | 3/15/2019 | | | | 86,173 | | | | 86,167 | | | | 85,941 | |
Education Funding Capital Trust IV 2004-1 A5 | | | 1.45 | # | | | 6/15/2043 | | | | 50,000 | | | | 47,016 | | | | 47,514 | |
Elara HGV Timeshare Issuer LLC 2014-A B^ | | | 3.02 | | | | 2/25/2027 | | | | 61,838 | | | | 61,274 | | | | 61,187 | |
Element Rail Leasing II LLC 2015-1A A1^ | | | 2.71 | | | | 2/19/2045 | | | | 487,271 | | | | 484,713 | | | | 483,292 | |
Entegry New Orleans Storm Recovery Funding I LLC 2015-1 A | | | 2.67 | | | | 6/1/2027 | | | | 180,000 | | | | 179,957 | | | | 183,634 | |
Exeter Automobile Receivables Trust 2015-3^ | | | 2.00 | | | | 3/16/2020 | | | | 81,869 | | | | 81,863 | | | | 81,586 | |
First Investors Auto Owner Trust 2015-2A A1^ | | | 1.59 | | | | 12/16/2019 | | | | 51,279 | | | | 51,278 | | | | 51,146 | |
Flagship Credit Auto Trust 2013-1^ | | | 1.32 | | | | 4/16/2018 | | | | 35,405 | | | | 35,377 | | | | 35,366 | |
Flagship Credit Auto Trust 2014-1^ | | | 1.21 | | | | 4/15/2019 | | | | 255,460 | | | | 254,747 | | | | 254,247 | |
Flagship Credit Auto Trust 2015-2 A^ | | | 1.98 | | | | 10/15/2020 | | | | 122,687 | | | | 122,675 | | | | 122,158 | |
Flagship Credit Auto Trust 2015-3^ | | | 2.38 | | | | 10/15/2020 | | | | 156,265 | | | | 156,265 | | | | 155,314 | |
FNA 2015-1 Trust^ | | | 3.24 | | | | 12/10/2023 | | | | 289,076 | | | | 289,064 | | | | 288,260 | |
FRS I LLC 2013-1A A1^ | | | 1.80 | | | | 4/15/2043 | | | | 55,069 | | | | 54,491 | | | | 54,000 | |
Global Container Assets 2013-1 Ltd.^ | | | 2.20 | | | | 11/5/2028 | | | | 204,073 | | | | 203,844 | | | | 203,546 | |
Global SC Finance II SRL 2014-1A A1+^ | | | 3.19 | | | | 7/17/2029 | | | | 266,083 | | | | 266,023 | | | | 256,693 | |
Goal Capital Funding Trust 2007-1 C1 | | | 1.00 | # | | | 6/25/2042 | | | | 524,043 | | | | 514,218 | | | | 516,316 | |
Goal Structured Solution Trust 2015-1 B^ | | | 1.92 | # | | | 9/25/2043 | | | | 100,000 | | | | 75,313 | | | | 85,418 | |
Green Tree Agency Advance Funding Trust I 2015-T2 AT2^ | | | 3.09 | | | | 10/15/2048 | | | | 100,000 | | | | 100,000 | | | | 98,934 | |
GSAMP Trust 2005-SEA2 A1^ | | | 0.57 | # | | | 1/25/2045 | | | | 94,433 | | | | 90,662 | | | | 92,077 | |
LCM XVI LP 16A A^ | | | 1.79 | # | | | 7/15/2026 | | | | 250,000 | | | | 250,000 | | | | 248,885 | |
Miramax LLC 2014-1A A2^ | | | 3.34 | | | | 7/20/2026 | | | | 77,480 | | | | 78,026 | | | | 76,922 | |
MVW Owner Trust 2013-1A A^ | | | 2.15 | | | | 4/22/2030 | | | | 278,348 | | | | 274,543 | | | | 273,664 | |
MVW Owner Trust 2015-1A A^ | | | 2.52 | | | | 12/20/2032 | | | | 91,816 | | | | 91,810 | | | | 91,587 | |
National Collegiate Student Loan Trust 2006-3 | | | 0.57 | # | | | 10/25/2027 | | | | 59,765 | | | | 59,094 | | | | 59,198 | |
Navient Private Education Loan Trust 2015-BA A1^ | | | 0.93 | # | | | 5/15/2023 | | | | 50,044 | | | | 49,981 | | | | 49,981 | |
Nelnet Student Loan Trust 2008-3 A4 | | | 2.04 | # | | | 11/25/2024 | | | | 225,000 | | | | 229,461 | | | | 226,444 | |
Nextgear Floorplan Master Owner Trust 2015-2A A^ | | | 2.38 | | | | 10/15/2020 | | | | 100,000 | | | | 99,991 | | | | 99,039 | |
NRZ Advance Receivables Trust 2015-T3 AT3^ | | | 2.54 | | | | 11/15/2046 | | | | 430,000 | | | | 430,000 | | | | 429,301 | |
Ocwen Master Advance Receivables Trust 2015-T1 AT1^ | | | 2.54 | | | | 9/17/2046 | | | | 100,000 | | | | 100,000 | | | | 99,913 | |
Ocwen Master Advance Receivables Trust 2015-T2 AT2^ | | | 2.53 | | | | 11/15/2046 | | | | 100,000 | | | | 100,000 | | | | 99,990 | |
See accompanying Notes to Financial Statements.
96
Babson Active Short Duration Bond Fund 2015 Semi-Annual Report
SCHEDULE OF INVESTMENTS (UNAUDITED) (CONTINUED)
December 31, 2015
| | | | | | | | | | | | | | | | | | | | |
| | | EFFECTIVE
INTEREST RATE | | | DUE DATE | | | PRINCIPAL ‡‡ | | | COST | | | FAIR
VALUE | |
Asset-Backed Securities (Continued) | | | | | | | | | | | | | | | | | | | | |
| | | | | |
Other Asset-Backed Securities (Continued) | | | | | | | | | | | | | | | | | | | | |
OneMain Financial Issuance Trust 2014-2A A^ | | | 2.47 | % | | | 9/18/2024 | | | | 230,000 | | | | $230,823 | | | | $229,547 | |
PHEAA Student Loan Trust 2003-1 A3 | | | 1.00 | # | | | 7/25/2042 | | | | 100,000 | | | | $99,938 | | | | $99,776 | |
Popular ABS Mortgage Pass-Through Trust 2006-B A3 | | | 0.50 | # | | | 5/25/2036 | | | | 157,685 | | | | 151,073 | | | | 152,279 | |
Santander Drive Auto Receivables Trust 2014-4 B | | | 1.82 | | | | 5/15/2019 | | | | 260,000 | | | | 261,148 | | | | 260,233 | |
Sierra Timeshare 2015-3 Receivables Funding LLC 2015 3A B^ | | | 3.08 | | | | 9/20/2032 | | | | 91,772 | | | | 91,772 | | | | 91,771 | |
Sierra Timeshare 2015-3 Receivables Funding LLC 2015-3A A^ | | | 2.58 | | | | 9/20/2032 | | | | 91,772 | | | | 91,754 | | | | 91,754 | |
Sierra Timeshare Receivables Funding LLC 2015-2A B^ | | | 3.02 | | | | 6/20/2032 | | | | 75,408 | | | | 75,392 | | | | 74,319 | |
Sierra Timeshare Receivables Funding LLC 2014-1A A^ | | | 2.07 | | | | 3/20/2030 | | | | 177,858 | | | | 176,719 | | | | 176,387 | |
SLC Private Student Loan Trust 2006-A A5 | | | 0.49 | # | | | 7/15/2036 | | | | 358,105 | | | | 355,969 | | | | 354,922 | |
SLC Private Student Loan Trust 2006-A C | | | 0.77 | # | | | 7/15/2036 | | | | 250,000 | | | | 221,449 | | | | 218,673 | |
SLC Student Loan Trust 2005-1 B | | | 0.56 | # | | | 2/15/2045 | | | | 222,929 | | | | 190,047 | | | | 186,119 | |
SLM Student Loan Trust 2003-14 A6 | | | 0.62 | # | | | 7/25/2025 | | | | 40,000 | | | | 38,311 | | | | 38,436 | |
SLM Student Loan Trust 2003-4 B | | | 1.16 | # | | | 6/15/2038 | | | | 155,379 | | | | 141,815 | | | | 137,406 | |
SLM Student Loan Trust 2005-4 B | | | 0.50 | # | | | 7/25/2040 | | | | 485,490 | | | | 401,379 | | | | 408,353 | |
SLM Student Loan Trust 2006-1 A5 | | | 0.43 | # | | | 7/26/2021 | | | | 100,000 | | | | 96,483 | | | | 97,813 | |
SLM Student Loan Trust 2006-9 A5 | | | 0.42 | # | | | 1/26/2026 | | | | 150,000 | | | | 145,716 | | | | 145,279 | |
SLM Student Loan Trust 2008-5 A4 | | | 2.02 | # | | | 7/25/2023 | | | | 100,000 | | | | 101,186 | | | | 100,590 | |
SLM Student Loan Trust 2012-5 A2 | | | 0.72 | # | | | 6/25/2019 | | | | 121,860 | | | | 121,039 | | | | 120,610 | |
SoFi Professional Loan Program 2015-C LLC^ | | | 2.51 | | | | 8/25/2033 | | | | 91,418 | | | | 90,925 | | | | 90,317 | |
Sonic Capital LLC 2011-1A A2^ | | | 5.44 | | | | 5/20/2041 | | | | 215,390 | | | | 226,065 | | | | 219,795 | |
SpringCastle America Funding LLC 2014-AA A^ | | | 2.70 | | | | 5/25/2023 | | | | 257,510 | | | | 258,035 | | | | 256,941 | |
SPS Servicer Advance Receivable^ | | | 2.92 | | | | 7/15/2047 | | | | 100,000 | | | | 99,991 | | | | 99,908 | |
TAL Advantage I LLC 2006-1A^ | | | 0.59 | # | | | 4/20/2021 | | | | 90,000 | | | | 89,608 | | | | 89,821 | |
Trinity Rail Leasing LP 2012-1A A1^ | | | 2.27 | | | | 1/15/2043 | | | | 79,276 | | | | 76,834 | | | | 77,256 | |
Westgate Resorts LLC 2015-2A A^ | | | 3.20 | | | | 7/20/2028 | | | | 417,550 | | | | 417,000 | | | | 416,112 | |
| | | | | | | | | | | | | | | | | | | | |
Total Other Asset-Backed Securities | | | | | | | | | | | 14,631,749 | | | | 14,349,693 | | | | 14,299,630 | |
| | | | | | | | | | | | | | | | | | | | |
Total Asset-Backed Securities | | | | | | | | | | | 17,991,749 | | | | 17,695,697 | | | | 17,633,090 | |
| | | | | | | | | | | | | | | | | | | | |
Convertible Bonds — 0.2%*: | |
|
Oil and Gas — 0.1%*: | |
Whiting Petroleum Corp.^ | | | 1.25 | | | | 4/1/2020 | | | | 80,000 | | | | 79,765 | | | | 54,400 | |
| | | | | | | | | | | | | | | | | | | | |
|
Retail — 0.0%*: | |
GNC Holdings, Inc.^ | | | 1.50 | | | | 8/15/2020 | | | | 10,000 | | | | 10,000 | | | | 8,006 | |
| | | | | | | | | | | | | | | | | | | | |
|
Semiconductors — 0.1%*: | |
Micron Technology, Inc. | | | 3.00 | | | | 11/15/2043 | | | | 135,000 | | | | 124,847 | | | | 112,219 | |
| | | | | | | | | | | | | | | | | | | | |
Total Convertible Bonds | | | | | | | | | | | 225,000 | | | | 214,612 | | | | 174,625 | |
| | | | | | | | | | | | | | | | | | | | |
See accompanying Notes to Financial Statements.
97
Babson Active Short Duration Bond Fund 2015 Semi-Annual Report
SCHEDULE OF INVESTMENTS (UNAUDITED) (CONTINUED)
December 31, 2015
| | | | | | | | | | | | | | | | | | | | |
| | | EFFECTIVE
INTEREST RATE | | | DUE DATE | | | PRINCIPAL ‡‡ | | | COST | | | FAIR
VALUE | |
Corporate Bonds — 36.0%*: | |
|
Aerospace/Defense — 0.4%*: | |
Harris Corp. | | | 2.00 | % | | | 4/27/2018 | | | | 250,000 | | | | $251,043 | | | | $247,192 | |
Harris Corp. | | | 2.70 | | | | 4/27/2020 | | | | 170,000 | | | | 166,565 | | | | 166,781 | |
| | | | | | | | | | | | | | | | | | | | |
Total Aerospace/Defense | | | | | | | | | | | 420,000 | | | | 417,608 | | | | 413,973 | |
| | | | | | | | | | | | | | | | | | | | |
|
Agriculture — 0.7%*: | |
Imperial Tobacco Finance PLC+^ | | | 2.05 | | | | 7/20/2018 | | | | 335,000 | | | | 333,548 | | | | 333,142 | |
Reynolds American, Inc. | | | 2.30 | | | | 6/12/2018 | | | | 335,000 | | | | 339,381 | | | | 337,104 | |
| | | | | | | | | | | | | | | | | | | | |
Total Agriculture | | | | | | | | | | | 670,000 | | | | 672,929 | | | | 670,246 | |
| | | | | | | | | | | | | | | | | | | | |
|
Apparel — 0.5%*: | |
Hanesbrands, Inc. | | | 6.38 | | | | 12/15/2020 | | | | 415,000 | | | | 431,816 | | | | 429,525 | |
| | | | | | | | | | | | | | | | | | | | |
|
Auto Manufacturers — 1.2%*: | |
Ford Motor Credit Co. LLC | | | 2.24 | | | | 6/15/2018 | | | | 530,000 | | | | 528,036 | | | | 525,181 | |
General Motors Financial Co. | | | 3.20 | | | | 7/13/2020 | | | | 440,000 | | | | 436,632 | | | | 433,225 | |
Hyundai Capital America^ | | | 2.40 | | | | 10/30/2018 | | | | 150,000 | | | | 150,076 | | | | 149,535 | |
| | | | | | | | | | | | | | | | | | | | |
Total Auto Manufacturers | | | | | | | | | | | 1,120,000 | | | | 1,114,744 | | | | 1,107,941 | |
| | | | | | | | | | | | | | | | | | | | |
|
Biotechnology — 0.5%*: | |
Celgene Corp. | | | 2.13 | | | | 8/15/2018 | | | | 420,000 | | | | 421,016 | | | | 420,093 | |
| | | | | | | | | | | | | | | | | | | | |
|
Chemicals — 0.8%*: | |
Airgas, Inc. | | | 2.38 | | | | 2/15/2020 | | | | 250,000 | | | | 247,677 | | | | 247,040 | |
Airgas, Inc. | | | 3.05 | | | | 8/1/2020 | | | | 150,000 | | | | 152,146 | | | | 150,937 | |
Incitec Pivot Finance LLC^ | | | 6.00 | | | | 12/10/2019 | | | | 195,000 | | | | 212,583 | | | | 211,439 | |
RPM International, Inc. | | | 6.13 | | | | 10/15/2019 | | | | 150,000 | | | | 167,054 | | | | 164,076 | |
| | | | | | | | | | | | | | | | | | | | |
Total Chemicals | | | | | | | | | | | 745,000 | | | | 779,460 | | | | 773,492 | |
| | | | | | | | | | | | | | | | | | | | |
|
Commercial Banks — 7.3%*: | |
ABN AMRO Bank NV^ | | | 2.50 | | | | 10/30/2018 | | | | 200,000 | | | | 202,388 | | | | 201,273 | |
ABN AMRO Bank NV+^ | | | 4.25 | | | | 2/2/2017 | | | | 200,000 | | | | 206,299 | | | | 205,378 | |
Banco Bilbao Vizcaya Argentaria SA | | | 3.00 | | | | 10/20/2020 | | | | 420,000 | | | | 418,388 | | | | 418,197 | |
Bank of America Corp. | | | 5.42 | | | | 3/15/2017 | | | | 500,000 | | | | 521,758 | | | | 520,447 | |
Bank of America Corp. MTN | | | 2.25 | | | | 4/21/2020 | | | | 250,000 | | | | 244,556 | | | | 243,966 | |
CIT Group, Inc. | | | 4.25 | | | | 8/15/2017 | | | | 535,000 | | | | 545,206 | | | | 547,038 | |
Credit Agricole SA+^ | | | 2.13 | | | | 4/17/2018 | | | | 245,000 | | | | 246,975 | | | | 245,601 | |
Credit Suisse+ | | | 1.75 | | | | 1/29/2018 | | | | 420,000 | | | | 420,605 | | | | 418,820 | |
First Horizon National Corp. | | | 3.50 | | | | 12/15/2020 | | | | 450,000 | | | | 448,900 | | | | 446,092 | |
Goldman Sachs Group, Inc. (The) | | | 2.38 | | | | 1/22/2018 | | | | 590,000 | | | | 598,474 | | | | 595,098 | |
Intesa Sanpaolo SpA+ | | | 3.88 | | | | 1/16/2018 | | | | 400,000 | | | | 411,602 | | | | 410,165 | |
Itau Unibanco Holding SA+^ | | | 2.85 | | | | 5/26/2018 | | | | 400,000 | | | | 394,281 | | | | 380,400 | |
Mitsubishi UFJ Trust & Banking Corp.^ | | | 2.65 | | | | 10/19/2020 | | | | 450,000 | | | | 448,951 | | | | 449,536 | |
Morgan Stanley | | | 2.13 | | | | 4/25/2018 | | | | 415,000 | | | | 418,476 | | | | 415,554 | |
Nordea Bank AB+^ | | | 2.50 | | | | 9/17/2020 | | | | 290,000 | | | | 289,771 | | | | 288,279 | |
Regions Bank | | | 7.50 | | | | 5/15/2018 | | | | 212,000 | | | | 239,017 | | | | 235,562 | |
See accompanying Notes to Financial Statements.
98
Babson Active Short Duration Bond Fund 2015 Semi-Annual Report
SCHEDULE OF INVESTMENTS (UNAUDITED) (CONTINUED)
December 31, 2015
| | | | | | | | | | | | | | | | | | | | |
| | | EFFECTIVE
INTEREST RATE | | | DUE DATE | | | PRINCIPAL ‡‡ | | | COST | | | FAIR
VALUE | |
Corporate Bonds (Continued) | | | | | | | | | | | | | | | | | | | | |
|
Commercial Banks (Continued) | |
Santander Holdings USA, Inc. | | | 3.45 | % | | | 8/27/2018 | | | | 400,000 | | | | $410,402 | | | | $406,658 | |
SVB Financial Group | | | 5.38 | | | | 9/15/2020 | | | | 200,000 | | | | 222,452 | | | | 218,809 | |
| | | | | | | | | | | | | | | | | | | | |
Total Commercial Banks | | | | | | | | | | | 6,577,000 | | | | 6,688,501 | | | | 6,646,873 | |
| | | | | | | | | | | | | | | | | | | | |
| | | | | |
Commercial Services — 1.0%*: | | | | | | | | | | | | | | | | | | | | |
ADT Corp. (The) | | | 2.25 | | | | 7/15/2017 | | | | 415,000 | | | | 413,906 | | | | 412,925 | |
McGraw Hill Financial, Inc. | | | 2.50 | | | | 8/15/2018 | | | | 260,000 | | | | 261,099 | | | | 261,623 | |
Western Union Co. (The) | | | 5.93 | | | | 10/1/2016 | | | | 200,000 | | | | 206,299 | | | | 206,350 | |
| | | | | | | | | | | | | | | | | | | | |
Total Commercial Services | | | | | | | | | | | 875,000 | | | | 881,304 | | | | 880,898 | |
| | | | | | | | | | | | | | | | | | | | |
| | | | | |
Construction Materials — 0.5%*: | | | | | | | | | | | | | | | | | | | | |
Masco Corp. | | | 7.13 | | | | 3/15/2020 | | | | 390,000 | | | | 450,793 | | | | 450,450 | |
| | | | | | | | | | | | | | | | | | | | |
| | | | | |
Diversified Financial Services — 2.6%*: | | | | | | | | | | | | | | | | | | | | |
AerCap Ireland Capital Ltd./AerCap Global Aviation Trust+ | | | 2.75 | | | | 5/15/2017 | | | | 415,000 | | | | 413,957 | | | | 412,406 | |
Air Lease Corp. | | | 2.13 | | | | 1/15/2018 | | | | 330,000 | | | | 328,382 | | | | 324,225 | |
Air Lease Corp. | | | 2.63 | | | | 9/4/2018 | | | | 125,000 | | | | 124,449 | | | | 123,558 | |
Air Lease Corp. | | | 3.38 | | | | 1/15/2019 | | | | 200,000 | | | | 204,617 | | | | 201,000 | |
Ally Financial, Inc. | | | 4.75 | | | | 9/10/2018 | | | | 535,000 | | | | 549,755 | | | | 547,706 | |
Icahn Enterprises LP / Icahn Enterprises Finance Corp. | | | 3.50 | | | | 3/15/2017 | | | | 200,000 | | | | 201,448 | | | | 201,000 | |
International Lease Finance Corp. | | | 3.88 | | | | 4/15/2018 | | | | 250,000 | | | | 252,403 | | | | 251,875 | |
Visa, Inc. | | | 2.20 | | | | 12/14/2020 | | | | 310,000 | | | | 309,739 | | | | 309,423 | |
| | | | | | | | | | | | | | | | | | | | |
Total Diversified Financial Services | | | | | | | | | | | 2,365,000 | | | | 2,384,750 | | | | 2,371,193 | |
| | | | | | | | | | | | | | | | | | | | |
| | | | | |
Electric — 0.6%*: | | | | | | | | | | | | | | | | | | | | |
Ameren Corp. | | | 2.70 | | | | 11/15/2020 | | | | 180,000 | | | | 179,959 | | | | 179,314 | |
Entergy Texas, Inc. | | | 7.13 | | | | 2/1/2019 | | | | 300,000 | | | | 342,844 | | | | 339,676 | |
| | | | | | | | | | | | | | | | | | | | |
Total Electric | | | | | | | | | | | 480,000 | | | | 522,803 | | | | 518,990 | |
| | | | | | | | | | | | | | | | | | | | |
| | | | | |
Electronics — 0.1%*: | | | | | | | | | | | | | | | | | | | | |
Tech Data Corp. | | | 3.75 | | | | 9/21/2017 | | | | 60,000 | | | | 61,763 | | | | 60,717 | |
| | | | | | | | | | | | | | | | | | | | |
| | | | | |
Environmental Control — 0.5%*: | | | | | | | | | | | | | | | | | | | | |
Clean Harbors, Inc. | | | 5.25 | | | | 8/1/2020 | | | | 415,000 | | | | 424,289 | | | | 423,300 | |
| | | | | | | | | | | | | | | | | | | | |
| | | | | |
Food — 0.8%*: | | | | | | | | | | | | | | | | | | | | |
JBS Investments GmbH+^ | | | 7.75 | | | | 10/28/2020 | | | | 415,000 | | | | 448,053 | | | | 398,400 | |
Tyson Foods, Inc. | | | 2.65 | | | | 8/15/2019 | | | | 335,000 | | | | 338,095 | | | | 335,186 | |
| | | | | | | | | | | | | | | | | | | | |
Total Food | | | | | | | | | | | 750,000 | | | | 786,148 | | | | 733,586 | |
| | | | | | | | | | | | | | | | | | | | |
| | | | | |
Forestry and Paper Products — 0.5%*: | | | | | | | | | | | | | | | | | | | | |
Domtar Corp. | | | 10.75 | | | | 6/1/2017 | | | | 196,000 | | | | 219,246 | | | | 218,094 | |
Sappi Papier Holding GmbH+^ | | | 7.75 | | | | 7/15/2017 | | | | 200,000 | | | | 213,152 | | | | 207,750 | |
| | | | | | | | | | | | | | | | | | | | |
Total Forestry and Paper Products | | | | | | | | | | | 396,000 | | | | 432,398 | | | | 425,844 | |
| | | | | | | | | | | | | | | | | | | | |
See accompanying Notes to Financial Statements.
99
Babson Active Short Duration Bond Fund 2015 Semi-Annual Report
SCHEDULE OF INVESTMENTS (UNAUDITED) (CONTINUED)
December 31, 2015
| | | | | | | | | | | | | | | | | | | | |
| | | EFFECTIVE
INTEREST RATE | | | DUE DATE | | | PRINCIPAL ‡‡ | | | COST | | | FAIR
VALUE | |
Corporate Bonds (Continued) | | | | | | | | | | | | | | | | | | | | |
| | | | | |
Hand/Machine Tools — 0.2%*: | | | | | | | | | | | | | | | | | | | | |
Stanley Black & Decker, Inc. | | | 2.45 | % | | | 11/17/2018 | | | | 175,000 | | | | $175,000 | | | | $175,683 | |
| | | | | | | | | | | | | | | | | | | | |
| | | | | |
Healthcare-Products — 0.4%*: | | | | | | | | | | | | | | | | | | | | |
Zimmer Biomet Holdings, Inc. | | | 2.00 | | | | 4/1/2018 | | | | 330,000 | | | | 330,547 | | | | 327,967 | |
| | | | | | | | | | | | | | | | | | | | |
| | | | | |
Healthcare-Services — 0.9%*: | | | | | | | | | | | | | | | | | | | | |
Anthem, Inc. | | | 1.88 | | | | 1/15/2018 | | | | 250,000 | | | | 250,094 | | | | 248,915 | |
Humana, Inc. | | | 6.30 | | | | 8/1/2018 | | | | 150,000 | | | | 165,802 | | | | 165,095 | |
Laboratory Corp. of America Holdings | | | 2.63 | | | | 2/1/2020 | | | | 420,000 | | | | 419,102 | | | | 414,646 | |
| | | | | | | | | | | | | | | | | | | | |
Total Healthcare-Services | | | | | | | | | | | 820,000 | | | | 834,998 | | | | 828,656 | |
| | | | | | | | | | | | | | | | | | | | |
| | | | | |
Holding Companies-Divers — 0.3%*: | | | | | | | | | | | | | | | | | | | | |
Hutchison Whampoa International 14 Ltd.+^ | | | 1.63 | | | | 10/31/2017 | | | | 250,000 | | | | 249,685 | | | | 247,793 | |
| | | | | | | | | | | | | | | | | | | | |
| | | | | |
Home Builders — 1.0%*: | | | | | | | | | | | | | | | | | | | | |
DR Horton, Inc. | | | 3.75 | | | | 3/1/2019 | | | | 535,000 | | | | 543,976 | | | | 535,000 | |
Lennar Corp. | | | 4.50 | | | | 6/15/2019 | | | | 150,000 | | | | 153,994 | | | | 152,531 | |
Lennar Corp. | | | 4.50 | | | | 11/15/2019 | | | | 200,000 | | | | 204,596 | | | | 203,375 | |
| | | | | | | | | | | | | | | | | | | | |
Total Home Builders | | | | | | | | | | | 885,000 | | | | 902,566 | | | | 890,906 | |
| | | | | | | | | | | | | | | | | | | | |
| | | | | |
Insurance — 1.4%*: | | | | | | | | | | | | | | | | | | | | |
Reinsurance Group of America, Inc. | | | 5.63 | | | | 3/15/2017 | | | | 450,000 | | | | 470,250 | | | | 468,973 | |
TIAA Asset Management Finance Co. LLC^ | | | 2.95 | | | | 11/1/2019 | | | | 385,000 | | | | 388,663 | | | | 385,767 | |
Willis Group Holdings PLC+ | | | 5.75 | | | | 3/15/2021 | | | | 370,000 | | | | 411,632 | | | | 408,893 | |
| | | | | | | | | | | | | | | | | | | | |
Total Insurance | | | | | | | | | | | 1,205,000 | | | | 1,270,545 | | | | 1,263,633 | |
| | | | | | | | | | | | | | | | | | | | |
| | | | | |
Internet — 0.8%*: | | | | | | | | | | | | | | | | | | | | |
Alibaba Group Holding Ltd.+ | | | 2.50 | | | | 11/28/2019 | | | | 250,000 | | | | 248,183 | | | | 244,240 | |
Expedia, Inc. | | | 7.46 | | | | 8/15/2018 | | | | 420,000 | | | | 471,970 | | | | 468,038 | |
| | | | | | | | | | | | | | | | | | | | |
Total Internet | | | | | | | | | | | 670,000 | | | | 720,153 | | | | 712,278 | |
| | | | | | | | | | | | | | | | | | | | |
| | | | | |
Investment Company Security — 0.6%*: | | | | | | | | | | | | | | | | | | | | |
Ares Capital Corp. | | | 4.88 | | | | 11/30/2018 | | | | 200,000 | | | | 209,055 | | | | 208,235 | |
FS Investment Corp. | | | 4.00 | | | | 7/15/2019 | | | | 335,000 | | | | 339,003 | | | | 331,923 | |
| | | | | | | | | | | | | | | | | | | | |
Total Investment Company Security | | | | | | | | | | | 535,000 | | | | 548,058 | | | | 540,158 | |
| | | | | | | | | | | | | | | | | | | | |
| | | | | |
IT Services — 0.3%*: | | | | | | | | | | | | | | | | | | | | |
Leidos Holdings, Inc. | | | 4.45 | | | | 12/1/2020 | | | | 250,000 | | | | 251,725 | | | | 248,847 | |
| | | | | | | | | | | | | | | | | | | | |
| | | | | |
Lodging — 0.5%*: | | | | | | | | | | | | | | | | | | | | |
Marriott International, Inc. | | | 2.88 | | | | 3/1/2021 | | | | 275,000 | | | | 274,076 | | | | 272,839 | |
Wyndham Worldwide Corp. | | | 2.95 | | | | 3/1/2017 | | | | 220,000 | | | | 221,889 | | | | 221,338 | |
| | | | | | | | | | | | | | | | | | | | |
Total Lodging | | | | | | | | | | | 495,000 | | | | 495,965 | | | | 494,177 | |
| | | | | | | | | | | | | | | | | | | | |
See accompanying Notes to Financial Statements.
100
Babson Active Short Duration Bond Fund 2015 Semi-Annual Report
SCHEDULE OF INVESTMENTS (UNAUDITED) (CONTINUED)
December 31, 2015
| | | | | | | | | | | | | | | | | | | | |
| | | EFFECTIVE
INTEREST RATE | | | DUE DATE | | | PRINCIPAL ‡‡ | | | COST | | | FAIR
VALUE | |
Corporate Bonds (Continued) | | | | | | | | | | | | | | | | | | | | |
| | | | | |
Machinery-Diversified — 0.4%*: | | | | | | | | | | | | | | | | | | | | |
Case New Holland Industrial, Inc.+ | | | 7.88 | % | | | 12/1/2017 | | | | 360,000 | | | | $387,478 | | | | $380,700 | |
| | | | | | | | | | | | | | | | | | | | |
| | | | | |
Media — 0.9%*: | | | | | | | | | | | | | | | | | | | | |
CCO Safari II LLC^ | | | 3.58 | | | | 7/23/2020 | | | | 415,000 | | | | 415,708 | | | | 412,514 | |
Sirius XM Radio, Inc.^ | | | 4.25 | | | | 5/15/2020 | | | | 385,000 | | | | 386,361 | | | | 388,850 | |
| | | | | | | | | | | | | | | | | | | | |
Total Media | | | | | | | | | | | 800,000 | | | | 802,069 | | | | 801,364 | |
| | | | | | | | | | | | | | | | | | | | |
| | | | | |
Mining — 0.3%*: | | | | | | | | | | | | | | | | | | | | |
Glencore Finance Canada Ltd.+^ | | | 2.70 | | | | 10/25/2017 | | | | 350,000 | | | | 349,921 | | | | 320,250 | |
| | | | | | | | | | | | | | | | | | | | |
| | | | | |
Miscellaneous Manufacturing — 0.7%*: | | | | | | | | | | | | | | | | | | | | |
Harsco Corp. | | | 5.75 | | | | 5/15/2018 | | | | 300,000 | | | | 306,626 | | | | 266,250 | |
Tyco Electronics Group SA | | | 2.35 | | | | 8/1/2019 | | | | 135,000 | | | | 134,937 | | | | 134,548 | |
Tyco Electronics Group SA+ | | | 2.38 | | | | 12/17/2018 | | | | 200,000 | | | | 202,353 | | | | 199,724 | |
| | | | | | | | | | | | | | | | | | | | |
Total Miscellaneous Manufacturing | | | | | | | | | | | 635,000 | | | | 643,916 | | | | 600,522 | |
| | | | | | | | | | | | | | | | | | | | |
|
Oil and Gas — 1.1%*: | |
Pioneer Natural Resources Co. | | | 3.45 | | | | 1/15/2021 | | | | 440,000 | | | | 438,914 | | | | 406,275 | |
Rowan Cos., Inc. | | | 7.88 | | | | 8/1/2019 | | | | 200,000 | | | | 225,584 | | | | 196,614 | |
Southwestern Energy Co. | | | 3.30 | | | | 1/23/2018 | | | | 200,000 | | | | 204,726 | | | | 164,000 | |
Transocean, Inc.+ | | | 6.00 | | | | 3/15/2018 | | | | 200,000 | | | | 201,260 | | | | 178,000 | |
WPX Energy, Inc. | | | 7.50 | | | | 8/1/2020 | | | | 85,000 | | | | 85,000 | | | | 68,850 | |
| | | | | | | | | | | | | | | | | | | | |
Total Oil and Gas | | | | | | | | | | | 1,125,000 | | | | 1,155,484 | | | | 1,013,739 | |
| | | | | | | | | | | | | | | | | | | | |
|
Oil and Gas Services — 0.7%*: | |
Cameron International Corp. | | | 6.38 | | | | 7/15/2018 | | | | 410,000 | | | | 451,962 | | | | 444,655 | |
SESI LLC | | | 7.13 | | | | 12/15/2021 | | | | 200,000 | | | | 211,265 | | | | 178,000 | |
| | | | | | | | | | | | | | | | | | | | |
Total Oil and Gas Services | | | | | | | | | | | 610,000 | | | | 663,227 | | | | 622,655 | |
| | | | | | | | | | | | | | | | | | | | |
|
Pharmaceuticals — 1.4%*: | |
AbbVie, Inc. | | | 1.80 | | | | 5/14/2018 | | | | 420,000 | | | | 419,578 | | | | 418,066 | |
Actavis Funding SCS+ | | | 2.35 | | | | 3/12/2018 | | | | 335,000 | | | | 336,893 | | | | 335,349 | |
Baxalta, Inc.^ | | | 2.00 | | | | 6/22/2018 | | | | 330,000 | | | | 329,948 | | | | 326,614 | |
Mylan, Inc. | | | 2.60 | | | | 6/24/2018 | | | | 200,000 | | | | 202,743 | | | | 198,462 | |
| | | | | | | | | | | | | | | | | | | | |
Total Pharmaceuticals | | | | | | | | | | | 1,285,000 | | | | 1,289,162 | | | | 1,278,491 | |
| | | | | | | | | | | | | | | | | | | | |
|
Pipelines — 0.8%*: | |
Energy Transfer Partners LP | | | 2.50 | | | | 6/15/2018 | | | | 415,000 | | | | 414,922 | | | | 397,506 | |
Kinder Morgan, Inc. | | | 7.00 | | | | 6/15/2017 | | | | 350,000 | | | | 372,102 | | | | 360,544 | |
| | | | | | | | | | | | | | | | | | | | |
Total Pipelines | | | | | | | | | | | 765,000 | | | | 787,024 | | | | 758,050 | |
| | | | | | | | | | | | | | | | | | | | |
|
Real Estate Investment Trusts — 2.0%*: | |
DDR Corp. | | | 4.75 | | | | 4/15/2018 | | | | 445,000 | | | | 467,739 | | | | 465,500 | |
DDR Corp. MTN | | | 7.50 | | | | 7/15/2018 | | | | 31,000 | | | | 34,874 | | | | 34,785 | |
Digital Delta Holdings LLC^ | | | 3.40 | | | | 10/1/2020 | | | | 85,000 | | | | 84,819 | | | | 85,093 | |
See accompanying Notes to Financial Statements.
101
Babson Active Short Duration Bond Fund 2015 Semi-Annual Report
SCHEDULE OF INVESTMENTS (UNAUDITED) (CONTINUED)
December 31, 2015
| | | | | | | | | | | | | | | | | | | | |
| | | EFFECTIVE
INTEREST RATE | | | DUE DATE | | | PRINCIPAL ‡‡ | | | COST | | | FAIR
VALUE | |
Corporate Bonds (Continued) | | | | | | | | | | | | | | | | | | | | |
|
Real Estate Investment Trusts (Continued) | |
Duke Realty LP | | | 5.95 | % | | | 2/15/2017 | | | | 300,000 | | | | $315,193 | | | | $313,226 | |
Duke Realty LP | | | 6.50 | | | | 1/15/2018 | | | | 140,000 | | | | 151,854 | | | | 151,408 | |
HCP, Inc. | | | 6.00 | | | | 1/30/2017 | | | | 390,000 | | | | 408,062 | | | | 406,263 | |
Highwoods Realty LP | | | 7.50 | | | | 4/15/2018 | | | | 370,000 | | | | 412,779 | | | | 408,908 | |
| | | | | | | | | | | | | | | | | | | | |
Total REITS | | | | | | | | | | | 1,761,000 | | | | 1,875,320 | | | | 1,865,183 | |
| | | | | | | | | | | | | | | | | | | | |
|
Retail — 0.6%*: | |
AutoNation, Inc. | | | 3.35 | | | | 1/15/2021 | | | | 355,000 | | | | 356,297 | | | | 353,738 | |
Best Buy Co., Inc. | | | 5.00 | | | | 8/1/2018 | | | | 200,000 | | | | 207,559 | | | | 207,700 | |
| | | | | | | | | | | | | | | | | | | | |
Total Retail | | | | | | | | | | | 555,000 | | | | 563,856 | | | | 561,438 | |
| | | | | | | | | | | | | | | | | | | | |
|
Semiconductors — 0.2%*: | |
KLA-Tencor Corp. | | | 3.38 | | | | 11/1/2019 | | | | 200,000 | | | | 205,148 | | | | 202,055 | |
| | | | | | | | | | | | | | | | | | | | |
|
Software — 0.5%*: | |
Hewlett Packard Enterprise Co.^ | | | 2.85 | | | | 10/5/2018 | | | | 425,000 | | | | 425,244 | | | | 424,763 | |
| | | | | | | | | | | | | | | | | | | | |
|
Telecommunications — 0.7%*: | |
Crown Castle Towers LLC^ | | | 4.17 | | | | 8/15/2037 | | | | 220,000 | | | | 227,325 | | | | 224,957 | |
Frontier Communications Corp. | | | 8.25 | | | | 4/15/2017 | | | | 200,000 | | | | 212,506 | | | | 210,000 | |
Sprint Communications, Inc.^ | | | 9.00 | | | | 11/15/2018 | | | | 200,000 | | | | 223,781 | | | | 210,500 | |
| | | | | | | | | | | | | | | | | | | | |
Total Telecommunications | | | | | | | | | | | 620,000 | | | | 663,612 | | | | 645,457 | |
| | | | | | | | | | | | | | | | | | | | |
| | | | | |
Transportation — 0.8%*: | | | | | | | | | | | | | | | | | | | | |
Asciano Finance Ltd.+^ | | | 5.00 | | | | 4/7/2018 | | | | 350,000 | | | | 369,409 | | | | 360,357 | |
Penske Truck Leasing Co. LP/PTL Finance Corp.^ | | | 3.05 | | | | 1/9/2020 | | | | 200,000 | | | | 202,673 | | | | 198,345 | |
PT Penske Truck Leasing Co. LP / L Finance Corp.^ | | | 3.20 | | | | 7/15/2020 | | | | 135,000 | | | | 134,912 | | | | 133,645 | |
PT Penske Truck Leasing Co. LP / L Finance Corp.^ | | | 3.30 | | | | 4/1/2021 | | | | 60,000 | | | | 59,732 | | | | 59,154 | |
| | | | | | | | | | | | | | | | | | | | |
Total Transportation | | | | | | | | | | | 745,000 | | | | 766,726 | | | | 751,501 | |
| | | | | | | | | | | | | | | | | | | | |
| | | | | |
Trucking and Leasing — 0.5%*: | | | | | | | | | | | | | | | | | | | | |
Aviation Capital Group Corp.^ | | | 2.88 | | | | 9/17/2018 | | | | 480,000 | | | | 477,908 | | | | 477,246 | |
| | | | | | | | | | | | | | | | | | | | |
Total Corporate Bonds | | | | | | | | | | | 32,429,000 | | | | 33,305,659 | | | | 32,760,633 | |
| | | | | | | | | | | | | | | | | | | | |
Mortgage-Backed Securities — 4.2%*: | | | | | | | | | | | | | | | | | | | | |
Banc of America Commercial Mortgage Trust 2007-4 AM | | | 6.00 | # | | | 2/10/2051 | | | | 255,000 | | | | 272,543 | | | | 266,534 | |
Banc of America Commercial Mortgage Trust 2008-1 A4 | | | 6.42 | # | | | 2/10/2051 | | | | 213,314 | | | | 232,060 | | | | 225,913 | |
Bear Stearns Commercial Mortgage Securities Trust 2006-PWR12 AM | | | 5.95 | # | | | 9/11/2038 | | | | 170,000 | | | | 175,328 | | | | 171,309 | |
See accompanying Notes to Financial Statements.
102
Babson Active Short Duration Bond Fund 2015 Semi-Annual Report
SCHEDULE OF INVESTMENTS (UNAUDITED) (CONTINUED)
December 31, 2015
| | | | | | | | | | | | | | | | | | | | |
| | | EFFECTIVE
INTEREST RATE | | | DUE DATE | | | PRINCIPAL ‡‡ | | | COST | | | FAIR
VALUE | |
Mortgage-Backed Securities (Continued) | | | | | | | | | | | | | | | | | | | | |
Bear Stearns Commercial Mortgage Securities Trust 2006-PWR14 AM | | | 5.24 | % | | | 12/11/2038 | | | | 220,000 | | | | $230,008 | | | | $224,283 | |
Bear Stearns Commercial Mortgage Securities Trust 2006-TOP22 AM | | | 5.82 | # | | | 4/12/2038 | | | | 220,000 | | | | 225,296 | | | | 221,039 | |
Bear Stearns Commercial Mortgage Securities Trust 2006-TOP24 AM | | | 5.57 | # | | | 10/12/2041 | | | | 220,000 | | | | 230,602 | | | | 224,470 | |
Bear Stearns Commercial Mortgage Securities Trust 2007-PWR17 AM | | | 5.92 | # | | | 6/11/2050 | | | | 160,000 | | | | 171,806 | | | | 168,306 | |
COMM Mortgage Trust 2007-C9 AM | | | 5.65 | # | | | 12/10/2049 | | | | 100,000 | | | | 106,613 | | | | 104,667 | |
Fannie Mae Connecticut Avenue Securities CAS 2015-C03 1M1 | | | 1.72 | # | | | 7/25/2025 | | | | 203,999 | | | | 204,090 | | | | 204,060 | |
Fannie Mae Connecticut Avenue Securities CAS 2015-C04 1M1 | | | 1.82 | # | | | 4/25/2028 | | | | 118,533 | | | | 118,533 | | | | 118,390 | |
JPMorgan Chase Commercial Mortgage Securities Trust 2006-LDP7 AM | | | 6.11 | # | | | 4/15/2045 | | | | 220,000 | | | | 228,410 | | | | 222,095 | |
JPMorgan Chase Commercial Mortgage Securities Trust 2007-CIBC20 AM | | | 6.09 | # | | | 2/12/2051 | | | | 210,000 | | | | 228,304 | | | | 221,720 | |
ML-CFC Commercial Mortgage Trust 2006-3 AM | | | 5.46 | # | | | 7/12/2046 | | | | 200,000 | | | | 207,738 | | | | 203,281 | |
ML-CFC Commercial Mortgage Trust 2006-4 AM | | | 5.20 | | | | 12/12/2049 | | | | 210,000 | | | | 219,573 | | | | 215,518 | |
Morgan Stanley Capital I Trust 2006-IQ12 AM | | | 5.37 | | | | 12/15/2043 | | | | 290,000 | | | | 303,409 | | | | 295,501 | |
Morgan Stanley Capital I Trust 2008-TOP29 A4 | | | 6.46 | # | | | 1/11/2043 | | | | 203,255 | | | | 222,514 | | | | 216,280 | |
Wachovia Bank Commercial Mortgage Trust 2006-C29 AM | | | 5.34 | | | | 11/15/2048 | | | | 280,000 | | | | 289,099 | | | | 285,779 | |
Wachovia Bank Commercial Mortgage Trust 2007-C33 A1A | | | 6.15 | # | | | 2/15/2051 | | | | 198,898 | | | | 214,068 | | | | 208,349 | |
| | | | | | | | | | | | | | | | | | | | |
Total Mortgage-Backed Securities | | | | | | | | 3,692,999 | | | | 3,879,994 | | | | 3,797,494 | |
| | | | | | | | | | | | | | | | | | | | |
U.S. Treasury & Government Agencies — 36.6%*: | |
Federal National Mortgage Association REMICS 2015-62 VA | | | 4.00 | | | | 10/25/2026 | | | | 140,645 | | | | 152,287 | | | | 151,024 | |
Federal National Mortgage Association TBA | | | 2.50 | | | | 1/1/2031 | | | | 5,225,000 | | | | 5,285,924 | | | | 5,266,637 | |
Federal National Motgage Association 2015-58 JP | | | 2.50 | | | | 3/25/2037 | | | | 110,797 | | | | 113,227 | | | | 111,447 | |
U.S. Treasury Note`` | | | 0.63 | | | | 8/31/2017 | | | | 16,250,000 | | | | 16,189,616 | | | | 16,145,902 | |
U.S. Treasury Note | | | 1.38 | | | | 4/30/2020 | | | | 11,770,000 | | | | 11,650,692 | | | | 11,617,814 | |
| | | | | | | | | | | | | | | | | | | | |
Total U.S. Treasury & Government Agencies | | | | | | | | | | | 33,496,442 | | | | 33,391,746 | | | | 33,292,824 | |
| | | | | | | | | | | | | | | | | | | | |
Total Fixed Income | | | | | | | | | | | 87,835,190 | | | | 88,487,708 | | | | 87,658,666 | |
| | | | | | | | | | | | | | | | | | | | |
See accompanying Notes to Financial Statements.
103
Babson Active Short Duration Bond Fund 2015 Semi-Annual Report
SCHEDULE OF INVESTMENTS (UNAUDITED) (CONTINUED)
December 31, 2015
| | | | | | | | | | | | | | | | | | | | |
| | | STRIKE
PRICE | | | EXPIRATION
DATE | | | NOTIONAL | | | COST | | | FAIR VALUE | |
Purchased Options — 0.1%*: | | | | | | | | | | | | | | | | | | | | |
|
Call Option Purchased — 0.1%*: | |
OTC—BCM Swaption with JPMorgan Chase Bank N.A. | | | $6.65 | | | | 7/27/2016 | | | | 2,040,000 | | | | $21,510 | | | | $54,242 | |
| | | | | | | | | | | | | | | | | | | | |
|
Put Option Purchased — 0.0%*: | |
OTC—BCM Swaption with JPMorgan Chase Bank N.A. | | | 120.00 | | | | 3/16/2016 | | | | 12,500,000 | | | | 25,845 | | | | 14,650 | |
| | | | | | | | | | | | | | | | | | | | |
Total Purchased Options | | | | | | | | | | | 14,540,000 | | | | 47,355 | | | | 68,892 | |
| | | | | | | | | | | | | | | | | | | | |
| | | | | |
| | | EFFECTIVE
INTEREST RATE | | | DUE DATE | | | PRINCIPAL ‡‡ | | | COST | | | FAIR VALUE | |
Short-Term Investments — 12.5%*: | | | | | | | | | | | | | | | | | | | | |
|
Bank Deposit — 5.1%*: | |
State Street Bank & Trust Co. Euro Time Deposit | | | 0.01 | % | | | 1/4/2016 | | | | 4,606,134 | | | | 4,606,134 | | | | 4,606,134 | |
| | | | | | | | | | | | | | | | | | | | |
Commercial Paper — 5.9%*: | |
|
Construction Materials — 2.2%*: | |
Holcim US Finance Sarl Cie | | | Zero Coupon | | | | 1/14/2016 | | | | 2,000,000 | | | | 1,999,300 | | | | 1,999,495 | |
| | | | | | | | | | | | | | | | | | | | |
|
Media — 1.5%*: | |
Thomas Reutuers Corp. | | | Zero Coupon | | | | 1/12/2016 | | | | 1,356,000 | | | | 1,355,718 | | | | 1,355,718 | |
| | | | | | | | | | | | | | | | | | | | |
|
Oil and Gas Services — 2.2%*: | |
Enbridge, Inc. | | | Zero Coupon | | | | 1/14/2016 | | | | 2,000,000 | | | | 1,999,314 | | | | 1,999,314 | |
| | | | | | | | | | | | | | | | | | | | |
Total Commercial Paper | | | | | | | | | | | 5,356,000 | | | | 5,354,332 | | | | 5,354,527 | |
| | | | | | | | | | | | | | | | | | | | |
Corporate Bonds — 1.5%*: | |
|
Agriculture — 0.5%*: | |
Bunge Ltd. Finance Corp. | | | 4.10 | | | | 3/15/2016 | | | | 385,000 | | | | 387,212 | | | | 386,976 | |
| | | | | | | | | | | | | | | | | | | | |
|
Auto Manufacturers — 0.2%*: | |
Hyundai Capital America+^ | | | 3.75 | | | | 4/6/2016 | | | | 200,000 | | | | 201,408 | | | | 201,090 | |
| | | | | | | | | | | | | | | | | | | | |
| | | | | |
Diversified Financial Services — 0.4%*: | | | | | | | | | | | | | | | | | | | | |
International Lease Finance Corp. | | | 5.75 | | | | 5/15/2016 | | | | 345,000 | | | | 349,474 | | | | 349,744 | |
| | | | | | | | | | | | | | | | | | | | |
| | | | | |
Iron/Steel — 0.2%*: | | | | | | | | | | | | | | | | | | | | |
Vale Overseas Ltd.+ | | | 6.25 | | | | 1/11/2016 | | | | 200,000 | | | | 200,261 | | | | 199,970 | |
| | | | | | | | | | | | | | | | | | | | |
See accompanying Notes to Financial Statements.
104
Babson Active Short Duration Bond Fund 2015 Semi-Annual Report
SCHEDULE OF INVESTMENTS (UNAUDITED) (CONTINUED)
December 31, 2015
| | | | | | | | | | | | | | | | | | | | |
| | | EFFECTIVE
INTEREST RATE | | | DUE DATE | | | PRINCIPAL ‡‡ | | | COST | | | FAIR VALUE | |
Corporate Bonds (Continued) | | | | | | | | | | | | | | | | | | | | |
| | | | | |
Oil and Gas — 0.2%*: | | | | | | | | | | | | | | | | | | | | |
Petrobras Global Finance BV+ | | | 3.88 | % | | | 1/27/2016 | | | | 200,000 | | | | $200,192 | | | | $199,200 | |
| | | | | | | | | | | | | | | | | | | | |
Total Corporate Bonds | | | | | | | | | | | 1,330,000 | | | | 1,338,547 | | | | 1,336,980 | |
| | | | | | | | | | | | | | | | | | | | |
Total Short-Term Investments | | | | | | | | | | | 11,292,134 | | | | 11,299,013 | | | | 11,297,641 | |
| | | | | | | | | | | | | | | | | | | | |
Total Investments | | | | | | | | | | | 113,668,224 | | | | 99,872,848 | | | | 99,041,894 | |
| | | | | | | | | | | | | | | | | | | | |
| | | | | |
Other assets and liabilities — (9.0%)* | | | | | | | | | | | | | | | | | | | (8,203,804 | ) |
| | | | | |
Net Assets — 100.0% | | | | | | | | | | | | | | | | | | | $90,838,090 | |
| | | | | | | | | | | | | | | | | | | | |
| TBA | To Be Announced: Securities purchased on a forward commitment basis with an approximate principal amount and maturity date. The actual principal amount and maturity date will be determined upon settlement. |
| ‡‡ | Unless otherwise indicated, all principal amounts are denominated in United States Dollars. |
| * | Calculated as a percentage of net assets applicable to common shareholders. |
Distributions of investments by country of risk (excluding temporary cash investments) as a percentage of total investments in securities, is as follows:
| | | | | | |
| | United States | | | 91.1% | |
| | Switzerland | | | 1.3% | |
| | Netherlands | | | 1.3% | |
| | Brazil | | | 1.2% | |
| | Other (Individually less than 1%) | | | 5.1% | |
| | | | | | |
| | Total | | | 100.0% | |
| | | | | | |
| ^ | Security acquired in a transaction exempt from registration under Rule 144A of the Securities Act of 1933. These securities may only be resold in transactions exempt from registration, normally to qualified institutional buyers. |
| # | Variable rate security. The interest rate shown is the rate in effect at December 31, 2015. |
| `` | Security has been fully or partially segregated to cover margin requirements for open futures contracts as of December 31, 2015. |
See accompanying Notes to Financial Statements.
105
Babson Active Short Duration Bond Fund 2015 Semi-Annual Report
SCHEDULE OF INVESTMENTS (UNAUDITED) (CONTINUED)
December 31, 2015
A summary of outstanding derivatives at December 31, 2015 is as follows:
Futures
| | | | | | | | | | | | | | | | | | | | |
| TYPE | | EXPIRATION DATE | | | CONTRACTS | | | POSITION | | | FAIR VALUE | | | UNREALIZED
DEPRECIATION | |
U.S. 2-Year Treasury Note | | | 03/31/16 | | | | 152 | | | | Long | | | $ | 33,019,625 | | | $ | (61,555 | ) |
U.S. 5-Year Treasury Note | | | 03/31/16 | | | | 58 | | | | Long | | | | 6,862,578 | | | | (14,972 | ) |
| | | | | | | | | | | | | | | | | | | | |
| | | $ | (76,527 | ) |
| | | | | | | | | | | | | | | | | | | | |
| | | | | | | | | | | | | | | | | | | | | | |
| TYPE | | EXPIRATION DATE | | CONTRACTS | | | POSITION | | | FAIR VALUE | | | UNREALIZED
APPRECIATION | |
U.S. 10-Year Treasury Note | | 03/21/16 | | | 40 | | | | Short | | | $ | 5,036,250 | | | $ | 13,623 | |
Credit Default Swaps — Sell Protection(1)
| | | | | | | | | | | | | | | | | | | | | | | | | | | | | | | | |
REFERENCE
OBLIGATION | | FIIXED-DEAL
RECEIVED
RATE | | | MATURITY
DATE | | | COUNTERPARTY | | | ORIGINAL
NOTIONAL
AMOUNT | | | CURRENT
NOTIONAL
AMOUNT(2) | | | UPFRONT
PREMIUMS
PAID/
(RECEIVED) | | | FAIR
VALUE(3) | | | UNREALIZED
DEPRECIATION | |
Markit CMBX.NA. BBB-.6 | | | 3.00 | % | | | 11/17/45 | | |
| JPMorgan Chase
Bank N.A. |
| | | 230,000 | | | | 230,000 | | | $ | 562 | | | $ | (7,229 | ) | | $ | (7,791 | ) |
| (1) | If the Fund is a seller of protection and a credit event occurs, as defined under the terms of that particular swap agreement, the Fund will either (i) pay to the buyer of protection an amount equal to the notional amount of the swap and take delivery of the referenced obligation or underlying securities comprising the referenced index or (ii) pay a net settlement amount in the form of cash or securities equal to the notional amount of the swap less the recovery value of the referenced obligation or underlying securities comprising the referenced index. |
| (2) | The maximum potential amount the portfolio could be required to make as a seller of credit protection or receive as a buyer of credit event as defined under the terms of that particular swap agreement. |
| (3) | The quoted market prices and resulting values for credit default swap agreements on asset-backed securities and credit indices serve as an indicator of the current status of the payment/performance risk and represent the expected amount paid or received for the credit derivative if the amount of the swap agreement was closed/sold as of the period end. Increasing market values, in absolute terms when compared to the notional amount of the swap, represent a deterioration of the referenced entity’s credit soundness and a greater likelihood or risk of default or other credit event occurring as defined under the terms of the agreements. |
See accompanying Notes to Financial Statements.
106
Babson Total Return Bond Fund 2015 Semi-Annual Report
SCHEDULE OF INVESTMENTS (UNAUDITED)
December 31, 2015
| | | | | | | | | | | | | | | | | | | | |
| | | EFFECTIVE
INTEREST RATE | | | DUE DATE | | | PRINCIPAL ‡‡ | | | COST | | | FAIR
VALUE | |
Fixed Income — 87.5%*: | | | | | | | | | | | | | | | | | | | | |
| | | | | |
Asset-Backed Securities — 17.4%*: | | | | | | | | | | | | | | | | | | | | |
| | | | | |
CDO/CLO — 5.0%*: | | | | | | | | | | | | | | | | | | | | |
ALM XIV Ltd. 2014-14A A1^ | | | 1.75 | #% | | | 7/28/2026 | | | | 250,000 | | | | $249,391 | | | | $247,339 | |
Atlas Senior Loan Fund V Ltd. 2014-1A A^ | | | 1.87 | # | | | 7/16/2026 | | | | 250,000 | | | | 249,806 | | | | 248,133 | |
Carlyle Global Market Strategies CLO Ltd. 2014-1A A^ | | | 1.84 | # | | | 4/17/2025 | | | | 250,000 | | | | 250,000 | | | | 248,805 | |
Carlyle Global Market Strategies CLO Ltd. 2014-4A A1^ | | | 1.82 | # | | | 10/15/2026 | | | | 250,000 | | | | 250,000 | | | | 248,306 | |
Madison Park Funding XIV Ltd. 2014-14A A2^ | | | 1.77 | # | | | 7/20/2026 | | | | 250,000 | | | | 249,847 | | | | 247,420 | |
| | | | | | | | | | | | | | | | | | | | |
Total CDO/CLO | | | | | | | | | | | 1,250,000 | | | | 1,249,044 | | | | 1,240,003 | |
| | | | | | | | | | | | | | | | | | | | |
| | | | | |
Other Asset-Backed Securities — 12.4%*: | | | | | | | | | | | | | | | | | | | | |
Access Group, Inc. 2006-1 B | | | 0.84 | # | | | 8/25/2037 | | | | 84,373 | | | | 73,376 | | | | 74,654 | |
Access Group, Inc. 2015-1 A^ | | | 1.12 | # | | | 7/25/2056 | | | | 91,925 | | | | 89,873 | | | | 89,245 | |
Access Group, Inc. 2015-1 B^ | | | 1.92 | # | | | 7/25/2058 | | | | 100,000 | | | | 86,137 | | | | 84,849 | |
Arbys Funding LLC 2015-1A A2^ | | | 4.97 | | | | 10/30/2045 | | | | 40,000 | | | | 40,000 | | | | 39,996 | |
Avis Budget Rental Car Funding AESOP LLC 2010-5A A^ | | | 3.15 | | | | 3/20/2017 | | | | 62,500 | | | | 62,965 | | | | 62,657 | |
Citi Held For Asset Issuance 2015-PM1 A^ | | | 1.85 | | | | 12/15/2021 | | | | 67,264 | | | | 67,263 | | | | 67,131 | |
CKE Restaurant Holdings, Inc. 2013-1A A2^ | | | 4.47 | | | | 3/20/2043 | | | | 124,637 | | | | 127,668 | | | | 123,925 | |
College Loan Corp. Trust I 2005-2 B | | | 0.81 | # | | | 1/15/2037 | | | | 133,062 | | | | 116,160 | | | | 115,302 | |
CPS Auto Receivables Trust 2011-C A^ | | | 4.21 | | | | 3/15/2019 | | | | 48,096 | | | | 48,678 | | | | 48,291 | |
CPS Auto Receivables Trust 2013-A A^ | | | 1.31 | | | | 6/15/2020 | | | | 95,043 | | | | 94,658 | | | | 94,083 | |
DB Master Finance LLC 2015-1A A2I^ | | | 3.26 | | | | 2/20/2045 | | | | 99,250 | | | | 99,281 | | | | 98,207 | |
Diamond Resorts Owner Trust 2015-1 A^ | | | 2.73 | | | | 7/20/2027 | | | | 74,574 | | | | 74,567 | | | | 74,433 | |
Domino’s Pizza Master Issuer LLC 2015 1A-A2I^ | | | 3.48 | | | | 10/25/2045 | | | | 60,000 | | | | 60,000 | | | | 58,800 | |
Domino’s Pizza Master Issuer LLC 2015-1A A2II^ | | | 4.47 | | | | 10/25/2045 | | | | 60,000 | | | | 60,000 | | | | 59,737 | |
Drive Auto Receivables Trust 2015-CA A3^ | | | 1.38 | | | | 10/15/2018 | | | | 125,000 | | | | 124,997 | | | | 124,717 | |
Drug Royalty LP 1 2012-1 A1^ | | | 5.57 | # | | | 7/15/2024 | | | | 60,000 | | | | 61,791 | | | | 61,335 | |
Entegry New Orleans Storm Recovery Funding I LLC 2015-1 A | | | 2.67 | | | | 6/1/2027 | | | | 100,000 | | | | 99,977 | | | | 102,019 | |
GSAMP Trust 2005-SEA2 A1^ | | | 0.77 | # | | | 1/25/2045 | | | | 26,050 | | | | 25,010 | | | | 25,401 | |
J.G. Wentworth XXXV LLC 2015-2A A^ | | | 3.87 | | | | 3/15/2058 | | | | 49,950 | | | | 49,911 | | | | 49,391 | |
Miramax LLC 2014-1A A2^ | | | 3.34 | | | | 7/20/2026 | | | | 77,480 | | | | 78,026 | | | | 76,923 | |
Nelnet Student Loan Trust 2008-3 A4 | | | 2.04 | # | | | 11/25/2024 | | | | 125,000 | | | | 127,478 | | | | 125,802 | |
NRZ Advance Receivables Trust 2015-T3 AT3^ | | | 2.54 | | | | 11/15/2046 | | | | 100,000 | | | | 100,000 | | | | 99,837 | |
Ocwen Master Advance Receivables Trust 2015-T1 AT1^ | | | 2.54 | | | | 9/17/2046 | | | | 100,000 | | | | 100,000 | | | | 99,913 | |
OneMain Financial Issuance Trust 2014-2A A^ | | | 2.47 | | | | 9/18/2024 | | | | 130,000 | | | | 130,465 | | | | 129,744 | |
Popular ABS Mortgage Pass-Through Trust 2006-B A3 | | | 0.70 | # | | | 5/25/2036 | | | | 76,590 | | | | 73,378 | | | | 73,964 | |
Santander Drive Auto Receivables Trust 2014-4 B | | | 1.82 | | | | 5/15/2019 | | | | 120,000 | | | | 120,530 | | | | 120,108 | |
See accompanying Notes to Financial Statements.
107
Babson Total Return Bond Fund 2015 Semi-Annual Report
SCHEDULE OF INVESTMENTS (UNAUDITED) (CONTINUED)
December 31, 2015
| | | | | | | | | | | | | | | | | | | | |
| | | EFFECTIVE
INTEREST RATE | | | DUE DATE | | | PRINCIPAL ‡‡ | | | COST | | | FAIR
VALUE | |
Asset-Backed Securities (Continued) | | | | | | | | | | | | | | | | | | | | |
| | | | | |
Other Asset-Backed Securities (Continued) | | | | | | | | | | | | | | | | | | | | |
Sierra Timeshare Receivables Funding LLC 2015-2A B^ | | | 3.02 | % | | | 6/20/2032 | | | | 75,408 | | | | $75,392 | | | | $74,319 | |
SLC Private Student Loan Trust 2006-A A5 | | | 0.49 | # | | | 7/15/2036 | | | | 102,316 | | | | 101,705 | | | | 101,406 | |
SLC Private Student Loan Trust 2006-A C | | | 0.77 | # | | | 7/15/2036 | | | | 140,000 | | | | 124,012 | | | | 122,457 | |
SLC Student Loan Trust 2005-1 B | | | 0.56 | # | | | 2/15/2045 | | | | 121,019 | | | | 103,169 | | | | 101,036 | |
SLM Student Loan Trust 2002-7 A11 | | | 1.75 | # | | | 3/15/2028 | | | | 50,000 | | | | 49,388 | | | | 49,910 | |
SLM Student Loan Trust 2003-4 B | | | 1.16 | # | | | 6/15/2038 | | | | 88,048 | | | | 80,362 | | | | 77,863 | |
SLM Student Loan Trust 2005-4 B | | | 0.50 | # | | | 7/25/2040 | | | | 118,753 | | | | 100,041 | | | | 99,885 | |
Sonic Capital LLC 2011-1A A2^ | | | 5.44 | | | | 5/20/2041 | | | | 118,464 | | | | 124,336 | | | | 120,887 | |
SpringCastle America Funding LLC
2014-AA A^ | | | 2.70 | | | | 5/25/2023 | | | | 59,886 | | | | 60,069 | | | | 59,754 | |
TAL Advantage I LLC 2006-1A^ | | | 0.59 | # | | | 4/20/2021 | | | | 50,000 | | | | 49,782 | | | | 49,901 | |
| | | | | | | | | | | | | | | | | | | | |
Total Other Asset-Backed Securities | | | | | | | | | | | 3,154,688 | | | | 3,060,445 | | | | 3,037,882 | |
| | | | | | | | | | | | | | | | | | | | |
Total Asset-Backed Securities | | | | | | | | | | | 4,404,688 | | | | 4,309,489 | | | | 4,277,885 | |
| | | | | | | | | | | | | | | | | | | | |
Convertible Bonds — 0.4%*: | | | | | | | | | | | | | | | | | | | | |
| | | | | |
Oil and Gas — 0.1%*: | | | | | | | | | | | | | | | | | | | | |
Whiting Petroleum Corp.^ | | | 1.25 | | | | 4/1/2020 | | | | 45,000 | | | | 44,868 | | | | 30,600 | |
| | | | | | | | | | | | | | | | | | | | |
| | | | | |
Retail — 0.0%*: | | | | | | | | | | | | | | | | | | | | |
GNC Holdings, Inc.^ | | | 1.50 | | | | 8/15/2020 | | | | 5,000 | | | | 5,000 | | | | 4,003 | |
| | | | | | | | | | | | | | | | | | | | |
| | | | | |
Semiconductors — 0.3%*: | | | | | | | | | | | | | | | | | | | | |
Micron Technology, Inc. | | | 3.00 | | | | 11/15/2043 | | | | 75,000 | | | | 69,359 | | | | 62,344 | |
| | | | | | | | | | | | | | | | | | | | |
Total Convertible Bonds | | | | | | | | | | | 125,000 | | | | 119,227 | | | | 96,947 | |
| | | | | | | | | | | | | | | | | | | | |
Corporate Bonds — 32.1%*: | | | | | | | | | | | | | | | | | | | | |
| | | | | |
Advertising — 0.1%*: | | | | | | | | | | | | | | | | | | | | |
WPP Finance 2010+ | | | 5.63 | | | | 11/15/2043 | | | | 35,000 | | | | 38,240 | | | | 35,508 | |
| | | | | | | | | | | | | | | | | | | | |
| | | | | |
Agriculture — 1.3%*: | | | | | | | | | | | | | | | | | | | | |
Altria Group, Inc. | | | 2.85 | | | | 8/9/2022 | | | | 50,000 | | | | 48,219 | | | | 48,744 | |
Altria Group, Inc. | | | 4.25 | | | | 8/9/2042 | | | | 30,000 | | | | 26,806 | | | | 27,526 | |
Bunge Ltd. Finance Corp. | | | 3.50 | | | | 11/24/2020 | | | | 5,000 | | | | 4,996 | | | | 4,972 | |
Imperial Tobacco Finance PLC+^ | | | 3.75 | | | | 7/21/2022 | | | | 200,000 | | | | 196,950 | | | | 200,801 | |
Reynolds American, Inc. | | | 4.45 | | | | 6/12/2025 | | | | 30,000 | | | | 30,648 | | | | 31,375 | |
| | | | | | | | | | | | | | | | | | | | |
Total Agriculture | | | | | | | | | | | 315,000 | | | | 307,619 | | | | 313,418 | |
| | | | | | | | | | | | | | | | | | | | |
| | | | | |
Auto Manufacturers — 0.6%*: | | | | | | | | | | | | | | | | | | | | |
Ford Motor Co. | | | 7.45 | | | | 7/16/2031 | | | | 60,000 | | | | 76,598 | | | | 74,041 | |
General Motors Co. | | | 5.20 | | | | 4/1/2045 | | | | 35,000 | | | | 34,577 | | | | 32,820 | |
General Motors Financial Co., Inc. | | | 4.30 | | | | 7/13/2025 | | | | 50,000 | | | | 49,652 | | | | 48,485 | |
| | | | | | | | | | | | | | | | | | | | |
Total Auto Manufacturers | | | | | | | | | | | 145,000 | | | | 160,827 | | | | 155,346 | |
| | | | | | | | | | | | | | | | | | | | |
| | | | | |
Beverages — 0.2%*: | | | | | | | | | | | | | | | | | | | | |
Anheuser-Busch InBev Worldwide, Inc.+ | | | 8.20 | | | | 1/15/2039 | | | | 35,000 | | | | 52,599 | | | | 50,451 | |
| | | | | | | | | | | | | | | | | | | | |
See accompanying Notes to Financial Statements.
108
Babson Total Return Bond Fund 2015 Semi-Annual Report
SCHEDULE OF INVESTMENTS (UNAUDITED) (CONTINUED)
December 31, 2015
| | | | | | | | | | | | | | | | | | | | |
| | | EFFECTIVE
INTEREST RATE | | | DUE DATE | | | PRINCIPAL ‡‡ | | | COST | | | FAIR
VALUE | |
Corporate Bonds (Continued) | | | | | | | | | | | | | | | | | | | | |
| | | | | |
Biotechnology — 0.4%*: | | | | | | | | | | | | | | | | | | | | |
Amgen, Inc. | | | 5.15 | % | | | 11/15/2041 | | | | 25,000 | | | | $26,068 | | | | $25,381 | |
Celgene Corp. | | | 3.55 | | | | 8/15/2022 | | | | 60,000 | | | | 59,845 | | | | 60,583 | |
Gilead Sciences, Inc. | | | 4.75 | | | | 3/1/2046 | | | | 10,000 | | | | 9,959 | | | | 10,120 | |
| | | | | | | | | | | | | | | | | | | | |
Total Biotechnology | | | | | | | | | | | 95,000 | | | | 95,872 | | | | 96,084 | |
| | | | | | | | | | | | | | | | | | | | |
| | | | | |
Chemicals — 0.7%*: | | | | | | | | | | | | | | | | | | | | |
LYB International Finance B.V. | | | 5.25 | | | | 7/15/2043 | | | | 35,000 | | | | 36,014 | | | | 33,603 | |
RPM International, Inc. | | | 6.13 | | | | 10/15/2019 | | | | 90,000 | | | | 100,622 | | | | 98,445 | |
Westlake Chemical Corp. | | | 3.60 | | | | 7/15/2022 | | | | 50,000 | | | | 49,491 | | | | 48,756 | |
| | | | | | | | | | | | | | | | | | | | |
Total Chemicals | | | | | | | | | | | 175,000 | | | | 186,127 | | | | 180,804 | |
| | | | | | | | | | | | | | | | | | | | |
| | | | | |
Commercial Banks — 5.1%*: | | | | | | | | | | | | | | | | | | | | |
Associated Banc-Corp | | | 2.75 | | | | 11/15/2019 | | | | 45,000 | | | | 45,237 | | | | 44,667 | |
Associated Banc-Corp | | | 4.25 | | | | 1/15/2025 | | | | 70,000 | | | | 70,021 | | | | 70,043 | |
Bank of America Corp. | | | 7.63 | | | | 6/1/2019 | | | | 120,000 | | | | 140,535 | | | | 138,998 | |
Bank of America Corp. MTN | | | 3.95 | | | | 4/21/2025 | | | | 45,000 | | | | 43,882 | | | | 43,820 | |
Bank of America Corp. MTN | | | 4.00 | | | | 4/1/2024 | | | | 25,000 | | | | 25,614 | | | | 25,568 | |
Bank of America Corp. MTN | | | 5.88 | | | | 2/7/2042 | | | | 25,000 | | | | 28,745 | | | | 29,177 | |
Bank of Nova Scotia (The)+ | | | 4.50 | | | | 12/16/2025 | | | | 20,000 | | | | 19,998 | | | | 19,908 | |
Barclays PLC+ | | | 4.38 | | | | 9/11/2024 | | | | 60,000 | | | | 58,045 | | | | 58,669 | |
Citigroup, Inc. | | | 3.88 | | | | 3/26/2025 | | | | 60,000 | | | | 58,352 | | | | 58,397 | |
Discover Bank | | | 7.00 | | | | 4/15/2020 | | | | 30,000 | | | | 34,447 | | | | 34,158 | |
Goldman Sachs Group, Inc. (The) | | | 5.15 | | | | 5/22/2045 | | | | 70,000 | | | | 67,739 | | | | 67,997 | |
Goldman Sachs Group, Inc. (The) | | | 5.95 | | | | 1/15/2027 | | | | 50,000 | | | | 56,175 | | | | 55,618 | |
ICICI Bank Ltd.+^ | | | 4.75 | | | | 11/25/2016 | | | | 200,000 | | | | 205,381 | | | | 204,727 | |
JPMorgan Chase & Co. | | | 4.50 | | | | 1/24/2022 | | | | 25,000 | | | | 26,771 | | | | 26,965 | |
JPMorgan Chase & Co. | | | 4.95 | | | | 6/1/2045 | | | | 40,000 | | | | 39,298 | | | | 39,992 | |
Morgan Stanley | | | 3.95 | | | | 4/23/2027 | | | | 100,000 | | | | 94,692 | | | | 97,058 | |
Morgan Stanley MTN | | | 6.63 | | | | 4/1/2018 | | | | 110,000 | | | | 121,423 | | | | 120,618 | |
Santander Holdings USA, Inc. | | | 2.65 | | | | 4/17/2020 | | | | 35,000 | | | | 34,663 | | | | 34,337 | |
SVB Financial Group | | | 3.50 | | | | 1/29/2025 | | | | 40,000 | | | | 39,059 | | | | 38,323 | |
Wells Fargo & Co. MTN | | | 4.30 | | | | 7/22/2027 | | | | 40,000 | | | | 39,852 | | | | 40,861 | |
| | | | | | | | | | | | | | | | | | | | |
Total Commercial Banks | | | | | | | | | | | 1,210,000 | | | | 1,249,929 | | | | 1,249,901 | |
| | | | | | | | | | | | | | | | | | | | |
| | | | | |
Commercial Services — 0.5%*: | | | | | | | | | | | | | | | | | | | | |
ERAC USA Finance LLC^ | | | 5.63 | | | | 3/15/2042 | | | | 20,000 | | | | 21,568 | | | | 21,465 | |
McGraw Hill Financial, Inc. | | | 3.30 | | | | 8/14/2020 | | | | 45,000 | | | | 44,950 | | | | 45,384 | |
McGraw Hill Financial, Inc. | | | 4.00 | | | | 6/15/2025 | | | | 50,000 | | | | 50,206 | | | | 50,122 | |
| | | | | | | | | | | | | | | | | | | | |
Total Commercial Services | | | | | | | | | | | 115,000 | | | | 116,724 | | | | 116,971 | |
| | | | | | | | | | | | | | | | | | | | |
| | | | | |
Construction Materials — 0.2%*: | | | | | | | | | | | | | | | | | | | | |
Owens Corning | | | 4.20 | | | | 12/1/2024 | | | | 50,000 | | | | 49,322 | | | | 48,663 | |
| | | | | | | | | | | | | | | | | | | | |
| | | | | |
Distribution/Wholesale — 0.2%*: | | | | | | | | | | | | | | | | | | | | |
Ingram Micro, Inc. | | | 4.95 | | | | 12/15/2024 | | | | 45,000 | | | | 46,313 | | | | 44,834 | |
| | | | | | | | | | | | | | | | | | | | |
See accompanying Notes to Financial Statements.
109
Babson Total Return Bond Fund 2015 Semi-Annual Report
SCHEDULE OF INVESTMENTS (UNAUDITED) (CONTINUED)
December 31, 2015
| | | | | | | | | | | | | | | | | | | | |
| | | EFFECTIVE
INTEREST RATE | | | DUE DATE | | | PRINCIPAL ‡‡ | | | COST | | | FAIR
VALUE | |
Corporate Bonds (Continued) | | | | | | | | | | | | | | | | | | | | |
| | | | | |
Diversified Financial Services — 1.6%*: | | | | | | | | | | | | | | | | | | | | |
Affiliated Managers Group, Inc. | | | 4.25 | % | | | 2/15/2024 | | | | 50,000 | | | | $51,487 | | | | $50,506 | |
Air Lease Corp. | | | 2.63 | | | | 9/4/2018 | | | | 110,000 | | | | 109,515 | | | | 108,731 | |
Air Lease Corp. | | | 3.38 | | | | 1/15/2019 | | | | 25,000 | | | | 25,599 | | | | 25,125 | |
Discover Financial Services | | | 3.75 | | | | 3/4/2025 | | | | 30,000 | | | | 28,821 | | | | 28,809 | |
General Electric Capital Corp. MTN | | | 6.88 | | | | 1/10/2039 | | | | 35,000 | | | | 47,063 | | | | 47,708 | |
Lazard Group LLC | | | 4.25 | | | | 11/14/2020 | | | | 130,000 | | | | 136,616 | | | | 134,651 | |
| | | | | | | | | | | | | | | | | | | | |
Total Diversified Financial Services | | | | | | | | | | | 380,000 | | | | 399,101 | | | | 395,530 | |
| | | | | | | | | | | | | | | | | | | | |
| | | | | |
Electric — 1.4%*: | | | | | | | | | | | | | | | | | | | | |
Appalachian Power Co. | | | 6.70 | | | | 8/15/2037 | | | | 30,000 | | | | 37,713 | | | | 35,920 | |
CMS Energy Corp. | | | 3.88 | | | | 3/1/2024 | | | | 50,000 | | | | 51,413 | | | | 50,757 | |
Duke Energy Florida LLC | | | 3.10 | | | | 8/15/2021 | | | | 50,000 | | | | 51,446 | | | | 51,061 | |
LG&E and KU Energy LLC | | | 4.38 | | | | 10/1/2021 | | | | 50,000 | | | | 53,913 | | | | 52,832 | |
NiSource Finance Corp. | | | 6.13 | | | | 3/1/2022 | | | | 50,000 | | | | 57,501 | | | | 57,231 | |
Pacific Gas & Electric Co. | | | 5.80 | | | | 3/1/2037 | | | | 25,000 | | | | 29,412 | | | | 29,067 | |
Puget Sound Energy, Inc. | | | 4.30 | | | | 5/20/2045 | | | | 30,000 | | | | 30,671 | | | | 30,386 | |
Southwestern Public Service Co. | | | 6.00 | | | | 10/1/2036 | | | | 30,000 | | | | 35,767 | | | | 34,921 | |
| | | | | | | | | | | | | | | | | | | | |
Total Electric | | | | | | | | | | | 315,000 | | | | 347,836 | | | | 342,175 | |
| | | | | | | | | | | | | | | | | | | | |
| | | | | |
Electrical Components and Equipment — 0.2%*: | | | | | | | | | | | | | | | | | | | | |
Legrand France SA+ | | | 8.50 | | | | 2/15/2025 | | | | 35,000 | | | | 47,366 | | | | 46,495 | |
| | | | | | | | | | | | | | | | | | | | |
| | | | | |
Electronics — 0.4%*: | | | | | | | | | | | | | | | | | | | | |
Agilent Technologies, Inc. | | | 3.88 | | | | 7/15/2023 | | | | 50,000 | | | | 50,605 | | | | 50,036 | |
Jabil Circuit, Inc. | | | 7.75 | | | | 7/15/2016 | | | | 50,000 | | | | $51,548 | | | | $51,250 | |
| | | | | | | | | | | | | | | | | | | | |
Total Electronics | | | | | | | | | | | 100,000 | | | | 102,153 | | | | 101,286 | |
| | | | | | | | | | | | | | | | | | | | |
| | | | | |
Environmental Control — 0.5%*: | | | | | | | | | | | | | | | | | | | | |
Republic Services, Inc. | | | 4.75 | | | | 5/15/2023 | | | | 50,000 | | | | 54,400 | | | | 54,470 | |
Waste Management, Inc. | | | 7.00 | | | | 7/15/2028 | | | | 50,000 | | | | 65,542 | | | | 62,951 | |
| | | | | | | | | | | | | | | | | | | | |
Total Environmental Control | | | | | | | | | | | 100,000 | | | | 119,942 | | | | 117,421 | |
| | | | | | | | | | | | | | | | | | | | |
| | | | | |
Food — 0.2%*: | | | | | | | | | | | | | | | | | | | | |
Kraft Heinz Foods Co.^ | | | 2.80 | | | | 7/2/2020 | | | | 40,000 | | | | 40,253 | | | | 39,897 | |
Whole Foods Market, Inc.^ | | | 5.20 | | | | 12/3/2025 | | | | 20,000 | | | | 19,972 | | | | 19,970 | |
| | | | | | | | | | | | | | | | | | | | |
Total Food | | | | | | | | | | | 60,000 | | | | 60,225 | | | | 59,867 | |
| | | | | | | | | | | | | | | | | | | | |
| | | | | |
Forestry and Paper Products — 0.7%*: | | | | | | | | | | | | | | | | | | | | |
Celulosa Arauco y Constitucion SA+ | | | 4.75 | | | | 1/11/2022 | | | | 30,000 | | | | 31,226 | | | | 30,534 | |
Domtar Corp. | | | 4.40 | | | | 4/1/2022 | | | | 50,000 | | | | 50,835 | | | | 50,841 | |
International Paper Co. | | | 9.38 | | | | 5/15/2019 | | | | 73,000 | | | | 88,121 | | | | 87,608 | |
| | | | | | | | | | | | | | | | | | | | |
Total Forestry and Paper Products | | | | | | | | | | | 153,000 | | | | 170,182 | | | | 168,983 | |
| | | | | | | | | | | | | | | | | | | | |
| | | | | |
Gas — 0.3%*: | | | | | | | | | | | | | | | | | | | | |
CenterPoint Energy Resources Corp. | | | 4.50 | | | | 1/15/2021 | | | | 25,000 | | | | 26,911 | | | | 26,241 | |
See accompanying Notes to Financial Statements.
110
Babson Total Return Bond Fund 2015 Semi-Annual Report
SCHEDULE OF INVESTMENTS (UNAUDITED) (CONTINUED)
December 31, 2015
| | | | | | | | | | | | | | | | | | | | |
| | | EFFECTIVE
INTEREST RATE | | | DUE DATE | | | PRINCIPAL ‡‡ | | | COST | | | FAIR
VALUE | |
Corporate Bonds (Continued) | | | | | | | | | | | | | | | | | | | | |
| | | | | |
Gas (Continued) | | | | | | | | | | | | | | | | | | | | |
CenterPoint Energy Resources Corp. | | | 5.85 | % | | | 1/15/2041 | | | | 20,000 | | | | $23,462 | | | | $22,091 | |
Laclede Group, Inc. (The) | | | 4.70 | | | | 8/15/2044 | | | | 25,000 | | | | 25,261 | | | | 24,677 | |
| | | | | | | | | | | | | | | | | | | | |
Total Gas | | | | | | | | | | | 70,000 | | | | 75,634 | | | | 73,009 | |
| | | | | | | | | | | | | | | | | | | | |
| | | | | |
Healthcare-Products — 0.1%*: | | | | | | | | | | | | | | | | | | | | |
Zimmer Biomet Holdings, Inc. | | | 3.55 | | | | 4/1/2025 | | | | 35,000 | | | | 34,231 | | | | 34,010 | |
| | | | | | | | | | | | | | | | | | | | |
| | | | | |
Housewares — 0.2%*: | | | | | | | | | | | | | | | | | | | | |
Newell Rubbermaid, Inc. | | | 3.90 | | | | 11/1/2025 | | | | 20,000 | | | | 19,938 | | | | 18,046 | |
Toro Co. (The) | | | 7.80 | | | | 6/15/2027 | | | | 25,000 | | | | 32,290 | | | | 31,572 | |
| | | | | | | | | | | | | | | | | | | | |
Total Housewares | | | | | | | | | | | 45,000 | | | | 52,228 | | | | 49,618 | |
| | | | | | | | | | | | | | | | | | | | |
| | | | | |
Insurance — 2.1%*: | | | | | | | | | | | | | | | | | | | | |
Allstate Corp. (The) | | | 5.75 | # | | | 8/15/2053 | | | | 110,000 | | | | 116,575 | | | | 113,080 | |
Arch Capital Group US, Inc. | | | 5.14 | | | | 11/1/2043 | | | | 25,000 | | | | 25,314 | | | | 25,295 | |
Brown & Brown, Inc. | | | 4.20 | | | | 9/15/2024 | | | | 30,000 | | | | 30,210 | | | | 29,624 | |
Liberty Mutual Group, Inc.^ | | | 4.25 | | | | 6/15/2023 | | | | 50,000 | | | | 51,614 | | | | 50,803 | |
Marsh & McLennan Cos., Inc. | | | 5.88 | | | | 8/1/2033 | | | | 20,000 | | | | 23,217 | | | | 22,959 | |
Prudential Financial, Inc. | | | 8.88 | # | | | 6/15/2038 | | | | 100,000 | | | | 117,144 | | | | 112,500 | |
Unum Group | | | 4.00 | | | | 3/15/2024 | | | | 30,000 | | | | 30,881 | | | | 29,949 | |
Voya Financial, Inc. | | | 5.65 | # | | | 5/15/2053 | | | | 35,000 | | | | 35,861 | | | | 34,475 | |
Willis North America, Inc.+ | | | 7.00 | | | | 9/29/2019 | | | | 50,000 | | | | 56,360 | | | | 56,037 | |
XLIT Ltd.+ | | | 5.50 | | | | 3/31/2045 | | | | 30,000 | | | | 28,757 | | | | 28,028 | |
| | | | | | | | | | | | | | | | | | | | |
Total Insurance | | | | | | | | | | | 480,000 | | | | 515,933 | | | | 502,750 | |
| | | | | | | | | | | | | | | | | | | | |
| | | | | |
Internet — 1.2%*: | | | | | | | | | | | | | | | | | | | | |
Baidu, Inc.+ | | | 2.25 | | | | 11/28/2017 | | | | 200,000 | | | | 200,969 | | | | 200,022 | |
Expedia, Inc.^ | | | 5.00 | | | | 2/15/2026 | | | | 40,000 | | | | 39,815 | | | | 38,950 | |
Expedia, Inc. | | | 7.46 | | | | 8/15/2018 | | | | 45,000 | | | | 50,675 | | | | 50,147 | |
| | | | | | | | | | | | | | | | | | | | |
Total Internet | | | | | | | | | | | 285,000 | | | | 291,459 | | | | 289,119 | |
| | | | | | | | | | | | | | | | | | | | |
| | | | | |
Investment Company Security — 0.3%*: | | | | | | | | | | | | | | | | | | | | |
Ares Capital Corp. | | | 3.88 | | | | 1/15/2020 | | | | 30,000 | | | | 30,673 | | | | 30,456 | |
FS Investment Corp. | | | 4.00 | | | | 7/15/2019 | | | | 30,000 | | | | 30,546 | | | | 29,724 | |
| | | | | | | | | | | | | | | | | | | | |
Total Investment Company Security | | | | | | | | | | | 60,000 | | | | 61,219 | | | | 60,180 | |
| | | | | | | | | | | | | | | | | | | | |
| | | | | |
Iron/Steel — 0.8%*: | | | | | | | | | | | | | | | | | | | | |
Reliance Steel & Aluminum Co. | | | 6.20 | | | | 11/15/2016 | | | | 55,000 | | | | 57,142 | | | | 56,844 | |
Vale Overseas Ltd.+ | | | 6.25 | | | | 1/23/2017 | | | | 120,000 | | | | 124,903 | | | | 119,772 | |
Vale Overseas Ltd.+ | | | 6.88 | | | | 11/10/2039 | | | | 25,000 | | | | $23,959 | | | | $17,373 | |
| | | | | | | | | | | | | | | | | | | | |
Total Iron/Steel | | | | | | | | | | | 200,000 | | | | 206,004 | | | | 193,989 | |
| | | | | | | | | | | | | | | | | | | | |
| | | | | |
IT Services — 0.2%*: | | | | | | | | | | | | | | | | | | | | |
Leidos Holdings, Inc. | | | 4.45 | | | | 12/1/2020 | | | | 50,000 | | | | 50,396 | | | | 49,769 | |
| | | | | | | | | | | | | | | | | | | | |
See accompanying Notes to Financial Statements.
111
Babson Total Return Bond Fund 2015 Semi-Annual Report
SCHEDULE OF INVESTMENTS (UNAUDITED) (CONTINUED)
December 31, 2015
| | | | | | | | | | | | | | | | | | | | |
| | | EFFECTIVE
INTEREST RATE | | | DUE DATE | | | PRINCIPAL ‡‡ | | | COST | | | FAIR
VALUE | |
Corporate Bonds (Continued) | | | | | | | | | | | | | | | | | | | | |
| | | | | |
Lodging — 0.4%*: | | | | | | | | | | | | | | | | | | | | |
Wyndham Worldwide Corp. | | | 5.63 | % | | | 3/1/2021 | | | | 90,000 | | | | $98,554 | | | | $96,776 | |
| | | | | | | | | | | | | | | | | | | | |
| | | | | |
Media — 0.8%*: | | | | | | | | | | | | | | | | | | | | |
CCO Safari II LLC^ | | | 4.46 | | | | 7/23/2022 | | | | 90,000 | | | | 90,000 | | | | 89,686 | |
Discovery Communications LLC | | | 4.88 | | | | 4/1/2043 | | | | 25,000 | | | | 22,733 | | | | 20,578 | |
Time Warner Cable, Inc. | | | 4.50 | | | | 9/15/2042 | | | | 60,000 | | | | 49,155 | | | | 47,087 | |
Time Warner Cable, Inc. | | | 5.50 | | | | 9/1/2041 | | | | 35,000 | | | | 32,612 | | | | 31,627 | |
| | | | | | | | | | | | | | | | | | | | |
Total Media | | | | | | | | | | | 210,000 | | | | 194,500 | | | | 188,978 | |
| | | | | | | | | | | | | | | | | | | | |
| | | | |
Medical Equipment and Devices Manufacturing — 0.2%*: | | | | | | | | | | | | | | | | | |
St. Jude Medical, Inc. | | | 2.80 | | | | 9/15/2020 | | | | 40,000 | | | | 39,983 | | | | 40,015 | |
| | | | | | | | | | | | | | | | | | | | |
| | | | | |
Mining — 0.2%*: | | | | | | | | | | | | | | | | | | | | |
Freeport-McMoRan, Inc. | | | 4.00 | | | | 11/14/2021 | | | | 45,000 | | | | 42,926 | | | | 27,000 | |
Newcrest Finance Pty Ltd.+^ | | | 4.45 | | | | 11/15/2021 | | | | 30,000 | | | | 29,859 | | | | 27,176 | |
| | | | | | | | | | | | | | | | | | | | |
Total Mining | | | | | | | | | | | 75,000 | | | | 72,785 | | | | 54,176 | |
| | | | | | | | | | | | | | | | | | | | |
| | | | | |
Miscellaneous Manufacturing — 0.4%*: | | | | | | | | | | | | | | | | | | | | |
Carlisle Cos., Inc. | | | 3.75 | | | | 11/15/2022 | | | | 50,000 | | | | 50,195 | | | | 49,514 | |
Textron, Inc. | | | 4.30 | | | | 3/1/2024 | | | | 50,000 | | | | 51,387 | | | | 50,926 | |
| | | | | | | | | | | | | | | | | | | | |
Total Miscellaneous Manufacturing | | | | | | | | | | | 100,000 | | | | 101,582 | | | | 100,440 | |
| | | | | | | | | | | | | | | | | | | | |
| | | | |
Oil and Gas — 2.0%*: | | | | | | | | | | | | | | | | | |
Anadarko Petroleum Corp. | | | 6.45 | | | | 9/15/2036 | | | | 45,000 | | | | 52,511 | | | | 43,374 | |
Newfield Exploration Co. | | | 5.38 | | | | 1/1/2026 | | | | 140,000 | | | | 139,858 | | | | 115,850 | |
Petroleos Mexicanos+ | | | 5.50 | | | | 1/21/2021 | | | | 55,000 | | | | 59,702 | | | | 55,479 | |
Phillips 66 | | | 4.30 | | | | 4/1/2022 | | | | 50,000 | | | | 52,508 | | | | 51,440 | |
Phillips 66 | | | 4.65 | | | | 11/15/2034 | | | | 30,000 | | | | 29,838 | | | | 28,118 | |
Pioneer Natural Resources Co. | | | 7.50 | | | | 1/15/2020 | | | | 50,000 | | | | 58,089 | | | | 53,105 | |
Rowan Cos., Inc. | | | 4.88 | | | | 6/1/2022 | | | | 25,000 | | | | 24,948 | | | | 18,385 | |
Rowan Cos., Inc. | | | 5.00 | | | | 9/1/2017 | | | | 80,000 | | | | 82,923 | | | | 79,398 | |
Southwestern Energy Co. | | | 4.10 | | | | 3/15/2022 | | | | 75,000 | | | | 74,200 | | | | 47,172 | |
| | | | | | | | | | | | | | | | | | | | |
Total Oil and Gas | | | | | | | | | | | 550,000 | | | | 574,577 | | | | 492,321 | |
| | | | | | | | | | | | | | | | | | | | |
| | | | |
Oil and Gas Services — 0.6%*: | | | | | | | | | | | | | | | | | |
Schlumberger Holdings Corp. | | | 4.00 | | | | 12/21/2025 | | | | 25,000 | | | | 24,984 | | | | 24,670 | |
SESI LLC | | | 7.13 | | | | 12/15/2021 | | | | 50,000 | | | | 52,818 | | | | 44,500 | |
Weatherford International Ltd. | | | 5.95 | | | | 4/15/2042 | | | | 30,000 | | | | 25,087 | | | | 21,075 | |
Weatherford International Ltd. | | | 6.00 | | | | 3/15/2018 | | | | 50,000 | | | | 52,470 | | | | 46,105 | |
| | | | | | | | | | | | | | | | | | | | |
Total Oil and Gas Services | | | | | | | | | | | 155,000 | | | | 155,359 | | | | 136,350 | |
| | | | | | | | | | | | | | | | | | | | |
| | | | |
Packaging and Containers — 0.4%*: | | | | | | | | | | | | | | | | | |
Brambles USA, Inc.+^ | | | 4.13 | | | | 10/23/2025 | | | | 10,000 | | | | 9,976 | | | | 10,056 | |
Brambles USA, Inc.+^ | | | 5.35 | | | | 4/1/2020 | | | | 50,000 | | | | 54,784 | | | | 54,520 | |
Sonoco Products Co. | | | 4.38 | | | | 11/1/2021 | | | | 41,000 | | | | 43,569 | | | | 42,703 | |
| | | | | | | | | | | | | | | | | | | | |
Total Packaging and Containers | | | | | | | | | | | 101,000 | | | | 108,329 | | | | 107,279 | |
| | | | | | | | | | | | | | | | | | | | |
See accompanying Notes to Financial Statements.
112
Babson Total Return Bond Fund 2015 Semi-Annual Report
SCHEDULE OF INVESTMENTS (UNAUDITED) (CONTINUED)
December 31, 2015
| | | | | | | | | | | | | | | | | | | | |
| | | EFFECTIVE
INTEREST RATE | | | DUE DATE | | | PRINCIPAL ‡‡ | | | COST | | | FAIR
VALUE | |
Corporate Bonds (Continued) | | | | | | | | | | | | | | | | | | | | |
| | | | |
Pharmaceuticals — 1.2%*: | | | | | | | | | | | | | | | | | |
AbbVie, Inc. | | | 4.50 | % | | | 5/14/2035 | | | | 30,000 | | | | $29,814 | | | | $29,388 | |
Actavis Funding SCS+ | | | 3.45 | | | | 3/15/2022 | | | | 50,000 | | | | 49,714 | | | | 50,055 | |
Allergan, Inc. | | | 2.80 | | | | 3/15/2023 | | | | 50,000 | | | | 46,337 | | | | 47,091 | |
AstraZeneca PLC+ | | | 6.45 | | | | 9/15/2037 | | | | 35,000 | | | | 45,067 | | | | 44,261 | |
McKesson Corp. | | | 6.00 | | | | 3/1/2041 | | | | 50,000 | | | | 55,963 | | | | 57,561 | |
Mylan, Inc. | | | 2.55 | | | | 3/28/2019 | | | | 60,000 | | | | 59,645 | | | | 59,215 | |
| | | | | | | | | | | | | | | | | | | | |
Total Pharmaceuticals | | | | | | | | | | | 275,000 | | | | 286,540 | | | | 287,571 | |
| | | | | | | | | | | | | | | | | | | | |
| | | | |
Pipelines — 0.7%*: | | | | | | | | | | | | | | | | | |
Energy Transfer Partners LP | | | 4.75 | | | | 1/15/2026 | | | | 30,000 | | | | 29,814 | | | | 25,233 | |
Enterprise Products Operating LLC | | | 5.95 | | | | 2/1/2041 | | | | 25,000 | | | | 26,740 | | | | 22,963 | |
Kinder Morgan Energy Partners LP MTN | | | 6.95 | | | | 1/15/2038 | | | | 30,000 | | | | 32,060 | | | | 25,767 | |
Kinder Morgan, Inc. | | | 3.05 | | | | 12/1/2019 | | | | 35,000 | | | | 35,121 | | | | 32,393 | |
MPLX LP | | | 4.00 | | | | 2/15/2025 | | | | 90,000 | | | | 88,151 | | | | 75,642 | |
| | | | | | | | | | | | | | | | | | | | |
Total Pipelines | | | | | | | | | | | 210,000 | | | | 211,886 | | | | 181,998 | |
| | | | | | | | | | | | | | | | | | | | |
| | | | |
Property & Casualty Insurance — 0.0%*: | | | | | | | | | | | | | | | | | |
Marsh & McLennan Cos., Inc. | | | 3.75 | | | | 3/14/2026 | | | | 10,000 | | | | 9,992 | | | | 10,013 | |
| | | | | | | | | | | | | | | | | | | | |
| | | | | |
Real Estate — 0.1%*: | | | | | | | | | | | | | | | | | | | | |
Prologis LP | | | 3.35 | | | | 2/1/2021 | | | | 25,000 | | | | 25,512 | | | | 25,314 | |
| | | | | | | | | | | | | | | | | | | | |
| | | | | |
Real Estate Investment Trusts — 1.0%*: | | | | | | | | | | | | | | | | | | | | |
American Tower Corp. | | | 3.45 | | | | 9/15/2021 | | | | 80,000 | | | | 80,064 | | | | 80,392 | |
Brandywine Operating Partnership LP | | | 4.95 | | | | 4/15/2018 | | | | 40,000 | | | | 42,218 | | | | 41,863 | |
DDR Corp. | | | 4.75 | | | | 4/15/2018 | | | | 3,000 | | | | 3,168 | | | | 3,138 | |
Digital Delta Holdings LLC^ | | | 3.40 | | | | 10/1/2020 | | | | 20,000 | | | | 19,958 | | | | 20,022 | |
Digital Realty Trust LP | | | 3.95 | | | | 7/1/2022 | | | | 35,000 | | | | 35,236 | | | | 34,755 | |
Host Hotels & Resorts LP | | | 4.75 | | | | 3/1/2023 | | | | 50,000 | | | | 52,413 | | | | 51,677 | |
| | | | | | | | | | | | | | | | | | | | |
Total REITS | | | | | | | | | | | 228,000 | | | | 233,057 | | | | 231,847 | |
| | | | | | | | | | | | | | | | | | | | |
| | | | |
Retail — 2.3%*: | | | | | | | | | | | | | | | | | |
Advance Auto Parts, Inc. | | | 4.50 | | | | 12/1/2023 | | | | 50,000 | | | | 51,961 | | | | 50,981 | |
CVS Health Corp. | | | 3.50 | | | | 7/20/2022 | | | | 120,000 | | | | 119,951 | | | | 122,107 | |
CVS Pass-Through Trust^ | | | 5.93 | | | | 1/10/2034 | | | | 31,583 | | | | 36,267 | | | | 34,693 | |
El Puerto de Liverpool SAB de CV+^ | | | 3.95 | | | | 10/2/2024 | | | | 200,000 | | | | 199,042 | | | | 194,250 | |
O’Reilly Automotive, Inc. | | | 3.85 | | | | 6/15/2023 | | | | 45,000 | | | | 45,868 | | | | 45,400 | |
O’Reilly Automotive, Inc. | | | 4.88 | | | | 1/14/2021 | | | | 30,000 | | | | 32,845 | | | | 32,451 | |
Wal-Mart Stores, Inc. | | | 5.63 | | | | 4/1/2040 | | | | 30,000 | | | | 35,744 | | | | 35,695 | |
Walgreens Boots Alliance, Inc. | | | 2.70 | | | | 11/18/2019 | | | | 25,000 | | | | 25,189 | | | | 24,953 | |
Walgreens Boots Alliance, Inc. | | | 3.80 | | | | 11/18/2024 | | | | 35,000 | | | | 34,585 | | | | 33,956 | |
| | | | | | | | | | | | | | | | | | | | |
Total Retail | | | | | | | | | | | 566,583 | | | | 581,452 | | | | 574,486 | |
| | | | | | | | | | | | | | | | | | | | |
See accompanying Notes to Financial Statements.
113
Babson Total Return Bond Fund 2015 Semi-Annual Report
SCHEDULE OF INVESTMENTS (UNAUDITED) (CONTINUED)
December 31, 2015
| | | | | | | | | | | | | | | | | | | | |
| | | EFFECTIVE
INTEREST RATE | | | DUE DATE | | | PRINCIPAL ‡‡ | | | COST | | | FAIR
VALUE | |
Corporate Bonds (Continued) | | | | | | | | | | | | | | | | | | | | |
| | | | |
Semiconductors — 0.3%*: | | | | | | | | | | | | | | | | | |
KLA-Tencor Corp. | | | 4.65 | % | | | 11/1/2024 | | | | 30,000 | | | | $30,158 | | | | $30,185 | |
Lam Research Corp. | | | 2.75 | | | | 3/15/2020 | | | | 50,000 | | | | 49,918 | | | | 48,353 | |
| | | | | | | | | | | | | | | | | | | | |
Total Semiconductors | | | | | | | | | | | 80,000 | | | | 80,076 | | | | 78,538 | |
| | | | | | | | | | | | | | | | | | | | |
| | | | |
Software — 0.2%*: | | | | | | | | | | | | | | | | | |
Hewlett Packard Enterprise Co.^ | | | 3.60 | | | | 10/15/2020 | | | | 20,000 | | | | 19,995 | | | | 20,046 | |
Oracle Corp. | | | 5.38 | | | | 7/15/2040 | | | | 35,000 | | | | 39,097 | | | | 38,936 | |
| | | | | | | | | | | | | | | | | | | | |
Total Software | | | | | | | | | | | 55,000 | | | | 59,092 | | | | 58,982 | |
| | | | | | | | | | | | | | | | | | | | |
| | | | |
Telecommunications — 1.3%*: | | | | | | | | | | | | | | | | | |
AT&T, Inc. | | | 3.40 | | | | 5/15/2025 | | | | 40,000 | | | | 38,423 | | | | 38,444 | |
AT&T, Inc. | | | 6.55 | | | | 2/15/2039 | | | | 25,000 | | | | 29,062 | | | | 28,104 | |
Crown Castle Towers LLC^ | | | 4.17 | | | | 8/15/2037 | | | | 120,000 | | | | 123,995 | | | | 122,704 | |
Telefonaktiebolaget LM Ericsson+ | | | 4.13 | | | | 5/15/2022 | | | | 30,000 | | | | 31,340 | | | | 30,757 | |
Verizon Communications, Inc. | | | 3.50 | | | | 11/1/2024 | | | | 35,000 | | | | 34,375 | | | | 34,569 | |
Verizon Communications, Inc. | | | 7.75 | | | | 12/1/2030 | | | | 40,000 | | | | 52,618 | | | | 51,214 | |
| | | | | | | | | | | | | | | | | | | | |
Total Telecommunications | | | | | | | | | | | 290,000 | | | | 309,813 | | | | 305,792 | |
| | | | | | | | | | | | | | | | | | | | |
| | | | |
Transportation — 0.3%*: | | | | | | | | | | | | | | | | | |
Burlington Northern Santa Fe LLC | | | 6.75 | | | | 3/15/2029 | | | | 25,000 | | | | 31,211 | | | | 30,809 | |
Penske Truck Leasing Co. LP/PTL Finance Corp.^ | | | 3.38 | | | | 2/1/2022 | | | | 45,000 | | | | 44,154 | | | | 43,694 | |
| | | | | | | | | | | | | | | | | | | | |
Total Transportation | | | | | | | | | | | 70,000 | | | | 75,365 | | | | 74,503 | |
| | | | | | | | | | | | | | | | | | | | |
| | | | |
Trucking and Leasing — 0.2%*: | | | | | | | | | | | | | | | | | |
Aviation Capital Group Corp.^ | | | 2.88 | | | | 9/17/2018 | | | | 40,000 | | | | 39,838 | | | | 39,771 | |
| | | | | | | | | | | | | | | | | | | | |
Total Corporate Bonds | | | | | | | | | | | 7,758,583 | | | | 8,095,773 | | | | 7,861,331 | |
| | | | | | | | | | | | | | | | | | | | |
Foreign Government — 0.4%*: | | | | | | | | | | | | | | | | | |
| | | | | |
Canada — 0.2%*: | | | | | | | | | | | | | | | | | | | | |
Province of Quebec Canada+ | | | 2.63 | | | | 2/13/2023 | | | | 25,000 | | | | 25,241 | | | | 24,784 | |
Province of Quebec Canada+ | | | 7.50 | | | | 9/15/2029 | | | | 15,000 | | | | 21,773 | | | | 21,573 | |
| | | | | | | | | | | | | | | | | | | | |
Total Canada | | | | | | | | | | | 40,000 | | | | 47,014 | | | | 46,357 | |
| | | | | | | | | | | | | | | | | | | | |
| | | | |
Mexico — 0.2%*: | | | | | | | | | | | | | | | | | |
Mexico Government International Bond+ | | | 5.55 | | | | 1/21/2045 | | | | 60,000 | | | | 64,737 | | | | 61,350 | |
| | | | | | | | | | | | | | | | | | | | |
Total Foreign Government | | | | | | | | | | | 100,000 | | | | 111,751 | | | | 107,707 | |
| | | | | | | | | | | | | | | | | | | | |
Mortgage-Backed Securities — 6.7%*: | | | | | | | | | | | | | | | | | |
Banc of America Commercial Mortgage Trust 2008-1 A4 | | | 6.22 | # | | | 2/10/2051 | | | | 118,508 | | | | 128,922 | | | | 125,507 | |
Bear Stearns Commercial Mortgage Securities Trust 2006-PWR14 AM | | | 5.24 | | | | 12/11/2038 | | | | 120,000 | | | | 125,459 | | | | 122,336 | |
Bear Stearns Commercial Mortgage Securities Trust 2006-TOP22 AM | | | 5.62 | # | | | 4/12/2038 | | | | 130,000 | | | | 133,129 | | | | 130,614 | |
See accompanying Notes to Financial Statements.
114
Babson Total Return Bond Fund 2015 Semi-Annual Report
SCHEDULE OF INVESTMENTS (UNAUDITED) (CONTINUED)
December 31, 2015
| | | | | | | | | | | | | | | | | | | | |
| | | EFFECTIVE
INTEREST RATE | | | DUE DATE | | | PRINCIPAL ‡‡ | | | COST | | | FAIR
VALUE | |
Mortgage-Backed Securities (Continued) | | | | | | | | | | | | | | | | | |
Bear Stearns Commercial Mortgage Securities Trust 2006-TOP24 AM | | | 5.57 | # % | | | 10/12/2041 | | | | 120,000 | | | | $125,783 | | | | $122,439 | |
Bear Stearns Commercial Mortgage Securities Trust 2007-PWR17 AM | | | 5.88 | # | | | 6/11/2050 | | | | 85,000 | | | | 91,272 | | | | 89,413 | |
Fannie Mae Connecticut Avenue Securities CAS 2015-C03 1M1 | | | 1.92 | # | | | 7/25/2025 | | | | 97,143 | | | | 97,264 | | | | 97,171 | |
Fannie Mae Connecticut Avenue Securities CAS 2015-C04 1M1 | | | 2.02 | # | | | 4/25/2028 | | | | 59,266 | | | | 59,266 | | | | 59,195 | |
GS Mortgage Securities Trust 2015-GC32 B | | | 4.40 | # | | | 7/10/2048 | | | | 100,000 | | | | 102,970 | | | | 102,414 | |
JPMorgan Chase Commercial Mortgage Securities Trust 2006-LDP7 AM | | | 5.91 | # | | | 4/15/2045 | | | | 120,000 | | | | 124,587 | | | | 121,143 | |
JPMorgan Chase Commercial Mortgage Securities Trust 2007-CIBC20 AM | | | 5.88 | # | | | 2/12/2051 | | | | 110,000 | | | | 119,588 | | | | 116,139 | |
ML-CFC Commercial Mortgage Trust 2006-3 AM | | | 5.46 | # | | | 7/12/2046 | | | | 70,000 | | | | 72,708 | | | | 71,149 | |
ML-CFC Commercial Mortgage Trust 2006-4 AM | | | 5.20 | | | | 12/12/2049 | | | | 120,000 | | | | 125,470 | | | | 123,153 | |
Morgan Stanley Capital I Trust 2006-IQ12 AM | | | 5.37 | | | | 12/15/2043 | | | | 120,000 | | | | 125,998 | | | | 122,276 | |
Morgan Stanley Capital I Trust 2008-TOP29 A4 | | | 6.27 | # | | | 1/11/2043 | | | | 114,883 | | | | 125,769 | | | | 122,245 | |
Wachovia Bank Commercial Mortgage Trust 2007-C33 A1A | | | 5.95 | # | | | 2/15/2051 | | | | 108,490 | | | | 116,765 | | | | 113,645 | |
| | | | | | | | | | | | | | | | | | | | |
Total Mortgage-Backed Securities | | | | | | | | | | | 1,593,290 | | | | 1,674,950 | | | | 1,638,839 | |
| | | | | | | | | | | | | | | | | | | | |
U.S. Treasury & Government Agencies — 30.5%*: | | | | | | | | | | | | | | | | | |
Federal Home Loan Mortgage Corp. | | | 3.50 | | | | 11/1/2045 | | | | 249,622 | | | | 259,973 | | | | 257,612 | |
Federal Home Loan Mortgage Corp. TBA | | | 3.50 | | | | 1/1/2046 | | | | 175,000 | | | | 180,715 | | | | 180,127 | |
Federal Home Loan Mortgage Corp. TBA | | | 4.00 | | | | 1/1/2046 | | | | 450,000 | | | | 476,437 | | | | 475,312 | |
Federal National Mortgage Association | | | 3.50 | | | | 11/1/2045 | | | | 323,638 | | | | 337,431 | | | | 334,555 | |
Federal National Mortgage Association | | | 3.50 | | | | 12/1/2045 | | | | 448,565 | | | | 464,540 | | | | 463,842 | |
Federal National Mortgage Association TBA | | | 2.50 | | | | 1/1/2031 | | | | 600,000 | | | | 607,031 | | | | 604,781 | |
Federal National Mortgage Association TBA | | | 2.50 | | | | 1/1/2046 | | | | 575,000 | | | | 557,548 | | | | 555,347 | |
Federal National Mortgage Association TBA | | | 3.00 | | | | 1/1/2046 | | | | 1,050,000 | | | | 1,048,031 | | | | 1,049,754 | |
Federal National Mortgage Association TBA | | | 4.00 | | | | 1/1/2046 | | | | 250,000 | | | | 264,883 | | | | 264,492 | |
Government National Mortgage Association TBA | | | 3.00 | | | | 1/1/2046 | | | | 350,000 | | | | 354,594 | | | | 354,566 | |
Government National Mortgage Association TBA | | | 3.50 | | | | 1/1/2046 | | | | 400,000 | | | | 416,969 | | | | 417,000 | |
Government National Mortgage Association TBA | | | 4.50 | | | | 1/1/2046 | | | | 1,175,000 | | | | 1,259,269 | | | | 1,262,391 | |
U.S. Treasury Bond`` | | | 3.00 | | | | 11/15/2044 | | | | 795,000 | | | | 795,385 | | | | 792,112 | |
U.S. Treasury Bond | | | 3.50 | | | | 2/15/2039 | | | | 325,000 | | | | 361,669 | | | | 359,481 | |
U.S. Treasury Note | | | 1.38 | | | | 4/30/2020 | | | | 120,000 | | | | 118,476 | | | | 118,448 | |
| | | | | | | | | | | | | | | | | | | | |
Total U.S. Treasury & Government Agencies | | | | | | | | | | | 7,286,825 | | | | 7,502,951 | | | | 7,489,820 | |
| | | | | | | | | | | | | | | | | | | | |
Total Fixed Income | | | | | | | | | | | 21,268,386 | | | | 21,814,141 | | | | 21,472,529 | |
| | | | | | | | | | | | | | | | | | | | |
See accompanying Notes to Financial Statements.
115
Babson Total Return Bond Fund 2015 Semi-Annual Report
SCHEDULE OF INVESTMENTS (UNAUDITED) (CONTINUED)
December 31, 2015
| | | | | | | | | | | | | | | | | | | | |
| | | | | | | | | SHARES | | | COST | | | FAIR
VALUE | |
Mutual Fund — 8.6%*: | | | | | | | | | | | | | | | | | | | | |
Babson U.S. High Yield Fund | | | | | | | | | | | 218,295 | | | | $2,100,000 | | | | $2,104,366 | |
| | | | | | | | | | | | | | | | | | | | |
| | | | | |
| | | STRIKE
PRICE | | | EXPIRATION
DATE | | | NOTIONAL | | | COST | | | FAIR
VALUE | |
Purchased Options — 0.5%*: | | | | | | | | | | | | | | | | | | | | |
| | | | | |
Call Option Purchased — 0.5%*: | | | | | | | | | | | | | | | | | | | | |
OTC—BCM Option with JPMorgan Chase Bank, N.A. | | | $6.65 | | | | 7/27/2016 | | | | 4,760,000 | | | | 50,190 | | | | 126,564 | |
| | | | | | | | | | | | | | | | | | | | |
| | | | | |
Put Options Purchased — 0.0%*: | | | | | | | | | | | | | | | | | | | | |
OTC—BCM Swaption with JPMorgan Chase Bank, N.A | | | 120.00 | | | | 3/16/2016 | | | | 1,800,000 | | | | 3,780 | | | | 2,110 | |
OTC—BCM Swaption with JPMorgan Chase Bank, N.A | | | 120.00 | | | | 3/16/2016 | | | | 3,600,000 | | | | 7,560 | | | | 4,219 | |
OTC—BCM Swaption with JPMorgan Chase Bank, N.A | | | 120.00 | | | | 3/16/2016 | | | | 650,000 | | | | 1,170 | | | | 762 | |
| | | | | | | | | | | | | | | | | | | | |
Total Put Options | | | | | | | | | | | 6,050,000 | | | | 12,510 | | | | 7,091 | |
| | | | | | | | | | | | | | | | | | | | |
Total Purchased Options | | | | | | | | | | | 10,810,000 | | | | 62,700 | | | | 133,655 | |
| | | | | | | | | | | | | | | | | | | | |
| | | | | |
| | | EFFECTIVE
INTEREST RATE | | | DUE DATE | | | PRINCIPAL ‡‡ | | | COST | | | FAIR
VALUE | |
Short-Term Investments — 25.4%*: | | | | | | | | | | | | | | | | | | | | |
| | | | | |
Bank Deposit — 4.2%*: | | | | | | | | | | | | | | | | | | | | |
State Street Bank & Trust Co. Euro Time Deposit | | | 0.01 | % | | | 1/4/2016 | | | | 1,029,894 | | | | 1,029,894 | | | | 1,029,894 | |
| | | | | | | | | | | | | | | | | | | | |
Commercial Paper — 20.7%*: | | | | | | | | | | | | | | | | | | | | |
| | | | | |
Chemicals — 5.1%*: | | | | | | | | | | | | | | | | | | | | |
Agrium, Inc. | | | Zero Coupon | | | | 1/15/2016 | | | | 625,000 | | | | 624,793 | | | | 624,793 | |
Airgas, Inc. | | | Zero Coupon | | | | 3/28/2016 | | | | 625,000 | | | | 623,565 | | | | 623,565 | |
| | | | | | | | | | | | | | | | | | | | |
Total Chemicals | | | | | | | | | | | 1,250,000 | | | | 1,248,358 | | | | 1,248,358 | |
| | | | | | | | | | | | | | | | | | | | |
| | | | | |
Electric — 2.5%*: | | | | | | | | | | | | | | | | | | | | |
Public Service Enterprise Group, Inc. | | | Zero Coupon | | | | 1/28/2016 | | | | 625,000 | | | | 624,555 | | | | 624,555 | |
| | | | | | | | | | | | | | | | | | | | |
| | | | | |
Packaging and Containers — 2.9%*: | | | | | | | | | | | | | | | | | | | | |
Bemis Co., Inc. | | | Zero Coupon | | | | 1/20/2016 | | | | 700,000 | | | | 699,704 | | | | 699,704 | |
| | | | | | | | | | | | | | | | | | | | |
| | | | | |
Pipelines — 2.5%*: | | | | | | | | | | | | | | | | | | | | |
TransCanada | | | Zero Coupon | | | | 2/16/2016 | | | | 625,000 | | | | 624,026 | | | | 624,026 | |
| | | | | | | | | | | | | | | | | | | | |
| | | | | |
Software — 2.6%*: | | | | | | | | | | | | | | | | | | | | |
Hewlett Packard Enterprise Co. | | | Zero Coupon | | | | 1/11/2016 | | | | 625,000 | | | | 624,835 | | | | 624,835 | |
| | | | | | | | | | | | | | | | | | | | |
See accompanying Notes to Financial Statements.
116
Babson Total Return Bond Fund 2015 Semi-Annual Report
SCHEDULE OF INVESTMENTS (UNAUDITED) (CONTINUED)
December 31, 2015
| | | | | | | | | | | | | | | | | | | | |
| | | EFFECTIVE
INTEREST RATE | | | DUE DATE | | | PRINCIPAL ‡‡ | | | COST | | | FAIR
VALUE | |
Commercial Paper (Continued) | | | | | | | | | | | | | | | | | | | | |
| | | | | |
Telecommunications — 5.1%*: | | | | | | | | | | | | | | | | | | | | |
Deutsche Telecom AG+ | | | Zero Coupon | | | | 1/29/2016 | | | | 625,000 | | | | $624,587 | | | | $624,587 | |
Telus Corp.+ | | | Zero Coupon | | | | 2/17/2016 | | | | 625,000 | | | | 624,502 | | | | 624,502 | |
| | | | | | | | | | | | | | | | | | | | |
Total Telecommunications | | | | | | | | | | | 1,250,000 | | | | 1,249,089 | | | | 1,249,089 | |
| | | | | | | | | | | | | | | | | | | | |
Total Commercial Paper | | | | | | | | | | | 5,075,000 | | | | 5,070,567 | | | | 5,070,567 | |
| | | | | | | | | | | | | | | | | | | | |
Corporate Bonds — 0.5%*: | | | | | | | | | | | | | | | | | | | | |
| | | | | |
Commercial Banks — 0.1%*: | | | | | | | | | | | | | | | | | | | | |
Bank of America Corp. MTN | | | 3.63 | % | | | 3/17/2016 | | | | 25,000 | | | | 25,148 | | | | 25,129 | |
| | | | | | | | | | | | | | | | | | | | |
| | | | | |
Telecommunications — 0.3%*: | | | | | | | | | | | | | | | | | | | | |
Embarq Corp. | | | 7.08 | | | | 6/1/2016 | | | | 30,000 | | | | 30,655 | | | | 30,468 | |
Telefonica Emisiones SAU+ | | | 3.99 | | | | 2/16/2016 | | | | 40,000 | | | | 40,144 | | | | 40,110 | |
| | | | | | | | | | | | | | | | | | | | |
Total Telecommunications | | | | | | | | | | | 70,000 | | | | 70,799 | | | | 70,578 | |
| | | | | | | | | | | | | | | | | | | | |
| | | | | |
Transportation — 0.1%*: | | | | | | | | | | | | | | | | | | | | |
Penske Truck Leasing Co. LP/PTL Finance Corp.^ | | | 2.50 | | | | 3/15/2016 | | | | 35,000 | | | | 35,095 | | | | 35,060 | |
| | | | | | | | | | | | | | | | | | | | |
Total Corporate Bonds | | | | | | | | | | | 130,000 | | | | 131,042 | | | | 130,767 | |
| | | | | | | | | | | | | | | | | | | | |
Total Short-Term Investments | | | | | | | | | | | 6,234,894 | | | | 6,231,503 | | | | 6,231,228 | |
| | | | | | | | | | | | | | | | | | | | |
Total Investments | | | | | | | | | | | 38,531,575 | | | | 30,208,344 | | | | 29,941,778 | |
| | | | | | | | | | | | | | | | | | | | |
| | | | | |
Other assets and liabilities — (22.0%)* | | | | | | | | | | | | | | | | | | | (5,407,219 | ) |
| | | | | |
Net Assets — 100.0% | | | | | | | | | | | | | | | | | | | $24,534,559 | |
| | | | | | | | | | | | | | | | | | | | |
| TBA | To Be Announced: Securities purchased on a forward commitment basis with an approximate principal amount and maturity date. The actual principal amount and maturity date will be determined upon settlement. |
| ‡‡ | Unless otherwise indicated, all principal amounts are denominated in United States Dollars. |
| * | Calculated as a percentage of net assets applicable to common shareholders. |
Distributions of investments by country of risk (excluding temporary cash investments) as a percentage of total investments in securities, is as follows:
| | | | | | |
| | United States | | | 89.8% | |
| | Canada | | | 2.4% | |
| | Germany | | | 2.1% | |
| | United Kingdom | | | 1.2% | |
| | Mexico | | | 1.1% | |
| | Other (Individually less than 1%) | | | 3.4% | |
| | | | | | |
| | Total | | | 100.0% | |
| | | | | | |
See accompanying Notes to Financial Statements.
117
Babson Total Return Bond Fund 2015 Semi-Annual Report
SCHEDULE OF INVESTMENTS (UNAUDITED) (CONTINUED)
December 31, 2015
| ^ | Security acquired in a transaction exempt from registration under Rule 144A of the Securities Act of 1933. These securities may only be resold in transactions exempt from registration, normally to qualified institutional buyers. |
| # | Variable rate security. The interest rate shown is the rate in effect at December 31, 2015. |
| `` | Security has been fully or partially segregated to cover margin requirements for open futures contracts as of December 31, 2015. |
A summary of outstanding derivatives at December 31, 2015 is as follows:
Cross Currency Forward Foreign Currency Exchange Contracts
| | | | | | | | | | | | | | | | |
EXPIRATION
DATE | | DELIVER/
RECEIVE | | COUNTERPARTY | | CONTRACT
AMOUNT
PURCHASED | | | CONTRACT
AMOUNT
SOLD | | | NET UNREALIZED
APPRECIATION
(DEPRECIATION) | |
| 3/1/16 | | HRK/EUR | | Bank of America N.A. | | | 99,494 | | | | 13,000 | | | $ | (5 | ) |
| 2/2/16 | | HUF/EUR | | JPMorgan Chase Bank N.A. | | | 7,841,130 | | | | 25,000 | | | | (184 | ) |
| 2/2/16 | | PLN/EUR | | Citibank N.A. | | | 136,861 | | | | 32,000 | | | | 67 | |
| 2/2/16 | | RON/EUR | | JPMorgan Chase Bank N.A. | | | 57,719 | | | | 13,000 | | | | (256 | ) |
| | | | | | | | | | | | | | | | |
Net unrealized depreciation on cross currency forward foreign currency exchange contracts | | | $ | (378 | ) |
| | | | | | | | | | | | | | | | |
Forward Foreign Currency Exchange Contracts to Buy
| | | | | | | | | | | | | | | | | | | | | | |
EXPIRATION
DATE | | COUNTERPARTY | | LOCAL
CURRENCY | | | VALUE IN USD | | | IN
EXCHANGE
FOR USD | | | NET UNREALIZED
APPRECIATION
(DEPRECIATION) | |
| 2/2/16 | | Bank of America N.A. | | | BRL | | | | 108,297 | | | | 27,104 | | | | 28,000 | | | $ | (896 | ) |
| 2/2/16 | | Citibank N.A. | | | COP | | | | 39,553,080 | | | | 12,424 | | | | 14,000 | | | | (1,576 | ) |
| 2/2/16 | | JPMorgan Chase Bank N.A. | | | IDR | | | | 196,546,000 | | | | 14,081 | | | | 14,000 | | | | 81 | |
| 2/2/16 | | Bank of America N.A. | | | KZT | | | | 4,449,200 | | | | 12,412 | | | | 14,000 | | | | (1,588 | ) |
| 2/2/16 | | Bank of America N.A. | | | MXN | | | | 347,678 | | | | 20,133 | | | | 21,000 | | | | (867 | ) |
| 2/2/16 | | Bank of America N.A. | | | MYR | | | | 90,453 | | | | 20,958 | | | | 21,000 | | | | (42 | ) |
| 2/2/16 | | Bank of America N.A. | | | NOK | | | | 59,734 | | | | 6,746 | | | | 7,000 | | | | (254 | ) |
| 2/2/16 | | JPMorgan Chase Bank N.A. | | | RUB | | | | 451,982 | | | | 6,156 | | | | 6,811 | | | | (655 | ) |
| 2/2/16 | | Bank of America N.A. | | | SEK | | | | 59,740 | | | | 7,083 | | | | 7,000 | | | | 83 | |
| 2/2/16 | | Bank of America N.A. | | | TRY | | | | 101,524 | | | | 34,522 | | | | 35,000 | | | | (478 | ) |
| 2/2/16 | | Bank of America N.A. | | | ZAR | | | | 685,859 | | | | 44,125 | | | | 49,000 | | | | (4,875 | ) |
| | | | | | | | | | | | | | | | | | | | | | |
Net unrealized depreciation on forward foreign exchange contracts to buy | | | | | | | $ | (11,067 | ) |
| | | | | | | | | | | | | | | | | | | | | | |
See accompanying Notes to Financial Statements.
118
Babson Total Return Bond Fund 2015 Semi-Annual Report
SCHEDULE OF INVESTMENTS (UNAUDITED) (CONTINUED)
December 31, 2015
Forward Foreign Currency Exchange Contracts to Sell
| | | | | | | | | | | | | | | | | | | | | | |
EXPIRATION
DATE | | COUNTERPARTY | | LOCAL
CURRENCY | | | VALUE IN USD | | | IN
EXCHANGE
FOR USD | | | NET UNREALIZED
APPRECIATION
(DEPRECIATION) | |
| 2/2/16 | | Bank of America N.A. | | | AUD | | | | 15,490 | | | | 11,272 | | | | 11,000 | | | $ | (272 | ) |
| 3/1/16 | | Bank of America N.A. | | | AUD | | | | 4,170 | | | | 3,030 | | | | 3,000 | | | | (30 | ) |
| 2/2/16 | | Bank of America N.A. | | | BRL | | | | 108,297 | | | | 27,105 | | | | 27,762 | | | | 657 | |
| 2/2/16 | | Bank of America N.A. | | | CAD | | | | 14,416 | | | | 10,419 | | | | 11,000 | | | | 581 | |
| 2/2/16 | | JPMorgan Chase Bank N.A. | | | CHF | | | | 13,835 | | | | 13,829 | | | | 14,000 | | | | 171 | |
| 2/2/16 | | Citibank N.A. | | | CLP | | | | 7,679,650 | | | | 10,802 | | | | 11,000 | | | | 198 | |
| 3/1/16 | | Bank of America N.A. | | | CLP | | | | 2,156,400 | | | | 3,024 | | | | 3,000 | | | | (24 | ) |
| 2/2/16 | | Bank of America N.A. | | | GBP | | | | 9,086 | | | | 13,396 | | | | 14,000 | | | | 604 | |
| 2/2/16 | | JPMorgan Chase Bank N.A. | | | IDR | | | | 196,546,000 | | | | 14,081 | | | | 13,986 | | | | (95 | ) |
| 3/1/16 | | JPMorgan Chase Bank N.A. | | | IDR | | | | 396,340,000 | | | | 28,143 | | | | 28,000 | | | | (143 | ) |
| 2/2/16 | | Bank of America N.A. | | | KZT | | | | 4,449,200 | | | | 12,412 | | | | 12,649 | | | | 237 | |
| 2/2/16 | | Citibank N.A. | | | MYR | | | | 29,757 | | | | 6,895 | | | | 7,000 | | | | 105 | |
| 2/2/16 | | JPMorgan Chase Bank N.A. | | | NOK | | | | 59,734 | | | | 6,747 | | | | 6,860 | | | | 113 | |
| 2/2/16 | | JPMorgan Chase Bank N.A. | | | NZD | | | | 27,180 | | | | 18,558 | | | | 18,000 | | | | (558 | ) |
| 3/1/16 | | Bank of America N.A. | | | PEN | | | | 48,062 | | | | 13,946 | | | | 14,000 | | | | 54 | |
| 2/2/16 | | JPMorgan Chase Bank N.A. | | | PHP | | | | 660,226 | | | | 14,036 | | | | 14,000 | | | | (36 | ) |
| 2/2/16 | | Bank of America N.A. | | | RUB | | | | 451,982 | | | | 6,156 | | | | 7,000 | | | | 844 | |
| 3/1/16 | | JPMorgan Chase Bank N.A. | | | RUB | | | | 474,030 | | | | 6,410 | | | | 7,000 | | | | 590 | |
| 2/2/16 | | JPMorgan Chase Bank N.A. | | | SEK | | | | 59,740 | | | | 7,083 | | | | 7,047 | | | | (36 | ) |
| 2/2/16 | | JPMorgan Chase Bank N.A. | | | SGD | | | | 49,135 | | | | 34,619 | | | | 35,000 | | | | 381 | |
| | | | | | | | | | | | | | | | | | | | | | |
Net unrealized appreciation on forward foreign exchange contracts to sell | | | $ | 3,341 | |
| | | | | | | | | | | | | | | | | | | | | | |
Currency Legend
| | | | |
| AUD | | – | | Australian Dollar |
| BRL | | – | | Brazilian Real |
| CAD | | – | | Canadian Dollar |
| CHF | | – | | Swiss Franc |
| CLP | | – | | Chilean Peso |
| COP | | – | | Colombian Peso |
| GBP | | – | | British Pound Sterling |
| HRK | | – | | Croatian Kuna |
| HUF | | – | | Hungarian Forint |
| IDR | | – | | Indonesian Rupiah |
| KZT | | – | | Kazakhstani Tenge |
| MXN | | – | | Mexican Peso |
| MYR | | – | | Malaysian Ringgit |
| NOK | | – | | Norwegian Krona |
| NZD | | – | | New Zealand Dollar |
| PEN | | – | | Peruvian Nouveau Sol |
| PHP | | – | | Philippines Peso |
| PLN | | – | | Polish Zloty |
| RON | | – | | New Romanian Leu |
See accompanying Notes to Financial Statements.
119
Babson Total Return Bond Fund 2015 Semi-Annual Report
SCHEDULE OF INVESTMENTS (UNAUDITED) (CONTINUED)
December 31, 2015
| | | | |
| RUB | | – | | Russian Ruble |
| SEK | | – | | Swedish Krona |
| SGD | | – | | Singapore Dollar |
| TRY | | – | | New Turkish Lira |
| ZAR | | – | | South African Rand |
Futures
| | | | | | | | | | | | | | | | | | |
| TYPE | | EXPIRATION
DATE | | CONTRACTS | | | POSITION | | | FAIR VALUE | | | UNREALIZED
APPRECIATION
(DEPRECIATION) | |
U.S. 2-Year Treasury Note | | 03/31/16 | | | 15 | | | | Long | | | $ | 3,258,516 | | | $ | (5,993 | ) |
U.S. 5-Year Treasury Note | | 03/31/16 | | | 24 | | | | Long | | | | 2,839,688 | | | | (6,193 | ) |
U.S. Long Bond | | 03/21/16 | | | 1 | | | | Long | | | | 153,750 | | | | 434 | |
U.S. Ultra Bond | | 03/21/16 | | | 1 | | | | Long | | | | 158,687 | | | | 950 | |
| | | | | | | | | | | | | | | | | | |
| | | | | | | | | | | | | | | | $ | (10,802 | ) |
| | | | | | | | | | | | | | | | | | |
| | | | | | | | | | | | | | | | | | |
| TYPE | | EXPIRATION
DATE | | CONTRACTS | | | POSITION | | | FAIR VALUE | | | UNREALIZED
APPRECIATION | |
U.S. 10-Year Treasury Note | | 03/21/16 | | | 6 | | | | Short | | | $ | 755,438 | | | $ | 2,590 | |
Credit Default Swaps – Sell Protection(1)
| | | | | | | | | | | | | | | | | | | | | | | | | | | | | | |
REFERENCE
OBLIGATION | | FIIXED-DEAL
RECEIVED
RATE | | | MATURITY
DATE | | | COUNTERPARTY | | ORIGINAL
NOTIONAL
AMOUNT | | | CURRENT
NOTIONAL
AMOUNT(2) | | | UPFRONT
PREMIUMS
PAID/
(RECEIVED) | | | FAIR
VALUE(3) | | | UNREALIZED
DEPRECIATION | |
Markit CMBX.NA. BBB-.6 | | | 3.00 | % | | | 11/17/45 | | | JPMorgan Chase
Bank N.A. | | | 60,000 | | | | 60,000 | | | $ | 147 | | | $ | (1,885 | ) | | $ | (2,032 | ) |
| (1) | If the Fund is a seller of protection and a credit event occurs, as defined under the terms of that particular swap agreement, the Fund will either (i) pay to the buyer of protection an amount equal to the notional amount of the swap and take delivery of the referenced obligation or underlying securities comprising the referenced index or (ii) pay a net settlement amount in the form of cash or securities equal to the notional amount of the swap less the recovery value of the referenced obligation or underlying securities comprising the referenced index. |
| (2) | The maximum potential amount the portfolio could be required to make as a seller of credit protection or receive as a buyer of credit event as defined under the terms of that particular swap agreement. |
| (3) | The quoted market prices and resulting values for credit default swap agreements on asset-backed securities and credit indices serve as an indicator of the current status of the payment/performance risk and represent the expected amount paid or received for the credit derivative if the amount of the swap agreement was closed/sold as of the period end. Increasing market values, in absolute terms when compared to the notional amount of the swap, represent a deterioration of the referenced entity’s credit soundness and a greater likelihood or risk of default or other credit event occurring as defined under the terms of the agreements. |
See accompanying Notes to Financial Statements.
120
Babson Emerging Markets Debt Blended Total Return Fund 2015 Semi-Annual Report
SCHEDULE OF INVESTMENTS (UNAUDITED)
December 31, 2015
| | | | | | | | | | | | | | | | | | | | |
| | | EFFECTIVE
INTEREST RATE | | | DUE DATE | | | PRINCIPAL ‡‡ | | | COST | | | FAIR
VALUE | |
Fixed Income — 94.0%*: | | | | | | | | | | | | | | | | | | | | |
| | | | | |
Corporate Bonds — 34.8%*+: | | | | | | | | | | | | | | | | | | | | |
| | | | | |
Chemicals — 4.0%*: | | | | | | | | | | | | | | | | | | | | |
Consolidated Energy Finance SA^ | | | 6.75 | % | | | 10/15/2019 | | | | 200,000 | | | | $199,040 | | | | $191,190 | |
OCP SA | | | 6.88 | | | | 4/25/2044 | | | | 200,000 | | | | 209,978 | | | | 195,844 | |
| | | | | | | | | | | | | | | | | | | | |
Total Chemicals | | | | | | | | | | | 400,000 | | | | 409,018 | | | | 387,034 | |
| | | | | | | | | | | | | | | | | | | | |
| | |
Commercial Banks — 10.3%*: | | | | | | | | | |
BBVA Bancomer SA^ | | | 5.35 | # | | | 11/12/2029 | | | | 200,000 | | | | 198,513 | | | | 196,000 | |
Emirates NBD Tier 1 Ltd. | | | 5.75 | # | | | 5/29/2049 | | | | 200,000 | | | | 200,499 | | | | 191,000 | |
ICICI Bank Ltd.^ | | | 7.25 | # | | | 8/29/2049 | | | | 200,000 | | | | 202,497 | | | | 202,000 | |
NBK Tier 1 Financing Ltd. | | | 5.75 | # | | | 12/29/2049 | | | | 200,000 | | | | 203,244 | | | | 198,500 | |
Russian Agricultural Bank OJSC Via RSHB Capital SA^ | | | 5.30 | | | | 12/27/2017 | | | | 200,000 | | | | 201,840 | | | | 200,000 | |
| | | | | | | | | | | | | | | | | | | | |
Total Commercial Banks | | | | | | | | | | | 1,000,000 | | | | 1,006,593 | | | | 987,500 | |
| | | | | | | | | | | | | | | | | | | | |
| | |
Construction Materials — 2.2%*: | | | | | | | | | |
Cemex Finance LLC^ | | | 9.38 | | | | 10/12/2022 | | | | 200,000 | | | | 218,852 | | | | 210,500 | |
| | | | | | | | | | | | | | | | | | | | |
| | | | | |
Electric — 6.1%*: | | | | | | | | | | | | | | | | | | | | |
AES El Salvador Trust II^ | | | 6.75 | | | | 3/28/2023 | | | | 200,000 | | | | 180,359 | | | | 178,500 | |
Empresa Electrica Angamos SA | | | 4.88 | | | | 5/25/2029 | | | | 200,000 | | | | 189,057 | | | | 178,500 | |
Israel Electric Corp. Ltd.^ | | | 6.88 | | | | 6/21/2023 | | | | 200,000 | | | | 229,645 | | | | 228,180 | |
| | | | | | | | | | | | | | | | | | | | |
Total Electric | | | | | | | | | | | 600,000 | | | | 599,061 | | | | 585,180 | |
| | | | | | | | | | | | | | | | | | | | |
| | |
Forestry and Paper Products — 1.9%*: | | | | | | | | | |
Klabin Finance SA^ | | | 5.25 | | | | 7/16/2024 | | | | 200,000 | | | | 180,276 | | | | 178,000 | |
| | | | | | | | | | | | | | | | | | | | |
| | |
Iron/Steel — 2.1%*: | | | | | | | | | |
Vale Overseas Ltd. | | | 6.25 | | | | 1/23/2017 | | | | 200,000 | | | | 204,254 | | | | 199,620 | |
| | | | | | | | | | | | | | | | | | | | |
| | |
IT Services — 2.2%*: | | | | | | | | | |
Lenovo Group Ltd. | | | 4.70 | | | | 5/8/2019 | | | | 200,000 | | | | 208,783 | | | | 206,558 | |
| | | | | | | | | | | | | | | | | | | | |
| | |
Real Estate — 4.3%*: | | | | | | | | | |
MAF Global Securities Ltd. | | | 7.13 | # | | | 10/29/2049 | | | | 200,000 | | | | 208,188 | | | | 202,208 | |
Sino-Ocean Land Perpetual Finance Ltd.^ | | | 10.25 | # | | | 12/29/2049 | | | | 200,000 | | | | 207,245 | | | | 204,736 | |
| | | | | | | | | | | | | | | | | | | | |
Total Real Estate | | | | | | | | | | | 400,000 | | | | 415,433 | | | | 406,944 | |
| | | | | | | | | | | | | | | | | | | | |
| | |
Telecommunications — 1.7%*: | | | | | | | | | |
Digicel Ltd.^ | | | 6.75 | | | | 3/1/2023 | | | | 200,000 | | | | 187,243 | | | | 167,000 | |
| | | | | | | | | | | | | | | | | | | | |
Total Corporate Bonds | | | | | | | | | | | 3,400,000 | | | | 3,429,513 | | | | 3,328,336 | |
| | | | | | | | | | | | | | | | | | | | |
Foreign Government — 59.2%*+: | | | | | | | | | |
| | |
Colombia — 2.5%*: | | | | | | | | | |
Republic of Colombia | | | 8.13 | | | | 5/21/2024 | | | | 200,000 | | | | 248,881 | | | | 239,800 | |
| | | | | | | | | | | | | | | | | | | | |
See accompanying Notes to Financial Statements.
121
Babson Emerging Markets Debt Blended Total Return Fund 2015 Semi-Annual Report
SCHEDULE OF INVESTMENTS (UNAUDITED) (CONTINUED)
December 31, 2015
| | | | | | | | | | | | | | | | | | | | |
| | | EFFECTIVE
INTEREST RATE | | | DUE DATE | | | PRINCIPAL ‡‡ | | | COST | | | FAIR
VALUE | |
Foreign Government (Continued) | | | | | | | | | | | | | | | | | | | | |
| | |
Costa Rica — 1.7%*: | | | | | | | | | |
Costa Rica Government Bond^ | | | 7.16 | % | | | 3/12/2045 | | | | 200,000 | | | | $183,028 | | | | $167,500 | |
| | | | | | | | | | | | | | | | | | | | |
| | |
Croatia — 2.1%*: | | | | | | | | | |
Croatia Government Bond^ | | | 5.50 | | | | 4/4/2023 | | | | 200,000 | | | | 208,082 | | | | 203,040 | |
| | | | | | | | | | | | | | | | | | | | |
| | |
Dominican Republic — 2.1%*: | | | | | | | | | |
Dominican Republic International Bond^ | | | 5.88 | | | | 4/18/2024 | | | | 200,000 | | | | 196,709 | | | | 199,500 | |
| | | | | | | | | | | | | | | | | | | | |
| | |
El Salvador — 2.1%*: | | | | | | | | | |
Republic of El Salvador^ | | | 7.38 | | | | 12/1/2019 | | | | 200,000 | | | | 206,725 | | | | 199,300 | |
| | | | | | | | | | | | | | | | | | | | |
| | |
Ghana — 2.1%*: | | | | | | | | | |
Republic of Ghana^ | | | 10.75 | | | | 10/14/2030 | | | | 200,000 | | | | 213,923 | | | | 202,900 | |
| | | | | | | | | | | | | | | | | | | | |
| | |
Hungary — 4.3%*: | | | | | | | | | |
Hungary Government Bond | | | 6.75 | | | | 10/22/2028 | | | | 90,000,000 | | | | 423,779 | | | | 407,078 | |
| | | | | | | | | | | | | | | | | | | | |
| | |
Indonesia — 6.8%*: | | | | | | | | | |
Indonesia Treasury Bond | | | 8.38 | | | | 3/15/2034 | | | | 6,500,000,000 | | | | 444,012 | | | | 441,335 | |
Republic of Indonesia^ | | | 5.88 | | | | 1/15/2024 | | | | 200,000 | | | | 222,575 | | | | 213,750 | |
| | | | | | | | | | | | | | | | | | | | |
Total Indonesia | | | | | | | | | | | 6,500,200,000 | | | | 666,587 | | | | 655,085 | |
| | | | | | | | | | | | | | | | | | | | |
| | |
Israel — 4.5%*: | | | | | | | | | |
Israel Government Bond | | | 5.50 | | | | 1/31/2042 | | | | 1,200,000 | | | | 448,574 | | | | 432,466 | |
| | | | | | | | | | | | | | | | | | | | |
| | |
Jamaica — 2.1%*: | | | | | | | | | |
Government of Jamaica | | | 6.75 | | | | 4/28/2028 | | | | 200,000 | | | | 202,476 | | | | 198,250 | |
| | | | | | | | | | | | | | | | | | | | |
| | |
Malaysia — 4.6%*: | | | | | | | | | |
Malaysia Government Bond | | | 4.13 | | | | 4/15/2032 | | | | 2,000,000 | | | | 447,340 | | | | 438,113 | |
| | | | | | | | | | | | | | | | | | | | |
| | |
Mexico — 10.6%*: | | | | | | | | | |
Mexican Bonos | | | 7.75 | | | | 11/13/2042 | | | | 10,000,000 | | | | 682,571 | | | | 636,050 | |
United Mexican States | | | 3.60 | | | | 1/30/2025 | | | | 200,000 | | | | 199,508 | | | | 194,800 | |
United Mexican States | | | 5.75 | | | | 10/12/2049 | | | | 200,000 | | | | 188,003 | | | | 186,500 | |
| | | | | | | | | | | | | | | | | | | | |
Total Mexico | | | | | | | | | | | 10,400,000 | | | | 1,070,082 | | | | 1,017,350 | |
| | | | | | | | | | | | | | | | | | | | |
| | |
Serbia — 4.2%*: | | | | | | | | | |
Serbia Treasury Bonds | | | 10.00 | | | | 2/5/2022 | | | | 40,000,000 | | | | 423,706 | | | | 399,133 | |
| | | | | | | | | | | | | | | | | | | | |
| | |
Slovenia — 2.1%*: | | | | | | | | | |
Africa Finance Corp.^ | | | 4.38 | | | | 4/29/2020 | | | | 200,000 | | | | 203,852 | | | | 200,556 | |
| | | | | | | | | | | | | | | | | | | | |
| | |
South Africa — 5.3%*: | | | | | | | | | |
South Africa Government Bond | | | 8.75 | | | | 2/28/2048 | | | | 9,300,000 | | | | 624,632 | | | | 507,292 | |
| | | | | | | | | | | | | | | | | | | | |
See accompanying Notes to Financial Statements.
122
Babson Emerging Markets Debt Blended Total Return Fund 2015 Semi-Annual Report
SCHEDULE OF INVESTMENTS (UNAUDITED) (CONTINUED)
December 31, 2015
| | | | | | | | | | | | | | | | | | | | |
| | | EFFECTIVE
INTEREST RATE | | | DUE DATE | | | PRINCIPAL ‡‡ | | | COST | | | FAIR
VALUE | |
Foreign Government (Continued) | | | | | | | | | | | | | | | | | | | | |
| | |
Uruguay — 2.1%*: | | | | | | | | | |
Republica Orient Uruguay | | | 4.38 | % | | | 10/27/2027 | | | | 200,000 | | | | $199,407 | | | | $196,500 | |
| | | | | | | | | | | | | | | | | | | | |
Total Foreign Government | | | | | | | | | | | 6,654,900,000 | | | | 5,967,783 | | | | 5,663,863 | |
| | | | | | | | | | | | | | | | | | | | |
Total Fixed Income | | | | | | | | | | | 6,658,300,000 | | | | 9,397,296 | | | | 8,992,199 | |
| | | | | | | | | | | | | | | | | | | | |
Short-Term Investments — 5.6%*: | | | | | | | | | |
Bank Deposit — 0.9%*: | | | | | | | | | |
State Street Bank & Trust Co. Euro Time Deposit | | | 0.01 | | | | 1/4/2016 | | | | 83,284 | | | | 83,284 | | | | 83,284 | |
| | | | | | | | | | | | | | | | | | | | |
Foreign Government — 4.7%*+: | | | | | | | | | |
| | |
Turkey — 4.7%*: | | | | | | | | | |
Turkey Government Bond | | | 2.50 | | | | 5/4/2016 | | | | 1,305,046 | | | | 454,822 | | | | 445,584 | |
| | | | | | | | | | | | | | | | | | | | |
Total Short-Term Investments | | | | | | | | | | | 1,388,330 | | | | 538,106 | | | | 528,868 | |
| | | | | | | | | | | | | | | | | | | | |
Total Investments | | | | | | | | | | | 6,659,688,330 | | | | 9,935,402 | | | | 9,521,067 | |
| | | | | | | | | | | | | | | | | | | | |
Other assets and liabilities – 0.4%* | | | | | | | | 41,902 | |
| | | | | |
Net Assets – 100.0% | | | | | | | | | | | | | | | | | | | $9,562,969 | |
| | | | | | | | | | | | | | | | | | | | |
| ‡‡ | Unless otherwise indicated, all principal amounts are denominated in United States Dollars. |
| * | Calculated as a percentage of net assets applicable to common shareholders. |
Distributions of investments by country of risk (excluding temporary cash investments) as a percentage of total investments in securities, is as follows:
| | | | | | |
| | Mexico | | | 15.1% | |
| | Israel | | | 7.0% | |
| | Indonesia | | | 6.9% | |
| | South Africa | | | 5.4% | |
| | Turkey | | | 4.7% | |
| | Malaysia | | | 4.6% | |
| | China | | | 4.4% | |
| | Hungary | | | 4.3% | |
| | Serbia | | | 4.2% | |
| | United Arab Emirates | | | 4.2% | |
| | El Salvador | | | 4.0% | |
| | Brazil | | | 4.0% | |
| | Jamaica | | | 3.9% | |
| | Colombia | | | 2.5% | |
| | Croatia | | | 2.2% | |
| | Ghana | | | 2.2% | |
| | India | | | 2.1% | |
| | Slovenia | | | 2.1% | |
| | Russia | | | 2.1% | |
| | Dominican Republic | | | 2.1% | |
See accompanying Notes to Financial Statements.
123
Babson Emerging Markets Debt Blended Total Return Fund 2015 Semi-Annual Report
SCHEDULE OF INVESTMENTS (UNAUDITED) (CONTINUED)
December 31, 2015
| | | | | | |
| | Ukrainian Ssr | | | 2.1% | |
| | Uruguay | | | 2.1% | |
| | Morocco | | | 2.1% | |
| | Trinidad And Tobago | | | 2.0% | |
| | Chile | | | 1.9% | |
| | Costa Rica | | | 1.8% | |
| | | | | | |
| | Total | | | 100.0% | |
| | | | | | |
| ^ | Security acquired in a transaction exempt from registration under Rule 144A of the Securities Act of 1933. These securities may only be resold in transactions exempt from registration, normally to qualified institutional buyers. |
| § | Bank loans are exempt from registration under the Securities Act of 1933, as amended, but contain certain restrictions on resale and cannot be sold publicly. These loans pay interest at rates which adjust periodically. The interest rates shown for bank loans are the current interest rates at December 31, 2015. Bank loans are also subject to mandatory and/or optional prepayment which cannot be predicted. As a result, the remaining maturity may be substantially less than the stated maturity shown. |
| # | Variable rate security. The interest rate shown is the rate in effect at December 31, 2015. |
A summary of outstanding derivatives at December 31, 2015 is as follows:
Cross Currency Forward Foreign Currency Exchange Contracts
| | | | | | | | | | | | | | | | |
EXPIRATION
DATE | | DELIVER/RECEIVE | | COUNTERPARTY | | CONTRACT
AMOUNT
PURCHASED | | | CONTRACT
AMOUNT
SOLD | | | NET UNREALIZED
APPRECIATION
(DEPRECIATION) | |
| 3/1/16 | | HRK/EUR | | Bank of America N.A. | | | 1,423,532 | | | | 186,000 | | | $ | (81 | ) |
| 1/26/16 | | PLN/EUR | | Bank of America N.A. | | | 222,369 | | | | 52,000 | | | | 121 | |
| 1/26/16 | | PLN/EUR | | JPMorgan Chase Bank N.A. | | | 1,718,041 | | | | 400,000 | | | | 2,844 | |
| 2/2/16 | | RON/EUR | | Citibank N.A. | | | 799,838 | | | | 180,000 | | | | (3,381 | ) |
| 2/2/16 | | RSD/EUR | | Citibank N.A. | | | 5,805,600 | | | | 48,000 | | | | (438 | ) |
| | | | | | | | | | | | | | | | |
Net unrealized depreciation on cross currency forward foreign currency exchange contracts | | | $ | (935 | ) |
| | | | | | | | | | | | | | | | |
Forward Foreign Currency Exchange Contracts to Buy
| | | | | | | | | | | | | | | | | | | | | | |
EXPIRATION
DATE | | COUNTERPARTY | | LOCAL CURRENCY | | | VALUE IN USD | | | IN
EXCHANGE
FOR USD | | | NET UNREALIZED
APPRECIATION (DEPRECIATION) | |
| 2/2/16 | | Bank of America N.A. | | | BRL | | | | 1,535,497 | | | | 384,303 | | | | 397,000 | | | $ | (12,697 | ) |
| 1/25/16 | | JPMorgan Chase Bank N.A. | | | CAD | | | | 391,837 | | | | 283,192 | | | | 299,000 | | | | (15,808 | ) |
| 1/26/16 | | Bank of America N.A. | | | CLP | | | | 53,048,000 | | | | 74,682 | | | | 76,000 | | | | (1,318 | ) |
| 2/2/16 | | Citibank N.A. | | | COP | | | | 562,178,980 | | | | 176,590 | | | | 199,000 | | | | (22,410 | ) |
| 1/26/16 | | Citibank N.A. | | | IDR | | | | 2,518,615,000 | | | | 181,016 | | | | 181,000 | | | | 16 | |
| 2/2/16 | | Bank of America N.A. | | | KZT | | | | 63,242,200 | | | | 176,422 | | | | 199,000 | | | | (22,578 | ) |
| 2/2/16 | | Citibank N.A. | | | NOK | | | | 840,117 | | | | 94,884 | | | | 99,000 | | | | (4,116 | ) |
| 2/2/16 | | JPMorgan Chase Bank N.A. | | | RUB | | | | 6,392,311 | | | | 87,065 | | | | 96,331 | | | | (9,266 | ) |
| 2/2/16 | | Bank of America N.A. | | | SEK | | | | 844,895 | | | | 100,172 | | | | 99,000 | | | | 1,172 | |
| 2/2/16 | | Bank of America N.A. | | | TRY | | | | 171,140 | | | | 58,194 | | | | 59,000 | | | | (806 | ) |
| 2/2/16 | | Bank of America N.A. | | | ZAR | | | | 3,639,250 | | | | 234,130 | | | | 260,000 | | | | (25,870 | ) |
| 2/9/16 | | Bank of America N.A. | | | ZAR | | | | 1,441,129 | | | | 92,595 | | | | 100,000 | | | | (7,405 | ) |
| | | | | | | | | | | | | | | | | | | | | | |
Net unrealized depreciation on forward foreign exchange contracts to buy | | | $ | (121,086 | ) |
| | | | | | | | | | | | | | | | | | | | | | |
See accompanying Notes to Financial Statements.
124
Babson Emerging Markets Debt Blended Total Return Fund 2015 Semi-Annual Report
SCHEDULE OF INVESTMENTS (UNAUDITED) (CONTINUED)
December 31, 2015
Forward Foreign Currency Exchange Contracts to Sell
| | | | | | | | | | | | | | | | | | | | | | |
EXPIRATION
DATE | | COUNTERPARTY | | LOCAL CURRENCY | | | VALUE IN USD | | | IN
EXCHANGE
FOR USD | | | NET UNREALIZED
APPRECIATION
(DEPRECIATION) | |
| 1/27/16 | | Bank of America N.A. | | | AUD | | | | 211,203 | | | | 153,738 | | | | 151,000 | | | $ | (2,738 | ) |
| 3/1/16 | | Bank of America N.A. | | | AUD | | | | 65,336 | | | | 47,479 | | | | 47,000 | | | | (479 | ) |
| 2/2/16 | | Bank of America N.A. | | | BRL | | | | 1,535,497 | | | | 384,303 | | | | 393,426 | | | | 9,123 | |
| 1/25/16 | | JPMorgan Chase Bank N.A. | | | CAD | | | | 590,621 | | | | 426,859 | | | | 450,000 | | | | 23,141 | |
| 2/2/16 | | JPMorgan Chase Bank N.A. | | | CHF | | | | 196,650 | | | | 196,569 | | | | 199,000 | | | | 2,431 | |
| 1/26/16 | | Citibank N.A. | | | CLP | | | | 156,555,000 | | | | 220,400 | | | | 225,000 | | | | 4,600 | |
| 3/1/16 | | Bank of America N.A. | | | CLP | | | | 39,534,000 | | | | 55,437 | | | | 55,000 | | | | (437 | ) |
| 1/26/16 | | Bank of America N.A. | | | EUR | | | | 1,255,597 | | | | 873,765 | | | | 1,406,145 | | | | 26,235 | |
| 2/2/16 | | Bank of America N.A. | | | GBP | | | | 129,156 | | | | 190,416 | | | | 199,000 | | | | 8,584 | |
| 1/26/16 | | Citibank N.A. | | | IDR | | | | 6,124,059,500 | | | | 440,144 | | | | 434,485 | | | | (5,660 | ) |
| 3/1/16 | | JPMorgan Chase Bank N.A. | | | IDR | | | | 8,436,380,000 | | | | 599,041 | | | | 596,000 | | | | (3,041 | ) |
| 1/26/16 | | Citibank N.A. | | | ILS | | | | 1,742,400 | | | | 447,939 | | | | 450,652 | | | | 2,714 | |
| 2/2/16 | | Bank of America N.A. | | | KZT | | | | 63,242,200 | | | | 176,422 | | | | 179,793 | | | | 3,371 | |
| 2/2/16 | | Bank of America N.A. | | | MXN | | | | 2,500,633 | | | | 144,802 | | | | 151,000 | | | | 6,198 | |
| 2/16/16 | | Bank of America N.A. | | | MXN | | | | 4,037,004 | | | | 233,538 | | | | 243,789 | | | | 10,251 | |
| 2/2/16 | | Bank of America N.A. | | | MYR | | | | 639,400 | | | | 148,151 | | | | 148,000 | | | | (151 | ) |
| 3/1/16 | | Citibank N.A. | | | MYR | | | | 404,301 | | | | 93,596 | | | | 95,000 | | | | 1,404 | |
| 2/2/16 | | JPMorgan Chase Bank N.A. | | | NOK | | | | 840,117 | | | | 94,884 | | | | 96,478 | | | | 1,594 | |
| 1/27/16 | | JPMorgan Chase Bank N.A. | | | NZD | | | | 373,857 | | | | 255,364 | | | | 249,000 | | | | (6,364 | ) |
| 3/1/16 | | Bank of America N.A. | | | PEN | | | | 683,167 | | | | 198,237 | | | | 199,000 | | | | 763 | |
| 2/2/16 | | JPMorgan Chase Bank N.A. | | | PHP | | | | 9,384,641 | | | | 199,507 | | | | 199,000 | | | | (507 | ) |
| 2/2/16 | | Bank of America N.A. | | | RUB | | | | 6,392,311 | | | | 87,065 | | | | 99,000 | | | | 11,935 | |
| 3/1/16 | | JPMorgan Chase Bank N.A. | | | RUB | | | | 6,704,132 | | | | 90,656 | | | | 99,000 | | | | 8,344 | |
| 2/2/16 | | JPMorgan Chase Bank N.A. | | | SEK | | | | 844,895 | | | | 100,172 | | | | 99,667 | | | | (505 | ) |
| 2/2/16 | | JPMorgan Chase Bank N.A. | | | SGD | | | | 697,712 | | | | 491,593 | | | | 497,000 | | | | 5,407 | |
| | | | | | | | | | | | | | | | | | | | | | |
Net unrealized appreciation on forward foreign exchange contracts to sell | | | $ | 106,213 | |
| | | | | | | | | | | | | | | | | | | | | | |
Currency Legend
| | | | |
| AUD | | – | | Australian Dollar |
| BRL | | – | | Brazilian Real |
| CAD | | – | | Canadian Dollar |
| CHF | | – | | Swiss Franc |
| CLP | | – | | Chilean Peso |
| COP | | – | | Colombian Peso |
| EUR | | – | | Euro |
| GBP | | – | | British Pound Sterling |
| HRK | | – | | Croatian Kuna |
| IDR | | – | | Indonesian Rupiah |
| ILS | | – | | Israeli Shekel |
| KZT | | – | | Kazakhstani Tenge |
| MXN | | – | | Mexican Peso |
| MYR | | – | | Malaysian Ringgit |
See accompanying Notes to Financial Statements.
125
Babson Emerging Markets Debt Blended Total Return Fund 2015 Semi-Annual Report
SCHEDULE OF INVESTMENTS (UNAUDITED) (CONTINUED)
December 31, 2015
| | | | |
| NOK | | – | | Norwegian Krona |
| NZD | | – | | New Zealand Dollar |
| PEN | | – | | Peruvian Nouveau Sol |
| PHP | | – | | Philippines Peso |
| PLN | | – | | Polish Zloty |
| RON | | – | | New Romanian Leu |
| RSD | | – | | Serbian Dinar. |
| RUB | | – | | Russian Ruble |
| SEK | | – | | Swedish Krona |
| SGD | | – | | Singapore Dollar |
| TRY | | – | | New Turkish Lira |
| ZAR | | – | | South African Rand |
Future
| | | | | | | | | | | | | | | | | | |
| TYPE | | EXPIRATION
DATE | | CONTRACTS | | | POSITION | | | FAIR
VALUE | | | UNREALIZED
APPRECIATION | |
U.S. 10-Year Treasury Note | | 03/21/16 | | | 3 | | | | Short | | | $ | 377,719 | | | $ | 1,022 | |
Credit Default Swaps – Sell Protection(1)
| | | | | | | | | | | | | | | | | | | | | | | | | | | | | | | | |
REFERENCE
OBLIGATION | | FIIXED-DEAL
RECEIVED
RATE | | | MATURITY
DATE | | | COUNTERPARTY | | | ORIGINAL
NOTIONAL
AMOUNT | | | CURRENT
NOTIONAL
AMOUNT(2) | | | UPFRONT
PREMIUMS
PAID/
(RECEIVED) | | | FAIR
VALUE(3) | | | UNREALIZED
APPRECIATION | |
| | | | | | | | |
Pernerbangan Malaysia Bhd | | | 1.00 | % | | | 12/20/20 | | | | Bank of America N.A. | | | | 200,000 | | | | 200,000 | | | $ | 9,276 | | | $ | (7,281 | ) | | $ | 1,994 | |
| (1) | If the Fund is a seller of protection and a credit event occurs, as defined under the terms of that particular swap agreement, the Fund will either (i) pay to the buyer of protection an amount equal to the notional amount of the swap and take delivery of the referenced obligation or underlying securities comprising the referenced index or (ii) pay a net settlement amount in the form of cash or securities equal to the notional amount of the swap less the recovery value of the referenced obligation or underlying securities comprising the referenced index. |
| (2) | The maximum potential amount the portfolio could be required to make as a seller of credit protection or receive as a buyer of credit event as defined under the terms of that particular swap agreement. |
| (3) | The quoted market prices and resulting values for credit default swap agreements on asset-backed securities and credit indices serve as an indicator of the current status of the payment/performance risk and represent the expected amount paid or received for the credit derivative if the amount of the swap agreement was closed/sold as of the period end. Increasing market values, in absolute terms when compared to the notional amount of the swap, represent a deterioration of the referenced entity’s credit soundness and a greater likelihood or risk of default or other credit event occurring as defined under the terms of the agreements. |
See accompanying Notes to Financial Statements.
126
Babson Emerging Markets Debt Blended Total Return Fund 2015 Semi-Annual Report
SCHEDULE OF INVESTMENTS (UNAUDITED) (CONTINUED)
December 31, 2015
OTC – Interest Rate Swaps
| | | | | | | | | | |
| DESCRIPTION | | NOTIONAL
AMOUNT | | UNREALIZED
APPRECIATION | | | VALUE | |
Agreement with Bank of America N.A. dated 12/21/15 receiving a fixed rate of 16.16% paying the notional amount multiplied by the BRL-CDI rate. Expiring 1/2/25 | | 961,503 | | $ | 10,877 | | | $ | 10,877 | |
See accompanying Notes to Financial Statements.
127
Babson Emerging Markets Local Currency Debt Fund 2015 Semi-Annual Report
SCHEDULE OF INVESTMENTS (UNAUDITED)
December 31, 2015
| | | | | | | | | | | | | | | | | | | | |
| | | EFFECTIVE
INTEREST RATE | | | DUE DATE | | | PRINCIPAL ‡‡ | | | COST | | | FAIR
VALUE | |
Fixed Income — 90.1%*: | | | | | | | | | | | | | | | | | | | | |
| | | | | |
Foreign Government — 90.1%*+: | | | | | | | | | | | | | | | | | | | | |
|
Brazil — 9.0%*: | |
Brazil Letras do Tesouro Nacional | | | Zero Coupon | | | | 1/1/2017 | | | | 2,000,000 | | | | $463,542 | | | | $436,667 | |
| | | | | | | | | | | | | | | | | | | | |
|
Colombia — 10.5%*: | |
Colombian TES | | | 7.75 | % | | | 9/18/2030 | | | | 1,800,000,000 | | | | 492,987 | | | | 508,367 | |
| | | | | | | | | | | | | | | | | | | | |
|
Hungary — 4.4%*: | |
Hungary Government Bond | | | 5.50 | | | | 12/20/2018 | | | | 57,000,000 | | | | 215,244 | | | | 213,157 | |
| | | | | | | | | | | | | | | | | | | | |
|
Indonesia — 10.5%*: | |
Indonesia Treasury Bond | | | 8.38 | | | | 3/15/2034 | | | | 7,500,000,000 | | | | 513,213 | | | | 509,233 | |
| | | | | | | | | | | | | | | | | | | | |
|
Israel — 4.5%*: | |
Israel Government Bond | | | 5.50 | | | | 1/31/2042 | | | | 600,000 | | | | 221,137 | | | | 216,230 | |
| | | | | | | | | | | | | | | | | | | | |
|
Malaysia — 11.8%*: | |
Malaysia Government Bond | | | 3.48 | | | | 3/15/2023 | | | | 2,000,000 | | | | 447,378 | | | | 446,059 | |
Malaysia Government Bond | | | 4.50 | | | | 4/15/2030 | | | | 550,000 | | | | 128,533 | | | | 126,802 | |
| | | | | | | | | | | | | | | | | | | | |
Total Malaysia | | | | | | | | | | | 2,550,000 | | | | 575,911 | | | | 572,861 | |
| | | | | | | | | | | | | | | | | | | | |
|
Mexico — 4.4%*: | |
Mexican Bonos | | | 7.75 | | | | 11/13/2042 | | | | 3,400,000 | | | | 218,527 | | | | 215,798 | |
| | | | | | | | | | | | | | | | | | | | |
|
Philippines — 4.5%*: | |
Philippine Government International Bond | | | 4.95 | | | | 1/15/2021 | | | | 10,000,000 | | | | 220,930 | | | | 215,971 | |
| | | | | | | | | | | | | | | | | | | | |
|
Poland — 4.6%*: | |
Poland Government Bond | | | 5.25 | | | | 10/25/2020 | | | | 775,000 | | | | 221,948 | | | | 223,043 | |
| | | | | | | | | | | | | | | | | | | | |
|
Romania — 4.3%*: | |
Romania Government Bond | | | 6.75 | | | | 6/11/2017 | | | | 800,000 | | | | 210,466 | | | | 207,208 | |
| | | | | | | | | | | | | | | | | | | | |
|
Russia — 4.3%*: | |
Russian Federal Inflation Linked Bond | | | 2.50 | | | | 8/16/2023 | | | | 15,375,150 | | | | 221,676 | | | | 209,930 | |
| | | | | | | | | | | | | | | | | | | | |
|
Serbia — 4.1%*: | |
Serbia Treasury Bonds | | | 10.00 | | | | 2/5/2022 | | | | 20,000,000 | | | | 202,658 | | | | 199,835 | |
| | | | | | | | | | | | | | | | | | | | |
|
South Africa — 6.6%*: | |
South Africa Government Bond | | | 8.75 | | | | 2/28/2048 | | | | 5,900,000 | | | | 361,454 | | | | 321,197 | |
| | | | | | | | | | | | | | | | | | | | |
|
Thailand — 4.6%*: | |
Thailand Government Bond | | | 1.20 | | | | 7/14/2021 | | | | 8,510,800 | | | | 225,887 | | | | 223,676 | |
| | | | | | | | | | | | | | | | | | | | |
|
Uruguay — 2.0%*: | |
Uruguay Government International Bond | | | 4.38 | | | | 12/15/2028 | | | | 3,225,630 | | | | 99,258 | | | | 97,044 | |
| | | | | | | | | | | | | | | | | | | | |
Total Foreign Government | | | | | | | | | | | 9,430,136,580 | | | | 4,464,838 | | | | 4,370,217 | |
| | | | | | | | | | | | | | | | | | | | |
Total Fixed Income | | | | | | | | | | | 9,430,136,580 | | | | 4,464,838 | | | | 4,370,217 | |
| | | | | | | | | | | | | | | | | | | | |
See accompanying Notes to Financial Statements.
128
Babson Emerging Markets Local Currency Debt Fund 2015 Semi-Annual Report
SCHEDULE OF INVESTMENTS (UNAUDITED) (CONTINUED)
December 31, 2015
| | | | | | | | | | | | | | | | | | | | |
| | | EFFECTIVE
INTEREST RATE | | | DUE DATE | | | PRINCIPAL ‡‡ | | | COST | | | FAIR
VALUE | |
Short-Term Investments — 9.5%*: | |
Bank Deposit — 7.5%*: | |
State Street Bank & Trust Co. Euro Time Deposit | | | 0.01 | % | | | 1/4/2016 | | | | 363,781 | | | | $363,781 | | | | $363,781 | |
| | | | | | | | | | | | | | | | | | | | |
Foreign Government — 2.0%*+: | |
|
Argentina — 2.0%*: | |
Argentine Bonad Bonds¤ | | | 1.75 | | | | 10/28/2016 | | | | 112,000 | | | | 100,353 | | | | 94,640 | |
| | | | | | | | | | | | | | | | | | | | |
Total Short-Term Investments | | | | | | | | | | | 475,781 | | | | 464,134 | | | | 458,421 | |
| | | | | | | | | | | | | | | | | | | | |
Total Investments | | | | | | | | 9,430,612,361 | | | | 4,928,972 | | | | 4,828,638 | |
| | | | | | | | | | | | | | | | | | | | |
| | | | |
Other assets and liabilities — 0.4%* | | | | | | | | | | | | | | | | 19,248 | |
| | | | |
Net Assets — 100.0% | | | | | | | | | | | | | | | | $4,847,886 | |
| | | | | | | | | | | | | | | | | | | | |
| ‡‡ | Unless otherwise indicated, all principal amounts are denominated in United States Dollars. |
| * | Calculated as a percentage of net assets applicable to common shareholders. |
Distributions of investments by country of risk (excluding temporary cash investments) as a percentage of total investments in securities, is as follows:
| | | | | | |
| | Malaysia | | | 12.8% | |
| | Indonesia | | | 11.4% | |
| | Colombia | | | 11.4% | |
| | Brazil | | | 9.8% | |
| | South Africa | | | 7.2% | |
| | Thailand | | | 5.0% | |
| | Poland | | | 5.0% | |
| | Israel | | | 4.9% | |
| | Philippines | | | 4.8% | |
| | Mexico | | | 4.8% | |
| | Hungary | | | 4.8% | |
| | Russia | | | 4.7% | |
| | Romania | | | 4.6% | |
| | Serbia | | | 4.5% | |
| | Uruguay | | | 2.2% | |
| | Argentina | | | 2.1% | |
| | | | | | |
| | Total | | | 100.0% | |
| | | | | | |
| ¤ | For fair value measurement disclosure purposes, security is categorized as Level 3 (See Note 2). |
See accompanying Notes to Financial Statements.
129
Babson Emerging Markets Local Currency Debt Fund 2015 Semi-Annual Report
SCHEDULE OF INVESTMENTS (UNAUDITED) (CONTINUED)
December 31, 2015
Forward Foreign Currency Exchange Contracts to Buy
| | | | | | | | | | | | | | | | | | | | | | |
EXPIRATION
DATE | | COUNTERPARTY | | LOCAL CURRENCY | | | VALUE IN USD | | | IN EXCHANGE
FOR USD | | | NET UNREALIZED
APPRECIATION
(DEPRECIATION) | |
| 3/8/16 | | Citibank N.A. | | | HUF | | | | 71,409,975 | | | | 245,217 | | | | 247,900 | | | $ | (2,683 | ) |
| 3/8/16 | | JPMorgan Chase Bank N.A. | | | MXN | | | | 6,420,288 | | | | 370,083 | | | | 375,000 | | | | (4,917 | ) |
| 3/8/16 | | Bank of America N.A. | | | NOK | | | | 435,492 | | | | 49,169 | | | | 50,000 | | | | (831 | ) |
| 3/8/16 | | JPMorgan Chase Bank N.A. | | | PLN | | | | 2,677,802 | | | | 677,275 | | | | 675,000 | | | | 2,275 | |
| 3/8/16 | | Citibank N.A. | | | RSD | | | | 13,981,250 | | | | 124,341 | | | | 125,000 | | | | (659 | ) |
| 3/8/16 | | Citibank N.A. | | | SEK | | | | 421,273 | | | | 50,059 | | | | 50,000 | | | | 59 | |
| 3/8/16 | | Citibank N.A. | | | TRY | | | | 2,040,134 | | | | 686,347 | | | | 683,550 | | | | 2,797 | |
| 3/8/16 | | Citibank N.A. | | | ZAR | | | | 6,935,295 | | | | 442,384 | | | | 470,450 | | | | (28,066 | ) |
| | | | | | | | | | | | | | | | | | | | | | |
Net unrealized depreciation on forward foreign exchange contracts to buy | | | $ | (32,025 | ) |
| | | | | | | | | | | | | | | | | | | | | | |
Forward Foreign Currency Exchange Contracts to Sell
| | | | | | | | | | | | | | | | | | | | | | |
EXPIRATION
DATE | | COUNTERPARTY | | | | | LOCAL
CURRENCY | | | VALUE IN USD | | | IN
EXCHANGE
FOR USD | | | NET UNREALIZED
APPRECIATION
(DEPRECIATION) | |
| 3/8/16 | | Citibank N.A. | | | AUD | | | | 139,422 | | | | 101,120 | | | | 100,000 | | | $ | (1,120 | ) |
| 3/8/16 | | Bank of America N.A. | | | CAD | | | | 101,793 | | | | 73,291 | | | | 75,000 | | | | 1,709 | |
| 3/8/16 | | JPMorgan Chase Bank N.A. | | | CHF | | | | 98,547 | | | | 98,711 | | | | 100,000 | | | | 1,289 | |
| 3/8/16 | | Bank of America N.A. | | | CLP | | | | 67,386,200 | | | | 94,415 | | | | 94,750 | | | | 335 | |
| 3/8/16 | | JPMorgan Chase Bank N.A. | | | EUR | | | | 730,305 | | | | 794,572 | | | | 801,400 | | | | 6,828 | |
| 3/8/16 | | Bank of America N.A. | | | GBP | | | | 66,266 | | | | 97,679 | | | | 100,000 | | | | 2,321 | |
| 3/8/16 | | Citibank N.A. | | | IDR | | | | 2,130,034,825 | | | | 151,251 | | | | 148,450 | | | | (2,801 | ) |
| 3/8/16 | | Bank of America N.A. | | | ILS | | | | 855,300 | | | | 220,078 | | | | 221,634 | | | | 1,556 | |
| 3/8/16 | | Bank of America N.A. | | | NZD | | | | 189,718 | | | | 129,387 | | | | 125,000 | | | | (4,387 | ) |
| 3/8/16 | | Citibank N.A. | | | PHP | | | | 14,313,320 | | | | 303,205 | | | | 300,700 | | | | (2,505 | ) |
| 3/8/16 | | Bank of America N.A. | | | RON | | | | 892,495 | | | | 214,448 | | | | 217,602 | | | | 3,154 | |
| 3/8/16 | | Citibank N.A. | | | SGD | | | | 352,442 | | | | 247,936 | | | | 250,000 | | | | 2,064 | |
| | | | | | | | | | | | | | | | | | | | | | |
Net unrealized appreciation on forward foreign exchange contracts to sell | | | $ | 8,443 | |
| | | | | | | | | | | | | | | | | | | | | | |
Currency Legend
| | | | |
| AUD | | – | | Australian Dollar |
| CAD | | – | | Canadian Dollar |
| CHF | | – | | Swiss Franc |
| CLP | | – | | Chilean Peso |
| EUR | | – | | Euro |
| GBP | | – | | British Pound Sterling |
| HUF | | – | | Hungarian Forint |
| IDR | | – | | Indonesian Rupiah |
| ILS | | – | | Israeli Shekel |
| MXN | | – | | Mexican Peso |
| NOK | | – | | Norwegian Krona |
See accompanying Notes to Financial Statements.
130
Babson Emerging Markets Local Currency Debt Fund 2015 Semi-Annual Report
SCHEDULE OF INVESTMENTS (UNAUDITED) (CONTINUED)
December 31, 2015
| | | | |
| NZD | | – | | New Zealand Dollar |
| PHP | | – | | Philippines Peso |
| PLN | | – | | Polish Zloty |
| RON | | – | | New Romanian Leu |
| RSD | | – | | Serbian Dinar. |
| SEK | | – | | Swedish Krona |
| SGD | | – | | Singapore Dollar |
| TRY | | – | | New Turkish Lira |
| ZAR | | – | | South African Rand |
OTC – Interest Rate Swaps
| | | | | | | | | | | | |
| DESCRIPTION | | NOTIONAL
AMOUNT | | | UNREALIZED
APPRECIATION
(DEPRECIATION) | | | VALUE | |
Agreement with Bank of America N.A. dated 12/9/15 paying a fixed rate of 15.38% recieving the notional amount multiplied by the BRL-CDI rate. Expiring 1/2/25 | | | 357,308 | | | $ | 7,952 | | | $ | 7,952 | |
Agreement with Bank of America N.A. dated 12/9/15 receiving a fixed rate of 8.68% paying the notional amount multiplied by the ZAR-JIBAR rate. Expiring 12/9/25 | | | 8,000,000 | | | | (26,145 | ) | | | (26,145 | ) |
Agreement with JPMorgan Chase Bank N.A. dated 12/9/15 receiving a fixed rate of 6.35% paying the notional amount multiplied by the MXN-TIIE rate. Expiring 11/27/25 | | | 9,500,000 | | | | (2,920 | ) | | | (2,920 | ) |
| | | | | | | | | | | | |
| | | | | | | | | | $ | (21,113 | ) |
| | | | | | | | | | | | |
See accompanying Notes to Financial Statements.
131
Babson Global High Yield Fund 2015 Semi-Annual Report
SCHEDULE OF INVESTMENTS (UNAUDITED)
December 31, 2015
| | | | | | | | | | | | | | | | | | | | |
| | | EFFECTIVE
INTEREST RATE | | | DUE DATE | | | PRINCIPAL ‡‡ | | | COST | | | FAIR
VALUE | |
Fixed Income — 94.3%*: | | | | | | | | | | | | | | | | | | | | |
| | | | | |
Corporate Bonds — 94.3%*: | | | | | | | | | | | | | | | | | | | | |
| | | | | |
Aerospace and Defense — 7.4%*: | | | | | | | | | | | | | | | | | | | | |
CPI International, Inc. | | | 8.75 | % | | | 2/15/2018 | | | | 500,000 | | | | $503,515 | | | | $492,500 | |
DigitalGlobe, Inc.^ | | | 5.25 | | | | 2/1/2021 | | | | 250,000 | | | | 223,739 | | | | 210,000 | |
Huntington Ingalls Industries, Inc.^ | | | 5.00 | | | | 11/15/2025 | | | | 700,000 | | | | 700,000 | | | | 710,500 | |
Swissport Investments SA+ | | | 6.75 | | | | 12/15/2021 | | | | 150,000 | | | | 164,235 | | | | 168,922 | |
TransDigm, Inc.^ | | | 6.50 | | | | 5/15/2025 | | | | 223,000 | | | | 226,543 | | | | 216,031 | |
| | | | | | | | | | | | | | | | | | | | |
Total Aerospace and Defense | | | | | | | 1,823,000 | | | | 1,818,032 | | | | 1,797,953 | |
| | | | | | | | | | | | | | | | | | | | |
| | |
Automobile — 3.2%*: | | | | | | | | | |
Affinia Group, Inc. | | | 7.75 | | | | 5/1/2021 | | | | 250,000 | | | | 260,656 | | | | 254,450 | |
Gates Global LLC/Gates Global Co.^ | | | 6.00 | | | | 7/15/2022 | | | | 125,000 | | | | 95,335 | | | | 90,000 | |
Goodyear Tire & Rubber Co. (The) | | | 5.13 | | | | 11/15/2023 | | | | 218,000 | | | | 218,000 | | | | 223,450 | |
International Automotive Components Group SA^ | | | 9.13 | | | | 6/1/2018 | | | | 250,000 | | | | 252,361 | | | | 213,750 | |
| | | | | | | | | | | | | | | | | | | | |
Total Automobile | | | | | | | 843,000 | | | | 826,352 | | | | 781,650 | |
| | | | | | | | | | | | | | | | | | | | |
| | |
Banking — 0.9%*: | | | | | | | | | |
Lock AS+ | | | 7.00 | | | | 8/15/2021 | | | | 200,000 | | | | 231,221 | | | | 226,500 | |
| | | | | | | | | | | | | | | | | | | | |
| | |
Beverage, Food and Tobacco — 1.4%*: | | | | | | | | | |
Boparan Finance PLC+ | | | 5.50 | | | | 7/15/2021 | | | | 250,000 | | | | 355,474 | | | | 326,167 | |
| | | | | | | | | | | | | | | | | | | | |
| | |
Broadcasting and Entertainment — 5.3%*: | | | | | | | | | |
CCOH Safari LLC^ | | | 5.75 | | | | 2/15/2026 | | | | 750,000 | | | | 750,000 | | | | 751,875 | |
Entertainment One Ltd.+ | | | 6.88 | | | | 12/15/2022 | | | | 100,000 | | | | 150,251 | | | | 146,757 | |
Gray Television, Inc. | | | 7.50 | | | | 10/1/2020 | | | | 174,000 | | | | 181,560 | | | | 178,785 | |
Unitymedia Hessen GmbH & Co. KG / Unitymedia NRW GmbH+ | | | 3.50 | | | | 1/15/2027 | | | | 200,000 | | | | 214,401 | | | | 199,962 | |
| | | | | | | | | | | | | | | | | | | | |
Total Broadcasting and Entertainment | | | | | | | 1,224,000 | | | | 1,296,212 | | | | 1,277,379 | |
| | | | | | | | | | | | | | | | | | | | |
| | |
Buildings and Real Estate — 4.7%*: | | | | | | | | | |
Brookfield Residential Properties, Inc.+^ | | | 6.50 | | | | 12/15/2020 | | | | 250,000 | | | | 249,390 | | | | 240,938 | |
M/I Homes, Inc.^ | | | 6.75 | | | | 1/15/2021 | | | | 250,000 | | | | 250,000 | | | | 246,250 | |
Paroc Group Oy+ | | | 6.25 | | | | 5/15/2020 | | | | 150,000 | | | | 158,362 | | | | 155,698 | |
Summit Materials LLC / Summit Materials Finance Corp.^ | | | 6.13 | | | | 7/15/2023 | | | | 500,000 | | | | 496,913 | | | | 492,500 | |
| | | | | | | | | | | | | | | | | | | | |
Total Buildings and Real Estate | | | | | | | 1,150,000 | | | | 1,154,665 | | | | 1,135,386 | |
| | | | | | | | | | | | | | | | | | | | |
| | |
Cargo Transport — 5.8%*: | | | | | | | | | |
Moto Finance PLC+ | | | 6.38 | | | | 9/1/2020 | | | | 100,000 | | | | 156,347 | | | | 151,400 | |
OPE KAG Finance Sub, Inc.^ | | | 7.88 | | | | 7/31/2023 | | | | 750,000 | | | | 781,437 | | | | 745,313 | |
WFS Global Holding SAS+ | | | 9.50 | | | | 7/15/2022 | | | | 250,000 | | | | 281,825 | | | | 284,495 | |
XPO Logistics, Inc.^ | | | 6.50 | | | | 6/15/2022 | | | | 250,000 | | | | 225,452 | | | | 231,250 | |
| | | | | | | | | | | | | | | | | | | | |
Total Cargo Transport | | | | | | | 1,350,000 | | | | 1,445,061 | | | | 1,412,458 | |
| | | | | | | | | | | | | | | | | | | | |
See accompanying Notes to Financial Statements.
132
Babson Global High Yield Fund 2015 Semi-Annual Report
SCHEDULE OF INVESTMENTS (UNAUDITED) (CONTINUED)
December 31, 2015
| | | | | | | | | | | | | | | | | | | | |
| | | EFFECTIVE
INTEREST RATE | | | DUE DATE | | | PRINCIPAL ‡‡ | | | COST | | | FAIR
VALUE | |
Corporate Bonds (Continued) | | | | | | | | | | | | | | | | | | | | |
| | |
Chemicals, Plastics and Rubber — 5.1%*: | | | | | | | | | |
Consolidated Energy Finance SA+^ | | | 6.75 | % | | | 10/15/2019 | | | | 370,000 | | | | $363,265 | | | | $353,701 | |
Huntsman International LLC | | | 4.88 | | | | 11/15/2020 | | | | 250,000 | | | | 237,967 | | | | 228,125 | |
INEOS Group Holdings SA+ | | | 5.75 | | | | 2/15/2019 | | | | 200,000 | | | | 221,244 | | | | 217,350 | |
LSB Industries, Inc. | | | 7.75 | | | | 8/1/2019 | | | | 63,000 | | | | 54,499 | | | | 52,290 | |
Platform Specialty Products Corp.^ | | | 10.38 | | | | 5/1/2021 | | | | 392,000 | | | | 392,000 | | | | 391,020 | |
| | | | | | | | | | | | | | | | | | | | |
Total Chemicals, Plastics and Rubber | | | | | | | 1,275,000 | | | | 1,268,975 | | | | 1,242,486 | |
| | | | | | | | | | | | | | | | | | | | |
| | |
Containers, Packaging and Glass — 5.4%*: | | | | | | | | | |
Ardagh Packaging Finance plc / Ardagh Holdings USA, Inc.^ | | | 6.25 | | | | 1/31/2019 | | | | 250,000 | | | | 252,399 | | | | 240,000 | |
Coveris Holdings SA^ | | | 7.88 | | | | 11/1/2019 | | | | 250,000 | | | | 240,480 | | | | 218,125 | |
Horizon Holdings I SASU+ | | | 7.25 | | | | 8/1/2023 | | | | 300,000 | | | | 344,301 | | | | 337,358 | |
Mustang Merger Corp.^ | | | 8.50 | | | | 8/15/2021 | | | | 334,000 | | | | 351,269 | | | | 346,525 | |
SIG Combibloc Holdings SCA+ | | | 7.75 | | | | 2/15/2023 | | | | 150,000 | | | | 173,721 | | | | 169,940 | |
| | | | | | | | | | | | | | | | | | | | |
Total Containers, Packaging and Glass | | | | | | | 1,284,000 | | | | 1,362,170 | | | | 1,311,948 | |
| | | | | | | | | | | | | | | | | | | | |
| | |
Diversified Natural Resources, Precious Metals and Minerals — 1.8%*: | | | | | | | | | |
Cemex SAB de CV+^ | | | 6.13 | | | | 5/5/2025 | | | | 500,000 | | | | 480,731 | | | | 427,500 | |
| | | | | | | | | | | | | | | | | | | | |
| | |
Diversified/Conglomerate Manufacturing — 1.8%*: | | | | | | | | | |
EnPro Industries, Inc. | | | 5.88 | | | | 9/15/2022 | | | | 221,000 | | | | 223,168 | | | | 218,790 | |
West Corp.^ | | | 5.38 | | | | 7/15/2022 | | | | 250,000 | | | | 239,574 | | | | 215,625 | |
| | | | | | | | | | | | | | | | | | | | |
Total Diversified/Conglomerate Manufacturing | | | | | | | 471,000 | | | | 462,742 | | | | 434,415 | |
| | | | | | | | | | | | | | | | | | | | |
| | |
Diversified/Conglomerate Service — 3.0%*: | | | | | | | | | |
Sabre GLBL, Inc.^ | | | 5.25 | | | | 11/15/2023 | | | | 307,000 | | | | 307,000 | | | | 303,546 | |
Verisure Holding AB+ | | | 6.00 | | | | 11/1/2022 | | | | 150,000 | | | | 168,899 | | | | 169,533 | |
Zachry Holdings, Inc.^ | | | 7.50 | | | | 2/1/2020 | | | | 250,000 | | | | 253,027 | | | | 245,000 | |
| | | | | | | | | | | | | | | | | | | | |
Total Diversified/Conglomerate Service | | | | | | | 707,000 | | | | 728,926 | | | | 718,079 | |
| | | | | | | | | | | | | | | | | | | | |
| | |
Finance — 8.2%*: | | | | | | | | | |
Ally Financial, Inc. | | | 3.25 | | | | 11/5/2018 | | | | 750,000 | | | | 748,988 | | | | 735,937 | |
CNH Industrial Capital LLC | | | 4.38 | | | | 11/6/2020 | | | | 500,000 | | | | 497,307 | | | | 471,250 | |
Galaxy Finco Ltd.+ | | | 7.88 | | | | 11/15/2021 | | | | 250,000 | | | | 381,934 | | | | 368,550 | |
Garfunkelux Holdco 3 SA+ | | | 8.50 | | | | 11/1/2022 | | | | 200,000 | | | | 312,881 | | | | 296,314 | |
Worldpay Finance PLC+ | | | 3.75 | | | | 11/15/2022 | | | | 100,000 | | | | 108,765 | | | | 110,713 | |
| | | | | | | | | | | | | | | | | | | | |
Total Finance | | | | | | | 1,800,000 | | | | 2,049,875 | | | | 1,982,764 | |
| | | | | | | | | | | | | | | | | | | | |
| | |
Healthcare, Education and Childcare — 11.6%*: | | | | | | | | | |
Alere, Inc.^ | | | 6.38 | | | | 7/1/2023 | | | | 250,000 | | | | 257,292 | | | | 233,750 | |
Capsugel SA PIK^ | | | 7.00 | | | | 5/15/2019 | | | | 375,000 | | | | 378,375 | | | | 365,625 | |
HCA, Inc. | | | 5.38 | | | | 2/1/2025 | | | | 375,000 | | | | 381,485 | | | | 370,313 | |
HCA, Inc. | | | 5.88 | | | | 2/15/2026 | | | | 375,000 | | | | 375,000 | | | | 376,406 | |
Kindred Healthcare, Inc. | | | 8.75 | | | | 1/15/2023 | | | | 250,000 | | | | 256,161 | | | | 228,750 | |
See accompanying Notes to Financial Statements.
133
Babson Global High Yield Fund 2015 Semi-Annual Report
SCHEDULE OF INVESTMENTS (UNAUDITED) (CONTINUED)
December 31, 2015
| | | | | | | | | | | | | | | | | | | | |
| | | EFFECTIVE
INTEREST RATE | | | DUE DATE | | | PRINCIPAL ‡‡ | | | COST | | | FAIR
VALUE | |
Corporate Bonds (Continued) | | | | | | | | | | | | | | | | | | | | |
| | |
Healthcare, Education and Childcare (Continued) | | | | | | | | | |
MEDNAX, Inc.^ | | | 5.25 | % | | | 12/1/2023 | | | | 101,000 | | | | $101,000 | | | | $101,505 | |
Molina Healthcare, Inc.^ | | | 5.38 | | | | 11/15/2022 | | | | 750,000 | | | | 750,000 | | | | 750,000 | |
Valeant Pharmaceuticals International, Inc.^ | | | 6.13 | | | | 4/15/2025 | | | | 425,000 | | | | 366,374 | | | | 379,312 | |
| | | | | | | | | | | | | | | | | | | | |
Total Healthcare, Education and Childcare | | | | | | | 2,901,000 | | | | 2,865,687 | | | | 2,805,661 | |
| | | | | | | | | | | | | | | | | | | | |
| | |
Home and Office Furnishings, Housewares, and Durable Consumer Products — 1.4%*: | | | | | | | | | |
LSF9 Balta Issuer SA+ | | | 7.75 | | | | 9/15/2022 | | | | 300,000 | | | | 344,738 | | | | 341,968 | |
| | | | | | | | | | | | | | | | | | | | |
| | |
Hotels, Motels, Inns and Gaming — 1.0%*: | | | | | | | | | |
Churchill Downs, Inc.^ | | | 5.38 | | | | 12/15/2021 | | | | 246,000 | | | | 248,444 | | | | 246,615 | |
| | | | | | | | | | | | | | | | | | | | |
| | |
Insurance — 0.9%*: | | | | | | | | | |
York Risk Services Holding Corp.^ | | | 8.50 | | | | 10/1/2022 | | | | 250,000 | | | | 223,813 | | | | 205,000 | |
| | | | | | | | | | | | | | | | | | | | |
| | |
Leisure, Amusement, Entertainment — 3.2%*: | | | | | | | | | |
Brunswick Corp. | | | 7.13 | | | | 8/1/2027 | | | | 167,000 | | | | 179,925 | | | | 177,020 | |
CPUK Finance Ltd.+ | | | 7.00 | | | | 2/28/2042 | | | | 200,000 | | | | 311,769 | | | | 301,474 | |
Odeon & UCI Finco PLC MTN+ | | | 9.00 | | | | 8/1/2018 | | | | 100,000 | | | | 158,256 | | | | 153,096 | |
Perform Group Financing PLC+ | | | 8.50 | | | | 11/15/2020 | | | | 100,000 | | | | 149,194 | | | | 137,115 | |
| | | | | | | | | | | | | | | | | | | | |
Total Leisure, Amusement, Entertainment | | | | | | | 567,000 | | | | 799,144 | | | | 768,705 | |
| | | | | | | | | | | | | | | | | | | | |
| | |
Machinery Non-Agriculture, Non-Construction, Non-Electronic — 1.0%*: | | | | | | | | | |
Xerium Technologies, Inc. | | | 8.88 | | | | 6/15/2018 | | | | 250,000 | | | | 253,606 | | | | 245,031 | |
| | | | | | | | | | | | | | | | | | | | |
| | |
Mining, Steel, Iron and Non-Precious Metals — 1.7%*: | | | | | | | | | |
Constellium NV | | | 7.00 | | | | 1/15/2023 | | | | 250,000 | | | | 239,754 | | | | 219,252 | |
Hecla Mining Co. | | | 6.88 | | | | 5/1/2021 | | | | 250,000 | | | | 212,704 | | | | 182,500 | |
| | | | | | | | | | | | | | | | | | | | |
Total Mining, Steel, Iron and Non-Precious Metals | | | | | | | 500,000 | | | | 452,458 | | | | 401,752 | |
| | | | | | | | | | | | | | | | | | | | |
| | |
Oil and Gas — 7.3%*: | | | | | | | | | |
Calumet Specialty Products Partners LP / Calumet Finance Corp.^ | | | 7.75 | | | | 4/15/2023 | | | | 52,000 | | | | 49,437 | | | | 44,200 | |
Citgo Holding, Inc.^ | | | 10.75 | | | | 2/15/2020 | | | | 341,000 | | | | 346,010 | | | | 330,770 | |
EP Energy LLC/Everest Acquisition Finance, Inc. | | | 9.38 | | | | 5/1/2020 | | | | 508,000 | | | | 452,368 | | | | 323,850 | |
Genesis Energy LP/Genesis Energy Finance Corp. | | | 6.75 | | | | 8/1/2022 | | | | 250,000 | | | | 244,434 | | | | 212,500 | |
Newfield Exploration Co. | | | 5.38 | | | | 1/1/2026 | | | | 250,000 | | | | 241,350 | | | | 206,875 | |
PBF Holding Co. LLC / PBF Finance Corp.^ | | | 7.00 | | | | 11/15/2023 | | | | 500,000 | | | | 500,000 | | | | 487,500 | |
Tullow Oil PLC+^ | | | 6.25 | | | | 4/15/2022 | | | | 250,000 | | | | 193,345 | | | | 167,500 | |
| | | | | | | | | | | | | | | | | | | | |
Total Oil and Gas | | | | | | | 2,151,000 | | | | 2,026,944 | | | | 1,773,195 | |
| | | | | | | | | | | | | | | | | | | | |
| | |
Personal Transportation — 0.9%*: | | | | | | | | | |
AA Bond Co. Ltd.+ | | | 5.50 | | | | 7/31/2043 | | | | 150,000 | | | | 221,578 | | | | 209,797 | |
| | | | | | | | | | | | | | | | | | | | |
See accompanying Notes to Financial Statements.
134
Babson Global High Yield Fund 2015 Semi-Annual Report
SCHEDULE OF INVESTMENTS (UNAUDITED) (CONTINUED)
December 31, 2015
| | | | | | | | | | | | | | | | | | | | |
| | | EFFECTIVE
INTEREST RATE | | | DUE DATE | | | PRINCIPAL ‡‡ | | | COST | | | FAIR VALUE | |
Corporate Bonds (Continued) | | | | | | | | | | | | | | | | | | | | |
| | |
Retail Stores — 3.6%*: | | | | | | | | | |
Brighthouse Group PLC MTN+ | | | 7.88 | % | | | 5/15/2018 | | | | 100,000 | | | | $146,910 | | | | $141,328 | |
Debenhams PLC+ | | | 5.25 | | | | 7/15/2021 | | | | 150,000 | | | | 232,803 | | | | 220,010 | |
Dollar Tree, Inc.^ | | | 5.75 | | | | 3/1/2023 | | | | 500,000 | | | | 525,495 | | | | 517,500 | |
| | | | | | | | | | | | | | | | | | | | |
Total Retail Stores | | | | | | | 750,000 | | | | 905,208 | | | | 878,838 | |
| | | | | | | | | | | | | | | | | | | | |
| | |
Telecommunications — 7.7%*: | | | | | | | | | |
Altice Financing SA+^ | | | 6.63 | | | | 2/15/2023 | | | | 250,000 | | | | 251,718 | | | | 246,875 | |
Sprint Corp. | | | 7.88 | | | | 9/15/2023 | | | | 250,000 | | | | 229,040 | | | | 187,750 | |
T-Mobile USA, Inc. | | | 6.50 | | | | 1/15/2026 | | | | 750,000 | | | | 750,000 | | | | 757,118 | |
Virgin Media Secured Finance PLC MTN+ | | | 5.13 | | | | 1/15/2025 | | | | 150,000 | | | | 227,108 | | | | 209,521 | |
Wind Acquisition Finance SA+ | | | 7.00 | | | | 4/23/2021 | | | | 250,000 | | | | 269,758 | | | | 268,291 | |
Ziggo Bond Finance BV+ | | | 4.63 | | | | 1/15/2025 | | | | 200,000 | | | | 205,604 | | | | 201,592 | |
| | | | | | | | | | | | | | | | | | | | |
Total Telecommunications | | | | | | | | | | | 1,850,000 | | | | 1,933,228 | | | | 1,871,147 | |
| | | | | | | | | | | | | | | | | | | | |
Total Corporate Bonds | | | | | | | | | | | 22,792,000 | | | | 23,755,284 | | | | 22,822,394 | |
| | | | | | | | | | | | | | | | | | | | |
Total Fixed Income | | | | | | | | | | | 22,792,000 | | | | 23,755,284 | | | | 22,822,394 | |
| | | | | | | | | | | | | | | | | | | | |
Short-Term Investment — 4.7%*: | | | | | | | | | | | | | | | | | | | | |
| | | | | |
Bank Deposit — 4.7%*: | | | | | | | | | | | | | | | | | | | | |
State Street Bank & Trust Co. Euro Time Deposit | | | 0.01 | | | | 1/4/2016 | | | | 1,147,156 | | | | 1,147,156 | | | | 1,147,156 | |
| | | | | | | | | | | | | | | | | | | | |
Total Investments | | | | | | | | | | | 23,939,156 | | | | 24,902,440 | | | | 23,969,550 | |
| | | | | | | | | | | | | | | | | | | | |
| | | | | |
Other assets and liabilities — 1.0%* | | | | | | | | | | | | | | | | | | | 245,762 | |
| | | | | |
Net Assets — 100.0% | | | | | | | | | | | | | | | | | | | $24,215,312 | |
| | | | | | | | | | | | | | | | | | | | |
‡‡ Unless otherwise indicated, all principal amounts are denominated in United States Dollars.
| * | Calculated as a percentage of net assets applicable to common shareholders. |
| | Distributions of investments by country of risk (excluding temporary cash investments) as a percentage of total investments in securities, is as follows: |
| | | | | | |
| | United States | | | 69.5% | |
| | United Kingdom | | | 10.8% | |
| | France | | | 2.7% | |
| | Switzerland | | | 2.4% | |
| | Germany | | | 2.2% | |
| | Mexico | | | 1.9% | |
| | Trinidad And Tobago | | | 1.6% | |
| | Belgium | | | 1.5% | |
| | Italy | | | 1.2% | |
See accompanying Notes to Financial Statements.
135
Babson Global High Yield Fund 2015 Semi-Annual Report
SCHEDULE OF INVESTMENTS (UNAUDITED) (CONTINUED)
December 31, 2015
| | | | | | |
| | Portugal | | | 1.1% | |
| | Canada | | | 1.1% | |
| | Norway | | | 1.0% | |
| | Other (Individually less than 1%) | | | 3.0% | |
| | | | | | |
| | Total | | | 100.0% | |
| | | | | | |
| ^ | Security acquired in a transaction exempt from registration under Rule 144A of the Securities Act of 1933. These securities may only be resold in transactions exempt from registration, normally to qualified institutional buyers. |
| § | Bank loans are exempt from registration under the Securities Act of 1933, as amended, but contain certain restrictions on resale and cannot be sold publicly. These loans pay interest at rates which adjust periodically. The interest rates shown for bank loans are the current interest rates at December 31, 2015. Bank loans are also subject to mandatory and/or optional prepayment which cannot be predicted. As a result, the remaining maturity may be substantially less than the stated maturity shown. |
A summary of outstanding derivatives at December 31, 2015 is as follows:
Forward Foreign Currency Exchange Contracts to Buy
| | | | | | | | | | | | | | | | | | | | | | |
EXPIRATION
DATE | | COUNTERPARTY | | LOCAL
CURRENCY | | | VALUE IN USD | | | IN
EXCHANGE
FOR USD | | | NET UNREALIZED
DEPRECIATION | |
| 1/8/16 | | JPMorgan Chase Bank N.A. | | | EUR | | | | 58,473 | | | | 63,551 | | | | 63,965 | | | $ | (414 | ) |
Forward Foreign Currency Exchange Contracts to Sell
| | | | | | | | | | | | | | | | | | | | | | |
EXPIRATION
DATE | | COUNTERPARTY | | LOCAL
CURRENCY | | | VALUE IN
USD | | | IN
EXCHANGE
FOR USD | | | NET UNREALIZED
APPRECIATION
(DEPRECIATION) | |
| 1/8/16 | | JPMorgan Chase Bank N.A. | | | EUR | | | | 2,799,255 | | | | 3,042,330 | | | | 2,974,544 | | | $ | (67,785 | ) |
| 1/8/16 | | Bank of America N.A. | | | EUR | | | | 150,000 | | | | 163,025 | | | | 164,374 | | | | 1,349 | |
| 1/8/16 | | Bank of America N.A. | | | GBP | | | | 1,868,677 | | | | 2,754,828 | | | | 2,814,804 | | | | 59,976 | |
| | | | | | | | | | | | | | | | | | | | | | |
Net unrealized depreciation on forward foreign exchange contracts to sell | | | | | | | $ | (6,460 | ) |
| | | | | | | | | | | | | | | | | | | | | | |
Currency Legend
| | | | |
| EUR | | – | | Euro |
| GBP | | – | | British Pound Sterling |
See accompanying Notes to Financial Statements.
136
Babson U.S. High Yield Fund 2015 Semi-Annual Report
SCHEDULE OF INVESTMENTS (UNAUDITED)
December 31, 2015
| | | | | | | | | | | | | | | | | | | | |
| | | EFFECTIVE
INTEREST RATE | | | DUE DATE | | | PRINCIPAL ‡‡ | | | COST | | | FAIR
VALUE | |
Fixed Income — 84.6%*: | | | | | | | | | | | | | | | | | | | | |
| | | | | |
Bank Loan — 0.3%*§: | | | | | | | | | | | | | | | | | | | | |
| | | | | |
Oil and Gas — 0.3%*: | | | | | | | | | | | | | | | | | | | | |
Fieldwood Energy LLC | | | 8.38 | #% | | | 9/30/2020 | | | | 500,000 | | | | $196,110 | | | | $75,000 | |
| | | | | | | | | | | | | | | | | | | | |
Corporate Bonds — 84.3%*: | | | | | | | | | |
|
Aerospace and Defense — 7.1%*: | |
American Airlines Group, Inc.^ | | | 4.63 | | | | 3/1/2020 | | | | 250,000 | | | | 248,791 | | | | 238,125 | |
CPI International, Inc. | | | 8.75 | | | | 2/15/2018 | | | | 500,000 | | | | 503,515 | | | | 492,500 | |
DigitalGlobe, Inc.^ | | | 5.25 | | | | 2/1/2021 | | | | 250,000 | | | | 223,738 | | | | 210,000 | |
Huntington Ingalls Industries, Inc.^ | | | 5.00 | | | | 11/15/2025 | | | | 700,000 | | | | 700,000 | | | | 710,500 | |
TransDigm, Inc.^ | | | 6.50 | | | | 5/15/2025 | | | | 223,000 | | | | 226,543 | | | | 216,031 | |
| | | | | | | | | | | | | | | | | | | | |
Total Aerospace and Defense | | | | | | | 1,923,000 | | | | 1,902,587 | | | | 1,867,156 | |
| | | | | | | | | | | | | | | | | | | | |
| | |
Automobile — 3.0%*: | | | | | | | | | |
Affinia Group, Inc. | | | 7.75 | | | | 5/1/2021 | | | | 250,000 | | | | 260,656 | | | | 254,450 | |
Gates Global LLC/Gates Global Co.^ | | | 6.00 | | | | 7/15/2022 | | | | 125,000 | | | | 95,335 | | | | 90,000 | |
Goodyear Tire & Rubber Co. (The) | | | 5.13 | | | | 11/15/2023 | | | | 218,000 | | | | 218,000 | | | | 223,450 | |
International Automotive Components Group SA^ | | | 9.13 | | | | 6/1/2018 | | | | 250,000 | | | | 252,361 | | | | 213,750 | |
| | | | | | | | | | | | | | | | | | | | |
Total Automobile | | | | | | | 843,000 | | | | 826,352 | | | | 781,650 | |
| | | | | | | | | | | | | | | | | | | | |
| | |
Beverage, Food and Tobacco — 2.3%*: | | | | | | | | | |
Carrols Restaurant Group, Inc. | | | 8.00 | | | | 5/1/2022 | | | | 100,000 | | | | 106,157 | | | | 105,500 | |
Constellation Brands, Inc. | | | 4.75 | | | | 12/1/2025 | | | | 481,000 | | | | 481,000 | | | | 490,019 | |
| | | | | | | | | | | | | | | | | | | | |
Total Beverage, Food and Tobacco | | | | | | | 581,000 | | | | 587,157 | | | | 595,519 | |
| | | | | | | | | | | | | | | | | | | | |
| | |
Broadcasting and Entertainment — 4.5%*: | | | | | | | | | |
CCOH Safari LLC^ | | | 5.75 | | | | 2/15/2026 | | | | 750,000 | | | | 750,000 | | | | 751,875 | |
Gray Television, Inc. | | | 7.50 | | | | 10/1/2020 | | | | 174,000 | | | | 181,560 | | | | 178,785 | |
RCN Telecom Services LLC/RCN Capital Corp.^ | | | 8.50 | | | | 8/15/2020 | | | | 250,000 | | | | 257,955 | | | | 252,500 | |
| | | | | | | | | | | | | | | | | | | | |
Total Broadcasting and Entertainment | | | | | | | 1,174,000 | | | | 1,189,515 | | | | 1,183,160 | |
| | | | | | | | | | | | | | | | | | | | |
| | |
Buildings and Real Estate — 4.7%*: | | | | | | | | | |
Allegion PLC | | | 5.88 | | | | 9/15/2023 | | | | 250,000 | | | | 264,904 | | | | 255,000 | |
Brookfield Residential Properties, Inc.+^ | | | 6.50 | | | | 12/15/2020 | | | | 250,000 | | | | 249,390 | | | | 240,937 | |
M/I Homes, Inc.^ | | | 6.75 | | | | 1/15/2021 | | | | 250,000 | | | | 250,000 | | | | 246,250 | |
Summit Materials LLC / Summit Materials Finance Corp.^ | | | 6.13 | | | | 7/15/2023 | | | | 500,000 | | | | 496,913 | | | | 492,500 | |
| | | | | | | | | | | | | | | | | | | | |
Total Buildings and Real Estate | | | | | | | 1,250,000 | | | | 1,261,207 | | | | 1,234,687 | |
| | | | | | | | | | | | | | | | | | | | |
| | |
Cargo Transport — 4.2%*: | | | | | | | | | |
OPE KAG Finance Sub, Inc.^ | | | 7.88 | | | | 7/31/2023 | | | | 750,000 | | | | 781,437 | | | | 745,313 | |
XPO Logistics, Inc.^ | | | 6.50 | | | | 6/15/2022 | | | | 375,000 | | | | 342,447 | | | | 346,875 | |
| | | | | | | | | | | | | | | | | | | | |
Total Cargo Transport | | | | | | | 1,125,000 | | | | 1,123,884 | | | | 1,092,188 | |
| | | | | | | | | | | | | | | | | | | | |
See accompanying Notes to Financial Statements.
137
Babson U.S. High Yield Fund 2015 Semi-Annual Report
SCHEDULE OF INVESTMENTS (UNAUDITED) (CONTINUED)
December 31, 2015
| | | | | | | | | | | | | | | | | | | | |
| | | EFFECTIVE
INTEREST RATE | | | DUE DATE | | | PRINCIPAL ‡‡ | | | COST | | | FAIR
VALUE | |
Corporate Bonds (Continued) | | | | | | | | | |
| | |
Chemicals, Plastics and Rubber — 4.4%*: | | | | | | | | | |
Consolidated Energy Finance SA+^ | | | 6.75 | % | | | 10/15/2019 | | | | 370,000 | | | | $363,265 | | | | $353,702 | |
Huntsman International LLC | | | 4.88 | | | | 11/15/2020 | | | | 250,000 | | | | 237,967 | | | | 228,125 | |
LSB Industries, Inc. | | | 7.75 | | | | 8/1/2019 | | | | 63,000 | | | | 54,497 | | | | 52,290 | |
OMNOVA Solutions, Inc. | | | 7.88 | | | | 11/1/2018 | | | | 141,000 | | | | 140,313 | | | | 138,180 | |
Platform Specialty Products Corp.^ | | | 10.38 | | | | 5/1/2021 | | | | 392,000 | | | | 392,000 | | | | 391,020 | |
| | | | | | | | | | | | | | | | | | | | |
Total Chemicals, Plastics and Rubber | | | | | | | 1,216,000 | | | | 1,188,042 | | | | 1,163,317 | |
| | | | | | | | | | | | | | | | | | | | |
| | |
Containers, Packaging and Glass — 3.5%*: | | | | | | | | | |
Coveris Holdings SA^ | | | 7.88 | | | | 11/1/2019 | | | | 250,000 | | | | 240,479 | | | | 218,125 | |
Multi-Color Corp.^ | | | 6.13 | | | | 12/1/2022 | | | | 45,000 | | | | 46,215 | | | | 44,550 | |
Mustang Merger Corp.^ | | | 8.50 | | | | 8/15/2021 | | | | 333,000 | | | | 350,217 | | | | 345,488 | |
Sealed Air Corp.^ | | | 6.88 | | | | 7/15/2033 | | | | 300,000 | | | | 310,630 | | | | 306,750 | |
| | | | | | | | | | | | | | | | | | | | |
Total Containers, Packaging and Glass | | | | | | | 928,000 | | | | 947,541 | | | | 914,913 | |
| | | | | | | | | | | | | | | | | | | | |
|
Diversified Natural Resources, Precious Metals and Minerals — 1.6%*: | |
Cemex SAB de CV+^ | | | 6.13 | | | | 5/5/2025 | | | | 500,000 | | | | 480,731 | | | | 427,500 | |
| | | | | | | | | | | | | | | | | | | | |
|
Diversified/Conglomerate Manufacturing — 2.6%*: | |
EnPro Industries, Inc. | | | 5.88 | | | | 9/15/2022 | | | | 220,000 | | | | 222,158 | | | | 217,800 | |
StoneMor Partners LP/Cornerstone Family Services of West Virginia Subsidiary | | | 7.88 | | | | 6/1/2021 | | | | 250,000 | | | | 259,306 | | | | 257,500 | |
West Corp.^ | | | 5.38 | | | | 7/15/2022 | | | | 250,000 | | | | 239,574 | | | | 215,625 | |
| | | | | | | | | | | | | | | | | | | | |
Total Diversified/Conglomerate Manufacturing | | | | | | | 720,000 | | | | 721,038 | | | | 690,925 | |
| | | | | | | | | | | | | | | | | | | | |
|
Diversified/Conglomerate Service — 2.1%*: | |
Sabre GLBL, Inc.^ | | | 5.25 | | | | 11/15/2023 | | | | 307,000 | | | | 307,000 | | | | 303,546 | |
Zachry Holdings, Inc.^ | | | 7.50 | | | | 2/1/2020 | | | | 250,000 | | | | 253,027 | | | | 245,000 | |
| | | | | | | | | | | | | | | | | | | | |
Total Diversified/Conglomerate Service | | | | | | | 557,000 | | | | 560,027 | | | | 548,546 | |
| | | | | | | | | | | | | | | | | | | | |
|
Finance — 5.6%*: | |
Ally Financial, Inc. | | | 3.25 | | | | 11/5/2018 | | | | 750,000 | | | | 748,989 | | | | 735,937 | |
CNH Industrial Capital LLC | | | 4.38 | | | | 11/6/2020 | | | | 500,000 | | | | 497,307 | | | | 471,250 | |
MSCI, Inc.^ | | | 5.75 | | | | 8/15/2025 | | | | 250,000 | | | | 263,890 | | | | 256,250 | |
| | | | | | | | | | | | | | | | | | | | |
Total Finance | | | | | | | 1,500,000 | | | | 1,510,186 | | | | 1,463,437 | |
| | | | | | | | | | | | | | | | | | | | |
| | |
Healthcare, Education and Childcare — 12.8%*: | | | | | | | | | |
Alere, Inc.^ | | | 6.38 | | | | 7/1/2023 | | | | 325,000 | | | | 336,522 | | | | 303,875 | |
Capsugel SA PIK^ | | | 7.00 | | | | 5/15/2019 | | | | 375,000 | | | | 378,375 | | | | 365,625 | |
DaVita HealthCare Partners, Inc. | | | 5.00 | | | | 5/1/2025 | | | | 250,000 | | | | 241,327 | | | | 241,250 | |
HCA, Inc. | | | 5.38 | | | | 2/1/2025 | | | | 375,000 | | | | 381,486 | | | | 370,313 | |
HCA, Inc. | | | 5.88 | | | | 2/15/2026 | | | | 375,000 | | | | 375,000 | | | | 376,406 | |
Kindred Healthcare, Inc. | | | 8.75 | | | | 1/15/2023 | | | | 250,000 | | | | 256,161 | | | | 228,750 | |
MEDNAX, Inc.^ | | | 5.25 | | | | 12/1/2023 | | | | 101,000 | | | | 101,000 | | | | 101,505 | |
Molina Healthcare, Inc.^ | | | 5.38 | | | | 11/15/2022 | | | | 750,000 | | | | 750,000 | | | | 750,000 | |
See accompanying Notes to Financial Statements.
138
Babson U.S. High Yield Fund 2015 Semi-Annual Report
SCHEDULE OF INVESTMENTS (UNAUDITED) (CONTINUED)
December 31, 2015
| | | | | | | | | | | | | | | | | | | | |
| | | EFFECTIVE
INTEREST RATE | | | DUE DATE | | | PRINCIPAL ‡‡ | | | COST | | | FAIR
VALUE | |
Corporate Bonds (Continued) | | | | | | | | | |
| | |
Healthcare, Education and Childcare (Continued) | | | | | | | | | |
Tenet Healthcare Corp. | | | 6.75 | % | | | 6/15/2023 | | | | 250,000 | | | | $250,615 | | | | $231,875 | |
Valeant Pharmaceuticals International, Inc.^ | | | 6.13 | | | | 4/15/2025 | | | | 425,000 | | | | 366,374 | | | | 379,312 | |
| | | | | | | | | | | | | | | | | | | | |
Total Healthcare, Education and Childcare | | | | | | | 3,476,000 | | | | 3,436,860 | | | | 3,348,911 | |
| | | | | | | | | | | | | | | | | | | | |
| | |
Hotels, Motels, Inns and Gaming — 1.0%*: | | | | | | | | | |
Churchill Downs, Inc.^ | | | 5.38 | | | | 12/15/2021 | | | | 247,000 | | | | 249,453 | | | | 247,618 | |
| | | | | | | | | | | | | | | | | | | | |
| | |
Insurance — 0.8%*: | | | | | | | | | |
York Risk Services Holding Corp.^ | | | 8.50 | | | | 10/1/2022 | | | | 250,000 | | | | 223,813 | | | | 205,000 | |
| | | | | | | | | | | | | | | | | | | | |
| | |
Leisure, Amusement, Entertainment — 2.1%*: | | | | | | | | | |
Brunswick Corp.^ | | | 4.63 | | | | 5/15/2021 | | | | 375,000 | | | | 378,673 | | | | 374,063 | |
Brunswick Corp. | | | 7.13 | | | | 8/1/2027 | | | | 167,000 | | | | 179,925 | | | | 177,020 | |
| | | | | | | | | | | | | | | | | | | | |
Total Leisure, Amusement, Entertainment | | | | | | | 542,000 | | | | 558,598 | | | | 551,083 | |
| | | | | | | | | | | | | | | | | | | | |
| | |
Machinery Non-Agriculture, Non-Construction, Non-Electronic — 0.9%*: | | | | | | | | | |
Xerium Technologies, Inc. | | | 8.88 | | | | 6/15/2018 | | | | 250,000 | | | | 253,606 | | | | 245,031 | |
| | | | | | | | | | | | | | | | | | | | |
| | |
Mining, Steel, Iron and Non-Precious Metals — 0.7%*: | | | | | | | | | |
Hecla Mining Co. | | | 6.88 | | | | 5/1/2021 | | | | 250,000 | | | | 212,704 | | | | 182,500 | |
| | | | | | | | | | | | | | | | | | | | |
| | |
Oil and Gas — 7.5%*: | | | | | | | | | |
Calumet Specialty Products Partners LP / Calumet Finance Corp.^ | | | 7.75 | | | | 4/15/2023 | | | | 53,000 | | | | 50,388 | | | | 45,050 | |
Citgo Holding, Inc.^ | | | 10.75 | | | | 2/15/2020 | | | | 341,000 | | | | 346,010 | | | | 330,770 | |
EP Energy LLC/Everest Acquisition Finance, Inc. | | | 9.38 | | | | 5/1/2020 | | | | 507,000 | | | | 451,474 | | | | 323,212 | |
Genesis Energy LP/Genesis Energy Finance Corp. | | | 6.75 | | | | 8/1/2022 | | | | 250,000 | | | | 244,434 | | | | 212,500 | |
Newfield Exploration Co. | | | 5.38 | | | | 1/1/2026 | | | | 250,000 | | | | 241,350 | | | | 206,875 | |
PBF Holding Co. LLC / PBF Finance Corp.^ | | | 7.00 | | | | 11/15/2023 | | | | 500,000 | | | | 500,000 | | | | 487,500 | |
Tullow Oil PLC+^ | | | 6.25 | | | | 4/15/2022 | | | | 250,000 | | | | 193,346 | | | | 167,500 | |
Welltec A/S+^ | | | 8.00 | | | | 2/1/2019 | | | | 200,000 | | | | 188,595 | | | | 187,500 | |
| | | | | | | | | | | | | | | | | | | | |
Total Oil and Gas | | | | | | | | | | | 2,351,000 | | | | 2,215,597 | | | | 1,960,907 | |
| | | | | | | | | | | | | | | | | | | | |
| | |
Personal Transportation — 0.9%*: | | | | | | | | | |
Watco Cos. LLC / Watco Finance Corp.^ | | | 6.38 | | | | 4/1/2023 | | | | 250,000 | | | | 250,617 | | | | 246,250 | |
| | | | | | | | | | | | | | | | | | | | |
| | |
Personal, Food and Miscellaneous — 1.6%*: | | | | | | | | | |
Landry’s, Inc.^ | | | 9.38 | | | | 5/1/2020 | | | | 405,000 | | | | 433,408 | | | | 426,263 | |
| | | | | | | | | | | | | | | | | | | | |
| | |
Printing and Publishing — 1.0%*: | | | | | | | | | |
MHGE Parent LLC/MHGE Parent Finance, Inc.^ | | | 8.50 | | | | 8/1/2019 | | | | 250,000 | | | | 252,428 | | | | 247,500 | |
| | | | | | | | | | | | | | | | | | | | |
| | |
Retail Stores — 3.9%*: | | | | | | | | | |
Dollar Tree, Inc.^ | | | 5.75 | | | | 3/1/2023 | | | | 500,000 | | | | 525,495 | | | | 517,500 | |
Sally Holdings LLC / Sally Capital, Inc. | | | 5.63 | | | | 12/1/2025 | | | | 500,000 | | | | 500,000 | | | | 505,000 | |
| | | | | | | | | | | | | | | | | | | | |
Total Retail Stores | | | | | | | | | | | 1,000,000 | | | | 1,025,495 | | | | 1,022,500 | |
| | | | | | | | | | | | | | | | | | | | |
See accompanying Notes to Financial Statements.
139
Babson U.S. High Yield Fund 2015 Semi-Annual Report
SCHEDULE OF INVESTMENTS (UNAUDITED) (CONTINUED)
December 31, 2015
| | | | | | | | | | | | | | | | | | | | |
| | | EFFECTIVE
INTEREST RATE | | | DUE DATE | | | PRINCIPAL ‡‡ | | | COST | | | FAIR VALUE | |
Corporate Bonds (Continued) | | | | | | | | | |
| | |
Telecommunications — 5.5%*: | | | | | | | | | |
Altice Financing SA+^ | | | 6.63 | % | | | 2/15/2023 | | | | 250,000 | | | | $251,718 | | | | $246,875 | |
Numericable-SFR SAS+^ | | | 6.00 | | | | 5/15/2022 | | | | 250,000 | | | | 251,715 | | | | 242,500 | |
Sprint Corp. | | | 7.88 | | | | 9/15/2023 | | | | 250,000 | | | | 229,040 | | | | 187,750 | |
T-Mobile USA, Inc. | | | 6.50 | | | | 1/15/2026 | | | | 750,000 | | | | 750,000 | | | | 757,117 | |
| | | | | | | | | | | | | | | | | | | | |
Total Telecommunications | | | | | | | | | | | 1,500,000 | | | | 1,482,473 | | | | 1,434,242 | |
| | | | | | | | | | | | | | | | | | | | |
Total Corporate Bonds | | | | | | | | | | | 23,088,000 | | | | 22,893,319 | | | | 22,080,803 | |
| | | | | | | | | | | | | | | | | | | | |
Total Fixed Income | | | | | | | | | | | 23,588,000 | | | | 23,089,429 | | | | 22,155,803 | |
| | | | | | | | | | | | | | | | | | | | |
Short-Term Investment — 14.7%*: | | | | | | | | | | | | | | | | | | | | |
| | | | | |
Bank Deposit — 14.7%*: | | | | | | | | | | | | | | | | | | | | |
State Street Bank & Trust Co. Euro Time Deposit | | | 0.01 | | | | 1/4/2016 | | | | 3,864,268 | | | | 3,864,268 | | | | 3,864,268 | |
| | | | | | | | | | | | | | | | | | | | |
Total Investments | | | | | | | | | | | 27,452,268 | | | | 26,953,697 | | | | 26,020,071 | |
| | | | | | | | | | | | | | | | | | | | |
| | | | | |
Other assets and liabilities — 0.7%* | | | | | | | | | | | | | | | | | | | 186,611 | |
| | | | | |
Net Assets — 100.0% | | | | | | | | | | | | | | | | | | | $26,206,682 | |
| | | | | | | | | | | | | | | | | | | | |
| ‡‡ | Unless otherwise indicated, all principal amounts are denominated in United States Dollars. |
| * | Calculated as a percentage of net assets applicable to common shareholders. |
| | Distributions of investments by country of risk (excluding temporary cash investments) as a percentage of total investments in securities, is as follows: |
| | | | | | |
| | United States | | | 91.6% | |
| | Mexico | | | 1.9% | |
| | Trinidad And Tobago | | | 1.6% | |
| | Portugal | | | 1.1% | |
| | France | | | 1.1% | |
| | Canada | | | 1.1% | |
| | Other (Individually less than 1%) | | | 1.6% | |
| | | | | | |
| | Total | | | 100.0% | |
| | | | | | |
| ^ | Security acquired in a transaction exempt from registration under Rule 144A of the Securities Act of 1933. These securities may only be resold in transactions exempt from registration, normally to qualified institutional buyers. |
| § | Bank loans are exempt from registration under the Securities Act of 1933, as amended, but contain certain restrictions on resale and cannot be sold publicly. These loans pay interest at rates which adjust periodically. The interest rates shown for bank loans are the current interest rates at December 31, 2015. Bank loans are also subject to mandatory and/or optional prepayment which cannot be predicted. As a result, the remaining maturity may be substantially less than the stated maturity shown. |
| # | Variable rate security. The interest rate shown is the rate in effect at December 31, 2015. |
See accompanying Notes to Financial Statements.
140
Babson Capital Funds Trust 2015 Semi-Annual Report
NOTES TO THE FINANCIAL STATEMENTS (UNAUDITED)
December 31, 2015
1. Organization
Babson Capital Funds Trust (the “Trust”) was organized as a business trust under the laws of the Commonwealth of Massachusetts on May 3, 2013 and commenced operations on September 16, 2013. The Trust is registered under the Investment Company Act of 1940, as amended (the “1940 Act”), as an open-end management investment company. As of December 31, 2015, the Trust currently consists of eight non-diversified funds (separately, a “Fund” and collectively, the “Funds”): Babson Global Floating Rate Fund (“Global Floating Rate Fund”), Babson Global Credit Income Opportunities Fund (“Global Credit Income Opportunities Fund”), Babson Active Short Duration Bond Fund (“Active Short Duration Bond Fund”), Babson Total Return Bond Fund (“Total Return Bond Fund”), Babson Emerging Markets Debt Blended Total Return Fund (“Emerging Markets Blended Total Return Fund”), Babson Emerging Markets Local Currency Debt Fund (“Emerging Markets Local Currency Debt Fund”), Babson Global High Yield Fund (“Global High Yield Fund”) and Babson U.S. High Yield Fund (“U.S. High Yield Fund”). Active Short Duration Bond Fund and Total Return Bond Fund commenced operations on July 8, 2015. Emerging Markets Debt Blended Total Return Fund commenced operations on October 21, 2015. Emerging Markets Local Currency Debt Fund commenced operations on December 8, 2015. Global High Yield Fund and U.S. High Yield Fund commenced operations on October 30, 2015.
Babson Capital Management LLC (“BCGA”), a wholly-owned indirect subsidiary of Massachusetts Mutual Life Insurance Company, is a registered investment adviser under the Investment Advisers Act of 1940, as amended, and serves as investment adviser to the Funds.
Babson Capital Global Advisors Limited (the “Sub-Adviser”), an indirect wholly-owned subsidiary of the Adviser, serves as a sub-adviser with respect to the Global Floating Rate Fund, Global Credit Income Opportunities Fund, Emerging Markets Debt Blended Total Return Fund and Global High Yield Fund European investments.
Cornersone Real Estate Advisers LLC (“Cornerstone”), a direct wholly-owned subsidiary of the Adviser, serves as a sub-adviser to the Active Short Duration Bond Fund and Total Return Bond Fund investment in commercial mortgage-backed securities.
The primary investment objective of the Global Floating Rate Fund is to seek a high level of current income. The
Fund seeks preservation of capital as a secondary investment objective. The primary investment objective of the Global Credit Income Opportunities Fund is to seek an absolute return, primarily through current income and secondarily through capital appreciation. The primary investment objective of the Active Short Duration Bond Fund is to seek to achieve a high total rate of return primarily from current income while minimizing fluctuations in capital values by investing primarily in a diversified portfolio of short-term investment grade fixed income securities. The primary investment objective of the Total Return Bond Fund is to seek a superior total rate of return by investing in fixed income instruments. The primary investment objective of the Emerging Markets Debt Blended Total Return Fund is to seek to achieve maximum total return, consistent with preservation of capital and prudent investment management, through high current income generation and, where appropriate, capital appreciation. The primary investment objective of the Emerging Markets Local Currency Debt Fund is to seek long-term total return through investment in a diversified portfolio of emerging markets local currency denominated debt securities. The primary investment objective of the Global High Yield Fund is to seek to provide high current income generation and, where appropriate, capital appreciation. The primary investment objective of the U.S. High Yield Fund is to seek to achieve a high level of total return, with an emphasis on current income, by investing primarily in high yield debt and related securities.
There can be no assurance that the Funds will achieve their investment objectives. Under normal market conditions, the Global Floating Rate Fund will invest at least 80% of its net assets (including the amount of any borrowings for investment purposes) in income-producing floating rate debt securities, consisting of floating rate loans, bonds and notes, issued primarily by North American and Western European companies that are, at the time of purchase, rated below-investment grade (below Baa3 by Moody’s Investors Service, Inc. (“Moody’s”) or below BBB- by either Standard & Poor’s Rating Services, a division of the McGraw-Hill Company, Inc. (“S&P”) or Fitch, Inc. (“Fitch”)) or unrated but judged by the Adviser or BCGA to be of comparable quality. Under normal market conditions, the Global Credit Income Opportunities Fund will invest at least 80% of its net assets (including the amount of any borrowings for investment purposes) in debt instruments, consisting of loans, bonds and notes, based in U.S. and non-U.S.
141
Babson Capital Funds Trust 2015 Semi-Annual Report
NOTES TO THE FINANCIAL STATEMENTS (UNAUDITED) (CONTINUED)
December 31, 2015
markets, as well as over-the-counter and exchange-traded derivatives. Investments may be issued or guaranteed by governments and their agencies, corporations, financial institutions and supranational organizations that the Global Floating Rate Fund and Global Credit Income Opportunities Fund believe have the potential to provide a high total return over time. A significant portion of the Global Floating Rate Fund and Global Credit Income Opportunities Fund’s investments in debt instruments will be denominated in a currency other than the U.S. dollar. Although the investments in non-U.S. dollar denominated assets may be on a currency hedged or unhedged basis, the Global Floating Rate Fund and Global Credit Income Opportunities Fund expect that, under current market conditions, they will seek to hedge substantially all of their exposure to foreign currencies. Under normal market conditions, the Active Short Duration Bond Fund invests at least 80% of its net assets (including the amount of any borrowings for investment purposes) in investment grade fixed income securities (rated Baa or higher by Moody’s or BBB or higher by S&P or, if unrated, determined to be of comparable quality by the Adviser). These typically include U.S. dollar-denominated corporate obligations, securities issued or guaranteed by the U.S. government or its agencies or instrumentalities, U.S. and foreign issuer dollar-denominated bonds including, but not limited to, corporate obligations, government and agency issues, private placement bonds, securities subject to resale pursuant to Rule 144A, mortgage-backed, and other asset-backed securities. Under normal market conditions, the Total Return Bond Fund invests at least 80% of its net assets (including the amount of any borrowings for investment purposes) in fixed income securities. These typically include: U.S. dollar denominated corporate obligations and bank loans, securities issued or guaranteed by the U.S. government or its agencies or instrumentalities, U.S. and foreign issuer dollar denominated bonds including, but not limited to, corporate obligations, government and agency issues, private placement bonds, securities subject to resale pursuant to Rule 144A, convertible bonds, mortgage-backed, and other asset-backed securities. Under normal market conditions, the Emerging Markets Debt Blended Total Return Fund will invest at least 80% of its net assets (including the amount of any borrowings for investment purposes) in (i) securities denominated in currencies of the emerging market countries, (ii) fixed income securities or debt instruments issued by emerging market
entities or sovereign nations, and/or (iii) debt instruments denominated in or based on the currencies, interest rates, or issues of emerging market countries. Emerging market countries are defined to include any country that did not become a member of the Organization for Economic Cooperation and Development (O.E.C.D.) prior to 1975 and Turkey. Certain emerging market countries are referred to as “frontier” market countries. The Fund will likely focus its investments in Asia, Africa, the Middle East, Latin America and the developing countries of Europe. Under normal market conditions, the Emerging Markets Local Currency Debt Fund invests at least 80% of its net assets (including the amount of any borrowings for investment purposes) in local currency-denominated debt instruments issued by emerging markets governments, and their quasi sovereign agencies (including supranational and sub-national government issuers). The Adviser considers emerging market countries to include any country that did not become a member of the O.E.C.D. prior to 1975 and Turkey and intends to focus on those with relatively low gross national product per capita and the potential for rapid economic growth. The Adviser will select the Fund’s country and currency composition based on its evaluation of relative interest rates, inflation rates, exchange rates, monetary and fiscal policies, trade and current account balances, legal and political developments, and any other specific factors the Adviser believes to be relevant. The Fund will likely focus its investments in Asia, Africa, the Middle East, Latin America and the developing countries of Europe. Under normal conditions, the Global High Yield Fund will invest at least 80% of its net assets (including the amount of any borrowing for investment purposes) in below investment grade (“high yield”) fixed and floating rate corporate debt securities including bonds, notes and other fixed and floating rate income securities issued primarily by North American and Western European companies. For this purpose, debt instruments issued by issuers based in the Channel Islands, Cayman Islands and Bermuda will be considered North American and Western European companies. Such debt securities may be secured or unsecured, and, either senior or subordinated. Secured debt means that collateral has been pledged as security against default, while investors in senior debt instruments are legally entitled to be repaid ahead of investors in subordinated (i.e. non-senior) instruments issued by the same corporation. Derivative instruments that provide exposure to such high yield debt securities or have similar
142
Babson Capital Funds Trust 2015 Semi-Annual Report
NOTES TO THE FINANCIAL STATEMENTS (UNAUDITED) (CONTINUED)
December 31, 2015
economic characteristics may be used to satisfy the Fund’s 80% policy. The Adviser expects that such instruments will primarily, at the time of purchase, be rated below investment grade (commonly referred to as “junk bonds”) by at least one credit rating agency (below Baa3 by Moody’s or below BBB- by either S&P, or Fitch) or unrated but judged by the Adviser or BCGA, to be of comparable quality. The Fund may invest in high yield securities of any rating, including securities that are in default at the time of purchase. Under normal circumstances, the U.S. High Yield Fund invests at least 80% of its net assets (including the amount of any borrowings for investment purposes) in lower rated fixed income securities (rated below Baa3 by Moody’s or BBB- by S&P (using the lower rating) or, if unrated, determined by the Adviser to be of comparable quality), and at least 80% of its net assets (including the amount of any borrowings for investment purposes) in securities of U.S. issuers. The Fund may also invest in convertible securities, preferred stocks, warrants, bank loans, and other fixed income securities, including Rule 144A securities, of both U.S. and foreign issuers. Currently, the Adviser does not expect that the Fund will invest more than 20% of its total assets in bank loans. The Fund may invest up to 15% of its total assets in securities that are not denominated in U.S. dollars including, but not limited to, corporate bonds, government and agency issues, Rule 144A securities, convertible securities, bank loans, mortgage-backed, and asset-backed securities.
Each Fund has four classes of shares: Class A, C, I, and Y, each with different expenses and dividends. A front-end sales charge is normally added to the net asset value (“NAV”) for Class A shares. There is no front-end sales charge in the case of Class C, I, and Y shares. There may be a contingent deferred sales charge (“CDSC”) in certain cases as follows: Class A shares purchased without an initial sales charge and redeemed within the first year of purchase (subject to certain exceptions as set forth in each Fund’s prospectus) and Class C shares redeemed within the first year of purchase. All classes of shares have equal voting rights, with the exception of matters that relate solely to one class.
| 2. | Significant Accounting Policies |
The following is a summary of significant accounting policies followed consistently by the Funds in the preparation of their financial statements in conformity with accounting principles generally accepted in the United States of America (“U.S. GAAP”).
| | A. Valuation of Investments |
The Funds’ investments in fixed income securities are generally valued using the prices provided directly by independent third party services or provided directly from one or more broker dealers or market makers, each in accordance with the valuation policies and procedures approved by the Funds’ Board of Trustees (the “Board”).
The pricing services may use valuation models or matrix pricing, which consider yield or prices with respect to comparable bond quotations from bond dealers or by reference to other securities that are considered comparable in such characteristics as credit rating, interest rates and maturity date to determine the current value. The Funds’ investments in bank loans are normally valued at the bid quotation obtained from dealers in loans by an independent pricing service in accordance with the Funds’ valuation policies and procedures approved by the Board. Short-term securities with remaining maturities of 60 days or less may be valued at amortized cost, which approximates fair value. Over-the-Counter (“OTC”) options are valued by an independent pricing service using a mathematical model, which incorporates a number of market data factors, such as the trades and prices of the underlying instruments.
A Valuation Committee, made up of officers of the Trust and employees of the Adviser, is responsible for determining, in accordance with the Funds’ valuation policies and procedures approved by the Board; (1) whether market quotations are readily available for investments held by the Funds; and (2) the fair value of investments held by the Funds for which market quotations are not readily available or are deemed not reliable by the Adviser. In certain cases, authorized pricing service vendors may not provide prices for a security held by the Funds, or the price provided by such pricing service vendor is deemed unreliable by the Adviser. In such cases, the Funds may use market maker quotations provided by an established market maker for that security (i.e., broker quotes) to value the security if the Adviser has experience obtaining quotations from the market maker and the Adviser determines that quotations obtained from the market maker in the past have generally been reliable (or, if the Adviser has no such experience with respect to a market maker, it determines based on other information available to it that quotations to be obtained by it from the market maker are reasonably likely to be reliable). In any such case, the Adviser will review any market quotations so obtained in
143
Babson Capital Funds Trust 2015 Semi-Annual Report
NOTES TO THE FINANCIAL STATEMENTS (UNAUDITED) (CONTINUED)
December 31, 2015
light of other information in its possession for their general reliability.
Bond investments are valued on the basis of last available bid prices or current market quotations provided by dealers or pricing services. Bank loan positions are valued at the bid price from one or more brokers or dealers as obtained from a pricing service. In determining the value of a particular investment, pricing services may use certain information with respect to transactions in such investments, quotations from dealers, pricing matrixes, market transactions in comparable investments, various relationships observed in the market between investments and calculated yield measures. Asset-backed and mortgage-backed securities are valued by independent pricing services using models that consider estimated cash flows of each tranche of the security, establish a benchmark yield and develop an estimated tranche-specific spread to the benchmark yield based on the unique attributes of the tranche.
Bank loans in which the Funds may invest have similar risks to lower-rated fixed income securities. Changes in the financial condition of the borrower or economic conditions or other circumstances may reduce the capacity of the borrower to make principal and interest payments on such instruments and may lead to defaults. Senior secured bank loans are supported by collateral; however, the value of the collateral may be insufficient to cover the amount owed to the Funds. By relying on a third party to administer a loan, the Funds are subject to the risk that the third party will fail to perform its obligations. The loans in which the Funds will invest are largely floating rate instruments; therefore, the interest rate risk generally is lower than for fixed-rate debt obligations. However, from the perspective of the borrower, an increase in interest rates may adversely affect the borrower’s financial condition. Due to the unique and customized nature of loan agreements evidencing loans and the private syndication thereof, loans are not as easily purchased or sold as publicly traded securities. Although the range of investors in loans has broadened in recent years, there can be no assurance that future levels of supply and demand in loan trading will provide the degree of liquidity which currently exists in the market. In addition, the terms of the loans may restrict their transferability without borrower consent. These factors may have an adverse effect on the market price and the Funds’ ability to dispose of particular portfolio investments. A less liquid secondary market also
may make it more difficult for the Funds to obtain precise valuations of the high yield loans in its portfolio.
The Funds may invest in collateralized debt obligations (“CDOs”), which include collateralized bond obligations (“CBOs”) and collateralized loan obligations (“CLOs”). CBOs and CLOs are types of asset-backed securities. A CDO is an entity that is backed by a diversified pool of debt securities (CBOs) or syndicated bank loans (CLOs). The cash flows of the CDO can be split into multiple segments, called “tranches,” which will vary in risk profile and yield. The riskiest segment is the subordinated or “equity” tranche. This tranche bears the greatest risk of defaults from the underlying assets in the CDO and serves to protect the other, more senior, tranches from default in all but the most severe circumstances. Since it is shielded from defaults by the more junior tranches, a “senior” tranche will typically have higher credit ratings and lower yields than their underlying securities, and often receive investment grade ratings from one or more of the nationally recognized rating agencies. Despite the protection from the more junior tranches, senior tranches can experience substantial losses due to actual defaults, increased sensitivity to future defaults and the disappearance of one or more protecting tranches as a result of changes in the credit profile of the underlying pool of assets.
Fair value is defined as the price that the Funds would receive upon selling an investment in a timely transaction to an independent buyer in the principal or most advantageous market of the investment. A three-tier hierarchy is utilized to maximize the use of observable market data and minimize the use of unobservable inputs and to establish classification of fair value measurements for disclosure purposes. Inputs refer broadly to the assumptions that market participants would use in pricing the asset or liability, including assumptions about risk. For example, market participants would consider the risk inherent in a particular valuation technique used to measure fair value, such as a pricing model, and/or the risk inherent in the inputs to the valuation technique. Inputs may be observable or unobservable. Observable inputs are inputs that reflect the assumptions market participants would use in pricing the asset or liability and are developed based on market data obtained from sources independent of the reporting entity. Unobservable inputs are inputs that reflect the reporting entity’s own assumptions about the assumptions market participants would use in pricing the asset or liability and
144
Babson Capital Funds Trust 2015 Semi-Annual Report
NOTES TO THE FINANCIAL STATEMENTS (UNAUDITED) (CONTINUED)
December 31, 2015
are developed based on the best information available in the circumstances. The three-tier hierarchy of inputs is summarized in the three broad levels listed below.
Level 1 – quoted prices in active markets for identical securities
Level 2 – other significant observable inputs (including quoted prices for similar securities, interest rates, prepayment speeds, credit risk, etc.)
Level 3 – significant unobservable inputs (including the Funds’ own assumptions in determining the fair value of investments)
The availability of observable inputs can vary from security to security and is affected by a wide variety of factors, including, for example, the type of security, whether the security is new and not yet established in the
marketplace, the liquidity of markets, and other characteristics particular to the security. To the extent that valuation is based on models or inputs that are less observable or unobservable in the market, the determination of fair value requires more judgment. Accordingly, the degree of judgment exercised in determining fair value is greatest for instruments categorized in Level 3.
The inputs used to measure fair value may fall into different levels of the fair value hierarchy. In such cases, for disclosure purposes, the level in the fair value hierarchy within which the fair value measurement falls in its entirety is determined based on the lowest level input that is significant to the fair value measurement in its entirety.
The following is a summary of the inputs used as of December 31, 2015 in valuing the Funds’ investments:
| | | | | | | | | | | | | | | | |
| DESCRIPTION | | LEVEL 1 | | | LEVEL 2 | | | LEVEL 3 | | | TOTAL INVESTMENTS | |
| | | | |
Assets:* | | | | | | | | | | | | | | | | |
| Fixed Income: | | | | | | | | | | | | | | | | |
Bank Loans | | $ | – | | | $ | 127,297,362 | | | $ | 1,495,790 | | | $ | 128,793,152 | |
Corporate Bonds | | | – | | | | 15,251,078 | | | | – | | | | 15,251,078 | |
| | | | | | | | | | | | | | | | |
| Total Fixed Income | | | – | | | | 142,548,440 | | | | 1,495,790 | | | | 144,044,230 | |
| | | | | | | | | | | | | | | | |
| Short-Term Investments: | | | | | | | | | | | | | | | | |
Bank Deposit | | | – | | | | 14,835,559 | | | | – | | | | 14,835,559 | |
Bank Loan | | | – | | | | – | | | | 78,780 | | | | 78,780 | |
| | | | | | | | | | | | | | | | |
| Total Short-Term Investments | | | – | | | | 14,835,559 | | | | 78,780 | | | | 14,914,339 | |
| | | | | | | | | | | | | | | | |
| Derivative Securities: | | | | | | | | | | | | | | | | |
Forward Foreign Currency Exchange Contracts | | | – | | | | 394,403 | | | | – | | | | 394,403 | |
| | | | | | | | | | | | | | | | |
| Total | | | – | | | | 157,778,402 | | | | 1,574,570 | | | | 159,352,972 | |
| | | | | | | | | | | | | | | | |
| | | | |
Liabilities:* | | | | | | | | | | | | | | | | |
| Derivative Securities: | | | | | | | | | | | | | | | | |
Forward Foreign Currency Exchange Contracts | | | – | | | | (11,957 | ) | | | – | | | | (11,957 | ) |
| | | | | | | | | | | | | | | | |
| Total Investments | | $ | – | | | $ | 157,766,445 | | | $ | 1,574,570 | | | $ | 159,341,015 | |
| | | | | | | | | | | | | | | | |
| | * | There were no transfers between levels during the period ended December 31, 2015. |
145
Babson Capital Funds Trust 2015 Semi-Annual Report
NOTES TO THE FINANCIAL STATEMENTS (UNAUDITED) (CONTINUED)
December 31, 2015
The following is a reconciliation of investments with unobservable inputs (Level 3) that were used in determining fair value:
| | | | | | | | | | | | | | | | | | | | | | | | | | | | | | | | | | | | |
INVESTMENTS IN SECURITIES | | BALANCE AS
OF
JULY 1,
2015 | | | REALIZED
GAIN (LOSS) | | | CHANGE IN UNREALIZED
APPRECIATION
(DEPRECIATION) | | | NET
TRANSFERS
IN (OUT)
OF LEVEL 3 | | | ACCRUED PREMIUMS/
DISCOUNTS | | | PURCHASES | | | SALES | | | BALANCE
AS OF
DECEMBER 31,
2015 | | | CHANGE IN UNREALIZED
APPRECIATION
(DEPRECIATION)
FROM
INVESTMENTS
HELD AT
DECEMBER 31,
2015 | |
| | | | | | | | | |
Fixed Income | | | | | | | | | | | | | | | | | | | | | | | | | | | | | | | | | | | | |
Bank Loans | | $ | 1,054,891 | | | $ | 21 | | | $ | (26,139 | ) | | $ | – | | | $ | 2,137 | | | $ | 548,582 | | | $ | (4,922 | ) | | $ | 1,574,570 | | | $ | (26,139 | ) |
| | | | | | | | | | | | | | | | | | | | | | | | | | | | | | | | | | | | |
| Total | | $ | 1,054,891 | | | $ | 21 | | | $ | (26,139 | ) | | $ | – | | | $ | 2,137 | | | $ | 548,582 | | | $ | (4,922 | ) | | $ | 1,574,570 | | | $ | (26,139 | ) |
| | | | | | | | | | | | | | | | | | | | | | | | | | | | | | | | | | | | |
| | Global | Credit Income Opportunities Fund |
| | | | | | | | | | | | | | | | |
| DESCRIPTION | | LEVEL 1 | | | LEVEL 2 | | | LEVEL 3 | | | TOTAL INVESTMENTS | |
| | | | |
Assets:* | | | | | | | | | | | | | | | | |
| Equities: | | | | | | | | | | | | | | | | |
Common Stocks | | $ | – | | | $ | – | | | $ | 409,919 | | | $ | 409,919 | |
| | | | | | | | | | | | | | | | |
| Total Equities | | | – | | | | – | | | | 409,919 | | | | 409,919 | |
| | | | | | | | | | | | | | | | |
| Fixed Income: | | | | | | | | | | | | | | | | |
Asset-Backed Securities | | | – | | | | 14,577,012 | | | | – | | | | 14,577,012 | |
Bank Loans | | | – | | | | 17,907,261 | | | | 714,865 | | | | 18,622,126 | |
Corporate Bonds | | | – | | | | 42,139,719 | | | | – | | | | 42,139,719 | |
| | | | | | | | | | | | | | | | |
| Total Fixed Income | | | – | | | | 74,623,992 | | | | 714,865 | | | | 75,338,857 | |
| | | | | | | | | | | | | | | | |
| Purchased Option: | | | | | | | | | | | | | | | | |
Put Option Purchased | | | – | | | | 406,452 | | | | – | | | | 406,452 | |
| Short-Term Investments: | | | | | | | | | | | | | | | | |
Bank Deposit | | | – | | | | 6,222,562 | | | | – | | | | 6,222,562 | |
Bank Loan | | | – | | | | – | | | | 78,780 | | | | 78,780 | |
| | | | | | | | | | | | | | | | |
| Total Short-Term Investments | | | – | | | | 6,222,562 | | | | 78,780 | | | | 6,301,342 | |
| | | | | | | | | | | | | | | | |
| Derivative Securities: | | | | | | | | | | | | | | | | |
Forward Foreign Currency Exchange Contracts | | | – | | | | 197,214 | | | | – | | | | 197,214 | |
| | | | | | | | | | | | | | | | |
| Total | | | – | | | | 81,450,220 | | | | 1,203,564 | | | | 82,653,784 | |
| | | | | | | | | | | | | | | | |
| | | | |
Liabilities:* | | | | | | | | | | | | | | | | |
| Derivative Securities: | | | | | | | | | | | | | | | | |
Forward Foreign Currency Exchange Contracts | | | – | | | | (8,461 | ) | | | – | | | | (8,461 | ) |
Written Option | | | – | | | | (207,921 | ) | | | – | | | | (207,921 | ) |
| | | | | | | | | | | | | | | | |
Total Derivative Securities | | | – | | | | (216,382 | ) | | | – | | | | (216,382 | ) |
| | | | | | | | | | | | | | | | |
| | | | |
Total Investments | | $ | – | | | $ | 81,233,838 | | | $ | 1,203,564 | | | $ | 82,437,402 | |
| | | | | | | | | | | | | | | | |
| | * | There were no transfers between levels during the period ended December 31, 2015. |
146
Babson Capital Funds Trust 2015 Semi-Annual Report
NOTES TO THE FINANCIAL STATEMENTS (UNAUDITED) (CONTINUED)
December 31, 2015
The following is a reconciliation of investments with unobservable inputs (Level 3) that were used in determining fair value:
| | | | | | | | | | | | | | | | | | | | | | | | | | | | | | | | | | | | |
INVESTMENTS IN SECURITIES | | BALANCE AS
OF JULY 1,
2015 | | | REALIZED
GAIN (LOSS) | | | CHANGE IN
UNREALIZED
APPRECIATION
(DEPRECIATION) | | | NET
TRANSFERS
IN (OUT)
OF LEVEL 3 | | | ACCRUED PREMIUMS/
DISCOUNTS | | | PURCHASES | | | SALES | | | BALANCE AS OF
DECEMBER 31,
2015 | | | CHANGE IN
UNREALIZED
APPRECIATION
(DEPRECIATION)
FROM
INVESTMENTS
HELD AT
DECEMBER 31,
2015 | |
| | | | | | | | | |
Equities | | | | | | | | | | | | | | | | | | | | | | | | | | | | | | | | | | | | |
Common Stock | | $ | – | | | $ | – | | | $ | 36,181 | | | $ | – | | | $ | – | | | $ | 373,738 | | | $ | – | | | $ | 409,919 | | | $ | 36,181 | |
| | | | | | | | | | | | | | | | | | | | | | | | | | | | | | | | | | | | |
| | | | | | | | | |
Fixed Income | | | | | | | | | | | | | | | | | | | | | | | | | | | | | | | | | | | | |
Bank Loans | | | 808,335 | | | | 24 | | | | (13,199 | ) | | | — | | | | 2,136 | | | | — | | | | (3,651 | ) | | | 793,645 | | | | (13,199 | ) |
| | | | | | | | | | | | | | | | | | | | | | | | | | | | | | | | | | | | |
| Total | | $ | 808,335 | | | $ | 24 | | | $ | 22,982 | | | $ | — | | | $ | 2,136 | | | $ | 373,738 | | | $ | (3,651 | ) | | $ | 1,203,564 | | | $ | 22,982 | |
| | | | | | | | | | | | | | | | | | | | | | | | | | | | | | | | | | | | |
| | Active | Short Duration Bond Fund |
| | | | | | | | | | | | | | | | |
| DESCRIPTION | | LEVEL 1 | | | LEVEL 2 | | | LEVEL 3 | | | TOTAL INVESTMENTS | |
| | | | |
Assets:* | | | | | | | | | | | | | | | | |
Convertible Preferred Stock | | $ | – | | | $ | 16,695 | | | $ | – | | | $ | 16,695 | |
| Fixed Income: | | | | | | | | | | | | | | | | |
Asset-Backed Securities | | | – | | | | 17,633,090 | | | | – | | | | 17,633,090 | |
Convertible Bonds | | | – | | | | 174,625 | | | | – | | | | 174,625 | |
Corporate Bonds | | | – | | | | 32,760,633 | | | | – | | | | 32,760,633 | |
Mortgage-Backed Securities | | | – | | | | 3,797,494 | | | | – | | | | 3,797,494 | |
U.S. Treasury & Government Agencies | | | – | | | | 33,292,824 | | | | – | | | | 33,292,824 | |
| | | | | | | | | | | | | | | | |
| Total Fixed Income | | | – | | | | 87,658,666 | | | | – | | | | 87,658,666 | |
| | | | | | | | | | | | | | | | |
| Purchased Options: | | | | | | | | | | | | | | | | |
Call Option Purchased | | | – | | | | 54,242 | | | | – | | | | 54,242 | |
Put Option Purchased | | | – | | | | 14,650 | | | | – | | | | 14,650 | |
| | | | | | | | | | | | | | | | |
| Total Purchased Options | | | – | | | | 68,892 | | | | – | | | | 68,892 | |
| | | | | | | | | | | | | | | | |
| Short-Term Investments: | | | | | | | | | | | | | | | | |
Bank Deposit | | | – | | | | 4,606,134 | | | | – | | | | 4,606,134 | |
Commercial Paper | | | – | | | | 5,354,527 | | | | – | | | | 5,354,527 | |
Corporate Bonds | | | – | | | | 1,336,980 | | | | – | | | | 1,336,980 | |
| | | | | | | | | | | | | | | | |
| Total Short-Term Investments | | | – | | | | 11,297,641 | | | | – | | | | 11,297,641 | |
| | | | | | | | | | | | | | | | |
| Derivative Securities: | | | | | | | | | | | | | | | | |
Futures | | | – | | | | 13,623 | | | | – | | | | 13,623 | |
| | | | | | | | | | | | | | | | |
| Total | | | – | | | | 99,055,517 | | | | – | | | | 99,055,517 | |
| | | | | | | | | | | | | | | | |
| | | | |
Liabilities:* | | | | | | | | | | | | | | | | |
| Derivative Securities: | | | | | | | | | | | | | | | | |
Credit Default Swaps | | | – | | | | (7,229 | ) | | | – | | | | (7,229 | ) |
Futures | | | – | | | | (76,527 | ) | | | – | | | | (76,527 | ) |
| | | | | | | | | | | | | | | | |
Total Derivative Securities | | | – | | | | (83,756 | ) | | | – | | | | (83,756 | ) |
| | | | | | | | | | | | | | | | |
| | | | |
Total Investments | | $ | – | | | $ | 98,971,761 | | | $ | – | | | $ | 98,971,761 | |
| | | | | | | | | | | | | | | | |
| | * | There were no transfers between levels during the period ended December 31, 2015. |
147
Babson Capital Funds Trust 2015 Semi-Annual Report
NOTES TO THE FINANCIAL STATEMENTS (UNAUDITED) (CONTINUED)
December 31, 2015
| | | | | | | | | | | | | | | | |
| DESCRIPTION | | LEVEL 1 | | | LEVEL 2 | | | LEVEL 3 | | | TOTAL INVESTMENTS | |
| | | | |
Assets:* | | | | | | | | | | | | | | | | |
| Fixed Income: | | | | | | | | | | | | | | | | |
Asset-Backed Securities | | $ | — | | | $ | 4,277,885 | | | $ | — | | | $ | 4,277,885 | |
Convertible Bonds | | | — | | | | 96,947 | | | | — | | | | 96,947 | |
Corporate Bonds | | | — | | | | 7,861,331 | | | | — | | | | 7,861,331 | |
Foreign Government | | | — | | | | 107,707 | | | | — | | | | 107,707 | |
Mortgage-Backed Securities | | | — | | | | 1,638,839 | | | | — | | | | 1,638,839 | |
U.S. Treasury & Government Agencies | | | — | | | | 7,489,820 | | | | — | | | | 7,489,820 | |
| | | | | | | | | | | | | | | | |
| Total Fixed Income | | | — | | | | 21,472,529 | | | | — | | | | 21,472,529 | |
| | | | | | | | | | | | | | | | |
| Mutual Fund: | | | | | | | | | | | | | | | | |
Mutual Fund | | | 2,104,366 | | | | — | | | | — | | | | 2,104,366 | |
| Purchased Options: | | | | | | | | | | | | | | | | |
Call Option Purchased | | | — | | | | 126,564 | | | | — | | | | 126,564 | |
Put Options Purchased | | | — | | | | 7,091 | | | | — | | | | 7,091 | |
| | | | | | | | | | | | | | | | |
| Total Purchased Options | | | — | | | | 133,655 | | | | — | | | | 133,655 | |
| | | | | | | | | | | | | | | | |
| Short-Term Investments: | | | | | | | | | | | | | | | | |
Bank Deposit | | | — | | | | 1,029,894 | | | | — | | | | 1,029,894 | |
Commercial Paper | | | — | | | | 5,070,567 | | | | — | | | | 5,070,567 | |
Corporate Bonds | | | — | | | | 130,767 | | | | — | | | | 130,767 | |
| | | | | | | | | | | | | | | | |
| Total Short-Term Investments | | | — | | | | 6,231,228 | | | | — | | | | 6,231,228 | |
| | | | | | | | | | | | | | | | |
| Derivative Securities: | | | | | | | | | | | | | | | | |
Forward Foreign Currency Exchange Contracts | | | — | | | | 4,766 | | | | — | | | | 4,766 | |
Futures | | | — | | | | 3,974 | | | | — | | | | 3,974 | |
| | | | | | | | | | | | | | | | |
| Total Derivative Securities | | | — | | | | 8,740 | | | | — | | | | 8,740 | |
| | | | | | | | | | | | | | | | |
| Total | | | 2,104,366 | | | | 27,846,152 | | | | — | | | | 29,950,518 | |
| | | | | | | | | | | | | | | | |
| | | | |
Liabilities:* | | | | | | | | | | | | | | | | |
| Derivative Securities: | | | | | | | | | | | | | | | | |
Credit Default Swaps | | | — | | | | (1,885 | ) | | | — | | | | (1,885 | ) |
Forward Foreign Currency Exchange Contracts | | | — | | | | (12,870 | ) | | | — | | | | (12,870 | ) |
Futures | | | — | | | | (12,186 | ) | | | — | | | | (12,186 | ) |
| | | | | | | | | | | | | | | | |
Total Derivative Securities | | | — | | | | (26,941 | ) | | | — | | | | (26,941 | ) |
| | | | | | | | | | | | | | | | |
| | | | |
Total Investments | | $ | 2,104,366 | | | $ | 27,819,211 | | | $ | — | | | $ | 29,923,577 | |
| | | | | | | | | | | | | | | | |
| | * | There were no transfers between levels during the period ended December 31, 2015. |
148
Babson Capital Funds Trust 2015 Semi-Annual Report
NOTES TO THE FINANCIAL STATEMENTS (UNAUDITED) (CONTINUED)
December 31, 2015
Emerging Markets Debt Blended Total Return Fund
| | | | | | | | | | | | | | | | |
| DESCRIPTION | | LEVEL 1 | | | LEVEL 2 | | | LEVEL 3 | | | TOTAL INVESTMENTS | |
| | | | |
Assets:* | | | | | | | | | | | | | | | | |
| Fixed Income: | | | | | | | | | | | | | | | | |
Corporate Bonds | | $ | — | | | $ | 3,328,336 | | | $ | — | | | $ | 3,328,336 | |
Foreign Government | | | — | | | | 5,663,863 | | | | — | | | | 5,663,863 | |
| | | | | | | | | | | | | | | | |
| Total Fixed Income | | | — | | | | 8,992,199 | | | | — | | | | 8,992,199 | |
| | | | | | | | | | | | | | | | |
| Short-Term Investments: | | | | | | | | | | | | | | | | |
Bank Deposit | | | — | | | | 83,284 | | | | — | | | | 83,284 | |
Foreign Government | | | — | | | | 445,584 | | | | — | | | | 445,584 | |
| | | | | | | | | | | | | | | | |
| Total Short-Term Investments | | | — | | | | 528,868 | | | | — | | | | 528,868 | |
| | | | | | | | | | | | | | | | |
| Derivative Securities: | | | | | | | | | | | | | | | | |
Forward Foreign Currency Exchange Contracts | | | — | | | | 130,248 | | | | — | | | | 130,248 | |
Futures | | | — | | | | 1,022 | | | | — | | | | 1,022 | |
Interest Rate Swaps | | | — | | | | 10,877 | | | | — | | | | 10,877 | |
| | | | | | | | | | | | | | | | |
| Total Derivative Securities | | | — | | | | 142,147 | | | | — | | | | 142,147 | |
| | | | | | | | | | | | | | | | |
| Total | | | — | | | | 9,663,214 | | | | — | | | | 9,663,214 | |
| | | | | | | | | | | | | | | | |
| | | | |
Liabilities:* | | | | | | | | | | | | | | | | |
| Derivative Securities: | | | | | | | | | | | | | | | | |
Credit Default Swaps | | | — | | | | (7,281 | ) | | | — | | | | (7,281 | ) |
Forward Foreign Currency Exchange Contracts | | | — | | | | (146,056 | ) | | | — | | | | (146,056 | ) |
| | | | | | | | | | | | | | | | |
Total Derivative Securities | | | — | | | | (153,337 | ) | | | — | | | | (153,337 | ) |
| | | | | | | | | | | | | | | | |
| | | | |
Total Investments | | $ | — | | | $ | 9,509,877 | | | $ | — | | | $ | 9,509,877 | |
| | | | | | | | | | | | | | | | |
| | * | There were no transfers between levels during the period ended December 31, 2015. |
149
Babson Capital Funds Trust 2015 Semi-Annual Report
NOTES TO THE FINANCIAL STATEMENTS (UNAUDITED) (CONTINUED)
December 31, 2015
| | Emerging | Markets Local Currency Debt Fund |
| | | | | | | | | | | | | | | | |
| DESCRIPTION | | LEVEL 1 | | | LEVEL 2 | | | LEVEL 3 | | | TOTAL INVESTMENTS | |
| | | | |
Assets:* | | | | | | | | | | | | | | | | |
| Fixed Income: | | | | | | | | | | | | | | | | |
Foreign Government | | $ | — | | | $ | 4,370,217 | | | $ | — | | | $ | 4,370,217 | |
| | | | | | | | | | | | | | | | |
| Total Fixed Income | | | — | | | | 4,370,217 | | | | — | | | | 4,370,217 | |
| | | | | | | | | | | | | | | | |
| Short-Term Investments: | | | | | | | | | | | | | | | | |
Bank Deposit | | | — | | | | 363,781 | | | | — | | | | 363,781 | |
Foreign Government | | | — | | | | — | | | | 94,640 | | | | 94,640 | |
| | | | | | | | | | | | | | | | |
| Total Short-Term Investments | | | — | | | | 363,781 | | | | 94,640 | | | | 458,421 | |
| | | | | | | | | | | | | | | | |
| Derivative Securities: | | | | | | | | | | | | | | | | |
Forward Foreign Currency Exchange Contracts | | | — | | | | 24,387 | | | | — | | | | 24,387 | |
Interest Rate Swaps | | | — | | | | 7,952 | | | | — | | | | 7,952 | |
| | | | | | | | | | | | | | | | |
| Total Derivative Securities | | | — | | | | 32,339 | | | | — | | | | 32,339 | |
| | | | | | | | | | | | | | | | |
| Total | | | — | | | | 4,766,337 | | | | 94,640 | | | | 4,860,977 | |
| | | | | | | | | | | | | | | | |
| | | | |
Liabilities:* | | | | | | | | | | | | | | | | |
| Derivative Securities: | | | | | | | | | | | | | | | | |
Forward Foreign Currency Exchange Contracts | | | — | | | | (47,969 | ) | | | — | | | | (47,969 | ) |
Interest Rate Swaps | | | — | | | | (29,065 | ) | | | — | | | | (29,065 | ) |
| | | | | | | | | | | | | | | | |
Total Derivative Securities | | | — | | | | (77,034 | ) | | | — | | | | (77,034 | ) |
| | | | | | | | | | | | | | | | |
| | | | |
Total Investments | | $ | — | | | $ | 4,689,303 | | | $ | 94,640 | | | $ | 4,783,943 | |
| | | | | | | | | | | | | | | | |
| | * | There were no transfers between levels during the period ended December 31, 2015. |
The following is a reconciliation of investments with unobservable inputs (Level 3) that were used in determining fair value:
| | | | | | | | | | | | | | | | | | | | | | | | | | | | | | | | | | | | |
INVESTMENTS IN SECURITIES | | BALANCE AS
OF
JULY 1,
2015 | | | REALIZED
GAIN (LOSS) | | | CHANGE IN UNREALIZED
APPRECIATION
(DEPRECIATION) | | | NET
TRANSFERS
IN (OUT)
OF LEVEL 3 | | | ACCRUED PREMIUMS/
DISCOUNTS | | | PURCHASES | | | SALES | | | BALANCE AS OF
DECEMBER 31,
2015 | | | CHANGE IN UNREALIZED
APPRECIATION
(DEPRECIATION)
FROM
INVESTMENTS
HELD AT
DECEMBER 31,
2015 | |
| | | | | | | | | |
Fixed Income | | | | | | | | | | | | | | | | | | | | | | | | | | | | | | | | | | | | |
Foreign Government | | $ | – | | | $ | – | | | $ | (5,713 | ) | | $ | – | | | $ | 673 | | | $ | 99,680 | | | $ | – | | | $ | 94,640 | | | $ | (5,713 | ) |
| | | | | | | | | | | | | | | | | | | | | | | | | | | | | | | | | | | | |
| Total | | $ | – | | | $ | – | | | $ | (5,713 | ) | | $ | – | | | $ | 673 | | | $ | 99,680 | | | $ | – | | | $ | 94,640 | | | $ | (5,713 | ) |
| | | | | | | | | | | | | | | | | | | | | | | | | | | | | | | | | | | | |
150
Babson Capital Funds Trust 2015 Semi-Annual Report
NOTES TO THE FINANCIAL STATEMENTS (UNAUDITED) (CONTINUED)
December 31, 2015
| | | | | | | | | | | | | | | | |
| DESCRIPTION | | LEVEL 1 | | | LEVEL 2 | | | LEVEL 3 | | | TOTAL INVESTMENTS | |
| | | | |
Assets:* | | | | | | | | | | | | | | | | |
| Fixed Income: | | | | | | | | | | | | | | | | |
Corporate Bonds | | $ | — | | | $ | 22,822,394 | | | $ | — | | | $ | 22,822,394 | |
| | | | | | | | | | | | | | | | |
| Total Fixed Income | | | — | | | | 22,822,394 | | | | — | | | | 22,822,394 | |
| | | | | | | | | | | | | | | | |
Short-Term Investment | | | — | | | | 1,147,156 | | | | — | | | | 1,147,156 | |
| Derivative Securities: | | | | | | | | | | | | | | | | |
Forward Foreign Currency Exchange Contracts | | | — | | | | 61,325 | | | | — | | | | 61,325 | |
| | | | | | | | | | | | | | | | |
| Total | | | — | | | | 24,030,875 | | | | — | | | | 24,030,875 | |
| | | | | | | | | | | | | | | | |
| | | | |
Liabilities:* | | | | | | | | | | | | | | | | |
| Derivative Securities: | | | | | | | | | | | | | | | | |
Forward Foreign Currency Exchange Contracts | | | — | | | | (68,199 | ) | | | — | | | | (68,199 | ) |
| | | | | | | | | | | | | | | | |
| | | | |
Total Investments | | $ | — | | | $ | 23,962,676 | | | $ | — | | | $ | 23,962,676 | |
| | | | | | | | | | | | | | | | |
| | * | There were no transfers between levels during the period ended December 31, 2015. |
| | | | | | | | | | | | | | | | |
| DESCRIPTION | | LEVEL 1 | | | LEVEL 2 | | | LEVEL 3 | | | TOTAL INVESTMENTS | |
| | | | |
Assets:* | | | | | | | | | | | | | | | | |
| Fixed Income: | | | | | | | | | | | | | | | | |
Bank Loan | | $ | — | | | $ | 75,000 | | | $ | — | | | $ | 75,000 | |
Corporate Bonds | | | — | | | | 22,080,803 | | | | — | | | | 22,080,803 | |
| | | | | | | | | | | | | | | | |
| Total Fixed Income | | | — | | | | 22,155,803 | | | | — | | | | 22,155,803 | |
| | | | | | | | | | | | | | | | |
Short-Term Investment | | | — | | | | 3,864,268 | | | | — | | | | 3,864,268 | |
| | | | | | | | | | | | | | | | |
| Total | | | — | | | | 26,020,071 | | | | — | | | | 26,020,071 | |
| | | | | | | | | | | | | | | | |
| | | | |
Total Investments | | $ | — | | | $ | 26,020,071 | | | $ | — | | | $ | 26,020,071 | |
| | | | | | | | | | | | | | | | |
| | * | There were no transfers between levels during the period ended December 31, 2015. |
| | B. | Forward Commitments and When-Issued Delayed Delivery Securities |
The Funds may purchase securities on a when-issued basis and may purchase or sell securities on a forward commitment basis. Settlement of such transactions normally occurs within a month or more after the purchase or sale commitment is made. The Funds may purchase securities under such conditions with the intention of actually acquiring them, but may enter into a separate agreement to sell the securities before the settlement date. Since the value of securities purchased may fluctuate prior to settlement, the Funds may be required to pay more at settlement than the security is worth. In addition, the Funds are not entitled to any of
the interest earned prior to settlement. When purchasing a security on a delayed delivery basis, the Funds assume the rights and risks of ownership of the security, including the risk of price and yield fluctuations. In the event of default by the counterparty, the Funds’ maximum amount of loss is the unrealized appreciation of unsettled when-issued transactions, which is shown in the Schedule of Investments.
| | C. | Cash and Short-Term Investments |
Cash and cash equivalents consist principally of short-term investments that are readily convertible into cash and have original maturities of three months or less. At December 31, 2015, all cash and cash equivalents are held by the custodian.
151
Babson Capital Funds Trust 2015 Semi-Annual Report
NOTES TO THE FINANCIAL STATEMENTS (UNAUDITED) (CONTINUED)
December 31, 2015
| | D. | Investment Transactions, Related Investment Income and Expenses |
Investment transactions are accounted for on a trade date basis. Interest income is recorded on the accrual basis, including the amortization of premiums and accretion of discounts on bonds held using the yield-to-maturity method.
Realized gains and losses on investment transactions and unrealized appreciation and depreciation of investments are reported for financial statement and Federal income tax purposes on the identified cost method.
Expenses are recorded on the accrual basis as incurred.
Effective July 1, 2015, the Funds no longer had redemption fees.
The preparation of financial statements in conformity with U.S. GAAP requires management to make estimates and assumptions that affect the reported amounts of assets and liabilities at the date of the financial statements and the reported amounts of revenues and expenses during the reporting period. Actual results could differ from these estimates.
| | G. | Federal Income Taxation |
The Funds have elected to be taxed as a Regulated Investment Company (“RIC”) under sub-chapter M of the U.S. Internal Revenue Code of 1986, as amended, and intend to maintain this qualification and to distribute substantially all of their net taxable income to their shareholders. As of December 31, 2015, the Funds had no uncertain tax positions that would require financial statement recognition, de-recognition, or disclosure. The Funds file a U.S. Federal income tax return annually after their fiscal year-end, which is subject to examination by the Internal Revenue Service for a period of three years from the date of the filings.
| | H. | Dividends and Distributions |
Each Fund declares a dividend daily based on the Adviser’s projections of the Funds’ estimated net investment income and distributes such dividend monthly. To the extent that these distributions exceed net investment income, they may be classified as return of capital. The Funds also pay a distribution at least annually from their net realized capital gains, if any.
Dividends and distributions are recorded on the ex-dividend date. All common shares have equal dividend and other distribution rights. A notice disclosing the source(s) of a distribution will be provided if payment is made from any source other than net investment income. Any such notice would be provided only for informational purposes in order to comply with the requirements of Section 19(a) of the 1940 Act and not for tax reporting purposes. The tax composition of the Funds’ distributions for each calendar year is reported on Internal Revenue Service Form 1099-DIV.
Dividends from net investment income and distributions from realized gains from investment transactions have been determined in accordance with Federal income tax regulations and may differ from net investment income and realized gains recorded by the Funds for financial reporting purposes. These differences, which could be temporary or permanent in nature may result in reclassification of distributions; however, net investment income, net realized gains and losses, and net assets are not affected.
The Funds may invest in bank loans, which usually take the form of loan participations and assignments. Loan participations and assignments are agreements to make money available to U.S. or foreign corporations, partnerships or other business entities (the “Borrower”) in a specified amount, at a specified rate and within a specified time. A loan is typically originated, negotiated and structured by a U.S. or foreign bank, insurance company or other financial institution (the “Agent”) for a group of loan investors (“Loan Investors”). The Agent typically administers and enforces the loan on behalf of the other Loan Investors in the syndicate and may hold any collateral on behalf of the Loan Investors. Such loan participations and assignments are typically senior, secured and collateralized in nature. The Funds record an investment when the Borrower withdraws money and records interest as earned. These loans pay interest at rates which are periodically reset by reference to a base lending rate plus a spread. These base lending rates are generally the prime rate offered by a designated U.S. bank or London InterBank Offered Rate (“LIBOR”).
The loans in which the Funds invest may be subject to some restrictions on resale. For example, the Funds may be contractually obligated to receive approval from the Agent and/or Borrower prior to the sale of these investments. The Funds generally have no right to
152
Babson Capital Funds Trust 2015 Semi-Annual Report
NOTES TO THE FINANCIAL STATEMENTS (UNAUDITED) (CONTINUED)
December 31, 2015
enforce compliance with the terms of the loan agreement with the Borrower. As a result, the Funds assume the credit risk of the Borrower, the selling participant and any other persons interpositioned between the Funds and the Borrower (“Intermediate Participants”). In the event that the Borrower, selling participant or Intermediate Participants become insolvent or enter into bankruptcy, the Funds may incur certain costs and delays in realizing payment or may suffer a loss of principal and/or interest.
Unfunded commitments represent the remaining obligation of the Funds to the Borrower. At any point in time, up to the maturity date of the issue, the Borrower may demand the unfunded portion. Until demanded by the Borrower, unfunded commitments are not recognized as an asset on the Statements of Assets and Liabilities. Unrealized appreciation/depreciation on unfunded commitments presented on the Statements of Assets and Liabilities represents mark to market of the unfunded portion of the Funds’ bank loans. As of December 31, 2015, the Funds had no unfunded loan commitments.
The following is a description of the derivative instruments that the Funds utilize as part of their investment strategy, including the primary underlying risk exposures related to the instrument.
Forward Foreign Currency Exchange Contracts – The Funds are subject to foreign currency exchange rate risk in the normal course of pursuing their investment objectives. The Funds may use forward foreign currency exchange contracts to hedge against changes in the value of foreign currencies. The Funds may enter into forward foreign currency exchange contracts obligating the Funds to deliver or receive a currency at a specified future date. Forward contracts are valued daily and unrealized appreciation or depreciation is recorded daily as the difference between the contract exchange rate and the closing forward rate applied to the face amount of the contract. A realized gain or loss is recorded at the time the forward contract expires. Credit risk may arise as a result of the failure of the counterparty to comply with the terms of the contract. The Funds consider the creditworthiness of each counterparty to a contract in evaluating potential credit risk quarterly. The Funds are also subject to credit risk with respect to the counterparties to derivative contracts that are not cleared through a central counterparty but instead are traded
over-the-counter between two counterparties. If a counterparty to an over-the-counter derivative becomes bankrupt or otherwise fails to perform its obligations under a derivative contract due to financial difficulties, the Funds may experience significant delays in obtaining any recovery under the derivative contract in a bankruptcy or other reorganization proceeding. The Funds may obtain only a limited recovery or may obtain no recovery in such circumstances. The counterparty risk for cleared derivatives is generally lower than for uncleared over-the-counter derivative transactions since generally a clearing organization becomes substituted for each counterparty to a cleared derivative contract and, in effect, guarantees the parties’ performance under the contract as each party to a trade looks only to the clearing house for performance of financial obligations. However, there can be no assurance that the clearing house, or its members, will satisfy its obligations to the Funds. In addition, in the event of a bankruptcy of a clearing house, the Funds could experience a loss of the funds deposited with such clearing house as margin and of any profits on its open positions. The counterparty risk to the Funds is limited to the net unrealized gain, if any, on the contract.
The use of forward foreign currency exchange contracts does not eliminate fluctuations in the underlying prices of the Funds’ investment securities; however, it does establish a rate of exchange that can be achieved in the future. The use of forward foreign currency exchange contracts involves the risk that anticipated currency movements will not be accurately predicted. A forward foreign currency exchange contract would limit the risk of loss due to a decline in the value of a particular currency; however, it would also limit any potential gain that might result should the value of the currency increase instead of decrease. These contracts may involve market risk in excess of the amount of receivable or payable reflected on the Statement of Assets and Liabilities.
The Funds may purchase and sell futures contracts to enhance returns, to attempt to hedge some of its investment risk, or as a substitute position in lieu of holding the underlying asset on which the instrument is based. At the time of entering into a futures transaction, an investor is required to deposit and maintain a specified amount of cash or eligible securities called “initial margin.” Subsequent payments made or received by a Fund called “variation margin” are made on a daily basis as the market price of the futures contract fluctuates. Each Fund will
153
Babson Capital Funds Trust 2015 Semi-Annual Report
NOTES TO THE FINANCIAL STATEMENTS (UNAUDITED) (CONTINUED)
December 31, 2015
record an unrealized gain (loss) based on the amount of variation margin. When a contract is closed, a realized gain (loss) is recorded equal to the difference between the opening and closing value of the contract.
The Funds may purchase call or put options. When a Fund purchases an option, the premium paid by the Fund is recorded as an asset and is subsequently adjusted to the current fair value of the option purchased. Purchasing call options tends to increase the Fund’s exposure to the underlying instrument. Purchasing put options tends to decrease the Fund’s exposure to the underlying instrument. Premiums paid for purchasing options that expire are treated as realized losses. Premiums paid for purchasing options that are exercised or closed are added to the amounts paid or offset against the proceeds on the underlying security to determine the realized gain or loss. The risks associated with purchasing put and call options are potential loss of the premium paid and, in the instances of over-the-counter derivatives, the failure of the counterparty to honor its obligation under the contract.
The Funds may enter into swap options (“swaptions”). A swaption is an option to enter into a pre-defined swap agreement by some specified date in the future. The writer of the swaption becomes the counterparty to the swap if the buyer exercises. The interest rate swaption agreement will specify whether the buyer of the swaption will be a fixed rate receiver or a fixed rate buyer. Depending on the terms of the particular option agreement, a Fund generally will incur a greater degree of risk when the Fund writes a swaption than the Fund will incur when it purchases a swaption. When a Fund purchases a swaption, the Fund’s risk of loss is limited to the amount of the premium it has paid should it decide to let the swaption expire unexercised.
When a Fund writes a covered call or a put option, an amount equal to the premium received by the Fund is included in the Fund’s Statement of Assets and Liabilities as an asset and as an equivalent liability. The amount of the liability is subsequently marked-to-market to reflect the current market value of the option written. The Fund receives a premium on the sale of a call option but gives up the opportunity to profit from any increase in stock value above the exercise price of the option, and when a Fund writes a put option, it is exposed to a decline in the price of the underlying security.
Whether an option which a Fund has written expires on its stipulated expiration date or a Fund enters into a
closing purchase transaction, the Fund realizes a gain (or loss, if the cost of a closing purchase transaction exceeds the premium received when the option was sold) without regard to any unrealized gain or loss on the underlying security, and the liability related to such option is extinguished. If a call option which a Fund has written is exercised, the Fund realizes a capital gain or loss from the sale of the underlying security, and the cost basis of the lots sold are decreased by the premium originally received. When a put option which a Fund has written is exercised, the amount of the premium originally received will reduce the cost of the security which the Fund purchases upon exercise of the option. Realized gains (losses) on purchased options are included in net realized gain (loss) from investments.
The Funds’ use of written options involves, to varying degrees, elements of market risk in excess of the amount recognized in the Statements of Assets and Liabilities. The face or contract amounts of these instruments reflect the extent of the Funds’ exposure to market risk. The risks may be caused by an imperfect correlation between movements in the price of the instrument and the price of the underlying securities, currencies and interest rates.
Transactions in written option contracts for the Global Credit Income Opportunities Fund for the period ended December 31, 2015 are as follows:
| | | | | | | | |
| | | NUMBER OF
CONTRACTS/
NOTIONAL
AMOUNT | | | PREMIUMS
RECEIVED | |
Options outstanding at June 30, 2015 | | | 30,000,000 | | | $ | 382,000 | |
Options written | | | 80,000,000 | | | | 1,465,020 | |
Options terminated in closing purchase transactions | | | (70,000,000 | ) | | | (875,020 | ) |
Options expired | | | – | | | | – | |
| | | | | | | | |
Options outstanding at December 31, 2015 | | | 40,000,000 | | | $ | 972,000 | |
| | | | | | | | |
The Funds may enter into credit default swap contracts. As a seller of a credit default swap contract (“seller of protection”), a Fund is required to pay the notional amount or other agreed-upon value of a referenced debt obligation to the counterparty in the event of a default by or other credit event involving the referenced issuer, obligation or index. In return, a Fund receives from the counterparty a periodic stream of payments over the term of the contract.
154
Babson Capital Funds Trust 2015 Semi-Annual Report
NOTES TO THE FINANCIAL STATEMENTS (UNAUDITED) (CONTINUED)
December 31, 2015
As a purchaser of a credit default swap contract (“buyer of protection”), a Fund would receive the notional amount or other agreed-upon value of a referenced debt obligation from the counterparty in the event of default by or other credit event involving the referenced issuer, obligation or index. In return, a Fund would make periodic payments to the counterparty over the term of the contracts, provided no event of default has occurred.
These credit default swaps may have as a reference obligation corporate or sovereign issuers or credit indices. These credit indices are comprised of a basket of securities representing a particular sector of the market. During the period, Active Short Duration Bond Fund and Total Return Bond Fund entered into credit default swaps based on a CMBX index, which is comprised of commercial mortgage-backed securities.
Credit default swaps are fair valued based upon quotations from counterparties, brokers or market makers and the change in value, if any, is recorded as an unrealized appreciation or depreciation. For a credit default swap sold by a Fund, payment of the agreed- upon amount made by a Fund in the event of default of the referenced debt obligation is recorded as the cost of the referenced debt obligation purchased/received. For a credit default swap purchased by a Fund, the agreed- upon amount received by a Fund in the event of default of the referenced debt obligation is recorded as proceeds from sale/delivery of the referenced debt obligation and the resulting gain or loss realized on the referenced debt obligation is recorded as such by a Fund.
Any upfront payments made or received upon entering a credit default swap contract would be amortized or accreted over the life of the swap and recorded as realized gains or losses. Collateral, in the form of cash or securities, may be required to be held in segregated accounts with the custodian bank or broker in accordance with the swap agreement. The value and credit rating of each credit default swap where a Fund is the seller of protection, are both measures of the current payment/performance risk of the swap. As the value of the swap changes as a positive or negative percentage of the total notional amount, the payment/performance risk may decrease or increase, respectively. The maximum potential amount of future payments (undiscounted) that a Fund as a seller of protection could be required to
make under a credit default swap agreement would be an amount equal to the notional amount of the agreement. These potential amounts would be partially offset by any recovery values of the respective referenced obligations, upfront payments received upon entering into the agreement, or net amounts received from the settlement of buy protection credit default swap agreements entered into by a Fund for the same referenced entity or entities.
Entering into credit default swaps involves credit and market risk. Such risks involve the possibility that there will be no liquid market for these agreements, that the counterparty to the agreements may default on its obligation to perform or disagree as to the meaning of the contractual terms in the agreements, that there may be unfavorable changes in interest rates, and that the Adviser does not correctly predict the creditworthiness of the issuers of the reference obligation on which the credit default swap is based.
Interest rate swaps involve the exchange by a Fund with another party of their respective commitments to receive or pay interest (e.g., an exchange of fixed rate payments for floating rate payments) with respect to a notional amount of principal.
During the period ended December 31, 2015, the Funds’ direct investment in derivatives consisted of forward foreign currency exchange contracts, futures contracts, credit default swaps, interest rate swaps, purchased options, and written options.
The following is a summary of the fair value of derivative instruments held directly by the Funds as of December 31, 2015:
Global Floating Rate Fund
| | | | | | |
| ASSET DERIVATIVES | | STATEMENTS OF ASSETS
AND LIABILITIES
LOCATION | | FOREIGN
EXCHANGE
CONTRACTS
RISK | |
Forward Foreign Currency Exchange Contracts | | Unrealized appreciation on forward foreign currency exchange contracts | | $ | 394,403 | |
| | | | | | |
Total | | | | $ | 394,403 | |
| | | | | | |
155
Babson Capital Funds Trust 2015 Semi-Annual Report
NOTES TO THE FINANCIAL STATEMENTS (UNAUDITED) (CONTINUED)
December 31, 2015
| | | | | | |
| LIABILITY DERIVATIVES | | STATEMENTS OF ASSETS
AND LIABILITIES
LOCATION | | FOREIGN
EXCHANGE
CONTRACTS
RISK | |
Forward Foreign Currency Exchange Contracts | | Unrealized depreciation on forward foreign currency exchange contracts | | $ | (11,957 | ) |
| | | | | | |
Total | | | | $ | (11,957 | ) |
| | | | | | |
Global Credit Income Opportunities Fund
| | | | | | | | | | | | | | |
| ASSET DERIVATIVES | | STATEMENTS OF ASSETS
AND LIABILITIES LOCATION | | FOREIGN EXCHANGE CONTRACTS
RISK | | | INTEREST RATE
RISK | | | TOTAL | |
Forward Foreign Currency Exchange Contracts | | Unrealized appreciation on forward foreign currency exchange contracts | | $ | 197,214 | | | $ | – | | | $ | 197,214 | |
Purchased Options | | Investments, at fair value | | | – | | | | 406,452 | | | | 406,452 | |
| | | | | | | | | | | | | | |
Total | | | | $ | 197,214 | | | $ | 406,452 | | | $ | 603,666 | |
| | | | | | | | | | | | | | |
| | | | | | | | | | | | | | |
| LIABILITY DERIVATIVES | | STATEMENTS OF ASSETS
AND LIABILITIES LOCATION | | FOREIGN
EXCHANGE CONTRACTS
RISK | | | INTEREST RATE
RISK | | | TOTAL | |
Forward Foreign Currency Exchange Contracts | | Unrealized depreciation on forward foreign currency exchange contracts | | $ | (8,461 | ) | | $ | – | | | $ | (8,461 | ) |
Written Options | | Written options, at fair value | | | – | | | | (207,921 | ) | | | (207,921 | ) |
| | | | | | | | | | | | | | |
Total | | | | $ | (8,461 | ) | | $ | (207,921 | ) | | $ | (216,382 | ) |
| | | | | | | | | | | | | | |
Active Short Duration Bond Fund
| | | | | | | | | | | | | | |
| ASSET DERIVATIVES | | STATEMENTS OF ASSETS
AND LIABILITIES LOCATION | | FOREIGN
EXCHANGE CONTRACTS
RISK | | | INTEREST RATE
RISK | | | TOTAL | |
Futures Contracts | | Includes cumulative unrealized appreciation/ depreciation of futures contracts as reported in the Schedule of Investments. Only current day’s variation margin is reported within the Statements of Assets and Liabilities. | | $ | – | | | $ | 13,623 | | | $ | 13,623 | |
Purchased Options | | Investments, at fair value | | | 54,242 | | | | 14,650 | | | | 68,892 | |
| | | | | | | | | | | | | | |
Total | | | | $ | 54,242 | | | $ | 28,273 | | | $ | 82,515 | |
| | | | | | | | | | | | | | |
156
Babson Capital Funds Trust 2015 Semi-Annual Report
NOTES TO THE FINANCIAL STATEMENTS (UNAUDITED) (CONTINUED)
December 31, 2015
| | | | | | | | | | | | | | |
| LIABILITY DERIVATIVES | | STATEMENTS OF ASSETS
AND LIABILITIES LOCATION | | INTEREST RATE
RISK | | | CREDIT RISK | | | TOTAL | |
Futures Contracts | | Includes cumulative unrealized appreciation/ depreciation of futures contracts as reported in the Schedule of Investments. Only current day’s variation margin is reported within the Statements of Assets and Liabilities. | | $ | (76,527 | ) | | $ | – | | | $ | (76,527 | ) |
Swaps Contracts | | Swap contracts, at fair value | | | – | | | | (7,229 | ) | | | (7,229 | ) |
| | | | | | | | | | | | | | |
Total | | | | $ | (76,527 | ) | | $ | (7,229 | ) | | $ | (83,756 | ) |
| | | | | | | | | | | | | | |
Total Return Bond Fund
| | | | | | | | | | | | | | |
| ASSET DERIVATIVES | | STATEMENTS OF ASSETS
AND LIABILITIES LOCATION | | FOREIGN
EXCHANGE CONTRACTS
RISK | | | INTEREST RATE
RISK | | | TOTAL | |
Forward Foreign Currency Exchange Contracts | | Unrealized appreciation on forward foreign currency exchange contracts | | $ | 4,766 | | | $ | – | | | $ | 4,766 | |
Futures Contracts | | Includes cumulative unrealized appreciation/ depreciation of futures contracts as reported in the Schedule of Investments. Only current day’s variation margin is reported within the Statements of Assets and Liabilities. | | | – | | | | 3,974 | | | | 3,974 | |
Purchased Options | | Investments, at fair value | | | 126,564 | | | | 7,091 | | | | 133,655 | |
| | | | | | | | | | | | | | |
Total | | | | $ | 131,330 | | | $ | 11,065 | | | $ | 142,395 | |
| | | | | | | | | | | | | | |
| | | | | | | | | | | | | | | | | | |
| LIABILITY DERIVATIVES | | STATEMENTS OF ASSETS
AND LIABILITIES
LOCATION | | FOREIGN
EXCHANGE CONTRACTS
RISK | | | INTEREST RATE
RISK | | | CREDIT
RISK | | | TOTAL | |
Forward Foreign Currency Exchange Contracts | | Unrealized depreciation on forward foreign currency exchange contracts | | $ | (12,870 | ) | | $ | – | | | $ | – | | | $ | (12,870 | ) |
Futures Contracts | | Includes cumulative unrealized appreciation/ depreciation of futures contracts as reported in the Schedule of Investments. Only current day’s variation margin is reported within the Statements of Assets and Liabilities. | | | – | | | | (12,186 | ) | | | – | | | | (12,186 | ) |
Swaps Contracts | | Swap contracts, at fair value | | | – | | | | – | | | | (1,885 | ) | | | (1,885 | ) |
| | | | | | | | | | | | | | | | | | |
Total | | | | $ | (12,870 | ) | | $ | (12,186 | ) | | $ | (1,885 | ) | | $ | (26,941 | ) |
| | | | | | | | | | | | | | | | | | |
157
Babson Capital Funds Trust 2015 Semi-Annual Report
NOTES TO THE FINANCIAL STATEMENTS (UNAUDITED) (CONTINUED)
December 31, 2015
Emerging Markets Debt Blended Total Return Fund
| | | | | | | | | | | | | | |
| ASSET DERIVATIVES | | STATEMENTS OF ASSETS
AND LIABILITIES LOCATION | | FOREIGN
EXCHANGE CONTRACTS
RISK | | | INTEREST RATE
RISK | | | TOTAL | |
Forward Foreign Currency Exchange Contracts | | Unrealized appreciation on forward foreign currency exchange contracts | | $ | 130,248 | | | $ | – | | | $ | 130,248 | |
Futures Contracts | | Includes cumulative unrealized appreciation/ depreciation of futures contracts as reported in the Schedule of Investments. Only current day’s variation margin is reported within the Statements of Assets and Liabilities. | | | – | | | | 1,022 | | | | 1,022 | |
Swaps Contracts | | Swap contracts, at fair value | | | | | | | 10,877 | | | | 10,877 | |
| | | | | | | | | | | | | | |
Total | | | | $ | 130,248 | | | $ | 11,899 | | | $ | 142,147 | |
| | | | | | | | | | | | | | |
| | | | | | | | | | | | | | |
| LIABILITY DERIVATIVES | | STATEMENTS OF ASSETS
AND LIABILITIES LOCATION | | FOREIGN
EXCHANGE CONTRACTS
RISK | | | CREDIT RISK | | | TOTAL | |
Forward Foreign Currency Exchange Contracts | | Unrealized depreciation on forward foreign currency exchange contracts | | $ | (146,056 | ) | | $ | – | | | $ | (146,056 | ) |
Swaps Contracts | | Swap contracts, at fair value | | | | | | | (7,281 | ) | | | (7,281 | ) |
| | | | | | | | | | | | | | |
Total | | | | $ | (146,056 | ) | | $ | (7,281 | ) | | $ | (153,337 | ) |
| | | | | | | | | | | | | | |
Emerging Markets Local Currency Debt Fund
| | | | | | | | | | | | | | |
| ASSET DERIVATIVES | | STATEMENTS OF ASSETS
AND LIABILITIES LOCATION | | FOREIGN
EXCHANGE CONTRACTS
RISK | | | INTEREST RATE
RISK | | | TOTAL | |
Forward Foreign Currency Exchange Contracts | | Unrealized appreciation on forward foreign currency exchange contracts | | $ | 24,387 | | | $ | – | | | $ | 24,387 | |
Swaps Contracts | | Swap contracts, at fair value | | | | | | | 7,952 | | | | 7,952 | |
| | | | | | | | | | | | | | |
Total | | | | $ | 24,387 | | | $ | 7,952 | | | $ | 32,339 | |
| | | | | | | | | | | | | | |
| | | | | | | | | | | | | | |
| LIABILITY DERIVATIVES | | STATEMENTS OF ASSETS
AND LIABILITIES LOCATION | | FOREIGN
EXCHANGE CONTRACTS
RISK | | | INTEREST RATE
RISK | | | TOTAL | |
Forward Foreign Currency Exchange Contracts | | Unrealized depreciation on forward foreign currency exchange contracts | | $ | (47,969 | ) | | $ | – | | | $ | (47,969 | ) |
Swaps Contracts | | Swap contracts, at fair value | | | | | | | (29,065 | ) | | | (29,065 | ) |
| | | | | | | | | | | | | | |
Total | | | | $ | (47,969 | ) | | $ | (29,065 | ) | | $ | (77,034 | ) |
| | | | | | | | | | | | | | |
158
Babson Capital Funds Trust 2015 Semi-Annual Report
NOTES TO THE FINANCIAL STATEMENTS (UNAUDITED) (CONTINUED)
December 31, 2015
Global High Yield Fund
| | | | | | |
ASSET
DERIVATIVES | | STATEMENTS OF ASSETS
AND LIABILITIES
LOCATION | | FOREIGN
EXCHANGE
CONTRACTS
RISK | |
Forward Foreign Currency Exchange Contracts | | Unrealized appreciation on forward foreign currency exchange contracts | | $ | 61,325 | |
| | | | | | |
Total | | | | $ | 61,325 | |
| | | | | | |
| | | | | | |
LIABILITY
DERIVATIVES | | STATEMENTS OF ASSETS
AND LIABILITIES
LOCATION | | FOREIGN
EXCHANGE
CONTRACTS
RISK | |
Forward Foreign Currency Exchange Contracts | | Unrealized depreciation on forward foreign currency exchange contracts | | $ | (68,199 | ) |
| | | | | | |
Total | | | | $ | (68,199 | ) |
| | | | | | |
Amount of Realized Gain/(Loss) on Derivatives:
Global Floating Rate Fund
| | | | |
| | | FOREIGN
EXCHANGE
CONTRACTS
RISK | |
Forward Foreign Currency Exchange Contracts | | $ | 670,025 | |
| | | | |
Total | | $ | 670,025 | |
| | | | |
Global Credit Income Opportunities Fund
| | | | | | | | | | | | |
| | | FOREIGN
EXCHANGE
CONTRACTS
RISK | | | INTEREST
RATE
RISK | | | TOTAL | |
Forward Foreign Currency Exchange Contracts | | $ | 439,379 | | | $ | – | | | $ | 439,379 | |
Purchased Options | | | – | | | | 232,460 | | | | 232,460 | |
Written Options | | | – | | | | (34,180 | ) | | | (34,180 | ) |
| | | | | | | | | | | | |
Total | | $ | 439,379 | | | $ | 198,280 | | | $ | 637,659 | |
| | | | | | | | | | | | |
Active Short Duration Bond Fund
| | | | | | | | | | | | |
| | | INTEREST
RATE
RISK | | | CREDIT
RISK | | | TOTAL | |
Futures Contracts | | $ | (80,683 | ) | | $ | – | | | $ | (80,683 | ) |
Swaps Contracts | | | – | | | | 3,498 | | | | 3,498 | |
| | | | | | | | | | | | |
Total | | $ | (80,683 | ) | | $ | 3,498 | | | $ | (77,185 | ) |
| | | | | | | | | | | | |
Total Return Bond Fund
| | | | | | | | | | | | | | | | |
| | | FOREIGN
EXCHANGE
CONTRACTS
RISK | | | INTEREST
RATE
RISK | | | CREDIT
RISK | | | TOTAL | |
Futures Contracts | | $ | – | | | $ | (19,608 | ) | | $ | – | | | $ | (19,608 | ) |
Purchased Options | | | 76,374 | | | | (5,419 | ) | | | – | | | | 70,955 | |
Swaps Contracts | | | – | | | | – | | | | 913 | | | | 913 | |
| | | | | | | | | | | | | | | | |
Total | | $ | 76,374 | | | $ | (25,027 | ) | | $ | 913 | | | $ | 52,260 | |
| | | | | | | | | | | | | | | | |
Emerging Markets Debt Blended Total Return Fund
| | | | | | | | | | | | | | | | |
| | | FOREIGN
EXCHANGE
CONTRACTS
RISK | | | INTEREST
RATE
RISK | | | CREDIT
RISK | | | TOTAL | |
Forward Foreign Currency Exchange Contracts | | $ | (5,772 | ) | | $ | – | | | $ | – | | | $ | (5,772 | ) |
Futures Contracts | | | – | | | | 3,818 | | | | – | | | | 3,818 | |
Swaps Contracts | | | – | | | | – | | | | 843 | | | | 843 | |
| | | | | | | | | | | | | | | | |
Total | | $ | (5,772 | ) | | $ | 3,818 | | | $ | 843 | | | $ | (1,111 | ) |
| | | | | | | | | | | | | | | | |
159
Babson Capital Funds Trust 2015 Semi-Annual Report
NOTES TO THE FINANCIAL STATEMENTS (UNAUDITED) (CONTINUED)
December 31, 2015
Emerging Markets Local Currency Debt Fund
| | | | |
| | | FOREIGN
EXCHANGE
CONTRACTS
RISK | |
Forward Foreign Currency Exchange Contracts | | $ | (11,053 | ) |
| | | | |
Total | | $ | (11,053 | ) |
| | | | |
Global High Yield Fund
| | | | |
| | | FOREIGN
EXCHANGE
CONTRACTS
RISK | |
Forward Foreign Currency Exchange Contracts | | $ | 81,280 | |
| | | | |
Total | | $ | 81,280 | |
| | | | |
Change in Unrealized Appreciation/(Depreciation) on Derivatives:
Global Floating Rate Fund
| | | | |
| | | FOREIGN
EXCHANGE
CONTRACTS
RISK | |
Forward Foreign Currency Exchange Contracts | | $ | 752,516 | |
| | | | |
Total | | $ | 752,516 | |
| | | | |
Global Credit Income Opportunities Fund
| | | | | | | | | | | | |
| | | FOREIGN
EXCHANGE
CONTRACTS
RISK | | | INTEREST
RATE
RISK | | | TOTAL | |
Forward Foreign Currency Exchange Contracts | | $ | 332,385 | | | $ | – | | | $ | 332,385 | |
Purchased Options | | | – | | | | (911,375 | ) | | | (911,375 | ) |
Written Options | | | – | | | | 701,556 | | | | 701,556 | |
| | | | | | | | | | | | |
Total | | $ | 332,385 | | | $ | (209,819 | ) | | $ | 122,566 | |
| | | | | | | | | | | | |
Active Short Duration Bond Fund
| | | | | | | | | | | | | | | | |
| | | FOREIGN
EXCHANGE
CONTRACTS
RISK | | | INTEREST
RATE
RISK | | | CREDIT
RISK | | | TOTAL | |
Futures Contracts | | $ | – | | | $ | (62,904 | ) | | $ | – | | | $ | (62,904 | ) |
Purchased Options | | | 32,732 | | | | (11,195 | ) | | | – | | | | 21,537 | |
Swaps Contracts | | | – | | | | – | | | | (7,791 | ) | | | (7,791 | ) |
| | | | | | | | | | | | | | | | |
Total | | $ | 32,732 | | | $ | (74,099 | ) | | $ | (7,791 | ) | | $ | (49,158 | ) |
| | | | | | | | | | | | | | | | |
Total Return Bond Fund
| | | | | | | | | | | | | | | | |
| | | FOREIGN
EXCHANGE
CONTRACTS
RISK | | | INTEREST
RATE
RISK | | | CREDIT
RISK | | | TOTAL | |
Forward Foreign Currency Exchange Contracts | | $ | (8,104 | ) | | $ | | | | $ | – | | | $ | (8,104 | ) |
Futures Contracts | | | – | | | | (8,212 | ) | | | – | | | | (8,212 | ) |
Purchased Options | | | 76,374 | | | | (5,419 | ) | | | – | | | | 70,955 | |
Swaps Contracts | | | – | | | | – | | | | (2,032 | ) | | | (2,032 | ) |
| | | | | | | | | | | | | | | | |
Total | | $ | 68,270 | | | $ | (13,631 | ) | | $ | (2,032 | ) | | $ | 52,607 | |
| | | | | | | | | | | | | | | | |
Emerging Markets Debt Blended Total Return Fund
| | | | | | | | | | | | | | | | |
| | | FOREIGN
EXCHANGE
CONTRACTS
RISK | | | INTEREST
RATE
RISK | | | CREDIT
RISK | | | TOTAL | |
Forward Foreign Currency Exchange Contracts | | $ | (15,808 | ) | | $ | – | | | $ | – | | | $ | (15,808 | ) |
Futures Contracts | | | – | | | | 1,022 | | | | – | | | | 1,022 | |
Swaps Contracts | | | – | | | | 10,877 | | | | 1,994 | | | | 12,871 | |
| | | | | | | | | | | | | | | | |
Total | | $ | (15,808 | ) | | $ | 11,899 | | | $ | 1,994 | | | $ | (1,915 | ) |
| | | | | | | | | | | | | | | | |
160
Babson Capital Funds Trust 2015 Semi-Annual Report
NOTES TO THE FINANCIAL STATEMENTS (UNAUDITED) (CONTINUED)
December 31, 2015
Emerging Markets Local Currency Debt Fund
| | | | | | | | | | | | |
| | | FOREIGN
EXCHANGE
CONTRACTS
RISK | | | INTEREST
RATE
RISK | | | TOTAL | |
Forward Foreign Currency Exchange Contracts | | $ | (23,582 | ) | | $ | – | | | $ | (23,582 | ) |
Swaps Contracts | | | – | | | | (21,113 | ) | | | (21,113 | ) |
| | | | | | | | | | | | |
Total | | $ | (23,582 | ) | | $ | (21,113 | ) | | $ | (44,695 | ) |
| | | | | | | | | | | | |
Global High Yield Fund
| | | | |
| | | FOREIGN
EXCHANGE
CONTRACTS
RISK | |
Forward Foreign Currency Exchange Contracts | | $ | (6,874 | ) |
| | | | |
Total | | $ | (6,874 | ) |
| | | | |
Global Floating Rate Fund
| | | | |
NUMBER OF CONTRACTS, NOTIONAL AMOUNTS OF SHARES/UNITS | | FOREIGN
EXCHANGE
CONTRACTS
RISK | |
Forward Foreign Currency Exchange Contracts(1) | | $ | 41,693,519 | |
| | | | |
Total | | $ | 41,693,519 | |
| | | | |
| | (1) | Volume of derivative activity is based on an average of month-end notional amounts outstanding during the period. |
Global Credit Income Opportunities Fund
| | | | | | | | | | | | |
| | | FOREIGN
EXCHANGE
CONTRACTS
RISK | | | INTEREST
RATE RISK | | | TOTAL | |
Forward Foreign Currency Exchange Contracts(1) | | $ | 23,748,605 | | | $ | – | | | $ | 23,748,605 | |
Purchased Options(1) | | | – | | | | 38,571,429 | | | | 38,571,429 | |
Written Options(1) | | | – | | | | (38,571,429 | ) | | | (38,571,429 | ) |
| | | | | | | | | | | | |
Total | | $ | 23,748,605 | | | $ | – | | | $ | 23,748,605 | |
| | | | | | | | | | | | |
| | (1) | Volume of derivative activity is based on an average of month-end notional amounts outstanding during the period. |
Active Short Duration Bond Fund
| | | | | | | | | | | | | | | | |
NUMBER OF
CONTRACTS,
NOTIONAL
AMOUNTS
OF SHARES/
UNITS | | FOREIGN
EXCHANGE
CONTRACTS
RISK | | | INTEREST
RATE RISK | | | CREDIT
RISK | | | TOTAL | |
Futures Contracts(1) | | $ | – | | | $ | 170 | | | $ | – | | | $ | 170 | |
Purchased Options(2) | | | 2,040,000 | | | | 6,250,000 | | | | – | | | | 8,290,000 | |
Swap Contracts(2) | | | – | | | | – | | | | 230,000 | | | | 230,000 | |
| | | | | | | | | | | | | | | | |
Total | | | 2,040,000 | | | | 6,250,170 | | | | 230,000 | | | | 8,520,170 | |
| | | | | | | | | | | | | | | | |
| | (1) | Volume of derivative activity is based on an average of month-end contracts outstanding during the period. |
| | (2) | Volume of derivative activity is based on an average of month-end notional amounts outstanding during the period. |
161
Babson Capital Funds Trust 2015 Semi-Annual Report
NOTES TO THE FINANCIAL STATEMENTS (UNAUDITED) (CONTINUED)
December 31, 2015
Total Return Bond Fund
| | | | | | | | | | | | | | | | |
NUMBER OF
CONTRACTS,
NOTIONAL
AMOUNTS OF
SHARES/UNITS | | FOREIGN
EXCHANGE
CONTRACTS
RISK | | | INTEREST
RATE RISK | | | CREDIT
RISK | | | TOTAL | |
Forward Foreign Currency Exchange Contracts(1) | | $ | 300,979 | | | $ | – | | | $ | – | | | $ | 300,979 | |
Futures Contracts(2) | | | – | | | | 45 | | | | – | | | | 45 | |
Purchased Options(1) | | | – | | | | 7,785,000 | | | | – | | | | 7,785,000 | |
Swap Contracts(1) | | | – | | | | – | | | | 669,467 | | | | 669,467 | |
| | | | | | | | | | | | | | | | |
Total | | $ | 300,979 | | | $ | 7,785,045 | | | $ | 669,467 | | | $ | 8,755,491 | |
| | | | | | | | | | | | | | | | |
| | (1) | Volume of derivative activity is based on an average of month-end notional amounts outstanding during the period. |
| | (2) | Volume of derivative activity is based on an average of month-end contracts outstanding during the period. |
Emerging Markets Debt Blended Total Return Fund
| | | | | | | | | | | | | | | | |
NUMBER OF
CONTRACTS,
NOTIONAL
AMOUNTS OF
SHARES/UNITS | | FOREIGN
EXCHANGE
CONTRACTS
RISK | | | INTEREST
RATE
RISK | | | CREDIT
RISK | | | TOTAL | |
Forward Foreign Currency Exchange Contracts(1) | | $ | 8,736,234 | | | $ | – | | | $ | – | | | $ | 8,736,234 | |
Futures Contracts(2) | | | – | | | | 3 | | | | – | | | | 3 | |
Swap Contracts(1) | | | – | | | | – | | | | 200,000 | | | | 200,000 | |
| | | | | | | | | | | | | | | | |
Total | | $ | 8,736,234 | | | $ | 3 | | | $ | 200,000 | | | $ | 8,936,237 | |
| | | | | | | | | | | | | | | | |
| | (1) | Volume of derivative activity is based on an average of month-end notional amounts outstanding during the period. |
| | (2) | Volume of derivative activity is based on an average of month-end contracts outstanding during the period. |
Emerging Markets Local Currency Debt Fund
| | | | |
NUMBER OF CONTRACTS, NOTIONAL AMOUNTS OF SHARES/UNITS | | FOREIGN
EXCHANGE
CONTRACTS
RISK | |
Forward Foreign Currency Exchange Contracts(1) | | $ | 5,211,436 | |
| | | | |
Total | | $ | 5,211,436 | |
| | | | |
| | (1) | Volume of derivative activity is based on an average of month-end notional amounts outstanding during the period. |
Global High Yield Fund
| | | | |
NUMBER OF CONTRACTS, NOTIONAL AMOUNTS OF SHARES/UNITS | | FOREIGN
EXCHANGE
CONTRACTS
RISK | |
Forward Foreign Currency Exchange Contracts(1) | | $ | 5,699,993 | |
| | | | |
Total | | $ | 5,699,993 | |
| | | | |
| | (1) | Volume of derivative activity is based on an average of month-end notional amounts outstanding during the period. |
| K. | Disclosures about Offsetting Assets and Liabilities |
The Financial Accounting Standards Board (“FASB”) issued Accounting Standards Update No. 2011-11 “Disclosures about Offsetting Assets and Liabilities” (“ASU 2011-11”). These disclosure requirements are intended to help better assess the effect or potential effect of offsetting arrangements on a Fund’s financial position. In addition, FASB issued Accounting Standards Update No. 2013-01 “Clarifying the Scope of Offsetting Assets and Liabilities” (“ASU 2013-01”), specifying which transactions are subject to disclosures about offsetting.
The following tables illustrate gross and net information about recognized assets eligible for offset in the Statement of Assets and Liabilities; and disclose such amounts subject to an enforceable master netting agreement or similar agreement, by counterparty. A master netting agreement is an agreement between two counterparties who have multiple contracts with each other that provides for the net settlement of all contracts, as well as cash collateral, through a single payment in the event of default on or termination of any one contract:
162
Babson Capital Funds Trust 2015 Semi-Annual Report
NOTES TO THE FINANCIAL STATEMENTS (UNAUDITED) (CONTINUED)
December 31, 2015
Global Floating Rate Fund
| | | | | | | | | | | | |
| DESCRIPTION | | GROSS AMOUNTS OF
RECOGNIZED ASSETS | | | GROSS AMOUNTS OFFSET
IN THE STATEMENTS OF
ASSETS AND LIABILITIES | | | NET AMOUNTS OF
ASSETS PRESENTED
IN THE STATEMENTS OF
ASSETS AND LIABILITIES | |
Forward Foreign Currency Exchange Contracts | | $ | 394,403 | | | $ | – | | | $ | 394,403 | |
| | | | | | | | | | | | |
Total | | $ | 394,403 | | | $ | – | | | $ | 394,403 | |
| | | | | | | | | | | | |
| | | | | | | | | | | | | | | | |
| | | | | | GROSS AMOUNTS NOT OFFSET IN THE
STATEMENTS OF ASSETS AND LIABILITIES | | | | | | | |
| COUNTERPARTY | | NET AMOUNTS OF ASSETS
PRESENTED IN THE STATEMENTS
OF ASSETS AND LIABILITIES | | | FINANCIAL
INSTRUMENT(a) | | | CASH
COLLATERAL
RECEIVED(a) | | | NET
AMOUNT(b) | |
Morgan Stanley & Co. | | $ | 394,403 | | | $ | (11,957 | ) | | $ | – | | | $ | 382,446 | |
| | | | | | | | | | | | | | | | |
Total | | $ | 394,403 | | | $ | (11,957 | ) | | $ | – | | | $ | 382,446 | |
| | | | | | | | | | | | | | | | |
| | (a) | Collateral disclosed is limited to an amount not to exceed 100% of the net amount of assets presented in the Statements of Assets and Liabilities, for each respective counterparty. |
| | (b) | Net Amount represents the amount that is subject to loss in the event of a counterparty failure as of December 31, 2015. |
| | | | | | | | | | | | |
| DESCRIPTION | | GROSS AMOUNTS OF
RECOGNIZED LIABILITIES | | | GROSS AMOUNTS OFFSET
IN THE STATEMENTS OF
ASSETS AND LIABILITIES | | | NET AMOUNTS OF
LIABILITIES PRESENTED
IN THE STATEMENTS OF
ASSETS AND LIABILITIES | |
Forward Foreign Currency Exchange Contracts | | $ | 11,957 | | | $ | – | | | $ | 11,957 | |
| | | | | | | | | | | | |
Total | | $ | 11,957 | | | $ | – | | | $ | 11,957 | |
| | | | | | | | | | | | |
| | | | | | | | | | | | | | | | |
| | | | | | GROSS AMOUNTS NOT OFFSET IN THE
STATEMENTS OF ASSETS AND LIABILITIES | | | | | | | |
| COUNTERPARTY | | NET AMOUNTS OF LIABILITIES
PRESENTED IN THE STATEMENTS
OF ASSETS AND LIABILITIES | | | FINANCIAL
INSTRUMENT(a) | | | CASH
COLLATERAL
PLEDGED(a) | | | NET
AMOUNT(b) | |
Morgan Stanley & Co. | | $ | 11,957 | | | $ | (11,957 | ) | | $ | – | | | $ | – | |
| | | | | | | | | | | | | | | | |
Total | | $ | 11,957 | | | $ | (11,957 | ) | | $ | – | | | $ | – | |
| | | | | | | | | | | | | | | | |
| | (a) | Collateral disclosed is limited to an amount not to exceed 100% of the net amount of assets presented in the Statements of Assets and Liabilities, for each respective counterparty. |
| | (b) | Net Amount represents the amount that is subject to loss in the event of a counterparty failure as of December 31, 2015. |
163
Babson Capital Funds Trust 2015 Semi-Annual Report
NOTES TO THE FINANCIAL STATEMENTS (UNAUDITED) (CONTINUED)
December 31, 2015
Global Credit Income Opportunities Fund
| | | | | | | | | | | | |
| DESCRIPTION | | GROSS AMOUNTS OF
RECOGNIZED ASSETS | | | GROSS AMOUNTS OFFSET
IN THE STATEMENTS OF
ASSETS AND LIABILITIES | | | NET AMOUNTS OF
ASSETS PRESENTED
IN THE STATEMENTS OF
ASSETS AND LIABILITIES | |
Forward Foreign Currency Exchange Contracts | | $ | 197,214 | | | $ | – | | | $ | 197,214 | |
Purchased Options | | | 406,452 | | | | – | | | | 406,452 | |
| | | | | | | | | | | | |
Total | | $ | 603,666 | | | $ | – | | | $ | 603,666 | |
| | | | | | | | | | | | |
| | | | | | | | | | | | | | | | |
| | | | | | GROSS AMOUNTS NOT OFFSET IN THE
STATEMENTS OF ASSETS AND LIABILITIES | | | | | | | |
| COUNTERPARTY | | NET AMOUNTS OF ASSETS
PRESENTED IN THE STATEMENTS
OF ASSETS AND LIABILITIES | | | FINANCIAL
INSTRUMENT(a) | | | CASH
COLLATERAL
RECEIVED(a) | | | NET
AMOUNT(b) | |
Citibank | | $ | 406,452 | | | $ | (207,921 | ) | | $ | – | | | $ | 198,531 | |
Morgan Stanley | | | 197,214 | | | | (8,461 | ) | | | – | | | | 188,753 | |
| | | | | | | | | | | | | | | | |
Total | | $ | 603,666 | | | $ | (216,382 | ) | | $ | – | | | $ | 387,284 | |
| | | | | | | | | | | | | | | | |
| | (a) | Collateral disclosed is limited to an amount not to exceed 100% of the net amount of assets presented in the Statements of Assets and Liabilities, for each respective counterparty. |
| | (b) | Net Amount represents the amount that is subject to loss in the event of a counterparty failure as of December 31, 2015. |
| | | | | | | | | | | | |
| DESCRIPTION | | GROSS AMOUNTS OF
RECOGNIZED LIABILITIES | | | GROSS AMOUNTS OFFSET
IN THE STATEMENTS OF
ASSETS AND LIABILITIES | | | NET AMOUNTS OF
LIABILITIES PRESENTED
IN THE STATEMENTS OF
ASSETS AND LIABILITIES | |
Forward Foreign Currency Exchange Contracts | | $ | 8,461 | | | $ | – | | | $ | 8,461 | |
Written Options | | | 207,921 | | | | – | | | | 207,921 | |
| | | | | | | | | | | | |
Total | | $ | 216,382 | | | $ | – | | | $ | 216,382 | |
| | | | | | | | | | | | |
| | | | | | | | | | | | | | | | |
| | | | | | GROSS AMOUNTS NOT OFFSET IN THE
STATEMENTS OF ASSETS AND LIABILITIES | | | | | | | |
| COUNTERPARTY | | NET AMOUNTS OF LIABILITIES
PRESENTED IN THE STATEMENTS
OF ASSETS AND LIABILITIES | | | FINANCIAL
INSTRUMENT(a) | | | CASH
COLLATERAL
PLEDGED(a) | | | NET
AMOUNT(b) | |
Citibank | | $ | 207,921 | | | $ | (207,921 | ) | | $ | – | | | $ | – | |
Morgan Stanley | | | 8,461 | | | | (8,461 | ) | | | – | | | | – | |
| | | | | | | | | | | | | | | | |
Total | | $ | 216,382 | | | $ | (216,382 | ) | | $ | – | | | $ | – | |
| | | | | | | | | | | | | | | | |
| | (a) | Collateral disclosed is limited to an amount not to exceed 100% of the net amount of assets presented in the Statements of Assets and Liabilities, for each respective counterparty. |
| | (b) | Net Amount represents the amount that is subject to loss in the event of a counterparty failure as of December 31, 2015. |
164
Babson Capital Funds Trust 2015 Semi-Annual Report
NOTES TO THE FINANCIAL STATEMENTS (UNAUDITED) (CONTINUED)
December 31, 2015
Active Short Duration Bond Fund
| | | | | | | | | | | | |
| DESCRIPTION | | GROSS AMOUNTS OF
RECOGNIZED ASSETS | | | GROSS AMOUNTS OFFSET
IN THE STATEMENTS OF
ASSETS AND LIABILITIES | | | NET AMOUNTS OF
ASSETS PRESENTED
IN THE STATEMENTS OF
ASSETS AND LIABILITIES | |
Purchased Options | | $ | 68,892 | | | $ | – | | | $ | 68,892 | |
| | | | | | | | | | | | |
Total | | $ | 68,892 | | | $ | – | | | $ | 68,892 | |
| | | | | | | | | | | | |
| | | | | | | | | | | | | | | | |
| | | | | | GROSS AMOUNTS NOT OFFSET IN THE
STATEMENTS OF ASSETS AND LIABILITIES | | | | | | | |
| COUNTERPARTY | | NET AMOUNTS OF ASSETS
PRESENTED IN THE STATEMENTS
OF ASSETS AND LIABILITIES | | | FINANCIAL
INSTRUMENT(a) | | | CASH
COLLATERAL
RECEIVED(a) | | | NET
AMOUNT(b) | |
JPMorgan Chase Bank N.A. | | $ | 68,892 | | | $ | (7,229 | ) | | $ | – | | | $ | 61,663 | |
| | | | | | | | | | | | | | | | |
Total | | $ | 68,892 | | | $ | (7,229 | ) | | $ | – | | | $ | 61,663 | |
| | | | | | | | | | | | | | | | |
| | (a) | Collateral disclosed is limited to an amount not to exceed 100% of the net amount of assets presented in the Statements of Assets and Liabilities, for each respective counterparty. |
| | (b) | Net Amount represents the amount that is subject to loss in the event of a counterparty failure as of December 31, 2015. |
| | | | | | | | | | | | |
| DESCRIPTION | | GROSS AMOUNTS OF
RECOGNIZED LIABILITIES | | | GROSS AMOUNTS OFFSET
IN THE STATEMENTS OF
ASSETS AND LIABILITIES | | | NET AMOUNTS OF
LIABILITIES PRESENTED
IN THE STATEMENTS OF
ASSETS AND LIABILITIES | |
Credit Default Swaps | | $ | 7,229 | | | $ | – | | | $ | 7,229 | |
| | | | | | | | | | | | |
Total | | $ | 7,229 | | | $ | – | | | $ | 7,229 | |
| | | | | | | | | | | | |
| | | | | | | | | | | | | | | | |
| | | | | | GROSS AMOUNTS NOT OFFSET IN THE
STATEMENTS OF ASSETS AND LIABILITIES | | | | | | | |
| COUNTERPARTY | | NET AMOUNTS OF LIABILITIES
PRESENTED IN THE STATEMENTS
OF ASSETS AND LIABILITIES | | | FINANCIAL
INSTRUMENT(a) | | | CASH
COLLATERAL
PLEDGED(a) | | | NET
AMOUNT(b) | |
JPMorgan Chase Bank N.A. | | $ | 7,229 | | | $ | (7,229 | ) | | $ | – | | | $ | – | |
| | | | | | | | | | | | | | | | |
Total | | $ | 7,229 | | | $ | (7,229 | ) | | $ | – | | | $ | – | |
| | | | | | | | | | | | | | | | |
| | (a) | Collateral disclosed is limited to an amount not to exceed 100% of the net amount of assets presented in the Statements of Assets and Liabilities, for each respective counterparty. |
| | (b) | Net Amount represents the amount that is subject to loss in the event of a counterparty failure as of December 31, 2015. |
165
Babson Capital Funds Trust 2015 Semi-Annual Report
NOTES TO THE FINANCIAL STATEMENTS (UNAUDITED) (CONTINUED)
December 31, 2015
Total Return Bond Fund
| | | | | | | | | | | | |
| DESCRIPTION | | GROSS AMOUNTS OF
RECOGNIZED ASSETS | | | GROSS AMOUNTS OFFSET
IN THE STATEMENTS OF
ASSETS AND LIABILITIES | | | NET AMOUNTS OF
ASSETS PRESENTED
IN THE STATEMENTS OF
ASSETS AND LIABILITIES | |
Forward Foreign Currency Exchange Contracts | | $ | 4,766 | | | $ | – | | | $ | 4,766 | |
Purchased Options | | | 133,655 | | | | – | | | | 133,655 | |
| | | | | | | | | | | | |
Total | | $ | 138,421 | | | $ | – | | | $ | 138,421 | |
| | | | | | | | | | | | |
| | | | | | | | | | | | | | | | |
| | | | | | GROSS AMOUNTS NOT OFFSET IN THE
STATEMENTS OF ASSETS AND LIABILITIES | | | | | | | |
| COUNTERPARTY | | NET AMOUNTS OF ASSETS
PRESENTED IN THE STATEMENTS
OF ASSETS AND LIABILITIES | | | FINANCIAL
INSTRUMENT(a) | | | CASH
COLLATERAL
RECEIVED(a) | | | NET
AMOUNT(b) | |
Bank of America N.A. | | $ | 3,060 | | | $ | (3,060 | ) | | $ | – | | | $ | – | |
Citibank N.A. | | | 370 | | | | (370 | ) | | | – | | | | – | |
JPMorgan Chase Bank N.A. | | | 134,991 | | | | (3,848 | ) | | | – | | | | 131,143 | |
| | | | | | | | | | | | | | | | |
Total | | $ | 138,421 | | | $ | (7,278 | ) | | $ | – | | | $ | 131,143 | |
| | | | | | | | | | | | | | | | |
| | (a) | Collateral disclosed is limited to an amount not to exceed 100% of the net amount of assets presented in the Statements of Assets and Liabilities, for each respective counterparty. |
| | (b) | Net Amount represents the amount that is subject to loss in the event of a counterparty failure as of December 31, 2015. |
| | | | | | | | | | | | |
| DESCRIPTION | | GROSS AMOUNTS OF
RECOGNIZED LIABILITIES | | | GROSS AMOUNTS OFFSET
IN THE STATEMENTS OF
ASSETS AND LIABILITIES | | | NET AMOUNTS OF
LIABILITIES PRESENTED
IN THE STATEMENTS OF
ASSETS AND LIABILITIES | |
Credit Default Swaps | | $ | 1,885 | | | $ | – | | | $ | 1,885 | |
Forward Foreign Currency Exchange Contracts | | | 12,870 | | | | – | | | | 12,870 | |
| | | | | | | | | | | | |
Total | | $ | 14,755 | | | $ | – | | | $ | 14,755 | |
| | | | | | | | | | | | |
166
Babson Capital Funds Trust 2015 Semi-Annual Report
NOTES TO THE FINANCIAL STATEMENTS (UNAUDITED) (CONTINUED)
December 31, 2015
| | | | | | | | | | | | | | | | |
| | | | | | GROSS AMOUNTS NOT OFFSET IN THE
STATEMENTS OF ASSETS AND LIABILITIES | | | | | | | |
| COUNTERPARTY | | NET AMOUNTS OF LIABILITIES
PRESENTED IN THE STATEMENTS
OF ASSETS AND LIABILITIES | | | FINANCIAL
INSTRUMENT(a) | | | CASH
COLLATERAL
PLEDGED(a) | | | NET
AMOUNT(b) | |
Bank of America N.A. | | $ | 9,331 | | | $ | (3,060 | ) | | $ | – | | | $ | 6,271 | |
Citibank N.A. | | | 1,576 | | | | (370 | ) | | | – | | | | 1,206 | |
JPMorgan Chase Bank N.A. | | | 3,848 | | | | (3,848 | ) | | | – | | | | – | |
| | | | | | | | | | | | | | | | |
Total | | $ | 14,755 | | | $ | (7,278 | ) | | $ | – | | | $ | 7,477 | |
| | | | | | | | | | | | | | | | |
| | (a) | Collateral disclosed is limited to an amount not to exceed 100% of the net amount of assets presented in the Statements of Assets and Liabilities, for each respective counterparty. |
| | (b) | Net Amount represents the amount that is subject to loss in the event of a counterparty failure as of December 31, 2015. |
Emerging Markets Debt Blended Total Return Fund
| | | | | | | | | | | | |
| DESCRIPTION | | GROSS AMOUNTS OF
RECOGNIZED ASSETS | | | GROSS AMOUNTS OFFSET
IN THE STATEMENTS OF
ASSETS AND LIABILITIES | | | NET AMOUNTS OF
ASSETS PRESENTED
IN THE STATEMENTS OF
ASSETS AND LIABILITIES | |
Forward Foreign Currency Exchange Contracts | | $ | 130,248 | | | $ | – | | | $ | 130,248 | |
Interest Rate Swaps | | | 10,877 | | | | – | | | | 10,877 | |
| | | | | | | | | | | | |
Total | | $ | 141,125 | | | $ | – | | | $ | 141,125 | |
| | | | | | | | | | | | |
| | | | | | | | | | | | | | | | |
| | | | | | GROSS AMOUNTS NOT OFFSET IN THE
STATEMENTS OF ASSETS AND LIABILITIES | | | | | | | |
| COUNTERPARTY | | NET AMOUNTS OF ASSETS
PRESENTED IN THE STATEMENTS
OF ASSETS AND LIABILITIES | | | FINANCIAL
INSTRUMENT(a) | | | CASH
COLLATERAL
RECEIVED(a) | | | NET
AMOUNT(b) | |
Bank of America N.A. | | $ | 88,630 | | | $ | (81,841 | ) | | $ | – | | | $ | 6,789 | |
Citibank N.A. | | | 8,734 | | | | (8,734 | ) | | | – | | | | – | |
JPMorgan Chase Bank N.A. | | | 43,761 | | | | (35,491 | ) | | | – | | | | 8,270 | |
| | | | | | | | | | | | | | | | |
Total | | $ | 141,125 | | | $ | (126,066 | ) | | $ | – | | | $ | 15,059 | |
| | | | | | | | | | | | | | | | |
| | (a) | Collateral disclosed is limited to an amount not to exceed 100% of the net amount of assets presented in the Statements of Assets and Liabilities, for each respective counterparty. |
| | (b) | Net Amount represents the amount that is subject to loss in the event of a counterparty failure as of December 31, 2015. |
167
Babson Capital Funds Trust 2015 Semi-Annual Report
NOTES TO THE FINANCIAL STATEMENTS (UNAUDITED) (CONTINUED)
December 31, 2015
| | | | | | | | | | | | |
| DESCRIPTION | | GROSS AMOUNTS OF
RECOGNIZED LIABILITIES | | | GROSS AMOUNTS OFFSET
IN THE STATEMENTS OF
ASSETS AND LIABILITIES | | | NET AMOUNTS OF
LIABILITIES PRESENTED
IN THE STATEMENTS OF
ASSETS AND LIABILITIES | |
Credit Default Swaps | | $ | 7,281 | | | $ | – | | | $ | 7,281 | |
Forward Foreign Currency Exchange Contracts | | | 146,056 | | | | – | | | | 146,056 | |
| | | | | | | | | | | | |
Total | | $ | 153,337 | | | $ | – | | | $ | 153,337 | |
| | | | | | | | | | | | |
| | | | | | | | | | | | | | | | |
| | | | | | GROSS AMOUNTS NOT OFFSET IN THE
STATEMENTS OF ASSETS AND LIABILITIES | | | | | | | |
| COUNTERPARTY | | NET AMOUNTS OF LIABILITIES
PRESENTED IN THE STATEMENTS
OF ASSETS AND LIABILITIES | | | FINANCIAL
INSTRUMENT(a) | | | CASH
COLLATERAL
PLEDGED(a) | | | NET
AMOUNT(b) | |
Bank of America N.A. | | $ | 81,841 | | | $ | (81,841 | ) | | $ | – | | | $ | – | |
Citibank N.A. | | | 36,005 | | | | (8,734 | ) | | | – | | | | 27,271 | |
JPMorgan Chase Bank N.A. | | | 35,491 | | | | (35,491 | ) | | | – | | | | – | |
| | | | | | | | | | | | | | | | |
Total | | $ | 153,337 | | | $ | (126,066 | ) | | $ | – | | | $ | 27,271 | |
| | | | | | | | | | | | | | | | |
| | (a) | Collateral disclosed is limited to an amount not to exceed 100% of the net amount of assets presented in the Statements of Assets and Liabilities, for each respective counterparty. |
| | (b) | Net Amount represents the amount that is subject to loss in the event of a counterparty failure as of December 31, 2015. |
Emerging Markets Local Currency Debt Fund
| | | | | | | | | | | | |
| DESCRIPTION | | GROSS AMOUNTS OF
RECOGNIZED ASSETS | | | GROSS AMOUNTS OFFSET
IN THE STATEMENTS OF
ASSETS AND LIABILITIES | | | NET AMOUNTS OF
ASSETS PRESENTED
IN THE STATEMENTS OF
ASSETS AND LIABILITIES | |
Forward Foreign Currency Exchange Contracts | | $ | 24,387 | | | $ | – | | | $ | 24,387 | |
Interest Rate Swaps | | | 7,952 | | | | – | | | | 7,952 | |
| | | | | | | | | | | | |
Total | | $ | 32,339 | | | $ | – | | | $ | 32,339 | |
| | | | | | | | | | | | |
168
Babson Capital Funds Trust 2015 Semi-Annual Report
NOTES TO THE FINANCIAL STATEMENTS (UNAUDITED) (CONTINUED)
December 31, 2015
| | | | | | | | | | | | | | | | |
| | | | | | GROSS AMOUNTS NOT OFFSET IN THE
STATEMENTS OF ASSETS AND LIABILITIES | | | | | | | |
| COUNTERPARTY | | NET AMOUNTS OF ASSETS
PRESENTED IN THE STATEMENTS
OF ASSETS AND LIABILITIES | | | FINANCIAL
INSTRUMENT(a) | | | CASH
COLLATERAL
RECEIVED(a) | | | NET
AMOUNT(b) | |
Bank of America N.A. | | $ | 17,027 | | | $ | (17,027 | ) | | $ | – | | | $ | – | |
Citibank N.A. | | | 4,920 | | | | (4,920 | ) | | | – | | | | – | |
JPMorgan Chase Bank N.A. | | | 10,392 | | | | (7,837 | ) | | | – | | | | 2,555 | |
| | | | | | | | | | | | | | | | |
Total | | $ | 32,339 | | | $ | (29,784 | ) | | $ | – | | | $ | 2,555 | |
| | | | | | | | | | | | | | | | |
| | (a) | Collateral disclosed is limited to an amount not to exceed 100% of the net amount of assets presented in the Statements of Assets and Liabilities, for each respective counterparty. |
| | (b) | Net Amount represents the amount that is subject to loss in the event of a counterparty failure as of December 31, 2015. |
| | | | | | | | | | | | |
| DESCRIPTION | | GROSS AMOUNTS OF
RECOGNIZED LIABILITIES | | | GROSS AMOUNTS OFFSET
IN THE STATEMENTS OF
ASSETS AND LIABILITIES | | | NET AMOUNTS OF
LIABILITIES PRESENTED
IN THE STATEMENTS OF
ASSETS AND LIABILITIES | |
Forward Foreign Currency Exchange Contracts | | $ | 47,969 | | | $ | – | | | $ | 47,969 | |
Interest Rate Swaps | | | 29,065 | | | | – | | | | 29,065 | |
| | | | | | | | | | | | |
Total | | $ | 77,034 | | | $ | – | | | $ | 77,034 | |
| | | | | | | | | | | | |
| | | | | | | | | | | | | | | | |
| | | | | | GROSS AMOUNTS NOT OFFSET IN THE
STATEMENTS OF ASSETS AND LIABILITIES | | | | | | | |
| COUNTERPARTY | | NET AMOUNTS OF LIABILITIES
PRESENTED IN THE STATEMENTS
OF ASSETS AND LIABILITIES | | | FINANCIAL
INSTRUMENT(a) | | | CASH
COLLATERAL
PLEDGED(a) | | | NET
AMOUNT(b) | |
Bank of America N.A. | | $ | 31,363 | | | $ | (17,027 | ) | | $ | – | | | $ | 14,336 | |
Citibank N.A. | | | 37,834 | | | | (4,920 | ) | | | – | | | | 32,914 | |
JPMorgan Chase Bank N.A. | | | 7,837 | | | | (7,837 | ) | | | – | | | | – | |
| | | | | | | | | | | | | | | | |
Total | | $ | 77,034 | | | $ | (29,784 | ) | | $ | – | | | $ | 47,250 | |
| | | | | | | | | | | | | | | | |
| | (a) | Collateral disclosed is limited to an amount not to exceed 100% of the net amount of assets presented in the Statements of Assets and Liabilities, for each respective counterparty. |
| | (b) | Net Amount represents the amount that is subject to loss in the event of a counterparty failure as of December 31, 2015. |
169
Babson Capital Funds Trust 2015 Semi-Annual Report
NOTES TO THE FINANCIAL STATEMENTS (UNAUDITED) (CONTINUED)
December 31, 2015
Global High Yield Fund
| | | | | | | | | | | | |
| DESCRIPTION | | GROSS AMOUNTS OF
RECOGNIZED ASSETS | | | GROSS AMOUNTS OFFSET
IN THE STATEMENTS OF
ASSETS AND LIABILITIES | | | NET AMOUNTS OF
ASSETS PRESENTED
IN THE STATEMENTS OF
ASSETS AND LIABILITIES | |
Forward Foreign Currency Exchange Contracts | | $ | 61,325 | | | $ | – | | | $ | 61,325 | |
| | | | | | | | | | | | |
Total | | $ | 61,325 | | | $ | – | | | $ | 61,325 | |
| | | | | | | | | | | | |
| | | | | | | | | | | | | | | | |
| | | | | | GROSS AMOUNTS NOT OFFSET IN THE
STATEMENTS OF ASSETS AND LIABILITIES | | | | | | | |
| COUNTERPARTY | | NET AMOUNTS OF ASSETS
PRESENTED IN THE STATEMENTS
OF ASSETS AND LIABILITIES | | | FINANCIAL
INSTRUMENT(a) | | | CASH
COLLATERAL
RECEIVED(a) | | | NET
AMOUNT(b) | |
Bank of America N.A. | | $ | 61,325 | | | $ | – | | | $ | – | | | $ | 61,325 | |
| | | | | | | | | | | | | | | | |
Total | | $ | 61,325 | | | $ | – | | | $ | – | | | $ | 61,325 | |
| | | | | | | | | | | | | | | | |
| | (a) | Collateral disclosed is limited to an amount not to exceed 100% of the net amount of assets presented in the Statements of Assets and Liabilities, for each respective counterparty. |
| | (b) | Net Amount represents the amount that is subject to loss in the event of a counterparty failure as of December 31, 2015. |
| | | | | | | | | | | | |
| DESCRIPTION | | GROSS AMOUNTS OF
RECOGNIZED LIABILITIES | | | GROSS AMOUNTS OFFSET
IN THE STATEMENTS OF
ASSETS AND LIABILITIES | | | NET AMOUNTS OF
LIABILITIES PRESENTED
IN THE STATEMENTS OF
ASSETS AND LIABILITIES | |
Forward Foreign Currency Exchange Contracts | | $ | 68,199 | | | $ | – | | | $ | 68,199 | |
| | | | | | | | | | | | |
Total | | $ | 68,199 | | | $ | – | | | $ | 68,199 | |
| | | | | | | | | | | | |
| | | | | | | | | | | | | | | | |
| | | | | | GROSS AMOUNTS NOT OFFSET IN THE
STATEMENTS OF ASSETS AND LIABILITIES | | | | | | | |
| COUNTERPARTY | | NET AMOUNTS OF LIABILITIES
PRESENTED IN THE STATEMENTS
OF ASSETS AND LIABILITIES | | | FINANCIAL
INSTRUMENT(a) | | | CASH
COLLATERAL
PLEDGED(a) | | | NET
AMOUNT(b) | |
JPMorgan Chase Bank N.A. | | $ | 68,199 | | | $ | – | | | $ | – | | | $ | 68,199 | |
| | | | | | | | | | | | | | | | |
Total | | $ | 68,199 | | | $ | – | | | $ | – | | | $ | 68,199 | |
| | | | | | | | | | | | | | | | |
| | (a) | Collateral disclosed is limited to an amount not to exceed 100% of the net amount of assets presented in the Statements of Assets and Liabilities, for each respective counterparty. |
| | (b) | Net Amount represents the amount that is subject to loss in the event of a counterparty failure as of December 31, 2015. |
170
Babson Capital Funds Trust 2015 Semi-Annual Report
NOTES TO THE FINANCIAL STATEMENTS (UNAUDITED) (CONTINUED)
December 31, 2015
Investing in securities of foreign companies and foreign governments involves special risks and considerations not typically associated with investing in U.S. companies and the U.S. government. These risks include valuation of currencies and adverse political and economic developments. Moreover, securities of many foreign companies, foreign governments, and their markets may be less liquid and their prices more volatile than those of securities of comparable U.S. companies and the U.S. government.
| | M. | Foreign Currency Translation |
The books and records of the Funds are maintained in U.S. dollars. Foreign currency transactions are translated into U.S. dollars on the following basis: (i) market value of investment securities, assets and liabilities at the daily rates of exchange, and (ii) purchases and sales of investment securities, dividend and interest income and certain expenses at the rates of exchange prevailing on the respective dates of such transactions. For financial reporting purposes, the Funds do not isolate changes in the exchange rate of investment securities from the fluctuations arising from changes in the market prices of securities. However, for Federal income tax purposes, the Funds do isolate and treat as ordinary income the effect of changes in foreign exchange rates on realized gain or loss from the sale of investment securities and payables and receivables arising from trade-date and settlement-date differences.
The Funds seek to manage counterparty credit risk by entering into agreements only with counterparties the Adviser believes have the financial resources to honor their obligations. The Adviser monitors the financial stability of the Funds’ counterparties.
The Funds have entered into an Investment Management Agreement (the “Agreement”) with the Adviser. Pursuant to the Agreement, the Funds have agreed to pay the
Adviser a fee payable at the end of each calendar month as set forth below:
| | |
Global Floating Rate Fund | | 0.65% of average daily net assets |
Global Credit Income Opportunities Fund | | 0.75% of average daily net assets |
Active Short Duration Bond Fund | | 0.35% of average daily net assets |
Total Return Bond Fund | | 0.40% of average daily net assets |
Emerging Markets Blended Total Return Fund | | 0.75% of average daily net assets |
Emerging Markets Local Currency Debt Fund | | 0.75% of average daily net assets |
Global High Yield Fund | | 0.60% of average daily net assets |
U.S. High Yield Fund | | 0.55% of average daily net assets |
The Adviser has contractually agreed to waive and/or reimburse a portion of its fees and/or reimburse expenses (excluding 12b-1 fees, interest expenses, taxes, fees incurred in acquiring and disposing of securities and extraordinary expenses) such that total net annual operating expenses for each class do not exceed the following rates:
| | | | | | | | | | | | | | | | |
| | | CLASS A | | | CLASS C | | | CLASS I | | | CLASS Y | |
Global Floating Rate Fund | | | 1.05 | % | | | 1.80 | % | | | 0.75 | % | | | 0.75 | % |
Global Credit Income Opportunities Fund | | | 1.20 | % | | | 1.95 | % | | | 0.95 | % | | | 0.95 | % |
Active Short Duration Bond Fund* | | | 0.65 | % | | | 0.90 | % | | | 0.40 | % | | | 0.40 | % |
Total Return Bond Fund | | | 0.80 | % | | | 1.55 | % | | | 0.55 | % | | | 0.55 | % |
Emerging Markets Debt Blended Total Return Fund | | | 1.20 | % | | | 1.95 | % | | | 0.95 | % | | | 0.95 | % |
Emerging Markets Local Currency Debt Fund | | | 1.20 | % | | | 1.95 | % | | | 0.95 | % | | | 0.95 | % |
Global High Yield Fund | | | 1.05 | % | | | 1.80 | % | | | 0.80 | % | | | 0.80 | % |
U.S. High Yield Fund | | | 1.00 | % | | | 1.75 | % | | | 0.75 | % | | | 0.75 | % |
| | * | From the period July 9, 2015 through September 27, 2015, the rates were 0.80% for Class A, 1.55% for Class C, 0.55% for Class I and 0.55% for Class Y. |
171
Babson Capital Funds Trust 2015 Semi-Annual Report
NOTES TO THE FINANCIAL STATEMENTS (UNAUDITED) (CONTINUED)
December 31, 2015
Pursuant to the expense waiver/reimbursement agreement, the Adviser is entitled to be reimbursed for any fees the Adviser waives and Fund expenses that the Adviser reimburses for a period of three years following such fee waivers and expense reimbursements, to the extent that such reimbursement of the Adviser by a Fund will not cause the Fund to exceed any applicable expense limitation that is in place for the Fund.
The contractual management fee waiver and expense reimbursement agreements between the Funds and the Adviser will remain in effect until November 1, 2016 and may be terminated only upon the approval of the Funds’ Board of Trustees.
Subject to the supervision of the Adviser and the Board, BCGA and Cornerstone manage the investment and reinvestment of a portion of the assets of the Funds, as allocated from time to time to BCGG and Cornerstone. The Adviser (not the Funds) will pay a portion of the fees it receives to BCGG and Cornerstone in return for their services.
| 4. | 12b-1 Distribution and Service Plan |
ALPS Distributors, Inc. (the “Distributor”) is the Distributor of the Funds’ shares as of December 31, 2015.
The Funds have adopted a Distribution and Shareholder Services Plan (the “Plan”), pursuant to Rule 12b-1 under the 1940 Act. Under the Plan, each Fund’s Class A and Class C shares may compensate certain financial institutions, including the Distributor, for certain distribution and shareholder servicing activities. The Funds’ Class A shares may expend an aggregate amount, on an annual basis, not to exceed 0.25% of the value of the average daily net assets of a Fund attributable to Class A shares and 1.00% of the value of the average daily net assets of a Fund attributable to Class C shares. The Plan provides that the distribution and service fees are payable to the Distributor regardless of the amounts actually expended by the Distributor for distribution of the Funds’ shares and service activities.
Under its terms, the Funds’ Plan shall remain in effect from year to year, provided such continuance is approved annually by a vote of a majority of the Boards’ members and a majority of those Boards’ members who are not “interested persons” of the Funds and who have no direct or indirect financial interest in the operation of the Plan or in any agreement related to the Plan.
| 5. | Sales Charges and Commissions |
For the period ended December 31, 2015, the amount of sales charges retained by the Distributor on sales of Class A and Class C shares of the Funds were as follows:
| | | | |
| | | CLASS C | |
Global Floating Rate Fund | | $ | – | |
Global Credit Income Opportunities Fund | | | 795 | |
Active Short Duration Bond Fund | | | – | |
Total Return Bond Fund | | | – | |
Emerging Markets Debt Blended Total Return Fund | | | – | |
Global High Yield Fund | | | – | |
U.S. High Yield Fund | | | – | |
Emerging Markets Local Currency Debt Fund | | | – | |
For the period ended December 31, 2015, the Distributor received the following commissions on sales of shares of the Funds, after concessions were paid to authorized dealers:
| | | | | | | | |
| | | DISTRIBUTOR
COMMISSIONS | | | DEALERS’
CONCESSIONS | |
Global Floating Rate Fund | | $ | 3,347 | | | $ | 59,230 | |
Global Credit Income Opportunities Fund | | | 578 | | | | 13,447 | |
Active Short Duration Bond Fund | | | – | | | | 800 | |
Total Return Bond Fund | | | – | | | | – | |
Emerging Markets Debt Blended Total Return Fund | | | – | | | | – | |
Global High Yield Fund | | | – | | | | – | |
U.S. High Yield Fund | | | – | | | | – | |
Emerging Markets Local Currency Debt Fund | | | – | | | | – | |
| 6. | Administrator, Custody, and Transfer Agent Fees |
The Funds have engaged State Street Bank and Trust (“SSB”) to serve as the Funds’ administrator, custodian, and fund accountant. SSB also served as transfer agent from the period July 1, 2015 to November 6, 2015. Effective November 7, 2015, the Funds engaged ALPS as transfer agent. For each of these services, the Funds have agreed to pay SSB and ALPS fees payable at the end of each calendar month pursuant to fee agreements between SSB, ALPS, and the Funds, respectively. For the period ended December 31, 2015, the aggregate
172
Babson Capital Funds Trust 2015 Semi-Annual Report
NOTES TO THE FINANCIAL STATEMENTS (UNAUDITED) (CONTINUED)
December 31, 2015
effective fee for these services was at the following annual rate of each Fund’s average daily managed assets:
| | | | |
Global Floating Rate Fund | | | 0.29 | % |
Global Credit Income Opportunities Fund | | | 0.41 | % |
Active Short Duration Bond Fund | | | 0.45 | % |
Total Return Bond Fund | | | 1.09 | % |
Emerging Markets Debt Blended Total Return Fund | | | 2.86 | % |
Emerging Markets Local Currency Debt Fund | | | 5.64 | % |
Global High Yield Fund | | | 1.08 | % |
U.S. High Yield Fund | | | 1.08 | % |
It is the Funds’ intention to qualify as a RIC under subchapter M of the Internal Revenue Code and distribute all of its taxable income. Accordingly, no provision for Federal income taxes is required in the financial statements.
The tax character of dividends paid to shareholders during the tax year ended June 30, 2015 was as follows:
| | | | | | | | | | | | |
| | | ORDINARY
INCOME | | | NET LONG-TERM
CAPITAL GAINS | | | TOTAL
DISTRIBUTIONS
PAID | |
Global Floating Rate Fund | | $ | 8,284,319 | | | $ | – | | | $ | 8,284,319 | |
Global Credit Income Opportunities Fund | | | 7,108,559 | | | | 265 | | | | 7,108,824 | |
In accordance with the Regulated Investment Company Modernization Act of 2010, the Funds will carryforward capital losses incurred in taxable years beginning after December 22, 2010 (“post-enactment losses”) indefinitely. Post-enactment losses will also retain their character as either short-term or long-term and be utilized before any pre-enactment losses.
As of December 31, 2015, the aggregate unrealized security gains and losses based on cost for U.S. Federal income tax purposes were as follows:
| | | | | | | | | | | | | | | | |
| | | COST OF
INVESTMENTS | | | GROSS
UNREALIZED
APPRECIATION | | | GROSS
UNREALIZED
DEPRECIATION | | | NET
UNREALIZED
DEPRECIATION | |
Global Floating Rate Fund | | $ | 173,271,411 | | | $ | 142,156 | | | $ | (14,454,998 | ) | | $ | (14,312,842 | ) |
Global Credit Income Opportunities Fund | | | 93,349,595 | | | | 178,871 | | | | (11,071,896 | ) | | | (10,893,025 | ) |
Active Short Duration Bond Fund | | | 99,913,942 | | | | 70,742 | | | | (942,790 | ) | | | (872,048 | ) |
Total Return Bond Fund | | | 30,210,279 | | | | 109,829 | | | | (378,330 | ) | | | (268,501 | ) |
Emerging Markets Debt Blended Total Return Fund | | | 9,935,402 | | | | 2,791 | | | | (417,126 | ) | | | (414,335 | ) |
Emerging Markets Local Currency Debt Fund | | | 4,928,972 | | | | 16,475 | | | | (116,809 | ) | | | (100,334 | ) |
Global High Yield Fund | | | 24,902,440 | | | | 55,529 | | | | (988,419 | ) | | | (932,890 | ) |
U.S. High Yield Fund | | | 26,953,697 | | | �� | 58,238 | | | | (991,864 | ) | | | (933,626 | ) |
The difference between book-basis and tax-basis unrealized gains (losses) is attributable to wash sales.
173
Babson Capital Funds Trust 2015 Semi-Annual Report
NOTES TO THE FINANCIAL STATEMENTS (UNAUDITED) (CONTINUED)
December 31, 2015
| 8. | Investment Transactions |
Purchases and sales of securities (excluding short-term debt securities) for the period ended December 31, 2015 were as follows:
| | | | | | | | | | | | | | | | |
| | | PURCHASES | | | SALES | | | GOVERNMENT
PURCHASES | | | GOVERNMENT
SALES | |
Global Floating Rate Fund | | $ | 53,186,452 | | | $ | 53,517,182 | | | $ | – | | | $ | – | |
Global Credit Income Opportunities Fund | | | 36,875,889 | | | | 28,879,383 | | | | – | | | | – | |
Active Short Duration Bond Fund | | | 58,997,071 | | | | 2,169,561 | | | | 104,699,578 | | | | 71,565,183 | |
Total Return Bond Fund | | | 20,656,204 | | | | 2,535,590 | | | | 63,996,761 | | | | 57,574,065 | |
Emerging Markets Debt Blended Total Return Fund | | | 10,243,957 | | | | 837,500 | | | | – | | | | – | |
Global High Yield Fund | | | 26,786,000 | | | | 3,076,391 | | | | – | | | | – | |
U.S. High Yield Fund | | | 25,790,921 | | | | 2,749,783 | | | | – | | | | – | |
Emerging Markets Local Currency Debt Fund | | | 4,460,892 | | | | – | | | | – | | | | – | |
Transactions in common stock for the period ended December 31, 2015 were as follows:
Global Floating Rate Fund
| | | | | | | | | | | | | | | | |
| | | FOR THE
SIX MONTHS ENDED
DECEMBER 31, 2015 | | | FOR THE
YEAR ENDED
JUNE 30, 2015 | |
| CLASS A | | SHARES | | | AMOUNT | | | SHARES | | | AMOUNT | |
Shares sold | | | 376,917 | | | $ | 3,574,690 | | | | 1,046,486 | | | $ | 10,379,529 | |
Shares sold through reinvestments of distributions | | | 14,662 | | | | 135,817 | | | | 83,026 | | | | 807,940 | |
Shares redeemed | | | (309,637 | ) | | | (2,924,156 | ) | | | (1,815,123 | ) | | | (17,653,590 | ) |
Redemption fees | | | – | | | | – | | | | – | | | | 676 | |
| | | | | | | | | | | | | | | | |
Net increase (decrease) | | | 81,942 | | | $ | 786,351 | | | | (685,611 | ) | | $ | (6,465,445 | ) |
| | | | | | | | | | | | | | | | |
CLASS C | | | | | | | | | | | | | | | | |
Shares sold | | | 287,726 | | | $ | 2,689,377 | | | | 335,871 | | | $ | 3,264,612 | |
Shares sold through reinvestments of distributions | | | 12,631 | | | | 116,556 | | | | 19,258 | | | | 185,848 | |
Shares redeemed | | | (136,930 | ) | | | (1,283,038 | ) | | | (20,267 | ) | | | (195,905 | ) |
Redemption fees | | | – | | | | – | | | | – | | | | 169 | |
| | | | | | | | | | | | | | | | |
Net increase | | | 163,427 | | | $ | 1,522,895 | | | | 334,862 | | | $ | 3,254,724 | |
| | | | | | | | | | | | | | | | |
CLASS I | | | | | | | | | | | | | | | | |
Shares sold | | | – | | | $ | 1,326 | | | | – | | | $ | – | |
Shares sold through reinvestments of distributions | | | 19,954 | | | | 189,886 | | | | 234,264 | | | | 2,279,655 | |
Shares redeemed | | | (261,489 | ) | | | (2,500,000 | ) | | | (753,573 | ) | | | (7,271,983 | ) |
Redemption fees | | | – | | | | – | | | | – | | | | 1,694 | |
| | | | | | | | | | | | | | | | |
Net decrease | | | (241,535 | ) | | $ | (2,308,788 | ) | | | (519,309 | ) | | $ | (4,990,634 | ) |
| | | | | | | | | | | | | | | | |
CLASS Y | | | | | | | | | | | | | | | | |
Shares sold | | | 3,330,921 | | | $ | 31,415,435 | | | | 9,236,912 | | | $ | 89,446,649 | |
Shares sold through reinvestments of distributions | | | 287,904 | | | | 2,680,348 | | | | 493,939 | | | | 4,805,968 | |
Shares redeemed | | | (3,779,325 | ) | | | (35,494,510 | ) | | | (2,813,208 | ) | | | (27,521,577 | ) |
Redemption fees | | | – | | | | – | | | | – | | | | 2,920 | |
| | | | | | | | | | | | | | | | |
Net increase (decrease) | | | (160,500 | ) | | $ | (1,398,727 | ) | | | 6,917,643 | | | $ | 66,733,960 | |
| | | | | | | | | | | | | | | | |
174
Babson Capital Funds Trust 2015 Semi-Annual Report
NOTES TO THE FINANCIAL STATEMENTS (UNAUDITED) (CONTINUED)
December 31, 2015
Global Credit Income Opportunities Fund
| | | | | | | | | | | | | | | | |
| | | FOR THE
SIX MONTHS ENDED
DECEMBER 31, 2015 | | | FOR THE
YEAR ENDED
JUNE 30, 2015 | |
| CLASS A | | SHARES | | | AMOUNT | | | SHARES | | | AMOUNT | |
Shares sold | | | 249,754 | | | $ | 2,321,902 | | | | 2,316,931 | | | $ | 23,545,838 | |
Shares sold through reinvestments of distributions | | | 44,106 | | | | 399,686 | | | | 127,930 | | | | 1,237,474 | |
Shares redeemed | | | (262,308 | ) | | | (2,418,504 | ) | | | (1,355,520 | ) | | | (13,184,266 | ) |
Redemption fees | | | – | | | | – | | | | – | | | | 2,624 | |
| | | | | | | | | | | | | | | | |
Net increase | | | 31,552 | | | $ | 303,084 | | | | 1,089,341 | | | $ | 11,601,670 | |
| | | | | | | | | | | | | | | | |
CLASS C | | | | | | | | | | | | | | | | |
Shares sold | | | 58,024 | | | $ | 532,797 | | | | 285,284 | | | $ | 2,802,118 | |
Shares sold through reinvestments of distributions | | | 9,185 | | | | 83,032 | | | | 13,552 | | | | 130,085 | |
Shares redeemed | | | (64,510 | ) | | | (591,956 | ) | | | (12,493 | ) | | | (121,540 | ) |
Redemption fees | | | – | | | | – | | | | – | | | | 343 | |
| | | | | | | | | | | | | | | | |
Net increase | | | 2,699 | | | $ | 23,873 | | | | 286,343 | | | $ | 2,811,006 | |
| | | | | | | | | | | | | | | | |
CLASS I | | | | | | | | | | | | | | | | |
Shares sold | | | – | | | $ | – | | | | – | | | $ | – | |
Shares sold through reinvestments of distributions | | | 27,127 | | | | 255,092 | | | | 253,647 | | | | 2,450,842 | |
Shares redeemed | | | – | | | | – | | | | – | | | | – | |
Redemption fees | | | – | | | | – | | | | – | | | | 4,679 | |
| | | | | | | | | | | | | | | | |
Net increase | | | 27,127 | | | $ | 255,092 | | | | 253,647 | | | $ | 2,455,521 | |
| | | | | | | | | | | | | | | | |
CLASS Y | | | | | | | | | | | | | | | | |
Shares sold | | | 1,412,060 | | | $ | 12,972,040 | | | | 1,654,908 | | | $ | 16,333,761 | |
Shares sold through reinvestments of distributions | | | 94,808 | | | | 866,819 | | | | 321,379 | | | | 3,108,290 | |
Shares redeemed | | | (732,942 | ) | | | (6,596,388 | ) | | | (1,114,834 | ) | | | (11,114,262 | ) |
Redemption fees | | | – | | | | – | | | | – | | | | 5,954 | |
| | | | | | | | | | | | | | | | |
Net increase | | | 773,926 | | | $ | 7,242,471 | | | | 861,453 | | | $ | 8,333,743 | |
| | | | | | | | | | | | | | | | |
175
Babson Capital Funds Trust 2015 Semi-Annual Report
NOTES TO THE FINANCIAL STATEMENTS (UNAUDITED) (CONTINUED)
December 31, 2015
Active Short Duration Bond Fund
| | | | | | | | | | | | | | | | |
| | | PERIOD FROM
JULY 9, 2015
THROUGH
DECEMBER 31, 2015 | | | FOR THE
YEAR ENDED
JUNE 30, 2015 | |
| CLASS A | | SHARES | | | AMOUNT | | | SHARES | | | AMOUNT | |
Shares sold | | | 1,163,542 | | | $ | 11,527,601 | | | | – | | | $ | – | |
Shares sold through reinvestments of distributions | | | 2,160 | | | | 21,319 | | | | – | | | | – | |
Shares redeemed | | | (96,479 | ) | | | (954,354 | ) | | | – | | | | – | |
| | | | | | | | | | | | | | | | |
Net increase | | | 1,069,223 | | | $ | 10,594,566 | | | | – | | | $ | – | |
| | | | | | | | | | | | | | | | |
CLASS C | | | | | | | | | | | | | | | | |
Shares sold | | | 34,614 | | | $ | 345,256 | | | | – | | | $ | – | |
Shares sold through reinvestments of distributions | | | 38 | | | | 381 | | | | – | | | | – | |
Shares redeemed | | | (3 | ) | | | (32 | ) | | | – | | | | – | |
| | | | | | | | | | | | | | | | |
Net increase | | | 34,649 | | | $ | 345,605 | | | | – | | | $ | – | |
| | | | | | | | | | | | | | | | |
CLASS I | | | | | | | | | | | | | | | | |
Shares sold | | | 2,230,000 | | | $ | 22,300,000 | | | | – | | | $ | – | |
Shares sold through reinvestments of distributions | | | 4,436 | | | | 44,099 | | | | – | | | | – | |
Shares redeemed | | | – | | | | – | | | | – | | | | – | |
| | | | | | | | | | | | | | | | |
Net increase | | | 2,234,436 | | | $ | 22,344,099 | | | | – | | | $ | – | |
| | | | | | | | | | | | | | | | |
CLASS Y | | | | | | | | | | | | | | | | |
Shares sold | | | 6,010,467 | | | $ | 59,709,650 | | | | – | | | $ | – | |
Shares sold through reinvestments of distributions | | | 12,667 | | | | 125,236 | | | | – | | | | – | |
Shares redeemed | | | (122,747 | ) | | | (1,214,939 | ) | | | – | | | | – | |
| | | | | | | | | | | | | | | | |
Net increase | | | 5,900,387 | | | $ | 58,619,947 | | | | – | | | $ | – | |
| | | | | | | | | | | | | | | | |
176
Babson Capital Funds Trust 2015 Semi-Annual Report
NOTES TO THE FINANCIAL STATEMENTS (UNAUDITED) (CONTINUED)
December 31, 2015
Total Return Bond Fund
| | | | | | | | | | | | | | | | |
| | | PERIOD FROM
JULY 9, 2015
THROUGH
DECEMBER 31, 2015 | | | FOR THE
YEAR ENDED
JUNE 30, 2015 | |
| CLASS A | | SHARES | | | AMOUNT | | | SHARES | | | AMOUNT | |
Shares sold | | | 20,000 | | | $ | 200,000 | | | | – | | | $ | – | |
Shares sold through reinvestments of distributions | | | 82 | | | | 806 | | | | – | | | | – | |
Shares redeemed | | | – | | | | – | | | | – | | | | – | |
| | | | | | | | | | | | | | | | |
Net increase | | | 20,082 | | | $ | 200,806 | | | | – | | | $ | – | |
| | | | | | | | | | | | | | | | |
CLASS C | | | | | | | | | | | | | | | | |
Shares sold | | | 20,000 | | | $ | 200,000 | | | | – | | | $ | – | |
Shares sold through reinvestments of distributions | | | 61 | | | | 596 | | | | – | | | | – | |
Shares redeemed | | | – | | | | – | | | | – | | | | – | |
| | | | | | | | | | | | | | | | |
Net increase | | | 20,061 | | | $ | 200,596 | | | | – | | | $ | – | |
| | | | | | | | | | | | | | | | |
CLASS I | | | | | | | | | | | | | | | | |
Shares sold | | | 1,230,000 | | | $ | 12,300,000 | | | | – | | | $ | – | |
Shares sold through reinvestments of distributions | | | 5,482 | | | | 54,097 | | | | – | | | | – | |
Shares redeemed | | | – | | | | – | | | | – | | | | – | |
| | | | | | | | | | | | | | | | |
Net increase | | | 1,235,482 | | | $ | 12,354,097 | | | | – | | | $ | – | |
| | | | | | | | | | | | | | | | |
CLASS Y | | | | | | | | | | | | | | | | |
Shares sold | | | 1,232,225 | | | $ | 12,322,092 | | | | – | | | $ | – | |
Shares sold through reinvestments of distributions | | | 5,506 | | | | 54,334 | | | | – | | | | – | |
Shares redeemed | | | – | | | | – | | | | – | | | | – | |
| | | | | | | | | | | | | | | | |
Net increase | | | 1,237,731 | | | $ | 12,376,426 | | | | – | | | $ | – | |
| | | | | | | | | | | | | | | | |
177
Babson Capital Funds Trust 2015 Semi-Annual Report
NOTES TO THE FINANCIAL STATEMENTS (UNAUDITED) (CONTINUED)
December 31, 2015
Emerging Markets Debt Blended Total Return Fund
| | | | | | | | | | | | | | | | |
| | | PERIOD FROM
OCTOBER 22, 2015
THROUGH
DECEMBER 31, 2015 | | | FOR THE
YEAR ENDED
JUNE 30, 2015 | |
| CLASS A | | SHARES | | | AMOUNT | | | SHARES | | | AMOUNT | |
Shares sold | | | 20,000 | | | $ | 200,000 | | | | – | | | $ | – | |
Shares sold through reinvestments of distributions | | | 6 | | | | 62 | | | | – | | | | – | |
Shares redeemed | | | – | | | | – | | | | – | | | | – | |
| | | | | | | | | | | | | | | | |
Net increase | | | 20,006 | | | $ | 200,062 | | | | – | | | $ | – | |
| | | | | | | | | | | | | | | | |
CLASS C | | | | | | | | | | | | | | | | |
Shares sold | | | 20,000 | | | $ | 200,000 | | | | – | | | $ | – | |
Shares sold through reinvestments of distributions | | | 6 | | | | 62 | | | | – | | | | – | |
Shares redeemed | | | – | | | | – | | | | – | | | | – | |
| | | | | | | | | | | | | | | | |
Net increase | | | 20,006 | | | $ | 200,062 | | | | – | | | $ | – | |
| | | | | | | | | | | | | | | | |
CLASS I | | | | | | | | | | | | | | | | |
Shares sold | | | 480,000 | | | $ | 4,800,000 | | | | – | | | $ | – | |
Shares sold through reinvestments of distributions | | | 156 | | | | 1,488 | | | | – | | | | – | |
Shares redeemed | | | – | | | | – | | | | – | | | | – | |
| | | | | | | | | | | | | | | | |
Net increase | | | 480,156 | | | $ | 4,801,488 | | | | – | | | $ | – | |
| | | | | | | | | | | | | | | | |
CLASS Y | | | | | | | | | | | | | | | | |
Shares sold | | | 480,000 | | | $ | 4,800,000 | | | | – | | | $ | – | |
Shares sold through reinvestments of distributions | | | 156 | | | | 1,488 | | | | – | | | | – | |
Shares redeemed | | | – | | | | – | | | | – | | | | – | |
| | | | | | | | | | | | | | | | |
Net increase | | | 480,156 | | | $ | 4,801,488 | | | | – | | | $ | – | |
| | | | | | | | | | | | | | | | |
178
Babson Capital Funds Trust 2015 Semi-Annual Report
NOTES TO THE FINANCIAL STATEMENTS (UNAUDITED) (CONTINUED)
December 31, 2015
Emerging Markets Local Currency Debt Fund
| | | | | | | | | | | | | | | | |
| | | PERIOD FROM
DECEMBER 9, 2015
THROUGH
DECEMBER 31, 2015 | | | FOR THE
YEAR ENDED
JUNE 30, 2015 | |
| CLASS A | | SHARES | | | AMOUNT | | | SHARES | | | AMOUNT | |
Shares sold | | | 10,000 | | | $ | 100,000 | | | | – | | | $ | – | |
Shares sold through reinvestments of distributions | | | – | | | | – | | | | – | | | | – | |
Shares redeemed | | | – | | | | – | | | | – | | | | – | |
| | | | | | | | | | | | | | | | |
Net increase | | | 10,000 | | | $ | 100,000 | | | | – | | | $ | – | |
| | | | | | | | | | | | | | | | |
CLASS C | | | | | | | | | | | | | | | | |
Shares sold | | | 10,000 | | | $ | 100,000 | | | | – | | | $ | – | |
Shares sold through reinvestments of distributions | | | – | | | | – | | | | – | | | | – | |
Shares redeemed | | | – | | | | – | | | | – | | | | – | |
| | | | | | | | | | | | | | | | |
Net increase | | | 10,000 | | | $ | 100,000 | | | | – | | | $ | – | |
| | | | | | | | | | | | | | | | |
CLASS I | | | | | | | | | | | | | | | | |
Shares sold | | | 240,000 | | | $ | 2,400,000 | | | | – | | | $ | – | |
Shares sold through reinvestments of distributions | | | – | | | | – | | | | – | | | | – | |
Shares redeemed | | | – | | | | – | | | | – | | | | – | |
| | | | | | | | | | | | | | | | |
Net increase | | | 240,000 | | | $ | 2,400,000 | | | | – | | | $ | – | |
| | | | | | | | | | | | | | | | |
CLASS Y | | | | | | | | | | | | | | | | |
Shares sold | | | 240,000 | | | $ | 2,400,000 | | | | – | | | $ | – | |
Shares sold through reinvestments of distributions | | | – | | | | – | | | | – | | | | – | |
Shares redeemed | | | – | | | | – | | | | – | | | | – | |
| | | | | | | | | | | | | | | | |
Net increase | | | 240,000 | | | $ | 2,400,000 | | | | – | | | $ | – | |
| | | | | | | | | | | | | | | | |
179
Babson Capital Funds Trust 2015 Semi-Annual Report
NOTES TO THE FINANCIAL STATEMENTS (UNAUDITED) (CONTINUED)
December 31, 2015
Global High Yield Fund
| | | | | | | | | | | | | | | | |
| | | PERIOD FROM
NOVEMBER 2, 2015
THROUGH
DECEMBER 31, 2015 | | | FOR THE
YEAR ENDED
JUNE 30, 2015 | |
| CLASS A | | SHARES | | | AMOUNT | | | SHARES | | | AMOUNT | |
Shares sold | | | 10,000 | | | $ | 100,000 | | | | – | | | $ | – | |
Shares sold through reinvestments of distributions | | | – | | | | – | | | | – | | | | – | |
Shares redeemed | | | – | | | | – | | | | – | | | | – | |
| | | | | | | | | | | | | | | | |
Net increase | | | 10,000 | | | $ | 100,000 | | | | – | | | $ | – | |
| | | | | | | | | | | | | | | | |
CLASS C | | | | | | | | | | | | | | | | |
Shares sold | | | 10,000 | | | $ | 100,000 | | | | – | | | $ | – | |
Shares sold through reinvestments of distributions | | | – | | | | – | | | | – | | | | – | |
Shares redeemed | | | – | | | | – | | | | – | | | | – | |
| | | | | | | | | | | | | | | | |
Net increase | | | 10,000 | | | $ | 100,000 | | | | – | | | $ | – | |
| | | | | | | | | | | | | | | | |
CLASS I | | | | | | | | | | | | | | | | |
Shares sold | | | 1,240,000 | | | $ | 12,400,000 | | | | – | | | $ | – | |
Shares sold through reinvestments of distributions | | | – | | | | – | | | | – | | | | – | |
Shares redeemed | | | – | | | | – | | | | – | | | | – | |
| | | | | | | | | | | | | | | | |
Net increase | | | 1,240,000 | | | $ | 12,400,000 | | | | – | | | $ | – | |
| | | | | | | | | | | | | | | | |
CLASS Y | | | | | | | | | | | | | | | | |
Shares sold | | | 1,240,779 | | | $ | 12,407,500 | | | | – | | | $ | – | |
Shares sold through reinvestments of distributions | | | 1 | | | | 13 | | | | – | | | | – | |
Shares redeemed | | | – | | | | – | | | | – | | | | – | |
| | | | | | | | | | | | | | | | |
Net increase | | | 1,240,780 | | | $ | 12,407,513 | | | | – | | | $ | – | |
| | | | | | | | | | | | | | | | |
180
Babson Capital Funds Trust 2015 Semi-Annual Report
NOTES TO THE FINANCIAL STATEMENTS (UNAUDITED) (CONTINUED)
December 31, 2015
U.S. High Yield Fund
| | | | | | | | | | | | | | | | |
| | | PERIOD FROM
NOVEMBER 2, 2015
THROUGH
DECEMBER 31, 2015 | | | FOR THE
YEAR ENDED
JUNE 30, 2015 | |
| CLASS A | | SHARES | | | AMOUNT | | | SHARES | | | AMOUNT | |
Shares sold | | | 10,000 | | | $ | 100,000 | | | | – | | | $ | – | |
Shares sold through reinvestments of distributions | | | – | | | | – | | | | – | | | | – | |
Shares redeemed | | | – | | | | – | | | | – | | | | – | |
| | | | | | | | | | | | | | | | |
Net increase | | | 10,000 | | | $ | 100,000 | | | | – | | | $ | – | |
| | | | | | | | | | | | | | | | |
CLASS C | | | | | | | | | | | | | | | | |
Shares sold | | | 10,000 | | | $ | 100,000 | | | | – | | | $ | – | |
Shares sold through reinvestments of distributions | | | – | | | | – | | | | – | | | | – | |
Shares redeemed | | | – | | | | – | | | | – | | | | – | |
| | | | | | | | | | | | | | | | |
Net increase | | | 10,000 | | | $ | 100,000 | | | | – | | | $ | – | |
| | | | | | | | | | | | | | | | |
CLASS I | | | | | | | | | | | | | | | | |
Shares sold | | | 1,458,295 | | | $ | 14,500,000 | | | | – | | | $ | – | |
Shares sold through reinvestments of distributions | | | 262 | | | | 2,525 | | | | – | | | | – | |
Shares redeemed | | | – | | | | – | | | | – | | | | – | |
| | | | | | | | | | | | | | | | |
Net increase | | | 1,458,557 | | | $ | 14,502,525 | | | | – | | | $ | – | |
| | | | | | | | | | | | | | | | |
CLASS Y | | | | | | | | | | | | | | | | |
Shares sold | | | 1,240,000 | | | $ | 12,400,000 | | | | – | | | $ | – | |
Shares sold through reinvestments of distributions | | | – | | | | – | | | | – | | | | – | |
Shares redeemed | | | – | | | | – | | | | – | | | | – | |
| | | | | | | | | | | | | | | | |
Net increase | | | 1,240,000 | | | $ | 12,400,000 | | | | – | | | $ | – | |
| | | | | | | | | | | | | | | | |
During the period ended December 31, 2015, the Trust (the “Borrower”) entered into a Credit Agreement (the “Credit Agreement”) with State Street Bank and Trust Company (the “Bank”). The Credit Agreement provides for a revolving credit facility of $40,000,000 (the “Facility Amount”) to be utilized for temporary or emergency purposes to fund shareholder redemptions or for other short-term liquidity purposes. Per the Credit Agreement, outstanding principal on the loan shall bear interest at a variable rate per annum equal to the higher of (a) the Federal Funds Rate as in effect on the day of the borrowing plus 1.25% and (b) the Overnight LIBOR rate as in effect on the day of the borrowing plus 1.25%. In addition, the Borrower shall pay to the Bank a commitment fee at the rate of 0.25% per annum on the daily unused portion of the Facility Amount. As of December 31, 2015, there were no loans outstanding pursuant to the Credit Agreement.
181
Babson Capital Funds Trust 2015 Semi-Annual Report
BASIS FOR BOARD RENEWAL OF INVESTMENT MANAGEMENT AGREEMENT AND SUB-ADVISORY AGREEMENTS
The Investment Company Act of 1940 (the “1940 Act”) requires that a majority of both the full Board of Trustees and the Trustees who are not interested persons of the Trust, as defined under the 1940 Act (“Independent Trustees”), voting separately, annually approve the continuation of the Investment Management Agreement between the Trust, on behalf of each of its eight series funds (the “Funds”), and Babson Capital Management LLC (“Babson Capital”) (the “Management Agreement”), the Sub-Advisory Agreement between Babson Capital and Babson Capital Global Advisors Limited (“BCGA”) (the “BCGA Sub-Advisory Agreement”) and the Sub-Advisory Agreement between Babson Capital and Cornerstone Real Estate Advisers LLC (“Cornerstone”) (the “Cornerstone Sub-Advisory Agreement”, and together with the Management Agreement and the BCGA Sub-Advisory Agreement, the “Agreements”). The Trustees considered matters bearing on the Funds and the Agreements at their meetings throughout the year, including a review of the Funds’ performance at each regular meeting. At a meeting held on July 16, 2015 (the “Meeting”), the Trustees met for the purpose of considering whether to approve the continuation of the Agreements for the Funds. The Trustees’ review process and considerations in approval the Agreements are set forth below.
Prior to the Meeting, the Trustees requested and received from Ropes & Gray LLP, counsel to the Funds, a memorandum describing the Trustees’ legal responsibilities in connection with their review and approval of the Agreements. The Trustees noted that they initially approved the Agreements for Babson Global Floating Rate Fund and Babson Global Credit Income Opportunities Fund in July 2013, and that they initially approved the Agreements for Babson Active Short Duration Bond Fund, Babson Emerging Markets Debt Blended Total Return Fund, Babson Emerging Markets Local Currency Debt Fund, Babson Global High Yield Fund, Babson Total Return Bond Fund and Babson U.S. High Yield Fund in January 2015. The Trustees also requested and received from Babson Capital extensive written and oral information regarding other matters including: the principal terms of the Agreements; the reasons why Babson Capital was proposing the continuance of the Agreements; Babson Capital and its personnel; the Funds’ investment performance, including comparative performance information; the nature and quality of the services provided by Babson Capital to the Funds; financial strength of Babson Capital; the fee arrangements between Babson Capital and each Fund and each Fund’s fee and expense information, including comparative fee and expense information; profitability of the Agreements to Babson Capital; and “fallout” benefits to Babson Capital resulting from the Agreements.
The Trustees’ conclusion as to the continuation of the Agreements was based on a comprehensive consideration of all information provided to the Board and not the result of any single issue. Some of the factors that figured particularly in the Trustees’ deliberations are described below, although individual Trustees may have evaluated the information presented differently from one another, giving different weights to different factors. It is also important to recognize that the Board’s review of the Agreements is the result of ongoing review and discussion, rather than a single discussion. The Trustees’ conclusions may be based, in part, on their consideration of these arrangements during the course of the year and in prior years.
The Trustees considered the terms of the Agreements, including the scope of the advisory services provided under the Agreements. In evaluating the nature, scope and quality of the services provided by Babson Capital to Babson Emerging Markets Local Currency Debt Fund and Babson U.S. High Yield Fund, the Trustees considered Babson Capital’s specific responsibilities in the day-to-day management of the Fund, the qualifications, experience and responsibilities of the portfolio managers and other key personnel that are involved in the day-to-day management of the Fund, the ability of Babson Capital to attract and retain high-quality personnel, and the organizational depth and stability of Babson Capital. In evaluating the nature, scope and quality of the services provided by Babson Capital and BCGA to Babson Emerging Markets Debt Blended Total Return Fund, Babson Global High Yield Bond Fund, Babson Global Floating Rate Fund and Babson Global Credit Income Opportunities Fund (“BCGA sub-advised Funds”) and by Babson Capital and Cornerstone to Babson Active Short Duration Fund and Babson Total Return Bond Fund (“Cornerstone sub-advised Funds”), the Trustees considered Babson Capital’s specific responsibilities in the day-to-day management of the Fund, the qualifications, experience and responsibilities of the portfolio managers and other key personnel that are involved in the day-to-day management of the Fund, the ability of each of Babson Capital and BCGA and Cornerstone to attract and retain high-quality personnel, and the organizational depth and stability of each of Babson, BCGA and Cornerstone. The Trustees also considered the trading capabilities of Babson Capital.
182
Babson Capital Funds Trust 2015 Semi-Annual Report
BASIS FOR BOARD RENEWAL OF INVESTMENT MANAGEMENT AGREEMENT AND SUB-ADVISORY AGREEMENTS (CONTINUED)
The Trustees reviewed the Funds’ total return investment performance, as well as the performance of peer groups of funds, over various time periods, using information provided by Lipper Inc. (“Lipper”) and Babson Capital. The Trustees noted that the total return performance of Babson Global Floating Rate Fund’s and Babson Global Credit Income Opportunities Fund’s shares each ranked in the 4th quintile of the Lipper performance universe for the one-year period ended December 30, 2014 (the 1st quintile being the best performers and the 5th quintile being the worst performers). The Trustees noted that the remaining six Funds had commenced operations after June 30, 2015 or had not yet commenced operations, and had limited or no operating histories and performance records. As a result, the Trustees did not receive information on the investment performance of these Funds. However, in the case of Babson Active Short Duration Bond Fund, Babson Emerging Markets Local Currency Debt Fund, Babson Emerging Markets Debt Blended Total Return Fund and Babson Total Return Bond Fund, each of which was modeled on a substantially similar fund sub-advised by Babson Capital (each, a “similar fund”), the Trustees considered one-, three-, and five-year performance information for the corresponding similar fund. In the course of their deliberations, the Trustees also took into account information provided by Babson Capital during investment review meetings conducted with portfolio management personnel during the course of the year. After reviewing these and related factors, the Trustees concluded, within the context of their overall conclusions regarding the Agreements, that they were satisfied with the responses of Babson Capital and BCGA and Cornerstone.
The Trustees considered the investment management fee paid by each Fund to Babson Capital pursuant to the Management Agreement. The Trustees noted that Babson Capital (and not the BCGA sub-advised Funds) pays BCGA its sub-advisory fee under the BCGA Sub-Advisory Agreement and that Babson Capital (and not the Cornerstone sub-advised Funds) pays Cornerstone its sub-advisory fee under the Cornerstone Sub-Advisory Agreement. In assessing the reasonableness of the fee paid by the Funds under the Management Agreement, the Trustees considered, among other information, each Fund’s advisory fee and the total expense ratio for the Fund’s shares as a percentage of net asset value and the advisory fee and total expense ratios of peer groups of funds based on information provided by Lipper Inc. The Trustees considered that, according to the Lipper data (which takes into account any fee reductions or expense limitations that were in effect during the last fiscal year), Babson Global Floating Rate Fund’s effective advisory fee rate and total expense ratio were each lower than the Lipper expense group median. The Trustees considered that, according to the Lipper data, Babson Global Credit Income Opportunities Fund’s effective advisory fee rate was lower than the Lipper expense group median and its total expense ratio was approximately at the Lipper expense group median. The Trustees also considered that, according to the Lipper data, the effective advisory fee rate was expected to be lower than the Lipper expense group median and the total expense ratio was expected to be approximately at the Lipper expense group median for Babson Active Short Duration Bond Fund, Babson Emerging Markets Local Currency Debt Fund, Babson Emerging Markets Debt Blended Total Return Fund, Babson Global High Yield Fund, Babson Total Return Bond Fund, and Babson U.S. High Yield Fund.
The Trustees then considered that, as each Fund’s assets increase, each Fund and its shareholders would be expected to realize economies of scale as certain expenses, such as fixed operating costs, become a smaller percentage of overall assets. They considered the extent to which any such savings would benefit shareholders and Babson Capital’s statement that it would consider proposing breakpoints in the management fee payable by a Fund once a Fund approached the breakeven point.
The Trustees reviewed information prepared by Babson Capital regarding Babson Capital’s costs of managing the Funds, and the profitability of the Management Agreement to Babson Capital. In considering the profitability of the Babson Capital, the Board noted that BCGA and Cornerstone are affiliates of Babson Capital and are paid by Babson Capital, and, therefore, did not consider their profitability separately. The Trustees then considered potential “fall-out” benefits to Babson Capital and its affiliates as a result of Babson Capital’s relationship with BCFT. The Board concluded that, in light of the expected costs of providing investment management and other services to BCFT and Babson Capital’s commitment to cap the expenses of each Fund, the other ancillary benefits that Babson Capital and its affiliates expect to receive supported the approval of the Agreements. The Trustees concluded that, at this time, and in light of the nature, extent and quality of the respective services expected to be provided by Babson Capital, the fee rates and expenses of each Fund
183
Babson Capital Funds Trust 2015 Semi-Annual Report
BASIS FOR BOARD RENEWAL OF INVESTMENT MANAGEMENT AGREEMENT AND SUB-ADVISORY AGREEMENTS (CONTINUED)
supported the approval of the Management Agreement, the BCGA Sub-Advisory Agreement and the Cornerstone Sub-Advisory Agreement.
Based on their evaluation of factors that they deemed to be material, including those factors described above, the Board of Trustees, including the Independent Trustees, concluding that the Management Agreement, the BCGA Sub-Advisory Agreement and the Cornerstone Sub-Advisory Agreement should be continued for an additional one-year period.
184
 Babson Capital Funds Trust
Item 2. Code of Ethics.
Not applicable to this semi-annual report.
Item 3. Audit Committee Financial Expert.
Not applicable to this semi-annual report.
Item 4. Principal Accountant Fees and Services.
Not applicable to this semi-annual report.
Item 5. Audit Committee of Listed Registrants.
Not applicable.
Item 6. Schedule of Investments.
| (a) | The Registrant’s Consolidated Schedule of Investments as of the close of the reporting period is included in the Semi-Annual Report to Shareholders filed under Item 1 of this form. |
Item 7. Disclosure of Proxy Voting Policies and Procedures for Closed-End Management Investment Companies.
Not applicable.
Item 8. Portfolio Managers of Closed-End Investment Management Companies.
Not applicable.
| Item 9. | Purchases of Equity Securities by Closed-End Management Investment Company and Affiliated Purchasers. |
Not applicable.
Item 10. Submission of Matters to a Vote of Security Holders.
There have been no material changes to procedures by which the shareholders may recommend nominees to the Registrant’s Board of Trustees.
Item 11. Controls and Procedures.
| (a) | The Registrant’s principal executive officer and principal financial officer, or persons performing similar functions, have concluded that the Registrant’s disclosure controls and procedures as defined in Rule 30a-3(c) under the Investment Company Act of 1940, as amended (the “1940 Act”), are effective as of a date within 90 days of the filing date of this report based on the evaluation of these controls and procedures required by Rule 30a-3(b) under the 1940 Act and Rules 13a-15(b) or 15d-15(b) under the Securities Exchange Act of 1934, as amended. |
| (b) | There were no changes in the Registrant’s internal control over financial reporting (as defined in Rule 30a-3(d) under the 1940 Act) that occurred during the second fiscal quarter of the period covered by this report that have materially affected or are reasonably likely to materially affect, the Registrant’s internal control over financial reporting. |
Item 12. Exhibits.
| (a)(1) | Not applicable to this semi-annual report. |
| (a)(2) | Certifications pursuant to Rule 30a-2(a) under the 1940 Act are attached hereto. |
Exhibit 99.1 Cert
Exhibit 99.2 Cert
| (b) | Certification pursuant to Rule 30a-2(b) under the 1940 Act is attached hereto. |
Exhibit 99.906 Cert
SIGNATURES
Pursuant to the requirements of the Securities Exchange Act of 1934 and the Investment Company Act of 1940, the Registrant has duly caused this report to be signed on its behalf by the undersigned, thereunto duly authorized.
| | |
| (Registrant) | | Babson Capital Funds Trust |
| | |
| |
| By (Signature and Title) | | /s/ Anthony J. Sciacca |
| | Anthony J. Sciacca, President (Principal Executive Officer) |
Pursuant to the requirements of the Securities Exchange Act of 1934 and the Investment Company Act of 1940, this report has been signed below by the following persons on behalf of the Registrant and in the capacities and on the dates indicated.
| | |
| By (Signature and Title) | | /s/ Anthony J. Sciacca |
| | Anthony J. Sciacca, President (Principal Executive Officer) |
| | |
| |
| By (Signature and Title) | | /s/ Patrick Hoefling |
| | Patrick Hoefling, Chief Financial Officer (Principal Financial Officer) |