UNITED STATES
SECURITIES AND EXCHANGE COMMISSION
Washington, D.C. 20549
FORM N-CSR
CERTIFIED SHAREHOLDER REPORT OF REGISTERED
MANAGEMENT INVESTMENT COMPANIES
Investment Company Act file number(s) 811-22845
Barings Funds Trust
(Exact Name of Registrant as Specified in Charter)
550 South Tryon Street
Suite 3300
Charlotte, NC 28202
(Address of Principal Executive Offices)
Registrant’s telephone number, including area code: (704) 805-7200
Janice M. Bishop
Secretary and Chief Legal Officer
c/o Barings LLC
Independence Wharf
470 Atlantic Avenue
Boston MA 02210
(Name and Address of Agent for Service)
Date of fiscal year end: June 30
Date of reporting period: December 31, 2016
Item 1. Reports to Stockholders.

BARINGS FUNDS TRUST
Semi-Annual Report
December 31, 2016
This page intentionally left blank.

Duncan Robertson
President,
Barings Funds Trust
Barings Funds Trust
Barings Global Floating Rate Fund
Barings Global Credit Income Opportunities Fund
Barings Active Short Duration Bond Fund
Barings Total Return Bond Fund
Barings Emerging Markets Debt Blended Total Return Fund
Barings Emerging Markets Local Currency Debt Fund
Barings Global High Yield Fund
Barings U.S. High Yield Fund
Dear Shareholder,
Thank you for your continued trust and partnership in 2016. The year was characterized by turbulence in markets and change on the geopolitical landscape. Markets got off to an inauspicious start with major stock indices and oil prices hitting their lows for the year in February before beginning an extended rebound that stretched through year end. Similarly, credit markets across the globe began the year in “risk off” mode but subsequently rebounded with asset classes including high yield bonds, senior secured loans and emerging market debt all experiencing strong returns for the full year.
In the political arena, few predicted a “Leave” result in the U.K.’s June European Union referendum (“Brexit”) vote, and even fewer predicted the meteoric rise of Donald Trump from political outsider to the winning candidate in November’s U.S. Presidential election. Even so, markets remained resilient, experiencing volatility around both events but ultimately sustaining a broad-based rally across risk assets, pushing equity markets to new all-time highs and resulting in tightened credit spreads across fixed income markets.
Looking ahead to 2017, we see reasons for continued optimism, while at the same time, recognizing a number of potential volatility triggers. The economic growth outlook has generally improved, helped in part by expectations of potential tax reform and deregulation under the Trump administration. The financial health of the corporate sector across developed and emerging markets also appears encouraging suggesting that fears of an impending end to the credit cycle may be overblown. But in similar fashion to 2016, we do not expect a completely smooth ride for markets in 2017. In fact, potential policy missteps by the Trump administration, headline risk around the Brexit negotiations and the outcome of several key elections in Europe all have the potential to spark renewed volatility in markets. Additionally, continued geopolitical tensions in the Middle East, question marks around the economic and political prospects for China and diverging monetary policies across developed and emerging markets all have the potential to complicate the picture for markets in 2017.
At Barings, we often find opportunity in markets during periods of volatility and change. The key is to be nimble and to adapt as the environment changes. This is also true in the way that we manage our own business—we believe that the ability to adapt to change is critical. This was the main driver behind our decision in 2016 to merge four Massachusetts Mutual Life Insurance Company affiliates (Babson Capital Management, Cornerstone Real Estate Advisers, Wood Creek Capital Management and Baring Asset Management) into the new Barings. While our investment process has stayed the same: a strict focus on bottom-up, fundamental analysis and long-term investing, we believe that this new global platform will help to provide our clients with solutions to meet their evolving needs and investment goals.
On behalf of the entire Barings team, we thank you for your partnership and trust, and we look forward to helping you achieve your investment objectives.
Sincerely,

Duncan Robertson
President
Cautionary Notice: Certain statements contained in this report may be “forward looking” statements. Investors are cautioned not to place undue reliance on forward-looking statements, which speak only as of the date in which they are made and reflect management’s current estimates, projections, expectations or beliefs, and which are subject to risks and uncertainties that may cause actual results to differ materially. These statements are subject to change at any time based upon economic, market or other conditions and may not be relied upon as investment advice or an indication of the Trust’s trading intent. References to specific securities are not recommendations of such securities, and may not be representative of the Trusts’ current or future investments. We undertake no obligation to publicly update these forward looking statements, whether as a result of new information, future events, or otherwise.
ALPS Distributors, Inc. is the distributor for the Barings mutual funds. ALPS and Barings are separate and unaffiliated. A prospectus can be obtained by calling 1.855.439.5459. Read the prospectus carefully before investing. Investors should carefully consider the investment objective, risks, charges and expenses of any mutual fund before investing. This and other important information is contained in the prospectus.
Barings Global Floating Rate Fund 2016 Semi-Annual Report
Investment Objective
The investment objective of the Barings Global Floating Rate Fund (“Global Floating Rate Fund” or the “Fund”) is to seek a high level of current income. Preservation of capital is a secondary goal.
Portfolio Management Commentary
How did the Fund perform?
| | ∎ | | The Fund reported a net total rate of return for the six month reporting period from June 30, 2016 through December 31, 2016 of 7.43% and outperformed the Credit Suisse Global Loan Benchmark, which returned 5.36%.1 |
What factors influenced performance of the Fund?
| | ∎ | | For the semi-annual reporting period, the Fund’s U.S. loans were the largest contributor to outperformance, contributing 247 basis points (“bps”). European loans contributed 32 bps and bonds contributed 8 bps to outperformance, while cash detracted 33 bps. |
| | ∎ | | All sectors in the Fund, except broadcasting (which was down 2.02%), generated positive returns during the six month period. The sectors that contributed the most to outperformance were metals / minerals (+87 bps) and energy (+85 bps). The two sectors that detracted the most from performance versus the Index were consumer non-durables (-6 bps) and broadcasting (-3 bps). The Fund’s top eight contributors were commodity-related, and six of the bottom 10 contributors were European companies. |
Describe recent portfolio activity.
| | ∎ | | The number of holdings in the portfolio decreased to 160 names from 187 during the six-month period, while the Fund’s asset size declined by $6.2 million to $160.4 million. Over the last six months, the Fund increased its exposure to the U.S. and reduced its exposure to Europe. The Fund’s U.S. exposure increased by 6.7%. |
| | ∎ | | However, despite the decrease in European exposure, the Fund remained overweight to European assets relative to the global senior secured loan market. The Fund increased its exposure to U.S. assets over the last six months as Barings found more attractive opportunities in the U.S. versus Europe. In Barings’ opinion, this exposure positions the Fund to capture the best risk-adjusted returns from the market. |
| | ∎ | | Over the last six months, two of the Fund’s top three industry exposures have changed—only healthcare, education & childcare remained in the top three. The Fund’s three largest sector exposures were healthcare, education & childcare (which increased 4.0%), oil and gas (which increased 3.5%) and diversified / conglomerate services (increased 1.5%). The two sector exposures that decreased the most during the period were chemicals, plastics & rubber, which declined 2.9%, and machinery non-agriculture, non-construction, non-electronic, which declined 2.0%. |
| 1 | Total return describes the return to an investor based on the Class Y net expense ratio and includes the reinvestment of dividends and capital gains. Performance data quoted represents past performance. Past performance is no guarantee of future results and investment returns and principal value of the Funds (or of the investment company) will fluctuate so that shares, when redeemed, may be worth more or less than their original cost. Current performance may be higher or lower than performance quoted. Call 1.855.439.5459 or visit barings.com for current month end performance. The net asset value (NAV) will fluctuate with market conditions. All returns 1-year or less are cumulative. The Credit Suisse Global Loan Benchmark is a market capitalization weighted average of the Credit Suisse Leveraged Loan Index and the Credit Suisse Western European Leveraged Loan Index. The Credit Suisse Leveraged Loan Index is designed to mirror the investable universe of the U.S. dollar-denominated leveraged loan market. The Credit Suisse Western European Leveraged Loan Index is designed to mirror the investable universe of the Western European leveraged loan market, with loans denominated in U.S. and Western European currencies. Indices are unmanaged. It is not possible to invest directly in an index. |
2
Barings Global Floating Rate Fund 2016 Semi-Annual Report
Describe portfolio positioning at period end.
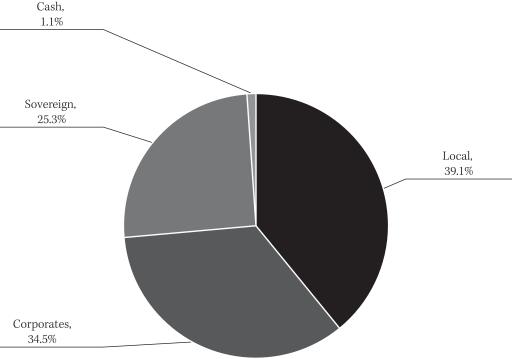
| | ∎ | | The Fund finished the six month reporting period, ending December 31, 2016, with 83.4% weighting to global senior secured loans, 8.2% to global senior secured high yield bonds, 8.3% to cash and 0.1% to equities. |
| | ∎ | | From an industry perspective, the Fund remains well-diversified across a number of sectors, with higher concentrations in healthcare, education & childcare (15.2%), oil and gas (7.8%), and diversified / conglomerate services (7.3%) as of December 31, 2016. |
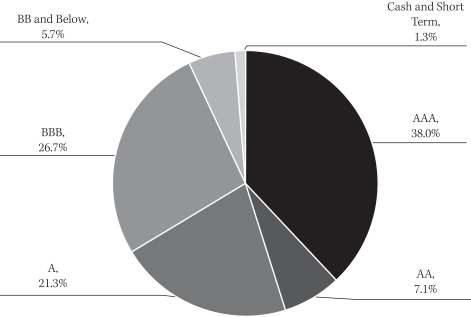
| | ∎ | | As of December 31, 2016, the Fund had the following credit quality breakdown: 2.1% in Baa assets, 20.2% in Ba assets, 56.6% in B credits and 6.1% in Caa and below assets. Approximately 6.7% of the Fund’s assets are not publicly rated and consist primarily of European issuers that Barings believes have a credit quality similar to that of other assets in the portfolio. Cash and accrued assets accounted for the remaining 8.3% of the portfolio assets. During the last six months, the B and Caa and below assets increased, while the assets not publically rated as well as the Baa and Ba assets all decreased.2 |
| | ∎ | | The top five countries in the portfolio at the end of the semi-annual reporting period are the U.S. (75.8%), the United Kingdom (7.9%), Germany (7.3%), France (2.6%) and the Netherlands (1.8%). Overall, the Fund has exposure to 15 different countries, and Barings continues to focus on building a well-diversified portfolio of global floating rate securities. |
Describe market and portfolio outlook.
| | ∎ | | In 2017, the political environment in both the U.S. and Europe will likely continue to dominate headlines and remain at the forefront of the market’s attention. With the U.S. government now under Republican control, policy positions and political appointments are likely to diverge significantly from what was seen under the Obama administration. |
| | ∎ | | To date, markets have reacted positively to the election results, although there has been some division across industries as investors anticipate regulatory changes. Despite the market’s exuberance over the expected policy moves of the new administration, much remains unknown and volatility may resurface should any major political surprises appear. |
| | ∎ | | Particularly, industries that have traded on policy speculation such as banking and energy, which have rallied since the election, and healthcare and pharmaceuticals, which have fallen, are likely to see additional volatility as concrete policy initiatives begin to materialize. |
| | ∎ | | In Europe, elections are scheduled to take place in many of the Eurozone’s most influential countries in 2017 including France, Germany and the Netherlands as populist sentiment continues to build. Moreover, as the European Central Bank and the Federal Reserve continue to diverge, government rates and currency volatility will likely remain a primary factor for risk assets throughout the year. |
| 2 | Ratings shown are the highest rating given by one of the following national rating agencies: S&P, Moody’s or Fitch. Additional information about ratings can be found, respectively, at www.standardandpoors.com, www.moodys.com and www.fitchratings.com. Credit ratings are subject to change. AAA, AA, A, and BBB are investment grade ratings categories used by S&P and Fitch; BB, B, CCC/CC/C and D are below investment grade ratings categories used by S&P and Fitch. Aaa, Aa, A and Baa are investment grade ratings categories used by Moody’s; Ba, B, Caa/Ca and C are below investment grade ratings categories used by Moody’s. Bonds backed by U.S. Government or agency securities are given an implied rating equal to the rating of such securities. Holdings designated Not Publicly Rated are not rated by these national rating agencies. |
3
Barings Global Floating Rate Fund 2016 Semi-Annual Report
PORTFOLIO COMPOSITION (% of Assets*)
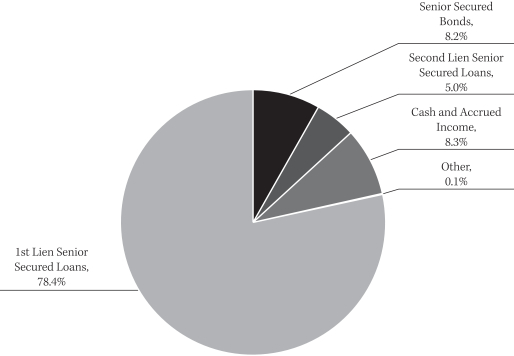
| * | The percentages shown above represent a percentage of the assets as of December 31, 2016. |
COUNTRY COMPOSITION (% of Assets**)
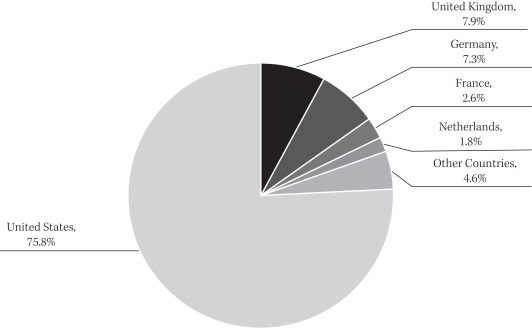
| ** | Percentage of assets is expressed by market value excluding cash and accrued income, and may vary over time. The percentages shown above represent a percentage of the assets as of December 31, 2016. |
4
Barings Global Credit Income Opportunities Fund 2016 Semi-Annual Report
Investment Objective
The investment objective of the Barings Global Credit Income Opportunities Fund (“Global Credit Income Opportunities Fund” or the “Fund”) is to seek an absolute return, primarily through current income and secondarily through capital appreciation.
Portfolio Management Commentary
How did the Fund perform?
| | ∎ | | The Fund reported a net total rate of return for the six month reporting period from June 30, 2016 through December 31, 2016, of 9.86% and outperformed the three month USD LIBOR + 500 basis points1 (“bps”) benchmark, which returned 2.95%.2 |
What factors influenced performance of the Fund?
| | ∎ | | During the semi-annual reporting period, all of the Fund’s asset classes, bond, loans, collateralized loan obligations (CLOs) and special situations contributed to performance. CLO’s and special situations had the highest returns during the last six months of 20% and 44%, respectively. On a gross basis, bonds contributed 409 bps, loans contributed 259 bps, CLO’s contributed 281 bps and special situations contributed 74 bps to performance. |
| | ∎ | | Almost all sectors were positive contributors, with energy (188 bps contribution), metals/minerals (80 bps contribution) and services (60 bps contribution) being the largest three sector contributors. The Fund’s top three contributors during the reporting period were commodity names, while five of the remaining seven top ten top contributors were CLOs. |
| | ∎ | | On a gross basis, the Fund’s North American assets contributed 784 bps, and the European assets contributed 257 bps. |
Describe recent portfolio activity.
| | ∎ | | The number of holdings in the portfolio remained consistent over the last six months, but the Fund grew from $98.9 million to $122.9 million since June 30th 2016. The Fund increased its exposure to North America by 6.5% to 71.8% and reduced its exposure to Europe. |
| | ∎ | | During the last six months, the Fund increased its exposure to global senior secured loans (up 2.2%) and global high yield bonds (up 1.6%) to focus on what Barings believes to be a more attractive part of the below-investment grade market from a risk-adjusted basis. The Fund’s exposure to CLO’s declined by 2.4% and to special situations by 1.4%. |
| | ∎ | | The following industries all had shifts of greater than 1% over the last six months, oil & gas up 3.4%, chemicals, plastics & rubber up 3.7%, healthcare, education & childcare up 3.7%, finance down 2.4% and broadcasting & entertainment down 1.1%. |
| 1 | A unit that is equal to 1/100th of 1% or 0.01%. |
| 2 | Total return describes the return to an investor based on the Class Y net expense ratio and includes the reinvestment of dividends and capital gains. Performance data quoted represents past performance. Past performance is no guarantee of future results and investment returns and principal value of the Funds (or of the investment company) will fluctuate so that shares, when redeemed, may be worth more or less than their original cost. Current performance may be higher or lower than performance quoted. Call 1.855.439.5459 or visit barings.com for current month end performance. The net asset value (NAV) will fluctuate with market conditions. All returns 1-year or less are cumulative. The 3 Month USD LIBOR (London Interbank Offered Rate) is an average interest rate, determined by the Intercontinental Exchange, that banks charge one another for the use of short-term money (3 months) in England’s Eurodollar market. The return shown includes 3 Month USD LIBOR plus 500 bps, or 5% per annum. LIBOR is unmanaged. It is not possible to invest directly in LIBOR. No assurance can be given that the Fund’s performance will exceed that of LIBOR by any given increment, or at all. Indices are unmanaged. It is not possible to invest directly in an index. |
5
Barings Global Credit Income Opportunities Fund 2016 Semi-Annual Report
Describe portfolio positioning at period end.
| | ∎ | | The Fund finished the semi-annual reporting period, December 31, 2016, with an allocation of 55.5%, 25%, and 12.9% to global high yield bonds, global senior secured loans and CLOs, respectively. The remainder of the portfolio was invested in a few opportunistic special situation credits at 0.2%, equity at 0.4% and cash at 6.0%. A significant portion of the portfolio (59.0%) is senior secured in nature (includes CLO’s backed by secured loans), which can potentially mitigate principal loss in the event that default rates increase. |
| | ∎ | | From an industry perspective, the Fund remains well-diversified across a number of sectors, with higher concentrations in oil & gas (9.5%), diversified/conglomerate services (7.9%), and healthcare, education & childcare (7.6%) as of December 31, 2016. |
| | ∎ | | As of December 31, 2016, the Fund had the following credit quality breakdown: 0.2% in Baa assets, 30.9% in Ba assets, 46.9% in single-B credits and 13.2% in Caa and below. Approximately 3.1% of the Fund’s assets are not publicly rated, primarily consisting of European issuers that Barings believes have a credit quality similar to that of other assets in the portfolio. Over the last six months there were no material changes to the ratings profile of the Fund.3 |
| | ∎ | | The top 5 countries in the portfolio at the end of the semi-annual reporting period are the U.S. (71.2%), the United Kingdom (11.0%), Germany (3.5%), the Netherlands (3.4%), and France (2.4%). The Cayman Islands exposure related to the Fund’s CLO holdings is included in the U.S. Overall, the Fund has exposure to 19 different countries, and Barings continues to focus on building a well-diversified portfolio of global high yield securities. |
Describe market and portfolio outlook.
| | ∎ | | For 2017, we believe the political environment in both the U.S. and Europe will likely continue to dominate headlines and remain at the forefront of the market’s attention. With the U.S. government now under Republican control, policy positions and political appointments are likely to diverge significantly from what was seen under the Obama administration. |
| | ∎ | | To date, markets have reacted positively to the election results, although there has been some division across industries as investors anticipate regulatory changes. Despite the market’s exuberance over the expected policy moves of the new administration, much remains unknown and volatility may resurface should any major political surprises appear. |
| | ∎ | | In particular this applies to industries that have traded on policy speculation such as banking and energy, which have rallied since the election, and healthcare and pharmaceuticals, which have fallen, are likely to see additional volatility as concrete policy initiatives begin to materialize. |
| | ∎ | | In Europe, elections are scheduled to take place in many of the Eurozone’s most influential countries during 2017 including France, Germany, and the Netherlands as populist sentiment continues to build. Moreover, as the European Central Bank and the Federal Reserve continue to diverge, government rates and currency volatility will likely remain a primary factor for risk assets throughout 2017. |
| 3 | Ratings shown are the highest rating given by one of the following national rating agencies: S&P, Moody’s or Fitch. Additional information about ratings can be found, respectively, at www.standardandpoors.com, www.moodys.com and www.fitchratings.com. Credit ratings are subject to change. AAA, AA, A, and BBB are investment grade ratings categories used by S&P and Fitch; BB, B, CCC/CC/C and D are below investment grade ratings categories used by S&P and Fitch. Aaa, Aa, A and Baa are investment grade ratings categories used by Moody’s; Ba, B, Caa/Ca and C are below investment grade ratings categories used by Moody’s. Bonds backed by U.S. Government or agency securities are given an implied rating equal to the rating of such securities. Holdings designated Not Publicly Rated are not rated by these national rating agencies. |
6
Barings Global Credit Income Opportunities Fund 2016 Semi-Annual Report
PORTFOLIO COMPOSITION (% of Assets*)
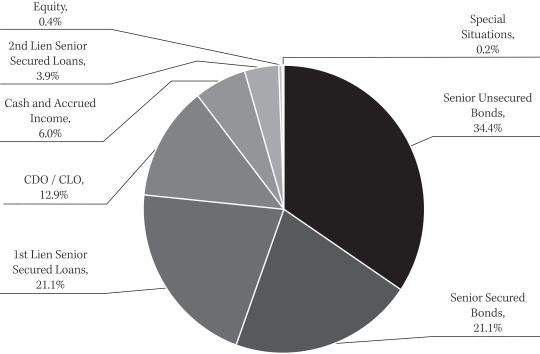
| * | The percentages shown above represent a percentage of the assets as of December 31, 2016. |
COUNTRY COMPOSITION (% of Assets**)
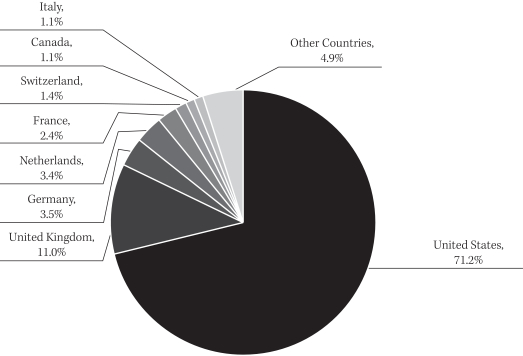
| ** | Percentage of assets is expressed by market value excluding cash and accrued income, and may vary over time. The percentages shown above represent a percentage of the assets as of December 31, 2016. |
7
Barings Active Short Duration Bond Fund 2016 Semi-Annual Report
Investment Objective
Barings Active Short Duration Bond Fund (“Active Short Duration Bond Fund” or the “Fund”) seeks to achieve a high total rate of return, mainly from current income, while minimizing fluctuations in capital values. It does so by investing primarily in a diversified portfolio of short-term investment grade fixed income securities.
Portfolio Management Commentary
How did the Fund perform?
| | ∎ | | The Fund reported a net total rate of return for the reporting period through December 31, 2016 of 0.57%, outperforming the Bloomberg Barclays U.S. 1-3 Year Government Bond Index, which returned -0.55%.1 |
What factors influenced performance of the Fund?
| | ∎ | | Duration positioning positively contributed to performance. From June to October, the front-end of the yield curve, between three months and three years, was fairly flat. In accordance with Barings’ duration management process, the Fund shortened duration to 1.5 years in early November. Following the outcome of the U.S. presidential election, the front-end of the yield curve steepened. This short duration position helped performance during the fourth quarter of 2016 as yields rose. |
| | ∎ | | The Fund’s allocation to corporate credit contributed positively to performance. Investment grade corporate credit was a strong driver of corporate outperformance. Allocations to banking and automobiles benefitted the Fund. An allocation to BB-rated high yield bonds also helped performance during the period. |
| | ∎ | | The securitized sector positively impacted performance over the period. Asset backed securities (ABS) with allocations to student loans and automobile receivables were the largest contributing subsectors. Allocations to residential mortgage backed securities (RMBS) and commercial mortgage backed securities (CMBS) also added to performance. |
Describe recent portfolio activity.
| | ∎ | | The Fund has not made significant sector changes over the period. Following the U.S. presidential election in November, a 1% Treasury Inflation Protected Security (TIPS) position was added in 5-year maturities in order to take advantage of widening break-even inflation rates. |
| | ∎ | | The Fund maintains an active allocation to ABS and took advantage of issuance in student loans as well as automobile and timeshare receivables. The Fund continues to hold a 4% diversified position in short, weighted average life, AAA-rated collateralized loan obligations (CLOs). |
| | ∎ | | The corporate credit allocation remained steady during the period. Purchases were broad-based across industries. |
| 1 | Total return describes the return to an investor based on the Class Y net expense ratio and includes the reinvestment of dividends and capital gains. Performance data quoted represents past performance. Past performance is no guarantee of future results and investment returns and principal value of the Funds (or of the investment company) will fluctuate so that shares, when redeemed, may be worth more or less than their original cost. Current performance may be higher or lower than performance quoted. Call 1.855.439.5459 or visit barings.com for current month end performance. The net asset value (NAV) will fluctuate with market conditions. All returns 1-year or less are cumulative. The Bloomberg Barclays U.S. 1-3 Year Government Bond Index is comprised of the U.S. Treasury and U.S. Agency Indices. The U.S. Government Index includes Treasuries (public obligations of the U.S. Treasury) and U.S. agency debentures (publicly issued debt of U.S. Government agencies, quasi-federal corporations, and corporate or foreign debt guaranteed by the U.S. Government) that have remaining maturities of more than one year and up to but not including 3 years. Indices are unmanaged. It is not possible to invest directly in an index. |
8
Barings Active Short Duration Bond Fund 2016 Semi-Annual Report
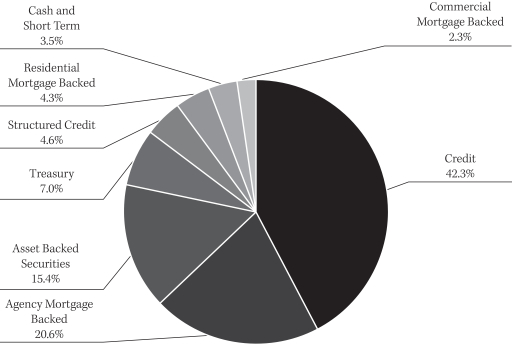
Describe portfolio positioning at period end.
| | ∎ | | Since the outcome of the U.S. election, interest rates have increased and the yield curve has steepened in anticipation of fiscal stimulus, increasing budget deficits and potential inflation. The duration of the Fund was increased to 2 years in accordance with Barings’ duration management process. |
| | ∎ | | From a sector perspective, the Fund continues to be well-diversified across corporate, securitized and government products. The corporate allocation is at approximately 42%, with 36% in investment grade corporates and 6% in BB-rated and crossover high yield. U.S. money centers and regional banks represent the largest corporate allocation to the Fund. Away from the Banking sector, opportunities exist in specific single names, often post M&A-event new issuance, where management is committed to maintaining an investment grade rating. Barings believes opportunities such as these will provide attractive spreads going forward. |
| | ∎ | | The securitized ABS allocation remains at approximately 27%. Automotive loan collateral represents the largest positioning, followed by student loans. Additional ABS subsectors consist of timeshares and franchise receivables. An active CMBS positioning remains in shorter-maturity seasoned issues. |
| | ∎ | | The agency MBS allocation is split almost equally between lower coupon 15-year FNMAs and agency collateralized mortgage obligations (CMOs), which have more stable duration characteristics. |
Describe market and portfolio outlook.
| | ∎ | | Unexpected voter outcomes, global central banks and commodity price volatility took center stage in 2016. Major central banks continue to be accommodative amid low growth. The U.S. Federal Reserve remains the outlier, acknowledging modest growth and higher base inflation. This confirms a tightening bias in U.S. monetary policy direction, allowing for a rise in both interest rate term premiums and inflation expectations. |
| | ∎ | | With a steepening of the yield curve, the duration of the Fund was increased to 2.0 years in accordance with Barings’ duration management process. The duration will likely continue to lengthen toward the maximum of three years early into 2017 as the yield curve remains steep. |
| | ∎ | | The Fund will continue to maintain the large underweight in both Treasury and Agency securities, with an active allocation to corporate bonds. Although fundamentals have slowed, there was record new issuance in 2016. Issuance in 2017 is expected to remain robust given the strong demand for corporate paper. The Fund’s credit exposure is focused on short / intermediate maturities with attractive roll-down characteristics. |
| | ∎ | | The Fund will continue to selectively add exposure to ABS, such as subprime automobile receivables, student loans and franchise whole business deals as opportunities arise. |
9
Barings Active Short Duration Bond Fund 2016 Semi-Annual Report
CREDIT QUALITY BREAKDOWN (% of Assets*)
| * | The percentages shown above represent a percentage of the assets as of December 31, 2016. |
PORTFOLIO COMPOSITION (% of Assets*)
| * | The percentages shown above represent a percentage of the assets as of December 31, 2016. |
10
Barings Total Return Bond Fund 2016 Semi-Annual Report
Investment Objective
Barings Total Return Bond Fund (“Total Return Bond Fund” or the “Fund”) seeks a superior total rate of return by investing in fixed income instruments.
Portfolio Management Commentary
How did the Fund perform?
| | ∎ | | The Fund reported a net total rate of return for the reporting period through December 31, 2016 of -1.25%, outperforming the Bloomberg Barclays U.S. Aggregate Index, which returned -2.53%.1 |
What factors influenced performance of the Fund?
| | ∎ | | Although the Fund posted a negative return for the six month period, it outperformed the benchmark on a relative basis. |
| | ∎ | | An out-of-index allocation to high yield was the primary positive contributor to performance as commodity related sectors recovered. Away from commodities, the Fund benefitted from the investment grade corporate insurance and banking industries. |
| | ∎ | | An underweight to Agency Mortgage Backed Securities (MBS) positively contributed to performance. Positioning in lower coupons and navigating between 15-year and 30-year mortgages during the period also helped. |
| | ∎ | | Asset backed securities (ABS) contributed positively, largely due to holdings in private and government-guaranteed FFELP student loans and whole business franchise receivables. |
| | ∎ | | An underweight to higher quality AAA, AA, and A-rated securities detracted from performance over the period. |
| | ∎ | | The currency overlay strategy, which is 5% of the Fund on a notional basis and helps to lower tracking error, was a slight positive contributor over the period. |
| | ∎ | | Downside derivative mitigation, such as using investment grade CDX index credit default swaps (a swap where the seller compensates the buyer in the event of a default) to partially hedge longer duration ABS exposures, modestly benefitted the Fund’s performance during the period. |
Describe recent portfolio activity.
| | ∎ | | The Agency MBS allocation remains underweight. The Fund opportunistically reduced the Government National Mortgage Association (GNMA) allocation and added to Federal National Mortgage Association (FNMA) conventionals based on relative value. |
| | ∎ | | The Fund maintained an active allocation to Asset Backed Securities (ABS), with purchases in Consumer and Commercial sectors such as student loans, timeshares, and automobile receivables. |
| | ∎ | | The Fund modestly reduced the Investment Grade Corporate allocation and maintained the High Yield exposure. |
| 1 | Total return describes the return to an investor based on the Class Y net expense ratio and includes the reinvestment of dividends and capital gains. Performance data quoted represents past performance. Past performance is no guarantee of future results and investment returns and principal value of the Funds (or of the investment company) will fluctuate so that shares, when redeemed, may be worth more or less than their original cost. Current performance may be higher or lower than performance quoted. Call 1.855.439.5459 or visit barings.com for current month end performance. The net asset value (NAV) will fluctuate with market conditions. All returns 1-year or less are cumulative. The Bloomberg Barclays U.S. Aggregate Index represents securities that are SEC-registered, taxable, and dollar denominated. The index covers the U.S. investment grade fixed rate bond market, with index components for government and corporate securities, mortgage pass-through securities, and asset-backed securities. These major sectors are subdivided into more specific indices that are calculated and reported on a regular basis. Indices are unmanaged. It is not possible to invest directly in an index. |
11
Barings Total Return Bond Fund 2016 Semi-Annual Report
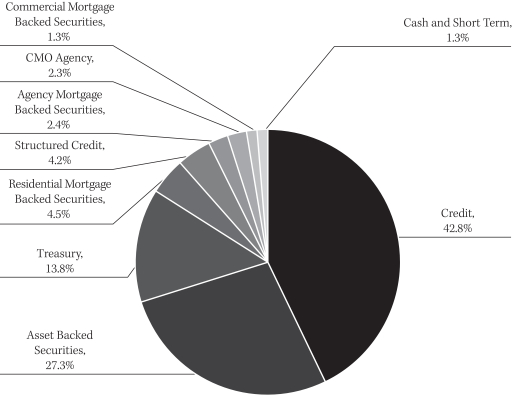
Describe portfolio positioning at period end.
| | ∎ | | The Fund was duration and curve neutral relative to the benchmark. |
| | ∎ | | The largest overweight relative to the benchmark is the ABS allocation, which represents 15% of the Fund. The allocation to ABS comprises of traditional automotive loan collateral, FFELP student loans, and compelling esoteric collateral such as timeshares, cell towers and personal consumer loans. |
| | ∎ | | Corporate credit represents approximately a 42% allocation versus 31% for the index. High yield corporates made up 9.6% of that exposure. Diversified industrials and banking were the largest industries within corporate credit. Select credits in recent M&A issues where management is committed to maintaining an investment grade rating provide attractive spread opportunities. |
| | ∎ | | Within Agency MBS, the Fund was underweight (20.6%) relative to the benchmark (28.1%). There has been a rotation from to-be-announced (TBA) securities into call-protected MBS pools. |
| | ∎ | | Commercial Mortgage Backed Securities (CMBS) has organically drifted lower through pay downs. The Fund’s strategy is tilted towards seasoned vintages, and BBB-rated tranches backed by 2012 vintage collateral that we believe represent the best value. However, they are difficult to source given their strong underwriting profile. The Fund has gained exposure to these vintages using CMBX, a synthetic index. |
Describe market and portfolio outlook.
| | ∎ | | Unexpected voter outcomes, global central banks, and commodity price volatility all took center stage in 2016. Major central banks continue to be accommodative, amid low growth. The U.S. Federal Reserve remains the outlier, acknowledging modest growth and higher base inflation. This confirms a tightening bias in the U.S.’ monetary policy direction, allowing for a rise in both interest rate term premiums and inflation expectations. |
| | ∎ | | Despite uncertainty surrounding the direction of weakened corporate fundamentals and monetary policy, we believe spreads will tighten modestly, driven by the strong technical backdrop and the new U.S. political administration, which appears to be pro-business. Given the strong technical backdrop, but limited overall spread tightening opportunity in corporate bonds, we will likely remain overweight risk, but in short-end maturities rather than farther along the curve. |
| | ∎ | | Within ABS, opportunities in the transportation sector (railcar, container, aviation) remain attractive, as energy and global growth concerns have weighed on the sectors. |
| | ∎ | | The Fund remains overweight spread sectors such as corporates and structured products relative to liquid products such as governments and agencies, and seeks to add alpha or return in excess to the benchmark by investing in under covered sectors where we have competitive advantages, such as esoteric ABS, CLOs, and emerging market corporates. |
12
Barings Total Return Bond Fund 2016 Semi-Annual Report
CREDIT QUALITY BREAKDOWN (% of Assets*)
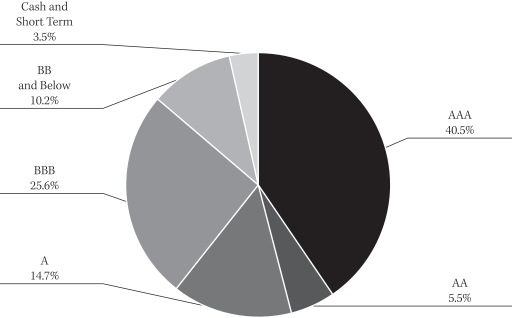
| * | The percentages shown above represent a percentage of the assets as of December 31, 2016. |
Ratings shown are the highest rating given by one of the following national rating agencies: S&P, Moody’s or Fitch. Additional information about ratings can be found, respectively, at www.standardandpoors.com, www.moodys.com and www.fitchratings.com. Credit ratings are subject to change. AAA, AA, A, and BBB are investment grade ratings categories used by S&P and Fitch; BB, B, CCC/CC/C and D are below investment grade ratings categories used by S&P and Fitch. Aaa, Aa, A and Baa are investment grade ratings categories used by Moody’s; Ba, B, Caa/Ca and C are below investment grade ratings categories used by Moody’s. Bonds backed by U.S. Government or agency securities are given an implied rating equal to the rating of such securities. Holdings designated Not Publicly Rated are not rated by these national rating agencies.
PORTFOLIO COMPOSITION (% of Assets*)
| * | The percentages shown above represent a percentage of the assets as of December 31, 2016. |
13
Barings Emerging Markets Debt Blended Total Return Fund 2016 Semi-Annual Report
Investment Objective
The Barings Emerging Markets Debt Blended Total Return Fund (“EMD Blended Total Return” or the “Fund”) seeks to achieve maximum total return, consistent with preservation of capital and prudent investment management, through high current income generation and, where appropriate, capital appreciation.
Portfolio Management Commentary
How did the Fund perform?
| | ∎ | | As a whole, emerging markets (EM) debt performance was mixed during the second half of 2016; EM corporates were slightly positive, whereas EM sovereign and EM local returned negative performance, driven largely by the outcome of the U.S. presidential election. Most developed market central banks remained dovish, including the European Central Bank, Bank of England and Bank of Japan, however, the U.S. Federal Reserve increased the short-term rate by 25 bps and surprised markets by indicating it may raise rates three times in 2017. |
| | ∎ | | The Fund reported a net total rate of return for the semi-annual reporting period from June 30, 2016 through December 31, 2016 of 0.90%.1 |
What factors influenced performance of the Fund?
| | ∎ | | For the semi-annual reporting period, the Fund’s positions in the Chinese renminbi, Ghana, PEMEX, Digicel and South Africa, as well as the Korean won were the primary contributors to performance. In addition, corporate holdings in Marfrig Global Foods, SB Capital and Next LP aided returns. Key detractors from performance were the Fund’s overall positioning in Mexico, local rates and currency in Malaysia, local rates in Peru, and local rates and currency in Indonesia. The Fund’s position in Office Cheriffen also detracted from returns. |
| | ∎ | | All EM debt asset classes experienced large sell-offs following the November U.S. Presidential election. Especially hard hit were the Fund’s overweight positions in Latin America, which took the brunt of the impact due to President Donald Trump’s anti-trade campaign rhetoric and cabinet, which the market believes will have a large and detrimental impact on Mexico’s trade with the U.S. For Mexico in particular, the Fund’s largest overall exposure was impacted across corporates, sovereign hard currency, local rates and the Mexican peso, whereby traders sent the Mexican peso to its lowest valuation ever versus the U.S. dollar. |
Describe recent portfolio activity.
| | ∎ | | As a result of overall moderate growth, low inflation and high rates in select EM local markets, the Fund increased its local rates exposure to 38% on expectations that local rates will fall over the next 12 months in countries that are well managed and where inflation is falling. The Fund increased its exposure to Colombia, Peru and Mexico. The Fund reduced its corporate holdings by reducing holdings in the Mexican oil company Pemex, as well as in Turkish manufacturer Acrelik. Additionally, during the reporting period, the Fund increased its exposure to Argentina by adding the Province of Santa Fe. |
| 1 | Total return describes the return to an investor based on the Class Y net expense ratio and includes the reinvestment of dividends and capital gains. Performance data quoted represents past performance. Past performance is no guarantee of future results and investment returns and principal value of the Funds (or of the investment company) will fluctuate so that shares, when redeemed, may be worth more or less than their original cost. Current performance may be higher or lower than performance quoted. Call 1.855.439.5459 or visit barings.com for current month end performance. The net asset value (NAV) will fluctuate with market conditions. All returns 1-year or less are cumulative. |
14
Barings Emerging Markets Debt Blended Total Return Fund 2016 Semi-Annual Report
Describe portfolio positioning at period end.
| | ∎ | | The Fund finished the semi-annual reporting period, December 31, 2016, with a 38% exposure to EM local debt and currencies, 35% exposure to corporate bonds, 25% exposure to sovereign hard currency bonds and a 1% cash position. |
| | ∎ | | The Top 5 countries in the portfolio at the end of the semi-annual reporting period are Mexico (23.2%), Brazil (15.9%), South Africa (10.5%), Peru (8.1%) and Colombia (6.84%). The Top 5 corporate bonds are Petrobas (4.5%), Fermaca Enterprises (2.4%), BBVA Bancomer (2.3%), VTR Finance (2.2%) and Altice Financing (2.1%). Overall, the Fund had exposure to 25 countries, 12 corporates, and 21 different currencies. |
Describe market and portfolio outlook.
| | ∎ | | Barings remains optimistic that some EM headwinds have reversed or are in the process of reversing to become tailwinds or at least stabilize. EM debt flows were +41.4 billion in 2016. |
| | ∎ | | Credit selection will be key to seeking the best risk-adjusted return opportunities across the EM corporate debt spectrum. |
| | ∎ | | Lower net supply, driven by reduced issuance and heightened buyback activity, will likely serve as a strong supportive technical factor for EM corporate debt. |
| | ∎ | | For EM sovereigns, Barings continues to favor select Latin American and Eastern European countries that have made meaningful fiscal adjustments on the back of lower currency prices. |
| | ∎ | | Currency valuations have adjusted significantly over the past 30 months and along with current commodity prices, Barings is now seeing some EM currencies at their most attractive levels in more than 10 years, thereby providing for selective EM growth prospects. |
| | ∎ | | The portfolio continues to be positioned in selective rates where inflation is falling along with narrowing current account deficits. |
15
Barings Emerging Markets Debt Blended Total Return Fund 2016 Semi-Annual Report
PORTFOLIO COMPOSITION (% of Assets*)
| * | The percentages shown above represent a percentage of the assets as of December 31, 2016. |
COUNTRY COMPOSITION (% of Assets**)
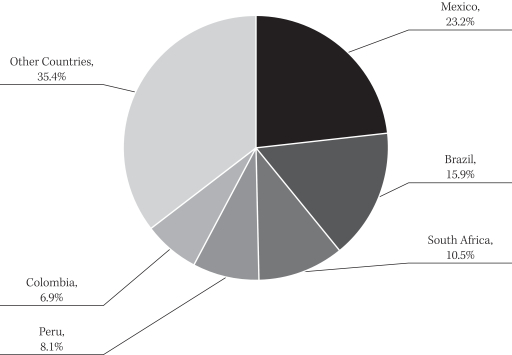
| ** | Percentage of assets are expressed by market value excluding cash and accrued income, and may vary over time. The percentages shown above represent a percentage of the assets as of December 31, 2016. |
16
Barings Emerging Markets Local Currency Debt Fund 2016 Semi-Annual Report
Investment Objective
The Barings Emerging Markets Local Currency Debt Fund (“EM Local Debt Fund” or the “Fund”) seeks long-term total return through investment in a diversified portfolio of emerging markets local currency-denominated debt securities.
Portfolio Management Commentary
How did the Fund perform?
| | ∎ | | During the second half of 2016, Emerging Markets (EM) local debt declined following the U.S. presidential election outcome and as a result of President Trump’s anti-trade campaign rhetoric, as well as higher U.S. Treasury rates. EM currencies declined 4.48% vs the U.S. dollar, despite higher oil and commodity prices, while rates gained 0.90% on overall lower inflation across EM countries. |
| | ∎ | | The Fund reported a net total rate of return for the semi-annual reporting period from June 30, 2016 through December 31, 2016 of -3.33% and outperformed the J.P. Morgan Government Bond Index Emerging Markets Global Diversified Index, which returned -3.58%.1 |
What factors influenced performance of the Fund?
| | ∎ | | For the semi-annual reporting period, the Fund’s positions in Mexico, Poland and Hungary were the primary detractors from performance relative to the benchmark. The Fund’s underweight Turkey, as well as underweight positioning in Asian currencies, positively impacted Fund performance. |
| | ∎ | | Mexico, Poland, Malaysia, Indonesia, Thailand and Romania all experienced large sell-offs following the November U.S. presidential election, and the Fund’s overweight positions were more negatively affected than the benchmark. Mexico, in particular, underperformed due to the then President-elect Trump’s anti-trade campaign rhetoric and initial cabinet nominees, which the market believes will have a large and detrimental impact on Mexico’s trade with the United States. Both rates and currency were affected, and the Mexican Peso dropped to its lowest ever valuation versus the U.S. dollar. |
Describe recent portfolio activity.
| | ∎ | | The Fund initiated underweight and defensive currency positioning in select Asian currencies, as well as in the Canadian dollar following the U.S. presidential election. The Fund also increased its exposure to select Eastern European currencies in countries that are experiencing healthy growth and where Barings expects the currencies to continue appreciating versus the euro. |
| 1 | Total return describes the return to an investor based on the Class Y net expense ratio and includes the reinvestment of dividends and capital gains. Performance data quoted represents past performance. Past performance is no guarantee of future results and investment returns and principal value of the Funds (or of the investment company) will fluctuate so that shares, when redeemed, may be worth more or less than their original cost. Current performance may be higher or lower than performance quoted. Call 1.855.439.5459 or visit barings.com for current month end performance. The net asset value (NAV) will fluctuate with market conditions. All returns 1-year or less are cumulative. J.P. Morgan GBI-EM Global Diversified consists of regularly traded, fixed-rate, domestic currency government bonds which international investors can readily access. The maximum weight to any country in the index is capped at 10%. The performance of the index does not reflect the deduction of expenses associated with a fund, such as investment management fees. By contrast, the performance of the Fund reflects the deduction of the fund expenses, including sales charges if applicable. Indices are unmanaged. It is not possible to invest directly in an index. |
17
Barings Emerging Markets Local Currency Debt Fund 2016 Semi-Annual Report
Describe portfolio positioning at period end.
| | ∎ | | The Fund finished the semi-annual reporting period, December 31, 2016, with a 92.9% exposure to emerging market bonds and a 7.1% cash position. The Fund had a duration of 2.075 years greater than the benchmark and 87% exposure to EM currencies. |
| | ∎ | | The top five countries in the portfolio at the end of the semi-annual reporting period [+/- years duration versus the benchmark] are South Africa (+.91 years), Mexico (+.55 years), Brazil (+.54 years), Colombia (+.29 years) and Peru (+.24 years). Overall, the Fund has exposure to 19 different countries and 30 different currencies. |
Describe market and portfolio outlook.
| | ∎ | | Barings believes EM local debt is still in a position to potentially deliver high single-digit returns over the next 12 months, as global growth is positive and inflation remains low. |
| | ∎ | | Barings is optimistic that select EM countries will continue to make the necessary adjustments to their current account deficits, although the adjustments are unlikely to be equally advanced across all countries. |
| | ∎ | | Moderate global growth, along with the fiscal adjustments EM countries have already made, will likely continue to keep inflation tamed over the next several years. |
| | ∎ | | As inflationary pressures fall, Barings expects to see lower overall interest rates for EM local bonds where nominal yields offer significant compensation for risk. |
18
Barings Emerging Markets Local Currency Debt Fund 2016 Semi-Annual Report
COUNTRY COMPOSITION (% of Assets*)
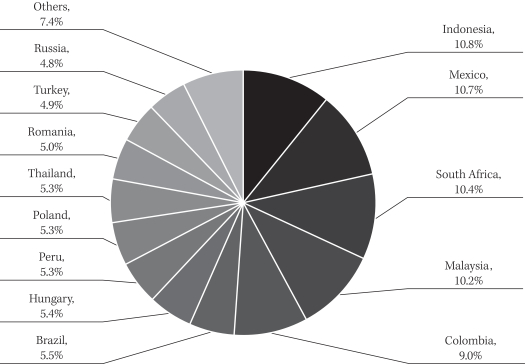
| * | Percentage of assets are expressed by market value excluding cash and accrued income, and may vary over time. The percentages shown above represent a percentage of the assets as of December 31, 2016. |
CONTRIBUTION TO DURATION (In Years**)
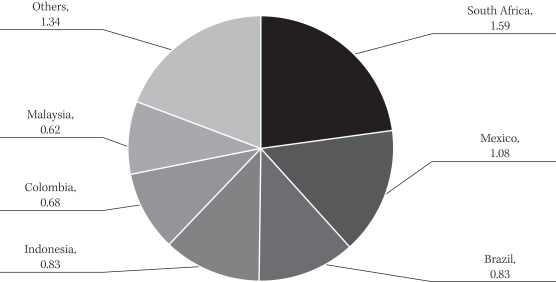
| ** | The values shown above represent the contribution to duration, in years, of the assets as of December 31, 2016. |
19
Barings Global High Yield Fund 2016 Semi-Annual Report
Investment Objective
The investment objective of the Barings Global High Yield Fund (“Global High Yield Fund” or the “Fund”) is to seek to provide a high level of income generation and, where appropriate, capital appreciation.
Portfolio Management Commentary
How did the Fund perform?
| | ∎ | | The Fund reported a net total return for the six month reporting period from June 30, 2016 through December 31, 2016 of 9.02% and outperformed the Bank of America Merrill Lynch Non-Financial Developed Markets High Yield Constrained Index (the “Index”) which returned 7.39%. |
What factors influenced performance of the Fund?
| | ∎ | | Over the last six months the high yield market experienced a strong rally, due to the recovery of commodity-related sectors in the U.S. and continued support from accommodative central bank measures in Europe. The Fund outperformed the Index during this period by selecting quality energy companies that rallied more than the market. Similarly, credit selection within the telecommunications sector drove outperformance relative to the Index. |
| | ∎ | | From a ratings category perspective, the Fund outperformed primarily due to its underweight position in the BB segment of the market coupled with prudent credit selection. The Fund’s overweight to the B and CCC segments also drove relative outperformance as these categories rallied most over the six month reporting period. Credit selection within the B category was also a benefit to performance. |
| | ∎ | | From a geographical perspective, the Fund’s overweight positioning to the European market and underweight to the U.S. market did not have a significant impact on performance. Credit selection, however, within both regions was the main contributor to performance relative to the Index. |
Describe recent portfolio activity.
| | ∎ | | The Fund remains underweight the BB ratings category relative to the Index, favoring the B and CCC rated credits that Barings believes will continue to outperform. Over the reporting period, the Fund’s allocation shifted slightly by increasing exposure to CCC rated credits and reducing allocation to BB and B credits. |
| | ∎ | | The Fund’s exposure to the Oil & Gas sector experienced a large market value increase over the past six months compared to other sectors and is now overweight compared to the Index, due largely to meaningful upward moves in market values as the sector continued to recover from their February troughs. Exposure to the telecommunications sector also increased over the period to take advantage of attractive investment opportunities in the space. |
| | ∎ | | The Fund’s geographical allocations shifted slightly over the past six months by reducing U.S. exposure by approximately 4% and increasing exposure to European assets. The Fund continues to emphasize an overweight to Europe, and the rest of world, and an underweight to the U.S. market. |
| 1 | Total return describes the return to an investor based on the Class Y net expense ratio and includes the reinvestment of dividends and capital gains. Performance data quoted represents past performance. Past performance is no guarantee of future results and investment returns and principal value of the Funds (or of the investment company) will fluctuate so that shares, when redeemed, may be worth more or less than their original cost. Current performance may be higher or lower than performance quoted. Call 1.855.439.5459 or visit barings.com for current month end performance. The net asset value (NAV) will fluctuate with market conditions. All returns 1-year or less are cumulative. The Bank of America Merrill Lynch Non-Financial Developed Markets High Yield Constrained Index contains all securities in the Bank of America Merrill Lynch Global High Yield Index that are non-financials and from developed markets countries, but caps issuer exposure at 2%. Developed markets is defined as an FX-G10 member, a Western European nation, or a territory of the U.S. or a Western European nation. Indices are unmanaged. It is not possible to invest directly in an index. |
20
Barings Global High Yield Fund 2016 Semi-Annual Report
Describe portfolio positioning at period end.
| | ∎ | | On a traded basis, the Fund finished 2016 with a 29.3% weighting to senior secured high yield bonds and a 67.4% weighting to senior unsecured high yield bonds. The remaining balance of the portfolio was in cash and accrued income at 3.3%. |
| | ∎ | | From an industry perspective, the Fund remains well-diversified across a number of Moody’s-based industries, with higher concentrations in oil & gas (15.6%), telecommunications (10.8%), and leisure, amusement, entertainment (7.5%), as of December 31, 2016. |
| | ∎ | | In terms of portfolio credit quality at the end of 2016, the Fund had the following weighting breakdown: 4.5% in Baa, 28.2% in Ba, 51.5% in B, 12.6% in Caa and below and 3.3% in cash and accrued income.2 |
| | ∎ | | The top five countries in the portfolio as of December 31, 2016 were the U.S. (66.1%), the U.K. (13.7%), France (5.0%), Canada (2.3%) and the United Arab Emirates (1.5%). Overall, the Fund has exposure to 18 countries and supports Barings focus on building a well-diversified portfolio of global high yield bonds. |
Describe market and portfolio outlook.
| | ∎ | | As we enter 2017, the political environment in both the U.S. and Europe will likely continue to dominate headlines and remain at the forefront of the market’s attention. With the U.S. government now under Republican control, policy positions and political appointments are likely to diverge significantly from what was seen under the Obama administration. |
| | ∎ | | To date, markets have reacted positively to the election results, although there has been some division across industries as investors anticipate regulatory changes. Despite the market’s exuberance over the expected policy moves of the new administration, much remains unknown, and volatility may resurface should any major political surprises appear. |
| | ∎ | | In particular this applies to industries that have traded on policy speculation such as banking and energy, which have rallied since the election, and healthcare and pharmaceuticals, which have fallen, are likely to see additional volatility as concrete policy initiatives materialize. |
| | ∎ | | In Europe, elections are scheduled to take place in many of the Eurozone’s most influential countries during 2017 including France, Germany, and the Netherlands, as populist sentiment continues to build. Moreover, as the European Central Bank and Federal Reserve continue to diverge, government rates and currency volatility will likely remain a primary factor for risk assets throughout 2017. |
| 2 | Ratings shown are the highest rating given by one of the following national rating agencies: S&P, Moody’s or Fitch. Additional information about ratings can be found, respectively, at www.standardandpoors.com, www.moodys.com and www.fitchratings.com. Credit ratings are subject to change. AAA, AA, A, and BBB are investment grade ratings categories used by S&P and Fitch; BB, B, CCC/CC/C and D are below investment grade ratings categories used by S&P and Fitch. Aaa, Aa, A and Baa are investment grade ratings categories used by Moody’s; Ba, B, Caa/Ca and C are below investment grade ratings categories used by Moody’s. Bonds backed by U.S. Government or agency securities are given an implied rating equal to the rating of such securities. Holdings designated Not Publicly Rated are not rated by these national rating agencies. |
21
Barings Global High Yield Fund 2016 Semi-Annual Report
CREDIT QUALITY COMPOSITION (% of Assets*)
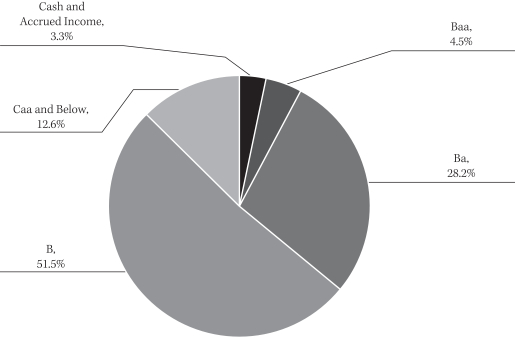
| * | The percentages shown above represent a percentage of the assets as of December 31, 2016. |
Country Composition (% of Assets*)
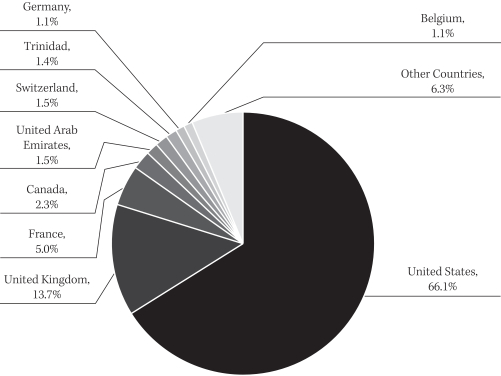
| * | Percentage of assets are expressed by market value excluding cash and accrued income, and may vary over time. The percentages shown above represent a percentage of the assets as of December 31, 2016. |
22
Barings U.S. High Yield Fund 2016 Semi-Annual Report
Investment Objective
The investment objective of the Barings U.S. High Yield Fund (“U.S. High Yield Fund” or the “Fund”) is to seek to achieve a high level of total return, with an emphasis on current income, by investing primarily in high yield debt and related securities.
Portfolio Management Commentary
How did the Fund perform?
| | ∎ | | The Fund reported a net total return for the six month reporting period from June 30, 2016 through December 31, 2016 of 7.88% and outperformed the Bloomberg Barclays U.S. Corporate High Yield Index which returned 7.40%.1 |
What factors influenced performance of the Fund?
| | ∎ | | Over the last six months, the high yield market experienced a strong rally which can be mainly attributed to the recovery of commodity-related sectors. The Fund outperformed the Index during this period by selecting quality energy companies that rallied more than the market. Similarly, credit selection within the telecommunications sector drove outperformance relative to the Index. |
| | ∎ | | From a ratings category perspective, the Fund outperformed primarily due to its underweight to the BB segment of the market coupled with prudent credit selection. The Fund’s overweight to the B and CCC segments also drove outperformance relative to the Index as these categories rallied most over the six month reporting period. |
Describe recent portfolio activity.
| | ∎ | | The Fund continues to be underweight in the double-B ratings category relative to the Index, favoring the B and CCC ratings categories that Barings believes will continue to outperform. During the reporting period, the Fund’s allocation shifted slightly by increasing exposure to CCC rated credits and reducing its allocation to B credits. |
| | ∎ | | The Fund’s exposure to the Oil and Gas sector experienced the largest market value increase compared to other sectors. It is now overweight compared to the benchmark, largely due to meaningful upward moves in market values as the sector continued to recover from their February troughs. The healthcare, education & childcare and chemicals, plastics & rubber sectors experienced modest decreases in exposure over the period. |
| 1 | Total return describes the return to an investor based on the Class Y net expense ratio and includes the reinvestment of dividends and capital gains. Performance data quoted represents past performance. Past performance is no guarantee of future results and investment returns and principal value of the Funds (or of the investment company) will fluctuate so that shares, when redeemed, may be worth more or less than their original cost. Current performance may be higher or lower than performance quoted. Call 1.855.439.5459 or visit barings.com for current month end performance. The net asset value (NAV) will fluctuate with market conditions. All returns 1-year or less are cumulative. The Bloomberg Barclays U.S. Corporate High Yield Index covers the universe of fixed-rate, non-investment grade debt focusing on corporate USD denominated and non-convertible debt. Indices are unmanaged. It is not possible to invest directly in an index. |
23
Barings U.S. High Yield Fund 2016 Semi-Annual Report
Describe portfolio positioning at period end.
| | ∎ | | On a traded basis, the Fund finished December 31, 2016 with a 93.2% weighting to high yield bonds. The remaining balance of the portfolio was invested in senior secured loans at 1.7% and cash and accrued income at 5.1%. |
| | ∎ | | From a sector perspective, the Fund remains well-diversified across a number of industries, with higher concentrations in Oil & Gas (17.3%), Healthcare, Education & Childcare (9.5%), and Telecommunications (8.2%) as of December 31, 2016. |
| | ∎ | | In terms of portfolio credit quality, as of December 31, 2016, the Fund had the following weighting breakdown: 6.9% in Baa, 31.1% in Ba, 40.3% in single-B, 16.1% in Caa and below and cash and accrued income at 5.6%.2 |
Describe market and portfolio outlook.
| | ∎ | | As we enter 2017, the political environment in both the U.S. and Europe will likely continue to dominate headlines and remain at the forefront of the market’s attention. With the U.S. government now under Republican control, policy positions and political appointments are likely to diverge significantly from what was seen under the Obama administration. |
| | ∎ | | To date, markets have reacted positively to the election results, although there has been some division across industries as investors anticipate regulatory changes. Despite the market’s exuberance over the expected policy moves of the new administration, much remains unknown, and volatility may resurface should major political surprises appear. |
| | ∎ | | In particular this applies to industries that have traded on policy speculation such as banking and energy, which have rallied since the election, and healthcare and pharmaceuticals, which have fallen, are likely to see additional volatility as concrete policy initiatives materialize. |
| 2 | Ratings shown are the highest rating given by one of the following national rating agencies: S&P, Moody’s or Fitch. Additional information about ratings can be found, respectively, at www.standardandpoors.com, www.moodys.com and www.fitchratings.com. Credit ratings are subject to change. AAA, AA, A, and BBB are investment grade ratings categories used by S&P and Fitch; BB, B, CCC/CC/C and D are below investment grade ratings categories used by S&P and Fitch. Aaa, Aa, A and Baa are investment grade ratings categories used by Moody’s; Ba, B, Caa/Ca and C are below investment grade ratings categories used by Moody’s. Bonds backed by U.S. Government or agency securities are given an implied rating equal to the rating of such securities. Holdings designated Not Publicly Rated are not rated by these national rating agencies. |
24
Barings U.S. High Yield Fund 2016 Semi-Annual Report
CREDIT QUALITY COMPOSITION (% of Assets*)
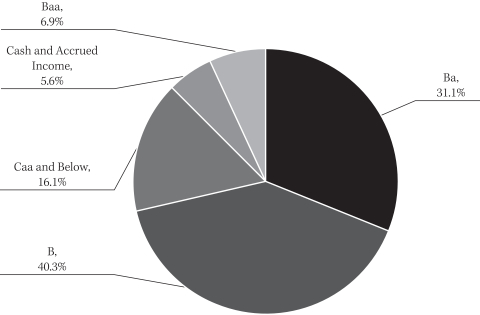
| * | The percentages shown above represent a percentage of the assets as of December 31, 2016. |
COUNTRY COMPOSITION (% of Assets*)
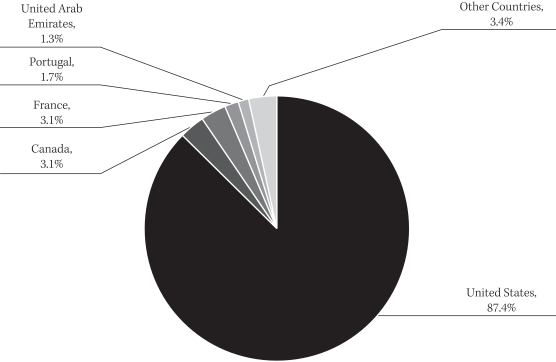
| * | Percentage of assets are expressed by market value excluding cash and accrued income, and may vary over time. The percentages shown above represent a percentage of the assets as of December 31, 2016. |
25
Barings Funds Trust 2016 Semi-Annual Report
SHAREHOLDER EXPENSES (UNAUDITED)
As a shareholder of Barings Global Floating Rate Fund (formerly known as Babson Global Floating Rate Fund), Barings Global Credit Income Opportunities Fund (formerly known as Babson Global Credit Income Opportunities Fund), Barings Active Short Duration Bond Fund (formerly known as Babson Active Short Duration Bond Fund), Barings Total Return Bond Fund (formerly known as Babson Total Return Bond Fund), Barings Emerging Markets Debt Blended Total Return Fund (formerly known as Babson Emerging Markets Debt Blended Total Return Fund), Barings Emerging Markets Local Currency Debt Fund (formerly known as Babson Emerging Markets Local Currency Debt Fund), Barings Global High Yield Fund (formerly known as Babson Global High Yield Fund) or Barings U.S. High Yield Fund (formerly known as Babson U.S. High Yield Fund) you incur ongoing expenses, such as management fees, shareholder service fees, distribution fees and other fund expenses. The following table is intended to help you understand your ongoing expenses (in dollars and cents) of investing in the Funds and to compare these expenses with the ongoing expenses of investing in other funds.
The table is based on an investment of $1,000 invested at the beginning of the period and held for the entire period from July 1, 2016 to December 31, 2016.
Actual Expenses
The first line in the table below provides information about the actual account values and actual expenses. You may use the information in this line, together with the amount you invested, to estimate the expenses that you paid over the period. Simply divide your account value by $1,000 (for example, an $8,600 account value divided by $1,000 = 8.6), then multiply the result by the number in the first line for the Fund under the heading entitled “Operating Expense Incurred” to estimate the expenses you paid on your account during this period.
Hypothetical Example for Comparison Purposes
The second line in the table below provides information about the hypothetical account values and hypothetical expenses based on the Fund’s actual expense ratio and an assumed rate of return of 5% per year before expenses, which is not the Fund’s actual return. The hypothetical account value and expenses may not be used to estimate the actual ending account balance or expenses you paid for the period. You may use this information to compare the ongoing costs of investing in your Fund and other funds. To do so, compare this 5% hypothetical example with the 5% hypothetical examples that appear in the shareholder reports of the other funds.
Barings Global Floating Rate Fund (formerly known as Babson Global Floating Rate Fund)
| | | | | | | | | | | | | | | | | | | | |
| | | EXPENSE
RATIO | | | BEGINNING
AMOUNT | | | ENDING
VALUE | | | AVERAGE
VALUE | | | OPERATING
EXPENSE
INCURRED* | |
Class A | | | | | | | | | | | | | | | | | | | | |
Actual | | | 0.97 | %** | | $ | 1,000.00 | | | $ | 1,072.90 | | | $ | 1,036.45 | | | $ | 5.07 | |
Hypothetical | | | 0.97 | %** | | | 1,000.00 | | | | 1,020.30 | | | | 1,010.15 | | | | 4.94 | |
| | | | | |
Class C | | | | | | | | | | | | | | | | | | | | |
Actual | | | 1.66 | %** | | | 1,000.00 | | | | 1,069.30 | | | | 1,034.65 | | | | 8.66 | |
Hypothetical | | | 1.66 | %** | | | 1,000.00 | | | | 1,016.80 | | | | 1,008.40 | | | | 8.44 | |
| | | | | |
Class I | | | | | | | | | | | | | | | | | | | | |
Actual | | | 0.75 | % | | | 1,000.00 | | | | 1,074.40 | | | | 1,037.20 | | | | 3.92 | |
Hypothetical | | | 0.75 | % | | | 1,000.00 | | | | 1,021.40 | | | | 1,010.70 | | | | 3.82 | |
| | | | | |
Class Y | | | | | | | | | | | | | | | | | | | | |
Actual | | | 0.75 | % | | | 1,000.00 | | | | 1,074.30 | | | | 1,037.15 | | | | 3.92 | |
Hypothetical | | | 0.75 | % | | | 1,000.00 | | | | 1,021.40 | | | | 1,010.70 | | | | 3.82 | |
| * | For each Class of the Fund, net expenses are equal to the annualized expense ratio net of any expenses waived or reimbursed by the advisor for such class multiplied by the average account value over the period, multiplied by 184/365. |
| ** | Expenses shown for each of Class A Shares and Class C Shares reflect a one-time voluntary reimbursement to the Fund during the period. The expense cap applicable to each of Class A Shares and Class C Shares is currently 1.00% and 1.75%, respectively. |
26
Barings Funds Trust 2016 Semi-Annual Report
SHAREHOLDER EXPENSES (UNAUDITED) (CONTINUED)
Barings Global Credit Income Opportunities Fund (formerly known as Babson Global Credit Income Opportunities Fund)
| | | | | | | | | | | | | | | | | | | | |
| | | EXPENSE
RATIO | | | BEGINNING
AMOUNT | | | ENDING
VALUE | | | AVERAGE
VALUE | | | OPERATING
EXPENSE
INCURRED* | |
Class A | | | | | | | | | | | | | | | | | | | | |
Actual | | | 1.20 | % | | $ | 1,000.00 | | | $ | 1,097.30 | | | $ | 1,048.65 | | | $ | 6.34 | |
Hypothetical | | | 1.20 | % | | | 1,000.00 | | | | 1,019.20 | | | | 1,009.60 | | | | 6.11 | |
| | | | | |
Class C | | | | | | | | | | | | | | | | | | | | |
Actual | | | 1.95 | % | | | 1,000.00 | | | | 1,093.10 | | | | 1,046.55 | | | | 10.29 | |
Hypothetical | | | 1.95 | % | | | 1,000.00 | | | | 1,015.40 | | | | 1,007.70 | | | | 9.91 | |
| | | | | |
Class I | | | | | | | | | | | | | | | | | | | | |
Actual | | | 0.95 | % | | | 1,000.00 | | | | 1,098.60 | | | | 1,049.30 | | | | 5.03 | |
Hypothetical | | | 0.95 | % | | | 1,000.00 | | | | 1,020.40 | | | | 1,010.20 | | | | 4.84 | |
| | | | | |
Class Y | | | | | | | | | | | | | | | | | | | | |
Actual | | | 0.95 | % | | | 1,000.00 | | | | 1,098.60 | | | | 1,049.30 | | | | 5.03 | |
Hypothetical | | | 0.95 | % | | | 1,000.00 | | | | 1,020.40 | | | | 1,010.20 | | | | 4.84 | |
| * | For each Class of the Fund, net expenses are equal to the annualized expense ratio net of any expenses waived or reimbursed by the advisor for such class multiplied by the average account value over the period, multiplied by 184/365. |
Barings Active Short Duration Bond Fund (formerly known as Babson Active Short Duration Bond Fund)
| | | | | | | | | | | | | | | | | | | | |
| | | EXPENSE
RATIO | | | BEGINNING
AMOUNT | | | ENDING
VALUE | | | AVERAGE
VALUE | | | OPERATING
EXPENSE
INCURRED* | |
Class A | | | | | | | | | | | | | | | | | | | | |
Actual | | | 0.65 | % | | $ | 1,000.00 | | | $ | 1,004.20 | | | $ | 1,002.10 | | | $ | 3.28 | |
Hypothetical | | | 0.65 | % | | | 1,000.00 | | | | 1,021.90 | | | | 1,010.95 | | | | 3.31 | |
| | | | | |
Class C | | | | | | | | | | | | | | | | | | | | |
Actual | | | (0.15 | %)** | | | 1,000.00 | | | | 1,008.40 | | | | 1,004.20 | | | | (0.76 | ) |
Hypothetical | | | (0.15 | %)** | | | 1,000.00 | | | | 1,026.00 | | | | 1,013.00 | | | | (0.77 | ) |
| | | | | |
Class I | | | | | | | | | | | | | | | | | | | | |
Actual | | | 0.40 | % | | | 1,000.00 | | | | 1,006.20 | | | | 1,003.10 | | | | 2.02 | |
Hypothetical | | | 0.40 | % | | | 1,000.00 | | | | 1,023.20 | | | | 1,011.60 | | | | 2.04 | |
| | | | | |
Class Y | | | | | | | | | | | | | | | | | | | | |
Actual | | | 0.40 | % | | | 1,000.00 | | | | 1,005.70 | | | | 1,002.85 | | | | 2.02 | |
Hypothetical | | | 0.40 | % | | | 1,000.00 | | | | 1,023.20 | | | | 1,011.60 | | | | 2.04 | |
| * | For each Class of the Fund, net expenses are equal to the annualized expense ratio net of any expenses waived or reimbursed by the advisor for such class multiplied by the average account value over the period, multiplied by 184/365. |
| ** | Expenses shown reflect a reimbursement to the Fund during the period for an overaccrual of 12b-1 fees made during and prior to the period. |
27
Barings Funds Trust 2016 Semi-Annual Report
SHAREHOLDER EXPENSES (UNAUDITED) (CONTINUED)
Barings Total Return Bond Fund (formerly known as Babson Total Return Bond Fund)
| | | | | | | | | | | | | | | | | | | | |
| | | EXPENSE
RATIO** | | | BEGINNING
AMOUNT | | | ENDING
VALUE | | | AVERAGE
VALUE | | | OPERATING
EXPENSE
INCURRED* | |
Class A | | | | | | | | | | | | | | | | | | | | |
Actual | | | 0.80 | % | | $ | 1,000.00 | | | $ | 986.20 | | | $ | 993.10 | | | $ | 4.01 | |
Hypothetical | | | 0.80 | % | | | 1,000.00 | | | | 1,021.20 | | | | 1,010.60 | | | | 4.08 | |
| | | | | |
Class C | | | | | | | | | | | | | | | | | | | | |
Actual | | | 1.55 | % | | | 1,000.00 | | | | 982.50 | | | | 991.25 | | | | 7.75 | |
Hypothetical | | | 1.55 | % | | | 1,000.00 | | | | 1,017.40 | | | | 1,008.70 | | | | 7.88 | |
| | | | | |
Class I | | | | | | | | | | | | | | | | | | | | |
Actual | | | 0.55 | % | | | 1,000.00 | | | | 987.50 | | | | 993.75 | | | | 2.76 | |
Hypothetical | | | 0.55 | % | | | 1,000.00 | | | | 1,022.40 | | | | 1,011.20 | | | | 2.80 | |
| | | | | |
Class Y | | | | | | | | | | | | | | | | | | | | |
Actual | | | 0.55 | % | | | 1,000.00 | | | | 987.50 | | | | 993.75 | | | | 2.76 | |
Hypothetical | | | 0.55 | % | | | 1,000.00 | | | | 1,022.40 | | | | 1,011.20 | | | | 2.80 | |
| * | For each Class of the Fund, net expenses are equal to the annualized expense ratio net of any expenses waived or reimbursed by the advisor for such class multiplied by the average account value over the period, multiplied by 184/365. |
| ** | Expense ratios (as disclosed in the table) do not include the expenses of any underlying funds in which the Fund invests. The annualized expense ratios, as stated in the fee table of the Prospectus, may differ from the expense ratios disclosed in this report. |
Barings Emerging Markets Debt Blended Total Return Fund (formerly known as Babson Emerging Markets Debt Blended Total Return Fund)
| | | | | | | | | | | | | | | | | | | | |
| | | EXPENSE
RATIO | | | BEGINNING
AMOUNT | | | ENDING
VALUE | | | AVERAGE
VALUE | | | OPERATING
EXPENSE
INCURRED* | |
Class A | | | | | | | | | | | | | | | | | | | | |
Actual | | | 1.09 | % | | $ | 1,000.00 | | | $ | 1,007.70 | | | $ | 1,003.85 | | | $ | 5.52 | |
Hypothetical | | | 1.09 | % | | | 1,000.00 | | | | 1,019.70 | | | | 1,009.85 | | | | 5.55 | |
| | | | | |
Class C | | | | | | | | | | | | | | | | | | | | |
Actual | | | 1.83 | % | | | 1,000.00 | | | | 1,004.00 | | | | 1,002.00 | | | | 9.24 | |
Hypothetical | | | 1.83 | % | | | 1,000.00 | | | | 1,016.00 | | | | 1,008.00 | | | | 9.30 | |
| | | | | |
Class I | | | | | | | | | | | | | | | | | | | | |
Actual | | | 0.85 | % | | | 1,000.00 | | | | 1,009.00 | | | | 1,004.50 | | | | 4.30 | |
Hypothetical | | | 0.85 | % | | | 1,000.00 | | | | 1,020.90 | | | | 1,010.45 | | | | 4.33 | |
| | | | | |
Class Y | | | | | | | | | | | | | | | | | | | | |
Actual | | | 0.85 | % | | | 1,000.00 | | | | 1,009.00 | | | | 1,004.50 | | | | 4.30 | |
Hypothetical | | | 0.85 | % | | | 1,000.00 | | | | 1,020.90 | | | | 1,010.45 | | | | 4.33 | |
| * | For each Class of the Fund, net expenses are equal to the annualized expense ratio net of any expenses waived or reimbursed by the advisor for such class multiplied by the average account value over the period, multiplied by 184/365. |
28
Barings Funds Trust 2016 Semi-Annual Report
SHAREHOLDER EXPENSES (UNAUDITED) (CONTINUED)
Barings Emerging Markets Local Currency Debt Fund (formerly known as Babson Emerging Markets Local Currency Debt Fund)
| | | | | | | | | | | | | | | | | | | | |
| | | EXPENSE
RATIO | | | BEGINNING
AMOUNT | | | ENDING
VALUE | | | AVERAGE
VALUE | | | OPERATING
EXPENSE
INCURRED* | |
Class A | | | | | | | | | | | | | | | | | | | | |
Actual | | | 0.98 | % | | $ | 1,000.00 | | | $ | 965.50 | | | $ | 982.75 | | | $ | 4.86 | |
Hypothetical | | | 0.98 | % | | | 1,000.00 | | | | 1,020.30 | | | | 1,010.15 | | | | 4.99 | |
| | | | | |
Class C | | | | | | | | | | | | | | | | | | | | |
Actual | | | 1.72 | % | | | 1,000.00 | | | | 961.90 | | | | 980.95 | | | | 8.51 | |
Hypothetical | | | 1.72 | % | | | 1,000.00 | | | | 1,016.50 | | | | 1,008.25 | | | | 8.74 | |
| | | | | |
Class I | | | | | | | | | | | | | | | | | | | | |
Actual | | | 0.73 | % | | | 1,000.00 | | | | 966.70 | | | | 983.35 | | | | 3.62 | |
Hypothetical | | | 0.73 | % | | | 1,000.00 | | | | 1,021.50 | | | | 1,010.75 | | | | 3.72 | |
| | | | | |
Class Y | | | | | | | | | | | | | | | | | | | | |
Actual | | | 0.73 | % | | | 1,000.00 | | | | 966.70 | | | | 983.35 | | | | 3.62 | |
Hypothetical | | | 0.73 | % | | | 1,000.00 | | | | 1,021.50 | | | | 1,010.75 | | | | 3.72 | |
| * | For each Class of the Fund, net expenses are equal to the annualized expense ratio net of any expenses waived or reimbursed by the advisor for such class multiplied by the average account value over the period, multiplied by 184/365. |
Barings Global High Yield Fund (formerly known as Babson Global High Yield Fund)
| | | | | | | | | | | | | | | | | | | | |
| | | EXPENSE
RATIO | | | BEGINNING
AMOUNT | | | ENDING
VALUE | | | AVERAGE
VALUE | | | OPERATING
EXPENSE
INCURRED* | |
Class A | | | | | | | | | | | | | | | | | | | | |
Actual | | | 1.05 | % | | $ | 1,000.00 | | | $ | 1,088.80 | | | $ | 1,044.40 | | | $ | 5.53 | |
Hypothetical | | | 1.05 | % | | | 1,000.00 | | | | 1,019.90 | | | | 1,009.95 | | | | 5.35 | |
| | | | | |
Class C | | | | | | | | | | | | | | | | | | | | |
Actual | | | 1.80 | % | | | 1,000.00 | | | | 1,084.70 | | | | 1,042.35 | | | | 9.46 | |
Hypothetical | | | 1.80 | % | | | 1,000.00 | | | | 1,016.10 | | | | 1,008.05 | | | | 9.15 | |
| | | | | |
Class I | | | | | | | | | | | | | | | | | | | | |
Actual | | | 0.80 | % | | | 1,000.00 | | | | 1,090.20 | | | | 1,045.10 | | | | 4.21 | |
Hypothetical | | | 0.80 | % | | | 1,000.00 | | | | 1,021.20 | | | | 1,010.60 | | | | 4.08 | |
| | | | | |
Class Y | | | | | | | | | | | | | | | | | | | | |
Actual | | | 0.80 | % | | | 1,000.00 | | | | 1,090.20 | | | | 1,045.10 | | | | 4.21 | |
Hypothetical | | | 0.80 | % | | | 1,000.00 | | | | 1,021.20 | | | | 1,010.60 | | | | 4.08 | |
| * | For each Class of the Fund, net expenses are equal to the annualized expense ratio net of any expenses waived or reimbursed by the advisor for such class multiplied by the average account value over the period, multiplied by 184/365. |
29
Barings Funds Trust 2016 Semi-Annual Report
SHAREHOLDER EXPENSES (UNAUDITED) (CONTINUED)
Barings U.S. High Yield Fund (formerly known as Babson U.S. High Yield Fund)
| | | | | | | | | | | | | | | | | | | | |
| | | EXPENSE
RATIO | | | BEGINNING
AMOUNT | | | ENDING
VALUE | | | AVERAGE
VALUE | | | OPERATING
EXPENSE
INCURRED* | |
Class A | | | | | | | | | | | | | | | | | | | | |
Actual | | | 1.00 | % | | $ | 1,000.00 | | | $ | 1,077.40 | | | $ | 1,038.70 | | | $ | 5.24 | |
Hypothetical | | | 1.00 | % | | | 1,000.00 | | | | 1,020.20 | | | | 1,010.10 | | | | 5.09 | |
| | | | | |
Class C | | | | | | | | | | | | | | | | | | | | |
Actual | | | 1.75 | % | | | 1,000.00 | | | | 1,073.50 | | | | 1,036.75 | | | | 9.15 | |
Hypothetical | | | 1.75 | % | | | 1,000.00 | | | | 1,016.40 | | | | 1,008.20 | | | | 8.89 | |
| | | | | |
Class I | | | | | | | | | | | | | | | | | | | | |
Actual | | | 0.75 | % | | | 1,000.00 | | | | 1,078.90 | | | | 1,039.45 | | | | 3.93 | |
Hypothetical | | | 0.75 | % | | | 1,000.00 | | | | 1,021.40 | | | | 1,010.70 | | | | 3.82 | |
| | | | | |
Class Y | | | | | | | | | | | | | | | | | | | | |
Actual | | | 0.75 | % | | | 1,000.00 | | | | 1,078.80 | | | | 1,039.40 | | | | 3.93 | |
Hypothetical | | | 0.75 | % | | | 1,000.00 | | | | 1,021.40 | | | | 1,010.70 | | | | 3.82 | |
| * | For each Class of the Fund, net expenses are equal to the annualized expense ratio net of any expenses waived or reimbursed by the advisor for such class multiplied by the average account value over the period, multiplied by 184/365. |
30
Barings Funds Trust 2016 Semi-Annual Report
BARINGS FUNDS TRUST
FINANCIAL REPORT
31
Barings Funds Trust 2016 Semi-Annual Report
STATEMENTS OF ASSETS AND LIABILITIES
December 31, 2016 (Unaudited)
| | | | | | | | | | | | | | | | |
| | | BARINGS GLOBAL
FLOATING RATE
FUND | | | BARINGS GLOBAL
CREDIT INCOME
OPPORTUNITIES
FUND | | | BARINGS ACTIVE
SHORT DURATION
BOND FUND | | | BARINGS TOTAL
RETURN BOND
FUND | |
|
| Assets | |
| Investments, at fair value (cost $171,374,204, $122,062,085, $252,059,103 and $31,092,445, respectively) | | $ | 167,778,893 | | | $ | 119,522,484 | | | $ | 251,290,322 | | | $ | 31,168,820 | |
| Cash | | | 10,845 | | | | – | | | | – | | | | – | |
| Cash collateral held | | | – | | | | 150,000 | | | | – | | | | – | |
| Foreign currency, at value (cost $314,268, $40,912, $0 and $0, respectively) | | | 315,241 | | | | 40,521 | | | | – | | | | – | |
| Receivable for investments sold | | | 5,533,109 | | | | 1,229,849 | | | | – | | | | – | |
| Receivable for TBA securities sold | | | – | | | | – | | | | 1,406,426 | | | | 364,629 | |
| Receivable for Fund shares sold | | | 1,378,339 | | | | 4,067,381 | | | | 2,692,859 | | | | 914,000 | |
| Interest and dividends receivable | | | 1,183,093 | | | | 1,806,002 | | | | 1,282,248 | | | | 154,051 | |
| Interest receivable on swap contracts | | | – | | | | – | | | | – | | | | 35 | |
| Receivable from adviser (see Note 3) | | | – | | | | – | | | | 335 | | | | 8,009 | |
| Cash collateral held at broker on open swap contracts | | | – | | | | – | | | | – | | | | 1,229 | |
| Receivable for variation margin on open centrally cleared swap contracts | | | – | | | | – | | | | 319 | | | | 100 | |
| Receivable for variation margin on open futures contracts | | | – | | | | – | | | | – | | | | 8,583 | |
| Foreign tax reclaims receivable | | | 625 | | | | 1,814 | | | | – | | | | – | |
| Unrealized appreciation on forward foreign currency exchange contracts | | | 297,336 | | | | 358,535 | | | | 266,105 | | | | 113,553 | |
| Prepaid expenses | | | 61,640 | | | | 34,916 | | | | 77,666 | | | | 25,155 | |
| | | | | | | | | | | | | | | | |
Total assets | | | 176,559,121 | | | | 127,211,502 | | | | 257,016,280 | | | | 32,758,164 | |
| | | | | | | | | | | | | | | | |
|
| Liabilities | |
| Payable for investments purchased | | | 15,556,766 | | | | 2,703,741 | | | | 510 | | | | 468,812 | |
| Payable for TBA and when-issued securities purchased | | | – | | | | – | | | | 7,383,188 | | | | 4,117,648 | |
| Payable for Fund shares repurchased | | | 248,844 | | | | 388,045 | | | | 921,466 | | | | 385 | |
| Swap contracts, at fair value (up-front net premiums received of $0, $0, $21,571 and $5,480, respectively) | | | – | | | | – | | | | 29,569 | | | | 7,392 | |
| Interest payable on swap contracts | | | – | | | | – | | | | – | | | | 160 | |
| Payable for variation margin on open futures contracts | | | – | | | | – | | | | 36,358 | | | | – | |
| Investment advisory fee payable (see Note 3) | | | 24,726 | | | | 44,396 | | | | – | | | | – | |
| Cash collateral Due to Broker | | | – | | | | 664,000 | | | | – | | | | – | |
| Distribution fees payable | | | 12,682 | | | | 7,722 | | | | 19,610 | | | | 215 | |
| Dividends payable | | | 45,994 | | | | 348,600 | | | | 48,580 | | | | 95,910 | |
| Unrealized depreciation on forward foreign currency exchange contracts | | | 1,660 | | | | 4,208 | | | | 255,735 | | | | 114,839 | |
| Unrealized depreciation on unfunded loan commitments | | | 13 | | | | 13 | | | | – | | | | – | |
| Accrued expenses and other liabilities | | | 221,922 | | | | 129,938 | | | | 104,786 | | | | 47,366 | |
| | | | | | | | | | | | | | | | |
Total liabilities | | | 16,112,607 | | | | 4,290,663 | | | | 8,799,802 | | | | 4,852,727 | |
| | | | | | | | | | | | | | | | |
Total net assets | | $ | 160,446,514 | | | $ | 122,920,839 | | | $ | 248,216,478 | | | $ | 27,905,437 | |
| | | | | | | | | | | | | | | | |
See accompanying Notes to the Financial Statements.
32
Barings Funds Trust 2016 Semi-Annual Report
STATEMENTS OF ASSETS AND LIABILITIES (CONTINUED)
December 31, 2016 (Unaudited)
| | | | | | | | | | | | | | | | |
| | | BARINGS GLOBAL
FLOATING RATE
FUND | | | BARINGS GLOBAL
CREDIT INCOME
OPPORTUNITIES
FUND | | | BARINGS ACTIVE
SHORT DURATION
BOND FUND | | | BARINGS TOTAL
RETURN BOND
FUND | |
|
| Composition of net assets | |
| Shares of beneficial interest outstanding (par value $0.00001 per share), unlimited number of shares authorized | | $ | 168 | | | $ | 131 | | | $ | 250 | | | $ | 28 | |
| Additional paid-in capital | | | 167,037,400 | | | | 127,658,031 | | | | 248,370,507 | | | | 28,169,916 | |
| Undistributed (distributions in excess of) net investment income | | | (1,114,255 | ) | | | (704,450 | ) | | | 20,581 | | | | (6,141 | ) |
| Accumulated net realized gain (loss) | | | (2,182,819 | ) | | | (1,834,611 | ) | | | 536,109 | | | | (315,476 | ) |
| Net unrealized appreciation (depreciation) | | | (3,293,980 | ) | | | (2,198,262 | ) | | | (710,969 | ) | | | 57,110 | |
| | | | | | | | | | | | | | | | |
Total net assets | | $ | 160,446,514 | | | $ | 122,920,839 | | | $ | 248,216,478 | | | $ | 27,905,437 | |
| | | | | | | | | | | | | | | | |
|
| Class A | |
| Net assets applicable to outstanding shares | | $ | 31,155,971 | | | $ | 21,926,510 | | | $ | 94,342,847 | | | $ | 219,746 | |
| | | | | | | | | | | | | | | | |
| Shares of beneficial interest outstanding | | | 3,259,232 | | | | 2,342,680 | | | | 9,491,882 | | | | 22,177 | |
| | | | | | | | | | | | | | | | |
| Net asset value per share outstanding | | $ | 9.56 | | | $ | 9.36 | | | $ | 9.94 | | | $ | 9.91 | |
| | | | | | | | | | | | | | | | |
| Maximum offering price per share outstanding (Net asset value plus sales charge of 3.00%, 4.00%, 0.00% and 4.00%, respectively) | | $ | 9.86 | | | $ | 9.75 | | | $ | 9.94 | | | $ | 10.32 | |
| | | | | | | | | | | | | | | | |
|
| Class C | |
| Net assets applicable to outstanding shares | | $ | 8,157,749 | | | $ | 4,586,273 | | | $ | 268,045 | | | $ | 198,771 | |
| | | | | | | | | | | | | | | | |
| Shares of beneficial interest outstanding | | | 856,402 | | | | 490,569 | | | | 26,985 | | | | 20,061 | |
| | | | | | | | | | | | | | | | |
| Net asset value per share outstanding | | $ | 9.53 | | | $ | 9.35 | | | $ | 9.93 | | | $ | 9.91 | |
| | | | | | | | | | | | | | | | |
|
| Class I | |
| Net assets applicable to outstanding shares | | $ | 21,039,613 | | | $ | 26,272,488 | | | $ | 99,477 | | | $ | 12,241,727 | |
| | | | | | | | | | | | | | | | |
| Shares of beneficial interest outstanding | | | 2,196,697 | | | | 2,807,664 | | | | 10,010 | | | | 1,235,482 | |
| | | | | | | | | | | | | | | | |
| Net asset value per share outstanding | | $ | 9.58 | | | $ | 9.36 | | | $ | 9.94 | | | $ | 9.91 | |
| | | | | | | | | | | | | | | | |
|
| Class Y | |
| Net assets applicable to outstanding shares | | $ | 100,093,181 | | | $ | 70,135,568 | | | $ | 153,506,109 | | | $ | 15,245,193 | |
| | | | | | | | | | | | | | | | |
| Shares of beneficial interest outstanding | | | 10,454,087 | | | | 7,495,156 | | | | 15,452,728 | | | | 1,538,565 | |
| | | | | | | | | | | | | | | | |
| Net asset value per share outstanding | | $ | 9.57 | | | $ | 9.36 | | | $ | 9.93 | | | $ | 9.91 | |
| | | | | | | | | | | | | | | | |
See accompanying Notes to the Financial Statements.
33
Barings Funds Trust 2016 Semi-Annual Report
STATEMENTS OF ASSETS AND LIABILITIES (CONTINUED)
December 31, 2016 (Unaudited)
| | | | | | | | | | | | | | | | |
| | | BARINGS
EMERGING
MARKETS DEBT
BLENDED TOTAL
RETURN FUND | | | BARINGS
EMERGING
MARKETS LOCAL
CURRENCY DEBT
FUND | | | BARINGS GLOBAL
HIGH YIELD
FUND | | | BARINGS U.S.
HIGH YIELD
FUND | |
|
| Assets | |
| Investments, at fair value (cost $9,820,349, $4,803,741, $26,085,360 and $30,414,834, respectively) | | $ | 9,592,771 | | | $ | 4,720,572 | | | $ | 26,461,958 | | | $ | 31,535,948 | |
| Foreign currency, at value (cost $1,804, $3,167, $4,701 and $0, respectively) | | | 1,731 | | | | 3,164 | | | | 4,600 | | | | – | |
| Receivable for Fund shares sold | | | – | | | | – | | | | 98,761 | | | | – | |
| Interest receivable | | | 174,923 | | | | 79,829 | | | | 489,044 | | | | 552,053 | |
| Receivable from adviser (see Note 3) | | | 9,396 | | | | 11,620 | | | | 1,518 | | | | – | |
| Receivable for variation margin on open futures contracts | | | 10,382 | | | | – | | | | – | | | | – | |
| Swap contracts, at fair value | | | 10,672 | | | | – | | | | – | | | | – | |
| Foreign tax reclaims receivable | | | – | | | | 510 | | | | 751 | | | | – | |
| Unrealized appreciation on forward foreign currency exchange contracts | | | 291,224 | | | | 214,831 | | | | 109,460 | | | | – | |
| Prepaid expenses | | | 24,694 | | | | 24,606 | | | | 25,018 | | | | 25,211 | |
| | | | | | | | | | | | | | | | |
Total assets | | | 10,115,793 | | | | 5,055,132 | | | | 27,191,110 | | | | 32,113,212 | |
| | | | | | | | | | | | | | | | |
|
| Liabilities | |
| Payable for Fund shares repurchased | | | – | | | | – | | | | 424 | | | | 16,613 | |
| Swap contracts, at fair value (up-front net premiums received of $0, $0, $0 and $0, respectively) | | | – | | | | 6,122 | | | | – | | | | – | |
| Investment advisory fee payable (see Note 3) | | | – | | | | – | | | | – | | | | 362 | |
| Distribution fees payable | | | 208 | | | | 104 | | | | 190 | | | | 559 | |
| Dividends payable | | | 41,464 | | | | 20,161 | | | | 141,889 | | | | 143,359 | |
| Unrealized depreciation on forward foreign currency exchange contracts | | | 288,771 | | | | 198,984 | | | | 2,354 | | | | – | |
| Accrued expenses and other liabilities | | | 38,926 | | | | 33,846 | | | | 47,728 | | | | 47,645 | |
| | | | | | | | | | | | | | | | |
Total liabilities | | | 369,369 | | | | 259,217 | | | | 192,585 | | | | 208,538 | |
| | | | | | | | | | | | | | | | |
Total net assets | | $ | 9,746,424 | | | $ | 4,795,915 | | | $ | 26,998,525 | | | $ | 31,904,674 | |
| | | | | | | | | | | | | | | | |
|
| Composition of net assets | |
| Shares of beneficial interest outstanding (par value $0.00001 per share), unlimited number of shares authorized | | $ | 10 | | | $ | 5 | | | $ | 26 | | | $ | 31 | |
| Additional paid-in capital | | | 10,017,344 | | | | 4,999,995 | | | | 26,453,982 | | | | 30,726,635 | |
| Undistributed (distributions in excess of) net investment income | | | (64,320 | ) | | | (165,357 | ) | | | 54,472 | | | | (94 | ) |
| Accumulated net realized gain | | | 98,740 | | | | 37,726 | | | | 10,267 | | | | 56,988 | |
| Net unrealized appreciation (depreciation) | | | (305,350 | ) | | | (76,454 | ) | | | 479,778 | | | | 1,121,114 | |
| | | | | | | | | | | | | | | | |
Total net assets | | $ | 9,746,424 | | | $ | 4,795,915 | | | $ | 26,998,525 | | | $ | 31,904,674 | |
| | | | | | | | | | | | | | | | |
See accompanying Notes to the Financial Statements.
34
Barings Funds Trust 2016 Semi-Annual Report
STATEMENTS OF ASSETS AND LIABILITIES (CONTINUED)
December 31, 2016 (Unaudited)
| | | | | | | | | | | | | | | | |
| | | BARINGS
EMERGING
MARKETS DEBT
BLENDED TOTAL
RETURN FUND | | | BARINGS
EMERGING
MARKETS LOCAL
CURRENCY DEBT
FUND | | | BARINGS GLOBAL
HIGH YIELD
FUND | | | BARINGS U.S.
HIGH YIELD
FUND | |
|
| Class A | |
| Net assets applicable to outstanding shares | | $ | 194,679 | | | $ | 95,919 | | | $ | 106,799 | | | $ | 2,237,636 | |
| | | | | | | | | | | | | | | | |
| Shares of beneficial interest outstanding | | | 20,006 | | | | 10,000 | | | | 10,447 | | | | 215,185 | |
| | | | | | | | | | | | | | | | |
| Net asset value per share outstanding | | $ | 9.73 | | | $ | 9.59 | | | $ | 10.22 | | | $ | 10.40 | |
| | | | | | | | | | | | | | | | |
| Maximum offering price per share outstanding (Net asset value plus sales charge of 4.00%) | | $ | 10.14 | | | $ | 9.99 | | | $ | 10.65 | | | $ | 10.83 | |
| | | | | | | | | | | | | | | | |
|
| Class C | |
| Net assets applicable to outstanding shares | | $ | 199,979 | | | $ | 95,919 | | | $ | 196,204 | | | $ | 110,015 | |
| | | | | | | | | | | | | | | | |
| Shares of beneficial interest outstanding | | | 20,552 | | | | 10,000 | | | | 19,192 | | | | 10,579 | |
| | | | | | | | | | | | | | | | |
| Net asset value per share outstanding | | $ | 9.73 | | | $ | 9.59 | | | $ | 10.22 | | | $ | 10.40 | |
| | | | | | | | | | | | | | | | |
|
| Class I | |
| Net assets applicable to outstanding shares | | $ | 4,672,192 | | | $ | 2,302,039 | | | $ | 12,675,770 | | | $ | 15,364,711 | |
| | | | | | | | | | | | | | | | |
| Shares of beneficial interest outstanding | | | 480,156 | | | | 240,000 | | | | 1,240,000 | | | | 1,477,389 | |
| | | | | | | | | | | | | | | | |
| Net asset value per share outstanding | | $ | 9.73 | | | $ | 9.59 | | | $ | 10.22 | | | $ | 10.40 | |
| | | | | | | | | | | | | | | | |
|
| Class Y | |
| Net assets applicable to outstanding shares | | $ | 4,679,574 | | | $ | 2,302,038 | | | $ | 14,019,752 | | | $ | 14,192,312 | |
| | | | | | | | | | | | | | | | |
| Shares of beneficial interest outstanding | | | 480,900 | | | | 240,000 | | | | 1,371,477 | | | | 1,364,767 | |
| | | | | | | | | | | | | | | | |
| Net asset value per share outstanding | | $ | 9.73 | | | $ | 9.59 | | | $ | 10.22 | | | $ | 10.40 | |
| | | | | | | | | | | | | | | | |
See accompanying Notes to the Financial Statements.
35
Barings Funds Trust 2016 Semi-Annual Report
STATEMENTS OF OPERATIONS
For the Six Months Ended December 31, 2016 (Unaudited)
| | | | | | | | | | | | | | | | |
| | | BARINGS GLOBAL
FLOATING RATE
FUND | | | BARINGS GLOBAL
CREDIT INCOME
OPPORTUNITIES
FUND | | | BARINGS ACTIVE
SHORT DURATION
BOND FUND | | | BARINGS TOTAL
RETURN BOND
FUND | |
| | | | |
| Investment Income | | | | | | | | | | | | | | | | |
Interest income | | $ | 4,658,109 | | | $ | 4,058,787 | | | $ | 2,245,451 | | | $ | 345,678 | |
Dividends | | | – | | | | – | | | | – | | | | 122,182 | |
Other income | | | 152,829 | | | | 69,220 | | | | 519 | | | | – | |
| | | | | | | | | | | | | | | | |
Total investment income | | | 4,810,938 | | | | 4,128,007 | | | | 2,245,970 | | | | 467,860 | |
| | | | | | | | | | | | | | | | |
| | | | |
| Operating Expenses | | | | | | | | | | | | | | | | |
Advisory fees | | | 529,884 | | | | 417,572 | | | | 359,358 | | | | 53,767 | |
12b-1 distribution and servicing plan | | | | | | | | | | | | | | | | |
Class A | | | 27,899 | | | | 19,853 | | | | 93,650 | | | | 276 | |
Class C | | | 35,480 | | | | 20,715 | | | | (776 | ) | | | 1,025 | |
Administrator fees | | | 170,816 | | | | 100,518 | | | | 126,932 | | | | 29,833 | |
Custody fees | | | 119,549 | | | | 71,089 | | | | 98,529 | | | | 25,238 | |
Professional fees | | | 55,365 | | | | 47,818 | | | | 30,711 | | | | 16,276 | |
Transfer agent fees | | | 18,000 | | | | 21,642 | | | | 29,011 | | | | 9,517 | |
Directors’ fees | | | 27,143 | | | | 20,044 | | | | 24,294 | | | | 13,006 | |
Registration fees | | | 40,186 | | | | 30,112 | | | | 58,304 | | | | 23,196 | |
Printing and mailing expenses | | | 10,361 | | | | 6,118 | | | | 8,712 | | | | 1,617 | |
Interest expense | | | – | | | | – | | | | 64 | | | | 30 | |
Other operating expenses | | | 24,591 | | | | 14,492 | | | | 22,576 | | | | 4,636 | |
| | | | | | | | | | | | | | | | |
Total operating expenses | | | 1,059,274 | | | | 769,973 | | | | 851,365 | | | | 178,417 | |
Reimbursement of expenses | | | | | | | | | | | | | | | | |
Class A | | | (54,721 | ) | | | (30,591 | ) | | | (120,067 | ) | | | (3,061 | ) |
Class C | | | (23,681 | ) | | | (10,129 | ) | | | (3,737 | ) | | | (2,994 | ) |
Class I | | | (46,495 | ) | | | (44,788 | ) | | | (5,489 | ) | | | (46,449 | ) |
Class Y | | | (265,958 | ) | | | (114,976 | ) | | | (218,444 | ) | | | (50,654 | ) |
| | | | | | | | | | | | | | | | |
Net operating expenses | | | 668,419 | | | | 569,489 | | | | 503,628 | | | | 75,259 | |
| | | | | | | | | | | | | | | | |
Net investment income | | | 4,142,519 | | | | 3,558,518 | | | | 1,742,342 | | | | 392,601 | |
| | | | | | | | | | | | | | | | |
See accompanying Notes to the Financial Statements.
36
Barings Funds Trust 2016 Semi-Annual Report
STATEMENTS OF OPERATIONS (CONTINUED)
For the Six Months Ended December 31, 2016 (Unaudited)
| | | | | | | | | | | | | | | | |
| | | BARINGS GLOBAL
FLOATING RATE
FUND | | | BARINGS GLOBAL
CREDIT INCOME
OPPORTUNITIES
FUND | | | BARINGS ACTIVE
SHORT DURATION
BOND FUND | | | BARINGS TOTAL
RETURN BOND
FUND | |
| Realized and Unrealized Gains (Losses) on Investments | | | | | | | | | | | | | | | | |
Net realized loss on investments | | $ | (2,389,702 | ) | | $ | (1,035,733 | ) | | $ | (73,779 | ) | | $ | (72,764 | ) |
Net realized gain on forward foreign currency exchange contracts | | | 3,668,047 | | | | 2,957,387 | | | | – | | | | 833 | |
Net realized loss on foreign currency and translation | | | (357,089 | ) | | | (10,596 | ) | | | – | | | | – | |
Net realized gain (loss) on futures contracts | | | – | | | | – | | | | 809,340 | | | | (101,606 | ) |
Net realized loss on swap contracts | | | – | | | | – | | | | (11,561 | ) | | | (14,347 | ) |
| | | | | | | | | | | | | | | | |
Net realized gain (loss) | | | 921,256 | | | | 1,911,058 | | | | 724,000 | | | | (187,884 | ) |
| | | | | | | | | | | | | | | | |
Net change in unrealized appreciation (depreciation) on investments | | | 8,028,954 | | | | 5,738,679 | | | | (1,785,082 | ) | | | (440,935 | ) |
Net change in unrealized appreciation (depreciation) on unfunded loan commitments | | | (13 | ) | | | (13 | ) | | | – | | | | – | |
Net change in unrealized appreciation (depreciation) on forward foreign currency exchange contracts | | | (1,501,095 | ) | | | (1,024,556 | ) | | | 12,342 | | | | 327 | |
Net change in unrealized depreciation on foreign currency and translation | | | (6,583 | ) | | | (37,458 | ) | | | – | | | | – | |
Net change in unrealized appreciation (depreciation) on futures contracts | | | – | | | | – | | | | 173,895 | | | | (107,400 | ) |
Net change in unrealized appreciation on swap contracts | | | – | | | | – | | | | 11,299 | | | | 2,996 | |
| | | | | | | | | | | | | | | | |
Net change in unrealized appreciation (depreciation) | | | 6,521,263 | | | | 4,676,652 | | | | (1,587,546 | ) | | | (545,012 | ) |
| | | | | | | | | | | | | | | | |
Net realized and unrealized gains (losses) on investments | | | 7,442,519 | | | | 6,587,710 | | | | (863,546 | ) | | | (732,896 | ) |
| | | | | | | | | | | | | | | | |
Net increase (decrease) in net assets resulting from operations | | $ | 11,585,038 | | | $ | 10,146,228 | | | $ | 878,796 | | | $ | (340,295 | ) |
| | | | | | | | | | | | | | | | |
See accompanying Notes to the Financial Statements.
37
Barings Funds Trust 2016 Semi-Annual Report
STATEMENTS OF OPERATIONS (CONTINUED)
For the Six Months Ended December 31, 2016 (Unaudited)
| | | | | | | | | | | | | | | | |
| | | BARINGS
EMERGING
MARKETS DEBT
BLENDED TOTAL
RETURN FUND | | | BARINGS
EMERGING
MARKETS LOCAL
CURRENCY DEBT
FUND | | | BARINGS GLOBAL
HIGH YIELD
FUND | | | BARINGS U.S.
HIGH YIELD
FUND | |
| | | | |
| Investment Income | | | | | | | | | | | | | | | | |
Interest income (net of withholding tax of $1,102, $3,056, $0 and $0, respectively) | | $ | 321,584 | | | $ | 52,973 | | | $ | 973,191 | | | $ | 1,124,536 | |
Other income | | | – | | | | – | | | | 5,985 | | | | – | |
| | | | | | | | | | | | | | | | |
Total investment income | | | 321,584 | | | | 52,973 | | | | 979,176 | | | | 1,124,536 | |
| | | | | | | | | | | | | | | | |
| | | | |
| Operating Expenses | | | | | | | | | | | | | | | | |
Advisory fees | | | 37,833 | | | | 20,296 | | | | 80,017 | | | | 84,564 | |
12b-1 distribution and servicing plan | | | | | | | | | | | | | | | | |
Class A | | | 252 | | | | 135 | | | | 135 | | | | 1,902 | |
Class C | | | 1,014 | | | | 541 | | | | 843 | | | | 531 | |
Administrator fees | | | 17,075 | | | | 13,781 | | | | 27,985 | | | | 29,673 | |
Custody fees | | | 14,375 | | | | 13,734 | | | | 20,181 | | | | 20,805 | |
Professional fees | | | 12,720 | | | | 12,210 | | | | 15,056 | | | | 13,189 | |
Transfer agent fees | | | 12,732 | | | | 9,168 | | | | 10,556 | | | | 9,554 | |
Directors’ fees | | | 11,294 | | | | 10,796 | | | | 12,940 | | | | 13,200 | |
Registration fees | | | 22,309 | | | | 21,903 | | | | 22,640 | | | | 23,075 | |
Printing and mailing expenses | | | 616 | | | | 330 | | | | 1,582 | | | | 1,746 | |
Other operating expenses | | | 2,374 | | | | 1,590 | | | | 4,551 | | | | 4,922 | |
| | | | | | | | | | | | | | | | |
Total operating expenses | | | 132,594 | | | | 104,484 | | | | 196,486 | | | | 203,161 | |
Reimbursement of expenses | | | | | | | | | | | | | | | | |
Class A | | | (4,670 | ) | | | (3,773 | ) | | | (2,901 | ) | | | (5,862 | ) |
Class C | | | (4,687 | ) | | | (3,780 | ) | | | (3,017 | ) | | | (2,538 | ) |
Class I | | | (39,616 | ) | | | (38,188 | ) | | | (40,742 | ) | | | (40,708 | ) |
Class Y | | | (39,654 | ) | | | (38,189 | ) | | | (42,159 | ) | | | (36,306 | ) |
| | | | | | | | | | | | | | | | |
Net operating expenses | | | 43,967 | | | | 20,554 | | | | 107,667 | | | | 117,747 | |
| | | | | | | | | | | | | | | | |
Net investment income | | | 277,617 | | | | 32,419 | | | | 871,509 | | | | 1,006,789 | |
| | | | | | | | | | | | | | | | |
See accompanying Notes to the Financial Statements.
38
Barings Funds Trust 2016 Semi-Annual Report
STATEMENTS OF OPERATIONS (CONTINUED)
For the Six Months Ended December 31, 2016 (Unaudited)
| | | | | | | | | | | | | | | | |
| | | BARINGS
EMERGING
MARKETS DEBT
BLENDED TOTAL
RETURN FUND | | | BARINGS
EMERGING
MARKETS LOCAL
CURRENCY DEBT
FUND | | | BARINGS GLOBAL
HIGH YIELD
FUND | | | BARINGS U.S.
HIGH YIELD
FUND | |
| Realized and Unrealized Gains (Losses) on Investments | | | | | | | | | | | | | | | | |
Net realized gain on investments | | $ | 183,130 | | | $ | 91,844 | | | $ | 112,901 | | | $ | 322,895 | |
Net realized gain on forward foreign currency exchange contracts | | | 78,437 | | | | 20,587 | | | | 623,851 | | | | – | |
Net realized loss on foreign currency and translation | | | (4,345 | ) | | | (1,063 | ) | | | (14,944 | ) | | | – | |
Net realized gain (loss) on futures contracts | | | 1 | | | | (160 | ) | | | – | | | | – | |
Net realized gain on swap contracts | | | 7,337 | | | | 10,498 | | | | – | | | | – | |
| | | | | | | | | | | | | | | | |
Net realized gain | | | 264,560 | | | | 121,706 | | | | 721,808 | | | | 322,895 | |
| | | | | | | | | | | | | | | | |
Net change in unrealized appreciation (depreciation) on investments | | | (420,030 | )(1) | | | (302,950 | )(2) | | | 864,799 | | | | 939,691 | |
Net change in unrealized appreciation (depreciation) on forward foreign currency exchange contracts | | | (31,084 | ) | | | 17,042 | | | | (173,783 | ) | | | – | |
Net change in unrealized appreciation (depreciation) on foreign currency and translation | | | (1,211 | ) | | | (4,152 | ) | | | 1,867 | | | | – | |
Net change in unrealized appreciation on futures contracts | | | 2,868 | | | | – | | | | – | | | | – | |
Net change in unrealized (depreciation) on swap contracts | | | (3,270 | ) | | | (42,602 | ) | | | – | | | | – | |
| | | | | | | | | | | | | | | | |
Net change in unrealized appreciation (depreciation) | | | (452,727 | ) | | | (332,662 | ) | | | 692,883 | | | | 939,691 | |
| | | | | | | | | | | | | | | | |
Net realized and unrealized gains (losses) on investments | | | (188,167 | ) | | | (210,956 | ) | | | 1,414,691 | | | | 1,262,586 | |
| | | | | | | | | | | | | | | | |
Net increase (decrease) in net assets resulting from operations | | $ | 89,450 | | | $ | (178,537 | ) | | $ | 2,286,200 | | | $ | 2,269,375 | |
| | | | | | | | | | | | | | | | |
| (1) | | Net of change in unrealized appreciation (depreciation) of foreign capital gains taxes of $(1,609). |
| (2) | | Net of change in unrealized appreciation (depreciation) of foreign capital gains taxes of $3,532. |
See accompanying Notes to the Financial Statements.
39
Barings Funds Trust 2016 Semi-Annual Report
STATEMENTS OF CHANGES IN NET ASSETS
(Unaudited)
| | | | | | | | | | | | | | | | |
| | | BARINGS GLOBAL
FLOATING RATE FUND | | | BARINGS GLOBAL
CREDIT INCOME
OPPORTUNITIES FUND | |
| | | FOR THE
SIX MONTHS ENDED
DECEMBER 31, 2016 | | | FOR THE
YEAR ENDED
JUNE 30, 2016 | | | FOR THE
SIX MONTHS ENDED
DECEMBER 31, 2016 | | | FOR THE
YEAR ENDED
JUNE 30, 2016 | |
|
| Operations | |
Net investment income | | $ | 4,142,519 | | | $ | 8,206,929 | | | $ | 3,558,518 | | | $ | 5,621,819 | |
Net realized gain (loss) on investments | | | 921,256 | | | | (3,068,981 | ) | | | 1,911,058 | | | | (2,698,429 | ) |
Net change in unrealized appreciation (depreciation) on investments | | | 6,521,263 | | | | (4,711,060 | ) | | | 4,676,652 | | | | (3,086,490 | ) |
| | | | | | | | | | | | | | | | |
Net increase (decrease) in net assets from operations | | | 11,585,038 | | | | 426,888 | | | | 10,146,228 | | | | (163,100 | ) |
| | | | | | | | | | | | | | | | |
|
| Dividends to Common Shareholders | |
Net investment income | |
Class A | | | (536,495 | ) | | | (304,354 | ) | | | (488,582 | ) | | | (835,584 | ) |
| | | | | | | | | | | | | | | | |
Class C | | | (149,993 | ) | | | (268,027 | ) | | | (112,854 | ) | | | (205,363 | ) |
| | | | | | | | | | | | | | | | |
Class I | | | (497,800 | ) | | | (1,191,256 | ) | | | (838,701 | ) | | | (1,782,878 | ) |
| | | | | | | | | | | | | | | | |
Class Y | | | (2,957,893 | ) | | | (6,742,434 | ) | | | (2,118,575 | ) | | | (3,292,537 | ) |
| | | | | | | | | | | | | | | | |
Total dividends to common shareholders | | | (4,142,181 | ) | | | (8,506,071 | ) | | | (3,558,712 | ) | | | (6,116,362 | ) |
| | | | | | | | | | | | | | | | |
|
| Capital Share Transactions | |
Net proceeds from sale of shares | | | 81,459,469 | | | | 76,837,249 | | | | 25,974,809 | | | | 38,204,380 | |
Net Asset Value of shares issued to shareholders in payment of distributions declared | | | 2,936,411 | | | | 6,057,323 | | | | 1,403,349 | | | | 2,714,185 | |
Cost of shares redeemed | | | (98,035,251 | ) | | | (74,331,498 | ) | | | (9,965,531 | ) | | | (17,451,036 | ) |
| | | | | | | | | | | | | | | | |
Net increase (decrease) in net assets resulting from capital stock transactions | | | (13,639,371 | ) | | | 8,563,074 | | | | 17,412,627 | | | | 23,467,529 | |
| | | | | | | | | | | | | | | | |
Total increase (decrease) in net assets | | | (6,196,514 | ) | | | 483,891 | | | | 24,000,143 | | | | 17,188,067 | |
| | | | | | | | | | | | | | | | |
|
| Net Assets | |
Beginning of period | | | 166,643,028 | | | | 166,159,137 | | | | 98,920,696 | | | | 81,732,629 | |
| | | | | | | | | | | | | | | | |
End of period (includes undistributed net investment income of $(1,114,255), $(1,114,593), $(704,450) and $(704,256), respectively) | | $ | 160,446,514 | | | $ | 166,643,028 | | | $ | 122,920,839 | | | $ | 98,920,696 | |
| | | | | | | | | | | | | | | | |
See accompanying Notes to the Financial Statements.
40
Barings Funds Trust 2016 Semi-Annual Report
STATEMENTS OF CHANGES IN NET ASSETS (CONTINUED)
(Unaudited)
| | | | | | | | | | | | | | | | |
| | | BARINGS ACTIVE SHORT
DURATION BOND FUND | | | BARINGS TOTAL
RETURN BOND FUND | |
| | | FOR THE
SIX MONTHS ENDED
DECEMBER 31, 2016 | | | PERIOD FROM
JULY 8, 2015
THROUGH
JUNE 30, 2016 (1) | | | FOR THE
SIX MONTHS ENDED
DECEMBER 31, 2016 | | | PERIOD FROM
JULY 8, 2015
THROUGH
JUNE 30, 2016 (1) | |
|
| Operations | |
Net investment income | | $ | 1,742,342 | | | $ | 1,645,747 | | | $ | 392,601 | | | $ | 675,606 | |
Net realized gain (loss) on investments | | | 724,000 | | | | (74,313 | ) | | | (187,884 | ) | | | (74,427 | ) |
Net change in unrealized appreciation (depreciation) on investments | | | (1,587,546 | ) | | | 876,577 | | | | (545,012 | ) | | | 602,122 | |
| | | | | | | | | | | | | | | | |
Net increase (decrease) in net assets from operations | | | 878,796 | | | | 2,448,011 | | | | (340,295 | ) | | | 1,203,301 | |
| | | | | | | | | | | | | | | | |
|
| Dividends to Common Shareholders | |
Net investment income | |
Class A | | | (577,846 | ) | | | (189,128 | ) | | | (2,966 | ) | | | (5,003 | ) |
| | | | | | | | | | | | | | | | |
Class C | | | (3,312 | ) | | | (2,030 | ) | | | (1,974 | ) | | | (3,522 | ) |
| | | | | | | | | | | | | | | | |
Class I | | | (10,205 | ) | | | (328,113 | ) | | | (184,545 | ) | | | (336,827 | ) |
| | | | | | | | | | | | | | | | |
Class Y | | | (1,160,196 | ) | | | (1,108,430 | ) | | | (203,474 | ) | | | (338,788 | ) |
| | | | | | | | | | | | | | | | |
Net realized gain | |
Class A | | | (38,267 | ) | | | – | | | | – | | | | (403 | ) |
| | | | | | | | | | | | | | | | |
Class C | | | (114 | ) | | | – | | | | – | | | | (402 | ) |
| | | | | | | | | | | | | | | | |
Class I | | | (42 | ) | | | – | | | | – | | | | (24,782 | ) |
| | | | | | | | | | | | | | | | |
Class Y | | | (63,403 | ) | | | – | | | | – | | | | (24,827 | ) |
| | | | | | | | | | | | | | | | |
Total dividends to common shareholders | | | (1,853,385 | ) | | | (1,627,701 | ) | | | (392,959 | ) | | | (734,554 | ) |
| | | | | | | | | | | | | | | | |
|
| Capital Share Transactions | |
Net proceeds from sale of shares | | | 150,896,792 | | | | 209,020,134 | | | | 2,712,412 | | | | 25,427,645 | |
Net Asset Value of shares issued to shareholders in payment of distributions declared | | | 1,543,602 | | | | 841,543 | | | | 18,759 | | | | 111,617 | |
Cost of shares redeemed | | | (59,113,830 | ) | | | (54,817,484 | ) | | | (100,489 | ) | | | – | |
| | | | | | | | | | | | | | | | |
Net increase in net assets resulting from capital stock transactions | | | 93,326,564 | | | | 155,044,193 | | | | 2,630,682 | | | | 25,539,262 | |
| | | | | | | | | | | | | | | | |
Total increase in net assets | | | 92,351,975 | | | | 155,864,503 | | | | 1,897,428 | | | | 26,008,009 | |
| | | | | | | | | | | | | | | | |
|
| Net Assets | |
Beginning of period | | | 155,864,503 | | | | – | | | | 26,008,009 | | | | – | |
| | | | | | | | | | | | | | | | |
End of period (includes undistributed net investment income of $20,581, $29,798, $(6,141) and $(5,783), respectively) | | $ | 248,216,478 | | | $ | 155,864,503 | | | $ | 27,905,437 | | | $ | 26,008,009 | |
| | | | | | | | | | | | | | | | |
| (1) | | Fund commenced operations on July 8, 2015. |
See accompanying Notes to the Financial Statements.
41
Barings Funds Trust 2016 Semi-Annual Report
STATEMENTS OF CHANGES IN NET ASSETS (CONTINUED)
(Unaudited)
| | | | | | | | | | | | | | | | |
| | | BARINGS EMERGING
MARKETS DEBT BLENDED
TOTAL RETURN FUND | | | BARINGS EMERGING
MARKETS LOCAL
CURRENCY DEBT FUND | |
| | | FOR THE
SIX MONTHS ENDED
DECEMBER 31, 2016 | | | PERIOD FROM
OCTOBER 21, 2015
THROUGH
JUNE 30, 2016 (1) | | | FOR THE
SIX MONTHS ENDED
DECEMBER 31, 2016 | | | PERIOD FROM
DECEMBER 8, 2015
THROUGH
JUNE 30, 2016 (2) | |
| | | | |
| Operations | | | | | | | | | | | | | | | | |
Net investment income | | $ | 277,617 | | | $ | 448,418 | | | $ | 32,419 | | | $ | 257,477 | |
Net realized gain (loss) on investments | | | 264,560 | | | | (334,735 | ) | | | 121,706 | | | | 110,231 | |
Net change in unrealized appreciation (depreciation) on investments | | | (452,727 | ) | | | 147,377 | | | | (332,662 | ) | | | 256,208 | |
| | | | | | | | | | | | | | | | |
Net increase (decrease) in net assets from operations | | | 89,450 | | | | 261,060 | | | | (178,537 | ) | | | 623,916 | |
| | | | | | | | | | | | | | | | |
| | | | |
| Dividends to Common Shareholders | | | | | | | | | | | | | | | | |
Net investment income | | | | | | | | | | | | | | | | |
Class A | | | (4,978 | ) | | | (6,867 | ) | | | (7,784 | ) | | | (3,143 | ) |
| | | | | | | | | | | | | | | | |
Class C | | | (4,253 | ) | | | (5,895 | ) | | | (7,383 | ) | | | (2,726 | ) |
| | | | | | | | | | | | | | | | |
Class I | | | (125,440 | ) | | | (172,655 | ) | | | (190,048 | ) | | | (78,768 | ) |
| | | | | | | | | | | | | | | | |
Class Y | | | (125,597 | ) | | | (172,655 | ) | | | (190,045 | ) | | | (78,767 | ) |
| | | | | | | | | | | | | | | | |
Net realized gain | | | | | | | | | | | | | | | | |
Class A | | | – | | | | (62 | ) | | | (1,816 | ) | | | – | |
| | | | | | | | | | | | | | | | |
Class C | | | – | | | | (62 | ) | | | (1,816 | ) | | | – | |
| | | | | | | | | | | | | | | | |
Class I | | | – | | | | (1,488 | ) | | | (43,584 | ) | | | – | |
| | | | | | | | | | | | | | | | |
Class Y | | | – | | | | (1,488 | ) | | | (43,584 | ) | | | – | |
| | | | | | | | | | | | | | | | |
Total dividends to common shareholders | | | (260,268 | ) | | | (361,172 | ) | | | (486,060 | ) | | | (163,404 | ) |
| | | | | | | | | | | | | | | | |
| | | | |
| Capital Share Transactions | | | | | | | | | | | | | | | | |
Net proceeds from sale of shares | | | 29,818 | | | | 10,000,000 | | | | – | | | | 5,000,000 | |
Net Asset Value of shares issued to shareholders in payment of distributions declared | | | 118 | | | | 3,100 | | | | – | | | | – | |
Cost of shares redeemed | | | (15,682 | ) | | | – | | | | – | | | | – | |
| | | | | | | | | | | | | | | | |
Net increase in net assets resulting from capital stock transactions | | | 14,254 | | | | 10,003,100 | | | | – | | | | 5,000,000 | |
| | | | | | | | | | | | | | | | |
Total increase (decrease) in net assets | | | (156,564 | ) | | | 9,902,988 | | | | (664,597 | ) | | | 5,460,512 | |
| | | | | | | | | | | | | | | | |
| | | | |
| Net Assets | | | | | | | | | | | | | | | | |
Beginning of period | | | 9,902,988 | | | | – | | | | 5,460,512 | | | | – | |
| | | | | | | | | | | | | | | | |
End of period (includes undistributed net investment income of $(64,320), $(81,669), $(165,357) and $197,484, respectively) | | $ | 9,746,424 | | | $ | 9,902,988 | | | $ | 4,795,915 | | | $ | 5,460,512 | |
| | | | | | | | | | | | | | | | |
| (1) | | Fund commenced operations on October 21, 2015. |
| (2) | | Fund commenced operations on December 8, 2015. |
See accompanying Notes to the Financial Statements.
42
Barings Funds Trust 2016 Semi-Annual Report
STATEMENTS OF CHANGES IN NET ASSETS (CONTINUED)
(Unaudited)
| | | | | | | | | | | | | | | | |
| | | BARINGS GLOBAL
HIGH YIELD FUND | | | BARINGS U.S.
HIGH YIELD FUND | |
| | | FOR THE
SIX MONTHS ENDED
DECEMBER 31, 2016 | | | PERIOD FROM
OCTOBER 30, 2015
THROUGH
JUNE 30, 2016 (1) | | | FOR THE
SIX MONTHS ENDED
DECEMBER 31, 2016 | | | PERIOD FROM
OCTOBER 30, 2015
THROUGH
JUNE 30, 2016 (1) | |
| | | | |
| Operations | | | | | | | | | | | | | | | | |
Net investment income | | $ | 871,509 | | | $ | 980,491 | | | $ | 1,006,789 | | | $ | 1,053,626 | |
Net realized gain on investments | | | 721,808 | | | | 345,486 | | | | 322,895 | | | | 288,570 | |
Net change in unrealized appreciation (depreciation) on investments | | | 692,883 | | | | (213,105 | ) | | | 939,691 | | | | 181,423 | |
| | | | | | | | | | | | | | | | |
Net increase in net assets resulting from operations | | | 2,286,200 | | | | 1,112,872 | | | | 2,269,375 | | | | 1,523,619 | |
| | | | | | | | | | | | | | | | |
| | | | |
| Dividends to Common Shareholders | | | | | | | | | | | | | | | | |
Net investment income | | | | | | | | | | | | | | | | |
Class A | | | (3,412 | ) | | | (3,764 | ) | | | (47,686 | ) | | | (4,605 | ) |
| | | | | | | | | | | | | | | | |
Class C | | | (4,615 | ) | | | (3,285 | ) | | | (2,957 | ) | | | (3,286 | ) |
| | | | | | | | | | | | | | | | |
Class I | | | (423,302 | ) | | | (486,534 | ) | | | (506,144 | ) | | | (559,016 | ) |
| | | | | | | | | | | | | | | | |
Class Y | | | (440,179 | ) | | | (486,908 | ) | | | (450,096 | ) | | | (486,719 | ) |
| | | | | | | | | | | | | | | | |
Net realized gain | | | | | | | | | | | | | | | | |
Class A | | | (3,988 | ) | | | – | | | | (24,333 | ) | | | – | |
| | | | | | | | | | | | | | | | |
Class C | | | (7,212 | ) | | | – | | | | (1,951 | ) | | | – | |
| | | | | | | | | | | | | | | | |
Class I | | | (474,176 | ) | | | – | | | | (274,369 | ) | | | – | |
| | | | | | | | | | | | | | | | |
Class Y | | | (517,180 | ) | | | – | | | | (253,824 | ) | | | – | |
| | | | | | | | | | | | | | | | |
Total dividends to common shareholders | | | (1,874,064 | ) | | | (980,491 | ) | | | (1,561,360 | ) | | | (1,053,626 | ) |
| | | | | | | | | | | | | | | | |
| | | | |
| Capital Share Transactions | | | | | | | | | | | | | | | | |
Net proceeds from sale of shares | | | 1,287,536 | | | | 25,138,500 | | | | 4,029,649 | | | | 27,302,500 | |
Net Asset Value of shares issued to shareholders in payment of distributions declared | | | 64,433 | | | | 262 | | | | 233,068 | | | | 72,759 | |
Cost of shares redeemed | | | (36,723 | ) | | | – | | | | (911,310 | ) | | | – | |
| | | | | | | | | | | | | | | | |
Net increase in net assets resulting from capital stock transactions | | | 1,315,246 | | | | 25,138,762 | | | | 3,351,407 | | | | 27,375,259 | |
| | | | | | | | | | | | | | | | |
Total increase in net assets | | | 1,727,382 | | | | 25,271,143 | | | | 4,059,422 | | | | 27,845,252 | |
| | | | | | | | | | | | | | | | |
| | | | |
| Net Assets | | | | | | | | | | | | | | | | |
Beginning of period | | | 25,271,143 | | | | – | | | | 27,845,252 | | | | – | |
| | | | | | | | | | | | | | | | |
End of period (includes undistributed net investment income of $54,472, $54,471, $(94) and $0, respectively) | | $ | 26,998,525 | | | $ | 25,271,143 | | | $ | 31,904,674 | | | $ | 27,845,252 | |
| | | | | | | | | | | | | | | | |
| (1) | | Fund commenced operations on October 30, 2015. |
See accompanying Notes to the Financial Statements.
43
Barings Global Floating Rate Fund 2016 Semi-Annual Report
FINANCIAL HIGHLIGHTS
| | | | | | | | | | | | | | | | |
| | | CLASS A | |
| | | FOR THE
SIX MONTHS ENDED
DECEMBER 31, 2016 (1) | | | FOR THE
YEAR ENDED
JUNE 30, 2016 | | | FOR THE
YEAR ENDED
JUNE 30, 2015 | | | PERIOD FROM
SEPTEMBER 16, 2013
THROUGH
JUNE 30, 2014 (2) | |
|
| Per Common Share Data | |
Net asset value, beginning of period | | $ | 9.13 | | | $ | 9.60 | | | $ | 10.20 | | | $ | 10.00 | |
Income from investment operations: | |
Net investment income (3) | | | 0.16 | | | | 0.44 | | | | 0.44 | | | | 0.30 | |
Net realized and unrealized gain (loss) on investments | | | 0.50 | | | | (0.45 | ) | | | (0.35 | ) | | | 0.08 | |
| | | | | | | | | | | | | | | | |
Total increase (decrease) from investment operations | | | 0.66 | | | | (0.01 | ) | | | 0.09 | | | | 0.38 | |
| | | | | | | | | | | | | | | | |
Less dividends and distributions: | |
From net investment income | | | (0.23 | ) | | | (0.46 | ) | | | (0.68 | ) | | | (0.18 | ) |
From net realized gain | | | – | | | | – | | | | (0.01 | ) | | | – | |
| | | | | | | | | | | | | | | | |
Total dividends and distributions | | | (0.23 | ) | | | (0.46 | ) | | | (0.69 | ) | | | (0.18 | ) |
| | | | | | | | | | | | | | | | |
Redemption fees | | | 0.00 | | | | 0.00 | | | | 0.00 | (4) | | | 0.00 | |
| | | | | | | | | | | | | | | | |
Net asset value, at end of period | | $ | 9.56 | | | $ | 9.13 | | | $ | 9.60 | | | $ | 10.20 | |
| | | | | | | | | | | | | | | | |
Total investment return (5) | | | 7.29 | %(6) | | | (0.04 | )% | | | 0.95 | % | | | 3.81 | %(6) |
| | | | | | | | | | | | | | | | |
|
| Supplemental Data and Ratios | |
Net assets, end of period (000’s) | | $ | 31,156 | | | $ | 13,980 | | | $ | 5,153 | | | $ | 12,464 | |
Ratio of total expenses (before reductions and reimbursements) to average net assets | | | 1.46 | %(8) | | | 1.72 | % | | | 1.74 | % | | | 2.27 | %(8) |
Ratio of net expenses to average net assets (7) | | | 0.97 | %(8)(9) | | | 1.05 | %(10) | | | 1.05 | %(10) | | | 1.05 | %(8)(10) |
Ratio of net investment income to average net assets | | | 4.81 | %(8) | | | 4.74 | % | | | 4.44 | % | | | 3.76 | %(8) |
Portfolio turnover rate | | | 44.23 | %(6) | | | 62.99 | % | | | 63.17 | % | | | 49.51 | %(6) |
| (2) | | Fund commenced operations on September 16, 2013. |
| (3) | | Calculated using average shares outstanding. |
| (4) | | Amount rounds to less than $.01 per share. |
| (5) | | Total investment return calculation does not consider the effects of sales loads and assumes the reinvestment of dividends at actual prices pursuant to the Fund’s dividend reinvestment plan. |
| (7) | | The Adviser has agreed to waive and/or reimburse certain fees and/or expense so that, on an annualized basis, such expenses incurred will not exceed 1.00% as a percentage of average daily net assets. |
| (8) | | Annualized for periods less than one full year. |
| (9) | | Net expenses reflect a one-time voluntary reimbursement to the Fund during the period in connection with a change to the fee waiver and/or expense reimbursement agreement. |
| (10) | | Net expenses reflect a previous fee waiver and/or expense reimbursement agreement. |
See accompanying Notes to the Financial Statements.
44
Barings Global Floating Rate Fund 2016 Semi-Annual Report
FINANCIAL HIGHLIGHTS (CONTINUED)
| | | | | | | | | | | | | | | | |
| | | CLASS C | |
| | | FOR THE
SIX MONTHS ENDED
DECEMBER 31, 2016 (1) | | | FOR THE
YEAR ENDED
JUNE 30, 2016 | | | FOR THE
YEAR ENDED
JUNE 30, 2015 | | | PERIOD FROM
SEPTEMBER 16, 2013
THROUGH
JUNE 30, 2014 (2) | |
|
| Per Common Share Data | |
Net asset value, beginning of period | | $ | 9.10 | | | $ | 9.57 | | | $ | 10.16 | | | $ | 10.00 | |
Income from investment operations: | |
Net investment income (3) | | | 0.21 | | | | 0.37 | | | | 0.35 | | | | 0.24 | |
Net realized and unrealized gain (loss) on investments | | | 0.42 | | | | (0.45 | ) | | | (0.33 | ) | | | 0.07 | |
| | | | | | | | | | | | | | | | |
Total increase (decrease) from investment operations | | | 0.63 | | | | (0.08 | ) | | | 0.02 | | | | 0.31 | |
| | | | | | | | | | | | | | | | |
Less dividends and distributions: | |
From net investment income | | | (0.20 | ) | | | (0.39 | ) | | | (0.60 | ) | | | (0.15 | ) |
From net realized gain | | | – | | | | – | | | | (0.01 | ) | | | – | |
| | | | | | | | | | | | | | | | |
Total dividends and distributions | | | (0.20 | ) | | | (0.39 | ) | | | (0.61 | ) | | | (0.15 | ) |
| | | | | | | | | | | | | | | | |
Redemption fees | | | 0.00 | | | | 0.00 | | | | 0.00 | (4) | | | 0.00 | |
| | | | | | | | | | | | | | | | |
Net asset value, at end of period | | $ | 9.53 | | | $ | 9.10 | | | $ | 9.57 | | | $ | 10.16 | |
| | | | | | | | | | | | | | | | |
Total investment return (5) | | | 6.93 | %(6) | | | (0.81 | )% | | | 0.30 | % | | | 3.15 | %(6) |
| | | | | | | | | | | | | | | | |
|
| Supplemental Data and Ratios | |
Net assets, end of period (000’s) | | $ | 8,158 | | | $ | 6,803 | | | $ | 5,461 | | | $ | 2,396 | |
Ratio of total expenses (before reductions and reimbursements) to average net assets | | | 2.33 | %(8) | | | 2.50 | % | | | 3.12 | % | | | 4.97 | %(8) |
Ratio of net expenses to average net assets (7) | | | 1.66 | %(8)(9) | | | 1.80 | %(10) | | | 1.80 | %(10) | | | 1.80 | %(8)(10) |
Ratio of net investment income to average net assets | | | 4.23 | %(8) | | | 4.04 | % | | | 3.60 | % | | | 3.07 | %(8) |
Portfolio turnover rate | | | 44.23 | %(6) | | | 62.99 | % | | | 63.17 | % | | | 49.51 | %(6) |
| (2) | | Fund commenced operations on September 16, 2013. |
| (3) | | Calculated using average shares outstanding. |
| (4) | | Amount rounds to less than $.01 per share. |
| (5) | | Total investment return calculation does not consider the effects of sales loads and assumes the reinvestment of dividends at actual prices pursuant to the Fund’s dividend reinvestment plan. |
| (7) | | The Adviser has agreed to waive and/or reimburse certain fees and/or expense so that, on an annualized basis, such expenses incurred will not exceed 1.75% as a percentage of average daily net assets. |
| (8) | | Annualized for periods less than one full year. |
| (9) | | Net expenses reflect a one-time voluntary reimbursement to the Fund during the period in connection with a change to the fee waiver and/or expense reimbursement agreement. |
| (10) | | Net expenses reflect a previous fee waiver and/or expense reimbursement agreement. |
See accompanying Notes to the Financial Statements.
45
Barings Global Floating Rate Fund 2016 Semi-Annual Report
FINANCIAL HIGHLIGHTS (CONTINUED)
| | | | | | | | | | | | | | | | |
| | | CLASS I | |
| | | FOR THE
SIX MONTHS ENDED
DECEMBER 31, 2016 (1) | | | FOR THE
YEAR ENDED
JUNE 30, 2016 | | | FOR THE
YEAR ENDED
JUNE 30, 2015 | | | PERIOD FROM
SEPTEMBER 16, 2013
THROUGH
JUNE 30, 2014 (2) | |
|
| Per Common Share Data | |
Net asset value, beginning of period | | $ | 9.15 | | | $ | 9.62 | | | $ | 10.21 | | | $ | 10.00 | |
Income from investment operations: | |
Net investment income (3) | | | 0.23 | | | | 0.47 | | | | 0.46 | | | | 0.30 | |
Net realized and unrealized gain (loss) on investments | | | 0.44 | | | | (0.45 | ) | | | (0.34 | ) | | | 0.10 | |
| | | | | | | | | | | | | | | | |
Total increase from investment operations | | | 0.67 | | | | 0.02 | | | | 0.12 | | | | 0.40 | |
| | | | | | | | | | | | | | | | |
Less dividends and distributions: | |
From net investment income | | | (0.24 | ) | | | (0.49 | ) | | | (0.70 | ) | | | (0.19 | ) |
From net realized gain | | | – | | | | – | | | | (0.01 | ) | | | – | |
| | | | | | | | | | | | | | | | |
Total dividends and distributions | | | (0.24 | ) | | | (0.49 | ) | | | (0.71 | ) | | | (0.19 | ) |
| | | | | | | | | | | | | | | | |
Redemption fees | | | 0.00 | | | | 0.00 | | | | 0.00 | (4) | | | 0.00 | |
| | | | | | | | | | | | | | | | |
Net asset value, at end of period | | $ | 9.58 | | | $ | 9.15 | | | $ | 9.62 | | | $ | 10.21 | |
| | | | | | | | | | | | | | | | |
Total investment return (5) | | | 7.44 | %(6) | | | 0.25 | % | | | 1.34 | % | | | 4.04 | %(6) |
| | | | | | | | | | | | | | | | |
|
| Supplemental Data and Ratios | |
Net assets, end of period (000’s) | | $ | 21,040 | | | $ | 19,903 | | | $ | 25,885 | | | $ | 32,772 | |
Ratio of total expenses (before reductions and reimbursements) to average net assets | | | 1.23 | %(8) | | | 1.29 | % | | | 1.31 | % | | | 1.52 | %(8) |
Ratio of net expenses to average net assets (7) | | | 0.75 | %(8) | | | 0.75 | % | | | 0.75 | % | | | 0.75 | %(8) |
Ratio of net investment income to average net assets | | | 5.17 | %(8) | | | 5.07 | % | | | 4.69 | % | | | 3.72 | %(8) |
Portfolio turnover rate | | | 44.23 | %(6) | | | 62.99 | % | | | 63.17 | % | | | 49.51 | %(6) |
| (2) | | Fund commenced operations on September 16, 2013. |
| (3) | | Calculated using average shares outstanding. |
| (4) | | Amount rounds to less than $.01 per share. |
| (5) | | Total investment return calculation assumes the reinvestment of dividends at actual prices pursuant to the Fund’s dividend reinvestment plan. |
| (7) | | The Adviser has agreed to waive and/or reimburse certain fees and/or expense so that, on an annualized basis, such expenses incurred will not exceed .75% as a percentage of average daily net assets. |
| (8) | | Annualized for periods less than one full year. |
See accompanying Notes to the Financial Statements.
46
Barings Global Floating Rate Fund 2016 Semi-Annual Report
FINANCIAL HIGHLIGHTS (CONTINUED)
| | | | | | | | | | | | | | | | |
| | | CLASS Y | |
| | | FOR THE
SIX MONTHS ENDED
DECEMBER 31, 2016 (1) | | | FOR THE
YEAR ENDED
JUNE 30, 2016 | | | FOR THE
YEAR ENDED
JUNE 30, 2015 | | | PERIOD FROM
SEPTEMBER 16, 2013
THROUGH
JUNE 30, 2014 (2) | |
|
| Per Common Share Data | |
Net asset value, beginning of period | | $ | 9.15 | | | $ | 9.62 | | | $ | 10.21 | | | $ | 10.00 | |
Income from investment operations: | |
Net investment income (3) | | | 0.20 | | | | 0.47 | | | | 0.45 | | | | 0.30 | |
Net realized and unrealized gain (loss) on investments | | | 0.46 | | | | (0.45 | ) | | | (0.33 | ) | | | 0.10 | |
| | | | | | | | | | | | | | | | |
Total increase from investment operations | | | 0.66 | | | | 0.02 | | | | 0.12 | | | | 0.40 | |
| | | | | | | | | | | | | | | | |
Less dividends and distributions: | |
From net investment income | | | (0.24 | ) | | | (0.49 | ) | | | (0.70 | ) | | | (0.19 | ) |
From net realized gain | | | – | | | | – | | | | (0.01 | ) | | | – | |
| | | | | | | | | | | | | | | | |
Total dividends and distributions | | | (0.24 | ) | | | (0.49 | ) | | | (0.71 | ) | | | (0.19 | ) |
| | | | | | | | | | | | | | | | |
Redemption fees | | | 0.00 | | | | 0.00 | | | | 0.00 | (4) | | | 0.00 | |
| | | | | | | | | | | | | | | | |
Net asset value, at end of period | | $ | 9.57 | | | $ | 9.15 | | | $ | 9.62 | | | $ | 10.21 | |
| | | | | | | | | | | | | | | | |
Total investment return (5) | | | 7.43 | %(6) | | | 0.22 | % | | | 1.28 | % | | | 4.04 | %(6) |
| | | | | | | | | | | | | | | | |
|
| Supplemental Data and Ratios | |
Net assets, end of period (000’s) | | $ | 100,093 | | | $ | 125,957 | | | $ | 129,659 | | | $ | 66,999 | |
Ratio of total expenses (before reductions and reimbursements) to average net assets | | | 1.22 | %(8) | | | 1.27 | % | | | 1.25 | % | | | 1.53 | %(8) |
Ratio of net expenses to average net assets (7) | | | 0.75 | %(8) | | | 0.75 | % | | | 0.75 | % | | | 0.75 | %(8) |
Ratio of net investment income to average net assets | | | 5.17 | %(8) | | | 5.08 | % | | | 4.58 | % | | | 3.80 | %(8) |
Portfolio turnover rate | | | 44.23 | %(6) | | | 62.99 | % | | | 63.17 | % | | | 49.51 | %(6) |
| (2) | | Fund commenced operations on September 16, 2013. |
| (3) | | Calculated using average shares outstanding. |
| (4) | | Amount rounds to less than $.01 per share. |
| (5) | | Total investment return calculation assumes the reinvestment of dividends at actual prices pursuant to the Fund’s dividend reinvestment plan. |
| (7) | | The Adviser has agreed to waive and/or reimburse certain fees and/or expense so that, on an annualized basis, such expenses incurred will not exceed .75% as a percentage of average daily net assets. |
| (8) | | Annualized for periods less than one full year. |
See accompanying Notes to the Financial Statements.
47
Barings Global Credit Income Opportunities Fund 2016 Semi-Annual Report
FINANCIAL HIGHLIGHTS
| | | | | | | | | | | | | | | | |
| | | CLASS A | |
| | | FOR THE
SIX MONTHS ENDED
DECEMBER 31, 2016 (1) | | | FOR THE
YEAR ENDED
JUNE 30, 2016 | | | FOR THE
YEAR ENDED
JUNE 30, 2015 | | | PERIOD FROM
SEPTEMBER 16, 2013
THROUGH
JUNE 30, 2014 (2) | |
|
| Per Common Share Data | |
Net asset value, beginning of period | | $ | 8.80 | | | $ | 9.51 | | | $ | 10.45 | | | $ | 10.00 | |
Income from investment operations: | |
Net investment income (3) | | | 0.27 | | | | 0.56 | | | | 0.54 | | | | 0.40 | |
Net realized and unrealized gain (loss) on investments | | | 0.58 | | | | (0.66 | ) | | | (0.57 | ) | | | 0.33 | |
| | | | | | | | | | | | | | | | |
Total increase (decrease) from investment operations | | | 0.85 | | | | (0.10 | ) | | | (0.03 | ) | | | 0.73 | |
| | | | | | | | | | | | | | | | |
Less dividends and distributions: | |
From net investment income | | | (0.29 | ) | | | (0.61 | ) | | | (0.78 | ) | | | (0.28 | ) |
From net realized gain | | | – | | | | – | | | | (0.13 | ) | | | – | |
| | | | | | | | | | | | | | | | |
Total dividends and distributions | | | (0.29 | ) | | | (0.61 | ) | | | (0.91 | ) | | | (0.28 | ) |
| | | | | | | | | | | | | | | | |
Redemption fees | | | 0.00 | | | | 0.00 | | | | 0.00 | (4) | | | 0.00 | |
| | | | | | | | | | | | | | | | |
Net asset value, at end of period | | $ | 9.36 | | | $ | 8.80 | | | $ | 9.51 | | | $ | 10.45 | |
| | | | | | | | | | | | | | | | |
Total investment return (5) | | | 9.73 | %(6) | | | (0.84 | )% | | | (0.11 | )% | | | 7.30 | %(6) |
| | | | | | | | | | | | | | | | |
|
| Supplemental Data and Ratios | |
Net assets, end of period (000’s) | | $ | 21,927 | | | $ | 12,340 | | | $ | 12,718 | | | $ | 2,591 | |
Ratio of total expenses (before reductions and reimbursements) to average net assets | | | 1.59 | %(8) | | | 1.90 | % | | | 1.98 | % | | | 3.95 | %(8) |
Ratio of net expenses to average net assets (7) | | | 1.20 | %(8) | | | 1.20 | % | | | 1.20 | % | | | 1.20 | %(8) |
Ratio of net investment income to average net assets | | | 6.15 | %(8) | | | 6.28 | % | | | 5.46 | % | | | 4.88 | %(8) |
Portfolio turnover rate | | | 21.74 | %(6) | | | 58.08 | % | | | 84.65 | % | | | 99.72 | %(6) |
| (2) | | Fund commenced operations on September 16, 2013. |
| (3) | | Calculated using average shares outstanding. |
| (4) | | Amount rounds to less than $.01 per share. |
| (5) | | Total investment return calculation does not consider the effects of sales loads and assumes the reinvestment of dividends at actual prices pursuant to the Fund’s dividend reinvestment plan. |
| (7) | | The Adviser has agreed to waive and/or reimburse certain fees and/or expense so that, on an annualized basis, such expenses incurred will not exceed 1.20% as a percentage of average daily net assets. |
| (8) | | Annualized for periods less than one full year. |
See accompanying Notes to the Financial Statements.
48
Barings Global Credit Income Opportunities Fund 2016 Semi-Annual Report
FINANCIAL HIGHLIGHTS (CONTINUED)
| | | | | | | | | | | | | | | | |
| | | CLASS C | |
| | | FOR THE
SIX MONTHS ENDED
DECEMBER 31, 2016 (1) | | | FOR THE
YEAR ENDED
JUNE 30, 2016 | | | FOR THE
YEAR ENDED
JUNE 30, 2015 | | | PERIOD FROM
SEPTEMBER 16, 2013
THROUGH
JUNE 30, 2014 (2) | |
| | | | |
| Per Common Share Data | | | | | | | | | | | | | | | | |
Net asset value, beginning of period | | $ | 8.79 | | | $ | 9.50 | | | $ | 10.45 | | | $ | 10.00 | |
Income from investment operations: | | | | | | | | | | | | | | | | |
Net investment income (3) | | | 0.29 | | | | 0.49 | | | | 0.47 | | | | 0.35 | |
Net realized and unrealized gain (loss) on investments | | | 0.52 | | | | (0.65 | ) | | | (0.58 | ) | | | 0.32 | |
| | | | | | | | | | | | | | | | |
Total increase (decrease) from investment operations | | | 0.81 | | | | (0.16 | ) | | | (0.11 | ) | | | 0.67 | |
| | | | | | | | | | | | | | | | |
Less dividends and distributions: | | | | | | | | | | | | | | | | |
From net investment income | | | (0.25 | ) | | | (0.55 | ) | | | (0.71 | ) | | | (0.22 | ) |
From net realized gain | | | – | | | | – | | | | (0.13 | ) | | | – | |
| | | | | | | | | | | | | | | | |
Total dividends and distributions | | | (0.25 | ) | | | (0.55 | ) | | | (0.84 | ) | | | (0.22 | ) |
| | | | | | | | | | | | | | | | |
Redemption fees | | | 0.00 | | | | 0.00 | | | | 0.00 | (4) | | | 0.00 | |
| | | | | | | | | | | | | | | | |
Net asset value, at end of period | | $ | 9.35 | | | $ | 8.79 | | | $ | 9.50 | | | $ | 10.45 | |
| | | | | | | | | | | | | | | | |
Total investment return (5) | | | 9.31 | %(6) | | | (1.59 | )% | | | (0.93 | )% | | | 6.75 | %(6) |
| | | | | | | | | | | | | | | | |
| | | | |
| Supplemental Data and Ratios | | | | | | | | | | | | | | | | |
Net assets, end of period (000’s) | | $ | 4,586 | | | $ | 3,578 | | | $ | 3,579 | | | $ | 944 | |
Ratio of total expenses (before reductions and reimbursements) to average net assets | | | 2.44 | %(8) | | | 2.91 | % | | | 4.09 | % | | | 10.50 | %(8) |
Ratio of net expenses to average net assets (7) | | | 1.95 | %(8) | | | 1.95 | % | | | 1.95 | % | | | 1.95 | %(8) |
Ratio of net investment income to average net assets | | | 5.45 | %(8) | | | 5.50 | % | | | 4.79 | % | | | 4.39 | %(8) |
Portfolio turnover rate | | | 21.74 | %(6) | | | 58.08 | % | | | 84.65 | % | | | 99.72 | %(6) |
| (2) | | Fund commenced operations on September 16, 2013. |
| (3) | | Calculated using average shares outstanding. |
| (4) | | Amount rounds to less than $.01 per share. |
| (5) | | Total investment return calculation does not consider the effects of sales loads and assumes the reinvestment of dividends at actual prices pursuant to the Fund’s dividend reinvestment plan. |
| (7) | | The Adviser has agreed to waive and/or reimburse certain fees and/or expense so that, on an annualized basis, such expenses incurred will not exceed 1.95% as a percentage of average daily net assets. |
| (8) | | Annualized for periods less than one full year. |
See accompanying Notes to the Financial Statements.
49
Barings Global Credit Income Opportunities Fund 2016 Semi-Annual Report
FINANCIAL HIGHLIGHTS (CONTINUED)
| | | | | | | | | | | | | | | | |
| | | CLASS I | |
| | | FOR THE
SIX MONTHS ENDED
DECEMBER 31, 2016 (1) | | | FOR THE
YEAR ENDED
JUNE 30, 2016 | | | FOR THE
YEAR ENDED
JUNE 30, 2015 | | | PERIOD FROM
SEPTEMBER 16, 2013
THROUGH
JUNE 30, 2014 (2) | |
| | | | |
| Per Common Share Data | | | | | | | | | | | | | | | | |
Net asset value, beginning of period | | $ | 8.80 | | | $ | 9.51 | | | $ | 10.46 | | | $ | 10.00 | |
Income from investment operations: | | | | | | | | | | | | | | | | |
Net investment income (3) | | | 0.30 | | | | 0.58 | | | | 0.56 | | | | 0.41 | |
Net realized and unrealized gain (loss) on investments | | | 0.56 | | | | (0.65 | ) | | | (0.58 | ) | | | 0.35 | |
| | | | | | | | | | | | | | | | |
Total increase (decrease) from investment operations | | | 0.86 | | | | (0.07 | ) | | | (0.02 | ) | | | 0.76 | |
| | | | | | | | | | | | | | | | |
Less dividends and distributions: | | | | | | | | | | | | | | | | |
From net investment income | | | (0.30 | ) | | | (0.64 | ) | | | (0.80 | ) | | | (0.30 | ) |
From net realized gain | | | – | | | | – | | | | (0.13 | ) | | | – | |
| | | | | | | | | | | | | | | | |
Total dividends and distributions | | | (0.30 | ) | | | (0.64 | ) | | | (0.93 | ) | | | (0.30 | ) |
| | | | | | | | | | | | | | | | |
Redemption fees | | | 0.00 | | | | 0.00 | | | | 0.00 | (4) | | | 0.00 | |
| | | | | | | | | | | | | | | | |
Net asset value, at end of period | | $ | 9.36 | | | $ | 8.80 | | | $ | 9.51 | | | $ | 10.46 | |
| | | | | | | | | | | | | | | | |
Total investment return (5) | | | 9.86 | %(6) | | | (0.61 | )% | | | 0.05 | % | | | 7.59 | %(6) |
| | | | | | | | | | | | | | | | |
| | | | |
| Supplemental Data and Ratios | | | | | | | | | | | | | | | | |
Net assets, end of period (000’s) | | $ | 26,272 | | | $ | 24,689 | | | $ | 26,428 | | | $ | 26,406 | |
Ratio of total expenses (before reductions and reimbursements) to average net assets | | | 1.30 | %(8) | | | 1.54 | % | | | 1.58 | % | | | 1.83 | %(8) |
Ratio of net expenses to average net assets (7) | | | 0.95 | %(8) | | | 0.95 | % | | | 0.95 | % | | | 0.95 | %(8) |
Ratio of net investment income to average net assets | | | 6.49 | %(8) | | | 6.54 | % | | | 5.69 | % | | | 5.02 | %(8) |
Portfolio turnover rate | | | 21.74 | %(6) | | | 58.08 | % | | | 84.65 | % | | | 99.72 | %(6) |
| (2) | | Fund commenced operations on September 16, 2013. |
| (3) | | Calculated using average shares outstanding. |
| (4) | | Amount rounds to less than $.01 per share. |
| (5) | | Total investment return calculation assumes the reinvestment of dividends at actual prices pursuant to the Fund���s dividend reinvestment plan. |
| (7) | | The Adviser has agreed to waive and/or reimburse certain fees and/or expense so that, on an annualized basis, such expenses incurred will not exceed .95% as a percentage of average daily net assets. |
| (8) | | Annualized for periods less than one full year. |
See accompanying Notes to the Financial Statements.
50
Barings Global Credit Income Opportunities Fund 2016 Semi-Annual Report
FINANCIAL HIGHLIGHTS (CONTINUED)
| | | | | | | | | | | | | | | | |
| | | CLASS Y | |
| | | FOR THE
SIX MONTHS ENDED
DECEMBER 31, 2016 (1) | | | FOR THE
YEAR ENDED
JUNE 30, 2016 | | | FOR THE
YEAR ENDED
JUNE 30, 2015 | | | PERIOD FROM
SEPTEMBER 16, 2013
THROUGH
JUNE 30, 2014 (2) | |
|
| Per Common Share Data | |
Net asset value, beginning of period | | $ | 8.80 | | | $ | 9.51 | | | $ | 10.46 | | | $ | 10.00 | |
Income from investment operations: | |
Net investment income (3) | | | 0.31 | | | | 0.59 | | | | 0.56 | | | | 0.41 | |
Net realized and unrealized gain (loss) on investments | | | 0.55 | | | | (0.66 | ) | | | (0.58 | ) | | | 0.35 | |
| | | | | | | | | | | | | | | | |
Total increase (decrease) from investment operations | | | 0.86 | | | | (0.07 | ) | | | (0.02 | ) | | | 0.76 | |
| | | | | | | | | | | | | | | | |
Less dividends and distributions: | |
From net investment income | | | (0.30 | ) | | | (0.64 | ) | | | (0.80 | ) | | | (0.30 | ) |
From net realized gain | | | – | | | | – | | | | (0.13 | ) | | | – | |
| | | | | | | | | | | | | | | | |
Total dividends and distributions | | | (0.30 | ) | | | (0.64 | ) | | | (0.93 | ) | | | (0.30 | ) |
| | | | | | | | | | | | | | | | |
Redemption fees | | | 0.00 | | | | 0.00 | | | | 0.00 | (4) | | | 0.00 | |
| | | | | | | | | | | | | | | | |
Net asset value, at end of period | | $ | 9.36 | | | $ | 8.80 | | | $ | 9.51 | | | $ | 10.46 | |
| | | | | | | | | | | | | | | | |
Total investment return (5) | | | 9.86 | %(6) | | | (0.61 | )% | | | 0.05 | % | | | 7.59 | %(6) |
| | | | | | | | | | | | | | | | |
|
| Supplemental Data and Ratios | |
Net assets, end of period (000’s) | | $ | 70,136 | | | $ | 58,312 | | | $ | 39,006 | | | $ | 33,885 | |
Ratio of total expenses (before reductions and reimbursements) to average net assets | | | 1.30 | %(8) | | | 1.55 | % | | | 1.58 | % | | | 1.84 | %(8) |
Ratio of net expenses to average net assets (7) | | | 0.95 | %(8) | | | 0.95 | % | | | 0.95 | % | | | 0.95 | %(8) |
Ratio of net investment income to average net assets | | | 6.47 | %(8) | | | 6.56 | % | | | 5.67 | % | | | 5.04 | %(8) |
Portfolio turnover rate | | | 21.74 | %(6) | | | 58.08 | % | | | 84.65 | % | | | 99.72 | %(6) |
| (2) | | Fund commenced operations on September 16, 2013. |
| (3) | | Calculated using average shares outstanding. |
| (4) | | Amount rounds to less than $.01 per share. |
| (5) | | Total investment return calculation assumes the reinvestment of dividends at actual prices pursuant to the Fund’s dividend reinvestment plan. |
| (7) | | The Adviser has agreed to waive and/or reimburse certain fees and/or expense so that, on an annualized basis, such expenses incurred will not exceed .95% as a percentage of average daily net assets. |
| (8) | | Annualized for periods less than one full year. |
See accompanying Notes to the Financial Statements.
51
Barings Active Short Duration Bond Fund 2016 Semi-Annual Report
FINANCIAL HIGHLIGHTS
| | | | | | | | |
| | | CLASS A | |
| | | FOR THE
SIX MONTHS ENDED
DECEMBER 31, 2016 (1) | | | PERIOD FROM
JULY 8, 2015
THROUGH
JUNE 30, 2016 (2) | |
|
| Per Common Share Data | |
Net asset value, beginning of period | | $ | 9.98 | | | $ | 10.00 | |
Income from investment operations: | |
Net investment income (3) | | | 0.08 | | | | 0.15 | |
Net realized and unrealized loss on investments | | | (0.04 | ) | | | (0.03 | )(4) |
| | | | | | | | |
Total increase from investment operations | | | 0.04 | | | | 0.12 | |
| | | | | | | | |
Less dividends and distributions: | |
From net investment income | | | (0.08 | ) | | | (0.14 | ) |
From net realized gain | | | (0.00 | )(5) | | | – | |
| | | | | | | | |
Total dividends and distributions | | | (0.08 | ) | | | (0.14 | ) |
| | | | | | | | |
Net asset value, at end of period | | $ | 9.94 | | | $ | 9.98 | |
| | | | | | | | |
Total investment return (6) | | | 0.42 | %(7) | | | 1.17 | %(7) |
| | | | | | | | |
|
| Supplemental Data and Ratios | |
Net assets, end of period (000’s) | | $ | 94,343 | | | $ | 39,992 | |
Ratio of total expenses (before reductions and reimbursements) to average net assets | | | 0.97 | %(9) | | | 1.18 | %(9) |
Ratio of net expenses to average net assets (8) | | | 0.65 | %(9) | | | 0.65 | %(9) |
Ratio of net investment income to average net assets | | | 1.53 | %(9) | | | 1.51 | %(9) |
Portfolio turnover rate | | | 59.76 | %(7) | | | 218.67 | %(7) |
| (2) | | Fund commenced operations on July 8, 2015. |
| (3) | | Calculated using average shares outstanding. |
| (4) | | The per share amount varies from the net realized and unrealized gain/loss for the period because of the timing of sales of fund shares and the per share amount of realized and unrealized gains and losses at such time. |
| (5) | | Amount rounds to less than $.01 per share. |
| (6) | | Total investment return calculation assumes the reinvestment of dividends at actual prices pursuant to the Fund’s dividend reinvestment plan. |
| (8) | | The Adviser has agreed to waive and/or reimburse certain fees and/or expense so that, on an annualized basis, such expenses incurred will not exceed .65% as a percentage of average daily net assets. |
| (9) | | Annualized for periods less than one full year. |
See accompanying Notes to the Financial Statements.
52
Barings Active Short Duration Bond Fund 2016 Semi-Annual Report
FINANCIAL HIGHLIGHTS (CONTINUED)
| | | | | | | | |
| | | CLASS C | |
| | | FOR THE
SIX MONTHS ENDED
DECEMBER 31, 2016 (1) | | | PERIOD FROM
JULY 8, 2015
THROUGH
JUNE 30, 2016 (2) | |
|
| Per Common Share Data | |
Net asset value, beginning of period | | $ | 9.97 | | | $ | 10.00 | |
Income from investment operations: | |
Net investment income (3) | | | 0.12 | | | | 0.07 | |
Net realized and unrealized loss on investments | | | (0.04 | ) | | | (0.03 | )(4) |
| | | | | | | | |
Total increase from investment operations | | | 0.08 | | | | 0.04 | |
| | | | | | | | |
Less dividends and distributions: | |
From net investment income | | | (0.12 | ) | | | (0.07 | ) |
From net realized gain | | | (0.00 | )(5) | | | – | |
| | | | | | | | |
Total dividends and distributions | | | (0.12 | ) | | | (0.07 | ) |
| | | | | | | | |
Net asset value, at end of period | | $ | 9.93 | | | $ | 9.97 | |
| | | | | | | | |
Total investment return (6) | | | 0.84 | %(7)(8) | | | 0.39 | %(7)(9) |
| | | | | | | | |
|
| Supplemental Data and Ratios | |
Net assets, end of period (000’s) | | $ | 268 | | | $ | 257 | |
Ratio of total expenses (before reductions and reimbursements) to average net assets | | | 2.51 | %(8)(11) | | | 5.44 | %(9)(11) |
Ratio of net expenses to average net assets (10) | | | (0.15 | )%(8)(11) | | | 1.40 | %(9)(11) |
Ratio of net investment income to average net assets | | | 2.35 | %(8)(11) | | | 0.71 | %(9)(11) |
Portfolio turnover rate | | | 59.76 | %(7) | | | 218.67 | %(7) |
| (2) | | Fund commenced operations on July 8, 2015. |
| (3) | | Calculated using average shares outstanding. |
| (4) | | The per share amount varies from the net realized and unrealized gain/loss for the period because of the timing of sales of fund shares and the per share amount of realized and unrealized gains and losses at such time. |
| (5) | | Amount rounds to less than $.01 per share. |
| (6) | | Total investment return calculation assumes the reinvestment of dividends at actual prices pursuant to the Fund’s dividend reinvestment plan. |
| (8) | | Expenses shown reflect a reimbursement to the Fund during the period for an overaccrual of 12b-1 fees made during and prior to the period. |
| (9) | | Expenses shown reflect an overaccrual of 12b-1 fees for the period of $1,478 or 0.50% of average net assets over the period. Subsequent to the period, the Fund was reimbursed for the overaccrued amount. |
| (10) | | The Adviser has agreed to waive and/or reimburse certain fees and/or expense so that, on an annualized basis, such expenses incurred will not exceed 0.90% as a percentage of average daily net assets. |
| (11) | | Annualized for periods less than one full year. |
See accompanying Notes to the Financial Statements.
53
Barings Active Short Duration Bond Fund 2016 Semi-Annual Report
FINANCIAL HIGHLIGHTS (CONTINUED)
| | | | | | | | |
| | | CLASS I | |
| | | FOR THE
SIX MONTHS ENDED
DECEMBER 31, 2016 (1) | | | PERIOD FROM
JULY 8, 2015
THROUGH
JUNE 30, 2016 (2) | |
|
| Per Common Share Data | |
Net asset value, beginning of period | | $ | 9.97 | | | $ | 10.00 | |
Income from investment operations: | |
Net investment income (3) | | | 0.09 | | | | 0.16 | |
Net realized and unrealized loss on investments | | | (0.03 | ) | | | (0.03 | )(4) |
| | | | | | | | |
Total increase from investment operations | | | 0.06 | | | | 0.13 | |
| | | | | | | | |
Less dividends and distributions: | |
From net investment income | | | (0.09 | ) | | | (0.16 | ) |
From net realized gain | | | (0.00 | )(5) | | | — | |
| | | | | | | | |
Total dividends and distributions | | | (0.09 | ) | | | (0.16 | ) |
| | | | | | | | |
Net asset value, at end of period | | $ | 9.94 | | | $ | 9.97 | |
| | | | | | | | |
Total investment return (6) | | | 0.62 | %(7) | | | 1.35 | %(7) |
| | | | | | | | |
|
| Supplemental Data and Ratios | |
Net assets, end of period (000’s) | | $ | 99 | | | $ | 5,971 | |
Ratio of total expenses (before reductions and reimbursements) to average net assets | | | 1.37 | %(9) | | | 0.96 | %(9) |
Ratio of net expenses to average net assets (8) | | | 0.40 | %(9) | | | 0.44 | %(9) |
Ratio of net investment income to average net assets | | | 1.82 | %(9) | | | 1.67 | %(9) |
Portfolio turnover rate | | | 59.76 | %(7) | | | 218.67 | %(7) |
| (2) | | Fund commenced operations on July 8, 2015. |
| (3) | | Calculated using average shares outstanding. |
| (4) | | The per share amount varies from the net realized and unrealized gain/loss for the period because of the timing of sales of fund shares and the per share amount of realized and unrealized gains and losses at such time. |
| (5) | | Amount rounds to less than $.01 per share. |
| (6) | | Total investment return calculation assumes the reinvestment of dividends at actual prices pursuant to the Fund’s dividend reinvestment plan. |
| (8) | | The Adviser has agreed to waive and/or reimburse certain fees and/or expense so that, on an annualized basis, such expenses incurred will not exceed .40% as a percentage of average daily net assets. |
| (9) | | Annualized for periods less than one full year. |
See accompanying Notes to the Financial Statements.
54
Barings Active Short Duration Bond Fund 2016 Semi-Annual Report
FINANCIAL HIGHLIGHTS (CONTINUED)
| | | | | | | | |
| | | CLASS Y | |
| | | FOR THE
SIX MONTHS ENDED
DECEMBER 31, 2016 (1) | | | PERIOD FROM
JULY 8, 2015
THROUGH
JUNE 30, 2016 (2) | |
|
| Per Common Share Data | |
Net asset value, beginning of period | | $ | 9.97 | | | $ | 10.00 | |
Income from investment operations: | |
Net investment income (3) | | | 0.09 | | | | 0.17 | |
Net realized and unrealized loss on investments | | | (0.04 | ) | | | (0.04 | )(4) |
| | | | | | | | |
Total increase from investment operations | | | 0.05 | | | | 0.13 | |
| | | | | | | | |
Less dividends and distributions: | |
From net investment income | | | (0.09 | ) | | | (0.16 | ) |
From net realized gain | | | (0.00 | )(5) | | | – | |
| | | | | | | | |
Total dividends and distributions | | | (0.09 | ) | | | (0.16 | ) |
| | | | | | | | |
Net asset value, at end of period | | $ | 9.93 | | | $ | 9.97 | |
| | | | | | | | |
Total investment return (6) | | | 0.57 | %(7) | | | 1.36 | %(7) |
| | | | | | | | |
|
| Supplemental Data and Ratios | |
Net assets, end of period (000’s) | | $ | 153,506 | | | $ | 109,645 | |
Ratio of total expenses (before reductions and reimbursements) to average net assets | | | 0.74 | %(9) | | | 0.87 | %(9) |
Ratio of net expenses to average net assets (8) | | | 0.40 | %(9) | | | 0.41 | %(9) |
Ratio of net investment income to average net assets | | | 1.79 | %(9) | | | 1.73 | %(9) |
Portfolio turnover rate | | | 59.76 | %(7) | | | 218.67 | %(7) |
| (2) | | Fund commenced operations on July 8, 2015. |
| (3) | | Calculated using average shares outstanding. |
| (4) | | The per share amount varies from the net realized and unrealized gain/loss for the period because of the timing of sales of fund shares and the per share amount of realized and unrealized gains and losses at such time. |
| (5) | | Amount rounds to less than $.01 per share. |
| (6) | | Total investment return calculation assumes the reinvestment of dividends at actual prices pursuant to the Fund’s dividend reinvestment plan. |
| (8) | | The Adviser has agreed to waive and/or reimburse certain fees and/or expense so that, on an annualized basis, such expenses incurred will not exceed .40% as a percentage of average daily net assets. |
| (9) | | Annualized for periods less than one full year. |
See accompanying Notes to the Financial Statements.
55
Barings Total Return Bond Fund 2016 Semi-Annual Report
FINANCIAL HIGHLIGHTS
| | | | | | | | |
| | | CLASS A | |
| | | FOR THE
SIX MONTHS ENDED
DECEMBER 31, 2016 (1) | | | PERIOD FROM
JULY 8, 2015
THROUGH
JUNE 30, 2016 (2) | |
|
| Per Common Share Data | |
Net asset value, beginning of period | | $ | 10.18 | | | $ | 10.00 | |
Income from investment operations: | |
Net investment income (3) | | | 0.14 | | | | 0.25 | |
Net realized and unrealized gain (loss) on investments | | | (0.27 | ) | | | 0.20 | |
| | | | | | | | |
Total increase (decrease) from investment operations | | | (0.13 | ) | | | 0.45 | |
| | | | | | | | |
Less dividends and distributions: | |
From net investment income | | | (0.14 | ) | | | (0.25 | ) |
From net realized gain | | | – | | | | (0.02 | ) |
| | | | | | | | |
Total dividends and distributions | | | (0.14 | ) | | | (0.27 | ) |
| | | | | | | | |
Net asset value, at end of period | | $ | 9.91 | | | $ | 10.18 | |
| | | | | | | | |
Total investment return (4) | | | (1.38 | )%(5) | | | 4.63 | %(5) |
| | | | | | | | |
|
| Supplemental Data and Ratios | |
Net assets, end of period (000’s) | | $ | 220 | | | $ | 211 | |
Ratio of total expenses (before reductions and reimbursements) to average net assets | | | 3.57 | %(7) | | | 5.60 | %(7) |
Ratio of net expenses to average net assets (6)(8) | | | 0.80 | %(7) | | | 0.80 | %(7) |
Ratio of net investment income to average net assets | | | 2.68 | %(7) | | | 2.52 | %(7) |
Portfolio turnover rate | | | 125.07 | %(5) | | | 434.37 | %(5) |
| (2) | | Fund commenced operations on July 8, 2015. |
| (3) | | Calculated using average shares outstanding. |
| (4) | | Total investment return calculation does not consider the effects of sales loads and assumes the reinvestment of dividends at actual prices pursuant to the Fund’s dividend reinvestment plan. |
| (6) | | The Adviser has agreed to waive and/or reimburse certain fees and/or expense so that, on an annualized basis, such expenses incurred will not exceed .80% as a percentage of average daily net assets. |
| (7) | | Annualized for periods less than one full year. |
| (8) | | Ratio of net expenses to average net assets does not include expenses of the underlying fund in which the Fund invests. |
See accompanying Notes to the Financial Statements.
56
Barings Total Return Bond Fund 2016 Semi-Annual Report
FINANCIAL HIGHLIGHTS (CONTINUED)
| | | | | | | | |
| | | CLASS C | |
| | | FOR THE
SIX MONTHS ENDED
DECEMBER 31, 2016 (1) | | | PERIOD FROM
JULY 8, 2015
THROUGH
JUNE 30, 2016 (2) | |
| | |
| Per Common Share Data | | | | | | | | |
Net asset value, beginning of period | | $ | 10.18 | | | $ | 10.00 | |
Income from investment operations: | | | | | | | | |
Net investment income (3) | | | 0.10 | | | | 0.17 | |
Net realized and unrealized gain (loss) on investments | | | (0.27 | ) | | | 0.21 | |
| | | | | | | | |
Total increase (decrease) from investment operations | | | (0.17 | ) | | | 0.38 | |
| | | | | | | | |
Less dividends and distributions: | |
From net investment income | | | (0.10 | ) | | | (0.18 | ) |
From net realized gain | | | – | | | | (0.02 | ) |
| | | | | | | | |
Total dividends and distributions | | | (0.10 | ) | | | (0.20 | ) |
| | | | | | | | |
Net asset value, at end of period | | $ | 9.91 | | | $ | 10.18 | |
| | | | | | | | |
Total investment return (4) | | | (1.75 | )%(5) | | | 3.87 | %(5) |
| | | | | | | | |
|
| Supplemental Data and Ratios | |
Net assets, end of period (000’s) | | $ | 199 | | | $ | 204 | |
Ratio of total expenses (before reductions and reimbursements) to average net assets | | | 4.47 | %(7) | | | 6.38 | %(7) |
Ratio of net expenses to average net assets (6)(8) | | | 1.55 | %(7) | | | 1.55 | %(7) |
Ratio of net investment income to average net assets | | | 1.92 | %(7) | | | 1.77 | %(7) |
Portfolio turnover rate | | | 125.07 | %(5) | | | 434.37 | %(5) |
| (2) | | Fund commenced operations on July 8, 2015. |
| (3) | | Calculated using average shares outstanding. |
| (4) | | Total investment return calculation does not consider the effects of sales loads and assumes the reinvestment of dividends at actual prices pursuant to the Fund’s dividend reinvestment plan. |
| (6) | | The Adviser has agreed to waive and/or reimburse certain fees and/or expense so that, on an annualized basis, such expenses incurred will not exceed 1.55% as a percentage of average daily net assets. |
| (7) | | Annualized for periods less than one full year. |
| (8) | | Ratio of net expenses to average net assets does not include expenses of the underlying fund in which the Fund invests. |
See accompanying Notes to the Financial Statements.
57
Barings Total Return Bond Fund 2016 Semi-Annual Report
FINANCIAL HIGHLIGHTS (CONTINUED)
| | | | | | | | |
| | | CLASS I | |
| | | FOR THE
SIX MONTHS ENDED
DECEMBER 31, 2016 (1) | | | PERIOD FROM
JULY 8, 2015
THROUGH
JUNE 30, 2016 (2) | |
| | |
| Per Common Share Data | | | | | | | | |
Net asset value, beginning of period | | $ | 10.18 | | | $ | 10.00 | |
Income from investment operations: | | | | | | | | |
Net investment income (3) | | | 0.15 | | | | 0.27 | |
Net realized and unrealized gain (loss) on investments | | | (0.27 | ) | | | 0.20 | |
| | | | | | | | |
Total increase (decrease) from investment operations | | | (0.12 | ) | | | 0.47 | |
| | | | | | | | |
Less dividends and distributions: | |
From net investment income | | | (0.15 | ) | | | (0.27 | ) |
From net realized gain | | | – | | | | (0.02 | ) |
| | | | | | | | |
Total dividends and distributions | | | (0.15 | ) | | | (0.29 | ) |
| | | | | | | | |
Net asset value, at end of period | | $ | 9.91 | | | $ | 10.18 | |
| | | | | | | | |
Total investment return (4) | | | (1.25 | )%(5) | | | 4.89 | %(5) |
| | | | | | | | |
|
| Supplemental Data and Ratios | |
Net assets, end of period (000’s) | | $ | 12,242 | | | $ | 12,582 | |
Ratio of total expenses (before reductions and reimbursements) to average net assets | | | 1.29 | %(7) | | | 1.37 | %(7) |
Ratio of net expenses to average net assets (6)(8) | | | 0.55 | %(7) | | | 0.55 | %(7) |
Ratio of net investment income to average net assets | | | 2.92 | %(7) | | | 2.77 | %(7) |
Portfolio turnover rate | | | 125.07 | %(5) | | | 434.37 | %(5) |
| (2) | | Fund commenced operations on July 8, 2015. |
| (3) | | Calculated using average shares outstanding. |
| (4) | | Total investment return calculation assumes the reinvestment of dividends at actual prices pursuant to the Fund’s dividend reinvestment plan. |
| (6) | | The Adviser has agreed to waive and/or reimburse certain fees and/or expense so that, on an annualized basis, such expenses incurred will not exceed .55% as a percentage of average daily net assets. |
| (7) | | Annualized for periods less than one full year. |
| (8) | | Ratio of net expenses to average net assets does not include expenses of the underlying fund in which the Fund invests. |
See accompanying Notes to the Financial Statements.
58
Barings Total Return Bond Fund 2016 Semi-Annual Report
FINANCIAL HIGHLIGHTS (CONTINUED)
| | | | | | | | |
| | | CLASS Y | |
| | | FOR THE
SIX MONTHS ENDED
DECEMBER 31, 2016 (1) | | | PERIOD FROM
JULY 8, 2015
THROUGH
JUNE 30, 2016 (2) | |
| | |
| Per Common Share Data | | | | | | | | |
Net asset value, beginning of period | | $ | 10.18 | | | $ | 10.00 | |
Income from investment operations: | | | | | | | | |
Net investment income (3) | | | 0.15 | | | | 0.27 | |
Net realized and unrealized gain (loss) on investments | | | (0.27 | ) | | | 0.20 | |
| | | | | | | | |
Total increase (decrease) from investment operations | | | (0.12 | ) | | | 0.47 | |
| | | | | | | | |
Less dividends and distributions: | |
From net investment income | | | (0.15 | ) | | | (0.27 | ) |
From net realized gain | | | – | | | | (0.02 | ) |
| | | | | | | | |
Total dividends and distributions | | | (0.15 | ) | | | (0.29 | ) |
| | | | | | | | |
Net asset value, at end of period | | $ | 9.91 | | | $ | 10.18 | |
| | | | | | | | |
Total investment return (4) | | | (1.25 | )%(5) | | | 4.89 | %(5) |
| | | | | | | | |
|
| Supplemental Data and Ratios | |
Net assets, end of period (000’s) | | $ | 15,245 | | | $ | 13,011 | |
Ratio of total expenses (before reductions and reimbursements) to average net assets | | | 1.28 | %(7) | | | 1.36 | %(7) |
Ratio of net expenses to average net assets (6)(8) | | | 0.55 | %(7) | | | 0.55 | %(7) |
Ratio of net investment income to average net assets | | | 2.94 | %(7) | | | 2.77 | %(7) |
Portfolio turnover rate | | | 125.07 | %(5) | | | 434.37 | %(5) |
| (2) | | Fund commenced operations on July 8, 2015. |
| (3) | | Calculated using average shares outstanding. |
| (4) | | Total investment return calculation assumes the reinvestment of dividends at actual prices pursuant to the Fund’s dividend reinvestment plan. |
| (6) | | The Adviser has agreed to waive and/or reimburse certain fees and/or expense so that, on an annualized basis, such expenses incurred will not exceed .55% as a percentage of average daily net assets. |
| (7) | | Annualized for periods less than one full year. |
| (8) | | Ratio of net expenses to average net assets does not include expenses of the underlying fund in which the Fund invests. |
See accompanying Notes to the Financial Statements.
59
Barings Emerging Markets Debt Blended Total Return Fund 2016 Semi-Annual Report
FINANCIAL HIGHLIGHTS
| | | | | | | | |
| | | CLASS A | |
| | | FOR THE
SIX MONTHS ENDED
DECEMBER 31, 2016 (1) | | | PERIOD FROM
OCTOBER 21, 2015
THROUGH
JUNE 30, 2016 (2) | |
| | |
| Per Common Share Data | | | | | | | | |
Net asset value, beginning of period | | $ | 9.90 | | | $ | 10.00 | |
Income from investment operations: | | | | | | | | |
Net investment income (3) | | | 0.27 | | | | 0.43 | |
Net realized and unrealized loss on investments | | | (0.19 | ) | | | (0.19 | ) |
| | | | | | | | |
Total increase from investment operations | | | 0.08 | | | | 0.24 | |
| | | | | | | | |
Less dividends and distributions: | |
From net investment income | | | (0.25 | ) | | | (0.34 | ) |
From net realized gain | | | – | | | | (0.00 | )(4) |
| | | | | | | | |
Total dividends and distributions | | | (0.25 | ) | | | (0.34 | ) |
| | | | | | | | |
Net asset value, at end of period | | $ | 9.73 | | | $ | 9.90 | |
| | | | | | | | |
Total investment return (5) | | | 0.77 | %(6) | | | 2.62 | %(6) |
| | | | | | | | |
|
| Supplemental Data and Ratios | |
Net assets, end of period (000’s) | | $ | 195 | | | $ | 198 | |
Ratio of total expenses (before reductions and reimbursements) to average net assets | | | 5.73 | %(8) | | | 6.82 | %(8) |
Ratio of net expenses to average net assets (7) | | | 1.09 | %(8)(9) | | | 1.16 | %(8) |
Ratio of net investment income to average net assets | | | 5.28 | %(8) | | | 6.52 | %(8) |
Portfolio turnover rate | | | 35.31 | %(6) | | | 83.26 | %(6) |
| (2) | | Fund commenced operations on October 21, 2015. |
| (3) | | Calculated using average shares outstanding. |
| (4) | | Amount rounds to less than $.01 per share. |
| (5) | | Total investment return calculation does not consider the effects of sales loads and assumes the reinvestment of dividends at actual prices pursuant to the Fund’s dividend reinvestment plan. |
| (7) | | The Adviser has agreed to waive and/or reimburse certain fees and/or expense so that, on an annualized basis, such expenses incurred will not exceed 1.20% as a percentage of average daily net assets. |
| (8) | | Annualized for periods less than one full year. |
| (9) | | Net expenses reflect voluntary expense reimbursements to prevent a negative yield. |
See accompanying Notes to the Financial Statements.
60
Barings Emerging Markets Debt Blended Total Return Fund 2016 Semi-Annual Report
FINANCIAL HIGHLIGHTS (CONTINUED)
| | | | | | | | |
| | | CLASS C | |
| | | FOR THE
SIX MONTHS ENDED
DECEMBER 31, 2016 (1) | | | PERIOD FROM
OCTOBER 21, 2015
THROUGH
JUNE 30, 2016 (2) | |
|
| Per Common Share Data | |
Net asset value, beginning of period | | $ | 9.90 | | | $ | 10.00 | |
Income from investment operations: | |
Net investment income (3) | | | 0.24 | | | | 0.38 | |
Net realized and unrealized loss on investments | | | (0.20 | ) | | | (0.19 | ) |
| | | | | | | | |
Total increase from investment operations | | | 0.04 | | | | 0.19 | |
| | | | | | | | |
Less dividends and distributions: | |
From net investment income | | | (0.21 | ) | | | (0.29 | ) |
From net realized gain | | | – | | | | (0.00 | )(4) |
| | | | | | | | |
Total dividends and distributions | | | (0.21 | ) | | | (0.29 | ) |
| | | | | | | | |
Net asset value, at end of period | | $ | 9.73 | | | $ | 9.90 | |
| | | | | | | | |
Total investment return (5) | | | 0.40 | %(6) | | | 2.10 | %(6) |
| | | | | | | | |
|
| Supplemental Data and Ratios | |
Net assets, end of period (000’s) | | $ | 200 | | | $ | 198 | |
Ratio of total expenses (before reductions and reimbursements) to average net assets | | | 6.46 | %(8) | | | 7.57 | %(8) |
Ratio of net expenses to average net assets (7) | | | 1.83 | %(8)(9) | | | 1.90 | %(8) |
Ratio of net investment income to average net assets | | | 4.54 | %(8) | | | 5.79 | %(8) |
Portfolio turnover rate | | | 35.31 | %(6) | | | 83.26 | %(6) |
| (2) | | Fund commenced operations on October 21, 2015. |
| (3) | | Calculated using average shares outstanding. |
| (4) | | Amount rounds to less than $.01 per share. |
| (5) | | Total investment return calculation does not consider the effects of sales loads and assumes the reinvestment of dividends at actual prices pursuant to the Fund’s dividend reinvestment plan. |
| (7) | | The Adviser has agreed to waive and/or reimburse certain fees and/or expense so that, on an annualized basis, such expenses incurred will not exceed 1.95% as a percentage of average daily net assets. |
| (8) | | Annualized for periods less than one full year. |
| (9) | | Net expenses reflect voluntary expense reimbursements to prevent a negative yield. |
See accompanying Notes to the Financial Statements.
61
Barings Emerging Markets Debt Blended Total Return Fund 2016 Semi-Annual Report
FINANCIAL HIGHLIGHTS (CONTINUED)
| | | | | | | | |
| | | CLASS I | |
| | | FOR THE
SIX MONTHS ENDED
DECEMBER 31, 2016 (1) | | | PERIOD FROM
OCTOBER 21, 2015
THROUGH
JUNE 30, 2016 (2) | |
|
| Per Common Share Data | |
Net asset value, beginning of period | | $ | 9.90 | | | $ | 10.00 | |
Income from investment operations: | |
Net investment income (3) | | | 0.28 | | | | 0.45 | |
Net realized and unrealized loss on investments | | | (0.19 | ) | | | (0.19 | ) |
| | | | | | | | |
Total increase from investment operations | | | 0.09 | | | | 0.26 | |
| | | | | | | | |
Less dividends and distributions: | |
From net investment income | | | (0.26 | ) | | | (0.36 | ) |
From net realized gain | | | – | | | | (0.00 | )(4) |
| | | | | | | | |
Total dividends and distributions | | | (0.26 | ) | | | (0.36 | ) |
| | | | | | | | |
Net asset value, at end of period | | $ | 9.73 | | | $ | 9.90 | |
| | | | | | | | |
Total investment return (5) | | | 0.90 | %(6) | | | 2.79 | %(6) |
| | | | | | | | |
|
| Supplemental Data and Ratios | |
Net assets, end of period (000’s) | | $ | 4,672 | | | $ | 4,753 | |
Ratio of total expenses (before reductions and reimbursements) to average net assets | | | 2.48 | %(8) | | | 2.58 | %(8) |
Ratio of net expenses to average net assets (7) | | | 0.85 | %(8)(9) | | | 0.92 | %(8) |
Ratio of net investment income to average net assets | | | 5.53 | %(8) | | | 6.77 | %(8) |
Portfolio turnover rate | | | 35.31 | %(6) | | | 83.26 | %(6) |
| (2) | | Fund commenced operations on October 21, 2015. |
| (3) | | Calculated using average shares outstanding. |
| (4) | | Amount rounds to less than $.01 per share. |
| (5) | | Total investment return calculation assumes the reinvestment of dividends at actual prices pursuant to the Fund’s dividend reinvestment plan. |
| (7) | | The Adviser has agreed to waive and/or reimburse certain fees and/or expense so that, on an annualized basis, such expenses incurred will not exceed .95% as a percentage of average daily net assets. |
| (8) | | Annualized for periods less than one full year. |
| (9) | | Net expenses reflect voluntary expense reimbursements to prevent a negative yield. |
See accompanying Notes to the Financial Statements.
62
Barings Emerging Markets Debt Blended Total Return Fund 2016 Semi-Annual Report
FINANCIAL HIGHLIGHTS (CONTINUED)
| | | | | | | | |
| | | CLASS Y | |
| | | FOR THE
SIX MONTHS ENDED
DECEMBER 31, 2016 (1) | | | PERIOD FROM
OCTOBER 21, 2015
THROUGH
JUNE 30, 2016 (2) | |
|
| Per Common Share Data | |
Net asset value, beginning of period | | $ | 9.90 | | | $ | 10.00 | |
Income from investment operations: | |
Net investment income (3) | | | 0.28 | | | | 0.45 | |
Net realized and unrealized loss on investments | | | (0.19 | ) | | | (0.19 | ) |
| | | | | | | | |
Total increase from investment operations | | | 0.09 | | | | 0.26 | |
| | | | | | | | |
Less dividends and distributions: | |
From net investment income | | | (0.26 | ) | | | (0.36 | ) |
From net realized gain | | | – | | | | (0.00 | )(4) |
| | | | | | | | |
Total dividends and distributions | | | (0.26 | ) | | | (0.36 | ) |
| | | | | | | | |
Net asset value, at end of period | | $ | 9.73 | | | $ | 9.90 | |
| | | | | | | | |
Total investment return (5) | | | 0.90 | %(6) | | | 2.79 | %(6) |
| | | | | | | | |
|
| Supplemental Data and Ratios | |
Net assets, end of period (000’s) | | $ | 4,680 | | | $ | 4,754 | |
Ratio of total expenses (before reductions and reimbursements) to average net assets | | | 2.48 | %(8) | | | 2.58 | %(8) |
Ratio of net expenses to average net assets (7) | | | 0.85 | %(8)(9) | | | 0.92 | %(8) |
Ratio of net investment income to average net assets | | | 5.53 | %(8) | | | 6.77 | %(8) |
Portfolio turnover rate | | | 35.31 | %(6) | | | 83.26 | %(6) |
| (2) | | Fund commenced operations on October 21, 2015. |
| (3) | | Calculated using average shares outstanding. |
| (4) | | Amount rounds to less than $.01 per share. |
| (5) | | Total investment return calculation assumes the reinvestment of dividends at actual prices pursuant to the Fund’s dividend reinvestment plan. |
| (7) | | The Adviser has agreed to waive and/or reimburse certain fees and/or expense so that, on an annualized basis, such expenses incurred will not exceed .95% as a percentage of average daily net assets. |
| (8) | | Annualized for periods less than one full year. |
| (9) | | Net expenses reflect voluntary expense reimbursements to prevent a negative yield. |
See accompanying Notes to the Financial Statements.
63
Barings Emerging Markets Local Currency Debt Fund 2016 Semi-Annual Report
FINANCIAL HIGHLIGHTS
| | | | | | | | |
| | | CLASS A | |
| | | FOR THE
SIX MONTHS ENDED
DECEMBER 31, 2016 (1) | | | PERIOD FROM
DECEMBER 8, 2015
THROUGH
JUNE 30, 2016 (2) | |
|
| Per Common Share Data | |
Net asset value, beginning of period | | $ | 10.92 | | | $ | 10.00 | |
Income from investment operations: | |
Net investment income (3) | | | 0.05 | | | | 0.50 | |
Net realized and unrealized gain (loss) on investments | | | (0.42 | ) | | | 0.73 | |
| | | | | | | | |
Total increase (decrease) from investment operations | | | (0.37 | ) | | | 1.23 | |
| | | | | | | | |
Less dividends and distributions: | |
From net investment income | | | (0.78 | ) | | | (0.31 | ) |
From net realized gain | | | (0.18 | ) | | | – | |
| | | | | | | | |
Total dividends and distributions | | | (0.96 | ) | | | (0.31 | ) |
| | | | | | | | |
Net asset value, at end of period | | $ | 9.59 | | | $ | 10.92 | |
| | | | | | | | |
Total investment return (4) | | | (3.45 | )%(5) | | | 12.58 | %(5) |
| | | | | | | | |
|
| Supplemental Data and Ratios | |
Net assets, end of period (000’s) | | $ | 96 | | | $ | 109 | |
Ratio of total expenses (before reductions and reimbursements) to average net assets | | | 7.95 | %(7) | | | 8.55 | %(7) |
Ratio of net expenses to average net assets (6) | | | 0.98 | %(7)(8) | | | 1.08 | %(7) |
Ratio of net investment income to average net assets | | | 0.98 | %(7) | | | 8.82 | %(7) |
Portfolio turnover rate | | | 38.78 | %(5) | | | 37.68 | %(5) |
| (2) | | Fund commenced operations on December 8, 2015. |
| (3) | | Calculated using average shares outstanding. |
| (4) | | Total investment return calculation does not consider the effects of sales loads and assumes the reinvestment of dividends at actual prices pursuant to the Fund’s dividend reinvestment plan. |
| (6) | | The Adviser has agreed to waive and/or reimburse certain fees and/or expense so that, on an annualized basis, such expenses incurred will not exceed 1.20% as a percentage of average daily net assets. |
| (7) | | Annualized for periods less than one full year. |
| (8) | | Net expenses reflect voluntary expense reimbursements to prevent a negative yield. |
See accompanying Notes to the Financial Statements.
64
Barings Emerging Markets Local Currency Debt Fund 2016 Semi-Annual Report
FINANCIAL HIGHLIGHTS (CONTINUED)
| | | | | | | | |
| | | CLASS C | |
| | | FOR THE
SIX MONTHS ENDED
DECEMBER 31, 2016 (1) | | | PERIOD FROM
DECEMBER 8, 2015
THROUGH
JUNE 30, 2016 (2) | |
|
| Per Common Share Data | |
Net asset value, beginning of period | | $ | 10.92 | | | $ | 10.00 | |
Income from investment operations: | |
Net investment income (3) | | | 0.01 | | | | 0.46 | |
Net realized and unrealized gain (loss) on investments | | | (0.42 | ) | | | 0.73 | |
| | | | | | | | |
Total increase (decrease) from investment operations | | | (0.41 | ) | | | 1.19 | |
| | | | | | | | |
Less dividends and distributions: | |
From net investment income | | | (0.74 | ) | | | (0.27 | ) |
From net realized gain | | | (0.18 | ) | | | – | |
| | | | | | | | |
Total dividends and distributions | | | (0.92 | ) | | | (0.27 | ) |
| | | | | | | | |
Net asset value, at end of period | | $ | 9.59 | | | $ | 10.92 | |
| | | | | | | | |
Total investment return (4) | | | (3.81 | )%(5) | | | 12.13 | %(5) |
| | | | | | | | |
|
| Supplemental Data and Ratios | |
Net assets, end of period (000’s) | | $ | 96 | | | $ | 109 | |
Ratio of total expenses (before reductions and reimbursements) to average net assets | | | 8.70 | %(7) | | | 9.30 | %(7) |
Ratio of net expenses to average net assets (6) | | | 1.72 | %(7)(8) | | | 1.81 | %(7) |
Ratio of net investment income to average net assets | | | 0.24 | %(7) | | | 8.09 | %(7) |
Portfolio turnover rate | | | 38.78 | %(5) | | | 37.68 | %(5) |
| (2) | | Fund commenced operations on December 8, 2015. |
| (3) | | Calculated using average shares outstanding. |
| (4) | | Total investment return calculation does not consider the effects of sales loads and assumes the reinvestment of dividends at actual prices pursuant to the Fund’s dividend reinvestment plan. |
| (6) | | The Adviser has agreed to waive and/or reimburse certain fees and/or expense so that, on an annualized basis, such expenses incurred will not exceed 1.95% as a percentage of average daily net assets. |
| (7) | | Annualized for periods less than one full year. |
| (8) | | Net expenses reflect voluntary expense reimbursements to prevent a negative yield. |
See accompanying Notes to the Financial Statements.
65
Barings Emerging Markets Local Currency Debt Fund 2016 Semi-Annual Report
FINANCIAL HIGHLIGHTS (CONTINUED)
| | | | | | | | |
| | | CLASS I | |
| | | FOR THE
SIX MONTHS ENDED
DECEMBER 31, 2016 (1) | | | PERIOD FROM
DECEMBER 8, 2015
THROUGH
JUNE 30, 2016 (2) | |
|
| Per Common Share Data | |
Net asset value, beginning of period | | $ | 10.92 | | | $ | 10.00 | |
Income from investment operations: | |
Net investment income (3) | | | 0.07 | | | | 0.52 | |
Net realized and unrealized gain (loss) on investments | | | (0.43 | ) | | | 0.73 | |
| | | | | | | | |
Total increase (decrease) from investment operations | | | (0.36 | ) | | | 1.25 | |
| | | | | | | | |
Less dividends and distributions: | |
From net investment income | | | (0.79 | ) | | | (0.33 | ) |
From net realized gain | | | (0.18 | ) | | | – | |
| | | | | | | | |
Total dividends and distributions | | | (0.97 | ) | | | (0.33 | ) |
| | | | | | | | |
Net asset value, at end of period | | $ | 9.59 | | | $ | 10.92 | |
| | | | | | | | |
Total investment return (4) | | | (3.33 | )%(5) | | | 12.73 | %(5) |
| | | | | | | | |
|
| Supplemental Data and Ratios | |
Net assets, end of period (000’s) | | $ | 2,302 | | | $ | 2,621 | |
Ratio of total expenses (before reductions and reimbursements) to average net assets | | | 3.67 | %(7) | | | 4.03 | %(7) |
Ratio of net expenses to average net assets (6) | | | 0.73 | %(7)(8) | | | 0.84 | %(7) |
Ratio of net investment income to average net assets | | | 1.22 | %(7) | | | 9.07 | %(7) |
Portfolio turnover rate | | | 38.78 | %(5) | | | 37.68 | %(5) |
| (2) | | Fund commenced operations on December 8, 2015. |
| (3) | | Calculated using average shares outstanding. |
| (4) | | Total investment return calculation assumes the reinvestment of dividends at actual prices pursuant to the Fund’s dividend reinvestment plan. |
| (6) | | The Adviser has agreed to waive and/or reimburse certain fees and/or expense so that, on an annualized basis, such expenses incurred will not exceed 0.95% as a percentage of average daily net assets. |
| (7) | | Annualized for periods less than one full year. |
| (8) | | Net expenses reflect voluntary expense reimbursements to prevent a negative yield. |
See accompanying Notes to the Financial Statements.
66
Barings Emerging Markets Local Currency Debt Fund 2016 Semi-Annual Report
FINANCIAL HIGHLIGHTS (CONTINUED)
| | | | | | | | |
| | | CLASS Y | |
| | | FOR THE
SIX MONTHS ENDED
DECEMBER 31, 2016 (1) | | | PERIOD FROM
DECEMBER 8, 2015
THROUGH
JUNE 30, 2016 (2) | |
|
| Per Common Share Data | |
Net asset value, beginning of period | | $ | 10.92 | | | $ | 10.00 | |
Income from investment operations: | |
Net investment income (3) | | | 0.07 | | | | 0.52 | |
Net realized and unrealized gain (loss) on investments | | | (0.43 | ) | | | 0.73 | |
| | | | | | | | |
Total increase (decrease) from investment operations | | | (0.36 | ) | | | 1.25 | |
| | | | | | | | |
Less dividends and distributions: | |
From net investment income | | | (0.79 | ) | | | (0.33 | ) |
From net realized gain | | | (0.18 | ) | | | – | |
| | | | | | | | |
Total dividends and distributions | | | (0.97 | ) | | | (0.33 | ) |
| | | | | | | | |
Net asset value, at end of period | | $ | 9.59 | | | $ | 10.92 | |
| | | | | | | | |
Total investment return (4) | | | (3.33 | )%(5) | | | 12.73 | %(5) |
| | | | | | | | |
|
| Supplemental Data and Ratios | |
Net assets, end of period (000’s) | | $ | 2,302 | | | $ | 2,621 | |
Ratio of total expenses (before reductions and reimbursements) to average net assets | | | 3.67 | %(7) | | | 4.03 | %(7) |
Ratio of net expenses to average net assets (6) | | | 0.73 | %(7)(8) | | | 0.84 | %(7) |
Ratio of net investment income to average net assets | | | 1.22 | %(7) | | | 9.07 | %(7) |
Portfolio turnover rate | | | 38.78 | %(5) | | | 37.68 | %(5) |
| (2) | | Fund commenced operations on December 8, 2015. |
| (3) | | Calculated using average shares outstanding. |
| (4) | | Total investment return calculation assumes the reinvestment of dividends at actual prices pursuant to the Fund’s dividend reinvestment plan. |
| (6) | | The Adviser has agreed to waive and/or reimburse certain fees and/or expense so that, on an annualized basis, such expenses incurred will not exceed 0.95% as a percentage of average daily net assets. |
| (7) | | Annualized for periods less than one full year. |
| (8) | | Net expenses reflect voluntary expense reimbursements to prevent a negative yield. |
See accompanying Notes to the Financial Statements.
67
Barings Global High Yield Fund 2016 Semi-Annual Report
FINANCIAL HIGHLIGHTS
| | | | | | | | |
| | | CLASS A | |
| | | FOR THE
SIX MONTHS ENDED
DECEMBER 31, 2016 (1) | | | PERIOD FROM
OCTOBER 30, 2015
THROUGH
JUNE 30, 2016 (2) | |
|
| Per Common Share Data | |
Net asset value, beginning of period | | $ | 10.05 | | | $ | 10.00 | |
Income from investment operations: | |
Net investment income (3) | | | 0.33 | | | | 0.38 | |
Net realized and unrealized gain on investments | | | 0.55 | | | | 0.05 | |
| | | | | | | | |
Total increase from investment operations | | | 0.88 | | | | 0.43 | |
| | | | | | | | |
Less dividends and distributions: | |
From net investment income | | | (0.33 | ) | | | (0.38 | ) |
From net realized gain | | | (0.38 | ) | | | – | |
| | | | | | | | |
Total dividends and distributions | | | (0.71 | ) | | | (0.38 | ) |
| | | | | | | | |
Net asset value, at end of period | | $ | 10.22 | | | $ | 10.05 | |
| | | | | | | | |
Total investment return (4) | | | 8.88 | %(5) | | | 4.45 | %(5) |
| | | | | | | | |
|
| Supplemental Data and Ratios | |
Net assets, end of period (000’s) | | $ | 107 | | | $ | 101 | |
Ratio of total expenses (before reductions and reimbursements) to average net assets | | | 6.40 | %(7) | | | 7.14 | %(7) |
Ratio of net expenses to average net assets (6) | | | 1.05 | %(7) | | | 1.04 | %(7) |
Ratio of net investment income to average net assets | | | 6.30 | %(7) | | | 5.83 | %(7) |
Portfolio turnover rate | | | 41.80 | %(5) | | | 83.24 | %(5) |
| (2) | | Fund commenced operations on October 30, 2015. |
| (3) | | Calculated using average shares outstanding. |
| (4) | | Total investment return calculation does not consider the effects of sales loads and assumes the reinvestment of dividends at actual prices pursuant to the Fund’s dividend reinvestment plan. |
| (6) | | The Adviser has agreed to waive and/or reimburse certain fees and/or expense so that, on an annualized basis, such expenses incurred will not exceed 1.05% as a percentage of average daily net assets. |
| (7) | | Annualized for periods less than one full year. |
See accompanying Notes to the Financial Statements.
68
Barings Global High Yield Fund 2016 Semi-Annual Report
FINANCIAL HIGHLIGHTS (CONTINUED)
| | | | | | | | |
| | | CLASS C | |
| | | FOR THE
SIX MONTHS ENDED
DECEMBER 31, 2016 (1) | | | PERIOD FROM
OCTOBER 30, 2015
THROUGH
JUNE 30, 2016 (2) | |
|
| Per Common Share Data | |
Net asset value, beginning of period | | $ | 10.05 | | | $ | 10.00 | |
Income from investment operations: | |
Net investment income (3) | | | 0.29 | | | | 0.33 | |
Net realized and unrealized gain on investments | | | 0.55 | | | | 0.05 | |
| | | | | | | | |
Total increase from investment operations | | | 0.84 | | | | 0.38 | |
| | | | | | | | |
Less dividends and distributions: | |
From net investment income | | | (0.29 | ) | | | (0.33 | ) |
From net realized gain | | | (0.38 | ) | | | – | |
| | | | | | | | |
Total dividends and distributions | | | (0.67 | ) | | | (0.33 | ) |
| | | | | | | | |
Net asset value, at end of period | | $ | 10.22 | | | $ | 10.05 | |
| | | | | | | | |
Total investment return (4) | | | 8.47 | %(5) | | | 3.94 | %(5) |
| | | | | | | | |
|
| Supplemental Data and Ratios | |
Net assets, end of period (000’s) | | $ | 196 | | | $ | 101 | |
Ratio of total expenses (before reductions and reimbursements) to average net assets | | | 5.38 | %(7) | | | 7.89 | %(7) |
Ratio of net expenses to average net assets (6) | | | 1.80 | %(7) | | | 1.78 | %(7) |
Ratio of net investment income to average net assets | | | 5.47 | %(7) | | | 5.09 | %(7) |
Portfolio turnover rate | | | 41.80 | %(5) | | | 83.24 | %(5) |
| (2) | | Fund commenced operations on October 30, 2015. |
| (3) | | Calculated using average shares outstanding. |
| (4) | | Total investment return calculation does not consider the effects of sales loads and assumes the reinvestment of dividends at actual prices pursuant to the Fund’s dividend reinvestment plan. |
| (6) | | The Adviser has agreed to waive and/or reimburse certain fees and/or expense so that, on an annualized basis, such expenses incurred will not exceed 1.80% as a percentage of average daily net assets. |
| (7) | | Annualized for periods less than one full year. |
See accompanying Notes to the Financial Statements.
69
Barings Global High Yield Fund 2016 Semi-Annual Report
FINANCIAL HIGHLIGHTS (CONTINUED)
| | | | | | | | |
| | | CLASS I | |
| | | FOR THE
SIX MONTHS ENDED
DECEMBER 31, 2016 (1) | | | PERIOD FROM
OCTOBER 30, 2015
THROUGH
JUNE 30, 2016 (2) | |
|
| Per Common Share Data | |
Net asset value, beginning of period | | $ | 10.05 | | | $ | 10.00 | |
Income from investment operations: | |
Net investment income (3) | | | 0.34 | | | | 0.39 | |
Net realized and unrealized gain on investments | | | 0.55 | | | | 0.05 | |
| | | | | | | | |
Total increase from investment operations | | | 0.89 | | | | 0.44 | |
| | | | | | | | |
Less dividends and distributions: | |
From net investment income | | | (0.34 | ) | | | (0.39 | ) |
From net realized gain | | | (0.38 | ) | | | – | |
| | | | | | | | |
Total dividends and distributions | | | (0.72 | ) | | | (0.39 | ) |
| | | | | | | | |
Net asset value, at end of period | | $ | 10.22 | | | $ | 10.05 | |
| | | | | | | | |
Total investment return (4) | | | 9.02 | %(5) | | | 4.62 | %(5) |
| | | | | | | | |
|
| Supplemental Data and Ratios | |
Net assets, end of period (000’s) | | $ | 12,676 | | | $ | 12,466 | |
Ratio of total expenses (before reductions and reimbursements) to average net assets | | | 1.43 | %(7) | | | 1.51 | %(7) |
Ratio of net expenses to average net assets (6) | | | 0.80 | %(7) | | | 0.79 | %(7) |
Ratio of net investment income to average net assets | | | 6.55 | %(7) | | | 6.08 | %(7) |
Portfolio turnover rate | | | 41.80 | %(5) | | | 83.24 | %(5) |
| (2) | | Fund commenced operations on October 30, 2015. |
| (3) | | Calculated using average shares outstanding. |
| (4) | | Total investment return calculation assumes the reinvestment of dividends at actual prices pursuant to the Fund’s dividend reinvestment plan. |
| (6) | | The Adviser has agreed to waive and/or reimburse certain fees and/or expense so that, on an annualized basis, such expenses incurred will not exceed .80% as a percentage of average daily net assets. |
| (7) | | Annualized for periods less than one full year. |
See accompanying Notes to the Financial Statements.
70
Barings Global High Yield Fund 2016 Semi-Annual Report
FINANCIAL HIGHLIGHTS (CONTINUED)
| | | | | | | | |
| | | CLASS Y | |
| | | FOR THE
SIX MONTHS ENDED
DECEMBER 31, 2016 (1) | | | PERIOD FROM
OCTOBER 30, 2015
THROUGH
JUNE 30, 2016 (2) | |
| | |
| Per Common Share Data | | | | | | | | |
Net asset value, beginning of period | | $ | 10.05 | | | $ | 10.00 | |
Income from investment operations: | | | | | | | | |
Net investment income (3) | | | 0.34 | | | | 0.39 | |
Net realized and unrealized gain on investments | | | 0.55 | | | | 0.05 | |
| | | | | | | | |
Total increase from investment operations | | | 0.89 | | | | 0.44 | |
| | | | | | | | |
Less dividends and distributions: | |
From net investment income | | | (0.34 | ) | | | (0.39 | ) |
From net realized gain | | | (0.38 | ) | | | – | |
| | | | | | | | |
Total dividends and distributions | | | (0.72 | ) | | | (0.39 | ) |
| | | | | | | | |
Net asset value, at end of period | | $ | 10.22 | | | $ | 10.05 | |
| | | | | | | | |
Total investment return (4) | | | 9.02 | %(5) | | | 4.62 | %(5) |
| | | | | | | | |
|
| Supplemental Data and Ratios | |
Net assets, end of period (000’s) | | $ | 14,020 | | | $ | 12,604 | |
Ratio of total expenses (before reductions and reimbursements) to average net assets | | | 1.43 | %(7) | | | 1.51 | %(7) |
Ratio of net expenses to average net assets (6) | | | 0.80 | %(7) | | | 0.79 | %(7) |
Ratio of net investment income to average net assets | | | 6.54 | %(7) | | | 6.08 | %(7) |
Portfolio turnover rate | | | 41.80 | %(5) | | | 83.24 | %(5) |
| (2) | | Fund commenced operations on October 30, 2015. |
| (3) | | Calculated using average shares outstanding. |
| (4) | | Total investment return calculation assumes the reinvestment of dividends at actual prices pursuant to the Fund’s dividend reinvestment plan. |
| (6) | | The Adviser has agreed to waive and/or reimburse certain fees and/or expense so that, on an annualized basis, such expenses incurred will not exceed .80% as a percentage of average daily net assets. |
| (7) | | Annualized for periods less than one full year. |
See accompanying Notes to the Financial Statements.
71
Barings U.S. High Yield Fund 2016 Semi-Annual Report
FINANCIAL HIGHLIGHTS
| | | | | | | | |
| | | CLASS A | |
| | | FOR THE
SIX MONTHS ENDED
DECEMBER 31, 2016 (1) | | | PERIOD FROM
OCTOBER 30, 2015
THROUGH
JUNE 30, 2016 (2) | |
| | |
| Per Common Share Data | | | | | | | | |
Net asset value, beginning of period | | $ | 10.14 | | | $ | 10.00 | |
Income from investment operations: | | | | | | | | |
Net investment income (3) | | | 0.33 | | | | 0.39 | |
Net realized and unrealized gain on investments | | | 0.45 | | | | 0.13 | |
| | | | | | | | |
Total increase from investment operations | | | 0.78 | | | | 0.52 | |
| | | | | | | | |
Less dividends and distributions: | |
From net investment income | | | (0.33 | ) | | | (0.38 | ) |
From net realized gain | | | (0.19 | ) | | | – | |
| | | | | | | | |
Total dividends and distributions | | | (0.52 | ) | | | (0.38 | ) |
| | | | | | | | |
Net asset value, at end of period | | $ | 10.40 | | | $ | 10.14 | |
| | | | | | | | |
Total investment return (4) | | | 7.74 | %(5) | | | 5.36 | %(5) |
| | | | | | | | |
|
| Supplemental Data and Ratios | |
Net assets, end of period (000’s) | | $ | 2,238 | | | $ | 206 | |
Ratio of total expenses (before reductions and reimbursements) to average net assets | | | 1.77 | %(7) | | | 5.47 | %(7) |
Ratio of net expenses to average net assets (6) | | | 1.00 | %(7) | | | 0.99 | %(7) |
Ratio of net investment income to average net assets | | | 6.27 | %(7) | | | 5.93 | %(7) |
Portfolio turnover rate | | | 29.21 | %(5) | | | 77.52 | %(5) |
| (2) | | Fund commenced operations on October 30, 2015. |
| (3) | | Calculated using average shares outstanding. |
| (4) | | Total investment return calculation does not consider the effects of sales loads and assumes the reinvestment of dividends at actual prices pursuant to the Fund’s dividend reinvestment plan. |
| (6) | | The Adviser has agreed to waive and/or reimburse certain fees and/or expense so that, on an annualized basis, such expenses incurred will not exceed 1.00% as a percentage of average daily net assets. |
| (7) | | Annualized for periods less than one full year. |
See accompanying Notes to the Financial Statements.
72
Barings U.S. High Yield Fund 2016 Semi-Annual Report
FINANCIAL HIGHLIGHTS (CONTINUED)
| | | | | | | | |
| | | CLASS C | |
| | | FOR THE
SIX MONTHS ENDED
DECEMBER 31, 2016 (1) | | | PERIOD FROM
OCTOBER 30, 2015
THROUGH
JUNE 30, 2016 (2) | |
| | |
| Per Common Share Data | | | | | | | | |
Net asset value, beginning of period | | $ | 10.14 | | | $ | 10.00 | |
Income from investment operations: | | | | | | | | |
Net investment income (3) | | | 0.29 | | | | 0.33 | |
Net realized and unrealized gain on investments | | | 0.45 | | | | 0.14 | |
| | | | | | | | |
Total increase from investment operations | | | 0.74 | | | | 0.47 | |
| | | | | | | | |
Less dividends and distributions: | |
From net investment income | | | (0.29 | ) | | | (0.33 | ) |
From net realized gain | | | (0.19 | ) | | | – | |
| | | | | | | | |
Total dividends and distributions | | | (0.48 | ) | | | (0.33 | ) |
| | | | | | | | |
Net asset value, at end of period | | $ | 10.40 | | | $ | 10.14 | |
| | | | | | | | |
Total investment return (4) | | | 7.35 | %(5) | | | 4.85 | %(5) |
| | | | | | | | |
|
| Supplemental Data and Ratios | |
Net assets, end of period (000’s) | | $ | 110 | | | $ | 101 | |
Ratio of total expenses (before reductions and reimbursements) to average net assets | | | 6.53 | %(7) | | | 7.30 | %(7) |
Ratio of net expenses to average net assets (6) | | | 1.75 | %(7) | | | 1.73 | %(7) |
Ratio of net investment income to average net assets | | | 5.57 | %(7) | | | 5.08 | %(7) |
Portfolio turnover rate | | | 29.21 | %(5) | | | 77.52 | %(5) |
| (2) | | Fund commenced operations on October 30, 2015. |
| (3) | | Calculated using average shares outstanding. |
| (4) | | Total investment return calculation does not consider the effects of sales loads and assumes the reinvestment of dividends at actual prices pursuant to the Fund’s dividend reinvestment plan. |
| (6) | | The Adviser has agreed to waive and/or reimburse certain fees and/or expense so that, on an annualized basis, such expenses incurred will not exceed 1.75% as a percentage of average daily net assets. |
| (7) | | Annualized for periods less than one full year. |
See accompanying Notes to the Financial Statements.
73
Barings U.S. High Yield Fund 2016 Semi-Annual Report
FINANCIAL HIGHLIGHTS (CONTINUED)
| | | | | | | | |
| | | CLASS I | |
| | | FOR THE
SIX MONTHS ENDED
DECEMBER 31, 2016 (1) | | | PERIOD FROM
OCTOBER 30, 2015
THROUGH
JUNE 30, 2016 (2) | |
| | |
| Per Common Share Data | | | | | | | | |
Net asset value, beginning of period | | $ | 10.14 | | | $ | 10.00 | |
Income from investment operations: | | | | | | | | |
Net investment income (3) | | | 0.34 | | | | 0.40 | |
Net realized and unrealized gain on investments | | | 0.45 | | | | 0.13 | |
| | | | | | | | |
Total increase from investment operations | | | 0.79 | | | | 0.53 | |
| | | | | | | | |
Less dividends and distributions: | |
From net investment income | | | (0.34 | ) | | | (0.39 | ) |
From net realized gain | | | (0.19 | ) | | | – | |
| | | | | | | | |
Total dividends and distributions | | | (0.53 | ) | | | (0.39 | ) |
| | | | | | | | |
Net asset value, at end of period | | $ | 10.40 | | | $ | 10.14 | |
| | | | | | | | |
Total investment return (4) | | | 7.89 | %(5) | | | 5.53 | %(5) |
| | | | | | | | |
|
| Supplemental Data and Ratios | |
Net assets, end of period (000’s) | | $ | 15,365 | | | $ | 14,863 | |
Ratio of total expenses (before reductions and reimbursements) to average net assets | | | 1.28 | %(7) | | | 1.38 | %(7) |
Ratio of net expenses to average net assets (6) | | | 0.75 | %(7) | | | 0.74 | %(7) |
Ratio of net investment income to average net assets | | | 6.57 | %(7) | | | 6.11 | %(7) |
Portfolio turnover rate | | | 29.21 | %(5) | | | 77.52 | %(5) |
| (2) | | Fund commenced operations on October 30, 2015. |
| (3) | | Calculated using average shares outstanding. |
| (4) | | Total investment return calculation assumes the reinvestment of dividends at actual prices pursuant to the Fund’s dividend reinvestment plan. |
| (6) | | The Adviser has agreed to waive and/or reimburse certain fees and/or expense so that, on an annualized basis, such expenses incurred will not exceed .75% as a percentage of average daily net assets. |
| (7) | | Annualized for periods less than one full year. |
See accompanying Notes to the Financial Statements.
74
Barings U.S. High Yield Fund 2016 Semi-Annual Report
FINANCIAL HIGHLIGHTS (CONTINUED)
| | | | | | | | |
| | | CLASS Y | |
| | | FOR THE
SIX MONTHS ENDED
DECEMBER 31, 2016 (1) | | | PERIOD FROM
OCTOBER 30, 2015
THROUGH
JUNE 30, 2016 (2) | |
| | |
| Per Common Share Data | | | | | | | | |
Net asset value, beginning of period | | $ | 10.14 | | | $ | 10.00 | |
Income from investment operations: | | | | | | | | |
Net investment income (3) | | | 0.34 | | | | 0.39 | |
Net realized and unrealized gain on investments | | | 0.45 | | | | 0.14 | |
| | | | | | | | |
Total increase from investment operations | | | 0.79 | | | | 0.53 | |
| | | | | | | | |
Less dividends and distributions: | |
From net investment income | | | (0.34 | ) | | | (0.39 | ) |
From net realized gain | | | (0.19 | ) | | | – | |
| | | | | | | | |
Total dividends and distributions | | | (0.53 | ) | | | (0.39 | ) |
| | | | | | | | |
Net asset value, at end of period | | $ | 10.40 | | | $ | 10.14 | |
| | | | | | | | |
Total investment return (4) | | | 7.88 | %(5) | | | 5.52 | %(5) |
| | | | | | | | |
|
| Supplemental Data and Ratios | |
Net assets, end of period (000’s) | | $ | 14,192 | | | $ | 12,675 | |
Ratio of total expenses (before reductions and reimbursements) to average net assets | | | 1.28 | %(7) | | | 1.42 | %(7) |
Ratio of net expenses to average net assets (6) | | | 0.75 | %(7) | | | 0.74 | %(7) |
Ratio of net investment income to average net assets | | | 6.56 | %(7) | | | 6.06 | %(7) |
Portfolio turnover rate | | | 29.21 | %(5) | | | 77.52 | %(5) |
| (2) | | Fund commenced operations on October 30, 2015. |
| (3) | | Calculated using average shares outstanding. |
| (4) | | Total investment return calculation assumes the reinvestment of dividends at actual prices pursuant to the Fund’s dividend reinvestment plan. |
| (6) | | The Adviser has agreed to waive and/or reimburse certain fees and/or expense so that, on an annualized basis, such expenses incurred will not exceed .75% as a percentage of average daily net assets. |
| (7) | | Annualized for periods less than one full year. |
See accompanying Notes to the Financial Statements.
75
Barings Global Floating Rate Fund 2016 Semi-Annual Report
SCHEDULE OF INVESTMENTS
December 31, 2016 (Unaudited)
| | | | | | | | | | | | | | | | | | | | |
| | | | | | | | | SHARES | | | COST | | | FAIR
VALUE | |
Common Stocks — 0.1%*: | |
|
Mining, Steel, Iron and Non-Precious Metals — 0.0%*: | |
Boomerang Tube LLC¤(1) | | | | | | | | | | | 2,007 | | | | $— | | | | $— | |
| | | | | | | | | | | | | | | | | | | | |
|
Oil and Gas — 0.1%*: | |
Sabine Oil & Gas LLC¤ | | | | | | | | | | | 1,230 | | | | 5,523 | | | | 8,610 | |
Sabine Oil & Gas LLC¤ | | | | | | | | | | | 219 | | | | 595 | | | | 1,314 | |
Sabine Oil & Gas LLC¤ | | | | | | | | | | | 387 | | | | 22,597 | | | | 17,415 | |
Southcross Energy Partners LP | | | | | | | | | | | 22 | | | | 5,500 | | | | 7,810 | |
Southcross Holdings LP¤ | | | | | | | | | | | 22 | | | | — | | | | — | |
Templar Energy LLC | | | | | | | | | | | 8,219 | | | | 47,506 | | | | 51,369 | |
Templar Energy LLC | | | | | | | | | | | 5,479 | | | | 54,790 | | | | 65,748 | |
| | | | | | | | | | | | | | | | | | | | |
Total Oil and Gas | | | | 15,578 | | | | 136,511 | | | | 152,266 | |
| | | | | | | | | | | | | | | | | | | | |
| | | | | | | | | | | | | | | | | | | | |
Total Common Stocks | | | | 17,585 | | | | 136,511 | | | | 152,266 | |
| | | | | | | | | | | | | | | | | | | | |
| | | | | |
| | | EFFECTIVE
INTEREST RATE | | | DUE DATE | | | PRINCIPAL ‡‡ | | | COST | | | FAIR
VALUE | |
Fixed Income — 91.6%*: | |
|
Bank Loans — 83.4%*§: | |
|
Aerospace and Defense — 1.0%*: | |
Doncasters Finance US LLC | | | 4.50 | % | | | 4/9/2020 | | | | 1,689,030 | | | | 1,650,621 | | | | 1,640,048 | |
| | | | | | | | | | | | | | | | | | | | |
|
Automobile — 2.8%*: | |
FPC Holdings, Inc. | | | 5.25 | | | | 11/19/2019 | | | | 485,063 | | | | 432,071 | | | | 456,968 | |
Gates Global LLC | | | 4.25 | | | | 7/6/2021 | | | | 1,449,802 | | | | 1,445,899 | | | | 1,449,802 | |
NN, Inc. | | | 5.00 | | | | 10/19/2022 | | | | 936,643 | | | | 938,987 | | | | 943,668 | |
Tectum Holdings, Inc. | | | 5.75 | | | | 8/24/2023 | | | | 1,570,821 | | | | 1,569,045 | | | | 1,590,456 | |
| | | | | | | | | | | | | | | | | | | | |
Total Automobile | | | | 4,442,329 | | | | 4,386,002 | | | | 4,440,894 | |
| | | | | | | | | | | | | | | | | | | | |
|
Beverage, Food and Tobacco — 2.0%*: | |
CTI Foods Holding Co. LLC | | | 4.50 | | | | 6/29/2020 | | | | 1,371,856 | | | | 1,363,031 | | | | 1,351,279 | |
Del Monte Foods, Inc. | | | 4.25 | | | | 2/18/2021 | | | | 1,489,920 | | | | 1,385,478 | | | | 1,363,277 | |
Deoleo S.A.+ | | | 4.50 | | | | 6/11/2021 | | | | 500,000 | | | | 677,556 | | | | 450,208 | |
| | | | | | | | | | | | | | | | | | | | |
Total Beverage, Food and Tobacco | | | | 3,361,776 | | | | 3,426,065 | | | | 3,164,764 | |
| | | | | | | | | | | | | | | | | | | | |
|
Broadcasting and Entertainment — 2.7%*: | |
All3Media International+ | | | 5.25 | | | | 6/30/2021 | | | | 1,500,000 | | | | 2,303,573 | | | | 1,829,443 | |
AP NMT Acquisition B.V.+ | | | 6.75 | | | | 8/13/2021 | | | | 1,104,671 | | | | 1,040,642 | | | | 1,015,899 | |
AP NMT Acquisition B.V.+ | | | 7.00 | | | | 8/13/2021 | | | | 532,232 | | | | 644,671 | | | | 518,835 | |
AP NMT Acquisition B.V.+ | | | 10.00 | | | | 8/13/2022 | | | | 182,721 | | | | 155,572 | | | | 145,915 | |
DLG Acquisitions Ltd.+ | | | 8.25 | | | | 6/30/2022 | | | | 500,000 | | | | 672,347 | | | | 511,062 | |
Tech Finance & Co. S.C.A+ | | | 5.00 | | | | 7/11/2020 | | | | 319,459 | | | | 357,334 | | | | 337,436 | |
| | | | | | | | | | | | | | | | | | | | |
Total Broadcasting and Entertainment | | | | 4,139,083 | | | | 5,174,139 | | | | 4,358,590 | |
| | | | | | | | | | | | | | | | | | | | |
See accompanying Notes to the Financial Statements.
76
Barings Global Floating Rate Fund 2016 Semi-Annual Report
SCHEDULE OF INVESTMENTS (CONTINUED)
December 31, 2016 (Unaudited)
| | | | | | | | | | | | | | | | | | | | |
| | | EFFECTIVE
INTEREST RATE | | | DUE DATE | | | PRINCIPAL ‡‡ | | | COST | | | FAIR
VALUE | |
Bank Loans (Continued) | |
|
Buildings and Real Estate — 1.8%*: | |
Cemex SAB de CV+ | | | 3.25 | % | | | 7/23/2020 | | | | 97,070 | | | | $106,733 | | | | $101,158 | |
Cemex SAB de CV+ | | | 4.02 | | | | 7/23/2020 | | | | 441,849 | | | | 441,849 | | | | 435,500 | |
Jeld-Wen, Inc. | | | 4.75 | | | | 7/1/2022 | | | | 995,703 | | | | 998,828 | | | | 1,006,905 | |
Quikrete Holdings, Inc. | | | 4.00 | | | | 11/15/2023 | | | | 1,427,119 | | | | 1,437,506 | | | | 1,440,206 | |
| | | | | | | | | | | | | | | | | | | | |
Total Buildings and Real Estate | | | | 2,961,741 | | | | 2,984,916 | | | | 2,983,769 | |
| | | | | | | | | | | | | | | | | | | | |
|
Chemicals, Plastics and Rubber — 4.9%*: | |
Allnex (Luxembourg) & Cy S.C.A.+ | | | 5.00 | | | | 9/13/2023 | | | | 698,250 | | | | 789,562 | | | | 743,833 | |
Allnex (Luxembourg) & Cy S.C.A.+ | | | 5.13 | | | | 9/13/2023 | | | | 426,673 | | | | 424,621 | | | | 428,807 | |
Allnex USA, Inc. | | | 5.13 | | | | 9/13/2023 | | | | 321,452 | | | | 319,905 | | | | 323,059 | |
Flint Group GmbH+ | | | 4.50 | | | | 9/7/2021 | | | | 89,648 | | | | 89,041 | | | | 89,984 | |
Flint Group US LLC+ | | | 4.50 | | | | 9/7/2021 | | | | 542,298 | | | | 538,624 | | | | 544,332 | |
INEOS Styrolution Group GmbH+ | | | 4.75 | | | | 9/30/2021 | | | | 417,609 | | | | 474,836 | | | | 445,790 | |
Methanol Holdings (Trinidad) Ltd.+ | | | 4.27 | | | | 6/30/2022 | | | | 1,118,429 | | | | 1,109,624 | | | | 1,091,867 | |
Novacap S.A.+ | | | 4.25 | | | | 6/22/2023 | | | | 500,000 | | | | 558,248 | | | | 530,141 | |
OXEA Finance & Cy S.C.A.+ | | | 4.50 | | | | 1/15/2020 | | | | 492,386 | | | | 521,783 | | | | 500,252 | |
OXEA Finance LLC+ | | | 4.25 | | | | 1/15/2020 | | | | 350,507 | | | | 345,968 | | | | 341,306 | |
Platform Specialty Products Corp. | | | 4.25 | | | | 6/7/2020 | | | | 493,763 | | | | 533,506 | | | | 523,439 | |
Platform Specialty Products Corp. | | | 4.50 | | | | 6/5/2020 | | | | 862,439 | | | | 863,344 | | | | 871,426 | |
Tronox Pigments (Netherlands) B.V.+ | | | 4.50 | | | | 3/19/2020 | | | | 1,389,203 | | | | 1,344,848 | | | | 1,393,829 | |
| | | | | | | | | | | | | | | | | | | | |
Total Chemicals, Plastics and Rubber | | | | 7,702,657 | | | | 7,913,910 | | | | 7,828,065 | |
| | | | | | | | | | | | | | | | | | | | |
|
Containers, Packaging and Glass — 6.4%*: | |
Consolidated Container Co. LLC | | | 4.75 | | | | 7/3/2019 | | | | 1,650,268 | | | | 1,647,612 | | | | 1,658,519 | |
Consolidated Container Co. LLC | | | 7.75 | | | | 1/3/2020 | | | | 188,280 | | | | 186,228 | | | | 184,044 | |
Mauser US Corporate LLC+ | | | 4.50 | | | | 7/31/2021 | | | | 1,548,547 | | | | 1,548,678 | | | | 1,558,225 | |
Mauser US Corporate LLC+ | | | 8.75 | | | | 7/31/2022 | | | | 120,928 | | | | 103,221 | | | | 120,324 | |
Multi Packaging Solutions, Inc. | | | 4.25 | | | | 9/30/2020 | | | | 278,163 | | | | 275,710 | | | | 278,163 | |
ProAmpac Intermediate Inc. | | | 9.50 | | | | 11/18/2024 | | | | 750,000 | | | | 738,900 | | | | 750,000 | |
Prolampac Intermediate Inc. | | | 5.00 | | | | 11/18/2023 | | | | 750,000 | | | | 753,734 | | | | 757,972 | |
Reynolds Group Holdings, Inc. | | | 4.25 | | | | 2/5/2023 | | | | 1,778,484 | | | | 1,787,451 | | | | 1,800,305 | |
Signode Industrial Group US, Inc. | | | 4.00 | | | | 5/1/2021 | | | | 1,521,971 | | | | 1,528,129 | | | | 1,533,386 | |
Tekni-Plex, Inc. | | | 4.50 | | | | 6/1/2022 | | | | 1,655,079 | | | | 1,636,793 | | | | 1,661,286 | |
| | | | | | | | | | | | | | | | | | | | |
Total Containers, Packaging and Glass | | | | 10,241,720 | | | | 10,206,456 | | | | 10,302,224 | |
| | | | | | | | | | | | | | | | | | | | |
|
Diversified/Conglomerate Manufacturing — 1.3%*: | |
MTS Systems Corp. | | | 5.00 | | | | 7/5/2023 | | | | 391,827 | | | | 388,173 | | | | 396,972 | |
Pelican Products, Inc. | | | 5.25 | | | | 4/10/2020 | | | | 967,841 | | | | 966,289 | | | | 961,192 | |
STS Operating, Inc. | | | 4.75 | | | | 2/12/2021 | | | | 302,043 | | | | 302,289 | | | | 289,961 | |
Triple Point Technology, Inc. | | | 5.25 | | | | 7/10/2020 | | | | 334,622 | | | | 317,234 | | | | 295,026 | |
Triple Point Technology, Inc.†† | | | 9.25 | | | | 7/10/2021 | | | | 145,676 | | | | 138,825 | | | | 103,431 | |
West Corp. | | | 2.77 | | | | 7/1/2019 | | | | 53,942 | | | | 52,892 | | | | 53,537 | |
| | | | | | | | | | | | | | | | | | | | |
Total Diversified/Conglomerate Manufacturing | | | | 2,195,951 | | | | 2,165,702 | | | | 2,100,119 | |
| | | | | | | | | | | | | | | | | | | | |
See accompanying Notes to the Financial Statements.
77
Barings Global Floating Rate Fund 2016 Semi-Annual Report
SCHEDULE OF INVESTMENTS (CONTINUED)
December 31, 2016 (Unaudited)
| | | | | | | | | | | | | | | | | | | | |
| | | EFFECTIVE
INTEREST RATE | | | DUE DATE | | | PRINCIPAL ‡‡ | | | COST | | | FAIR
VALUE | |
Bank Loans (Continued) | |
|
Diversified/Conglomerate Service — 6.8%*: | |
Acosta Holdco, Inc. | | | 4.25 | % | | | 9/26/2021 | | | | 1,174,748 | | | $ | 1,168,101 | | | $ | 1,143,911 | |
Aquilex Holdings LLC | | | 5.00 | | | | 12/31/2020 | | | | 183,676 | | | | 183,412 | | | | 178,855 | |
Atrium Innovations, Inc. | | | 4.25 | | | | 2/13/2021 | | | | 1,611,587 | | | | 1,604,156 | | | | 1,611,587 | |
Garda World Security Corp.+ | | | 4.00 | | | | 11/6/2020 | | | | 84,179 | | | | 84,011 | | | | 84,179 | |
Garda World Security Corp.+ | | | 4.00 | | | | 11/8/2020 | | | | 88,458 | | | | 88,305 | | | | 88,458 | |
Northgate Information Solutions Ltd.+ | | | 6.50 | | | | 3/23/2022 | | | | 500,000 | | | | 520,776 | | | | 503,430 | |
PowerTeam Services, LLC | | | 8.25 | | | | 11/6/2020 | | | | 500,000 | | | | 497,220 | | | | 497,500 | |
Prime Security Services Borrower, LLC | | | 4.25 | | | | 5/2/2022 | | | | 1,502,353 | | | | 1,506,101 | | | | 1,524,137 | |
Quest Software US Holdings, Inc. | | | 7.00 | | | | 10/31/2022 | | | | 1,499,130 | | | | 1,483,365 | | | | 1,516,939 | |
RP Crown Parent, LLC | | | 4.50 | | | | 10/12/2023 | | | | 1,778,012 | | | | 1,773,037 | | | | 1,795,347 | |
Triangle FM Services Holding GmbH+ | | | 5.25 | | | | 8/31/2023 | | | | 500,000 | | | | 552,965 | | | | 531,789 | |
VF Holding Corp. | | | 4.75 | | | | 6/30/2023 | | | | 1,496,250 | | | | 1,499,452 | | | | 1,499,450 | |
| | | | | | | | | | | | | | | | | | | | |
Total Diversified/Conglomerate Service | | | | 10,918,393 | | | | 10,960,901 | | | | 10,975,582 | |
| | | | | | | | | | | | | | | | | | | | |
|
Ecological — 0.8%*: | |
Emerald 3 Ltd.+ | | | 8.00 | | | | 5/31/2022 | | | | 390,426 | | | | 387,746 | | | | 339,671 | |
Emerald US, Inc.+ | | | 5.00 | | | | 5/9/2021 | | | | 600,000 | | | | 554,250 | | | | 534,000 | |
PHS Group Ltd.+ | | | 6.25 | | | | 4/17/2020 | | | | 299,197 | | | | 369,978 | | | | 368,730 | |
| | | | | | | | | | | | | | | | | | | | |
Total Ecological | | | | 1,289,623 | | | | 1,311,974 | | | | 1,242,401 | |
| | | | | | | | | | | | | | | | | | | | |
|
Electronics — 5.2%*: | |
First Data Corp. | | | 3.76 | | | | 7/10/2022 | | | | 953,925 | | | | 963,339 | | | | 963,665 | |
Informatica Corp. | | | 4.50 | | | | 8/5/2022 | | | | 654,861 | | | | 652,725 | | | | 651,312 | |
Kronos, Inc. | | | 5.00 | | | | 11/1/2023 | | | | 1,111,111 | | | | 1,116,667 | | | | 1,124,133 | |
MH Sub I, LLC | | | 4.75 | | | | 7/8/2021 | | | | 578,536 | | | | 576,382 | | | | 581,069 | |
Renaissance Learning, Inc. | | | 4.50 | | | | 4/9/2021 | | | | 1,471,010 | | | | 1,456,097 | | | | 1,474,070 | |
Sophia, L.P. | | | 4.75 | | | | 9/30/2022 | | | | 1,106,638 | | | | 1,117,704 | | | | 1,117,018 | |
Tessera Holding Corp. | | | 4.00 | | | | 12/1/2023 | | | | 1,500,000 | | | | 1,499,192 | | | | 1,512,195 | |
Western Digital Corp. | | | 4.52 | | | | 4/29/2023 | | | | 944,206 | | | | 949,500 | | | | 958,662 | |
| | | | | | | | | | | | | | | | | | | | |
Total Electronics | | | | 8,320,287 | | | | 8,331,606 | | | | 8,382,124 | |
| | | | | | | | | | | | | | | | | | | | |
|
Finance — 4.2%*: | |
Alliant Holdings I, Inc. | | | 4.75 | | | | 8/12/2022 | | | | 1,234,336 | | | | 1,225,380 | | | | 1,239,742 | |
Cunningham Lindsey U.S., Inc. | | | 5.03 | | | | 12/10/2019 | | | | 481,024 | | | | 479,882 | | | | 402,377 | |
Cunningham Lindsey U.S., Inc. | | | 9.32 | | | | 6/10/2020 | | | | 748,546 | | | | 749,608 | | | | 348,074 | |
GENEX Holdings, Inc. | | | 5.25 | | | | 5/30/2021 | | | | 1,481,013 | | | | 1,476,659 | | | | 1,469,905 | |
Moneygram International, Inc. | | | 4.25 | | | | 3/27/2020 | | | | 1,290,447 | | | | 1,227,427 | | | | 1,273,245 | |
SAM Finance Lux S.A.R.L+ | | | 5.00 | | | | 12/17/2020 | | | | 335,477 | | | | 542,214 | | | | 415,096 | |
Sedgwick Claims Management Services, Inc. | | | 3.75 | | | | 3/1/2021 | | | | 984,968 | | | | 982,392 | | | | 986,376 | |
Sedgwick Claims Management Services, Inc. | | | 6.75 | | | | 2/28/2022 | | | | 561,418 | | | | 560,950 | | | | 560,015 | |
| | | | | | | | | | | | | | | | | | | | |
Total Finance | | | | 7,117,229 | | | | 7,244,512 | | | | 6,694,830 | |
| | | | | | | | | | | | | | | | | | | | |
|
Healthcare, Education and Childcare — 14.8%*: | |
Alere, Inc. | | | 4.25 | | | | 6/18/2022 | | | | 1,120,234 | | | | 1,118,662 | | | | 1,118,833 | |
Arbor Pharmaceuticals, Inc. | | | 6.00 | | | | 7/5/2023 | | | | 1,606,733 | | | | 1,587,811 | | | | 1,620,792 | |
See accompanying Notes to the Financial Statements.
78
Barings Global Floating Rate Fund 2016 Semi-Annual Report
SCHEDULE OF INVESTMENTS (CONTINUED)
December 31, 2016 (Unaudited)
| | | | | | | | | | | | | | | | | | | | |
| | | EFFECTIVE
INTEREST RATE | | | DUE DATE | | | PRINCIPAL ‡‡ | | | COST | | | FAIR
VALUE | |
Bank Loans (Continued) | |
|
Healthcare, Education and Childcare (Continued) | |
CareCore National, LLC | | | 5.50 | % | | | 3/5/2021 | | | | 660,304 | | | $ | 660,054 | | | $ | 648,749 | |
Community Health Systems, Inc. | | | 4.18 | | | | 12/31/2018 | | | | 1,740,261 | | | | 1,730,269 | | | | 1,709,806 | |
Concentra, Inc. | | | 4.00 | | | | 6/1/2022 | | | | 1,492,424 | | | | 1,478,093 | | | | 1,496,155 | |
Envision Healthcare Corp. | | | 4.00 | | | | 12/12/2023 | | | | 472,544 | | | | 467,866 | | | | 476,976 | |
Explorer Holdings, Inc. | | | 6.00 | | | | 5/2/2023 | | | | 526,030 | | | | 521,257 | | | | 537,209 | |
Greatbatch Ltd. | | | 5.25 | | | | 10/27/2022 | | | | 1,485,000 | | | | 1,475,284 | | | | 1,491,029 | |
Jaguar Holding Co. II | | | 4.25 | | | | 8/18/2022 | | | | 1,514,252 | | | | 1,517,964 | | | | 1,529,773 | |
Kindred Healthcare, Inc. | | | 4.25 | | | | 4/9/2021 | | | | 1,677,522 | | | | 1,633,769 | | | | 1,674,033 | |
Kinetic Concepts, Inc. | | | 5.00 | | | | 11/4/2020 | | | | 1,816,127 | | | | 1,800,998 | | | | 1,819,160 | |
Ortho-Clinical Diagnostics, Inc. | | | 4.75 | | | | 6/30/2021 | | | | 2,015,337 | | | | 2,005,865 | | | | 1,995,909 | |
Press Ganey Holdings, Inc. | | | 4.25 | | | | 10/21/2023 | | | | 1,250,000 | | | | 1,261,875 | | | | 1,256,250 | |
Press Ganey Holdings, Inc. | | | 8.25 | | | | 10/21/2024 | | | | 821,256 | | | | 832,603 | | | | 833,575 | |
Riemser Pharma GmbH+ | | | 5.50 | | | | 7/31/2023 | | | | 500,000 | | | | 537,103 | | | | 495,272 | |
Rodenstock GmbH+ | | | 4.13 | | | | 5/30/2019 | | | | 1,500,000 | | | | 1,768,402 | | | | 1,502,395 | |
Tecomet, Inc. | | | 5.75 | | | | 12/5/2021 | | | | 1,365,277 | | | | 1,320,004 | | | | 1,365,277 | |
Tunstall Group Holdings Ltd.+ | | | 5.53 | | | | 10/16/2020 | | | | 500,000 | | | | 794,934 | | | | 537,123 | |
Valeant Pharmaceuticals International, Inc. | | | 5.50 | | | | 4/1/2022 | | | | 1,600,814 | | | | 1,566,674 | | | | 1,601,119 | |
| | | | | | | | | | | | | | | | | | | | |
Total Healthcare, Education and Childcare | | | | 23,664,115 | | | | 24,079,487 | | | | 23,709,435 | |
| | | | | | | | | | | | | | | | | | | | |
|
Home and Office Furnishings, Housewares, and Durable Consumer Products — 1.4%*: | |
Serta Simmons Bedding, LLC | | | 4.50 | | | | 11/8/2023 | | | | 1,730,289 | | | | 1,721,704 | | | | 1,748,128 | |
Serta Simmons Bedding, LLC | | | 9.00 | | | | 11/8/2024 | | | | 500,000 | | | | 492,588 | | | | 501,665 | |
| | | | | | | | | | | | | | | | | | | | |
Total Home and Office Furnishings, Housewares, and Durable Consumer Products | | | | | | | | | | | 2,230,289 | | | | 2,214,292 | | | | 2,249,793 | |
| | | | | | | | | | | | | | | | | | | | |
|
Hotels, Motels, Inns and Gaming — 1.4%*: | |
Cyan Blue Holdco 3 Ltd.+ | | | 6.25 | | | | 2/25/2022 | | | | 500,000 | | | | 737,746 | | | | 620,051 | |
Financiere Sun S.A.S.+ | | | 6.00 | | | | 3/14/2023 | | | | 500,000 | | | | 537,670 | | | | 526,983 | |
HNVR Holdco Ltd.+ | | | 6.25 | | | | 5/31/2023 | | | | 500,000 | | | | 550,413 | | | | 527,641 | |
Tackle S.A.R.L+ | | | 6.50 | | | | 8/8/2022 | | | | 500,000 | | | | 553,965 | | | | 534,136 | |
| | | | | | | | | | | | | | | | | | | | |
Total Hotels, Motels, Inns and Gaming | | | | 2,000,000 | | | | 2,379,794 | | | | 2,208,811 | |
| | | | | | | | | | | | | | | | | | | | |
|
Insurance — 1.7%*: | |
Asurion LLC | | | 4.02 | | | | 7/8/2020 | | | | 761,643 | | | | 764,763 | | | | 767,592 | |
Asurion LLC | | | 4.75 | | | | 11/3/2023 | | | | 890,439 | | | | 886,071 | | | | 902,683 | |
York Risk Services Holding Corp. | | | 4.75 | | | | 10/1/2021 | | | | 1,174,653 | | | | 1,150,841 | | | | 1,107,110 | |
| | | | | | | | | | | | | | | | | | | | |
Total Insurance | | | | 2,826,735 | | | | 2,801,675 | | | | 2,777,385 | |
| | | | | | | | | | | | | | | | | | | | |
|
Leisure, Amusement, Entertainment — 1.3%*: | |
Delta 2 (LUX) S.a.r.l.+ | | | 5.07 | | | | 7/30/2021 | | | | 1,587,247 | | | | 1,583,576 | | | | 1,602,627 | |
Delta 2 (LUX) S.a.r.l.+ | | | 8.07 | | | | 7/29/2022 | | | | 437,500 | | | | 436,894 | | | | 440,051 | |
| | | | | | | | | | | | | | | | | | | | |
Total Leisure, Amusement, Entertainment | | | | 2,024,747 | | | | 2,020,470 | | | | 2,042,678 | |
| | | | | | | | | | | | | | | | | | | | |
|
Machinery Non-Agriculture, Non-Construction, Non-Electronic — 3.6%*: | |
Alison Bidco S.a.r.l.+ | | | 5.25 | | | | 8/29/2021 | | | | 290,570 | | | | 288,626 | | | | 288,632 | |
See accompanying Notes to the Financial Statements.
79
Barings Global Floating Rate Fund 2016 Semi-Annual Report
SCHEDULE OF INVESTMENTS (CONTINUED)
December 31, 2016 (Unaudited)
| | | | | | | | | | | | | | | | | | | | |
| | | EFFECTIVE
INTEREST RATE | | | DUE DATE | | | PRINCIPAL ‡‡ | | | COST | | | FAIR
VALUE | |
Bank Loans (Continued) | |
|
Machinery Non-Agriculture, Non-Construction, Non-Electronic (Continued) | |
Apex Tool Group, LLC | | | 4.50 | % | | | 1/31/2020 | | | | 1,974,359 | | | $ | 1,951,152 | | | $ | 1,954,615 | |
Gardner Denver, Inc. | | | 4.56 | | | | 7/30/2020 | | | | 1,622,401 | | | | 1,551,867 | | | | 1,604,523 | |
Husky Injection Molding Systems Ltd.+ | | | 4.25 | | | | 6/30/2021 | | | | 1,380,456 | | | | 1,376,027 | | | | 1,387,538 | |
Schenck Measuring and Process Technologies+ | | | 6.25 | | | | 5/13/2022 | | | | 500,000 | | | | 549,155 | | | | 524,572 | |
| | | | | | | | | | | | | | | | | | | | |
Total Machinery Non-Agriculture, Non-Construction, Non-Electronic | | | | | | | | | | | 5,767,786 | | | | 5,716,827 | | | | 5,759,880 | |
| | | | | | | | | | | | | | | | | | | | |
|
Mining, Steel, Iron and Non-Precious Metals — 2.7%*: | |
Arch Coal Inc. | | | 10.00 | | | | 6/15/2021 | | | | 255,489 | | | | 255,489 | | | | 258,790 | |
Boomerang Tube, LLC¤†† | | | 15.00 | | | | 2/2/2020 | | | | 32,825 | | | | 26,312 | | | | 26,260 | |
Boomerang Tube, LLC¤†† | | | 15.77 | | | | 2/2/2020 | | | | 95,096 | | | | 95,096 | | | | 95,096 | |
Boomerang Tube, LLC¤†† | | | 18.27 | | | | 2/2/2020 | | | | 79,295 | | | | 79,295 | | | | 11,894 | |
Boomerang Tube, LLC¤†† | | | 20.00 | | | | 2/2/2020 | | | | 34,590 | | | | 32,392 | | | | 31,131 | |
FMG Resources (August 2006) Pty Ltd.+ | | | 3.75 | | | | 6/30/2019 | | | | 1,041,821 | | | | 1,004,602 | | | | 1,043,904 | |
H.C. Starck GmbH+ | | | 8.00 | | | | 5/30/2020 | | | | 1,043,604 | | | | 1,048,776 | | | | 902,116 | |
Murray Energy Corp. | | | 8.25 | | | | 4/16/2020 | | | | 769,627 | | | | 754,984 | | | | 733,555 | |
Peabody Energy Corp. | | | 4.25 | | | | 9/24/2020 | | | | 618,791 | | | | 573,783 | | | | 601,001 | |
Zekelman Industries, Inc. | | | 6.00 | | | | 6/14/2021 | | | | 598,392 | | | | 593,017 | | | | 602,880 | |
| | | | | | | | | | | | | | | | | | | | |
Total Mining, Steel, Iron and Non-Precious Metals | | | | 4,569,530 | | | | 4,463,746 | | | | 4,306,627 | |
| | | | | | | | | | | | | | | | | | | | |
|
Oil and Gas — 6.3%*: | |
Caelus Energy Alaska O3, LLC | | | 8.75 | | | | 4/15/2020 | | | | 1,692,308 | | | | 1,573,042 | | | | 1,353,846 | |
Fieldwood Energy LLC PIK | | | 8.00 | | | | 8/31/2020 | | | | 555,855 | | | | 499,304 | | | | 525,283 | |
Fieldwood Energy LLC PIK | | | 8.38 | | | | 9/30/2020 | | | | 1,613,837 | | | | 856,065 | | | | 1,252,949 | |
Floatel International, Ltd. | | | 6.00 | | | | 6/27/2020 | | | | 400,294 | | | | 397,936 | | | | 321,736 | |
Gulf Finance, LLC | | | 6.25 | | | | 8/25/2023 | | | | 1,496,250 | | | | 1,453,494 | | | | 1,499,991 | |
Paragon Offshore Finance Co. | | | 5.50 | | | | 7/18/2021 | | | | 545,863 | | | | 465,236 | | | | 200,152 | |
Seadrill Partners Finco, LLC | | | 4.00 | | | | 2/21/2021 | | | | 2,454,213 | | | | 1,570,729 | | | | 1,671,319 | |
Southcross Holdings Borrower LP | | | 9.00 | | | | 4/13/2023 | | | | 20,011 | | | | 20,011 | | | | 15,175 | |
TPF II Power LLC | | | 5.00 | | | | 10/2/2021 | | | | 488,206 | | | | 485,709 | | | | 492,112 | |
UTEX Industries, Inc. | | | 5.00 | | | | 5/22/2021 | | | | 993,127 | | | | 846,788 | | | | 917,401 | |
UTEX Industries, Inc. | | | 8.25 | | | | 5/22/2022 | | | | 1,000,000 | | | | 545,400 | | | | 698,330 | |
Western Refining, Inc. | | | 5.50 | | | | 6/23/2023 | | | | 1,117,500 | | | | 1,096,732 | | | | 1,123,087 | |
| | | | | | | | | | | | | | | | | | | | |
Total Oil and Gas | | | | 12,377,464 | | | | 9,810,446 | | | | 10,071,381 | |
| | | | | | | | | | | | | | | | | | | | |
|
Personal Transportation — 1.1%*: | |
Travelport Finance (Luxembourg) S.a.r.l | | | 5.00 | | | | 9/2/2021 | | | | 1,758,167 | | | | 1,753,691 | | | | 1,773,833 | |
| | | | | | | | | | | | | | | | | | | | |
|
Printing and Publishing — 2.1%*: | |
Cengage Learning Acquisitions, Inc. | | | 5.25 | | | | 6/7/2023 | | | | 812,340 | | | | 812,295 | | | | 789,116 | |
Houghton Mifflin Harcourt Publishing Co. | | | 4.00 | | | | 5/31/2021 | | | | 680,238 | | | | 671,934 | | | | 646,226 | |
Springer Science+Business Media Deutschland GmbH+ | | | 4.75 | | | | 8/14/2020 | | | | 1,883,036 | | | | 1,874,848 | | | | 1,882,245 | |
| | | | | | | | | | | | | | | | | | | | |
Total Printing and Publishing | | | | 3,375,614 | | | | 3,359,077 | | | | 3,317,587 | |
| | | | | | | | | | | | | | | | | | | | |
See accompanying Notes to the Financial Statements.
80
Barings Global Floating Rate Fund 2016 Semi-Annual Report
SCHEDULE OF INVESTMENTS (CONTINUED)
December 31, 2016 (Unaudited)
| | | | | | | | | | | | | | | | | | | | |
| | | EFFECTIVE
INTEREST RATE | | | DUE DATE | | | PRINCIPAL ‡‡ | | | COST | | | FAIR
VALUE | |
Bank Loans (Continued) | |
|
Retail Stores — 3.5%*: | |
Academy, Ltd. | | | 5.00 | % | | | 7/1/2022 | | | | 1,580,359 | | | | $1,544,564 | | | | $1,459,461 | |
Advantage Sales & Marketing, Inc. | | | 4.25 | | | | 7/23/2021 | | | | 1,101,107 | | | | 1,096,365 | | | | 1,104,136 | |
Maxeda DIY B.V.+ | | | 7.00 | | | | 6/28/2019 | | | | 583,334 | | | | 651,037 | | | | 564,732 | |
Nature’s Bounty Co. (The) | | | 5.00 | | | | 5/5/2023 | | | | 1,791,000 | | | | 1,798,353 | | | | 1,803,877 | |
The Talbots, Inc. | | | 5.50 | | | | 3/19/2020 | | | | 729,795 | | | | 722,315 | | | | 708,266 | |
| | | | | | | | | | | | | | | | | | | | |
Total Retail Stores | | | | 5,785,595 | | | | 5,812,634 | | | | 5,640,472 | |
| | | | | | | | | | | | | | | | | | | | |
|
Telecommunications — 1.4%*: | |
Consolidated Communications, Inc. | | | 4.00 | | | | 10/4/2023 | | | | 177,315 | | | | 176,884 | | | | 178,233 | |
Numericable U.S. LLC+ | | | 4.04 | | | | 1/14/2025 | | | | 1,500,000 | | | | 1,495,504 | | | | 1,511,625 | |
UPC Financing Partnership+ | | | 3.00 | | | | 6/17/2025 | | | | 500,000 | | | | 525,284 | | | | 527,804 | |
| | | | | | | | | | | | | | | | | | | | |
Total Telecommunications | | | | 2,177,315 | | | | 2,197,672 | | | | 2,217,662 | |
| | | | | | | | | | | | | | | | | | | | |
|
Utilities — 2.2%*: | |
Calpine Construction Finance Co., LP | | | 3.27 | | | | 1/31/2022 | | | | 994,861 | | | | 984,480 | | | | 993,926 | |
Dynegy, Inc. | | | 5.00 | | | | 6/27/2023 | | | | 1,500,000 | | | | 1,485,982 | | | | 1,518,120 | |
Vistra Operations Co. LLC | | | 4.00 | | | | 12/14/2023 | | | | 1,089,696 | | | | 1,100,610 | | | | 1,103,317 | |
| | | | | | | | | | | | | | | | | | | | |
Total Utilities | | | | 3,584,557 | | | | 3,571,072 | | | | 3,615,363 | |
| | | | | | | | | | | | | | | | | | | | |
| | | | | | | | | | | | | | | | | | | | |
Total Bank Loans | | | | 136,521,733 | | | | 135,937,687 | | | | 133,804,317 | |
| | | | | | | | | | | | | | | | | | | | |
Corporate Bonds — 8.2%*: | |
|
Banking — 0.1%*: | |
Lock AS+ | | | 5.50 | # | | | 8/15/2020 | | | | 100,000 | | | | 110,831 | | | | 105,486 | |
| | | | | | | | | | | | | | | | | | | | |
|
Broadcasting and Entertainment — 0.2%*: | |
Entertainment One Ltd.+ | | | 6.88 | | | | 12/15/2022 | | | | 100,000 | | | | 150,232 | | | | 133,777 | |
VTR Finance B.V.+^ | | | 6.88 | | | | 1/15/2024 | | | | 211,000 | | | | 214,400 | | | | 217,857 | |
| | | | | | | | | | | | | | | | | | | | |
Total Broadcasting and Entertainment | | | | 311,000 | | | | 364,632 | | | | 351,634 | |
| | | | | | | | | | | | | | | | | | | | |
|
Buildings and Real Estate — 0.1%*: | |
Paroc Group Oy+ | | | 6.25 | | | | 5/15/2020 | | | | 100,000 | | | | 137,565 | | | | 107,897 | |
Paroc Group Oy MTN+ | | | 4.94 | # | | | 5/15/2020 | | | | 100,000 | | | | 137,565 | | | | 103,823 | |
| | | | | | | | | | | | | | | | | | | | |
Total Buildings and Real Estate | | | | 200,000 | | | | 275,130 | | | | 211,720 | |
| | | | | | | | | | | | | | | | | | | | |
|
Cargo Transport — 0.3%*: | |
Deck Chassis Acquisition, Inc.^ | | | 10.00 | | | | 6/15/2023 | | | | 336,000 | | | | 336,000 | | | | 346,920 | |
WFS Global Holding SAS+ | | | 9.50 | | | | 7/15/2022 | | | | 100,000 | | | | 113,435 | | | | 108,228 | |
| | | | | | | | | | | | | | | | | | | | |
Total Cargo Transport | | | | 436,000 | | | | 449,435 | | | | 455,148 | |
| | | | | | | | | | | | | | | | | | | | |
|
Chemicals, Plastics and Rubber — 0.1%*: | |
Pinnacle Operating Corp.^ | | | 9.00 | | | | 11/15/2020 | | | | 500,000 | | | | 525,607 | | | | 220,000 | |
| | | | | | | | | | | | | | | | | | | | |
|
Containers, Packaging and Glass — 0.1%*: | |
Reynolds Group Issuer, Inc./Reynolds Group Issuer LLC/Reynolds Group Issuer Lu^ | | | 5.13 | | | | 7/15/2023 | | | | 178,000 | | | | 178,000 | | | | 181,783 | |
| | | | | | | | | | | | | | | | | | | | |
See accompanying Notes to the Financial Statements.
81
Barings Global Floating Rate Fund 2016 Semi-Annual Report
SCHEDULE OF INVESTMENTS (CONTINUED)
December 31, 2016 (Unaudited)
| | | | | | | | | | | | | | | | | | | | |
| | | EFFECTIVE
INTEREST RATE | | | DUE DATE | | | PRINCIPAL ‡‡ | | | COST | | | FAIR
VALUE | |
Corporate Bonds (Continued) | |
|
Diversified/Conglomerate Manufacturing — 0.3%*: | |
Appvion, Inc.^ | | | 9.00 | % | | | 6/1/2020 | | | | 460,000 | | | $ | 465,729 | | | $ | 257,600 | |
Galapagos SA/Luxembourg+ | | | 4.43 | # | | | 6/15/2021 | | | | 200,000 | | | | 272,630 | | | | 196,422 | |
| | | | | | | | | | | | | | | | | | | | |
Total Diversified/Conglomerate Manufacturing | | | | 660,000 | | | | 738,359 | | | | 454,022 | |
| | | | | | | | | | | | | | | | | | | | |
|
Diversified/Conglomerate Service — 0.5%*: | |
Carlson Travel, Inc. | | | 4.43 | # | | | 6/15/2023 | | | | 150,000 | | | | 158,362 | | | | 160,677 | |
Sabre GLBL, Inc.^ | | | 5.38 | | | | 4/15/2023 | | | | 561,000 | | | | 570,869 | | | | 572,220 | |
| | | | | | | | | | | | | | | | | | | | |
Total Diversified/Conglomerate Service | | | | 711,000 | | | | 729,231 | | | | 732,897 | |
| | | | | | | | | | | | | | | | | | | | |
|
Electronics — 0.3%*: | |
First Data Corp.^ | | | 5.00 | | | | 1/15/2024 | | | | 179,000 | | | | 177,970 | | | | 179,953 | |
Prime Security Services Borrower LLC/Prime Finance, Inc.^ | | | 9.25 | | | | 5/15/2023 | | | | 271,000 | | | | 271,000 | | | | 295,051 | |
| | | | | | | | | | | | | | | | | | | | |
Total Electronics | | | | 450,000 | | | | 448,970 | | | | 475,004 | |
| | | | | | | | | | | | | | | | | | | | |
|
Finance — 0.9%*: | |
Arrow Global Finance PLC+ | | | 4.75 | # | | | 5/1/2023 | | | | 100,000 | | | | 111,285 | | | | 108,592 | |
Arrow Global Finance PLC+ | | | 4.94 | # | | | 11/1/2021 | | | | 150,000 | | | | 167,753 | | | | 164,839 | |
Galaxy Bidco Ltd.+ | | | 5.40 | # | | | 11/15/2019 | | | | 100,000 | | | | 161,221 | | | | 123,008 | |
Garfunkelux Holdco 3 SA+ | | | 5.50 | # | | | 10/1/2021 | | | | 100,000 | | | | 111,952 | | | | 106,841 | |
Garfunkelux Holdco 3 SA+ | | | 8.50 | | | | 11/1/2022 | | | | 250,000 | | | | 386,591 | | | | 320,424 | |
Marlin Intermediate Holdings PLC MTN+ | | | 10.50 | | | | 8/1/2020 | | | | 500,000 | | | | 819,332 | | | | 670,117 | |
| | | | | | | | | | | | | | | | | | | | |
Total Finance | | | | 1,200,000 | | | | 1,758,134 | | | | 1,493,821 | |
| | | | | | | | | | | | | | | | | | | | |
|
Grocery — 0.2%*: | |
Premier Foods Finance PLC+ | | | 5.37 | # | | | 3/16/2020 | | | | 100,000 | | | | 167,370 | | | | 121,830 | |
Premier Foods Finance PLC+ | | | 6.50 | | | | 3/15/2021 | | | | 100,000 | | | | 146,338 | | | | 126,506 | |
| | | | | | | | | | | | | | | | | | | | |
Total Grocery | | | | 200,000 | | | | 313,708 | | | | 248,336 | |
| | | | | | | | | | | | | | | | | | | | |
|
Healthcare, Education and Childcare — 0.4%*: | |
HCA, Inc. | | | 5.25 | | | | 6/15/2026 | | | | 82,000 | | | | 82,000 | | | | 84,768 | |
IDH Finance PLC+ | | | 6.25 | | | | 8/15/2022 | | | | 100,000 | | | | 131,025 | | | | 119,543 | |
Tenet Healthcare Corp. | | | 4.46 | # | | | 6/15/2020 | | | | 489,000 | | | | 487,260 | | | | 492,667 | |
| | | | | | | | | | | | | | | | | | | | |
Total Healthcare, Education and Childcare | | | | 671,000 | | | | 700,285 | | | | 696,978 | |
| | | | | | | | | | | | | | | | | | | | |
|
Hotels, Motels, Inns and Gaming — 0.3%*: | |
TVL Finance PLC+ | | | 8.50 | | | | 5/15/2023 | | | | 350,000 | | | | 497,072 | | | | 457,220 | |
| | | | | | | | | | | | | | | | | | | | |
|
Leisure, Amusement, Entertainment — 0.1%*: | |
Vue International Bidco PLC+ | | | 4.94 | # | | | 7/15/2020 | | | | 100,000 | | | | 134,821 | | | | 105,412 | |
WMG Acquisition Corp.^ | | | 5.00 | | | | 8/1/2023 | | | | 63,000 | | | | 63,000 | | | | 63,315 | |
| | | | | | | | | | | | | | | | | | | | |
Total Leisure, Amusement, Entertainment | | | | 163,000 | | | | 197,821 | | | | 168,727 | |
| | | | | | | | | | | | | | | | | | | | |
See accompanying Notes to the Financial Statements.
82
Barings Global Floating Rate Fund 2016 Semi-Annual Report
SCHEDULE OF INVESTMENTS (CONTINUED)
December 31, 2016 (Unaudited)
| | | | | | | | | | | | | | | | | | | | |
| | | EFFECTIVE
INTEREST RATE | | | DUE DATE | | | PRINCIPAL ‡‡ | | | COST | | | FAIR
VALUE | |
Corporate Bonds (Continued) | |
|
Oil and Gas — 1.4%*: | |
Citgo Holding, Inc.^ | | | 10.75 | % | | | 2/15/2020 | | | | 1,500,000 | | | $ | 1,482,958 | | | $ | 1,608,750 | |
Kosmos Energy Ltd.^ | | | 7.88 | | | | 8/1/2021 | | | | 200,000 | | | | 192,918 | | | | 199,000 | |
Shelf Drilling Holdings Ltd.+^ | | | 8.63 | | | | 11/1/2018 | | | | 438,000 | | | | 391,140 | | | | 367,920 | |
| | | | | | | | | | | | | | | | | | | | |
Total Oil and Gas | | | | 2,138,000 | | | | 2,067,016 | | | | 2,175,670 | |
| | | | | | | | | | | | | | | | | | | | |
|
Retail Stores — 1.3%*: | |
Boing Group Financing PLC MTN+ | | | 6.63 | | | | 7/15/2019 | | | | 350,000 | | | | 398,344 | | | | 365,296 | |
House of Fraser Funding PLC+ | | | 6.13 | # | | | 9/15/2020 | | | | 300,000 | | | | 464,681 | | | | 330,899 | |
HSS Financing PLC+ | | | 6.75 | | | | 8/1/2019 | | | | 68,000 | | | | 112,557 | | | | 84,935 | |
Takko Luxembourg 2 S.C.A. MTN+ | | | 9.88 | | | | 4/15/2019 | | | | 425,000 | | | | 377,843 | | | | 360,585 | |
Travelex Financing PLC+ | | | 6.40 | # | | | 8/1/2018 | | | | 700,000 | | | | 1,122,903 | | | | 838,525 | |
Travelex Financing PLC+ | | | 8.00 | | | | 8/1/2018 | | | | 100,000 | | | | 158,875 | | | | 123,240 | |
| | | | | | | | | | | | | | | | | | | | |
Total Retail Stores | | | | 1,943,000 | | | | 2,635,203 | | | | 2,103,480 | |
| | | | | | | | | | | | | | | | | | | | |
|
Telecommunications — 1.6%*: | |
Hughes Satellite Systems Corp.^ | | | 5.25 | | | | 8/1/2026 | | | | 1,388,000 | | | | 1,398,150 | | | | 1,360,240 | |
Numericable-SFR SA+^ | | | 6.00 | | | | 5/15/2022 | | | | 646,000 | | | | 645,376 | | | | 662,957 | |
Numericable-SFR SA+^ | | | 7.38 | | | | 5/1/2026 | | | | 217,000 | | | | 217,000 | | | | 222,425 | |
Ziggo Secured Finance B.V.+ | | | 4.25 | | | | 1/15/2027 | | | | 350,000 | | | | 372,443 | | | | 367,159 | |
| | | | | | | | | | | | | | | | | | | | |
Total Telecommunications | | | | 2,601,000 | | | | 2,632,969 | | | | 2,612,781 | |
| | | | | | | | | | | | | | | | | | | | |
Total Corporate Bonds | | | | 12,812,000 | | | | 14,622,403 | | | | 13,144,707 | |
| | | | | | | | | | | | | | | | | | | | |
Total Fixed Income | | | | 149,333,733 | | | | 150,560,090 | | | | 146,949,024 | |
| | | | | | | | | | | | | | | | | | | | |
Short-Term Investment — 12.9%*: | |
|
Bank Deposit — 12.9%*: | |
State Street Bank & Trust Co. Euro Time Deposit | | | 0.01 | | | | 1/3/2017 | | | | 20,677,603 | | | | 20,677,603 | | | | 20,677,603 | |
| | | | | | | | | | | | | | | | | | | | |
Total Investments | | | | 170,028,921 | | | | 171,374,204 | | | | 167,778,893 | |
| | | | | | | | | | | | | | | | | | | | |
| |
Other assets and liabilities — (4.6%)* | | | | (7,332,379 | ) |
| |
Net Assets — 100.0% | | | | $160,446,514 | |
| | | | | | | | | | | | | | | | | | | | |
| | |
| MTN | | Medium Term Note |
| PIK | | Payment-in-kind |
| ‡‡ | Unless otherwise indicated, all principal amounts are denominated in United States Dollars. |
| * | Calculated as a percentage of net assets applicable to common shareholders. |
See accompanying Notes to the Financial Statements.
83
Barings Global Floating Rate Fund 2016 Semi-Annual Report
SCHEDULE OF INVESTMENTS (CONTINUED)
December 31, 2016 (Unaudited)
| | Distributions of investments by country of risk (excluding temporary cash investments) as a percentage of total investments in securities, is as follows: |
| | | | | | |
| | United States | | | 75.8% | |
| | United Kingdom | | | 7.9% | |
| | Germany | | | 7.3% | |
| | France | | | 2.6% | |
| | Netherlands | | | 1.8% | |
| | Canada | | | 1.1% | |
| | Other (Individually less than 1%) | | | 3.5% | |
| | | | | | |
| | Total | | | 100.0% | |
| | | | | | |
| ^ | Security acquired in a transaction exempt from registration under Rule 144A of the Securities Act of 1933. These securities may only be resold in transactions exempt from registration, normally to qualified institutional buyers. |
| § | Bank loans are exempt from registration under the Securities Act of 1933, as amended, but contain certain restrictions on resale and cannot be sold publicly. These loans pay interest at rates which adjust periodically. The interest rates shown for bank loans are the current interest rates at December 31, 2016. Bank loans are also subject to mandatory and/or optional prepayment which cannot be predicted. As a result, the remaining maturity may be substantially less than the stated maturity shown. |
| ¤ | For fair value measurement disclosure purposes, security is categorized as Level 3 (See Note 2). |
| # | Variable rate security. The interest rate shown is the rate in effect at December 31, 2016. |
| (1) | Non-income producing security. |
A summary of outstanding derivatives at December 31, 2016 is as follows:
Forward Foreign Currency Exchange Contracts to Buy
| | | | | | | | | | | | | | | | | | | | | | |
EXPIRATION
DATE | | COUNTERPARTY | | LOCAL
CURRENCY | | | VALUE IN USD | | | IN
EXCHANGE
FOR USD | | | NET UNREALIZED
APPRECIATION
(DEPRECIATION) | |
| 1/13/17 | | Morgan Stanley & Co. | | | EUR | | | | 36,126 | | | | 38,052 | | | | 37,892 | | | $ | 160 | |
| 1/13/17 | | Morgan Stanley & Co. | | | GBP | | | | 506,076 | | | | 623,884 | | | | 625,383 | | | | (1,499 | ) |
| | | | | | | | | | | | | | | | | | | | | | |
Net unrealized depreciation on forward foreign exchange contracts to buy | | | $ | (1,339 | ) |
| | | | | | | | | | | | | | | | | | | | | | |
Forward Foreign Currency Exchange Contracts to Sell
| | | | | | | | | | | | | | | | | | | | | | |
EXPIRATION
DATE | | COUNTERPARTY | | LOCAL
CURRENCY | | | VALUE IN USD | | | IN
EXCHANGE
FOR USD | | | NET UNREALIZED
APPRECIATION
(DEPRECIATION) | |
| 1/3/17 | | Morgan Stanley & Co. | | | EUR | | | | 36,126 | | | | 38,028 | | | | 37,867 | | | $ | (161 | ) |
| 1/13/17 | | Morgan Stanley & Co. | | | EUR | | | | 13,865,327 | | | | 14,604,236 | | | | 14,739,294 | | | | 135,058 | |
| 1/13/17 | | Morgan Stanley & Co. | | | GBP | | | | 6,526,413 | | | | 8,045,680 | | | | 8,207,798 | | | | 162,118 | |
| | | | | | | | | | | | | | | | | | | | | | |
Net unrealized appreciation on forward foreign exchange contracts to sell | | | $ | 297,015 | |
| | | | | | | | | | | | | | | | | | | | | | |
Currency Legend
| | | | |
| EUR | | – | | Euro |
| GBP | | – | | British Pound Sterling |
See accompanying Notes to the Financial Statements.
84
Barings Global Credit Income Opportunities Fund 2016 Semi-Annual Report
SCHEDULE OF INVESTMENTS
December 31, 2016 (Unaudited)
| | | | | | | | | | | | | | | | | | | | |
| | | | | | | | | SHARES | | | COST | | | FAIR
VALUE | |
Common Stocks — 0.4%*: | |
|
Retail Stores — 0.4%*: | |
Maxeda DIY B.V.+¤ | | | | | | | | | | | 18,859,871 | | | | $373,738 | | | | $397,057 | |
Maxeda DIY B.V.+¤ | | | | | | | | | | | 10,446 | | | | – | | | | 99,272 | |
| | | | | | | | | | | | | | | | | | | | |
Total Retail Stores | | | | 18,870,317 | | | | 373,738 | | | | 496,329 | |
| | | | | | | | | | | | | | | | | | | | |
|
Mining, Steel, Iron and Non-Precious Metals — 0.0%*: | |
Boomerang Tube LLC¤(1)†† | | | | | | | | | | | 2,007 | | | | – | | | | – | |
| | | | | | | | | | | | | | | | | | | | |
|
Oil and Gas — 0.0%*: | |
Southcross Holdings LP¤(1) | | | | | | | | | | | 11 | | | | – | | | | – | |
Southcross Energy Partners LP | | | | | | | | | | | 11 | | | | 2,750 | | | | 3,905 | |
| | | | | | | | | | | | | | | | | | | | |
Total Oil and Gas | | | | 22 | | | | 2,750 | | | | 3,905 | |
| | | | | | | | | | | | | | | | | | | | |
| | | | | | | | | | | | | | | | | | | | |
Total Common Stocks | | | | 18,872,346 | | | | 376,488 | | | | 500,234 | |
| | | | | | | | | | | | | | | | | | | | |
| | | | | |
| | | EFFECTIVE
INTEREST RATE | | | DUE DATE | | | PRINCIPAL ‡‡ | | | COST | | | FAIR
VALUE | |
Fixed Income — 91.3%*: | |
|
Asset-Backed Securities — 12.9%*: | |
|
CDO/CLO — 12.9%*: | |
ALM VI Ltd. 2012-6A ER^ | | | 7.28 | #% | | | 7/15/2026 | | | | 371,795 | | | | 233,605 | | | | 320,043 | |
Apidos CLO XII 2013-12A F^ | | | 5.78 | # | | | 4/15/2025 | | | | 500,000 | | | | 453,869 | | | | 397,957 | |
Apidos CLO XV 2013-15A E^ | | | 6.38 | # | | | 10/20/2025 | | | | 500,000 | | | | 466,467 | | | | 405,453 | |
Apidos CLO XVI 2013-16A D^ | | | 5.38 | # | | | 1/19/2025 | | | | 500,000 | | | | 445,095 | | | | 437,754 | |
Atlas Senior Loan Fund VI Ltd. 2014-6A E^ | | | 6.08 | # | | | 10/15/2026 | | | | 800,000 | | | | 737,572 | | | | 724,622 | |
Atrium IX 9A E^ | | | 5.94 | # | | | 2/28/2024 | | | | 500,000 | | | | 428,630 | | | | 461,139 | |
BlueMountain CLO Ltd. 2014-1A^ | | | Zero Coupon | | | | 4/30/2026 | | | | 250,000 | | | | 240,390 | | | | 167,046 | |
Cairn CLO B.V. 2013-3A E+^ | | | 4.90 | # | | | 10/20/2028 | | | | 1,000,000 | | | | 1,026,958 | | | | 969,703 | |
Carlyle Global Market Strategies CLO Ltd. 2013-3A D^ | | | 5.48 | # | | | 7/15/2025 | | | | 500,000 | | | | 462,320 | | | | 452,690 | |
Carlyle Global Market Strategies CLO Ltd. 2013-4A E^ | | | 5.38 | # | | | 10/15/2025 | | | | 500,000 | | | | 467,089 | | | | 452,705 | |
Carlyle Global Market Strategies CLO Ltd. 2013-4A F^ | | | 6.08 | # | | | 10/15/2025 | | | | 500,000 | | | | 459,998 | | | | 410,185 | |
Carlyle Global Market Strategies CLO Ltd. 2014-1A E^ | | | 5.33 | # | | | 4/17/2025 | | | | 1,000,000 | | | | 897,640 | | | | 891,162 | |
Carlyle Global Market Strategies CLO Ltd. 2014-5A D^ | | | 5.65 | # | | | 10/16/2025 | | | | 500,000 | | | | 457,345 | | | | 460,455 | |
Carlyle Global Market Strategies CLO Ltd. 2015-1A E1^ | | | 6.18 | # | | | 4/20/2027 | | | | 500,000 | | | | 445,001 | | | | 460,036 | |
Dryden 41 Senior Loan Fund 2015-41A E^ | | | 6.53 | # | | | 1/15/2028 | | | | 500,000 | | | | 467,115 | | | | 468,966 | |
Dryden 45 Senior Loan Fund 2016-45A E^ | | | 7.66 | # | | | 7/15/2027 | | | | 500,000 | | | | 480,414 | | | | 490,325 | |
Dryden XXXI Senior Loan Fund 2014-31A E^ | | | 5.13 | # | | | 4/18/2026 | | | | 1,000,000 | | | | 902,270 | | | | 874,426 | |
Eaton Vance CLO Ltd. 2013-1A DR^ | | | 8.33 | # | | | 1/15/2028 | | | | 500,000 | | | | 487,423 | | | | 487,401 | |
See accompanying Notes to the Financial Statements.
85
Barings Global Credit Income Opportunities Fund 2016 Semi-Annual Report
SCHEDULE OF INVESTMENTS (CONTINUED)
December 31, 2016 (Unaudited)
| | | | | | | | | | | | | | | | | | | | |
| | | EFFECTIVE
INTEREST RATE | | | DUE DATE | | | PRINCIPAL ‡‡ | | | COST | | | FAIR
VALUE | |
Asset-Backed Securities (Continued) | |
|
CDO/CLO (Continued) | |
GoldenTree Loan Opportunities VII Ltd. 2013-7A F^ | | | 6.13 | # % | | | 4/25/2025 | | | | 500,000 | | | | $470,474 | | | | $404,833 | |
LCM XIII LP 13A ER^ | | | 8.18 | # | | | 7/19/2027 | | | | 750,000 | | | | 721,047 | | | | 721,140 | |
LCM XV LP 15A E1^ | | | 5.38 | # | | | 8/25/2024 | | | | 500,000 | | | | 471,177 | | | | 437,520 | |
LCM XVII LP 17A E^ | | | 5.63 | # | | | 10/15/2026 | | | | 1,000,000 | | | | 906,063 | | | | 899,418 | |
Madison Park Funding XIII Ltd. 2014-13A^ | | | Zero Coupon | | | | 1/19/2025 | | | | 500,000 | | | | 400,249 | | | | 366,011 | |
Oak Hill Credit Partners X Ltd. 2014-10A^ | | | Zero Coupon | # | | | 7/20/2026 | | | | 500,000 | | | | 455,704 | | | | 327,773 | |
OHA Credit Partners IX Ltd. 2013-9A E^ | | | 5.88 | # | | | 10/20/2025 | | | | 500,000 | | | | 471,453 | | | | 465,142 | |
Pinnacle Park CLO Ltd. 2014-1A E^ | | | 5.83 | # | | | 4/15/2026 | | | | 500,000 | | | | 472,870 | | | | 447,828 | |
Seneca Park CLO Ltd. 2014-1A E^ | | | 5.58 | # | | | 7/17/2026 | | | | 1,020,000 | | | | 936,505 | | | | 898,274 | |
Tryon Park CLO Ltd. 2013-1A D^ | | | 5.28 | # | | | 7/15/2025 | | | | 500,000 | | | | 467,717 | | | | 443,149 | |
Voya CLO Ltd. 2013-2A E^ | | | 6.38 | # | | | 4/25/2025 | | | | 500,000 | | | | 469,974 | | | | 415,735 | |
Voya CLO Ltd. 2013-3A D^ | | | 5.38 | # | | | 1/18/2026 | | | | 750,000 | | | | 683,424 | | | | 679,759 | |
| | | | | | | | | | | | | | | | | | | | |
Total CDO/CLO | | | | 17,941,795 | | | | 16,485,858 | | | | 15,838,650 | |
| | | | | | | | | | | | | | | | | | | | |
| | | | | | | | | | | | | | | | | | | | |
Total Asset-Backed Securities | | | | 17,941,795 | | | | 16,485,858 | | | | 15,838,650 | |
| | | | | | | | | | | | | | | | | | | | |
Bank Loans — 24.4%*§: | |
|
Aerospace and Defense — 1.2%*: | |
Swissport Investments SA+ | | | 6.25 | | | | 2/9/2022 | | | | 500,000 | | | | 533,443 | | | | 533,268 | |
TransDigm, Inc. | | | 3.77 | | | | 6/9/2023 | | | | 498,747 | | | | 496,918 | | | | 503,485 | |
TransDigm, Inc. | | | 3.85 | | | | 5/14/2022 | | | | 495,206 | | | | 490,285 | | | | 499,143 | |
| | | | | | | | | | | | | | | | | | | | |
Total Aerospace and Defense | | | | 1,493,953 | | | | 1,520,646 | | | | 1,535,896 | |
| | | | | | | | | | | | | | | | | | | | |
|
Automobile — 0.1%*: | |
Tectum Holdings, Inc. | | | 5.75 | | | | 8/24/2023 | | | | 121,113 | | | | 119,960 | | | | 122,627 | |
| | | | | | | | | | | | | | | | | | | | |
|
Beverage, Food and Tobacco — 0.4%*: | |
Deoleo S.A.+ | | | 4.50 | | | | 6/11/2021 | | | | 500,000 | | | | 555,397 | | | | 450,208 | |
| | | | | | | | | | | | | | | | | | | | |
|
Broadcasting and Entertainment — 1.4%*: | |
All3Media International+ | | | 5.25 | | | | 6/30/2021 | | | | 500,000 | | | | 834,813 | | | | 609,656 | |
AP NMT Acquisition B.V.+ | | | 6.75 | | | | 8/13/2021 | | | | 498,725 | | | | 454,624 | | | | 458,647 | |
AP NMT Acquisition B.V.+ | | | 7.00 | | | | 8/13/2021 | | | | 397,190 | | | | 485,606 | | | | 387,192 | |
AP NMT Acquisition B.V.+ | | | 10.00 | | | | 8/13/2022 | | | | 300,000 | | | | 283,040 | | | | 239,571 | |
| | | | | | | | | | | | | | | | | | | | |
Total Broadcasting and Entertainment | | | | 1,695,915 | | | | 2,058,083 | | | | 1,695,066 | |
| | | | | | | | | | | | | | | | | | | | |
|
Buildings and Real Estate — 0.1%*: | |
Jeld-Wen, Inc. | | | 4.75 | | | | 7/1/2022 | | | | 161,885 | | | | 161,489 | | | | 163,706 | |
| | | | | | | | | | | | | | | | | | | | |
|
Chemicals, Plastics and Rubber — 1.2%*: | |
INEOS Styrolution Group GmbH+ | | | 4.75 | | | | 9/30/2021 | | | | 348,008 | | | | 395,697 | | | | 371,492 | |
Methanol Holdings (Trinidad) Ltd. | | | 4.27 | | | | 6/30/2022 | | | | 347,203 | | | | 344,469 | | | | 338,957 | |
Platform Specialty Products Corp. | | | 4.50 | | | | 6/7/2020 | | | | 272,729 | | | | 273,015 | | | | 275,571 | |
Tronox Pigments (Netherlands) B.V. | | | 4.50 | | | | 3/19/2020 | | | | 496,144 | | | | 479,202 | | | | 497,796 | |
| | | | | | | | | | | | | | | | | | | | |
Total Chemicals, Plastics and Rubber | | | | 1,464,084 | | | | 1,492,383 | | | | 1,483,816 | |
| | | | | | | | | | | | | | | | | | | | |
See accompanying Notes to the Financial Statements.
86
Barings Global Credit Income Opportunities Fund 2016 Semi-Annual Report
SCHEDULE OF INVESTMENTS (CONTINUED)
December 31, 2016 (Unaudited)
| | | | | | | | | | | | | | | | | | | | |
| | | EFFECTIVE
INTEREST RATE | | | DUE DATE | | | PRINCIPAL ‡‡ | | | COST | | | FAIR
VALUE | |
Bank Loans (Continued) | |
|
Containers, Packaging and Glass — 1.2%*: | |
Consolidated Container Co. LLC | | | 5.00 | % | | | 7/3/2019 | | | | 721,787 | | | $ | 716,078 | | | $ | 725,395 | |
Consolidated Container Co. LLC | | | 7.75 | | | | 1/3/2020 | | | | 94,140 | | | | 93,114 | | | | 92,022 | |
ProAmpac Intermediate Inc. | | | 9.50 | | | | 11/18/2024 | | | | 500,000 | | | | 492,600 | | | | 500,000 | |
Signode Industrial Group US, Inc. | | | 4.00 | | | | 5/1/2021 | | | | 176,541 | | | | 175,665 | | | | 177,865 | |
| | | | | | | | | | | | | | | | | | | | |
Total Containers, Packaging and Glass | | | | 1,492,468 | | | | 1,477,457 | | | | 1,495,282 | |
| | | | | | | | | | | | | | | | | | | | |
|
Diversified/Conglomerate Manufacturing — 0.3%*: | |
Triple Point Technology, Inc. | | | 5.25 | | | | 7/10/2020 | | | | 334,622 | | | | 317,234 | | | | 295,026 | |
Triple Point Technology, Inc.†† | | | 9.25 | | | | 7/10/2021 | | | | 50,845 | | | | 48,215 | | | | 36,100 | |
West Corp. | | | 2.77 | | | | 7/1/2019 | | | | 39,870 | | | | 39,094 | | | | 39,571 | |
| | | | | | | | | | | | | | | | | | | | |
Total Diversified/Conglomerate Manufacturing | | | | 425,337 | | | | 404,543 | | | | 370,697 | |
| | | | | | | | | | | | | | | | | | | | |
|
Diversified/Conglomerate Service — 4.3%*: | |
Aquilex Holdings LLC | | | 5.00 | | | | 12/31/2020 | | | | 91,838 | | | | 91,706 | | | | 89,427 | |
Atrium Innovations, Inc. | | | 4.25 | | | | 2/13/2021 | | | | 954,444 | | | | 946,491 | | | | 954,444 | |
MH Sub I, LLC | | | 8.50 | | | | 7/8/2022 | | | | 650,000 | | | | 646,971 | | | | 648,375 | |
PowerTeam Services, LLC | | | 8.25 | | | | 11/6/2020 | | | | 300,000 | | | | 299,149 | | | | 298,500 | |
Quest Software US Holdings, Inc. | | | 7.00 | | | | 10/31/2022 | | | | 1,005,892 | | | | 997,493 | | | | 1,017,841 | |
RP Crown Parent, LLC | | | 4.50 | | | | 10/12/2023 | | | | 743,298 | | | | 739,691 | | | | 750,545 | |
Triangle FM Services Holding GmbH+ | | | 5.25 | | | | 8/31/2023 | | | | 500,000 | | | | 552,965 | | | | 531,789 | |
VF Holding Corp. | | | 4.75 | | | | 6/30/2023 | | | | 997,500 | | | | 999,629 | | | | 999,635 | |
| | | | | | | | | | | | | | | | | | | | |
Total Diversified/Conglomerate Service | | | | 5,242,972 | | | | 5,274,095 | | | | 5,290,556 | |
| | | | | | | | | | | | | |
|
Ecological — 0.1%*: | |
Emerald 3 Ltd.+ | | | 8.00 | | | | 5/31/2022 | | | | 196,488 | | | | 195,129 | | | | 170,945 | |
| | | | | | | | | | | | | | | | | | | | |
|
Electronics — 0.2%*: | |
Tessera Holding Corp. | | | 4.00 | | | | 12/1/2023 | | | | 183,808 | | | | 181,986 | | | | 185,302 | |
| | | | | | | | | | | | | | | | | | | | |
|
Finance — 0.7%*: | |
Moneygram International, Inc. | | | 4.25 | | | | 3/27/2020 | | | | 616,025 | | | | 592,239 | | | | 607,813 | |
Sedgwick Claims Management Services, Inc. | | | 3.75 | | | | 3/1/2021 | | | | 290,439 | | | | 290,006 | | | | 290,854 | |
| | | | | | | | | | | | | | | | | | | | |
Total Finance | | | | 906,464 | | | | 882,245 | | | | 898,667 | |
| | | | | | | | | | | | | |
|
Healthcare, Education and Childcare — 2.2%*: | |
Arbor Pharmaceuticals, Inc. | | | 6.00 | | | | 7/5/2023 | | | | 123,412 | | | | 116,485 | | | | 124,492 | |
Concentra, Inc. | | | 4.00 | | | | 6/1/2022 | | | | 994,949 | | | | 985,395 | | | | 997,437 | |
Envision Healthcare Corp. | | | 4.00 | | | | 12/11/2023 | | | | 158,096 | | | | 156,531 | | | | 159,579 | |
Jaguar Holding Co. II | | | 4.25 | | | | 8/18/2022 | | | | 105,040 | | | | 104,783 | | | | 106,117 | |
Ortho-Clinical Diagnostics, Inc. | | | 4.75 | | | | 6/30/2021 | | | | 250,887 | | | | 246,497 | | | | 248,468 | |
Rodenstock GmbH+ | | | 4.13 | | | | 5/30/2019 | | | | 500,000 | | | | 537,127 | | | | 500,798 | |
Tecomet, Inc. | | | 5.75 | | | | 12/5/2021 | | | | 573,644 | | | | 548,285 | | | | 573,644 | |
| | | | | | | | | | | | | | | | | | | | |
Total Healthcare, Education and Childcare | | | | | | | | | | | 2,706,028 | | | | 2,695,103 | | | | 2,710,535 | |
| | | | | | | | | | | | | |
See accompanying Notes to the Financial Statements.
87
Barings Global Credit Income Opportunities Fund 2016 Semi-Annual Report
SCHEDULE OF INVESTMENTS (CONTINUED)
December 31, 2016 (Unaudited)
| | | | | | | | | | | | | | | | | | | | |
| | | EFFECTIVE
INTEREST RATE | | | DUE DATE | | | PRINCIPAL ‡‡ | | | COST | | | FAIR
VALUE | |
Bank Loans (Continued) | |
|
Home and Office Furnishings, Housewares, and Durable Consumer Products — 0.6%*: | |
Serta Simmons Bedding, LLC | | | 4.50 | % | | | 11/8/2023 | | | | 236,156 | | | $ | 234,988 | | | $ | 238,591 | |
Serta Simmons Bedding, LLC | | | 9.00 | | | | 11/8/2024 | | | | 500,000 | | | | 492,588 | | | | 501,665 | |
| | | | | | | | | | | | | | | | | | | | |
Total Home and Office Furnishings, Housewares, and Durable Consumer Products | | | | | | | | | | | 736,156 | | | | 727,576 | | | | 740,256 | |
| | | | | | | | | | | | | |
|
Hotels, Motels, Inns and Gaming — 0.5%*: | |
Parkdean Resorts Holdco Ltd.+ | | | 5.28 | | | | 11/10/2022 | | | | 500,000 | | | | 756,172 | | | | 616,329 | |
| | | | | | | | | | | | | | | | | | | | |
|
Leisure, Amusement, Entertainment — 0.7%*: | |
Delta 2 (LUX) S.a.r.l.+ | | | 8.07 | | | | 7/31/2022 | | | | 125,000 | | | | 124,658 | | | | 125,729 | |
Lions Gate Entertainment Corp.+ | | | 3.75 | | | | 12/8/2023 | | | | 676,957 | | | | 673,598 | | | | 680,342 | |
| | | | | | | | | | | | | | | | | | | | |
Total Leisure, Amusement, Entertainment | | | | | | | | | | | 801,957 | | | | 798,256 | | | | 806,071 | |
| | | | | | | | | | | | | |
|
Machinery Non-Agriculture, Non-Construction, Non-Electronic — 0.8%*: | |
Alison Bidco S.a.r.l.+ | | | 5.25 | | | | 8/29/2021 | | | | 145,284 | | | | 144,314 | | | | 144,315 | |
Gardner Denver, Inc. | | | 4.56 | | | | 7/30/2020 | | | | 860,488 | | | | 825,481 | | | | 851,005 | |
| | | | | | | | | | | | | | | | | | | | |
Total Machinery Non-Agriculture, Non-Construction, Non-Electronic | | | | | | | | | | | 1,005,772 | | | | 969,795 | | | | 995,320 | |
| | | | | | | | | | | | | |
|
Mining, Steel, Iron and Non-Precious Metals — 0.6%*: | |
Arch Coal Inc. | | | 10.00 | | | | 6/15/2021 | | | | 127,527 | | | | 127,527 | | | | 129,175 | |
Boomerang Tube LLC¤†† | | | 18.77 | | | | 8/1/2017 | | | | 9,289 | | | | 9,289 | | | | 9,289 | |
Boomerang Tube LLC¤†† | | | 18.77 | | | | 8/12/2017 | | | | 9,289 | | | | 9,289 | | | | 9,289 | |
Boomerang Tube, LLC¤†† | | | 15.00 | | | | 2/20/2020 | | | | 32,825 | | | | 26,312 | | | | 26,260 | |
Boomerang Tube, LLC¤†† | | | 15.77 | | | | 2/2/2020 | | | | 95,096 | | | | 95,096 | | | | 95,096 | |
Boomerang Tube, LLC¤†† | | | 18.27 | | | | 2/2/2020 | | | | 79,294 | | | | 79,294 | | | | 11,894 | |
Boomerang Tube, LLC¤†† | | | 20.00 | | | | 2/2/2020 | | | | 34,590 | | | | 32,391 | | | | 31,131 | |
Murray Energy Corp. | | | 8.25 | | | | 4/16/2020 | | | | 205,073 | | | | 201,172 | | | | 195,462 | |
Zekelman Industries, Inc. | | | 6.00 | | | | 6/14/2021 | | | | 179,294 | | | | 177,683 | | | | 180,638 | |
| | | | | | | | | | | | | | | | | | | | |
Total Mining, Steel, Iron and Non-Precious Metals | | | | | | | | | | | 772,277 | | | | 758,053 | | | | 688,234 | |
| | | | | | | | | | | | | |
|
Oil and Gas — 4.9%*: | |
Ascent Resources — Marcellus LLC | | | 8.50 | | | | 8/4/2021 | | | | 60,369 | | | | 59,773 | | | | 7,244 | |
Caelus Energy Alaska O3, LLC | | | 8.75 | | | | 4/15/2020 | | | | 846,154 | | | | 783,896 | | | | 676,923 | |
Fieldwood Energy LLC PIK | | | 8.00 | | | | 9/30/2020 | | | | 649,368 | | | | 583,304 | | | | 613,653 | |
Fieldwood Energy LLC PIK | | | 8.38 | | | | 8/31/2020 | | | | 1,025,641 | | | | 582,643 | | | | 717,949 | |
Fieldwood Energy LLC PIK | | | 8.38 | | | | 9/30/2020 | | | | 859,699 | | | | 317,212 | | | | 745,789 | |
Floatel International, Ltd. | | | 6.00 | | | | 6/27/2020 | | | | 200,147 | | | | 198,968 | | | | 160,868 | |
Gulf Finance, LLC | | | 6.25 | | | | 8/25/2023 | | | | 994,447 | | | | 971,147 | | | | 996,933 | |
Jonah Energy LLC | | | 7.50 | | | | 5/12/2021 | | | | 173,566 | | | | 171,941 | | | | 162,862 | |
Paragon Offshore Finance Co. | | | 5.50 | | | | 7/18/2021 | | | | 479,874 | | | | 399,462 | | | | 175,955 | |
Seadrill Partners Finco, LLC | | | 4.00 | | | | 2/21/2021 | | | | 252,460 | | | | 169,193 | | | | 171,925 | |
Southcross Holdings Borrower LP | | | 9.00 | | | | 4/13/2023 | | | | 10,005 | | | | 10,006 | | | | 7,588 | |
See accompanying Notes to the Financial Statements.
88
Barings Global Credit Income Opportunities Fund 2016 Semi-Annual Report
SCHEDULE OF INVESTMENTS (CONTINUED)
December 31, 2016 (Unaudited)
| | | | | | | | | | | | | | | | | | | | |
| | | EFFECTIVE
INTEREST RATE | | | DUE DATE | | | PRINCIPAL ‡‡ | | | COST | | | FAIR
VALUE | |
Bank Loans (Continued) | |
|
Oil and Gas (Continued) | |
UTEX Industries, Inc. | | | 5.00 | % | | | 5/22/2021 | | | | 1,271,260 | | | $ | 1,083,896 | | | $ | 1,174,326 | |
Western Refining, Inc. | | | 5.50 | | | | 6/23/2023 | | | | 372,500 | | | | 365,577 | | | | 374,363 | |
| | | | | | | | | | | | | | | | | | | | |
Total Oil and Gas | | | | | | | | | | | 7,195,490 | | | | 5,697,018 | | | | 5,986,378 | |
| | | | | | | | | | | | | |
|
Printing and Publishing — 0.7%*: | |
Springer Science+Business Media Deutschland GmbH+ | | | 4.75 | | | | 8/14/2020 | | | | 448,858 | | | | 437,986 | | | | 448,670 | |
Springer Science+Business Media Deutschland GmbH+ | | | 9.00 | | | | 8/14/2021 | | | | 446,875 | | | | 517,761 | | | | 470,403 | |
| | | | | | | | | | | | | | | | | | | | |
Total Printing and Publishing | | | | | | | | | | | 895,733 | | | | 955,747 | | | | 919,073 | |
| | | | | | | | | | | | | |
|
Retail Stores — 1.2%*: | |
Academy, Ltd. | | | 5.00 | | | | 7/1/2022 | | | | 494,682 | | | | 475,009 | | | | 456,839 | |
Container Store, Inc. (The) | | | 4.25 | | | | 4/6/2019 | | | | 495,760 | | | | 458,488 | | | | 451,142 | |
Maxeda DIY B.V.+ | | | 7.00 | | | | 6/28/2019 | | | | 583,333 | | | | 638,024 | | | | 564,732 | |
| | | | | | | | | | | | | | | | | | | | |
Total Retail Stores | | | | | | | | | | | 1,573,775 | | | | 1,571,521 | | | | 1,472,713 | |
| | | | | | | | | | | | | |
|
Utilities — 1.0%*: | |
Dynegy, Inc. | | | 5.00 | | | | 6/27/2023 | | | | 499,093 | | | | 494,429 | | | | 505,122 | |
EFS Cogen Holdings I LLC | | | 4.50 | | | | 6/28/2023 | | | | 757,730 | | | | 750,680 | | | | 763,224 | |
| | | | | | | | | | | | | | | | | | | | |
Total Utilities | | | | | | | | | | | 1,256,823 | | | | 1,245,109 | | | | 1,268,346 | |
| | | | | | | | | | | | | |
| | | | | | | | | | | | | | | | | | | | |
Total Bank Loans | | | | | | | | | | | 31,328,498 | | | | 30,497,763 | | | | 30,066,023 | |
| | | | | | | | | | | | | |
Corporate Bonds — 54.0%*: | |
|
Aerospace and Defense — 0.7%*: | |
CPI International, Inc. | | | 8.75 | | | | 2/15/2018 | | | | 814,000 | | | | 821,178 | | | | 826,210 | |
| | | | | | | | | | | | | | | | | | | | |
|
Automobile — 2.8%*: | |
Allied Specialty Vehicles, Inc.^ | | | 8.50 | | | | 11/1/2019 | | | | 1,000,000 | | | | 1,019,192 | | | | 1,027,500 | |
Gates Global LLC/Gates Global Co.^ | | | 6.00 | | | | 7/15/2022 | | | | 1,000,000 | | | | 788,997 | | | | 978,000 | |
International Automotive Components Group SA^ | | | 9.13 | | | | 6/1/2018 | | | | 940,000 | | | | 952,242 | | | | 916,500 | |
JB Poindexter & Co., Inc.^ | | | 9.00 | | | | 4/1/2022 | | | | 500,000 | | | | 519,906 | | | | 525,000 | |
| | | | | | | | | | | | | | | | | | | | |
Total Automobile | | | | | | | | | | | 3,440,000 | | | | 3,280,337 | | | | 3,447,000 | |
| | | | | | | | | | | | | |
|
Banking — 0.4%*: | |
Lock AS+ | | | 7.00 | | | | 8/15/2021 | | | | 500,000 | | | | 620,407 | | | | 558,884 | |
| | | | | | | | | | | | | | | | | | | | |
|
Beverage, Food and Tobacco — 0.7%*: | |
Boparan Finance PLC+ | | | 5.50 | | | | 7/15/2021 | | | | 550,000 | | | | 740,500 | | | | 661,901 | |
US Foods, Inc.^ | | | 5.88 | | | | 6/15/2024 | | | | 154,000 | | | | 154,000 | | | | 159,390 | |
| | | | | | | | | | | | | | | | | | | | |
Total Beverage, Food and Tobacco | | | | 704,000 | | | | 894,500 | | | | 821,291 | |
| | | | | | | | | | | | | |
|
Broadcasting and Entertainment — 2.2%*: | |
DISH DBS Corp. | | | 7.75 | | | | 7/1/2026 | | | | 750,000 | | | | 755,421 | | | | 845,625 | |
See accompanying Notes to the Financial Statements.
89
Barings Global Credit Income Opportunities Fund 2016 Semi-Annual Report
SCHEDULE OF INVESTMENTS (CONTINUED)
December 31, 2016 (Unaudited)
| | | | | | | | | | | | | | | | | | | | |
| | | EFFECTIVE
INTEREST RATE | | | DUE DATE | | | PRINCIPAL ‡‡ | | | COST | | | FAIR
VALUE | |
Corporate Bonds (Continued) | |
|
Broadcasting and Entertainment (Continued) | |
Entertainment One Ltd.+ | | | 6.88 | % | | | 12/15/2022 | | | | 200,000 | | | $ | 302,481 | | | $ | 267,554 | |
RCN Telecom Services LLC/RCN Capital Corp.^ | | | 8.50 | | | | 8/15/2020 | | | | 775,000 | | | | 777,178 | | | | 821,500 | |
Unitymedia Hessen GmbH & Co. KG/Unitymedia NRW GmbH+ | | | 3.50 | | | | 1/15/2027 | | | | 300,000 | | | | 326,933 | | | | 309,479 | |
Unitymedia Hessen GmbH & Co. KG/Unitymedia NRW GmbH+ | | | 6.25 | | | | 1/15/2029 | | | | 200,000 | | | | 246,781 | | | | 232,668 | |
VTR Finance B.V.+^ | | | 6.88 | | | | 1/15/2024 | | | | 250,000 | | | | 243,740 | | | | 258,125 | |
| | | | | | | | | | | | | | | | | | | | |
Total Broadcasting and Entertainment | | | | | | | | | | | 2,475,000 | | | | 2,652,534 | | | | 2,734,951 | |
| | | | | | | | | | | | | |
|
Buildings and Real Estate — 1.6%*: | |
Cemex Finance LLC+^ | | | 9.38 | | | | 10/12/2022 | | | | 400,000 | | | | 431,937 | | | | 436,000 | |
Cemex SAB de CV+ | | | 4.38 | | | | 3/5/2023 | | | | 100,000 | | | | 111,980 | | | | 107,897 | |
GEO Group, Inc. (The) | | | 5.88 | | | | 1/15/2022 | | | | 500,000 | | | | 475,058 | | | | 506,250 | |
Keystone Financing PLC+ | | | 9.50 | | | | 10/15/2019 | | | | 350,000 | | | | 564,905 | | | | 451,095 | |
Paroc Group Oy+ | | | 6.25 | | | | 5/15/2020 | | | | 100,000 | | | | 137,565 | | | | 107,897 | |
Paroc Group Oy MTN+ | | | 4.94 | # | | | 5/15/2020 | | | | 100,000 | | | | 137,565 | | | | 103,823 | |
William Lyon Homes, Inc. | | | 7.00 | | | | 8/15/2022 | | | | 295,000 | | | | 299,987 | | | | 305,325 | |
| | | | | | | | | | | | | | | | | | | | |
Total Buildings and Real Estate | | | | | | | | | | | 1,845,000 | | | | 2,158,997 | | | | 2,018,287 | |
| | | | | | | | | | | | | |
|
Cargo Transport — 1.9%*: | |
Deck Chassis Acquisition, Inc.^ | | | 10.00 | | | | 6/15/2023 | | | | 580,000 | | | | 580,000 | | | | 598,850 | |
Kenan Advantage Group, Inc.^ | | | 7.88 | | | | 7/31/2023 | | | | 1,367,000 | | | | 1,367,000 | | | | 1,380,670 | |
Moto Finance PLC+ | | | 6.38 | | | | 9/1/2020 | | | | 200,000 | | | | 300,330 | | | | 256,339 | |
WFS Global Holding SAS+ | | | 9.50 | | | | 7/15/2022 | | | | 150,000 | | | | 170,153 | | | | 162,342 | |
| | | | | | | | | | | | | | | | | | | | |
Total Cargo Transport | | | | | | | | | | | 2,297,000 | | | | 2,417,483 | | | | 2,398,201 | |
| | | | | | | | | | | | | |
|
Chemicals, Plastics and Rubber — 2.2%*: | |
A. Schulman, Inc.^ | | | 6.88 | | | | 6/1/2023 | | | | 500,000 | | | | 513,592 | | | | 522,500 | |
Consolidated Energy Finance SA+^ | | | 6.75 | | | | 10/15/2019 | | | | 1,000,000 | | | | 995,076 | | | | 1,000,000 | |
LSB Industries, Inc. | | | 8.50 | | | | 8/1/2019 | | | | 238,000 | | | | 209,395 | | | | 218,960 | |
Monitchem HoldCo 2 SA+ | | | 6.88 | | | | 6/15/2022 | | | | 200,000 | | | | 199,877 | | | | 193,170 | |
Pinnacle Operating Corp.^ | | | 9.00 | | | | 11/15/2020 | | | | 600,000 | | | | 611,968 | | | | 264,000 | |
Platform Specialty Products Corp.^ | | | 10.38 | | | | 5/1/2021 | | | | 250,000 | | | | 271,858 | | | | 276,875 | |
Trinseo Materials Operating SCA/Trinseo Materials Finance, Inc. | | | 6.38 | | | | 5/1/2022 | | | | 200,000 | | | | 219,995 | | | | 225,267 | |
| | | | | | | | | | | | | | | | | | | | |
Total Chemicals, Plastics and Rubber | | | | | | | | | | | 2,988,000 | | | | 3,021,761 | | | | 2,700,772 | |
| | | | | | | | | | | | | |
|
Containers, Packaging and Glass — 3.2%*: | |
Ardagh Packaging Finance PLC/Ardagh Holdings USA, Inc.+ | | | 6.75 | | | | 5/15/2024 | | | | 300,000 | | | | 343,004 | | | | 337,111 | |
Coveris Holdings SA^ | | | 7.88 | | | | 11/1/2019 | | | | 900,000 | | | | 902,144 | | | | 893,250 | |
Horizon Holdings I SASU+ | | | 7.25 | | | | 8/1/2023 | | | | 300,000 | | | | 347,914 | | | | 337,111 | |
Iron Mountain Europe PLC+ | | | 6.13 | | | | 9/15/2022 | | | | 300,000 | | | | 432,355 | | | | 390,055 | |
SIG Combibloc Holdings SCA+ | | | 7.75 | | | | 2/15/2023 | | | | 700,000 | | | | 817,824 | | | | 791,530 | |
See accompanying Notes to the Financial Statements.
90
Barings Global Credit Income Opportunities Fund 2016 Semi-Annual Report
SCHEDULE OF INVESTMENTS (CONTINUED)
December 31, 2016 (Unaudited)
| | | | | | | | | | | | | | | | | | | | |
| | | EFFECTIVE
INTEREST RATE | | | DUE DATE | | | PRINCIPAL ‡‡ | | | COST | | | FAIR
VALUE | |
Corporate Bonds (Continued) | |
|
Containers, Packaging and Glass (Continued) | |
Signode Industrial Group Lux SA/Signode Industrial Group US, Inc.^ | | | 6.38 | % | | | 5/1/2022 | | | | 1,200,000 | | | $ | 1,191,492 | | | $ | 1,197,000 | |
| | | | | | | | | | | | | | | | | | | | |
Total Containers, Packaging and Glass | | | | | | | | | | | 3,700,000 | | | | 4,034,733 | | | | 3,946,057 | |
| | | | | | | | | | | | | |
|
Diversified/Conglomerate Manufacturing — 2.6%*: | |
Appvion, Inc.^ | | | 9.00 | | | | 6/1/2020 | | | | 500,000 | | | | 509,523 | | | | 280,000 | |
CTP Transportation Products LLC/CTP Finance, Inc.^ | | | 8.25 | | | | 12/15/2019 | | | | 648,000 | | | | 660,169 | | | | 558,900 | |
EnPro Industries, Inc. | | | 5.88 | | | | 9/15/2022 | | | | 400,000 | | | | 403,530 | | | | 411,000 | |
Galapagos SA+ | | | 5.38 | | | | 6/15/2021 | | | | 175,000 | | | | 219,859 | | | | 175,003 | |
Griffon Corp. | | | 5.25 | | | | 3/1/2022 | | | | 800,000 | | | | 791,013 | | | | 810,600 | |
StoneMor Partners LP/Cornerstone Family Services of West Virginia Subsidiary | | | 7.88 | | | | 6/1/2021 | | | | 500,000 | | | | 514,084 | | | | 455,000 | |
West Corp.^ | | | 5.38 | | | | 7/15/2022 | | | | 500,000 | | | | 478,988 | | | | 483,125 | |
| | | | | | | | | | | | | | | | | | | | |
Total Diversified/Conglomerate Manufacturing | | | | | | | | | | | 3,523,000 | | | | 3,577,166 | | | | 3,173,628 | |
| | | | | | | | | | | | | |
|
Diversified/Conglomerate Service — 3.6%*: | |
Carlson Travel, Inc. | | | 4.43 | # | | | 6/15/2023 | | | | 100,000 | | | | 105,575 | | | | 107,118 | |
Carlson Travel, Inc.^ | | | 6.75 | | | | 12/15/2023 | | | | 238,000 | | | | 238,000 | | | | 247,520 | |
Carlson Travel, Inc.^ | | | 9.50 | | | | 12/15/2024 | | | | 277,000 | | | | 277,000 | | | | 289,811 | |
Infor Software Parent LLC/Infor Software Parent, Inc. PIK^ | | | 7.13 | | | | 5/1/2021 | | | | 1,200,000 | | | | 1,130,324 | | | | 1,236,000 | |
Nuance Communications, Inc.^ | | | 5.63 | | | | 12/15/2026 | | | | 1,000,000 | | | | 990,639 | | | | 983,250 | |
ServiceMaster Co. LLC (The)^ | | | 5.13 | | | | 11/15/2024 | | | | 627,000 | | | | 627,000 | | | | 636,405 | |
Zachry Holdings, Inc.^ | | | 7.50 | | | | 2/1/2020 | | | | 871,000 | | | | 868,401 | | | | 893,864 | |
| | | | | | | | | | | | | | | | | | | | |
Total Diversified/Conglomerate Service | | | | | | | | | | | 4,313,000 | | | | 4,236,939 | | | | 4,393,968 | |
| | | | | | | | | | | | | |
|
Electronics — 1.0%*: | |
NXP BV/NXP Funding LLC^ | | | 4.13 | | | | 6/1/2021 | | | | 226,000 | | | | 229,898 | | | | 233,345 | |
Prime Security Services Borrower LLC/Prime Finance, Inc.^ | | | 9.25 | | | | 5/15/2023 | | | | 491,000 | | | | 491,000 | | | | 534,576 | |
WESCO Distribution, Inc.^ | | | 5.38 | | | | 6/15/2024 | | | | 443,000 | | | | 443,000 | | | | 444,108 | |
| | | | | | | | | | | | | | | | | | | | |
Total Electronics | | | | | | | | | | | 1,160,000 | | | | 1,163,898 | | | | 1,212,029 | |
| | | | | | | | | | | | | |
|
Finance — 2.4%*: | |
Arrow Global Finance PLC+ | | | 5.13 | | | | 9/15/2024 | | | | 200,000 | | | | 258,495 | | | | 245,740 | |
Galaxy Finco Ltd.+ | | | 7.88 | | | | 11/15/2021 | | | | 550,000 | | | | 817,078 | | | | 681,033 | |
Garfunkelux Holdco 3 SA+ | | | 7.50 | | | | 8/1/2022 | | | | 100,000 | | | | 110,305 | | | | 109,739 | |
Garfunkelux Holdco 3 SA+ | | | 8.50 | | | | 11/1/2022 | | | | 650,000 | | | | 1,006,774 | | | | 833,102 | |
Marlin Intermediate Holdings PLC MTN+ | | | 10.50 | | | | 8/1/2020 | | | | 200,000 | | | | 304,158 | | | | 268,047 | |
National Financial Partners Corp.^ | | | 9.00 | | | | 7/15/2021 | | | | 779,000 | | | | 779,068 | | | | 821,845 | |
| | | | | | | | | | | | | | | | | | | | |
Total Finance | | | | | | | | | | | 2,479,000 | | | | 3,275,878 | | | | 2,959,506 | |
| | | | | | | | | | | | | |
See accompanying Notes to the Financial Statements.
91
Barings Global Credit Income Opportunities Fund 2016 Semi-Annual Report
SCHEDULE OF INVESTMENTS (CONTINUED)
December 31, 2016 (Unaudited)
| | | | | | | | | | | | | | | | | | | | |
| | | EFFECTIVE
INTEREST RATE | | | DUE DATE | | | PRINCIPAL ‡‡ | | | COST | | | FAIR
VALUE | |
Corporate Bonds (Continued) | |
|
Grocery — 0.4%*: | |
C&S Group Enterprises LLC^ | | | 5.38 | % | | | 7/15/2022 | | | | 270,000 | | | $ | 260,613 | | | $ | 260,550 | |
Premier Foods Finance PLC+ | | | 6.50 | | | | 3/15/2021 | | | | 200,000 | | | | 338,450 | | | | 253,012 | |
| | | | | | | | | | | | | | | | | | | | |
Total Grocery | | | | | | | | | | | 470,000 | | | | 599,063 | | | | 513,562 | |
| | | | | | | | | | | | | |
|
Healthcare, Education and Childcare — 5.4%*: | |
Alere, Inc.^ | | | 6.38 | | | | 7/1/2023 | | | | 490,000 | | | | 490,000 | | | | 486,938 | |
Alere, Inc. | | | 6.50 | | | | 6/15/2020 | | | | 500,000 | | | | 505,630 | | | | 492,500 | |
Capsugel SA PIK^ | | | 7.00 | | | | 5/15/2019 | | | | 500,000 | | | | 503,906 | | | | 504,375 | |
Cerberus Nightingale 1 Sarl+ | | | 8.25 | | | | 2/1/2020 | | | | 550,000 | | | | 625,184 | | | | 593,721 | |
Cognita Financing PLC+ | | | 7.75 | | | | 8/15/2021 | | | | 600,000 | | | | 884,750 | | | | 783,865 | |
Halyard Health, Inc. | | | 6.25 | | | | 10/15/2022 | | | | 288,000 | | | | 289,698 | | | | 296,640 | |
IDH Finance PLC+ | | | 6.25 | | | | 8/15/2022 | | | | 250,000 | | | | 327,563 | | | | 298,857 | |
Kinetic Concepts, Inc./KCI USA, Inc.^ | | | 7.88 | | | | 2/15/2021 | | | | 199,000 | | | | 208,410 | | | | 215,915 | |
Kinetic Concepts, Inc./KCI USA, Inc.^ | | | 9.63 | | | | 10/1/2021 | | | | 1,100,000 | | | | 1,100,000 | | | | 1,163,250 | |
Quintiles IMS, Inc.^ | | | 5.00 | | | | 10/15/2026 | | | | 533,000 | | | | 533,000 | | | | 534,333 | |
Tenet Healthcare Corp. | | | 6.75 | | | | 6/15/2023 | | | | 294,000 | | | | 292,756 | | | | 259,455 | |
Valeant Pharmaceuticals International, Inc. | | | 4.50 | | | | 5/15/2023 | | | | 100,000 | | | | 89,349 | | | | 75,822 | |
Valeant Pharmaceuticals International, Inc.^ | | | 6.13 | | | | 4/15/2025 | | | | 1,325,000 | | | | 1,103,665 | | | | 995,406 | |
| | | | | | | | | | | | | | | | | | | | |
Total Healthcare, Education and Childcare | | | | 6,729,000 | | | | 6,953,911 | | | | 6,701,077 | |
| | | | | | | | | | | | | | | | | | | | |
|
Home and Office Furnishings, Housewares, and Durable Consumer Products — 0.4%*: | |
LSF9 Balta Issuer SA+ | | | 7.75 | | | | 9/15/2022 | | | | 400,000 | | | | 478,550 | | | | 463,166 | |
| | | | | | | | | | | | | | | | | | | | |
|
Hotels, Motels, Inns and Gaming — 1.9%*: | |
MGM Resorts International | | | 4.63 | | | | 9/1/2026 | | | | 1,000,000 | | | | 1,000,000 | | | | 962,500 | |
NH Hotels SA+ | | | 3.75 | | | | 10/1/2023 | | | | 200,000 | | | | 224,580 | | | | 217,056 | |
Thomas Cook Group PLC+ | | | 6.25 | | | | 6/15/2022 | | | | 300,000 | | | | 319,905 | | | | 332,501 | |
TVL Finance PLC+ | | | 8.50 | | | | 5/15/2023 | | | | 600,000 | | | | 857,927 | | | | 783,806 | |
| | | | | | | | | | | | | | | | | | | | |
Total Hotels, Motels, Inns and Gaming | | | | 2,100,000 | | | | 2,402,412 | | | | 2,295,863 | |
| | | | | | | | | | | | | | | | | | | | |
|
Leisure, Amusement, Entertainment — 2.6%*: | |
AMC Entertainment Holdings, Inc. | | | 6.38 | | | | 11/15/2024 | | | | 100,000 | | | | 121,910 | | | | 130,326 | |
CPUK Finance Ltd.+ | | | 7.00 | | | | 8/28/2020 | | | | 483,000 | | | | 734,239 | | | | 628,674 | |
Interval Acquisition Corp. | | | 5.63 | | | | 4/15/2023 | | | | 459,000 | | | | 459,000 | | | | 468,180 | |
NCL Corp. Ltd.^ | | | 4.75 | | | | 12/15/2021 | | | | 653,000 | | | | 653,000 | | | | 652,595 | |
Perform Group Financing PLC+ | | | 8.50 | | | | 11/15/2020 | | | | 150,000 | | | | 224,468 | | | | 189,020 | |
WMG Acquisition Corp. | | | 4.13 | | | | 11/1/2024 | | | | 150,000 | | | | 165,758 | | | | 163,424 | |
WMG Acquisition Corp.^ | | | 6.75 | | | | 4/15/2022 | | | | 950,000 | | | | 902,371 | | | | 999,875 | |
| | | | | | | | | | | | | | | | | | | | |
Total Leisure, Amusement, Entertainment | | | | 2,945,000 | | | | 3,260,746 | | | | 3,232,094 | |
| | | | | | | | | | | | | | | | | | | | |
|
Machinery Non-Agriculture, Non-Construction, Non-Electronic — 2.5%*: | |
Apex Tool Group LLC^ | | | 7.00 | | | | 2/1/2021 | | | | 750,000 | | | | 665,807 | | | | 671,250 | |
Gardner Denver, Inc.^ | | | 6.88 | | | | 8/15/2021 | | | | 1,000,000 | | | | 1,000,000 | | | | 995,000 | |
Milacron LLC/Mcron Finance Corp.^ | | | 7.75 | | | | 2/15/2021 | | | | 905,000 | | | | 927,033 | | | | 929,888 | |
See accompanying Notes to the Financial Statements.
92
Barings Global Credit Income Opportunities Fund 2016 Semi-Annual Report
SCHEDULE OF INVESTMENTS (CONTINUED)
December 31, 2016 (Unaudited)
| | | | | | | | | | | | | | | | | | | | |
| | | EFFECTIVE
INTEREST RATE | | | DUE DATE | | | PRINCIPAL ‡‡ | | | COST | | | FAIR
VALUE | |
Corporate Bonds (Continued) | |
|
Machinery Non-Agriculture, Non-Construction, Non-Electronic (Continued) | |
Xerium Technologies, Inc.^ | | | 9.50 | % | | | 8/15/2021 | | | | 500,000 | | | $ | 495,644 | | | $ | 498,750 | |
| | | | | | | | | | | | | | | | | | | | |
Total Machinery Non-Agriculture, Non-Construction, Non-Electronic | | | | | | | | | | | 3,155,000 | | | | 3,088,484 | | | | 3,094,888 | |
| | | | | | | | | | | | | | | | | | | | |
|
Mining, Steel, Iron and Non-Precious Metals — 1.9%*: | |
BlueScope Steel Finance Ltd./BlueScope Steel Finance USA LLC+^ | | | 6.50 | | | | 5/15/2021 | | | | 166,000 | | | | 166,000 | | | | 175,894 | |
Constellium NV+ | | | 7.00 | | | | 1/15/2023 | | | | 600,000 | | | | 646,768 | | | | 634,748 | |
SunCoke Energy Partners LP/SunCoke Energy Partners Finance Corp.^ | | | 7.38 | | | | 2/1/2020 | | | | 550,000 | | | | 545,983 | | | | 547,250 | |
TMS International Corp.^ | | | 7.63 | | | | 10/15/2021 | | | | 1,000,000 | | | | 960,189 | | | | 955,000 | |
| | | | | | | | | | | | | | | | | | | | |
Total Mining, Steel, Iron and Non-Precious Metals | | | | 2,316,000 | | | | 2,318,940 | | | | 2,312,892 | |
| | | | | | | | | | | | | | | | | | | | |
|
Oil and Gas — 4.6%*: | |
Citgo Holding, Inc.^ | | | 10.75 | | | | 2/15/2020 | | | | 350,000 | | | | 341,554 | | | | 375,375 | |
Energy Transfer Equity LP | | | 5.50 | | | | 6/1/2027 | | | | 111,000 | | | | 95,831 | | | | 108,225 | |
EP Energy LLC/Everest Acquisition Finance, Inc. | | | 9.38 | | | | 5/1/2020 | | | | 350,000 | | | | 285,901 | | | | 322,654 | |
Genesis Energy LP/Genesis Energy Finance Corp. | | | 6.75 | | | | 8/1/2022 | | | | 500,000 | | | | 481,818 | | | | 519,500 | |
Globe Luxembourg S.C.A.^+ | | | 9.63 | | | | 5/1/2018 | | | | 450,000 | | | | 423,469 | | | | 444,375 | |
Jupiter Resources, Inc.+^ | | | 8.50 | | | | 10/1/2022 | | | | 1,450,000 | | | | 1,209,629 | | | | 1,250,627 | |
Kosmos Energy Ltd.^ | | | 7.88 | | | | 8/1/2021 | | | | 1,325,000 | | | | 1,278,602 | | | | 1,318,375 | |
Shelf Drilling Holdings Ltd.+^ | | | 8.63 | | | | 11/1/2018 | | | | 439,000 | | | | 392,033 | | | | 368,760 | |
Sunoco LP/Sunoco Finance Corp. | | | 5.50 | | | | 8/1/2020 | | | | 302,000 | | | | 302,000 | | | | 308,040 | |
Sunoco LP/Sunoco Finance Corp. | | | 6.25 | | | | 4/15/2021 | | | | 600,000 | | | | 598,692 | | | | 611,250 | |
| | | | | | | | | | | | | | | | | | | | |
Total Oil and Gas | | | | 5,877,000 | | | | 5,409,529 | | | | 5,627,181 | |
| | | | | | | | | | | | | | | | | | | | |
|
Personal and Non-Durable Consumer Products Mfg. Only — 0.2%*: | |
Wolverine World Wide, Inc.^ | | | 5.00 | | | | 9/1/2026 | | | | 283,000 | | | | 283,000 | | | | 272,388 | |
| | | | | | | | | | | | | | | | | | | | |
|
Personal Transportation — 0.9%*: | |
AA Bond Co. Ltd.+ | | | 5.50 | | | | 7/31/2022 | | | | 850,000 | | | | 1,153,635 | | | | 1,069,276 | |
| | | | | | | | | | | | | | | | | | | | |
|
Personal, Food and Miscellaneous — 0.2%*: | |
Wagamama Finance PLC+ | | | 7.88 | | | | 2/1/2020 | | | | 200,000 | | | | 296,719 | | | | 257,581 | |
| | | | | | | | | | | | | | | | | | | | |
|
Printing and Publishing — 0.4%*: | |
MHGE Parent LLC/MHGE Parent Finance, Inc.^ | | | 8.50 | | | | 8/1/2019 | | | | 500,000 | | | | 506,775 | | | | 502,500 | |
| | | | | | | | | | | | | | | | | | | | |
|
Retail Stores — 2.7%*: | |
Boing Group Financing PLC MTN+ | | | 6.63 | | | | 7/15/2019 | | | | 300,000 | | | | 375,386 | | | | 313,111 | |
Dollar Tree, Inc. | | | 5.75 | | | | 3/1/2023 | | | | 815,000 | | | | 838,144 | | | | 862,938 | |
House of Fraser Funding PLC+ | | | 6.13 | # | | | 9/15/2020 | | | | 150,000 | | | | 232,340 | | | | 165,450 | |
HSS Financing PLC+ | | | 6.75 | | | | 8/1/2019 | | | | 204,000 | | | | 307,968 | | | | 254,804 | |
Penske Automotive Group, Inc. | | | 5.50 | | | | 5/15/2026 | | | | 545,000 | | | | 543,670 | | | | 538,187 | |
Takko Luxembourg 2 S.C.A.+ | | | 6.69 | # | | | 4/15/2019 | | | | 100,000 | | | | 67,837 | | | | 76,843 | |
See accompanying Notes to the Financial Statements.
93
Barings Global Credit Income Opportunities Fund 2016 Semi-Annual Report
SCHEDULE OF INVESTMENTS (CONTINUED)
December 31, 2016 (Unaudited)
| | | | | | | | | | | | | | | | | | | | |
| | | EFFECTIVE
INTEREST RATE | | | DUE DATE | | | PRINCIPAL ‡‡ | | | COST | | | FAIR VALUE | |
Corporate Bonds (Continued) | |
|
Retail Stores (Continued) | |
Takko Luxembourg 2 S.C.A. MTN+ | | | 9.88 | % | | | 4/15/2019 | | | | 525,000 | | | $ | 512,083 | | | $ | 445,429 | |
Travelex Financing PLC+ | | | 8.00 | | | | 8/1/2018 | | | | 500,000 | | | | 643,158 | | | | 616,200 | |
| | | | | | | | | | | | | | | | | | | | |
Total Retail Stores | | | | 3,139,000 | | | | 3,520,586 | | | | 3,272,962 | |
| | | | | | | | | | | | | | | | | | | | |
|
Telecommunications — 4.3%*: | |
Altice Financing SA+^ | | | 7.50 | | | | 5/15/2026 | | | | 825,000 | | | | 827,027 | | | | 858,000 | |
Altice Luxembourg SA+ | | | 6.25 | | | | 2/15/2025 | | | | 250,000 | | | | 284,288 | | | | 274,870 | |
Hughes Satellite Systems Corp.^ | | | 6.63 | | | | 8/1/2026 | | | | 426,000 | | | | 425,481 | | | | 428,130 | |
LGE HoldCo VI B.V.+ | | | 7.13 | | | | 5/15/2024 | | | | 250,000 | | | | 308,472 | | | | 298,689 | |
Numericable-SFR SA+^ | | | 6.00 | | | | 5/15/2022 | | | | 315,000 | | | | 315,000 | | | | 323,269 | |
Numericable-SFR SA+^ | | | 7.38 | | | | 5/1/2026 | | | | 397,000 | | | | 397,000 | | | | 406,925 | |
T-Mobile USA, Inc. | | | 6.50 | | | | 1/15/2026 | | | | 294,000 | | | | 294,000 | | | | 317,887 | |
Telenet Finance VI Luxembourg S.C.A.+ | | | 4.88 | | | | 7/15/2027 | | | | 100,000 | | | | 114,211 | | | | 109,737 | |
UPCB Finance IV Ltd.+ | | | 4.00 | | | | 1/15/2027 | | | | 250,000 | | | | 278,881 | | | | 262,505 | |
Virgin Media Finance PLC+ | | | 6.38 | | | | 10/15/2024 | | | | 250,000 | | | | 375,139 | | | | 325,834 | |
Wind Acquisition Finance SA+^ | | | 7.38 | | | | 4/23/2021 | | | | 1,200,000 | | | | 1,168,594 | | | | 1,248,000 | |
Ziggo Secured Finance B.V.+ | | | 4.25 | | | | 1/15/2027 | | | | 400,000 | | | | 446,180 | | | | 419,610 | |
| | | | | | | | | | | | | | | | | | | | |
Total Telecommunications | | | | 4,957,000 | | | | 5,234,273 | | | | 5,273,456 | |
| | | | | | | | | | | | | | | | | | | | |
|
Utilities — 0.3%*: | |
NRG Energy, Inc.^ | | | 7.25 | | | | 5/15/2026 | | | | 327,000 | | | | 327,000 | | | | 325,365 | |
| | | | | | | | | | | | | | | | | | | | |
Total Corporate Bonds | | | | 64,486,000 | | | | 67,989,434 | | | | 66,405,035 | |
| | | | | | | | | | | | | | | | | | | | |
| | | | | | | | | | | | | | | | | | | | |
Total Fixed Income | | | | 113,756,293 | | | | 114,973,055 | | | | 112,309,708 | |
| | | | | | | | | | | | | | | | | | | | |
Short-Term Investment — 5.5%*: | |
|
Bank Deposit — 5.5%*: | |
State Street Bank & Trust Co. Euro Time Deposit | | | 0.01 | | | | 1/3/2017 | | | | 6,712,542 | | | | 6,712,542 | | | | 6,712,542 | |
| | | | | | | | | | | | | | | | | | | | |
Total Investments | | | | 139,341,181 | | | | 122,062,085 | | | | 119,522,484 | |
| | | | | | | | | | | | | | | | | | | | |
| | |
Other assets and liabilities – 2.8%* | | | | | | | | 3,398,355 | |
| | |
Net Assets – 100.0% | | | | | | | | $122,920,839 | |
| | | | | | | | | | | | | | | | | | | | |
| TBA | To Be Announced: Securities purchased on a forward commitment basis with an approximate principal amount and maturity date. The actual principal amount and maturity date will be determined upon settlement. |
| ‡‡ | Unless otherwise indicated, all principal amounts are denominated in United States Dollars. |
| * | Calculated as a percentage of net assets applicable to common shareholders. |
See accompanying Notes to the Financial Statements.
94
Barings Global Credit Income Opportunities Fund 2016 Semi-Annual Report
SCHEDULE OF INVESTMENTS (CONTINUED)
December 31, 2016 (Unaudited)
Distributions of investments by country of risk (excluding temporary cash investments) as a percentage of total investments in securities, is as follows:
| | | | | | |
| | United States | | | 71.2% | |
| | United Kingdom | | | 11.0% | |
| | Germany | | | 3.5% | |
| | Netherlands | | | 3.4% | |
| | France | | | 2.4% | |
| | Switzerland | | | 1.4% | |
| | Canada | | | 1.1% | |
| | Italy | | | 1.1% | |
| | Other (Individually less than 1%) | | | 4.9% | |
| | | | | | |
| | Total | | | 100.0% | |
| | | | | | |
| ^ | Security acquired in a transaction exempt from registration under Rule 144A of the Securities Act of 1933. These securities may only be resold in transactions exempt from registration, normally to qualified institutional buyers. |
| § | Bank loans are exempt from registration under the Securities Act of 1933, as amended, but contain certain restrictions on resale and cannot be sold publicly. These loans pay interest at rates which adjust periodically. The interest rates shown for bank loans are the current interest rates at December 31, 2016. Bank loans are also subject to mandatory and/or optional prepayment which cannot be predicted. As a result, the remaining maturity may be substantially less than the stated maturity shown. |
| ¤ | For fair value measurement disclosure purposes, security is categorized as Level 3 (See Note 2). |
| # | Variable rate security. The interest rate shown is the rate in effect at December 31, 2016. |
| (1) | Non-income producing security. |
| A | summary of outstanding derivatives at December 31, 2016 is as follows: |
Forward Foreign Currency Exchange Contracts to Buy
| | | | | | | | | | | | | | | | | | | | | | |
EXPIRATION
DATE | | COUNTERPARTY | | LOCAL
CURRENCY | | | VALUE IN USD | | | IN
EXCHANGE
FOR USD | | | NET UNREALIZED
APPRECIATION
(DEPRECIATION) | |
| 1/13/17 | | Citibank N.A. | | | EUR | | | | 667,734 | | | | 703,319 | | | | 700,714 | | | $ | 2,605 | |
| 1/13/17 | | Morgan Stanley & Co. | | | EUR | | | | 19,890 | | | | 20,950 | | | | 20,838 | | | | 112 | |
| 1/13/17 | | Morgan Stanley & Co. | | | GBP | | | | 160,421 | | | | 197,765 | | | | 201,973 | | | | (4,208 | ) |
| | | | | | | | | | | | | | | | | | | | | | |
Net unrealized depreciation on forward foreign exchange contracts to buy | | | | | | | $ | (1,491 | ) |
| | | | | | | | | | | | | | | | | | | | | | |
Forward Foreign Currency Exchange Contracts to Sell
| | | | | | | | | | | | | | | | | | | | | | |
EXPIRATION
DATE | | COUNTERPARTY | | LOCAL
CURRENCY | | | VALUE IN USD | | | IN
EXCHANGE
FOR USD | | | NET UNREALIZED
APPRECIATION | |
| 1/13/17 | | Citibank N.A. | | | EUR | | | | 13,855,695 | | | | 14,594,090 | | | | 14,718,251 | | | $ | 124,161 | |
| 1/13/17 | | JPMorgan Chase Bank N.A. | | | GBP | | | | 9,269,055 | | | | 11,426,775 | | | | 11,658,432 | | | | 231,657 | |
| | | | | | | | | | | | | | | | | | | | | | |
Net unrealized appreciation on forward foreign exchange contracts to sell | | | | | | | $ | 355,818 | |
| | | | | | | | | | | | | | | | | | | | | | |
See accompanying Notes to the Financial Statements.
95
Barings Global Credit Income Opportunities Fund 2016 Semi-Annual Report
SCHEDULE OF INVESTMENTS (CONTINUED)
December 31, 2016 (Unaudited)
Currency Legend
| | | | |
| EUR | | – | | Euro |
| GBP | | – | | British Pound Sterling |
See accompanying Notes to the Financial Statements.
96
Barings Active Short Duration Bond Fund 2016 Semi-Annual Report
SCHEDULE OF INVESTMENTS
December 31, 2016 (Unaudited)
| | | | | | | | | | | | | | | | | | | | |
| | | EFFECTIVE
INTEREST RATE | | | DUE DATE | | | PRINCIPAL ‡‡ | | | COST | | | FAIR
VALUE | |
Fixed Income — 97.6%*: | |
|
Asset-Backed Securities — 31.6%*: | |
|
CDO/CLO — 4.2%*: | |
AIMCO CLO Series 2014-A A^ | | | 2.42 | #% | | | 7/20/2026 | | | | 450,000 | | | | $448,927 | | | | $450,016 | |
ALM VII Ltd. 2012-7A A1R^ | | | 2.33 | # | | | 10/15/2028 | | | | 390,000 | | | | 390,000 | | | | 391,161 | |
ALM XIV Ltd. 2014-14A A1^ | | | 2.32 | # | | | 7/28/2026 | | | | 500,000 | | | | 498,854 | | | | 499,998 | |
Apidos CLO XXV 2016-25A A1^ | | | 2.20 | # | | | 10/20/2028 | | | | 470,000 | | | | 470,000 | | | | 470,072 | |
BlueMountain CLO Ltd. 2013-3A A^ | | | 2.29 | # | | | 10/29/2025 | | | | 500,000 | | | | 497,073 | | | | 500,135 | |
BlueMountain CLO Ltd. 2015-2A A1^ | | | 2.31 | # | | | 7/18/2027 | | | | 500,000 | | | | 492,858 | | | | 501,193 | |
Carlyle Global Market Strategies CLO Ltd. 2014-4A A1^ | | | 2.38 | # | | | 10/15/2026 | | | | 250,000 | | | | 250,000 | | | | 250,165 | |
Galaxy XX CLO Ltd. 2015-20A A^ | | | 2.33 | # | | | 7/20/2027 | | | | 250,000 | | | | 247,026 | | | | 250,323 | |
Goldentree Loan Opportunities VIII Ltd. 2014-8A A^ | | | 2.33 | # | | | 4/19/2026 | | | | 900,000 | | | | 896,167 | | | | 900,034 | |
LCM XIV LP 2014-A^ | | | 2.03 | # | | | 7/15/2025 | | | | 700,000 | | | | 699,153 | | | | 697,484 | |
LCM XVI LP 16A A^ | | | 2.38 | # | | | 7/15/2026 | | | | 250,000 | | | | 250,000 | | | | 250,069 | |
LCM XXIII Ltd. 23A A1^ | | | 2.51 | # | | | 10/20/2029 | | | | 610,000 | | | | 610,000 | | | | 609,995 | |
Madison Park Funding XII Ltd. 2014-12A A^ | | | 2.38 | # | | | 7/20/2026 | | | | 250,000 | | | | 248,377 | | | | 250,067 | |
Madison Park Funding XIV Ltd. 2014-14A A2^ | | | 2.33 | # | | | 7/20/2026 | | | | 250,000 | | | | 249,856 | | | | 250,052 | |
Madison Park Funding XXII Ltd. 2016-22A A^ | | | 2.38 | # | | | 10/25/2029 | | | | 350,000 | | | | 350,000 | | | | 350,776 | |
Magnetite XVIII Ltd. 2016-8A A^ | | | 2.25 | # | | | 11/15/2028 | | | | 380,000 | | | | 380,000 | | | | 379,988 | |
OHA Loan Funding Ltd. 2015-1A AR^ | | | 2.35 | # | | | 8/15/2029 | | | | 840,000 | | | | 840,000 | | | | 839,997 | |
Seneca Park CLO Ltd. 2014-1A A^ | | | 2.36 | # | | | 7/17/2026 | | | | 360,000 | | | | 358,549 | | | | 360,065 | |
Symphony CLO XV Ltd. 2014-15A A^ | | | 2.33 | # | | | 10/17/2026 | | | | 250,000 | | | | 248,138 | | | | 250,064 | |
TCI-Symphony CLO Ltd. 2016-1A A^ | | | 2.40 | # | | | 10/13/2029 | | | | 320,000 | | | | 320,000 | | | | 320,979 | |
Treman Park CLO Ltd.^ | | | 2.25 | # | | | 4/20/2027 | | | | 970,000 | | | | 970,000 | | | | 970,000 | |
Voya CLO Ltd. 2014-2A A1^ | | | 2.33 | # | | | 7/17/2026 | | | | 535,000 | | | | 535,000 | | | | 535,003 | |
| | | | | | | | | | | | | | | | | | | | |
Total CDO/CLO | | | | 10,275,000 | | | | 10,249,978 | | | | 10,277,636 | |
| | | | | | | | | | | | | | | | | | | | |
|
Other Asset-Backed Securities — 27.4%*: | |
321 Henderson Receivables II LLC 2006-3A A1^ | | | 0.64 | # | | | 9/15/2041 | | | | 196,003 | | | | 190,302 | | | | 184,857 | |
Access Group, Inc. 2002-A A2 | | | 2.05 | # | | | 9/25/2037 | | | | 850,000 | | | | 781,487 | | | | 833,000 | |
Access Group, Inc. 2005-1 A3 | | | 1.15 | # | | | 6/22/2022 | | | | 87,208 | | | | 86,127 | | | | 86,597 | |
Access Group, Inc. 2015-1 A^ | | | 1.46 | # | | | 7/25/2056 | | | | 172,791 | | | | 168,986 | | | | 170,764 | |
Access Group, Inc. 2015-1 B^ | | | 2.26 | # | | | 7/25/2058 | | | | 100,000 | | | | 86,323 | | | | 82,798 | |
Alterna Funding I LLC Series 2014-1A^ | | | 1.64 | | | | 2/15/2021 | | | | 236,445 | | | | 233,929 | | | | 229,795 | |
American Credit Acceptance Receivables Trust 2015-3 A^ | | | 1.95 | | | | 9/12/2019 | | | | 40,382 | | | | 40,380 | | | | 40,446 | |
American Credit Acceptance Receivables Trust 2016-1A^ | | | 2.37 | | | | 5/12/2020 | | | | 50,911 | | | | 50,910 | | | | 51,026 | |
American Credit Acceptance Receivables Trust 2016-2^ | | | 2.22 | | | | 7/13/2020 | | | | 298,427 | | | | 298,421 | | | | 298,819 | |
AmeriCredit Automobile Receivables Trust 2014-1 D | | | 2.54 | | | | 6/8/2020 | | | | 310,000 | | | | 309,638 | | | | 312,012 | |
Arbys Funding LLC 2015-1A A2^ | | | 4.97 | | | | 10/30/2045 | | | | 79,200 | | | | 79,200 | | | | 80,041 | |
See accompanying Notes to the Financial Statements.
97
Barings Active Short Duration Bond Fund 2016 Semi-Annual Report
SCHEDULE OF INVESTMENTS (CONTINUED)
December 31, 2016 (Unaudited)
| | | | | | | | | | | | | | | | | | | | |
| | | EFFECTIVE
INTEREST RATE | | | DUE DATE | | | PRINCIPAL ‡‡ | | | COST | | | FAIR
VALUE | |
Asset-Backed Securities (Continued) | |
|
Other Asset-Backed Securities (Continued) | |
Argent Securities, Inc. Asset-Backed Pass-Through Certificates Series 2004-W10 | | | 1.48 | # % | | | 10/25/2034 | | | | 366,141 | | | $ | 331,724 | | | $ | 350,188 | |
ARI Fleet Lease Trust 2016-A A3^ | | | 2.11 | | | | 7/15/2024 | | | | 200,000 | | | | 199,964 | | | | 198,990 | |
Asset Backed Securities Corp. Home Equity Loan Trust 2005-HE1 M1 | | | 1.51 | # | | | 3/25/2035 | | | | 517,033 | | | | 513,909 | | | | 523,169 | |
AVANT Loans Funding Trust 2016-A A^ | | | 4.11 | | | | 5/15/2019 | | | | 347,218 | | | | 348,909 | | | | 347,961 | |
AVANT Loans Funding Trust 2016-C A^ | | | 2.96 | | | | 9/16/2019 | | | | 98,892 | | | | 98,890 | | | | 98,836 | |
Avis Budget Rental Car Funding AESOP LLC Series 2012-3A A^ | | | 2.10 | | | | 3/20/2019 | | | | 240,000 | | | | 238,982 | | | | 240,246 | |
BCC Funding XIII LLC 2016-1 A1^ | | | 1.10 | | | | 9/20/2017 | | | | 548,895 | | | | 548,895 | | | | 547,542 | |
Blackbird Capital Aircraft Lease Securitization Ltd. 2016-1^ | | | 2.49 | | | | 12/16/2041 | | | | 380,000 | | | | 380,000 | | | | 380,594 | |
BlueVirgo Trust 2015-1A^ | | | 3.00 | | | | 12/15/2022 | | | | 267,045 | | | | 266,020 | | | | 269,862 | |
Capital Automotive REIT 2010-1A A^ | | | 5.73 | | | | 12/15/2038 | | | | 90,688 | | | | 94,335 | | | | 91,765 | |
CarFinance Capital Auto Trust 2013-2A^ | | | 4.04 | | | | 8/15/2019 | | | | 650,000 | | | | 652,612 | | | | 655,492 | |
CarFinance Capital Auto Trust 2014-2^ | | | 1.44 | | | | 11/16/2020 | | | | 122,078 | | | | 121,145 | | | | 121,934 | |
Cazenovia Creek Funding I LLC 2015-1A A^ | | | 2.00 | | | | 12/10/2023 | | | | 161,607 | | | | 160,011 | | | | 160,294 | |
Centex Home Equity Loan Trust 2006-A AV4 | | | 1.01 | # | | | 6/25/2036 | | | | 222,011 | | | | 216,679 | | | | 220,501 | |
Chase Issuance Trust Series 2014-A1 | | | 1.15 | | | | 1/15/2019 | | | | 3,000,000 | | | | 3,003,798 | | | | 3,000,009 | |
Chesapeake Funding II LLC^ | | | 1.88 | | | | 6/15/2028 | | | | 290,000 | | | | 289,985 | | | | 289,294 | |
Citi Held For Asset Issuance 2015-PM1 A^ | | | 1.85 | | | | 12/15/2021 | | | | 4,517 | | | | 4,517 | | | | 4,514 | |
Citi Held For Asset Issuance 2015-PM2 A^ | | | 2.35 | | | | 3/15/2022 | | | | 21,962 | | | | 21,961 | | | | 21,974 | |
Citi Held For Asset Issuance 2015-PM3 A^ | | | 2.56 | | | | 5/16/2022 | | | | 31,833 | | | | 31,833 | | | | 31,798 | |
Citigroup Mortgage Loan Trust Asset Backed Pass-Through Certificates 2005-OPT3 M2 | | | 1.43 | # | | | 5/25/2035 | | | | 408,878 | | | | 407,865 | | | | 408,723 | |
CKE Restaurant Holdings, Inc. 2013-1A A2^ | | | 4.47 | | | | 3/20/2043 | | | | 457,719 | | | | 462,073 | | | | 452,026 | |
CLI Funding V LLC 2013-1A^ | | | 2.83 | | | | 3/18/2028 | | | | 60,900 | | | | 60,608 | | | | 58,662 | |
CLI Funding V LLC 2014-1A A^ | | | 3.29 | | | | 6/18/2029 | | | | 186,760 | | | | 181,419 | | | | 180,120 | |
College Loan Corp. Trust I 2005-2 B | | | 1.37 | # | | | 1/15/2037 | | | | 224,108 | | | | 196,694 | | | | 188,913 | |
CPS Auto Receivables Trust 2013-A A^ | | | 1.31 | | | | 6/15/2020 | | | | 117,943 | | | | 117,570 | | | | 117,544 | |
CPS Auto Receivables Trust 2014-D A^ | | | 1.49 | | | | 4/15/2019 | | | | 96,671 | | | | 96,316 | | | | 96,584 | |
CPS Auto Receivables Trust 2015-B A^ | | | 1.65 | | | | 11/15/2019 | | | | 127,219 | | | | 126,312 | | | | 127,292 | |
CPS Auto Receivables Trust 2015-C A^ | | | 1.77 | | | | 6/17/2019 | | | | 41,072 | | | | 41,070 | | | | 41,124 | |
CPS Auto Receivables Trust 2015-C B^ | | | 2.55 | | | | 2/18/2020 | | | | 100,000 | | | | 99,987 | | | | 100,492 | |
CPS Auto Receivables Trust 2016-A A^ | | | 2.25 | | | | 10/15/2019 | | | | 95,608 | | | | 95,605 | | | | 95,980 | |
CPS Auto Receivables Trust 2016-B A^ | | | 2.07 | | | | 11/15/2019 | | | | 183,469 | | | | 183,464 | | | | 183,689 | |
CPS Auto Receivables Trust 2016-C A^ | | | 1.62 | | | | 1/15/2020 | | | | 142,833 | | | | 142,833 | | | | 142,836 | |
CPS Auto Receivables Trust 2016-C B^ | | | 2.48 | | | | 9/15/2020 | | | | 180,000 | | | | 179,984 | | | | 179,914 | |
Credit Suisse ABS Repackaging Trust 2013-A B^ | | | 2.50 | | | | 1/25/2030 | | | | 105,896 | | | | 100,766 | | | | 98,608 | |
DB Master Finance LLC 2015-1A A2I^ | | | 3.26 | | | | 2/20/2045 | | | | 609,150 | | | | 604,624 | | | | 609,949 | |
DB Master Finance LLC 2015-1A A2II^ | | | 3.98 | | | | 2/20/2045 | | | | 1,179,000 | | | | 1,187,836 | | | | 1,196,687 | |
Diamond Resorts Owner Trust 2013-1^ | | | 1.95 | | | | 1/20/2025 | | | | 428,928 | | | | 426,304 | | | | 425,313 | |
Diamond Resorts Owner Trust 2013-2 A^ | | | 2.27 | | | | 5/20/2026 | | | | 628,877 | | | | 624,028 | | | | 625,534 | |
Diamond Resorts Owner Trust 2015-1 A^ | | | 2.73 | | | | 7/20/2027 | | | | 41,142 | | | | 41,139 | | | | 40,893 | |
Diamond Resorts Owner Trust 2015-2^ | | | 2.99 | | | | 5/22/2028 | | | | 167,247 | | | | 169,138 | | | | 166,224 | |
See accompanying Notes to the Financial Statements.
98
Barings Active Short Duration Bond Fund 2016 Semi-Annual Report
SCHEDULE OF INVESTMENTS (CONTINUED)
December 31, 2016 (Unaudited)
| | | | | | | | | | | | | | | | | | | | |
| | | EFFECTIVE
INTEREST RATE | | | DUE DATE | | | PRINCIPAL ‡‡ | | | COST | | | FAIR
VALUE | |
Asset-Backed Securities (Continued) | |
|
Other Asset-Backed Securities (Continued) | |
Diamond Resorts Owner Trust 2015-2 B^ | | | 3.54 | % | | | 5/22/2028 | | | | 60,817 | | | $ | 60,814 | | | $ | 60,878 | |
Diamond Resorts Owner Trust 2016-1^ | | | 3.08 | | | | 11/20/2028 | | | | 1,403,725 | | | | 1,403,725 | | | | 1,395,096 | |
Domino’s Pizza Master Issuer LLC 2012-1A A2^ | | | 5.22 | | | | 1/25/2042 | | | | 232,800 | | | | 238,390 | | | | 237,447 | |
Domino’s Pizza Master Issuer LLC 2015 1A-A2I^ | | | 3.48 | | | | 10/25/2045 | | | | 336,600 | | | | 330,775 | | | | 333,099 | |
DRB Prime Student Loan Trust 2015-A A2^ | | | 3.06 | | | | 7/25/2031 | | | | 99,892 | | | | 98,628 | | | | 96,968 | |
DRB Prime Student Loan Trust 2015-B A2^ | | | 3.17 | | | | 7/25/2031 | | | | 275,385 | | | | 274,316 | | | | 275,131 | |
DRB Prime Student Loan Trust 2015-B A3^ | | | 2.54 | | | | 4/27/2026 | | | | 55,876 | | | | 55,870 | | | | 55,265 | |
DRB Prime Student Loan Trust 2015-D A1^ | | | 2.46 | # | | | 1/25/2040 | | | | 230,415 | | | | 225,507 | | | | 229,261 | |
DRB Prime Student Loan Trust 2015-D A2^ | | | 3.20 | | | | 1/25/2040 | | | | 1,004,386 | | | | 1,003,326 | | | | 996,942 | |
DRB Prime Student Loan Trust 2016-A A1^ | | | 2.76 | # | | | 4/25/2040 | | | | 281,151 | | | | 280,577 | | | | 280,369 | |
DRB Prime Student Loan Trust 2016-B^ | | | 2.89 | | | | 6/25/2040 | | | | 272,194 | | | | 272,112 | | | | 263,789 | |
DRB Prime Student Loan Trust 2016-R^ | | | 2.43 | # | | | 10/25/2044 | | | | 1,049,153 | | | | 1,049,153 | | | | 1,049,153 | |
Drive Auto Receivables Trust 2015-AA C^ | | | 3.06 | | | | 5/17/2021 | | | | 500,000 | | | | 505,769 | | | | 504,477 | |
Drive Auto Receivables Trust 2016-B^ | | | 2.56 | | | | 6/15/2020 | | | | 130,000 | | | | 129,996 | | | | 130,508 | |
Drive Auto Receivables Trust 2016-C^ | | | 0.90 | | | | 12/15/2017 | | | | 1,054,131 | | | | 1,054,131 | | | | 1,054,118 | |
Drug Royalty LP 1 2012-1 A1^ | | | 6.13 | # | | | 7/15/2024 | | | | 60,641 | | | | 62,009 | | | | 61,496 | |
DT Auto Owner Trust 2015-3A A^ | | | 1.66 | | | | 3/15/2019 | | | | 18,676 | | | | 18,675 | | | | 18,677 | |
DT Auto Owner Trust 2016-1A A^ | | | 2.00 | | | | 9/16/2019 | | | | 109,925 | | | | 109,922 | | | | 109,902 | |
DT Auto Owner Trust 2016-1A B^ | | | 2.79 | | | | 5/15/2020 | | | | 230,000 | | | | 229,991 | | | | 231,324 | |
DT Auto Owner Trust 2016-2A B^ | | | 2.92 | | | | 5/15/2020 | | | | 460,000 | | | | 459,992 | | | | 463,857 | |
Earnest Student Loan Program LLC 2016-B A1^ | | | 2.81 | # | | | 2/26/2035 | | | | 399,400 | | | | 399,400 | | | | 399,399 | |
Earnest Student Loan Program LLC 2016-C A2^ | | | 2.68 | | | | 7/25/2035 | | | | 533,045 | | | | 529,936 | | | | 518,163 | |
Earnest Student Loan Program LLC 2016-D A2^ | | | 2.72 | | | | 1/25/2041 | | | | 603,065 | | | | 602,876 | | | | 593,297 | |
ECMC Group Student Loan Trust 2016-1A A^ | | | 2.11 | # | | | 7/26/2066 | | | | 594,220 | | | | 594,220 | | | | 592,468 | |
Education Funding Capital Trust IV 2004-1 A5 | | | 1.45 | # | | | 6/15/2043 | | | | 50,000 | | | | 47,071 | | | | 48,451 | |
Elara HGV Timeshare Issuer LLC 2014-A B^ | | | 3.02 | | | | 2/25/2027 | | | | 42,781 | | | | 42,421 | | | | 42,981 | |
Elara HGV Timeshare Issuer LLC 2016-A^ | | | 2.73 | | | | 4/25/2028 | | | | 308,283 | | | | 308,278 | | | | 302,393 | |
Element Rail Leasing II LLC 2015-1A A1^ | | | 2.71 | | | | 2/19/2045 | | | | 479,216 | | | | 474,963 | | | | 467,600 | |
Element Rail Leasing II LLC 2015-1A A1+^ | | | 3.97 | | | | 3/19/2046 | | | | 151,668 | | | | 151,668 | | | | 152,069 | |
Entegry New Orleans Storm Recovery Funding I LLC 2015-1 A | | | 2.67 | | | | 6/1/2027 | | | | 159,174 | | | | 159,140 | | | | 160,729 | |
Enterprise Fleet Financing LLC 2016-1 A2^ | | | 1.83 | | | | 9/20/2021 | | | | 580,057 | | | | 579,988 | | | | 580,336 | |
Exeter Automobile Receivables Trust 2015-2A C^ | | | 3.90 | | | | 3/15/2021 | | | | 800,000 | | | | 811,579 | | | | 808,677 | |
Exeter Automobile Receivables Trust 2015-3A A^ | | | 2.00 | | | | 3/16/2020 | | | | 104,240 | | | | 104,276 | | | | 104,415 | |
Exeter Automobile Receivables Trust 2016-3A B^ | | | 2.84 | | | | 8/16/2021 | | | | 240,000 | | | | 239,959 | | | | 239,055 | |
First Franklin Mortgage Loan Trust 2004-FFH4 M5 | | | 2.33 | # | | | 1/25/2035 | | | | 400,000 | | | | 401,965 | | | | 403,896 | |
First Franklin Mortgage Loan Trust 2005 FF3 M3 | | | 1.48 | # | | | 4/25/2035 | | | | 432,904 | | | | 430,783 | | | | 431,209 | |
First Investors Auto Owner Trust 2015-2A A1^ | | | 1.59 | | | | 12/16/2019 | | | | 20,835 | | | | 20,835 | | | | 20,846 | |
First Investors Auto Owner Trust 2016-1A A1^ | | | 1.92 | | | | 5/15/2020 | | | | 247,350 | | | | 247,345 | | | | 247,884 | |
First Investors Auto Owner Trust 2016-2A B^ | | | 2.21 | | | | 7/15/2022 | | | | 520,000 | | | | 519,973 | | | | 515,160 | |
Flagship Credit Auto Trust 2013-2 B^ | | | 3.21 | | | | 8/15/2019 | | | | 250,000 | | | | 252,311 | | | | 250,881 | |
See accompanying Notes to the Financial Statements.
99
Barings Active Short Duration Bond Fund 2016 Semi-Annual Report
SCHEDULE OF INVESTMENTS (CONTINUED)
December 31, 2016 (Unaudited)
| | | | | | | | | | | | | | | | | | | | |
| | | EFFECTIVE
INTEREST RATE | | | DUE DATE | | | PRINCIPAL ‡‡ | | | COST | | | FAIR
VALUE | |
Asset-Backed Securities (Continued) | |
|
Other Asset-Backed Securities (Continued) | |
Flagship Credit Auto Trust 2014-1 A^ | | | 1.21 | % | | | 4/15/2019 | | | | 38,991 | | | $ | 38,915 | | | $ | 38,979 | |
Flagship Credit Auto Trust 2015-2 A^ | | | 1.98 | | | | 10/15/2020 | | | | 66,633 | | | | 66,628 | | | | 66,724 | |
Flagship Credit Auto Trust 2015-3 A^ | | | 2.38 | | | | 10/15/2020 | | | | 436,135 | | | | 437,802 | | | | 437,599 | |
Flagship Credit Auto Trust 2016-1 A^ | | | 2.77 | | | | 12/15/2020 | | | | 330,472 | | | | 329,810 | | | | 332,939 | |
Flagship Credit Auto Trust 2016-3 B^ | | | 2.43 | | | | 6/15/2021 | | | | 310,000 | | | | 309,974 | | | | 308,787 | |
Flagship Credit Auto Trust 2016-4 B^ | | | 2.41 | | | | 10/15/2021 | | | | 940,000 | | | | 939,886 | | | | 932,383 | |
Flagship Credit Auto Trust 2016-4 B^ | | | 2.71 | | | | 11/15/2022 | | | | 410,000 | | | | 409,978 | | | | 405,262 | |
FNA Trust 2015-1 A^ | | | 3.24 | | | | 12/10/2023 | | | | 273,386 | | | | 273,517 | | | | 271,773 | |
FRS I LLC 2013-1A A1^ | | | 1.80 | | | | 4/15/2043 | | | | 38,619 | | | | 38,225 | | | | 37,847 | |
Global SC Finance II SRL 2014-1A A1+^ | | | 3.19 | | | | 7/17/2029 | | | | 235,083 | | | | 235,033 | | | | 225,545 | |
Goal Structured Solution Trust 2015-1 B^ | | | 2.26 | # | | | 9/25/2043 | | | | 100,000 | | | | 75,840 | | | | 87,913 | |
Goodgreen Trust 2016-1 A^ | | | 3.23 | | | | 10/15/2052 | | | | 639,620 | | | | 639,302 | | | | 634,983 | |
Green Tree Agency Advance Funding Trust I 2015-T2 AT2^ | | | 3.09 | | | | 10/15/2048 | | | | 100,000 | | | | 100,000 | | | | 100,000 | |
GSAMP Trust 2005-SEA2 A1^ | | | 1.11 | # | | | 1/25/2045 | | | | 47,580 | | | | 45,735 | | | | 47,237 | |
HERO Funding Trust 2015-1A^ | | | 3.84 | | | | 9/21/2040 | | | | 1,184,484 | | | | 1,206,656 | | | | 1,205,212 | |
HERO Funding Trust 2016-4A A1^ | | | 3.57 | | | | 9/20/2047 | | | | 930,000 | | | | 929,626 | | | | 930,000 | |
Hilton Grand Vacations Trust 2013-A^ | | | 2.28 | | | | 1/25/2026 | | | | 78,471 | | | | 77,316 | | | | 77,824 | |
Leaf Receivables Funding 11 LLC 2016-1 A1^ | | | 1.00 | | | | 6/15/2017 | | | | 132,978 | | | | 132,978 | | | | 132,883 | |
Marlette Funding Trust 2016-1A A^ | | | 3.06 | | | | 1/17/2023 | | | | 846,293 | | | | 847,159 | | | | 845,500 | |
Miramax LLC 2014-1A A2^ | | | 3.34 | | | | 7/20/2026 | | | | 130,788 | | | | 131,222 | | | | 130,062 | |
Morgan Stanley ABS Capital I, Inc. Trust 2005-WMC6 M2 | | | 1.51 | # | | | 7/25/2035 | | | | 22,024 | | | | 21,808 | | | | 21,958 | |
MVW Owner Trust 2013-1A A^ | | | 2.15 | | | | 4/22/2030 | | | | 208,682 | | | | 206,000 | | | | 206,706 | |
MVW Owner Trust 2015-1A A^ | | | 2.52 | | | | 12/20/2032 | | | | 66,518 | | | | 66,513 | | | | 66,058 | |
MVW Owner Trust 2016-1A A^ | | | 2.25 | | | | 12/20/2033 | | | | 94,591 | | | | 94,582 | | | | 92,705 | |
Nations Equipment Finance Funding III LLC 2016-1A A^ | | | 3.61 | | | | 2/20/2021 | | | | 255,896 | | | | 255,892 | | | | 255,768 | |
Navient Private Education Loan Trust 2015-BA A1^ | | | 1.30 | # | | | 5/15/2023 | | | | 487 | | | | 487 | | | | 487 | |
Navient Student Loan Trust 2016-6 A3^ | | | 2.06 | # | | | 3/25/2066 | | | | 1,100,000 | | | | 1,100,000 | | | | 1,100,009 | |
Navistar Financial Dealer Note Master Owner Trust II 2016-1 A^ | | | 2.11 | # | | | 9/27/2021 | | | | 550,000 | | | | 550,000 | | | | 550,441 | |
Navitas Equipment Receivables LLC 2015-1 A2^ | | | 2.12 | | | | 11/15/2018 | | | | 178,254 | | | | 178,212 | | | | 178,441 | |
Nelnet Private Education Loan Trust 2016-A A1A^ | | | 2.37 | # | | | 12/26/2040 | | | | 500,000 | | | | 500,000 | | | | 499,849 | |
Nelnet Private Education Loan Trust 2016-A A1B^ | | | 3.60 | | | | 12/26/2040 | | | | 360,000 | | | | 357,602 | | | | 359,580 | |
New Residential Advance Receivables Trust Advance Receivables Backed Notes 2016-T2 AT2^ | | | 2.58 | | | | 10/15/2049 | | | | 1,950,000 | | | | 1,950,000 | | | | 1,926,867 | |
NextGear Floorplan Master Owner Trust 2015-2A A^ | | | 2.38 | | | | 10/15/2020 | | | | 100,000 | | | | 99,993 | | | | 100,444 | |
NextGear Floorplan Master Owner Trust 2016-1A A1^ | | | 2.40 | # | | | 4/15/2021 | | | | 490,000 | | | | 490,000 | | | | 496,734 | |
See accompanying Notes to the Financial Statements.
100
Barings Active Short Duration Bond Fund 2016 Semi-Annual Report
SCHEDULE OF INVESTMENTS (CONTINUED)
December 31, 2016 (Unaudited)
| | | | | | | | | | | | | | | | | | | | |
| | | EFFECTIVE
INTEREST RATE | | | DUE DATE | | | PRINCIPAL ‡‡ | | | COST | | | FAIR
VALUE | |
Asset-Backed Securities (Continued) | |
|
Other Asset-Backed Securities (Continued) | |
NextGear Floorplan Master Owner Trust 2016-2A A2^ | | | 2.19 | % | | | 9/15/2021 | | | | 762,000 | | | $ | 759,320 | | | $ | 755,848 | |
Northstar Education Finance, Inc. 2005-1 A5 | | | 1.64 | # | | | 10/30/2045 | | | | 255,900 | | | | 244,832 | | | | 242,785 | |
NovaStar Mortgage Funding Trust 2004-4 M5 | | | 2.48 | # | | | 3/25/2035 | | | | 600,000 | | | | 599,813 | | | | 603,844 | |
NRZ Advance Receivables Trust 2016-T4 AT4^ | | | 3.11 | | | | 12/15/2050 | | | | 900,000 | | | | 900,000 | | | | 899,999 | |
OnDeck Asset Securitization Trust II LLC 2016-1A A^ | | | 4.21 | | | | 5/17/2020 | | | | 110,000 | | | | 109,994 | | | | 108,607 | |
OneMain Financial Issuance Trust 2014-2A A^ | | | 2.47 | | | | 9/18/2024 | | | | 139,685 | | | | 140,133 | | | | 139,743 | |
Orange Lake Timeshare Trust 2016-A^ | | | 2.61 | | | | 3/8/2029 | | | | 323,633 | | | | 323,597 | | | | 319,939 | |
Oscar US Funding Trust II 2015 1A A3^ | | | 1.86 | | | | 10/15/2019 | | | | 720,000 | | | | 717,925 | | | | 715,705 | |
Oscar US Funding Trust II 2015 1A A4^ | | | 2.44 | | | | 6/15/2022 | | | | 270,000 | | | | 262,729 | | | | 265,889 | |
Oscar US Funding Trust IV 2016 1A A2B^ | | | 2.40 | # | | | 7/15/2020 | | | | 162,718 | | | | 162,718 | | | | 162,769 | |
Oscar US Funding Trust IV 2016-1A A2A^ | | | 2.53 | | | | 7/15/2020 | | | | 406,795 | | | | 407,877 | | | | 406,823 | |
Oscar US Funding Trust V 2016-2A A1^ | | | 0.90 | | | | 9/17/2017 | | | | 211,039 | | | | 211,039 | | | | 210,889 | |
Oscar US Funding Trust V 2016-2A A2A^ | | | 2.31 | | | | 11/15/2019 | | | | 450,000 | | | | 449,949 | | | | 450,269 | |
Oxford Finance Funding LLC 2016-1A A^ | | | 3.97 | | | | 6/17/2024 | | | | 170,000 | | | | 170,000 | | | | 169,298 | |
PFS Financing Corp. 2014-AA A^ | | | 1.30 | # | | | 2/15/2019 | | | | 820,000 | | | | 819,714 | | | | 819,522 | |
Popular ABS Mortgage Pass-Through Trust 2006-B A3 | | | 1.04 | # | | | 5/25/2036 | | | | 117,045 | | | | 112,327 | | | | 116,528 | |
Prestige Auto Receivables Trust 2015-1 B^ | | | 2.04 | | | | 4/15/2021 | | | | 260,000 | | | | 260,864 | | | | 259,271 | |
Santander Drive Auto Receivables Trust 2014-4 B | | | 1.82 | | | | 5/15/2019 | | | | 147,986 | | | | 148,450 | | | | 148,119 | |
Santander Drive Auto Receivables Trust 2014-4 D | | | 3.10 | | | | 11/16/2020 | | | | 540,000 | | | | 545,870 | | | | 546,840 | |
Santander Drive Auto Receivables Trust 2015-2 C | | | 2.44 | | | | 4/15/2021 | | | | 720,000 | | | | 725,467 | | | | 723,816 | |
Santander Drive Auto Receivables Trust 2016-1 A3 | | | 1.62 | | | | 3/16/2020 | | | | 180,000 | | | | 179,978 | | | | 180,018 | |
Santander Drive Auto Receivables Trust 2016-1 B | | | 2.47 | | | | 12/15/2020 | | | | 360,000 | | | | 359,984 | | | | 363,041 | |
Santander Drive Auto Receivables Trust 2016-1 D | | | 4.02 | | | | 4/15/2022 | | | | 430,000 | | | | 439,986 | | | | 446,356 | |
Sierra Timeshare Receivables Funding LLC 2014-1A A^ | | | 2.07 | | | | 3/20/2030 | | | | 107,874 | | | | 107,225 | | | | 107,145 | |
Sierra Timeshare Receivables Funding LLC 2014-2A A^ | | | 2.05 | | | | 6/20/2031 | | | | 95,988 | | | | 94,912 | | | | 95,813 | |
Sierra Timeshare Receivables Funding LLC 2014-3A A^ | | | 2.30 | | | | 10/20/2031 | | | | 353,249 | | | | 351,114 | | | | 352,664 | |
Sierra Timeshare Receivables Funding LLC 2015 3A B^ | | | 3.08 | | | | 9/20/2032 | | | | 50,730 | | | | 50,729 | | | | 49,904 | |
Sierra Timeshare Receivables Funding LLC 2015-1A A^ | | | 2.40 | | | | 3/22/2032 | | | | 270,261 | | | | 266,917 | | | | 269,721 | |
Sierra Timeshare Receivables Funding LLC 2015-2A B^ | | | 3.02 | | | | 6/20/2032 | | | | 42,097 | | | | 42,088 | | | | 42,364 | |
Sierra Timeshare Receivables Funding LLC 2015-3A A^ | | | 2.58 | | | | 9/20/2032 | | | | 50,730 | | | | 50,720 | | | | 50,044 | |
SLC Private Student Loan Trust 2006-A A5 | | | 1.05 | # | | | 7/15/2036 | | | | 184,327 | | | | 183,262 | | | | 183,986 | |
SLC Private Student Loan Trust 2006-A C | | | 1.33 | # | | | 7/15/2036 | | | | 350,000 | | | | 309,178 | | | | 312,557 | |
SLC Student Loan Trust 2005-1 B | | | 1.10 | # | | | 2/15/2045 | | | | 294,470 | | | | 245,227 | | | | 248,736 | |
SLM Student Loan Trust 2003-14 A6 | | | 1.18 | # | | | 7/25/2025 | | | | 40,000 | | | | 38,467 | | | | 39,134 | |
See accompanying Notes to the Financial Statements.
101
Barings Active Short Duration Bond Fund 2016 Semi-Annual Report
SCHEDULE OF INVESTMENTS (CONTINUED)
December 31, 2016 (Unaudited)
| | | | | | | | | | | | | | | | | | | | |
| | | EFFECTIVE
INTEREST RATE | | | DUE DATE | | | PRINCIPAL ‡‡ | | | COST | | | FAIR
VALUE | |
Asset-Backed Securities (Continued) | |
|
Other Asset-Backed Securities (Continued) | |
SLM Student Loan Trust 2003-4 B | | | 1.61 | # % | | | 6/15/2038 | | | | 138,380 | | | $ | 126,688 | | | $ | 121,348 | |
SLM Student Loan Trust 2005-4 B | | | 1.06 | # | | | 7/25/2040 | | | | 438,312 | | | | 364,837 | | | | 376,630 | |
SLM Student Loan Trust 2006-5 B | | | 1.09 | # | | | 10/25/2040 | | | | 493,355 | | | | 424,791 | | | | 425,344 | |
SLM Student Loan Trust 2006-9 A5 | | | 0.98 | # | | | 1/26/2026 | | | | 140,793 | | | | 137,127 | | | | 138,258 | |
SLM Student Loan Trust 2012-5 A2 | | | 1.06 | # | | | 6/25/2019 | | | | 58,790 | | | | 58,495 | | | | 58,519 | |
SMB Private Education Loan Trust 2015-A A2B^ | | | 1.70 | # | | | 6/15/2027 | | | | 100,000 | | | | 98,250 | | | | 99,173 | |
SMB Private Education Loan Trust 2016-A A1^ | | | 1.40 | # | | | 5/15/2023 | | | | 395,425 | | | | 395,425 | | | | 396,101 | |
SMB Private Education Loan Trust 2016-B A2B^ | | | 2.15 | # | | | 2/17/2032 | | | | 132,000 | | | | 132,000 | | | | 132,000 | |
SoFi Consumer Loan Program LLC 2016-1A A^ | | | 3.26 | | | | 8/25/2025 | | | | 1,003,818 | | | | 1,007,750 | | | | 1,005,103 | |
SoFi Consumer Loan Program LLC 2016-2A A^ | | | 3.09 | | | | 10/27/2025 | | | | 474,158 | | | | 474,087 | | | | 472,732 | |
SoFi Consumer Loan Program LLC 2016-3 A^ | | | 3.05 | | | | 12/26/2025 | | | | 415,401 | | | | 415,393 | | | | 413,756 | |
SoFi Consumer Loan Program LLC 2016-5 A^ | | | 3.06 | | | | 9/25/2028 | | | | 2,300,000 | | | | 2,292,237 | | | | 2,295,678 | |
SoFi Professional Loan Program LLC 2015-C A2^ | | | 2.51 | | | | 8/25/2033 | | | | 65,185 | | | | 64,850 | | | | 64,701 | |
SoFi Professional Loan Program LLC 2016 A A1^ | | | 2.51 | # | | | 8/25/2036 | | | | 259,800 | | | | 257,528 | | | | 267,457 | |
SoFi Professional Loan Program LLC 2016-B A1^ | | | 1.96 | # | | | 6/25/2033 | | | | 304,425 | | | | 304,425 | | | | 307,739 | |
SoFi Professional Loan Program LLC 2016-B A2A^ | | | 1.68 | | | | 3/25/2031 | | | | 252,361 | | | | 252,341 | | | | 251,857 | |
SoFi Professional Loan Program LLC 2016-D A1^ | | | 1.71 | # | | | 1/25/2039 | | | | 210,016 | | | | 210,016 | | | | 210,699 | |
SoFi Professional Loan Program LLC 2016-E A2B^ | | | 2.49 | | | | 1/25/2036 | | | | 330,000 | | | | 329,344 | | | | 327,040 | |
SpringCastle America Funding LLC 2016-AA A^ | | | 3.05 | | | | 4/25/2029 | | | | 687,134 | | | | 687,108 | | | | 690,570 | |
Springleaf Funding Trust 2016-AA A^ | | | 2.90 | | | | 11/15/2029 | | | | 1,560,000 | | | | 1,559,760 | | | | 1,556,515 | |
SPS Servicer Advance Receivable 2015-T3 AT3^ | | | 2.92 | | | | 7/15/2047 | | | | 100,000 | | | | 99,991 | | | | 100,080 | |
SPS Servicer Advance Receivable 2016-T1 AT1^ | | | 2.53 | | | | 11/16/2048 | | | | 1,040,000 | | | | 1,039,909 | | | | 1,037,302 | |
SVO VOI Mortgage LLC 2012-AA A^ | | | 2.00 | | | | 9/20/2029 | | | | 449,577 | | | | 443,330 | | | | 441,569 | |
Taco Bell Funding LLC 2016-1A A2I^ | | | 3.83 | | | | 5/25/2046 | | | | 329,175 | | | | 330,266 | | | | 331,283 | |
Trinity Rail Leasing LP 2012-1A A1^ | | | 2.27 | | | | 1/15/2043 | | | | 65,324 | | | | 63,365 | | | | 62,448 | |
VSE VOI Mortgage LLC 2016-A A^ | | | 2.54 | | | | 7/20/2033 | | | | 809,788 | | | | 809,706 | | | | 801,394 | |
Wendys Funding LLC 2015 1A A2I^ | | | 3.37 | | | | 6/15/2045 | | | | 740,625 | | | | 738,110 | | | | 739,496 | |
Westgate Resorts LLC 2015-2A A^ | | | 3.20 | | | | 7/20/2028 | | | | 293,539 | | | | 293,178 | | | | 292,523 | |
Westlake Automobile Receivables Trust 2016-1A A2B^ | | | 1.75 | # | | | 1/15/2019 | | | | 251,169 | | | | 251,169 | | | | 251,395 | |
Westlake Automobile Receivables Trust 2016-2A A2^ | | | 1.57 | | | | 6/17/2019 | | | | 290,000 | | | | 289,986 | | | | 290,251 | |
| | | | | | | | | | | | | | | | | | | | |
Total Other Asset-Backed Securities | | | | 68,517,774 | | | | 68,058,730 | | | | 68,062,337 | |
| | | | | | | | | | | | | | | | | | | | |
| | | | | | | | | | | | | | | | | | | | |
Total Asset-Backed Securities | | | | 78,792,774 | | | | 78,308,708 | | | | 78,339,973 | |
| | | | | | | | | | | | | | | | | | | | |
See accompanying Notes to the Financial Statements.
102
Barings Active Short Duration Bond Fund 2016 Semi-Annual Report
SCHEDULE OF INVESTMENTS (CONTINUED)
December 31, 2016 (Unaudited)
| | | | | | | | | | | | | | | | | | | | |
| | | EFFECTIVE
INTEREST RATE | | | DUE DATE | | | PRINCIPAL ‡‡ | | | COST | | | FAIR
VALUE | |
Corporate Bonds — 42.3%*: | |
|
Advertising — 0.4%*: | |
S&P Global, Inc. | | | 2.50 | % | | | 8/15/2018 | | | | 260,000 | | | | $260,687 | | | | $262,171 | |
S&P Global, Inc. | | | 3.30 | | | | 8/14/2020 | | | | 700,000 | | | | 727,702 | | | | 713,712 | |
| | | | | | | | | | | | | | | | | | | | |
Total Advertising | | | | 960,000 | | | | 988,389 | | | | 975,883 | |
| | | | | | | | | | | | | | | | | | | | |
|
Aerospace/Defense — 0.9%*: | |
Harris Corp. | | | 2.00 | | | | 4/27/2018 | | | | 785,000 | | | | 786,297 | | | | 785,478 | |
Harris Corp. | | | 2.70 | | | | 4/27/2020 | | | | 330,000 | | | | 330,535 | | | | 329,637 | |
L-3 Communications Corp. | | | 5.20 | | | | 10/15/2019 | | | | 1,065,000 | | | | 1,124,415 | | | | 1,145,478 | |
| | | | | | | | | | | | | | | | | | | | |
Total Aerospace/Defense | | | | 2,180,000 | | | | 2,241,247 | | | | 2,260,593 | |
| | | | | | | | | | | | | | | | | | | | |
|
Agriculture — 1.0%*: | |
Bunge Ltd. Finance Corp. | | | 3.50 | | | | 11/24/2020 | | | | 1,050,000 | | | | 1,073,823 | | | | 1,068,716 | |
Imperial Brands Finance PLC+^ | | | 2.05 | | | | 7/20/2018 | | | | 335,000 | | | | 334,107 | | | | 334,924 | |
Imperial Brands Finance PLC+^ | | | 2.95 | | | | 7/21/2020 | | | | 1,097,000 | | | | 1,119,418 | | | | 1,103,712 | |
| | | | | | | | | | | | | | | | | | | | |
Total Agriculture | | | | 2,482,000 | | | | 2,527,348 | | | | 2,507,352 | |
| | | | | | | | | | | | | | | | | | | | |
|
Airlines — 0.2%*: | |
WestJet Airlines Ltd.+^ | | | 3.50 | | | | 6/16/2021 | | | | 490,000 | | | | 489,401 | | | | 489,795 | |
| | | | | | | | | | | | | | | | | | | | |
|
Auto Manufacturers — 1.8%*: | |
Ford Motor Credit Co. LLC | | | 2.24 | | | | 6/15/2018 | | | | 930,000 | | | | 928,847 | | | | 931,260 | |
Ford Motor Credit Co. LLC | | | 3.34 | | | | 3/18/2021 | | | | 315,000 | | | | 315,000 | | | | 317,186 | |
General Motors Co. | | | 3.50 | | | | 10/2/2018 | | | | 250,000 | | | | 253,531 | | | | 254,975 | |
General Motors Financial Co., Inc. | | | 3.20 | | | | 7/13/2020 | | | | 1,350,000 | | | | 1,346,839 | | | | 1,354,061 | |
Hyundai Capital America^ | | | 2.00 | | | | 7/1/2019 | | | | 70,000 | | | | 69,959 | | | | 69,459 | |
Hyundai Capital America^ | | | 2.40 | | | | 10/30/2018 | | | | 150,000 | | | | 150,050 | | | | 150,626 | |
Hyundai Capital America^ | | | 2.55 | | | | 2/6/2019 | | | | 620,000 | | | | 626,303 | | | | 623,627 | |
Hyundai Capital America^ | | | 3.00 | | | | 10/30/2020 | | | | 280,000 | | | | 284,800 | | | | 280,000 | |
Nissan Motor Acceptance Corp.^+ | | | 1.90 | | | | 9/14/2021 | | | | 560,000 | | | | 558,623 | | | | 540,374 | |
| | | | | | | | | | | | | | | | | | | | |
Total Auto Manufacturers | | | | 4,525,000 | | | | 4,533,952 | | | | 4,521,568 | |
| | | | | | | | | | | | | | | | | | | | |
|
Auto Parts&Equipment — 0.9%*: | |
Goodyear Tire & Rubber Co. (The) | | | 5.13 | | | | 11/15/2023 | | | | 1,115,000 | | | | 1,154,012 | | | | 1,148,450 | |
Lear Corp. | | | 4.75 | | | | 1/15/2023 | | | | 1,110,000 | | | | 1,150,383 | | | | 1,132,200 | |
| | | | | | | | | | | | | | | | | | | | |
Total Auto Parts&Equipment | | | | 2,225,000 | | | | 2,304,395 | | | | 2,280,650 | |
| | | | | | | | | | | | | | | | | | | | |
|
Beverages — 0.8%*: | |
Anheuser-Busch InBev Finance, Inc.+ | | | 2.65 | | | | 2/1/2021 | | | | 695,000 | | | | 705,512 | | | | 698,993 | |
Coca-Cola Femsa SAB de CV+ | | | 2.38 | | | | 11/26/2018 | | | | 964,000 | | | | 974,394 | | | | 970,695 | |
Molson Coors Brewing Co. | | | 2.10 | | | | 7/15/2021 | | | | 325,000 | | | | 322,334 | | | | 316,521 | |
| | | | | | | | | | | | | | | | | | | | |
Total Beverages | | | | 1,984,000 | | | | 2,002,240 | | | | 1,986,209 | |
| | | | | | | | | | | | | | | | | | | | |
|
Biotechnology — 0.5%*: | |
Celgene Corp. | | | 2.13 | | | | 8/15/2018 | | | | 420,000 | | | | 420,635 | | | | 421,687 | |
Celgene Corp. | | | 2.25 | | | | 5/15/2019 | | | | 250,000 | | | | 250,365 | | | | 250,143 | |
Celgene Corp. | | | 2.88 | | | | 8/15/2020 | | | | 680,000 | | | | 698,575 | | | | 687,789 | |
| | | | | | | | | | | | | | | | | | | | |
Total Biotechnology | | | | 1,350,000 | | | | 1,369,575 | | | | 1,359,619 | |
| | | | | | | | | | | | | | | | | | | | |
See accompanying Notes to the Financial Statements.
103
Barings Active Short Duration Bond Fund 2016 Semi-Annual Report
SCHEDULE OF INVESTMENTS (CONTINUED)
December 31, 2016 (Unaudited)
| | | | | | | | | | | | | | | | | | | | |
| | | EFFECTIVE
INTEREST RATE | | | DUE DATE | | | PRINCIPAL ‡‡ | | | COST | | | FAIR
VALUE | |
Corporate Bonds (Continued) | |
|
Chemicals — 2.3%*: | |
Air Liquide Finance SA+^ | | | 1.75 | % | | | 9/27/2021 | | | | 500,000 | | | $ | 494,734 | | | $ | 481,955 | |
Airgas, Inc. | | | 2.38 | | | | 2/15/2020 | | | | 250,000 | | | | 248,218 | | | | 250,123 | |
Airgas, Inc. | | | 3.05 | | | | 8/1/2020 | | | | 450,000 | | | | 457,039 | | | | 460,082 | |
CF Industries, Inc. | | | 6.88 | | | | 5/1/2018 | | | | 1,190,000 | | | | 1,267,261 | | | | 1,252,642 | |
Dow Chemical Co. (The) | | | 8.55 | | | | 5/15/2019 | | | | 125,000 | | | | 143,613 | | | | 143,260 | |
Ecolab, Inc. | | | 2.00 | | | | 1/14/2019 | | | | 530,000 | | | | 534,255 | | | | 530,407 | |
Incitec Pivot Finance LLC+^ | | | 6.00 | | | | 12/10/2019 | | | | 195,000 | | | | 208,345 | | | | 209,787 | |
LyondellBasell Industries NV | | | 5.00 | | | | 4/15/2019 | | | | 837,000 | | | | 882,188 | | | | 884,418 | |
LyondellBasell Industries NV | | | 6.00 | | | | 11/15/2021 | | | | 300,000 | | | | 348,580 | | | | 340,221 | |
RPM International, Inc. | | | 6.13 | | | | 10/15/2019 | | | | 855,000 | | | | 936,222 | | | | 938,932 | |
RPM International, Inc. | | | 6.50 | | | | 2/15/2018 | | | | 265,000 | | | | 277,299 | | | | 277,731 | |
| | | | | | | | | | | | | | | | | | | | |
Total Chemicals | | | | 5,497,000 | | | | 5,797,754 | | | | 5,769,558 | |
| | | | | | | | | | | | | | | | | | | | |
|
Commercial Banks — 6.5%*: | |
ANZ New Zealand Int’l Ltd.+^ | | | 2.25 | | | | 2/1/2019 | | | | 1,225,000 | | | | 1,231,115 | | | | 1,226,203 | |
Bancolombia SA+ | | | 5.95 | | | | 6/3/2021 | | | | 315,000 | | | | 344,687 | | | | 341,870 | |
Bank of America Corp. | | | 5.42 | | | | 3/15/2017 | | | | 1,000,000 | | | | 1,007,249 | | | | 1,007,246 | |
Bank of America Corp. MTN | | | 2.25 | | | | 4/21/2020 | | | | 850,000 | | | | 833,981 | | | | 845,045 | |
CIT Group, Inc. | | | 4.25 | | | | 8/15/2017 | | | | 1,275,000 | | | | 1,287,611 | | | | 1,292,531 | |
Citigroup, Inc. | | | 2.35 | | | | 8/2/2021 | | | | 1,160,000 | | | | 1,161,682 | | | | 1,134,711 | |
First Horizon National Corp. | | | 3.50 | | | | 12/15/2020 | | | | 1,570,000 | | | | 1,580,602 | | | | 1,584,300 | |
First Tennessee Bank N.A. | | | 2.95 | | | | 12/1/2019 | | | | 550,000 | | | | 547,364 | | | | 551,364 | |
Goldman Sachs Group, Inc. (The) | | | 2.38 | | | | 1/22/2018 | | | | 590,000 | | | | 594,390 | | | | 593,508 | |
Goldman Sachs Group, Inc. (The) | | | 2.55 | | | | 10/23/2019 | | | | 650,000 | | | | 649,719 | | | | 654,772 | |
Goldman Sachs Group, Inc. (The) | | | 2.88 | | | | 2/25/2021 | | | | 1,035,000 | | | | 1,061,495 | | | | 1,039,786 | |
Itau Unibanco Holding SA+^ | | | 2.85 | | | | 5/26/2018 | | | | 400,000 | | | | 396,596 | | | | 401,000 | |
Macquarie Bank Ltd.+^ | | | 2.85 | | | | 1/15/2021 | | | | 130,000 | | | | 133,977 | | | | 130,542 | |
Mitsubishi UFJ Trust & Banking Corp.+^ | | | 2.65 | | | | 10/19/2020 | | | | 1,080,000 | | | | 1,090,720 | | | | 1,076,172 | |
Morgan Stanley | | | 2.13 | | | | 4/25/2018 | | | | 415,000 | | | | 416,989 | | | | 416,653 | |
Morgan Stanley | | | 2.45 | | | | 2/1/2019 | | | | 1,405,000 | | | | 1,418,669 | | | | 1,414,648 | |
Regions Bank | | | 7.50 | | | | 5/15/2018 | | | | 212,000 | | | | 227,764 | | | | 227,122 | |
Regions Financial Corp. | | | 3.20 | | | | 2/8/2021 | | | | 1,130,000 | | | | 1,163,829 | | | | 1,145,989 | |
Sumitomo Mitsui Financial Group, Inc.+ | | | 2.06 | | | | 7/14/2021 | | | | 582,000 | | | | 577,600 | | | | 562,905 | |
SVB Financial Group | | | 5.38 | | | | 9/15/2020 | | | | 200,000 | | | | 217,913 | | | | 216,704 | |
Turkiye Garanti Bankasi AS+^ | | | 4.75 | | | | 10/17/2019 | | | | 325,000 | | | | 334,868 | | | | 323,131 | |
| | | | | | | | | | | | | | | | | | | | |
Total Commercial Banks | | | | 16,099,000 | | | | 16,278,820 | | | | 16,186,202 | |
| | | | | | | | | | | | | | | | | | | | |
|
Construction Materials — 1.3%*: | |
Holcim US Finance Sarl & Cie SCS+^ | | | 6.00 | | | | 12/30/2019 | | | | 1,210,000 | | | | 1,330,008 | | | | 1,325,668 | |
James Hardie International Finance Ltd.+^ | | | 5.88 | | | | 2/15/2023 | | | | 650,000 | | | | 688,193 | | | | 672,750 | |
Masco Corp. | | | 3.50 | | | | 4/1/2021 | | | | 380,000 | | | | 383,570 | | | | 380,950 | |
Masco Corp. | | | 7.13 | | | | 3/15/2020 | | | | 715,000 | | | | 809,782 | | | | 804,375 | |
| | | | | | | | | | | | | | | | | | | | |
Total Construction Materials | | | | 2,955,000 | | | | 3,211,553 | | | | 3,183,743 | |
| | | | | | | | | | | | | | | | | | | | |
See accompanying Notes to the Financial Statements.
104
Barings Active Short Duration Bond Fund 2016 Semi-Annual Report
SCHEDULE OF INVESTMENTS (CONTINUED)
December 31, 2016 (Unaudited)
| | | | | | | | | | | | | | | | | | | | |
| | | EFFECTIVE
INTEREST RATE | | | DUE DATE | | | PRINCIPAL ‡‡ | | | COST | | | FAIR
VALUE | |
Corporate Bonds (Continued) | |
|
Diversified Financial Services — 2.6%*: | |
AerCap Ireland Capital Ltd./AerCap Global Aviation Trust+ | | | 2.75 | % | | | 5/15/2017 | | | | 415,000 | | | $ | 414,714 | | | $ | 415,519 | |
AerCap Ireland Capital Ltd./AerCap Global Aviation Trust | | | 3.95 | | | | 2/1/2022 | | | | 380,000 | | | | 379,358 | | | | 383,325 | |
Air Lease Corp. | | | 2.13 | | | | 1/15/2018 | | | | 530,000 | | | | 527,436 | | | | 530,943 | |
Air Lease Corp. | | | 2.13 | | | | 1/15/2020 | | | | 400,000 | | | | 398,675 | | | | 394,031 | |
Air Lease Corp. | | | 2.63 | | | | 9/4/2018 | | | | 125,000 | | | | 124,651 | | | | 125,872 | |
Air Lease Corp. | | | 3.38 | | | | 1/15/2019 | | | | 200,000 | | | | 203,137 | | | | 203,391 | |
Ally Financial, Inc. | | | 4.75 | | | | 9/10/2018 | | | | 1,355,000 | | | | 1,387,136 | | | | 1,395,650 | |
BGC Partners, Inc. | | | 5.13 | | | | 5/27/2021 | | | | 770,000 | | | | 782,168 | | | | 792,369 | |
Icahn Enterprises LP/Icahn Enterprises Finance Corp. | | | 3.50 | | | | 3/15/2017 | | | | 1,100,000 | | | | 1,100,687 | | | | 1,102,062 | |
International Lease Finance Corp. | | | 3.88 | | | | 4/15/2018 | | | | 350,000 | | | | 351,037 | | | | 356,562 | |
Lazard Group LLC | | | 4.25 | | | | 11/14/2020 | | | | 715,000 | | | | 749,520 | | | | 748,432 | |
| | | | | | | | | | | | | | | | | | | | |
Total Diversified Financial Services | | | | 6,340,000 | | | | 6,418,519 | | | | 6,448,156 | |
| | | | | | | | | | | | | | | | | | | | |
|
Electric — 1.7%*: | |
Ameren Corp. | | | 2.70 | | | | 11/15/2020 | | | | 560,000 | | | | 567,574 | | | | 563,006 | |
Duke Energy Corp. | | | 1.80 | | | | 9/1/2021 | | | | 610,000 | | | | 594,454 | | | | 587,615 | |
EDP Finance BV+^ | | | 4.13 | | | | 1/15/2020 | | | | 1,060,000 | | | | 1,087,782 | | | | 1,083,235 | |
EDP Finance BV+^ | | | 4.90 | | | | 10/1/2019 | | | | 89,000 | | | | 93,135 | | | | 93,262 | |
Entergy Texas, Inc. | | | 2.55 | | | | 6/1/2021 | | | | 170,000 | | | | 169,722 | | | | 169,436 | |
Entergy Texas, Inc. | | | 7.13 | | | | 2/1/2019 | | | | 300,000 | | | | 329,275 | | | | 330,148 | |
IPALCO Enterprises, Inc. | | | 5.00 | | | | 5/1/2018 | | | | 150,000 | | | | 154,733 | | | | 154,875 | |
Israel Electric Corp. Ltd.+^ | | | 7.25 | | | | 1/15/2019 | | | | 320,000 | | | | 350,944 | | | | 345,565 | |
Majapahit Holding B.V.+^ | | | 7.75 | | | | 1/20/2020 | | | | 300,000 | | | | 338,919 | | | | 336,750 | |
Southern Co. (The) | | | 1.85 | | | | 7/1/2019 | | | | 130,000 | | | | 129,980 | | | | 129,598 | |
Southern Co. (The) | | | 2.35 | | | | 7/1/2021 | | | | 440,000 | | | | 441,549 | | | | 432,526 | |
| | | | | | | | | | | | | | | | | | | | |
Total Electric | | | | 4,129,000 | | | | 4,258,067 | | | | 4,226,016 | |
| | | | | | | | | | | | | | | | | | | | |
|
Electronics — 0.4%*: | |
FLIR Systems, Inc. | | | 3.13 | | | | 6/15/2021 | | | | 480,000 | | | | 490,195 | | | | 481,268 | |
Tech Data Corp. | | | 3.75 | | | | 9/21/2017 | | | | 60,000 | | | | 60,744 | | | | 60,738 | |
Tyco Electronics Group SA+ | | | 2.35 | | | | 8/1/2019 | | | | 135,000 | | | | 134,954 | | | | 135,402 | |
Tyco Electronics Group SA+ | | | 2.38 | | | | 12/17/2018 | | | | 200,000 | | | | 201,572 | | | | 201,929 | |
| | | | | | | | | | | | | | | | | | | | |
Total Electronics | | | | 875,000 | | | | 887,465 | | | | 879,337 | |
| | | | | | | | | | | | | | | | | | | | |
|
Engineering&Construction — 0.1%*: | |
SBA Tower Trust^ | | | 3.60 | | | | 4/15/2018 | | | | 330,000 | | | | 328,666 | | | | 331,218 | |
| | | | | | | | | | | | | | | | | | | | |
|
Environmental Control — 0.2%*: | |
Clean Harbors, Inc. | | | 5.25 | | | | 8/1/2020 | | | | 415,000 | | | | 422,427 | | | | 424,856 | |
| | | | | | | | | | | | | | | | | | | | |
|
Food — 1.1%*: | |
Danone SA^+ | | | 2.08 | | | | 11/2/2021 | | | | 1,310,000 | | | | 1,310,000 | | | | 1,272,137 | |
JBS Investments GmbH+^ | | | 7.75 | | | | 10/28/2020 | | | | 415,000 | | | | 441,916 | | | | 440,440 | |
See accompanying Notes to the Financial Statements.
105
Barings Active Short Duration Bond Fund 2016 Semi-Annual Report
SCHEDULE OF INVESTMENTS (CONTINUED)
December 31, 2016 (Unaudited)
| | | | | | | | | | | | | | | | | | | | |
| | | EFFECTIVE
INTEREST RATE | | | DUE DATE | | | PRINCIPAL ‡‡ | | | COST | | | FAIR
VALUE | |
Corporate Bonds (Continued) | |
|
Food (Continued) | |
Mondelez International Holdings Netherlands B.V.^ | | | 2.00 | % | | | 10/28/2021 | | | | 600,000 | | | $ | 585,359 | | | $ | 574,824 | |
Tyson Foods, Inc. | | | 2.65 | | | | 8/15/2019 | | | | 335,000 | | | | 337,266 | | | | 338,193 | |
| | | | | | | | | | | | | | | | | | | | |
Total Food | | | | 2,660,000 | | | | 2,674,541 | | | | 2,625,594 | |
| | | | | | | | | | | | | | | | | | | | |
|
Forestry and Paper Products — 0.4%*: | |
Sappi Papier Holding GmbH+^ | | | 7.75 | | | | 7/15/2017 | | | | 960,000 | | | | 979,954 | | | | 972,000 | |
| | | | | | | | | | | | | | | | | | | | |
|
Hand/Machine Tools — 0.4%*: | |
Stanley Black & Decker, Inc. | | | 1.62 | | | | 11/17/2018 | | | | 315,000 | | | | 315,000 | | | | 313,061 | |
Stanley Black & Decker, Inc. | | | 2.45 | | | | 11/17/2018 | | | | 700,000 | | | | 708,724 | | | | 705,998 | |
| | | | | | | | | | | | | | | | | | | | |
Total Hand/Machine Tools | | | | 1,015,000 | | | | 1,023,724 | | | | 1,019,059 | |
| | | | | | | | | | | | | | | | | | | | |
|
Healthcare-Products — 0.8%*: | |
Abbott Laboratories | | | 2.35 | | | | 11/22/2019 | | | | 600,000 | | | | 599,433 | | | | 600,707 | |
Abbott Laboratories | | | 2.90 | | | | 11/30/2021 | | | | 610,000 | | | | 608,942 | | | | 608,262 | |
Boston Scientific Corp. | | | 2.85 | | | | 5/15/2020 | | | | 350,000 | | | | 353,522 | | | | 355,220 | |
Zimmer Biomet Holdings, Inc. | | | 2.00 | | | | 4/1/2018 | | | | 480,000 | | | | 480,470 | | | | 480,586 | |
| | | | | | | | | | | | | | | | | | | | |
Total Healthcare-Products | | | | 2,040,000 | | | | 2,042,367 | | | | 2,044,775 | |
| | | | | | | | | | | | | | | | | | | | |
|
Healthcare-Services — 2.0%*: | |
Aetna, Inc. | | | 1.90 | | | | 6/7/2019 | | | | 690,000 | | | | 691,547 | | | | 688,418 | |
Anthem, Inc. | | | 1.88 | | | | 1/15/2018 | | | | 250,000 | | | | 250,048 | | | | 250,110 | |
Cigna Corp. | | | 4.00 | | | | 2/15/2022 | | | | 442,000 | | | | 473,602 | | | | 461,768 | |
Cigna Corp. | | | 4.50 | | | | 3/15/2021 | | | | 580,000 | | | | 625,627 | | | | 616,472 | |
HCA, Inc. | | | 3.75 | | | | 3/15/2019 | | | | 1,130,000 | | | | 1,150,942 | | | | 1,161,075 | |
Humana, Inc. | | | 6.30 | | | | 8/1/2018 | | | | 150,000 | | | | 159,785 | | | | 160,607 | |
Laboratory Corp. of America Holdings | | | 2.63 | | | | 2/1/2020 | | | | 520,000 | | | | 521,437 | | | | 519,490 | |
UnitedHealth Group, Inc. | | | 1.70 | | | | 2/15/2019 | | | | 1,150,000 | | | | 1,154,575 | | | | 1,146,543 | |
| | | | | | | | | | | | | | | | | | | | |
Total Healthcare-Services | | | | 4,912,000 | | | | 5,027,563 | | | | 5,004,483 | |
| | | | | | | | | | | | | | | | | | | | |
|
Home Builders — 0.5%*: | |
Lennar Corp. | | | 4.50 | | | | 6/15/2019 | | | | 150,000 | | | | 152,888 | | | | 154,875 | |
Lennar Corp. | | | 4.50 | | | | 11/15/2019 | | | | 850,000 | | | | 878,292 | | | | 882,937 | |
Lennar Corp. | | | 4.75 | | | | 4/1/2021 | | | | 140,000 | | | | 140,000 | | | | 144,550 | |
| | | | | | | | | | | | | | | | | | | | |
Total Home Builders | | | | 1,140,000 | | | | 1,171,180 | | | | 1,182,362 | |
| | | | | | | | | | | | | | | | | | | | |
|
Housewares — 0.4%*: | |
Newell Brands, Inc. | | | 2.60 | | | | 3/29/2019 | | | | 910,000 | | | | 919,385 | | | | 919,985 | |
| | | | | | | | | | | | | | | | | | | | |
|
Insurance — 2.1%*: | |
American International Group, Inc. | | | 3.30 | | | | 3/1/2021 | | | | 700,000 | | | | 699,458 | | | | 716,998 | |
CNA Financial Corp. | | | 5.75 | | | | 8/15/2021 | | | | 341,000 | | | | 374,447 | | | | 380,930 | |
Lincoln National Corp. | | | 4.20 | | | | 3/15/2022 | | | | 350,000 | | | | 376,809 | | | | 370,458 | |
Lincoln National Corp. | | | 6.25 | | | | 2/15/2020 | | | | 300,000 | | | | 328,045 | | | | 331,325 | |
See accompanying Notes to the Financial Statements.
106
Barings Active Short Duration Bond Fund 2016 Semi-Annual Report
SCHEDULE OF INVESTMENTS (CONTINUED)
December 31, 2016 (Unaudited)
| | | | | | | | | | | | | | | | | | | | |
| | | EFFECTIVE
INTEREST RATE | | | DUE DATE | | | PRINCIPAL ‡‡ | | | COST | | | FAIR
VALUE | |
Corporate Bonds (Continued) | |
|
Insurance (Continued) | |
Reinsurance Group of America, Inc. | | | 5.63 | % | | | 3/15/2017 | | | | 450,000 | | | $ | 453,415 | | | $ | 453,660 | |
TIAA Asset Management Finance Co. LLC^ | | | 2.95 | | | | 11/1/2019 | | | | 1,145,000 | | | | 1,162,842 | | | | 1,164,764 | |
Trinity Acquisition PLC | | | 3.50 | | | | 9/15/2021 | | | | 600,000 | | | | 602,189 | | | | 605,855 | |
Unum Group | | | 3.00 | | | | 5/15/2021 | | | | 120,000 | | | | 119,770 | | | | 119,650 | |
Willis Towers Watson PLC | | | 5.75 | | | | 3/15/2021 | | | | 370,000 | | | | 404,164 | | | | 404,309 | |
XLIT Ltd.+ | | | 5.75 | | | | 10/1/2021 | | | | 585,000 | | | | 661,850 | | | | 650,129 | |
| | | | | | | | | | | | | | | | | | | | |
Total Insurance | | | | 4,961,000 | | | | 5,182,989 | | | | 5,198,078 | |
| | | | | | | | | | | | | | | | | | | | |
|
Internet — 0.5%*: | |
Alibaba Group Holding Ltd.+ | | | 2.50 | | | | 11/28/2019 | | | | 250,000 | | | | 248,631 | | | | 251,124 | |
Expedia, Inc. | | | 7.46 | | | | 8/15/2018 | | | | 999,000 | | | | 1,081,462 | | | | 1,080,466 | |
| | | | | | | | | | | | | | | | | | | | |
Total Internet | | | | 1,249,000 | | | | 1,330,093 | | | | 1,331,590 | |
| | | | | | | | | | | | | | | | | | | | |
|
Investment Company Security — 0.3%*: | |
Ares Capital Corp. | | | 3.88 | | | | 1/15/2020 | | | | 317,000 | | | | 326,703 | | | | 321,430 | |
Ares Capital Corp. | | | 4.88 | | | | 11/30/2018 | | | | 200,000 | | | | 206,039 | | | | 207,299 | |
FS Investment Corp. | | | 4.00 | | | | 7/15/2019 | | | | 335,000 | | | | 337,920 | | | | 335,863 | |
| | | | | | | | | | | | | | | | | | | | |
Total Investment Company Security | | | | 852,000 | | | | 870,662 | | | | 864,592 | |
| | | | | | | | | | | | | | | | | | | | |
|
IT Services — 0.7%*: | |
Diamond 1 Finance Corp./Diamond 2 Finance Corp.^ | | | 3.48 | | | | 6/1/2019 | | | | 405,000 | | | | 407,044 | | | | 413,426 | |
Diamond 1 Finance Corp./Diamond 2 Finance Corp.^ | | | 4.42 | | | | 6/15/2021 | | | | 370,000 | | | | 378,696 | | | | 382,856 | |
Leidos Holdings, Inc. | | | 4.45 | | | | 12/1/2020 | | | | 975,000 | | | | 989,831 | | | | 1,004,348 | |
| | | | | | | | | | | | | | | | | | | | |
Total IT Services | | | | 1,750,000 | | | | 1,775,571 | | | | 1,800,630 | |
| | | | | | | | | | | | | | | | | | | | |
|
Leisure Time — 0.4%*: | |
Brunswick Corp.^ | | | 4.63 | | | | 5/15/2021 | | | | 1,111,000 | | | | 1,137,568 | | | | 1,123,499 | |
| | | | | | | | | | | | | | | | | | | | |
|
Lodging — 0.4%*: | |
Marriott International, Inc. | | | 2.30 | | | | 1/15/2022 | | | | 300,000 | | | | 298,877 | | | | 291,014 | |
Marriott International, Inc. | | | 2.88 | | | | 3/1/2021 | | | | 605,000 | | | | 614,028 | | | | 607,728 | |
| | | | | | | | | | | | | | | | | | | | |
Total Lodging | | | | 905,000 | | | | 912,905 | | | | 898,742 | |
| | | | | | | | | | | | | | | | | | | | |
|
Machinery-Diversified — 0.5%*: | |
CNH Industrial Capital LLC | | | 3.38 | | | | 7/15/2019 | | | | 885,000 | | | | 897,096 | | | | 887,212 | |
CNH Industrial Capital LLC | | | 3.88 | | | | 10/15/2021 | | | | 260,000 | | | | 258,459 | | | | 255,775 | |
| | | | | | | | | | | | | | | | | | | | |
Total Machinery-Diversified | | | | 1,145,000 | | | | 1,155,555 | | | | 1,142,987 | |
| | | | | | | | | | | | | | | | | | | | |
|
Media — 0.9%*: | |
Charter Communications Operating LLC/Charter Communications Operating Capital | | | 3.58 | | | | 7/23/2020 | | | | 575,000 | | | | 582,873 | | | | 586,635 | |
Sirius XM Radio, Inc.^ | | | 4.25 | | | | 5/15/2020 | | | | 625,000 | | | | 631,399 | | | | 634,375 | |
Sirius XM Radio, Inc.^ | | | 5.75 | | | | 8/1/2021 | | | | 200,000 | | | | 206,193 | | | | 208,250 | |
See accompanying Notes to the Financial Statements.
107
Barings Active Short Duration Bond Fund 2016 Semi-Annual Report
SCHEDULE OF INVESTMENTS (CONTINUED)
December 31, 2016 (Unaudited)
| | | | | | | | | | | | | | | | | | | | |
| | | EFFECTIVE
INTEREST RATE | | | DUE DATE | | | PRINCIPAL ‡‡ | | | COST | | | FAIR
VALUE | |
Corporate Bonds (Continued) | |
|
Media (Continued) | |
Viacom, Inc. | | | 2.25 | % | | | 2/4/2022 | | | | 80,000 | | | $ | 79,764 | | | $ | 75,179 | |
Viacom, Inc. | | | 2.75 | | | | 12/15/2019 | | | | 275,000 | | | | 281,502 | | | | 274,641 | |
Viacom, Inc. | | | 6.13 | | | | 10/5/2017 | | | | 400,000 | | | | 409,874 | | | | 411,444 | |
| | | | | | | | | | | | | | | | | | | | |
Total Media | | | | 2,155,000 | | | | 2,191,605 | | | | 2,190,524 | |
| | | | | | | | | | | | | | | | | | | | |
|
Mining — 0.5%*: | |
Glencore Canada Corp.+ | | | 5.50 | | | | 6/15/2017 | | | | 696,000 | | | | 705,339 | | | | 707,162 | |
Glencore Finance Canada Ltd.+^ | | | 2.70 | | | | 10/25/2017 | | | | 430,000 | | | | 430,762 | | | | 433,290 | |
| | | | | | | | | | | | | | | | | | | | |
Total Mining | | | | 1,126,000 | | | | 1,136,101 | | | | 1,140,452 | |
| | | | | | | | | | | | | | | | | | | | |
|
Office/Business Equip — 0.6%*: | |
Pitney Bowes, Inc. | | | 3.38 | | | | 10/1/2021 | | | | 1,225,000 | | | | 1,222,127 | | | | 1,189,333 | |
Pitney Bowes, Inc. | | | 4.75 | | | | 5/15/2018 | | | | 200,000 | | | | 206,687 | | | | 205,928 | |
| | | | | | | | | | | | | | | | | | | | |
Total Office/Business Equip | | | | 1,425,000 | | | | 1,428,814 | | | | 1,395,261 | |
| | | | | | | | | | | | | | | | | | | | |
|
Packaging and Containers — 0.5%*: | |
Graphic Packaging International, Inc. | | | 4.75 | | | | 4/15/2021 | | | | 1,086,000 | | | | 1,143,398 | | | | 1,140,300 | |
| | | | | | | | | | | | | | | | | | | | |
|
Pharmaceuticals — 1.8%*: | |
AbbVie, Inc. | | | 1.80 | | | | 5/14/2018 | | | | 1,020,000 | | | | 1,022,539 | | | | 1,020,766 | |
Actavis Funding SCS+ | | | 2.35 | | | | 3/12/2018 | | | | 335,000 | | | | 336,039 | | | | 336,937 | |
Baxalta, Inc. | | | 2.00 | | | | 6/22/2018 | | | | 705,000 | | | | 704,596 | | | | 705,037 | |
Express Scripts Holding Co. | | | 3.30 | | | | 2/25/2021 | | | | 835,000 | | | | 842,078 | | | | 850,671 | |
Express Scripts Holding Co. | | | 4.75 | | | | 11/15/2021 | | | | 250,000 | | | | 279,502 | | | | 268,518 | |
Shire Acquisitions Investments Ireland DAC | | | 2.40 | | | | 9/23/2021 | | | | 290,000 | | | | 289,703 | | | | 280,136 | |
Teva Pharmaceutical Finance Netherlands III B.V.+ | | | 2.20 | | | | 7/21/2021 | | | | 1,140,000 | | | | 1,139,942 | | | | 1,090,623 | |
| | | | | | | | | | | | | | | | | | | | |
Total Pharmaceuticals | | | | 4,575,000 | | | | 4,614,399 | | | | 4,552,688 | |
| | | | | | | | | | | | | | | | | | | | |
|
Real Estate Investment Trusts — 1.8%*: | |
American Tower Corp. | | | 2.25 | | | | 1/15/2022 | | | | 330,000 | | | | 329,553 | | | | 316,097 | |
American Tower Corp. | | | 3.30 | | | | 2/15/2021 | | | | 530,000 | | | | 538,172 | | | | 536,037 | |
American Tower Corp. | | | 4.50 | | | | 1/15/2018 | | | | 300,000 | | | | 307,246 | | | | 307,918 | |
Crown Castle International Corp. | | | 3.40 | | | | 2/15/2021 | | | | 732,000 | | | | 758,553 | | | | 742,798 | |
DDR Corp. | | | 4.75 | | | | 4/15/2018 | | | | 445,000 | | | | 457,934 | | | | 457,666 | |
DDR Corp. MTN | | | 7.50 | | | | 7/15/2018 | | | | 31,000 | | | | 33,375 | | | | 33,397 | |
Digital Realty Trust LP | | | 3.40 | | | | 10/1/2020 | | | | 385,000 | | | | 388,869 | | | | 392,273 | |
Duke Realty LP | | | 3.88 | | | | 2/15/2021 | | | | 100,000 | | | | 102,998 | | | | 104,217 | |
Duke Realty LP | | | 6.50 | | | | 1/15/2018 | | | | 140,000 | | | | 146,103 | | | | 146,566 | |
Highwoods Realty LP | | | 7.50 | | | | 4/15/2018 | | | | 370,000 | | | | 394,314 | | | | 394,750 | |
Simon Property Group LP | | | 2.35 | | | | 1/30/2022 | | | | 705,000 | | | | 702,732 | | | | 695,530 | |
Weyerhaeuser Co. | | | 7.38 | | | | 10/1/2019 | | | | 315,000 | | | | 350,894 | | | | 353,615 | |
| | | | | | | | | | | | | | | | | | | | |
Total REITS | | | | 4,383,000 | | | | 4,510,743 | | | | 4,480,864 | |
| | | | | | | | | | | | | | | | | | | | |
See accompanying Notes to the Financial Statements.
108
Barings Active Short Duration Bond Fund 2016 Semi-Annual Report
SCHEDULE OF INVESTMENTS (CONTINUED)
December 31, 2016 (Unaudited)
| | | | | | | | | | | | | | | | | | | | |
| | | EFFECTIVE
INTEREST RATE | | | DUE DATE | | | PRINCIPAL ‡‡ | | | COST | | | FAIR
VALUE | |
Corporate Bonds (Continued) | |
|
Retail — 1.3%*: | |
AutoNation, Inc. | | | 3.35 | % | | | 1/15/2021 | | | | 355,000 | | | $ | 356,056 | | | $ | 356,717 | |
CVS Health Corp. | | | 2.13 | | | | 6/1/2021 | | | | 805,000 | | | | 805,336 | | | | 789,338 | |
Dollar Tree, Inc. | | | 5.75 | | | | 3/1/2023 | | | | 1,090,000 | | | | 1,151,050 | | | | 1,154,114 | |
Home Depot, Inc. (The) | | | 2.00 | | | | 4/1/2021 | | | | 575,000 | | | | 578,376 | | | | 569,418 | |
QVC, Inc. | | | 3.13 | | | | 4/1/2019 | | | | 297,000 | | | | 303,147 | | | | 300,090 | |
| | | | | | | | | | | | | | | | | | | | |
Total Retail | | | | 3,122,000 | | | | 3,193,965 | | | | 3,169,677 | |
| | | | | | | | | | | | | | | | | | | | |
|
Semiconductors — 0.7%*: | |
Analog Devices, Inc. | | | 2.50 | | | | 12/5/2021 | | | | 250,000 | | | | 248,999 | | | | 247,706 | |
KLA-Tencor Corp. | | | 2.38 | | | | 11/1/2017 | | | | 390,000 | | | | 391,184 | | | | 392,336 | |
KLA-Tencor Corp. | | | 3.38 | | | | 11/1/2019 | | | | 200,000 | | | | 203,853 | | | | 204,752 | |
NXP BV/NXP Funding LLC^ | | | 4.13 | | | | 6/1/2021 | | | | 770,000 | | | | 784,772 | | | | 795,025 | |
| | | | | | | | | | | | | | | | | | | | |
Total Semiconductors | | | | 1,610,000 | | | | 1,628,808 | | | | 1,639,819 | |
| | | | | | | | | | | | | | | | | | | | |
|
Telecommunications — 0.1%*: | |
Verizon Communications, Inc. | | | 1.75 | | | | 8/15/2021 | | | | 290,000 | | | | 288,836 | | | | 278,197 | |
| | | | | | | | | | | | | | | | | | | | |
|
Transportation — 1.3%*: | |
Asciano Finance Ltd.+^ | | | 5.00 | | | | 4/7/2018 | | | | 550,000 | | | | 563,283 | | | | 565,073 | |
Penske Truck Leasing Co. LP/PTL Finance Corp.^ | | | 3.05 | | | | 1/9/2020 | | | | 470,000 | | | | 477,663 | | | | 475,137 | |
PT Penske Truck Leasing Co. LP/L Finance Corp.^ | | | 2.50 | | | | 6/15/2019 | | | | 285,000 | | | | 281,702 | | | | 285,690 | |
PT Penske Truck Leasing Co. LP/L Finance Corp.^ | | | 3.20 | | | | 7/15/2020 | | | | 135,000 | | | | 134,930 | | | | 136,497 | |
PT Penske Truck Leasing Co. LP/L Finance Corp.^ | | | 3.30 | | | | 4/1/2021 | | | | 240,000 | | | | 247,014 | | | | 242,697 | |
Ryder System, Inc. | | | 2.25 | | | | 9/1/2021 | | | | 475,000 | | | | 472,590 | | | | 463,876 | |
Ryder System, Inc. | | | 2.45 | | | | 9/3/2019 | | | | 200,000 | | | | 203,638 | | | | 201,108 | |
Ryder System, Inc. | | | 2.50 | | | | 3/1/2018 | | | | 250,000 | | | | 250,490 | | | | 251,814 | |
Ryder System, Inc. | | | 2.55 | | | | 6/1/2019 | | | | 185,000 | | | | 184,694 | | | | 186,392 | |
Ryder System, Inc. | | | 2.88 | | | | 9/1/2020 | | | | 200,000 | | | | 198,389 | | | | 202,175 | |
TTX Co.^ | | | 2.25 | | | | 2/1/2019 | | | | 250,000 | | | | 249,776 | | | | 249,856 | |
| | | | | | | | | | | | | | | | | | | | |
Total Transportation | | | | 3,240,000 | | | | 3,264,169 | | | | 3,260,315 | |
| | | | | | | | | | | | | | | | | | | | |
|
Trucking and Leasing — 0.7%*: | |
Aviation Capital Group Corp.^ | | | 2.88 | | | | 9/17/2018 | | | | 955,000 | | | | 959,949 | | | | 966,937 | |
Aviation Capital Group Corp.^ | | | 6.75 | | | | 4/6/2021 | | | | 200,000 | | | | 219,338 | | | | 231,000 | |
GATX Corp. | | | 2.60 | | | | 3/30/2020 | | | | 575,000 | | | | 566,531 | | | | 567,910 | |
| | | | | | | | | | | | | | | | | | | | |
Total Trucking and Leasing | | | | 1,730,000 | | | | 1,745,818 | | | | 1,765,847 | |
| | | | | | | | | | | | | | | | | | | | |
| | | | | | | | | | | | | | | | | | | | |
Total Corporate Bonds | | | | 103,188,000 | | | | 105,410,531 | | | | 104,973,075 | |
| | | | | | | | | | | | | | | | | | | | |
|
Mortgage-Backed Securities — 3.1%*: | |
Banc of America Commercial Mortgage Trust 2007-4 AM | | | 5.81 | # | | | 2/10/2051 | | | | 255,000 | | | | 272,333 | | | | 259,694 | |
See accompanying Notes to the Financial Statements.
109
Barings Active Short Duration Bond Fund 2016 Semi-Annual Report
SCHEDULE OF INVESTMENTS (CONTINUED)
December 31, 2016 (Unaudited)
| | | | | | | | | | | | | | | | | | | | |
| | | EFFECTIVE
INTEREST RATE | | | DUE DATE | | | PRINCIPAL ‡‡ | | | COST | | | FAIR
VALUE | |
Mortgage-Backed Securities (Continued) | |
Banc of America Commercial Mortgage Trust 2008-1 A1A | | | 6.19 | # % | | | 2/10/2051 | | | | 632,747 | | | $ | 661,173 | | | $ | 649,913 | |
Banc of America Commercial Mortgage Trust 2008-1 A4 | | | 6.24 | # | | | 2/10/2051 | | | | 181,398 | | | | 197,147 | | | | 186,084 | |
Bear Stearns Commercial Mortgage Securities Trust 2007-PWR17 AM | | | 5.89 | # | | | 6/11/2050 | | | | 160,000 | | | | 171,689 | | | | 163,452 | |
COMM Mortgage Trust 2007-C9 AM | | | 5.65 | # | | | 12/10/2049 | | | | 100,000 | | | | 106,541 | | | | 101,212 | |
Fannie Mae Connecticut Avenue Securities CAS 2015-C03 1M1 | | | 2.26 | # | | | 7/25/2025 | | | | 50,411 | | | | 50,429 | | | | 50,505 | |
Fannie Mae Connecticut Avenue Securities CAS 2015-C04 1M1 | | | 2.36 | # | | | 4/25/2028 | | | | 65,194 | | | | 65,194 | | | | 65,317 | |
Fannie Mae Connecticut Avenue Securities CAS 2016-C04 1M1 | | | 2.21 | # | | | 1/25/2029 | | | | 693,046 | | | | 695,663 | | | | 695,802 | |
Fannie Mae Connecticut Avenue Securities CAS 2016-C05 2M1 | | | 2.11 | # | | | 1/25/2029 | | | | 738,649 | | | | 740,684 | | | | 740,296 | |
Fannie Mae Connecticut Avenue Securities CAS 2016-C06 1M1 | | | 2.06 | # | | | 4/25/2029 | | | | 564,606 | | | | 564,606 | | | | 567,380 | |
Freddie Mac Structured Agency Credit Risk Debt Notes 2016-DNA1 M1 | | | 2.21 | # | | | 7/25/2028 | | | | 170,776 | | | | 170,776 | | | | 171,231 | |
JPMorgan Chase Commercial Mortgage Securities Trust 2006-LDP7 AM | | | 5.93 | # | | | 4/17/2045 | | | | 17,843 | | | | 18,511 | | | | 17,816 | |
JPMorgan Chase Commercial Mortgage Securities Trust 2007-CIBC18 AM | | | 5.47 | # | | | 6/12/2047 | | | | 700,000 | | | | 717,031 | | | | 704,375 | |
JPMorgan Chase Commercial Mortgage Securities Trust 2007-CIBC20 A4 | | | 5.79 | # | | | 2/12/2051 | | | | 176,965 | | | | 184,034 | | | | 179,680 | |
JPMorgan Chase Commercial Mortgage Securities Trust 2007-CIBC20 AM | | | 5.96 | # | | | 2/12/2051 | | | | 210,000 | | | | 228,020 | | | | 215,055 | |
ML-CFC Commercial Mortgage Trust 2007-9 AM | | | 5.86 | # | | | 9/12/2049 | | | | 450,000 | | | | 467,713 | | | | 461,857 | |
Morgan Stanley Capital I Trust 2008-TOP29 A4 | | | 6.28 | # | | | 1/11/2043 | | | | 183,666 | | | | 200,776 | | | | 190,287 | |
New Residential Mortgage Loan Trust 2016-4A A1^ | | | 3.75 | # | | | 11/25/2056 | | | | 596,021 | | | | 614,042 | | | | 614,340 | |
Shellpoint Co-Originator Trust 2016-1 2A3^ | | | 3.00 | # | | | 10/25/2031 | | | | 1,064,720 | | | | 1,076,298 | | | | 1,070,959 | |
Velocity Commercial Capital Loan Trust 2016-2 AFX | | | 3.00 | # | | | 10/25/2046 | | | | 490,083 | | | | 490,083 | | | | 490,083 | |
Wachovia Bank Commercial Mortgage Trust 2007-C33 A1A | | | 5.97 | # | | | 2/15/2051 | | | | 193,699 | | | | 208,216 | | | | 196,845 | |
| | | | | | | | | | | | | | | | | | | | |
Total Mortgage-Backed Securities | | | | 7,694,824 | | | | 7,900,959 | | | | 7,792,183 | |
| | | | | | | | | | | | | | | | | | | | |
|
U.S. Treasury & Government Agencies — 20.6%*: | |
Education Loan Asset-Backed Trust I 2013-1 A1^ | | | 1.56 | # | | | 6/25/2026 | | | | 692,899 | | | | 684,386 | | | | 685,773 | |
Federal Home Loan Mortgage Corp. | | | 1.15 | # | | | 9/15/2042 | | | | 438,620 | | | | 436,440 | | | | 435,195 | |
Federal Home Loan Mortgage Corp. | | | 1.18 | # | | | 10/15/2040 | | | | 490,313 | | | | 489,854 | | | | 489,549 | |
Federal Home Loan Mortgage Corp. | | | 3.50 | | | | 6/15/2042 | | | | 503,380 | | | | 529,585 | | | | 513,975 | |
Federal Home Loan Mortgage Corp. | | | 4.00 | | | | 3/15/2040 | | | | 451,472 | | | | 481,642 | | | | 473,959 | |
See accompanying Notes to the Financial Statements.
110
Barings Active Short Duration Bond Fund 2016 Semi-Annual Report
SCHEDULE OF INVESTMENTS (CONTINUED)
December 31, 2016 (Unaudited)
| | | | | | | | | | | | | | | | | | | | |
| | | EFFECTIVE
INTEREST RATE | | | DUE DATE | | | PRINCIPAL ‡‡ | | | COST | | | FAIR
VALUE | |
U.S. Treasury & Government Agencies (Continued) | |
Federal Home Loan Mortgage Corp. TBA | | | 4.00 | % | | | 2/1/2047 | | | | 1,350,000 | | | $ | 1,404,422 | | | $ | 1,416,076 | |
Federal National Mortgage Association REMICS 2012-111 EC | | | 2.00 | | | | 12/25/2041 | | | | 1,168,280 | | | | 1,171,882 | | | | 1,128,949 | |
Federal National Mortgage Association REMICS 2015-58 JP | | | 2.50 | | | | 3/25/2037 | | | | 90,892 | | | | 92,813 | | | | 91,512 | |
Federal National Mortgage Association REMICS 2015-62 VA | | | 4.00 | | | | 10/25/2026 | | | | 129,893 | | | | 139,796 | | | | 137,453 | |
Federal National Mortgage Association REMICS 2016-62 FA | | | 1.26 | # | | | 9/25/2046 | | | | 929,916 | | | | 929,916 | | | | 931,757 | |
Federal National Mortgage Association REMICS 2016-62 FC | | | 1.26 | # | | | 9/25/2046 | | | | 640,397 | | | | 639,998 | | | | 636,559 | |
Federal National Mortgage Association REMICS 2016-74 GF | | | 1.26 | # | | | 10/25/2046 | | | | 847,421 | | | | 847,493 | | | | 842,059 | |
Federal National Mortgage Association TBA | | | 4.00 | | | | 1/1/2047 | | | | 4,325,000 | | | | 4,557,469 | | | | 4,546,656 | |
Goal Capital Funding Trust 2010-1 A^ | | | 1.63 | # | | | 8/25/2048 | | | | 117,816 | | | | 113,002 | | | | 114,038 | |
Higher Education Funding I 2004-1 B1^ | | | 0.35 | # | | | 1/1/2044 | | | | 950,000 | | | | 824,324 | | | | 820,192 | |
Navient Student Loan Trust 2015-2 A3 | | | 1.33 | # | | | 11/26/2040 | | | | 500,000 | | | | 492,544 | | | | 493,245 | |
Navient Student Loan Trust 2016-5A A^ | | | 2.01 | # | | | 6/25/2065 | | | | 1,232,701 | | | | 1,238,167 | | | | 1,250,775 | |
Nelnet Student Loan Trust 2006-2 A6 | | | 1.00 | # | | | 4/25/2031 | | | | 280,000 | | | | 273,794 | | | | 274,647 | |
Nelnet Student Loan Trust 2014-6A A^ | | | 1.41 | # | | | 11/25/2052 | | | | 416,202 | | | | 403,090 | | | | 404,595 | |
NorthStar Student Loan Trust III 2016-1 A^ | | | 2.01 | # | | | 5/27/2036 | | | | 296,588 | | | | 283,348 | | | | 284,177 | |
PHEAA Student Loan Trust 2016-2A A^ | | | 1.50 | # | | | 11/25/2065 | | | | 870,000 | | | | 870,000 | | | | 869,889 | |
SLM Student Loan Trust 2003-12 A5^ | | | 1.24 | # | | | 9/15/2022 | | | | 70,461 | | | | 70,010 | | | | 70,304 | |
SMB Private Education Loan Trust 2016-C^ | | | 1.80 | # | | | 9/15/2034 | | | | 280,000 | | | | 280,000 | | | | 280,006 | |
U.S. Treasury Note | | | 0.13 | | | | 4/15/2021 | | | | 2,345,724 | | | | 2,360,895 | | | | 2,359,950 | |
U.S. Treasury Note | | | 0.63 | | | | 6/30/2018 | | | | 3,700,000 | | | | 3,692,243 | | | | 3,676,731 | |
U.S. Treasury Note | | | 0.75 | | | | 10/31/2018 | | | | 2,700,000 | | | | 2,677,555 | | | | 2,680,592 | |
U.S. Treasury Note | | | 0.88 | | | | 7/15/2018 | | | | 13,000,000 | | | | 13,036,901 | | | | 12,958,361 | |
U.S. Treasury Note`` | | | 0.88 | | | | 7/31/2019 | | | | 8,600,000 | | | | 8,590,165 | | | | 8,500,223 | |
U.S. Treasury Note | | | 1.75 | | | | 10/31/2018 | | | | 3,660,000 | | | | 3,708,307 | | | | 3,699,030 | |
| | | | | | | | | | | | | | | | | | | | |
Total U.S. Treasury & Government Agencies | | | | | | | | | | | 51,077,975 | | | | 51,320,041 | | | | 51,066,227 | |
| | | | | | | | | | | | | | | | | | | | |
Total Fixed Income | | | | | | | | | | | 240,753,573 | | | | 242,940,239 | | | | 242,171,458 | |
| | | | | | | | | | | | | | | | | | | | |
Short-Term Investments — 3.6%*: | |
|
Bank Deposit — 0.8%*: | |
State Street Bank & Trust Co. Euro Time Deposit | | | 0.01 | | | | 1/3/2017 | | | | 2,119,459 | | | | 2,119,459 | | | | 2,119,459 | |
| | | | | | | | | | | | | | | | | | | | |
|
Commercial Paper — 2.8%*: | |
|
Chemicals, Plastics and Rubber — 1.2%*: | |
ONEOK Partners LP | | | Zero Coupon | | | | 1/5/2017 | | | | 3,000,000 | | | | 2,999,600 | | | | 2,999,600 | |
| | | | | | | | | | | | | | | | | | | | |
See accompanying Notes to the Financial Statements.
111
Barings Active Short Duration Bond Fund 2016 Semi-Annual Report
SCHEDULE OF INVESTMENTS (CONTINUED)
December 31, 2016 (Unaudited)
| | | | | | | | | | | | | | | | | | | | |
| | | EFFECTIVE
INTEREST RATE | | | DUE DATE | | | PRINCIPAL ‡‡ | | | COST | | | FAIR
VALUE | |
Commercial Paper (Continued) | |
|
Electric Utilities — 1.6%*: | |
Edison International | | | Zero Coupon | | | | 1/3/2017 | | | | 4,000,000 | | | $ | 3,999,805 | | | $ | 3,999,805 | |
| | | | | | | | | | | | | | | | | | | | |
Total Commercial Paper | | | | | | | | | | | 7,000,000 | | | | 6,999,405 | | | | 6,999,405 | |
| | | | | | | | | | | | | | | | | | | | |
Total Short-Term Investments | | | | | | | | | | | 9,119,459 | | | | 9,118,864 | | | | 9,118,864 | |
| | | | | | | | | | | | | | | | | | | | |
Total Investments | | | | | | | | | | | 249,873,032 | | | | 252,059,103 | | | | 251,290,322 | |
| | | | | | | | | | | | | | | | | | | | |
| | | | | |
Other assets and liabilities — (1.2%)* | | | | | | | | | | | | | | | | | | | (3,073,844 | ) |
| | | | | |
Net Assets — 100.0% | | | | | | | | | | | | | | | | | | | $248,216,478 | |
| | | | | | | | | | | | | | | | | | | | |
| | |
| MTN | | Medium Term Note |
| OTC | | Over the Counter |
| TBA | | To Be Announced: Securities purchased on a forward commitment basis with an approximate principal amount and maturity date. The actual principal amount and maturity date will be determined upon settlement. |
| ‡‡ | Unless otherwise indicated, all principal amounts are denominated in United States Dollars. |
| * | Calculated as a percentage of net assets applicable to common shareholders. |
Distributions of investments by country of risk (excluding temporary cash investments) as a percentage of total investments in securities, is as follows:
| | | | | | |
| | United States | | | 91.7% | |
| | Switzerland | | | 1.1% | |
| | Other (Individually less than 1%) | | | 7.2% | |
| | | | | | |
| | Total | | | 100.0% | |
| | | | | | |
| ^ | Security acquired in a transaction exempt from registration under Rule 144A of the Securities Act of 1933. These securities may only be resold in transactions exempt from registration, normally to qualified institutional buyers. |
| # | Variable rate security. The interest rate shown is the rate in effect at December 31, 2016. |
| `` | Security has been fully or partially segregated to cover margin requirements for open futures contracts as of December 31, 2016. |
A summary of outstanding derivatives at December 31, 2016 is as follows:
Forward Foreign Currency Exchange Contracts to Buy
| | | | | | | | | | | | | | | | | | | | | | |
EXPIRATION
DATE | | COUNTERPARTY | | LOCAL
CURRENCY | | | VALUE IN USD | | | IN
EXCHANGE
FOR USD | | | NET
UNREALIZED
DEPRECIATION | |
| 3/15/17 | | JPMorgan Chase Bank N.A. | | | CNH | | | | 29,376,600 | | | | 4,133,895 | | | | 4,389,630 | | | $ | (255,735 | ) |
See accompanying Notes to the Financial Statements.
112
Barings Active Short Duration Bond Fund 2016 Semi-Annual Report
SCHEDULE OF INVESTMENTS (CONTINUED)
December 31, 2016 (Unaudited)
Forward Foreign Currency Exchange Contracts to Sell
| | | | | | | | | | | | | | | | | | | | | | |
EXPIRATION
DATE | | COUNTERPARTY | | LOCAL
CURRENCY | | | VALUE IN USD | | | IN
EXCHANGE
FOR USD | | | NET
UNREALIZED
APPRECIATION | |
| 3/15/17 | | JPMorgan Chase Bank N.A. | | | CNH | | | | 29,376,600 | | | | 4,133,895 | | | | 4,400,000 | | | $ | 266,105 | |
Currency Legend
| | | | |
| CNH | | – | | Chinese Yuan Renminbi |
Futures
| | | | | | | | | | | | | | | | | | | | |
| TYPE | | EXPIRATION DATE | | | CONTRACTS | | | POSITION | | | FAIR VALUE | | | UNREALIZED
DEPRECIATION | |
Long Future | |
U.S. 2-Year Treasury Note | | | 03/31/17 | | | | 311 | | | | Long | | | $ | 67,389,812 | | | $ | (23,512 | ) |
| | | | | | | | | | | | | | | | | | | | |
| TYPE | | EXPIRATION DATE | | | CONTRACTS | | | POSITION | | | FAIR VALUE | | | UNREALIZED
APPRECIATION | |
Short Futures | |
U.S. 10-Year Treasury Note | | | 03/22/17 | | | | 73 | | | | Short | | | $ | 9,072,531 | | | $ | 11,802 | |
U.S. 10-Year Ultra Bond | | | 03/22/17 | | | | 13 | | | | Short | | | | 1,742,812 | | | | 10,723 | |
U.S. 5-Year Treasury Note | | | 03/31/17 | | | | 121 | | | | Short | | | | 14,237,352 | | | | 52,134 | |
U.S. Long Bond | | | 03/22/17 | | | | 4 | | | | Short | | | | 602,625 | | | | 2,707 | |
| | | | | | | | | | | | | | | | | | | | |
Total Short Futures | | | $ | 77,366 | |
| | | | | | | | | | | | | | | | | | | | |
OTC Credit Default Swaps — Sell Protection(1) (2)
| | | | | | | | | | | | | | | | | | | | | | | | | | | | | | |
REFERENCE
OBLIGATION | | FIIXED-DEAL
RECEIVED
RATE | | | MATURITY
DATE | | | COUNTERPARTY | | ORIGINAL
NOTIONAL
AMOUNT | | | CURRENT
NOTIONAL
AMOUNT(3) | | | UPFRONT
PREMIUMS
PAID/
(RECEIVED) | | | FAIR
VALUE(4) | | | UNREALIZED
APPRECIATION
(DEPRECIATION) | |
CMBX.NA. BBB-.6† | | | 3.00 | % | | | 11/17/2045 | | | JPMorgan Chase
Bank N.A. | | | 230,000 | | | | 230,000 | | | $ | 543 | | | $ | (13,079 | ) | | $ | (13,622 | ) |
CMBX.NA. BBB-.6† | | | 3.00 | % | | | 5/11/2063 | | | Goldman Sachs
& Co. | | | 290,000 | | | | 290,000 | | | | (22,114 | ) | | | (16,490 | ) | | | 5,624 | |
| | | | | | | | | | | | | | | | | | | | | | | | | | | | | | |
| Total OTC Credit Default Swap | | | | (21,571 | ) | | | (29,569 | ) | | | (7,998 | ) |
| | | | | | | | | | | | | | | | | | | | | | | | | | | | | | |
Centrally Cleared Credit Default Swaps — Buy Protection
| | | | | | | | | | | | | | | | | | | | | | | | | | | | |
REFERENCE
OBLIGATION | | FIXED-DEAL
RECEIVED
RATE | | | MATURITY
DATE | | | ORIGINAL
NOTIONAL
AMOUNT | | | CURRENT
NOTIONAL
AMOUNT(3) | | | UPFRONT
PREMIUMS
PAID/
(RECEIVED) | | | FAIR
VALUE(4) | | | UNREALIZED
APPRECIATION | |
| CDX.NA.JG.26in | | | 1.00 | % | | | 12/20/2021 | | | | 1,530,000 | | | | 1,530,000 | | | $ | (24,552 | ) | | $ | (22,966 | ) | | | 1,586 | |
See accompanying Notes to the Financial Statements.
113
Barings Active Short Duration Bond Fund 2016 Semi-Annual Report
SCHEDULE OF INVESTMENTS (CONTINUED)
December 31, 2016 (Unaudited)
| (1) | If the Fund is a seller of protection and a credit event occurs, as defined under the terms of that particular swap agreement, the Fund will either (i) pay to the buyer of protection an amount equal to the notional amount of the swap and take delivery of the referenced obligation or underlying securities comprising the referenced index or (ii) pay a net settlement amount in the form of cash or securities equal to the notional amount of the swap less the recovery value of the referenced obligation or underlying securities comprising the referenced index. |
| (2) | Represents an investment grade index of single name credit default swaps (CDS). All of the companies underlying the single name CDS within the index are rated investment grade or higher. Rating represents a weighted average of the credit ratings of all the companies underlying the single name CDS within the index. |
| (3) | The maximum potential amount the Portfolio could be required to make as a seller of credit protection or receive as a buyer of credit event as defined under the terms of that particular swap agreement. |
| (4) | The quoted market prices and resulting values for credit default swap agreements on asset-backed securities and credit indices serve as an indicator of the current status of the payment/performance risk and represent the expected amount paid or received for the credit derivative if the amount of the swap agreement was closed/sold as of the period end. Increasing market values, in absolute terms when compared to the notional amount of the swap, represent a deterioration of the referenced entity’s credit soundness and a greater likelihood or risk of default or other credit event occurring as defined under the terms of the agreements. |
| † | Payment is based on a percentage of the index. Reference entities are a number of individual issuers comprising the index. |
See accompanying Notes to the Financial Statements.
114
Barings Total Return Bond Fund 2016 Semi-Annual Report
SCHEDULE OF INVESTMENTS
December 31, 2016 (Unaudited)
| | | | | | | | | | | | | | | | | | | | |
| | | EFFECTIVE
INTEREST RATE | | | DUE DATE | | | PRINCIPAL ‡‡ | | | COST | | | FAIR
VALUE | |
Fixed Income — 84.5%*: | |
|
Asset-Backed Securities — 23.6%*: | |
|
CDO/CLO — 4.5%*: | |
ALM VII Ltd. 2012-7A A1R^ | | | 2.33 | #% | | | 10/15/2028 | | | | 250,000 | | | | $250,000 | | | | $250,744 | |
ALM XIV Ltd. 2014-14A A1^ | | | 2.32 | # | | | 7/28/2026 | | | | 250,000 | | | | 249,428 | | | | 249,999 | |
Carlyle Global Market Strategies CLO Ltd. 2014-4A A1^ | | | 2.38 | # | | | 10/15/2026 | | | | 250,000 | | | | 250,000 | | | | 250,165 | |
LCM XXIII Ltd. 23A A1^+ | | | 2.51 | # | | | 10/20/2029 | | | | 250,000 | | | | 250,000 | | | | 249,998 | |
Madison Park Funding XIV Ltd. 2014-14A A2^ | | | 2.33 | # | | | 7/20/2026 | | | | 250,000 | | | | 249,856 | | | | 250,052 | |
| | | | | | | | | | | | | | | | | | | | |
Total CDO/CLO | | | | 1,250,000 | | | | 1,249,284 | | | | 1,250,958 | |
| | | | | | | | | | | | | | | | | | | | |
|
Other Asset-Backed Securities — 19.1%*: | |
Access Group, Inc. 2006-1 B | | | 1.38 | # | | | 8/25/2037 | | | | 74,364 | | | | 64,979 | | | | 66,501 | |
Access Group, Inc. 2015-1 A^ | | | 1.46 | # | | | 7/25/2056 | | | | 75,127 | | | | 73,472 | | | | 74,245 | |
Access Group, Inc. 2015-1 B^ | | | 2.26 | # | | | 7/25/2058 | | | | 100,000 | | | | 86,323 | | | | 82,798 | |
American Credit Acceptance Receivables Trust 2016-1A^ | | | 2.37 | | | | 5/12/2020 | | | | 12,728 | | | | 12,728 | | | | 12,757 | |
Arbys Funding LLC 2015-1A A2^ | | | 4.97 | | | | 10/30/2045 | | | | 39,600 | | | | 39,600 | | | | 40,021 | |
Argent Securities, Inc. Asset-Backed Pass-Through Certificates Series 2004-W10 | | | 1.48 | # | | | 10/25/2034 | | | | 65,905 | | | | 59,710 | | | | 63,034 | |
Asset Backed Securities Corp. Home Equity Loan Trust 2005-HE1 M1 | | | 1.51 | # | | | 3/25/2035 | | | | 89,919 | | | | 89,376 | | | | 90,986 | |
Citi Held For Asset Issuance 2015-PM1 A^ | | | 1.85 | | | | 12/15/2021 | | | | 4,517 | | | | 4,517 | | | | 4,514 | |
CKE Restaurant Holdings, Inc. 2013-1A A2^ | | | 4.47 | | | | 3/20/2043 | | | | 122,687 | | | | 125,612 | | | | 121,162 | |
CLI Funding VI LLC 2016 1A A^ | | | 4.21 | | | | 2/18/2041 | | | | 84,797 | | | | 84,789 | | | | 83,462 | |
College Loan Corp. Trust I 2005-2 B | | | 1.37 | # | | | 1/15/2037 | | | | 117,657 | | | | 103,264 | | | | 99,179 | |
CPS Auto Receivables Trust 2013-A A^ | | | 1.31 | | | | 6/15/2020 | | | | 50,126 | | | | 49,967 | | | | 49,956 | |
Credit Suisse ABS Repackaging Trust
2013-A B^ | | | 2.50 | | | | 1/25/2030 | | | | 44,123 | | | | 42,040 | | | | 41,087 | |
CWABS Asset-Backed Certificates Trust 2005-4 MV5 | | | 1.25 | # | | | 10/25/2035 | | | | 60,000 | | | | 53,794 | | | | 56,146 | |
DB Master Finance LLC 2015-1A A2I^ | | | 3.26 | | | | 2/20/2045 | | | | 98,250 | | | | 98,280 | | | | 98,379 | |
DB Master Finance LLC 2015-1A A2II^ | | | 3.98 | | | | 2/20/2045 | | | | 49,125 | | | | 50,141 | | | | 49,862 | |
Diamond Resorts Owner Trust 2013-2 A^ | | | 2.27 | | | | 5/20/2026 | | | | 45,829 | | | | 45,534 | | | | 45,586 | |
Diamond Resorts Owner Trust 2015-1 A^ | | | 2.73 | | | | 7/20/2027 | | | | 41,142 | | | | 41,139 | | | | 40,893 | |
Diamond Resorts Owner Trust 2016-1^ | | | 3.37 | | | | 11/20/2028 | | | | 145,213 | | | | 145,186 | | | | 144,327 | |
Domino’s Pizza Master Issuer LLC
2015 1A-A2I^ | | | 3.48 | | | | 10/25/2045 | | | | 59,400 | | | | 59,400 | | | | 58,782 | |
Domino’s Pizza Master Issuer LLC 2015-1A A2II^ | | | 4.47 | | | | 10/25/2045 | | | | 59,400 | | | | 59,400 | | | | 56,500 | |
DRB Prime Student Loan Trust 2015-B^ | | | 2.49 | # | | | 10/27/2031 | | | | 70,191 | | | | 70,063 | | | | 71,528 | |
DRB Prime Student Loan Trust 2016-R^ | | | 3.07 | | | | 10/25/2044 | | | | 99,919 | | | | 99,901 | | | | 99,919 | |
Drive Auto Receivables Trust 2016-B^ | | | 2.56 | | | | 6/15/2020 | | | | 20,000 | | | | 19,999 | | | | 20,078 | |
Drug Royalty LP 1 2012-1 A1^ | | | 6.13 | # | | | 7/15/2024 | | | | 27,564 | | | | 28,302 | | | | 27,953 | |
Earnest Student Loan Program LLC
2016-C A1^ | | | 2.61 | # | | | 10/27/2036 | | | | 100,630 | | | | 100,630 | | | | 100,630 | |
ECMC Group Student Loan Trust 2016-1A A^ | | | 2.11 | # | | | 7/26/2066 | | | | 92,847 | | | | 92,847 | | | | 92,573 | |
Element Rail Leasing II LLC 2015-1A A1^ | | | 2.71 | | | | 2/19/2045 | | | | 73,726 | | | | 71,217 | | | | 71,938 | |
See accompanying Notes to the Financial Statements.
115
Barings Total Return Bond Fund 2016 Semi-Annual Report
SCHEDULE OF INVESTMENTS (CONTINUED)
December 31, 2016 (Unaudited)
| | | | | | | | | | | | | | | | | | | | |
| | | EFFECTIVE
INTEREST RATE | | | DUE DATE | | | PRINCIPAL ‡‡ | | | COST | | | FAIR
VALUE | |
Asset-Backed Securities (Continued) | |
|
Other Asset-Backed Securities (Continued) | |
Entegry New Orleans Storm Recovery Funding I LLC 2015-1 A | | | 2.67 | % | | | 6/1/2027 | | | | 88,430 | | | | $88,411 | | | | $89,294 | |
First Franklin Mortgage Loan Trust 2004-FFH4 | | | 2.48 | # | | | 1/25/2035 | | | | 50,000 | | | | 49,813 | | | | 49,876 | |
First Franklin Mortgage Loan Trust 2005 FF3 M3 | | | 1.48 | # | | | 4/25/2035 | | | | 75,037 | | | | 74,669 | | | | 74,743 | |
Flagship Credit Auto Trust 2016-2^ | | | 3.05 | | | | 8/16/2021 | | | | 60,000 | | | | 59,997 | | | | 60,388 | |
Flagship Credit Auto Trust 2016-4 B^ | | | 2.71 | | | | 11/15/2022 | | | | 40,000 | | | | 39,998 | | | | 39,538 | |
FNA Trust 2015-1 A^ | | | 3.24 | | | | 12/10/2023 | | | | 39,055 | | | | 39,089 | | | | 38,825 | |
GSAMP Trust 2005-SEA2 A1^ | | | 1.11 | # | | | 1/25/2045 | | | | 13,125 | | | | 12,617 | | | | 13,031 | |
HERO Funding Trust 2015-1A^ | | | 3.84 | | | | 9/21/2040 | | | | 133,254 | | | | 135,749 | | | | 135,586 | |
J.G. Wentworth XXXV LLC 2015-2A A^ | | | 3.87 | | | | 3/15/2058 | | | | 49,084 | | | | 49,046 | | | | 47,816 | |
Marlette Funding Trust 2016-1A A^ | | | 3.06 | | | | 1/17/2023 | | | | 73,591 | | | | 73,689 | | | | 73,522 | |
Miramax LLC 2014-1A A2^ | | | 3.34 | | | | 7/20/2026 | | | | 62,280 | | | | 62,683 | | | | 61,934 | |
Navient Student Loan Trust 2016-6 A3^ | | | 2.06 | # | | | 3/25/2066 | | | | 290,000 | | | | 290,000 | | | | 290,003 | |
Nelnet Private Education Loan Trust 2016-A A1B^ | | | 3.60 | | | | 12/26/2040 | | | | 100,000 | | | | 99,334 | | | | 99,883 | |
New Residential Advance Receivables Trust Advance Receivables Backed Notes 2016-T2 AT2^ | | | 2.58 | | | | 10/15/2049 | | | | 250,000 | | | | 250,000 | | | | 247,034 | |
Northstar Education Finance, Inc. 2005-1 A5 | | | 1.64 | # | | | 10/30/2045 | | | | 32,324 | | | | 30,926 | | | | 30,668 | |
NovaStar Mortgage Funding Trust 2004-4 M5 | | | 2.48 | # | | | 3/25/2035 | | | | 100,000 | | | | 99,969 | | | | 100,641 | |
NRZ Advance Receivables Trust 2016-T4 AT4^ | | | 3.11 | | | | 12/15/2050 | | | | 100,000 | | | | 100,000 | | | | 100,000 | |
NRZ Advance Receivables Trust Advance Receivables Backed 2016-T3^ | | | 2.83 | | | | 10/16/2051 | | | | 230,000 | | | | 230,000 | | | | 223,923 | |
OneMain Financial Issuance Trust 2014-2A A^ | | | 2.47 | | | | 9/18/2024 | | | | 78,952 | | | | 79,206 | | | | 78,985 | |
OSCAR US Funding Trust V 2016-2A A4^ | | | 2.99 | | | | 12/15/2023 | | | | 80,000 | | | | 79,979 | | | | 78,410 | |
Popular ABS Mortgage Pass-Through Trust 2006-B A3 | | | 1.04 | # | | | 5/25/2036 | | | | 56,851 | | | | 54,559 | | | | 56,599 | |
Santander Drive Auto Receivables Trust 2014-4 B | | | 1.82 | | | | 5/15/2019 | | | | 68,301 | | | | 68,515 | | | | 68,363 | |
Sierra Timeshare Receivables Funding LLC 2015-2A B^ | | | 3.02 | | | | 6/20/2032 | | | | 42,097 | | | | 42,088 | | | | 42,364 | |
SLC Private Student Loan Trust 2006-A A5 | | | 1.05 | # | | | 7/15/2036 | | | | 52,665 | | | | 52,360 | | | | 52,567 | |
SLC Private Student Loan Trust 2006-A C | | | 1.33 | # | | | 7/15/2036 | | | | 140,000 | | | | 124,624 | | | | 125,023 | |
SLC Student Loan Trust 2005-1 B | | | 1.10 | # | | | 2/15/2045 | | | | 111,899 | | | | 95,848 | | | | 94,520 | |
SLM Student Loan Trust 2002-7 A11 | | | 3.03 | # | | | 3/15/2028 | | | | 50,000 | | | | 49,403 | | | | 49,991 | |
SLM Student Loan Trust 2003-2 | | | 4.16 | # | | | 9/15/2028 | | | | 100,000 | | | | 99,755 | | | | 99,547 | |
SLM Student Loan Trust 2003-4 B | | | 1.61 | # | | | 6/15/2038 | | | | 78,415 | | | | 71,790 | | | | 68,764 | |
SLM Student Loan Trust 2005-4 B | | | 1.06 | # | | | 7/25/2040 | | | | 107,213 | | | | 90,883 | | | | 92,125 | |
SLM Student Loan Trust 2006-5 B | �� | | 1.09 | # | | | 10/25/2040 | | | | 66,670 | | | | 57,404 | | | | 57,479 | |
Sofi Consumer Loan Program 2016-5 LLC^ | | | 4.55 | # | | | 9/25/2028 | | | | 100,000 | | | | 98,187 | | | | 98,036 | |
SoFi Consumer Loan Program LLC 2016-1A A^ | | | 3.26 | | | | 8/25/2025 | | | | 83,651 | | | | 83,643 | | | | 83,759 | |
SoFi Consumer Loan Program LLC 2016-5 A^ | | | 3.06 | | | | 9/25/2028 | | | | 160,000 | | | | 159,460 | | | | 159,699 | |
SPS Servicer Advance Receivables Trust^ | | | 2.75 | | | | 11/15/2049 | | | | 100,000 | | | | 99,985 | | | | 99,479 | |
Taco Bell Funding LLC 2016-1A A23^ | | | 4.97 | | | | 5/25/2046 | | | | 69,825 | | | | 70,458 | | | | 70,766 | |
Taco Bell Funding LLC 2016-1A A2I^ | | | 3.83 | | | | 5/25/2046 | | | | 79,800 | | | | 80,050 | | | | 80,311 | |
See accompanying Notes to the Financial Statements.
116
Barings Total Return Bond Fund 2016 Semi-Annual Report
SCHEDULE OF INVESTMENTS (CONTINUED)
December 31, 2016 (Unaudited)
| | | | | | | | | | | | | | | | | | | | |
| | | EFFECTIVE
INTEREST RATE | | | DUE DATE | | | PRINCIPAL ‡‡ | | | COST | | | FAIR
VALUE | |
Asset-Backed Securities (Continued) | |
|
Other Asset-Backed Securities (Continued) | |
Wendys Funding LLC 2015 1A A2I^ | | | 3.37 | % | | | 6/15/2045 | | | | 128,375 | | | | $127,939 | | | | $128,179 | |
| | | | | | | | | | | | | | | | | | | | |
Total Other Asset-Backed Securities | | | | 5,465,680 | | | | 5,344,336 | | | | 5,326,467 | |
| | | | | | | | | | | | | | | | | | | | |
| | | | | | | | | | | | | | | | | | | | |
Total Asset-Backed Securities | | | | 6,715,680 | | | | 6,593,620 | | | | 6,577,425 | |
| | | | | | | | | | | | | | | | | | | | |
Corporate Bonds — 31.3%*: | |
|
Advertising — 0.5%*: | |
S&P Global, Inc. | | | 3.30 | | | | 8/14/2020 | | | | 45,000 | | | | 44,961 | | | | 45,881 | |
S&P Global, Inc. | | | 4.00 | | | | 6/15/2025 | | | | 50,000 | | | | 50,187 | | | | 51,369 | |
WPP Finance 2010+ | | | 5.63 | | | | 11/15/2043 | | | | 35,000 | | | | 38,184 | | | | 37,390 | |
| | | | | | | | | | | | | | | | | | | | |
Total Advertising | | | | 130,000 | | | | 133,332 | | | | 134,640 | |
| | | | | | | | | | | | | | | | | | | | |
|
Aerospace/Defense — 0.0%*: | |
Spirit AeroSystems, Inc. | | | 3.85 | | | | 6/15/2026 | | | | 5,000 | | | | 4,996 | | | | 4,933 | |
| | | | | | | | | | | | | | | | | | | | |
|
Agriculture — 1.2%*: | |
Altria Group, Inc. | | | 2.85 | | | | 8/9/2022 | | | | 50,000 | | | | 48,463 | | | | 50,061 | |
Altria Group, Inc. | | | 4.25 | | | | 8/9/2042 | | | | 30,000 | | | | 26,866 | | | | 29,524 | |
Bunge Ltd. Finance Corp. | | | 3.25 | | | | 8/15/2026 | | | | 25,000 | | | | 24,977 | | | | 24,007 | |
Bunge Ltd. Finance Corp. | | | 3.50 | | | | 11/24/2020 | | | | 5,000 | | | | 4,997 | | | | 5,089 | |
Imperial Tobacco Finance PLC+^ | | | 3.75 | | | | 7/21/2022 | | | | 200,000 | | | | 197,366 | | | | 205,314 | |
Reynolds American, Inc. | | | 4.45 | | | | 6/12/2025 | | | | 30,000 | | | | 30,591 | | | | 31,674 | |
| | | | | | | | | | | | | | | | | | | | |
Total Agriculture | | | | 340,000 | | | | 333,260 | | | | 345,669 | |
| | | | | | | | | | | | | | | | | | | | |
|
Airlines — 0.1%*: | |
WestJet Airlines Ltd.+^ | | | 3.50 | | | | 6/16/2021 | | | | 14,000 | | | | 13,983 | | | | 13,994 | |
| | | | | | | | | | | | | | | | | | | | |
|
Auto Manufacturers — 1.1%*: | |
Ford Motor Co. | | | 7.45 | | | | 7/16/2031 | | | | 60,000 | | | | 75,863 | | | | 75,303 | |
General Motors Co. | | | 5.20 | | | | 4/1/2045 | | | | 35,000 | | | | 34,583 | | | | 33,737 | |
General Motors Financial Co., Inc. | | | 3.20 | | | | 7/6/2021 | | | | 130,000 | | | | 129,784 | | | | 128,915 | |
General Motors Financial Co., Inc. | | | 3.70 | | | | 5/9/2023 | | | | 25,000 | | | | 24,941 | | | | 24,600 | |
General Motors Financial Co., Inc. | | | 4.30 | | | | 7/13/2025 | | | | 50,000 | | | | 49,683 | | | | 49,599 | |
| | | | | | | | | | | | | | | | | | | | |
Total Auto Manufacturers | | | | 300,000 | | | | 314,854 | | | | 312,154 | |
| | | | | | | | | | | | | | | | | | | | |
|
Beverages — 0.4%*: | |
Anheuser-Busch InBev Finance, Inc.+ | | | 3.65 | | | | 2/1/2026 | | | | 50,000 | | | | 49,923 | | | | 50,760 | |
Anheuser-Busch InBev Worldwide, Inc.+ | | | 8.20 | | | | 1/15/2039 | | | | 35,000 | | | | 52,158 | | | | 52,636 | |
Molson Coors Brewing Co. | | | 4.20 | | | | 7/15/2046 | | | | 10,000 | | | | 9,936 | | | | 9,323 | |
| | | | | | | | | | | | | | | | | | | | |
Total Beverages | | | | 95,000 | | | | 112,017 | | | | 112,719 | |
| | | | | | | | | | | | | | | | | | | | |
|
Biotechnology — 0.4%*: | |
Amgen, Inc. | | | 5.15 | | | | 11/15/2041 | | | | 25,000 | | | | 26,046 | | | | 26,429 | |
Celgene Corp. | | | 3.55 | | | | 8/15/2022 | | | | 60,000 | | | | 59,866 | | | | 61,535 | |
Gilead Sciences, Inc. | | | 4.75 | | | | 3/1/2046 | | | | 10,000 | | | | 9,960 | | | | 10,347 | |
| | | | | | | | | | | | | | | | | | | | |
Total Biotechnology | | | | 95,000 | | | | 95,872 | | | | 98,311 | |
| | | | | | | | | | | | | | | | | | | | |
See accompanying Notes to the Financial Statements.
117
Barings Total Return Bond Fund 2016 Semi-Annual Report
SCHEDULE OF INVESTMENTS (CONTINUED)
December 31, 2016 (Unaudited)
| | | | | | | | | | | | | | | | | | | | |
| | | EFFECTIVE
INTEREST RATE | | | DUE DATE | | | PRINCIPAL ‡‡ | | | COST | | | FAIR
VALUE | |
Corporate Bonds (Continued) | |
|
Chemicals — 0.9%*: | |
Chevron Phillips Chemical Co. LLC/Chevron Phillips Chemical Co. LP^ | | | 3.40 | % | | | 12/1/2026 | | | | 40,000 | | | $ | 39,896 | | | $ | 39,932 | |
LYB International Finance B.V. | | | 5.25 | | | | 7/15/2043 | | | | 35,000 | | | | 35,996 | | | | 37,630 | |
Monsanto Co. | | | 4.40 | | | | 7/15/2044 | | | | 15,000 | | | | 14,279 | | | | 14,497 | |
RPM International, Inc. | | | 6.13 | | | | 10/15/2019 | | | | 90,000 | | | | 97,922 | | | | 98,835 | |
Westlake Chemical Corp. | | | 3.60 | | | | 7/15/2022 | | | | 50,000 | | | | 49,561 | | | | 49,985 | |
| | | | | | | | | | | | | | | | | | | | |
Total Chemicals | | | | 230,000 | | | | 237,654 | | | | 240,879 | |
| | | | | | | | | | | | | | | | | | | | |
|
Commercial Banks — 4.0%*: | |
Associated Banc-Corp | | | 2.75 | | | | 11/15/2019 | | | | 45,000 | | | | 45,178 | | | | 45,116 | |
Associated Banc-Corp | | | 4.25 | | | | 1/15/2025 | | | | 70,000 | | | | 70,019 | | | | 69,371 | |
Bank of America Corp. | | | 7.63 | | | | 6/1/2019 | | | | 120,000 | | | | 134,690 | | | | 134,846 | |
Bank of America Corp. MTN | | | 3.95 | | | | 4/21/2025 | | | | 45,000 | | | | 43,982 | | | | 44,797 | |
Bank of America Corp. MTN | | | 4.18 | | | | 11/25/2027 | | | | 65,000 | | | | 65,000 | | | | 65,042 | |
Bank of America Corp. MTN | | | 4.45 | | | | 3/3/2026 | | | | 25,000 | | | | 25,000 | | | | 25,763 | |
Bank of America Corp. MTN | | | 5.88 | | | | 2/7/2042 | | | | 25,000 | | | | 28,672 | | | | 30,216 | |
Bank of Nova Scotia (The)+ | | | 4.50 | | | | 12/16/2025 | | | | 30,000 | | | | 30,381 | | | | 30,819 | |
Citigroup, Inc. | | | 3.88 | | | | 3/26/2025 | | | | 60,000 | | | | 58,502 | | | | 59,604 | |
Citigroup, Inc. | | | 4.60 | | | | 3/9/2026 | | | | 45,000 | | | | 44,917 | | | | 46,511 | |
Goldman Sachs Group, Inc. (The) | | | 3.50 | | | | 11/16/2026 | | | | 35,000 | | | | 34,910 | | | | 34,195 | |
Goldman Sachs Group, Inc. (The) | | | 5.15 | | | | 5/22/2045 | | | | 70,000 | | | | 67,771 | | | | 73,616 | |
Goldman Sachs Group, Inc. (The) | | | 5.95 | | | | 1/15/2027 | | | | 57,000 | | | | 63,689 | | | | 64,961 | |
JPMorgan Chase & Co. | | | 3.63 | | | | 12/1/2027 | | | | 80,000 | | | | 79,863 | | | | 77,615 | |
JPMorgan Chase & Co. | | | 4.50 | | | | 1/24/2022 | | | | 25,000 | | | | 26,501 | | | | 26,961 | |
JPMorgan Chase & Co. | | | 4.95 | | | | 6/1/2045 | | | | 40,000 | | | | 39,309 | | | | 42,652 | |
Morgan Stanley | | | 3.95 | | | | 4/23/2027 | | | | 100,000 | | | | 95,060 | | | | 98,991 | |
Morgan Stanley MTN | | | 6.63 | | | | 4/1/2018 | | | | 110,000 | | | | 116,394 | | | | 116,328 | |
SVB Financial Group | | | 3.50 | | | | 1/29/2025 | | | | 40,000 | | | | 39,147 | | | | 38,541 | |
| | | | | | | | | | | | | | | | | | | | |
Total Commercial Banks | | | | 1,087,000 | | | | 1,108,985 | | | | 1,125,945 | |
| | | | | | | | | | | | | | | | | | | | |
|
Commercial Services — 0.3%*: | |
ERAC USA Finance LLC^ | | | 4.20 | | | | 11/1/2046 | | | | 70,000 | | | | 69,468 | | | | 63,968 | |
ERAC USA Finance LLC^ | | | 5.63 | | | | 3/15/2042 | | | | 20,000 | | | | 21,538 | | | | 22,045 | |
| | | | | | | | | | | | | | | | | | | | |
Total Commercial Services | | | | 90,000 | | | | 91,006 | | | | 86,013 | |
| | | | | | | | | | | | | | | | | | | | |
|
Construction Materials — 0.4%*: | |
Masco Corp. | | | 3.50 | | | | 4/1/2021 | | | | 48,000 | | | | 47,859 | | | | 48,120 | |
Owens Corning | | | 4.20 | | | | 12/1/2024 | | | | 50,000 | | | | 49,385 | | | | 51,219 | |
| | | | | | | | | | | | | | | | | | | | |
Total Construction Materials | | | | 98,000 | | | | 97,244 | | | | 99,339 | |
| | | | | | | | | | | | | | | | | | | | |
|
Distribution/Wholesale — 0.2%*: | |
Ingram Micro, Inc. | | | 5.45 | | | | 12/15/2024 | | | | 45,000 | | | | 46,195 | | | | 42,344 | |
| | | | | | | | | | | | | | | | | | | | |
|
Diversified Financial Services — 2.4%*: | |
Affiliated Managers Group, Inc. | | | 4.25 | | | | 2/15/2024 | | | | 50,000 | | | | 51,328 | | | | 50,261 | |
See accompanying Notes to the Financial Statements.
118
Barings Total Return Bond Fund 2016 Semi-Annual Report
SCHEDULE OF INVESTMENTS (CONTINUED)
December 31, 2016 (Unaudited)
| | | | | | | | | | | | | | | | | | | | |
| | | EFFECTIVE
INTEREST RATE | | | DUE DATE | | | PRINCIPAL ‡‡ | | | COST | | | FAIR
VALUE | |
Corporate Bonds (Continued) | |
|
Diversified Financial Services (Continued) | |
Air Lease Corp. | | | 2.63 | % | | | 9/4/2018 | | | | 110,000 | | | $ | 109,692 | | | $ | 110,767 | |
Air Lease Corp. | | | 3.38 | | | | 1/15/2019 | | | | 25,000 | | | | 25,407 | | | | 25,424 | |
Air Lease Corp. | | | 3.38 | | | | 6/1/2021 | | | | 5,000 | | | | 4,959 | | | | 5,069 | |
Brookfield Finance, Inc.+ | | | 4.25 | | | | 6/2/2026 | | | | 60,000 | | | | 59,449 | | | | 59,430 | |
Discover Financial Services | | | 3.75 | | | | 3/4/2025 | | | | 30,000 | | | | 28,929 | | | | 29,330 | |
General Electric Co. MTN | | | 6.88 | | | | 1/10/2039 | | | | 35,000 | | | | 46,754 | | | | 49,348 | |
International Lease Finance Corp. | | | 6.25 | | | | 5/15/2019 | | | | 145,000 | | | | 156,690 | | | | 155,875 | |
Lazard Group LLC | | | 3.63 | | | | 3/1/2027 | | | | 50,000 | | | | 49,787 | | | | 47,381 | |
Lazard Group LLC | | | 4.25 | | | | 11/14/2020 | | | | 130,000 | | | | 135,336 | | | | 136,079 | |
Legg Mason, Inc. | | | 4.75 | | | | 3/15/2026 | | | | 5,000 | | | | 4,998 | | | | 5,175 | |
| | | | | | | | | | | | | | | | | | | | |
Total Diversified Financial Services | | | | 645,000 | | | | 673,329 | | | | 674,139 | |
| | | | | | | | | | | | | | | | | | | | |
|
Electric — 1.4%*: | |
Appalachian Power Co. | | | 6.70 | | | | 8/15/2037 | | | | 30,000 | | | | 37,503 | | | | 38,443 | |
CMS Energy Corp. | | | 3.88 | | | | 3/1/2024 | | | | 50,000 | | | | 51,261 | | | | 52,001 | |
Duke Energy Corp. | | | 3.75 | | | | 9/1/2046 | | | | 25,000 | | | | 24,986 | | | | 22,505 | |
Duke Energy Florida LLC | | | 3.10 | | | | 8/15/2021 | | | | 50,000 | | | | 51,203 | | | | 51,274 | |
Indianapolis Power & Light Co.^ | | | 4.05 | | | | 5/1/2046 | | | | 45,000 | | | | 44,703 | | | | 42,472 | |
LG&E and KU Energy LLC | | | 4.38 | | | | 10/1/2021 | | | | 50,000 | | | | 53,276 | | | | 53,213 | |
NiSource Finance Corp. | | | 6.13 | | | | 3/1/2022 | | | | 50,000 | | | | 56,386 | | | | 57,663 | |
Puget Sound Energy, Inc. | | | 4.30 | | | | 5/20/2045 | | | | 30,000 | | | | 30,659 | | | | 31,184 | |
Southwestern Public Service Co. | | | 6.00 | | | | 10/1/2036 | | | | 30,000 | | | | 35,595 | | | | 35,965 | |
| | | | | | | | | | | | | | | | | | | | |
Total Electric | | | | 360,000 | | | | 385,572 | | | | 384,720 | |
| | | | | | | | | | | | | | | | | | | | |
|
Electrical Components and Equipment — 0.2%*: | |
Legrand France SA+ | | | 8.50 | | | | 2/15/2025 | | | | 35,000 | | | | 46,211 | | | | 45,158 | |
| | | | | | | | | | | | | | | | | | | | |
|
Electronics — 0.3%*: | |
Agilent Technologies, Inc. | | | 3.88 | | | | 7/15/2023 | | | | 50,000 | | | | 50,534 | | | | 51,442 | |
Avnet, Inc. | | | 3.75 | | | | 12/1/2021 | | | | 10,000 | | | | 9,978 | | | | 10,062 | |
FLIR Systems, Inc. | | | 3.13 | | | | 6/15/2021 | | | | 25,000 | | | | 24,985 | | | | 25,066 | |
| | | | | | | | | | | | | | | | | | | | |
Total Electronics | | | | 85,000 | | | | 85,497 | | | | 86,570 | |
| | | | | | | | | | | | | | | | | | | | |
|
Environmental Control — 0.4%*: | |
Republic Services, Inc. | | | 4.75 | | | | 5/15/2023 | | | | 50,000 | | | | 53,865 | | | | 54,608 | |
Waste Management, Inc. | | | 7.00 | | | | 7/15/2028 | | | | 50,000 | | | | 64,556 | | | | 64,787 | |
| | | | | | | | | | | | | | | | | | | | |
Total Environmental Control | | | | 100,000 | | | | 118,421 | | | | 119,395 | |
| | | | | | | | | | | | | | | | | | | | |
|
Food — 0.1%*: | |
Kraft Heinz Foods Co. | | | 3.00 | | | | 6/1/2026 | | | | 20,000 | | | | 19,917 | | | | 18,777 | |
| | | | | | | | | | | | | | | | | | | | |
|
Forestry and Paper Products — 0.6%*: | |
Celulosa Arauco y Constitucion SA+ | | | 4.75 | | | | 1/11/2022 | | | | 30,000 | | | | 31,042 | | | | 31,210 | |
Domtar Corp. | | | 4.40 | | | | 4/1/2022 | | | | 50,000 | | | | 50,715 | | | | 51,443 | |
International Paper Co. | | | 9.38 | | | | 5/15/2019 | | | | 73,000 | | | | 83,782 | | | | 84,776 | |
| | | | | | | | | | | | | | | | | | | | |
Total Forestry and Paper Products | | | | 153,000 | | | | 165,539 | | | | 167,429 | |
| | | | | | | | | | | | | | | | | | | | |
See accompanying Notes to the Financial Statements.
119
Barings Total Return Bond Fund 2016 Semi-Annual Report
SCHEDULE OF INVESTMENTS (CONTINUED)
December 31, 2016 (Unaudited)
| | | | | | | | | | | | | | | | | | | | |
| | | EFFECTIVE
INTEREST RATE | | | DUE DATE | | | PRINCIPAL ‡‡ | | | COST | | | FAIR
VALUE | |
Corporate Bonds (Continued) | |
|
Gas — 0.3%*: | |
CenterPoint Energy Resources Corp. | | | 4.50 | % | | | 1/15/2021 | | | | 25,000 | | | $ | 26,553 | | | $ | 26,230 | |
CenterPoint Energy Resources Corp. | | | 5.85 | | | | 1/15/2041 | | | | 20,000 | | | | 23,387 | | | | 22,629 | |
Spire, Inc. | | | 4.70 | | | | 8/15/2044 | | | | 25,000 | | | | 25,257 | | | | 23,511 | |
| | | | | | | | | | | | | | | | | | | | |
Total Gas | | | | 70,000 | | | | 75,197 | | | | 72,370 | |
| | | | | | | | | | | | | | | | | | | | |
|
Healthcare-Products — 0.3%*: | |
Abbott Laboratories | | | 2.90 | | | | 11/30/2021 | | | | 30,000 | | | | 29,948 | | | | 29,914 | |
Abbott Laboratories | | | 3.75 | | | | 11/30/2026 | | | | 20,000 | | | | 19,853 | | | | 19,862 | |
Abbott Laboratories | | | 4.90 | | | | 11/30/2046 | | | | 15,000 | | | | 14,883 | | | | 15,395 | |
Becton Dickinson and Co. | | | 4.69 | | | | 12/15/2044 | | | | 25,000 | | | | 25,956 | | | | 25,899 | |
| | | | | | | | | | | | | | | | | | | | |
Total Healthcare-Products | | | | 90,000 | | | | 90,640 | | | | 91,070 | |
| | | | | | | | | | | | | | | | | | | | |
|
Healthcare-Services — 0.3%*: | |
Aetna, Inc. | | | 2.40 | | | | 6/15/2021 | | | | 35,000 | | | | 34,997 | | | | 34,842 | |
Aetna, Inc. | | | 3.20 | | | | 6/15/2026 | | | | 40,000 | | | | 39,858 | | | | 39,571 | |
Aetna, Inc. | | | 4.38 | | | | 6/15/2046 | | | | 10,000 | | | | 9,990 | | | | 10,041 | |
| | | | | | | | | | | | | | | | | | | | |
Total Healthcare-Services | | | | 85,000 | | | | 84,845 | | | | 84,454 | |
| | | | | | | | | | | | | | | | | | | | |
|
Housewares — 0.3%*: | |
Newell Rubbermaid, Inc. | | | 3.85 | | | | 4/1/2023 | | | | 40,000 | | | | 39,989 | | | | 41,492 | |
Newell Rubbermaid, Inc. | | | 3.90 | | | | 11/1/2025 | | | | 20,000 | | | | 19,943 | | | | 20,183 | |
Toro Co. (The) | | | 7.80 | | | | 6/15/2027 | | | | 25,000 | | | | 31,791 | | | | 30,370 | |
| | | | | | | | | | | | | | | | | | | | |
Total Housewares | | | | 85,000 | | | | 91,723 | | | | 92,045 | |
| | | | | | | | | | | | | | | | | | | | |
|
Insurance — 2.0%*: | |
Allstate Corp. (The) | | | 5.75 | # | | | 8/15/2053 | | | | 110,000 | | | | 116,518 | | | | 113,729 | |
American International Group, Inc. | | | 3.90 | | | | 4/1/2026 | | | | 20,000 | | | | 19,991 | | | | 20,352 | |
Arch Capital Finance LLC | | | 4.01 | | | | 12/15/2026 | | | | 20,000 | | | | 20,000 | | | | 20,288 | |
Arch Capital Group US, Inc. | | | 5.14 | | | | 11/1/2043 | | | | 25,000 | | | | 25,308 | | | | 26,396 | |
Brown & Brown, Inc. | | | 4.20 | | | | 9/15/2024 | | | | 13,000 | | | | 13,082 | | | | 13,096 | |
Liberty Mutual Group, Inc.^ | | | 4.25 | | | | 6/15/2023 | | | | 50,000 | | | | 51,423 | | | | 52,349 | |
Marsh & McLennan Cos., Inc. | | | 5.88 | | | | 8/1/2033 | | | | 20,000 | | | | 23,094 | | | | 23,707 | |
Prudential Financial, Inc. | | | 8.88 | # | | | 6/15/2068 | | | | 100,000 | | | | 117,116 | | | | 108,000 | |
Reinsurance Group of America, Inc. | | | 3.95 | | | | 9/15/2026 | | | | 40,000 | | | | 39,999 | | | | 39,573 | |
Trinity Acquisition PLC+ | | | 4.40 | | | | 3/15/2026 | | | | 5,000 | | | | 4,980 | | | | 5,061 | |
Unum Group | | | 3.00 | | | | 5/15/2021 | | | | 20,000 | | | | 19,962 | | | | 19,942 | |
Unum Group | | | 4.00 | | | | 3/15/2024 | | | | 30,000 | | | | 30,787 | | | | 30,122 | |
Willis North America, Inc.+ | | | 7.00 | | | | 9/29/2019 | | | | 50,000 | | | | 54,734 | | | | 55,629 | |
XLIT Ltd.+ | | | 5.50 | | | | 3/31/2045 | | | | 30,000 | | | | 28,774 | | | | 28,466 | |
| | | | | | | | | | | | | | | | | | | | |
Total Insurance | | | | 533,000 | | | | 565,768 | | | | 556,710 | |
| | | | | | | | | | | | | | | | | | | | |
|
Internet — 1.0%*: | |
Baidu, Inc.+ | | | 2.25 | | | | 11/28/2017 | | | | 200,000 | | | | 200,465 | | | | 200,482 | |
Expedia, Inc. | | | 5.00 | | | | 2/15/2026 | | | | 40,000 | | | | 39,829 | | | | 41,236 | |
Expedia, Inc. | | | 7.46 | | | | 8/15/2018 | | | | 45,000 | | | | 48,554 | | | | 48,670 | |
| | | | | | | | | | | | | | | | | | | | |
Total Internet | | | | 285,000 | | | | 288,848 | | | | 290,388 | |
| | | | | | | | | | | | | | | | | | | | |
See accompanying Notes to the Financial Statements.
120
Barings Total Return Bond Fund 2016 Semi-Annual Report
SCHEDULE OF INVESTMENTS (CONTINUED)
December 31, 2016 (Unaudited)
| | | | | | | | | | | | | | | | | | | | |
| | | EFFECTIVE
INTEREST RATE | | | DUE DATE | | | PRINCIPAL ‡‡ | | | COST | | | FAIR
VALUE | |
Corporate Bonds (Continued) | |
|
Investment Company Security — 0.2%*: | |
Ares Capital Corp. | | | 3.88 | % | | | 1/15/2020 | | | | 30,000 | | | $ | 30,514 | | | $ | 30,419 | |
FS Investment Corp. | | | 4.00 | | | | 7/15/2019 | | | | 30,000 | | | | 30,398 | | | | 30,077 | |
| | | | | | | | | | | | | | | | | | | | |
Total Investment Company Security | | | | 60,000 | | | | 60,912 | | | | 60,496 | |
| | | | | | | | | | | | | | | | | | | | |
|
Iron/Steel — 0.1%*: | |
Vale Overseas Ltd.+ | | | 6.88 | | | | 11/21/2036 | | | | 15,000 | | | | 14,988 | | | | 14,775 | |
| | | | | | | | | | | | | | | | | | | | |
|
IT Services — 0.3%*: | |
Diamond 1 Finance Corp./Diamond 2 Finance Corp.^ | | | 4.42 | | | | 6/15/2021 | | | | 45,000 | | | | 44,988 | | | | 46,564 | |
Leidos Holdings, Inc. | | | 4.45 | | | | 12/1/2020 | | | | 50,000 | | | | 50,322 | | | | 51,505 | |
| | | | | | | | | | | | | | | | | | | | |
Total IT Services | | | | 95,000 | | | | 95,310 | | | | 98,069 | |
| | | | | | | | | | | | | | | | | | | | |
|
Lodging — 0.4%*: | |
Wyndham Worldwide Corp. | | | 5.63 | | | | 3/1/2021 | | | | 90,000 | | | | 97,015 | | | | 98,683 | |
| | | | | | | | | | | | | | | | | | | | |
|
Machinery-Diversified — 0.0%*: | |
Xylem, Inc. | | | 3.25 | | | | 11/1/2026 | | | | 10,000 | | | | 9,980 | | | | 9,711 | |
| | | | | | | | | | | | | | | | | | | | |
|
Media — 0.5%*: | |
Comcast Corp. | | | 3.40 | | | | 7/15/2046 | | | | 20,000 | | | | 19,827 | | | | 17,466 | |
Discovery Communications LLC | | | 4.88 | | | | 4/1/2043 | | | | 25,000 | | | | 22,770 | | | | 23,102 | |
Time Warner Cable, Inc. | | | 4.50 | | | | 9/15/2042 | | | | 60,000 | | | | 49,331 | | | | 54,339 | |
Time Warner Cable, Inc. | | | 5.50 | | | | 9/1/2041 | | | | 35,000 | | | | 32,653 | | | | 35,582 | |
Viacom, Inc. | | | 2.25 | | | | 2/4/2022 | | | | 15,000 | | | | 14,956 | | | | 14,096 | |
| | | | | | | | | | | | | | | | | | | | |
Total Media | | | | 155,000 | | | | 139,537 | | | | 144,585 | |
| | | | | | | | | | | | | | | | | | | | |
|
Medical Equipment and Devices Manufacturing — 0.1%*: | |
St. Jude Medical, Inc. | | | 2.80 | | | | 9/15/2020 | | | | 40,000 | | | | 39,986 | | | | 40,224 | |
| | | | | | | | | | | | | | | | | | | | |
|
Miscellaneous Manufacturing — 0.4%*: | |
Carlisle Cos., Inc. | | | 3.75 | | | | 11/15/2022 | | | | 50,000 | | | | 50,170 | | | | 49,713 | |
Textron, Inc. | | | 4.30 | | | | 3/1/2024 | | | | 50,000 | | | | 51,239 | | | | 51,863 | |
| | | | | | | | | | | | | | | | | | | | |
Total Miscellaneous Manufacturing | | | | 100,000 | | | | 101,409 | | | | 101,576 | |
| | | | | | | | | | | | | | | | | | | | |
|
Office/Business Equip — 0.4%*: | |
Pitney Bowes, Inc. | | | 3.38 | | | | 10/1/2021 | | | | 115,000 | | | | 114,699 | | | | 111,652 | |
| | | | | | | | | | | | | | | | | | | | |
|
Oil and Gas — 1.2%*: | |
Anadarko Petroleum Corp. | | | 5.55 | | | | 3/15/2026 | | | | 20,000 | | | | 19,942 | | | | 22,385 | |
Nabors Industries, Inc.^ | | | 5.50 | | | | 1/15/2023 | | | | 10,000 | | | | 10,000 | | | | 10,413 | |
Newfield Exploration Co. | | | 5.38 | | | | 1/1/2026 | | | | 140,000 | | | | 139,869 | | | | 142,744 | |
Petroleos Mexicanos+ | | | 5.50 | | | | 1/21/2021 | | | | 55,000 | | | | 58,838 | | | | 56,581 | |
Petroleos Mexicanos^+ | | | 6.50 | | | | 3/13/2027 | | | | 15,000 | | | | 14,865 | | | | 15,472 | |
Phillips 66 | | | 4.65 | | | | 11/15/2034 | | | | 30,000 | | | | 29,843 | | | | 31,228 | |
Pioneer Natural Resources Co. | | | 7.50 | | | | 1/15/2020 | | | | 50,000 | | | | 56,181 | | | | 56,839 | |
See accompanying Notes to the Financial Statements.
121
Barings Total Return Bond Fund 2016 Semi-Annual Report
SCHEDULE OF INVESTMENTS (CONTINUED)
December 31, 2016 (Unaudited)
| | | | | | | | | | | | | | | | | | | | |
| | | EFFECTIVE
INTEREST RATE | | | DUE DATE | | | PRINCIPAL ‡‡ | | | COST | | | FAIR
VALUE | |
Corporate Bonds (Continued) | |
|
Oil and Gas (Continued) | |
Rowan Cos., Inc. | | | 4.88 | % | | | 6/1/2022 | | | | 8,000 | | | $ | 7,986 | | | $ | 7,560 | |
| | | | | | | | | | | | | | | | | | | | |
Total Oil and Gas | | | | 328,000 | | | | 337,524 | | | | 343,222 | |
| | | | | | | | | | | | | | | | | | | | |
|
Oil and Gas Services — 0.5%*: | |
Schlumberger Holdings Corp.^ | | | 4.00 | | | | 12/21/2025 | | | | 25,000 | | | | 24,985 | | | | 26,200 | |
SESI LLC | | | 7.13 | | | | 12/15/2021 | | | | 32,000 | | | | 33,543 | | | | 32,560 | |
Weatherford International Ltd. | | | 5.95 | | | | 4/15/2042 | | | | 30,000 | | | | 25,152 | | | | 22,650 | |
Weatherford International Ltd. | | | 6.00 | | | | 3/15/2018 | | | | 50,000 | | | | 51,371 | | | | 49,500 | |
| | | | | | | | | | | | | | | | | | | | |
Total Oil and Gas Services | | | | | | | | | | | 137,000 | | | | 135,051 | | | | 130,910 | |
| | | | | | | | | | | | | | | | | | | | |
|
Packaging and Containers — 0.4%*: | |
Brambles USA, Inc.+^ | | | 4.13 | | | | 10/23/2025 | | | | 10,000 | | | | 9,978 | | | | 10,181 | |
Brambles USA, Inc.+^ | | | 5.35 | | | | 4/1/2020 | | | | 50,000 | | | | 53,709 | | | | 53,916 | |
Sonoco Products Co. | | | 4.38 | | | | 11/1/2021 | | | | 41,000 | | | | 43,161 | | | | 43,219 | |
| | | | | | | | | | | | | | | | | | | | |
Total Packaging and Containers | | | | | | | | | | | 101,000 | | | | 106,848 | | | | 107,316 | |
| | | | | | | | | | | | | | | | | | | | |
|
Pharmaceuticals — 2.2%*: | |
AbbVie, Inc. | | | 3.20 | | | | 5/14/2026 | | | | 60,000 | | | | 59,783 | | | | 57,085 | |
AbbVie, Inc. | | | 4.50 | | | | 5/14/2035 | | | | 30,000 | | | | 29,821 | | | | 29,476 | |
Actavis Funding SCS+ | | | 3.45 | | | | 3/15/2022 | | | | 50,000 | | | | 49,756 | | | | 50,750 | |
Allergan, Inc. | | | 2.80 | | | | 3/15/2023 | | | | 50,000 | | | | 46,786 | | | | 47,877 | |
AstraZeneca PLC+ | | | 6.45 | | | | 9/15/2037 | | | | 35,000 | | | | 44,781 | | | | 45,279 | |
Express Scripts Holding Co. | | | 3.00 | | | | 7/15/2023 | | | | 60,000 | | | | 59,950 | | | | 58,081 | |
Express Scripts Holding Co. | | | 3.30 | | | | 2/25/2021 | | | | 10,000 | | | | 9,982 | | | | 10,188 | |
Express Scripts Holding Co. | | | 4.80 | | | | 7/15/2046 | | | | 25,000 | | | | 24,957 | | | | 23,936 | |
McKesson Corp. | | | 6.00 | | | | 3/1/2041 | | | | 50,000 | | | | 55,843 | | | | 57,850 | |
Mylan NV+^ | | | 3.95 | | | | 6/15/2026 | | | | 25,000 | | | | 24,817 | | | | 23,396 | |
Mylan NV+^ | | | 5.25 | | | | 6/15/2046 | | | | 40,000 | | | | 39,994 | | | | 36,892 | |
Mylan, Inc. | | | 2.55 | | | | 3/28/2019 | | | | 60,000 | | | | 59,751 | | | | 59,871 | |
Shire Acquisitions Investments Ireland DAC+ | | | 2.88 | | | | 9/23/2023 | | | | 100,000 | | | | 99,987 | | | | 95,045 | |
Teva Pharmaceutical Finance Netherlands III B.V.+ | | | 4.10 | | | | 10/1/2046 | | | | 10,000 | | | | 9,917 | | | | 8,568 | |
| | | | | | | | | | | | | | | | | | | | |
Total Pharmaceuticals | | | | | | | | | | | 605,000 | | | | 616,125 | | | | 604,294 | |
| | | | | | | | | | | | | | | | | | | | |
|
Pipelines — 0.9%*: | |
Energy Transfer Partners LP | | | 4.75 | | | | 1/15/2026 | | | | 30,000 | | | | 29,829 | | | | 31,015 | |
EnLink Midstream Partners LP | | | 4.85 | | | | 7/15/2026 | | | | 10,000 | | | | 9,986 | | | | 10,087 | |
Enterprise Products Operating LLC | | | 5.95 | | | | 2/1/2041 | | | | 25,000 | | | | 26,706 | | | | 28,223 | |
Kinder Morgan Energy Partners LP MTN | | | 6.95 | | | | 1/15/2038 | | | | 30,000 | | | | 32,016 | | | | 34,799 | |
Kinder Morgan, Inc. | | | 3.05 | | | | 12/1/2019 | | | | 35,000 | | | | 35,091 | | | | 35,503 | |
MPLX LP | | | 4.00 | | | | 2/15/2025 | | | | 77,000 | | | | 75,563 | | | | 74,845 | |
Phillips 66 Partners LP | | | 4.90 | | | | 10/1/2046 | | | | 15,000 | | | | 14,896 | | | | 14,404 | |
Plains All American Pipeline LP/PAA Finance Corp. | | | 4.50 | | | | 12/15/2026 | | | | 30,000 | | | | 29,916 | | | | 30,433 | |
| | | | | | | | | | | | | | | | | | | | |
Total Pipelines | | | | | | | | | | | 252,000 | | | | 254,003 | | | | 259,309 | |
| | | | | | | | | | | | | | | | | | | | |
See accompanying Notes to the Financial Statements.
122
Barings Total Return Bond Fund 2016 Semi-Annual Report
SCHEDULE OF INVESTMENTS (CONTINUED)
December 31, 2016 (Unaudited)
| | | | | | | | | | | | | | | | | | | | |
| | | EFFECTIVE
INTEREST RATE | | | DUE DATE | | | PRINCIPAL ‡‡ | | | COST | | | FAIR
VALUE | |
Corporate Bonds (Continued) | |
|
Real Estate — 0.1%*: | |
Prologis LP | | | 3.35 | % | | | 2/1/2021 | | | | 25,000 | | | $ | 25,417 | | | $ | 25,726 | |
| | | | | | | | | | | | | | | | | | | | |
|
Real Estate Investment Trusts — 1.0%*: | |
American Tower Corp. | | | 3.45 | | | | 9/15/2021 | | | | 80,000 | | | | 80,054 | | | | 81,035 | |
Brandywine Operating Partnership LP | | | 4.95 | | | | 4/15/2018 | | | | 40,000 | | | | 41,262 | | | | 41,349 | |
CubeSmart LP | | | 3.13 | | | | 9/1/2026 | | | | 45,000 | | | | 44,784 | | | | 42,410 | |
DDR Corp. | | | 4.75 | | | | 4/15/2018 | | | | 3,000 | | | | 3,095 | | | | 3,085 | |
Digital Realty Trust LP | | | 3.40 | | | | 10/1/2020 | | | | 20,000 | | | | 19,966 | | | | 20,378 | |
Digital Realty Trust LP | | | 3.95 | | | | 7/1/2022 | | | | 35,000 | | | | 35,204 | | | | 35,966 | |
Host Hotels & Resorts LP | | | 4.75 | | | | 3/1/2023 | | | | 50,000 | | | | 52,115 | | | | 52,078 | |
Weingarten Realty Investors | | | 3.25 | | | | 8/15/2026 | | | | 10,000 | | | | 9,918 | | | | 9,434 | |
| | | | | | | | | | | | | | | | | | | | |
Total REITS | | | | | | | | | | | 283,000 | | | | 286,398 | | | | 285,735 | |
| | | | | | | | | | | | | | | | | | | | |
|
Retail — 2.0%*: | |
Advance Auto Parts, Inc. | | | 4.50 | | | | 12/1/2023 | | | | 65,000 | | | | 70,115 | | | | 67,213 | |
CVS Health Corp. | | | 2.88 | | | | 6/1/2026 | | | | 10,000 | | | | 9,918 | | | | 9,532 | |
CVS Health Corp. | | | 3.50 | | | | 7/20/2022 | | | | 120,000 | | | | 119,958 | | | | 123,299 | |
CVS Pass-Through Trust^ | | | 5.93 | | | | 1/10/2034 | | | | 30,576 | | | | 34,946 | | | | 34,928 | |
El Puerto de Liverpool SAB de CV+^ | | | 3.95 | | | | 10/2/2024 | | | | 200,000 | | | | 199,136 | | | | 190,000 | |
O’Reilly Automotive, Inc. | | | 3.55 | | | | 3/15/2026 | | | | 10,000 | | | | 9,984 | | | | 9,935 | |
O’Reilly Automotive, Inc. | | | 4.88 | | | | 1/14/2021 | | | | 30,000 | | | | 32,312 | | | | 32,206 | |
Wal-Mart Stores, Inc. | | | 5.63 | | | | 4/1/2040 | | | | 30,000 | | | | 35,606 | | | | 37,112 | |
Walgreens Boots Alliance, Inc. | | | 2.70 | | | | 11/18/2019 | | | | 25,000 | | | | 25,142 | | | | 25,332 | |
Walgreens Boots Alliance, Inc. | | | 3.80 | | | | 11/18/2024 | | | | 35,000 | | | | 34,625 | | | | 35,622 | |
| | | | | | | | | | | | | | | | | | | | |
Total Retail | | | | 555,576 | | | | 571,742 | | | | 565,179 | |
| | | | | | | | | | | | | | | | | | | | |
|
Semiconductors — 0.2%*: | |
Lam Research Corp. | | | 2.75 | | | | 3/15/2020 | | | | 50,000 | | | | 49,937 | | | | 50,104 | |
| | | | | | | | | | | | | | | | | | | | |
|
Software — 0.2%*: | |
Broadridge Financial Solutions, Inc. | | | 3.40 | | | | 6/27/2026 | | | | 20,000 | | | | 19,922 | | | | 19,300 | |
Oracle Corp. | | | 5.38 | | | | 7/15/2040 | | | | 35,000 | | | | 39,004 | | | | 40,674 | |
| | | | | | | | | | | | | | | | | | | | |
Total Software | | | | 55,000 | | | | 58,926 | | | | 59,974 | |
| | | | | | | | | | | | | | | | | | | | |
|
Telecommunications — 0.8%*: | |
AT&T, Inc. | | | 3.40 | | | | 5/15/2025 | | | | 40,000 | | | | 38,565 | | | | 38,553 | |
AT&T, Inc. | | | 6.55 | | | | 2/15/2039 | | | | 25,000 | | | | 28,969 | | | | 28,943 | |
Telefonaktiebolaget LM Ericsson+ | | | 4.13 | | | | 5/15/2022 | | | | 30,000 | | | | 31,148 | | | | 30,106 | |
Verizon Communications, Inc. | | | 3.50 | | | | 11/1/2024 | | | | 35,000 | | | | 34,436 | | | | 34,888 | |
Verizon Communications, Inc. | | | 6.55 | | | | 9/15/2043 | | | | 75,000 | | | | 93,720 | | | | 93,673 | |
| | | | | | | | | | | | | | | | | | | | |
Total Telecommunications | | | | 205,000 | | | | 226,838 | | | | 226,163 | |
| | | | | | | | | | | | | | | | | | | | |
|
Transportation — 0.2%*: | |
Penske Truck Leasing Co. LP/PTL Finance Corp.^ | | | 3.38 | | | | 2/1/2022 | | | | 45,000 | | | | 44,281 | | | | 45,381 | |
| | | | | | | | | | | | | | | | | | | | |
See accompanying Notes to the Financial Statements.
123
Barings Total Return Bond Fund 2016 Semi-Annual Report
SCHEDULE OF INVESTMENTS (CONTINUED)
December 31, 2016 (Unaudited)
| | | | | | | | | | | | | | | | | | | | |
| | | EFFECTIVE
INTEREST RATE | | | DUE DATE | | | PRINCIPAL ‡‡ | | | COST | | | FAIR
VALUE | |
Corporate Bonds (Continued) | |
|
Trucking and Leasing — 0.1%*: | |
Aviation Capital Group Corp.^ | | | 2.88 | % | | | 9/17/2018 | | | | 40,000 | | | $ | 39,896 | | | $ | 40,500 | |
| | | | | | | | | | | | | | | | | | | | |
Total Corporate Bonds | | | | 8,436,576 | | | | 8,707,727 | | | | 8,723,749 | |
| | | | | | | | | | | | | | | | | | | | |
|
Foreign Government — 0.6%*: | |
|
Canada — 0.2%*: | |
Province of Quebec Canada+ | | | 2.63 | | | | 2/13/2023 | | | | 25,000 | | | | 25,210 | | | | 25,062 | |
Province of Quebec Canada+ | | | 7.50 | | | | 9/15/2029 | | | | 15,000 | | | | 21,375 | | | | 21,018 | |
| | | | | | | | | | | | | | | | | | | | |
Total Canada | | | | 40,000 | | | | 46,585 | | | | 46,080 | |
| | | | | | | | | | | | | | | | | | | | |
|
Mexico — 0.4%*: | |
Mexico Government International Bond+ | | | 4.75 | | | | 3/8/2044 | | | | 68,000 | | | | 69,504 | | | | 61,965 | |
Mexico Government International Bond+ | | | 5.55 | | | | 1/21/2045 | | | | 60,000 | | | | 64,663 | | | | 61,125 | |
| | | | | | | | | | | | | | | | | | | | |
Total Mexico | | | | 128,000 | | | | 134,167 | | | | 123,090 | |
| | | | | | | | | | | | | | | | | | | | |
| | | | | | | | | | | | | | | | | | | | |
Total Foreign Government | | | | | | | | | | | 168,000 | | | | 180,752 | | | | 169,170 | |
| | | | | | | | | | | | | | | | | | | | |
Mortgage-Backed Securities — 2.3%*: | |
Banc of America Commercial Mortgage Trust 2008-1 A4 | | | 6.24 | # | | | 2/10/2051 | | | | 100,777 | | | | 109,517 | | | | 103,380 | |
Bear Stearns Commercial Mortgage Securities Trust 2007-PWR17 AM | | | 5.89 | # | | | 6/11/2050 | | | | 85,000 | | | | 91,210 | | | | 86,834 | |
GS Mortgage Securities Trust 2015-GC32 B | | | 4.40 | # | | | 7/10/2048 | | | | 100,000 | | | | 102,880 | | | | 105,578 | |
JPMorgan Chase Commercial Mortgage Securities Trust 2006-LDP7 AM | | | 5.93 | # | | | 4/17/2045 | | | | 9,733 | | | | 10,097 | | | | 9,718 | |
JPMorgan Chase Commercial Mortgage Securities Trust 2007-CIBC20 AM | | | 5.96 | # | | | 2/12/2051 | | | | 110,000 | | | | 119,439 | | | | 112,648 | |
Morgan Stanley Capital I Trust 2008-TOP29 A4 | | | 6.28 | # | | | 1/11/2043 | | | | 103,811 | | | | 113,482 | | | | 107,553 | |
Wachovia Bank Commercial Mortgage Trust 2007-C33 A1A | | | 5.97 | # | | | 2/15/2051 | | | | 105,654 | | | | $114,406 | | | | $107,370 | |
| | | | | | | | | | | | | | | | | | | | |
Total Mortgage-Backed Securities | | | | 614,975 | | | | 661,031 | | | | 633,081 | |
| | | | | | | | | | | | | | | | | | | | |
U.S. Treasury & Government Agencies — 26.7%*: | |
Federal Home Loan Mortgage Corp. | | | 3.50 | | | | 11/1/2045 | | | | 231,822 | | | | 241,242 | | | | 238,169 | |
Federal Home Loan Mortgage Corp. | | | 3.50 | | | | 7/1/2046 | | | | 59,306 | | | | 62,744 | | | | 60,900 | |
Federal Home Loan Mortgage Corp. | | | 3.50 | | | | 11/1/2046 | | | | 79,881 | | | | 84,429 | | | | 82,000 | |
Federal Home Loan Mortgage Corp. | | | 4.50 | | | | 8/1/2040 | | | | 18,652 | | | | 20,502 | | | | 20,190 | |
Federal Home Loan Mortgage Corp. | | | 4.50 | | | | 10/1/2040 | | | | 26,796 | | | | 29,304 | | | | 29,052 | |
Federal Home Loan Mortgage Corp. | | | 4.50 | | | | 10/1/2041 | | | | 32,092 | | | | 35,090 | | | | 34,634 | |
Federal Home Loan Mortgage Corp. | | | 4.50 | | | | 1/1/2042 | | | | 24,879 | | | | 27,208 | | | | 26,936 | |
Federal Home Loan Mortgage Corp. | | | 4.50 | | | | 5/1/2042 | | | | 131,820 | | | | 143,878 | | | | 141,862 | |
Federal Home Loan Mortgage Corp. | | | 4.50 | | | | 9/1/2043 | | | | 22,148 | | | | 24,289 | | | | 24,072 | |
Federal Home Loan Mortgage Corp. TBA | | | 3.00 | | | | 1/1/2047 | | | | 175,000 | | | | 174,371 | | | | 173,865 | |
Federal Home Loan Mortgage Corp. TBA | | | 4.00 | | | | 2/1/2047 | | | | 350,000 | | | | 364,109 | | | | 367,131 | |
Federal National Mortgage Association | | | 3.50 | | | | 12/1/2028 | | | | 60,656 | | | | 64,492 | | | | 63,515 | |
Federal National Mortgage Association | | | 3.50 | | | | 11/1/2045 | | | | 299,785 | | | | 312,304 | | | | 308,147 | |
See accompanying Notes to the Financial Statements.
124
Barings Total Return Bond Fund 2016 Semi-Annual Report
SCHEDULE OF INVESTMENTS (CONTINUED)
December 31, 2016 (Unaudited)
| | | | | | | | | | | | | | | | | | | | |
| | | EFFECTIVE
INTEREST RATE | | | DUE DATE | | | PRINCIPAL ‡‡ | | | COST | | | FAIR
VALUE | |
U.S. Treasury & Government Agencies (Continued) | |
Federal National Mortgage Association | | | 3.50 | % | | | 12/1/2045 | | | | 102,483 | | | $ | 105,924 | | | $ | 105,422 | |
Federal National Mortgage Association | | | 3.50 | | | | 1/1/2046 | | | | 279,528 | | | | 290,385 | | | | 287,510 | |
Federal National Mortgage Association | | | 4.00 | | | | 9/1/2042 | | | | 70,939 | | | | 76,672 | | | | 75,110 | |
Federal National Mortgage Association | | | 4.00 | | | | 4/1/2046 | | | | 23,548 | | | | 25,301 | | | | 24,792 | |
Federal National Mortgage Association | | | 4.50 | | | | 9/1/2040 | | | | 13,986 | | | | 15,313 | | | | 15,092 | |
Federal National Mortgage Association | | | 4.50 | | | | 3/1/2041 | | | | 20,097 | | | | 22,103 | | | | 21,766 | |
Federal National Mortgage Association | | | 4.50 | | | | 10/1/2042 | | | | 27,484 | | | | 30,063 | | | | 29,729 | |
Federal National Mortgage Association | | | 4.50 | | | | 11/1/2042 | | | | 51,262 | | | | 56,269 | | | | 55,559 | |
Federal National Mortgage Association | | | 5.00 | | | | 6/1/2040 | | | | 13,640 | | | | 15,185 | | | | 15,065 | |
Federal National Mortgage Association | | | 5.00 | | | | 7/1/2040 | | | | 104,190 | | | | 115,497 | | | | 113,802 | |
Federal National Mortgage Association | | | 5.00 | | | | 2/1/2044 | | | | 40,036 | | | | 44,491 | | | | 43,773 | |
Federal National Mortgage Association TBA | | | 2.50 | | | | 1/1/2032 | | | | 1,575,000 | | | | 1,576,231 | | | | 1,578,568 | |
Federal National Mortgage Association TBA | | | 3.00 | | | | 1/1/2047 | | | | 200,000 | | | | 205,156 | | | | 198,844 | |
Federal National Mortgage Association TBA | | | 3.50 | | | | 1/1/2047 | | | | 800,000 | | | | 817,906 | | | | 820,000 | |
Federal National Mortgage Association TBA | | | 4.00 | | | | 1/1/2047 | | | | 350,000 | | | | 368,813 | | | | 367,938 | |
Government National Mortgage Association TBA | | | 2.50 | | | | 1/1/2047 | | | | 250,000 | | | | 242,578 | | | | 242,596 | |
U.S. Treasury Bond | | | 2.50 | | | | 5/15/2046 | | | | 305,000 | | | | 272,682 | | | | 271,045 | |
U.S. Treasury Bond | | | 3.50 | | | | 2/15/2039 | | | | 500,000 | | | | 577,386 | | | | 546,797 | |
U.S. Treasury Inflation Indexed Note | | | 0.13 | | | | 7/15/2026 | | | | 262,189 | | | | 256,207 | | | | 253,594 | |
U.S. Treasury Note | | | 0.75 | | | | 10/31/2018 | | | | 150,000 | | | | 148,904 | | | | 148,922 | |
U.S. Treasury Note | | | 1.13 | | | | 9/30/2021 | | | | 425,000 | | | | 408,301 | | | | 409,942 | |
U.S. Treasury Note | | | 1.25 | | | | 3/31/2021 | | | | 100,000 | | | | 97,652 | | | | 97,691 | |
U.S. Treasury Note | | | 2.00 | | | | 11/15/2026 | | | | 155,000 | | | | 148,298 | | | | 149,133 | |
| | | | | | | | | | | | | | | | | | | | |
Total U.S. Treasury & Government Agencies | | | | 7,332,219 | | | | 7,501,279 | | | | 7,443,163 | |
| | | | | | | | | | | | | | | | | | | | |
| | | | | | | | | | | | | | | | | | | | |
Total Fixed Income | | | | 23,267,450 | | | | 23,644,409 | | | | 23,546,588 | |
| | | | | | | | | | | | | | | | | | | | |
| | | | | |
| | | | | | | | | SHARES | | | COST | | | FAIR
VALUE | |
Mutual Fund — 8.8%*: | |
Barings US High Yield Fund | | | | | | | | | | | 237,389 | | | | 2,294,646 | | | | 2,468,842 | |
| | | | | | | | | | | | | | | | | | | | |
| | | | | |
| | | EFFECTIVE
INTEREST RATE | | | DUE DATE | | | PRINCIPAL ‡‡ | | | COST | | | FAIR
VALUE | |
Short-Term Investments — 18.4%*: | |
|
Bank Deposit — 2.5%*: | |
State Street Bank & Trust Co. Euro Time Deposit | | | 0.01 | | | | 1/3/2017 | | | | 707,678 | | | | 707,678 | | | | 707,678 | |
| | | | | | | | | | | | | | | | | | | | |
Commercial Paper — 15.9%*: | |
|
Auto Manufacturers — 2.2%*: | |
Ford Motor Credit Co. LLC | | | Zero Coupon | | | | 2/3/2017 | | | | 625,000 | | | | 624,364 | | | | 624,364 | |
| | | | | | | | | | | | | | | | | | | | |
See accompanying Notes to the Financial Statements.
125
Barings Total Return Bond Fund 2016 Semi-Annual Report
SCHEDULE OF INVESTMENTS (CONTINUED)
December 31, 2016 (Unaudited)
| | | | | | | | | | | | | | | | | | | | |
| | | EFFECTIVE
INTEREST RATE | | | DUE DATE | | | PRINCIPAL ‡‡ | | | COST | | | FAIR
VALUE | |
Commercial Paper (Continued) | |
|
Electric — 2.3%*: | |
Molex Electronics Technologies | | | Zero Coupon | | | | 1/25/2017 | | | | 625,000 | | | | $624,521 | | | | $624,521 | |
| | | | | | | | | | | | | | | | | | | | |
|
Lodging — 2.3%*: | |
Marriott International, Inc. | | | Zero Coupon | | | | 1/25/2017 | | | | 625,000 | | | | 624,521 | | | | 624,521 | |
| | | | | | | | | | | | | | | | | | | | |
|
Oil and Gas — 2.2%*: | |
Sempra Global | | | Zero Coupon | | | | 2/7/2017 | | | | 625,000 | | | | 624,229 | | | | 624,229 | |
| | | | | | | | | | | | | | | | | | | | |
|
Oil and Gas Services — 2.5%*: | |
Spectra Energy Capital | | | Zero Coupon | | | | 1/5/2017 | | | | 700,000 | | | | 699,922 | | | | 699,922 | |
| | | | | | | | | | | | | | | | | | | | |
|
Pipelines — 2.2%*: | |
Bell Canada | | | Zero Coupon | | | | 2/28/2017 | | | | 625,000 | | | | 623,842 | | | | 623,842 | |
| | | | | | | | | | | | | | | | | | | | |
|
Retail — 2.2%*: | |
CVS Corp. | | | Zero Coupon | | | | 2/6/2017 | | | | 625,000 | | | | 624,313 | | | | 624,313 | |
| | | | | | | | | | | | | | | | | | | | |
Total Commercial Paper | | | | 4,450,000 | | | | 4,445,712 | | | | 4,445,712 | |
| | | | | | | | | | | | | | | | | | | | |
Total Short-Term Investments | | | | 5,157,678 | | | | 5,153,390 | | | | 5,153,390 | |
| | | | | | | | | | | | | | | | | | | | |
Total Investments | | | | 28,662,517 | | | | 31,092,445 | | | | 31,168,820 | |
| | | | | | | | | | | | | | | | | | | | |
| |
Other assets and liabilities — (11.7%)* | | | | (3,263,383 | ) |
| |
Net Assets — 100.0% | | | | $27,905,437 | |
| | | | | | | | | | | | | | | | | | | | |
| TBA | To Be Announced: Securities purchased on a forward commitment basis with an approximate principal amount and maturity date. The actual principal amount and maturity date will be determined upon settlement. |
| ‡‡ | Unless otherwise indicated, all principal amounts are denominated in United States Dollars. |
| * | Calculated as a percentage of net assets applicable to common shareholders. |
Distributions of investments by country of risk (excluding temporary cash investments) as a percentage of total investments in securities, is as follows:
| | | | | | |
| | United States | | | 93.4% | |
| | Canada | | | 2.5% | |
| | Mexico | | | 1.3% | |
| | Other (Individually less than 1%) | | | 2.8% | |
| | | | | | |
| | Total | | | 100.0% | |
| | | | | | |
| ^ | Security acquired in a transaction exempt from registration under Rule 144A of the Securities Act of 1933. These securities may only be resold in transactions exempt from registration, normally to qualified institutional buyers. |
| # | Variable rate security. The interest rate shown is the rate in effect at December 31, 2016. |
See accompanying Notes to the Financial Statements.
126
Barings Total Return Bond Fund 2016 Semi-Annual Report
SCHEDULE OF INVESTMENTS (CONTINUED)
December 31, 2016 (Unaudited)
A summary of outstanding derivatives at December 31, 2016 is as follows:
Cross Currency Forward Foreign Currency Exchange Contracts
| | | | | | | | | | | | | | | | |
EXPIRATION
DATE | | DELIVER/ RECEIVE | | COUNTERPARTY | | CONTRACT
AMOUNT
PURCHASED | | | CONTRACT
AMOUNT
SOLD | | | NET UNREALIZED
(DEPRECIATION) | |
| 1/17/17 | | EUR/PLN | | JPMorgan Chase Bank N.A. | | | 269,273 | | | | 62,534 | | | $ | (1,547 | ) |
Forward Foreign Currency Exchange Contracts to Buy
| | | | | | | | | | | | | | | | | | | | | | |
EXPIRATION
DATE | | COUNTERPARTY | | LOCAL
CURRENCY | | | VALUE IN USD | | | IN
EXCHANGE
FOR USD | | | NET UNREALIZED
APPRECIATION
(DEPRECIATION) | |
| 1/17/17 | | Citibank N.A. | | | CHF | | | | 13,835 | | | | 13,598 | | | | 13,526 | | | $ | 72 | |
| 2/22/17 | | Bank of America N.A. | | | CNH | | | | 237,722 | | | | 33,587 | | | | 35,270 | | | | (1,683 | ) |
| 3/15/17 | | JPMorgan Chase Bank N.A. | | | CNH | | | | 11,016,225 | | | | 1,550,210 | | | | 1,646,111 | | | | (95,901 | ) |
| 1/17/17 | | BNP Paribas S.A. | | | COP | | | | 40,481,560 | | | | 13,452 | | | | 13,619 | | | | (167 | ) |
| 1/17/17 | | JPMorgan Chase Bank N.A. | | | HKD | | | | 271,429 | | | | 35,005 | | | | 34,957 | | | | 48 | |
| 1/17/17 | | BNP Paribas S.A. | | | JPY | | | | 1,429,125 | | | | 12,238 | | | | 12,164 | | | | 74 | |
| 1/17/17 | | JPMorgan Chase Bank N.A. | | | KRW | | | | 15,542,800 | | | | 12,874 | | | | 13,582 | | | | (708 | ) |
| 1/17/17 | | JPMorgan Chase Bank N.A. | | | KZT | | | | 11,655,000 | | | | 34,837 | | | | 34,482 | | | | 355 | |
| 1/17/17 | | JPMorgan Chase Bank N.A. | | | MXN | | | | 2,166,829 | | | | 104,331 | | | | 112,479 | | | | (8,148 | ) |
| 1/17/17 | | BNP Paribas S.A. | | | MXN | | | | 263,770 | | | | 12,700 | | | | 13,000 | | | | (300 | ) |
| 1/17/17 | | Bank of America N.A. | | | MXN | | | | 258,050 | | | | 12,425 | | | | 13,000 | | | | (575 | ) |
| 1/17/17 | | JPMorgan Chase Bank N.A. | | | RUB | | | | 2,283,896 | | | | 37,153 | | | | 35,786 | | | | 1,367 | |
| 1/17/17 | | Citibank N.A. | | | SEK | | | | 288,968 | | | | 31,748 | | | | 33,109 | | | | (1,361 | ) |
| 1/17/17 | | Bank of America N.A. | | | SEK | | | | 26,653 | | | | 2,928 | | | | 3,000 | | | | (72 | ) |
| 1/17/17 | | JPMorgan Chase Bank N.A. | | | SGD | | | | 49,135 | | | | 33,926 | | | | 35,540 | | | | (1,614 | ) |
| 1/17/17 | | JPMorgan Chase Bank N.A. | | | THB | | | | 1,201,294 | | | | 33,542 | | | | 33,787 | | | | (245 | ) |
| | | | | | | | | | | | | | | | | | | | | | |
Net unrealized depreciation on forward foreign exchange contracts to buy | | | $ | (108,858 | ) |
| | | | | | | | | | | | | | | | | | | | | | |
Forward Foreign Currency Exchange Contracts to Sell
| | | | | | | | | | | | | | | | | | | | | | |
EXPIRATION
DATE | | COUNTERPARTY | | LOCAL
CURRENCY | | | VALUE IN USD | | | IN
EXCHANGE
FOR USD | | | NET UNREALIZED
APPRECIATION
(DEPRECIATION) | |
| 1/17/17 | | Citibank N.A. | | | AUD | | | | 9 | | | | 7 | | | | 7 | | | $ | — | |
| 1/17/17 | | BNP Paribas S.A. | | | CAD | | | | 47,031 | | | | 35,035 | | | | 35,000 | | | | (35 | ) |
| 1/17/17 | | JPMorgan Chase Bank N.A. | | | CHF | | | | 13,835 | | | | 13,598 | | | | 14,087 | | | | 489 | |
| 2/6/17 | | Bank of America N.A. | | | CLP | | | | 9,208,500 | | | | 13,717 | | | | 14,000 | | | | 283 | |
| 2/22/17 | | JPMorgan Chase Bank N.A. | | | CNH | | | | 237,722 | | | | 33,588 | | | | 35,000 | | | | 1,412 | |
| 3/15/17 | | JPMorgan Chase Bank N.A. | | | CNH | | | | 11,016,225 | | | | 1,550,211 | | | | 1,650,000 | | | | 99,789 | |
| 11/14/17 | | BNP Paribas S.A. | | | CNH | | | | 487,606 | | | | 66,789 | | | | 70,000 | | | | 3,211 | |
| 1/17/17 | | Citibank N.A. | | | COP | | | | 40,481,560 | | | | 13,451 | | | | 13,364 | | | | (87 | ) |
| 1/17/17 | | BNP Paribas S.A. | | | EUR | | | | 28,650 | | | | 30,182 | | | | 30,000 | | | | (182 | ) |
| 1/17/17 | | Goldman Sachs & Co. | | | HKD | | | | 271,429 | | | | 35,005 | | | | 35,008 | | | | 3 | |
| 1/17/17 | | BNP Paribas S.A. | | | ILS | | | | 77,916 | | | | 20,233 | | | | 20,479 | | | | 246 | |
See accompanying Notes to the Financial Statements.
127
Barings Total Return Bond Fund 2016 Semi-Annual Report
SCHEDULE OF INVESTMENTS (CONTINUED)
December 31, 2016 (Unaudited)
| | | | | | | | | | | | | | | | | | | | | | |
EXPIRATION
DATE | | COUNTERPARTY | | LOCAL
CURRENCY | | | VALUE IN USD | | | IN
EXCHANGE
FOR USD | | | NET UNREALIZED
APPRECIATION
(DEPRECIATION) | |
| 1/17/17 | | BNP Paribas S.A. | | | JPY | | | | 1,429,125 | | | | 12,238 | | | | 14,000 | | | $ | 1,762 | |
| 1/17/17 | | BNP Paribas S.A. | | | KRW | | | | 15,542,800 | | | | 12,874 | | | | 14,000 | | | | 1,126 | |
| 1/17/17 | | JPMorgan Chase Bank N.A. | | | MXN | | | | 299,996 | | | | 14,445 | | | | 16,000 | | | | 1,555 | |
| 1/17/17 | | BNP Paribas S.A. | | | RUB | | | | 2,283,896 | | | | 37,152 | | | | 34,938 | | | | (2,214 | ) |
Forward Foreign Currency Exchange Contracts to Sell
| | | | | | | | | | | | | | | | | | | | | | |
EXPIRATION
DATE | | COUNTERPARTY | | LOCAL
CURRENCY | | | VALUE IN USD | | | IN
EXCHANGE
FOR USD | | | NET UNREALIZED
APPRECIATION
(DEPRECIATION) | |
| 1/17/17 | | JPMorgan Chase Bank N.A. | | | SGD | | | | 49,135 | | | | 33,925 | | | | 35,686 | | | $ | 1,761 | |
| | | | | | | | | | | | | | | | | | | | | | |
Net unrealized appreciation on forward foreign exchange contracts to sell | | | $ | 109,119 | |
| | | | | | | | | | | | | | | | | | | | | | |
Currency Legend
| | | | |
| AUD | | – | | Australian Dollar |
| CAD | | – | | Canadian Dollar |
| CHF | | – | | Swiss Franc |
| CLP | | – | | Chilean Peso |
| CNH | | – | | Chinese Yuan Renminbi |
| COP | | – | | Colombian Peso |
| EUR | | – | | Euro |
| HKD | | – | | Hong Kong Dollar |
| ILS | | – | | Israeli Shekel |
| JPY | | – | | Japanese Yen |
| KRW | | – | | South Korean Won |
| KZT | | – | | Kazakhstani Tenge |
| MXN | | – | | Mexican Peso |
| PLN | | – | | Polish Zloty |
| RUB | | – | | Russian Ruble |
| SEK | | – | | Swedish Krona |
| SGD | | – | | Singapore Dollar |
| THB | | – | | Thai Baht |
Futures
| | | | | | | | | | | | | | | | | | |
| TYPE | | EXPIRATION
DATE | | CONTRACTS | | | POSITION | | | FAIR VALUE | | | UNREALIZED
DEPRECIATION | |
Long Futures | |
U.S. 2-Year Treasury Note | | 03/31/17 | | | 12 | | | | Long | | | $ | 2,600,250 | | | $ | (2,129 | ) |
U.S. 5-Year Treasury Note | | 03/31/17 | | | 11 | | | | Long | | | | 1,294,305 | | | | (4,934 | ) |
U.S. Long Bond | | 03/22/17 | | | 1 | | | | Long | | | | 150,656 | | | | (1,245 | ) |
U.S. Ultra Bond | | 03/22/17 | | | 6 | | | | Long | | | | 961,500 | | | | (8,799 | ) |
| | | | | | | | | | | | | | | | | | |
Total Long Futures | | | $ | (17,107 | ) |
| | | | | | | | | | | | | | | | | | |
See accompanying Notes to the Financial Statements.
128
Barings Total Return Bond Fund 2016 Semi-Annual Report
SCHEDULE OF INVESTMENTS (CONTINUED)
December 31, 2016 (Unaudited)
| | | | | | | | | | | | | | | | | | |
| TYPE | | EXPIRATION
DATE | | CONTRACTS | | | POSITION | | | FAIR VALUE | | | UNREALIZED
APPRECIATION | |
Short Future | |
U.S. 10-Year Ultra Bond | | 03/22/17 | | | 1 | | | | Short | | | $ | 134,063 | | | $ | 825 | |
OTC Credit Default Swaps – Sell Protection(1)(2)
| | | | | | | | | | | | | | | | | | | | | | | | | | | | | | |
REFERENCE
OBLIGATION | | FIIXED-DEAL
RECEIVED
RATE | | | MATURITY
DATE | | | COUNTERPARTY | | ORIGINAL
NOTIONAL
AMOUNT | | | CURRENT
NOTIONAL
AMOUNT(3) | | | UPFRONT
PREMIUMS
PAID/
(RECEIVED) | | | FAIR
VALUE(4) | | | UNREALIZED
APPRECIATION
(DEPRECIATION) | |
CMBX.NA. BBB-.6† | | | 3.00 | % | | | 11/17/2045 | | | JPMorgan Chase
Bank N.A. | | | 60,000 | | | | 60,000 | | | $ | (142 | ) | | $ | (3,411 | ) | | $ | (3,553 | ) |
CMBX.NA. BBB-.6† | | | 3.00 | % | | | 5/11/2063 | | | Goldman Sachs &
Co. | | | 70,000 | | | | 70,000 | | | | (5,338 | ) | | | (3,981 | ) | | | 1,357 | |
| | | | | | | | | | | | | | | | | | | | | | | | | | | | | | |
Total OTC Credit Default Swap | | | $ | (5,480 | ) | | $ | (7,392 | ) | | $ | (2,196 | ) |
| | | | | | | | | | | | | | | | | | | | | | | | | | | | | | |
Centrally Cleared Credit Default Swaps – Buy Protection
| | | | | | | | | | | | | | | | | | | | | | | | | | | | | | |
REFERENCE
OBLIGATION | | FIXED-DEAL
RECEIVED
RATE | | | MATURITY
DATE | | | ORIGINAL
NOTIONAL
AMOUNT | | | CURRENT
NOTIONAL
AMOUNT(3) | | | UPFRONT
PREMIUMS
PAID/
(RECEIVED) | | | FAIR
VALUE(4) | | | UNREALIZED
APPRECIATION | |
| CDX.NA.BBB-.6 | | | 1.00 | % | | | 12/20/2021 | | | | 480,000 | | | | 480,000 | | | | (7,703 | ) | | | (7,205 | ) | | | 498 | |
| (1) | If the Fund is a seller of protection and a credit event occurs, as defined under the terms of that particular swap agreement, the Fund will either (i) pay to the buyer of protection an amount equal to the notional amount of the swap and take delivery of the referenced obligation or underlying securities comprising the referenced index or (ii) pay a net settlement amount in the form of cash or securities equal to the notional amount of the swap less the recovery value of the referenced obligation or underlying securities comprising the referenced index. |
| (2) | Represents an investment grade index of single name credit default swaps (CDS). All of the companies underlying the single name CDS within the index are rated investment grade or higher. Rating represents a weighted average of the credit ratings of all the companies underlying the single name CDS within the index. |
| (3) | The maximum potential amount the Fund could be required to make as a seller of credit protection or receive as a buyer of credit event as defined under the terms of that particular swap agreement. |
| (4) | The quoted market prices and resulting values for credit default swap agreements on asset-backed securities and credit indices serve as an indicator of the current status of the payment/performance risk and represent the expected amount paid or received for the credit derivative if the amount of the swap agreement was closed/sold as of the period end. Increasing market values, in absolute terms when compared to the notional amount of the swap, represent a deterioration of the referenced entity’s credit soundness and a greater likelihood or risk of default or other credit event occurring as defined under the terms of the agreements. |
| † | Payment is based on a percentage of the index. Reference entities are a number of individual issuers comprising the index. |
See accompanying Notes to the Financial Statements.
129
Barings Emerging Markets Debt Blended Total Return Fund 2016 Semi-Annual Report
SCHEDULE OF INVESTMENTS
December 31, 2016 (Unaudited)
| | | | | | | | | | | | | | | | | | | | |
| | | EFFECTIVE
INTEREST RATE | | | DUE DATE | | | PRINCIPAL ‡‡ | | | COST | | | FAIR
VALUE | |
Fixed Income — 97.4%*: | |
|
Corporate Bonds — 34.5%*: | |
|
Auto Parts&Equipment — 1.5%*: | |
Metalsa SA de CV+^ | | | 4.90 | % | | | 4/24/2023 | | | | 150,000 | | | | $137,080 | | | | $142,549 | |
| | | | | | | | | | | | | | | | | | | | |
|
Chemicals — 2.1%*: | |
OCP SA+ | | | 6.88 | | | | 4/25/2044 | | | | 200,000 | | | | 209,849 | | | | 201,025 | |
| | | | | | | | | | | | | | | | | | | | |
|
Commercial Banks — 8.1%*: | |
BBVA Bancomer SA+^ | | | 5.35 | # | | | 11/12/2029 | | | | 200,000 | | | | 198,588 | | | | 184,000 | |
BBVA Bancomer SA+^ | | | 6.75 | | | | 9/30/2022 | | | | 200,000 | | | | 220,743 | | | | 218,500 | |
Sberbank of Russia Via SB Capital SA+^ | | | 5.50 | # | | | 2/26/2024 | | | | 200,000 | | | | 187,440 | | | | 202,250 | |
Turkiye Halk Bankasi AS+^ | | | 3.88 | | | | 2/5/2020 | | | | 200,000 | | | | 195,340 | | | | 187,000 | |
| | | | | | | | | | | | | | | | | | | | |
Total Commercial Banks | | | | 800,000 | | | | 802,111 | | | | 791,750 | |
| | | | | | | | | | | | | | | | | | | | |
|
Construction Materials — 1.7%*: | |
Cemex SAB de CV+^ | | | 4.38 | | | | 3/5/2023 | | | | 150,000 | | | | 165,321 | | | | 161,845 | |
| | | | | | | | | | | | | | | | | | | | |
|
Electric — 2.1%*: | |
Abengoa Transmision Sur SA+^ | | | 6.88 | | | | 4/30/2043 | | | | 199,580 | | | | 204,522 | | | | 204,569 | |
| | | | | | | | | | | | | | | | | | | | |
|
Engineering&Construction — 2.0%*: | |
Mexico City Airport Trust+^ | | | 4.25 | | | | 10/31/2026 | | | | 200,000 | | | | 198,059 | | | | 196,000 | |
| | | | | | | | | | | | | | | | | | | | |
|
Food — 4.1%*: | |
Marfrig Overseas Ltd.+^ | | | 9.50 | | | | 5/4/2020 | | | | 200,000 | | | | 205,526 | | | | 205,750 | |
Minerva Luxembourg SA+^ | | | 6.50 | | | | 9/20/2026 | | | | 200,000 | | | | 198,229 | | | | 192,750 | |
| | | | | | | | | | | | | | | | | | | | |
Total Food | | | | 400,000 | | | | 403,755 | | | | 398,500 | |
| | | | | | | | | | | | | | | | | | | | |
|
Gas — 2.4%*: | |
Fermaca Enterprises S de RL de CV+^ | | | 6.38 | | | | 3/30/2038 | | | | 238,428 | | | | 232,547 | | | | 234,852 | |
| | | | | | | | | | | | | | | | | | | | |
|
Media — 4.2%*: | |
Altice Financing SA+^ | | | 6.63 | | | | 2/15/2023 | | | | 200,000 | | | | 196,724 | | | | 205,500 | |
VTR Finance B.V.+^ | | | 6.88 | | | | 1/15/2024 | | | | 200,000 | | | | 186,752 | | | | 206,500 | |
| | | | | | | | | | | | | | | | | | | | |
Total Media | | | | 400,000 | | | | 383,476 | | | | 412,000 | |
| | | | | | | | | | | | | | | | | | | | |
|
Oil and Gas — 4.5%*: | |
Petrobras Global Finance B.V.+ | | | 3.25 | | | | 4/1/2019 | | | | 125,000 | | | | 134,147 | | | | 134,049 | |
Petrobras Global Finance B.V.+ | | | 3.75 | | | | 1/14/2021 | | | | 225,000 | | | | 247,847 | | | | 236,550 | |
Petrobras Global Finance BV+ | | | 5.63 | | | | 5/20/2043 | | | | 100,000 | | | | 75,568 | | | | 73,750 | |
| | | | | | | | | | | | | | | | | | | | |
Total Oil and Gas | | | | 450,000 | | | | 457,562 | | | | 444,349 | |
| | | | | | | | | | | | | | | | | | | | |
|
Telecommunications — 1.8%*: | |
Digicel Ltd.+^ | | | 6.75 | | | | 3/1/2023 | | | | 200,000 | | | | 188,631 | | | | 180,326 | |
| | | | | | | | | | | | | | | | | | | | |
Total Corporate Bonds | | | | 3,388,008 | | | | 3,382,913 | | | | 3,367,765 | |
| | | | | | | | | | | | | | | | | | | | |
See accompanying Notes to the Financial Statements.
130
Barings Emerging Markets Debt Blended Total Return Fund 2016 Semi-Annual Report
SCHEDULE OF INVESTMENTS (CONTINUED)
December 31, 2016 (Unaudited)
| | | | | | | | | | | | | | | | | | | | |
| | | EFFECTIVE
INTEREST RATE | | | DUE DATE | | | PRINCIPAL ‡‡ | | | COST | | | FAIR
VALUE | |
Foreign Government — 62.9%*: | |
|
Argentina — 3.5%*: | |
Province of Santa Fe+^ | | | 6.90 | % | | | 11/1/2027 | | | | 150,000 | | | $ | 150,000 | | | $ | 141,000 | |
Provincia de Cordoba+^ | | | 7.13 | | | | 6/10/2021 | | | | 200,000 | | | | 200,000 | | | | 205,000 | |
| | | | | | | | | | | | | | | | | | | | |
Total Argentina | | | | 350,000 | | | | 350,000 | | | | 346,000 | |
| | | | | | | | | | | | | | | | | | | | |
|
Armenia — 2.2%*: | |
Republic of Armenia International Bond^+ | | | 7.15 | | | | 3/26/2025 | | | | 200,000 | | | | 212,286 | | | | 210,000 | |
| | | | | | | | | | | | | | | | | | | | |
|
Brazil — 6.8%*: | |
Brazil Notas do Tesouro Nacional Serie B+ | | | 6.00 | | | | 8/15/2050 | | | | 460,000 | | | | 383,600 | | | | 434,727 | |
Brazilian Government International Bond+ | | | 8.25 | | | | 1/20/2034 | | | | 200,000 | | | | 230,497 | | | | 230,750 | |
| | | | | | | | | | | | | | | | | | | | |
Total Brazil | | | | 660,000 | | | | 614,097 | | | | 665,477 | |
| | | | | | | | | | | | | | | | | | | | |
|
Colombia — 6.7%*: | |
Colombia Government International Bond+ | | | 5.63 | | | | 2/26/2044 | | | | 200,000 | | | | 206,445 | | | | 206,000 | |
Colombian TES+ | | | 7.75 | | | | 9/18/2030 | | | | 1,311,000,000 | | | | 454,641 | | | | 450,871 | |
| | | | | | | | | | | | | | | | | | | | |
Total Colombia | | | | 1,311,200,000 | | | | 661,086 | | | | 656,871 | |
| | | | | | | | | | | | | | | | | | | | |
|
Croatia — 2.2%*: | |
Croatia Government Bond+^ | | | 5.50 | | | | 4/4/2023 | | | | 200,000 | | | | 207,125 | | | | 210,750 | |
| | | | | | | | | | | | | | | | | | | | |
|
Dominican Republic — 2.1%*: | |
Dominican Republic International Bond+^ | | | 5.88 | | | | 4/18/2024 | | | | 200,000 | | | | 197,026 | | | | 200,000 | |
| | | | | | | | | | | | | | | | | | | | |
|
El Salvador — 2.1%*: | |
Republic of El Salvador+^ | | | 7.38 | | | | 12/1/2019 | | | | 200,000 | | | | 205,160 | | | | 206,000 | |
| | | | | | | | | | | | | | | | | | | | |
|
Ghana — 4.4%*: | |
Ghana Government International Bond+^ | | | 7.88 | | | | 8/7/2023 | | | | 200,000 | | | | 180,808 | | | | 196,750 | |
Ghana Government International Bond+^ | | | 10.75 | | | | 10/14/2030 | | | | 200,000 | | | | 213,475 | | | | 236,750 | |
| | | | | | | | | | | | | | | | | | | | |
Total Ghana | | | | 400,000 | | | | 394,283 | | | | 433,500 | |
| | | | | | | | | | | | | | | | | | | | |
|
Indonesia — 2.4%*: | |
Indonesia Treasury Bond+ | | | 8.38 | | | | 3/15/2034 | | | | 3,140,000,000 | | | | 214,852 | | | | 233,417 | |
| | | | | | | | | | | | | | | | | | | | |
|
Malaysia — 3.4%*: | |
Malaysia Government Bond+ | | | 4.13 | | | | 4/15/2032 | | | | 1,610,000 | | | | 360,800 | | | | 328,478 | |
| | | | | | | | | | | | | | | | | | | | |
|
Mexico — 11.0%*: | |
Mexican Bonos+ | | | 7.50 | | | | 6/3/2027 | | | | 6,900,000 | | | | 409,369 | | | | 331,284 | |
Mexican Bonos+ | | | 5.75 | | | | 10/12/2110 | | | | 430,000 | | | | 413,343 | | | | 398,288 | |
Mexican Bonos+ | | | 7.75 | | | | 11/13/2042 | | | | 7,100,000 | | | | 482,963 | | | | 339,080 | |
| | | | | | | | | | | | | | | | | | | | |
Total Mexico | | | | 14,430,000 | | | | 1,305,675 | | | | 1,068,652 | |
| | | | | | | | | | | | | | | | | | | | |
|
Peru — 5.8%*: | |
Peru Government Bond+ | | | 6.85 | | | | 2/12/2042 | | | | 590,000 | | | | 184,279 | | | | 169,589 | |
Peru Government Bond+ | | | 6.90 | | | | 8/12/2037 | | | | 600,000 | | | | 197,132 | | | | 177,457 | |
Peru Government Bond+ | | | 6.95 | | | | 8/12/2031 | | | | 720,000 | | | | 241,847 | | | | 217,769 | |
| | | | | | | | | | | | | | | | | | | | |
Total Peru | | | | 1,910,000 | | | | 623,258 | | | | 564,815 | |
| | | | | | | | | | | | | | | | | | | | |
See accompanying Notes to the Financial Statements.
131
Barings Emerging Markets Debt Blended Total Return Fund 2016 Semi-Annual Report
SCHEDULE OF INVESTMENTS (CONTINUED)
December 31, 2016 (Unaudited)
| | | | | | | | | | | | | | | | | | | | |
| | | EFFECTIVE
INTEREST RATE | | | DUE DATE | | | PRINCIPAL ‡‡ | | | COST | | | FAIR
VALUE | |
Foreign Government (Continued) | |
|
South Africa — 10.3%*: | |
South Africa Government Bond+ | | | 6.50 | % | | | 2/28/2041 | | | | 4,200,000 | | | $ | 206,424 | | | $ | 217,570 | |
South Africa Government Bond+ | | | 8.75 | | | | 2/28/2048 | | | | 11,800,000 | | | | 786,484 | | | | 784,596 | |
| | | | | | | | | | | | | | | | | | | | |
Total South Africa | | | | 16,000,000 | | | | 992,908 | | | | 1,002,166 | |
| | | | | | | | | | | | | | | | | | | | |
Total Foreign Government | | | | 4,487,360,000 | | | | 6,338,556 | | | | 6,126,126 | |
| | | | | | | | | | | | | | | | | | | | |
Total Fixed Income | | | | 4,490,748,008 | | | | 9,721,469 | | | | 9,493,891 | |
| | | | | | | | | | | | | | | | | | | | |
Short-Term Investment — 1.0%*: | |
|
Bank Deposit — 1.0%*: | |
State Street Bank & Trust Co. Euro Time Deposit | | | 0.01 | | | | 1/3/2017 | | | | 98,880 | | | | 98,880 | | | | 98,880 | |
| | | | | | | | | | | | | | | | | | | | |
Total Investments | | | | 4,490,846,888 | | | | 9,820,349 | | | | 9,592,771 | |
| | | | | | | | | | | | | | | | | | | | |
| |
Other assets and liabilities — 1.6%* | | | | 153,653 | |
| |
Net Assets — 100.0% | | | | $9,746,424 | |
| | | | | | | | | | | | | | | | | | | | |
| ‡‡ | Unless otherwise indicated, all principal amounts are denominated in United States Dollars. |
| * | Calculated as a percentage of net assets applicable to common shareholders. |
Distributions of investments by country of risk (excluding temporary cash investments) as a percentage of total investments in securities, is as follows:
| | | | | | |
| | Mexico | | | 23.2% | |
| | Brazil | | | 15.9% | |
| | South Africa | | | 10.5% | |
| | Peru | | | 8.1% | |
| | Colombia | | | 6.9% | |
| | Ghana | | | 4.6% | |
| | Argentina | | | 3.6% | |
| | Malaysia | | | 3.5% | |
| | Indonesia | | | 2.5% | |
| | Croatia | | | 2.2% | |
| | Armenia | | | 2.2% | |
| | Chile | | | 2.2% | |
| | El Salvador | | | 2.2% | |
| | Portugal | | | 2.2% | |
| | Russia | | | 2.1% | |
| | Morocco | | | 2.1% | |
| | Dominican Republic | | | 2.1% | |
| | Turkey | | | 2.0% | |
| | Jamaica | | | 1.9% | |
| | | | | | |
| | Total | | | 100.0% | |
| | | | | | |
See accompanying Notes to the Financial Statements.
132
Barings Emerging Markets Debt Blended Total Return Fund 2016 Semi-Annual Report
SCHEDULE OF INVESTMENTS (CONTINUED)
December 31, 2016 (Unaudited)
| ^ | Security acquired in a transaction exempt from registration under Rule 144A of the Securities Act of 1933. These securities may only be resold in transactions exempt from registration, normally to qualified institutional buyers. |
| # | Variable rate security. The interest rate shown is the rate in effect at December 31, 2016. |
A summary of outstanding derivatives at December 31, 2016 is as follows:
Cross Currency Forward Foreign Currency Exchange Contracts
| | | | | | | | | | | | | | | | |
EXPIRATION
DATE | | DELIVER/RECEIVE | | COUNTERPARTY | | CONTRACT
AMOUNT
PURCHASED | | | CONTRACT
AMOUNT
SOLD | | | NET UNREALIZED
APPRECIATION
(DEPRECIATION) | |
| 1/17/17 | | EUR/PLN | | JPMorgan Chase Bank N.A. | | | 3,973,789 | | | | 922,849 | | | $ | (22,829 | ) |
| 1/17/17 | | HUF/EUR | | Citibank N.A. | | | 144,710 | | | | 44,262,285 | | | | 1,715 | |
| | | | | | | | | | | | | | | | |
Net unrealized depreciation on cross currency forward foreign currency exchange contracts | | | $ | (21,114 | ) |
| | | | | | | | | | | | | | | | |
Forward Foreign Currency Exchange Contracts to Buy
| | | | | | | | | | | | | | | | | | | | | | |
EXPIRATION
DATE | | COUNTERPARTY | | LOCAL
CURRENCY | | | VALUE IN USD | | | IN
EXCHANGE
FOR USD | | | NET UNREALIZED
APPRECIATION
(DEPRECIATION) | |
| 1/17/17 | | JPMorgan Chase Bank N.A. | | | BRL | | | | 375,269 | | | | 114,868 | | | | 117,144 | | | $ | (2,276 | ) |
| 1/17/17 | | Citibank N.A. | | | CHF | | | | 196,650 | | | | 193,281 | | | | 192,266 | | | | 1,016 | |
| 2/22/17 | | JPMorgan Chase Bank N.A. | | | CNH | | | | 223,512 | | | | 31,580 | | | | 34,000 | | | | (2,420 | ) |
| 2/22/17 | | Bank of America N.A. | | | CNH | | | | 3,172,518 | | | | 448,245 | | | | 470,700 | | | | (22,453 | ) |
| 1/17/17 | | BNP Paribas S.A. | | | COP | | | | 606,073,167 | | | | 201,393 | | | | 203,893 | | | | (2,500 | ) |
Forward Foreign Currency Exchange Contracts to Buy
| | | | | | | | | | | | | | | | | | | | | | |
EXPIRATION
DATE | | COUNTERPARTY | | LOCAL
CURRENCY | | | VALUE IN USD | | | IN
EXCHANGE
FOR USD | | | NET UNREALIZED
APPRECIATION
(DEPRECIATION) | |
| 1/17/17 | | JPMorgan Chase Bank N.A. | | | HKD | | | | 4,001,618 | | | | 516,067 | | | | 515,360 | | | $ | 707 | |
| 1/17/17 | | Citibank N.A. | | | HUF | | | | 127,109,790 | | | | 432,868 | | | | 463,738 | | | | (30,870 | ) |
| 1/17/17 | | JPMorgan Chase Bank N.A. | | | KRW | | | | 219,819,600 | | | | 182,081 | | | | 192,100 | | | | (10,019 | ) |
| 1/17/17 | | JPMorgan Chase Bank N.A. | | | KZT | | | | 171,001,500 | | | | 511,131 | | | | 505,922 | | | | 5,209 | |
| 1/17/17 | | JPMorgan Chase Bank N.A. | | | MXN | | | | 23,348,118 | | | | 1,124,198 | | | | 1,211,994 | | | | (87,796 | ) |
| 1/17/17 | | BNP Paribas S.A. | | | MXN | | | | 4,078,290 | | | | 196,367 | | | | 201,000 | | | | (4,633 | ) |
| 1/17/17 | | Bank of America N.A. | | | MXN | | | | 3,989,850 | | | | 192,109 | | | | 201,000 | | | | (8,891 | ) |
| 1/17/17 | | JPMorgan Chase Bank N.A. | | | RUB | | | | 33,350,197 | | | | 542,516 | | | | 522,563 | | | | 19,953 | |
| 1/17/17 | | Citibank N.A. | | | SEK | | | | 2,522,873 | | | | 277,184 | | | | 289,067 | | | | (11,883 | ) |
| 1/17/17 | | JPMorgan Chase Bank N.A. | | | SGD | | | | 702,553 | | | | 485,088 | | | | 508,162 | | | | (23,074 | ) |
| 1/17/17 | | JPMorgan Chase Bank N.A. | | | THB | | | | 18,004,993 | | | | 502,725 | | | | 506,398 | | | | (3,673 | ) |
| | | | | | | | | | | | | | | | | | | | | | |
Net unrealized depreciation on forward foreign exchange contracts to buy | | | $ | (183,603 | ) |
| | | | | | | | | | | | | | | | | | | | | | |
See accompanying Notes to the Financial Statements.
133
Barings Emerging Markets Debt Blended Total Return Fund 2016 Semi-Annual Report
SCHEDULE OF INVESTMENTS (CONTINUED)
December 31, 2016 (Unaudited)
Forward Foreign Currency Exchange Contracts to Sell
| | | | | | | | | | | | | | | | | | | | | | |
EXPIRATION
DATE | | COUNTERPARTY | | LOCAL
CURRENCY | | | VALUE IN USD | | | IN
EXCHANGE
FOR USD | | | NET UNREALIZED
APPRECIATION
(DEPRECIATION) | |
| 1/17/17 | | Citibank N.A. | | | AUD | | | | 1,394 | | | | 1,006 | | | | 1,051 | | | $ | 45 | |
| 1/17/17 | | BNP Paribas S.A. | | | BRL | | | | 189,582 | | | | 58,030 | | | | 57,000 | | | | (1,030 | ) |
| 1/17/17 | | Citibank N.A. | | | BRL | | | | 185,687 | | | | 56,838 | | | | 56,141 | | | | (697 | ) |
| 1/17/17 | | BNP Paribas S.A. | | | CAD | | | | 681,281 | | | | 507,507 | | | | 507,000 | | | | (507 | ) |
| 1/17/17 | | JPMorgan Chase Bank N.A. | | | CHF | | | | 196,650 | | | | 193,281 | | | | 200,234 | | | | 6,953 | |
| 2/6/17 | | Bank of America N.A. | | | CLP | | | | 134,181,000 | | | | 199,872 | | | | 204,000 | | | | 4,128 | |
| 2/22/17 | | JPMorgan Chase Bank N.A. | | | CNH | | | | 3,396,030 | | | | 479,825 | | | | 500,000 | | | | 20,175 | |
| 11/14/17 | | BNP Paribas S.A. | | | CNH | | | | 7,063,321 | | | | 967,484 | | | | 1,014,000 | | | | 46,516 | |
| 1/17/17 | | JPMorgan Chase Bank N.A. | | | COP | | | | 1,358,169,780 | | | | 451,309 | | | | 452,533 | | | | 1,224 | |
| 1/17/17 | | BNP Paribas S.A. | | | COP | | | | 327,240,000 | | | | 108,739 | | | | 108,000 | | | | (739 | ) |
| 1/17/17 | | Citibank N.A. | | | EUR | | | | 973,314 | | | | 1,025,361 | | | | 1,078,080 | | | | 52,719 | |
| 1/17/17 | | BNP Paribas S.A. | | | EUR | | | | 372,456 | | | | 392,373 | | | | 390,000 | | | | (2,373 | ) |
| 1/17/17 | | Goldman Sachs & Co. | | | HKD | | | | 4,001,618 | | | | 516,067 | | | | 516,109 | | | | 42 | |
| 1/17/17 | | BNP Paribas S.A. | | | ILS | | | | 1,179,274 | | | | 306,227 | | | | 309,948 | | | | 3,721 | |
| 1/17/17 | | BNP Paribas S.A. | | | KRW | | | | 219,819,600 | | | | 182,081 | | | | 198,000 | | | | 15,919 | |
| 1/17/17 | | JPMorgan Chase Bank N.A. | | | MXN | | | | 11,662,231 | | | | 561,530 | | | | 623,311 | | | | 61,781 | |
| 1/17/17 | | JPMorgan Chase Bank N.A. | | | MYR | | | | 1,596,736 | | | | 355,834 | | | | 379,877 | | | | 24,043 | |
| 2/6/17 | | JPMorgan Chase Bank N.A. | | | PEN | | | | 683,700 | | | | 202,908 | | | | 200,000 | | | | (2,908 | ) |
| 1/17/17 | | BNP Paribas S.A. | | | RUB | | | | 33,350,197 | | | | 542,516 | | | | 510,185 | | | | (32,331 | ) |
| 1/17/17 | | Citibank N.A. | | | SGD | | | | 46,568 | | | | 32,154 | | | | 34,000 | | | | 1,846 | |
| 1/17/17 | | JPMorgan Chase Bank N.A. | | | SGD | | | | 655,985 | | | | 452,934 | | | | 476,446 | | | | 23,512 | |
| 1/17/17 | | JPMorgan Chase Bank N.A. | | | ZAR | | | | 3,863,176 | | | | 280,631 | | | | 265,762 | | | | (14,869 | ) |
| | | | | | | | | | | | | | | | | | | | | | |
Net unrealized appreciation on forward foreign exchange contracts to sell | | | $ | 207,170 | |
| | | | | | | | | | | | | | | | | | | | | | |
Currency Legend
| | | | |
| AUD | | – | | Australian Dollar |
| BRL | | – | | Brazilian Real |
| CAD | | – | | Canadian Dollar |
| CHF | | – | | Swiss Franc |
| CLP | | – | | Chilean Peso |
| CNH | | – | | Chinese Yuan Renminbi |
| COP | | – | | Colombian Peso |
| CZK | | – | | Czech Koruna |
| EUR | | – | | Euro |
| HKD | | – | | Hong Kong Dollar |
| HRK | | – | | Croatian Kuna |
| HUF | | – | | Hungarian Forint |
| ILS | | – | | Israeli Shekel |
| KRW | | – | | South Korean Won |
| KZT | | – | | Kazakhstani Tenge |
| MXN | | – | | Mexican Peso |
| MYR | | – | | Malaysian Ringgit |
| PEN | | – | | Peruvian Nouveau Sol |
See accompanying Notes to the Financial Statements.
134
Barings Emerging Markets Debt Blended Total Return Fund 2016 Semi-Annual Report
SCHEDULE OF INVESTMENTS (CONTINUED)
December 31, 2016 (Unaudited)
| | | | |
| PLN | | – | | Polish Zloty |
| RSD | | – | | Serbian Dinar. |
| RUB | | – | | Russian Ruble |
| SEK | | – | | Swedish Krona |
| SGD | | – | | Singapore Dollar |
| THB | | – | | Thai Baht |
| ZAR | | – | | South African Rand |
Future
| | | | | | | | | | | | | | | | | | | | |
| TYPE | | EXPIRATION
DATE | | | CONTRACTS | | | POSITION | | | FAIR
VALUE | | | UNREALIZED
APPRECIATION | |
Short Future | | | | | | | | | | | | | | | | | | | | |
U.S. Ultra Bond | | | 03/22/17 | | | | 2 | | | | Short | | | $ | 320,500 | | | $ | 2,868 | |
OTC – Interest Rate Swaps
| | | | | | | | | | | | | | | | |
| DESCRIPTION | | NOTIONAL
AMOUNT | | | UNREALIZED
APPRECIATION
(DEPRECIATION) | | | VALUE | |
Agreement with Bank of America N.A. dated 12/9/15 receiving a fixed rate of 12.50% paying the notional amount multiplied by the BRL-BZDIO rate. Expiring 1/2/25 | | | BRL | | | | 625,257 | | | $ | 10,977 | | | $ | 10,977 | |
Agreement with Bank of America N.A. dated 12/9/15 paying a fixed rate of 1.48% receiving the notional amount multiplied by the KRW-KSDA rate. Expiring 10/24/26 | | | KRW | | | | 172,000,000 | | | | 4,537 | | | | 4,537 | |
Agreement with JPMorgan Chase Bank N.A. dated 5/19/16 receiving a fixed rate of 11.45% paying the notional amount multiplied by the BRL-MBZDIO rate. Expiring 1/2/23 | | | BRL | | | | 1,017,920 | | | | (4,549 | ) | | | (4,549 | ) |
Agreement with JPMorgan Chase Bank N.A. dated 4/26/16 paying a fixed rate of 0.26% receiving the notional amount multiplied by the CZK-PRIBO rate. Expiring 7/15/21 | | | CZK | | | | 15,800,000 | | | | 5,547 | | | | 5,547 | |
Agreement with JPMorgan Chase Bank N.A. dated 5/19/16 receiving a fixed rate of 2.46% paying the notional amount multiplied by the PLN-WIBOR rate. Expiring 6/21/26 | | | PLN | | | | 1,100,000 | | | | (8,216 | ) | | | (8,216 | ) |
Agreement with JPMorgan Chase Bank N.A. dated 5/19/16 paying a fixed rate of 1.64% receiving the notional amount multiplied by the KRW-KSDA rate. Expiring 5/20/26 | | | KRW | | | | 190,000,000 | | | | 2,376 | | | | 2,376 | |
| | | | | | | | | | | | | | | | |
Total Interest Rate Swaps | | | | | | | | | | | | | | $ | 10,672 | |
| | | | | | | | | | | | | | | | |
Abbreviation Legend
See accompanying Notes to the Financial Statements.
135
Barings Emerging Markets Local Currency Debt Fund 2016 Semi-Annual Report
SCHEDULE OF INVESTMENTS
December 31, 2016 (Unaudited)
| | | | | | | | | | | | | | | | | | | | |
| | | EFFECTIVE
INTEREST RATE | | | DUE DATE | | | PRINCIPAL ‡‡ | | | COST | | | FAIR
VALUE | |
Fixed Income — 91.3%*: | | | | | | | | | | | | | | | | | | | | |
| | | | | |
Foreign Government — 91.3%*: | | | | | | | | | | | | | | | | | | | | |
|
Brazil — 5.0%*: | |
Brazil Notas do Tesouro Nacional Serie B+ | | | 6.00 | % | | | 8/15/2050 | | | | 200,000 | | | | $160,976 | | | | $189,012 | |
Brazil Notas do Tesouro Nacional Serie F+ | | | 10.00 | | | | 1/1/2025 | | | | 180,000 | | | | 54,515 | | | | 51,314 | |
| | | | | | | | | | | | | | | | | | | | |
Total Brazil | | | | 380,000 | | | | 215,491 | | | | 240,326 | |
| | | | | | | | | | | | | | | | | | | | |
|
Chile — 1.1%*: | |
Chile Government International Bond+ | | | 5.50 | | | | 8/5/2020 | | | | 32,300,000 | | | | 47,918 | | | | 50,619 | |
| | | | | | | | | | | | | | | | | | | | |
|
Colombia — 8.3%*: | |
Colombian TES+ | | | 7.50 | | | | 8/26/2026 | | | | 223,500,000 | | | | 76,812 | | | | 76,387 | |
Colombian TES+ | | | 7.75 | | | | 9/18/2030 | | | | 929,000,000 | | | | 255,496 | | | | 319,496 | |
| | | | | | | | | | | | | | | | | | | | |
Total Colombia | | | | 1,152,500,000 | | | | 332,308 | | | | 395,883 | |
| | | | | | | | | | | | | | | | | | | | |
|
Croatia — 2.2%*: | |
Croatia Government Bond+ | | | 4.25 | | | | 12/14/2026 | | | | 700,000 | | | | 110,343 | | | | 107,752 | |
| | | | | | | | | | | | | | | | | | | | |
|
Ghana — 1.2%*: | |
Ghana Government Bond+ | | | 24.75 | | | | 3/1/2021 | | | | 100,000 | | | | 26,772 | | | | 27,007 | |
Ghana Government Bond+ | | | 24.75 | | | | 7/19/2021 | | | | 110,000 | | | | 28,592 | | | | 30,154 | |
| | | | | | | | | | | | | | | | | | | | |
Total Ghana | | | | 210,000 | | | | 55,364 | | | | 57,161 | |
| | | | | | | | | | | | | | | | | | | | |
|
Hungary — 4.9%*: | |
Hungary Government Bond+ | | | 6.75 | | | | 11/24/2017 | | | | 64,970,000 | | | | 242,247 | | | | 235,002 | |
| | | | | | | | | | | | | | | | | | | | |
|
Indonesia — 9.9%*: | |
Indonesia Treasury Bond+ | | | 8.38 | | | | 3/15/2024 | | | | 1,000,000,000 | | | | 82,304 | | | | 75,489 | |
Indonesia Treasury Bond+ | | | 8.38 | | | | 3/15/2034 | | | | 5,369,000,000 | | | | 367,833 | | | | 399,113 | |
| | | | | | | | | | | | | | | | | | | | |
Total Indonesia | | | | 6,369,000,000 | | | | 450,137 | | | | 474,602 | |
| | | | | | | | | | | | | | | | | | | | |
|
Malaysia — 9.3%*: | |
Malaysia Government Bond+ | | | 3.48 | | | | 3/15/2023 | | | | 1,540,000 | | | | 346,512 | | | | 327,241 | |
Malaysia Government Bond+ | | | 4.50 | | | | 4/15/2030 | | | | 550,000 | | | | 128,548 | | | | 118,803 | |
| | | | | | | | | | | | | | | | | | | | |
Total Malaysia | | | | 2,090,000 | | | | 475,060 | | | | 446,044 | |
| | | | | | | | | | | | | | | | | | | | |
|
Mexico — 9.7%*: | |
Mexican Bonos+ | | | 5.00 | | | | 6/15/2017 | | | | 1,960,000 | | | | 105,127 | | | | 94,617 | |
Mexican Bonos+ | | | 7.50 | | | | 6/3/2027 | | | | 930,000 | | | | 52,905 | | | | 44,929 | |
Mexican Bonos+ | | | 7.75 | | | | 11/13/2042 | | | | 6,830,000 | | | | 407,239 | | | | 328,215 | |
| | | | | | | | | | | | | | | | | | | | |
Total Mexico | | | | 9,720,000 | | | | 565,271 | | | | 467,761 | |
| | | | | | | | | | | | | | | | | | | | |
|
Peru — 4.8%*: | |
Peru Government Bond+ | | | 6.85 | | | | 2/12/2042 | | | | 270,000 | | | | 83,508 | | | | 77,681 | |
Peru Government Bond+ | | | 6.95 | | | | 8/12/2031 | | | | 310,000 | | | | 103,981 | | | | 93,850 | |
Peru Government Bond+ | | | 7.84 | | | | 8/12/2020 | | | | 183,000 | | | | 54,267 | | | | 59,290 | |
| | | | | | | | | | | | | | | | | | | | |
Total Peru | | | | 763,000 | | | | 241,756 | | | | 230,821 | |
| | | | | | | | | | | | | | | | | | | | |
See accompanying Notes to the Financial Statements.
136
Barings Emerging Markets Local Currency Debt Fund 2016 Semi-Annual Report
SCHEDULE OF INVESTMENTS (CONTINUED)
December 31, 2016 (Unaudited)
| | | | | | | | | | | | | | | | | | | | |
| | | EFFECTIVE
INTEREST RATE | | | DUE DATE | | | PRINCIPAL ‡‡ | | | COST | | | FAIR
VALUE | |
Foreign Government (Continued) | |
|
Poland — 4.9%*: | |
Poland Government Bond+ | | | 2.50 | % | | | 7/25/2018 | | | | 970,000 | | | $ | 255,373 | | | $ | 234,282 | |
| | | | | | | | | | | | | | | | | | | | |
|
Romania — 4.5%*: | |
Romania Government Bond+ | | | 5.80 | | | | 7/26/2027 | | | | 180,000 | | | | 52,769 | | | | 49,102 | |
Romania Government Bond+ | | | 5.90 | | | | 7/26/2017 | | | | 160,000 | | | | 39,964 | | | | 38,196 | |
Romania Government Bond+ | | | 6.75 | | | | 6/11/2017 | | | | 550,000 | | | | 137,321 | | | | 130,980 | |
| | | | | | | | | | | | | | | | | | | | |
Total Romania | | | | 890,000 | | | | 230,054 | | | | 218,278 | |
| | | | | | | | | | | | | | | | | | | | |
|
Russia — 4.4%*: | |
Russian Federal Bond — OFZ+ | | | 7.00 | | | | 8/16/2023 | | | | 8,243,000 | | | | 117,594 | | | | 126,299 | |
Russian Federal Bond — OFZ+ | | | 7.60 | | | | 7/20/2022 | | | | 2,325,000 | | | | 34,196 | | | | 37,095 | |
Russian Federal Bond — OFZ+ | | | 8.50 | | | | 9/17/2031 | | | | 3,000,000 | | | | 49,008 | | | | 49,078 | |
| | | | | | | | | | | | | | | | | | | | |
Total Russia | | | | 13,568,000 | | | | 200,798 | | | | 212,472 | |
| | | | | | | | | | | | | | | | | | | | |
|
South Africa — 9.5%*: | |
South Africa Government Bond+ | | | 6.50 | | | | 2/28/2041 | | | | 1,200,000 | | | | 58,642 | | | | 62,430 | |
South Africa Government Bond+ | | | 7.00 | | | | 2/28/2031 | | | | 1,900,000 | | | | 110,216 | | | | 113,524 | |
South Africa Government Bond+ | | | 8.75 | | | | 2/28/2048 | | | | 4,200,000 | | | | 254,063 | | | | 280,462 | |
| | | | | | | | | | | | | | | | | | | | |
Total South Africa | | | | 7,300,000 | | | | 422,921 | | | | 456,416 | |
| | | | | | | | | | | | | | | | | | | | |
|
Thailand — 4.9%*: | |
Thailand Government Bond+ | | | 1.20 | | | | 7/14/2021 | | | | 8,539,200 | | | | 228,578 | | | | 232,771 | |
| | | | | | | | | | | | | | | | | | | | |
|
Turkey — 4.5%*: | |
Turkey Government Bond+ | | | 8.00 | | | | 3/12/2025 | | | | 910,000 | | | | 281,199 | | | | 215,626 | |
| | | | | | | | | | | | | | | | | | | | |
|
Ukrainian — 2.2%*: | |
Ukraine Government International Bond+^ | | | Zero Coupon | | | | 5/31/2040 | | | | 350,000 | | | | 109,475 | | | | 105,308 | |
| | | | | | | | | | | | | | | | | | | | |
Total Foreign Government | | | | 7,665,160,200 | | | | 4,464,293 | | | | 4,381,124 | |
| | | | | | | | | | | | | | | | | | | | |
| | | | | | | | | | | | | | | | | | | | |
Total Fixed Income | | | | 7,665,160,200 | | | | 4,464,293 | | | | 4,381,124 | |
| | | | | | | | | | | | | | | | | | | | |
Short-Term Investments — 7.1%*: | |
|
Bank Deposit — 7.1%*: | |
State Street Bank & Trust Co. Euro Time Deposit | | | 0.01 | | | | 1/3/2017 | | | | 339,448 | | | | 339,448 | | | | 339,448 | |
| | | | | | | | | | | | | | | | | | | | |
Total Investments | | | | 7,665,499,648 | | | | 4,803,741 | | | | 4,720,572 | |
| | | | | | | | | | | | | | | | | | | | |
| |
Other assets and liabilities – 1.6%* | | | | 75,343 | |
| |
Net Assets – 100.0% | | | | $4,795,915 | |
| | | | | | | | | | | | | | | | | | | | |
| ‡‡ | Unless otherwise indicated, all principal amounts are denominated in United States Dollars. |
| * | Calculated as a percentage of net assets applicable to common shareholders. |
See accompanying Notes to the Financial Statements.
137
Barings Emerging Markets Local Currency Debt Fund 2016 Semi-Annual Report
SCHEDULE OF INVESTMENTS (CONTINUED)
December 31, 2016 (Unaudited)
Distributions of investments by country of risk (excluding temporary cash investments) as a percentage of total investments in securities, is as follows:
| | | | | | |
| | Indonesia | | | 10.8% | |
| | Mexico | | | 10.7% | |
| | South Africa | | | 10.4% | |
| | Malaysia | | | 10.2% | |
| | Colombia | | | 9.0% | |
| | Brazil | | | 5.5% | |
| | Hungary | | | 5.4% | |
| | Poland | | | 5.3% | |
| | Thailand | | | 5.3% | |
| | Peru | | | 5.3% | |
| | Romania | | | 5.0% | |
| | Turkey | | | 4.9% | |
| | Russia | | | 4.8% | |
| | Croatia | | | 2.5% | |
| | Ukrainian | | | 2.4% | |
| | Ghana | | | 1.3% | |
| | Chile | | | 1.2% | |
| | | | | | |
| | Total | | | 100.0% | |
| | | | | | |
| ^ | Security acquired in a transaction exempt from registration under Rule 144A of the Securities Act of 1933. These securities may only be resold in transactions exempt from registration, normally to qualified institutional buyers. |
A summary of outstanding derivatives at December 31, 2016 is as follows:
Cross Currency Forward Foreign Currency Exchange Contracts
| | | | | | | | | | | | | | | | |
EXPIRATION
DATE | | DELIVER/
RECEIVE | | COUNTERPARTY | | CONTRACT
AMOUNT
PURCHASED | | | CONTRACT
AMOUNT
SOLD | | | NET UNREALIZED
APPRECIATION
(DEPRECIATION) | |
| 1/17/17 | | EUR/PLN | | JPMorgan Chase Bank N.A. | | | 432,275 | | | | 100,389 | | | $ | (2,439 | ) |
| 1/17/17 | | EUR/RON | | Bank of America N.A. | | | 775,316 | | | | 172,352 | | | | (1,818 | ) |
| 1/17/17 | | EUR/RON | | JPMorgan Chase Bank N.A. | | | 250,179 | | | | 56,000 | | | | (994 | ) |
| 3/7/17 | | EUR/RSD | | BNP Paribas S.A. | | | 11,646,600 | | | | 94,000 | | | | (535 | ) |
| 1/17/17 | | HUF/EUR | | Citibank N.A. | | | 103,293 | | | | 31,739,221 | | | | 598 | |
| 1/17/17 | | PLN/EUR | | Citibank N.A. | | | 40,000 | | | | 176,804 | | | | (121 | ) |
| | | | | | | | | | | | | | | | |
Net unrealized depreciation on cross currency forward foreign currency exchange contracts | | | $ | (5,309 | ) |
| | | | | | | | | | | | | | | | |
See accompanying Notes to the Financial Statements.
138
Barings Emerging Markets Local Currency Debt Fund 2016 Semi-Annual Report
SCHEDULE OF INVESTMENTS (CONTINUED)
December 31, 2016 (Unaudited)
Forward Foreign Currency Exchange Contracts to Buy
| | | | | | | | | | | | | | | | | | | | | | |
EXPIRATION
DATE | | COUNTERPARTY | | LOCAL
CURRENCY | | | VALUE IN USD | | | IN
EXCHANGE
FOR USD | | | NET UNREALIZED
APPRECIATION
(DEPRECIATION) | |
| 3/1/17 | | JPMorgan Chase Bank N.A. | | | ARS | | | | 1,881,000 | | | | 113,938 | | | | 100,000 | | | $ | 13,938 | |
| 1/17/17 | | BNP Paribas S.A. | | | BRL | | | | 361,892 | | | | 110,773 | | | | 109,000 | | | | 1,773 | |
| 3/16/17 | | BNP Paribas S.A. | | | BRL | | | | 591,915 | | | | 178,330 | | | | 174,168 | | | | 4,162 | |
| 1/17/17 | | JPMorgan Chase Bank N.A. | | | CAD | | | | 29,428 | | | | 21,948 | | | | 22,000 | | | | (52 | ) |
| 1/17/17 | | Citibank N.A. | | | CHF | | | | 98,547 | | | | 97,054 | | | | 96,350 | | | | 704 | |
| 1/17/17 | | Citibank N.A. | | | CLP | | | | 6,043,500 | | | | 9,015 | | | | 9,000 | | | | 15 | |
| 2/22/17 | | Bank of America N.A. | | | CNH | | | | 1,698,015 | | | | 240,115 | | | | 251,931 | | | | (11,816 | ) |
| 11/14/17 | | JPMorgan Chase Bank N.A. | | | CNH | | | | 107,746 | | | | 14,772 | | | | 15,000 | | | | (228 | ) |
| 1/17/17 | | BNP Paribas S.A. | | | COP | | | | 497,208,530 | | | | 165,250 | | | | 167,269 | | | | (2,019 | ) |
| 1/17/17 | | JPMorgan Chase Bank N.A. | | | HKD | | | | 2,101,639 | | | | 271,084 | | | | 270,666 | | | | 418 | |
| 1/17/17 | | Citibank N.A. | | | HUF | | | | 103,050,842 | | | | 352,069 | | | | 375,963 | | | | (23,894 | ) |
| 1/17/17 | | BNP Paribas S.A. | | | JPY | | | | 11,297,148 | | | | 96,941 | | | | 96,159 | | | | 782 | |
| 1/17/17 | | JPMorgan Chase Bank N.A. | | | KRW | | | | 118,791,400 | | | | 98,611 | | | | 103,811 | | | | (5,200 | ) |
| 1/17/17 | | JPMorgan Chase Bank N.A. | | | KZT | | | | 35,964,000 | | | | 107,498 | | | | 106,402 | | | | 1,095 | |
| 1/17/17 | | Citibank N.A. | | | MXN | | | | 703,544 | | | | 34,090 | | | | 34,000 | | | | 90 | |
| 1/17/17 | | JPMorgan Chase Bank N.A. | | | MXN | | | | 13,268,817 | | | | 642,932 | | | | 688,780 | | | | (45,848 | ) |
| 1/17/17 | | BNP Paribas S.A. | | | MXN | | | | 669,570 | | | | 32,443 | | | | 33,000 | | | | (557 | ) |
| 1/17/17 | | Bank of America N.A. | | | MXN | | | | 655,050 | | | | 31,740 | | | | 33,000 | | | | (1,260 | ) |
| 1/17/17 | | Bank of America N.A. | | | MYR | | | | 476,748 | | | | 106,257 | | | | 114,000 | | | | (7,743 | ) |
| 1/17/17 | | BNP Paribas S.A. | | | NOK | | | | 1,152,510 | | | | 133,918 | | | | 133,882 | | | | 36 | |
| 1/17/17 | | JPMorgan Chase Bank N.A. | | | PHP | | | | 5,579,800 | | | | 112,393 | | | | 115,000 | | | | (2,607 | ) |
| 1/17/17 | | JPMorgan Chase Bank N.A. | | | PLN | | | | 2,499,050 | | | | 598,518 | | | | 644,832 | | | | (46,314 | ) |
| 1/17/17 | | JPMorgan Chase Bank N.A. | | | RUB | | | | 14,101,301 | | | | 230,653 | | | | 220,953 | | | | 9,700 | |
| 1/17/17 | | Citibank N.A. | | | SEK | | | | 1,395,666 | | | | 153,780 | | | | 159,913 | | | | (6,133 | ) |
| 1/17/17 | | BNP Paribas S.A. | | | SGD | | | | 196,275 | | | | 135,850 | | | | 142,000 | | | | (6,150 | ) |
| 1/17/17 | | JPMorgan Chase Bank N.A. | | | THB | | | | 11,409,605 | | | | 318,573 | | | | 320,900 | | | | (2,327 | ) |
| 1/17/17 | | Bank of America N.A. | | | TRY | | | | 458,439 | | | | 129,952 | | | | 145,550 | | | | (15,598 | ) |
| 1/17/17 | | JPMorgan Chase Bank N.A. | | | ZAR | | | | 2,566,826 | | | | 187,262 | | | | 176,409 | | | | 10,853 | |
| | | | | | | | | | | | | | | | | | | | | | |
Net unrealized depreciation on forward foreign exchange contracts to buy | | | $ | (134,180 | ) |
| | | | | | | | | | | | | | | | | | | | | | |
See accompanying Notes to the Financial Statements.
139
Barings Emerging Markets Local Currency Debt Fund 2016 Semi-Annual Report
SCHEDULE OF INVESTMENTS (CONTINUED)
December 31, 2016 (Unaudited)
Forward Foreign Currency Exchange Contracts to Sell
| | | | | | | | | | | | | | | | | | | | | | |
EXPIRATION
DATE | | COUNTERPARTY | | LOCAL
CURRENCY | | | VALUE IN USD | | | IN
EXCHANGE
FOR USD | | | NET UNREALIZED
APPRECIATION
(DEPRECIATION) | |
| 3/1/17 | | BNP Paribas S.A. | | | ARS | | | | 1,881,000 | | | | 113,938 | | | | 116,327 | | | $ | 2,389 | |
| 1/17/17 | | Citibank N.A. | | | AUD | | | | 74,437 | | | | 53,881 | | | | 56,126 | | | | 2,245 | |
| 1/17/17 | | Goldman Sachs & Co. | | | CAD | | | | 74,482 | | | | 55,551 | | | | 56,269 | | | | 718 | |
| 1/17/17 | | BNP Paribas S.A. | | | CAD | | | | 274,125 | | | | 204,448 | | | | 204,000 | | | | (448 | ) |
| 1/17/17 | | JPMorgan Chase Bank N.A. | | | CHF | | | | 98,547 | | | | 97,054 | | | | 100,343 | | | | 3,289 | |
| 1/17/17 | | Goldman Sachs & Co. | | | CLP | | | | 66,527,421 | | | | 99,237 | | | | 98,878 | | | | (359 | ) |
| 2/6/17 | | Bank of America N.A. | | | CLP | | | | 35,518,500 | | | | 52,911 | | | | 54,000 | | | | 1,089 | |
| 2/22/17 | | JPMorgan Chase Bank N.A. | | | CNH | | | | 1,698,015 | | | | 240,115 | | | | 250,000 | | | | 9,885 | |
| 11/14/17 | | BNP Paribas S.A. | | | CNH | | | | 3,037,089 | | | | 416,391 | | | | 436,000 | | | | 19,609 | |
| 1/17/17 | | Citibank N.A. | | | COP | | | | 247,272,480 | | | | 82,182 | | | | 82,507 | | | | 325 | |
| 1/17/17 | | BNP Paribas S.A. | | | COP | | | | 233,310,000 | | | | 77,542 | | | | 77,000 | | | | (542 | ) |
| 1/17/17 | | Citibank N.A. | | | EUR | | | | 471,498 | | | | 497,703 | | | | 522,250 | | | | 24,547 | |
| 1/17/17 | | BNP Paribas S.A. | | | EUR | | | | 181,453 | | | | 191,537 | | | | 190,000 | | | | (1,537 | ) |
| 1/17/17 | | Goldman Sachs & Co. | | | HKD | | | | 2,101,639 | | | | 271,084 | | | | 271,059 | | | | (25 | ) |
| 1/17/17 | | Goldman Sachs & Co. | | | HUF | | | | 39,770,728 | | | | 135,875 | | | | 140,621 | | | | 4,746 | |
| 1/17/17 | | BNP Paribas S.A. | | | ILS | | | | 635,218 | | | | 165,096 | | | | 166,954 | | | | 1,858 | |
| 1/17/17 | | BNP Paribas S.A. | | | JPY | | | | 5,614,422 | | | | 48,177 | | | | 55,000 | | | | 6,823 | |
| 1/17/17 | | JPMorgan Chase Bank N.A. | | | JPY | | | | 5,682,726 | | | | 48,764 | | | | 55,192 | | | | 6,428 | |
| 1/17/17 | | BNP Paribas S.A. | | | KRW | | | | 118,791,400 | | | | 98,611 | | | | 107,000 | | | | 8,389 | |
| 1/17/17 | | JPMorgan Chase Bank N.A. | | | MXN | | | | 6,511,282 | | | | 315,500 | | | | 341,678 | | | | 26,178 | |
| 1/17/17 | | Citibank N.A. | | | MYR | | | | 440,110 | | | | 98,091 | | | | 105,959 | | | | 7,868 | |
| 1/17/17 | | JPMorgan Chase Bank N.A. | | | MYR | | | | 168,752 | | | | 37,611 | | | | 40,148 | | | | 2,537 | |
| 1/17/17 | | Goldman Sachs & Co. | | | NOK | | | | 1,152,510 | | | | 133,918 | | | | 140,931 | | | | 7,013 | |
| 3/16/17 | | BNP Paribas S.A. | | | NZD | | | | 153,780 | | | | 106,994 | | | | 110,772 | | | | 3,778 | |
| 2/6/17 | | JPMorgan Chase Bank N.A. | | | PEN | | | | 540,123 | | | | 160,448 | | | | 158,000 | | | | (2,448 | ) |
| 1/17/17 | | Citibank N.A. | | | PHP | | | | 14,893,755 | | | | 300,002 | | | | 303,057 | | | | 3,055 | |
| 1/17/17 | | Goldman Sachs & Co. | | | RON | | | | 231,895 | | | | 53,871 | | | | 56,330 | | | | 2,459 | |
| 1/17/17 | | JPMorgan Chase Bank N.A. | | | RON | | | | 892,495 | | | | 207,334 | | | | 220,565 | | | | 13,231 | |
| 1/17/17 | | BNP Paribas S.A. | | | RUB | | | | 7,255,934 | | | | 118,684 | | | | 111,000 | | | | (7,684 | ) |
| 1/17/17 | | JPMorgan Chase Bank N.A. | | | SGD | | | | 352,442 | | | | 243,940 | | | | 255,981 | | | | 12,041 | |
| 1/17/17 | | JPMorgan Chase Bank N.A. | | | THB | | | | 1,875,380 | | | | 52,363 | | | | 52,000 | | | | (363 | ) |
| 1/17/17 | | Citibank N.A. | | | TRY | | | | 49,471 | | | | 14,024 | | | | 14,000 | | | | (24 | ) |
| 1/17/17 | | BNP Paribas S.A. | | | ZAR | | | | 1,065,522 | | | | 77,735 | | | | 76,000 | | | | (1,735 | ) |
| | | | | | | | | | | | | | | | | | | | | | |
Net unrealized appreciation on forward foreign exchange contracts to sell | | | $ | 155,335 | |
| | | | | | | | | | | | | | | | | | | | | | |
See accompanying Notes to the Financial Statements.
140
Barings Emerging Markets Local Currency Debt Fund 2016 Semi-Annual Report
SCHEDULE OF INVESTMENTS (CONTINUED)
December 31, 2016 (Unaudited)
Currency Legend
| | | | |
| ARS | | – | | Argentine Peso |
| AUD | | – | | Australian Dollar |
| BRL | | – | | Brazilian Real |
| CAD | | – | | Canadian Dollar |
| CHF | | – | | Swiss Franc |
| CLP | | – | | Chilean Peso |
| CNH | | – | | Chinese Yuan Renminbi |
| COP | | – | | Colombian Peso |
| CZK | | – | | Czech Koruna |
| EUR | | – | | Euro |
| HKD | | – | | Hong Kong Dollar |
| HUF | | – | | Hungarian Forint |
| ILS | | – | | Israeli Shekel |
| JPY | | – | | Japanese Yen |
| KRW | | – | | South Korean Won |
| KZT | | – | | Kazakhstani Tenge |
| MXN | | – | | Mexican Peso |
| MYR | | – | | Malaysian Ringgit |
| NOK | | – | | Norwegian Krona |
| NZD | | – | | New Zealand Dollar |
| PEN | | – | | Peruvian Nouveau Sol |
| PHP | | – | | Philippines Peso |
| PLN | | – | | Polish Zloty |
| RON | | – | | New Romanian Leu |
| RSD | | – | | Serbian Dinar. |
| RUB | | – | | Russian Ruble |
| SEK | | – | | Swedish Krona |
| SGD | | – | | Singapore Dollar |
| THB | | – | | Thai Baht |
| TRY | | – | | New Turkish Lira |
| ZAR | | – | | South African Rand |
See accompanying Notes to the Financial Statements.
141
Barings Emerging Markets Local Currency Debt Fund 2016 Semi-Annual Report
SCHEDULE OF INVESTMENTS (CONTINUED)
December 31, 2016 (Unaudited)
OTC – Interest Rate Swaps
| | | | | | | | | | | | | | |
| DESCRIPTION | | NOTIONAL
AMOUNT | | | UNREALIZED
APPRECIATION
(DEPRECIATION) | | | VALUE | |
Agreement with Bank of America N.A. dated 6/24/16 receiving a fixed rate of 12.50% paying the notional amount multiplied by the BRL-CDI rate. Expiring 1/2/25 | | BRL | | | 220,679 | | | $ | 3,874 | | | $ | 3,874 | |
Agreement with Bank of America N.A. dated 12/9/15 receiving a fixed rate of 8.68% paying the notional amount multiplied by the ZAR-JIBAR rate. Expiring 12/9/25 | | ZAR | | | 8,000,000 | | | | 15,927 | | | | 15,927 | |
Agreement with JPMorgan Chase Bank N.A. dated 6/7/16 receiving a fixed rate of 2.46% paying the notional amount multiplied by the PLN-WIBOR rate. Expiring 6/21/26 | | PLN | | | 600,000 | | | | (4,530 | ) | | | (4,530 | ) |
Agreement with JPMorgan Chase Bank N.A. dated 12/9/15 receiving a fixed rate of 6.35% paying the notional amount multiplied by the MXN-TIIE rate. Expiring 11/27/25 | | MXN | | | 4,750,000 | | | | (23,310 | ) | | | (23,310 | ) |
Agreement with JPMorgan Chase Bank N.A. dated 9/28/16 receiving a fixed rate of 11.45% paying the notional amount multiplied by the BRL-CDI rate. Expiring 1/02/23 | | BRL | | | 508,960 | | | | (2,275 | ) | | | (2,275 | ) |
Agreement with JPMorgan Chase Bank N.A. dated 5/19/16 paying a fixed rate of 1.64% receiving the notional amount multiplied by the KRW-KSDA rate. Expiring 5/20/26 | | KRW | | | 159,000,000 | | | | 1,988 | | | | 1,988 | |
Agreement with JPMorgan Chase Bank N.A. dated 7/13/16 paying a fixed rate of 0.26% receiving the notional amount multiplied by the CZK-PRIBO rate. Expiring 7/15/21 | | CZK | | | 4,300,000 | | | | 1,513 | | | | 1,513 | |
Agreement with JPMorgan Chase Bank N.A. dated 12/12/15 paying a fixed rate of 0.25% receiving the notional amount multiplied by the CZK-PRIBO rate. Expiring 2/16/21 | | CZK | | | 2,500,000 | | | | 691 | | | | 691 | |
| | | | | | | | | | | | | | |
Total Interest Rate Swaps | | | | | | | $ | (6,122 | ) |
| | | | | | | | | | | | | | |
Abbreviation Legend
See accompanying Notes to the Financial Statements.
142
Barings Global High Yield Fund 2016 Semi-Annual Report
SCHEDULE OF INVESTMENTS
December 31, 2016 (Unaudited)
| | | | | | | | | | | | | | | | | | | | |
| | | EFFECTIVE
INTEREST RATE | | | DUE DATE | | | PRINCIPAL ‡‡ | | | COST | | | FAIR
VALUE | |
Fixed Income — 97.0%*: | |
|
Corporate Bonds — 97.0%*: | |
|
Aerospace and Defense — 2.9%*: | |
American Airlines Group, Inc.^ | | | 5.50 | % | | | 10/1/2019 | | | | 265,000 | | | | $269,904 | | | | $273,613 | |
CPI International, Inc. | | | 8.75 | | | | 2/15/2018 | | | | 500,000 | | | | 501,932 | | | | 507,500 | |
| | | | | | | | | | | | | | | | | | | | |
Total Aerospace and Defense | | | | 765,000 | | | | 771,836 | | | | 781,113 | |
| | | | | | | | | | | | | | | | | | | | |
|
Automobile — 3.0%*: | |
Allison Transmission, Inc.^ | | | 5.00 | | | | 10/1/2024 | | | | 176,000 | | | | 176,000 | | | | 177,760 | |
Gates Global LLC/Gates Global Co.^ | | | 6.00 | | | | 7/15/2022 | | | | 125,000 | | | | 98,625 | | | | 122,250 | |
International Automotive Components Group SA^ | | | 9.13 | | | | 6/1/2018 | | | | 250,000 | | | | 251,441 | | | | 243,750 | |
JB Poindexter & Co., Inc.^ | | | 9.00 | | | | 4/1/2022 | | | | 250,000 | | | | 262,152 | | | | 262,500 | |
| | | | | | | | | | | | | | | | | | | | |
Total Automobile | | | | 801,000 | | | | 788,218 | | | | 806,260 | |
| | | | | | | | | | | | | | | | | | | | |
|
Banking — 0.4%*: | |
Lock AS+ | | | 7.00 | | | | 8/15/2021 | | | | 100,000 | | | | 114,475 | | | | 111,777 | |
| | | | | | | | | | | | | | | | | | | | |
|
Beverage, Food and Tobacco — 0.7%*: | |
Boparan Finance PLC+ | | | 5.25 | | | | 7/15/2019 | | | | 150,000 | | | | 192,008 | | | | 185,784 | |
| | | | | | | | | | | | | | | | | | | | |
|
Broadcasting and Entertainment — 4.6%*: | |
CCO Holdings LLC/CCO Holdings Capital Corp.^ | | | 5.75 | | | | 2/15/2026 | | | | 250,000 | | | | 250,000 | | | | 258,750 | |
DISH DBS Corp. | | | 7.75 | | | | 7/1/2026 | | | | 316,000 | | | | 316,000 | | | | 356,290 | |
Entertainment One Ltd.+ | | | 6.88 | | | | 12/15/2022 | | | | 100,000 | | | | 150,232 | | | | 133,777 | |
Netflix, Inc.^ | | | 4.38 | | | | 11/15/2026 | | | | 300,000 | | | | 300,000 | | | | 291,000 | |
Unitymedia Hessen GmbH & Co. KG/Unitymedia NRW GmbH+ | | | 3.50 | | | | 1/15/2027 | | | | 200,000 | | | | 214,769 | | | | 206,319 | |
| | | | | | | | | | | | | | | | | | | | |
Total Broadcasting and Entertainment | | | | 1,166,000 | | | | 1,231,001 | | | | 1,246,136 | |
| | | | | | | | | | | | | | | | | | | | |
|
Buildings and Real Estate — 2.9%*: | |
Brookfield Residential Properties, Inc.^ | | | 6.50 | | | | 12/15/2020 | | | | 250,000 | | | | 249,498 | | | | 255,625 | |
GEO Group, Inc. (The) | | | 6.00 | | | | 4/15/2026 | | | | 250,000 | | | | 250,000 | | | | 245,625 | |
Keystone Financing PLC+ | | | 9.50 | | | | 10/15/2019 | | | | 100,000 | | | | 133,497 | | | | 128,884 | |
Paroc Group Oy+ | | | 6.25 | | | | 5/15/2020 | | | | 150,000 | | | | 159,303 | | | | 161,845 | |
| | | | | | | | | | | | | | | | | | | | |
Total Buildings and Real Estate | | | | 750,000 | | | | 792,298 | | | | 791,979 | |
| | | | | | | | | | | | | | | | | | | | |
|
Cargo Transport — 4.0%*: | |
Deck Chassis Acquisition, Inc.^ | | | 10.00 | | | | 6/15/2023 | | | | 387,000 | | | | 394,662 | | | | 399,578 | |
Kenan Advantage Group, Inc.^ | | | 7.88 | | | | 7/31/2023 | | | | 400,000 | | | | 412,733 | | | | 404,000 | |
WFS Global Holding SAS+ | | | 9.50 | | | | 7/15/2022 | | | | 250,000 | | | | 280,189 | | | | 270,570 | |
| | | | | | | | | | | | | | | | | | | | |
Total Cargo Transport | | | | 1,037,000 | | | | 1,087,584 | | | | 1,074,148 | |
| | | | | | | | | | | | | | | | | | | | |
|
Chemicals, Plastics and Rubber — 4.4%*: | |
A. Schulman, Inc.^ | | | 6.88 | | | | 6/1/2023 | | | | 250,000 | | | | 253,045 | | | | 261,250 | |
Consolidated Energy Finance SA+^ | | | 6.75 | | | | 10/15/2019 | | | | 370,000 | | | | 364,870 | | | | 370,000 | |
See accompanying Notes to the Financial Statements.
143
Barings Global High Yield Fund 2016 Semi-Annual Report
SCHEDULE OF INVESTMENTS (CONTINUED)
December 31, 2016 (Unaudited)
| | | | | | | | | | | | | | | | | | | | |
| | | EFFECTIVE
INTEREST RATE | | | DUE DATE | | | PRINCIPAL ‡‡ | | | COST | | | FAIR
VALUE | |
Corporate Bonds (Continued) | |
|
Chemicals, Plastics and Rubber (Continued) | |
LBC Tank Terminals Holding Netherlands BV^ | | | 6.88 | % | | | 5/15/2023 | | | | 215,000 | | | $ | 207,551 | | | $ | 219,837 | |
LSB Industries, Inc. | | | 8.50 | | | | 8/1/2019 | | | | 232,000 | | | | 204,240 | | | | 213,440 | |
Trinseo Materials Operating SCA/Trinseo Materials Finance, Inc. | | | 6.38 | | | | 5/1/2022 | | | | 100,000 | | | | 116,901 | | | | 112,634 | |
| | | | | | | | | | | | | | | | | | | | |
Total Chemicals, Plastics and Rubber | | | | 1,167,000 | | | | 1,146,607 | | | | 1,177,161 | |
| | | | | | | | | | | | | | | | | | | | |
|
Containers, Packaging and Glass — 4.6%*: | |
Ardagh Packaging Finance PLC/Ardagh Holdings USA, Inc.+ | | | 6.75 | | | | 5/15/2024 | | | | 100,000 | | | | 110,781 | | | | 112,370 | |
Coveris Holdings SA^ | | | 7.88 | | | | 11/1/2019 | | | | 372,000 | | | | 353,363 | | | | 369,210 | |
Horizon Holdings I SASU+ | | | 7.25 | | | | 8/1/2023 | | | | 300,000 | | | | 345,789 | | | | 337,111 | |
Iron Mountain Europe PLC+ | | | 6.13 | | | | 9/15/2022 | | | | 100,000 | | | | 132,632 | | | | 130,018 | |
Plastipak Holdings, Inc.^ | | | 6.50 | | | | 10/1/2021 | | | | 125,000 | | | | 125,555 | | | | 130,625 | |
SIG Combibloc Holdings SCA+ | | | 7.75 | | | | 2/15/2023 | | | | 150,000 | | | | 172,460 | | | | 169,614 | |
| | | | | | | | | | | | | | | | | | | | |
Total Containers, Packaging and Glass | | | | 1,147,000 | | | | 1,240,580 | | | | 1,248,948 | |
| | | | | | | | | | | | | | | | | | | | |
|
Diversified Natural Resources, Precious Metals and Minerals — 0.8%*: | |
Kinross Gold Corp.+ | | | 5.95 | | | | 3/15/2024 | | | | 127,000 | | | | 132,521 | | | | 128,587 | |
Kinross Gold Corp. | | | 6.88 | | | | 9/1/2041 | | | | 82,000 | | | | 81,591 | | | | 75,748 | |
| | | | | | | | | | | | | | | | | | | | |
Total Diversified Natural Resources, Precious Metals and Minerals | | | | | | | | | | | 209,000 | | | | 214,112 | | | | 204,335 | |
| | | | | | | | | | | | | | | | | | | | |
|
Diversified/Conglomerate Manufacturing — 2.3%*: | |
Boise Cascade Co.^ | | | 5.63 | | | | 9/1/2024 | | | | 157,000 | | | | 157,000 | | | | 155,823 | |
EnPro Industries, Inc. | | | 5.88 | | | | 9/15/2022 | | | | 221,000 | | | | 222,893 | | | | 227,078 | |
West Corp.^ | | | 5.38 | | | | 7/15/2022 | | | | 250,000 | | | | 240,914 | | | | 241,562 | |
| | | | | | | | | | | | | | | | | | | | |
Total Diversified/Conglomerate Manufacturing | | | | 628,000 | | | | 620,807 | | | | 624,463 | |
| | | | | | | | | | | | | | | | | | | | |
|
Diversified/Conglomerate Service — 3.2%*: | |
Carlson Travel, Inc.^ | | | 9.50 | | | | 12/15/2024 | | | | 280,000 | | | | 280,000 | | | | 292,950 | |
Infor Software Parent LLC/Infor Software Parent, Inc. PIK^ | | | 7.13 | | | | 5/1/2021 | | | | 304,000 | | | | 270,109 | | | | 313,120 | |
Zachry Holdings, Inc.^ | | | 7.50 | | | | 2/1/2020 | | | | 250,000 | | | | 252,363 | | | | 256,563 | |
| | | | | | | | | | | | | | | | | | | | |
Total Diversified/Conglomerate Service | | | | 834,000 | | | | 802,472 | | | | 862,633 | |
| | | | | | | | | | | | | | | | | | | | |
|
Electronics — 2.3%*: | |
Diamond 1 Finance Corp./Diamond 2 Finance Corp.^ | | | 7.13 | | | | 6/15/2024 | | | | 154,000 | | | | 154,000 | | | | 170,967 | |
Prime Security Services Borrower LLC/Prime Finance, Inc.^ | | | 9.25 | | | | 5/15/2023 | | | | 250,000 | | | | 250,000 | | | | 272,188 | |
Western Digital Corp.^ | | | 10.50 | | | | 4/1/2024 | | | | 150,000 | | | | 150,000 | | | | 177,375 | |
| | | | | | | | | | | | | | | | | | | | |
Total Electronics | | | | 554,000 | | | | 554,000 | | | | 620,530 | |
| | | | | | | | | | | | | | | | | | | | |
|
Finance — 3.7%*: | |
Aircastle Ltd. | | | 5.00 | | | | 4/1/2023 | | | | 19,000 | | | | 20,013 | | | | 19,380 | |
Aircastle Ltd. | | | 5.50 | | | | 2/15/2022 | | | | 19,000 | | | | 20,444 | | | | 20,140 | |
See accompanying Notes to the Financial Statements.
144
Barings Global High Yield Fund 2016 Semi-Annual Report
SCHEDULE OF INVESTMENTS (CONTINUED)
December 31, 2016 (Unaudited)
| | | | | | | | | | | | | | | | | | | | |
| | | EFFECTIVE
INTEREST RATE | | | DUE DATE | | | PRINCIPAL ‡‡ | | | COST | | | FAIR
VALUE | |
Corporate Bonds (Continued) | |
|
Finance (Continued) | |
Arrow Global Finance PLC+ | | | 5.13 | % | | | 9/15/2024 | | | | 100,000 | | | $ | 118,600 | | | $ | 122,870 | |
Galaxy Finco Ltd.+ | | | 7.88 | | | | 11/15/2021 | | | | 250,000 | | | | 381,558 | | | | 309,560 | |
Garfunkelux Holdco 3 SA+ | | | 8.50 | | | | 11/1/2022 | | | | 300,000 | | | | 460,048 | | | | 384,509 | |
Marlin Intermediate Holdings PLC MTN+ | | | 10.50 | | | | 8/1/2020 | | | | 100,000 | | | | 141,446 | | | | 134,024 | |
| | | | | | | | | | | | | | | | | | | | |
Total Finance | | | | 788,000 | | | | 1,142,109 | | | | 990,483 | |
| | | | | | | | | | | | | | | | | | | | |
|
Grocery — 0.5%*: | |
Premier Foods Finance PLC+ | | | 6.50 | | | | 3/15/2021 | | | | 100,000 | | | | 146,338 | | | | 126,506 | |
| | | | | | | | | | | | | | | | | | | | |
|
Healthcare, Education and Childcare — 6.1%*: | |
Cerberus Nightingale 1 Sarl+ | | | 8.25 | | | | 2/1/2020 | | | | 100,000 | | | | 110,265 | | | | 107,949 | |
HCA, Inc. | | | 5.38 | | | | 2/1/2025 | | | | 375,000 | | | | 380,908 | | | | 375,938 | |
Horizon Pharma, Inc./Horizon Pharma USA, Inc.^ | | | 8.75 | | | | 11/1/2024 | | | | 125,000 | | | | 125,000 | | | | 126,563 | |
IDH Finance PLC+ | | | 6.25 | | | | 8/15/2022 | | | | 100,000 | | | | 131,025 | | | | 119,543 | |
Kinetic Concepts, Inc./KCI USA, Inc.^ | | | 9.63 | | | | 10/1/2021 | | | | 375,000 | | | | 375,000 | | | | 396,562 | |
RegionalCare Hospital Partners Holdings, Inc.^ | | | 8.25 | | | | 5/1/2023 | | | | 132,000 | | | | 132,000 | | | | 131,670 | |
Valeant Pharmaceuticals International, Inc.^ | | | 5.50 | | | | 3/1/2023 | | | | 101,000 | | | | 73,450 | | | | 75,750 | |
Valeant Pharmaceuticals International, Inc.^ | | | 6.13 | | | | 4/15/2025 | | | | 424,000 | | | | 367,782 | | | | 318,530 | |
| | | | | | | | | | | | | | | | | | | | |
Total Healthcare, Education and Childcare | | | | 1,732,000 | | | | 1,695,430 | | | | 1,652,505 | |
| | | | | | | | | | | | | | | | | | | | |
|
Home and Office Furnishings, Housewares, and Durable Consumer Products — 0.6%*: | |
LSF9 Balta Issuer SA+ | | | 7.75 | | | | 9/15/2022 | | | | 150,000 | | | | 171,213 | | | | 173,687 | |
| | | | | | | | | | | | | | | | | | | | |
|
Hotels, Motels, Inns and Gaming — 2.9%*: | |
NH Hotels SA+ | | | 3.75 | | | | 10/1/2023 | | | | 100,000 | | | | 112,290 | | | | 108,528 | |
Pinnacle Entertainment, Inc.^ | | | 5.63 | | | | 5/1/2024 | | | | 250,000 | | | | 251,220 | | | | 250,625 | |
Thomas Cook Group PLC+ | | | 6.25 | | | | 6/15/2022 | | | | 150,000 | | | | 159,952 | | | | 166,250 | |
TVL Finance PLC+ | | | 8.50 | | | | 5/15/2023 | | | | 200,000 | | | | 285,595 | | | | 261,269 | |
| | | | | | | | | | | | | | | | | | | | |
Total Hotels, Motels, Inns and Gaming | | | | 700,000 | | | | 809,057 | | | | 786,672 | |
| | | | | | | | | | | | | | | | | | | | |
|
Insurance — 1.4%*: | |
Centene Corp. | | | 4.75 | | | | 1/15/2025 | | | | 174,000 | | | | 174,000 | | | | 169,868 | |
York Risk Services Holding Corp.^ | | | 8.50 | | | | 10/1/2022 | | | | 250,000 | | | | 226,642 | | | | 208,750 | |
| | | | | | | | | | | | | | | | | | | | |
Total Insurance | | | | 424,000 | | | | 400,642 | | | | 378,618 | |
| | | | | | | | | | | | | | | | | | | | |
|
Leisure, Amusement, Entertainment — 7.5%*: | |
AMC Entertainment Holdings, Inc.^ | | | 5.88 | | | | 11/15/2026 | | | | 250,000 | | | | 250,000 | | | | 255,625 | |
AMC Entertainment Holdings, Inc. | | | 6.38 | | | | 11/15/2024 | | | | 100,000 | | | | 121,910 | | | | 130,326 | |
Brunswick Corp. | | | 7.13 | | | | 8/1/2027 | | | | 817,000 | | | | 867,523 | | | | 953,848 | |
CPUK Finance Ltd.+ | | | 7.00 | | | | 8/28/2020 | | | | 100,000 | | | | 155,834 | | | | 130,160 | |
Perform Group Financing PLC+ | | | 8.50 | | | | 11/15/2020 | | | | 100,000 | | | | 149,645 | | | | 126,013 | |
WMG Acquisition Corp. | | | 4.13 | | | | 11/1/2024 | | | | 100,000 | | | | 110,505 | | | | 108,949 | |
WMG Acquisition Corp.^ | | | 5.00 | | | | 8/1/2023 | | | | 160,000 | | | | 160,000 | | | | 160,800 | |
WMG Acquisition Corp.^ | | | 6.75 | | | | 4/15/2022 | | | | 150,000 | | | | 151,043 | | | | 157,875 | |
| | | | | | | | | | | | | | | | | | | | |
Total Leisure, Amusement, Entertainment | | | | 1,777,000 | | | | 1,966,460 | | | | 2,023,596 | |
| | | | | | | | | | | | | | | | | | | | |
See accompanying Notes to the Financial Statements.
145
Barings Global High Yield Fund 2016 Semi-Annual Report
SCHEDULE OF INVESTMENTS (CONTINUED)
December 31, 2016 (Unaudited)
| | | | | | | | | | | | | | | | | | | | |
| | | EFFECTIVE
INTEREST RATE | | | DUE DATE | | | PRINCIPAL ‡‡ | | | COST | | | FAIR
VALUE | |
Corporate Bonds (Continued) | |
|
Machinery Non-Agriculture, Non-Construction, Non-Electronic — 0.5%*: | |
Gardner Denver, Inc.^ | | | 6.88 | % | | | 8/15/2021 | | | | 124,000 | | | $ | 119,263 | | | $ | 123,380 | |
| | | | | | | | | | | | | | | | | | | | |
|
Mining, Steel, Iron and Non-Precious Metals — 4.8%*: | |
Constellium NV+ | | | 7.00 | | | | 1/15/2023 | | | | 130,000 | | | | 126,480 | | | | 137,529 | |
Freeport-McMoRan, Inc. | | | 3.55 | | | | 3/1/2022 | | | | 213,000 | | | | 174,903 | | | | 198,090 | |
Freeport-McMoRan, Inc. | | | 4.00 | | | | 11/14/2021 | | | | 107,000 | | | | 84,863 | | | | 104,325 | |
Grinding Media, Inc./MC Grinding Media Canada, Inc.^ | | | 7.38 | | | | 12/15/2023 | | | | 94,000 | | | | 94,000 | | | | 98,756 | |
Hecla Mining Co. | | | 6.88 | | | | 5/1/2021 | | | | 250,000 | | | | 218,238 | | | | 255,625 | |
HudBay Minerals, Inc.+^ | | | 7.25 | | | | 1/15/2023 | | | | 56,000 | | | | 56,000 | | | | 57,960 | |
HudBay Minerals, Inc.+^ | | | 7.63 | | | | 1/15/2025 | | | | 65,000 | | | | 65,000 | | | | 67,560 | |
SunCoke Energy Partners LP/SunCoke Energy Partners Finance Corp. | | | 7.38 | | | | 2/1/2020 | | | | 60,000 | | | | 59,560 | | | | 59,700 | |
SunCoke Energy Partners LP/SunCoke Energy Partners Finance Corp.2^ | | | 7.38 | | | | 2/1/2020 | | | | 324,000 | | | | 276,662 | | | | 322,582 | |
| | | | | | | | | | | | | | | | | | | | |
Total Mining, Steel, Iron and Non-Precious Metals | | | | 1,299,000 | | | | 1,155,706 | | | | 1,302,127 | |
| | | | | | | | | | | | | | | | | | | | |
|
Oil and Gas — 15.6%*: | |
Chesapeake Energy Corp.^ | | | 8.00 | | | | 1/15/2025 | | | | 200,000 | | | | 197,053 | | | | 204,000 | |
Citgo Holding, Inc.^ | | | 10.75 | | | | 2/15/2020 | | | | 341,000 | | | | 344,974 | | | | 365,722 | |
Continental Resources, Inc. | | | 5.00 | | | | 9/15/2022 | | | | 250,000 | | | | 219,936 | | | | 252,348 | |
EP Energy LLC/Everest Acquisition Finance, Inc.^ | | | 8.00 | | | | 11/29/2024 | | | | 125,000 | | | | 125,000 | | | | 134,338 | |
EP Energy LLC/Everest Acquisition Finance, Inc. | | | 9.38 | | | | 5/1/2020 | | | | 183,000 | | | | 168,508 | | | | 168,702 | |
Ferrellgas Partners LP/Ferrellgas Partners Finance Corp. | | | 8.63 | | | | 6/15/2020 | | | | 250,000 | | | | 251,434 | | | | 246,250 | |
Genesis Energy LP/Genesis Energy Finance Corp. | | | 6.75 | | | | 8/1/2022 | | | | 250,000 | | | | 245,124 | | | | 259,750 | |
Globe Luxembourg S.C.A.+^ | | | 9.63 | | | | 5/1/2018 | | | | 200,000 | | | | 184,150 | | | | 197,500 | |
Hornbeck Offshore Services, Inc. | | | 5.88 | | | | 4/1/2020 | | | | 250,000 | | | | 165,918 | | | | 178,750 | |
Jupiter Resources, Inc.+^ | | | 8.50 | | | | 10/1/2022 | | | | 405,000 | | | | 322,627 | | | | 349,312 | |
Kosmos Energy Ltd.^ | | | 7.88 | | | | 8/1/2021 | | | | 250,000 | | | | 226,999 | | | | 248,750 | |
Newfield Exploration Co. | | | 5.38 | | | | 1/1/2026 | | | | 250,000 | | | | 242,008 | | | | 254,900 | |
Rowan Cos., Inc. | | | 7.38 | | | | 6/15/2025 | | | | 188,000 | | | | 188,000 | | | | 191,760 | |
Sabine Pass Liquefaction LLC^ | | | 5.88 | | | | 6/30/2026 | | | | 250,000 | | | | 250,000 | | | | 269,375 | |
Summit Midstream Holdings LLC/Summit Midstream Finance Corp. | | | 5.50 | | | | 8/15/2022 | | | | 291,000 | | | | 213,516 | | | | 283,725 | |
Topaz Marine SA+^ | | | 8.63 | | | | 11/1/2018 | | | | 400,000 | | | | 390,587 | | | | 388,000 | |
Tullow Oil PLC+^ | | | 6.25 | | | | 4/15/2022 | | | | 250,000 | | | | 199,964 | | | | 232,500 | |
| | | | | | | | | | | | | | | | | | | | |
Total Oil and Gas | | | | 4,333,000 | | | | 3,935,798 | | | | 4,225,682 | |
| | | | | | | | | | | | | | | | | | | | |
|
Personal Transportation — 0.9%*: | |
AA Bond Co. Ltd.+ | | | 5.50 | | | | 7/31/2022 | | | | 200,000 | | | | 276,607 | | | | 251,594 | |
| | | | | | | | | | | | | | | | | | | | |
See accompanying Notes to the Financial Statements.
146
Barings Global High Yield Fund 2016 Semi-Annual Report
SCHEDULE OF INVESTMENTS (CONTINUED)
December 31, 2016 (Unaudited)
| | | | | | | | | | | | | | | | | | | | |
| | | EFFECTIVE
INTEREST RATE | | | DUE DATE | | | PRINCIPAL ‡‡ | | | COST | | | FAIR
VALUE | |
Corporate Bonds (Continued) | |
|
Retail Stores — 4.1%*: | |
Boing Group Financing PLC MTN+ | | | 6.63 | % | | | 7/15/2019 | | | | 100,000 | | | $ | 103,186 | | | $ | 104,370 | |
Debenhams PLC+ | | | 5.25 | | | | 7/15/2021 | | | | 150,000 | | | | 232,603 | | | | 193,456 | |
Dollar Tree, Inc. | | | 5.75 | | | | 3/1/2023 | | | | 250,000 | | | | 260,285 | | | | 264,705 | |
HSS Financing PLC+ | | | 6.75 | | | | 8/1/2019 | | | | 68,000 | | | | 98,004 | | | | 84,935 | |
Penske Automotive Group, Inc. | | | 5.50 | | | | 5/15/2026 | | | | 250,000 | | | | 250,000 | | | | 246,875 | |
Takko Luxembourg 2 S.C.A. MTN+ | | | 9.88 | | | | 4/15/2019 | | | | 100,000 | | | | 74,989 | | | | 84,844 | |
Travelex Financing PLC+ | | | 6.40 | # | | | 8/1/2018 | | | | 100,000 | | | | 121,688 | | | | 119,789 | |
| | | | | | | | | | | | | | | | | | | | |
Total Retail Stores | | | | 1,018,000 | | | | 1,140,755 | | | | 1,098,974 | |
| | | | | | | | | | | | | | | | | | | | |
|
Telecommunications — 10.8%*: | |
Altice Financing SA+^ | | | 6.63 | | | | 2/15/2023 | | | | 250,000 | | | | 251,521 | | | | 256,875 | |
Altice Luxembourg SA+ | | | 6.25 | | | | 2/15/2025 | | | | 100,000 | | | | 113,715 | | | | 109,948 | |
Digicel Ltd.+^ | | | 6.00 | | | | 4/15/2021 | | | | 250,000 | | | | 230,007 | | | | 226,118 | |
GTT Escrow Corp.^ | | | 7.88 | | | | 12/31/2024 | | | | 250,000 | | | | 250,000 | | | | 260,675 | |
Hughes Satellite Systems Corp.^ | | | 6.63 | | | | 8/1/2026 | | | | 270,000 | | | | 269,845 | | | | 271,350 | |
Numericable-SFR SA+^ | | | 7.38 | | | | 5/1/2026 | | | | 350,000 | | | | 350,000 | | | | 358,750 | |
Sprint Corp. | | | 7.00 | | | | 8/15/2020 | | | | 75,000 | | | | 74,143 | | | | 79,508 | |
Sprint Corp. | | | 7.88 | | | | 9/15/2023 | | | | 389,000 | | | | 366,569 | | | | 415,257 | |
Telenet Finance VI Luxembourg S.C.A.+ | | | 4.88 | | | | 7/15/2027 | | | | 100,000 | | | | 115,250 | | | | 109,739 | |
UPCB Finance IV Ltd.+ | | | 4.00 | | | | 1/15/2027 | | | | 200,000 | | | | 216,548 | | | | 210,004 | |
Virgin Media Secured Finance PLC MTN+ | | | 5.13 | | | | 1/15/2025 | | | | 150,000 | | | | 227,441 | | | | 188,982 | |
Wind Acquisition Finance SA+^ | | | 7.38 | | | | 4/23/2021 | | | | 200,000 | | | | 205,286 | | | | 208,000 | |
Ziggo Bond Finance BV+ | | | 4.63 | | | | 1/15/2025 | | | | 200,000 | | | | 206,457 | | | | 215,004 | |
| | | | | | | | | | | | | | | | | | | | |
Total Telecommunications | | | | 2,784,000 | | | | 2,876,782 | | | | 2,910,210 | |
| | | | | | | | | | | | | | | | | | | | |
|
Textiles and Leather — 1.5%*: | |
Hanesbrands, Inc.^ | | | 4.63 | | | | 5/15/2024 | | | | 167,000 | | | | 167,000 | | | | 161,990 | |
Hanesbrands, Inc.^ | | | 4.88 | | | | 5/15/2026 | | | | 246,000 | | | | 246,000 | | | | 240,465 | |
| | | | | | | | | | | | | | | | | | | | |
Total Textiles and Leather | | | | 413,000 | | | | 413,000 | | | | 402,455 | |
| | | | | | | | | | | | | | | | | | | | |
Total Corporate Bonds | | | | 25,150,000 | | | | 25,805,158 | | | | 26,181,756 | |
| | | | | | | | | | | | | | | | | | | | |
Total Fixed Income | | | | 25,150,000 | | | | 25,805,158 | | | | 26,181,756 | |
| | | | | | | | | | | | | | | | | | | | |
Short-Term Investment — 1.0%*: | |
|
Bank Deposit — 1.0%*: | |
State Street Bank & Trust Co. Euro Time Deposit | | | 0.01 | | | | 1/3/2017 | | | | 280,202 | | | | 280,202 | | | | 280,202 | |
| | | | | | | | | | | | | | | | | | | | |
Total Investments | | | | 25,430,202 | | | | 26,085,360 | | | | 26,461,958 | |
| | | | | | | | | | | | | | | | | | | | |
| |
Other assets and liabilities – 2.0%* | | | | 536,567 | |
| |
Net Assets – 100.0% | | | | $26,998,525 | |
| | | | | | | | | | | | | | | | | | | | |
See accompanying Notes to the Financial Statements.
147
Barings Global High Yield Fund 2016 Semi-Annual Report
SCHEDULE OF INVESTMENTS (CONTINUED)
December 31, 2016 (Unaudited)
| ‡‡ | Unless otherwise indicated, all principal amounts are denominated in United States Dollars. |
| * | Calculated as a percentage of net assets applicable to common shareholders. |
Distributions of investments by country of risk (excluding temporary cash investments) as a percentage of total investments in securities, is as follows:
| | | | | | |
| | United States | | | 66.1% | |
| | United Kingdom | | | 13.7% | |
| | France | | | 5.0% | |
| | Canada | | | 2.3% | |
| | United Arab Emirates | | | 1.5% | |
| | Switzerland | | | 1.5% | |
| | Trinidad And Tobago | | | 1.4% | |
| | Germany | | | 1.1% | |
| | Belgium | | | 1.1% | |
| | Portugal | | | 1.0% | |
| | Other (Individually less than 1%) | | | 5.3% | |
| | | | | | |
| | Total | | | 100.0% | |
| | | | | | |
| ^ | Security acquired in a transaction exempt from registration under Rule 144A of the Securities Act of 1933. These securities may only be resold in transactions exempt from registration, normally to qualified institutional buyers. |
| # | Variable rate security. The interest rate shown is the rate in effect at December 31, 2016. |
| A | summary of outstanding derivatives at December 31, 2016 is as follows: |
Forward Foreign Currency Exchange Contracts to Buy
| | | | | | | | | | | | | | | | | | | | | | |
EXPIRATION
DATE | | COUNTERPARTY | | LOCAL
CURRENCY | | | VALUE IN USD | | | IN
EXCHANGE
FOR USD | | | NET UNREALIZED
DEPRECIATION | |
| 1/9/17 | | JPMorgan Chase Bank N.A. | | | EUR | | | | 169,887 | | | | 178,898 | | | | 180,836 | | | $ | (1,938 | ) |
Forward Foreign Currency Exchange Contracts to Sell
| | | | | | | | | | | | | | | | | | | | | | |
EXPIRATION
DATE | | COUNTERPARTY | | LOCAL
CURRENCY | | | VALUE IN USD | | | IN
EXCHANGE
FOR USD | | | NET UNREALIZED
APPRECIATION
(DEPRECIATION) | |
| 1/9/17 | | Bank of America N.A. | | | EUR | | | | 2,974,410 | | | | 3,132,182 | | | | 3,157,190 | | | $ | 25,008 | |
| 1/9/17 | | JPMorgan Chase Bank N.A. | | | EUR | | | | 150,000 | | | | 157,957 | | | | 160,816 | | | | 2,859 | |
| 1/9/17 | | Goldman Sachs & Co. | | | EUR | | | | 62,428 | | | | 65,739 | | | | 65,323 | | | | (416 | ) |
| 1/9/17 | | Citibank N.A. | | | GBP | | | | 2,511,695 | | | | 3,096,004 | | | | 3,171,995 | | | | 75,991 | |
| 1/9/17 | | JPMorgan Chase Bank N.A. | | | GBP | | | | 154,103 | | | | 189,953 | | | | 195,555 | | | | 5,602 | |
| | | | | | | | | | | | | | | | | | | | | | |
Net unrealized appreciation on forward foreign exchange contracts to sell | | | $ | 109,044 | |
| | | | | | | | | | | | | | | | | | | | | | |
Currency Legend
| | | | |
| EUR | | – | | Euro |
| GBP | | – | | British Pound Sterling |
See accompanying Notes to the Financial Statements.
148
Barings U.S. High Yield Fund 2016 Semi-Annual Report
SCHEDULE OF INVESTMENTS
December 31, 2016 (Unaudited)
| | | | | | | | | | | | | | | | | | | | |
| | | EFFECTIVE
INTEREST RATE | | | DUE DATE | | | PRINCIPAL ‡‡ | | | COST | | | FAIR
VALUE | |
Fixed Income — 94.9%*: | |
|
Bank Loans — 1.7%*§: | |
|
Oil and Gas — 1.7%*: | |
Fieldwood Energy LLC PIK | | | 8.00 | % | | | 8/31/2020 | | | | 172,215 | | | | $154,695 | | | | $162,743 | |
Fieldwood Energy LLC PIK | | | 8.38 | | | | 9/30/2020 | | | | 500,000 | | | | 225,706 | | | | 388,190 | |
| | | | | | | | | | | | | | | | | | | | |
Total Oil and Gas | | | | 672,215 | | | | 380,401 | | | | 550,933 | |
| | | | | | | | | | | | | | | | | | | | |
| | | | | | | | | | | | | | | | | | | | |
Total Bank Loans | | | | 672,215 | | | | 380,401 | | | | 550,933 | |
| | | | | | | | | | | | | | | | | | | | |
Corporate Bonds — 93.2%*: | |
|
Aerospace and Defense — 3.3%*: | |
American Airlines Group, Inc.^ | | | 4.63 | | | | 3/1/2020 | | | | 250,000 | | | | 249,060 | | | | 253,125 | |
American Airlines Group, Inc.^ | | | 5.50 | | | | 10/1/2019 | | | | 282,000 | | | | 288,307 | | | | 291,165 | |
CPI International, Inc. | | | 8.75 | | | | 2/15/2018 | | | | 500,000 | | | | 501,932 | | | | 507,500 | |
| | | | | | | | | | | | | | | | | | | | |
Total Aerospace and Defense | | | | 1,032,000 | | | | 1,039,299 | | | | 1,051,790 | |
| | | | | | | | | | | | | | | | | | | | |
|
Automobile — 3.0%*: | |
Allison Transmission, Inc.^ | | | 5.00 | | | | 10/1/2024 | | | | 176,000 | | | | 176,000 | | | | 177,760 | |
Gates Global LLC/Gates Global Co.^ | | | 6.00 | | | | 7/15/2022 | | | | 125,000 | | | | 98,625 | | | | 122,250 | |
International Automotive Components Group SA^ | | | 9.13 | | | | 6/1/2018 | | | | 250,000 | | | | 251,441 | | | | 243,750 | |
JB Poindexter & Co., Inc.^ | | | 9.00 | | | | 4/1/2022 | | | | 410,000 | | | | 429,922 | | | | 430,500 | |
| | | | | | | | | | | | | | | | | | | | |
Total Automobile | | | | 961,000 | | | | 955,988 | | | | 974,260 | |
| | | | | | | | | | | | | | | | | | | | |
|
Beverage, Food and Tobacco — 2.4%*: | |
Carrols Restaurant Group, Inc. | | | 8.00 | | | | 5/1/2022 | | | | 260,000 | | | | 273,544 | | | | 280,150 | |
KeHE Distributors LLC/KeHE Finance Corp.^ | | | 7.63 | | | | 8/15/2021 | | | | 203,000 | | | | 200,351 | | | | 201,985 | |
Manitowoc Foodservice, Inc. | | | 9.50 | | | | 2/15/2024 | | | | 250,000 | | | | 250,000 | | | | 288,125 | |
| | | | | | | | | | | | | | | | | | | | |
Total Beverage, Food and Tobacco | | | | 713,000 | | | | 723,895 | | | | 770,260 | |
| | | | | | | | | | | | | | | | | | | | |
|
Broadcasting and Entertainment — 4.5%*: | |
CCO Holdings LLC/CCO Holdings Capital Corp.^ | | | 5.75 | | | | 2/15/2026 | | | | 500,000 | | | | 500,000 | | | | 517,500 | |
DISH DBS Corp. | | | 7.75 | | | | 7/1/2026 | | | | 316,000 | | | | 316,000 | | | | 356,290 | |
Netflix, Inc.^ | | | 4.38 | | | | 11/15/2026 | | | | 300,000 | | | | 300,000 | | | | 291,000 | |
RCN Telecom Services LLC/RCN Capital Corp.^ | | | 8.50 | | | | 8/15/2020 | | | | 250,000 | | | | 256,457 | | | | 265,000 | |
| | | | | | | | | | | | | | | | | | | | |
Total Broadcasting and Entertainment | | | | 1,366,000 | | | | 1,372,457 | | | | 1,429,790 | |
| | | | | | | | | | | | | | | | | | | | |
|
Buildings and Real Estate — 5.0%*: | |
Beazer Homes USA, Inc.^ | | | 8.75 | | | | 3/15/2022 | | | | 194,000 | | | | 194,000 | | | | 209,520 | |
BMC East LLC^ | | | 5.50 | | | | 10/1/2024 | | | | 100,000 | | | | 100,000 | | | | 99,750 | |
Brookfield Residential Properties, Inc.^+ | | | 6.50 | | | | 12/15/2020 | | | | 250,000 | | | | 249,498 | | | | 255,625 | |
GEO Group, Inc. (The) | | | 6.00 | | | | 4/15/2026 | | | | 250,000 | | | | 250,000 | | | | 245,625 | |
M/I Homes, Inc. | | | 6.75 | | | | 1/15/2021 | | | | 250,000 | | | | 250,000 | | | | 260,625 | |
MPT Operating Partnership LP/MPT Finance Corp. | | | 6.38 | | | | 3/1/2024 | | | | 495,000 | | | | 495,000 | | | | 517,894 | |
| | | | | | | | | | | | | | | | | | | | |
Total Buildings and Real Estate | | | | 1,539,000 | | | | 1,538,498 | | | | 1,589,039 | |
| | | | | | | | | | | | | | | | | | | | |
See accompanying Notes to the Financial Statements.
149
Barings U.S. High Yield Fund 2016 Semi-Annual Report
SCHEDULE OF INVESTMENTS (CONTINUED)
December 31, 2016 (Unaudited)
| | | | | | | | | | | | | | | | | | | | |
| | | EFFECTIVE
INTEREST RATE | | | DUE DATE | | | PRINCIPAL ‡‡ | | | COST | | | FAIR
VALUE | |
Corporate Bonds (Continued) | |
|
Cargo Transport — 2.9%*: | |
Deck Chassis Acquisition, Inc.^ | | | 10.00 | % | | | 6/15/2023 | | | | 454,000 | | | $ | 464,714 | | | $ | 468,755 | |
Kenan Advantage Group, Inc.^ | | | 7.88 | | | | 7/31/2023 | | | | 450,000 | | | | 464,939 | | | | 454,500 | |
| | | | | | | | | | | | | | | | | | | | |
Total Cargo Transport | | | | 904,000 | | | | 929,653 | | | | 923,255 | |
| | | | | | | | | | | | | | | | | | | | |
|
Chemicals, Plastics and Rubber — 3.4%*: | |
A. Schulman, Inc.^ | | | 6.88 | | | | 6/1/2023 | | | | 250,000 | | | | 253,045 | | | | 261,250 | |
Consolidated Energy Finance SA+^ | | | 6.75 | | | | 10/15/2019 | | | | 370,000 | | | | 364,870 | | | | 370,000 | |
LBC Tank Terminals Holding Netherlands BV^ | | | 6.88 | | | | 5/15/2023 | | | | 250,000 | | | | 241,338 | | | | 255,625 | |
LSB Industries, Inc. | | | 8.50 | | | | 8/1/2019 | | | | 232,000 | | | | 204,240 | | | | 213,440 | |
| | | | | | | | | | | | | | | | | | | | |
Total Chemicals, Plastics and Rubber | | | | 1,102,000 | | | | 1,063,493 | | | | 1,100,315 | |
| | | | | | | | | | | | | | | | | | | | |
|
Containers, Packaging and Glass — 2.0%*: | |
Coveris Holdings SA^ | | | 7.88 | | | | 11/1/2019 | | | | 500,000 | | | | 467,679 | | | | 496,250 | |
Plastipak Holdings, Inc.^ | | | 6.50 | | | | 10/1/2021 | | | | 125,000 | | | | 125,555 | | | | 130,625 | |
| | | | | | | | | | | | | | | | | | | | |
Total Containers, Packaging and Glass | | | | 625,000 | | | | 593,234 | | | | 626,875 | |
| | | | | | | | | | | | | | | | | | | | |
|
Diversified Natural Resources, Precious Metals and Minerals — 0.8%*: | |
Kinross Gold Corp.+ | | | 5.95 | | | | 3/15/2024 | | | | 152,000 | | | | 158,639 | | | | 153,900 | |
Kinross Gold Corp. | | | 6.88 | | | | 9/1/2041 | | | | 99,000 | | | | 98,506 | | | | 91,451 | |
| | | | | | | | | | | | | | | | | | | | |
Total Diversified Natural Resources, Precious Metals and Minerals | | | | | | | | | | | 251,000 | | | | 257,145 | | | | 245,351 | |
| | | | | | | | | | | | | | | | | | | | |
|
Diversified/Conglomerate Manufacturing — 3.3%*: | |
Amsted Industries, Inc.^ | | | 5.38 | | | | 9/15/2024 | | | | 200,000 | | | | 193,257 | | | | 196,500 | |
Boise Cascade Co.^ | | | 5.63 | | | | 9/1/2024 | | | | 157,000 | | | | 157,000 | | | | 155,823 | |
EnPro Industries, Inc. | | | 5.88 | | | | 9/15/2022 | | | | 220,000 | | | | 221,885 | | | | 226,050 | |
StoneMor Partners LP/Cornerstone Family Services of West Virginia Subsidiary | | | 7.88 | | | | 6/1/2021 | | | | 250,000 | | | | 257,835 | | | | 227,500 | |
West Corp.^ | | | 5.38 | | | | 7/15/2022 | | | | 250,000 | | | | 240,914 | | | | 241,562 | |
| | | | | | | | | | | | | | | | | | | | |
Total Diversified/Conglomerate Manufacturing | | | | 1,077,000 | | | | 1,070,891 | | | | 1,047,435 | |
| | | | | | | | | | | | | | | | | | | | |
|
Diversified/Conglomerate Service — 3.4%*: | |
Carlson Travel, Inc.^ | | | 9.50 | | | | 12/15/2024 | | | | 350,000 | | | | 350,000 | | | | 366,187 | |
Infor Software Parent LLC/Infor Software Parent, Inc. PIK^ | | | 7.13 | | | | 5/1/2021 | | | | 319,000 | | | | 283,386 | | | | 328,570 | |
Ritchie Bros Auctioneers, Inc.^ | | | 5.38 | | | | 1/15/2025 | | | | 139,000 | | | | 139,000 | | | | 141,780 | |
Zachry Holdings, Inc.^ | | | 7.50 | | | | 2/1/2020 | | | | 250,000 | | | | 252,363 | | | | 256,563 | |
| | | | | | | | | | | | | | | | | | | | |
Total Diversified/Conglomerate Service | | | | 1,058,000 | | | | 1,024,749 | | | | 1,093,100 | |
| | | | | | | | | | | | | | | | | | | | |
|
Electronics — 4.0%*: | |
Diamond 1 Finance Corp./Diamond 2 Finance Corp.^ | | | 7.13 | | | | 6/15/2024 | | | | 154,000 | | | | 154,000 | | | | 170,967 | |
NXP BV/NXP Funding LLC^ | | | 4.13 | | | | 6/1/2021 | | | | 250,000 | | | | 254,312 | | | | 258,125 | |
NXP BV/NXP Funding LLC^ | | | 4.63 | | | | 6/1/2023 | | | | 270,000 | | | | 270,000 | | | | 283,500 | |
Prime Security Services Borrower LLC/Prime Finance, Inc.^ | | | 9.25 | | | | 5/15/2023 | | | | 250,000 | | | | 250,000 | | | | 272,188 | |
See accompanying Notes to the Financial Statements.
150
Barings U.S. High Yield Fund 2016 Semi-Annual Report
SCHEDULE OF INVESTMENTS (CONTINUED)
December 31, 2016 (Unaudited)
| | | | | | | | | | | | | | | | | | | | |
| | | EFFECTIVE
INTEREST RATE | | | DUE DATE | | | PRINCIPAL ‡‡ | | | COST | | | FAIR
VALUE | |
Corporate Bonds (Continued) | |
|
Electronics (Continued) | |
Western Digital Corp.^ | | | 10.50 | % | | | 4/1/2024 | | | | 250,000 | | | $ | 250,000 | | | $ | 295,625 | |
| | | | | | | | | | | | | | | | | | | | |
Total Electronics | | | | 1,174,000 | | | | 1,178,312 | | | | 1,280,405 | |
| | | | | | | | | | | | | | | | | | | | |
|
Finance — 1.7%*: | |
Aircastle Ltd. | | | 5.00 | | | | 4/1/2023 | | | | 271,000 | | | | 272,119 | | | | 276,420 | |
Aircastle Ltd. | | | 5.50 | | | | 2/15/2022 | | | | 21,000 | | | | 22,597 | | | | 22,260 | |
MSCI, Inc.^ | | | 4.75 | | | | 8/1/2026 | | | | 250,000 | | | | 250,000 | | | | 248,750 | |
| | | | | | | | | | | | | | | | | | | | |
Total Finance | | | | 542,000 | | | | 544,716 | | | | 547,430 | |
| | | | | | | | | | | | | | | | | | | | |
|
Healthcare, Education and Childcare — 9.5%*: | |
Alere, Inc.^ | | | 6.38 | | | | 7/1/2023 | | | | 325,000 | | | | 335,256 | | | | 322,969 | |
AMN Healthcare, Inc.^ | | | 5.13 | | | | 10/1/2024 | | | | 231,000 | | | | 231,000 | | | | 230,423 | |
Capsugel SA PIK^ | | | 7.00 | | | | 5/15/2019 | | | | 350,000 | | | | 351,938 | | | | 353,062 | |
HCA, Inc. | | | 5.25 | | | | 6/15/2026 | | | | 225,000 | | | | 225,000 | | | | 232,594 | |
HCA, Inc. | | | 5.38 | | | | 2/1/2025 | | | | 375,000 | | | | 380,908 | | | | 375,937 | |
Horizon Pharma, Inc./Horizon Pharma USA, Inc.^ | | | 8.75 | | | | 11/1/2024 | | | | 125,000 | | | | 125,000 | | | | 126,563 | |
inVentiv Group Holdings Inc/inVentiv Health Inc/inVentiv Health Clinical, Inc.^ | | | 7.50 | | | | 10/1/2024 | | | | 156,000 | | | | 156,000 | | | | 163,394 | |
Kinetic Concepts, Inc./KCI USA, Inc.^ | | | 9.63 | | | | 10/1/2021 | | | | 375,000 | | | | 375,000 | | | | 396,562 | |
RegionalCare Hospital Partners Holdings, Inc.^ | | | 8.25 | | | | 5/1/2023 | | | | 132,000 | | | | 132,000 | | | | 131,670 | |
Tenet Healthcare Corp. | | | 6.75 | | | | 6/15/2023 | | | | 250,000 | | | | 250,549 | | | | 220,625 | |
Valeant Pharmaceuticals International, Inc.^ | | | 5.50 | | | | 3/1/2023 | | | | 118,000 | | | | 85,813 | | | | 88,500 | |
Valeant Pharmaceuticals International, Inc.^ | | | 6.13 | | | | 4/15/2025 | | | | 516,000 | | | | 447,211 | | | | 387,645 | |
| | | | | | | | | | | | | | | | | | | | |
Total Healthcare, Education and Childcare | | | | 3,178,000 | | | | 3,095,675 | | | | 3,029,944 | |
| | | | | | | | | | | | | | | | | | | | |
|
Home and Office Furnishings, Housewares, and Durable Consumer Products — 0.7%*: | |
Louisiana-Pacific Corp. | | | 4.88 | | | | 9/15/2024 | | | | 250,000 | | | | 250,000 | | | | 242,500 | |
| | | | | | | | | | | | | | | | | | | | |
|
Hotels, Motels, Inns and Gaming — 1.2%*: | |
Hilton Domestic Operating Co., Inc.^ | | | 4.25 | | | | 9/1/2024 | | | | 127,000 | | | | 127,000 | | | | 123,190 | |
Pinnacle Entertainment, Inc.^ | | | 5.63 | | | | 5/1/2024 | | | | 250,000 | | | | 251,220 | | | | 250,625 | |
| | | | | | | | | | | | | | | | | | | | |
Total Hotels, Motels, Inns and Gaming | | | | 377,000 | | | | 378,220 | | | | 373,815 | |
| | | | | | | | | | | | | | | | | | | | |
|
Insurance — 1.2%*: | |
Centene Corp. | | | 4.75 | | | | 1/15/2025 | | | | 174,000 | | | | 174,000 | | | | 169,868 | |
York Risk Services Holding Corp.^ | | | 8.50 | | | | 10/1/2022 | | | | 250,000 | | | | 226,642 | | | | 208,750 | |
| | | | | | | | | | | | | | | | | | | | |
Total Insurance | | | | 424,000 | | | | 400,642 | | | | 378,618 | |
| | | | | | | | | | | | | | | | | | | | |
|
Leisure, Amusement, Entertainment — 5.2%*: | |
AMC Entertainment Holdings, Inc.^ | | | 5.88 | | | | 11/15/2026 | | | | 250,000 | | | | 250,000 | | | | 255,625 | |
Brunswick Corp. | | | 7.13 | | | | 8/1/2027 | | | | 567,000 | | | | 603,395 | | | | 661,972 | |
Lions Gate Entertainment Corp.^ | | | 5.88 | | | | 11/1/2024 | | | | 175,000 | | | | 175,000 | | | | 177,625 | |
NCL Corp. Ltd.^ | | | 4.75 | | | | 12/15/2021 | | | | 250,000 | | | | 250,000 | | | | 249,845 | |
WMG Acquisition Corp.^ | | | 5.00 | | | | 8/1/2023 | | | | 160,000 | | | | 160,000 | | | | 160,800 | |
See accompanying Notes to the Financial Statements.
151
Barings U.S. High Yield Fund 2016 Semi-Annual Report
SCHEDULE OF INVESTMENTS (CONTINUED)
December 31, 2016 (Unaudited)
| | | | | | | | | | | | | | | | | | | | |
| | | EFFECTIVE
INTEREST RATE | | | DUE DATE | | | PRINCIPAL ‡‡ | | | COST | | | FAIR
VALUE | |
Corporate Bonds (Continued) | |
|
Leisure, Amusement, Entertainment (Continued) | |
WMG Acquisition Corp.^ | | | 6.75 | % | | | 4/15/2022 | | | | 150,000 | | | $ | 151,042 | | | $ | 157,875 | |
| | | | | | | | | | | | | | | | | | | | |
Total Leisure, Amusement, Entertainment | | | | 1,552,000 | | | | 1,589,437 | | | | 1,663,742 | |
| | | | | | | | | | | | | | | | | | | | |
|
Machinery Non-Agriculture, Non-Construction, Non-Electronic — 0.5%*: | |
Gardner Denver, Inc.^ | | | 6.88 | | | | 8/15/2021 | | | | 149,000 | | | | 143,305 | | | | 148,255 | |
| | | | | | | | | | | | | | | | | | | | |
|
Mining, Steel, Iron and Non-Precious Metals — 5.3%*: | |
Constellium NV+^ | | | 7.88 | | | | 4/1/2021 | | | | 300,000 | | | | 300,000 | | | | 322,500 | |
Freeport-McMoRan, Inc. | | | 3.55 | | | | 3/1/2022 | | | | 253,000 | | | | 208,439 | | | | 235,290 | |
Freeport-McMoRan, Inc. | | | 4.00 | | | | 11/14/2021 | | | | 107,000 | | | | 84,863 | | | | 104,325 | |
Grinding Media, Inc./MC Grinding Media Canada, Inc.^ | | | 7.38 | | | | 12/15/2023 | | | | 94,000 | | | | 94,000 | | | | 98,756 | |
Hecla Mining Co. | | | 6.88 | | | | 5/1/2021 | | | | 250,000 | | | | 218,238 | | | | 255,625 | |
HudBay Minerals, Inc.^+ | | | 7.25 | | | | 1/15/2023 | | | | 56,000 | | | | 56,000 | | | | 57,960 | |
HudBay Minerals, Inc.^+ | | | 7.63 | | | | 1/15/2025 | | | | 65,000 | | | | 65,000 | | | | 67,560 | |
Novelis Corp.^ | | | 5.88 | | | | 9/30/2026 | | | | 159,000 | | | | 159,000 | | | | 160,590 | |
SunCoke Energy Partners LP/SunCoke Energy Partners Finance Corp. | | | 7.38 | | | | 2/1/2020 | | | | 70,000 | | | | 69,486 | | | | 69,650 | |
SunCoke Energy Partners LP/SunCoke Energy Partners Finance Corp.2^ | | | 7.38 | | | | 2/1/2020 | | | | 325,000 | | | | 277,516 | | | | 323,578 | |
| | | | | | | | | | | | | | | | | | | | |
Total Mining, Steel, Iron and Non-Precious Metals | | | | 1,679,000 | | | | 1,532,542 | | | | 1,695,834 | |
| | | | | | | | | | | | | | | | | | | | |
|
Oil and Gas — 15.6%*: | |
Chesapeake Energy Corp.^ | | | 8.00 | | | | 1/15/2025 | | | | 300,000 | | | | 295,579 | | | | 306,000 | |
Citgo Holding, Inc.^ | | | 10.75 | | | | 2/15/2020 | | | | 341,000 | | | | 344,974 | | | | 365,722 | |
Continental Resources, Inc. | | | 5.00 | | | | 9/15/2022 | | | | 250,000 | | | | 219,936 | | | | 252,348 | |
Energy Transfer Equity LP | | | 5.88 | | | | 1/15/2024 | | | | 80,000 | | | | 74,751 | | | | 82,600 | |
EP Energy LLC/Everest Acquisition Finance, Inc.^ | | | 8.00 | | | | 11/29/2024 | | | | 150,000 | | | | 150,000 | | | | 161,205 | |
EP Energy LLC/Everest Acquisition Finance, Inc. | | | 9.38 | | | | 5/1/2020 | | | | 207,000 | | | | 190,608 | | | | 190,827 | |
Ferrellgas Partners LP/Ferrellgas Partners Finance Corp. | | | 8.63 | | | | 6/15/2020 | | | | 250,000 | | | | 251,434 | | | | 246,250 | |
Genesis Energy LP/Genesis Energy Finance Corp. | | | 6.75 | | | | 8/1/2022 | | | | 250,000 | | | | 245,124 | | | | 259,750 | |
Hornbeck Offshore Services, Inc. | | | 5.88 | | | | 4/1/2020 | | | | 250,000 | | | | 165,918 | | | | 178,750 | |
Jupiter Resources, Inc.+^ | | | 8.50 | | | | 10/1/2022 | | | | 479,000 | | | | 384,150 | | | | 413,137 | |
Kosmos Energy Ltd.^ | | | 7.88 | | | | 8/1/2021 | | | | 466,000 | | | | 444,612 | | | | 463,670 | |
Newfield Exploration Co. | | | 5.38 | | | | 1/1/2026 | | | | 250,000 | | | | 242,008 | | | | 254,900 | |
Rowan Cos., Inc. | | | 7.38 | | | | 6/15/2025 | | | | 188,000 | | | | 188,000 | | | | 191,760 | |
Sabine Pass Liquefaction LLC^ | | | 5.88 | | | | 6/30/2026 | | | | 250,000 | | | | 250,000 | | | | 269,375 | |
SM Energy Co. | | | 6.50 | | | | 1/1/2023 | | | | 250,000 | | | | 188,439 | | | | 254,063 | |
Sunoco LP/Sunoco Finance Corp. | | | 6.25 | | | | 4/15/2021 | | | | 250,000 | | | | 250,000 | | | | 254,688 | |
Topaz Marine SA^+ | | | 8.63 | | | | 11/1/2018 | | | | 400,000 | | | | 390,587 | | | | 388,000 | |
Tullow Oil PLC+^ | | | 6.25 | | | | 4/15/2022 | | | | 250,000 | | | | 199,964 | | | | 232,500 | |
See accompanying Notes to the Financial Statements.
152
Barings U.S. High Yield Fund 2016 Semi-Annual Report
SCHEDULE OF INVESTMENTS (CONTINUED)
December 31, 2016 (Unaudited)
| | | | | | | | | | | | | | | | | | | | |
| | | EFFECTIVE
INTEREST RATE | | | DUE DATE | | | PRINCIPAL ‡‡ | | | COST | | | FAIR
VALUE | |
Corporate Bonds (Continued) | |
|
Oil and Gas (Continued) | |
Welltec A/S+^ | | | 8.00 | % | | | 2/1/2019 | | | | 200,000 | | | $ | 191,925 | | | $ | 201,000 | |
| | | | | | | | | | | | | | | | | | | | |
Total Oil and Gas | | | | 5,061,000 | | | | 4,668,009 | | | | 4,966,545 | |
| | | | | | | | | | | | | | | | | | | | |
|
Personal Transportation — 0.8%*: | |
Watco Cos. LLC/Watco Finance Corp.^ | | | 6.38 | | | | 4/1/2023 | | | | 250,000 | | | | 250,547 | | | | 258,750 | |
| | | | | | | | | | | | | | | | | | | | |
|
Printing and Publishing — 0.8%*: | |
MHGE Parent LLC/MHGE Parent Finance, Inc.^ | | | 8.50 | | | | 8/1/2019 | | | | 250,000 | | | | 251,818 | | | | 251,250 | |
| | | | | | | | | | | | | | | | | | | | |
|
Retail Stores — 1.6%*: | |
Dollar Tree, Inc. | | | 5.75 | | | | 3/1/2023 | | | | 250,000 | | | | 260,285 | | | | 264,705 | |
Penske Automotive Group, Inc. | | | 5.50 | | | | 5/15/2026 | | | | 250,000 | | | | 250,000 | | | | 246,875 | |
| | | | | | | | | | | | | | | | | | | | |
Total Retail Stores | | | | 500,000 | | | | 510,285 | | | | 511,580 | |
| | | | | | | | | | | | | | | | | | | | |
|
Telecommunications — 8.2%*: | |
Altice Financing SA+^ | | | 6.63 | | | | 2/15/2023 | | | | 250,000 | | | | 251,521 | | | | 256,875 | |
Altice Financing SA+^ | | | 7.50 | | | | 5/15/2026 | | | | 250,000 | | | | 250,000 | | | | 260,000 | |
Digicel Ltd.+^ | | | 6.00 | | | | 4/15/2021 | | | | 250,000 | | | | 229,873 | | | | 226,118 | |
GTT Escrow Corp.^ | | | 7.88 | | | | 12/31/2024 | | | | 285,000 | | | | 285,000 | | | | 297,169 | |
Hughes Satellite Systems Corp.^ | | | 6.63 | | | | 8/1/2026 | | | | 355,000 | | | | 354,741 | | | | 356,775 | |
Numericable-SFR SA+^ | | | 6.00 | | | | 5/15/2022 | | | | 250,000 | | | | 251,486 | | | | 256,563 | |
Numericable-SFR SA+^ | | | 7.38 | | | | 5/1/2026 | | | | 350,000 | | | | 350,000 | | | | 358,750 | |
RP Crown Parent LLC^ | | | 7.38 | | | | 10/15/2024 | | | | 96,000 | | | | 96,000 | | | | 99,600 | |
Sprint Corp. | | | 7.00 | | | | 8/15/2020 | | | | 75,000 | | | | 74,143 | | | | 79,508 | |
Sprint Corp. | | | 7.88 | | | | 9/15/2023 | | | | 416,000 | | | | 392,924 | | | | 444,080 | |
| | | | | | | | | | | | | | | | | | | | |
Total Telecommunications | | | | 2,577,000 | | | | 2,535,688 | | | | 2,635,438 | |
| | | | | | | | | | | | | | | | | | | | |
|
Textiles and Leather — 1.3%*: | |
Hanesbrands, Inc.^ | | | 4.63 | | | | 5/15/2024 | | | | 167,000 | | | | 167,000 | | | | 161,990 | |
Hanesbrands, Inc.^ | | | 4.88 | | | | 5/15/2026 | | | | 246,000 | | | | 246,000 | | | | 240,465 | |
| | | | | | | | | | | | | | | | | | | | |
Total Textiles and Leather | | | | 413,000 | | | | 413,000 | | | | 402,455 | |
| | | | | | | | | | | | | | | | | | | | |
|
Utilities — 1.6%*: | |
NRG Energy, Inc.^ | | | 7.25 | | | | 5/15/2026 | | | | 250,000 | | | | 250,000 | | | | 248,750 | |
Teine Energy Ltd.+^ | | | 6.88 | | | | 9/30/2022 | | | | 250,000 | | | | 230,013 | | | | 255,312 | |
| | | | | | | | | | | | | | | | | | | | |
Total Utilities | | | | 500,000 | | | | 480,013 | | | | 504,062 | |
| | | | | | | | | | | | | | | | | | | | |
Total Corporate Bonds | | | | 29,504,000 | | | | 28,791,511 | | | | 29,742,093 | |
| | | | | | | | | | | | | | | | | | | | |
Total Fixed Income | | | | 30,176,215 | | | | 29,171,912 | | | | 30,293,026 | |
| | | | | | | | | | | | | | | | | | | | |
See accompanying Notes to the Financial Statements.
153
Barings U.S. High Yield Fund 2016 Semi-Annual Report
SCHEDULE OF INVESTMENTS (CONTINUED)
December 31, 2016 (Unaudited)
| | | | | | | | | | | | | | | | | | | | |
| | | EFFECTIVE
INTEREST RATE | | | DUE
DATE | | | PRINCIPAL ‡‡ | | | COST | | | FAIR VALUE | |
Short-Term Investment — 3.9%*: | |
|
Bank Deposit — 3.9%*: | |
State Street Bank & Trust Co. Euro Time Deposit | | | 0.01 | % | | | 1/3/2017 | | | | 1,242,922 | | | | $1,242,922 | | | | $1,242,922 | |
| | | | | | | | | | | | | | | | | | | | |
| | | |
Total Investments | | | | 31,419,137 | | | | 30,414,834 | | | | 31,535,948 | |
| | | | | | | | | | | | | | | | | | | | |
| |
Other assets and liabilities — 1.2%* | | | | 368,726 | |
| |
Net Assets — 100.0% | | | | $31,904,674 | |
| | | | | | | | | | | | | | | | | | | | |
| ‡‡ | Unless otherwise indicated, all principal amounts are denominated in United States Dollars. |
| * | Calculated as a percentage of net assets applicable to common shareholders. |
Distributions of investments by country of risk (excluding temporary cash investments) as a percentage of total investments in securities, is as follows:
| | | | | | |
| | United States | | | 87.4% | |
| | Canada | | | 3.1% | |
| | France | | | 3.1% | |
| | Portugal | | | 1.7% | |
| | United Arab Emirates | | | 1.3% | |
| | Trinidad And Tobago | | | 1.2% | |
| | Other (Individually less than 1%) | | | 2.2% | |
| | | | | | |
| | Total | | | 100.0% | |
| | | | | | |
| ^ | Security acquired in a transaction exempt from registration under Rule 144A of the Securities Act of 1933. These securities may only be resold in transactions exempt from registration, normally to qualified institutional buyers. |
| § | Bank loans are exempt from registration under the Securities Act of 1933, as amended, but contain certain restrictions on resale and cannot be sold publicly. These loans pay interest at rates which adjust periodically. The interest rates shown for bank loans are the current interest rates at December 31, 2016. Bank loans are also subject to mandatory and/or optional prepayment which cannot be predicted. As a result, the remaining maturity may be substantially less than the stated maturity shown. |
See accompanying Notes to the Financial Statements.
154
Barings Funds Trust 2016 Semi-Annual Report
NOTES TO FINANCIAL STATEMENTS
December 31, 2016 (Unaudited)
Barings Funds Trust (formerly known as Babson Capital Funds Trust) (the “Trust”) was organized as a business trust under the laws of the Commonwealth of Massachusetts on May 3, 2013 and commenced operations on September 16, 2013. The Trust is registered under the Investment Company Act of 1940, as amended (the “1940 Act”), as an open-end management investment company. As of December 31, 2016, the Trust consists of eight funds (separately, a “Fund” and collectively, the “Funds”): Barings Global Floating Rate Fund (formerly known as Babson Global Floating Rate Fund) (“Global Floating Rate Fund”), Barings Global Credit Income Opportunities Fund (formerly known as Babson Global Credit Income Opportunities Fund) (“Global Credit Income Opportunities Fund”), Barings Active Short Duration Bond Fund (formerly known as Babson Active Short Duration Bond Fund) (“Active Short Duration Bond Fund”), Barings Total Return Bond Fund (formerly known as Babson Total Return Bond Fund) (“Total Return Bond Fund”), Barings Emerging Markets Debt Blended Total Return Fund (formerly known as Babson Emerging Markets Debt Blended Total Return Fund) (“Emerging Markets Debt Blended Total Return Fund”), Barings Emerging Markets Local Currency Debt Fund (formerly known as Babson Emerging Markets Local Currency Debt Fund) (“Emerging Markets Local Currency Debt Fund”), Barings Global High Yield Fund (formerly known as Babson Global High Yield Fund) (“Global High Yield Fund”) and Barings U.S. High Yield Fund (formerly known as Babson U.S. High Yield Fund) (“U.S. High Yield Fund”). Each Fund, other than Active Short Duration Bond Fund and Total Return Bond Fund, is a “non-diversified” investment company. Active Short Duration Bond Fund and Total Return Bond Fund commenced operations on July 8, 2015. Emerging Markets Debt Blended Total Return Fund commenced operations on October 21, 2015. Emerging Markets Local Currency Debt Fund commenced operations on December 8, 2015. Global High Yield Fund and U.S. High Yield Fund commenced operations on October 30, 2015.
Barings LLC (the “Adviser”), a wholly-owned indirect subsidiary of Massachusetts Mutual Life Insurance Company, is a registered investment adviser under the 1940 Act, as amended, and serves as investment adviser to the Funds.
Barings Global Advisers Limited (“BGA”), an indirect wholly-owned subsidiary of the Adviser, serves as a sub-adviser with respect to the Global Floating Rate Fund, Global Credit Income Opportunities Fund, Emerging
Markets Debt Blended Total Return Fund and Global High Yield Fund European investments.
During the relavant period, Barings Real Estate Advisers LLC (formerly known as Cornerstone Real Estate Advisers LLC) (“BREA”), a direct wholly-owned subsidiary of the Adviser, served as sub-adviser to the Active Short Duration Bond Fund and Total Return Bond Fund investment in commercial mortgage-backed securities. Effective following the close of markets on December 30, 2016, BREA merged into the Adviser.
The primary investment objective of the Global Floating Rate Fund is to seek a high level of current income. The Fund seeks preservation of capital as a secondary investment objective. The investment objective of the Global Credit Income Opportunities Fund is to seek an absolute return, primarily through current income and secondarily through capital appreciation. The investment objective of the Active Short Duration Bond Fund is to seek to achieve a high total rate of return primarily from current income while minimizing fluctuations in capital values by investing primarily in a diversified portfolio of short-term investment grade fixed income securities. The investment objective of the Total Return Bond Fund is to seek a superior total rate of return by investing in fixed income instruments. The investment objective of the Emerging Markets Debt Blended Total Return Fund is to seek to achieve maximum total return, consistent with preservation of capital and prudent investment management, through high current income generation and, where appropriate, capital appreciation. The investment objective of the Emerging Markets Local Currency Debt Fund is to seek long-term total return through investment in a diversified portfolio of emerging markets local currency denominated debt securities. The investment objective of the Global High Yield Fund is to seek to provide high current income generation and, where appropriate, capital appreciation. The investment objective of the U.S. High Yield Fund is to seek to achieve a high level of total return, with an emphasis on current income, by investing primarily in high yield debt and related securities.
There can be no assurance that the Funds will achieve their investment objectives. Under normal market conditions, the Global Floating Rate Fund invests at least 80% of its net assets (including the amount of any borrowings for investment purposes) in income producing floating rate debt securities, consisting of floating rate loans, bonds and notes, issued primarily by North American and Western European companies that are, at the time of purchase, rated below-investment grade
155
Barings Funds Trust 2016 Semi-Annual Report
NOTES TO FINANCIAL STATEMENTS (CONTINUED)
December 31, 2016 (Unaudited)
(below Baa3 by Moody’s Investors Service, Inc. (“Moody’s”) or below BBB- by either Standard & Poor’s Rating Services, a division of the McGraw-Hill Company, Inc. (“S&P”) or Fitch, Inc. (“Fitch”)) or unrated but judged by the Adviser or BGA to be of comparable quality. Under normal market conditions, the Global Credit Income Opportunities Fund invests at least 80% of its net assets (including the amount of any borrowings for investment purposes) in debt instruments, consisting of loans, bonds and notes, based in U.S. and non-U.S. markets, as well as over-the-counter and exchange traded derivatives. Investments may be issued or guaranteed by governments and their agencies, corporations, financial institutions and supranational organizations that the Global Floating Rate Fund and Global Credit Income Opportunities Fund believe have the potential to provide a high total return over time. A significant portion of the Global Floating Rate Fund and Global Credit Income Opportunities Fund’s investments in debt instruments will be denominated in a currency other than the U.S. dollar. Although the investments in non-U.S. dollar denominated assets may be on a currency hedged or unhedged basis, the Global Floating Rate Fund and Global Credit Income Opportunities Fund expect that, under current market conditions, they will seek to hedge substantially all of their exposure to foreign currencies. Under normal market conditions, the Active Short Duration Bond Fund invests at least 80% of its net assets (including the amount of any borrowings for investment purposes) in investment grade fixed income securities (rated Baa or higher by Moody’s or BBB or higher by S&P or, if unrated, determined to be of comparable quality by the Adviser). These typically include U.S. dollar-denominated corporate obligations, securities issued or guaranteed by the U.S. government or its agencies or instrumentalities, U.S. and foreign issuer dollar-denominated bonds including, but not limited to, corporate obligations, government and agency issues, private placement bonds, securities subject to resale pursuant to Rule 144A, mortgage-backed, and other asset-backed securities. Under normal market conditions, the Total Return Bond Fund invests at least 80% of its net assets (including the amount of any borrowings for investment purposes) in fixed income securities. These typically include: U.S. dollar denominated corporate obligations and bank loans, securities issued or guaranteed by the U.S. government or its agencies or instrumentalities, U.S. and foreign issuer dollar denominated bonds including, but not limited to, corporate obligations, government and agency issues, private placement bonds, securities subject to resale
pursuant to Rule 144A, convertible bonds, mortgage-backed, and other asset-backed securities. Under normal market conditions, the Emerging Markets Debt Blended Total Return Fund will invest at least 80% of its net assets (including the amount of any borrowings for investment purposes) in (i) securities denominated in currencies of the emerging market countries, (ii) fixed income securities or debt instruments issued by emerging market entities or sovereign nations, and/or (iii) debt instruments denominated in or based on the currencies, interest rates, or issues of emerging market countries. Emerging market countries are defined to include any country that did not become a member of the Organization for Economic Cooperation and Development (O.E.C.D.) prior to 1975 and Turkey. Certain emerging market countries are referred to as “frontier” market countries. The Fund will likely focus its investments in Asia, Africa, the Middle East, Latin America and the developing countries of Europe. Under normal market conditions, the Emerging Markets Local Currency Debt Fund invests at least 80% of its net assets (including the amount of any borrowings for investment purposes) in local currency-denominated debt instruments issued by emerging markets governments, and their quasi sovereign agencies (including supranational and sub-national government issuers). The Adviser will select the Fund’s country and currency composition based on its evaluation of relative interest rates, inflation rates, exchange rates, monetary and fiscal policies, trade and current account balances, legal and political developments, and any other specific factors the Adviser believes to be relevant. The Fund will likely focus its investments in Asia, Africa, the Middle East, Latin America and the developing countries of Europe. Under normal conditions, the Global High Yield Fund will invest at least 80% of its net assets (including the amount of any borrowing for investment purposes) in below investment grade (“high yield”) fixed and floating rate corporate debt securities including bonds, notes and other fixed and floating rate income securities issued primarily by North American and Western European companies. For this purpose, debt instruments issued by issuers based in the Channel Islands, Cayman Islands and Bermuda will be considered North American and Western European companies. Such debt securities may be secured or unsecured, and, either senior or subordinated. Secured debt means that collateral has been pledged as security against default, while investors in senior debt instruments are legally entitled to be repaid ahead of investors in subordinated (i.e. non-senior) instruments issued by the same corporation. Derivative instruments that provide
156
Barings Funds Trust 2016 Semi-Annual Report
NOTES TO FINANCIAL STATEMENTS (CONTINUED)
December 31, 2016 (Unaudited)
exposure to such high yield debt securities or have similar economic characteristics may be used to satisfy the Fund’s 80% policy. The Adviser expects that such instruments will primarily, at the time of purchase, be rated below investment grade (commonly referred to as “junk bonds”) by at least one credit rating agency (below Baa3 by Moody’s or below BBB- by either S&P, or Fitch) or unrated but judged by the Adviser or BGA, to be of comparable quality. The Fund may invest in high yield securities of any rating, including securities that are in default at the time of purchase. Under normal circumstances, the U.S. High Yield Fund invests at least 80% of its net assets (including the amount of any borrowings for investment purposes) in lower rated fixed income securities (rated below Baa3 by Moody’s or BBB by S&P (using the lower rating) or, if unrated, determined by the Adviser to be of comparable quality), and at least 80% of its net assets (including the amount of any borrowings for investment purposes) in securities of U.S. issuers. The Fund may also invest in convertible securities, preferred stocks, warrants, bank loans, and other fixed income securities, including Rule 144A securities, of both U.S. and foreign issuers. Currently, the Adviser does not expect that the Fund will invest more than 20% of its total assets in bank loans. The Fund may invest up to 15% of its total assets in securities that are not denominated in U.S. dollars including, but not limited to, corporate bonds, government and agency issues, Rule 144A securities, convertible securities, bank loans, mortgage-backed, and asset-backed securities.
Each Fund, with the exception of Active Short Duration Bond Fund which has no sales charge on any class, has four classes of shares: Class A, C, I, and Y, each with different expenses and dividends. A front-end sales charge is normally added to the net asset value (“NAV”) for Class A shares. There is no front-end sales charge in the case of Class C, I, and Y shares. There may be a contingent deferred sales charge (“CDSC”) in certain cases as follows: Class A shares purchased without an initial sales charge and redeemed within the first year of purchase (subject to certain exceptions as set forth in each Fund’s prospectus) and Class C shares redeemed within the first year of purchase. All classes of shares have equal voting rights, with the exception of matters that relate solely to one class.
| 2. | Significant Accounting Policies |
The following is a summary of significant accounting policies followed consistently by the Funds in the preparation of their financial statements in conformity
with accounting principles generally accepted in the United States of America (“U.S. GAAP”).
| | A. | Valuation of Investments |
The Funds’ investments in fixed income securities are generally valued using the prices provided directly by independent third party services or provided directly from one or more broker dealers or market makers, each in accordance with the valuation policies and procedures approved by the Funds’ Board of Trustees (the “Board”).
The pricing services may use valuation models or matrix pricing, which consider yield or prices with respect to comparable bond quotations from bond dealers or by reference to other securities that are considered comparable in such characteristics as credit rating, interest rates and maturity date to determine the current value. The Funds’ investments in bank loans are normally valued at the bid quotation obtained from dealers in loans by an independent pricing service in accordance with the Funds’ valuation policies and procedures approved by the Board. Short-term securities with remaining maturities of 60 days or less may be valued at amortized cost, which approximates fair value. Derivative financial instruments, such as futures contracts or options contracts that are traded on a national securities exchange, are stated at the last reported sale or settlement price on the day of valuation. Futures traded on inactive markets are valued using broker quotations. OTC derivative financial instruments, such as foreign currency contracts, options contracts, or swaps agreements, derive their value from underlying asset prices, indices, reference rates, and other inputs or a combination of these factors. These contracts are normally valued on the basis of an independent pricing service providers or broker dealer quotations. Depending on the derivative type and the terms of the derivative, the value of the derivative financial instruments is assigned by independent pricing service providers using a series of techniques, which may include pricing models. The pricing models use inputs that are observed from actively quoted markets such as issuer details, indices, spreads, interest rates, curves, volatilities, dividends and exchange rates.
The assets and liabilities shown in the Statements of Assets and Liabilities related to investments purchased for “to-be-announced” (“TBA”) or when-issued securities approximate fair value and are determined using Level 2 inputs, as of December 31, 2016. The assets and liabilities shown in the Statements of Assets and Liabilities related to cash collateral held at broker for futures contracts are determined using Level 1 inputs as of December 31, 2016.
157
Barings Funds Trust 2016 Semi-Annual Report
NOTES TO FINANCIAL STATEMENTS (CONTINUED)
December 31, 2016 (Unaudited)
A Valuation Committee, made up of officers of the Trust and employees of the Adviser, is responsible for determining, in accordance with the Funds’ valuation policies and procedures approved by the Board; (1) whether market quotations are readily available for investments held by the Fund; and (2) the fair value of investments held by the Fund for which market quotations are not readily available or are deemed not reliable by the Adviser. In certain cases, authorized pricing service vendors may not provide prices for a security held by the Funds, or the price provided by such pricing service vendor is deemed unreliable by the Adviser. In such cases, the Funds may use market maker quotations provided by an established market maker for that security (i.e., broker quotes) to value the security if the Adviser has experience obtaining quotations from the market maker and the Adviser determines that quotations obtained from the market maker in the past have generally been reliable (or, if the Adviser has no such experience with respect to a market maker, it determines based on other information available to it that quotations to be obtained by it from the market maker are reasonably likely to be reliable). In any such case, the Adviser will review any market quotations so obtained in light of other information in its possession for their general reliability.
Bond investments are valued on the basis of last available bid prices or current market quotations provided by dealers or pricing services. Bank loan positions are valued at the bid price from one or more brokers or dealers as obtained from a pricing service. In determining the value of a particular investment, pricing services may use certain information with respect to transactions in such investments, quotations from dealers, pricing matrixes, market transactions in comparable investments, various relationships observed in the market between investments and calculated yield measures. Asset-backed and mortgage-backed securities are valued by independent pricing services using models that consider estimated cash flows of each tranche of the security, establish a benchmark yield and develop an estimated tranche-specific spread to the benchmark yield based on the unique attributes of the tranche.
Bank loans in which the Funds may invest have similar risks to lower-rated fixed income securities. Changes in the financial condition of the borrower or economic conditions or other circumstances may reduce the capacity of the borrower to make principal and interest payments on such instruments and may lead to defaults.
Senior secured bank loans are supported by collateral; however, the value of the collateral may be insufficient to cover the amount owed to the Funds. By relying on a third party to administer a loan, the Funds are subject to the risk that the third party will fail to perform its obligations. The loans in which the Funds will invest are largely floating rate instruments; therefore, the interest rate risk generally is lower than for fixed-rate debt obligations. However, from the perspective of the borrower, an increase in interest rates may adversely affect the borrower’s financial condition. Due to the unique and customized nature of loan agreements evidencing loans and the private syndication thereof, loans are not as easily purchased or sold as publicly traded securities. Although the range of investors in loans has broadened in recent years, there can be no assurance that future levels of supply and demand in loan trading will provide the degree of liquidity which currently exists in the market. In addition, the terms of the loans may restrict their transferability without borrower consent. These factors may have an adverse effect on the market price and the Funds’ ability to dispose of particular portfolio investments. A less liquid secondary market also may make it more difficult for the Funds to obtain precise valuations of the high yield loans in its portfolio.
The Funds may invest in collateralized debt obligations (“CDOs”), which include collateralized bond obligations (“CBOs”) and collateralized loan obligations (“CLOs”). CBOs and CLOs are types of asset-backed securities. A CDO is an entity that is backed by a diversified pool of debt securities (CBOs) or syndicated bank loans (CLOs). The cash flows of the CDO can be split into multiple segments, called “tranches,” which will vary in risk profile and yield. The riskiest segment is the subordinated or “equity” tranche. This tranche bears the greatest risk of defaults from the underlying assets in the CDO and serves to protect the other, more senior, tranches from default in all but the most severe circumstances. Since it is shielded from defaults by the more junior tranches, a “senior” tranche will typically have higher credit ratings and lower yields than their underlying securities, and often receive investment grade ratings from one or more of the nationally recognized rating agencies. Despite the protection from the more junior tranches, senior tranches can experience substantial losses due to actual defaults, increased sensitivity to future defaults and the disappearance of one or more protecting tranches as a result of changes in the credit profile of the underlying pool of assets.
158
Barings Funds Trust 2016 Semi-Annual Report
NOTES TO FINANCIAL STATEMENTS (CONTINUED)
December 31, 2016 (Unaudited)
Fair value is defined as the price that the Funds would receive upon selling an investment in a timely transaction to an independent buyer in the principal or most advantageous market of the investment. A three-tier hierarchy is utilized to maximize the use of observable market data and minimize the use of unobservable inputs and to establish classification of fair value measurements for disclosure purposes. Inputs refer broadly to the assumptions that market participants would use in pricing the asset or liability, including assumptions about risk. For example, market participants would consider the risk inherent in a particular valuation technique used to measure fair value, such as a pricing model, and/or the risk inherent in the inputs to the valuation technique. Inputs may be observable or unobservable. Observable inputs are inputs that reflect the assumptions market participants would use in pricing the asset or liability and are developed based on market data obtained from sources independent of the reporting entity. Unobservable inputs are inputs that reflect the reporting entity’s own assumptions about the assumptions market participants would use in pricing the asset or liability and are developed based on the best information available in the circumstances. The three-tier hierarchy of inputs is summarized in the three broad levels listed below.
Level 1 – quoted prices in active markets for identical securities
Level 2 – other significant observable inputs (including quoted prices for similar securities, interest rates, prepayment speeds, credit risk, etc.)
Level 3 – significant unobservable inputs (including the Funds’ own assumptions in determining the fair value of investments)
The availability of observable inputs can vary from security to security and is affected by a wide variety of factors, including, for example, the type of security, whether the security is new and not yet established in the marketplace, the liquidity of markets, and other characteristics particular to the security. To the extent that valuation is based on models or inputs that are less observable or unobservable in the market, the determination of fair value requires more judgment. Accordingly, the degree of judgment exercised in determining fair value is greatest for instruments categorized in level 3.
The inputs used to measure fair value may fall into different levels of the fair value hierarchy. In such cases, for disclosure purposes, the level in the fair value hierarchy within which the fair value measurement falls in its entirety is determined based on the lowest level input that is significant to the fair value measurement in its entirety.
The following is a summary of the inputs used as of December 31, 2016 in valuing the Funds’ investments:
Global Floating Rate Fund
| | | | | | | | | | | | | | | | |
| DESCRIPTION | | LEVEL 1 | | | LEVEL 2 | | | LEVEL 3 | | | TOTAL INVESTMENTS | |
| | | | |
Assets:* | | | | | | | | | | | | | | | | |
| Equities: | | | | | | | | | | | | | | | | |
Common Stocks | | $ | – | | | $ | 7,810 | | | $ | 144,456 | ** | | $ | 152,266 | |
| | | | | | | | | | | | | | | | |
| Total Equities | | | – | | | | 7,810 | | | | 144,456 | | | | 152,266 | |
| | | | | | | | | | | | | | | | |
| Fixed Income: | | | | | | | | | | | | | | | | |
Bank Loans | | | – | | | | 133,639,936 | | | | 164,381 | | | | 133,804,317 | |
Corporate Bonds | | | – | | | | 13,144,707 | | | | – | | | | 13,144,707 | |
| | | | | | | | | | | | | | | | |
| Total Fixed Income | | | – | | | | 146,784,643 | | | | 164,381 | | | | 146,949,024 | |
| | | | | | | | | | | | | | | | |
| Short-Term Investment | | | – | | | | 20,677,603 | | | | – | | | | 20,677,603 | |
| Derivative Securities: | | | | | | | | | | | | | | | | |
Forward Foreign Currency Exchange Contracts | | | – | | | | 297,336 | | | | – | | | | 297,336 | |
| | | | | | | | | | | | | | | | |
| Total | | $ | – | | | $ | 167,767,392 | | | $ | 308,837 | | | $ | 168,076,229 | |
| | | | | | | | | | | | | | | | |
| | | | |
Liabilities:* | | | | | | | | | | | | | | | | |
| Derivative Securities: | | | | | | | | | | | | | | | | |
Forward Foreign Currency Exchange Contracts | | | – | | | | (1,660 | ) | | | – | | | | (1,660 | ) |
| | | | | | | | | | | | | | | | |
| | | | |
Total Investments | | $ | – | | | $ | 167,765,732 | | | $ | 308,837 | | | $ | 168,074,569 | |
| | | | | | | | | | | | | | | | |
| | * | There were no transfers between levels during the period ended December 31, 2016. |
| | ** | Includes two securities valued at $0. |
159
Barings Funds Trust 2016 Semi-Annual Report
NOTES TO FINANCIAL STATEMENTS (CONTINUED)
December 31, 2016 (Unaudited)
The following is a reconciliation of investments with unobservable inputs (Level 3) that were used in determining fair value:
| | | | | | | | | | | | | | | | | | | | | | | | | | | | | | | | | | | | |
INVESTMENTS
IN SECURITIES | | BALANCE
AS OF
JULY 1,
2016 | �� | | REALIZED
GAIN (LOSS) | | | CHANGE IN
UNREALIZED
APPRECIATION
(DEPRECIATION) | | | NET
TRANSFERS
IN (OUT)
OF LEVEL 3 | | | ACCRUED PREMIUMS/
DISCOUNTS | | | PURCHASES | | | SALES | | | BALANCE AS OF
DECEMBER 31,
2016 | | | CHANGE IN
UNREALIZED
APPRECIATION
(DEPRECIATION)
FROM
INVESTMENTS
HELD AT
DECEMBER 31,
2016 | |
| | | | | | | | | |
Equities | | | | | | | | | | | | | | | | | | | | | | | | | | | | | | | | | | | | |
Common Stock | | $ | – | | | $ | – | | | $ | 13,445 | | | $ | – | | | $ | – | | | $ | 131,011 | | | $ | – | | | $ | 144,456 | | | $ | 13,445 | |
| | | | | | | | | | | | | | | | | | | | | | | | | | | | | | | | | | | | |
| | | | | | | | | |
Fixed Income | | | | | | | | | | | | | | | | | | | | | | | | | | | | | | | | | | | | |
Bank Loans | | $ | 221,345 | | | $ | – | | | $ | (68,076 | ) | | $ | – | | | $ | 349 | | | $ | 17,328 | | | $ | – | | | $ | 170,946 | | | $ | (68,075 | ) |
| | | | | | | | | | | | | | | | | | | | | | | | | | | | | | | | | | | | |
| Total | | $ | 221,345 | | | $ | – | | | $ | (54,631 | ) | | $ | – | | | $ | 349 | | | $ | 148,339 | | | $ | – | | | $ | 315,402 | | | $ | (54,631 | ) |
| | | | | | | | | | | | | | | | | | | | | | | | | | | | | | | | | | | | |
Global Credit Income Opportunities Fund
| | | | | | | | | | | | | | | | |
| DESCRIPTION | | LEVEL 1 | | | LEVEL 2 | | | LEVEL 3 | | | TOTAL INVESTMENTS | |
| | | | |
Assets:* | | | | | | | | | | | | | | | | |
| Equities: | | | | | | | | | | | | | | | | |
Common Stocks | | $ | – | | | $ | 3,905 | | | $ | 496,329 | ** | | $ | 500,234 | |
| | | | | | | | | | | | | | | | |
| Total Equities | | | – | | | | 3,905 | | | | 496,329 | | | | 500,234 | |
| | | | | | | | | | | | | | | | |
| Fixed Income: | | | | | | | | | | | | | | | | |
Asset-Backed Securities | | | – | | | | 15,351,249 | | | | 487,401 | | | | 15,838,650 | |
Bank Loans | | | – | | | | 29,883,064 | | | | 182,959 | | | | 30,066,023 | |
Corporate Bonds | | | – | | | | 66,405,035 | | | | – | | | | 66,405,035 | |
| | | | | | | | | | | | | | | | |
| Total Fixed Income | | | – | | | | 111,639,348 | | | | 670,360 | | | | 112,309,708 | |
| | | | | | | | | | | | | | | | |
| Short-Term Investment | | | – | | | | 6,712,542 | | | | – | | | | 6,712,542 | |
| Derivative Securities: | | | | | | | | | | | | | | | | |
Forward Foreign Currency Exchange Contracts | | | – | | | | 358,535 | | | | – | | | | 358,535 | |
| | | | | | | | | | | | | | | | |
| Total | | $ | – | | | $ | 118,714,330 | | | $ | 1,166,689 | | | $ | 119,881,019 | |
| | | | | | | | | | | | | | | | |
| | | | |
Liabilities:* | | | | | | | | | | | | | | | | |
| Derivative Securities: | | | | | | | | | | | | | | | | |
Forward Foreign Currency Exchange Contracts | | | – | | | | (4,208 | ) | | | – | | | | (4,208 | ) |
| | | | | | | | | | | | | | | | |
| | | | |
Total Investments | | $ | – | | | $ | 118,710,122 | | | $ | 1,166,689 | | | $ | 119,876,811 | |
| | | | | | | | | | | | | | | | |
| | * | There were no transfers between levels during the period ended December 31, 2016. |
| | ** | Includes two securities valued at $0. |
160
Barings Funds Trust 2016 Semi-Annual Report
NOTES TO FINANCIAL STATEMENTS (CONTINUED)
December 31, 2016 (Unaudited)
The following is a reconciliation of investments with unobservable inputs (Level 3) that were used in determining fair value:
| | | | | | | | | | | | | | | | | | | | | | | | | | | | | | | | | | | | |
INVESTMENTS
IN SECURITIES | | BALANCE
AS OF
JULY 1,
2016 | | | REALIZED
GAIN (LOSS) | | | CHANGE IN
UNREALIZED
APPRECIATION
(DEPRECIATION) | | | NET
TRANSFERS
IN (OUT)
OF LEVEL 3 | | | ACCRUED PREMIUMS/
DISCOUNTS | | | PURCHASES | | | SALES | | | BALANCE AS OF
DECEMBER 31,
2016 | | | CHANGE IN
UNREALIZED
APPRECIATION
(DEPRECIATION)
FROM
INVESTMENTS
HELD AT
DECEMBER 31,
2016 | |
| | | | | | | | | |
Equities | | | | | | | | | | | | | | | | | | | | | | | | | | | | | | | | | | | | |
Common Stock | | $ | 418,595 | | | $ | – | | | $ | 77,734 | | | $ | – | | | $ | – | | | $ | – | | | $ | – | | | $ | 496,329 | | | $ | 77,734 | |
| | | | | | | | | | | | | | | | | | | | | | | | | | | | | | | | | | | | |
| | | | | | | | | |
Fixed Income | | | | | | | | | | | | | | | | | | | | | | | | | | | | | | | | | | | | |
Bank Loans | | $ | 221,345 | | | $ | – | | | $ | (68,075 | ) | | $ | – | | | $ | 348 | | | $ | 35,905 | | | $ | – | | | $ | 189,523 | | | $ | (68,075 | ) |
| | | | | | | | | | | | | | | | | | | | | | | | | | | | | | | | | | | | |
Asset Backed Securities | | $ | – | | | $ | – | | | $ | (22 | ) | | $ | – | | | $ | 22 | | | $ | 487,401 | | | $ | – | | | $ | 487,401 | | | $ | (22 | ) |
| | | | | | | | | | | | | | | | | | | | | | | | | | | | | | | | | | | | |
| Total | | $ | 639,940 | | | $ | – | | | $ | 9,637 | | | $ | – | | | $ | 370 | | | $ | 523,306 | | | $ | – | | | $ | 1,173,253 | | | $ | 9,637 | |
| | | | | | | | | | | | | | | | | | | | | | | | | | | | | | | | | | | | |
Active Short Duration Bond Fund
| | | | | | | | | | | | | | | | |
| DESCRIPTION | | LEVEL 1 | | | LEVEL 2 | | | LEVEL 3 | | | TOTAL INVESTMENTS | |
| | | | |
Assets:* | | | | | | | | | | | | | | | | |
| Fixed Income: | | | | | | | | | | | | | | | | |
Asset-Backed Securities | | $ | – | | | $ | 71,060,973 | | | $ | 7,279,000 | | | $ | 78,339,973 | |
Corporate Bonds | | | – | | | | 104,973,075 | | | | – | | | | 104,973,075 | |
Mortgage-Backed Securities | | | – | | | | 7,792,183 | | | | – | | | | 7,792,183 | |
U.S. Treasury & Government Agencies | | | – | | | | 51,066,227 | | | | – | | | | 51,066,227 | |
| | | | | | | | | | | | | | | | |
| Total Fixed Income | | | – | | | | 234,892,458 | | | | 7,279,000 | | | | 242,171,458 | |
| | | | | | | | | | | | | | | | |
| Short-Term Investments: | | | | | | | | | | | | | | | | |
Bank Deposit | | | – | | | | 2,119,459 | | | | – | | | | 2,119,459 | |
Commercial Paper | | | – | | | | 6,999,405 | | | | – | | | | 6,999,405 | |
| | | | | | | | | | | | | | | | |
| Total Short-Term Investments | | | – | | | | 9,118,864 | | | | – | | | | 9,118,864 | |
| | | | | | | | | | | | | | | | |
| Derivative Securities: | | | | | | | | | | | | | | | | |
Forward Foreign Currency Exchange Contracts | | | – | | | | 266,105 | | | | – | | | | 266,105 | |
Futures** | | | – | | | | 77,366 | | | | – | | | | 77,366 | |
| | | | | | | | | | | | | | | | |
| Total Derivative Securities | | | – | | | | 343,471 | | | | – | | | | 343,471 | |
| | | | | | | | | | | | | | | | |
| Total | | $ | – | | | $ | 244,354,793 | | | $ | 7,279,000 | | | $ | 251,633,793 | |
| | | | | | | | | | | | | | | | |
| | | | |
Liabilities:* | | | | | | | | | | | | | | | | |
| Derivative Securities: | | | | | | | | | | | | | | | | |
Centrally Cleared Credit Default Swaps** | | | – | | | | (22,966 | ) | | | – | | | | (22,966 | ) |
Forward Foreign Currency Exchange Contracts | | | – | | | | (255,735 | ) | | | – | | | | (255,735 | ) |
Futures** | | | – | | | | (23,512 | ) | | | – | | | | (23,512 | ) |
OTC – Credit Default Swaps | | | – | | | | (29,569 | ) | | | – | | | | (29,569 | ) |
| | | | | | | | | | | | | | | | |
| Total Derivative Securities | | | – | | | | (331,782 | ) | | | – | | | | (331,782 | ) |
| | | | | | | | | | | | | | | | |
| Total Investments | | $ | – | | | $ | 244,023,011 | | | $ | 7,279,000 | | | $ | 251,302,011 | |
| | | | | | | | | | | | | | | | |
| | * | There were no transfers between levels during the period ended December 31, 2016. |
| | ** | Centrally Cleared Swaps and Futures are valued at unrealized appreciation/depreciation. Only current day’s variation margin, if any, is reported on the Statement of Assets and Liabilities. |
161
Barings Funds Trust 2016 Semi-Annual Report
NOTES TO FINANCIAL STATEMENTS (CONTINUED)
December 31, 2016 (Unaudited)
The following is a reconciliation of investments with unobservable inputs (Level 3) that were used in determining fair value:
| | | | | | | | | | | | | | | | | | | | | | | | | | | | | | | | | | | | |
INVESTMENTS
IN SECURITIES | | BALANCE
AS OF
JULY 1,
2016 | | | REALIZED
GAIN
(LOSS) | | | CHANGE IN
UNREALIZED
APPRECIATION
(DEPRECIATION) | | | NET
TRANSFERS
IN (OUT)
OF LEVEL 3 | | | ACCRUED
PREMIUMS/
DISCOUNTS | | | PURCHASES | | | SALES | | | BALANCE
AS OF
DECEMBER 31,
2016 | | | CHANGE IN
UNREALIZED
APPRECIATION
(DEPRECIATION)
FROM
INVESTMENTS
HELD AT
DECEMBER 31,
2016 | |
| | | | | | | | | |
Asset Backed Securities | | $ | – | | | $ | – | | | $ | (22,298 | ) | | $ | – | | | $ | 68 | | | $ | 7,302,077 | | | $ | (847 | ) | | $ | 7,279,000 | | | $ | (22,298 | ) |
| | | | | | | | | | | | | | | | | | | | | | | | | | | | | | | | | | | | |
Total | | $ | – | | | $ | – | | | $ | (22,298 | ) | | $ | – | | | $ | 68 | | | $ | 7,302,077 | | | $ | (847 | ) | | $ | 7,279,000 | | | $ | (22,298 | ) |
| | | | | | | | | | | | | | | | | | | | | | | | | | | | | | | | | | | | |
Total Return Bond Fund
| | | | | | | | | | | | | | | | |
| DESCRIPTION | | LEVEL 1 | | | LEVEL 2 | | | LEVEL 3 | | | TOTAL INVESTMENTS | |
| | | | |
Assets:* | | | | | | | | | | | | | | | | |
| Fixed Income: | | | | | | | | | | | | | | | | |
Asset-Backed Securities | | $ | – | | | $ | 5,649,335 | | | $ | 928,090 | | | $ | 6,577,425 | |
Corporate Bonds | | | – | | | | 8,723,749 | | | | – | | | | 8,723,749 | |
Foreign Government | | | – | | | | 169,170 | | | | – | | | | 169,170 | |
Mortgage-Backed Securities | | | – | | | | 633,081 | | | | – | | | | 633,081 | |
U.S. Treasury & Government Agencies | | | – | | | | 7,443,163 | �� | | | – | | | | 7,443,163 | |
| | | | | | | | | | | | | | | | |
| Total Fixed Income | | | – | | | | 22,618,498 | | | | 928,090 | | | | 23,546,588 | |
| | | | | | | | | | | | | | | | |
| | | | |
Mutual Fund: | | | | | | | | | | | | | | | | |
Mutual Fund | | | 2,468,842 | | | | – | | | | – | | | | 2,468,842 | |
| Short-Term Investments: | | | | | | | | | | | | | | | | |
Bank Deposit | | | – | | | | 707,678 | | | | – | | | | 707,678 | |
Commercial Paper | | | – | | | | 4,445,712 | | | | – | | | | 4,445,712 | |
| | | | | | | | | | | | | | | | |
| Total Short-Term Investments | | | – | | | | 5,153,390 | | | | – | | | | 5,153,390 | |
| | | | | | | | | | | | | | | | |
| | | | |
Derivative Securities: | | | | | | | | | | | | | | | | |
Forward Foreign Currency Exchange Contracts | | | – | | | | 113,553 | | | | – | | | | 113,553 | |
Futures** | | | – | | | | 825 | | | | – | | | | 825 | |
| | | | | | | | | | | | | | | | |
| Total Derivative Securities | | | – | | | | 114,378 | | | | – | | | | 114,378 | |
| | | | | | | | | | | | | | | | |
| Total | | $ | 2,468,842 | | | $ | 27,886,266 | | | $ | 928,090 | | | $ | 31,283,198 | |
| | | | | | | | | | | | | | | | |
| | | | |
Liabilities:* | | | | | | | | | | | | | | | | |
| Derivative Securities: | | | | | | | | | | | | | | | | |
Centrally Cleared Credit Default Swaps** | | | – | | | | (7,205 | ) | | | – | | | | (7,205 | ) |
Forward Foreign Currency Exchange Contracts | | | – | | | | (114,839 | ) | | | – | | | | (114,839 | ) |
Futures** | | | – | | | | (17,107 | ) | | | – | | | | (17,107 | ) |
OTC – Credit Default Swaps | | | – | | | | (7,392 | ) | | | – | | | | (7,392 | ) |
| | | | | | | | | | | | | | | | |
| Total Derivative Securities | | | – | | | | (146,543 | ) | | | – | | | | (146,543 | ) |
| | | | | | | | | | | | | | | | |
| Total Investments | | $ | 2,468,842 | | | $ | 27,739,723 | | | $ | 928,090 | | | $ | 31,136,655 | |
| | | | | | | | | | | | | | | | |
| | * | There were no transfers between levels during the period ended December 31, 2016. |
| | ** | Centrally Cleared Swaps and Futures are valued at unrealized appreciation/depreciation. Only current day’s variation margin, if any, is reported on the Statement of Assets and Liabilities. |
162
Barings Funds Trust 2016 Semi-Annual Report
NOTES TO FINANCIAL STATEMENTS (CONTINUED)
December 31, 2016 (Unaudited)
The following is a reconciliation of investments with unobservable inputs (Level 3) that were used in determining fair value:
| | | | | | | | | | | | | | | | | | | | | | | | | | | | | | | | | | | | |
INVESTMENTS IN SECURITIES | | BALANCE
AS OF
JULY 1,
2016 | | | REALIZED
GAIN (LOSS) | | | CHANGE IN
UNREALIZED
APPRECIATION
(DEPRECIATION) | | | NET
TRANSFERS
IN (OUT)
OF LEVEL 3 | | | ACCRUED PREMIUMS/
DISCOUNTS | | | PURCHASES | | | SALES | | | BALANCE AS OF
DECEMBER 31,
2016 | | | CHANGE IN
UNREALIZED
APPRECIATION
(DEPRECIATION)
FROM
INVESTMENTS
HELD AT
DECEMBER 31,
2016 | |
| | | | | | | | | |
Asset | | | | | | | | | | | | | | | | | | | | | | | | | | | | | | | | | | | | |
Backed Securities | | $ | – | | | $ | – | | | $ | (9,442 | ) | | $ | – | | | $ | 18 | | | $ | 937,595 | | | $ | 81 | | | $ | 928,090 | | | $ | (9,442 | ) |
| | | | | | | | | | | | | | | | | | | | | | | | | | | | | | | | | | | | |
| Total | | $ | – | | | $ | – | | | $ | (9,442 | ) | | $ | – | | | $ | 18 | | | $ | 937,595 | | | $ | 81 | | | $ | 928,090 | | | $ | (9,442 | ) |
| | | | | | | | | | | | | | | | | | | | | | | | | | | | | | | | | | | | |
Emerging Markets Debt Blended Total Return Fund
| | | | | | | | | | | | | | | | |
| DESCRIPTION | | LEVEL 1 | | | LEVEL 2 | | | LEVEL 3 | | | TOTAL INVESTMENTS | |
| | | | |
Assets:* | | | | | | | | | | | | | | | | |
| Fixed Income: | | | | | | | | | | | | | | | | |
Corporate Bonds | | $ | – | | | $ | 3,367,765 | | | $ | – | | | $ | 3,367,765 | |
Foreign Government | | | – | | | | 6,126,126 | | | | – | | | | 6,126,126 | |
| | | | | | | | | | | | | | | | |
| Total Fixed Income | | | – | | | | 9,493,891 | | | | – | | | | 9,493,891 | |
| | | | | | | | | | | | | | | | |
| Short-Term Investment | | | – | | | | 98,880 | | | | – | | | | 98,880 | |
| Derivative Securities: | | | | | | | | | | | | | | | | |
Forward Foreign Currency Exchange Contracts | | | – | | | | 291,224 | | | | – | | | | 291,224 | |
Futures** | | | – | | | | 2,868 | | | | – | | | | 2,868 | |
Interest Rate Swaps | | | – | | | | 23,437 | | | | – | | | | 23,437 | |
| | | | | | | | | | | | | | | | |
| Total Derivative Securities | | | – | | | | 317,529 | | | | – | | | | 317,529 | |
| | | | | | | | | | | | | | | | |
| Total | | $ | – | | | $ | 9,910,300 | | | $ | – | | | $ | 9,910,300 | |
| | | | | | | | | | | | | | | | |
| | | | |
Liabilities:* | | | | | | | | | | | | | | | | |
| Derivative Securities: | | | | | | | | | | | | | | | | |
Forward Foreign Currency Exchange Contracts | | | – | | | | (288,771 | ) | | | – | | | | (288,771 | ) |
Interest Rate Swaps | | | – | | | | (12,765 | ) | | | – | | | | (12,765 | ) |
| | | | | | | | | | | | | | | | |
Total Derivative Securities | | | – | | | | (301,536 | ) | | | – | | | | (301,536 | ) |
| | | | | | | | | | | | | | | | |
| | | | |
Total Investments | | $ | – | | | $ | 9,608,764 | | | $ | – | | | $ | 9,608,764 | |
| | | | | | | | | | | | | | | | |
| | * | There were no transfers between levels during the period ended December 31, 2016. |
| | ** | Centrally Cleared Swaps and Futures are valued at unrealized appreciation/depreciation. Only current day’s variation margin, if any, is reported on the Statement of Assets and Liabilities. |
163
Barings Funds Trust 2016 Semi-Annual Report
NOTES TO FINANCIAL STATEMENTS (CONTINUED)
December 31, 2016 (Unaudited)
| | Emerging | Markets Local Currency Debt Fund |
| | | | | | | | | | | | | | | | |
| DESCRIPTION | | LEVEL 1 | | | LEVEL 2 | | | LEVEL 3 | | | TOTAL INVESTMENTS | |
| | | | |
Assets:* | | | | | | | | | | | | | | | | |
| Fixed Income: | | | | | | | | | | | | | | | | |
Foreign Government | | $ | – | | | $ | 4,381,124 | | | $ | – | | | $ | 4,381,124 | |
| | | | | | | | | | | | | | | | |
| Total Fixed Income | | | – | | | | 4,381,124 | | | | – | | | | 4,381,124 | |
| | | | | | | | | | | | | | | | |
| Short-Term Investment | | | – | | | | 339,448 | | | | – | | | | 339,448 | |
| Derivative Securities: | | | | | | | | | | | | | | | | |
Forward Foreign Currency Exchange Contracts | | | – | | | | 214,664 | | | | – | | | | 214,664 | |
Interest Rate Swaps | | | – | | | | 23,993 | | | | – | | | | 23,993 | |
| | | | | | | | | | | | | | | | |
Total Derivative Securities | | | – | | | | 238,657 | | | | – | | | | 238,657 | |
| | | | | | | | | | | | | | | | |
| | | | |
Total | | $ | – | | | $ | 4,959,396 | | | $ | – | | | $ | 4,959,396 | |
| | | | | | | | | | | | | | | | |
| | | | |
Liabilities:* | | | | | | | | | | | | | | | | |
| Derivative Securities: | | | | | | | | | | | | | | | | |
Forward Foreign Currency Exchange Contracts | | | – | | | | (198,818 | ) | | | – | | | | (198,818 | ) |
Interest Rate Swaps | | | – | | | | (30,115 | ) | | | – | | | | (30,115 | ) |
| | | | | | | | | | | | | | | | |
Total Derivative Securities | | | – | | | | (228,933 | ) | | | – | | | | (228,933 | ) |
| | | | | | | | | | | | | | | | |
| | | | |
Total Investments | | $ | – | | | $ | 4,730,296 | | | $ | – | | | $ | 4,730,296 | |
| | | | | | | | | | | | | | | | |
| | * | There were no transfers between levels during the period ended December 31, 2016. |
Global High Yield Fund
| | | | | | | | | | | | | | | | |
| DESCRIPTION | | LEVEL 1 | | | LEVEL 2 | | | LEVEL 3 | | | TOTAL INVESTMENTS | |
| | | | |
Assets:* | | | | | | | | | | | | | | | | |
| Fixed Income: | | | | | | | | | | | | | | | | |
Corporate Bonds | | $ | – | | | $ | 26,181,756 | | | $ | – | | | $ | 26,181,756 | |
| | | | | | | | | | | | | | | | |
| Total Fixed Income | | | – | | | | 26,181,756 | | | | – | | | | 26,181,756 | |
| | | | | | | | | | | | | | | | |
| Short-Term Investment | | | – | | | | 280,202 | | | | – | | | | 280,202 | |
| Derivative Securities: | | | | | | | | | | | | | | | | |
Forward Foreign Currency Exchange Contracts | | | – | | | | 109,460 | | | | – | | | | 109,460 | |
| | | | | | | | | | | | | | | | |
| Total | | $ | – | | | $ | 26,571,418 | | | $ | – | | | $ | 26,571,418 | |
| | | | | | | | | | | | | | | | |
| | | | |
Liabilities:* | | | | | | | | | | | | | | | | |
| Derivative Securities: | | | | | | | | | | | | | | | | |
Forward Foreign Currency Exchange Contracts | | | – | | | | (2,354 | ) | | | – | | | | (2,354 | ) |
| | | | | | | | | | | | | | | | |
| | | | |
Total Investments | | $ | – | | | $ | 26,569,064 | | | $ | – | | | $ | 26,569,064 | |
| | | | | | | | | | | | | | | | |
| | * | There were no transfers between levels during the period ended December 31, 2016. |
164
Barings Funds Trust 2016 Semi-Annual Report
NOTES TO FINANCIAL STATEMENTS (CONTINUED)
December 31, 2016 (Unaudited)
U.S. High Yield Fund
| | | | | | | | | | | | | | | | |
| DESCRIPTION | | LEVEL 1 | | | LEVEL 2 | | | LEVEL 3 | | | TOTAL INVESTMENTS | |
| | | | |
Assets:* | | | | | | | | | | | | | | | | |
| Fixed Income: | | | | | | | | | | | | | | | | |
Bank Loans | | $ | – | | | $ | 550,933 | | | $ | – | | | $ | 550,933 | |
Corporate Bonds | | | – | | | | 29,742,093 | | | | – | | | | 29,742,093 | |
| | | | | | | | | | | | | | | | |
| Total Fixed Income | | | – | | | | 30,293,026 | | | | – | | | | 30,293,026 | |
| | | | | | | | | | | | | | | | |
Short-Term Investment | | | – | | | | 1,242,922 | | | | – | | | | 1,242,922 | |
| | | | | | | | | | | | | | | | |
| Total | | $ | – | | | $ | 31,535,948 | | | $ | – | | | $ | 31,535,948 | |
| | | | | | | | | | | | | | | | |
| | | | |
Total Investments | | $ | – | | | $ | 31,535,948 | | | $ | – | | | $ | 31,535,948 | |
| | | | | | | | | | | | | | | | |
| | * | There were no transfers between levels during the period ended December 31, 2016. |
| | B. | When-Issued, Delayed-Delivery, Forward Commitment, and To-Be-Announced Transactions |
The Funds may enter into when-issued, delayed-delivery, forward commitment, or to-be-announced (“TBA”) transactions (collectively, the “Forward Transactions”) in order to lock in the purchase price of the underlying security, or in order to adjust the interest rate exposure of the Fund’s existing portfolio. In Forward Transactions, a Fund commits to purchase or sell particular securities, with payment and delivery to take place at a future date. In the case of TBA purchase commitments, the unit price and the estimated principal amount are established when the Fund enters into a commitment, with the actual principal amount being within a specified range of the estimate. Although a Fund does not typically pay for the securities in these types of transactions until they are delivered, it immediately assumes the risks of ownership, including the risk of price fluctuation. As a result, each of these types of transactions may create investment leverage in a Fund’s portfolio and increase the volatility of the Fund. If a Fund’s counterparty fails to deliver a security purchased in a Forward Transaction, there may be a loss, and the Fund may have missed an opportunity to make an alternative investment.
These securities are valued on the basis of valuations furnished by a pricing service, selected pursuant to procedures approved by the Trustees, which determines valuations taking into account appropriate factors such as institutional-size trading in similar groups of securities, yield, quality, coupon rate, maturity, type of issue, trading characteristics, and other market data. Securities for which no market quotation is available are valued at fair
value in accordance with procedures approved by the Trustees. The Funds record on a daily basis the unrealized appreciation (depreciation) based upon changes in the values of these securities. When a Forward Transaction is closed, the Funds record a realized gain or loss equal to the difference between the value of the transaction at the time it was opened and the value of the transaction at the time it was closed.
| | C. | Cash and Short-Term Investments |
Cash and cash equivalents consist principally of short-term investments that are readily convertible into cash and have original maturities of three months or less. At December 31, 2016, all cash and cash equivalents are held by the custodian.
| | D. | Investment Transactions, Related Investment Income and Expenses |
Investment transactions are accounted for on a trade date basis. Interest income is recorded on the accrual basis, including the amortization of premiums and accretion of discounts on bonds held using the yield-to-maturity method.
Realized gains and losses on investment transactions and unrealized appreciation and depreciation of investments are reported for financial statement and Federal income tax purposes on the identified cost method.
Expenses are recorded on the accrual basis as incurred.
Effective July 1, 2015, the Funds no longer had redemption fees.
165
Barings Funds Trust 2016 Semi-Annual Report
NOTES TO FINANCIAL STATEMENTS (CONTINUED)
December 31, 2016 (Unaudited)
The preparation of financial statements in conformity with U.S. GAAP requires management to make estimates and assumptions that affect the reported amounts of assets and liabilities at the date of the financial statements and the reported amounts of revenues and expenses during the reporting period. Actual results could differ from these estimates.
| | G. | Federal Income Taxation |
The Funds have elected to be taxed as a Regulated Investment Company (“RIC”) under sub-chapter M of the U.S. Internal Revenue Code of 1986, as amended, and intend to maintain this qualification and to distribute substantially all of their net taxable income to their shareholders. As of December 31, 2016, the Funds had no uncertain tax positions that would require financial statement recognition, de-recognition, or disclosure. The Funds file a U.S. federal income tax return annually after their fiscal year-end, which is subject to examination by the Internal Revenue Service for a period of three years from the date of the filings.
| | H. | Dividends and Distributions |
Each Fund declares a dividend daily based on the Adviser’s projections of the Funds’ estimated net investment income and distributes such dividend monthly. To the extent that these distributions exceed net investment income, they may be classified as return of capital. The Funds also pay a distribution at least annually from their net realized capital gains, if any. Dividends and distributions are recorded on the ex-dividend date. All common shares have equal dividend and other distribution rights. A notice disclosing the source(s) of a distribution will be provided if payment is made from any source other than net investment income. Any such notice would be provided only for informational purposes in order to comply with the requirements of Section 19(a) of the 1940 Act and not for tax reporting purposes. The tax composition of the Funds’ distributions for each calendar year is reported on Internal Revenue Service Form 1099-DIV.
Dividends from net investment income and distributions from realized gains from investment transactions have been determined in accordance with Federal income tax regulations and may differ from net investment income and realized gains recorded by the Funds for financial reporting purposes. These differences, which could be temporary or permanent in nature may result in
reclassification of distributions; however, net investment income, net realized gains and losses, and net assets are not affected.
The Funds may invest in bank loans, which usually take the form of loan participations and assignments. Loan participations and assignments are agreements to make money available to U.S. or foreign corporations, partnerships or other business entities (the “Borrower”) in a specified amount, at a specified rate and within a specified time. A loan is typically originated, negotiated and structured by a U.S. or foreign bank, insurance company or other financial institution (the “Agent”) for a group of loan investors (“Loan Investors”). The Agent typically administers and enforces the loan on behalf of the other Loan Investors in the syndicate and may hold any collateral on behalf of the Loan Investors. Such loan participations and assignments are typically senior, secured and collateralized in nature. The Funds record an investment when the Borrower withdraws money and records interest as earned. These loans pay interest at rates which are periodically reset by reference to a base lending rate plus a spread. These base lending rates are generally the prime rate offered by a designated U.S. bank or London InterBank Offered Rate (“LIBOR”).
The loans in which the Funds invest may be subject to some restrictions on resale. For example, the Funds may be contractually obligated to receive approval from the Agent and/or Borrower prior to the sale of these investments. The Funds generally have no right to enforce compliance with the terms of the loan agreement with the Borrower. As a result, the Funds assume the credit risk of the Borrower, the selling participant and any other persons interpositioned between the Funds and the Borrower (“Intermediate Participants”). In the event that the Borrower, selling participant or Intermediate Participants become insolvent or enter into bankruptcy, the Funds may incur certain costs and delays in realizing payment or may suffer a loss of principal and/or interest.
Unfunded commitments represent the remaining obligation of the Funds to the Borrower. At any point in time, up to the maturity date of the issue, the Borrower may demand the unfunded portion. Until demanded by the Borrower, unfunded commitments are not recognized as an asset on the Statements of Assets and Liabilities. Unrealized appreciation/depreciation on unfunded commitments presented on the Statements of
166
Barings Funds Trust 2016 Semi-Annual Report
NOTES TO FINANCIAL STATEMENTS (CONTINUED)
December 31, 2016 (Unaudited)
Assets and Liabilities represents mark to market of the unfunded portion of the Funds’ bank loans. As of December 31, 2016, the following Funds had unfunded loan commitments:
| | | | | | |
| FUND | | SECURITY | | AMOUNT | |
Global Floating Rate Fund | | Boomerang Tube, LLC, 15.00%, 2/2/2020 | | $ | 6,565 | |
Global Credit Income Opportunities Fund | | Boomerang Tube, LLC, 15.00%, 2/2/2020 | | $ | 6,565 | |
The following is a description of the derivative instruments that the Funds utilize as part of their investment strategy, including the primary underlying risk exposures related to the instrument.
The Funds are subject to foreign currency exchange rate risk in the normal course of pursuing their investment objectives. The Funds may use forward foreign currency exchange contracts to hedge against changes in the value of foreign currencies. The Funds may enter into forward foreign currency exchange contracts obligating the Funds to deliver or receive a currency at a specified future date. Forward contracts are valued daily and unrealized appreciation or depreciation is recorded daily as the difference between the contract exchange rate and the closing forward rate applied to the face amount of the contract. A realized gain or loss is recorded at the time the forward contract expires. Credit risk may arise as a result of the failure of the counterparty to comply with the terms of the contract. The Funds consider the creditworthiness of each counterparty to a contract in evaluating potential credit risk quarterly. The Funds are also subject to credit risk with respect to the counterparties to derivative contracts that are not cleared through a central counterparty but instead are traded over-the-counter between two counterparties. If a counterparty to an over-the-counter derivative becomes bankrupt or otherwise fails to perform its obligations under a derivative contract due to financial difficulties, the Funds may experience significant delays in obtaining any recovery under the derivative contract in a bankruptcy or other reorganization proceeding. The Funds may obtain only a limited recovery or may obtain no recovery in such circumstances. The counterparty risk for cleared derivatives is generally lower than for uncleared over-the-counter derivative transactions since
generally a clearing organization becomes substituted for each counterparty to a cleared derivative contract and, in effect, guarantees the parties’ performance under the contract as each party to a trade looks only to the clearing house for performance of financial obligations. However, there can be no assurance that the clearing house, or its members, will satisfy its obligations to the Funds. In addition, in the event of a bankruptcy of a clearing house, the Funds could experience a loss of the funds deposited with such clearing house as margin and of any profits on its open positions. The counterparty risk to the Funds is limited to the net unrealized gain, if any, on the contract.
The use of forward foreign currency exchange contracts does not eliminate fluctuations in the underlying prices of the Funds’ investment securities; however, it does establish a rate of exchange that can be achieved in the future. The use of forward foreign currency exchange contracts involves the risk that anticipated currency movements will not be accurately predicted. A forward foreign currency exchange contract would limit the risk of loss due to a decline in the value of a particular currency; however, it would also limit any potential gain that might result should the value of the currency increase instead of decrease. These contracts may involve market risk in excess of the amount of receivable or payable reflected on the Statement of Assets and Liabilities.
The Funds may purchase and sell futures contracts to enhance returns, to attempt to hedge some of its investment risk, or as a substitute position in lieu of holding the underlying asset on which the instrument is based. At the time of entering into a futures transaction, an investor is required to deposit and maintain a specified amount of cash or eligible securities called “initial margin.” Subsequent payments made or received by a Fund called “variation margin” are made on a daily basis as the market price of the futures contract fluctuates. Each Fund will record an unrealized gain (loss) based on the amount of variation margin. When a contract is closed, a realized gain (loss) is recorded equal to the difference between the opening and closing value of the contract.
The Funds may purchase call or put options. When a Fund purchases an option, the premium paid by the Fund is recorded as an asset and is subsequently adjusted to the current fair value of the option purchased. Purchasing call options tends to increase the Fund’s exposure to the
167
Barings Funds Trust 2016 Semi-Annual Report
NOTES TO FINANCIAL STATEMENTS (CONTINUED)
December 31, 2016 (Unaudited)
underlying instrument. Purchasing put options tends to decrease the Fund’s exposure to the underlying instrument. Premiums paid for purchasing options that expire are treated as realized losses. Premiums paid for purchasing options that are exercised or closed are added to the amounts paid or offset against the proceeds on the underlying security to determine the realized gain or loss. The risks associated with purchasing put and call options are potential loss of the premium paid and, in the instances of over-the-counter derivatives, the failure of the counterparty to honor its obligation under the contract.
The Funds may enter into swap options (“swaptions”). A swaption is an option to enter into a pre-defined swap agreement by some specified date in the future. The writer of the swaption becomes the counterparty to the swap if the buyer exercises. The interest rate swaption agreement will specify whether the buyer of the swaption will be a fixed rate receiver or a fixed rate buyer. Depending on the terms of the particular option agreement, a Fund generally will incur a greater degree of risk when the Fund writes a swaption than the Fund will incur when it purchases a swaption. When a Fund purchases a swaption, the Fund’s risk of loss is limited to the amount of the premium it has paid should it decide to let the swaption expire unexercised.
When a Fund writes a covered call or a put option, an amount equal to the premium received by the Fund is included in the Fund’s Statement of Assets and Liabilities as an asset and as an equivalent liability. The amount of the liability is subsequently marked-to-market to reflect the current market value of the option written. The Fund receives a premium on the sale of a call option but gives up the opportunity to profit from any increase in stock value above the exercise price of the option, and when a Fund writes a put option, it is exposed to a decline in the price of the underlying security.
Whether an option which a Fund has written expires on its stipulated expiration date or a Fund enters into a closing purchase transaction, the Fund realizes a gain (or loss, if the cost of a closing purchase transaction exceeds the premium received when the option was sold) without regard to any unrealized gain or loss on the underlying security, and the liability related to such option is extinguished. If a call option which a Fund has written is exercised, the Fund realizes a capital gain or loss from the sale of the underlying security, and the cost basis of the lots sold are decreased by the premium originally
received. When a put option which a Fund has written is exercised, the amount of the premium originally received will reduce the cost of the security which the Fund purchases upon exercise of the option. Realized gains (losses) on purchased options are included in net realized gain (loss) from investments.
The Funds’ use of written options involves, to varying degrees, elements of market risk in excess of the amount recognized in the Statements of Assets and Liabilities. The face or contract amounts of these instruments reflect the extent of the Funds’ exposure to market risk. The risks may be caused by an imperfect correlation between movements in the price of the instrument and the price of the underlying securities, currencies and interest rates.
The Funds may enter into credit default swap contracts. As a seller of a credit default swap contract (“seller of protection”), a Fund is required to pay the notional amount or other agreed-upon value of a referenced debt obligation to the counterparty (or central clearing party in the case of centrally cleared swaps) in the event of a default by or other credit event involving the referenced issuer, obligation or index. In return, a Fund receives from the counterparty (or central clearing party in the case of centrally cleared swaps) a periodic stream of payments over the term of the contract.
As a purchaser of a credit default swap contract (“buyer of protection”), a Fund would receive the notional amount or other agreed upon value of a referenced debt obligation from the counterparty (or central clearing party in the case of centrally cleared swaps) in the event of default by or other credit event involving the referenced issuer, obligation or index. In return, a Fund would make periodic payments to the counterparty (or central clearing party in the case of centrally cleared swaps) over the term of the contracts, provided no event of default has occurred.
These credit default swaps may have as a reference obligation corporate or sovereign issuers or credit indices. These credit indices are comprised of a basket of securities representing a particular sector of the market. During the period, Active Short Duration Bond Fund and Total Return Bond Fund entered into credit default swaps based on a CMBX index, which is comprised of commercial mortgage-backed securities and a CDX index, which is comprised of North American and Emerging Market companies.
168
Barings Funds Trust 2016 Semi-Annual Report
NOTES TO FINANCIAL STATEMENTS (CONTINUED)
December 31, 2016 (Unaudited)
Credit default swaps are fair valued based upon quotations from counterparties, brokers or market-makers and the change in value, if any, is recorded as an unrealized appreciation or depreciation. For a credit default swap sold by a Fund, payment of the agreed-upon amount made by a Fund in the event of default of the referenced debt obligation is recorded as the cost of the referenced debt obligation purchased/received. For a credit default swap purchased by a Fund, the agreed-upon amount received by a Fund in the event of default of the referenced debt obligation is recorded as proceeds from sale/delivery of the referenced debt obligation and the resulting gain or loss realized on the referenced debt obligation is recorded as such by a Fund.
Any upfront payments made or received upon entering a credit default swap contract would be amortized or accreted over the life of the swap and recorded as realized gains or losses. Collateral, in the form of cash or securities, may be required to be held in segregated accounts with the custodian bank or broker in accordance with the swap agreement. The value and credit rating of each credit default swap where a Fund is the seller of protection, are both measures of the current payment/performance risk of the swap. As the value of the swap changes as a positive or negative percentage of the total notional amount, the payment/performance risk may decrease or increase, respectively. The maximum potential amount of future payments (undiscounted) that a Fund as a seller of protection could be required to make under a credit default swap agreement would be an amount equal to the notional amount of the agreement. These potential amounts would be partially offset by any recovery values of the respective referenced obligations, upfront payments received upon entering into the agreement, or net amounts received from the settlement of buy protection credit default swap agreements entered into by a Fund for the same referenced entity or entities. For centrally cleared swaps, the daily change in valuation is recorded as a receivable or payable for variation margin and settled in cash with the central clearing party daily.
Entering into swap agreements involves counterparty and market risk. Such risks involve the possibility that there will be no liquid market for these agreements, that the counterparty to the agreements may default on its obligation to perform or disagree as to the meaning of the contractual terms in the agreements, that there may be unfavorable changes in interest rates, and, in the case of credit default swaps, that the Adviser does not
correctly predict the creditworthiness of the issuers of the reference obligation on which the credit default swap is based. In the case of centrally cleared swaps, counterparty risk is minimal due to protections provided by the central clearing party.
Interest rate swaps involve the exchange by a Fund with another party of their respective commitments to receive or pay interest (e.g., an exchange of fixed rate payments for floating rate payments) with respect to a notional amount of principal. When a Fund enters into an interest rate swap, it typically agrees to make payments to its counterparty based on a specified long- or short-term interest rate, and will receive payments from its counterparty based on another interest rate. Other forms of interest rate swap agreements include interest rate caps, under which, in return for a specified payment stream, one party agrees to make payments to the other to the extent that interest rates exceed a specified rate, or “cap”; interest rate floors, under which, in return for a specified payment stream, one party agrees to make payments to the other to the extent that interest rates fall below a specified rate, or “floor”; and interest rate collars, under which a party sells a cap and purchases a floor or vice versa in an attempt to protect itself against interest rate movements exceeding given minimum or maximum levels. A Fund may enter into an interest rate swap in order, for example, to hedge against the effect of interest rate changes on the value of specific securities in its portfolio, or to adjust the interest rate sensitivity (duration) or the credit exposure of its portfolio overall, or otherwise as a substitute for a direct investment in debt securities.
During the period ended December 31, 2016, the Funds’ direct investment in derivatives consisted of forward foreign currency exchange contracts, futures contracts, credit default swaps, interest rate swaps and purchased options.
169
Barings Funds Trust 2016 Semi-Annual Report
NOTES TO FINANCIAL STATEMENTS (CONTINUED)
December 31, 2016 (Unaudited)
The following is a summary of the fair value of derivative instruments held directly by the Funds as of December 31, 2016:
Global Floating Rate Fund
| | | | | | |
ASSET
DERIVATIVES | | STATEMENTS OF ASSETS
AND LIABILITIES
LOCATION | | FOREIGN
EXCHANGE
CONTRACTS
RISK | |
Forward Foreign Currency Exchange Contracts | | Unrealized appreciation on forward foreign currency exchange contracts | | $ | 297,015 | |
| | | | | | |
Total | | | | $ | 297,015 | |
| | | | | | |
| | | | | | |
LIABILITY
DERIVATIVES | | STATEMENTS OF ASSETS
AND LIABILITIES
LOCATION | | FOREIGN
EXCHANGE
CONTRACTS
RISK | |
Forward Foreign Currency Exchange Contracts | | Unrealized depreciation on forward foreign currency exchange contracts | | $ | (1,339 | ) |
| | | | | | |
Total | | | | $ | (1,339 | ) |
| | | | | | |
Global Credit Income Opportunities Fund
| | | | | | |
ASSET
DERIVATIVES | | STATEMENTS OF ASSETS
AND LIABILITIES
LOCATION | | FOREIGN
EXCHANGE
CONTRACTS
RISK | |
Forward Foreign Currency Exchange Contracts | | Unrealized appreciation on forward foreign currency exchange contracts | | $ | 358,535 | |
| | | | | | |
Total | | | | $ | 358,535 | |
| | | | | | |
| | | | | | |
LIABILITY
DERIVATIVES | | STATEMENTS OF ASSETS
AND LIABILITIES
LOCATION | | FOREIGN
EXCHANGE
CONTRACTS
RISK | |
Forward Foreign Currency Exchange Contracts | | Unrealized depreciation on forward foreign currency exchange contracts | | $ | (4,208 | ) |
| | | | | | |
Total | | | | $ | (4,208 | ) |
| | | | | | |
Active Short Duration Bond Fund
| | | | | | | | | | | | | | | | | | |
| ASSET DERIVATIVES | | STATEMENTS OF ASSETS
AND LIABILITIES
LOCATION | | FOREIGN
EXCHANGE CONTRACTS
RISK | | | INTEREST RATE
RISK | | | CREDIT
RISK | | | TOTAL | |
Forward Foreign Currency Exchange Contracts | | Unrealized appreciation on forward foreign currency exchange contracts | | $ | 266,105 | | | $ | – | | | $ | – | | | $ | 266,105 | |
Futures Contracts | | Includes cumulative unrealized appreciation/ depreciation of futures contracts as reported in the Schedule of Investments. Only current day’s variation margin is reported within the Statements of Assets and Liabilities. | | | – | | | | 77,366 | | | | – | | | | 77,366 | |
Swaps Contracts | | Swap contracts, at fair value | | | – | | | | – | | | | 7,210 | | | | 7,210 | |
| | | | | | | | | | | | | | | | | | |
Total | | | | $ | 266,105 | | | $ | 77,366 | | | $ | 7,210 | | | $ | 350,681 | |
| | | | | | | | | | | | | | | | | | |
170
Barings Funds Trust 2016 Semi-Annual Report
NOTES TO FINANCIAL STATEMENTS (CONTINUED)
December 31, 2016 (Unaudited)
| | | | | | | | | | | | | | | | | | |
| LIABILITY DERIVATIVES | | STATEMENTS OF ASSETS
AND LIABILITIES
LOCATION | | FOREIGN
EXCHANGE CONTRACTS
RISK | | | INTEREST RATE
RISK | | | CREDIT
RISK | | | TOTAL | |
Forward Foreign Currency Exchange Contracts | | Unrealized depreciation on forward foreign currency exchange contracts | | $ | (255,735 | ) | | $ | – | | | $ | | | | $ | (255,735 | ) |
Futures Contracts | | Includes cumulative unrealized appreciation/ depreciation of futures contracts as reported in the Schedule of Investments. Only current day’s variation margin is reported within the Statements of Assets and Liabilities. | | | | | | | (23,512 | ) | | | – | | | | (23,512 | ) |
Swaps Contracts | | Swap contracts, at fair value | | | | | | | – | | | | (13,622 | ) | | | (13,622 | ) |
| | | | | | | | | | | | | | | | | | |
Total | | | | $ | (255,735 | ) | | $ | (23,512 | ) | | $ | (13,622 | ) | | $ | (292,869 | ) |
| | | | | | | | | | | | | | | | | | |
Total Return Bond Fund
| | | | | | | | | | | | | | | | | | |
| ASSET DERIVATIVES | | STATEMENTS OF ASSETS
AND LIABILITIES
LOCATION | | FOREIGN
EXCHANGE CONTRACTS
RISK | | | INTEREST RATE
RISK | | | CREDIT
RISK | | | TOTAL | |
Forward Foreign Currency Exchange Contracts | | Unrealized appreciation on forward foreign currency exchange contracts | | $ | 113,553 | | | $ | – | | | $ | – | | | $ | 113,553 | |
Futures Contracts | | Includes cumulative unrealized appreciation/depreciation of futures contracts as reported in the Schedule of Investments. Only current day’s variation margin is reported within the Statements of Assets and Liabilities. | | | – | | | | 825 | | | | – | | | | 825 | |
Swaps Contracts | | Swap contracts, at fair value | | | – | | | | – | | | | 1,855 | | | | 1,855 | |
| | | | | | | | | | | | | | | | | | |
Total | | | | $ | 113,553 | | | $ | 825 | | | $ | 1,855 | | | $ | 116,233 | |
| | | | | | | | | | | | | | | | | | |
171
Barings Funds Trust 2016 Semi-Annual Report
NOTES TO FINANCIAL STATEMENTS (CONTINUED)
December 31, 2016 (Unaudited)
| | | | | | | | | | | | | | | | | | |
| LIABILITY DERIVATIVES | | STATEMENTS OF ASSETS
AND LIABILITIES
LOCATION | | FOREIGN
EXCHANGE CONTRACTS
RISK | | | INTEREST RATE
RISK | | | CREDIT
RISK | | | TOTAL | |
Forward Foreign Currency Exchange Contracts | | Unrealized depreciation on forward foreign currency exchange contracts | | $ | (114,839 | ) | | $ | – | | | $ | | | | $ | (114,839 | ) |
Futures Contracts | | Includes cumulative unrealized appreciation/depreciation of futures contracts as reported in the Schedule of Investments. Only current day’s variation margin is reported within the Statements of Assets and Liabilities. | | | | | | | (17,107 | ) | | | – | | | | (17,107 | ) |
Swaps Contracts | | Swap contracts, at fair value | | | | | | | – | | | | (3,553 | ) | | | (3,553 | ) |
| | | | | | | | | | | | | | | | | | |
Total | | | | $ | (114,839 | ) | | $ | (17,107 | ) | | $ | (3,553 | ) | | $ | (135,499 | ) |
| | | | | | | | | | | | | | | | | | |
Emerging Markets Debt Blended Total Return Fund
| | | | | | | | | | | | | | |
| ASSET DERIVATIVES | | STATEMENTS OF ASSETS
AND LIABILITIES
LOCATION | | FOREIGN
EXCHANGE CONTRACTS
RISK | | | INTEREST RATE
RISK | | | TOTAL | |
Forward Foreign Currency Exchange Contracts | | Unrealized appreciation on forward foreign currency exchange contracts | | $ | 291,224 | | | $ | – | | | $ | 291,224 | |
Futures Contracts | | Includes cumulative unrealized appreciation/
depreciation of futures contracts as reported in the Schedule of Investments. Only current day’s variation margin is reported within the Statements of Assets and Liabilities. | | | – | | | | 2,868 | | | | 2,868 | |
Swaps Contracts | | Swap contracts, at fair value | | | | | | | 23,437 | | | | 23,437 | |
| | | | | | | | | | | | | | |
Total | | | | $ | 291,224 | | | $ | 26,305 | | | $ | 317,529 | |
| | | | | | | | | | | | | | |
172
Barings Funds Trust 2016 Semi-Annual Report
NOTES TO FINANCIAL STATEMENTS (CONTINUED)
December 31, 2016 (Unaudited)
| | | | | | | | | | | | | | |
| LIABILITY DERIVATIVES | | STATEMENTS OF ASSETS
AND LIABILITIES
LOCATION | | FOREIGN
EXCHANGE CONTRACTS
RISK | | | INTEREST RATE
RISK | | | TOTAL | |
Forward Foreign Currency Exchange Contracts | | Unrealized depreciation on forward foreign currency exchange contracts | | $ | (288,771 | ) | | $ | – | | | $ | (288,771 | ) |
Swaps Contracts | | Swap contracts, at fair value | | | | | | | (12,765 | ) | | | (12,765 | ) |
| | | | | | | | | | | | | | |
Total | | | | $ | (288,771 | ) | | $ | (12,765 | ) | | $ | (301,536 | ) |
| | | | | | | | | | | | | | |
Emerging Markets Local Currency Debt Fund
| | | | | | | | | | | | | | |
| ASSET DERIVATIVES | | STATEMENTS OF ASSETS
AND LIABILITIES
LOCATION | | FOREIGN
EXCHANGE CONTRACTS
RISK | | | INTEREST RATE
RISK | | | TOTAL | |
Forward Foreign Currency Exchange Contracts | | Unrealized appreciation on forward foreign currency exchange contracts | | $ | 214,664 | | | $ | – | | | $ | 214,664 | |
Swaps Contracts | | Swap contracts, at fair value | | | | | | | 15,927 | | | | 15,927 | |
| | | | | | | | | | | | | | |
Total | | | | $ | 214,664 | | | $ | 15,927 | | | $ | 230,591 | |
| | | | | | | | | | | | | | |
| | | | | | | | | | | | | | |
| LIABILITY DERIVATIVES | | STATEMENTS OF ASSETS
AND LIABILITIES
LOCATION | | FOREIGN
EXCHANGE CONTRACTS
RISK | | | INTEREST RATE
RISK | | | TOTAL | |
Forward Foreign Currency Exchange Contracts | | Unrealized depreciation on forward foreign currency exchange contracts | | $ | (198,818 | ) | | $ | – | | | $ | (198,818 | ) |
Swaps Contracts | | Swap contracts, at fair value | | | | | | | (30,115 | ) | | | (30,115 | ) |
| | | | | | | | | | | | | | |
Total | | | | $ | (198,818 | ) | | $ | (30,115 | ) | | $ | (228,933 | ) |
| | | | | | | | | | | | | | |
Global High Yield Fund
| | | | | | |
ASSET
DERIVATIVES | | STATEMENTS OF ASSETS
AND LIABILITIES
LOCATION | | FOREIGN
EXCHANGE
CONTRACTS
RISK | |
Forward Foreign Currency Exchange Contracts | | Unrealized appreciation on forward foreign currency exchange contracts | | $ | 109,460 | |
| | | | | | |
Total | | | | $ | 109,460 | |
| | | | | | |
| | | | | | |
LIABILITY
DERIVATIVES | | STATEMENTS OF ASSETS
AND LIABILITIES
LOCATION | | FOREIGN
EXCHANGE
CONTRACTS
RISK | |
Forward Foreign Currency Exchange Contracts | | Unrealized depreciation on forward foreign currency exchange contracts | | $ | (2,354 | ) |
| | | | | | |
Total | | | | $ | (2,354 | ) |
| | | | | | |
173
Barings Funds Trust 2016 Semi-Annual Report
NOTES TO FINANCIAL STATEMENTS (CONTINUED)
December 31, 2016 (Unaudited)
Amount of Realized Gain/(Loss) on Derivatives:
Global Floating Rate Fund
| | | | |
| | | FOREIGN
EXCHANGE
CONTRACTS
RISK | |
Forward Foreign Currency Exchange Contracts | | $ | 3,668,258 | |
| | | | |
Total | | $ | 3,668,258 | |
| | | | |
Global Credit Income Opportunities Fund
| | | | | | | | | | | | |
| | | FOREIGN
EXCHANGE
CONTRACTS
RISK | | | INTEREST
RATE
RISK | | | TOTAL | |
Forward Foreign Currency Exchange Contracts | | $ | 2,957,387 | | | $ | – | | | $ | 2,957,387 | |
Purchased Options | | | – | | | | (319,720 | ) | | | (319,720 | ) |
| | | | | | | | | | | | |
Total | | $ | 2,957,387 | | | $ | (319,720 | ) | | $ | 2,637,667 | |
| | | | | | | | | | | | |
Active Short Duration Bond Fund
| | | | | | | | | | | | |
| | | INTEREST
RATE
RISK | | | CREDIT
RISK | | | TOTAL | |
Futures Contracts | | $ | 809,340 | | | $ | – | | | $ | 809,340 | |
Swaps Contracts | | | – | | | | (11,561 | ) | | | (11,561 | ) |
| | | | | | | | | | | | |
Total | | $ | 809,340 | | | $ | (11,561 | ) | | $ | 797,779 | |
| | | | | | | | | | | | |
Total Return Bond Fund
| | | | | | | | | | | | | | | | |
| | | FOREIGN
EXCHANGE
CONTRACTS
RISK | | | INTEREST
RATE
RISK | | | CREDIT
RISK | | | TOTAL | |
Forward Foreign Currency Exchange Contracts | | $ | 833 | | | $ | – | | | $ | – | | | $ | 833 | |
Futures Contracts | | | – | | | | (101,606 | ) | | | – | | | | (101,606 | ) |
Swaps Contracts | | | – | | | | – | | | | (14,347 | ) | | | (14,347 | ) |
| | | | | | | | | | | | | | | | |
Total | | $ | 833 | | | $ | (101,606 | ) | | $ | (14,347 | ) | | $ | (115,120 | ) |
| | | | | | | | | | | | | | | | |
Emerging Markets Debt Blended Total Return Fund
| | | | | | | | | | | | |
| | | FOREIGN
EXCHANGE
CONTRACTS
RISK | | | INTEREST
RATE
RISK | | | TOTAL | |
Forward Foreign Currency Exchange Contracts | | $ | 78,437 | | | $ | – | | | $ | 78,437 | |
Futures Contracts | | | – | | | | 1 | | | | 1 | |
Swaps Contracts | | | – | | | | 7,337 | | | | 7,337 | |
| | | | | | | | | | | | |
Total | | $ | 78,437 | | | $ | 7,338 | | | $ | 85,775 | |
| | | | | | | | | | | | |
Emerging Markets Local Currency Debt Fund
| | | | | | | | | | | | |
| | | FOREIGN
EXCHANGE
CONTRACTS
RISK | | | INTEREST
RATE
RISK | | | TOTAL | |
Forward Foreign Currency Exchange Contracts | | $ | 20,587 | | | $ | – | | | $ | 20,587 | |
Futures Contracts | | | – | | | | (160 | ) | | | (160 | ) |
Swaps Contracts | | | – | | | | 10,498 | | | | 10,498 | |
| | | | | | | | | | | | |
Total | | $ | 20,587 | | | $ | 10,338 | | | $ | 30,925 | |
| | | | | | | | | | | | |
174
Barings Funds Trust 2016 Semi-Annual Report
NOTES TO FINANCIAL STATEMENTS (CONTINUED)
December 31, 2016 (Unaudited)
Global High Yield Fund
| | | | |
| | | FOREIGN
EXCHANGE
CONTRACTS
RISK | |
Forward Foreign Currency Exchange Contracts | | $ | 623,851 | |
| | | | |
Total | | $ | 623,851 | |
| | | | |
Change in Unrealized Appreciation/(Depreciation) on Derivatives:
Global Floating Rate Fund
| | | | |
| | | FOREIGN
EXCHANGE
CONTRACTS
RISK | |
Forward Foreign Currency Exchange Contracts | | $ | 295,675 | |
| | | | |
Total | | $ | 295,675 | |
| | | | |
Global Credit Income Opportunities Fund
| | | | | | | | | | | | |
| | | FOREIGN
EXCHANGE
CONTRACTS
RISK | | | INTEREST
RATE
RISK | | | TOTAL | |
Forward Foreign Currency Exchange Contracts | | $ | (1,024,556 | ) | | $ | – | | | $ | (1,024,556 | ) |
| | | | | | | | | | | | |
Total | | $ | (1,024,556 | ) | | $ | – | | | $ | (1,024,556 | ) |
| | | | | | | | | | | | |
Active Short Duration Bond Fund
| | | | | | | | | | | | | | | | |
| | | FOREIGN
EXCHANGE
CONTRACTS
RISK | | | INTEREST
RATE
RISK | | | CREDIT
RISK | | | TOTAL | |
Forward Foreign Currency Exchange Contracts | | $ | 12,342 | | | $ | – | | | $ | – | | | $ | 12,342 | |
Futures Contracts | | | – | | | | 173,895 | | | | – | | | | 173,895 | |
Swaps Contracts | | | – | | | | – | | | | 11,299 | | | | 11,299 | |
| | | | | | | | | | | | | | | | |
Total | | $ | 12,342 | | | $ | 173,895 | | | $ | 11,299 | | | $ | 197,536 | |
| | | | | | | | | | | | | | | | |
Total Return Bond Fund
| | | | | | | | | | | | | | | | |
| | | FOREIGN
EXCHANGE
CONTRACTS
RISK | | | INTEREST
RATE
RISK | | | CREDIT
RISK | | | TOTAL | |
Forward Foreign Currency Exchange Contracts | | $ | 327 | | | $ | – | | | $ | – | | | $ | 327 | |
Futures Contracts | | | – | | | | (107,400 | ) | | | – | | | | (107,400 | ) |
Swaps Contracts | | | – | | | | – | | | | 2,996 | | | | 2,996 | |
| | | | | | | | | | | | | | | | |
Total | | $ | 327 | | | $ | (107,400 | ) | | $ | 2,996 | | | $ | (104,077 | ) |
| | | | | | | | | | | | | | | | |
Emerging Markets Debt Blended Total Return Fund
| | | | | | | | | | | | |
| | | FOREIGN
EXCHANGE
CONTRACTS
RISK | | | INTEREST
RATE
RISK | | | TOTAL | |
Forward Foreign Currency Exchange Contracts | | $ | (31,084 | ) | | $ | – | | | $ | (31,084 | ) |
Futures Contracts | | | – | | | | 2,868 | | | | 2,868 | |
Swaps Contracts | | | – | | | | (3,270 | ) | | | (3,270 | ) |
| | | | | | | | | | | | |
Total | | $ | (31,084 | ) | | $ | (402 | ) | | $ | (31,486 | ) |
| | | | | | | | | | | | |
175
Barings Funds Trust 2016 Semi-Annual Report
NOTES TO FINANCIAL STATEMENTS (CONTINUED)
December 31, 2016 (Unaudited)
Emerging Markets Local Currency Debt Fund
| | | | | | | | | | | | |
| | | FOREIGN
EXCHANGE
CONTRACTS
RISK | | | INTEREST
RATE
RISK | | | TOTAL | |
Forward Foreign Currency Exchange Contracts | | $ | 17,042 | | | $ | – | | | $ | 17,042 | |
Futures Contracts | | | – | | | | 1 | | | | 1 | |
Swaps Contracts | | | – | | | | (42,602 | ) | | | (42,602 | ) |
| | | | | | | | | | | | |
Total | | $ | 17,042 | | | $ | (42,601 | ) | | $ | (25,559 | ) |
| | | | | | | | | | | | |
Global High Yield Fund
| | | | |
| | | FOREIGN
EXCHANGE
CONTRACTS
RISK | |
Forward Foreign Currency Exchange Contracts | | $ | (173,783 | ) |
| | | | |
Total | | $ | (173,783 | ) |
| | | | |
Global Floating Rate Fund
| | | | |
NUMBER OF CONTRACTS, NOTIONAL AMOUNTS OF SHARES/UNITS | | FOREIGN
EXCHANGE CONTRACTS
RISK | |
Forward Foreign Currency Exchange Contracts(1) | | | 34,370,432 | |
| | | | |
Total | | | 34,370,432 | |
| | | | |
| | (1) | Volume of derivative activity is based on an average of month-end notional amounts outstanding during the period. |
Global Credit Income Opportunities Fund
| | | | | | | | | | | | |
| | | FOREIGN
EXCHANGE
CONTRACTS
RISK | | | INTEREST
RATE
RISK | | | TOTAL | |
Forward Foreign Currency Exchange Contracts(1) | | $ | 30,748,097 | | | $ | – | | | $ | 30,748,097 | |
Purchased Options(1) | | | – | | | | 42,920,000 | | | | 42,920,000 | |
| | | | | | | | | | | | |
Total | | $ | 30,748,097 | | | $ | 42,920,000 | | | $ | 73,668,097 | |
| | | | | | | | | | | | |
| | (1) | Volume of derivative activity is based on an average of month-end notional amounts outstanding during the period. |
Active Short Duration Bond Fund
| | | | | | | | | | | | | | | | |
| | | FOREIGN
EXCHANGE
CONTRACTS
RISK | | | INTEREST
RATE
RISK | | | CREDIT
RISK | | | TOTAL | |
Forward Foreign Currency Exchange Contracts(1) | | $ | 8,476,826 | | | $ | – | | | $ | – | | | $ | 8,476,826 | |
Futures Contracts(2) | | | – | | | | 231 | | | | – | | | | 231 | |
Swap Contracts(1) | | | – | | | | – | | | | 2,050,000 | | | | 2,050,000 | |
| | | | | | | | | | | | | | | | |
Total | | $ | 8,476,826 | | | $ | 231 | | | $ | 2,050,000 | | | $ | 10,527,057 | |
| | | | | | | | | | | | | | | | |
| | (1) | Volume of derivative activity is based on an average of month-end notional amounts outstanding during the period. |
| | (2) | Volume of derivative activity is based on an average of month-end contracts outstanding during the period. |
176
Barings Funds Trust 2016 Semi-Annual Report
NOTES TO FINANCIAL STATEMENTS (CONTINUED)
December 31, 2016 (Unaudited)
Total Return Bond Fund
| | | | | | | | | | | | | | | | |
NUMBER OF
CONTRACTS,
NOTIONAL
AMOUNTS
OF SHARES/
UNITS | | FOREIGN
EXCHANGE
CONTRACTS
RISK | | | INTEREST
RATE
RISK | | | CREDIT
RISK | | | TOTAL | |
Forward Foreign Currency Exchange Contracts(1) | | | 3,910,247 | | | | – | | | | – | | | | 3,910,247 | |
Futures Contracts(2) | | | – | | | | 5 | | | | – | | | | 5 | |
Swap Contracts(1) | | | – | | | | – | | | | 610,000 | | | | 610,000 | |
| | | | | | | | | | | | | | | | |
Total | | | 3,910,247 | | | | 5 | | | | 610,000 | | | | 4,520,252 | |
| | | | | | | | | | | | | | | | |
| | (1) | Volume of derivative activity is based on an average of month-end notional amounts outstanding during the period. |
| | (2) | Volume of derivative activity is based on an average of month-end contracts outstanding during the period. |
Emerging Markets Debt Blended Total Return Fund
| | | | | | | | | | | | |
| | | FOREIGN
EXCHANGE
CONTRACTS
RISK | | | INTEREST
RATE
RISK | | | TOTAL | |
Forward Foreign Currency Exchange Contracts(1) | | $ | 13,516,875 | | | $ | – | | | $ | 13,516,875 | |
Futures Contracts(2) | | | – | | | | 2 | | | | 2 | |
Swap Contracts(1) | | | – | | | | 287,026,211 | | | | 287,026,211 | |
| | | | | | | | | | | | |
Total | | $ | 13,516,875 | | | $ | 287,026,213 | | | $ | 300,543,088 | |
| | | | | | | | | | | | |
| | (1) | Volume of derivative activity is based on an average of month-end notional amounts outstanding during the period. |
| | (2) | Volume of derivative activity is based on an average of month-end contracts outstanding during the period. |
Emerging Markets Local Currency Debt Fund
| | | | | | | | | | | | |
| | | FOREIGN
EXCHANGE
CONTRACTS
RISK | | | INTEREST
RATE RISK | | | TOTAL | |
Forward Foreign Currency Exchange Contracts(1) | | $ | 9,205,551 | | | $ | – | | | $ | 9,205,551 | |
Futures Contracts(2) | | | – | | | | 1 | | | | 1 | |
Swap Contracts(1) | | | – | | | | 238,182,963 | | | | 238,182,963 | |
| | | | | | | | | | | | |
Total | | $ | 9,205,551 | | | $ | 238,182,964 | | | $ | 247,388,515 | |
| | | | | | | | | | | | |
| | (1) | Volume of derivative activity is based on an average of month-end notional amounts outstanding during the period. |
| | (2) | Volume of derivative activity is based on an average of month-end contracts outstanding during the period. |
Global High Yield Fund
| | | | |
NUMBER OF CONTRACTS, NOTIONAL AMOUNTS OF SHARES/UNITS | | FOREIGN
EXCHANGE CONTRACTS
RISK | |
Forward Foreign Currency Exchange Contracts(1) | | | 6,657,539 | |
| | | | |
Total | | $ | 6,657,539 | |
| | | | |
| | (1) | Volume of derivative activity is based on an average of month-end notional amounts outstanding during the period. |
| | K. | Disclosures about Offsetting Assets and Liabilities |
The Financial Accounting Standards Board (“FASB”) issued Accounting Standards Update No. 2011-11 “Disclosures about Offsetting Assets and Liabilities” (“ASU 2011-11”). These disclosure requirements are intended to help better assess the effect or potential effect of offsetting arrangements on a Fund’s financial position. In addition, FASB issued Accounting Standards Update No. 2013-01 “Clarifying the Scope of Offsetting Assets and Liabilities” (“ASU 2013-01”), specifying which transactions are subject to disclosures about offsetting. In order to better define its contractual rights and to secure rights that will
177
Barings Funds Trust 2016 Semi-Annual Report
NOTES TO FINANCIAL STATEMENTS (CONTINUED)
December 31, 2016 (Unaudited)
help the Fund mitigate its counterparty risk, the Fund may enter into an International Swaps and Derivatives Association, Inc. Master Agreement (“ISDA Master Agreement”) or similar agreement with its counterparties. An ISDA Master Agreement is a bilateral agreement between the Fund and a counterparty that governs certain OTC derivatives and typically contains, among other things, collateral posting terms and netting provisions in the event of a default and/or termination event. Under an ISDA Master Agreement, the Fund may, under certain circumstances, offset with the counterparty certain derivative financial instruments’ payables and/or receivables with collateral held and/or posted and create one single net payment. The provisions of the ISDA Master Agreement typically permit a single net payment in the event of default including the bankruptcy or insolvency of the counterparty. Bankruptcy or insolvency laws of a particular jurisdiction may restrict or prohibit the
right of offset in bankruptcy, insolvency or other events. In addition, certain ISDA Master Agreements allow counterparties to terminate derivative contracts prior to maturity in the event the Fund’s net assets decline by a stated percentage or the Fund fails to meet the terms of its ISDA Master Agreements. The result would cause the Fund to accelerate payment of any net liability owed to the counterparty.
The following tables illustrate gross and net information about recognized assets eligible for offset in the Statement of Assets and Liabilities; and disclose such amounts subject to an enforceable master netting agreement or similar agreement, by counterparty. A master netting agreement is an agreement between two counterparties who have multiple contracts with each other that provides for the net settlement of all contracts, as well as cash collateral, through a single payment in the event of default on or termination of any one contract:
Global Floating Rate Fund
| | | | | | | | | | | | |
| DESCRIPTION | | GROSS AMOUNTS OF
RECOGNIZED ASSETS | | | GROSS AMOUNTS OFFSET
IN THE STATEMENTS OF
ASSETS AND LIABILITIES | | | NET AMOUNTS OF
ASSETS PRESENTED
IN THE STATEMENTS OF
ASSETS AND LIABILITIES | |
Forward Foreign Currency Exchange Contracts | | $ | 297,336 | | | $ | – | | | $ | 297,336 | |
| | | | | | | | | | | | |
Total | | $ | 297,336 | | | $ | – | | | $ | 297,336 | |
| | | | | | | | | | | | |
| | | | | | | | | | | | | | | | |
| | | | | | GROSS AMOUNTS NOT OFFSET IN THE
STATEMENTS OF ASSETS AND LIABILITIES | | | | | | | |
| COUNTERPARTY | | NET AMOUNTS OF ASSETS
PRESENTED IN THE STATEMENTS
OF ASSETS AND LIABILITIES | | | FINANCIAL
INSTRUMENT | | | CASH
COLLATERAL
RECEIVED (a) | | | NET
AMOUNT (b) | |
Morgan Stanley & Co. | | $ | 297,336 | | | $ | (1,660 | ) | | $ | – | | | $ | 295,676 | |
| | | | | | | | | | | | | | | | |
Total | | $ | 297,336 | | | $ | (1,660 | ) | | $ | – | | | $ | 295,676 | |
| | | | | | | | | | | | | | | | |
| | (a) | Collateral disclosed is limited to an amount not to exceed 100% of the net amount of assets presented in the Statements of Assets and Liabilities, for each respective counterparty. |
| | (b) | Net Amount represents the amount that is subject to loss in the event of a counterparty failure as of December 31, 2016. |
178
Barings Funds Trust 2016 Semi-Annual Report
NOTES TO FINANCIAL STATEMENTS (CONTINUED)
December 31, 2016 (Unaudited)
| | | | | | | | | | | | |
| DESCRIPTION | | GROSS AMOUNTS OF
RECOGNIZED LIABILITIES | | | GROSS AMOUNTS OFFSET
IN THE STATEMENTS OF
ASSETS AND LIABILITIES | | | NET AMOUNTS OF
LIABILITIES PRESENTED
IN THE STATEMENTS OF
ASSETS AND LIABILITIES | |
Forward Foreign Currency Exchange Contracts | | $ | 1,660 | | | $ | – | | | $ | 1,660 | |
| | | | | | | | | | | | |
Total | | $ | 1,660 | | | $ | – | | | $ | 1,660 | |
| | | | | | | | | | | | |
| | | | | | | | | | | | | | | | |
| | | | | | GROSS AMOUNTS NOT OFFSET IN THE
STATEMENTS OF ASSETS AND LIABILITIES | | | | | | | |
| COUNTERPARTY | | NET AMOUNTS OF LIABILITIES
PRESENTED IN THE STATEMENTS
OF ASSETS AND LIABILITIES | | | FINANCIAL
INSTRUMENT | | | CASH
COLLATERAL
PLEDGED (a) | | | NET
AMOUNT (b) | |
Morgan Stanley & Co. | | $ | 1,660 | | | $ | (1,660 | ) | | $ | – | | | $ | – | |
| | | | | | | | | | | | | | | | |
Total | | $ | 1,660 | | | $ | (1,660 | ) | | $ | – | | | $ | – | |
| | | | | | | | | | | | | | | | |
| | (a) | Collateral disclosed is limited to an amount not to exceed 100% of the net amount of assets presented in the Statements of Assets and Liabilities, for each respective counterparty. |
| | (b) | Net Amount represents the amount that is subject to loss in the event of a counterparty failure as of December 31, 2016. |
Global Credit Income Opportunities Fund
| | | | | | | | | | | | |
| DESCRIPTION | | GROSS AMOUNTS OF
RECOGNIZED ASSETS | | | GROSS AMOUNTS OFFSET
IN THE STATEMENTS OF
ASSETS AND LIABILITIES | | | NET AMOUNTS OF
ASSETS PRESENTED
IN THE STATEMENTS OF
ASSETS AND LIABILITIES | |
Forward Foreign Currency Exchange Contracts | | $ | 358,535 | | | $ | – | | | $ | 358,535 | |
| | | | | | | | | | | | |
Total | | $ | 358,535 | | | $ | – | | | $ | 358,535 | |
| | | | | | | | | | | | |
| | | | | | | | | | | | | | | | |
| | | | | | GROSS AMOUNTS NOT OFFSET IN THE
STATEMENTS OF ASSETS AND LIABILITIES | | | | | | | |
| COUNTERPARTY | | NET AMOUNTS OF ASSETS
PRESENTED IN THE STATEMENTS
OF ASSETS AND LIABILITIES | | | FINANCIAL
INSTRUMENT | | | CASH
COLLATERAL
RECEIVED (a) | | | NET
AMOUNT (b) | |
Citibank N.A. | | $ | 126,766 | | | $ | – | | | $ | 126,766 | | | $ | – | |
JPMorgan Chase Bank N.A. | | | 231,657 | | | | – | | | | 231,657 | | | | – | |
Morgan Stanley & Co. | | | 112 | | | | (112 | ) | | | – | | | | – | |
| | | | | | | | | | | | | | | | |
Total | | $ | 358,535 | | | $ | (112 | ) | | $ | 358,423 | | | $ | – | |
| | | | | | | | | | | | | | | | |
179
Barings Funds Trust 2016 Semi-Annual Report
NOTES TO FINANCIAL STATEMENTS (CONTINUED)
December 31, 2016 (Unaudited)
| | (a) | Collateral disclosed is limited to an amount not to exceed 100% of the net amount of assets presented in the Statements of Assets and Liabilities, for each respective counterparty. |
| | (b) | Net Amount represents the amount that is subject to loss in the event of a counterparty failure as of December 31, 2016. |
| | | | | | | | | | | | |
| DESCRIPTION | | GROSS AMOUNTS OF
RECOGNIZED LIABILITIES | | | GROSS AMOUNTS OFFSET
IN THE STATEMENTS OF
ASSETS AND LIABILITIES | | | NET AMOUNTS OF
LIABILITIES PRESENTED
IN THE STATEMENTS OF
ASSETS AND LIABILITIES | |
Forward Foreign Currency Exchange Contracts | | $ | 4,208 | | | $ | – | | | $ | 4,208 | |
| | | | | | | | | | | | |
Total | | $ | 4,208 | | | $ | – | | | $ | 4,208 | |
| | | | | | | | | | | | |
| | | | | | | | | | | | | | | | |
| | | | | | GROSS AMOUNTS NOT OFFSET IN THE
STATEMENTS OF ASSETS AND LIABILITIES | | | | | | | |
| COUNTERPARTY | | NET AMOUNTS OF LIABILITIES
PRESENTED IN THE STATEMENTS
OF ASSETS AND LIABILITIES | | | FINANCIAL
INSTRUMENT | | | CASH
COLLATERAL
PLEDGED (a) | | | NET
AMOUNT (b) | |
Morgan Stanley & Co. | | $ | 4,208 | | | $ | (112 | ) | | $ | — | | | $ | 4,096 | |
| | | | | | | | | | | | | | | | |
Total | | $ | 4,208 | | | $ | (112 | ) | | $ | — | | | $ | 4,096 | |
| | | | | | | | | | | | | | | | |
| | (a) | Collateral disclosed is limited to an amount not to exceed 100% of the net amount of assets presented in the Statements of Assets and Liabilities, for each respective counterparty. |
| | (b) | Net Amount represents the amount that is subject to loss in the event of a counterparty failure as of December 31, 2016. |
Active Short Duration Bond Fund
| | | | | | | | | | | | |
| DESCRIPTION | | GROSS AMOUNTS OF
RECOGNIZED ASSETS | | | GROSS AMOUNTS OFFSET
IN THE STATEMENTS OF
ASSETS AND LIABILITIES | | | NET AMOUNTS OF
ASSETS PRESENTED
IN THE STATEMENTS OF
ASSETS AND LIABILITIES | |
Forward Foreign Currency Exchange Contracts | | $ | 266,105 | | | $ | — | | | $ | 266,105 | |
Swap Contracts | | | 5,624 | | | | — | | | | 5,624 | |
| | | | | | | | | | | | |
Total | | $ | 271,729 | | | $ | — | | | $ | 271,729 | |
| | | | | | | | | | | | |
| | | | | | | | | | | | | | | | |
| | | | | | GROSS AMOUNTS NOT OFFSET IN THE
STATEMENTS OF ASSETS AND LIABILITIES | | | | | | | |
| COUNTERPARTY | | NET AMOUNTS OF ASSETS
PRESENTED IN THE STATEMENTS
OF ASSETS AND LIABILITIES | | | FINANCIAL
INSTRUMENT | | | CASH
COLLATERAL
RECEIVED (a) | | | NET
AMOUNT (b) | |
Goldman Sachs & Co. | | $ | 5,624 | | | $ | — | | | $ | — | | | $ | 5,624 | |
JPMorgan Chase Bank N.A. | | | 266,105 | | | | (266,105 | ) | | | — | | | | — | |
| | | | | | | | | | | | | | | | |
Total | | $ | 271,729 | | | $ | (266,105 | ) | | $ | — | | | $ | 5,624 | |
| | | | | | | | | | | | | | | | |
180
Barings Funds Trust 2016 Semi-Annual Report
NOTES TO FINANCIAL STATEMENTS (CONTINUED)
December 31, 2016 (Unaudited)
| | (a) | Collateral disclosed is limited to an amount not to exceed 100% of the net amount of assets presented in the Statements of Assets and Liabilities, for each respective counterparty. |
| | (b) | Net Amount represents the amount that is subject to loss in the event of a counterparty failure as of December 31, 2016. |
| | | | | | | | | | | | |
| DESCRIPTION | | GROSS AMOUNTS OF
RECOGNIZED LIABILITIES | | | GROSS AMOUNTS OFFSET
IN THE STATEMENTS OF
ASSETS AND LIABILITIES | | | NET AMOUNTS OF
LIABILITIES PRESENTED
IN THE STATEMENTS OF
ASSETS AND LIABILITIES | |
Forward Foreign Currency Exchange Contracts | | $ | 255,735 | | | $ | — | | | $ | 255,735 | |
Swap Contracts | | | 13,622 | | | | — | | | | 13,622 | |
| | | | | | | | | | | | |
Total | | $ | 269,357 | | | $ | — | | | $ | 269,357 | |
| | | | | | | | | | | | |
| | | | | | | | | | | | | | | | |
| | | | | | GROSS AMOUNTS NOT OFFSET IN THE
STATEMENTS OF ASSETS AND LIABILITIES | | | | | | | |
| COUNTERPARTY | | NET AMOUNTS OF LIABILITIES
PRESENTED IN THE STATEMENTS
OF ASSETS AND LIABILITIES | | | FINANCIAL
INSTRUMENT | | | CASH
COLLATERAL
PLEDGED (a) | | | NET
AMOUNT (b) | |
JPMorgan Chase Bank N.A. | | $ | 269,357 | | | $ | (266,105 | ) | | $ | — | | | $ | 3,252 | |
| | | | | | | | | | | | | | | | |
Total | | $ | 269,357 | | | $ | (266,105 | ) | | $ | — | | | $ | 3,252 | |
| | | | | | | | | | | | | | | | |
| | (a) | Collateral disclosed is limited to an amount not to exceed 100% of the net amount of assets presented in the Statements of Assets and Liabilities, for each respective counterparty. |
| | (b) | Net Amount represents the amount that is subject to loss in the event of a counterparty failure as of December 31, 2016. |
Total Return Bond Fund
| | | | | | | | | | | | |
| DESCRIPTION | | GROSS AMOUNTS OF RECOGNIZED ASSETS | | | GROSS AMOUNTS OFFSET
IN THE STATEMENTS OF
ASSETS AND LIABILITIES | | | NET AMOUNTS OF
ASSETS PRESENTED
IN THE STATEMENTS OF
ASSETS AND LIABILITIES | |
Forward Foreign Currency Exchange Contracts | | $ | 113,553 | | | $ | — | | | $ | 113,553 | |
Swap Contracts | | | 1,357 | | | | — | | | | 1,357 | |
| | | | | | | | | | | | |
Total | | $ | 114,910 | | | $ | — | | | $ | 114,910 | |
| | | | | | | | | | | | |
181
Barings Funds Trust 2016 Semi-Annual Report
NOTES TO FINANCIAL STATEMENTS (CONTINUED)
December 31, 2016 (Unaudited)
| | | | | | | | | | | | | | | | |
| | | | | | GROSS AMOUNTS NOT OFFSET IN THE
STATEMENTS OF ASSETS AND LIABILITIES | | | | | | | |
| COUNTERPARTY | | NET AMOUNTS OF ASSETS
PRESENTED IN THE STATEMENTS
OF ASSETS AND LIABILITIES | | | FINANCIAL
INSTRUMENT | | | CASH
COLLATERAL
RECEIVED (a) | | | NET
AMOUNT (b) | |
Bank of America N.A. | | $ | 283 | | | $ | (283 | ) | | $ | — | | | $ | — | |
BNP Paribas S.A. | | | 6,419 | | | | (2,898 | ) | | | — | | | | 3,521 | |
Citibank N.A. | | | 72 | | | | (72 | ) | | | — | | | | — | |
Goldman Sachs & Co. | | | 1,360 | | | | — | | | | — | | | | 1,360 | |
JPMorgan Chase Bank N.A. | | | 106,776 | | | | (106,776 | ) | | | — | | | | — | |
| | | | | | | | | | | | | | | | |
Total | | $ | 114,910 | | | $ | (110,029 | ) | | $ | — | | | $ | 4,881 | |
| | | | | | | | | | | | | | | | |
| | (a) | Collateral disclosed is limited to an amount not to exceed 100% of the net amount of assets presented in the Statements of Assets and Liabilities, for each respective counterparty. |
| | (b) | Net Amount represents the amount that is subject to loss in the event of a counterparty failure as of December 31, 2016. |
| | | | | | | | | | | | |
| DESCRIPTION | | GROSS AMOUNTS OF
RECOGNIZED LIABILITIES | | | GROSS AMOUNTS OFFSET
IN THE STATEMENTS OF
ASSETS AND LIABILITIES | | | NET AMOUNTS OF
LIABILITIES PRESENTED
IN THE STATEMENTS OF
ASSETS AND LIABILITIES | |
Forward Foreign Currency Exchange Contracts | | $ | 114,839 | | | $ | — | | | $ | 114,839 | |
Swap Contracts | | | 3,553 | | | | — | | | | 3,553 | |
| | | | | | | | | | | | |
Total | | $ | 118,392 | | | $ | — | | | $ | 118,392 | |
| | | | | | | | | | | | |
| | | | | | | | | | | | | | | | |
| | | | | | GROSS AMOUNTS NOT OFFSET IN THE
STATEMENTS OF ASSETS AND LIABILITIES | | | | | | | |
| COUNTERPARTY | | NET AMOUNTS OF LIABILITIES
PRESENTED IN THE STATEMENTS
OF ASSETS AND LIABILITIES | | | FINANCIAL
INSTRUMENT | | | CASH
COLLATERAL
PLEDGED (a) | | | NET
AMOUNT (b) | |
Bank of America N.A. | | $ | 2,330 | | | $ | (283 | ) | | $ | — | | | $ | 2,047 | |
BNP Paribas S.A. | | | 2,898 | | | | (2,898 | ) | | | — | | | | — | |
Citibank N.A. | | | 1,448 | | | | (72 | ) | | | — | | | | 1,376 | |
JPMorgan Chase Bank N.A. | | | 111,716 | | | | (106,776 | ) | | | — | | | | 4,940 | |
| | | | | | | | | | | | | | | | |
Total | | $ | 118,392 | | | $ | (110,029 | ) | | $ | — | | | $ | 8,363 | |
| | | | | | | | | | | | | | | | |
| | (a) | Collateral disclosed is limited to an amount not to exceed 100% of the net amount of assets presented in the Statements of Assets and Liabilities, for each respective counterparty. |
| | (b) | Net Amount represents the amount that is subject to loss in the event of a counterparty failure as of December 31, 2016. |
182
Barings Funds Trust 2016 Semi-Annual Report
NOTES TO FINANCIAL STATEMENTS (CONTINUED)
December 31, 2016 (Unaudited)
Emerging Markets Debt Blended Total Return Fund
| | | | | | | | | | | | |
| DESCRIPTION | | GROSS AMOUNTS OF RECOGNIZED ASSETS | | | GROSS AMOUNTS OFFSET
IN THE STATEMENTS OF
ASSETS AND LIABILITIES | | | NET AMOUNTS OF
ASSETS PRESENTED
IN THE STATEMENTS OF
ASSETS AND LIABILITIES | |
Forward Foreign Currency Exchange Contracts | | $ | 291,224 | | | $ | — | | | $ | 291,224 | |
Swap Contracts | | | 23,437 | | | | — | | | | 23,437 | |
| | | | | | | | | | | | |
Total | | $ | 314,661 | | | $ | — | | | $ | 314,661 | |
| | | | | | | | | | | | |
| | | | | | | | | | | | | | | | |
| | | | | | GROSS AMOUNTS NOT OFFSET IN THE
STATEMENTS OF ASSETS AND LIABILITIES | | | | | | | |
| COUNTERPARTY | | NET AMOUNTS OF ASSETS
PRESENTED IN THE STATEMENTS
OF ASSETS AND LIABILITIES | | | FINANCIAL
INSTRUMENT | | | CASH
COLLATERAL
RECEIVED (a) | | | NET
AMOUNT (b) | |
Bank of America N.A. | | $ | 15,105 | | | $ | (15,105 | ) | | $ | — | | | $ | — | |
BANK OF AMERICA, N.A. | | | 4,537 | | | | — | | | | — | | | | 4,537 | |
BNP Paribas S.A. | | | 66,156 | | | | (44,113 | ) | | | — | | | | 22,043 | |
Citibank N.A. | | | 57,341 | | | | (43,450 | ) | | | — | | | | 13,891 | |
Goldman Sachs & Co. | | | 42 | | | | — | | | | — | | | | 42 | |
JPMORGAN CHASE BANK | | | 5,547 | | | | — | | | | — | | | | 5,547 | |
JPMorgan Chase Bank N.A. | | | 165,933 | | | | (165,933 | ) | | | — | | | | — | |
| | | | | | | | | | | | | | | | |
Total | | $ | 314,661 | | | $ | (268,601 | ) | | $ | — | | | $ | 46,060 | |
| | | | | | | | | | | | | | | | |
| | (a) | Collateral disclosed is limited to an amount not to exceed 100% of the net amount of assets presented in the Statements of Assets and Liabilities, for each respective counterparty. |
| | (b) | Net Amount represents the amount that is subject to loss in the event of a counterparty failure as of December 31, 2016. |
| | | | | | | | | | | | |
| DESCRIPTION | | GROSS AMOUNTS OF
RECOGNIZED LIABILITIES | | | GROSS AMOUNTS OFFSET
IN THE STATEMENTS OF
ASSETS AND LIABILITIES | | | NET AMOUNTS OF
LIABILITIES PRESENTED
IN THE STATEMENTS OF
ASSETS AND LIABILITIES | |
Forward Foreign Currency Exchange Contracts | | $ | 288,771 | | | $ | – | | | $ | 288,771 | |
Swap Contracts | | | 12,765 | | | | – | | | | 12,765 | |
| | | | | | | | | | | | |
Total | | $ | 301,536 | | | $ | – | | | $ | 301,536 | |
| | | | | | | | | | | | |
183
Barings Funds Trust 2016 Semi-Annual Report
NOTES TO FINANCIAL STATEMENTS (CONTINUED)
December 31, 2016 (Unaudited)
| | | | | | | | | | | | | | | | |
| | | | | | GROSS AMOUNTS NOT OFFSET IN THE
STATEMENTS OF ASSETS AND LIABILITIES | | | | | | | |
COUNTERPARTY | | NET AMOUNTS OF LIABILITIES
PRESENTED IN THE STATEMENTS
OF ASSETS AND LIABILITIES | | | FINANCIAL
INSTRUMENT | | | CASH
COLLATERAL
PLEDGED (a) | | | NET
AMOUNT (b) | |
Bank of America N.A. | | $ | 31,344 | | | $ | (15,105 | ) | | $ | – | | | $ | 16,239 | |
BNP Paribas S.A. | | | 44,113 | | | | (44,113 | ) | | | – | | | | – | |
Citibank N.A. | | | 43,450 | | | | (43,450 | ) | | | – | | | | – | |
JP MORGAN | | | 4,549 | | | | – | | | | – | | | | 4,549 | |
JPMorgan Chase Bank N.A. | | | 178,080 | | | | (165,933 | ) | | | – | | | | 12,147 | |
| | | | | | | | | | | | | | | | |
Total | | $ | 301,536 | | | $ | (268,601 | ) | | $ | – | | | $ | 32,935 | |
| | | | | | | | | | | | | | | | |
| | (a) | Collateral disclosed is limited to an amount not to exceed 100% of the net amount of assets presented in the Statements of Assets and Liabilities, for each respective counterparty. |
| | (b) | Net Amount represents the amount that is subject to loss in the event of a counterparty failure as of December 31, 2016. |
Emerging Markets Local Currency Debt Fund
| | | | | | | | | | | | |
| DESCRIPTION | | GROSS AMOUNTS OF
RECOGNIZED ASSETS | | | GROSS AMOUNTS OFFSET
IN THE STATEMENTS OF
ASSETS AND LIABILITIES | | | NET AMOUNTS OF
ASSETS PRESENTED
IN THE STATEMENTS OF
ASSETS AND LIABILITIES | |
Forward Foreign Currency Exchange Contracts | | $ | 214,831 | | | $ | – | | | $ | 214,831 | |
Swap Contracts | | | 23,993 | | | | – | | | | 23,993 | |
| | | | | | | | | | | | |
Total | | $ | 238,824 | | | $ | – | | | $ | 238,824 | |
| | | | | | | | | | | | |
| | | | | | | | | | | | | | | | |
| | | | | | GROSS AMOUNTS NOT OFFSET IN THE
STATEMENTS OF ASSETS AND LIABILITIES | | | | | | | |
| COUNTERPARTY | | NET AMOUNTS OF ASSETS
PRESENTED IN THE STATEMENTS
OF ASSETS AND LIABILITIES | | | FINANCIAL
INSTRUMENT | | | CASH
COLLATERAL
RECEIVED (a) | | | NET
AMOUNT (b) | |
Bank of America N.A. | | $ | 20,890 | | | $ | (20,890 | ) | | $ | – | | | $ | – | |
BNP Paribas S.A. | | | 49,599 | | | | (21,207 | ) | | | – | | | | 28,392 | |
Citibank N.A. | | | 39,614 | | | | (30,339 | ) | | | – | | | | 9,275 | |
Goldman Sachs & Co. | | | 14,936 | | | | (384 | ) | | | – | | | | 14,552 | |
JPMorgan Chase Bank N.A. | | | 113,785 | | | | (113,785 | ) | | | – | | | | – | |
| | | | | | | | | | | | | | | | |
Total | | $ | 238,824 | | | $ | (186,605 | ) | | $ | – | | | $ | 52,219 | |
| | | | | | | | | | | | | | | | |
| | (a) | Collateral disclosed is limited to an amount not to exceed 100% of the net amount of assets presented in the Statements of Assets and Liabilities, for each respective counterparty. |
| | (b) | Net Amount represents the amount that is subject to loss in the event of a counterparty failure as of December 31, 2016. |
184
Barings Funds Trust 2016 Semi-Annual Report
NOTES TO FINANCIAL STATEMENTS (CONTINUED)
December 31, 2016 (Unaudited)
| | | | | | | | | | | | |
| DESCRIPTION | | GROSS AMOUNTS OF
RECOGNIZED LIABILITIES | | | GROSS AMOUNTS OFFSET
IN THE STATEMENTS OF
ASSETS AND LIABILITIES | | | NET AMOUNTS OF
LIABILITIES PRESENTED
IN THE STATEMENTS OF
ASSETS AND LIABILITIES | |
Forward Foreign Currency Exchange Contracts | | $ | 198,985 | | | $ | – | | | $ | 198,985 | |
Swap Contracts | | | 30,115 | | | | – | | | | 30,115 | |
| | | | | | | | | | | | |
Total | | $ | 229,100 | | | $ | – | | | $ | 229,100 | |
| | | | | | | | | | | | |
| | | | | | | | | | | | | | | | |
| | | | | | GROSS AMOUNTS NOT OFFSET IN THE
STATEMENTS OF ASSETS AND LIABILITIES | | | | | | | |
| COUNTERPARTY | | NET AMOUNTS OF LIABILITIES
PRESENTED IN THE STATEMENTS
OF ASSETS AND LIABILITIES | | | FINANCIAL
INSTRUMENT | | | CASH
COLLATERAL
PLEDGED (a) | | | NET
AMOUNT (b) | |
Bank of America N.A. | | $ | 38,235 | | | $ | (20,890 | ) | | $ | – | | | $ | 17,345 | |
BNP Paribas S.A. | | | 21,207 | | | | (21,207 | ) | | | – | | | | – | |
Citibank N.A. | | | 30,339 | | | | (30,339 | ) | | | – | | | | – | |
Goldman Sachs & Co. | | | 384 | | | | (384 | ) | | | – | | | | – | |
JPMorgan Chase Bank N.A. | | | 138,935 | | | | (113,785 | ) | | | – | | | | 25,150 | |
| | | | | | | | | | | | | | | | |
Total | | $ | 229,100 | | | $ | (186,605 | ) | | $ | – | | | $ | 42,495 | |
| | | | | | | | | | | | | | | | |
| | (a) | Collateral disclosed is limited to an amount not to exceed 100% of the net amount of assets presented in the Statements of Assets and Liabilities, for each respective counterparty. |
| | (b) | Net Amount represents the amount that is subject to loss in the event of a counterparty failure as of December 31, 2016. |
Global High Yield Fund
| | | | | | | | | | | | |
| DESCRIPTION | | GROSS AMOUNTS OF
RECOGNIZED ASSETS | | | GROSS AMOUNTS OFFSET
IN THE STATEMENTS OF
ASSETS AND LIABILITIES | | | NET AMOUNTS OF
ASSETS PRESENTED
IN THE STATEMENTS OF
ASSETS AND LIABILITIES | |
Forward Foreign Currency Exchange Contracts | | $ | 109,460 | | | $ | – | | | $ | 109,460 | |
| | | | | | | | | | | | |
Total | | $ | 109,460 | | | $ | – | | | $ | 109,460 | |
| | | | | | | | | | | | |
185
Barings Funds Trust 2016 Semi-Annual Report
NOTES TO FINANCIAL STATEMENTS (CONTINUED)
December 31, 2016 (Unaudited)
| | | | | | | | | | | | | | | | |
| | | | | | GROSS AMOUNTS NOT OFFSET IN THE
STATEMENTS OF ASSETS AND LIABILITIES | | | | | | | |
| COUNTERPARTY | | NET AMOUNTS OF ASSETS
PRESENTED IN THE STATEMENTS
OF ASSETS AND LIABILITIES | | | FINANCIAL
INSTRUMENT | | | CASH
COLLATERAL
RECEIVED (a) | | | NET
AMOUNT (b) | |
Bank of America N.A. | | $ | 25,008 | | | $ | – | | | $ | – | | | $ | 25,008 | |
Citibank N.A. | | | 75,991 | | | | – | | | | – | | | | 75,991 | |
JPMorgan Chase Bank N.A. | | | 8,461 | | | | (1,938 | ) | | | – | | | | 6,523 | |
| | | | | | | | | | | | | | | | |
Total | | $ | 109,460 | | | $ | (1,938 | ) | | $ | – | | | $ | 107,522 | |
| | | | | | | | | | | | | | | | |
| | (a) | Collateral disclosed is limited to an amount not to exceed 100% of the net amount of assets presented in the Statements of Assets and Liabilities, for each respective counterparty. |
| | (b) | Net Amount represents the amount that is subject to loss in the event of a counterparty failure as of December 31, 2016. |
| | | | | | | | | | | | |
| DESCRIPTION | | GROSS AMOUNTS OF
RECOGNIZED LIABILITIES | | | GROSS AMOUNTS OFFSET
IN THE STATEMENTS OF
ASSETS AND LIABILITIES | | | NET AMOUNTS OF
LIABILITIES PRESENTED
IN THE STATEMENTS OF
ASSETS AND LIABILITIES | |
Forward Foreign Currency Exchange Contracts | | $ | 2,354 | | | $ | – | | | $ | 2,354 | |
| | | | | | | | | | | | |
Total | | $ | 2,354 | | | $ | – | | | $ | 2,354 | |
| | | | | | | | | | | | |
| | | | | | | | | | | | | | | | |
| | | | | | GROSS AMOUNTS NOT OFFSET IN THE
STATEMENTS OF ASSETS AND LIABILITIES | | | | | | | |
| COUNTERPARTY | | NET AMOUNTS OF LIABILITIES
PRESENTED IN THE STATEMENTS
OF ASSETS AND LIABILITIES | | | FINANCIAL
INSTRUMENT | | | CASH
COLLATERAL
PLEDGED (a) | | | NET
AMOUNT (b) | |
Goldman Sachs & Co. | | $ | 416 | | | $ | – | | | $ | – | | | $ | 416 | |
JPMorgan Chase Bank N.A. | | | 1,938 | | | | (1,938 | ) | | | – | | | | – | |
| | | | | | | | | | | | | | | | |
Total | | $ | 2,354 | | | $ | (1,938 | ) | | $ | – | | | $ | 416 | |
| | | | | | | | | | | | | | | | |
| | (a) | Collateral disclosed is limited to an amount not to exceed 100% of the net amount of assets presented in the Statements of Assets and Liabilities, for each respective counterparty. |
| | (b) | Net Amount represents the amount that is subject to loss in the event of a counterparty failure as of December 31, 2016. |
Investing in securities of foreign companies and foreign governments involves special risks and considerations not typically associated with investing in U.S. companies and the U.S. government. These risks include valuation of currencies and adverse political and economic
developments. Moreover, securities of many foreign companies, foreign governments, and their markets may be less liquid and their prices more volatile than those of securities of comparable U.S. companies and the U.S. government.
186
Barings Funds Trust 2016 Semi-Annual Report
NOTES TO FINANCIAL STATEMENTS (CONTINUED)
December 31, 2016 (Unaudited)
| | M. | Foreign Currency Translation |
The books and records of the Funds are maintained in U.S. dollars. Foreign currency transactions are translated into U.S. dollars on the following basis: (i) market value of investment securities, assets and liabilities at the daily rates of exchange, and (ii) purchases and sales of investment securities, dividend and interest income and certain expenses at the rates of exchange prevailing on the respective dates of such transactions. For financial reporting purposes, the Funds do not isolate changes in the exchange rate of investment securities from the fluctuations arising from changes in the market prices of securities. However, for Federal income tax purposes, the Funds do isolate and treat as ordinary income the effect of changes in foreign exchange rates on realized gain or loss from the sale of investment securities and payables and receivables arising from trade-date and settlement-date differences.
The Funds seek to manage counterparty credit risk by entering into agreements only with counterparties the Adviser believes have the financial resources to honor their obligations. The Adviser monitors the financial stability of the Funds’ counterparties.
The Funds have entered into an Investment Management Agreement (the “Agreement”) with the Adviser. Pursuant to the Agreement, the Funds have agreed to pay the Adviser a fee payable at the end of each calendar month as set forth below:
| | |
Global Floating Rate Fund | | 0.65% of average daily net assets |
Global Credit Income Opportunities Fund | | 0.75% of average daily net assets |
Active Short Duration Bond Fund | | 0.35% of average daily net assets |
Total Return Bond Fund | | 0.40% of average daily net assets |
Emerging Markets Blended Total Return Fund | | 0.75% of average daily net assets |
Emerging Markets Local Currency Debt Fund | | 0.75% of average daily net assets |
Global High Yield Fund | | 0.60% of average daily net assets |
U.S. High Yield Fund | | 0.55% of average daily net assets |
The Adviser has contractually agreed to waive and/or reimburse fees and/or expenses (excluding 12b-1 fees, interest expenses, taxes, acquired fund fees and expenses, fees incurred in acquiring and disposing of securities and extraordinary expenses) such that total net annual operating expenses (including 12b-1 fees) for each class do not exceed the following rates:
| | | | | | | | | | | | | | | | |
| | | CLASS A | | | CLASS C | | | CLASS I | | | CLASS Y | |
Global Floating Rate Fund | | | 1.00 | % | | | 1.75 | % | | | 0.75 | % | | | 0.75 | % |
Global Credit Income Opportunities Fund | | | 1.20 | % | | | 1.95 | % | | | 0.95 | % | | | 0.95 | % |
Active Short Duration Bond Fund | | | 0.65 | % | | | 0.90 | % | | | 0.40 | % | | | 0.40 | % |
Total Return Bond Fund | | | 0.80 | % | | | 1.55 | % | | | 0.55 | % | | | 0.55 | % |
Emerging Markets Debt Blended Total Return Fund | | | 1.20 | % | | | 1.95 | % | | | 0.95 | % | | | 0.95 | % |
Emerging Markets Local Currency Debt Fund | | | 1.20 | % | | | 1.95 | % | | | 0.95 | % | | | 0.95 | % |
Global High Yield Fund | | | 1.05 | % | | | 1.80 | % | | | 0.80 | % | | | 0.80 | % |
U.S. High Yield Fund | | | 1.00 | % | | | 1.75 | % | | | 0.75 | % | | | 0.75 | % |
Pursuant to the expense waiver/reimbursement agreement, the Adviser is entitled to be reimbursed for any fees the Adviser waives and Fund expenses that the Adviser reimburses for a period of three years following such fee waivers and expense reimbursements, to the extent that such reimbursement of the Adviser by a Fund will not cause the Fund to exceed any applicable expense limitation that is in place for the Fund.
The contractual management fee waiver and expense reimbursement agreements between the Funds and the Adviser will remain in effect until November 1, 2017 and may be terminated only upon the approval of the Funds’ Board of Trustees.
Subject to the supervision of the Adviser and the Board, BGA manages the investment and reinvestment of a portion of the assets of the Funds, as allocated from time to time to BGA. The Adviser (not the Funds) will pay a portion of the fees it receives to BGA in return for its services.
187
Barings Funds Trust 2016 Semi-Annual Report
NOTES TO FINANCIAL STATEMENTS (CONTINUED)
December 31, 2016 (Unaudited)
The Adviser or its affiliates voluntarily agreed to waive certain fees for the Global Floating Rate Fund, the Total Return Bond Fund, the Emerging Markets Debt Blended Total Return Fund and the Emerging Markets Local Currency Debt Fund in order to maintain a minimum net investment income of not less than $0. Such arrangements may be discontinued by the investment adviser at any time. For the six months ended December 31, 2016 the amount of the waivers were $93, $2, $5,220, and $5,829, respectively.
| 4. | 12b-1 Distribution and Service Plan |
ALPS Distributors, Inc. (the “Distributor”) is the Distributor of the Funds’ shares as of December 31, 2016.
The Funds have adopted a Distribution and Shareholder Services Plan (the “Plan”), pursuant to Rule 12b-1 under the 1940 Act. Under the Plan, each Fund’s Class A and Class C shares may compensate certain financial institutions, including the Distributor, for certain distribution and shareholder servicing activities. The Funds’ Class A shares may expend an aggregate amount, on an annual basis, not to exceed 0.25% of the value of the average daily net assets of a Fund attributable to Class A shares and 1.00% (0.50% for Active Short Duration Bond Fund) of the value of the average daily net assets of a Fund attributable to Class C shares. The Plan provides that the distribution and service fees are payable to the Distributor regardless of the amounts actually expended by the Distributor for distribution of the Funds’ shares and service activities.
Under its terms, the Funds’ Plan shall remain in effect from year to year, provided such continuance is approved annually by a vote of a majority of the Boards’ members and a majority of those Boards’ members who are not “interested persons” of the Funds and who have no direct or indirect financial interest in the operation of the Plan or in any agreement related to the Plan.
| 5. | Sales Charges and Commissions |
For the year ended December 31, 2016, the amount of sales charges retained by the Distributor on sales of Class A and Class C shares of the Funds were as follows:
| | | | |
| | | CLASS C | |
Global Floating Rate Fund | | $ | 2,238 | |
Global Credit Income Opportunities Fund | | | 201 | |
Active Short Duration Bond Fund | | | 40 | |
For the year ended December 31, 2016, the Distributor received the following commissions on sales of shares of the Funds, after concessions were paid to authorized dealers:
| | | | | | | | |
| | | DISTRIBUTOR
COMMISSIONS | | | DEALERS’
CONCESSIONS | |
Global Floating Rate Fund | | $ | 484 | | | $ | 222,012 | |
Global Credit Income Opportunities Fund | | | 4,136 | | | | 54,067 | |
Active Short Duration Bond Fund | | | – | | | | 140 | |
Total Return Bond Fund | | | – | | | | – | |
Emerging Markets Debt Blended Total Return Fund | | | – | | | | 53 | |
Emerging Markets Local Currency Debt Fund | | | – | | | | – | |
Global High Yield Fund | | | 23 | | | | 1,074 | |
U.S. High Yield Fund | | | – | | | | 59 | |
| 6. | Administrator, Custody, and Transfer Agent Fees |
The Funds have engaged State Street Bank and Trust (“SSB”) to serve as the Funds’ administrator, custodian, and fund accountant. SSB also served as transfer agent from the period July 1, 2015 to November 6, 2015. Effective November 7, 2015, the Funds engaged ALPS Fund Services, Inc. (“ALPS”) as transfer agent. For each of these services, the Funds have agreed to pay SSB and ALPS fees payable at the end of each calendar month pursuant to fee agreements between SSB, ALPS, and the Funds, respectively. For the six months ended December 31, 2016, the aggregate effective fee for the services was at the following annual rate of each Fund’s average daily managed assets:
| | | | |
Global Floating Rate Fund | | | 0.38 | % |
Global Credit Income Opportunities Fund | | | 0.35 | % |
Active Short Duration Bond Fund | | | 0.25 | % |
Total Return Bond Fund | | | 0.48 | % |
Emerging Markets Debt Blended Total Return Fund | | | 0.88 | % |
Emerging Markets Local Currency Debt Fund | | | 1.36 | % |
Global High Yield Fund | | | 0.44 | % |
U.S. High Yield Fund | | | 0.39 | % |
It is the Funds’ intention to qualify as a RIC under subchapter M of the Internal Revenue Code and distribute all of its taxable income. Accordingly, no provision for Federal income taxes is required in the financial statements.
188
Barings Funds Trust 2016 Semi-Annual Report
NOTES TO FINANCIAL STATEMENTS (CONTINUED)
December 31, 2016 (Unaudited)
The tax character of dividends paid to shareholders during the tax year ended June 30, 2016 was as follows:
| | | | | | | | | | | | |
| | | ORDINARY
INCOME | | | NET
LONG-TERM
CAPITAL
GAINS | | | TOTAL
DISTRIBUTIONS
PAID | |
Global Floating Rate Fund | | $ | 8,506,071 | | | $ | – | | | $ | 8,506,071 | |
Global Credit Income Opportunities Fund | | | 6,116,362 | | | | – | | | | 6,116,362 | |
Active Short Duration Bond Fund | | | 1,627,701 | | | | – | | | | 1,627,701 | |
Total Return Bond Fund | | | 732,690 | | | | 1,864 | | | | 734,554 | |
Emerging Markets Debt Blended Total Return Fund | | | 358,072 | | | | 3,100 | | | | 361,172 | |
| | | | | | | | | | | | |
| | | ORDINARY
INCOME | | | NET
LONG-TERM
CAPITAL
GAINS | | | TOTAL
DISTRIBUTIONS
PAID | |
Emerging Markets Local Currency Debt Fund | | $ | 163,404 | | | $ | – | | | $ | 163,404 | |
Global High Yield Fund | | | 980,491 | | | | – | | | | 980,491 | |
U.S. High Yield Fund | | | 1,053,626 | | | | – | | | | 1,053,626 | |
In accordance with the Regulated Investment Company Modernization Act of 2010, the Funds will carryforward capital losses incurred in taxable years beginning after December 22, 2010 (“post-enactment losses”) indefinitely. Post-enactment losses will also retain their character as either short-term or long-term and be utilized before any pre-enactment losses.
As of December 31, 2016, the aggregate unrealized security gains and losses based on cost for U.S. federal income tax purposes were as follows:
| | | | | | | | | | | | | | | | |
| | | COST OF
INVESTMENTS | | | GROSS
UNREALIZED
APPRECIATION | | | GROSS
UNREALIZED
DEPRECIATION | | | NET
UNREALIZED
APPRECIATION
(DEPRECIATION) | |
Global Floating Rate Fund | | $ | 171,695,299 | | | $ | 2,073,801 | | | $ | (5,983,642 | ) | | $ | (3,909,841 | ) |
Global Credit Income Opportunities Fund | | | 122,085,055 | | | | 2,676,302 | | | | (5,232,308 | ) | | | (2,556,006 | ) |
Active Short Duration Bond Fund | | | 252,091,504 | | | | 608,672 | | | | (1,409,854 | ) | | | (801,182 | ) |
Total Return Bond Fund | | | 31,113,744 | | | | 303,892 | | | | (248,816 | ) | | | 55,076 | |
Emerging Markets Debt Blended Total Return Fund | | | 9,820,349 | | | | 193,381 | | | | (411,704 | ) | | | (218,323 | ) |
Emerging Markets Local Currency Debt Fund | | | 4,803,872 | | | | 186,223 | | | | (265,500 | ) | | | (79,277 | ) |
Global High Yield Fund | | | 26,085,360 | | | | 988,202 | | | | (611,604 | ) | | | 376,598 | |
U.S. High Yield Fund | | | 30,414,834 | | | | 1,369,207 | | | | (248,093 | ) | | | 1,121,114 | |
The difference between book-basis and tax-basis unrealized gains (losses) is attributable to wash sales.
189
Barings Funds Trust 2016 Semi-Annual Report
NOTES TO FINANCIAL STATEMENTS (CONTINUED)
December 31, 2016 (Unaudited)
| 8. | Investment Transactions |
Purchases and sales of securities (excluding short-term debt securities) for the year ended December 31, 2016 were as follows:
| | | | | | | | | | | | | | | | |
| | | PURCHASES | | | SALES | | | GOVERNMENT
PURCHASES | | | GOVERNMENT
SALES | |
Global Floating Rate Fund | | $ | 67,189,240 | | | $ | 76,748,633 | | | $ | – | | | $ | – | |
Global Credit Income Opportunities Fund | | | 43,556,056 | | | | 22,606,343 | | | | – | | | | – | |
Active Short Duration Bond Fund | | | 102,848,816 | | | | 57,828,094 | | | | 128,619,572 | | | | 60,623,100 | |
Total Return Bond Fund | | | 4,981,949 | | | | 1,628,123 | | | | 31,156,226 | | | | 30,541,348 | |
Emerging Markets Debt Blended Total Return Fund | | | 5,107,284 | | | | 3,372,807 | | | | – | | | | – | |
Emerging Markets Local Currency Debt Fund | | | 1,853,658 | | | | 2,266,064 | | | | – | | | | – | |
Global High Yield Fund | | | 12,225,100 | | | | 10,796,715 | | | | – | | | | – | |
U.S. High Yield Fund | | | 12,742,091 | | | | 8,676,166 | | | | – | | | | – | |
Transactions in common stock for the year ended December 31, 2016 were as follows:
Global Floating Rate Fund
| | | | | | | | | | | | | | | | |
| | | FOR THE
SIX MONTHS ENDED
DECEMBER 31, 2016 | | | FOR THE
YEAR ENDED
JUNE 30, 2016 | |
| CLASS A | | SHARES | | | AMOUNT | | | SHARES | | | AMOUNT | |
Shares sold | | | 1,809,249 | | | $ | 16,965,916 | | | | 1,852,982 | | | $ | 17,065,312 | |
Shares sold through reinvestments of distributions | | | 56,305 | | | | 530,002 | | | | 32,710 | | | | 300,004 | |
Shares redeemed | | | (137,127 | ) | | | (1,297,317 | ) | | | (891,508 | ) | | | (8,232,099 | ) |
| | | | | | | | | | | | | | | | |
Net increase | | | 1,728,427 | | | $ | 16,198,601 | | | | 994,184 | | | $ | 9,133,217 | |
| | | | | | | | | | | | | | | | |
CLASS C | | | | | | | | | | | | | | | | |
Shares sold | | | 219,408 | | | $ | 2,064,160 | | | | 373,886 | | | $ | 3,471,934 | |
Shares sold through reinvestments of distributions | | | 14,543 | | | | 136,166 | | | | 26,532 | | | | 241,938 | |
Shares redeemed | | | (125,143 | ) | | | (1,165,680 | ) | | | (223,482 | ) | | | (2,060,431 | ) |
| | | | | | | | | | | | | | | | |
Net increase | | | 108,808 | | | $ | 1,034,646 | | | | 176,936 | | | $ | 1,653,441 | |
| | | | | | | | | | | | | | | | |
CLASS I | | | | | | | | | | | | | | | | |
Shares sold | | | 2,195,701 | | | $ | 21,011,826 | | | | – | | | $ | 82 | |
Shares sold through reinvestments of distributions | | | 3,209 | | | | 30,739 | | | | 19,954 | | | | 191,130 | |
Shares redeemed | | | (2,177,717 | ) | | | (20,747,335 | ) | | | (535,014 | ) | | | (5,000,000 | ) |
| | | | | | | | | | | | | | | | |
Net increase (decrease) | | | 21,193 | | | $ | 295,230 | | | | (515,060 | ) | | $ | (4,808,788 | ) |
| | | | | | | | | | | | | | | | |
CLASS Y | | | | | | | | | | | | | | | | |
Shares sold | | | 4,394,123 | | | $ | 41,417,567 | | | | 6,086,197 | | | $ | 56,300,003 | |
Shares sold through reinvestments of distributions | | | 238,450 | | | | 2,239,504 | | | | 579,714 | | | | 5,324,169 | |
Shares redeemed | | | (7,950,420 | ) | | | (74,824,919 | ) | | | (6,374,723 | ) | | | (59,038,968 | ) |
| | | | | | | | | | | | | | | | |
Net increase (decrease) | | | (3,317,847 | ) | | $ | (31,167,848 | ) | | | 291,188 | | | $ | 2,585,204 | |
| | | | | | | | | | | | | | | | |
190
Barings Funds Trust 2016 Semi-Annual Report
NOTES TO FINANCIAL STATEMENTS (CONTINUED)
December 31, 2016 (Unaudited)
Global Credit Income Opportunities Fund
| | | | | | | | | | | | | | | | |
| | | FOR THE
SIX MONTHS ENDED
DECEMBER 31, 2016 | | | FOR THE
YEAR ENDED
JUNE 30, 2016 | |
| CLASS A | | SHARES | | | AMOUNT | | | SHARES | | | AMOUNT | |
Shares sold | | | 1,449,304 | | | $ | 13,318,671 | | | | 649,098 | | | $ | 5,795,169 | |
Shares sold through reinvestments of distributions | �� | | 45,531 | | | | 418,569 | | | | 84,775 | | | | 750,428 | |
Shares redeemed | | | (554,522 | ) | | | (5,025,835 | ) | | | (668,631 | ) | | | (5,921,877 | ) |
| | | | | | | | | | | | | | | | |
Net increase | | | 940,313 | | | $ | 8,711,405 | | | | 65,242 | | | $ | 623,720 | |
| | | | | | | | | | | | | | | | |
CLASS C | | | | | | | | | | | | | | | | |
Shares sold | | | 124,711 | | | $ | 1,140,087 | | | | 112,563 | | | $ | 1,006,877 | |
Shares sold through reinvestments of distributions | | | 10,185 | | | | 93,460 | | | | 17,988 | | | | 158,913 | |
Shares redeemed | | | (51,394 | ) | | | (466,486 | ) | | | (100,203 | ) | | | (894,804 | ) |
| | | | | | | | | | | | | | | | |
Net increase | | | 83,502 | | | $ | 767,061 | | | | 30,348 | | | $ | 270,986 | |
| | | | | | | | | | | | | | | | |
CLASS I | | | | | | | | | | | | | | | | |
Shares sold | | | 3,073 | | | $ | 27,397 | | | | – | | | $ | 666 | |
Shares sold through reinvestments of distributions | | | 50 | | | | 457 | | | | 27,127 | | | | 254,427 | |
Shares redeemed | | | (1,510 | ) | | | (13,652 | ) | | | – | | | | – | |
| | | | | | | | | | | | | | | | |
Net increase | | | 1,613 | | | $ | 14,202 | | | | 27,127 | | | $ | 255,093 | |
| | | | | | | | | | | | | | | | |
CLASS Y | | | | | | | | | | | | | | | | |
Shares sold | | | 1,257,051 | | | $ | 11,488,654 | | | | 3,557,814 | | | $ | 31,402,334 | |
Shares sold through reinvestments of distributions | | | 97,021 | | | | 890,863 | | | | 173,660 | | | | 1,549,751 | |
Shares redeemed | | | (486,469 | ) | | | (4,459,558 | ) | | | (1,205,725 | ) | | | (10,634,355 | ) |
| | | | | | | | | | | | | | | | |
Net increase | | | 867,603 | | | $ | 7,919,959 | | | | 2,525,749 | | | $ | 22,317,730 | |
| | | | | | | | | | | | | | | | |
191
Barings Funds Trust 2016 Semi-Annual Report
NOTES TO FINANCIAL STATEMENTS (CONTINUED)
December 31, 2016 (Unaudited)
Active Short Duration Bond Fund
| | | | | | | | | | | | | | | | |
| | | FOR THE
SIX MONTHS ENDED
DECEMBER 31, 2016 | | | PERIOD FROM
JULY 8, 2015*
THROUGH
JUNE 30, 2016 | |
| CLASS A | | SHARES | | | AMOUNT | | | SHARES | | | AMOUNT | |
Shares sold | | | 7,412,384 | | | $ | 73,964,643 | | | | 4,326,156 | | | $ | 42,899,831 | |
Shares sold through reinvestments of distributions | | | 61,147 | | | | 609,321 | | | | 18,550 | | | | 184,208 | |
Shares redeemed | | | (1,989,031 | ) | | | (19,832,069 | ) | | | (337,324 | ) | | | (3,344,883 | ) |
| | | | | | | | | | | | | | | | |
Net increase | | | 5,484,500 | | | $ | 54,741,895 | | | | 4,007,382 | | | $ | 39,739,156 | |
| | | | | | | | | | | | | | | | |
CLASS C | | | | | | | | | | | | | | | | |
Shares sold | | | 2,805 | | | $ | 28,000 | | | | 47,683 | | | $ | 474,468 | |
Shares sold through reinvestments of distributions | | | 343 | | | | 3,425 | | | | 124 | | | | 1,231 | |
Shares redeemed | | | (1,909 | ) | | | (19,025 | ) | | | (22,061 | ) | | | (218,571 | ) |
| | | | | | | | | | | | | | | | |
Net increase | | | 1,239 | | | $ | 12,400 | | | | 25,746 | | | $ | 257,128 | |
| | | | | | | | | | | | | | | | |
CLASS I | | | | | | | | | | | | | | | | |
Shares sold | | | 10,010 | | | $ | 100,000 | | | | 2,230,000 | | | $ | 22,300,000 | |
Shares sold through reinvestments of distributions | | | – | | | | – | | | | 4,437 | | | | 44,099 | |
Shares redeemed | | | (598,837 | ) | | | (5,976,390 | ) | | | (1,635,600 | ) | | | (16,250,000 | ) |
| | | | | | | | | | | | | | | | |
Net increase (decrease) | | | (588,827 | ) | | $ | (5,876,390 | ) | | | 598,837 | | | $ | 6,094,099 | |
| | | | | | | | | | | | | | | | |
CLASS Y | | | | | | | | | | | | | | | | |
Shares sold | | | 7,703,931 | | | $ | 76,804,149 | | | | 14,461,202 | | | $ | 143,345,835 | |
Shares sold through reinvestments of distributions | | | 93,452 | | | | 930,856 | | | | 61,721 | | | | 612,005 | |
Shares redeemed | | | (3,339,782 | ) | | | (33,286,346 | ) | | | (3,527,796 | ) | | | (35,004,030 | ) |
| | | | | | | | | | | | | | | | |
Net increase | | | 4,457,601 | | | $ | 44,448,659 | | | | 10,995,127 | | | $ | 108,953,810 | |
| | | | | | | | | | | | | | | | |
| | * | Commencement of operations |
192
Barings Funds Trust 2016 Semi-Annual Report
NOTES TO FINANCIAL STATEMENTS (CONTINUED)
December 31, 2016 (Unaudited)
Total Return Bond Fund
| | | | | | | | | | | | | | | | |
| | | FOR THE
SIX MONTHS ENDED
DECEMBER 31, 2016 | | | PERIOD FROM
JULY 8, 2015*
THROUGH
JUNE 30, 2016 | |
| CLASS A | | SHARES | | | AMOUNT | | | SHARES | | | AMOUNT | |
Shares sold | | | 1,858 | | | $ | 19,007 | | | | 20,626 | | | $ | 206,304 | |
Shares sold through reinvestments of distributions | | | 22 | | | | 223 | | | | 83 | | | | 821 | |
Shares redeemed | | | (412 | ) | | | (4,094 | ) | | | – | | | | – | |
| | | | | | | | | | | | | | | | |
Net increase | | | 1,468 | | | $ | 15,136 | | | | 20,709 | | | $ | 207,125 | |
| | | | | | | | | | | | | | | | |
CLASS C | | | | | | | | | | | | | | | | |
Shares sold | | | – | | | $ | – | | | | 20,000 | | | $ | 200,000 | |
Shares sold through reinvestments of distributions | | | – | | | | – | | | | 61 | | | | 596 | |
Shares redeemed | | | – | | | | – | | | | – | | | | – | |
| | | | | | | | | | | | | | | | |
Net increase | | | – | | | $ | – | | | | 20,061 | | | $ | 200,596 | |
| | | | | | | | | | | | | | | | |
CLASS I | | | | | | | | | | | | | | | | |
Shares sold | | | – | | | $ | – | | | | 1,230,000 | | | $ | 12,300,000 | |
Shares sold through reinvestments of distributions | | | – | | | | – | | | | 5,482 | | | | 54,097 | |
Shares redeemed | | | – | | | | – | | | | – | | | | – | |
| | | | | | | | | | | | | | | | |
Net increase | | | – | | | $ | – | | | | 1,235,482 | | | $ | 12,354,097 | |
| | | | | | | | | | | | | | | | |
CLASS Y | | | | | | | | | | | | | | | | |
Shares sold | | | 268,703 | | | $ | 2,693,405 | | | | 1,271,976 | | | $ | 12,721,341 | |
Shares sold through reinvestments of distributions | | | 1,846 | | | | 18,536 | | | | 5,682 | | | | 56,103 | |
Shares redeemed | | | (9,642 | ) | | | (96,395 | ) | | | – | | | | – | |
| | | | | | | | | | | | | | | | |
Net increase | | | 260,907 | | | $ | 2,615,546 | | | | 1,277,658 | | | $ | 12,777,444 | |
| | | | | | | | | | | | | | | | |
| | * | Commencement of operations |
193
Barings Funds Trust 2016 Semi-Annual Report
NOTES TO FINANCIAL STATEMENTS (CONTINUED)
December 31, 2016 (Unaudited)
Emerging Markets Debt Blended Total Return Fund
| | | | | | | | | | | | | | | | |
| | | FOR THE SIX
MONTHS ENDED
DECEMBER 31, 2016 | | | PERIOD FROM
OCTOBER 21, 2015*
THROUGH
JUNE 30, 2016 | |
| CLASS A | | SHARES | | | AMOUNT | | | SHARES | | | AMOUNT | |
Shares sold | | | – | | | $ | – | | | | 20,000 | | | $ | 200,000 | |
Shares sold through reinvestments of distributions | | | – | | | | – | | | | 6 | | | | 62 | |
Shares redeemed | | | – | | | | – | | | | – | | | | – | |
| | | | | | | | | | | | | | | | |
Net increase | | | – | | | $ | – | | | | 20,006 | | | $ | 200,062 | |
| | | | | | | | | | | | | | | | |
CLASS C | | | | | | | | | | | | | | | | |
Shares sold | | | 543 | | | $ | 5,318 | | | | 20,000 | | | $ | 200,000 | |
Shares sold through reinvestments of distributions | | | 3 | | | | 25 | | | | 6 | | | | 62 | |
Shares redeemed | | | – | | | | (1 | ) | | | – | | | | – | |
| | | | | | | | | | | | | | | | |
Net increase | | | 546 | | | $ | 5,342 | | | | 20,006 | | | $ | 200,062 | |
| | | | | | | | | | | | | | | | |
CLASS I | | | | | | | | | | | | | | | | |
Shares sold | | | – | | | $ | – | | | | 480,000 | | | $ | 4,800,000 | |
Shares sold through reinvestments of distributions | | | – | | | | – | | | | 156 | | | | 1,488 | |
Shares redeemed | | | – | | | | – | | | | – | | | | – | |
| | | | | | | | | | | | | | | | |
Net increase | | | – | | | $ | – | | | | 480,156 | | | $ | 4,801,488 | |
| | | | | | | | | | | | | | | | |
CLASS Y | | | | | | | | | | | | | | | | |
Shares sold | | | 2,383 | | | $ | 24,500 | | | | 480,000 | | | $ | 4,800,000 | |
Shares sold through reinvestments of distributions | | | 10 | | | | 93 | | | | 156 | | | | 1,488 | |
Shares redeemed | | | (1,649 | ) | | | (15,681 | ) | | | – | | | | – | |
| | | | | | | | | | | | | | | | |
Net increase | | | 744 | | | $ | 8,912 | | | | 480,156 | | | $ | 4,801,488 | |
| | | | | | | | | | | | | | | | |
| | * | Commencement of operations |
194
Barings Funds Trust 2016 Semi-Annual Report
NOTES TO FINANCIAL STATEMENTS (CONTINUED)
December 31, 2016 (Unaudited)
Emerging Markets Local Currency Debt Fund
| | | | | | | | | | | | | | | | |
| | | FOR THE SIX
MONTHS ENDED
DECEMBER 31, 2016 | | | PERIOD FROM
DECEMBER 8, 2015*
THROUGH
JUNE 30, 2016 | |
| CLASS A | | SHARES | | | AMOUNT | | | SHARES | | | AMOUNT | |
Shares sold | | | – | | | $ | – | | | | 10,000 | | | $ | 100,000 | |
Shares sold through reinvestments of distributions | | | – | | | | – | | | | – | | | | – | |
Shares redeemed | | | – | | | | – | | | | – | | | | – | |
| | | | | | | | | | | | | | | | |
Net increase | | | – | | | $ | – | | | | 10,000 | | | $ | 100,000 | |
| | | | | | | | | | | | | | | | |
CLASS C | | | | | | | | | | | | | | | | |
Shares sold | | | – | | | $ | – | | | | 10,000 | | | $ | 100,000 | |
Shares sold through reinvestments of distributions | | | – | | | | – | | | | – | | | | – | |
Shares redeemed | | | – | | | | – | | | | – | | | | – | |
| | | | | | | | | | | | | | | | |
Net increase | | | – | | | $ | – | | | | 10,000 | | | $ | 100,000 | |
| | | | | | | | | | | | | | | | |
CLASS I | | | | | | | | | | | | | | | | |
Shares sold | | | – | | | $ | – | | | | 240,000 | | | $ | 2,400,000 | |
Shares sold through reinvestments of distributions | | | – | | | | – | | | | – | | | | – | |
Shares redeemed | | | – | | | | – | | | | – | | | | – | |
| | | | | | | | | | | | | | | | |
Net increase | | | – | | | $ | – | | | | 240,000 | | | $ | 2,400,000 | |
| | | | | | | | | | | | | | | | |
CLASS Y | | | | | | | | | | | | | | | | |
Shares sold | | | – | | | $ | – | | | | 240,000 | | | $ | 2,400,000 | |
Shares sold through reinvestments of distributions | | | – | | | | – | | | | – | | | | – | |
Shares redeemed | | | – | | | | – | | | | – | | | | – | |
| | | | | | | | | | | | | | | | |
Net increase | | | – | | | $ | – | | | | 240,000 | | | $ | 2,400,000 | |
| | | | | | | | | | | | | | | | |
| | * | Commencement of operations |
195
Barings Funds Trust 2016 Semi-Annual Report
NOTES TO FINANCIAL STATEMENTS (CONTINUED)
December 31, 2016 (Unaudited)
Global High Yield Fund
| | | | | | | | | | | | | | | | |
| | | FOR THE
SIX MONTHS ENDED
DECEMBER 31, 2016 | | | PERIOD FROM
OCTOBER 30, 2015*
THROUGH
JUNE 30, 2016 | |
| CLASS A | | SHARES | | | AMOUNT | | | SHARES | | | AMOUNT | |
Shares sold | | | 565 | | | $ | 5,820 | | | | 10,000 | | | $ | 100,000 | |
Shares sold through reinvestments of distributions | | | 28 | | | | 291 | | | | – | | | | – | |
Shares redeemed | | | (146 | ) | | | (1,491 | ) | | | – | | | | – | |
| | | | | | | | | | | | | | | | |
Net increase | | | 447 | | | $ | 4,620 | | | | 10,000 | | | $ | 100,000 | |
| | | | | | | | | | | | | | | | |
CLASS C | | | | | | | | | | | | | | | | |
Shares sold | | | 8,858 | | | $ | 91,630 | | | | 10,000 | | | $ | 100,000 | |
Shares sold through reinvestments of distributions | | | 500 | | | | 5,125 | | | | – | | | | – | |
Shares redeemed | | | (166 | ) | | | (1,719 | ) | | | – | | | | – | |
| | | | | | | | | | | | | | | | |
Net increase | | | 9,192 | | | $ | 95,036 | | | | 10,000 | | | $ | 100,000 | |
| | | | | | | | | | | | | | | | |
CLASS I | | | | | | | | | | | | | | | | |
Shares sold | | | – | | | $ | – | | | | 1,240,000 | | | $ | 12,400,000 | |
Shares sold through reinvestments of distributions | | | – | | | | – | | | | – | | | | – | |
Shares redeemed | | | – | | | | – | | | | – | | | | – | |
| | | | | | | | | | | | | | | | |
Net increase | | | – | | | $ | – | | | | 1,240,000 | | | $ | 12,400,000 | |
| | | | | | | | | | | | | | | | |
CLASS Y | | | | | | | | | | | | | | | | |
Shares sold | | | 115,074 | | | $ | 1,190,086 | | | | 1,253,790 | | | $ | 12,538,500 | |
Shares sold through reinvestments of distributions | | | 5,768 | | | | 59,017 | | | | 27 | | | | 262 | |
Shares redeemed | | | (3,181 | ) | | | (33,513 | ) | | | – | | | | – | |
| | | | | | | | | | | | | | | | |
Net increase | | | 117,661 | | | $ | 1,215,590 | | | | 1,253,817 | | | $ | 12,538,762 | |
| | | | | | | | | | | | | | | | |
| | * | Commencement of operations |
196
Barings Funds Trust 2016 Semi-Annual Report
NOTES TO FINANCIAL STATEMENTS (CONTINUED)
December 31, 2016 (Unaudited)
U.S. High Yield Fund
| | | | | | | | | | | | | | | | |
| | | FOR THE
SIX MONTHS ENDED
DECEMBER 31, 2016 | | | PERIOD FROM
OCTOBER 30, 2015*
THROUGH
JUNE 30, 2016 | |
| CLASS A | | SHARES | | | AMOUNT | | | SHARES | | | AMOUNT | |
Shares sold | | | 274,361 | | | $ | 2,858,871 | | | | 20,304 | | | $ | 202,500 | |
Shares sold through reinvestments of distributions | | | 6,253 | | | | 65,146 | | | | 11 | | | | 107 | |
Shares redeemed | | | (85,744 | ) | | | (905,713 | ) | | | – | | | | – | |
| | | | | | | | | | | | | | | | |
Net increase | | | 194,870 | | | $ | 2,018,304 | | | | 20,315 | | | $ | 202,607 | |
| | | | | | | | | | | | | | | | |
CLASS C | | | | | | | | | | | | | | | | |
Shares sold | | | 568 | | | $ | 5,933 | | | | 10,000 | | | $ | 100,000 | |
Shares sold through reinvestments of distributions | | | 12 | | | | 123 | | | | – | | | | – | |
Shares redeemed | | | (1 | ) | | | (12 | ) | | | – | | | | – | |
| | | | | | | | | | | | | | | | |
Net increase | | | 579 | | | $ | 6,044 | | | | 10,000 | | | $ | 100,000 | |
| | | | | | | | | | | | | | | | |
CLASS I | | | | | | | | | | | | | | | | |
Shares sold | | | – | | | $ | – | | | | 1,458,295 | | | $ | 14,500,000 | |
Shares sold through reinvestments of distributions | | | 11,742 | | | | 122,182 | | | | 7,352 | | | | 72,465 | |
Shares redeemed | | | – | | | | – | | | | – | | | | – | |
| | | | | | | | | | | | | | | | |
Net increase | | | 11,742 | | | $ | 122,182 | | | | 1,465,647 | | | $ | 14,572,465 | |
| | | | | | | | | | | | | | | | |
CLASS Y | | | | | | | | | | | | | | | | |
Shares sold | | | 111,039 | | | $ | 1,164,845 | | | | 1,249,862 | | | $ | 12,500,000 | |
Shares sold through reinvestments of distributions | | | 4,384 | | | | 45,617 | | | | 18 | | | | 187 | |
Shares redeemed | | | (536 | ) | | | (5,585 | ) | | | – | | | | – | |
| | | | | | | | | | | | | | | | |
Net increase | | | 114,887 | | | $ | 1,204,877 | | | | 1,249,880 | | | $ | 12,500,187 | |
| | | | | | | | | | | | | | | | |
| | * | Commencement of operations |
During the six months ended December 31, 2016, the Trust (the “Borrower”) entered into a Credit Agreement (the “Credit Agreement”) with State Street Bank and Trust Company (the “Bank”). The Credit Agreement provides for a revolving credit facility of $40,000,000 (the “Facility Amount”) to be utilized for temporary or emergency purposes to fund shareholder redemptions or for other short-term liquidity purposes. Per the Credit Agreement, outstanding principal on the loan shall bear interest at a variable rate per annum equal to the higher of (a) the Federal Funds Rate as in effect on the day of the borrowing plus 1.25% and (b) the Overnight LIBOR rate as in effect on the day of the borrowing plus 1.25%. In addition, the Borrower shall pay to the Bank a commitment fee at the rate of 0.25% per annum on the daily unused portion of the Facility Amount. As of
December 31, 2016, there were no loans outstanding pursuant to the Credit Agreement.
Management has considered the circumstances under which the Funds should recognize or make disclosures regarding events or transactions occurring subsequent to December 31, 2016 through the date the financial statements were issued. Adjustments or additional disclosures, if any, have been included in these financial statements.
197
Barings Funds Trust1 2016 Semi-Annual Report
RENEWAL OF INVESTMENT MANAGEMENT AGREEMENT AND SUB-ADVISORY AGREEMENTS
The Investment Company Act of 1940 (the “1940 Act”) requires that a majority of both the full Board of Trustees and the Trustees who are not interested persons of the Trust, as defined under the 1940 Act (“Independent Trustees”), voting separately, annually approve the continuation of the Investment Management Agreement between Barings Funds Trust (the “Trust”), on behalf of each of its eight series funds (the “Funds”), and Barings LLC (“Barings”) (the “Management Agreement”), the Sub-Advisory Agreement between Barings and Barings Global Advisers Limited (formerly, Babson Capital Global Advisors Limited) (“BGA”) (the “BGA Sub-Advisory Agreement”) and the Sub-Advisory Agreement between Barings and Barings Real Estate Advisers LLC (formerly, Cornerstone Real Estate Advisers LLC) (“BREA”) (the “BREA Sub-Advisory Agreement,” and together with the Management Agreement and the BGA Sub-Advisory Agreement, the “Agreements”). The Trustees considered matters bearing on the Funds and the Agreements at their meetings throughout the year, including a review of the Funds’ performance at each regular meeting. At meetings held on May 5, 2016 and July 18, 2016 (the “Meetings”), the Trustees met for the purpose of considering whether to approve the continuation of the Agreements for the Funds. The Trustees’ review process and considerations in approving the Agreements are summarized below.
Prior to the Meetings, the Trustees requested and received from Ropes & Gray LLP, counsel to the Funds, a memorandum describing the Trustees’ legal responsibilities in connection with their review and approval of the Agreements. The Independent Trustees requested and received a similar memorandum from Morgan, Lewis & Bockius LLP, independent legal counsel to the Independent Trustees. The Independent Trustees met prior to the July Board meeting with independent legal counsel to discuss their duties, the memoranda and the Agreements. The Trustees noted that they initially approved the Agreements for Barings Global Credit Income Opportunities Fund and Barings Global Floating Rate Fund in July 2013, and that they initially approved the Agreements for Barings Active Short Duration Bond Fund, Barings Emerging Markets Debt Blended Total Return Fund, Barings Emerging Markets Local Currency Debt Fund, Barings Global High Yield Fund, Barings Total Return Bond Fund and Barings U.S. High Yield Fund in January 2015. The Trustees also requested and received from Barings extensive written and oral information regarding various matters including: the principal terms of the Agreements; Barings and its personnel; the Funds’ investment performance, including comparative performance information; the nature and quality of the services provided by Barings to the Funds; the financial strength of Barings; the fee arrangements between Barings and each Fund and each Fund’s fee and expense information, including comparative fee and expense information; the profitability of the Agreements to Barings; and the potential “fallout” benefits to Barings resulting from the Agreements.
The Trustees’ conclusion as to the continuation of the Agreements was based on a comprehensive consideration of all information provided to the Board and not the result of any single issue. Some of the more significant factors that influenced the Trustees’ deliberations are described below, although individual Trustees may have evaluated the information presented differently from one another, giving different weights to different factors. It is also important to recognize that the Board’s review of the Agreements is the result of ongoing review and discussion, rather than a single discussion. The Trustees’ conclusions may be based, in part, on their consideration of these arrangements throughout the year and in prior years.
The Trustees considered the terms of the Agreements, including the scope of the advisory and non-advisory services provided under the Agreements or otherwise. In evaluating the nature, scope and quality of the services provided by Barings to Barings Emerging Markets Local Currency Debt Fund and Barings U.S. High Yield Fund; by Barings and BGA to Barings Emerging Markets Debt Blended Total Return Fund, Barings Global Credit Income Opportunities Fund, Barings Global Floating Rate Fund and Barings Global High Yield Fund (“BGA Funds”); and by Barings and BREA to Barings Active Short Duration Fund and Barings Total Return Bond Fund (“BREA Funds”), the Trustees considered the specific responsibilities of each of Barings, BGA and BREA in the day-to-day management of the Fund, the qualifications, experience and
| 1 | On September 12, 2016, the name of the “Babson Capital Funds Trust” changed to the “Barings Funds Trust” and the names of its eight series funds also changed from “Babson” to “Barings”. The name change was intended to clarify the Trust’s relationship to Babson Capital Management LLC, its investment adviser, which also changed its name to “Barings LLC”. The name changes were effected in connection with Babson Capital’s combination with two of its subsidiaries, BREA and Wood Creek Capital Management, and its sister company, Baring Asset Management Limited. |
198
Barings Funds Trust 2016 Semi-Annual Report
RENEWAL OF INVESTMENT MANAGEMENT AGREEMENT AND SUB-ADVISORY AGREEMENTS (CONTINUED)
responsibilities of the portfolio managers and other key personnel who are involved in the day-to-day management of the Fund, the ability of each of Barings, BGA and BREA to attract and retain high-quality personnel, and the organizational depth and stability of each of Barings, BGA and BREA. The Trustees also considered the trading capabilities of each of Barings, BGA and BREA.
The Trustees reviewed the Funds’ investment performance, as well as the performance of peer groups of funds, over various time periods, using information provided by Broadridge Financial Solutions, Inc. (“Broadridge”) (formerly known as Lipper Inc.) and Barings. The Trustees noted that the total return performance of Barings Global Floating Rate Fund’s and Babson Global Credit Income Opportunities Fund’s shares ranked in the 4th quintile of their respective Broadridge performance universes for the one-year period ended March 31, 2016 (the 1st quintile being the best performers and the 5th quintile being the worst performers). The Trustees noted that the remaining six Funds had commenced operations on July 8, 2015 or later, and had limited or no operating histories and performance records. For these Funds, the Trustees reviewed the year-to-date returns as of March 31, 2016. Of their respective Broadridge performance universes: U.S. High Yield Fund ranked in the 2nd quintile; Global High Yield Fund ranked in the 3rd quintile; Active Short Duration Bond Fund ranked in the 1st quintile; Total Return Bond Fund ranked in the 2nd quartile; Emerging Markets Debt Blended Total Return Fund ranked in the 5th quintile; and Emerging Markets Local Currency Debt ranked in the 1st quintile. In the course of their deliberations, the Trustees also took into account information provided by Barings during investment review meetings conducted with portfolio management personnel during the course of the year. After reviewing these and related factors, the Trustees concluded, within the context of their overall conclusions regarding the Agreements, that they were satisfied with the performance achieved by Barings, BGA and BREA.
The Trustees considered the investment management fee paid by each Fund to Barings pursuant to the Management Agreement. The Trustees noted that Barings (and not the BGA Funds) pays BGA its sub-advisory fee under the BGA Sub-Advisory Agreement and that Barings (and not the BREA Funds) pays BREA its sub-advisory fee under the BREA Sub-Advisory Agreement. In assessing the reasonableness of the fee paid by the Funds under the Management Agreement, the Trustees considered, among other information, each Fund’s advisory fee and the total expense ratio for the Fund’s shares as a percentage of net asset value and the advisory fee and total expense ratios of peer groups of funds based on information provided by Broadridge. The Trustees considered that, according to the Broadridge data (which takes into account any fee reductions or expense limitations that were in effect during the last fiscal year), for each of Barings Global Floating Rate Fund and Barings Global High Yield Fund, its effective advisory fee rate was lower than the Broadridge expense group median and its total expense ratio was approximately at the Broadridge expense group median. The Trustees considered that, according to the Broadridge data, for each of Barings Global Credit Income Opportunities Fund and Barings Emerging Markets Local Currency Debt Fund, its effective advisory fee rate was lower than the Broadridge expense group median and its total expense ratio was above the Broadridge expense group median. The Trustees considered that, according to the Broadridge data, for each of Barings U.S. High Yield Fund, Barings Active Short Duration Bond Fund and Barings Total Return Bond Fund, its effective advisory fee rate and total expense ratio were each lower than the Broadridge expense group median. The Trustees also considered that, according to the Broadridge data, Barings Emerging Markets Debt Blended Total Return Fund’s effective advisory fee rate approximately at the Broadridge expense group median and its total expense ratio was above the Broadridge expense group median.
The Trustees then considered that, as each Fund’s assets increase, each Fund and its shareholders would be expected to realize economies of scale as certain expenses, such as fixed operating costs, become a smaller percentage of overall assets. They considered the extent to which any such savings would benefit shareholders and Barings’s statement that it would consider proposing breakpoints in the management fee payable by a Fund once a Fund approached the break-even point. The Trustees noted that Barings has instituted caps on expenses that insulate shareholders from the effects on expenses of the Funds’ relatively small size.
The Trustees reviewed information prepared by Barings regarding Barings’s costs of managing the Funds, and the profitability of the Management Agreement to Barings. In considering the profitability of Barings, the Board noted that BGA and BREA are affiliates of Barings and are paid by Barings, and, therefore, did not consider their profitability separately. The Trustees then considered potential “fall-out” benefits to Barings and its affiliates as a result of Barings’s relationship with BFT. The Board concluded that, in light of the expected costs of providing investment management and other services to BFT
199
Barings Funds Trust 2016 Semi-Annual Report
RENEWAL OF INVESTMENT MANAGEMENT AGREEMENT AND SUB-ADVISORY AGREEMENTS (CONTINUED)
and Barings’ commitment to cap the expenses of each Fund, the other ancillary benefits that Barings and its affiliates expect to receive supported the approval of the Agreements. The Trustees concluded that, at this time, and in light of the nature, extent and quality of the respective services expected to be provided by Barings, the fee rates and expenses of each Fund supported the approval of the Management Agreement, the BGA Sub-Advisory Agreement and the BREA Sub-Advisory Agreement.
Based on their evaluation of factors that they deemed to be material, including those factors described above, the Board of Trustees, including the Independent Trustees, concluded that the Management Agreement, the BGA Sub-Advisory Agreement and the BREA Sub-Advisory Agreement should be continued for an additional one-year period through July 31, 2017.
200
Barings Funds Trust
Not applicable to this semi-annual report.
| Item 3. | Audit Committee Financial Expert. |
Not applicable to this semi-annual report.
| Item 4. | Principal Accountant Fees and Services. |
Not applicable to this semi-annual report.
| Item 5. | Audit Committee of Listed Registrants. |
Not applicable to this semi-annual report.
| Item 6. | Schedule of Investments. |
| (a) | The Registrant’s Consolidated Schedule of Investments as of the close of the reporting period is included in the Semi-Annual Report to Shareholders filed under Item 1 of this form. |
| Item 7. | Disclosure of Proxy Voting Policies and Procedures for Closed-End Management Investment Companies. |
Not applicable.
| Item 8. | Portfolio Managers of Closed-End Investment Management Companies. |
Not applicable.
| Item 9. | Purchases of Equity Securities by Closed-End Management Investment Company and Affiliated Purchasers. |
Not applicable.
| Item 10. | Submission of Matters to a Vote of Security Holders. |
There have been no material changes to procedures by which the shareholders may recommend nominees to the Registrant’s Board of Trustees.
| Item 11. | Controls and Procedures. |
| (a) | The Registrant’s principal executive officer and principal financial officer, or persons performing similar functions, have concluded that the Registrant’s disclosure controls and procedures as defined in Rule 30a-3(c) under the Investment Company Act of 1940, as amended (the “1940 Act”), are effective as of a date within 90 days of the filing date of this report based on the evaluation of these controls and procedures required by Rule 30a-3(b) under the 1940 Act and Rules 13a-15(b) or 15d-15(b) under the Securities Exchange Act of 1934, as amended. |
| (b) | There were no changes in the Registrant’s internal control over financial reporting (as defined in Rule 30a-3(d) under the 1940 Act) that occurred during the second fiscal quarter of the period covered by this report that have materially affected or are reasonably likely to materially affect, the Registrant’s internal control over financial reporting. |
| | |
| (a)(1) | | Not applicable. |
| |
| (a)(2) | | Certifications pursuant to Rule 30a-2(a) under the 1940 Act are attached hereto. |
| |
| | Exhibit 99.1 Cert |
| | Exhibit 99.2 Cert |
| |
| (a)(3) | | Not applicable. |
| |
| (b) | | Certification pursuant to Rule 30a-2(b) under the 1940 Act is attached hereto. |
| |
| | Exhibit 99.906 Cert |
SIGNATURES
Pursuant to the requirements of the Securities Exchange Act of 1934 and the Investment Company Act of 1940, the Registrant has duly caused this report to be signed on its behalf by the undersigned, thereunto duly authorized.
| | |
| (Registrant) | | Barings Funds Trust |
| | |
| |
| By (Signature and Title) | | /s/ Duncan Robertson |
| | Duncan Robertson, President (Principal Executive Officer) |
|
| Date March 10, 2017 |
Pursuant to the requirements of the Securities Exchange Act of 1934 and the Investment Company Act of 1940, this report has been signed below by the following persons on behalf of the Registrant and in the capacities and on the dates indicated.
| | |
| By (Signature and Title) | | /s/ Duncan Robertson |
| | Duncan Robertson, President (Principal Executive Officer) |
|
| Date March 10, 2017 |
| |
| By (Signature and Title) | | /s/ Carlene Pollock |
| | Carlene Pollock, Chief Financial Officer (Principal Financial Officer) |
|
| Date March 10, 2017 |