UNITED STATES
SECURITIES AND EXCHANGE COMMISSION
Washington, D.C. 20549
FORM N-CSR
CERTIFIED SHAREHOLDER REPORT OF REGISTERED
MANAGEMENT INVESTMENT COMPANIES
Investment Company Act file number(s): 811-22845
BABSON CAPITAL FUNDS TRUST
(Exact Name of Registrant as Specified in Charter)
550 South Tryon Street
Suite 3300
Charlotte, NC 28202
(Address of Principal Executive Offices)
Registrant’s telephone number, including area code: (704) 805-7200
Janice M. Bishop
Vice President, Secretary and Chief Legal Officer
c/o Babson Capital Management LLC
Independence Wharf
470 Atlantic Avenue, Boston MA 02210
(Name and Address of Agent for Service)
Date of fiscal year end: June 30
Date of reporting period: December 31, 2013
Item 1. Reports to Stockholders.
The Report to Stockholders is attached hereto.

BABSON CAPITAL FUNDS TRUST
Semi-Annual Report
December 31, 2013
Babson Capital Funds Trust 2013 Semi-Annual Report
Dear Shareholder,
We are pleased to provide our inaugural semi-annual Shareholder Letter for the Babson Capital Funds Trust (“the Funds”), which launched on September 16, 2013. As investment adviser to the Funds, we bring one of the industry’s longest track records in managing global high yield assets. Operating with research, portfolio management and trading integrated across the United States and Europe has enabled us to create Funds that offer a truly global approach and capable of uncovering the most attractive opportunities up and down the capital structure and across industries and geographies.
Looking back, as we entered 2013, investors in the U.S. were worried about an impending “fiscal cliff” of automatic tax hikes and spending cuts that threatened to push the economy back toward recession. Exiting 2013, investors were much more upbeat about the prospects for the U.S. economy, as the consensus view seemed to be that any surprises would be to the upside. In between, several events marked 2013 as a year where investment performance was dominated by risk assets.
During the past year, we moved beyond the five-year anniversary of some major events, like the collapse of Lehman and announcement of TARP, which came to symbolize the financial crisis and set the stage for the current environment. The massive intervention of major global central banks since the crisis seems to have calmed the markets to the point that systemic risk concerns have abated sharply. Developed market central banks in the U.S., Europe, United Kingdom and Japan continue to keep benchmark interest rates near historic lows and supply the financial markets with ample liquidity. The European Central Bank was particularly effective during 2013 as government bond yields in peripheral Euro area countries rallied sharply, indicating contagion risk was abating in that region.
In addition to continued accommodative monetary policy conditions, the economic environment in developed markets improved during 2013. Stronger macroeconomic fundamentals helped position the U.S. as the furthest along in the global recovery process and enabled the Euro area to finally pull out of its long recession. Fourth quarter economic data in the U.S. have generally been positive, which renewed hope that despite fiscal drag, a partial government shutdown and policy uncertainty the economy can still grow. In Europe, some early growth signs emerged, including manufacturing indictors that point toward continued expansion, yet the Euro area economy remains fragile. So, while 2013 ushered in some signs of optimism in advanced economies there are still economic challenges, including high unemployment rates and elevated levels of government debt, that warrant caution.
The ongoing accommodative monetary policy has provided a favorable backdrop to credit markets. In particular, the corporate sector continues to benefit from stronger balance sheets, record profit margins and high cash balances. Although there were periods of increased uncertainty and market volatility in 2013, riskier asset classes generally outperformed lower-risk investments. Higher interest rates resulted in poor performance for most fixed income assets, but high yield assets generated positive returns as investors turned to this segment of the credit markets in the current low-rate environment.
At Babson Capital, we take a long-term view, focusing on total returns and risk-adjusted relative value opportunities. Our process seeks to provide a differentiated approach and results for our clients. On the following pages of this report, you will find details of each Fund’s investment performance and a discussion of the circumstances that influenced performance. We appreciate your continued partnership and look forward to helping you achieve your investment objectives.
Sincerely,

Anthony Sciacca
President and Chief Executive Officer
Babson Capital Funds Trust
Cautionary Notice: Certain statements contained in this report may be “forward looking” statements. Investors are cautioned not to place undue reliance on forward-looking statements, which speak only as of the date in which they are made and which reflect management’s current estimates, projections, expectations or beliefs, and which are subject to risks and uncertainties that may cause actual results to differ materially. These statements are subject to change at any time based upon economic, market or other conditions and may not be relied upon as investment advice or an indication of the Trust’s trading intent. References to specific securities are not recommendations of such securities, and may not be representative of the Fund’s current or future investments. We undertake no obligation to publicly update forward looking statements, whether as a result of new information, future events, or otherwise.
1
Babson Global Floating Rate Fund 2013 Semi-Annual Report
Investment Objective
The investment objective of the Babson Global Floating Rate Fund (“Global Floating Rate Fund” or the “Fund”) is to seek a high level of current income. Preservation of capital is a secondary goal.
Portfolio Management Commentary
How did the Fund perform?
| n | The Fund reported a total rate of return for the fourth quarter of +1.70%. Furthermore, the Fund returned +1.60% since the Fund’s inception date of September 16, 2013. |
What factors influenced performance of the Fund?
| n | The initial ramping of the portfolio influenced the performance of the Fund during this period. In addition, many of the loans experienced longer than anticipated settlement times, which affected the Fund’s ability to generate current income. By the beginning of 2014, we expect most of the loans to be settled and generating attractive income streams for our investors. |
Describe recent portfolio activity.
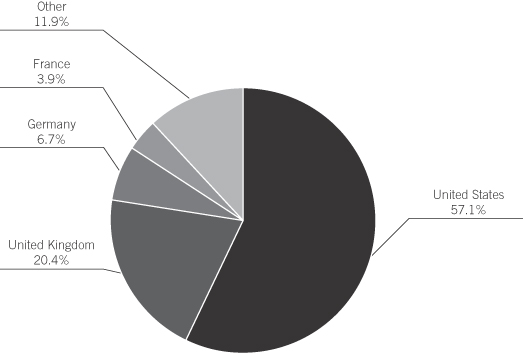
| n | During the period, the Fund continued to ramp the initial capital funding by constructing a well-diversified portfolio across issuers, countries and industries. As of December 31, 2013, the portfolio had a geographical weighting of 57.1% in U.S. and 42.9% in non-U.S. issuers. |
| n | The majority of the Fund’s holdings were purchased in the U.S. new issue market with an Original Issue Discount. The Fund also made secondary purchases in the European market to take advantage of opportunities that we believe offer attractive yields and the potential for capital appreciation. |
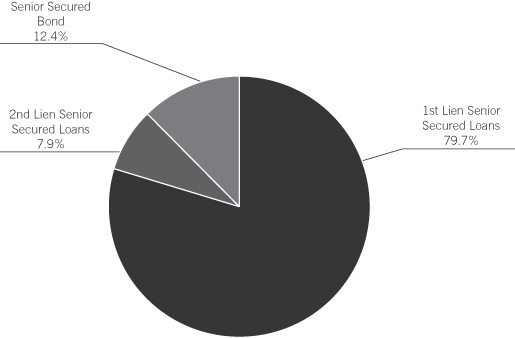
Describe portfolio positioning at period end.
| n | On a traded basis, the Fund ended the year with an 87.6% weighting to senior secured loans. The remaining balance of the portfolio was invested in senior secured bonds (12.4%). Of the senior secured bonds, 9.4% are floating rate notes primarily issued by European companies, increasing the total floating rate exposure of the portfolio to 97.0%. |
| n | From an industry perspective, the Fund remains well-diversified across a number of industries (as determined by Moody’s), with higher concentrations in Finance (11.7%), Healthcare, Education and Childcare (10.9%), and Diversified/Conglomerate Service (9.0%) as of year-end. |
| n | As of December 31, 2013, the Fund had the following Moody’s credit quality breakdown: 5.9% in Ba assets, 70.6% in single-B credits and a small exposure to Caa and below at 4.1%. Approximately (19.4%) of the Fund’s assets are not publicly rated, primarily consisting of European issuers that we believe are of a comparable quality to other assets in the portfolio. |
| n | The Fund remains overweight to European assets relative to the weighting of the global loan market as we believe the Western European loan market offers higher return potential than the U.S. loan market for similar fundamental credit risk. The U.S. loan primary market continues to experience high levels of issuance, which allowed the manager to be selective when investing in this segment of the market. While the secondary market has rallied appreciably in Europe, ongoing bank de-levering is continuing to provide discounted investment opportunities that we believe are attractive. |
Describe market and portfolio outlook.
| n | As we enter 2014, overall monetary policy continues to be very accommodative (despite the Fed’s modest reduction in its QE program) with indications of a generally improving economic environment. Senior secured loan spreads in the U.S. and Europe are beginning the year at attractive levels based on historical standards. Additionally, high yield corporate credit fundamentals should remain favorable, in our opinion, and we believe the global loan market will generate attractive risk-adjusted performance for its investors. |
Cautionary Notice: Certain statements contained in this report may be “forward looking” statements. Investors are cautioned not to place undue reliance on forward-looking statements, which speak only as of the date in which they are made and which reflect management’s current estimates, projections, expectations or beliefs, and which are subject to risks and uncertainties that may cause actual results to differ materially. These statements are subject to change at any time based upon economic, market or other conditions and may not be relied upon as investment advice or an indication of the Trust’s trading intent. References to specific securities are not recommendations of such securities, and may not be representative of the Fund’s current or future investments. We undertake no obligation to publicly update forward looking statements, whether as a result of new information, future events, or otherwise.
2
Babson Global Floating Rate Fund 2013 Semi-Annual Report
PORTFOLIO COMPOSITION (% OF ASSETS*)
COUNTRY COMPOSITION (% OF ASSETS*)
| * | Percentage of assets are expressed by market value excluding cash and accrued income, and may vary over time. The percentages shown above represent a percentage of the assets as of December 31, 2013. |
3
Babson Global Credit Income Opportunities Fund Semi-Annual Report
Investment Objective
The investment objective of the Babson Global Credit Income Opportunities Fund (“Global Credit Income Opportunities Fund” or the “Fund”) is to seek an absolute return, primarily through current income and secondarily through capital appreciation.
Portfolio Management Commentary
How did the Fund perform?
| n | The Fund reported a total rate of return for the fourth quarter of +3.40%. In addition, the Fund returned +3.30% since the Fund’s inception date of September 16, 2013. |
What factors influenced performance of the Fund?
| n | The initial ramping of the portfolio influenced the performance of the Fund during this period. In addition, many of the loans experienced longer than anticipated settlement times, which affected the ability of the Fund to generate current income. By the beginning of 2014, we expect most of the loans to be settled and generating attractive income streams for our investors. |
Describe recent portfolio activity.
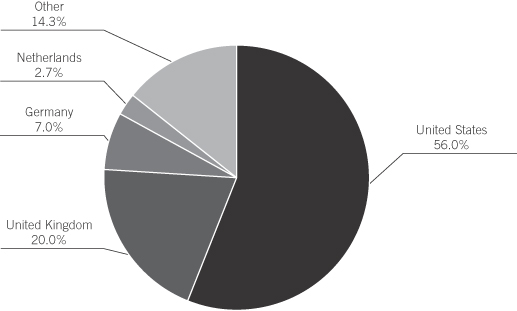
| n | During the period, the Fund continued to ramp the initial capital funding by constructing a diversified portfolio across assets classes, issuers, countries and industries. As of December 31, 2013, the portfolio had an asset class weighting of 57.0% in high yield bonds and 43.0% in senior secured loans. From a geographical weighting perspective, the portfolio had a weighting of 56.0% in U.S. and 44.0% in non-U.S. issuers. |
| n | The majority of the Fund’s holdings were purchased in the U.S. new issue senior secured loan and high yield bond markets. For issuers in the European market, the Fund made many secondary purchases to take advantage of opportunities that we believe offer attractive yields and the potential for capital appreciation. |
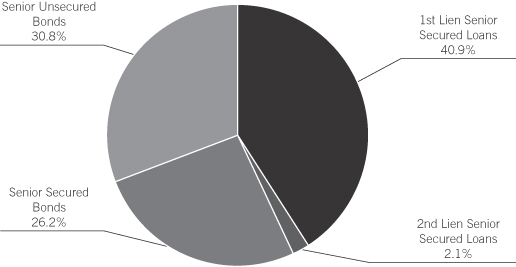
Describe portfolio positioning at period end.
| n | The Fund ended the year with a higher percentage of assets in global high yield bonds (57.0%) than global senior secured loans (43.0%). At this point in time, we believe that global high yield bonds are more attractive than global senior secured loans from a relative value perspective. Additionally, a significant portion of the portfolio (69.2%) is senior secured in nature and is intended to provide the portfolio with added protection against principal loss in the event that default rates increase. |
| n | From an industry perspective, the Fund remains well-diversified across a number of industries (as determined by Moody’s), with higher concentrations in Retail Stores (9.8%), Oil and Gas (8.1%), and Broadcasting and Entertainment (7.9%) as of year-end. |
| n | As of December 31, 2013, the Fund had the following Moody’s credit quality breakdown: 0.3% in Baa assets, 12.7% in Ba assets, 63.4% in single-B credits, and a small exposure to Caa and below at 3.7%. A portion of the assets are not publicly rated (19.9%) and primarily consist of European issuers that we believe are of a comparable quality to other assets in the portfolio. |
| n | We believe the Western European loan market offers higher return potential than the U.S. market for similar fundamental credit risk. The U.S. primary market continues to experience high levels of issuance, which allowed the manager to be selective when investing in this segment of the market. While the secondary market has rallied appreciably in Europe, ongoing bank de-levering is continuing to provide discounted investment opportunities that we believe are attractive. |
4
Babson Global Credit Income Opportunities Fund Semi-Annual Report
Describe market and portfolio outlook.
| n | As we enter into 2014, overall monetary policy continues to be very accommodative (despite the Fed’s modest reduction in its QE program) with indications of a generally improving economic environment. We believe that corporate fundamentals, including low leverage levels, strong liquidity and earnings growth will remain stable into 2014 in both the U.S. and European markets. Against that backdrop, we expect fundamentals to remain favorable with default rates below historical averages. If these trends continue, we believe the Fund is well positioned to take advantage of attractive relative value opportunities across the high yield market on a global basis and offer attractive risk-adjusted performance to its investors. |
Cautionary Notice: Certain statements contained in this report may be “forward looking” statements. Investors are cautioned not to place undue reliance on forward-looking statements, which speak only as of the date in which they are made and which reflect management’s current estimates, projections, expectations or beliefs, and which are subject to risks and uncertainties that may cause actual results to differ materially. These statements are subject to change at any time based upon economic, market or other conditions and may not be relied upon as investment advice or an indication of the Trust’s trading intent. References to specific securities are not recommendations of such securities, and may not be representative of the Fund’s current or future investments. We undertake no obligation to publicly update forward looking statements, whether as a result of new information, future events, or otherwise.
5
Babson Global Credit Income Opportunities Fund 2013 Semi-Annual Report
PORTFOLIO COMPOSITION (% OF ASSETS*)
COUNTRY COMPOSITION (% OF ASSETS*)
| * | Percentage of assets are expressed by market value excluding cash and accrued income, and may vary over time. The percentages shown above represent a percentage of the assets as of December 31, 2013. |
6
Babson Capital Funds Trust 2013 Semi-Annual Report
SHAREHOLDER EXPENSES (UNAUDITED)
As a shareholder of Babson Global Floating Rate Fund or Babson Global Credit Income Opportunities Fund, you incur ongoing expenses, such as management fees, shareholder service fees, distribution fees and other fund expenses. The following table is intended to help you understand your ongoing expenses (in dollars and cents) of investing in the Funds and to compare these expenses with the ongoing expenses of investing in other funds.
The table is based on an investment of $1,000 invested at the beginning of the period and held for the entire period from September 16, 2013, commencement of operations, to December 31, 2013.
Actual Expenses
The first line in the table below provides information about the actual account values and actual expenses. You may use the information in this line, together with the amount you invested, to estimate the expenses that you paid over the period. Simply divide your account value by $1,000 (for example, an $8,600 account value divided by $1,000 = 8.6), then multiply the result by the number in the first line for the Fund under the heading entitled “Operating Expenses Incurred” to estimate the expenses you paid on your account during this period.
Hypothetical Example for Comparison Purposes
The second line in the table below provides information about the hypothetical account values and hypothetical expenses based on the Fund’s actual expense ratio and an assumed rate of return of 5% per year before expenses, which is not the Fund’s actual return. The hypothetical account value and expenses may not be used to estimate the actual ending account balance or expenses you paid for the period. You may use this information to compare the ongoing costs of investing in your Fund and other funds. To do so, compare this 5% hypothetical example with the 5% hypothetical examples that appear in the shareholder reports of the other funds.
Babson Global Floating Rate Fund
| EXPENSE RATIO | BEGINNING AMOUNT | ENDING VALUE | AVERAGE VALUE | OPERATING EXPENSE INCURRED* | ||||||||||||||||
Class A | ||||||||||||||||||||
Actual | 1.05 | % | 1,000.00 | 1,016.00 | 1,008.00 | 3.07 | ||||||||||||||
Hypothetical | 1.05 | % | 1,000.00 | 1,011.50 | 1,005.75 | 3.07 | ||||||||||||||
| Class C | ||||||||||||||||||||
Actual | 1.80 | % | 1,000.00 | 1,013.00 | 1,006.50 | 5.26 | ||||||||||||||
Hypothetical | 1.80 | % | 1,000.00 | 1,009.30 | 1,004.65 | 5.25 | ||||||||||||||
| Class I | ||||||||||||||||||||
Actual | 0.75 | % | 1,000.00 | 1,016.00 | 1,008.00 | 2.20 | ||||||||||||||
Hypothetical | 0.75 | % | 1,000.00 | 1,012.30 | 1,006.15 | 2.19 | ||||||||||||||
| Class Y | ||||||||||||||||||||
Actual | 0.75 | % | 1,000.00 | 1,016.00 | 1,008.00 | 2.20 | ||||||||||||||
Hypothetical | 0.75 | % | 1,000.00 | 1,012.30 | 1,006.15 | 2.19 | ||||||||||||||
| * | For each Class of the Fund, net expenses are equal to the annualized expense ratio for such class multiplied by the average account value over the period, multiplied by 106/365. |
7
Babson Capital Funds Trust 2013 Semi-Annual Report
Babson Global Credit Income Opportunities Fund
| EXPENSE RATIO | BEGINNING AMOUNT | ENDING VALUE | AVERAGE VALUE | OPERATING EXPENSE INCURRED* | ||||||||||||||||
Class A | ||||||||||||||||||||
Actual | 1.20 | % | 1,000.00 | 1,033.00 | 1,016.50 | 3.54 | ||||||||||||||
Hypothetical | 1.20 | % | 1,000.00 | 1,011.00 | 1,005.50 | 3.50 | ||||||||||||||
| Class C | ||||||||||||||||||||
Actual | 1.95 | % | 1,000.00 | 1,030.00 | 1,015.00 | 5.75 | ||||||||||||||
Hypothetical | 1.95 | % | 1,000.00 | 1,008.90 | 1,004.45 | 5.69 | ||||||||||||||
| Class I | ||||||||||||||||||||
Actual | 0.95 | % | 1,000.00 | 1,033.00 | 1,016.50 | 2.80 | ||||||||||||||
Hypothetical | 0.95 | % | 1,000.00 | 1,011.80 | 1,005.90 | 2.78 | ||||||||||||||
| Class Y | ||||||||||||||||||||
Actual | 0.95 | % | 1,000.00 | 1,033.00 | 1,016.50 | 2.80 | ||||||||||||||
Hypothetical | 0.95 | % | 1,000.00 | 1,011.80 | 1,005.90 | 2.78 | ||||||||||||||
| * | For each Class of the Fund, net expenses are equal to the annualized expense ratio for such class multiplied by the average account value over the period, multiplied by 106/365. |
8
Babson Capital Funds Trust 2013 Semi-Annual Report
BABSON CAPITAL FUNDS TRUST
FINANCIAL REPORT
9
Babson Capital Funds Trust 2013 Semi-Annual Report
STATEMENTS OF ASSETS AND LIABILITIES
December 31, 2013 (Unaudited)
| BABSON GLOBAL FLOATING RATE FUND | BABSON GLOBAL CREDIT INCOME OPPORTUNITIES FUND | |||||||
| Assets | ||||||||
| Investments, at fair value (cost $63,064,726 and $50,064,601, respectively) | $ | 63,907,465 | $ | 51,457,132 | ||||
| Cash | 5,476 | 13,655 | ||||||
| Foreign currency, at value (cost $1,509,616 and $1,949,841, respectively) | 1,529,268 | 1,969,544 | ||||||
| Receivable for investments sold | 7,094,975 | 4,823,113 | ||||||
| Interest receivable | 216,743 | 642,236 | ||||||
| Receivable from adviser (see Note 3) | 36,437 | 12,975 | ||||||
| Foreign tax reclaims receivable | — | 2,366 | ||||||
| Unrealized appreciation on forward foreign currency exchange contracts | 5,740 | — | ||||||
| Unrealized appreciation on unfunded loan commitments | 208 | — | ||||||
| Prepaid expenses | 550 | 550 | ||||||
|
|
|
| |||||
Total assets | 72,796,862 | 58,921,571 | ||||||
|
|
|
| |||||
| Liabilities | ||||||||
| Payable for investments purchased | 14,579,085 | 6,913,125 | ||||||
| Distribution fees payable | 280 | 284 | ||||||
| Unrealized depreciation on forward foreign currency exchange contracts | 161,104 | 164,073 | ||||||
| Accrued expenses and other liabilities | 119,344 | 119,381 | ||||||
Total liabilities | 14,859,813 | 7,196,863 | ||||||
|
|
|
| |||||
Total net assets | $ | 57,937,049 | $ | 51,724,708 | ||||
|
|
|
| |||||
| Composition of net assets | ||||||||
| Shares of beneficial interest outstanding (par value $0.00001 per share), unlimited number of shares authorized | $ | 570 | $ | 501 | ||||
| Additional paid-in capital | 57,049,430 | 50,049,532 | ||||||
| Undistributed net investment income | 388,262 | 585,431 | ||||||
| Accumulated net realized loss | (124,654 | ) | (74,640 | ) | ||||
| Net unrealized appreciation | 623,441 | 1,163,884 | ||||||
|
|
|
| |||||
Total net assets | $ | 57,937,049 | $ | 51,724,708 | ||||
|
|
|
| |||||
| Class A | ||||||||
| Net assets applicable to outstanding shares | $ | 914,006 | $ | 929,490 | ||||
|
|
|
| |||||
| Shares of beneficial interest outstanding | 90,000 | 90,003 | ||||||
|
|
|
| |||||
| Net asset value per share outstanding | $ | 10.16 | $ | 10.33 | ||||
|
|
|
| |||||
| Maximum offering price per share outstanding (Net asset value plus sales charge of 3.00% and 3.75%, respectively) | $ | 10.47 | $ | 10.73 | ||||
|
|
|
| |||||
| Class C | ||||||||
| Net assets applicable to outstanding shares | $ | 101,335 | $ | 103,048 | ||||
|
|
|
| |||||
| Shares of beneficial interest outstanding | 10,000 | 10,000 | ||||||
|
|
|
| |||||
| Net asset value per share outstanding | $ | 10.13 | $ | 10.30 | ||||
|
|
|
| |||||
See accompanying Notes to Financial Statements
10
Babson Capital Funds Trust 2013 Semi-Annual Report
STATEMENTS OF ASSETS AND LIABILITIES (CONTINUED)
December 31, 2013 (Unaudited)
| BABSON GLOBAL FLOATING RATE FUND | BABSON GLOBAL CREDIT INCOME OPPORTUNITIES FUND | |||||||
| Class I | ||||||||
| Net assets applicable to outstanding shares | $ | 32,018,738 | $ | 25,371,923 | ||||
|
|
|
| |||||
| Shares of beneficial interest outstanding | 3,150,134 | 2,455,000 | ||||||
|
|
|
| |||||
| Net asset value per share outstanding | $ | 10.16 | $ | 10.33 | ||||
|
|
|
| |||||
| Class Y | ||||||||
| Net assets applicable to outstanding shares | $ | 24,902,970 | $ | 25,320,247 | ||||
|
|
|
| |||||
| Shares of beneficial interest outstanding | 2,450,000 | 2,450,000 | ||||||
|
|
|
| |||||
| Net asset value per share outstanding | $ | 10.16 | $ | 10.33 | ||||
|
|
|
| |||||
See accompanying Notes to Financial Statements
11
Babson Capital Funds Trust 2013 Semi-Annual Report
Period from September 16, 2013 through December 31, 2013* (Unaudited)
| BABSON GLOBAL FLOATING RATE FUND | BABSON GLOBAL CREDIT INCOME OPPORTUNITIES FUND | |||||||
| Investment Income | ||||||||
Interest income | $ | 506,042 | $ | 726,685 | ||||
|
|
|
| |||||
Total investment income | 506,042 | 726,685 | ||||||
|
|
|
| |||||
| Operating Expenses | ||||||||
Advisory fees | 101,126 | 110,758 | ||||||
12b-1 distribution and servicing plan — Class A | 658 | 664 | ||||||
12b-1 distribution and servicing plan — Class C | 292 | 295 | ||||||
Professional fees | 42,659 | 42,659 | ||||||
Administrator fees | 33,241 | 33,241 | ||||||
Custody fees | 24,930 | 24,930 | ||||||
Directors’ fees | 17,240 | 17,242 | ||||||
Transfer agent fees | 16,765 | 16,765 | ||||||
Printing and mailing expenses | 5,540 | 5,540 | ||||||
Shareholder servicing expenses | 4,847 | 4,847 | ||||||
Registration fees | 2,379 | 2,379 | ||||||
Other operating expenses | 5,666 | 5,667 | ||||||
|
|
|
| |||||
Total operating expenses | 255,343 | 264,987 | ||||||
Reimbursement of expenses | (137,563 | ) | (123,733 | ) | ||||
|
|
|
| |||||
Net operating expenses | 117,780 | 141,254 | ||||||
|
|
|
| |||||
| Net investment income | 388,262 | 585,431 | ||||||
|
|
|
| |||||
| Realized and Unrealized Gains (Losses) on Investments | ||||||||
Net realized gain on investments | 179,104 | 261,138 | ||||||
Net realized loss on forward foreign currency exchange contracts | (141,665 | ) | (214,418 | ) | ||||
Net realized loss on foreign currency and translation | (162,093 | ) | (121,360 | ) | ||||
|
|
|
| |||||
Net realized loss on investments | (124,654 | ) | (74,640 | ) | ||||
|
|
|
| |||||
Net change in unrealized appreciation on investments | 842,947 | 1,392,531 | ||||||
Net change in unrealized depreciation on forward foreign currency exchange contracts | (155,364 | ) | (164,073 | ) | ||||
Net change in unrealized depreciation on foreign currency and translation | (64,142 | ) | (64,574 | ) | ||||
|
|
|
| |||||
Net change in unrealized appreciation on investments | 623,441 | 1,163,884 | ||||||
|
|
|
| |||||
Net realized and unrealized gains on investments | 498,787 | 1,089,244 | ||||||
|
|
|
| |||||
Net increase in net assets resulting from operations | $ | 887,049 | $ | 1,674,675 | ||||
|
|
|
| |||||
| * | Funds commenced operations on September 16, 2013. |
See accompanying Notes to Financial Statements
12
Babson Global Floating Rate Fund 2013 Semi-Annual Report
for the period ended December 31, 2013 (Unaudited)
| Cash flows used in operating activities: | ||||
| Net increase in net assets resulting from operations | $ | 887,049 | ||
| Adjustments to reconcile net increase in net assets resulting from operations to net cash provided by operating activities: | ||||
Purchases of long-term investments | (71,521,683 | ) | ||
Proceeds from sales of long-term investments | 15,685,810 | |||
Amortization and (accretion) of discount and premium, net | (7,834 | ) | ||
Changes in operating assets and liabilities: | ||||
Increase in restricted cash | (7,041,707 | ) | ||
Increase in receivable for investments sold | (7,094,975 | ) | ||
Increase in interest receivable | (216,743 | ) | ||
Increase in receivable from Adviser | (36,437 | ) | ||
Increase in other assets | (758 | ) | ||
Increase in receivable for open forward foreign currency contracts | (5,740 | ) | ||
Increase in payable for investments purchased | 14,579,085 | |||
Increase in distributions payable | 280 | |||
Increase in payable for open forward foreign currency contracts | 161,104 | |||
Increase in accrued expenses | 119,344 | |||
Net change in unrealized (appreciation) depreciation on investments | (842,947 | ) | ||
Net realized gain from investments | (179,104 | ) | ||
|
| |||
Net cash used in operating activities | (55,515,256 | ) | ||
|
| |||
| Cash flows from financing activities: | ||||
Proceeds from shares sold | 57,050,000 | |||
|
| |||
Net cash from financing activities | 57,050,000 | |||
|
| |||
Net increase in cash: (1) | 1,534,744 | |||
Cash at beginning of period | – | |||
|
| |||
Cash at end of period | $ | 1,534,744 | ||
|
| |||
| (1) | Balance includes foreign currency of $1,529,268. |
See accompanying Notes to Financial Statements
13
Babson Global Credit Income Opportunities Fund 2013 Semi-Annual Report
STATEMENT OF CASH FLOWS (CONTINUED)
for the period ended December 31, 2013 (Unaudited)
| Cash flows used in operating activities: | ||||
| Net increase in net assets resulting from operations | $ | 1,674,675 | ||
| Adjustments to reconcile net increase in net assets resulting from operations to net cash provided by operating activities: | ||||
Purchases of long-term investments | (66,278,173 | ) | ||
Proceeds from sales of long-term investments | 17,094,680 | |||
Amortization (accretion) of discount and premium, net | 19,046 | |||
Increase in restricted cash | (639,016 | ) | ||
Increase in receivable for investments sold | (4,823,113 | ) | ||
Increase in dividends and interest receivable | (642,236 | ) | ||
Increase in manager receivable | (12,975 | ) | ||
Increase in receivable from Adviser | (2,366 | ) | ||
Increase in other assets | (550 | ) | ||
Increase in payable for investments purchased | 6,913,125 | |||
Increase in distributions payable | 284 | |||
Increase in payable for open forward foreign currency contracts | 164,073 | |||
Increase in accrued expenses | 119,381 | |||
Net change in unrealized (appreciation) depreciation on investments | (1,392,531 | ) | ||
Net realized gain from investments | (261,138 | ) | ||
|
| |||
Net cash provided by operating activities | (48,066,834 | ) | ||
|
| |||
| Cash flows from financing activities: | ||||
Proceeds from shares sold | 50,050,033 | |||
|
| |||
Net cash from financing activities | 50,050,033 | |||
|
| |||
Net increase in cash: (1) | 1,983,199 | |||
Cash at beginning of period | – | |||
|
| |||
Cash at end of period | $ | 1,983,199 | ||
|
| |||
| (1) | Balance includes foreign currency of $1,969,544. |
See accompanying Notes to Financial Statements
14
Babson Capital Funds Trust 2013 Semi-Annual Report
STATEMENTS OF CHANGES IN NET ASSETS
(Unaudited)
| BABSON GLOBAL FLOATING RATE FUND | BABSON GLOBAL CREDIT INCOME OPPORTUNITIES FUND | |||||||
| PERIOD FROM SEPTEMBER 16, 2013 THROUGH DECEMBER 31, 2013 (1) | PERIOD FROM SEPTEMBER 16, 2013 THROUGH DECEMBER 31, 2013 (1) | |||||||
| Operations | ||||||||
Net investment income | $ | 388,262 | $ | 585,431 | ||||
Net realized loss on investments | (124,654 | ) | (74,640 | ) | ||||
Net change in unrealized appreciation on investments | 623,441 | 1,163,884 | ||||||
|
|
|
| |||||
Net increase in net assets resulting from operations | 887,049 | 1,674,675 | ||||||
|
|
|
| |||||
| Capital Share Transactions | ||||||||
Net proceeds from sale of shares | ||||||||
Class A | 900,000 | 900,033 | ||||||
|
|
|
| |||||
Class C | 100,000 | 100,000 | ||||||
|
|
|
| |||||
Class I | 31,550,000 | 24,550,000 | ||||||
|
|
|
| |||||
Class Y | 24,500,000 | 24,500,000 | ||||||
|
|
|
| |||||
Net increase in net assets capital stock transactions | 57,050,000 | 50,050,033 | ||||||
|
|
|
| |||||
Total increase in net assets | 57,937,049 | 51,724,708 | ||||||
|
|
|
| |||||
| Net Assets | ||||||||
Beginning of period | – | – | ||||||
|
|
|
| |||||
End of period (includes undistributed net investment income of $388,262 and $585,431, respectively) | $ | 57,937,049 | $ | 51,724,708 | ||||
|
|
|
| |||||
| (1) | Fund commenced operations on September 16, 2013. |
See accompanying Notes to Financial Statements
15
Babson Global Floating Rate Fund 2013 Semi-Annual Report
FINANCIAL HIGHLIGHTS (UNAUDITED)
| CLASS A | ||||
| PERIOD FROM SEPTEMBER 16, 2013 THROUGH DECEMBER 31, 2013 (1) | ||||
| Per Common Share Data | ||||
Net asset value, beginning of period | $ | 10.00 | ||
Income from investment operations: | ||||
Net investment income (2) | 0.06 | |||
Net realized and unrealized gain on investments | 0.10 | |||
|
| |||
Total increase from investment operations | 0.16 | |||
|
| |||
Net asset value, at end of period | $ | 10.16 | ||
|
| |||
Total investment return (3)(4) | 1.60 | % | ||
|
| |||
| Supplemental Data and Ratios | ||||
Net assets, end of period (000’s) | $ | 914 | ||
Ratio of total expenses (before reductions and reimbursements) to average net assets (5)(6) | 3.37 | % | ||
Ratio of net expenses to average net assets (5) | 1.05 | % | ||
Ratio of net investment income to average net assets (5) | 2.11 | % | ||
Portfolio turnover rate (4) | 32.47 | % | ||
| (1) | Fund commenced operations on September 16, 2013. |
| (2) | Calculated using average shares outstanding. |
| (3) | Total investment return calculation does not consider the effects of sales loads and assumes the reinvestment of dividends at actual prices pursuant to the Fund’s dividend reinvestment plan. |
| (4) | Not annualized. |
| (5) | Annualized for periods less than one full year. |
| (6) | The Adviser has agreed to waive and/or reimburse fees and/or expenses so that, on an annualized basis, such expenses incurred will not exceed 1.05% as a percentage of average daily net assets. |
See accompanying Notes to Financial Statements
16
Babson Global Floating Rate Fund 2013 Semi-Annual Report
FINANCIAL HIGHLIGHTS (UNAUDITED) (CONTINUED)
| CLASS C | ||||
| PERIOD FROM SEPTEMBER 16, 2013 THROUGH DECEMBER 31, 2013 (1) | ||||
| Per Common Share Data | ||||
Net asset value, beginning of period | $ | 10.00 | ||
Income from investment operations: | ||||
Net investment income (2) | 0.04 | |||
Net realized and unrealized gain on investments | 0.09 | |||
|
| |||
Total increase from investment operations | 0.13 | |||
|
| |||
Net asset value, at end of period | $ | 10.13 | ||
|
| |||
Total investment return (3)(4) | 1.30 | % | ||
|
| |||
| Supplemental Data and Ratios | ||||
Net assets, end of period (000’s) | $ | 101 | ||
Ratio of total expenses (before reductions and reimbursements) to average net assets (5)(6) | 16.88 | % | ||
Ratio of net expenses to average net assets (5) | 1.80 | % | ||
Ratio of net investment income to average net assets (5) | 1.35 | % | ||
Portfolio turnover rate (4) | 32.47 | % | ||
| (1) | Fund commenced operations on September 16, 2013. |
| (2) | Calculated using average shares outstanding. |
| (3) | Total investment return calculation does not consider the effects of sales loads and assumes the reinvestment of dividends at actual prices pursuant to the Fund’s dividend reinvestment plan. |
| (4) | Not annualized. |
| (5) | Annualized for periods less than one full year. |
| (6) | The Adviser has agreed to waive and/or reimburse fees and/or expenses so that, on an annualized basis, such expenses incurred will not exceed 1.80% as a percentage of average daily net assets. |
See accompanying Notes to Financial Statements
17
Babson Global Floating Rate Fund 2013 Semi-Annual Report
FINANCIAL HIGHLIGHTS (UNAUDITED) (CONTINUED)
| CLASS I | ||||
| PERIOD FROM SEPTEMBER 16, 2013 THROUGH DECEMBER 31, 2013 (1) | ||||
| Per Common Share Data | ||||
Net asset value, beginning of period | $ | 10.00 | ||
Income from investment operations: | ||||
Net investment income (2) | 0.08 | |||
Net realized and unrealized gain on investments | 0.08 | |||
|
| |||
Total increase from investment operations | 0.16 | |||
|
| |||
Net asset value, at end of period | $ | 10.16 | ||
|
| |||
Total investment return (3)(4) | 1.60 | % | ||
|
| |||
| Supplemental Data and Ratios | ||||
Net assets, end of period (000’s) | $ | 32,019 | ||
Ratio of total expenses (before reductions and reimbursements) to average net assets (5)(6) | 1.58 | % | ||
Ratio of net expenses to average net assets (5) | 0.75 | % | ||
Ratio of net investment income to average net assets (5) | 2.59 | % | ||
Portfolio turnover rate (4) | 32.47 | % | ||
| (1) | Fund commenced operations on September 16, 2013. |
| (2) | Calculated using average shares outstanding. |
| (3) | Total investment return calculation assumes the reinvestment of dividends at actual prices pursuant to the Fund’s dividend reinvestment plan. |
| (4) | Not annualized. |
| (5) | Annualized for periods less than one full year. |
| (6) | The Adviser has agreed to waive and/or reimburse fees and/or expenses so that, on an annualized basis, such expenses incurred will not exceed .75% as a percentage of average daily net assets. |
See accompanying Notes to Financial Statements
18
Babson Global Floating Rate Fund 2013 Semi-Annual Report
FINANCIAL HIGHLIGHTS (UNAUDITED) (CONTINUED)
| CLASS Y | ||||
| PERIOD FROM SEPTEMBER 16, 2013 THROUGH DECEMBER 31, 2013 (1) | ||||
| Per Common Share Data | ||||
Net asset value, beginning of period | $ | 10.00 | ||
Income from investment operations: | ||||
Net investment income (2) | 0.07 | |||
Net realized and unrealized gain on investments | 0.09 | |||
|
| |||
Total increase from investment operations | 0.16 | |||
|
| |||
Net asset value, at end of period | $ | 10.16 | ||
|
| |||
Total investment return (3)(4) | 1.60 | % | ||
|
| |||
| Supplemental Data and Ratios | ||||
Net assets, end of period (000’s) | $ | 24,903 | ||
Ratio of total expenses (before reductions and reimbursements) to average net assets (5)(6) | 1.59 | % | ||
Ratio of net expenses to average net assets (5) | 0.75 | % | ||
Ratio of net investment income to average net assets (5) | 2.41 | % | ||
Portfolio turnover rate (4) | 32.47 | % | ||
| (1) | Fund commenced operations on September 16, 2013. |
| (2) | Calculated using average shares outstanding. |
| (3) | Total investment return calculation assumes the reinvestment of dividends at actual prices pursuant to the Fund’s dividend reinvestment plan. |
| (4) | Not annualized. |
| (5) | Annualized for periods less than one full year. |
| (6) | The Adviser has agreed to waive and/or reimburse fees and/or expenses so that, on an annualized basis, such expenses incurred will not exceed .75% as a percentage of average daily net assets. |
See accompanying Notes to Financial Statements
19
Babson Global Credit Income Opportunities Fund 2013 Semi-Annual Report
FINANCIAL HIGHLIGHTS (UNAUDITED) (CONTINUED)
| CLASS A | ||||
| PERIOD FROM SEPTEMBER 16, 2013 THROUGH DECEMBER 31, 2013 (1) | ||||
| Per Common Share Data | ||||
Net asset value, beginning of period | $ | 10.00 | ||
Income from investment operations: | ||||
Net investment income (2) | 0.11 | |||
Net realized and unrealized gain on investments | 0.22 | |||
|
| |||
Total increase from investment operations | 0.33 | |||
|
| |||
Net asset value, at end of period | $ | 10.33 | ||
|
| |||
Total investment return (3)(4) | 3.30 | % | ||
|
| |||
| Supplemental Data and Ratios | ||||
Net assets, end of period (000’s) | $ | 929 | ||
Ratio of total expenses (before reductions and reimbursements) to average net assets (5)(6) | 3.50 | % | ||
Ratio of net expenses to average net assets (5) | 1.20 | % | ||
Ratio of net investment income to average net assets (5) | 3.72 | % | ||
Portfolio turnover rate (4) | 36.01 | % | ||
| (1) | Fund commenced operations on September 16, 2013. |
| (2) | Calculated using average shares outstanding. |
| (3) | Total investment return calculation does not consider the effects of sales loads and assumes the reinvestment of dividends at actual prices pursuant to the Fund’s dividend reinvestment plan. |
| (4) | Not annualized. |
| (5) | Annualized for periods less than one full year. |
| (6) | The Adviser has agreed to waive and/or reimburse fees and/or expenses so that, on an annualized basis, such expenses incurred will not exceed 1.20% as a percentage of average daily net assets. |
See accompanying Notes to Financial Statements
20
Babson Global Credit Income Opportunities Fund 2013 Semi-Annual Report
FINANCIAL HIGHLIGHTS (UNAUDITED) (CONTINUED)
| CLASS C | ||||
| PERIOD FROM SEPTEMBER 16, 2013 THROUGH DECEMBER 31, 2013 (1) | ||||
| Per Common Share Data | ||||
Net asset value, beginning of period | $ | 10.00 | ||
Income from investment operations: | ||||
Net investment income (2) | 0.09 | |||
Net realized and unrealized gain on investments | 0.21 | |||
|
| |||
Total increase from investment operations | 0.30 | |||
|
| |||
Net asset value, at end of period | $ | 10.30 | ||
|
| |||
Total investment return (3)(4) | 3.00 | % | ||
|
| |||
| Supplemental Data and Ratios | ||||
Net assets, end of period (000’s) | $ | 103 | ||
Ratio of total expenses (before reductions and reimbursements) to average net assets (5)(6) | 16.90 | % | ||
Ratio of net expenses to average net assets (5) | 1.95 | % | ||
Ratio of net investment income to average net assets (5) | 2.97 | % | ||
Portfolio turnover rate (4) | 36.01 | % | ||
| (1) | Fund commenced operations on September 16, 2013. |
| (2) | Calculated using average shares outstanding. |
| (3) | Total investment return calculation does not consider the effects of sales loads and assumes the reinvestment of dividends at actual prices pursuant to the Fund’s dividend reinvestment plan. |
| (4) | Not annualized. |
| (5) | Annualized for periods less than one full year. |
| (6) | The Adviser has agreed to waive and/or reimburse fees and/or expenses so that, on an annualized basis, such expenses incurred will not exceed 1.95% as a percentage of average daily net assets. |
See accompanying Notes to Financial Statements
21
Babson Global Credit Income Opportunities Fund 2013 Semi-Annual Report
FINANCIAL HIGHLIGHTS (UNAUDITED) (CONTINUED)
| CLASS I | ||||
| PERIOD FROM SEPTEMBER 16, 2013 THROUGH DECEMBER 31, 2013 (1) | ||||
| Per Common Share Data | ||||
Net asset value, beginning of period | $ | 10.00 | ||
Income from investment operations: | ||||
Net investment income (2) | 0.12 | |||
Net realized and unrealized gain on investments | 0.21 | |||
|
| |||
Total increase from investment operations | 0.33 | |||
|
| |||
Net asset value, at end of period | $ | 10.33 | ||
|
| |||
Total investment return (3)(4) | 3.30 | % | ||
|
| |||
| Supplemental Data and Ratios | ||||
Net assets, end of period (000’s) | $ | 25,372 | ||
Ratio of total expenses (before reductions and reimbursements) to average net assets (5)(6) | 1.73 | % | ||
Ratio of net expenses to average net assets (5) | 0.95 | % | ||
Ratio of net investment income to average net assets (5) | 3.97 | % | ||
Portfolio turnover rate (4) | 36.01 | % | ||
| (1) | Fund commenced operations on September 16, 2013. |
| (2) | Calculated using average shares outstanding. |
| (3) | Total investment return calculation assumes the reinvestment of dividends at actual prices pursuant to the Fund’s dividend reinvestment plan. |
| (4) | Not annualized. |
| (5) | Annualized for periods less than one full year. |
| (6) | The Adviser has agreed to waive and/or reimburse fees and/or expenses so that, on an annualized basis, such expenses incurred will not exceed .95% as a percentage of average daily net assets. |
See accompanying Notes to Financial Statements
22
Babson Global Credit Income Opportunities Fund 2013 Semi-Annual Report
FINANCIAL HIGHLIGHTS (UNAUDITED) (CONTINUED)
| CLASS Y | ||||
| PERIOD FROM SEPTEMBER 16, 2013 THROUGH DECEMBER 31, 2013 (1) | ||||
| Per Common Share Data | ||||
Net asset value, beginning of period | $ | 10.00 | ||
Income from investment operations: | ||||
Net investment income (2) | 0.12 | |||
Net realized and unrealized gain on investments | 0.21 | |||
|
| |||
Total increase from investment operations | 0.33 | |||
|
| |||
Net asset value, at end of period | $ | 10.33 | ||
|
| |||
Total investment return (3)(4) | 3.30 | % | ||
|
| |||
| Supplemental Data and Ratios | ||||
Net assets, end of period (000’s) | $ | 25,320 | ||
Ratio of total expenses (before reductions and reimbursements) to average net assets (5)(6) | 1.73 | % | ||
Ratio of net expenses to average net assets (5) | 0.95 | % | ||
Ratio of net investment income to average net assets (5) | 3.97 | % | ||
Portfolio turnover rate (4) | 36.01 | % | ||
| (1) | Fund commenced operations on September 16, 2013. |
| (2) | Calculated using average shares outstanding. |
| (3) | Total investment return calculation assumes the reinvestment of dividends at actual prices pursuant to the Fund’s dividend reinvestment plan. |
| (4) | Not annualized. |
| (5) | Annualized for periods less than one full year. |
| (6) | The Adviser has agreed to waive and/or reimburse fees and/or expenses so that, on an annualized basis, such expenses incurred will not exceed .95% as a percentage of average daily net assets. |
See accompanying Notes to Financial Statements
23
Babson Global Floating Rate Fund 2013 Semi-Annual Report
SCHEDULE OF INVESTMENTS (UNAUDITED)
December 31, 2013
| EFFECTIVE INTEREST RATE ‡ | DUE DATE | PRINCIPAL | COST | FAIR VALUE | ||||||||||||||||
Fixed Income — 98.2%*: | ||||||||||||||||||||
Bank Loans — 86.0%*§: | ||||||||||||||||||||
Aerospace and Defense — 0.9%*: | ||||||||||||||||||||
TransDigm Group, Inc. | 3.75 | % | 2/28/2020 | 498,740 | $ | 496,323 | $ | 499,648 | ||||||||||||
|
|
|
|
|
| |||||||||||||||
Automobile — 1.1%*: |
| |||||||||||||||||||
Autobahn Tank & Rast GmbH+ | 3.75 | 12/4/2018 | 250,000 | 336,266 | 343,639 | |||||||||||||||
Autobahn Tank & Rast GmbH+ | 4.00 | 12/4/2019 | 200,000 | 271,730 | 276,937 | |||||||||||||||
|
|
|
|
|
| |||||||||||||||
Total Automobile | 450,000 | 607,996 | 620,576 | |||||||||||||||||
|
|
|
|
|
| |||||||||||||||
Beverage, Food and Tobacco — 3.4%*: |
| |||||||||||||||||||
Acosta, Inc. | 3.50 | 3/2/2018 | 400,526 | 402,644 | 402,628 | |||||||||||||||
AHT Cooling Systems GmbH+ | 4.75 | 9/30/2020 | 500,000 | 684,125 | 687,850 | |||||||||||||||
Del Monte Foods Co. | 4.25 | 11/6/2020 | 250,000 | 248,750 | 251,250 | |||||||||||||||
Del Monte Foods Co. | 8.25 | 4/11/2021 | 156,341 | 154,778 | 157,710 | |||||||||||||||
JBS USA Holdings, Inc. | 3.75 | 9/18/2020 | 498,750 | 499,978 | 497,089 | |||||||||||||||
|
|
|
|
|
| |||||||||||||||
Total Beverage, Food and Tobacco | 1,805,617 | 1,990,275 | 1,996,527 | |||||||||||||||||
|
|
|
|
|
| |||||||||||||||
Broadcasting and Entertainment — 7.2%*: |
| |||||||||||||||||||
Cumulus Media Holdings, Inc. | 4.25 | 12/23/2020 | 375,082 | 371,332 | 376,958 | |||||||||||||||
Learfield Communications, Inc. | 5.00 | 10/9/2020 | 419,598 | 417,562 | 423,794 | |||||||||||||||
Learfield Communications, Inc. | 8.75 | 10/9/2021 | 1,000,000 | 1,022,690 | 1,020,000 | |||||||||||||||
Nexstar Broadcasting, Inc. | 3.75 | 10/1/2020 | 313,039 | 313,039 | 313,333 | |||||||||||||||
Tyrol Acquisitions 2 SAS+ | 3.25 | 1/29/2016 | 1,158,726 | 1,511,686 | 1,548,946 | |||||||||||||||
Univision Communications, Inc. | 4.00 | 3/1/2020 | 497,494 | 496,280 | 499,360 | |||||||||||||||
|
|
|
|
|
| |||||||||||||||
Total Broadcasting and Entertainment | 3,763,939 | 4,132,589 | 4,182,391 | |||||||||||||||||
|
|
|
|
|
| |||||||||||||||
Buildings and Real Estate — 2.9%*: |
| |||||||||||||||||||
Monier Group Gmbh+ | 7.25 | 4/16/2015 | 500,000 | 659,163 | 683,262 | |||||||||||||||
Quikrete Holdings, Inc. | 4.00 | 9/28/2020 | 997,500 | 992,666 | 1,001,051 | |||||||||||||||
|
|
|
|
|
| |||||||||||||||
Total Buildings and Real Estate | 1,497,500 | 1,651,829 | 1,684,313 | |||||||||||||||||
|
|
|
|
|
| |||||||||||||||
Cargo Transport — 2.0%*: |
| |||||||||||||||||||
CEVA Group PLC+ | 5.25 | 8/31/2016 | 500,000 | 659,357 | 668,934 | |||||||||||||||
Direct ChassisLink, Inc. | 8.75 | 10/31/2019 | 500,000 | 492,590 | 492,500 | |||||||||||||||
|
|
|
|
|
| |||||||||||||||
Total Cargo Transport | 1,000,000 | 1,151,947 | 1,161,434 | |||||||||||||||||
|
|
|
|
|
| |||||||||||||||
Chemicals, Plastics and Rubber — 4.7%*: |
| |||||||||||||||||||
Chromaflo Technologies Corp. | 4.50 | 12/2/2019 | 626,406 | 627,932 | 626,017 | |||||||||||||||
Flint Group SA | 6.50 | 12/30/2016 | 1,000,000 | 992,822 | 997,500 | |||||||||||||||
Ineos US Finance LLC | 4.00 | 5/4/2018 | 465,211 | 462,964 | 466,374 | |||||||||||||||
OCI Beaumont LLC | 6.25 | 8/20/2019 | 138,388 | 137,702 | 139,772 | |||||||||||||||
Vantage Specialties, Inc. | 5.00 | 2/10/2019 | 498,735 | 497,505 | 499,673 | |||||||||||||||
|
|
|
|
|
| |||||||||||||||
Total Chemicals, Plastics and Rubber | 2,728,740 | 2,718,925 | 2,729,336 | |||||||||||||||||
|
|
|
|
|
| |||||||||||||||
Containers, Packaging and Glass — 4.3%*: |
| |||||||||||||||||||
Ardagh Packaging Finance PLC | 4.25 | 12/17/2019 | 74,019 | 73,649 | 74,389 | |||||||||||||||
Chesapeake Corp.+ | 6.00 | 9/30/2020 | 498,750 | 794,299 | 829,002 | |||||||||||||||
Coveris+ | 5.00 | 5/8/2019 | 500,000 | 686,624 | 691,936 | |||||||||||||||
See accompanying Notes to Financial Statements
24
Babson Global Floating Rate Fund 2013 Semi-Annual Report
SCHEDULE OF INVESTMENTS (UNAUDITED) (CONTINUED)
December 31, 2013
| EFFECTIVE INTEREST RATE ‡ | DUE DATE | PRINCIPAL | COST | FAIR VALUE | ||||||||||||||||
Bank Loans (Continued) | ||||||||||||||||||||
Containers, Packaging and Glass (Continued) | ||||||||||||||||||||
Coveris | 5.25 | % | 5/8/2019 | 388,645 | $ | 386,731 | $ | 394,475 | ||||||||||||
Multi Packaging Solutions, Inc. | 4.25 | 8/15/2020 | 250,000 | 249,375 | 250,312 | |||||||||||||||
Multi Packaging Solutions, Inc. | 4.25 | 9/30/2020 | 250,000 | 249,375 | 250,000 | |||||||||||||||
|
|
|
|
|
| |||||||||||||||
Total Containers, Packaging and Glass | 1,961,414 | 2,440,053 | 2,490,114 | |||||||||||||||||
|
|
|
|
|
| |||||||||||||||
Diversified/Conglomerate Manufacturing — 3.3%*: |
| |||||||||||||||||||
Filtration Group Corp. | 4.50 | 11/21/2020 | 366,960 | 365,139 | 370,402 | |||||||||||||||
Information Resources, Inc. | 4.75 | 9/30/2020 | 159,038 | 158,266 | 159,702 | |||||||||||||||
Quality Home Brands Holdings | 7.75 | 5/25/2018 | 263,673 | 261,036 | 263,673 | |||||||||||||||
Rexnord LLC | 4.00 | 8/20/2020 | 928,707 | 923,225 | 930,639 | |||||||||||||||
ValleyCrest Co. LLC | 5.50 | 6/13/2019 | 166,249 | $ | 167,266 | $ | 166,872 | |||||||||||||
|
|
|
|
|
| |||||||||||||||
Total Diversified/Conglomerate Manufacturing | 1,884,627 | 1,874,932 | 1,891,288 | |||||||||||||||||
|
|
|
|
|
| |||||||||||||||
Diversified/Conglomerate Service — 8.8%*: |
| |||||||||||||||||||
Aquilex Holdings LLC | 5.25 | 12/31/2020 | 200,142 | 199,642 | 200,643 | |||||||||||||||
Brickman Group Holdings, Inc | 7.75 | 12/5/2020 | 82,405 | 81,993 | 84,131 | |||||||||||||||
Brickman Group Holdings, Inc. | 4.00 | 12/18/2018 | 234,904 | 233,729 | 235,785 | |||||||||||||||
EIG Investors Corp. | 5.00 | 11/9/2019 | 601,532 | 604,198 | 604,167 | |||||||||||||||
Garda World Security Corp. | 4.00 | 11/8/2020 | 138,843 | 138,161 | 138,973 | |||||||||||||||
Infor (US), Inc. | 3.75 | 6/3/2020 | 997,483 | 994,950 | 994,990 | |||||||||||||||
Northgate Information Solutions+ | 4.25 | 3/6/2018 | 500,000 | 666,798 | 672,373 | |||||||||||||||
Northgate Information Solutions+ | 4.75 | 3/7/2018 | 500,000 | 666,798 | 672,373 | |||||||||||||||
Power Team Services LLC | 8.25 | 11/6/2020 | 500,000 | 495,051 | 490,000 | |||||||||||||||
Protection One, Inc. | 4.25 | 3/21/2019 | 125,387 | 125,230 | 125,355 | |||||||||||||||
Sabre, Inc. | 4.50 | 2/19/2019 | 498,750 | 498,750 | 499,373 | |||||||||||||||
Triple Point Technology, Inc. | 5.25 | 7/10/2020 | 446,151 | 405,151 | 397,074 | |||||||||||||||
|
|
|
|
|
| |||||||||||||||
Total Diversified/Conglomerate Service | 4,825,597 | 5,110,451 | 5,115,237 | |||||||||||||||||
|
|
|
|
|
| |||||||||||||||
Ecological — 0.8%*: |
| |||||||||||||||||||
ADS Waste Holdings, Inc. | 4.25 | 10/9/2019 | 477,986 | 477,986 | 480,108 | |||||||||||||||
|
|
|
|
|
| |||||||||||||||
Electronics — 0.7%*: |
| |||||||||||||||||||
Kronos, Inc. | 4.50 | 10/30/2019 | 90,985 | 90,084 | 91,725 | |||||||||||||||
Kronos, Inc. | 9.75 | 4/30/2020 | 115,144 | 113,035 | 118,886 | |||||||||||||||
Magic Newco LLC | 5.00 | 12/12/2018 | 96,598 | 96,598 | 97,202 | |||||||||||||||
Omnitracs, Inc. | 4.75 | 11/25/2020 | 73,464 | 73,101 | 73,464 | |||||||||||||||
|
|
|
|
|
| |||||||||||||||
Total Electronics | 376,191 | 372,818 | 381,277 | |||||||||||||||||
|
|
|
|
|
| |||||||||||||||
Farming and Agriculture — 0.3%*: |
| |||||||||||||||||||
Dole Food Co., Inc. | 4.50 | 11/1/2018 | 152,301 | 151,560 | 152,808 | |||||||||||||||
|
|
|
|
|
| |||||||||||||||
Finance — 9.3%*: |
| |||||||||||||||||||
Confie Seguros Holdings II Co. | 5.75 | 11/9/2018 | 456,866 | 454,685 | 456,866 | |||||||||||||||
Confie Seguros Holdings II Co. | 10.25 | 5/8/2019 | 297,015 | 297,015 | 297,945 | |||||||||||||||
Evertec Group LLC | 3.50 | 4/17/2020 | 178,238 | 172,998 | 173,336 | |||||||||||||||
First Data Corp. | 4.25 | 3/23/2018 | 500,000 | 497,014 | 500,345 | |||||||||||||||
Nuveen Investments, Inc. | 4.25 | 5/13/2017 | 500,000 | 495,320 | 497,605 | |||||||||||||||
Nuveen Investments, Inc. | 6.50 | 2/28/2019 | 500,000 | 490,284 | 494,000 | |||||||||||||||
See accompanying Notes to Financial Statements
25
Babson Global Floating Rate Fund 2013 Semi-Annual Report
SCHEDULE OF INVESTMENTS (UNAUDITED) (CONTINUED)
December 31, 2013
| EFFECTIVE INTEREST RATE ‡ | DUE DATE | PRINCIPAL | COST | FAIR VALUE | ||||||||||||||||
Bank Loans (Continued) | ||||||||||||||||||||
Finance (Continued) | ||||||||||||||||||||
P2 Newco Acquisition, Inc. | 5.50 | % | 10/22/2020 | 484,694 | $ | 479,958 | $ | 485,905 | ||||||||||||
P2 Newco Acquisition, Inc. | 9.50 | 10/22/2021 | 500,000 | 495,100 | 500,000 | |||||||||||||||
SAM Finance Lux Sarl+ | 4.25 | 11/11/2020 | 500,000 | 806,318 | 825,905 | |||||||||||||||
SAM Finance Lux Sarl | 4.25 | 12/17/2020 | 500,000 | 497,500 | 500,625 | |||||||||||||||
Ship US Bidco, Inc. | 4.50 | 11/30/2019 | 376,772 | 373,049 | 378,750 | |||||||||||||||
TransUnion LLC | 4.25 | 2/10/2019 | 185,118 | 185,118 | 185,998 | |||||||||||||||
VFH Parent LLC | 5.75 | 11/6/2019 | 120,000 | 120,742 | 120,700 | |||||||||||||||
|
|
|
|
|
| |||||||||||||||
Total Finance | 5,098,703 | 5,365,101 | 5,417,980 | |||||||||||||||||
|
|
|
|
|
| |||||||||||||||
Healthcare, Education and Childcare — 9.4%*: |
| |||||||||||||||||||
Aenova Holding GmbH+ | 5.25 | 9/27/2019 | 600,000 | 798,667 | 827,071 | |||||||||||||||
Britax US Holdings, Inc. | 4.50 | 10/15/2020 | 439,636 | 437,492 | 440,551 | |||||||||||||||
Envision Healthcare Corp. | 4.00 | 5/25/2018 | 497,448 | 497,448 | 498,482 | |||||||||||||||
Heartland Dental Care, Inc. | 5.50 | 12/21/2018 | 392,016 | 390,076 | 392,996 | |||||||||||||||
PRA Holdings, Inc. | 5.00 | 9/23/2020 | 864,029 | 855,690 | 865,100 | |||||||||||||||
Sheridan Holdings, Inc. | 8.25 | 12/31/2021 | 66,570 | 66,238 | 66,945 | |||||||||||||||
TriZetto Group, Inc. (The) | 4.75 | 5/2/2018 | 872,129 | 818,100 | 861,777 | |||||||||||||||
Tunstall Group Holdings Ltd.+ | 5.25 | 10/16/2020 | 500,000 | 791,606 | 827,387 | |||||||||||||||
Vitalia Holdco Sarl+ | 5.25 | 7/27/2018 | 500,000 | 666,096 | 682,347 | |||||||||||||||
|
|
|
|
|
| |||||||||||||||
Total Healthcare, Education and Childcare | 4,731,828 | 5,321,413 | 5,462,656 | |||||||||||||||||
|
|
|
|
|
| |||||||||||||||
Home and Office Furnishings, Housewares, and Durable Consumer Products — 0.9%*: |
| |||||||||||||||||||
Leslie’s Poolmart, Inc. | 4.25 | 10/16/2019 | 548,269 | 547,767 | 549,985 | |||||||||||||||
|
|
|
|
|
| |||||||||||||||
Hotels, Motels, Inns and Gaming — 3.5%*: |
| |||||||||||||||||||
Gala Group Ltd.+ | 5.25 | 5/25/2018 | 500,000 | 800,200 | 834,773 | |||||||||||||||
Hilton Worldwide Finance LLC | 3.75 | 10/25/2020 | 789,474 | 785,621 | 795,395 | |||||||||||||||
Marina District Finance Co. | 6.75 | 8/15/2018 | 379,384 | 375,590 | 380,571 | |||||||||||||||
|
|
|
|
|
| |||||||||||||||
Total Hotels, Motels, Inns and Gaming | 1,668,858 | 1,961,411 | 2,010,739 | |||||||||||||||||
|
|
|
|
|
| |||||||||||||||
Insurance — 2.9%*: |
| |||||||||||||||||||
AmWINS Group LLC | 5.00 | 9/6/2019 | 153,772 | 153,395 | 154,541 | |||||||||||||||
Asurion LLC | 4.50 | 5/24/2019 | 497,488 | 495,051 | 497,114 | |||||||||||||||
Hub International Ltd. | 4.75 | 10/2/2020 | 997,500 | 992,673 | 1,008,722 | |||||||||||||||
|
|
|
|
|
| |||||||||||||||
Total Insurance | 1,648,760 | 1,641,119 | 1,660,377 | |||||||||||||||||
|
|
|
|
|
| |||||||||||||||
Leisure, Amusement, Entertainment — 0.3%*: |
| |||||||||||||||||||
Town Sports International, Inc. | 4.50 | 11/15/2020 | 181,325 | 180,433 | 182,458 | |||||||||||||||
|
|
|
|
|
| |||||||||||||||
Machinery Non-Agriculture, Non-Construction, Non-Electronic — 1.9%*: |
| |||||||||||||||||||
Gardner Denver, Inc. | 4.25 | 7/30/2020 | 498,750 | 498,750 | 498,690 | |||||||||||||||
Intelligrated, Inc. | 4.50 | 7/30/2018 | 121,417 | 121,118 | 121,645 | |||||||||||||||
Silver II US Holdings LLC | 4.00 | 12/13/2019 | 489,987 | 489,987 | 490,497 | |||||||||||||||
|
|
|
|
|
| |||||||||||||||
Total Machinery Non-Agriculture, Non-Construction, Non-Electronic | 1,110,154 | 1,109,855 | 1,110,832 | |||||||||||||||||
|
|
|
|
|
| |||||||||||||||
See accompanying Notes to Financial Statements
26
Babson Global Floating Rate Fund 2013 Semi-Annual Report
SCHEDULE OF INVESTMENTS (UNAUDITED) (CONTINUED)
December 31, 2013
| EFFECTIVE INTEREST RATE ‡ | DUE DATE | PRINCIPAL | COST | FAIR VALUE | ||||||||||||||||
Bank Loans (Continued) | ||||||||||||||||||||
Mining, Steel, Iron and Non-Precious Metals — 2.4%*: |
| |||||||||||||||||||
H.C. Starck GmbH+ | 4.75 | % | 12/30/2014 | 250,000 | $ | 339,625 | $ | 341,346 | ||||||||||||
H.C. Starck GmbH+ | 4.75 | 12/30/2015 | 250,000 | 339,625 | 343,065 | |||||||||||||||
Metal Services LLC | 6.00 | 6/30/2017 | 106,886 | 106,887 | 107,581 | |||||||||||||||
Murray Energy Corp. | 5.25 | 12/5/2019 | 397,701 | 395,731 | 401,431 | |||||||||||||||
TMS International Corp. | 4.50 | 10/16/2020 | 216,723 | 215,669 | 218,257 | |||||||||||||||
|
|
|
|
|
| |||||||||||||||
Total Mining, Steel, Iron and Non-Precious Metals | 1,221,310 | 1,397,537 | 1,411,680 | |||||||||||||||||
|
|
|
|
|
| |||||||||||||||
Oil and Gas — 1.8%*: |
| |||||||||||||||||||
Energy Transfer Equity LP | 3.25 | 12/2/2019 | 154,464 | 154,082 | 153,846 | |||||||||||||||
Equipower Resources Holdings LLC | 4.25 | 12/31/2019 | 108,598 | 108,326 | 108,870 | |||||||||||||||
Quicksilver Resources, Inc. | 7.00 | 6/21/2019 | 500,000 | 489,657 | 494,375 | |||||||||||||||
Western Refining, Inc. | 4.25 | 11/12/2020 | 285,542 | 285,542 | 288,754 | |||||||||||||||
|
|
|
|
|
| |||||||||||||||
Total Oil and Gas | 1,048,604 | 1,037,607 | 1,045,845 | |||||||||||||||||
|
|
|
|
|
| |||||||||||||||
Personal and Non-Durable Consumer Products Mfg. Only — 1.7%*: |
| |||||||||||||||||||
Pacific Industrial Services US Finco LLC | 5.00 | 10/2/2018 | 997,500 | 992,707 | 1,010,388 | |||||||||||||||
|
|
|
|
|
| |||||||||||||||
Personal, Food and Miscellaneous — 0.3%*: |
| |||||||||||||||||||
Redtop Acquisitions Ltd. | 8.25 | 5/31/2021 | 158,761 | 156,792 | 160,746 | |||||||||||||||
|
|
|
|
|
| |||||||||||||||
Printing and Publishing — 2.6%: |
| |||||||||||||||||||
Emap B2B+ | 5.15 | 10/31/2017 | 500,000 | 771,086 | 790,716 | |||||||||||||||
Springer Science and Business Media GmbH | 5.00 | 8/14/2020 | 498,750 | 496,292 | 500,411 | |||||||||||||||
SuperMedia, Inc. | 11.60 | 12/30/2016 | 262,567 | 195,192 | 195,573 | |||||||||||||||
|
|
|
|
|
| |||||||||||||||
Total Printing and Publishing | 1,261,317 | 1,462,570 | 1,486,700 | |||||||||||||||||
|
|
|
|
|
| |||||||||||||||
Retail Stores — 3.8%*: |
| |||||||||||||||||||
Advantage Sales and Marketing, Inc. | 4.25 | 12/18/2017 | 120,554 | 119,951 | 120,885 | |||||||||||||||
BJ’s Wholesale Club, Inc. | 4.50 | 9/26/2019 | 136,343 | 135,674 | 137,042 | |||||||||||||||
FleetPride Corp. | 5.25 | 11/19/2019 | 748,111 | 732,846 | 738,296 | |||||||||||||||
Hudson’s Bay Co. | 4.75 | 11/4/2020 | 795,317 | 787,956 | 807,549 | |||||||||||||||
Hudson’s Bay Co. | 8.25 | 11/4/2021 | 107,296 | 106,243 | 110,783 | |||||||||||||||
Smart and Final Stores LLC | 4.75 | 11/15/2019 | 279,018 | 278,321 | 278,321 | |||||||||||||||
|
|
|
|
|
| |||||||||||||||
Total Retail Stores | 2,186,639 | 2,160,991 | 2,192,876 | |||||||||||||||||
|
|
|
|
|
| |||||||||||||||
Telecommunications — 3.2%*: |
| |||||||||||||||||||
Altice Financing SA | 4.75 | 7/15/2019 | 265,625 | 268,438 | 266,953 | |||||||||||||||
CDS Holdco III B.V.+ | 5.00 | 8/31/2020 | 500,000 | 672,180 | 690,003 | |||||||||||||||
Com Hem Communications AB+ | 5.25 | 3/29/2018 | 5,000,000 | 763,990 | 757,947 | |||||||||||||||
Syniverse Holdings, Inc. | 4.00 | 4/23/2019 | 113,184 | 113,184 | 113,290 | |||||||||||||||
|
|
|
|
|
| |||||||||||||||
Total Telecommunications | 5,878,809 | 1,817,792 | 1,828,193 | |||||||||||||||||
|
|
|
|
|
| |||||||||||||||
Utilities — 1.6%*: |
| |||||||||||||||||||
Dynegy Holdings, Inc. | 4.00 | 4/23/2020 | 598,353 | 596,297 | 600,596 | |||||||||||||||
EFS Cogen Holdings I, Inc. | 3.75 | 12/17/2020 | 304,340 | 301,312 | 306,242 | |||||||||||||||
|
|
|
|
|
| |||||||||||||||
Total Utilities | 902,693 | 897,609 | 906,838 | |||||||||||||||||
|
|
|
|
|
| |||||||||||||||
Total Bank Loans | 50,066,182 | 49,228,388 | 49,823,350 | |||||||||||||||||
|
|
|
|
|
| |||||||||||||||
See accompanying Notes to Financial Statements
27
Babson Global Floating Rate Fund 2013 Semi-Annual Report
SCHEDULE OF INVESTMENTS (UNAUDITED) (CONTINUED)
December 31, 2013
| EFFECTIVE INTEREST RATE ‡ | DUE DATE | PRINCIPAL | COST | FAIR VALUE | ||||||||||||||||
Corporate Bonds — 12.2%*: | ||||||||||||||||||||
Beverage, Food and Tobacco — 0.6%*: |
| |||||||||||||||||||
Albain Bidco Norway AS+ | 6.67 | %# | 11/1/2020 | 1,000,000 | $ | 166,715 | $ | 165,697 | ||||||||||||
Findus Bondco SA+ | 9.13 | 7/1/2018 | 100,000 | 141,728 | 151,327 | |||||||||||||||
|
|
|
|
|
| |||||||||||||||
Total Beverage, Food and Tobacco | 1,100,000 | 308,443 | 317,024 | |||||||||||||||||
|
|
|
|
|
| |||||||||||||||
Broadcasting and Entertainment — 0.3%*: |
| |||||||||||||||||||
CET 21 Spol Sro+ | 9.00 | 11/1/2017 | 100,000 | 142,601 | 143,417 | |||||||||||||||
|
|
|
|
|
| |||||||||||||||
Finance — 2.2%*: |
| |||||||||||||||||||
Equiniti Newco 2 PLC+ | 6.28 | # | 12/15/2018 | 750,000 | 1,215,109 | 1,257,487 | ||||||||||||||
|
|
|
|
|
| |||||||||||||||
Healthcare, Education and Childcare — 1.3%*: |
| |||||||||||||||||||
Care UK Health & Social Care PLC+ | 9.75 | 8/1/2017 | 100,000 | 165,314 | 175,117 | |||||||||||||||
Unilabs Subholding AB+ | 7.48 | # | 7/15/2018 | 400,000 | 551,836 | 558,534 | ||||||||||||||
|
|
|
|
|
| |||||||||||||||
Total Healthcare, Education and Childcare | 500,000 | 717,150 | 733,651 | |||||||||||||||||
|
|
|
|
|
| |||||||||||||||
Insurance — 2.4%*: |
| |||||||||||||||||||
Galaxy Bidco Ltd.+ | 5.52 | # | 11/15/2019 | 100,000 | 160,874 | 166,539 | ||||||||||||||
Hastings Insurance Group Finance PLC+ | 6.58 | # | 10/21/2019 | 150,000 | 237,540 | 248,082 | ||||||||||||||
Hastings Insurance Group Finance PLC+ | 8.00 | 10/21/2020 | 100,000 | 159,915 | 170,563 | |||||||||||||||
Towergate Finance PLC+ | 6.01 | # | 2/15/2018 | 500,000 | 796,763 | 823,835 | ||||||||||||||
|
|
|
|
|
| |||||||||||||||
Total Insurance | 850,000 | 1,355,092 | 1,409,019 | |||||||||||||||||
|
|
|
|
|
| |||||||||||||||
Leisure, Amusement, Entertainment — 2.9%*: |
| |||||||||||||||||||
Travelex Financing PLC+ | 6.51 | # | 8/1/2018 | 700,000 | 1,119,681 | 1,159,165 | ||||||||||||||
Travelex Financing PLC+ | 8.00 | 8/1/2018 | 100,000 | 158,219 | 171,391 | |||||||||||||||
Vougeot Bidco PLC+ | 5.48 | # | 7/15/2020 | 250,000 | 338,833 | 349,943 | ||||||||||||||
|
|
|
|
|
| |||||||||||||||
Total Leisure, Amusement, Entertainment | 1,050,000 | 1,616,733 | 1,680,499 | |||||||||||||||||
|
|
|
|
|
| |||||||||||||||
Machinery Non-Agriculture, Non-Construction, Non-Electronic — 0.2%: |
| |||||||||||||||||||
Channel Link Enterprises Finance PLC+ | 3.64 | # | 6/30/2050 | 100,000 | 128,221 | 131,379 | ||||||||||||||
|
|
|
|
|
| |||||||||||||||
Personal Transportation — 0.8%: |
| |||||||||||||||||||
Bond Mission Critical Services PLC+ | 6.26 | # | 5/1/2019 | 300,000 | 476,494 | 476,913 | ||||||||||||||
|
|
|
|
|
| |||||||||||||||
Personal, Food and Miscellaneous — 0.2%*: |
| |||||||||||||||||||
TeamSystem Holding SpA+ | 7.38 | 5/15/2020 | 100,000 | 132,409 | 141,697 | |||||||||||||||
|
|
|
|
|
| |||||||||||||||
Retail Stores — 1.0%*: |
| |||||||||||||||||||
Brighthouse Group PLC+ | 7.88 | 5/15/2018 | 150,000 | 245,222 | 255,844 | |||||||||||||||
New Look Bondco I PLC+ | 8.75 | 5/14/2018 | 200,000 | 325,175 | 349,654 | |||||||||||||||
|
|
|
|
|
| |||||||||||||||
Total Retail Stores | 350,000 | 570,397 | 605,498 | |||||||||||||||||
|
|
|
|
|
| |||||||||||||||
Telecommunications — 0.3%*: |
| |||||||||||||||||||
Manutencoop Facility Management SpA+ | 8.50 | 8/1/2020 | 100,000 | 131,982 | 145,824 | |||||||||||||||
|
|
|
|
|
| |||||||||||||||
Total Corporate Bonds | 5,300,000 | 6,794,631 | 7,042,408 | |||||||||||||||||
|
|
|
|
|
| |||||||||||||||
Total Fixed Income | 55,366,182 | 56,023,019 | 56,865,758 | |||||||||||||||||
|
|
|
|
|
| |||||||||||||||
See accompanying Notes to Financial Statements
28
Babson Global Floating Rate Fund 2013 Semi-Annual Report
SCHEDULE OF INVESTMENTS (UNAUDITED) (CONTINUED)
December 31, 2013
| EFFECTIVE INTEREST RATE ‡ | DUE DATE | PRINCIPAL | COST | FAIR VALUE | ||||||||||||||||
Short-Term Investment — 12.1%*: | ||||||||||||||||||||
Bank Deposit — 12.1%*: |
| |||||||||||||||||||
State Street Bank & Trust Co. Euro Time Deposit | 0.01 | % | 1/2/2014 | 7,041,707 | $ | 7,041,707 | $ | 7,041,707 | ||||||||||||
|
|
|
|
|
| |||||||||||||||
Total Investments | 62,407,889 | 63,064,726 | 63,907,465 | |||||||||||||||||
|
|
|
|
|
| |||||||||||||||
Other assets and liabilities — (10.3%) | (5,970,416 | ) | ||||||||||||||||||
Net Assets — 100.0% | $ | 57,937,049 | ||||||||||||||||||
|
| |||||||||||||||||||
| ‡ | The effective interest rates are based on settled commitment amount. |
| * | Calculated as a percentage of net assets applicable to common shareholders. |
| + | Foreign security. |
Distributions of investments by country of issue (excluding temporary cash investments) as a percentage of total investments in securities, is as follows:
| US | United States | 57.1% | ||||
| UK | United Kingdom | 20.4% | ||||
| DE | Germany | 6.7% | ||||
| FR | France | 3.9% | ||||
| ES | Spain | 2.3% | ||||
| SE | Sweden | 2.3% | ||||
| AU | Australia | 1.8% | ||||
| NL | Netherlands | 1.2% | ||||
| AT | Austria | 1.2% | ||||
| Other (Individually less than 1%) | 3.1% | |||||
|
| |||||
| Total | 100.0% | |||||
|
| |||||
| ^ | Security acquired in a transaction exempt from registration under Rule 144A of the Securities Act of 1933. These securities may only be resold in transactions exempt from registration, normally to qualified institutional buyers. |
| § | Bank loans are exempt from registration under the Securities Act of 1933, as amended, but contain certain restrictions on resale and cannot be sold publicly. These loans pay interest at rates which adjust periodically. The interest rates shown for bank loans are the current interest rates at December 31, 2013. Bank loans are also subject to mandatory and/or optional prepayment which cannot be predicted. As a result, the remaining maturity may be substantially less than the stated maturity shown. See accompanying Notes to the Financial Statement (2G) for additional information on bank loans. |
| # | Variable rate security. The interest rate shown is the rate in effect at December 31, 2013. |
A summary of outstanding financial instruments at December 31, 2013 is as follows:
Forward Foreign Currency Exchange Contracts to Buy
| EXPIRATION DATE | COUNTERPARTY | LOCAL CURRENCY | VALUE IN USD | IN EXCHANGE FOR USD | NET UNREALIZED APPRECIATION | |||||||||||||||||
| 01/14/14 | State Street Bank & Trust Co. | GBP | 218,769 | 362,244 | 356,641 | $ | 5,603 | |||||||||||||||
| 01/14/14 | State Street Bank & Trust Co. | SEK | 72,875 | 11,328 | 11,191 | 137 | ||||||||||||||||
|
| |||||||||||||||||||||
Net unrealized appreciation on forward foreign exchange contracts to buy |
| $ | 5,740 | |||||||||||||||||||
|
| |||||||||||||||||||||
See accompanying Notes to Financial Statements
29
Babson Global Floating Rate Fund 2013 Semi-Annual Report
SCHEDULE OF INVESTMENTS (UNAUDITED) (CONTINUED)
December 31, 2013
Forward Foreign Currency Exchange Contracts to Sell
| EXPIRATION DATE | COUNTERPARTY | LOCAL CURRENCY | VALUE IN USD | IN EXCHANGE FOR USD | NET UNREALIZED DEPRECIATION | |||||||||||||||||
| 01/14/14 | State Street Bank & Trust Co. | EUR | 4,562,818 | 6,277,033 | 6,253,677 | $ | (23,356 | ) | ||||||||||||||
| 01/14/14 | State Street Bank & Trust Co. | GBP | 6,205,658 | 10,275,510 | 10,140,410 | (135,100 | ) | |||||||||||||||
| 01/14/14 | State Street Bank & Trust Co. | NOK | 1,008,015 | 166,125 | 163,477 | (2,648 | ) | |||||||||||||||
|
| |||||||||||||||||||||
Net unrealized depreciation on forward foreign exchange contracts to sell |
| $ | (161,104 | ) | ||||||||||||||||||
|
| |||||||||||||||||||||
Currency Legend
| EUR | – | Euro | ||
| GBP | – | British Pound Sterling | ||
| NOK | – | Norwegian Krona | ||
| SEK | – | Swedish Krona |
See accompanying Notes to Financial Statements
30
Babson Global Credit Income Opportunities Fund 2013 Semi-Annual Report
SCHEDULE OF INVESTMENTS (UNAUDITED)
December 31, 2013
| EFFECTIVE INTEREST RATE ‡ | DUE DATE | PRINCIPAL | COST | FAIR VALUE | ||||||||||||||||
Fixed Income — 98.3%*: | ||||||||||||||||||||
Bank Loans — 42.2%*§: | ||||||||||||||||||||
Beverage, Food and Tobacco — 1.7%*: | ||||||||||||||||||||
Acosta, Inc. | 3.50 | % | 3/2/2018 | 200,263 | $ | 201,322 | $ | 201,314 | ||||||||||||
AHT Cooling Systems GmbH+ | 4.75 | 11/19/2020 | 500,000 | 684,124 | 687,850 | |||||||||||||||
|
|
|
|
|
| |||||||||||||||
Total Beverage, Food and Tobacco | 700,263 | 885,446 | 889,164 | |||||||||||||||||
|
|
|
|
|
| |||||||||||||||
Broadcasting and Entertainment — 3.2%*: |
| |||||||||||||||||||
Cumulus Media Holdings, Inc. | 4.25 | 12/23/2020 | 187,542 | 185,666 | 188,479 | |||||||||||||||
Learfield Communications, Inc. | 5.00 | 10/9/2020 | 209,799 | 208,588 | 211,897 | |||||||||||||||
Tyrol Acquisitions 2 SAS+ | 3.25 | 1/29/2016 | 926,980 | 1,209,350 | 1,239,157 | |||||||||||||||
|
|
|
|
|
| |||||||||||||||
Total Broadcasting and Entertainment | 1,324,321 | 1,603,604 | 1,639,533 | |||||||||||||||||
|
|
|
|
|
| |||||||||||||||
Buildings and Real Estate — 1.3%*: |
| |||||||||||||||||||
Monier Group Gmbh+ | 7.25 | 2/28/2018 | 500,000 | 658,804 | 683,262 | |||||||||||||||
|
|
|
|
|
| |||||||||||||||
Cargo Transport — 0.9%*: |
| |||||||||||||||||||
Direct ChassisLink, Inc. | 8.75 | 10/31/2019 | 500,000 | 492,590 | 492,500 | |||||||||||||||
|
|
|
|
|
| |||||||||||||||
Chemicals, Plastics and Rubber — 2.1%*: |
| |||||||||||||||||||
Chromaflo Technologies Corp. | 4.50 | 12/2/2019 | 75,054 | 74,868 | 75,007 | |||||||||||||||
Flint Group SA | 6.50 | 12/30/2016 | 1,000,000 | 993,201 | 997,500 | |||||||||||||||
|
|
|
|
|
| |||||||||||||||
Total Chemicals, Plastics and Rubber | 1,075,054 | 1,068,069 | 1,072,507 | |||||||||||||||||
|
|
|
|
|
| |||||||||||||||
Containers, Packaging and Glass — 3.8%*: |
| |||||||||||||||||||
Chesapeake Corp.+ | 6.00 | 9/30/2020 | 498,750 | 794,298 | 829,002 | |||||||||||||||
Coveris+ | 5.00 | 5/8/2019 | 500,000 | 686,624 | 691,935 | |||||||||||||||
Coveris | 5.25 | 5/8/2019 | 64,774 | 64,455 | 65,746 | |||||||||||||||
Multi Packaging Solutions, Inc. | 4.25 | 8/15/2020 | 184,512 | 184,051 | 184,743 | |||||||||||||||
Multi Packaging Solutions, Inc. | 4.25 | 9/30/2020 | 184,512 | 184,051 | 184,512 | |||||||||||||||
|
|
|
|
|
| |||||||||||||||
Total Containers, Packaging and Glass | 1,432,548 | 1,913,479 | 1,955,938 | |||||||||||||||||
|
|
|
|
|
| |||||||||||||||
Diversified/Conglomerate Manufacturing — 1.9%*: |
| |||||||||||||||||||
Filtration Group Corp. | 4.50 | 11/20/2020 | 91,740 | 91,287 | 92,601 | |||||||||||||||
Information Resources, Inc. | 4.75 | 9/30/2020 | 79,519 | 79,133 | 79,851 | |||||||||||||||
Quality Home Brands Holdings | 7.75 | 5/25/2018 | 131,836 | 130,518 | 131,836 | |||||||||||||||
ValleyCrest Co. LLC | 5.50 | 6/13/2019 | 166,249 | 167,266 | 166,872 | |||||||||||||||
Wilsonart LLC | 4.00 | 10/31/2019 | 498,741 | 494,227 | 494,691 | |||||||||||||||
|
|
|
|
|
| |||||||||||||||
Total Diversified/Conglomerate Manufacturing | 968,085 | 962,431 | 965,851 | |||||||||||||||||
|
|
|
|
|
| |||||||||||||||
Diversified/Conglomerate Service — 2.3%*: |
| |||||||||||||||||||
Aquilex Holdings LLC | 5.25 | 12/31/2020 | 100,071 | 99,821 | 100,321 | |||||||||||||||
Brickman Group Holdings, Inc. | 4.00 | 12/18/2020 | 117,452 | 116,865 | 117,892 | |||||||||||||||
Protection One, Inc. | 4.25 | 3/21/2019 | 62,693 | 62,615 | 62,678 | |||||||||||||||
Sabre, Inc. | 4.50 | 2/19/2019 | 498,750 | 498,588 | 499,374 | |||||||||||||||
Triple Point Technology, Inc. | 5.25 | 7/10/2020 | 446,151 | 405,151 | 397,074 | |||||||||||||||
|
|
|
|
|
| |||||||||||||||
Total Diversified/Conglomerate Service | 1,225,117 | 1,183,040 | 1,177,339 | |||||||||||||||||
|
|
|
|
|
| |||||||||||||||
See accompanying Notes to Financial Statements
31
Babson Global Credit Income Opportunities Fund 2013 Semi-Annual Report
SCHEDULE OF INVESTMENTS (UNAUDITED) (CONTINUED)
December 31, 2013
| EFFECTIVE INTEREST RATE ‡ | DUE DATE | PRINCIPAL | COST | FAIR VALUE | ||||||||||||||||
Bank Loans (Continued) |
| |||||||||||||||||||
Electronics — 1.3%*: |
| |||||||||||||||||||
Dell, Inc.+ | 4.00 | % | 4/29/2020 | 500,000 | $ | 669,803 | $ | 691,145 | ||||||||||||
|
|
|
|
|
| |||||||||||||||
Finance — 3.4%*: |
| |||||||||||||||||||
Confie Seguros Holdings II Co. | 5.75 | 11/9/2018 | 228,433 | 227,343 | 228,433 | |||||||||||||||
Confie Seguros Holdings II Co. | 10.25 | 5/8/2019 | 148,508 | 148,508 | 148,972 | |||||||||||||||
First Data Corp. | 4.25 | 3/23/2018 | 500,000 | 497,014 | 500,345 | |||||||||||||||
Nuveen Investments, Inc. | 4.25 | 5/13/2017 | 500,000 | 495,320 | 497,605 | |||||||||||||||
P2 Newco Acquisition, Inc. | 9.50 | 10/22/2021 | 103,373 | 102,360 | 103,373 | |||||||||||||||
SAM Finance Lux Sarl | 4.25 | 12/17/2020 | 191,456 | 190,499 | 191,696 | |||||||||||||||
TransUnion LLC | 4.25 | 2/10/2019 | 92,559 | 92,559 | 92,999 | |||||||||||||||
|
|
|
|
|
| |||||||||||||||
Total Finance | 1,764,329 | 1,753,603 | 1,763,423 | |||||||||||||||||
|
|
|
|
|
| |||||||||||||||
Healthcare, Education and Childcare — 4.7%*: |
| |||||||||||||||||||
Aenova Holding GmbH+ | 5.25 | 9/27/2019 | 600,000 | 798,642 | 827,071 | |||||||||||||||
Britax US Holdings, Inc. | 4.50 | 10/15/2020 | 219,818 | 218,746 | 220,275 | |||||||||||||||
Heartland Dental Care, Inc. | 5.50 | 12/21/2018 | 98,004 | 97,519 | 98,249 | |||||||||||||||
PRA Holdings, Inc. | 5.00 | 9/23/2020 | 432,015 | 427,845 | 432,550 | |||||||||||||||
TriZetto Group, Inc. (The) | 4.75 | 5/2/2018 | 872,129 | 817,742 | 861,777 | |||||||||||||||
|
|
|
|
|
| |||||||||||||||
Total Healthcare, Education and Childcare | 2,221,966 | 2,360,494 | 2,439,922 | |||||||||||||||||
|
|
|
|
|
| |||||||||||||||
Home and Office Furnishings, Housewares, and Durable Consumer Products — 0.3%*: |
| |||||||||||||||||||
Leslie’s Poolmart, Inc. | 4.25 | 10/16/2019 | 137,067 | 137,067 | 137,496 | |||||||||||||||
|
|
|
|
|
| |||||||||||||||
Hotels, Motels, Inns and Gaming — 0.2%*: |
| |||||||||||||||||||
Marina District Finance Co. | 6.75 | 8/15/2018 | 94,846 | 93,898 | 95,143 | |||||||||||||||
|
|
|
|
|
| |||||||||||||||
Insurance — 2.2%*: |
| |||||||||||||||||||
AmWINS Group LLC | 5.00 | 9/6/2019 | 76,886 | 76,697 | 77,271 | |||||||||||||||
Asurion LLC | 4.50 | 5/24/2019 | 497,487 | 495,051 | 497,114 | |||||||||||||||
Hub International Ltd. | 4.75 | 10/2/2020 | 573,721 | 570,945 | 580,175 | |||||||||||||||
|
|
|
|
|
| |||||||||||||||
Total Insurance | 1,148,094 | 1,142,693 | 1,154,560 | |||||||||||||||||
|
|
|
|
|
| |||||||||||||||
Leisure, Amusement, Entertainment — 0.2%*: |
| |||||||||||||||||||
Town Sports International, Inc. | 4.50 | 11/15/2020 | 90,663 | 90,217 | 91,229 | |||||||||||||||
|
|
|
|
|
| |||||||||||||||
Machinery Non-Agriculture, Non-Construction, Non-Electronic — 1.0%*: |
| |||||||||||||||||||
Gardner Denver, Inc. | 4.25 | 7/30/2020 | 498,750 | 498,750 | 498,690 | |||||||||||||||
|
|
|
|
|
| |||||||||||||||
Mining, Steel, Iron and Non-Precious Metals — 0.4%*: |
| |||||||||||||||||||
Murray Energy Corp. | 5.25 | 12/5/2019 | 99,425 | 98,933 | 100,358 | |||||||||||||||
TMS International Corp. | 4.50 | 10/16/2020 | 108,362 | 107,834 | 109,128 | |||||||||||||||
|
|
|
|
|
| |||||||||||||||
Total Mining, Steel, Iron and Non-Precious Metals | 207,787 | 206,767 | 209,486 | |||||||||||||||||
|
|
|
|
|
| |||||||||||||||
Oil and Gas — 0.8%*: |
| |||||||||||||||||||
Fieldwood Energy LLC | 8.38 | 9/30/2020 | 324,231 | 314,629 | 330,716 | |||||||||||||||
Western Refining, Inc. | 4.25 | 11/12/2020 | 71,385 | 71,386 | 72,188 | |||||||||||||||
|
|
|
|
|
| |||||||||||||||
Total Oil and Gas | 395,616 | 386,015 | 402,904 | |||||||||||||||||
|
|
|
|
|
| |||||||||||||||
See accompanying Notes to Financial Statements
32
Babson Global Credit Income Opportunities Fund 2013 Semi-Annual Report
SCHEDULE OF INVESTMENTS (UNAUDITED) (CONTINUED)
December 31, 2013
| EFFECTIVE INTEREST RATE ‡ | DUE DATE | PRINCIPAL | COST | FAIR VALUE | ||||||||||||||||
Bank Loans (Continued) |
| |||||||||||||||||||
Personal and Non-Durable Consumer Products Mfg. Only — 1.0%*: |
| |||||||||||||||||||
Pacific Industrial Services US Finco LLC | 5.00 | % | 10/2/2018 | 498,750 | $ | 496,353 | $ | 505,194 | ||||||||||||
|
|
|
|
|
| |||||||||||||||
Printing and Publishing — 1.9%*: |
| |||||||||||||||||||
Emap B2B+ | 5.15 | 10/31/2017 | 500,000 | 771,086 | 790,716 | |||||||||||||||
SuperMedia, Inc. | 11.60 | 12/30/2016 | 262,567 | 195,253 | 195,573 | |||||||||||||||
|
|
|
|
|
| |||||||||||||||
Total Printing and Publishing | 762,567 | 966,339 | 986,289 | |||||||||||||||||
|
|
|
|
|
| |||||||||||||||
Retail Stores — 5.6%*: |
| |||||||||||||||||||
Advantage Sales and Marketing, Inc. | 4.25 | 12/18/2017 | 60,277 | 59,975 | 60,443 | |||||||||||||||
Alliance Boots Holdings Ltd.+ | 3.75 | 7/10/2017 | 1,000,000 | 1,593,642 | 1,652,853 | |||||||||||||||
BJ’s Wholesale Club, Inc. | 4.50 | 9/26/2019 | 311,715 | 311,981 | 313,314 | |||||||||||||||
FleetPride Corp. | 5.25 | 11/19/2019 | 221,662 | 218,920 | 218,754 | |||||||||||||||
Hudson’s Bay Co. | 4.75 | 11/4/2020 | 500,000 | 495,092 | 507,690 | |||||||||||||||
Smart and Final Stores LLC | 4.75 | 11/15/2019 | 139,509 | 139,160 | 139,160 | |||||||||||||||
|
|
|
|
|
| |||||||||||||||
Total Retail Stores | 2,233,163 | 2,818,770 | 2,892,214 | |||||||||||||||||
|
|
|
|
|
| |||||||||||||||
Telecommunications — 1.9%*: |
| |||||||||||||||||||
Altice Financing SA | 4.75 | 7/15/2019 | 265,625 | 268,437 | 266,953 | |||||||||||||||
CDS Holdco III B.V.+ | 5.00 | 9/30/2020 | 500,000 | 672,180 | 690,003 | |||||||||||||||
Syniverse Holdings, Inc. | 4.00 | 4/23/2019 | 56,592 | 56,592 | 56,645 | |||||||||||||||
|
|
|
|
|
| |||||||||||||||
Total Telecommunications | 822,217 | 997,209 | 1,013,601 | |||||||||||||||||
|
|
|
|
|
| |||||||||||||||
Utilities — 0.1%*: |
| |||||||||||||||||||
EFS Cogen Holdings I, Inc. | 3.75 | 12/17/2020 | 76,085 | 75,248 | 76,561 | |||||||||||||||
|
|
|
|
|
| |||||||||||||||
Total Bank Loans | 19,177,288 | 21,460,689 | 21,833,951 | |||||||||||||||||
|
|
|
|
|
| |||||||||||||||
Corporate Bonds — 56.1%*: |
| |||||||||||||||||||
Aerospace and Defense — 3.2%*: | ||||||||||||||||||||
AAR Corp.^ | 7.25 | 1/15/2022 | 500,000 | 523,256 | 535,000 | |||||||||||||||
Aguila 3 SA+ | 7.88 | 1/31/2018 | 250,000 | 288,438 | 297,427 | |||||||||||||||
DAE Aviation Holdings, Inc.^ | 11.25 | 8/1/2015 | 750,000 | 754,087 | 751,875 | |||||||||||||||
GenCorp, Inc. | 7.13 | 3/15/2021 | 60,000 | 62,907 | 64,200 | |||||||||||||||
|
|
|
|
|
| |||||||||||||||
Total Aerospace and Defense | 1,560,000 | 1,628,688 | 1,648,502 | |||||||||||||||||
|
|
|
|
|
| |||||||||||||||
Automobile — 4.5%*: |
| |||||||||||||||||||
Allied Specialty Vehicles, Inc.^ | 8.50 | 11/1/2019 | 500,000 | 497,160 | 511,250 | |||||||||||||||
Cooper-Standard Holding, Inc. PIK^ | 7.38 | 4/1/2018 | 500,000 | 504,727 | 502,500 | |||||||||||||||
Deutsche Raststaetten Gruppe IV GmbH | 6.75 | 12/30/2020 | 100,000 | 135,605 | 144,105 | |||||||||||||||
International Automotive Components Group SA^ | 9.13 | 6/1/2018 | 619,000 | 640,512 | 645,307 | |||||||||||||||
JB Poindexter & Co., Inc.^ | 9.00 | 4/1/2022 | 500,000 | 528,091 | 533,750 | |||||||||||||||
|
|
|
|
|
| |||||||||||||||
Total Automobile | 2,219,000 | 2,306,095 | 2,336,912 | |||||||||||||||||
|
|
|
|
|
| |||||||||||||||
Beverage, Food and Tobacco — 0.7%*: |
| |||||||||||||||||||
Albain Bidco Norway AS | 6.75 | 11/1/2020 | 100,000 | 135,285 | 139,920 | |||||||||||||||
Findus Bondco SA+ | 9.13 | 7/1/2018 | 150,000 | 212,590 | 226,990 | |||||||||||||||
|
|
|
|
|
| |||||||||||||||
Total Beverage, Food and Tobacco | 250,000 | 347,875 | 366,910 | |||||||||||||||||
|
|
|
|
|
| |||||||||||||||
See accompanying Notes to Financial Statements
33
Babson Global Credit Income Opportunities Fund 2013 Semi-Annual Report
SCHEDULE OF INVESTMENTS (UNAUDITED) (CONTINUED)
December 31, 2013
| EFFECTIVE INTEREST RATE ‡ | DUE DATE | PRINCIPAL | COST | FAIR VALUE | ||||||||||||||||
Corporate Bonds (Continued) |
| |||||||||||||||||||
Broadcasting and Entertainment — 4.6%*: |
| |||||||||||||||||||
Arqiva Broadcast Finance PLC+ | 9.50 | % | 3/31/2020 | 350,000 | $ | 595,711 | $ | 643,337 | ||||||||||||
CET 21 Spol Sro+ | 9.00 | 11/1/2017 | 200,000 | 285,201 | 286,833 | |||||||||||||||
Nexstar Broadcasting, Inc.^ | 6.88 | 11/15/2020 | 750,000 | 751,822 | 802,500 | |||||||||||||||
RCN Telecom Services LLC/RCN Capital Corp.^ | 8.50 | 8/15/2020 | 500,000 | 497,576 | 505,000 | |||||||||||||||
Unitymedia Hessen GmbH & Co. KG/Unitymedia NRW GmbH | 6.25 | 1/15/2029 | 100,000 | 133,825 | 135,850 | |||||||||||||||
|
|
|
|
|
| |||||||||||||||
Total Broadcasting and Entertainment | 1,900,000 | 2,264,135 | 2,373,520 | |||||||||||||||||
|
|
|
|
|
| |||||||||||||||
Buildings and Real Estate — 1.8%*: |
| |||||||||||||||||||
Astaldi SpA | 7.13 | 12/1/2020 | 100,000 | 135,745 | 146,340 | |||||||||||||||
US Concrete, Inc.^ | 8.50 | 12/1/2018 | 230,000 | 230,000 | 235,175 | |||||||||||||||
William Lyon Homes, Inc. | 8.50 | 11/15/2020 | 500,000 | 531,524 | 541,250 | |||||||||||||||
|
|
|
|
|
| |||||||||||||||
Total Buildings and Real Estate | 830,000 | 897,269 | 922,765 | |||||||||||||||||
|
|
|
|
|
| |||||||||||||||
Cargo Transport — 2.1%*: |
| |||||||||||||||||||
Kenan Advantage Group, Inc. (The)^ | 8.38 | 12/15/2018 | 500,000 | 524,836 | 526,250 | |||||||||||||||
Moto Finance PLC | 10.25 | 3/15/2017 | 300,000 | 525,292 | 536,528 | |||||||||||||||
|
|
|
|
|
| |||||||||||||||
Total Cargo Transport | 800,000 | 1,050,128 | 1,062,778 | |||||||||||||||||
|
|
|
|
|
| |||||||||||||||
Chemicals, Plastics and Rubber — 2.4%*: |
| |||||||||||||||||||
Ciech Group Financing AB+ | 9.50 | 11/30/2019 | 200,000 | 297,594 | 313,687 | |||||||||||||||
Huntsman International LLC | 5.13 | 4/15/2021 | 200,000 | 275,810 | 276,185 | |||||||||||||||
Pinnacle Operating Corp.^ | 9.00 | 11/15/2020 | 600,000 | 618,957 | 636,750 | |||||||||||||||
|
|
|
|
|
| |||||||||||||||
Total Chemicals, Plastics and Rubber | 1,000,000 | 1,192,361 | 1,226,622 | |||||||||||||||||
|
|
|
|
|
| |||||||||||||||
Containers, Packaging and Glass — 1.8%*: |
| |||||||||||||||||||
GCS Holdco Finance I SA | 6.50 | 11/15/2018 | 100,000 | 133,495 | 141,525 | |||||||||||||||
Mustang Merger Corp.^ | 8.50 | 8/15/2021 | 750,000 | 745,433 | 810,000 | |||||||||||||||
|
|
|
|
|
| |||||||||||||||
Total Containers, Packaging and Glass | 850,000 | 878,928 | 951,525 | |||||||||||||||||
|
|
|
|
|
| |||||||||||||||
Diversified/Conglomerate Manufacturing — 0.6%*: |
| |||||||||||||||||||
CTP Transportation Products LLC/CTP Finance, Inc.^ | 8.25 | 12/15/2019 | 290,000 | 290,000 | 302,325 | |||||||||||||||
|
|
|
|
|
| |||||||||||||||
Diversified/Conglomerate Service — 1.2%*: |
| |||||||||||||||||||
ADT Corp. (The)^ | 6.25 | 10/15/2021 | 500,000 | 500,000 | 525,000 | |||||||||||||||
Safway Group Holding LLC/Safway Finance Corp.^ | 7.00 | 5/15/2018 | 95,000 | 95,899 | 100,225 | |||||||||||||||
|
|
|
|
|
| |||||||||||||||
Total Diversified/Conglomerate Service | 595,000 | 595,899 | 625,225 | |||||||||||||||||
|
|
|
|
|
| |||||||||||||||
Farming and Agriculture — 1.0%*: |
| |||||||||||||||||||
Chiquita Brands International, Inc./Chiquita Brands LLC^ | 7.88 | 2/1/2021 | 500,000 | 533,935 | 541,250 | |||||||||||||||
|
|
|
|
|
| |||||||||||||||
See accompanying Notes to Financial Statements
34
Babson Global Credit Income Opportunities Fund 2013 Semi-Annual Report
SCHEDULE OF INVESTMENTS (UNAUDITED) (CONTINUED)
December 31, 2013
| EFFECTIVE INTEREST RATE ‡ | DUE DATE | PRINCIPAL | COST | FAIR VALUE | ||||||||||||||||
Corporate Bonds (Continued) |
| |||||||||||||||||||
Finance — 1.4%*: |
| |||||||||||||||||||
Nuveen Investments, Inc. | 5.50 | % | 9/15/2015 | 280,000 | $ | 269,411 | $ | 281,400 | ||||||||||||
TMF Group Holding BV+ | 9.88 | 12/1/2019 | 300,000 | 423,975 | 446,461 | |||||||||||||||
|
|
|
|
|
| |||||||||||||||
Total Finance | 580,000 | 693,386 | 727,861 | |||||||||||||||||
|
|
|
|
|
| |||||||||||||||
Healthcare, Education and Childcare — 2.7%*: |
| |||||||||||||||||||
Care UK Health & Social Care PLC+ | 9.75 | 8/1/2017 | 300,000 | 496,746 | 525,350 | |||||||||||||||
Elli Finance UK PLC+ | 8.75 | 6/15/2019 | 100,000 | 175,966 | 183,397 | |||||||||||||||
Priory Group No. 3 PLC+ | 8.88 | 2/15/2019 | 400,000 | 632,962 | 682,251 | |||||||||||||||
|
|
|
|
|
| |||||||||||||||
Total Healthcare, Education and Childcare | 800,000 | 1,305,674 | 1,390,998 | |||||||||||||||||
|
|
|
|
|
| |||||||||||||||
Hotels, Motels, Inns and Gaming — 0.3%*: |
| |||||||||||||||||||
NH Hoteles SA+ | 6.88 | 11/15/2019 | 100,000 | 135,775 | 145,136 | |||||||||||||||
|
|
|
|
|
| |||||||||||||||
Insurance — 5.0%*: |
| |||||||||||||||||||
Audatex North America, Inc.^ | 6.00 | 6/15/2021 | 420,000 | 427,228 | 439,950 | |||||||||||||||
Audatex North America, Inc.^ | 6.13 | 11/1/2023 | 700,000 | 700,000 | 721,000 | |||||||||||||||
Galaxy Bidco Ltd.+ | 6.38 | 11/15/2020 | 100,000 | 161,665 | 166,340 | |||||||||||||||
Galaxy Finco Ltd.+ | 7.88 | 11/15/2021 | 100,000 | 161,665 | 165,222 | |||||||||||||||
Hastings Insurance Group Finance PLC+ | 8.00 | 10/21/2020 | 100,000 | 159,915 | 170,563 | |||||||||||||||
Towergate Finance PLC+ | 8.50 | 2/15/2018 | 350,000 | 590,628 | 612,909 | |||||||||||||||
WellCare Health Plans, Inc. | 5.75 | 11/15/2020 | 320,000 | 320,000 | 327,200 | |||||||||||||||
|
|
|
|
|
| |||||||||||||||
Total Insurance | 2,090,000 | 2,521,101 | 2,603,184 | |||||||||||||||||
|
|
|
|
|
| |||||||||||||||
Leisure, Amusement, Entertainment — 2.4%*: |
| |||||||||||||||||||
Travelex Financing PLC+ | 8.00 | 8/1/2018 | 200,000 | 316,773 | 342,782 | |||||||||||||||
Vougeot Bidco PLC+ | 7.88 | 7/15/2020 | 500,000 | 851,915 | 887,589 | |||||||||||||||
|
|
|
|
|
| |||||||||||||||
Total Leisure, Amusement, Entertainment | 700,000 | 1,168,688 | 1,230,371 | |||||||||||||||||
|
|
|
|
|
| |||||||||||||||
Machinery Non-Agriculture, Non-Construction, Non-Electronic — 2.0%*: |
| |||||||||||||||||||
Channel Link Enterprises Finance PLC+ | 3.64 | # | 6/30/2050 | 100,000 | 128,221 | 131,379 | ||||||||||||||
KraussMaffei Group GmbH+ | 8.75 | 12/15/2020 | 100,000 | 145,901 | 153,391 | |||||||||||||||
Xerium Technologies, Inc. | 8.88 | 6/15/2018 | 720,000 | 744,551 | 756,000 | |||||||||||||||
|
|
|
|
|
| |||||||||||||||
Total Machinery Non-Agriculture, Non-Construction, Non-Electronic | 920,000 | 1,018,673 | 1,040,770 | |||||||||||||||||
|
|
|
|
|
| |||||||||||||||
Mining, Steel, Iron and Non-Precious Metals — 1.3%*: |
| |||||||||||||||||||
ALBA Group PLC & Co. KG+ | 8.00 | 5/15/2018 | 250,000 | 334,000 | 351,491 | |||||||||||||||
Arch Coal, Inc.^ | 8.00 | 1/15/2019 | 305,000 | 305,000 | 304,238 | |||||||||||||||
|
|
|
|
|
| |||||||||||||||
Total Mining, Steel, Iron and Non-Precious Metals | 555,000 | 639,000 | 655,729 | |||||||||||||||||
|
|
|
|
|
| |||||||||||||||
Oil and Gas — 7.2%*: |
| |||||||||||||||||||
Halcon Resources Corp.^ | 9.75 | 7/15/2020 | 365,000 | 374,997 | 380,056 | |||||||||||||||
Linn Energy LLC/Linn Energy Finance Corp. | 8.63 | 4/15/2020 | 500,000 | 521,307 | 540,000 | |||||||||||||||
Magnum Hunter Resources Corp. | 9.75 | 5/15/2020 | 500,000 | 520,565 | 540,000 | |||||||||||||||
Midstates Petroleum Co., Inc./Midstates Petroleum Co. LLC | 9.25 | 6/1/2021 | 500,000 | 497,566 | 522,500 | |||||||||||||||
See accompanying Notes to Financial Statements
35
Babson Global Credit Income Opportunities Fund 2013 Semi-Annual Report
SCHEDULE OF INVESTMENTS (UNAUDITED) (CONTINUED)
December 31, 2013
| EFFECTIVE INTEREST RATE ‡ | DUE DATE | PRINCIPAL | COST | FAIR VALUE | ||||||||||||||||
Corporate Bonds (Continued) |
| |||||||||||||||||||
Oil and Gas (Continued) | ||||||||||||||||||||
Millennium Offshore Services Superholdings LLC^ | 9.50 | % | 2/15/2018 | 500,000 | $ | 525,058 | $ | 520,000 | ||||||||||||
Niska Gas Storage US LLC/Niska Gas Storage Canada ULC | 8.88 | 3/15/2018 | 378,000 | 391,554 | 393,120 | |||||||||||||||
Ocean Rig UDW, Inc.+^ | 9.50 | 4/27/2016 | 500,000 | 528,078 | 530,625 | |||||||||||||||
Shelf Drilling Holdings Ltd.^ | 8.63 | 11/1/2018 | 285,000 | 302,111 | 307,800 | |||||||||||||||
|
|
|
|
|
| |||||||||||||||
Total Oil and Gas | 3,528,000 | 3,661,236 | �� | 3,734,101 | ||||||||||||||||
|
|
|
|
|
| |||||||||||||||
Personal, Food and Miscellaneous — 1.9%*: |
| |||||||||||||||||||
Brakes Capital+ | 7.13 | 12/15/2018 | 100,000 | 161,700 | 165,181 | |||||||||||||||
Cerved Group SpA+ | 8.00 | 1/15/2021 | 300,000 | 406,633 | 436,441 | |||||||||||||||
TeamSystem Holding SpA+ | 7.38 | 5/15/2020 | 250,000 | 331,023 | 354,242 | |||||||||||||||
|
|
|
|
|
| |||||||||||||||
Total Personal, Food and Miscellaneous | 650,000 | 899,356 | 955,864 | |||||||||||||||||
|
|
|
|
|
| |||||||||||||||
Retail Stores — 4.1%*: |
| |||||||||||||||||||
Brighthouse Group PLC+ | 7.88 | 5/15/2018 | 300,000 | 490,444 | 511,689 | |||||||||||||||
House of Fraser Funding PLC+ | 8.88 | 8/15/2018 | 200,000 | 349,001 | 361,825 | |||||||||||||||
New Look Bondco I PLC+ | 8.75 | 5/14/2018 | 450,000 | 732,955 | 786,721 | |||||||||||||||
Pendragon PLC+ | 6.88 | 5/1/2020 | 100,000 | 172,812 | 174,289 | |||||||||||||||
Takko Luxembourg 2 S.C.A.+ | 9.88 | 4/15/2019 | 200,000 | 256,288 | 269,499 | |||||||||||||||
|
|
|
|
|
| |||||||||||||||
Total Retail Stores | 1,250,000 | 2,001,500 | 2,104,023 | |||||||||||||||||
|
|
|
|
|
| |||||||||||||||
Telecommunications — 3.9%*: |
| |||||||||||||||||||
Manutencoop Facility Management SpA+ | 8.50 | 8/1/2020 | 200,000 | 263,521 | 291,648 | |||||||||||||||
T-Mobile USA, Inc. | 6.46 | 4/28/2019 | 470,000 | 479,092 | 499,375 | |||||||||||||||
T-Mobile USA, Inc. | 6.73 | 4/28/2022 | 300,000 | 297,056 | 312,750 | |||||||||||||||
T-Mobile USA, Inc. | 6.84 | 4/28/2023 | 90,000 | 88,228 | 93,375 | |||||||||||||||
Telenet Finance V Luxembourg SCA+ | 6.75 | 8/15/2024 | 200,000 | 276,697 | 292,543 | |||||||||||||||
UPC Holding BV+ | 6.75 | 3/15/2023 | 200,000 | 213,033 | 228,978 | |||||||||||||||
Wind Acquisition Finance SA^ | 11.75 | 7/15/2017 | 300,000 | 317,567 | 319,125 | |||||||||||||||
|
|
|
|
|
| |||||||||||||||
Total Telecommunications | 1,760,000 | 1,935,194 | 2,037,794 | |||||||||||||||||
|
|
|
|
|
| |||||||||||||||
Total Corporate Bonds | 23,727,000 | 27,964,896 | 28,984,165 | |||||||||||||||||
|
|
|
|
|
| |||||||||||||||
Total Fixed Income | 42,904,288 | 49,425,585 | 50,818,116 | |||||||||||||||||
|
|
|
|
|
| |||||||||||||||
Short-Term Investment — 1.2%*: | ||||||||||||||||||||
Bank Deposit — 1.2%*: | ||||||||||||||||||||
State Street Bank & Trust Co. Euro Time Deposit | 0.01 | 1/2/2014 | 639,016 | 639,016 | 639,016 | |||||||||||||||
|
|
|
|
|
| |||||||||||||||
Total Investments | 43,543,304 | 50,064,601 | 51,457,132 | |||||||||||||||||
|
|
|
|
|
| |||||||||||||||
Other assets and liabilities — 0.5% | 267,576 | |||||||||||||||||||
Net Assets — 100.0% | $ | 51,724,708 | ||||||||||||||||||
|
| |||||||||||||||||||
See accompanying Notes to Financial Statements
36
Babson Global Credit Income Opportunities Fund 2013 Semi-Annual Report
SCHEDULE OF INVESTMENTS (UNAUDITED) (CONTINUED)
December 31, 2013
| PIK | Payment-in-kind |
| ‡ | The effective interest rates are based on settled commitment amount. |
| * | Calculated as a percentage of net assets applicable to common shareholders. |
| + | Foreign security. |
Distributions of investments by country of issue (excluding temporary cash investments) as a percentage of total investments in securities, is as follows:
| US | United States | 56.0% | ||||
| UK | United Kingdom | 20.0% | ||||
| DE | Germany | 7.0% | ||||
| NL | Netherlands | 2.7% | ||||
| FR | France | 2.4% | ||||
| IT | Italy | 2.4% | ||||
| AE | United Arab Emirates | 1.6% | ||||
| AT | Austria | 1.4% | ||||
| LU | Luxembourg | 1.4% | ||||
| AU | Australia | 1.0% | ||||
| Other (Individually less than 1%) | 4.1% | |||||
|
| |||||
| Total | 100.0% | |||||
|
| |||||
| ^ | Security acquired in a transaction exempt from registration under Rule 144A of the Securities Act of 1933. These securities may only be resold in transactions exempt from registration, normally to qualified institutional buyers. |
| § | Bank loans are exempt from registration under the Securities Act of 1933, as amended, but contain certain restrictions on resale and cannot be sold publicly. These loans pay interest at rates which adjust periodically. The interest rates shown for bank loans are the current interest rates at December 31, 2013. Bank loans are also subject to mandatory and/or optional prepayment which cannot be predicted. As a result, the remaining maturity may be substantially less than the stated maturity shown. See accompanying Notes to the Financial Statement (2G) for additional information on bank loans. |
| # | Variable rate security. The interest rate shown is the rate in effect at December 31, 2013. |
A summary of outstanding financial instruments at December 31, 2013 is as follows:
Forward Foreign Currency Exchange Contracts to Buy
| EXPIRATION DATE | COUNTERPARTY | LOCAL CURRENCY | VALUE IN USD | IN EXCHANGE FOR USD | NET UNREALIZED DEPRECIATION | |||||||||||||||||
| 01/14/14 | State Street Bank & Trust Co. | CHF | 470,407 | 527,368 | 527,300 | $ | (68 | ) | ||||||||||||||
| 01/14/14 | State Street Bank & Trust Co. | EUR | 6,072,657 | 8,354,106 | 8,318,133 | (35,973 | ) | |||||||||||||||
| 01/14/14 | State Street Bank & Trust Co. | GBP | 5,971,930 | 9,888,496 | 9,760,464 | (128,032 | ) | |||||||||||||||
|
| |||||||||||||||||||||
Net unrealized depreciation on forward foreign exchange contracts to sell |
| $ | (164,073 | ) | ||||||||||||||||||
|
| |||||||||||||||||||||
Currency Legend
| CHF | – | Swiss Franc | ||
| EUR | – | Euro | ||
| GBP | – | British Pound Sterling |
See accompanying Notes to Financial Statements
37
Babson Capital Funds Trust 2013 Semi-Annual Report
NOTES TO FINANCIAL STATEMENTS (UNAUDITED)
December 31, 2013
| 1. | Organization |
Babson Capital Funds Trust (the “Trust”) was organized as a business trust under the laws of the Commonwealth of Massachusetts on May 3, 2013 and commenced operations on September 16, 2013. The Trust is registered under the Investment Company Act of 1940, as amended (the “1940 Act”), as a non-diversified, open-end management investment company. The Trust currently consists of two funds (separately, a “Fund” and collectively, the “Funds”): Babson Global Floating Rate Fund (“Global Floating Rate Fund”) and Babson Global Credit Income Opportunities Fund (“Global Credit Income Opportunities Fund”).
Babson Capital Management LLC (the “Adviser”), a wholly-owned indirect subsidiary of Massachusetts Mutual Life Insurance Company, is a registered investment adviser under the Investment Advisers Act of 1940, as amended, and serves as investment adviser to the Funds.
Babson Capital Global Advisor Limited (“Sub-Adviser”), an indirect wholly-owned subsidiary of the Adviser, will serve as a sub-adviser with respect to the Funds’ European investments.
The primary investment objective of the Global Floating Rate Fund is to seek a high level of current income. The Fund seeks preservation of capital as a secondary investment objective. The primary investment objective of the Global Credit Income Opportunities Fund is to seek an absolute return, primarily through current income and secondarily through capital appreciation.
There can be no assurance that the Funds will achieve their investment objectives. The Funds will seek to take advantage of inefficiencies between geographies, primarily the North American and European high yield bond, loan and other debt markets. Under normal market conditions, the Global Floating Rate Fund will invest at least 80% of its net assets in income-producing floating rate debt securities, consisting of floating rate loans, bonds and notes, issued primarily by North American and Western European companies that are, at the time of purchase, rated below investment grade (below Baa3 by Moody’s Investors Service, Inc. (“Moody’s”) or below BBB- by either Standard & Poor’s Rating Services, a division of the McGraw-Hill Company, Inc. (“S&P”) or Fitch, Inc. (“Fitch”)) or unrated but judged by the Adviser or Sub-Adviser to be of comparable quality. Under normal market conditions, the Global Credit Income Opportunities Fund will invest at least 80% of its net assets in debt instruments, consisting of loans, bonds and notes, based in U.S. and non-U.S. markets, as well as over-the-
counter and exchange-traded derivatives. Investments may be issued or guaranteed by governments and their agencies, corporations, financial institutions and supranational organizations that the Funds believe have the potential to provide a high total return over time. A significant portion of the Funds’ investments in debt instruments will be denominated in a currency other than the U.S. dollar. Although the investments in non-U.S. dollar denominated assets may be on a currency hedged or unhedged basis, the Funds expect that, under current market conditions, it will seek to hedge substantially all of its exposure to foreign currencies.
Each Fund has four classes of shares: Class A, C, I, and Y, each with different expenses and dividends. A front-end sales charge is normally added to the net asset value (“NAV”) for Class A shares. There is no front-end sales charge in the case of Class C, I, and Y shares. There may be a contingent deferred sales charge (“CDSC”) in certain cases as follows: Class A shares purchased without an initial sales charge and redeemed within the first year of purchase (subject to certain exceptions as set forth in each Fund’s prospectus) and Class C shares redeemed within the first year of purchase.
| 2. | Significant Accounting Policies |
The following is a summary of significant accounting policies followed consistently by the Funds in the preparation of their financial statements in conformity with accounting principles generally accepted in the United States of America (“U.S. GAAP”).
| A. | Valuation of Investments |
The Funds’ investments in fixed income securities are generally valued using the prices provided directly by independent third party services or provided directly from one or more broker dealers or market makers, each in accordance with the valuation policies and procedures approved by the Funds’ Board of Trustees (the “Board”).
The pricing services may use valuation models or matrix pricing, which consider yield or prices with respect to comparable bond quotations from bond dealers or by reference to other securities that are considered comparable in such characteristics as credit rating, interest rates and maturity date to determine the current value. The Funds’ investments in bank loans are normally valued at the bid quotation obtained from dealers in loans by an independent pricing service in accordance with the Funds’ valuation policies and procedures approved by the Board.
38
Babson Capital Funds Trust 2013 Semi-Annual Report
NOTES TO FINANCIAL STATEMENTS (UNAUDITED) (CONTINUED)
December 31, 2013
The Board has determined that it is in the best interest of the Funds and their shareholders to delegate the Board’s responsibility to a Valuation Committee, made up of officers of the Trust and employees of the Adviser, for: (1) determining whether market quotations are readily available for investments held by the Fund; and (2) determining the fair value of investments held by the Fund for which market quotations are not readily available or are deemed not reliable by the Adviser. In certain cases, authorized pricing service vendors may not provide prices for a security held by the Funds, or the price provided by such pricing service vendor is deemed unreliable by the Adviser. In such cases, the Funds may use market maker quotations provided by an established market maker for that security (i.e., broker quotes) to value the security if the Adviser has experience obtaining quotations from the market maker and the Adviser determines that quotations obtained from the market maker in the past have generally been reliable (or, if the Adviser has no such experience with respect to a market maker, it determines based on other information available to it that quotations to be obtained by it from the market maker are reasonably likely to be reliable). In any such case, the Adviser will review any market quotations so obtained in light of other information in its possession for their general reliability.
Bank loans in which the Funds may invest have similar risks to lower-rated fixed income securities. Changes in the financial condition of the borrower or economic conditions or other circumstances may reduce the capacity of the borrower to make principal and interest payments on such instruments and may lead to defaults. Senior secured bank loans are supported by collateral; however, the value of the collateral may be insufficient to cover the amount owed to the Funds. By relying on a third party to administer a loan, the Funds are subject to the risk that the third party will fail to perform its obligations. The loans in which the Funds will invest are largely floating rate instruments; therefore, the interest rate risk generally is lower than for fixed-rate debt obligations. However, from the perspective of the borrower, an increase in interest rates may adversely affect the borrower’s financial condition. Due to the unique and customized nature of loan agreements evidencing loans and the private syndication thereof, loans are not as easily purchased or sold as publicly traded securities. Although the range of investors in loans has broadened in recent years, there can be no assurance that future levels of supply and demand in loan trading will provide the degree of liquidity which currently exists in the market. In addition, the terms of the loans may restrict their transferability without borrower consent. These factors may have an
adverse effect on the market price and the Funds’ ability to dispose of particular portfolio investments. A less liquid secondary market also may make it more difficult for the Funds to obtain precise valuations of the high yield loans in its portfolio.
Fair value is defined as the price that the Funds would receive upon selling an investment in a timely transaction to an independent buyer in the principal or most advantageous market of the investment. A three-tier hierarchy is utilized to maximize the use of observable market data and minimize the use of unobservable inputs and to establish classification of fair value measurements for disclosure purposes. Inputs refer broadly to the assumptions that market participants would use in pricing the asset or liability, including assumptions about risk. For example, market participants would consider the risk inherent in a particular valuation technique used to measure fair value, such as a pricing model, and/or the risk inherent in the inputs to the valuation technique. Inputs may be observable or unobservable. Observable inputs are inputs that reflect the assumptions market participants would use in pricing the asset or liability and are developed based on market data obtained from sources independent of the reporting entity. Unobservable inputs are inputs that reflect the reporting entity’s own assumptions about the assumptions market participants would use in pricing the asset or liability and are developed based on the best information available in the circumstances. The three-tier hierarchy of inputs is summarized in the three broad levels listed below.
Level 1 – quoted prices in active markets for identical securities
Level 2 – other significant observable inputs (including quoted prices for similar securities, interest rates, prepayment speeds, credit risk, etc.)
Level 3 – significant unobservable inputs (including the Funds’ own assumptions in determining the fair value of investments)
The availability of observable inputs can vary from security to security and is affected by a wide variety of factors, including, for example, the type of security, whether the security is new and not yet established in the marketplace, the liquidity of markets, and other characteristics particular to the security. To the extent that valuation is based on models or inputs that are less observable or unobservable in the market, the determination of fair value requires more judgment. Accordingly, the degree of judgment exercised in determining fair value is greatest for instruments categorized in level 3.
39
Babson Capital Funds Trust 2013 Semi-Annual Report
NOTES TO FINANCIAL STATEMENTS (UNAUDITED) (CONTINUED)
December 31, 2013
The inputs used to measure fair value may fall into different levels of the fair value hierarchy. In such cases, for disclosure purposes, the level in the fair value hierarchy
within which the fair value measurement falls in its entirety is determined based on the lowest level input that is significant to the fair value measurement in its entirety.
The following is a summary of the inputs used as of December 31, 2013 in valuing the Funds’ investments:
Global Floating Rate Fund
| DESCRIPTION | LEVEL 1 | LEVEL 2 | LEVEL 3 | TOTAL INVESTMENTS | ||||||||||||
Assets:* | ||||||||||||||||
| Fixed Income: | ||||||||||||||||
Bank Loans | $ | – | $ | 49,330,850 | $ | 492,500 | $ | 49,823,350 | ||||||||
Corporate Bonds | – | 7,042,408 | – | 7,042,408 | ||||||||||||
|
|
|
|
|
|
|
| |||||||||
| Total Fixed Income | – | 56,373,258 | 492,500 | 56,865,758 | ||||||||||||
|
|
|
|
|
|
|
| |||||||||
| Short-Term Investment: | ||||||||||||||||
Bank Deposit | – | 7,041,707 | – | 7,041,707 | ||||||||||||
|
|
|
|
|
|
|
| |||||||||
| Total Short-Term Investment | – | 7,041,707 | – | 7,041,707 | ||||||||||||
|
|
|
|
|
|
|
| |||||||||
| Derivative Securities: | ||||||||||||||||
Forward Foreign Currency Exchange Contracts | – | 5,740 | – | 5,740 | ||||||||||||
|
|
|
|
|
|
|
| |||||||||
| Total Derivative Securities | – | 5,740 | – | 5,740 | ||||||||||||
|
|
|
|
|
|
|
| |||||||||
Total Investments | – | 63,420,705 | 492,500 | 63,913,205 | ||||||||||||
|
|
|
|
|
|
|
| |||||||||
Liabilities:* | ||||||||||||||||
| Derivative Securities: | ||||||||||||||||
Forward Foreign Currency Exchange Contracts | – | (161,104 | ) | – | (161,104 | ) | ||||||||||
|
|
|
|
|
|
|
| |||||||||
| Total Derivative Securities | – | (161,104 | ) | – | (161,104 | ) | ||||||||||
|
|
|
|
|
|
|
| |||||||||
Total Investments | $ | – | $ | 63,259,601 | $ | 492,500 | $ | 63,752,101 | ||||||||
|
|
|
|
|
|
|
| |||||||||
| * | There were no transfers between levels during the period ended December 31, 2013. |
The following is a reconciliation of investments with unobservable inputs (Level 3) that were used in determining fair value:
| INVESTMENTS IN SECURITIES | BALANCE AS OF SEPTEMBER 16, 2013* | REALIZED GAIN (LOSS) | CHANGE IN UNREALIZED APPRECIATION (DEPRECIATION) | NET TRANSFERS IN (OUT) OF LEVEL 3 | ACCRUED PREMIUMS/ | NET PURCHASES & SALES | BALANCE AS OF DECEMBER 31, 2013 | CHANGE IN UNREALIZED APPRECIATION (DEPRECIATION) FROM INVESTMENTS HELD AT DECEMBER 31, 2013 | ||||||||||||||||||||||||
Fixed Income | ||||||||||||||||||||||||||||||||
Bank Loans | $ | – | $ | – | $ | (90 | ) | $ | – | $ | 90 | $ | 492,500 | $ | 492,500 | $ | (90 | ) | ||||||||||||||
|
|
|
|
|
|
|
|
|
|
|
|
|
|
|
| |||||||||||||||||
| Total | $ | – | $ | – | $ | (90 | ) | $ | – | $ | 90 | $ | 492,500 | $ | 492,500 | $ | (90 | ) | ||||||||||||||
|
|
|
|
|
|
|
|
|
|
|
|
|
|
|
| |||||||||||||||||
| * | Fund commenced operations on September 16, 2013. |
40
Babson Capital Funds Trust 2013 Semi-Annual Report
NOTES TO FINANCIAL STATEMENTS (UNAUDITED) (CONTINUED)
December 31, 2013
Global Credit Income Opportunities Fund
| DESCRIPTION | LEVEL 1 | LEVEL 2 | LEVEL 3 | TOTAL INVESTMENTS | ||||||||||||
Assets:* | ||||||||||||||||
| Fixed Income: | ||||||||||||||||
Bank Loans | $ | – | $ | 21,341,451 | $ | 492,500 | $ | 21,833,951 | ||||||||
Corporate Bonds | – | 28,984,165 | – | 28,984,165 | ||||||||||||
|
|
|
|
|
|
|
| |||||||||
| Total Fixed Income | – | 50,325,616 | 492,500 | 50,818,116 | ||||||||||||
|
|
|
|
|
|
|
| |||||||||
| Short-Term Investment: | ||||||||||||||||
Bank Deposit | – | 639,016 | – | 639,016 | ||||||||||||
|
|
|
|
|
|
|
| |||||||||
| Total Short-Term Investment | – | 639,016 | – | 639,016 | ||||||||||||
|
|
|
|
|
|
|
| |||||||||
| Total Investments | – | 50,964,632 | 492,500 | 51,457,132 | ||||||||||||
|
|
|
|
|
|
|
| |||||||||
Liabilities:* | ||||||||||||||||
| Derivative Securities: | ||||||||||||||||
Forward Foreign Currency Exchange Contracts | – | (164,073 | ) | – | (164,073 | ) | ||||||||||
|
|
|
|
|
|
|
| |||||||||
| Total Derivative Securities | – | (164,073 | ) | – | (164,073 | ) | ||||||||||
|
|
|
|
|
|
|
| |||||||||
Total Investments | $ | – | $ | 50,800,559 | $ | 492,500 | $ | 51,293,059 | ||||||||
|
|
|
|
|
|
|
| |||||||||
| * | There were no transfers between levels during the period ended December 31, 2013. |
The following is a reconciliation of investments with unobservable inputs (Level 3) that were used in determining fair value:
| INVESTMENTS IN SECURITIES | BALANCE AS OF SEPTEMBER 16, 2013* | REALIZED GAIN (LOSS) | CHANGE IN UNREALIZED APPRECIATION (DEPRECIATION) | NET TRANSFERS IN (OUT) OF LEVEL 3 | ACCRUED PREMIUMS/ | NET PURCHASES & SALES | BALANCE AS OF DECEMBER 31, 2013 | CHANGE IN UNREALIZED APPRECIATION (DEPRECIATION) FROM INVESTMENTS HELD AT DECEMBER 31, 2013 | ||||||||||||||||||||||||
Fixed Income | ||||||||||||||||||||||||||||||||
Bank Loans | $ | – | $ | – | $ | (90 | ) | $ | – | $ | 90 | $ | 492,500 | $ | 492,500 | $ | (90 | ) | ||||||||||||||
|
|
|
|
|
|
|
|
|
|
|
|
|
|
|
| |||||||||||||||||
| Total | $ | – | $ | – | $ | (90 | ) | $ | – | $ | 90 | $ | 492,500 | $ | 492,500 | $ | (90 | ) | ||||||||||||||
|
|
|
|
|
|
|
|
|
|
|
|
|
|
|
| |||||||||||||||||
| * | Fund commenced operations on September 16, 2013. |
| B. | Cash and Cash Equivalents |
Cash and cash equivalents consist principally of short-term investments that are readily convertible into cash and have original maturities of three months or less. At December 31, 2013, all cash and cash equivalents are held by the custodian.
| C. | Investment Transactions, Related Investment Income and Expenses |
Investment transactions are accounted for on a trade date basis. Interest income is recorded on the accrual basis, including the amortization of premiums and accretion of discounts on bonds held using the yield-to-maturity method.
Realized gains and losses on investment transactions and unrealized appreciation and depreciation of investments are
41
Babson Capital Funds Trust 2013 Semi-Annual Report
NOTES TO FINANCIAL STATEMENTS (UNAUDITED) (CONTINUED)
December 31, 2013
reported for financial statement and Federal income tax purposes on the identified cost method.
Expenses are recorded on the accrual basis as incurred.
| D. | Use of Estimates |
The preparation of financial statements in conformity with U.S. GAAP requires management to make estimates and assumptions that affect the reported amounts of assets and liabilities at the date of the financial statements and the reported amounts of revenues and expenses during the reporting period. Actual results could differ from these estimates.
| E. | Federal Income Taxation |
The Funds have elected to be taxed as a Regulated Investment Company (“RIC”) under sub-chapter M of the U.S. Internal Revenue Code of 1986, as amended, and intends to maintain this qualification and to distribute substantially all of their net taxable income to its shareholders. As of December 31, 2013, the Funds had no uncertain tax positions that would require financial statement recognition, de-recognition, or disclosure. The Funds file a U.S. federal income tax return annually after its fiscal year-end, which is subject to examination by the Internal Revenue Service for a period of three from the date of filings.
| F. | Dividends and Distributions |
The Funds declare and pay dividends monthly from net investment income. To the extent that these distributions exceed net investment income, they may be classified as return of capital. The Funds also pay a distribution at least annually from its net realized capital gains, if any. Dividends and distributions are recorded on the ex-dividend date. All common shares have equal dividend and other distribution rights. A notice disclosing the source(s) of a distribution will be provided if payment is made from any source other than net investment income. Any such notice would be provided only for informational purposes in order to comply with the requirements of Section 19(a) of the 1940 Act and not for tax reporting purposes. The tax composition of the Funds’ distributions for each calendar year is reported on Internal Revenue Service Form 1099-DIV.
Dividends from net investment income and distributions from realized gains from investment transactions have been determined in accordance with Federal income tax regulations and may differ from net investment income and realized gains recorded by the Funds for financial reporting
purposes. These differences, which could be temporary or permanent in nature may result in reclassification of distributions; however, net investment income, net realized gains and losses, and net assets are not affected.
| G. | Bank Loans |
The Funds may invest in bank loans, which usually take the form of loan participations and assignments. Loan participations and assignments are agreements to make money available to U.S. or foreign corporations, partnerships or other business entities (the “Borrower”) in a specified amount, at a specified rate and within a specified time. A loan is typically originated, negotiated and structured by a U.S. or foreign bank, insurance company or other financial institution (the “Agent”) for a group of loan investors (“Loan Investors”). The Agent typically administers and enforces the loan on behalf of the other Loan Investors in the syndicate and may hold any collateral on behalf of the Loan Investors. Such loan participations and assignments are typically senior, secured and collateralized in nature. The Funds record an investment when the Borrower withdraws money and records interest as earned. These loans pay interest at rates which are periodically reset by reference to a base lending rate plus a spread. These base lending rates are generally the prime rate offered by a designated U.S. bank or London InterBank Offered Rate (“LIBOR”).
The loans in which the Funds invest may be subject to some restrictions on resale. For example, the Funds may be contractually obligated to receive approval from the Agent and/or Borrower prior to the sale of these investments. The Funds generally have no right to enforce compliance with the terms of the loan agreement with the Borrower. As a result, the Funds assume the credit risk of the Borrower, the selling participant and any other persons interpositioned between the Funds and the Borrower (“Intermediate Participants”). In the event that the Borrower, selling participant or Intermediate Participants become insolvent or enter into bankruptcy, the Funds may incur certain costs and delays in realizing payment or may suffer a loss of principal and/or interest.
Unfunded commitments represent the remaining obligation of the Funds to the Borrower. At any point in time, up to the maturity date of the issue, the Borrower may demand the unfunded portion. Until demanded by the Borrower, unfunded commitments are not recognized as an asset on the Statements of Assets and Liabilities. Unrealized appreciation/depreciation on unfunded commitments presented on the Statements of Assets and Liabilities represents mark to market of the unfunded portion of the
42
Babson Capital Funds Trust 2013 Semi-Annual Report
NOTES TO FINANCIAL STATEMENTS (UNAUDITED) (CONTINUED)
December 31, 2013
Funds’ bank loans. As of December 31, 2013, the Global Floating Rate Fund had one unfunded loan commitment which amounted to $35,518 of par and had cost and fair value of $35,343 and $35,551, respectively.
| H. | Derivative Instruments |
The following is a description of the derivative instruments that the Funds utilize as part of their investment strategy, including the primary underlying risk exposures related to the instrument.
Forward Foreign Currency Exchange Contracts – The Funds are subject to foreign currency exchange rate risk in the normal course of pursuing their investment objectives. The Funds may use forward currency exchange contracts to hedge against changes in the value of foreign currencies. The Funds may enter into forward currency exchange contracts obligating the Funds to deliver or receive a currency at a specified future date. Forward contracts are valued daily and unrealized appreciation or depreciation is recorded daily as the difference between the contract exchange rate and the closing forward rate applied to the face amount of the contract. A realized gain or loss is recorded at the time the forward contract expires. Credit risk may arise as a result of the failure of the counterparty to comply with the terms of the contract. The Funds consider the creditworthiness of each counterparty to a contract in evaluating potential credit risk quarterly. The Funds are also subject to credit risk with respect to the counterparties to derivative contracts that are not cleared through a central counterparty but instead are traded over-the-counter between two counterparties. If a counterparty to an over-the-counter derivative becomes bankrupt or otherwise fails to perform its obligations under a derivative contract due to financial difficulties, the Funds may experience significant delays in obtaining any recovery under the derivative contract in a bankruptcy or other reorganization proceeding. The Funds may obtain only a limited recovery or may obtain no recovery in such circumstances. The counterparty risk for cleared derivatives is generally lower than for uncleared over-the-counter derivative transactions since generally a clearing organization becomes substituted for each counterparty to a cleared derivative contract and, in effect, guarantees the party’s performance under the contract as each party to a trade looks only to the clearing house for performance of financial obligations. However, there can be no assurance that the clearing house, or its members, will satisfy its obligations to the Funds. In addition, in the event of a bankruptcy of a clearing house, the Funds could experience a loss of the funds deposited with such clearing house as
margin and of any profits on its open positions. The counterparty risk to the Funds is limited to the net unrealized gain, in any, on the contract.
The use of forward currency exchange contracts does not eliminate fluctuations in the underlying prices of the Funds’ investment securities; however, it does establish a rate of exchange that can be achieved in the future. The use of forward currency exchange contracts involves the risk that anticipated currency movements will not be accurately predicted. A forward currency exchange contract would limit the risk of loss due to a decline in the value of a particular currency; however, it would also limit any potential gain that might result should the value of the currency increase instead of decrease. These contracts may involve market risk in excess of the amount of receivable or payable reflected on the Statement of Assets and Liabilities.
During the period from September 16, 2013 through December 31, 2013, the Funds’ direct investment in derivatives consisted of forward foreign currency exchange contracts.
The following is a summary of the fair value of derivative instruments held directly by the Funds as of December 31, 2013:
Fair values of derivative instruments on the Statement of Assets and Liabilities as of December 31, 2013:
Global Floating Rate Fund
| ASSET DERIVATIVES | STATEMENT OF ASSETS AND LIABILITIES LOCATION | FOREIGN EXCHANGE CONTRACTS RISK | ||||
Forward Foreign Currency Exchange Contracts | Unrealized appreciation on open forward foreign currency exchange contracts | $ | 5,740 | |||
|
| |||||
Total | $ | 5,740 | ||||
|
| |||||
| LIABILITY DERIVATIVES | STATEMENT OF ASSETS AND LIABILITIES LOCATION | FOREIGN EXCHANGE CONTRACTS RISK | ||||
Forward Foreign Currency Exchange Contracts | Unrealized depreciation on open forward foreign currency exchange contracts | $ | 161,104 | |||
|
| |||||
Total | $ | 161,104 | ||||
|
| |||||
43
Babson Capital Funds Trust 2013 Semi-Annual Report
NOTES TO FINANCIAL STATEMENTS (UNAUDITED) (CONTINUED)
December 31, 2013
Global Credit Income Opportunities Fund
| LIABILITY DERIVATIVES | STATEMENT OF ASSETS LOCATION | FOREIGN EXCHANGE CONTRACTS RISK | ||||
Forward Foreign Currency Exchange Contracts | Unrealized depreciation on open forward foreign currency exchange contracts | $ | 164,073 | |||
|
| |||||
Total | $ | 164,073 | ||||
|
| |||||
The effect of derivative instruments on the Statement of Operations for the period September 16, 2013 through December 31, 2013:
Amount of Realized Gain/(Loss) on Derivatives:
Global Floating Rate Fund
| FORWARD FOREIGN CURRENCY EXCHANGE CONTRACTS | ||||
Derivatives | ||||
Forward Foreign Currency Exchange Contracts | $ | (141,665 | ) | |
|
| |||
Total | $ | (141,665 | ) | |
|
| |||
Global Credit Income Opportunities Fund
| FORWARD FOREIGN CURRENCY EXCHANGE CONTRACTS | ||||
Derivatives | ||||
Forward Foreign Currency Exchange Contracts | $ | (214,418 | ) | |
|
| |||
Total | $ | (214,418 | ) | |
|
| |||
Change in Unrealized Appreciation/(Depreciation) on Derivatives:
Global Floating Rate Fund
| FORWARD FOREIGN CURRENCY EXCHANGE CONTRACTS | ||||
Derivatives | ||||
Forward Foreign Currency Exchange Contracts | $ | (155,364 | ) | |
|
| |||
Total | $ | (155,364 | ) | |
|
| |||
Global Credit Income Opportunities Fund
| FORWARD FOREIGN CURRENCY EXCHANGE CONTRACTS | ||||
Derivatives | ||||
Forward Foreign Currency Exchange Contracts | $ | (164,073 | ) | |
|
| |||
Total | $ | (164,073 | ) | |
|
| |||
Global Floating Rate Fund
| NUMBER OF CONTRACTS, NOTIONAL AMOUNTS OR SHARES/UNITS | FOREIGN EXCHANGE CONTRACT RISK | |||
Forward Foreign Currency Exchange Contracts(1) | $ | 10,125,106 | ||
|
| |||
| (1) | Volume of derivative activity is based on an average of month-end notional amounts outstanding during the period. |
Global Credit Income Opportunities Fund
| NUMBER OF CONTRACTS, NOTIONAL AMOUNTS OR SHARES/UNITS | FOREIGN EXCHANGE CONTRACT RISK | |||
Forward Foreign Currency Exchange Contracts(1) | $ | 13,291,619 | ||
|
| |||
| (1) | Volume of derivative activity is based on an average of month-end notional amounts outstanding during the period. |
44
Babson Capital Funds Trust 2013 Semi-Annual Report
NOTES TO FINANCIAL STATEMENTS (UNAUDITED) (CONTINUED)
December 31, 2013
| I. | Disclosures about Offsetting Assets and Liabilities |
The Financial Accounting Standards Board (“FASB”) issued Accounting Standards Update No. 2011-11 “Disclosures about Offsetting Assets and Liabilities” (“ASU 2011-11”). These disclosure requirements are intended to help better assess the effect or potential effect of offsetting arrangements on a fund’s financial position. In addition, FASB issued Accounting Standards Update No. 2013-01 “Clarifying the Scope of Offsetting Assets and Liabilities” (“ASU 2013-01”), specifying which transactions are subject to disclosures about offsetting.
The following tables illustrate gross and net information about recognized assets eligible for offset in the Statement of Assets and Liabilities; and disclose such amounts subject to an enforceable master netting agreement or similar agreement, by counterparty. A master netting agreement is an agreement between two counterparties who have multiple contracts with each other that provides for the net settlement of all contracts, as well as cash collateral, through a single payment in the event of default on or termination of any one contract:
Global Floating Rate Fund
| DESCRIPTION | GROSS AMOUNTS OF RECOGNIZED ASSETS | GROSS AMOUNTS OFFSET IN THE STATEMENTS OF ASSETS AND LIABILITIES | NET AMOUNTS OF ASSETS PRESENTED IN THE STATEMENTS OF ASSETS AND LIABILITIES | |||||||||
Forward Foreign Currency Exchange Contracts | $ | 5,740 | $ | – | $ | 5,740 | ||||||
|
|
|
|
|
| |||||||
Total | $ | 5,740 | $ | – | $ | 5,740 | ||||||
|
|
|
|
|
| |||||||
| GROSS AMOUNTS NOT OFFSET IN THE STATEMENTS OF ASSETS AND LIABILITIES | ||||||||||||||||
| COUNTERPARTY | NET AMOUNTS OF ASSETS PRESENTED IN THE STATEMENTS OF ASSETS AND LIABILITIES | FINANCIAL INSTRUMENT COLLATERAL(a) | CASH COLLATERAL RECEIVED(a) | NET AMOUNT(b) | ||||||||||||
State Street Bank & Trust Co. | $ | 5,740 | $ | – | $ | – | $ | 5,740 | ||||||||
|
|
|
|
|
|
|
| |||||||||
Total | $ | 5,740 | $ | – | $ | – | $ | 5,740 | ||||||||
|
|
|
|
|
|
|
| |||||||||
| (a) | Collateral disclosed is limited to an amount not to exceed 100% of the net amount of assets presented in the Statements of Assets and Liabilities, for each respective counterparty. |
| (b) | Net Amount represents the amount that is subject to loss in the event of a counterparty failure as of December 31, 2013. |
| DESCRIPTION | GROSS AMOUNTS OF RECOGNIZED LIABILITIES | GROSS AMOUNTS OFFSET IN THE STATEMENT OF ASSETS AND LIABILITIES | NET AMOUNTS OF LIABILITIES PRESENTED IN THE STATEMENTS OF ASSETS AND LIABILITIES | |||||||||
Forward Foreign Currency Exchange Contracts | $ | 161,104 | $ | – | $ | 161,104 | ||||||
|
|
|
|
|
| |||||||
Total | $ | 161,104 | $ | – | $ | 161,104 | ||||||
|
|
|
|
|
| |||||||
45
Babson Capital Funds Trust 2013 Semi-Annual Report
NOTES TO FINANCIAL STATEMENTS (UNAUDITED) (CONTINUED)
December 31, 2013
| GROSS AMOUNTS NOT OFFSET IN THE STATEMENTS OF ASSETS AND LIABILITIES | ||||||||||||||||
| COUNTERPARTY | NET AMOUNTS OF ASSETS PRESENTED IN THE STATEMENTS OF ASSETS AND LIABILITIES | FINANCIAL INSTRUMENT COLLATERAL(a) | CASH COLLATERAL RECEIVED (a) | NET AMOUNT (b) | ||||||||||||
State Street Bank & Trust Co. | $ | 161,104 | $ | – | $ | – | $ | 161,104 | ||||||||
|
|
|
|
|
|
|
| |||||||||
Total | $ | 161,104 | $ | – | $ | – | $ | 161,104 | ||||||||
|
|
|
|
|
|
|
| |||||||||
| (a) | Collateral disclosed is limited to an amount not to exceed 100% of the net amount of assets presented in the Statements of Assets and Liabilities, for each respective counterparty. |
| (b) | Net Amount represents the amount that is subject to loss in the event of a counterparty failure as of December 31, 2013. |
Global Credit Income Opportunities Fund
| DESCRIPTION | GROSS AMOUNTS OF RECOGNIZED LIABILITIES | GROSS AMOUNTS OFFSET IN THE STATEMENTS OF ASSETS AND LIABILITIES | NET AMOUNTS OF LIABILITIES PRESENTED IN THE STATEMENTS OF ASSETS AND LIABILITIES | |||||||||
Forward Foreign Currency Exchange Contracts | $ | 164,073 | $ | – | $ | 164,073 | ||||||
|
|
|
|
|
| |||||||
Total | $ | 164,073 | $ | – | $ | 164,073 | ||||||
|
|
|
|
|
| |||||||
| GROSS AMOUNTS NOT OFFSET IN THE STATEMENTS OF ASSETS AND LIABILITIES | ||||||||||||||||
| COUNTERPARTY | NET AMOUNTS OF ASSETS PRESENTED IN THE STATEMENTS OF ASSETS AND LIABILITIES | FINANCIAL INSTRUMENT COLLATERAL (a) | CASH COLLATERAL RECEIVED (a) | NET AMOUNT (b) | ||||||||||||
State Street Bank & Trust Co. | $ | 164,073 | $ | – | $ | – | $ | 164,073 | ||||||||
|
|
|
|
|
|
|
| |||||||||
Total | $ | 164,073 | $ | – | $ | – | $ | 164,073 | ||||||||
|
|
|
|
|
|
|
| |||||||||
| (a) | Collateral disclosed is limited to an amount not to exceed 100% of the net amount of assets presented in the Statements of Assets and Liabilities, for each respective counterparty. |
| (b) | Net Amount represents the amount that is subject to loss in the event of a counterparty failure as of December 31, 2013. |
| J. | Foreign Securities |
Investing in securities of foreign companies and foreign governments involves special risks and considerations not typically associated with investing in U.S. companies and the U.S. government. These risks include valuation of currencies and adverse political and economic developments. Moreover, securities of many foreign companies, foreign governments, and their markets may be less liquid and their prices more volatile than those of securities of comparable U.S. companies and the U.S. government.
| K. | Foreign Currency Translation |
The books and records of the Funds are maintained in U.S. dollars. Foreign currency transactions are translated into U.S. dollars on the following basis: (i) market value of investment securities, assets and liabilities at the daily rates of exchange, and (ii) purchases and sales of investment securities, dividend and interest income and certain expenses at the rates of exchange prevailing on the respective dates of such transactions. For financial reporting purposes, the Funds do not isolate changes in the exchange rate of investment securities from the fluctuations
46
Babson Capital Funds Trust 2013 Semi-Annual Report
NOTES TO FINANCIAL STATEMENTS (UNAUDITED) (CONTINUED)
December 31, 2013
arising from changes in the market prices of securities. However, for Federal income tax purposes, the Funds do isolate and treat as ordinary income the effect of changes in foreign exchange rates on realized gain or loss from the sale of investment securities and payables and receivables arising from trade-date and settlement-date differences.
| L. | Counterparty Risk |
The Funds seek to manage counterparty credit risk by entering into agreements only with counterparties the Adviser believes have the financial resources to honor their obligations. The Adviser monitors the financial stability of the Funds’ counterparties.
| 3. | Advisory Fee |
The Funds have entered into an Investment Management Agreement (the “Agreement”) with the Adviser. Pursuant to the Agreement, the Global Floating Rate Fund agrees to pay the Adviser a fee payable at the end of each calendar month, at an annual rate of 0.65% of the Fund’s average daily net assets during such month. The Global Credit Income Opportunities Fund agrees to pay the Adviser a fee payable at the end of each calendar month, at an annual rate of 0.75% of the Fund’s average daily net assets during such month.
The Adviser has contractually agreed to waive and/or reimburse a portion of its fees and/or reimburse expenses (excluding 12b-1 fees, interest expenses, taxes, fees incurred in acquiring and disposing of securities and extraordinary expenses) such that total net annual operating expenses for each class do not exceed the following rates:
| CLASS A | CLASS C | CLASS I | CLASS Y | |||||||||||||
Global Floating Rate Fund | 1.05 | % | 1.80 | % | 0.75 | % | 0.75 | % | ||||||||
Global Credit Income Opportunities Fund | 1.20 | % | 1.95 | % | 0.95 | % | 0.95 | % | ||||||||
Pursuant to the expense waiver/reimbursement agreement, the Adviser is entitled to be reimbursed for any fees the Adviser waives and Fund expenses that the Adviser reimburses for a period of three years following such fee waivers and expense reimbursements, to the extent that such reimbursement of the Adviser by a Fund will not cause the Fund to exceed any applicable expense limitation that is in place for the Fund.
The contractual management fee waiver and expense reimbursement agreements between the Funds and the Adviser may be terminated only upon the approval of the Funds’ Board of Trustees.
Subject to the supervision of the Adviser and the Board, the Sub-Adviser manages the investment and reinvestment of a portion of the assets of the Funds, as allocated from time to time to the Sub-Adviser. The Adviser (not the Funds) will pay a portion of the fees it receives to the Sub-Adviser in return for its services.
| 4. | Administrator, Custody, and Transfer Agent Fees |
The Funds have engaged State Street Bank and Trust (“SSB”) to serve as the Funds’ administrator, custodian, fund accountant, and transfer agent. For each of these services, the Funds have agreed to pay SSB a fee payable at the end of each calendar month pursuant to fee agreements between SSB and the Funds. For the period ended December 31, 2013, the aggregate effective fee for these services was at an annual rate of 0.48% and 0.51% of Global Floating Rate Fund and Global Credit Income Opportunities Fund’s average daily managed assets, respectively.
| 5. | Income Taxes |
It is the Funds’ intention to qualify as a RIC under subchapter M of the Internal Revenue Code and distribute all of its taxable income. Accordingly, no provision for Federal income taxes is required in the financial statements.
The cost basis of investments for Federal income tax purposes at December 31, 2013 for the Global Floating Rate Fund and the Global Credit Income Opportunities Fund was as follows:
Global Floating Rate Fund
Cost of investments | $ | 63,064,726 | ||
Gross unrealized appreciation | 872,776 | |||
Gross unrealized depreciation | (30,037 | ) | ||
|
| |||
Net unrealized appreciation | $ | 842,739 | ||
|
|
Global Credit Income Opportunities Fund
Cost of investments | $ | 50,066,227 | ||
Gross unrealized appreciation | 1,411,443 | |||
Gross unrealized depreciation | (20,538 | ) | ||
|
| |||
Net unrealized appreciation | $ | 1,390,905 | ||
|
|
47
Babson Capital Funds Trust 2013 Semi-Annual Report
NOTES TO FINANCIAL STATEMENTS (UNAUDITED) (CONTINUED)
December 31, 2013
| 6. | Investment Transactions |
Purchases and sales of securities (excluding short-term debt securities) for the period from September 16, 2013 through December 31, 2013 were as follows:
| PURCHASES | SALES | |||||||
Global Floating Rate Fund | $ | 71,557,234 | $ | 15,685,810 | ||||
Global Credit Income Opportunities Fund | 66,278,173 | 17,094,680 | ||||||
| 7. | Common Stock |
Transactions in common stock for the period September 16, 2013 through December 31, 2013 were as follows:
Global Floating Rate Fund
Beginning shares | $ | – | ||
Shares sold | 5,700,134 | |||
Shares sold through reinvestments of distributions | – | |||
Shares redeemed | – | |||
|
| |||
Shares at December 31, 2013 | $ | 5,700,134 | ||
|
|
Global Credit Income Opportunities Fund
Beginning shares | $ | – | ||
Shares sold | 5,005,003 | |||
Shares sold through reinvestments of distributions | – | |||
Shares redeemed | – | |||
|
| |||
Shares at December 31, 2013 | $ | 5,005,003 | ||
|
|
48
 Babson Capital Funds Trust
Item 2. Code of Ethics.
Not applicable to this semi-annual report.
Item 3. Audit Committee Financial Expert.
Not applicable to this semi-annual report.
Item 4. Principal Accountant Fees and Services.
Not applicable to this semi-annual report.
Item 5. Audit Committee of Listed Registrants.
Not applicable.
Item 6. Schedule of Investments.
| (a) | The registrant’s Consolidated Schedule of Investments as of the close of the reporting period is included in the Report to Stockholders filed under item 1 of this form. |
| (b) | Not applicable. |
Item 7. Disclosure of Proxy Voting Policies and Procedures for Closed-End Management Investment Companies.
Not applicable.
Item 8. Portfolio Managers of Closed-End Investment Management Companies.
Not applicable.
Item 9. Purchases of Equity Securities by Closed-End Management Investment Company and Affiliated Purchasers.
Not applicable.
Item 10. Submission of Matters to a Vote of Security Holders.
There have been no material changes to procedures by which the shareholders may recommend nominees to the registrant’s Board of Trustees.
Item 11. Controls and Procedures.
| (a) | The registrant’s principal executive officer and principal financial officers, or persons performing similar functions, have concluded that the registrant’s disclosure controls and procedures as defined in Rule 30a-3(c) under the Investment Company Act of 1940, as amended (the “1940 Act”), are effective as of a date within 90 days of the filing date of this report based on the evaluation of these controls and procedures required by Rule 30a-3(b) under the 1940 Act and Rules 13a-15(b) or 15d-15(b) under the Securities Exchange Act of 1934, as amended. |
| (b) | There were no changes in the registrant’s internal control over financial reporting (as defined in Rule 30a-3(d) under the 1940 Act) that occurred during the second fiscal quarter of the period covered by this report that have materially affected or are reasonably likely to materially affect, the registrant’s internal control over financial reporting. |
Item 12. Exhibits.
| (a)(1) | Not applicable to this semi-annual report. | |
| (a)(2) | Certifications pursuant to Rule 30a-2(a) are attached hereto. | |
| (a)(3) | Not applicable. | |
| (b) | Certification pursuant to Rule 30a-2(b) is attached hereto. | |
SIGNATURES
Pursuant to the requirements of the Securities Exchange Act of 1934 and the Investment Company Act of 1940, the registrant has duly caused this report to be signed on its behalf by the undersigned, thereunto duly authorized.
(Registrant) | Babson Capital Funds Trust | |
| By: (Signature and Title) | /s/ Anthony J. Sciacca | |
| Anthony J. Sciacca, President (Principal Executive Officer) | ||
Date March 7, 2014 | ||
Pursuant to the requirements of the Securities Exchange Act of 1934 and the Investment Company Act of 1940, this report has been signed below by the following persons on behalf of the registrant and in the capacities and on the dates indicated.
| By: (Signature and Title) | /s/ Anthony J. Sciacca | |
| Anthony J. Sciacca, President (Principal Executive Officer) | ||
Date March 7, 2014 | ||
| By: (Signature and Title) | /s/ Patrick Hoefling | |
| Patrick Hoefling, Chief Financial Officer (Principal Financial Officer) | ||
Date March 7, 2014 | ||